UNITED STATES
SECURITIES AND EXCHANGE COMMISSION
Washington, D.C. 20549
FORM N-CSR
CERTIFIED SHAREHOLDER REPORT OF REGISTERED
MANAGEMENT INVESTMENT COMPANIES
Investment Company Act file number 811-02105
Fidelity Salem Street Trust
(Exact name of registrant as specified in charter)
245 Summer St., Boston, MA 02210
(Address of principal executive offices) (Zip code)
Margaret Carey, Secretary
245 Summer St.
Boston, Massachusetts 02210
(Name and address of agent for service)
Registrant's telephone number, including area code:
617-563-7000
| |
Date of fiscal year end: | August 31 |
|
|
Date of reporting period: | February 28, 2023 |
Item 1.
Reports to Stockholders
Fidelity® Short-Term Bond Fund
Semi-Annual Report
February 28, 2023
Includes Fidelity and Fidelity Advisor share classes
Contents
To view a fund's proxy voting guidelines and proxy voting record for the 12-month period ended June 30, visit http://www.fidelity.com/proxyvotingresults or visit the Securities and Exchange Commission's (SEC) web site at http://www.sec.gov.
You may also call 1-800-544-8544 if you're an individual investing directly with Fidelity, call 1-800-835-5092 if you're a plan sponsor or participant with Fidelity as your recordkeeper or call 1-877-208-0098 on institutional accounts or if you're an advisor or invest through one to request a free copy of the proxy voting guidelines.
Standard & Poor's, S&P and S&P 500 are registered service marks of The McGraw-Hill Companies, Inc. and have been licensed for use by Fidelity Distributors Corporation.
Other third-party marks appearing herein are the property of their respective owners.
All other marks appearing herein are registered or unregistered trademarks or service marks of FMR LLC or an affiliated company. © 2023 FMR LLC. All rights reserved.
This report and the financial statements contained herein are submitted for the general information of the shareholders of the Fund. This report is not authorized for distribution to prospective investors in the Fund unless preceded or accompanied by an effective prospectus.
A fund files its complete schedule of portfolio holdings with the SEC for the first and third quarters of each fiscal year on Form N-PORT. Forms N-PORT are available on the SEC's web site at http://www.sec.gov. A fund's Forms N-PORT may be reviewed and copied at the SEC's Public Reference Room in Washington, DC. Information regarding the operation of the SEC's Public Reference Room may be obtained by calling 1-800-SEC-0330.
For a complete list of a fund's portfolio holdings, view the most recent holdings listing, semiannual report, or annual report on Fidelity's web site at http://www.fidelity.com, http://www.institutional.fidelity.com, or http://www.401k.com, as applicable.
NOT FDIC INSURED •MAY LOSE VALUE •NO BANK GUARANTEE
Neither the Fund nor Fidelity Distributors Corporation is a bank.
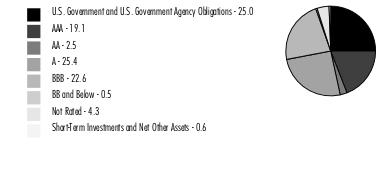
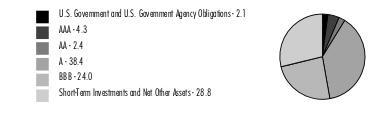
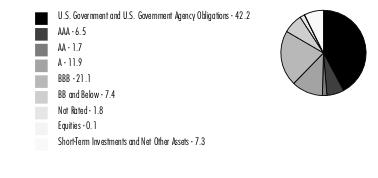
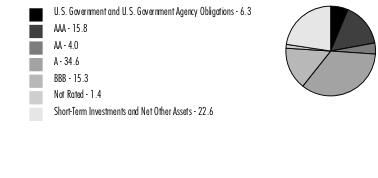
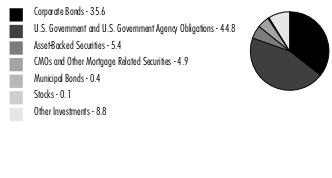
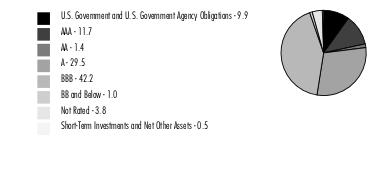
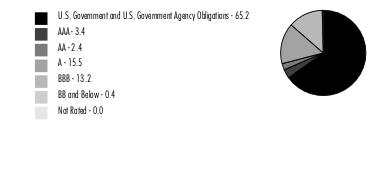
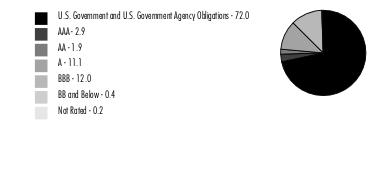
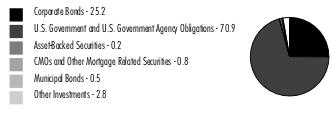
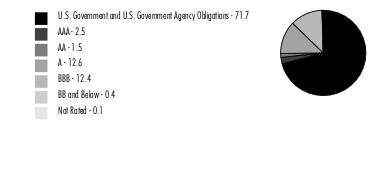
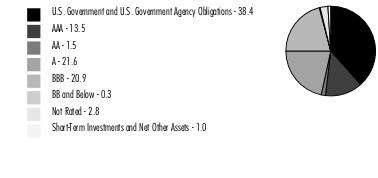
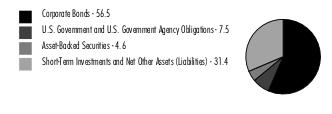
Quality Diversification (% of Fund's net assets) |
|
| |
| We have used ratings from Moody's Investors Service, Inc. Where Moody's® ratings are not available, we have used S&P® ratings. All ratings are as of the date indicated and do not reflect subsequent changes. |
Securities rated BB or below were rated investment grade at the time of acquisition.
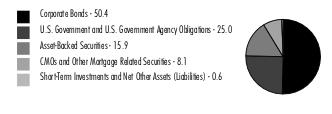
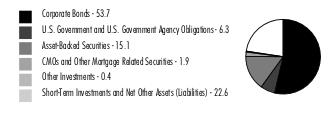
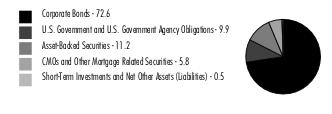
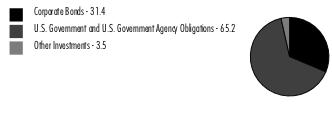
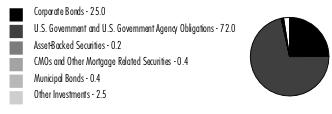
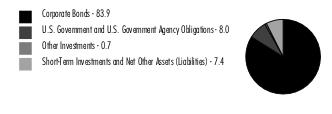
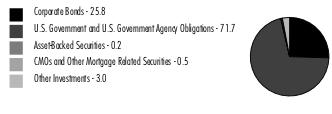
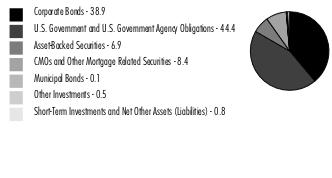
Asset Allocation (% of Fund's net assets) |
|
Foreign investments - 20% |
Futures - 9.2% |
|
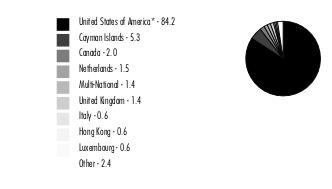
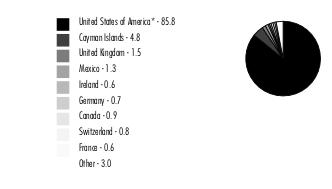
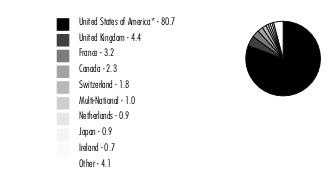
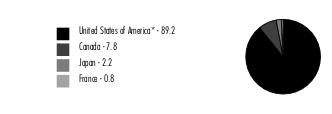
Geographic Diversification (% of Fund's net assets) |
|
* Includes Short-Term investments and Net Other Assets (Liabilities). Percentages are based on country or territory of incorporation and are adjusted for the effect of derivatives, if applicable. |
| |
Showing Percentage of Net Assets
| Nonconvertible Bonds - 50.4% |
| | | Principal Amount (a) (000s) | Value ($) (000s) |
| COMMUNICATION SERVICES - 1.7% | | | |
| Diversified Telecommunication Services - 1.2% | | | |
| AT&T, Inc. 0.9% 3/25/24 | | 10,610 | 10,118 |
| NTT Finance Corp.: | | | |
| 0.373% 3/3/23 (b) | | 8,340 | 8,339 |
| 0.583% 3/1/24 (b) | | 3,469 | 3,304 |
| Verizon Communications, Inc.: | | | |
| U.S. Secured Overnight Fin. Rate (SOFR) Averages Index + 0.500% 4.913% 3/22/24 (c)(d) | | 5,170 | 5,167 |
| 0.75% 3/22/24 | | 3,860 | 3,678 |
| | | | 30,606 |
| Media - 0.1% | | | |
| Magallanes, Inc.: | | | |
| 3.428% 3/15/24 (b) | | 1,645 | 1,605 |
| 3.638% 3/15/25 (b) | | 901 | 859 |
| | | | 2,464 |
| Wireless Telecommunication Services - 0.4% | | | |
| Rogers Communications, Inc. 2.95% 3/15/25 (b) | | 4,725 | 4,481 |
| T-Mobile U.S.A., Inc. 3.5% 4/15/25 | | 7,030 | 6,734 |
| | | | 11,215 |
TOTAL COMMUNICATION SERVICES | | | 44,285 |
| CONSUMER DISCRETIONARY - 3.3% | | | |
| Automobiles - 2.7% | | | |
| BMW U.S. Capital LLC: | | | |
| 3.25% 4/1/25 (b) | | 8,000 | 7,715 |
| 3.45% 4/12/23 (b) | | 12,171 | 12,146 |
| Daimler Finance North America LLC: | | | |
| 0.75% 3/1/24 (b) | | 8,516 | 8,133 |
| 5.5% 11/27/24 (b) | | 5,640 | 5,654 |
| General Motors Financial Co., Inc.: | | | |
| U.S. Secured Overnight Fin. Rate (SOFR) Index + 1.200% 5.7531% 11/17/23 (c)(d) | | 10,000 | 10,007 |
| 1.05% 3/8/24 | | 1,943 | 1,856 |
| 1.25% 1/8/26 | | 6,779 | 5,996 |
| 4.15% 6/19/23 | | 4,200 | 4,184 |
| Volkswagen Group of America Finance LLC: | | | |
| 0.875% 11/22/23 (b) | | 8,525 | 8,249 |
| 3.125% 5/12/23 (b) | | 5,897 | 5,869 |
| 3.95% 6/6/25 (b) | | 2,950 | 2,852 |
| | | | 72,661 |
| Distributors - 0.2% | | | |
| Genuine Parts Co. 1.75% 2/1/25 | | 4,784 | 4,464 |
| Multiline Retail - 0.3% | | | |
| Dollar General Corp. 4.25% 9/20/24 | | 6,347 | 6,235 |
| Specialty Retail - 0.1% | | | |
| Lowe's Companies, Inc. 4.4% 9/8/25 | | 3,318 | 3,261 |
TOTAL CONSUMER DISCRETIONARY | | | 86,621 |
| CONSUMER STAPLES - 2.8% | | | |
| Beverages - 0.4% | | | |
| Constellation Brands, Inc. 3.6% 5/9/24 | | 7,000 | 6,858 |
| Dr. Pepper Snapple Group, Inc. 0.75% 3/15/24 | | 5,000 | 4,756 |
| | | | 11,614 |
| Food & Staples Retailing - 0.3% | | | |
| 7-Eleven, Inc. 0.8% 2/10/24 (b) | | 1,912 | 1,826 |
| Mondelez International Holdings Netherlands BV 0.75% 9/24/24 (b) | | 7,661 | 7,117 |
| | | | 8,943 |
| Food Products - 0.7% | | | |
| Conagra Brands, Inc. 0.5% 8/11/23 | | 5,758 | 5,635 |
| JDE Peet's BV 0.8% 9/24/24 (b) | | 6,779 | 6,240 |
| Mondelez International, Inc. 2.125% 3/17/24 | | 7,500 | 7,266 |
| | | | 19,141 |
| Tobacco - 1.4% | | | |
| Altria Group, Inc. 2.35% 5/6/25 | | 1,269 | 1,190 |
| BAT Capital Corp. 3.222% 8/15/24 | | 10,014 | 9,651 |
| BAT International Finance PLC 1.668% 3/25/26 | | 6,714 | 5,962 |
| Imperial Tobacco Finance PLC 3.125% 7/26/24 (b) | | 7,381 | 7,081 |
| Philip Morris International, Inc.: | | | |
| 2.875% 5/1/24 | | 6,658 | 6,463 |
| 5% 11/17/25 | | 5,425 | 5,393 |
| | | | 35,740 |
TOTAL CONSUMER STAPLES | | | 75,438 |
| ENERGY - 2.9% | | | |
| Energy Equipment & Services - 0.0% | | | |
| Baker Hughes Co. 1.231% 12/15/23 | | 1,575 | 1,526 |
| Oil, Gas & Consumable Fuels - 2.9% | | | |
| Canadian Natural Resources Ltd. 2.05% 7/15/25 | | 4,512 | 4,167 |
| ConocoPhillips Co. 2.4% 3/7/25 | | 2,991 | 2,832 |
| Enbridge, Inc.: | | | |
| 0.55% 10/4/23 | | 10,000 | 9,708 |
| 2.15% 2/16/24 | | 1,167 | 1,130 |
| 2.5% 2/14/25 | | 1,218 | 1,150 |
| Energy Transfer LP: | | | |
| 4.2% 9/15/23 | | 1,944 | 1,931 |
| 4.25% 3/15/23 | | 5,208 | 5,206 |
| Enterprise Products Operating LP 5.05% 1/10/26 | | 4,128 | 4,119 |
| EQT Corp. 5.678% 10/1/25 | | 5,225 | 5,157 |
| Equinor ASA 1.75% 1/22/26 | | 1,409 | 1,286 |
| Kinder Morgan Energy Partners LP 3.5% 9/1/23 | | 3,732 | 3,700 |
| MPLX LP: | | | |
| 1.75% 3/1/26 | | 10,071 | 9,006 |
| 4.5% 7/15/23 | | 1,148 | 1,144 |
| Occidental Petroleum Corp. 2.9% 8/15/24 | | 2,755 | 2,638 |
| Phillips 66 Co.: | | | |
| 0.9% 2/15/24 | | 8,080 | 7,735 |
| 3.85% 4/9/25 | | 8,057 | 7,821 |
| Pioneer Natural Resources Co. 0.55% 5/15/23 | | 6,522 | 6,458 |
| The Williams Companies, Inc. 5.4% 3/2/26 | | 1,346 | 1,346 |
| | | | 76,534 |
TOTAL ENERGY | | | 78,060 |
| FINANCIALS - 30.2% | | | |
| Banks - 17.1% | | | |
| Bank of America Corp.: | | | |
| U.S. Secured Overnight Fin. Rate (SOFR) Index + 1.290% 5.08% 1/20/27 (c)(d) | | 6,000 | 5,937 |
| 0.81% 10/24/24 (c) | | 7,030 | 6,810 |
| 0.976% 4/22/25 (c) | | 8,000 | 7,561 |
| 1.843% 2/4/25 (c) | | 10,000 | 9,636 |
| 3.841% 4/25/25 (c) | | 7,500 | 7,345 |
| 4.827% 7/22/26 (c) | | 5,015 | 4,933 |
| Bank of Montreal 4.25% 9/14/24 | | 7,000 | 6,877 |
| Bank of Nova Scotia 0.8% 6/15/23 | | 11,078 | 10,901 |
| Banque Federative du Credit Mutuel SA 4.524% 7/13/25 (b) | | 5,542 | 5,416 |
| Barclays PLC: | | | |
| 1.007% 12/10/24 (c) | | 4,487 | 4,320 |
| 2.852% 5/7/26 (c) | | 4,878 | 4,567 |
| 4.338% 5/16/24 (c) | | 7,085 | 7,058 |
| 5.304% 8/9/26 (c) | | 2,578 | 2,540 |
| BNP Paribas SA 3.5% 3/1/23 (b) | | 5,640 | 5,640 |
| BPCE SA 1.625% 1/14/25 (b) | | 9,500 | 8,829 |
| Canadian Imperial Bank of Commerce: | | | |
| 0.95% 6/23/23 | | 16,765 | 16,549 |
| 3.945% 8/4/25 | | 6,059 | 5,870 |
| Citigroup, Inc.: | | | |
| 0.981% 5/1/25 (c) | | 4,488 | 4,238 |
| 2.014% 1/25/26 (c) | | 8,000 | 7,461 |
| 3.106% 4/8/26 (c) | | 6,714 | 6,376 |
| 4.14% 5/24/25 (c) | | 7,000 | 6,871 |
| 5.61% 9/29/26 (c) | | 5,000 | 5,000 |
| Danske Bank A/S: | | | |
| 3.875% 9/12/23 (b) | | 7,592 | 7,521 |
| 6.466% 1/9/26 (b)(c) | | 3,260 | 3,280 |
| DNB Bank ASA 0.856% 9/30/25 (b)(c) | | 10,000 | 9,234 |
| HSBC Holdings PLC: | | | |
| 0.976% 5/24/25 (c) | | 8,400 | 7,902 |
| 1.162% 11/22/24 (c) | | 8,100 | 7,815 |
| 1.645% 4/18/26 (c) | | 6,806 | 6,235 |
| 3.95% 5/18/24 (c) | | 5,000 | 4,978 |
| Huntington National Bank 5.699% 11/18/25 (c) | | 5,500 | 5,508 |
| Intesa Sanpaolo SpA 3.25% 9/23/24 (b) | | 10,000 | 9,525 |
| JPMorgan Chase & Co.: | | | |
| 0.824% 6/1/25 (c) | | 6,568 | 6,162 |
| 1.514% 6/1/24 (c) | | 13,972 | 13,835 |
| 3.845% 6/14/25 (c) | | 7,500 | 7,321 |
| KeyBank NA 4.15% 8/8/25 | | 2,003 | 1,954 |
| KeyCorp 3.878% 5/23/25 (c) | | 2,344 | 2,293 |
| Lloyds Banking Group PLC: | | | |
| 0.695% 5/11/24 (c) | | 5,464 | 5,403 |
| 4.716% 8/11/26 (c) | | 7,515 | 7,327 |
| Mitsubishi UFJ Financial Group, Inc.: | | | |
| 0.848% 9/15/24 (c) | | 8,059 | 7,846 |
| 0.953% 7/19/25 (c) | | 7,000 | 6,535 |
| 0.962% 10/11/25 (c) | | 8,775 | 8,101 |
| 2.193% 2/25/25 | | 9,124 | 8,549 |
| 4.788% 7/18/25 (c) | | 4,000 | 3,946 |
| Mizuho Financial Group, Inc.: | | | |
| 0.849% 9/8/24 (c) | | 4,265 | 4,153 |
| 2.651% 5/22/26 (c) | | 6,307 | 5,882 |
| National Bank of Canada 0.55% 11/15/24 (c) | | 3,356 | 3,236 |
| NatWest Group PLC: | | | |
| 2.359% 5/22/24 (c) | | 5,310 | 5,264 |
| 3.875% 9/12/23 | | 14,202 | 14,063 |
| 5.847% 3/2/27 (c) | | 5,500 | 5,503 |
| NatWest Markets PLC 0.8% 8/12/24 (b) | | 4,320 | 4,024 |
| PNC Bank NA 2.5% 8/27/24 | | 6,217 | 5,974 |
| Rabobank Nederland New York Branch 3.875% 8/22/24 | | 7,890 | 7,734 |
| Regions Financial Corp. 2.25% 5/18/25 | | 3,950 | 3,692 |
| Royal Bank of Canada 2.55% 7/16/24 | | 8,572 | 8,255 |
| Santander Holdings U.S.A., Inc.: | | | |
| 3.5% 6/7/24 | | 7,230 | 7,039 |
| 5.807% 9/9/26 (c) | | 3,956 | 3,955 |
| Societe Generale: | | | |
| 2.226% 1/21/26 (b)(c) | | 10,000 | 9,294 |
| 2.625% 10/16/24 (b) | | 1,249 | 1,186 |
| 3.875% 3/28/24 (b) | | 4,871 | 4,772 |
| 4.351% 6/13/25 (b) | | 4,500 | 4,392 |
| Sumitomo Mitsui Financial Group, Inc. 0.508% 1/12/24 | | 804 | 771 |
| Svenska Handelsbanken AB 0.625% 6/30/23 (b) | | 10,340 | 10,184 |
| The Toronto-Dominion Bank 2.35% 3/8/24 | | 7,500 | 7,273 |
| Truist Financial Corp.: | | | |
| 4.26% 7/28/26 (c) | | 5,500 | 5,361 |
| 5.9% 10/28/26 (c) | | 7,375 | 7,487 |
| U.S. Bancorp 5.727% 10/21/26 (c) | | 6,750 | 6,833 |
| Wells Fargo & Co.: | | | |
| 1.654% 6/2/24 (c) | | 8,218 | 8,137 |
| 2.164% 2/11/26 (c) | | 20,142 | 18,824 |
| | | | 455,293 |
| Capital Markets - 5.4% | | | |
| Credit Suisse AG: | | | |
| 0.495% 2/2/24 | | 8,000 | 7,542 |
| 0.52% 8/9/23 | | 7,000 | 6,773 |
| Credit Suisse Group AG 6.373% 7/15/26 (b)(c) | | 4,600 | 4,327 |
| Deutsche Bank AG New York Branch: | | | |
| 0.898% 5/28/24 | | 2,427 | 2,287 |
| 0.962% 11/8/23 | | 5,352 | 5,191 |
| 1.447% 4/1/25 (c) | | 5,743 | 5,436 |
| 2.129% 11/24/26 (c) | | 5,000 | 4,481 |
| 2.222% 9/18/24 (c) | | 20,476 | 20,015 |
| Goldman Sachs Group, Inc.: | | | |
| 0.657% 9/10/24 (c) | | 10,000 | 9,720 |
| 1.757% 1/24/25 (c) | | 10,000 | 9,625 |
| 5.7% 11/1/24 | | 5,500 | 5,532 |
| Intercontinental Exchange, Inc. 3.65% 5/23/25 | | 4,172 | 4,066 |
| Morgan Stanley: | | | |
| 0.731% 4/5/24 (c) | | 7,335 | 7,298 |
| 0.79% 5/30/25 (c) | | 8,500 | 7,960 |
| 3.62% 4/17/25 (c) | | 5,750 | 5,617 |
| 3.737% 4/24/24 (c) | | 7,548 | 7,526 |
| 4% 7/23/25 | | 6,714 | 6,543 |
| 4.679% 7/17/26 (c) | | 4,223 | 4,141 |
| UBS AG London Branch 1.375% 1/13/25 (b) | | 5,623 | 5,223 |
| UBS Group AG: | | | |
| 1.008% 7/30/24 (b)(c) | | 8,398 | 8,231 |
| 4.49% 8/5/25 (b)(c) | | 7,500 | 7,389 |
| | | | 144,923 |
| Consumer Finance - 4.0% | | | |
| AerCap Ireland Capital Ltd./AerCap Global Aviation Trust: | | | |
| U.S. Secured Overnight Fin. Rate (SOFR) Index + 0.680% 5.1017% 9/29/23 (c)(d) | | 7,000 | 6,966 |
| 1.15% 10/29/23 | | 7,000 | 6,793 |
| 1.65% 10/29/24 | | 7,750 | 7,189 |
| 1.75% 1/30/26 | | 5,724 | 5,060 |
| 4.875% 1/16/24 | | 2,014 | 1,994 |
| Ally Financial, Inc.: | | | |
| 3.05% 6/5/23 | | 5,730 | 5,691 |
| 5.125% 9/30/24 | | 6,284 | 6,229 |
| American Express Co.: | | | |
| 2.25% 3/4/25 | | 3,469 | 3,263 |
| 3.375% 5/3/24 | | 6,000 | 5,863 |
| Capital One Financial Corp.: | | | |
| 1.343% 12/6/24 (c) | | 6,500 | 6,265 |
| 2.6% 5/11/23 | | 4,486 | 4,464 |
| 4.166% 5/9/25 (c) | | 10,090 | 9,864 |
| 4.985% 7/24/26 (c) | | 2,457 | 2,417 |
| Hyundai Capital America 1% 9/17/24 (b) | | 7,995 | 7,439 |
| John Deere Capital Corp. 3.4% 6/6/25 | | 4,589 | 4,427 |
| Synchrony Financial: | | | |
| 4.25% 8/15/24 | | 9,435 | 9,207 |
| 4.375% 3/19/24 | | 8,076 | 7,964 |
| Toyota Motor Credit Corp. 5.4% 11/10/25 | | 6,500 | 6,564 |
| | | | 107,659 |
| Diversified Financial Services - 1.6% | | | |
| Athene Global Funding: | | | |
| 0.95% 1/8/24 (b) | | 7,220 | 6,939 |
| 1% 4/16/24 (b) | | 7,000 | 6,583 |
| 1.716% 1/7/25 (b) | | 6,500 | 6,024 |
| Blackstone Private Credit Fund 4.7% 3/24/25 | | 7,096 | 6,844 |
| Corebridge Financial, Inc. 3.5% 4/4/25 (b) | | 812 | 777 |
| GA Global Funding Trust 1.25% 12/8/23 (b) | | 8,200 | 7,918 |
| Jackson Financial, Inc. 1.125% 11/22/23 | | 8,613 | 8,347 |
| | | | 43,432 |
| Insurance - 2.1% | | | |
| American International Group, Inc. 2.5% 6/30/25 | | 4,476 | 4,213 |
| Equitable Financial Life Global Funding: | | | |
| 0.5% 11/17/23 (b) | | 10,000 | 9,646 |
| 1.1% 11/12/24 (b) | | 8,150 | 7,587 |
| Great-West Lifeco U.S. Finance 2020 LP 0.904% 8/12/25 (b) | | 3,527 | 3,135 |
| MassMutual Global Funding II 4.15% 8/26/25 (b) | | 5,651 | 5,492 |
| Metropolitan Life Global Funding I 0.9% 6/8/23 (b) | | 5,675 | 5,608 |
| Pacific Life Global Funding II 1.2% 6/24/25 (b) | | 5,535 | 5,008 |
| Principal Life Global Funding II U.S. Secured Overnight Fin. Rate (SOFR) Index + 0.450% 4.8969% 4/12/24 (b)(c)(d) | | 3,616 | 3,616 |
| Protective Life Global Funding: | | | |
| 0.502% 4/12/23 (b) | | 8,500 | 8,456 |
| 3.218% 3/28/25 (b) | | 1,703 | 1,618 |
| | | | 54,379 |
TOTAL FINANCIALS | | | 805,686 |
| HEALTH CARE - 2.6% | | | |
| Biotechnology - 0.3% | | | |
| Amgen, Inc. 5.25% 3/2/25 (e) | | 8,000 | 7,982 |
| Health Care Providers & Services - 1.0% | | | |
| Cigna Group 0.613% 3/15/24 | | 1,965 | 1,871 |
| CVS Health Corp. 5% 2/20/26 | | 7,000 | 6,961 |
| Elevance Health, Inc. 0.45% 3/15/23 | | 9,394 | 9,378 |
| Humana, Inc. 0.65% 8/3/23 | | 8,872 | 8,698 |
| | | | 26,908 |
| Life Sciences Tools & Services - 0.6% | | | |
| PerkinElmer, Inc. 0.85% 9/15/24 | | 8,310 | 7,732 |
| Thermo Fisher Scientific, Inc. 1.215% 10/18/24 | | 8,500 | 7,965 |
| | | | 15,697 |
| Pharmaceuticals - 0.7% | | | |
| AstraZeneca Finance LLC 0.7% 5/28/24 | | 6,275 | 5,935 |
| Bayer U.S. Finance II LLC 4.25% 12/15/25 (b) | | 6,748 | 6,527 |
| GSK Consumer Healthcare Capital 3.125% 3/24/25 | | 7,390 | 7,027 |
| | | | 19,489 |
TOTAL HEALTH CARE | | | 70,076 |
| INDUSTRIALS - 2.6% | | | |
| Aerospace & Defense - 0.5% | | | |
| Raytheon Technologies Corp. 5% 2/27/26 | | 3,832 | 3,826 |
| The Boeing Co.: | | | |
| 1.95% 2/1/24 | | 3,500 | 3,380 |
| 4.875% 5/1/25 | | 4,713 | 4,647 |
| | | | 11,853 |
| Airlines - 0.3% | | | |
| Delta Air Lines, Inc. 2.9% 10/28/24 | | 7,598 | 7,230 |
| Commercial Services & Supplies - 0.3% | | | |
| Republic Services, Inc. 0.875% 11/15/25 | | 10,000 | 8,865 |
| Industrial Conglomerates - 0.2% | | | |
| Siemens Financieringsmaatschappij NV 0.65% 3/11/24 (b) | | 5,142 | 4,893 |
| Machinery - 0.5% | | | |
| Daimler Trucks Finance North America LLC: | | | |
| 1.625% 12/13/24 (b) | | 2,657 | 2,485 |
| 5.2% 1/17/25 (b) | | 2,880 | 2,861 |
| Parker Hannifin Corp. 3.65% 6/15/24 | | 7,000 | 6,843 |
| | | | 12,189 |
| Road & Rail - 0.4% | | | |
| Canadian Pacific Railway Co. 1.35% 12/2/24 | | 12,296 | 11,462 |
| Trading Companies & Distributors - 0.2% | | | |
| Air Lease Corp.: | | | |
| 0.7% 2/15/24 | | 2,930 | 2,792 |
| 0.8% 8/18/24 | | 3,717 | 3,451 |
| | | | 6,243 |
| Transportation Infrastructure - 0.2% | | | |
| Avolon Holdings Funding Ltd. 2.875% 2/15/25 (b) | | 7,000 | 6,511 |
TOTAL INDUSTRIALS | | | 69,246 |
| INFORMATION TECHNOLOGY - 1.4% | | | |
| Electronic Equipment & Components - 0.1% | | | |
| Dell International LLC/EMC Corp. 5.45% 6/15/23 | | 2,804 | 2,802 |
| IT Services - 0.3% | | | |
| The Western Union Co.: | | | |
| 2.85% 1/10/25 | | 1,585 | 1,505 |
| 4.25% 6/9/23 | | 6,025 | 6,002 |
| | | | 7,507 |
| Semiconductors & Semiconductor Equipment - 0.3% | | | |
| Analog Devices, Inc. U.S. Secured Overnight Fin. Rate (SOFR) Index + 0.250% 4.6746% 10/1/24 (c)(d) | | 4,150 | 4,108 |
| Microchip Technology, Inc. 0.983% 9/1/24 | | 4,231 | 3,952 |
| | | | 8,060 |
| Software - 0.7% | | | |
| Oracle Corp. 5.8% 11/10/25 | | 7,000 | 7,083 |
| VMware, Inc.: | | | |
| 0.6% 8/15/23 | | 8,000 | 7,826 |
| 1% 8/15/24 | | 5,608 | 5,240 |
| | | | 20,149 |
TOTAL INFORMATION TECHNOLOGY | | | 38,518 |
| MATERIALS - 0.4% | | | |
| Chemicals - 0.4% | | | |
| Celanese U.S. Holdings LLC 5.9% 7/5/24 | | 7,100 | 7,092 |
| Nutrien Ltd. 5.9% 11/7/24 | | 3,720 | 3,740 |
| | | | 10,832 |
| REAL ESTATE - 0.3% | | | |
| Equity Real Estate Investment Trusts (REITs) - 0.3% | | | |
| American Tower Corp. 1.3% 9/15/25 | | 2,980 | 2,679 |
| Crown Castle International Corp. 1.35% 7/15/25 | | 700 | 636 |
| Welltower Op 3.625% 3/15/24 | | 3,276 | 3,208 |
| | | | 6,523 |
| UTILITIES - 2.2% | | | |
| Electric Utilities - 1.1% | | | |
| Duke Energy Corp. U.S. Secured Overnight Fin. Rate (SOFR) Index + 0.250% 4.6101% 6/10/23 (c)(d) | | 6,139 | 6,134 |
| FirstEnergy Corp.: | | | |
| 1.6% 1/15/26 | | 747 | 665 |
| 2.05% 3/1/25 | | 4,143 | 3,865 |
| Florida Power & Light Co. 2.85% 4/1/25 | | 1,893 | 1,812 |
| PPL Electric Utilities Corp. 3 month U.S. LIBOR + 0.250% 4.9739% 9/28/23 (c)(d) | | 3,666 | 3,656 |
| Southern Co.: | | | |
| U.S. Secured Overnight Fin. Rate (SOFR) Averages Index + 0.370% 4.9251% 5/10/23 (c)(d) | | 6,389 | 6,386 |
| 0.6% 2/26/24 | | 3,086 | 2,939 |
| Tampa Electric Co. 3.875% 7/12/24 | | 4,057 | 3,963 |
| | | | 29,420 |
| Gas Utilities - 0.2% | | | |
| CenterPoint Energy Resources Corp. 3 month U.S. LIBOR + 0.500% 5.2786% 3/2/23 (c)(d) | | 4,082 | 4,082 |
| Dominion Gas Holdings LLC 2.5% 11/15/24 | | 1,475 | 1,407 |
| | | | 5,489 |
| Independent Power and Renewable Electricity Producers - 0.1% | | | |
| Emera U.S. Finance LP 0.833% 6/15/24 | | 3,897 | 3,656 |
| Multi-Utilities - 0.8% | | | |
| CenterPoint Energy, Inc. U.S. Secured Overnight Fin. Rate (SOFR) Averages Index + 0.650% 5.2048% 5/13/24 (c)(d) | | 5,926 | 5,898 |
| DTE Energy Co. 4.22% 11/1/24 | | 7,490 | 7,325 |
| NiSource, Inc. 0.95% 8/15/25 | | 2,976 | 2,683 |
| Sempra Energy 3.3% 4/1/25 | | 2,834 | 2,713 |
| WEC Energy Group, Inc. 5% 9/27/25 | | 2,638 | 2,614 |
| | | | 21,233 |
TOTAL UTILITIES | | | 59,798 |
| TOTAL NONCONVERTIBLE BONDS (Cost $1,395,285) | | | 1,345,083 |
| | | | |
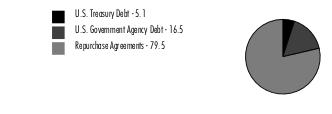
| U.S. Treasury Obligations - 24.3% |
| | | Principal Amount (a) (000s) | Value ($) (000s) |
| U.S. Treasury Notes: | | | |
| 0.25% 7/31/25 (f) | | 123,941 | 111,663 |
| 0.25% 10/31/25 | | 101,409 | 90,563 |
| 3.875% 1/15/26 | | 180,000 | 176,916 |
| 4.125% 10/31/27 | | 135,000 | 134,325 |
| 4.25% 9/30/24 | | 30,257 | 29,916 |
| 4.5% 11/30/24 | | 5,000 | 4,964 |
| 4.5% 11/15/25 | | 100,000 | 99,832 |
| TOTAL U.S. TREASURY OBLIGATIONS (Cost $657,671) | | | 648,179 |
| | | | |
| U.S. Government Agency - Mortgage Securities - 0.3% |
| | | Principal Amount (a) (000s) | Value ($) (000s) |
| Fannie Mae - 0.3% | | | |
| 4.5% 3/1/39 to 9/1/49 | | 6,087 | 5,978 |
| 5.5% 11/1/34 | | 1,169 | 1,186 |
| 7.5% 11/1/31 | | 0 | 0 |
TOTAL FANNIE MAE | | | 7,164 |
| Freddie Mac - 0.0% | | | |
| 8.5% 5/1/26 to 7/1/28 | | 11 | 11 |
| Ginnie Mae - 0.0% | | | |
| 7% to 7% 1/15/25 to 8/15/32 | | 134 | 138 |
| TOTAL U.S. GOVERNMENT AGENCY - MORTGAGE SECURITIES (Cost $7,895) | | | 7,313 |
| | | | |
| Asset-Backed Securities - 15.9% |
| | | Principal Amount (a) (000s) | Value ($) (000s) |
| Aimco: | | | |
| Series 2021-10A Class AR, 3 month U.S. LIBOR + 1.060% 5.8753% 7/22/32 (b)(c)(d) | | 8,770 | 8,658 |
| Series 2021-BA Class AR, 3 month U.S. LIBOR + 1.100% 5.8924% 1/15/32 (b)(c)(d) | | 8,883 | 8,772 |
| AIMCO CLO Ltd. Series 2022-12A Class AR, CME TERM SOFR 3 MONTH INDEX + 1.170% 5.8276% 1/17/32 (b)(c)(d) | | 5,000 | 4,961 |
| American Express Credit Account Master Trust: | | | |
| Series 2021-1 Class A, 0.9% 11/15/26 | | 9,780 | 9,111 |
| Series 2022-2 Class A, 3.39% 5/15/27 | | 8,500 | 8,195 |
| Series 2022-3 Class A, 3.75% 8/15/27 | | 7,000 | 6,795 |
| Series 2022-4 Class A, 4.95% 10/15/27 | | 4,492 | 4,491 |
| AmeriCredit Automobile Receivables Trust Series 2021-3 Class A3, 0.76% 8/18/26 | | 7,993 | 7,652 |
| Ares LII CLO Ltd. Series 2021-52A Class A1R, 3 month U.S. LIBOR + 1.050% 5.8653% 4/22/31 (b)(c)(d) | | 7,663 | 7,567 |
| Bank of America Credit Card Master Trust: | | | |
| Series 2020-A1 Class A1, 0.34% 5/15/26 | | 4,973 | 4,789 |
| Series 2021-A1 Class A1, 0.44% 9/15/26 | | 9,066 | 8,597 |
| Series 2022-A1 Class A1, 3.53% 11/15/27 | | 7,895 | 7,635 |
| BMW Vechicle Lease Trust 2023-1 Series 2023-1 Class A3, 5.16% 11/25/25 | | 3,820 | 3,815 |
| Capital One Multi-Asset Execution Trust: | | | |
| Series 2021-A3 Class A3, 1.04% 11/15/26 | | 9,890 | 9,218 |
| Series 2022-A1 Class A1, 2.8% 3/15/27 | | 12,000 | 11,447 |
| Series 2022-A2 Class A, 3.49% 5/15/27 | | 7,000 | 6,769 |
| Series 2022-A3 Class A, 4.95% 10/15/27 | | 5,420 | 5,412 |
| CarMax Auto Owner Trust: | | | |
| Series 2020-4 Class A3, 0.5% 8/15/25 | | 3,012 | 2,936 |
| Series 2021-1 Class A3, 0.34% 12/15/25 | | 3,298 | 3,185 |
| Carmax Auto Owner Trust Series 2022-4 Class A2A, 5.34% 12/15/25 | | 5,081 | 5,080 |
| Carvana Auto Receivables Trust: | | | |
| Series 2021-P2 Class A3, 0.49% 3/10/26 | | 5,558 | 5,366 |
| Series 2021-P3 Class A3, 0.7% 11/10/26 | | 6,606 | 6,204 |
| Cedar Funding Ltd.: | | | |
| Series 2021-10A Class AR, 3 month U.S. LIBOR + 1.100% 5.9077% 10/20/32 (b)(c)(d) | | 2,196 | 2,165 |
| Series 2021-14A Class A, 3 month U.S. LIBOR + 1.100% 5.8924% 7/15/33 (b)(c)(d) | | 9,276 | 9,136 |
| Cent CLO LP Series 2021-21A Class A1R3, 3 month U.S. LIBOR + 0.970% 5.7846% 7/27/30 (b)(c)(d) | | 7,884 | 7,801 |
| Chase Issuance Trust Series 2022-A1 Class A, 3.97% 9/15/27 | | 6,734 | 6,558 |
| Countrywide Home Loans, Inc. Series 2004-2 Class 3A4, 1 month U.S. LIBOR + 0.500% 5.117% 7/25/34 (c)(d) | | 129 | 122 |
| Dell Equipment Finance Trust: | | | |
| Series 2020-2 Class A3, 0.57% 10/23/23 (b) | | 744 | 741 |
| Series 2021-1 Class A3, 0.43% 5/22/26 (b) | | 2,444 | 2,407 |
| Discover Card Execution Note Trust: | | | |
| Series 2021-A1 Class A1, 0.58% 9/15/26 | | 4,839 | 4,503 |
| Series 2022-A1 Class A1, 1.96% 2/15/27 | | 4,911 | 4,613 |
| Series 2022-A2 Class A, 3.32% 5/15/27 | | 7,150 | 6,890 |
| Series 2022-A3 Class A3, 3.56% 7/15/27 | | 6,653 | 6,428 |
| DLLAD LLC Series 2021-1A Class A2, 0.35% 9/20/24 (b) | | 1,607 | 1,589 |
| Donlen Fleet Lease Funding Series 2021-2 Class A2, 0.56% 12/11/34 (b) | | 2,474 | 2,396 |
| Eaton Vance CLO, Ltd. Series 2021-1A Class AR, 3 month U.S. LIBOR + 1.100% 5.8924% 4/15/31 (b)(c)(d) | | 8,070 | 7,996 |
| Enterprise Fleet Financing Series 2023-1 Class A2, 5.51% 1/22/29 (b) | | 4,908 | 4,911 |
| Enterprise Fleet Financing LLC: | | | |
| Series 2020-1 Class A2, 1.78% 12/22/25 (b) | | 699 | 697 |
| Series 2020-2 Class A2, 0.61% 7/20/26 (b) | | 2,613 | 2,561 |
| Series 2021-1 Class A2, 0.44% 12/21/26 (b) | | 1,303 | 1,266 |
| Series 2021-2 Class A2, 0.48% 5/20/27 (b) | | 4,746 | 4,561 |
| Series 2022-3 Class A2, 4.38% 7/20/29 (b) | | 1,191 | 1,170 |
| Ford Credit Floorplan Master Owner Trust Series 2020-1 Class A1, 0.7% 9/15/25 | | 12,164 | 11,859 |
| GM Financial Automobile Leasing Trust Series 2023-1 Class A3, 5.16% 4/20/26 | | 4,665 | 4,662 |
| GM Financial Consumer Automobile Receivables Series 2022-2 Class A3, 3.1% 2/16/27 | | 6,602 | 6,381 |
| GMF Floorplan Owner Revolving Trust: | | | |
| Series 2020-1 Class A, 0.68% 8/15/25 (b) | | 3,218 | 3,150 |
| Series 2020-2 Class A, 0.69% 10/15/25 (b) | | 6,742 | 6,548 |
| Hyundai Auto Receivables Trust Series 2020-C Class A3, 0.38% 5/15/25 | | 3,546 | 3,461 |
| Madison Park Funding XXXII, Ltd. / Madison Park Funding XXXII LLC Series 2021-32A Class A1R, 3 month U.S. LIBOR + 1.000% 5.8153% 1/22/31 (b)(c)(d) | | 6,559 | 6,497 |
| Marlette Funding Trust: | | | |
| Series 2021-3A Class A, 0.65% 12/15/31 (b) | | 611 | 606 |
| Series 2022-1A Class A, 1.36% 4/15/32 (b) | | 1,700 | 1,679 |
| Series 2022-2A Class A, 4.25% 8/15/32 (b) | | 3,941 | 3,892 |
| MMAF Equipment Finance LLC: | | | |
| Series 2019-B Class A3, 2.01% 12/12/24 (b) | | 2,236 | 2,198 |
| Series 2022-B Class A2, 5.57% 9/9/25 (b) | | 4,064 | 4,060 |
| Niagara Park CLO, Ltd. Series 2021-1A Class AR, 3 month U.S. LIBOR + 1.000% 5.7924% 7/17/32 (b)(c)(d) | | 8,390 | 8,272 |
| OneMain Direct Auto Receivables Trust Series 2021-1A Class A, 0.87% 7/14/28 (b) | | 8,012 | 7,487 |
| Palmer Square Loan Funding, Ltd. Series 2021-2A Class A1, 3 month U.S. LIBOR + 0.800% 5.7153% 5/20/29 (b)(c)(d) | | 5,524 | 5,483 |
| Palmer Square Loan Funding, Ltd. / Palmer Square Loan Funding LLC Series 2022-1A Class A1, CME TERM SOFR 3 MONTH INDEX + 1.050% 5.6819% 4/15/30 (b)(c)(d) | | 6,908 | 6,830 |
| Park Place Securities, Inc. Series 2005-WCH1 Class M4, 1 month U.S. LIBOR + 1.240% 5.862% 1/25/36 (c)(d) | | 147 | 144 |
| Prpm 2021-5, LLC Series 2021-5 Class A1, 1.793% 6/25/26 (b)(c) | | 4,529 | 4,096 |
| Santander Consumer Auto Receivables Trust Series 2021-AA Class A3, 0.33% 10/15/25 (b) | | 2,543 | 2,503 |
| Santander Drive Auto Receivables Trust Series 2022-5 Class A3, 4.11% 8/17/26 | | 4,564 | 4,508 |
| Santander Retail Auto Lease Trust: | | | |
| Series 2020-B Class A3, 0.57% 4/22/24 (b) | | 5,130 | 5,065 |
| Series 2021-A Class A3, 0.51% 7/22/24 (b) | | 3,936 | 3,857 |
| Sofi Consumer Loan Program Series 2023-1S Class A, 5.81% 5/15/31 (b) | | 3,329 | 3,328 |
| Symphony CLO XXI, Ltd. Series 2021-21A Class AR, 3 month U.S. LIBOR + 1.060% 5.8524% 7/15/32 (b)(c)(d) | | 6,342 | 6,265 |
| Symphony CLO XXIII Ltd. Series 2021-23A Class AR, 3 month U.S. LIBOR + 1.020% 5.8124% 1/15/34 (b)(c)(d) | | 8,047 | 7,966 |
| TCI-Flatiron CLO Ltd. / LLC Series 2021-1A Class AR, 3 month U.S. LIBOR + 0.960% 5.8366% 11/18/30 (b)(c)(d) | | 8,441 | 8,366 |
| TCI-Symphony CLO Series 2021-1A Class AR, 3 month U.S. LIBOR + 0.920% 5.7224% 7/15/30 (b)(c)(d) | | 8,996 | 8,905 |
| Terwin Mortgage Trust Series 2003-4HE Class A1, 1 month U.S. LIBOR + 0.860% 5.477% 9/25/34 (c)(d) | | 140 | 135 |
| Tesla Auto Lease Trust Series 2021-A Class A3, 0.56% 3/20/25 (b) | | 6,423 | 6,274 |
| Toyota Auto Loan Extended Note Trust Series 2020-1A Class A, 1.35% 5/25/33 (b) | | 4,906 | 4,500 |
| Trapeza CDO XII Ltd./Trapeza CDO XII, Inc. Series 2007-12A Class B, 3 month U.S. LIBOR + 0.560% 5.3484% 4/6/42 (b)(c)(d) | | 261 | 199 |
| Upstart Securitization Trust: | | | |
| Series 2021-2 Class A, 0.91% 6/20/31 (b) | | 616 | 610 |
| Series 2021-3 Class A, 0.83% 7/20/31 (b) | | 1,441 | 1,416 |
| Series 2021-4 Class A, 0.84% 9/20/31 (b) | | 2,416 | 2,355 |
| Series 2021-5 Class A, 1.31% 11/20/31 (b) | | 3,100 | 3,014 |
| 3.12% 3/20/32 (b) | | 4,400 | 4,285 |
| VCAT Asset Securitization, LLC: | | | |
| Series 2021-NPL1 Class A1, 2.2891% 12/26/50 (b) | | 1,006 | 952 |
| Series 2021-NPL2 Class A1, 2.115% 3/27/51 (b) | | 4,487 | 4,195 |
| Series 2021-NPL3 Class A1, 1.743% 5/25/51 (b)(c) | | 5,709 | 5,208 |
| Verizon Master Trust: | | | |
| Series 2021-1 Class A, 0.5% 5/20/27 | | 6,240 | 5,892 |
| Series 2021-2 Class A, 0.99% 4/20/28 | | 8,190 | 7,655 |
| Series 2022-5 Class A1A, 3.72% 7/20/27 | | 3,412 | 3,365 |
| Voya CLO Ltd. Series 2021-1A Class A1R, 3 month U.S. LIBOR + 0.950% 5.7424% 4/17/30 (b)(c)(d) | | 8,048 | 7,970 |
| Wheels SPV LLC Series 2021-1A Class A, 1 month U.S. LIBOR + 0.280% 4.8713% 8/20/29 (b)(c)(d) | | 3,390 | 3,361 |
| World Omni Automobile Lease Securitization Trust Series 2020-B Class A3, 0.45% 2/15/24 | | 765 | 764 |
| TOTAL ASSET-BACKED SECURITIES (Cost $437,741) | | | 425,384 |
| | | | |
| Collateralized Mortgage Obligations - 2.7% |
| | | Principal Amount (a) (000s) | Value ($) (000s) |
| Private Sponsor - 2.3% | | | |
| Ajax Mortgage Loan Trust sequential payer Series 2021-B Class A, 2.239% 6/25/66 (b)(c) | | 2,570 | 2,399 |
| Angel Oak Mortgage Trust Series 2021-8 Class A1, 1.82% 11/25/66 (b) | | 4,944 | 4,152 |
| Brass PLC Series 2021-10A Class A1, 0.669% 4/16/69 (b)(c) | | 952 | 907 |
| Cascade Funding Mortgage Trust: | | | |
| Series 2021-EBO1 Class A, 0.9849% 11/25/50 (b)(c) | | 1,457 | 1,368 |
| Series 2021-HB5 Class A, 0.8006% 2/25/31 (b) | | 1,123 | 1,086 |
| Series 2021-HB6 Class A, 0.8983% 6/25/36 (b) | | 1,511 | 1,434 |
| Series 2021-HB7 Class A, 1.1512% 10/27/31 (b) | | 1,879 | 1,763 |
| Cfmt 2022-Ebo2 sequential payer Series 2022-EBO2 Class A, 3.169% 7/25/54 (b) | | 1,250 | 1,208 |
| CFMT 2022-Hb8 LLC sequential payer Series 2022-HB8 Class A, 3.75% 4/25/25 (b) | | 5,935 | 5,661 |
| Csmc 2021-Rpl9 Trust sequential payer Series 2021-RPL9 Class A1, 2.4364% 2/25/61 (b) | | 6,989 | 6,426 |
| Finance of America HECM Buyout sequential payer Series 2022-HB1 Class A, 2.6948% 2/25/32 (b)(c) | | 5,383 | 5,195 |
| GCAT Trust sequential payer Series 2021-NQM7 Class A1, 1.915% 8/25/66 (b) | | 2,689 | 2,334 |
| Legacy Mortgage Asset Trust Series 2021-GS5 Class A1, 2.25% 7/25/67 (b)(c) | | 5,818 | 5,227 |
| New York Mortgage Trust sequential payer Series 2021-SP1 Class A1, 1.6696% 8/25/61 (b) | | 2,087 | 1,872 |
| Oceanview Mortgage Loan Trust sequential payer Series 2020-1 Class A1A, 1.7329% 5/28/50 (b) | | 2,402 | 2,130 |
| Oceanview Trust sequential payer Series 2021-1 Class A, 1.2187% 12/29/51 (b)(c) | | 2,069 | 1,984 |
| Preston Ridge Partners Mortgage Trust: | | | |
| sequential payer Series 2021-8 Class A1, 1.743% 9/25/26 (b)(c) | | 5,188 | 4,634 |
| Series 2021-2 Class A1, 2.115% 3/25/26 (b) | | 3,992 | 3,759 |
| Series 2021-RPL1 Class A1, 1.319% 7/25/51 (b) | | 896 | 784 |
| Series 2021-RPL2 Class A1, 1.455% 10/25/51 (b)(c) | | 1,128 | 995 |
| PRET LLC Series 2022-RN1 Class A1, 3.721% 7/25/51 (b) | | 3,623 | 3,316 |
| RMF Buyout Issuance Trust sequential payer: | | | |
| Series 2021-HB1 Class A, 1.2586% 11/25/31 (b) | | 2,208 | 2,083 |
| Series 2022-HB1 Class A, 4.272% 4/25/32 (b) | | 1,014 | 979 |
| Sequoia Mortgage Trust floater Series 2004-6 Class A3B, 6 month U.S. LIBOR + 0.880% 6.0669% 7/20/34 (c)(d) | | 2 | 1 |
TOTAL PRIVATE SPONSOR | | | 61,697 |
| U.S. Government Agency - 0.4% | | | |
| Fannie Mae: | | | |
| floater Series 2015-27 Class KF, 1 month U.S. LIBOR + 0.300% 4.917% 5/25/45 (c)(d) | | 2,745 | 2,718 |
| sequential payer Series 2001-40 Class Z, 6% 8/25/31 | | 49 | 49 |
| Series 2016-27: | | | |
Class HK, 3% 1/25/41 | | 2,923 | 2,733 |
Class KG, 3% 1/25/40 | | 1,348 | 1,261 |
| Series 2016-42 Class FL, 1 month U.S. LIBOR + 0.350% 4.967% 7/25/46 (c)(d) | | 3,107 | 3,091 |
| Freddie Mac Series 3949 Class MK, 4.5% 10/15/34 | | 309 | 304 |
TOTAL U.S. GOVERNMENT AGENCY | | | 10,156 |
| TOTAL COLLATERALIZED MORTGAGE OBLIGATIONS (Cost $77,644) | | | 71,853 |
| | | | |
| Commercial Mortgage Securities - 5.8% |
| | | Principal Amount (a) (000s) | Value ($) (000s) |
| BAMLL Commercial Mortgage Securities Trust: | | | |
| floater Series 2022-DKLX Class A, CME Term SOFR 1 Month Index + 1.150% 5.713% 1/15/39 (b)(c)(d) | | 1,838 | 1,811 |
| sequential payer Series 2019-BPR Class ANM, 3.112% 11/5/32 (b) | | 2,246 | 2,050 |
| Benchmark Mortgage Trust: | | | |
| sequential payer Series 2021-B31 Class A1, 1.357% 12/15/54 | | 5,451 | 5,016 |
| Series 2018-B7 Class A1, 3.436% 5/15/53 | | 455 | 451 |
| BLOX Trust floater sequential payer Series 2021-BLOX Class A, 1 month U.S. LIBOR + 0.750% 5.338% 9/15/26 (b)(c)(d) | | 4,272 | 4,038 |
| BPR Trust floater Series 2022-OANA Class A, CME Term SOFR 1 Month Index + 1.890% 6.4605% 4/15/37 (b)(c)(d) | | 6,214 | 6,101 |
| BX Commercial Mortgage Trust floater: | | | |
| Series 2021-PAC Class A, 1 month U.S. LIBOR + 0.680% 5.2771% 10/15/36 (b)(c)(d) | | 3,704 | 3,620 |
| Series 2021-VINO Class A, 1 month U.S. LIBOR + 0.650% 5.2403% 5/15/38 (b)(c)(d) | | 3,400 | 3,328 |
| Series 2022-LP2 Class A, CME Term SOFR 1 Month Index + 1.010% 5.5754% 2/15/39 (b)(c)(d) | | 4,334 | 4,269 |
| BX Trust: | | | |
| floater: | | | |
Series 2021-ACNT Class A, 1 month U.S. LIBOR + 0.850% 5.438% 11/15/38 (b)(c)(d) | | 3,607 | 3,546 |
Series 2021-BXMF Class A, 1 month U.S. LIBOR + 0.630% 5.2239% 10/15/26 (b)(c)(d) | | 3,376 | 3,294 |
Series 2022-GPA Class A, CME Term SOFR 1 Month Index + 2.160% 6.7275% 10/15/39 (b)(c)(d) | | 1,533 | 1,530 |
| floater sequential payer Series 2021-SOAR Class A, 5.258% 6/15/38 (b)(c) | | 3,606 | 3,542 |
| floater, sequential payer: | | | |
Series 2019-IMC Class A, 1 month U.S. LIBOR + 1.000% 5.588% 4/15/34 (b)(c)(d) | | 4,300 | 4,224 |
Series 2019-XL Class A, CME Term SOFR 1 Month Index + 1.030% 5.597% 10/15/36 (b)(c)(d) | | 6,185 | 6,154 |
| CF Hippolyta Issuer LLC sequential payer: | | | |
| Series 2020-1 Class A1, 1.69% 7/15/60 (b) | | 7,471 | 6,689 |
| Series 2021-1A Class A1, 1.53% 3/15/61 (b) | | 4,365 | 3,791 |
| CGDB Commercial Mortgage Trust floater Series 2019-MOB Class A, 1 month U.S. LIBOR + 0.950% 5.5379% 11/15/36 (b)(c)(d) | | 1,678 | 1,653 |
| CHC Commercial Mortgage Trust floater Series 2019-CHC Class A, 1 month U.S. LIBOR + 1.120% 5.708% 6/15/34 (b)(c)(d) | | 6,209 | 6,034 |
| Citigroup Commercial Mortgage Trust sequential payer: | | | |
| Series 2014-GC21 Class AAB, 3.477% 5/10/47 | | 478 | 471 |
| Series 2016-GC36 Class AAB, 3.368% 2/10/49 | | 1,980 | 1,908 |
| COMM Mortgage Trust sequential payer: | | | |
| Series 2014-CR18 Class ASB, 3.452% 7/15/47 | | 915 | 910 |
| Series 2020-SBX Class A, 1.67% 1/10/38 (b) | | 6,921 | 6,129 |
| Credit Suisse Mortgage Trust: | | | |
| floater Series 2019-ICE4 Class A, 1 month U.S. LIBOR + 0.980% 5.568% 5/15/36 (b)(c)(d) | | 8,003 | 7,963 |
| sequential payer Series 2020-NET Class A, 2.2569% 8/15/37 (b) | | 1,073 | 964 |
| CSAIL 2018-CX12 Commercial Mortgage Trust sequential payer Series 2018-CX12 Class ASB, 4.1628% 8/15/51 | | 3,364 | 3,222 |
| CSMC Trust Series 2017-CHOP Class A, 1 month U.S. LIBOR + 0.750% 5.338% 7/15/32 (b)(c)(d) | | 7,508 | 7,145 |
| ELP Commercial Mortgage Trust floater Series 2021-ELP Class A, 1 month U.S. LIBOR + 0.700% 5.289% 11/15/38 (b)(c)(d) | | 5,020 | 4,888 |
| Extended Stay America Trust floater Series 2021-ESH Class A, 1 month U.S. LIBOR + 1.080% 5.668% 7/15/38 (b)(c)(d) | | 1,717 | 1,691 |
| GS Mortgage Securities Trust: | | | |
| floater Series 2021-IP Class A, 1 month U.S. LIBOR + 0.950% 5.538% 10/15/36 (b)(c)(d) | | 2,194 | 2,081 |
| Series 2011-GC5 Class A/S, 5.1538% 8/10/44 (b)(c) | | 5,371 | 5,291 |
| JPMorgan Chase Commercial Mortgage Securities Trust: | | | |
| floater Series 2019-BKWD Class A, 1 month U.S. LIBOR + 1.250% 5.838% 9/15/29 (b)(c)(d) | | 2,788 | 2,650 |
| Series 2013-LC11 Class A/S, 3.216% 4/15/46 | | 3,949 | 3,624 |
| Life Financial Services Trust floater Series 2022-BMR2 Class A1, CME Term SOFR 1 Month Index + 1.290% 5.8577% 5/15/39 (b)(c)(d) | | 4,992 | 4,973 |
| LIFE Mortgage Trust floater Series 2021-BMR Class A, 1 month U.S. LIBOR + 0.700% 5.288% 3/15/38 (b)(c)(d) | | 3,374 | 3,312 |
| Merit floater Series 2021-STOR Class A, 1 month U.S. LIBOR + 0.700% 5.288% 7/15/38 (b)(c)(d) | | 1,937 | 1,897 |
| Morgan Stanley BAML Trust sequential payer Series 2016-C28: | | | |
| Class A3, 3.272% 1/15/49 | | 1,640 | 1,543 |
| Class ASB, 3.288% 1/15/49 | | 1,697 | 1,639 |
| Morgan Stanley Capital I Trust: | | | |
| sequential payer Series 2019-MEAD Class A, 3.17% 11/10/36 (b) | | 4,896 | 4,563 |
| Series 2019-H7 Class A1, 2.327% 7/15/52 | | 1,502 | 1,464 |
| OPG Trust floater Series 2021-PORT Class A, 1 month U.S. LIBOR + 0.480% 5.072% 10/15/36 (b)(c)(d) | | 5,675 | 5,510 |
| SREIT Trust floater Series 2021-MFP Class A, 1 month U.S. LIBOR + 0.730% 5.3187% 11/15/38 (b)(c)(d) | | 3,363 | 3,291 |
| Wells Fargo Commercial Mortgage Trust sequential payer: | | | |
| Series 2015-LC22 Class ASB, 3.571% 9/15/58 | | 2,555 | 2,475 |
| Series 2017-RC1 Class ASB, 3.453% 1/15/60 | | 3,269 | 3,151 |
| WF-RBS Commercial Mortgage Trust sequential payer: | | | |
| Series 2013-C14 Class ASB, 2.977% 6/15/46 | | 101 | 100 |
| Series 2014-C20 Class ASB, 3.638% 5/15/47 | | 452 | 446 |
| TOTAL COMMERCIAL MORTGAGE SECURITIES (Cost $161,665) | | | 154,442 |
| | | | |
| Money Market Funds - 0.5% |
| | | Shares | Value ($) (000s) |
Fidelity Cash Central Fund 4.63% (g) (Cost $12,341) | | 12,338,945 | 12,341 |
| | | | |
| TOTAL INVESTMENT IN SECURITIES - 99.9% (Cost $2,750,242) | 2,664,595 |
NET OTHER ASSETS (LIABILITIES) - 0.1% | 3,071 |
| NET ASSETS - 100.0% | 2,667,666 |
| | |
| Futures Contracts |
| | Number of contracts | Expiration Date | Notional Amount ($) (000s) | Value ($) (000s) | Unrealized Appreciation/ (Depreciation) ($) (000s) |
| Purchased | | | | | |
| | | | | | |
| Treasury Contracts | | | | | |
| CBOT 2-Year U.S. Treasury Note Contracts (United States) | 1,061 | Jun 2023 | 216,154 | (491) | (491) |
| CBOT 5-Year U.S. Treasury Note Contracts (United States) | 284 | Jun 2023 | 30,404 | (38) | (38) |
| | | | | | |
| TOTAL FUTURES CONTRACTS | | | | | (529) |
| The notional amount of futures purchased as a percentage of Net Assets is 9.2% |
For the period, the average monthly notional amount at value for futures contracts in the aggregate was $203,243,000.
Any values shown as $0 in the Schedule of Investments may reflect amounts less than $500.
Legend
| (a) | Amount is stated in United States dollars unless otherwise noted. |
| (b) | Security exempt from registration under Rule 144A of the Securities Act of 1933. These securities may be resold in transactions exempt from registration, normally to qualified institutional buyers. At the end of the period, the value of these securities amounted to $729,525,000 or 27.3% of net assets. |
| (c) | Coupon rates for floating and adjustable rate securities reflect the rates in effect at period end. |
| (d) | Coupon is indexed to a floating interest rate which may be multiplied by a specified factor and/or subject to caps or floors. |
| (e) | Security or a portion of the security purchased on a delayed delivery or when-issued basis. |
| (f) | Security or a portion of the security was pledged to cover margin requirements for futures contracts. At period end, the value of securities pledged amounted to $1,515,000. |
| (g) | Affiliated fund that is generally available only to investment companies and other accounts managed by Fidelity Investments. The rate quoted is the annualized seven-day yield of the fund at period end. A complete unaudited listing of the fund's holdings as of its most recent quarter end is available upon request. In addition, each Fidelity Central Fund's financial statements are available on the SEC's website or upon request. |
Affiliated Central Funds
Fiscal year to date information regarding the Fund's investments in Fidelity Central Funds, including the ownership percentage, is presented below.
| Affiliate (Amounts in thousands) | Value, beginning of period ($) | Purchases ($) | Sales Proceeds ($) | Dividend Income ($) | Realized Gain (loss) ($) | Change in Unrealized appreciation (depreciation) ($) | Value, end of period ($) | % ownership, end of period |
| Fidelity Cash Central Fund 4.63% | 6,183 | 257,014 | 250,856 | 197 | - | - | 12,341 | 0.0% |
| Fidelity Securities Lending Cash Central Fund 4.63% | - | 230,443 | 230,443 | 44 | - | - | - | 0.0% |
| Total | 6,183 | 487,457 | 481,299 | 241 | - | - | 12,341 | |
| | | | | | | | | |
Amounts in the dividend income column in the above table include any capital gain distributions from underlying funds, which are presented in the corresponding line item in the Statement of Operations, if applicable.
Amount for Fidelity Securities Lending Cash Central Fund represents the income earned on investing cash collateral, less rebates paid to borrowers and any lending agent fees associated with the loan, plus any premium payments received for lending certain types of securities.
Amounts included in the purchases and sales proceeds columns may include in-kind transactions, if applicable.
Investment Valuation
The following is a summary of the inputs used, as of February 28, 2023, involving the Fund's assets and liabilities carried at fair value. The inputs or methodology used for valuing securities may not be an indication of the risk associated with investing in those securities. For more information on valuation inputs, and their aggregation into the levels used below, please refer to the Investment Valuation section in the accompanying Notes to Financial Statements.
| Valuation Inputs at Reporting Date: |
Description (Amounts in thousands) | Total ($) | Level 1 ($) | Level 2 ($) | Level 3 ($) |
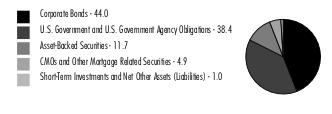
Investments in Securities: | | | | |
|
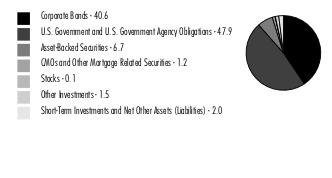
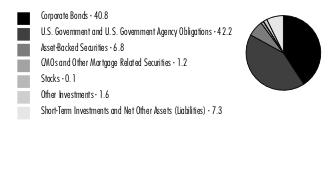
| Corporate Bonds | 1,345,083 | - | 1,345,083 | - |
|
| U.S. Government and Government Agency Obligations | 648,179 | - | 648,179 | - |
|
| U.S. Government Agency - Mortgage Securities | 7,313 | - | 7,313 | - |
|
| Asset-Backed Securities | 425,384 | - | 425,384 | - |
|
| Collateralized Mortgage Obligations | 71,853 | - | 71,853 | - |
|
| Commercial Mortgage Securities | 154,442 | - | 154,442 | - |
|
| Money Market Funds | 12,341 | 12,341 | - | - |
| Total Investments in Securities: | 2,664,595 | 12,341 | 2,652,254 | - |
Derivative Instruments: | | | | |
|
| Liabilities | | | | |
Futures Contracts | (529) | (529) | - | - |
| Total Liabilities | (529) | (529) | - | - |
| Total Derivative Instruments: | (529) | (529) | - | - |
Value of Derivative Instruments
The following table is a summary of the Fund's value of derivative instruments by primary risk exposure as of February 28, 2023. For additional information on derivative instruments, please refer to the Derivative Instruments section in the accompanying Notes to Financial Statements.
Primary Risk Exposure / Derivative Type | Value |
| (Amounts in thousands) | Asset ($) | Liability ($) |
| Interest Rate Risk | | |
Futures Contracts (a) | 0 | (529) |
| Total Interest Rate Risk | 0 | (529) |
| Total Value of Derivatives | 0 | (529) |
(a)Reflects gross cumulative appreciation (depreciation) on futures contracts as presented in the Schedule of Investments. In the Statement of Assets and Liabilities, the period end daily variation margin is included in receivable or payable for daily variation margin on futures contracts, and the net cumulative appreciation (depreciation) is included in Total accumulated earnings (loss).
| Statement of Assets and Liabilities |
| Amounts in thousands (except per-share amounts) | | | | February 28, 2023 (Unaudited) |
| | | | | |
| Assets | | | | |
| Investment in securities, at value - See accompanying schedule: | | | | |
Unaffiliated issuers (cost $2,737,901) | $ | 2,652,254 | | |
Fidelity Central Funds (cost $12,341) | | 12,341 | | |
| | | | | |
| | | | | |
| Total Investment in Securities (cost $2,750,242) | | | $ | 2,664,595 |
| Receivable for investments sold | | | | 90,163 |
| Receivable for fund shares sold | | | | 14,706 |
| Interest receivable | | | | 14,066 |
| Distributions receivable from Fidelity Central Funds | | | | 67 |
| Receivable from investment adviser for expense reductions | | | | 9 |
| Other receivables | | | | 8 |
Total assets | | | | 2,783,614 |
| Liabilities | | | | |
| Payable for investments purchased | | | | |
Regular delivery | $ | 101,274 | | |
Delayed delivery | | 7,995 | | |
| Payable for fund shares redeemed | | 4,797 | | |
| Distributions payable | | 766 | | |
| Accrued management fee | | 666 | | |
| Distribution and service plan fees payable | | 58 | | |
| Payable for daily variation margin on futures contracts | | 27 | | |
| Other affiliated payables | | 358 | | |
| Other payables and accrued expenses | | 7 | | |
| Total Liabilities | | | | 115,948 |
| Net Assets | | | $ | 2,667,666 |
| Net Assets consist of: | | | | |
| Paid in capital | | | $ | 2,809,375 |
| Total accumulated earnings (loss) | | | | (141,709) |
| Net Assets | | | $ | 2,667,666 |
| | | | | |
| Net Asset Value and Maximum Offering Price | | | | |
| Class A : | | | | |
Net Asset Value and redemption price per share ($215,531 ÷ 26,220 shares) (a) | | | $ | 8.22 |
| Maximum offering price per share (100/98.50 of $8.22) | | | $ | 8.35 |
| Class M : | | | | |
Net Asset Value and redemption price per share ($53,178 ÷ 6,469 shares) (a) | | | $ | 8.22 |
| Maximum offering price per share (100/98.50 of $8.22) | | | $ | 8.35 |
| Class C : | | | | |
Net Asset Value and offering price per share ($29,436 ÷ 3,597 shares) (a) | | | $ | 8.18 |
| Short-Term Bond : | | | | |
Net Asset Value , offering price and redemption price per share ($1,979,347 ÷ 240,896 shares) | | | $ | 8.22 |
| Class I : | | | | |
Net Asset Value , offering price and redemption price per share ($241,087 ÷ 29,328 shares) | | | $ | 8.22 |
| Class Z : | | | | |
Net Asset Value , offering price and redemption price per share ($149,087 ÷ 18,147 shares) | | | $ | 8.22 |
(a)Redemption price per share is equal to net asset value less any applicable contingent deferred sales charge. |
| Statement of Operations |
| Amounts in thousands | | | | Six months ended February 28, 2023 (Unaudited) |
| Investment Income | | | | |
| Interest | | | $ | 36,070 |
| Income from Fidelity Central Funds (including $44 from security lending) | | | | 241 |
| Total Income | | | | 36,311 |
| Expenses | | | | |
| Management fee | $ | 4,082 | | |
| Transfer agent fees | | 1,471 | | |
| Distribution and service plan fees | | 347 | | |
| Fund wide operations fee | | 704 | | |
| Independent trustees' fees and expenses | | 5 | | |
| Total expenses before reductions | | 6,609 | | |
| Expense reductions | | (34) | | |
| Total expenses after reductions | | | | 6,575 |
| Net Investment income (loss) | | | | 29,736 |
| Realized and Unrealized Gain (Loss) | | | | |
| Net realized gain (loss) on: | | | | |
| Investment Securities: | | | | |
| Unaffiliated issuers | | (36,666) | | |
| Futures contracts | | (4,954) | | |
| Total net realized gain (loss) | | | | (41,620) |
| Change in net unrealized appreciation (depreciation) on: | | | | |
| Investment Securities: | | | | |
| Unaffiliated issuers | | 18,207 | | |
| Futures contracts | | (215) | | |
| Total change in net unrealized appreciation (depreciation) | | | | 17,992 |
| Net gain (loss) | | | | (23,628) |
| Net increase (decrease) in net assets resulting from operations | | | $ | 6,108 |
| Statement of Changes in Net Assets |
| |
| Amount in thousands | | Six months ended February 28, 2023 (Unaudited) | | Year ended August 31, 2022 |
| Increase (Decrease) in Net Assets | | | | |
| Operations | | | | |
| Net investment income (loss) | $ | 29,736 | $ | 26,764 |
| Net realized gain (loss) | | (41,620) | | (24,983) |
| Change in net unrealized appreciation (depreciation) | | 17,992 | | (132,210) |
| Net increase (decrease) in net assets resulting from operations | | 6,108 | | (130,429) |
| Distributions to shareholders | | (22,576) | | (34,111) |
| Share transactions - net increase (decrease) | | (110,499) | | (366,829) |
| Total increase (decrease) in net assets | | (126,967) | | (531,369) |
| | | | | |
| Net Assets | | | | |
| Beginning of period | | 2,794,633 | | 3,326,002 |
| End of period | $ | 2,667,666 | $ | 2,794,633 |
| | | | | |
| | | | | |
Financial Highlights
| Fidelity Advisor® Short-Term Bond Fund Class A |
| |
| | Six months ended (Unaudited) February 28, 2023 | | Years ended August 31, 2022 | | 2021 | | 2020 | | 2019 | | 2018 |
Selected Per-Share Data | | | | | | | | | | | | |
| Net asset value, beginning of period | $ | 8.27 | $ | 8.73 | $ | 8.89 | $ | 8.72 | $ | 8.53 | $ | 8.64 |
| Income from Investment Operations | | | | | | | | | | | | |
Net investment income (loss) A,B | | .082 | | .061 | | .082 | | .153 | | .178 | | .123 |
| Net realized and unrealized gain (loss) | | (.071) | | (.441) | | (.065) | | .168 | | .171 | | (.114) |
| Total from investment operations | | .011 | | (.380) | | .017 | | .321 | | .349 | | .009 |
| Distributions from net investment income | | (.061) | | (.054) | | (.118) | | (.151) | | (.159) | | (.119) |
| Distributions from net realized gain | | - | | (.026) | | (.059) | | - | | - | | - |
| Total distributions | | (.061) | | (.080) | | (.177) | | (.151) | | (.159) | | (.119) |
| Net asset value, end of period | $ | 8.22 | $ | 8.27 | $ | 8.73 | $ | 8.89 | $ | 8.72 | $ | 8.53 |
Total Return C,D,E | | .14% | | (4.38)% | | .20% | | 3.73% | | 4.13% | | .12% |
Ratios to Average Net Assets B,F,G | | | | | | | | | | | | |
| Expenses before reductions | | .65% H | | .65% | | .65% | | .65% | | .65% | | .65% |
| Expenses net of fee waivers, if any | | .65% H | | .65% | | .65% | | .65% | | .65% | | .65% |
| Expenses net of all reductions | | .65% H | | .65% | | .65% | | .65% | | .65% | | .65% |
| Net investment income (loss) | | 2.02% H | | .72% | | .93% | | 1.75% | | 2.08% | | 1.43% |
| Supplemental Data | | | | | | | | | | | | |
| Net assets, end of period (in millions) | $ | 216 | $ | 225 | $ | 234 | $ | 222 | $ | 175 | $ | 143 |
Portfolio turnover rate I | | 56% H | | 52% | | 64% J | | 67% J | | 46% | | 56% |
A Calculated based on average shares outstanding during the period.
B Net investment income (loss) is affected by the timing of the declaration of dividends by any underlying mutual funds or exchange-traded funds (ETFs). Net investment income (loss) of any mutual funds or ETFs is not included in the Fund's net investment income (loss) ratio.
C Total returns for periods of less than one year are not annualized.
D Total returns would have been lower if certain expenses had not been reduced during the applicable periods shown.
E Total returns do not include the effect of the sales charges.
F Fees and expenses of any underlying mutual funds or exchange-traded funds (ETFs) are not included in the Fund's expense ratio. The Fund indirectly bears its proportionate share of these expenses. For additional expense information related to investments in Fidelity Central Funds, please refer to the "Investments in Fidelity Central Funds" note found in the Notes to Financial Statements section of the most recent Annual or Semi-Annual report.
G Expense ratios reflect operating expenses of the class. Expenses before reductions do not reflect amounts reimbursed, waived, or reduced through arrangements with the investment adviser, brokerage services, or other offset arrangements, if applicable, and do not represent the amount paid by the class during periods when reimbursements, waivers or reductions occur.
H Annualized.
I Amount does not include the portfolio activity of any underlying mutual funds or exchange-traded funds (ETFs).
J Portfolio turnover rate excludes securities received or delivered in-kind.
| Fidelity Advisor® Short-Term Bond Fund Class M |
| |
| | Six months ended (Unaudited) February 28, 2023 | | Years ended August 31, 2022 | | 2021 | | 2020 | | 2019 | | 2018 |
Selected Per-Share Data | | | | | | | | | | | | |
| Net asset value, beginning of period | $ | 8.27 | $ | 8.73 | $ | 8.89 | $ | 8.72 | $ | 8.53 | $ | 8.64 |
| Income from Investment Operations | | | | | | | | | | | | |
Net investment income (loss) A,B | | .082 | | .060 | | .082 | | .152 | | .177 | | .122 |
| Net realized and unrealized gain (loss) | | (.071) | | (.441) | | (.065) | | .169 | | .171 | | (.114) |
| Total from investment operations | | .011 | | (.381) | | .017 | | .321 | | .348 | | .008 |
| Distributions from net investment income | | (.061) | | (.053) | | (.118) | | (.151) | | (.158) | | (.118) |
| Distributions from net realized gain | | - | | (.026) | | (.059) | | - | | - | | - |
| Total distributions | | (.061) | | (.079) | | (.177) | | (.151) | | (.158) | | (.118) |
| Net asset value, end of period | $ | 8.22 | $ | 8.27 | $ | 8.73 | $ | 8.89 | $ | 8.72 | $ | 8.53 |
Total Return C,D,E | | .13% | | (4.39)% | | .19% | | 3.72% | | 4.12% | | .10% |
Ratios to Average Net Assets B,F,G | | | | | | | | | | | | |
| Expenses before reductions | | .66% H | | .65% | | .65% | | .66% | | .67% | | .67% |
| Expenses net of fee waivers, if any | | .66% H | | .65% | | .65% | | .66% | | .67% | | .67% |
| Expenses net of all reductions | | .66% H | | .65% | | .65% | | .66% | | .67% | | .66% |
| Net investment income (loss) | | 2.01% H | | .71% | | .93% | | 1.74% | | 2.06% | | 1.42% |
| Supplemental Data | | | | | | | | | | | | |
| Net assets, end of period (in millions) | $ | 53 | $ | 57 | $ | 67 | $ | 73 | $ | 71 | $ | 70 |
Portfolio turnover rate I | | 56% H | | 52% | | 64% J | | 67% J | | 46% | | 56% |
A Calculated based on average shares outstanding during the period.
B Net investment income (loss) is affected by the timing of the declaration of dividends by any underlying mutual funds or exchange-traded funds (ETFs). Net investment income (loss) of any mutual funds or ETFs is not included in the Fund's net investment income (loss) ratio.
C Total returns for periods of less than one year are not annualized.
D Total returns would have been lower if certain expenses had not been reduced during the applicable periods shown.
E Total returns do not include the effect of the sales charges.
F Fees and expenses of any underlying mutual funds or exchange-traded funds (ETFs) are not included in the Fund's expense ratio. The Fund indirectly bears its proportionate share of these expenses. For additional expense information related to investments in Fidelity Central Funds, please refer to the "Investments in Fidelity Central Funds" note found in the Notes to Financial Statements section of the most recent Annual or Semi-Annual report.
G Expense ratios reflect operating expenses of the class. Expenses before reductions do not reflect amounts reimbursed, waived, or reduced through arrangements with the investment adviser, brokerage services, or other offset arrangements, if applicable, and do not represent the amount paid by the class during periods when reimbursements, waivers or reductions occur.
H Annualized.
I Amount does not include the portfolio activity of any underlying mutual funds or exchange-traded funds (ETFs).
J Portfolio turnover rate excludes securities received or delivered in-kind.
| Fidelity Advisor® Short-Term Bond Fund Class C |
| |
| | Six months ended (Unaudited) February 28, 2023 | | Years ended August 31, 2022 | | 2021 | | 2020 | | 2019 | | 2018 |
Selected Per-Share Data | | | | | | | | | | | | |
| Net asset value, beginning of period | $ | 8.24 | $ | 8.72 | $ | 8.88 | $ | 8.72 | $ | 8.52 | $ | 8.64 |
| Income from Investment Operations | | | | | | | | | | | | |
Net investment income (loss) A,B | | .047 | | (.012) | | .007 | | .078 | | .104 | | .049 |
| Net realized and unrealized gain (loss) | | (.082) | | (.437) | | (.058) | | .158 | | .181 | | (.123) |
| Total from investment operations | | (.035) | | (.449) | | (.051) | | .236 | | .285 | | (.074) |
| Distributions from net investment income | | (.025) | | (.005) | | (.050) | | (.076) | | (.085) | | (.046) |
| Distributions from net realized gain | | - | | (.026) | | (.059) | | - | | - | | - |
| Total distributions | | (.025) | | (.031) | | (.109) | | (.076) | | (.085) | | (.046) |
| Net asset value, end of period | $ | 8.18 | $ | 8.24 | $ | 8.72 | $ | 8.88 | $ | 8.72 | $ | 8.52 |
Total Return C,D,E | | (.42)% | | (5.17)% | | (.58)% | | 2.73% | | 3.36% | | (.86)% |
Ratios to Average Net Assets B,F,G | | | | | | | | | | | | |
| Expenses before reductions | | 1.53% H | | 1.51% | | 1.51% | | 1.51% | | 1.51% | | 1.51% |
| Expenses net of fee waivers, if any | | 1.53% H | | 1.51% | | 1.51% | | 1.51% | | 1.51% | | 1.51% |
| Expenses net of all reductions | | 1.52% H | | 1.51% | | 1.51% | | 1.51% | | 1.51% | | 1.51% |
| Net investment income (loss) | | 1.15% H | | (.15)% | | .08% | | .89% | | 1.20% | | .57% |
| Supplemental Data | | | | | | | | | | | | |
| Net assets, end of period (in millions) | $ | 29 | $ | 27 | $ | 33 | $ | 43 | $ | 33 | $ | 52 |
Portfolio turnover rate I | | 56% H | | 52% | | 64% J | | 67% J | | 46% | | 56% |
A Calculated based on average shares outstanding during the period.
B Net investment income (loss) is affected by the timing of the declaration of dividends by any underlying mutual funds or exchange-traded funds (ETFs). Net investment income (loss) of any mutual funds or ETFs is not included in the Fund's net investment income (loss) ratio.
C Total returns for periods of less than one year are not annualized.
D Total returns would have been lower if certain expenses had not been reduced during the applicable periods shown.
E Total returns do not include the effect of the contingent deferred sales charge.
F Fees and expenses of any underlying mutual funds or exchange-traded funds (ETFs) are not included in the Fund's expense ratio. The Fund indirectly bears its proportionate share of these expenses. For additional expense information related to investments in Fidelity Central Funds, please refer to the "Investments in Fidelity Central Funds" note found in the Notes to Financial Statements section of the most recent Annual or Semi-Annual report.
G Expense ratios reflect operating expenses of the class. Expenses before reductions do not reflect amounts reimbursed, waived, or reduced through arrangements with the investment adviser, brokerage services, or other offset arrangements, if applicable, and do not represent the amount paid by the class during periods when reimbursements, waivers or reductions occur.
H Annualized.
I Amount does not include the portfolio activity of any underlying mutual funds or exchange-traded funds (ETFs).
J Portfolio turnover rate excludes securities received or delivered in-kind.
| Fidelity® Short-Term Bond Fund |
| |
| | Six months ended (Unaudited) February 28, 2023 | | Years ended August 31, 2022 | | 2021 | | 2020 | | 2019 | | 2018 |
Selected Per-Share Data | | | | | | | | | | | | |
| Net asset value, beginning of period | $ | 8.27 | $ | 8.73 | $ | 8.88 | $ | 8.72 | $ | 8.52 | $ | 8.64 |
| Income from Investment Operations | | | | | | | | | | | | |
Net investment income (loss) A,B | | .090 | | .078 | | .100 | | .171 | | .195 | | .140 |
| Net realized and unrealized gain (loss) | | (.071) | | (.442) | | (.055) | | .158 | | .181 | | (.123) |
| Total from investment operations | | .019 | | (.364) | | .045 | | .329 | | .376 | | .017 |
| Distributions from net investment income | | (.069) | | (.070) | | (.136) | | (.169) | | (.176) | | (.137) |
| Distributions from net realized gain | | - | | (.026) | | (.059) | | - | | - | | - |
| Total distributions | | (.069) | | (.096) | | (.195) | | (.169) | | (.176) | | (.137) |
| Net asset value, end of period | $ | 8.22 | $ | 8.27 | $ | 8.73 | $ | 8.88 | $ | 8.72 | $ | 8.52 |
Total Return C,D | | .23% | | (4.19)% | | .51% | | 3.82% | | 4.47% | | .20% |
Ratios to Average Net Assets B,E,F | | | | | | | | | | | | |
| Expenses before reductions | | .45% G | | .45% | | .45% | | .45% | | .45% | | .45% |
| Expenses net of fee waivers, if any | | .45% G | | .45% | | .45% | | .45% | | .45% | | .45% |
| Expenses net of all reductions | | .45% G | | .45% | | .45% | | .45% | | .45% | | .45% |
| Net investment income (loss) | | 2.22% G | | .91% | | 1.13% | | 1.95% | | 2.28% | | 1.64% |
| Supplemental Data | | | | | | | | | | | | |
| Net assets, end of period (in millions) | $ | 1,979 | $ | 2,086 | $ | 2,568 | $ | 4,420 | $ | 5,017 | $ | 4,617 |
Portfolio turnover rate H | | 56% G | | 52% | | 64% I | | 67% I | | 46% | | 56% |
A Calculated based on average shares outstanding during the period.
B Net investment income (loss) is affected by the timing of the declaration of dividends by any underlying mutual funds or exchange-traded funds (ETFs). Net investment income (loss) of any mutual funds or ETFs is not included in the Fund's net investment income (loss) ratio.
C Total returns for periods of less than one year are not annualized.
D Total returns would have been lower if certain expenses had not been reduced during the applicable periods shown.
E Fees and expenses of any underlying mutual funds or exchange-traded funds (ETFs) are not included in the Fund's expense ratio. The Fund indirectly bears its proportionate share of these expenses. For additional expense information related to investments in Fidelity Central Funds, please refer to the "Investments in Fidelity Central Funds" note found in the Notes to Financial Statements section of the most recent Annual or Semi-Annual report.
F Expense ratios reflect operating expenses of the class. Expenses before reductions do not reflect amounts reimbursed, waived, or reduced through arrangements with the investment adviser, brokerage services, or other offset arrangements, if applicable, and do not represent the amount paid by the class during periods when reimbursements, waivers or reductions occur.
G Annualized.
H Amount does not include the portfolio activity of any underlying mutual funds or exchange-traded funds (ETFs).
I Portfolio turnover rate excludes securities received or delivered in-kind.
| Fidelity Advisor® Short-Term Bond Fund Class I |
| |
| | Six months ended (Unaudited) February 28, 2023 | | Years ended August 31, 2022 | | 2021 | | 2020 | | 2019 | | 2018 |
Selected Per-Share Data | | | | | | | | | | | | |
| Net asset value, beginning of period | $ | 8.27 | $ | 8.73 | $ | 8.89 | $ | 8.72 | $ | 8.53 | $ | 8.64 |
| Income from Investment Operations | | | | | | | | | | | | |
Net investment income (loss) A,B | | .088 | | .073 | | .095 | | .166 | | .191 | | .135 |
| Net realized and unrealized gain (loss) | | (.071) | | (.441) | | (.065) | | .168 | | .171 | | (.113) |
| Total from investment operations | | .017 | | (.368) | | .030 | | .334 | | .362 | | .022 |
| Distributions from net investment income | | (.067) | | (.066) | | (.131) | | (.164) | | (.172) | | (.132) |
| Distributions from net realized gain | | - | | (.026) | | (.059) | | - | | - | | - |
| Total distributions | | (.067) | | (.092) | | (.190) | | (.164) | | (.172) | | (.132) |
| Net asset value, end of period | $ | 8.22 | $ | 8.27 | $ | 8.73 | $ | 8.89 | $ | 8.72 | $ | 8.53 |
Total Return C,D | | .21% | | (4.24)% | | .34% | | 3.88% | | 4.29% | | .26% |
Ratios to Average Net Assets B,E,F | | | | | | | | | | | | |
| Expenses before reductions | | .50% G | | .50% | | .50% | | .50% | | .51% | | .51% |
| Expenses net of fee waivers, if any | | .50% G | | .50% | | .50% | | .50% | | .51% | | .51% |
| Expenses net of all reductions | | .50% G | | .50% | | .50% | | .50% | | .51% | | .51% |
| Net investment income (loss) | | 2.17% G | | .86% | | 1.08% | | 1.89% | | 2.22% | | 1.58% |
| Supplemental Data | | | | | | | | | | | | |
| Net assets, end of period (in millions) | $ | 241 | $ | 253 | $ | 269 | $ | 291 | $ | 334 | $ | 367 |
Portfolio turnover rate H | | 56% G | | 52% | | 64% I | | 67% I | | 46% | | 56% |
A Calculated based on average shares outstanding during the period.
B Net investment income (loss) is affected by the timing of the declaration of dividends by any underlying mutual funds or exchange-traded funds (ETFs). Net investment income (loss) of any mutual funds or ETFs is not included in the Fund's net investment income (loss) ratio.
C Total returns for periods of less than one year are not annualized.
D Total returns would have been lower if certain expenses had not been reduced during the applicable periods shown.
E Fees and expenses of any underlying mutual funds or exchange-traded funds (ETFs) are not included in the Fund's expense ratio. The Fund indirectly bears its proportionate share of these expenses. For additional expense information related to investments in Fidelity Central Funds, please refer to the "Investments in Fidelity Central Funds" note found in the Notes to Financial Statements section of the most recent Annual or Semi-Annual report.
F Expense ratios reflect operating expenses of the class. Expenses before reductions do not reflect amounts reimbursed, waived, or reduced through arrangements with the investment adviser, brokerage services, or other offset arrangements, if applicable, and do not represent the amount paid by the class during periods when reimbursements, waivers or reductions occur.
G Annualized.
H Amount does not include the portfolio activity of any underlying mutual funds or exchange-traded funds (ETFs).
I Portfolio turnover rate excludes securities received or delivered in-kind.
| Fidelity Advisor® Short-Term Bond Fund Class Z |
| |
| | Six months ended (Unaudited) February 28, 2023 | | Years ended August 31, 2022 | | 2021 | | 2020 | | 2019 A |
Selected Per-Share Data | | | | | | | | | | |
| Net asset value, beginning of period | $ | 8.27 | $ | 8.73 | $ | 8.88 | $ | 8.72 | $ | 8.51 |
| Income from Investment Operations | | | | | | | | | | |
Net investment income (loss) B,C | | .094 | | .085 | | .107 | | .178 | | .190 |
| Net realized and unrealized gain (loss) | | (.071) | | (.441) | | (.055) | | .159 | | .189 |
| Total from investment operations | | .023 | | (.356) | | .052 | | .337 | | .379 |
| Distributions from net investment income | | (.073) | | (.078) | | (.143) | | (.177) | | (.169) |
| Distributions from net realized gain | | - | | (.026) | | (.059) | | - | | - |
| Total distributions | | (.073) | | (.104) | | (.202) | | (.177) | | (.169) |
| Net asset value, end of period | $ | 8.22 | $ | 8.27 | $ | 8.73 | $ | 8.88 | $ | 8.72 |
Total Return D,E | | .28% | | (4.10)% | | .60% | | 3.91% | | 4.50% |
Ratios to Average Net Assets C,F,G | | | | | | | | | | |
| Expenses before reductions | | .40% H | | .40% | | .40% | | .40% | | .40% H |
| Expenses net of fee waivers, if any | | .36% H | | .36% | | .36% | | .36% | | .36% H |
| Expenses net of all reductions | | .36% H | | .36% | | .36% | | .36% | | .36% H |
| Net investment income (loss) | | 2.31% H | | 1.00% | | 1.22% | | 2.04% | | 2.43% H |
| Supplemental Data | | | | | | | | | | |
| Net assets, end of period (in millions) | $ | 149 | $ | 146 | $ | 155 | $ | 118 | $ | 116 |
Portfolio turnover rate I | | 56% H | | 52% | | 64% J | | 67% J | | 46% |
A For the period October 2, 2018 (commencement of sale of shares) through August 31, 2019.
B Calculated based on average shares outstanding during the period.
C Net investment income (loss) is affected by the timing of the declaration of dividends by any underlying mutual funds or exchange-traded funds (ETFs). Net investment income (loss) of any mutual funds or ETFs is not included in the Fund's net investment income (loss) ratio.
D Total returns for periods of less than one year are not annualized.
E Total returns would have been lower if certain expenses had not been reduced during the applicable periods shown.
F Fees and expenses of any underlying mutual funds or exchange-traded funds (ETFs) are not included in the Fund's expense ratio. The Fund indirectly bears its proportionate share of these expenses. For additional expense information related to investments in Fidelity Central Funds, please refer to the "Investments in Fidelity Central Funds" note found in the Notes to Financial Statements section of the most recent Annual or Semi-Annual report.
G Expense ratios reflect operating expenses of the class. Expenses before reductions do not reflect amounts reimbursed, waived, or reduced through arrangements with the investment adviser, brokerage services, or other offset arrangements, if applicable, and do not represent the amount paid by the class during periods when reimbursements, waivers or reductions occur.
H Annualized.
I Amount does not include the portfolio activity of any underlying mutual funds or exchange-traded funds (ETFs).
J Portfolio turnover rate excludes securities received or delivered in-kind.
For the period ended February 28, 2023
( Amounts in thousands except percentages)
1. Organization.
Fidelity Short-Term Bond Fund (the Fund) is a fund of Fidelity Salem Street Trust (the Trust) and is authorized to issue an unlimited number of shares. The Trust is registered under the Investment Company Act of 1940, as amended (the 1940 Act), as an open-end management investment company organized as a Massachusetts business trust. The Fund offers Class A, Class M, Class C, Short-Term Bond, Class I and Class Z shares, each of which has equal rights as to assets and voting privileges. Each class has exclusive voting rights with respect to matters that affect that class. Class C shares will automatically convert to Class A shares after a holding period of eight years from the initial date of purchase, with certain exceptions.
2. Investments in Fidelity Central Funds.
Funds may invest in Fidelity Central Funds, which are open-end investment companies generally available only to other investment companies and accounts managed by the investment adviser and its affiliates. The Schedule of Investments lists any Fidelity Central Funds held as an investment as of period end, but does not include the underlying holdings of each Fidelity Central Fund. An investing fund indirectly bears its proportionate share of the expenses of the underlying Fidelity Central Funds.
Based on its investment objective, each Fidelity Central Fund may invest or participate in various investment vehicles or strategies that are similar to those of the investing fund. These strategies are consistent with the investment objectives of the investing fund and may involve certain economic risks which may cause a decline in value of each of the Fidelity Central Funds and thus a decline in the value of the investing fund.
| Fidelity Central Fund | Investment Manager | Investment Objective | Investment Practices | Expense Ratio A |
| Fidelity Money Market Central Funds | Fidelity Management & Research Company LLC (FMR) | Each fund seeks to obtain a high level of current income consistent with the preservation of capital and liquidity. | Short-term Investments | Less than .005% |
A Expenses expressed as a percentage of average net assets and are as of each underlying Central Fund's most recent annual or semi-annual shareholder report.
A complete unaudited list of holdings for each Fidelity Central Fund is available upon request or at the Securities and Exchange Commission website at www.sec.gov. In addition, the financial statements of the Fidelity Central Funds which contain the significant accounting policies (including investment valuation policies) of those funds, and are not covered by the Report of Independent Registered Public Accounting Firm, are available on the Securities and Exchange Commission website or upon request.
3. Significant Accounting Policies.
The Fund is an investment company and applies the accounting and reporting guidance of the Financial Accounting Standards Board (FASB) Accounting Standards Codification Topic 946 Financial Services - Investment Companies . The financial statements have been prepared in conformity with accounting principles generally accepted in the United States of America (GAAP), which require management to make certain estimates and assumptions at the date of the financial statements. Actual results could differ from those estimates. Subsequent events, if any, through the date that the financial statements were issued have been evaluated in the preparation of the financial statements. The Fund's Schedule of Investments lists any underlying mutual funds or exchange-traded funds (ETFs) but does not include the underlying holdings of these funds. The following summarizes the significant accounting policies of the Fund:
Investment Valuation. Investments are valued as of 4:00 p.m. Eastern time on the last calendar day of the period. The Board of Trustees (the Board) has designated the Fund's investment adviser as the valuation designee responsible for the fair valuation function and performing fair value determinations as needed. The investment adviser has established a Fair Value Committee (the Committee) to carry out the day-to-day fair valuation responsibilities and has adopted policies and procedures to govern the fair valuation process and the activities of the Committee. In accordance with these fair valuation policies and procedures, which have been approved by the Board, the Fund attempts to obtain prices from one or more third party pricing services or brokers to value its investments. When current market prices, quotations or currency exchange rates are not readily available or reliable, investments will be fair valued in good faith by the Committee, in accordance with the policies and procedures. Factors used in determining fair value vary by investment type and may include market or investment specific events, transaction data, estimated cash flows, and market observations of comparable investments. The frequency that the fair valuation procedures are used cannot be predicted and they may be utilized to a significant extent. The Committee manages the Fund's fair valuation practices and maintains the fair valuation policies and procedures. The Fund's investment adviser reports to the Board information regarding the fair valuation process and related material matters.
The Fund categorizes the inputs to valuation techniques used to value its investments into a disclosure hierarchy consisting of three levels as shown below:
Level 1 - unadjusted quoted prices in active markets for identical investments
Level 2 - other significant observable inputs (including quoted prices for similar investments, interest rates, prepayment speeds, etc.)
Level 3 - unobservable inputs (including the Fund's own assumptions based on the best information available)
Valuation techniques used to value the Fund's investments by major category are as follows:
Debt securities, including restricted securities, are valued based on evaluated prices received from third party pricing services or from brokers who make markets in such securities. Corporate bonds and U.S. government and government agency obligations are valued by pricing services who utilize matrix pricing which considers yield or price of bonds of comparable quality, coupon, maturity and type or by broker-supplied prices. Asset backed securities, collateralized mortgage obligations, commercial mortgage securities and U.S. government agency mortgage securities are valued by pricing services who utilize matrix pricing which considers prepayment speed assumptions, attributes of the collateral, yield or price of bonds of comparable quality, coupon, maturity and type or by broker-supplied prices. When independent prices are unavailable or unreliable, debt securities may be valued utilizing pricing methodologies which consider similar factors that would be used by third party pricing services. Debt securities are generally categorized as Level 2 in the hierarchy but may be Level 3 depending on the circumstances.
Futures contracts are valued at the settlement price established each day by the board of trade or exchange on which they are traded and are categorized as Level 1 in the hierarchy. Investments in open-end mutual funds, including the Fidelity Central Funds, are valued at their closing net asset value (NAV) each business day and are categorized as Level 1 in the hierarchy.
Changes in valuation techniques may result in transfers in or out of an assigned level within the disclosure hierarchy. The aggregate value of investments by input level as of February 28, 2023 is included at the end of the Fund's Schedule of Investments.
Investment Transactions and Income. For financial reporting purposes, the Fund's investment holdings and NAV include trades executed through the end of the last business day of the period. The NAV per share for processing shareholder transactions is calculated as of the close of business of the New York Stock Exchange (NYSE), normally 4:00 p.m. Eastern time and includes trades executed through the end of the prior business day. Gains and losses on securities sold are determined on the basis of identified cost and include proceeds received from litigation. Income and capital gain distributions from Fidelity Central Funds, if any, are recorded on the ex-dividend date. Interest income is accrued as earned and includes coupon interest and amortization of premium and accretion of discount on debt securities as applicable. Debt obligations may be placed on non-accrual status and related interest income may be reduced by ceasing current accruals and writing off interest receivables when the collection of all or a portion of interest has become doubtful based on consistently applied procedures. A debt obligation is removed from non-accrual status when the issuer resumes interest payments or when collectability of interest is reasonably assured.
Class Allocations and Expenses. Investment income, realized and unrealized capital gains and losses, common expenses of a fund, and certain fund-level expense reductions, if any, are allocated daily on a pro-rata basis to each class based on the relative net assets of each class to the total net assets of a fund. Each class differs with respect to transfer agent and distribution and service plan fees incurred, as applicable. Certain expense reductions may also differ by class, if applicable. For the reporting period, the allocated portion of income and expenses to each class as a percent of its average net assets may vary due to the timing of recording these transactions in relation to fluctuating net assets of the classes. Expenses directly attributable to a fund are charged to that fund. Expenses attributable to more than one fund are allocated among the respective funds on the basis of relative net assets or other appropriate methods. Expenses included in the accompanying financial statements reflect the expenses of that fund and do not include any expenses associated with any underlying mutual funds or exchange-traded funds. Although not included in a fund's expenses, a fund indirectly bears its proportionate share of these expenses through the net asset value of each underlying mutual fund or exchange-traded fund. Expense estimates are accrued in the period to which they relate and adjustments are made when actual amounts are known.
Deferred Trustee Compensation. Under a Deferred Compensation Plan (the Plan) for certain Funds, certain independent Trustees have elected to defer receipt of a portion of their annual compensation. Deferred amounts are invested in affiliated mutual funds, are marked-to-market and remain in a fund until distributed in accordance with the Plan. The investment of deferred amounts and the offsetting payable to the Trustees presented below are included in the accompanying Statement of Assets and Liabilities in other receivables and other payables and accrued expenses, as applicable.
| Fidelity Short-Term Bond Fund | $8 |
Income Tax Information and Distributions to Shareholders. Each year, the Fund intends to qualify as a regulated investment company under Subchapter M of the Internal Revenue Code, including distributing substantially all of its taxable income and realized gains. As a result, no provision for U.S. Federal income taxes is required. The Fund files a U.S. federal tax return, in addition to state and local tax returns as required. The Fund's federal income tax returns are subject to examination by the Internal Revenue Service (IRS) for a period of three fiscal years after they are filed. State and local tax returns may be subject to examination for an additional fiscal year depending on the jurisdiction.
Distributions are declared and recorded daily and paid monthly from net investment income. Distributions from realized gains, if any, are declared and recorded on the ex-dividend date. Income and capital gain distributions are declared separately for each class. Income and capital gain distributions are determined in accordance with income tax regulations, which may differ from GAAP.
Capital accounts within the financial statements are adjusted for permanent book-tax differences. These adjustments have no impact on net assets or the results of operations. Capital accounts are not adjusted for temporary book-tax differences which will reverse in a subsequent period.
Book-tax differences are primarily due to futures contracts, market discount, capital loss carryforwards and losses deferred due to wash sales.
As of period end, the cost and unrealized appreciation (depreciation) in securities, and derivatives if applicable, for federal income tax purposes were as follows:
| Gross unrealized appreciation | $1,583 |
| Gross unrealized depreciation | (83,685) |
| Net unrealized appreciation (depreciation) | $(82,102) |
| Tax cost | $2,746,168 |
Capital loss carryforwards are only available to offset future capital gains of the Fund to the extent provided by regulations and may be limited. The capital loss carryforward information presented below, including any applicable limitation, is estimated as of prior fiscal period end and is subject to adjustment.
| Short-term | $(12,394) |
| Long-term | (10,129) |
| Total capital loss carryforward | $(22,523) |
Delayed Delivery Transactions and When-Issued Securities. During the period, certain Funds transacted in securities on a delayed delivery or when-issued basis. Payment and delivery may take place after the customary settlement period for that security. The price of the underlying securities and the date when the securities will be delivered and paid for are fixed at the time the transaction is negotiated. Securities purchased on a delayed delivery or when-issued basis are identified as such in the Schedule of Investments. Compensation for interest forgone in the purchase of a delayed delivery or when-issued debt security may be received. With respect to purchase commitments, each applicable Fund identifies securities as segregated in its records with a value at least equal to the amount of the commitment. Payables and receivables associated with the purchases and sales of delayed delivery securities having the same coupon, settlement date and broker are offset. Delayed delivery or when-issued securities that have been purchased from and sold to different brokers are reflected as both payables and receivables in the Statement of Assets and Liabilities under the caption "Delayed delivery", as applicable. Losses may arise due to changes in the value of the underlying securities or if the counterparty does not perform under the contract's terms, or if the issuer does not issue the securities due to political, economic, or other factors.
Restricted Securities (including Private Placements). Funds may invest in securities that are subject to legal or contractual restrictions on resale. These securities generally may be resold in transactions exempt from registration or to the public if the securities are registered. Disposal of these securities may involve time-consuming negotiations and expense, and prompt sale at an acceptable price may be difficult. Information regarding restricted securities held at period end is included at the end of the Schedule of Investments, if applicable.
4. Derivative Instruments.
Risk Exposures and the Use of Derivative Instruments. The Fund's investment objectives allow for various types of derivative instruments, including futures contracts. Derivatives are investments whose value is primarily derived from underlying assets, indices or reference rates and may be transacted on an exchange or over-the-counter (OTC). Derivatives may involve a future commitment to buy or sell a specified asset based on specified terms, to exchange future cash flows at periodic intervals based on a notional principal amount, or for one party to make one or more payments upon the occurrence of specified events in exchange for periodic payments from the other party.
Derivatives were used to increase returns and to manage exposure to certain risks as defined below. The success of any strategy involving derivatives depends on analysis of numerous economic factors, and if the strategies for investment do not work as intended, the objectives may not be achieved.
Derivatives were used to increase or decrease exposure to the following risk(s):
| | |
| Interest Rate Risk | Interest rate risk relates to the fluctuations in the value of interest-bearing securities due to changes in the prevailing levels of market interest rates. |
Funds are also exposed to additional risks from investing in derivatives, such as liquidity risk and counterparty credit risk. Liquidity risk is the risk that a fund will be unable to close out the derivative in the open market in a timely manner. Counterparty credit risk is the risk that the counterparty will not be able to fulfill its obligation to a fund. Counterparty credit risk related to exchange-traded contracts may be mitigated by the protection provided by the exchange on which they trade.
Investing in derivatives may involve greater risks than investing in the underlying assets directly and, to varying degrees, may involve risk of loss in excess of any initial investment and collateral received and amounts recognized in the Statement of Assets and Liabilities. In addition, there may be the risk that the change in value of the derivative contract does not correspond to the change in value of the underlying instrument.
Futures Contracts. A futures contract is an agreement between two parties to buy or sell a specified underlying instrument for a fixed price at a specified future date. Futures contracts were used to manage exposure to the bond market and fluctuations in interest rates.
Upon entering into a futures contract, a fund is required to deposit either cash or securities (initial margin) with a clearing broker in an amount equal to a certain percentage of the face value of the contract. Futures contracts are marked-to-market daily and subsequent daily payments are made or received by a fund depending on the daily fluctuations in the value of the futures contracts and are recorded as unrealized appreciation or (depreciation). This receivable and/or payable, if any, is included in daily variation margin on futures contracts in the Statement of Assets and Liabilities. Realized gain or (loss) is recorded upon the expiration or closing of a futures contract. The net realized gain (loss) and change in net unrealized appreciation (depreciation) on futures contracts during the period is presented in the Statement of Operations.
Any open futures contracts at period end are presented in the Schedule of Investments under the caption "Futures Contracts". The notional amount at value reflects each contract's exposure to the underlying instrument or index at period end, and is representative of volume of activity during the period unless an average notional amount is presented. Any securities deposited to meet initial margin requirements are identified in the Schedule of Investments. Any cash deposited to meet initial margin requirements is presented as segregated cash with brokers for derivative instruments in the Statement of Assets and Liabilities.
5. Purchases and Sales of Investments.
Purchases and sales of securities, other than short-term securities, U.S. government securities and in-kind transactions, as applicable, are noted in the table below.
| | Purchases ($) | Sales ($) |
| Fidelity Short-Term Bond Fund | 185,700 | 207,072 |
6. Fees and Other Transactions with Affiliates.
Management Fee. Fidelity Management & Research Company LLC (the investment adviser) and its affiliates provide the Fund with investment management related services for which the Fund pays a monthly management fee. The management fee is the sum of an individual fund fee rate that is based on an annual rate of .20% of the Fund's average net assets and an annualized group fee rate that averaged .10% during the period. The group fee rate is based upon the monthly average net assets of a group of registered investment companies with which the investment adviser has management contracts. The group fee rate decreases as assets under management increase and increases as assets under management decrease. For the reporting period, the total annualized management fee rate was .30% of the Fund's average net assets.
During March 2023, the Board approved changes to the management fee effective April 1, 2023. The Fund will pay a monthly management fee that is based on an annual rate of .20% of the Fund's average net assets. Under the management contract, the investment adviser will pay all other fund-level expenses, except the compensation of the independent Trustees and certain other expenses such as proxy and shareholder meeting expenses.
Distribution and Service Plan Fees. In accordance with Rule 12b-1 of the 1940 Act, the Fund has adopted separate Distribution and Service Plans for each class of shares. Certain classes pay Fidelity Distributors Company LLC (FDC), an affiliate of the investment adviser, separate Distribution and Service Fees, each of which is based on an annual percentage of each class' average net assets. In addition, FDC may pay financial intermediaries for selling shares of the Fund and providing shareholder support services. For the period, the Distribution and Service Fee rates, total fees and amounts retained by FDC were as follows:
| | Distribution Fee | Service Fee | Total Fees | Retained by FDC |
| Class A | -% | .15% | $166 | $19 |
| Class M | -% | .15% | 41 | - A |
| Class C | .75% | .25% | 140 | 24 |
| | | | $347 | $43 |
A Amount represents less than five hundred dollars.
Sales Load. FDC may receive a front-end sales charge of up to 1.50% for selling Class A and Class M shares, some of which is paid to financial intermediaries for selling shares of the Fund. Depending on the holding period, FDC may receive a contingent deferred sales charges levied on Class A, Class M and Class C redemptions. The deferred sales charges are 1.00% for Class C shares, .75% or .50% for certain purchases of Class A shares and .25% for certain purchases of Class M shares.
For the period, sales charge amounts retained by FDC were as follows:
| | Retained by FDC |
| Class A | $18 |
| Class M | 2 |
Class C A | - B |
| | $20 |
A When Class C shares are initially sold, FDC pays commissions from its own resources to financial intermediaries through which the sales are made.
B Amount represents less than five hundred dollars.
Transfer Agent Fees. Fidelity Investments Institutional Operations Company LLC (FIIOC), an affiliate of the investment adviser, is the transfer, dividend disbursing and shareholder servicing agent for each class of the Fund. FIIOC receives account fees and asset-based fees that vary according to the account size and type of account of the shareholders of each respective class of the Fund, with the exception of Short-Term Bond and Class Z. FIIOC receives an asset-based fee of Short-Term Bond's and Class Z's average net assets. FIIOC pays for typesetting, printing and mailing of shareholder reports, except proxy statements. For the period, transfer agent fees for each class were as follows:
| | Amount | % of Class-Level Average Net Assets A |
| Class A | $162 | .15 |
| Class M | 44 | .16 |
| Class C | 23 | .16 |
| Short-Term Bond | 1,015 | .10 |
| Class I | 188 | .15 |
| Class Z | 39 | .05 |
| | $1,471 | |
A Annualized
Fund Wide Operations Fee. Pursuant to the Fund Wide Operations and Expense Agreement (FWOE), the investment adviser has agreed to provide for fund-level expenses (which may not include transfer agent, the compensation of the independent Trustees, interest, taxes or extraordinary expenses, as applicable) in return for a FWOE fee equal to .35% of fund-level average net assets less the total amount of the management fee. The FWOE paid by a fund is reduced by an amount equal to the fees and expenses paid to the independent Trustees. For the period, the FWOE fees were equivalent to the following annualized rate expressed as a percentage of average net assets:
| Fidelity Short-Term Bond Fund | .05% |
During March 2023, the Board approved the termination of the FWOE effective April 1, 2023.
Interfund Trades. Funds may purchase from or sell securities to other Fidelity Funds under procedures adopted by the Board. The procedures have been designed to ensure these interfund trades are executed in accordance with Rule 17a-7 of the 1940 Act. Any interfund trades are included within the respective purchases and sales amounts shown in the Purchases and Sales of Investments note. During the period, there were no interfund trades.
7. Committed Line of Credit.
Certain Funds participate with other funds managed by the investment adviser or an affiliate in a $4.25 billion credit facility (the "line of credit") to be utilized for temporary or emergency purposes to fund shareholder redemptions or for other short-term liquidity purposes. The commitment fees on the pro-rata portion of the line of credit are borne by the investment adviser. During the period, there were no borrowings on this line of credit.
8. Security Lending.
Funds lend portfolio securities from time to time in order to earn additional income. Lending agents are used, including National Financial Services (NFS), an affiliate of the investment adviser. Pursuant to a securities lending agreement, NFS will receive a fee, which is capped at 9.9% of a fund's daily lending revenue, for its services as lending agent. A fund may lend securities to certain qualified borrowers, including NFS. On the settlement date of the loan, a fund receives collateral (in the form of U.S. Treasury obligations, letters of credit and/or cash) against the loaned securities and maintains collateral in an amount not less than 100% of the market value of the loaned securities during the period of the loan. The market value of the loaned securities is determined at the close of business of a fund and any additional required collateral is delivered to a fund on the next business day. A fund or borrower may terminate the loan at any time, and if the borrower defaults on its obligation to return the securities loaned because of insolvency or other reasons, a fund may apply collateral received from the borrower against the obligation. A fund may experience delays and costs in recovering the securities loaned. Any cash collateral received is invested in the Fidelity Securities Lending Cash Central Fund. Any loaned securities are identified as such in the Schedule of Investments, and the value of loaned securities and cash collateral at period end, as applicable, are presented in the Statement of Assets and Liabilities. Security lending income represents the income earned on investing cash collateral, less rebates paid to borrowers and any lending agent fees associated with the loan, plus any premium payments received for lending certain types of securities. Security lending income is presented in the Statement of Operations as a component of income from Fidelity Central Funds. Affiliated security lending activity, if any, was as follows:
| | Total Security Lending Fees Paid to NFS | Security Lending Income From Securities Loaned to NFS | Value of Securities Loaned to NFS at Period End |
| Fidelity Short-Term Bond Fund | $5 | $- | $- |
9. Expense Reductions.
The investment adviser contractually agreed to reimburse expenses of each class to the extent annual operating expenses exceeded certain levels of class-level average net assets as noted in the table below. Some expenses, for example the compensation of the independent Trustees and certain other expenses such as interest expense, are excluded from this reimbursement.
The following classes were in reimbursement during the period:
| | Expense Limitations | Reimbursement |
| Class Z | .36% | $33 |
Through arrangements with the Fund's custodian, credits realized as a result of certain uninvested cash balances were used to reduce the Fund's expenses. During the period, custodian credits reduced the Fund's expenses by $1.
Effective April 1, 2023, the investment adviser contractually agreed to reimburse expenses to the extent annual operating expenses exceed certain levels of class-level average net assets as noted in the table below. This reimbursement will remain in place through December 31, 2024. Some expenses, for example the compensation of the independent Trustees, and certain miscellaneous expenses such proxy and shareholder meeting expenses, are excluded from this reimbursement.
| | Expense Limitations |
| Class A | None |
| Class M | None |
| Class C | None |
| Short-Term Bond | None |
| Class I | .30% |
| Class Z | None |
10. Distributions to Shareholders.
Distributions to shareholders of each class were as follows:
| | Six months ended February 28, 2023 | Year ended August 31, 2022 |
| Fidelity Short-Term Bond Fund | | |
| Distributions to shareholders | | |
| Class A | $1,634 | $2,129 |
| Class M | 405 | 583 |
| Class C | 88 | 119 |
| Short-Term Bond | 17,044 | 26,668 |
| Class I | 2,035 | 2,734 |
| Class Z | 1,370 | 1,878 |
Total | $22,576 | $34,111 |
11. Share Transactions.
Share transactions for each class were as follows and may contain in-kind transactions, automatic conversions between classes or exchanges between affiliated funds:
| | Shares | Shares | Dollars | Dollars |
| | Six months ended February 28, 2023 | Year ended August 31, 2022 | Six months ended February 28, 2023 | Year ended August 31, 2022 |
| Fidelity Short-Term Bond Fund | | | | |
| Class A | | | | |
| Shares sold | 5,953 | 19,288 | $48,861 | $163,691 |
| Reinvestment of distributions | 179 | 234 | 1,467 | 1,991 |
| Shares redeemed | (7,171) | (19,072) | (58,832) | (162,116) |
| Net increase (decrease) | (1,039) | 450 | $(8,504) | $3,566 |
| Class M | | | | |
| Shares sold | 352 | 1,266 | $2,895 | $10,745 |
| Reinvestment of distributions | 47 | 65 | 386 | 558 |
| Shares redeemed | (854) | (2,054) | (7,009) | (17,437) |
| Net increase (decrease) | (455) | (723) | $(3,728) | $(6,134) |
| Class C | | | | |
| Shares sold | 1,277 | 1,751 | $10,419 | $14,829 |
| Reinvestment of distributions | 10 | 13 | 85 | 115 |
| Shares redeemed | (932) | (2,316) | (7,611) | (19,617) |
| Net increase (decrease) | 355 | (552) | $2,893 | $(4,673) |
| Short-Term Bond | | | | |
| Shares sold | 31,111 | 41,855 | $254,482 | $354,127 |
| Reinvestment of distributions | 1,652 | 2,640 | 13,556 | 22,511 |
| Shares redeemed | (44,197) | (86,466) | (362,667) | (732,749) |
| Net increase (decrease) | (11,434) | (41,971) | $(94,629) | $(356,111) |
| Class I | | | | |
| Shares sold | 10,506 | 17,325 | $86,131 | $145,973 |
| Reinvestment of distributions | 237 | 298 | 1,948 | 2,543 |
| Shares redeemed | (11,989) | (17,812) | (98,502) | (150,956) |
| Net increase (decrease) | (1,246) | (189) | $(10,423) | $(2,440) |
| Class Z | | | | |
| Shares sold | 6,036 | 9,084 | $49,436 | $76,963 |
| Reinvestment of distributions | 133 | 165 | 1,093 | 1,406 |
| Shares redeemed | (5,686) | (9,349) | (46,637) | (79,406) |
| Net increase (decrease) | 483 | (100) | $3,892 | $(1,037) |
12. Other.
A fund's organizational documents provide former and current trustees and officers with a limited indemnification against liabilities arising in connection with the performance of their duties to the fund. In the normal course of business, a fund may also enter into contracts that provide general indemnifications. A fund's maximum exposure under these arrangements is unknown as this would be dependent on future claims that may be made against a fund. The risk of material loss from such claims is considered remote.
13. Credit Risk.
The Fund invests a significant portion of its assets in structured securities of issuers backed by commercial and residential mortgage loans, credit card receivables and automotive loans. The value and related income of these securities is sensitive to changes in economic conditions, including delinquencies and/or defaults.
14. Risk and Uncertainties.
Many factors affect a fund's performance. Developments that disrupt global economies and financial markets, such as pandemics, epidemics, outbreaks of infectious diseases, war, terrorism, and environmental disasters, may significantly affect a fund's investment performance. The effects of these developments to a fund will be impacted by the types of securities in which a fund invests, the financial condition, industry, economic sector, and geographic location of an issuer, and a fund's level of investment in the securities of that issuer. Significant concentrations in security types, issuers, industries, sectors, and geographic locations may magnify the factors that affect a fund's performance.
As a shareholder, you incur two types of costs: (1) transaction costs, which may include sales charges (loads) on purchase payments or redemption proceeds, as applicable and (2) ongoing costs, which generally include management fees, distribution and/or service (12b-1) fees and other Fund expenses. This Example is intended to help you understand your ongoing costs (in dollars) of investing in a fund and to compare these costs with the ongoing costs of investing in other mutual funds.
| The Example is based on an investment of $1,000 invested at the beginning of the period and held for the entire period (September 1, 2022 to February 28, 2023). |
Actual Expenses
The first line of the accompanying table provides information about actual account values and actual expenses. You may use the information in this line, together with the amount you invested, to estimate the expenses that you paid over the period. Simply divide your account value by $1,000.00 (for example, an $8,600 account value divided by $1,000.00 = 8.6), then multiply the result by the number in the first line for a class/Fund under the heading entitled "Expenses Paid During Period" to estimate the expenses you paid on your account during this period. If any fund is a shareholder of any underlying mutual funds or exchange-traded funds (ETFs) (the Underlying Funds), such fund indirectly bears its proportional share of the expenses of the Underlying Funds in addition to the direct expenses incurred presented in the table. These fees and expenses are not included in the annualized expense ratio used to calculate the expense estimate in the table below.
Hypothetical Example for Comparison Purposes
The second line of the accompanying table provides information about hypothetical account values and hypothetical expenses based on the actual expense ratio and an assumed rate of return of 5% per year before expenses, which is not the actual return. The hypothetical account values and expenses may not be used to estimate the actual ending account balance or expenses you paid for the period. You may use this information to compare the ongoing costs of investing in the Fund and other funds. To do so, compare this 5% hypothetical example with the 5% hypothetical examples that appear in the shareholder reports of the other funds. If any fund is a shareholder of any Underlying Funds, such fund indirectly bears its proportional share of the expenses of the Underlying Funds in addition to the direct expenses as presented in the table. These fees and expenses are not included in the annualized expense ratio used to calculate the expense estimate in the table below.
Please note that the expenses shown in the table are meant to highlight your ongoing costs only and do not reflect any transaction costs. Therefore, the second line of the table is useful in comparing ongoing costs only, and will not help you determine the relative total costs of owning different funds. In addition, if these transactional costs were included, your costs would have been higher.
| | | | | Annualized Expense Ratio- A | | Beginning Account Value September 1, 2022 | | Ending Account Value February 28, 2023 | | Expenses Paid During Period- C September 1, 2022 to February 28, 2023 |
| Fidelity® Short-Term Bond Fund | | | | | | | | | | |
Class A ** | | | | .65% | | | | | | |
| Actual | | | | | | $ 1,000 | | $ 1,001.40 | | $ 3.23 |
Hypothetical- B | | | | | | $ 1,000 | | $ 1,021.57 | | $ 3.26 |
Class M ** | | | | .66% | | | | | | |
| Actual | | | | | | $ 1,000 | | $ 1,001.30 | | $ 3.28 |
Hypothetical- B | | | | | | $ 1,000 | | $ 1,021.52 | | $ 3.31 |
Class C ** | | | | 1.53% | | | | | | |
| Actual | | | | | | $ 1,000 | | $ 995.80 | | $ 7.57 |
Hypothetical- B | | | | | | $ 1,000 | | $ 1,017.21 | | $ 7.65 |
Fidelity® Short-Term Bond Fund ** | | | | .45% | | | | | | |
| Actual | | | | | | $ 1,000 | | $ 1,002.30 | | $ 2.23 |
Hypothetical- B | | | | | | $ 1,000 | | $ 1,022.56 | | $ 2.26 |
Class I ** | | | | .50% | | | | | | |
| Actual | | | | | | $ 1,000 | | $ 1,002.10 | | $ 2.48 |
Hypothetical- B | | | | | | $ 1,000 | | $ 1,022.32 | | $ 2.51 |
Class Z ** | | | | .36% | | | | | | |
| Actual | | | | | | $ 1,000 | | $ 1,002.80 | | $ 1.79 |
Hypothetical- B | | | | | | $ 1,000 | | $ 1,023.01 | | $ 1.81 |
| |
A Annualized expense ratio reflects expenses net of applicable fee waivers.
B 5% return per year before expenses
C Expenses are equal to the annualized expense ratio, multiplied by the average account value over the period, multiplied by 181/ 365 (to reflect the one-half year period). The fees and expenses of any Underlying Funds are not included in each annualized expense ratio.
** If fees and changes to the expense contract and/or expense cap, effective April 1, 2023, had been in effect during the current period, the restated annualized expense ratio and the expenses paid in the actual and hypothetical examples above would have been as shown in table below:
| | | | | Annualized Expense Ratio- A | | Expenses Paid |
| Fidelity® Short-Term Bond Fund | | | | | | |
| Class A | | | | .50% | | |
| Actual | | | | | | $ 2.48 |
Hypothetical - B | | | | | | $ 2.51 |
| Class M | | | | .51% | | |
| Actual | | | | | | $ 2.53 |
Hypothetical - B | | | | | | $ 2.56 |
| Class C | | | | 1.38% | | |
| Actual | | | | | | $ 6.83 |
Hypothetical - B | | | | | | $ 6.90 |
| Fidelity® Short-Term Bond Fund | | | | .30% | | |
| Actual | | | | | | $ 1.49 |
Hypothetical - B | | | | | | $ 1.51 |
| Class I | | | | .30% | | |
| Actual | | | | | | $ 1.49 |
Hypothetical - B | | | | | | $ 1.51 |
| Class Z | | | | .25% | | |
| Actual | | | | | | $ 1.24 |
Hypothetical - B | | | | | | $ 1.25 |
| | | | | | | |
| A Annualized expense ratio reflects expenses net of applicable fee waivers. | | | | | | |
| B 5% return per year before expenses | | | | | | |
Board Approval of Investment Advisory Contracts and Management Fees
Fidelity Short-Term Bond Fund
Each year, the Board of Trustees, including the Independent Trustees (together, the Board), votes on the renewal of the management contract with Fidelity Management & Research Company LLC (FMR) and the sub-advisory agreements (together, the Advisory Contracts) for the fund. FMR and the sub-advisers are referred to herein as the Investment Advisers. The Board, assisted by the advice of fund counsel and Independent Trustees' counsel, requests and considers a broad range of information relevant to the renewal of the Advisory Contracts throughout the year.
The Board meets regularly and, at each of its meetings, covers an extensive agenda of topics and materials and considers factors that are relevant to its annual consideration of the renewal of the fund's Advisory Contracts, including the services and support provided to the fund and its shareholders. The Board has established four standing committees (Committees) - Operations, Audit, Fair Valuation, and Governance and Nominating - each composed of and chaired by Independent Trustees with varying backgrounds, to which the Board has assigned specific subject matter responsibilities in order to enhance effective decision-making by the Board. The Operations Committee, of which all the Independent Trustees are members, meets regularly throughout the year and requests, receives and considers, among other matters, information related to the annual consideration of the renewal of the fund's Advisory Contracts before making its recommendation to the Board. The Board also meets as needed to review matters specifically related to the Board's annual consideration of the renewal of the Advisory Contracts. Members of the Board may also meet from time to time with trustees of other Fidelity funds through joint ad hoc committees to discuss certain matters relevant to all of the Fidelity funds.
At its September 2022 meeting, the Board unanimously determined to renew the fund's Advisory Contracts. In reaching its determination, the Board considered all factors it believed relevant, including (i) the nature, extent, and quality of the services provided to the fund and its shareholders (including the investment performance of the fund); (ii) the competitiveness relative to peer funds of the fund's management fee and the total expense ratio of a representative class (the retail class); (iii) the total costs of the services provided by and the profits realized by Fidelity from its relationships with the fund; and (iv) the extent to which, if any, economies of scale exist and are realized as the fund grows, and whether any economies of scale are appropriately shared with fund shareholders.
In considering whether to renew the Advisory Contracts for the fund, the Board reached a determination, with the assistance of fund counsel and Independent Trustees' counsel and through the exercise of its business judgment, that the renewal of the Advisory Contracts was in the best interests of the fund and its shareholders and that the compensation payable under the Advisory Contracts was fair and reasonable. The Board's decision to renew the Advisory Contracts was not based on any single factor, but rather was based on a comprehensive consideration of all the information provided to the Board at its meetings throughout the year. The Board, in reaching its determination to renew the Advisory Contracts, was aware that shareholders of the fund have a broad range of investment choices available to them, including a wide choice among funds offered by Fidelity's competitors, and that the fund's shareholders, who have the opportunity to review and weigh the disclosure provided by the fund in its prospectus and other public disclosures, have chosen to invest in this fund, which is part of the Fidelity family of funds.
Nature, Extent, and Quality of Services Provided . The Board considered Fidelity's staffing as it relates to the fund, including the backgrounds of investment personnel of Fidelity, and also considered the fund's investment objective, strategies, and related investment philosophy. The Independent Trustees also had discussions with senior management of Fidelity's investment operations and investment groups. The Board considered the structure of the investment personnel compensation program and whether this structure provides appropriate incentives to act in the best interests of the fund. Additionally, the Board considered the portfolio managers' investments, if any, in the funds that they manage. The Board also considered the steps Fidelity had taken to ensure the continued provision of high quality services to the Fidelity funds throughout the COVID-19 pandemic, including the expansion of staff in client facing positions to maintain service levels in periods of high volumes and volatility.
Resources Dedicated to Investment Management and Support Services. The Board reviewed the general qualifications and capabilities of Fidelity's investment staff, including its size, education, experience, and resources, as well as Fidelity's approach to recruiting, training, managing, and compensating investment personnel. The Board noted the resources devoted to Fidelity's global investment organization, and that Fidelity's analysts have extensive resources, tools and capabilities that allow them to conduct quantitative and fundamental analysis, as well as credit analysis of issuers, counterparties and guarantors. Further, the Board considered that Fidelity's investment professionals have sufficient access to global information and data so as to provide competitive investment results over time, and that those professionals also have access to sophisticated tools that permit them to assess portfolio construction and risk and performance attribution characteristics continuously, as well as to transmit new information and research conclusions rapidly around the world. Additionally, in its deliberations, the Board considered Fidelity's trading, risk management, compliance, cybersecurity and technology and operations capabilities and resources, which are integral parts of the investment management process.
Shareholder and Administrative Services. The Board considered (i) the nature, extent, quality, and cost of advisory, administrative, and shareholder services performed by the Investment Advisers and their affiliates under the Advisory Contracts and under separate agreements covering transfer agency, pricing and bookkeeping, and securities lending services for the fund; (ii) the nature and extent of the supervision of third party service providers, principally custodians, subcustodians, and pricing vendors; and (iii) the resources devoted to, and the record of compliance with, the fund's compliance policies and procedures.
The Board noted that the growth of fund assets over time across the complex allows Fidelity to reinvest in the development of services designed to enhance the value and convenience of the Fidelity funds as investment vehicles. These services include 24-hour access to account information and market information over the Internet and through telephone representatives, investor education materials and asset allocation tools. The Board also considered that it reviews customer service metrics such as telephone response times, continuity of services on the website and metrics addressing services at Fidelity Investor Centers.
Investment in a Large Fund Family. The Board considered the benefits to shareholders of investing in a Fidelity fund, including the benefits of investing in a fund that is part of a large family of funds offering a variety of investment disciplines and providing a large variety of mutual fund investor services. The Board noted that Fidelity had taken, or had made recommendations to the Board that resulted in the Fidelity funds taking, a number of actions over the previous year that benefited particular funds, including: (i) continuing to dedicate additional resources to Fidelity's investment research process, which includes meetings with management of issuers of securities in which the funds invest; (ii) continuing efforts to enhance Fidelity's global research capabilities; (iii) launching new funds, ETFs, and share classes with innovative structures, strategies and pricing and making other enhancements to meet investor needs; (iv) broadening eligibility requirements for certain funds and share classes; (v) reducing management fees and total expenses for certain funds and classes; (vi) lowering expenses for certain existing funds and classes by implementing or lowering expense caps; (vii) rationalizing product lines and gaining increased efficiencies from fund mergers and liquidations; (viii) continuing to develop, acquire and implement systems and technology to improve services to the funds and shareholders, strengthen information security, and increase efficiency; and (ix) continuing to implement enhancements to further strengthen Fidelity's product line to increase investors' probability of success in achieving their investment goals, including their retirement income goals.
Investment Performance. The Board considered whether the fund has operated in accordance with its investment objective, as well as its record of compliance with its investment restrictions and its performance history.
The Board took into account discussions that occur at Board meetings throughout the year with representatives of the Investment Advisers about fund investment performance. In this regard the Board noted that as part of regularly scheduled fund reviews and other reports to the Board on fund performance, the Board considers annualized return information for the fund for different time periods, measured against an appropriate securities market index (benchmark index) and an appropriate peer group of funds with similar objectives (peer group). The Board also receives and considers information about performance attribution. In its evaluation of fund investment performance at meetings throughout the year, the Board gave particular attention to information indicating underperformance of certain Fidelity funds for specific time periods and discussed with the Investment Advisers the reasons for such underperformance.
In addition to reviewing absolute and relative fund performance, the Independent Trustees periodically consider the appropriateness of fund performance metrics in evaluating the results achieved. In general, the Independent Trustees believe that fund performance should be evaluated based on gross performance (before fees and expenses but after transaction costs) compared to appropriate benchmark indices, over appropriate time periods that may include full market cycles, and on net performance (after fees and expenses) compared to appropriate peer groups, as applicable, over the same periods, taking into account relevant factors including the following: general market conditions; expectations for interest rate levels and credit conditions; issuer-specific information including credit quality; the potential for incremental return versus the fund's benchmark index weighed against the risks involved in obtaining that incremental return, including the risk of diminished or negative total returns; and fund cash flows and other factors. The Independent Trustees generally give greater weight to fund performance over longer time periods than over shorter time periods. Depending on the circumstances, the Independent Trustees may be satisfied with a fund's performance notwithstanding that it lags its benchmark index or peer group for certain periods.
The Independent Trustees recognize that shareholders evaluate performance on a net basis over their own holding periods, for which one-, three-, and five-year periods are often used as a proxy. For this reason, the performance information reviewed by the Board also included net cumulative calendar year total return information for the representative class (the retail class) and an appropriate benchmark index and peer group for the most recent one-, three-, and five-year periods. The Independent Trustees recognize that shareholders who are not investing through a tax-advantaged retirement account also consider tax consequences in evaluating performance.
Based on its review, the Board concluded that the nature, extent, and quality of services provided to the fund under the Advisory Contracts should continue to benefit the shareholders of the fund.
Competitiveness of Management Fee and Total Expense Ratio. The Board considered the fund's management fee and total expense ratio compared to selected groups of competitive funds and classes (referred to as "mapped groups" below) for the purpose of facilitating the Trustees' competitive analysis of management fees and total expenses. Fidelity creates "mapped groups" by combining similar investment objective categories (as classified by Lipper) that have comparable investment mandates. Combining funds with similar investment objective categories aids the Board's comparison of management fees and total expense ratios by broadening the competitive group used for such comparison.
Management Fee. The Board considered two proprietary management fee comparisons for the 12-month periods shown in basis points (BP) in the chart below. The group of Lipper funds used by the Board for management fee comparisons is referred to below as the "Total Mapped Group" and is broader than the Lipper peer group used by the Board for performance comparisons. The Total Mapped Group comparison focuses on a fund's standing in terms of gross management fees before expense reimbursements or caps relative to the total universe of funds with comparable investment mandates, regardless of whether their management fee structures also are comparable. Funds with comparable investment mandates offer exposure to similar types of securities. Funds with comparable management fee structures have similar management fee contractual arrangements (e.g., flat rate charged for advisory services, all-inclusive fee rate, etc.). "TMG %" represents the percentage of funds in the Total Mapped Group that had management fees that were lower than the fund's. For example, a hypothetical TMG % of 20% would mean that 80% of the funds in the Total Mapped Group had higher, and 20% had lower, management fees than the fund. The fund's actual TMG %s and the number of funds in the Total Mapped Group are in the chart below. The "Asset-Sized Peer Group" (ASPG) comparison focuses on a fund's standing relative to a subset of non-Fidelity funds within the Total Mapped Group that are similar in size and management fee structure. For example, if a fund is in the first quartile of the ASPG, the fund's management fee ranks in the least expensive or lowest 25% of funds in the ASPG. The ASPG represents at least 15% of the funds in the Total Mapped Group with comparable asset size and management fee structures, subject to a minimum of 50 funds (or all funds in the Total Mapped Group if fewer than 50). Additional information, such as the ASPG quartile in which the fund's management fee rate ranked, is also included in the chart and was considered by the Board.
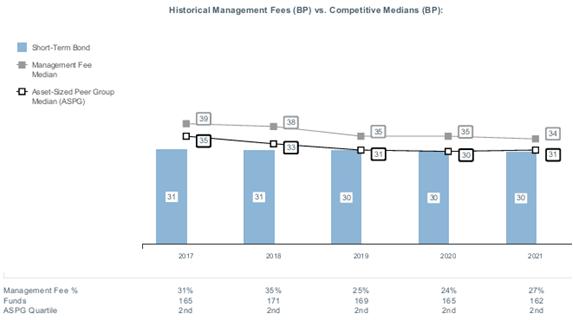
The Board noted that the fund's management fee rate ranked below the median of its Total Mapped Group and below the median of its ASPG for 2021.
Based on its review, the Board concluded that the fund's management fee is fair and reasonable in light of the services that the fund receives and the other factors considered.
Total Expense Ratio. In its review of the total expense ratio of the representative class (the retail class) of the fund, the Board considered the fund's management fee rate as well as other fund or class expenses, as applicable, such as transfer agent fees, pricing and bookkeeping fees, fund-paid 12b-1 fees, and custodial, legal, and audit fees. The Board also noted that Fidelity may agree to waive fees or reimburse expenses from time to time, and the extent to which, if any, it has done so for the fund. The fund's representative classis compared to those funds and classes in the Total Mapped Group (used by the Board for management fee comparisons) that have a similar sales load structure. The Board also considered a total expense ASPG comparison, which focuses on the total expenses of the representative class relative to a subset of non-Fidelity funds within the similar sales load structure group that are similar in size and management fee structure. The total expense ASPG is limited to 15 larger and 15 smaller classes of different funds, where possible. The total expense ASPG comparison excludes performance adjustments and fund-paid 12b-1 fees to eliminate variability in expenses relating to these items.
The Board noted that the total net expense ratio of the retail class ranked below the similar sales load structure group competitive median for 2021 and above the ASPG competitive median for 2021. The Board further noted that total expense ratio of the retail class was 10 BP above its ASPG median but that, when compared to funds with investment strategies of investing primarily in short term investment grade debt within the ASPG, and excluding funds in a fund complex with an unique at-cost service model from the ASPG, the retail class ranked below median. The Board noted that the fund offers multiple classes, each of which has a different 12b-1 fee structure than the others, and that the multiple structures are intended to offer a range of pricing options for the intermediary market. The Board also noted that the total expense ratios of the classes vary primarily by the level of their 12b-1 fees, although differences in transfer agent fees may also cause expenses to vary from class to class.
The Board considered that the current contractual arrangements for the fund have the effect of setting the total "fund-level" (but not "class-level") expenses (including, among certain other "fund-level" expenses, the management fee) for each class at 0.35%. These contractual arrangements may not be amended to increase the fees or expenses payable except by a vote of a majority of the Board.
The Board recognized that the fund's management contract incorporates a "group fee" structure, which provides for lower group fee rates as total "group assets" increase, and for higher group fee rates as total "group assets" decrease ("group assets" as defined in the management contract). FMR calculates the group fee rates based on a tiered asset "breakpoint" schedule that varies based on asset class. The Board considered that Fidelity agreed to impose a temporary fee waiver in the form of additional breakpoints to the current breakpoint schedule. The Board noted, however, that because the current contractual arrangements set the total "fund-level" expenses for each class at 0.35%, increases or decreases in the management fee due to changes in the group fee rate will not impact the total expense ratio.
Fees Charged to Other Fidelity Clients. The Board also considered Fidelity fee structures and other information with respect to clients of Fidelity, such as other funds advised or subadvised by Fidelity, pension plan clients, and other institutional clients with similar mandates. The Board noted that a joint ad hoc committee created by it and the boards of other Fidelity funds periodically reviews and compares Fidelity's institutional investment advisory business with its business of providing services to the Fidelity funds and also noted the most recent findings of the committee. The Board noted that the committee's review included a consideration of the differences in services provided, fees charged, and costs incurred, as well as competition in the markets serving the different categories of clients.
Based on its review of total expense ratios and fees charged to other Fidelity clients, the Board concluded that the total expense ratio of each class of the fund was reasonable in light of the services that the fund and its shareholders receive and the other factors considered.
Costs of the Services and Profitability. The Board considered the revenues earned and the expenses incurred by Fidelity in conducting the business of developing, marketing, distributing, managing, administering and servicing the fund and servicing the fund's shareholders. The Board also considered the level of Fidelity's profits in respect of all the Fidelity funds.
On an annual basis, Fidelity presents to the Board information about the profitability of its relationships with the fund. Fidelity calculates profitability information for each fund, as well as aggregate profitability information for groups of Fidelity funds and all Fidelity funds, using a series of detailed revenue and cost allocation methodologies which originate with the books and records of Fidelity on which Fidelity's audited financial statements are based. The Audit Committee of the Board reviews any significant changes from the prior year's methodologies and the full Board approves such changes.
A public accounting firm has been engaged annually by the Board as part of the Board's assessment of Fidelity's profitability analysis. The engagement includes the review and assessment of the methodologies used by Fidelity in determining the revenues and expenses attributable to Fidelity's mutual fund business, and completion of agreed-upon procedures in respect of the mathematical accuracy of certain fund profitability information and its conformity to established allocation methodologies. After considering the reports issued under the engagement and information provided by Fidelity, the Board concluded that while other allocation methods may also be reasonable, Fidelity's profitability methodologies are reasonable in all material respects.
The Board also reviewed Fidelity's non-fund businesses and potential indirect benefits such businesses may have received as a result of their association with Fidelity's mutual fund business (i.e., fall-out benefits) as well as cases where Fidelity's affiliates may benefit from the funds' business. The Board considered areas where potential indirect benefits to the Fidelity funds from their relationships with Fidelity may exist. The Board's consideration of these matters was informed by the findings of a joint ad hoc committee created by it and the boards of other Fidelity funds to evaluate potential fall-out benefits.
The Board considered the costs of the services provided by and the profits realized by Fidelity in connection with the operation of the fund and was satisfied that the profitability was not excessive.
Economies of Scale. The Board considered whether there have been economies of scale in respect of the management of the Fidelity funds, whether the Fidelity funds (including the fund) have appropriately benefited from any such economies of scale, and whether there is potential for realization of any further economies of scale. The Board considered the extent to which the fund will benefit from economies of scale as assets grow through increased services to the fund, through waivers or reimbursements, or through fee or expense ratio reductions. The Board also noted that a committee (the Economies of Scale Committee) created by it and the boards of other Fidelity funds periodically analyzes whether Fidelity attains economies of scale in respect of the management and servicing of the Fidelity funds, whether the Fidelity funds have appropriately benefited from such economies of scale, and whether there is potential for realization of any further economies of scale.
The Board concluded, taking into account the analysis of the Economies of Scale Committee, that economies of scale, if any, are being appropriately shared between fund shareholders and Fidelity.
Additional Information Requested by the Board. In order to develop fully the factual basis for consideration of the Fidelity funds' advisory contracts, the Board requested and received additional information on certain topics, including: (i) Fidelity's fund profitability methodology, profitability trends for certain funds, the allocation of various costs to different funds, and the impact of certain factors on fund profitability results; (ii) portfolio manager changes that have occurred during the past year and the amount of the investment that each portfolio manager has made in the Fidelity fund(s) that he or she manages; (iii) the extent to which current market conditions have affected retention and recruitment of personnel; (iv) the arrangements with and compensation paid to certain fund sub-advisers on behalf of the Fidelity funds and the treatment of such compensation within Fidelity's fund profitability methodology; (v) the terms of the funds' various management fee structures, including the basic group fee and the terms of Fidelity's voluntary expense limitation arrangements; (vi) Fidelity's transfer agent, pricing and bookkeeping fees, expense and service structures for different funds and classes relative to competitive trends; (vii) the impact on fund profitability of recent industry trends, such as the growth in passively managed funds and the changes in flows for different types of funds; (viii) the types of management fee and total expense comparisons provided, and the challenges and limitations associated with such information; and (ix) explanations regarding the relative total expense ratios and management fees of certain funds and classes, total expense and management fee competitive trends, and methodologies for total expense and management fee competitive comparisons. In addition, the Board considered its discussions with Fidelity regarding Fidelity's efforts to maintain the continuous investment and shareholder services necessary for the funds during the current pandemic and economic circumstances.
Based on its evaluation of all of the conclusions noted above, and after considering all factors it believed relevant, the Board concluded that the advisory fee arrangements are fair and reasonable and that the fund's Advisory Contracts should be renewed.
The Securities and Exchange Commission adopted Rule 22e-4 under the Investment Company Act of 1940 (the Liquidity Rule) to promote effective liquidity risk management throughout the open-end investment company industry, thereby reducing the risk that funds will be unable to meet their redemption obligations and mitigating dilution of the interests of fund shareholders.
The Fund has adopted and implemented a liquidity risk management program (the Program) reasonably designed to assess and manage the Fund's liquidity risk and to comply with the requirements of the Liquidity Rule. The Fund's Board of Trustees (the Board) has designated the Fund's investment adviser as administrator of the Program. The Fidelity advisers have established a Liquidity Risk Management Committee (the LRM Committee) to manage the Program for each of the Fidelity Funds. The LRM Committee monitors the adequacy and effectiveness of implementation of the Program and on a periodic basis assesses each Fund's liquidity risk based on a variety of factors including (1) the Fund's investment strategy, (2) portfolio liquidity and cash flow projections during normal and reasonably foreseeable stressed conditions, (3) shareholder redemptions, (4) borrowings and other funding sources and (5) certain factors specific to ETFs including the effect of the Fund's prices and spreads, market participants, and basket compositions on the overall liquidity of the Fund's portfolio, as applicable.
In accordance with the Program, each of the Fund's portfolio investments is classified into one of four defined liquidity categories based on a determination of a reasonable expectation for how long it would take to convert the investment to cash (or sell or dispose of the investment) without significantly changing its market value.
- Highly liquid investments - cash or convertible to cash within three business days or less
- Moderately liquid investments - convertible to cash in three to seven calendar days
- Less liquid investments - can be sold or disposed of, but not settled, within seven calendar days
- Illiquid investments - cannot be sold or disposed of within seven calendar days
Liquidity classification determinations take into account a variety of factors including various market, trading and investment-specific considerations, as well as market depth, and generally utilize analysis from a third-party liquidity metrics service.
The Liquidity Rule places a 15% limit on a fund's illiquid investments and requires funds that do not primarily hold assets that are highly liquid investments to determine and maintain a minimum percentage of the fund's net assets to be invested in highly liquid investments (highly liquid investment minimum or HLIM). The Program includes provisions reasonably designed to comply with the 15% limit on illiquid investments and for determining, periodically reviewing and complying with the HLIM requirement as applicable.
At a recent meeting of the Fund's Board of Trustees, the LRM Committee provided a written report to the Board pertaining to the operation, adequacy, and effectiveness of the Program for the period December 1, 2021 through November 30, 2022. The report concluded that the Program is operating effectively and is reasonably designed to assess and manage the Fund's liquidity risk.
1.538290.125
STP-SANN-0423
Fidelity® Tactical Bond Fund
Semi-Annual Report
February 28, 2023
Includes Fidelity and Fidelity Advisor share classes
Contents
To view a fund's proxy voting guidelines and proxy voting record for the 12-month period ended June 30, visit http://www.fidelity.com/proxyvotingresults or visit the Securities and Exchange Commission's (SEC) web site at http://www.sec.gov.
You may also call 1-800-544-8544 if you're an individual investing directly with Fidelity, call 1-800-835-5092 if you're a plan sponsor or participant with Fidelity as your recordkeeper or call 1-877-208-0098 on institutional accounts or if you're an advisor or invest through one to request a free copy of the proxy voting guidelines.
Standard & Poor's, S&P and S&P 500 are registered service marks of The McGraw-Hill Companies, Inc. and have been licensed for use by Fidelity Distributors Corporation.
Other third-party marks appearing herein are the property of their respective owners.
All other marks appearing herein are registered or unregistered trademarks or service marks of FMR LLC or an affiliated company. © 2023 FMR LLC. All rights reserved.
This report and the financial statements contained herein are submitted for the general information of the shareholders of the Fund. This report is not authorized for distribution to prospective investors in the Fund unless preceded or accompanied by an effective prospectus.
A fund files its complete schedule of portfolio holdings with the SEC for the first and third quarters of each fiscal year on Form N-PORT. Forms N-PORT are available on the SEC's web site at http://www.sec.gov. A fund's Forms N-PORT may be reviewed and copied at the SEC's Public Reference Room in Washington, DC. Information regarding the operation of the SEC's Public Reference Room may be obtained by calling 1-800-SEC-0330.
For a complete list of a fund's portfolio holdings, view the most recent holdings listing, semiannual report, or annual report on Fidelity's web site at http://www.fidelity.com, http://www.institutional.fidelity.com, or http://www.401k.com, as applicable.
NOT FDIC INSURED •MAY LOSE VALUE •NO BANK GUARANTEE
Neither the Fund nor Fidelity Distributors Corporation is a bank.
The information in the following tables is based on the combined Investments of the Fund and its pro-rata share of investments in Fidelity's Central Funds, other than the Money Market Central Funds.
Quality Diversification (% of Fund's net assets) |
|
| |
| We have used ratings from Moody's Investors Service, Inc. Where Moody's® ratings are not available, we have used S&P® ratings. All ratings are as of the date indicated and do not reflect subsequent changes. |
Asset Allocation (% of Fund's net assets) |
|
Foreign investments - 13.6% |
Futures and Swaps - 4.2% |
|
An unaudited holdings listing for the Fund, which presents direct holdings as well as the pro-rata share of any securities and other investments held indirectly through its investment in underlying non-money market Fidelity Central Funds, is available at fidelity.com and/or institutional. fidelity.com, as applicable.
Geographic Diversification (% of Fund's net assets) |
|
* Includes Short-Term investments and Net Other Assets (Liabilities). Percentages are based on country or territory of incorporation and are adjusted for the effect of derivatives, if applicable. |
| |
Showing Percentage of Net Assets
| Nonconvertible Bonds - 10.6% |
| | | Principal Amount (a) | Value ($) |
| COMMUNICATION SERVICES - 2.1% | | | |
| Media - 1.2% | | | |
| Charter Communications Operating LLC/Charter Communications Operating Capital Corp.: | | | |
| 3.7% 4/1/51 | | 250,000 | 152,867 |
| 5.5% 4/1/63 | | 130,000 | 101,048 |
| Magallanes, Inc.: | | | |
| 5.05% 3/15/42 (b) | | 10,000 | 8,101 |
| 5.141% 3/15/52 (b) | | 16,000 | 12,542 |
| Sirius XM Radio, Inc. 4.125% 7/1/30 (b) | | 140,000 | 113,782 |
| | | | 388,340 |
| Wireless Telecommunication Services - 0.9% | | | |
| Millicom International Cellular SA: | | | |
| 4.5% 4/27/31 (b) | | 310,000 | 250,325 |
| 6.25% 3/25/29 (b) | | 72,000 | 65,160 |
| | | | 315,485 |
TOTAL COMMUNICATION SERVICES | | | 703,825 |
| CONSUMER DISCRETIONARY - 1.0% | | | |
| Household Durables - 1.0% | | | |
| Toll Brothers Finance Corp. 4.875% 3/15/27 | | 360,000 | 345,467 |
| ENERGY - 3.6% | | | |
| Oil, Gas & Consumable Fuels - 3.6% | | | |
| DCP Midstream Operating LP: | | | |
| 5.125% 5/15/29 | | 12,000 | 11,551 |
| 5.85% 5/21/43 (b)(c) | | 260,000 | 257,296 |
| Kinder Morgan, Inc. 3.6% 2/15/51 | | 600,000 | 405,468 |
| MPLX LP: | | | |
| 5% 3/1/33 | | 100,000 | 93,823 |
| 5.65% 3/1/53 | | 100,000 | 92,079 |
| Petroleos Mexicanos 7.69% 1/23/50 | | 250,000 | 175,613 |
| Targa Resources Corp.: | | | |
| 4.2% 2/1/33 | | 130,000 | 113,183 |
| 4.95% 4/15/52 | | 130,000 | 103,985 |
| | | | 1,252,998 |
| FINANCIALS - 2.4% | | | |
| Banks - 1.3% | | | |
| Bank of America Corp. 2.299% 7/21/32 (c) | | 280,000 | 218,973 |
| Intesa Sanpaolo SpA 5.71% 1/15/26 (b) | | 250,000 | 239,303 |
| | | | 458,276 |
| Consumer Finance - 0.8% | | | |
| Capital One Financial Corp.: | | | |
| 5.468% 2/1/29 (c) | | 18,000 | 17,672 |
| 5.817% 2/1/34 (c) | | 32,000 | 31,073 |
| Ford Motor Credit Co. LLC 3.375% 11/13/25 | | 250,000 | 230,268 |
| | | | 279,013 |
| Diversified Financial Services - 0.3% | | | |
| Blackstone Private Credit Fund 4.7% 3/24/25 | | 61,000 | 58,834 |
| Corebridge Financial, Inc.: | | | |
| 3.85% 4/5/29 (b) | | 7,000 | 6,323 |
| 3.9% 4/5/32 (b) | | 9,000 | 7,875 |
| 4.35% 4/5/42 (b) | | 2,000 | 1,649 |
| 4.4% 4/5/52 (b) | | 6,000 | 4,783 |
| | | | 79,464 |
TOTAL FINANCIALS | | | 816,753 |
| HEALTH CARE - 0.6% | | | |
| Health Care Providers & Services - 0.6% | | | |
| Centene Corp. 4.625% 12/15/29 | | 120,000 | 109,739 |
| Prime Healthcare Foundation, Inc. 7% 12/1/27 | | 110,000 | 107,889 |
| | | | 217,628 |
| INFORMATION TECHNOLOGY - 0.3% | | | |
| Software - 0.3% | | | |
| Oracle Corp. 3.85% 4/1/60 | | 160,000 | 106,647 |
| REAL ESTATE - 0.0% | | | |
| Equity Real Estate Investment Trusts (REITs) - 0.0% | | | |
| American Homes 4 Rent LP: | | | |
| 3.625% 4/15/32 | | 8,000 | 6,759 |
| 4.3% 4/15/52 | | 6,000 | 4,598 |
| | | | 11,357 |
| UTILITIES - 0.6% | | | |
| Electric Utilities - 0.6% | | | |
| DPL, Inc. 4.125% 7/1/25 | | 200,000 | 187,865 |
| Multi-Utilities - 0.0% | | | |
| Puget Energy, Inc. 4.224% 3/15/32 | | 15,000 | 13,263 |
TOTAL UTILITIES | | | 201,128 |
| TOTAL NONCONVERTIBLE BONDS (Cost $4,139,695) | | | 3,655,803 |
| | | | |
| U.S. Treasury Obligations - 34.7% |
| | | Principal Amount (a) | Value ($) |
| U.S. Treasury Bonds 2.875% 5/15/52 | | 4,240,000 | 3,471,997 |
| U.S. Treasury Notes: | | | |
| 3.5% 1/31/30 | | 1,600,000 | 1,545,250 |
| 4.125% 11/15/32 | | 6,880,000 | 6,989,649 |
| TOTAL U.S. TREASURY OBLIGATIONS (Cost $12,456,816) | | | 12,006,896 |
| | | | |
| Asset-Backed Securities - 12.3% |
| | | Principal Amount (a) | Value ($) |
| Allegro CLO XV, Ltd. / Allegro CLO VX LLC Series 2022-1A Class B, CME TERM SOFR 3 MONTH INDEX + 2.050% 6.689% 7/20/35 (b)(c)(d) | | 250,000 | 246,438 |
| Ares XXXIV CLO Ltd. Series 2020-2A Class BR2, 3 month U.S. LIBOR + 1.600% 6.3924% 4/17/33 (b)(c)(d) | | 250,000 | 243,407 |
| Cedar Funding Ltd. Series 2022-15A Class B, CME TERM SOFR 3 MONTH INDEX + 1.800% 6.439% 4/20/35 (b)(c)(d) | | 750,000 | 722,631 |
| Columbia Cent Clo 32 Ltd. / Coliseum Series 2022-32A Class B1, CME TERM SOFR 3 MONTH INDEX + 2.400% 7.0586% 7/24/34 (b)(c)(d) | | 100,000 | 96,590 |
| DB Master Finance LLC Series 2021-1A Class A23, 2.791% 11/20/51 (b) | | 246,875 | 198,145 |
| Dominos Pizza Master Issuer LLC Series 2021-1A Class A2II, 3.151% 4/25/51 (b) | | 933,375 | 778,357 |
| Horizon Aircraft Finance Ltd. Series 2019-1 Class A, 3.721% 7/15/39 (b) | | 194,506 | 165,328 |
| Magnetite XXIX, Ltd. / Magnetite XXIX LLC Series 2021-29A Class B, 3 month U.S. LIBOR + 1.400% 6.1924% 1/15/34 (b)(c)(d) | | 650,000 | 634,997 |
| Planet Fitness Master Issuer LLC Series 2022-1A Class A2II, 4.008% 12/5/51 (b) | | 496,250 | 411,512 |
| SYMP Series 2022-32A Class B, CME TERM SOFR 3 MONTH INDEX + 1.850% 6.5035% 4/23/35 (b)(c)(d) | | 760,000 | 741,967 |
| TOTAL ASSET-BACKED SECURITIES (Cost $4,447,826) | | | 4,239,372 |
| | | | |
| Commercial Mortgage Securities - 1.8% |
| | | Principal Amount (a) | Value ($) |
| BPR Trust floater Series 2022-OANA Class B, CME Term SOFR 1 Month Index + 2.440% 7.0095% 4/15/37 (b)(c)(d) | | 11,000 | 10,794 |
| BX Trust floater Series 2022-IND: | | | |
| Class C, CME Term SOFR 1 Month Index + 2.290% 6.8518% 4/15/37 (b)(c)(d) | | 252,068 | 245,684 |
| Class D, CME Term SOFR 1 Month Index + 2.830% 7.4008% 4/15/37 (b)(c)(d) | | 9,336 | 9,003 |
| Life Financial Services Trust floater Series 2022-BMR2: | | | |
| Class B, CME Term SOFR 1 Month Index + 1.790% 6.3564% 5/15/39 (b)(c)(d) | | 100,000 | 99,605 |
| Class C, CME Term SOFR 1 Month Index + 2.090% 6.6556% 5/15/39 (b)(c)(d) | | 100,000 | 98,780 |
| Class D, CME Term SOFR 1 Month Index + 2.540% 7.1044% 5/15/39 (b)(c)(d) | | 100,000 | 98,516 |
| VLS Commercial Mortgage Trust sequential payer Series 2020-LAB Class A, 2.13% 10/10/42 (b) | | 100,000 | 78,385 |
| TOTAL COMMERCIAL MORTGAGE SECURITIES (Cost $646,582) | | | 640,767 |
| | | | |
| Municipal Securities - 0.5% |
| | | Principal Amount (a) | Value ($) |
| Chicago Board of Ed.: | | | |
| Series 2009 G, 1.75% 12/15/25 | | 120,000 | 105,107 |
| Series 2010 C, 6.319% 11/1/29 | | 60,000 | 58,729 |
| TOTAL MUNICIPAL SECURITIES (Cost $170,962) | | | 163,836 |
| | | | |
| Foreign Government and Government Agency Obligations - 4.1% |
| | | Principal Amount (a) | Value ($) |
| Brazilian Federative Republic: | | | |
| 5.625% 2/21/47 | | 140,000 | 114,083 |
| 10% 1/1/27 | BRL | 1,000,000 | 174,909 |
| Dominican Republic: | | | |
| 5.5% 2/22/29 (b) | | 250,000 | 231,297 |
| 6% 2/22/33 (b) | | 250,000 | 226,219 |
| United Mexican States: | | | |
| 7.75% 5/29/31 | MXN | 6,900,000 | 343,222 |
| 7.75% 11/13/42 | MXN | 7,300,000 | 342,563 |
| TOTAL FOREIGN GOVERNMENT AND GOVERNMENT AGENCY OBLIGATIONS (Cost $1,486,493) | | | 1,432,293 |
| | | | |
| Fixed-Income Funds - 32.9% |
| | | Shares | Value ($) |
| Fidelity Floating Rate Central Fund (e) | | 48,526 | 4,698,805 |
| Fidelity High Income Central Fund (e) | | 17,875 | 1,825,981 |
| Fidelity International Credit Central Fund (e) | | 60,878 | 4,830,070 |
| TOTAL FIXED-INCOME FUNDS (Cost $12,475,578) | | | 11,354,856 |
| | | | |
| Preferred Securities - 1.3% |
| | | Principal Amount (a) | Value ($) |
| ENERGY - 0.7% | | | |
| Oil, Gas & Consumable Fuels - 0.7% | | | |
| Enbridge, Inc. 5.75% 7/15/80 (c) | | 250,000 | 236,254 |
| FINANCIALS - 0.6% | | | |
| Banks - 0.6% | | | |
| Bank of Nova Scotia 4.9% (c)(f) | | 240,000 | 233,016 |
| TOTAL PREFERRED SECURITIES (Cost $516,717) | | | 469,270 |
| | | | |
| Money Market Funds - 0.4% |
| | | Shares | Value ($) |
Fidelity Cash Central Fund 4.63% (g) (Cost $123,913) | | 123,888 | 123,913 |
| | | | |
| TOTAL INVESTMENT IN SECURITIES - 98.6% (Cost $36,464,582) | 34,087,006 |
NET OTHER ASSETS (LIABILITIES) - 1.4% | 469,262 |
| NET ASSETS - 100.0% | 34,556,268 |
| | |
| Forward Foreign Currency Contracts |
Currency Purchased | Currency Sold | Counterparty | Settlement Date | Unrealized Appreciation/ (Depreciation) ($) |
| | | | | | | |
| USD | 344,349 | MXN | 6,365,000 | BNP Paribas S.A. | 3/30/23 | (1,581) |
| | | | | | | |
| TOTAL FORWARD FOREIGN CURRENCY CONTRACTS | | (1,581) |
| | | | | | | |
| Unrealized Depreciation | | | (1,581) |
Currency Abbreviations
| BRL | - | Brazilian real |
| MXN | - | Mexican peso |
| USD | - | U.S. dollar |
Legend
| (a) | Amount is stated in United States dollars unless otherwise noted. |
| (b) | Security exempt from registration under Rule 144A of the Securities Act of 1933. These securities may be resold in transactions exempt from registration, normally to qualified institutional buyers. At the end of the period, the value of these securities amounted to $6,304,794 or 18.2% of net assets. |
| (c) | Coupon rates for floating and adjustable rate securities reflect the rates in effect at period end. |
| (d) | Coupon is indexed to a floating interest rate which may be multiplied by a specified factor and/or subject to caps or floors. |
| (e) | Affiliated fund that is generally available only to investment companies and other accounts managed by Fidelity Investments. A complete unaudited schedule of portfolio holdings for each Fidelity Central Fund is filed with the SEC for the first and third quarters of each fiscal year on Form N-PORT and is available upon request or at the SEC's website at www.sec.gov. An unaudited holdings listing for the Fund, which presents direct holdings as well as the pro-rata share of securities and other investments held indirectly through its investment in underlying non-money market Fidelity Central Funds, is available at fidelity.com and/or institutional.fidelity.com, as applicable. In addition, each Fidelity Central Fund's financial statements are available on the SEC's website or upon request. |
| (f) | Security is perpetual in nature with no stated maturity date. |
| (g) | Affiliated fund that is generally available only to investment companies and other accounts managed by Fidelity Investments. The rate quoted is the annualized seven-day yield of the fund at period end. A complete unaudited listing of the fund's holdings as of its most recent quarter end is available upon request. In addition, each Fidelity Central Fund's financial statements are available on the SEC's website or upon request. |
Affiliated Central Funds
Fiscal year to date information regarding the Fund's investments in Fidelity Central Funds, including the ownership percentage, is presented below.
| Affiliate | Value, beginning of period ($) | Purchases ($) | Sales Proceeds ($) | Dividend Income ($) | Realized Gain (loss) ($) | Change in Unrealized appreciation (depreciation) ($) | Value, end of period ($) | % ownership, end of period |
| Fidelity Cash Central Fund 4.63% | 2,250,044 | 6,593,080 | 8,719,211 | 31,406 | - | - | 123,913 | 0.0% |
| Fidelity Floating Rate Central Fund | 6,441,145 | 234,483 | 1,970,000 | 234,483 | (81,046) | 74,223 | 4,698,805 | 0.2% |
| Fidelity High Income Central Fund | 1,001,612 | 844,607 | - | 44,607 | (143) | (20,095) | 1,825,981 | 0.1% |
| Fidelity International Credit Central Fund | 6,065,161 | 280,592 | 1,150,000 | 280,594 | (225,908) | (139,775) | 4,830,070 | 1.3% |
| Total | 15,757,962 | 7,952,762 | 11,839,211 | 591,090 | (307,097) | (85,647) | 11,478,769 | |
| | | | | | | | | |
Amounts in the dividend income column in the above table include any capital gain distributions from underlying funds, which are presented in the corresponding line item in the Statement of Operations, if applicable.
Amounts included in the purchases and sales proceeds columns may include in-kind transactions, if applicable.
Investment Valuation
The following is a summary of the inputs used, as of February 28, 2023, involving the Fund's assets and liabilities carried at fair value. The inputs or methodology used for valuing securities may not be an indication of the risk associated with investing in those securities. For more information on valuation inputs, and their aggregation into the levels used below, please refer to the Investment Valuation section in the accompanying Notes to Financial Statements.
| Valuation Inputs at Reporting Date: |
| Description | Total ($) | Level 1 ($) | Level 2 ($) | Level 3 ($) |
Investments in Securities: | | | | |
|
| Corporate Bonds | 3,655,803 | - | 3,655,803 | - |
|
| U.S. Government and Government Agency Obligations | 12,006,896 | - | 12,006,896 | - |
|
| Asset-Backed Securities | 4,239,372 | - | 4,239,372 | - |
|
| Commercial Mortgage Securities | 640,767 | - | 640,767 | - |
|
| Municipal Securities | 163,836 | - | 163,836 | - |
|
| Foreign Government and Government Agency Obligations | 1,432,293 | - | 1,432,293 | - |
|
| Fixed-Income Funds | 11,354,856 | 11,354,856 | - | - |
|
| Preferred Securities | 469,270 | - | 469,270 | - |
|
| Money Market Funds | 123,913 | 123,913 | - | - |
| Total Investments in Securities: | 34,087,006 | 11,478,769 | 22,608,237 | - |
Derivative Instruments: | | | | |
|
| Assets | | | | |
Forward Foreign Currency Contracts | - | - | - | - |
| Total Assets | - | - | - | - |
|
| Liabilities | | | | |
Forward Foreign Currency Contracts | (1,581) | - | (1,581) | - |
| Total Liabilities | (1,581) | - | (1,581) | - |
| Total Derivative Instruments: | (1,581) | - | (1,581) | - |
Value of Derivative Instruments
The following table is a summary of the Fund's value of derivative instruments by primary risk exposure as of February 28, 2023. For additional information on derivative instruments, please refer to the Derivative Instruments section in the accompanying Notes to Financial Statements.
Primary Risk Exposure / Derivative Type | Value |
| Asset ($) | Liability ($) |
| Foreign Exchange Risk | | |
Forward Foreign Currency Contracts (a) | 0 | (1,581) |
| Total Foreign Exchange Risk | 0 | (1,581) |
| Total Value of Derivatives | 0 | (1,581) |
(a)Gross value is presented in the Statement of Assets and Liabilities in the unrealized appreciation/depreciation on forward foreign currency contracts line-items.
| Statement of Assets and Liabilities |
| | | | February 28, 2023 (Unaudited) |
| | | | | |
| Assets | | | | |
| Investment in securities, at value - See accompanying schedule: | | | | |
Unaffiliated issuers (cost $23,865,091) | $ | 22,608,237 | | |
Fidelity Central Funds (cost $12,599,491) | | 11,478,769 | | |
| | | | | |
| | | | | |
| Total Investment in Securities (cost $36,464,582) | | | $ | 34,087,006 |
| Cash | | | | 1 |
| Foreign currency held at value (cost $355,271) | | | | 340,058 |
| Receivable for investments sold | | | | 2,411,269 |
| Receivable for fund shares sold | | | | 74,378 |
| Interest receivable | | | | 197,793 |
| Distributions receivable from Fidelity Central Funds | | | | 2,227 |
| Prepaid expenses | | | | 21 |
| Receivable from investment adviser for expense reductions | | | | 9,632 |
Total assets | | | | 37,122,385 |
| Liabilities | | | | |
| Payable for investments purchased | $ | 2,484,354 | | |
| Unrealized depreciation on forward foreign currency contracts | | 1,581 | | |
| Payable for fund shares redeemed | | 5,753 | | |
| Distributions payable | | 8,680 | | |
| Accrued management fee | | 15,397 | | |
| Distribution and service plan fees payable | | 3,206 | | |
| Other affiliated payables | | 3,533 | | |
| Other payables and accrued expenses | | 43,613 | | |
| Total Liabilities | | | | 2,566,117 |
| Net Assets | | | $ | 34,556,268 |
| Net Assets consist of: | | | | |
| Paid in capital | | | $ | 38,009,759 |
| Total accumulated earnings (loss) | | | | (3,453,491) |
| Net Assets | | | $ | 34,556,268 |
| | | | | |
| Net Asset Value and Maximum Offering Price | | | | |
| Class A : | | | | |
Net Asset Value and redemption price per share ($3,310,879 ÷ 374,000 shares) (a) | | | $ | 8.85 |
| Maximum offering price per share (100/96.00 of $8.85) | | | $ | 9.22 |
| Class M : | | | | |
Net Asset Value and redemption price per share ($2,564,302 ÷ 289,669 shares) (a) | | | $ | 8.85 |
| Maximum offering price per share (100/96.00 of $8.85) | | | $ | 9.22 |
| Class C : | | | | |
Net Asset Value and offering price per share ($2,352,032 ÷ 265,717 shares) (a) | | | $ | 8.85 |
| Fidelity Tactical Bond Fund : | | | | |
Net Asset Value , offering price and redemption price per share ($16,799,570 ÷ 1,897,656 shares) | | | $ | 8.85 |
| Class I : | | | | |
Net Asset Value , offering price and redemption price per share ($4,850,280 ÷ 547,894 shares) | | | $ | 8.85 |
| Class Z : | | | | |
Net Asset Value , offering price and redemption price per share ($4,679,205 ÷ 528,541 shares) | | | $ | 8.85 |
(a)Redemption price per share is equal to net asset value less any applicable contingent deferred sales charge. |
| Statement of Operations |
| | | | Six months ended February 28, 2023 (Unaudited) |
| Investment Income | | | | |
| Dividends | | | $ | 13,067 |
| Interest | | | | 368,657 |
| Income from Fidelity Central Funds | | | | 591,090 |
| Total Income | | | | 972,814 |
| Expenses | | | | |
| Management fee | $ | 83,631 | | |
| Transfer agent fees | | 13,662 | | |
| Distribution and service plan fees | | 18,365 | | |
| Accounting fees and expenses | | 6,241 | | |
| Custodian fees and expenses | | 566 | | |
| Independent trustees' fees and expenses | | 57 | | |
| Registration fees | | 119,222 | | |
| Audit | | 42,996 | | |
| Legal | | 21 | | |
| Miscellaneous | | 110 | | |
| Total expenses before reductions | | 284,871 | | |
| Expense reductions | | (163,163) | | |
| Total expenses after reductions | | | | 121,708 |
| Net Investment income (loss) | | | | 851,106 |
| Realized and Unrealized Gain (Loss) | | | | |
| Net realized gain (loss) on: | | | | |
| Investment Securities: | | | | |
| Unaffiliated issuers | | (44,556) | | |
| Fidelity Central Funds | | (307,097) | | |
| Forward foreign currency contracts | | (46,308) | | |
| Foreign currency transactions | | 2,742 | | |
| Total net realized gain (loss) | | | | (395,219) |
| Change in net unrealized appreciation (depreciation) on: | | | | |
| Investment Securities: | | | | |
| Unaffiliated issuers | | (459,041) | | |
| Fidelity Central Funds | | (85,647) | | |
| Forward foreign currency contracts | | (5,425) | | |
| Assets and liabilities in foreign currencies | | 5,947 | | |
| Total change in net unrealized appreciation (depreciation) | | | | (544,166) |
| Net gain (loss) | | | | (939,385) |
| Net increase (decrease) in net assets resulting from operations | | | $ | (88,279) |
| Statement of Changes in Net Assets |
| |
| | Six months ended February 28, 2023 (Unaudited) | | For the period February 10, 2022 (commencement of operations) through August 31, 2022 |
| Increase (Decrease) in Net Assets | | | | |
| Operations | | | | |
| Net investment income (loss) | $ | 851,106 | $ | 460,774 |
| Net realized gain (loss) | | (395,219) | | (719,649) |
| Change in net unrealized appreciation (depreciation) | | (544,166) | | (1,849,708) |
| Net increase (decrease) in net assets resulting from operations | | (88,279) | | (2,108,583) |
| Distributions to shareholders | | (894,170) | | (362,461) |
| Share transactions - net increase (decrease) | | 6,661,107 | | 31,348,654 |
| Total increase (decrease) in net assets | | 5,678,658 | | 28,877,610 |
| | | | | |
| Net Assets | | | | |
| Beginning of period | | 28,877,610 | | - |
| End of period | $ | 34,556,268 | $ | 28,877,610 |
| | | | | |
| | | | | |
Financial Highlights
| Fidelity Advisor® Tactical Bond Fund Class A |
| |
| | Six months ended (Unaudited) February 28, 2023 | | Years ended August 31, 2022 A |
Selected Per-Share Data | | | | |
| Net asset value, beginning of period | $ | 9.15 | $ | 10.00 |
| Income from Investment Operations | | | | |
Net investment income (loss) B,C | | .245 | | .144 |
| Net realized and unrealized gain (loss) | | (.286) | | (.885) |
| Total from investment operations | | (.041) | | (.741) |
| Distributions from net investment income | | (.259) | | (.109) |
| Total distributions | | (.259) | | (.109) |
| Net asset value, end of period | $ | 8.85 | $ | 9.15 |
Total Return D,E,F | | (.41)% | | (7.43)% |
Ratios to Average Net Assets C,G,H | | | | |
| Expenses before reductions | | 2.10% I | | 1.97% I |
| Expenses net of fee waivers, if any | | .96% I | | 1.00% I |
| Expenses net of all reductions | | .95% I | | 1.00% I |
| Net investment income (loss) | | 5.57% I | | 2.73% I |
| Supplemental Data | | | | |
| Net assets, end of period (000 omitted) | $ | 3,311 | $ | 2,432 |
Portfolio turnover rate J | | 42% I | | 96% I |
A For the period February 10, 2022 (commencement of operations) through August 31, 2022
B Calculated based on average shares outstanding during the period.
C Net investment income (loss) is affected by the timing of the declaration of dividends by any underlying mutual funds or exchange-traded funds (ETFs). Net investment income (loss) of any mutual funds or ETFs is not included in the Fund's net investment income (loss) ratio.
D Total returns for periods of less than one year are not annualized.
E Total returns would have been lower if certain expenses had not been reduced during the applicable periods shown.
F Total returns do not include the effect of the sales charges.
G Fees and expenses of any underlying mutual funds or exchange-traded funds (ETFs) are not included in the Fund's expense ratio. The Fund indirectly bears its proportionate share of these expenses. For additional expense information related to investments in Fidelity Central Funds, please refer to the "Investments in Fidelity Central Funds" note found in the Notes to Financial Statements section of the most recent Annual or Semi-Annual report.
H Expense ratios reflect operating expenses of the class. Expenses before reductions do not reflect amounts reimbursed, waived, or reduced through arrangements with the investment adviser, brokerage services, or other offset arrangements, if applicable, and do not represent the amount paid by the class during periods when reimbursements, waivers or reductions occur.
I Annualized.
J Amount does not include the portfolio activity of any underlying mutual funds or exchange-traded funds (ETFs).
| Fidelity Advisor® Tactical Bond Fund Class M |
| |
| | Six months ended (Unaudited) February 28, 2023 | | Years ended August 31, 2022 A |
Selected Per-Share Data | | | | |
| Net asset value, beginning of period | $ | 9.15 | $ | 10.00 |
| Income from Investment Operations | | | | |
Net investment income (loss) B,C | | .246 | | .144 |
| Net realized and unrealized gain (loss) | | (.287) | | (.885) |
| Total from investment operations | | (.041) | | (.741) |
| Distributions from net investment income | | (.259) | | (.109) |
| Total distributions | | (.259) | | (.109) |
| Net asset value, end of period | $ | 8.85 | $ | 9.15 |
Total Return D,E,F | | (.40)% | | (7.43)% |
Ratios to Average Net Assets C,G,H | | | | |
| Expenses before reductions | | 2.11% I | | 1.97% I |
| Expenses net of fee waivers, if any | | .96% I | | 1.00% I |
| Expenses net of all reductions | | .96% I | | 1.00% I |
| Net investment income (loss) | | 5.57% I | | 2.73% I |
| Supplemental Data | | | | |
| Net assets, end of period (000 omitted) | $ | 2,564 | $ | 2,511 |
Portfolio turnover rate J | | 42% I | | 96% I |
A For the period February 10, 2022 (commencement of operations) through August 31, 2022
B Calculated based on average shares outstanding during the period.
C Net investment income (loss) is affected by the timing of the declaration of dividends by any underlying mutual funds or exchange-traded funds (ETFs). Net investment income (loss) of any mutual funds or ETFs is not included in the Fund's net investment income (loss) ratio.
D Total returns for periods of less than one year are not annualized.
E Total returns would have been lower if certain expenses had not been reduced during the applicable periods shown.
F Total returns do not include the effect of the sales charges.
G Fees and expenses of any underlying mutual funds or exchange-traded funds (ETFs) are not included in the Fund's expense ratio. The Fund indirectly bears its proportionate share of these expenses. For additional expense information related to investments in Fidelity Central Funds, please refer to the "Investments in Fidelity Central Funds" note found in the Notes to Financial Statements section of the most recent Annual or Semi-Annual report.
H Expense ratios reflect operating expenses of the class. Expenses before reductions do not reflect amounts reimbursed, waived, or reduced through arrangements with the investment adviser, brokerage services, or other offset arrangements, if applicable, and do not represent the amount paid by the class during periods when reimbursements, waivers or reductions occur.
I Annualized.
J Amount does not include the portfolio activity of any underlying mutual funds or exchange-traded funds (ETFs).
| Fidelity Advisor® Tactical Bond Fund Class C |
| |
| | Six months ended (Unaudited) February 28, 2023 | | Years ended August 31, 2022 A |
Selected Per-Share Data | | | | |
| Net asset value, beginning of period | $ | 9.14 | $ | 10.00 |
| Income from Investment Operations | | | | |
Net investment income (loss) B,C | | .213 | | .104 |
| Net realized and unrealized gain (loss) | | (.277) | | (.893) |
| Total from investment operations | | (.064) | | (.789) |
| Distributions from net investment income | | (.226) | | (.071) |
| Total distributions | | (.226) | | (.071) |
| Net asset value, end of period | $ | 8.85 | $ | 9.14 |
Total Return D,E,F | | (.67)% | | (7.90)% |
Ratios to Average Net Assets C,G,H | | | | |
| Expenses before reductions | | 2.87% I | | 2.71% I |
| Expenses net of fee waivers, if any | | 1.71% I | | 1.75% I |
| Expenses net of all reductions | | 1.71% I | | 1.75% I |
| Net investment income (loss) | | 4.82% I | | 1.98% I |
| Supplemental Data | | | | |
| Net assets, end of period (000 omitted) | $ | 2,352 | $ | 2,344 |
Portfolio turnover rate J | | 42% I | | 96% I |
A For the period February 10, 2022 (commencement of operations) through August 31, 2022
B Calculated based on average shares outstanding during the period.
C Net investment income (loss) is affected by the timing of the declaration of dividends by any underlying mutual funds or exchange-traded funds (ETFs). Net investment income (loss) of any mutual funds or ETFs is not included in the Fund's net investment income (loss) ratio.
D Total returns for periods of less than one year are not annualized.
E Total returns would have been lower if certain expenses had not been reduced during the applicable periods shown.
F Total returns do not include the effect of the contingent deferred sales charge.
G Fees and expenses of any underlying mutual funds or exchange-traded funds (ETFs) are not included in the Fund's expense ratio. The Fund indirectly bears its proportionate share of these expenses. For additional expense information related to investments in Fidelity Central Funds, please refer to the "Investments in Fidelity Central Funds" note found in the Notes to Financial Statements section of the most recent Annual or Semi-Annual report.
H Expense ratios reflect operating expenses of the class. Expenses before reductions do not reflect amounts reimbursed, waived, or reduced through arrangements with the investment adviser, brokerage services, or other offset arrangements, if applicable, and do not represent the amount paid by the class during periods when reimbursements, waivers or reductions occur.
I Annualized.
J Amount does not include the portfolio activity of any underlying mutual funds or exchange-traded funds (ETFs).
| Fidelity® Tactical Bond Fund |
| |
| | Six months ended (Unaudited) February 28, 2023 | | Years ended August 31, 2022 A |
Selected Per-Share Data | | | | |
| Net asset value, beginning of period | $ | 9.15 | $ | 10.00 |
| Income from Investment Operations | | | | |
Net investment income (loss) B,C | | .257 | | .156 |
| Net realized and unrealized gain (loss) | | (.287) | | (.884) |
| Total from investment operations | | (.030) | | (.728) |
| Distributions from net investment income | | (.270) | | (.122) |
| Total distributions | | (.270) | | (.122) |
| Net asset value, end of period | $ | 8.85 | $ | 9.15 |
Total Return D,E | | (.28)% | | (7.30)% |
Ratios to Average Net Assets C,F,G | | | | |
| Expenses before reductions | | 1.77% H | | 1.63% H |
| Expenses net of fee waivers, if any | | .71% H | | .75% H |
| Expenses net of all reductions | | .71% H | | .75% H |
| Net investment income (loss) | | 5.82% H | | 2.98% H |
| Supplemental Data | | | | |
| Net assets, end of period (000 omitted) | $ | 16,800 | $ | 16,048 |
Portfolio turnover rate I | | 42% H | | 96% H |
A For the period February 10, 2022 (commencement of operations) through August 31, 2022
B Calculated based on average shares outstanding during the period.
C Net investment income (loss) is affected by the timing of the declaration of dividends by any underlying mutual funds or exchange-traded funds (ETFs). Net investment income (loss) of any mutual funds or ETFs is not included in the Fund's net investment income (loss) ratio.
D Total returns for periods of less than one year are not annualized.
E Total returns would have been lower if certain expenses had not been reduced during the applicable periods shown.
F Fees and expenses of any underlying mutual funds or exchange-traded funds (ETFs) are not included in the Fund's expense ratio. The Fund indirectly bears its proportionate share of these expenses. For additional expense information related to investments in Fidelity Central Funds, please refer to the "Investments in Fidelity Central Funds" note found in the Notes to Financial Statements section of the most recent Annual or Semi-Annual report.
G Expense ratios reflect operating expenses of the class. Expenses before reductions do not reflect amounts reimbursed, waived, or reduced through arrangements with the investment adviser, brokerage services, or other offset arrangements, if applicable, and do not represent the amount paid by the class during periods when reimbursements, waivers or reductions occur.
H Annualized.
I Amount does not include the portfolio activity of any underlying mutual funds or exchange-traded funds (ETFs).
| Fidelity Advisor® Tactical Bond Fund Class I |
| |
| | Six months ended (Unaudited) February 28, 2023 | | Years ended August 31, 2022 A |
Selected Per-Share Data | | | | |
| Net asset value, beginning of period | $ | 9.15 | $ | 10.00 |
| Income from Investment Operations | | | | |
Net investment income (loss) B,C | | .256 | | .156 |
| Net realized and unrealized gain (loss) | | (.286) | | (.884) |
| Total from investment operations | | (.030) | | (.728) |
| Distributions from net investment income | | (.270) | | (.122) |
| Total distributions | | (.270) | | (.122) |
| Net asset value, end of period | $ | 8.85 | $ | 9.15 |
Total Return D,E | | (.28)% | | (7.30)% |
Ratios to Average Net Assets C,F,G | | | | |
| Expenses before reductions | | 1.73% H | | 1.64% H |
| Expenses net of fee waivers, if any | | .71% H | | .75% H |
| Expenses net of all reductions | | .71% H | | .75% H |
| Net investment income (loss) | | 5.82% H | | 2.98% H |
| Supplemental Data | | | | |
| Net assets, end of period (000 omitted) | $ | 4,850 | $ | 2,924 |
Portfolio turnover rate I | | 42% H | | 96% H |
A For the period February 10, 2022 (commencement of operations) through August 31, 2022
B Calculated based on average shares outstanding during the period.
C Net investment income (loss) is affected by the timing of the declaration of dividends by any underlying mutual funds or exchange-traded funds (ETFs). Net investment income (loss) of any mutual funds or ETFs is not included in the Fund's net investment income (loss) ratio.
D Total returns for periods of less than one year are not annualized.
E Total returns would have been lower if certain expenses had not been reduced during the applicable periods shown.
F Fees and expenses of any underlying mutual funds or exchange-traded funds (ETFs) are not included in the Fund's expense ratio. The Fund indirectly bears its proportionate share of these expenses. For additional expense information related to investments in Fidelity Central Funds, please refer to the "Investments in Fidelity Central Funds" note found in the Notes to Financial Statements section of the most recent Annual or Semi-Annual report.
G Expense ratios reflect operating expenses of the class. Expenses before reductions do not reflect amounts reimbursed, waived, or reduced through arrangements with the investment adviser, brokerage services, or other offset arrangements, if applicable, and do not represent the amount paid by the class during periods when reimbursements, waivers or reductions occur.
H Annualized.
I Amount does not include the portfolio activity of any underlying mutual funds or exchange-traded funds (ETFs).
| Fidelity Advisor® Tactical Bond Fund Class Z |
| |
| | Six months ended (Unaudited) February 28, 2023 | | Years ended August 31, 2022 A |
Selected Per-Share Data | | | | |
| Net asset value, beginning of period | $ | 9.15 | $ | 10.00 |
| Income from Investment Operations | | | | |
Net investment income (loss) B,C | | .259 | | .161 |
| Net realized and unrealized gain (loss) | | (.285) | | (.884) |
| Total from investment operations | | (.026) | | (.723) |
| Distributions from net investment income | | (.274) | | (.127) |
| Total distributions | | (.274) | | (.127) |
| Net asset value, end of period | $ | 8.85 | $ | 9.15 |
Total Return D,E | | (.24)% | | (7.25)% |
Ratios to Average Net Assets C,F,G | | | | |
| Expenses before reductions | | 1.76% H | | 1.62% H |
| Expenses net of fee waivers, if any | | .61% H | | .66% H |
| Expenses net of all reductions | | .61% H | | .66% H |
| Net investment income (loss) | | 5.91% H | | 3.07% H |
| Supplemental Data | | | | |
| Net assets, end of period (000 omitted) | $ | 4,679 | $ | 2,620 |
Portfolio turnover rate I | | 42% H | | 96% H |
A For the period February 10, 2022 (commencement of operations) through August 31, 2022
B Calculated based on average shares outstanding during the period.
C Net investment income (loss) is affected by the timing of the declaration of dividends by any underlying mutual funds or exchange-traded funds (ETFs). Net investment income (loss) of any mutual funds or ETFs is not included in the Fund's net investment income (loss) ratio.
D Total returns for periods of less than one year are not annualized.
E Total returns would have been lower if certain expenses had not been reduced during the applicable periods shown.
F Fees and expenses of any underlying mutual funds or exchange-traded funds (ETFs) are not included in the Fund's expense ratio. The Fund indirectly bears its proportionate share of these expenses. For additional expense information related to investments in Fidelity Central Funds, please refer to the "Investments in Fidelity Central Funds" note found in the Notes to Financial Statements section of the most recent Annual or Semi-Annual report.
G Expense ratios reflect operating expenses of the class. Expenses before reductions do not reflect amounts reimbursed, waived, or reduced through arrangements with the investment adviser, brokerage services, or other offset arrangements, if applicable, and do not represent the amount paid by the class during periods when reimbursements, waivers or reductions occur.
H Annualized.
I Amount does not include the portfolio activity of any underlying mutual funds or exchange-traded funds (ETFs).
For the period ended February 28, 2023
1. Organization.
Fidelity Tactical Bond Fund (the Fund) is a fund of Fidelity Salem Street Trust (the Trust) and is authorized to issue an unlimited number of shares. The Trust is registered under the Investment Company Act of 1940, as amended (the 1940 Act), as an open-end management investment company organized as a Massachusetts business trust. The Fund offers Class A, Class M, Class C, Tactical Bond, Class I and Class Z shares, each of which has equal rights as to assets and voting privileges. Each class has exclusive voting rights with respect to matters that affect that class. Class C shares will automatically convert to Class A shares after a holding period of eight years from the initial date of purchase, with certain exceptions.
2. Investments in Fidelity Central Funds.
Funds may invest in Fidelity Central Funds, which are open-end investment companies generally available only to other investment companies and accounts managed by the investment adviser and its affiliates. The Schedule of Investments lists any Fidelity Central Funds held as an investment as of period end, but does not include the underlying holdings of each Fidelity Central Fund. An investing fund indirectly bears its proportionate share of the expenses of the underlying Fidelity Central Funds.
Based on its investment objective, each Fidelity Central Fund may invest or participate in various investment vehicles or strategies that are similar to those of the investing fund. These strategies are consistent with the investment objectives of the investing fund and may involve certain economic risks which may cause a decline in value of each of the Fidelity Central Funds and thus a decline in the value of the investing fund.
| Fidelity Central Fund | Investment Manager | Investment Objective | Investment Practices | Expense Ratio A |
| Fidelity Floating Rate Central Fund | Fidelity Management & Research Company LLC (FMR) | Seeks a high level of income by normally investing in floating rate loans and other floating rate securities. | Foreign Securities Loans & Direct Debt Instruments Restricted Securities | Less than .005% |
| Fidelity High Income Central Fund | Fidelity Management & Research Company LLC (FMR) | Seeks a high level of income and may also seek capital appreciation by investing primarily in debt securities, preferred stocks, and convertible securities, with an emphasis on lower-quality debt securities. | Loans & Direct Debt Instruments Restricted Securities | .03% |
| Fidelity International Credit Central Fund | Fidelity Management & Research Company LLC (FMR) | Seeks a high level of current income by normally investing in debt securities of foreign issuers, including debt securities of issuers located in emerging markets. Foreign currency exposure is hedged utilizing foreign currency contracts. | Foreign Securities Futures Options Restricted Securities Swaps | Less than .005% |
| Fidelity Money Market Central Funds | Fidelity Management & Research Company LLC (FMR) | Each fund seeks to obtain a high level of current income consistent with the preservation of capital and liquidity. | Short-term Investments | Less than .005% |
A Expenses expressed as a percentage of average net assets and are as of each underlying Central Fund's most recent annual or semi-annual shareholder report.
An unaudited holdings listing for the investing fund, which presents direct holdings as well as the pro-rata share of any securities and other investments held indirectly through its investment in underlying non-money market Fidelity Central Funds, is available at fidelity.com and/or institutional.fidelity.com, as applicable. A complete unaudited list of holdings for each Fidelity Central Fund is available upon request or at the Securities and Exchange Commission website at www.sec.gov. In addition, the financial statements of the Fidelity Central Funds which contain the significant accounting policies (including investment valuation policies) of those funds, and are not covered by the Report of Independent Registered Public Accounting Firm, are available on the Securities and Exchange Commission website or upon request.
3. Significant Accounting Policies.
The Fund is an investment company and applies the accounting and reporting guidance of the Financial Accounting Standards Board (FASB) Accounting Standards Codification Topic 946 Financial Services - Investment Companies . The financial statements have been prepared in conformity with accounting principles generally accepted in the United States of America (GAAP), which require management to make certain estimates and assumptions at the date of the financial statements. Actual results could differ from those estimates. Subsequent events, if any, through the date that the financial statements were issued have been evaluated in the preparation of the financial statements. The Fund's Schedule of Investments lists any underlying mutual funds or exchange-traded funds (ETFs) but does not include the underlying holdings of these funds. The following summarizes the significant accounting policies of the Fund:
Investment Valuation. Investments are valued as of 4:00 p.m. Eastern time on the last calendar day of the period. The Board of Trustees (the Board) has designated the Fund's investment adviser as the valuation designee responsible for the fair valuation function and performing fair value determinations as needed. The investment adviser has established a Fair Value Committee (the Committee) to carry out the day-to-day fair valuation responsibilities and has adopted policies and procedures to govern the fair valuation process and the activities of the Committee. In accordance with these fair valuation policies and procedures, which have been approved by the Board, the Fund attempts to obtain prices from one or more third party pricing services or brokers to value its investments. When current market prices, quotations or currency exchange rates are not readily available or reliable, investments will be fair valued in good faith by the Committee, in accordance with the policies and procedures. Factors used in determining fair value vary by investment type and may include market or investment specific events, transaction data, estimated cash flows, and market observations of comparable investments. The frequency that the fair valuation procedures are used cannot be predicted and they may be utilized to a significant extent. The Committee manages the Fund's fair valuation practices and maintains the fair valuation policies and procedures. The Fund's investment adviser reports to the Board information regarding the fair valuation process and related material matters.
The Fund categorizes the inputs to valuation techniques used to value its investments into a disclosure hierarchy consisting of three levels as shown below:
Level 1 - unadjusted quoted prices in active markets for identical investments
Level 2 - other significant observable inputs (including quoted prices for similar investments, interest rates, prepayment speeds, etc.)
Level 3 - unobservable inputs (including the Fund's own assumptions based on the best information available)
Valuation techniques used to value the Fund's investments by major category are as follows:
Debt securities, including restricted securities, are valued based on evaluated prices received from third party pricing services or from brokers who make markets in such securities. Corporate bonds, foreign government and government agency obligations, municipal securities, preferred securities and U.S. government and government agency obligations are valued by pricing services who utilize matrix pricing which considers yield or price of bonds of comparable quality, coupon, maturity and type or by broker-supplied prices. Asset backed securities and commercial mortgage securities are valued by pricing services who utilize matrix pricing which considers prepayment speed assumptions, attributes of the collateral, yield or price of bonds of comparable quality, coupon, maturity and type or by broker-supplied prices. When independent prices are unavailable or unreliable, debt securities may be valued utilizing pricing methodologies which consider similar factors that would be used by third party pricing services. Debt securities are generally categorized as Level 2 in the hierarchy but may be Level 3 depending on the circumstances.
The U.S. dollar value of forward foreign currency contracts is determined using currency exchange rates supplied by a pricing service and are categorized as Level 2 in the hierarchy. Investments in open-end mutual funds, including the Fidelity Central Funds, are valued at their closing net asset value (NAV) each business day and are categorized as Level 1 in the hierarchy.
Changes in valuation techniques may result in transfers in or out of an assigned level within the disclosure hierarchy. The aggregate value of investments by input level as of February 28, 2023 is included at the end of the Fund's Schedule of Investments.
Foreign Currency. Foreign-denominated assets, including investment securities, and liabilities are translated into U.S. dollars at the exchange rates at period end. Purchases and sales of investment securities, income and dividends received, and expenses denominated in foreign currencies are translated into U.S. dollars at the exchange rate in effect on the transaction date.
The effects of exchange rate fluctuations on investments are included with the net realized and unrealized gain (loss) on investment securities. Other foreign currency transactions resulting in realized and unrealized gain (loss) are disclosed separately.
Realized gains and losses on foreign currency transactions arise from the disposition of foreign currency, realized changes in the value of foreign currency between the trade and settlement dates on security transactions, and the difference between the amounts of dividends, interest and foreign withholding taxes recorded on transaction date and the U.S. dollar equivalent of the amounts actually received or paid. Unrealized gains and losses on assets and liabilities in foreign currencies arise from changes in the value of foreign currency, and from assets and liabilities denominated in foreign currencies, other than investments, which are held at period end.
Investment Transactions and Income. For financial reporting purposes, the Fund's investment holdings and NAV include trades executed through the end of the last business day of the period. The NAV per share for processing shareholder transactions is calculated as of the close of business of the New York Stock Exchange (NYSE), normally 4:00 p.m. Eastern time and includes trades executed through the end of the prior business day. Gains and losses on securities sold are determined on the basis of identified cost. Dividend income is recorded on the ex-dividend date. Income and capital gain distributions from Fidelity Central Funds, if any, are recorded on the ex-dividend date. Interest income is accrued as earned and includes coupon interest and amortization of premium and accretion of discount on debt securities as applicable. Investment income is recorded net of foreign taxes withheld where recovery of such taxes is uncertain. Debt obligations may be placed on non-accrual status and related interest income may be reduced by ceasing current accruals and writing off interest receivables when the collection of all or a portion of interest has become doubtful based on consistently applied procedures. A debt obligation is removed from non-accrual status when the issuer resumes interest payments or when collectability of interest is reasonably assured.
Class Allocations and Expenses. Investment income, realized and unrealized capital gains and losses, common expenses of a fund, and certain fund-level expense reductions, if any, are allocated daily on a pro-rata basis to each class based on the relative net assets of each class to the total net assets of a fund. Each class differs with respect to transfer agent and distribution and service plan fees incurred, as applicable. Certain expense reductions may also differ by class, if applicable. For the reporting period, the allocated portion of income and expenses to each class as a percent of its average net assets may vary due to the timing of recording these transactions in relation to fluctuating net assets of the classes. Expenses directly attributable to a fund are charged to that fund. Expenses attributable to more than one fund are allocated among the respective funds on the basis of relative net assets or other appropriate methods. Expenses included in the accompanying financial statements reflect the expenses of that fund and do not include any expenses associated with any underlying mutual funds or exchange-traded funds. Although not included in a fund's expenses, a fund indirectly bears its proportionate share of these expenses through the net asset value of each underlying mutual fund or exchange-traded fund. Expense estimates are accrued in the period to which they relate and adjustments are made when actual amounts are known.
Income Tax Information and Distributions to Shareholders. Each year, the Fund intends to qualify as a regulated investment company under Subchapter M of the Internal Revenue Code, including distributing substantially all of its taxable income and realized gains. As a result, no provision for U.S. Federal income taxes is required. The Fund files a U.S. federal tax return, in addition to state and local tax returns as required. The Fund's federal income tax returns are subject to examination by the Internal Revenue Service (IRS) for a period of three fiscal years after they are filed. State and local tax returns may be subject to examination for an additional fiscal year depending on the jurisdiction. Foreign taxes are provided for based on the Fund's understanding of the tax rules and rates that exist in the foreign markets in which it invests.
Distributions are declared and recorded daily and paid monthly from net investment income. Distributions from realized gains, if any, are declared and recorded on the ex-dividend date. Income and capital gain distributions are declared separately for each class. Income and capital gain distributions are determined in accordance with income tax regulations, which may differ from GAAP.
Capital accounts within the financial statements are adjusted for permanent book-tax differences. These adjustments have no impact on net assets or the results of operations. Capital accounts are not adjusted for temporary book-tax differences which will reverse in a subsequent period.
Book-tax differences are primarily due to the short-term gain distributions from the underlying mutual funds or exchange-traded funds (ETFs), foreign currency transactions, market discount, capital loss carryforwards, and losses deferred due to wash sales and currency forward transactions.
As of period end, the cost and unrealized appreciation (depreciation) in securities, and derivatives if applicable, for federal income tax purposes were as follows:
| Gross unrealized appreciation | $58,874 |
| Gross unrealized depreciation | (2,431,584) |
| Net unrealized appreciation (depreciation) | $(2,372,710) |
| Tax cost | $36,458,135 |
Capital loss carryforwards are only available to offset future capital gains of the Fund to the extent provided by regulations and may be limited. The capital loss carryforward information presented below, including any applicable limitation, is estimated as of prior fiscal period end and is subject to adjustment.
Restricted Securities (including Private Placements). Funds may invest in securities that are subject to legal or contractual restrictions on resale. These securities generally may be resold in transactions exempt from registration or to the public if the securities are registered. Disposal of these securities may involve time-consuming negotiations and expense, and prompt sale at an acceptable price may be difficult. Information regarding restricted securities held at period end is included at the end of the Schedule of Investments, if applicable.
4. Derivative Instruments.
Risk Exposures and the Use of Derivative Instruments. The Fund's investment objectives allow for various types of derivative instruments, including forward foreign currency contracts. Derivatives are investments whose value is primarily derived from underlying assets, indices or reference rates and may be transacted on an exchange or over-the-counter (OTC). Derivatives may involve a future commitment to buy or sell a specified asset based on specified terms, to exchange future cash flows at periodic intervals based on a notional principal amount, or for one party to make one or more payments upon the occurrence of specified events in exchange for periodic payments from the other party.
Derivatives were used to increase returns, to facilitate transactions in foreign-denominated securities and to manage exposure to certain risks as defined below. The success of any strategy involving derivatives depends on analysis of numerous economic factors, and if the strategies for investment do not work as intended, the objectives may not be achieved.
Derivatives were used to increase or decrease exposure to the following risk(s):
| | |
| Foreign Exchange Risk | Foreign exchange rate risk relates to fluctuations in the value of an asset or liability due to changes in currency exchange rates. |
Funds are also exposed to additional risks from investing in derivatives, such as liquidity risk and counterparty credit risk. Liquidity risk is the risk that a fund will be unable to close out the derivative in the open market in a timely manner. Counterparty credit risk is the risk that the counterparty will not be able to fulfill its obligation to a fund. Derivative counterparty credit risk is managed through formal evaluation of the creditworthiness of all potential counterparties. On certain OTC derivatives such as forward foreign currency contracts, a fund attempts to reduce its exposure to counterparty credit risk by entering into an International Swaps and Derivatives Association, Inc. (ISDA) Master Agreement with each of its counterparties. The ISDA Master Agreement gives a fund the right to terminate all transactions traded under such agreement upon the deterioration in the credit quality of the counterparty beyond specified levels. The ISDA Master Agreement gives each party the right, upon an event of default by the other party or a termination of the agreement, to close out all transactions traded under such agreement and to net amounts owed under each transaction to one net payable by one party to the other. To mitigate counterparty credit risk on bi-lateral OTC derivatives, a fund receives collateral in the form of cash or securities once net unrealized appreciation on outstanding derivative contracts under an ISDA Master Agreement exceeds certain applicable thresholds, subject to certain minimum transfer provisions. The collateral received is held in segregated accounts with the custodian bank in accordance with the collateral agreements entered into between a fund, the counterparty and the custodian bank. A fund could experience delays and costs in gaining access to the collateral even though it is held by the custodian bank. The maximum risk of loss to a fund from counterparty credit risk related to bi-lateral OTC derivatives is generally the aggregate unrealized appreciation and unpaid counterparty payments in excess of any collateral pledged by the counterparty to a fund. A fund may be required to pledge collateral for the benefit of the counterparties on bi-lateral OTC derivatives in an amount not less than each counterparty's unrealized appreciation on outstanding derivative contracts, subject to certain minimum transfer provisions, and any such pledged collateral is identified in the Schedule of Investments.
Investing in derivatives may involve greater risks than investing in the underlying assets directly and, to varying degrees, may involve risk of loss in excess of any initial investment and collateral received and amounts recognized in the Statement of Assets and Liabilities. In addition, there may be the risk that the change in value of the derivative contract does not correspond to the change in value of the underlying instrument.
Forward Foreign Currency Contracts. Forward foreign currency contracts represent obligations to purchase or sell foreign currency on a specified future date at a price fixed at the time the contracts are entered into. Forward foreign currency contracts were used to facilitate transactions in foreign-denominated securities and to manage exposure to certain foreign currencies.
Forward foreign currency contracts are valued daily and fluctuations in exchange rates on open contracts are recorded as unrealized appreciation or (depreciation) and reflected in total accumulated earnings (loss) in the Statement of Assets and Liabilities. When the contract is closed, a gain or loss is realized equal to the difference between the closing value and the value at the time it was opened. Non-deliverable forward foreign currency exchange contracts are settled with the counterparty in cash without the delivery of foreign currency. The net realized gain (loss) and change in net unrealized appreciation (depreciation) on forward foreign currency contracts during the period is presented in the Statement of Operations.
Any open forward foreign currency contracts at period end are presented in the Schedule of Investments under the caption "Forward Foreign Currency Contracts." The contract amount and unrealized appreciation (depreciation) reflects each contract's exposure to the underlying currency at period end, and is representative of volume of activity during the period unless an average contract value is presented.
5. Purchases and Sales of Investments.
Purchases and sales of securities, other than short-term securities and in-kind transactions, as applicable, are noted in the table below.
| | Purchases ($) | Sales ($) |
| Fidelity Tactical Bond Fund | 2,553,395 | 3,204,830 |
6. Fees and Other Transactions with Affiliates.
Management Fee. Fidelity Management & Research Company LLC (the investment adviser) and its affiliates provide the Fund with investment management related services for which the Fund pays a monthly management fee. The management fee is the sum of an individual fund fee rate that is based on an annual rate of .45% of the Fund's average net assets and an annualized group fee rate that averaged .10% during the period. In September 2022 the Board approved a change in the individual fund fee rate from .50% to .45% effective October 1, 2022. The group fee rate is based upon the monthly average net assets of a group of registered investment companies with which the investment adviser has management contracts. The group fee rate decreases as assets under management increase and increases as assets under management decrease. For the reporting period, the total annualized management fee rate was .56% of the Fund's average net assets.
Distribution and Service Plan Fees. In accordance with Rule 12b-1 of the 1940 Act, the Fund has adopted separate Distribution and Service Plans for each class of shares. Certain classes pay Fidelity Distributors Company LLC (FDC), an affiliate of the investment adviser, separate Distribution and Service Fees, each of which is based on an annual percentage of each class' average net assets. In addition, FDC may pay financial intermediaries for selling shares of the Fund and providing shareholder support services. For the period, the Distribution and Service Fee rates, total fees and amounts retained by FDC were as follows:
| | Distribution Fee | Service Fee | Total Fees | Retained by FDC |
| Class A | -% | .25% | $3,616 | $2,856 |
| Class M | -% | .25% | 3,114 | 2,848 |
| Class C | .75% | .25% | 11,635 | 11,330 |
| | | | $18,365 | $17,034 |
Sales Load. FDC may receive a front-end sales charge of up to 4.00% for selling Class A shares and Class M shares, some of which is paid to financial intermediaries for selling shares of the Fund. Depending on the holding period, FDC may receive contingent deferred sales charges levied on Class A, Class M and Class C redemptions. The deferred sales charges are 1.00% for Class C shares, .75% for certain purchases of Class A shares and .25% for certain purchases of Class M shares.
For the period, sales charge amounts retained by FDC were as follows:
| | Retained by FDC |
| Class A | $102 |
| | |
Transfer Agent Fees. Fidelity Investments Institutional Operations Company LLC (FIIOC), an affiliate of the investment adviser, is the transfer, dividend disbursing and shareholder servicing agent for each class of the Fund. FIIOC receives account fees and asset-based fees that vary according to the account size and type of account of the shareholders of the respective classes of the Fund, except for Class Z. FIIOC receives an asset-based fee of Class Z's average net assets. FIIOC pays for typesetting, printing and mailing of shareholder reports, except proxy statements.
For the period, transfer agent fees for each class were as follows:
| | Amount | % of Class-Level Average Net Assets A |
| Class A | $1,969 | .14 |
| Class M | 1,911 | .15 |
| Class C | 1,753 | .15 |
| Fidelity Tactical Bond Fund | 5,157 | .07 |
| Class I | 1,939 | .12 |
| Class Z | 933 | .05 |
| | $13,662 | |
A Annualized
Accounting Fees. Fidelity Service Company, Inc. (FSC), an affiliate of the investment adviser, maintains the Fund's accounting records. The accounting fee is based on the level of average net assets for each month. For the period, the fees were equivalent to the following annualized rates:
| | % of Average Net Assets |
| Fidelity Tactical Bond Fund | .04 |
Interfund Trades. Funds may purchase from or sell securities to other Fidelity Funds under procedures adopted by the Board. The procedures have been designed to ensure these interfund trades are executed in accordance with Rule 17a-7 of the 1940 Act. Any interfund trades are included within the respective purchases and sales amounts shown in the Purchases and Sales of Investments note. During the period, there were no interfund trades.
7. Committed Line of Credit.
Certain Funds participate with other funds managed by the investment adviser or an affiliate in a $4.25 billion credit facility (the "line of credit") to be utilized for temporary or emergency purposes to fund shareholder redemptions or for other short-term liquidity purposes. The participating funds have agreed to pay commitment fees on their pro-rata portion of the line of credit, which are reflected in Miscellaneous expenses on the Statement of Operations, and are listed below. During the period, there were no borrowings on this line of credit.
| | Amount |
| Fidelity Tactical Bond Fund | $27 |
8. Expense Reductions.
The investment adviser contractually agreed to reimburse expenses of each class to the extent annual operating expenses exceeded certain levels of class-level average net assets as noted in the table below. This reimbursement will remain in place through December 31, 2024. Some expenses, for example the compensation of the independent Trustees, and certain miscellaneous expenses such as proxy and shareholder meeting expenses, are excluded from this reimbursement.
The following classes were in reimbursement during the period:
| | Expense Limitations | Reimbursement |
| Class A | 1.00%/.95% A | $16,354 |
| Class M | 1.00%/.95% A | 14,271 |
| Class C | 1.75%/1.70% A | 13,355 |
| Fidelity Tactical Bond Fund | .75%/.70% A | 81,876 |
| Class I | .75%/.70% A | 15,850 |
| Class Z | .66%/.61% A | 21,059 |
| | | $162,765 |
A Expense limitation effective October 1, 2022.
Through arrangements with the Fund's custodian, credits realized as a result of certain uninvested cash balances were used to reduce the Fund's expenses. During the period, custodian credits reduced the Fund's expenses by $96.
In addition, during the period the investment adviser or an affiliate reimbursed and/or waived a portion of fund-level operating expenses in the amount of $302.
9. Distributions to Shareholders.
Distributions to shareholders of each class were as follows:
| | Six months ended February 28, 2023 | Year ended August 31, 2022 (a) |
| Fidelity Tactical Bond Fund | | |
| Distributions to shareholders | | |
| Class A | $85,407 | $28,599 |
| Class M | 72,493 | 29,281 |
| Class C | 59,411 | 17,846 |
| Fidelity Tactical Bond Fund | 467,496 | 190,476 |
| Class I | 92,599 | 63,990 |
| Class Z | 116,764 | 32,269 |
| Total | $894,170 | $362,461 |
(a) For the period February 10, 2022 (commencement of operations) through August 31, 2022.
10. Share Transactions.
Share transactions for each class were as follows and may contain in-kind transactions, automatic conversions between classes or exchanges between affiliated funds:
| | Shares | Shares | Dollars | Dollars |
| | Six months ended February 28, 2023 | Year ended August 31, 2022 (a) | Six months ended February 28, 2023 | Year ended August 31, 2022 A |
| Fidelity Tactical Bond Fund | | | | |
| Class A | | | | |
| Shares sold | 129,488 | 267,406 | $1,139,584 | $2,665,959 |
| Reinvestment of distributions | 9,666 | 3,059 | 85,406 | 28,599 |
| Shares redeemed | (31,107) | (4,512) | (278,010) | (42,144) |
| Net increase (decrease) | 108,047 | 265,953 | $946,980 | $2,652,414 |
| Class M | | | | |
| Shares sold | 15,213 | 271,401 | $137,640 | $2,706,943 |
| Reinvestment of distributions | 8,208 | 3,131 | 72,490 | 29,281 |
| Shares redeemed | (8,284) | - | (71,459) | - |
| Net increase (decrease) | 15,137 | 274,532 | $138,671 | $2,736,224 |
| Class C | | | | |
| Shares sold | 5,963 | 254,415 | $52,878 | $2,541,585 |
| Reinvestment of distributions | 6,725 | 1,914 | 59,401 | 17,846 |
| Shares redeemed | (3,290) | (10) | (29,443) | (92) |
| Net increase (decrease) | 9,398 | 256,319 | $82,836 | $2,559,339 |
| Fidelity Tactical Bond Fund | | | | |
| Shares sold | 291,177 | 1,813,635 | $2,604,789 | $17,855,558 |
| Reinvestment of distributions | 51,484 | 19,973 | 454,744 | 186,588 |
| Shares redeemed | (199,727) | (78,886) | (1,773,711) | (737,945) |
| Net increase (decrease) | 142,934 | 1,754,722 | $1,285,822 | $17,304,201 |
| Class I | | | | |
| Shares sold | 253,636 | 913,955 | $2,270,515 | $8,816,450 |
| Reinvestment of distributions | 10,484 | 3,680 | 92,599 | 34,370 |
| Shares redeemed | (35,911) | (597,950) | (322,211) | (5,590,738) |
| Net increase (decrease) | 228,209 | 319,685 | $2,040,903 | $3,260,082 |
| Class Z | | | | |
| Shares sold | 233,533 | 284,036 | $2,090,112 | $2,813,700 |
| Reinvestment of distributions | 8,620 | 3,412 | 76,140 | 31,948 |
| Shares redeemed | (39) | (1,021) | (357) | (9,254) |
| Net increase (decrease) | 242,114 | 286,427 | $2,165,895 | $2,836,394 |
(a) For the period February 10, 2022 (commencement of operations) through February 28, 2022.
11. Other.
A fund's organizational documents provide former and current trustees and officers with a limited indemnification against liabilities arising in connection with the performance of their duties to the fund. In the normal course of business, a fund may also enter into contracts that provide general indemnifications. A fund's maximum exposure under these arrangements is unknown as this would be dependent on future claims that may be made against a fund. The risk of material loss from such claims is considered remote.
At the end of the period, the investment adviser or its affiliates were owners of record of more than 10% of the outstanding shares as follows:
| Fund | Affiliated % |
| Fidelity Tactical Bond Fund | 67% |
12. Risk and Uncertainties.
Many factors affect a fund's performance. Developments that disrupt global economies and financial markets, such as pandemics, epidemics, outbreaks of infectious diseases, war, terrorism, and environmental disasters, may significantly affect a fund's investment performance. The effects of these developments to a fund will be impacted by the types of securities in which a fund invests, the financial condition, industry, economic sector, and geographic location of an issuer, and a fund's level of investment in the securities of that issuer. Significant concentrations in security types, issuers, industries, sectors, and geographic locations may magnify the factors that affect a fund's performance.
As a shareholder, you incur two types of costs: (1) transaction costs, which may include sales charges (loads) on purchase payments or redemption proceeds, as applicable and (2) ongoing costs, which generally include management fees, distribution and/or service (12b-1) fees and other Fund expenses. This Example is intended to help you understand your ongoing costs (in dollars) of investing in a fund and to compare these costs with the ongoing costs of investing in other mutual funds.
| The Example is based on an investment of $1,000 invested at the beginning of the period and held for the entire period (September 1, 2022 to February 28, 2023). |
Actual Expenses
The first line of the accompanying table provides information about actual account values and actual expenses. You may use the information in this line, together with the amount you invested, to estimate the expenses that you paid over the period. Simply divide your account value by $1,000.00 (for example, an $8,600 account value divided by $1,000.00 = 8.6), then multiply the result by the number in the first line for a class/Fund under the heading entitled "Expenses Paid During Period" to estimate the expenses you paid on your account during this period. If any fund is a shareholder of any underlying mutual funds or exchange-traded funds (ETFs) (the Underlying Funds), such fund indirectly bears its proportional share of the expenses of the Underlying Funds in addition to the direct expenses incurred presented in the table. These fees and expenses are not included in the annualized expense ratio used to calculate the expense estimate in the table below.
Hypothetical Example for Comparison Purposes
The second line of the accompanying table provides information about hypothetical account values and hypothetical expenses based on the actual expense ratio and an assumed rate of return of 5% per year before expenses, which is not the actual return. The hypothetical account values and expenses may not be used to estimate the actual ending account balance or expenses you paid for the period. You may use this information to compare the ongoing costs of investing in the Fund and other funds. To do so, compare this 5% hypothetical example with the 5% hypothetical examples that appear in the shareholder reports of the other funds. If any fund is a shareholder of any Underlying Funds, such fund indirectly bears its proportional share of the expenses of the Underlying Funds in addition to the direct expenses as presented in the table. These fees and expenses are not included in the annualized expense ratio used to calculate the expense estimate in the table below.
Please note that the expenses shown in the table are meant to highlight your ongoing costs only and do not reflect any transaction costs. Therefore, the second line of the table is useful in comparing ongoing costs only, and will not help you determine the relative total costs of owning different funds. In addition, if these transactional costs were included, your costs would have been higher.
| | | | | Annualized Expense Ratio- A | | Beginning Account Value September 1, 2022 | | Ending Account Value February 28, 2023 | | Expenses Paid During Period- C September 1, 2022 to February 28, 2023 |
| Fidelity® Tactical Bond Fund | | | | | | | | | | |
| Class A | | | | .96% | | | | | | |
| Actual | | | | | | $ 1,000 | | $ 995.90 | | $ 4.75 |
Hypothetical- B | | | | | | $ 1,000 | | $ 1,020.03 | | $ 4.81 |
| Class M | | | | .96% | | | | | | |
| Actual | | | | | | $ 1,000 | | $ 996.00 | | $ 4.75 |
Hypothetical- B | | | | | | $ 1,000 | | $ 1,020.03 | | $ 4.81 |
| Class C | | | | 1.71% | | | | | | |
| Actual | | | | | | $ 1,000 | | $ 993.30 | | $ 8.45 |
Hypothetical- B | | | | | | $ 1,000 | | $ 1,016.31 | | $ 8.55 |
| Fidelity® Tactical Bond Fund | | | | .71% | | | | | | |
| Actual | | | | | | $ 1,000 | | $ 997.20 | | $ 3.52 |
Hypothetical- B | | | | | | $ 1,000 | | $ 1,021.27 | | $ 3.56 |
| Class I | | | | .71% | | | | | | |
| Actual | | | | | | $ 1,000 | | $ 997.20 | | $ 3.52 |
Hypothetical- B | | | | | | $ 1,000 | | $ 1,021.27 | | $ 3.56 |
| Class Z | | | | .61% | | | | | | |
| Actual | | | | | | $ 1,000 | | $ 997.60 | | $ 3.02 |
Hypothetical- B | | | | | | $ 1,000 | | $ 1,021.77 | | $ 3.06 |
| |
A Annualized expense ratio reflects expenses net of applicable fee waivers.
B 5% return per year before expenses
C Expenses are equal to the annualized expense ratio, multiplied by the average account value over the period, multiplied by 181/ 365 (to reflect the one-half year period). The fees and expenses of any Underlying Funds are not included in each annualized expense ratio.
Board Approval of Investment Advisory Contracts and Management Fees
Fidelity Tactical Bond Fund
At its September 2022 meeting the Board of Trustees, including the Independent Trustees (together, the Board), voted to approve an amended and restated management contract (the Amended Contract) for the fund to decrease the management fees paid to Fidelity Management & Research Company LLC (FMR), the fund's investment adviser, by 5 basis points, effective October 1, 2022. The Board, assisted by the advice of fund counsel and Independent Trustees' counsel, considered a broad range of information.
Nature, Extent, and Quality of Services Provided. The Board previously received and considered materials relating to the nature, extent and quality of services to be provided by FMR to the fund, including the resources dedicated to investment management and support services, shareholder and administrative services, and the benefits to shareholders of investment in a large fund family in connection with the approval of the fund's current management contract (Current Management Contract). At its November 2021 meeting, the Board concluded that the nature, extent and quality of the services to be provided to the fund under the Current Management Contract should benefit the fund's shareholders. In connection with its approval of the Amended Contract at its September 2022 meeting, the Board noted that such approval would not change the fund's portfolio managers, the investment processes, the level or nature of services provided, the resources and personnel allocated or trading and compliance operations. The Board concluded that the nature, extent, and quality of services to be provided to the fund under the Amended Contract will continue to benefit the fund's shareholders.
Competitiveness of Management Fee and Total Expense Ratio. In reviewing the Amended Contract, the Board considered the fund's proposed management fee rate, which is 5 basis points lower than the current management fee rate, and the projected total net expense ratio of each class of the fund. The Board noted that the fund's proposed management fee rate is lower than the median fee rate of funds with similar Lipper investment objective categories and comparable investment mandates, regardless of whether their management fee structures are comparable. The Board also considered that the projected total net expense ratio of each of Class A, Class M, Class C, Class Z, and the retail class of the fund is below the median of those funds and classes used by the Board for management fee comparisons that have a similar sales load structure, and the projected total net expense ratio of Class I is at the median.
The Board also noted that FMR has contractually agreed to reimburse each class of the fund to the extent that total operating expenses, with certain exceptions, as a percentage of their respective average net assets, exceed a certain limit through December 31, 2024.
Based on its review, the Board concluded that the management fee and the projected total net expense ratio of each class of the fund continue to be fair and reasonable in light of the services that each fund receives and the other factors considered.
Costs of the Services and Profitability. Because the Board was approving an arrangement under which the management fees were being reduced, the Board did not consider FMR's costs of services, revenues, or profitability to be significant factors in its decision to approve the Amended Contract.
Economies of Scale. In connection with the approval of the fund's Amended Contract, the Board did not consider economies of scale because the proposed fee arrangement lowers the fund's management fee and FMR will continue to contractually limit expenses. The Board will review economies of scale in connection with its consideration of future renewals of the Amended Contract.
Based on its evaluation of all of the conclusions noted above, and after considering all factors it believed relevant, the Board ultimately concluded that the advisory fee structure is fair and reasonable, and that the fund's Amended Contract should be approved.
The Securities and Exchange Commission adopted Rule 22e-4 under the Investment Company Act of 1940 (the Liquidity Rule) to promote effective liquidity risk management throughout the open-end investment company industry, thereby reducing the risk that funds will be unable to meet their redemption obligations and mitigating dilution of the interests of fund shareholders.
The Fund has adopted and implemented a liquidity risk management program (the Program) reasonably designed to assess and manage the Fund's liquidity risk and to comply with the requirements of the Liquidity Rule. The Fund's Board of Trustees (the Board) has designated the Fund's investment adviser as administrator of the Program. The Fidelity advisers have established a Liquidity Risk Management Committee (the LRM Committee) to manage the Program for each of the Fidelity Funds. The LRM Committee monitors the adequacy and effectiveness of implementation of the Program and on a periodic basis assesses each Fund's liquidity risk based on a variety of factors including (1) the Fund's investment strategy, (2) portfolio liquidity and cash flow projections during normal and reasonably foreseeable stressed conditions, (3) shareholder redemptions, (4) borrowings and other funding sources and (5) certain factors specific to ETFs including the effect of the Fund's prices and spreads, market participants, and basket compositions on the overall liquidity of the Fund's portfolio, as applicable.
In accordance with the Program, each of the Fund's portfolio investments is classified into one of four defined liquidity categories based on a determination of a reasonable expectation for how long it would take to convert the investment to cash (or sell or dispose of the investment) without significantly changing its market value.
- Highly liquid investments - cash or convertible to cash within three business days or less
- Moderately liquid investments - convertible to cash in three to seven calendar days
- Less liquid investments - can be sold or disposed of, but not settled, within seven calendar days
- Illiquid investments - cannot be sold or disposed of within seven calendar days
Liquidity classification determinations take into account a variety of factors including various market, trading and investment-specific considerations, as well as market depth, and generally utilize analysis from a third-party liquidity metrics service.
The Liquidity Rule places a 15% limit on a fund's illiquid investments and requires funds that do not primarily hold assets that are highly liquid investments to determine and maintain a minimum percentage of the fund's net assets to be invested in highly liquid investments (highly liquid investment minimum or HLIM). The Program includes provisions reasonably designed to comply with the 15% limit on illiquid investments and for determining, periodically reviewing and complying with the HLIM requirement as applicable.
At a recent meeting of the Fund's Board of Trustees, the LRM Committee provided a written report to the Board pertaining to the operation, adequacy, and effectiveness of the Program for the period December 1, 2021 through November 30, 2022. The report concluded that the Program is operating effectively and is reasonably designed to assess and manage the Fund's liquidity risk.
1.9904497.101
TBF-SANN-0423
Fidelity® Sustainable Low Duration Bond Fund
Semi-Annual Report
February 28, 2023
Includes Fidelity and Fidelity Advisor share classes
Contents
To view a fund's proxy voting guidelines and proxy voting record for the 12-month period ended June 30, visit http://www.fidelity.com/proxyvotingresults or visit the Securities and Exchange Commission's (SEC) web site at http://www.sec.gov.
You may also call 1-800-544-8544 if you're an individual investing directly with Fidelity, call 1-800-835-5092 if you're a plan sponsor or participant with Fidelity as your recordkeeper or call 1-877-208-0098 on institutional accounts or if you're an advisor or invest through one to request a free copy of the proxy voting guidelines.
Standard & Poor's, S&P and S&P 500 are registered service marks of The McGraw-Hill Companies, Inc. and have been licensed for use by Fidelity Distributors Corporation.
Other third-party marks appearing herein are the property of their respective owners.
All other marks appearing herein are registered or unregistered trademarks or service marks of FMR LLC or an affiliated company. © 2023 FMR LLC. All rights reserved.
This report and the financial statements contained herein are submitted for the general information of the shareholders of the Fund. This report is not authorized for distribution to prospective investors in the Fund unless preceded or accompanied by an effective prospectus.
A fund files its complete schedule of portfolio holdings with the SEC for the first and third quarters of each fiscal year on Form N-PORT. Forms N-PORT are available on the SEC's web site at http://www.sec.gov. A fund's Forms N-PORT may be reviewed and copied at the SEC's Public Reference Room in Washington, DC. Information regarding the operation of the SEC's Public Reference Room may be obtained by calling 1-800-SEC-0330.
For a complete list of a fund's portfolio holdings, view the most recent holdings listing, semiannual report, or annual report on Fidelity's web site at http://www.fidelity.com, http://www.institutional.fidelity.com, or http://www.401k.com, as applicable.
NOT FDIC INSURED •MAY LOSE VALUE •NO BANK GUARANTEE
Neither the Fund nor Fidelity Distributors Corporation is a bank.
Quality Diversification (% of Fund's net assets) |
|
| |
| We have used ratings from Moody's Investors Service, Inc. Where Moody's® ratings are not available, we have used S&P® ratings. All ratings are as of the date indicated and do not reflect subsequent changes. |
Asset Allocation (% of Fund's net assets) |
|
Foreign investments - 12.7% |
|
Geographic Diversification (% of Fund's net assets) |
|
* Includes Short-Term investments and Net Other Assets (Liabilities). Percentages are based on country or territory of incorporation and are adjusted for the effect of derivatives, if applicable. |
| |
Showing Percentage of Net Assets
| Nonconvertible Bonds - 65.3% |
| | | Principal Amount (a) | Value ($) |
| COMMUNICATION SERVICES - 2.4% | | | |
| Diversified Telecommunication Services - 1.7% | | | |
| AT&T, Inc.: | | | |
| U.S. Secured Overnight Fin. Rate (SOFR) Averages Index + 0.640% 5.0552% 3/25/24 (b)(c) | | 50,000 | 50,003 |
| 0.9% 3/25/24 | | 125,000 | 119,204 |
| Verizon Communications, Inc.: | | | |
| U.S. Secured Overnight Fin. Rate (SOFR) Averages Index + 0.500% 4.913% 3/22/24 (b)(c) | | 150,000 | 149,905 |
| 0.75% 3/22/24 | | 75,000 | 71,468 |
| | | | 390,580 |
| Media - 0.7% | | | |
| Discovery Communications LLC 3.8% 3/13/24 | | 50,000 | 49,057 |
| Magallanes, Inc.: | | | |
| U.S. Secured Overnight Fin. Rate (SOFR) Averages Index + 1.780% 6.1741% 3/15/24 (b)(c)(d) | | 50,000 | 50,342 |
| 3.428% 3/15/24 (d) | | 75,000 | 73,199 |
| | | | 172,598 |
TOTAL COMMUNICATION SERVICES | | | 563,178 |
| CONSUMER DISCRETIONARY - 4.3% | | | |
| Automobiles - 2.2% | | | |
| American Honda Finance Corp. 3.55% 1/12/24 | | 100,000 | 98,466 |
| General Motors Financial Co., Inc.: | | | |
| U.S. Secured Overnight Fin. Rate (SOFR) Index + 0.000% 5.0719% 10/15/24 (b)(c) | | 75,000 | 74,412 |
| U.S. Secured Overnight Fin. Rate (SOFR) Index + 0.760% 5.1077% 3/8/24 (b)(c) | | 75,000 | 74,848 |
| U.S. Secured Overnight Fin. Rate (SOFR) Index + 1.200% 5.7531% 11/17/23 (b)(c) | | 50,000 | 50,037 |
| 1.7% 8/18/23 | | 50,000 | 49,061 |
| 4.25% 5/15/23 | | 50,000 | 49,890 |
| 5.1% 1/17/24 | | 50,000 | 49,762 |
| Toyota Motor Corp. 3.419% 7/20/23 | | 50,000 | 49,669 |
| | | | 496,145 |
| Hotels, Restaurants & Leisure - 0.7% | | | |
| Starbucks Corp. U.S. Secured Overnight Fin. Rate (SOFR) Averages Index + 0.420% 4.9745% 2/14/24 (b)(c) | | 155,000 | 154,779 |
| Specialty Retail - 1.4% | | | |
| AutoZone, Inc. 3.125% 7/15/23 | | 180,000 | 178,477 |
| The Home Depot, Inc.: | | | |
| 2.7% 4/1/23 | | 105,000 | 104,781 |
| 3.75% 2/15/24 | | 50,000 | 49,345 |
| | | | 332,603 |
TOTAL CONSUMER DISCRETIONARY | | | 983,527 |
| CONSUMER STAPLES - 0.3% | | | |
| Food Products - 0.3% | | | |
| Conagra Brands, Inc. 0.5% 8/11/23 | | 75,000 | 73,403 |
| ENERGY - 2.4% | | | |
| Energy Equipment & Services - 0.6% | | | |
| Baker Hughes Co. 1.231% 12/15/23 | | 150,000 | 145,348 |
| Oil, Gas & Consumable Fuels - 1.8% | | | |
| Chevron Corp. 1.141% 5/11/23 | | 50,000 | 49,621 |
| ConocoPhillips Co. 2.125% 3/8/24 | | 75,000 | 72,675 |
| Enbridge, Inc.: | | | |
| U.S. Secured Overnight Fin. Rate (SOFR) Averages Index + 0.630% 5.1834% 2/16/24 (b)(c) | | 50,000 | 49,895 |
| 0.55% 10/4/23 | | 20,000 | 19,415 |
| 4% 10/1/23 | | 75,000 | 74,360 |
| Shell International Finance BV 3.5% 11/13/23 | | 100,000 | 98,803 |
| Spectra Energy Partners LP 4.75% 3/15/24 | | 50,000 | 49,562 |
| | | | 414,331 |
TOTAL ENERGY | | | 559,679 |
| FINANCIALS - 37.7% | | | |
| Banks - 22.4% | | | |
| Bank of America Corp.: | | | |
| U.S. Secured Overnight Fin. Rate (SOFR) Index + 0.660% 5.2163% 2/4/25 (b)(c) | | 125,000 | 124,931 |
| U.S. Secured Overnight Fin. Rate (SOFR) Index + 0.730% 5.2301% 10/24/24 (b)(c) | | 100,000 | 100,073 |
| 0.523% 6/14/24 (b) | | 50,000 | 49,205 |
| 3.841% 4/25/25 (b) | | 100,000 | 97,933 |
| 4.125% 1/22/24 | | 75,000 | 74,234 |
| Bank of Montreal: | | | |
| U.S. Secured Overnight Fin. Rate (SOFR) Averages Index + 0.460% 4.9036% 1/10/25 (b)(c) | | 108,000 | 107,814 |
| 3.3% 2/5/24 | | 150,000 | 147,021 |
| Bank of Nova Scotia: | | | |
| U.S. Secured Overnight Fin. Rate (SOFR) Averages Index + 0.440% 4.8969% 4/15/24 (b)(c) | | 50,000 | 50,001 |
| U.S. Secured Overnight Fin. Rate (SOFR) Index + 0.380% 4.8925% 7/31/24 (b)(c) | | 50,000 | 49,934 |
| 0.55% 9/15/23 | | 125,000 | 121,820 |
| 3.4% 2/11/24 | | 75,000 | 73,575 |
| BB&T Corp. 3.75% 12/6/23 | | 375,000 | 371,285 |
| BNP Paribas SA 3.25% 3/3/23 | | 308,000 | 307,987 |
| Canadian Imperial Bank of Commerce: | | | |
| U.S. Secured Overnight Fin. Rate (SOFR) Index + 0.800% 5.2168% 3/17/23 (b)(c) | | 105,000 | 105,026 |
| 0.45% 6/22/23 | | 100,000 | 98,506 |
| 0.5% 12/14/23 | | 125,000 | 120,423 |
| Citigroup, Inc.: | | | |
| 3 month U.S. LIBOR + 1.020% 4.044% 6/1/24 (b)(c) | | 190,000 | 189,238 |
| U.S. Secured Overnight Fin. Rate (SOFR) Index + 0.690% 5.1852% 1/25/26 (b)(c) | | 40,000 | 39,674 |
| U.S. Secured Overnight Fin. Rate (SOFR) Index + 1.370% 5.9232% 5/24/25 (b)(c) | | 50,000 | 50,359 |
| 0.981% 5/1/25 (b) | | 100,000 | 94,440 |
| 3.375% 3/1/23 | | 108,000 | 108,000 |
| Fifth Third Bancorp: | | | |
| 1.625% 5/5/23 | | 233,000 | 231,511 |
| 3.65% 1/25/24 | | 100,000 | 98,575 |
| JPMorgan Chase & Co.: | | | |
| U.S. Secured Overnight Fin. Rate (SOFR) Index + 0.530% 4.8313% 6/1/25 (b)(c) | | 50,000 | 49,812 |
| U.S. Secured Overnight Fin. Rate (SOFR) Index + 0.580% 4.9815% 3/16/24 (b)(c) | | 100,000 | 100,008 |
| 0.563% 2/16/25 (b) | | 50,000 | 47,413 |
| 0.697% 3/16/24 (b) | | 150,000 | 149,634 |
| 3.375% 5/1/23 | | 100,000 | 99,704 |
| 4.023% 12/5/24 (b) | | 100,000 | 98,697 |
| Mitsubishi UFJ Financial Group, Inc.: | | | |
| 3 month U.S. LIBOR + 0.740% 5.5186% 3/2/23 (b)(c) | | 75,000 | 75,000 |
| 3 month U.S. LIBOR + 0.860% 5.6819% 7/26/23 (b)(c) | | 25,000 | 25,054 |
| 3.455% 3/2/23 | | 195,000 | 195,000 |
| PNC Financial Services Group, Inc. 3.5% 1/23/24 | | 125,000 | 123,038 |
| Royal Bank of Canada: | | | |
| U.S. Secured Overnight Fin. Rate (SOFR) Averages Index + 0.340% 4.7767% 10/7/24 (b)(c) | | 50,000 | 49,888 |
| U.S. Secured Overnight Fin. Rate (SOFR) Averages Index + 0.360% 4.8666% 7/29/24 (b)(c) | | 50,000 | 49,925 |
| U.S. Secured Overnight Fin. Rate (SOFR) Averages Index + 0.450% 4.9461% 10/26/23 (b)(c) | | 50,000 | 50,055 |
| 0.425% 1/19/24 | | 50,000 | 47,924 |
| 1.6% 4/17/23 | | 250,000 | 248,914 |
| The Toronto-Dominion Bank: | | | |
| U.S. Secured Overnight Fin. Rate (SOFR) Index + 0.350% 4.6748% 3/4/24 (b)(c) | | 50,000 | 49,952 |
| U.S. Secured Overnight Fin. Rate (SOFR) Index + 0.910% 5.2577% 3/8/24 (b)(c) | | 50,000 | 50,223 |
| 0.75% 6/12/23 | | 200,000 | 197,626 |
| 2.35% 3/8/24 | | 125,000 | 121,216 |
| Truist Financial Corp. U.S. Secured Overnight Fin. Rate (SOFR) Index + 0.400% 4.7538% 6/9/25 (b)(c) | | 50,000 | 49,612 |
| Wells Fargo & Co.: | | | |
| 1.654% 6/2/24 (b) | | 108,000 | 106,932 |
| 3.75% 1/24/24 | | 100,000 | 98,498 |
| 4.125% 8/15/23 | | 265,000 | 263,799 |
| | | | 5,159,489 |
| Capital Markets - 6.5% | | | |
| Bank of New York Mellon Corp.: | | | |
| U.S. Secured Overnight Fin. Rate (SOFR) Index + 0.200% 4.6912% 10/25/24 (b)(c) | | 150,000 | 149,178 |
| 0.35% 12/7/23 | | 125,000 | 120,395 |
| Goldman Sachs Group, Inc.: | | | |
| U.S. Secured Overnight Fin. Rate (SOFR) Index + 0.700% 5.1779% 1/24/25 (b)(c) | | 80,000 | 79,878 |
| U.S. Secured Overnight Fin. Rate (SOFR) Index + 1.390% 5.7841% 3/15/24 (b)(c) | | 75,000 | 75,533 |
| 1.757% 1/24/25 (b) | | 100,000 | 96,254 |
| 3% 3/15/24 | | 100,000 | 97,364 |
| 3.625% 2/20/24 | | 75,000 | 73,654 |
| Morgan Stanley: | | | |
| U.S. Secured Overnight Fin. Rate (SOFR) Index + 0.460% 5.0208% 11/10/23 (b)(c) | | 50,000 | 49,993 |
| U.S. Secured Overnight Fin. Rate (SOFR) Index + 0.620% 5.1251% 1/24/25 (b)(c) | | 50,000 | 49,890 |
| 0.791% 1/22/25 (b) | | 225,000 | 215,155 |
| 3.62% 4/17/25 (b) | | 50,000 | 48,843 |
| 3.737% 4/24/24 (b) | | 50,000 | 49,853 |
| State Street Corp.: | | | |
| 3.1% 5/15/23 | | 100,000 | 99,542 |
| 3.7% 11/20/23 | | 200,000 | 197,721 |
| 3.776% 12/3/24 (b) | | 100,000 | 98,718 |
| | | | 1,501,971 |
| Consumer Finance - 4.8% | | | |
| Ally Financial, Inc.: | | | |
| 1.45% 10/2/23 | | 50,000 | 48,734 |
| 3.875% 5/21/24 | | 50,000 | 48,957 |
| American Express Co.: | | | |
| U.S. Secured Overnight Fin. Rate (SOFR) Averages Index + 0.230% 4.7786% 11/3/23 (b)(c) | | 105,000 | 104,814 |
| U.S. Secured Overnight Fin. Rate (SOFR) Averages Index + 0.720% 5.2686% 5/3/24 (b)(c) | | 50,000 | 50,159 |
| Capital One Financial Corp.: | | | |
| U.S. Secured Overnight Fin. Rate (SOFR) Index + 1.350% 5.9054% 5/9/25 (b)(c) | | 45,000 | 44,988 |
| 1.343% 12/6/24 (b) | | 75,000 | 72,287 |
| 2.6% 5/11/23 | | 203,000 | 202,003 |
| 3.9% 1/29/24 | | 175,000 | 172,494 |
| Toyota Motor Credit Corp.: | | | |
| U.S. Secured Overnight Fin. Rate (SOFR) Averages Index + 0.330% 4.7747% 1/11/24 (b)(c) | | 50,000 | 49,978 |
| U.S. Secured Overnight Fin. Rate (SOFR) Averages Index + 0.650% 5.0717% 12/29/23 (b)(c) | | 57,000 | 57,209 |
| U.S. Secured Overnight Fin. Rate (SOFR) Index + 0.620% 5.033% 3/22/24 (b)(c) | | 50,000 | 50,108 |
| 0.5% 8/14/23 | | 75,000 | 73,463 |
| 2.9% 3/30/23 | | 125,000 | 124,776 |
| | | | 1,099,970 |
| Diversified Financial Services - 2.2% | | | |
| AIG Global Funding 0.8% 7/7/23 (d) | | 175,000 | 172,473 |
| Athene Global Funding: | | | |
| U.S. Secured Overnight Fin. Rate (SOFR) Averages Index + 0.700% 5.2511% 5/24/24 (b)(c)(d) | | 75,000 | 74,539 |
| 0.95% 1/8/24 (d) | | 100,000 | 96,105 |
| Equitable Holdings, Inc. 3.9% 4/20/23 | | 50,000 | 49,869 |
| Jackson Financial, Inc. 1.125% 11/22/23 | | 100,000 | 96,916 |
| | | | 489,902 |
| Insurance - 1.8% | | | |
| Equitable Financial Life Global Funding: | | | |
| U.S. Secured Overnight Fin. Rate (SOFR) Index + 0.390% 4.8301% 4/6/23 (b)(c)(d) | | 75,000 | 74,974 |
| 0.5% 11/17/23 (d) | | 50,000 | 48,229 |
| Lincoln National Corp. 4% 9/1/23 | | 100,000 | 99,218 |
| Marsh & McLennan Companies, Inc.: | | | |
| 3.875% 3/15/24 | | 75,000 | 73,740 |
| 4.05% 10/15/23 | | 75,000 | 74,358 |
| New York Life Global Funding 1.1% 5/5/23 (d) | | 50,000 | 49,606 |
| | | | 420,125 |
TOTAL FINANCIALS | | | 8,671,457 |
| HEALTH CARE - 5.2% | | | |
| Biotechnology - 0.6% | | | |
| AbbVie, Inc.: | | | |
| 2.85% 5/14/23 | | 25,000 | 24,891 |
| 3.85% 6/15/24 | | 50,000 | 49,060 |
| Amgen, Inc. 5.25% 3/2/25 (e) | | 75,000 | 74,833 |
| | | | 148,784 |
| Health Care Providers & Services - 2.6% | | | |
| Cigna Group: | | | |
| 0.613% 3/15/24 | | 125,000 | 119,022 |
| 3% 7/15/23 | | 50,000 | 49,525 |
| 3.75% 7/15/23 | | 50,000 | 49,655 |
| CVS Health Corp. 4% 12/5/23 | | 100,000 | 99,153 |
| Elevance Health, Inc. 0.45% 3/15/23 | | 25,000 | 24,958 |
| Humana, Inc. 0.65% 8/3/23 | | 100,000 | 98,035 |
| UnitedHealth Group, Inc.: | | | |
| 2.875% 3/15/23 | | 75,000 | 74,938 |
| 3.5% 6/15/23 | | 75,000 | 74,677 |
| | | | 589,963 |
| Life Sciences Tools & Services - 0.5% | | | |
| Thermo Fisher Scientific, Inc. U.S. Secured Overnight Fin. Rate (SOFR) Averages Index + 0.530% 4.9846% 10/18/24 (b)(c) | | 115,000 | 114,885 |
| Pharmaceuticals - 1.5% | | | |
| AstraZeneca PLC 3.5% 8/17/23 | | 100,000 | 99,127 |
| Bristol-Myers Squibb Co. 0.537% 11/13/23 | | 75,000 | 72,559 |
| Shire Acquisitions Investments Ireland DAC 2.875% 9/23/23 | | 175,000 | 172,408 |
| | | | 344,094 |
TOTAL HEALTH CARE | | | 1,197,726 |
| INDUSTRIALS - 1.4% | | | |
| Machinery - 1.1% | | | |
| Caterpillar Financial Services Corp.: | | | |
| U.S. Secured Overnight Fin. Rate (SOFR) Index + 0.270% 4.6365% 9/13/24 (b)(c) | | 200,000 | 199,522 |
| 3.75% 11/24/23 | | 50,000 | 49,541 |
| | | | 249,063 |
| Trading Companies & Distributors - 0.3% | | | |
| Air Lease Corp.: | | | |
| 0.7% 2/15/24 | | 30,000 | 28,588 |
| 3% 9/15/23 | | 50,000 | 49,352 |
| | | | 77,940 |
TOTAL INDUSTRIALS | | | 327,003 |
| INFORMATION TECHNOLOGY - 3.2% | | | |
| Electronic Equipment & Components - 0.1% | | | |
| Dell International LLC/EMC Corp. 5.45% 6/15/23 | | 25,000 | 24,982 |
| IT Services - 0.2% | | | |
| The Western Union Co. 4.25% 6/9/23 | | 50,000 | 49,808 |
| Semiconductors & Semiconductor Equipment - 0.2% | | | |
| Analog Devices, Inc. U.S. Secured Overnight Fin. Rate (SOFR) Index + 0.250% 4.6746% 10/1/24 (b)(c) | | 50,000 | 49,496 |
| Software - 2.7% | | | |
| Microsoft Corp.: | | | |
| 2.375% 5/1/23 | | 50,000 | 49,776 |
| 3.625% 12/15/23 | | 100,000 | 98,892 |
| Oracle Corp. 3.625% 7/15/23 | | 150,000 | 149,179 |
| Roper Technologies, Inc.: | | | |
| 2.35% 9/15/24 | | 75,000 | 71,596 |
| 3.65% 9/15/23 | | 200,000 | 197,880 |
| VMware, Inc. 0.6% 8/15/23 | | 50,000 | 48,913 |
| | | | 616,236 |
TOTAL INFORMATION TECHNOLOGY | | | 740,522 |
| MATERIALS - 0.9% | | | |
| Chemicals - 0.9% | | | |
| The Mosaic Co. 4.25% 11/15/23 | | 205,000 | 203,443 |
| REAL ESTATE - 0.9% | | | |
| Equity Real Estate Investment Trusts (REITs) - 0.9% | | | |
| Federal Realty Investment Trust 3.95% 1/15/24 | | 100,000 | 98,525 |
| Simon Property Group LP U.S. Secured Overnight Fin. Rate (SOFR) Averages Index + 0.430% 4.8747% 1/11/24 (b)(c) | | 105,000 | 104,746 |
| | | | 203,271 |
| UTILITIES - 6.6% | | | |
| Electric Utilities - 5.4% | | | |
| Alabama Power Co. 3.55% 12/1/23 | | 125,000 | 123,113 |
| Duke Energy Carolinas LLC 3.05% 3/15/23 | | 75,000 | 74,938 |
| Duke Energy Corp.: | | | |
| U.S. Secured Overnight Fin. Rate (SOFR) Index + 0.250% 4.6101% 6/10/23 (b)(c) | | 155,000 | 154,869 |
| 3.75% 4/15/24 | | 100,000 | 98,135 |
| Edison International 2.95% 3/15/23 | | 25,000 | 24,973 |
| Eversource Energy U.S. Secured Overnight Fin. Rate (SOFR) Averages Index + 0.250% 4.8037% 8/15/23 (b)(c) | | 80,000 | 79,841 |
| Mississippi Power Co. U.S. Secured Overnight Fin. Rate (SOFR) Index + 0.300% 4.7164% 6/28/24 (b)(c) | | 105,000 | 103,575 |
| NextEra Energy Capital Holdings, Inc.: | | | |
| U.S. Secured Overnight Fin. Rate (SOFR) Averages Index + 0.400% 4.9486% 11/3/23 (b)(c) | | 50,000 | 49,979 |
| U.S. Secured Overnight Fin. Rate (SOFR) Averages Index + 0.540% 4.8363% 3/1/23 (b)(c) | | 100,000 | 100,000 |
| Southern California Edison Co. U.S. Secured Overnight Fin. Rate (SOFR) Averages Index + 0.830% 5.2546% 4/1/24 (b)(c) | | 75,000 | 74,903 |
| Southern Co.: | | | |
| U.S. Secured Overnight Fin. Rate (SOFR) Averages Index + 0.370% 4.9251% 5/10/23 (b)(c) | | 45,000 | 44,982 |
| 0.6% 2/26/24 | | 50,000 | 47,612 |
| 2.95% 7/1/23 | | 75,000 | 74,374 |
| Tampa Electric Co. 3.875% 7/12/24 | | 85,000 | 83,031 |
| Virginia Electric & Power Co.: | | | |
| 2.75% 3/15/23 | | 50,000 | 49,953 |
| 3.45% 2/15/24 | | 50,000 | 49,028 |
| | | | 1,233,306 |
| Gas Utilities - 0.2% | | | |
| Southern California Gas Co. 3 month U.S. LIBOR + 0.350% 5.1027% 9/14/23 (b)(c) | | 50,000 | 49,929 |
| Multi-Utilities - 1.0% | | | |
| CenterPoint Energy, Inc. U.S. Secured Overnight Fin. Rate (SOFR) Averages Index + 0.650% 5.2048% 5/13/24 (b)(c) | | 75,000 | 74,640 |
| Dominion Energy, Inc. 3 month U.S. LIBOR + 0.530% 5.299% 9/15/23 (b)(c) | | 150,000 | 149,991 |
| | | | 224,631 |
TOTAL UTILITIES | | | 1,507,866 |
| TOTAL NONCONVERTIBLE BONDS (Cost $15,046,914) | | | 15,031,075 |
| | | | |
| U.S. Treasury Obligations - 30.8% |
| | | Principal Amount (a) | Value ($) |
| U.S. Treasury Bills, yield at date of purchase 3.72% to 5.03% 6/15/23 to 1/25/24 | | 6,800,000 | 6,603,285 |
| U.S. Treasury Notes 3% 6/30/24 | | 500,000 | 486,484 |
| TOTAL U.S. TREASURY OBLIGATIONS (Cost $7,103,260) | | | 7,089,769 |
| | | | |
| Asset-Backed Securities - 3.5% |
| | | Principal Amount (a) | Value ($) |
| BMW Vechicle Lease Trust 2023-1 Series 2023-1 Class A2, 5.27% 2/25/25 | | 38,000 | 37,985 |
| BMW Vehicle Owner Trust Series 2022-A Class A2B, U.S. 30-Day Avg. Secured Overnight Fin. Rate (SOFR) Index + 0.950% 5.0041% 12/26/24 (b)(c) | | 16,166 | 16,174 |
| BMWLT 2021 Series 2021-2 Class A3, 0.33% 12/26/24 | | 23,964 | 23,489 |
| Capital One Prime Auto Receivables Series 2023-1 Class A2, 5.2% 5/15/26 | | 50,000 | 49,953 |
| CarMax Auto Owner Trust: | | | |
| Series 2021-1 Class A3, 0.34% 12/15/25 | | 6,583 | 6,359 |
| Series 2022-2 Class A2B, U.S. 30-Day Avg. Secured Overnight Fin. Rate (SOFR) Index + 0.600% 5.0012% 5/15/25 (b)(c) | | 4,946 | 4,947 |
| Series 2022-3 Class A2A, 3.81% 9/15/25 | | 16,187 | 16,055 |
| Carmax Owner Trust Series 2023-1 Class A2A, 5.23% 1/15/26 | | 34,000 | 33,901 |
| DLLAD Series 2023-1A Class A2, 5.19% 4/20/26 (d) | | 48,000 | 47,712 |
| Ford Credit Auto Lease Trust Series 2022-A Class A2B, U.S. 30-Day Avg. Secured Overnight Fin. Rate (SOFR) Index + 0.600% 5.0012% 10/15/24 (b)(c) | | 5,492 | 5,495 |
| Ford Credit Auto Owner Trust: | | | |
| Series 2019-1 Class A, 3.52% 7/15/30 (d) | | 100,000 | 98,393 |
| Series 2022-C Class A2A, 4.52% 4/15/25 | | 24,000 | 23,897 |
| Fordl 2023-A Series 2023-A Class A2A, 5.19% 6/15/25 | | 26,000 | 25,961 |
| FORDO Series 2022-B Class A2B, U.S. 30-Day Avg. Secured Overnight Fin. Rate (SOFR) Index + 1.840% 5.0012% 2/15/25 (b)(c) | | 11,841 | 11,849 |
| GM Financial Automobile Leasing Trust: | | | |
| Series 2021-3 Class A3, 0.39% 10/21/24 | | 24,741 | 24,177 |
| Series 2022-2 Class A2, 2.93% 10/21/24 | | 7,225 | 7,136 |
| Series 2023-A Class A2A, 5.27% 6/20/25 | | 56,000 | 55,989 |
| Gm Financial Consumer Automobile Re Series 2023-1 Class A2A, 5.19% 3/16/26 | | 25,000 | 24,968 |
| GM Financial Consumer Automobile Receivables Trust: | | | |
| Series 2022-3 Class A2A, 3.5% 9/16/25 | | 23,244 | 23,011 |
| Series 2022-4 Class A2A, 4.6% 11/17/25 | | 25,000 | 24,858 |
| Hyundai Auto Receivables Trust: | | | |
| Series 2022-B Class A2A, 3.64% 5/15/25 | | 19,260 | 19,081 |
| Series 2022-C, Class A2A, 5.35% 11/17/25 | | 63,000 | 62,990 |
| Mercedes-Benz Auto Receivables Series 2023-1 Class A2, 5.09% 1/15/26 | | 32,000 | 31,924 |
| Toyota Auto Receivables Series 2022-D Class A2A, 5.27% 1/15/26 | | 69,000 | 68,964 |
| Toyota Auto Receivables Owner Trust Series 2023-A Class A2, 5.05% 1/15/26 | | 52,000 | 51,882 |
| World Omni Auto Receivables Trust Series 2022-B, Class A2B, U.S. 30-Day Avg. Secured Overnight Fin. Rate (SOFR) Index + 1.050% 4.9712% 10/15/25 (b)(c) | | 11,032 | 11,036 |
| TOTAL ASSET-BACKED SECURITIES (Cost $810,028) | | | 808,186 |
| | | | |
| Bank Notes - 0.3% |
| | | Principal Amount (a) | Value ($) |
Truist Bank 3.689% 8/2/24 (b) (Cost $74,419) | | 75,000 | 74,411 |
| | | | |
| Money Market Funds - 0.7% |
| | | Shares | Value ($) |
Fidelity Cash Central Fund 4.63% (f) (Cost $152,175) | | 152,145 | 152,175 |
| | | | |
| TOTAL INVESTMENT IN SECURITIES - 100.6% (Cost $23,186,796) | 23,155,616 |
NET OTHER ASSETS (LIABILITIES) - (0.6)% | (140,631) |
| NET ASSETS - 100.0% | 23,014,985 |
| | |
Legend
| (a) | Amount is stated in United States dollars unless otherwise noted. |
| (b) | Coupon rates for floating and adjustable rate securities reflect the rates in effect at period end. |
| (c) | Coupon is indexed to a floating interest rate which may be multiplied by a specified factor and/or subject to caps or floors. |
| (d) | Security exempt from registration under Rule 144A of the Securities Act of 1933. These securities may be resold in transactions exempt from registration, normally to qualified institutional buyers. At the end of the period, the value of these securities amounted to $785,572 or 3.4% of net assets. |
| (e) | Security or a portion of the security purchased on a delayed delivery or when-issued basis. |
| (f) | Affiliated fund that is generally available only to investment companies and other accounts managed by Fidelity Investments. The rate quoted is the annualized seven-day yield of the fund at period end. A complete unaudited listing of the fund's holdings as of its most recent quarter end is available upon request. In addition, each Fidelity Central Fund's financial statements are available on the SEC's website or upon request. |
Affiliated Central Funds
Fiscal year to date information regarding the Fund's investments in Fidelity Central Funds, including the ownership percentage, is presented below.
| Affiliate | Value, beginning of period ($) | Purchases ($) | Sales Proceeds ($) | Dividend Income ($) | Realized Gain (loss) ($) | Change in Unrealized appreciation (depreciation) ($) | Value, end of period ($) | % ownership, end of period |
| Fidelity Cash Central Fund 4.63% | 826,951 | 14,619,288 | 15,294,064 | 12,215 | - | - | 152,175 | 0.0% |
| Total | 826,951 | 14,619,288 | 15,294,064 | 12,215 | - | - | 152,175 | |
| | | | | | | | | |
Amounts in the dividend income column in the above table include any capital gain distributions from underlying funds, which are presented in the corresponding line item in the Statement of Operations, if applicable.
Amounts included in the purchases and sales proceeds columns may include in-kind transactions, if applicable.
Investment Valuation
The following is a summary of the inputs used, as of February 28, 2023, involving the Fund's assets and liabilities carried at fair value. The inputs or methodology used for valuing securities may not be an indication of the risk associated with investing in those securities. For more information on valuation inputs, and their aggregation into the levels used below, please refer to the Investment Valuation section in the accompanying Notes to Financial Statements.
| Valuation Inputs at Reporting Date: |
| Description | Total ($) | Level 1 ($) | Level 2 ($) | Level 3 ($) |
Investments in Securities: | | | | |
|
| Corporate Bonds | 15,031,075 | - | 15,031,075 | - |
|
| U.S. Government and Government Agency Obligations | 7,089,769 | - | 7,089,769 | - |
|
| Asset-Backed Securities | 808,186 | - | 808,186 | - |
|
| Bank Notes | 74,411 | - | 74,411 | - |
|
| Money Market Funds | 152,175 | 152,175 | - | - |
| Total Investments in Securities: | 23,155,616 | 152,175 | 23,003,441 | - |
| Statement of Assets and Liabilities |
| | | | February 28, 2023 (Unaudited) |
| | | | | |
| Assets | | | | |
| Investment in securities, at value - See accompanying schedule: | | | | |
Unaffiliated issuers (cost $23,034,621) | $ | 23,003,441 | | |
Fidelity Central Funds (cost $152,175) | | 152,175 | | |
| | | | | |
| | | | | |
| Total Investment in Securities (cost $23,186,796) | | | $ | 23,155,616 |
| Cash | | | | 103,333 |
| Receivable for fund shares sold | | | | 40,182 |
| Interest receivable | | | | 111,512 |
| Distributions receivable from Fidelity Central Funds | | | | 2,289 |
| Receivable from investment adviser for expense reductions | | | | 1,231 |
Total assets | | | | 23,414,163 |
| Liabilities | | | | |
| Payable for investments purchased | | | | |
Regular delivery | $ | 292,013 | | |
Delayed delivery | | 74,951 | | |
| Payable for fund shares redeemed | | 18,791 | | |
| Distributions payable | | 5,148 | | |
| Accrued management fee | | 5,559 | | |
| Distribution and service plan fees payable | | 1,272 | | |
| Other affiliated payables | | 1,444 | | |
| Total Liabilities | | | | 399,178 |
| Net Assets | | | $ | 23,014,985 |
| Net Assets consist of: | | | | |
| Paid in capital | | | $ | 22,904,575 |
| Total accumulated earnings (loss) | | | | 110,410 |
| Net Assets | | | $ | 23,014,985 |
| | | | | |
| Net Asset Value and Maximum Offering Price | | | | |
| Class A : | | | | |
Net Asset Value and redemption price per share ($3,726,165 ÷ 372,015 shares) (a) | | | $ | 10.02 |
| Maximum offering price per share (100/98.50 of $10.02) | | | $ | 10.17 |
| Class M : | | | | |
Net Asset Value and redemption price per share ($671,247 ÷ 67,017 shares) (a) | | | $ | 10.02 |
| Maximum offering price per share (100/98.50 of $10.02) | | | $ | 10.17 |
| Class C : | | | | |
Net Asset Value and offering price per share ($897,601 ÷ 89,664 shares) (a) | | | $ | 10.01 |
| Fidelity Sustainable Low Duration Bond Fund : | | | | |
Net Asset Value , offering price and redemption price per share ($8,297,526 ÷ 828,392 shares) | | | $ | 10.02 |
| Class I : | | | | |
Net Asset Value , offering price and redemption price per share ($561,562 ÷ 56,065 shares) | | | $ | 10.02 |
| Class Z : | | | | |
Net Asset Value , offering price and redemption price per share ($8,860,884 ÷ 884,609 shares) | | | $ | 10.02 |
(a)Redemption price per share is equal to net asset value less any applicable contingent deferred sales charge. |
| Statement of Operations |
| | | | Six months ended February 28, 2023 (Unaudited) |
| Investment Income | | | | |
| Interest | | | $ | 357,194 |
| Income from Fidelity Central Funds | | | | 12,215 |
| Total Income | | | | 369,409 |
| Expenses | | | | |
| Management fee | $ | 28,098 | | |
| Transfer agent fees | | 7,278 | | |
| Distribution and service plan fees | | 6,583 | | |
| Independent trustees' fees and expenses | | 28 | | |
| Total expenses before reductions | | 41,987 | | |
| Expense reductions | | (4,315) | | |
| Total expenses after reductions | | | | 37,672 |
| Net Investment income (loss) | | | | 331,737 |
| Realized and Unrealized Gain (Loss) | | | | |
| Net realized gain (loss) on: | | | | |
| Investment Securities: | | | | |
| Unaffiliated issuers | | (9,668) | | |
| Total net realized gain (loss) | | | | (9,668) |
| Change in net unrealized appreciation (depreciation) on investment securities | | | | (1,290) |
| Net gain (loss) | | | | (10,958) |
| Net increase (decrease) in net assets resulting from operations | | | $ | 320,779 |
| Statement of Changes in Net Assets |
| |
| | Six months ended February 28, 2023 (Unaudited) | | For the period April 13, 2022 (commencement of operations) through August 31, 2022 |
| Increase (Decrease) in Net Assets | | | | |
| Operations | | | | |
| Net investment income (loss) | $ | 331,737 | $ | 36,746 |
| Net realized gain (loss) | | (9,668) | | (775) |
| Change in net unrealized appreciation (depreciation) | | (1,290) | | (29,890) |
| Net increase (decrease) in net assets resulting from operations | | 320,779 | | 6,081 |
| Distributions to shareholders | | (190,475) | | (25,975) |
| Share transactions - net increase (decrease) | | 13,892,720 | | 9,011,855 |
| Total increase (decrease) in net assets | | 14,023,024 | | 8,991,961 |
| | | | | |
| Net Assets | | | | |
| Beginning of period | | 8,991,961 | | - |
| End of period | $ | 23,014,985 | $ | 8,991,961 |
| | | | | |
| | | | | |
Financial Highlights
| Fidelity Advisor® Sustainable Low Duration Bond Fund Class A |
| |
| | Six months ended (Unaudited) February 28, 2023 | | Years ended August 31, 2022 A |
Selected Per-Share Data | | | | |
| Net asset value, beginning of period | $ | 9.96 | $ | 10.00 |
| Income from Investment Operations | | | | |
Net investment income (loss) B,C | | .171 | | .053 |
| Net realized and unrealized gain (loss) | | (.018) | | (.058) |
| Total from investment operations | | .153 | | (.005) |
| Distributions from net investment income | | (.093) | | (.035) |
| Total distributions | | (.093) | | (.035) |
| Net asset value, end of period | $ | 10.02 | $ | 9.96 |
Total Return D,E,F | | 1.54% | | (.05)% |
Ratios to Average Net Assets C,G,H | | | | |
| Expenses before reductions | | .57% I | | .51% I |
| Expenses net of fee waivers, if any | | .55% I | | .51% I |
| Expenses net of all reductions | | .55% I | | .51% I |
| Net investment income (loss) | | 3.48% I | | 1.40% I |
| Supplemental Data | | | | |
| Net assets, end of period (000 omitted) | $ | 3,726 | $ | 1,730 |
Portfolio turnover rate J | | 12% I | | 5% K |
A For the period April 13, 2022 (commencement of operations) through August 31, 2022
B Calculated based on average shares outstanding during the period.
C Net investment income (loss) is affected by the timing of the declaration of dividends by any underlying mutual funds or exchange-traded funds (ETFs). Net investment income (loss) of any mutual funds or ETFs is not included in the Fund's net investment income (loss) ratio.
D Total returns for periods of less than one year are not annualized.
E Total returns would have been lower if certain expenses had not been reduced during the applicable periods shown.
F Total returns do not include the effect of the sales charges.
G Fees and expenses of any underlying mutual funds or exchange-traded funds (ETFs) are not included in the Fund's expense ratio. The Fund indirectly bears its proportionate share of these expenses. For additional expense information related to investments in Fidelity Central Funds, please refer to the "Investments in Fidelity Central Funds" note found in the Notes to Financial Statements section of the most recent Annual or Semi-Annual report.
H Expense ratios reflect operating expenses of the class. Expenses before reductions do not reflect amounts reimbursed, waived, or reduced through arrangements with the investment adviser, brokerage services, or other offset arrangements, if applicable, and do not represent the amount paid by the class during periods when reimbursements, waivers or reductions occur.
I Annualized.
J Amount does not include the portfolio activity of any underlying mutual funds or exchange-traded funds (ETFs).
K Amount not annualized.
| Fidelity Advisor® Sustainable Low Duration Bond Fund Class M |
| |
| | Six months ended (Unaudited) February 28, 2023 | | Years ended August 31, 2022 A |
Selected Per-Share Data | | | | |
| Net asset value, beginning of period | $ | 9.96 | $ | 10.00 |
| Income from Investment Operations | | | | |
Net investment income (loss) B,C | | .171 | | .054 |
| Net realized and unrealized gain (loss) | | (.018) | | (.059) |
| Total from investment operations | | .153 | | (.005) |
| Distributions from net investment income | | (.093) | | (.035) |
| Total distributions | | (.093) | | (.035) |
| Net asset value, end of period | $ | 10.02 | $ | 9.96 |
Total Return D,E,F | | 1.55% | | (.05)% |
Ratios to Average Net Assets C,G,H | | | | |
| Expenses before reductions | | .53% I | | .51% I |
| Expenses net of fee waivers, if any | | .53% I | | .51% I |
| Expenses net of all reductions | | .53% I | | .51% I |
| Net investment income (loss) | | 3.50% I | | 1.40% I |
| Supplemental Data | | | | |
| Net assets, end of period (000 omitted) | $ | 671 | $ | 515 |
Portfolio turnover rate J | | 12% I | | 5% K |
A For the period April 13, 2022 (commencement of operations) through August 31, 2022
B Calculated based on average shares outstanding during the period.
C Net investment income (loss) is affected by the timing of the declaration of dividends by any underlying mutual funds or exchange-traded funds (ETFs). Net investment income (loss) of any mutual funds or ETFs is not included in the Fund's net investment income (loss) ratio.
D Total returns for periods of less than one year are not annualized.
E Total returns would have been lower if certain expenses had not been reduced during the applicable periods shown.
F Total returns do not include the effect of the sales charges.
G Fees and expenses of any underlying mutual funds or exchange-traded funds (ETFs) are not included in the Fund's expense ratio. The Fund indirectly bears its proportionate share of these expenses. For additional expense information related to investments in Fidelity Central Funds, please refer to the "Investments in Fidelity Central Funds" note found in the Notes to Financial Statements section of the most recent Annual or Semi-Annual report.
H Expense ratios reflect operating expenses of the class. Expenses before reductions do not reflect amounts reimbursed, waived, or reduced through arrangements with the investment adviser, brokerage services, or other offset arrangements, if applicable, and do not represent the amount paid by the class during periods when reimbursements, waivers or reductions occur.
I Annualized.
J Amount does not include the portfolio activity of any underlying mutual funds or exchange-traded funds (ETFs).
K Amount not annualized.
| Fidelity Advisor® Sustainable Low Duration Bond Fund Class C |
| |
| | Six months ended (Unaudited) February 28, 2023 | | Years ended August 31, 2022 A |
Selected Per-Share Data | | | | |
| Net asset value, beginning of period | $ | 9.95 | $ | 10.00 |
| Income from Investment Operations | | | | |
Net investment income (loss) B,C | | .129 | | .021 |
| Net realized and unrealized gain (loss) | | (.018) | | (.064) |
| Total from investment operations | | .111 | | (.043) |
| Distributions from net investment income | | (.051) | | (.007) |
| Total distributions | | (.051) | | (.007) |
| Net asset value, end of period | $ | 10.01 | $ | 9.95 |
Total Return D,E,F | | 1.11% | | (.43)% |
Ratios to Average Net Assets C,G,H | | | | |
| Expenses before reductions | | 1.40% I | | 1.36% I |
| Expenses net of fee waivers, if any | | 1.40% I | | 1.36% I |
| Expenses net of all reductions | | 1.40% I | | 1.36% I |
| Net investment income (loss) | | 2.63% I | | .55% I |
| Supplemental Data | | | | |
| Net assets, end of period (000 omitted) | $ | 898 | $ | 759 |
Portfolio turnover rate J | | 12% I | | 5% K |
A For the period April 13, 2022 (commencement of operations) through August 31, 2022
B Calculated based on average shares outstanding during the period.
C Net investment income (loss) is affected by the timing of the declaration of dividends by any underlying mutual funds or exchange-traded funds (ETFs). Net investment income (loss) of any mutual funds or ETFs is not included in the Fund's net investment income (loss) ratio.
D Total returns for periods of less than one year are not annualized.
E Total returns would have been lower if certain expenses had not been reduced during the applicable periods shown.
F Total returns do not include the effect of the contingent deferred sales charge.
G Fees and expenses of any underlying mutual funds or exchange-traded funds (ETFs) are not included in the Fund's expense ratio. The Fund indirectly bears its proportionate share of these expenses. For additional expense information related to investments in Fidelity Central Funds, please refer to the "Investments in Fidelity Central Funds" note found in the Notes to Financial Statements section of the most recent Annual or Semi-Annual report.
H Expense ratios reflect operating expenses of the class. Expenses before reductions do not reflect amounts reimbursed, waived, or reduced through arrangements with the investment adviser, brokerage services, or other offset arrangements, if applicable, and do not represent the amount paid by the class during periods when reimbursements, waivers or reductions occur.
I Annualized.
J Amount does not include the portfolio activity of any underlying mutual funds or exchange-traded funds (ETFs).
K Amount not annualized.
| Fidelity Sustainable Low Duration Bond Fund |
| |
| | Six months ended (Unaudited) February 28, 2023 | | Years ended August 31, 2022 A |
Selected Per-Share Data | | | | |
| Net asset value, beginning of period | $ | 9.96 | $ | 10.00 |
| Income from Investment Operations | | | | |
Net investment income (loss) B,C | | .179 | | .059 |
| Net realized and unrealized gain (loss) | | (.017) | | (.058) |
| Total from investment operations | | .162 | | .001 |
| Distributions from net investment income | | (.102) | | (.041) |
| Total distributions | | (.102) | | (.041) |
| Net asset value, end of period | $ | 10.02 | $ | 9.96 |
Total Return D,E | | 1.64% | | .01% |
Ratios to Average Net Assets C,F,G | | | | |
| Expenses before reductions | | .41% H | | .39% H |
| Expenses net of fee waivers, if any | | .35% H | | .35% H |
| Expenses net of all reductions | | .35% H | | .35% H |
| Net investment income (loss) | | 3.68% H | | 1.56% H |
| Supplemental Data | | | | |
| Net assets, end of period (000 omitted) | $ | 8,298 | $ | 4,499 |
Portfolio turnover rate I | | 12% H | | 5% J |
A For the period April 13, 2022 (commencement of operations) through August 31, 2022
B Calculated based on average shares outstanding during the period.
C Net investment income (loss) is affected by the timing of the declaration of dividends by any underlying mutual funds or exchange-traded funds (ETFs). Net investment income (loss) of any mutual funds or ETFs is not included in the Fund's net investment income (loss) ratio.
D Total returns for periods of less than one year are not annualized.
E Total returns would have been lower if certain expenses had not been reduced during the applicable periods shown.
F Fees and expenses of any underlying mutual funds or exchange-traded funds (ETFs) are not included in the Fund's expense ratio. The Fund indirectly bears its proportionate share of these expenses. For additional expense information related to investments in Fidelity Central Funds, please refer to the "Investments in Fidelity Central Funds" note found in the Notes to Financial Statements section of the most recent Annual or Semi-Annual report.
G Expense ratios reflect operating expenses of the class. Expenses before reductions do not reflect amounts reimbursed, waived, or reduced through arrangements with the investment adviser, brokerage services, or other offset arrangements, if applicable, and do not represent the amount paid by the class during periods when reimbursements, waivers or reductions occur.
H Annualized.
I Amount does not include the portfolio activity of any underlying mutual funds or exchange-traded funds (ETFs).
J Amount not annualized.
| Fidelity Advisor® Sustainable Low Duration Bond Fund Class I |
| |
| | Six months ended (Unaudited) February 28, 2023 | | Years ended August 31, 2022 A |
Selected Per-Share Data | | | | |
| Net asset value, beginning of period | $ | 9.96 | $ | 10.00 |
| Income from Investment Operations | | | | |
Net investment income (loss) B,C | | .180 | | .060 |
| Net realized and unrealized gain (loss) | | (.018) | | (.059) |
| Total from investment operations | | .162 | | .001 |
| Distributions from net investment income | | (.102) | | (.041) |
| Total distributions | | (.102) | | (.041) |
| Net asset value, end of period | $ | 10.02 | $ | 9.96 |
Total Return D,E | | 1.64% | | .01% |
Ratios to Average Net Assets C,F,G | | | | |
| Expenses before reductions | | .38% H | | .37% H |
| Expenses net of fee waivers, if any | | .35% H | | .35% H |
| Expenses net of all reductions | | .35% H | | .35% H |
| Net investment income (loss) | | 3.69% H | | 1.56% H |
| Supplemental Data | | | | |
| Net assets, end of period (000 omitted) | $ | 562 | $ | 526 |
Portfolio turnover rate I | | 12% H | | 5% J |
A For the period April 13, 2022 (commencement of operations) through August 31, 2022
B Calculated based on average shares outstanding during the period.
C Net investment income (loss) is affected by the timing of the declaration of dividends by any underlying mutual funds or exchange-traded funds (ETFs). Net investment income (loss) of any mutual funds or ETFs is not included in the Fund's net investment income (loss) ratio.
D Total returns for periods of less than one year are not annualized.
E Total returns would have been lower if certain expenses had not been reduced during the applicable periods shown.
F Fees and expenses of any underlying mutual funds or exchange-traded funds (ETFs) are not included in the Fund's expense ratio. The Fund indirectly bears its proportionate share of these expenses. For additional expense information related to investments in Fidelity Central Funds, please refer to the "Investments in Fidelity Central Funds" note found in the Notes to Financial Statements section of the most recent Annual or Semi-Annual report.
G Expense ratios reflect operating expenses of the class. Expenses before reductions do not reflect amounts reimbursed, waived, or reduced through arrangements with the investment adviser, brokerage services, or other offset arrangements, if applicable, and do not represent the amount paid by the class during periods when reimbursements, waivers or reductions occur.
H Annualized.
I Amount does not include the portfolio activity of any underlying mutual funds or exchange-traded funds (ETFs).
J Amount not annualized.
| Fidelity Advisor® Sustainable Low Duration Bond Fund Class Z |
| |
| | Six months ended (Unaudited) February 28, 2023 | | Years ended August 31, 2022 A |
Selected Per-Share Data | | | | |
| Net asset value, beginning of period | $ | 9.96 | $ | 10.00 |
| Income from Investment Operations | | | | |
Net investment income (loss) B,C | | .181 | | .061 |
| Net realized and unrealized gain (loss) | | (.017) | | (.058) |
| Total from investment operations | | .164 | | .003 |
| Distributions from net investment income | | (.104) | | (.043) |
| Total distributions | | (.104) | | (.043) |
| Net asset value, end of period | $ | 10.02 | $ | 9.96 |
Total Return D,E | | 1.66% | | .03% |
Ratios to Average Net Assets C,F,G | | | | |
| Expenses before reductions | | .36% H | | .35% H |
| Expenses net of fee waivers, if any | | .30% H | | .30% H |
| Expenses net of all reductions | | .30% H | | .30% H |
| Net investment income (loss) | | 3.73% H | | 1.61% H |
| Supplemental Data | | | | |
| Net assets, end of period (000 omitted) | $ | 8,861 | $ | 962 |
Portfolio turnover rate I | | 12% H | | 5% J |
A For the period April 13, 2022 (commencement of operations) through August 31, 2022
B Calculated based on average shares outstanding during the period.
C Net investment income (loss) is affected by the timing of the declaration of dividends by any underlying mutual funds or exchange-traded funds (ETFs). Net investment income (loss) of any mutual funds or ETFs is not included in the Fund's net investment income (loss) ratio.
D Total returns for periods of less than one year are not annualized.
E Total returns would have been lower if certain expenses had not been reduced during the applicable periods shown.
F Fees and expenses of any underlying mutual funds or exchange-traded funds (ETFs) are not included in the Fund's expense ratio. The Fund indirectly bears its proportionate share of these expenses. For additional expense information related to investments in Fidelity Central Funds, please refer to the "Investments in Fidelity Central Funds" note found in the Notes to Financial Statements section of the most recent Annual or Semi-Annual report.
G Expense ratios reflect operating expenses of the class. Expenses before reductions do not reflect amounts reimbursed, waived, or reduced through arrangements with the investment adviser, brokerage services, or other offset arrangements, if applicable, and do not represent the amount paid by the class during periods when reimbursements, waivers or reductions occur.
H Annualized.
I Amount does not include the portfolio activity of any underlying mutual funds or exchange-traded funds (ETFs).
J Amount not annualized.
For the period ended February 28, 2023
1. Organization.
Fidelity Sustainable Low Duration Bond Fund (the Fund) is a fund of Fidelity Salem Street Trust (the Trust) and is authorized to issue an unlimited number of shares. The Trust is registered under the Investment Company Act of 1940, as amended (the 1940 Act), as an open-end management investment company organized as a Massachusetts business trust. The Fund offers Class A, Class M, Class C, Sustainable Low Duration Bond, Class I and Class Z shares, each of which has equal rights as to assets and voting privileges. Each class has exclusive voting rights with respect to matters that affect that class. Class C shares will automatically convert to Class A shares after a holding period of eight years from the initial date of purchase, with certain exceptions.
2. Investments in Fidelity Central Funds.
Funds may invest in Fidelity Central Funds, which are open-end investment companies generally available only to other investment companies and accounts managed by the investment adviser and its affiliates. The Schedule of Investments lists any Fidelity Central Funds held as an investment as of period end, but does not include the underlying holdings of each Fidelity Central Fund. An investing fund indirectly bears its proportionate share of the expenses of the underlying Fidelity Central Funds.
Based on its investment objective, each Fidelity Central Fund may invest or participate in various investment vehicles or strategies that are similar to those of the investing fund. These strategies are consistent with the investment objectives of the investing fund and may involve certain economic risks which may cause a decline in value of each of the Fidelity Central Funds and thus a decline in the value of the investing fund.
| Fidelity Central Fund | Investment Manager | Investment Objective | Investment Practices | Expense Ratio A |
| Fidelity Money Market Central Funds | Fidelity Management & Research Company LLC (FMR) | Each fund seeks to obtain a high level of current income consistent with the preservation of capital and liquidity. | Short-term Investments | Less than .005% |
A Expenses expressed as a percentage of average net assets and are as of each underlying Central Fund's most recent annual or semi-annual shareholder report.
A complete unaudited list of holdings for each Fidelity Central Fund is available upon request or at the Securities and Exchange Commission website at www.sec.gov. In addition, the financial statements of the Fidelity Central Funds which contain the significant accounting policies (including investment valuation policies) of those funds, and are not covered by the Report of Independent Registered Public Accounting Firm, are available on the Securities and Exchange Commission website or upon request.
3. Significant Accounting Policies.
The Fund is an investment company and applies the accounting and reporting guidance of the Financial Accounting Standards Board (FASB) Accounting Standards Codification Topic 946 Financial Services - Investment Companies . The financial statements have been prepared in conformity with accounting principles generally accepted in the United States of America (GAAP), which require management to make certain estimates and assumptions at the date of the financial statements. Actual results could differ from those estimates. Subsequent events, if any, through the date that the financial statements were issued have been evaluated in the preparation of the financial statements. The Fund's Schedule of Investments lists any underlying mutual funds or exchange-traded funds (ETFs) but does not include the underlying holdings of these funds. The following summarizes the significant accounting policies of the Fund:
Investment Valuation. Investments are valued as of 4:00 p.m. Eastern time on the last calendar day of the period. The Board of Trustees (the Board) has designated the Fund's investment adviser as the valuation designee responsible for the fair valuation function and performing fair value determinations as needed. The investment adviser has established a Fair Value Committee (the Committee) to carry out the day-to-day fair valuation responsibilities and has adopted policies and procedures to govern the fair valuation process and the activities of the Committee. In accordance with these fair valuation policies and procedures, which have been approved by the Board, the Fund attempts to obtain prices from one or more third party pricing services or brokers to value its investments. When current market prices, quotations or currency exchange rates are not readily available or reliable, investments will be fair valued in good faith by the Committee, in accordance with the policies and procedures. Factors used in determining fair value vary by investment type and may include market or investment specific events, transaction data, estimated cash flows, and market observations of comparable investments. The frequency that the fair valuation procedures are used cannot be predicted and they may be utilized to a significant extent. The Committee manages the Fund's fair valuation practices and maintains the fair valuation policies and procedures. The Fund's investment adviser reports to the Board information regarding the fair valuation process and related material matters.
The Fund categorizes the inputs to valuation techniques used to value its investments into a disclosure hierarchy consisting of three levels as shown below:
Level 1 - unadjusted quoted prices in active markets for identical investments
Level 2 - other significant observable inputs (including quoted prices for similar investments, interest rates, prepayment speeds, etc.)
Level 3 - unobservable inputs (including the Fund's own assumptions based on the best information available)
Valuation techniques used to value the Fund's investments by major category are as follows:
Debt securities, including restricted securities, are valued based on evaluated prices received from third party pricing services or from brokers who make markets in such securities. Corporate bonds, bank notes and U.S. government and government agency obligations are valued by pricing services who utilize matrix pricing which considers yield or price of bonds of comparable quality, coupon, maturity and type or by broker-supplied prices. Asset backed securities are valued by pricing services who utilize matrix pricing which considers prepayment speed assumptions, attributes of the collateral, yield or price of bonds of comparable quality, coupon, maturity and type or by broker-supplied prices. When independent prices are unavailable or unreliable, debt securities may be valued utilizing pricing methodologies which consider similar factors that would be used by third party pricing services. Debt securities are generally categorized as Level 2 in the hierarchy but may be Level 3 depending on the circumstances.
Investments in open-end mutual funds, including the Fidelity Central Funds, are valued at their closing net asset value (NAV) each business day and are categorized as Level 1 in the hierarchy.
Changes in valuation techniques may result in transfers in or out of an assigned level within the disclosure hierarchy. The aggregate value of investments by input level as of February 28, 2023 is included at the end of the Fund's Schedule of Investments.
Investment Transactions and Income. For financial reporting purposes, the Fund's investment holdings and NAV include trades executed through the end of the last business day of the period. The NAV per share for processing shareholder transactions is calculated as of the close of business of the New York Stock Exchange (NYSE), normally 4:00 p.m. Eastern time and includes trades executed through the end of the prior business day. Gains and losses on securities sold are determined on the basis of identified cost. Income and capital gain distributions from Fidelity Central Funds, if any, are recorded on the ex-dividend date. Interest income is accrued as earned and includes coupon interest and amortization of premium and accretion of discount on debt securities as applicable.
Class Allocations and Expenses. Investment income, realized and unrealized capital gains and losses, common expenses of a fund, and certain fund-level expense reductions, if any, are allocated daily on a pro-rata basis to each class based on the relative net assets of each class to the total net assets of a fund. Each class differs with respect to transfer agent and distribution and service plan fees incurred, as applicable. Certain expense reductions may also differ by class, if applicable. For the reporting period, the allocated portion of income and expenses to each class as a percent of its average net assets may vary due to the timing of recording these transactions in relation to fluctuating net assets of the classes. Expenses directly attributable to a fund are charged to that fund. Expenses attributable to more than one fund are allocated among the respective funds on the basis of relative net assets or other appropriate methods. Expenses included in the accompanying financial statements reflect the expenses of that fund and do not include any expenses associated with any underlying mutual funds or exchange-traded funds. Although not included in a fund's expenses, a fund indirectly bears its proportionate share of these expenses through the net asset value of each underlying mutual fund or exchange-traded fund. Expense estimates are accrued in the period to which they relate and adjustments are made when actual amounts are known.
Income Tax Information and Distributions to Shareholders. Each year, the Fund intends to qualify as a regulated investment company under Subchapter M of the Internal Revenue Code, including distributing substantially all of its taxable income and realized gains. As a result, no provision for U.S. Federal income taxes is required. The Fund files a U.S. federal tax return, in addition to state and local tax returns as required. The Fund's federal income tax returns are subject to examination by the Internal Revenue Service (IRS) for a period of three fiscal years after they are filed. State and local tax returns may be subject to examination for an additional fiscal year depending on the jurisdiction.
Distributions are declared and recorded daily and paid monthly from net investment income. Distributions from realized gains, if any, are declared and recorded on the ex-dividend date. Income and capital gain distributions are declared separately for each class. Income and capital gain distributions are determined in accordance with income tax regulations, which may differ from GAAP.
Capital accounts within the financial statements are adjusted for permanent book-tax differences. These adjustments have no impact on net assets or the results of operations. Capital accounts are not adjusted for temporary book-tax differences which will reverse in a subsequent period.
Book-tax differences are primarily due to market discount and losses deferred due to wash sales.
As of period end, the cost and unrealized appreciation (depreciation) in securities, and derivatives if applicable, for federal income tax purposes were as follows:
| Gross unrealized appreciation | $99,332 |
| Gross unrealized depreciation | (17,727) |
| Net unrealized appreciation (depreciation) | $81,605 |
| Tax cost | $23,074,011 |
Delayed Delivery Transactions and When-Issued Securities. During the period, certain Funds transacted in securities on a delayed delivery or when-issued basis. Payment and delivery may take place after the customary settlement period for that security. The price of the underlying securities and the date when the securities will be delivered and paid for are fixed at the time the transaction is negotiated. Securities purchased on a delayed delivery or when-issued basis are identified as such in the Schedule of Investments. Compensation for interest forgone in the purchase of a delayed delivery or when-issued debt security may be received. With respect to purchase commitments, each applicable Fund identifies securities as segregated in its records with a value at least equal to the amount of the commitment. Payables and receivables associated with the purchases and sales of delayed delivery securities having the same coupon, settlement date and broker are offset. Delayed delivery or when-issued securities that have been purchased from and sold to different brokers are reflected as both payables and receivables in the Statement of Assets and Liabilities under the caption "Delayed delivery", as applicable. Losses may arise due to changes in the value of the underlying securities or if the counterparty does not perform under the contract's terms, or if the issuer does not issue the securities due to political, economic, or other factors.
Restricted Securities (including Private Placements). Funds may invest in securities that are subject to legal or contractual restrictions on resale. These securities generally may be resold in transactions exempt from registration or to the public if the securities are registered. Disposal of these securities may involve time-consuming negotiations and expense, and prompt sale at an acceptable price may be difficult. Information regarding restricted securities held at period end is included at the end of the Schedule of Investments, if applicable.
4. Purchases and Sales of Investments.
Purchases and sales of securities, other than short-term securities, U.S. government securities and in-kind transactions, as applicable, are noted in the table below.
| | Purchases ($) | Sales ($) |
| Fidelity Sustainable Low Duration Bond Fund | 7,080,293 | 438,697 |
5. Fees and Other Transactions with Affiliates.
Management Fee. Fidelity Management & Research Company LLC (the investment adviser) and its affiliates provide the Fund with investment management related services for which the Fund pays a monthly management fee that is based on an annual rate of .30% of the Fund's average net assets. Under the management contract, the investment adviser pays all other expenses, except the compensation of the independent Trustees and certain other expenses such as proxy and shareholder meeting expenses.
During March 2023, the Board approved changes to the management fee effective April 1, 2023. The Fund will pay a monthly management fee that is based on an annual rate of .20% of the Fund's average net assets. Under the management contract, the investment adviser will pay all other fund-level expenses, except the compensation of the independent Trustees and certain other expenses such as proxy and shareholder meeting expenses.
Distribution and Service Plan Fees. In accordance with Rule 12b-1 of the 1940 Act, the Fund has adopted separate Distribution and Service Plans for each class of shares. Certain classes pay Fidelity Distributors Company LLC (FDC), an affiliate of the investment adviser, separate Distribution and Service Fees, each of which is based on an annual percentage of each class' average net assets. In addition, FDC may pay financial intermediaries for selling shares of the Fund and providing shareholder support services. For the period, the Distribution and Service Fee rates, total fees and amounts retained by FDC were as follows:
| | Distribution Fee | Service Fee | Total Fees | Retained by FDC |
| Class A | - % | .15% | $1,986 | $644 |
| Class M | - % | .15% | 476 | 378 |
| Class C | .75% | .25% | 4,121 | 3,210 |
| | | | $6,583 | $4,232 |
Sales Load. FDC may receive a front-end sales charge of up to 1.50% for selling Class A and Class M shares, some of which is paid to financial intermediaries for selling shares of the Fund. Depending on the holding period, FDC may receive a contingent deferred sales charges levied on Class A, Class M and Class C redemptions. The deferred sales charges are 1.00% for Class C shares, .75% or .50% for certain purchases of Class A shares and .25% for certain purchases of Class M shares.
For the period, sales charge amounts retained by FDC were as follows:
| | Retained by FDC |
| Class A | $159 |
Transfer Agent Fees. Fidelity Investments Institutional Operations Company LLC (FIIOC), an affiliate of the investment adviser, is the transfer, dividend disbursing and shareholder servicing agent for each class of the Fund. FIIOC receives account fees and asset-based fees that vary according to the account size and type of account of the shareholders of the respective classes of the Fund, except for Class Z. FIIOC receives an asset-based fee of Class Z's average net assets. FIIOC pays for typesetting, printing and mailing of shareholder reports, except proxy statements.
For the period, transfer agent fees for each class were as follows:
| | Amount | % of Class-Level Average Net Assets A |
| Class A | $1,408 | .11 |
| Class M | 231 | .07 |
| Class C | 326 | .08 |
| Fidelity Sustainable Low Duration Bond Fund | 3,174 | .10 |
| Class I | 191 | .07 |
| Class Z | 1,948 | .05 |
| | $7,278 | |
A Annualized
Interfund Trades. Funds may purchase from or sell securities to other Fidelity Funds under procedures adopted by the Board. The procedures have been designed to ensure these interfund trades are executed in accordance with Rule 17a-7 of the 1940 Act. Any interfund trades are included within the respective purchases and sales amounts shown in the Purchases and Sales of Investments note. During the period, there were no interfund trades.
6. Expense Reductions.
The investment adviser contractually agreed to reimburse expenses of each class to the extent annual operating expenses exceeded certain levels of class-level average net assets as noted in the table below. Some expenses, for example the compensation of the independent Trustees, and certain miscellaneous expenses such as proxy and shareholder meeting expenses, are excluded from this reimbursement.
The following classes were in reimbursement during the period:
| | Expense Limitations | Reimbursement |
| Class A | .55% | $161 |
| Class M | .55% | - |
| Class C | 1.40% | - |
| Fidelity Sustainable Low Duration Bond Fund | .35% | 1,727 |
| Class I | .35% | 67 |
| Class Z | .30% | 2,067 |
| | | $4,022 |
Through arrangements with the Fund's custodian, credits realized as a result of certain uninvested cash balances were used to reduce the Fund's expenses. During the period, custodian credits reduced the Fund's expenses by $293.
Effective April 1, 2023, the investment adviser contractually agreed to reimburse expenses of each class to the extent annual operating expenses exceed certain levels of class-level average net assets as noted in the table below. This reimbursement will remain in place through December 31, 2024. Some expenses, for example the compensation of the independent Trustees, and certain miscellaneous expenses such proxy and shareholder meeting expenses, are excluded from this reimbursement.
| | Expense Limitations |
| Class A | .45% |
| Class M | .45% |
| Class C | 1.30% |
| Fidelity Limited Term Bond Fund | .25% |
| Class I | .25% |
| Class Z | .20% |
7. Distributions to Shareholders.
Distributions to shareholders of each class were as follows:
| | Six months ended February 28, 2023 | Year ended August 31, 2022 A |
| Fidelity Sustainable Low Duration Bond Fund | | |
| Distributions to shareholders | | |
| Class A | $25,388 | $4,872 |
| Class M | 5,985 | 1,800 |
| Class C | 4,225 | 563 |
| Fidelity Sustainable Low Duration Bond Fund | 65,455 | 14,311 |
| Class I | 5,485 | 2,146 |
| Class Z | 83,937 | 2,283 |
Total | $190,475 | $25,975 |
A For the period April 13, 2022 (commencement of operations) through August 31, 2022.
8. Share Transactions.
Share transactions for each class were as follows and may contain in-kind transactions, automatic conversions between classes or exchanges between affiliated funds:
| | Shares | Shares | Dollars | Dollars |
| | Six months ended February 28, 2023 | Year ended August 31, 2022 A | Six months ended February 28, 2023 | Year ended August 31, 2022 A |
| Fidelity Sustainable Low Duration Bond Fund | | | | |
| Class A | | | | |
| Shares sold | 336,465 | 189,715 | $3,353,435 | $1,891,861 |
| Reinvestment of distributions | 2,537 | 485 | 25,330 | 4,830 |
| Shares redeemed | (140,681) | (16,506) | (1,401,718) | (164,308) |
| Net increase (decrease) | 198,321 | 173,694 | $1,977,047 | $1,732,383 |
| Class M | | | | |
| Shares sold | 14,718 | 51,520 | $146,470 | $515,153 |
| Reinvestment of distributions | 600 | 181 | 5,985 | 1,799 |
| Shares redeemed | (2) | - | (15) | - |
| Net increase (decrease) | 15,316 | 51,701 | $152,440 | $516,952 |
| Class C | | | | |
| Shares sold | 14,035 | 76,426 | $139,792 | $763,276 |
| Reinvestment of distributions | 423 | 57 | 4,225 | 562 |
| Shares redeemed | (1,084) | (193) | (10,807) | (1,921) |
| Net increase (decrease) | 13,374 | 76,290 | $133,210 | $761,917 |
| Fidelity Sustainable Low Duration Bond Fund | | | | |
| Shares sold | 643,456 | 456,050 | $6,420,056 | $4,551,570 |
| Reinvestment of distributions | 6,232 | 1,410 | 62,203 | 14,040 |
| Shares redeemed | (273,021) | (5,735) | (2,725,398) | (57,099) |
| Net increase (decrease) | 376,667 | 451,725 | $3,756,861 | $4,508,511 |
| Class I | | | | |
| Shares sold | 5,703 | 52,639 | $56,937 | $526,334 |
| Reinvestment of distributions | 544 | 215 | 5,424 | 2,146 |
| Shares redeemed | (3,036) | - | (30,288) | - |
| Net increase (decrease) | 3,211 | 52,854 | $32,073 | $528,480 |
| Class Z | | | | |
| Shares sold | 905,375 | 96,323 | $9,014,827 | $961,329 |
| Reinvestment of distributions | 5,825 | 229 | 58,161 | 2,283 |
| Shares redeemed | (123,143) | - | (1,231,899) | - |
| Net increase (decrease) | 788,057 | 96,552 | $7,841,089 | $963,612 |
A For the period April 13, 2022 (commencement of operations) through August 31, 2022.
9. Other.
A fund's organizational documents provide former and current trustees and officers with a limited indemnification against liabilities arising in connection with the performance of their duties to the fund. In the normal course of business, a fund may also enter into contracts that provide general indemnifications. A fund's maximum exposure under these arrangements is unknown as this would be dependent on future claims that may be made against a fund. The risk of material loss from such claims is considered remote.
10. Risk and Uncertainties.
Many factors affect a fund's performance. Developments that disrupt global economies and financial markets, such as pandemics, epidemics, outbreaks of infectious diseases, war, terrorism, and environmental disasters, may significantly affect a fund's investment performance. The effects of these developments to a fund will be impacted by the types of securities in which a fund invests, the financial condition, industry, economic sector, and geographic location of an issuer, and a fund's level of investment in the securities of that issuer. Significant concentrations in security types, issuers, industries, sectors, and geographic locations may magnify the factors that affect a fund's performance.
As a shareholder, you incur two types of costs: (1) transaction costs, which may include sales charges (loads) on purchase payments or redemption proceeds, as applicable and (2) ongoing costs, which generally include management fees, distribution and/or service (12b-1) fees and other Fund expenses. This Example is intended to help you understand your ongoing costs (in dollars) of investing in a fund and to compare these costs with the ongoing costs of investing in other mutual funds.
| The Example is based on an investment of $1,000 invested at the beginning of the period and held for the entire period (September 1, 2022 to February 28, 2023). |
Actual Expenses
The first line of the accompanying table provides information about actual account values and actual expenses. You may use the information in this line, together with the amount you invested, to estimate the expenses that you paid over the period. Simply divide your account value by $1,000.00 (for example, an $8,600 account value divided by $1,000.00 = 8.6), then multiply the result by the number in the first line for a class/Fund under the heading entitled "Expenses Paid During Period" to estimate the expenses you paid on your account during this period. If any fund is a shareholder of any underlying mutual funds or exchange-traded funds (ETFs) (the Underlying Funds), such fund indirectly bears its proportional share of the expenses of the Underlying Funds in addition to the direct expenses incurred presented in the table. These fees and expenses are not included in the annualized expense ratio used to calculate the expense estimate in the table below.
Hypothetical Example for Comparison Purposes
The second line of the accompanying table provides information about hypothetical account values and hypothetical expenses based on the actual expense ratio and an assumed rate of return of 5% per year before expenses, which is not the actual return. The hypothetical account values and expenses may not be used to estimate the actual ending account balance or expenses you paid for the period. You may use this information to compare the ongoing costs of investing in the Fund and other funds. To do so, compare this 5% hypothetical example with the 5% hypothetical examples that appear in the shareholder reports of the other funds. If any fund is a shareholder of any Underlying Funds, such fund indirectly bears its proportional share of the expenses of the Underlying Funds in addition to the direct expenses as presented in the table. These fees and expenses are not included in the annualized expense ratio used to calculate the expense estimate in the table below.
Please note that the expenses shown in the table are meant to highlight your ongoing costs only and do not reflect any transaction costs. Therefore, the second line of the table is useful in comparing ongoing costs only, and will not help you determine the relative total costs of owning different funds. In addition, if these transactional costs were included, your costs would have been higher.
| | | | | Annualized Expense Ratio- A | | Beginning Account Value September 1, 2022 | | Ending Account Value February 28, 2023 | | Expenses Paid During Period- C September 1, 2022 to February 28, 2023 |
| Fidelity® Sustainable Low Duration Bond Fund | | | | | | | | | | |
Class A ** | | | | .55% | | | | | | |
| Actual | | | | | | $ 1,000 | | $ 1,015.40 | | $ 2.75 |
Hypothetical- B | | | | | | $ 1,000 | | $ 1,022.07 | | $ 2.76 |
Class M ** | | | | .53% | | | | | | |
| Actual | | | | | | $ 1,000 | | $ 1,015.50 | | $ 2.65 |
Hypothetical- B | | | | | | $ 1,000 | | $ 1,022.17 | | $ 2.66 |
Class C ** | | | | 1.40% | | | | | | |
| Actual | | | | | | $ 1,000 | | $ 1,011.10 | | $ 6.98 |
Hypothetical- B | | | | | | $ 1,000 | | $ 1,017.85 | | $ 7.00 |
Fidelity® Sustainable Low Duration Bond Fund ** | | | | .35% | | | | | | |
| Actual | | | | | | $ 1,000 | | $ 1,016.40 | | $ 1.75 |
Hypothetical- B | | | | | | $ 1,000 | | $ 1,023.06 | | $ 1.76 |
Class I ** | | | | .35% | | | | | | |
| Actual | | | | | | $ 1,000 | | $ 1,016.40 | | $ 1.75 |
Hypothetical- B | | | | | | $ 1,000 | | $ 1,023.06 | | $ 1.76 |
Class Z ** | | | | .30% | | | | | | |
| Actual | | | | | | $ 1,000 | | $ 1,016.60 | | $ 1.50 |
Hypothetical- B | | | | | | $ 1,000 | | $ 1,023.31 | | $ 1.51 |
| |
A Annualized expense ratio reflects expenses net of applicable fee waivers.
B 5% return per year before expenses
C Expenses are equal to the annualized expense ratio, multiplied by the average account value over the period, multiplied by 181/ 365 (to reflect the one-half year period). The fees and expenses of any Underlying Funds are not included in each annualized expense ratio.
** If fees and changes to the expense contract and/or expense cap, effective April 1, 2023, had been in effect during the current period, the restated annualized expense ratio and the expenses paid in the actual and hypothetical examples above would have been as shown in table below:
| | | | | Annualized Expense Ratio- A | | Expenses Paid |
| Fidelity® Sustainable Low Duration Bond Fund | | | | | | |
| Class A | | | | .45% | | |
| Actual | | | | | | $ 2.25 |
Hypothetical - B | | | | | | $ 2.26 |
| Class M | | | | .45% | | |
| Actual | | | | | | $ 2.25 |
Hypothetical - B | | | | | | $ 2.26 |
| Class C | | | | 1.30% | | |
| Actual | | | | | | $ 6.48 |
Hypothetical - B | | | | | | $ 6.51 |
| Fidelity® Sustainable Low Duration Bond Fund | | | | .25% | | |
| Actual | | | | | | $ 1.25 |
Hypothetical - B | | | | | | $ 1.25 |
| Class I | | | | .25% | | |
| Actual | | | | | | $ 1.25 |
Hypothetical - B | | | | | | $ 1.25 |
| Class Z | | | | .20% | | |
| Actual | | | | | | $ 1.00 |
Hypothetical - B | | | | | | $ 1.00 |
| | | | | | | |
| A Annualized expense ratio reflects expenses net of applicable fee waivers. | | | | | | |
| B 5% return per year before expenses | | | | | | |
The Securities and Exchange Commission adopted Rule 22e-4 under the Investment Company Act of 1940 (the Liquidity Rule) to promote effective liquidity risk management throughout the open-end investment company industry, thereby reducing the risk that funds will be unable to meet their redemption obligations and mitigating dilution of the interests of fund shareholders.
The Fund has adopted and implemented a liquidity risk management program (the Program) reasonably designed to assess and manage the Fund's liquidity risk and to comply with the requirements of the Liquidity Rule. The Fund's Board of Trustees (the Board) has designated the Fund's investment adviser as administrator of the Program. The Fidelity advisers have established a Liquidity Risk Management Committee (the LRM Committee) to manage the Program for each of the Fidelity Funds. The LRM Committee monitors the adequacy and effectiveness of implementation of the Program and on a periodic basis assesses each Fund's liquidity risk based on a variety of factors including (1) the Fund's investment strategy, (2) portfolio liquidity and cash flow projections during normal and reasonably foreseeable stressed conditions, (3) shareholder redemptions, (4) borrowings and other funding sources and (5) certain factors specific to ETFs including the effect of the Fund's prices and spreads, market participants, and basket compositions on the overall liquidity of the Fund's portfolio, as applicable.
In accordance with the Program, each of the Fund's portfolio investments is classified into one of four defined liquidity categories based on a determination of a reasonable expectation for how long it would take to convert the investment to cash (or sell or dispose of the investment) without significantly changing its market value.
- Highly liquid investments - cash or convertible to cash within three business days or less
- Moderately liquid investments - convertible to cash in three to seven calendar days
- Less liquid investments - can be sold or disposed of, but not settled, within seven calendar days
- Illiquid investments - cannot be sold or disposed of within seven calendar days
Liquidity classification determinations take into account a variety of factors including various market, trading and investment-specific considerations, as well as market depth, and generally utilize analysis from a third-party liquidity metrics service.
The Liquidity Rule places a 15% limit on a fund's illiquid investments and requires funds that do not primarily hold assets that are highly liquid investments to determine and maintain a minimum percentage of the fund's net assets to be invested in highly liquid investments (highly liquid investment minimum or HLIM). The Program includes provisions reasonably designed to comply with the 15% limit on illiquid investments and for determining, periodically reviewing and complying with the HLIM requirement as applicable.
At a recent meeting of the Fund's Board of Trustees, the LRM Committee provided a written report to the Board pertaining to the operation, adequacy, and effectiveness of the Program for the period December 1, 2021 through November 30, 2022. The report concluded that the Program is operating effectively and is reasonably designed to assess and manage the Fund's liquidity risk.
1.9904901.100
SLD-SANN-0423
Fidelity® Sustainable Core Plus Bond Fund
Semi-Annual Report
February 28, 2023
Includes Fidelity and Fidelity Advisor share classes
Contents
To view a fund's proxy voting guidelines and proxy voting record for the 12-month period ended June 30, visit http://www.fidelity.com/proxyvotingresults or visit the Securities and Exchange Commission's (SEC) web site at http://www.sec.gov.
You may also call 1-800-544-8544 if you're an individual investing directly with Fidelity, call 1-800-835-5092 if you're a plan sponsor or participant with Fidelity as your recordkeeper or call 1-877-208-0098 on institutional accounts or if you're an advisor or invest through one to request a free copy of the proxy voting guidelines.
Standard & Poor's, S&P and S&P 500 are registered service marks of The McGraw-Hill Companies, Inc. and have been licensed for use by Fidelity Distributors Corporation.
Other third-party marks appearing herein are the property of their respective owners.
All other marks appearing herein are registered or unregistered trademarks or service marks of FMR LLC or an affiliated company. © 2023 FMR LLC. All rights reserved.
This report and the financial statements contained herein are submitted for the general information of the shareholders of the Fund. This report is not authorized for distribution to prospective investors in the Fund unless preceded or accompanied by an effective prospectus.
A fund files its complete schedule of portfolio holdings with the SEC for the first and third quarters of each fiscal year on Form N-PORT. Forms N-PORT are available on the SEC's web site at http://www.sec.gov. A fund's Forms N-PORT may be reviewed and copied at the SEC's Public Reference Room in Washington, DC. Information regarding the operation of the SEC's Public Reference Room may be obtained by calling 1-800-SEC-0330.
For a complete list of a fund's portfolio holdings, view the most recent holdings listing, semiannual report, or annual report on Fidelity's web site at http://www.fidelity.com, http://www.institutional.fidelity.com, or http://www.401k.com, as applicable.
NOT FDIC INSURED •MAY LOSE VALUE •NO BANK GUARANTEE
Neither the Fund nor Fidelity Distributors Corporation is a bank.
Quality Diversification (% of Fund's net assets) |
|
| |
| We have used ratings from Moody's Investors Service, Inc. Where Moody's® ratings are not available, we have used S&P® ratings. All ratings are as of the date indicated and do not reflect subsequent changes. |
Asset Allocation (% of Fund's net assets) |
|
Foreign investments - 15.6% |
Futures - 1.4% |
Percentages in the above tables are adjusted for the effect of TBA Sale Commitments. |
|
Geographic Diversification (% of Fund's net assets) |
|
* Includes Short-Term investments and Net Other Assets (Liabilities). Percentages are based on country or territory of incorporation and are adjusted for the effect of derivatives, if applicable. |
| |
Showing Percentage of Net Assets
| Corporate Bonds - 40.6% |
| | | Principal Amount (a) | Value ($) |
| Convertible Bonds - 0.1% | | | |
| COMMUNICATION SERVICES - 0.1% | | | |
| Media - 0.1% | | | |
| DISH Network Corp.: | | | |
| 2.375% 3/15/24 | | 5,000 | 4,592 |
| 3.375% 8/15/26 | | 32,000 | 20,451 |
| | | | 25,043 |
| CONSUMER DISCRETIONARY - 0.0% | | | |
| Hotels, Restaurants & Leisure - 0.0% | | | |
| DraftKings, Inc. 0% 3/15/28 | | 4,000 | 2,772 |
| | | | |
| Internet & Direct Marketing Retail - 0.0% | | | |
| Wayfair LLC 0.625% 10/1/25 | | 3,000 | 2,226 |
| | | | |
TOTAL CONSUMER DISCRETIONARY | | | 4,998 |
| | | | |
| HEALTH CARE - 0.0% | | | |
| Health Care Providers & Services - 0.0% | | | |
| Oak Street Health, Inc. 0% 3/15/26 | | 2,000 | 1,850 |
| | | | |
| INFORMATION TECHNOLOGY - 0.0% | | | |
| Software - 0.0% | | | |
| MicroStrategy, Inc. 0% 2/15/27 | | 5,000 | 2,340 |
| | | | |
| REAL ESTATE - 0.0% | | | |
| Real Estate Management & Development - 0.0% | | | |
| Redfin Corp. 0.5% 4/1/27 | | 16,000 | 9,622 |
| | | | |
| TOTAL CONVERTIBLE BONDS | | | 43,853 |
| Nonconvertible Bonds - 40.5% | | | |
| COMMUNICATION SERVICES - 3.5% | | | |
| Diversified Telecommunication Services - 1.5% | | | |
| Altice France SA 5.125% 7/15/29 (b) | | 10,000 | 7,716 |
| Frontier Communications Holdings LLC 8.75% 5/15/30 (b) | | 10,000 | 10,113 |
| Level 3 Financing, Inc. 3.75% 7/15/29 (b) | | 46,000 | 28,916 |
| TELUS Corp. 3.4% 5/13/32 | | 130,000 | 110,819 |
| Verizon Communications, Inc.: | | | |
| 2.355% 3/15/32 | | 70,000 | 55,031 |
| 3.875% 3/1/52 | | 270,000 | 206,738 |
| Virgin Media Finance PLC 5% 7/15/30 (b) | | 8,000 | 6,520 |
| Zayo Group Holdings, Inc. 6.125% 3/1/28 (b) | | 18,000 | 11,339 |
| | | | 437,192 |
| Entertainment - 0.4% | | | |
| The Walt Disney Co. 2.65% 1/13/31 | | 140,000 | 119,244 |
| | | | |
| Media - 1.2% | | | |
| Altice Financing SA 5.75% 8/15/29 (b) | | 29,000 | 23,716 |
| Altice France Holding SA 6% 2/15/28 (b) | | 32,000 | 22,000 |
| CCO Holdings LLC/CCO Holdings Capital Corp.: | | | |
| 4.25% 1/15/34(b) | | 25,000 | 18,714 |
| 4.75% 2/1/32(b) | | 47,000 | 38,070 |
| DIRECTV Financing LLC / DIRECTV Financing Co-Obligor, Inc. 5.875% 8/15/27 (b) | | 10,000 | 8,940 |
| DISH DBS Corp. 5.75% 12/1/28 (b) | | 2,000 | 1,598 |
| DISH Network Corp. 11.75% 11/15/27 (b) | | 6,000 | 6,079 |
| Magallanes, Inc.: | | | |
| 4.279% 3/15/32(b) | | 135,000 | 116,547 |
| 5.141% 3/15/52(b) | | 141,000 | 110,530 |
| TEGNA, Inc. 4.75% 3/15/26 (b) | | 8,000 | 7,600 |
| UPC Broadband Finco BV 4.875% 7/15/31 (b) | | 8,000 | 6,754 |
| | | | 360,548 |
| Wireless Telecommunication Services - 0.4% | | | |
| Millicom International Cellular SA 4.5% 4/27/31 (b) | | 13,000 | 10,498 |
| Rogers Communications, Inc.: | | | |
| 3.2% 3/15/27(b) | | 60,000 | 55,168 |
| 4.55% 3/15/52(b) | | 70,000 | 55,828 |
| | | | 121,494 |
TOTAL COMMUNICATION SERVICES | | | 1,038,478 |
| | | | |
| CONSUMER DISCRETIONARY - 3.8% | | | |
| Auto Components - 0.0% | | | |
| Patrick Industries, Inc. 4.75% 5/1/29 (b) | | 12,000 | 10,201 |
| | | | |
| Automobiles - 0.2% | | | |
| General Motors Co. 5.4% 10/15/29 | | 40,000 | 38,410 |
| McLaren Finance PLC 7.5% 8/1/26 (b) | | 4,000 | 3,101 |
| Rivian Holdco & Rivian LLC & Rivian Automotive LLC 6 month U.S. LIBOR + 5.620% 10.1636% 10/15/26 (b)(c)(d) | | 18,000 | 17,550 |
| | | | 59,061 |
| Diversified Consumer Services - 0.3% | | | |
| Adtalem Global Education, Inc. 5.5% 3/1/28 (b) | | 10,000 | 9,205 |
| GEMS MENASA Cayman Ltd. 7.125% 7/31/26 (b) | | 11,000 | 10,700 |
| Sotheby's 7.375% 10/15/27 (b) | | 10,000 | 9,434 |
| StoneMor, Inc. 8.5% 5/15/29 (b) | | 6,000 | 4,338 |
| WASH Multifamily Acquisition, Inc. 5.75% 4/15/26 (b) | | 42,000 | 39,070 |
| | | | 72,747 |
| Hotels, Restaurants & Leisure - 0.6% | | | |
| 1011778 BC Unlimited Liability Co./New Red Finance, Inc.: | | | |
| 3.5% 2/15/29(b) | | 13,000 | 11,025 |
| 4% 10/15/30(b) | | 5,000 | 4,130 |
| Carnival Corp. 6% 5/1/29 (b) | | 35,000 | 27,143 |
| Constellation Merger Sub, Inc. 8.5% 9/15/25 (b) | | 8,000 | 6,680 |
| Hilton Domestic Operating Co., Inc. 3.625% 2/15/32 (b) | | 26,000 | 21,346 |
| Life Time, Inc. 8% 4/15/26 (b) | | 10,000 | 9,636 |
| MajorDrive Holdings IV LLC 6.375% 6/1/29 (b) | | 12,000 | 9,275 |
| Royal Caribbean Cruises Ltd. 5.5% 4/1/28 (b) | | 24,000 | 20,918 |
| Wynn Las Vegas LLC/Wynn Las Vegas Capital Corp. 5.25% 5/15/27 (b) | | 30,000 | 27,939 |
| Yum! Brands, Inc. 4.625% 1/31/32 | | 34,000 | 30,054 |
| | | | 168,146 |
| Household Durables - 0.3% | | | |
| The Berkeley Group PLC 2.5% 8/11/31 (Reg. S) | GBP | 100,000 | 85,064 |
| | | | |
| Internet & Direct Marketing Retail - 0.2% | | | |
| Match Group Holdings II LLC 4.625% 6/1/28 (b) | | 10,000 | 8,883 |
| Uber Technologies, Inc.: | | | |
| 4.5% 8/15/29(b) | | 65,000 | 57,465 |
| 8% 11/1/26(b) | | 2,000 | 2,030 |
| | | | 68,378 |
| Multiline Retail - 0.0% | | | |
| Macy's Retail Holdings LLC 5.875% 4/1/29 (b) | | 4,000 | 3,633 |
| Nordstrom, Inc. 4.375% 4/1/30 | | 6,000 | 4,733 |
| | | | 8,366 |
| Specialty Retail - 1.7% | | | |
| At Home Group, Inc. 4.875% 7/15/28 (b) | | 8,000 | 5,880 |
| Bath & Body Works, Inc. 6.95% 3/1/33 | | 8,000 | 6,960 |
| Carvana Co. 4.875% 9/1/29 (b) | | 30,000 | 14,191 |
| LBM Acquisition LLC 6.25% 1/15/29 (b) | | 10,000 | 7,125 |
| Lowe's Companies, Inc.: | | | |
| 3.75% 4/1/32 | | 130,000 | 115,160 |
| 4.25% 4/1/52 | | 130,000 | 102,360 |
| Michaels Companies, Inc. 5.25% 5/1/28 (b) | | 24,000 | 19,974 |
| The Home Depot, Inc. 3.25% 4/15/32 | | 130,000 | 113,884 |
| TJX Companies, Inc. 3.875% 4/15/30 | | 120,000 | 112,855 |
| Upbound Group, Inc. 6.375% 2/15/29 (b) | | 14,000 | 12,010 |
| Victoria's Secret & Co. 4.625% 7/15/29 (b) | | 8,000 | 6,524 |
| | | | 516,923 |
| Textiles, Apparel & Luxury Goods - 0.5% | | | |
| Crocs, Inc. 4.125% 8/15/31 (b) | | 18,000 | 14,760 |
| Hanesbrands, Inc. 4.625% 5/15/24 (b) | | 10,000 | 9,993 |
| Tapestry, Inc. 3.05% 3/15/32 | | 140,000 | 111,240 |
| | | | 135,993 |
TOTAL CONSUMER DISCRETIONARY | | | 1,124,879 |
| | | | |
| CONSUMER STAPLES - 1.3% | | | |
| Beverages - 0.0% | | | |
| Triton Water Holdings, Inc. 6.25% 4/1/29 (b) | | 12,000 | 9,565 |
| | | | |
| Food & Staples Retailing - 0.4% | | | |
| Albertsons Companies LLC/Safeway, Inc./New Albertson's, Inc./Albertson's LLC: | | | |
| 3.25% 3/15/26(b) | | 12,000 | 11,011 |
| 4.875% 2/15/30(b) | | 6,000 | 5,384 |
| Alimentation Couche-Tard, Inc. 3.625% 5/13/51 (b) | | 150,000 | 101,935 |
| U.S. Foods, Inc. 4.625% 6/1/30 (b) | | 8,000 | 6,988 |
| | | | 125,318 |
| Food Products - 0.9% | | | |
| Darling Ingredients, Inc. 6% 6/15/30 (b) | | 5,000 | 4,831 |
| General Mills, Inc. 2.25% 10/14/31 | | 290,000 | 232,529 |
| Post Holdings, Inc. 4.5% 9/15/31 (b) | | 10,000 | 8,421 |
| TreeHouse Foods, Inc. 4% 9/1/28 | | 8,000 | 6,861 |
| | | | 252,642 |
TOTAL CONSUMER STAPLES | | | 387,525 |
| | | | |
| ENERGY - 1.1% | | | |
| Energy Equipment & Services - 0.2% | | | |
| Archrock Partners LP / Archrock Partners Finance Corp. 6.25% 4/1/28 (b) | | 12,000 | 11,391 |
| CGG SA 8.75% 4/1/27 (b) | | 18,000 | 15,770 |
| Oceaneering International, Inc. 6% 2/1/28 | | 12,000 | 11,383 |
| Transocean Titan Finance Ltd. 8.375% 2/1/28 (b) | | 2,000 | 2,041 |
| Transocean, Inc. 8.75% 2/15/30 (b) | | 5,000 | 5,088 |
| Weatherford International Ltd. 8.625% 4/30/30 (b) | | 8,000 | 7,989 |
| | | | 53,662 |
| Multi Industry Energy - 0.0% | | | |
| Enviva Partners LP / Enviva Partners Finance Corp. 6.5% 1/15/26 (b) | | 10,000 | 9,375 |
| | | | |
| Oil, Gas & Consumable Fuels - 0.9% | | | |
| California Resources Corp. 7.125% 2/1/26 (b) | | 26,000 | 26,196 |
| CNX Resources Corp.: | | | |
| 6% 1/15/29(b) | | 4,000 | 3,627 |
| 7.375% 1/15/31(b) | | 5,000 | 4,764 |
| Crestwood Midstream Partners LP/Crestwood Midstream Finance Corp. 6% 2/1/29 (b) | | 25,000 | 22,743 |
| CVR Energy, Inc. 5.25% 2/15/25 (b) | | 38,000 | 36,480 |
| EG Global Finance PLC 6.75% 2/7/25 (b) | | 15,000 | 13,538 |
| Energean PLC 6.5% 4/30/27 (b) | | 10,000 | 9,200 |
| Global Partners LP/GLP Finance Corp. 6.875% 1/15/29 | | 6,000 | 5,550 |
| Holly Energy Partners LP/Holly Energy Finance Corp. 5% 2/1/28 (b) | | 10,000 | 9,075 |
| MEG Energy Corp. 5.875% 2/1/29 (b) | | 30,000 | 27,980 |
| New Fortress Energy, Inc. 6.5% 9/30/26 (b) | | 56,000 | 51,240 |
| Northern Oil & Gas, Inc. 8.125% 3/1/28 (b) | | 8,000 | 7,720 |
| Parkland Corp. 4.625% 5/1/30 (b) | | 15,000 | 12,488 |
| SM Energy Co. 6.5% 7/15/28 | | 8,000 | 7,380 |
| Sunoco LP/Sunoco Finance Corp. 4.5% 5/15/29 | | 14,000 | 12,287 |
| Tallgrass Energy Partners LP / Tallgrass Energy Finance Corp. 6% 3/1/27 (b) | | 5,000 | 4,642 |
| Teine Energy Ltd. 6.875% 4/15/29 (b) | | 18,000 | 16,461 |
| | | | 271,371 |
TOTAL ENERGY | | | 334,408 |
| | | | |
| FINANCIALS - 11.8% | | | |
| Banks - 7.0% | | | |
| AIB Group PLC 2.875% 5/30/31 (Reg. S) (c) | EUR | 100,000 | 95,752 |
| Banco Bilbao Vizcaya Argentaria SA 1% 1/16/30 (Reg. S) (c) | EUR | 100,000 | 96,699 |
| Bank of America Corp.: | | | |
| 2.456% 10/22/25(c) | | 260,000 | 246,731 |
| 2.687% 4/22/32(c) | | 70,000 | 56,772 |
| 5.015% 7/22/33(c) | | 168,000 | 161,633 |
| 6.204% 11/10/28(c) | | 50,000 | 51,409 |
| Citigroup, Inc.: | | | |
| 2.014% 1/25/26(c) | | 260,000 | 242,471 |
| 4.91% 5/24/33(c) | | 90,000 | 85,292 |
| ING Groep NV 1.4% 7/1/26 (b)(c) | | 200,000 | 181,194 |
| Intesa Sanpaolo SpA 4% 9/23/29 (b) | | 210,000 | 183,690 |
| JPMorgan Chase & Co.: | | | |
| 0.768% 8/9/25(c) | | 260,000 | 241,432 |
| 2.963% 1/25/33(c) | | 70,000 | 57,676 |
| 4.586% 4/26/33(c) | | 142,000 | 132,341 |
| 4.912% 7/25/33(c) | | 28,000 | 26,810 |
| KBC Group NV 0.5% 12/3/29 (c) | EUR | 100,000 | 96,917 |
| NatWest Group PLC 2.057% 11/9/28 (Reg. S) (c) | GBP | 100,000 | 102,507 |
| Santander Holdings U.S.A., Inc. 5.807% 9/9/26 (c) | | 35,000 | 34,994 |
| | | | 2,094,320 |
| Capital Markets - 2.4% | | | |
| Coinbase Global, Inc.: | | | |
| 3.375% 10/1/28(b) | | 8,000 | 5,240 |
| 3.625% 10/1/31(b) | | 5,000 | 3,015 |
| Goldman Sachs Group, Inc.: | | | |
| 3.102% 2/24/33(c) | | 109,000 | 89,845 |
| 3.615% 3/15/28(c) | | 130,000 | 120,647 |
| Hightower Holding LLC 6.75% 4/15/29 (b) | | 10,000 | 8,459 |
| Morgan Stanley: | | | |
| 0.864% 10/21/25(c) | | 270,000 | 248,704 |
| 2.943% 1/21/33(c) | | 70,000 | 57,281 |
| 4.889% 7/20/33(c) | | 68,000 | 64,567 |
| State Street Corp. 3.031% 11/1/34 (c) | | 130,000 | 111,131 |
| StoneX Group, Inc. 8.625% 6/15/25 (b) | | 6,000 | 6,035 |
| | | | 714,924 |
| Consumer Finance - 0.5% | | | |
| Ally Financial, Inc. 2.2% 11/2/28 | | 140,000 | 114,055 |
| OneMain Finance Corp. 3.875% 9/15/28 | | 46,000 | 36,570 |
| | | | 150,625 |
| Diversified Financial Services - 0.0% | | | |
| Altus Midstream LP 5.875% 6/15/30 (b) | | 5,000 | 4,621 |
| | | | |
| Insurance - 1.8% | | | |
| AIA Group Ltd. 3.375% 4/7/30 (b) | | 200,000 | 180,314 |
| Equitable Financial Life Global Funding 1.3% 7/12/26 (b) | | 200,000 | 174,210 |
| Marsh & McLennan Companies, Inc. 2.375% 12/15/31 | | 210,000 | 168,387 |
| | | | 522,911 |
| Mortgage Real Estate Investment Trusts - 0.0% | | | |
| Rithm Capital Corp. 6.25% 10/15/25 (b) | | 8,000 | 7,299 |
| | | | |
| Thrifts & Mortgage Finance - 0.1% | | | |
| Radian Group, Inc. 6.625% 3/15/25 | | 8,000 | 7,994 |
| | | | |
TOTAL FINANCIALS | | | 3,502,694 |
| | | | |
| HEALTH CARE - 3.2% | | | |
| Biotechnology - 0.8% | | | |
| Amgen, Inc. 3% 2/22/29 | | 260,000 | 231,344 |
| Emergent BioSolutions, Inc. 3.875% 8/15/28 (b) | | 10,000 | 6,050 |
| | | | 237,394 |
| Health Care Providers & Services - 1.3% | | | |
| Akumin Escrow, Inc. 7.5% 8/1/28 (b) | | 8,000 | 5,600 |
| Cano Health, Inc. 6.25% 10/1/28 (b) | | 15,000 | 9,750 |
| Cigna Group 3.4% 3/15/51 | | 150,000 | 105,211 |
| Community Health Systems, Inc.: | | | |
| 4.75% 2/15/31(b) | | 34,000 | 26,265 |
| 5.25% 5/15/30(b) | | 15,000 | 12,002 |
| 6.875% 4/15/29(b) | | 10,000 | 6,994 |
| 8% 3/15/26(b) | | 5,000 | 4,875 |
| DaVita HealthCare Partners, Inc. 3.75% 2/15/31 (b) | | 16,000 | 12,082 |
| Encompass Health Corp. 4.625% 4/1/31 | | 10,000 | 8,551 |
| HealthEquity, Inc. 4.5% 10/1/29 (b) | | 18,000 | 15,732 |
| Horizon Pharma U.S.A., Inc. 5.5% 8/1/27 (b) | | 8,000 | 8,129 |
| Humana, Inc. 3.7% 3/23/29 | | 130,000 | 117,942 |
| Pediatrix Medical Group, Inc. 5.375% 2/15/30 (b) | | 20,000 | 17,644 |
| RegionalCare Hospital Partners Holdings, Inc. 5.375% 1/15/29 (b) | | 12,000 | 7,876 |
| Tenet Healthcare Corp. 6.125% 10/1/28 | | 45,000 | 41,625 |
| | | | 400,278 |
| Health Care Technology - 0.0% | | | |
| Athenahealth Group, Inc. 6.5% 2/15/30 (b) | | 10,000 | 7,909 |
| | | | |
| Life Sciences Tools & Services - 0.0% | | | |
| Charles River Laboratories International, Inc. 3.75% 3/15/29 (b) | | 3,000 | 2,605 |
| | | | |
| Pharmaceuticals - 1.1% | | | |
| AstraZeneca Finance LLC 1.75% 5/28/28 | | 140,000 | 119,945 |
| Bristol-Myers Squibb Co. 2.95% 3/15/32 | | 70,000 | 60,431 |
| Catalent Pharma Solutions 3.5% 4/1/30 (b) | | 18,000 | 15,634 |
| HLF Financing SARL LLC / Herbalife International, Inc. 4.875% 6/1/29 (b) | | 2,000 | 1,550 |
| Zoetis, Inc. 2% 5/15/30 | | 140,000 | 114,734 |
| | | | 312,294 |
TOTAL HEALTH CARE | | | 960,480 |
| | | | |
| INDUSTRIALS - 2.5% | | | |
| Aerospace & Defense - 0.2% | | | |
| Bombardier, Inc. 6% 2/15/28 (b) | | 27,000 | 25,297 |
| Howmet Aerospace, Inc. 3% 1/15/29 | | 3,000 | 2,576 |
| Triumph Group, Inc.: | | | |
| 8.875% 6/1/24(b) | | 10,000 | 10,403 |
| 9% 3/15/28(b)(e) | | 10,000 | 10,000 |
| | | | 48,276 |
| Air Freight & Logistics - 0.0% | | | |
| Rand Parent LLC 8.5% 2/15/30 (b) | | 10,000 | 9,601 |
| | | | |
| Building Products - 0.4% | | | |
| Carrier Global Corp. 2.493% 2/15/27 | | 130,000 | 117,171 |
| Cornerstone Building Brands, Inc. 6.125% 1/15/29 (b) | | 8,000 | 5,800 |
| | | | 122,971 |
| Commercial Services & Supplies - 0.3% | | | |
| APX Group, Inc. 5.75% 7/15/29 (b) | | 12,000 | 10,054 |
| Brand Energy & Infrastructure Services, Inc. 8.5% 7/15/25 (b) | | 14,000 | 11,714 |
| Covanta Holding Corp. 4.875% 12/1/29 (b) | | 38,000 | 32,097 |
| KAR Auction Services, Inc. 5.125% 6/1/25 (b) | | 2,000 | 1,949 |
| Neptune BidCo U.S., Inc. 9.29% 4/15/29 (b) | | 5,000 | 4,727 |
| Stericycle, Inc.: | | | |
| 3.875% 1/15/29(b) | | 24,000 | 20,574 |
| 5.375% 7/15/24(b) | | 16,000 | 15,765 |
| | | | 96,880 |
| Construction & Engineering - 0.1% | | | |
| AECOM 5.125% 3/15/27 | | 12,000 | 11,476 |
| Pike Corp. 5.5% 9/1/28 (b) | | 4,000 | 3,471 |
| Railworks Holdings LP 8.25% 11/15/28 (b) | | 10,000 | 9,357 |
| | | | 24,304 |
| Electrical Equipment - 0.1% | | | |
| Atkore, Inc. 4.25% 6/1/31 (b) | | 8,000 | 6,964 |
| Regal Rexnord Corp.: | | | |
| 6.05% 4/15/28(b) | | 2,000 | 1,956 |
| 6.3% 2/15/30(b) | | 2,000 | 1,957 |
| Sensata Technologies BV 4% 4/15/29 (b) | | 8,000 | 7,056 |
| | | | 17,933 |
| Industrial Conglomerates - 0.6% | | | |
| Honeywell International, Inc. 1.75% 9/1/31 | | 140,000 | 110,764 |
| Trane Technologies Financing Ltd. 5.25% 3/3/33 (e) | | 50,000 | 49,633 |
| | | | 160,397 |
| Machinery - 0.8% | | | |
| Ingersoll-Rand Luxembourg Finance SA 3.8% 3/21/29 | | 130,000 | 119,708 |
| Otis Worldwide Corp. 2.565% 2/15/30 | | 140,000 | 117,963 |
| Vertical Holdco GmbH 7.625% 7/15/28 (b) | | 7,000 | 6,425 |
| | | | 244,096 |
| Marine - 0.0% | | | |
| Seaspan Corp. 5.5% 8/1/29 (b) | | 10,000 | 7,525 |
| | | | |
| Professional Services - 0.0% | | | |
| Dun & Bradstreet Corp. 5% 12/15/29 (b) | | 3,000 | 2,482 |
| | | | |
| Road & Rail - 0.0% | | | |
| Hertz Corp. 4.625% 12/1/26 (b) | | 12,000 | 10,686 |
| | | | |
| Trading Companies & Distributors - 0.0% | | | |
| Fortress Transportation & Infrastructure Investors LLC 5.5% 5/1/28 (b) | | 12,000 | 10,717 |
| | | | |
TOTAL INDUSTRIALS | | | 755,868 |
| | | | |
| INFORMATION TECHNOLOGY - 1.8% | | | |
| Communications Equipment - 0.1% | | | |
| CommScope, Inc. 4.75% 9/1/29 (b) | | 16,000 | 13,040 |
| HTA Group Ltd. 7% 12/18/25 (b) | | 8,000 | 7,562 |
| | | | 20,602 |
| Electronic Equipment & Components - 0.4% | | | |
| Coherent Corp. 5% 12/15/29 (b) | | 10,000 | 8,761 |
| Dell International LLC/EMC Corp. 6.2% 7/15/30 | | 110,000 | 111,687 |
| | | | 120,448 |
| IT Services - 0.2% | | | |
| Go Daddy Operating Co. LLC / GD Finance Co., Inc. 3.5% 3/1/29 (b) | | 28,000 | 23,458 |
| Rackspace Hosting, Inc. 3.5% 2/15/28 (b) | | 4,000 | 2,435 |
| Tempo Acquisition LLC 5.75% 6/1/25 (b) | | 6,000 | 5,940 |
| Twilio, Inc. 3.625% 3/15/29 | | 18,000 | 15,121 |
| Virtusa Corp. 7.125% 12/15/28 (b) | | 12,000 | 9,966 |
| | | | 56,920 |
| Semiconductors & Semiconductor Equipment - 0.9% | | | |
| Broadcom, Inc. 2.6% 2/15/33 (b) | | 10,000 | 7,558 |
| Entegris Escrow Corp. 5.95% 6/15/30 (b) | | 20,000 | 18,602 |
| Entegris, Inc. 3.625% 5/1/29 (b) | | 28,000 | 23,218 |
| Micron Technology, Inc. 2.703% 4/15/32 | | 140,000 | 106,225 |
| NXP BV/NXP Funding LLC/NXP U.S.A., Inc. 2.5% 5/11/31 | | 140,000 | 109,851 |
| onsemi 3.875% 9/1/28 (b) | | 2,000 | 1,758 |
| | | | 267,212 |
| Software - 0.2% | | | |
| Black Knight InfoServ LLC 3.625% 9/1/28 (b) | | 8,000 | 6,920 |
| Elastic NV 4.125% 7/15/29 (b) | | 28,000 | 22,979 |
| Gen Digital, Inc. 5% 4/15/25 (b) | | 14,000 | 13,599 |
| MicroStrategy, Inc. 6.125% 6/15/28 (b) | | 4,000 | 3,320 |
| NCR Corp. 6.125% 9/1/29 (b) | | 15,000 | 14,588 |
| Open Text Corp. 3.875% 12/1/29 (b) | | 14,000 | 11,300 |
| Open Text Holdings, Inc.: | | | |
| 4.125% 2/15/30(b) | | 5,000 | 4,114 |
| 4.125% 12/1/31(b) | | 1,000 | 796 |
| | | | 77,616 |
TOTAL INFORMATION TECHNOLOGY | | | 542,798 |
| | | | |
| MATERIALS - 1.5% | | | |
| Chemicals - 0.8% | | | |
| International Flavors & Fragrances, Inc. 2.3% 11/1/30 (b) | | 150,000 | 115,816 |
| Methanex Corp.: | | | |
| 5.125% 10/15/27 | | 10,000 | 9,399 |
| 5.65% 12/1/44 | | 30,000 | 24,450 |
| NOVA Chemicals Corp.: | | | |
| 4.875% 6/1/24(b) | | 10,000 | 9,801 |
| 5.25% 6/1/27(b) | | 10,000 | 9,000 |
| Nufarm Australia Ltd. 5% 1/27/30 (b) | | 10,000 | 8,730 |
| Olympus Water U.S. Holding Corp. 6.25% 10/1/29 (b) | | 18,000 | 14,590 |
| The Chemours Co. LLC 4.625% 11/15/29 (b) | | 43,000 | 34,898 |
| | | | 226,684 |
| Construction Materials - 0.1% | | | |
| Eco Material Technologies, Inc. 7.875% 1/31/27 (b) | | 2,000 | 1,909 |
| VM Consolidated, Inc. 5.5% 4/15/29 (b) | | 28,000 | 24,796 |
| | | | 26,705 |
| Containers & Packaging - 0.2% | | | |
| Berry Global, Inc. 5.625% 7/15/27 (b) | | 30,000 | 28,875 |
| Clydesdale Acquisition Holdings, Inc. 6.625% 4/15/29 (b) | | 10,000 | 9,541 |
| Crown Americas LLC/Crown Americas Capital Corp. IV 4.75% 2/1/26 | | 10,000 | 9,550 |
| | | | 47,966 |
| Metals & Mining - 0.4% | | | |
| ATI, Inc. 4.875% 10/1/29 | | 12,000 | 10,744 |
| Coeur d'Alene Mines Corp. 5.125% 2/15/29 (b) | | 6,000 | 4,541 |
| Eldorado Gold Corp. 6.25% 9/1/29 (b) | | 10,000 | 8,793 |
| ERO Copper Corp. 6.5% 2/15/30 (b) | | 22,000 | 18,618 |
| First Quantum Minerals Ltd. 6.875% 10/15/27 (b) | | 10,000 | 9,356 |
| FMG Resources Pty Ltd. 6.125% 4/15/32 (b) | | 20,000 | 18,900 |
| IAMGOLD Corp. 5.75% 10/15/28 (b) | | 6,000 | 4,485 |
| Infrabuild Australia Pty Ltd. 12% 10/1/24 (b) | | 14,000 | 13,545 |
| Mineral Resources Ltd. 8.5% 5/1/30 (b) | | 24,000 | 24,029 |
| | | | 113,011 |
| Paper & Forest Products - 0.0% | | | |
| Domtar Corp. 6.75% 10/1/28 (b) | | 8,000 | 7,200 |
| Mercer International, Inc. 5.125% 2/1/29 | | 10,000 | 8,200 |
| | | | 15,400 |
TOTAL MATERIALS | | | 429,766 |
| | | | |
| REAL ESTATE - 4.1% | | | |
| Equity Real Estate Investment Trusts (REITs) - 3.4% | | | |
| Alexandria Real Estate Equities, Inc. 2% 5/18/32 | | 220,000 | 168,309 |
| Boston Properties, Inc.: | | | |
| 2.45% 10/1/33 | | 220,000 | 160,656 |
| 6.75% 12/1/27 | | 19,000 | 19,720 |
| Corporate Office Properties LP 2% 1/15/29 | | 150,000 | 115,468 |
| Hudson Pacific Properties LP 5.95% 2/15/28 | | 122,000 | 113,413 |
| MPT Operating Partnership LP/MPT Finance Corp.: | | | |
| 4.625% 8/1/29 | | 10,000 | 7,475 |
| 5% 10/15/27 | | 48,000 | 39,400 |
| Prologis LP 2.875% 11/15/29 | | 200,000 | 173,573 |
| SBA Communications Corp. 3.125% 2/1/29 | | 7,000 | 5,780 |
| Uniti Group LP / Uniti Group Finance, Inc. 10.5% 2/15/28 (b) | | 5,000 | 5,001 |
| Uniti Group, Inc. 6% 1/15/30 (b) | | 34,000 | 21,073 |
| WP Carey, Inc. 2.45% 2/1/32 | | 220,000 | 173,842 |
| | | | 1,003,710 |
| Real Estate Management & Development - 0.7% | | | |
| CBRE Group, Inc. 2.5% 4/1/31 | | 140,000 | 113,768 |
| Howard Hughes Corp. 4.375% 2/1/31 (b) | | 15,000 | 12,222 |
| Realogy Group LLC/Realogy Co.-Issuer Corp. 5.25% 4/15/30 (b) | | 6,000 | 4,110 |
| Taylor Morrison Communities, Inc./Monarch Communities, Inc. 5.125% 8/1/30 (b) | | 14,000 | 12,355 |
| Vonovia SE 0.625% 3/24/31 (Reg. S) | EUR | 100,000 | 77,070 |
| | | | 219,525 |
TOTAL REAL ESTATE | | | 1,223,235 |
| | | | |
| UTILITIES - 5.9% | | | |
| Electric Utilities - 2.4% | | | |
| Duke Energy Carolinas LLC 3.95% 11/15/28 | | 170,000 | 162,014 |
| NextEra Energy Capital Holdings, Inc. 1.9% 6/15/28 | | 130,000 | 109,900 |
| Northern States Power Co. 2.25% 4/1/31 | | 210,000 | 173,359 |
| Oncor Electric Delivery Co. LLC 4.15% 6/1/32 | | 130,000 | 122,154 |
| PG&E Corp. 5% 7/1/28 | | 10,000 | 9,131 |
| Wisconsin Electric Power Co. 4.75% 9/30/32 | | 160,000 | 156,375 |
| | | | 732,933 |
| Independent Power and Renewable Electricity Producers - 1.2% | | | |
| Atlantica Sustainable Infrastructure PLC 4.125% 6/15/28 (b) | | 24,000 | 21,182 |
| Sunnova Energy Corp. 5.875% 9/1/26 (b) | | 20,000 | 17,428 |
| TerraForm Power Operating LLC 4.75% 1/15/30 (b) | | 8,000 | 6,916 |
| The AES Corp.: | | | |
| 1.375% 1/15/26 | | 140,000 | 123,895 |
| 2.45% 1/15/31 | | 228,000 | 181,108 |
| | | | 350,529 |
| Multi-Utilities - 2.3% | | | |
| Consolidated Edison Co. of New York, Inc. 3.35% 4/1/30 | | 190,000 | 169,812 |
| Dominion Energy, Inc. 2.25% 8/15/31 | | 220,000 | 173,971 |
| NiSource, Inc. 1.7% 2/15/31 | | 230,000 | 175,318 |
| Puget Energy, Inc. 4.224% 3/15/32 | | 190,000 | 167,997 |
| | | | 687,098 |
TOTAL UTILITIES | | | 1,770,560 |
| | | | |
| TOTAL NONCONVERTIBLE BONDS | | | 12,070,691 |
| TOTAL CORPORATE BONDS (Cost $13,226,406) | | | 12,114,544 |
| | | | |
| U.S. Treasury Obligations - 32.6% |
| | | Principal Amount (a) | Value ($) |
| U.S. Treasury Bills, yield at date of purchase 1.91% 4/20/23 | | 1,950,000 | 1,937,558 |
| U.S. Treasury Bonds: | | | |
| 2.25% 2/15/52 | | 2,500,000 | 1,782,520 |
| 2.875% 5/15/52 | | 250,000 | 204,717 |
| 3.25% 5/15/42 | | 200,000 | 176,773 |
| 3.375% 8/15/42 | | 700,000 | 630,219 |
| 4% 11/15/42 | | 100,000 | 98,578 |
| 5% 5/15/37 | | 10,000 | 11,180 |
| U.S. Treasury Notes: | | | |
| 2.5% 4/30/24 | | 500,000 | 485,059 |
| 2.5% 5/31/24 | | 500,000 | 484,180 |
| 2.5% 3/31/27 | | 200,000 | 186,531 |
| 2.625% 7/31/29 | | 200,000 | 183,391 |
| 3.5% 1/31/28 | | 300,000 | 290,883 |
| 3.5% 1/31/30 | | 430,000 | 415,286 |
| 3.5% 2/15/33 | | 710,000 | 686,592 |
| 3.875% 11/30/27 | | 100,000 | 98,574 |
| 3.875% 12/31/27 | | 450,000 | 443,257 |
| 3.875% 2/28/30 | | 400,000 | 398,500 |
| 4% 10/31/29 | | 25,000 | 24,853 |
| 4.125% 10/31/27 | | 600,000 | 597,000 |
| 4.125% 11/15/32 | | 600,000 | 609,563 |
| TOTAL U.S. TREASURY OBLIGATIONS (Cost $10,396,621) | | | 9,745,214 |
| | | | |
| U.S. Government Agency - Mortgage Securities - 20.5% |
| | | Principal Amount (a) | Value ($) |
| Fannie Mae - 2.4% | | | |
| 2% 10/1/35 | | 46,988 | 41,898 |
| 2.5% 7/1/51 to 1/1/52 | | 249,516 | 212,242 |
| 3% 10/1/51 to 5/1/52 | | 296,148 | 261,065 |
| 4% 4/1/52 to 9/1/52 | | 98,919 | 93,548 |
| 4.5% 7/1/52 | | 48,587 | 47,453 |
| 5% 11/1/52 | | 49,279 | 49,096 |
TOTAL FANNIE MAE | | | 705,302 |
| Freddie Mac - 3.3% | | | |
| 2% 11/1/51 | | 349,966 | 285,438 |
| 2.5% 12/1/51 to 8/1/52 | | 196,325 | 166,389 |
| 3.5% 6/1/52 | | 199,999 | 182,224 |
| 4% 10/1/52 | | 49,624 | 47,171 |
| 4.5% 11/1/52 | | 148,723 | 143,252 |
| 5% 12/1/52 to 3/1/53 | | 149,402 | 147,457 |
TOTAL FREDDIE MAC | | | 971,931 |
| Ginnie Mae - 3.3% | | | |
| 2% 1/20/51 to 2/20/51 | | 73,787 | 62,209 |
| 2% 3/1/53 (e) | | 50,000 | 41,909 |
| 2% 3/1/53 (e) | | 100,000 | 83,817 |
| 2% 3/1/53 (e) | | 50,000 | 41,909 |
| 2% 3/1/53 (e) | | 75,000 | 62,863 |
| 2% 4/1/53 (e) | | 100,000 | 83,907 |
| 2% 4/1/53 (e) | | 50,000 | 41,954 |
| 2.5% 3/1/53 (e) | | 150,000 | 129,715 |
| 2.5% 3/1/53 (e) | | 75,000 | 64,857 |
| 2.5% 3/1/53 (e) | | 75,000 | 64,857 |
| 3% 3/1/53 (e) | | 50,000 | 44,603 |
| 3% 3/1/53 (e) | | 50,000 | 44,603 |
| 3% 3/1/53 (e) | | 50,000 | 44,603 |
| 3.5% 3/1/53 (e) | | 50,000 | 45,960 |
| 3.5% 3/1/53 (e) | | 25,000 | 22,980 |
| 3.5% 3/1/53 (e) | | 25,000 | 22,980 |
| 4% 3/1/53 (e) | | 100,000 | 94,491 |
TOTAL GINNIE MAE | | | 998,217 |
| Uniform Mortgage Backed Securities - 11.5% | | | |
| 1.5% 3/1/53 (e) | | 100,000 | 77,214 |
| 1.5% 3/1/53 (e) | | 25,000 | 19,304 |
| 2% 3/1/38 (e) | | 100,000 | 88,752 |
| 2% 3/1/38 (e) | | 100,000 | 88,752 |
| 2% 3/1/38 (e) | | 150,000 | 133,128 |
| 2% 4/1/38 (e) | | 250,000 | 222,153 |
| 2% 4/1/38 (e) | | 100,000 | 88,861 |
| 2% 3/1/53 (e) | | 100,000 | 81,425 |
| 2% 3/1/53 (e) | | 400,000 | 325,702 |
| 2% 3/1/53 (e) | | 200,000 | 162,851 |
| 2% 3/1/53 (e) | | 50,000 | 40,713 |
| 2% 3/1/53 (e) | | 350,000 | 284,989 |
| 2% 4/1/53 (e) | | 400,000 | 326,092 |
| 2% 4/1/53 (e) | | 200,000 | 163,046 |
| 2% 4/1/53 (e) | | 50,000 | 40,762 |
| 2.5% 3/1/53 (e) | | 200,000 | 169,438 |
| 2.5% 3/1/53 (e) | | 150,000 | 127,078 |
| 2.5% 3/1/53 (e) | | 50,000 | 42,359 |
| 2.5% 4/1/53 (e) | | 50,000 | 42,402 |
| 3% 3/1/38 (e) | | 150,000 | 139,992 |
| 3% 3/1/53 (e) | | 100,000 | 87,957 |
| 3% 3/1/53 (e) | | 100,000 | 87,957 |
| 3% 3/1/53 (e) | | 100,000 | 87,957 |
| 3% 3/1/53 (e) | | 50,000 | 43,979 |
| 3% 4/1/53 (e) | | 200,000 | 176,070 |
| 3% 4/1/53 (e) | | 50,000 | 44,018 |
| 4% 3/1/53 (e) | | 150,000 | 140,695 |
| 4.5% 3/1/53 (e) | | 25,000 | 24,069 |
| 4.5% 3/1/53 (e) | | 75,000 | 72,208 |
TOTAL UNIFORM MORTGAGE BACKED SECURITIES | | | 3,429,923 |
| TOTAL U.S. GOVERNMENT AGENCY - MORTGAGE SECURITIES (Cost $6,236,778) | | | 6,105,373 |
| | | | |
| Asset-Backed Securities - 6.7% |
| | | Principal Amount (a) | Value ($) |
| Allegro CLO XV, Ltd. / Allegro CLO VX LLC Series 2022-1A Class A, CME TERM SOFR 3 MONTH INDEX + 1.500% 6.139% 7/20/35 (b)(c)(d) | | 250,000 | 247,167 |
| Ares LIX CLO Ltd. Series 2021-59A Class A, 3 month U.S. LIBOR + 1.030% 5.8477% 4/25/34 (b)(c)(d) | | 250,000 | 244,859 |
| CEDF Series 2021-6A Class ARR, 3 month U.S. LIBOR + 1.050% 5.8577% 4/20/34 (b)(c)(d) | | 200,000 | 194,370 |
| Dryden CLO, Ltd. Series 2021-76A Class A1R, 3 month U.S. LIBOR + 1.150% 5.9577% 10/20/34 (b)(c)(d) | | 320,000 | 314,519 |
| Eaton Vance CLO, Ltd. Series 2021-1A Class AR, 3 month U.S. LIBOR + 1.100% 5.8924% 4/15/31 (b)(c)(d) | | 250,000 | 247,717 |
| Planet Fitness Master Issuer LLC Series 2022-1A Class A2I, 3.251% 12/5/51 (b) | | 99,250 | 87,793 |
| Symphony CLO XXVI Ltd. / Symphony CLO XXVI LLC Series 2021-26A Class AR, 3 month U.S. LIBOR + 1.080% 5.8877% 4/20/33 (b)(c)(d) | | 570,000 | 559,294 |
| Verizon Master Trust Series 2021-2 Class A, 0.99% 4/20/28 | | 109,000 | 101,874 |
| TOTAL ASSET-BACKED SECURITIES (Cost $2,020,722) | | | 1,997,593 |
| | | | |
| Commercial Mortgage Securities - 1.2% |
| | | Principal Amount (a) | Value ($) |
| BXHPP Trust floater Series 2021-FILM Class A, 1 month U.S. LIBOR + 0.650% 5.238% 8/15/36 (b)(c)(d) | | 250,000 | 236,721 |
| SLG Office Trust sequential payer Series 2021-OVA Class A, 2.5854% 7/15/41 (b) | | 150,000 | 121,154 |
| TOTAL COMMERCIAL MORTGAGE SECURITIES (Cost $381,124) | | | 357,875 |
| | | | |
| Foreign Government and Government Agency Obligations - 0.5% |
| | | Principal Amount (a) | Value ($) |
| German Federal Republic 0% 8/15/31 | EUR | 46,000 | 39,221 |
| United Kingdom, Great Britain and Northern Ireland: | | | |
| 1% 4/22/24(Reg. S) | GBP | 3,000 | 3,486 |
| 1.75% 9/7/37 (Reg. S) | GBP | 23,000 | 20,707 |
| 2.25% 9/7/23 | GBP | 25,000 | 29,797 |
| 4.25% 6/7/32 (f) | GBP | 39,000 | 48,895 |
| 4.5% 9/7/34 | GBP | 16,000 | 20,366 |
| TOTAL FOREIGN GOVERNMENT AND GOVERNMENT AGENCY OBLIGATIONS (Cost $154,286) | | | 162,472 |
| | | | |
| Common Stocks - 0.1% |
| | | Shares | Value ($) |
| COMMUNICATION SERVICES - 0.0% | | | |
| Media - 0.0% | | | |
| Charter Communications, Inc. Class A (g) | | 8 | 2,941 |
| CONSUMER DISCRETIONARY - 0.0% | | | |
| Auto Components - 0.0% | | | |
| Aptiv PLC (g) | | 25 | 2,907 |
| ENERGY - 0.1% | | | |
| Oil, Gas & Consumable Fuels - 0.1% | | | |
| Denbury, Inc. (g) | | 38 | 3,168 |
| EQT Corp. | | 61 | 2,024 |
| New Fortress Energy, Inc. | | 114 | 3,761 |
| | | | 8,953 |
| HEALTH CARE - 0.0% | | | |
| Health Care Providers & Services - 0.0% | | | |
| Cano Health, Inc. (g) | | 400 | 660 |
| INDUSTRIALS - 0.0% | | | |
| Electrical Equipment - 0.0% | | | |
| Regal Rexnord Corp. | | 20 | 3,153 |
| INFORMATION TECHNOLOGY - 0.0% | | | |
| Electronic Equipment & Components - 0.0% | | | |
| Coherent Corp. (g) | | 65 | 2,803 |
| TOTAL COMMON STOCKS (Cost $21,225) | | | 21,417 |
| | | | |
| Bank Loan Obligations - 0.0% |
| | | Principal Amount (a) | Value ($) |
| INDUSTRIALS - 0.0% | | | |
| Commercial Services & Supplies - 0.0% | | | |
| Brand Energy & Infrastructure Services, Inc. Tranche B, term loan 3 month U.S. LIBOR + 4.250% 9.0646% 6/21/24 (c)(d)(h) | | 5,953 | 5,615 |
| Neptune BidCo U.S., Inc. Tranche B 1LN, term loan CME Term SOFR 1 Month Index + 5.000% 9.735% 4/11/29 (c)(d)(h) | | 5,000 | 4,588 |
| TOTAL BANK LOAN OBLIGATIONS (Cost $10,188) | | | 10,203 |
| | | | |
| Preferred Securities - 1.0% |
| | | Principal Amount (a) | Value ($) |
| COMMUNICATION SERVICES - 0.3% | | | |
| Diversified Telecommunication Services - 0.3% | | | |
| Telefonica Europe BV 2.502% (Reg. S) (c)(i) | EUR | 100,000 | 92,767 |
| CONSUMER STAPLES - 0.3% | | | |
| Food Products - 0.3% | | | |
| Danone SA 1% (Reg. S) (c)(i) | EUR | 100,000 | 90,441 |
| FINANCIALS - 0.0% | | | |
| Consumer Finance - 0.0% | | | |
| Ally Financial, Inc. 4.7% (c)(i) | | 20,000 | 15,710 |
| UTILITIES - 0.4% | | | |
| Electric Utilities - 0.4% | | | |
| TenneT Holding BV 2.995% (Reg. S) (c)(i) | EUR | 100,000 | 105,892 |
| TOTAL PREFERRED SECURITIES (Cost $335,232) | | | 304,810 |
| | | | |
| Money Market Funds - 11.3% |
| | | Shares | Value ($) |
Fidelity Cash Central Fund 4.63% (j) (Cost $3,360,370) | | 3,359,698 | 3,360,370 |
| | | | |
| TOTAL INVESTMENT IN SECURITIES - 114.5% (Cost $36,142,952) | 34,179,871 |
NET OTHER ASSETS (LIABILITIES) - (14.5)% | (4,338,369) |
| NET ASSETS - 100.0% | 29,841,502 |
| | |
| TBA Sale Commitments |
| | Principal Amount (a) | Value ($) |
| Ginnie Mae | | |
| 2% 3/1/53 | (50,000) | (41,909) |
| 2% 3/1/53 | (100,000) | (83,817) |
| 2% 3/1/53 | (50,000) | (41,909) |
| | | |
| TOTAL GINNIE MAE | | (167,635) |
| | | |
| Uniform Mortgage Backed Securities | | |
| 2% 3/1/38 | (250,000) | (221,880) |
| 2% 3/1/38 | (100,000) | (88,752) |
| 2% 3/1/53 | (400,000) | (325,699) |
| 2% 3/1/53 | (200,000) | (162,851) |
| 2% 3/1/53 | (50,000) | (40,713) |
| 2% 3/1/53 | (50,000) | (40,713) |
| 2% 3/1/53 | (50,000) | (40,713) |
| 2% 3/1/53 | (50,000) | (40,713) |
| 2% 3/1/53 | (50,000) | (40,713) |
| 2.5% 3/1/53 | (50,000) | (42,359) |
| 2.5% 3/1/53 | (50,000) | (42,359) |
| 2.5% 3/1/53 | (50,000) | (42,359) |
| 2.5% 3/1/53 | (50,000) | (42,359) |
| 3% 3/1/53 | (200,000) | (175,914) |
| 3% 3/1/53 | (50,000) | (43,979) |
| | | |
| TOTAL UNIFORM MORTGAGE BACKED SECURITIES | | (1,392,076) |
| | | |
TOTAL TBA SALE COMMITMENTS (Proceeds $1,568,975) | | (1,559,711) |
| Futures Contracts |
| | Number of contracts | Expiration Date | Notional Amount ($) | Value ($) | Unrealized Appreciation/ (Depreciation) ($) |
| Purchased | | | | | |
| | | | | | |
| Treasury Contracts | | | | | |
| CBOT 2-Year U.S. Treasury Note Contracts (United States) | 1 | Jun 2023 | 203,727 | (463) | (463) |
| CBOT 5-Year U.S. Treasury Note Contracts (United States) | 1 | Jun 2023 | 107,055 | (135) | (135) |
| CBOT Ultra 10-Year U.S. Treasury Note Contracts (United States) | 2 | Jun 2023 | 234,375 | 652 | 652 |
| | | | | | |
| TOTAL PURCHASED | | | | | 54 |
| | | | | | |
| Sold | | | | | |
| | | | | | |
| Bond Index Contracts | | | | | |
| ICE Long Gilt Contracts (United Kingdom) | 1 | Jun 2023 | 120,237 | 778 | 778 |
| | | | | | |
| TOTAL FUTURES CONTRACTS | | | | | 832 |
| The notional amount of futures purchased as a percentage of Net Assets is 1.9% |
| The notional amount of futures sold as a percentage of Net Assets is 0.4% |
For the period, the average monthly notional amount at value for futures contracts in the aggregate was $669,872.
| Forward Foreign Currency Contracts |
Currency Purchased | Currency Sold | Counterparty | Settlement Date | Unrealized Appreciation/ (Depreciation) ($) |
| | | | | | | |
| EUR | 2,000 | USD | 2,136 | Brown Brothers Harriman & Co | 4/20/23 | (15) |
| EUR | 7,000 | USD | 7,451 | JPMorgan Chase Bank, N.A. | 4/20/23 | (25) |
| GBP | 3,000 | USD | 3,638 | JPMorgan Chase Bank, N.A. | 4/20/23 | (26) |
| GBP | 2,000 | USD | 2,434 | JPMorgan Chase Bank, N.A. | 4/20/23 | (26) |
| GBP | 2,000 | USD | 2,421 | JPMorgan Chase Bank, N.A. | 4/20/23 | (13) |
| USD | 708,183 | EUR | 654,000 | BNP Paribas S.A. | 4/20/23 | 14,396 |
| USD | 2,179 | EUR | 2,000 | BNP Paribas S.A. | 4/20/23 | 58 |
| USD | 2,144 | EUR | 2,000 | Bank of America, N.A. | 4/20/23 | 23 |
| USD | 2,178 | EUR | 2,000 | Brown Brothers Harriman & Co | 4/20/23 | 57 |
| USD | 2,182 | EUR | 2,000 | Brown Brothers Harriman & Co | 4/20/23 | 60 |
| USD | 9,821 | EUR | 9,000 | JPMorgan Chase Bank, N.A. | 4/20/23 | 273 |
| USD | 2,199 | EUR | 2,000 | JPMorgan Chase Bank, N.A. | 4/20/23 | 77 |
| USD | 329,951 | GBP | 270,000 | Bank of America, N.A. | 4/20/23 | 4,880 |
| USD | 2,467 | GBP | 2,000 | Brown Brothers Harriman & Co | 4/20/23 | 59 |
| USD | 7,344 | GBP | 6,000 | HSBC Bank | 4/20/23 | 120 |
| USD | 2,455 | GBP | 2,000 | JPMorgan Chase Bank, N.A. | 4/20/23 | 47 |
| USD | 2,436 | GBP | 2,000 | State Street Bank and Trust Co | 4/20/23 | 28 |
| | | | | | | |
| TOTAL FORWARD FOREIGN CURRENCY CONTRACTS | | 19,973 |
| | | | | | | |
| Unrealized Appreciation | | | 20,078 |
| Unrealized Depreciation | | | (105) |
Currency Abbreviations
| EUR | - | European Monetary Unit |
| GBP | - | British pound sterling |
| USD | - | U.S. dollar |
Legend
| (a) | Amount is stated in United States dollars unless otherwise noted. |
| (b) | Security exempt from registration under Rule 144A of the Securities Act of 1933. These securities may be resold in transactions exempt from registration, normally to qualified institutional buyers. At the end of the period, the value of these securities amounted to $5,459,317 or 18.3% of net assets. |
| (c) | Coupon rates for floating and adjustable rate securities reflect the rates in effect at period end. |
| (d) | Coupon is indexed to a floating interest rate which may be multiplied by a specified factor and/or subject to caps or floors. |
| (e) | Security or a portion of the security purchased on a delayed delivery or when-issued basis. |
| (f) | Security or a portion of the security was pledged to cover margin requirements for futures contracts. At period end, the value of securities pledged amounted to $25,077. |
| (h) | Remaining maturities of bank loan obligations may be less than the stated maturities shown as a result of contractual or optional prepayments by the borrower. Such prepayments cannot be predicted with certainty. |
| (i) | Security is perpetual in nature with no stated maturity date. |
| (j) | Affiliated fund that is generally available only to investment companies and other accounts managed by Fidelity Investments. The rate quoted is the annualized seven-day yield of the fund at period end. A complete unaudited listing of the fund's holdings as of its most recent quarter end is available upon request. In addition, each Fidelity Central Fund's financial statements are available on the SEC's website or upon request. |
Affiliated Central Funds
Fiscal year to date information regarding the Fund's investments in Fidelity Central Funds, including the ownership percentage, is presented below.
| Affiliate | Value, beginning of period ($) | Purchases ($) | Sales Proceeds ($) | Dividend Income ($) | Realized Gain (loss) ($) | Change in Unrealized appreciation (depreciation) ($) | Value, end of period ($) | % ownership, end of period |
| Fidelity Cash Central Fund 4.63% | 3,745,873 | 5,275,785 | 5,661,288 | 83,714 | - | - | 3,360,370 | 0.0% |
| Total | 3,745,873 | 5,275,785 | 5,661,288 | 83,714 | - | - | 3,360,370 | |
| | | | | | | | | |
Amounts in the dividend income column in the above table include any capital gain distributions from underlying funds, which are presented in the corresponding line item in the Statement of Operations, if applicable.
Amounts included in the purchases and sales proceeds columns may include in-kind transactions, if applicable.
Investment Valuation
The following is a summary of the inputs used, as of February 28, 2023, involving the Fund's assets and liabilities carried at fair value. The inputs or methodology used for valuing securities may not be an indication of the risk associated with investing in those securities. For more information on valuation inputs, and their aggregation into the levels used below, please refer to the Investment Valuation section in the accompanying Notes to Financial Statements.
| Valuation Inputs at Reporting Date: |
| Description | Total ($) | Level 1 ($) | Level 2 ($) | Level 3 ($) |
Investments in Securities: | | | | |
|
| Equities: | | | | |
Communication Services | 2,941 | 2,941 | - | - |
Consumer Discretionary | 2,907 | 2,907 | - | - |
Energy | 8,953 | 8,953 | - | - |
Health Care | 660 | 660 | - | - |
Industrials | 3,153 | 3,153 | - | - |
Information Technology | 2,803 | 2,803 | - | - |
|
| Corporate Bonds | 12,114,544 | - | 12,114,544 | - |
|
| U.S. Government and Government Agency Obligations | 9,745,214 | - | 9,745,214 | - |
|
| U.S. Government Agency - Mortgage Securities | 6,105,373 | - | 6,105,373 | - |
|
| Asset-Backed Securities | 1,997,593 | - | 1,997,593 | - |
|
| Commercial Mortgage Securities | 357,875 | - | 357,875 | - |
|
| Foreign Government and Government Agency Obligations | 162,472 | - | 162,472 | - |
|
| Bank Loan Obligations | 10,203 | - | 10,203 | - |
|
| Preferred Securities | 304,810 | - | 304,810 | - |
|
| Money Market Funds | 3,360,370 | 3,360,370 | - | - |
| Total Investments in Securities: | 34,179,871 | 3,381,787 | 30,798,084 | - |
Derivative Instruments: | | | | |
|
| Assets | | | | |
Futures Contracts | 1,430 | 1,430 | - | - |
Forward Foreign Currency Contracts | 20,078 | 20,078 | - | - |
| Total Assets | 21,508 | 21,508 | - | - |
|
| Liabilities | | | | |
Futures Contracts | (598) | (598) | - | - |
Forward Foreign Currency Contracts | (105) | (105) | - | - |
| Total Liabilities | (703) | (703) | - | - |
| Total Derivative Instruments: | 20,805 | 20,805 | - | - |
Other Financial Instruments: | | | | |
|
| TBA Sale Commitments | (1,559,711) | - | (1,559,711) | - |
| Total Other Financial Instruments: | (1,559,711) | - | (1,559,711) | - |
Value of Derivative Instruments
The following table is a summary of the Fund's value of derivative instruments by primary risk exposure as of February 28, 2023. For additional information on derivative instruments, please refer to the Derivative Instruments section in the accompanying Notes to Financial Statements.
Primary Risk Exposure / Derivative Type | Value |
| Asset ($) | Liability ($) |
| Foreign Exchange Risk | | |
Forward Foreign Currency Contracts (a) | 20,078 | (105) |
| Total Foreign Exchange Risk | 20,078 | (105) |
| Interest Rate Risk | | |
Futures Contracts (b) | 1,430 | (598) |
| Total Interest Rate Risk | 1,430 | (598) |
| Total Value of Derivatives | 21,508 | (703) |
(a)Gross value is presented in the Statement of Assets and Liabilities in the unrealized appreciation/depreciation on forward foreign currency contracts line-items.
(b)Reflects gross cumulative appreciation (depreciation) on futures contracts as presented in the Schedule of Investments. In the Statement of Assets and Liabilities, the period end daily variation margin is included in receivable or payable for daily variation margin on futures contracts, and the net cumulative appreciation (depreciation) is included in Total accumulated earnings (loss).
| Statement of Assets and Liabilities |
| | | | February 28, 2023 (Unaudited) |
| | | | | |
| Assets | | | | |
| Investment in securities, at value - See accompanying schedule: | | | | |
Unaffiliated issuers (cost $32,782,582) | $ | 30,819,501 | | |
Fidelity Central Funds (cost $3,360,370) | | 3,360,370 | | |
| | | | | |
| | | | | |
| Total Investment in Securities (cost $36,142,952) | | | $ | 34,179,871 |
| Cash | | | | 26,957 |
| Foreign currency held at value (cost $14,934) | | | | 14,795 |
| Receivable for investments sold | | | | 696,778 |
| Receivable for TBA sale commitments | | | | 1,568,975 |
| Unrealized appreciation on forward foreign currency contracts | | | | 20,078 |
| Receivable for fund shares sold | | | | 1,849 |
| Dividends receivable | | | | 10 |
| Interest receivable | | | | 197,905 |
| Distributions receivable from Fidelity Central Funds | | | | 13,738 |
| Receivable for daily variation margin on futures contracts | | | | 818 |
| Receivable from investment adviser for expense reductions | | | | 148 |
Total assets | | | | 36,721,922 |
| Liabilities | | | | |
| Payable for investments purchased | | | | |
Regular delivery | $ | 776,685 | | |
Delayed delivery | | 4,525,328 | | |
| TBA sale commitments, at value | | 1,559,711 | | |
| Unrealized depreciation on forward foreign currency contracts | | 105 | | |
| Payable for fund shares redeemed | | 9 | | |
| Distributions payable | | 5,340 | | |
| Accrued management fee | | 8,654 | | |
| Distribution and service plan fees payable | | 1,254 | | |
| Other affiliated payables | | 2,193 | | |
| Other payables and accrued expenses | | 1,141 | | |
| Total Liabilities | | | | 6,880,420 |
| Net Assets | | | $ | 29,841,502 |
| Net Assets consist of: | | | | |
| Paid in capital | | | $ | 32,115,388 |
| Total accumulated earnings (loss) | | | | (2,273,886) |
| Net Assets | | | $ | 29,841,502 |
| | | | | |
| Net Asset Value and Maximum Offering Price | | | | |
| Class A : | | | | |
Net Asset Value and redemption price per share ($1,214,472 ÷ 132,390 shares) (a) | | | $ | 9.17 |
| Maximum offering price per share (100/96.00 of $9.17) | | | $ | 9.55 |
| Class M : | | | | |
Net Asset Value and redemption price per share ($1,003,933 ÷ 109,440 shares) (a) | | | $ | 9.17 |
| Maximum offering price per share (100/96.00 of $9.17) | | | $ | 9.55 |
| Class C : | | | | |
Net Asset Value and offering price per share ($936,410 ÷ 102,090 shares) (a) | | | $ | 9.17 |
| Fidelity Sustainable Core Plus Bond Fund : | | | | |
Net Asset Value , offering price and redemption price per share ($23,140,944 ÷ 2,522,570 shares) | | | $ | 9.17 |
| Class I : | | | | |
Net Asset Value , offering price and redemption price per share ($946,240 ÷ 103,148 shares) | | | $ | 9.17 |
| Class Z : | | | | |
Net Asset Value , offering price and redemption price per share ($2,599,503 ÷ 283,365 shares) | | | $ | 9.17 |
(a)Redemption price per share is equal to net asset value less any applicable contingent deferred sales charge. |
| Statement of Operations |
| | | | Six months ended February 28, 2023 (Unaudited) |
| Investment Income | | | | |
| Dividends | | | $ | 8,698 |
| Interest | | | | 486,419 |
| Income from Fidelity Central Funds | | | | 83,714 |
| Total Income | | | | 578,831 |
| Expenses | | | | |
| Management fee | $ | 48,940 | | |
| Transfer agent fees | | 12,704 | | |
| Distribution and service plan fees | | 7,408 | | |
| Independent trustees' fees and expenses | | 52 | | |
| Total expenses before reductions | | 69,104 | | |
| Expense reductions | | (1,077) | | |
| Total expenses after reductions | | | | 68,027 |
| Net Investment income (loss) | | | | 510,804 |
| Realized and Unrealized Gain (Loss) | | | | |
| Net realized gain (loss) on: | | | | |
| Investment Securities: | | | | |
| Unaffiliated issuers | | (287,115) | | |
| Forward foreign currency contracts | | (18,434) | | |
| Foreign currency transactions | | 164 | | |
| Futures contracts | | (25,678) | | |
| Total net realized gain (loss) | | | | (331,063) |
| Change in net unrealized appreciation (depreciation) on: | | | | |
| Investment Securities: | | | | |
| Unaffiliated issuers | | (581,867) | | |
| Forward foreign currency contracts | | (12,154) | | |
| Assets and liabilities in foreign currencies | | 1,766 | | |
| Futures contracts | | 4,997 | | |
| TBA Sale commitments | | 1,304 | | |
| Total change in net unrealized appreciation (depreciation) | | | | (585,954) |
| Net gain (loss) | | | | (917,017) |
| Net increase (decrease) in net assets resulting from operations | | | $ | (406,213) |
| Statement of Changes in Net Assets |
| |
| | Six months ended February 28, 2023 (Unaudited) | | For the period April 13, 2022 (commencement of operations) through August 31, 2022 |
| Increase (Decrease) in Net Assets | | | | |
| Operations | | | | |
| Net investment income (loss) | $ | 510,804 | $ | 266,038 |
| Net realized gain (loss) | | (331,063) | | (4,851) |
| Change in net unrealized appreciation (depreciation) | | (585,954) | | (1,347,011) |
| Net increase (decrease) in net assets resulting from operations | | (406,213) | | (1,085,824) |
| Distributions to shareholders | | (564,836) | | (216,947) |
| Share transactions - net increase (decrease) | | 3,667,388 | | 28,447,934 |
| Total increase (decrease) in net assets | | 2,696,339 | | 27,145,163 |
| | | | | |
| Net Assets | | | | |
| Beginning of period | | 27,145,163 | | - |
| End of period | $ | 29,841,502 | $ | 27,145,163 |
| | | | | |
| | | | | |
Financial Highlights
| Fidelity Advisor® Sustainable Core Plus Bond Fund Class A |
| |
| | Six months ended (Unaudited) February 28, 2023 | | Years ended August 31, 2022 A |
Selected Per-Share Data | | | | |
| Net asset value, beginning of period | $ | 9.51 | $ | 10.00 |
| Income from Investment Operations | | | | |
Net investment income (loss) B,C | | .160 | | .094 |
| Net realized and unrealized gain (loss) | | (.323) | | (.508) |
| Total from investment operations | | (.163) | | (.414) |
| Distributions from net investment income | | (.177) | | (.076) |
| Total distributions | | (.177) | | (.076) |
| Net asset value, end of period | $ | 9.17 | $ | 9.51 |
Total Return D,E,F | | (1.70)% | | (4.15)% |
Ratios to Average Net Assets C,G,H | | | | |
| Expenses before reductions | | .68% I | | .65% I |
| Expenses net of fee waivers, if any | | .68% I | | .65% I |
| Expenses net of all reductions | | .68% I | | .65% I |
| Net investment income (loss) | | 3.50% I | | 2.54% I |
| Supplemental Data | | | | |
| Net assets, end of period (000 omitted) | $ | 1,214 | $ | 1,226 |
Portfolio turnover rate J | | 334% I | | 118% K |
A For the period April 13, 2022 (commencement of operations) through August 31, 2022
B Calculated based on average shares outstanding during the period.
C Net investment income (loss) is affected by the timing of the declaration of dividends by any underlying mutual funds or exchange-traded funds (ETFs). Net investment income (loss) of any mutual funds or ETFs is not included in the Fund's net investment income (loss) ratio.
D Total returns for periods of less than one year are not annualized.
E Total returns would have been lower if certain expenses had not been reduced during the applicable periods shown.
F Total returns do not include the effect of the sales charges.
G Fees and expenses of any underlying mutual funds or exchange-traded funds (ETFs) are not included in the Fund's expense ratio. The Fund indirectly bears its proportionate share of these expenses. For additional expense information related to investments in Fidelity Central Funds, please refer to the "Investments in Fidelity Central Funds" note found in the Notes to Financial Statements section of the most recent Annual or Semi-Annual report.
H Expense ratios reflect operating expenses of the class. Expenses before reductions do not reflect amounts reimbursed, waived, or reduced through arrangements with the investment adviser, brokerage services, or other offset arrangements, if applicable, and do not represent the amount paid by the class during periods when reimbursements, waivers or reductions occur.
I Annualized.
J Amount does not include the portfolio activity of any underlying mutual funds or exchange-traded funds (ETFs).
K Amount not annualized.
| Fidelity Advisor® Sustainable Core Plus Bond Fund Class M |
| |
| | Six months ended (Unaudited) February 28, 2023 | | Years ended August 31, 2022 A |
Selected Per-Share Data | | | | |
| Net asset value, beginning of period | $ | 9.51 | $ | 10.00 |
| Income from Investment Operations | | | | |
Net investment income (loss) B,C | | .161 | | .095 |
| Net realized and unrealized gain (loss) | | (.323) | | (.509) |
| Total from investment operations | | (.162) | | (.414) |
| Distributions from net investment income | | (.178) | | (.076) |
| Total distributions | | (.178) | | (.076) |
| Net asset value, end of period | $ | 9.17 | $ | 9.51 |
Total Return D,E,F | | (1.69)% | | (4.15)% |
Ratios to Average Net Assets C,G,H | | | | |
| Expenses before reductions | | .66% I | | .65% I |
| Expenses net of fee waivers, if any | | .66% I | | .65% I |
| Expenses net of all reductions | | .66% I | | .65% I |
| Net investment income (loss) | | 3.52% I | | 2.54% I |
| Supplemental Data | | | | |
| Net assets, end of period (000 omitted) | $ | 1,004 | $ | 1,020 |
Portfolio turnover rate J | | 334% I | | 118% K |
A For the period April 13, 2022 (commencement of operations) through August 31, 2022
B Calculated based on average shares outstanding during the period.
C Net investment income (loss) is affected by the timing of the declaration of dividends by any underlying mutual funds or exchange-traded funds (ETFs). Net investment income (loss) of any mutual funds or ETFs is not included in the Fund's net investment income (loss) ratio.
D Total returns for periods of less than one year are not annualized.
E Total returns would have been lower if certain expenses had not been reduced during the applicable periods shown.
F Total returns do not include the effect of the sales charges.
G Fees and expenses of any underlying mutual funds or exchange-traded funds (ETFs) are not included in the Fund's expense ratio. The Fund indirectly bears its proportionate share of these expenses. For additional expense information related to investments in Fidelity Central Funds, please refer to the "Investments in Fidelity Central Funds" note found in the Notes to Financial Statements section of the most recent Annual or Semi-Annual report.
H Expense ratios reflect operating expenses of the class. Expenses before reductions do not reflect amounts reimbursed, waived, or reduced through arrangements with the investment adviser, brokerage services, or other offset arrangements, if applicable, and do not represent the amount paid by the class during periods when reimbursements, waivers or reductions occur.
I Annualized.
J Amount does not include the portfolio activity of any underlying mutual funds or exchange-traded funds (ETFs).
K Amount not annualized.
| Fidelity Advisor® Sustainable Core Plus Bond Fund Class C |
| |
| | Six months ended (Unaudited) February 28, 2023 | | Years ended August 31, 2022 A |
Selected Per-Share Data | | | | |
| Net asset value, beginning of period | $ | 9.51 | $ | 10.00 |
| Income from Investment Operations | | | | |
Net investment income (loss) B,C | | .126 | | .067 |
| Net realized and unrealized gain (loss) | | (.323) | | (.508) |
| Total from investment operations | | (.197) | | (.441) |
| Distributions from net investment income | | (.143) | | (.049) |
| Total distributions | | (.143) | | (.049) |
| Net asset value, end of period | $ | 9.17 | $ | 9.51 |
Total Return D,E,F | | (2.06)% | | (4.41)% |
Ratios to Average Net Assets C,G,H | | | | |
| Expenses before reductions | | 1.41% I | | 1.39% I |
| Expenses net of fee waivers, if any | | 1.41% I | | 1.39% I |
| Expenses net of all reductions | | 1.41% I | | 1.39% I |
| Net investment income (loss) | | 2.77% I | | 1.79% I |
| Supplemental Data | | | | |
| Net assets, end of period (000 omitted) | $ | 936 | $ | 955 |
Portfolio turnover rate J | | 334% I | | 118% K |
A For the period April 13, 2022 (commencement of operations) through August 31, 2022
B Calculated based on average shares outstanding during the period.
C Net investment income (loss) is affected by the timing of the declaration of dividends by any underlying mutual funds or exchange-traded funds (ETFs). Net investment income (loss) of any mutual funds or ETFs is not included in the Fund's net investment income (loss) ratio.
D Total returns for periods of less than one year are not annualized.
E Total returns would have been lower if certain expenses had not been reduced during the applicable periods shown.
F Total returns do not include the effect of the contingent deferred sales charge.
G Fees and expenses of any underlying mutual funds or exchange-traded funds (ETFs) are not included in the Fund's expense ratio. The Fund indirectly bears its proportionate share of these expenses. For additional expense information related to investments in Fidelity Central Funds, please refer to the "Investments in Fidelity Central Funds" note found in the Notes to Financial Statements section of the most recent Annual or Semi-Annual report.
H Expense ratios reflect operating expenses of the class. Expenses before reductions do not reflect amounts reimbursed, waived, or reduced through arrangements with the investment adviser, brokerage services, or other offset arrangements, if applicable, and do not represent the amount paid by the class during periods when reimbursements, waivers or reductions occur.
I Annualized.
J Amount does not include the portfolio activity of any underlying mutual funds or exchange-traded funds (ETFs).
K Amount not annualized.
| Fidelity Sustainable Core Plus Bond Fund |
| |
| | Six months ended (Unaudited) February 28, 2023 | | Years ended August 31, 2022 A |
Selected Per-Share Data | | | | |
| Net asset value, beginning of period | $ | 9.51 | $ | 10.00 |
| Income from Investment Operations | | | | |
Net investment income (loss) B,C | | .170 | | .102 |
| Net realized and unrealized gain (loss) | | (.323) | | (.509) |
| Total from investment operations | | (.153) | | (.407) |
| Distributions from net investment income | | (.187) | | (.083) |
| Total distributions | | (.187) | | (.083) |
| Net asset value, end of period | $ | 9.17 | $ | 9.51 |
Total Return D,E | | (1.59)% | | (4.08)% |
Ratios to Average Net Assets B,F,G | | | | |
| Expenses before reductions | | .45% H | | .45% H |
| Expenses net of fee waivers, if any | | .45% H | | .45% H |
| Expenses net of all reductions | | .45% H | | .44% H |
| Net investment income (loss) | | 3.73% H | | 2.74% H |
| Supplemental Data | | | | |
| Net assets, end of period (000 omitted) | $ | 23,141 | $ | 21,580 |
Portfolio turnover rate I | | 334% H | | 118% J |
A For the period April 13, 2022 (commencement of operations) through August 31, 2022
B Net investment income (loss) is affected by the timing of the declaration of dividends by any underlying mutual funds or exchange-traded funds (ETFs). Net investment income (loss) of any mutual funds or ETFs is not included in the Fund's net investment income (loss) ratio.
C Calculated based on average shares outstanding during the period.
D Total returns for periods of less than one year are not annualized.
E Total returns would have been lower if certain expenses had not been reduced during the applicable periods shown.
F Fees and expenses of any underlying mutual funds or exchange-traded funds (ETFs) are not included in the Fund's expense ratio. The Fund indirectly bears its proportionate share of these expenses. For additional expense information related to investments in Fidelity Central Funds, please refer to the "Investments in Fidelity Central Funds" note found in the Notes to Financial Statements section of the most recent Annual or Semi-Annual report.
G Expense ratios reflect operating expenses of the class. Expenses before reductions do not reflect amounts reimbursed, waived, or reduced through arrangements with the investment adviser, brokerage services, or other offset arrangements, if applicable, and do not represent the amount paid by the class during periods when reimbursements, waivers or reductions occur.
H Annualized.
I Amount does not include the portfolio activity of any underlying mutual funds or exchange-traded funds (ETFs).
J Amount not annualized.
| Fidelity Advisor® Sustainable Core Plus Bond Fund Class I |
| |
| | Six months ended (Unaudited) February 28, 2023 | | Years ended August 31, 2022 A |
Selected Per-Share Data | | | | |
| Net asset value, beginning of period | $ | 9.51 | $ | 10.00 |
| Income from Investment Operations | | | | |
Net investment income (loss) B,C | | .172 | | .104 |
| Net realized and unrealized gain (loss) | | (.323) | | (.509) |
| Total from investment operations | | (.151) | | (.405) |
| Distributions from net investment income | | (.189) | | (.085) |
| Total distributions | | (.189) | | (.085) |
| Net asset value, end of period | $ | 9.17 | $ | 9.51 |
Total Return D,E | | (1.57)% | | (4.06)% |
Ratios to Average Net Assets C,F,G | | | | |
| Expenses before reductions | | .41% H | | .40% H |
| Expenses net of fee waivers, if any | | .41% H | | .40% H |
| Expenses net of all reductions | | .41% H | | .40% H |
| Net investment income (loss) | | 3.77% H | | 2.79% H |
| Supplemental Data | | | | |
| Net assets, end of period (000 omitted) | $ | 946 | $ | 959 |
Portfolio turnover rate I | | 334% H | | 118% J |
A For the period April 13, 2022 (commencement of operations) through August 31, 2022
B Calculated based on average shares outstanding during the period.
C Net investment income (loss) is affected by the timing of the declaration of dividends by any underlying mutual funds or exchange-traded funds (ETFs). Net investment income (loss) of any mutual funds or ETFs is not included in the Fund's net investment income (loss) ratio.
D Total returns for periods of less than one year are not annualized.
E Total returns would have been lower if certain expenses had not been reduced during the applicable periods shown.
F Fees and expenses of any underlying mutual funds or exchange-traded funds (ETFs) are not included in the Fund's expense ratio. The Fund indirectly bears its proportionate share of these expenses. For additional expense information related to investments in Fidelity Central Funds, please refer to the "Investments in Fidelity Central Funds" note found in the Notes to Financial Statements section of the most recent Annual or Semi-Annual report.
G Expense ratios reflect operating expenses of the class. Expenses before reductions do not reflect amounts reimbursed, waived, or reduced through arrangements with the investment adviser, brokerage services, or other offset arrangements, if applicable, and do not represent the amount paid by the class during periods when reimbursements, waivers or reductions occur.
H Annualized.
I Amount does not include the portfolio activity of any underlying mutual funds or exchange-traded funds (ETFs).
J Amount not annualized.
| Fidelity Advisor® Sustainable Core Plus Bond Fund Class Z |
| |
| | Six months ended (Unaudited) February 28, 2023 | | Years ended August 31, 2022 A |
Selected Per-Share Data | | | | |
| Net asset value, beginning of period | $ | 9.51 | $ | 10.00 |
| Income from Investment Operations | | | | |
Net investment income (loss) B,C | | .174 | | .105 |
| Net realized and unrealized gain (loss) | | (.322) | | (.509) |
| Total from investment operations | | (.148) | | (.404) |
| Distributions from net investment income | | (.192) | | (.086) |
| Total distributions | | (.192) | | (.086) |
| Net asset value, end of period | $ | 9.17 | $ | 9.51 |
Total Return D,E | | (1.54)% | | (4.05)% |
Ratios to Average Net Assets C,F,G | | | | |
| Expenses before reductions | | .40% H | | .40% H |
| Expenses net of fee waivers, if any | | .36% H | | .36% H |
| Expenses net of all reductions | | .36% H | | .36% H |
| Net investment income (loss) | | 3.82% H | | 2.82% H |
| Supplemental Data | | | | |
| Net assets, end of period (000 omitted) | $ | 2,600 | $ | 1,404 |
Portfolio turnover rate I | | 334% H | | 118% J |
A For the period April 13, 2022 (commencement of operations) through August 31, 2022
B Calculated based on average shares outstanding during the period.
C Net investment income (loss) is affected by the timing of the declaration of dividends by any underlying mutual funds or exchange-traded funds (ETFs). Net investment income (loss) of any mutual funds or ETFs is not included in the Fund's net investment income (loss) ratio.
D Total returns for periods of less than one year are not annualized.
E Total returns would have been lower if certain expenses had not been reduced during the applicable periods shown.
F Fees and expenses of any underlying mutual funds or exchange-traded funds (ETFs) are not included in the Fund's expense ratio. The Fund indirectly bears its proportionate share of these expenses. For additional expense information related to investments in Fidelity Central Funds, please refer to the "Investments in Fidelity Central Funds" note found in the Notes to Financial Statements section of the most recent Annual or Semi-Annual report.
G Expense ratios reflect operating expenses of the class. Expenses before reductions do not reflect amounts reimbursed, waived, or reduced through arrangements with the investment adviser, brokerage services, or other offset arrangements, if applicable, and do not represent the amount paid by the class during periods when reimbursements, waivers or reductions occur.
H Annualized.
I Amount does not include the portfolio activity of any underlying mutual funds or exchange-traded funds (ETFs).
J Amount not annualized.
For the period ended February 28, 2023
1. Organization.
Fidelity Sustainable Core Plus Bond Fund (the Fund) is a fund of Fidelity Salem Street Trust (the Trust) and is authorized to issue an unlimited number of shares. The Trust is registered under the Investment Company Act of 1940, as amended (the 1940 Act), as an open-end management investment company organized as a Massachusetts business trust. The Fund offers Class A, Class M, Class C, Fidelity Sustainable Core Plus Bond Fund, Class I and Class Z shares, each of which has equal rights as to assets and voting privileges. Each class has exclusive voting rights with respect to matters that affect that class. Class C shares will automatically convert to Class A shares after a holding period of eight years from the initial date of purchase, with certain exceptions.
2. Investments in Fidelity Central Funds.
Funds may invest in Fidelity Central Funds, which are open-end investment companies generally available only to other investment companies and accounts managed by the investment adviser and its affiliates. The Schedule of Investments lists any Fidelity Central Funds held as an investment as of period end, but does not include the underlying holdings of each Fidelity Central Fund. An investing fund indirectly bears its proportionate share of the expenses of the underlying Fidelity Central Funds.
Based on its investment objective, each Fidelity Central Fund may invest or participate in various investment vehicles or strategies that are similar to those of the investing fund. These strategies are consistent with the investment objectives of the investing fund and may involve certain economic risks which may cause a decline in value of each of the Fidelity Central Funds and thus a decline in the value of the investing fund.
| Fidelity Central Fund | Investment Manager | Investment Objective | Investment Practices | Expense Ratio A |
| Fidelity Money Market Central Funds | Fidelity Management & Research Company LLC (FMR) | Each fund seeks to obtain a high level of current income consistent with the preservation of capital and liquidity. | Short-term Investments | Less than .005% |
A Expenses expressed as a percentage of average net assets and are as of each underlying Central Fund's most recent annual or semi-annual shareholder report.
A complete unaudited list of holdings for each Fidelity Central Fund is available upon request or at the Securities and Exchange Commission website at www.sec.gov. In addition, the financial statements of the Fidelity Central Funds which contain the significant accounting policies (including investment valuation policies) of those funds, and are not covered by the Report of Independent Registered Public Accounting Firm, are available on the Securities and Exchange Commission website or upon request.
3. Significant Accounting Policies.
The Fund is an investment company and applies the accounting and reporting guidance of the Financial Accounting Standards Board (FASB) Accounting Standards Codification Topic 946 Financial Services - Investment Companies . The financial statements have been prepared in conformity with accounting principles generally accepted in the United States of America (GAAP), which require management to make certain estimates and assumptions at the date of the financial statements. Actual results could differ from those estimates. Subsequent events, if any, through the date that the financial statements were issued have been evaluated in the preparation of the financial statements. The Fund's Schedule of Investments lists any underlying mutual funds or exchange-traded funds (ETFs) but does not include the underlying holdings of these funds. The following summarizes the significant accounting policies of the Fund:
Investment Valuation. Investments are valued as of 4:00 p.m. Eastern time on the last calendar day of the period. The Board of Trustees (the Board) has designated the Fund's investment adviser as the valuation designee responsible for the fair valuation function and performing fair value determinations as needed. The investment adviser has established a Fair Value Committee (the Committee) to carry out the day-to-day fair valuation responsibilities and has adopted policies and procedures to govern the fair valuation process and the activities of the Committee. In accordance with these fair valuation policies and procedures, which have been approved by the Board, the Fund attempts to obtain prices from one or more third party pricing services or brokers to value its investments. When current market prices, quotations or currency exchange rates are not readily available or reliable, investments will be fair valued in good faith by the Committee, in accordance with the policies and procedures. Factors used in determining fair value vary by investment type and may include market or investment specific events, transaction data, estimated cash flows, and market observations of comparable investments. The frequency that the fair valuation procedures are used cannot be predicted and they may be utilized to a significant extent. The Committee manages the Fund's fair valuation practices and maintains the fair valuation policies and procedures. The Fund's investment adviser reports to the Board information regarding the fair valuation process and related material matters.
The Fund categorizes the inputs to valuation techniques used to value its investments into a disclosure hierarchy consisting of three levels as shown below:
Level 1 - unadjusted quoted prices in active markets for identical investments
Level 2 - other significant observable inputs (including quoted prices for similar investments, interest rates, prepayment speeds, etc.)
Level 3 - unobservable inputs (including the Fund's own assumptions based on the best information available)
Valuation techniques used to value the Fund's investments by major category are as follows:
Debt securities, including restricted securities, are valued based on evaluated prices received from third party pricing services or from brokers who make markets in such securities. Corporate bonds, bank loan obligations, foreign government and government agency obligations, preferred securities and U.S. government and government agency obligations are valued by pricing services who utilize matrix pricing which considers yield or price of bonds of comparable quality, coupon, maturity and type or by broker-supplied prices. Asset backed securities, commercial mortgage securities and U.S. government agency mortgage securities are valued by pricing services who utilize matrix pricing which considers prepayment speed assumptions, attributes of the collateral, yield or price of bonds of comparable quality, coupon, maturity and type or by broker-supplied prices. When independent prices are unavailable or unreliable, debt securities may be valued utilizing pricing methodologies which consider similar factors that would be used by third party pricing services. For foreign debt securities, when significant market or security specific events arise, valuations may be determined in good faith in accordance with procedures adopted by the Board. Debt securities are generally categorized as Level 2 in the hierarchy but may be Level 3 depending on the circumstances.
Equity securities, including restricted securities, for which market quotations are readily available, are valued at the last reported sale price or official closing price as reported by a third party pricing service on the primary market or exchange on which they are traded and are categorized as Level 1 in the hierarchy. In the event there were no sales during the day or closing prices are not available, securities are valued at the last quoted bid price or may be valued using the last available price and are generally categorized as Level 2 in the hierarchy. For foreign equity securities, when market or security specific events arise, comparisons to the valuation of American Depositary Receipts (ADRs), futures contracts, ETFs and certain indexes as well as quoted prices for similar securities may be used and would be categorized as Level 2 in the hierarchy. For equity securities, including restricted securities, where observable inputs are limited, assumptions about market activity and risk are used and these securities may be categorized as Level 3 in the hierarchy.
The U.S. dollar value of forward foreign currency contracts is determined using currency exchange rates supplied by a pricing service and are categorized as Level 2 in the hierarchy. Futures contracts are valued at the settlement price established each day by the board of trade or exchange on which they are traded and are categorized as Level 1 in the hierarchy. Investments in open-end mutual funds, including the Fidelity Central Funds, are valued at their closing net asset value (NAV) each business day and are categorized as Level 1 in the hierarchy.
Changes in valuation techniques may result in transfers in or out of an assigned level within the disclosure hierarchy. The aggregate value of investments by input level as of February 28, 2023 is included at the end of the Fund's Schedule of Investments.
Foreign Currency. Certain Funds may use foreign currency contracts to facilitate transactions in foreign-denominated securities. Gains and losses from these transactions may arise from changes in the value of the foreign currency or if the counterparties do not perform under the contracts' terms.
Foreign-denominated assets, including investment securities, and liabilities are translated into U.S. dollars at the exchange rates at period end. Purchases and sales of investment securities, income and dividends received, and expenses denominated in foreign currencies are translated into U.S. dollars at the exchange rate in effect on the transaction date.
The effects of exchange rate fluctuations on investments are included with the net realized and unrealized gain (loss) on investment securities. Other foreign currency transactions resulting in realized and unrealized gain (loss) are disclosed separately.
Investment Transactions and Income. For financial reporting purposes, the Fund's investment holdings and NAV include trades executed through the end of the last business day of the period. The NAV per share for processing shareholder transactions is calculated as of the close of business of the New York Stock Exchange (NYSE), normally 4:00 p.m. Eastern time and includes trades executed through the end of the prior business day. Gains and losses on securities sold are determined on the basis of identified cost. Dividend income is recorded on the ex-dividend date, except for certain dividends from foreign securities where the ex-dividend date may have passed, which are recorded as soon as the Fund is informed of the ex-dividend date. Non-cash dividends included in dividend income, if any, are recorded at the fair market value of the securities received. Income and capital gain distributions from Fidelity Central Funds, if any, are recorded on the ex-dividend date. Interest income is accrued as earned and includes coupon interest and amortization of premium and accretion of discount on debt securities as applicable. Investment income is recorded net of foreign taxes withheld where recovery of such taxes is uncertain. Debt obligations may be placed on non-accrual status and related interest income may be reduced by ceasing current accruals and writing off interest receivables when the collection of all or a portion of interest has become doubtful based on consistently applied procedures. A debt obligation is removed from non-accrual status when the issuer resumes interest payments or when collectability of interest is reasonably assured.
Class Allocations and Expenses. Investment income, realized and unrealized capital gains and losses, common expenses of a fund, and certain fund-level expense reductions, if any, are allocated daily on a pro-rata basis to each class based on the relative net assets of each class to the total net assets of a fund. Each class differs with respect to transfer agent and distribution and service plan fees incurred, as applicable. Certain expense reductions may also differ by class, if applicable. For the reporting period, the allocated portion of income and expenses to each class as a percent of its average net assets may vary due to the timing of recording these transactions in relation to fluctuating net assets of the classes. Expenses directly attributable to a fund are charged to that fund. Expenses attributable to more than one fund are allocated among the respective funds on the basis of relative net assets or other appropriate methods. Expenses included in the accompanying financial statements reflect the expenses of that fund and do not include any expenses associated with any underlying mutual funds or exchange-traded funds. Although not included in a fund's expenses, a fund indirectly bears its proportionate share of these expenses through the net asset value of each underlying mutual fund or exchange-traded fund. Expense estimates are accrued in the period to which they relate and adjustments are made when actual amounts are known.
Income Tax Information and Distributions to Shareholders. Each year, the Fund intends to qualify as a regulated investment company under Subchapter M of the Internal Revenue Code, including distributing substantially all of its taxable income and realized gains. As a result, no provision for U.S. Federal income taxes is required. The Fund files a U.S. federal tax return, in addition to state and local tax returns as required. The Fund's federal income tax returns are subject to examination by the Internal Revenue Service (IRS) for a period of three fiscal years after they are filed. State and local tax returns may be subject to examination for an additional fiscal year depending on the jurisdiction. Foreign taxes are provided for based on the Fund's understanding of the tax rules and rates that exist in the foreign markets in which it invests.
Distributions are declared and recorded daily and paid monthly from net investment income. Distributions from realized gains, if any, are declared and recorded on the ex-dividend date. Income and capital gain distributions are declared separately for each class. Income and capital gain distributions are determined in accordance with income tax regulations, which may differ from GAAP.
Capital accounts within the financial statements are adjusted for permanent book-tax differences. These adjustments have no impact on net assets or the results of operations. Capital accounts are not adjusted for temporary book-tax differences which will reverse in a subsequent period.
Book-tax differences are primarily due to futures contracts, foreign currency transactions, market discount, capital loss carryforwards and losses deferred due to wash sales.
As of period end, the cost and unrealized appreciation (depreciation) in securities, and derivatives if applicable, for federal income tax purposes were as follows:
| Gross unrealized appreciation | $85,541 |
| Gross unrealized depreciation | (1,907,638) |
| Net unrealized appreciation (depreciation) | $(1,822,097) |
| Tax cost | $36,032,037 |
Capital loss carryforwards are only available to offset future capital gains of the Fund to the extent provided by regulations and may be limited. The capital loss carryforward information presented below, including any applicable limitation, is estimated as of prior fiscal period end and is subject to adjustment.
| Short-term | $(75,548) |
| Long-term | (1,343) |
| Total capital loss carryforward | $(76,891) |
Delayed Delivery Transactions and When-Issued Securities. During the period, certain Funds transacted in securities on a delayed delivery or when-issued basis. Payment and delivery may take place after the customary settlement period for that security. The price of the underlying securities and the date when the securities will be delivered and paid for are fixed at the time the transaction is negotiated. Securities purchased on a delayed delivery or when-issued basis are identified as such in the Schedule of Investments. Compensation for interest forgone in the purchase of a delayed delivery or when-issued debt security may be received. With respect to purchase commitments, each applicable Fund identifies securities as segregated in its records with a value at least equal to the amount of the commitment. Payables and receivables associated with the purchases and sales of delayed delivery securities having the same coupon, settlement date and broker are offset. Delayed delivery or when-issued securities that have been purchased from and sold to different brokers are reflected as both payables and receivables in the Statement of Assets and Liabilities under the caption "Delayed delivery", as applicable. Losses may arise due to changes in the value of the underlying securities or if the counterparty does not perform under the contract's terms, or if the issuer does not issue the securities due to political, economic, or other factors.
To-Be-Announced (TBA) Securities and Mortgage Dollar Rolls. TBA securities involve buying or selling mortgage-backed securities (MBS) on a forward commitment basis. A TBA transaction typically does not designate the actual security to be delivered and only includes an approximate principal amount; however delivered securities must meet specified terms defined by industry guidelines, including issuer, rate and current principal amount outstanding on underlying mortgage pools. Funds may enter into a TBA transaction with the intent to take possession of or deliver the underlying MBS, or a fund may elect to extend the settlement by entering into either a mortgage or reverse mortgage dollar roll. Mortgage dollar rolls are transactions where a fund sells TBA securities and simultaneously agrees to repurchase MBS on a later date at a lower price and with the same counterparty. Reverse mortgage dollar rolls involve the purchase and simultaneous agreement to sell TBA securities on a later date at a lower price. Transactions in mortgage dollar rolls and reverse mortgage dollar rolls are accounted for as purchases and sales and may result in an increase to a fund's portfolio turnover rate.
Purchases and sales of TBA securities involve risks similar to those discussed above for delayed delivery and when-issued securities. Also, if the counterparty in a mortgage dollar roll or a reverse mortgage dollar roll transaction files for bankruptcy or becomes insolvent, a fund's right to repurchase or sell securities may be limited. Additionally, when a fund sells TBA securities without already owning or having the right to obtain the deliverable securities (an uncovered forward commitment to sell), it incurs a risk of loss because it could have to purchase the securities at a price that is higher than the price at which it sold them. A fund may be unable to purchase the deliverable securities if the corresponding market is illiquid.
TBA securities subject to a forward commitment to sell at period end are included at the end of the Schedule of Investments under the caption "TBA Sale Commitments." The proceeds and value of these commitments are reflected in the Statement of Assets and Liabilities as "Receivable for TBA sale commitments" and "TBA sale commitments, at value," respectively.
Restricted Securities (including Private Placements). Funds may invest in securities that are subject to legal or contractual restrictions on resale. These securities generally may be resold in transactions exempt from registration or to the public if the securities are registered. Disposal of these securities may involve time-consuming negotiations and expense, and prompt sale at an acceptable price may be difficult. Information regarding restricted securities held at period end is included at the end of the Schedule of Investments, if applicable.
Loans and Other Direct Debt Instruments. Direct debt instruments are interests in amounts owed to lenders by corporate or other borrowers. These instruments may be in the form of loans, trade claims or other receivables and may include standby financing commitments such as revolving credit facilities that obligate a fund to supply additional cash to the borrower on demand. Loans may be acquired through assignment, participation, or may be made directly to a borrower. Such instruments are presented in the Bank Loan Obligations section in the Schedule of Investments. Certain funds may also invest in unfunded loan commitments, which are contractual obligations for future funding. Information regarding unfunded commitments is included at the end of the Schedule of Investments, if applicable.
4. Derivative Instruments.
Risk Exposures and the Use of Derivative Instruments. The Fund's investment objectives allow for various types of derivative instruments, including futures contracts and forward foreign currency contracts. Derivatives are investments whose value is primarily derived from underlying assets, indices or reference rates and may be transacted on an exchange or over-the-counter (OTC). Derivatives may involve a future commitment to buy or sell a specified asset based on specified terms, to exchange future cash flows at periodic intervals based on a notional principal amount, or for one party to make one or more payments upon the occurrence of specified events in exchange for periodic payments from the other party.
Derivatives were used to increase returns, to facilitate transactions in foreign-denominated securities and to manage exposure to certain risks as defined below. The success of any strategy involving derivatives depends on analysis of numerous economic factors, and if the strategies for investment do not work as intended, the objectives may not be achieved.
Derivatives were used to increase or decrease exposure to the following risk(s):
| | |
| Foreign Exchange Risk | Foreign exchange rate risk relates to fluctuations in the value of an asset or liability due to changes in currency exchange rates. |
| Interest Rate Risk | Interest rate risk relates to the fluctuations in the value of interest-bearing securities due to changes in the prevailing levels of market interest rates. |
Funds are also exposed to additional risks from investing in derivatives, such as liquidity risk and counterparty credit risk. Liquidity risk is the risk that a fund will be unable to close out the derivative in the open market in a timely manner. Counterparty credit risk is the risk that the counterparty will not be able to fulfill its obligation to a fund. Derivative counterparty credit risk is managed through formal evaluation of the creditworthiness of all potential counterparties. On certain OTC derivatives such as forward foreign currency contracts, a fund attempts to reduce its exposure to counterparty credit risk by entering into an International Swaps and Derivatives Association, Inc. (ISDA) Master Agreement with each of its counterparties. The ISDA Master Agreement gives a fund the right to terminate all transactions traded under such agreement upon the deterioration in the credit quality of the counterparty beyond specified levels. The ISDA Master Agreement gives each party the right, upon an event of default by the other party or a termination of the agreement, to close out all transactions traded under such agreement and to net amounts owed under each transaction to one net payable by one party to the other. To mitigate counterparty credit risk on bi-lateral OTC derivatives, a fund receives collateral in the form of cash or securities once net unrealized appreciation on outstanding derivative contracts under an ISDA Master Agreement exceeds certain applicable thresholds, subject to certain minimum transfer provisions. The collateral received is held in segregated accounts with the custodian bank in accordance with the collateral agreements entered into between a fund, the counterparty and the custodian bank. A fund could experience delays and costs in gaining access to the collateral even though it is held by the custodian bank. The maximum risk of loss to a fund from counterparty credit risk related to bi-lateral OTC derivatives is generally the aggregate unrealized appreciation and unpaid counterparty payments in excess of any collateral pledged by the counterparty to a fund. A fund may be required to pledge collateral for the benefit of the counterparties on bi-lateral OTC derivatives in an amount not less than each counterparty's unrealized appreciation on outstanding derivative contracts, subject to certain minimum transfer provisions, and any such pledged collateral is identified in the Schedule of Investments. Exchange-traded contracts are not covered by the ISDA Master Agreement; however counterparty credit risk related to these contracts may be mitigated by the protection provided by the exchange on which they trade.
Investing in derivatives may involve greater risks than investing in the underlying assets directly and, to varying degrees, may involve risk of loss in excess of any initial investment and collateral received and amounts recognized in the Statement of Assets and Liabilities. In addition, there may be the risk that the change in value of the derivative contract does not correspond to the change in value of the underlying instrument.
Net Realized Gain (Loss) and Change in Net Unrealized Appreciation (Depreciation) on Derivatives. The table below, which reflects the impacts of derivatives on the financial performance, summarizes the net realized gain (loss) and change in net unrealized appreciation (depreciation) for derivatives during the period as presented in the Statement of Operations.
| Primary Risk Exposure / Derivative Type | Net Realized Gain (Loss) | Change in Net Unrealized Appreciation (Depreciation) |
| Fidelity Sustainable Core Plus Bond Fund | | |
| Foreign Exchange Risk | | |
| Forward Foreign Currency Contracts | $(18,434) | $(12,154) |
| Total Foreign Exchange Risk | (18,434) | (12,154) |
| Interest Rate Risk | | |
| Futures Contracts | $(25,678) | $4,997 |
| Total Interest Rate Risk | (25,678) | 4,997 |
| Totals | $(44,112) | $(7,157) |
If there are any open positions at period end, a summary of the value of derivatives by primary risk exposure is included at the end of the Schedule of Investments.
Forward Foreign Currency Contracts. Forward foreign currency contracts represent obligations to purchase or sell foreign currency on a specified future date at a price fixed at the time the contracts are entered into. Forward foreign currency contracts were used to facilitate transactions in foreign-denominated securities and to manage exposure to certain foreign currencies.
Forward foreign currency contracts are valued daily and fluctuations in exchange rates on open contracts are recorded as unrealized appreciation or (depreciation) and reflected in total accumulated earnings (loss) in the Statement of Assets and Liabilities. When the contract is closed, a gain or loss is realized equal to the difference between the closing value and the value at the time it was opened. Non-deliverable forward foreign currency exchange contracts are settled with the counterparty in cash without the delivery of foreign currency. The net realized gain (loss) and change in net unrealized appreciation (depreciation) on forward foreign currency contracts during the period is presented in the Statement of Operations.
Any open forward foreign currency contracts at period end are presented in the Schedule of Investments under the caption "Forward Foreign Currency Contracts." The contract amount and unrealized appreciation (depreciation) reflects each contract's exposure to the underlying currency at period end, and is representative of volume of activity during the period unless an average contract value is presented.
Futures Contracts. A futures contract is an agreement between two parties to buy or sell a specified underlying instrument for a fixed price at a specified future date. Futures contracts were used to manage exposure to the bond market and fluctuations in interest rates.
Upon entering into a futures contract, a fund is required to deposit either cash or securities (initial margin) with a clearing broker in an amount equal to a certain percentage of the face value of the contract. Futures contracts are marked-to-market daily and subsequent daily payments are made or received by a fund depending on the daily fluctuations in the value of the futures contracts and are recorded as unrealized appreciation or (depreciation). This receivable and/or payable, if any, is included in daily variation margin on futures contracts in the Statement of Assets and Liabilities. Realized gain or (loss) is recorded upon the expiration or closing of a futures contract. The net realized gain (loss) and change in net unrealized appreciation (depreciation) on futures contracts during the period is presented in the Statement of Operations.
Any open futures contracts at period end are presented in the Schedule of Investments under the caption "Futures Contracts". The notional amount at value reflects each contract's exposure to the underlying instrument or index at period end, and is representative of volume of activity during the period unless an average notional amount is presented. Any securities deposited to meet initial margin requirements are identified in the Schedule of Investments. Any cash deposited to meet initial margin requirements is presented as segregated cash with brokers for derivative instruments in the Statement of Assets and Liabilities.
5. Purchases and Sales of Investments.
Purchases and sales of securities, other than short-term securities, U.S. government securities and in-kind transactions, as applicable, are noted in the table below.
| | Purchases ($) | Sales ($) |
| Fidelity Sustainable Core Plus Bond Fund | 31,130,833 | 30,793,734 |
6. Fees and Other Transactions with Affiliates.
Management Fee. Fidelity Management & Research Company LLC (the investment adviser) and its affiliates provide the Fund with investment management related services for which the Fund pays a monthly management fee that is based on an annual rate of .35% of the Fund's average net assets. Under the management contract, the investment adviser pays all other expenses, except the compensation of the independent Trustees and certain other expenses such as proxy and shareholder meeting expenses.
Distribution and Service Plan Fees. In accordance with Rule 12b-1 of the 1940 Act, the Fund has adopted separate Distribution and Service Plans for each class of shares. Certain classes pay Fidelity Distributors Company LLC (FDC), an affiliate of the investment adviser, separate Distribution and Service Fees, each of which is based on an annual percentage of each class' average net assets. In addition, FDC may pay financial intermediaries for selling shares of the Fund and providing shareholder support services. For the period, the Distribution and Service Fee rates, total fees and amounts retained by FDC were as follows:
| | Distribution Fee | Service Fee | Total Fees | Retained by FDC |
| Class A | -% | .25% | $1,498 | $1,180 |
| Class M | -% | .25% | 1,247 | 1,172 |
| Class C | .75% | .25% | 4,663 | 4,663 |
| | | | $7,408 | $7,015 |
Sales Load. FDC may receive a front-end sales charge of up to 4.00% for selling Class A shares and Class M shares, some of which is paid to financial intermediaries for selling shares of the Fund. Depending on the holding period, FDC may receive contingent deferred sales charges levied on Class A, Class M and Class C redemptions. The deferred sales charges are 1.00% for Class C shares, .75% for certain purchases of Class A shares and .25% for certain purchases of Class M shares.
For the period, sales charge amounts retained by FDC were as follows:
| | Retained by FDC |
| Class A | $28 |
Transfer Agent Fees. Fidelity Investments Institutional Operations Company LLC (FIIOC), an affiliate of the investment adviser, is the transfer, dividend disbursing and shareholder servicing agent for each class of the Fund. FIIOC receives account fees and asset-based fees that vary according to the account size and type of account of the shareholders of the respective classes of the Fund, except for Class Z. FIIOC receives an asset-based fee of Class Z's average net assets. FIIOC pays for typesetting, printing and mailing of shareholder reports, except proxy statements.
For the period, transfer agent fees for each class were as follows:
| | Amount | % of Class-Level Average Net Assets A |
| Class A | $438 | .07 |
| Class M | 269 | .05 |
| Class C | 243 | .05 |
| Fidelity Sustainable Core Plus Bond Fund | 10,939 | .10 |
| Class I | 280 | .06 |
| Class Z | 535 | .05 |
| | $12,704 | |
A Annualized
Interfund Trades. Funds may purchase from or sell securities to other Fidelity Funds under procedures adopted by the Board. The procedures have been designed to ensure these interfund trades are executed in accordance with Rule 17a-7 of the 1940 Act. Any interfund trades are included within the respective purchases and sales amounts shown in the Purchases and Sales of Investments note. Interfund trades during the period are noted in the table below.
| | Purchases ($) | Sales ($) | Realized Gain (Loss) ($) |
| Fidelity Sustainable Core Plus Bond Fund | 2,577 | - | - |
7. Expense Reductions.
The investment adviser contractually agreed to reimburse expenses of each class to the extent annual operating expenses exceeded certain levels of class-level average net assets as noted in the table below. This reimbursement will remain in place through December 31, 2023. Some expenses, for example the compensation of the independent Trustees, and certain miscellaneous expenses such as proxy and shareholder meeting expenses, are excluded from this reimbursement.
The following classes were in reimbursement during the period:
| | Expense Limitations | Reimbursement |
| Class I | .45% | $- |
| Class Z | .36% | 466 |
| | | $466 |
Through arrangements with the Fund's custodian and each class' transfer agent, credits realized as a result of certain uninvested cash balances were used to reduce the Fund's expenses. During the period, custodian credits reduced the Fund's expenses by $449. During the period, transfer agent credits reduced each class' expenses as noted in the table below.
| | Expense reduction |
| Class M | $4 |
| Fidelity Sustainable Core Plus Bond Fund | 151 |
| Class Z | 7 |
| | $162 |
8. Distributions to Shareholders.
Distributions to shareholders of each class were as follows:
| | Six months ended February 28, 2023 | Year ended August 31, 2022 A |
| Fidelity Sustainable Core Plus Bond Fund | | |
| Distributions to shareholders | | |
| Class A | $22,962 | $8,626 |
| Class M | 19,254 | 7,990 |
| Class C | 14,505 | 4,929 |
| Fidelity Sustainable Core Plus Bond Fund | 442,742 | 176,769 |
| Class I | 19,274 | 8,539 |
| Class Z | 46,099 | 10,094 |
Total | $564,836 | $216,947 |
A Distributions for Class A, Class M, Class C, Fidelity Sustainable Core Plus Bond Fund, Class I, Class Z are for the period April 13, 2022
(commencement of sale of shares) through August 31, 2022.
9. Share Transactions.
Share transactions for each class were as follows and may contain in-kind transactions, automatic conversions between classes or exchanges between affiliated funds:
| | Shares | Shares | Dollars | Dollars |
| | Six months ended February 28, 2023 | Year ended August 31, 2022 A | Six months ended February 28, 2023 | Year ended August 31, 2022 A |
| Fidelity Sustainable Core Plus Bond Fund | | | | |
| Class A | | | | |
| Shares sold | 4,737 | 128,095 | $43,334 | $1,274,103 |
| Reinvestment of distributions | 2,499 | 894 | 22,948 | 8,626 |
| Shares redeemed | (3,835) | - | (34,397) | - |
| Net increase (decrease) | 3,401 | 128,989 | $31,885 | $1,282,729 |
| Class M | | | | |
| Shares sold | - | 106,515 | $ - | $1,063,912 |
| Reinvestment of distributions | 2,097 | 828 | 19,254 | 7,990 |
| Net increase (decrease) | 2,097 | 107,343 | $19,254 | $1,071,902 |
| Class C | | | | |
| Shares sold | - | 100,000 | $ - | $1,000,000 |
| Reinvestment of distributions | 1,579 | 511 | 14,505 | 4,929 |
| Net increase (decrease) | 1,579 | 100,511 | $14,505 | $1,004,929 |
| Fidelity Sustainable Core Plus Bond Fund | | | | |
| Shares sold | 256,604 | 2,282,092 | $2,375,742 | $22,734,686 |
| Reinvestment of distributions | 46,746 | 18,248 | 429,201 | 176,180 |
| Shares redeemed | (50,764) | (30,356) | (470,821) | (289,711) |
| Net increase (decrease) | 252,586 | 2,269,984 | $2,334,122 | $22,621,155 |
| Class I | | | | |
| Shares sold | 165 | 100,000 | $1,500 | $1,000,000 |
| Reinvestment of distributions | 2,099 | 884 | 19,274 | 8,539 |
| Net increase (decrease) | 2,264 | 100,884 | $20,774 | $1,008,539 |
| Class Z | | | | |
| Shares sold | 166,128 | 146,829 | $1,519,300 | $1,450,000 |
| Reinvestment of distributions | 3,311 | 899 | 30,453 | 8,680 |
| Shares redeemed | (33,802) | - | (302,905) | - |
| Net increase (decrease) | 135,637 | 147,728 | $1,246,848 | $1,458,680 |
A For the period April 13, 2022 (commencement of operations)through August 31, 2022.
10. Other.
A fund's organizational documents provide former and current trustees and officers with a limited indemnification against liabilities arising in connection with the performance of their duties to the fund. In the normal course of business, a fund may also enter into contracts that provide general indemnifications. A fund's maximum exposure under these arrangements is unknown as this would be dependent on future claims that may be made against a fund. The risk of material loss from such claims is considered remote.
At the end of the period, the investment adviser or its affiliates were owners of record of more than 10% of the outstanding shares as follows:
| Fund | Affiliated % |
Fidelity Sustainable Core Plus Bond Fund | 79% |
11. Risk and Uncertainties.
Many factors affect a fund's performance. Developments that disrupt global economies and financial markets, such as pandemics, epidemics, outbreaks of infectious diseases, war, terrorism, and environmental disasters, may significantly affect a fund's investment performance. The effects of these developments to a fund will be impacted by the types of securities in which a fund invests, the financial condition, industry, economic sector, and geographic location of an issuer, and a fund's level of investment in the securities of that issuer. Significant concentrations in security types, issuers, industries, sectors, and geographic locations may magnify the factors that affect a fund's performance.
As a shareholder, you incur two types of costs: (1) transaction costs, which may include sales charges (loads) on purchase payments or redemption proceeds, as applicable and (2) ongoing costs, which generally include management fees, distribution and/or service (12b-1) fees and other Fund expenses. This Example is intended to help you understand your ongoing costs (in dollars) of investing in a fund and to compare these costs with the ongoing costs of investing in other mutual funds.
| The Example is based on an investment of $1,000 invested at the beginning of the period and held for the entire period (September 1, 2022 to February 28, 2023). |
Actual Expenses
The first line of the accompanying table provides information about actual account values and actual expenses. You may use the information in this line, together with the amount you invested, to estimate the expenses that you paid over the period. Simply divide your account value by $1,000.00 (for example, an $8,600 account value divided by $1,000.00 = 8.6), then multiply the result by the number in the first line for a class/Fund under the heading entitled "Expenses Paid During Period" to estimate the expenses you paid on your account during this period. If any fund is a shareholder of any underlying mutual funds or exchange-traded funds (ETFs) (the Underlying Funds), such fund indirectly bears its proportional share of the expenses of the Underlying Funds in addition to the direct expenses incurred presented in the table. These fees and expenses are not included in the annualized expense ratio used to calculate the expense estimate in the table below.
Hypothetical Example for Comparison Purposes
The second line of the accompanying table provides information about hypothetical account values and hypothetical expenses based on the actual expense ratio and an assumed rate of return of 5% per year before expenses, which is not the actual return. The hypothetical account values and expenses may not be used to estimate the actual ending account balance or expenses you paid for the period. You may use this information to compare the ongoing costs of investing in the Fund and other funds. To do so, compare this 5% hypothetical example with the 5% hypothetical examples that appear in the shareholder reports of the other funds. If any fund is a shareholder of any Underlying Funds, such fund indirectly bears its proportional share of the expenses of the Underlying Funds in addition to the direct expenses as presented in the table. These fees and expenses are not included in the annualized expense ratio used to calculate the expense estimate in the table below.
Please note that the expenses shown in the table are meant to highlight your ongoing costs only and do not reflect any transaction costs. Therefore, the second line of the table is useful in comparing ongoing costs only, and will not help you determine the relative total costs of owning different funds. In addition, if these transactional costs were included, your costs would have been higher.
| | | | | Annualized Expense Ratio- A | | Beginning Account Value September 1, 2022 | | Ending Account Value February 28, 2023 | | Expenses Paid During Period- C September 1, 2022 to February 28, 2023 |
| Fidelity® Sustainable Core Plus Bond Fund | | | | | | | | | | |
| Class A | | | | .68% | | | | | | |
| Actual | | | | | | $ 1,000 | | $ 983.00 | | $ 3.34 |
Hypothetical- B | | | | | | $ 1,000 | | $ 1,021.42 | | $ 3.41 |
| Class M | | | | .66% | | | | | | |
| Actual | | | | | | $ 1,000 | | $ 983.10 | | $ 3.25 |
Hypothetical- B | | | | | | $ 1,000 | | $ 1,021.52 | | $ 3.31 |
| Class C | | | | 1.41% | | | | | | |
| Actual | | | | | | $ 1,000 | | $ 979.40 | | $ 6.92 |
Hypothetical- B | | | | | | $ 1,000 | | $ 1,017.80 | | $ 7.05 |
| Fidelity® Sustainable Core Plus Bond Fund | | | | .45% | | | | | | |
| Actual | | | | | | $ 1,000 | | $ 984.10 | | $ 2.21 |
Hypothetical- B | | | | | | $ 1,000 | | $ 1,022.56 | | $ 2.26 |
| Class I | | | | .41% | | | | | | |
| Actual | | | | | | $ 1,000 | | $ 984.30 | | $ 2.02 |
Hypothetical- B | | | | | | $ 1,000 | | $ 1,022.76 | | $ 2.06 |
| Class Z | | | | .36% | | | | | | |
| Actual | | | | | | $ 1,000 | | $ 984.60 | | $ 1.77 |
Hypothetical- B | | | | | | $ 1,000 | | $ 1,023.01 | | $ 1.81 |
| |
A Annualized expense ratio reflects expenses net of applicable fee waivers.
B 5% return per year before expenses
C Expenses are equal to the annualized expense ratio, multiplied by the average account value over the period, multiplied by 181/ 365 (to reflect the one-half year period). The fees and expenses of any Underlying Funds are not included in each annualized expense ratio.
The Securities and Exchange Commission adopted Rule 22e-4 under the Investment Company Act of 1940 (the Liquidity Rule) to promote effective liquidity risk management throughout the open-end investment company industry, thereby reducing the risk that funds will be unable to meet their redemption obligations and mitigating dilution of the interests of fund shareholders.
The Fund has adopted and implemented a liquidity risk management program (the Program) reasonably designed to assess and manage the Fund's liquidity risk and to comply with the requirements of the Liquidity Rule. The Fund's Board of Trustees (the Board) has designated the Fund's investment adviser as administrator of the Program. The Fidelity advisers have established a Liquidity Risk Management Committee (the LRM Committee) to manage the Program for each of the Fidelity Funds. The LRM Committee monitors the adequacy and effectiveness of implementation of the Program and on a periodic basis assesses each Fund's liquidity risk based on a variety of factors including (1) the Fund's investment strategy, (2) portfolio liquidity and cash flow projections during normal and reasonably foreseeable stressed conditions, (3) shareholder redemptions, (4) borrowings and other funding sources and (5) certain factors specific to ETFs including the effect of the Fund's prices and spreads, market participants, and basket compositions on the overall liquidity of the Fund's portfolio, as applicable.
In accordance with the Program, each of the Fund's portfolio investments is classified into one of four defined liquidity categories based on a determination of a reasonable expectation for how long it would take to convert the investment to cash (or sell or dispose of the investment) without significantly changing its market value.
- Highly liquid investments - cash or convertible to cash within three business days or less
- Moderately liquid investments - convertible to cash in three to seven calendar days
- Less liquid investments - can be sold or disposed of, but not settled, within seven calendar days
- Illiquid investments - cannot be sold or disposed of within seven calendar days
Liquidity classification determinations take into account a variety of factors including various market, trading and investment-specific considerations, as well as market depth, and generally utilize analysis from a third-party liquidity metrics service.
The Liquidity Rule places a 15% limit on a fund's illiquid investments and requires funds that do not primarily hold assets that are highly liquid investments to determine and maintain a minimum percentage of the fund's net assets to be invested in highly liquid investments (highly liquid investment minimum or HLIM). The Program includes provisions reasonably designed to comply with the 15% limit on illiquid investments and for determining, periodically reviewing and complying with the HLIM requirement as applicable.
At a recent meeting of the Fund's Board of Trustees, the LRM Committee provided a written report to the Board pertaining to the operation, adequacy, and effectiveness of the Program for the period December 1, 2021 through November 30, 2022. The report concluded that the Program is operating effectively and is reasonably designed to assess and manage the Fund's liquidity risk.
1.9904880.100
SCB-SANN-0423
Fidelity® Series Government Money Market Fund
Semi-Annual Report
February 28, 2023
Contents
To view a fund's proxy voting guidelines and proxy voting record for the 12-month period ended June 30, visit http://www.fidelity.com/proxyvotingresults or visit the Securities and Exchange Commission's (SEC) web site at http://www.sec.gov.
You may also call 1-800-544-8544 to request a free copy of the proxy voting guidelines.
Standard & Poor's, S&P and S&P 500 are registered service marks of The McGraw-Hill Companies, Inc. and have been licensed for use by Fidelity Distributors Corporation.
Other third-party marks appearing herein are the property of their respective owners.
All other marks appearing herein are registered or unregistered trademarks or service marks of FMR LLC or an affiliated company. © 2023 FMR LLC. All rights reserved.
This report and the financial statements contained herein are submitted for the general information of the shareholders of the Fund. This report is not authorized for distribution to prospective investors in the Fund unless preceded or accompanied by an effective prospectus.
A fund files its complete schedule of portfolio holdings with the SEC for the first and third quarters of each fiscal year on Form N-PORT. Forms N-PORT are available on the SEC's web site at http://www.sec.gov. A fund's Forms N-PORT may be reviewed and copied at the SEC's Public Reference Room in Washington, DC. Information regarding the operation of the SEC's Public Reference Room may be obtained by calling 1-800-SEC-0330.
For a complete list of a fund's portfolio holdings, view the most recent holdings listing, semiannual report, or annual report on Fidelity's web site at http://www.fidelity.com, http://www.institutional.fidelity.com, or http://www.401k.com, as applicable.
NOT FDIC INSURED •MAY LOSE VALUE •NO BANK GUARANTEE
Neither the Fund nor Fidelity Distributors Corporation is a bank.
| Current 7-Day Yields |
| | | |
| Fidelity® Series Government Money Market Fund | 4.64% | |
| | | |
Yield refers to the income paid by the Fund over a given period. Yield for money market funds is usually for seven-day periods, as it is here, though it is expressed as an annual percentage rate. Past performance is no guarantee of future results. Yield will vary and it's possible to lose money investing in the Fund. | |
| Effective Maturity Diversification (% of Fund's Investments) |
| Days |
| 1 - 7 | 95.5 | |
| 8 - 30 | 1.2 | |
| 31 - 60 | 1.7 | |
| 61 - 90 | 1.0 | |
| 91 - 180 | 0.3 | |
| > 180 | 0.3 | |
| Effective maturity is determined in accordance with the requirements of Rule 2a-7 under the Investment Company Act of 1940. |
Asset Allocation (% of Fund's net assets) |
|
Net Other Assets (Liabilities) - (1.1)% |
Net Other Assets (Liabilities) are not available in the pie chart. |
|
Showing Percentage of Net Assets
| U.S. Treasury Debt - 5.1% |
| | | Yield (%)(a) | Principal Amount (b) | Value ($) |
| U.S. Treasury Obligations - 5.1% | | | | |
| U.S. Treasury Bills | | | | |
| 3/2/23 to 5/4/23 | | 3.29 to 4.56 | 9,000,000 | 8,967,835 |
| U.S. Treasury Notes | | | | |
| 4/30/23 to 10/31/24 (c) | | 4.73 to 4.95 | 208,000,000 | 207,946,091 |
| | | | | |
| TOTAL U.S. TREASURY DEBT (Cost $216,913,926) | | | | 216,913,926 |
| | | | | |
| U.S. Government Agency Debt - 16.5% |
| | | Yield (%)(a) | Principal Amount (b) | Value ($) |
| Federal Agencies - 16.5% | | | | |
| Federal Farm Credit Bank | | | | |
| 7/26/23 to 2/10/25 (c)(d) | | 4.61 to 4.75 | 54,000,000 | 53,998,256 |
| Federal Home Loan Bank | | | | |
| 3/1/23 to 11/22/24 (c) | | 3.38 to 5.15 | 633,670,000 | 632,966,209 |
| Freddie Mac | | | | |
| 5/3/24 (c)(d) | | 4.68 | 12,000,000 | 12,000,000 |
| | | | | |
| TOTAL U.S. GOVERNMENT AGENCY DEBT (Cost $698,964,465) | | | | 698,964,465 |
| | | | | |
| U.S. Government Agency Repurchase Agreement - 12.8% |
| | | Maturity Amount ($) | Value ($) |
| In a joint trading account at 4.55% dated 2/28/23 due 3/1/23 (Collateralized by U.S. Government Obligations) # | | 183,473,208 | 183,450,000 |
| With: | | | |
| ABN AMRO Bank NV at 4.55%, dated 2/28/23 due 3/1/23 (Collateralized by U.S. Treasury Obligations valued at $7,148,236, 1.25% - 5.00%, 5/15/27 - 2/1/53) | | 7,000,885 | 7,000,000 |
| BMO Harris Bank NA at 4.56%, dated: | | | |
2/2/23 due 3/7/23 (Collateralized by U.S. Government Obligations valued at $5,117,442, 3.50% - 6.00%, 10/20/47 - 1/20/53) | | 5,031,033 | 5,000,000 |
2/27/23 due 3/7/23 (Collateralized by U.S. Government Obligations valued at $4,081,034, 3.00%, 9/20/47) | | 4,012,160 | 4,000,000 |
| BNP Paribas, SA at: | | | |
4.53%, dated: | | | |
| 1/18/23 due 3/7/23 (Collateralized by U.S. Government Obligations valued at $17,483,210, 0.00% - 7.00%, 5/31/23 - 1/20/53) | | 17,130,489 | 17,000,000 |
| 1/19/23 due 3/7/23 (Collateralized by U.S. Government Obligations valued at $5,126,891, 0.00% - 7.00%, 10/31/23 - 2/1/53) | | 5,037,750 | 5,000,000 |
4.55%, dated 1/23/23 due 3/7/23 (Collateralized by U.S. Treasury Obligations valued at $25,627,210, 0.00% - 6.00%, 4/30/23 - 1/1/57) | | 25,186,424 | 25,000,000 |
4.56%, dated: | | | |
| 2/3/23 due 3/3/23 (Collateralized by U.S. Government Obligations valued at $8,188,883, 0.00% - 6.50%, 3/23/23 - 2/1/53) | | 8,028,342 | 8,000,000 |
| 2/6/23 due 3/6/23 (Collateralized by U.S. Government Obligations valued at $23,551,659, 0.00% - 7.00%, 4/30/24 - 2/1/53) | | 23,081,484 | 23,000,000 |
| 2/8/23 due 3/7/23 (Collateralized by U.S. Government Obligations valued at $4,091,047, 0.00% - 4.84%, 1/31/24 - 2/15/53) | | 4,014,171 | 4,000,000 |
4.57%, dated 1/27/23 due 3/7/23 (Collateralized by U.S. Treasury Obligations valued at $4,135,415, 0.00% - 7.00%, 3/28/23 - 5/15/52) | | 4,029,959 | 4,000,000 |
4.75%, dated 2/28/23 due 3/7/23 (Collateralized by U.S. Government Obligations valued at $27,047,903, 0.00% - 6.50%, 4/30/23 - 1/1/53) | | 26,706,295 | 26,500,000 |
4.8%, dated 2/17/23 due 3/7/23 (Collateralized by U.S. Treasury Obligations valued at $10,219,808, 0.00% - 6.00%, 4/30/23 - 2/1/57) | | 10,118,667 | 10,000,000 |
| BofA Securities, Inc. at 4.75%, dated 2/28/23 due 3/7/23 (Collateralized by U.S. Treasury Obligations valued at $6,120,864, 0.88%, 9/30/26) | | 6,051,458 | 6,000,000 |
| CIBC Bank U.S.A. at: | | | |
4.56%, dated 2/16/23 due 3/7/23 (Collateralized by U.S. Government Obligations valued at $4,086,786, 1.88% - 6.00%, 2/28/27 - 3/1/53) | | 4,012,667 | 4,000,000 |
4.62%, dated 2/2/23 due 3/23/23 (Collateralized by U.S. Government Obligations valued at $1,029,895, 0.00% - 7.00%, 8/15/26 - 9/16/63) | | 1,006,288 | 1,000,000 |
| Citibank NA at 4.56%, dated 2/23/23 due 3/2/23 (Collateralized by U.S. Treasury Obligations valued at $8,169,259, 0.00% - 8.63%, 4/15/23 - 9/15/65) | | 8,007,093 | 8,000,000 |
| Citigroup Global Capital Markets, Inc. at 4.56%, dated: | | | |
2/2/23 due 3/1/23 (Collateralized by U.S. Treasury Obligations valued at $8,187,942, 1.38% - 6.68%, 8/31/26 - 1/20/73) | | 8,027,360 | 8,000,000 |
2/23/23 due 3/2/23 (Collateralized by U.S. Government Obligations valued at $7,145,510, 1.63% - 4.50%, 11/30/26 - 5/20/52) | | 7,006,207 | 7,000,000 |
| Deutsche Bank AG, New York at 4.56%, dated: | | | |
2/23/23 due 3/2/23 (Collateralized by U.S. Treasury Obligations valued at $3,062,420, 4.00%, 10/31/29) | | 3,002,660 | 3,000,000 |
2/28/23 due 3/1/23 (Collateralized by U.S. Government Obligations valued at $10,301,305, 3.75%, 11/15/46) | | 10,001,267 | 10,000,000 |
| Goldman Sachs & Co. at 4.56%, dated: | | | |
2/22/23 due 3/1/23 (Collateralized by U.S. Government Obligations valued at $24,501,706, 3.00% - 4.50%, 3/1/46 - 4/1/52) | | 24,021,280 | 24,000,000 |
2/24/23 due 3/3/23 (Collateralized by U.S. Government Obligations valued at $35,722,610, 2.50% - 6.50%, 12/15/24 - 6/20/52) | | 35,031,033 | 35,000,000 |
2/28/23 due 3/7/23 (Collateralized by U.S. Government Obligations valued at $11,221,421, 3.50% - 7.50%, 6/1/30 - 6/20/52) | | 11,009,753 | 11,000,000 |
| Mitsubishi UFJ Securities (U.S.A.), Inc. at 4.58%, dated: | | | |
2/15/23 due 4/26/23 (Collateralized by U.S. Government Obligations valued at $4,087,267, 2.50% - 5.00%, 1/1/26 - 3/1/53) | | 4,035,622 | 4,000,000 |
2/28/23 due 4/26/23 (Collateralized by U.S. Government Obligations valued at $18,362,337, 2.50% - 5.50%, 7/1/24 - 1/1/53) | | 18,130,530 | 18,000,000 |
| RBC Dominion Securities at 4.56%, dated 2/2/23 due 3/7/23 (Collateralized by U.S. Government Obligations valued at $22,521,485, 0.00% - 4.50%, 1/15/25 - 8/20/52) | | 22,136,547 | 22,000,000 |
| RBC Financial Group at 4.56%, dated 2/2/23 due 3/7/23 (Collateralized by U.S. Government Obligations valued at $50,153,229, 0.13% - 6.50%, 4/30/24 - 2/20/53) | | 49,304,127 | 49,000,000 |
| TD Securities (U.S.A.) at 4.56%, dated 2/28/23 due 3/1/23 (Collateralized by U.S. Government Obligations valued at $12,241,551, 2.50%, 7/20/51) | | 12,001,520 | 12,000,000 |
| TOTAL U.S. GOVERNMENT AGENCY REPURCHASE AGREEMENT (Cost $543,950,000) | | | 543,950,000 |
| | | | |
| U.S. Treasury Repurchase Agreement - 66.7% |
| | | Maturity Amount ($) | Value ($) |
| With: | | | |
| ABN AMRO Bank NV at 4.55%, dated 2/28/23 due 3/1/23 (Collateralized by U.S. Treasury Obligations valued at $9,207,612, 0.50% - 3.38%, 4/30/27 - 8/15/46) | | 9,001,138 | 9,000,000 |
| Barclays Bank PLC at 4.55%, dated 2/28/23 due 3/1/23 (Collateralized by U.S. Treasury Obligations valued at $31,624,057, 0.75% - 2.38%, 5/31/26 - 5/15/27) | | 31,003,918 | 31,000,000 |
| CIBC Bank U.S.A. at 4.55%, dated 2/2/23 due 3/7/23 | | | |
(Collateralized by U.S. Treasury Obligations valued at $10,234,981, 0.50% - 3.38%, 2/29/24 - 11/15/50) | | 10,061,931 | 10,000,000 |
(Collateralized by U.S. Treasury Obligations valued at $4,094,065, 0.50% - 4.50%, 7/31/24 - 8/15/48) | | 4,024,772 | 4,000,000 |
| Commerz Markets LLC at 4.55%, dated: | | | |
2/22/23 due 3/1/23 (Collateralized by U.S. Treasury Obligations valued at $9,188,221, 0.38% - 3.88%, 7/31/24 - 5/15/45) | | 9,007,963 | 9,000,000 |
2/23/23 due 3/2/23 (Collateralized by U.S. Treasury Obligations valued at $11,228,890, 0.25% - 4.00%, 7/31/24 - 5/15/45) | | 11,009,732 | 11,000,000 |
2/28/23 due 3/1/23 (Collateralized by U.S. Treasury Obligations valued at $8,161,073, 1.88% - 3.25%, 7/31/24 - 5/15/45) | | 8,001,011 | 8,000,000 |
| Deutsche Bank Securities, Inc. at 4.55%, dated 2/28/23 due 3/1/23 (Collateralized by U.S. Treasury Obligations valued at $3,060,448, 2.50%, 5/15/24) | | 3,000,379 | 3,000,000 |
| Federal Reserve Bank of New York at 4.55%, dated 2/28/23 due 3/1/23 (Collateralized by U.S. Treasury Obligations valued at $1,965,248,438, 0.25% - 2.75%, 7/31/23 - 8/15/27) | | 1,965,248,354 | 1,965,000,000 |
| Lloyds Bank PLC at: | | | |
4.59%, dated: | | | |
| 1/9/23 due 3/9/23 (Collateralized by U.S. Treasury Obligations valued at $3,085,265, 1.25% - 2.88%, 8/15/23 - 9/30/28) | | 3,022,568 | 3,000,000 |
| 1/23/23 due 3/23/23 (Collateralized by U.S. Treasury Obligations valued at $3,079,069, 1.50% - 3.25%, 8/15/23 - 11/30/28) | | 3,022,568 | 3,000,000 |
| 2/2/23 due 3/2/23 (Collateralized by U.S. Treasury Obligations valued at $3,070,547, 2.38% - 3.25%, 8/15/23 - 6/30/27) | | 3,010,710 | 3,000,000 |
4.6%, dated 1/13/23 due 3/13/23 (Collateralized by U.S. Treasury Obligations valued at $2,050,578, 2.38% - 3.25%, 8/15/23 - 6/30/27) | | 2,015,078 | 2,000,000 |
4.62%, dated 1/25/23 due 3/27/23 (Collateralized by U.S. Treasury Obligations valued at $2,049,374, 2.38% - 3.25%, 8/15/23 - 6/30/27) | | 2,015,657 | 2,000,000 |
4.75%, dated: | | | |
| 2/6/23 due 5/9/23 (Collateralized by U.S. Treasury Obligations valued at $2,048,857, 2.25% - 3.25%, 8/15/23 - 8/15/27) | | 2,024,278 | 2,000,000 |
| 2/7/23 due 5/9/23 (Collateralized by U.S. Treasury Obligations valued at $2,044,222, 2.38% - 3.25%, 8/15/23 - 6/30/27) | | 2,024,014 | 2,000,000 |
4.87%, dated 2/22/23 due 5/22/23 (Collateralized by U.S. Treasury Obligations valued at $2,044,927, 0.38% - 2.88%, 8/15/23 - 7/31/27) | | 2,024,079 | 2,000,000 |
4.9%, dated 2/28/23 due 5/30/23 (Collateralized by U.S. Treasury Obligations valued at $3,059,219, 0.25% - 2.50%, 8/15/23 - 9/30/25) | | 3,037,158 | 3,000,000 |
| Mizuho Bank, Ltd. at 4.55%, dated 2/28/23 due 3/1/23 (Collateralized by U.S. Treasury Obligations valued at $11,235,602, 0.25%, 3/15/24) | | 11,001,390 | 11,000,000 |
| MUFG Securities EMEA PLC at 4.55%, dated 2/28/23 due 3/1/23 (Collateralized by U.S. Treasury Obligations valued at $20,403,038, 1.00%, 7/31/28) | | 20,002,528 | 20,000,000 |
| Natixis SA at 4.55%, dated 2/2/23 due 3/7/23 (Collateralized by U.S. Treasury Obligations valued at $6,140,936, 0.00% - 6.00%, 4/25/23 - 2/15/42) | | 6,037,158 | 6,000,000 |
| RBS Securities, Inc. at 4.56%, dated 2/24/23 due 3/3/23 (Collateralized by U.S. Treasury Obligations valued at $2,041,297, 6.13% - 6.63%, 2/15/27 - 11/15/27) | | 2,001,773 | 2,000,000 |
| Royal Bank of Canada at 4.56%, dated 2/2/23 due 3/7/23 (Collateralized by U.S. Treasury Obligations valued at $1,023,831, 1.25% - 2.75%, 9/30/24 - 8/15/42) | | 1,004,433 | 1,000,000 |
| SMBC Nikko Securities America, Inc. at 4.55%, dated 2/28/23 due 3/1/23 (Collateralized by U.S. Treasury Obligations valued at $713,996,559, 0.50% - 2.75%, 10/31/27 - 8/15/32) | | 700,088,472 | 700,000,000 |
| Societe Generale at 4.55%, dated: | | | |
2/23/23 due 3/2/23 (Collateralized by U.S. Treasury Obligations valued at $3,062,419, 4.00%, 11/15/42) | | 3,002,654 | 3,000,000 |
2/24/23 due 3/3/23 (Collateralized by U.S. Treasury Obligations valued at $9,185,866, 4.00%, 11/15/42) | | 9,007,963 | 9,000,000 |
2/28/23 due 3/7/23 (Collateralized by U.S. Treasury Obligations valued at $2,040,322, 4.00%, 11/15/42) | | 2,001,769 | 2,000,000 |
| TOTAL U.S. TREASURY REPURCHASE AGREEMENT (Cost $2,826,000,000) | | | 2,826,000,000 |
| | | | |
| TOTAL INVESTMENT IN SECURITIES - 101.1% (Cost $4,285,828,391) | 4,285,828,391 |
NET OTHER ASSETS (LIABILITIES) - (1.1)% | (45,257,655) |
| NET ASSETS - 100.0% | 4,240,570,736 |
| | |
The date shown for securities represents the date when principal payments must be paid, taking into account any call options exercised by the issuer and any permissible maturity shortening features other than interest rate resets.
Legend
| (a) | Yield represents either the annualized yield at the date of purchase, or the stated coupon rate, or, for floating and adjustable rate securities, the rate at period end. |
| (b) | Amount is stated in United States dollars unless otherwise noted. |
| (c) | Coupon rates for floating and adjustable rate securities reflect the rates in effect at period end. |
| (d) | Coupon is indexed to a floating interest rate which may be multiplied by a specified factor and/or subject to caps or floors. |
Investment Valuation
All investments are categorized as Level 2 under the Fair Value Hierarchy. The inputs or methodology used for valuing securities may not be an indication of the risk associated with investing in these securities. For more information on valuation inputs, refer to the Investment Valuation section in the accompanying Notes to Financial Statements.
| Other Information |
| # Additional information on each counterparty to the repurchase agreement is as follows: |
| Repurchase Agreement / Counterparty | Value ($) | |
| $183,450,000 due 3/01/23 at 4.55% | | |
| BNY Mellon Capital Markets LLC | 11,310,000 | |
| Bank of America, N.A. | 19,616,000 | |
| Bank of Nova Scotia | 3,675,000 | |
| BofA Securities, Inc. | 10,906,000 | |
| Citigroup Global Markets, Inc. | 13,622,000 | |
| HSBC Securities (USA), Inc. | 2,452,000 | |
| ING Financial Markets LLC | 980,000 | |
| JP Morgan Securities LLC | 5,449,000 | |
| Mitsubishi UFJ Securities Holdings Ltd | 2,724,000 | |
| Mizuho Securities USA, Inc. | 1,362,000 | |
| Nomura Securities International | 16,347,000 | |
| RBC Dominion Securities, Inc. | 20,163,000 | |
| Sumitomo Mitsui Banking Corp. | 41,412,000 | |
| Sumitomo Mitsui Banking Corp. NY | 19,810,000 | |
| Wells Fargo Securities LLC | 13,622,000 | |
| | 183,450,000 | |
| | | |
| Statement of Assets and Liabilities |
| | | | February 28, 2023 (Unaudited) |
| | | | | |
| Assets | | | | |
Investment in securities, at value (including repurchase agreements of $3,369,950,000) - See accompanying schedule Unaffiliated issuers (cost $4,285,828,391): | | | $ | 4,285,828,391 |
| Cash | | | | 16 |
| Receivable for investments sold | | | | 2,573,917 |
| Receivable for fund shares sold | | | | 2,261,191 |
| Interest receivable | | | | 4,638,425 |
Total assets | | | | 4,295,301,940 |
| Liabilities | | | | |
| Payable for investments purchased | $ | 13,999,824 | | |
| Payable for fund shares redeemed | | 40,712,701 | | |
| Other payables and accrued expenses | | 18,679 | | |
| Total Liabilities | | | | 54,731,204 |
| Net Assets | | | $ | 4,240,570,736 |
| Net Assets consist of: | | | | |
| Paid in capital | | | $ | 4,240,542,700 |
| Total accumulated earnings (loss) | | | | 28,036 |
| Net Assets | | | $ | 4,240,570,736 |
Net Asset Value , offering price and redemption price per share ($4,240,570,736 ÷ 4,240,547,544 shares) | | | $ | 1.00 |
| Statement of Operations |
| | | | Six months ended February 28, 2023 (Unaudited) |
| Investment Income | | | | |
| Interest | | | $ | 66,833,014 |
| Expenses | | | | |
| Custodian fees and expenses | $ | 27,242 | | |
| Independent trustees' fees and expenses | | 5,723 | | |
| Total expenses before reductions | | 32,965 | | |
| Expense reductions | | (2,919) | | |
| Total expenses after reductions | | | | 30,046 |
| Net Investment income (loss) | | | | 66,802,968 |
| Realized and Unrealized Gain (Loss) | | | | |
| Net realized gain (loss) on: | | | | |
| Investment Securities: | | | | |
| Unaffiliated issuers | | (61,662) | | |
| Total net realized gain (loss) | | | | (61,662) |
| Net increase in net assets resulting from operations | | | $ | 66,741,306 |
| Statement of Changes in Net Assets |
| |
| | Six months ended February 28, 2023 (Unaudited) | | Year ended August 31, 2022 |
| Increase (Decrease) in Net Assets | | | | |
| Operations | | | | |
| Net investment income (loss) | $ | 66,802,968 | $ | 16,325,351 |
| Net realized gain (loss) | | (61,662) | | (5,778) |
Net increase in net assets resulting from operations | | 66,741,306 | | 16,319,573 |
| Distributions to shareholders | | (66,913,257) | | (16,325,108) |
| Share transactions | | | | |
| Proceeds from sales of shares | | 3,567,166,419 | | 479,055,294 |
| Reinvestment of distributions | | 64,907,872 | | 16,320,750 |
| Cost of shares redeemed | | (1,764,098,305) | | (7,815,340,786) |
Net increase (decrease) in net assets and shares resulting from share transactions | | 1,867,975,986 | | (7,319,964,742) |
| Total increase (decrease) in net assets | | 1,867,804,035 | | (7,319,970,277) |
| | | | | |
| Net Assets | | | | |
| Beginning of period | | 2,372,766,701 | | 9,692,736,978 |
| End of period | $ | 4,240,570,736 | $ | 2,372,766,701 |
| | | | | |
| Other Information | | | | |
| Shares | | | | |
| Sold | | 3,567,166,419 | | 479,055,294 |
| Issued in reinvestment of distributions | | 64,907,872 | | 16,320,750 |
| Redeemed | | (1,764,098,305) | | (7,815,340,786) |
| Net increase (decrease) | | 1,867,975,986 | | (7,319,964,742) |
| | | | | |
Financial Highlights
| Fidelity® Series Government Money Market Fund |
| |
| | Six months ended (Unaudited) February 28, 2023 | | Years ended August 31, 2022 | | 2021 | | 2020 | | 2019 | | 2018 |
Selected Per-Share Data | | | | | | | | | | | | |
| Net asset value, beginning of period | $ | 1.00 | $ | 1.00 | $ | 1.00 | $ | 1.00 | $ | 1.00 | $ | 1.00 |
| Income from Investment Operations | | | | | | | | | | | | |
Net investment income (loss) A | | .019 | | .003 | | .001 | | .010 | | .024 | | .015 |
| Net realized and unrealized gain (loss) | | - B | | .002 | | - B | | .001 | | - B | | - B |
| Total from investment operations | | .019 | | .005 | | .001 | | .011 | | .024 | | .015 |
| Distributions from net investment income | | (.019) | | (.005) | | (.001) | | (.011) | | (.024) | | (.015) |
| Total distributions | | (.019) | | (.005) | | (.001) | | (.011) | | (.024) | | (.015) |
| Net asset value, end of period | $ | 1.00 | $ | 1.00 | $ | 1.00 | $ | 1.00 | $ | 1.00 | $ | 1.00 |
Total Return C,D | | 1.89% | | .53% | | .10% | | 1.08% | | 2.38% | | 1.53% |
Ratios to Average Net Assets A,E,F | | | | | | | | | | | | |
Expenses before reductions G | | -% H | | -% | | -% | | -% | | -% | | -% |
Expenses net of fee waivers, if any G | | -% H | | -% | | -% | | -% | | -% | | -% |
Expenses net of all reductions G | | -% H | | -% | | -% | | -% | | -% | | -% |
| Net investment income (loss) | | 3.90% H | | .31% | | .10% | | .98% | | 2.35% | | 1.54% |
| Supplemental Data | | | | | | | | | | | | |
| Net assets, end of period (000 omitted) | $ | 4,240,571 | $ | 2,372,767 | $ | 9,692,737 | $ | 9,500,272 | $ | 6,572,472 | $ | 7,839,750 |
A Net investment income (loss) is affected by the timing of the declaration of dividends by any underlying mutual funds or exchange-traded funds (ETFs). Net investment income (loss) of any mutual funds or ETFs is not included in the Fund's net investment income (loss) ratio.
B Amount represents less than $.0005 per share.
C Total returns for periods of less than one year are not annualized.
D Total returns would have been lower if certain expenses had not been reduced during the applicable periods shown.
E Fees and expenses of any underlying mutual funds or exchange-traded funds (ETFs) are not included in the Fund's expense ratio. The Fund indirectly bears its proportionate share of these expenses.
F Expense ratios reflect operating expenses of the class. Expenses before reductions do not reflect amounts reimbursed, waived, or reduced through arrangements with the investment adviser, brokerage services, or other offset arrangements, if applicable, and do not represent the amount paid by the class during periods when reimbursements, waivers or reductions occur.
G Amount represents less than .005%.
H Annualized.
For the period ended February 28, 2023
1. Organization.
Fidelity Series Government Money Market Fund (the Fund) is a fund of Fidelity Salem Street Trust (the Trust) and is authorized to issue an unlimited number of shares. The Trust is registered under the Investment Company Act of 1940, as amended (the 1940 Act), as an open-end management investment company organized as a Massachusetts business trust. Shares are offered only to certain other Fidelity funds, Fidelity managed 529 plans, and Fidelity managed collective investment trusts.
2. Significant Accounting Policies.
The Fund is an investment company and applies the accounting and reporting guidance of the Financial Accounting Standards Board (FASB) Accounting Standards Codification Topic 946 Financial Services - Investment Companies . The financial statements have been prepared in conformity with accounting principles generally accepted in the United States of America (GAAP), which require management to make certain estimates and assumptions at the date of the financial statements. Actual results could differ from those estimates. Subsequent events, if any, through the date that the financial statements were issued have been evaluated in the preparation of the financial statements. The Fund's Schedule of Investments lists any underlying mutual funds or exchange-traded funds (ETFs) but does not include the underlying holdings of these funds. The following summarizes the significant accounting policies of the Fund:
Investment Valuation. The Fund categorizes the inputs to valuation techniques used to value its investments into a disclosure hierarchy consisting of three levels as shown below:
Level 1 - unadjusted quoted prices in active markets for identical investments
Level 2 - other significant observable inputs (including quoted prices for similar investments, interest rates, prepayment speeds, etc.)
Level 3 - unobservable inputs (including the Fund's own assumptions based on the best information available)
As permitted by compliance with certain conditions under Rule 2a-7 of the 1940 Act, securities are valued at amortized cost, which approximates fair value. The amortized cost of an instrument is determined by valuing it at its original cost and thereafter amortizing any discount or premium from its face value at a constant rate until maturity. Securities held by a money market fund are generally high quality and liquid; however, they are reflected as Level 2 because the inputs used to determine fair value are not quoted prices in an active market.
Investment Transactions and Income. The net asset value per share for processing shareholder transactions is calculated as of the close of business of the New York Stock Exchange (NYSE), normally 4:00 p.m. Eastern time. Security transactions are accounted for as of trade date. Gains and losses on securities sold are determined on the basis of identified cost. Interest income is accrued as earned and includes coupon interest and amortization of premium and accretion of discount on debt securities as applicable.
Expenses. Expenses directly attributable to a fund are charged to that fund. Expenses attributable to more than one fund are allocated among the respective funds on the basis of relative net assets or other appropriate methods. Expenses included in the accompanying financial statements reflect the expenses of that fund and do not include any expenses associated with any underlying mutual funds or exchange-traded funds. Although not included in a fund's expenses, a fund indirectly bears its proportionate share of these expenses through the net asset value of each underlying mutual fund or exchange-traded fund. Expense estimates are accrued in the period to which they relate and adjustments are made when actual amounts are known.
Income Tax Information and Distributions to Shareholders. Each year, the Fund intends to qualify as a regulated investment company under Subchapter M of the Internal Revenue Code, including distributing substantially all of its taxable income and realized gains. As a result, no provision for U.S. Federal income taxes is required. The Fund files a U.S. federal tax return, in addition to state and local tax returns as required. The Fund's federal income tax returns are subject to examination by the Internal Revenue Service (IRS) for a period of three fiscal years after they are filed. State and local tax returns may be subject to examination for an additional fiscal year depending on the jurisdiction.
Distributions are declared and recorded daily and paid monthly from net investment income. Distributions from realized gains, if any, are declared and recorded on the ex-dividend date. Income and capital gain distributions are determined in accordance with income tax regulations, which may differ from GAAP.
Capital accounts within the financial statements are adjusted for permanent book-tax differences. These adjustments have no impact on net assets or the results of operations. Capital accounts are not adjusted for temporary book-tax differences which will reverse in a subsequent period.
Book-tax differences are primarily due to losses deferred due to wash sales.
As of period end, the cost and unrealized appreciation (depreciation) in securities for federal income tax purposes were as follows:
| Gross unrealized appreciation | $- |
| Gross unrealized depreciation | - |
| Net unrealized appreciation (depreciation) | $- |
| Tax cost | $4,285,828,391 |
Capital loss carryforwards are only available to offset future capital gains of the Fund to the extent provided by regulations and may be limited. The capital loss carryforward information presented below, including any applicable limitation, is estimated as of prior fiscal period end and is subject to adjustment.
Repurchase Agreements. Pursuant to an Exemptive Order issued by the Securities and Exchange Commission, funds and other registered investment companies having management contracts with Fidelity Management and Research Company LLC, or its affiliates are permitted to transfer uninvested cash balances into joint trading accounts which are then invested in repurchase agreements. Funds may also invest directly with institutions in repurchase agreements. Repurchase agreements may be collateralized by cash or government securities. Upon settlement date, collateral is held in segregated accounts with custodian banks and may be obtained in the event of a default of the counterparty. The collateral balance is monitored on a daily basis to ensure it is at least equal to the principal amount of the repurchase agreement (including accrued interest). In the event of a default by the counterparty, realization of the collateral proceeds could be delayed, during which time the value of the collateral may decline.
3. Fees and Other Transactions with Affiliates.
Management Fee. Fidelity Management & Research Company LLC (the investment adviser) and its affiliates provide the Fund with investment management related services for which the Fund does not pay a management fee. Under the management contract, the investment adviser or an affiliate pays all ordinary operating expenses of the Fund, except custody fees, fees and expenses of the independent Trustees, and certain miscellaneous expenses such as proxy and shareholder meeting expenses.
Interfund Trades. Funds may purchase from or sell securities to other Fidelity Funds under procedures adopted by the Board. The procedures have been designed to ensure these interfund trades are executed in accordance with Rule 17a-7 of the 1940 Act. During the period, there were no interfund trades.
4. Expense Reductions.
Through arrangements with the Fund's custodian, credits realized as a result of certain uninvested cash balances were used to reduce the Fund's expenses by $2,919.
5. Other.
A fund's organizational documents provide former and current trustees and officers with a limited indemnification against liabilities arising in connection with the performance of their duties to the fund. In the normal course of business, a fund may also enter into contracts that provide general indemnifications. A fund's maximum exposure under these arrangements is unknown as this would be dependent on future claims that may be made against a fund. The risk of material loss from such claims is considered remote.
At the end of the period, mutual funds and accounts managed by the investment adviser or its affiliates were the owners of record of all of the outstanding shares of the Fund.
6. Risk and Uncertainties.
Many factors affect a fund's performance. Developments that disrupt global economies and financial markets, such as pandemics, epidemics, outbreaks of infectious diseases, war, terrorism, and environmental disasters, may significantly affect a fund's investment performance. The effects of these developments to a fund will be impacted by the types of securities in which a fund invests, the financial condition, industry, economic sector, and geographic location of an issuer, and a fund's level of investment in the securities of that issuer. Significant concentrations in security types, issuers, industries, sectors, and geographic locations may magnify the factors that affect a fund's performance.
As a shareholder, you incur two types of costs: (1) transaction costs, which may include sales charges (loads) on purchase payments or redemption proceeds, as applicable and (2) ongoing costs, which generally include management fees, distribution and/or service (12b-1) fees and other Fund expenses. This Example is intended to help you understand your ongoing costs (in dollars) of investing in a fund and to compare these costs with the ongoing costs of investing in other mutual funds.
| The Example is based on an investment of $1,000 invested at the beginning of the period and held for the entire period (September 1, 2022 to February 28, 2023). |
Actual Expenses
The first line of the accompanying table provides information about actual account values and actual expenses. You may use the information in this line, together with the amount you invested, to estimate the expenses that you paid over the period. Simply divide your account value by $1,000.00 (for example, an $8,600 account value divided by $1,000.00 = 8.6), then multiply the result by the number in the first line for a class/Fund under the heading entitled "Expenses Paid During Period" to estimate the expenses you paid on your account during this period. If any fund is a shareholder of any underlying mutual funds or exchange-traded funds (ETFs) (the Underlying Funds), such fund indirectly bears its proportional share of the expenses of the Underlying Funds in addition to the direct expenses incurred presented in the table. These fees and expenses are not included in the annualized expense ratio used to calculate the expense estimate in the table below.
Hypothetical Example for Comparison Purposes
The second line of the accompanying table provides information about hypothetical account values and hypothetical expenses based on the actual expense ratio and an assumed rate of return of 5% per year before expenses, which is not the actual return. The hypothetical account values and expenses may not be used to estimate the actual ending account balance or expenses you paid for the period. You may use this information to compare the ongoing costs of investing in the Fund and other funds. To do so, compare this 5% hypothetical example with the 5% hypothetical examples that appear in the shareholder reports of the other funds. If any fund is a shareholder of any Underlying Funds, such fund indirectly bears its proportional share of the expenses of the Underlying Funds in addition to the direct expenses as presented in the table. These fees and expenses are not included in the annualized expense ratio used to calculate the expense estimate in the table below.
Please note that the expenses shown in the table are meant to highlight your ongoing costs only and do not reflect any transaction costs. Therefore, the second line of the table is useful in comparing ongoing costs only, and will not help you determine the relative total costs of owning different funds. In addition, if these transactional costs were included, your costs would have been higher.
| | | | | Annualized Expense Ratio- A | | Beginning Account Value September 1, 2022 | | Ending Account Value February 28, 2023 | | Expenses Paid During Period- C September 1, 2022 to February 28, 2023 |
| | | | | | | | | | |
| Fidelity® Series Government Money Market Fund | | | | -%- D | | | | | | |
| Actual | | | | | | $ 1,000 | | $ 1,018.90 | | $- E |
Hypothetical- B | | | | | | $ 1,000 | | $ 1,024.79 | | $- E |
| |
A Annualized expense ratio reflects expenses net of applicable fee waivers.
B 5% return per year before expenses
C Expenses are equal to the annualized expense ratio, multiplied by the average account value over the period, multiplied by 181/ 365 (to reflect the one-half year period). The fees and expenses of any Underlying Funds are not included in each annualized expense ratio.
D Amount represents less than .005%.
E Amount represents less than $.005.
Board Approval of Investment Advisory Contracts and Management Fees
Fidelity Series Government Money Market Fund
Each year, the Board of Trustees, including the Independent Trustees (together, the Board), votes on the renewal of the management contract with Fidelity Management & Research Company LLC (FMR) and the sub-advisory agreements (together, the Advisory Contracts) for the fund. FMR and the sub-advisers are referred to herein as the Investment Advisers. The Board, assisted by the advice of fund counsel and Independent Trustees' counsel, requests and considers a broad range of information relevant to the renewal of the Advisory Contracts throughout the year.
The Board meets regularly and, at each of its meetings, covers an extensive agenda of topics and materials and considers factors that are relevant to its annual consideration of the renewal of the fund's Advisory Contracts, including the services and support provided to the fund and its shareholders. The Board has established four standing committees (Committees) - Operations, Audit, Fair Valuation, and Governance and Nominating - each composed of and chaired by Independent Trustees with varying backgrounds, to which the Board has assigned specific subject matter responsibilities in order to enhance effective decision-making by the Board. The Operations Committee, of which all the Independent Trustees are members, meets regularly throughout the year and requests, receives and considers, among other matters, information related to the annual consideration of the renewal of the fund's Advisory Contracts before making its recommendation to the Board. The Board also meets as needed to review matters specifically related to the Board's annual consideration of the renewal of the Advisory Contracts. Members of the Board may also meet from time to time with trustees of other Fidelity funds through joint ad hoc committees to discuss certain matters relevant to all of the Fidelity funds.
At its September 2022 meeting, the Board unanimously determined to renew the fund's Advisory Contracts. In considering whether to renew the Advisory Contracts for the fund, the Board considered all factors it believed relevant and reached a determination, with the assistance of fund counsel and Independent Trustees' counsel and through the exercise of its business judgment, that the renewal of the Advisory Contracts was in the best interests of the fund and its shareholders and the fact that no fee is payable under the management contract was fair and reasonable.
Nature, Extent, and Quality of Services Provided. The Board considered Fidelity's staffing as it relates to the fund, including the backgrounds of investment personnel of Fidelity, and also considered the fund's investment objective, strategies, and related investment philosophy. The Independent Trustees also had discussions with senior management of Fidelity's investment operations and investment groups. The Board considered the structure of the investment personnel compensation program and whether this structure provides appropriate incentives to act in the best interests of the fund. The Board also considered the steps Fidelity had taken to ensure the continued provision of high quality services to the Fidelity funds throughout the COVID-19 pandemic, including the expansion of staff in client facing positions to maintain service levels in periods of high volumes and volatility.
Resources Dedicated to Investment Management and Support Services . The Board reviewed the general qualifications and capabilities of Fidelity's investment staff, including its size, education, experience, and resources, as well as Fidelity's approach to recruiting, training, managing, and compensating investment personnel. The Board noted the resources devoted to Fidelity's global investment organization, and that Fidelity's analysts have extensive resources, tools and capabilities that allow them to conduct quantitative and fundamental analysis, as well as credit analysis of issuers, counterparties and guarantors. Further, the Board considered that Fidelity's investment professionals have sufficient access to global information and data so as to provide competitive investment results over time, and that those professionals also have access to sophisticated tools that permit them to assess portfolio construction and risk and performance attribution characteristics continuously, as well as to transmit new information and research conclusions rapidly around the world. Additionally, in its deliberations, the Board considered Fidelity's trading, risk management, compliance, cybersecurity, and technology and operations capabilities and resources, which are integral parts of the investment management process.
Administrative Services . The Board considered (i) the nature, extent, quality, and cost of advisory and administrative services performed by the Investment Advisers and their affiliates under the Advisory Contracts and under separate agreements covering transfer agency, pricing and bookkeeping, and securities lending services for the fund; (ii) the nature and extent of the supervision of third party service providers, principally custodians, subcustodians, and pricing vendors; and (iii) the resources devoted to, and the record of compliance with, the fund's compliance policies and procedures.
Investment Performance . The Board considered whether the fund has operated in accordance with its investment objective, as well as its record of compliance with its investment restrictions. The Board reviewed the fund's absolute investment performance, as well as the fund's relative investment performance. In this regard, the Board noted that the fund is designed to offer an investment option for other investment companies, collective investment trusts, and 529 plans managed by Fidelity and ultimately to enhance the performance of those investment companies, collective investment trusts, and 529 plans.
Based on its review, the Board concluded that the nature, extent, and quality of services provided to the fund under the Advisory Contracts should continue to benefit the shareholders of the fund.
Competitiveness of Management Fee and Total Expense Ratio . The Board considered that the fund does not pay FMR a management fee for investment advisory services, but that FMR receives fees for providing services to funds, collective investment trusts, and 529 plans that invest in the fund. The Board also noted that FMR or an affiliate undertakes to pay all operating expenses of the fund, except transfer agent fees, 12b-1 fees, Independent Trustee fees and expenses, custodian fees and expenses, proxy and shareholder meeting expenses, interest, taxes, and extraordinary expenses (such as litigation expenses). The Board further noted that the fund pays its non-operating expenses, including brokerage commissions and fees and expenses associated with the fund's securities lending program, if applicable.
The Board further considered that FMR has contractually agreed to reimburse the fund to the extent that total operating expenses, with certain exceptions, as a percentage of its average net assets, exceed 0.003% through December 31, 2024.
Based on its review, the Board considered that the fund does not pay a management fee and concluded that the fund's total expense ratio was reasonable in light of the services that the fund and its shareholders receive and the other factors considered.
Costs of the Services and Profitability . The Board considered the level of Fidelity's profits in respect of all the Fidelity funds.
A public accounting firm has been engaged annually by the Board as part of the Board's assessment of Fidelity's profitability analysis. The engagement includes the review and assessment of the methodologies used by Fidelity in determining the revenues and expenses attributable to Fidelity's mutual fund business, and completion of agreed-upon procedures in respect of the mathematical accuracy of certain fund profitability information and its conformity to established allocation methodologies. After considering the reports issued under the engagement and information provided by Fidelity, the Board concluded that while other allocation methods may also be reasonable, Fidelity's profitability methodologies are reasonable in all material respects.
The Board also reviewed Fidelity's non-fund businesses and potential indirect benefits such businesses may have received as a result of their association with Fidelity's mutual fund business (i.e., fall-out benefits) as well as cases where Fidelity's affiliates may benefit from the funds' business. The Board considered areas where potential indirect benefits to the Fidelity funds from their relationships with Fidelity may exist. The Board's consideration of these matters was informed by the findings of a joint ad hoc committee created by it and the boards of other Fidelity funds to evaluate potential fall-out benefits.
The Board concluded that the costs of the services provided by and the profits realized by Fidelity in connection with the operation of the fund were not relevant to the renewal of the Advisory Contracts because the fund pays no advisory fees and FMR or an affiliate bears all expenses of the fund, with limited exceptions.
Economies of Scale. The Board concluded that because the fund pays no advisory fees and FMR or an affiliate bears all expenses of the fund with certain limited exceptions, the realization of economies of scale was not a material factor in the Board's decision to renew the fund's Advisory Contracts.
Additional Information Requested by the Board . In order to develop fully the factual basis for consideration of the Fidelity funds' advisory contracts, the Board requested and received additional information on certain topics, including: (i) Fidelity's fund profitability methodology, profitability trends for certain funds, the allocation of various costs to different funds, and the impact of certain factors on fund profitability results; (ii) portfolio manager changes that have occurred during the past year and the amount of the investment that each portfolio manager has made in the Fidelity fund(s) that he or she manages; (iii) the extent to which current market conditions have affected retention and recruitment of personnel; (iv) the arrangements with and compensation paid to certain fund sub-advisers on behalf of the Fidelity funds and the treatment of such compensation within Fidelity's fund profitability methodology; (v) the terms of the funds' various management fee structures, including the basic group fee and the terms of Fidelity's voluntary expense limitation arrangements; (vi) Fidelity's transfer agent, pricing and bookkeeping fees, expense and service structures for different funds and classes relative to competitive trends; (vii) the impact on fund profitability of recent industry trends, such as the growth in passively managed funds and the changes in flows for different types of funds; (viii) the types of management fee and total expense comparisons provided, and the challenges and limitations associated with such information; and (ix) explanations regarding the relative total expense ratios and management fees of certain funds and classes, total expense and management fee competitive trends, and methodologies for total expense and management fee competitive comparisons. In addition, the Board considered its discussions with Fidelity regarding Fidelity's efforts to maintain the continuous investment and shareholder services necessary for the funds during the current pandemic and economic circumstances.
Based on its evaluation of all of the conclusions noted above, and after considering all factors it believed relevant, the Board concluded that the advisory fee arrangements are fair and reasonable and that the fund's Advisory Contracts should be renewed.
1.9878696.106
GVM-SANN-0423
Fidelity® SAI Sustainable Core Plus Bond Fund
Semi-Annual Report
February 28, 2023
Offered exclusively to certain clients of the Adviser, or its affiliates, including Strategic Advisers LLC (Strategic Advisers) - not available for sale to the general public. Fidelity ® SAI is a product name of Fidelity ® funds dedicated to certain programs affiliated with Strategic Advisers.
Contents
To view a fund's proxy voting guidelines and proxy voting record for the 12-month period ended June 30, visit http://www.fidelity.com/proxyvotingresults or visit the Securities and Exchange Commission's (SEC) web site at http://www.sec.gov.
You may also call 1-800-544-3455 to request a free copy of the proxy voting guidelines.
Standard & Poor's, S&P and S&P 500 are registered service marks of The McGraw-Hill Companies, Inc. and have been licensed for use by Fidelity Distributors Corporation.
Other third-party marks appearing herein are the property of their respective owners.
All other marks appearing herein are registered or unregistered trademarks or service marks of FMR LLC or an affiliated company. © 2023 FMR LLC. All rights reserved.
This report and the financial statements contained herein are submitted for the general information of the shareholders of the Fund. This report is not authorized for distribution to prospective investors in the Fund unless preceded or accompanied by an effective prospectus.
A fund files its complete schedule of portfolio holdings with the SEC for the first and third quarters of each fiscal year on Form N-PORT. Forms N-PORT are available on the SEC's web site at http://www.sec.gov. A fund's Forms N-PORT may be reviewed and copied at the SEC's Public Reference Room in Washington, DC. Information regarding the operation of the SEC's Public Reference Room may be obtained by calling 1-800-SEC-0330.
For a complete list of a fund's portfolio holdings, view the most recent holdings listing, semiannual report, or annual report on Fidelity's web site at http://www.fidelity.com, http://www.institutional.fidelity.com, or http://www.401k.com, as applicable.
NOT FDIC INSURED •MAY LOSE VALUE •NO BANK GUARANTEE
Neither the Fund nor Fidelity Distributors Corporation is a bank.
Quality Diversification (% of Fund's net assets) |
|
| |
| We have used ratings from Moody's Investors Service, Inc. Where Moody's® ratings are not available, we have used S&P® ratings. All ratings are as of the date indicated and do not reflect subsequent changes. |
Asset Allocation (% of Fund's net assets) |
|
Foreign investments - 15.8% |
Futures and Swaps - 1.4% |
Percentages in the above tables are adjusted for the effect of TBA Sale Commitments. |
|
Geographic Diversification (% of Fund's net assets) |
|
* Includes Short-Term investments and Net Other Assets (Liabilities). Percentages are based on country or territory of incorporation and are adjusted for the effect of derivatives, if applicable. |
| |
Showing Percentage of Net Assets
| Corporate Bonds - 40.8% |
| | | Principal Amount (a) | Value ($) |
| Convertible Bonds - 0.2% | | | |
| COMMUNICATION SERVICES - 0.1% | | | |
| Media - 0.1% | | | |
| DISH Network Corp.: | | | |
| 2.375% 3/15/24 | | 5,000 | 4,592 |
| 3.375% 8/15/26 | | 32,000 | 20,451 |
| | | | 25,043 |
| CONSUMER DISCRETIONARY - 0.0% | | | |
| Hotels, Restaurants & Leisure - 0.0% | | | |
| DraftKings, Inc. 0% 3/15/28 | | 4,000 | 2,772 |
| | | | |
| Internet & Direct Marketing Retail - 0.0% | | | |
| Wayfair LLC 0.625% 10/1/25 | | 3,000 | 2,226 |
| | | | |
TOTAL CONSUMER DISCRETIONARY | | | 4,998 |
| | | | |
| HEALTH CARE - 0.0% | | | |
| Health Care Providers & Services - 0.0% | | | |
| Oak Street Health, Inc. 0% 3/15/26 | | 2,000 | 1,850 |
| | | | |
| INFORMATION TECHNOLOGY - 0.0% | | | |
| Software - 0.0% | | | |
| MicroStrategy, Inc. 0% 2/15/27 | | 5,000 | 2,340 |
| | | | |
| REAL ESTATE - 0.1% | | | |
| Real Estate Management & Development - 0.1% | | | |
| Redfin Corp. 0.5% 4/1/27 | | 16,000 | 9,622 |
| | | | |
| TOTAL CONVERTIBLE BONDS | | | 43,853 |
| Nonconvertible Bonds - 40.6% | | | |
| COMMUNICATION SERVICES - 3.5% | | | |
| Diversified Telecommunication Services - 1.5% | | | |
| Altice France SA 5.125% 7/15/29 (b) | | 10,000 | 7,716 |
| Frontier Communications Holdings LLC 8.75% 5/15/30 (b) | | 10,000 | 10,113 |
| Level 3 Financing, Inc. 3.75% 7/15/29 (b) | | 46,000 | 28,916 |
| TELUS Corp. 3.4% 5/13/32 | | 130,000 | 110,819 |
| Verizon Communications, Inc.: | | | |
| 2.355% 3/15/32 | | 70,000 | 55,031 |
| 3.875% 3/1/52 | | 270,000 | 206,738 |
| Virgin Media Finance PLC 5% 7/15/30 (b) | | 8,000 | 6,520 |
| Zayo Group Holdings, Inc. 6.125% 3/1/28 (b) | | 18,000 | 11,339 |
| | | | 437,192 |
| Entertainment - 0.4% | | | |
| The Walt Disney Co. 2.65% 1/13/31 | | 140,000 | 119,244 |
| | | | |
| Media - 1.2% | | | |
| Altice Financing SA 5.75% 8/15/29 (b) | | 29,000 | 23,716 |
| Altice France Holding SA 6% 2/15/28 (b) | | 32,000 | 22,000 |
| CCO Holdings LLC/CCO Holdings Capital Corp.: | | | |
| 4.25% 1/15/34(b) | | 25,000 | 18,714 |
| 4.75% 2/1/32(b) | | 47,000 | 38,070 |
| DIRECTV Financing LLC / DIRECTV Financing Co-Obligor, Inc. 5.875% 8/15/27 (b) | | 10,000 | 8,940 |
| DISH DBS Corp. 5.75% 12/1/28 (b) | | 2,000 | 1,598 |
| DISH Network Corp. 11.75% 11/15/27 (b) | | 5,000 | 5,066 |
| Magallanes, Inc.: | | | |
| 4.279% 3/15/32(b) | | 135,000 | 116,547 |
| 5.141% 3/15/52(b) | | 141,000 | 110,530 |
| TEGNA, Inc. 4.75% 3/15/26 (b) | | 8,000 | 7,600 |
| UPC Broadband Finco BV 4.875% 7/15/31 (b) | | 8,000 | 6,754 |
| | | | 359,535 |
| Wireless Telecommunication Services - 0.4% | | | |
| Millicom International Cellular SA 4.5% 4/27/31 (b) | | 13,000 | 10,498 |
| Rogers Communications, Inc.: | | | |
| 3.2% 3/15/27(b) | | 60,000 | 55,168 |
| 4.55% 3/15/52(b) | | 70,000 | 55,828 |
| | | | 121,494 |
TOTAL COMMUNICATION SERVICES | | | 1,037,465 |
| | | | |
| CONSUMER DISCRETIONARY - 3.8% | | | |
| Auto Components - 0.0% | | | |
| Patrick Industries, Inc. 4.75% 5/1/29 (b) | | 12,000 | 10,201 |
| | | | |
| Automobiles - 0.2% | | | |
| General Motors Co. 5.4% 10/15/29 | | 40,000 | 38,410 |
| McLaren Finance PLC 7.5% 8/1/26 (b) | | 4,000 | 3,101 |
| Rivian Holdco & Rivian LLC & Rivian Automotive LLC 6 month U.S. LIBOR + 5.620% 10.1636% 10/15/26 (b)(c)(d) | | 18,000 | 17,550 |
| | | | 59,061 |
| Diversified Consumer Services - 0.2% | | | |
| Adtalem Global Education, Inc. 5.5% 3/1/28 (b) | | 10,000 | 9,205 |
| GEMS MENASA Cayman Ltd. 7.125% 7/31/26 (b) | | 11,000 | 10,700 |
| Sotheby's 7.375% 10/15/27 (b) | | 10,000 | 9,434 |
| StoneMor, Inc. 8.5% 5/15/29 (b) | | 6,000 | 4,338 |
| WASH Multifamily Acquisition, Inc. 5.75% 4/15/26 (b) | | 42,000 | 39,070 |
| | | | 72,747 |
| Hotels, Restaurants & Leisure - 0.6% | | | |
| 1011778 BC Unlimited Liability Co./New Red Finance, Inc.: | | | |
| 3.5% 2/15/29(b) | | 13,000 | 11,025 |
| 4% 10/15/30(b) | | 5,000 | 4,130 |
| Carnival Corp. 6% 5/1/29 (b) | | 35,000 | 27,143 |
| Constellation Merger Sub, Inc. 8.5% 9/15/25 (b) | | 8,000 | 6,680 |
| Hilton Domestic Operating Co., Inc. 3.625% 2/15/32 (b) | | 26,000 | 21,346 |
| Life Time, Inc. 8% 4/15/26 (b) | | 10,000 | 9,636 |
| MajorDrive Holdings IV LLC 6.375% 6/1/29 (b) | | 12,000 | 9,275 |
| Royal Caribbean Cruises Ltd. 5.5% 4/1/28 (b) | | 24,000 | 20,918 |
| Wynn Las Vegas LLC/Wynn Las Vegas Capital Corp. 5.25% 5/15/27 (b) | | 30,000 | 27,939 |
| Yum! Brands, Inc. 4.625% 1/31/32 | | 34,000 | 30,054 |
| | | | 168,146 |
| Household Durables - 0.3% | | | |
| The Berkeley Group PLC 2.5% 8/11/31 (Reg. S) | GBP | 100,000 | 85,064 |
| | | | |
| Internet & Direct Marketing Retail - 0.2% | | | |
| Match Group Holdings II LLC 4.625% 6/1/28 (b) | | 10,000 | 8,883 |
| Uber Technologies, Inc.: | | | |
| 4.5% 8/15/29(b) | | 65,000 | 57,465 |
| 8% 11/1/26(b) | | 2,000 | 2,030 |
| | | | 68,378 |
| Multiline Retail - 0.0% | | | |
| Macy's Retail Holdings LLC 5.875% 4/1/29 (b) | | 3,000 | 2,725 |
| Nordstrom, Inc. 4.375% 4/1/30 | | 6,000 | 4,733 |
| | | | 7,458 |
| Specialty Retail - 1.8% | | | |
| At Home Group, Inc. 4.875% 7/15/28 (b) | | 8,000 | 5,880 |
| Bath & Body Works, Inc. 6.95% 3/1/33 | | 8,000 | 6,960 |
| Carvana Co. 4.875% 9/1/29 (b) | | 30,000 | 14,191 |
| LBM Acquisition LLC 6.25% 1/15/29 (b) | | 10,000 | 7,125 |
| Lowe's Companies, Inc.: | | | |
| 3.75% 4/1/32 | | 130,000 | 115,160 |
| 4.25% 4/1/52 | | 130,000 | 102,360 |
| Michaels Companies, Inc. 5.25% 5/1/28 (b) | | 24,000 | 19,974 |
| The Home Depot, Inc. 3.25% 4/15/32 | | 130,000 | 113,884 |
| TJX Companies, Inc. 3.875% 4/15/30 | | 120,000 | 112,855 |
| Upbound Group, Inc. 6.375% 2/15/29 (b) | | 14,000 | 12,010 |
| Victoria's Secret & Co. 4.625% 7/15/29 (b) | | 8,000 | 6,524 |
| | | | 516,923 |
| Textiles, Apparel & Luxury Goods - 0.5% | | | |
| Crocs, Inc. 4.125% 8/15/31 (b) | | 18,000 | 14,760 |
| Hanesbrands, Inc. 4.625% 5/15/24 (b) | | 10,000 | 9,993 |
| Tapestry, Inc. 3.05% 3/15/32 | | 140,000 | 111,240 |
| | | | 135,993 |
TOTAL CONSUMER DISCRETIONARY | | | 1,123,971 |
| | | | |
| CONSUMER STAPLES - 1.3% | | | |
| Beverages - 0.0% | | | |
| Triton Water Holdings, Inc. 6.25% 4/1/29 (b) | | 12,000 | 9,565 |
| | | | |
| Food & Staples Retailing - 0.4% | | | |
| Albertsons Companies LLC/Safeway, Inc./New Albertson's, Inc./Albertson's LLC: | | | |
| 3.25% 3/15/26(b) | | 12,000 | 11,011 |
| 4.875% 2/15/30(b) | | 6,000 | 5,384 |
| Alimentation Couche-Tard, Inc. 3.625% 5/13/51 (b) | | 150,000 | 101,935 |
| U.S. Foods, Inc. 4.625% 6/1/30 (b) | | 8,000 | 6,988 |
| | | | 125,318 |
| Food Products - 0.9% | | | |
| Darling Ingredients, Inc. 6% 6/15/30 (b) | | 5,000 | 4,831 |
| General Mills, Inc. 2.25% 10/14/31 | | 290,000 | 232,529 |
| Post Holdings, Inc. 4.5% 9/15/31 (b) | | 10,000 | 8,421 |
| TreeHouse Foods, Inc. 4% 9/1/28 | | 8,000 | 6,861 |
| | | | 252,642 |
TOTAL CONSUMER STAPLES | | | 387,525 |
| | | | |
| ENERGY - 1.1% | | | |
| Energy Equipment & Services - 0.2% | | | |
| Archrock Partners LP / Archrock Partners Finance Corp. 6.25% 4/1/28 (b) | | 12,000 | 11,391 |
| CGG SA 8.75% 4/1/27 (b) | | 18,000 | 15,770 |
| Oceaneering International, Inc. 6% 2/1/28 | | 12,000 | 11,383 |
| Transocean Titan Finance Ltd. 8.375% 2/1/28 (b) | | 2,000 | 2,041 |
| Transocean, Inc. 8.75% 2/15/30 (b) | | 5,000 | 5,088 |
| Weatherford International Ltd. 8.625% 4/30/30 (b) | | 8,000 | 7,989 |
| | | | 53,662 |
| Multi Industry Energy - 0.0% | | | |
| Enviva Partners LP / Enviva Partners Finance Corp. 6.5% 1/15/26 (b) | | 11,000 | 10,312 |
| | | | |
| Oil, Gas & Consumable Fuels - 0.9% | | | |
| California Resources Corp. 7.125% 2/1/26 (b) | | 26,000 | 26,196 |
| CNX Resources Corp.: | | | |
| 6% 1/15/29(b) | | 4,000 | 3,627 |
| 7.375% 1/15/31(b) | | 5,000 | 4,764 |
| Crestwood Midstream Partners LP/Crestwood Midstream Finance Corp. 6% 2/1/29 (b) | | 25,000 | 22,743 |
| CVR Energy, Inc. 5.25% 2/15/25 (b) | | 37,000 | 35,520 |
| EG Global Finance PLC 6.75% 2/7/25 (b) | | 15,000 | 13,538 |
| Energean PLC 6.5% 4/30/27 (b) | | 10,000 | 9,200 |
| Global Partners LP/GLP Finance Corp. 6.875% 1/15/29 | | 6,000 | 5,550 |
| Holly Energy Partners LP/Holly Energy Finance Corp. 5% 2/1/28 (b) | | 10,000 | 9,075 |
| MEG Energy Corp. 5.875% 2/1/29 (b) | | 30,000 | 27,980 |
| New Fortress Energy, Inc. 6.5% 9/30/26 (b) | | 56,000 | 51,240 |
| Northern Oil & Gas, Inc. 8.125% 3/1/28 (b) | | 8,000 | 7,720 |
| Parkland Corp. 4.625% 5/1/30 (b) | | 15,000 | 12,488 |
| SM Energy Co. 6.5% 7/15/28 | | 8,000 | 7,380 |
| Sunoco LP/Sunoco Finance Corp. 4.5% 5/15/29 | | 14,000 | 12,287 |
| Tallgrass Energy Partners LP / Tallgrass Energy Finance Corp. 6% 3/1/27 (b) | | 5,000 | 4,642 |
| Teine Energy Ltd. 6.875% 4/15/29 (b) | | 18,000 | 16,461 |
| | | | 270,411 |
TOTAL ENERGY | | | 334,385 |
| | | | |
| FINANCIALS - 11.6% | | | |
| Banks - 6.9% | | | |
| AIB Group PLC 2.875% 5/30/31 (Reg. S) (c) | EUR | 100,000 | 95,752 |
| Banco Bilbao Vizcaya Argentaria SA 1% 1/16/30 (Reg. S) (c) | EUR | 100,000 | 96,699 |
| Bank of America Corp.: | | | |
| 2.456% 10/22/25(c) | | 260,000 | 246,731 |
| 2.687% 4/22/32(c) | | 70,000 | 56,772 |
| 5.015% 7/22/33(c) | | 148,000 | 142,391 |
| 6.204% 11/10/28(c) | | 25,000 | 25,704 |
| Citigroup, Inc.: | | | |
| 2.014% 1/25/26(c) | | 260,000 | 242,471 |
| 4.91% 5/24/33(c) | | 79,000 | 74,867 |
| ING Groep NV 1.4% 7/1/26 (b)(c) | | 200,000 | 181,194 |
| Intesa Sanpaolo SpA 4% 9/23/29 (b) | | 210,000 | 183,690 |
| JPMorgan Chase & Co.: | | | |
| 0.768% 8/9/25(c) | | 260,000 | 241,432 |
| 2.963% 1/25/33(c) | | 70,000 | 57,676 |
| 4.586% 4/26/33(c) | | 124,000 | 115,565 |
| 4.912% 7/25/33(c) | | 26,000 | 24,895 |
| KBC Group NV 0.5% 12/3/29 (c) | EUR | 100,000 | 96,917 |
| NatWest Group PLC 2.057% 11/9/28 (Reg. S) (c) | GBP | 100,000 | 102,507 |
| Santander Holdings U.S.A., Inc. 5.807% 9/9/26 (c) | | 31,000 | 30,994 |
| | | | 2,016,257 |
| Capital Markets - 2.4% | | | |
| Coinbase Global, Inc.: | | | |
| 3.375% 10/1/28(b) | | 8,000 | 5,240 |
| 3.625% 10/1/31(b) | | 5,000 | 3,015 |
| Goldman Sachs Group, Inc.: | | | |
| 3.102% 2/24/33(c) | | 97,000 | 79,954 |
| 3.615% 3/15/28(c) | | 130,000 | 120,647 |
| Hightower Holding LLC 6.75% 4/15/29 (b) | | 10,000 | 8,459 |
| Morgan Stanley: | | | |
| 0.864% 10/21/25(c) | | 270,000 | 248,704 |
| 2.943% 1/21/33(c) | | 70,000 | 57,281 |
| 4.889% 7/20/33(c) | | 63,000 | 59,819 |
| State Street Corp. 3.031% 11/1/34 (c) | | 130,000 | 111,131 |
| StoneX Group, Inc. 8.625% 6/15/25 (b) | | 6,000 | 6,035 |
| | | | 700,285 |
| Consumer Finance - 0.5% | | | |
| Ally Financial, Inc. 2.2% 11/2/28 | | 140,000 | 114,055 |
| OneMain Finance Corp. 3.875% 9/15/28 | | 46,000 | 36,570 |
| | | | 150,625 |
| Diversified Financial Services - 0.0% | | | |
| Altus Midstream LP 5.875% 6/15/30 (b) | | 5,000 | 4,621 |
| | | | |
| Insurance - 1.8% | | | |
| AIA Group Ltd. 3.375% 4/7/30 (b) | | 200,000 | 180,314 |
| Equitable Financial Life Global Funding 1.3% 7/12/26 (b) | | 200,000 | 174,210 |
| Marsh & McLennan Companies, Inc. 2.375% 12/15/31 | | 210,000 | 168,387 |
| | | | 522,911 |
| Mortgage Real Estate Investment Trusts - 0.0% | | | |
| Rithm Capital Corp. 6.25% 10/15/25 (b) | | 8,000 | 7,299 |
| | | | |
| Thrifts & Mortgage Finance - 0.0% | | | |
| Radian Group, Inc. 6.625% 3/15/25 | | 8,000 | 7,994 |
| | | | |
TOTAL FINANCIALS | | | 3,409,992 |
| | | | |
| HEALTH CARE - 3.3% | | | |
| Biotechnology - 0.8% | | | |
| Amgen, Inc. 3% 2/22/29 | | 260,000 | 231,344 |
| Emergent BioSolutions, Inc. 3.875% 8/15/28 (b) | | 10,000 | 6,050 |
| | | | 237,394 |
| Health Care Providers & Services - 1.4% | | | |
| Akumin Escrow, Inc. 7.5% 8/1/28 (b) | | 8,000 | 5,600 |
| Cano Health, Inc. 6.25% 10/1/28 (b) | | 14,000 | 9,100 |
| Cigna Group 3.4% 3/15/51 | | 150,000 | 105,211 |
| Community Health Systems, Inc.: | | | |
| 4.75% 2/15/31(b) | | 34,000 | 26,265 |
| 5.25% 5/15/30(b) | | 15,000 | 12,002 |
| 6.875% 4/15/29(b) | | 10,000 | 6,994 |
| 8% 3/15/26(b) | | 5,000 | 4,875 |
| DaVita HealthCare Partners, Inc. 3.75% 2/15/31 (b) | | 11,000 | 8,306 |
| Encompass Health Corp. 4.625% 4/1/31 | | 10,000 | 8,551 |
| HealthEquity, Inc. 4.5% 10/1/29 (b) | | 18,000 | 15,732 |
| Horizon Pharma U.S.A., Inc. 5.5% 8/1/27 (b) | | 8,000 | 8,129 |
| Humana, Inc. 3.7% 3/23/29 | | 130,000 | 117,942 |
| Pediatrix Medical Group, Inc. 5.375% 2/15/30 (b) | | 20,000 | 17,644 |
| RegionalCare Hospital Partners Holdings, Inc. 5.375% 1/15/29 (b) | | 12,000 | 7,876 |
| Tenet Healthcare Corp. 6.125% 10/1/28 | | 40,000 | 37,000 |
| | | | 391,227 |
| Health Care Technology - 0.0% | | | |
| Athenahealth Group, Inc. 6.5% 2/15/30 (b) | | 10,000 | 7,909 |
| | | | |
| Life Sciences Tools & Services - 0.0% | | | |
| Charles River Laboratories International, Inc. 3.75% 3/15/29 (b) | | 3,000 | 2,605 |
| | | | |
| Pharmaceuticals - 1.1% | | | |
| AstraZeneca Finance LLC 1.75% 5/28/28 | | 140,000 | 119,945 |
| Bristol-Myers Squibb Co. 2.95% 3/15/32 | | 70,000 | 60,431 |
| Catalent Pharma Solutions 3.5% 4/1/30 (b) | | 18,000 | 15,634 |
| HLF Financing SARL LLC / Herbalife International, Inc. 4.875% 6/1/29 (b) | | 2,000 | 1,550 |
| Zoetis, Inc. 2% 5/15/30 | | 140,000 | 114,734 |
| | | | 312,294 |
TOTAL HEALTH CARE | | | 951,429 |
| | | | |
| INDUSTRIALS - 2.6% | | | |
| Aerospace & Defense - 0.2% | | | |
| Bombardier, Inc. 6% 2/15/28 (b) | | 27,000 | 25,297 |
| Howmet Aerospace, Inc. 3% 1/15/29 | | 3,000 | 2,576 |
| Triumph Group, Inc.: | | | |
| 8.875% 6/1/24(b) | | 10,000 | 10,403 |
| 9% 3/15/28(b)(e) | | 10,000 | 10,000 |
| | | | 48,276 |
| Air Freight & Logistics - 0.0% | | | |
| Rand Parent LLC 8.5% 2/15/30 (b) | | 10,000 | 9,601 |
| | | | |
| Building Products - 0.4% | | | |
| Carrier Global Corp. 2.493% 2/15/27 | | 130,000 | 117,171 |
| Cornerstone Building Brands, Inc. 6.125% 1/15/29 (b) | | 8,000 | 5,800 |
| | | | 122,971 |
| Commercial Services & Supplies - 0.3% | | | |
| APX Group, Inc. 5.75% 7/15/29 (b) | | 12,000 | 10,054 |
| Brand Energy & Infrastructure Services, Inc. 8.5% 7/15/25 (b) | | 14,000 | 11,714 |
| Covanta Holding Corp. 4.875% 12/1/29 (b) | | 37,000 | 31,252 |
| KAR Auction Services, Inc. 5.125% 6/1/25 (b) | | 2,000 | 1,949 |
| Neptune BidCo U.S., Inc. 9.29% 4/15/29 (b) | | 5,000 | 4,727 |
| Stericycle, Inc.: | | | |
| 3.875% 1/15/29(b) | | 24,000 | 20,574 |
| 5.375% 7/15/24(b) | | 15,000 | 14,780 |
| | | | 95,050 |
| Construction & Engineering - 0.1% | | | |
| AECOM 5.125% 3/15/27 | | 12,000 | 11,476 |
| Pike Corp. 5.5% 9/1/28 (b) | | 4,000 | 3,471 |
| Railworks Holdings LP 8.25% 11/15/28 (b) | | 10,000 | 9,357 |
| | | | 24,304 |
| Electrical Equipment - 0.1% | | | |
| Atkore, Inc. 4.25% 6/1/31 (b) | | 8,000 | 6,964 |
| Regal Rexnord Corp.: | | | |
| 6.05% 4/15/28(b) | | 2,000 | 1,956 |
| 6.3% 2/15/30(b) | | 2,000 | 1,957 |
| Sensata Technologies BV 4% 4/15/29 (b) | | 8,000 | 7,056 |
| | | | 17,933 |
| Industrial Conglomerates - 0.6% | | | |
| Honeywell International, Inc. 1.75% 9/1/31 | | 140,000 | 110,764 |
| Trane Technologies Financing Ltd. 5.25% 3/3/33 (e) | | 50,000 | 49,633 |
| | | | 160,397 |
| Machinery - 0.8% | | | |
| Ingersoll-Rand Luxembourg Finance SA 3.8% 3/21/29 | | 130,000 | 119,708 |
| Otis Worldwide Corp. 2.565% 2/15/30 | | 140,000 | 117,963 |
| Vertical Holdco GmbH 7.625% 7/15/28 (b) | | 7,000 | 6,425 |
| | | | 244,096 |
| Marine - 0.0% | | | |
| Seaspan Corp. 5.5% 8/1/29 (b) | | 10,000 | 7,525 |
| | | | |
| Professional Services - 0.0% | | | |
| Dun & Bradstreet Corp. 5% 12/15/29 (b) | | 3,000 | 2,482 |
| | | | |
| Road & Rail - 0.0% | | | |
| Hertz Corp. 4.625% 12/1/26 (b) | | 12,000 | 10,686 |
| | | | |
| Trading Companies & Distributors - 0.1% | | | |
| Fortress Transportation & Infrastructure Investors LLC 5.5% 5/1/28 (b) | | 12,000 | 10,717 |
| | | | |
TOTAL INDUSTRIALS | | | 754,038 |
| | | | |
| INFORMATION TECHNOLOGY - 1.9% | | | |
| Communications Equipment - 0.1% | | | |
| CommScope, Inc. 4.75% 9/1/29 (b) | | 16,000 | 13,040 |
| HTA Group Ltd. 7% 12/18/25 (b) | | 8,000 | 7,562 |
| | | | 20,602 |
| Electronic Equipment & Components - 0.4% | | | |
| Coherent Corp. 5% 12/15/29 (b) | | 10,000 | 8,761 |
| Dell International LLC/EMC Corp. 6.2% 7/15/30 | | 110,000 | 111,687 |
| | | | 120,448 |
| IT Services - 0.2% | | | |
| Go Daddy Operating Co. LLC / GD Finance Co., Inc. 3.5% 3/1/29 (b) | | 28,000 | 23,458 |
| Rackspace Hosting, Inc. 3.5% 2/15/28 (b) | | 4,000 | 2,435 |
| Tempo Acquisition LLC 5.75% 6/1/25 (b) | | 6,000 | 5,940 |
| Twilio, Inc. 3.625% 3/15/29 | | 18,000 | 15,121 |
| Virtusa Corp. 7.125% 12/15/28 (b) | | 12,000 | 9,966 |
| | | | 56,920 |
| Semiconductors & Semiconductor Equipment - 0.9% | | | |
| Broadcom, Inc. 2.6% 2/15/33 (b) | | 10,000 | 7,558 |
| Entegris Escrow Corp. 5.95% 6/15/30 (b) | | 20,000 | 18,602 |
| Entegris, Inc. 3.625% 5/1/29 (b) | | 28,000 | 23,218 |
| Micron Technology, Inc. 2.703% 4/15/32 | | 140,000 | 106,225 |
| NXP BV/NXP Funding LLC/NXP U.S.A., Inc. 2.5% 5/11/31 | | 140,000 | 109,851 |
| onsemi 3.875% 9/1/28 (b) | | 2,000 | 1,758 |
| | | | 267,212 |
| Software - 0.3% | | | |
| Black Knight InfoServ LLC 3.625% 9/1/28 (b) | | 8,000 | 6,920 |
| Elastic NV 4.125% 7/15/29 (b) | | 28,000 | 22,979 |
| Gen Digital, Inc. 5% 4/15/25 (b) | | 14,000 | 13,599 |
| MicroStrategy, Inc. 6.125% 6/15/28 (b) | | 4,000 | 3,320 |
| NCR Corp. 6.125% 9/1/29 (b) | | 15,000 | 14,588 |
| Open Text Corp. 3.875% 12/1/29 (b) | | 14,000 | 11,300 |
| Open Text Holdings, Inc.: | | | |
| 4.125% 2/15/30(b) | | 5,000 | 4,114 |
| 4.125% 12/1/31(b) | | 1,000 | 796 |
| | | | 77,616 |
TOTAL INFORMATION TECHNOLOGY | | | 542,798 |
| | | | |
| MATERIALS - 1.5% | | | |
| Chemicals - 0.8% | | | |
| International Flavors & Fragrances, Inc. 2.3% 11/1/30 (b) | | 150,000 | 115,816 |
| Methanex Corp.: | | | |
| 5.125% 10/15/27 | | 10,000 | 9,399 |
| 5.65% 12/1/44 | | 30,000 | 24,450 |
| NOVA Chemicals Corp.: | | | |
| 4.875% 6/1/24(b) | | 10,000 | 9,801 |
| 5.25% 6/1/27(b) | | 10,000 | 9,000 |
| Nufarm Australia Ltd. 5% 1/27/30 (b) | | 10,000 | 8,730 |
| Olympus Water U.S. Holding Corp. 6.25% 10/1/29 (b) | | 18,000 | 14,590 |
| The Chemours Co. LLC 4.625% 11/15/29 (b) | | 43,000 | 34,898 |
| | | | 226,684 |
| Construction Materials - 0.1% | | | |
| Eco Material Technologies, Inc. 7.875% 1/31/27 (b) | | 2,000 | 1,909 |
| VM Consolidated, Inc. 5.5% 4/15/29 (b) | | 28,000 | 24,796 |
| | | | 26,705 |
| Containers & Packaging - 0.2% | | | |
| Berry Global, Inc. 5.625% 7/15/27 (b) | | 30,000 | 28,875 |
| Clydesdale Acquisition Holdings, Inc. 6.625% 4/15/29 (b) | | 10,000 | 9,541 |
| Crown Americas LLC/Crown Americas Capital Corp. IV 4.75% 2/1/26 | | 10,000 | 9,550 |
| | | | 47,966 |
| Metals & Mining - 0.4% | | | |
| ATI, Inc. 4.875% 10/1/29 | | 12,000 | 10,744 |
| Coeur d'Alene Mines Corp. 5.125% 2/15/29 (b) | | 6,000 | 4,541 |
| Eldorado Gold Corp. 6.25% 9/1/29 (b) | | 10,000 | 8,793 |
| ERO Copper Corp. 6.5% 2/15/30 (b) | | 22,000 | 18,618 |
| First Quantum Minerals Ltd. 6.875% 10/15/27 (b) | | 10,000 | 9,356 |
| FMG Resources Pty Ltd. 6.125% 4/15/32 (b) | | 20,000 | 18,900 |
| IAMGOLD Corp. 5.75% 10/15/28 (b) | | 6,000 | 4,485 |
| Infrabuild Australia Pty Ltd. 12% 10/1/24 (b) | | 14,000 | 13,545 |
| Mineral Resources Ltd. 8.5% 5/1/30 (b) | | 24,000 | 24,029 |
| | | | 113,011 |
| Paper & Forest Products - 0.0% | | | |
| Domtar Corp. 6.75% 10/1/28 (b) | | 8,000 | 7,200 |
| Mercer International, Inc. 5.125% 2/1/29 | | 10,000 | 8,200 |
| | | | 15,400 |
TOTAL MATERIALS | | | 429,766 |
| | | | |
| REAL ESTATE - 4.1% | | | |
| Equity Real Estate Investment Trusts (REITs) - 3.4% | | | |
| Alexandria Real Estate Equities, Inc. 2% 5/18/32 | | 220,000 | 168,309 |
| Boston Properties, Inc.: | | | |
| 2.45% 10/1/33 | | 220,000 | 160,656 |
| 6.75% 12/1/27 | | 17,000 | 17,645 |
| Corporate Office Properties LP 2% 1/15/29 | | 150,000 | 115,468 |
| Hudson Pacific Properties LP 5.95% 2/15/28 | | 108,000 | 100,398 |
| MPT Operating Partnership LP/MPT Finance Corp.: | | | |
| 4.625% 8/1/29 | | 10,000 | 7,475 |
| 5% 10/15/27 | | 48,000 | 39,400 |
| Prologis LP 2.875% 11/15/29 | | 200,000 | 173,573 |
| SBA Communications Corp. 3.125% 2/1/29 | | 7,000 | 5,780 |
| Uniti Group LP / Uniti Group Finance, Inc. 10.5% 2/15/28 (b) | | 5,000 | 5,001 |
| Uniti Group, Inc. 6% 1/15/30 (b) | | 34,000 | 21,073 |
| WP Carey, Inc. 2.45% 2/1/32 | | 220,000 | 173,842 |
| | | | 988,620 |
| Real Estate Management & Development - 0.7% | | | |
| CBRE Group, Inc. 2.5% 4/1/31 | | 140,000 | 113,768 |
| Howard Hughes Corp. 4.375% 2/1/31 (b) | | 15,000 | 12,222 |
| Realogy Group LLC/Realogy Co.-Issuer Corp. 5.25% 4/15/30 (b) | | 6,000 | 4,110 |
| Taylor Morrison Communities, Inc./Monarch Communities, Inc. 5.125% 8/1/30 (b) | | 14,000 | 12,355 |
| Vonovia SE 0.625% 3/24/31 (Reg. S) | EUR | 100,000 | 77,070 |
| | | | 219,525 |
TOTAL REAL ESTATE | | | 1,208,145 |
| | | | |
| UTILITIES - 5.9% | | | |
| Electric Utilities - 2.4% | | | |
| Duke Energy Carolinas LLC 3.95% 11/15/28 | | 170,000 | 162,014 |
| NextEra Energy Capital Holdings, Inc. 1.9% 6/15/28 | | 130,000 | 109,900 |
| Northern States Power Co. 2.25% 4/1/31 | | 210,000 | 173,359 |
| Oncor Electric Delivery Co. LLC 4.15% 6/1/32 | | 130,000 | 122,154 |
| PG&E Corp. 5% 7/1/28 | | 10,000 | 9,131 |
| Wisconsin Electric Power Co. 4.75% 9/30/32 | | 125,000 | 122,168 |
| | | | 698,726 |
| Independent Power and Renewable Electricity Producers - 1.2% | | | |
| Atlantica Sustainable Infrastructure PLC 4.125% 6/15/28 (b) | | 24,000 | 21,182 |
| Sunnova Energy Corp. 5.875% 9/1/26 (b) | | 20,000 | 17,428 |
| TerraForm Power Operating LLC 4.75% 1/15/30 (b) | | 8,000 | 6,916 |
| The AES Corp.: | | | |
| 1.375% 1/15/26 | | 140,000 | 123,895 |
| 2.45% 1/15/31 | | 227,000 | 180,314 |
| | | | 349,735 |
| Multi-Utilities - 2.3% | | | |
| Consolidated Edison Co. of New York, Inc. 3.35% 4/1/30 | | 190,000 | 169,812 |
| Dominion Energy, Inc. 2.25% 8/15/31 | | 220,000 | 173,971 |
| NiSource, Inc. 1.7% 2/15/31 | | 230,000 | 175,318 |
| Puget Energy, Inc. 4.224% 3/15/32 | | 190,000 | 167,997 |
| | | | 687,098 |
TOTAL UTILITIES | | | 1,735,559 |
| | | | |
| TOTAL NONCONVERTIBLE BONDS | | | 11,915,073 |
| TOTAL CORPORATE BONDS (Cost $13,064,212) | | | 11,958,926 |
| | | | |
| U.S. Treasury Obligations - 33.5% |
| | | Principal Amount (a) | Value ($) |
| U.S. Treasury Bills, yield at date of purchase 1.91% 4/20/23 | | 1,550,000 | 1,540,121 |
| U.S. Treasury Bonds: | | | |
| 2.25% 2/15/52 | | 2,410,000 | 1,718,340 |
| 3.25% 5/15/42 | | 100,000 | 88,387 |
| 3.375% 8/15/42 | | 600,000 | 540,188 |
| 4% 11/15/42 | | 225,000 | 221,801 |
| 5% 5/15/37 | | 10,000 | 11,180 |
| U.S. Treasury Notes: | | | |
| 2.5% 4/30/24 | | 200,000 | 194,023 |
| 2.5% 3/31/27 | | 50,000 | 46,633 |
| 3.5% 1/31/28 | | 300,000 | 290,883 |
| 3.5% 1/31/30 | | 650,000 | 627,758 |
| 3.5% 2/15/33 | | 1,070,000 | 1,034,723 |
| 3.875% 11/30/27 | | 600,000 | 591,445 |
| 3.875% 12/31/27 | | 1,650,000 | 1,625,274 |
| 3.875% 2/28/30 | | 500,000 | 498,125 |
| 4.125% 10/31/27 | | 500,000 | 497,500 |
| 4.125% 11/15/32 | | 300,000 | 304,781 |
| TOTAL U.S. TREASURY OBLIGATIONS (Cost $10,384,481) | | | 9,831,162 |
| | | | |
| U.S. Government Agency - Mortgage Securities - 19.5% |
| | | Principal Amount (a) | Value ($) |
| Fannie Mae - 1.6% | | | |
| 2% 10/1/35 | | 46,988 | 41,898 |
| 2.5% 7/1/51 to 1/1/52 | | 299,516 | 254,692 |
| 3% 5/1/52 | | 47,992 | 42,240 |
| 4% 4/1/52 to 9/1/52 | | 98,919 | 93,548 |
| 4.5% 7/1/52 | | 48,587 | 47,453 |
TOTAL FANNIE MAE | | | 479,831 |
| Freddie Mac - 2.8% | | | |
| 2% 11/1/51 | | 324,969 | 265,050 |
| 2.5% 12/1/51 | | 98,025 | 83,063 |
| 3.5% 6/1/52 | | 199,999 | 182,223 |
| 4% 10/1/52 | | 49,623 | 47,170 |
| 4.5% 11/1/52 | | 99,149 | 95,502 |
| 5% 12/1/52 to 3/1/53 | | 149,402 | 147,457 |
TOTAL FREDDIE MAC | | | 820,465 |
| Ginnie Mae - 3.2% | | | |
| 2% 1/20/51 to 2/20/51 | | 73,787 | 62,209 |
| 2% 3/1/53 (e) | | 50,000 | 41,909 |
| 2% 3/1/53 (e) | | 100,000 | 83,817 |
| 2% 3/1/53 (e) | | 50,000 | 41,909 |
| 2% 3/1/53 (e) | | 75,000 | 62,863 |
| 2% 4/1/53 (e) | | 100,000 | 83,907 |
| 2% 4/1/53 (e) | | 50,000 | 41,954 |
| 2.5% 3/1/53 (e) | | 200,000 | 172,953 |
| 2.5% 3/1/53 (e) | | 75,000 | 64,857 |
| 2.5% 3/1/53 (e) | | 50,000 | 43,238 |
| 3% 3/1/53 (e) | | 50,000 | 44,603 |
| 3% 3/1/53 (e) | | 50,000 | 44,603 |
| 3% 3/1/53 (e) | | 50,000 | 44,603 |
| 3.5% 3/1/53 (e) | | 50,000 | 45,960 |
| 3.5% 3/1/53 (e) | | 25,000 | 22,980 |
| 3.5% 3/1/53 (e) | | 25,000 | 22,980 |
TOTAL GINNIE MAE | | | 925,345 |
| Uniform Mortgage Backed Securities - 11.9% | | | |
| 1.5% 3/1/53 (e) | | 100,000 | 77,214 |
| 1.5% 3/1/53 (e) | | 25,000 | 19,304 |
| 2% 3/1/38 (e) | | 100,000 | 88,752 |
| 2% 3/1/38 (e) | | 100,000 | 88,752 |
| 2% 3/1/38 (e) | | 150,000 | 133,128 |
| 2% 4/1/38 (e) | | 250,000 | 222,153 |
| 2% 4/1/38 (e) | | 100,000 | 88,861 |
| 2% 3/1/53 (e) | | 50,000 | 40,713 |
| 2% 3/1/53 (e) | | 350,000 | 284,989 |
| 2% 3/1/53 (e) | | 200,000 | 162,851 |
| 2% 3/1/53 (e) | | 50,000 | 40,713 |
| 2% 3/1/53 (e) | | 300,000 | 244,276 |
| 2% 4/1/53 (e) | | 350,000 | 285,331 |
| 2% 4/1/53 (e) | | 200,000 | 163,046 |
| 2.5% 3/1/53 (e) | | 250,000 | 211,797 |
| 2.5% 3/1/53 (e) | | 175,000 | 148,258 |
| 2.5% 3/1/53 (e) | | 100,000 | 84,719 |
| 2.5% 4/1/53 (e) | | 50,000 | 42,402 |
| 3% 3/1/38 (e) | | 100,000 | 93,328 |
| 3% 3/1/53 (e) | | 150,000 | 131,935 |
| 3% 3/1/53 (e) | | 100,000 | 87,957 |
| 3% 3/1/53 (e) | | 150,000 | 131,935 |
| 3% 3/1/53 (e) | | 100,000 | 87,957 |
| 3% 4/1/53 (e) | | 300,000 | 264,105 |
| 3% 4/1/53 (e) | | 100,000 | 88,035 |
| 4% 3/1/53 (e) | | 100,000 | 93,797 |
| 4.5% 3/1/53 (e) | | 25,000 | 24,069 |
| 4.5% 3/1/53 (e) | | 75,000 | 72,208 |
TOTAL UNIFORM MORTGAGE BACKED SECURITIES | | | 3,502,585 |
| TOTAL U.S. GOVERNMENT AGENCY - MORTGAGE SECURITIES (Cost $5,861,822) | | | 5,728,226 |
| | | | |
| Asset-Backed Securities - 6.8% |
| | | Principal Amount (a) | Value ($) |
| Allegro CLO XV, Ltd. / Allegro CLO VX LLC Series 2022-1A Class A, CME TERM SOFR 3 MONTH INDEX + 1.500% 6.139% 7/20/35 (b)(c)(d) | | 250,000 | 247,167 |
| Ares LIX CLO Ltd. Series 2021-59A Class A, 3 month U.S. LIBOR + 1.030% 5.8477% 4/25/34 (b)(c)(d) | | 250,000 | 244,859 |
| Cedar Funding Ltd. Series 2021-14A Class A, 3 month U.S. LIBOR + 1.100% 5.8924% 7/15/33 (b)(c)(d) | | 260,000 | 256,064 |
| CEDF Series 2021-6A Class ARR, 3 month U.S. LIBOR + 1.050% 5.8577% 4/20/34 (b)(c)(d) | | 200,000 | 194,370 |
| Dryden CLO, Ltd. Series 2021-76A Class A1R, 3 month U.S. LIBOR + 1.150% 5.9577% 10/20/34 (b)(c)(d) | | 310,000 | 304,690 |
| Eaton Vance CLO, Ltd. Series 2021-1A Class AR, 3 month U.S. LIBOR + 1.100% 5.8924% 4/15/31 (b)(c)(d) | | 250,000 | 247,717 |
| Planet Fitness Master Issuer LLC Series 2022-1A Class A2I, 3.251% 12/5/51 (b) | | 99,250 | 87,793 |
| Symphony CLO XXVI Ltd. / Symphony CLO XXVI LLC Series 2021-26A Class AR, 3 month U.S. LIBOR + 1.080% 5.8877% 4/20/33 (b)(c)(d) | | 310,000 | 304,178 |
| Verizon Master Trust Series 2021-2 Class A, 0.99% 4/20/28 | | 107,000 | 100,005 |
| TOTAL ASSET-BACKED SECURITIES (Cost $2,008,728) | | | 1,986,843 |
| | | | |
| Commercial Mortgage Securities - 1.2% |
| | | Principal Amount (a) | Value ($) |
| BXHPP Trust floater Series 2021-FILM Class A, 1 month U.S. LIBOR + 0.650% 5.238% 8/15/36 (b)(c)(d) | | 250,000 | 236,721 |
| SLG Office Trust sequential payer Series 2021-OVA Class A, 2.5854% 7/15/41 (b) | | 150,000 | 121,154 |
| TOTAL COMMERCIAL MORTGAGE SECURITIES (Cost $381,124) | | | 357,875 |
| | | | |
| Foreign Government and Government Agency Obligations - 0.6% |
| | | Principal Amount (a) | Value ($) |
| German Federal Republic 0% 8/15/31 | EUR | 46,000 | 39,221 |
| United Kingdom, Great Britain and Northern Ireland: | | | |
| 1% 4/22/24(Reg. S) | GBP | 3,000 | 3,486 |
| 1.75% 9/7/37 (Reg. S) | GBP | 23,000 | 20,707 |
| 2.25% 9/7/23 | GBP | 25,000 | 29,797 |
| 4.25% 6/7/32 (f) | GBP | 39,000 | 48,895 |
| 4.5% 9/7/34 | GBP | 16,000 | 20,366 |
| TOTAL FOREIGN GOVERNMENT AND GOVERNMENT AGENCY OBLIGATIONS (Cost $154,286) | | | 162,472 |
| | | | |
| Common Stocks - 0.1% |
| | | Shares | Value ($) |
| COMMUNICATION SERVICES - 0.0% | | | |
| Media - 0.0% | | | |
| Charter Communications, Inc. Class A (g) | | 8 | 2,941 |
| CONSUMER DISCRETIONARY - 0.0% | | | |
| Auto Components - 0.0% | | | |
| Aptiv PLC (g) | | 25 | 2,907 |
| ENERGY - 0.1% | | | |
| Oil, Gas & Consumable Fuels - 0.1% | | | |
| Denbury, Inc. (g) | | 38 | 3,168 |
| EQT Corp. | | 60 | 1,991 |
| New Fortress Energy, Inc. | | 114 | 3,761 |
| | | | 8,920 |
| HEALTH CARE - 0.0% | | | |
| Health Care Providers & Services - 0.0% | | | |
| Cano Health, Inc. (g) | | 400 | 660 |
| INDUSTRIALS - 0.0% | | | |
| Electrical Equipment - 0.0% | | | |
| Regal Rexnord Corp. | | 20 | 3,153 |
| INFORMATION TECHNOLOGY - 0.0% | | | |
| Electronic Equipment & Components - 0.0% | | | |
| Coherent Corp. (g) | | 65 | 2,803 |
| TOTAL COMMON STOCKS (Cost $21,185) | | | 21,384 |
| | | | |
| Bank Loan Obligations - 0.0% |
| | | Principal Amount (a) | Value ($) |
| INDUSTRIALS - 0.0% | | | |
| Commercial Services & Supplies - 0.0% | | | |
| Brand Energy & Infrastructure Services, Inc. Tranche B, term loan 3 month U.S. LIBOR + 4.250% 9.0646% 6/21/24 (c)(d)(h) | | 5,953 | 5,615 |
| Neptune BidCo U.S., Inc. Tranche B 1LN, term loan CME Term SOFR 1 Month Index + 5.000% 9.735% 4/11/29 (c)(d)(h) | | 5,000 | 4,588 |
| TOTAL BANK LOAN OBLIGATIONS (Cost $10,188) | | | 10,203 |
| | | | |
| Preferred Securities - 1.0% |
| | | Principal Amount (a) | Value ($) |
| COMMUNICATION SERVICES - 0.3% | | | |
| Diversified Telecommunication Services - 0.3% | | | |
| Telefonica Europe BV 2.502% (Reg. S) (c)(i) | EUR | 100,000 | 92,767 |
| CONSUMER STAPLES - 0.3% | | | |
| Food Products - 0.3% | | | |
| Danone SA 1% (Reg. S) (c)(i) | EUR | 100,000 | 90,441 |
| FINANCIALS - 0.0% | | | |
| Consumer Finance - 0.0% | | | |
| Ally Financial, Inc. 4.7% (c)(i) | | 20,000 | 15,710 |
| UTILITIES - 0.4% | | | |
| Electric Utilities - 0.4% | | | |
| TenneT Holding BV 2.995% (Reg. S) (c)(i) | EUR | 100,000 | 105,892 |
| TOTAL PREFERRED SECURITIES (Cost $335,232) | | | 304,810 |
| | | | |
| Money Market Funds - 10.6% |
| | | Shares | Value ($) |
Fidelity Cash Central Fund 4.63% (j) (Cost $3,109,141) | | 3,108,520 | 3,109,141 |
| | | | |
| TOTAL INVESTMENT IN SECURITIES - 114.1% (Cost $35,330,399) | 33,471,042 |
NET OTHER ASSETS (LIABILITIES) - (14.1)% | (4,129,277) |
| NET ASSETS - 100.0% | 29,341,765 |
| | |
| TBA Sale Commitments |
| | Principal Amount (a) | Value ($) |
| Ginnie Mae | | |
| 2% 3/1/53 | (50,000) | (41,909) |
| 2% 3/1/53 | (100,000) | (83,817) |
| 2% 3/1/53 | (50,000) | (41,909) |
| | | |
| TOTAL GINNIE MAE | | (167,635) |
| | | |
| Uniform Mortgage Backed Securities | | |
| 2% 3/1/38 | (250,000) | (221,880) |
| 2% 3/1/38 | (100,000) | (88,752) |
| 2% 3/1/53 | (50,000) | (40,713) |
| 2% 3/1/53 | (50,000) | (40,713) |
| 2% 3/1/53 | (50,000) | (40,713) |
| 2% 3/1/53 | (50,000) | (40,713) |
| 2% 3/1/53 | (350,000) | (284,989) |
| 2% 3/1/53 | (200,000) | (162,851) |
| 2.5% 3/1/53 | (25,000) | (21,180) |
| 2.5% 3/1/53 | (50,000) | (42,359) |
| 2.5% 3/1/53 | (100,000) | (84,719) |
| 2.5% 3/1/53 | (50,000) | (42,359) |
| 2.5% 3/1/53 | (50,000) | (42,359) |
| 3% 3/1/53 | (300,000) | (263,870) |
| 3% 3/1/53 | (100,000) | (87,957) |
| | | |
| TOTAL UNIFORM MORTGAGE BACKED SECURITIES | | (1,506,127) |
| | | |
TOTAL TBA SALE COMMITMENTS (Proceeds $1,683,553) | | (1,673,762) |
| Futures Contracts |
| | Number of contracts | Expiration Date | Notional Amount ($) | Value ($) | Unrealized Appreciation/ (Depreciation) ($) |
| Purchased | | | | | |
| | | | | | |
| Treasury Contracts | | | | | |
| CBOT 2-Year U.S. Treasury Note Contracts (United States) | 1 | Jun 2023 | 203,727 | (463) | (463) |
| CBOT 5-Year U.S. Treasury Note Contracts (United States) | 1 | Jun 2023 | 107,055 | (135) | (135) |
| CBOT Ultra 10-Year U.S. Treasury Note Contracts (United States) | 2 | Jun 2023 | 234,375 | 652 | 652 |
| | | | | | |
| TOTAL PURCHASED | | | | | 54 |
| | | | | | |
| Sold | | | | | |
| | | | | | |
| Bond Index Contracts | | | | | |
| ICE Long Gilt Contracts (United Kingdom) | 1 | Jun 2023 | 120,237 | 778 | 778 |
| | | | | | |
| TOTAL FUTURES CONTRACTS | | | | | 832 |
| The notional amount of futures purchased as a percentage of Net Assets is 1.9% |
| The notional amount of futures sold as a percentage of Net Assets is 0.4% |
| Forward Foreign Currency Contracts |
Currency Purchased | Currency Sold | Counterparty | Settlement Date | Unrealized Appreciation/ (Depreciation) ($) |
| | | | | | | |
| EUR | 2,000 | USD | 2,136 | Brown Brothers Harriman & Co | 4/20/23 | (15) |
| EUR | 7,000 | USD | 7,451 | JPMorgan Chase Bank, N.A. | 4/20/23 | (25) |
| GBP | 3,000 | USD | 3,638 | JPMorgan Chase Bank, N.A. | 4/20/23 | (26) |
| GBP | 2,000 | USD | 2,434 | JPMorgan Chase Bank, N.A. | 4/20/23 | (26) |
| GBP | 2,000 | USD | 2,421 | JPMorgan Chase Bank, N.A. | 4/20/23 | (13) |
| USD | 708,183 | EUR | 654,000 | BNP Paribas S.A. | 4/20/23 | 14,396 |
| USD | 2,179 | EUR | 2,000 | BNP Paribas S.A. | 4/20/23 | 58 |
| USD | 2,144 | EUR | 2,000 | Bank of America, N.A. | 4/20/23 | 23 |
| USD | 2,178 | EUR | 2,000 | Brown Brothers Harriman & Co | 4/20/23 | 57 |
| USD | 2,182 | EUR | 2,000 | Brown Brothers Harriman & Co | 4/20/23 | 60 |
| USD | 9,821 | EUR | 9,000 | JPMorgan Chase Bank, N.A. | 4/20/23 | 273 |
| USD | 2,199 | EUR | 2,000 | JPMorgan Chase Bank, N.A. | 4/20/23 | 77 |
| USD | 329,951 | GBP | 270,000 | Bank of America, N.A. | 4/20/23 | 4,880 |
| USD | 2,467 | GBP | 2,000 | Brown Brothers Harriman & Co | 4/20/23 | 59 |
| USD | 7,344 | GBP | 6,000 | HSBC Bank | 4/20/23 | 120 |
| USD | 2,455 | GBP | 2,000 | JPMorgan Chase Bank, N.A. | 4/20/23 | 47 |
| USD | 2,436 | GBP | 2,000 | State Street Bank and Trust Co | 4/20/23 | 28 |
| | | | | | | |
| TOTAL FORWARD FOREIGN CURRENCY CONTRACTS | | 19,973 |
| | | | | | | |
| Unrealized Appreciation | | | 20,078 |
| Unrealized Depreciation | | | (105) |
Currency Abbreviations
| EUR | - | European Monetary Unit |
| GBP | - | British pound sterling |
| USD | - | U.S. dollar |
Legend
| (a) | Amount is stated in United States dollars unless otherwise noted. |
| (b) | Security exempt from registration under Rule 144A of the Securities Act of 1933. These securities may be resold in transactions exempt from registration, normally to qualified institutional buyers. At the end of the period, the value of these securities amounted to $5,442,236 or 18.5% of net assets. |
| (c) | Coupon rates for floating and adjustable rate securities reflect the rates in effect at period end. |
| (d) | Coupon is indexed to a floating interest rate which may be multiplied by a specified factor and/or subject to caps or floors. |
| (e) | Security or a portion of the security purchased on a delayed delivery or when-issued basis. |
| (f) | Security or a portion of the security was pledged to cover margin requirements for futures contracts. At period end, the value of securities pledged amounted to $25,077. |
| (h) | Remaining maturities of bank loan obligations may be less than the stated maturities shown as a result of contractual or optional prepayments by the borrower. Such prepayments cannot be predicted with certainty. |
| (i) | Security is perpetual in nature with no stated maturity date. |
| (j) | Affiliated fund that is generally available only to investment companies and other accounts managed by Fidelity Investments. The rate quoted is the annualized seven-day yield of the fund at period end. A complete unaudited listing of the fund's holdings as of its most recent quarter end is available upon request. In addition, each Fidelity Central Fund's financial statements are available on the SEC's website or upon request. |
Affiliated Central Funds
Fiscal year to date information regarding the Fund's investments in Fidelity Central Funds, including the ownership percentage, is presented below.
| Affiliate | Value, beginning of period ($) | Purchases ($) | Sales Proceeds ($) | Dividend Income ($) | Realized Gain (loss) ($) | Change in Unrealized appreciation (depreciation) ($) | Value, end of period ($) | % ownership, end of period |
| Fidelity Cash Central Fund 4.63% | 3,283,645 | 5,859,021 | 6,033,525 | 79,637 | - | - | 3,109,141 | 0.0% |
| Total | 3,283,645 | 5,859,021 | 6,033,525 | 79,637 | - | - | 3,109,141 | |
| | | | | | | | | |
Amounts in the dividend income column in the above table include any capital gain distributions from underlying funds, which are presented in the corresponding line item in the Statement of Operations, if applicable.
Amounts included in the purchases and sales proceeds columns may include in-kind transactions, if applicable.
Investment Valuation
The following is a summary of the inputs used, as of February 28, 2023, involving the Fund's assets and liabilities carried at fair value. The inputs or methodology used for valuing securities may not be an indication of the risk associated with investing in those securities. For more information on valuation inputs, and their aggregation into the levels used below, please refer to the Investment Valuation section in the accompanying Notes to Financial Statements.
| Valuation Inputs at Reporting Date: |
| Description | Total ($) | Level 1 ($) | Level 2 ($) | Level 3 ($) |
Investments in Securities: | | | | |
|
| Equities: | | | | |
Communication Services | 2,941 | 2,941 | - | - |
Consumer Discretionary | 2,907 | 2,907 | - | - |
Energy | 8,920 | 8,920 | - | - |
Health Care | 660 | 660 | - | - |
Industrials | 3,153 | 3,153 | - | - |
Information Technology | 2,803 | 2,803 | - | - |
|
| Corporate Bonds | 11,958,926 | - | 11,958,926 | - |
|
| U.S. Government and Government Agency Obligations | 9,831,162 | - | 9,831,162 | - |
|
| U.S. Government Agency - Mortgage Securities | 5,728,226 | - | 5,728,226 | - |
|
| Asset-Backed Securities | 1,986,843 | - | 1,986,843 | - |
|
| Commercial Mortgage Securities | 357,875 | - | 357,875 | - |
|
| Foreign Government and Government Agency Obligations | 162,472 | - | 162,472 | - |
|
| Bank Loan Obligations | 10,203 | - | 10,203 | - |
|
| Preferred Securities | 304,810 | - | 304,810 | - |
|
| Money Market Funds | 3,109,141 | 3,109,141 | - | - |
| Total Investments in Securities: | 33,471,042 | 3,130,525 | 30,340,517 | - |
Derivative Instruments: | | | | |
|
| Assets | | | | |
Futures Contracts | 1,430 | 1,430 | - | - |
Forward Foreign Currency Contracts | 20,078 | - | 20,078 | - |
| Total Assets | 21,508 | 1,430 | 20,078 | - |
|
| Liabilities | | | | |
Futures Contracts | (598) | (598) | - | - |
Forward Foreign Currency Contracts | (105) | - | (105) | - |
| Total Liabilities | (703) | (598) | (105) | - |
| Total Derivative Instruments: | 20,805 | 832 | 19,973 | - |
Other Financial Instruments: | | | | |
|
| TBA Sale Commitments | (1,673,762) | - | (1,673,762) | - |
| Total Other Financial Instruments: | (1,673,762) | - | (1,673,762) | - |
Value of Derivative Instruments
The following table is a summary of the Fund's value of derivative instruments by primary risk exposure as of February 28, 2023. For additional information on derivative instruments, please refer to the Derivative Instruments section in the accompanying Notes to Financial Statements.
Primary Risk Exposure / Derivative Type | Value |
| Asset ($) | Liability ($) |
| Foreign Exchange Risk | | |
Forward Foreign Currency Contracts (a) | 20,078 | (105) |
| Total Foreign Exchange Risk | 20,078 | (105) |
| Interest Rate Risk | | |
Futures Contracts (b) | 1,430 | (598) |
| Total Interest Rate Risk | 1,430 | (598) |
| Total Value of Derivatives | 21,508 | (703) |
(a)Gross value is presented in the Statement of Assets and Liabilities in the unrealized appreciation/depreciation on forward foreign currency contracts line-items.
(b)Reflects gross cumulative appreciation (depreciation) on futures contracts as presented in the Schedule of Investments. In the Statement of Assets and Liabilities, the period end daily variation margin is included in receivable or payable for daily variation margin on futures contracts, and the net cumulative appreciation (depreciation) is included in Total accumulated earnings (loss).
| Statement of Assets and Liabilities |
| | | | February 28, 2023 (Unaudited) |
| | | | | |
| Assets | | | | |
| Investment in securities, at value - See accompanying schedule: | | | | |
Unaffiliated issuers (cost $32,221,258) | $ | 30,361,901 | | |
Fidelity Central Funds (cost $3,109,141) | | 3,109,141 | | |
| | | | | |
| | | | | |
| Total Investment in Securities (cost $35,330,399) | | | $ | 33,471,042 |
| Cash | | | | 25,877 |
| Foreign currency held at value (cost $14,936) | | | | 14,792 |
| Receivable for investments sold | | | | 844,595 |
| Receivable for TBA sale commitments | | | | 1,683,553 |
| Unrealized appreciation on forward foreign currency contracts | | | | 20,078 |
| Receivable for fund shares sold | | | | 242,594 |
| Dividends receivable | | | | 17 |
| Interest receivable | | | | 193,311 |
| Distributions receivable from Fidelity Central Funds | | | | 12,695 |
| Receivable for daily variation margin on futures contracts | | | | 818 |
| Prepaid expenses | | | | 2,497 |
| Receivable from investment adviser for expense reductions | | | | 23,673 |
Total assets | | | | 36,535,542 |
| Liabilities | | | | |
| Payable for investments purchased | | | | |
Regular delivery | $ | 911,897 | | |
Delayed delivery | | 4,526,022 | | |
| TBA sale commitments, at value | | 1,673,762 | | |
| Unrealized depreciation on forward foreign currency contracts | | 105 | | |
| Distributions payable | | 161 | | |
| Accrued management fee | | 7,097 | | |
| Other payables and accrued expenses | | 74,733 | | |
| Total Liabilities | | | | 7,193,777 |
| Net Assets | | | $ | 29,341,765 |
| Net Assets consist of: | | | | |
| Paid in capital | | | $ | 31,466,744 |
| Total accumulated earnings (loss) | | | | (2,124,979) |
| Net Assets | | | $ | 29,341,765 |
Net Asset Value , offering price and redemption price per share ($29,341,765 ÷ 3,198,380 shares) | | | $ | 9.17 |
| Statement of Operations |
| | | | Six months ended February 28, 2023 (Unaudited) |
| Investment Income | | | | |
| Dividends | | | $ | 8,698 |
| Interest | | | | 456,657 |
| Income from Fidelity Central Funds | | | | 79,637 |
| Total Income | | | | 544,992 |
| Expenses | | | | |
| Management fee | $ | 38,509 | | |
| Custodian fees and expenses | | 12,254 | | |
| Independent trustees' fees and expenses | | 48 | | |
| Registration fees | | 20,337 | | |
| Audit | | 62,136 | | |
| Legal | | 18 | | |
| Miscellaneous | | 60 | | |
| Total expenses before reductions | | 133,362 | | |
| Expense reductions | | (87,968) | | |
| Total expenses after reductions | | | | 45,394 |
| Net Investment income (loss) | | | | 499,598 |
| Realized and Unrealized Gain (Loss) | | | | |
| Net realized gain (loss) on: | | | | |
| Investment Securities: | | | | |
| Unaffiliated issuers | | (256,204) | | |
| Forward foreign currency contracts | | (18,926) | | |
| Foreign currency transactions | | 271 | | |
| Futures contracts | | (25,678) | | |
| Total net realized gain (loss) | | | | (300,537) |
| Change in net unrealized appreciation (depreciation) on: | | | | |
| Investment Securities: | | | | |
| Unaffiliated issuers | | (530,986) | | |
| Forward foreign currency contracts | | (11,776) | | |
| Assets and liabilities in foreign currencies | | 1,766 | | |
| Futures contracts | | 4,997 | | |
| TBA Sale commitments | | 1,831 | | |
| Total change in net unrealized appreciation (depreciation) | | | | (534,168) |
| Net gain (loss) | | | | (834,705) |
| Net increase (decrease) in net assets resulting from operations | | | $ | (335,107) |
| Statement of Changes in Net Assets |
| |
| | Six months ended February 28, 2023 (Unaudited) | | For the period April 13, 2022 (commencement of operations) through August 31, 2022 |
| Increase (Decrease) in Net Assets | | | | |
| Operations | | | | |
| Net investment income (loss) | $ | 499,598 | $ | 268,343 |
| Net realized gain (loss) | | (300,537) | | (5,244) |
| Change in net unrealized appreciation (depreciation) | | (534,168) | | (1,294,546) |
| Net increase (decrease) in net assets resulting from operations | | (335,107) | | (1,031,447) |
| Distributions to shareholders | | (537,818) | | (220,609) |
| Share transactions | | | | |
| Proceeds from sales of shares | | 5,454,902 | | 25,334,197 |
| Reinvestment of distributions | | 537,529 | | 220,605 |
| Cost of shares redeemed | | (80,278) | | (209) |
Net increase (decrease) in net assets resulting from share transactions | | 5,912,153 | | 25,554,593 |
| Total increase (decrease) in net assets | | 5,039,228 | | 24,302,537 |
| | | | | |
| Net Assets | | | | |
| Beginning of period | | 24,302,537 | | - |
| End of period | $ | 29,341,765 | $ | 24,302,537 |
| | | | | |
| Other Information | | | | |
| Shares | | | | |
| Sold | | 591,358 | | 2,534,410 |
| Issued in reinvestment of distributions | | 58,530 | | 22,857 |
| Redeemed | | (8,754) | | (21) |
| Net increase (decrease) | | 641,134 | | 2,557,246 |
| | | | | |
Financial Highlights
| Fidelity® SAI Sustainable Core Plus Bond Fund |
| |
| | Six months ended (Unaudited) February 28, 2023 | | Years ended August 31, 2022 A |
Selected Per-Share Data | | | | |
| Net asset value, beginning of period | $ | 9.50 | $ | 10.00 |
| Income from Investment Operations | | | | |
Net investment income (loss) B,C | | .178 | | .107 |
| Net realized and unrealized gain (loss) | | (.317) | | (.519) |
| Total from investment operations | | (.139) | | (.412) |
| Distributions from net investment income | | (.191) | | (.088) |
| Total distributions | | (.191) | | (.088) |
| Net asset value, end of period | $ | 9.17 | $ | 9.50 |
Total Return D,E | | (1.45)% | | (4.13)% |
Ratios to Average Net Assets C,F,G | | | | |
| Expenses before reductions | | 1.04% H | | .94% H,I |
| Expenses net of fee waivers, if any | | .36% H | | .36% H |
| Expenses net of all reductions | | .35% H | | .36% H |
| Net investment income (loss) | | 3.90% H | | 2.85% H |
| Supplemental Data | | | | |
| Net assets, end of period (000 omitted) | $ | 29,342 | $ | 24,303 |
Portfolio turnover rate J | | 340% H | | 124% K |
A For the period April 13, 2022 (commencement of operations) through August 31, 2022.
B Calculated based on average shares outstanding during the period.
C Net investment income (loss) is affected by the timing of the declaration of dividends by any underlying mutual funds or exchange-traded funds (ETFs). Net investment income (loss) of any mutual funds or ETFs is not included in the Fund's net investment income (loss) ratio.
D Total returns for periods of less than one year are not annualized.
E Total returns would have been lower if certain expenses had not been reduced during the applicable periods shown.
F Fees and expenses of any underlying mutual funds or exchange-traded funds (ETFs) are not included in the Fund's expense ratio. The Fund indirectly bears its proportionate share of these expenses. For additional expense information related to investments in Fidelity Central Funds, please refer to the "Investments in Fidelity Central Funds" note found in the Notes to Financial Statements section of the most recent Annual or Semi-Annual report.
G Expense ratios reflect operating expenses of the class. Expenses before reductions do not reflect amounts reimbursed, waived, or reduced through arrangements with the investment adviser, brokerage services, or other offset arrangements, if applicable, and do not represent the amount paid by the class during periods when reimbursements, waivers or reductions occur.
H Annualized.
I Audit fees are not annualized.
J Amount does not include the portfolio activity of any underlying mutual funds or exchange-traded funds (ETFs).
K Amount not annualized.
For the period ended February 28, 2023
1. Organization.
Fidelity SAI Sustainable Core Plus Bond Fund (the Fund) is a fund of Fidelity Salem Street Trust (the Trust) and is authorized to issue an unlimited number of shares. Shares are offered exclusively to certain clients of Fidelity Management & Research Company LLC (FMR) or its affiliates. The Trust is registered under the Investment Company Act of 1940, as amended (the 1940 Act), as an open-end management investment company organized as a Massachusetts business trust.
2. Investments in Fidelity Central Funds.
Funds may invest in Fidelity Central Funds, which are open-end investment companies generally available only to other investment companies and accounts managed by the investment adviser and its affiliates. The Schedule of Investments lists any Fidelity Central Funds held as an investment as of period end, but does not include the underlying holdings of each Fidelity Central Fund. An investing fund indirectly bears its proportionate share of the expenses of the underlying Fidelity Central Funds.
Based on its investment objective, each Fidelity Central Fund may invest or participate in various investment vehicles or strategies that are similar to those of the investing fund. These strategies are consistent with the investment objectives of the investing fund and may involve certain economic risks which may cause a decline in value of each of the Fidelity Central Funds and thus a decline in the value of the investing fund.
| Fidelity Central Fund | Investment Manager | Investment Objective | Investment Practices | Expense Ratio A |
| Fidelity Money Market Central Funds | Fidelity Management & Research Company LLC (FMR) | Each fund seeks to obtain a high level of current income consistent with the preservation of capital and liquidity. | Short-term Investments | Less than .005% |
A Expenses expressed as a percentage of average net assets and are as of each underlying Central Fund's most recent annual or semi-annual shareholder report.
A complete unaudited list of holdings for each Fidelity Central Fund is available upon request or at the Securities and Exchange Commission website at www.sec.gov. In addition, the financial statements of the Fidelity Central Funds which contain the significant accounting policies (including investment valuation policies) of those funds, and are not covered by the Report of Independent Registered Public Accounting Firm, are available on the Securities and Exchange Commission website or upon request.
3. Significant Accounting Policies.
The Fund is an investment company and applies the accounting and reporting guidance of the Financial Accounting Standards Board (FASB) Accounting Standards Codification Topic 946 Financial Services - Investment Companies . The financial statements have been prepared in conformity with accounting principles generally accepted in the United States of America (GAAP), which require management to make certain estimates and assumptions at the date of the financial statements. Actual results could differ from those estimates. Subsequent events, if any, through the date that the financial statements were issued have been evaluated in the preparation of the financial statements. The Fund's Schedule of Investments lists any underlying mutual funds or exchange-traded funds (ETFs) but does not include the underlying holdings of these funds. The following summarizes the significant accounting policies of the Fund:
Investment Valuation. Investments are valued as of 4:00 p.m. Eastern time on the last calendar day of the period. The Board of Trustees (the Board) has designated the Fund's investment adviser as the valuation designee responsible for the fair valuation function and performing fair value determinations as needed. The investment adviser has established a Fair Value Committee (the Committee) to carry out the day-to-day fair valuation responsibilities and has adopted policies and procedures to govern the fair valuation process and the activities of the Committee. In accordance with these fair valuation policies and procedures, which have been approved by the Board, the Fund attempts to obtain prices from one or more third party pricing services or brokers to value its investments. When current market prices, quotations or currency exchange rates are not readily available or reliable, investments will be fair valued in good faith by the Committee, in accordance with the policies and procedures. Factors used in determining fair value vary by investment type and may include market or investment specific events, transaction data, estimated cash flows, and market observations of comparable investments. The frequency that the fair valuation procedures are used cannot be predicted and they may be utilized to a significant extent. The Committee manages the Fund's fair valuation practices and maintains the fair valuation policies and procedures. The Fund's investment adviser reports to the Board information regarding the fair valuation process and related material matters.
The Fund categorizes the inputs to valuation techniques used to value its investments into a disclosure hierarchy consisting of three levels as shown below:
Level 1 - unadjusted quoted prices in active markets for identical investments
Level 2 - other significant observable inputs (including quoted prices for similar investments, interest rates, prepayment speeds, etc.)
Level 3 - unobservable inputs (including the Fund's own assumptions based on the best information available)
Valuation techniques used to value the Fund's investments by major category are as follows:
Debt securities, including restricted securities, are valued based on evaluated prices received from third party pricing services or from brokers who make markets in such securities. Corporate bonds, bank loan obligations, foreign government and government agency obligations, preferred securities and U.S. government and government agency obligations are valued by pricing services who utilize matrix pricing which considers yield or price of bonds of comparable quality, coupon, maturity and type or by broker-supplied prices. Asset backed securities, commercial mortgage securities and U.S. government agency mortgage securities are valued by pricing services who utilize matrix pricing which considers prepayment speed assumptions, attributes of the collateral, yield or price of bonds of comparable quality, coupon, maturity and type or by broker-supplied prices. When independent prices are unavailable or unreliable, debt securities may be valued utilizing pricing methodologies which consider similar factors that would be used by third party pricing services. Debt securities are generally categorized as Level 2 in the hierarchy but may be Level 3 depending on the circumstances.
Equity securities, including restricted securities, for which market quotations are readily available, are valued at the last reported sale price or official closing price as reported by a third party pricing service on the primary market or exchange on which they are traded and are categorized as Level 1 in the hierarchy. In the event there were no sales during the day or closing prices are not available, securities are valued at the last quoted bid price or may be valued using the last available price and are generally categorized as Level 2 in the hierarchy. For foreign equity securities, when market or security specific events arise, comparisons to the valuation of American Depositary Receipts (ADRs), futures contracts, ETFs and certain indexes as well as quoted prices for similar securities may be used and would be categorized as Level 2 in the hierarchy. For equity securities, including restricted securities, where observable inputs are limited, assumptions about market activity and risk are used and these securities may be categorized as Level 3 in the hierarchy.
The U.S. dollar value of forward foreign currency contracts is determined using currency exchange rates supplied by a pricing service and are categorized as Level 2 in the hierarchy. Futures contracts are valued at the settlement price established each day by the board of trade or exchange on which they are traded and are categorized as Level 1 in the hierarchy. Investments in open-end mutual funds, including the Fidelity Central Funds, are valued at their closing net asset value (NAV) each business day and are categorized as Level 1 in the hierarchy.
Changes in valuation techniques may result in transfers in or out of an assigned level within the disclosure hierarchy. The aggregate value of investments by input level as of February 28, 2023 is included at the end of the Fund's Schedule of Investments.
Foreign Currency. Certain Funds may use foreign currency contracts to facilitate transactions in foreign-denominated securities. Gains and losses from these transactions may arise from changes in the value of the foreign currency or if the counterparties do not perform under the contracts' terms.
Foreign-denominated assets, including investment securities, and liabilities are translated into U.S. dollars at the exchange rates at period end. Purchases and sales of investment securities, income and dividends received, and expenses denominated in foreign currencies are translated into U.S. dollars at the exchange rate in effect on the transaction date.
The effects of exchange rate fluctuations on investments are included with the net realized and unrealized gain (loss) on investment securities. Other foreign currency transactions resulting in realized and unrealized gain (loss) are disclosed separately.
Investment Transactions and Income. For financial reporting purposes, the Fund's investment holdings and NAV include trades executed through the end of the last business day of the period. The NAV per share for processing shareholder transactions is calculated as of the close of business of the New York Stock Exchange (NYSE), normally 4:00 p.m. Eastern time and includes trades executed through the end of the prior business day. Gains and losses on securities sold are determined on the basis of identified cost. Dividend income is recorded on the ex-dividend date, except for certain dividends from foreign securities where the ex-dividend date may have passed, which are recorded as soon as the Fund is informed of the ex-dividend date. Non-cash dividends included in dividend income, if any, are recorded at the fair market value of the securities received. Income and capital gain distributions from Fidelity Central Funds, if any, are recorded on the ex-dividend date. Interest income is accrued as earned and includes coupon interest and amortization of premium and accretion of discount on debt securities as applicable. Investment income is recorded net of foreign taxes withheld where recovery of such taxes is uncertain.
Expenses. Expenses directly attributable to a fund are charged to that fund. Expenses attributable to more than one fund are allocated among the respective funds on the basis of relative net assets or other appropriate methods. Expenses included in the accompanying financial statements reflect the expenses of that fund and do not include any expenses associated with any underlying mutual funds or exchange-traded funds. Although not included in a fund's expenses, a fund indirectly bears its proportionate share of these expenses through the net asset value of each underlying mutual fund or exchange-traded fund. Expense estimates are accrued in the period to which they relate and adjustments are made when actual amounts are known.
Income Tax Information and Distributions to Shareholders. Each year, the Fund intends to qualify as a regulated investment company under Subchapter M of the Internal Revenue Code, including distributing substantially all of its taxable income and realized gains. As a result, no provision for U.S. Federal income taxes is required. The Fund files a U.S. federal tax return, in addition to state and local tax returns as required. The Fund's federal income tax returns are subject to examination by the Internal Revenue Service (IRS) for a period of three fiscal years after they are filed. State and local tax returns may be subject to examination for an additional fiscal year depending on the jurisdiction. Foreign taxes are provided for based on the Fund's understanding of the tax rules and rates that exist in the foreign markets in which it invests.
Distributions are declared and recorded daily and paid monthly from net investment income. Distributions from realized gains, if any, are declared and recorded on the ex-dividend date. Income and capital gain distributions are determined in accordance with income tax regulations, which may differ from GAAP.
Capital accounts within the financial statements are adjusted for permanent book-tax differences. These adjustments have no impact on net assets or the results of operations. Capital accounts are not adjusted for temporary book-tax differences which will reverse in a subsequent period.
Book-tax differences are primarily due to futures contracts, foreign currency transactions, market discount, capital loss carryforwards and losses deferred due to wash sales.
As of period end, the cost and unrealized appreciation (depreciation) in securities, and derivatives if applicable, for federal income tax purposes were as follows:
| Gross unrealized appreciation | $79,330 |
| Gross unrealized depreciation | (1,800,842) |
| Net unrealized appreciation (depreciation) | $(1,721,512) |
| Tax cost | $35,223,150 |
Capital loss carryforwards are only available to offset future capital gains of the Fund to the extent provided by regulations and may be limited. The capital loss carryforward information presented below, including any applicable limitation, is estimated as of prior fiscal period end and is subject to adjustment.
Short-term | $(76,287) |
Long-term | (1,344) |
| Total capital loss carryforward | $(77,631) |
Delayed Delivery Transactions and When-Issued Securities. During the period, certain Funds transacted in securities on a delayed delivery or when-issued basis. Payment and delivery may take place after the customary settlement period for that security. The price of the underlying securities and the date when the securities will be delivered and paid for are fixed at the time the transaction is negotiated. Securities purchased on a delayed delivery or when-issued basis are identified as such in the Schedule of Investments. Compensation for interest forgone in the purchase of a delayed delivery or when-issued debt security may be received. With respect to purchase commitments, each applicable Fund identifies securities as segregated in its records with a value at least equal to the amount of the commitment. Payables and receivables associated with the purchases and sales of delayed delivery securities having the same coupon, settlement date and broker are offset. Delayed delivery or when-issued securities that have been purchased from and sold to different brokers are reflected as both payables and receivables in the Statement of Assets and Liabilities under the caption "Delayed delivery", as applicable. Losses may arise due to changes in the value of the underlying securities or if the counterparty does not perform under the contract's terms, or if the issuer does not issue the securities due to political, economic, or other factors.
To-Be-Announced (TBA) Securities and Mortgage Dollar Rolls. TBA securities involve buying or selling mortgage-backed securities (MBS) on a forward commitment basis. A TBA transaction typically does not designate the actual security to be delivered and only includes an approximate principal amount; however delivered securities must meet specified terms defined by industry guidelines, including issuer, rate and current principal amount outstanding on underlying mortgage pools. Funds may enter into a TBA transaction with the intent to take possession of or deliver the underlying MBS, or a fund may elect to extend the settlement by entering into either a mortgage or reverse mortgage dollar roll. Mortgage dollar rolls are transactions where a fund sells TBA securities and simultaneously agrees to repurchase MBS on a later date at a lower price and with the same counterparty. Reverse mortgage dollar rolls involve the purchase and simultaneous agreement to sell TBA securities on a later date at a lower price. Transactions in mortgage dollar rolls and reverse mortgage dollar rolls are accounted for as purchases and sales and may result in an increase to a fund's portfolio turnover rate.
Purchases and sales of TBA securities involve risks similar to those discussed above for delayed delivery and when-issued securities. Also, if the counterparty in a mortgage dollar roll or a reverse mortgage dollar roll transaction files for bankruptcy or becomes insolvent, a fund's right to repurchase or sell securities may be limited. Additionally, when a fund sells TBA securities without already owning or having the right to obtain the deliverable securities (an uncovered forward commitment to sell), it incurs a risk of loss because it could have to purchase the securities at a price that is higher than the price at which it sold them. A fund may be unable to purchase the deliverable securities if the corresponding market is illiquid.
TBA securities subject to a forward commitment to sell at period end are included at the end of the Schedule of Investments under the caption "TBA Sale Commitments." The proceeds and value of these commitments are reflected in the Statement of Assets and Liabilities as "Receivable for TBA sale commitments" and "TBA sale commitments, at value," respectively.
Restricted Securities (including Private Placements). Funds may invest in securities that are subject to legal or contractual restrictions on resale. These securities generally may be resold in transactions exempt from registration or to the public if the securities are registered. Disposal of these securities may involve time-consuming negotiations and expense, and prompt sale at an acceptable price may be difficult. Information regarding restricted securities held at period end is included at the end of the Schedule of Investments, if applicable.
Loans and Other Direct Debt Instruments. Direct debt instruments are interests in amounts owed to lenders by corporate or other borrowers. These instruments may be in the form of loans, trade claims or other receivables and may include standby financing commitments such as revolving credit facilities that obligate a fund to supply additional cash to the borrower on demand. Loans may be acquired through assignment, participation, or may be made directly to a borrower. Such instruments are presented in the Bank Loan Obligations section in the Schedule of Investments. Certain funds may also invest in unfunded loan commitments, which are contractual obligations for future funding. Information regarding unfunded commitments is included at the end of the Schedule of Investments, if applicable.
4. Derivative Instruments.
Risk Exposures and the Use of Derivative Instruments. The Fund's investment objectives allow for various types of derivative instruments, including futures contracts and forward foreign currency contracts. Derivatives are investments whose value is primarily derived from underlying assets, indices or reference rates and may be transacted on an exchange or over-the-counter (OTC). Derivatives may involve a future commitment to buy or sell a specified asset based on specified terms, to exchange future cash flows at periodic intervals based on a notional principal amount, or for one party to make one or more payments upon the occurrence of specified events in exchange for periodic payments from the other party.
Derivatives were used to increase returns, to facilitate transactions in foreign-denominated securities and to manage exposure to certain risks as defined below. The success of any strategy involving derivatives depends on analysis of numerous economic factors, and if the strategies for investment do not work as intended, the objectives may not be achieved.
Derivatives were used to increase or decrease exposure to the following risk(s):
| Foreign Exchange Risk | Foreign exchange rate risk relates to fluctuations in the value of an asset or liability due to changes in currency exchange rates. |
| Interest Rate Risk | Interest rate risk relates to the fluctuations in the value of interest-bearing securities due to changes in the prevailing levels of market interest rates. |
Funds are also exposed to additional risks from investing in derivatives, such as liquidity risk and counterparty credit risk. Liquidity risk is the risk that a fund will be unable to close out the derivative in the open market in a timely manner. Counterparty credit risk is the risk that the counterparty will not be able to fulfill its obligation to a fund. Derivative counterparty credit risk is managed through formal evaluation of the creditworthiness of all potential counterparties. On certain OTC derivatives such as forward foreign currency contracts, a fund attempts to reduce its exposure to counterparty credit risk by entering into an International Swaps and Derivatives Association, Inc. (ISDA) Master Agreement with each of its counterparties. The ISDA Master Agreement gives a fund the right to terminate all transactions traded under such agreement upon the deterioration in the credit quality of the counterparty beyond specified levels. The ISDA Master Agreement gives each party the right, upon an event of default by the other party or a termination of the agreement, to close out all transactions traded under such agreement and to net amounts owed under each transaction to one net payable by one party to the other. To mitigate counterparty credit risk on bi-lateral OTC derivatives, a fund receives collateral in the form of cash or securities once net unrealized appreciation on outstanding derivative contracts under an ISDA Master Agreement exceeds certain applicable thresholds, subject to certain minimum transfer provisions. The collateral received is held in segregated accounts with the custodian bank in accordance with the collateral agreements entered into between a fund, the counterparty and the custodian bank. A fund could experience delays and costs in gaining access to the collateral even though it is held by the custodian bank. The maximum risk of loss to a fund from counterparty credit risk related to bi-lateral OTC derivatives is generally the aggregate unrealized appreciation and unpaid counterparty payments in excess of any collateral pledged by the counterparty to a fund. A fund may be required to pledge collateral for the benefit of the counterparties on bi-lateral OTC derivatives in an amount not less than each counterparty's unrealized appreciation on outstanding derivative contracts, subject to certain minimum transfer provisions, and any such pledged collateral is identified in the Schedule of Investments. Exchange-traded contracts are not covered by the ISDA Master Agreement; however counterparty credit risk related to these contracts may be mitigated by the protection provided by the exchange on which they trade.
Investing in derivatives may involve greater risks than investing in the underlying assets directly and, to varying degrees, may involve risk of loss in excess of any initial investment and collateral received and amounts recognized in the Statement of Assets and Liabilities. In addition, there may be the risk that the change in value of the derivative contract does not correspond to the change in value of the underlying instrument.
Net Realized Gain (Loss) and Change in Net Unrealized Appreciation (Depreciation) on Derivatives. The table below, which reflects the impacts of derivatives on the financial performance, summarizes the net realized gain (loss) and change in net unrealized appreciation (depreciation) for derivatives during the period as presented in the Statement of Operations.
| Primary Risk Exposure / Derivative Type | Net Realized Gain (Loss) | Change in Net Unrealized Appreciation (Depreciation) |
| Fidelity SAI Sustainable Core Plus Bond Fund | | |
| Foreign Exchange Risk | | |
| Forward Foreign Currency Contracts | $(18,926) | $(11,776) |
| Total Foreign Exchange Risk | (18,926) | (11,776) |
| Interest Rate Risk | | |
| Futures Contracts | $(25,678) | $4,997 |
| Total Interest Rate Risk | (25,678) | 4,997 |
| Totals | $(44,604) | $(6,779) |
If there are any open positions at period end, a summary of the value of derivatives by primary risk exposure is included at the end of the Schedule of Investments.
Forward Foreign Currency Contracts. Forward foreign currency contracts represent obligations to purchase or sell foreign currency on a specified future date at a price fixed at the time the contracts are entered into. Forward foreign currency contracts were used to facilitate transactions in foreign-denominated securities and to manage exposure to certain foreign currencies.
Forward foreign currency contracts are valued daily and fluctuations in exchange rates on open contracts are recorded as unrealized appreciation or (depreciation) and reflected in total accumulated earnings (loss) in the Statement of Assets and Liabilities. When the contract is closed, a gain or loss is realized equal to the difference between the closing value and the value at the time it was opened. Non-deliverable forward foreign currency exchange contracts are settled with the counterparty in cash without the delivery of foreign currency. The net realized gain (loss) and change in net unrealized appreciation (depreciation) on forward foreign currency contracts during the period is presented in the Statement of Operations.
Any open forward foreign currency contracts at period end are presented in the Schedule of Investments under the caption "Forward Foreign Currency Contracts." The contract amount and unrealized appreciation (depreciation) reflects each contract's exposure to the underlying currency at period end, and is representative of volume of activity during the period unless an average contract value is presented.
Futures Contracts. A futures contract is an agreement between two parties to buy or sell a specified underlying instrument for a fixed price at a specified future date. Futures contracts were used to manage exposure to the bond market and fluctuations in interest rates.
Upon entering into a futures contract, a fund is required to deposit either cash or securities (initial margin) with a clearing broker in an amount equal to a certain percentage of the face value of the contract. Futures contracts are marked-to-market daily and subsequent daily payments are made or received by a fund depending on the daily fluctuations in the value of the futures contracts and are recorded as unrealized appreciation or (depreciation). This receivable and/or payable, if any, is included in daily variation margin on futures contracts in the Statement of Assets and Liabilities. Realized gain or (loss) is recorded upon the expiration or closing of a futures contract. The net realized gain (loss) and change in net unrealized appreciation (depreciation) on futures contracts during the period is presented in the Statement of Operations.
Any open futures contracts at period end are presented in the Schedule of Investments under the caption "Futures Contracts". The notional amount at value reflects each contract's exposure to the underlying instrument or index at period end, and is representative of volume of activity during the period unless an average notional amount is presented. Any securities deposited to meet initial margin requirements are identified in the Schedule of Investments. Any cash deposited to meet initial margin requirements is presented as segregated cash with brokers for derivative instruments in the Statement of Assets and Liabilities.
5. Purchases and Sales of Investments.
Purchases and sales of securities, other than short-term securities, U.S. government securities and in-kind transactions, as applicable, are noted in the table below.
| | Purchases ($) | Sales ($) |
| Fidelity SAI Sustainable Core Plus Bond Fund | 29,537,983 | 29,410,285 |
6. Fees and Other Transactions with Affiliates.
Management Fee. Fidelity Management & Research Company LLC (the investment adviser) and its affiliates provide the Fund with investment management related services for which the Fund pays a monthly management fee. The management fee is the sum of an individual fund fee rate that is based on an annual rate of .20% of the Fund's average net assets and an annualized group fee rate that averaged .10% during the period. The group fee rate is based upon the monthly average net assets of a group of registered investment companies with which the investment adviser has management contracts. The group fee rate decreases as assets under management increase and increases as assets under management decrease. For the reporting period, the total annualized management fee rate was .30% of the Fund's average net assets.
Interfund Trades. Funds may purchase from or sell securities to other Fidelity Funds under procedures adopted by the Board. The procedures have been designed to ensure these interfund trades are executed in accordance with Rule 17a-7 of the 1940 Act. Any interfund trades are included within the respective purchases and sales amounts shown in the Purchases and Sales of Investments note. Interfund trades during the period are noted in the table below.
| | Purchases ($) | Sales ($) | Realized Gain (Loss) ($) |
| Fidelity SAI Sustainable Core Plus Bond Fund | 2,577 | - | - |
7. Expense Reductions.
The investment adviser contractually agreed to reimburse the Fund to the extent annual operating expenses exceeded .36% of average net assets. This reimbursement will remain in place through December 31, 2023. Some expenses, for example the compensation of the independent Trustees, and certain miscellaneous expenses such as proxy and shareholder meeting expenses, are excluded from this reimbursement. During the period this reimbursement reduced the Fund's expenses by $87,250.
Through arrangements with the Fund's custodian and transfer agent, credits realized as a result of certain uninvested cash balances were used to reduce the Fund's expenses by $310 and $150, respectively.
In addition, during the period the investment adviser or an affiliate reimbursed and/or waived a portion of operating expenses in the amount of $258.
8. Other.
A fund's organizational documents provide former and current trustees and officers with a limited indemnification against liabilities arising in connection with the performance of their duties to the fund. In the normal course of business, a fund may also enter into contracts that provide general indemnifications. A fund's maximum exposure under these arrangements is unknown as this would be dependent on future claims that may be made against a fund. The risk of material loss from such claims is considered remote.
At the end of the period, the investment adviser or its affiliates were owners of record of more than 10% of the outstanding shares as follows:
| Fund | Affiliated % |
| Fidelity SAI Sustainable Core Plus Bond Fund | 81% |
9. Risk and Uncertainties.
Many factors affect a fund's performance. Developments that disrupt global economies and financial markets, such as pandemics, epidemics, outbreaks of infectious diseases, war, terrorism, and environmental disasters, may significantly affect a fund's investment performance. The effects of these developments to a fund will be impacted by the types of securities in which a fund invests, the financial condition, industry, economic sector, and geographic location of an issuer, and a fund's level of investment in the securities of that issuer. Significant concentrations in security types, issuers, industries, sectors, and geographic locations may magnify the factors that affect a fund's performance.
As a shareholder, you incur two types of costs: (1) transaction costs, which may include sales charges (loads) on purchase payments or redemption proceeds, as applicable and (2) ongoing costs, which generally include management fees, distribution and/or service (12b-1) fees and other Fund expenses. This Example is intended to help you understand your ongoing costs (in dollars) of investing in a fund and to compare these costs with the ongoing costs of investing in other mutual funds.
| The Example is based on an investment of $1,000 invested at the beginning of the period and held for the entire period (September 1, 2022 to February 28, 2023). |
Actual Expenses
The first line of the accompanying table provides information about actual account values and actual expenses. You may use the information in this line, together with the amount you invested, to estimate the expenses that you paid over the period. Simply divide your account value by $1,000.00 (for example, an $8,600 account value divided by $1,000.00 = 8.6), then multiply the result by the number in the first line for a class/Fund under the heading entitled "Expenses Paid During Period" to estimate the expenses you paid on your account during this period. If any fund is a shareholder of any underlying mutual funds or exchange-traded funds (ETFs) (the Underlying Funds), such fund indirectly bears its proportional share of the expenses of the Underlying Funds in addition to the direct expenses incurred presented in the table. These fees and expenses are not included in the annualized expense ratio used to calculate the expense estimate in the table below.
Hypothetical Example for Comparison Purposes
The second line of the accompanying table provides information about hypothetical account values and hypothetical expenses based on the actual expense ratio and an assumed rate of return of 5% per year before expenses, which is not the actual return. The hypothetical account values and expenses may not be used to estimate the actual ending account balance or expenses you paid for the period. You may use this information to compare the ongoing costs of investing in the Fund and other funds. To do so, compare this 5% hypothetical example with the 5% hypothetical examples that appear in the shareholder reports of the other funds. If any fund is a shareholder of any Underlying Funds, such fund indirectly bears its proportional share of the expenses of the Underlying Funds in addition to the direct expenses as presented in the table. These fees and expenses are not included in the annualized expense ratio used to calculate the expense estimate in the table below.
Please note that the expenses shown in the table are meant to highlight your ongoing costs only and do not reflect any transaction costs. Therefore, the second line of the table is useful in comparing ongoing costs only, and will not help you determine the relative total costs of owning different funds. In addition, if these transactional costs were included, your costs would have been higher.
| | | | | Annualized Expense Ratio- A | | Beginning Account Value September 1, 2022 | | Ending Account Value February 28, 2023 | | Expenses Paid During Period- C September 1, 2022 to February 28, 2023 |
| | | | | | | | | | |
| Fidelity® SAI Sustainable Core Plus Bond Fund | | | | .36% | | | | | | |
| Actual | | | | | | $ 1,000 | | $ 985.50 | | $ 1.77 |
Hypothetical- B | | | | | | $ 1,000 | | $ 1,023.01 | | $ 1.81 |
| |
A Annualized expense ratio reflects expenses net of applicable fee waivers.
B 5% return per year before expenses
C Expenses are equal to the annualized expense ratio, multiplied by the average account value over the period, multiplied by 181/ 365 (to reflect the one-half year period). The fees and expenses of any Underlying Funds are not included in each annualized expense ratio.
The Securities and Exchange Commission adopted Rule 22e-4 under the Investment Company Act of 1940 (the Liquidity Rule) to promote effective liquidity risk management throughout the open-end investment company industry, thereby reducing the risk that funds will be unable to meet their redemption obligations and mitigating dilution of the interests of fund shareholders.
The Fund has adopted and implemented a liquidity risk management program (the Program) reasonably designed to assess and manage the Fund's liquidity risk and to comply with the requirements of the Liquidity Rule. The Fund's Board of Trustees (the Board) has designated the Fund's investment adviser as administrator of the Program. The Fidelity advisers have established a Liquidity Risk Management Committee (the LRM Committee) to manage the Program for each of the Fidelity Funds. The LRM Committee monitors the adequacy and effectiveness of implementation of the Program and on a periodic basis assesses each Fund's liquidity risk based on a variety of factors including (1) the Fund's investment strategy, (2) portfolio liquidity and cash flow projections during normal and reasonably foreseeable stressed conditions, (3) shareholder redemptions, (4) borrowings and other funding sources and (5) certain factors specific to ETFs including the effect of the Fund's prices and spreads, market participants, and basket compositions on the overall liquidity of the Fund's portfolio, as applicable.
In accordance with the Program, each of the Fund's portfolio investments is classified into one of four defined liquidity categories based on a determination of a reasonable expectation for how long it would take to convert the investment to cash (or sell or dispose of the investment) without significantly changing its market value.
- Highly liquid investments - cash or convertible to cash within three business days or less
- Moderately liquid investments - convertible to cash in three to seven calendar days
- Less liquid investments - can be sold or disposed of, but not settled, within seven calendar days
- Illiquid investments - cannot be sold or disposed of within seven calendar days
Liquidity classification determinations take into account a variety of factors including various market, trading and investment-specific considerations, as well as market depth, and generally utilize analysis from a third-party liquidity metrics service.
The Liquidity Rule places a 15% limit on a fund's illiquid investments and requires funds that do not primarily hold assets that are highly liquid investments to determine and maintain a minimum percentage of the fund's net assets to be invested in highly liquid investments (highly liquid investment minimum or HLIM). The Program includes provisions reasonably designed to comply with the 15% limit on illiquid investments and for determining, periodically reviewing and complying with the HLIM requirement as applicable.
At a recent meeting of the Fund's Board of Trustees, the LRM Committee provided a written report to the Board pertaining to the operation, adequacy, and effectiveness of the Program for the period December 1, 2021 through November 30, 2022. The report concluded that the Program is operating effectively and is reasonably designed to assess and manage the Fund's liquidity risk.
1.9904894.100
SSU-SANN-0423
Fidelity® SAI Low Duration Income Fund
Semi-Annual Report
February 28, 2023
Offered exclusively to certain clients of the Adviser, or its affiliates, including Strategic Advisers LLC (Strategic Advisers) - not available for sale to the general public. Fidelity ® SAI is a product name of Fidelity ® funds dedicated to certain programs affiliated with Strategic Advisers.
Contents
To view a fund's proxy voting guidelines and proxy voting record for the 12-month period ended June 30, visit http://www.fidelity.com/proxyvotingresults or visit the Securities and Exchange Commission's (SEC) web site at http://www.sec.gov.
You may also call 1-800-544-3455 to request a free copy of the proxy voting guidelines.
Standard & Poor's, S&P and S&P 500 are registered service marks of The McGraw-Hill Companies, Inc. and have been licensed for use by Fidelity Distributors Corporation.
Other third-party marks appearing herein are the property of their respective owners.
All other marks appearing herein are registered or unregistered trademarks or service marks of FMR LLC or an affiliated company. © 2023 FMR LLC. All rights reserved.
This report and the financial statements contained herein are submitted for the general information of the shareholders of the Fund. This report is not authorized for distribution to prospective investors in the Fund unless preceded or accompanied by an effective prospectus.
A fund files its complete schedule of portfolio holdings with the SEC for the first and third quarters of each fiscal year on Form N-PORT. Forms N-PORT are available on the SEC's web site at http://www.sec.gov. A fund's Forms N-PORT may be reviewed and copied at the SEC's Public Reference Room in Washington, DC. Information regarding the operation of the SEC's Public Reference Room may be obtained by calling 1-800-SEC-0330.
For a complete list of a fund's portfolio holdings, view the most recent holdings listing, semiannual report, or annual report on Fidelity's web site at http://www.fidelity.com, http://www.institutional.fidelity.com, or http://www.401k.com, as applicable.
NOT FDIC INSURED •MAY LOSE VALUE •NO BANK GUARANTEE
Neither the Fund nor Fidelity Distributors Corporation is a bank.
Quality Diversification (% of Fund's net assets) |
|
| |
| We have used ratings from Moody's Investors Service, Inc. Where Moody's® ratings are not available, we have used S&P® ratings. All ratings are as of the date indicated and do not reflect subsequent changes. |
Asset Allocation (% of Fund's net assets) |
|
Foreign investments - 21.7% |
|
Geographic Diversification (% of Fund's net assets) |
|
* Includes Short-Term investments and Net Other Assets (Liabilities). Percentages are based on country or territory of incorporation and are adjusted for the effect of derivatives, if applicable. |
| |
Showing Percentage of Net Assets
| Nonconvertible Bonds - 53.7% |
| | | Principal Amount (a) | Value ($) |
| COMMUNICATION SERVICES - 1.0% | | | |
| Diversified Telecommunication Services - 0.7% | | | |
| AT&T, Inc. 0.9% 3/25/24 | | 15,000,000 | 14,304,534 |
| NTT Finance Corp.: | | | |
| 0.373% 3/3/23 (b) | | 15,000,000 | 14,998,123 |
| 0.583% 3/1/24 (b) | | 3,719,000 | 3,541,661 |
| Verizon Communications, Inc. U.S. Secured Overnight Fin. Rate (SOFR) Averages Index + 0.500% 4.913% 3/22/24 (c)(d) | | 6,019,000 | 6,015,184 |
| | | | 38,859,502 |
| Media - 0.3% | | | |
| Discovery Communications LLC 3.8% 3/13/24 | | 2,000,000 | 1,962,263 |
| Magallanes, Inc. U.S. Secured Overnight Fin. Rate (SOFR) Averages Index + 1.780% 6.1741% 3/15/24 (b)(c)(d) | | 10,341,000 | 10,411,712 |
| | | | 12,373,975 |
TOTAL COMMUNICATION SERVICES | | | 51,233,477 |
| CONSUMER DISCRETIONARY - 4.5% | | | |
| Automobiles - 3.9% | | | |
| American Honda Finance Corp. 3.55% 1/12/24 | | 5,000,000 | 4,923,301 |
| BMW U.S. Capital LLC: | | | |
| U.S. Secured Overnight Fin. Rate (SOFR) Averages Index + 0.530% 4.9546% 4/1/24 (b)(c)(d) | | 23,993,000 | 24,000,640 |
| U.S. Secured Overnight Fin. Rate (SOFR) Averages Index + 0.840% 5.2646% 4/1/25 (b)(c)(d) | | 13,000,000 | 13,049,270 |
| 3.8% 4/6/23 (b) | | 4,500,000 | 4,493,856 |
| Daimler Finance North America LLC: | | | |
| 3 month U.S. LIBOR + 0.840% 5.6461% 5/4/23 (b)(c)(d) | | 11,390,000 | 11,397,792 |
| 0.75% 3/1/24 (b) | | 15,000,000 | 14,326,138 |
| 3.65% 2/22/24 (b) | | 6,401,000 | 6,291,539 |
| 5.5% 11/27/24 (b) | | 10,000,000 | 10,025,324 |
| General Motors Financial Co., Inc.: | | | |
| U.S. Secured Overnight Fin. Rate (SOFR) Averages Index + 1.300% 5.7367% 4/7/25 (c)(d) | | 13,000,000 | 12,999,747 |
| U.S. Secured Overnight Fin. Rate (SOFR) Index + 0.000% 5.0719% 10/15/24 (c)(d) | | 11,310,000 | 11,221,340 |
| U.S. Secured Overnight Fin. Rate (SOFR) Index + 0.760% 5.1077% 3/8/24 (c)(d) | | 9,606,000 | 9,586,480 |
| U.S. Secured Overnight Fin. Rate (SOFR) Index + 1.200% 5.7531% 11/17/23 (c)(d) | | 8,000,000 | 8,005,864 |
| 1.05% 3/8/24 | | 10,000,000 | 9,551,174 |
| 1.7% 8/18/23 | | 10,000,000 | 9,812,237 |
| 3.95% 4/13/24 | | 3,000,000 | 2,942,058 |
| 4.15% 6/19/23 | | 9,338,000 | 9,302,321 |
| 5.1% 1/17/24 | | 2,000,000 | 1,990,495 |
| Toyota Motor Corp. 0.681% 3/25/24 | | 3,000,000 | 2,859,867 |
| Volkswagen Group of America Finance LLC: | | | |
| U.S. Secured Overnight Fin. Rate (SOFR) Index + 0.950% 5.2737% 6/7/24 (b)(c)(d) | | 13,000,000 | 13,012,965 |
| 0.875% 11/22/23 (b) | | 5,000,000 | 4,838,336 |
| 3.125% 5/12/23 (b) | | 15,000,000 | 14,928,754 |
| 4.25% 11/13/23 (b) | | 9,000,000 | 8,913,331 |
| | | | 208,472,829 |
| Hotels, Restaurants & Leisure - 0.2% | | | |
| Starbucks Corp. U.S. Secured Overnight Fin. Rate (SOFR) Averages Index + 0.420% 4.9745% 2/14/24 (c)(d) | | 11,071,000 | 11,055,206 |
| Multiline Retail - 0.4% | | | |
| Dollar General Corp. 4.25% 9/20/24 | | 19,487,000 | 19,144,395 |
TOTAL CONSUMER DISCRETIONARY | | | 238,672,430 |
| CONSUMER STAPLES - 1.2% | | | |
| Beverages - 0.2% | | | |
| Dr. Pepper Snapple Group, Inc. 0.75% 3/15/24 | | 11,500,000 | 10,939,266 |
| Food & Staples Retailing - 0.1% | | | |
| 7-Eleven, Inc. 0.8% 2/10/24 (b) | | 7,898,000 | 7,544,095 |
| Tobacco - 0.9% | | | |
| Altria Group, Inc.: | | | |
| 3.8% 2/14/24 | | 2,000,000 | 1,966,207 |
| 4% 1/31/24 | | 7,000,000 | 6,913,798 |
| BAT Capital Corp. 3.222% 8/15/24 | | 15,000,000 | 14,456,245 |
| Philip Morris International, Inc.: | | | |
| 3.6% 11/15/23 | | 9,000,000 | 8,909,165 |
| 5.125% 11/15/24 | | 12,200,000 | 12,161,873 |
| Reynolds American, Inc. 4.85% 9/15/23 | | 2,500,000 | 2,491,196 |
| | | | 46,898,484 |
TOTAL CONSUMER STAPLES | | | 65,381,845 |
| ENERGY - 1.9% | | | |
| Energy Equipment & Services - 0.2% | | | |
| Baker Hughes Co. 1.231% 12/15/23 | | 9,196,000 | 8,910,799 |
| Oil, Gas & Consumable Fuels - 1.7% | | | |
| Chevron Corp. 3 month U.S. LIBOR + 0.900% 5.7726% 5/11/23 (c)(d) | | 15,141,000 | 15,161,155 |
| ConocoPhillips Co. 2.125% 3/8/24 | | 13,000,000 | 12,596,955 |
| Enbridge, Inc. U.S. Secured Overnight Fin. Rate (SOFR) Averages Index + 0.630% 5.1834% 2/16/24 (c)(d) | | 14,987,000 | 14,955,602 |
| Energy Transfer LP 4.9% 2/1/24 | | 7,250,000 | 7,193,404 |
| Equinor ASA 2.65% 1/15/24 | | 20,000,000 | 19,561,098 |
| Kinder Morgan Energy Partners LP: | | | |
| 4.15% 2/1/24 | | 2,000,000 | 1,973,050 |
| 4.3% 5/1/24 | | 2,000,000 | 1,971,450 |
| Phillips 66 Co. 0.9% 2/15/24 | | 5,000,000 | 4,786,452 |
| Pioneer Natural Resources Co. 0.55% 5/15/23 | | 5,000,000 | 4,951,150 |
| Shell International Finance BV 3.5% 11/13/23 | | 5,000,000 | 4,940,149 |
| Spectra Energy Partners LP 4.75% 3/15/24 | | 2,000,000 | 1,982,480 |
| The Williams Companies, Inc. 4.3% 3/4/24 | | 2,000,000 | 1,974,668 |
| | | | 92,047,613 |
TOTAL ENERGY | | | 100,958,412 |
| FINANCIALS - 35.0% | | | |
| Banks - 21.7% | | | |
| Bank of America Corp.: | | | |
| U.S. Secured Overnight Fin. Rate (SOFR) Index + 0.660% 5.2163% 2/4/25 (c)(d) | | 18,000,000 | 17,990,100 |
| U.S. Secured Overnight Fin. Rate (SOFR) Index + 0.690% 5.1853% 4/22/25 (c)(d) | | 15,950,000 | 15,932,136 |
| U.S. Secured Overnight Fin. Rate (SOFR) Index + 1.100% 5.6051% 4/25/25 (c)(d) | | 18,000,000 | 18,072,900 |
| 0.523% 6/14/24 (c) | | 12,000,000 | 11,809,080 |
| 0.81% 10/24/24 (c) | | 10,000,000 | 9,687,387 |
| 3.841% 4/25/25 (c) | | 10,000,000 | 9,793,349 |
| 4.125% 1/22/24 | | 10,000,000 | 9,897,831 |
| 4.2% 8/26/24 | | 10,000,000 | 9,806,614 |
| Bank of Montreal: | | | |
| U.S. Secured Overnight Fin. Rate (SOFR) Averages Index + 0.260% 4.6591% 9/15/23 (c)(d) | | 13,800,000 | 13,801,255 |
| U.S. Secured Overnight Fin. Rate (SOFR) Averages Index + 0.270% 4.7219% 4/14/23 (c)(d) | | 12,000,000 | 12,000,237 |
| 3.3% 2/5/24 | | 7,000,000 | 6,860,985 |
| Bank of Nova Scotia: | | | |
| U.S. Secured Overnight Fin. Rate (SOFR) Averages Index + 0.440% 4.8969% 4/15/24 (c)(d) | | 15,000,000 | 15,000,300 |
| U.S. Secured Overnight Fin. Rate (SOFR) Averages Index + 0.550% 4.9441% 9/15/23 (c)(d) | | 10,963,000 | 10,978,191 |
| U.S. Secured Overnight Fin. Rate (SOFR) Index + 0.260% 4.6541% 9/15/23 (c)(d) | | 17,000,000 | 16,998,554 |
| U.S. Secured Overnight Fin. Rate (SOFR) Index + 0.380% 4.8925% 7/31/24 (c)(d) | | 17,300,000 | 17,277,221 |
| 0.55% 9/15/23 | | 10,000,000 | 9,745,636 |
| Barclays PLC 1.007% 12/10/24 (c) | | 5,000,000 | 4,814,450 |
| BB&T Corp. 3.75% 12/6/23 | | 5,500,000 | 5,445,512 |
| BNP Paribas SA 3.5% 3/1/23 (b) | | 10,500,000 | 10,500,000 |
| BPCE SA: | | | |
| 3 month U.S. LIBOR + 1.240% 5.9751% 9/12/23 (b)(c)(d) | | 4,800,000 | 4,814,787 |
| U.S. Secured Overnight Fin. Rate (SOFR) Index + 0.570% 5.0219% 1/14/25 (b)(c)(d) | | 9,396,000 | 9,311,661 |
| 2.375% 1/14/25 (b) | | 7,962,000 | 7,483,891 |
| 4% 9/12/23 (b) | | 5,509,000 | 5,451,850 |
| 5.7% 10/22/23 (b) | | 5,000,000 | 4,984,661 |
| Canadian Imperial Bank of Commerce: | | | |
| U.S. Secured Overnight Fin. Rate (SOFR) Index + 0.340% 4.753% 6/22/23 (c)(d) | | 14,351,000 | 14,352,725 |
| U.S. Secured Overnight Fin. Rate (SOFR) Index + 0.940% 5.3768% 4/7/25 (c)(d) | | 13,000,000 | 13,059,677 |
| 0.5% 12/14/23 | | 3,000,000 | 2,890,155 |
| 3.1% 4/2/24 | | 2,000,000 | 1,949,472 |
| Citigroup, Inc.: | | | |
| 3 month U.S. LIBOR + 1.020% 4.044% 6/1/24 (c)(d) | | 17,000,000 | 16,931,845 |
| U.S. Secured Overnight Fin. Rate (SOFR) Index + 0.690% 5.1852% 1/25/26 (c)(d) | | 17,500,000 | 17,357,373 |
| U.S. Secured Overnight Fin. Rate (SOFR) Index + 1.370% 5.9232% 5/24/25 (c)(d) | | 15,000,000 | 15,107,783 |
| Credit Agricole SA 3.75% 4/24/23 (b) | | 9,600,000 | 9,578,981 |
| Danske Bank A/S: | | | |
| 3.773% 3/28/25 (b)(c) | | 8,645,000 | 8,459,944 |
| 3.875% 9/12/23 (b) | | 5,000,000 | 4,953,203 |
| 6.466% 1/9/26 (b)(c) | | 14,604,000 | 14,693,762 |
| Discover Bank 4.2% 8/8/23 | | 20,000,000 | 19,886,244 |
| DNB Bank ASA: | | | |
| U.S. Secured Overnight Fin. Rate (SOFR) Averages Index + 0.830% 5.2464% 3/28/25 (b)(c)(d) | | 13,000,000 | 13,021,710 |
| 2.968% 3/28/25 (b)(c) | | 13,050,000 | 12,635,643 |
| Federation des caisses Desjardin U.S. Secured Overnight Fin. Rate (SOFR) Index + 0.430% 4.9821% 5/21/24 (b)(c)(d) | | 12,811,000 | 12,770,441 |
| Fifth Third Bancorp 3.65% 1/25/24 | | 10,000,000 | 9,857,536 |
| HSBC Holdings PLC: | | | |
| U.S. Secured Overnight Fin. Rate (SOFR) Index + 0.580% 5.1324% 11/22/24 (c)(d) | | 13,000,000 | 12,878,004 |
| 1.162% 11/22/24 (c) | | 5,000,000 | 4,824,031 |
| 3.803% 3/11/25 (c) | | 10,000,000 | 9,789,901 |
| 3.95% 5/18/24 (c) | | 8,000,000 | 7,964,502 |
| Huntington National Bank: | | | |
| U.S. Secured Overnight Fin. Rate (SOFR) Averages Index + 1.190% 5.7434% 5/16/25 (c)(d) | | 18,000,000 | 18,110,880 |
| 5.699% 11/18/25 (c) | | 10,000,000 | 10,013,697 |
| JPMorgan Chase & Co.: | | | |
| U.S. Secured Overnight Fin. Rate (SOFR) Index + 0.530% 4.8313% 6/1/25 (c)(d) | | 15,475,000 | 15,416,814 |
| U.S. Secured Overnight Fin. Rate (SOFR) Index + 0.580% 4.9815% 3/16/24 (c)(d) | | 18,000,000 | 18,001,418 |
| U.S. Secured Overnight Fin. Rate (SOFR) Index + 0.920% 5.4712% 2/24/26 (c)(d) | | 15,958,000 | 15,982,256 |
| U.S. Secured Overnight Fin. Rate (SOFR) Index + 0.970% 5.3569% 6/14/25 (c)(d) | | 17,000,000 | 17,059,670 |
| U.S. Secured Overnight Fin. Rate (SOFR) Index + 1.320% 5.8161% 4/26/26 (c)(d) | | 14,956,000 | 15,111,463 |
| 0.697% 3/16/24 (c) | | 14,000,000 | 13,965,840 |
| 3.22% 3/1/25 (c) | | 5,000,000 | 4,879,949 |
| 3.559% 4/23/24 (c) | | 10,000,000 | 9,966,903 |
| KeyBank NA: | | | |
| U.S. Secured Overnight Fin. Rate (SOFR) Averages Index + 0.320% 4.7069% 6/14/24 (c)(d) | | 21,050,000 | 21,002,006 |
| U.S. Secured Overnight Fin. Rate (SOFR) Averages Index + 0.340% 4.7646% 1/3/24 (c)(d) | | 15,000,000 | 14,997,113 |
| Lloyds Banking Group PLC: | | | |
| 0.695% 5/11/24 (c) | | 11,318,000 | 11,192,140 |
| 3.9% 3/12/24 | | 12,800,000 | 12,579,764 |
| 4.05% 8/16/23 | | 20,000,000 | 19,872,070 |
| M&T Bank Corp. 3 month U.S. LIBOR + 0.680% 5.5019% 7/26/23 (c)(d) | | 4,700,000 | 4,700,902 |
| Mitsubishi UFJ Financial Group, Inc.: | | | |
| 3 month U.S. LIBOR + 0.860% 5.6819% 7/26/23 (c)(d) | | 15,300,000 | 15,333,180 |
| U.S. Secured Overnight Fin. Rate (SOFR) Index + 1.380% 5.711% 9/12/25 (c)(d) | | 12,955,000 | 13,051,644 |
| 3.455% 3/2/23 | | 5,000,000 | 5,000,000 |
| 4.788% 7/18/25 (c) | | 10,000,000 | 9,864,255 |
| Mizuho Financial Group, Inc.: | | | |
| U.S. Secured Overnight Fin. Rate (SOFR) Index + 0.960% 5.5119% 5/22/26 (c)(d) | | 21,000,000 | 20,874,419 |
| 3.549% 3/5/23 | | 5,000,000 | 4,999,190 |
| 3.922% 9/11/24 (c) | | 16,400,000 | 16,228,308 |
| NatWest Markets PLC: | | | |
| U.S. Secured Overnight Fin. Rate (SOFR) Index + 0.530% 5.0848% 8/12/24 (b)(c)(d) | | 14,209,000 | 14,055,997 |
| U.S. Secured Overnight Fin. Rate (SOFR) Index + 1.450% 5.863% 3/22/25 (b)(c)(d) | | 11,324,000 | 11,339,390 |
| 2.375% 5/21/23 (b) | | 5,000,000 | 4,965,574 |
| PNC Financial Services Group, Inc. 3.5% 1/23/24 | | 7,500,000 | 7,382,263 |
| Rabobank Nederland 2.625% 7/22/24 (b) | | 11,000,000 | 10,583,069 |
| Rabobank Nederland New York Branch: | | | |
| 0.375% 1/12/24 | | 20,959,000 | 20,108,747 |
| 3.875% 8/22/24 | | 13,000,000 | 12,742,800 |
| Royal Bank of Canada: | | | |
| U.S. Secured Overnight Fin. Rate (SOFR) Averages Index + 0.300% 4.7672% 1/19/24 (c)(d) | | 5,000,000 | 4,995,723 |
| U.S. Secured Overnight Fin. Rate (SOFR) Averages Index + 0.340% 4.7767% 10/7/24 (c)(d) | | 2,000,000 | 1,995,501 |
| U.S. Secured Overnight Fin. Rate (SOFR) Averages Index + 0.360% 4.8666% 7/29/24 (c)(d) | | 2,000,000 | 1,997,004 |
| U.S. Secured Overnight Fin. Rate (SOFR) Averages Index + 0.450% 4.9461% 10/26/23 (c)(d) | | 15,700,000 | 15,717,333 |
| 0.425% 1/19/24 | | 3,000,000 | 2,875,418 |
| 2.55% 7/16/24 | | 5,000,000 | 4,815,000 |
| 3.97% 7/26/24 | | 15,733,000 | 15,426,758 |
| Santander Holdings U.S.A., Inc. 3.5% 6/7/24 | | 5,000,000 | 4,867,844 |
| Societe Generale: | | | |
| U.S. Secured Overnight Fin. Rate (SOFR) Index + 1.050% 5.5243% 1/21/26 (b)(c)(d) | | 18,000,000 | 17,841,420 |
| 2.625% 1/22/25 (b) | | 13,000,000 | 12,251,116 |
| Sumitomo Mitsui Financial Group, Inc.: | | | |
| 0.508% 1/12/24 | | 14,852,000 | 14,240,092 |
| 2.696% 7/16/24 | | 3,000,000 | 2,887,598 |
| Sumitomo Mitsui Trust Bank Ltd. U.S. Secured Overnight Fin. Rate (SOFR) Index + 0.440% 4.8159% 9/16/24 (b)(c)(d) | | 2,000,000 | 1,993,440 |
| Svenska Handelsbanken AB 0.625% 6/30/23 (b) | | 5,000,000 | 4,924,385 |
| Swedbank AB U.S. Secured Overnight Fin. Rate (SOFR) Averages Index + 0.910% 5.3362% 4/4/25 (b)(c)(d) | | 11,081,000 | 11,069,918 |
| The Toronto-Dominion Bank: | | | |
| U.S. Secured Overnight Fin. Rate (SOFR) Index + 0.220% 4.5215% 6/2/23 (c)(d) | | 16,000,000 | 15,993,541 |
| U.S. Secured Overnight Fin. Rate (SOFR) Index + 0.350% 4.6748% 3/4/24 (c)(d) | | 21,000,000 | 20,979,874 |
| U.S. Secured Overnight Fin. Rate (SOFR) Index + 0.450% 4.8664% 9/28/23 (c)(d) | | 7,342,000 | 7,347,654 |
| U.S. Secured Overnight Fin. Rate (SOFR) Index + 0.910% 5.2577% 3/8/24 (c)(d) | | 15,914,000 | 15,984,900 |
| 2.35% 3/8/24 | | 7,000,000 | 6,788,088 |
| 2.65% 6/12/24 | | 5,000,000 | 4,834,432 |
| 3.25% 3/11/24 | | 2,000,000 | 1,956,863 |
| Truist Bank: | | | |
| U.S. Secured Overnight Fin. Rate (SOFR) Index + 0.200% 4.6546% 1/17/24 (c)(d) | | 16,000,000 | 15,967,184 |
| U.S. Secured Overnight Fin. Rate (SOFR) Index + 0.730% 5.0838% 3/9/23 (c)(d) | | 14,724,000 | 14,725,458 |
| Truist Financial Corp. U.S. Secured Overnight Fin. Rate (SOFR) Index + 0.400% 4.7538% 6/9/25 (c)(d) | | 16,000,000 | 15,875,840 |
| Wells Fargo & Co.: | | | |
| U.S. Secured Overnight Fin. Rate (SOFR) Index + 1.320% 5.8112% 4/25/26 (c)(d) | | 13,951,000 | 14,083,059 |
| 3.3% 9/9/24 | | 10,900,000 | 10,580,878 |
| 3.75% 1/24/24 | | 20,000,000 | 19,699,515 |
| | | | 1,153,519,077 |
| Capital Markets - 5.8% | | | |
| Bank of New York Mellon Corp. 0.35% 12/7/23 | | 3,000,000 | 2,889,489 |
| Bank of New York, New York 5.224% 11/21/25 (c) | | 8,260,000 | 8,231,098 |
| Credit Suisse AG: | | | |
| U.S. Secured Overnight Fin. Rate (SOFR) Averages Index + 0.380% 4.9354% 8/9/23 (c)(d) | | 17,000,000 | 16,862,794 |
| U.S. Secured Overnight Fin. Rate (SOFR) Averages Index + 0.390% 4.9306% 2/2/24 (c)(d) | | 16,147,000 | 15,749,461 |
| U.S. Secured Overnight Fin. Rate (SOFR) Averages Index + 1.260% 5.8127% 2/21/25 (c)(d) | | 14,000,000 | 13,389,724 |
| Deutsche Bank AG New York Branch: | | | |
| U.S. Secured Overnight Fin. Rate (SOFR) Index + 0.500% 5.0557% 11/8/23 (c)(d) | | 17,390,000 | 17,372,838 |
| 0.898% 5/28/24 | | 5,000,000 | 4,711,344 |
| 0.962% 11/8/23 | | 16,967,000 | 16,455,239 |
| Goldman Sachs Group, Inc.: | | | |
| U.S. Secured Overnight Fin. Rate (SOFR) Index + 0.700% 5.1779% 1/24/25 (c)(d) | | 19,500,000 | 19,470,300 |
| U.S. Secured Overnight Fin. Rate (SOFR) Index + 1.390% 5.7841% 3/15/24 (c)(d) | | 14,000,000 | 14,099,463 |
| 0.523% 3/8/23 | | 15,600,000 | 15,587,115 |
| 1.757% 1/24/25 (c) | | 3,000,000 | 2,887,606 |
| 3.625% 2/20/24 | | 15,000,000 | 14,730,712 |
| 4% 3/3/24 | | 16,000,000 | 15,762,783 |
| Morgan Stanley: | | | |
| U.S. Secured Overnight Fin. Rate (SOFR) Index + 0.460% 5.0208% 11/10/23 (c)(d) | | 11,540,000 | 11,538,449 |
| U.S. Secured Overnight Fin. Rate (SOFR) Index + 0.620% 5.1251% 1/24/25 (c)(d) | | 17,500,000 | 17,461,325 |
| U.S. Secured Overnight Fin. Rate (SOFR) Index + 1.160% 5.6371% 4/17/25 (c)(d) | | 18,000,000 | 18,082,980 |
| 0.791% 1/22/25 (c) | | 4,000,000 | 3,824,977 |
| 2.63% 2/18/26 (c) | | 14,000,000 | 13,205,219 |
| 3.7% 10/23/24 | | 15,900,000 | 15,488,674 |
| 3.737% 4/24/24 (c) | | 5,035,000 | 5,020,178 |
| State Street Corp. 3.776% 12/3/24 (c) | | 5,000,000 | 4,935,881 |
| UBS AG London Branch: | | | |
| U.S. Secured Overnight Fin. Rate (SOFR) Index + 0.320% 4.6163% 6/1/23 (b)(c)(d) | | 16,000,000 | 16,007,040 |
| U.S. Secured Overnight Fin. Rate (SOFR) Index + 0.450% 5.0054% 8/9/24 (b)(c)(d) | | 5,000,000 | 5,002,963 |
| U.S. Secured Overnight Fin. Rate (SOFR) Index + 0.470% 4.9192% 1/13/25 (b)(c)(d) | | 20,000,000 | 19,953,869 |
| | | | 308,721,521 |
| Consumer Finance - 3.8% | | | |
| AerCap Ireland Capital Ltd./AerCap Global Aviation Trust U.S. Secured Overnight Fin. Rate (SOFR) Index + 0.680% 5.1017% 9/29/23 (c)(d) | | 15,093,000 | 15,019,768 |
| Ally Financial, Inc. 3.875% 5/21/24 | | 5,000,000 | 4,895,692 |
| American Express Co.: | | | |
| U.S. Secured Overnight Fin. Rate (SOFR) Averages Index + 0.720% 5.2686% 5/3/24 (c)(d) | | 15,230,000 | 15,278,486 |
| U.S. Secured Overnight Fin. Rate (SOFR) Index + 0.930% 5.2498% 3/4/25 (c)(d) | | 20,000,000 | 20,142,349 |
| Capital One Financial Corp.: | | | |
| U.S. Secured Overnight Fin. Rate (SOFR) Index + 0.690% 5.0434% 12/6/24 (c)(d) | | 22,000,000 | 21,858,100 |
| U.S. Secured Overnight Fin. Rate (SOFR) Index + 1.350% 5.9054% 5/9/25 (c)(d) | | 18,000,000 | 17,995,302 |
| 1.343% 12/6/24 (c) | | 12,000,000 | 11,565,944 |
| 3.3% 10/30/24 | | 7,000,000 | 6,758,287 |
| 3.75% 4/24/24 | | 10,000,000 | 9,807,030 |
| 3.9% 1/29/24 | | 15,000,000 | 14,785,195 |
| John Deere Capital Corp. 3.35% 6/12/24 | | 5,000,000 | 4,885,560 |
| Toyota Motor Credit Corp.: | | | |
| U.S. Secured Overnight Fin. Rate (SOFR) Averages Index + 0.260% 4.669% 6/18/24 (c)(d) | | 2,000,000 | 1,997,320 |
| U.S. Secured Overnight Fin. Rate (SOFR) Averages Index + 0.330% 4.7747% 1/11/24 (c)(d) | | 5,000,000 | 4,997,818 |
| U.S. Secured Overnight Fin. Rate (SOFR) Averages Index + 0.650% 5.0717% 12/29/23 (c)(d) | | 17,000,000 | 17,062,390 |
| U.S. Secured Overnight Fin. Rate (SOFR) Index + 0.320% 4.7548% 4/6/23 (c)(d) | | 17,000,000 | 16,999,994 |
| U.S. Secured Overnight Fin. Rate (SOFR) Index + 0.620% 5.033% 3/22/24 (c)(d) | | 16,000,000 | 16,034,448 |
| | | | 200,083,683 |
| Diversified Financial Services - 1.5% | | | |
| Athene Global Funding: | | | |
| U.S. Secured Overnight Fin. Rate (SOFR) Averages Index + 0.560% 5.113% 8/19/24 (b)(c)(d) | | 2,000,000 | 1,972,078 |
| U.S. Secured Overnight Fin. Rate (SOFR) Averages Index + 0.700% 5.2511% 5/24/24 (b)(c)(d) | | 16,500,000 | 16,398,525 |
| U.S. Secured Overnight Fin. Rate (SOFR) Averages Index + 0.710% 5.1497% 1/7/25 (b)(c)(d) | | 20,600,000 | 20,230,691 |
| 0.95% 1/8/24 (b) | | 7,649,000 | 7,351,056 |
| 1% 4/16/24 (b) | | 5,000,000 | 4,702,224 |
| GA Global Funding Trust 1.25% 12/8/23 (b) | | 9,000,000 | 8,690,542 |
| Jackson Financial, Inc. 1.125% 11/22/23 | | 24,255,000 | 23,507,028 |
| | | | 82,852,144 |
| Insurance - 2.2% | | | |
| Equitable Financial Life Global Funding: | | | |
| U.S. Secured Overnight Fin. Rate (SOFR) Index + 0.390% 4.8301% 4/6/23 (b)(c)(d) | | 12,000,000 | 11,995,784 |
| 0.5% 11/17/23 (b) | | 25,000,000 | 24,114,530 |
| Lincoln National Corp. 4% 9/1/23 | | 9,303,000 | 9,230,213 |
| Marsh & McLennan Companies, Inc. 3.875% 3/15/24 | | 20,800,000 | 20,450,546 |
| New York Life Global Funding U.S. Secured Overnight Fin. Rate (SOFR) Index + 0.310% 4.8061% 4/26/24 (b)(c)(d) | | 8,000,000 | 8,003,808 |
| Northwestern Mutual Global Funding U.S. Secured Overnight Fin. Rate (SOFR) Index + 0.330% 4.7426% 3/25/24 (b)(c)(d) | | 9,564,000 | 9,561,956 |
| Pacific Life Global Funding II U.S. Secured Overnight Fin. Rate (SOFR) Index + 0.380% 4.8327% 4/12/24 (b)(c)(d) | | 7,300,000 | 7,260,945 |
| Protective Life Global Funding: | | | |
| U.S. Secured Overnight Fin. Rate (SOFR) Index + 0.550% 4.9731% 3/31/23 (b)(c)(d) | | 13,232,000 | 13,231,989 |
| U.S. Secured Overnight Fin. Rate (SOFR) Index + 0.980% 5.3964% 3/28/25 (b)(c)(d) | | 13,000,000 | 13,025,480 |
| | | | 116,875,251 |
TOTAL FINANCIALS | | | 1,862,051,676 |
| HEALTH CARE - 3.2% | | | |
| Biotechnology - 0.3% | | | |
| Amgen, Inc. 5.25% 3/2/25 (e) | | 16,415,000 | 16,378,495 |
| Health Care Equipment & Supplies - 0.1% | | | |
| Becton, Dickinson & Co. 3.363% 6/6/24 | | 8,000,000 | 7,795,419 |
| Health Care Providers & Services - 1.0% | | | |
| Cigna Group 0.613% 3/15/24 | | 24,758,000 | 23,573,990 |
| Humana, Inc. 0.65% 8/3/23 | | 30,523,000 | 29,923,330 |
| | | | 53,497,320 |
| Life Sciences Tools & Services - 0.4% | | | |
| PerkinElmer, Inc. 0.55% 9/15/23 | | 12,400,000 | 12,085,240 |
| Thermo Fisher Scientific, Inc. U.S. Secured Overnight Fin. Rate (SOFR) Averages Index + 0.530% 4.9846% 10/18/24 (c)(d) | | 8,554,000 | 8,545,461 |
| | | | 20,630,701 |
| Pharmaceuticals - 1.4% | | | |
| AstraZeneca PLC 3.5% 8/17/23 | | 5,000,000 | 4,956,359 |
| Bayer U.S. Finance II LLC 3.875% 12/15/23 (b) | | 15,000,000 | 14,797,697 |
| Bristol-Myers Squibb Co. 0.537% 11/13/23 | | 10,000,000 | 9,674,563 |
| GSK Consumer Healthcare Capital U.S. LLC U.S. Secured Overnight Fin. Rate (SOFR) Index + 0.890% 5.3052% 3/24/24 (c)(d) | | 9,497,000 | 9,471,094 |
| Roche Holdings, Inc. U.S. Secured Overnight Fin. Rate (SOFR) Index + 0.330% 4.6872% 9/11/23 (b)(c)(d) | | 22,250,000 | 22,258,433 |
| Shire Acquisitions Investments Ireland DAC 2.875% 9/23/23 | | 12,026,000 | 11,847,900 |
| | | | 73,006,046 |
TOTAL HEALTH CARE | | | 171,307,981 |
| INDUSTRIALS - 2.0% | | | |
| Aerospace & Defense - 0.1% | | | |
| The Boeing Co. 4.508% 5/1/23 | | 7,000,000 | 6,989,989 |
| Industrial Conglomerates - 0.3% | | | |
| Siemens Financieringsmaatschappij NV U.S. Secured Overnight Fin. Rate (SOFR) Index + 0.430% 4.7901% 3/11/24 (b)(c)(d) | | 17,000,000 | 17,011,059 |
| Machinery - 1.3% | | | |
| Caterpillar Financial Services Corp.: | | | |
| U.S. Secured Overnight Fin. Rate (SOFR) Index + 0.240% 4.7981% 5/17/24 (c)(d) | | 4,000,000 | 3,993,292 |
| 0.95% 1/10/24 | | 2,000,000 | 1,927,485 |
| 3.65% 12/7/23 | | 2,000,000 | 1,975,360 |
| 3.75% 11/24/23 | | 2,000,000 | 1,981,638 |
| Daimler Trucks Finance North America LLC: | | | |
| U.S. Secured Overnight Fin. Rate (SOFR) Index + 0.500% 4.8384% 6/14/23 (b)(c)(d) | | 15,000,000 | 15,001,874 |
| U.S. Secured Overnight Fin. Rate (SOFR) Index + 1.000% 5.433% 4/5/24 (b)(c)(d) | | 11,000,000 | 11,008,233 |
| 1.125% 12/14/23 (b) | | 25,282,000 | 24,467,656 |
| 5.1491% 12/13/24 (b)(c) | | 2,000,000 | 1,987,393 |
| 5.2% 1/17/25 (b) | | 5,340,000 | 5,305,666 |
| | | | 67,648,597 |
| Road & Rail - 0.2% | | | |
| Canadian Pacific Railway Co. 1.35% 12/2/24 | | 13,000,000 | 12,118,289 |
| Trading Companies & Distributors - 0.1% | | | |
| Air Lease Corp. 4.25% 2/1/24 | | 5,000,000 | 4,929,307 |
TOTAL INDUSTRIALS | | | 108,697,241 |
| INFORMATION TECHNOLOGY - 0.5% | | | |
| Electronic Equipment & Components - 0.1% | | | |
| Dell International LLC/EMC Corp. 4% 7/15/24 | | 5,000,000 | 4,899,353 |
| Semiconductors & Semiconductor Equipment - 0.2% | | | |
| Analog Devices, Inc. U.S. Secured Overnight Fin. Rate (SOFR) Index + 0.250% 4.6746% 10/1/24 (c)(d) | | 5,416,000 | 5,361,402 |
| Microchip Technology, Inc. 0.972% 2/15/24 | | 5,000,000 | 4,778,325 |
| | | | 10,139,727 |
| Software - 0.2% | | | |
| VMware, Inc. 0.6% 8/15/23 | | 12,018,000 | 11,756,797 |
TOTAL INFORMATION TECHNOLOGY | | | 26,795,877 |
| MATERIALS - 0.2% | | | |
| Chemicals - 0.2% | | | |
| Celanese U.S. Holdings LLC 3.5% 5/8/24 | | 3,000,000 | 2,920,153 |
| Nutrien Ltd. 5.9% 11/7/24 | | 5,356,000 | 5,384,591 |
| The Mosaic Co. 4.25% 11/15/23 | | 2,000,000 | 1,984,805 |
| | | | 10,289,549 |
| REAL ESTATE - 0.8% | | | |
| Equity Real Estate Investment Trusts (REITs) - 0.8% | | | |
| Federal Realty Investment Trust 3.95% 1/15/24 | | 20,000,000 | 19,704,957 |
| Simon Property Group LP U.S. Secured Overnight Fin. Rate (SOFR) Averages Index + 0.430% 4.8747% 1/11/24 (c)(d) | | 9,519,000 | 9,495,986 |
| Ventas Realty LP 3.75% 5/1/24 | | 10,600,000 | 10,366,619 |
| | | | 39,567,562 |
| UTILITIES - 3.4% | | | |
| Electric Utilities - 2.6% | | | |
| Alabama Power Co. 3.55% 12/1/23 | | 12,000,000 | 11,818,822 |
| Duke Energy Corp.: | | | |
| U.S. Secured Overnight Fin. Rate (SOFR) Index + 0.250% 4.6101% 6/10/23 (c)(d) | | 7,302,000 | 7,295,816 |
| 3.75% 4/15/24 | | 2,000,000 | 1,962,700 |
| Eversource Energy U.S. Secured Overnight Fin. Rate (SOFR) Averages Index + 0.250% 4.8037% 8/15/23 (c)(d) | | 10,000,000 | 9,980,100 |
| Florida Power & Light Co. U.S. Secured Overnight Fin. Rate (SOFR) Averages Index + 0.250% 4.8051% 5/10/23 (c)(d) | | 8,596,000 | 8,593,344 |
| Mississippi Power Co. U.S. Secured Overnight Fin. Rate (SOFR) Index + 0.300% 4.7164% 6/28/24 (c)(d) | | 13,012,000 | 12,835,427 |
| NextEra Energy Capital Holdings, Inc.: | | | |
| U.S. Secured Overnight Fin. Rate (SOFR) Averages Index + 0.400% 4.9486% 11/3/23 (c)(d) | | 17,000,000 | 16,992,746 |
| U.S. Secured Overnight Fin. Rate (SOFR) Averages Index + 0.540% 4.8363% 3/1/23 (c)(d) | | 8,165,000 | 8,165,000 |
| PPL Electric Utilities Corp.: | | | |
| 3 month U.S. LIBOR + 0.250% 4.9739% 9/28/23 (c)(d) | | 4,027,000 | 4,015,916 |
| U.S. Secured Overnight Fin. Rate (SOFR) Index + 0.330% 4.7452% 6/24/24 (c)(d) | | 11,827,000 | 11,807,949 |
| Southern California Edison Co.: | | | |
| U.S. Secured Overnight Fin. Rate (SOFR) Averages Index + 0.640% 5.0646% 4/3/23 (c)(d) | | 12,000,000 | 11,998,232 |
| U.S. Secured Overnight Fin. Rate (SOFR) Averages Index + 0.830% 5.2546% 4/1/24 (c)(d) | | 12,000,000 | 11,984,434 |
| Southern Co.: | | | |
| U.S. Secured Overnight Fin. Rate (SOFR) Averages Index + 0.370% 4.9251% 5/10/23 (c)(d) | | 8,433,000 | 8,429,627 |
| 0.6% 2/26/24 | | 5,000,000 | 4,761,232 |
| Tampa Electric Co. 3.875% 7/12/24 | | 9,610,000 | 9,387,399 |
| | | | 140,028,744 |
| Gas Utilities - 0.4% | | | |
| Atmos Energy Corp. 3 month U.S. LIBOR + 0.380% 5.1034% 3/9/23 (c)(d) | | 11,128,000 | 11,128,472 |
| CenterPoint Energy Resources Corp. 3 month U.S. LIBOR + 0.500% 5.2786% 3/2/23 (c)(d) | | 4,681,000 | 4,681,000 |
| Southern California Gas Co. 3 month U.S. LIBOR + 0.350% 5.1027% 9/14/23 (c)(d) | | 2,073,000 | 2,070,057 |
| | | | 17,879,529 |
| Multi-Utilities - 0.4% | | | |
| CenterPoint Energy, Inc. U.S. Secured Overnight Fin. Rate (SOFR) Averages Index + 0.650% 5.2048% 5/13/24 (c)(d) | | 14,429,000 | 14,359,759 |
| Dominion Energy, Inc. 3 month U.S. LIBOR + 0.530% 5.299% 9/15/23 (c)(d) | | 5,803,000 | 5,802,666 |
| Public Service Enterprise Group, Inc. 2.875% 6/15/24 | | 2,000,000 | 1,930,554 |
| | | | 22,092,979 |
TOTAL UTILITIES | | | 180,001,252 |
| TOTAL NONCONVERTIBLE BONDS (Cost $2,865,415,862) | | | 2,854,957,302 |
| | | | |
| U.S. Treasury Obligations - 17.1% |
| | | Principal Amount (a) | Value ($) |
| U.S. Treasury Bills, yield at date of purchase 4.59% to 4.72% 5/11/23 to 1/25/24 | | 585,385,000 | 574,730,201 |
| U.S. Treasury Notes: | | | |
| 3% 6/30/24 | | 214,874,000 | 209,065,687 |
| 4.125% 1/31/25 (f) | | 129,000,000 | 127,321,993 |
| TOTAL U.S. TREASURY OBLIGATIONS (Cost $916,651,297) | | | 911,117,881 |
| | | | |
| Asset-Backed Securities - 15.1% |
| | | Principal Amount (a) | Value ($) |
| Aimco: | | | |
| Series 2021-10A Class AR, 3 month U.S. LIBOR + 1.060% 5.8753% 7/22/32 (b)(c)(d) | | 10,424,000 | 10,291,438 |
| Series 2021-BA Class AR, 3 month U.S. LIBOR + 1.100% 5.8924% 1/15/32 (b)(c)(d) | | 10,292,000 | 10,163,340 |
| AIMCO CLO Ltd. Series 2022-12A Class AR, CME TERM SOFR 3 MONTH INDEX + 1.170% 5.8276% 1/17/32 (b)(c)(d) | | 12,657,000 | 12,558,187 |
| Ally Auto Receivables Trust Series 2022-2 Class A2, 4.62% 10/15/25 | | 13,000,000 | 12,932,612 |
| American Express Credit Account Master Trust Series 2018-9 Class A, 1 month U.S. LIBOR + 0.380% 4.9679% 4/15/26 (c)(d) | | 2,500,000 | 2,499,719 |
| AmeriCredit Automobile Receivables Trust Series 2021-3 Class A2, 0.41% 2/18/25 | | 2,435,593 | 2,424,350 |
| Ares LII CLO Ltd. Series 2021-52A Class A1R, 3 month U.S. LIBOR + 1.050% 5.8653% 4/22/31 (b)(c)(d) | | 8,970,000 | 8,857,848 |
| BMW Vechicle Lease Trust 2023-1 Series 2023-1: | | | |
| Class A2, 5.27% 2/25/25 | | 8,956,000 | 8,952,412 |
| Class A3, 5.16% 11/25/25 | | 7,283,000 | 7,273,627 |
| BMW Vehicle Lease Trust: | | | |
| Series 2021-1 Class A3, 0.29% 1/25/24 | | 3,217,636 | 3,200,959 |
| Series 2022-1: | | | |
Class A2, 0.67% 5/28/24 | | 2,273,177 | 2,262,537 |
Class A3, 1.1% 3/25/25 | | 3,595,000 | 3,496,616 |
| BMWLT 2021 Series 2021-2 Class A3, 0.33% 12/26/24 | | 2,092,835 | 2,051,361 |
| Capital One Prime Auto Receivables Series 2023-1 Class A2, 5.2% 5/15/26 | | 22,670,000 | 22,648,593 |
| CarMax Auto Owner Trust: | | | |
| Series 2020-4 Class A3, 0.5% 8/15/25 | | 4,662,262 | 4,543,913 |
| Series 2021-3 Class A2A, 0.29% 9/16/24 | | 503,201 | 502,306 |
| Series 2022-2 Class A2B, U.S. 30-Day Avg. Secured Overnight Fin. Rate (SOFR) Index + 0.600% 5.0012% 5/15/25 (c)(d) | | 4,699,541 | 4,700,208 |
| Series 2022-3 Class A2A, 3.81% 9/15/25 | | 9,669,099 | 9,590,043 |
| Carmax Auto Owner Trust Series 2022-4 Class A2A, 5.34% 12/15/25 | | 7,317,000 | 7,315,757 |
| Carmax Owner Trust Series 2023-1 Class A2A, 5.23% 1/15/26 | | 7,789,000 | 7,766,366 |
| Carvana Auto Receivables Trust Series 2021-P3 Class A2, 0.38% 1/10/25 | | 1,401,323 | 1,392,925 |
| Cedar Funding Ltd.: | | | |
| Series 2021-10A Class AR, 3 month U.S. LIBOR + 1.100% 5.9077% 10/20/32 (b)(c)(d) | | 2,864,000 | 2,823,824 |
| Series 2021-14A Class A, 3 month U.S. LIBOR + 1.100% 5.8924% 7/15/33 (b)(c)(d) | | 10,797,000 | 10,633,555 |
| Cent CLO LP Series 2021-21A Class A1R3, 3 month U.S. LIBOR + 0.970% 5.7846% 7/27/30 (b)(c)(d) | | 10,124,910 | 10,019,065 |
| Chesapeake Funding II LLC Series 2021-1A Class A2, 1 month U.S. LIBOR + 0.230% 4.8179% 4/15/33 (b)(c)(d) | | 4,415,010 | 4,404,508 |
| CNH Equipment Trust Series 2021-C Class A2, 0.33% 1/15/25 | | 3,166,714 | 3,134,893 |
| Daimler Trucks Retail Trust Series 2022-1 Class A2, 5.07% 9/16/24 | | 11,850,000 | 11,839,161 |
| Dell Equipment Finance Trust Series 2021-1 Class A3, 0.43% 5/22/26 (b) | | 2,843,484 | 2,800,426 |
| Dell Equipment Finance Trust 2022-2 4.03% 7/22/27 (b) | | 16,759,000 | 16,594,646 |
| DLLAD Series 2023-1A Class A2, 5.19% 4/20/26 (b) | | 10,746,000 | 10,681,429 |
| DLLAD LLC Series 2021-1A Class A2, 0.35% 9/20/24 (b) | | 1,887,290 | 1,866,381 |
| DLLMT LLC Series 2021-1A Class A2, 0.6% 3/20/24 (b) | | 4,998,888 | 4,959,742 |
| Donlen Fleet Lease Funding Series 2021-2 Class A1, 1 month U.S. LIBOR + 0.330% 4.7316% 12/11/34 (b)(c)(d) | | 4,670,953 | 4,650,660 |
| Eaton Vance CLO, Ltd. Series 2021-1A Class AR, 3 month U.S. LIBOR + 1.100% 5.8924% 4/15/31 (b)(c)(d) | | 9,297,000 | 9,212,100 |
| Enterprise Fleet Financing Series 2023-1 Class A2, 5.51% 1/22/29 (b) | | 9,755,000 | 9,761,097 |
| Enterprise Fleet Financing LLC: | | | |
| Series 2020-2 Class A2, 0.61% 7/20/26 (b) | | 5,349,035 | 5,242,076 |
| Series 2021-1 Class A2, 0.44% 12/21/26 (b) | | 1,295,949 | 1,259,562 |
| Series 2021-2 Class A2, 0.48% 5/20/27 (b) | | 5,574,790 | 5,357,267 |
| Series 2022-3 Class A2, 4.38% 7/20/29 (b) | | 1,749,000 | 1,717,704 |
| Ford Credit Auto Lease Trust Series 2022-A Class A2B, U.S. 30-Day Avg. Secured Overnight Fin. Rate (SOFR) Index + 0.600% 5.0012% 10/15/24 (c)(d) | | 5,109,557 | 5,112,032 |
| Ford Credit Auto Owner Trust: | | | |
| Series 2022-C Class A2A, 4.52% 4/15/25 | | 7,720,000 | 7,686,876 |
| Series 2022-D, Class A2A, 5.37% 8/15/25 | | 21,450,000 | 21,449,082 |
| Fordl 2023-A Series 2023-A Class A2A, 5.19% 6/15/25 | | 5,980,000 | 5,970,989 |
| FORDO Series 2022-B Class A2B, U.S. 30-Day Avg. Secured Overnight Fin. Rate (SOFR) Index + 1.840% 5.0012% 2/15/25 (c)(d) | | 7,776,617 | 7,781,716 |
| GM Financial Automobile Leasing Trust: | | | |
| Series 2022-2 Class A2, 2.93% 10/21/24 | | 6,768,033 | 6,684,730 |
| Series 2022-3 Class A2A, 4.01% 10/21/24 | | 12,709,855 | 12,622,726 |
| Series 2023-1 Class A3, 5.16% 4/20/26 | | 8,911,000 | 8,904,717 |
| Series 2023-A Class A2A, 5.27% 6/20/25 | | 13,028,000 | 13,025,390 |
| Gm Financial Consumer Automobile Re Series 2023-1 Class A2A, 5.19% 3/16/26 | | 5,925,000 | 5,917,468 |
| GM Financial Consumer Automobile Receivables Series 2022-2 Class A2, 2.52% 5/16/25 | | 6,460,306 | 6,387,509 |
| GM Financial Consumer Automobile Receivables Trust: | | | |
| Series 2020-4 Class A3, 0.38% 8/18/25 | | 3,468,939 | 3,379,428 |
| Series 2022-3 Class A2A, 3.5% 9/16/25 | | 15,806,131 | 15,647,185 |
| Series 2022-4 Class A2A, 4.6% 11/17/25 | | 7,129,000 | 7,088,612 |
| GMF Floorplan Owner Revolving Trust Series 2020-2 Class A, 0.69% 10/15/25 (b) | | 7,895,000 | 7,667,367 |
| Honda Auto Receivables Series 2023-1 Class A2, 5.22% 10/21/25 | | 17,000,000 | 16,984,870 |
| HPEFS Equipment Trust: | | | |
| Series 2022-1A Class A2, 1.02% 5/21/29 (b) | | 7,581,853 | 7,478,605 |
| Series 2022-3A Class A2, 5.26% 8/20/29 (b) | | 7,000,000 | 6,983,471 |
| Hyundai Auto Lease Securitization Series 2022-C Class A2A, 4.34% 1/15/25 (b) | | 6,202,978 | 6,163,106 |
| Hyundai Auto Lease Securitization Trust: | | | |
| Series 2021-A Class A3, 0.33% 1/16/24 (b) | | 864,936 | 862,205 |
| Series 2022-A Class A2, 0.81% 4/15/24 (b) | | 6,666,619 | 6,606,849 |
| Series 2023-A Class A2A, 5.2% 4/15/25 (b) | | 9,593,000 | 9,582,016 |
| Hyundai Auto Receivables Trust: | | | |
| Series 2020-C Class A3, 0.38% 5/15/25 | | 4,019,353 | 3,923,614 |
| Series 2022-A Class A2B, U.S. 30-Day Avg. Secured Overnight Fin. Rate (SOFR) Index + 0.630% 5.0312% 2/18/25 (c)(d) | | 830,481 | 830,971 |
| Series 2022-B Class A2A, 3.64% 5/15/25 | | 11,537,723 | 11,430,681 |
| Series 2022-C, Class A2A, 5.35% 11/17/25 | | 13,661,000 | 13,658,840 |
| John Deere Owner Trust: | | | |
| Series 2021-A Class A3, 0.36% 9/15/25 | | 11,249,501 | 10,857,025 |
| 3.73% 6/16/25 | | 15,958,000 | 15,803,225 |
| Madison Park Funding XXXII, Ltd. / Madison Park Funding XXXII LLC Series 2021-32A Class A1R, 3 month U.S. LIBOR + 1.000% 5.8153% 1/22/31 (b)(c)(d) | | 7,538,000 | 7,467,075 |
| Marlette Funding Trust: | | | |
| Series 2021-3A Class A, 0.65% 12/15/31 (b) | | 791,360 | 784,137 |
| Series 2022-1A Class A, 1.36% 4/15/32 (b) | | 2,495,364 | 2,464,546 |
| Series 2022-2A Class A, 4.25% 8/15/32 (b) | | 5,958,752 | 5,884,364 |
| Mercedes-Benz Auto Lease Trust Series 2021-B Class A3, 0.4% 11/15/24 | | 2,495,736 | 2,437,601 |
| Mercedes-Benz Auto Receivables: | | | |
| Series 2022-1, Class A2, 5.26% 10/15/25 | | 16,917,000 | 16,913,036 |
| Series 2023-1 Class A2, 5.09% 1/15/26 | | 7,149,000 | 7,131,950 |
| MMAF Equipment Finance LLC Series 2022-B Class A2, 5.57% 9/9/25 (b) | | 5,832,000 | 5,826,632 |
| Niagara Park CLO, Ltd. Series 2021-1A Class AR, 3 month U.S. LIBOR + 1.000% 5.7924% 7/17/32 (b)(c)(d) | | 11,000,000 | 10,845,549 |
| Nissan Auto Receivables Series 2022-B Class A2, 4.5% 8/15/25 | | 12,000,000 | 11,923,024 |
| Palmer Square Loan Funding, Ltd. Series 2021-2A Class A1, 3 month U.S. LIBOR + 0.800% 5.7153% 5/20/29 (b)(c)(d) | | 6,427,903 | 6,380,362 |
| Palmer Square Loan Funding, Ltd. / Palmer Square Loan Funding LLC Series 2022-1A Class A1, CME TERM SOFR 3 MONTH INDEX + 1.050% 5.6819% 4/15/30 (b)(c)(d) | | 10,053,799 | 9,940,352 |
| Santander Consumer Auto Receivables Trust Series 2021-AA Class A3, 0.33% 10/15/25 (b) | | 2,717,478 | 2,674,166 |
| Santander Drive Auto Receivables Trust: | | | |
| Series 2022-5 Class A2, 3.98% 1/15/25 | | 5,126,460 | 5,110,451 |
| Series 2022-6 Class A2, 4.37% 5/15/25 | | 8,090,645 | 8,065,053 |
| Santander Retail Auto Lease Trust: | | | |
| Series 2020-B Class A3, 0.57% 4/22/24 (b) | | 6,188,811 | 6,110,665 |
| Series 2022-A Class A2, 0.97% 3/20/25 (b) | | 6,868,348 | 6,727,690 |
| Sofi Consumer Loan Program Series 2023-1S Class A, 5.81% 5/15/31 (b) | | 6,571,000 | 6,568,391 |
| Symphony CLO XXI, Ltd. Series 2021-21A Class AR, 3 month U.S. LIBOR + 1.060% 5.8524% 7/15/32 (b)(c)(d) | | 7,764,000 | 7,669,124 |
| Symphony CLO XXIII Ltd. Series 2021-23A Class AR, 3 month U.S. LIBOR + 1.020% 5.8124% 1/15/34 (b)(c)(d) | | 10,983,000 | 10,872,939 |
| TCI-Flatiron CLO Ltd. / LLC Series 2021-1A Class AR, 3 month U.S. LIBOR + 0.960% 5.8366% 11/18/30 (b)(c)(d) | | 9,653,426 | 9,567,530 |
| TCI-Symphony CLO Series 2021-1A Class AR, 3 month U.S. LIBOR + 0.920% 5.7224% 7/15/30 (b)(c)(d) | | 11,682,956 | 11,564,899 |
| Tesla Auto Lease Trust: | | | |
| Series 2021-A Class A2, 0.36% 3/20/25 (b) | | 1,262,078 | 1,255,731 |
| Series 2021-B Class A2, 0.36% 9/22/25 (b) | | 6,144,997 | 6,063,779 |
| Toyota Auto Loan Extended Note Trust Series 2019-1A Class A, 2.56% 11/25/31 (b) | | 6,200,000 | 5,993,202 |
| Toyota Auto Receivables: | | | |
| Series 2021-D Class A3, 0.71% 4/15/26 | | 3,220,000 | 3,047,523 |
| Series 2022-D Class A2A, 5.27% 1/15/26 | | 14,902,000 | 14,894,127 |
| Toyota Auto Receivables 2022-B Series 2022-B Class A2B, U.S. 30-Day Avg. Secured Overnight Fin. Rate (SOFR) Index + 0.000% 4.8912% 1/15/25 (c)(d) | | 3,436,655 | 3,436,411 |
| Toyota Auto Receivables Owner Trust: | | | |
| Series 2022-C Class A2A, 3.83% 8/15/25 | | 4,002,000 | 3,965,176 |
| Series 2023-A Class A2, 5.05% 1/15/26 | | 11,805,000 | 11,778,260 |
| Upstart Securitization Trust: | | | |
| Series 2021-2 Class A, 0.91% 6/20/31 (b) | | 720,942 | 713,670 |
| Series 2021-3 Class A, 0.83% 7/20/31 (b) | | 1,696,967 | 1,666,499 |
| Series 2021-4 Class A, 0.84% 9/20/31 (b) | | 3,132,153 | 3,052,825 |
| Series 2021-5 Class A, 1.31% 11/20/31 (b) | | 4,674,067 | 4,545,346 |
| Verizon Master Trust Series 2022-1 Class A, 1.04% 1/20/27 | | 17,500,000 | 17,220,474 |
| Volkswagen Auto Lease Trust Series 2020-A Class A3, 0.39% 1/22/24 | | 1,221,072 | 1,217,433 |
| Volkswagen Auto Loan Enhanced Trust Series 2021-1 Class A2, 0.49% 10/21/24 | | 4,237,357 | 4,203,558 |
| Voya CLO Ltd. Series 2021-1A Class A1R, 3 month U.S. LIBOR + 0.950% 5.7424% 4/17/30 (b)(c)(d) | | 9,401,240 | 9,310,536 |
| Wheels SPV LLC Series 2021-1A Class A, 1 month U.S. LIBOR + 0.280% 4.8713% 8/20/29 (b)(c)(d) | | 3,951,229 | 3,917,523 |
| WOART 2023-A Series 2023-A Class A2A, 5.18% 7/15/26 | | 22,000,000 | 21,964,976 |
| World Omni Auto Receivables Trust: | | | |
| Series 2021-C Class A2, 0.22% 9/16/24 | | 1,087,861 | 1,085,852 |
| Series 2022-D, Class A2A, 5.51% 3/16/26 | | 9,765,000 | 9,782,366 |
| World Omni Automobile Lease Securitization Trust Series 2020-B Class A3, 0.45% 2/15/24 | | 860,330 | 858,991 |
| TOTAL ASSET-BACKED SECURITIES (Cost $807,591,999) | | | 801,778,312 |
| | | | |
| Collateralized Mortgage Obligations - 0.9% |
| | | Principal Amount (a) | Value ($) |
| Private Sponsor - 0.9% | | | |
| Cascade Funding Mortgage Trust: | | | |
| Series 2021-EBO1 Class A, 0.9849% 11/25/50 (b)(c) | | 1,886,763 | 1,772,069 |
| Series 2021-HB5 Class A, 0.8006% 2/25/31 (b) | | 1,106,254 | 1,070,393 |
| Series 2021-HB6 Class A, 0.8983% 6/25/36 (b) | | 1,815,232 | 1,722,327 |
| Series 2021-HB7 Class A, 1.1512% 10/27/31 (b) | | 2,452,217 | 2,301,009 |
| Cfmt 2022-Ebo2 sequential payer Series 2022-EBO2 Class A, 3.169% 7/25/54 (b) | | 1,959,381 | 1,893,800 |
| CFMT 2022-Hb8 LLC sequential payer Series 2022-HB8 Class A, 3.75% 4/25/25 (b) | | 7,913,312 | 7,548,421 |
| Finance of America HECM Buyout sequential payer Series 2022-HB1 Class A, 2.6948% 2/25/32 (b)(c) | | 8,452,578 | 8,157,622 |
| Oceanview Trust sequential payer Series 2021-1 Class A, 1.2187% 12/29/51 (b)(c) | | 2,847,919 | 2,730,952 |
| RMF Buyout Issuance Trust sequential payer Series 2021-HB1 Class A, 1.2586% 11/25/31 (b) | | 3,013,015 | 2,842,268 |
| Silverstone Master Issuer PLC floater Series 2022-1A Class 1A, U.S. Secured Overnight Fin. Rate (SOFR) Index + 0.380% 4.8296% 1/21/70 (b)(c)(d) | | 18,000,000 | 17,934,552 |
| | | | |
| TOTAL COLLATERALIZED MORTGAGE OBLIGATIONS (Cost $49,326,635) | | | 47,973,413 |
| | | | |
| Commercial Mortgage Securities - 1.0% |
| | | Principal Amount (a) | Value ($) |
| BAMLL Commercial Mortgage Securities Trust floater Series 2022-DKLX Class A, CME Term SOFR 1 Month Index + 1.150% 5.713% 1/15/39 (b)(c)(d) | | 2,702,000 | 2,662,463 |
| BX Commercial Mortgage Trust floater Series 2022-LP2 Class A, CME Term SOFR 1 Month Index + 1.010% 5.5754% 2/15/39 (b)(c)(d) | | 8,693,444 | 8,564,198 |
| BX Trust: | | | |
| floater: | | | |
Series 2021-ACNT Class A, 1 month U.S. LIBOR + 0.850% 5.438% 11/15/38 (b)(c)(d) | | 4,756,000 | 4,675,607 |
Series 2021-BXMF Class A, 1 month U.S. LIBOR + 0.630% 5.2239% 10/15/26 (b)(c)(d) | | 4,422,000 | 4,314,244 |
Series 2022-GPA Class A, CME Term SOFR 1 Month Index + 2.160% 6.7275% 10/15/39 (b)(c)(d) | | 2,296,000 | 2,291,688 |
| floater, sequential payer Series 2019-XL Class A, CME Term SOFR 1 Month Index + 1.030% 5.597% 10/15/36 (b)(c)(d) | | 8,221,298 | 8,179,993 |
| ELP Commercial Mortgage Trust floater Series 2021-ELP Class A, 1 month U.S. LIBOR + 0.700% 5.289% 11/15/38 (b)(c)(d) | | 6,595,000 | 6,421,474 |
| Life Financial Services Trust floater Series 2022-BMR2 Class A1, CME Term SOFR 1 Month Index + 1.290% 5.8577% 5/15/39 (b)(c)(d) | | 7,914,000 | 7,884,304 |
| LIFE Mortgage Trust floater Series 2021-BMR Class A, 1 month U.S. LIBOR + 0.700% 5.288% 3/15/38 (b)(c)(d) | | 3,836,532 | 3,766,977 |
| Merit floater Series 2021-STOR Class A, 1 month U.S. LIBOR + 0.700% 5.288% 7/15/38 (b)(c)(d) | | 2,275,000 | 2,228,081 |
| SREIT Trust floater Series 2021-MFP Class A, 1 month U.S. LIBOR + 0.730% 5.3187% 11/15/38 (b)(c)(d) | | 4,580,000 | 4,481,278 |
| TOTAL COMMERCIAL MORTGAGE SECURITIES (Cost $55,915,496) | | | 55,470,307 |
| | | | |
| Bank Notes - 0.4% |
| | | Principal Amount (a) | Value ($) |
| Citibank NA 3.65% 1/23/24 | | 18,031,000 | 17,768,558 |
| Svenska Handelsbanken AB 3.9% 11/20/23 | | 2,000,000 | 1,978,344 |
| TOTAL BANK NOTES (Cost $19,802,191) | | | 19,746,902 |
| | | | |
| Certificates of Deposit - 4.6% |
| | | Principal Amount (a) | Value ($) |
| Bank of America NA 5.12% 8/31/23 | | 14,000,000 | 13,992,420 |
| Bank of Montreal yankee U.S. Secured Overnight Fin. Rate (SOFR) Index + 0.750% 5.3% 8/1/23 (c)(d) | | 15,000,000 | 15,035,288 |
| Barclays Bank PLC yankee: | | | |
| U.S. Secured Overnight Fin. Rate (SOFR) Index + 0.650% 5.2% 6/8/23 (c)(d) | | 18,800,000 | 18,823,763 |
| U.S. Secured Overnight Fin. Rate (SOFR) Index + 0.810% 5.36% 8/11/23 (c)(d) | | 15,000,000 | 14,999,963 |
| 5.4% 11/6/23 | | 22,000,000 | 21,987,731 |
| 5.56% 11/27/23 | | 22,700,000 | 22,700,281 |
| Canadian Imperial Bank of Commerce yankee U.S. Secured Overnight Fin. Rate (SOFR) Index + 0.760% 5.31% 8/22/23 (c)(d) | | 15,000,000 | 15,047,603 |
| Credit Suisse AG yankee U.S. Secured Overnight Fin. Rate (SOFR) Averages Index + 0.320% 4.8727% 3/20/23 (c)(d) | | 13,800,000 | 13,799,476 |
| Lloyds Bank Corporate Markets PLC yankee U.S. Secured Overnight Fin. Rate (SOFR) Index + 0.810% 5.36% 7/3/23 (c)(d) | | 20,000,000 | 20,045,710 |
| Nordea Bank Finland PLC yankee U.S. Secured Overnight Fin. Rate (SOFR) Index + 0.580% 5.13% 8/31/23 (c)(d) | | 15,000,000 | 15,032,156 |
| Sumitomo Mitsui Banking Corp. yankee: | | | |
| U.S. Secured Overnight Fin. Rate (SOFR) Index + 0.600% 5.15% 5/3/23 (c)(d) | | 15,000,000 | 15,011,349 |
| U.S. Secured Overnight Fin. Rate (SOFR) Index + 0.650% 5.2% 7/7/23 (c)(d) | | 18,800,000 | 18,831,084 |
| U.S. Secured Overnight Fin. Rate (SOFR) Index + 0.700% 5.25% 7/11/23 (c)(d) | | 17,700,000 | 17,733,322 |
| U.S. Secured Overnight Fin. Rate (SOFR) Index + 0.800% 5.35% 8/1/23 (c)(d) | | 15,000,000 | 15,038,663 |
| Svenska Handelsbanken, Inc. yankee U.S. Secured Overnight Fin. Rate (SOFR) Index + 0.730% 5.28% 8/3/23 (c)(d) | | 8,750,000 | 8,771,564 |
| TOTAL CERTIFICATES OF DEPOSIT (Cost $246,550,000) | | | 246,850,373 |
| | | | |
| Commercial Paper - 4.6% |
| | | Principal Amount (a) | Value ($) |
| AT&T, Inc. 5.42% 12/19/23 | | 19,000,000 | 18,157,755 |
| Bank of Montreal U.S. Secured Overnight Fin. Rate (SOFR) Index + 0.680% 5.23% 7/11/23 (c)(d) | | 17,700,000 | 17,699,393 |
| BPCE SA yankee 5.15% 12/7/23 | | 25,000,000 | 23,974,225 |
| Citigroup Global Markets, Inc. U.S. Secured Overnight Fin. Rate (SOFR) Index + 0.650% 5.2% 9/22/23 (c)(d) | | 20,000,000 | 19,999,978 |
| Federation des caisses Desjardin U.S. Secured Overnight Fin. Rate (SOFR) Index + 0.680% 5.23% 4/28/23 (c)(d) | | 15,000,000 | 15,013,638 |
| HSBC U.S.A., Inc. yankee 5.35% 11/1/23 | | 22,750,000 | 21,935,709 |
| NatWest Markets PLC yankee: | | | |
| 5.28% 11/7/23 | | 22,700,000 | 21,862,597 |
| 5.34% 2/9/24 | | 25,000,000 | 23,703,943 |
| Philip Morris International, Inc. 5% 10/24/23 | | 17,000,000 | 16,442,776 |
| Royal Bank of Canada: | | | |
| U.S. Secured Overnight Fin. Rate (SOFR) Index + 0.660% 5.21% 7/7/23 (c)(d) | | 19,800,000 | 19,799,309 |
| U.S. Secured Overnight Fin. Rate (SOFR) Index + 0.750% 5.3% 7/27/23 (c)(d) | | 15,000,000 | 15,031,944 |
| Svenska Handelsbanken, Inc. U.S. Secured Overnight Fin. Rate (SOFR) Index + 0.690% 5.24% 8/29/23 (c)(d) | | 15,000,000 | 15,038,816 |
| The Toronto-Dominion Bank yankee 4.97% 10/27/23 | | 17,000,000 | 16,405,138 |
| TOTAL COMMERCIAL PAPER (Cost $245,040,683) | | | 245,065,221 |
| | | | |
| Money Market Funds - 5.2% |
| | | Shares | Value ($) |
| Fidelity Cash Central Fund 4.63% (g) | | 151,398,336 | 151,428,615 |
| Fidelity Securities Lending Cash Central Fund 4.63% (g)(h) | | 123,683,183 | 123,695,551 |
| TOTAL MONEY MARKET FUNDS (Cost $275,124,166) | | | 275,124,166 |
| | | | |
| TOTAL INVESTMENT IN SECURITIES - 102.6% (Cost $5,481,418,329) | 5,458,083,877 |
NET OTHER ASSETS (LIABILITIES) - (2.6)% | (138,943,762) |
| NET ASSETS - 100.0% | 5,319,140,115 |
| | |
Legend
| (a) | Amount is stated in United States dollars unless otherwise noted. |
| (b) | Security exempt from registration under Rule 144A of the Securities Act of 1933. These securities may be resold in transactions exempt from registration, normally to qualified institutional buyers. At the end of the period, the value of these securities amounted to $1,109,309,596 or 20.9% of net assets. |
| (c) | Coupon rates for floating and adjustable rate securities reflect the rates in effect at period end. |
| (d) | Coupon is indexed to a floating interest rate which may be multiplied by a specified factor and/or subject to caps or floors. |
| (e) | Security or a portion of the security purchased on a delayed delivery or when-issued basis. |
| (f) | Security or a portion of the security is on loan at period end. |
| (g) | Affiliated fund that is generally available only to investment companies and other accounts managed by Fidelity Investments. The rate quoted is the annualized seven-day yield of the fund at period end. A complete unaudited listing of the fund's holdings as of its most recent quarter end is available upon request. In addition, each Fidelity Central Fund's financial statements are available on the SEC's website or upon request. |
| (h) | Investment made with cash collateral received from securities on loan. |
Affiliated Central Funds
Fiscal year to date information regarding the Fund's investments in Fidelity Central Funds, including the ownership percentage, is presented below.
| Affiliate | Value, beginning of period ($) | Purchases ($) | Sales Proceeds ($) | Dividend Income ($) | Realized Gain (loss) ($) | Change in Unrealized appreciation (depreciation) ($) | Value, end of period ($) | % ownership, end of period |
| Fidelity Cash Central Fund 4.63% | 242,746,450 | 2,306,146,751 | 2,397,464,586 | 7,114,266 | - | - | 151,428,615 | 0.3% |
| Fidelity Securities Lending Cash Central Fund 4.63% | - | 246,054,988 | 122,359,437 | 29,877 | - | - | 123,695,551 | 0.4% |
| Total | 242,746,450 | 2,552,201,739 | 2,519,824,023 | 7,144,143 | - | - | 275,124,166 | |
| | | | | | | | | |
Amounts in the dividend income column in the above table include any capital gain distributions from underlying funds, which are presented in the corresponding line item in the Statement of Operations, if applicable.
Amount for Fidelity Securities Lending Cash Central Fund represents the income earned on investing cash collateral, less rebates paid to borrowers and any lending agent fees associated with the loan, plus any premium payments received for lending certain types of securities.
Amounts included in the purchases and sales proceeds columns may include in-kind transactions, if applicable.
Investment Valuation
The following is a summary of the inputs used, as of February 28, 2023, involving the Fund's assets and liabilities carried at fair value. The inputs or methodology used for valuing securities may not be an indication of the risk associated with investing in those securities. For more information on valuation inputs, and their aggregation into the levels used below, please refer to the Investment Valuation section in the accompanying Notes to Financial Statements.
| Valuation Inputs at Reporting Date: |
| Description | Total ($) | Level 1 ($) | Level 2 ($) | Level 3 ($) |
Investments in Securities: | | | | |
|
| Corporate Bonds | 2,854,957,302 | - | 2,854,957,302 | - |
|
| U.S. Government and Government Agency Obligations | 911,117,881 | - | 911,117,881 | - |
|
| Asset-Backed Securities | 801,778,312 | - | 801,778,312 | - |
|
| Collateralized Mortgage Obligations | 47,973,413 | - | 47,973,413 | - |
|
| Commercial Mortgage Securities | 55,470,307 | - | 55,470,307 | - |
|
| Bank Notes | 19,746,902 | - | 19,746,902 | - |
|
| Certificates of Deposit | 246,850,373 | - | 246,850,373 | - |
|
| Commercial Paper | 245,065,221 | - | 245,065,221 | - |
|
| Money Market Funds | 275,124,166 | 275,124,166 | - | - |
| Total Investments in Securities: | 5,458,083,877 | 275,124,166 | 5,182,959,711 | - |
| Statement of Assets and Liabilities |
| | | | February 28, 2023 (Unaudited) |
| | | | | |
| Assets | | | | |
| Investment in securities, at value (including securities loaned of $120,658,541) - See accompanying schedule: | | | | |
Unaffiliated issuers (cost $5,206,294,163) | $ | 5,182,959,711 | | |
Fidelity Central Funds (cost $275,124,166) | | 275,124,166 | | |
| | | | | |
| | | | | |
| Total Investment in Securities (cost $5,481,418,329) | | | $ | 5,458,083,877 |
| Receivable for investments sold | | | | 84,836 |
| Receivable for fund shares sold | | | | 9,257,919 |
| Interest receivable | | | | 24,373,074 |
| Distributions receivable from Fidelity Central Funds | | | | 1,311,988 |
| Prepaid expenses | | | | 2,881 |
| Receivable from investment adviser for expense reductions | | | | 467,692 |
Total assets | | | | 5,493,582,267 |
| Liabilities | | | | |
| Payable for investments purchased | | | | |
Regular delivery | $ | 21,509,639 | | |
Delayed delivery | | 16,404,166 | | |
| Payable for fund shares redeemed | | 9,922,747 | | |
| Distributions payable | | 1,471,045 | | |
| Accrued management fee | | 1,309,678 | | |
| Other payables and accrued expenses | | 129,326 | | |
| Collateral on securities loaned | | 123,695,551 | | |
| Total Liabilities | | | | 174,442,152 |
| Net Assets | | | $ | 5,319,140,115 |
| Net Assets consist of: | | | | |
| Paid in capital | | | $ | 5,336,143,374 |
| Total accumulated earnings (loss) | | | | (17,003,259) |
| Net Assets | | | $ | 5,319,140,115 |
Net Asset Value , offering price and redemption price per share ($5,319,140,115 ÷ 534,599,052 shares) | | | $ | 9.95 |
| Statement of Operations |
| | | | Six months ended February 28, 2023 (Unaudited) |
| Investment Income | | | | |
| Interest | | | $ | 81,528,885 |
| Income from Fidelity Central Funds (including $29,877 from security lending) | | | | 7,144,143 |
| Total Income | | | | 88,673,028 |
| Expenses | | | | |
| Management fee | $ | 6,994,349 | | |
| Custodian fees and expenses | | 20,327 | | |
| Independent trustees' fees and expenses | | 8,442 | | |
| Registration fees | | 107,490 | | |
| Audit | | 29,141 | | |
| Legal | | 3,056 | | |
| Miscellaneous | | 8,466 | | |
| Total expenses before reductions | | 7,171,271 | | |
| Expense reductions | | (2,078,136) | | |
| Total expenses after reductions | | | | 5,093,135 |
| Net Investment income (loss) | | | | 83,579,893 |
| Realized and Unrealized Gain (Loss) | | | | |
| Net realized gain (loss) on: | | | | |
| Investment Securities: | | | | |
| Unaffiliated issuers | | (2,077,501) | | |
| Total net realized gain (loss) | | | | (2,077,501) |
| Change in net unrealized appreciation (depreciation) on investment securities | | | | 14,369,955 |
| Net gain (loss) | | | | 12,292,454 |
| Net increase (decrease) in net assets resulting from operations | | | $ | 95,872,347 |
| Statement of Changes in Net Assets |
| |
| | Six months ended February 28, 2023 (Unaudited) | | Year ended August 31, 2022 |
| Increase (Decrease) in Net Assets | | | | |
| Operations | | | | |
| Net investment income (loss) | $ | 83,579,893 | $ | 27,646,608 |
| Net realized gain (loss) | | (2,077,501) | | (4,311,715) |
| Change in net unrealized appreciation (depreciation) | | 14,369,955 | | (42,180,493) |
| Net increase (decrease) in net assets resulting from operations | | 95,872,347 | | (18,845,600) |
| Distributions to shareholders | | (73,094,645) | | (26,559,969) |
| Share transactions | | | | |
| Proceeds from sales of shares | | 2,091,702,905 | | 2,620,928,236 |
| Reinvestment of distributions | | 64,691,090 | | 23,210,193 |
| Cost of shares redeemed | | (1,036,877,225) | | (2,649,571,958) |
Net increase (decrease) in net assets resulting from share transactions | | 1,119,516,770 | | (5,433,529) |
| Total increase (decrease) in net assets | | 1,142,294,472 | | (50,839,098) |
| | | | | |
| Net Assets | | | | |
| Beginning of period | | 4,176,845,643 | | 4,227,684,741 |
| End of period | $ | 5,319,140,115 | $ | 4,176,845,643 |
| | | | | |
| Other Information | | | | |
| Shares | | | | |
| Sold | | 211,373,719 | | 263,437,656 |
| Issued in reinvestment of distributions | | 6,523,522 | | 2,338,485 |
| Redeemed | | (104,682,699) | | (266,565,367) |
| Net increase (decrease) | | 113,214,542 | | (789,226) |
| | | | | |
Financial Highlights
| Fidelity® SAI Low Duration Income Fund |
| |
| | Six months ended (Unaudited) February 28, 2023 | | Years ended August 31, 2022 | | 2021 A |
Selected Per-Share Data | | | | | | |
| Net asset value, beginning of period | $ | 9.91 | $ | 10.01 | $ | 10.00 |
| Income from Investment Operations | | | | | | |
Net investment income (loss) B,C | | .178 | | .063 | | .016 |
| Net realized and unrealized gain (loss) | | .015 | | (.102) | | .007 |
| Total from investment operations | | .193 | | (.039) | | .023 |
| Distributions from net investment income | | (.153) | | (.059) | | (.013) |
| Distributions from net realized gain | | - | | (.002) | | - |
| Total distributions | | (.153) | | (.061) | | (.013) |
| Net asset value, end of period | $ | 9.95 | $ | 9.91 | $ | 10.01 |
Total Return D,E | | 1.96% | | (.38)% | | .23% |
Ratios to Average Net Assets C,F,G | | | | | | |
| Expenses before reductions | | .31% H | | .30% | | .34% H |
| Expenses net of fee waivers, if any | | .22% H | | .22% | | .22% H |
| Expenses net of all reductions | | .22% H | | .22% | | .22% H |
| Net investment income (loss) | | 3.62% H | | .63% | | .17% H |
| Supplemental Data | | | | | | |
| Net assets, end of period (000 omitted) | $ | 5,319,140 | $ | 4,176,846 | $ | 4,227,685 |
Portfolio turnover rate I | | 49% H | | 59% | | 15% H,J |
A For the period September 15, 2020 (commencement of operations) through August 31, 2021.
B Calculated based on average shares outstanding during the period.
C Net investment income (loss) is affected by the timing of the declaration of dividends by any underlying mutual funds or exchange-traded funds (ETFs). Net investment income (loss) of any mutual funds or ETFs is not included in the Fund's net investment income (loss) ratio.
D Total returns for periods of less than one year are not annualized.
E Total returns would have been lower if certain expenses had not been reduced during the applicable periods shown.
F Fees and expenses of any underlying mutual funds or exchange-traded funds (ETFs) are not included in the Fund's expense ratio. The Fund indirectly bears its proportionate share of these expenses. For additional expense information related to investments in Fidelity Central Funds, please refer to the "Investments in Fidelity Central Funds" note found in the Notes to Financial Statements section of the most recent Annual or Semi-Annual report.
G Expense ratios reflect operating expenses of the class. Expenses before reductions do not reflect amounts reimbursed, waived, or reduced through arrangements with the investment adviser, brokerage services, or other offset arrangements, if applicable, and do not represent the amount paid by the class during periods when reimbursements, waivers or reductions occur.
H Annualized.
I Amount does not include the portfolio activity of any underlying mutual funds or exchange-traded funds (ETFs).
J Portfolio turnover rate excludes securities received or delivered in-kind.
For the period ended February 28, 2023
1. Organization.
Fidelity SAI Low Duration Income Fund (the Fund) is a fund of Fidelity Salem Street Trust (the Trust) and is authorized to issue an unlimited number of shares. Shares are offered exclusively to certain clients of Fidelity Management & Research Company LLC (FMR) or its affiliates. The Trust is registered under the Investment Company Act of 1940, as amended (the 1940 Act), as an open-end management investment company organized as a Massachusetts business trust.
2. Investments in Fidelity Central Funds.
Funds may invest in Fidelity Central Funds, which are open-end investment companies generally available only to other investment companies and accounts managed by the investment adviser and its affiliates. The Schedule of Investments lists any Fidelity Central Funds held as an investment as of period end, but does not include the underlying holdings of each Fidelity Central Fund. An investing fund indirectly bears its proportionate share of the expenses of the underlying Fidelity Central Funds.
Based on its investment objective, each Fidelity Central Fund may invest or participate in various investment vehicles or strategies that are similar to those of the investing fund. These strategies are consistent with the investment objectives of the investing fund and may involve certain economic risks which may cause a decline in value of each of the Fidelity Central Funds and thus a decline in the value of the investing fund.
| Fidelity Central Fund | Investment Manager | Investment Objective | Investment Practices | Expense Ratio A |
| Fidelity Money Market Central Funds | Fidelity Management & Research Company LLC (FMR) | Each fund seeks to obtain a high level of current income consistent with the preservation of capital and liquidity. | Short-term Investments | Less than .005% |
A Expenses expressed as a percentage of average net assets and are as of each underlying Central Fund's most recent annual or semi-annual shareholder report.
A complete unaudited list of holdings for each Fidelity Central Fund is available upon request or at the Securities and Exchange Commission website at www.sec.gov. In addition, the financial statements of the Fidelity Central Funds which contain the significant accounting policies (including investment valuation policies) of those funds, and are not covered by the Report of Independent Registered Public Accounting Firm, are available on the Securities and Exchange Commission website or upon request.
3. Significant Accounting Policies.
The Fund is an investment company and applies the accounting and reporting guidance of the Financial Accounting Standards Board (FASB) Accounting Standards Codification Topic 946 Financial Services - Investment Companies . The financial statements have been prepared in conformity with accounting principles generally accepted in the United States of America (GAAP), which require management to make certain estimates and assumptions at the date of the financial statements. Actual results could differ from those estimates. Subsequent events, if any, through the date that the financial statements were issued have been evaluated in the preparation of the financial statements. The Fund's Schedule of Investments lists any underlying mutual funds or exchange-traded funds (ETFs) but does not include the underlying holdings of these funds. The following summarizes the significant accounting policies of the Fund:
Investment Valuation. Investments are valued as of 4:00 p.m. Eastern time on the last calendar day of the period. The Board of Trustees (the Board) has designated the Fund's investment adviser as the valuation designee responsible for the fair valuation function and performing fair value determinations as needed. The investment adviser has established a Fair Value Committee (the Committee) to carry out the day-to-day fair valuation responsibilities and has adopted policies and procedures to govern the fair valuation process and the activities of the Committee. In accordance with these fair valuation policies and procedures, which have been approved by the Board, the Fund attempts to obtain prices from one or more third party pricing services or brokers to value its investments. When current market prices, quotations or currency exchange rates are not readily available or reliable, investments will be fair valued in good faith by the Committee, in accordance with the policies and procedures. Factors used in determining fair value vary by investment type and may include market or investment specific events, transaction data, estimated cash flows, and market observations of comparable investments. The frequency that the fair valuation procedures are used cannot be predicted and they may be utilized to a significant extent. The Committee manages the Fund's fair valuation practices and maintains the fair valuation policies and procedures. The Fund's investment adviser reports to the Board information regarding the fair valuation process and related material matters.
The Fund categorizes the inputs to valuation techniques used to value its investments into a disclosure hierarchy consisting of three levels as shown below:
Level 1 - unadjusted quoted prices in active markets for identical investments
Level 2 - other significant observable inputs (including quoted prices for similar investments, interest rates, prepayment speeds, etc.)
Level 3 - unobservable inputs (including the Fund's own assumptions based on the best information available)
Valuation techniques used to value the Fund's investments by major category are as follows:
Debt securities, including restricted securities, are valued based on evaluated prices received from third party pricing services or from brokers who make markets in such securities. Corporate bonds, bank notes, U.S. government and government agency obligations, commercial paper, and certificates of deposit are valued by pricing services who utilize matrix pricing which considers yield or price of bonds of comparable quality, coupon, maturity and type or by broker-supplied prices. Asset backed securities, collateralized mortgage obligations and commercial mortgage securities are valued by pricing services who utilize matrix pricing which considers prepayment speed assumptions, attributes of the collateral, yield or price of bonds of comparable quality, coupon, maturity and type or by broker-supplied prices. When independent prices are unavailable or unreliable, debt securities may be valued utilizing pricing methodologies which consider similar factors that would be used by third party pricing services. Debt securities are generally categorized as Level 2 in the hierarchy but may be Level 3 depending on the circumstances.
Investments in open-end mutual funds, including the Fidelity Central Funds, are valued at their closing net asset value (NAV) each business day and are categorized as Level 1 in the hierarchy.
Changes in valuation techniques may result in transfers in or out of an assigned level within the disclosure hierarchy. The aggregate value of investments by input level as of February 28, 2023, is included at the end of the Fund's Schedule of Investments.
Investment Transactions and Income. For financial reporting purposes, the Fund's investment holdings and NAV include trades executed through the end of the last business day of the period. The NAV per share for processing shareholder transactions is calculated as of the close of business of the New York Stock Exchange (NYSE), normally 4:00 p.m. Eastern time and includes trades executed through the end of the prior business day. Gains and losses on securities sold are determined on the basis of identified cost. Commissions paid to certain brokers with whom the investment adviser, or its affiliates, places trades on behalf of a fund include an amount in addition to trade execution, which may be rebated back to a fund. Any such rebates are included in net realized gain (loss) on investments in the Statement of Operations. Income and capital gain distributions from Fidelity Central Funds, if any, are recorded on the ex-dividend date. Interest income is accrued as earned and includes coupon interest and amortization of premium and accretion of discount on debt securities as applicable.
Expenses. Expenses directly attributable to a fund are charged to that fund. Expenses attributable to more than one fund are allocated among the respective funds on the basis of relative net assets or other appropriate methods. Expenses included in the accompanying financial statements reflect the expenses of that fund and do not include any expenses associated with any underlying mutual funds or exchange-traded funds. Although not included in a fund's expenses, a fund indirectly bears its proportionate share of these expenses through the net asset value of each underlying mutual fund or exchange-traded fund. Expense estimates are accrued in the period to which they relate and adjustments are made when actual amounts are known.
Income Tax Information and Distributions to Shareholders. Each year, the Fund intends to qualify as a regulated investment company under Subchapter M of the Internal Revenue Code, including distributing substantially all of its taxable income and realized gains. As a result, no provision for U.S. Federal income taxes is required. The Fund files a U.S. federal tax return, in addition to state and local tax returns as required. The Fund's federal income tax returns are subject to examination by the Internal Revenue Service (IRS) for a period of three fiscal years after they are filed. State and local tax returns may be subject to examination for an additional fiscal year depending on the jurisdiction.
Distributions are declared and recorded daily and paid monthly from net investment income. Distributions from realized gains, if any, are declared and recorded on the ex-dividend date. Income and capital gain distributions are determined in accordance with income tax regulations, which may differ from GAAP.
Capital accounts within the financial statements are adjusted for permanent book-tax differences. These adjustments have no impact on net assets or the results of operations. Capital accounts are not adjusted for temporary book-tax differences which will reverse in a subsequent period.
Book-tax differences are primarily due to market discount and capital loss carryforwards.
As of period end, the cost and unrealized appreciation (depreciation) in securities, and derivatives if applicable, for federal income tax purposes were as follows:
| Gross unrealized appreciation | $13,825,330 |
| Gross unrealized depreciation | (25,545,474) |
| Net unrealized appreciation (depreciation) | $(11,720,144) |
| Tax cost | $5,469,804,021 |
Capital loss carryforwards are only available to offset future capital gains of the Fund to the extent provided by regulations and may be limited. The capital loss carryforward information presented below, including any applicable limitation, is estimated as of prior fiscal period end and is subject to adjustment.
| Short-term | $(2,471,401) |
| Long-term | (1,713,529) |
| Total capital loss carryforward | $(4,184,930) |
Delayed Delivery Transactions and When-Issued Securities. During the period, certain Funds transacted in securities on a delayed delivery or when-issued basis. Payment and delivery may take place after the customary settlement period for that security. The price of the underlying securities and the date when the securities will be delivered and paid for are fixed at the time the transaction is negotiated. Securities purchased on a delayed delivery or when-issued basis are identified as such in the Schedule of Investments. Compensation for interest forgone in the purchase of a delayed delivery or when-issued debt security may be received. With respect to purchase commitments, each applicable Fund identifies securities as segregated in its records with a value at least equal to the amount of the commitment. Payables and receivables associated with the purchases and sales of delayed delivery securities having the same coupon, settlement date and broker are offset. Delayed delivery or when-issued securities that have been purchased from and sold to different brokers are reflected as both payables and receivables in the Statement of Assets and Liabilities under the caption "Delayed delivery", as applicable. Losses may arise due to changes in the value of the underlying securities or if the counterparty does not perform under the contract's terms, or if the issuer does not issue the securities due to political, economic, or other factors.
Restricted Securities (including Private Placements). Funds may invest in securities that are subject to legal or contractual restrictions on resale. These securities generally may be resold in transactions exempt from registration or to the public if the securities are registered. Disposal of these securities may involve time-consuming negotiations and expense, and prompt sale at an acceptable price may be difficult. Information regarding restricted securities held at period end is included at the end of the Schedule of Investments, if applicable.
LIBOR Accounting Pronouncement. In March 2020, the Financial Accounting Standards Board (FASB) issued an Accounting Standards Update (ASU), ASU 2020-04, which provides optional, temporary relief with respect to the financial reporting of contracts subject to certain types of modifications due to the planned discontinuation of the London Interbank Offered Rate (LIBOR) and other IBOR-based reference rates. The temporary relief provided by ASU 2020-04 is effective for certain reference rate-related contract modifications that occur during the period March 12, 2020 through December 31, 2024. Management does not expect the adoption of ASU 2020-04 to have a material impact on the Fund's financial statements.
4. Purchases and Sales of Investments.
Purchases and sales of securities, other than short-term securities, U.S. government securities and in-kind transactions, as applicable, are noted in the table below.
| | Purchases ($) | Sales ($) |
| Fidelity SAI Low Duration Income Fund | 1,185,163,435 | 714,186,072 |
5. Fees and Other Transactions with Affiliates.
Management Fee. Fidelity Management & Research Company LLC (the investment adviser) and its affiliates provide the Fund with investment management related services for which the Fund pays a monthly management fee that is based on an annual rate of .30% of the Fund's average net assets.
During March 2023, the Board approved changes to the management fee effective April 1, 2023. The Fund will pay a monthly management fee that is based on an annual rate of .20% of the Fund's average net assets.
Interfund Trades. Funds may purchase from or sell securities to other Fidelity Funds under procedures adopted by the Board. The procedures have been designed to ensure these interfund trades are executed in accordance with Rule 17a-7 of the 1940 Act. Any interfund trades are included within the respective purchases and sales amounts shown in the Purchases and Sales of Investments note. During the period, there were no interfund trades.
6. Committed Line of Credit.
Certain Funds participate with other funds managed by the investment adviser or an affiliate in a $4.25 billion credit facility (the "line of credit") to be utilized for temporary or emergency purposes to fund shareholder redemptions or for other short-term liquidity purposes. The participating funds have agreed to pay commitment fees on their pro-rata portion of the line of credit, which are reflected in Miscellaneous expenses on the Statement of Operations, and are listed below. During the period, there were no borrowings on this line of credit.
| | Amount |
| Fidelity SAI Low Duration Income Fund | $3,939 |
7. Security Lending.
Funds lend portfolio securities from time to time in order to earn additional income. Lending agents are used, including National Financial Services (NFS), an affiliate of the investment adviser. Pursuant to a securities lending agreement, NFS will receive a fee, which is capped at 9.9% of a fund's daily lending revenue, for its services as lending agent. A fund may lend securities to certain qualified borrowers, including NFS. On the settlement date of the loan, a fund receives collateral (in the form of U.S. Treasury obligations, letters of credit and/or cash) against the loaned securities and maintains collateral in an amount not less than 100% of the market value of the loaned securities during the period of the loan. The market value of the loaned securities is determined at the close of business of a fund and any additional required collateral is delivered to a fund on the next business day. A fund or borrower may terminate the loan at any time, and if the borrower defaults on its obligation to return the securities loaned because of insolvency or other reasons, a fund may apply collateral received from the borrower against the obligation. A fund may experience delays and costs in recovering the securities loaned. Any cash collateral received is invested in the Fidelity Securities Lending Cash Central Fund. Any loaned securities are identified as such in the Schedule of Investments, and the value of loaned securities and cash collateral at period end, as applicable, are presented in the Statement of Assets and Liabilities. Security lending income represents the income earned on investing cash collateral, less rebates paid to borrowers and any lending agent fees associated with the loan, plus any premium payments received for lending certain types of securities. Security lending income is presented in the Statement of Operations as a component of income from Fidelity Central Funds. Affiliated security lending activity, if any, was as follows:
| | Total Security Lending Fees Paid to NFS | Security Lending Income From Securities Loaned to NFS | Value of Securities Loaned to NFS at Period End |
| Fidelity SAI Low Duration Income Fund | $3,360 | $- | $- |
8. Expense Reductions.
The investment adviser contractually agreed to reimburse the Fund to the extent annual operating expenses exceeded .22% of average net assets. Some expenses, for example the compensation of the independent Trustees, and certain miscellaneous expenses such as proxy and shareholder meeting expenses, are excluded from this reimbursement. During the period this reimbursement reduced the Fund's expenses by $2,077,456.
Through arrangements with the Fund's custodian, credits realized as a result of certain uninvested cash balances were used to reduce the Fund's expenses by $680.
Effective April 1, 2023, the investment adviser contractually agreed to reimburse the Fund to the extent annual operating expenses exceed .20% of average net assets. This reimbursement will remain in place through December 31, 2024. Some expenses, for example the compensation of the independent Trustees, and certain miscellaneous expenses such as proxy and shareholder meeting expenses, are excluded from this reimbursement.
9. Other.
A fund's organizational documents provide former and current trustees and officers with a limited indemnification against liabilities arising in connection with the performance of their duties to the fund. In the normal course of business, a fund may also enter into contracts that provide general indemnifications. A fund's maximum exposure under these arrangements is unknown as this would be dependent on future claims that may be made against a fund. The risk of material loss from such claims is considered remote.
10. Risk and Uncertainties.
Many factors affect a fund's performance. Developments that disrupt global economies and financial markets, such as pandemics, epidemics, outbreaks of infectious diseases, war, terrorism, and environmental disasters, may significantly affect a fund's investment performance. The effects of these developments to a fund will be impacted by the types of securities in which a fund invests, the financial condition, industry, economic sector, and geographic location of an issuer, and a fund's level of investment in the securities of that issuer. Significant concentrations in security types, issuers, industries, sectors, and geographic locations may magnify the factors that affect a fund's performance.
As a shareholder, you incur two types of costs: (1) transaction costs, which may include sales charges (loads) on purchase payments or redemption proceeds, as applicable and (2) ongoing costs, which generally include management fees, distribution and/or service (12b-1) fees and other Fund expenses. This Example is intended to help you understand your ongoing costs (in dollars) of investing in a fund and to compare these costs with the ongoing costs of investing in other mutual funds.
| The Example is based on an investment of $1,000 invested at the beginning of the period and held for the entire period (September 1, 2022 to February 28, 2023). |
Actual Expenses
The first line of the accompanying table provides information about actual account values and actual expenses. You may use the information in this line, together with the amount you invested, to estimate the expenses that you paid over the period. Simply divide your account value by $1,000.00 (for example, an $8,600 account value divided by $1,000.00 = 8.6), then multiply the result by the number in the first line for a class/Fund under the heading entitled "Expenses Paid During Period" to estimate the expenses you paid on your account during this period. If any fund is a shareholder of any underlying mutual funds or exchange-traded funds (ETFs) (the Underlying Funds), such fund indirectly bears its proportional share of the expenses of the Underlying Funds in addition to the direct expenses incurred presented in the table. These fees and expenses are not included in the annualized expense ratio used to calculate the expense estimate in the table below.
Hypothetical Example for Comparison Purposes
The second line of the accompanying table provides information about hypothetical account values and hypothetical expenses based on the actual expense ratio and an assumed rate of return of 5% per year before expenses, which is not the actual return. The hypothetical account values and expenses may not be used to estimate the actual ending account balance or expenses you paid for the period. You may use this information to compare the ongoing costs of investing in the Fund and other funds. To do so, compare this 5% hypothetical example with the 5% hypothetical examples that appear in the shareholder reports of the other funds. If any fund is a shareholder of any Underlying Funds, such fund indirectly bears its proportional share of the expenses of the Underlying Funds in addition to the direct expenses as presented in the table. These fees and expenses are not included in the annualized expense ratio used to calculate the expense estimate in the table below.
Please note that the expenses shown in the table are meant to highlight your ongoing costs only and do not reflect any transaction costs. Therefore, the second line of the table is useful in comparing ongoing costs only, and will not help you determine the relative total costs of owning different funds. In addition, if these transactional costs were included, your costs would have been higher.
| | | | | Annualized Expense Ratio- A | | Beginning Account Value September 1, 2022 | | Ending Account Value February 28, 2023 | | Expenses Paid During Period- C September 1, 2022 to February 28, 2023 |
| | | | | | | | | | |
| Fidelity® SAI Low Duration Income Fund | | | | .22% | | | | | | |
| Actual | | | | | | $ 1,000 | | $ 1,019.60 | | $ 1.10 |
Hypothetical- B | | | | | | $ 1,000 | | $ 1,023.70 | | $ 1.10 |
| |
A Annualized expense ratio reflects expenses net of applicable fee waivers.
B 5% return per year before expenses
C Expenses are equal to the annualized expense ratio, multiplied by the average account value over the period, multiplied by 181/ 365 (to reflect the one-half year period). The fees and expenses of any Underlying Funds are not included in each annualized expense ratio.
Board Approval of Investment Advisory Contracts and Management Fees
Fidelity SAI Low Duration Income Fund
Each year, the Board of Trustees, including the Independent Trustees (together, the Board), votes on the renewal of the management contract with Fidelity Management & Research Company LLC (FMR) and the sub-advisory agreements (together, the Advisory Contracts) for the fund. FMR and the sub-advisers are referred to herein as the Investment Advisers. The Board, assisted by the advice of fund counsel and Independent Trustees' counsel, requests and considers a broad range of information relevant to the renewal of the Advisory Contracts throughout the year.
The Board meets regularly and, at each of its meetings, covers an extensive agenda of topics and materials and considers factors that are relevant to its annual consideration of the renewal of the fund's Advisory Contracts, including the services and support provided to the fund and its shareholders. The Board has established four standing committees (Committees) - Operations, Audit, Fair Valuation, and Governance and Nominating - each composed of and chaired by Independent Trustees with varying backgrounds, to which the Board has assigned specific subject matter responsibilities in order to enhance effective decision-making by the Board. The Operations Committee, of which all the Independent Trustees are members, meets regularly throughout the year and requests, receives and considers, among other matters, information related to the annual consideration of the renewal of the fund's Advisory Contracts before making its recommendation to the Board. The Board also meets as needed to review matters specifically related to the Board's annual consideration of the renewal of the Advisory Contracts. Members of the Board may also meet from time to time with trustees of other Fidelity funds through joint ad hoc committees to discuss certain matters relevant to all of the Fidelity funds.
At its September 2022 meeting, the Board unanimously determined to renew the fund's Advisory Contracts. In reaching its determination, the Board considered all factors it believed relevant, including (i) the nature, extent, and quality of the services provided to the fund and its shareholders (including the investment performance of the fund); (ii) the competitiveness relative to peer funds of the fund's management fee and the total expense ratio; (iii) the total costs of the services provided by and the profits realized by Fidelity from its relationships with the fund; and (iv) the extent to which, if any, economies of scale exist and are realized as the fund grows, and whether any economies of scale are appropriately shared with fund shareholders.
In considering whether to renew the Advisory Contracts for the fund, the Board reached a determination, with the assistance of fund counsel and Independent Trustees' counsel and through the exercise of its business judgment, that the renewal of the Advisory Contracts was in the best interests of the fund and its shareholders and that the compensation payable under the Advisory Contracts was fair and reasonable. The Board's decision to renew the Advisory Contracts was not based on any single factor, but rather was based on a comprehensive consideration of all the information provided to the Board at its meetings throughout the year. The Board, in reaching its determination to renew the Advisory Contracts, was aware that shareholders of the fund have a broad range of investment choices available to them, including a wide choice among funds offered by Fidelity's competitors, and that the fund's shareholders, who have the opportunity to review and weigh the disclosure provided by the fund in its prospectus and other public disclosures, have chosen to invest in this fund, which is part of the Fidelity family of funds.
Nature, Extent, and Quality of Services Provided . The Board considered Fidelity's staffing as it relates to the fund, including the backgrounds of investment personnel of Fidelity, and also considered the fund's investment objective, strategies, and related investment philosophy. The Independent Trustees also had discussions with senior management of Fidelity's investment operations and investment groups. The Board considered the structure of the investment personnel compensation program and whether this structure provides appropriate incentives to act in the best interests of the fund. Additionally, the Board considered the portfolio managers' investments, if any, in the funds that they manage. The Board also considered the steps Fidelity had taken to ensure the continued provision of high quality services to the Fidelity funds throughout the COVID-19 pandemic, including the expansion of staff in client facing positions to maintain service levels in periods of high volumes and volatility.
Resources Dedicated to Investment Management and Support Services . The Board reviewed the general qualifications and capabilities of Fidelity's investment staff, including its size, education, experience, and resources, as well as Fidelity's approach to recruiting, training, managing, and compensating investment personnel. The Board noted the resources devoted to Fidelity's global investment organization, and that Fidelity's analysts have extensive resources, tools and capabilities that allow them to conduct quantitative and fundamental analysis, as well as credit analysis of issuers, counterparties and guarantors. Further, the Board considered that Fidelity's investment professionals have sufficient access to global information and data so as to provide competitive investment results over time, and that those professionals also have access to sophisticated tools that permit them to assess portfolio construction and risk and performance attribution characteristics continuously, as well as to transmit new information and research conclusions rapidly around the world. Additionally, in its deliberations, the Board considered Fidelity's trading, risk management, compliance, cybersecurity, and technology and operations capabilities and resources, which are integral parts of the investment management process.
Shareholder and Administrative Services . The Board considered (i) the nature, extent, quality, and cost of advisory, administrative, and shareholder services performed by the Investment Advisers and their affiliates under the Advisory Contracts and under separate agreements covering transfer agency, pricing and bookkeeping, and securities lending services for the fund; (ii) the nature and extent of the supervision of third party service providers, principally custodians, subcustodians, and pricing vendors; and (iii) the resources devoted to, and the record of compliance with, the fund's compliance policies and procedures.
The Board noted that the growth of fund assets over time across the complex allows Fidelity to reinvest in the development of services designed to enhance the value and convenience of the Fidelity funds as investment vehicles. These services include 24-hour access to account information and market information over the Internet and through telephone representatives, investor education materials and asset allocation tools. The Board also considered that it reviews customer service metrics such as telephone response times, continuity of services on the website and metrics addressing services at Fidelity Investor Centers.
Investment in a Large Fund Family. The Board considered the benefits to shareholders of investing in a Fidelity fund, including the benefits of investing in a fund that is part of a large family of funds offering a variety of investment disciplines and providing a large variety of mutual fund investor services. The Board noted that Fidelity had taken, or had made recommendations to the Board that resulted in the Fidelity funds taking, a number of actions over the previous year that benefited particular funds, including: (i) continuing to dedicate additional resources to Fidelity's investment research process, which includes meetings with management of issuers of securities in which the funds invest; (ii) continuing efforts to enhance Fidelity's global research capabilities; (iii) launching new funds, ETFs, and share classes with innovative structures, strategies and pricing and making other enhancements to meet investor needs; (iv) broadening eligibility requirements for certain funds and share classes; (v) reducing management fees and total expenses for certain funds and classes; (vi) lowering expenses for certain existing funds and classes by implementing or lowering expense caps; (vii) rationalizing product lines and gaining increased efficiencies from fund mergers and liquidations; (viii) continuing to develop, acquire and implement systems and technology to improve services to the funds and shareholders, strengthen information security, and increase efficiency; and (ix) continuing to implement enhancements to further strengthen Fidelity's product line to increase investors' probability of success in achieving their investment goals, including their retirement income goals.
Investment Performance . The Board considered whether the fund has operated in accordance with its investment objective, as well as its record of compliance with its investment restrictions.
The Board took into account discussions that occur at Board meetings throughout the year with representatives of the Investment Advisers about fund investment performance. In this regard the Board noted that as part of regularly scheduled fund reviews and other reports to the Board on fund performance, the Board considers annualized return information for the fund for different time periods, measured against an appropriate securities market index (benchmark index) and an appropriate peer group of funds with similar objectives (peer group). The Board also receives and considers information about performance attribution. In its evaluation of fund investment performance at meetings throughout the year, the Board gave particular attention to information indicating underperformance of certain Fidelity funds for specific time periods and discussed with the Investment Advisers the reasons for such underperformance.
In addition to reviewing absolute and relative fund performance, the Independent Trustees periodically consider the appropriateness of fund performance metrics in evaluating the results achieved. In general, the Independent Trustees believe that fund performance should be evaluated based on gross performance (before fees and expenses but after transaction costs) compared to appropriate benchmark indices, over appropriate time periods that may include full market cycles, and on net performance (after fees and expenses) compared to appropriate peer groups, as applicable, over the same periods, taking into account relevant factors including the following: general market conditions; expectations for interest rate levels and credit conditions; issuer-specific information including credit quality; the potential for incremental return versus the fund's benchmark index weighed against the risks involved in obtaining that incremental return, including the risk of diminished or negative total returns; and fund cash flows and other factors. The Independent Trustees generally give greater weight to fund performance over longer time periods than over shorter time periods. Depending on the circumstances, the Independent Trustees may be satisfied with a fund's performance notwithstanding that it lags its benchmark index or peer group for certain periods.
The Independent Trustees recognize that shareholders evaluate performance on a net basis over their own holding periods, for which one-, three-, and five-year periods are often used as a proxy. For this reason, the performance information reviewed by the Board also included net calendar year total return information for the fund and an appropriate benchmark index for the most recent one-year period. No performance peer group information was considered by the Board as Fidelity advised the Board that competitor funds have different and/or broader investment mandates compared with the fund's more specialized strategies. The Independent Trustees recognize that shareholders who are not investing through a tax-advantaged retirement account also consider tax consequences in evaluating performance.
Based on its review, the Board concluded that the nature, extent, and quality of services provided to the fund under the Advisory Contracts should continue to benefit the shareholders of the fund.
Competitiveness of Management Fee and Total Expense Ratio . The Board considered the fund's management fee and total expense ratio compared to selected groups of competitive funds and classes (referred to as "mapped groups" below) for the purpose of facilitating the Trustees' competitive analysis of management fees and total expenses. Fidelity creates "mapped groups" by combining similar investment objective categories (as classified by Lipper) that have comparable investment mandates. Combining funds with similar investment objective categories aids the Board's comparison of management fees and total expense ratios by broadening the competitive group used for such comparison.
Management Fee . The Board considered two proprietary management fee comparisons for the 12-month (or shorter) periods shown in basis points (BP) in the chart below. The group of Lipper funds used by the Board for management fee comparisons is referred to below as the "Total Mapped Group." The Total Mapped Group comparison focuses on a fund's standing in terms of gross management fees before expense reimbursements or caps relative to the total universe of funds with comparable investment mandates, regardless of whether their management fee structures also are comparable. Funds with comparable investment mandates offer exposure to similar types of securities. Funds with comparable management fee structures have similar management fee contractual arrangements (e.g., flat rate charged for advisory services, all-inclusive fee rate, etc.). "TMG %" represents the percentage of funds in the Total Mapped Group that had management fees that were lower than the fund's. For example, a hypothetical TMG % of 20% would mean that 80% of the funds in the Total Mapped Group had higher, and 20% had lower, management fees than the fund. The fund's actual TMG % and the number of funds in the Total Mapped Group are in the chart below. The "Asset-Sized Peer Group" (ASPG) comparison focuses on a fund's standing relative to a subset of non-Fidelity funds within the Total Mapped Group that are similar in size and management fee structure. For example, if a fund is in the first quartile of the ASPG, the fund's management fee ranks in the least expensive or lowest 25% of funds in the ASPG. The ASPG represents at least 15% of the funds in the Total Mapped Group with comparable asset size and management fee structures, subject to a minimum of 50 funds (or all funds in the Total Mapped Group if fewer than 50). Additional information, such as the ASPG quartile in which the fund's management fee rate ranked, is also included in the chart and was considered by the Board.
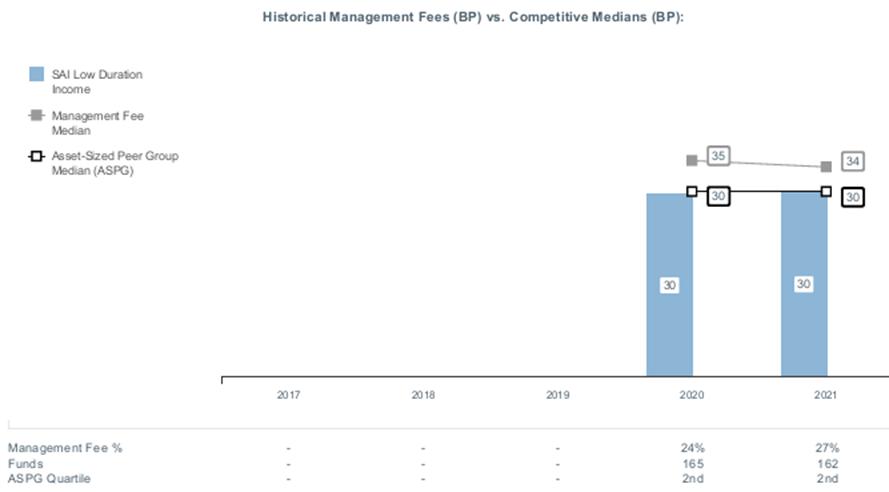
The Board noted that the fund's management fee rate ranked below the median of its Total Mapped Group and equal to the median of its ASPG for 2021.
Based on its review, the Board concluded that the fund's management fee is fair and reasonable in light of the services that the fund receives and the other factors considered.
Total Expense Ratio . In its review of the fund's total expense ratio, the Board considered the fund's management fee rate as well as other fund expenses, such as custodial, legal, and audit fees. The Board also noted that Fidelity may agree to waive fees or reimburse expenses from time to time, and the extent to which, if any, it has done so for the fund. The fund is compared to those funds and classes in the Total Mapped Group (used by the Board for management fee comparisons) that have a similar sales load structure. The Board also considered a total expense ASPG comparison, which focuses on the total expenses of the fund relative to a subset of non-Fidelity funds within the similar sales load structure group that are similar in size and management fee structure. The total expense ASPG is limited to 15 larger and 15 smaller classes of different funds, where possible. The total expense ASPG comparison excludes performance adjustments and fund-paid 12b-1 fees to eliminate variability in expenses relating to these items.
The Board noted that the fund's total net expense ratio ranked below the similar sales load structure group competitive median for 2021 and below the ASPG competitive median for 2021.
The Board further considered that FMR has contractually agreed to reimburse the fund to the extent that total operating expenses, with certain exceptions, as a percentage of its average net assets, exceed 0.22% through December 31, 2023.
Fees Charged to Other Fidelity Clients . The Board also considered Fidelity fee structures and other information with respect to clients of Fidelity, such as other funds advised or subadvised by Fidelity, pension plan clients, and other institutional clients with similar mandates. The Board noted that a joint ad hoc committee created by it and the boards of other Fidelity funds periodically reviews and compares Fidelity's institutional investment advisory business with its business of providing services to the Fidelity funds and also noted the most recent findings of the committee. The Board noted that the committee's review included a consideration of the differences in services provided, fees charged, and costs incurred, as well as competition in the markets serving the different categories of clients.
Based on its review of total expense ratios and fees charged to other Fidelity clients, the Board concluded that the fund's total expense ratio was reasonable in light of the services that the fund and its shareholders receive and the other factors considered.
Costs of the Services and Profitability . The Board considered the revenues earned and the expenses incurred by Fidelity in conducting the business of developing, marketing, distributing, managing, administering and servicing the fund and servicing the fund's shareholders. The Board also considered the level of Fidelity's profits in respect of all the Fidelity funds.
On an annual basis, Fidelity presents to the Board information about the profitability of its relationships with the fund. Fidelity calculates profitability information for each fund, as well as aggregate profitability information for groups of Fidelity funds and all Fidelity funds, using a series of detailed revenue and cost allocation methodologies which originate with the books and records of Fidelity on which Fidelity's audited financial statements are based. The Audit Committee of the Board reviews any significant changes from the prior year's methodologies and the full Board approves such changes.
A public accounting firm has been engaged annually by the Board as part of the Board's assessment of Fidelity's profitability analysis. The engagement includes the review and assessment of the methodologies used by Fidelity in determining the revenues and expenses attributable to Fidelity's mutual fund business, and completion of agreed-upon procedures in respect of the mathematical accuracy of certain fund profitability information and its conformity to established allocation methodologies. After considering the reports issued under the engagement and information provided by Fidelity, the Board concluded that while other allocation methods may also be reasonable, Fidelity's profitability methodologies are reasonable in all material respects.
The Board also reviewed Fidelity's non-fund businesses and potential indirect benefits such businesses may have received as a result of their association with Fidelity's mutual fund business (i.e., fall-out benefits) as well as cases where Fidelity's affiliates may benefit from the funds' business. The Board considered areas where potential indirect benefits to the Fidelity funds from their relationships with Fidelity may exist. The Board's consideration of these matters was informed by the findings of a joint ad hoc committee created by it and the boards of other Fidelity funds to evaluate potential fall-out benefits.
The Board considered the costs of the services provided by and the profits realized by Fidelity in connection with the operation of the fund and was satisfied that the profitability was not excessive.
Economies of Scale . The Board considered whether there have been economies of scale in respect of the management of the Fidelity funds, whether the Fidelity funds (including the fund) have appropriately benefited from any such economies of scale, and whether there is potential for realization of any further economies of scale. The Board considered the extent to which the fund will benefit from economies of scale as assets grow through increased services to the fund, through waivers or reimbursements, or through fee or expense ratio reductions. The Board also noted that a committee (the Economies of Scale Committee) created by it and the boards of other Fidelity funds periodically analyzes whether Fidelity attains economies of scale in respect of the management and servicing of the Fidelity funds, whether the Fidelity funds have appropriately benefited from such economies of scale, and whether there is potential for realization of any further economies of scale.
The Board concluded, taking into account the analysis of the Economies of Scale Committee, that economies of scale, if any, are being appropriately shared between fund shareholders and Fidelity.
Additional Information Requested by the Board . In order to develop fully the factual basis for consideration of the Fidelity funds' advisory contracts, the Board requested and received additional information on certain topics, including: (i) Fidelity's fund profitability methodology, profitability trends for certain funds, the allocation of various costs to different funds, and the impact of certain factors on fund profitability results; (ii) portfolio manager changes that have occurred during the past year and the amount of the investment that each portfolio manager has made in the Fidelity fund(s) that he or she manages; (iii) the extent to which current market conditions have affected retention and recruitment of personnel; (iv) the arrangements with and compensation paid to certain fund sub-advisers on behalf of the Fidelity funds and the treatment of such compensation within Fidelity's fund profitability methodology; (v) the terms of the funds' various management fee structures, including the basic group fee and the terms of Fidelity's voluntary expense limitation arrangements; (vi) Fidelity's transfer agent, pricing and bookkeeping fees, expense and service structures for different funds and classes relative to competitive trends; (vii) the impact on fund profitability of recent industry trends, such as the growth in passively managed funds and the changes in flows for different types of funds; (viii) the types of management fee and total expense comparisons provided, and the challenges and limitations associated with such information; and (ix) explanations regarding the relative total expense ratios and management fees of certain funds and classes, total expense and management fee competitive trends, and methodologies for total expense and management fee competitive comparisons. In addition, the Board considered its discussions with Fidelity regarding Fidelity's efforts to maintain the continuous investment and shareholder services necessary for the funds during the current pandemic and economic circumstances.
Based on its evaluation of all of the conclusions noted above, and after considering all factors it believed relevant, the Board concluded that the advisory fee arrangements are fair and reasonable and that the fund's Advisory Contracts should be renewed.
The Securities and Exchange Commission adopted Rule 22e-4 under the Investment Company Act of 1940 (the Liquidity Rule) to promote effective liquidity risk management throughout the open-end investment company industry, thereby reducing the risk that funds will be unable to meet their redemption obligations and mitigating dilution of the interests of fund shareholders.
The Fund has adopted and implemented a liquidity risk management program (the Program) reasonably designed to assess and manage the Fund's liquidity risk and to comply with the requirements of the Liquidity Rule. The Fund's Board of Trustees (the Board) has designated the Fund's investment adviser as administrator of the Program. The Fidelity advisers have established a Liquidity Risk Management Committee (the LRM Committee) to manage the Program for each of the Fidelity Funds. The LRM Committee monitors the adequacy and effectiveness of implementation of the Program and on a periodic basis assesses each Fund's liquidity risk based on a variety of factors including (1) the Fund's investment strategy, (2) portfolio liquidity and cash flow projections during normal and reasonably foreseeable stressed conditions, (3) shareholder redemptions, (4) borrowings and other funding sources and (5) certain factors specific to ETFs including the effect of the Fund's prices and spreads, market participants, and basket compositions on the overall liquidity of the Fund's portfolio, as applicable.
In accordance with the Program, each of the Fund's portfolio investments is classified into one of four defined liquidity categories based on a determination of a reasonable expectation for how long it would take to convert the investment to cash (or sell or dispose of the investment) without significantly changing its market value.
- Highly liquid investments - cash or convertible to cash within three business days or less
- Moderately liquid investments - convertible to cash in three to seven calendar days
- Less liquid investments - can be sold or disposed of, but not settled, within seven calendar days
- Illiquid investments - cannot be sold or disposed of within seven calendar days
Liquidity classification determinations take into account a variety of factors including various market, trading and investment-specific considerations, as well as market depth, and generally utilize analysis from a third-party liquidity metrics service.
The Liquidity Rule places a 15% limit on a fund's illiquid investments and requires funds that do not primarily hold assets that are highly liquid investments to determine and maintain a minimum percentage of the fund's net assets to be invested in highly liquid investments (highly liquid investment minimum or HLIM). The Program includes provisions reasonably designed to comply with the 15% limit on illiquid investments and for determining, periodically reviewing and complying with the HLIM requirement as applicable.
At a recent meeting of the Fund's Board of Trustees, the LRM Committee provided a written report to the Board pertaining to the operation, adequacy, and effectiveness of the Program for the period December 1, 2021 through November 30, 2022. The report concluded that the Program is operating effectively and is reasonably designed to assess and manage the Fund's liquidity risk.
1.9900848.102
LDI-SANN-0423
Fidelity® Corporate Bond Fund
Semi-Annual Report
February 28, 2023
Includes Fidelity and Fidelity Advisor share classes
Contents
To view a fund's proxy voting guidelines and proxy voting record for the 12-month period ended June 30, visit http://www.fidelity.com/proxyvotingresults or visit the Securities and Exchange Commission's (SEC) web site at http://www.sec.gov.
You may also call 1-800-544-8544 if you're an individual investing directly with Fidelity, call 1-800-835-5092 if you're a plan sponsor or participant with Fidelity as your recordkeeper or call 1-877-208-0098 on institutional accounts or if you're an advisor or invest through one to request a free copy of the proxy voting guidelines.
Standard & Poor's, S&P and S&P 500 are registered service marks of The McGraw-Hill Companies, Inc. and have been licensed for use by Fidelity Distributors Corporation.
Other third-party marks appearing herein are the property of their respective owners.
All other marks appearing herein are registered or unregistered trademarks or service marks of FMR LLC or an affiliated company. © 2023 FMR LLC. All rights reserved.
This report and the financial statements contained herein are submitted for the general information of the shareholders of the Fund. This report is not authorized for distribution to prospective investors in the Fund unless preceded or accompanied by an effective prospectus.
A fund files its complete schedule of portfolio holdings with the SEC for the first and third quarters of each fiscal year on Form N-PORT. Forms N-PORT are available on the SEC's web site at http://www.sec.gov. A fund's Forms N-PORT may be reviewed and copied at the SEC's Public Reference Room in Washington, DC. Information regarding the operation of the SEC's Public Reference Room may be obtained by calling 1-800-SEC-0330.
For a complete list of a fund's portfolio holdings, view the most recent holdings listing, semiannual report, or annual report on Fidelity's web site at http://www.fidelity.com, http://www.institutional.fidelity.com, or http://www.401k.com, as applicable.
NOT FDIC INSURED •MAY LOSE VALUE •NO BANK GUARANTEE
Neither the Fund nor Fidelity Distributors Corporation is a bank.
Quality Diversification (% of Fund's net assets) |
|
| |
| We have used ratings from Moody's Investors Service, Inc. Where Moody's® ratings are not available, we have used S&P® ratings. All ratings are as of the date indicated and do not reflect subsequent changes. |
Asset Allocation (% of Fund's net assets) |
|
Foreign investments - 20% |
|
Geographic Diversification (% of Fund's net assets) |
|
* Includes Short-Term investments and Net Other Assets (Liabilities). Percentages are based on country or territory of incorporation and are adjusted for the effect of derivatives, if applicable. |
| |
Showing Percentage of Net Assets
| Nonconvertible Bonds - 87.3% |
| | | Principal Amount (a) | Value ($) |
| COMMUNICATION SERVICES - 6.9% | | | |
| Diversified Telecommunication Services - 2.2% | | | |
| AT&T, Inc.: | | | |
| 2.25% 2/1/32 | | 13,000,000 | 10,146,954 |
| 3.55% 9/15/55 | | 5,501,000 | 3,726,396 |
| 3.65% 9/15/59 | | 3,848,000 | 2,606,032 |
| 3.8% 12/1/57 | | 16,364,000 | 11,488,569 |
| 4.3% 2/15/30 | | 5,000,000 | 4,690,377 |
| 4.5% 5/15/35 | | 3,834,000 | 3,448,551 |
| Level 3 Financing, Inc. 3.4% 3/1/27 (b) | | 8,250,000 | 6,924,521 |
| Verizon Communications, Inc.: | | | |
| 2.355% 3/15/32 | | 14,000,000 | 11,006,130 |
| 2.55% 3/21/31 | | 4,843,000 | 3,961,515 |
| 3% 11/20/60 | | 8,375,000 | 5,042,411 |
| 3.15% 3/22/30 | | 721,000 | 631,322 |
| 3.7% 3/22/61 | | 12,000,000 | 8,435,841 |
| 4.016% 12/3/29 | | 10,000,000 | 9,223,038 |
| 4.329% 9/21/28 | | 2,268,000 | 2,172,803 |
| 4.4% 11/1/34 | | 13,039,000 | 11,852,942 |
| 4.5% 8/10/33 | | 1,048,000 | 974,028 |
| | | | 96,331,430 |
| Entertainment - 0.6% | | | |
| The Walt Disney Co.: | | | |
| 3.8% 3/22/30 | | 11,650,000 | 10,832,387 |
| 4.7% 3/23/50 | | 5,000,000 | 4,678,800 |
| 6.65% 11/15/37 | | 9,414,000 | 10,670,142 |
| | | | 26,181,329 |
| Media - 2.7% | | | |
| CCO Holdings LLC/CCO Holdings Capital Corp. 4.5% 8/15/30 (b) | | 13,200,000 | 10,857,264 |
| Charter Communications Operating LLC/Charter Communications Operating Capital Corp.: | | | |
| 3.7% 4/1/51 | | 7,300,000 | 4,463,731 |
| 3.85% 4/1/61 | | 8,500,000 | 5,006,048 |
| 5.25% 4/1/53 | | 8,700,000 | 6,803,224 |
| 5.375% 5/1/47 | | 4,670,000 | 3,720,374 |
| 5.5% 4/1/63 | | 3,700,000 | 2,875,983 |
| Comcast Corp.: | | | |
| 2.937% 11/1/56 | | 2,589,000 | 1,623,883 |
| 2.987% 11/1/63 | | 10,034,000 | 6,132,249 |
| 3.999% 11/1/49 | | 1,427,000 | 1,149,489 |
| Discovery Communications LLC: | | | |
| 3.95% 3/20/28 | | 13,000,000 | 11,872,013 |
| 4.65% 5/15/50 | | 5,800,000 | 4,253,514 |
| Fox Corp.: | | | |
| 3.5% 4/8/30 | | 9,550,000 | 8,397,605 |
| 4.709% 1/25/29 | | 405,000 | 386,731 |
| 5.476% 1/25/39 | | 400,000 | 367,590 |
| 5.576% 1/25/49 | | 265,000 | 241,278 |
| Magallanes, Inc.: | | | |
| 3.755% 3/15/27 (b) | | 2,104,000 | 1,930,072 |
| 4.054% 3/15/29 (b) | | 729,000 | 651,912 |
| 4.279% 3/15/32 (b) | | 17,886,000 | 15,441,184 |
| 5.05% 3/15/42 (b) | | 3,039,000 | 2,462,002 |
| 5.141% 3/15/52 (b) | | 13,496,000 | 10,579,566 |
| 5.391% 3/15/62 (b) | | 5,490,000 | 4,282,257 |
| Time Warner Cable LLC: | | | |
| 5.5% 9/1/41 | | 561,000 | 472,287 |
| 5.875% 11/15/40 | | 7,482,000 | 6,607,379 |
| 6.55% 5/1/37 | | 1,930,000 | 1,848,432 |
| 6.75% 6/15/39 | | 1,246,000 | 1,197,102 |
| 7.3% 7/1/38 | | 6,915,000 | 6,930,525 |
| | | | 120,553,694 |
| Wireless Telecommunication Services - 1.4% | | | |
| Rogers Communications, Inc.: | | | |
| 3.8% 3/15/32 (b) | | 11,945,000 | 10,433,706 |
| 4.55% 3/15/52 (b) | | 11,010,000 | 8,780,955 |
| T-Mobile U.S.A., Inc.: | | | |
| 2.4% 3/15/29 | | 3,174,000 | 2,682,575 |
| 2.7% 3/15/32 | | 21,520,000 | 17,443,638 |
| 3.5% 4/15/25 | | 2,000,000 | 1,915,723 |
| 3.75% 4/15/27 | | 7,500,000 | 7,051,020 |
| 5.65% 1/15/53 | | 4,000,000 | 3,921,353 |
| Vodafone Group PLC: | | | |
| 3.25% 6/4/81 (c) | | 2,900,000 | 2,529,960 |
| 4.125% 5/30/25 | | 5,882,000 | 5,724,354 |
| | | | 60,483,284 |
TOTAL COMMUNICATION SERVICES | | | 303,549,737 |
| CONSUMER DISCRETIONARY - 4.9% | | | |
| Automobiles - 1.7% | | | |
| Ford Motor Co. 3.25% 2/12/32 | | 11,000,000 | 8,313,675 |
| General Motors Co.: | | | |
| 5% 4/1/35 | | 2,279,000 | 2,022,459 |
| 5.2% 4/1/45 | | 2,600,000 | 2,144,017 |
| 5.4% 4/1/48 | | 1,050,000 | 875,675 |
| 5.6% 10/15/32 | | 5,000,000 | 4,753,800 |
| 5.95% 4/1/49 | | 4,960,000 | 4,450,183 |
| General Motors Financial Co., Inc.: | | | |
| 3.1% 1/12/32 | | 12,060,000 | 9,598,455 |
| 4.3% 4/6/29 | | 11,200,000 | 10,215,134 |
| Stellantis Finance U.S., Inc.: | | | |
| 1.711% 1/29/27 (b) | | 5,994,000 | 5,200,144 |
| 2.691% 9/15/31 (b) | | 11,150,000 | 8,766,407 |
| Volkswagen Group of America Finance LLC: | | | |
| 1.625% 11/24/27 (b) | | 12,000,000 | 10,152,687 |
| 4.75% 11/13/28 (b) | | 8,072,000 | 7,840,588 |
| | | | 74,333,224 |
| Distributors - 0.1% | | | |
| Genuine Parts Co. 2.75% 2/1/32 | | 6,032,000 | 4,876,298 |
| Diversified Consumer Services - 0.2% | | | |
| Ingersoll-Rand Global Holding Co. Ltd.: | | | |
| 3.75% 8/21/28 | | 5,146,000 | 4,833,228 |
| 5.75% 6/15/43 | | 358,000 | 359,690 |
| Massachusetts Institute of Technology 3.885% 7/1/2116 | | 6,610,000 | 4,972,447 |
| | | | 10,165,365 |
| Hotels, Restaurants & Leisure - 0.2% | | | |
| McDonald's Corp. 4.875% 12/9/45 | | 6,679,000 | 6,083,780 |
| Household Durables - 0.1% | | | |
| Toll Brothers Finance Corp. 4.375% 4/15/23 | | 5,162,000 | 5,153,021 |
| Multiline Retail - 0.7% | | | |
| Dollar General Corp. 3.5% 4/3/30 | | 11,170,000 | 9,994,134 |
| Dollar Tree, Inc.: | | | |
| 2.65% 12/1/31 | | 12,000,000 | 9,700,888 |
| 4% 5/15/25 | | 6,286,000 | 6,104,852 |
| 4.2% 5/15/28 | | 6,377,000 | 6,063,906 |
| | | | 31,863,780 |
| Specialty Retail - 1.7% | | | |
| Advance Auto Parts, Inc. 1.75% 10/1/27 | | 5,010,000 | 4,254,400 |
| AutoNation, Inc.: | | | |
| 1.95% 8/1/28 | | 12,350,000 | 10,036,088 |
| 2.4% 8/1/31 | | 5,500,000 | 4,127,707 |
| 3.85% 3/1/32 | | 5,400,000 | 4,528,113 |
| 4.75% 6/1/30 | | 354,000 | 328,845 |
| AutoZone, Inc. 4% 4/15/30 | | 9,600,000 | 8,821,950 |
| Lowe's Companies, Inc.: | | | |
| 3% 10/15/50 | | 11,700,000 | 7,434,864 |
| 3.75% 4/1/32 | | 10,000,000 | 8,858,442 |
| 5.625% 4/15/53 | | 6,450,000 | 6,173,718 |
| O'Reilly Automotive, Inc.: | | | |
| 3.9% 6/1/29 | | 2,918,000 | 2,702,379 |
| 4.35% 6/1/28 | | 6,286,000 | 6,055,595 |
| Ross Stores, Inc. 4.6% 4/15/25 | | 5,150,000 | 5,070,471 |
| The Home Depot, Inc. 5.95% 4/1/41 | | 846,000 | 907,831 |
| Triton Container International Ltd. 1.15% 6/7/24 (b) | | 5,450,000 | 5,093,025 |
| | | | 74,393,428 |
| Textiles, Apparel & Luxury Goods - 0.2% | | | |
| Tapestry, Inc. 3.05% 3/15/32 | | 12,275,000 | 9,753,367 |
TOTAL CONSUMER DISCRETIONARY | | | 216,622,263 |
| CONSUMER STAPLES - 6.1% | | | |
| Beverages - 1.6% | | | |
| Anheuser-Busch Companies LLC / Anheuser-Busch InBev Worldwide, Inc. 4.9% 2/1/46 | | 12,000,000 | 11,007,290 |
| Anheuser-Busch InBev Finance, Inc.: | | | |
| 4.7% 2/1/36 | | 2,027,000 | 1,902,601 |
| 4.9% 2/1/46 | | 966,000 | 886,087 |
| Anheuser-Busch InBev Worldwide, Inc.: | | | |
| 3.5% 6/1/30 | | 15,000,000 | 13,659,674 |
| 4.5% 6/1/50 | | 7,000,000 | 6,165,726 |
| 4.6% 4/15/48 | | 10,509,000 | 9,285,559 |
| 4.9% 1/23/31 | | 5,729,000 | 5,729,615 |
| Constellation Brands, Inc. 2.875% 5/1/30 | | 8,624,000 | 7,324,169 |
| PepsiCo, Inc. 3.9% 7/18/32 | | 15,000,000 | 14,107,046 |
| | | | 70,067,767 |
| Food & Staples Retailing - 0.2% | | | |
| Alimentation Couche-Tard, Inc. 2.95% 1/25/30 (b) | | 9,622,000 | 8,175,380 |
| Food Products - 1.4% | | | |
| JBS U.S.A. Lux SA / JBS Food Co.: | | | |
| 2.5% 1/15/27 (b) | | 13,215,000 | 11,563,918 |
| 3% 5/15/32 (b) | | 12,645,000 | 9,639,847 |
| 4.375% 2/2/52 (b) | | 5,480,000 | 3,891,490 |
| 5.5% 1/15/30 (b) | | 12,850,000 | 12,094,998 |
| 6.5% 12/1/52 (b) | | 8,000,000 | 7,603,240 |
| JDE Peet's BV 2.25% 9/24/31 (b) | | 4,272,000 | 3,257,300 |
| Smithfield Foods, Inc. 3% 10/15/30 (b) | | 2,115,000 | 1,646,697 |
| Viterra Finance BV 4.9% 4/21/27 (b) | | 13,300,000 | 12,599,545 |
| | | | 62,297,035 |
| Tobacco - 2.9% | | | |
| Altria Group, Inc.: | | | |
| 2.45% 2/4/32 | | 5,875,000 | 4,434,691 |
| 3.4% 2/4/41 | | 10,300,000 | 6,903,565 |
| 4.25% 8/9/42 | | 1,221,000 | 918,083 |
| 4.8% 2/14/29 | | 99,000 | 94,965 |
| BAT Capital Corp.: | | | |
| 2.259% 3/25/28 | | 11,550,000 | 9,676,555 |
| 2.726% 3/25/31 | | 15,400,000 | 12,019,704 |
| 3.215% 9/6/26 | | 11,285,000 | 10,408,278 |
| 3.222% 8/15/24 | | 5,433,000 | 5,236,052 |
| 3.557% 8/15/27 | | 8,000,000 | 7,285,339 |
| 3.984% 9/25/50 | | 5,000,000 | 3,285,017 |
| 4.7% 4/2/27 | | 2,012,000 | 1,944,337 |
| 7.75% 10/19/32 | | 9,600,000 | 10,314,546 |
| BAT International Finance PLC 4.448% 3/16/28 | | 7,650,000 | 7,152,206 |
| Imperial Tobacco Finance PLC: | | | |
| 3.5% 7/26/26 (b) | | 7,764,000 | 7,149,109 |
| 4.25% 7/21/25 (b) | | 4,713,000 | 4,530,911 |
| 6.125% 7/27/27 (b) | | 1,922,000 | 1,937,347 |
| Philip Morris International, Inc.: | | | |
| 4.375% 11/15/41 | | 1,886,000 | 1,562,287 |
| 5.125% 2/15/30 | | 17,925,000 | 17,546,206 |
| 5.625% 11/17/29 | | 8,750,000 | 8,866,154 |
| 5.75% 11/17/32 | | 9,298,000 | 9,406,247 |
| Reynolds American, Inc.: | | | |
| 4.45% 6/12/25 | | 527,000 | 512,812 |
| 5.7% 8/15/35 | | 274,000 | 249,140 |
| | | | 131,433,551 |
TOTAL CONSUMER STAPLES | | | 271,973,733 |
| ENERGY - 7.6% | | | |
| Energy Equipment & Services - 0.3% | | | |
| Baker Hughes Co. 4.486% 5/1/30 | | 12,000,000 | 11,382,466 |
| Oil, Gas & Consumable Fuels - 7.3% | | | |
| Boardwalk Pipelines LP 4.95% 12/15/24 | | 3,700,000 | 3,640,014 |
| Canadian Natural Resources Ltd.: | | | |
| 2.95% 7/15/30 | | 13,764,000 | 11,662,739 |
| 3.9% 2/1/25 | | 3,884,000 | 3,758,823 |
| 5.85% 2/1/35 | | 476,000 | 458,172 |
| 6.25% 3/15/38 | | 3,908,000 | 3,938,662 |
| Cenovus Energy, Inc.: | | | |
| 2.65% 1/15/32 | | 1,233,000 | 975,739 |
| 3.75% 2/15/52 | | 3,820,000 | 2,704,902 |
| 4.25% 4/15/27 | | 2,604,000 | 2,486,411 |
| 5.375% 7/15/25 | | 9,137,000 | 9,058,985 |
| 5.4% 6/15/47 | | 4,008,000 | 3,608,057 |
| 6.75% 11/15/39 | | 2,416,000 | 2,525,037 |
| Cheniere Corpus Christi Holdings LLC 5.875% 3/31/25 | | 5,721,000 | 5,740,129 |
| ConocoPhillips Co.: | | | |
| 6.5% 2/1/39 | | 4,132,000 | 4,656,454 |
| 6.95% 4/15/29 | | 2,739,000 | 3,003,579 |
| DCP Midstream Operating LP: | | | |
| 3.875% 3/15/23 | | 201,000 | 200,856 |
| 5.125% 5/15/29 | | 8,176,000 | 7,869,986 |
| 5.375% 7/15/25 | | 5,000,000 | 4,938,330 |
| 5.6% 4/1/44 | | 307,000 | 287,963 |
| 5.85% 5/21/43 (b)(c) | | 6,734,000 | 6,663,966 |
| 6.75% 9/15/37 (b) | | 1,924,000 | 2,018,969 |
| Eastern Gas Transmission & Storage, Inc.: | | | |
| 3% 11/15/29 | | 7,508,000 | 6,493,344 |
| 3.9% 11/15/49 | | 7,000,000 | 5,145,136 |
| Enbridge, Inc.: | | | |
| 4.25% 12/1/26 | | 383,000 | 367,293 |
| 5.5% 12/1/46 | | 3,408,000 | 3,214,093 |
| Energy Transfer LP: | | | |
| 3.75% 5/15/30 | | 10,655,000 | 9,452,369 |
| 4% 10/1/27 | | 4,055,000 | 3,780,231 |
| 4.2% 9/15/23 | | 259,000 | 257,226 |
| 4.25% 4/1/24 | | 11,475,000 | 11,295,337 |
| 4.95% 6/15/28 | | 882,000 | 851,847 |
| 5% 5/15/50 | | 16,650,000 | 13,643,678 |
| 5.4% 10/1/47 | | 1,753,000 | 1,507,118 |
| 5.75% 2/15/33 | | 4,000,000 | 3,935,120 |
| 5.8% 6/15/38 | | 493,000 | 461,911 |
| 6% 6/15/48 | | 322,000 | 296,148 |
| Florida Gas Transmission Co. LLC 4.35% 7/15/25 (b) | | 4,510,000 | 4,353,308 |
| Hess Corp.: | | | |
| 4.3% 4/1/27 | | 13,487,000 | 12,909,984 |
| 5.6% 2/15/41 | | 7,562,000 | 7,063,189 |
| 5.8% 4/1/47 | | 11,100,000 | 10,492,954 |
| 7.3% 8/15/31 | | 3,175,000 | 3,446,606 |
| 7.875% 10/1/29 | | 5,544,000 | 6,096,300 |
| Magellan Midstream Partners LP 3.25% 6/1/30 | | 10,200,000 | 8,882,051 |
| MPLX LP: | | | |
| 1.75% 3/1/26 | | 9,336,000 | 8,348,860 |
| 2.65% 8/15/30 | | 12,000,000 | 9,846,221 |
| 4.875% 12/1/24 | | 381,000 | 375,798 |
| 4.95% 9/1/32 | | 3,872,000 | 3,638,856 |
| 5.65% 3/1/53 | | 14,060,000 | 12,946,281 |
| Occidental Petroleum Corp.: | | | |
| 2.9% 8/15/24 | | 1,164,000 | 1,114,530 |
| 5.55% 3/15/26 | | 670,000 | 666,362 |
| Ovintiv, Inc.: | | | |
| 5.15% 11/15/41 | | 1,620,000 | 1,434,774 |
| 7.375% 11/1/31 | | 1,041,000 | 1,111,681 |
| 8.125% 9/15/30 | | 4,649,000 | 5,092,534 |
| Petroleos Mexicanos: | | | |
| 4.5% 1/23/26 | | 7,000,000 | 6,441,750 |
| 6.49% 1/23/27 | | 991,000 | 899,432 |
| 6.5% 3/13/27 | | 8,572,000 | 7,761,089 |
| Phillips 66 Co. 3.85% 4/9/25 | | 234,000 | 227,155 |
| Plains All American Pipeline LP/PAA Finance Corp.: | | | |
| 3.8% 9/15/30 | | 1,694,000 | 1,474,960 |
| 3.85% 10/15/23 | | 4,984,000 | 4,931,164 |
| 4.65% 10/15/25 | | 5,859,000 | 5,716,192 |
| Southeast Supply Header LLC 4.25% 6/15/24 (b) | | 667,000 | 628,648 |
| Spectra Energy Partners LP: | | | |
| 3.375% 10/15/26 | | 4,157,000 | 3,877,628 |
| 4.5% 3/15/45 | | 872,000 | 722,009 |
| Suncor Energy, Inc. 6.5% 6/15/38 | | 3,417,000 | 3,509,662 |
| The Williams Companies, Inc.: | | | |
| 2.6% 3/15/31 | | 12,300,000 | 9,980,860 |
| 3.5% 11/15/30 | | 3,807,000 | 3,331,474 |
| 4.65% 8/15/32 | | 3,870,000 | 3,605,828 |
| 5.3% 8/15/52 | | 855,000 | 772,482 |
| 5.75% 6/24/44 | | 4,411,000 | 4,205,219 |
| TransCanada PipeLines Ltd. 4.25% 5/15/28 | | 9,800,000 | 9,267,046 |
| Transcontinental Gas Pipe Line Co. LLC 3.25% 5/15/30 | | 448,000 | 390,042 |
| Western Gas Partners LP: | | | |
| 4.3% 2/1/30 | | 21,139,000 | 18,727,939 |
| 4.65% 7/1/26 | | 238,000 | 226,100 |
| | | | 325,415,592 |
TOTAL ENERGY | | | 336,798,058 |
| FINANCIALS - 31.9% | | | |
| Banks - 18.2% | | | |
| AIB Group PLC: | | | |
| 4.263% 4/10/25 (b)(c) | | 5,181,000 | 5,061,347 |
| 7.583% 10/14/26 (b)(c) | | 10,050,000 | 10,286,437 |
| Banco Santander SA 2.749% 12/3/30 | | 17,400,000 | 13,594,407 |
| Bank of America Corp.: | | | |
| 3 month U.S. LIBOR + 0.640% 2.015% 2/13/26 (c)(d) | | 9,000,000 | 8,373,591 |
| 1.898% 7/23/31 (c) | | 11,200,000 | 8,729,223 |
| 2.592% 4/29/31 (c) | | 12,500,000 | 10,322,665 |
| 2.972% 2/4/33 (c) | | 30,000,000 | 24,550,252 |
| 3.194% 7/23/30 (c) | | 16,960,000 | 14,736,328 |
| 3.705% 4/24/28 (c) | | 6,286,000 | 5,847,455 |
| 4.571% 4/27/33 (c) | | 14,000,000 | 13,013,786 |
| 5.015% 7/22/33 (c) | | 18,200,000 | 17,510,279 |
| 6.11% 1/29/37 | | 2,152,000 | 2,212,010 |
| Bank of Ireland Group PLC 4.5% 11/25/23 (b) | | 6,356,000 | 6,272,779 |
| Bank of Nova Scotia 4.5% 12/16/25 | | 6,650,000 | 6,445,217 |
| Barclays PLC: | | | |
| 3.65% 3/16/25 | | 3,904,000 | 3,747,866 |
| 3.811% 3/10/42 (c) | | 12,000,000 | 8,692,777 |
| 5.088% 6/20/30 (c) | | 10,793,000 | 9,998,350 |
| 5.746% 8/9/33 (c) | | 3,331,000 | 3,212,468 |
| 7.437% 11/2/33 (c) | | 11,800,000 | 12,739,756 |
| BNP Paribas SA: | | | |
| U.S. Secured Overnight Fin. Rate (SOFR) Index + 1.000% 1.323% 1/13/27 (b)(c)(d) | | 6,494,000 | 5,749,815 |
| 1.904% 9/30/28 (b)(c) | | 11,750,000 | 9,901,554 |
| 2.159% 9/15/29 (b)(c) | | 6,296,000 | 5,206,297 |
| 2.219% 6/9/26 (b)(c) | | 3,473,000 | 3,207,681 |
| 2.824% 1/26/41 (b) | | 9,300,000 | 6,127,142 |
| 4.625% 3/13/27 (b) | | 4,075,000 | 3,904,919 |
| BPCE SA: | | | |
| 2.277% 1/20/32 (b)(c) | | 12,075,000 | 9,245,928 |
| 3.116% 10/19/32 (b)(c) | | 9,800,000 | 7,572,802 |
| Citigroup, Inc.: | | | |
| 2.666% 1/29/31 (c) | | 8,200,000 | 6,822,837 |
| 3.106% 4/8/26 (c) | | 14,000,000 | 13,294,772 |
| 3.785% 3/17/33 (c) | | 10,000,000 | 8,693,608 |
| 3.98% 3/20/30 (c) | | 12,000,000 | 10,944,049 |
| 4.4% 6/10/25 | | 1,331,000 | 1,302,298 |
| 4.412% 3/31/31 (c) | | 10,000,000 | 9,295,317 |
| 4.6% 3/9/26 | | 921,000 | 896,758 |
| 4.91% 5/24/33 (c) | | 5,257,000 | 4,981,972 |
| 8.125% 7/15/39 | | 1,728,000 | 2,189,118 |
| Citizens Financial Group, Inc. 2.638% 9/30/32 | | 6,941,000 | 5,287,467 |
| Commonwealth Bank of Australia 3.784% 3/14/32 (b) | | 26,452,000 | 22,208,104 |
| Credit Agricole SA 2.811% 1/11/41 (b) | | 6,691,000 | 4,399,350 |
| Fifth Third Bancorp 8.25% 3/1/38 | | 3,460,000 | 4,315,590 |
| HSBC Holdings PLC: | | | |
| 2.251% 11/22/27 (c) | | 8,604,000 | 7,568,422 |
| 2.357% 8/18/31 (c) | | 24,800,000 | 19,582,853 |
| 2.848% 6/4/31 (c) | | 9,800,000 | 8,061,962 |
| 4.041% 3/13/28 (c) | | 6,005,000 | 5,605,415 |
| 4.762% 3/29/33 (c) | | 12,550,000 | 11,275,671 |
| 4.95% 3/31/30 | | 462,000 | 445,158 |
| 5.402% 8/11/33 (c) | | 8,117,000 | 7,779,587 |
| Huntington Bancshares, Inc.: | | | |
| 2.487% 8/15/36 (c) | | 9,956,000 | 7,329,229 |
| 4.443% 8/4/28 (c) | | 4,512,000 | 4,309,867 |
| ING Groep NV: | | | |
| 4.017% 3/28/28 (c) | | 15,000,000 | 14,086,617 |
| 4.252% 3/28/33 (c) | | 10,000,000 | 8,988,173 |
| Intesa Sanpaolo SpA 5.71% 1/15/26 (b) | | 19,037,000 | 18,222,446 |
| JPMorgan Chase & Co.: | | | |
| 2.739% 10/15/30 (c) | | 15,000,000 | 12,652,458 |
| 2.956% 5/13/31 (c) | | 1,884,000 | 1,582,192 |
| 2.963% 1/25/33 (c) | | 15,000,000 | 12,359,102 |
| 4.323% 4/26/28 (c) | | 15,000,000 | 14,380,277 |
| 4.586% 4/26/33 (c) | | 15,000,000 | 13,979,690 |
| 4.912% 7/25/33 (c) | | 20,000,000 | 19,150,200 |
| 5.717% 9/14/33 (c) | | 31,050,000 | 30,854,097 |
| KBC Group NV 5.796% 1/19/29 (b)(c) | | 10,140,000 | 10,006,388 |
| Lloyds Banking Group PLC: | | | |
| 3.87% 7/9/25 (c) | | 5,500,000 | 5,356,840 |
| 4.375% 3/22/28 | | 6,937,000 | 6,560,096 |
| 4.976% 8/11/33 (c) | | 10,000,000 | 9,314,124 |
| 7.953% 11/15/33 (c) | | 9,950,000 | 10,894,795 |
| Mitsubishi UFJ Financial Group, Inc. 4.08% 4/19/28 (c) | | 14,650,000 | 13,905,038 |
| Mizuho Financial Group, Inc. 2.564% 9/13/31 | | 17,000,000 | 13,232,399 |
| PNC Financial Services Group, Inc. 5.068% 1/24/34 (c) | | 24,300,000 | 23,496,835 |
| Rabobank Nederland: | | | |
| 3.649% 4/6/28 (b)(c) | | 11,150,000 | 10,397,220 |
| 3.75% 7/21/26 | | 6,754,000 | 6,333,808 |
| Royal Bank of Canada 4.65% 1/27/26 | | 1,061,000 | 1,035,077 |
| Santander Holdings U.S.A., Inc.: | | | |
| 2.49% 1/6/28 (c) | | 2,768,000 | 2,410,878 |
| 5.807% 9/9/26 (c) | | 5,963,000 | 5,961,929 |
| Societe Generale: | | | |
| 1.488% 12/14/26 (b)(c) | | 4,601,000 | 4,076,304 |
| 3.625% 3/1/41 (b) | | 12,500,000 | 8,416,153 |
| 4.25% 4/14/25 (b) | | 2,698,000 | 2,586,727 |
| 4.75% 11/24/25 (b) | | 6,461,000 | 6,225,428 |
| 6.221% 6/15/33 (b)(c) | | 13,500,000 | 12,821,429 |
| 6.446% 1/10/29 (b)(c) | | 11,000,000 | 11,107,131 |
| 7.367% 1/10/53 (b) | | 5,000,000 | 5,048,623 |
| Standard Chartered PLC 3.785% 5/21/25 (b)(c) | | 6,937,000 | 6,763,298 |
| SVB Financial Group: | | | |
| 1.8% 10/28/26 | | 6,500,000 | 5,666,536 |
| 3.125% 6/5/30 | | 2,947,000 | 2,486,364 |
| Synchrony Bank 5.625% 8/23/27 | | 3,367,000 | 3,292,919 |
| Truist Financial Corp. 5.122% 1/26/34 (c) | | 6,800,000 | 6,616,762 |
| UniCredit SpA 1.982% 6/3/27 (b)(c) | | 9,900,000 | 8,633,774 |
| Wells Fargo & Co.: | | | |
| 2.188% 4/30/26 (c) | | 12,500,000 | 11,622,266 |
| 3.068% 4/30/41 (c) | | 12,500,000 | 9,057,847 |
| 4.897% 7/25/33 (c) | | 10,454,000 | 9,984,997 |
| Westpac Banking Corp. U.S. TREASURY 1 YEAR INDEX + 2.680% 5.405% 8/10/33 (c)(d) | | 16,000,000 | 15,320,607 |
| Zions Bancorp NA 3.25% 10/29/29 | | 8,229,000 | 6,840,783 |
| | | | 804,581,162 |
| Capital Markets - 4.6% | | | |
| Ares Capital Corp.: | | | |
| 2.15% 7/15/26 | | 10,800,000 | 9,304,688 |
| 2.875% 6/15/27 | | 5,125,000 | 4,459,443 |
| 3.25% 7/15/25 | | 5,300,000 | 4,929,961 |
| 3.875% 1/15/26 | | 6,017,000 | 5,582,236 |
| 4.25% 3/1/25 | | 5,162,000 | 4,954,063 |
| Blackstone Holdings Finance Co. LLC: | | | |
| 2.8% 9/30/50 (b) | | 2,000,000 | 1,177,961 |
| 3.5% 9/10/49 (b) | | 7,409,000 | 5,060,504 |
| Credit Suisse Group AG: | | | |
| 2.593% 9/11/25 (b)(c) | | 3,093,000 | 2,802,397 |
| 3.091% 5/14/32 (b)(c) | | 8,500,000 | 5,980,903 |
| 4.194% 4/1/31 (b)(c) | | 9,628,000 | 7,635,740 |
| 4.55% 4/17/26 | | 4,872,000 | 4,352,561 |
| 6.537% 8/12/33 (b)(c) | | 11,500,000 | 10,326,889 |
| 9.016% 11/15/33 (b)(c) | | 5,900,000 | 6,196,048 |
| Deutsche Bank AG 4.5% 4/1/25 | | 15,225,000 | 14,680,412 |
| Deutsche Bank AG New York Branch: | | | |
| 2.129% 11/24/26 (c) | | 12,621,000 | 11,311,451 |
| 3.035% 5/28/32 (c) | | 6,468,000 | 5,095,630 |
| 6.72% 1/18/29 (c) | | 2,800,000 | 2,829,657 |
| Goldman Sachs Group, Inc. 4.482% 8/23/28 (c) | | 10,000,000 | 9,583,804 |
| Morgan Stanley: | | | |
| 1.794% 2/13/32 (c) | | 11,750,000 | 8,942,425 |
| 2.188% 4/28/26 (c) | | 11,770,000 | 10,970,366 |
| 2.699% 1/22/31 (c) | | 10,000,000 | 8,354,073 |
| 4.3% 1/27/45 | | 851,000 | 731,384 |
| 6.342% 10/18/33 (c) | | 24,000,000 | 25,300,922 |
| Peachtree Corners Funding Trust 3.976% 2/15/25 (b) | | 6,763,000 | 6,507,495 |
| S&P Global, Inc. 3.9% 3/1/62 (b) | | 3,876,000 | 3,059,571 |
| UBS Group AG: | | | |
| 3.126% 8/13/30 (b)(c) | | 8,605,000 | 7,363,451 |
| 4.988% 8/5/33 (b)(c) | | 16,800,000 | 15,726,214 |
| | | | 203,220,249 |
| Consumer Finance - 3.4% | | | |
| AerCap Ireland Capital Ltd./AerCap Global Aviation Trust: | | | |
| 1.65% 10/29/24 | | 4,500,000 | 4,174,545 |
| 1.75% 1/30/26 | | 6,211,000 | 5,490,369 |
| 2.45% 10/29/26 | | 8,864,000 | 7,814,253 |
| 3% 10/29/28 | | 6,952,000 | 5,923,886 |
| 3.3% 1/30/32 | | 2,088,000 | 1,670,897 |
| 3.4% 10/29/33 | | 4,321,000 | 3,361,787 |
| 3.85% 10/29/41 | | 7,060,000 | 5,168,755 |
| 4.875% 1/16/24 | | 371,000 | 367,354 |
| Ally Financial, Inc.: | | | |
| 2.2% 11/2/28 | | 3,965,000 | 3,230,208 |
| 3.05% 6/5/23 | | 4,445,000 | 4,414,841 |
| 3.875% 5/21/24 | | 1,970,000 | 1,928,902 |
| 5.75% 11/20/25 | | 7,714,000 | 7,551,103 |
| 5.8% 5/1/25 | | 1,997,000 | 1,998,319 |
| 8% 11/1/31 | | 20,573,000 | 22,270,010 |
| Capital One Financial Corp.: | | | |
| 2.359% 7/29/32 (c) | | 13,862,000 | 10,199,108 |
| 5.247% 7/26/30 (c) | | 6,476,000 | 6,209,605 |
| 5.268% 5/10/33 (c) | | 18,000,000 | 17,047,698 |
| 5.468% 2/1/29 (c) | | 3,317,000 | 3,256,503 |
| 5.817% 2/1/34 (c) | | 5,764,000 | 5,597,008 |
| Discover Financial Services: | | | |
| 4.5% 1/30/26 | | 1,042,000 | 1,008,710 |
| 6.7% 11/29/32 | | 1,017,000 | 1,050,790 |
| Ford Motor Credit Co. LLC: | | | |
| 3.375% 11/13/25 | | 8,750,000 | 8,059,363 |
| 3.625% 6/17/31 | | 200,000 | 158,444 |
| 4.063% 11/1/24 | | 8,000,000 | 7,691,603 |
| 4.95% 5/28/27 | | 16,400,000 | 15,279,716 |
| Synchrony Financial 4.375% 3/19/24 | | 513,000 | 505,880 |
| | | | 151,429,657 |
| Diversified Financial Services - 2.3% | | | |
| Aon Corp. / Aon Global Holdings PLC 2.6% 12/2/31 | | 3,303,000 | 2,691,861 |
| Athene Global Funding: | | | |
| 1.45% 1/8/26 (b) | | 17,950,000 | 15,775,727 |
| 2.5% 3/24/28 (b) | | 11,200,000 | 9,517,805 |
| Blackstone Private Credit Fund: | | | |
| 4.7% 3/24/25 | | 9,805,000 | 9,456,790 |
| 7.05% 9/29/25 (b) | | 4,993,000 | 5,010,858 |
| Brixmor Operating Partnership LP: | | | |
| 2.25% 4/1/28 | | 3,781,000 | 3,177,398 |
| 4.05% 7/1/30 | | 2,172,000 | 1,920,258 |
| 4.125% 5/15/29 | | 1,112,000 | 1,001,671 |
| Corebridge Financial, Inc.: | | | |
| 3.65% 4/5/27 (b) | | 1,496,000 | 1,395,838 |
| 3.85% 4/5/29 (b) | | 1,468,000 | 1,326,049 |
| 3.9% 4/5/32 (b) | | 1,747,000 | 1,528,645 |
| 4.35% 4/5/42 (b) | | 397,000 | 327,229 |
| 4.4% 4/5/52 (b) | | 1,175,000 | 936,661 |
| Equitable Holdings, Inc.: | | | |
| 4.35% 4/20/28 | | 6,107,000 | 5,800,743 |
| 5% 4/20/48 | | 2,979,000 | 2,632,674 |
| Jackson Financial, Inc.: | | | |
| 3.125% 11/23/31 | | 18,220,000 | 14,565,375 |
| 4% 11/23/51 | | 6,000,000 | 4,014,810 |
| 5.17% 6/8/27 | | 1,619,000 | 1,602,989 |
| 5.67% 6/8/32 | | 9,062,000 | 8,853,541 |
| Rexford Industrial Realty LP 2.15% 9/1/31 | | 4,635,000 | 3,585,842 |
| Voya Financial, Inc.: | | | |
| 4.7% 1/23/48 (c) | | 5,029,000 | 4,266,498 |
| 5.7% 7/15/43 | | 2,341,000 | 2,218,099 |
| | | | 101,607,361 |
| Insurance - 3.4% | | | |
| AIA Group Ltd.: | | | |
| 3.2% 9/16/40 (b) | | 1,743,000 | 1,311,682 |
| 3.375% 4/7/30 (b) | | 2,730,000 | 2,461,282 |
| 3.6% 4/9/29 (b) | | 3,500,000 | 3,228,282 |
| 3.9% 4/6/28 (b) | | 4,213,000 | 3,977,561 |
| American International Group, Inc. 5.75% 4/1/48 (c) | | 5,747,000 | 5,545,855 |
| AmFam Holdings, Inc. 2.805% 3/11/31 (b) | | 8,775,000 | 6,733,969 |
| Aon Corp. 6.25% 9/30/40 | | 228,000 | 236,581 |
| Assurant, Inc. 2.65% 1/15/32 | | 12,450,000 | 9,325,560 |
| Athene Holding Ltd.: | | | |
| 3.45% 5/15/52 | | 11,000,000 | 6,995,271 |
| 3.95% 5/25/51 | | 2,575,000 | 1,799,017 |
| 6.65% 2/1/33 | | 8,100,000 | 8,321,042 |
| Brown & Brown, Inc. 2.375% 3/15/31 | | 5,701,000 | 4,387,381 |
| Empower Finance 2020 LP 3.075% 9/17/51 (b) | | 5,656,000 | 3,666,226 |
| Fairfax Financial Holdings Ltd.: | | | |
| 3.375% 3/3/31 | | 5,515,000 | 4,521,078 |
| 5.625% 8/16/32 (b) | | 21,500,000 | 20,438,378 |
| Hartford Financial Services Group, Inc. 4.3% 4/15/43 | | 1,090,000 | 904,114 |
| Intact Financial Corp. 5.459% 9/22/32 (b) | | 11,832,000 | 11,624,561 |
| Liberty Mutual Group, Inc. 5.5% 6/15/52 (b) | | 9,450,000 | 8,855,073 |
| Massachusetts Mutual Life Insurance Co.: | | | |
| 3.2% 12/1/61 (b) | | 9,725,000 | 6,075,529 |
| 3.729% 10/15/70 (b) | | 2,604,000 | 1,788,252 |
| Pacific LifeCorp: | | | |
| 3.35% 9/15/50 (b) | | 11,300,000 | 7,954,196 |
| 5.125% 1/30/43 (b) | | 1,156,000 | 1,075,910 |
| Pricoa Global Funding I 5.625% 6/15/43 (c) | | 4,490,000 | 4,467,550 |
| Principal Financial Group, Inc. 3.7% 5/15/29 | | 1,265,000 | 1,175,261 |
| Prudential Financial, Inc.: | | | |
| 3.935% 12/7/49 | | 1,354,000 | 1,074,411 |
| 6% 9/1/52 (c) | | 6,884,000 | 6,640,741 |
| Reliance Standard Life Global Funding II 2.75% 5/7/25 (b) | | 8,978,000 | 8,401,155 |
| Unum Group: | | | |
| 4.125% 6/15/51 | | 8,470,000 | 6,069,757 |
| 5.75% 8/15/42 | | 3,366,000 | 3,152,747 |
| | | | 152,208,422 |
TOTAL FINANCIALS | | | 1,413,046,851 |
| HEALTH CARE - 6.0% | | | |
| Biotechnology - 0.8% | | | |
| AbbVie, Inc.: | | | |
| 3.2% 11/21/29 | | 5,000,000 | 4,422,271 |
| 4.05% 11/21/39 | | 5,000,000 | 4,217,361 |
| 4.55% 3/15/35 | | 4,916,000 | 4,571,905 |
| Amgen, Inc.: | | | |
| 4.663% 6/15/51 | | 6,000,000 | 5,184,123 |
| 5.25% 3/2/30 (e) | | 2,269,000 | 2,257,933 |
| 5.25% 3/2/33 (e) | | 2,561,000 | 2,543,157 |
| 5.65% 3/2/53 (e) | | 1,210,000 | 1,200,040 |
| 5.75% 3/2/63 (e) | | 2,205,000 | 2,174,577 |
| Regeneron Pharmaceuticals, Inc.: | | | |
| 1.75% 9/15/30 | | 5,900,000 | 4,593,477 |
| 2.8% 9/15/50 | | 4,000,000 | 2,509,055 |
| | | | 33,673,899 |
| Health Care Providers & Services - 3.4% | | | |
| Centene Corp.: | | | |
| 2.625% 8/1/31 | | 16,630,000 | 12,958,310 |
| 3% 10/15/30 | | 15,525,000 | 12,658,279 |
| 4.25% 12/15/27 | | 1,615,000 | 1,492,341 |
| 4.625% 12/15/29 | | 5,880,000 | 5,377,218 |
| Cigna Group: | | | |
| 3.4% 3/15/50 | | 7,000,000 | 4,909,584 |
| 3.4% 3/15/51 | | 7,000,000 | 4,909,849 |
| 4.125% 11/15/25 | | 838,000 | 814,925 |
| 4.375% 10/15/28 | | 1,336,000 | 1,282,833 |
| 4.8% 8/15/38 | | 4,331,000 | 3,989,131 |
| 4.9% 12/15/48 | | 831,000 | 747,400 |
| CVS Health Corp.: | | | |
| 4.78% 3/25/38 | | 3,477,000 | 3,158,638 |
| 5.125% 2/21/30 | | 22,720,000 | 22,309,318 |
| Elevance Health, Inc. 2.25% 5/15/30 | | 8,725,000 | 7,192,881 |
| HCA Holdings, Inc.: | | | |
| 3.375% 3/15/29 (b) | | 3,530,000 | 3,093,052 |
| 3.625% 3/15/32 (b) | | 12,535,000 | 10,596,320 |
| 4.625% 3/15/52 (b) | | 5,310,000 | 4,177,580 |
| 5.125% 6/15/39 | | 3,015,000 | 2,681,979 |
| 5.25% 6/15/49 | | 3,323,000 | 2,866,094 |
| Quest Diagnostics, Inc. 2.95% 6/30/30 | | 10,000,000 | 8,630,124 |
| Sabra Health Care LP: | | | |
| 3.2% 12/1/31 | | 9,732,000 | 7,230,639 |
| 3.9% 10/15/29 | | 1,261,000 | 1,048,793 |
| UnitedHealth Group, Inc.: | | | |
| 3.95% 10/15/42 | | 119,000 | 101,828 |
| 4.25% 3/15/43 | | 2,244,000 | 1,974,030 |
| 4.625% 7/15/35 | | 671,000 | 642,827 |
| 4.75% 7/15/45 | | 1,642,000 | 1,542,771 |
| Universal Health Services, Inc.: | | | |
| 2.65% 10/15/30 | | 15,083,000 | 12,283,156 |
| 2.65% 1/15/32 | | 15,293,000 | 11,873,957 |
| | | | 150,543,857 |
| Pharmaceuticals - 1.8% | | | |
| AstraZeneca PLC 6.45% 9/15/37 | | 4,965,000 | 5,611,954 |
| Bayer U.S. Finance II LLC: | | | |
| 3.375% 7/15/24 (b) | | 7,000,000 | 6,800,263 |
| 4.25% 12/15/25 (b) | | 13,334,000 | 12,896,583 |
| 4.375% 12/15/28 (b) | | 8,500,000 | 7,990,944 |
| 4.875% 6/25/48 (b) | | 8,545,000 | 7,415,344 |
| Elanco Animal Health, Inc.: | | | |
| 5.772% 8/28/23 | | 283,000 | 281,964 |
| 6.4% 8/28/28 (c) | | 11,422,000 | 10,906,525 |
| Mylan NV 4.55% 4/15/28 | | 8,085,000 | 7,537,369 |
| Perrigo Finance PLC 4.4% 6/15/30 | | 10,400,000 | 8,928,088 |
| Viatris, Inc.: | | | |
| 2.7% 6/22/30 | | 8,964,000 | 7,106,406 |
| 4% 6/22/50 | | 10,251,000 | 6,612,068 |
| | | | 82,087,508 |
TOTAL HEALTH CARE | | | 266,305,264 |
| INDUSTRIALS - 4.6% | | | |
| Aerospace & Defense - 1.7% | | | |
| BAE Systems PLC: | | | |
| 3% 9/15/50 (b) | | 6,954,000 | 4,608,138 |
| 3.4% 4/15/30 (b) | | 863,000 | 768,524 |
| Northrop Grumman Corp.: | | | |
| 2.93% 1/15/25 | | 50,000 | 47,866 |
| 4.03% 10/15/47 | | 5,388,000 | 4,455,246 |
| The Boeing Co.: | | | |
| 2.75% 2/1/26 | | 3,325,000 | 3,081,621 |
| 3.25% 2/1/28 | | 7,000,000 | 6,337,624 |
| 5.04% 5/1/27 | | 26,500,000 | 26,101,332 |
| 5.15% 5/1/30 | | 16,500,000 | 15,966,492 |
| 5.805% 5/1/50 | | 13,000,000 | 12,365,942 |
| | | | 73,732,785 |
| Airlines - 0.6% | | | |
| American Airlines 2019-1 Class B Pass Through Trust equipment trust certificate 3.85% 8/15/29 | | 2,228,770 | 2,002,453 |
| American Airlines, Inc. 3.75% 4/15/27 | | 2,977,370 | 2,787,178 |
| British Airways 2021-1 Class A Pass Through Trust equipment trust certificate 2.9% 9/15/36 (b) | | 2,249,473 | 1,851,542 |
| Southwest Airlines Co.: | | | |
| 5.125% 6/15/27 | | 7,250,000 | 7,146,018 |
| 5.25% 5/4/25 | | 12,600,000 | 12,547,828 |
| United Airlines 2019-2 Class B Pass Through Trust equipment trust certificate 3.5% 11/1/29 | | 1,697,852 | 1,520,896 |
| United Airlines, Inc. equipment trust certificate 4.6% 9/1/27 | | 1,443,968 | 1,380,101 |
| | | | 29,236,016 |
| Building Products - 0.4% | | | |
| Carlisle Companies, Inc. 2.75% 3/1/30 | | 10,000,000 | 8,356,318 |
| Carrier Global Corp. 2.7% 2/15/31 | | 10,200,000 | 8,420,515 |
| | | | 16,776,833 |
| Electrical Equipment - 0.1% | | | |
| Hubbell, Inc. 3.5% 2/15/28 | | 5,388,000 | 4,989,061 |
| Machinery - 0.1% | | | |
| Ingersoll-Rand Luxembourg Finance SA 4.65% 11/1/44 | | 504,000 | 431,785 |
| Westinghouse Air Brake Tech Co. 3.2% 6/15/25 | | 6,416,000 | 6,039,758 |
| | | | 6,471,543 |
| Professional Services - 0.0% | | | |
| Booz Allen Hamilton, Inc. 3.875% 9/1/28 (b) | | 100,000 | 88,774 |
| Road & Rail - 0.4% | | | |
| Burlington Northern Santa Fe LLC: | | | |
| 4.15% 4/1/45 | | 906,000 | 770,989 |
| 4.4% 3/15/42 | | 2,244,000 | 2,000,508 |
| Canadian Pacific Railway Co. 3.1% 12/2/51 | | 3,713,000 | 2,533,961 |
| CSX Corp.: | | | |
| 3.8% 4/15/50 | | 126,000 | 97,484 |
| 4.3% 3/1/48 | | 8,870,000 | 7,546,379 |
| Union Pacific Corp. 3.25% 2/5/50 | | 5,500,000 | 3,967,089 |
| | | | 16,916,410 |
| Trading Companies & Distributors - 0.7% | | | |
| Air Lease Corp.: | | | |
| 2.875% 1/15/26 | | 7,000,000 | 6,452,510 |
| 2.875% 1/15/32 | | 15,300,000 | 12,011,297 |
| 5.3% 2/1/28 | | 11,300,000 | 10,979,179 |
| | | | 29,442,986 |
| Transportation Infrastructure - 0.6% | | | |
| Avolon Holdings Funding Ltd.: | | | |
| 2.875% 2/15/25 (b) | | 24,460,000 | 22,750,422 |
| 4.25% 4/15/26 (b) | | 1,403,000 | 1,301,978 |
| 4.375% 5/1/26 (b) | | 1,008,000 | 937,727 |
| 5.5% 1/15/26 (b) | | 1,800,000 | 1,741,833 |
| | | | 26,731,960 |
TOTAL INDUSTRIALS | | | 204,386,368 |
| INFORMATION TECHNOLOGY - 3.6% | | | |
| Electronic Equipment & Components - 1.0% | | | |
| Dell International LLC/EMC Corp.: | | | |
| 3.375% 12/15/41 (b) | | 6,000,000 | 3,978,950 |
| 3.45% 12/15/51 (b) | | 8,000,000 | 4,889,446 |
| 5.3% 10/1/29 | | 10,000,000 | 9,662,038 |
| 5.85% 7/15/25 | | 485,000 | 487,940 |
| 6.02% 6/15/26 | | 3,386,000 | 3,427,682 |
| Vontier Corp.: | | | |
| 2.4% 4/1/28 | | 12,350,000 | 10,064,694 |
| 2.95% 4/1/31 | | 13,858,000 | 10,557,717 |
| | | | 43,068,467 |
| IT Services - 0.2% | | | |
| CDW LLC/CDW Finance Corp. 2.67% 12/1/26 | | 8,591,000 | 7,629,639 |
| Fiserv, Inc. 3.5% 7/1/29 | | 3,773,000 | 3,373,750 |
| | | | 11,003,389 |
| Semiconductors & Semiconductor Equipment - 1.4% | | | |
| Broadcom, Inc.: | | | |
| 1.95% 2/15/28 (b) | | 843,000 | 714,443 |
| 2.45% 2/15/31 (b) | | 7,200,000 | 5,705,207 |
| 2.6% 2/15/33 (b) | | 7,289,000 | 5,508,897 |
| 3.137% 11/15/35 (b) | | 11,000,000 | 8,108,953 |
| 3.5% 2/15/41 (b) | | 5,793,000 | 4,145,548 |
| 3.75% 2/15/51 (b) | | 2,719,000 | 1,895,209 |
| Marvell Technology, Inc. 2.45% 4/15/28 | | 8,000,000 | 6,843,559 |
| Microchip Technology, Inc.: | | | |
| 0.972% 2/15/24 | | 7,000,000 | 6,689,655 |
| 0.983% 9/1/24 | | 4,181,000 | 3,905,597 |
| Micron Technology, Inc.: | | | |
| 2.703% 4/15/32 | | 3,275,000 | 2,484,904 |
| 3.366% 11/1/41 | | 3,570,000 | 2,388,477 |
| 3.477% 11/1/51 | | 3,580,000 | 2,236,098 |
| 4.185% 2/15/27 | | 13,879,000 | 13,137,659 |
| | | | 63,764,206 |
| Software - 0.9% | | | |
| Oracle Corp.: | | | |
| 2.5% 4/1/25 | | 7,000,000 | 6,599,797 |
| 2.8% 4/1/27 | | 5,000,000 | 4,535,170 |
| 2.875% 3/25/31 | | 12,000,000 | 9,948,805 |
| 3.95% 3/25/51 | | 8,510,000 | 6,112,589 |
| 4.375% 5/15/55 | | 3,725,000 | 2,825,579 |
| 5.375% 7/15/40 | | 216,000 | 197,853 |
| Roper Technologies, Inc.: | | | |
| 1.75% 2/15/31 | | 6,000,000 | 4,627,144 |
| 2.95% 9/15/29 | | 4,544,000 | 3,950,458 |
| | | | 38,797,395 |
| Technology Hardware, Storage & Peripherals - 0.1% | | | |
| Apple, Inc. 3.85% 8/4/46 | | 4,529,000 | 3,828,624 |
TOTAL INFORMATION TECHNOLOGY | | | 160,462,081 |
| MATERIALS - 1.3% | | | |
| Chemicals - 1.0% | | | |
| Celanese U.S. Holdings LLC: | | | |
| 6.165% 7/15/27 | | 19,000,000 | 18,859,180 |
| 6.33% 7/15/29 | | 6,000,000 | 5,885,447 |
| International Flavors & Fragrances, Inc.: | | | |
| 1.832% 10/15/27 (b) | | 8,450,000 | 7,074,483 |
| 2.3% 11/1/30 (b) | | 8,500,000 | 6,562,905 |
| LYB International Finance III LLC 2.25% 10/1/30 | | 5,205,000 | 4,160,760 |
| The Dow Chemical Co. 4.55% 11/30/25 | | 136,000 | 133,437 |
| | | | 42,676,212 |
| Containers & Packaging - 0.1% | | | |
| Avery Dennison Corp. 4.875% 12/6/28 | | 5,802,000 | 5,674,389 |
| Metals & Mining - 0.2% | | | |
| Anglo American Capital PLC 3.875% 3/16/29 (b) | | 10,000,000 | 9,050,000 |
TOTAL MATERIALS | | | 57,400,601 |
| REAL ESTATE - 6.0% | | | |
| Equity Real Estate Investment Trusts (REITs) - 5.6% | | | |
| Agree LP 4.8% 10/1/32 | | 10,929,000 | 10,221,914 |
| Alexandria Real Estate Equities, Inc.: | | | |
| 1.875% 2/1/33 | | 16,250,000 | 12,044,604 |
| 4.7% 7/1/30 | | 1,381,000 | 1,328,711 |
| American Homes 4 Rent LP: | | | |
| 2.375% 7/15/31 | | 340,000 | 267,305 |
| 3.375% 7/15/51 | | 526,000 | 341,896 |
| 3.625% 4/15/32 | | 1,607,000 | 1,357,655 |
| 4.3% 4/15/52 | | 1,113,000 | 852,988 |
| American Tower Corp.: | | | |
| 2.1% 6/15/30 | | 5,700,000 | 4,512,336 |
| 2.4% 3/15/25 | | 8,080,000 | 7,585,276 |
| Camden Property Trust 3.15% 7/1/29 | | 6,286,000 | 5,579,331 |
| Corporate Office Properties LP: | | | |
| 2% 1/15/29 | | 7,677,000 | 5,909,632 |
| 2.25% 3/15/26 | | 831,000 | 741,087 |
| 2.75% 4/15/31 | | 4,027,000 | 3,032,010 |
| 2.9% 12/1/33 | | 13,205,000 | 9,320,317 |
| Crown Castle International Corp. 3.3% 7/1/30 | | 14,000,000 | 12,193,108 |
| Hudson Pacific Properties LP: | | | |
| 3.95% 11/1/27 | | 4,132,000 | 3,571,195 |
| 5.95% 2/15/28 | | 28,823,000 | 26,794,261 |
| Invitation Homes Operating Partnership LP: | | | |
| 2% 8/15/31 | | 4,645,000 | 3,484,204 |
| 4.15% 4/15/32 | | 2,349,000 | 2,066,342 |
| Kite Realty Group Trust: | | | |
| 4% 3/15/25 | | 225,000 | 213,199 |
| 4.75% 9/15/30 | | 4,559,000 | 4,080,573 |
| LXP Industrial Trust (REIT) 4.4% 6/15/24 | | 225,000 | 217,970 |
| MPT Operating Partnership LP/MPT Finance Corp. 3.5% 3/15/31 | | 19,000,000 | 13,023,740 |
| Omega Healthcare Investors, Inc.: | | | |
| 3.25% 4/15/33 | | 3,096,000 | 2,213,035 |
| 3.375% 2/1/31 | | 11,659,000 | 9,187,485 |
| 4.375% 8/1/23 | | 1,387,000 | 1,378,892 |
| 4.75% 1/15/28 | | 5,000,000 | 4,689,683 |
| Piedmont Operating Partnership LP 2.75% 4/1/32 | | 670,000 | 472,299 |
| Realty Income Corp. 2.85% 12/15/32 | | 481,000 | 395,077 |
| Simon Property Group LP 2.45% 9/13/29 | | 7,542,000 | 6,316,911 |
| Spirit Realty LP 2.1% 3/15/28 | | 4,920,000 | 4,075,890 |
| Store Capital Corp.: | | | |
| 2.7% 12/1/31 | | 13,000,000 | 9,453,113 |
| 2.75% 11/18/30 | | 979,000 | 739,413 |
| Sun Communities Operating LP: | | | |
| 2.3% 11/1/28 | | 764,000 | 645,920 |
| 2.7% 7/15/31 | | 1,942,000 | 1,549,295 |
| 4.2% 4/15/32 | | 15,000,000 | 13,306,383 |
| 5.7% 1/15/33 | | 12,406,000 | 12,205,020 |
| UDR, Inc. 2.1% 8/1/32 | | 7,194,000 | 5,419,310 |
| Ventas Realty LP: | | | |
| 2.5% 9/1/31 | | 5,636,000 | 4,438,731 |
| 3% 1/15/30 | | 8,140,000 | 6,918,937 |
| 4.4% 1/15/29 | | 10,000,000 | 9,304,597 |
| VICI Properties LP: | | | |
| 4.75% 2/15/28 | | 3,225,000 | 3,042,239 |
| 4.95% 2/15/30 | | 9,650,000 | 9,009,315 |
| 5.125% 5/15/32 | | 820,000 | 760,837 |
| Vornado Realty LP: | | | |
| 2.15% 6/1/26 | | 837,000 | 717,138 |
| 3.4% 6/1/31 | | 3,027,000 | 2,302,033 |
| WP Carey, Inc.: | | | |
| 2.4% 2/1/31 | | 5,638,000 | 4,545,279 |
| 4% 2/1/25 | | 7,950,000 | 7,755,240 |
| | | | 249,581,726 |
| Real Estate Management & Development - 0.4% | | | |
| Brandywine Operating Partnership LP: | | | |
| 4.1% 10/1/24 | | 2,694,000 | 2,590,828 |
| 4.55% 10/1/29 | | 1,809,000 | 1,499,316 |
| 7.55% 3/15/28 | | 4,241,000 | 4,157,996 |
| Tanger Properties LP 2.75% 9/1/31 | | 9,752,000 | 7,233,472 |
| | | | 15,481,612 |
TOTAL REAL ESTATE | | | 265,063,338 |
| UTILITIES - 8.4% | | | |
| Electric Utilities - 4.7% | | | |
| Alabama Power Co. 3.05% 3/15/32 | | 3,060,000 | 2,605,922 |
| American Transmission Systems, Inc. 2.65% 1/15/32 (b) | | 9,388,000 | 7,693,058 |
| Cleco Corporate Holdings LLC: | | | |
| 3.375% 9/15/29 | | 11,165,000 | 9,426,274 |
| 3.743% 5/1/26 | | 16,357,000 | 15,349,420 |
| Cleveland Electric Illuminating Co.: | | | |
| 3.5% 4/1/28 (b) | | 3,597,000 | 3,290,045 |
| 5.95% 12/15/36 | | 3,300,000 | 3,298,621 |
| Duke Energy Corp.: | | | |
| 2.45% 6/1/30 | | 1,269,000 | 1,042,278 |
| 2.55% 6/15/31 | | 7,000,000 | 5,637,795 |
| 4.5% 8/15/32 | | 20,130,000 | 18,629,804 |
| 5% 8/15/52 | | 20,130,000 | 17,891,205 |
| Duke Energy Industries, Inc. 4.9% 7/15/43 | | 2,694,000 | 2,490,340 |
| Duquesne Light Holdings, Inc.: | | | |
| 2.532% 10/1/30 (b) | | 1,167,000 | 927,738 |
| 2.775% 1/7/32 (b) | | 4,292,000 | 3,375,642 |
| 3.616% 8/1/27 (b) | | 4,394,000 | 3,938,558 |
| Edison International 3.55% 11/15/24 | | 4,250,000 | 4,101,133 |
| Exelon Corp.: | | | |
| 3.35% 3/15/32 | | 20,822,000 | 17,778,696 |
| 4.05% 4/15/30 | | 7,586,000 | 6,957,423 |
| 4.1% 3/15/52 | | 609,000 | 483,796 |
| FirstEnergy Corp.: | | | |
| 2.05% 3/1/25 | | 2,196,000 | 2,048,537 |
| 2.25% 9/1/30 | | 9,244,000 | 7,372,090 |
| 2.65% 3/1/30 | | 4,770,000 | 3,955,570 |
| 7.375% 11/15/31 | | 7,300,000 | 8,186,950 |
| IPALCO Enterprises, Inc.: | | | |
| 3.7% 9/1/24 | | 430,000 | 415,325 |
| 4.25% 5/1/30 | | 14,400,000 | 13,048,564 |
| Southern Co.: | | | |
| 3.7% 4/30/30 | | 14,820,000 | 13,347,517 |
| 4.4% 7/1/46 | | 13,000,000 | 10,698,343 |
| 5.113% 8/1/27 (f) | | 18,500,000 | 18,268,251 |
| Tampa Electric Co. 6.55% 5/15/36 | | 449,000 | 475,724 |
| Xcel Energy, Inc.: | | | |
| 3.5% 12/1/49 | | 7,338,000 | 5,331,602 |
| 4.8% 9/15/41 | | 499,000 | 446,814 |
| | | | 208,513,035 |
| Gas Utilities - 0.2% | | | |
| Boston Gas Co. 4.487% 2/15/42 (b) | | 1,796,000 | 1,496,915 |
| ONE Gas, Inc. 2% 5/15/30 | | 5,208,000 | 4,251,728 |
| Southern Co. Gas Capital Corp. 3.15% 9/30/51 | | 4,891,000 | 3,280,888 |
| | | | 9,029,531 |
| Independent Power and Renewable Electricity Producers - 1.4% | | | |
| Atlantica Sustainable Infrastructure PLC 4.125% 6/15/28 (b) | | 10,000,000 | 8,825,827 |
| Emera U.S. Finance LP: | | | |
| 2.639% 6/15/31 | | 12,675,000 | 9,964,965 |
| 3.55% 6/15/26 | | 14,650,000 | 13,752,534 |
| 4.75% 6/15/46 | | 8,751,000 | 6,876,048 |
| The AES Corp.: | | | |
| 1.375% 1/15/26 | | 4,810,000 | 4,256,677 |
| 2.45% 1/15/31 | | 13,083,000 | 10,392,287 |
| 3.3% 7/15/25 (b) | | 3,929,000 | 3,687,147 |
| 3.95% 7/15/30 (b) | | 5,583,000 | 4,887,917 |
| | | | 62,643,402 |
| Multi-Utilities - 2.1% | | | |
| Berkshire Hathaway Energy Co. 2.85% 5/15/51 | | 6,500,000 | 4,221,785 |
| Consolidated Edison Co. of New York, Inc. 5.2% 3/1/33 | | 13,002,000 | 13,003,383 |
| Dominion Energy, Inc. 3.071% 8/15/24 (c) | | 8,845,000 | 8,529,524 |
| NiSource, Inc.: | | | |
| 0.95% 8/15/25 | | 2,663,000 | 2,400,923 |
| 1.7% 2/15/31 | | 5,000,000 | 3,811,260 |
| 2.95% 9/1/29 | | 1,798,000 | 1,551,840 |
| 3.49% 5/15/27 | | 3,591,000 | 3,354,607 |
| 3.6% 5/1/30 | | 8,164,000 | 7,287,734 |
| 4.375% 5/15/47 | | 5,000,000 | 4,179,101 |
| 4.8% 2/15/44 | | 8,000,000 | 7,092,539 |
| 5% 6/15/52 | | 3,500,000 | 3,197,553 |
| 5.25% 2/15/43 | | 212,000 | 201,706 |
| 5.95% 6/15/41 | | 1,024,000 | 1,030,914 |
| Puget Energy, Inc.: | | | |
| 2.379% 6/15/28 | | 10,580,000 | 9,006,171 |
| 3.65% 5/15/25 | | 2,636,000 | 2,493,914 |
| 4.1% 6/15/30 | | 2,781,000 | 2,496,931 |
| 4.224% 3/15/32 | | 17,115,000 | 15,132,997 |
| WEC Energy Group, Inc.: | | | |
| 3 month U.S. LIBOR + 2.610% 6.9761% 5/15/67 (c)(d) | | 105,000 | 89,693 |
| 2.2% 12/15/28 | | 5,000,000 | 4,242,486 |
| | | | 93,325,061 |
TOTAL UTILITIES | | | 373,511,029 |
| TOTAL NONCONVERTIBLE BONDS (Cost $4,434,302,231) | | | 3,869,119,323 |
| | | | |
| U.S. Treasury Obligations - 6.9% |
| | | Principal Amount (a) | Value ($) |
| U.S. Treasury Bonds: | | | |
| 1.75% 8/15/41 | | 21,300,000 | 14,760,234 |
| 1.875% 2/15/41 | | 20,000,000 | 14,294,531 |
| 2% 11/15/41 | | 31,000,000 | 22,405,977 |
| 2.25% 2/15/52 | | 4,300,000 | 3,065,934 |
| 2.875% 5/15/52 | | 26,900,000 | 22,027,527 |
| 3.625% 2/15/53 | | 213,500,000 | 203,258,668 |
| U.S. Treasury Notes 3.5% 2/15/33 | | 28,000,000 | 27,076,875 |
| TOTAL U.S. TREASURY OBLIGATIONS (Cost $333,674,520) | | | 306,889,746 |
| | | | |
| Asset-Backed Securities - 0.0% |
| | | Principal Amount (a) | Value ($) |
Dominos Pizza Master Issuer LLC Series 2018-1A Class A2I, 4.116% 7/25/48 (b) (Cost $2,200,335) | | 2,200,335 | 2,094,510 |
| | | | |
| Municipal Securities - 0.1% |
| | | Principal Amount (a) | Value ($) |
| American Muni. Pwr., Inc. Rev. (Combined Hydroelectric Proj.) Series 2010 B, 8.084% 2/15/50 | | 1,395,000 | 1,895,201 |
| California Gen. Oblig. Series 2010, 7.625% 3/1/40 | | 305,000 | 386,839 |
| TOTAL MUNICIPAL SECURITIES (Cost $2,420,157) | | | 2,282,040 |
| | | | |
| Foreign Government and Government Agency Obligations - 0.1% |
| | | Principal Amount (a) | Value ($) |
United Mexican States 4.5% 4/22/29 (Cost $5,564,696) | | 5,000,000 | 4,745,000 |
| | | | |
| Bank Notes - 0.1% |
| | | Principal Amount (a) | Value ($) |
Regions Bank 6.45% 6/26/37 (Cost $2,725,762) | | 2,611,000 | 2,719,581 |
| | | | |
| Preferred Securities - 0.3% |
| | | Principal Amount (a) | Value ($) |
| ENERGY - 0.1% | | | |
| Oil, Gas & Consumable Fuels - 0.1% | | | |
| Enbridge, Inc. 5.75% 7/15/80 (c) | | 5,706,000 | 5,392,272 |
| FINANCIALS - 0.2% | | | |
| Capital Markets - 0.2% | | | |
| UBS Group AG: | | | |
| 4.375% (b)(c)(g) | | 3,595,000 | 2,832,081 |
| 4.875% (b)(c)(g) | | 7,660,000 | 6,726,665 |
| | | | 9,558,746 |
| TOTAL PREFERRED SECURITIES (Cost $16,961,000) | | | 14,951,018 |
| | | | |
| Money Market Funds - 4.7% |
| | | Shares | Value ($) |
Fidelity Cash Central Fund 4.63% (h) (Cost $207,319,928) | | 207,279,744 | 207,321,200 |
| | | | |
| TOTAL INVESTMENT IN SECURITIES - 99.5% (Cost $5,005,168,629) | 4,410,122,418 |
NET OTHER ASSETS (LIABILITIES) - 0.5% | 23,252,261 |
| NET ASSETS - 100.0% | 4,433,374,679 |
| | |
Legend
| (a) | Amount is stated in United States dollars unless otherwise noted. |
| (b) | Security exempt from registration under Rule 144A of the Securities Act of 1933. These securities may be resold in transactions exempt from registration, normally to qualified institutional buyers. At the end of the period, the value of these securities amounted to $800,277,248 or 18.1% of net assets. |
| (c) | Coupon rates for floating and adjustable rate securities reflect the rates in effect at period end. |
| (d) | Coupon is indexed to a floating interest rate which may be multiplied by a specified factor and/or subject to caps or floors. |
| (e) | Security or a portion of the security purchased on a delayed delivery or when-issued basis. |
| (f) | Security initially issued at one coupon which converts to a higher coupon at a specified date. The rate shown is the rate at period end. |
| (g) | Security is perpetual in nature with no stated maturity date. |
| (h) | Affiliated fund that is generally available only to investment companies and other accounts managed by Fidelity Investments. The rate quoted is the annualized seven-day yield of the fund at period end. A complete unaudited listing of the fund's holdings as of its most recent quarter end is available upon request. In addition, each Fidelity Central Fund's financial statements are available on the SEC's website or upon request. |
Affiliated Central Funds
Fiscal year to date information regarding the Fund's investments in Fidelity Central Funds, including the ownership percentage, is presented below.
| Affiliate | Value, beginning of period ($) | Purchases ($) | Sales Proceeds ($) | Dividend Income ($) | Realized Gain (loss) ($) | Change in Unrealized appreciation (depreciation) ($) | Value, end of period ($) | % ownership, end of period |
| Fidelity Cash Central Fund 4.63% | 287,414,556 | 448,205,136 | 528,298,492 | 4,437,521 | - | - | 207,321,200 | 0.5% |
| Fidelity Securities Lending Cash Central Fund 4.63% | - | 339,546,478 | 339,546,478 | 10,789 | - | - | - | 0.0% |
| Total | 287,414,556 | 787,751,614 | 867,844,970 | 4,448,310 | - | - | 207,321,200 | |
| | | | | | | | | |
Amounts in the dividend income column in the above table include any capital gain distributions from underlying funds, which are presented in the corresponding line item in the Statement of Operations, if applicable.
Amount for Fidelity Securities Lending Cash Central Fund represents the income earned on investing cash collateral, less rebates paid to borrowers and any lending agent fees associated with the loan, plus any premium payments received for lending certain types of securities.
Amounts included in the purchases and sales proceeds columns may include in-kind transactions, if applicable.
Investment Valuation
The following is a summary of the inputs used, as of February 28, 2023, involving the Fund's assets and liabilities carried at fair value. The inputs or methodology used for valuing securities may not be an indication of the risk associated with investing in those securities. For more information on valuation inputs, and their aggregation into the levels used below, please refer to the Investment Valuation section in the accompanying Notes to Financial Statements.
| Valuation Inputs at Reporting Date: |
| Description | Total ($) | Level 1 ($) | Level 2 ($) | Level 3 ($) |
Investments in Securities: | | | | |
|
| Corporate Bonds | 3,869,119,323 | - | 3,869,119,323 | - |
|
| U.S. Government and Government Agency Obligations | 306,889,746 | - | 306,889,746 | - |
|
| Asset-Backed Securities | 2,094,510 | - | 2,094,510 | - |
|
| Municipal Securities | 2,282,040 | - | 2,282,040 | - |
|
| Foreign Government and Government Agency Obligations | 4,745,000 | - | 4,745,000 | - |
|
| Bank Notes | 2,719,581 | - | 2,719,581 | - |
|
| Preferred Securities | 14,951,018 | - | 14,951,018 | - |
|
| Money Market Funds | 207,321,200 | 207,321,200 | - | - |
| Total Investments in Securities: | 4,410,122,418 | 207,321,200 | 4,202,801,218 | - |
| Statement of Assets and Liabilities |
| | | | February 28, 2023 (Unaudited) |
| | | | | |
| Assets | | | | |
| Investment in securities, at value - See accompanying schedule: | | | | |
Unaffiliated issuers (cost $4,797,848,701) | $ | 4,202,801,218 | | |
Fidelity Central Funds (cost $207,319,928) | | 207,321,200 | | |
| | | | | |
| | | | | |
| Total Investment in Securities (cost $5,005,168,629) | | | $ | 4,410,122,418 |
| Receivable for fund shares sold | | | | 1,065,092 |
| Interest receivable | | | | 46,568,713 |
| Distributions receivable from Fidelity Central Funds | | | | 818,425 |
| Receivable from investment adviser for expense reductions | | | | 198,261 |
Total assets | | | | 4,458,772,909 |
| Liabilities | | | | |
| Payable for investments purchased | | | | |
Regular delivery | $ | 14,231,250 | | |
Delayed delivery | | 8,209,487 | | |
| Payable for fund shares redeemed | | 1,034,253 | | |
| Distributions payable | | 345,553 | | |
| Accrued management fee | | 1,312,927 | | |
| Distribution and service plan fees payable | | 21,693 | | |
| Other affiliated payables | | 243,067 | | |
| Total Liabilities | | | | 25,398,230 |
| Net Assets | | | $ | 4,433,374,679 |
| Net Assets consist of: | | | | |
| Paid in capital | | | $ | 5,084,244,747 |
| Total accumulated earnings (loss) | | | | (650,870,068) |
| Net Assets | | | $ | 4,433,374,679 |
| | | | | |
| Net Asset Value and Maximum Offering Price | | | | |
| Class A : | | | | |
Net Asset Value and redemption price per share ($57,883,037 ÷ 5,706,281 shares) (a) | | | $ | 10.14 |
| Maximum offering price per share (100/96.00 of $10.14) | | | $ | 10.56 |
| Class M : | | | | |
Net Asset Value and redemption price per share ($8,256,804 ÷ 813,929 shares) (a) | | | $ | 10.14 |
| Maximum offering price per share (100/96.00 of $10.14) | | | $ | 10.56 |
| Class C : | | | | |
Net Asset Value and offering price per share ($9,068,185 ÷ 894,104 shares) (a) | | | $ | 10.14 |
| Corporate Bond : | | | | |
Net Asset Value , offering price and redemption price per share ($880,895,344 ÷ 86,844,029 shares) | | | $ | 10.14 |
| Class I : | | | | |
Net Asset Value , offering price and redemption price per share ($93,083,537 ÷ 9,176,350 shares) | | | $ | 10.14 |
| Class Z : | | | | |
Net Asset Value , offering price and redemption price per share ($3,384,187,772 ÷ 333,726,815 shares) | | | $ | 10.14 |
(a)Redemption price per share is equal to net asset value less any applicable contingent deferred sales charge. |
| Statement of Operations |
| | | | Six months ended February 28, 2023 (Unaudited) |
| Investment Income | | | | |
| Dividends | | | $ | 429,401 |
| Interest | | | | 85,699,708 |
| Income from Fidelity Central Funds (including $10,789 from security lending) | | | | 4,448,310 |
| Total Income | | | | 90,577,419 |
| Expenses | | | | |
| Management fee | $ | 7,457,057 | | |
| Transfer agent fees | | 1,396,436 | | |
| Distribution and service plan fees | | 126,828 | | |
| Independent trustees' fees and expenses | | 8,000 | | |
| Total expenses before reductions | | 8,988,321 | | |
| Expense reductions | | (687,952) | | |
| Total expenses after reductions | | | | 8,300,369 |
| Net Investment income (loss) | | | | 82,277,050 |
| Realized and Unrealized Gain (Loss) | | | | |
| Net realized gain (loss) on: | | | | |
| Investment Securities: | | | | |
| Unaffiliated issuers | | (34,702,555) | | |
| Total net realized gain (loss) | | | | (34,702,555) |
| Change in net unrealized appreciation (depreciation) on investment securities | | | | (79,417,165) |
| Net gain (loss) | | | | (114,119,720) |
| Net increase (decrease) in net assets resulting from operations | | | $ | (31,842,670) |
| Statement of Changes in Net Assets |
| |
| | Six months ended February 28, 2023 (Unaudited) | | Year ended August 31, 2022 |
| Increase (Decrease) in Net Assets | | | | |
| Operations | | | | |
| Net investment income (loss) | $ | 82,277,050 | $ | 104,575,548 |
| Net realized gain (loss) | | (34,702,555) | | (18,146,874) |
| Change in net unrealized appreciation (depreciation) | | (79,417,165) | | (712,132,109) |
| Net increase (decrease) in net assets resulting from operations | | (31,842,670) | | (625,703,435) |
| Distributions to shareholders | | (79,653,458) | | (128,697,407) |
| Share transactions - net increase (decrease) | | 312,606,913 | | 1,520,463,185 |
| Total increase (decrease) in net assets | | 201,110,785 | | 766,062,343 |
| | | | | |
| Net Assets | | | | |
| Beginning of period | | 4,232,263,894 | | 3,466,201,551 |
| End of period | $ | 4,433,374,679 | $ | 4,232,263,894 |
| | | | | |
| | | | | |
Financial Highlights
| Fidelity Advisor® Corporate Bond Fund Class A |
| |
| | Six months ended (Unaudited) February 28, 2023 | | Years ended August 31, 2022 | | 2021 | | 2020 | | 2019 | | 2018 |
Selected Per-Share Data | | | | | | | | | | | | |
| Net asset value, beginning of period | $ | 10.41 | $ | 12.76 | $ | 12.86 | $ | 12.24 | $ | 11.22 | $ | 11.68 |
| Income from Investment Operations | | | | | | | | | | | | |
Net investment income (loss) A,B | | .176 | | .287 | | .277 | | .311 | | .376 | | .352 |
| Net realized and unrealized gain (loss) | | (.276) | | (2.270) | | .004 | | .624 | | 1.018 | | (.465) |
| Total from investment operations | | (.100) | | (1.983) | | .281 | | .935 | | 1.394 | | (.113) |
| Distributions from net investment income | | (.170) | | (.280) | | (.274) | | (.315) | | (.374) | | (.347) |
| Distributions from net realized gain | | - | | (.087) | | (.107) | | - | | - | | - |
| Total distributions | | (.170) | | (.367) | | (.381) | | (.315) | | (.374) | | (.347) |
| Net asset value, end of period | $ | 10.14 | $ | 10.41 | $ | 12.76 | $ | 12.86 | $ | 12.24 | $ | 11.22 |
Total Return C,D,E | | (.94)% | | (15.81)% | | 2.24% | | 7.78% | | 12.72% | | (.97)% |
Ratios to Average Net Assets B,F,G | | | | | | | | | | | | |
| Expenses before reductions | | .78% H | | .77% | | .77% | | .77% | | .79% | | .79% |
| Expenses net of fee waivers, if any | | .78% H | | .77% | | .77% | | .77% | | .79% | | .79% |
| Expenses net of all reductions | | .78% H | | .77% | | .77% | | .77% | | .79% | | .79% |
| Net investment income (loss) | | 3.51% H | | 2.47% | | 2.19% | | 2.53% | | 3.31% | | 3.09% |
| Supplemental Data | | | | | | | | | | | | |
| Net assets, end of period (000 omitted) | $ | 57,883 | $ | 59,296 | $ | 81,746 | $ | 74,657 | $ | 48,410 | $ | 37,046 |
Portfolio turnover rate I | | 26% H | | 26% | | 46% | | 31% J | | 28% | | 47% |
A Calculated based on average shares outstanding during the period.
B Net investment income (loss) is affected by the timing of the declaration of dividends by any underlying mutual funds or exchange-traded funds (ETFs). Net investment income (loss) of any mutual funds or ETFs is not included in the Fund's net investment income (loss) ratio.
C Total returns for periods of less than one year are not annualized.
D Total returns would have been lower if certain expenses had not been reduced during the applicable periods shown.
E Total returns do not include the effect of the sales charges.
F Fees and expenses of any underlying mutual funds or exchange-traded funds (ETFs) are not included in the Fund's expense ratio. The Fund indirectly bears its proportionate share of these expenses. For additional expense information related to investments in Fidelity Central Funds, please refer to the "Investments in Fidelity Central Funds" note found in the Notes to Financial Statements section of the most recent Annual or Semi-Annual report.
G Expense ratios reflect operating expenses of the class. Expenses before reductions do not reflect amounts reimbursed, waived, or reduced through arrangements with the investment adviser, brokerage services, or other offset arrangements, if applicable, and do not represent the amount paid by the class during periods when reimbursements, waivers or reductions occur.
H Annualized.
I Amount does not include the portfolio activity of any underlying mutual funds or exchange-traded funds (ETFs).
J Portfolio turnover rate excludes securities received or delivered in-kind.
| Fidelity Advisor® Corporate Bond Fund Class M |
| |
| | Six months ended (Unaudited) February 28, 2023 | | Years ended August 31, 2022 | | 2021 | | 2020 | | 2019 | | 2018 |
Selected Per-Share Data | | | | | | | | | | | | |
| Net asset value, beginning of period | $ | 10.41 | $ | 12.76 | $ | 12.86 | $ | 12.24 | $ | 11.22 | $ | 11.68 |
| Income from Investment Operations | | | | | | | | | | | | |
Net investment income (loss) A,B | | .173 | | .282 | | .274 | | .304 | | .368 | | .343 |
| Net realized and unrealized gain (loss) | | (.276) | | (2.270) | | .004 | | .624 | | 1.017 | | (.465) |
| Total from investment operations | | (.103) | | (1.988) | | .278 | | .928 | | 1.385 | | (.122) |
| Distributions from net investment income | | (.167) | | (.275) | | (.271) | | (.308) | | (.365) | | (.338) |
| Distributions from net realized gain | | - | | (.087) | | (.107) | | - | | - | | - |
| Total distributions | | (.167) | | (.362) | | (.378) | | (.308) | | (.365) | | (.338) |
| Net asset value, end of period | $ | 10.14 | $ | 10.41 | $ | 12.76 | $ | 12.86 | $ | 12.24 | $ | 11.22 |
Total Return C,D,E | | (.97)% | | (15.85)% | | 2.21% | | 7.72% | | 12.64% | | (1.05)% |
Ratios to Average Net Assets B,F,G | | | | | | | | | | | | |
| Expenses before reductions | | .84% H | | .81% | | .79% | | .82% | | .87% | | .87% |
| Expenses net of fee waivers, if any | | .84% H | | .81% | | .79% | | .82% | | .87% | | .87% |
| Expenses net of all reductions | | .84% H | | .81% | | .79% | | .82% | | .87% | | .87% |
| Net investment income (loss) | | 3.45% H | | 2.42% | | 2.16% | | 2.47% | | 3.24% | | 3.00% |
| Supplemental Data | | | | | | | | | | | | |
| Net assets, end of period (000 omitted) | $ | 8,257 | $ | 8,439 | $ | 12,127 | $ | 11,858 | $ | 9,093 | $ | 7,819 |
Portfolio turnover rate I | | 26% H | | 26% | | 46% | | 31% J | | 28% | | 47% |
A Calculated based on average shares outstanding during the period.
B Net investment income (loss) is affected by the timing of the declaration of dividends by any underlying mutual funds or exchange-traded funds (ETFs). Net investment income (loss) of any mutual funds or ETFs is not included in the Fund's net investment income (loss) ratio.
C Total returns for periods of less than one year are not annualized.
D Total returns would have been lower if certain expenses had not been reduced during the applicable periods shown.
E Total returns do not include the effect of the sales charges.
F Fees and expenses of any underlying mutual funds or exchange-traded funds (ETFs) are not included in the Fund's expense ratio. The Fund indirectly bears its proportionate share of these expenses. For additional expense information related to investments in Fidelity Central Funds, please refer to the "Investments in Fidelity Central Funds" note found in the Notes to Financial Statements section of the most recent Annual or Semi-Annual report.
G Expense ratios reflect operating expenses of the class. Expenses before reductions do not reflect amounts reimbursed, waived, or reduced through arrangements with the investment adviser, brokerage services, or other offset arrangements, if applicable, and do not represent the amount paid by the class during periods when reimbursements, waivers or reductions occur.
H Annualized.
I Amount does not include the portfolio activity of any underlying mutual funds or exchange-traded funds (ETFs).
J Portfolio turnover rate excludes securities received or delivered in-kind.
| Fidelity Advisor® Corporate Bond Fund Class C |
| |
| | Six months ended (Unaudited) February 28, 2023 | | Years ended August 31, 2022 | | 2021 | | 2020 | | 2019 | | 2018 |
Selected Per-Share Data | | | | | | | | | | | | |
| Net asset value, beginning of period | $ | 10.41 | $ | 12.76 | $ | 12.86 | $ | 12.23 | $ | 11.22 | $ | 11.68 |
| Income from Investment Operations | | | | | | | | | | | | |
Net investment income (loss) A,B | | .137 | | .199 | | .180 | | .215 | | .292 | | .266 |
| Net realized and unrealized gain (loss) | | (.276) | | (2.271) | | .003 | | .634 | | 1.005 | | (.465) |
| Total from investment operations | | (.139) | | (2.072) | | .183 | | .849 | | 1.297 | | (.199) |
| Distributions from net investment income | | (.131) | | (.191) | | (.176) | | (.219) | | (.287) | | (.261) |
| Distributions from net realized gain | | - | | (.087) | | (.107) | | - | | - | | - |
| Total distributions | | (.131) | | (.278) | | (.283) | | (.219) | | (.287) | | (.261) |
| Net asset value, end of period | $ | 10.14 | $ | 10.41 | $ | 12.76 | $ | 12.86 | $ | 12.23 | $ | 11.22 |
Total Return C,D,E | | (1.32)% | | (16.46)% | | 1.46% | | 7.04% | | 11.78% | | (1.72)% |
Ratios to Average Net Assets B,F,G | | | | | | | | | | | | |
| Expenses before reductions | | 1.56% H | | 1.54% | | 1.54% | | 1.54% | | 1.55% | | 1.55% |
| Expenses net of fee waivers, if any | | 1.56% H | | 1.54% | | 1.54% | | 1.54% | | 1.55% | | 1.55% |
| Expenses net of all reductions | | 1.56% H | | 1.54% | | 1.54% | | 1.54% | | 1.55% | | 1.55% |
| Net investment income (loss) | | 2.73% H | | 1.70% | | 1.42% | | 1.75% | | 2.56% | | 2.33% |
| Supplemental Data | | | | | | | | | | | | |
| Net assets, end of period (000 omitted) | $ | 9,068 | $ | 9,756 | $ | 17,010 | $ | 17,956 | $ | 14,009 | $ | 14,836 |
Portfolio turnover rate I | | 26% H | | 26% | | 46% | | 31% J | | 28% | | 47% |
A Calculated based on average shares outstanding during the period.
B Net investment income (loss) is affected by the timing of the declaration of dividends by any underlying mutual funds or exchange-traded funds (ETFs). Net investment income (loss) of any mutual funds or ETFs is not included in the Fund's net investment income (loss) ratio.
C Total returns for periods of less than one year are not annualized.
D Total returns would have been lower if certain expenses had not been reduced during the applicable periods shown.
E Total returns do not include the effect of the contingent deferred sales charge.
F Fees and expenses of any underlying mutual funds or exchange-traded funds (ETFs) are not included in the Fund's expense ratio. The Fund indirectly bears its proportionate share of these expenses. For additional expense information related to investments in Fidelity Central Funds, please refer to the "Investments in Fidelity Central Funds" note found in the Notes to Financial Statements section of the most recent Annual or Semi-Annual report.
G Expense ratios reflect operating expenses of the class. Expenses before reductions do not reflect amounts reimbursed, waived, or reduced through arrangements with the investment adviser, brokerage services, or other offset arrangements, if applicable, and do not represent the amount paid by the class during periods when reimbursements, waivers or reductions occur.
H Annualized.
I Amount does not include the portfolio activity of any underlying mutual funds or exchange-traded funds (ETFs).
J Portfolio turnover rate excludes securities received or delivered in-kind.
| Fidelity® Corporate Bond Fund |
| |
| | Six months ended (Unaudited) February 28, 2023 | | Years ended August 31, 2022 | | 2021 | | 2020 | | 2019 | | 2018 |
Selected Per-Share Data | | | | | | | | | | | | |
| Net asset value, beginning of period | $ | 10.41 | $ | 12.76 | $ | 12.86 | $ | 12.24 | $ | 11.22 | $ | 11.68 |
| Income from Investment Operations | | | | | | | | | | | | |
Net investment income (loss) A,B | | .193 | | .325 | | .318 | | .350 | | .415 | | .389 |
| Net realized and unrealized gain (loss) | | (.277) | | (2.270) | | .003 | | .624 | | 1.017 | | (.463) |
| Total from investment operations | | (.084) | | (1.945) | | .321 | | .974 | | 1.432 | | (.074) |
| Distributions from net investment income | | (.186) | | (.318) | | (.314) | | (.354) | | (.412) | | (.386) |
| Distributions from net realized gain | | - | | (.087) | | (.107) | | - | | - | | - |
| Total distributions | | (.186) | | (.405) | | (.421) | | (.354) | | (.412) | | (.386) |
| Net asset value, end of period | $ | 10.14 | $ | 10.41 | $ | 12.76 | $ | 12.86 | $ | 12.24 | $ | 11.22 |
Total Return C,D | | (.78)% | | (15.54)% | | 2.56% | | 8.12% | | 13.10% | | (.63)% |
Ratios to Average Net Assets B,E,F | | | | | | | | | | | | |
| Expenses before reductions | | .45% G | | .44% | | .45% | | .45% | | .45% | | .45% |
| Expenses net of fee waivers, if any | | .45% G | | .44% | | .45% | | .45% | | .45% | | .45% |
| Expenses net of all reductions | | .45% G | | .44% | | .45% | | .45% | | .45% | | .45% |
| Net investment income (loss) | | 3.83% G | | 2.79% | | 2.50% | | 2.84% | | 3.65% | | 3.43% |
| Supplemental Data | | | | | | | | | | | | |
| Net assets, end of period (000 omitted) | $ | 880,895 | $ | 975,308 | $ | 1,481,426 | $ | 2,179,540 | $ | 1,411,052 | $ | 1,142,503 |
Portfolio turnover rate H | | 26% G | | 26% | | 46% | | 31% I | | 28% | | 47% |
A Calculated based on average shares outstanding during the period.
B Net investment income (loss) is affected by the timing of the declaration of dividends by any underlying mutual funds or exchange-traded funds (ETFs). Net investment income (loss) of any mutual funds or ETFs is not included in the Fund's net investment income (loss) ratio.
C Total returns for periods of less than one year are not annualized.
D Total returns would have been lower if certain expenses had not been reduced during the applicable periods shown.
E Fees and expenses of any underlying mutual funds or exchange-traded funds (ETFs) are not included in the Fund's expense ratio. The Fund indirectly bears its proportionate share of these expenses. For additional expense information related to investments in Fidelity Central Funds, please refer to the "Investments in Fidelity Central Funds" note found in the Notes to Financial Statements section of the most recent Annual or Semi-Annual report.
F Expense ratios reflect operating expenses of the class. Expenses before reductions do not reflect amounts reimbursed, waived, or reduced through arrangements with the investment adviser, brokerage services, or other offset arrangements, if applicable, and do not represent the amount paid by the class during periods when reimbursements, waivers or reductions occur.
G Annualized.
H Amount does not include the portfolio activity of any underlying mutual funds or exchange-traded funds (ETFs).
I Portfolio turnover rate excludes securities received or delivered in-kind.
| Fidelity Advisor® Corporate Bond Fund Class I |
| |
| | Six months ended (Unaudited) February 28, 2023 | | Years ended August 31, 2022 | | 2021 | | 2020 | | 2019 | | 2018 |
Selected Per-Share Data | | | | | | | | | | | | |
| Net asset value, beginning of period | $ | 10.41 | $ | 12.76 | $ | 12.86 | $ | 12.24 | $ | 11.22 | $ | 11.68 |
| Income from Investment Operations | | | | | | | | | | | | |
Net investment income (loss) A,B | | .190 | | .322 | | .311 | | .344 | | .412 | | .385 |
| Net realized and unrealized gain (loss) | | (.276) | | (2.273) | | .004 | | .624 | | 1.015 | | (.465) |
| Total from investment operations | | (.086) | | (1.951) | | .315 | | .968 | | 1.427 | | (.080) |
| Distributions from net investment income | | (.184) | | (.312) | | (.308) | | (.348) | | (.407) | | (.380) |
| Distributions from net realized gain | | - | | (.087) | | (.107) | | - | | - | | - |
| Total distributions | | (.184) | | (.399) | | (.415) | | (.348) | | (.407) | | (.380) |
| Net asset value, end of period | $ | 10.14 | $ | 10.41 | $ | 12.76 | $ | 12.86 | $ | 12.24 | $ | 11.22 |
Total Return C,D | | (.80)% | | (15.58)% | | 2.51% | | 8.07% | | 13.06% | | (.68)% |
Ratios to Average Net Assets B,E,F | | | | | | | | | | | | |
| Expenses before reductions | | .50% G | | .50% | | .50% | | .50% | | .49% | | .50% |
| Expenses net of fee waivers, if any | | .50% G | | .50% | | .50% | | .50% | | .49% | | .50% |
| Expenses net of all reductions | | .50% G | | .50% | | .50% | | .50% | | .49% | | .50% |
| Net investment income (loss) | | 3.79% G | | 2.74% | | 2.45% | | 2.80% | | 3.63% | | 3.38% |
| Supplemental Data | | | | | | | | | | | | |
| Net assets, end of period (000 omitted) | $ | 93,084 | $ | 111,046 | $ | 200,288 | $ | 183,627 | $ | 122,654 | $ | 129,845 |
Portfolio turnover rate H | | 26% G | | 26% | | 46% | | 31% I | | 28% | | 47% |
A Calculated based on average shares outstanding during the period.
B Net investment income (loss) is affected by the timing of the declaration of dividends by any underlying mutual funds or exchange-traded funds (ETFs). Net investment income (loss) of any mutual funds or ETFs is not included in the Fund's net investment income (loss) ratio.
C Total returns for periods of less than one year are not annualized.
D Total returns would have been lower if certain expenses had not been reduced during the applicable periods shown.
E Fees and expenses of any underlying mutual funds or exchange-traded funds (ETFs) are not included in the Fund's expense ratio. The Fund indirectly bears its proportionate share of these expenses. For additional expense information related to investments in Fidelity Central Funds, please refer to the "Investments in Fidelity Central Funds" note found in the Notes to Financial Statements section of the most recent Annual or Semi-Annual report.
F Expense ratios reflect operating expenses of the class. Expenses before reductions do not reflect amounts reimbursed, waived, or reduced through arrangements with the investment adviser, brokerage services, or other offset arrangements, if applicable, and do not represent the amount paid by the class during periods when reimbursements, waivers or reductions occur.
G Annualized.
H Amount does not include the portfolio activity of any underlying mutual funds or exchange-traded funds (ETFs).
I Portfolio turnover rate excludes securities received or delivered in-kind.
| Fidelity Advisor® Corporate Bond Fund Class Z |
| |
| | Six months ended (Unaudited) February 28, 2023 | | Years ended August 31, 2022 | | 2021 | | 2020 | | 2019 A |
Selected Per-Share Data | | | | | | | | | | |
| Net asset value, beginning of period | $ | 10.41 | $ | 12.76 | $ | 12.86 | $ | 12.23 | $ | 11.16 |
| Income from Investment Operations | | | | | | | | | | |
Net investment income (loss) B,C | | .197 | | .326 | | .328 | | .360 | | .358 |
| Net realized and unrealized gain (loss) | | (.276) | | (2.262) | | .005 | | .635 | | 1.097 |
| Total from investment operations | | (.079) | | (1.936) | | .333 | | .995 | | 1.455 |
| Distributions from net investment income | | (.191) | | (.327) | | (.326) | | (.365) | | (.385) |
| Distributions from net realized gain | | - | | (.087) | | (.107) | | - | | - |
| Total distributions | | (.191) | | (.414) | | (.433) | | (.365) | | (.385) |
| Net asset value, end of period | $ | 10.14 | $ | 10.41 | $ | 12.76 | $ | 12.86 | $ | 12.23 |
Total Return D,E | | (.73)% | | (15.47)% | | 2.66% | | 8.30% | | 13.34% |
Ratios to Average Net Assets B,F,G | | | | | | | | | | |
| Expenses before reductions | | .40% H | | .40% | | .40% | | .40% | | .40% H |
| Expenses net of fee waivers, if any | | .36% H | | .36% | | .36% | | .36% | | .36% H |
| Expenses net of all reductions | | .36% H | | .36% | | .36% | | .36% | | .36% H |
| Net investment income (loss) | | 3.93% H | | 2.87% | | 2.59% | | 2.93% | | 3.54% H |
| Supplemental Data | | | | | | | | | | |
| Net assets, end of period (000 omitted) | $ | 3,384,188 | $ | 3,068,418 | $ | 1,673,604 | $ | 852,967 | $ | 100,483 |
Portfolio turnover rate I | | 26% H | | 26% | | 46% | | 31% J | | 28% |
A For the period October 2, 2018 (commencement of sale of shares) through August 31, 2019.
B Net investment income (loss) is affected by the timing of the declaration of dividends by any underlying mutual funds or exchange-traded funds (ETFs). Net investment income (loss) of any mutual funds or ETFs is not included in the Fund's net investment income (loss) ratio.
C Calculated based on average shares outstanding during the period.
D Total returns for periods of less than one year are not annualized.
E Total returns would have been lower if certain expenses had not been reduced during the applicable periods shown.
F Expense ratios reflect operating expenses of the class. Expenses before reductions do not reflect amounts reimbursed, waived, or reduced through arrangements with the investment adviser, brokerage services, or other offset arrangements, if applicable, and do not represent the amount paid by the class during periods when reimbursements, waivers or reductions occur.
G Fees and expenses of any underlying mutual funds or exchange-traded funds (ETFs) are not included in the Fund's expense ratio. The Fund indirectly bears its proportionate share of these expenses. For additional expense information related to investments in Fidelity Central Funds, please refer to the "Investments in Fidelity Central Funds" note found in the Notes to Financial Statements section of the most recent Annual or Semi-Annual report.
H Annualized.
I Amount does not include the portfolio activity of any underlying mutual funds or exchange-traded funds (ETFs).
J Portfolio turnover rate excludes securities received or delivered in-kind.
For the period ended February 28, 2023
1 . Organization.
Fidelity Corporate Bond Fund (the Fund) is a fund of Fidelity Salem Street Trust (the Trust) and is authorized to issue an unlimited number of shares. The Trust is registered under the Investment Company Act of 1940, as amended (the 1940 Act), as an open-end management investment company organized as a Massachusetts business trust. The Fund offers Class A, Class M, Class C, Corporate Bond, Class I and Class Z shares, each of which has equal rights as to assets and voting privileges. Each class has exclusive voting rights with respect to matters that affect that class. Class C shares will automatically convert to Class A shares after a holding period of eight years from the initial date of purchase, with certain exceptions.
2. Investments in Fidelity Central Funds.
Funds may invest in Fidelity Central Funds, which are open-end investment companies generally available only to other investment companies and accounts managed by the investment adviser and its affiliates. The Schedule of Investments lists any Fidelity Central Funds held as an investment as of period end, but does not include the underlying holdings of each Fidelity Central Fund. An investing fund indirectly bears its proportionate share of the expenses of the underlying Fidelity Central Funds.
Based on its investment objective, each Fidelity Central Fund may invest or participate in various investment vehicles or strategies that are similar to those of the investing fund. These strategies are consistent with the investment objectives of the investing fund and may involve certain economic risks which may cause a decline in value of each of the Fidelity Central Funds and thus a decline in the value of the investing fund.
| Fidelity Central Fund | Investment Manager | Investment Objective | Investment Practices | Expense Ratio A |
| Fidelity Money Market Central Funds | Fidelity Management & Research Company LLC (FMR) | Each fund seeks to obtain a high level of current income consistent with the preservation of capital and liquidity. | Short-term Investments | Less than .005% |
A Expenses expressed as a percentage of average net assets and are as of each underlying Central Fund's most recent annual or semi-annual shareholder report.
A complete unaudited list of holdings for each Fidelity Central Fund is available upon request or at the Securities and Exchange Commission website at www.sec.gov. In addition, the financial statements of the Fidelity Central Funds which contain the significant accounting policies (including investment valuation policies) of those funds, and are not covered by the Report of Independent Registered Public Accounting Firm, are available on the Securities and Exchange Commission website or upon request.
3. Significant Accounting Policies.
The Fund is an investment company and applies the accounting and reporting guidance of the Financial Accounting Standards Board (FASB) Accounting Standards Codification Topic 946 Financial Services - Investment Companies . The financial statements have been prepared in conformity with accounting principles generally accepted in the United States of America (GAAP), which require management to make certain estimates and assumptions at the date of the financial statements. Actual results could differ from those estimates. Subsequent events, if any, through the date that the financial statements were issued have been evaluated in the preparation of the financial statements. The Fund's Schedule of Investments lists any underlying mutual funds or exchange-traded funds (ETFs) but does not include the underlying holdings of these funds. The following summarizes the significant accounting policies of the Fund:
Investment Valuation. Investments are valued as of 4:00 p.m. Eastern time on the last calendar day of the period. The Board of Trustees (the Board) has designated the Fund's investment adviser as the valuation designee responsible for the fair valuation function and performing fair value determinations as needed. The investment adviser has established a Fair Value Committee (the Committee) to carry out the day-to-day fair valuation responsibilities and has adopted policies and procedures to govern the fair valuation process and the activities of the Committee. In accordance with these fair valuation policies and procedures, which have been approved by the Board, the Fund attempts to obtain prices from one or more third party pricing services or brokers to value its investments. When current market prices, quotations or currency exchange rates are not readily available or reliable, investments will be fair valued in good faith by the Committee, in accordance with the policies and procedures. Factors used in determining fair value vary by investment type and may include market or investment specific events, transaction data, estimated cash flows, and market observations of comparable investments. The frequency that the fair valuation procedures are used cannot be predicted and they may be utilized to a significant extent. The Committee manages the Fund's fair valuation practices and maintains the fair valuation policies and procedures. The Fund's investment adviser reports to the Board information regarding the fair valuation process and related material matters.
The Fund categorizes the inputs to valuation techniques used to value its investments into a disclosure hierarchy consisting of three levels as shown below:
Level 1 - unadjusted quoted prices in active markets for identical investments
Level 2 - other significant observable inputs (including quoted prices for similar investments, interest rates, prepayment speeds, etc.)
Level 3 - unobservable inputs (including the Fund's own assumptions based on the best information available)
Valuation techniques used to value the Fund's investments by major category are as follows:
Debt securities, including restricted securities, are valued based on evaluated prices received from third party pricing services or from brokers who make markets in such securities. Corporate bonds, bank notes, foreign government and government agency obligations, municipal securities, preferred securities and U.S. government and government agency obligations are valued by pricing services who utilize matrix pricing which considers yield or price of bonds of comparable quality, coupon, maturity and type or by broker-supplied prices. Asset backed securities are valued by pricing services who utilize matrix pricing which considers prepayment speed assumptions, attributes of the collateral, yield or price of bonds of comparable quality, coupon, maturity and type or by broker-supplied prices. When independent prices are unavailable or unreliable, debt securities may be valued utilizing pricing methodologies which consider similar factors that would be used by third party pricing services. Debt securities are generally categorized as Level 2 in the hierarchy but may be Level 3 depending on the circumstances.
Investments in open-end mutual funds, including the Fidelity Central Funds, are valued at their closing net asset value (NAV) each business day and are categorized as Level 1 in the hierarchy.
Changes in valuation techniques may result in transfers in or out of an assigned level within the disclosure hierarchy. The aggregate value of investments by input level as of February 28, 2023 is included at the end of the Fund's Schedule of Investments.
Investment Transactions and Income. For financial reporting purposes, the Fund's investment holdings and NAV include trades executed through the end of the last business day of the period. The NAV per share for processing shareholder transactions is calculated as of the close of business of the New York Stock Exchange (NYSE), normally 4:00 p.m. Eastern time and includes trades executed through the end of the prior business day. Gains and losses on securities sold are determined on the basis of identified cost and include proceeds received from litigation. Dividend income is recorded on the ex-dividend date. Income and capital gain distributions from Fidelity Central Funds, if any, are recorded on the ex-dividend date. Interest income is accrued as earned and includes coupon interest and amortization of premium and accretion of discount on debt securities as applicable. Debt obligations may be placed on non-accrual status and related interest income may be reduced by ceasing current accruals and writing off interest receivables when the collection of all or a portion of interest has become doubtful based on consistently applied procedures. A debt obligation is removed from non-accrual status when the issuer resumes interest payments or when collectability of interest is reasonably assured.
Class Allocations and Expenses. Investment income, realized and unrealized capital gains and losses, common expenses of a fund, and certain fund-level expense reductions, if any, are allocated daily on a pro-rata basis to each class based on the relative net assets of each class to the total net assets of a fund. Each class differs with respect to transfer agent and distribution and service plan fees incurred, as applicable. Certain expense reductions may also differ by class, if applicable. For the reporting period, the allocated portion of income and expenses to each class as a percent of its average net assets may vary due to the timing of recording these transactions in relation to fluctuating net assets of the classes. Expenses directly attributable to a fund are charged to that fund. Expenses attributable to more than one fund are allocated among the respective funds on the basis of relative net assets or other appropriate methods. Expenses included in the accompanying financial statements reflect the expenses of that fund and do not include any expenses associated with any underlying mutual funds or exchange-traded funds. Although not included in a fund's expenses, a fund indirectly bears its proportionate share of these expenses through the net asset value of each underlying mutual fund or exchange-traded fund. Expense estimates are accrued in the period to which they relate and adjustments are made when actual amounts are known.
Income Tax Information and Distributions to Shareholders. Each year, the Fund intends to qualify as a regulated investment company under Subchapter M of the Internal Revenue Code, including distributing substantially all of its taxable income and realized gains. As a result, no provision for U.S. Federal income taxes is required. The Fund files a U.S. federal tax return, in addition to state and local tax returns as required. The Fund's federal income tax returns are subject to examination by the Internal Revenue Service (IRS) for a period of three fiscal years after they are filed. State and local tax returns may be subject to examination for an additional fiscal year depending on the jurisdiction.
Distributions are declared and recorded daily and paid monthly from net investment income. Distributions from realized gains, if any, are declared and recorded on the ex-dividend date. Income and capital gain distributions are declared separately for each class. Income and capital gain distributions are determined in accordance with income tax regulations, which may differ from GAAP.
Capital accounts within the financial statements are adjusted for permanent book-tax differences. These adjustments have no impact on net assets or the results of operations. Capital accounts are not adjusted for temporary book-tax differences which will reverse in a subsequent period.
Book-tax differences are primarily due to market discount and losses deferred due to wash sales and excise tax regulations.
As of period end, the cost and unrealized appreciation (depreciation) in securities, and derivatives if applicable, for federal income tax purposes were as follows:
| Gross unrealized appreciation | $9,158,986 |
| Gross unrealized depreciation | (600,138,758) |
| Net unrealized appreciation (depreciation) | $(590,979,772) |
| Tax cost | $5,001,102,190 |
The Fund elected to defer to its next fiscal year approximately $25,385,935 of capital losses recognized during the period November 1,2021 to August 31, 2022.
Delayed Delivery Transactions and When-Issued Securities. During the period, certain Funds transacted in securities on a delayed delivery or when-issued basis. Payment and delivery may take place after the customary settlement period for that security. The price of the underlying securities and the date when the securities will be delivered and paid for are fixed at the time the transaction is negotiated. Securities purchased on a delayed delivery or when-issued basis are identified as such in the Schedule of Investments. Compensation for interest forgone in the purchase of a delayed delivery or when-issued debt security may be received. With respect to purchase commitments, each applicable Fund identifies securities as segregated in its records with a value at least equal to the amount of the commitment. Payables and receivables associated with the purchases and sales of delayed delivery securities having the same coupon, settlement date and broker are offset. Delayed delivery or when-issued securities that have been purchased from and sold to different brokers are reflected as both payables and receivables in the Statement of Assets and Liabilities under the caption "Delayed delivery", as applicable. Losses may arise due to changes in the value of the underlying securities or if the counterparty does not perform under the contract's terms, or if the issuer does not issue the securities due to political, economic, or other factors.
Restricted Securities (including Private Placements). Funds may invest in securities that are subject to legal or contractual restrictions on resale. These securities generally may be resold in transactions exempt from registration or to the public if the securities are registered. Disposal of these securities may involve time-consuming negotiations and expense, and prompt sale at an acceptable price may be difficult. Information regarding restricted securities held at period end is included at the end of the Schedule of Investments, if applicable.
4. Purchases and Sales of Investments.
Purchases and sales of securities, other than short-term securities, U.S. government securities and in-kind transactions, as applicable, are noted in the table below.
| | Purchases ($) | Sales ($) |
| Fidelity Corporate Bond Fund | 479,046,780 | 152,758,571 |
5. Fees and Other Transactions with Affiliates.
Management Fee. Fidelity Management & Research Company LLC (the investment adviser) and its affiliates provide the Fund with investment management related services for which the Fund pays a monthly management fee that is based on an annual rate of .35% of the Fund's average net assets. Under the management contract, the investment adviser pays all other expenses, except the compensation of the independent Trustees and certain other expenses such as transfer agent and distribution and service plan fees, and other expenses such as interest expense.
Distribution and Service Plan Fees. In accordance with Rule 12b-1 of the 1940 Act, the Fund has adopted separate Distribution and Service Plans for each class of shares. Certain classes pay Fidelity Distributors Company LLC (FDC), an affiliate of the investment adviser, separate Distribution and Service Fees, each of which is based on an annual percentage of each class' average net assets. In addition, FDC may pay financial intermediaries for selling shares of the Fund and providing shareholder support services. For the period, the Distribution and Service Fee rates, total fees and amounts retained by FDC were as follows:
| | Distribution Fee | Service Fee | Total Fees | Retained by FDC |
| Class A | - % | .25% | $71,034 | $2,446 |
| Class M | - % | .25% | 10,143 | 128 |
| Class C | .75% | .25% | 45,651 | 5,201 |
| | | | $126,828 | $7,775 |
Sales Load. FDC may receive a front-end sales charge of up to 4.00% for selling Class A shares and Class M shares, some of which is paid to financial intermediaries for selling shares of the Fund. Depending on the holding period, FDC may receive contingent deferred sales charges levied on Class A, Class M and Class C redemptions. The deferred sales charges are 1.00% for Class C shares, .75% for certain purchases of Class A shares and .25% for certain purchases of Class M shares.
For the period, sales charge amounts retained by FDC were as follows:
| | Retained by FDC |
| Class A | $3,901 |
| Class M | 422 |
Class C A | 94 |
| | $4,417 |
A When Class C shares are initially sold, FDC pays commissions from its own resources to financial intermediaries through which the sales are made.
Transfer Agent Fees. Fidelity Investments Institutional Operations Company LLC (FIIOC), an affiliate of the investment adviser, is the transfer, dividend disbursing and shareholder servicing agent for each class of the Fund. FIIOC receives account fees and asset-based fees that vary according to the account size and type of account of the shareholders of each respective class of the Fund, with the exception of Corporate Bond and Class Z. FIIOC receives an asset-based fee of Corporate Bond's and Class Z's average net assets. FIIOC pays for typesetting, printing and mailing of shareholder reports, except proxy statements. For the period, transfer agent fees for each class were as follows:
| | Amount | % of Class-Level Average Net Assets A |
| Class A | $49,864 | .18 |
| Class M | 9,602 | .24 |
| Class C | 8,992 | .20 |
| Corporate Bond | 450,289 | .10 |
| Class I | 83,140 | .15 |
| Class Z | 794,549 | .05 |
| | $1,396,436 | |
A Annualized
Interfund Trades. Funds may purchase from or sell securities to other Fidelity Funds under procedures adopted by the Board. The procedures have been designed to ensure these interfund trades are executed in accordance with Rule 17a-7 of the 1940 Act. Any interfund trades are included within the respective purchases and sales amounts shown in the Purchases and Sales of Investments note. During the period, there were no interfund trades.
Other. During the period, the investment adviser reimbursed the Fund for certain losses as follows:
| | Amount ($) |
| Fidelity Corporate Bond Fund | 4,142 |
6. Committed Line of Credit.
Certain Funds participate with other funds managed by the investment adviser or an affiliate in a $4.25 billion credit facility (the "line of credit") to be utilized for temporary or emergency purposes to fund shareholder redemptions or for other short-term liquidity purposes. The commitment fees on the pro-rata portion of the line of credit are borne by the investment adviser. During the period, there were no borrowings on this line of credit.
7. Security Lending.
Funds lend portfolio securities from time to time in order to earn additional income. Lending agents are used, including National Financial Services (NFS), an affiliate of the investment adviser. Pursuant to a securities lending agreement, NFS will receive a fee, which is capped at 9.9% of a fund's daily lending revenue, for its services as lending agent. A fund may lend securities to certain qualified borrowers, including NFS. On the settlement date of the loan, a fund receives collateral (in the form of U.S. Treasury obligations, letters of credit and/or cash) against the loaned securities and maintains collateral in an amount not less than 100% of the market value of the loaned securities during the period of the loan. The market value of the loaned securities is determined at the close of business of a fund and any additional required collateral is delivered to a fund on the next business day. A fund or borrower may terminate the loan at any time, and if the borrower defaults on its obligation to return the securities loaned because of insolvency or other reasons, a fund may apply collateral received from the borrower against the obligation. A fund may experience delays and costs in recovering the securities loaned. Any cash collateral received is invested in the Fidelity Securities Lending Cash Central Fund. Any loaned securities are identified as such in the Schedule of Investments, and the value of loaned securities and cash collateral at period end, as applicable, are presented in the Statement of Assets and Liabilities. Security lending income represents the income earned on investing cash collateral, less rebates paid to borrowers and any lending agent fees associated with the loan, plus any premium payments received for lending certain types of securities. Security lending income is presented in the Statement of Operations as a component of income from Fidelity Central Funds. Affiliated security lending activity, if any, was as follows:
| | Total Security Lending Fees Paid to NFS | Security Lending Income From Securities Loaned to NFS | Value of Securities Loaned to NFS at Period End |
| Fidelity Corporate Bond Fund | $1,176 | $- | $- |
8. Expense Reductions.
The investment adviser contractually agreed to reimburse expenses of each class to the extent annual operating expenses exceeded certain levels of class-level average net assets as noted in the table below. This reimbursement will remain in place through December 31, 2023. Some expenses, for example the compensation of the independent Trustees and certain other expenses such as interest expense, are excluded from this reimbursement.
The following classes were in reimbursement during the period:
| | Expense Limitations | Reimbursement |
| Class Z | .36% | $687,448 |
Through arrangements with the Fund's custodian and each class' transfer agent, credits realized as a result of certain uninvested cash balances were used to reduce the Fund's expenses. During the period, custodian credits reduced the Fund's expenses by $305. During the period, transfer agent credits reduced each class' expenses as noted in the table below.
| | Expense reduction |
| Class A | $1 |
| Class M | 198 |
| | $199 |
9. Distributions to Shareholders.
Distributions to shareholders of each class were as follows:
| | Six months ended February 28, 2023 | Year ended August 31, 2022 |
| Fidelity Corporate Bond Fund | | |
| Distributions to shareholders | | |
| Class A | $952,194 | $2,287,021 |
| Class M | 133,678 | 320,980 |
| Class C | 117,815 | 334,690 |
| Corporate Bond | 16,481,255 | 42,444,861 |
| Class I | 2,038,720 | 5,590,492 |
| Class Z | 59,929,796 | 77,719,363 |
Total | $79,653,458 | $128,697,407 |
10. Share Transactions.
Share transactions for each class were as follows and may contain in-kind transactions, automatic conversions between classes or exchanges between affiliated funds:
| | Shares | Shares | Dollars | Dollars |
| | Six months ended February 28, 2023 | Year ended August 31, 2022 | Six months ended February 28, 2023 | Year ended August 31, 2022 |
| Fidelity Corporate Bond Fund | | | | |
| Class A | | | | |
| Shares sold | 614,604 | 1,179,666 | $6,255,781 | $13,976,580 |
| Reinvestment of distributions | 93,690 | 193,886 | 943,068 | 2,269,171 |
| Shares redeemed | (698,893) | (2,081,425) | (7,043,938) | (24,067,524) |
| Net increase (decrease) | 9,401 | (707,873) | $154,911 | $(7,821,773) |
| Class M | | | | |
| Shares sold | 42,636 | 95,578 | $435,733 | $1,102,808 |
| Reinvestment of distributions | 13,212 | 27,168 | 132,993 | 318,111 |
| Shares redeemed | (52,604) | (262,183) | (529,365) | (3,035,109) |
| Net increase (decrease) | 3,244 | (139,437) | $39,361 | $(1,614,190) |
| Class C | | | | |
| Shares sold | 83,037 | 227,434 | $845,168 | $2,709,731 |
| Reinvestment of distributions | 11,648 | 28,159 | 117,226 | 332,745 |
| Shares redeemed | (138,020) | (651,038) | (1,391,885) | (7,540,547) |
| Net increase (decrease) | (43,335) | (395,445) | $(429,491) | $(4,498,071) |
| Corporate Bond | | | | |
| Shares sold | 6,847,489 | 18,433,215 | $69,802,363 | $211,107,164 |
| Reinvestment of distributions | 1,455,422 | 3,255,463 | 14,636,747 | 38,200,866 |
| Shares redeemed | (15,164,008) | (44,055,578) | (150,992,710) | (514,921,231) |
| Net increase (decrease) | (6,861,097) | (22,366,900) | $(66,553,600) | $(265,613,201) |
| Class I | | | | |
| Shares sold | 2,261,764 | 8,271,807 | $22,875,945 | $93,803,206 |
| Reinvestment of distributions | 177,433 | 464,204 | 1,788,397 | 5,497,008 |
| Shares redeemed | (3,931,410) | (13,759,605) | (40,191,564) | (155,353,790) |
| Net increase (decrease) | (1,492,213) | (5,023,594) | $(15,527,222) | $(56,053,576) |
| Class Z | | | | |
| Shares sold | 38,490,440 | 181,425,823 | $391,787,372 | $2,063,754,531 |
| Reinvestment of distributions | 5,921,697 | 6,747,145 | 59,631,644 | 77,136,214 |
| Shares redeemed | (5,574,134) | (24,451,818) | (56,496,062) | (284,826,749) |
| Net increase (decrease) | 38,838,003 | 163,721,150 | $394,922,954 | $1,856,063,996 |
11. Other.
A fund's organizational documents provide former and current trustees and officers with a limited indemnification against liabilities arising in connection with the performance of their duties to the fund. In the normal course of business, a fund may also enter into contracts that provide general indemnifications. A fund's maximum exposure under these arrangements is unknown as this would be dependent on future claims that may be made against a fund. The risk of material loss from such claims is considered remote.
At the end of the period, the following mutual funds managed by the investment adviser or its affiliates were the owners of record of 10% or more of the total outstanding shares.
| | Strategic Advisers Fidelity Core Income Fund |
| Fidelity Corporate Bond Fund | 62% |
Affiliated Redemptions In-Kind. Effective subsequent to period end , shares of the Fund were redeemed in-kind for investments, including accrued interest and cash, if any. The net realized gain or loss on the investments delivered through in-kind redemptions are shown in the table below. There was no gain or loss for federal income tax purposes.
| | Shares | Total net realized gain or loss ($) | Total Proceeds ($) | Participating classes |
Fidelity Corporate Bond Fund | 271,635,649 | (306,798,495) | 2,797,847,189 | Class Z |
12. Risk and Uncertainties.
Many factors affect a fund's performance. Developments that disrupt global economies and financial markets, such as pandemics, epidemics, outbreaks of infectious diseases, war, terrorism, and environmental disasters, may significantly affect a fund's investment performance. The effects of these developments to a fund will be impacted by the types of securities in which a fund invests, the financial condition, industry, economic sector, and geographic location of an issuer, and a fund's level of investment in the securities of that issuer. Significant concentrations in security types, issuers, industries, sectors, and geographic locations may magnify the factors that affect a fund's performance.
As a shareholder, you incur two types of costs: (1) transaction costs, which may include sales charges (loads) on purchase payments or redemption proceeds, as applicable and (2) ongoing costs, which generally include management fees, distribution and/or service (12b-1) fees and other Fund expenses. This Example is intended to help you understand your ongoing costs (in dollars) of investing in a fund and to compare these costs with the ongoing costs of investing in other mutual funds.
| The Example is based on an investment of $1,000 invested at the beginning of the period and held for the entire period (September 1, 2022 to February 28, 2023). |
Actual Expenses
The first line of the accompanying table provides information about actual account values and actual expenses. You may use the information in this line, together with the amount you invested, to estimate the expenses that you paid over the period. Simply divide your account value by $1,000.00 (for example, an $8,600 account value divided by $1,000.00 = 8.6), then multiply the result by the number in the first line for a class/Fund under the heading entitled "Expenses Paid During Period" to estimate the expenses you paid on your account during this period. If any fund is a shareholder of any underlying mutual funds or exchange-traded funds (ETFs) (the Underlying Funds), such fund indirectly bears its proportional share of the expenses of the Underlying Funds in addition to the direct expenses incurred presented in the table. These fees and expenses are not included in the annualized expense ratio used to calculate the expense estimate in the table below.
Hypothetical Example for Comparison Purposes
The second line of the accompanying table provides information about hypothetical account values and hypothetical expenses based on the actual expense ratio and an assumed rate of return of 5% per year before expenses, which is not the actual return. The hypothetical account values and expenses may not be used to estimate the actual ending account balance or expenses you paid for the period. You may use this information to compare the ongoing costs of investing in the Fund and other funds. To do so, compare this 5% hypothetical example with the 5% hypothetical examples that appear in the shareholder reports of the other funds. If any fund is a shareholder of any Underlying Funds, such fund indirectly bears its proportional share of the expenses of the Underlying Funds in addition to the direct expenses as presented in the table. These fees and expenses are not included in the annualized expense ratio used to calculate the expense estimate in the table below.
Please note that the expenses shown in the table are meant to highlight your ongoing costs only and do not reflect any transaction costs. Therefore, the second line of the table is useful in comparing ongoing costs only, and will not help you determine the relative total costs of owning different funds. In addition, if these transactional costs were included, your costs would have been higher.
| | | | | Annualized Expense Ratio- A | | Beginning Account Value September 1, 2022 | | Ending Account Value February 28, 2023 | | Expenses Paid During Period- C September 1, 2022 to February 28, 2023 |
| Fidelity® Corporate Bond Fund | | | | | | | | | | |
| Class A | | | | .78% | | | | | | |
| Actual | | | | | | $ 1,000 | | $ 990.60 | | $ 3.85 |
Hypothetical- B | | | | | | $ 1,000 | | $ 1,020.93 | | $ 3.91 |
| Class M | | | | .84% | | | | | | |
| Actual | | | | | | $ 1,000 | | $ 990.30 | | $ 4.15 |
Hypothetical- B | | | | | | $ 1,000 | | $ 1,020.63 | | $ 4.21 |
| Class C | | | | 1.56% | | | | | | |
| Actual | | | | | | $ 1,000 | | $ 986.80 | | $ 7.68 |
Hypothetical- B | | | | | | $ 1,000 | | $ 1,017.06 | | $ 7.80 |
| Fidelity® Corporate Bond Fund | | | | .45% | | | | | | |
| Actual | | | | | | $ 1,000 | | $ 992.20 | | $ 2.22 |
Hypothetical- B | | | | | | $ 1,000 | | $ 1,022.56 | | $ 2.26 |
| Class I | | | | .50% | | | | | | |
| Actual | | | | | | $ 1,000 | | $ 992.00 | | $ 2.47 |
Hypothetical- B | | | | | | $ 1,000 | | $ 1,022.32 | | $ 2.51 |
| Class Z | | | | .36% | | | | | | |
| Actual | | | | | | $ 1,000 | | $ 992.70 | | $ 1.78 |
Hypothetical- B | | | | | | $ 1,000 | | $ 1,023.01 | | $ 1.81 |
| |
A Annualized expense ratio reflects expenses net of applicable fee waivers.
B 5% return per year before expenses
C Expenses are equal to the annualized expense ratio, multiplied by the average account value over the period, multiplied by 181/ 365 (to reflect the one-half year period). The fees and expenses of any Underlying Funds are not included in each annualized expense ratio.
Board Approval of Investment Advisory Contracts and Management Fees
Fidelity Corporate Bond Fund
Each year, the Board of Trustees, including the Independent Trustees (together, the Board), votes on the renewal of the management contract with Fidelity Management & Research Company LLC (FMR) and the sub-advisory agreements (together, the Advisory Contracts) for the fund. FMR and the sub-advisers are referred to herein as the Investment Advisers. The Board, assisted by the advice of fund counsel and Independent Trustees' counsel, requests and considers a broad range of information relevant to the renewal of the Advisory Contracts throughout the year.
The Board meets regularly and, at each of its meetings, covers an extensive agenda of topics and materials and considers factors that are relevant to its annual consideration of the renewal of the fund's Advisory Contracts, including the services and support provided to the fund and its shareholders. The Board has established four standing committees (Committees) - Operations, Audit, Fair Valuation, and Governance and Nominating - each composed of and chaired by Independent Trustees with varying backgrounds, to which the Board has assigned specific subject matter responsibilities in order to enhance effective decision-making by the Board. The Operations Committee, of which all the Independent Trustees are members, meets regularly throughout the year and requests, receives and considers, among other matters, information related to the annual consideration of the renewal of the fund's Advisory Contracts before making its recommendation to the Board. The Board also meets as needed to review matters specifically related to the Board's annual consideration of the renewal of the Advisory Contracts. Members of the Board may also meet from time to time with trustees of other Fidelity funds through joint ad hoc committees to discuss certain matters relevant to all of the Fidelity funds.
At its September 2022 meeting, the Board unanimously determined to renew the fund's Advisory Contracts. In reaching its determination, the Board considered all factors it believed relevant, including (i) the nature, extent, and quality of the services provided to the fund and its shareholders (including the investment performance of the fund); (ii) the competitiveness relative to peer funds of the fund's management fee and the total expense ratio of a representative class (the retail class); (iii) the total costs of the services provided by and the profits realized by Fidelity from its relationships with the fund; and (iv) the extent to which, if any, economies of scale exist and are realized as the fund grows, and whether any economies of scale are appropriately shared with fund shareholders.
In considering whether to renew the Advisory Contracts for the fund, the Board reached a determination, with the assistance of fund counsel and Independent Trustees' counsel and through the exercise of its business judgment, that the renewal of the Advisory Contracts was in the best interests of the fund and its shareholders and that the compensation payable under the Advisory Contracts was fair and reasonable. The Board's decision to renew the Advisory Contracts was not based on any single factor, but rather was based on a comprehensive consideration of all the information provided to the Board at its meetings throughout the year. The Board, in reaching its determination to renew the Advisory Contracts, was aware that shareholders of the fund have a broad range of investment choices available to them, including a wide choice among funds offered by Fidelity's competitors, and that the fund's shareholders, who have the opportunity to review and weigh the disclosure provided by the fund in its prospectus and other public disclosures, have chosen to invest in this fund, which is part of the Fidelity family of funds.
Nature, Extent, and Quality of Services Provided. The Board considered Fidelity's staffing as it relates to the fund, including the backgrounds of investment personnel of Fidelity, and also considered the fund's investment objective, strategies, and related investment philosophy. The Independent Trustees also had discussions with senior management of Fidelity's investment operations and investment groups. The Board considered the structure of the investment personnel compensation program and whether this structure provides appropriate incentives to act in the best interests of the fund. Additionally, the Board considered the portfolio managers' investments, if any, in the funds that they manage. The Board also considered the steps Fidelity had taken to ensure the continued provision of high quality services to the Fidelity funds throughout the COVID-19 pandemic, including the expansion of staff in client facing positions to maintain service levels in periods of high volumes and volatility.
Resources Dedicated to Investment Management and Support Services. The Board reviewed the general qualifications and capabilities of Fidelity's investment staff, including its size, education, experience, and resources, as well as Fidelity's approach to recruiting, training, managing, and compensating investment personnel. The Board noted the resources devoted to Fidelity's global investment organization, and that Fidelity's analysts have extensive resources, tools, and capabilities that allow them to conduct quantitative and fundamental analysis, as well as credit analysis of issuers, counterparties, and guarantors. Further, the Board considered that Fidelity's investment professionals have sufficient access to global information and data so as to provide competitive investment results over time, and that those professionals also have access to sophisticated tools that permit them to assess portfolio construction and risk and performance attribution characteristics continuously, as well as to transmit new information and research conclusions rapidly around the world. Additionally, in its deliberations, the Board considered Fidelity's trading, risk management, compliance, cybersecurity, and technology and operations capabilities and resources, which are integral parts of the investment management process.
Shareholder and Administrative Services. The Board considered (i) the nature, extent, quality, and cost of advisory, administrative, and shareholder services performed by the Investment Advisers and their affiliates under the Advisory Contracts and under separate agreements covering transfer agency, pricing and bookkeeping, and securities lending services for the fund; (ii) the nature and extent of the supervision of third party service providers, principally custodians, subcustodians, and pricing vendors; and (iii) the resources devoted to, and the record of compliance with, the fund's compliance policies and procedures.
The Board noted that the growth of fund assets over time across the complex allows Fidelity to reinvest in the development of services designed to enhance the value and convenience of the Fidelity funds as investment vehicles. These services include 24-hour access to account information and market information over the Internet and through telephone representatives, investor education materials and asset allocation tools. The Board also considered that it reviews customer service metrics such as telephone response times, continuity of services on the website and metrics addressing services at Fidelity Investor Centers.
Investment in a Large Fund Family. The Board considered the benefits to shareholders of investing in a Fidelity fund, including the benefits of investing in a fund that is part of a large family of funds offering a variety of investment disciplines and providing a large variety of mutual fund investor services. The Board noted that Fidelity had taken, or had made recommendations to the Board that resulted in the Fidelity funds taking, a number of actions over the previous year that benefited particular funds, including: (i) continuing to dedicate additional resources to Fidelity's investment research process, which includes meetings with management of issuers of securities in which the funds invest; (ii) continuing efforts to enhance Fidelity's global research capabilities; (iii) launching new funds, ETFs, and share classes with innovative structures, strategies and pricing and making other enhancements to meet investor needs; (iv) broadening eligibility requirements for certain funds and share classes; (v) reducing management fees and total expenses for certain funds and classes; (vi) lowering expenses for certain existing funds and classes by implementing or lowering expense caps; (vii) rationalizing product lines and gaining increased efficiencies from fund mergers and liquidations; (viii) continuing to develop, acquire and implement systems and technology to improve services to the funds and shareholders, strengthen information security, and increase efficiency; and (ix) continuing to implement enhancements to further strengthen Fidelity's product line to increase investors' probability of success in achieving their investment goals, including their retirement income goals.
Investment Performance. The Board considered whether the fund has operated in accordance with its investment objective, as well as its record of compliance with its investment restrictions and its performance history. The Board noted that there was a portfolio management change for the fund in January 2022.
The Board took into account discussions that occur at Board meetings throughout the year with representatives of the Investment Advisers about fund investment performance. In this regard the Board noted that as part of regularly scheduled fund reviews and other reports to the Board on fund performance, the Board considers annualized return information for the fund for different time periods, measured against an appropriate securities market index (benchmark index) and an appropriate peer group of funds with similar objectives (peer group). The Board also receives and considers information about performance attribution. In its evaluation of fund investment performance at meetings throughout the year, the Board gave particular attention to information indicating underperformance of certain Fidelity funds for specific time periods and discussed with the Investment Advisers the reasons for such underperformance.
In addition to reviewing absolute and relative fund performance, the Independent Trustees periodically consider the appropriateness of fund performance metrics in evaluating the results achieved. In general, the Independent Trustees believe that fund performance should be evaluated based on gross performance (before fees and expenses but after transaction costs) compared to appropriate benchmark indices, over appropriate time periods that may include full market cycles, and on net performance (after fees and expenses) compared to appropriate peer groups, as applicable, over the same periods, taking into account relevant factors including the following: general market conditions; expectations for interest rate levels and credit conditions; issuer-specific information including credit quality; the potential for incremental return versus the fund's benchmark index weighed against the risks involved in obtaining that incremental return, including the risk of diminished or negative total returns; and fund cash flows and other factors. The Independent Trustees generally give greater weight to fund performance over longer time periods than over shorter time periods. Depending on the circumstances, the Independent Trustees may be satisfied with a fund's performance notwithstanding that it lags its benchmark index or peer group for certain periods.
The Independent Trustees recognize that shareholders evaluate performance on a net basis over their own holding periods, for which one-, three-, and five-year periods are often used as a proxy. For this reason, the performance information reviewed by the Board also included net cumulative calendar year total return information for the representative class (the retail class) and an appropriate benchmark index and peer group for the most recent one-, three-, and five-year periods. The Independent Trustees recognize that shareholders who are not investing through a tax-advantaged retirement account also consider tax consequences in evaluating performance.
Based on its review, the Board concluded that the nature, extent, and quality of services provided to the fund under the Advisory Contracts should continue to benefit the shareholders of the fund.
Competitiveness of Management Fee and Total Expense Ratio. The Board considered the fund's management fee and total expense ratio compared to selected groups of competitive funds and classes (referred to as "mapped groups" below) for the purpose of facilitating the Trustees' competitive analysis of management fees and total expenses. Fidelity creates "mapped groups" by combining similar investment objective categories (as classified by Lipper) that have comparable investment mandates. Combining funds with similar investment objective categories aids the Board's comparison of management fees and total expense ratios by broadening the competitive group used for such comparison.
Management Fee. The Board considered two proprietary management fee comparisons for the 12-month periods shown in basis points (BP) in the chart below. The group of Lipper funds used by the Board for management fee comparisons is referred to below as the "Total Mapped Group" and is broader than the Lipper peer group used by the Board for performance comparisons. The Total Mapped Group comparison focuses on a fund's standing in terms of gross management fees before expense reimbursements or caps relative to the total universe of funds with comparable investment mandates, regardless of whether their management fee structures also are comparable. Funds with comparable investment mandates offer exposure to similar types of securities. Funds with comparable management fee structures have similar management fee contractual arrangements (e.g., flat rate charged for advisory services, all-inclusive fee rate, etc.). "TMG %" represents the percentage of funds in the Total Mapped Group that had management fees that were lower than the fund's. For example, a hypothetical TMG % of 20% would mean that 80% of the funds in the Total Mapped Group had higher, and 20% had lower, management fees than the fund. The fund's actual TMG %s and the number of funds in the Total Mapped Group are in the chart below. The "Asset-Sized Peer Group" (ASPG) comparison focuses on a fund's standing relative to a subset of non-Fidelity funds within the Total Mapped Group that are similar in size and management fee structure. For example, if a fund is in the first quartile of the ASPG, the fund's management fee ranks in the least expensive or lowest 25% of funds in the ASPG. The ASPG represents at least 15% of the funds in the Total Mapped Group with comparable asset size and management fee structures, subject to a minimum of 50 funds (or all funds in the Total Mapped Group if fewer than 50). Additional information, such as the ASPG quartile in which the fund's management fee rate ranked, is also included in the chart and was considered by the Board.
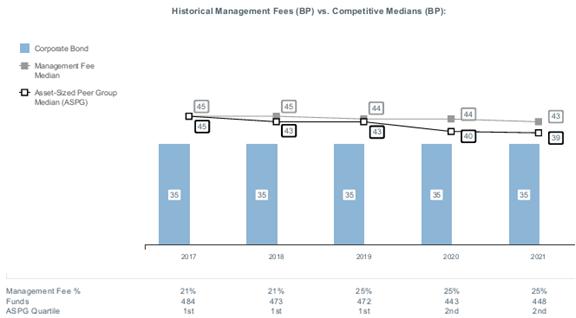
The Board noted that the fund's management fee rate ranked below the median of its Total Mapped Group and below the median of its ASPG for 2021.
Based on its review, the Board concluded that the fund's management fee is fair and reasonable in light of the services that the fund receives and the other factors considered.
Total Expense Ratio. In its review of the total expense ratio of the representative class (the retail class) of the fund, the Board considered the fund's management fee rate as well as other "fund-level" expenses, such as pricing and bookkeeping fees and custodial, legal, and audit fees, paid by FMR under the fund's management contract. The Board also considered other "class-level" expenses, such as transfer agent fees. The Board also noted that Fidelity may agree to waive fees or reimburse expenses from time to time, and the extent to which, if any, it has done so for the fund. The fund's representative class is compared to those funds and classes in the Total Mapped Group (used by the Board for management fee comparisons) that have a similar sales load structure. The Board also considered a total expense ASPG comparison, which focuses on the total expenses of the representative class relative to a subset of non-Fidelity funds within the similar sales load structure group that are similar in size and management fee structure. The total expense ASPG is limited to 15 larger and 15 smaller classes of different funds, where possible. The total expense ASPG comparison excludes performance adjustments and fund-paid 12b-1 fees to eliminate variability in expenses relating to these items.
The Board noted that the total net expense ratio of the retail class ranked below the similar sales load structure group competitive median for 2021 and below the ASPG competitive median for 2021.
The Board further considered that FMR has contractually agreed to reimburse Class Z of the fund to the extent that total operating expenses, with certain exceptions, as a percentage of its average net assets, exceed 0.36% through December 31, 2023.
Fees Charged to Other Fidelity Clients. The Board also considered Fidelity fee structures and other information with respect to clients of Fidelity, such as other funds advised or subadvised by Fidelity, pension plan clients, and other institutional clients with similar mandates. The Board noted that a joint ad hoc committee created by it and the boards of other Fidelity funds periodically reviews and compares Fidelity's institutional investment advisory business with its business of providing services to the Fidelity funds and also noted the most recent findings of the committee. The Board noted that the committee's review included a consideration of the differences in services provided, fees charged, and costs incurred, as well as competition in the markets serving the different categories of clients.
Based on its review of total expense ratios and fees charged to other Fidelity clients, the Board concluded that the total expense ratio of each class of the fund was reasonable in light of the services that the fund and its shareholders receive and the other factors considered.
Costs of the Services and Profitability. The Board considered the revenues earned and the expenses incurred by Fidelity in conducting the business of developing, marketing, distributing, managing, administering and servicing the fund and servicing the fund's shareholders. The Board also considered the level of Fidelity's profits in respect of all the Fidelity funds.
On an annual basis, Fidelity presents to the Board information about the profitability of its relationships with the fund. Fidelity calculates profitability information for each fund, as well as aggregate profitability information for groups of Fidelity funds and all Fidelity funds, using a series of detailed revenue and cost allocation methodologies which originate with the books and records of Fidelity on which Fidelity's audited financial statements are based. The Audit Committee of the Board reviews any significant changes from the prior year's methodologies and the full Board approves such changes.
A public accounting firm has been engaged annually by the Board as part of the Board's assessment of Fidelity's profitability analysis. The engagement includes the review and assessment of the methodologies used by Fidelity in determining the revenues and expenses attributable to Fidelity's mutual fund business, and completion of agreed-upon procedures in respect of the mathematical accuracy of certain fund profitability information and its conformity to established allocation methodologies. After considering the reports issued under the engagement and information provided by Fidelity, the Board concluded that while other allocation methods may also be reasonable, Fidelity's profitability methodologies are reasonable in all material respects.
The Board also reviewed Fidelity's non-fund businesses and potential indirect benefits such businesses may have received as a result of their association with Fidelity's mutual fund business (i.e., fall-out benefits) as well as cases where Fidelity's affiliates may benefit from the funds' business. The Board considered areas where potential indirect benefits to the Fidelity funds from their relationships with Fidelity may exist. The Board's consideration of these matters was informed by the findings of a joint ad hoc committee created by it and the boards of other Fidelity funds to evaluate potential fall-out benefits.
The Board considered the costs of the services provided by and the profits realized by Fidelity in connection with the operation of the fund and was satisfied that the profitability was not excessive.
Economies of Scale. The Board considered whether there have been economies of scale in respect of the management of the Fidelity funds, whether the Fidelity funds (including the fund) have appropriately benefited from any such economies of scale, and whether there is potential for realization of any further economies of scale. The Board considered the extent to which the fund will benefit from economies of scale as assets grow through increased services to the fund, through waivers or reimbursements, or through fee or expense ratio reductions. The Board also noted that a committee (the Economies of Scale Committee) created by it and the boards of other Fidelity funds periodically analyzes whether Fidelity attains economies of scale in respect of the management and servicing of the Fidelity funds, whether the Fidelity funds have appropriately benefited from such economies of scale, and whether there is potential for realization of any further economies of scale.
The Board concluded, taking into account the analysis of the Economies of Scale Committee, that economies of scale, if any, are being appropriately shared between fund shareholders and Fidelity.
Additional Information Requested by the Board. In order to develop fully the factual basis for consideration of the Fidelity funds' advisory contracts, the Board requested and received additional information on certain topics, including: (i) Fidelity's fund profitability methodology, profitability trends for certain funds, the allocation of various costs to different funds, and the impact of certain factors on fund profitability results; (ii) portfolio manager changes that have occurred during the past year and the amount of the investment that each portfolio manager has made in the Fidelity fund(s) that he or she manages; (iii) the extent to which current market conditions have affected retention and recruitment of personnel; (iv) the arrangements with and compensation paid to certain fund sub-advisers on behalf of the Fidelity funds and the treatment of such compensation within Fidelity's fund profitability methodology; (v) the terms of the funds' various management fee structures, including the basic group fee and the terms of Fidelity's voluntary expense limitation arrangements; (vi) Fidelity's transfer agent, pricing and bookkeeping fees, expense and service structures for different funds and classes relative to competitive trends; (vii) the impact on fund profitability of recent industry trends, such as the growth in passively managed funds and the changes in flows for different types of funds; (viii) the types of management fee and total expense comparisons provided, and the challenges and limitations associated with such information; and (ix) explanations regarding the relative total expense ratios and management fees of certain funds and classes, total expense and management fee competitive trends, and methodologies for total expense and management fee competitive comparisons. In addition, the Board considered its discussions with Fidelity regarding Fidelity's efforts to maintain the continuous investment and shareholder services necessary for the funds during the current pandemic and economic circumstances.
Based on its evaluation of all of the conclusions noted above, and after considering all factors it believed relevant, the Board concluded that the advisory fee arrangements are fair and reasonable and that the fund's Advisory Contracts should be renewed.
The Securities and Exchange Commission adopted Rule 22e-4 under the Investment Company Act of 1940 (the Liquidity Rule) to promote effective liquidity risk management throughout the open-end investment company industry, thereby reducing the risk that funds will be unable to meet their redemption obligations and mitigating dilution of the interests of fund shareholders.
The Fund has adopted and implemented a liquidity risk management program (the Program) reasonably designed to assess and manage the Fund's liquidity risk and to comply with the requirements of the Liquidity Rule. The Fund's Board of Trustees (the Board) has designated the Fund's investment adviser as administrator of the Program. The Fidelity advisers have established a Liquidity Risk Management Committee (the LRM Committee) to manage the Program for each of the Fidelity Funds. The LRM Committee monitors the adequacy and effectiveness of implementation of the Program and on a periodic basis assesses each Fund's liquidity risk based on a variety of factors including (1) the Fund's investment strategy, (2) portfolio liquidity and cash flow projections during normal and reasonably foreseeable stressed conditions, (3) shareholder redemptions, (4) borrowings and other funding sources and (5) certain factors specific to ETFs including the effect of the Fund's prices and spreads, market participants, and basket compositions on the overall liquidity of the Fund's portfolio, as applicable.
In accordance with the Program, each of the Fund's portfolio investments is classified into one of four defined liquidity categories based on a determination of a reasonable expectation for how long it would take to convert the investment to cash (or sell or dispose of the investment) without significantly changing its market value.
- Highly liquid investments - cash or convertible to cash within three business days or less
- Moderately liquid investments - convertible to cash in three to seven calendar days
- Less liquid investments - can be sold or disposed of, but not settled, within seven calendar days
- Illiquid investments - cannot be sold or disposed of within seven calendar days
Liquidity classification determinations take into account a variety of factors including various market, trading and investment-specific considerations, as well as market depth, and generally utilize analysis from a third-party liquidity metrics service.
The Liquidity Rule places a 15% limit on a fund's illiquid investments and requires funds that do not primarily hold assets that are highly liquid investments to determine and maintain a minimum percentage of the fund's net assets to be invested in highly liquid investments (highly liquid investment minimum or HLIM). The Program includes provisions reasonably designed to comply with the 15% limit on illiquid investments and for determining, periodically reviewing and complying with the HLIM requirement as applicable.
At a recent meeting of the Fund's Board of Trustees, the LRM Committee provided a written report to the Board pertaining to the operation, adequacy, and effectiveness of the Program for the period December 1, 2021 through November 30, 2022. The report concluded that the Program is operating effectively and is reasonably designed to assess and manage the Fund's liquidity risk.
1.907007.112
CBD-SANN-0423
Fidelity® Series Investment Grade Bond Fund
Semi-Annual Report
February 28, 2023
Contents
To view a fund's proxy voting guidelines and proxy voting record for the 12-month period ended June 30, visit http://www.fidelity.com/proxyvotingresults or visit the Securities and Exchange Commission's (SEC) web site at http://www.sec.gov.
You may also call 1-800-544-8544 to request a free copy of the proxy voting guidelines.
Standard & Poor's, S&P and S&P 500 are registered service marks of The McGraw-Hill Companies, Inc. and have been licensed for use by Fidelity Distributors Corporation.
Other third-party marks appearing herein are the property of their respective owners.
All other marks appearing herein are registered or unregistered trademarks or service marks of FMR LLC or an affiliated company. © 2023 FMR LLC. All rights reserved.
This report and the financial statements contained herein are submitted for the general information of the shareholders of the Fund. This report is not authorized for distribution to prospective investors in the Fund unless preceded or accompanied by an effective prospectus.
A fund files its complete schedule of portfolio holdings with the SEC for the first and third quarters of each fiscal year on Form N-PORT. Forms N-PORT are available on the SEC's web site at http://www.sec.gov. A fund's Forms N-PORT may be reviewed and copied at the SEC's Public Reference Room in Washington, DC. Information regarding the operation of the SEC's Public Reference Room may be obtained by calling 1-800-SEC-0330.
For a complete list of a fund's portfolio holdings, view the most recent holdings listing, semiannual report, or annual report on Fidelity's web site at http://www.fidelity.com, http://www.institutional.fidelity.com, or http://www.401k.com, as applicable.
NOT FDIC INSURED •MAY LOSE VALUE •NO BANK GUARANTEE
Neither the Fund nor Fidelity Distributors Corporation is a bank.
Quality Diversification (% of Fund's net assets) |
|
Short-Term Investments and Net Other Assets (Liabilities) - (1.1)%* |
*Short-term investments and Net Other Assets (Liabilities) are not available in the pie chart. |
| |
| We have used ratings from Moody's Investors Service, Inc. Where Moody's® ratings are not available, we have used S&P® ratings. All ratings are as of the date indicated and do not reflect subsequent changes. |
Securities rated BB or below were rated investment grade at the time of acquisition.
Asset Allocation (% of Fund's net assets) |
|
Short-Term Investments and Net Other Assets (Liabilities) - (1.1)%* |
Foreign investments - 12.1% |
Futures and Swaps - (0.2)% |
Short-Term Investments and Net Other Assets (Liabilities) are not available in the pie chart. |
Percentages in the above tables are adjusted for the effect of TBA Sale Commitments. |
|
Geographic Diversification (% of Fund's net assets) |
|
* Includes Short-Term investments and Net Other Assets (Liabilities). Percentages are based on country or territory of incorporation and are adjusted for the effect of derivatives, if applicable. |
| |
Showing Percentage of Net Assets
| Nonconvertible Bonds - 35.8% |
| | | Principal Amount (a) | Value ($) |
| COMMUNICATION SERVICES - 2.8% | | | |
| Diversified Telecommunication Services - 0.6% | | | |
| AT&T, Inc.: | | | |
| 2.55% 12/1/33 | | 8,942,000 | 6,846,436 |
| 3.8% 12/1/57 | | 74,998,000 | 52,653,367 |
| 4.3% 2/15/30 | | 15,664,000 | 14,694,012 |
| 4.75% 5/15/46 | | 20,994,000 | 18,050,802 |
| Verizon Communications, Inc.: | | | |
| 2.1% 3/22/28 | | 32,783,000 | 28,295,110 |
| 2.55% 3/21/31 | | 30,343,000 | 24,820,204 |
| 2.987% 10/30/56 | | 33,707,000 | 20,650,540 |
| 3% 3/22/27 | | 6,931,000 | 6,404,013 |
| 4.329% 9/21/28 | | 11,520,000 | 11,036,458 |
| 4.5% 8/10/33 | | 17,268,000 | 16,049,154 |
| 4.862% 8/21/46 | | 18,891,000 | 17,059,729 |
| 5.012% 4/15/49 | | 705,000 | 646,753 |
| | | | 217,206,578 |
| Entertainment - 0.1% | | | |
| The Walt Disney Co. 2.65% 1/13/31 | | 25,000,000 | 21,293,527 |
| Media - 1.7% | | | |
| Charter Communications Operating LLC/Charter Communications Operating Capital Corp.: | | | |
| 2.25% 1/15/29 | | 16,500,000 | 13,225,087 |
| 4.4% 4/1/33 | | 9,969,000 | 8,526,728 |
| 4.908% 7/23/25 | | 28,398,000 | 27,787,594 |
| 5.25% 4/1/53 | | 30,969,000 | 24,217,130 |
| 5.375% 5/1/47 | | 56,404,000 | 44,934,469 |
| 5.5% 4/1/63 | | 9,969,000 | 7,748,832 |
| 5.75% 4/1/48 | | 9,412,000 | 7,860,321 |
| 6.484% 10/23/45 | | 26,013,000 | 23,535,203 |
| Comcast Corp.: | | | |
| 2.937% 11/1/56 | | 33,000,000 | 20,698,392 |
| 3.9% 3/1/38 | | 5,928,000 | 5,084,118 |
| 4.65% 7/15/42 | | 14,116,000 | 13,029,597 |
| Discovery Communications LLC: | | | |
| 3.625% 5/15/30 | | 18,602,000 | 15,918,790 |
| 4.65% 5/15/50 | | 50,307,000 | 36,893,363 |
| Fox Corp.: | | | |
| 4.03% 1/25/24 | | 6,818,000 | 6,728,573 |
| 4.709% 1/25/29 | | 9,867,000 | 9,421,917 |
| 5.476% 1/25/39 | | 9,730,000 | 8,941,618 |
| 5.576% 1/25/49 | | 6,456,000 | 5,878,067 |
| Magallanes, Inc.: | | | |
| 3.428% 3/15/24 (b) | | 20,581,000 | 20,086,680 |
| 3.638% 3/15/25 (b) | | 11,271,000 | 10,750,744 |
| 3.755% 3/15/27 (b) | | 22,043,000 | 20,220,803 |
| 4.054% 3/15/29 (b) | | 7,640,000 | 6,832,110 |
| 4.279% 3/15/32 (b) | | 30,761,000 | 26,556,315 |
| 5.05% 3/15/42 (b) | | 15,981,000 | 12,946,778 |
| 5.141% 3/15/52 (b) | | 46,085,000 | 36,126,206 |
| Time Warner Cable LLC: | | | |
| 4.5% 9/15/42 | | 21,984,000 | 16,405,358 |
| 5.5% 9/1/41 | | 15,667,000 | 13,189,514 |
| 5.875% 11/15/40 | | 11,331,000 | 10,006,444 |
| 6.55% 5/1/37 | | 50,619,000 | 48,479,674 |
| 6.75% 6/15/39 | | 13,940,000 | 13,392,943 |
| 7.3% 7/1/38 | | 32,280,000 | 32,352,474 |
| | | | 547,775,842 |
| Wireless Telecommunication Services - 0.4% | | | |
| Rogers Communications, Inc.: | | | |
| 3.2% 3/15/27 (b) | | 23,829,000 | 21,910,013 |
| 3.8% 3/15/32 (b) | | 20,795,000 | 18,163,994 |
| T-Mobile U.S.A., Inc.: | | | |
| 3.75% 4/15/27 | | 32,520,000 | 30,573,222 |
| 3.875% 4/15/30 | | 47,090,000 | 42,698,725 |
| 4.375% 4/15/40 | | 7,013,000 | 5,959,485 |
| 4.5% 4/15/50 | | 13,777,000 | 11,428,495 |
| | | | 130,733,934 |
TOTAL COMMUNICATION SERVICES | | | 917,009,881 |
| CONSUMER DISCRETIONARY - 1.0% | | | |
| Automobiles - 0.2% | | | |
| General Motors Financial Co., Inc.: | | | |
| 2.35% 2/26/27 | | 21,000,000 | 18,559,302 |
| 3.7% 5/9/23 | | 4,723,000 | 4,708,785 |
| 4.25% 5/15/23 | | 10,018,000 | 9,995,983 |
| Volkswagen Group of America Finance LLC 3.125% 5/12/23 (b) | | 26,699,000 | 26,572,187 |
| | | | 59,836,257 |
| Diversified Consumer Services - 0.0% | | | |
| Ingersoll-Rand Global Holding Co. Ltd. 4.25% 6/15/23 | | 18,902,000 | 18,843,835 |
| Hotels, Restaurants & Leisure - 0.1% | | | |
| McDonald's Corp.: | | | |
| 3.5% 7/1/27 | | 9,188,000 | 8,664,052 |
| 3.6% 7/1/30 | | 10,934,000 | 9,974,766 |
| 4.2% 4/1/50 | | 5,533,000 | 4,596,808 |
| | | | 23,235,626 |
| Household Durables - 0.1% | | | |
| Lennar Corp.: | | | |
| 4.75% 11/29/27 | | 2,190,000 | 2,097,020 |
| 5% 6/15/27 | | 2,921,000 | 2,857,896 |
| Toll Brothers Finance Corp.: | | | |
| 4.35% 2/15/28 | | 2,486,000 | 2,289,584 |
| 4.875% 11/15/25 | | 28,000 | 27,620 |
| 4.875% 3/15/27 | | 27,187,000 | 26,089,476 |
| | | | 33,361,596 |
| Leisure Products - 0.1% | | | |
| Hasbro, Inc. 3% 11/19/24 | | 25,757,000 | 24,685,734 |
| Specialty Retail - 0.5% | | | |
| AutoNation, Inc. 4.75% 6/1/30 | | 4,077,000 | 3,787,296 |
| AutoZone, Inc.: | | | |
| 3.625% 4/15/25 | | 6,224,000 | 6,005,420 |
| 4% 4/15/30 | | 28,926,000 | 26,581,638 |
| Lowe's Companies, Inc.: | | | |
| 3.35% 4/1/27 | | 3,413,000 | 3,193,066 |
| 3.75% 4/1/32 | | 10,505,000 | 9,305,793 |
| 4.25% 4/1/52 | | 66,805,000 | 52,601,160 |
| 4.45% 4/1/62 | | 44,060,000 | 34,515,129 |
| 4.5% 4/15/30 | | 20,756,000 | 19,770,639 |
| O'Reilly Automotive, Inc. 4.2% 4/1/30 | | 6,418,000 | 6,016,721 |
| | | | 161,776,862 |
TOTAL CONSUMER DISCRETIONARY | | | 321,739,910 |
| CONSUMER STAPLES - 2.4% | | | |
| Beverages - 1.1% | | | |
| Anheuser-Busch Companies LLC / Anheuser-Busch InBev Worldwide, Inc. 4.9% 2/1/46 | | 21,000,000 | 19,262,758 |
| Anheuser-Busch InBev Finance, Inc.: | | | |
| 4.7% 2/1/36 | | 52,011,000 | 48,819,041 |
| 4.9% 2/1/46 | | 67,409,000 | 61,832,535 |
| Anheuser-Busch InBev Worldwide, Inc.: | | | |
| 3.5% 6/1/30 | | 15,700,000 | 14,297,126 |
| 4.35% 6/1/40 | | 15,700,000 | 13,779,703 |
| 4.5% 6/1/50 | | 41,000,000 | 36,113,540 |
| 4.6% 6/1/60 | | 15,700,000 | 13,611,094 |
| 4.75% 4/15/58 | | 32,390,000 | 29,003,292 |
| 5.45% 1/23/39 | | 25,203,000 | 25,119,946 |
| 5.55% 1/23/49 | | 57,590,000 | 57,944,821 |
| 5.8% 1/23/59 (Reg. S) | | 61,052,000 | 63,123,402 |
| | | | 382,907,258 |
| Food & Staples Retailing - 0.2% | | | |
| Sysco Corp.: | | | |
| 3.25% 7/15/27 | | 13,314,000 | 12,298,574 |
| 3.3% 2/15/50 | | 16,790,000 | 11,513,665 |
| 5.95% 4/1/30 | | 19,674,000 | 20,394,509 |
| 6.6% 4/1/50 | | 27,580,000 | 30,264,639 |
| | | | 74,471,387 |
| Food Products - 0.5% | | | |
| General Mills, Inc. 2.875% 4/15/30 | | 3,825,000 | 3,307,274 |
| JBS U.S.A. Lux SA / JBS Food Co.: | | | |
| 2.5% 1/15/27 (b) | | 46,350,000 | 40,559,031 |
| 3% 5/15/32 (b) | | 51,930,000 | 39,588,555 |
| 3.625% 1/15/32 (b) | | 19,632,000 | 15,725,625 |
| 5.125% 2/1/28 (b) | | 16,760,000 | 15,930,045 |
| 5.5% 1/15/30 (b) | | 6,359,000 | 5,985,377 |
| 5.75% 4/1/33 (b) | | 34,520,000 | 32,197,494 |
| | | | 153,293,401 |
| Tobacco - 0.6% | | | |
| Altria Group, Inc.: | | | |
| 4.25% 8/9/42 | | 26,130,000 | 19,647,417 |
| 4.5% 5/2/43 | | 17,568,000 | 13,407,847 |
| 4.8% 2/14/29 | | 4,818,000 | 4,621,641 |
| 5.375% 1/31/44 | | 15,947,000 | 13,910,832 |
| 5.95% 2/14/49 | | 6,241,000 | 5,588,293 |
| Imperial Tobacco Finance PLC: | | | |
| 4.25% 7/21/25 (b) | | 25,864,000 | 24,864,731 |
| 6.125% 7/27/27 (b) | | 16,185,000 | 16,314,235 |
| Reynolds American, Inc.: | | | |
| 4.45% 6/12/25 | | 12,732,000 | 12,389,219 |
| 5.7% 8/15/35 | | 6,607,000 | 6,007,546 |
| 5.85% 8/15/45 | | 50,684,000 | 43,502,698 |
| 6.15% 9/15/43 | | 11,136,000 | 10,207,957 |
| 7.25% 6/15/37 | | 15,680,000 | 16,314,293 |
| | | | 186,776,709 |
TOTAL CONSUMER STAPLES | | | 797,448,755 |
| ENERGY - 4.5% | | | |
| Energy Equipment & Services - 0.0% | | | |
| Halliburton Co.: | | | |
| 3.8% 11/15/25 | | 315,000 | 304,641 |
| 4.85% 11/15/35 | | 11,266,000 | 10,501,124 |
| | | | 10,805,765 |
| Oil, Gas & Consumable Fuels - 4.5% | | | |
| Canadian Natural Resources Ltd. 5.85% 2/1/35 | | 12,899,000 | 12,415,894 |
| Cenovus Energy, Inc.: | | | |
| 3.75% 2/15/52 | | 23,742,000 | 16,811,462 |
| 5.4% 6/15/47 | | 5,584,000 | 5,026,794 |
| 6.75% 11/15/39 | | 12,889,000 | 13,470,698 |
| Columbia Pipeline Group, Inc. 4.5% 6/1/25 | | 7,777,000 | 7,600,815 |
| DCP Midstream Operating LP: | | | |
| 3.875% 3/15/23 | | 40,552,000 | 40,522,895 |
| 5.6% 4/1/44 | | 1,458,000 | 1,367,589 |
| 5.85% 5/21/43 (b)(c) | | 2,410,000 | 2,384,936 |
| 6.45% 11/3/36 (b) | | 7,882,000 | 8,003,935 |
| 6.75% 9/15/37 (b) | | 2,991,000 | 3,138,636 |
| Empresa Nacional de Petroleo 4.375% 10/30/24 (b) | | 16,015,000 | 15,567,581 |
| Enbridge, Inc.: | | | |
| 4% 10/1/23 | | 15,502,000 | 15,369,755 |
| 4.25% 12/1/26 | | 9,000,000 | 8,630,904 |
| Energy Transfer LP: | | | |
| 3.75% 5/15/30 | | 34,654,000 | 30,742,600 |
| 3.9% 5/15/24 (c) | | 7,783,000 | 7,604,686 |
| 4.2% 9/15/23 | | 6,601,000 | 6,555,777 |
| 4.25% 3/15/23 | | 5,605,000 | 5,603,108 |
| 4.5% 4/15/24 | | 6,788,000 | 6,699,990 |
| 4.95% 6/15/28 | | 22,521,000 | 21,751,065 |
| 5% 5/15/50 | | 37,928,000 | 31,079,724 |
| 5.25% 4/15/29 | | 11,043,000 | 10,769,988 |
| 5.4% 10/1/47 | | 7,311,000 | 6,285,534 |
| 5.8% 6/15/38 | | 12,558,000 | 11,766,079 |
| 6% 6/15/48 | | 8,178,000 | 7,521,420 |
| 6.25% 4/15/49 | | 7,585,000 | 7,214,298 |
| Exxon Mobil Corp. 3.482% 3/19/30 | | 71,930,000 | 66,682,209 |
| Hess Corp.: | | | |
| 4.3% 4/1/27 | | 29,485,000 | 28,223,539 |
| 5.6% 2/15/41 | | 13,347,000 | 12,466,595 |
| 5.8% 4/1/47 | | 19,267,000 | 18,213,310 |
| 7.125% 3/15/33 | | 5,555,000 | 5,969,177 |
| 7.3% 8/15/31 | | 7,267,000 | 7,888,656 |
| 7.875% 10/1/29 | | 2,497,000 | 2,745,754 |
| Kinder Morgan Energy Partners LP 6.55% 9/15/40 | | 2,324,000 | 2,326,698 |
| Kinder Morgan, Inc.: | | | |
| 3.6% 2/15/51 | | 45,000,000 | 30,410,095 |
| 5.55% 6/1/45 | | 13,098,000 | 11,843,198 |
| MPLX LP: | | | |
| 2.65% 8/15/30 | | 10,000,000 | 8,205,184 |
| 4.5% 7/15/23 | | 9,847,000 | 9,811,920 |
| 4.8% 2/15/29 | | 5,907,000 | 5,673,642 |
| 4.875% 12/1/24 | | 15,019,000 | 14,813,921 |
| 4.95% 9/1/32 | | 30,643,000 | 28,797,900 |
| 5.5% 2/15/49 | | 17,721,000 | 15,911,768 |
| Occidental Petroleum Corp.: | | | |
| 5.55% 3/15/26 | | 28,220,000 | 28,066,765 |
| 6.45% 9/15/36 | | 24,570,000 | 24,692,850 |
| 6.6% 3/15/46 | | 53,949,000 | 54,900,121 |
| 7.5% 5/1/31 | | 40,626,000 | 43,469,820 |
| Ovintiv, Inc. 8.125% 9/15/30 | | 2,868,000 | 3,141,619 |
| Petroleos Mexicanos: | | | |
| 4.5% 1/23/26 | | 20,014,000 | 18,417,884 |
| 5.95% 1/28/31 | | 16,396,000 | 12,494,572 |
| 6.35% 2/12/48 | | 13,566,000 | 8,378,701 |
| 6.49% 1/23/27 | | 38,273,000 | 34,736,575 |
| 6.5% 3/13/27 | | 37,289,000 | 33,761,461 |
| 6.75% 9/21/47 | | 95,358,000 | 61,420,088 |
| 6.84% 1/23/30 | | 136,623,000 | 113,520,051 |
| 6.95% 1/28/60 | | 19,817,000 | 12,698,238 |
| 7.69% 1/23/50 | | 124,733,000 | 87,618,696 |
| Phillips 66 Co. 3.85% 4/9/25 | | 3,215,000 | 3,120,954 |
| Plains All American Pipeline LP/PAA Finance Corp.: | | | |
| 3.55% 12/15/29 | | 7,628,000 | 6,614,040 |
| 3.6% 11/1/24 | | 6,687,000 | 6,470,531 |
| 3.85% 10/15/23 | | 25,000,000 | 24,734,970 |
| 4.65% 10/15/25 | | 23,040,000 | 22,478,421 |
| Sabine Pass Liquefaction LLC 4.5% 5/15/30 | | 42,700,000 | 39,998,935 |
| The Williams Companies, Inc.: | | | |
| 2.6% 3/15/31 | | 21,000,000 | 17,040,493 |
| 3.5% 11/15/30 | | 55,862,000 | 48,884,375 |
| 3.9% 1/15/25 | | 6,023,000 | 5,845,821 |
| 4.3% 3/4/24 | | 18,081,000 | 17,851,985 |
| 4.5% 11/15/23 | | 8,697,000 | 8,646,672 |
| 4.55% 6/24/24 | | 90,947,000 | 89,691,539 |
| 4.65% 8/15/32 | | 32,008,000 | 29,823,087 |
| 5.3% 8/15/52 | | 7,262,000 | 6,561,130 |
| Transcontinental Gas Pipe Line Co. LLC: | | | |
| 3.25% 5/15/30 | | 5,447,000 | 4,742,318 |
| 3.95% 5/15/50 | | 17,552,000 | 13,599,368 |
| Western Gas Partners LP: | | | |
| 3.95% 6/1/25 | | 5,006,000 | 4,755,700 |
| 4.65% 7/1/26 | | 8,954,000 | 8,506,300 |
| 4.75% 8/15/28 | | 6,312,000 | 5,854,380 |
| | | | 1,476,428,189 |
TOTAL ENERGY | | | 1,487,233,954 |
| FINANCIALS - 16.3% | | | |
| Banks - 6.9% | | | |
| Bank of America Corp.: | | | |
| 2.299% 7/21/32 (c) | | 42,030,000 | 32,869,391 |
| 2.972% 2/4/33 (c) | | 21,000,000 | 17,185,176 |
| 3.419% 12/20/28 (c) | | 32,593,000 | 29,665,624 |
| 3.5% 4/19/26 | | 28,726,000 | 27,372,839 |
| 3.864% 7/23/24 (c) | | 7,284,000 | 7,230,163 |
| 3.95% 4/21/25 | | 43,026,000 | 41,706,362 |
| 4% 1/22/25 | | 14,494,000 | 14,120,371 |
| 4.1% 7/24/23 | | 35,942,000 | 35,777,464 |
| 4.183% 11/25/27 | | 3,728,000 | 3,554,036 |
| 4.2% 8/26/24 | | 41,416,000 | 40,615,073 |
| 4.25% 10/22/26 | | 45,120,000 | 43,333,774 |
| 4.45% 3/3/26 | | 10,553,000 | 10,260,030 |
| 5.015% 7/22/33 (c) | | 152,527,000 | 146,746,724 |
| Barclays PLC: | | | |
| 2.852% 5/7/26 (c) | | 42,733,000 | 40,010,596 |
| 2.894% 11/24/32 (c) | | 14,928,000 | 11,590,547 |
| 4.375% 1/12/26 | | 34,752,000 | 33,587,245 |
| 4.836% 5/9/28 | | 3,148,000 | 2,949,598 |
| 5.088% 6/20/30 (c) | | 44,892,000 | 41,586,761 |
| 5.2% 5/12/26 | | 41,312,000 | 40,228,543 |
| BNP Paribas SA 2.219% 6/9/26 (b)(c) | | 40,110,000 | 37,045,812 |
| BPCE SA 4.875% 4/1/26 (b) | | 3,984,000 | 3,853,907 |
| Citigroup, Inc.: | | | |
| 3.352% 4/24/25 (c) | | 27,281,000 | 26,543,144 |
| 3.785% 3/17/33 (c) | | 21,000,000 | 18,256,577 |
| 4.075% 4/23/29 (c) | | 14,005,000 | 13,036,639 |
| 4.125% 7/25/28 | | 3,728,000 | 3,488,916 |
| 4.3% 11/20/26 | | 9,646,000 | 9,249,539 |
| 4.4% 6/10/25 | | 71,128,000 | 69,594,189 |
| 4.412% 3/31/31 (c) | | 57,587,000 | 53,528,939 |
| 4.45% 9/29/27 | | 48,296,000 | 46,122,788 |
| 4.6% 3/9/26 | | 10,087,000 | 9,821,499 |
| 4.91% 5/24/33 (c) | | 5,636,000 | 5,341,144 |
| 5.3% 5/6/44 | | 5,127,000 | 4,815,705 |
| 5.5% 9/13/25 | | 18,506,000 | 18,539,667 |
| Citizens Financial Group, Inc. 2.638% 9/30/32 | | 32,329,000 | 24,627,361 |
| Commonwealth Bank of Australia: | | | |
| 3.61% 9/12/34 (b)(c) | | 14,950,000 | 12,625,390 |
| 3.784% 3/14/32 (b) | | 11,585,000 | 9,726,330 |
| Discover Bank 4.2% 8/8/23 | | 35,498,000 | 35,296,094 |
| First Citizens Bank & Trust Co. 3.929% 6/19/24 (c) | | 6,715,000 | 6,674,952 |
| HSBC Holdings PLC: | | | |
| 3.973% 5/22/30 (c) | | 10,000,000 | 8,959,935 |
| 4.25% 3/14/24 | | 12,994,000 | 12,798,562 |
| 4.95% 3/31/30 | | 7,768,000 | 7,484,815 |
| 5.25% 3/14/44 | | 560,000 | 505,734 |
| Intesa Sanpaolo SpA: | | | |
| 5.017% 6/26/24 (b) | | 7,267,000 | 7,018,977 |
| 5.71% 1/15/26 (b) | | 81,601,000 | 78,109,462 |
| JPMorgan Chase & Co.: | | | |
| 2.739% 10/15/30 (c) | | 55,000,000 | 46,392,345 |
| 2.956% 5/13/31 (c) | | 23,105,000 | 19,403,693 |
| 2.963% 1/25/33 (c) | | 21,000,000 | 17,302,743 |
| 3.797% 7/23/24 (c) | | 69,237,000 | 68,737,379 |
| 3.875% 9/10/24 | | 56,148,000 | 54,808,025 |
| 4.125% 12/15/26 | | 61,839,000 | 59,666,012 |
| 4.586% 4/26/33 (c) | | 155,774,000 | 145,178,148 |
| 4.912% 7/25/33 (c) | | 38,769,000 | 37,121,706 |
| NatWest Group PLC: | | | |
| 3 month U.S. LIBOR + 1.750% 4.892% 5/18/29 (c)(d) | | 10,000,000 | 9,558,832 |
| 3.073% 5/22/28 (c) | | 24,822,000 | 22,395,622 |
| 4.8% 4/5/26 | | 20,881,000 | 20,332,170 |
| 5.125% 5/28/24 | | 55,246,000 | 54,793,786 |
| NatWest Markets PLC 2.375% 5/21/23 (b) | | 46,436,000 | 46,116,275 |
| Rabobank Nederland 4.375% 8/4/25 | | 42,555,000 | 41,221,965 |
| Santander Holdings U.S.A., Inc. 2.49% 1/6/28 (c) | | 29,541,000 | 25,729,682 |
| Societe Generale: | | | |
| 1.038% 6/18/25 (b)(c) | | 87,080,000 | 81,498,475 |
| 1.488% 12/14/26 (b)(c) | | 51,731,000 | 45,831,623 |
| 3.337% 1/21/33 (b)(c) | | 21,000,000 | 17,011,483 |
| 4.25% 4/14/25 (b) | | 3,837,000 | 3,678,752 |
| Wells Fargo & Co.: | | | |
| 2.406% 10/30/25 (c) | | 24,506,000 | 23,244,255 |
| 3.196% 6/17/27 (c) | | 34,559,000 | 32,062,112 |
| 3.526% 3/24/28 (c) | | 46,819,000 | 43,354,300 |
| 4.478% 4/4/31 (c) | | 77,500,000 | 72,890,762 |
| 5.013% 4/4/51 (c) | | 114,738,000 | 105,596,274 |
| Westpac Banking Corp. 4.11% 7/24/34 (c) | | 20,547,000 | 18,171,511 |
| | | | 2,255,554,324 |
| Capital Markets - 3.8% | | | |
| Affiliated Managers Group, Inc.: | | | |
| 3.5% 8/1/25 | | 30,803,000 | 29,550,682 |
| 4.25% 2/15/24 | | 24,489,000 | 24,121,179 |
| Ares Capital Corp.: | | | |
| 3.875% 1/15/26 | | 65,900,000 | 61,138,338 |
| 4.2% 6/10/24 | | 48,934,000 | 47,883,428 |
| Credit Suisse Group AG: | | | |
| 2.593% 9/11/25 (b)(c) | | 58,126,000 | 52,664,762 |
| 3.091% 5/14/32 (b)(c) | | 15,102,000 | 10,626,305 |
| 3.75% 3/26/25 | | 31,994,000 | 29,226,839 |
| 3.8% 6/9/23 | | 46,298,000 | 45,742,424 |
| 3.869% 1/12/29 (b)(c) | | 19,608,000 | 16,082,113 |
| 4.194% 4/1/31 (b)(c) | | 52,365,000 | 41,529,446 |
| 4.55% 4/17/26 | | 1,588,000 | 1,418,692 |
| Deutsche Bank AG 4.5% 4/1/25 | | 70,869,000 | 68,334,062 |
| Deutsche Bank AG New York Branch: | | | |
| 3.035% 5/28/32 (c) | | 9,360,000 | 7,374,010 |
| 4.1% 1/13/26 | | 4,496,000 | 4,300,336 |
| 6.72% 1/18/29 (c) | | 20,750,000 | 20,969,780 |
| Goldman Sachs Group, Inc.: | | | |
| 2.383% 7/21/32 (c) | | 50,634,000 | 39,768,963 |
| 3.102% 2/24/33 (c) | | 39,600,000 | 32,640,818 |
| 3.272% 9/29/25 (c) | | 104,473,000 | 100,438,274 |
| 3.8% 3/15/30 | | 57,860,000 | 52,506,656 |
| 4.25% 10/21/25 | | 32,884,000 | 31,852,565 |
| 6.75% 10/1/37 | | 31,825,000 | 33,876,128 |
| Moody's Corp.: | | | |
| 3.25% 1/15/28 | | 12,370,000 | 11,369,889 |
| 4.875% 2/15/24 | | 11,615,000 | 11,539,175 |
| Morgan Stanley: | | | |
| 2.943% 1/21/33 (c) | | 21,000,000 | 17,184,293 |
| 3.125% 7/27/26 | | 7,974,000 | 7,420,531 |
| 3.622% 4/1/31 (c) | | 54,679,000 | 48,416,678 |
| 3.625% 1/20/27 | | 8,956,000 | 8,466,183 |
| 3.737% 4/24/24 (c) | | 163,561,000 | 163,079,498 |
| 4.1% 5/22/23 | | 24,196,000 | 24,141,740 |
| 4.431% 1/23/30 (c) | | 23,749,000 | 22,356,185 |
| 4.889% 7/20/33 (c) | | 94,211,000 | 89,454,734 |
| 5% 11/24/25 | | 50,969,000 | 50,440,749 |
| UBS Group AG: | | | |
| 1.494% 8/10/27 (b)(c) | | 31,236,000 | 27,070,494 |
| 4.125% 9/24/25 (b) | | 27,816,000 | 26,918,485 |
| | | | 1,259,904,434 |
| Consumer Finance - 3.1% | | | |
| AerCap Ireland Capital Ltd./AerCap Global Aviation Trust: | | | |
| 1.65% 10/29/24 | | 56,080,000 | 52,024,110 |
| 2.45% 10/29/26 | | 20,465,000 | 18,041,367 |
| 2.875% 8/14/24 | | 33,555,000 | 31,907,031 |
| 3% 10/29/28 | | 21,434,000 | 18,264,180 |
| 3.3% 1/30/32 | | 22,930,000 | 18,349,454 |
| 4.45% 4/3/26 | | 16,892,000 | 16,052,761 |
| 4.875% 1/16/24 | | 27,051,000 | 26,785,121 |
| 6.5% 7/15/25 | | 19,270,000 | 19,335,831 |
| Ally Financial, Inc.: | | | |
| 1.45% 10/2/23 | | 11,838,000 | 11,538,144 |
| 3.05% 6/5/23 | | 50,233,000 | 49,892,178 |
| 4.625% 3/30/25 | | 10,429,000 | 10,206,010 |
| 5.125% 9/30/24 | | 11,402,000 | 11,302,355 |
| 5.8% 5/1/25 | | 27,438,000 | 27,456,120 |
| 7.1% 11/15/27 | | 36,750,000 | 38,153,442 |
| 8% 11/1/31 | | 22,726,000 | 24,600,605 |
| Capital One Financial Corp.: | | | |
| 2.6% 5/11/23 | | 39,980,000 | 39,783,653 |
| 2.636% 3/3/26 (c) | | 24,182,000 | 22,733,461 |
| 3.273% 3/1/30 (c) | | 35,931,000 | 30,979,291 |
| 3.65% 5/11/27 | | 72,123,000 | 67,172,351 |
| 3.8% 1/31/28 | | 34,796,000 | 32,218,393 |
| 4.985% 7/24/26 (c) | | 30,637,000 | 30,140,984 |
| 5.247% 7/26/30 (c) | | 39,510,000 | 37,884,725 |
| Discover Financial Services: | | | |
| 3.75% 3/4/25 | | 20,000,000 | 19,224,586 |
| 3.95% 11/6/24 | | 17,423,000 | 16,957,215 |
| 4.1% 2/9/27 | | 1,920,000 | 1,819,310 |
| 4.5% 1/30/26 | | 25,399,000 | 24,587,555 |
| 6.7% 11/29/32 | | 7,709,000 | 7,965,136 |
| Ford Motor Credit Co. LLC: | | | |
| 4.063% 11/1/24 | | 101,625,000 | 97,707,397 |
| 5.584% 3/18/24 | | 33,908,000 | 33,670,644 |
| Synchrony Financial: | | | |
| 3.95% 12/1/27 | | 42,034,000 | 38,211,029 |
| 4.25% 8/15/24 | | 36,929,000 | 36,037,020 |
| 4.375% 3/19/24 | | 29,366,000 | 28,958,438 |
| 5.15% 3/19/29 | | 45,267,000 | 42,596,680 |
| Toyota Motor Credit Corp. 2.9% 3/30/23 | | 42,183,000 | 42,107,385 |
| | | | 1,024,663,962 |
| Diversified Financial Services - 1.3% | | | |
| Blackstone Private Credit Fund: | | | |
| 4.7% 3/24/25 | | 80,609,000 | 77,746,292 |
| 7.05% 9/29/25 (b) | | 38,296,000 | 38,432,970 |
| Brixmor Operating Partnership LP: | | | |
| 3.85% 2/1/25 | | 22,346,000 | 21,423,088 |
| 4.05% 7/1/30 | | 26,564,000 | 23,485,150 |
| 4.125% 6/15/26 | | 25,594,000 | 24,086,689 |
| 4.125% 5/15/29 | | 28,249,000 | 25,446,229 |
| Corebridge Financial, Inc.: | | | |
| 3.5% 4/4/25 (b) | | 10,416,000 | 9,962,896 |
| 3.65% 4/5/27 (b) | | 35,355,000 | 32,987,877 |
| 3.85% 4/5/29 (b) | | 14,571,000 | 13,162,033 |
| 3.9% 4/5/32 (b) | | 17,347,000 | 15,178,826 |
| 4.35% 4/5/42 (b) | | 3,946,000 | 3,252,511 |
| 4.4% 4/5/52 (b) | | 11,669,000 | 9,302,042 |
| Equitable Holdings, Inc. 3.9% 4/20/23 | | 3,740,000 | 3,730,219 |
| Jackson Financial, Inc.: | | | |
| 5.17% 6/8/27 | | 15,288,000 | 15,136,814 |
| 5.67% 6/8/32 | | 19,303,000 | 18,858,960 |
| Park Aerospace Holdings Ltd. 5.5% 2/15/24 (b) | | 33,993,000 | 33,587,305 |
| Pine Street Trust I 4.572% 2/15/29 (b) | | 31,229,000 | 29,450,692 |
| Pine Street Trust II 5.568% 2/15/49 (b) | | 31,271,000 | 27,861,711 |
| | | | 423,092,304 |
| Insurance - 1.2% | | | |
| AIA Group Ltd.: | | | |
| 3.2% 9/16/40 (b) | | 18,698,000 | 14,071,049 |
| 3.375% 4/7/30 (b) | | 39,186,000 | 35,328,863 |
| American International Group, Inc. 2.5% 6/30/25 | | 42,536,000 | 40,038,109 |
| Five Corners Funding Trust II 2.85% 5/15/30 (b) | | 58,620,000 | 49,510,312 |
| Liberty Mutual Group, Inc. 4.569% 2/1/29 (b) | | 24,484,000 | 23,167,190 |
| Marsh & McLennan Companies, Inc.: | | | |
| 4.375% 3/15/29 | | 21,405,000 | 20,378,906 |
| 4.75% 3/15/39 | | 9,822,000 | 9,139,043 |
| Massachusetts Mutual Life Insurance Co. 3.729% 10/15/70 (b) | | 37,673,000 | 25,871,285 |
| Pricoa Global Funding I 5.375% 5/15/45 (c) | | 28,973,000 | 28,123,512 |
| Swiss Re Finance Luxembourg SA 5% 4/2/49 (b)(c) | | 12,400,000 | 11,780,000 |
| Teachers Insurance & Annuity Association of America 4.9% 9/15/44 (b) | | 29,603,000 | 27,277,971 |
| TIAA Asset Management Finance LLC 4.125% 11/1/24 (b) | | 10,865,000 | 10,589,982 |
| Unum Group: | | | |
| 3.875% 11/5/25 | | 25,368,000 | 23,997,224 |
| 4% 6/15/29 | | 24,228,000 | 22,173,477 |
| 5.75% 8/15/42 | | 41,569,000 | 38,935,389 |
| | | | 380,382,312 |
TOTAL FINANCIALS | | | 5,343,597,336 |
| HEALTH CARE - 2.1% | | | |
| Biotechnology - 0.3% | | | |
| AbbVie, Inc. 3.2% 11/21/29 | | 21,000,000 | 18,573,538 |
| Amgen, Inc.: | | | |
| 5.15% 3/2/28 (e) | | 18,313,000 | 18,240,541 |
| 5.25% 3/2/30 (e) | | 16,718,000 | 16,636,455 |
| 5.25% 3/2/33 (e) | | 18,873,000 | 18,741,512 |
| 5.6% 3/2/43 (e) | | 17,930,000 | 17,706,471 |
| 5.65% 3/2/53 (e) | | 8,913,000 | 8,839,634 |
| 5.75% 3/2/63 (e) | | 16,243,000 | 16,018,892 |
| | | | 114,757,043 |
| Health Care Providers & Services - 1.2% | | | |
| Centene Corp.: | | | |
| 2.45% 7/15/28 | | 43,675,000 | 36,600,524 |
| 2.625% 8/1/31 | | 20,375,000 | 15,876,462 |
| 3.375% 2/15/30 | | 21,905,000 | 18,482,987 |
| 4.25% 12/15/27 | | 25,155,000 | 23,244,478 |
| 4.625% 12/15/29 | | 39,085,000 | 35,742,953 |
| Cigna Group: | | | |
| 3.05% 10/15/27 | | 17,500,000 | 16,004,389 |
| 4.375% 10/15/28 | | 32,914,000 | 31,604,171 |
| 4.8% 8/15/38 | | 20,493,000 | 18,875,379 |
| 4.8% 7/15/46 | | 11,000,000 | 9,715,015 |
| 4.9% 12/15/48 | | 20,474,000 | 18,414,293 |
| CVS Health Corp.: | | | |
| 3% 8/15/26 | | 3,494,000 | 3,241,934 |
| 3.625% 4/1/27 | | 9,782,000 | 9,198,728 |
| 4.78% 3/25/38 | | 33,481,000 | 30,415,407 |
| HCA Holdings, Inc.: | | | |
| 3.5% 9/1/30 | | 15,777,000 | 13,565,143 |
| 3.625% 3/15/32 (b) | | 4,163,000 | 3,519,145 |
| 5.625% 9/1/28 | | 19,767,000 | 19,546,034 |
| 5.875% 2/1/29 | | 21,543,000 | 21,534,525 |
| Humana, Inc. 3.7% 3/23/29 | | 13,384,000 | 12,142,625 |
| Sabra Health Care LP 3.2% 12/1/31 | | 48,562,000 | 36,080,382 |
| Toledo Hospital 5.325% 11/15/28 | | 11,480,000 | 9,462,964 |
| | | | 383,267,538 |
| Pharmaceuticals - 0.6% | | | |
| Bayer U.S. Finance II LLC 4.25% 12/15/25 (b) | | 46,388,000 | 44,866,260 |
| Elanco Animal Health, Inc.: | | | |
| 5.772% 8/28/23 | | 17,308,000 | 17,244,645 |
| 6.4% 8/28/28 (c) | | 7,291,000 | 6,961,957 |
| Shire Acquisitions Investments Ireland DAC 2.875% 9/23/23 | | 20,004,000 | 19,707,749 |
| Utah Acquisition Sub, Inc. 3.95% 6/15/26 | | 38,227,000 | 35,749,247 |
| Viatris, Inc.: | | | |
| 1.65% 6/22/25 | | 5,144,000 | 4,682,430 |
| 2.7% 6/22/30 | | 47,152,000 | 37,380,773 |
| 3.85% 6/22/40 | | 11,393,000 | 7,770,532 |
| 4% 6/22/50 | | 19,674,000 | 12,690,062 |
| | | | 187,053,655 |
TOTAL HEALTH CARE | | | 685,078,236 |
| INDUSTRIALS - 0.8% | | | |
| Aerospace & Defense - 0.3% | | | |
| BAE Systems Holdings, Inc. 3.8% 10/7/24 (b) | | 15,580,000 | 15,160,967 |
| BAE Systems PLC 3.4% 4/15/30 (b) | | 11,875,000 | 10,575,002 |
| The Boeing Co.: | | | |
| 5.04% 5/1/27 | | 15,531,000 | 15,297,351 |
| 5.15% 5/1/30 | | 15,531,000 | 15,028,824 |
| 5.705% 5/1/40 | | 15,530,000 | 14,784,853 |
| 5.805% 5/1/50 | | 36,500,000 | 34,719,761 |
| 5.93% 5/1/60 | | 15,530,000 | 14,502,208 |
| | | | 120,068,966 |
| Professional Services - 0.0% | | | |
| Thomson Reuters Corp. 3.85% 9/29/24 | | 5,745,000 | 5,562,530 |
| Trading Companies & Distributors - 0.3% | | | |
| Air Lease Corp.: | | | |
| 3% 9/15/23 | | 5,123,000 | 5,056,639 |
| 3.375% 7/1/25 | | 33,735,000 | 31,808,459 |
| 4.25% 2/1/24 | | 30,862,000 | 30,425,654 |
| 4.25% 9/15/24 | | 21,001,000 | 20,572,764 |
| | | | 87,863,516 |
| Transportation Infrastructure - 0.2% | | | |
| Avolon Holdings Funding Ltd.: | | | |
| 3.95% 7/1/24 (b) | | 11,478,000 | 11,098,892 |
| 4.25% 4/15/26 (b) | | 8,740,000 | 8,110,682 |
| 4.375% 5/1/26 (b) | | 25,641,000 | 23,853,434 |
| 5.25% 5/15/24 (b) | | 20,991,000 | 20,656,525 |
| | | | 63,719,533 |
TOTAL INDUSTRIALS | | | 277,214,545 |
| INFORMATION TECHNOLOGY - 1.3% | | | |
| Electronic Equipment & Components - 0.2% | | | |
| Dell International LLC/EMC Corp.: | | | |
| 5.3% 10/1/29 | | 12,450,000 | 12,029,237 |
| 5.45% 6/15/23 | | 6,431,000 | 6,426,492 |
| 5.85% 7/15/25 | | 6,711,000 | 6,751,684 |
| 6.02% 6/15/26 | | 8,322,000 | 8,424,445 |
| 6.1% 7/15/27 | | 12,320,000 | 12,659,532 |
| 6.2% 7/15/30 | | 10,663,000 | 10,826,567 |
| | | | 57,117,957 |
| Semiconductors & Semiconductor Equipment - 0.6% | | | |
| Broadcom, Inc.: | | | |
| 1.95% 2/15/28 (b) | | 8,829,000 | 7,482,584 |
| 2.45% 2/15/31 (b) | | 75,132,000 | 59,533,830 |
| 2.6% 2/15/33 (b) | | 75,132,000 | 56,783,435 |
| 3.5% 2/15/41 (b) | | 60,671,000 | 43,416,975 |
| 3.75% 2/15/51 (b) | | 28,473,000 | 19,846,375 |
| | | | 187,063,199 |
| Software - 0.5% | | | |
| Oracle Corp.: | | | |
| 1.65% 3/25/26 | | 35,590,000 | 31,813,889 |
| 2.3% 3/25/28 | | 56,229,000 | 48,796,582 |
| 2.8% 4/1/27 | | 31,398,000 | 28,479,053 |
| 2.875% 3/25/31 | | 59,040,000 | 48,948,121 |
| 3.6% 4/1/40 | | 31,590,000 | 23,319,019 |
| | | | 181,356,664 |
TOTAL INFORMATION TECHNOLOGY | | | 425,537,820 |
| REAL ESTATE - 3.2% | | | |
| Equity Real Estate Investment Trusts (REITs) - 2.7% | | | |
| Alexandria Real Estate Equities, Inc. 4.9% 12/15/30 | | 22,618,000 | 21,930,065 |
| American Homes 4 Rent LP: | | | |
| 2.375% 7/15/31 | | 4,099,000 | 3,222,603 |
| 3.625% 4/15/32 | | 15,949,000 | 13,474,322 |
| Boston Properties, Inc.: | | | |
| 3.25% 1/30/31 | | 20,338,000 | 16,968,651 |
| 4.5% 12/1/28 | | 20,395,000 | 18,926,410 |
| 6.75% 12/1/27 | | 23,825,000 | 24,728,438 |
| Corporate Office Properties LP: | | | |
| 2.25% 3/15/26 | | 8,922,000 | 7,956,650 |
| 2.75% 4/15/31 | | 6,692,000 | 5,038,542 |
| Healthcare Trust of America Holdings LP: | | | |
| 3.1% 2/15/30 | | 7,500,000 | 6,387,997 |
| 3.5% 8/1/26 | | 7,811,000 | 7,261,020 |
| Healthpeak Properties, Inc.: | | | |
| 3.25% 7/15/26 | | 3,144,000 | 2,943,664 |
| 3.5% 7/15/29 | | 3,594,000 | 3,201,341 |
| Hudson Pacific Properties LP 4.65% 4/1/29 | | 42,373,000 | 35,995,116 |
| Invitation Homes Operating Partnership LP 4.15% 4/15/32 | | 23,566,000 | 20,730,274 |
| Kite Realty Group Trust: | | | |
| 4% 3/15/25 | | 32,398,000 | 30,698,808 |
| 4.75% 9/15/30 | | 50,933,000 | 45,588,032 |
| LXP Industrial Trust (REIT): | | | |
| 2.7% 9/15/30 | | 9,405,000 | 7,524,788 |
| 4.4% 6/15/24 | | 8,452,000 | 8,187,933 |
| Omega Healthcare Investors, Inc.: | | | |
| 3.25% 4/15/33 | | 34,179,000 | 24,431,304 |
| 3.625% 10/1/29 | | 33,134,000 | 27,477,358 |
| 4.375% 8/1/23 | | 6,684,000 | 6,644,928 |
| 4.5% 1/15/25 | | 14,849,000 | 14,482,662 |
| 4.5% 4/1/27 | | 74,033,000 | 69,900,756 |
| 4.75% 1/15/28 | | 36,570,000 | 34,300,341 |
| 4.95% 4/1/24 | | 7,995,000 | 7,858,491 |
| 5.25% 1/15/26 | | 31,863,000 | 31,234,761 |
| Piedmont Operating Partnership LP 2.75% 4/1/32 | | 7,712,000 | 5,436,372 |
| Prologis LP 3.25% 6/30/26 | | 318,000 | 300,955 |
| Realty Income Corp.: | | | |
| 2.2% 6/15/28 | | 4,085,000 | 3,526,428 |
| 2.85% 12/15/32 | | 5,025,000 | 4,127,361 |
| 3.25% 1/15/31 | | 5,362,000 | 4,673,554 |
| 3.4% 1/15/28 | | 8,338,000 | 7,723,535 |
| Retail Opportunity Investments Partnership LP: | | | |
| 4% 12/15/24 | | 5,977,000 | 5,770,168 |
| 5% 12/15/23 | | 4,492,000 | 4,454,891 |
| Simon Property Group LP: | | | |
| 2.45% 9/13/29 | | 8,537,000 | 7,150,288 |
| 3.375% 12/1/27 | | 17,457,000 | 16,124,926 |
| SITE Centers Corp.: | | | |
| 3.625% 2/1/25 | | 13,207,000 | 12,531,469 |
| 4.25% 2/1/26 | | 16,356,000 | 15,499,527 |
| Store Capital Corp.: | | | |
| 2.75% 11/18/30 | | 10,084,000 | 7,616,181 |
| 4.625% 3/15/29 | | 9,743,000 | 8,597,090 |
| Sun Communities Operating LP: | | | |
| 2.3% 11/1/28 | | 8,675,000 | 7,334,234 |
| 2.7% 7/15/31 | | 23,304,000 | 18,591,537 |
| Ventas Realty LP: | | | |
| 3% 1/15/30 | | 43,597,000 | 37,057,112 |
| 3.5% 2/1/25 | | 8,762,000 | 8,412,813 |
| 4% 3/1/28 | | 12,591,000 | 11,631,422 |
| 4.125% 1/15/26 | | 8,982,000 | 8,645,408 |
| 4.75% 11/15/30 | | 53,358,000 | 50,299,423 |
| VICI Properties LP: | | | |
| 4.375% 5/15/25 | | 4,156,000 | 3,999,693 |
| 4.75% 2/15/28 | | 32,852,000 | 30,990,277 |
| 4.95% 2/15/30 | | 42,556,000 | 39,730,611 |
| 5.125% 5/15/32 | | 10,727,000 | 9,953,047 |
| Vornado Realty LP 2.15% 6/1/26 | | 10,254,000 | 8,785,581 |
| WP Carey, Inc.: | | | |
| 3.85% 7/15/29 | | 7,008,000 | 6,373,112 |
| 4% 2/1/25 | | 32,062,000 | 31,276,541 |
| 4.6% 4/1/24 | | 2,875,000 | 2,838,468 |
| | | | 876,547,279 |
| Real Estate Management & Development - 0.5% | | | |
| Brandywine Operating Partnership LP: | | | |
| 3.95% 11/15/27 | | 24,749,000 | 20,878,671 |
| 4.1% 10/1/24 | | 30,631,000 | 29,457,931 |
| 4.55% 10/1/29 | | 31,499,000 | 26,106,659 |
| 7.55% 3/15/28 | | 32,475,000 | 31,839,403 |
| CBRE Group, Inc.: | | | |
| 2.5% 4/1/31 | | 30,503,000 | 24,787,504 |
| 4.875% 3/1/26 | | 4,233,000 | 4,141,872 |
| Essex Portfolio LP 3.875% 5/1/24 | | 1,038,000 | 1,014,775 |
| Mid-America Apartments LP 4% 11/15/25 | | 447,000 | 431,319 |
| Tanger Properties LP: | | | |
| 2.75% 9/1/31 | | 23,464,000 | 17,404,243 |
| 3.125% 9/1/26 | | 16,163,000 | 14,670,089 |
| 3.875% 7/15/27 | | 8,715,000 | 8,002,806 |
| | | | 178,735,272 |
TOTAL REAL ESTATE | | | 1,055,282,551 |
| UTILITIES - 1.4% | | | |
| Electric Utilities - 0.6% | | | |
| Alabama Power Co. 3.05% 3/15/32 | | 33,143,000 | 28,224,856 |
| Cleco Corporate Holdings LLC 3.375% 9/15/29 | | 19,437,000 | 16,410,075 |
| Duke Energy Corp. 2.45% 6/1/30 | | 14,856,000 | 12,201,792 |
| Duquesne Light Holdings, Inc.: | | | |
| 2.532% 10/1/30 (b) | | 7,078,000 | 5,626,847 |
| 2.775% 1/7/32 (b) | | 24,917,000 | 19,597,127 |
| Entergy Corp. 2.8% 6/15/30 | | 15,246,000 | 12,774,529 |
| Eversource Energy 2.8% 5/1/23 | | 32,099,000 | 31,966,689 |
| Exelon Corp.: | | | |
| 2.75% 3/15/27 | | 7,336,000 | 6,651,040 |
| 3.35% 3/15/32 | | 8,906,000 | 7,604,316 |
| 4.05% 4/15/30 | | 9,268,000 | 8,500,052 |
| 4.1% 3/15/52 | | 6,597,000 | 5,240,722 |
| 4.7% 4/15/50 | | 4,127,000 | 3,589,664 |
| FirstEnergy Corp. 7.375% 11/15/31 | | 19,834,000 | 22,243,831 |
| IPALCO Enterprises, Inc. 3.7% 9/1/24 | | 11,464,000 | 11,072,767 |
| | | | 191,704,307 |
| Gas Utilities - 0.0% | | | |
| Nakilat, Inc. 6.067% 12/31/33 (b) | | 5,431,123 | 5,651,083 |
| Independent Power and Renewable Electricity Producers - 0.4% | | | |
| Emera U.S. Finance LP 3.55% 6/15/26 | | 9,377,000 | 8,802,561 |
| The AES Corp.: | | | |
| 2.45% 1/15/31 | | 9,656,000 | 7,670,100 |
| 3.3% 7/15/25 (b) | | 45,861,000 | 43,037,987 |
| 3.95% 7/15/30 (b) | | 66,879,000 | 58,552,565 |
| | | | 118,063,213 |
| Multi-Utilities - 0.4% | | | |
| Consolidated Edison Co. of New York, Inc. 3.35% 4/1/30 | | 4,303,000 | 3,845,797 |
| NiSource, Inc.: | | | |
| 2.95% 9/1/29 | | 47,860,000 | 41,307,598 |
| 3.6% 5/1/30 | | 21,965,000 | 19,607,433 |
| 5.8% 2/1/42 | | 11,523,000 | 11,127,900 |
| 5.95% 6/15/41 | | 17,565,000 | 17,683,596 |
| Puget Energy, Inc.: | | | |
| 4.1% 6/15/30 | | 17,963,000 | 16,128,144 |
| 4.224% 3/15/32 | | 30,357,000 | 26,841,507 |
| Sempra Energy 6% 10/15/39 | | 1,481,000 | 1,500,353 |
| WEC Energy Group, Inc. 3 month U.S. LIBOR + 2.610% 6.9761% 5/15/67 (c)(d) | | 14,096,000 | 12,041,094 |
| | | | 150,083,422 |
TOTAL UTILITIES | | | 465,502,025 |
| TOTAL NONCONVERTIBLE BONDS (Cost $13,055,167,699) | | | 11,775,645,013 |
| | | | |
| U.S. Treasury Obligations - 30.8% |
| | | Principal Amount (a) | Value ($) |
| U.S. Treasury Bonds: | | | |
| 1.75% 8/15/41 | | 238,590,000 | 165,335,414 |
| 1.875% 11/15/51 | | 440,986,000 | 286,813,158 |
| 2% 11/15/41 | | 311,610,000 | 225,223,432 |
| 2% 8/15/51 | | 996,710,000 | 669,937,072 |
| 2.25% 2/15/52 | | 536,840,000 | 382,771,113 |
| 2.875% 5/15/49 | | 264,876,000 | 216,618,904 |
| 2.875% 5/15/52 | | 83,620,000 | 68,473,674 |
| 3% 2/15/47 | | 647,997,000 | 539,356,253 |
| 3.25% 5/15/42 | | 163,800,000 | 144,777,446 |
| 3.625% 2/15/53 | | 395,000 | 376,052 |
| U.S. Treasury Notes: | | | |
| 0.75% 4/30/26 | | 132,810,000 | 118,392,852 |
| 0.875% 9/30/26 (f)(g) | | 318,050,000 | 281,350,013 |
| 1.125% 10/31/26 | | 400,000,000 | 356,312,500 |
| 1.125% 8/31/28 | | 300,720,000 | 256,352,054 |
| 1.25% 5/31/28 | | 1,469,052,000 | 1,268,664,109 |
| 1.875% 2/28/27 | | 350,000,000 | 318,746,092 |
| 2.5% 3/31/27 | | 413,000,000 | 385,187,031 |
| 2.625% 7/31/29 (f)(h) | | 305,690,000 | 280,303,399 |
| 2.75% 8/15/32 | | 545,773,000 | 495,971,214 |
| 2.875% 5/15/32 | | 783,535,000 | 720,607,345 |
| 3.125% 8/31/29 | | 250,000,000 | 236,083,985 |
| 3.875% 1/15/26 (h) | | 78,700,000 | 77,347,344 |
| 3.875% 11/30/29 | | 375,000,000 | 370,195,313 |
| 4% 2/15/26 (h) | | 13,700,000 | 13,510,555 |
| 4% 10/31/29 | | 1,270,000,000 | 1,262,508,981 |
| 4.125% 11/15/32 | | 950,000,000 | 965,140,625 |
| 4.375% 10/31/24 (f)(g)(h) | | 32,900,000 | 32,591,563 |
| TOTAL U.S. TREASURY OBLIGATIONS (Cost $11,935,428,920) | | | 10,138,947,493 |
| | | | |
| U.S. Government Agency - Mortgage Securities - 23.4% |
| | | Principal Amount (a) | Value ($) |
| Fannie Mae - 7.0% | | | |
| 12 month U.S. LIBOR + 1.360% 3.615% 10/1/35 (c)(d) | | 25,188 | 25,255 |
| 12 month U.S. LIBOR + 1.440% 1.945% 4/1/37 (c)(d) | | 45,417 | 45,432 |
| 12 month U.S. LIBOR + 1.460% 3.85% 1/1/35 (c)(d) | | 46,678 | 46,702 |
| 12 month U.S. LIBOR + 1.480% 3.796% 7/1/34 (c)(d) | | 21,235 | 21,429 |
| 12 month U.S. LIBOR + 1.530% 3.476% 3/1/36 (c)(d) | | 2,749 | 2,755 |
| 12 month U.S. LIBOR + 1.550% 3.803% 6/1/36 (c)(d) | | 29,075 | 29,536 |
| 12 month U.S. LIBOR + 1.560% 2.065% 3/1/37 (c)(d) | | 47,574 | 47,784 |
| 12 month U.S. LIBOR + 1.620% 3.584% 3/1/33 (c)(d) | | 44,861 | 44,971 |
| 12 month U.S. LIBOR + 1.620% 3.871% 5/1/35 (c)(d) | | 87,077 | 87,933 |
| 12 month U.S. LIBOR + 1.630% 3.491% 11/1/36 (c)(d) | | 72,810 | 73,463 |
| 12 month U.S. LIBOR + 1.630% 3.815% 9/1/36 (c)(d) | | 29,743 | 30,025 |
| 12 month U.S. LIBOR + 1.640% 3.274% 5/1/36 (c)(d) | | 80,775 | 81,873 |
| 12 month U.S. LIBOR + 1.640% 3.895% 6/1/47 (c)(d) | | 65,539 | 66,425 |
| 12 month U.S. LIBOR + 1.680% 3.76% 7/1/43 (c)(d) | | 57,390 | 58,163 |
| 12 month U.S. LIBOR + 1.700% 3.186% 6/1/42 (c)(d) | | 376,269 | 383,208 |
| 12 month U.S. LIBOR + 1.710% 3.926% 8/1/35 (c)(d) | | 7,077 | 7,175 |
| 12 month U.S. LIBOR + 1.730% 3.442% 5/1/36 (c)(d) | | 71,684 | 72,964 |
| 12 month U.S. LIBOR + 1.730% 3.854% 3/1/40 (c)(d) | | 94,626 | 95,628 |
| 12 month U.S. LIBOR + 1.750% 3.701% 7/1/35 (c)(d) | | 44,152 | 44,423 |
| 12 month U.S. LIBOR + 1.750% 4% 8/1/41 (c)(d) | | 134,078 | 136,467 |
| 12 month U.S. LIBOR + 1.800% 4.048% 12/1/40 (c)(d) | | 2,717,272 | 2,758,416 |
| 12 month U.S. LIBOR + 1.800% 4.05% 7/1/41 (c)(d) | | 168,255 | 171,598 |
| 12 month U.S. LIBOR + 1.800% 4.055% 1/1/42 (c)(d) | | 199,423 | 201,616 |
| 12 month U.S. LIBOR + 1.810% 2.521% 2/1/42 (c)(d) | | 117,839 | 119,298 |
| 12 month U.S. LIBOR + 1.810% 4.051% 7/1/41 (c)(d) | | 237,375 | 242,878 |
| 12 month U.S. LIBOR + 1.810% 4.06% 12/1/39 (c)(d) | | 73,711 | 74,362 |
| 12 month U.S. LIBOR + 1.810% 4.068% 9/1/41 (c)(d) | | 124,494 | 126,680 |
| 12 month U.S. LIBOR + 1.820% 2.792% 2/1/35 (c)(d) | | 8,698 | 8,760 |
| 12 month U.S. LIBOR + 1.830% 4.08% 10/1/41 (c)(d) | | 98,799 | 98,249 |
| 12 month U.S. LIBOR + 1.950% 3.622% 9/1/36 (c)(d) | | 44,770 | 45,178 |
| 12 month U.S. LIBOR + 1.950% 3.771% 7/1/37 (c)(d) | | 49,873 | 51,107 |
| 6 month U.S. LIBOR + 1.470% 3.112% 10/1/33 (c)(d) | | 14,788 | 14,760 |
| 6 month U.S. LIBOR + 1.500% 3.727% 1/1/35 (c)(d) | | 96,624 | 96,881 |
| 6 month U.S. LIBOR + 1.510% 5.523% 2/1/33 (c)(d) | | 6,873 | 6,994 |
| 6 month U.S. LIBOR + 1.530% 3.258% 12/1/34 (c)(d) | | 28,798 | 28,815 |
| 6 month U.S. LIBOR + 1.530% 3.437% 3/1/35 (c)(d) | | 35,715 | 35,756 |
| 6 month U.S. LIBOR + 1.550% 4.211% 10/1/33 (c)(d) | | 13,103 | 13,340 |
| 6 month U.S. LIBOR + 1.560% 5.64% 7/1/35 (c)(d) | | 22,624 | 23,141 |
| 6 month U.S. LIBOR + 1.740% 3.865% 12/1/34 (c)(d) | | 2,405 | 2,428 |
| 6 month U.S. LIBOR + 1.960% 3.434% 9/1/35 (c)(d) | | 19,011 | 19,265 |
| U.S. TREASURY 1 YEAR INDEX + 2.200% 2.583% 3/1/35 (c)(d) | | 33,346 | 33,816 |
| U.S. TREASURY 1 YEAR INDEX + 2.270% 4.395% 6/1/36 (c)(d) | | 66,587 | 67,753 |
| U.S. TREASURY 1 YEAR INDEX + 2.280% 3.53% 12/1/33 (c)(d) | | 301,216 | 306,500 |
| U.S. TREASURY 1 YEAR INDEX + 2.280% 4.407% 10/1/33 (c)(d) | | 64,857 | 65,975 |
| U.S. TREASURY 1 YEAR INDEX + 2.420% 4.166% 5/1/35 (c)(d) | | 16,528 | 16,848 |
| U.S. TREASURY 1 YEAR INDEX + 2.460% 3.982% 7/1/34 (c)(d) | | 95,499 | 97,425 |
| 1.5% 1/1/36 to 11/1/51 | | 76,134,883 | 63,160,525 |
| 2% 2/1/28 to 4/1/52 | | 529,454,972 | 439,937,866 |
| 2.5% 1/1/28 to 2/1/52 | | 751,486,290 | 650,954,724 |
| 3% 4/1/29 to 2/1/52 (f)(g) | | 385,097,494 | 347,045,205 |
| 3.4% 7/1/42 to 9/1/42 | | 64,215 | 59,660 |
| 3.5% 5/1/36 to 11/1/52 | | 269,157,311 | 247,844,505 |
| 3.65% 5/1/42 to 8/1/42 | | 20,440 | 19,268 |
| 3.9% 4/1/42 | | 5,574 | 5,325 |
| 4% 3/1/36 to 9/1/52 | | 147,657,885 | 141,521,183 |
| 4.25% 11/1/41 | | 11,056 | 10,756 |
| 4.5% to 4.5% 6/1/24 to 1/1/53 | | 221,170,762 | 215,225,361 |
| 5% 3/1/23 to 12/1/52 | | 82,040,061 | 81,679,983 |
| 5.264% 8/1/41 (c) | | 1,598,097 | 1,596,337 |
| 5.5% 12/1/23 to 12/1/52 | | 53,030,887 | 53,090,585 |
| 6% to 6% 9/1/29 to 12/1/52 | | 45,812,686 | 46,568,332 |
| 6.5% 7/1/23 to 5/1/38 | | 4,497,497 | 4,648,528 |
| 6.67% 2/1/39 (c) | | 719,945 | 732,384 |
| 7% to 7% 4/1/23 to 7/1/37 | | 758,283 | 785,001 |
| 7.5% to 7.5% 8/1/23 to 9/1/32 | | 400,383 | 413,614 |
| 8% 3/1/37 | | 25,501 | 27,756 |
| 8.5% 9/1/25 | | 138 | 140 |
| 9% 10/1/30 | | 5,864 | 6,282 |
TOTAL FANNIE MAE | | | 2,301,462,770 |
| Freddie Mac - 5.5% | | | |
| 12 month U.S. LIBOR + 1.320% 3.575% 1/1/36 (c)(d) | | 32,007 | 31,633 |
| 12 month U.S. LIBOR + 1.370% 3.634% 3/1/36 (c)(d) | | 215,679 | 214,344 |
| 12 month U.S. LIBOR + 1.500% 3.824% 3/1/36 (c)(d) | | 105,876 | 105,567 |
| 12 month U.S. LIBOR + 1.750% 4% 12/1/40 (c)(d) | | 1,282,344 | 1,286,910 |
| 12 month U.S. LIBOR + 1.750% 4% 7/1/41 (c)(d) | | 260,437 | 264,343 |
| 12 month U.S. LIBOR + 1.750% 4% 9/1/41 (c)(d) | | 463,687 | 468,302 |
| 12 month U.S. LIBOR + 1.860% 3.239% 4/1/36 (c)(d) | | 66,824 | 67,685 |
| 12 month U.S. LIBOR + 1.880% 3.255% 4/1/41 (c)(d) | | 46,990 | 47,677 |
| 12 month U.S. LIBOR + 1.880% 4.13% 9/1/41 (c)(d) | | 187,629 | 189,655 |
| 12 month U.S. LIBOR + 1.900% 3.966% 10/1/42 (c)(d) | | 165,657 | 167,302 |
| 12 month U.S. LIBOR + 1.910% 3.22% 5/1/41 (c)(d) | | 374,147 | 379,658 |
| 12 month U.S. LIBOR + 1.910% 3.568% 5/1/41 (c)(d) | | 387,109 | 394,233 |
| 12 month U.S. LIBOR + 1.910% 3.791% 6/1/41 (c)(d) | | 471,066 | 480,036 |
| 12 month U.S. LIBOR + 1.910% 4.16% 6/1/41 (c)(d) | | 122,511 | 125,031 |
| 12 month U.S. LIBOR + 1.960% 3.711% 6/1/33 (c)(d) | | 15,225 | 15,408 |
| 12 month U.S. LIBOR + 2.020% 2.93% 4/1/38 (c)(d) | | 57,762 | 58,542 |
| 12 month U.S. LIBOR + 2.030% 4.158% 3/1/33 (c)(d) | | 1,982 | 1,986 |
| 12 month U.S. LIBOR + 2.040% 4.265% 7/1/36 (c)(d) | | 92,728 | 94,479 |
| 12 month U.S. LIBOR + 2.160% 4.41% 11/1/35 (c)(d) | | 9,320 | 9,410 |
| 12 month U.S. LIBOR + 2.200% 4.45% 12/1/36 (c)(d) | | 121,662 | 123,339 |
| 6 month U.S. LIBOR + 1.120% 3.029% 8/1/37 (c)(d) | | 63,910 | 62,987 |
| 6 month U.S. LIBOR + 1.580% 5.08% 12/1/35 (c)(d) | | 340 | 345 |
| 6 month U.S. LIBOR + 1.650% 4.441% 4/1/35 (c)(d) | | 50,408 | 51,263 |
| 6 month U.S. LIBOR + 1.880% 3.488% 10/1/36 (c)(d) | | 165,130 | 165,990 |
| 6 month U.S. LIBOR + 1.990% 4% 10/1/35 (c)(d) | | 80,234 | 80,776 |
| 6 month U.S. LIBOR + 2.020% 5.51% 6/1/37 (c)(d) | | 57,310 | 58,581 |
| 6 month U.S. LIBOR + 2.680% 5.679% 10/1/35 (c)(d) | | 26,207 | 27,175 |
| U.S. TREASURY 1 YEAR INDEX + 2.030% 3.174% 6/1/33 (c)(d) | | 119,048 | 119,710 |
| U.S. TREASURY 1 YEAR INDEX + 2.240% 4.372% 1/1/35 (c)(d) | | 2,856 | 2,886 |
| U.S. TREASURY 1 YEAR INDEX + 2.260% 3.229% 6/1/33 (c)(d) | | 244,512 | 246,795 |
| U.S. TREASURY 1 YEAR INDEX + 2.430% 4.392% 3/1/35 (c)(d) | | 430,466 | 437,536 |
| 1.5% 7/1/35 to 8/1/51 | | 55,998,157 | 47,465,641 |
| 2% 8/1/35 to 4/1/52 | | 487,891,587 | 400,995,473 |
| 2.5% 1/1/28 to 4/1/52 | | 451,457,332 | 392,177,201 |
| 3% 6/1/31 to 4/1/52 (f) | | 228,555,838 | 205,019,907 |
| 3.5% 1/1/32 to 11/1/52 | | 332,292,905 | 307,782,529 |
| 4% 1/1/36 to 10/1/52 | | 170,621,072 | 164,220,151 |
| 4% 4/1/48 | | 50,963 | 48,712 |
| 4.5% 6/1/25 to 10/1/52 | | 55,004,011 | 54,150,656 |
| 5% 7/1/33 to 2/1/53 | | 141,189,482 | 139,861,781 |
| 5.5% 10/1/52 to 1/1/53 | | 51,200,276 | 51,169,324 |
| 6% 3/1/24 to 11/1/52 | | 3,336,093 | 3,399,967 |
| 6.5% 1/1/24 to 1/1/53 | | 13,161,973 | 13,566,009 |
| 7% 3/1/26 to 9/1/36 | | 848,942 | 885,425 |
| 7.5% 1/1/27 to 7/1/34 | | 63,974 | 67,276 |
| 8% 7/1/24 to 4/1/32 | | 17,647 | 18,541 |
| 8.5% 1/1/25 to 1/1/28 | | 14,751 | 15,238 |
TOTAL FREDDIE MAC | | | 1,786,623,415 |
| Ginnie Mae - 4.1% | | | |
| 3.5% 10/20/40 to 12/20/49 (f) | | 72,675,885 | 68,125,833 |
| 4% 7/20/33 to 5/20/49 | | 119,434,402 | 114,687,571 |
| 4.5% 6/20/33 to 5/20/42 | | 32,346,981 | 31,790,686 |
| 5.5% 6/15/33 to 9/15/39 | | 1,283,013 | 1,308,873 |
| 6% to 6% 10/15/30 to 5/15/40 | | 2,542,207 | 2,627,469 |
| 7% to 7% 12/15/23 to 11/15/32 | | 1,315,148 | 1,357,468 |
| 7.5% to 7.5% 4/15/23 to 9/15/31 | | 199,023 | 203,768 |
| 8% 12/15/23 to 11/15/29 | | 35,931 | 36,793 |
| 8.5% to 8.5% 11/15/27 to 1/15/31 | | 16,138 | 17,026 |
| 2% 10/20/50 to 4/20/51 | | 109,661,922 | 92,461,510 |
| 2% 3/1/53 (e) | | 31,300,000 | 26,234,799 |
| 2% 3/1/53 (e) | | 119,000,000 | 99,742,528 |
| 2% 3/1/53 (e) | | 35,800,000 | 30,006,576 |
| 2% 3/1/53 (e) | | 23,850,000 | 19,990,414 |
| 2% 3/1/53 (e) | | 29,700,000 | 24,893,723 |
| 2% 3/1/53 (e) | | 46,500,000 | 38,975,021 |
| 2% 3/1/53 (e) | | 20,550,000 | 17,224,445 |
| 2% 3/1/53 (e) | | 19,850,000 | 16,637,724 |
| 2% 4/1/53 (e) | | 118,200,000 | 99,178,180 |
| 2% 4/1/53 (e) | | 88,650,000 | 74,383,635 |
| 2.5% 7/20/51 to 12/20/51 | | 57,694,183 | 50,078,413 |
| 2.5% 3/1/53 (e) | | 62,400,000 | 53,961,236 |
| 2.5% 3/1/53 (e) | | 124,100,000 | 107,317,138 |
| 2.5% 3/1/53 (e) | | 49,250,000 | 42,589,597 |
| 2.5% 3/1/53 (e) | | 42,025,000 | 36,341,682 |
| 3% 4/15/42 to 2/20/50 (f)(g) | | 36,736,284 | 33,296,478 |
| 3% 3/1/53 (e) | | 50,500,000 | 45,048,702 |
| 3% 3/1/53 (e) | | 33,600,000 | 29,972,998 |
| 3% 3/1/53 (e) | | 68,625,000 | 61,217,171 |
| 3% 3/1/53 (e) | | 42,650,000 | 38,046,082 |
| 3.5% 3/1/53 (e) | | 17,350,000 | 15,948,170 |
| 3.5% 3/1/53 (e) | | 28,850,000 | 26,519,004 |
| 3.5% 3/1/53 (e) | | 20,125,000 | 18,498,958 |
| 3.5% 3/1/53 (e) | | 23,075,000 | 21,210,607 |
| 5% 12/15/32 to 4/20/48 (f) | | 16,751,954 | 16,707,505 |
| 6.5% 3/20/31 to 6/15/37 | | 333,353 | 346,190 |
TOTAL GINNIE MAE | | | 1,356,983,973 |
| Uniform Mortgage Backed Securities - 6.8% | | | |
| 1.5% 3/1/38 (e) | | 45,950,000 | 39,722,750 |
| 1.5% 3/1/38 (e) | | 45,900,000 | 39,679,526 |
| 1.5% 3/1/38 (e) | | 26,375,000 | 22,800,599 |
| 1.5% 3/1/38 (e) | | 6,200,000 | 5,359,762 |
| 1.5% 4/1/38 (e) | | 48,650,000 | 42,119,555 |
| 1.5% 4/1/38 (e) | | 46,925,000 | 40,626,107 |
| 1.5% 3/1/53 (e) | | 107,300,000 | 82,850,654 |
| 1.5% 3/1/53 (e) | | 66,800,000 | 51,578,972 |
| 2% 3/1/38 (e) | | 48,000,000 | 42,600,912 |
| 2% 3/1/38 (e) | | 32,000,000 | 28,400,608 |
| 2% 4/1/38 (e) | | 37,250,000 | 33,100,823 |
| 2% 4/1/38 (e) | | 20,050,000 | 17,816,685 |
| 2% 3/1/53 (e) | | 48,050,000 | 39,124,914 |
| 2% 3/1/53 (e) | | 237,900,000 | 193,711,074 |
| 2% 3/1/53 (e) | | 132,800,000 | 108,132,958 |
| 2% 3/1/53 (e) | | 26,550,000 | 21,618,449 |
| 2% 3/1/53 (e) | | 203,550,000 | 165,741,442 |
| 2% 3/1/53 (e) | | 19,600,000 | 15,959,382 |
| 2% 4/1/53 (e) | | 15,650,000 | 12,758,362 |
| 2% 4/1/53 (e) | | 230,100,000 | 187,584,607 |
| 2% 4/1/53 (e) | | 137,550,000 | 112,134,997 |
| 2.5% 3/1/53 (e) | | 124,450,000 | 105,432,596 |
| 2.5% 3/1/53 (e) | | 96,750,000 | 81,965,478 |
| 2.5% 3/1/53 (e) | | 49,750,000 | 42,147,623 |
| 2.5% 4/1/53 (e) | | 31,700,000 | 26,883,115 |
| 3% 3/1/53 (e) | | 77,200,000 | 67,902,796 |
| 3% 3/1/53 (e) | | 54,100,000 | 47,584,732 |
| 3% 3/1/53 (e) | | 57,400,000 | 50,487,312 |
| 3% 3/1/53 (e) | | 22,800,000 | 20,054,194 |
| 3% 4/1/53 (e) | | 107,450,000 | 94,593,736 |
| 3% 4/1/53 (e) | | 35,850,000 | 31,560,591 |
| 4% 3/1/53 (e) | | 18,450,000 | 17,305,521 |
| 4% 3/1/53 (e) | | 18,450,000 | 17,305,521 |
| 4% 3/1/53 (e) | | 25,550,000 | 23,965,098 |
| 4% 3/1/53 (e) | | 25,650,000 | 24,058,895 |
| 4.5% 3/1/53 (e) | | 20,750,000 | 19,977,544 |
| 4.5% 3/1/53 (e) | | 35,450,000 | 34,130,310 |
| 5% 3/1/53 (e) | | 51,700,000 | 50,803,310 |
| 5.5% 3/1/53 (e) | | 42,850,000 | 42,774,665 |
| 5.5% 3/1/53 (e) | | 37,800,000 | 37,733,544 |
| 5.5% 3/1/53 (e) | | 39,250,000 | 39,180,995 |
| 5.5% 4/1/53 (e) | | 43,400,000 | 43,303,353 |
| 6.5% 3/1/53 (e) | | 11,150,000 | 11,419,106 |
TOTAL UNIFORM MORTGAGE BACKED SECURITIES | | | 2,233,993,173 |
| TOTAL U.S. GOVERNMENT AGENCY - MORTGAGE SECURITIES (Cost $8,234,934,986) | | | 7,679,063,331 |
| | | | |
| Asset-Backed Securities - 6.7% |
| | | Principal Amount (a) | Value ($) |
| AASET Trust: | | | |
| Series 2018-1A Class A, 3.844% 1/16/38 (b) | | 13,658,181 | 8,638,952 |
| Series 2019-1 Class A, 3.844% 5/15/39 (b) | | 10,188,863 | 7,176,053 |
| Series 2019-2: | | | |
Class A, 3.376% 10/16/39 (b) | | 27,481,441 | 21,253,537 |
Class B, 4.458% 10/16/39 (b) | | 5,909,968 | 1,947,344 |
| Series 2021-1A Class A, 2.95% 11/16/41 (b) | | 27,735,004 | 24,333,114 |
| Series 2021-2A Class A, 2.798% 1/15/47 (b) | | 51,017,141 | 43,009,312 |
| Aimco Series 2021-BA Class AR, 3 month U.S. LIBOR + 1.100% 5.8924% 1/15/32 (b)(c)(d) | | 8,704,000 | 8,595,191 |
| AIMCO CLO Ltd. Series 2021-11A Class AR, 3 month U.S. LIBOR + 1.130% 5.9224% 10/17/34 (b)(c)(d) | | 21,227,000 | 20,866,969 |
| AIMCO CLO Ltd. / AIMCO CLO LLC Series 2021-14A Class A, 3 month U.S. LIBOR + 0.990% 5.7977% 4/20/34 (b)(c)(d) | | 56,239,000 | 55,140,259 |
| Allegro CLO XV, Ltd. / Allegro CLO VX LLC Series 2022-1A Class A, CME TERM SOFR 3 MONTH INDEX + 1.500% 6.139% 7/20/35 (b)(c)(d) | | 28,071,000 | 27,752,899 |
| Allegro CLO, Ltd. Series 2021-1A Class A, 3 month U.S. LIBOR + 1.140% 5.9477% 7/20/34 (b)(c)(d) | | 27,167,000 | 26,611,462 |
| Apollo Aviation Securitization Equity Trust Series 2020-1A: | | | |
| Class A, 3.351% 1/16/40 (b) | | 8,716,917 | 7,180,385 |
| Class B, 4.335% 1/16/40 (b) | | 1,551,112 | 683,344 |
| Ares CLO Series 2019-54A Class A, 3 month U.S. LIBOR + 1.320% 6.1124% 10/15/32 (b)(c)(d) | | 31,563,000 | 31,252,894 |
| Ares LIX CLO Ltd. Series 2021-59A Class A, 3 month U.S. LIBOR + 1.030% 5.8477% 4/25/34 (b)(c)(d) | | 18,644,000 | 18,260,605 |
| Ares LV CLO Ltd. Series 2021-55A Class A1R, 3 month U.S. LIBOR + 1.130% 5.9224% 7/15/34 (b)(c)(d) | | 34,311,000 | 33,856,722 |
| Ares LVIII CLO LLC Series 2022-58A Class AR, CME TERM SOFR 3 MONTH INDEX + 1.330% 5.9876% 1/15/35 (b)(c)(d) | | 42,880,000 | 42,134,788 |
| Ares XLI CLO Ltd. / Ares XLI CLO LLC Series 2021-41A Class AR2, 3 month U.S. LIBOR + 1.070% 5.8624% 4/15/34 (b)(c)(d) | | 37,984,000 | 37,239,514 |
| Ares XXXIV CLO Ltd. Series 2020-2A Class AR2, 3 month U.S. LIBOR + 1.250% 6.0424% 4/17/33 (b)(c)(d) | | 12,146,000 | 12,011,653 |
| Babson CLO Ltd. Series 2021-1A Class AR, 3 month U.S. LIBOR + 1.150% 5.9424% 10/15/36 (b)(c)(d) | | 21,905,000 | 21,551,650 |
| Barings CLO Ltd.: | | | |
| Series 2021-1A Class A, 3 month U.S. LIBOR + 1.020% 5.8377% 4/25/34 (b)(c)(d) | | 40,974,000 | 40,256,504 |
| Series 2021-4A Class A, 3 month U.S. LIBOR + 1.220% 6.0277% 1/20/32 (b)(c)(d) | | 36,000,000 | 35,712,864 |
| Bear Stearns Asset Backed Securities I Trust Series 2005-HE2 Class M2, 1 month U.S. LIBOR + 1.120% 5.742% 2/25/35 (c)(d) | | 268,753 | 265,222 |
| BETHP Series 2021-1A Class A, 3 month U.S. LIBOR + 1.130% 5.9224% 1/15/35 (b)(c)(d) | | 33,084,000 | 32,458,117 |
| Blackbird Capital Aircraft: | | | |
| Series 2016-1A: | | | |
Class A, 4.213% 12/16/41 (b) | | 32,505,105 | 27,142,413 |
Class AA, 2.487% 12/16/41 (b)(c) | | 2,831,789 | 2,607,661 |
| Series 2021-1A Class A, 2.443% 7/15/46 (b) | | 41,828,319 | 35,385,607 |
| Bristol Park CLO, Ltd. Series 2020-1A Class AR, 3 month U.S. LIBOR + 0.990% 5.7824% 4/15/29 (b)(c)(d) | | 33,912,366 | 33,629,469 |
| Castlelake Aircraft Securitization Trust Series 2019-1A: | | | |
| Class A, 3.967% 4/15/39 (b) | | 21,875,563 | 19,087,304 |
| Class B, 5.095% 4/15/39 (b) | | 11,988,233 | 8,572,077 |
| Castlelake Aircraft Structured Trust: | | | |
| Series 2018-1 Class A, 4.125% 6/15/43 (b) | | 13,187,920 | 11,525,061 |
| Series 2021-1A Class A, 3.474% 1/15/46 (b) | | 8,155,005 | 7,461,829 |
| Cedar Funding Ltd.: | | | |
| Series 2021-10A Class AR, 3 month U.S. LIBOR + 1.100% 5.9077% 10/20/32 (b)(c)(d) | | 26,444,000 | 26,073,044 |
| Series 2022-15A Class A, CME TERM SOFR 3 MONTH INDEX + 1.320% 5.959% 4/20/35 (b)(c)(d) | | 39,364,000 | 38,913,597 |
| Cedar Funding XII CLO Ltd. / Cedar Funding XII CLO LLC Series 2021-12A Class A1R, 3 month U.S. LIBOR + 1.130% 5.9477% 10/25/34 (b)(c)(d) | | 19,756,000 | 19,335,256 |
| CEDF Series 2021-6A Class ARR, 3 month U.S. LIBOR + 1.050% 5.8577% 4/20/34 (b)(c)(d) | | 32,995,000 | 32,066,191 |
| Cent CLO Ltd. / Cent CLO Series 2021-29A Class AR, 3 month U.S. LIBOR + 1.170% 5.9777% 10/20/34 (b)(c)(d) | | 32,158,000 | 31,439,204 |
| Citi Mortgage Loan Trust Series 2007-1 Class 1A, 1 month U.S. LIBOR + 1.350% 5.967% 10/25/37 (b)(c)(d) | | 59,791 | 59,557 |
| Columbia Cent CLO 31 Ltd. Series 2021-31A Class A1, 3 month U.S. LIBOR + 1.200% 6.0077% 4/20/34 (b)(c)(d) | | 35,800,000 | 34,882,625 |
| Columbia Cent CLO Ltd. / Columbia Cent CLO Corp. Series 2021-30A Class A1, 3 month U.S. LIBOR + 1.310% 6.1177% 1/20/34 (b)(c)(d) | | 47,700,000 | 46,873,741 |
| DB Master Finance LLC: | | | |
| Series 2017-1A Class A2II, 4.03% 11/20/47 (b) | | 30,135,900 | 27,984,347 |
| Series 2019-1A Class A23, 4.352% 5/20/49 (b) | | 2,735,775 | 2,545,332 |
| Dryden 98 CLO Ltd. Series 2022-98A Class A, CME TERM SOFR 3 MONTH INDEX + 1.300% 5.939% 4/20/35 (b)(c)(d) | | 22,130,000 | 21,716,545 |
| Dryden CLO, Ltd.: | | | |
| Series 2021-76A Class A1R, 3 month U.S. LIBOR + 1.150% 5.9577% 10/20/34 (b)(c)(d) | | 21,386,000 | 21,019,679 |
| Series 2021-83A Class A, 3 month U.S. LIBOR + 1.220% 6.0147% 1/18/32 (b)(c)(d) | | 25,810,000 | 25,537,550 |
| Dryden Senior Loan Fund: | | | |
| Series 2018-70X Class A1, 3 month U.S. LIBOR + 1.170% 5.9997% 1/16/32 (c)(d) | | 346,000 | 343,720 |
| Series 2020-78A Class A, 3 month U.S. LIBOR + 1.180% 5.9724% 4/17/33 (b)(c)(d) | | 23,800,000 | 23,542,032 |
| Series 2021-85A Class AR, 3 month U.S. LIBOR + 1.150% 5.9424% 10/15/35 (b)(c)(d) | | 29,140,000 | 28,562,999 |
| Series 2021-90A Class A1A, 3 month U.S. LIBOR + 1.130% 6.0453% 2/20/35 (b)(c)(d) | | 16,803,000 | 16,468,452 |
| Eaton Vance CLO, Ltd.: | | | |
| Series 2021-1A Class AR, 3 month U.S. LIBOR + 1.100% 5.8924% 4/15/31 (b)(c)(d) | | 14,552,000 | 14,419,111 |
| Series 2021-2A Class AR, 3 month U.S. LIBOR + 1.150% 5.9424% 1/15/35 (b)(c)(d) | | 37,869,000 | 37,339,667 |
| Eaton Vance CLO, Ltd. / Eaton Vance CLO LLC Series 2021-1A Class A13R, 3 month U.S. LIBOR + 1.250% 6.0424% 1/15/34 (b)(c)(d) | | 7,800,000 | 7,686,385 |
| Flatiron CLO Ltd. Series 2021-1A: | | | |
| Class A1, 3 month U.S. LIBOR + 1.110% 5.9076% 7/19/34 (b)(c)(d) | | 24,705,000 | 24,236,173 |
| Class AR, 3 month U.S. LIBOR + 1.080% 5.9516% 11/16/34 (b)(c)(d) | | 32,500,000 | 32,115,233 |
| Flatiron CLO Ltd. / Flatiron CLO LLC Series 2020-1A Class A, 3 month U.S. LIBOR + 1.300% 6.2153% 11/20/33 (b)(c)(d) | | 43,083,000 | 42,506,851 |
| Horizon Aircraft Finance I Ltd. Series 2018-1 Class A, 4.458% 12/15/38 (b) | | 12,575,159 | 10,720,222 |
| Horizon Aircraft Finance Ltd. Series 2019-1 Class A, 3.721% 7/15/39 (b) | | 12,419,586 | 10,556,549 |
| Invesco CLO Ltd. Series 2021-3A Class A, 3 month U.S. LIBOR + 1.130% 5.9453% 10/22/34 (b)(c)(d) | | 22,628,000 | 22,260,408 |
| KKR CLO Ltd. Series 2022-41A Class A1, CME TERM SOFR 3 MONTH INDEX + 1.330% 5.9619% 4/15/35 (b)(c)(d) | | 30,000,000 | 29,357,670 |
| Lucali CLO Ltd. Series 2021-1A Class A, 3 month U.S. LIBOR + 1.210% 6.0024% 1/15/33 (b)(c)(d) | | 16,500,000 | 16,356,632 |
| Madison Park Funding Series 2020-19A Class A1R2, 3 month U.S. LIBOR + 0.920% 5.7353% 1/22/28 (b)(c)(d) | | 20,400,934 | 20,281,119 |
| Madison Park Funding L Ltd. / Madison Park Funding L LLC Series 2021-50A Class A, 3 month U.S. LIBOR + 1.140% 5.9376% 4/19/34 (b)(c)(d) | | 38,620,000 | 38,052,402 |
| Madison Park Funding LII Ltd. / Madison Park Funding LII LLC Series 2021-52A Class A, 3 month U.S. LIBOR + 1.100% 5.9153% 1/22/35 (b)(c)(d) | | 36,551,000 | 35,665,808 |
| Madison Park Funding XLV Ltd./Madison Park Funding XLV LLC Series 2021-45A Class AR, 3 month U.S. LIBOR + 1.120% 5.9124% 7/15/34 (b)(c)(d) | | 24,703,000 | 24,377,242 |
| Madison Park Funding XXXII, Ltd. / Madison Park Funding XXXII LLC Series 2021-32A Class A2R, 3 month U.S. LIBOR + 1.200% 6.0153% 1/22/31 (b)(c)(d) | | 10,024,000 | 9,797,197 |
| Magnetite CLO Ltd. Series 2021-27A Class AR, 3 month U.S. LIBOR + 1.140% 5.9477% 10/20/34 (b)(c)(d) | | 7,927,000 | 7,805,439 |
| Magnetite IX, Ltd. / Magnetite IX LLC Series 2021-30A Class A, 3 month U.S. LIBOR + 1.130% 5.9477% 10/25/34 (b)(c)(d) | | 39,908,000 | 39,293,976 |
| Magnetite XXI Ltd. Series 2021-21A Class AR, 3 month U.S. LIBOR + 1.020% 5.8277% 4/20/34 (b)(c)(d) | | 31,864,000 | 31,335,121 |
| Magnetite XXIII, Ltd. Series 2021-23A Class AR, 3 month U.S. LIBOR + 1.130% 5.9477% 1/25/35 (b)(c)(d) | | 26,894,000 | 26,436,990 |
| Magnetite XXIX, Ltd. / Magnetite XXIX LLC Series 2021-29A Class A, 3 month U.S. LIBOR + 0.990% 5.7824% 1/15/34 (b)(c)(d) | | 33,150,000 | 32,765,990 |
| Milos CLO, Ltd. Series 2020-1A Class AR, 3 month U.S. LIBOR + 1.070% 5.8777% 10/20/30 (b)(c)(d) | | 37,023,609 | 36,703,021 |
| Park Place Securities, Inc. Series 2005-WCH1 Class M4, 1 month U.S. LIBOR + 1.240% 5.862% 1/25/36 (c)(d) | | 359,988 | 352,675 |
| Peace Park CLO, Ltd. Series 2021-1A Class A, 3 month U.S. LIBOR + 1.130% 5.9377% 10/20/34 (b)(c)(d) | | 13,185,000 | 12,968,542 |
| Planet Fitness Master Issuer LLC: | | | |
| Series 2019-1A Class A2, 3.858% 12/5/49 (b) | | 27,509,200 | 23,186,432 |
| Series 2022-1A: | | | |
Class A2I, 3.251% 12/5/51 (b) | | 26,331,025 | 23,291,450 |
Class A2II, 4.008% 12/5/51 (b) | | 23,529,198 | 19,511,446 |
| Project Silver Series 2019-1 Class A, 3.967% 7/15/44 (b) | | 23,504,648 | 19,920,208 |
| Rockland Park CLO Ltd. Series 2021-1A Class A, 3 month U.S. LIBOR + 1.120% 5.9277% 4/20/34 (b)(c)(d) | | 46,460,000 | 45,764,169 |
| RR 7 Ltd. Series 2022-7A Class A1AB, CME TERM SOFR 3 MONTH INDEX + 1.340% 5.9976% 1/15/37 (b)(c)(d) | | 42,692,000 | 42,244,887 |
| Sapphire Aviation Finance Series 2020-1A: | | | |
| Class A, 3.228% 3/15/40 (b) | | 24,995,086 | 20,153,215 |
| Class B, 4.335% 3/15/40 (b) | | 2,922,293 | 2,024,562 |
| SBA Tower Trust: | | | |
| Series 2019, 2.836% 1/15/50 (b) | | 34,963,000 | 32,836,218 |
| 1.884% 7/15/50 (b) | | 12,544,000 | 11,104,216 |
| 2.328% 7/15/52 (b) | | 9,591,000 | 8,264,546 |
| SYMP Series 2022-32A Class A1, CME TERM SOFR 3 MONTH INDEX + 1.320% 5.9735% 4/23/35 (b)(c)(d) | | 44,162,000 | 43,678,294 |
| Symphony CLO XXI, Ltd. Series 2021-21A Class AR, 3 month U.S. LIBOR + 1.060% 5.8524% 7/15/32 (b)(c)(d) | | 4,219,000 | 4,167,444 |
| Symphony CLO XXV Ltd. / Symphony CLO XXV LLC Series 2021-25A Class A, 3 month U.S. LIBOR + 0.980% 5.7776% 4/19/34 (b)(c)(d) | | 41,341,000 | 40,533,445 |
| Symphony CLO XXVI Ltd. / Symphony CLO XXVI LLC Series 2021-26A Class AR, 3 month U.S. LIBOR + 1.080% 5.8877% 4/20/33 (b)(c)(d) | | 36,991,000 | 36,296,235 |
| Terwin Mortgage Trust Series 2003-4HE Class A1, 1 month U.S. LIBOR + 0.860% 5.477% 9/25/34 (c)(d) | | 82,001 | 78,749 |
| Thunderbolt Aircraft Lease Ltd. Series 2018-A Class A, 4.147% 9/15/38 (b)(c) | | 27,623,736 | 22,790,411 |
| Thunderbolt III Aircraft Lease Ltd. Series 2019-1 Class A, 3.671% 11/15/39 (b) | | 36,597,025 | 29,382,478 |
| Trapeza CDO XII Ltd./Trapeza CDO XII, Inc. Series 2007-12A Class B, 3 month U.S. LIBOR + 0.560% 5.3484% 4/6/42 (b)(c)(d) | | 2,720,000 | 2,073,211 |
| Voya CLO Ltd. Series 2019-2A Class A, 3 month U.S. LIBOR + 1.270% 6.0777% 7/20/32 (b)(c)(d) | | 35,926,000 | 35,653,214 |
| Voya CLO Ltd./Voya CLO LLC: | | | |
| Series 2021-2A Class A1R, 3 month U.S. LIBOR + 1.160% 5.9576% 7/19/34 (b)(c)(d) | | 22,263,000 | 21,886,466 |
| Series 2021-3A Class AR, 3 month U.S. LIBOR + 1.150% 5.9577% 10/20/34 (b)(c)(d) | | 44,263,000 | 43,376,368 |
| Voya CLO, Ltd. Series 2021-1A Class AR, 3 month U.S. LIBOR + 1.150% 5.9424% 7/16/34 (b)(c)(d) | | 22,574,000 | 22,144,304 |
| TOTAL ASSET-BACKED SECURITIES (Cost $2,336,513,475) | | | 2,214,717,037 |
| | | | |
| Collateralized Mortgage Obligations - 1.1% |
| | | Principal Amount (a) | Value ($) |
| Private Sponsor - 0.4% | | | |
| Brass PLC Series 2021-10A Class A1, 0.669% 4/16/69 (b)(c) | | 11,077,844 | 10,562,248 |
| Cascade Funding Mortgage Trust: | | | |
| Series 2021-HB5 Class A, 0.8006% 2/25/31 (b) | | 13,076,635 | 12,652,743 |
| Series 2021-HB6 Class A, 0.8983% 6/25/36 (b) | | 15,656,998 | 14,855,662 |
| CFMT Series 2022-HB10 Class A, 3.25% 11/25/35 (b) | | 14,041,545 | 13,402,516 |
| CFMT LLC Series 2020-HB4 Class A, 0.9461% 12/26/30 (b) | | 7,978,755 | 7,751,552 |
| Citigroup Mortgage Loan Trust sequential payer Series 2014-8 Class 2A1, 3.45% 6/27/37 (b)(c) | | 26,740 | 26,136 |
| CSMC: | | | |
| floater Series 2015-1R Class 6A1, 1 month U.S. LIBOR + 0.280% 4.6105% 5/27/37 (b)(c)(d) | | 57,931 | 55,571 |
| Series 2014-3R: | | | |
Class 2A1, 1 month U.S. LIBOR + 0.700% 0% 5/27/37 (b)(c)(d)(i) | | 316,680 | 32 |
Class AA1, 1 month U.S. LIBOR + 0.280% 4.6106% 5/27/37 (b)(c)(d) | | 294,868 | 273,799 |
| New Residential Mortgage Loan Trust Series 2020-1A Class A1B, 3.5% 10/25/59 (b) | | 12,908,362 | 11,732,353 |
| New York Mortgage Trust sequential payer Series 2021-SP1 Class A1, 1.6696% 8/25/61 (b) | | 16,519,993 | 14,812,447 |
| Oceanview Trust sequential payer Series 2021-1 Class A, 1.2187% 12/29/51 (b)(c) | | 8,989,006 | 8,619,818 |
| Preston Ridge Partners Mortgage Trust Series 2021-RPL1 Class A1, 1.319% 7/25/51 (b) | | 10,435,134 | 9,134,389 |
| RMF Buyout Issuance Trust: | | | |
| sequential payer Series 2021-HB1 Class A, 1.2586% 11/25/31 (b) | | 14,119,383 | 13,319,241 |
| Series 2020-HB1 Class A1, 1.7188% 10/25/50 (b) | | 8,934,577 | 8,113,865 |
| Sequoia Mortgage Trust floater Series 2004-6 Class A3B, 6 month U.S. LIBOR + 0.880% 6.0669% 7/20/34 (c)(d) | | 4,229 | 3,780 |
| Thornburg Mortgage Securities Trust floater Series 2003-4 Class A1, 1 month U.S. LIBOR + 0.640% 5.257% 9/25/43 (c)(d) | | 105,451 | 98,324 |
| Towd Point Mortgage Trust sequential payer Series 2022-K147 Class A2, 3.75% 7/25/62 (b) | | 18,933,894 | 17,483,408 |
| Wells Fargo Mortgage Backed Securities Trust Series 2003-I Class A1, 4.1686% 9/25/33 (c) | | 11,407 | 10,865 |
TOTAL PRIVATE SPONSOR | | | 142,908,749 |
| U.S. Government Agency - 0.7% | | | |
| Fannie Mae: | | | |
| floater: | | | |
Series 2002-18 Class FD, 1 month U.S. LIBOR + 0.800% 5.417% 2/25/32 (c)(d) | | 17,140 | 17,212 |
Series 2002-39 Class FD, 1 month U.S. LIBOR + 1.000% 5.5979% 3/18/32 (c)(d) | | 31,994 | 32,360 |
Series 2002-60 Class FV, 1 month U.S. LIBOR + 1.000% 5.617% 4/25/32 (c)(d) | | 36,469 | 36,829 |
Series 2002-63 Class FN, 1 month U.S. LIBOR + 1.000% 5.617% 10/25/32 (c)(d) | | 44,783 | 45,231 |
Series 2002-7 Class FC, 1 month U.S. LIBOR + 0.750% 5.367% 1/25/32 (c)(d) | | 16,348 | 16,392 |
Series 2003-118 Class S, 8.100% - 1 month U.S. LIBOR 3.483% 12/25/33 (c)(j)(k) | | 626,278 | 87,338 |
Series 2006-104 Class GI, 6.680% - 1 month U.S. LIBOR 2.063% 11/25/36 (c)(j)(k) | | 444,743 | 37,625 |
| planned amortization class: | | | |
Series 1993-207 Class H, 6.5% 11/25/23 | | 24,372 | 24,357 |
Series 1996-28 Class PK, 6.5% 7/25/25 | | 11,486 | 11,489 |
Series 1999-17 Class PG, 6% 4/25/29 | | 192,510 | 193,689 |
Series 1999-32 Class PL, 6% 7/25/29 | | 226,140 | 227,896 |
Series 1999-33 Class PK, 6% 7/25/29 | | 168,112 | 169,365 |
Series 2001-52 Class YZ, 6.5% 10/25/31 | | 26,034 | 26,594 |
Series 2003-28 Class KG, 5.5% 4/25/23 | | 520 | 518 |
Series 2005-102 Class CO 11/25/35 (l) | | 108,496 | 91,274 |
Series 2005-39 Class TE, 5% 5/25/35 | | 24,280 | 24,360 |
Series 2005-73 Class SA, 17.500% - 1 month U.S. LIBOR 5.5458% 8/25/35 (c)(k) | | 25,337 | 25,301 |
Series 2005-81 Class PC, 5.5% 9/25/35 | | 318,039 | 323,114 |
Series 2006-12 Class BO 10/25/35 (l) | | 492,815 | 418,973 |
Series 2006-15 Class OP 3/25/36 (l) | | 616,313 | 512,513 |
Series 2006-37 Class OW 5/25/36 (l) | | 61,582 | 47,853 |
Series 2006-45 Class OP 6/25/36 (l) | | 191,101 | 149,863 |
Series 2006-62 Class KP 4/25/36 (l) | | 293,663 | 236,990 |
Series 2012-149: | | | |
Class DA, 1.75% 1/25/43 | | 2,489,627 | 2,248,268 |
Class GA, 1.75% 6/25/42 | | 2,697,106 | 2,418,643 |
| sequential payer: | | | |
Series 1997-41 Class J, 7.5% 6/18/27 | | 35,274 | 35,830 |
Series 1999-25 Class Z, 6% 6/25/29 | | 172,468 | 171,756 |
Series 2001-20 Class Z, 6% 5/25/31 | | 215,138 | 217,213 |
Series 2001-31 Class ZC, 6.5% 7/25/31 | | 110,112 | 110,763 |
Series 2002-16 Class ZD, 6.5% 4/25/32 | | 78,544 | 80,362 |
Series 2002-74 Class SV, 7.550% - 1 month U.S. LIBOR 2.933% 11/25/32 (c)(j)(k) | | 195,138 | 5,577 |
Series 2012-67 Class AI, 4.5% 7/25/27 (j) | | 236,641 | 7,534 |
| Series 06-116 Class SG, 6.640% - 1 month U.S. LIBOR 2.023% 12/25/36 (c)(j)(k) | | 302,134 | 27,109 |
| Series 07-40 Class SE, 6.440% - 1 month U.S. LIBOR 1.823% 5/25/37 (c)(j)(k) | | 162,003 | 17,033 |
| Series 1993-165 Class SH, 19.800% - 1 month U.S. LIBOR 6.7404% 9/25/23 (c)(k) | | 1,090 | 1,086 |
| Series 2003-21 Class SK, 8.100% - 1 month U.S. LIBOR 3.483% 3/25/33 (c)(j)(k) | | 42,363 | 4,672 |
| Series 2005-72 Class ZC, 5.5% 8/25/35 | | 2,458,267 | 2,462,393 |
| Series 2005-79 Class ZC, 5.9% 9/25/35 | | 1,019,493 | 1,020,379 |
| Series 2007-57 Class SA, 40.600% - 1 month U.S. LIBOR 12.918% 6/25/37 (c)(k) | | 147,603 | 177,123 |
| Series 2007-66: | | | |
Class SA, 39.600% - 1 month U.S. LIBOR 11.898% 7/25/37 (c)(k) | | 204,522 | 245,426 |
Class SB, 39.600% - 1 month U.S. LIBOR 11.898% 7/25/37 (c)(k) | | 63,862 | 70,953 |
| Series 2008-12 Class SG, 6.350% - 1 month U.S. LIBOR 1.733% 3/25/38 (c)(j)(k) | | 1,056,165 | 94,502 |
| Series 2010-135: | | | |
Class LS, 6.050% - 1 month U.S. LIBOR 1.433% 12/25/40 (c)(j)(k) | | 1,077,238 | 62,421 |
Class ZA, 4.5% 12/25/40 | | 1,447,815 | 1,428,156 |
| Series 2010-139 Class NI, 4.5% 2/25/40 (j) | | 256,056 | 5,878 |
| Series 2010-150 Class ZC, 4.75% 1/25/41 | | 3,423,015 | 3,348,426 |
| Series 2010-95 Class ZC, 5% 9/25/40 | | 7,958,468 | 7,962,103 |
| Series 2011-39 Class ZA, 6% 11/25/32 | | 721,702 | 735,191 |
| Series 2011-4 Class PZ, 5% 2/25/41 | | 1,054,703 | 1,002,752 |
| Series 2011-67 Class AI, 4% 7/25/26 (j) | | 84,842 | 2,278 |
| Series 2011-83 Class DI, 6% 9/25/26 (j) | | 527 | 5 |
| Series 2012-100 Class WI, 3% 9/25/27 (j) | | 1,596,890 | 69,060 |
| Series 2012-14 Class JS, 6.650% - 1 month U.S. LIBOR 2.033% 12/25/30 (c)(j)(k) | | 157,420 | 794 |
| Series 2012-9 Class SH, 6.550% - 1 month U.S. LIBOR 1.933% 6/25/41 (c)(j)(k) | | 143,841 | 1,178 |
| Series 2013-133 Class IB, 3% 4/25/32 (j) | | 570,111 | 16,983 |
| Series 2013-134 Class SA, 6.050% - 1 month U.S. LIBOR 1.433% 1/25/44 (c)(j)(k) | | 492,121 | 46,127 |
| Series 2013-51 Class GI, 3% 10/25/32 (j) | | 1,855,669 | 112,764 |
| Series 2013-N1 Class A, 6.720% - 1 month U.S. LIBOR 2.103% 6/25/35 (c)(j)(k) | | 882,813 | 63,479 |
| Series 2015-42 Class IL, 6% 6/25/45 (j) | | 3,094,596 | 535,558 |
| Series 2015-70 Class JC, 3% 10/25/45 | | 4,432,615 | 4,154,119 |
| Series 2017-30 Class AI, 5.5% 5/25/47 (j) | | 1,804,170 | 317,907 |
| Fannie Mae Stripped Mortgage-Backed Securities: | | | |
| Series 339 Class 5, 5.5% 7/25/33 (j) | | 154,620 | 25,191 |
| Series 343 Class 16, 5.5% 5/25/34 (j) | | 145,991 | 24,040 |
| Series 348 Class 14, 6.5% 8/25/34 (c)(j) | | 105,831 | 20,871 |
| Series 351: | | | |
Class 12, 5.5% 4/25/34 (c)(j) | | 66,222 | 11,245 |
Class 13, 6% 3/25/34 (j) | | 96,991 | 17,866 |
| Series 359 Class 19, 6% 7/25/35 (c)(j) | | 56,123 | 10,621 |
| Series 384 Class 6, 5% 7/25/37 (j) | | 619,481 | 105,737 |
| Freddie Mac: | | | |
| floater: | | | |
Series 2412 Class FK, 1 month U.S. LIBOR + 0.800% 5.3879% 1/15/32 (c)(d) | | 12,732 | 12,787 |
Series 2423 Class FA, 1 month U.S. LIBOR + 0.900% 5.4879% 3/15/32 (c)(d) | | 19,369 | 19,509 |
Series 2424 Class FM, 1 month U.S. LIBOR + 1.000% 5.5879% 3/15/32 (c)(d) | | 16,582 | 16,749 |
Series 2432: | | | |
Class FE, 1 month U.S. LIBOR + 0.900% 5.4879% 6/15/31 (c)(d) | | 31,673 | 31,878 |
Class FG, 1 month U.S. LIBOR + 0.900% 5.4879% 3/15/32 (c)(d) | | 10,732 | 10,807 |
| floater target amortization class Series 3366 Class FD, 1 month U.S. LIBOR + 0.250% 4.8379% 5/15/37 (c)(d) | | 783,021 | 771,592 |
| planned amortization class: | | | |
Series 2095 Class PE, 6% 11/15/28 | | 243,316 | 245,537 |
Series 2101 Class PD, 6% 11/15/28 | | 18,691 | 18,849 |
Series 2104 Class PG, 6% 12/15/28 | | 4,828 | 4,871 |
Series 2121 Class MG, 6% 2/15/29 | | 97,893 | 98,761 |
Series 2131 Class BG, 6% 3/15/29 | | 652,918 | 659,126 |
Series 2137 Class PG, 6% 3/15/29 | | 102,746 | 103,700 |
Series 2154 Class PT, 6% 5/15/29 | | 186,337 | 188,084 |
Series 2162 Class PH, 6% 6/15/29 | | 36,255 | 36,529 |
Series 2520 Class BE, 6% 11/15/32 | | 326,143 | 333,445 |
Series 2693 Class MD, 5.5% 10/15/33 | | 831,605 | 830,353 |
Series 2802 Class OB, 6% 5/15/34 | | 267,781 | 270,919 |
Series 3002 Class NE, 5% 7/15/35 | | 747,290 | 744,955 |
Series 3110 Class OP 9/15/35 (l) | | 183,260 | 167,427 |
Series 3119 Class PO 2/15/36 (l) | | 730,877 | 578,633 |
Series 3121 Class KO 3/15/36 (l) | | 114,463 | 92,813 |
Series 3123 Class LO 3/15/36 (l) | | 406,417 | 324,514 |
Series 3145 Class GO 4/15/36 (l) | | 430,858 | 345,631 |
Series 3189 Class PD, 6% 7/15/36 | | 640,304 | 658,309 |
Series 3225 Class EO 10/15/36 (l) | | 215,402 | 168,575 |
Series 3258 Class PM, 5.5% 12/15/36 | | 266,067 | 269,836 |
Series 3415 Class PC, 5% 12/15/37 | | 300,047 | 296,219 |
Series 3806 Class UP, 4.5% 2/15/41 | | 1,421,669 | 1,394,032 |
Series 3832 Class PE, 5% 3/15/41 | | 2,917,446 | 2,907,056 |
Series 4135 Class AB, 1.75% 6/15/42 | | 1,967,631 | 1,775,600 |
| sequential payer: | | | |
Series 2114 Class ZM, 6% 1/15/29 | | 2,123 | 2,143 |
Series 2135 Class JE, 6% 3/15/29 | | 53,746 | 54,268 |
Series 2274 Class ZM, 6.5% 1/15/31 | | 69,240 | 69,656 |
Series 2281 Class ZB, 6% 3/15/30 | | 128,594 | 129,731 |
Series 2303 Class ZV, 6% 4/15/31 | | 66,532 | 67,248 |
Series 2357 Class ZB, 6.5% 9/15/31 | | 532,099 | 541,085 |
Series 2502 Class ZC, 6% 9/15/32 | | 132,045 | 134,978 |
Series 2519 Class ZD, 5.5% 11/15/32 | | 191,834 | 194,341 |
Series 2546 Class MJ, 5.5% 3/15/23 | | 613 | 611 |
Series 2601 Class TB, 5.5% 4/15/23 | | 364 | 364 |
Series 2998 Class LY, 5.5% 7/15/25 | | 59,820 | 59,706 |
Series 3871 Class KB, 5.5% 6/15/41 | | 2,630,400 | 2,701,429 |
Series 4423 Class NJ, 3% 9/15/41 | | 2,127,451 | 2,098,893 |
| Series 06-3115 Class SM, 6.600% - 1 month U.S. LIBOR 2.0121% 2/15/36 (c)(j)(k) | | 221,198 | 17,425 |
| Series 1658 Class GZ, 7% 1/15/24 | | 1,740 | 1,746 |
| Series 2013-4281 Class AI, 4% 12/15/28 (j) | | 566,732 | 10,886 |
| Series 2017-4683 Class LM, 3% 5/15/47 | | 4,482,162 | 4,206,611 |
| Series 2380 Class SY, 8.200% - 1 month U.S. LIBOR 3.6121% 11/15/31 (c)(j)(k) | | 19,755 | 671 |
| Series 2587 Class IM, 6.5% 3/15/33 (j) | | 4,783 | 834 |
| Series 2933 Class ZM, 5.75% 2/15/35 | | 2,326,266 | 2,365,507 |
| Series 2935 Class ZK, 5.5% 2/15/35 | | 2,902,251 | 2,961,974 |
| Series 2947 Class XZ, 6% 3/15/35 | | 1,290,348 | 1,322,425 |
| Series 2996 Class ZD, 5.5% 6/15/35 | | 1,569,706 | 1,597,782 |
| Series 3237 Class C, 5.5% 11/15/36 | | 2,148,940 | 2,152,711 |
| Series 3244 Class SG, 6.660% - 1 month U.S. LIBOR 2.0721% 11/15/36 (c)(j)(k) | | 944,275 | 79,947 |
| Series 3287 Class SD, 6.750% - 1 month U.S. LIBOR 2.1621% 3/15/37 (c)(j)(k) | | 1,405,591 | 128,679 |
| Series 3297 Class BI, 6.760% - 1 month U.S. LIBOR 2.1721% 4/15/37 (c)(j)(k) | | 1,974,547 | 214,495 |
| Series 3336 Class LI, 6.580% - 1 month U.S. LIBOR 1.9921% 6/15/37 (c)(j)(k) | | 631,667 | 63,506 |
| Series 3949 Class MK, 4.5% 10/15/34 | | 524,084 | 516,304 |
| Series 4055 Class BI, 3.5% 5/15/31 (j) | | 547,070 | 14,795 |
| Series 4149 Class IO, 3% 1/15/33 (j) | | 1,012,270 | 81,271 |
| Series 4314 Class AI, 5% 3/15/34 (j) | | 165,660 | 5,242 |
| Series 4427 Class LI, 3.5% 2/15/34 (j) | | 1,729,684 | 105,632 |
| Series 4471 Class PA 4% 12/15/40 | | 2,460,993 | 2,389,775 |
| target amortization class Series 2156 Class TC, 6.25% 5/15/29 | | 81,162 | 81,548 |
| Freddie Mac Manufactured Housing participation certificates guaranteed: | | | |
| floater Series 1686 Class FA, 1 month U.S. LIBOR + 0.900% 5.359% 2/15/24 (c)(d) | | 6,317 | 6,324 |
| planned amortization class Series 2043 Class CJ, 6.5% 4/15/28 | | 5,816 | 5,849 |
| sequential payer: | | | |
Series 2043 Class ZH, 6% 4/15/28 | | 72,718 | 73,222 |
Series 2056 Class Z, 6% 5/15/28 | | 180,938 | 182,429 |
| Freddie Mac Multi-family Structured pass-thru certificates Series 4386 Class AZ, 4.5% 11/15/40 | | 5,854,485 | 5,659,981 |
| Ginnie Mae guaranteed REMIC pass-thru certificates: | | | |
| floater: | | | |
Series 2007-37 Class TS, 6.690% - 1 month U.S. LIBOR 2.1% 6/16/37 (c)(j)(k) | | 399,408 | 38,082 |
Series 2010-H03 Class FA, 1 month U.S. LIBOR + 0.550% 5.0673% 3/20/60 (c)(d)(m) | | 4,238,889 | 4,226,050 |
Series 2010-H17 Class FA, 1 month U.S. LIBOR + 0.330% 4.8473% 7/20/60 (c)(d)(m) | | 742,357 | 737,043 |
Series 2010-H18 Class AF, 1 month U.S. LIBOR + 0.300% 4.6916% 9/20/60 (c)(d)(m) | | 903,418 | 897,083 |
Series 2010-H19 Class FG, 1 month U.S. LIBOR + 0.300% 4.6916% 8/20/60 (c)(d)(m) | | 698,726 | 693,557 |
Series 2010-H27 Class FA, 1 month U.S. LIBOR + 0.380% 4.7716% 12/20/60 (c)(d)(m) | | 1,902,038 | 1,890,659 |
Series 2011-H05 Class FA, 1 month U.S. LIBOR + 0.500% 4.8916% 12/20/60 (c)(d)(m) | | 1,752,239 | 1,745,847 |
Series 2011-H07 Class FA, 1 month U.S. LIBOR + 0.500% 4.8916% 2/20/61 (c)(d)(m) | | 1,489,172 | 1,482,806 |
Series 2011-H12 Class FA, 1 month U.S. LIBOR + 0.490% 4.8816% 2/20/61 (c)(d)(m) | | 2,221,115 | 2,211,705 |
Series 2011-H13 Class FA, 1 month U.S. LIBOR + 0.500% 4.8916% 4/20/61 (c)(d)(m) | | 1,586,582 | 1,579,956 |
Series 2011-H14: | | | |
Class FB, 1 month U.S. LIBOR + 0.500% 4.8916% 5/20/61 (c)(d)(m) | | 3,007,436 | 2,996,463 |
Class FC, 1 month U.S. LIBOR + 0.500% 4.8916% 5/20/61 (c)(d)(m) | | 1,886,570 | 1,879,202 |
Series 2011-H17 Class FA, 1 month U.S. LIBOR + 0.530% 4.9216% 6/20/61 (c)(d)(m) | | 2,141,083 | 2,133,941 |
Series 2011-H20 Class FA, 1 month U.S. LIBOR + 0.550% 4.9416% 9/20/61 (c)(d)(m) | | 429,956 | 428,542 |
Series 2011-H21 Class FA, 1 month U.S. LIBOR + 0.600% 4.9916% 10/20/61 (c)(d)(m) | | 2,493,590 | 2,487,497 |
Series 2012-98 Class FA, 1 month U.S. LIBOR + 0.400% 4.9979% 8/20/42 (c)(d) | | 217,277 | 212,945 |
Series 2012-H01 Class FA, 1 month U.S. LIBOR + 0.700% 5.0916% 11/20/61 (c)(d)(m) | | 2,310,349 | 2,307,365 |
Series 2012-H03 Class FA, 1 month U.S. LIBOR + 0.700% 5.0916% 1/20/62 (c)(d)(m) | | 1,283,096 | 1,281,487 |
Series 2012-H06 Class FA, 1 month U.S. LIBOR + 0.630% 5.0216% 1/20/62 (c)(d)(m) | | 2,102,421 | 2,097,409 |
Series 2012-H07 Class FA, 1 month U.S. LIBOR + 0.630% 5.0216% 3/20/62 (c)(d)(m) | | 1,027,707 | 1,022,580 |
Series 2012-H21 Class DF, 1 month U.S. LIBOR + 0.650% 4.8391% 5/20/61 (c)(d)(m) | | 31,391 | 31,086 |
Series 2012-H23 Class WA, 1 month U.S. LIBOR + 0.520% 4.9116% 10/20/62 (c)(d)(m) | | 271,583 | 270,471 |
Series 2013-H07 Class BA, 1 month U.S. LIBOR + 0.360% 4.7516% 3/20/63 (c)(d)(m) | | 391,223 | 388,767 |
Series 2014-H03 Class FA, 1 month U.S. LIBOR + 0.600% 4.9916% 1/20/64 (c)(d)(m) | | 1,285,276 | 1,282,027 |
Series 2014-H05 Class FB, 1 month U.S. LIBOR + 0.600% 4.9916% 12/20/63 (c)(d)(m) | | 6,295,501 | 6,283,634 |
Series 2014-H11 Class BA, 1 month U.S. LIBOR + 0.500% 4.8916% 6/20/64 (c)(d)(m) | | 1,729,939 | 1,723,442 |
Series 2015-H07 Class FA, 1 month U.S. LIBOR + 0.300% 4.6916% 3/20/65 (c)(d)(m) | | 25,728 | 25,507 |
Series 2015-H13 Class FL, 1 month U.S. LIBOR + 0.280% 4.6716% 5/20/63 (c)(d)(m) | | 24,468 | 24,049 |
Series 2015-H19 Class FA, 1 month U.S. LIBOR + 0.200% 4.5916% 4/20/63 (c)(d)(m) | | 42,848 | 42,202 |
Series 2016-H20 Class FM, 1 month U.S. LIBOR + 0.400% 4.5967% 12/20/62 (c)(d)(m) | | 7,478 | 7,319 |
Series 2019-11 Class F, 1 month U.S. LIBOR + 0.400% 4.9979% 1/20/49 (c)(d) | | 5,847,357 | 5,782,203 |
Series 2019-128 Class FH, 1 month U.S. LIBOR + 0.500% 5.0979% 10/20/49 (c)(d) | | 2,066,330 | 2,022,508 |
Series 2019-23 Class NF, 1 month U.S. LIBOR + 0.450% 5.0479% 2/20/49 (c)(d) | | 4,268,243 | 4,215,610 |
| planned amortization class: | | | |
Series 2010-158 Class MS, 10.000% - 1 month U.S. LIBOR 0.8043% 12/20/40 (c)(k) | | 2,940,785 | 2,437,465 |
Series 2011-136 Class WI, 4.5% 5/20/40 (j) | | 142,436 | 9,912 |
Series 2016-69 Class WA, 3% 2/20/46 | | 4,886,620 | 4,520,543 |
Series 2017-134 Class BA, 2.5% 11/20/46 | | 2,975,640 | 2,673,993 |
Series 2017-153 Class GA, 3% 9/20/47 | | 5,584,221 | 5,078,051 |
Series 2017-182 Class KA, 3% 10/20/47 | | 4,266,592 | 3,888,913 |
Series 2018-13 Class Q, 3% 4/20/47 | | 5,441,448 | 5,036,601 |
| sequential payer: | | | |
Series 2004-24 Class ZM, 5% 4/20/34 | | 1,113,634 | 1,088,941 |
Series 2010-160 Class DY, 4% 12/20/40 | | 5,808,236 | 5,590,570 |
Series 2010-170 Class B, 4% 12/20/40 | | 1,292,591 | 1,244,138 |
Series 2017-139 Class BA, 3% 9/20/47 | | 9,973,388 | 8,923,317 |
| Series 2004-32 Class GS, 6.500% - 1 month U.S. LIBOR 1.91% 5/16/34 (c)(j)(k) | | 243,643 | 16,072 |
| Series 2004-73 Class AL, 7.200% - 1 month U.S. LIBOR 2.61% 8/17/34 (c)(j)(k) | | 227,587 | 23,434 |
| Series 2007-35 Class SC, 40.200% - 1 month U.S. LIBOR 12.66% 6/16/37 (c)(k) | | 10,239 | 11,403 |
| Series 2010-116 Class QB, 4% 9/16/40 | | 1,396,778 | 1,352,295 |
| Series 2010-14 Class SN, 5.950% - 1 month U.S. LIBOR 1.36% 2/16/40 (c)(j)(k) | | 1,411,383 | 73,162 |
| Series 2010-H10 Class FA, 1 month U.S. LIBOR + 0.330% 4.8473% 5/20/60 (c)(d)(m) | | 2,350,882 | 2,335,507 |
| Series 2011-52 Class HI, 7% 4/16/41 (j) | | 59,254 | 9,294 |
| Series 2011-94 Class SA, 6.100% - 1 month U.S. LIBOR 1.5021% 7/20/41 (c)(j)(k) | | 562,428 | 47,911 |
| Series 2012-76 Class GS, 6.700% - 1 month U.S. LIBOR 2.11% 6/16/42 (c)(j)(k) | | 887,442 | 76,780 |
| Series 2013-149 Class MA, 2.5% 5/20/40 | | 4,501,612 | 4,289,500 |
| Series 2014-2 Class BA, 3% 1/20/44 | | 10,157,913 | 9,245,107 |
| Series 2014-21 Class HA, 3% 2/20/44 | | 3,752,201 | 3,423,096 |
| Series 2014-25 Class HC, 3% 2/20/44 | | 6,448,183 | 5,874,497 |
| Series 2014-5 Class A, 3% 1/20/44 | | 5,518,079 | 5,025,866 |
| Series 2015-H13 Class HA, 2.5% 8/20/64 (m) | | 75,828 | 70,541 |
| Series 2016-H13 Class FB, U.S. TREASURY 1 YEAR INDEX + 0.500% 5.23% 5/20/66 (c)(d)(m) | | 817,261 | 815,236 |
| Series 2017-186 Class HK, 3% 11/16/45 | | 629,093 | 574,534 |
| Series 2017-H06 Class FA, U.S. TREASURY 1 YEAR INDEX + 0.350% 5.08% 8/20/66 (c)(d)(m) | | 10,445,326 | 10,399,524 |
| Ginnie Mae REMIC Trust Series 2015-H17 Class GZ, 4.3016% 5/20/65 (c)(m) | | 395,234 | 384,810 |
TOTAL U.S. GOVERNMENT AGENCY | | | 214,923,685 |
| TOTAL COLLATERALIZED MORTGAGE OBLIGATIONS (Cost $382,477,277) | | | 357,832,434 |
| | | | |
| Commercial Mortgage Securities - 5.4% |
| | | Principal Amount (a) | Value ($) |
| BAMLL Commercial Mortgage Securities Trust: | | | |
| floater Series 2022-DKLX: | | | |
Class A, CME Term SOFR 1 Month Index + 1.150% 5.713% 1/15/39 (b)(c)(d) | | 23,840,000 | 23,491,161 |
Class B, CME Term SOFR 1 Month Index + 1.550% 6.113% 1/15/39 (b)(c)(d) | | 4,503,000 | 4,428,358 |
Class C, CME Term SOFR 1 Month Index + 2.150% 6.713% 1/15/39 (b)(c)(d) | | 3,215,000 | 3,133,107 |
| sequential payer Series 2019-BPR: | | | |
Class AMP, 3.287% 11/5/32 (b) | | 38,600,000 | 35,332,676 |
Class ANM, 3.112% 11/5/32 (b) | | 22,568,000 | 20,596,399 |
| Series 2019-BPR: | | | |
Class BNM, 3.465% 11/5/32 (b) | | 5,065,000 | 4,239,825 |
Class CNM, 3.7186% 11/5/32 (b)(c) | | 2,095,000 | 1,661,379 |
| BANK: | | | |
| sequential payer: | | | |
Series 2018-BN10 Class A5, 3.688% 2/15/61 | | 965,000 | 897,729 |
Series 2019-BN21 Class A5, 2.851% 10/17/52 | | 26,963,000 | 23,405,790 |
Series 2019-BN24 Class A3, 2.96% 11/15/62 | | 12,772,000 | 11,117,722 |
| Series 2020-BN25 Class XB, 0.4397% 1/15/63 (c)(j) | | 27,800,000 | 676,491 |
| Series 2021-BN33 Class XA, 1.0572% 5/15/64 (c)(j) | | 14,543,651 | 837,112 |
| Bayview Commercial Asset Trust floater: | | | |
| Series 2005-3A Class A2, 1 month U.S. LIBOR + 0.600% 5.217% 11/25/35 (b)(c)(d) | | 15,103 | 13,869 |
| Series 2005-4A: | | | |
Class A2, 1 month U.S. LIBOR + 0.580% 5.202% 1/25/36 (b)(c)(d) | | 36,913 | 33,904 |
Class M1, 1 month U.S. LIBOR + 0.670% 5.292% 1/25/36 (b)(c)(d) | | 11,907 | 10,857 |
| Series 2006-4A Class A2, 1 month U.S. LIBOR + 0.400% 5.022% 12/25/36 (b)(c)(d) | | 79,150 | 73,317 |
| Series 2007-1 Class A2, 1 month U.S. LIBOR + 0.270% 5.022% 3/25/37 (b)(c)(d) | | 20,413 | 18,506 |
| Series 2007-2A: | | | |
Class A1, 1 month U.S. LIBOR + 0.270% 4.887% 7/25/37 (b)(c)(d) | | 63,519 | 56,586 |
Class A2, 1 month U.S. LIBOR + 0.320% 4.937% 7/25/37 (b)(c)(d) | | 59,540 | 54,373 |
Class M1, 1 month U.S. LIBOR + 0.370% 4.987% 7/25/37 (b)(c)(d) | | 20,320 | 18,400 |
| Series 2007-3: | | | |
Class A2, 1 month U.S. LIBOR + 0.290% 4.907% 7/25/37 (b)(c)(d) | | 21,760 | 19,507 |
Class M1, 1 month U.S. LIBOR + 0.310% 4.927% 7/25/37 (b)(c)(d) | | 11,544 | 10,347 |
Class M2, 1 month U.S. LIBOR + 0.340% 4.957% 7/25/37 (b)(c)(d) | | 12,361 | 10,994 |
Class M3, 1 month U.S. LIBOR + 0.370% 4.987% 7/25/37 (b)(c)(d) | | 19,819 | 16,876 |
Class M4, 1 month U.S. LIBOR + 0.500% 5.117% 7/25/37 (b)(c)(d) | | 31,260 | 26,585 |
Class M5, 1 month U.S. LIBOR + 0.600% 5.217% 7/25/37 (b)(c)(d) | | 14,833 | 16,048 |
| Benchmark Mortgage Trust: | | | |
| sequential payer: | | | |
Series 2018-B4 Class A5, 4.121% 7/15/51 | | 3,988,000 | 3,783,159 |
Series 2019-B10 Class A4, 3.717% 3/15/62 | | 6,658,000 | 6,126,045 |
Series 2019-B13 Class A4, 2.952% 8/15/57 | | 25,034,000 | 21,902,582 |
| Series 2018-B8 Class A5, 4.2317% 1/15/52 | | 49,694,000 | 47,135,793 |
| Series 2019-B14 Class XA, 0.7766% 12/15/62 (c)(j) | | 147,963,479 | 4,580,579 |
| Series 2020-B17 Class XA, 1.4159% 3/15/53 (c)(j) | | 134,820,775 | 7,988,158 |
| BFLD Trust floater sequential payer Series 2020-OBRK Class A, CME Term SOFR 1 Month Index + 2.160% 6.7265% 11/15/28 (b)(c)(d) | | 18,140,000 | 17,999,531 |
| BPR Trust floater Series 2022-OANA: | | | |
| Class A, CME Term SOFR 1 Month Index + 1.890% 6.4605% 4/15/37 (b)(c)(d) | | 82,074,000 | 80,585,416 |
| Class B, CME Term SOFR 1 Month Index + 2.440% 7.0095% 4/15/37 (b)(c)(d) | | 21,804,000 | 21,394,907 |
| BX Commercial Mortgage Trust: | | | |
| floater: | | | |
Series 2021-PAC: | | | |
| Class A, 1 month U.S. LIBOR + 0.680% 5.2771% 10/15/36 (b)(c)(d) | | 43,844,000 | 42,844,094 |
| Class B, 1 month U.S. LIBOR + 0.890% 5.4868% 10/15/36 (b)(c)(d) | | 6,559,000 | 6,339,747 |
| Class C, 1 month U.S. LIBOR + 1.090% 5.6866% 10/15/36 (b)(c)(d) | | 8,779,000 | 8,489,560 |
| Class D, 1 month U.S. LIBOR + 1.290% 5.8863% 10/15/36 (b)(c)(d) | | 8,523,000 | 8,158,540 |
| Class E, 1 month U.S. LIBOR + 1.940% 6.5355% 10/15/36 (b)(c)(d) | | 29,632,000 | 28,493,367 |
Series 2022-LP2: | | | |
| Class A, CME Term SOFR 1 Month Index + 1.010% 5.5754% 2/15/39 (b)(c)(d) | | 54,114,924 | 53,310,397 |
| Class B, CME Term SOFR 1 Month Index + 1.310% 5.8748% 2/15/39 (b)(c)(d) | | 16,305,313 | 15,945,925 |
| Class C, CME Term SOFR 1 Month Index + 1.560% 6.1242% 2/15/39 (b)(c)(d) | | 16,305,313 | 15,745,069 |
| Class D, CME Term SOFR 1 Month Index + 1.960% 6.5233% 2/15/39 (b)(c)(d) | | 16,305,313 | 15,447,820 |
| floater sequential payer Series 2019-CALM Class A, CME Term SOFR 1 Month Index + 0.990% 5.5525% 11/15/32 (b)(c)(d) | | 1,688,087 | 1,677,507 |
| BX Trust: | | | |
| floater: | | | |
Series 2018-EXCL Class D, 1 month U.S. LIBOR + 2.620% 7.213% 9/15/37 (b)(c)(d) | | 8,036,000 | 7,476,292 |
Series 2019-IMC: | | | |
| Class B, 1 month U.S. LIBOR + 1.300% 5.888% 4/15/34 (b)(c)(d) | | 16,075,000 | 15,629,854 |
| Class C, 1 month U.S. LIBOR + 1.600% 6.188% 4/15/34 (b)(c)(d) | | 10,627,000 | 10,252,476 |
| Class D, 1 month U.S. LIBOR + 1.900% 6.488% 4/15/34 (b)(c)(d) | | 11,156,000 | 10,706,679 |
Series 2019-XL: | | | |
| Class B, CME Term SOFR 1 Month Index + 1.190% 5.757% 10/15/36 (b)(c)(d) | | 15,196,300 | 15,043,609 |
| Class C, CME Term SOFR 1 Month Index + 1.360% 5.927% 10/15/36 (b)(c)(d) | | 19,103,750 | 18,864,239 |
| Class D, CME Term SOFR 1 Month Index + 1.560% 6.127% 10/15/36 (b)(c)(d) | | 30,204,750 | 29,711,585 |
| Class E, CME Term SOFR 1 Month Index + 1.910% 6.477% 10/15/36 (b)(c)(d) | | 38,021,350 | 37,342,083 |
Series 2022-GPA Class A, CME Term SOFR 1 Month Index + 2.160% 6.7275% 10/15/39 (b)(c)(d) | | 20,271,000 | 20,232,933 |
Series 2022-IND: | | | |
| Class A, CME Term SOFR 1 Month Index + 1.490% 6.0528% 4/15/37 (b)(c)(d) | | 41,273,866 | 41,183,517 |
| Class B, CME Term SOFR 1 Month Index + 1.940% 6.5018% 4/15/37 (b)(c)(d) | | 21,039,309 | 20,901,146 |
| Class C, CME Term SOFR 1 Month Index + 2.290% 6.8518% 4/15/37 (b)(c)(d) | | 4,747,288 | 4,627,044 |
| Class D, CME Term SOFR 1 Month Index + 2.830% 7.4008% 4/15/37 (b)(c)(d) | | 3,975,212 | 3,833,505 |
| floater sequential payer: | | | |
Series 2019-IMC Class A, 1 month U.S. LIBOR + 1.000% 5.588% 4/15/34 (b)(c)(d) | | 32,462,000 | 31,889,922 |
Series 2019-XL Class A, CME Term SOFR 1 Month Index + 1.030% 5.597% 10/15/36 (b)(c)(d) | | 14,398,382 | 14,326,043 |
| CD Mortgage Trust sequential payer Series 2017-CD5 Class AAB, 3.22% 8/15/50 | | 2,661,923 | 2,520,658 |
| CF Hippolyta Issuer LLC sequential payer Series 2021-1A Class A1, 1.53% 3/15/61 (b) | | 52,378,503 | 45,485,046 |
| CGDB Commercial Mortgage Trust floater Series 2019-MOB: | | | |
| Class A, 1 month U.S. LIBOR + 0.950% 5.5379% 11/15/36 (b)(c)(d) | | 16,796,000 | 16,542,909 |
| Class B, 1 month U.S. LIBOR + 1.250% 5.8379% 11/15/36 (b)(c)(d) | | 9,400,000 | 9,234,752 |
| CHC Commercial Mortgage Trust floater Series 2019-CHC: | | | |
| Class A, 1 month U.S. LIBOR + 1.120% 5.708% 6/15/34 (b)(c)(d) | | 43,485,635 | 42,262,997 |
| Class B, 1 month U.S. LIBOR + 1.500% 6.088% 6/15/34 (b)(c)(d) | | 8,518,674 | 8,171,883 |
| Class C, 1 month U.S. LIBOR + 1.750% 6.338% 6/15/34 (b)(c)(d) | | 9,623,333 | 9,029,759 |
| CIM Retail Portfolio Trust floater Series 2021-RETL: | | | |
| Class C, 1 month U.S. LIBOR + 2.300% 6.888% 8/15/36 (b)(c)(d) | | 295,687 | 297,729 |
| Class D, 1 month U.S. LIBOR + 3.050% 7.638% 8/15/36 (b)(c)(d) | | 6,155,250 | 6,168,646 |
| Citigroup Commercial Mortgage Trust: | | | |
| Series 2015-GC33 Class XA, 0.8719% 9/10/58 (c)(j) | | 2,620,812 | 46,091 |
| Series 2016-P6 Class XA, 0.5604% 12/10/49 (c)(j) | | 2,094,578 | 35,466 |
| Series 2019-GC41 Class XA, 1.0409% 8/10/56 (c)(j) | | 14,761,054 | 665,828 |
| COMM Mortgage Trust: | | | |
| sequential payer: | | | |
Series 2013-CR7 Class AM, 3.314% 3/10/46 (b) | | 50,000 | 49,802 |
Series 2014-CR18 Class A5, 3.828% 7/15/47 | | 6,763,000 | 6,565,146 |
| Series 2014-CR20 Class XA, 0.9434% 11/10/47 (c)(j) | | 596,405 | 7,135 |
| Series 2014-LC17 Class XA, 0.6616% 10/10/47 (c)(j) | | 1,765,252 | 14,103 |
| Series 2014-UBS6 Class XA, 0.8349% 12/10/47 (c)(j) | | 1,438,354 | 15,755 |
| Credit Suisse Mortgage Trust: | | | |
| floater Series 2019-ICE4: | | | |
Class A, 1 month U.S. LIBOR + 0.980% 5.568% 5/15/36 (b)(c)(d) | | 3,732,713 | 3,713,973 |
Class B, 1 month U.S. LIBOR + 1.230% 5.818% 5/15/36 (b)(c)(d) | | 21,819,715 | 21,627,540 |
Class C, 1 month U.S. LIBOR + 1.430% 6.018% 5/15/36 (b)(c)(d) | | 4,146,684 | 4,104,946 |
| sequential payer Series 2020-NET Class A, 2.2569% 8/15/37 (b) | | 9,968,654 | 8,955,524 |
| Series 2018-SITE: | | | |
Class A, 4.284% 4/15/36 (b) | | 19,432,000 | 18,625,646 |
Class B, 4.5349% 4/15/36 (b) | | 6,067,000 | 5,744,496 |
Class C, 4.782% 4/15/36 (b)(c) | | 4,009,000 | 3,783,812 |
Class D, 4.782% 4/15/36 (b)(c) | | 8,018,000 | 7,453,501 |
| ELP Commercial Mortgage Trust floater Series 2021-ELP Class A, 1 month U.S. LIBOR + 0.700% 5.289% 11/15/38 (b)(c)(d) | | 59,815,000 | 58,241,166 |
| Extended Stay America Trust floater Series 2021-ESH: | | | |
| Class A, 1 month U.S. LIBOR + 1.080% 5.668% 7/15/38 (b)(c)(d) | | 21,033,038 | 20,716,757 |
| Class B, 1 month U.S. LIBOR + 1.380% 5.968% 7/15/38 (b)(c)(d) | | 11,978,855 | 11,784,820 |
| Class C, 1 month U.S. LIBOR + 1.700% 6.288% 7/15/38 (b)(c)(d) | | 8,831,611 | 8,654,545 |
| Class D, 1 month U.S. LIBOR + 2.250% 6.838% 7/15/38 (b)(c)(d) | | 17,699,341 | 17,300,140 |
| Freddie Mac sequential payer Series 2022-150 Class A2, 3.71% 9/25/32 | | 11,000,000 | 10,337,017 |
| GS Mortgage Securities Trust: | | | |
| floater: | | | |
Series 2018-3PCK Class A, 1 month U.S. LIBOR + 1.700% 6.538% 9/15/31 (b)(c)(d) | | 6,912,986 | 6,796,722 |
Series 2021-IP: | | | |
| Class A, 1 month U.S. LIBOR + 0.950% 5.538% 10/15/36 (b)(c)(d) | | 26,417,000 | 25,055,280 |
| Class B, 1 month U.S. LIBOR + 1.150% 5.738% 10/15/36 (b)(c)(d) | | 4,084,000 | 3,814,793 |
| Class C, 1 month U.S. LIBOR + 1.550% 6.138% 10/15/36 (b)(c)(d) | | 3,365,000 | 3,114,281 |
| Series 2014-GC20 Class XA, 1.0069% 4/10/47 (c)(j) | | 497,236 | 3,471 |
| Series 2015-GC34 Class XA, 1.2034% 10/10/48 (c)(j) | | 1,283,346 | 32,290 |
| Intown Mortgage Trust floater sequential payer Series 2022-STAY Class A, CME Term SOFR 1 Month Index + 2.480% 7.0506% 8/15/39 (b)(c)(d) | | 37,020,000 | 37,066,301 |
| JPMBB Commercial Mortgage Securities Trust Series 2013-C14 Class A/S, 4.4093% 8/15/46 | | 2,674,000 | 2,644,292 |
| JPMDB Commercial Mortgage Securities Trust sequential payer Series 2019-COR6 Class A4, 3.0565% 11/13/52 | | 8,383,000 | 7,128,328 |
| JPMorgan Chase Commercial Mortgage Securities Trust Series 2018-WPT: | | | |
| Class AFX, 4.2475% 7/5/33 (b) | | 11,968,000 | 10,771,200 |
| Class CFX, 4.9498% 7/5/33 (b) | | 4,047,000 | 3,318,540 |
| Class DFX, 5.3503% 7/5/33 (b) | | 6,993,000 | 5,524,470 |
| Class EFX, 5.3635% 7/5/33 (b)(c) | | 8,515,000 | 6,386,250 |
| Class XAFX, 1.116% 7/5/33 (b)(c)(j) | | 1,280,000 | 1,326 |
| Life Financial Services Trust floater Series 2022-BMR2: | | | |
| Class A1, CME Term SOFR 1 Month Index + 1.290% 5.8577% 5/15/39 (b)(c)(d) | | 54,000,000 | 53,797,370 |
| Class B, CME Term SOFR 1 Month Index + 1.790% 6.3564% 5/15/39 (b)(c)(d) | | 37,495,000 | 37,346,996 |
| Class C, CME Term SOFR 1 Month Index + 2.090% 6.6556% 5/15/39 (b)(c)(d) | | 21,010,000 | 20,753,779 |
| Class D, CME Term SOFR 1 Month Index + 2.540% 7.1044% 5/15/39 (b)(c)(d) | | 18,672,000 | 18,394,831 |
| LIFE Mortgage Trust floater Series 2021-BMR: | | | |
| Class A, 1 month U.S. LIBOR + 0.700% 5.288% 3/15/38 (b)(c)(d) | | 33,123,145 | 32,522,629 |
| Class B, 1 month U.S. LIBOR + 0.880% 5.468% 3/15/38 (b)(c)(d) | | 9,484,679 | 9,223,784 |
| Class C, 1 month U.S. LIBOR + 1.100% 5.688% 3/15/38 (b)(c)(d) | | 5,967,612 | 5,788,109 |
| Class D, 1 month U.S. LIBOR + 1.400% 5.988% 3/15/38 (b)(c)(d) | | 8,301,183 | 8,041,087 |
| Class E, 1 month U.S. LIBOR + 1.750% 6.338% 3/15/38 (b)(c)(d) | | 7,252,354 | 7,030,197 |
| Morgan Stanley BAML Trust Series 2015-C25 Class XA, 1.0381% 10/15/48 (c)(j) | | 1,510,441 | 27,344 |
| Morgan Stanley Capital I Trust: | | | |
| floater Series 2018-BOP Class A, 1 month U.S. LIBOR + 0.850% 5.438% 8/15/33 (b)(c)(d) | | 236,691 | 222,848 |
| floater sequential payer Series 2019-NUGS Class A, 1 month U.S. LIBOR + 0.950% 5.538% 12/15/36 (b)(c)(d) | | 34,300,000 | 33,106,991 |
| sequential payer Series 2019-MEAD Class A, 3.17% 11/10/36 (b) | | 49,092,000 | 45,750,185 |
| Series 2018-H4 Class A4, 4.31% 12/15/51 | | 11,199,000 | 10,622,409 |
| Series 2019-MEAD: | | | |
Class B, 3.1771% 11/10/36 (b)(c) | | 7,093,000 | 6,441,629 |
Class C, 3.1771% 11/10/36 (b)(c) | | 6,805,000 | 5,989,179 |
| Series 2021-L6 Class XA, 1.227% 6/15/54 (c)(j) | | 43,370,445 | 2,705,145 |
| Prima Capital Ltd.: | | | |
| floater Series 2021-9A Class B, 1 month U.S. LIBOR + 1.800% 6.3979% 12/15/37 (b)(c)(d) | | 11,673,000 | 11,405,859 |
| floater sequential payer Series 2021-9A Class A, 1 month U.S. LIBOR + 1.450% 6.0479% 12/15/37 (b)(c)(d) | | 2,434,781 | 2,410,953 |
| SPGN Mortgage Trust floater Series 2022-TFLM: | | | |
| Class B, CME Term SOFR 1 Month Index + 2.000% 6.5625% 2/15/39 (b)(c)(d) | | 10,413,000 | 9,917,003 |
| Class C, CME Term SOFR 1 Month Index + 2.650% 7.2125% 2/15/39 (b)(c)(d) | | 5,415,000 | 5,137,148 |
| SREIT Trust floater Series 2021-MFP: | | | |
| Class A, 1 month U.S. LIBOR + 0.730% 5.3187% 11/15/38 (b)(c)(d) | | 40,616,000 | 39,740,522 |
| Class B, 1 month U.S. LIBOR + 1.070% 5.6677% 11/15/38 (b)(c)(d) | | 23,262,000 | 22,651,589 |
| Class C, 1 month U.S. LIBOR + 1.320% 5.9169% 11/15/38 (b)(c)(d) | | 14,448,000 | 14,049,758 |
| Class D, 1 month U.S. LIBOR + 1.570% 6.1661% 11/15/38 (b)(c)(d) | | 9,495,000 | 9,221,388 |
| UBS Commercial Mortgage Trust Series 2017-C7 Class XA, 1.0036% 12/15/50 (c)(j) | | 1,885,781 | 66,578 |
| VLS Commercial Mortgage Trust: | | | |
| sequential payer Series 2020-LAB Class A, 2.13% 10/10/42 (b) | | 30,230,000 | 23,695,922 |
| Series 2020-LAB: | | | |
Class B, 2.453% 10/10/42 (b) | | 1,800,000 | 1,408,771 |
Class X, 0.4294% 10/10/42 (b)(c)(j) | | 57,900,000 | 1,518,752 |
| Wells Fargo Commercial Mortgage Trust: | | | |
| floater Series 2021-FCMT Class A, 1 month U.S. LIBOR + 1.200% 5.788% 5/15/31 (b)(c)(d) | | 25,318,000 | 24,218,171 |
| sequential payer Series 2015-C26 Class A4, 3.166% 2/15/48 | | 20,013,000 | 19,187,538 |
| Series 2015-C31 Class XA, 0.954% 11/15/48 (c)(j) | | 1,309,390 | 26,377 |
| Series 2017-C42 Class XA, 0.861% 12/15/50 (c)(j) | | 2,496,882 | 82,717 |
| Series 2018-C46 Class XA, 0.9301% 8/15/51 (c)(j) | | 12,911,008 | 311,602 |
| Series 2018-C48 Class A5, 4.302% 1/15/52 | | 12,901,000 | 12,260,891 |
| WF-RBS Commercial Mortgage Trust: | | | |
| Series 2014-C24 Class XA, 0.8392% 11/15/47 (c)(j) | | 975,759 | 10,179 |
| Series 2014-LC14 Class XA, 1.2358% 3/15/47 (c)(j) | | 881,862 | 5,859 |
| TOTAL COMMERCIAL MORTGAGE SECURITIES (Cost $1,868,869,540) | | | 1,775,074,262 |
| | | | |
| Municipal Securities - 0.8% |
| | | Principal Amount (a) | Value ($) |
| California Gen. Oblig.: | | | |
| Series 2009, 7.35% 11/1/39 | | 4,580,000 | 5,617,309 |
| Series 2010, 7.625% 3/1/40 | | 9,470,000 | 12,011,024 |
| Illinois Gen. Oblig.: | | | |
| Series 2003: | | | |
4.95% 6/1/23 | | 6,504,545 | 6,495,346 |
5.1% 6/1/33 | | 105,490,000 | 103,664,527 |
| Series 2010-1, 6.63% 2/1/35 | | 20,916,923 | 21,986,419 |
| Series 2010-3: | | | |
6.725% 4/1/35 | | 33,175,000 | 34,964,251 |
7.35% 7/1/35 | | 14,392,857 | 15,659,973 |
| New Jersey Econ. Dev. Auth. State Pension Fdg. Rev. Series 1997, 7.425% 2/15/29 (Nat'l. Pub. Fin. Guarantee Corp. Insured) | | 42,356,000 | 45,601,368 |
| TOTAL MUNICIPAL SECURITIES (Cost $251,185,644) | | | 246,000,217 |
| | | | |
| Foreign Government and Government Agency Obligations - 0.2% |
| | | Principal Amount (a) | Value ($) |
| Emirate of Abu Dhabi 3.875% 4/16/50 (b) | | 21,930,000 | 18,037,425 |
| Kingdom of Saudi Arabia: | | | |
| 3.25% 10/22/30 (b) | | 14,315,000 | 12,859,343 |
| 4.5% 4/22/60 (b) | | 9,380,000 | 7,986,484 |
| State of Qatar 4.4% 4/16/50 (b) | | 38,725,000 | 34,755,688 |
| TOTAL FOREIGN GOVERNMENT AND GOVERNMENT AGENCY OBLIGATIONS (Cost $85,600,769) | | | 73,638,940 |
| | | | |
| Supranational Obligations - 0.1% |
| | | Principal Amount (a) | Value ($) |
Corporacion Andina de Fomento 2.375% 5/12/23 (Cost $30,895,316) | | 30,900,000 | 30,706,554 |
| | | | |
| Bank Notes - 0.2% |
| | | Principal Amount (a) | Value ($) |
| Discover Bank 4.682% 8/9/28 (c) | | 15,090,000 | 14,435,974 |
| KeyBank NA 6.95% 2/1/28 | | 3,200,000 | 3,359,119 |
| Regions Bank 6.45% 6/26/37 | | 42,478,000 | 44,244,482 |
| TOTAL BANK NOTES (Cost $58,810,032) | | | 62,039,575 |
| | | | |
| Preferred Securities - 0.0% |
| | | Principal Amount (a) | Value ($) |
| FINANCIALS - 0.0% | | | |
| Banks - 0.0% | | | |
Bank of Nova Scotia 3 month U.S. LIBOR + 2.640% 7.4539% (c)(d)(n) (Cost $7,052,335) | | 6,962,000 | 6,822,332 |
| | | | |
| Money Market Funds - 5.0% |
| | | Shares | Value ($) |
Fidelity Cash Central Fund 4.63% (o) (Cost $1,637,274,571) | | 1,636,953,394 | 1,637,280,785 |
| | | | |
| TOTAL INVESTMENT IN SECURITIES - 109.5% (Cost $39,884,210,564) | 35,997,767,973 |
NET OTHER ASSETS (LIABILITIES) - (9.5)% | (3,124,846,471) |
| NET ASSETS - 100.0% | 32,872,921,502 |
| | |
| TBA Sale Commitments |
| | Principal Amount (a) | Value ($) |
| Ginnie Mae | | |
| 2% 3/1/53 | (24,250,000) | (20,325,683) |
| 2% 3/1/53 | (5,750,000) | (4,819,492) |
| 2% 3/1/53 | (118,200,000) | (99,071,990) |
| 2% 3/1/53 | (88,650,000) | (74,303,992) |
| | | |
| TOTAL GINNIE MAE | | (198,521,157) |
| | | |
| Uniform Mortgage Backed Securities | | |
| 1.5% 3/1/38 | (37,700,000) | (32,590,809) |
| 1.5% 3/1/38 | (1,950,000) | (1,685,732) |
| 1.5% 3/1/38 | (48,650,000) | (42,056,840) |
| 1.5% 3/1/38 | (46,925,000) | (40,565,616) |
| 2% 3/1/38 | (5,400,000) | (4,792,603) |
| 2% 3/1/38 | (17,300,000) | (15,354,079) |
| 2% 3/1/38 | (37,250,000) | (33,060,083) |
| 2% 3/1/38 | (20,050,000) | (17,794,756) |
| 2% 3/1/53 | (24,400,000) | (19,867,802) |
| 2% 3/1/53 | (32,550,000) | (26,503,974) |
| 2% 3/1/53 | (28,550,000) | (23,246,957) |
| 2% 3/1/53 | (41,100,000) | (33,465,848) |
| 2% 3/1/53 | (15,650,000) | (12,743,078) |
| 2% 3/1/53 | (230,100,000) | (187,359,892) |
| 2% 3/1/53 | (137,550,000) | (112,000,665) |
| 2.5% 3/1/53 | (2,500,000) | (2,117,971) |
| 2.5% 3/1/53 | (3,400,000) | (2,880,441) |
| 2.5% 3/1/53 | (3,550,000) | (3,007,519) |
| 2.5% 3/1/53 | (6,800,000) | (5,760,881) |
| 2.5% 3/1/53 | (18,600,000) | (15,757,704) |
| 2.5% 3/1/53 | (45,800,000) | (38,801,229) |
| 2.5% 3/1/53 | (31,700,000) | (26,855,872) |
| 2.5% 3/1/53 | (10,700,000) | (9,064,916) |
| 2.5% 3/1/53 | (20,150,000) | (17,070,846) |
| 3% 3/1/53 | (19,850,000) | (17,459,463) |
| 3% 3/1/53 | (107,450,000) | (94,509,786) |
| 3% 3/1/53 | (35,850,000) | (31,532,581) |
| 3.5% 3/1/53 | (34,975,000) | (31,843,667) |
| 3.5% 3/1/53 | (6,000,000) | (5,462,816) |
| 5.5% 3/1/53 | (43,400,000) | (43,323,698) |
| 5.5% 3/1/53 | (6,475,000) | (6,463,616) |
| 6.5% 3/1/53 | (11,150,000) | (11,419,106) |
| | | |
| TOTAL UNIFORM MORTGAGE BACKED SECURITIES | | (966,420,846) |
| | | |
TOTAL TBA SALE COMMITMENTS (Proceeds $1,174,287,607) | | (1,164,942,003) |
| Futures Contracts |
| | Number of contracts | Expiration Date | Notional Amount ($) | Value ($) | Unrealized Appreciation/ (Depreciation) ($) |
| Purchased | | | | | |
| | | | | | |
| Treasury Contracts | | | | | |
| CBOT 2-Year U.S. Treasury Note Contracts (United States) | 697 | Jun 2023 | 141,997,414 | (322,640) | (322,640) |
| CBOT 5-Year U.S. Treasury Note Contracts (United States) | 757 | Jun 2023 | 81,040,398 | (102,061) | (102,061) |
| | | | | | |
| TOTAL PURCHASED | | | | | (424,701) |
| | | | | | |
| Sold | | | | | |
| | | | | | |
| Treasury Contracts | | | | | |
| CBOT 10-Year U.S. Treasury Note Contracts (United States) | 954 | Jun 2023 | 106,520,063 | (91,450) | (91,450) |
| CBOT Long Term U.S. Treasury Bond Contracts (United States) | 1,373 | Jun 2023 | 171,925,344 | 10,558 | 10,558 |
| CBOT Ultra Long Term U.S. Treasury Bond Contracts (United States) | 104 | Jun 2023 | 14,046,500 | (80,668) | (80,668) |
| | | | | | |
| TOTAL SOLD | | | | | (161,560) |
| | | | | | |
| TOTAL FUTURES CONTRACTS | | | | | (586,261) |
| The notional amount of futures purchased as a percentage of Net Assets is 0.6% |
| The notional amount of futures sold as a percentage of Net Assets is 0.8% |
For the period, the average monthly notional amount at value for futures contracts in the aggregate was $695,777,027.
| Credit Default Swaps |
| Underlying Reference | | Maturity Date | Clearinghouse / Counterparty | Fixed Payment Received/ (Paid) | Payment Frequency | Notional Amount (1) | Value ($) | Upfront Premium Received/ (Paid) ($) | Unrealized Appreciation/ (Depreciation) ($) |
| Buy Protection | | | | | | | | | | |
| CMBX N.A. AAA Index Series 12 | | Aug 2061 | Citigroup Global Markets Ltd. | (0.5%) | Monthly | | 88,920,000 | 857,705 | (1,149) | 856,556 |
| CMBX N.A. AAA Index Series 13 | | Dec 2072 | Citigroup Global Markets Ltd. | (0.5%) | Monthly | | 14,200,000 | 192,440 | (160,112) | 32,328 |
| CMBX N.A. AAA Index Series 13 | | Dec 2072 | Citigroup Global Markets Ltd. | (0.5%) | Monthly | | 9,360,000 | 126,848 | (103,112) | 23,736 |
| CMBX N.A. AAA Index Series 13 | | Dec 2072 | Citigroup Global Markets Ltd. | (0.5%) | Monthly | | 4,750,000 | 64,372 | (97,759) | (33,387) |
| CMBX N.A. AAA Index Series 13 | | Dec 2072 | Citigroup Global Markets Ltd. | (0.5%) | Monthly | | 10,400,000 | 140,942 | (79,782) | 61,160 |
| CMBX N.A. AAA Index Series 13 | | Dec 2072 | Citigroup Global Markets Ltd. | (0.5%) | Monthly | | 7,900,000 | 107,062 | 7,330 | 114,392 |
| CMBX N.A. AAA Index Series 13 | | Dec 2072 | Citigroup Global Markets Ltd. | (0.5%) | Monthly | | 4,770,000 | 64,644 | (16,134) | 48,510 |
| CMBX N.A. AAA Index Series 13 | | Dec 2072 | Citigroup Global Markets Ltd. | (0.5%) | Monthly | | 6,630,000 | 89,850 | (20,197) | 69,653 |
| CMBX N.A. AAA Index Series 13 | | Dec 2072 | Goldman Sachs & Co. LLC | (0.5%) | Monthly | | 4,670,000 | 63,288 | (55,389) | 7,899 |
| CMBX N.A. AAA Index Series 13 | | Dec 2072 | Goldman Sachs & Co. LLC | (0.5%) | Monthly | | 3,440,000 | 46,619 | (65,525) | (18,906) |
| CMBX N.A. AAA Index Series 13 | | Dec 2072 | Goldman Sachs & Co. LLC | (0.5%) | Monthly | | 4,760,000 | 64,508 | (110,628) | (46,120) |
| CMBX N.A. AAA Index Series 13 | | Dec 2072 | Goldman Sachs & Co. LLC | (0.5%) | Monthly | | 4,670,000 | 63,288 | (6,933) | 56,355 |
| CMBX N.A. AAA Index Series 13 | | Dec 2072 | JPMorgan Securities LLC | (0.5%) | Monthly | | 23,710,000 | 321,320 | (28,969) | 292,351 |
| CMBX N.A. AAA Index Series 13 | | Dec 2072 | JPMorgan Securities LLC | (0.5%) | Monthly | | 4,630,000 | 62,746 | (64,534) | (1,788) |
| CMBX N.A. AAA Index Series 13 | | Dec 2072 | Morgan Stanley Capital Services LLC | (0.5%) | Monthly | | 4,570,000 | 61,933 | (77,413) | (15,480) |
| CMBX N.A. AAA Index Series 13 | | Dec 2072 | Morgan Stanley Capital Services LLC | (0.5%) | Monthly | | 9,360,000 | 126,848 | (88,342) | 38,506 |
| CMBX N.A. AAA Index Series 13 | | Dec 2072 | Morgan Stanley Capital Services LLC | (0.5%) | Monthly | | 13,230,000 | 179,294 | (226,017) | (46,723) |
| CMBX N.A. AAA Index Series 13 | | Dec 2072 | Morgan Stanley Capital Services LLC | (0.5%) | Monthly | | 4,940,000 | 66,947 | (66,747) | 200 |
| CMBX N.A. AAA Index Series 13 | | Dec 2072 | Morgan Stanley Capital Services LLC | (0.5%) | Monthly | | 8,020,000 | 108,688 | (43,029) | 65,659 |
| | | | | | | | | | | |
| TOTAL CREDIT DEFAULT SWAPS | | | | | | | | 2,809,342 | (1,304,441) | 1,504,901 |
(1)Notional amount is stated in U.S. Dollars unless otherwise noted.
| Interest Rate Swaps |
| Payment Received | Payment Frequency | Payment Paid | Payment Frequency | Clearinghouse / Counterparty (1) | Maturity Date | Notional Amount (2) | Value ($) | Upfront Premium Received/ (Paid) ($) (3) | Unrealized Appreciation/ (Depreciation) ($) |
| 4.5% | Annual | U.S. Secured Overnight Fin. Rate (SOFR) Index (4) | Annual | LCH | Mar 2025 | | 40,073,000 | (640,486) | 0 | (640,486) |
| 4% | Annual | U.S. Secured Overnight Fin. Rate (SOFR) Index (4) | Annual | LCH | Mar 2028 | | 4,509,000 | (126,945) | 0 | (126,945) |
| 3.75% | Annual | U.S. Secured Overnight Fin. Rate (SOFR) Index (4) | Annual | LCH | Mar 2030 | | 41,927,000 | (1,363,259) | 0 | (1,363,259) |
| 3.25% | Annual | U.S. Secured Overnight Fin. Rate (SOFR) Index (4) | Annual | LCH | Mar 2053 | | 1,971,000 | (154,022) | 0 | (154,022) |
| TOTAL INTEREST RATE SWAPS | | | | | | | | (2,284,712) | 0 | (2,284,712) |
(1)Swaps with LCH Clearnet Group (LCH) are centrally cleared over-the-counter (OTC) swaps.
(2)Notional amount is stated in U.S. Dollars unless otherwise noted.
(3)Any premiums for centrally cleared over-the-counter (OTC) swaps are recorded periodically throughout the term of the swap to variation margin and included in unrealized appreciation (depreciation).
(4)Represents floating rate.
Legend
| (a) | Amount is stated in United States dollars unless otherwise noted. |
| (b) | Security exempt from registration under Rule 144A of the Securities Act of 1933. These securities may be resold in transactions exempt from registration, normally to qualified institutional buyers. At the end of the period, the value of these securities amounted to $5,807,391,606 or 17.7% of net assets. |
| (c) | Coupon rates for floating and adjustable rate securities reflect the rates in effect at period end. |
| (d) | Coupon is indexed to a floating interest rate which may be multiplied by a specified factor and/or subject to caps or floors. |
| (e) | Security or a portion of the security purchased on a delayed delivery or when-issued basis. |
| (f) | Security or a portion of the security was pledged to cover margin requirements for futures contracts. At period end, the value of securities pledged amounted to $7,998,988. |
| (g) | Security or a portion of the security was pledged to cover margin requirements for centrally cleared OTC swaps. At period end, the value of securities pledged amounted to $2,523,669. |
| (h) | Security or a portion of the security has been segregated as collateral for mortgage-backed or asset-backed securities purchased on a delayed delivery or when-issued basis. At period end, the value of securities pledged amounted to $67,341,378. |
| (j) | Interest Only (IO) security represents the right to receive only monthly interest payments on an underlying pool of mortgages or assets. Principal shown is the outstanding par amount of the pool as of the end of the period. |
| (k) | Coupon is inversely indexed to a floating interest rate multiplied by a specified factor. The price may be considerably more volatile than the price of a comparable fixed rate security. |
| (l) | Principal Only Strips represent the right to receive the monthly principal payments on an underlying pool of mortgage loans. |
| (m) | Represents an investment in an underlying pool of reverse mortgages which typically do not require regular principal and interest payments as repayment is deferred until a maturity event. |
| (n) | Security is perpetual in nature with no stated maturity date. |
| (o) | Affiliated fund that is generally available only to investment companies and other accounts managed by Fidelity Investments. The rate quoted is the annualized seven-day yield of the fund at period end. A complete unaudited listing of the fund's holdings as of its most recent quarter end is available upon request. In addition, each Fidelity Central Fund's financial statements are available on the SEC's website or upon request. |
Affiliated Central Funds
Fiscal year to date information regarding the Fund's investments in Fidelity Central Funds, including the ownership percentage, is presented below.
| Affiliate | Value, beginning of period ($) | Purchases ($) | Sales Proceeds ($) | Dividend Income ($) | Realized Gain (loss) ($) | Change in Unrealized appreciation (depreciation) ($) | Value, end of period ($) | % ownership, end of period |
| Fidelity Cash Central Fund 4.63% | 1,236,037,565 | 4,347,058,700 | 3,945,815,480 | 32,115,458 | - | - | 1,637,280,785 | 3.7% |
| Fidelity Securities Lending Cash Central Fund 4.63% | 513,299,160 | 3,132,138,751 | 3,645,437,911 | 304,442 | - | - | - | 0.0% |
| Total | 1,749,336,725 | 7,479,197,451 | 7,591,253,391 | 32,419,900 | - | - | 1,637,280,785 | |
| | | | | | | | | |
Amounts in the dividend income column in the above table include any capital gain distributions from underlying funds, which are presented in the corresponding line item in the Statement of Operations, if applicable.
Amount for Fidelity Securities Lending Cash Central Fund represents the income earned on investing cash collateral, less rebates paid to borrowers and any lending agent fees associated with the loan, plus any premium payments received for lending certain types of securities.
Amounts included in the purchases and sales proceeds columns may include in-kind transactions, if applicable.
Investment Valuation
The following is a summary of the inputs used, as of February 28, 2023, involving the Fund's assets and liabilities carried at fair value. The inputs or methodology used for valuing securities may not be an indication of the risk associated with investing in those securities. For more information on valuation inputs, and their aggregation into the levels used below, please refer to the Investment Valuation section in the accompanying Notes to Financial Statements.
| Valuation Inputs at Reporting Date: |
| Description | Total ($) | Level 1 ($) | Level 2 ($) | Level 3 ($) |
Investments in Securities: | | | | |
|
| Corporate Bonds | 11,775,645,013 | - | 11,775,645,013 | - |
|
| U.S. Government and Government Agency Obligations | 10,138,947,493 | - | 10,138,947,493 | - |
|
| U.S. Government Agency - Mortgage Securities | 7,679,063,331 | - | 7,679,063,331 | - |
|
| Asset-Backed Securities | 2,214,717,037 | - | 2,214,717,037 | - |
|
| Collateralized Mortgage Obligations | 357,832,434 | - | 357,832,402 | 32 |
|
| Commercial Mortgage Securities | 1,775,074,262 | - | 1,775,074,262 | - |
|
| Municipal Securities | 246,000,217 | - | 246,000,217 | - |
|
| Foreign Government and Government Agency Obligations | 73,638,940 | - | 73,638,940 | - |
|
| Supranational Obligations | 30,706,554 | - | 30,706,554 | - |
|
| Bank Notes | 62,039,575 | - | 62,039,575 | - |
|
| Preferred Securities | 6,822,332 | - | 6,822,332 | - |
|
| Money Market Funds | 1,637,280,785 | 1,637,280,785 | - | - |
| Total Investments in Securities: | 35,997,767,973 | 1,637,280,785 | 34,360,487,156 | 32 |
Derivative Instruments: | | | | |
|
| Assets | | | | |
Futures Contracts | 10,558 | 10,558 | - | - |
Swaps | 2,809,342 | - | 2,809,342 | - |
| Total Assets | 2,819,900 | 10,558 | 2,809,342 | - |
|
| Liabilities | | | | |
Futures Contracts | (596,819) | (596,819) | - | - |
Swaps | (2,284,712) | - | (2,284,712) | - |
| Total Liabilities | (2,881,531) | (596,819) | (2,284,712) | - |
| Total Derivative Instruments: | (61,631) | (586,261) | 524,630 | - |
Other Financial Instruments: | | | | |
|
| TBA Sale Commitments | (1,164,942,003) | - | (1,164,942,003) | - |
| Total Other Financial Instruments: | (1,164,942,003) | - | (1,164,942,003) | - |
Value of Derivative Instruments
The following table is a summary of the Fund's value of derivative instruments by primary risk exposure as of February 28, 2023. For additional information on derivative instruments, please refer to the Derivative Instruments section in the accompanying Notes to Financial Statements.
Primary Risk Exposure / Derivative Type | Value |
| Asset ($) | Liability ($) |
| Credit Risk | | |
Swaps (a) | 2,809,342 | 0 |
| Total Credit Risk | 2,809,342 | 0 |
| Interest Rate Risk | | |
Futures Contracts (b) | 10,558 | (596,819) |
Swaps (c) | 0 | (2,284,712) |
| Total Interest Rate Risk | 10,558 | (2,881,531) |
| Total Value of Derivatives | 2,819,900 | (2,881,531) |
(a)For bi-lateral over-the-counter (OTC) swaps, reflects gross value which is presented in the Statement of Assets and Liabilities in the bi-lateral OTC swaps, at value line-items.
(b)Reflects gross cumulative appreciation (depreciation) on futures contracts as presented in the Schedule of Investments. In the Statement of Assets and Liabilities, the period end daily variation margin is included in receivable or payable for daily variation margin on futures contracts, and the net cumulative appreciation (depreciation) is included in Total accumulated earnings (loss).
(c)For centrally cleared over-the-counter (OTC) swaps, reflects gross cumulative appreciation (depreciation) as presented in the Schedule of Investments. In the Statement of Assets and Liabilities, the period end daily variation margin for centrally cleared OTC swaps is included in receivable or payable for daily variation margin on centrally cleared OTC swaps, and the net cumulative appreciation (depreciation) for centrally cleared OTC swaps is included in Total accumulated earnings (loss).
| Statement of Assets and Liabilities |
| | | | February 28, 2023 (Unaudited) |
| | | | | |
| Assets | | | | |
| Investment in securities, at value - See accompanying schedule: | | | | |
Unaffiliated issuers (cost $38,246,935,993) | $ | 34,360,487,188 | | |
Fidelity Central Funds (cost $1,637,274,571) | | 1,637,280,785 | | |
| | | | | |
| | | | | |
| Total Investment in Securities (cost $39,884,210,564) | | | $ | 35,997,767,973 |
| Receivable for investments sold | | | | 21,478,340 |
| Receivable for TBA sale commitments | | | | 1,174,287,607 |
| Receivable for fund shares sold | | | | 131,940,078 |
| Interest receivable | | | | 245,572,826 |
| Distributions receivable from Fidelity Central Funds | | | | 5,974,450 |
| Receivable for daily variation margin on futures contracts | | | | 71,500 |
| Receivable for daily variation margin on centrally cleared OTC swaps | | | | 238,470 |
| Bi-lateral OTC swaps, at value | | | | 2,809,342 |
| Other receivables | | | | 7,949 |
Total assets | | | | 37,580,148,535 |
| Liabilities | | | | |
| Payable for investments purchased | | | | |
Regular delivery | $ | 185,308,450 | | |
Delayed delivery | | 3,346,308,035 | | |
| TBA sale commitments, at value | | 1,164,942,003 | | |
| Payable for fund shares redeemed | | 10,491,867 | | |
| Other payables and accrued expenses | | 176,678 | | |
| Total Liabilities | | | | 4,707,227,033 |
| Net Assets | | | $ | 32,872,921,502 |
| Net Assets consist of: | | | | |
| Paid in capital | | | $ | 37,785,102,953 |
| Total accumulated earnings (loss) | | | | (4,912,181,451) |
| Net Assets | | | $ | 32,872,921,502 |
Net Asset Value , offering price and redemption price per share ($32,872,921,502 ÷ 3,320,517,811 shares) | | | $ | 9.90 |
| Statement of Operations |
| | | | Six months ended February 28, 2023 (Unaudited) |
| Investment Income | | | | |
| Dividends | | | $ | 278,708 |
| Interest | | | | 568,263,755 |
| Income from Fidelity Central Funds (including $304,442 from security lending) | | | | 32,419,900 |
| Total Income | | | | 600,962,363 |
| Expenses | | | | |
| Custodian fees and expenses | $ | 209,679 | | |
| Independent trustees' fees and expenses | | 61,990 | | |
| Total expenses before reductions | | 271,669 | | |
| Expense reductions | | (8,760) | | |
| Total expenses after reductions | | | | 262,909 |
| Net Investment income (loss) | | | | 600,699,454 |
| Realized and Unrealized Gain (Loss) | | | | |
| Net realized gain (loss) on: | | | | |
| Investment Securities: | | | | |
| Unaffiliated issuers | | (423,466,465) | | |
| Futures contracts | | 23,815,343 | | |
| Swaps | | (2,703,828) | | |
| Total net realized gain (loss) | | | | (402,354,950) |
| Change in net unrealized appreciation (depreciation) on: | | | | |
| Investment Securities: | | | | |
| Unaffiliated issuers | | (618,804,186) | | |
| Futures contracts | | (6,931,285) | | |
| Swaps | | (1,193,458) | | |
| TBA Sale commitments | | (4,697,758) | | |
| Total change in net unrealized appreciation (depreciation) | | | | (631,626,687) |
| Net gain (loss) | | | | (1,033,981,637) |
| Net increase (decrease) in net assets resulting from operations | | | $ | (433,282,183) |
| Statement of Changes in Net Assets |
| |
| | Six months ended February 28, 2023 (Unaudited) | | Year ended August 31, 2022 |
| Increase (Decrease) in Net Assets | | | | |
| Operations | | | | |
| Net investment income (loss) | $ | 600,699,454 | $ | 920,119,105 |
| Net realized gain (loss) | | (402,354,950) | | (535,867,093) |
| Change in net unrealized appreciation (depreciation) | | (631,626,687) | | (4,868,694,717) |
| Net increase (decrease) in net assets resulting from operations | | (433,282,183) | | (4,484,442,705) |
| Distributions to shareholders | | (600,798,647) | | (960,794,454) |
| Share transactions | | | | |
| Proceeds from sales of shares | | 4,786,384,872 | | 6,878,115,868 |
| Reinvestment of distributions | | 597,410,392 | | 960,793,948 |
| Cost of shares redeemed | | (4,352,264,491) | | (9,995,264,676) |
Net increase (decrease) in net assets resulting from share transactions | | 1,031,530,773 | | (2,156,354,860) |
| Total increase (decrease) in net assets | | (2,550,057) | | (7,601,592,019) |
| | | | | |
| Net Assets | | | | |
| Beginning of period | | 32,875,471,559 | | 40,477,063,578 |
| End of period | $ | 32,872,921,502 | $ | 32,875,471,559 |
| | | | | |
| Other Information | | | | |
| Shares | | | | |
| Sold | | 482,295,281 | | 617,533,601 |
| Issued in reinvestment of distributions | | 60,450,279 | | 87,457,810 |
| Redeemed | | (438,724,547) | | (917,543,527) |
| Net increase (decrease) | | 104,021,013 | | (212,552,116) |
| | | | | |
Financial Highlights
| Fidelity® Series Investment Grade Bond Fund |
| |
| | Six months ended (Unaudited) February 28, 2023 | | Years ended August 31, 2022 | | 2021 | | 2020 | | 2019 | | 2018 |
Selected Per-Share Data | | | | | | | | | | | | |
| Net asset value, beginning of period | $ | 10.22 | $ | 11.80 | $ | 12.28 | $ | 11.68 | $ | 10.97 | $ | 11.37 |
| Income from Investment Operations | | | | | | | | | | | | |
Net investment income (loss) A,B | | .186 | | .273 | | .267 | | .333 | | .362 | | .338 |
| Net realized and unrealized gain (loss) | | (.320) | | (1.568) | | (.028) | | .603 | | .727 | | (.390) |
| Total from investment operations | | (.134) | | (1.295) | | .239 | | .936 | | 1.089 | | (.052) |
| Distributions from net investment income | | (.186) | | (.276) | | (.251) | | (.336) | | (.379) | | (.337) |
| Distributions from net realized gain | | - | | (.009) | | (.468) | | - | | - | | (.011) |
| Total distributions | | (.186) | | (.285) | | (.719) | | (.336) | | (.379) | | (.348) |
| Net asset value, end of period | $ | 9.90 | $ | 10.22 | $ | 11.80 | $ | 12.28 | $ | 11.68 | $ | 10.97 |
Total Return C,D | | (1.29)% | | (11.11)% | | 2.06% | | 8.16% | | 10.16% | | (.45)% |
Ratios to Average Net Assets B,E,F | | | | | | | | | | | | |
Expenses before reductions G | | -% H | | -% | | -% | | -% | | -% | | -% |
Expenses net of fee waivers, if any G | | -% H | | -% | | -% | | -% | | -% | | -% |
Expenses net of all reductions G | | -% H | | -% | | -% | | -% | | -% | | -% |
| Net investment income (loss) | | 3.78% H | | 2.47% | | 2.27% | | 2.82% | | 3.27% | | 3.05% |
| Supplemental Data | | | | | | | | | | | | |
| Net assets, end of period (000 omitted) | $ | 32,872,922 | $ | 32,875,472 | $ | 40,477,064 | $ | 35,945,504 | $ | 29,040,336 | $ | 26,378,204 |
Portfolio turnover rate I | | 225% H | | 159% | | 248% | | 259% J | | 175% | | 103% |
A Calculated based on average shares outstanding during the period.
B Net investment income (loss) is affected by the timing of the declaration of dividends by any underlying mutual funds or exchange-traded funds (ETFs). Net investment income (loss) of any mutual funds or ETFs is not included in the Fund's net investment income (loss) ratio.
C Total returns for periods of less than one year are not annualized.
D Total returns would have been lower if certain expenses had not been reduced during the applicable periods shown.
E Fees and expenses of any underlying mutual funds or exchange-traded funds (ETFs) are not included in the Fund's expense ratio. The Fund indirectly bears its proportionate share of these expenses. For additional expense information related to investments in Fidelity Central Funds, please refer to the "Investments in Fidelity Central Funds" note found in the Notes to Financial Statements section of the most recent Annual or Semi-Annual report.
F Expense ratios reflect operating expenses of the class. Expenses before reductions do not reflect amounts reimbursed, waived, or reduced through arrangements with the investment adviser, brokerage services, or other offset arrangements, if applicable, and do not represent the amount paid by the class during periods when reimbursements, waivers or reductions occur.
G Amount represents less than .005%.
H Annualized.
I Amount does not include the portfolio activity of any underlying mutual funds or exchange-traded funds (ETFs).
J Portfolio turnover rate excludes securities received or delivered in-kind.
For the period ended February 28, 2023
1. Organization.
Fidelity Series Investment Grade Bond Fund (the Fund) is a fund of Fidelity Salem Street Trust (the Trust) and is authorized to issue an unlimited number of shares. Shares are offered only to certain other Fidelity funds, Fidelity managed 529 plans, and Fidelity managed collective investment trusts. The Trust is registered under the Investment Company Act of 1940, as amended (the 1940 Act), as an open-end management investment company organized as a Massachusetts business trust.
2. Investments in Fidelity Central Funds.
Funds may invest in Fidelity Central Funds, which are open-end investment companies generally available only to other investment companies and accounts managed by the investment adviser and its affiliates. The Schedule of Investments lists any Fidelity Central Funds held as an investment as of period end, but does not include the underlying holdings of each Fidelity Central Fund. An investing fund indirectly bears its proportionate share of the expenses of the underlying Fidelity Central Funds.
Based on its investment objective, each Fidelity Central Fund may invest or participate in various investment vehicles or strategies that are similar to those of the investing fund. These strategies are consistent with the investment objectives of the investing fund and may involve certain economic risks which may cause a decline in value of each of the Fidelity Central Funds and thus a decline in the value of the investing fund.
| Fidelity Central Fund | Investment Manager | Investment Objective | Investment Practices | Expense Ratio A |
| Fidelity Money Market Central Funds | Fidelity Management & Research Company LLC (FMR) | Each fund seeks to obtain a high level of current income consistent with the preservation of capital and liquidity. | Short-term Investments | Less than .005% |
A Expenses expressed as a percentage of average net assets and are as of each underlying Central Fund's most recent annual or semi-annual shareholder report.
A complete unaudited list of holdings for each Fidelity Central Fund is available upon request or at the Securities and Exchange Commission website at www.sec.gov. In addition, the financial statements of the Fidelity Central Funds which contain the significant accounting policies (including investment valuation policies) of those funds, and are not covered by the Report of Independent Registered Public Accounting Firm, are available on the Securities and Exchange Commission website or upon request.
3. Significant Accounting Policies.
The Fund is an investment company and applies the accounting and reporting guidance of the Financial Accounting Standards Board (FASB) Accounting Standards Codification Topic 946 Financial Services - Investment Companies . The financial statements have been prepared in conformity with accounting principles generally accepted in the United States of America (GAAP), which require management to make certain estimates and assumptions at the date of the financial statements. Actual results could differ from those estimates. Subsequent events, if any, through the date that the financial statements were issued have been evaluated in the preparation of the financial statements. The Fund's Schedule of Investments lists any underlying mutual funds or exchange-traded funds (ETFs) but does not include the underlying holdings of these funds. The following summarizes the significant accounting policies of the Fund:
Investment Valuation. Investments are valued as of 4:00 p.m. Eastern time on the last calendar day of the period. The Board of Trustees (the Board) has designated the Fund's investment adviser as the valuation designee responsible for the fair valuation function and performing fair value determinations as needed. The investment adviser has established a Fair Value Committee (the Committee) to carry out the day-to-day fair valuation responsibilities and has adopted policies and procedures to govern the fair valuation process and the activities of the Committee. In accordance with these fair valuation policies and procedures, which have been approved by the Board, the Fund attempts to obtain prices from one or more third party pricing services or brokers to value its investments. When current market prices, quotations or currency exchange rates are not readily available or reliable, investments will be fair valued in good faith by the Committee, in accordance with the policies and procedures. Factors used in determining fair value vary by investment type and may include market or investment specific events, transaction data, estimated cash flows, and market observations of comparable investments. The frequency that the fair valuation procedures are used cannot be predicted and they may be utilized to a significant extent. The Committee manages the Fund's fair valuation practices and maintains the fair valuation policies and procedures. The Fund's investment adviser reports to the Board information regarding the fair valuation process and related material matters.
The Fund categorizes the inputs to valuation techniques used to value its investments into a disclosure hierarchy consisting of three levels as shown below:
Level 1 - unadjusted quoted prices in active markets for identical investments
Level 2 - other significant observable inputs (including quoted prices for similar investments, interest rates, prepayment speeds, etc.)
Level 3 - unobservable inputs (including the Fund's own assumptions based on the best information available)
Valuation techniques used to value the Fund's investments by major category are as follows:
Debt securities, including restricted securities, are valued based on evaluated prices received from third party pricing services or from brokers who make markets in such securities. Corporate bonds, bank notes, foreign government and government agency obligations, municipal securities, preferred securities, supranational obligations and U.S. government and government agency obligations are valued by pricing services who utilize matrix pricing which considers yield or price of bonds of comparable quality, coupon, maturity and type or by broker-supplied prices. Asset backed securities, collateralized mortgage obligations, commercial mortgage securities and U.S. government agency mortgage securities are valued by pricing services who utilize matrix pricing which considers prepayment speed assumptions, attributes of the collateral, yield or price of bonds of comparable quality, coupon, maturity and type or by broker-supplied prices. Swaps are marked-to-market daily based on valuations from third party pricing services, registered derivatives clearing organizations (clearinghouses) or broker-supplied valuations. These pricing sources may utilize inputs such as interest rate curves, credit spread curves, default possibilities and recovery rates. When independent prices are unavailable or unreliable, debt securities and swaps may be valued utilizing pricing methodologies which consider similar factors that would be used by third party pricing services. Debt securities and swaps are generally categorized as Level 2 in the hierarchy but may be Level 3 depending on the circumstances.
Futures contracts are valued at the settlement price established each day by the board of trade or exchange on which they are traded and are categorized as Level 1 in the hierarchy. Investments in open-end mutual funds, including the Fidelity Central Funds, are valued at their closing net asset value (NAV) each business day and are categorized as Level 1 in the hierarchy.
Changes in valuation techniques may result in transfers in or out of an assigned level within the disclosure hierarchy. The aggregate value of investments by input level as of February 28, 2023 is included at the end of the Fund's Schedule of Investments.
Investment Transactions and Income. For financial reporting purposes, the Fund's investment holdings and NAV include trades executed through the end of the last business day of the period. The NAV per share for processing shareholder transactions is calculated as of the close of business of the New York Stock Exchange (NYSE), normally 4:00 p.m. Eastern time and includes trades executed through the end of the prior business day. Gains and losses on securities sold are determined on the basis of identified cost and include proceeds received from litigation. Dividend income is recorded on the ex-dividend date. Income and capital gain distributions from Fidelity Central Funds, if any, are recorded on the ex-dividend date. Interest income is accrued as earned and includes coupon interest and amortization of premium and accretion of discount on debt securities as applicable. Debt obligations may be placed on non-accrual status and related interest income may be reduced by ceasing current accruals and writing off interest receivables when the collection of all or a portion of interest has become doubtful based on consistently applied procedures. A debt obligation is removed from non-accrual status when the issuer resumes interest payments or when collectability of interest is reasonably assured.
Expenses. Expenses directly attributable to a fund are charged to that fund. Expenses attributable to more than one fund are allocated among the respective funds on the basis of relative net assets or other appropriate methods. Expenses included in the accompanying financial statements reflect the expenses of that fund and do not include any expenses associated with any underlying mutual funds or exchange-traded funds. Although not included in a fund's expenses, a fund indirectly bears its proportionate share of these expenses through the net asset value of each underlying mutual fund or exchange-traded fund. Expense estimates are accrued in the period to which they relate and adjustments are made when actual amounts are known.
Income Tax Information and Distributions to Shareholders. Each year, the Fund intends to qualify as a regulated investment company under Subchapter M of the Internal Revenue Code, including distributing substantially all of its taxable income and realized gains. As a result, no provision for U.S. Federal income taxes is required. The Fund files a U.S. federal tax return, in addition to state and local tax returns as required. The Fund's federal income tax returns are subject to examination by the Internal Revenue Service (IRS) for a period of three fiscal years after they are filed. State and local tax returns may be subject to examination for an additional fiscal year depending on the jurisdiction.
Distributions are declared and recorded daily and paid monthly from net investment income. Distributions from realized gains, if any, are declared and recorded on the ex-dividend date. Income and capital gain distributions are determined in accordance with income tax regulations, which may differ from GAAP.
Capital accounts within the financial statements are adjusted for permanent book-tax differences. These adjustments have no impact on net assets or the results of operations. Capital accounts are not adjusted for temporary book-tax differences which will reverse in a subsequent period.
Book-tax differences are primarily due to futures contracts, swaps, options, market discount, capital loss carryforwards and losses deferred due to wash sales, futures transactions and excise tax regulations.
As of period end, the cost and unrealized appreciation (depreciation) in securities, and derivatives if applicable, for federal income tax purposes were as follows:
| Gross unrealized appreciation | $60,747,974 |
| Gross unrealized depreciation | (3,909,310,544) |
| Net unrealized appreciation (depreciation) | $(3,848,562,570) |
| Tax cost | $39,854,310,075 |
The Fund elected to defer to its next fiscal year approximately $667,716,512 of capital losses recognized during the period November 1, 2021 to August 31, 2022.
Delayed Delivery Transactions and When-Issued Securities. During the period, certain Funds transacted in securities on a delayed delivery or when-issued basis. Payment and delivery may take place after the customary settlement period for that security. The price of the underlying securities and the date when the securities will be delivered and paid for are fixed at the time the transaction is negotiated. Securities purchased on a delayed delivery or when-issued basis are identified as such in the Schedule of Investments. Compensation for interest forgone in the purchase of a delayed delivery or when-issued debt security may be received. With respect to purchase commitments, each applicable Fund identifies securities as segregated in its records with a value at least equal to the amount of the commitment. Payables and receivables associated with the purchases and sales of delayed delivery securities having the same coupon, settlement date and broker are offset. Delayed delivery or when-issued securities that have been purchased from and sold to different brokers are reflected as both payables and receivables in the Statement of Assets and Liabilities under the caption "Delayed delivery", as applicable. Losses may arise due to changes in the value of the underlying securities or if the counterparty does not perform under the contract's terms, or if the issuer does not issue the securities due to political, economic, or other factors.
To-Be-Announced (TBA) Securities and Mortgage Dollar Rolls. TBA securities involve buying or selling mortgage-backed securities (MBS) on a forward commitment basis. A TBA transaction typically does not designate the actual security to be delivered and only includes an approximate principal amount; however delivered securities must meet specified terms defined by industry guidelines, including issuer, rate and current principal amount outstanding on underlying mortgage pools. Funds may enter into a TBA transaction with the intent to take possession of or deliver the underlying MBS, or a fund may elect to extend the settlement by entering into either a mortgage or reverse mortgage dollar roll. Mortgage dollar rolls are transactions where a fund sells TBA securities and simultaneously agrees to repurchase MBS on a later date at a lower price and with the same counterparty. Reverse mortgage dollar rolls involve the purchase and simultaneous agreement to sell TBA securities on a later date at a lower price. Transactions in mortgage dollar rolls and reverse mortgage dollar rolls are accounted for as purchases and sales and may result in an increase to a fund's portfolio turnover rate.
Purchases and sales of TBA securities involve risks similar to those discussed above for delayed delivery and when-issued securities. Also, if the counterparty in a mortgage dollar roll or a reverse mortgage dollar roll transaction files for bankruptcy or becomes insolvent, a fund's right to repurchase or sell securities may be limited. Additionally, when a fund sells TBA securities without already owning or having the right to obtain the deliverable securities (an uncovered forward commitment to sell), it incurs a risk of loss because it could have to purchase the securities at a price that is higher than the price at which it sold them. A fund may be unable to purchase the deliverable securities if the corresponding market is illiquid.
TBA securities subject to a forward commitment to sell at period end are included at the end of the Schedule of Investments under the caption "TBA Sale Commitments." The proceeds and value of these commitments are reflected in the Statement of Assets and Liabilities as "Receivable for TBA sale commitments" and "TBA sale commitments, at value," respectively.
Restricted Securities (including Private Placements). Funds may invest in securities that are subject to legal or contractual restrictions on resale. These securities generally may be resold in transactions exempt from registration or to the public if the securities are registered. Disposal of these securities may involve time-consuming negotiations and expense, and prompt sale at an acceptable price may be difficult. Information regarding restricted securities held at period end is included at the end of the Schedule of Investments, if applicable.
4. Derivative Instruments.
Risk Exposures and the Use of Derivative Instruments. The Fund's investment objectives allow for various types of derivative instruments, including futures contracts and swaps. Derivatives are investments whose value is primarily derived from underlying assets, indices or reference rates and may be transacted on an exchange or over-the-counter (OTC). Derivatives may involve a future commitment to buy or sell a specified asset based on specified terms, to exchange future cash flows at periodic intervals based on a notional principal amount, or for one party to make one or more payments upon the occurrence of specified events in exchange for periodic payments from the other party.
Derivatives were used to increase returns, to gain exposure to certain types of assets and to manage exposure to certain risks as defined below. The success of any strategy involving derivatives depends on analysis of numerous economic factors, and if the strategies for investment do not work as intended, the objectives may not be achieved.
Derivatives were used to increase or decrease exposure to the following risk(s):
| | |
| Credit Risk | Credit risk relates to the ability of the issuer of a financial instrument to make further principal or interest payments on an obligation or commitment that it has to a fund. |
| Interest Rate Risk | Interest rate risk relates to the fluctuations in the value of interest-bearing securities due to changes in the prevailing levels of market interest rates. |
Funds are also exposed to additional risks from investing in derivatives, such as liquidity risk and counterparty credit risk. Liquidity risk is the risk that a fund will be unable to close out the derivative in the open market in a timely manner. Counterparty credit risk is the risk that the counterparty will not be able to fulfill its obligation to a fund. Derivative counterparty credit risk is managed through formal evaluation of the creditworthiness of all potential counterparties. On certain OTC derivatives such as bi-lateral swaps, a fund attempts to reduce its exposure to counterparty credit risk by entering into an International Swaps and Derivatives Association, Inc. (ISDA) Master Agreement with each of its counterparties. The ISDA Master Agreement gives a fund the right to terminate all transactions traded under such agreement upon the deterioration in the credit quality of the counterparty beyond specified levels. The ISDA Master Agreement gives each party the right, upon an event of default by the other party or a termination of the agreement, to close out all transactions traded under such agreement and to net amounts owed under each transaction to one net payable by one party to the other. To mitigate counterparty credit risk on bi-lateral OTC derivatives, a fund receives collateral in the form of cash or securities once net unrealized appreciation on outstanding derivative contracts under an ISDA Master Agreement exceeds certain applicable thresholds, subject to certain minimum transfer provisions. The collateral received is held in segregated accounts with the custodian bank in accordance with the collateral agreements entered into between a fund, the counterparty and the custodian bank. A fund could experience delays and costs in gaining access to the collateral even though it is held by the custodian bank. The maximum risk of loss to a fund from counterparty credit risk related to bi-lateral OTC derivatives is generally the aggregate unrealized appreciation and unpaid counterparty payments in excess of any collateral pledged by the counterparty to a fund. A fund may be required to pledge collateral for the benefit of the counterparties on bi-lateral OTC derivatives in an amount not less than each counterparty's unrealized appreciation on outstanding derivative contracts, subject to certain minimum transfer provisions, and any such pledged collateral is identified in the Schedule of Investments. Exchange-traded contracts are not covered by the ISDA Master Agreement; however counterparty credit risk related to these contracts may be mitigated by the protection provided by the exchange on which they trade. Counterparty credit risk related to centrally cleared OTC swaps may be mitigated by the protection provided by the clearinghouse.
Investing in derivatives may involve greater risks than investing in the underlying assets directly and, to varying degrees, may involve risk of loss in excess of any initial investment and collateral received and amounts recognized in the Statement of Assets and Liabilities. In addition, there may be the risk that the change in value of the derivative contract does not correspond to the change in value of the underlying instrument.
Net Realized Gain (Loss) and Change in Net Unrealized Appreciation (Depreciation) on Derivatives. The table below, which reflects the impacts of derivatives on the financial performance, summarizes the net realized gain (loss) and change in net unrealized appreciation (depreciation) for derivatives during the period as presented in the Statement of Operations.
| Primary Risk Exposure / Derivative Type | Net Realized Gain (Loss) | Change in Net Unrealized Appreciation (Depreciation) |
| Fidelity Series Investment Grade Bond Fund | | |
| Credit Risk | | |
| Swaps | (562,556) | 372,809 |
| Total Credit Risk | (562,556) | 372,809 |
| Interest Rate Risk | | |
| Futures Contracts | 23,815,343 | (6,931,285) |
| Swaps | (2,141,272) | (1,566,267) |
| Total Interest Rate Risk | 21,674,071 | (8,497,552) |
| Totals | $21,111,515 | $(8,124,743) |
If there are any open positions at period end, a summary of the value of derivatives by primary risk exposure is included at the end of the Schedule of Investments.
Futures Contracts. A futures contract is an agreement between two parties to buy or sell a specified underlying instrument for a fixed price at a specified future date. Futures contracts were used to manage exposure to the bond market and fluctuations in interest rates.
Upon entering into a futures contract, a fund is required to deposit either cash or securities (initial margin) with a clearing broker in an amount equal to a certain percentage of the face value of the contract. Futures contracts are marked-to-market daily and subsequent daily payments are made or received by a fund depending on the daily fluctuations in the value of the futures contracts and are recorded as unrealized appreciation or (depreciation). This receivable and/or payable, if any, is included in daily variation margin on futures contracts in the Statement of Assets and Liabilities. Realized gain or (loss) is recorded upon the expiration or closing of a futures contract. The net realized gain (loss) and change in net unrealized appreciation (depreciation) on futures contracts during the period is presented in the Statement of Operations.
Any open futures contracts at period end are presented in the Schedule of Investments under the caption "Futures Contracts". The notional amount at value reflects each contract's exposure to the underlying instrument or index at period end, and is representative of volume of activity during the period unless an average notional amount is presented. Any securities deposited to meet initial margin requirements are identified in the Schedule of Investments. Any cash deposited to meet initial margin requirements is presented as segregated cash with brokers for derivative instruments in the Statement of Assets and Liabilities.
Swaps. A swap is a contract between two parties to exchange future cash flows at periodic intervals based on a notional principal amount. A bi-lateral OTC swap is a transaction between a fund and a dealer counterparty where cash flows are exchanged between the two parties for the life of the swap. A centrally cleared OTC swap is a transaction executed between a fund and a dealer counterparty, then cleared by a futures commission merchant (FCM) through a clearinghouse. Once cleared, the clearinghouse serves as a central counterparty, with whom a fund exchanges cash flows for the life of the transaction, similar to transactions in futures contracts.
Bi-lateral OTC swaps are marked-to-market daily and changes in value are reflected in the Statement of Assets and Liabilities in the bi-lateral OTC swaps at value line items. Any upfront premiums paid or received upon entering a bi-lateral OTC swap to compensate for differences between stated terms of the swap and prevailing market conditions (e.g. credit spreads, interest rates or other factors) are recorded in total accumulated earnings (loss) in the Statement of Assets and Liabilities and amortized to realized gain or (loss) ratably over the term of the swap. Any unamortized upfront premiums are presented in the Schedule of Investments.
Centrally cleared OTC swaps require a fund to deposit either cash or securities (initial margin) with the FCM, at the instruction of and for the benefit of the clearinghouse. Any securities deposited to meet initial margin requirements are identified in the Schedule of Investments. Any cash deposited to meet initial margin requirements is presented in segregated cash with brokers for derivative instruments in the Statement of Assets and Liabilities. Centrally cleared OTC swaps are marked-to-market daily and subsequent payments (variation margin) are made or received depending on the daily fluctuations in the value of the swaps and are recorded as unrealized appreciation or (depreciation). These daily payments, if any, are included in receivable or payable for daily variation margin on centrally cleared OTC swaps in the Statement of Assets and Liabilities. Any premiums for centrally cleared OTC swaps are recorded periodically throughout the term of the swap to variation margin and included in total accumulated earnings (loss) in the Statement of Assets and Liabilities. Any premiums are recognized as realized gain (loss) upon termination or maturity of the swap.
For both bi-lateral and centrally cleared OTC swaps, payments are exchanged at specified intervals, accrued daily commencing with the effective date of the contract and recorded as realized gain or (loss). Some swaps may be terminated prior to the effective date and realize a gain or loss upon termination. The net realized gain (loss) and change in net unrealized appreciation (depreciation) on swaps during the period is presented in the Statement of Operations.
Any open swaps at period end are included in the Schedule of Investments under the caption "Swaps", and are representative of volume of activity during the period unless an average notional amount is presented.
Credit Default Swaps. Credit default swaps enable a fund to buy or sell protection against specified credit events on a single-name issuer or a traded credit index. Under the terms of a credit default swap the buyer of protection (buyer) receives credit protection in exchange for making periodic payments to the seller of protection (seller) based on a fixed percentage applied to a notional principal amount. In return for these payments, the seller will be required to make a payment upon the occurrence of one or more specified credit events. A fund enters into credit default swaps as a seller to gain credit exposure to an issuer and/or as a buyer to obtain a measure of protection against defaults of an issuer. Periodic payments are made over the life of the contract by the buyer provided that no credit event occurs.
For credit default swaps on most corporate and sovereign issuers, credit events include bankruptcy, failure to pay or repudiation/moratorium. For credit default swaps on corporate or sovereign issuers, the obligation that may be put to the seller is not limited to the specific reference obligation described in the Schedule of Investments. For credit default swaps on asset-backed securities, a credit event may be triggered by events such as failure to pay principal, maturity extension, rating downgrade or write-down. For credit default swaps on asset-backed securities, the reference obligation described represents the security that may be put to the seller. For credit default swaps on a traded credit index, a specified credit event may affect all or individual underlying securities included in the index.
As a seller, if an underlying credit event occurs, a fund will pay a net settlement amount of cash equal to the notional amount of the swap less the recovery value of the reference obligation or underlying securities comprising an index. Only in the event of the industry's inability to value the underlying asset will a fund be required to take delivery of the reference obligation or underlying securities comprising an index and pay an amount equal to the notional amount of the swap.
As a buyer, if an underlying credit event occurs, a fund will receive a net settlement amount of cash equal to the notional amount of the swap less the recovery value of the reference obligation or underlying securities comprising an index. Only in the event of the industry's inability to value the underlying asset will a fund be required to deliver the reference obligation or underlying securities comprising an index in exchange for payment of an amount equal to the notional amount of the swap.
Typically, the value of each credit default swap and credit rating disclosed for each reference obligation in the Schedule of Investments, where a fund is the seller, can be used as measures of the current payment/performance risk of the swap. As the value of the swap changes as a positive or negative percentage of the total notional amount, the payment/performance risk may decrease or increase, respectively. In addition to these measures, the investment adviser monitors a variety of factors including cash flow assumptions, market activity and market sentiment as part of its ongoing process of assessing payment/performance risk.
Interest Rate Swaps. Interest rate swaps are agreements between counterparties to exchange cash flows, one based on a fixed rate, and the other on a floating rate. A fund enters into interest rate swaps to manage its exposure to interest rate changes. Changes in interest rates can have an effect on both the value of bond holdings as well as the amount of interest income earned. In general, the value of bonds can fall when interest rates rise and can rise when interest rates fall.
5. Purchases and Sales of Investments.
Purchases and sales of securities, other than short-term securities, U.S. government securities and in-kind transactions, as applicable, are noted in the table below.
| | Purchases ($) | Sales ($) |
| Fidelity Series Investment Grade Bond Fund | 23,665,326,906 | 24,359,397,750 |
6. Fees and Other Transactions with Affiliates.
Management Fee. Fidelity Management & Research Company LLC (the investment adviser) and its affiliates provide the Fund with investment management related services for which the Fund does not pay a management fee. Under the management contract, the investment adviser or an affiliate pays all ordinary operating expenses of the Fund, except custody fees, fees and expenses of the independent Trustees, and certain miscellaneous expenses such as proxy and shareholder meeting expenses.
Interfund Trades. Funds may purchase from or sell securities to other Fidelity Funds under procedures adopted by the Board. The procedures have been designed to ensure these interfund trades are executed in accordance with Rule 17a-7 of the 1940 Act. Any interfund trades are included within the respective purchases and sales amounts shown in the Purchases and Sales of Investments note. During the period, there were no interfund trades.
Other. During the period, the investment adviser reimbursed the Fund for certain losses as follows:
| | Amount ($) |
| Fidelity Series Investment Grade Bond Fund | 9,342 |
7. Committed Line of Credit.
Certain Funds participate with other funds managed by the investment adviser or an affiliate in a $4.25 billion credit facility (the "line of credit") to be utilized for temporary or emergency purposes to fund shareholder redemptions or for other short-term liquidity purposes. The commitment fees on the pro-rata portion of the line of credit are borne by the investment adviser. During the period, there were no borrowings on this line of credit.
8. Security Lending.
Funds lend portfolio securities from time to time in order to earn additional income. Lending agents are used, including National Financial Services (NFS), an affiliate of the investment adviser. Pursuant to a securities lending agreement, NFS will receive a fee, which is capped at 9.9% of a fund's daily lending revenue, for its services as lending agent. A fund may lend securities to certain qualified borrowers, including NFS. On the settlement date of the loan, a fund receives collateral (in the form of U.S. Treasury obligations, letters of credit and/or cash) against the loaned securities and maintains collateral in an amount not less than 100% of the market value of the loaned securities during the period of the loan. The market value of the loaned securities is determined at the close of business of a fund and any additional required collateral is delivered to a fund on the next business day. A fund or borrower may terminate the loan at any time, and if the borrower defaults on its obligation to return the securities loaned because of insolvency or other reasons, a fund may apply collateral received from the borrower against the obligation. A fund may experience delays and costs in recovering the securities loaned. Any cash collateral received is invested in the Fidelity Securities Lending Cash Central Fund. Any loaned securities are identified as such in the Schedule of Investments, and the value of loaned securities and cash collateral at period end, as applicable, are presented in the Statement of Assets and Liabilities. Security lending income represents the income earned on investing cash collateral, less rebates paid to borrowers and any lending agent fees associated with the loan, plus any premium payments received for lending certain types of securities. Security lending income is presented in the Statement of Operations as a component of income from Fidelity Central Funds. Affiliated security lending activity, if any, was as follows:
| | Total Security Lending Fees Paid to NFS | Security Lending Income From Securities Loaned to NFS | Value of Securities Loaned to NFS at Period End |
| Fidelity Series Investment Grade Bond Fund | $32,609 | $- | $- |
9. Expense Reductions.
Through arrangements with the Fund's custodian, credits realized as a result of certain uninvested cash balances were used to reduce the Fund's expenses by $8,760.
10. Other.
A fund's organizational documents provide former and current trustees and officers with a limited indemnification against liabilities arising in connection with the performance of their duties to the fund. In the normal course of business, a fund may also enter into contracts that provide general indemnifications. A fund's maximum exposure under these arrangements is unknown as this would be dependent on future claims that may be made against a fund. The risk of material loss from such claims is considered remote.
At the end of the period, mutual funds and accounts managed by the investment adviser or its affiliates were the owners of record of all of the outstanding shares of the Fund.
11. Risk and Uncertainties.
Many factors affect a fund's performance. Developments that disrupt global economies and financial markets, such as pandemics, epidemics, outbreaks of infectious diseases, war, terrorism, and environmental disasters, may significantly affect a fund's investment performance. The effects of these developments to a fund will be impacted by the types of securities in which a fund invests, the financial condition, industry, economic sector, and geographic location of an issuer, and a fund's level of investment in the securities of that issuer. Significant concentrations in security types, issuers, industries, sectors, and geographic locations may magnify the factors that affect a fund's performance.
As a shareholder, you incur two types of costs: (1) transaction costs, which may include sales charges (loads) on purchase payments or redemption proceeds, as applicable and (2) ongoing costs, which generally include management fees, distribution and/or service (12b-1) fees and other Fund expenses. This Example is intended to help you understand your ongoing costs (in dollars) of investing in a fund and to compare these costs with the ongoing costs of investing in other mutual funds.
| The Example is based on an investment of $1,000 invested at the beginning of the period and held for the entire period (September 1, 2022 to February 28, 2023). |
Actual Expenses
The first line of the accompanying table provides information about actual account values and actual expenses. You may use the information in this line, together with the amount you invested, to estimate the expenses that you paid over the period. Simply divide your account value by $1,000.00 (for example, an $8,600 account value divided by $1,000.00 = 8.6), then multiply the result by the number in the first line for a class/Fund under the heading entitled "Expenses Paid During Period" to estimate the expenses you paid on your account during this period. If any fund is a shareholder of any underlying mutual funds or exchange-traded funds (ETFs) (the Underlying Funds), such fund indirectly bears its proportional share of the expenses of the Underlying Funds in addition to the direct expenses incurred presented in the table. These fees and expenses are not included in the annualized expense ratio used to calculate the expense estimate in the table below.
Hypothetical Example for Comparison Purposes
The second line of the accompanying table provides information about hypothetical account values and hypothetical expenses based on the actual expense ratio and an assumed rate of return of 5% per year before expenses, which is not the actual return. The hypothetical account values and expenses may not be used to estimate the actual ending account balance or expenses you paid for the period. You may use this information to compare the ongoing costs of investing in the Fund and other funds. To do so, compare this 5% hypothetical example with the 5% hypothetical examples that appear in the shareholder reports of the other funds. If any fund is a shareholder of any Underlying Funds, such fund indirectly bears its proportional share of the expenses of the Underlying Funds in addition to the direct expenses as presented in the table. These fees and expenses are not included in the annualized expense ratio used to calculate the expense estimate in the table below.
Please note that the expenses shown in the table are meant to highlight your ongoing costs only and do not reflect any transaction costs. Therefore, the second line of the table is useful in comparing ongoing costs only, and will not help you determine the relative total costs of owning different funds. In addition, if these transactional costs were included, your costs would have been higher.
| | | | | Annualized Expense Ratio- A | | Beginning Account Value September 1, 2022 | | Ending Account Value February 28, 2023 | | Expenses Paid During Period- C September 1, 2022 to February 28, 2023 |
| | | | | | | | | | |
| Fidelity® Series Investment Grade Bond Fund | | | | -%- D | | | | | | |
| Actual | | | | | | $ 1,000 | | $ 987.10 | | $- E |
Hypothetical- B | | | | | | $ 1,000 | | $ 1,024.79 | | $- E |
| |
A Annualized expense ratio reflects expenses net of applicable fee waivers.
B 5% return per year before expenses
C Expenses are equal to the annualized expense ratio, multiplied by the average account value over the period, multiplied by 181/ 365 (to reflect the one-half year period). The fees and expenses of any Underlying Funds are not included in each annualized expense ratio.
D Amount represents less than .005%.
E Amount represents less than $.005.
Board Approval of Investment Advisory Contracts and Management Fees
Fidelity Series Investment Grade Bond Fund
Each year, the Board of Trustees, including the Independent Trustees (together, the Board), votes on the renewal of the management contract with Fidelity Management & Research Company LLC (FMR) and the sub-advisory agreements (together, the Advisory Contracts) for the fund. FMR and the sub-advisers are referred to herein as the Investment Advisers. The Board, assisted by the advice of fund counsel and Independent Trustees' counsel, requests and considers a broad range of information relevant to the renewal of the Advisory Contracts throughout the year.
The Board meets regularly and, at each of its meetings, covers an extensive agenda of topics and materials and considers factors that are relevant to its annual consideration of the renewal of the fund's Advisory Contracts, including the services and support provided to the fund and its shareholders. The Board has established four standing committees (Committees) - Operations, Audit, Fair Valuation, and Governance and Nominating - each composed of and chaired by Independent Trustees with varying backgrounds, to which the Board has assigned specific subject matter responsibilities in order to enhance effective decision-making by the Board. The Operations Committee, of which all the Independent Trustees are members, meets regularly throughout the year and requests, receives and considers, among other matters, information related to the annual consideration of the renewal of the fund's Advisory Contracts before making its recommendation to the Board. The Board also meets as needed to review matters specifically related to the Board's annual consideration of the renewal of the Advisory Contracts. Members of the Board may also meet from time to time with trustees of other Fidelity funds through joint ad hoc committees to discuss certain matters relevant to all of the Fidelity funds.
At its September 2022 meeting, the Board unanimously determined to renew the fund's Advisory Contracts. In considering whether to renew the Advisory Contracts for the fund, the Board considered all factors it believed relevant and reached a determination, with the assistance of fund counsel and Independent Trustees' counsel and through the exercise of its business judgment, that the renewal of the Advisory Contracts was in the best interests of the fund and its shareholders and the fact that no fee is payable under the management contract was fair and reasonable.
Nature, Extent, and Quality of Services Provided. The Board considered Fidelity's staffing as it relates to the fund, including the backgrounds of investment personnel of Fidelity, and also considered the fund's investment objective, strategies, and related investment philosophy. The Independent Trustees also had discussions with senior management of Fidelity's investment operations and investment groups. The Board considered the structure of the investment personnel compensation program and whether this structure provides appropriate incentives to act in the best interests of the fund. The Board also considered the steps Fidelity had taken to ensure the continued provision of high quality services to the Fidelity funds throughout the COVID-19 pandemic, including the expansion of staff in client facing positions to maintain service levels in periods of high volumes and volatility.
Resources Dedicated to Investment Management and Support Services . The Board reviewed the general qualifications and capabilities of Fidelity's investment staff, including its size, education, experience, and resources, as well as Fidelity's approach to recruiting, training, managing, and compensating investment personnel. The Board noted the resources devoted to Fidelity's global investment organization, and that Fidelity's analysts have extensive resources, tools and capabilities that allow them to conduct quantitative and fundamental analysis, as well as credit analysis of issuers, counterparties and guarantors. Further, the Board considered that Fidelity's investment professionals have sufficient access to global information and data so as to provide competitive investment results over time, and that those professionals also have access to sophisticated tools that permit them to assess portfolio construction and risk and performance attribution characteristics continuously, as well as to transmit new information and research conclusions rapidly around the world. Additionally, in its deliberations, the Board considered Fidelity's trading, risk management, compliance, cybersecurity, and technology and operations capabilities and resources, which are integral parts of the investment management process.
Administrative Services . The Board considered (i) the nature, extent, quality, and cost of advisory and administrative services performed by the Investment Advisers and their affiliates under the Advisory Contracts and under separate agreements covering transfer agency, pricing and bookkeeping, and securities lending services for the fund; (ii) the nature and extent of the supervision of third party service providers, principally custodians, subcustodians, and pricing vendors; and (iii) the resources devoted to, and the record of compliance with, the fund's compliance policies and procedures.
Investment Performance . The Board considered whether the fund has operated in accordance with its investment objective, as well as its record of compliance with its investment restrictions. The Board reviewed the fund's absolute investment performance, as well as the fund's relative investment performance. In this regard, the Board noted that the fund is designed to offer an investment option for other investment companies, collective investment trusts, and 529 plans managed by Fidelity and ultimately to enhance the performance of those investment companies, collective investment trusts, and 529 plans.
Based on its review, the Board concluded that the nature, extent, and quality of services provided to the fund under the Advisory Contracts should continue to benefit the shareholders of the fund.
Competitiveness of Management Fee and Total Expense Ratio . The Board considered that the fund does not pay FMR a management fee for investment advisory services, but that FMR receives fees for providing services to funds, collective investment trusts, and 529 plans that invest in the fund. The Board also noted that FMR or an affiliate undertakes to pay all operating expenses of the fund, except transfer agent fees, 12b-1 fees, Independent Trustee fees and expenses, custodian fees and expenses, proxy and shareholder meeting expenses, interest, taxes, and extraordinary expenses (such as litigation expenses). The Board further noted that the fund pays its non-operating expenses, including brokerage commissions and fees and expenses associated with the fund's securities lending program, if applicable.
The Board further considered that FMR has contractually agreed to reimburse the fund to the extent that total operating expenses, with certain exceptions, as a percentage of its average net assets, exceed 0.003% through December 31, 2024.
Based on its review, the Board considered that the fund does not pay a management fee and concluded that the fund's total expense ratio was reasonable in light of the services that the fund and its shareholders receive and the other factors considered.
Costs of the Services and Profitability. The Board considered the level of Fidelity's profits in respect of all the Fidelity funds.
A public accounting firm has been engaged annually by the Board as part of the Board's assessment of Fidelity's profitability analysis. The engagement includes the review and assessment of the methodologies used by Fidelity in determining the revenues and expenses attributable to Fidelity's mutual fund business, and completion of agreed-upon procedures in respect of the mathematical accuracy of certain fund profitability information and its conformity to established allocation methodologies. After considering the reports issued under the engagement and information provided by Fidelity, the Board concluded that while other allocation methods may also be reasonable, Fidelity's profitability methodologies are reasonable in all material respects.
The Board also reviewed Fidelity's non-fund businesses and potential indirect benefits such businesses may have received as a result of their association with Fidelity's mutual fund business (i.e., fall-out benefits) as well as cases where Fidelity's affiliates may benefit from the funds' business. The Board considered areas where potential indirect benefits to the Fidelity funds from their relationships with Fidelity may exist. The Board's consideration of these matters was informed by the findings of a joint ad hoc committee created by it and the boards of other Fidelity funds to evaluate potential fall-out benefits.
The Board concluded that the costs of the services provided by and the profits realized by Fidelity in connection with the operation of the fund were not relevant to the renewal of the Advisory Contracts because the fund pays no advisory fees and FMR or an affiliate bears all expenses of the fund, with limited exceptions.
Economies of Scale. The Board concluded that because the fund pays no advisory fees and FMR or an affiliate bears all expenses of the fund with certain limited exceptions, the realization of economies of scale was not a material factor in the Board's decision to renew the fund's Advisory Contracts.
Additional Information Requested by the Board. In order to develop fully the factual basis for consideration of the Fidelity funds' advisory contracts, the Board requested and received additional information on certain topics, including: (i) Fidelity's fund profitability methodology, profitability trends for certain funds, the allocation of various costs to different funds, and the impact of certain factors on fund profitability results; (ii) portfolio manager changes that have occurred during the past year and the amount of the investment that each portfolio manager has made in the Fidelity fund(s) that he or she manages; (iii) the extent to which current market conditions have affected retention and recruitment of personnel; (iv) the arrangements with and compensation paid to certain fund sub-advisers on behalf of the Fidelity funds and the treatment of such compensation within Fidelity's fund profitability methodology; (v) the terms of the funds' various management fee structures, including the basic group fee and the terms of Fidelity's voluntary expense limitation arrangements; (vi) Fidelity's transfer agent, pricing and bookkeeping fees, expense and service structures for different funds and classes relative to competitive trends; (vii) the impact on fund profitability of recent industry trends, such as the growth in passively managed funds and the changes in flows for different types of funds; (viii) the types of management fee and total expense comparisons provided, and the challenges and limitations associated with such information; and (ix) explanations regarding the relative total expense ratios and management fees of certain funds and classes, total expense and management fee competitive trends, and methodologies for total expense and management fee competitive comparisons. In addition, the Board considered its discussions with Fidelity regarding Fidelity's efforts to maintain the continuous investment and shareholder services necessary for the funds during the current pandemic and economic circumstances.
Based on its evaluation of all of the conclusions noted above, and after considering all factors it believed relevant, the Board concluded that the advisory fee arrangements are fair and reasonable and that the fund's Advisory Contracts should be renewed.
The Securities and Exchange Commission adopted Rule 22e-4 under the Investment Company Act of 1940 (the Liquidity Rule) to promote effective liquidity risk management throughout the open-end investment company industry, thereby reducing the risk that funds will be unable to meet their redemption obligations and mitigating dilution of the interests of fund shareholders.
The Fund has adopted and implemented a liquidity risk management program (the Program) reasonably designed to assess and manage the Fund's liquidity risk and to comply with the requirements of the Liquidity Rule. The Fund's Board of Trustees (the Board) has designated the Fund's investment adviser as administrator of the Program. The Fidelity advisers have established a Liquidity Risk Management Committee (the LRM Committee) to manage the Program for each of the Fidelity Funds. The LRM Committee monitors the adequacy and effectiveness of implementation of the Program and on a periodic basis assesses each Fund's liquidity risk based on a variety of factors including (1) the Fund's investment strategy, (2) portfolio liquidity and cash flow projections during normal and reasonably foreseeable stressed conditions, (3) shareholder redemptions, (4) borrowings and other funding sources and (5) certain factors specific to ETFs including the effect of the Fund's prices and spreads, market participants, and basket compositions on the overall liquidity of the Fund's portfolio, as applicable.
In accordance with the Program, each of the Fund's portfolio investments is classified into one of four defined liquidity categories based on a determination of a reasonable expectation for how long it would take to convert the investment to cash (or sell or dispose of the investment) without significantly changing its market value.
- Highly liquid investments - cash or convertible to cash within three business days or less
- Moderately liquid investments - convertible to cash in three to seven calendar days
- Less liquid investments - can be sold or disposed of, but not settled, within seven calendar days
- Illiquid investments - cannot be sold or disposed of within seven calendar days
Liquidity classification determinations take into account a variety of factors including various market, trading and investment-specific considerations, as well as market depth, and generally utilize analysis from a third-party liquidity metrics service.
The Liquidity Rule places a 15% limit on a fund's illiquid investments and requires funds that do not primarily hold assets that are highly liquid investments to determine and maintain a minimum percentage of the fund's net assets to be invested in highly liquid investments (highly liquid investment minimum or HLIM). The Program includes provisions reasonably designed to comply with the 15% limit on illiquid investments and for determining, periodically reviewing and complying with the HLIM requirement as applicable.
At a recent meeting of the Fund's Board of Trustees, the LRM Committee provided a written report to the Board pertaining to the operation, adequacy, and effectiveness of the Program for the period December 1, 2021 through November 30, 2022. The report concluded that the Program is operating effectively and is reasonably designed to assess and manage the Fund's liquidity risk.
1.873110.114
LIG-SANN-0423
Fidelity® Investment Grade Bond Fund
Semi-Annual Report
February 28, 2023
Includes Fidelity and Fidelity Advisor share classes
Contents
To view a fund's proxy voting guidelines and proxy voting record for the 12-month period ended June 30, visit http://www.fidelity.com/proxyvotingresults or visit the Securities and Exchange Commission's (SEC) web site at http://www.sec.gov.
You may also call 1-800-544-8544 if you're an individual investing directly with Fidelity, call 1-800-835-5092 if you're a plan sponsor or participant with Fidelity as your recordkeeper or call 1-877-208-0098 on institutional accounts or if you're an advisor or invest through one to request a free copy of the proxy voting guidelines.
Standard & Poor's, S&P and S&P 500 are registered service marks of The McGraw-Hill Companies, Inc. and have been licensed for use by Fidelity Distributors Corporation.
Other third-party marks appearing herein are the property of their respective owners.
All other marks appearing herein are registered or unregistered trademarks or service marks of FMR LLC or an affiliated company. © 2023 FMR LLC. All rights reserved.
This report and the financial statements contained herein are submitted for the general information of the shareholders of the Fund. This report is not authorized for distribution to prospective investors in the Fund unless preceded or accompanied by an effective prospectus.
A fund files its complete schedule of portfolio holdings with the SEC for the first and third quarters of each fiscal year on Form N-PORT. Forms N-PORT are available on the SEC's web site at http://www.sec.gov. A fund's Forms N-PORT may be reviewed and copied at the SEC's Public Reference Room in Washington, DC. Information regarding the operation of the SEC's Public Reference Room may be obtained by calling 1-800-SEC-0330.
For a complete list of a fund's portfolio holdings, view the most recent holdings listing, semiannual report, or annual report on Fidelity's web site at http://www.fidelity.com, http://www.institutional.fidelity.com, or http://www.401k.com, as applicable.
NOT FDIC INSURED •MAY LOSE VALUE •NO BANK GUARANTEE
Neither the Fund nor Fidelity Distributors Corporation is a bank.
The information in the following tables is based on the combined Investments of the Fund and its pro-rata share of investments in Fidelity's Central Funds, other than the Money Market Central Funds.
Quality Diversification (% of Fund's net assets) |
|
Short-Term Investments and Net Other Assets (Liabilities) - (2.3)%* |
*Short-term investments and Net Other Assets (Liabilities) are not available in the pie chart. |
| |
| We have used ratings from Moody's Investors Service, Inc. Where Moody's® ratings are not available, we have used S&P® ratings. All ratings are as of the date indicated and do not reflect subsequent changes. |
Securities rated BB or below were rated investment grade at the time of acquisition.
Asset Allocation (% of Fund's net assets) |
|
Short-Term Investments and Net Other Assets (Liabilities) - (2.3)%* |
Foreign investments - 12.4% |
Futures and Swaps - 0.8% |
Short-Term Investments and Net Other Assets (Liabilities) are not available in the pie chart. |
Percentages in the above tables are adjusted for the effect of TBA Sale Commitments. |
|
An unaudited holdings listing for the Fund, which presents direct holdings as well as the pro-rata share of any securities and other investments held indirectly through its investment in underlying non-money market Fidelity Central Funds, is available at fidelity.com and/or institutional. fidelity.com, as applicable.
Geographic Diversification (% of Fund's net assets) |
|
* Includes Short-Term investments and Net Other Assets (Liabilities). Percentages are based on country or territory of incorporation and are adjusted for the effect of derivatives, if applicable. |
| |
Showing Percentage of Net Assets
| Nonconvertible Bonds - 37.3% |
| | | Principal Amount (a) (000s) | Value ($) (000s) |
| COMMUNICATION SERVICES - 3.4% | | | |
| Diversified Telecommunication Services - 0.8% | | | |
| AT&T, Inc.: | | | |
| 2.55% 12/1/33 | | 1,806 | 1,383 |
| 4.3% 2/15/30 | | 34,036 | 31,928 |
| Verizon Communications, Inc.: | | | |
| 2.987% 10/30/56 | | 869 | 532 |
| 4.329% 9/21/28 | | 19,797 | 18,966 |
| 4.5% 8/10/33 | | 3,429 | 3,187 |
| 4.862% 8/21/46 | | 14,251 | 12,870 |
| 5.012% 4/15/49 | | 82 | 75 |
| | | | 68,941 |
| Entertainment - 0.2% | | | |
| The Walt Disney Co.: | | | |
| 2.2% 1/13/28 | | 6,562 | 5,825 |
| 2.65% 1/13/31 | | 10,500 | 8,943 |
| | | | 14,768 |
| Media - 1.9% | | | |
| Charter Communications Operating LLC/Charter Communications Operating Capital Corp.: | | | |
| 2.8% 4/1/31 | | 25,400 | 19,906 |
| 3.7% 4/1/51 | | 15,400 | 9,417 |
| 3.85% 4/1/61 | | 4,000 | 2,356 |
| 3.9% 6/1/52 | | 7,000 | 4,424 |
| 4.8% 3/1/50 | | 12,000 | 8,770 |
| 4.908% 7/23/25 | | 2,932 | 2,869 |
| 5.375% 5/1/47 | | 22,326 | 17,786 |
| 5.75% 4/1/48 | | 11,014 | 9,198 |
| 6.834% 10/23/55 | | 7,000 | 6,584 |
| Comcast Corp.: | | | |
| 3.75% 4/1/40 | | 622 | 509 |
| 4.65% 7/15/42 | | 1,628 | 1,503 |
| Discovery Communications LLC: | | | |
| 3.625% 5/15/30 | | 4,063 | 3,477 |
| 4.65% 5/15/50 | | 10,998 | 8,066 |
| Fox Corp.: | | | |
| 5.476% 1/25/39 | | 1,366 | 1,255 |
| 5.576% 1/25/49 | | 906 | 825 |
| Magallanes, Inc.: | | | |
| 3.428% 3/15/24 (b) | | 4,934 | 4,815 |
| 3.638% 3/15/25 (b) | | 2,702 | 2,577 |
| 3.755% 3/15/27 (b) | | 5,285 | 4,848 |
| 4.054% 3/15/29 (b) | | 1,832 | 1,638 |
| 4.279% 3/15/32 (b) | | 5,334 | 4,605 |
| 5.05% 3/15/42 (b) | | 2,865 | 2,321 |
| 5.141% 3/15/52 (b) | | 27,262 | 21,371 |
| Time Warner Cable LLC: | | | |
| 4.5% 9/15/42 | | 544 | 406 |
| 5.5% 9/1/41 | | 966 | 813 |
| 5.875% 11/15/40 | | 7,077 | 6,250 |
| 6.55% 5/1/37 | | 3,601 | 3,449 |
| 6.75% 6/15/39 | | 6,233 | 5,988 |
| 7.3% 7/1/38 | | 2,390 | 2,395 |
| | | | 158,421 |
| Wireless Telecommunication Services - 0.5% | | | |
| Rogers Communications, Inc.: | | | |
| 3.2% 3/15/27 (b) | | 5,750 | 5,287 |
| 3.8% 3/15/32 (b) | | 5,018 | 4,383 |
| T-Mobile U.S.A., Inc.: | | | |
| 3.75% 4/15/27 | | 6,800 | 6,393 |
| 3.875% 4/15/30 | | 20,000 | 18,135 |
| 4.5% 4/15/50 | | 2,885 | 2,393 |
| | | | 36,591 |
TOTAL COMMUNICATION SERVICES | | | 278,721 |
| CONSUMER DISCRETIONARY - 2.0% | | | |
| Automobiles - 0.4% | | | |
| General Motors Financial Co., Inc.: | | | |
| 3.7% 5/9/23 | | 5,526 | 5,509 |
| 4% 1/15/25 | | 15,000 | 14,538 |
| 4.25% 5/15/23 | | 858 | 856 |
| Volkswagen Group of America Finance LLC: | | | |
| 3.125% 5/12/23 (b) | | 5,817 | 5,789 |
| 3.35% 5/13/25 (b) | | 9,370 | 8,981 |
| | | | 35,673 |
| Household Durables - 0.6% | | | |
| D.R. Horton, Inc.: | | | |
| 1.3% 10/15/26 | | 10,194 | 8,789 |
| 2.6% 10/15/25 | | 9,432 | 8,749 |
| Lennar Corp.: | | | |
| 4.75% 11/29/27 | | 15,563 | 14,902 |
| 5% 6/15/27 | | 8,419 | 8,237 |
| Toll Brothers Finance Corp.: | | | |
| 4.35% 2/15/28 | | 2,908 | 2,678 |
| 4.875% 11/15/25 | | 32 | 32 |
| 4.875% 3/15/27 | | 10,045 | 9,639 |
| | | | 53,026 |
| Internet & Direct Marketing Retail - 0.2% | | | |
| Alibaba Group Holding Ltd.: | | | |
| 2.125% 2/9/31 | | 3,090 | 2,456 |
| 2.7% 2/9/41 | | 16,100 | 10,498 |
| | | | 12,954 |
| Leisure Products - 0.1% | | | |
| Hasbro, Inc. 3% 11/19/24 | | 4,130 | 3,958 |
| Specialty Retail - 0.5% | | | |
| AutoNation, Inc. 4.75% 6/1/30 | | 909 | 844 |
| AutoZone, Inc. 4% 4/15/30 | | 21,631 | 19,878 |
| Lowe's Companies, Inc.: | | | |
| 3.35% 4/1/27 | | 817 | 764 |
| 3.75% 4/1/32 | | 2,515 | 2,228 |
| 4.25% 4/1/52 | | 10,263 | 8,081 |
| 4.45% 4/1/62 | | 10,550 | 8,265 |
| | | | 40,060 |
| Textiles, Apparel & Luxury Goods - 0.2% | | | |
| Tapestry, Inc. 3.05% 3/15/32 | | 20,094 | 15,966 |
TOTAL CONSUMER DISCRETIONARY | | | 161,637 |
| CONSUMER STAPLES - 2.7% | | | |
| Beverages - 1.0% | | | |
| Anheuser-Busch InBev Finance, Inc.: | | | |
| 4.7% 2/1/36 | | 4,168 | 3,912 |
| 4.9% 2/1/46 | | 9,089 | 8,337 |
| Anheuser-Busch InBev Worldwide, Inc.: | | | |
| 3.5% 6/1/30 | | 8,200 | 7,467 |
| 4.35% 6/1/40 | | 3,930 | 3,449 |
| 4.5% 6/1/50 | | 9,000 | 7,927 |
| 4.6% 6/1/60 | | 7,261 | 6,295 |
| 4.75% 1/23/29 | | 18,172 | 17,864 |
| 4.75% 4/15/58 | | 3,562 | 3,190 |
| 5.45% 1/23/39 | | 3,537 | 3,525 |
| 5.55% 1/23/49 | | 8,082 | 8,132 |
| 5.8% 1/23/59 (Reg. S) | | 8,567 | 8,858 |
| Constellation Brands, Inc. 4.75% 11/15/24 | | 2,399 | 2,377 |
| PepsiCo, Inc.: | | | |
| 2.625% 3/19/27 | | 712 | 659 |
| 2.75% 3/19/30 | | 6,600 | 5,817 |
| | | | 87,809 |
| Food & Staples Retailing - 0.3% | | | |
| Sysco Corp. 6.6% 4/1/50 | | 24,546 | 26,935 |
| Food Products - 1.4% | | | |
| General Mills, Inc. 2.875% 4/15/30 | | 797 | 689 |
| JBS U.S.A. Lux SA / JBS Food Co.: | | | |
| 2.5% 1/15/27 (b) | | 14,165 | 12,395 |
| 3% 5/15/32 (b) | | 14,250 | 10,863 |
| 3.625% 1/15/32 (b) | | 1,330 | 1,065 |
| 5.125% 2/1/28 (b) | | 4,285 | 4,073 |
| 5.5% 1/15/30 (b) | | 39,620 | 37,292 |
| 5.75% 4/1/33 (b) | | 8,830 | 8,236 |
| Kraft Heinz Foods Co.: | | | |
| 3% 6/1/26 | | 5,000 | 4,653 |
| 3.875% 5/15/27 | | 12,300 | 11,692 |
| 4.375% 6/1/46 | | 10,122 | 8,256 |
| 5.2% 7/15/45 | | 8,219 | 7,572 |
| 7.125% 8/1/39 (b) | | 5,618 | 6,192 |
| | | | 112,978 |
TOTAL CONSUMER STAPLES | | | 227,722 |
| ENERGY - 3.0% | | | |
| Oil, Gas & Consumable Fuels - 3.0% | | | |
| Columbia Pipeline Group, Inc. 4.5% 6/1/25 | | 538 | 526 |
| DCP Midstream Operating LP: | | | |
| 3.875% 3/15/23 | | 1,968 | 1,967 |
| 5.125% 5/15/29 | | 3,593 | 3,459 |
| 5.6% 4/1/44 | | 1,707 | 1,601 |
| 5.85% 5/21/43 (b)(c) | | 2,821 | 2,792 |
| Enbridge, Inc.: | | | |
| 4% 10/1/23 | | 2,296 | 2,276 |
| 4.25% 12/1/26 | | 923 | 885 |
| Energy Transfer LP: | | | |
| 3.75% 5/15/30 | | 2,274 | 2,017 |
| 3.9% 5/15/24 (c) | | 549 | 536 |
| 4.2% 9/15/23 | | 759 | 754 |
| 4.25% 3/15/23 | | 830 | 830 |
| 4.5% 4/15/24 | | 952 | 940 |
| 4.95% 6/15/28 | | 2,591 | 2,502 |
| 5% 5/15/50 | | 18,683 | 15,310 |
| 5.25% 4/15/29 | | 1,549 | 1,511 |
| 5.4% 10/1/47 | | 1,426 | 1,226 |
| 5.8% 6/15/38 | | 1,445 | 1,354 |
| 6% 6/15/48 | | 1,441 | 1,325 |
| 6.125% 12/15/45 | | 400 | 374 |
| 6.25% 4/15/49 | | 1,064 | 1,012 |
| Hess Corp.: | | | |
| 4.3% 4/1/27 | | 834 | 798 |
| 5.6% 2/15/41 | | 22,554 | 21,066 |
| 7.125% 3/15/33 | | 839 | 902 |
| 7.3% 8/15/31 | | 1,023 | 1,111 |
| 7.875% 10/1/29 | | 2,921 | 3,212 |
| Kinder Morgan, Inc. 3.6% 2/15/51 | | 18,000 | 12,164 |
| MPLX LP: | | | |
| 4.8% 2/15/29 | | 816 | 784 |
| 4.875% 12/1/24 | | 1,247 | 1,230 |
| 4.95% 9/1/32 | | 7,989 | 7,508 |
| 5.5% 2/15/49 | | 2,450 | 2,200 |
| Occidental Petroleum Corp.: | | | |
| 5.55% 3/15/26 | | 3,038 | 3,022 |
| 6.45% 9/15/36 | | 2,750 | 2,764 |
| 6.6% 3/15/46 | | 3,032 | 3,085 |
| 7.5% 5/1/31 | | 3,937 | 4,213 |
| Ovintiv, Inc.: | | | |
| 5.15% 11/15/41 | | 2,000 | 1,771 |
| 8.125% 9/15/30 | | 3,357 | 3,677 |
| Petroleos Mexicanos: | | | |
| 5.95% 1/28/31 | | 2,610 | 1,989 |
| 6.49% 1/23/27 | | 1,757 | 1,595 |
| 6.5% 3/13/27 | | 5,805 | 5,256 |
| 6.75% 9/21/47 | | 14,189 | 9,139 |
| 6.84% 1/23/30 | | 5,979 | 4,968 |
| 6.95% 1/28/60 | | 4,247 | 2,721 |
| 7.69% 1/23/50 | | 70,161 | 49,285 |
| Plains All American Pipeline LP/PAA Finance Corp.: | | | |
| 3.55% 12/15/29 | | 1,242 | 1,077 |
| 4.65% 10/15/25 | | 26,960 | 26,303 |
| Sabine Pass Liquefaction LLC 4.5% 5/15/30 | | 9,286 | 8,699 |
| The Williams Companies, Inc.: | | | |
| 3.5% 11/15/30 | | 9,960 | 8,716 |
| 4.65% 8/15/32 | | 8,326 | 7,758 |
| 5.3% 8/15/52 | | 1,888 | 1,706 |
| Western Gas Partners LP: | | | |
| 3.95% 6/1/25 | | 764 | 726 |
| 4.65% 7/1/26 | | 1,129 | 1,073 |
| 4.75% 8/15/28 | | 781 | 724 |
| 5.5% 2/1/50 | | 7,720 | 6,303 |
| | | | 250,742 |
| FINANCIALS - 17.3% | | | |
| Banks - 9.1% | | | |
| Bank of America Corp.: | | | |
| 1.922% 10/24/31 (c) | | 20,000 | 15,502 |
| 2.299% 7/21/32 (c) | | 25,000 | 19,551 |
| 2.884% 10/22/30 (c) | | 50,000 | 42,275 |
| 3.419% 12/20/28 (c) | | 3,280 | 2,985 |
| 3.5% 4/19/26 | | 3,838 | 3,657 |
| 3.95% 4/21/25 | | 32,873 | 31,865 |
| 4% 1/22/25 | | 16,960 | 16,523 |
| 4.1% 7/24/23 | | 900 | 896 |
| 4.183% 11/25/27 | | 4,363 | 4,159 |
| 4.2% 8/26/24 | | 5,249 | 5,147 |
| 4.25% 10/22/26 | | 23,937 | 22,989 |
| 4.45% 3/3/26 | | 11,356 | 11,041 |
| 5.015% 7/22/33 (c) | | 13,700 | 13,181 |
| Barclays PLC: | | | |
| 2.852% 5/7/26 (c) | | 9,444 | 8,842 |
| 4.375% 1/12/26 | | 2,821 | 2,726 |
| 4.836% 5/9/28 | | 3,683 | 3,451 |
| 5.088% 6/20/30 (c) | | 11,424 | 10,583 |
| 5.2% 5/12/26 | | 26,475 | 25,781 |
| BNP Paribas SA 2.219% 6/9/26 (b)(c) | | 9,008 | 8,320 |
| BPCE SA 4.875% 4/1/26 (b) | | 4,662 | 4,510 |
| Citigroup, Inc.: | | | |
| 2.976% 11/5/30 (c) | | 50,000 | 42,562 |
| 4.075% 4/23/29 (c) | | 16,389 | 15,256 |
| 4.125% 7/25/28 | | 4,363 | 4,083 |
| 4.3% 11/20/26 | | 1,115 | 1,069 |
| 4.4% 6/10/25 | | 11,914 | 11,657 |
| 4.412% 3/31/31 (c) | | 21,454 | 19,942 |
| 4.45% 9/29/27 | | 55,258 | 52,772 |
| 4.6% 3/9/26 | | 5,613 | 5,465 |
| 5.3% 5/6/44 | | 6,000 | 5,636 |
| 5.5% 9/13/25 | | 4,886 | 4,895 |
| Citizens Financial Group, Inc. 2.638% 9/30/32 | | 4,614 | 3,515 |
| Commonwealth Bank of Australia 3.61% 9/12/34 (b)(c) | | 2,250 | 1,900 |
| First Citizens Bank & Trust Co. 3.929% 6/19/24 (c) | | 2,035 | 2,023 |
| HSBC Holdings PLC: | | | |
| 4.25% 3/14/24 | | 905 | 891 |
| 4.95% 3/31/30 | | 1,541 | 1,485 |
| 5.25% 3/14/44 | | 656 | 592 |
| Intesa Sanpaolo SpA: | | | |
| 5.017% 6/26/24 (b) | | 836 | 807 |
| 5.71% 1/15/26 (b) | | 37,209 | 35,617 |
| JPMorgan Chase & Co.: | | | |
| 2.956% 5/13/31 (c) | | 5,034 | 4,228 |
| 4.125% 12/15/26 | | 9,713 | 9,372 |
| 4.493% 3/24/31 (c) | | 17,000 | 16,040 |
| 5.717% 9/14/33 (c) | | 65,747 | 65,332 |
| NatWest Group PLC: | | | |
| 3.073% 5/22/28 (c) | | 5,536 | 4,995 |
| 4.8% 4/5/26 | | 12,145 | 11,826 |
| 5.125% 5/28/24 | | 19,005 | 18,849 |
| NatWest Markets PLC 2.375% 5/21/23 (b) | | 10,214 | 10,144 |
| Rabobank Nederland 4.375% 8/4/25 | | 3,024 | 2,929 |
| Societe Generale: | | | |
| 1.038% 6/18/25 (b)(c) | | 50,000 | 46,795 |
| 1.488% 12/14/26 (b)(c) | | 13,930 | 12,341 |
| 4.25% 4/14/25 (b) | | 4,491 | 4,306 |
| Wells Fargo & Co.: | | | |
| 2.406% 10/30/25 (c) | | 4,928 | 4,674 |
| 3.196% 6/17/27 (c) | | 40,441 | 37,519 |
| 3.526% 3/24/28 (c) | | 11,202 | 10,373 |
| 4.3% 7/22/27 | | 16,184 | 15,657 |
| 4.478% 4/4/31 (c) | | 15,500 | 14,578 |
| Westpac Banking Corp. 4.11% 7/24/34 (c) | | 3,103 | 2,744 |
| | | | 756,853 |
| Capital Markets - 3.8% | | | |
| Affiliated Managers Group, Inc. 4.25% 2/15/24 | | 881 | 868 |
| Ares Capital Corp.: | | | |
| 3.25% 7/15/25 | | 42,008 | 39,075 |
| 3.875% 1/15/26 | | 16,340 | 15,159 |
| 4.2% 6/10/24 | | 7,281 | 7,125 |
| Credit Suisse Group AG: | | | |
| 2.593% 9/11/25 (b)(c) | | 9,092 | 8,238 |
| 3.75% 3/26/25 | | 6,137 | 5,606 |
| 4.194% 4/1/31 (b)(c) | | 30,399 | 24,109 |
| 4.55% 4/17/26 | | 1,859 | 1,661 |
| Deutsche Bank AG 4.5% 4/1/25 | | 8,603 | 8,295 |
| Deutsche Bank AG New York Branch: | | | |
| 3.729% 1/14/32 (c) | | 8,509 | 6,674 |
| 4.1% 1/13/26 | | 5,262 | 5,033 |
| Goldman Sachs Group, Inc.: | | | |
| 2.383% 7/21/32 (c) | | 12,267 | 9,635 |
| 3.272% 9/29/25 (c) | | 60,430 | 58,096 |
| 3.5% 4/1/25 | | 12,527 | 12,068 |
| 4.25% 10/21/25 | | 7,670 | 7,429 |
| 6.75% 10/1/37 | | 24,081 | 25,633 |
| Intercontinental Exchange, Inc. 3.75% 12/1/25 | | 1,287 | 1,240 |
| Morgan Stanley: | | | |
| 3.125% 7/27/26 | | 9,330 | 8,682 |
| 3.622% 4/1/31 (c) | | 35,865 | 31,757 |
| 3.625% 1/20/27 | | 10,480 | 9,907 |
| 3.7% 10/23/24 | | 3,002 | 2,924 |
| 3.875% 4/29/24 | | 2,765 | 2,721 |
| 5% 11/24/25 | | 13,117 | 12,981 |
| State Street Corp. 2.901% 3/30/26 (c) | | 691 | 658 |
| UBS Group AG 1.494% 8/10/27 (b)(c) | | 7,599 | 6,586 |
| | | | 312,160 |
| Consumer Finance - 2.8% | | | |
| AerCap Ireland Capital Ltd./AerCap Global Aviation Trust: | | | |
| 1.65% 10/29/24 | | 39,436 | 36,584 |
| 1.75% 1/30/26 | | 10,220 | 9,034 |
| 2.45% 10/29/26 | | 5,268 | 4,644 |
| 2.875% 8/14/24 | | 5,100 | 4,850 |
| 3% 10/29/28 | | 5,518 | 4,702 |
| 3.3% 1/30/32 | | 5,903 | 4,724 |
| 4.45% 4/3/26 | | 2,472 | 2,349 |
| 4.875% 1/16/24 | | 3,901 | 3,863 |
| 6.5% 7/15/25 | | 4,349 | 4,364 |
| Ally Financial, Inc.: | | | |
| 1.45% 10/2/23 | | 3,119 | 3,040 |
| 3.05% 6/5/23 | | 11,466 | 11,388 |
| 3.875% 5/21/24 | | 7,111 | 6,963 |
| 4.625% 3/30/25 | | 2,237 | 2,189 |
| 5.125% 9/30/24 | | 2,258 | 2,238 |
| 5.8% 5/1/25 | | 19,772 | 19,785 |
| 7.1% 11/15/27 | | 9,050 | 9,396 |
| 8% 11/1/31 | | 3,172 | 3,434 |
| Capital One Financial Corp.: | | | |
| 3.65% 5/11/27 | | 15,715 | 14,636 |
| 3.8% 1/31/28 | | 6,614 | 6,124 |
| 4.985% 7/24/26 (c) | | 8,087 | 7,956 |
| 5.247% 7/26/30 (c) | | 10,430 | 10,001 |
| Discover Financial Services: | | | |
| 3.95% 11/6/24 | | 1,184 | 1,152 |
| 4.1% 2/9/27 | | 8,206 | 7,776 |
| 4.5% 1/30/26 | | 3,562 | 3,448 |
| 6.7% 11/29/32 | | 1,995 | 2,061 |
| Ford Motor Credit Co. LLC: | | | |
| 4.063% 11/1/24 | | 18,137 | 17,438 |
| 5.584% 3/18/24 | | 4,908 | 4,874 |
| Synchrony Financial: | | | |
| 3.95% 12/1/27 | | 5,215 | 4,741 |
| 4.25% 8/15/24 | | 7,369 | 7,191 |
| 4.375% 3/19/24 | | 5,520 | 5,443 |
| 5.15% 3/19/29 | | 7,283 | 6,853 |
| | | | 233,241 |
| Diversified Financial Services - 0.7% | | | |
| Blackstone Private Credit Fund 7.05% 9/29/25 (b) | | 10,049 | 10,085 |
| Brixmor Operating Partnership LP: | | | |
| 4.05% 7/1/30 | | 6,803 | 6,015 |
| 4.125% 6/15/26 | | 3,253 | 3,061 |
| 4.125% 5/15/29 | | 12,222 | 11,009 |
| Corebridge Financial, Inc.: | | | |
| 3.85% 4/5/29 (b) | | 3,438 | 3,106 |
| 3.9% 4/5/32 (b) | | 4,093 | 3,581 |
| 4.35% 4/5/42 (b) | | 931 | 767 |
| 4.4% 4/5/52 (b) | | 2,754 | 2,195 |
| Equitable Holdings, Inc. 3.9% 4/20/23 | | 425 | 424 |
| Jackson Financial, Inc.: | | | |
| 5.17% 6/8/27 | | 3,740 | 3,703 |
| 5.67% 6/8/32 | | 4,713 | 4,605 |
| Park Aerospace Holdings Ltd. 5.5% 2/15/24 (b) | | 4,907 | 4,848 |
| Pine Street Trust I 4.572% 2/15/29 (b) | | 4,516 | 4,259 |
| Pine Street Trust II 5.568% 2/15/49 (b) | | 4,529 | 4,035 |
| | | | 61,693 |
| Insurance - 0.9% | | | |
| Five Corners Funding Trust II 2.85% 5/15/30 (b) | | 13,114 | 11,076 |
| Liberty Mutual Group, Inc. 3.95% 5/15/60 (b) | | 10,260 | 7,109 |
| Lincoln National Corp. 3.4% 1/15/31 | | 9,415 | 7,943 |
| MetLife, Inc. 4.55% 3/23/30 | | 19,500 | 19,149 |
| Pacific LifeCorp 5.125% 1/30/43 (b) | | 1,657 | 1,542 |
| Pricoa Global Funding I 5.375% 5/15/45 (c) | | 1,988 | 1,930 |
| Prudential Financial, Inc.: | | | |
| 3.935% 12/7/49 | | 2,764 | 2,193 |
| 6% 9/1/52 (c) | | 14,201 | 13,699 |
| Swiss Re Finance Luxembourg SA 5% 4/2/49 (b)(c) | | 1,800 | 1,710 |
| Unum Group: | | | |
| 4% 6/15/29 | | 3,614 | 3,308 |
| 5.75% 8/15/42 | | 1,024 | 959 |
| | | | 70,618 |
TOTAL FINANCIALS | | | 1,434,565 |
| HEALTH CARE - 3.1% | | | |
| Biotechnology - 0.8% | | | |
| AbbVie, Inc. 3.2% 11/21/29 | | 43,367 | 38,356 |
| Amgen, Inc.: | | | |
| 5.15% 3/2/28 (d) | | 4,595 | 4,577 |
| 5.25% 3/2/30 (d) | | 4,195 | 4,175 |
| 5.25% 3/2/33 (d) | | 4,736 | 4,703 |
| 5.6% 3/2/43 (d) | | 4,499 | 4,443 |
| 5.65% 3/2/53 (d) | | 2,236 | 2,218 |
| 5.75% 3/2/63 (d) | | 4,076 | 4,020 |
| | | | 62,492 |
| Health Care Providers & Services - 0.9% | | | |
| Centene Corp.: | | | |
| 2.45% 7/15/28 | | 12,745 | 10,681 |
| 2.625% 8/1/31 | | 5,945 | 4,632 |
| 3.375% 2/15/30 | | 5,110 | 4,312 |
| 4.25% 12/15/27 | | 5,450 | 5,036 |
| 4.625% 12/15/29 | | 8,470 | 7,746 |
| Cigna Group 4.375% 10/15/28 | | 4,187 | 4,020 |
| CVS Health Corp. 3.625% 4/1/27 | | 1,944 | 1,828 |
| HCA Holdings, Inc.: | | | |
| 3.5% 9/1/30 | | 3,895 | 3,349 |
| 3.625% 3/15/32 (b) | | 1,074 | 908 |
| 5.625% 9/1/28 | | 4,885 | 4,830 |
| 5.875% 2/1/29 | | 3,803 | 3,802 |
| Humana, Inc. 3.7% 3/23/29 | | 3,206 | 2,909 |
| Sabra Health Care LP 3.2% 12/1/31 | | 12,177 | 9,047 |
| Toledo Hospital 5.325% 11/15/28 | | 1,513 | 1,247 |
| Universal Health Services, Inc. 2.65% 10/15/30 | | 10,442 | 8,504 |
| | | | 72,851 |
| Pharmaceuticals - 1.4% | | | |
| Bayer U.S. Finance II LLC: | | | |
| 4.25% 12/15/25 (b) | | 49,732 | 48,101 |
| 4.375% 12/15/28 (b) | | 58,400 | 54,902 |
| Elanco Animal Health, Inc.: | | | |
| 5.772% 8/28/23 | | 2,148 | 2,140 |
| 6.4% 8/28/28 (c) | | 905 | 864 |
| Utah Acquisition Sub, Inc. 3.95% 6/15/26 | | 1,304 | 1,219 |
| Viatris, Inc.: | | | |
| 1.65% 6/22/25 | | 1,203 | 1,095 |
| 2.7% 6/22/30 | | 6,115 | 4,848 |
| 3.85% 6/22/40 | | 2,664 | 1,817 |
| 4% 6/22/50 | | 4,600 | 2,967 |
| | | | 117,953 |
TOTAL HEALTH CARE | | | 253,296 |
| INDUSTRIALS - 1.0% | | | |
| Aerospace & Defense - 0.4% | | | |
| BAE Systems PLC 3.4% 4/15/30 (b) | | 2,547 | 2,268 |
| The Boeing Co.: | | | |
| 5.04% 5/1/27 | | 4,840 | 4,767 |
| 5.15% 5/1/30 | | 14,840 | 14,360 |
| 5.805% 5/1/50 | | 4,840 | 4,604 |
| 5.93% 5/1/60 | | 4,840 | 4,520 |
| | | | 30,519 |
| Trading Companies & Distributors - 0.4% | | | |
| Air Lease Corp.: | | | |
| 0.7% 2/15/24 | | 9,054 | 8,628 |
| 3% 9/15/23 | | 368 | 363 |
| 3.375% 7/1/25 | | 7,888 | 7,438 |
| 3.75% 6/1/26 | | 15,000 | 14,093 |
| 4.25% 2/1/24 | | 4,331 | 4,270 |
| 4.25% 9/15/24 | | 1,473 | 1,443 |
| | | | 36,235 |
| Transportation Infrastructure - 0.2% | | | |
| Avolon Holdings Funding Ltd.: | | | |
| 3.25% 2/15/27 (b) | | 7,484 | 6,613 |
| 3.95% 7/1/24 (b) | | 5,580 | 5,396 |
| 4.375% 5/1/26 (b) | | 4,949 | 4,604 |
| 5.25% 5/15/24 (b) | | 3,116 | 3,066 |
| | | | 19,679 |
TOTAL INDUSTRIALS | | | 86,433 |
| INFORMATION TECHNOLOGY - 1.0% | | | |
| Electronic Equipment & Components - 0.1% | | | |
| Dell International LLC/EMC Corp.: | | | |
| 5.45% 6/15/23 | | 907 | 906 |
| 5.85% 7/15/25 | | 1,437 | 1,446 |
| 6.02% 6/15/26 | | 1,159 | 1,173 |
| 6.1% 7/15/27 | | 2,638 | 2,711 |
| 6.2% 7/15/30 | | 2,284 | 2,319 |
| | | | 8,555 |
| Semiconductors & Semiconductor Equipment - 0.6% | | | |
| Broadcom, Inc.: | | | |
| 1.95% 2/15/28 (b) | | 2,435 | 2,064 |
| 2.45% 2/15/31 (b) | | 20,716 | 16,415 |
| 2.6% 2/15/33 (b) | | 20,716 | 15,657 |
| 3.5% 2/15/41 (b) | | 16,728 | 11,971 |
| 3.75% 2/15/51 (b) | | 7,851 | 5,472 |
| | | | 51,579 |
| Software - 0.3% | | | |
| Oracle Corp.: | | | |
| 2.5% 4/1/25 | | 6,375 | 6,011 |
| 2.8% 4/1/27 | | 6,375 | 5,782 |
| 2.95% 4/1/30 | | 6,400 | 5,461 |
| 3.6% 4/1/50 | | 6,370 | 4,314 |
| 3.85% 4/1/60 | | 6,400 | 4,266 |
| | | | 25,834 |
TOTAL INFORMATION TECHNOLOGY | | | 85,968 |
| REAL ESTATE - 2.7% | | | |
| Equity Real Estate Investment Trusts (REITs) - 2.2% | | | |
| Alexandria Real Estate Equities, Inc.: | | | |
| 2% 5/18/32 | | 6,718 | 5,140 |
| 4.9% 12/15/30 | | 4,519 | 4,382 |
| American Homes 4 Rent LP: | | | |
| 2.375% 7/15/31 | | 977 | 768 |
| 3.375% 7/15/51 | | 1,510 | 981 |
| 3.625% 4/15/32 | | 3,763 | 3,179 |
| 4.3% 4/15/52 | | 2,608 | 1,999 |
| Boston Properties, Inc.: | | | |
| 3.25% 1/30/31 | | 4,526 | 3,776 |
| 4.5% 12/1/28 | | 2,824 | 2,621 |
| Corporate Office Properties LP: | | | |
| 2% 1/15/29 | | 747 | 575 |
| 2.25% 3/15/26 | | 2,339 | 2,086 |
| 2.75% 4/15/31 | | 2,202 | 1,658 |
| Healthcare Trust of America Holdings LP: | | | |
| 3.1% 2/15/30 | | 1,129 | 962 |
| 3.5% 8/1/26 | | 1,176 | 1,093 |
| Hudson Pacific Properties LP 4.65% 4/1/29 | | 6,288 | 5,342 |
| Invitation Homes Operating Partnership LP 4.15% 4/15/32 | | 5,643 | 4,964 |
| Kimco Realty Op LLC 2.25% 12/1/31 | | 9,524 | 7,396 |
| Kite Realty Group Trust: | | | |
| 4% 3/15/25 | | 8,142 | 7,715 |
| 4.75% 9/15/30 | | 13,258 | 11,867 |
| LXP Industrial Trust (REIT): | | | |
| 2.7% 9/15/30 | | 2,571 | 2,057 |
| 4.4% 6/15/24 | | 599 | 580 |
| Omega Healthcare Investors, Inc.: | | | |
| 3.25% 4/15/33 | | 8,532 | 6,099 |
| 3.375% 2/1/31 | | 4,780 | 3,767 |
| 3.625% 10/1/29 | | 5,204 | 4,316 |
| 4.375% 8/1/23 | | 635 | 631 |
| 4.5% 1/15/25 | | 1,271 | 1,240 |
| 4.5% 4/1/27 | | 452 | 427 |
| 4.75% 1/15/28 | | 7,132 | 6,689 |
| 4.95% 4/1/24 | | 557 | 547 |
| 5.25% 1/15/26 | | 2,371 | 2,324 |
| Piedmont Operating Partnership LP 2.75% 4/1/32 | | 1,917 | 1,351 |
| Prologis LP 3.25% 6/30/26 | | 372 | 352 |
| Realty Income Corp.: | | | |
| 2.2% 6/15/28 | | 1,146 | 989 |
| 2.85% 12/15/32 | | 1,410 | 1,158 |
| 3.25% 1/15/31 | | 1,277 | 1,113 |
| 3.4% 1/15/28 | | 1,957 | 1,813 |
| Retail Opportunity Investments Partnership LP: | | | |
| 4% 12/15/24 | | 405 | 391 |
| 5% 12/15/23 | | 312 | 309 |
| Simon Property Group LP: | | | |
| 2.45% 9/13/29 | | 1,897 | 1,589 |
| 3.375% 12/1/27 | | 3,864 | 3,569 |
| SITE Centers Corp.: | | | |
| 3.625% 2/1/25 | | 967 | 918 |
| 4.25% 2/1/26 | | 1,683 | 1,595 |
| Store Capital Corp.: | | | |
| 2.75% 11/18/30 | | 2,849 | 2,152 |
| 4.625% 3/15/29 | | 1,396 | 1,232 |
| Sun Communities Operating LP: | | | |
| 2.3% 11/1/28 | | 2,169 | 1,834 |
| 2.7% 7/15/31 | | 5,600 | 4,468 |
| Ventas Realty LP: | | | |
| 2.5% 9/1/31 | | 16,206 | 12,763 |
| 3% 1/15/30 | | 6,770 | 5,754 |
| 4% 3/1/28 | | 1,358 | 1,255 |
| 4.125% 1/15/26 | | 630 | 606 |
| 4.75% 11/15/30 | | 10,898 | 10,273 |
| VICI Properties LP: | | | |
| 4.375% 5/15/25 | | 963 | 927 |
| 4.75% 2/15/28 | | 7,611 | 7,180 |
| 4.95% 2/15/30 | | 9,911 | 9,253 |
| 5.125% 5/15/32 | | 998 | 926 |
| Vornado Realty LP: | | | |
| 2.15% 6/1/26 | | 2,457 | 2,105 |
| 3.4% 6/1/31 | | 8,887 | 6,759 |
| WP Carey, Inc.: | | | |
| 3.85% 7/15/29 | | 1,045 | 950 |
| 4% 2/1/25 | | 2,162 | 2,109 |
| 4.6% 4/1/24 | | 3,364 | 3,321 |
| | | | 184,195 |
| Real Estate Management & Development - 0.5% | | | |
| Brandywine Operating Partnership LP: | | | |
| 3.95% 11/15/27 | | 2,767 | 2,334 |
| 4.1% 10/1/24 | | 2,463 | 2,369 |
| 4.55% 10/1/29 | | 1,135 | 941 |
| 7.55% 3/15/28 | | 8,285 | 8,123 |
| CBRE Group, Inc.: | | | |
| 2.5% 4/1/31 | | 7,642 | 6,210 |
| 4.875% 3/1/26 | | 4,953 | 4,846 |
| Essex Portfolio LP 3.875% 5/1/24 | | 1,215 | 1,188 |
| Mid-America Apartments LP 4% 11/15/25 | | 522 | 504 |
| Tanger Properties LP: | | | |
| 2.75% 9/1/31 | | 5,725 | 4,246 |
| 3.125% 9/1/26 | | 1,660 | 1,507 |
| 3.875% 7/15/27 | | 6,943 | 6,376 |
| | | | 38,644 |
TOTAL REAL ESTATE | | | 222,839 |
| UTILITIES - 1.1% | | | |
| Electric Utilities - 0.2% | | | |
| Cleco Corporate Holdings LLC 3.375% 9/15/29 | | 2,932 | 2,475 |
| DPL, Inc. 4.35% 4/15/29 | | 2,835 | 2,452 |
| Duquesne Light Holdings, Inc.: | | | |
| 2.532% 10/1/30 (b) | | 1,869 | 1,486 |
| 2.775% 1/7/32 (b) | | 5,941 | 4,673 |
| FirstEnergy Corp. 7.375% 11/15/31 | | 2,316 | 2,597 |
| IPALCO Enterprises, Inc. 3.7% 9/1/24 | | 1,240 | 1,198 |
| | | | 14,881 |
| Gas Utilities - 0.0% | | | |
| Nakilat, Inc. 6.067% 12/31/33 (b) | | 683 | 711 |
| Independent Power and Renewable Electricity Producers - 0.3% | | | |
| The AES Corp.: | | | |
| 2.45% 1/15/31 | | 5,591 | 4,441 |
| 3.3% 7/15/25 (b) | | 10,148 | 9,523 |
| 3.95% 7/15/30 (b) | | 8,852 | 7,750 |
| | | | 21,714 |
| Multi-Utilities - 0.6% | | | |
| Berkshire Hathaway Energy Co.: | | | |
| 3.7% 7/15/30 | | 1,064 | 978 |
| 4.05% 4/15/25 | | 13,567 | 13,270 |
| NiSource, Inc.: | | | |
| 2.95% 9/1/29 | | 19,262 | 16,625 |
| 3.49% 5/15/27 | | 10,080 | 9,416 |
| 5.95% 6/15/41 | | 1,097 | 1,104 |
| Puget Energy, Inc.: | | | |
| 4.1% 6/15/30 | | 3,951 | 3,547 |
| 4.224% 3/15/32 | | 7,271 | 6,429 |
| Sempra Energy 6% 10/15/39 | | 1,733 | 1,756 |
| WEC Energy Group, Inc. 3 month U.S. LIBOR + 2.610% 6.9761% 5/15/67 (c)(e) | | 1,164 | 994 |
| | | | 54,119 |
TOTAL UTILITIES | | | 91,425 |
| TOTAL NONCONVERTIBLE BONDS (Cost $3,490,416) | | | 3,093,348 |
| | | | |
| U.S. Treasury Obligations - 34.5% |
| | | Principal Amount (a) (000s) | Value ($) (000s) |
| U.S. Treasury Bonds: | | | |
| 2.25% 2/15/52 | | 58,500 | 41,711 |
| 2.375% 2/15/42 (f)(g) | | 1,266 | 974 |
| 2.375% 5/15/51 | | 600,429 | 440,776 |
| 2.875% 5/15/52 | | 224,700 | 183,999 |
| 3.625% 2/15/53 (h) | | 117,014 | 111,401 |
| U.S. Treasury Notes: | | | |
| 0.5% 5/31/27 | | 138,600 | 118,422 |
| 1.25% 4/30/28 | | 400,000 | 346,109 |
| 2.75% 8/15/32 | | 135,200 | 122,863 |
| 2.875% 5/15/32 | | 500,671 | 460,485 |
| 3.125% 11/15/28 | | 38,238 | 36,247 |
| 3.5% 1/31/30 | | 98,900 | 95,516 |
| 3.5% 2/15/33 | | 255,700 | 247,270 |
| 3.875% 1/15/26 | | 8,600 | 8,452 |
| 3.875% 11/30/27 | | 120,000 | 118,289 |
| 3.875% 12/31/29 | | 78,700 | 77,741 |
| 4% 10/31/29 (f)(g)(h) | | 198,900 | 197,727 |
| 4.125% 11/15/32 | | 245,100 | 249,006 |
| 4.375% 10/31/24 (g) | | 700 | 693 |
| TOTAL U.S. TREASURY OBLIGATIONS (Cost $3,190,423) | | | 2,857,681 |
| | | | |
| U.S. Government Agency - Mortgage Securities - 12.5% |
| | | Principal Amount (a) (000s) | Value ($) (000s) |
| Fannie Mae - 3.9% | | | |
| 12 month U.S. LIBOR + 1.360% 3.615% 10/1/35 (c)(e) | | 21 | 21 |
| 12 month U.S. LIBOR + 1.440% 1.945% 4/1/37 (c)(e) | | 5 | 5 |
| 12 month U.S. LIBOR + 1.460% 3.85% 1/1/35 (c)(e) | | 37 | 37 |
| 12 month U.S. LIBOR + 1.480% 3.796% 7/1/34 (c)(e) | | 3 | 3 |
| 12 month U.S. LIBOR + 1.550% 3.098% 2/1/44 (c)(e) | | 4 | 4 |
| 12 month U.S. LIBOR + 1.550% 3.2% 5/1/44 (c)(e) | | 5 | 5 |
| 12 month U.S. LIBOR + 1.550% 3.803% 6/1/36 (c)(e) | | 12 | 13 |
| 12 month U.S. LIBOR + 1.560% 2.065% 3/1/37 (c)(e) | | 39 | 39 |
| 12 month U.S. LIBOR + 1.560% 3.343% 2/1/44 (c)(e) | | 9 | 9 |
| 12 month U.S. LIBOR + 1.570% 2.554% 4/1/44 (c)(e) | | 15 | 15 |
| 12 month U.S. LIBOR + 1.580% 2.08% 4/1/44 (c)(e) | | 6 | 6 |
| 12 month U.S. LIBOR + 1.580% 3.83% 1/1/44 (c)(e) | | 8 | 8 |
| 12 month U.S. LIBOR + 1.620% 3.584% 3/1/33 (c)(e) | | 35 | 35 |
| 12 month U.S. LIBOR + 1.620% 3.871% 5/1/35 (c)(e) | | 10 | 10 |
| 12 month U.S. LIBOR + 1.630% 3.491% 11/1/36 (c)(e) | | 17 | 17 |
| 12 month U.S. LIBOR + 1.630% 3.815% 9/1/36 (c)(e) | | 3 | 3 |
| 12 month U.S. LIBOR + 1.640% 3.274% 5/1/36 (c)(e) | | 9 | 9 |
| 12 month U.S. LIBOR + 1.640% 3.895% 6/1/47 (c)(e) | | 53 | 54 |
| 12 month U.S. LIBOR + 1.680% 3.76% 7/1/43 (c)(e) | | 91 | 92 |
| 12 month U.S. LIBOR + 1.700% 3.186% 6/1/42 (c)(e) | | 65 | 67 |
| 12 month U.S. LIBOR + 1.730% 3.442% 5/1/36 (c)(e) | | 19 | 20 |
| 12 month U.S. LIBOR + 1.730% 3.854% 3/1/40 (c)(e) | | 39 | 40 |
| 12 month U.S. LIBOR + 1.750% 3.701% 7/1/35 (c)(e) | | 28 | 28 |
| 12 month U.S. LIBOR + 1.750% 4% 8/1/41 (c)(e) | | 15 | 15 |
| 12 month U.S. LIBOR + 1.770% 4.071% 2/1/37 (c)(e) | | 108 | 109 |
| 12 month U.S. LIBOR + 1.800% 4.048% 12/1/40 (c)(e) | | 304 | 308 |
| 12 month U.S. LIBOR + 1.800% 4.05% 7/1/41 (c)(e) | | 29 | 30 |
| 12 month U.S. LIBOR + 1.800% 4.055% 1/1/42 (c)(e) | | 190 | 192 |
| 12 month U.S. LIBOR + 1.810% 2.521% 2/1/42 (c)(e) | | 112 | 114 |
| 12 month U.S. LIBOR + 1.810% 4.051% 7/1/41 (c)(e) | | 42 | 43 |
| 12 month U.S. LIBOR + 1.810% 4.06% 12/1/39 (c)(e) | | 8 | 9 |
| 12 month U.S. LIBOR + 1.810% 4.068% 9/1/41 (c)(e) | | 21 | 22 |
| 12 month U.S. LIBOR + 1.820% 2.792% 2/1/35 (c)(e) | | 14 | 14 |
| 12 month U.S. LIBOR + 1.830% 4.08% 10/1/41 (c)(e) | | 18 | 17 |
| 12 month U.S. LIBOR + 1.850% 2.429% 4/1/36 (c)(e) | | 68 | 69 |
| 12 month U.S. LIBOR + 1.890% 3.586% 8/1/35 (c)(e) | | 60 | 61 |
| 12 month U.S. LIBOR + 1.950% 3.771% 7/1/37 (c)(e) | | 15 | 16 |
| 6 month U.S. LIBOR + 1.470% 3.112% 10/1/33 (c)(e) | | 1 | 1 |
| 6 month U.S. LIBOR + 1.500% 3.727% 1/1/35 (c)(e) | | 11 | 11 |
| 6 month U.S. LIBOR + 1.510% 5.523% 2/1/33 (c)(e) | | 1 | 1 |
| 6 month U.S. LIBOR + 1.530% 3.258% 12/1/34 (c)(e) | | 4 | 4 |
| 6 month U.S. LIBOR + 1.530% 3.437% 3/1/35 (c)(e) | | 7 | 7 |
| 6 month U.S. LIBOR + 1.550% 4.211% 10/1/33 (c)(e) | | 2 | 2 |
| 6 month U.S. LIBOR + 1.550% 4.275% 9/1/33 (c)(e) | | 101 | 103 |
| 6 month U.S. LIBOR + 1.560% 5.64% 7/1/35 (c)(e) | | 4 | 4 |
| 6 month U.S. LIBOR + 1.740% 3.865% 12/1/34 (c)(e) | | 1 | 1 |
| 6 month U.S. LIBOR + 1.960% 3.434% 9/1/35 (c)(e) | | 2 | 2 |
| U.S. TREASURY 1 YEAR INDEX + 2.180% 4.056% 7/1/36 (c)(e) | | 9 | 10 |
| U.S. TREASURY 1 YEAR INDEX + 2.200% 2.583% 3/1/35 (c)(e) | | 4 | 4 |
| U.S. TREASURY 1 YEAR INDEX + 2.270% 4.395% 6/1/36 (c)(e) | | 7 | 7 |
| U.S. TREASURY 1 YEAR INDEX + 2.280% 4.407% 10/1/33 (c)(e) | | 8 | 8 |
| U.S. TREASURY 1 YEAR INDEX + 2.460% 3.982% 7/1/34 (c)(e) | | 11 | 11 |
| 1.5% 1/1/36 to 11/1/41 | | 15,627 | 12,921 |
| 2% 2/1/28 to 3/1/52 | | 42,129 | 35,398 |
| 2.5% 1/1/28 to 2/1/52 | | 120,331 | 104,711 |
| 3% 12/1/28 to 2/1/52 (f) | | 86,261 | 77,709 |
| 3.25% 12/1/41 | | 12 | 12 |
| 3.4% 7/1/42 to 9/1/42 | | 122 | 114 |
| 3.5% 5/1/36 to 3/1/52 | | 29,347 | 27,208 |
| 3.65% 5/1/42 to 8/1/42 | | 52 | 49 |
| 3.9% 4/1/42 | | 14 | 14 |
| 4% 3/1/36 to 9/1/52 | | 26,320 | 25,190 |
| 4.025% 5/1/42 | | 18 | 17 |
| 4.25% 11/1/41 | | 23 | 22 |
| 4.5% to 4.5% 6/1/24 to 8/1/52 | | 18,565 | 18,213 |
| 5% 6/1/23 to 12/1/52 | | 12,240 | 12,172 |
| 5.264% 8/1/41 (c) | | 223 | 223 |
| 5.5% 12/1/23 to 11/1/52 | | 1,030 | 1,032 |
| 6% to 6% 9/1/29 to 11/1/52 | | 3,825 | 3,916 |
| 6.5% 7/1/23 to 4/1/37 | | 1,657 | 1,715 |
| 6.67% 2/1/39 (c) | | 118 | 120 |
| 7% to 7% 4/1/23 to 7/1/37 | | 100 | 104 |
| 7.5% to 7.5% 6/1/25 to 11/1/31 | | 62 | 64 |
| 8% 3/1/37 | | 4 | 5 |
TOTAL FANNIE MAE | | | 322,664 |
| Freddie Mac - 2.2% | | | |
| 12 month U.S. LIBOR + 1.320% 3.575% 1/1/36 (c)(e) | | 22 | 22 |
| 12 month U.S. LIBOR + 1.370% 3.634% 3/1/36 (c)(e) | | 19 | 19 |
| 12 month U.S. LIBOR + 1.500% 3.824% 3/1/36 (c)(e) | | 11 | 11 |
| 12 month U.S. LIBOR + 1.660% 4.04% 7/1/36 (c)(e) | | 72 | 72 |
| 12 month U.S. LIBOR + 1.750% 4% 12/1/40 (c)(e) | | 131 | 131 |
| 12 month U.S. LIBOR + 1.750% 4% 7/1/41 (c)(e) | | 30 | 30 |
| 12 month U.S. LIBOR + 1.750% 4% 9/1/41 (c)(e) | | 379 | 382 |
| 12 month U.S. LIBOR + 1.860% 3.239% 4/1/36 (c)(e) | | 8 | 8 |
| 12 month U.S. LIBOR + 1.880% 3.255% 4/1/41 (c)(e) | | 8 | 8 |
| 12 month U.S. LIBOR + 1.880% 4.13% 9/1/41 (c)(e) | | 33 | 33 |
| 12 month U.S. LIBOR + 1.880% 4.13% 10/1/41 (c)(e) | | 250 | 253 |
| 12 month U.S. LIBOR + 1.900% 3.966% 10/1/42 (c)(e) | | 155 | 157 |
| 12 month U.S. LIBOR + 1.910% 3.22% 5/1/41 (c)(e) | | 66 | 67 |
| 12 month U.S. LIBOR + 1.910% 3.568% 5/1/41 (c)(e) | | 68 | 69 |
| 12 month U.S. LIBOR + 1.910% 3.791% 6/1/41 (c)(e) | | 83 | 84 |
| 12 month U.S. LIBOR + 1.910% 4.16% 6/1/41 (c)(e) | | 21 | 22 |
| 12 month U.S. LIBOR + 2.020% 2.93% 4/1/38 (c)(e) | | 7 | 7 |
| 12 month U.S. LIBOR + 2.030% 4.158% 3/1/33 (c)(e) | | 0 | 0 |
| 12 month U.S. LIBOR + 2.040% 4.265% 7/1/36 (c)(e) | | 73 | 74 |
| 12 month U.S. LIBOR + 2.200% 4.45% 12/1/36 (c)(e) | | 13 | 13 |
| 6 month U.S. LIBOR + 1.120% 3.029% 8/1/37 (c)(e) | | 10 | 9 |
| 6 month U.S. LIBOR + 1.580% 5.08% 12/1/35 (c)(e) | | 0 | 0 |
| 6 month U.S. LIBOR + 1.660% 3.165% 1/1/37 (c)(e) | | 17 | 17 |
| 6 month U.S. LIBOR + 1.660% 5.54% 7/1/35 (c)(e) | | 13 | 13 |
| 6 month U.S. LIBOR + 1.880% 3.488% 10/1/36 (c)(e) | | 129 | 129 |
| 6 month U.S. LIBOR + 1.990% 4% 10/1/35 (c)(e) | | 65 | 66 |
| 6 month U.S. LIBOR + 2.010% 4.76% 5/1/37 (c)(e) | | 12 | 12 |
| 6 month U.S. LIBOR + 2.020% 5.51% 6/1/37 (c)(e) | | 26 | 27 |
| 6 month U.S. LIBOR + 2.680% 5.679% 10/1/35 (c)(e) | | 11 | 12 |
| U.S. TREASURY 1 YEAR INDEX + 2.030% 3.174% 6/1/33 (c)(e) | | 97 | 97 |
| U.S. TREASURY 1 YEAR INDEX + 2.230% 3.067% 4/1/34 (c)(e) | | 30 | 30 |
| U.S. TREASURY 1 YEAR INDEX + 2.260% 3.229% 6/1/33 (c)(e) | | 28 | 28 |
| U.S. TREASURY 1 YEAR INDEX + 2.430% 4.392% 3/1/35 (c)(e) | | 49 | 50 |
| U.S. TREASURY 1 YEAR INDEX + 2.540% 4.046% 7/1/35 (c)(e) | | 84 | 85 |
| 1.5% 10/1/36 to 12/1/50 | | 2,173 | 1,809 |
| 2% 4/1/41 to 2/1/52 | | 39,997 | 32,975 |
| 2.5% 1/1/28 to 1/1/52 | | 43,497 | 37,971 |
| 3% 6/1/31 to 1/1/52 | | 25,023 | 22,517 |
| 3.5% 3/1/32 to 12/1/52 | | 44,862 | 41,733 |
| 4% 1/1/36 to 2/1/50 | | 16,220 | 15,592 |
| 4% 4/1/48 | | 8 | 8 |
| 4.5% 6/1/25 to 10/1/48 | | 7,485 | 7,380 |
| 5% 8/1/33 to 3/1/53 | | 16,321 | 16,185 |
| 5.5% 10/1/52 to 12/1/52 | | 1,787 | 1,787 |
| 6% 1/1/24 to 12/1/37 | | 236 | 241 |
| 6.5% 5/1/26 to 9/1/39 | | 310 | 323 |
| 7% 3/1/26 to 9/1/36 | | 96 | 100 |
| 7.5% 6/1/26 to 11/1/31 | | 1 | 1 |
| 8% 7/1/24 to 4/1/32 | | 3 | 3 |
| 8.5% 1/1/25 to 9/1/29 | | 2 | 2 |
TOTAL FREDDIE MAC | | | 180,664 |
| Ginnie Mae - 2.0% | | | |
| 3.5% 9/20/40 to 12/20/49 | | 9,243 | 8,669 |
| 4% 7/15/39 to 6/20/49 | | 10,286 | 9,884 |
| 4.5% 6/20/33 to 8/15/41 | | 5,761 | 5,657 |
| 5% 12/15/32 to 4/20/48 | | 3,499 | 3,509 |
| 5.5% 6/15/33 to 9/15/39 | | 223 | 228 |
| 6% to 6% 10/15/30 to 5/15/40 | | 1,671 | 1,719 |
| 7% to 7% 12/15/23 to 11/15/32 | | 196 | 202 |
| 7.5% to 7.5% 4/15/23 to 9/15/31 | | 53 | 55 |
| 8% 12/15/23 to 11/15/29 | | 9 | 9 |
| 8.5% 11/15/27 to 1/15/31 | | 2 | 2 |
| 2% 12/20/50 to 4/20/51 | | 5,478 | 4,619 |
| 2% 3/1/53 (d) | | 4,500 | 3,772 |
| 2% 3/1/53 (d) | | 16,150 | 13,536 |
| 2% 3/1/53 (d) | | 4,850 | 4,065 |
| 2% 3/1/53 (d) | | 3,250 | 2,724 |
| 2% 3/1/53 (d) | | 4,050 | 3,395 |
| 2% 3/1/53 (d) | | 6,300 | 5,280 |
| 2% 3/1/53 (d) | | 2,800 | 2,347 |
| 2% 3/1/53 (d) | | 2,700 | 2,263 |
| 2% 4/1/53 (d) | | 17,800 | 14,935 |
| 2% 4/1/53 (d) | | 13,300 | 11,160 |
| 2.5% 7/20/51 to 12/20/51 | | 2,372 | 2,058 |
| 2.5% 3/1/53 (d) | | 8,750 | 7,567 |
| 2.5% 3/1/53 (d) | | 17,400 | 15,047 |
| 2.5% 3/1/53 (d) | | 6,900 | 5,967 |
| 2.5% 3/1/53 (d) | | 5,900 | 5,102 |
| 3% 5/15/42 to 2/20/50 | | 3,688 | 3,348 |
| 3% 3/1/53 (d) | | 6,700 | 5,977 |
| 3% 3/1/53 (d) | | 4,450 | 3,970 |
| 3% 3/1/53 (d) | | 9,075 | 8,095 |
| 3% 3/1/53 (d) | | 5,650 | 5,040 |
| 3.5% 3/1/53 (d) | | 1,700 | 1,563 |
| 3.5% 3/1/53 (d) | | 2,850 | 2,620 |
| 3.5% 3/1/53 (d) | | 1,975 | 1,815 |
| 3.5% 3/1/53 (d) | | 2,275 | 2,091 |
| 5.47% 8/20/59 (c)(i) | | 1 | 1 |
| 6.5% 3/20/31 to 6/15/37 | | 60 | 62 |
TOTAL GINNIE MAE | | | 168,353 |
| Uniform Mortgage Backed Securities - 4.4% | | | |
| 1.5% 3/1/38 (d) | | 3,600 | 3,112 |
| 1.5% 3/1/38 (d) | | 3,600 | 3,112 |
| 1.5% 3/1/38 (d) | | 2,000 | 1,729 |
| 1.5% 4/1/38 (d) | | 4,650 | 4,026 |
| 1.5% 4/1/38 (d) | | 4,450 | 3,853 |
| 1.5% 3/1/53 (d) | | 16,900 | 13,049 |
| 1.5% 3/1/53 (d) | | 10,550 | 8,146 |
| 2% 3/1/38 (d) | | 450 | 399 |
| 2% 3/1/38 (d) | | 300 | 266 |
| 2% 3/1/53 (d) | | 8,650 | 7,043 |
| 2% 3/1/53 (d) | | 42,800 | 34,850 |
| 2% 3/1/53 (d) | | 23,900 | 19,461 |
| 2% 3/1/53 (d) | | 4,800 | 3,908 |
| 2% 3/1/53 (d) | | 51,300 | 41,771 |
| 2% 4/1/53 (d) | | 3,900 | 3,179 |
| 2% 4/1/53 (d) | | 57,900 | 47,202 |
| 2% 4/1/53 (d) | | 31,550 | 25,721 |
| 2.5% 3/1/53 (d) | | 14,800 | 12,538 |
| 2.5% 3/1/53 (d) | | 11,475 | 9,721 |
| 2.5% 3/1/53 (d) | | 7,650 | 6,481 |
| 2.5% 3/1/53 (d) | | 4,225 | 3,579 |
| 2.5% 4/1/53 (d) | | 5,100 | 4,325 |
| 3% 3/1/53 (d) | | 4,500 | 3,958 |
| 3% 3/1/53 (d) | | 3,100 | 2,727 |
| 3% 3/1/53 (d) | | 3,350 | 2,947 |
| 3% 3/1/53 (d) | | 1,350 | 1,187 |
| 3% 4/1/53 (d) | | 4,150 | 3,653 |
| 3% 4/1/53 (d) | | 1,400 | 1,232 |
| 3.5% 3/1/53 (d) | | 7,000 | 6,373 |
| 4% 3/1/53 (d) | | 2,400 | 2,251 |
| 4% 3/1/53 (d) | | 2,400 | 2,251 |
| 4% 3/1/53 (d) | | 3,050 | 2,861 |
| 4% 3/1/53 (d) | | 3,050 | 2,861 |
| 4.5% 3/1/53 (d) | | 8,550 | 8,232 |
| 4.5% 3/1/53 (d) | | 14,550 | 14,008 |
| 5% 3/1/53 (d) | | 4,800 | 4,717 |
| 5% 3/1/53 (d) | | 2,600 | 2,555 |
| 5.5% 3/1/53 (d) | | 7,750 | 7,736 |
| 5.5% 3/1/53 (d) | | 11,350 | 11,330 |
| 5.5% 3/1/53 (d) | | 11,750 | 11,729 |
| 5.5% 4/1/53 (d) | | 10,300 | 10,277 |
TOTAL UNIFORM MORTGAGE BACKED SECURITIES | | | 360,356 |
| TOTAL U.S. GOVERNMENT AGENCY - MORTGAGE SECURITIES (Cost $1,081,091) | | | 1,032,037 |
| | | | |
| Asset-Backed Securities - 7.2% |
| | | Principal Amount (a) (000s) | Value ($) (000s) |
| AASET Trust: | | | |
| Series 2018-1A Class A, 3.844% 1/16/38 (b) | | 7,070 | 4,472 |
| Series 2019-1 Class A, 3.844% 5/15/39 (b) | | 1,524 | 1,074 |
| Series 2019-2: | | | |
Class A, 3.376% 10/16/39 (b) | | 4,120 | 3,187 |
Class B, 4.458% 10/16/39 (b) | | 886 | 292 |
| Series 2021-1A Class A, 2.95% 11/16/41 (b) | | 7,041 | 6,178 |
| Series 2021-2A Class A, 2.798% 1/15/47 (b) | | 13,052 | 11,003 |
| Aimco Series 2021-BA Class AR, 3 month U.S. LIBOR + 1.100% 5.8924% 1/15/32 (b)(c)(e) | | 2,225 | 2,197 |
| AIMCO CLO Ltd. Series 2021-11A Class AR, 3 month U.S. LIBOR + 1.130% 5.9224% 10/17/34 (b)(c)(e) | | 5,465 | 5,372 |
| AIMCO CLO Ltd. / AIMCO CLO LLC Series 2021-14A Class A, 3 month U.S. LIBOR + 0.990% 5.7977% 4/20/34 (b)(c)(e) | | 14,203 | 13,926 |
| Allegro CLO XV, Ltd. / Allegro CLO VX LLC Series 2022-1A Class A, CME TERM SOFR 3 MONTH INDEX + 1.500% 6.139% 7/20/35 (b)(c)(e) | | 6,465 | 6,392 |
| Allegro CLO, Ltd. Series 2021-1A Class A, 3 month U.S. LIBOR + 1.140% 5.9477% 7/20/34 (b)(c)(e) | | 6,507 | 6,374 |
| Apollo Aviation Securitization Equity Trust Series 2020-1A: | | | |
| Class A, 3.351% 1/16/40 (b) | | 1,510 | 1,244 |
| Class B, 4.335% 1/16/40 (b) | | 268 | 118 |
| Ares CLO Series 2019-54A Class A, 3 month U.S. LIBOR + 1.320% 6.1124% 10/15/32 (b)(c)(e) | | 4,806 | 4,759 |
| Ares LIX CLO Ltd. Series 2021-59A Class A, 3 month U.S. LIBOR + 1.030% 5.8477% 4/25/34 (b)(c)(e) | | 4,698 | 4,601 |
| Ares LV CLO Ltd. Series 2021-55A Class A1R, 3 month U.S. LIBOR + 1.130% 5.9224% 7/15/34 (b)(c)(e) | | 8,184 | 8,076 |
| Ares LVIII CLO LLC Series 2022-58A Class AR, CME TERM SOFR 3 MONTH INDEX + 1.330% 5.9876% 1/15/35 (b)(c)(e) | | 10,462 | 10,280 |
| Ares XLI CLO Ltd. / Ares XLI CLO LLC Series 2021-41A Class AR2, 3 month U.S. LIBOR + 1.070% 5.8624% 4/15/34 (b)(c)(e) | | 9,992 | 9,796 |
| Ares XXXIV CLO Ltd. Series 2020-2A Class AR2, 3 month U.S. LIBOR + 1.250% 6.0424% 4/17/33 (b)(c)(e) | | 16,288 | 16,108 |
| Babson CLO Ltd. Series 2021-1A Class AR, 3 month U.S. LIBOR + 1.150% 5.9424% 10/15/36 (b)(c)(e) | | 5,474 | 5,386 |
| Barings CLO Ltd.: | | | |
| Series 2021-1A Class A, 3 month U.S. LIBOR + 1.020% 5.8377% 4/25/34 (b)(c)(e) | | 10,335 | 10,154 |
| Series 2021-4A Class A, 3 month U.S. LIBOR + 1.220% 6.0277% 1/20/32 (b)(c)(e) | | 9,800 | 9,722 |
| BETHP Series 2021-1A Class A, 3 month U.S. LIBOR + 1.130% 5.9224% 1/15/35 (b)(c)(e) | | 8,274 | 8,117 |
| Blackbird Capital Aircraft: | | | |
| Series 2016-1A: | | | |
Class A, 4.213% 12/16/41 (b) | | 3,296 | 2,752 |
Class AA, 2.487% 12/16/41 (b)(c) | | 288 | 266 |
| Series 2021-1A Class A, 2.443% 7/15/46 (b) | | 9,972 | 8,436 |
| Bristol Park CLO, Ltd. Series 2020-1A Class AR, 3 month U.S. LIBOR + 0.990% 5.7824% 4/15/29 (b)(c)(e) | | 6,042 | 5,992 |
| Castlelake Aircraft Securitization Trust: | | | |
| Series 2019-1A: | | | |
Class A, 3.967% 4/15/39 (b) | | 4,100 | 3,577 |
Class B, 5.095% 4/15/39 (b) | | 1,844 | 1,318 |
| Series 2021-1R Class A, 2.741% 8/15/41 (b) | | 14,910 | 13,279 |
| Castlelake Aircraft Structured Trust: | | | |
| Series 2018-1 Class A, 4.125% 6/15/43 (b) | | 1,518 | 1,327 |
| Series 2021-1A: | | | |
Class A, 3.474% 1/15/46 (b) | | 2,184 | 1,998 |
Class B, 6.656% 1/15/46 (b) | | 1,414 | 1,160 |
| Cedar Funding Ltd. Series 2021-10A Class AR, 3 month U.S. LIBOR + 1.100% 5.9077% 10/20/32 (b)(c)(e) | | 6,612 | 6,519 |
| Cedar Funding XII CLO Ltd. / Cedar Funding XII CLO LLC Series 2021-12A Class A1R, 3 month U.S. LIBOR + 1.130% 5.9477% 10/25/34 (b)(c)(e) | | 5,100 | 4,991 |
| CEDF Series 2021-6A Class ARR, 3 month U.S. LIBOR + 1.050% 5.8577% 4/20/34 (b)(c)(e) | | 8,665 | 8,421 |
| Cent CLO Ltd. / Cent CLO Series 2021-29A Class AR, 3 month U.S. LIBOR + 1.170% 5.9777% 10/20/34 (b)(c)(e) | | 8,292 | 8,107 |
| Columbia Cent CLO 31 Ltd. Series 2021-31A Class A1, 3 month U.S. LIBOR + 1.200% 6.0077% 4/20/34 (b)(c)(e) | | 9,800 | 9,549 |
| Columbia Cent Clo 32 Ltd. / Coliseum Series 2022-32A Class A1, CME TERM SOFR 3 MONTH INDEX + 1.700% 6.3586% 7/24/34 (b)(c)(e) | | 9,668 | 9,609 |
| Columbia Cent CLO Ltd. / Columbia Cent CLO Corp. Series 2021-30A Class A1, 3 month U.S. LIBOR + 1.310% 6.1177% 1/20/34 (b)(c)(e) | | 12,900 | 12,677 |
| DB Master Finance LLC: | | | |
| Series 2017-1A Class A2II, 4.03% 11/20/47 (b) | | 3,300 | 3,065 |
| Series 2019-1A: | | | |
Class A23, 4.352% 5/20/49 (b) | | 593 | 551 |
Class A2II, 4.021% 5/20/49 (b) | | 797 | 749 |
| Series 2021-1A Class A23, 2.791% 11/20/51 (b) | | 1,383 | 1,110 |
| Dominos Pizza Master Issuer LLC: | | | |
| Series 2019-1A Class A2, 3.668% 10/25/49 (b) | | 5,521 | 4,906 |
| Series 2021-1A Class A2II, 3.151% 4/25/51 (b) | | 274 | 229 |
| Dryden CLO, Ltd.: | | | |
| Series 2021-76A Class A1R, 3 month U.S. LIBOR + 1.150% 5.9577% 10/20/34 (b)(c)(e) | | 5,507 | 5,413 |
| Series 2021-83A Class A, 3 month U.S. LIBOR + 1.220% 6.0147% 1/18/32 (b)(c)(e) | | 7,090 | 7,015 |
| Dryden Senior Loan Fund: | | | |
| Series 2018-70A Class A1, 3 month U.S. LIBOR + 1.170% 5.9997% 1/16/32 (b)(c)(e) | | 1,808 | 1,796 |
| Series 2020-78A Class A, 3 month U.S. LIBOR + 1.180% 5.9724% 4/17/33 (b)(c)(e) | | 4,300 | 4,253 |
| Series 2021-85A Class AR, 3 month U.S. LIBOR + 1.150% 5.9424% 10/15/35 (b)(c)(e) | | 7,281 | 7,137 |
| Series 2021-90A Class A1A, 3 month U.S. LIBOR + 1.130% 6.0453% 2/20/35 (b)(c)(e) | | 4,292 | 4,207 |
| Eaton Vance CLO, Ltd.: | | | |
| Series 2021-1A Class AR, 3 month U.S. LIBOR + 1.100% 5.8924% 4/15/31 (b)(c)(e) | | 3,720 | 3,686 |
| Series 2021-2A Class AR, 3 month U.S. LIBOR + 1.150% 5.9424% 1/15/35 (b)(c)(e) | | 9,611 | 9,477 |
| Eaton Vance CLO, Ltd. / Eaton Vance CLO LLC Series 2021-1A Class A13R, 3 month U.S. LIBOR + 1.250% 6.0424% 1/15/34 (b)(c)(e) | | 2,050 | 2,020 |
| Flatiron CLO Ltd. Series 2021-1A: | | | |
| Class A1, 3 month U.S. LIBOR + 1.110% 5.9076% 7/19/34 (b)(c)(e) | | 5,916 | 5,804 |
| Class AR, 3 month U.S. LIBOR + 1.080% 5.9516% 11/16/34 (b)(c)(e) | | 8,250 | 8,152 |
| Flatiron CLO Ltd. / Flatiron CLO LLC Series 2020-1A Class A, 3 month U.S. LIBOR + 1.300% 6.2153% 11/20/33 (b)(c)(e) | | 9,100 | 8,978 |
| Ford Credit Floorplan Master Owner Trust: | | | |
| Series 2019-2 Class A, 3.06% 4/15/26 | | 7,032 | 6,855 |
| Series 2019-4 Class A, 2.44% 9/15/26 | | 1,010 | 966 |
| Series 2020-2 Class B, 1.32% 9/15/27 | | 4,000 | 3,565 |
| GMF Floorplan Owner Revolving Trust: | | | |
| Series 2020-1 Class C, 1.48% 8/15/25 (b) | | 4,912 | 4,799 |
| Series 2020-2 Class C, 1.31% 10/15/25 (b) | | 6,000 | 5,804 |
| Horizon Aircraft Finance I Ltd. Series 2018-1 Class A, 4.458% 12/15/38 (b) | | 1,741 | 1,484 |
| Horizon Aircraft Finance Ltd. Series 2019-1 Class A, 3.721% 7/15/39 (b) | | 2,352 | 1,999 |
| Invesco CLO Ltd. Series 2021-3A Class A, 3 month U.S. LIBOR + 1.130% 5.9453% 10/22/34 (b)(c)(e) | | 5,835 | 5,740 |
| Lucali CLO Ltd. Series 2021-1A Class A, 3 month U.S. LIBOR + 1.210% 6.0024% 1/15/33 (b)(c)(e) | | 4,700 | 4,659 |
| Madison Park Funding Series 2020-19A Class A1R2, 3 month U.S. LIBOR + 0.920% 5.7353% 1/22/28 (b)(c)(e) | | 4,054 | 4,030 |
| Madison Park Funding L Ltd. / Madison Park Funding L LLC Series 2021-50A Class A, 3 month U.S. LIBOR + 1.140% 5.9376% 4/19/34 (b)(c)(e) | | 10,220 | 10,070 |
| Madison Park Funding LII Ltd. / Madison Park Funding LII LLC Series 2021-52A Class A, 3 month U.S. LIBOR + 1.100% 5.9153% 1/22/35 (b)(c)(e) | | 9,350 | 9,124 |
| Madison Park Funding XLV Ltd./Madison Park Funding XLV LLC Series 2021-45A Class AR, 3 month U.S. LIBOR + 1.120% 5.9124% 7/15/34 (b)(c)(e) | | 5,879 | 5,801 |
| Madison Park Funding XXXII, Ltd. / Madison Park Funding XXXII LLC Series 2021-32A Class A2R, 3 month U.S. LIBOR + 1.200% 6.0153% 1/22/31 (b)(c)(e) | | 2,629 | 2,570 |
| Magnetite CLO Ltd. Series 2021-27A Class AR, 3 month U.S. LIBOR + 1.140% 5.9477% 10/20/34 (b)(c)(e) | | 1,967 | 1,937 |
| Magnetite XVI, Ltd. / Magnetite XVI, LLC Series 2015-16A Class AR, 3 month U.S. LIBOR + 0.800% 5.5947% 1/18/28 (b)(c)(e) | | 3,009 | 2,995 |
| Magnetite XXI Ltd. Series 2021-21A Class AR, 3 month U.S. LIBOR + 1.020% 5.8277% 4/20/34 (b)(c)(e) | | 8,363 | 8,224 |
| Magnetite XXIII, Ltd. Series 2021-23A Class AR, 3 month U.S. LIBOR + 1.130% 5.9477% 1/25/35 (b)(c)(e) | | 6,892 | 6,775 |
| Magnetite XXIX, Ltd. / Magnetite XXIX LLC Series 2021-29A Class A, 3 month U.S. LIBOR + 0.990% 5.7824% 1/15/34 (b)(c)(e) | | 8,900 | 8,797 |
| MAPS Trust Series 2021-1A Class A, 2.521% 6/15/46 (b) | | 27,432 | 23,649 |
| Milos CLO, Ltd. Series 2020-1A Class AR, 3 month U.S. LIBOR + 1.070% 5.8777% 10/20/30 (b)(c)(e) | | 6,462 | 6,406 |
| Peace Park CLO, Ltd. Series 2021-1A Class A, 3 month U.S. LIBOR + 1.130% 5.9377% 10/20/34 (b)(c)(e) | | 3,230 | 3,177 |
| Planet Fitness Master Issuer LLC: | | | |
| Series 2018-1A Class A2II, 4.666% 9/5/48 (b) | | 3,091 | 2,913 |
| Series 2019-1A Class A2, 3.858% 12/5/49 (b) | | 6,003 | 5,060 |
| Series 2022-1A: | | | |
Class A2I, 3.251% 12/5/51 (b) | | 6,430 | 5,688 |
Class A2II, 4.008% 12/5/51 (b) | | 5,747 | 4,765 |
| Project Silver Series 2019-1 Class A, 3.967% 7/15/44 (b) | | 8,331 | 7,061 |
| Rockland Park CLO Ltd. Series 2021-1A Class A, 3 month U.S. LIBOR + 1.120% 5.9277% 4/20/34 (b)(c)(e) | | 11,224 | 11,056 |
| RR 7 Ltd. Series 2022-7A Class A1AB, CME TERM SOFR 3 MONTH INDEX + 1.340% 5.9976% 1/15/37 (b)(c)(e) | | 10,760 | 10,647 |
| Sapphire Aviation Finance Series 2020-1A: | | | |
| Class A, 3.228% 3/15/40 (b) | | 13,072 | 10,540 |
| Class B, 4.335% 3/15/40 (b) | | 522 | 362 |
| SBA Tower Trust: | | | |
| Series 2019, 2.836% 1/15/50 (b) | | 5,278 | 4,957 |
| 1.884% 7/15/50 (b) | | 3,008 | 2,663 |
| 2.328% 7/15/52 (b) | | 2,300 | 1,982 |
| Stratus CLO, Ltd. Series 2022-1A Class A, CME TERM SOFR 3 MONTH INDEX + 1.750% 6.389% 7/20/30 (b)(c)(e) | | 1,494 | 1,494 |
| SYMP Series 2022-32A Class A1, CME TERM SOFR 3 MONTH INDEX + 1.320% 5.9735% 4/23/35 (b)(c)(e) | | 5,480 | 5,420 |
| Symphony CLO XXI, Ltd. Series 2021-21A Class AR, 3 month U.S. LIBOR + 1.060% 5.8524% 7/15/32 (b)(c)(e) | | 1,079 | 1,066 |
| Symphony CLO XXV Ltd. / Symphony CLO XXV LLC Series 2021-25A Class A, 3 month U.S. LIBOR + 0.980% 5.7776% 4/19/34 (b)(c)(e) | | 10,365 | 10,163 |
| Symphony CLO XXVI Ltd. / Symphony CLO XXVI LLC Series 2021-26A Class AR, 3 month U.S. LIBOR + 1.080% 5.8877% 4/20/33 (b)(c)(e) | | 9,694 | 9,512 |
| Terwin Mortgage Trust Series 2003-4HE Class A1, 1 month U.S. LIBOR + 0.860% 5.477% 9/25/34 (c)(e) | | 4 | 3 |
| Thunderbolt Aircraft Lease Ltd. Series 2018-A Class A, 4.147% 9/15/38 (b)(c) | | 9,652 | 7,963 |
| Thunderbolt III Aircraft Lease Ltd. Series 2019-1 Class A, 3.671% 11/15/39 (b) | | 6,101 | 4,899 |
| Trapeza CDO XII Ltd./Trapeza CDO XII, Inc. Series 2007-12A Class B, 3 month U.S. LIBOR + 0.560% 5.3484% 4/6/42 (b)(c)(e) | | 491 | 374 |
| Upstart Securitization Trust 3.12% 3/20/32 (b) | | 1,736 | 1,691 |
| Voya CLO Ltd. Series 2019-2A Class A, 3 month U.S. LIBOR + 1.270% 6.0777% 7/20/32 (b)(c)(e) | | 5,397 | 5,356 |
| Voya CLO Ltd./Voya CLO LLC: | | | |
| Series 2021-2A Class A1R, 3 month U.S. LIBOR + 1.160% 5.9576% 7/19/34 (b)(c)(e) | | 5,438 | 5,346 |
| Series 2021-3A Class AR, 3 month U.S. LIBOR + 1.150% 5.9577% 10/20/34 (b)(c)(e) | | 11,071 | 10,849 |
| Voya CLO, Ltd. Series 2021-1A Class AR, 3 month U.S. LIBOR + 1.150% 5.9424% 7/16/34 (b)(c)(e) | | 5,466 | 5,362 |
| TOTAL ASSET-BACKED SECURITIES (Cost $628,570) | | | 593,972 |
| | | | |
| Collateralized Mortgage Obligations - 1.6% |
| | | Principal Amount (a) (000s) | Value ($) (000s) |
| Private Sponsor - 0.3% | | | |
| BVEBO sequential payer Series 2022-3 Class A, 3.242% 5/29/52 (b) | | 4,074 | 3,914 |
| Cascade Funding Mortgage Trust Series 2021-HB6 Class A, 0.8983% 6/25/36 (b) | | 4,414 | 4,188 |
| CFMT 2022-EBO2 sequential payer Series 2022-EBO2 Class A, 3.169% 7/25/54 (b) | | 3,789 | 3,663 |
| CFMT 2022-Hb8 LLC sequential payer Series 2022-HB8 Class A, 3.75% 4/25/25 (b) | | 6,568 | 6,265 |
| CSMC Series 2014-3R: | | | |
| Class 2A1, 1 month U.S. LIBOR + 0.700% 0% 5/27/37 (b)(c)(e)(j) | | 343 | 0 |
| Class AA1, 1 month U.S. LIBOR + 0.280% 4.6106% 5/27/37 (b)(c)(e) | | 345 | 320 |
| CSMC Trust sequential payer Series 2020-RPL3 Class A1, 2.691% 3/25/60 (b)(c) | | 3,214 | 3,111 |
| RMF Buyout Issuance Trust sequential payer Series 2022-HB1 Class A, 4.272% 4/25/32 (b) | | 1,979 | 1,908 |
| Sequoia Mortgage Trust floater Series 2004-6 Class A3B, 6 month U.S. LIBOR + 0.880% 6.0669% 7/20/34 (c)(e) | | 1 | 1 |
TOTAL PRIVATE SPONSOR | | | 23,370 |
| U.S. Government Agency - 1.3% | | | |
| Fannie Mae: | | | |
| floater: | | | |
Series 1994-42 Class FK, 10-Year Treasury Constant Maturity Rate - 0.500% 2.99% 4/25/24 (c)(e) | | 15 | 15 |
Series 2001-38 Class QF, 1 month U.S. LIBOR + 0.980% 5.597% 8/25/31 (c)(e) | | 18 | 18 |
Series 2002-18 Class FD, 1 month U.S. LIBOR + 0.800% 5.417% 2/25/32 (c)(e) | | 2 | 2 |
Series 2002-39 Class FD, 1 month U.S. LIBOR + 1.000% 5.5979% 3/18/32 (c)(e) | | 4 | 4 |
Series 2002-60 Class FV, 1 month U.S. LIBOR + 1.000% 5.617% 4/25/32 (c)(e) | | 8 | 8 |
Series 2002-63 Class FN, 1 month U.S. LIBOR + 1.000% 5.617% 10/25/32 (c)(e) | | 5 | 5 |
Series 2002-7 Class FC, 1 month U.S. LIBOR + 0.750% 5.367% 1/25/32 (c)(e) | | 2 | 2 |
Series 2002-74 Class FV, 1 month U.S. LIBOR + 0.450% 5.067% 11/25/32 (c)(e) | | 105 | 105 |
Series 2002-75 Class FA, 1 month U.S. LIBOR + 1.000% 5.617% 11/25/32 (c)(e) | | 8 | 8 |
Series 2003-118 Class S, 8.100% - 1 month U.S. LIBOR 3.483% 12/25/33 (c)(k)(l) | | 70 | 10 |
Series 2006-104 Class GI, 6.680% - 1 month U.S. LIBOR 2.063% 11/25/36 (c)(k)(l) | | 51 | 4 |
Series 2010-15 Class FJ, 1 month U.S. LIBOR + 0.930% 5.547% 6/25/36 (c)(e) | | 1,489 | 1,495 |
| planned amortization class: | | | |
Series 1993-207 Class H, 6.5% 11/25/23 | | 3 | 3 |
Series 1996-28 Class PK, 6.5% 7/25/25 | | 1 | 1 |
Series 1999-17 Class PG, 6% 4/25/29 | | 21 | 21 |
Series 1999-32 Class PL, 6% 7/25/29 | | 24 | 24 |
Series 1999-33 Class PK, 6% 7/25/29 | | 18 | 18 |
Series 2001-52 Class YZ, 6.5% 10/25/31 | | 3 | 3 |
Series 2003-28 Class KG, 5.5% 4/25/23 | | 0 | 0 |
Series 2003-70 Class BJ, 5% 7/25/33 | | 117 | 115 |
Series 2005-102 Class CO 11/25/35 (m) | | 16 | 14 |
Series 2005-64 Class PX, 5.5% 6/25/35 | | 117 | 116 |
Series 2005-68 Class CZ, 5.5% 8/25/35 | | 1,647 | 1,658 |
Series 2005-73 Class SA, 17.500% - 1 month U.S. LIBOR 5.5458% 8/25/35 (c)(l) | | 3 | 3 |
Series 2005-81 Class PC, 5.5% 9/25/35 | | 42 | 42 |
Series 2006-12 Class BO 10/25/35 (m) | | 56 | 48 |
Series 2006-15 Class OP 3/25/36 (m) | | 71 | 59 |
Series 2006-37 Class OW 5/25/36 (m) | | 9 | 7 |
Series 2006-45 Class OP 6/25/36 (m) | | 22 | 17 |
Series 2006-62 Class KP 4/25/36 (m) | | 34 | 27 |
Series 2010-118 Class PB, 4.5% 10/25/40 | | 1,189 | 1,167 |
Series 2012-149: | | | |
Class DA, 1.75% 1/25/43 | | 412 | 372 |
Class GA, 1.75% 6/25/42 | | 447 | 401 |
| sequential payer: | | | |
Series 1997-41 Class J, 7.5% 6/18/27 | | 4 | 4 |
Series 1999-25 Class Z, 6% 6/25/29 | | 20 | 20 |
Series 2001-20 Class Z, 6% 5/25/31 | | 23 | 23 |
Series 2001-31 Class ZC, 6.5% 7/25/31 | | 12 | 12 |
Series 2002-16 Class ZD, 6.5% 4/25/32 | | 9 | 9 |
Series 2002-74 Class SV, 7.550% - 1 month U.S. LIBOR 2.933% 11/25/32 (c)(k)(l) | | 22 | 1 |
Series 2003-117 Class MD, 5% 12/25/23 | | 21 | 21 |
Series 2004-52 Class KZ, 5.5% 7/25/34 | | 571 | 569 |
Series 2004-91 Class Z, 5% 12/25/34 | | 1,275 | 1,254 |
Series 2005-117 Class JN, 4.5% 1/25/36 | | 135 | 133 |
Series 2005-14 Class ZB, 5% 3/25/35 | | 391 | 384 |
Series 2006-72 Class CY, 6% 8/25/26 | | 139 | 140 |
Series 2009-59 Class HB, 5% 8/25/39 | | 694 | 687 |
Series 2012-67 Class AI, 4.5% 7/25/27 (k) | | 26 | 1 |
| Series 06-116 Class SG, 6.640% - 1 month U.S. LIBOR 2.023% 12/25/36 (c)(k)(l) | | 34 | 3 |
| Series 07-40 Class SE, 6.440% - 1 month U.S. LIBOR 1.823% 5/25/37 (c)(k)(l) | | 18 | 2 |
| Series 1993-165 Class SH, 19.800% - 1 month U.S. LIBOR 6.7404% 9/25/23 (c)(l) | | 0 | 0 |
| Series 2003-21 Class SK, 8.100% - 1 month U.S. LIBOR 3.483% 3/25/33 (c)(k)(l) | | 5 | 1 |
| Series 2005-72 Class ZC, 5.5% 8/25/35 | | 282 | 282 |
| Series 2005-79 Class ZC, 5.9% 9/25/35 | | 161 | 162 |
| Series 2007-57 Class SA, 40.600% - 1 month U.S. LIBOR 12.918% 6/25/37 (c)(l) | | 18 | 21 |
| Series 2007-66: | | | |
Class SA, 39.600% - 1 month U.S. LIBOR 11.898% 7/25/37 (c)(l) | | 23 | 28 |
Class SB, 39.600% - 1 month U.S. LIBOR 11.898% 7/25/37 (c)(l) | | 9 | 10 |
| Series 2008-12 Class SG, 6.350% - 1 month U.S. LIBOR 1.733% 3/25/38 (c)(k)(l) | | 119 | 11 |
| Series 2010-135: | | | |
Class LS, 6.050% - 1 month U.S. LIBOR 1.433% 12/25/40 (c)(k)(l) | | 121 | 7 |
Class ZA, 4.5% 12/25/40 | | 55 | 54 |
| Series 2010-139 Class NI, 4.5% 2/25/40 (k) | | 251 | 6 |
| Series 2010-150 Class ZC, 4.75% 1/25/41 | | 538 | 526 |
| Series 2010-39 Class FG, 1 month U.S. LIBOR + 0.920% 5.537% 3/25/36 (c)(e) | | 1,019 | 1,029 |
| Series 2010-95 Class ZC, 5% 9/25/40 | | 1,249 | 1,249 |
| Series 2011-39 Class ZA, 6% 11/25/32 | | 83 | 84 |
| Series 2011-4 Class PZ, 5% 2/25/41 | | 167 | 158 |
| Series 2011-67 Class AI, 4% 7/25/26 (k) | | 77 | 2 |
| Series 2011-83 Class DI, 6% 9/25/26 (k) | | 0 | 0 |
| Series 2012-100 Class WI, 3% 9/25/27 (k) | | 246 | 11 |
| Series 2012-14 Class JS, 6.650% - 1 month U.S. LIBOR 2.033% 12/25/30 (c)(k)(l) | | 24 | 0 |
| Series 2012-9 Class SH, 6.550% - 1 month U.S. LIBOR 1.933% 6/25/41 (c)(k)(l) | | 24 | 0 |
| Series 2013-133 Class IB, 3% 4/25/32 (k) | | 88 | 3 |
| Series 2013-134 Class SA, 6.050% - 1 month U.S. LIBOR 1.433% 1/25/44 (c)(k)(l) | | 77 | 7 |
| Series 2013-51 Class GI, 3% 10/25/32 (k) | | 106 | 6 |
| Series 2013-N1 Class A, 6.720% - 1 month U.S. LIBOR 2.103% 6/25/35 (c)(k)(l) | | 99 | 7 |
| Series 2015-42 Class IL, 6% 6/25/45 (k) | | 504 | 87 |
| Series 2015-70 Class JC, 3% 10/25/45 | | 560 | 525 |
| Series 2017-30 Class AI, 5.5% 5/25/47 (k) | | 279 | 49 |
| Series 2017-74 Class SH, 6.200% - 1 month U.S. LIBOR 1.583% 10/25/47 (c)(k)(l) | | 2,282 | 243 |
| Series 2018-45 Class GI, 4% 6/25/48 (k) | | 3,124 | 604 |
| Fannie Mae Stripped Mortgage-Backed Securities: | | | |
| Series 339 Class 5, 5.5% 7/25/33 (k) | | 18 | 3 |
| Series 343 Class 16, 5.5% 5/25/34 (k) | | 17 | 3 |
| Series 348 Class 14, 6.5% 8/25/34 (c)(k) | | 11 | 2 |
| Series 351: | | | |
Class 12, 5.5% 4/25/34 (c)(k) | | 9 | 2 |
Class 13, 6% 3/25/34 (k) | | 10 | 2 |
| Series 359 Class 19, 6% 7/25/35 (c)(k) | | 8 | 1 |
| Series 384 Class 6, 5% 7/25/37 (k) | | 70 | 12 |
| Freddie Mac: | | | |
| floater: | | | |
Series 2412 Class FK, 1 month U.S. LIBOR + 0.800% 5.3879% 1/15/32 (c)(e) | | 1 | 1 |
Series 2423 Class FA, 1 month U.S. LIBOR + 0.900% 5.4879% 3/15/32 (c)(e) | | 2 | 2 |
Series 2424 Class FM, 1 month U.S. LIBOR + 1.000% 5.5879% 3/15/32 (c)(e) | | 2 | 2 |
Series 2432: | | | |
Class FE, 1 month U.S. LIBOR + 0.900% 5.4879% 6/15/31 (c)(e) | | 4 | 4 |
Class FG, 1 month U.S. LIBOR + 0.900% 5.4879% 3/15/32 (c)(e) | | 1 | 1 |
Series 2526 Class FC, 1 month U.S. LIBOR + 0.400% 4.9879% 11/15/32 (c)(e) | | 24 | 24 |
Series 2711 Class FC, 1 month U.S. LIBOR + 0.900% 5.4879% 2/15/33 (c)(e) | | 378 | 381 |
| floater planned amortization class Series 2770 Class FH, 1 month U.S. LIBOR + 0.400% 4.9879% 3/15/34 (c)(e) | | 570 | 566 |
| floater target amortization class Series 3366 Class FD, 1 month U.S. LIBOR + 0.250% 4.8379% 5/15/37 (c)(e) | | 90 | 88 |
| planned amortization class: | | | |
Series 2095 Class PE, 6% 11/15/28 | | 26 | 26 |
Series 2101 Class PD, 6% 11/15/28 | | 12 | 13 |
Series 2121 Class MG, 6% 2/15/29 | | 10 | 11 |
Series 2131 Class BG, 6% 3/15/29 | | 75 | 75 |
Series 2137 Class PG, 6% 3/15/29 | | 12 | 12 |
Series 2154 Class PT, 6% 5/15/29 | | 20 | 20 |
Series 2162 Class PH, 6% 6/15/29 | | 4 | 4 |
Series 2520 Class BE, 6% 11/15/32 | | 36 | 37 |
Series 2693 Class MD, 5.5% 10/15/33 | | 77 | 77 |
Series 2802 Class OB, 6% 5/15/34 | | 75 | 76 |
Series 2996 Class MK, 5.5% 6/15/35 | | 23 | 23 |
Series 3002 Class NE, 5% 7/15/35 | | 84 | 84 |
Series 3110 Class OP 9/15/35 (m) | | 21 | 19 |
Series 3119 Class PO 2/15/36 (m) | | 84 | 66 |
Series 3121 Class KO 3/15/36 (m) | | 17 | 14 |
Series 3123 Class LO 3/15/36 (m) | | 47 | 37 |
Series 3145 Class GO 4/15/36 (m) | | 56 | 45 |
Series 3189 Class PD, 6% 7/15/36 | | 72 | 74 |
Series 3225 Class EO 10/15/36 (m) | | 28 | 22 |
Series 3258 Class PM, 5.5% 12/15/36 | | 30 | 31 |
Series 3415 Class PC, 5% 12/15/37 | | 256 | 253 |
Series 3806 Class UP, 4.5% 2/15/41 | | 159 | 156 |
Series 3832 Class PE, 5% 3/15/41 | | 327 | 326 |
Series 3857 Class ZP, 5% 5/15/41 | | 2,147 | 2,151 |
Series 4135 Class AB, 1.75% 6/15/42 | | 326 | 294 |
| sequential payer: | | | |
Series 1929 Class EZ, 7.5% 2/17/27 | | 25 | 25 |
Series 2004-2862 Class NE, 5% 9/15/24 | | 39 | 39 |
Series 2135 Class JE, 6% 3/15/29 | | 5 | 5 |
Series 2145 Class MZ, 6.5% 4/15/29 | | 72 | 72 |
Series 2274 Class ZM, 6.5% 1/15/31 | | 7 | 7 |
Series 2281 Class ZB, 6% 3/15/30 | | 14 | 14 |
Series 2303 Class ZV, 6% 4/15/31 | | 44 | 45 |
Series 2357 Class ZB, 6.5% 9/15/31 | | 123 | 125 |
Series 2502 Class ZC, 6% 9/15/32 | | 14 | 14 |
Series 2519 Class ZD, 5.5% 11/15/32 | | 22 | 22 |
Series 2546 Class MJ, 5.5% 3/15/23 | | 0 | 0 |
Series 2601 Class TB, 5.5% 4/15/23 | | 0 | 0 |
Series 2877 Class ZD, 5% 10/15/34 | | 1,546 | 1,523 |
Series 2998 Class LY, 5.5% 7/15/25 | | 21 | 21 |
Series 3007 Class EW, 5.5% 7/15/25 | | 51 | 51 |
Series 3871 Class KB, 5.5% 6/15/41 | | 417 | 429 |
| Series 06-3115 Class SM, 6.600% - 1 month U.S. LIBOR 2.0121% 2/15/36 (c)(k)(l) | | 25 | 2 |
| Series 2013-4281 Class AI, 4% 12/15/28 (k) | | 64 | 1 |
| Series 2017-4683 Class LM, 3% 5/15/47 | | 723 | 678 |
| Series 2018-4763 Class SC, 6.200% - 1 month U.S. LIBOR 1.6121% 8/15/47 (c)(k)(l) | | 1,147 | 119 |
| Series 2933 Class ZM, 5.75% 2/15/35 | | 366 | 372 |
| Series 2935 Class ZK, 5.5% 2/15/35 | | 296 | 302 |
| Series 2947 Class XZ, 6% 3/15/35 | | 145 | 148 |
| Series 2996 Class ZD, 5.5% 6/15/35 | | 247 | 251 |
| Series 3237 Class C, 5.5% 11/15/36 | | 340 | 340 |
| Series 3244 Class SG, 6.660% - 1 month U.S. LIBOR 2.0721% 11/15/36 (c)(k)(l) | | 106 | 9 |
| Series 3287 Class SD, 6.750% - 1 month U.S. LIBOR 2.1621% 3/15/37 (c)(k)(l) | | 158 | 14 |
| Series 3297 Class BI, 6.760% - 1 month U.S. LIBOR 2.1721% 4/15/37 (c)(k)(l) | | 222 | 24 |
| Series 3336 Class LI, 6.580% - 1 month U.S. LIBOR 1.9921% 6/15/37 (c)(k)(l) | | 71 | 7 |
| Series 3843 Class PZ, 5% 4/15/41 | | 1,976 | 1,984 |
| Series 3949 Class MK, 4.5% 10/15/34 | | 59 | 58 |
| Series 4055 Class BI, 3.5% 5/15/31 (k) | | 88 | 2 |
| Series 4149 Class IO, 3% 1/15/33 (k) | | 72 | 6 |
| Series 4314 Class AI, 5% 3/15/34 (k) | | 27 | 1 |
| Series 4427 Class LI, 3.5% 2/15/34 (k) | | 270 | 16 |
| Series 4471 Class PA 4% 12/15/40 | | 288 | 279 |
| target amortization class Series 2156 Class TC, 6.25% 5/15/29 | | 9 | 9 |
| Freddie Mac Manufactured Housing participation certificates guaranteed: | | | |
| floater Series 1686 Class FA, 1 month U.S. LIBOR + 0.900% 5.359% 2/15/24 (c)(e) | | 1 | 1 |
| sequential payer: | | | |
Series 2043 Class ZH, 6% 4/15/28 | | 8 | 8 |
Series 2056 Class Z, 6% 5/15/28 | | 21 | 21 |
| Freddie Mac Multi-family Structured pass-thru certificates: | | | |
| sequential payer Series 4341 Class ML, 3.5% 11/15/31 | | 1,497 | 1,434 |
| Series 4386 Class AZ, 4.5% 11/15/40 | | 722 | 698 |
| Ginnie Mae guaranteed REMIC pass-thru certificates: | | | |
| floater: | | | |
Series 2007-37 Class TS, 6.690% - 1 month U.S. LIBOR 2.1% 6/16/37 (c)(k)(l) | | 45 | 4 |
Series 2007-59 Class FC, 1 month U.S. LIBOR + 0.500% 5.0979% 7/20/37 (c)(e) | | 323 | 321 |
Series 2008-2 Class FD, 1 month U.S. LIBOR + 0.480% 5.0779% 1/20/38 (c)(e) | | 84 | 83 |
Series 2008-73 Class FA, 1 month U.S. LIBOR + 0.860% 5.4579% 8/20/38 (c)(e) | | 451 | 455 |
Series 2008-83 Class FB, 1 month U.S. LIBOR + 0.900% 5.4979% 9/20/38 (c)(e) | | 336 | 340 |
Series 2009-108 Class CF, 1 month U.S. LIBOR + 0.600% 5.19% 11/16/39 (c)(e) | | 412 | 410 |
Series 2009-116 Class KF, 1 month U.S. LIBOR + 0.530% 5.12% 12/16/39 (c)(e) | | 258 | 257 |
Series 2010-H03 Class FA, 1 month U.S. LIBOR + 0.550% 5.0673% 3/20/60 (c)(e)(i) | | 485 | 484 |
Series 2010-H17 Class FA, 1 month U.S. LIBOR + 0.330% 4.8473% 7/20/60 (c)(e)(i) | | 3,533 | 3,508 |
Series 2010-H18 Class AF, 1 month U.S. LIBOR + 0.300% 4.6916% 9/20/60 (c)(e)(i) | | 4,253 | 4,223 |
Series 2010-H19 Class FG, 1 month U.S. LIBOR + 0.300% 4.6916% 8/20/60 (c)(e)(i) | | 3,261 | 3,237 |
Series 2010-H27 Class FA, 1 month U.S. LIBOR + 0.380% 4.7716% 12/20/60 (c)(e)(i) | | 1,783 | 1,772 |
Series 2011-H05 Class FA, 1 month U.S. LIBOR + 0.500% 4.8916% 12/20/60 (c)(e)(i) | | 1,763 | 1,757 |
Series 2011-H07 Class FA, 1 month U.S. LIBOR + 0.500% 4.8916% 2/20/61 (c)(e)(i) | | 1,499 | 1,492 |
Series 2011-H12 Class FA, 1 month U.S. LIBOR + 0.490% 4.8816% 2/20/61 (c)(e)(i) | | 2,060 | 2,051 |
Series 2011-H13 Class FA, 1 month U.S. LIBOR + 0.500% 4.8916% 4/20/61 (c)(e)(i) | | 1,470 | 1,464 |
Series 2011-H14: | | | |
Class FB, 1 month U.S. LIBOR + 0.500% 4.8916% 5/20/61 (c)(e)(i) | | 2,468 | 2,459 |
Class FC, 1 month U.S. LIBOR + 0.500% 4.8916% 5/20/61 (c)(e)(i) | | 1,766 | 1,759 |
Series 2011-H17 Class FA, 1 month U.S. LIBOR + 0.530% 4.9216% 6/20/61 (c)(e)(i) | | 1,999 | 1,993 |
Series 2011-H20 Class FA, 1 month U.S. LIBOR + 0.550% 4.9416% 9/20/61 (c)(e)(i) | | 679 | 677 |
Series 2011-H21 Class FA, 1 month U.S. LIBOR + 0.600% 4.9916% 10/20/61 (c)(e)(i) | | 2,227 | 2,221 |
Series 2012-98 Class FA, 1 month U.S. LIBOR + 0.400% 4.9979% 8/20/42 (c)(e) | | 343 | 336 |
Series 2012-H01 Class FA, 1 month U.S. LIBOR + 0.700% 5.0916% 11/20/61 (c)(e)(i) | | 2,070 | 2,067 |
Series 2012-H03 Class FA, 1 month U.S. LIBOR + 0.700% 5.0916% 1/20/62 (c)(e)(i) | | 1,154 | 1,153 |
Series 2012-H06 Class FA, 1 month U.S. LIBOR + 0.630% 5.0216% 1/20/62 (c)(e)(i) | | 1,899 | 1,894 |
Series 2012-H07 Class FA, 1 month U.S. LIBOR + 0.630% 5.0216% 3/20/62 (c)(e)(i) | | 932 | 927 |
Series 2012-H21 Class DF, 1 month U.S. LIBOR + 0.650% 4.8391% 5/20/61 (c)(e)(i) | | 20 | 19 |
Series 2012-H23 Class WA, 1 month U.S. LIBOR + 0.520% 4.9116% 10/20/62 (c)(e)(i) | | 24 | 24 |
Series 2013-H07 Class BA, 1 month U.S. LIBOR + 0.360% 4.7516% 3/20/63 (c)(e)(i) | | 35 | 35 |
Series 2013-H19: | | | |
Class FC, 1 month U.S. LIBOR + 0.600% 4.9916% 8/20/63 (c)(e)(i) | | 116 | 115 |
Class FD, 1 month U.S. LIBOR + 0.600% 4.9916% 8/20/63 (c)(e)(i) | | 265 | 265 |
Series 2014-H03 Class FA, 1 month U.S. LIBOR + 0.600% 4.9916% 1/20/64 (c)(e)(i) | | 147 | 147 |
Series 2014-H05 Class FB, 1 month U.S. LIBOR + 0.600% 4.9916% 12/20/63 (c)(e)(i) | | 721 | 719 |
Series 2014-H11 Class BA, 1 month U.S. LIBOR + 0.500% 4.8916% 6/20/64 (c)(e)(i) | | 531 | 529 |
Series 2015-H07 Class FA, 1 month U.S. LIBOR + 0.300% 4.6916% 3/20/65 (c)(e)(i) | | 3 | 3 |
Series 2015-H13 Class FL, 1 month U.S. LIBOR + 0.280% 4.6716% 5/20/63 (c)(e)(i) | | 26 | 25 |
Series 2015-H19 Class FA, 1 month U.S. LIBOR + 0.200% 4.5916% 4/20/63 (c)(e)(i) | | 34 | 34 |
Series 2016-H20 Class FM, 1 month U.S. LIBOR + 0.400% 4.5967% 12/20/62 (c)(e)(i) | | 14 | 13 |
| planned amortization class: | | | |
Series 2010-158 Class MS, 10.000% - 1 month U.S. LIBOR 0.8043% 12/20/40 (c)(l) | | 447 | 371 |
Series 2010-31 Class BP, 5% 3/20/40 | | 1,894 | 1,883 |
Series 2011-136 Class WI, 4.5% 5/20/40 (k) | | 132 | 9 |
Series 2011-68 Class EC, 3.5% 4/20/41 | | 195 | 187 |
Series 2016-69 Class WA, 3% 2/20/46 | | 363 | 335 |
Series 2017-134 Class BA, 2.5% 11/20/46 | | 492 | 442 |
Series 2017-153 Class GA, 3% 9/20/47 | | 982 | 893 |
Series 2017-182 Class KA, 3% 10/20/47 | | 757 | 690 |
Series 2018-13 Class Q, 3% 4/20/47 | | 965 | 893 |
| sequential payer: | | | |
Series 2004-24 Class ZM, 5% 4/20/34 | | 125 | 122 |
Series 2010-160 Class DY, 4% 12/20/40 | | 918 | 884 |
Series 2010-170 Class B, 4% 12/20/40 | | 204 | 196 |
Series 2011-69 Class GX, 4.5% 5/16/40 | | 2,007 | 1,983 |
Series 2014-H04 Class HA, 2.75% 2/20/64 (i) | | 2,593 | 2,543 |
Series 2017-139 Class BA, 3% 9/20/47 | | 1,709 | 1,529 |
Series 2018-H12 Class HA, 3.25% 8/20/68 (i) | | 4,011 | 3,837 |
| Series 2004-22 Class M1, 5.5% 4/20/34 | | 573 | 605 |
| Series 2004-32 Class GS, 6.500% - 1 month U.S. LIBOR 1.91% 5/16/34 (c)(k)(l) | | 26 | 2 |
| Series 2004-73 Class AL, 7.200% - 1 month U.S. LIBOR 2.61% 8/17/34 (c)(k)(l) | | 29 | 3 |
| Series 2007-35 Class SC, 40.200% - 1 month U.S. LIBOR 12.66% 6/16/37 (c)(l) | | 5 | 5 |
| Series 2010-116 Class QB, 4% 9/16/40 | | 71 | 68 |
| Series 2010-14 Class SN, 5.950% - 1 month U.S. LIBOR 1.36% 2/16/40 (c)(k)(l) | | 170 | 9 |
| Series 2010-169 Class Z, 4.5% 12/20/40 | | 2,593 | 2,317 |
| Series 2010-H10 Class FA, 1 month U.S. LIBOR + 0.330% 4.8473% 5/20/60 (c)(e)(i) | | 269 | 267 |
| Series 2010-H16 Class BA, 3.55% 7/20/60 (i) | | 440 | 427 |
| Series 2010-H18 Class PL, 5.01% 9/20/60 (c)(i) | | 55 | 55 |
| Series 2011-94 Class SA, 6.100% - 1 month U.S. LIBOR 1.5021% 7/20/41 (c)(k)(l) | | 85 | 7 |
| Series 2012-76 Class GS, 6.700% - 1 month U.S. LIBOR 2.11% 6/16/42 (c)(k)(l) | | 99 | 9 |
| Series 2013-149 Class MA, 2.5% 5/20/40 | | 714 | 680 |
| Series 2013-H01 Class FA, 1.65% 1/20/63 (i) | | 0 | 0 |
| Series 2013-H04 Class BA, 1.65% 2/20/63 (i) | | 2 | 2 |
| Series 2013-H08 Class MA, 3% 3/20/63 (i) | | 25 | 23 |
| Series 2014-2 Class BA, 3% 1/20/44 | | 1,828 | 1,664 |
| Series 2014-21 Class HA, 3% 2/20/44 | | 678 | 618 |
| Series 2014-25 Class HC, 3% 2/20/44 | | 1,161 | 1,057 |
| Series 2014-5 Class A, 3% 1/20/44 | | 997 | 908 |
| Series 2015-H13 Class HA, 2.5% 8/20/64 (i) | | 9 | 8 |
| Series 2015-H30 Class HA, 1.75% 9/20/62 (c)(i) | | 108 | 103 |
| Series 2016-H13 Class FB, U.S. TREASURY 1 YEAR INDEX + 0.500% 5.23% 5/20/66 (c)(e)(i) | | 4,924 | 4,912 |
| Series 2017-186 Class HK, 3% 11/16/45 | | 995 | 909 |
| Series 2017-H06 Class FA, U.S. TREASURY 1 YEAR INDEX + 0.350% 5.08% 8/20/66 (c)(e)(i) | | 6,461 | 6,433 |
| Series 2090-118 Class XZ, 5% 12/20/39 | | 6,940 | 6,965 |
| Ginnie Mae REMIC Trust Series 2015-H17 Class GZ, 4.3016% 5/20/65 (c)(i) | | 60 | 58 |
TOTAL U.S. GOVERNMENT AGENCY | | | 112,626 |
| TOTAL COLLATERALIZED MORTGAGE OBLIGATIONS (Cost $140,750) | | | 135,996 |
| | | | |
| Commercial Mortgage Securities - 8.4% |
| | | Principal Amount (a) (000s) | Value ($) (000s) |
| BAMLL Commercial Mortgage Securities Trust: | | | |
| floater: | | | |
Series 2019-RLJ Class A, 1 month U.S. LIBOR + 1.050% 5.638% 4/15/36 (b)(c)(e) | | 8,900 | 8,765 |
Series 2022-DKLX: | | | |
| Class A, CME Term SOFR 1 Month Index + 1.150% 5.713% 1/15/39 (b)(c)(e) | | 5,821 | 5,736 |
| Class B, CME Term SOFR 1 Month Index + 1.550% 6.113% 1/15/39 (b)(c)(e) | | 1,099 | 1,081 |
| Class C, CME Term SOFR 1 Month Index + 2.150% 6.713% 1/15/39 (b)(c)(e) | | 785 | 765 |
| sequential payer Series 2019-BPR Class ANM, 3.112% 11/5/32 (b) | | 3,676 | 3,355 |
| Series 2019-BPR: | | | |
Class BNM, 3.465% 11/5/32 (b) | | 825 | 691 |
Class CNM, 3.7186% 11/5/32 (b)(c) | | 341 | 270 |
| BANK: | | | |
| sequential payer: | | | |
Series 2017-BNK9 Class ASB, 3.47% 11/15/54 | | 969 | 925 |
Series 2018-BN10 Class A5, 3.688% 2/15/61 | | 2,479 | 2,306 |
Series 2018-BN12 Class ASB, 4.165% 5/15/61 | | 2,000 | 1,925 |
Series 2019-BN21 Class A5, 2.851% 10/17/52 | | 5,732 | 4,976 |
Series 2019-BN24 Class A3, 2.96% 11/15/62 | | 6,283 | 5,469 |
| Series 2021-BN33 Class XA, 1.0572% 5/15/64 (c)(k) | | 16,536 | 952 |
| Bayview Commercial Asset Trust floater: | | | |
| Series 2003-2 Class M1, 1 month U.S. LIBOR + 1.270% 5.892% 12/25/33 (b)(c)(e) | | 4 | 3 |
| Series 2005-3A: | | | |
Class A2, 1 month U.S. LIBOR + 0.600% 5.217% 11/25/35 (b)(c)(e) | | 18 | 16 |
Class M1, 1 month U.S. LIBOR + 0.660% 5.277% 11/25/35 (b)(c)(e) | | 9 | 8 |
Class M2, 1 month U.S. LIBOR + 0.730% 5.352% 11/25/35 (b)(c)(e) | | 12 | 11 |
Class M3, 1 month U.S. LIBOR + 0.760% 5.382% 11/25/35 (b)(c)(e) | | 11 | 10 |
Class M4, 1 month U.S. LIBOR + 0.900% 5.517% 11/25/35 (b)(c)(e) | | 14 | 13 |
| Series 2005-4A: | | | |
Class A2, 1 month U.S. LIBOR + 0.580% 5.202% 1/25/36 (b)(c)(e) | | 43 | 40 |
Class B1, 1 month U.S. LIBOR + 2.100% 6.717% 1/25/36 (b)(c)(e) | | 12 | 35 |
Class M1, 1 month U.S. LIBOR + 0.670% 5.292% 1/25/36 (b)(c)(e) | | 14 | 13 |
Class M2, 1 month U.S. LIBOR + 0.700% 5.322% 1/25/36 (b)(c)(e) | | 10 | 9 |
Class M3, 1 month U.S. LIBOR + 0.750% 5.367% 1/25/36 (b)(c)(e) | | 14 | 13 |
Class M4, 1 month U.S. LIBOR + 0.910% 5.532% 1/25/36 (b)(c)(e) | | 15 | 13 |
Class M5, 1 month U.S. LIBOR + 0.970% 5.592% 1/25/36 (b)(c)(e) | | 15 | 13 |
Class M6, 1 month U.S. LIBOR + 1.050% 5.667% 1/25/36 (b)(c)(e) | | 15 | 14 |
| Series 2006-1: | | | |
Class A2, 1 month U.S. LIBOR + 0.540% 5.157% 4/25/36 (b)(c)(e) | | 13 | 12 |
Class M1, 1 month U.S. LIBOR + 0.570% 5.187% 4/25/36 (b)(c)(e) | | 8 | 7 |
Class M2, 1 month U.S. LIBOR + 0.600% 5.217% 4/25/36 (b)(c)(e) | | 8 | 7 |
Class M3, 1 month U.S. LIBOR + 0.630% 5.247% 4/25/36 (b)(c)(e) | | 13 | 12 |
Class M4, 1 month U.S. LIBOR + 0.780% 5.397% 4/25/36 (b)(c)(e) | | 7 | 7 |
Class M5, 1 month U.S. LIBOR + 0.840% 5.457% 4/25/36 (b)(c)(e) | | 7 | 6 |
Class M6, 1 month U.S. LIBOR + 0.960% 5.577% 4/25/36 (b)(c)(e) | | 8 | 7 |
| Series 2006-2A: | | | |
Class M1, 1 month U.S. LIBOR + 0.460% 4.927% 7/25/36 (b)(c)(e) | | 12 | 11 |
Class M2, 1 month U.S. LIBOR + 0.490% 4.947% 7/25/36 (b)(c)(e) | | 8 | 8 |
Class M3, 1 month U.S. LIBOR + 0.520% 4.967% 7/25/36 (b)(c)(e) | | 13 | 12 |
Class M4, 1 month U.S. LIBOR + 0.630% 5.037% 7/25/36 (b)(c)(e) | | 8 | 7 |
Class M5, 1 month U.S. LIBOR + 0.700% 5.087% 7/25/36 (b)(c)(e) | | 11 | 10 |
| Series 2006-3A Class M4, 1 month U.S. LIBOR + 0.430% 5.047% 10/25/36 (b)(c)(e) | | 9 | 57 |
| Series 2006-4A: | | | |
Class A2, 1 month U.S. LIBOR + 0.400% 5.022% 12/25/36 (b)(c)(e) | | 93 | 86 |
Class M1, 1 month U.S. LIBOR + 0.430% 5.052% 12/25/36 (b)(c)(e) | | 14 | 13 |
Class M2, 1 month U.S. LIBOR + 0.460% 5.082% 12/25/36 (b)(c)(e) | | 17 | 16 |
Class M3, 1 month U.S. LIBOR + 0.510% 5.127% 12/25/36 (b)(c)(e) | | 9 | 8 |
| Series 2007-1 Class A2, 1 month U.S. LIBOR + 0.270% 5.022% 3/25/37 (b)(c)(e) | | 24 | 22 |
| Series 2007-2A: | | | |
Class A1, 1 month U.S. LIBOR + 0.270% 4.887% 7/25/37 (b)(c)(e) | | 74 | 66 |
Class A2, 1 month U.S. LIBOR + 0.320% 4.937% 7/25/37 (b)(c)(e) | | 70 | 63 |
Class M1, 1 month U.S. LIBOR + 0.370% 4.987% 7/25/37 (b)(c)(e) | | 24 | 21 |
Class M2, 1 month U.S. LIBOR + 0.410% 5.027% 7/25/37 (b)(c)(e) | | 29 | 26 |
Class M3, 1 month U.S. LIBOR + 0.490% 5.107% 7/25/37 (b)(c)(e) | | 34 | 34 |
| Series 2007-3: | | | |
Class A2, 1 month U.S. LIBOR + 0.290% 4.907% 7/25/37 (b)(c)(e) | | 25 | 23 |
Class M1, 1 month U.S. LIBOR + 0.310% 4.927% 7/25/37 (b)(c)(e) | | 13 | 12 |
Class M2, 1 month U.S. LIBOR + 0.340% 4.957% 7/25/37 (b)(c)(e) | | 14 | 13 |
Class M3, 1 month U.S. LIBOR + 0.370% 4.987% 7/25/37 (b)(c)(e) | | 23 | 20 |
Class M4, 1 month U.S. LIBOR + 0.500% 5.117% 7/25/37 (b)(c)(e) | | 37 | 31 |
Class M5, 1 month U.S. LIBOR + 0.600% 5.217% 7/25/37 (b)(c)(e) | | 17 | 19 |
| Benchmark Mortgage Trust: | | | |
| sequential payer: | | | |
Series 2018-B4 Class A5, 4.121% 7/15/51 | | 806 | 765 |
Series 2019-B10 Class A4, 3.717% 3/15/62 | | 1,426 | 1,312 |
Series 2019-B13 Class A4, 2.952% 8/15/57 | | 8,383 | 7,334 |
| Series 2018-B8 Class A5, 4.2317% 1/15/52 | | 10,843 | 10,285 |
| BFLD Trust floater sequential payer Series 2020-OBRK Class A, CME Term SOFR 1 Month Index + 2.160% 6.7265% 11/15/28 (b)(c)(e) | | 6,788 | 6,735 |
| BPR Trust floater Series 2022-OANA: | | | |
| Class A, CME Term SOFR 1 Month Index + 1.890% 6.4605% 4/15/37 (b)(c)(e) | | 18,788 | 18,447 |
| Class B, CME Term SOFR 1 Month Index + 2.440% 7.0095% 4/15/37 (b)(c)(e) | | 4,991 | 4,897 |
| BX Commercial Mortgage Trust floater: | | | |
| Series 2021-PAC: | | | |
Class A, 1 month U.S. LIBOR + 0.680% 5.2771% 10/15/36 (b)(c)(e) | | 11,302 | 11,044 |
Class B, 1 month U.S. LIBOR + 0.890% 5.4868% 10/15/36 (b)(c)(e) | | 1,691 | 1,634 |
Class C, 1 month U.S. LIBOR + 1.090% 5.6866% 10/15/36 (b)(c)(e) | | 2,263 | 2,188 |
Class D, 1 month U.S. LIBOR + 1.290% 5.8863% 10/15/36 (b)(c)(e) | | 2,197 | 2,103 |
Class E, 1 month U.S. LIBOR + 1.940% 6.5355% 10/15/36 (b)(c)(e) | | 7,638 | 7,345 |
| Series 2022-LP2: | | | |
Class B, CME Term SOFR 1 Month Index + 1.310% 5.8748% 2/15/39 (b)(c)(e) | | 4,043 | 3,954 |
Class C, CME Term SOFR 1 Month Index + 1.560% 6.1242% 2/15/39 (b)(c)(e) | | 4,043 | 3,904 |
Class D, CME Term SOFR 1 Month Index + 1.960% 6.5233% 2/15/39 (b)(c)(e) | | 4,043 | 3,831 |
| BX Trust: | | | |
| floater: | | | |
Series 2018-EXCL Class D, 1 month U.S. LIBOR + 2.620% 7.213% 9/15/37 (b)(c)(e) | | 1,060 | 986 |
Series 2019-IMC: | | | |
| Class B, 1 month U.S. LIBOR + 1.300% 5.888% 4/15/34 (b)(c)(e) | | 2,644 | 2,571 |
| Class C, 1 month U.S. LIBOR + 1.600% 6.188% 4/15/34 (b)(c)(e) | | 1,748 | 1,686 |
| Class D, 1 month U.S. LIBOR + 1.900% 6.488% 4/15/34 (b)(c)(e) | | 1,835 | 1,761 |
Series 2019-XL: | | | |
| Class B, CME Term SOFR 1 Month Index + 1.190% 5.757% 10/15/36 (b)(c)(e) | | 10,782 | 10,674 |
| Class C, CME Term SOFR 1 Month Index + 1.360% 5.927% 10/15/36 (b)(c)(e) | | 2,859 | 2,823 |
| Class D, CME Term SOFR 1 Month Index + 1.560% 6.127% 10/15/36 (b)(c)(e) | | 4,049 | 3,983 |
| Class E, CME Term SOFR 1 Month Index + 1.910% 6.477% 10/15/36 (b)(c)(e) | | 5,690 | 5,588 |
Series 2022-GPA Class A, CME Term SOFR 1 Month Index + 2.160% 6.7275% 10/15/39 (b)(c)(e) | | 5,384 | 5,374 |
Series 2022-IND: | | | |
| Class A, CME Term SOFR 1 Month Index + 1.490% 6.0528% 4/15/37 (b)(c)(e) | | 9,445 | 9,424 |
| Class B, CME Term SOFR 1 Month Index + 1.940% 6.5018% 4/15/37 (b)(c)(e) | | 4,815 | 4,783 |
| Class C, CME Term SOFR 1 Month Index + 2.290% 6.8518% 4/15/37 (b)(c)(e) | | 1,087 | 1,059 |
| Class D, CME Term SOFR 1 Month Index + 2.830% 7.4008% 4/15/37 (b)(c)(e) | | 909 | 877 |
| floater sequential payer: | | | |
Series 2019-IMC Class A, 1 month U.S. LIBOR + 1.000% 5.588% 4/15/34 (b)(c)(e) | | 5,741 | 5,640 |
Series 2019-XL Class A, CME Term SOFR 1 Month Index + 1.030% 5.597% 10/15/36 (b)(c)(e) | | 30,696 | 30,542 |
| CAMB Commercial Mortgage Trust floater Series 2019-LIFE: | | | |
| Class A, 1 month U.S. LIBOR + 1.070% 5.658% 12/15/37 (b)(c)(e) | | 5,900 | 5,880 |
| Class B, 1 month U.S. LIBOR + 1.250% 5.838% 12/15/37 (b)(c)(e) | | 1,800 | 1,787 |
| CD Commercial Mortgage Trust sequential payer Series 2017-CD6 Class ASB, 3.332% 11/13/50 | | 1,903 | 1,811 |
| CF Hippolyta Issuer LLC sequential payer: | | | |
| Series 2020-1: | | | |
Class A1, 1.69% 7/15/60 (b) | | 18,974 | 16,988 |
Class A2, 1.99% 7/15/60 (b) | | 12,332 | 10,368 |
| Series 2021-1A Class A1, 1.53% 3/15/61 (b) | | 13,159 | 11,427 |
| CHC Commercial Mortgage Trust floater Series 2019-CHC: | | | |
| Class A, 1 month U.S. LIBOR + 1.120% 5.708% 6/15/34 (b)(c)(e) | | 7,501 | 7,290 |
| Class B, 1 month U.S. LIBOR + 1.500% 6.088% 6/15/34 (b)(c)(e) | | 1,284 | 1,232 |
| Class C, 1 month U.S. LIBOR + 1.750% 6.338% 6/15/34 (b)(c)(e) | | 1,451 | 1,362 |
| CIM Retail Portfolio Trust floater Series 2021-RETL: | | | |
| Class C, 1 month U.S. LIBOR + 2.300% 6.888% 8/15/36 (b)(c)(e) | | 72 | 72 |
| Class D, 1 month U.S. LIBOR + 3.050% 7.638% 8/15/36 (b)(c)(e) | | 1,493 | 1,496 |
| Citigroup Commercial Mortgage Trust Series 2014-GC25 Class A/S, 4.017% 10/10/47 | | 4,150 | 3,931 |
| COMM Mortgage Trust: | | | |
| sequential payer: | | | |
Series 2014-CR18 Class A5, 3.828% 7/15/47 | | 1,366 | 1,326 |
Series 2020-SBX Class A, 1.67% 1/10/38 (b) | | 22,582 | 19,998 |
| Series 2013-CR13 Class AM, 4.449% 11/10/46 | | 2,011 | 1,976 |
| Commercial Mortgage Trust sequential payer Series 2018-CD7 Class ASB, 4.213% 8/15/51 | | 2,000 | 1,933 |
| Credit Suisse Mortgage Trust: | | | |
| floater Series 2019-ICE4: | | | |
Class A, 1 month U.S. LIBOR + 0.980% 5.568% 5/15/36 (b)(c)(e) | | 26,512 | 26,379 |
Class B, 1 month U.S. LIBOR + 1.230% 5.818% 5/15/36 (b)(c)(e) | | 19,357 | 19,186 |
Class C, 1 month U.S. LIBOR + 1.430% 6.018% 5/15/36 (b)(c)(e) | | 2,013 | 1,993 |
| sequential payer Series 2020-NET Class A, 2.2569% 8/15/37 (b) | | 2,527 | 2,270 |
| Series 2018-SITE: | | | |
Class A, 4.284% 4/15/36 (b) | | 2,941 | 2,819 |
Class B, 4.5349% 4/15/36 (b) | | 861 | 815 |
Class C, 4.782% 4/15/36 (b)(c) | | 561 | 529 |
Class D, 4.782% 4/15/36 (b)(c) | | 1,122 | 1,043 |
| DBCCRE Mortgage Trust sequential payer Series 2014-ARCP Class A, 4.2382% 1/10/34 (b) | | 15,370 | 14,873 |
| ELP Commercial Mortgage Trust floater Series 2021-ELP: | | | |
| Class A, 1 month U.S. LIBOR + 0.700% 5.289% 11/15/38 (b)(c)(e) | | 15,449 | 15,043 |
| Class B, 1 month U.S. LIBOR + 1.120% 5.7082% 11/15/38 (b)(c)(e) | | 3,900 | 3,789 |
| Extended Stay America Trust floater Series 2021-ESH: | | | |
| Class A, 1 month U.S. LIBOR + 1.080% 5.668% 7/15/38 (b)(c)(e) | | 6,158 | 6,065 |
| Class B, 1 month U.S. LIBOR + 1.380% 5.968% 7/15/38 (b)(c)(e) | | 2,856 | 2,810 |
| Class C, 1 month U.S. LIBOR + 1.700% 6.288% 7/15/38 (b)(c)(e) | | 2,106 | 2,063 |
| Class D, 1 month U.S. LIBOR + 2.250% 6.838% 7/15/38 (b)(c)(e) | | 4,248 | 4,153 |
| Freddie Mac sequential payer Series 2022-150 Class A2, 3.71% 9/25/32 | | 1,700 | 1,598 |
| GS Mortgage Securities Trust: | | | |
| floater Series 2021-IP: | | | |
Class A, 1 month U.S. LIBOR + 0.950% 5.538% 10/15/36 (b)(c)(e) | | 6,605 | 6,265 |
Class B, 1 month U.S. LIBOR + 1.150% 5.738% 10/15/36 (b)(c)(e) | | 1,021 | 954 |
Class C, 1 month U.S. LIBOR + 1.550% 6.138% 10/15/36 (b)(c)(e) | | 841 | 778 |
| sequential payer Series 2018-GS10 Class AAB, 4.106% 7/10/51 | | 2,000 | 1,939 |
| Series 2011-GC5 Class A/S, 5.1538% 8/10/44 (b)(c) | | 5,371 | 5,291 |
| Series 2013-GC12 Class A/S, 3.375% 6/10/46 | | 3,450 | 3,428 |
| Series 2015-GC34 Class XA, 1.2034% 10/10/48 (c)(k) | | 17,426 | 438 |
| Intown Mortgage Trust floater sequential payer Series 2022-STAY Class A, CME Term SOFR 1 Month Index + 2.480% 7.0506% 8/15/39 (b)(c)(e) | | 8,964 | 8,975 |
| J.P. Morgan Chase Commercial Mortgage Securities Trust floater Series 2012-NLP Class A, CME Term SOFR 1 Month Index + 0.590% 5.159% 4/15/37 (b)(c)(e) | | 6,968 | 6,601 |
| JP Morgan Chase Commercial Mortgage Securities Trust sequential payer Series 2021-2NU Class A, 1.9739% 1/5/40 (b) | | 25,800 | 20,763 |
| JPMBB Commercial Mortgage Securities Trust Series 2013-C14 Class A/S, 4.4093% 8/15/46 | | 654 | 647 |
| JPMDB Commercial Mortgage Securities Trust sequential payer: | | | |
| Series 2018-C8 Class ASB, 4.145% 6/15/51 | | 2,000 | 1,930 |
| Series 2019-COR6 Class A4, 3.0565% 11/13/52 | | 1,823 | 1,550 |
| JPMorgan Chase Commercial Mortgage Securities Trust: | | | |
| sequential payer Series 2020-NNN Class AFX, 2.8123% 1/16/37 (b) | | 31,484 | 28,392 |
| Series 2013-LC11 Class A/S, 3.216% 4/15/46 | | 1,177 | 1,080 |
| Series 2018-WPT: | | | |
Class AFX, 4.2475% 7/5/33 (b) | | 2,821 | 2,539 |
Class CFX, 4.9498% 7/5/33 (b) | | 485 | 398 |
Class DFX, 5.3503% 7/5/33 (b) | | 955 | 754 |
Class EFX, 5.3635% 7/5/33 (b)(c) | | 1,020 | 765 |
| Life Financial Services Trust floater Series 2022-BMR2: | | | |
| Class A1, CME Term SOFR 1 Month Index + 1.290% 5.8577% 5/15/39 (b)(c)(e) | | 12,720 | 12,672 |
| Class B, CME Term SOFR 1 Month Index + 1.790% 6.3564% 5/15/39 (b)(c)(e) | | 8,835 | 8,800 |
| Class C, CME Term SOFR 1 Month Index + 2.090% 6.6556% 5/15/39 (b)(c)(e) | | 4,950 | 4,890 |
| Class D, CME Term SOFR 1 Month Index + 2.540% 7.1044% 5/15/39 (b)(c)(e) | | 4,400 | 4,335 |
| LIFE Mortgage Trust floater Series 2021-BMR: | | | |
| Class A, 1 month U.S. LIBOR + 0.700% 5.288% 3/15/38 (b)(c)(e) | | 9,783 | 9,605 |
| Class B, 1 month U.S. LIBOR + 0.880% 5.468% 3/15/38 (b)(c)(e) | | 2,360 | 2,295 |
| Class C, 1 month U.S. LIBOR + 1.100% 5.688% 3/15/38 (b)(c)(e) | | 1,485 | 1,441 |
| Class D, 1 month U.S. LIBOR + 1.400% 5.988% 3/15/38 (b)(c)(e) | | 2,066 | 2,001 |
| Class E, 1 month U.S. LIBOR + 1.750% 6.338% 3/15/38 (b)(c)(e) | | 1,805 | 1,749 |
| Morgan Stanley BAML Trust sequential payer Series 2016-C28 Class A3, 3.272% 1/15/49 | | 7,430 | 6,990 |
| Morgan Stanley Capital I Trust: | | | |
| sequential payer: | | | |
Series 2019-MEAD Class A, 3.17% 11/10/36 (b) | | 7,903 | 7,365 |
Series 2021-L6 Class A4, 2.444% 6/15/54 (c) | | 5,294 | 4,255 |
| Series 2018-H4 Class A4, 4.31% 12/15/51 | | 1,756 | 1,666 |
| Series 2019-MEAD: | | | |
Class B, 3.1771% 11/10/36 (b)(c) | | 1,142 | 1,037 |
Class C, 3.1771% 11/10/36 (b)(c) | | 1,096 | 965 |
| MSCCG Trust floater Series 2018-SELF: | | | |
| Class A, 1 month U.S. LIBOR + 0.900% 5.488% 10/15/37 (b)(c)(e) | | 927 | 919 |
| Class B, 1 month U.S. LIBOR + 1.080% 5.668% 10/15/37 (b)(c)(e) | | 3,125 | 3,078 |
| NYT Mortgage Trust floater Series 2019-NYT Class A, 1 month U.S. LIBOR + 1.200% 5.788% 12/15/35 (b)(c)(e) | | 22,356 | 21,379 |
| Prima Capital Ltd.: | | | |
| floater Series 2021-9A Class B, 1 month U.S. LIBOR + 1.800% 6.3979% 12/15/37 (b)(c)(e) | | 2,833 | 2,768 |
| floater sequential payer Series 2021-9A Class A, 1 month U.S. LIBOR + 1.450% 6.0479% 12/15/37 (b)(c)(e) | | 641 | 635 |
| SPGN Mortgage Trust floater Series 2022-TFLM: | | | |
| Class B, CME Term SOFR 1 Month Index + 2.000% 6.5625% 2/15/39 (b)(c)(e) | | 2,586 | 2,463 |
| Class C, CME Term SOFR 1 Month Index + 2.650% 7.2125% 2/15/39 (b)(c)(e) | | 1,345 | 1,276 |
| SREIT Trust floater: | | | |
| Series 2021-FLWR Class A, 1 month U.S. LIBOR + 0.570% 5.1646% 7/15/36 (b)(c)(e) | | 4,098 | 3,997 |
| Series 2021-MFP: | | | |
Class A, 1 month U.S. LIBOR + 0.730% 5.3187% 11/15/38 (b)(c)(e) | | 13,222 | 12,937 |
Class B, 1 month U.S. LIBOR + 1.070% 5.6677% 11/15/38 (b)(c)(e) | | 5,947 | 5,791 |
Class C, 1 month U.S. LIBOR + 1.320% 5.9169% 11/15/38 (b)(c)(e) | | 3,694 | 3,592 |
Class D, 1 month U.S. LIBOR + 1.570% 6.1661% 11/15/38 (b)(c)(e) | | 2,427 | 2,357 |
| UBS Commercial Mortgage Trust sequential payer Series 2019-C17 Class ASB, 2.8655% 10/15/52 | | 2,200 | 1,994 |
| VLS Commercial Mortgage Trust: | | | |
| sequential payer Series 2020-LAB Class A, 2.13% 10/10/42 (b) | | 9,860 | 7,729 |
| Series 2020-LAB Class B, 2.453% 10/10/42 (b) | | 510 | 399 |
| Wells Fargo Commercial Mortgage Trust: | | | |
| floater: | | | |
Series 2016-C32 Class A3FL, 1 month U.S. LIBOR + 1.420% 6.0214% 1/15/59 (c)(e) | | 23,714 | 23,733 |
Series 2021-FCMT Class A, 1 month U.S. LIBOR + 1.200% 5.788% 5/15/31 (b)(c)(e) | | 5,818 | 5,565 |
| sequential payer: | | | |
Series 2015-C26 Class A4, 3.166% 2/15/48 | | 8,381 | 8,035 |
Series 2015-C29 Class ASB, 3.4% 6/15/48 | | 1,655 | 1,614 |
Series 2018-C46 Class ASB, 4.086% 8/15/51 | | 2,000 | 1,929 |
Series 2019-C52 Class A5, 2.892% 8/15/52 | | 2,411 | 2,097 |
| Series 2015-SG1 Class ASB, 3.556% 9/15/48 | | 1,444 | 1,407 |
| Series 2018-C48 Class A5, 4.302% 1/15/52 | | 2,498 | 2,374 |
| WF-RBS Commercial Mortgage Trust sequential payer Series 2014-C24 Class A4, 3.343% 11/15/47 | | 7,819 | 7,515 |
| TOTAL COMMERCIAL MORTGAGE SECURITIES (Cost $737,335) | | | 695,053 |
| | | | |
| Municipal Securities - 0.4% |
| | | Principal Amount (a) (000s) | Value ($) (000s) |
| Chicago Board of Ed. Series 2009 G, 1.75% 12/15/25 | | 3,960 | 3,469 |
| Illinois Gen. Oblig.: | | | |
| Series 2003: | | | |
4.95% 6/1/23 | | 811 | 810 |
5.1% 6/1/33 | | 13,950 | 13,709 |
| Series 2010-1, 6.63% 2/1/35 | | 1,186 | 1,247 |
| Series 2010-3: | | | |
6.725% 4/1/35 | | 1,710 | 1,802 |
7.35% 7/1/35 | | 813 | 884 |
| New Jersey Econ. Dev. Auth. State Pension Fdg. Rev. Series 1997, 7.425% 2/15/29 (Nat'l. Pub. Fin. Guarantee Corp. Insured) | | 7,201 | 7,753 |
| TOTAL MUNICIPAL SECURITIES (Cost $31,335) | | | 29,674 |
| | | | |
| Foreign Government and Government Agency Obligations - 0.3% |
| | | Principal Amount (a) (000s) | Value ($) (000s) |
| Indonesian Republic 3.85% 10/15/30 | | 10,505 | 9,781 |
| Panamanian Republic 3.298% 1/19/33 | | 18,095 | 14,655 |
| TOTAL FOREIGN GOVERNMENT AND GOVERNMENT AGENCY OBLIGATIONS (Cost $28,566) | | | 24,436 |
| | | | |
| Bank Notes - 0.1% |
| | | Principal Amount (a) (000s) | Value ($) (000s) |
| Discover Bank 4.682% 8/9/28 (c) | | 1,865 | 1,784 |
| KeyBank NA 6.95% 2/1/28 | | 725 | 761 |
| Regions Bank 6.45% 6/26/37 | | 2,685 | 2,797 |
| TOTAL BANK NOTES (Cost $5,115) | | | 5,342 |
| | | | |
| Fixed-Income Funds - 1.6% |
| | | Shares | Value ($) (000s) |
Fidelity Specialized High Income Central Fund (n) (Cost $147,137) | | 1,556,555 | 129,474 |
| | | | |
| Preferred Securities - 0.2% |
| | | Principal Amount (a) (000s) | Value ($) (000s) |
| FINANCIALS - 0.2% | | | |
| Banks - 0.2% | | | |
| Bank of Nova Scotia: | | | |
| 3 month U.S. LIBOR + 2.640% 7.4539% (c)(e)(o) | | 8,146 | 7,983 |
| 4.9% (c)(o) | | 11,200 | 10,874 |
| (Cost $19,945) | | | 18,857 |
| | | | |
| Money Market Funds - 2.4% |
| | | Shares | Value ($) (000s) |
Fidelity Cash Central Fund 4.63% (p) (Cost $203,075) | | 203,034,595 | 203,075 |
| | | | |
| TOTAL INVESTMENT IN SECURITIES - 106.5% (Cost $9,703,758) | 8,818,945 |
NET OTHER ASSETS (LIABILITIES) - (6.5)% | (535,208) |
| NET ASSETS - 100.0% | 8,283,737 |
| | |
| TBA Sale Commitments |
| | Principal Amount (a) (000s) | Value ($) (000s) |
| Ginnie Mae | | |
| 2% 3/1/53 | (17,800) | (14,919) |
| 2% 3/1/53 | (13,300) | (11,148) |
| | | |
| TOTAL GINNIE MAE | | (26,067) |
| | | |
| Uniform Mortgage Backed Securities | | |
| 1.5% 3/1/38 | (100) | (86) |
| 1.5% 3/1/38 | (4,650) | (4,020) |
| 1.5% 3/1/38 | (4,450) | (3,847) |
| 2% 3/1/38 | (750) | (666) |
| 2% 3/1/53 | (3,900) | (3,176) |
| 2% 3/1/53 | (57,900) | (47,145) |
| 2% 3/1/53 | (31,550) | (25,690) |
| 2.5% 3/1/53 | (7,400) | (6,269) |
| 2.5% 3/1/53 | (5,100) | (4,321) |
| 3% 3/1/53 | (4,875) | (4,288) |
| 3% 3/1/53 | (4,150) | (3,650) |
| 3% 3/1/53 | (1,400) | (1,231) |
| 5.5% 3/1/53 | (10,300) | (10,282) |
| | | |
| TOTAL UNIFORM MORTGAGE BACKED SECURITIES | | (114,671) |
| | | |
TOTAL TBA SALE COMMITMENTS (Proceeds $141,626) | | (140,738) |
| Futures Contracts |
| | Number of contracts | Expiration Date | Notional Amount ($) (000s) | Value ($) (000s) | Unrealized Appreciation/ (Depreciation) ($) (000s) |
| Purchased | | | | | |
| | | | | | |
| Treasury Contracts | | | | | |
| CBOT 2-Year U.S. Treasury Note Contracts (United States) | 20 | Jun 2023 | 4,075 | (9) | (9) |
| CBOT 5-Year U.S. Treasury Note Contracts (United States) | 142 | Jun 2023 | 15,202 | (19) | (19) |
| | | | | | |
| TOTAL PURCHASED | | | | | (28) |
| | | | | | |
| Sold | | | | | |
| | | | | | |
| Treasury Contracts | | | | | |
| CBOT 10-Year U.S. Treasury Note Contracts (United States) | 184 | Jun 2023 | 20,545 | (18) | (18) |
| CBOT Long Term U.S. Treasury Bond Contracts (United States) | 338 | Jun 2023 | 42,324 | 3 | 3 |
| CBOT Ultra Long Term U.S. Treasury Bond Contracts (United States) | 25 | Jun 2023 | 3,377 | (18) | (18) |
| | | | | | |
| TOTAL SOLD | | | | | (33) |
| | | | | | |
| TOTAL FUTURES CONTRACTS | | | | | (61) |
| The notional amount of futures purchased as a percentage of Net Assets is 0.2% |
| The notional amount of futures sold as a percentage of Net Assets is 0.7% |
| Credit Default Swaps |
| Underlying Reference | | Maturity Date | Clearinghouse / Counterparty | Fixed Payment Received/ (Paid) | Payment Frequency | Notional Amount (000s) (1) | Value ($) (000s) | Upfront Premium Received/ (Paid) ($) (000s) | Unrealized Appreciation/ (Depreciation) ($) (000s) |
| Buy Protection | | | | | | | | | | |
| CMBX N.A. AAA Index Series 13 | | Dec 2072 | Goldman Sachs & Co. LLC | (0.5%) | Monthly | | 7,540 | 102 | (67) | 35 |
| CMBX N.A. AAA Index Series 13 | | Dec 2072 | Goldman Sachs & Co. LLC | (0.5%) | Monthly | | 1,640 | 22 | (19) | 3 |
| CMBX N.A. AAA Index Series 13 | | Dec 2072 | Goldman Sachs & Co. LLC | (0.5%) | Monthly | | 4,080 | 55 | (95) | (40) |
| CMBX N.A. AAA Index Series 13 | | Dec 2072 | JPMorgan Securities LLC | (0.5%) | Monthly | | 1,320 | 18 | (12) | 6 |
| CMBX N.A. AAA Index Series 13 | | Dec 2072 | JPMorgan Securities LLC | (0.5%) | Monthly | | 2,280 | 31 | (32) | (1) |
| CMBX N.A. AAA Index Series 13 | | Dec 2072 | Morgan Stanley Capital Services LLC | (0.5%) | Monthly | | 6,080 | 82 | (90) | (8) |
| CMBX N.A. AAA Index Series 13 | | Dec 2072 | Morgan Stanley Capital Services LLC | (0.5%) | Monthly | | 8,020 | 109 | (132) | (23) |
| CMBX N.A. AAA Index Series 13 | | Dec 2072 | Morgan Stanley Capital Services LLC | (0.5%) | Monthly | | 820 | 11 | (11) | 0 |
| CMBX N.A. AAA Index Series 13 | | Dec 2072 | Morgan Stanley Capital Services LLC | (0.5%) | Monthly | | 2,510 | 34 | (18) | 16 |
| CMBX N.A. AAA Index Series 13 | | Dec 2072 | Morgan Stanley Capital Services LLC | (0.5%) | Monthly | | 1,650 | 23 | (16) | 7 |
| | | | | | | | | | | |
| TOTAL CREDIT DEFAULT SWAPS | | | | | | | | 487 | (492) | (5) |
(1)Notional amount is stated in U.S. Dollars unless otherwise noted.
| Interest Rate Swaps |
| Payment Received | Payment Frequency | Payment Paid | Payment Frequency | Clearinghouse / Counterparty (1) | Maturity Date | Notional Amount (000s) (2) | Value ($) (000s) | Upfront Premium Received/ (Paid) ($) (000s) (3) | Unrealized Appreciation/ (Depreciation) ($) (000s) |
| 4.5% | Annual | U.S. Secured Overnight Fin. Rate (SOFR) Index (4) | Annual | LCH | Mar 2025 | | 37,632 | (601) | 0 | (601) |
| 4% | Annual | U.S. Secured Overnight Fin. Rate (SOFR) Index (4) | Annual | LCH | Mar 2028 | | 15,725 | (443) | 0 | (443) |
| 3.75% | Annual | U.S. Secured Overnight Fin. Rate (SOFR) Index (4) | Annual | LCH | Mar 2030 | | 2,251 | (73) | 0 | (73) |
| TOTAL INTEREST RATE SWAPS | | | | | | | | (1,117) | 0 | (1,117) |
(1)Swaps with LCH Clearnet Group (LCH) are centrally cleared over-the-counter (OTC) swaps.
(2)Notional amount is stated in U.S. Dollars unless otherwise noted.
(3)Any premiums for centrally cleared over-the-counter (OTC) swaps are recorded periodically throughout the term of the swap to variation margin and included in unrealized appreciation (depreciation).
(4)Represents floating rate.
Any values shown as $0 in the Schedule of Investments may reflect amounts less than $500.
Legend
| (a) | Amount is stated in United States dollars unless otherwise noted. |
| (b) | Security exempt from registration under Rule 144A of the Securities Act of 1933. These securities may be resold in transactions exempt from registration, normally to qualified institutional buyers. At the end of the period, the value of these securities amounted to $1,746,649,000 or 21.1% of net assets. |
| (c) | Coupon rates for floating and adjustable rate securities reflect the rates in effect at period end. |
| (d) | Security or a portion of the security purchased on a delayed delivery or when-issued basis. |
| (e) | Coupon is indexed to a floating interest rate which may be multiplied by a specified factor and/or subject to caps or floors. |
| (f) | Security or a portion of the security was pledged to cover margin requirements for futures contracts. At period end, the value of securities pledged amounted to $1,816,000. |
| (g) | Security or a portion of the security was pledged to cover margin requirements for centrally cleared OTC swaps. At period end, the value of securities pledged amounted to $1,079,000. |
| (h) | Security or a portion of the security has been segregated as collateral for mortgage-backed or asset-backed securities purchased on a delayed delivery or when-issued basis. At period end, the value of securities pledged amounted to $10,130,000. |
| (i) | Represents an investment in an underlying pool of reverse mortgages which typically do not require regular principal and interest payments as repayment is deferred until a maturity event. |
| (k) | Interest Only (IO) security represents the right to receive only monthly interest payments on an underlying pool of mortgages or assets. Principal shown is the outstanding par amount of the pool as of the end of the period. |
| (l) | Coupon is inversely indexed to a floating interest rate multiplied by a specified factor. The price may be considerably more volatile than the price of a comparable fixed rate security. |
| (m) | Principal Only Strips represent the right to receive the monthly principal payments on an underlying pool of mortgage loans. |
| (n) | Affiliated fund that is generally available only to investment companies and other accounts managed by Fidelity Investments. A complete unaudited schedule of portfolio holdings for each Fidelity Central Fund is filed with the SEC for the first and third quarters of each fiscal year on Form N-PORT and is available upon request or at the SEC's website at www.sec.gov. An unaudited holdings listing for the Fund, which presents direct holdings as well as the pro-rata share of securities and other investments held indirectly through its investment in underlying non-money market Fidelity Central Funds, is available at fidelity.com and/or institutional.fidelity.com, as applicable. In addition, each Fidelity Central Fund's financial statements are available on the SEC's website or upon request. |
| (o) | Security is perpetual in nature with no stated maturity date. |
| (p) | Affiliated fund that is generally available only to investment companies and other accounts managed by Fidelity Investments. The rate quoted is the annualized seven-day yield of the fund at period end. A complete unaudited listing of the fund's holdings as of its most recent quarter end is available upon request. In addition, each Fidelity Central Fund's financial statements are available on the SEC's website or upon request. |
Affiliated Central Funds
Fiscal year to date information regarding the Fund's investments in Fidelity Central Funds, including the ownership percentage, is presented below.
| Affiliate (Amounts in thousands) | Value, beginning of period ($) | Purchases ($) | Sales Proceeds ($) | Dividend Income ($) | Realized Gain (loss) ($) | Change in Unrealized appreciation (depreciation) ($) | Value, end of period ($) | % ownership, end of period |
| Fidelity Cash Central Fund 4.63% | 419,834 | 1,703,171 | 1,919,929 | 3,850 | - | (1) | 203,075 | 0.5% |
| Fidelity Securities Lending Cash Central Fund 4.63% | 127,155 | 951,034 | 1,078,189 | 136 | - | - | - | 0.0% |
| Fidelity Specialized High Income Central Fund | 127,129 | 3,218 | - | 3,218 | - | (873) | 129,474 | 38.2% |
| Total | 674,118 | 2,657,423 | 2,998,118 | 7,204 | - | (874) | 332,549 | |
| | | | | | | | | |
Amounts in the dividend income column in the above table include any capital gain distributions from underlying funds, which are presented in the corresponding line item in the Statement of Operations, if applicable.
Amount for Fidelity Securities Lending Cash Central Fund represents the income earned on investing cash collateral, less rebates paid to borrowers and any lending agent fees associated with the loan, plus any premium payments received for lending certain types of securities.
Amounts included in the purchases and sales proceeds columns may include in-kind transactions, if applicable.
Investment Valuation
The following is a summary of the inputs used, as of February 28, 2023, involving the Fund's assets and liabilities carried at fair value. The inputs or methodology used for valuing securities may not be an indication of the risk associated with investing in those securities. For more information on valuation inputs, and their aggregation into the levels used below, please refer to the Investment Valuation section in the accompanying Notes to Financial Statements.
| Valuation Inputs at Reporting Date: |
Description (Amounts in thousands) | Total ($) | Level 1 ($) | Level 2 ($) | Level 3 ($) |
Investments in Securities: | | | | |
|
| Corporate Bonds | 3,093,348 | - | 3,093,348 | - |
|
| U.S. Government and Government Agency Obligations | 2,857,681 | - | 2,857,681 | - |
|
| U.S. Government Agency - Mortgage Securities | 1,032,037 | - | 1,032,037 | - |
|
| Asset-Backed Securities | 593,972 | - | 593,972 | - |
|
| Collateralized Mortgage Obligations | 135,996 | - | 135,996 | - |
|
| Commercial Mortgage Securities | 695,053 | - | 695,053 | - |
|
| Municipal Securities | 29,674 | - | 29,674 | - |
|
| Foreign Government and Government Agency Obligations | 24,436 | - | 24,436 | - |
|
| Bank Notes | 5,342 | - | 5,342 | - |
|
| Fixed-Income Funds | 129,474 | 129,474 | - | - |
|
| Preferred Securities | 18,857 | - | 18,857 | - |
|
| Money Market Funds | 203,075 | 203,075 | - | - |
| Total Investments in Securities: | 8,818,945 | 332,549 | 8,486,396 | - |
Derivative Instruments: | | | | |
|
| Assets | | | | |
Futures Contracts | 3 | 3 | - | - |
Swaps | 487 | - | 487 | - |
| Total Assets | 490 | 3 | 487 | - |
|
| Liabilities | | | | |
Futures Contracts | (64) | (64) | - | - |
Swaps | (1,117) | - | (1,117) | - |
| Total Liabilities | (1,181) | (64) | (1,117) | - |
| Total Derivative Instruments: | (691) | (61) | (630) | - |
Other Financial Instruments: | | | | |
|
| TBA Sale Commitments | (140,738) | - | (140,738) | - |
| Total Other Financial Instruments: | (140,738) | - | (140,738) | - |
Value of Derivative Instruments
The following table is a summary of the Fund's value of derivative instruments by primary risk exposure as of February 28, 2023. For additional information on derivative instruments, please refer to the Derivative Instruments section in the accompanying Notes to Financial Statements.
Primary Risk Exposure / Derivative Type | Value |
| (Amounts in thousands) | Asset ($) | Liability ($) |
| Credit Risk | | |
Swaps (a) | 487 | 0 |
| Total Credit Risk | 487 | 0 |
| Interest Rate Risk | | |
Futures Contracts (b) | 3 | (64) |
Swaps (c) | 0 | (1,117) |
| Total Interest Rate Risk | 3 | (1,181) |
| Total Value of Derivatives | 490 | (1,181) |
(a)For bi-lateral over-the-counter (OTC) swaps, reflects gross value which is presented in the Statement of Assets and Liabilities in the bi-lateral OTC swaps, at value line-items.
(b)Reflects gross cumulative appreciation (depreciation) on futures contracts as presented in the Schedule of Investments. In the Statement of Assets and Liabilities, the period end daily variation margin is included in receivable or payable for daily variation margin on futures contracts, and the net cumulative appreciation (depreciation) is included in Total accumulated earnings (loss).
(c)For centrally cleared over-the-counter (OTC) swaps, reflects gross cumulative appreciation (depreciation) as presented in the Schedule of Investments. In the Statement of Assets and Liabilities, the period end daily variation margin for centrally cleared OTC swaps is included in receivable or payable for daily variation margin on centrally cleared OTC swaps, and the net cumulative appreciation (depreciation) for centrally cleared OTC swaps is included in Total accumulated earnings (loss).
| Statement of Assets and Liabilities |
| Amounts in thousands (except per-share amounts) | | | | February 28, 2023 (Unaudited) |
| | | | | |
| Assets | | | | |
| Investment in securities, at value - See accompanying schedule: | | | | |
Unaffiliated issuers (cost $9,353,546) | $ | 8,486,396 | | |
Fidelity Central Funds (cost $350,212) | | 332,549 | | |
| | | | | |
| | | | | |
| Total Investment in Securities (cost $9,703,758) | | | $ | 8,818,945 |
| Receivable for investments sold | | | | 134,417 |
| Receivable for TBA sale commitments | | | | 141,626 |
| Receivable for fund shares sold | | | | 14,056 |
| Interest receivable | | | | 67,002 |
| Distributions receivable from Fidelity Central Funds | | | | 563 |
| Receivable for daily variation margin on futures contracts | | | | 24 |
| Bi-lateral OTC swaps, at value | | | | 487 |
| Receivable from investment adviser for expense reductions | | | | 76 |
| Other receivables | | | | 148 |
Total assets | | | | 9,177,344 |
| Liabilities | | | | |
| Payable to custodian bank | $ | 1 | | |
| Payable for investments purchased | | | | |
Regular delivery | | 212,028 | | |
Delayed delivery | | 523,523 | | |
| TBA sale commitments, at value | | 140,738 | | |
| Payable for fund shares redeemed | | 8,390 | | |
| Distributions payable | | 5,591 | | |
| Accrued management fee | | 2,063 | | |
| Distribution and service plan fees payable | | 57 | | |
| Payable for daily variation margin on centrally cleared OTC swaps | | 15 | | |
| Other affiliated payables | | 1,063 | | |
| Other payables and accrued expenses | | 138 | | |
| Total Liabilities | | | | 893,607 |
| Net Assets | | | $ | 8,283,737 |
| Net Assets consist of: | | | | |
| Paid in capital | | | $ | 9,672,987 |
| Total accumulated earnings (loss) | | | | (1,389,250) |
| Net Assets | | | $ | 8,283,737 |
| | | | | |
| Net Asset Value and Maximum Offering Price | | | | |
| Class A : | | | | |
Net Asset Value and redemption price per share ($162,544 ÷ 22,911 shares) (a) | | | $ | 7.09 |
| Maximum offering price per share (100/96.00 of $7.09) | | | $ | 7.39 |
| Class M : | | | | |
Net Asset Value and redemption price per share ($26,926 ÷ 3,793 shares) (a) | | | $ | 7.10 |
| Maximum offering price per share (100/96.00 of $7.10) | | | $ | 7.40 |
| Class C : | | | | |
Net Asset Value and offering price per share ($19,788 ÷ 2,785 shares) (a)(b) | | | $ | 7.10 |
| Investment Grade Bond : | | | | |
Net Asset Value , offering price and redemption price per share ($5,424,951 ÷ 764,085 shares) | | | $ | 7.10 |
| Class I : | | | | |
Net Asset Value , offering price and redemption price per share ($1,323,506 ÷ 186,189 shares) | | | $ | 7.11 |
| Class Z : | | | | |
Net Asset Value , offering price and redemption price per share ($1,326,022 ÷ 186,407 shares) | | | $ | 7.11 |
(a)Redemption price per share is equal to net asset value less any applicable contingent deferred sales charge. |
(b)Corresponding Net Asset Value does not calculate due to rounding of fractional net assets and/or shares |
| Statement of Operations |
| Amounts in thousands | | | | Six months ended February 28, 2023 (Unaudited) |
| Investment Income | | | | |
| Dividends | | | $ | 601 |
| Interest | | | | 144,310 |
| Income from Fidelity Central Funds (including $136 from security lending) | | | | 7,204 |
| Total Income | | | | 152,115 |
| Expenses | | | | |
| Management fee | $ | 12,153 | | |
| Transfer agent fees | | 4,115 | | |
| Distribution and service plan fees | | 334 | | |
| Fund wide operations fee | | 2,097 | | |
| Independent trustees' fees and expenses | | 15 | | |
| Total expenses before reductions | | 18,714 | | |
| Expense reductions | | (311) | | |
| Total expenses after reductions | | | | 18,403 |
| Net Investment income (loss) | | | | 133,712 |
| Realized and Unrealized Gain (Loss) | | | | |
| Net realized gain (loss) on: | | | | |
| Investment Securities: | | | | |
| Unaffiliated issuers | | (164,122) | | |
| Futures contracts | | 7,077 | | |
| Swaps | | (1,253) | | |
| Total net realized gain (loss) | | | | (158,298) |
| Change in net unrealized appreciation (depreciation) on: | | | | |
| Investment Securities: | | | | |
| Unaffiliated issuers | | (120,377) | | |
| Fidelity Central Funds | | (874) | | |
| Futures contracts | | (1,538) | | |
| Swaps | | (746) | | |
| TBA Sale commitments | | (2,263) | | |
| Total change in net unrealized appreciation (depreciation) | | | | (125,798) |
| Net gain (loss) | | | | (284,096) |
| Net increase (decrease) in net assets resulting from operations | | | $ | (150,384) |
| Statement of Changes in Net Assets |
| |
| Amount in thousands | | Six months ended February 28, 2023 (Unaudited) | | Year ended August 31, 2022 |
| Increase (Decrease) in Net Assets | | | | |
| Operations | | | | |
| Net investment income (loss) | $ | 133,712 | $ | 190,460 |
| Net realized gain (loss) | | (158,298) | | (168,203) |
| Change in net unrealized appreciation (depreciation) | | (125,798) | | (1,154,524) |
| Net increase (decrease) in net assets resulting from operations | | (150,384) | | (1,132,267) |
| Distributions to shareholders | | (129,927) | | (188,023) |
| Share transactions - net increase (decrease) | | (185,230) | | 34,833 |
| Total increase (decrease) in net assets | | (465,541) | | (1,285,457) |
| | | | | |
| Net Assets | | | | |
| Beginning of period | | 8,749,278 | | 10,034,735 |
| End of period | $ | 8,283,737 | $ | 8,749,278 |
| | | | | |
| | | | | |
Financial Highlights
| Fidelity Advisor® Investment Grade Bond Fund Class A |
| |
| | Six months ended (Unaudited) February 28, 2023 | | Years ended August 31, 2022 | | 2021 | | 2020 | | 2019 | | 2018 |
Selected Per-Share Data | | | | | | | | | | | | |
| Net asset value, beginning of period | $ | 7.34 | $ | 8.48 | $ | 8.76 | $ | 8.25 | $ | 7.71 | $ | 7.97 |
| Income from Investment Operations | | | | | | | | | | | | |
Net investment income (loss) A,B | | .106 | | .140 | | .105 | | .158 | | .199 | | .178 |
| Net realized and unrealized gain (loss) | | (.253) | | (1.142) | | (.031) | | .518 | | .565 | | (.277) |
| Total from investment operations | | (.147) | | (1.002) | | .074 | | .676 | | .764 | | (.099) |
| Distributions from net investment income | | (.103) | | (.134) | | (.101) | | (.166) | | (.224) | | (.161) |
| Distributions from net realized gain | | - | | (.004) | | (.253) | | - | | - | | - |
| Total distributions | | (.103) | | (.138) | | (.354) | | (.166) | | (.224) | | (.161) |
| Net asset value, end of period | $ | 7.09 | $ | 7.34 | $ | 8.48 | $ | 8.76 | $ | 8.25 | $ | 7.71 |
Total Return C,D,E | | (2.00)% | | (11.91)% | | .89% | | 8.30% | | 10.11% | | (1.25)% |
Ratios to Average Net Assets B,F,G | | | | | | | | | | | | |
| Expenses before reductions | | .76% H | | .75% | | .75% | | .76% | | .77% | | .77% |
| Expenses net of fee waivers, if any | | .76% H | | .75% | | .75% | | .76% | | .77% | | .77% |
| Expenses net of all reductions | | .76% H | | .75% | | .75% | | .76% | | .77% | | .77% |
| Net investment income (loss) | | 3.00% H | | 1.76% | | 1.24% | | 1.88% | | 2.55% | | 2.29% |
| Supplemental Data | | | | | | | | | | | | |
| Net assets, end of period (in millions) | $ | 163 | $ | 162 | $ | 209 | $ | 168 | $ | 72 | $ | 88 |
Portfolio turnover rate I | | 132% H | | 75% | | 40% | | 118% J | | 59% J | | 56% J |
A Calculated based on average shares outstanding during the period.
B Net investment income (loss) is affected by the timing of the declaration of dividends by any underlying mutual funds or exchange-traded funds (ETFs). Net investment income (loss) of any mutual funds or ETFs is not included in the Fund's net investment income (loss) ratio.
C Total returns for periods of less than one year are not annualized.
D Total returns would have been lower if certain expenses had not been reduced during the applicable periods shown.
E Total returns do not include the effect of the sales charges.
F Fees and expenses of any underlying mutual funds or exchange-traded funds (ETFs) are not included in the Fund's expense ratio. The Fund indirectly bears its proportionate share of these expenses. For additional expense information related to investments in Fidelity Central Funds, please refer to the "Investments in Fidelity Central Funds" note found in the Notes to Financial Statements section of the most recent Annual or Semi-Annual report.
G Expense ratios reflect operating expenses of the class. Expenses before reductions do not reflect amounts reimbursed, waived, or reduced through arrangements with the investment adviser, brokerage services, or other offset arrangements, if applicable, and do not represent the amount paid by the class during periods when reimbursements, waivers or reductions occur.
H Annualized.
I Amount does not include the portfolio activity of any underlying mutual funds or exchange-traded funds (ETFs).
J Portfolio turnover rate excludes securities received or delivered in-kind.
| Fidelity Advisor® Investment Grade Bond Fund Class M |
| |
| | Six months ended (Unaudited) February 28, 2023 | | Years ended August 31, 2022 | | 2021 | | 2020 | | 2019 | | 2018 |
Selected Per-Share Data | | | | | | | | | | | | |
| Net asset value, beginning of period | $ | 7.34 | $ | 8.48 | $ | 8.77 | $ | 8.26 | $ | 7.72 | $ | 7.98 |
| Income from Investment Operations | | | | | | | | | | | | |
Net investment income (loss) A,B | | .106 | | .140 | | .106 | | .158 | | .199 | | .178 |
| Net realized and unrealized gain (loss) | | (.243) | | (1.142) | | (.041) | | .519 | | .564 | | (.279) |
| Total from investment operations | | (.137) | | (1.002) | | .065 | | .677 | | .763 | | (.101) |
| Distributions from net investment income | | (.103) | | (.134) | | (.102) | | (.167) | | (.223) | | (.159) |
| Distributions from net realized gain | | - | | (.004) | | (.253) | | - | | - | | - |
| Total distributions | | (.103) | | (.138) | | (.355) | | (.167) | | (.223) | | (.159) |
| Net asset value, end of period | $ | 7.10 | $ | 7.34 | $ | 8.48 | $ | 8.77 | $ | 8.26 | $ | 7.72 |
Total Return C,D,E | | (1.86)% | | (11.91)% | | .78% | | 8.30% | | 10.09% | | (1.26)% |
Ratios to Average Net Assets B,F,G | | | | | | | | | | | | |
| Expenses before reductions | | .76% H | | .75% | | .74% | | .75% | | .77% | | .79% |
| Expenses net of fee waivers, if any | | .76% H | | .75% | | .74% | | .75% | | .77% | | .79% |
| Expenses net of all reductions | | .76% H | | .75% | | .74% | | .75% | | .77% | | .79% |
| Net investment income (loss) | | 3.00% H | | 1.76% | | 1.25% | | 1.88% | | 2.54% | | 2.28% |
| Supplemental Data | | | | | | | | | | | | |
| Net assets, end of period (in millions) | $ | 27 | $ | 27 | $ | 34 | $ | 36 | $ | 22 | $ | 20 |
Portfolio turnover rate I | | 132% H | | 75% | | 40% | | 118% J | | 59% J | | 56% J |
A Calculated based on average shares outstanding during the period.
B Net investment income (loss) is affected by the timing of the declaration of dividends by any underlying mutual funds or exchange-traded funds (ETFs). Net investment income (loss) of any mutual funds or ETFs is not included in the Fund's net investment income (loss) ratio.
C Total returns for periods of less than one year are not annualized.
D Total returns would have been lower if certain expenses had not been reduced during the applicable periods shown.
E Total returns do not include the effect of the sales charges.
F Fees and expenses of any underlying mutual funds or exchange-traded funds (ETFs) are not included in the Fund's expense ratio. The Fund indirectly bears its proportionate share of these expenses. For additional expense information related to investments in Fidelity Central Funds, please refer to the "Investments in Fidelity Central Funds" note found in the Notes to Financial Statements section of the most recent Annual or Semi-Annual report.
G Expense ratios reflect operating expenses of the class. Expenses before reductions do not reflect amounts reimbursed, waived, or reduced through arrangements with the investment adviser, brokerage services, or other offset arrangements, if applicable, and do not represent the amount paid by the class during periods when reimbursements, waivers or reductions occur.
H Annualized.
I Amount does not include the portfolio activity of any underlying mutual funds or exchange-traded funds (ETFs).
J Portfolio turnover rate excludes securities received or delivered in-kind.
| Fidelity Advisor® Investment Grade Bond Fund Class C |
| |
| | Six months ended (Unaudited) February 28, 2023 | | Years ended August 31, 2022 | | 2021 | | 2020 | | 2019 | | 2018 |
Selected Per-Share Data | | | | | | | | | | | | |
| Net asset value, beginning of period | $ | 7.35 | $ | 8.49 | $ | 8.77 | $ | 8.26 | $ | 7.72 | $ | 7.99 |
| Income from Investment Operations | | | | | | | | | | | | |
Net investment income (loss) A,B | | .078 | | .079 | | .040 | | .093 | | .140 | | .119 |
| Net realized and unrealized gain (loss) | | (.253) | | (1.142) | | (.031) | | .518 | | .564 | | (.288) |
| Total from investment operations | | (.175) | | (1.063) | | .009 | | .611 | | .704 | | (.169) |
| Distributions from net investment income | | (.075) | | (.073) | | (.036) | | (.101) | | (.164) | | (.101) |
| Distributions from net realized gain | | - | | (.004) | | (.253) | | - | | - | | - |
| Total distributions | | (.075) | | (.077) | | (.289) | | (.101) | | (.164) | | (.101) |
| Net asset value, end of period | $ | 7.10 | $ | 7.35 | $ | 8.49 | $ | 8.77 | $ | 8.26 | $ | 7.72 |
Total Return C,D,E | | (2.37)% | | (12.57)% | | .12% | | 7.46% | | 9.26% | | (2.12)% |
Ratios to Average Net Assets B,F,G | | | | | | | | | | | | |
| Expenses before reductions | | 1.54% H | | 1.53% | | 1.52% | | 1.53% | | 1.54% | | 1.54% |
| Expenses net of fee waivers, if any | | 1.54% H | | 1.53% | | 1.52% | | 1.53% | | 1.54% | | 1.54% |
| Expenses net of all reductions | | 1.54% H | | 1.53% | | 1.52% | | 1.53% | | 1.54% | | 1.54% |
| Net investment income (loss) | | 2.22% H | | .99% | | .47% | | 1.10% | | 1.78% | | 1.53% |
| Supplemental Data | | | | | | | | | | | | |
| Net assets, end of period (in millions) | $ | 20 | $ | 22 | $ | 35 | $ | 37 | $ | 16 | $ | 22 |
Portfolio turnover rate I | | 132% H | | 75% | | 40% | | 118% J | | 59% J | | 56% J |
A Calculated based on average shares outstanding during the period.
B Net investment income (loss) is affected by the timing of the declaration of dividends by any underlying mutual funds or exchange-traded funds (ETFs). Net investment income (loss) of any mutual funds or ETFs is not included in the Fund's net investment income (loss) ratio.
C Total returns for periods of less than one year are not annualized.
D Total returns would have been lower if certain expenses had not been reduced during the applicable periods shown.
E Total returns do not include the effect of the contingent deferred sales charge.
F Fees and expenses of any underlying mutual funds or exchange-traded funds (ETFs) are not included in the Fund's expense ratio. The Fund indirectly bears its proportionate share of these expenses. For additional expense information related to investments in Fidelity Central Funds, please refer to the "Investments in Fidelity Central Funds" note found in the Notes to Financial Statements section of the most recent Annual or Semi-Annual report.
G Expense ratios reflect operating expenses of the class. Expenses before reductions do not reflect amounts reimbursed, waived, or reduced through arrangements with the investment adviser, brokerage services, or other offset arrangements, if applicable, and do not represent the amount paid by the class during periods when reimbursements, waivers or reductions occur.
H Annualized.
I Amount does not include the portfolio activity of any underlying mutual funds or exchange-traded funds (ETFs).
J Portfolio turnover rate excludes securities received or delivered in-kind.
| Fidelity® Investment Grade Bond Fund |
| |
| | Six months ended (Unaudited) February 28, 2023 | | Years ended August 31, 2022 | | 2021 | | 2020 | | 2019 | | 2018 |
Selected Per-Share Data | | | | | | | | | | | | |
| Net asset value, beginning of period | $ | 7.35 | $ | 8.48 | $ | 8.77 | $ | 8.26 | $ | 7.72 | $ | 7.98 |
| Income from Investment Operations | | | | | | | | | | | | |
Net investment income (loss) A,B | | .117 | | .164 | | .131 | | .184 | | .225 | | .203 |
| Net realized and unrealized gain (loss) | | (.253) | | (1.132) | | (.041) | | .518 | | .564 | | (.277) |
| Total from investment operations | | (.136) | | (.968) | | .090 | | .702 | | .789 | | (.074) |
| Distributions from net investment income | | (.114) | | (.158) | | (.127) | | (.192) | | (.249) | | (.186) |
| Distributions from net realized gain | | - | | (.004) | | (.253) | | - | | - | | - |
| Total distributions | | (.114) | | (.162) | | (.380) | | (.192) | | (.249) | | (.186) |
| Net asset value, end of period | $ | 7.10 | $ | 7.35 | $ | 8.48 | $ | 8.77 | $ | 8.26 | $ | 7.72 |
Total Return C,D | | (1.84)% | | (11.52)% | | 1.07% | | 8.63% | | 10.45% | | (.93)% |
Ratios to Average Net Assets B,E,F | | | | | | | | | | | | |
| Expenses before reductions | | .45% G | | .45% | | .45% | | .45% | | .45% | | .45% |
| Expenses net of fee waivers, if any | | .45% G | | .45% | | .45% | | .45% | | .45% | | .45% |
| Expenses net of all reductions | | .45% G | | .45% | | .45% | | .45% | | .45% | | .45% |
| Net investment income (loss) | | 3.31% G | | 2.06% | | 1.54% | | 2.19% | | 2.87% | | 2.61% |
| Supplemental Data | | | | | | | | | | | | |
| Net assets, end of period (in millions) | $ | 5,425 | $ | 5,715 | $ | 6,910 | $ | 6,527 | $ | 7,638 | $ | 11,730 |
Portfolio turnover rate H | | 132% G | | 75% | | 40% | | 118% I | | 59% I | | 56% I |
A Calculated based on average shares outstanding during the period.
B Net investment income (loss) is affected by the timing of the declaration of dividends by any underlying mutual funds or exchange-traded funds (ETFs). Net investment income (loss) of any mutual funds or ETFs is not included in the Fund's net investment income (loss) ratio.
C Total returns for periods of less than one year are not annualized.
D Total returns would have been lower if certain expenses had not been reduced during the applicable periods shown.
E Fees and expenses of any underlying mutual funds or exchange-traded funds (ETFs) are not included in the Fund's expense ratio. The Fund indirectly bears its proportionate share of these expenses. For additional expense information related to investments in Fidelity Central Funds, please refer to the "Investments in Fidelity Central Funds" note found in the Notes to Financial Statements section of the most recent Annual or Semi-Annual report.
F Expense ratios reflect operating expenses of the class. Expenses before reductions do not reflect amounts reimbursed, waived, or reduced through arrangements with the investment adviser, brokerage services, or other offset arrangements, if applicable, and do not represent the amount paid by the class during periods when reimbursements, waivers or reductions occur.
G Annualized.
H Amount does not include the portfolio activity of any underlying mutual funds or exchange-traded funds (ETFs).
I Portfolio turnover rate excludes securities received or delivered in-kind.
| Fidelity Advisor® Investment Grade Bond Fund Class I |
| |
| | Six months ended (Unaudited) February 28, 2023 | | Years ended August 31, 2022 | | 2021 | | 2020 | | 2019 | | 2018 |
Selected Per-Share Data | | | | | | | | | | | | |
| Net asset value, beginning of period | $ | 7.35 | $ | 8.49 | $ | 8.78 | $ | 8.27 | $ | 7.73 | $ | 7.99 |
| Income from Investment Operations | | | | | | | | | | | | |
Net investment income (loss) A,B | | .115 | | .161 | | .127 | | .183 | | .221 | | .199 |
| Net realized and unrealized gain (loss) | | (.243) | | (1.143) | | (.041) | | .517 | | .564 | | (.277) |
| Total from investment operations | | (.128) | | (.982) | | .086 | | .700 | | .785 | | (.078) |
| Distributions from net investment income | | (.112) | | (.154) | | (.123) | | (.190) | | (.245) | | (.182) |
| Distributions from net realized gain | | - | | (.004) | | (.253) | | - | | - | | - |
| Total distributions | | (.112) | | (.158) | | (.376) | | (.190) | | (.245) | | (.182) |
| Net asset value, end of period | $ | 7.11 | $ | 7.35 | $ | 8.49 | $ | 8.78 | $ | 8.27 | $ | 7.73 |
Total Return C,D | | (1.73)% | | (11.67)% | | 1.03% | | 8.58% | | 10.38% | | (.98)% |
Ratios to Average Net Assets B,E,F | | | | | | | | | | | | |
| Expenses before reductions | | .51% G | | .49% | | .49% | | .49% | | .50% | | .50% |
| Expenses net of fee waivers, if any | | .51% G | | .49% | | .49% | | .49% | | .50% | | .50% |
| Expenses net of all reductions | | .51% G | | .49% | | .49% | | .49% | | .50% | | .50% |
| Net investment income (loss) | | 3.25% G | | 2.02% | | 1.50% | | 2.15% | | 2.82% | | 2.56% |
| Supplemental Data | | | | | | | | | | | | |
| Net assets, end of period (in millions) | $ | 1,324 | $ | 1,194 | $ | 1,548 | $ | 1,324 | $ | 1,452 | $ | 1,059 |
Portfolio turnover rate H | | 132% G | | 75% | | 40% | | 118% I | | 59% I | | 56% I |
A Calculated based on average shares outstanding during the period.
B Net investment income (loss) is affected by the timing of the declaration of dividends by any underlying mutual funds or exchange-traded funds (ETFs). Net investment income (loss) of any mutual funds or ETFs is not included in the Fund's net investment income (loss) ratio.
C Total returns for periods of less than one year are not annualized.
D Total returns would have been lower if certain expenses had not been reduced during the applicable periods shown.
E Fees and expenses of any underlying mutual funds or exchange-traded funds (ETFs) are not included in the Fund's expense ratio. The Fund indirectly bears its proportionate share of these expenses. For additional expense information related to investments in Fidelity Central Funds, please refer to the "Investments in Fidelity Central Funds" note found in the Notes to Financial Statements section of the most recent Annual or Semi-Annual report.
F Expense ratios reflect operating expenses of the class. Expenses before reductions do not reflect amounts reimbursed, waived, or reduced through arrangements with the investment adviser, brokerage services, or other offset arrangements, if applicable, and do not represent the amount paid by the class during periods when reimbursements, waivers or reductions occur.
G Annualized.
H Amount does not include the portfolio activity of any underlying mutual funds or exchange-traded funds (ETFs).
I Portfolio turnover rate excludes securities received or delivered in-kind.
| Fidelity Advisor® Investment Grade Bond Fund Class Z |
| |
| | Six months ended (Unaudited) February 28, 2023 | | Years ended August 31, 2022 | | 2021 | | 2020 | | 2019 A |
Selected Per-Share Data | | | | | | | | | | |
| Net asset value, beginning of period | $ | 7.36 | $ | 8.50 | $ | 8.78 | $ | 8.27 | $ | 7.68 |
| Income from Investment Operations | | | | | | | | | | |
Net investment income (loss) B,C | | .120 | | .170 | | .138 | | .193 | | .197 |
| Net realized and unrealized gain (loss) | | (.253) | | (1.141) | | (.030) | | .517 | | .629 |
| Total from investment operations | | (.133) | | (.971) | | .108 | | .710 | | .826 |
| Distributions from net investment income | | (.117) | | (.165) | | (.135) | | (.200) | | (.236) |
| Distributions from net realized gain | | - | | (.004) | | (.253) | | - | | - |
| Total distributions | | (.117) | | (.169) | | (.388) | | (.200) | | (.236) |
| Net asset value, end of period | $ | 7.11 | $ | 7.36 | $ | 8.50 | $ | 8.78 | $ | 8.27 |
Total Return D,E | | (1.79)% | | (11.53)% | | 1.28% | | 8.71% | | 10.97% |
Ratios to Average Net Assets C,F,G | | | | | | | | | | |
| Expenses before reductions | | .40% H | | .40% | | .40% | | .40% | | .40% H |
| Expenses net of fee waivers, if any | | .36% H | | .36% | | .36% | | .36% | | .36% H |
| Expenses net of all reductions | | .36% H | | .36% | | .36% | | .36% | | .36% H |
| Net investment income (loss) | | 3.40% H | | 2.15% | | 1.63% | | 2.28% | | 2.83% H |
| Supplemental Data | | | | | | | | | | |
| Net assets, end of period (in millions) | $ | 1,326 | $ | 1,628 | $ | 1,298 | $ | 1,142 | $ | 74 |
Portfolio turnover rate I | | 132% H | | 75% | | 40% | | 118% J | | 59% J |
A For the period October 2, 2018 (commencement of sale of shares) through August 31, 2019.
B Calculated based on average shares outstanding during the period.
C Net investment income (loss) is affected by the timing of the declaration of dividends by any underlying mutual funds or exchange-traded funds (ETFs). Net investment income (loss) of any mutual funds or ETFs is not included in the Fund's net investment income (loss) ratio.
D Total returns for periods of less than one year are not annualized.
E Total returns would have been lower if certain expenses had not been reduced during the applicable periods shown.
F Fees and expenses of any underlying mutual funds or exchange-traded funds (ETFs) are not included in the Fund's expense ratio. The Fund indirectly bears its proportionate share of these expenses. For additional expense information related to investments in Fidelity Central Funds, please refer to the "Investments in Fidelity Central Funds" note found in the Notes to Financial Statements section of the most recent Annual or Semi-Annual report.
G Expense ratios reflect operating expenses of the class. Expenses before reductions do not reflect amounts reimbursed, waived, or reduced through arrangements with the investment adviser, brokerage services, or other offset arrangements, if applicable, and do not represent the amount paid by the class during periods when reimbursements, waivers or reductions occur.
H Annualized.
I Amount does not include the portfolio activity of any underlying mutual funds or exchange-traded funds (ETFs).
J Portfolio turnover rate excludes securities received or delivered in-kind.
For the period ended February 28, 2023
( Amounts in thousands except percentages)
1. Organization.
Fidelity Investment Grade Bond Fund (the Fund) is a fund of Fidelity Salem Street Trust (the Trust) and is authorized to issue an unlimited number of shares. The Trust is registered under the Investment Company Act of 1940, as amended (the 1940 Act), as an open-end management investment company organized as a Massachusetts business trust. The Fund offers Class A, Class M, Class C, Investment Grade Bond, Class I and Class Z shares, each of which has equal rights as to assets and voting privileges. Each class has exclusive voting rights with respect to matters that affect that class. Class C shares will automatically convert to Class A shares after a holding period of eight years from the initial date of purchase, with certain exceptions.
2. Investments in Fidelity Central Funds.
Funds may invest in Fidelity Central Funds, which are open-end investment companies generally available only to other investment companies and accounts managed by the investment adviser and its affiliates. The Schedule of Investments lists any Fidelity Central Funds held as an investment as of period end, but does not include the underlying holdings of each Fidelity Central Fund. An investing fund indirectly bears its proportionate share of the expenses of the underlying Fidelity Central Funds.
Based on its investment objective, each Fidelity Central Fund may invest or participate in various investment vehicles or strategies that are similar to those of the investing fund. These strategies are consistent with the investment objectives of the investing fund and may involve certain economic risks which may cause a decline in value of each of the Fidelity Central Funds and thus a decline in the value of the investing fund.
| Fidelity Central Fund | Investment Manager | Investment Objective | Investment Practices | Expense Ratio A |
| Fidelity Specialized High Income Central Fund | Fidelity Management & Research Company LLC (FMR) | Seeks a high level of current income by normally investing in income-producing debt securities, with an emphasis on lower-quality debt securities. | Loans & Direct Debt Instruments Restricted Securities | Less than .005% |
| Fidelity Money Market Central Funds | Fidelity Management & Research Company LLC (FMR) | Each fund seeks to obtain a high level of current income consistent with the preservation of capital and liquidity. | Short-term Investments | Less than .005% |
A Expenses expressed as a percentage of average net assets and are as of each underlying Central Fund's most recent annual or semi-annual shareholder report.
An unaudited holdings listing for the investing fund, which presents direct holdings as well as the pro-rata share of any securities and other investments held indirectly through its investment in underlying non-money market Fidelity Central Funds, is available at fidelity.com and/or institutional.fidelity.com, as applicable. A complete unaudited list of holdings for each Fidelity Central Fund is available upon request or at the Securities and Exchange Commission website at www.sec.gov. In addition, the financial statements of the Fidelity Central Funds which contain the significant accounting policies (including investment valuation policies) of those funds, and are not covered by the Report of Independent Registered Public Accounting Firm, are available on the Securities and Exchange Commission website or upon request.
3. Significant Accounting Policies.
The Fund is an investment company and applies the accounting and reporting guidance of the Financial Accounting Standards Board (FASB) Accounting Standards Codification Topic 946 Financial Services - Investment Companies . The financial statements have been prepared in conformity with accounting principles generally accepted in the United States of America (GAAP), which require management to make certain estimates and assumptions at the date of the financial statements. Actual results could differ from those estimates. Subsequent events, if any, through the date that the financial statements were issued have been evaluated in the preparation of the financial statements. The Fund's Schedule of Investments lists any underlying mutual funds or exchange-traded funds (ETFs) but does not include the underlying holdings of these funds. The following summarizes the significant accounting policies of the Fund:
Investment Valuation. Investments are valued as of 4:00 p.m. Eastern time on the last calendar day of the period. The Board of Trustees (the Board) has designated the Fund's investment adviser as the valuation designee responsible for the fair valuation function and performing fair value determinations as needed. The investment adviser has established a Fair Value Committee (the Committee) to carry out the day-to-day fair valuation responsibilities and has adopted policies and procedures to govern the fair valuation process and the activities of the Committee. In accordance with these fair valuation policies and procedures, which have been approved by the Board, the Fund attempts to obtain prices from one or more third party pricing services or brokers to value its investments. When current market prices, quotations or currency exchange rates are not readily available or reliable, investments will be fair valued in good faith by the Committee, in accordance with the policies and procedures. Factors used in determining fair value vary by investment type and may include market or investment specific events, transaction data, estimated cash flows, and market observations of comparable investments. The frequency that the fair valuation procedures are used cannot be predicted and they may be utilized to a significant extent. The Committee manages the Fund's fair valuation practices and maintains the fair valuation policies and procedures. The Fund's investment adviser reports to the Board information regarding the fair valuation process and related material matters.
The Fund categorizes the inputs to valuation techniques used to value its investments into a disclosure hierarchy consisting of three levels as shown below:
Level 1 - unadjusted quoted prices in active markets for identical investments
Level 2 - other significant observable inputs (including quoted prices for similar investments, interest rates, prepayment speeds, etc.)
Level 3 - unobservable inputs (including the Fund's own assumptions based on the best information available)
Valuation techniques used to value the Fund's investments by major category are as follows:
Debt securities, including restricted securities, are valued based on evaluated prices received from third party pricing services or from brokers who make markets in such securities. Corporate bonds, bank notes, foreign government and government agency obligations, municipal securities, preferred securities and U.S. government and government agency obligations are valued by pricing services who utilize matrix pricing which considers yield or price of bonds of comparable quality, coupon, maturity and type or by broker-supplied prices. Asset backed securities, collateralized mortgage obligations, commercial mortgage securities, and U.S. government agency mortgage securities are valued by pricing services who utilize matrix pricing which considers prepayment speed assumptions, attributes of the collateral, yield or price of bonds of comparable quality, coupon, maturity and type or by broker-supplied prices. Swaps are marked-to-market daily based on valuations from third party pricing services, registered derivatives clearing organizations (clearinghouses) or broker-supplied valuations. These pricing sources may utilize inputs such as interest rate curves, credit spread curves, default possibilities and recovery rates. When independent prices are unavailable or unreliable, debt securities and swaps may be valued utilizing pricing methodologies which consider similar factors that would be used by third party pricing services. Debt securities and swaps are generally categorized as Level 2 in the hierarchy but may be Level 3 depending on the circumstances.
Futures contracts are valued at the settlement price established each day by the board of trade or exchange on which they are traded and are categorized as Level 1 in the hierarchy. Investments in open-end mutual funds, including the Fidelity Central Funds, are valued at their closing net asset value (NAV) each business day and are categorized as Level 1 in the hierarchy.
Changes in valuation techniques may result in transfers in or out of an assigned level within the disclosure hierarchy. The aggregate value of investments by input level as of February 28, 2023 is included at the end of the Fund's Schedule of Investments.
Investment Transactions and Income. For financial reporting purposes, the Fund's investment holdings and NAV include trades executed through the end of the last business day of the period. The NAV per share for processing shareholder transactions is calculated as of the close of business of the New York Stock Exchange (NYSE), normally 4:00 p.m. Eastern time and includes trades executed through the end of the prior business day. Gains and losses on securities sold are determined on the basis of identified cost and include proceeds received from litigation. Dividend income is recorded on the ex-dividend date. Income and capital gain distributions from Fidelity Central Funds, if any, are recorded on the ex-dividend date. Interest income is accrued as earned and includes coupon interest and amortization of premium and accretion of discount on debt securities as applicable. Debt obligations may be placed on non-accrual status and related interest income may be reduced by ceasing current accruals and writing off interest receivables when the collection of all or a portion of interest has become doubtful based on consistently applied procedures. A debt obligation is removed from non-accrual status when the issuer resumes interest payments or when collectability of interest is reasonably assured.
Class Allocations and Expenses. Investment income, realized and unrealized capital gains and losses, common expenses of a fund, and certain fund-level expense reductions, if any, are allocated daily on a pro-rata basis to each class based on the relative net assets of each class to the total net assets of a fund. Each class differs with respect to transfer agent and distribution and service plan fees incurred, as applicable. Certain expense reductions may also differ by class, if applicable. For the reporting period, the allocated portion of income and expenses to each class as a percent of its average net assets may vary due to the timing of recording these transactions in relation to fluctuating net assets of the classes. Expenses directly attributable to a fund are charged to that fund. Expenses attributable to more than one fund are allocated among the respective funds on the basis of relative net assets or other appropriate methods. Expenses included in the accompanying financial statements reflect the expenses of that fund and do not include any expenses associated with any underlying mutual funds or exchange-traded funds. Although not included in a fund's expenses, a fund indirectly bears its proportionate share of these expenses through the net asset value of each underlying mutual fund or exchange-traded fund. Expense estimates are accrued in the period to which they relate and adjustments are made when actual amounts are known.
Deferred Trustee Compensation. Under a Deferred Compensation Plan (the Plan) for certain Funds, certain independent Trustees have elected to defer receipt of a portion of their annual compensation. Deferred amounts are invested in affiliated mutual funds, are marked-to-market and remain in a fund until distributed in accordance with the Plan. The investment of deferred amounts and the offsetting payable to the Trustees presented below are included in the accompanying Statement of Assets and Liabilities in other receivables and other payables and accrued expenses, as applicable.
| Fidelity Investment Grade Bond Fund | $138 |
Income Tax Information and Distributions to Shareholders. Each year, the Fund intends to qualify as a regulated investment company under Subchapter M of the Internal Revenue Code, including distributing substantially all of its taxable income and realized gains. As a result, no provision for U.S. Federal income taxes is required. The Fund files a U.S. federal tax return, in addition to state and local tax returns as required. The Fund's federal income tax returns are subject to examination by the Internal Revenue Service (IRS) for a period of three fiscal years after they are filed. State and local tax returns may be subject to examination for an additional fiscal year depending on the jurisdiction.
Distributions are declared and recorded daily and paid monthly from net investment income. Distributions from realized gains, if any, are declared and recorded on the ex-dividend date. Income and capital gain distributions are declared separately for each class. Income and capital gain distributions are determined in accordance with income tax regulations, which may differ from GAAP.
Capital accounts within the financial statements are adjusted for permanent book-tax differences. These adjustments have no impact on net assets or the results of operations. Capital accounts are not adjusted for temporary book-tax differences which will reverse in a subsequent period.
Book-tax differences are primarily due to the short-term gain distributions from the Fidelity Central Funds, futures contracts, swaps, market discount, deferred Trustee compensation, capital loss carryforwards and losses deferred due to wash sales and excise tax regulations.
As of period end, the cost and unrealized appreciation (depreciation) in securities, and derivatives if applicable, for federal income tax purposes were as follows:
| Gross unrealized appreciation | $8,756 |
| Gross unrealized depreciation | (887,042) |
| Net unrealized appreciation (depreciation) | $(878,286) |
| Tax cost | $9,696,936 |
Capital loss carryforwards are only available to offset future capital gains of the Fund to the extent provided by regulations and may be limited. The capital loss carryforward information presented below, including any applicable limitation, is estimated as of prior fiscal period end and is subject to adjustment.
Short-term | $(230,518) |
Long-term | (122,822) |
| Total capital loss carryforward | $(353,340) |
Delayed Delivery Transactions and When-Issued Securities. During the period, certain Funds transacted in securities on a delayed delivery or when-issued basis. Payment and delivery may take place after the customary settlement period for that security. The price of the underlying securities and the date when the securities will be delivered and paid for are fixed at the time the transaction is negotiated. Securities purchased on a delayed delivery or when-issued basis are identified as such in the Schedule of Investments. Compensation for interest forgone in the purchase of a delayed delivery or when-issued debt security may be received. With respect to purchase commitments, each applicable Fund identifies securities as segregated in its records with a value at least equal to the amount of the commitment. Payables and receivables associated with the purchases and sales of delayed delivery securities having the same coupon, settlement date and broker are offset. Delayed delivery or when-issued securities that have been purchased from and sold to different brokers are reflected as both payables and receivables in the Statement of Assets and Liabilities under the caption "Delayed delivery", as applicable. Losses may arise due to changes in the value of the underlying securities or if the counterparty does not perform under the contract's terms, or if the issuer does not issue the securities due to political, economic, or other factors.
To-Be-Announced (TBA) Securities and Mortgage Dollar Rolls. TBA securities involve buying or selling mortgage-backed securities (MBS) on a forward commitment basis. A TBA transaction typically does not designate the actual security to be delivered and only includes an approximate principal amount; however delivered securities must meet specified terms defined by industry guidelines, including issuer, rate and current principal amount outstanding on underlying mortgage pools. Funds may enter into a TBA transaction with the intent to take possession of or deliver the underlying MBS, or a fund may elect to extend the settlement by entering into either a mortgage or reverse mortgage dollar roll. Mortgage dollar rolls are transactions where a fund sells TBA securities and simultaneously agrees to repurchase MBS on a later date at a lower price and with the same counterparty. Reverse mortgage dollar rolls involve the purchase and simultaneous agreement to sell TBA securities on a later date at a lower price. Transactions in mortgage dollar rolls and reverse mortgage dollar rolls are accounted for as purchases and sales and may result in an increase to a fund's portfolio turnover rate.
Purchases and sales of TBA securities involve risks similar to those discussed above for delayed delivery and when-issued securities. Also, if the counterparty in a mortgage dollar roll or a reverse mortgage dollar roll transaction files for bankruptcy or becomes insolvent, a fund's right to repurchase or sell securities may be limited. Additionally, when a fund sells TBA securities without already owning or having the right to obtain the deliverable securities (an uncovered forward commitment to sell), it incurs a risk of loss because it could have to purchase the securities at a price that is higher than the price at which it sold them. A fund may be unable to purchase the deliverable securities if the corresponding market is illiquid.
TBA securities subject to a forward commitment to sell at period end are included at the end of the Schedule of Investments under the caption "TBA Sale Commitments." The proceeds and value of these commitments are reflected in the Statement of Assets and Liabilities as "Receivable for TBA sale commitments" and "TBA sale commitments, at value," respectively.
Restricted Securities (including Private Placements). Funds may invest in securities that are subject to legal or contractual restrictions on resale. These securities generally may be resold in transactions exempt from registration or to the public if the securities are registered. Disposal of these securities may involve time-consuming negotiations and expense, and prompt sale at an acceptable price may be difficult. Information regarding restricted securities held at period end is included at the end of the Schedule of Investments, if applicable.
4. Derivative Instruments.
Risk Exposures and the Use of Derivative Instruments. The Fund's investment objectives allow for various types of derivative instruments, including futures contracts and swaps. Derivatives are investments whose value is primarily derived from underlying assets, indices or reference rates and may be transacted on an exchange or over-the-counter (OTC). Derivatives may involve a future commitment to buy or sell a specified asset based on specified terms, to exchange future cash flows at periodic intervals based on a notional principal amount, or for one party to make one or more payments upon the occurrence of specified events in exchange for periodic payments from the other party.
Derivatives were used to increase returns, to gain exposure to certain types of assets and to manage exposure to certain risks as defined below. The success of any strategy involving derivatives depends on analysis of numerous economic factors, and if the strategies for investment do not work as intended, the objectives may not be achieved.
Derivatives were used to increase or decrease exposure to the following risk(s):
| | |
| Credit Risk | Credit risk relates to the ability of the issuer of a financial instrument to make further principal or interest payments on an obligation or commitment that it has to a fund. |
| Interest Rate Risk | Interest rate risk relates to the fluctuations in the value of interest-bearing securities due to changes in the prevailing levels of market interest rates. |
Funds are also exposed to additional risks from investing in derivatives, such as liquidity risk and counterparty credit risk. Liquidity risk is the risk that a fund will be unable to close out the derivative in the open market in a timely manner. Counterparty credit risk is the risk that the counterparty will not be able to fulfill its obligation to a fund. Derivative counterparty credit risk is managed through formal evaluation of the creditworthiness of all potential counterparties. On certain OTC derivatives such as bi-lateral swaps, a fund attempts to reduce its exposure to counterparty credit risk by entering into an International Swaps and Derivatives Association, Inc. (ISDA) Master Agreement with each of its counterparties. The ISDA Master Agreement gives a fund the right to terminate all transactions traded under such agreement upon the deterioration in the credit quality of the counterparty beyond specified levels. The ISDA Master Agreement gives each party the right, upon an event of default by the other party or a termination of the agreement, to close out all transactions traded under such agreement and to net amounts owed under each transaction to one net payable by one party to the other. To mitigate counterparty credit risk on bi-lateral OTC derivatives, a fund receives collateral in the form of cash or securities once net unrealized appreciation on outstanding derivative contracts under an ISDA Master Agreement exceeds certain applicable thresholds, subject to certain minimum transfer provisions. The collateral received is held in segregated accounts with the custodian bank in accordance with the collateral agreements entered into between a fund, the counterparty and the custodian bank. A fund could experience delays and costs in gaining access to the collateral even though it is held by the custodian bank. The maximum risk of loss to a fund from counterparty credit risk related to bi-lateral OTC derivatives is generally the aggregate unrealized appreciation and unpaid counterparty payments in excess of any collateral pledged by the counterparty to a fund. A fund may be required to pledge collateral for the benefit of the counterparties on bi-lateral OTC derivatives in an amount not less than each counterparty's unrealized appreciation on outstanding derivative contracts, subject to certain minimum transfer provisions, and any such pledged collateral is identified in the Schedule of Investments. Exchange-traded contracts are not covered by the ISDA Master Agreement; however counterparty credit risk related to these contracts may be mitigated by the protection provided by the exchange on which they trade. Counterparty credit risk related to centrally cleared OTC swaps may be mitigated by the protection provided by the clearinghouse.
Investing in derivatives may involve greater risks than investing in the underlying assets directly and, to varying degrees, may involve risk of loss in excess of any initial investment and collateral received and amounts recognized in the Statement of Assets and Liabilities. In addition, there may be the risk that the change in value of the derivative contract does not correspond to the change in value of the underlying instrument.
Net Realized Gain (Loss) and Change in Net Unrealized Appreciation (Depreciation) on Derivatives. The table below, which reflects the impacts of derivatives on the financial performance, summarizes the net realized gain (loss) and change in net unrealized appreciation (depreciation) for derivatives during the period as presented in the Statement of Operations.
| Primary Risk Exposure / Derivative Type | Net Realized Gain (Loss) | Change in Net Unrealized Appreciation (Depreciation) |
| Fidelity Investment Grade Bond Fund | | |
| Credit Risk | | |
| Swaps | (97) | 2 |
| Total Credit Risk | (97) | 2 |
| Interest Rate Risk | | |
| Futures Contracts | 7,077 | (1,538) |
| Swaps | (1,156) | (748) |
| Total Interest Rate Risk | 5,921 | (2,286) |
| Totals | $5,824 | $(2,284) |
If there are any open positions at period end, a summary of the value of derivatives by primary risk exposure is included at the end of the Schedule of Investments.
Futures Contracts. A futures contract is an agreement between two parties to buy or sell a specified underlying instrument for a fixed price at a specified future date. Futures contracts were used to manage exposure to the bond market and fluctuations in interest rates.
Upon entering into a futures contract, a fund is required to deposit either cash or securities (initial margin) with a clearing broker in an amount equal to a certain percentage of the face value of the contract. Futures contracts are marked-to-market daily and subsequent daily payments are made or received by a fund depending on the daily fluctuations in the value of the futures contracts and are recorded as unrealized appreciation or (depreciation). This receivable and/or payable, if any, is included in daily variation margin on futures contracts in the Statement of Assets and Liabilities. Realized gain or (loss) is recorded upon the expiration or closing of a futures contract. The net realized gain (loss) and change in net unrealized appreciation (depreciation) on futures contracts during the period is presented in the Statement of Operations.
Any open futures contracts at period end are presented in the Schedule of Investments under the caption "Futures Contracts". The notional amount at value reflects each contract's exposure to the underlying instrument or index at period end, and is representative of volume of activity during the period unless an average notional amount is presented. Any securities deposited to meet initial margin requirements are identified in the Schedule of Investments. Any cash deposited to meet initial margin requirements is presented as segregated cash with brokers for derivative instruments in the Statement of Assets and Liabilities.
Swaps. A swap is a contract between two parties to exchange future cash flows at periodic intervals based on a notional principal amount. A bi-lateral OTC swap is a transaction between a fund and a dealer counterparty where cash flows are exchanged between the two parties for the life of the swap. A centrally cleared OTC swap is a transaction executed between a fund and a dealer counterparty, then cleared by a futures commission merchant (FCM) through a clearinghouse. Once cleared, the clearinghouse serves as a central counterparty, with whom a fund exchanges cash flows for the life of the transaction, similar to transactions in futures contracts.
Bi-lateral OTC swaps are marked-to-market daily and changes in value are reflected in the Statement of Assets and Liabilities in the bi-lateral OTC swaps at value line items. Any upfront premiums paid or received upon entering a bi-lateral OTC swap to compensate for differences between stated terms of the swap and prevailing market conditions (e.g. credit spreads, interest rates or other factors) are recorded in total accumulated earnings (loss) in the Statement of Assets and Liabilities and amortized to realized gain or (loss) ratably over the term of the swap. Any unamortized upfront premiums are presented in the Schedule of Investments.
Centrally cleared OTC swaps require a fund to deposit either cash or securities (initial margin) with the FCM, at the instruction of and for the benefit of the clearinghouse. Any securities deposited to meet initial margin requirements are identified in the Schedule of Investments. Any cash deposited to meet initial margin requirements is presented in segregated cash with brokers for derivative instruments in the Statement of Assets and Liabilities. Centrally cleared OTC swaps are marked-to-market daily and subsequent payments (variation margin) are made or received depending on the daily fluctuations in the value of the swaps and are recorded as unrealized appreciation or (depreciation). These daily payments, if any, are included in receivable or payable for daily variation margin on centrally cleared OTC swaps in the Statement of Assets and Liabilities. Any premiums for centrally cleared OTC swaps are recorded periodically throughout the term of the swap to variation margin and included in total accumulated earnings (loss) in the Statement of Assets and Liabilities. Any premiums are recognized as realized gain (loss) upon termination or maturity of the swap.
For both bi-lateral and centrally cleared OTC swaps, payments are exchanged at specified intervals, accrued daily commencing with the effective date of the contract and recorded as realized gain or (loss). Some swaps may be terminated prior to the effective date and realize a gain or loss upon termination. The net realized gain (loss) and change in net unrealized appreciation (depreciation) on swaps during the period is presented in the Statement of Operations.
Any open swaps at period end are included in the Schedule of Investments under the caption "Swaps", and are representative of volume of activity during the period unless an average notional amount is presented.
Credit Default Swaps. Credit default swaps enable a fund to buy or sell protection against specified credit events on a single-name issuer or a traded credit index. Under the terms of a credit default swap the buyer of protection (buyer) receives credit protection in exchange for making periodic payments to the seller of protection (seller) based on a fixed percentage applied to a notional principal amount. In return for these payments, the seller will be required to make a payment upon the occurrence of one or more specified credit events. A fund enters into credit default swaps as a seller to gain credit exposure to an issuer and/or as a buyer to obtain a measure of protection against defaults of an issuer. Periodic payments are made over the life of the contract by the buyer provided that no credit event occurs.
For credit default swaps on most corporate and sovereign issuers, credit events include bankruptcy, failure to pay or repudiation/moratorium. For credit default swaps on corporate or sovereign issuers, the obligation that may be put to the seller is not limited to the specific reference obligation described in the Schedule of Investments. For credit default swaps on asset-backed securities, a credit event may be triggered by events such as failure to pay principal, maturity extension, rating downgrade or write-down. For credit default swaps on asset-backed securities, the reference obligation described represents the security that may be put to the seller. For credit default swaps on a traded credit index, a specified credit event may affect all or individual underlying securities included in the index.
As a seller, if an underlying credit event occurs, a fund will pay a net settlement amount of cash equal to the notional amount of the swap less the recovery value of the reference obligation or underlying securities comprising an index. Only in the event of the industry's inability to value the underlying asset will a fund be required to take delivery of the reference obligation or underlying securities comprising an index and pay an amount equal to the notional amount of the swap.
As a buyer, if an underlying credit event occurs, a fund will receive a net settlement amount of cash equal to the notional amount of the swap less the recovery value of the reference obligation or underlying securities comprising an index. Only in the event of the industry's inability to value the underlying asset will a fund be required to deliver the reference obligation or underlying securities comprising an index in exchange for payment of an amount equal to the notional amount of the swap.
Typically, the value of each credit default swap and credit rating disclosed for each reference obligation in the Schedule of Investments, where a fund is the seller, can be used as measures of the current payment/performance risk of the swap. As the value of the swap changes as a positive or negative percentage of the total notional amount, the payment/performance risk may decrease or increase, respectively. In addition to these measures, the investment adviser monitors a variety of factors including cash flow assumptions, market activity and market sentiment as part of its ongoing process of assessing payment/performance risk.
Interest Rate Swaps. Interest rate swaps are agreements between counterparties to exchange cash flows, one based on a fixed rate, and the other on a floating rate. A fund enters into interest rate swaps to manage its exposure to interest rate changes. Changes in interest rates can have an effect on both the value of bond holdings as well as the amount of interest income earned. In general, the value of bonds can fall when interest rates rise and can rise when interest rates fall.
5. Purchases and Sales of Investments.
Purchases and sales of securities, other than short-term securities, U.S. government securities and in-kind transactions, as applicable, are noted in the table below.
| | Purchases ($) | Sales ($) |
| Fidelity Investment Grade Bond Fund | 3,178,064 | 3,203,865 |
6. Fees and Other Transactions with Affiliates.
Management Fee and Expense Contract. Fidelity Management & Research Company LLC (the investment adviser) and its affiliates provide the Fund with investment management related services for which the Fund pays a monthly management fee. The management fee is the sum of an individual fund fee rate that is based on an annual rate of .20% of the Fund's average net assets and an annualized group fee rate that averaged .10% during the period. The group fee rate is based upon the monthly average net assets of a group of registered investment companies with which the investment adviser has management contracts. The group fee rate decreases as assets under management increase and increases as assets under management decrease. For the reporting period, the total annualized management fee rate was .30% of the Fund's average net assets.
In addition, under the expense contract, the investment adviser pays class-level expenses for Investment Grade Bond, so that the total expenses, except the compensation of the independent Trustees and certain other expenses such as interest expense do not exceed .45% of the Class' average net assets. This agreement does not apply to any of the other classes and any change or modification that would increase expenses can only be made with shareholder approval.
Distribution and Service Plan Fees. In accordance with Rule 12b-1 of the 1940 Act, the Fund has adopted separate Distribution and Service Plans for each class of shares. Certain classes pay Fidelity Distributors Company LLC (FDC), an affiliate of the investment adviser, separate Distribution and Service Fees, each of which is based on an annual percentage of each class' average net assets. In addition, FDC may pay financial intermediaries for selling shares of the Fund and providing shareholder support services. For the period, the Distribution and Service Fee rates, total fees and amounts retained by FDC were as follows:
| | Distribution Fee | Service Fee | Total Fees | Retained by FDC |
| Class A | - % | .25% | $199 | $8 |
| Class M | - % | .25% | 33 | - (a) |
| Class C | .75% | .25% | 102 | 9 |
| | | | $334 | $17 |
(a) In the amount of less than five hundred dollars.
Sales Load. FDC may receive a front-end sales charge of up to 4.00% for selling Class A shares and Class M shares, some of which is paid to financial intermediaries for selling shares of the Fund. Depending on the holding period, FDC may receive contingent deferred sales charges levied on Class A, Class M and Class C redemptions. The deferred sales charges are 1.00% for Class C shares, .75% for certain purchases of Class A shares and .25% for certain purchases of Class M shares.
For the period, sales charge amounts retained by FDC were as follows:
| | Retained by FDC |
| Class A | $9 |
| Class M | 1 |
Class C A | - B |
| | $10 |
A When Class C shares are initially sold, FDC pays commissions from its own resources to financial intermediaries through which the sales are made.
B In the amount of less than five hundred dollars.
Transfer Agent Fees. Fidelity Investments Institutional Operations Company LLC (FIIOC), an affiliate of the investment adviser, is the transfer, dividend disbursing and shareholder servicing agent for each class of the Fund. FIIOC receives account fees and asset-based fees that vary according to the account size and type of account of the shareholders of each respective class of the Fund, with the exception of Investment Grade Bond and Class Z. FIIOC receives an asset-based fee of Investment Grade Bond's and Class Z's average net assets. FIIOC pays for typesetting, printing and mailing of shareholder reports, except proxy statements. For the period, transfer agent fees for each class were as follows:
| | Amount | % of Class-Level Average Net Assets A |
| Class A | $124 | .16 |
| Class M | 21 | .16 |
| Class C | 18 | .18 |
| Investment Grade Bond | 2,649 | .10 |
| Class I | 942 | .16 |
| Class Z | 361 | .05 |
| | $4,115 | |
A Annualized
Fund Wide Operations Fee. Pursuant to the Fund Wide Operations and Expense Agreement (FWOE), the investment adviser has agreed to provide for fund-level expenses (which may not include transfer agent, the compensation of the independent Trustees, interest, taxes or extraordinary expenses, as applicable) in return for a FWOE fee equal to .35% of fund-level average net assets less the total amount of the management fee. The FWOE paid by a fund is reduced by an amount equal to the fees and expenses paid to the independent Trustees. For the period, the FWOE fees were equivalent to the following annualized rate expressed as a percentage of average net assets:
| Fidelity Investment Grade Bond Fund | .05% |
Interfund Trades. Funds may purchase from or sell securities to other Fidelity Funds under procedures adopted by the Board. The procedures have been designed to ensure these interfund trades are executed in accordance with Rule 17a-7 of the 1940 Act. Any interfund trades are included within the respective purchases and sales amounts shown in the Purchases and Sales of Investments note. During the period, there were no interfund trades.
Other. During the period, the investment adviser reimbursed the Fund for certain losses as follows:
| | Amount ($) |
| Fidelity Investment Grade Bond Fund | 2 |
Prior Fiscal Year Affiliated Exchanges In-Kind. During the prior period, the Fund redeemed 9,709 shares of Fidelity Mortgage Backed Securities Central Fund in exchange for investments, including accrued interest and cash, if any, with a value of $981,238. The net realized loss of $77,627 on the Fund's redemptions of Fidelity Mortgage Backed Securities Central Fund shares is included in "Net realized gain (loss)" in the accompanying Statement of Changes in Net Assets. The Fund recognized a net loss on the exchanges for federal income tax purposes.
8. Committed Line of Credit.
Certain Funds participate with other funds managed by the investment adviser or an affiliate in a $4.25 billion credit facility (the "line of credit") to be utilized for temporary or emergency purposes to fund shareholder redemptions or for other short-term liquidity purposes. The commitment fees on the pro-rata portion of the line of credit are borne by the investment adviser. During the period, there were no borrowings on this line of credit.
9. Security Lending.
Funds lend portfolio securities from time to time in order to earn additional income. Lending agents are used, including National Financial Services (NFS), an affiliate of the investment adviser. Pursuant to a securities lending agreement, NFS will receive a fee, which is capped at 9.9% of a fund's daily lending revenue, for its services as lending agent. A fund may lend securities to certain qualified borrowers, including NFS. On the settlement date of the loan, a fund receives collateral (in the form of U.S. Treasury obligations, letters of credit and/or cash) against the loaned securities and maintains collateral in an amount not less than 100% of the market value of the loaned securities during the period of the loan. The market value of the loaned securities is determined at the close of business of a fund and any additional required collateral is delivered to a fund on the next business day. A fund or borrower may terminate the loan at any time, and if the borrower defaults on its obligation to return the securities loaned because of insolvency or other reasons, a fund may apply collateral received from the borrower against the obligation. A fund may experience delays and costs in recovering the securities loaned. Any cash collateral received is invested in the Fidelity Securities Lending Cash Central Fund. Any loaned securities are identified as such in the Schedule of Investments, and the value of loaned securities and cash collateral at period end, as applicable, are presented in the Statement of Assets and Liabilities. Security lending income represents the income earned on investing cash collateral, less rebates paid to borrowers and any lending agent fees associated with the loan, plus any premium payments received for lending certain types of securities. Security lending income is presented in the Statement of Operations as a component of income from Fidelity Central Funds. Affiliated security lending activity, if any, was as follows:
| | Total Security Lending Fees Paid to NFS | Security Lending Income From Securities Loaned to NFS | Value of Securities Loaned to NFS at Period End |
| Fidelity Investment Grade Bond Fund | $14 | $- | $- |
10. Expense Reductions.
The investment adviser contractually agreed to reimburse expenses of each class to the extent annual operating expenses exceeded certain levels of class-level average net assets as noted in the table below. This reimbursement will remain in place through December 31, 2023. Some expenses, for example the compensation of the independent Trustees and certain other expenses such as interest expense, are excluded from this reimbursement.
The following classes were in reimbursement during the period:
| | Expense Limitations | Reimbursement |
| Class Z | .36% | $307 |
| | | |
| | | |
Through arrangements with the Fund's custodian and each class' transfer agent, credits realized as a result of certain uninvested cash balances were used to reduce the Fund's expenses. During the period, custodian credits reduced the Fund's expenses by $4. During the period, transfer agent credits reduced each class' expenses as noted in the table below.
| | Expense Reduction |
| Class M | $- A |
A In the amount of less than five hundred dollars. | |
| | |
11. Distributions to Shareholders.
Distributions to shareholders of each class were as follows:
| | Six months ended February 28, 2023 | Year ended August 31, 2022 |
| Fidelity Investment Grade Bond Fund | | |
| Distributions to shareholders | | |
| Class A | $2,294 | $3,220 |
| Class M | 381 | 527 |
| Class C | 216 | 259 |
| Investment Grade Bond | 84,535 | 126,887 |
| Class I | 18,894 | 26,760 |
| Class Z | 23,607 | 30,370 |
Total | $129,927 | $188,023 |
12. Share Transactions.
Share transactions for each class were as follows and may contain in-kind transactions, automatic conversions between classes or exchanges between affiliated funds:
| | Shares | Shares | Dollars | Dollars |
| | Six months ended February 28, 2023 | Year ended August 31, 2022 | Six months ended February 28, 2023 | Year ended August 31, 2022 |
| Fidelity Investment Grade Bond Fund | | | | |
| Class A | | | | |
| Shares sold | 3,332 | 5,346 | $23,743 | $42,829 |
| Reinvestment of distributions | 311 | 395 | 2,204 | 3,101 |
| Shares redeemed | (2,821) | (8,356) | (20,058) | (66,378) |
| Net increase (decrease) | 822 | (2,615) | $5,889 | $(20,448) |
| Class M | | | | |
| Shares sold | 579 | 488 | $4,130 | $3,829 |
| Reinvestment of distributions | 53 | 65 | 373 | 511 |
| Shares redeemed | (561) | (871) | (3,997) | (6,967) |
| Net increase (decrease) | 71 | (318) | $506 | $(2,627) |
| Class C | | | | |
| Shares sold | 335 | 368 | $2,402 | $2,924 |
| Reinvestment of distributions | 29 | 31 | 203 | 240 |
| Shares redeemed | (578) | (1,496) | (4,102) | (11,957) |
| Net increase (decrease) | (214) | (1,097) | $(1,497) | $(8,793) |
| Investment Grade Bond | | | | |
| Shares sold | 197,491 | 411,767 | $1,384,658 | $3,214,031 |
| Reinvestment of distributions | 9,460 | 13,441 | 67,001 | 105,818 |
| Shares redeemed | (220,932) | (461,552) | (1,562,562) | (3,623,475) |
| Net increase (decrease) | (13,981) | (36,344) | $(110,903) | $(303,626) |
| Class I | | | | |
| Shares sold | 66,968 | 94,072 | $479,745 | $742,572 |
| Reinvestment of distributions | 2,425 | 3,094 | 17,203 | 24,419 |
| Shares redeemed | (45,578) | (117,061) | (323,521) | (925,766) |
| Net increase (decrease) | 23,815 | (19,895) | $173,427 | $(158,775) |
| Class Z | | | | |
| Shares sold | 57,315 | 157,877 | $408,845 | $1,228,855 |
| Reinvestment of distributions | 1,791 | 1,848 | 12,687 | 14,403 |
| Shares redeemed | (93,954) | (91,232) | (674,184) | (714,156) |
| Net increase (decrease) | (34,848) | 68,493 | $(252,652) | $529,102 |
13. Other.
A fund's organizational documents provide former and current trustees and officers with a limited indemnification against liabilities arising in connection with the performance of their duties to the fund. In the normal course of business, a fund may also enter into contracts that provide general indemnifications. A fund's maximum exposure under these arrangements is unknown as this would be dependent on future claims that may be made against a fund. The risk of material loss from such claims is considered remote.
14. Credit Risk.
The Fund invests a significant portion of its assets in structured securities of issuers backed by commercial and residential mortgage loans, credit card receivables and automotive loans. The value and related income of these securities is sensitive to changes in economic conditions, including delinquencies and/or defaults.
15. Risk and Uncertainties.
Many factors affect a fund's performance. Developments that disrupt global economies and financial markets, such as pandemics, epidemics, outbreaks of infectious diseases, war, terrorism, and environmental disasters, may significantly affect a fund's investment performance. The effects of these developments to a fund will be impacted by the types of securities in which a fund invests, the financial condition, industry, economic sector, and geographic location of an issuer, and a fund's level of investment in the securities of that issuer. Significant concentrations in security types, issuers, industries, sectors, and geographic locations may magnify the factors that affect a fund's performance.
As a shareholder, you incur two types of costs: (1) transaction costs, which may include sales charges (loads) on purchase payments or redemption proceeds, as applicable and (2) ongoing costs, which generally include management fees, distribution and/or service (12b-1) fees and other Fund expenses. This Example is intended to help you understand your ongoing costs (in dollars) of investing in a fund and to compare these costs with the ongoing costs of investing in other mutual funds.
| The Example is based on an investment of $1,000 invested at the beginning of the period and held for the entire period (September 1, 2022 to February 28, 2023). |
Actual Expenses
The first line of the accompanying table provides information about actual account values and actual expenses. You may use the information in this line, together with the amount you invested, to estimate the expenses that you paid over the period. Simply divide your account value by $1,000.00 (for example, an $8,600 account value divided by $1,000.00 = 8.6), then multiply the result by the number in the first line for a class/Fund under the heading entitled "Expenses Paid During Period" to estimate the expenses you paid on your account during this period. If any fund is a shareholder of any underlying mutual funds or exchange-traded funds (ETFs) (the Underlying Funds), such fund indirectly bears its proportional share of the expenses of the Underlying Funds in addition to the direct expenses incurred presented in the table. These fees and expenses are not included in the annualized expense ratio used to calculate the expense estimate in the table below.
Hypothetical Example for Comparison Purposes
The second line of the accompanying table provides information about hypothetical account values and hypothetical expenses based on the actual expense ratio and an assumed rate of return of 5% per year before expenses, which is not the actual return. The hypothetical account values and expenses may not be used to estimate the actual ending account balance or expenses you paid for the period. You may use this information to compare the ongoing costs of investing in the Fund and other funds. To do so, compare this 5% hypothetical example with the 5% hypothetical examples that appear in the shareholder reports of the other funds. If any fund is a shareholder of any Underlying Funds, such fund indirectly bears its proportional share of the expenses of the Underlying Funds in addition to the direct expenses as presented in the table. These fees and expenses are not included in the annualized expense ratio used to calculate the expense estimate in the table below.
Please note that the expenses shown in the table are meant to highlight your ongoing costs only and do not reflect any transaction costs. Therefore, the second line of the table is useful in comparing ongoing costs only, and will not help you determine the relative total costs of owning different funds. In addition, if these transactional costs were included, your costs would have been higher.
| | | | | Annualized Expense Ratio- A | | Beginning Account Value September 1, 2022 | | Ending Account Value February 28, 2023 | | Expenses Paid During Period- C September 1, 2022 to February 28, 2023 |
| Fidelity® Investment Grade Bond Fund | | | | | | | | | | |
| Class A | | | | .76% | | | | | | |
| Actual | | | | | | $ 1,000 | | $ 980.00 | | $ 3.73 |
Hypothetical- B | | | | | | $ 1,000 | | $ 1,021.03 | | $ 3.81 |
| Class M | | | | .76% | | | | | | |
| Actual | | | | | | $ 1,000 | | $ 981.40 | | $ 3.73 |
Hypothetical- B | | | | | | $ 1,000 | | $ 1,021.03 | | $ 3.81 |
| Class C | | | | 1.54% | | | | | | |
| Actual | | | | | | $ 1,000 | | $ 976.30 | | $ 7.55 |
Hypothetical- B | | | | | | $ 1,000 | | $ 1,017.16 | | $ 7.70 |
| Fidelity® Investment Grade Bond Fund | | | | .45% | | | | | | |
| Actual | | | | | | $ 1,000 | | $ 981.60 | | $ 2.21 |
Hypothetical- B | | | | | | $ 1,000 | | $ 1,022.56 | | $ 2.26 |
| Class I | | | | .51% | | | | | | |
| Actual | | | | | | $ 1,000 | | $ 982.70 | | $ 2.51 |
Hypothetical- B | | | | | | $ 1,000 | | $ 1,022.27 | | $ 2.56 |
| Class Z | | | | .36% | | | | | | |
| Actual | | | | | | $ 1,000 | | $ 982.10 | | $ 1.77 |
Hypothetical- B | | | | | | $ 1,000 | | $ 1,023.01 | | $ 1.81 |
| |
A Annualized expense ratio reflects expenses net of applicable fee waivers.
B 5% return per year before expenses
C Expenses are equal to the annualized expense ratio, multiplied by the average account value over the period, multiplied by 181/ 365 (to reflect the one-half year period). The fees and expenses of any Underlying Funds are not included in each annualized expense ratio.
Board Approval of Investment Advisory Contracts and Management Fees
Fidelity Investment Grade Bond Fund
Each year, the Board of Trustees, including the Independent Trustees (together, the Board), votes on the renewal of the management contract with Fidelity Management & Research Company LLC (FMR) and the sub-advisory agreements (together, the Advisory Contracts) for the fund. FMR and the sub-advisers are referred to herein as the Investment Advisers. The Board, assisted by the advice of fund counsel and Independent Trustees' counsel, requests and considers a broad range of information relevant to the renewal of the Advisory Contracts throughout the year.
The Board meets regularly and, at each of its meetings, covers an extensive agenda of topics and materials and considers factors that are relevant to its annual consideration of the renewal of the fund's Advisory Contracts, including the services and support provided to the fund and its shareholders. The Board has established four standing committees (Committees) - Operations, Audit, Fair Valuation, and Governance and Nominating - each composed of and chaired by Independent Trustees with varying backgrounds, to which the Board has assigned specific subject matter responsibilities in order to enhance effective decision-making by the Board. The Operations Committee, of which all the Independent Trustees are members, meets regularly throughout the year and requests, receives and considers, among other matters, information related to the annual consideration of the renewal of the fund's Advisory Contracts before making its recommendation to the Board. The Board also meets as needed to review matters specifically related to the Board's annual consideration of the renewal of the Advisory Contracts. Members of the Board may also meet from time to time with trustees of other Fidelity funds through joint ad hoc committees to discuss certain matters relevant to all of the Fidelity funds.
At its September 2022 meeting, the Board unanimously determined to renew the fund's Advisory Contracts. In reaching its determination, the Board considered all factors it believed relevant, including (i) the nature, extent, and quality of the services provided to the fund and its shareholders (including the investment performance of the fund); (ii) the competitiveness relative to peer funds of the fund's management fee and the total expense ratio of a representative class (the retail class); (iii) the total costs of the services provided by and the profits realized by Fidelity from its relationships with the fund; and (iv) the extent to which, if any, economies of scale exist and are realized as the fund grows, and whether any economies of scale are appropriately shared with fund shareholders.
In considering whether to renew the Advisory Contracts for the fund, the Board reached a determination, with the assistance of fund counsel and Independent Trustees' counsel and through the exercise of its business judgment, that the renewal of the Advisory Contracts was in the best interests of the fund and its shareholders and that the compensation payable under the Advisory Contracts was fair and reasonable. The Board's decision to renew the Advisory Contracts was not based on any single factor, but rather was based on a comprehensive consideration of all the information provided to the Board at its meetings throughout the year. The Board, in reaching its determination to renew the Advisory Contracts, was aware that shareholders of the fund have a broad range of investment choices available to them, including a wide choice among funds offered by Fidelity's competitors, and that the fund's shareholders, who have the opportunity to review and weigh the disclosure provided by the fund in its prospectus and other public disclosures, have chosen to invest in this fund, which is part of the Fidelity family of funds.
Nature, Extent, and Quality of Services Provided. The Board considered Fidelity's staffing as it relates to the fund, including the backgrounds of investment personnel of Fidelity, and also considered the fund's investment objective, strategies, and related investment philosophy. The Independent Trustees also had discussions with senior management of Fidelity's investment operations and investment groups. The Board considered the structure of the investment personnel compensation program and whether this structure provides appropriate incentives to act in the best interests of the fund. Additionally, the Board considered the portfolio managers' investments, if any, in the funds that they manage. The Board also considered the steps Fidelity had taken to ensure the continued provision of high quality services to the Fidelity funds throughout the COVID-19 pandemic, including the expansion of staff in client facing positions to maintain service levels in periods of high volumes and volatility.
Resources Dedicated to Investment Management and Support Services. The Board reviewed the general qualifications and capabilities of Fidelity's investment staff, including its size, education, experience, and resources, as well as Fidelity's approach to recruiting, managing, training, and compensating investment personnel. The Board noted the resources devoted to Fidelity's global investment organization, and that Fidelity's analysts have extensive resources, tools, and capabilities that allow them to conduct quantitative and fundamental analysis, as well as credit analysis of issuers, counterparties, and guarantors. Further, the Board considered that Fidelity's investment professionals have sufficient access to global information and data so as to provide competitive investment results over time, and that those professionals also have access to sophisticated tools that permit them to assess portfolio construction and risk and performance attribution characteristics continuously, as well as to transmit new information and research conclusions rapidly around the world. Additionally, in its deliberations, the Board considered Fidelity's trading, risk management, compliance, cybersecurity, and technology and operations capabilities and resources, which are integral parts of the investment management process.
Shareholder and Administrative Services . The Board considered (i) the nature, extent, quality, and cost of advisory, administrative, and shareholder services performed by the Investment Advisers and their affiliates under the Advisory Contracts and under separate agreements covering transfer agency, pricing and bookkeeping, and securities lending services for the fund; (ii) the nature and extent of the supervision of third party service providers, principally custodians, subcustodians, and pricing vendors; and (iii) the resources devoted to, and the record of compliance with, the fund's compliance policies and procedures.
The Board noted that the growth of fund assets over time across the complex allows Fidelity to reinvest in the development of services designed to enhance the value and convenience of the Fidelity funds as investment vehicles. These services include 24-hour access to account information and market information over the Internet and through telephone representatives, investor education materials and asset allocation tools. The Board also considered that it reviews customer service metrics such as telephone response times, continuity of services on the website and metrics addressing services at Fidelity Investor Centers.
Investment in a Large Fund Family . The Board considered the benefits to shareholders of investing in a Fidelity fund, including the benefits of investing in a fund that is part of a large family of funds offering a variety of investment disciplines and providing a large variety of mutual fund investor services. The Board noted that Fidelity had taken, or had made recommendations to the Board that resulted in the Fidelity funds taking, a number of actions over the previous year that benefited particular funds, including: (i) continuing to dedicate additional resources to Fidelity's investment research process, which includes meetings with management of issuers of securities in which the funds invest; (ii) continuing efforts to enhance Fidelity's global research capabilities; (iii) launching new funds, ETFs, and share classes with innovative structures, strategies and pricing and making other enhancements to meet investor needs; (iv) broadening eligibility requirements for certain funds and share classes; (v) reducing management fees and total expenses for certain funds and classes; (vi) lowering expenses for certain existing funds and classes by implementing or lowering expense caps; (vii) rationalizing product lines and gaining increased efficiencies from fund mergers and liquidations; (viii) continuing to develop, acquire and implement systems and technology to improve services to the funds and shareholders, strengthen information security, and increase efficiency; and (ix) continuing to implement enhancements to further strengthen Fidelity's product line to increase investors' probability of success in achieving their investment goals, including their retirement income goals.
Investment Performance . The Board considered whether the fund has operated in accordance with its investment objective, as well as its record of compliance with its investment restrictions and its performance history. The Board noted that there was a portfolio management change for the fund in June 2022.
The Board took into account discussions that occur at Board meetings throughout the year with representatives of the Investment Advisers about fund investment performance. In this regard the Board noted that as part of regularly scheduled fund reviews and other reports to the Board on fund performance, the Board considers annualized return information for the fund for different time periods, measured against an appropriate securities market index (benchmark index) and an appropriate peer group of funds with similar objectives (peer group). The Board also receives and considers information about performance attribution. In its evaluation of fund investment performance at meetings throughout the year, the Board gave particular attention to information indicating underperformance of certain Fidelity funds for specific time periods and discussed with the Investment Advisers the reasons for such underperformance.
In addition to reviewing absolute and relative fund performance, the Independent Trustees periodically consider the appropriateness of fund performance metrics in evaluating the results achieved. In general, the Independent Trustees believe that fund performance should be evaluated based on gross performance (before fees and expenses but after transaction costs) compared to appropriate benchmark indices, over appropriate time periods that may include full market cycles, and on net performance (after fees and expenses) compared to appropriate peer groups, as applicable, over the same periods, taking into account relevant factors including the following: general market conditions; expectations for interest rate levels and credit conditions; issuer-specific information including credit quality; the potential for incremental return versus the fund's benchmark index weighed against the risks involved in obtaining that incremental return, including the risk of diminished or negative total returns; and fund cash flows and other factors. The Independent Trustees generally give greater weight to fund performance over longer time periods than over shorter time periods. Depending on the circumstances, the Independent Trustees may be satisfied with a fund's performance notwithstanding that it lags its benchmark index or peer group for certain periods.
The Independent Trustees recognize that shareholders evaluate performance on a net basis over their own holding periods, for which one-, three-, and five-year periods are often used as a proxy. For this reason, the performance information reviewed by the Board also included net cumulative calendar year total return information for the representative class (the retail class) and an appropriate benchmark index and peer group for the most recent one-, three-, and five-year periods. The Independent Trustees recognize that shareholders who are not investing through a tax-advantaged retirement account also consider tax consequences in evaluating performance.
Based on its review, the Board concluded that the nature, extent, and quality of services provided to the fund under the Advisory Contracts should continue to benefit the shareholders of the fund.
Competitiveness of Management Fee and Total Expense Ratio . The Board considered the fund's management fee and total expense ratio compared to selected groups of competitive funds and classes (referred to as "mapped groups" below) for the purpose of facilitating the Trustees' competitive analysis of management fees and total expenses. Fidelity creates "mapped groups" by combining similar investment objective categories (as classified by Lipper) that have comparable investment mandates. Combining funds with similar investment objective categories aids the Board's comparison of management fees and total expense ratios by broadening the competitive group used for such comparison.
Management Fee. The Board considered two proprietary management fee comparisons for the 12-month periods shown in basis points (BP) in the chart below. The group of Lipper funds used by the Board for management fee comparisons is referred to below as the "Total Mapped Group" and is broader than the Lipper peer group used by the Board for performance comparisons. The Total Mapped Group comparison focuses on a fund's standing in terms of gross management fees before expense reimbursements or caps relative to the total universe of funds with comparable investment mandates, regardless of whether their management fee structures also are comparable. Funds with comparable investment mandates offer exposure to similar types of securities. Funds with comparable management fee structures have similar management fee contractual arrangements (e.g., flat rate charged for advisory services, all-inclusive fee rate, etc.). "TMG %" represents the percentage of funds in the Total Mapped Group that had management fees that were lower than the fund's. For example, a hypothetical TMG % of 20% would mean that 80% of the funds in the Total Mapped Group had higher, and 20% had lower, management fees than the fund. The fund's actual TMG %s and the number of funds in the Total Mapped Group are in the chart below. The "Asset-Sized Peer Group" (ASPG) comparison focuses on a fund's standing relative to a subset of non-Fidelity funds within the Total Mapped Group that are similar in size and management fee structure. For example, if a fund is in the first quartile of the ASPG, the fund's management fee ranks in the least expensive or lowest 25% of funds in the ASPG. The ASPG represents at least 15% of the funds in the Total Mapped Group with comparable asset size and management fee structures, subject to a minimum of 50 funds (or all funds in the Total Mapped Group if fewer than 50). Additional information, such as the ASPG quartile in which the fund's management fee rate ranked, is also included in the chart and was considered by the Board.
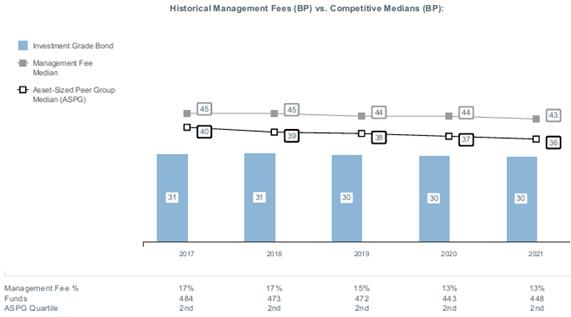
The Board noted that the fund's management fee rate ranked below the median of its Total Mapped Group and below the median of its ASPG for 2021.
Based on its review, the Board concluded that the fund's management fee is fair and reasonable in light of the services that the fund receives and the other factors considered.
Total Expense Ratio. In its review of the total expense ratio of the representative class (the retail class) of the fund, the Board considered the fund's management fee rate as well as other fund or class expenses, as applicable, such as transfer agent fees, pricing and bookkeeping fees, fund-paid 12b-1 fees, and custodial, legal, and audit fees. The Board also noted that Fidelity may agree to waive fees or reimburse expenses from time to time, and the extent to which, if any, it has done so for the fund. The fund's representative class is compared to those funds and classes in the Total Mapped Group (used by the Board for management fee comparisons) that have a similar sales load structure. The Board also considered a total expense ASPG comparison, which focuses on the total expenses of the representative class relative to a subset of non-Fidelity funds within the similar sales load structure group that are similar in size and management fee structure. The total expense ASPG is limited to 15 larger and 15 smaller classes of different funds, where possible. The total expense ASPG comparison excludes performance adjustments and fund-paid 12b-1 fees to eliminate variability in expenses relating to these items.
The Board noted that the total net expense ratio of the retail class ranked below the similar sales load structure group competitive median for 2021 and above the ASPG competitive median for 2021. The Board considered that, when compared to a subset of the ASPG that excludes funds in a fund complex with a unique at-cost service model, the retail class would not be above the ASPG competitive median for 2021. The Board noted that the fund offers multiple classes, each of which has a different sales load and 12b-1 fee structure than the others, and that the multiple structures are intended to offer a range of pricing options for the intermediary market. The Board also noted that the total expense ratios of the classes vary primarily by the level of their 12b-1 fees, although differences in transfer agent fees may also cause expenses to vary from class to class.
The Board considered that the current contractual arrangements for the fund have the effect of setting the total "fund-level" (but not "class-level") expenses (including, among certain other "fund-level" expenses, the management fee) for each class at 0.35%. The Board also considered that current contractual arrangements oblige FMR to pay all "class-level" expenses of the retail class of the fund to the extent necessary to limit total operating expenses, with certain exceptions, to 0.45%. These contractual arrangements may not be amended to increase the fees or expenses payable by the retail class of the fund except by a vote of a majority of the Board and by a vote of a majority of the outstanding voting securities of the fund or class, as applicable. The Board further considered that FMR has contractually agreed to reimburse Class Z of the fund to the extent that total operating expenses, with certain exceptions, as a percentage of its average net assets, exceed 0.36% through December 31, 2023.
The Board recognized that the fund's management contract incorporates a "group fee" structure, which provides for lower group fee rates as total "group assets" increase, and for higher group fee rates as total "group assets" decrease ("group assets" as defined in the management contract). FMR calculates the group fee rates based on a tiered asset "breakpoint" schedule that varies based on asset class. The Board considered that Fidelity agreed to impose a temporary fee waiver in the form of additional breakpoints to the current breakpoint schedule. The Board noted, however, that because the current contractual arrangements set the total "fund-level" expenses for each class at 0.35%, increases or decreases in the management fee due to changes in the group fee rate will not impact the total expense ratio.
Fees Charged to Other Fidelity Clients. The Board also considered Fidelity fee structures and other information with respect to clients of Fidelity, such as other funds advised or subadvised by Fidelity, pension plan clients, and other institutional clients with similar mandates. The Board noted that a joint ad hoc committee created by it and the boards of other Fidelity funds periodically reviews and compares Fidelity's institutional investment advisory business with its business of providing services to the Fidelity funds and also noted the most recent findings of the committee. The Board noted that the committee's review included a consideration of the differences in services provided, fees charged, and costs incurred, as well as competition in the markets serving the different categories of clients.
Based on its review of total expense ratios and fees charged to other Fidelity clients, the Board concluded that the total expense ratio of each class of the fund was reasonable in light of the services that the fund and its shareholders receive and the other factors considered.
Costs of the Services and Profitability . The Board considered the revenues earned and the expenses incurred by Fidelity in conducting the business of developing, marketing, distributing, managing, administering and servicing the fund and servicing the fund's shareholders. The Board also considered the level of Fidelity's profits in respect of all the Fidelity funds.
On an annual basis, Fidelity presents to the Board information about the profitability of its relationships with the fund. Fidelity calculates profitability information for each fund, as well as aggregate profitability information for groups of Fidelity funds and all Fidelity funds, using a series of detailed revenue and cost allocation methodologies which originate with the books and records of Fidelity on which Fidelity's audited financial statements are based. The Audit Committee of the Board reviews any significant changes from the prior year's methodologies and the full Board approves such changes.
A public accounting firm has been engaged annually by the Board as part of the Board's assessment of Fidelity's profitability analysis. The engagement includes the review and assessment of the methodologies used by Fidelity in determining the revenues and expenses attributable to Fidelity's mutual fund business, and completion of agreed-upon procedures in respect of the mathematical accuracy of certain fund profitability information and its conformity to established allocation methodologies. After considering the reports issued under the engagement and information provided by Fidelity, the Board concluded that while other allocation methods may also be reasonable, Fidelity's profitability methodologies are reasonable in all material respects.
The Board also reviewed Fidelity's non-fund businesses and potential indirect benefits such businesses may have received as a result of their association with Fidelity's mutual fund business (i.e., fall-out benefits) as well as cases where Fidelity's affiliates may benefit from the funds' business. The Board considered areas where potential indirect benefits to the Fidelity funds from their relationships with Fidelity may exist. The Board's consideration of these matters was informed by the findings of a joint ad hoc committee created by it and the boards of other Fidelity funds to evaluate potential fall-out benefits.
The Board considered the costs of the services provided by and the profits realized by Fidelity in connection with the operation of the fund and was satisfied that the profitability was not excessive.
Economies of Scale. The Board considered whether there have been economies of scale in respect of the management of the Fidelity funds, whether the Fidelity funds (including the fund) have appropriately benefited from any such economies of scale, and whether there is potential for realization of any further economies of scale. The Board considered the extent to which the fund will benefit from economies of scale as assets grow through increased services to the fund, through waivers or reimbursements, or through fee or expense ratio reductions. The Board also noted that a committee (the Economies of Scale Committee) created by it and the boards of other Fidelity funds periodically analyzes whether Fidelity attains economies of scale in respect of the management and servicing of the Fidelity funds, whether the Fidelity funds have appropriately benefited from such economies of scale, and whether there is potential for realization of any further economies of scale.
The Board concluded, taking into account the analysis of the Economies of Scale Committee, that economies of scale, if any, are being appropriately shared between fund shareholders and Fidelity.
Additional Information Requested by the Board. In order to develop fully the factual basis for consideration of the Fidelity funds' advisory contracts, the Board requested and received additional information on certain topics, including: (i) Fidelity's fund profitability methodology, profitability trends for certain funds, the allocation of various costs to different funds, and the impact of certain factors on fund profitability results; (ii) portfolio manager changes that have occurred during the past year and the amount of the investment that each portfolio manager has made in the Fidelity fund(s) that he or she manages; (iii) the extent to which current market conditions have affected retention and recruitment of personnel; (iv) the arrangements with and compensation paid to certain fund sub-advisers on behalf of the Fidelity funds and the treatment of such compensation within Fidelity's fund profitability methodology; (v) the terms of the funds' various management fee structures, including the basic group fee and the terms of Fidelity's voluntary expense limitation arrangements; (vi) Fidelity's transfer agent, pricing and bookkeeping fees, expense and service structures for different funds and classes relative to competitive trends; (vii) the impact on fund profitability of recent industry trends, such as the growth in passively managed funds and the changes in flows for different types of funds; (viii) the types of management fee and total expense comparisons provided, and the challenges and limitations associated with such information; and (ix) explanations regarding the relative total expense ratios and management fees of certain funds and classes, total expense and management fee competitive trends, and methodologies for total expense and management fee competitive comparisons. In addition, the Board considered its discussions with Fidelity regarding Fidelity's efforts to maintain the continuous investment and shareholder services necessary for the funds during the current pandemic and economic circumstances.
Based on its evaluation of all of the conclusions noted above, and after considering all factors it believed relevant, the Board concluded that the advisory fee arrangements are fair and reasonable and that the fund's Advisory Contracts should be renewed.
The Securities and Exchange Commission adopted Rule 22e-4 under the Investment Company Act of 1940 (the Liquidity Rule) to promote effective liquidity risk management throughout the open-end investment company industry, thereby reducing the risk that funds will be unable to meet their redemption obligations and mitigating dilution of the interests of fund shareholders.
The Fund has adopted and implemented a liquidity risk management program (the Program) reasonably designed to assess and manage the Fund's liquidity risk and to comply with the requirements of the Liquidity Rule. The Fund's Board of Trustees (the Board) has designated the Fund's investment adviser as administrator of the Program. The Fidelity advisers have established a Liquidity Risk Management Committee (the LRM Committee) to manage the Program for each of the Fidelity Funds. The LRM Committee monitors the adequacy and effectiveness of implementation of the Program and on a periodic basis assesses each Fund's liquidity risk based on a variety of factors including (1) the Fund's investment strategy, (2) portfolio liquidity and cash flow projections during normal and reasonably foreseeable stressed conditions, (3) shareholder redemptions, (4) borrowings and other funding sources and (5) certain factors specific to ETFs including the effect of the Fund's prices and spreads, market participants, and basket compositions on the overall liquidity of the Fund's portfolio, as applicable.
In accordance with the Program, each of the Fund's portfolio investments is classified into one of four defined liquidity categories based on a determination of a reasonable expectation for how long it would take to convert the investment to cash (or sell or dispose of the investment) without significantly changing its market value.
- Highly liquid investments - cash or convertible to cash within three business days or less
- Moderately liquid investments - convertible to cash in three to seven calendar days
- Less liquid investments - can be sold or disposed of, but not settled, within seven calendar days
- Illiquid investments - cannot be sold or disposed of within seven calendar days
Liquidity classification determinations take into account a variety of factors including various market, trading and investment-specific considerations, as well as market depth, and generally utilize analysis from a third-party liquidity metrics service.
The Liquidity Rule places a 15% limit on a fund's illiquid investments and requires funds that do not primarily hold assets that are highly liquid investments to determine and maintain a minimum percentage of the fund's net assets to be invested in highly liquid investments (highly liquid investment minimum or HLIM). The Program includes provisions reasonably designed to comply with the 15% limit on illiquid investments and for determining, periodically reviewing and complying with the HLIM requirement as applicable.
At a recent meeting of the Fund's Board of Trustees, the LRM Committee provided a written report to the Board pertaining to the operation, adequacy, and effectiveness of the Program for the period December 1, 2021 through November 30, 2022. The report concluded that the Program is operating effectively and is reasonably designed to assess and manage the Fund's liquidity risk.
1.538655.125
IGB-SANN-0423
Fidelity® SAI Total Bond Fund
Semi-Annual Report
February 28, 2023
Offered exclusively to certain clients of the Adviser, or its affiliates, including Strategic Advisers LLC (Strategic Advisers) - not available for sale to the general public. Fidelity ® SAI is a product name of Fidelity ® funds dedicated to certain programs affiliated with Strategic Advisers.
Contents
To view a fund's proxy voting guidelines and proxy voting record for the 12-month period ended June 30, visit http://www.fidelity.com/proxyvotingresults or visit the Securities and Exchange Commission's (SEC) web site at http://www.sec.gov.
You may also call 1-800-544-3455 to request a free copy of the proxy voting guidelines.
Standard & Poor's, S&P and S&P 500 are registered service marks of The McGraw-Hill Companies, Inc. and have been licensed for use by Fidelity Distributors Corporation.
Other third-party marks appearing herein are the property of their respective owners.
All other marks appearing herein are registered or unregistered trademarks or service marks of FMR LLC or an affiliated company. © 2023 FMR LLC. All rights reserved.
This report and the financial statements contained herein are submitted for the general information of the shareholders of the Fund. This report is not authorized for distribution to prospective investors in the Fund unless preceded or accompanied by an effective prospectus.
A fund files its complete schedule of portfolio holdings with the SEC for the first and third quarters of each fiscal year on Form N-PORT. Forms N-PORT are available on the SEC's web site at http://www.sec.gov. A fund's Forms N-PORT may be reviewed and copied at the SEC's Public Reference Room in Washington, DC. Information regarding the operation of the SEC's Public Reference Room may be obtained by calling 1-800-SEC-0330.
For a complete list of a fund's portfolio holdings, view the most recent holdings listing, semiannual report, or annual report on Fidelity's web site at http://www.fidelity.com, http://www.institutional.fidelity.com, or http://www.401k.com, as applicable.
NOT FDIC INSURED •MAY LOSE VALUE •NO BANK GUARANTEE
Neither the Fund nor Fidelity Distributors Corporation is a bank.
Quality Diversification (% of Fund's net assets) |
|
Short-Term Investments and Net Other Assets (Liabilities) - (0.0)%* |
Percentages shown as 0.0% may reflect amounts less than 0.05%. |
*Short-term investments and Net Other Assets (Liabilities) are not available in the pie chart. |
| |
| We have used ratings from Moody's Investors Service, Inc. Where Moody's® ratings are not available, we have used S&P® ratings. All ratings are as of the date indicated and do not reflect subsequent changes. |
Asset Allocation (% of Fund's net assets) |
|
Short-Term Investments and Net Other Assets (Liabilities) - (0.0)%* |
Foreign investments - 14.2% |
Futures and Swaps - 0.3% |
Short-Term Investments and Net Other Assets (Liabilities) are not available in the pie chart. |
Percentages in the above tables are adjusted for the effect of TBA Sale Commitments. |
Percentages shown as 0.0% may reflect amounts less than 0.05%. |
|
Geographic Diversification (% of Fund's net assets) |
|
* Includes Short-Term investments and Net Other Assets (Liabilities). Percentages are based on country or territory of incorporation and are adjusted for the effect of derivatives, if applicable. |
| |
Showing Percentage of Net Assets
| Corporate Bonds - 35.6% |
| | | Principal Amount (a) | Value ($) |
| Convertible Bonds - 0.1% | | | |
| COMMUNICATION SERVICES - 0.1% | | | |
| Media - 0.1% | | | |
| DISH Network Corp.: | | | |
| 2.375% 3/15/24 | | 11,248,000 | 10,331,114 |
| 3.375% 8/15/26 | | 14,551,000 | 9,299,255 |
| | | | 19,630,369 |
| ENERGY - 0.0% | | | |
| Oil, Gas & Consumable Fuels - 0.0% | | | |
| Mesquite Energy, Inc. 15% 7/15/23 (b)(c) | | 521,057 | 3,190,328 |
| Mesquite Energy, Inc. 15% 7/15/23 (b)(c) | | 899,094 | 5,504,973 |
| | | | 8,695,301 |
| TOTAL CONVERTIBLE BONDS | | | 28,325,670 |
| Nonconvertible Bonds - 35.5% | | | |
| COMMUNICATION SERVICES - 3.7% | | | |
| Diversified Telecommunication Services - 1.0% | | | |
| Altice France SA: | | | |
| 5.125% 1/15/29(d) | | 6,850,000 | 5,258,424 |
| 5.125% 7/15/29(d) | | 4,520,000 | 3,487,728 |
| 5.5% 1/15/28(d) | | 2,480,000 | 2,042,702 |
| 5.5% 10/15/29(d) | | 2,400,000 | 1,871,254 |
| 8.125% 2/1/27(d) | | 40,000 | 37,342 |
| AT&T, Inc.: | | | |
| 2.55% 12/1/33 | | 3,443,000 | 2,636,130 |
| 3.8% 12/1/57 | | 8,798,000 | 6,176,756 |
| 3.85% 6/1/60 | | 20,000,000 | 13,994,781 |
| 4.3% 2/15/30 | | 5,781,000 | 5,423,013 |
| C&W Senior Financing Designated Activity Co. 6.875% 9/15/27 (d) | | 17,754,000 | 15,996,354 |
| Cablevision Lightpath LLC: | | | |
| 3.875% 9/15/27(d) | | 565,000 | 460,566 |
| 5.625% 9/15/28(d) | | 445,000 | 331,525 |
| Colombia Telecomunicaciones SA 4.95% 7/17/30 (d) | | 300,000 | 230,400 |
| Connect Finco SARL / Connect U.S. Finco LLC 6.75% 10/1/26 (d) | | 40,000 | 37,002 |
| Consolidated Communications, Inc.: | | | |
| 5% 10/1/28(d) | | 690,000 | 458,912 |
| 6.5% 10/1/28(d) | | 20,000 | 14,600 |
| Frontier Communications Holdings LLC: | | | |
| 5% 5/1/28(d) | | 4,540,000 | 3,983,850 |
| 5.875% 10/15/27(d) | | 1,469,000 | 1,364,848 |
| 5.875% 11/1/29 | | 1,760,000 | 1,409,302 |
| 6% 1/15/30(d) | | 20,000 | 15,975 |
| 6.75% 5/1/29(d) | | 20,000 | 16,804 |
| 8.75% 5/15/30(d) | | 1,505,000 | 1,521,931 |
| Holdco SASU: | | | |
| 6.5% 10/15/26(d) | | 20,000 | 18,692 |
| 7% 10/15/28(d) | | 20,000 | 18,370 |
| IHS Holding Ltd. 5.625% 11/29/26 (d) | | 720,000 | 610,785 |
| Iliad SA 1.875% 2/11/28 (Reg. S) | EUR | 900,000 | 780,748 |
| Level 3 Financing, Inc.: | | | |
| 3.4% 3/1/27(d) | | 520,000 | 436,455 |
| 3.625% 1/15/29(d) | | 440,000 | 282,339 |
| 3.75% 7/15/29(d) | | 20,000 | 12,572 |
| 4.25% 7/1/28(d) | | 6,470,000 | 4,415,775 |
| 4.625% 9/15/27(d) | | 2,020,000 | 1,509,950 |
| Liquid Telecommunications Financing PLC 5.5% 9/4/26 (d) | | 1,205,000 | 837,475 |
| Lumen Technologies, Inc.: | | | |
| 4% 2/15/27(d) | | 40,000 | 30,716 |
| 4.5% 1/15/29(d) | | 6,475,000 | 3,422,038 |
| Qtel International Finance Ltd.: | | | |
| 2.625% 4/8/31(d) | | 670,000 | 572,557 |
| 5% 10/19/25(d) | | 360,000 | 359,640 |
| Sable International Finance Ltd. 5.75% 9/7/27 (d) | | 2,080,000 | 1,910,740 |
| Sprint Capital Corp.: | | | |
| 6.875% 11/15/28 | | 2,999,000 | 3,144,452 |
| 8.75% 3/15/32 | | 4,169,000 | 4,963,153 |
| Telecom Italia Capital SA: | | | |
| 6% 9/30/34 | | 1,165,000 | 973,358 |
| 7.2% 7/18/36 | | 1,334,000 | 1,171,759 |
| 7.721% 6/4/38 | | 300,000 | 273,000 |
| Telecom Italia SpA 5.303% 5/30/24 (d) | | 20,000 | 19,477 |
| Telefonica Celular del Paraguay SA 5.875% 4/15/27 (d) | | 1,099,000 | 988,320 |
| Telenet Finance Luxembourg Notes SARL 5.5% 3/1/28 (d) | | 4,000,000 | 3,732,200 |
| Turk Telekomunikasyon A/S 6.875% 2/28/25 (d) | | 1,286,000 | 1,207,072 |
| Verizon Communications, Inc.: | | | |
| 2.1% 3/22/28 | | 11,222,000 | 9,685,743 |
| 2.355% 3/15/32 | | 51,205,000 | 40,254,922 |
| 2.55% 3/21/31 | | 30,387,000 | 24,856,196 |
| 2.987% 10/30/56 | | 12,327,000 | 7,552,117 |
| 3% 3/22/27 | | 2,669,000 | 2,466,067 |
| 4.862% 8/21/46 | | 14,509,000 | 13,102,515 |
| 5.012% 4/15/49 | | 324,000 | 297,231 |
| Windstream Escrow LLC 7.75% 8/15/28 (d) | | 6,455,000 | 5,275,026 |
| Zayo Group Holdings, Inc.: | | | |
| 4% 3/1/27(d) | | 1,390,000 | 1,066,304 |
| 6.125% 3/1/28(d) | | 4,239,000 | 2,670,316 |
| | | | 205,688,279 |
| Entertainment - 0.2% | | | |
| Live Nation Entertainment, Inc.: | | | |
| 4.75% 10/15/27(d) | | 20,000 | 18,011 |
| 4.875% 11/1/24(d) | | 20,000 | 19,400 |
| 6.5% 5/15/27(d) | | 20,000 | 19,665 |
| Roblox Corp. 3.875% 5/1/30 (d) | | 5,005,000 | 4,114,661 |
| The Walt Disney Co.: | | | |
| 3.6% 1/13/51 | | 20,000,000 | 15,499,291 |
| 3.8% 3/22/30 | | 20,840,000 | 19,377,420 |
| WMG Acquisition Corp.: | | | |
| 3% 2/15/31(d) | | 20,000 | 15,707 |
| 3.75% 12/1/29(d) | | 20,000 | 16,883 |
| | | | 39,081,038 |
| Interactive Media & Services - 0.0% | | | |
| Baidu, Inc.: | | | |
| 1.72% 4/9/26 | | 815,000 | 723,508 |
| 2.375% 10/9/30 | | 345,000 | 280,475 |
| Tencent Holdings Ltd.: | | | |
| 1.81% 1/26/26(d) | | 350,000 | 314,300 |
| 2.39% 6/3/30(d) | | 435,000 | 354,038 |
| 2.88% 4/22/31(d) | | 285,000 | 235,713 |
| 3.975% 4/11/29(d) | | 260,000 | 238,144 |
| | | | 2,146,178 |
| Media - 2.0% | | | |
| Advantage Sales & Marketing, Inc. 6.5% 11/15/28 (d) | | 4,735,000 | 3,618,061 |
| Altice Financing SA: | | | |
| 5% 1/15/28(d) | | 3,079,000 | 2,555,201 |
| 5.75% 8/15/29(d) | | 10,810,000 | 8,840,526 |
| Altice France Holding SA: | | | |
| 6% 2/15/28(d) | | 6,304,000 | 4,334,000 |
| 10.5% 5/15/27(d) | | 20,000 | 16,519 |
| AMC Networks, Inc.: | | | |
| 4.25% 2/15/29 | | 20,000 | 14,700 |
| 4.75% 8/1/25 | | 20,000 | 18,914 |
| Block Communications, Inc. 4.875% 3/1/28 (d) | | 500,000 | 437,442 |
| Cable Onda SA 4.5% 1/30/30 (d) | | 1,750,000 | 1,409,844 |
| CCO Holdings LLC/CCO Holdings Capital Corp.: | | | |
| 4.25% 2/1/31(d) | | 4,059,000 | 3,258,159 |
| 4.25% 1/15/34(d) | | 2,295,000 | 1,717,928 |
| 4.5% 8/15/30(d) | | 6,560,000 | 5,395,731 |
| 4.5% 5/1/32 | | 4,714,000 | 3,730,895 |
| 4.5% 6/1/33(d) | | 7,745,000 | 6,025,629 |
| 4.75% 3/1/30(d) | | 2,440,000 | 2,051,967 |
| 4.75% 2/1/32(d) | | 1,225,000 | 992,250 |
| 5% 2/1/28(d) | | 2,475,000 | 2,242,969 |
| 5.125% 5/1/27(d) | | 1,040,000 | 962,281 |
| 5.375% 6/1/29(d) | | 3,020,000 | 2,693,689 |
| 6.375% 9/1/29(d) | | 20,000 | 18,647 |
| Charter Communications Operating LLC/Charter Communications Operating Capital Corp.: | | | |
| 3.85% 4/1/61 | | 2,000,000 | 1,177,894 |
| 3.9% 6/1/52 | | 22,000,000 | 13,902,461 |
| 4.4% 4/1/33 | | 14,572,000 | 12,463,785 |
| 4.8% 3/1/50 | | 5,000,000 | 3,654,309 |
| 4.908% 7/23/25 | | 7,411,000 | 7,251,703 |
| 5.25% 4/1/53 | | 30,184,000 | 23,603,276 |
| 5.375% 5/1/47 | | 18,624,000 | 14,836,883 |
| 5.5% 4/1/63 | | 20,184,000 | 15,688,877 |
| 6.484% 10/23/45 | | 5,093,000 | 4,607,880 |
| 6.834% 10/23/55 | | 2,000,000 | 1,881,014 |
| Clear Channel Outdoor Holdings, Inc.: | | | |
| 5.125% 8/15/27(d) | | 20,000 | 17,850 |
| 7.5% 6/1/29(d) | | 20,000 | 16,200 |
| Comcast Corp. 6.45% 3/15/37 | | 797,000 | 873,508 |
| CSC Holdings LLC: | | | |
| 3.375% 2/15/31(d) | | 40,000 | 27,432 |
| 4.125% 12/1/30(d) | | 1,490,000 | 1,076,793 |
| 4.5% 11/15/31(d) | | 630,000 | 447,286 |
| 4.625% 12/1/30(d) | | 5,147,000 | 2,771,016 |
| 5% 11/15/31(d) | | 20,000 | 10,650 |
| 5.25% 6/1/24 | | 40,000 | 38,754 |
| 5.375% 2/1/28(d) | | 4,305,000 | 3,590,801 |
| 5.5% 4/15/27(d) | | 20,000 | 17,399 |
| 5.75% 1/15/30(d) | | 2,495,000 | 1,428,961 |
| 6.5% 2/1/29(d) | | 40,000 | 33,904 |
| 7.5% 4/1/28(d) | | 4,279,000 | 2,865,689 |
| Diamond Sports Group LLC/Diamond Sports Finance Co. 5.375% 8/15/26 (d) | | 8,145,000 | 913,869 |
| DIRECTV Financing LLC / DIRECTV Financing Co-Obligor, Inc. 5.875% 8/15/27 (d) | | 560,000 | 500,650 |
| Discovery Communications LLC: | | | |
| 3.625% 5/15/30 | | 7,624,000 | 6,524,291 |
| 4.65% 5/15/50 | | 20,572,000 | 15,086,773 |
| DISH DBS Corp.: | | | |
| 5.125% 6/1/29 | | 20,000 | 11,818 |
| 5.25% 12/1/26(d) | | 60,000 | 50,250 |
| 5.75% 12/1/28(d) | | 3,105,000 | 2,480,274 |
| 5.875% 11/15/24 | | 540,000 | 503,917 |
| 7.375% 7/1/28 | | 20,000 | 13,682 |
| 7.75% 7/1/26 | | 40,000 | 31,050 |
| DISH Network Corp. 11.75% 11/15/27 (d) | | 5,130,000 | 5,197,844 |
| Dolya Holdco 18 DAC 5% 7/15/28 (d) | | 1,220,000 | 1,058,970 |
| Fox Corp.: | | | |
| 4.03% 1/25/24 | | 2,489,000 | 2,456,354 |
| 4.709% 1/25/29 | | 3,602,000 | 3,439,520 |
| 5.476% 1/25/39 | | 3,552,000 | 3,264,196 |
| Gray Escrow II, Inc. 5.375% 11/15/31 (d) | | 810,000 | 601,387 |
| Gray Television, Inc. 7% 5/15/27 (d) | | 20,000 | 18,113 |
| iHeartCommunications, Inc. 8.375% 5/1/27 | | 40,000 | 35,200 |
| Lagardere S.C.A.: | | | |
| 1.75% 10/7/27 (Reg. S) | EUR | 1,100,000 | 1,105,297 |
| 2.125% 10/16/26 (Reg. S) | EUR | 1,100,000 | 1,111,896 |
| Lamar Media Corp.: | | | |
| 3.625% 1/15/31 | | 20,000 | 16,473 |
| 3.75% 2/15/28 | | 20,000 | 17,704 |
| LCPR Senior Secured Financing DAC: | | | |
| 5.125% 7/15/29(d) | | 2,590,000 | 2,177,413 |
| 6.75% 10/15/27(d) | | 20,000 | 18,546 |
| Magallanes, Inc.: | | | |
| 3.428% 3/15/24(d) | | 8,648,000 | 8,440,290 |
| 3.638% 3/15/25(d) | | 4,736,000 | 4,517,392 |
| 3.755% 3/15/27(d) | | 9,262,000 | 8,496,352 |
| 4.054% 3/15/29(d) | | 3,210,000 | 2,870,559 |
| 4.279% 3/15/32(d) | | 46,121,000 | 39,816,774 |
| 5.05% 3/15/42(d) | | 7,082,000 | 5,737,381 |
| 5.141% 3/15/52(d) | | 41,680,000 | 32,673,110 |
| Mcgraw-Hill Education, Inc. 5.75% 8/1/28 (d) | | 40,000 | 35,032 |
| Midas Opco Holdings LLC 5.625% 8/15/29 (d) | | 40,000 | 34,400 |
| News Corp.: | | | |
| 3.875% 5/15/29(d) | | 20,000 | 17,139 |
| 5.125% 2/15/32(d) | | 1,245,000 | 1,104,883 |
| Nexstar Broadcasting, Inc.: | | | |
| 4.75% 11/1/28(d) | | 530,000 | 463,363 |
| 5.625% 7/15/27(d) | | 680,000 | 631,538 |
| Outfront Media Capital LLC / Corp.: | | | |
| 4.625% 3/15/30(d) | | 20,000 | 16,351 |
| 5% 8/15/27(d) | | 20,000 | 18,050 |
| Paramount Global 6.375% 3/30/62 (e) | | 40,000 | 34,464 |
| Radiate Holdco LLC/Radiate Financial Service Ltd.: | | | |
| 4.5% 9/15/26(d) | | 3,935,000 | 2,936,300 |
| 6.5% 9/15/28(d) | | 5,929,000 | 2,788,577 |
| Sinclair Television Group, Inc.: | | | |
| 4.125% 12/1/30(d) | | 20,000 | 15,564 |
| 5.5% 3/1/30(d) | | 1,260,000 | 929,200 |
| Sirius XM Radio, Inc.: | | | |
| 3.125% 9/1/26(d) | | 520,000 | 459,726 |
| 3.875% 9/1/31(d) | | 40,000 | 31,103 |
| 4% 7/15/28(d) | | 6,945,000 | 5,937,975 |
| 4.125% 7/1/30(d) | | 4,150,000 | 3,372,828 |
| 5% 8/1/27(d) | | 1,020,000 | 935,850 |
| 5.5% 7/1/29(d) | | 715,000 | 645,288 |
| TEGNA, Inc.: | | | |
| 4.625% 3/15/28 | | 1,410,000 | 1,254,900 |
| 4.75% 3/15/26(d) | | 20,000 | 19,000 |
| 5% 9/15/29 | | 585,000 | 519,012 |
| Time Warner Cable LLC: | | | |
| 4.5% 9/15/42 | | 10,467,000 | 7,810,902 |
| 5.5% 9/1/41 | | 4,708,000 | 3,963,505 |
| 5.875% 11/15/40 | | 6,004,000 | 5,302,153 |
| 6.55% 5/1/37 | | 17,014,000 | 16,294,932 |
| 7.3% 7/1/38 | | 14,056,000 | 14,087,558 |
| TV Azteca SA de CV 8.25% 8/9/24 (Reg. S) (f) | | 2,133,000 | 977,597 |
| Univision Communications, Inc.: | | | |
| 4.5% 5/1/29(d) | | 1,620,000 | 1,366,369 |
| 5.125% 2/15/25(d) | | 20,000 | 19,472 |
| 6.625% 6/1/27(d) | | 5,730,000 | 5,439,947 |
| 7.375% 6/30/30(d) | | 20,000 | 18,968 |
| UPC Broadband Finco BV 4.875% 7/15/31 (d) | | 40,000 | 33,771 |
| Videotron Ltd.: | | | |
| 3.625% 6/15/29(d) | | 20,000 | 16,850 |
| 5.125% 4/15/27(d) | | 20,000 | 18,700 |
| Virgin Media Secured Finance PLC: | | | |
| 4.5% 8/15/30(d) | | 4,900,000 | 4,055,779 |
| 5.5% 5/15/29(d) | | 40,000 | 36,246 |
| VTR Finance BV 6.375% 7/15/28 (d) | | 450,000 | 193,275 |
| VZ Secured Financing BV 5% 1/15/32 (d) | | 40,000 | 32,904 |
| Ziggo BV 4.875% 1/15/30 (d) | | 1,285,000 | 1,086,677 |
| | | | 394,763,170 |
| Wireless Telecommunication Services - 0.5% | | | |
| AXIAN Telecom 7.375% 2/16/27 (d) | | 930,000 | 847,346 |
| Bharti Airtel International BV 5.35% 5/20/24 (d) | | 1,045,000 | 1,038,260 |
| CT Trust 5.125% 2/3/32 (d) | | 1,265,000 | 994,606 |
| Digicel Group Ltd. 6.75% 3/1/23 (d) | | 404,000 | 157,510 |
| Intelsat Jackson Holdings SA 6.5% 3/15/30 (d) | | 4,488,000 | 3,904,529 |
| Millicom International Cellular SA: | | | |
| 4.5% 4/27/31(d) | | 4,625,000 | 3,734,688 |
| 5.125% 1/15/28(d) | | 441,000 | 387,749 |
| MTN (Mauritius) Investments Ltd.: | | | |
| 4.755% 11/11/24(d) | | 405,000 | 390,521 |
| 6.5% 10/13/26(d) | | 456,000 | 449,958 |
| Rogers Communications, Inc.: | | | |
| 3.2% 3/15/27(d) | | 9,947,000 | 9,145,952 |
| 3.8% 3/15/32(d) | | 8,681,000 | 7,582,671 |
| Sprint Corp.: | | | |
| 7.125% 6/15/24 | | 5,015,000 | 5,078,189 |
| 7.625% 2/15/25 | | 2,380,000 | 2,437,847 |
| 7.625% 3/1/26 | | 3,560,000 | 3,697,064 |
| 7.875% 9/15/23 | | 1,345,000 | 1,357,561 |
| T-Mobile U.S.A., Inc.: | | | |
| 2.25% 11/15/31 | | 10,000,000 | 7,840,891 |
| 3.5% 4/15/31 | | 3,210,000 | 2,778,856 |
| 3.75% 4/15/27 | | 12,950,000 | 12,174,761 |
| 3.875% 4/15/30 | | 23,000,000 | 20,855,185 |
| 4.375% 4/15/40 | | 2,795,000 | 2,375,126 |
| 4.5% 4/15/50 | | 5,491,000 | 4,554,973 |
| VimpelCom Holdings BV 7.25% 12/26/23 (d) | | 625,000 | 603,125 |
| Vodafone Group PLC: | | | |
| 4.875% 10/3/78 (Reg. S)(e) | GBP | 2,300,000 | 2,636,527 |
| 6.25% 10/3/78 (Reg. S)(e) | | 2,515,000 | 2,433,263 |
| 7% 4/4/79(e) | | 60,000 | 58,818 |
| VTR Comunicaciones SpA: | | | |
| 4.375% 4/15/29(d) | | 310,000 | 203,825 |
| 5.125% 1/15/28(d) | | 1,108,000 | 776,281 |
| | | | 98,496,082 |
TOTAL COMMUNICATION SERVICES | | | 740,174,747 |
| | | | |
| CONSUMER DISCRETIONARY - 1.7% | | | |
| Auto Components - 0.1% | | | |
| Adient Global Holdings Ltd. 0% 4/15/28 (d)(g) | | 385,000 | 385,963 |
| Allison Transmission, Inc.: | | | |
| 3.75% 1/30/31(d) | | 660,000 | 547,800 |
| 4.75% 10/1/27(d) | | 520,000 | 482,270 |
| American Axle & Manufacturing, Inc.: | | | |
| 5% 10/1/29 | | 20,000 | 16,133 |
| 6.5% 4/1/27 | | 20,000 | 18,486 |
| Clarios Global LP 6.75% 5/15/25 (d) | | 40,000 | 39,765 |
| Dana Financing Luxembourg SARL 5.75% 4/15/25 (d) | | 520,000 | 507,098 |
| Dana, Inc.: | | | |
| 4.25% 9/1/30 | | 520,000 | 420,040 |
| 5.375% 11/15/27 | | 500,000 | 461,360 |
| 5.625% 6/15/28 | | 20,000 | 18,100 |
| FXI Holdings, Inc. 12.25% 11/15/26 (d) | | 20,000 | 17,513 |
| IHO Verwaltungs GmbH 4.75% 9/15/26 pay-in-kind (d)(e) | | 255,000 | 235,156 |
| Metalsa SA de CV 3.75% 5/4/31 (d) | | 660,000 | 504,818 |
| Panther BF Aggregator 2 LP / Panther Finance Co., Inc.: | | | |
| 6.25% 5/15/26(d) | | 40,000 | 39,260 |
| 8.5% 5/15/27(d) | | 40,000 | 39,771 |
| The Goodyear Tire & Rubber Co.: | | | |
| 4.875% 3/15/27 | | 20,000 | 18,554 |
| 5% 7/15/29 | | 20,000 | 17,400 |
| 5.25% 4/30/31 | | 20,000 | 17,150 |
| 5.25% 7/15/31 | | 20,000 | 17,025 |
| Tupy Overseas SA 4.5% 2/16/31 (d) | | 295,000 | 228,773 |
| Valeo SA 1% 8/3/28 (Reg. S) | EUR | 1,800,000 | 1,519,284 |
| ZF Europe Finance BV 2% 2/23/26 (Reg. S) | EUR | 800,000 | 768,102 |
| ZF Finance GmbH 2% 5/6/27 (Reg. S) | EUR | 1,800,000 | 1,635,511 |
| ZF North America Capital, Inc. 4.75% 4/29/25 (d) | | 1,525,000 | 1,456,772 |
| | | | 9,412,104 |
| Automobiles - 0.2% | | | |
| Aston Martin Capital Holdings Ltd. 10.5% 11/30/25 (d) | | 40,000 | 39,900 |
| Ford Motor Co.: | | | |
| 3.25% 2/12/32 | | 1,840,000 | 1,390,651 |
| 4.346% 12/8/26 | | 520,000 | 496,401 |
| 4.75% 1/15/43 | | 640,000 | 466,999 |
| 5.291% 12/8/46 | | 255,000 | 199,538 |
| 6.1% 8/19/32 | | 3,850,000 | 3,585,531 |
| 7.4% 11/1/46 | | 515,000 | 512,925 |
| General Motors Financial Co., Inc.: | | | |
| 4% 1/15/25 | | 6,564,000 | 6,361,986 |
| 4.25% 5/15/23 | | 1,967,000 | 1,962,677 |
| 5.15% 8/15/26 (Reg. S) | GBP | 820,000 | 969,984 |
| Rivian Holdco & Rivian LLC & Rivian Automotive LLC 6 month U.S. LIBOR + 5.620% 10.1636% 10/15/26 (d)(e)(h) | | 6,565,000 | 6,400,875 |
| Volkswagen Group of America Finance LLC 3.125% 5/12/23 (d) | | 10,902,000 | 10,850,218 |
| | | | 33,237,685 |
| Diversified Consumer Services - 0.1% | | | |
| Adtalem Global Education, Inc. 5.5% 3/1/28 (d) | | 3,507,000 | 3,228,302 |
| GEMS MENASA Cayman Ltd. 7.125% 7/31/26 (d) | | 8,765,000 | 8,525,606 |
| Grand Canyon University 4.125% 10/1/24 | | 20,000 | 18,800 |
| Ingersoll-Rand Global Holding Co. Ltd. 4.25% 6/15/23 | | 3,073,000 | 3,063,544 |
| Service Corp. International: | | | |
| 3.375% 8/15/30 | | 20,000 | 16,250 |
| 4% 5/15/31 | | 2,350,000 | 1,985,304 |
| 4.625% 12/15/27 | | 520,000 | 484,250 |
| 5.125% 6/1/29 | | 2,460,000 | 2,303,175 |
| Sotheby's 7.375% 10/15/27 (d) | | 2,845,000 | 2,683,916 |
| TKC Holdings, Inc. 10.5% 5/15/29 (d) | | 20,000 | 12,250 |
| WASH Multifamily Acquisition, Inc. 5.75% 4/15/26 (d) | | 3,330,000 | 3,097,666 |
| | | | 25,419,063 |
| Hotels, Restaurants & Leisure - 0.5% | | | |
| 1011778 BC Unlimited Liability Co./New Red Finance, Inc.: | | | |
| 3.5% 2/15/29(d) | | 20,000 | 16,961 |
| 3.875% 1/15/28(d) | | 20,000 | 17,797 |
| 4% 10/15/30(d) | | 2,149,000 | 1,774,902 |
| 4.375% 1/15/28(d) | | 20,000 | 17,881 |
| 5.75% 4/15/25(d) | | 560,000 | 556,503 |
| Affinity Gaming LLC 6.875% 12/15/27 (d) | | 3,755,000 | 3,349,272 |
| Aramark Services, Inc.: | | | |
| 5% 4/1/25(d) | | 20,000 | 19,401 |
| 5% 2/1/28(d) | | 1,338,000 | 1,231,897 |
| 6.375% 5/1/25(d) | | 3,155,000 | 3,134,461 |
| Boyd Gaming Corp.: | | | |
| 4.75% 12/1/27 | | 20,000 | 18,750 |
| 4.75% 6/15/31(d) | | 20,000 | 17,660 |
| Caesars Entertainment, Inc.: | | | |
| 4.625% 10/15/29(d) | | 40,000 | 34,212 |
| 6.25% 7/1/25(d) | | 2,570,000 | 2,548,627 |
| 7% 2/15/30(d) | | 2,410,000 | 2,428,075 |
| 8.125% 7/1/27(d) | | 3,557,000 | 3,592,570 |
| Caesars Resort Collection LLC 5.75% 7/1/25 (d) | | 2,625,000 | 2,620,616 |
| Carnival Corp.: | | | |
| 5.75% 3/1/27(d) | | 4,340,000 | 3,558,800 |
| 6% 5/1/29(d) | | 3,870,000 | 3,001,274 |
| 6.65% 1/15/28 | | 225,000 | 172,442 |
| 7.625% 3/1/26(d) | | 4,300,000 | 3,872,645 |
| 10.5% 2/1/26(d) | | 500,000 | 517,790 |
| Carnival Holdings (Bermuda) Ltd. 10.375% 5/1/28 (d) | | 60,000 | 64,200 |
| CDI Escrow Issuer, Inc. 5.75% 4/1/30 (d) | | 20,000 | 18,575 |
| Cedar Fair LP/Canada's Wonderland Co. 5.375% 4/15/27 | | 20,000 | 19,106 |
| Fertitta Entertainment LLC / Fertitta Entertainment Finance Co., Inc.: | | | |
| 4.625% 1/15/29(d) | | 500,000 | 432,450 |
| 6.75% 1/15/30(d) | | 2,430,000 | 2,013,911 |
| Garden SpinCo Corp. 8.625% 7/20/30 (d) | | 580,000 | 611,947 |
| GENM Capital Labuan Ltd. 3.882% 4/19/31 (d) | | 860,000 | 666,500 |
| Golden Entertainment, Inc. 7.625% 4/15/26 (d) | | 2,450,000 | 2,456,811 |
| Hilton Domestic Operating Co., Inc.: | | | |
| 3.625% 2/15/32(d) | | 4,895,000 | 4,018,746 |
| 3.75% 5/1/29(d) | | 370,000 | 320,808 |
| 4% 5/1/31(d) | | 2,360,000 | 2,008,171 |
| 4.875% 1/15/30 | | 20,000 | 18,350 |
| 5.75% 5/1/28(d) | | 230,000 | 223,055 |
| Hilton Grand Vacations Borrower Escrow LLC 4.875% 7/1/31 (d) | | 795,000 | 668,357 |
| InterContinental Hotel Group PLC 3.375% 10/8/28 (Reg. S) | GBP | 4,260,000 | 4,550,206 |
| International Game Technology PLC: | | | |
| 4.125% 4/15/26(d) | | 20,000 | 18,650 |
| 5.25% 1/15/29(d) | | 20,000 | 18,561 |
| Jacobs Entertainment, Inc. 6.75% 2/15/29 (d) | | 700,000 | 637,161 |
| Las Vegas Sands Corp.: | | | |
| 2.9% 6/25/25 | | 520,000 | 481,969 |
| 3.2% 8/8/24 | | 20,000 | 19,247 |
| 3.5% 8/18/26 | | 520,000 | 475,751 |
| 3.9% 8/8/29 | | 20,000 | 17,438 |
| Life Time, Inc. 8% 4/15/26 (d) | | 20,000 | 19,271 |
| MajorDrive Holdings IV LLC 6.375% 6/1/29 (d) | | 1,080,000 | 834,708 |
| Marriott Ownership Resorts, Inc.: | | | |
| 4.5% 6/15/29(d) | | 225,000 | 188,827 |
| 4.75% 1/15/28 | | 775,000 | 684,697 |
| McDonald's Corp.: | | | |
| 3.5% 7/1/27 | | 3,551,000 | 3,348,503 |
| 3.6% 7/1/30 | | 4,224,000 | 3,853,431 |
| Melco Resorts Finance Ltd.: | | | |
| 4.875% 6/6/25(d) | | 20,000 | 18,650 |
| 5.375% 12/4/29(d) | | 40,000 | 33,060 |
| 5.625% 7/17/27(d) | | 20,000 | 17,677 |
| MGM China Holdings Ltd.: | | | |
| 5.25% 6/18/25(d) | | 20,000 | 18,778 |
| 5.375% 5/15/24(d) | | 20,000 | 19,429 |
| 5.875% 5/15/26(d) | | 20,000 | 18,560 |
| MGM Resorts International: | | | |
| 4.625% 9/1/26 | | 20,000 | 18,631 |
| 5.75% 6/15/25 | | 20,000 | 19,640 |
| NagaCorp Ltd. 7.95% 7/6/24 (Reg. S) | | 1,450,000 | 1,359,647 |
| NCL Corp. Ltd.: | | | |
| 3.625% 12/15/24(d) | | 20,000 | 18,782 |
| 5.875% 3/15/26(d) | | 690,000 | 596,850 |
| 5.875% 2/15/27(d) | | 20,000 | 18,550 |
| 7.75% 2/15/29(d) | | 1,480,000 | 1,288,340 |
| NCL Finance Ltd. 6.125% 3/15/28 (d) | | 475,000 | 395,438 |
| Premier Entertainment Sub LLC 5.875% 9/1/31 (d) | | 20,000 | 14,412 |
| Royal Caribbean Cruises Ltd.: | | | |
| 4.25% 7/1/26(d) | | 2,850,000 | 2,500,676 |
| 5.375% 7/15/27(d) | | 1,095,000 | 962,432 |
| 5.5% 8/31/26(d) | | 3,920,000 | 3,601,774 |
| 5.5% 4/1/28(d) | | 3,635,000 | 3,168,266 |
| 7.25% 1/15/30(d) | | 640,000 | 642,800 |
| 11.625% 8/15/27(d) | | 520,000 | 554,866 |
| Scientific Games Corp.: | | | |
| 7% 5/15/28(d) | | 20,000 | 19,548 |
| 7.25% 11/15/29(d) | | 20,000 | 19,650 |
| 8.625% 7/1/25(d) | | 20,000 | 20,446 |
| Six Flags Entertainment Corp.: | | | |
| 4.875% 7/31/24(d) | | 20,000 | 19,650 |
| 5.5% 4/15/27(d) | | 20,000 | 18,887 |
| Station Casinos LLC 4.5% 2/15/28 (d) | | 1,190,000 | 1,051,008 |
| Studio City Finance Ltd.: | | | |
| 5% 1/15/29(d) | | 20,000 | 15,400 |
| 6% 7/15/25(d) | | 20,000 | 18,035 |
| Sugarhouse HSP Gaming Prop Mezz LP/Sugarhouse HSP Gaming Finance Corp. 5.875% 5/15/25 (d) | | 352,000 | 331,894 |
| Times Square Hotel Trust 8.528% 8/1/26 (d) | | 375,180 | 372,428 |
| Viking Cruises Ltd. 5.875% 9/15/27 (d) | | 20,000 | 17,151 |
| Viking Ocean Cruises Ship VII Ltd. 5.625% 2/15/29 (d) | | 475,000 | 407,769 |
| Voc Escrow Ltd. 5% 2/15/28 (d) | | 1,115,000 | 982,259 |
| Whitbread PLC: | | | |
| 2.375% 5/31/27 (Reg. S) | GBP | 2,210,000 | 2,284,191 |
| 3.375% 10/16/25 (Reg. S) | GBP | 3,300,000 | 3,724,056 |
| Wyndham Hotels & Resorts, Inc. 4.375% 8/15/28 (d) | | 1,345,000 | 1,218,185 |
| Wynn Las Vegas LLC/Wynn Las Vegas Capital Corp.: | | | |
| 5.25% 5/15/27(d) | | 2,427,000 | 2,260,296 |
| 5.5% 3/1/25(d) | | 40,000 | 38,812 |
| Wynn Macau Ltd.: | | | |
| 4.875% 10/1/24(d) | | 20,000 | 19,100 |
| 5.5% 1/15/26(d) | | 20,000 | 18,150 |
| 5.625% 8/26/28(d) | | 40,000 | 33,800 |
| Wynn Resorts Finance LLC / Wynn Resorts Capital Corp.: | | | |
| 5.125% 10/1/29(d) | | 20,000 | 17,892 |
| 7.125% 2/15/31(d) | | 640,000 | 638,720 |
| Yum! Brands, Inc.: | | | |
| 3.625% 3/15/31 | | 660,000 | 552,143 |
| 4.625% 1/31/32 | | 2,610,000 | 2,307,083 |
| 4.75% 1/15/30(d) | | 520,000 | 473,850 |
| 5.375% 4/1/32 | | 510,000 | 472,510 |
| | | | 93,832,114 |
| Household Durables - 0.0% | | | |
| Adams Homes, Inc. 7.5% 2/15/25 (d) | | 280,000 | 245,073 |
| Ashton Woods U.S.A. LLC/Ashton Woods Finance Co. 4.625% 8/1/29 (d) | | 690,000 | 566,173 |
| Brookfield Residential Properties, Inc./Brookfield Residential U.S. Corp. 6.25% 9/15/27 (d) | | 20,000 | 17,435 |
| Newell Brands, Inc.: | | | |
| 4.45% 4/1/26 | | 660,000 | 623,898 |
| 4.875% 6/1/25 | | 20,000 | 19,381 |
| 5.75% 4/1/46(i) | | 510,000 | 409,627 |
| 6.375% 9/15/27 | | 620,000 | 616,609 |
| Taylor Morrison Communities, Inc./Monarch Communities, Inc. 5.625% 3/1/24 (d) | | 565,000 | 562,232 |
| The Berkeley Group PLC 2.5% 8/11/31 (Reg. S) | GBP | 1,950,000 | 1,658,741 |
| TopBuild Corp. 4.125% 2/15/32 (d) | | 990,000 | 812,908 |
| TRI Pointe Homes, Inc. 5.7% 6/15/28 | | 255,000 | 237,041 |
| | | | 5,769,118 |
| Internet & Direct Marketing Retail - 0.1% | | | |
| Alibaba Group Holding Ltd. 2.125% 2/9/31 | | 435,000 | 345,771 |
| JD.com, Inc. 3.375% 1/14/30 | | 1,420,000 | 1,256,189 |
| Match Group Holdings II LLC: | | | |
| 3.625% 10/1/31(d) | | 385,000 | 301,263 |
| 4.125% 8/1/30(d) | | 3,275,000 | 2,714,901 |
| 5% 12/15/27(d) | | 2,095,000 | 1,950,969 |
| Meituan: | | | |
| 2.125% 10/28/25(d) | | 995,000 | 893,821 |
| 3.05% 10/28/30(d) | | 665,000 | 510,097 |
| Prosus NV: | | | |
| 3.68% 1/21/30(d) | | 840,000 | 694,470 |
| 4.027% 8/3/50(d) | | 1,110,000 | 695,346 |
| 4.193% 1/19/32(d) | | 455,000 | 373,328 |
| QVC, Inc.: | | | |
| 4.45% 2/15/25 | | 20,000 | 16,150 |
| 4.75% 2/15/27 | | 20,000 | 12,800 |
| Terrier Media Buyer, Inc. 8.875% 12/15/27 (d) | | 20,000 | 13,460 |
| Uber Technologies, Inc.: | | | |
| 4.5% 8/15/29(d) | | 2,425,000 | 2,143,894 |
| 6.25% 1/15/28(d) | | 20,000 | 19,685 |
| 7.5% 5/15/25(d) | | 3,220,000 | 3,252,641 |
| 7.5% 9/15/27(d) | | 20,000 | 20,278 |
| 8% 11/1/26(d) | | 4,925,000 | 4,999,990 |
| | | | 20,215,053 |
| Leisure Products - 0.1% | | | |
| Hasbro, Inc. 3% 11/19/24 | | 8,864,000 | 8,495,335 |
| Mattel, Inc.: | | | |
| 3.375% 4/1/26(d) | | 3,205,000 | 2,940,588 |
| 3.75% 4/1/29(d) | | 4,375,000 | 3,784,375 |
| 5.45% 11/1/41 | | 510,000 | 428,400 |
| 5.875% 12/15/27(d) | | 2,075,000 | 2,026,341 |
| | | | 17,675,039 |
| Multiline Retail - 0.1% | | | |
| John Lewis PLC 6.125% 1/21/25 | GBP | 7,731,000 | 9,013,728 |
| Marks & Spencer PLC: | | | |
| 3.75% 5/19/26 (Reg. S) | GBP | 2,645,000 | 2,874,520 |
| 4.5% 7/10/27 (Reg. S) | GBP | 700,000 | 755,002 |
| NMG Holding Co., Inc. / Neiman Marcus Group LLC 7.125% 4/1/26 (d) | | 40,000 | 38,600 |
| Nordstrom, Inc.: | | | |
| 4.25% 8/1/31 | | 1,180,000 | 863,418 |
| 4.375% 4/1/30 | | 775,000 | 611,281 |
| | | | 14,156,549 |
| Specialty Retail - 0.5% | | | |
| Asbury Automotive Group, Inc.: | | | |
| 4.625% 11/15/29(d) | | 20,000 | 17,391 |
| 4.75% 3/1/30 | | 20,000 | 17,327 |
| AutoNation, Inc. 4.75% 6/1/30 | | 1,671,000 | 1,552,262 |
| AutoZone, Inc.: | | | |
| 3.625% 4/15/25 | | 2,398,000 | 2,313,785 |
| 4% 4/15/30 | | 11,145,000 | 10,241,733 |
| 4.75% 8/1/32 | | 15,000,000 | 14,313,809 |
| Bath & Body Works, Inc.: | | | |
| 6.625% 10/1/30(d) | | 40,000 | 37,889 |
| 6.694% 1/15/27 | | 480,000 | 475,191 |
| Carvana Co.: | | | |
| 4.875% 9/1/29(d) | | 1,190,000 | 562,899 |
| 5.5% 4/15/27(d) | | 1,550,000 | 790,184 |
| 5.875% 10/1/28(d) | | 910,000 | 437,509 |
| 10.25% 5/1/30(d) | | 240,000 | 149,940 |
| Foot Locker, Inc. 4% 10/1/29 (d) | | 2,490,000 | 2,047,032 |
| Gap, Inc. 3.875% 10/1/31 (d) | | 20,000 | 14,349 |
| Jaguar Land Rover Automotive PLC 7.75% 10/15/25 (d) | | 20,000 | 19,700 |
| LBM Acquisition LLC 6.25% 1/15/29 (d) | | 2,695,000 | 1,920,080 |
| Lithia Motors, Inc.: | | | |
| 3.875% 6/1/29(d) | | 20,000 | 16,711 |
| 4.625% 12/15/27(d) | | 20,000 | 18,160 |
| Lowe's Companies, Inc.: | | | |
| 3.35% 4/1/27 | | 1,437,000 | 1,344,400 |
| 3.75% 4/1/32 | | 27,423,000 | 24,292,506 |
| 4.25% 4/1/52 | | 18,092,000 | 14,245,344 |
| 4.45% 4/1/62 | | 20,496,000 | 16,055,880 |
| 4.5% 4/15/30 | | 8,031,000 | 7,649,740 |
| Michaels Companies, Inc.: | | | |
| 5.25% 5/1/28(d) | | 1,020,000 | 848,875 |
| 7.875% 5/1/29(d) | | 825,000 | 620,813 |
| O'Reilly Automotive, Inc. 4.2% 4/1/30 | | 2,481,000 | 2,325,878 |
| Penske Automotive Group, Inc.: | | | |
| 3.5% 9/1/25 | | 20,000 | 18,701 |
| 3.75% 6/15/29 | | 20,000 | 16,807 |
| PetSmart, Inc. / PetSmart Finance Corp. 7.75% 2/15/29 (d) | | 20,000 | 19,510 |
| Sally Holdings LLC 5.625% 12/1/25 | | 1,360,000 | 1,326,000 |
| VIA Outlets 1.75% 11/15/28 (Reg. S) | EUR | 1,900,000 | 1,578,122 |
| | | | 105,288,527 |
| Textiles, Apparel & Luxury Goods - 0.0% | | | |
| Crocs, Inc.: | | | |
| 4.125% 8/15/31(d) | | 840,000 | 688,800 |
| 4.25% 3/15/29(d) | | 500,000 | 428,750 |
| Hanesbrands, Inc. 4.875% 5/15/26 (d) | | 520,000 | 480,212 |
| Kontoor Brands, Inc. 4.125% 11/15/29 (d) | | 410,000 | 347,475 |
| Levi Strauss & Co. 3.5% 3/1/31 (d) | | 1,670,000 | 1,365,225 |
| The William Carter Co. 5.625% 3/15/27 (d) | | 500,000 | 480,578 |
| Under Armour, Inc. 3.25% 6/15/26 | | 1,000,000 | 890,500 |
| Wolverine World Wide, Inc. 4% 8/15/29 (d) | | 2,280,000 | 1,836,403 |
| | | | 6,517,943 |
TOTAL CONSUMER DISCRETIONARY | | | 331,523,195 |
| | | | |
| CONSUMER STAPLES - 2.1% | | | |
| Beverages - 1.0% | | | |
| Anheuser-Busch Companies LLC / Anheuser-Busch InBev Worldwide, Inc. 4.9% 2/1/46 | | 30,000,000 | 27,518,225 |
| Anheuser-Busch InBev Finance, Inc.: | | | |
| 4.7% 2/1/36 | | 13,110,000 | 12,305,428 |
| 4.9% 2/1/46 | | 16,343,000 | 14,991,012 |
| Anheuser-Busch InBev SA NV 9.75% 7/30/24 | GBP | 175,000 | 223,758 |
| Anheuser-Busch InBev Worldwide, Inc.: | | | |
| 3.5% 6/1/30 | | 18,100,000 | 16,482,673 |
| 4.35% 6/1/40 | | 7,470,000 | 6,556,330 |
| 4.5% 6/1/50 | | 20,000,000 | 17,616,361 |
| 4.75% 4/15/58 | | 10,214,000 | 9,146,021 |
| 5.45% 1/23/39 | | 9,200,000 | 9,169,682 |
| 5.55% 1/23/49 | | 21,036,000 | 21,165,606 |
| 5.8% 1/23/59 (Reg. S) | | 22,287,000 | 23,043,164 |
| Central American Bottling Corp. 5.25% 4/27/29 (d) | | 845,000 | 774,231 |
| Constellation Brands, Inc. 4.75% 5/9/32 | | 20,000,000 | 19,023,174 |
| Primo Water Holdings, Inc. 4.375% 4/30/29 (d) | | 2,595,000 | 2,222,566 |
| The Coca-Cola Co.: | | | |
| 3.375% 3/25/27 | | 13,095,000 | 12,494,719 |
| 3.45% 3/25/30 | | 7,303,000 | 6,716,343 |
| Triton Water Holdings, Inc. 6.25% 4/1/29 (d) | | 6,830,000 | 5,443,852 |
| | | | 204,893,145 |
| Food & Staples Retailing - 0.1% | | | |
| Albertsons Companies LLC/Safeway, Inc./New Albertson's, Inc./Albertson's LLC: | | | |
| 3.25% 3/15/26(d) | | 345,000 | 316,567 |
| 3.5% 3/15/29(d) | | 5,675,000 | 4,803,178 |
| 4.625% 1/15/27(d) | | 20,000 | 18,800 |
| 4.875% 2/15/30(d) | | 1,860,000 | 1,669,029 |
| C&S Group Enterprises LLC 5% 12/15/28 (d) | | 2,070,000 | 1,594,176 |
| NBM U.S. Holdings, Inc. 6.625% 8/6/29 (d) | | 1,555,000 | 1,416,313 |
| Performance Food Group, Inc.: | | | |
| 4.25% 8/1/29(d) | | 20,000 | 17,463 |
| 5.5% 10/15/27(d) | | 1,314,000 | 1,246,053 |
| 6.875% 5/1/25(d) | | 500,000 | 501,078 |
| SEG Holding LLC/SEG Finance Corp. 5.625% 10/15/28 (d) | | 522,000 | 491,410 |
| Sysco Corp.: | | | |
| 5.95% 4/1/30 | | 4,765,000 | 4,939,506 |
| 6.6% 4/1/50 | | 7,190,000 | 7,889,875 |
| Tesco Corporate Treasury Services PLC 5.5% 2/27/35 (Reg. S) | GBP | 2,850,000 | 3,326,513 |
| U.S. Foods, Inc.: | | | |
| 4.625% 6/1/30(d) | | 580,000 | 506,598 |
| 4.75% 2/15/29(d) | | 1,655,000 | 1,491,536 |
| United Natural Foods, Inc. 6.75% 10/15/28 (d) | | 255,000 | 241,369 |
| | | | 30,469,464 |
| Food Products - 0.6% | | | |
| Adecoagro SA 6% 9/21/27 (d) | | 990,000 | 913,461 |
| B&G Foods, Inc. 5.25% 4/1/25 | | 20,000 | 18,100 |
| Camposol SA 6% 2/3/27 (d) | | 325,000 | 204,750 |
| Chobani LLC/Finance Corp., Inc. 4.625% 11/15/28 (d) | | 510,000 | 444,562 |
| Darling Ingredients, Inc.: | | | |
| 5.25% 4/15/27(d) | | 20,000 | 19,243 |
| 6% 6/15/30(d) | | 850,000 | 821,308 |
| JBS U.S.A. Lux SA / JBS Food Co.: | | | |
| 2.5% 1/15/27(d) | | 17,765,000 | 15,545,441 |
| 3% 5/15/32(d) | | 18,025,000 | 13,741,261 |
| 3.625% 1/15/32(d) | | 27,395,000 | 21,943,943 |
| 5.125% 2/1/28(d) | | 7,390,000 | 7,024,047 |
| 5.5% 1/15/30(d) | | 5,555,000 | 5,228,616 |
| 5.75% 4/1/33(d) | | 15,215,000 | 14,191,335 |
| JDE Peet's BV 2.25% 9/24/31 (d) | | 3,800,000 | 2,897,411 |
| Kraft Heinz Foods Co. 4.875% 10/1/49 | | 20,000,000 | 17,561,917 |
| Lamb Weston Holdings, Inc.: | | | |
| 4.125% 1/31/30(d) | | 3,330,000 | 2,922,377 |
| 4.375% 1/31/32(d) | | 660,000 | 580,632 |
| Pilgrim's Pride Corp.: | | | |
| 3.5% 3/1/32 | | 640,000 | 494,562 |
| 4.25% 4/15/31 | | 810,000 | 676,350 |
| 5.875% 9/30/27(d) | | 520,000 | 509,600 |
| Post Holdings, Inc.: | | | |
| 4.5% 9/15/31(d) | | 40,000 | 33,683 |
| 4.625% 4/15/30(d) | | 1,275,000 | 1,105,451 |
| 5.5% 12/15/29(d) | | 2,009,000 | 1,838,485 |
| 5.625% 1/15/28(d) | | 20,000 | 19,100 |
| 5.75% 3/1/27(d) | | 1,000,000 | 973,814 |
| TreeHouse Foods, Inc. 4% 9/1/28 | | 735,000 | 630,373 |
| | | | 110,339,822 |
| Household Products - 0.0% | | | |
| Central Garden & Pet Co. 4.125% 10/15/30 | | 20,000 | 16,663 |
| Energizer Holdings, Inc. 4.375% 3/31/29 (d) | | 20,000 | 16,955 |
| | | | 33,618 |
| Personal Products - 0.0% | | | |
| BellRing Brands, Inc. 7% 3/15/30 (d) | | 510,000 | 504,338 |
| Coty, Inc.: | | | |
| 5% 4/15/26(d) | | 20,000 | 19,025 |
| 6.5% 4/15/26(d) | | 20,000 | 19,614 |
| Edgewell Personal Care Co. 5.5% 6/1/28 (d) | | 20,000 | 18,676 |
| Natura Cosmeticos SA 4.125% 5/3/28 (d) | | 595,000 | 462,018 |
| Prestige Brands, Inc. 3.75% 4/1/31 (d) | | 20,000 | 16,250 |
| | | | 1,039,921 |
| Tobacco - 0.4% | | | |
| Altria Group, Inc.: | | | |
| 4.25% 8/9/42 | | 10,924,000 | 8,213,868 |
| 4.5% 5/2/43 | | 7,299,000 | 5,570,576 |
| 4.8% 2/14/29 | | 1,994,000 | 1,912,734 |
| 5.375% 1/31/44 | | 13,161,000 | 11,480,558 |
| 5.95% 2/14/49 | | 2,582,000 | 2,311,965 |
| Imperial Tobacco Finance PLC: | | | |
| 3.5% 7/26/26(d) | | 8,401,000 | 7,735,661 |
| 4.25% 7/21/25(d) | | 6,702,000 | 6,443,065 |
| 6.125% 7/27/27(d) | | 7,555,000 | 7,615,326 |
| Reynolds American, Inc.: | | | |
| 4.45% 6/12/25 | | 5,354,000 | 5,209,855 |
| 5.7% 8/15/35 | | 1,538,000 | 1,398,457 |
| 5.85% 8/15/45 | | 12,953,000 | 11,117,718 |
| 6.15% 9/15/43 | | 1,637,000 | 1,500,577 |
| 7.25% 6/15/37 | | 1,835,000 | 1,909,230 |
| | | | 72,419,590 |
TOTAL CONSUMER STAPLES | | | 419,195,560 |
| | | | |
| ENERGY - 4.6% | | | |
| Energy Equipment & Services - 0.1% | | | |
| Archrock Partners LP / Archrock Partners Finance Corp. 6.875% 4/1/27 (d) | | 20,000 | 19,403 |
| CGG SA 8.75% 4/1/27 (d) | | 1,750,000 | 1,533,220 |
| Guara Norte SARL 5.198% 6/15/34 (d) | | 860,489 | 718,874 |
| Halliburton Co.: | | | |
| 3.8% 11/15/25 | | 86,000 | 83,172 |
| 4.85% 11/15/35 | | 3,103,000 | 2,892,330 |
| Nabors Industries Ltd. 7.25% 1/15/26 (d) | | 20,000 | 19,038 |
| Nabors Industries, Inc. 7.375% 5/15/27 (d) | | 20,000 | 19,276 |
| NuStar Logistics LP: | | | |
| 5.625% 4/28/27 | | 20,000 | 18,618 |
| 5.75% 10/1/25 | | 20,000 | 19,286 |
| Oleoducto Central SA 4% 7/14/27 (d) | | 1,590,000 | 1,363,723 |
| Southern Gas Corridor CJSC 6.875% 3/24/26 (d) | | 2,024,000 | 2,064,480 |
| State Oil Co. of Azerbaijan Republic: | | | |
| 4.75% 3/13/23 (Reg. S) | | 235,000 | 234,225 |
| 6.95% 3/18/30 (Reg. S) | | 400,000 | 411,252 |
| Summit Midstream Holdings LLC 8.5% (d)(j) | | 20,000 | 18,990 |
| Technip Energies NV 1.125% 5/28/28 | EUR | 2,655,000 | 2,354,782 |
| The Oil and Gas Holding Co.: | | | |
| 7.5% 10/25/27(d) | | 903,000 | 929,268 |
| 7.625% 11/7/24(d) | | 1,750,000 | 1,780,625 |
| 8.375% 11/7/28(d) | | 260,000 | 274,300 |
| Transocean Poseidon Ltd. 6.875% 2/1/27 (d) | | 926,250 | 899,620 |
| Transocean Titan Finance Ltd. 8.375% 2/1/28 (d) | | 20,000 | 20,414 |
| Transocean, Inc. 8.75% 2/15/30 (d) | | 1,605,000 | 1,633,088 |
| U.S.A. Compression Partners LP: | | | |
| 6.875% 4/1/26 | | 20,000 | 19,168 |
| 6.875% 9/1/27 | | 20,000 | 18,937 |
| Weatherford International Ltd.: | | | |
| 6.5% 9/15/28(d) | | 20,000 | 19,650 |
| 8.625% 4/30/30(d) | | 40,000 | 39,946 |
| | | | 17,405,685 |
| Multi Industry Energy - 0.0% | | | |
| Enviva Partners LP / Enviva Partners Finance Corp. 6.5% 1/15/26 (d) | | 435,000 | 407,795 |
| | | | |
| Oil, Gas & Consumable Fuels - 4.5% | | | |
| Antero Midstream Partners LP/Antero Midstream Finance Corp.: | | | |
| 5.375% 6/15/29(d) | | 20,000 | 18,000 |
| 5.75% 3/1/27(d) | | 1,140,000 | 1,076,171 |
| 5.75% 1/15/28(d) | | 20,000 | 18,775 |
| 7.875% 5/15/26(d) | | 1,140,000 | 1,151,347 |
| Antero Resources Corp.: | | | |
| 5.375% 3/1/30(d) | | 20,000 | 18,210 |
| 7.625% 2/1/29(d) | | 500,000 | 503,708 |
| Apache Corp.: | | | |
| 4.25% 1/15/30 | | 1,075,000 | 950,131 |
| 5.1% 9/1/40 | | 1,155,000 | 950,357 |
| Ascent Resources - Utica LLC/ARU Finance Corp. 7% 11/1/26 (d) | | 20,000 | 19,411 |
| Buckeye Partners LP 3.95% 12/1/26 | | 20,000 | 17,684 |
| California Resources Corp. 7.125% 2/1/26 (d) | | 880,000 | 886,644 |
| Callon Petroleum Co. 8% 8/1/28 (d) | | 20,000 | 19,613 |
| Canadian Natural Resources Ltd.: | | | |
| 2.95% 7/15/30 | | 12,000,000 | 10,168,038 |
| 3.9% 2/1/25 | | 9,072,000 | 8,779,620 |
| 5.85% 2/1/35 | | 3,955,000 | 3,806,873 |
| Cenovus Energy, Inc.: | | | |
| 3.75% 2/15/52 | | 12,540,000 | 8,879,443 |
| 5.4% 6/15/47 | | 2,296,000 | 2,066,891 |
| 6.75% 11/15/39 | | 1,902,000 | 1,987,840 |
| Centennial Resource Production LLC: | | | |
| 5.875% 7/1/29(d) | | 1,855,000 | 1,660,225 |
| 7.75% 2/15/26(d) | | 910,000 | 896,350 |
| Cheniere Energy Partners LP: | | | |
| 3.25% 1/31/32 | | 2,435,000 | 1,951,628 |
| 4% 3/1/31 | | 1,285,000 | 1,107,218 |
| Cheniere Energy, Inc. 4.625% 10/15/28 | | 560,000 | 519,126 |
| Chesapeake Energy Corp. 6.75% 4/15/29 (d) | | 20,000 | 19,375 |
| Citgo Holding, Inc. 9.25% 8/1/24 (d) | | 675,000 | 676,557 |
| Citgo Petroleum Corp.: | | | |
| 6.375% 6/15/26(d) | | 2,900,000 | 2,799,906 |
| 7% 6/15/25(d) | | 4,260,000 | 4,193,459 |
| CNX Resources Corp.: | | | |
| 6% 1/15/29(d) | | 20,000 | 18,133 |
| 7.25% 3/14/27(d) | | 640,000 | 634,738 |
| 7.375% 1/15/31(d) | | 1,350,000 | 1,286,145 |
| Columbia Pipeline Group, Inc. 4.5% 6/1/25 | | 1,708,000 | 1,669,306 |
| Comstock Resources, Inc.: | | | |
| 5.875% 1/15/30(d) | | 1,545,000 | 1,328,700 |
| 6.75% 3/1/29(d) | | 1,990,000 | 1,830,800 |
| CQP Holdco LP / BIP-V Chinook Holdco LLC 5.5% 6/15/31 (d) | | 20,000 | 17,550 |
| Crestwood Midstream Partners LP/Crestwood Midstream Finance Corp.: | | | |
| 5.625% 5/1/27(d) | | 8,202,000 | 7,586,850 |
| 5.75% 4/1/25 | | 3,221,000 | 3,124,250 |
| 6% 2/1/29(d) | | 4,900,000 | 4,457,530 |
| 7.375% 2/1/31(d) | | 1,235,000 | 1,203,038 |
| CrownRock LP/CrownRock Finance, Inc.: | | | |
| 5% 5/1/29(d) | | 940,000 | 851,203 |
| 5.625% 10/15/25(d) | | 200,000 | 193,000 |
| CVR Energy, Inc.: | | | |
| 5.25% 2/15/25(d) | | 3,700,000 | 3,552,000 |
| 5.75% 2/15/28(d) | | 4,053,000 | 3,597,240 |
| DCP Midstream Operating LP: | | | |
| 3.875% 3/15/23 | | 2,008,000 | 2,006,559 |
| 5.125% 5/15/29 | | 7,248,000 | 6,976,720 |
| 5.85% 5/21/43(d)(e) | | 9,176,000 | 9,080,570 |
| 6.45% 11/3/36(d) | | 4,987,000 | 5,064,149 |
| Delek Logistics Partners LP 7.125% 6/1/28 (d) | | 2,852,000 | 2,509,760 |
| Delek Overriding Royalty Levia 7.494% 12/30/23 (Reg. S) (d) | | 1,870,000 | 1,861,585 |
| DT Midstream, Inc.: | | | |
| 4.125% 6/15/29(d) | | 1,185,000 | 1,016,138 |
| 4.375% 6/15/31(d) | | 660,000 | 552,750 |
| Ecopetrol SA 8.875% 1/13/33 | | 1,010,000 | 987,275 |
| EG Global Finance PLC: | | | |
| 6.75% 2/7/25(d) | | 2,905,000 | 2,621,763 |
| 8.5% 10/30/25(d) | | 4,875,000 | 4,389,233 |
| EIG Pearl Holdings SARL 3.545% 8/31/36 (d) | | 2,185,000 | 1,822,967 |
| Empresa Nacional de Petroleo 4.375% 10/30/24 (d) | | 3,283,000 | 3,191,281 |
| Enbridge, Inc.: | | | |
| 4% 10/1/23 | | 5,655,000 | 5,606,758 |
| 4.25% 12/1/26 | | 2,805,000 | 2,689,965 |
| Endeavor Energy Resources LP/EER Finance, Inc. 5.75% 1/30/28 (d) | | 2,219,000 | 2,141,335 |
| Energean Israel Finance Ltd. 4.875% 3/30/26 (Reg. S) (d) | | 1,095,000 | 1,011,506 |
| Energean PLC 6.5% 4/30/27 (d) | | 770,000 | 708,400 |
| Energy Transfer LP: | | | |
| 3.75% 5/15/30 | | 24,728,000 | 21,936,948 |
| 3.9% 5/15/24(e) | | 1,542,000 | 1,506,672 |
| 4.2% 9/15/23 | | 2,098,000 | 2,083,627 |
| 4.25% 3/15/23 | | 2,044,000 | 2,043,310 |
| 4.5% 4/15/24 | | 2,483,000 | 2,450,807 |
| 4.95% 6/15/28 | | 7,159,000 | 6,914,252 |
| 5% 5/15/50 | | 21,347,000 | 17,492,588 |
| 5.25% 4/15/29 | | 4,040,000 | 3,940,121 |
| 5.4% 10/1/47 | | 19,219,000 | 16,523,277 |
| 5.8% 6/15/38 | | 3,992,000 | 3,740,260 |
| 6% 6/15/48 | | 3,699,000 | 3,402,021 |
| 6.125% 12/15/45 | | 900,000 | 842,418 |
| 6.25% 4/15/49 | | 2,774,000 | 2,638,426 |
| EnLink Midstream LLC: | | | |
| 5.375% 6/1/29 | | 20,000 | 18,572 |
| 5.625% 1/15/28(d) | | 2,155,000 | 2,052,638 |
| 6.5% 9/1/30(d) | | 510,000 | 502,314 |
| EnLink Midstream Partners LP: | | | |
| 4.15% 6/1/25 | | 625,000 | 599,328 |
| 4.85% 7/15/26 | | 1,130,000 | 1,071,071 |
| EQM Midstream Partners LP: | | | |
| 4% 8/1/24 | | 1,675,000 | 1,600,077 |
| 4.75% 1/15/31(d) | | 660,000 | 536,250 |
| 5.5% 7/15/28 | | 20,000 | 17,850 |
| 6% 7/1/25(d) | | 145,000 | 139,924 |
| 6.5% 7/1/27(d) | | 2,790,000 | 2,642,381 |
| 6.5% 7/15/48 | | 385,000 | 286,779 |
| 7.5% 6/1/27(d) | | 670,000 | 656,600 |
| 7.5% 6/1/30(d) | | 2,670,000 | 2,543,765 |
| Exxon Mobil Corp. 3.482% 3/19/30 | | 31,960,000 | 29,628,297 |
| FEL Energy VI SARL 5.75% 12/1/40 (d) | | 383,439 | 319,113 |
| Galaxy Pipeline Assets BidCo Ltd.: | | | |
| 2.16% 3/31/34(d) | | 499,316 | 421,922 |
| 2.625% 3/31/36(d) | | 1,890,000 | 1,500,188 |
| Genesis Energy LP/Genesis Energy Finance Corp.: | | | |
| 6.5% 10/1/25 | | 20,000 | 19,293 |
| 7.75% 2/1/28 | | 20,000 | 19,150 |
| GeoPark Ltd. 5.5% 1/17/27 (d) | | 835,000 | 702,600 |
| Global Partners LP/GLP Finance Corp.: | | | |
| 6.875% 1/15/29 | | 615,000 | 568,900 |
| 7% 8/1/27 | | 2,877,000 | 2,733,150 |
| Golar LNG Ltd. 7% 10/20/25 (d) | | 1,365,000 | 1,355,445 |
| Harvest Midstream I LP 7.5% 9/1/28 (d) | | 765,000 | 737,735 |
| Hess Corp.: | | | |
| 4.3% 4/1/27 | | 11,010,000 | 10,538,958 |
| 5.6% 2/15/41 | | 10,536,000 | 9,841,016 |
| 5.8% 4/1/47 | | 13,479,000 | 12,741,849 |
| 7.125% 3/15/33 | | 2,041,000 | 2,193,176 |
| 7.3% 8/15/31 | | 4,951,000 | 5,374,534 |
| 7.875% 10/1/29 | | 8,500,000 | 9,346,781 |
| Hess Midstream Partners LP: | | | |
| 4.25% 2/15/30(d) | | 800,000 | 675,504 |
| 5.125% 6/15/28(d) | | 2,915,000 | 2,674,552 |
| 5.5% 10/15/30(d) | | 640,000 | 576,000 |
| 5.625% 2/15/26(d) | | 3,025,000 | 2,943,839 |
| Hilcorp Energy I LP/Hilcorp Finance Co.: | | | |
| 5.75% 2/1/29(d) | | 555,000 | 502,275 |
| 6% 2/1/31(d) | | 20,000 | 17,944 |
| 6.25% 11/1/28(d) | | 575,000 | 534,225 |
| Holly Energy Partners LP/Holly Energy Finance Corp. 5% 2/1/28 (d) | | 4,150,000 | 3,766,084 |
| Indika Energy Capital IV Pte Ltd. 8.25% 10/22/25 (d) | | 510,000 | 498,525 |
| ITT Holdings LLC 6.5% 8/1/29 (d) | | 20,000 | 16,437 |
| KazMunaiGaz National Co.: | | | |
| 3.5% 4/14/33(d) | | 645,000 | 482,138 |
| 4.75% 4/24/25(d) | | 152,000 | 147,516 |
| 5.375% 4/24/30(d) | | 370,000 | 332,260 |
| 5.75% 4/19/47(d) | | 250,000 | 199,500 |
| Kinder Morgan Energy Partners LP: | | | |
| 5.5% 3/1/44 | | 15,589,000 | 14,080,955 |
| 6.55% 9/15/40 | | 686,000 | 686,796 |
| Kinder Morgan, Inc.: | | | |
| 5.05% 2/15/46 | | 1,762,000 | 1,486,751 |
| 5.55% 6/1/45 | | 4,783,000 | 4,324,783 |
| Kosmos Energy Ltd. 7.125% 4/4/26 (d) | | 2,695,000 | 2,415,394 |
| Leviathan Bond Ltd.: | | | |
| 5.75% 6/30/23 (Reg. S)(d) | | 120,000 | 119,546 |
| 6.125% 6/30/25 (Reg. S)(d) | | 1,200,000 | 1,167,000 |
| 6.5% 6/30/27 (Reg. S)(d) | | 115,000 | 109,768 |
| MC Brazil Downstream Trading SARL 7.25% 6/30/31 (d) | | 1,732,202 | 1,412,611 |
| Medco Laurel Tree PTE Ltd. 6.95% 11/12/28 (d) | | 890,000 | 806,451 |
| Medco Oak Tree Pte Ltd. 7.375% 5/14/26 (d) | | 575,000 | 556,313 |
| Medco Platinum Road Pte Ltd. 6.75% 1/30/25 (d) | | 700,000 | 685,694 |
| MEG Energy Corp.: | | | |
| 5.875% 2/1/29(d) | | 20,000 | 18,653 |
| 7.125% 2/1/27(d) | | 500,000 | 507,500 |
| Mesquite Energy, Inc. 7.25% 12/31/49 (c)(d)(f) | | 4,592,000 | 0 |
| Moss Creek Resources Holdings, Inc. 7.5% 1/15/26 (d) | | 20,000 | 17,977 |
| MPLX LP: | | | |
| 4.5% 7/15/23 | | 3,588,000 | 3,575,218 |
| 4.8% 2/15/29 | | 2,198,000 | 2,111,167 |
| 4.875% 12/1/24 | | 4,860,000 | 4,793,638 |
| 4.95% 9/1/32 | | 14,675,000 | 13,791,377 |
| 5.5% 2/15/49 | | 6,593,000 | 5,919,885 |
| Murphy Oil Corp. 6.375% 7/15/28 | | 20,000 | 19,306 |
| Murphy Oil U.S.A., Inc.: | | | |
| 3.75% 2/15/31(d) | | 525,000 | 424,783 |
| 4.75% 9/15/29 | | 20,000 | 17,850 |
| NAK Naftogaz Ukraine: | | | |
| 7.375% 7/19/24 (Reg. S)(f) | | 955,000 | 217,859 |
| 7.625% 11/8/26(d) | | 305,000 | 57,950 |
| New Fortress Energy, Inc.: | | | |
| 6.5% 9/30/26(d) | | 15,145,000 | 13,857,675 |
| 6.75% 9/15/25(d) | | 13,954,000 | 13,084,108 |
| NGL Energy Operating LLC/NGL Energy Finance Corp. 7.5% 2/1/26 (d) | | 1,775,000 | 1,694,978 |
| Nostrum Oil & Gas Finance BV: | | | |
| 5% 6/30/26(d) | | 899,000 | 692,230 |
| 14% 6/30/26 pay-in-kind(d)(e) | | 1,242,246 | 583,856 |
| Occidental Petroleum Corp.: | | | |
| 4.2% 3/15/48 | | 640,000 | 489,600 |
| 4.4% 4/15/46 | | 1,920,000 | 1,473,073 |
| 4.4% 8/15/49 | | 895,000 | 689,150 |
| 4.5% 7/15/44 | | 1,575,000 | 1,228,797 |
| 5.5% 12/1/25 | | 635,000 | 629,285 |
| 5.55% 3/15/26 | | 10,081,000 | 10,026,260 |
| 5.875% 9/1/25 | | 925,000 | 922,688 |
| 6.125% 1/1/31 | | 1,400,000 | 1,409,954 |
| 6.45% 9/15/36 | | 10,256,000 | 10,307,280 |
| 6.6% 3/15/46 | | 10,444,000 | 10,628,128 |
| 6.625% 9/1/30 | | 5,930,000 | 6,093,075 |
| 7.5% 5/1/31 | | 15,894,000 | 17,006,580 |
| 7.875% 9/15/31 | | 465,000 | 504,995 |
| 7.95% 6/15/39 | | 320,000 | 352,816 |
| 8.5% 7/15/27 | | 20,000 | 21,458 |
| 8.875% 7/15/30 | | 2,765,000 | 3,140,625 |
| Parkland Corp. 4.5% 10/1/29 (d) | | 20,000 | 16,800 |
| PBF Holding Co. LLC/PBF Finance Corp. 7.25% 6/15/25 | | 40,000 | 39,913 |
| Petroleos de Venezuela SA: | | | |
| 5.375% 4/12/27(f) | | 353,900 | 15,068 |
| 6% 5/16/24(d)(f) | | 1,847,331 | 79,435 |
| 6% 11/15/26(d)(f) | | 1,619,833 | 68,843 |
| 12.75% 12/31/49(d)(f) | | 98,000 | 4,655 |
| Petroleos Mexicanos: | | | |
| 4.5% 1/23/26 | | 13,054,000 | 12,012,944 |
| 4.875% 1/18/24 | | 2,709,000 | 2,668,365 |
| 5.95% 1/28/31 | | 38,105,000 | 29,037,915 |
| 6.35% 2/12/48 | | 31,726,000 | 19,594,771 |
| 6.49% 1/23/27 | | 14,935,000 | 13,555,006 |
| 6.5% 3/13/27 | | 42,674,000 | 38,637,040 |
| 6.5% 6/2/41 | | 255,000 | 170,697 |
| 6.625% 6/15/35 | | 3,392,000 | 2,491,661 |
| 6.7% 2/16/32 | | 11,667,000 | 9,235,597 |
| 6.75% 9/21/47 | | 18,053,000 | 11,627,937 |
| 6.84% 1/23/30 | | 33,047,000 | 27,458,752 |
| 6.875% 10/16/25 | | 575,000 | 570,688 |
| 6.875% 8/4/26 | | 1,070,000 | 1,022,011 |
| 6.95% 1/28/60 | | 16,303,000 | 10,446,555 |
| 7.69% 1/23/50 | | 31,233,000 | 21,939,621 |
| Petronas Capital Ltd.: | | | |
| 3.404% 4/28/61(d) | | 415,000 | 290,837 |
| 3.5% 4/21/30(d) | | 335,000 | 305,456 |
| Petrorio Luxembourg SARL 6.125% 6/9/26 (d) | | 575,000 | 543,203 |
| Phillips 66 Co. 3.85% 4/9/25 | | 1,307,000 | 1,268,767 |
| Plains All American Pipeline LP/PAA Finance Corp.: | | | |
| 3.55% 12/15/29 | | 2,689,000 | 2,331,562 |
| 3.6% 11/1/24 | | 2,794,000 | 2,703,554 |
| PT Adaro Indonesia 4.25% 10/31/24 (d) | | 1,565,000 | 1,489,978 |
| PT Pertamina Persero 4.175% 1/21/50 (d) | | 405,000 | 310,660 |
| Qatar Petroleum: | | | |
| 1.375% 9/12/26(d) | | 2,205,000 | 1,953,454 |
| 2.25% 7/12/31(d) | | 1,865,000 | 1,527,901 |
| 3.125% 7/12/41(d) | | 1,850,000 | 1,398,253 |
| 3.3% 7/12/51(d) | | 1,545,000 | 1,121,380 |
| Range Resources Corp.: | | | |
| 4.75% 2/15/30(d) | | 20,000 | 17,900 |
| 4.875% 5/15/25 | | 520,000 | 507,311 |
| 8.25% 1/15/29 | | 500,000 | 513,125 |
| Rockies Express Pipeline LLC: | | | |
| 3.6% 5/15/25(d) | | 20,000 | 18,494 |
| 4.8% 5/15/30(d) | | 110,000 | 95,110 |
| 4.95% 7/15/29(d) | | 1,290,000 | 1,122,171 |
| 6.875% 4/15/40(d) | | 490,000 | 401,245 |
| SA Global Sukuk Ltd. 1.602% 6/17/26 (d) | | 2,215,000 | 1,993,722 |
| Sabine Pass Liquefaction LLC 4.5% 5/15/30 | | 17,428,000 | 16,325,561 |
| Saudi Arabian Oil Co.: | | | |
| 1.625% 11/24/25(d) | | 1,725,000 | 1,565,761 |
| 3.25% 11/24/50(d) | | 620,000 | 422,530 |
| 3.5% 4/16/29(d) | | 2,590,000 | 2,361,433 |
| 3.5% 11/24/70(d) | | 645,000 | 421,387 |
| 4.25% 4/16/39(d) | | 2,995,000 | 2,623,620 |
| Sibur Securities DAC 2.95% 7/8/25 (d)(f) | | 330,000 | 222,750 |
| Sinopec Group Overseas Development Ltd.: | | | |
| 1.45% 1/8/26(d) | | 530,000 | 476,719 |
| 2.7% 5/13/30(d) | | 325,000 | 285,662 |
| SM Energy Co.: | | | |
| 5.625% 6/1/25 | | 1,430,000 | 1,375,224 |
| 6.5% 7/15/28 | | 20,000 | 18,450 |
| 6.625% 1/15/27 | | 20,000 | 19,025 |
| Southwestern Energy Co.: | | | |
| 4.75% 2/1/32 | | 1,190,000 | 1,022,603 |
| 5.375% 3/15/30 | | 20,000 | 18,270 |
| Sunoco LP/Sunoco Finance Corp.: | | | |
| 4.5% 5/15/29 | | 1,460,000 | 1,281,317 |
| 5.875% 3/15/28 | | 1,270,000 | 1,218,868 |
| 6% 4/15/27 | | 20,000 | 19,650 |
| Tallgrass Energy Partners LP / Tallgrass Energy Finance Corp.: | | | |
| 5.5% 1/15/28(d) | | 2,863,000 | 2,571,321 |
| 6% 3/1/27(d) | | 5,215,000 | 4,842,073 |
| 6% 12/31/30(d) | | 5,380,000 | 4,639,389 |
| 6% 9/1/31(d) | | 2,615,000 | 2,234,607 |
| 7.5% 10/1/25(d) | | 5,155,000 | 5,130,772 |
| Targa Resources Partners LP/Targa Resources Partners Finance Corp. 4.875% 2/1/31 | | 1,285,000 | 1,166,870 |
| Teine Energy Ltd. 6.875% 4/15/29 (d) | | 500,000 | 457,239 |
| Tengizchevroil Finance Co. International Ltd. 3.25% 8/15/30 (d) | | 955,000 | 716,250 |
| The Williams Companies, Inc.: | | | |
| 3.5% 11/15/30 | | 18,443,000 | 16,139,317 |
| 3.9% 1/15/25 | | 9,678,000 | 9,393,302 |
| 4% 9/15/25 | | 1,089,000 | 1,050,387 |
| 4.3% 3/4/24 | | 14,855,000 | 14,666,846 |
| 4.5% 11/15/23 | | 2,658,000 | 2,642,619 |
| 4.55% 6/24/24 | | 12,340,000 | 12,169,655 |
| 4.65% 8/15/32 | | 34,934,000 | 32,549,354 |
| 5.3% 8/15/52 | | 3,368,000 | 3,042,947 |
| 5.75% 6/24/44 | | 6,964,000 | 6,639,117 |
| Transcontinental Gas Pipe Line Co. LLC 3.25% 5/15/30 | | 2,221,000 | 1,933,668 |
| Tullow Oil PLC: | | | |
| 7% 3/1/25(d) | | 455,000 | 286,650 |
| 10.25% 5/15/26(d) | | 1,300,000 | 1,044,875 |
| Uzbekneftegaz JSC 4.75% 11/16/28 (d) | | 200,000 | 164,500 |
| Venture Global Calcasieu Pass LLC: | | | |
| 3.875% 8/15/29(d) | | 3,420,000 | 2,949,750 |
| 3.875% 11/1/33(d) | | 720,000 | 587,088 |
| 4.125% 8/15/31(d) | | 1,525,000 | 1,311,500 |
| 6.25% 1/15/30(d) | | 1,855,000 | 1,829,494 |
| Western Gas Partners LP: | | | |
| 3.35% 2/1/25 | | 2,712,000 | 2,570,336 |
| 3.95% 6/1/25 | | 2,404,000 | 2,283,800 |
| 4.3% 2/1/30 | | 20,000 | 17,719 |
| 4.65% 7/1/26 | | 2,854,000 | 2,711,300 |
| 4.75% 8/15/28 | | 2,108,000 | 1,955,170 |
| 5.3% 3/1/48 | | 640,000 | 527,140 |
| 5.5% 8/15/48 | | 385,000 | 322,438 |
| 5.5% 2/1/50 | | 1,280,000 | 1,044,983 |
| YPF SA: | | | |
| 8.5% 3/23/25(d) | | 532,500 | 502,148 |
| 8.75% 4/4/24(d) | | 1,999,200 | 1,940,848 |
| | | | 888,807,474 |
TOTAL ENERGY | | | 906,620,954 |
| | | | |
| FINANCIALS - 14.0% | | | |
| Banks - 5.9% | | | |
| Access Bank PLC 6.125% 9/21/26 (d) | | 1,015,000 | 827,225 |
| AIB Group PLC: | | | |
| 1.875% 11/19/29 (Reg. S)(e) | EUR | 4,000,000 | 3,949,232 |
| 2.25% 4/4/28 (Reg. S)(e) | EUR | 5,000,000 | 4,777,123 |
| 2.875% 5/30/31 (Reg. S)(e) | EUR | 3,285,000 | 3,145,463 |
| 3.625% 7/4/26 (Reg. S)(e) | EUR | 1,800,000 | 1,863,590 |
| 4.625% 7/23/29 (Reg. S)(e) | EUR | 300,000 | 309,441 |
| Alpha Bank SA 4.25% 2/13/30 (Reg. S) (e) | EUR | 1,750,000 | 1,636,452 |
| Bank of America Corp.: | | | |
| 2.299% 7/21/32(e) | | 18,130,000 | 14,178,493 |
| 3.419% 12/20/28(e) | | 8,456,000 | 7,696,515 |
| 3.5% 4/19/26 | | 7,461,000 | 7,109,544 |
| 3.705% 4/24/28(e) | | 11,813,000 | 10,988,863 |
| 3.864% 7/23/24(e) | | 24,740,000 | 24,557,143 |
| 3.95% 4/21/25 | | 6,226,000 | 6,035,044 |
| 4.1% 7/24/23 | | 4,167,000 | 4,147,924 |
| 4.2% 8/26/24 | | 14,710,000 | 14,425,529 |
| 4.25% 10/22/26 | | 5,344,000 | 5,132,440 |
| 4.376% 4/27/28(e) | | 20,000,000 | 19,121,209 |
| 4.45% 3/3/26 | | 3,050,000 | 2,965,327 |
| 4.571% 4/27/33(e) | | 10,000,000 | 9,295,561 |
| 5.015% 7/22/33(e) | | 121,493,000 | 116,888,811 |
| Bank of Ireland Group PLC: | | | |
| 1.375% 8/11/31 (Reg. S)(e) | EUR | 5,545,000 | 5,040,488 |
| 2.029% 9/30/27(d)(e) | | 4,565,000 | 3,961,197 |
| 2.375% 10/14/29 (Reg. S)(e) | EUR | 2,960,000 | 2,968,104 |
| BankMuscat SAOG 4.75% 3/17/26 (Reg. S) | | 390,000 | 376,179 |
| Barclays PLC: | | | |
| 2.852% 5/7/26(e) | | 17,739,000 | 16,608,896 |
| 4.375% 1/12/26 | | 9,104,000 | 8,798,869 |
| 5.088% 6/20/30(e) | | 14,797,000 | 13,707,549 |
| 5.2% 5/12/26 | | 6,970,000 | 6,787,203 |
| 5.262% 1/29/34 (Reg. S)(e) | EUR | 940,000 | 998,106 |
| 5.746% 8/9/33(e) | | 1,073,000 | 1,034,818 |
| 7.437% 11/2/33(e) | | 950,000 | 1,025,658 |
| 8.407% 11/14/32 (Reg. S)(e) | GBP | 1,350,000 | 1,699,857 |
| BNP Paribas SA: | | | |
| 2.159% 9/15/29(d)(e) | | 5,025,000 | 4,155,280 |
| 2.219% 6/9/26(d)(e) | | 15,515,000 | 14,329,737 |
| 2.5% 3/31/32 (Reg. S)(e) | EUR | 3,800,000 | 3,569,528 |
| 5.125% 1/13/29(d)(e) | | 1,018,000 | 1,001,026 |
| BPCE SA 1.5% 1/13/42 (Reg. S) (e) | EUR | 3,400,000 | 3,026,977 |
| Citigroup, Inc.: | | | |
| 3.352% 4/24/25(e) | | 9,970,000 | 9,700,346 |
| 4.3% 11/20/26 | | 3,067,000 | 2,940,943 |
| 4.4% 6/10/25 | | 18,137,000 | 17,745,892 |
| 4.412% 3/31/31(e) | | 22,342,000 | 20,767,596 |
| 4.45% 9/29/27 | | 10,486,000 | 10,014,153 |
| 4.6% 3/9/26 | | 4,812,000 | 4,685,343 |
| 4.91% 5/24/33(e) | | 54,777,000 | 51,911,257 |
| 5.5% 9/13/25 | | 8,473,000 | 8,488,415 |
| 5.875% 7/1/24 (Reg. S) | GBP | 850,000 | 1,023,909 |
| Citizens Financial Group, Inc. 2.638% 9/30/32 | | 5,802,000 | 4,419,807 |
| Commerzbank AG 8.625% 2/28/33 (Reg. S) (e) | GBP | 400,000 | 492,910 |
| Commonwealth Bank of Australia 3.61% 9/12/34 (d)(e) | | 5,339,000 | 4,508,827 |
| Credit Agricole SA: | | | |
| 1.25% 10/2/24 (Reg. S) | GBP | 900,000 | 1,018,845 |
| 4.875% 10/23/29 (Reg. S) | GBP | 600,000 | 706,889 |
| Danske Bank A/S: | | | |
| 2.25% 1/14/28 (Reg. S)(e) | GBP | 2,290,000 | 2,391,177 |
| 4.625% 4/13/27 (Reg. S)(e) | GBP | 1,000,000 | 1,178,165 |
| 5.375% 1/12/24 (Reg. S) | | 5,350,000 | 5,334,022 |
| Discover Bank 4.2% 8/8/23 | | 6,479,000 | 6,442,149 |
| First Citizens Bank & Trust Co. 3.929% 6/19/24 (e) | | 2,695,000 | 2,678,927 |
| HAT Holdings I LLC/HAT Holdings II LLC 3.375% 6/15/26 (d) | | 20,000 | 17,350 |
| HSBC Holdings PLC: | | | |
| 4.25% 3/14/24 | | 2,247,000 | 2,213,204 |
| 4.95% 3/31/30 | | 3,002,000 | 2,892,561 |
| 5.402% 8/11/33(e) | | 540,000 | 517,553 |
| 7.39% 11/3/28(e) | | 1,700,000 | 1,795,601 |
| 8.201% 11/16/34 (Reg. S)(e) | GBP | 1,900,000 | 2,420,410 |
| Intesa Sanpaolo SpA: | | | |
| 3.875% 7/14/27(d) | | 3,181,000 | 2,874,009 |
| 4.198% 6/1/32(d)(e) | | 2,306,000 | 1,737,452 |
| 5.017% 6/26/24(d) | | 9,040,000 | 8,731,464 |
| 5.71% 1/15/26(d) | | 32,509,000 | 31,118,007 |
| JPMorgan Chase & Co.: | | | |
| 2.956% 5/13/31(e) | | 9,435,000 | 7,923,559 |
| 3.797% 7/23/24(e) | | 25,215,000 | 25,033,046 |
| 3.875% 9/10/24 | | 12,990,000 | 12,679,993 |
| 4.125% 12/15/26 | | 11,765,000 | 11,351,584 |
| 4.323% 4/26/28(e) | | 25,000,000 | 23,967,128 |
| 4.452% 12/5/29(e) | | 20,700,000 | 19,615,878 |
| 4.493% 3/24/31(e) | | 30,800,000 | 29,060,033 |
| 4.586% 4/26/33(e) | | 73,217,000 | 68,236,731 |
| 4.912% 7/25/33(e) | | 53,314,000 | 51,048,689 |
| 5.717% 9/14/33(e) | | 22,300,000 | 22,159,303 |
| Lloyds Bank Corporate Markets PLC: | | | |
| 1.5% 6/23/23 (Reg. S) | GBP | 880,000 | 1,046,335 |
| 1.75% 7/11/24 (Reg. S) | GBP | 910,000 | 1,043,246 |
| Lloyds Banking Group PLC: | | | |
| 1.985% 12/15/31(e) | GBP | 1,840,000 | 1,890,875 |
| 4.5% 1/11/29 (Reg. S)(e) | EUR | 1,170,000 | 1,229,723 |
| 4.976% 8/11/33(e) | | 540,000 | 502,963 |
| National Bank of Uzbekistan 4.85% 10/21/25 (Reg. S) | | 525,000 | 486,150 |
| NatWest Group PLC: | | | |
| 2.105% 11/28/31 (Reg. S)(e) | GBP | 3,085,000 | 3,144,070 |
| 3.073% 5/22/28(e) | | 9,805,000 | 8,846,550 |
| 3.619% 3/29/29 (Reg. S)(e) | GBP | 2,830,000 | 3,053,270 |
| 3.622% 8/14/30 (Reg. S)(e) | GBP | 1,055,000 | 1,184,509 |
| 4.8% 4/5/26 | | 9,111,000 | 8,871,529 |
| 5.125% 5/28/24 | | 25,230,000 | 25,023,481 |
| 7.416% 6/6/33 (Reg. S)(e) | GBP | 1,550,000 | 1,900,203 |
| NatWest Markets PLC 2.375% 5/21/23 (d) | | 18,955,000 | 18,824,490 |
| Oschadbank Via SSB #1 PLC 9.375% 3/10/23 (d) | | 61,000 | 43,958 |
| Rabobank Nederland: | | | |
| 4% 1/10/30 (Reg. S) | EUR | 1,600,000 | 1,653,904 |
| 4.375% 8/4/25 | | 9,413,000 | 9,118,138 |
| Societe Generale: | | | |
| 1.038% 6/18/25(d)(e) | | 36,500,000 | 34,160,477 |
| 1.488% 12/14/26(d)(e) | | 18,670,000 | 16,540,883 |
| 4.25% 4/14/25(d) | | 1,800,000 | 1,725,763 |
| 4.75% 11/24/25(d) | | 400,000 | 385,416 |
| 6.691% 1/10/34(d)(e) | | 1,000,000 | 1,020,134 |
| Synchrony Bank: | | | |
| 5.4% 8/22/25 | | 14,157,000 | 13,932,053 |
| 5.625% 8/23/27 | | 12,818,000 | 12,535,977 |
| UniCredit SpA: | | | |
| 2.731% 1/15/32 (Reg. S)(e) | EUR | 3,350,000 | 3,042,805 |
| 5.459% 6/30/35(d)(e) | | 20,000 | 16,967 |
| 5.861% 6/19/32(d)(e) | | 1,500,000 | 1,361,338 |
| 7.296% 4/2/34(d)(e) | | 20,000 | 18,847 |
| Virgin Money UK PLC 5.125% 12/11/30 (Reg. S) (e) | GBP | 1,840,000 | 2,083,402 |
| Wells Fargo & Co.: | | | |
| 2.125% 12/20/23 (Reg. S) | GBP | 880,000 | 1,033,184 |
| 2.406% 10/30/25(e) | | 9,442,000 | 8,955,858 |
| 3.526% 3/24/28(e) | | 19,749,000 | 18,287,534 |
| 4.478% 4/4/31(e) | | 30,867,000 | 29,031,215 |
| 4.897% 7/25/33(e) | | 70,571,000 | 67,404,939 |
| 5.013% 4/4/51(e) | | 34,319,000 | 31,584,641 |
| Wells Fargo Bank NA 5.25% 8/1/23 (Reg. S) | GBP | 850,000 | 1,021,461 |
| Westpac Banking Corp. 4.11% 7/24/34 (e) | | 7,550,000 | 6,677,126 |
| | | | 1,168,666,942 |
| Capital Markets - 3.3% | | | |
| Affiliated Managers Group, Inc.: | | | |
| 3.5% 8/1/25 | | 7,624,000 | 7,314,041 |
| 4.25% 2/15/24 | | 5,321,000 | 5,241,079 |
| AG Issuer LLC 6.25% 3/1/28 (d) | | 20,000 | 18,668 |
| Ares Capital Corp.: | | | |
| 3.875% 1/15/26 | | 25,763,000 | 23,901,472 |
| 4.2% 6/10/24 | | 17,909,000 | 17,524,509 |
| AssuredPartners, Inc.: | | | |
| 5.625% 1/15/29(d) | | 1,015,000 | 860,002 |
| 7% 8/15/25(d) | | 20,000 | 19,589 |
| Coinbase Global, Inc.: | | | |
| 3.375% 10/1/28(d) | | 3,175,000 | 2,079,625 |
| 3.625% 10/1/31(d) | | 4,355,000 | 2,626,413 |
| Credit Suisse Group AG: | | | |
| 2.125% 11/15/29 (Reg. S)(e) | GBP | 2,000,000 | 1,767,471 |
| 2.593% 9/11/25(d)(e) | | 21,556,000 | 19,530,703 |
| 3.75% 3/26/25 | | 7,059,000 | 6,448,467 |
| 3.8% 6/9/23 | | 13,301,000 | 13,141,388 |
| 3.869% 1/12/29(d)(e) | | 6,719,000 | 5,510,798 |
| 4.194% 4/1/31(d)(e) | | 21,526,000 | 17,071,763 |
| 4.207% 6/12/24(d)(e) | | 10,289,000 | 10,137,693 |
| 4.282% 1/9/28(d) | | 3,350,000 | 2,812,477 |
| 6.5% 8/8/23 (Reg. S) | | 3,255,000 | 3,179,810 |
| 6.537% 8/12/33(d)(e) | | 30,530,000 | 27,415,645 |
| 7.375% 9/7/33 (Reg. S)(e) | GBP | 1,100,000 | 1,255,152 |
| Deutsche Bank AG: | | | |
| 3.25% 5/24/28 (Reg. S)(e) | EUR | 1,900,000 | 1,866,645 |
| 4% 6/24/32 (Reg. S)(e) | EUR | 4,200,000 | 3,999,430 |
| 4.1% 1/13/26 | | 3,085,000 | 2,942,484 |
| 4.5% 4/1/25 | | 43,904,000 | 42,333,582 |
| 6.125% 12/12/30 (Reg. S)(e) | GBP | 3,600,000 | 4,223,303 |
| Deutsche Bank AG New York Branch: | | | |
| 3.729% 1/14/32(e) | | 29,675,000 | 23,274,829 |
| 5.882% 7/8/31(e) | | 4,150,000 | 3,810,111 |
| 6.72% 1/18/29(e) | | 10,450,000 | 10,560,684 |
| Goldman Sachs Group, Inc.: | | | |
| 2.383% 7/21/32(e) | | 18,352,000 | 14,414,030 |
| 3.102% 2/24/33(e) | | 39,245,000 | 32,348,204 |
| 3.691% 6/5/28(e) | | 72,922,000 | 67,734,376 |
| 3.75% 5/22/25 | | 7,259,000 | 7,013,570 |
| 3.8% 3/15/30 | | 36,810,000 | 33,404,252 |
| 6.75% 10/1/37 | | 3,974,000 | 4,230,125 |
| Hightower Holding LLC 6.75% 4/15/29 (d) | | 1,895,000 | 1,603,066 |
| Jane Street Group LLC/JSG Finance, Inc. 4.5% 11/15/29 (d) | | 680,000 | 596,829 |
| Jefferies Finance LLC/JFIN Co-Issuer Corp. 5% 8/15/28 (d) | | 655,000 | 553,154 |
| LPL Holdings, Inc.: | | | |
| 4% 3/15/29(d) | | 20,000 | 17,596 |
| 4.375% 5/15/31(d) | | 640,000 | 553,620 |
| 4.625% 11/15/27(d) | | 20,000 | 18,600 |
| Moody's Corp.: | | | |
| 3.25% 1/15/28 | | 4,181,000 | 3,842,967 |
| 3.75% 3/24/25 | | 10,682,000 | 10,331,589 |
| 4.875% 2/15/24 | | 3,926,000 | 3,900,370 |
| Morgan Stanley: | | | |
| 3.125% 7/27/26 | | 39,505,000 | 36,762,991 |
| 3.622% 4/1/31(e) | | 21,065,000 | 18,652,450 |
| 3.737% 4/24/24(e) | | 45,366,000 | 45,232,448 |
| 4.21% 4/20/28(e) | | 20,000,000 | 18,998,376 |
| 4.431% 1/23/30(e) | | 8,668,000 | 8,159,645 |
| 4.656% 3/2/29(e) | EUR | 1,300,000 | 1,381,587 |
| 4.889% 7/20/33(e) | | 44,206,000 | 41,974,249 |
| 5% 11/24/25 | | 15,462,000 | 15,301,749 |
| MSCI, Inc.: | | | |
| 3.25% 8/15/33(d) | | 1,605,000 | 1,265,591 |
| 3.625% 9/1/30(d) | | 2,440,000 | 2,074,244 |
| 3.875% 2/15/31(d) | | 20,000 | 17,214 |
| 4% 11/15/29(d) | | 3,020,000 | 2,673,002 |
| UBS Group AG: | | | |
| 1.494% 8/10/27(d)(e) | | 11,454,000 | 9,926,541 |
| 4.125% 9/24/25(d) | | 6,852,000 | 6,630,912 |
| 4.988% 8/5/33 (Reg. S)(e) | | 500,000 | 468,042 |
| VistaJet Malta Finance PLC / XO Management Holding, Inc.: | | | |
| 6.375% 2/1/30(d) | | 535,000 | 468,267 |
| 7.875% 5/1/27(d) | | 535,000 | 510,264 |
| | | | 651,927,753 |
| Consumer Finance - 2.7% | | | |
| AerCap Ireland Capital Ltd./AerCap Global Aviation Trust: | | | |
| 1.65% 10/29/24 | | 21,930,000 | 20,343,950 |
| 2.45% 10/29/26 | | 8,002,000 | 7,054,338 |
| 2.875% 8/14/24 | | 12,392,000 | 11,783,398 |
| 3% 10/29/28 | | 8,382,000 | 7,142,407 |
| 3.3% 1/30/32 | | 18,966,000 | 15,177,311 |
| 4.45% 4/3/26 | | 6,213,000 | 5,904,322 |
| 4.875% 1/16/24 | | 9,923,000 | 9,825,469 |
| 6.5% 7/15/25 | | 7,728,000 | 7,754,401 |
| Ally Financial, Inc.: | | | |
| 1.45% 10/2/23 | | 4,483,000 | 4,369,446 |
| 3.05% 6/5/23 | | 20,571,000 | 20,431,429 |
| 4.75% 6/9/27 | | 25,000,000 | 23,819,905 |
| 5.125% 9/30/24 | | 4,357,000 | 4,318,923 |
| 5.75% 11/20/25 | | 10,920,000 | 10,689,402 |
| 5.8% 5/1/25 | | 11,179,000 | 11,186,382 |
| 6.7% 2/14/33 | | 2,560,000 | 2,432,400 |
| 7.1% 11/15/27 | | 21,840,000 | 22,674,046 |
| 8% 11/1/31 | | 5,892,000 | 6,378,015 |
| Capital One Financial Corp.: | | | |
| 2.6% 5/11/23 | | 16,326,000 | 16,245,821 |
| 2.636% 3/3/26(e) | | 10,020,000 | 9,419,787 |
| 3.273% 3/1/30(e) | | 12,815,000 | 11,048,944 |
| 3.65% 5/11/27 | | 29,451,000 | 27,429,432 |
| 3.8% 1/31/28 | | 13,624,000 | 12,614,766 |
| 4.927% 5/10/28(e) | | 27,617,000 | 26,739,738 |
| 4.985% 7/24/26(e) | | 14,379,000 | 14,146,203 |
| 5.247% 7/26/30(e) | | 22,350,000 | 21,430,615 |
| 5.268% 5/10/33(e) | | 10,000,000 | 9,470,943 |
| Discover Financial Services: | | | |
| 3.95% 11/6/24 | | 5,349,000 | 5,206,000 |
| 4.1% 2/9/27 | | 6,829,000 | 6,470,868 |
| 4.5% 1/30/26 | | 9,265,000 | 8,969,002 |
| 6.7% 11/29/32 | | 3,827,000 | 3,954,154 |
| First Cash Financial Services, Inc. 5.625% 1/1/30 (d) | | 20,000 | 17,691 |
| Ford Motor Credit Co. LLC: | | | |
| U.S. Secured Overnight Fin. Rate (SOFR) Index + 2.950% 7.3899% 3/6/26(e)(h) | | 3,440,000 | 3,479,713 |
| 2.3% 2/10/25 | | 5,680,000 | 5,220,493 |
| 2.9% 2/10/29 | | 3,765,000 | 3,064,672 |
| 3.375% 11/13/25 | | 1,160,000 | 1,068,441 |
| 3.625% 6/17/31 | | 1,755,000 | 1,390,348 |
| 3.81% 1/9/24 | | 40,000 | 39,101 |
| 3.815% 11/2/27 | | 1,190,000 | 1,044,903 |
| 4% 11/13/30 | | 650,000 | 541,743 |
| 4.063% 11/1/24 | | 42,632,000 | 40,988,553 |
| 4.125% 8/17/27 | | 1,415,000 | 1,260,706 |
| 4.271% 1/9/27 | | 40,000 | 36,225 |
| 4.389% 1/8/26 | | 1,240,000 | 1,166,356 |
| 4.95% 5/28/27 | | 12,475,000 | 11,622,833 |
| 5.113% 5/3/29 | | 20,000 | 18,282 |
| 5.125% 6/16/25 | | 620,000 | 598,535 |
| 5.584% 3/18/24 | | 12,456,000 | 12,368,808 |
| 6.86% 6/5/26 | GBP | 2,140,000 | 2,571,525 |
| 6.95% 3/6/26 | | 4,995,000 | 4,994,399 |
| 7.35% 11/4/27 | | 40,000 | 40,524 |
| Navient Corp.: | | | |
| 5% 3/15/27 | | 20,000 | 17,780 |
| 5.5% 3/15/29 | | 20,000 | 16,917 |
| OneMain Finance Corp.: | | | |
| 3.5% 1/15/27 | | 2,320,000 | 1,948,396 |
| 3.875% 9/15/28 | | 4,330,000 | 3,442,350 |
| 4% 9/15/30 | | 20,000 | 15,276 |
| 5.375% 11/15/29 | | 2,020,000 | 1,700,921 |
| 6.625% 1/15/28 | | 20,000 | 18,624 |
| 6.875% 3/15/25 | | 3,080,000 | 3,006,792 |
| 7.125% 3/15/26 | | 3,600,000 | 3,499,127 |
| Shriram Transport Finance Co. Ltd.: | | | |
| 4.15% 7/18/25(d) | | 695,000 | 641,702 |
| 5.1% 7/16/23(d) | | 390,000 | 384,638 |
| SLM Corp. 3.125% 11/2/26 | | 20,000 | 17,254 |
| Synchrony Financial: | | | |
| 3.95% 12/1/27 | | 14,204,000 | 12,912,153 |
| 4.25% 8/15/24 | | 11,783,000 | 11,498,394 |
| 4.375% 3/19/24 | | 11,497,000 | 11,337,436 |
| 5.15% 3/19/29 | | 21,450,000 | 20,184,655 |
| Toyota Motor Credit Corp. 2.9% 3/30/23 | | 16,253,000 | 16,223,866 |
| | | | 542,831,949 |
| Diversified Financial Services - 1.3% | | | |
| 1MDB Global Investments Ltd. 4.4% 3/9/23 | | 3,300,000 | 3,274,260 |
| Altus Midstream LP 5.875% 6/15/30 (d) | | 3,385,000 | 3,128,451 |
| Blackstone Private Credit Fund: | | | |
| 4.7% 3/24/25 | | 38,436,000 | 37,071,003 |
| 4.875% 4/14/26 | GBP | 3,960,000 | 4,358,978 |
| 7.05% 9/29/25(d) | | 18,929,000 | 18,996,702 |
| Brixmor Operating Partnership LP: | | | |
| 3.85% 2/1/25 | | 5,199,000 | 4,984,276 |
| 4.05% 7/1/30 | | 10,439,000 | 9,229,087 |
| 4.125% 6/15/26 | | 8,538,000 | 8,035,170 |
| 4.125% 5/15/29 | | 10,374,000 | 9,344,727 |
| Compass Group Diversified Holdings LLC 5.25% 4/15/29 (d) | | 20,000 | 17,433 |
| Corebridge Financial, Inc.: | | | |
| 3.5% 4/4/25(d) | | 4,316,000 | 4,128,251 |
| 3.65% 4/5/27(d) | | 15,270,000 | 14,247,628 |
| 3.85% 4/5/29(d) | | 6,037,000 | 5,453,242 |
| 3.9% 4/5/32(d) | | 7,187,000 | 6,288,708 |
| 4.35% 4/5/42(d) | | 1,635,000 | 1,347,657 |
| 4.4% 4/5/52(d) | | 4,834,000 | 3,853,464 |
| Equitable Holdings, Inc. 3.9% 4/20/23 | | 1,202,000 | 1,198,857 |
| GACI First Investment 5.25% 10/13/32 (Reg. S) | | 405,000 | 403,988 |
| Icahn Enterprises LP/Icahn Enterprises Finance Corp.: | | | |
| 4.375% 2/1/29 | | 4,970,000 | 4,292,601 |
| 4.75% 9/15/24 | | 740,000 | 721,500 |
| 5.25% 5/15/27 | | 10,219,000 | 9,503,670 |
| 6.25% 5/15/26 | | 9,820,000 | 9,525,400 |
| 6.375% 12/15/25 | | 1,435,000 | 1,416,316 |
| Jackson Financial, Inc.: | | | |
| 5.17% 6/8/27 | | 6,781,000 | 6,713,942 |
| 5.67% 6/8/32 | | 46,562,000 | 45,490,903 |
| Leighton Finance U.S.A. Pty Ltd. 1.5% 5/28/29 (Reg. S) | EUR | 3,255,000 | 2,722,150 |
| Liberty Costa Rica SR SF 10.875% 1/15/31 (d) | | 720,000 | 675,900 |
| MDGH GMTN RSC Ltd.: | | | |
| 2.875% 11/7/29(d) | | 740,000 | 654,900 |
| 5.5% 4/28/33(d) | | 510,000 | 528,207 |
| MidCap Financial Issuer Trust 6.5% 5/1/28 (d) | | 20,000 | 17,250 |
| MPH Acquisition Holdings LLC: | | | |
| 5.5% 9/1/28(d) | | 20,000 | 15,153 |
| 5.75% 11/1/28(d) | | 20,000 | 12,998 |
| Park Aerospace Holdings Ltd. 5.5% 2/15/24 (d) | | 12,849,000 | 12,695,652 |
| Pine Street Trust I 4.572% 2/15/29 (d) | | 11,350,000 | 10,703,684 |
| Pine Street Trust II 5.568% 2/15/49 (d) | | 11,300,000 | 10,068,029 |
| PTT Treasury Center Co. Ltd. 3.7% 7/16/70 (d) | | 335,000 | 215,510 |
| United Shore Financial Services LLC 5.75% 6/15/27 (d) | | 20,000 | 17,605 |
| VMED O2 UK Financing I PLC 4.25% 1/31/31 (d) | | 2,790,000 | 2,238,591 |
| | | | 253,591,843 |
| Insurance - 0.8% | | | |
| Acrisure LLC / Acrisure Finance, Inc.: | | | |
| 4.25% 2/15/29(d) | | 530,000 | 431,396 |
| 7% 11/15/25(d) | | 275,000 | 256,994 |
| AIA Group Ltd.: | | | |
| 0.88% 9/9/33 (Reg. S)(e) | EUR | 1,160,000 | 973,868 |
| 3.375% 4/7/30(d) | | 15,590,000 | 14,055,453 |
| Alliant Holdings Intermediate LLC: | | | |
| 4.25% 10/15/27(d) | | 3,470,000 | 3,063,098 |
| 6.75% 4/15/28(d) | | 2,545,000 | 2,489,035 |
| American International Group, Inc. 2.5% 6/30/25 | | 20,400,000 | 19,202,027 |
| AmWINS Group, Inc. 4.875% 6/30/29 (d) | | 4,400,000 | 3,736,937 |
| Cloverie PLC 4.5% 9/11/44 (Reg. S) (e) | | 13,795,000 | 13,206,505 |
| Credit Agricole Assurances SA 4.75% 9/27/48 (e) | EUR | 1,700,000 | 1,744,147 |
| Demeter Investments BV: | | | |
| 5.625% 8/15/52 (Reg. S)(e) | | 2,769,000 | 2,658,932 |
| 5.75% 8/15/50 (Reg. S)(e) | | 7,415,000 | 7,167,013 |
| Fidelidade-Companhia de Seguros SA 4.25% 9/4/31 (Reg. S) (e) | EUR | 1,500,000 | 1,382,345 |
| Five Corners Funding Trust II 2.85% 5/15/30 (d) | | 24,197,000 | 20,436,728 |
| GTCR AP Finance, Inc. 8% 5/15/27 (d) | | 20,000 | 19,228 |
| HUB International Ltd.: | | | |
| 5.625% 12/1/29(d) | | 20,000 | 17,164 |
| 7% 5/1/26(d) | | 315,000 | 309,658 |
| Liberty Mutual Group, Inc. 4.569% 2/1/29 (d) | | 4,589,000 | 4,342,192 |
| Marsh & McLennan Companies, Inc. 4.375% 3/15/29 | | 7,831,000 | 7,455,604 |
| National Financial Partners Corp. 6.875% 8/15/28 (d) | | 60,000 | 51,096 |
| Pacific LifeCorp 5.125% 1/30/43 (d) | | 12,258,000 | 11,408,742 |
| Pricoa Global Funding I 5.375% 5/15/45 (e) | | 6,348,000 | 6,161,877 |
| Prudential PLC 2.95% 11/3/33 (Reg. S) (e) | | 6,730,000 | 5,641,423 |
| QBE Insurance Group Ltd.: | | | |
| 2.5% 9/13/38 (Reg. S)(e) | GBP | 2,970,000 | 2,761,751 |
| 6.75% 12/2/44 (Reg. S)(e) | | 3,395,000 | 3,352,563 |
| Sagicor Financial Co. Ltd. 5.3% 5/13/28 (d) | | 485,000 | 462,787 |
| Swiss Re Finance Luxembourg SA 5% 4/2/49 (d)(e) | | 4,600,000 | 4,370,000 |
| TIAA Asset Management Finance LLC 4.125% 11/1/24 (d) | | 2,195,000 | 2,139,440 |
| Unum Group: | | | |
| 3.875% 11/5/25 | | 7,835,000 | 7,411,631 |
| 4% 6/15/29 | | 8,872,000 | 8,119,658 |
| 5.75% 8/15/42 | | 9,271,000 | 8,683,634 |
| Zurich Finance (Ireland) DAC 3.5% 5/2/52 (Reg. S) (e) | | 2,500,000 | 1,973,850 |
| | | | 165,486,776 |
| Mortgage Real Estate Investment Trusts - 0.0% | | | |
| Starwood Property Trust, Inc.: | | | |
| 3.75% 12/31/24(d) | | 20,000 | 18,823 |
| 4.375% 1/15/27(d) | | 20,000 | 17,339 |
| | | | 36,162 |
| Thrifts & Mortgage Finance - 0.0% | | | |
| Freedom Mortgage Corp.: | | | |
| 7.625% 5/1/26(d) | | 20,000 | 17,073 |
| 8.25% 4/15/25(d) | | 20,000 | 18,946 |
| Nationstar Mortgage Holdings, Inc.: | | | |
| 5.5% 8/15/28(d) | | 20,000 | 16,988 |
| 5.75% 11/15/31(d) | | 20,000 | 15,688 |
| 6% 1/15/27(d) | | 20,000 | 18,400 |
| Nationwide Building Society 6.178% 12/7/27 (Reg. S) (e) | GBP | 1,300,000 | 1,591,967 |
| PennyMac Financial Services, Inc.: | | | |
| 4.25% 2/15/29(d) | | 20,000 | 15,653 |
| 5.375% 10/15/25(d) | | 20,000 | 18,278 |
| Quicken Loans LLC/Quicken Loans Co-Issuer, Inc.: | | | |
| 3.625% 3/1/29(d) | | 20,000 | 16,076 |
| 3.875% 3/1/31(d) | | 40,000 | 31,174 |
| Quicken Loans LLC/Quicken Loans Co.-Issuer, Inc.: | | | |
| 2.875% 10/15/26(d) | | 40,000 | 34,516 |
| 4% 10/15/33(d) | | 510,000 | 377,042 |
| | | | 2,171,801 |
TOTAL FINANCIALS | | | 2,784,713,226 |
| | | | |
| HEALTH CARE - 2.0% | | | |
| Biotechnology - 0.3% | | | |
| Amgen, Inc.: | | | |
| 5.15% 3/2/28(g) | | 9,178,000 | 9,141,686 |
| 5.25% 3/2/30(g) | | 8,379,000 | 8,338,130 |
| 5.25% 3/2/33(g) | | 9,459,000 | 9,393,099 |
| 5.6% 3/2/43(g) | | 10,396,000 | 10,266,396 |
| 5.65% 3/2/53(g) | | 4,467,000 | 4,430,231 |
| 5.75% 3/2/63(g) | | 8,141,000 | 8,028,677 |
| Emergent BioSolutions, Inc. 3.875% 8/15/28 (d) | | 5,785,000 | 3,499,925 |
| Grifols Escrow Issuer SA 4.75% 10/15/28 (d) | | 1,610,000 | 1,376,550 |
| | | | 54,474,694 |
| Health Care Equipment & Supplies - 0.0% | | | |
| AdaptHealth LLC 5.125% 3/1/30 (d) | | 20,000 | 17,300 |
| Avantor Funding, Inc.: | | | |
| 3.875% 11/1/29(d) | | 2,935,000 | 2,538,775 |
| 4.625% 7/15/28(d) | | 1,320,000 | 1,214,400 |
| Embecta Corp. 5% 2/15/30 (d) | | 800,000 | 678,360 |
| Hologic, Inc.: | | | |
| 3.25% 2/15/29(d) | | 2,540,000 | 2,190,242 |
| 4.625% 2/1/28(d) | | 272,000 | 253,639 |
| Mozart Borrower LP: | | | |
| 3.875% 4/1/29(d) | | 700,000 | 583,433 |
| 5.25% 10/1/29(d) | | 40,000 | 32,827 |
| Teleflex, Inc.: | | | |
| 4.25% 6/1/28(d) | | 700,000 | 631,814 |
| 4.625% 11/15/27 | | 20,000 | 18,864 |
| | | | 8,159,654 |
| Health Care Providers & Services - 1.3% | | | |
| 180 Medical, Inc. 3.875% 10/15/29 (d) | | 1,805,000 | 1,571,595 |
| AMN Healthcare 4% 4/15/29 (d) | | 2,270,000 | 1,940,850 |
| Centene Corp.: | | | |
| 2.45% 7/15/28 | | 25,480,000 | 21,352,750 |
| 2.5% 3/1/31 | | 2,000,000 | 1,558,740 |
| 2.625% 8/1/31 | | 7,320,000 | 5,703,838 |
| 3% 10/15/30 | | 1,575,000 | 1,284,173 |
| 3.375% 2/15/30 | | 7,780,000 | 6,564,603 |
| 4.25% 12/15/27 | | 10,435,000 | 9,642,462 |
| 4.625% 12/15/29 | | 16,065,000 | 14,691,328 |
| Cigna Group: | | | |
| 2.375% 3/15/31 | | 20,000,000 | 16,282,775 |
| 3.05% 10/15/27 | | 5,900,000 | 5,395,766 |
| 4.375% 10/15/28 | | 11,163,000 | 10,718,763 |
| 4.8% 8/15/38 | | 6,950,000 | 6,401,400 |
| Community Health Systems, Inc.: | | | |
| 4.75% 2/15/31(d) | | 3,265,000 | 2,522,213 |
| 5.25% 5/15/30(d) | | 7,080,000 | 5,664,850 |
| 5.625% 3/15/27(d) | | 4,190,000 | 3,677,417 |
| 6% 1/15/29(d) | | 1,810,000 | 1,563,181 |
| 6.125% 4/1/30(d) | | 2,160,000 | 1,479,168 |
| 6.875% 4/15/29(d) | | 2,610,000 | 1,825,442 |
| 8% 3/15/26(d) | | 3,040,000 | 2,964,000 |
| 8% 12/15/27(d) | | 2,520,000 | 2,444,400 |
| CVS Health Corp.: | | | |
| 3% 8/15/26 | | 1,290,000 | 1,196,936 |
| 3.625% 4/1/27 | | 3,769,000 | 3,544,266 |
| 4.78% 3/25/38 | | 10,528,000 | 9,564,034 |
| DaVita HealthCare Partners, Inc.: | | | |
| 3.75% 2/15/31(d) | | 865,000 | 653,162 |
| 4.625% 6/1/30(d) | | 7,580,000 | 6,247,209 |
| Encompass Health Corp.: | | | |
| 4.5% 2/1/28 | | 20,000 | 18,361 |
| 4.75% 2/1/30 | | 20,000 | 17,703 |
| HCA Holdings, Inc.: | | | |
| 3.5% 9/1/30 | | 20,318,000 | 17,469,518 |
| 3.625% 3/15/32(d) | | 1,921,000 | 1,623,896 |
| 5.5% 6/15/47 | | 1,280,000 | 1,151,128 |
| 5.625% 9/1/28 | | 10,497,000 | 10,379,659 |
| 5.875% 2/1/29 | | 9,711,000 | 9,707,180 |
| HealthEquity, Inc. 4.5% 10/1/29 (d) | | 1,985,000 | 1,734,870 |
| Humana, Inc.: | | | |
| 3.7% 3/23/29 | | 5,638,000 | 5,115,072 |
| 5.875% 3/1/33 | | 1,280,000 | 1,316,766 |
| LifePoint Health, Inc. 6.75% 4/15/25 (d) | | 20,000 | 19,115 |
| ModivCare Escrow Issuer, Inc. 5% 10/1/29 (d) | | 550,000 | 465,311 |
| Molina Healthcare, Inc.: | | | |
| 3.875% 11/15/30(d) | | 1,135,000 | 956,186 |
| 3.875% 5/15/32(d) | | 685,000 | 562,392 |
| Option Care Health, Inc. 4.375% 10/31/29 (d) | | 1,290,000 | 1,105,620 |
| Owens & Minor, Inc.: | | | |
| 4.5% 3/31/29(d) | | 750,000 | 575,625 |
| 6.625% 4/1/30(d) | | 20,000 | 16,450 |
| Pediatrix Medical Group, Inc. 5.375% 2/15/30 (d) | | 3,525,000 | 3,109,700 |
| Regionalcare Hospital Partners 9.75% 12/1/26 (d) | | 20,000 | 17,025 |
| RP Escrow Issuer LLC 5.25% 12/15/25 (d) | | 1,615,000 | 1,262,058 |
| Sabra Health Care LP: | | | |
| 3.2% 12/1/31 | | 24,037,000 | 17,858,905 |
| 3.9% 10/15/29 | | 4,785,000 | 3,979,758 |
| Select Medical Corp. 6.25% 8/15/26 (d) | | 20,000 | 19,100 |
| Tenet Healthcare Corp.: | | | |
| 4.25% 6/1/29 | | 2,965,000 | 2,596,451 |
| 4.375% 1/15/30 | | 3,920,000 | 3,430,000 |
| 4.625% 7/15/24 | | 449,000 | 441,704 |
| 4.625% 6/15/28 | | 2,985,000 | 2,700,735 |
| 4.875% 1/1/26 | | 1,500,000 | 1,428,580 |
| 6.125% 10/1/28 | | 3,915,000 | 3,621,375 |
| 6.125% 6/15/30(d) | | 3,545,000 | 3,376,568 |
| 6.25% 2/1/27 | | 1,129,000 | 1,099,496 |
| Toledo Hospital 5.325% 11/15/28 | | 3,971,000 | 3,273,295 |
| | | | 246,904,923 |
| Health Care Technology - 0.0% | | | |
| Athenahealth Group, Inc. 6.5% 2/15/30 (d) | | 735,000 | 581,344 |
| IQVIA, Inc.: | | | |
| 5% 10/15/26(d) | | 20,000 | 19,100 |
| 5% 5/15/27(d) | | 40,000 | 38,059 |
| | | | 638,503 |
| Life Sciences Tools & Services - 0.0% | | | |
| Charles River Laboratories International, Inc.: | | | |
| 3.75% 3/15/29(d) | | 870,000 | 755,334 |
| 4% 3/15/31(d) | | 1,655,000 | 1,416,116 |
| 4.25% 5/1/28(d) | | 300,000 | 270,663 |
| | | | 2,442,113 |
| Pharmaceuticals - 0.4% | | | |
| 1375209 BC Ltd. 9% 1/30/28 (d) | | 953,000 | 951,551 |
| Bausch Health Companies, Inc.: | | | |
| 4.875% 6/1/28(d) | | 40,000 | 24,950 |
| 5.25% 1/30/30(d) | | 20,000 | 8,627 |
| 5.25% 2/15/31(d) | | 20,000 | 8,930 |
| 5.5% 11/1/25(d) | | 40,000 | 34,788 |
| 5.75% 8/15/27(d) | | 20,000 | 13,267 |
| 6.25% 2/15/29(d) | | 20,000 | 8,785 |
| 9% 12/15/25(d) | | 20,000 | 15,838 |
| 11% 9/30/28(d) | | 20,000 | 15,650 |
| Bayer AG 3.75% 7/1/74 (Reg. S) (e) | EUR | 2,200,000 | 2,248,406 |
| Bayer U.S. Finance II LLC 4.25% 12/15/25 (d) | | 8,579,000 | 8,297,569 |
| Catalent Pharma Solutions: | | | |
| 3.125% 2/15/29(d) | | 20,000 | 17,263 |
| 3.5% 4/1/30(d) | | 1,210,000 | 1,050,921 |
| 5% 7/15/27(d) | | 20,000 | 19,277 |
| Elanco Animal Health, Inc.: | | | |
| 5.772% 8/28/23 | | 5,786,000 | 5,764,821 |
| 6.4% 8/28/28(e) | | 2,437,000 | 2,327,018 |
| Jazz Securities DAC 4.375% 1/15/29 (d) | | 2,245,000 | 1,988,284 |
| Mylan NV 4.55% 4/15/28 | | 7,694,000 | 7,172,853 |
| Organon & Co. / Organon Foreign Debt Co-Issuer BV: | | | |
| 4.125% 4/30/28(d) | | 4,690,000 | 4,139,863 |
| 5.125% 4/30/31(d) | | 1,390,000 | 1,179,763 |
| Perrigo Finance PLC: | | | |
| 3.9% 12/15/24 | | 20,000 | 19,131 |
| 4.375% 3/15/26 | | 20,000 | 18,781 |
| 4.4% 6/15/30 | | 20,000 | 17,169 |
| Teva Pharmaceutical Finance Netherlands III BV: | | | |
| 3.15% 10/1/26 | | 40,000 | 35,014 |
| 4.75% 5/9/27 | | 405,000 | 364,496 |
| 5.125% 5/9/29 | | 20,000 | 17,703 |
| 6.75% 3/1/28 | | 20,000 | 19,225 |
| 7.125% 1/31/25 | | 20,000 | 20,250 |
| Utah Acquisition Sub, Inc. 3.95% 6/15/26 | | 4,038,000 | 3,776,270 |
| Valeant Pharmaceuticals International, Inc. 9.25% 4/1/26 (d) | | 20,000 | 14,955 |
| Viatris, Inc.: | | | |
| 1.65% 6/22/25 | | 2,070,000 | 1,884,260 |
| 2.7% 6/22/30 | | 40,521,000 | 32,123,903 |
| 3.85% 6/22/40 | | 4,583,000 | 3,125,810 |
| | | | 76,725,391 |
TOTAL HEALTH CARE | | | 389,345,278 |
| | | | |
| INDUSTRIALS - 1.5% | | | |
| Aerospace & Defense - 0.5% | | | |
| BAE Systems Holdings, Inc. 3.8% 10/7/24 (d) | | 3,311,000 | 3,221,949 |
| Bombardier, Inc.: | | | |
| 6% 2/15/28(d) | | 20,000 | 18,739 |
| 7.5% 2/1/29(d) | | 20,000 | 19,601 |
| 7.875% 4/15/27(d) | | 3,920,000 | 3,897,780 |
| BWX Technologies, Inc.: | | | |
| 4.125% 6/30/28(d) | | 4,355,000 | 3,885,194 |
| 4.125% 4/15/29(d) | | 1,935,000 | 1,688,288 |
| DAE Funding LLC: | | | |
| 1.55% 8/1/24(d) | | 905,000 | 845,044 |
| 1.625% 2/15/24(d) | | 440,000 | 418,770 |
| Embraer Netherlands Finance BV 5.05% 6/15/25 | | 1,285,000 | 1,238,098 |
| Howmet Aerospace, Inc.: | | | |
| 3% 1/15/29 | | 20,000 | 17,175 |
| 5.125% 10/1/24 | | 20,000 | 19,778 |
| 5.9% 2/1/27 | | 1,620,000 | 1,612,820 |
| 5.95% 2/1/37 | | 510,000 | 499,759 |
| 6.875% 5/1/25 | | 1,620,000 | 1,648,350 |
| Moog, Inc. 4.25% 12/15/27 (d) | | 190,000 | 173,852 |
| Rolls-Royce PLC: | | | |
| 3.375% 6/18/26 | GBP | 3,505,000 | 3,807,629 |
| 3.625% 10/14/25(d) | | 40,000 | 37,000 |
| 5.75% 10/15/27(d) | | 20,000 | 19,306 |
| Spirit Aerosystems, Inc. 9.375% 11/30/29 (d) | | 20,000 | 21,125 |
| The Boeing Co.: | | | |
| 5.04% 5/1/27 | | 7,640,000 | 7,525,063 |
| 5.15% 5/1/30 | | 7,640,000 | 7,392,970 |
| 5.705% 5/1/40 | | 7,640,000 | 7,273,424 |
| 5.805% 5/1/50 | | 23,600,000 | 22,448,941 |
| 5.93% 5/1/60 | | 7,640,000 | 7,134,377 |
| TransDigm, Inc.: | | | |
| 4.625% 1/15/29 | | 5,120,000 | 4,400,653 |
| 5.5% 11/15/27 | | 8,819,000 | 8,102,456 |
| 6.25% 3/15/26(d) | | 7,660,000 | 7,558,473 |
| 6.375% 6/15/26 | | 1,235,000 | 1,197,739 |
| 6.75% 8/15/28(d) | | 1,920,000 | 1,910,400 |
| 7.5% 3/15/27 | | 959,000 | 947,013 |
| 8% 12/15/25(d) | | 2,515,000 | 2,570,330 |
| Triumph Group, Inc. 6.25% 9/15/24 (d) | | 20,000 | 19,975 |
| | | | 101,572,071 |
| Air Freight & Logistics - 0.0% | | | |
| Aeropuerto Internacional de Tocumen SA: | | | |
| 4% 8/11/41(d) | | 400,000 | 323,825 |
| 5.125% 8/11/61(d) | | 295,000 | 231,354 |
| Rand Parent LLC 8.5% 2/15/30 (d) | | 895,000 | 859,294 |
| | | | 1,414,473 |
| Airlines - 0.0% | | | |
| Air Canada 3.875% 8/15/26 (d) | | 1,020,000 | 918,849 |
| American Airlines Group, Inc. 3.75% 3/1/25 (d) | | 20,000 | 18,258 |
| American Airlines, Inc.: | | | |
| 7.25% 2/15/28(d) | | 640,000 | 626,048 |
| 11.75% 7/15/25(d) | | 60,000 | 65,807 |
| American Airlines, Inc. / AAdvantage Loyalty IP Ltd.: | | | |
| 5.5% 4/20/26(d) | | 4,730,000 | 4,603,465 |
| 5.75% 4/20/29(d) | | 60,000 | 57,067 |
| Azul Investments LLP: | | | |
| 5.875% 10/26/24(d) | | 1,107,000 | 704,329 |
| 7.25% 6/15/26(d) | | 375,000 | 188,438 |
| Delta Air Lines, Inc.: | | | |
| 2.9% 10/28/24 | | 20,000 | 19,030 |
| 3.75% 10/28/29 | | 20,000 | 17,154 |
| 7.375% 1/15/26 | | 20,000 | 20,580 |
| Delta Air Lines, Inc. / SkyMiles IP Ltd. 4.5% 10/20/25 (d) | | 348,000 | 338,023 |
| Hawaiian Brand Intellectual Property Ltd. / HawaiianMiles Loyalty Ltd. 5.75% 1/20/26 (d) | | 20,000 | 18,598 |
| Mileage Plus Holdings LLC 6.5% 6/20/27 (d) | | 558,000 | 558,000 |
| Spirit Loyalty Cayman Ltd. / Spirit IP Cayman Ltd.: | | | |
| 8% 9/20/25(d) | | 20,000 | 20,075 |
| 8% 9/20/25(d) | | 1,855,000 | 1,863,811 |
| United Airlines, Inc.: | | | |
| 4.375% 4/15/26(d) | | 40,000 | 37,647 |
| 4.625% 4/15/29(d) | | 40,000 | 35,461 |
| | | | 10,110,640 |
| Building Products - 0.0% | | | |
| Advanced Drain Systems, Inc. 5% 9/30/27 (d) | | 2,845,000 | 2,646,704 |
| Builders FirstSource, Inc.: | | | |
| 4.25% 2/1/32(d) | | 1,625,000 | 1,364,228 |
| 6.375% 6/15/32(d) | | 20,000 | 19,208 |
| Camelot Return Merger Sub, Inc. 8.75% 8/1/28 (d) | | 20,000 | 19,000 |
| Griffon Corp. 5.75% 3/1/28 | | 20,000 | 18,406 |
| Standard Industries, Inc./New Jersey: | | | |
| 3.375% 1/15/31(d) | | 20,000 | 15,350 |
| 4.375% 7/15/30(d) | | 40,000 | 33,300 |
| 5% 2/15/27(d) | | 20,000 | 18,477 |
| | | | 4,134,673 |
| Commercial Services & Supplies - 0.2% | | | |
| ADT Corp. 4.125% 8/1/29 (d) | | 1,330,000 | 1,144,438 |
| Allied Universal Holdco LLC / Allied Universal Finance Corp.: | | | |
| 6% 6/1/29(d) | | 40,000 | 29,799 |
| 6.625% 7/15/26(d) | | 40,000 | 37,990 |
| 9.75% 7/15/27(d) | | 645,000 | 591,813 |
| APX Group, Inc.: | | | |
| 5.75% 7/15/29(d) | | 20,000 | 16,756 |
| 6.75% 2/15/27(d) | | 1,165,000 | 1,118,403 |
| Brand Energy & Infrastructure Services, Inc. 8.5% 7/15/25 (d) | | 6,554,000 | 5,483,928 |
| Clean Harbors, Inc. 6.375% 2/1/31 (d) | | 585,000 | 580,837 |
| CoreCivic, Inc.: | | | |
| 4.75% 10/15/27 | | 4,913,000 | 4,241,601 |
| 8.25% 4/15/26 | | 6,570,000 | 6,651,271 |
| Covanta Holding Corp. 4.875% 12/1/29 (d) | | 1,945,000 | 1,642,858 |
| Garda World Security Corp. 9.5% 11/1/27 (d) | | 20,000 | 19,215 |
| GFL Environmental, Inc.: | | | |
| 3.75% 8/1/25(d) | | 1,260,000 | 1,185,975 |
| 4% 8/1/28(d) | | 20,000 | 17,404 |
| 4.25% 6/1/25(d) | | 20,000 | 19,144 |
| 4.75% 6/15/29(d) | | 20,000 | 17,786 |
| 5.125% 12/15/26(d) | | 1,240,000 | 1,187,151 |
| Legends Hospitality Holding Co. LLC/Legends Hospitality Co-Issuer, Inc. 5% 2/1/26 (d) | | 2,985,000 | 2,716,350 |
| Madison IAQ LLC: | | | |
| 4.125% 6/30/28(d) | | 2,825,000 | 2,410,008 |
| 5.875% 6/30/29(d) | | 2,770,000 | 2,205,276 |
| Neptune BidCo U.S., Inc. 9.29% 4/15/29 (d) | | 2,480,000 | 2,344,592 |
| PowerTeam Services LLC 9.033% 12/4/25 (d) | | 630,000 | 541,800 |
| Prime Securities Services Borrower LLC/Prime Finance, Inc.: | | | |
| 5.75% 4/15/26(d) | | 1,240,000 | 1,198,150 |
| 6.25% 1/15/28(d) | | 20,000 | 18,552 |
| Staples, Inc. 7.5% 4/15/26 (d) | | 60,000 | 53,400 |
| Stericycle, Inc.: | | | |
| 3.875% 1/15/29(d) | | 2,100,000 | 1,800,239 |
| 5.375% 7/15/24(d) | | 2,455,000 | 2,418,961 |
| The Bidvest Group UK PLC 3.625% 9/23/26 (d) | | 475,000 | 421,503 |
| The Brink's Co.: | | | |
| 4.625% 10/15/27(d) | | 20,000 | 18,184 |
| 5.5% 7/15/25(d) | | 40,000 | 38,940 |
| The GEO Group, Inc. 9.5% 12/31/28 (d) | | 1,220,000 | 1,165,610 |
| | | | 41,337,934 |
| Construction & Engineering - 0.1% | | | |
| AECOM 5.125% 3/15/27 | | 855,000 | 817,659 |
| Great Lakes Dredge & Dock Corp. 5.25% 6/1/29 (d) | | 750,000 | 584,095 |
| Greensaif Pipelines Bidco SARL: | | | |
| 6.129% 2/23/38(d) | | 535,000 | 531,367 |
| 6.51% 2/23/42(d) | | 535,000 | 542,035 |
| Pike Corp. 5.5% 9/1/28 (d) | | 5,265,000 | 4,569,020 |
| Railworks Holdings LP 8.25% 11/15/28 (d) | | 2,020,000 | 1,890,114 |
| SRS Distribution, Inc.: | | | |
| 4.625% 7/1/28(d) | | 985,000 | 861,855 |
| 6% 12/1/29(d) | | 870,000 | 726,624 |
| | | | 10,522,769 |
| Electrical Equipment - 0.0% | | | |
| Regal Rexnord Corp.: | | | |
| 6.05% 2/15/26(d) | | 1,860,000 | 1,845,086 |
| 6.05% 4/15/28(d) | | 1,235,000 | 1,207,594 |
| 6.3% 2/15/30(d) | | 1,237,000 | 1,210,260 |
| Sensata Technologies BV: | | | |
| 4% 4/15/29(d) | | 1,330,000 | 1,173,020 |
| 5% 10/1/25(d) | | 275,000 | 267,539 |
| Vertiv Group Corp. 4.125% 11/15/28 (d) | | 775,000 | 673,312 |
| Wesco Distribution, Inc.: | | | |
| 7.125% 6/15/25(d) | | 20,000 | 20,181 |
| 7.25% 6/15/28(d) | | 20,000 | 20,267 |
| | | | 6,417,259 |
| Industrial Conglomerates - 0.0% | | | |
| Ladder Capital Finance Holdings LLLP/Ladder Capital Finance Corp. 4.75% 6/15/29 (d) | | 975,000 | 792,844 |
| Turkiye Sise ve Cam Fabrikalari A/S 6.95% 3/14/26 (d) | | 645,000 | 616,701 |
| | | | 1,409,545 |
| Machinery - 0.1% | | | |
| Chart Industries, Inc.: | | | |
| 7.5% 1/1/30(d) | | 190,000 | 192,850 |
| 9.5% 1/1/31(d) | | 20,000 | 20,900 |
| Hillenbrand, Inc. 5.75% 6/15/25 | | 20,000 | 19,750 |
| Mueller Water Products, Inc. 4% 6/15/29 (d) | | 1,905,000 | 1,662,256 |
| Vertical Holdco GmbH 7.625% 7/15/28 (d) | | 2,910,000 | 2,671,121 |
| Vertical U.S. Newco, Inc. 5.25% 7/15/27 (d) | | 7,350,000 | 6,658,599 |
| | | | 11,225,476 |
| Marine - 0.0% | | | |
| MISC Capital Two (Labuan) Ltd.: | | | |
| 3.625% 4/6/25(d) | | 495,000 | 471,271 |
| 3.75% 4/6/27(d) | | 1,040,000 | 962,195 |
| Seaspan Corp. 5.5% 8/1/29 (d) | | 3,930,000 | 2,957,514 |
| | | | 4,390,980 |
| Professional Services - 0.1% | | | |
| ASGN, Inc. 4.625% 5/15/28 (d) | | 3,290,000 | 2,973,272 |
| Booz Allen Hamilton, Inc.: | | | |
| 3.875% 9/1/28(d) | | 4,685,000 | 4,159,062 |
| 4% 7/1/29(d) | | 60,000 | 52,636 |
| Korn Ferry 4.625% 12/15/27 (d) | | 595,000 | 550,570 |
| Thomson Reuters Corp. 3.85% 9/29/24 | | 1,266,000 | 1,225,790 |
| TriNet Group, Inc. 3.5% 3/1/29 (d) | | 2,865,000 | 2,392,283 |
| | | | 11,353,613 |
| Road & Rail - 0.0% | | | |
| Alpha Trains Finance SA 2.064% 6/30/30 | EUR | 2,765,000 | 2,724,402 |
| Avis Budget Car Rental LLC/Avis Budget Finance, Inc. 5.375% 3/1/29 (d) | | 20,000 | 18,003 |
| Hertz Corp. 5% 12/1/29 (d) | | 40,000 | 33,209 |
| JSC Georgian Railway 4% 6/17/28 (d) | | 325,000 | 284,375 |
| | | | 3,059,989 |
| Trading Companies & Distributors - 0.2% | | | |
| Air Lease Corp.: | | | |
| 3% 9/15/23 | | 1,163,000 | 1,147,935 |
| 3.375% 7/1/25 | | 13,572,000 | 12,796,929 |
| 4.25% 2/1/24 | | 11,266,000 | 11,106,714 |
| 4.25% 9/15/24 | | 4,366,000 | 4,276,972 |
| Fortress Transportation & Infrastructure Investors LLC: | | | |
| 5.5% 5/1/28(d) | | 40,000 | 35,722 |
| 6.5% 10/1/25(d) | | 20,000 | 19,507 |
| H&E Equipment Services, Inc. 3.875% 12/15/28 (d) | | 20,000 | 17,200 |
| Herc Holdings, Inc. 5.5% 7/15/27 (d) | | 20,000 | 18,840 |
| Travis Perkins PLC: | | | |
| 3.75% 2/17/26 (Reg. S) | GBP | 860,000 | 932,661 |
| 4.5% 9/7/23 (Reg. S) | GBP | 1,329,000 | 1,586,342 |
| United Rentals North America, Inc.: | | | |
| 3.875% 2/15/31 | | 40,000 | 34,236 |
| 4.875% 1/15/28 | | 40,000 | 38,128 |
| 5.25% 1/15/30 | | 20,000 | 18,850 |
| 6% 12/15/29(d) | | 640,000 | 640,000 |
| Williams Scotsman International, Inc. 6.125% 6/15/25 (d) | | 20,000 | 19,633 |
| | | | 32,689,669 |
| Transportation Infrastructure - 0.3% | | | |
| Avolon Holdings Funding Ltd.: | | | |
| 2.875% 2/15/25(d) | | 12,030,000 | 11,189,189 |
| 3.95% 7/1/24(d) | | 4,160,000 | 4,022,599 |
| 4.25% 4/15/26(d) | | 3,220,000 | 2,988,146 |
| 4.375% 5/1/26(d) | | 21,312,000 | 19,826,231 |
| 5.25% 5/15/24(d) | | 7,670,000 | 7,547,785 |
| 5.5% 1/15/26(d) | | 7,243,000 | 7,008,942 |
| DP World Crescent Ltd.: | | | |
| 3.7495% 1/30/30(d) | | 1,415,000 | 1,305,338 |
| 3.875% 7/18/29 (Reg. S) | | 420,000 | 390,154 |
| DP World Ltd. 5.625% 9/25/48 (d) | | 785,000 | 755,710 |
| First Student Bidco, Inc./First Transit Parent, Inc. 4% 7/31/29 (d) | | 1,700,000 | 1,453,500 |
| Heathrow Funding Ltd.: | | | |
| 2.625% 3/16/28 (Reg. S) | GBP | 2,800,000 | 2,799,189 |
| 7.125% 2/14/24 | GBP | 3,705,000 | 4,500,037 |
| Holding d'Infrastructures et des Metiers de l'Environnement 0.625% 9/16/28 (Reg. S) | EUR | 1,000,000 | 848,318 |
| | | | 64,635,138 |
TOTAL INDUSTRIALS | | | 304,274,229 |
| | | | |
| INFORMATION TECHNOLOGY - 1.3% | | | |
| Communications Equipment - 0.0% | | | |
| Commscope Technologies LLC 6% 6/15/25 (d) | | 20,000 | 19,167 |
| CommScope, Inc.: | | | |
| 4.75% 9/1/29(d) | | 1,006,000 | 819,890 |
| 6% 3/1/26(d) | | 2,125,000 | 2,047,570 |
| 7.125% 7/1/28(d) | | 40,000 | 31,513 |
| 8.25% 3/1/27(d) | | 20,000 | 17,000 |
| HTA Group Ltd. 7% 12/18/25 (d) | | 1,085,000 | 1,025,528 |
| Hughes Satellite Systems Corp.: | | | |
| 5.25% 8/1/26 | | 20,000 | 19,150 |
| 6.625% 8/1/26 | | 20,000 | 18,825 |
| Nokia Corp. 4.375% 6/12/27 | | 20,000 | 18,722 |
| ViaSat, Inc.: | | | |
| 5.625% 4/15/27(d) | | 20,000 | 18,248 |
| 6.5% 7/15/28(d) | | 20,000 | 14,788 |
| | | | 4,050,401 |
| Electronic Equipment & Components - 0.2% | | | |
| Coherent Corp. 5% 12/15/29 (d) | | 3,730,000 | 3,267,853 |
| Dell International LLC/EMC Corp.: | | | |
| 5.45% 6/15/23 | | 2,400,000 | 2,398,318 |
| 5.85% 7/15/25 | | 2,748,000 | 2,764,659 |
| 6.02% 6/15/26 | | 3,119,000 | 3,157,396 |
| 6.1% 7/15/27 | | 5,045,000 | 5,184,037 |
| 6.2% 7/15/30 | | 4,367,000 | 4,433,988 |
| Imola Merger Corp. 4.75% 5/15/29 (d) | | 60,000 | 51,031 |
| Sensata Technologies, Inc. 3.75% 2/15/31 (d) | | 660,000 | 550,191 |
| TTM Technologies, Inc. 4% 3/1/29 (d) | | 5,530,000 | 4,561,744 |
| | | | 26,369,217 |
| IT Services - 0.1% | | | |
| Acuris Finance U.S. 5% 5/1/28 (d) | | 4,450,000 | 3,543,313 |
| Arches Buyer, Inc. 4.25% 6/1/28 (d) | | 20,000 | 16,464 |
| Block, Inc.: | | | |
| 2.75% 6/1/26 | | 1,160,000 | 1,035,052 |
| 3.5% 6/1/31 | | 520,000 | 420,108 |
| CA Magnum Holdings 5.375% (d)(j) | | 1,145,000 | 1,044,813 |
| Gartner, Inc.: | | | |
| 3.625% 6/15/29(d) | | 685,000 | 592,340 |
| 3.75% 10/1/30(d) | | 1,705,000 | 1,443,537 |
| 4.5% 7/1/28(d) | | 1,855,000 | 1,702,940 |
| Go Daddy Operating Co. LLC / GD Finance Co., Inc.: | | | |
| 3.5% 3/1/29(d) | | 3,170,000 | 2,655,759 |
| 5.25% 12/1/27(d) | | 2,215,000 | 2,096,187 |
| Rackspace Hosting, Inc.: | | | |
| 3.5% 2/15/28(d) | | 2,245,000 | 1,366,644 |
| 5.375% 12/1/28(d) | | 15,649,000 | 6,147,586 |
| Sabre GLBL, Inc.: | | | |
| 9.25% 4/15/25(d) | | 20,000 | 19,687 |
| 11.25% 12/15/27(d) | | 20,000 | 19,987 |
| Twilio, Inc.: | | | |
| 3.625% 3/15/29 | | 20,000 | 16,801 |
| 3.875% 3/15/31 | | 940,000 | 769,625 |
| | | | 22,890,843 |
| Semiconductors & Semiconductor Equipment - 0.6% | | | |
| Broadcom, Inc.: | | | |
| 1.95% 2/15/28(d) | | 3,204,000 | 2,715,392 |
| 2.45% 2/15/31(d) | | 72,567,000 | 57,501,351 |
| 2.6% 2/15/33(d) | | 29,461,000 | 22,266,102 |
| 3.5% 2/15/41(d) | | 22,019,000 | 15,757,089 |
| 3.75% 2/15/51(d) | | 10,333,000 | 7,202,353 |
| Entegris Escrow Corp.: | | | |
| 4.75% 4/15/29(d) | | 4,285,000 | 3,896,060 |
| 5.95% 6/15/30(d) | | 6,010,000 | 5,589,858 |
| Entegris, Inc. 3.625% 5/1/29 (d) | | 1,115,000 | 924,558 |
| onsemi 3.875% 9/1/28 (d) | | 1,885,000 | 1,656,613 |
| | | | 117,509,376 |
| Software - 0.4% | | | |
| Black Knight InfoServ LLC 3.625% 9/1/28 (d) | | 3,145,000 | 2,720,425 |
| Clarivate Science Holdings Corp.: | | | |
| 3.875% 7/1/28(d) | | 735,000 | 634,259 |
| 4.875% 7/1/29(d) | | 725,000 | 626,400 |
| Crowdstrike Holdings, Inc. 3% 2/15/29 | | 650,000 | 547,475 |
| Elastic NV 4.125% 7/15/29 (d) | | 1,995,000 | 1,637,283 |
| Fair Isaac Corp.: | | | |
| 4% 6/15/28(d) | | 1,975,000 | 1,793,616 |
| 5.25% 5/15/26(d) | | 520,000 | 506,308 |
| Gen Digital, Inc.: | | | |
| 5% 4/15/25(d) | | 40,000 | 38,854 |
| 7.125% 9/30/30(d) | | 40,000 | 39,000 |
| ION Trading Technologies Ltd. 5.75% 5/15/28 (d) | | 4,195,000 | 3,403,194 |
| McAfee Corp. 7.375% 2/15/30 (d) | | 20,000 | 15,851 |
| MicroStrategy, Inc. 6.125% 6/15/28 (d) | | 3,910,000 | 3,245,300 |
| NCR Corp.: | | | |
| 5.125% 4/15/29(d) | | 20,000 | 17,080 |
| 5.75% 9/1/27(d) | | 20,000 | 19,385 |
| 6.125% 9/1/29(d) | | 20,000 | 19,450 |
| Open Text Corp.: | | | |
| 3.875% 2/15/28(d) | | 20,000 | 17,244 |
| 3.875% 12/1/29(d) | | 3,095,000 | 2,498,196 |
| Open Text Holdings, Inc.: | | | |
| 4.125% 2/15/30(d) | | 1,490,000 | 1,226,119 |
| 4.125% 12/1/31(d) | | 2,375,000 | 1,889,906 |
| Oracle Corp.: | | | |
| 1.65% 3/25/26 | | 12,241,000 | 10,942,226 |
| 2.3% 3/25/28 | | 19,340,000 | 16,783,615 |
| 2.8% 4/1/27 | | 14,371,000 | 13,034,985 |
| 2.875% 3/25/31 | | 24,420,000 | 20,245,818 |
| Picard Midco, Inc. 6.5% 3/31/29 (d) | | 60,000 | 51,976 |
| PTC, Inc.: | | | |
| 3.625% 2/15/25(d) | | 20,000 | 19,017 |
| 4% 2/15/28(d) | | 20,000 | 18,168 |
| SS&C Technologies, Inc. 5.5% 9/30/27 (d) | | 40,000 | 37,640 |
| Veritas U.S., Inc./Veritas Bermuda Ltd. 7.5% 9/1/25 (d) | | 20,000 | 15,397 |
| | | | 82,044,187 |
| Technology Hardware, Storage & Peripherals - 0.0% | | | |
| Lenovo Group Ltd.: | | | |
| 3.421% 11/2/30(d) | | 930,000 | 758,982 |
| 5.875% 4/24/25 (Reg. S) | | 200,000 | 198,475 |
| Western Digital Corp.: | | | |
| 2.85% 2/1/29 | | 20,000 | 15,722 |
| 4.75% 2/15/26 | | 20,000 | 18,883 |
| Xerox Holdings Corp. 5% 8/15/25 (d) | | 20,000 | 18,615 |
| | | | 1,010,677 |
TOTAL INFORMATION TECHNOLOGY | | | 253,874,701 |
| | | | |
| MATERIALS - 0.7% | | | |
| Chemicals - 0.4% | | | |
| Axalta Coating Systems/Dutch Holding BV 4.75% 6/15/27 (d) | | 20,000 | 18,446 |
| Braskem Idesa SAPI: | | | |
| 6.99% 2/20/32(d) | | 260,000 | 180,859 |
| 7.45% 11/15/29(d) | | 180,000 | 139,050 |
| Braskem Netherlands BV 7.25% 2/13/33 (d) | | 405,000 | 394,247 |
| Chevron Phillips Chemical Co. LLC / Chevron Phillips Chemical Co. LP 5.125% 4/1/25 (d) | | 12,132,000 | 12,057,563 |
| CVR Partners LP 6.125% 6/15/28 (d) | | 1,470,000 | 1,305,765 |
| Element Solutions, Inc. 3.875% 9/1/28 (d) | | 1,770,000 | 1,526,625 |
| ENN Clean Energy International Investment Ltd. 3.375% 5/12/26 (d) | | 1,290,000 | 1,161,000 |
| Equate Petrochemical BV: | | | |
| 2.625% 4/28/28(d) | | 595,000 | 518,877 |
| 4.25% 11/3/26(d) | | 325,000 | 310,944 |
| Kronos Acquisition Holdings, Inc. / KIK Custom Products, Inc.: | | | |
| 5% 12/31/26(d) | | 1,325,000 | 1,199,444 |
| 7% 12/31/27(d) | | 330,000 | 282,975 |
| LSB Industries, Inc. 6.25% 10/15/28 (d) | | 995,000 | 905,758 |
| MEGlobal Canada, Inc. 5% 5/18/25 (d) | | 825,000 | 807,366 |
| Methanex Corp.: | | | |
| 5.125% 10/15/27 | | 4,719,000 | 4,435,530 |
| 5.65% 12/1/44 | | 3,232,000 | 2,634,080 |
| NOVA Chemicals Corp.: | | | |
| 4.25% 5/15/29(d) | | 1,435,000 | 1,188,108 |
| 4.875% 6/1/24(d) | | 3,625,000 | 3,552,714 |
| 5% 5/1/25(d) | | 3,402,000 | 3,242,729 |
| 5.25% 6/1/27(d) | | 2,134,000 | 1,920,600 |
| Nufarm Australia Ltd. 5% 1/27/30 (d) | | 1,850,000 | 1,615,059 |
| OCP SA: | | | |
| 3.75% 6/23/31(d) | | 745,000 | 600,656 |
| 4.5% 10/22/25(d) | | 165,000 | 157,503 |
| 5.625% 4/25/24(d) | | 925,000 | 912,455 |
| 6.875% 4/25/44(d) | | 150,000 | 136,313 |
| Olin Corp. 5% 2/1/30 | | 20,000 | 18,199 |
| Olympus Water U.S. Holding Corp.: | | | |
| 4.25% 10/1/28(d) | | 3,410,000 | 2,846,204 |
| 6.25% 10/1/29(d) | | 1,635,000 | 1,325,271 |
| Orbia Advance Corp. S.A.B. de CV: | | | |
| 1.875% 5/11/26(d) | | 890,000 | 780,029 |
| 2.875% 5/11/31(d) | | 725,000 | 568,219 |
| SABIC Capital II BV 4% 10/10/23 (d) | | 902,000 | 891,853 |
| Sasol Financing U.S.A. LLC: | | | |
| 4.375% 9/18/26 | | 1,115,000 | 1,001,816 |
| 5.875% 3/27/24 | | 1,170,000 | 1,153,269 |
| SCIH Salt Holdings, Inc. 4.875% 5/1/28 (d) | | 295,000 | 255,078 |
| SCIL IV LLC / SCIL U.S.A. Holdings LLC 5.375% 11/1/26 (d) | | 1,100,000 | 988,614 |
| The Chemours Co. LLC: | | | |
| 4.625% 11/15/29(d) | | 960,000 | 779,107 |
| 5.375% 5/15/27 | | 4,271,000 | 3,889,387 |
| 5.75% 11/15/28(d) | | 3,120,000 | 2,740,241 |
| The Scotts Miracle-Gro Co.: | | | |
| 4% 4/1/31 | | 255,000 | 204,000 |
| 4.375% 2/1/32 | | 385,000 | 314,324 |
| Tronox, Inc. 4.625% 3/15/29 (d) | | 680,000 | 554,200 |
| Valvoline, Inc. 4.25% 2/15/30 (d) | | 1,255,000 | 1,226,493 |
| W.R. Grace Holding LLC: | | | |
| 5.625% 8/15/29(d) | | 4,445,000 | 3,564,013 |
| 7.375% 3/1/31(d) | | 515,000 | 511,256 |
| | | | 64,816,239 |
| Construction Materials - 0.0% | | | |
| Smyrna Ready Mix LLC 6% 11/1/28 (d) | | 20,000 | 17,752 |
| | | | |
| Containers & Packaging - 0.1% | | | |
| Ardagh Metal Packaging Finance U.S.A. LLC/Ardagh Metal Packaging Finance PLC: | | | |
| 3.25% 9/1/28(d) | | 445,000 | 373,602 |
| 4% 9/1/29(d) | | 885,000 | 709,664 |
| 6% 6/15/27(d) | | 1,780,000 | 1,722,577 |
| Ardagh Packaging Finance PLC/Ardagh MP Holdings U.S.A., Inc.: | | | |
| 4.125% 8/15/26(d) | | 1,370,000 | 1,246,700 |
| 5.25% 4/30/25(d) | | 20,000 | 19,335 |
| 5.25% 8/15/27(d) | | 410,000 | 336,585 |
| 5.25% 8/15/27(d) | | 255,000 | 209,340 |
| Ball Corp.: | | | |
| 2.875% 8/15/30 | | 680,000 | 542,776 |
| 4.875% 3/15/26 | | 1,855,000 | 1,792,394 |
| 5.25% 7/1/25 | | 20,000 | 19,679 |
| 6.875% 3/15/28 | | 20,000 | 20,200 |
| Berry Global, Inc.: | | | |
| 4.875% 7/15/26(d) | | 1,615,000 | 1,546,363 |
| 5.625% 7/15/27(d) | | 1,000,000 | 962,500 |
| BWAY Holding Co. 7.875% 8/15/26 (d) | | 1,925,000 | 1,937,031 |
| Clydesdale Acquisition Holdings, Inc.: | | | |
| 6.625% 4/15/29(d) | | 640,000 | 610,599 |
| 8.75% 4/15/30(d) | | 20,000 | 18,068 |
| Crown Americas LLC/Crown Americas Capital Corp. IV 4.75% 2/1/26 | | 20,000 | 19,100 |
| Graham Packaging Co., Inc. 7.125% 8/15/28 (d) | | 115,000 | 98,913 |
| Graphic Packaging International, Inc. 3.75% 2/1/30 (d) | | 610,000 | 519,842 |
| OI European Group BV 4.75% 2/15/30 (d) | | 20,000 | 17,802 |
| Owens-Brockway Glass Container, Inc. 6.625% 5/13/27 (d) | | 20,000 | 19,450 |
| Pactiv Evergreen Group Issuer, Inc. 4.375% 10/15/28 (d) | | 20,000 | 17,156 |
| Reynolds Group Issuer, Inc./Reynolds Group Issuer LLC/Reynolds Group Issuer (Luxembourg) SA 4% 10/15/27 (d) | | 20,000 | 17,447 |
| Sealed Air Corp.: | | | |
| 4% 12/1/27(d) | | 20,000 | 18,019 |
| 5% 4/15/29(d) | | 1,790,000 | 1,634,594 |
| 6.125% 2/1/28(d) | | 740,000 | 728,863 |
| Silgan Holdings, Inc. 4.125% 2/1/28 | | 20,000 | 18,300 |
| Trivium Packaging Finance BV: | | | |
| 5.5% 8/15/26(d) | | 4,023,000 | 3,801,735 |
| 8.5% 8/15/27(d) | | 1,575,000 | 1,496,092 |
| | | | 20,474,726 |
| Metals & Mining - 0.2% | | | |
| Antofagasta PLC: | | | |
| 2.375% 10/14/30(d) | | 1,255,000 | 990,509 |
| 5.625% 5/13/32(d) | | 360,000 | 348,300 |
| Arconic Corp.: | | | |
| 6% 5/15/25(d) | | 630,000 | 630,000 |
| 6.125% 2/15/28(d) | | 20,000 | 19,650 |
| ATI, Inc.: | | | |
| 4.875% 10/1/29 | | 1,030,000 | 922,227 |
| 5.875% 12/1/27 | | 3,770,000 | 3,591,244 |
| Celtic Resources Holdings DAC 4.125% 10/9/24 (c)(d)(f) | | 650,000 | 87,547 |
| Cleveland-Cliffs, Inc.: | | | |
| 4.875% 3/1/31(d) | | 255,000 | 232,124 |
| 6.75% 3/15/26(d) | | 20,000 | 20,203 |
| Commercial Metals Co.: | | | |
| 3.875% 2/15/31 | | 775,000 | 653,909 |
| 4.125% 1/15/30 | | 1,175,000 | 1,024,520 |
| Compania de Minas Buenaventura SAA 5.5% 7/23/26 (d) | | 425,000 | 357,080 |
| Constellium NV: | | | |
| 3.75% 4/15/29(d) | | 20,000 | 16,610 |
| 5.875% 2/15/26(d) | | 1,000,000 | 976,505 |
| Corporacion Nacional del Cobre de Chile (Codelco): | | | |
| 3% 9/30/29(d) | | 155,000 | 134,492 |
| 3.15% 1/14/30(d) | | 405,000 | 352,046 |
| 3.7% 1/30/50(d) | | 1,195,000 | 866,973 |
| 5.125% 2/2/33(d) | | 500,000 | 484,313 |
| CSN Resources SA 5.875% 4/8/32 (d) | | 660,000 | 552,701 |
| Eldorado Gold Corp. 6.25% 9/1/29 (d) | | 2,805,000 | 2,466,493 |
| Endeavour Mining PLC 5% 10/14/26 (d) | | 485,000 | 406,066 |
| ERO Copper Corp. 6.5% 2/15/30 (d) | | 3,315,000 | 2,805,319 |
| First Quantum Minerals Ltd.: | | | |
| 6.875% 3/1/26(d) | | 900,000 | 846,563 |
| 6.875% 10/15/27(d) | | 2,855,000 | 2,671,209 |
| 7.5% 4/1/25(d) | | 1,280,000 | 1,242,240 |
| FMG Resources Pty Ltd.: | | | |
| 4.375% 4/1/31(d) | | 680,000 | 574,688 |
| 4.5% 9/15/27(d) | | 760,000 | 699,200 |
| 5.125% 5/15/24(d) | | 500,000 | 493,750 |
| 6.125% 4/15/32(d) | | 20,000 | 18,900 |
| Fresnillo PLC 4.25% 10/2/50 (d) | | 505,000 | 388,313 |
| Gcm Mining Corp. 6.875% 8/9/26 (d) | | 1,185,000 | 1,006,663 |
| HudBay Minerals, Inc. 4.5% 4/1/26 (d) | | 640,000 | 574,618 |
| JSW Steel Ltd. 3.95% 4/5/27 (d) | | 645,000 | 565,988 |
| Kaiser Aluminum Corp.: | | | |
| 4.5% 6/1/31(d) | | 615,000 | 486,859 |
| 4.625% 3/1/28(d) | | 3,124,000 | 2,690,493 |
| Metinvest BV 8.5% 4/23/26 (Reg. S) | | 235,000 | 124,697 |
| Mineral Resources Ltd.: | | | |
| 8% 11/1/27(d) | | 20,000 | 19,900 |
| 8.5% 5/1/30(d) | | 3,810,000 | 3,814,610 |
| Novelis Corp. 4.75% 1/30/30 (d) | | 20,000 | 17,570 |
| PMHC II, Inc. 9% 2/15/30 (d) | | 1,545,000 | 1,196,913 |
| POSCO: | | | |
| 5.75% 1/17/28(d) | | 715,000 | 722,525 |
| 5.875% 1/17/33(d) | | 305,000 | 315,876 |
| PT Freeport Indonesia: | | | |
| 4.763% 4/14/27(d) | | 315,000 | 302,262 |
| 5.315% 4/14/32(d) | | 925,000 | 851,102 |
| 6.2% 4/14/52(d) | | 365,000 | 321,154 |
| PT Indonesia Asahan Aluminium Tbk 5.45% 5/15/30 (d) | | 1,145,000 | 1,129,268 |
| Roller Bearing Co. of America, Inc. 4.375% 10/15/29 (d) | | 2,585,000 | 2,234,345 |
| Stillwater Mining Co.: | | | |
| 4% 11/16/26(d) | | 945,000 | 838,688 |
| 4.5% 11/16/29(d) | | 440,000 | 361,433 |
| TMK Capital SA 4.3% 2/12/27 (Reg. S) (f) | | 600,000 | 282,000 |
| VM Holding SA 6.5% 1/18/28 (d) | | 965,000 | 932,972 |
| Volcan Compania Minera SAA 4.375% 2/11/26 (d) | | 665,000 | 516,206 |
| | | | 44,179,836 |
| Paper & Forest Products - 0.0% | | | |
| Glatfelter Corp. 4.75% 11/15/29 (d) | | 980,000 | 642,562 |
| Mercer International, Inc. 5.125% 2/1/29 | | 875,000 | 717,459 |
| SPA Holdings 3 OY 4.875% 2/4/28 (d) | | 2,440,000 | 2,072,177 |
| | | | 3,432,198 |
TOTAL MATERIALS | | | 132,920,751 |
| | | | |
| REAL ESTATE - 2.4% | | | |
| Equity Real Estate Investment Trusts (REITs) - 1.9% | | | |
| Alexandria Real Estate Equities, Inc. 4.9% 12/15/30 | | 8,767,000 | 8,500,348 |
| American Finance Trust, Inc./American Finance Operating Partnership LP 4.5% 9/30/28 (d) | | 795,000 | 627,470 |
| American Homes 4 Rent LP: | | | |
| 2.375% 7/15/31 | | 1,451,000 | 1,140,765 |
| 3.625% 4/15/32 | | 6,608,000 | 5,582,690 |
| American Tower Corp. 4.05% 3/15/32 | | 714,000 | 635,894 |
| Boston Properties, Inc.: | | | |
| 3.25% 1/30/31 | | 8,522,000 | 7,110,180 |
| 4.5% 12/1/28 | | 7,625,000 | 7,075,944 |
| 6.75% 12/1/27 | | 11,623,000 | 12,063,741 |
| Brookfield Property REIT, Inc./BPR Nimbus LLC/BPR Cumulus LLC/GGSI Sellco LLC 4.5% 4/1/27 (d) | | 20,000 | 17,135 |
| Corporate Office Properties LP: | | | |
| 2.25% 3/15/26 | | 3,379,000 | 3,013,396 |
| 2.75% 4/15/31 | | 6,606,000 | 4,973,791 |
| CTR Partnership LP/CareTrust Capital Corp. 3.875% 6/30/28 (d) | | 3,950,000 | 3,356,225 |
| Global Net Lease, Inc. / Global Net Lease Operating Partnership LP 3.75% 12/15/27 (d) | | 625,000 | 515,026 |
| Healthcare Trust of America Holdings LP: | | | |
| 3.1% 2/15/30 | | 2,678,000 | 2,280,941 |
| 3.5% 8/1/26 | | 2,790,000 | 2,593,553 |
| Healthpeak Properties, Inc.: | | | |
| 3.25% 7/15/26 | | 1,156,000 | 1,082,340 |
| 3.5% 7/15/29 | | 1,322,000 | 1,177,566 |
| Hudson Pacific Properties LP 4.65% 4/1/29 | | 15,534,000 | 13,195,859 |
| Invitation Homes Operating Partnership LP 4.15% 4/15/32 | | 9,940,000 | 8,743,908 |
| Iron Mountain, Inc.: | | | |
| 4.5% 2/15/31(d) | | 640,000 | 529,906 |
| 4.875% 9/15/27(d) | | 20,000 | 18,409 |
| 4.875% 9/15/29(d) | | 20,000 | 17,410 |
| 5% 7/15/28(d) | | 20,000 | 18,128 |
| 5.25% 7/15/30(d) | | 40,000 | 34,878 |
| 5.625% 7/15/32(d) | | 20,000 | 17,303 |
| iStar Financial, Inc.: | | | |
| 4.25% 8/1/25 | | 560,000 | 557,178 |
| 4.75% 10/1/24 | | 680,000 | 678,285 |
| Kite Realty Group Trust 4.75% 9/15/30 | | 764,000 | 683,825 |
| LXP Industrial Trust (REIT): | | | |
| 2.7% 9/15/30 | | 3,649,000 | 2,919,506 |
| 4.4% 6/15/24 | | 1,672,000 | 1,619,761 |
| MPT Operating Partnership LP/MPT Finance Corp.: | | | |
| 2.5% 3/24/26 | GBP | 1,665,000 | 1,562,141 |
| 3.5% 3/15/31 | | 5,110,000 | 3,502,701 |
| 4.625% 8/1/29 | | 3,790,000 | 2,833,025 |
| 5% 10/15/27 | | 10,940,000 | 8,979,871 |
| 5.25% 8/1/26 | | 520,000 | 463,830 |
| Office Properties Income Trust 4.5% 2/1/25 | | 20,000 | 18,400 |
| Omega Healthcare Investors, Inc.: | | | |
| 3.25% 4/15/33 | | 19,138,000 | 13,679,929 |
| 3.375% 2/1/31 | | 6,759,000 | 5,326,204 |
| 3.625% 10/1/29 | | 11,904,000 | 9,871,747 |
| 4.375% 8/1/23 | | 3,145,000 | 3,126,616 |
| 4.5% 1/15/25 | | 3,878,000 | 3,782,326 |
| 4.5% 4/1/27 | | 18,502,000 | 17,469,288 |
| 4.75% 1/15/28 | | 10,700,000 | 10,035,922 |
| 4.95% 4/1/24 | | 9,727,000 | 9,560,918 |
| 5.25% 1/15/26 | | 10,610,000 | 10,400,804 |
| Park Intermediate Holdings LLC: | | | |
| 4.875% 5/15/29(d) | | 20,000 | 16,716 |
| 7.5% 6/1/25(d) | | 580,000 | 581,830 |
| Piedmont Operating Partnership LP 2.75% 4/1/32 | | 2,906,000 | 2,048,508 |
| Realty Income Corp.: | | | |
| 2.2% 6/15/28 | | 1,564,000 | 1,350,143 |
| 2.85% 12/15/32 | | 1,925,000 | 1,581,128 |
| 3.25% 1/15/31 | | 2,129,000 | 1,855,650 |
| 3.4% 1/15/28 | | 3,355,000 | 3,107,755 |
| Retail Opportunity Investments Partnership LP: | | | |
| 4% 12/15/24 | | 1,225,000 | 1,182,609 |
| 5% 12/15/23 | | 737,000 | 730,912 |
| RHP Hotel Properties LP/RHP Finance Corp.: | | | |
| 4.5% 2/15/29(d) | | 20,000 | 17,409 |
| 4.75% 10/15/27 | | 20,000 | 18,388 |
| RLJ Lodging Trust LP 3.75% 7/1/26 (d) | | 370,000 | 334,773 |
| SBA Communications Corp.: | | | |
| 3.125% 2/1/29 | | 4,260,000 | 3,517,482 |
| 3.875% 2/15/27 | | 520,000 | 470,597 |
| Senior Housing Properties Trust 9.75% 6/15/25 | | 193,000 | 187,015 |
| Service Properties Trust: | | | |
| 4.35% 10/1/24 | | 20,000 | 19,144 |
| 4.75% 10/1/26 | | 20,000 | 17,350 |
| 4.95% 10/1/29 | | 20,000 | 15,777 |
| Simon Property Group LP 2.45% 9/13/29 | | 3,576,000 | 2,995,131 |
| SITE Centers Corp.: | | | |
| 3.625% 2/1/25 | | 3,106,000 | 2,947,130 |
| 4.25% 2/1/26 | | 10,537,000 | 9,985,236 |
| Store Capital Corp.: | | | |
| 2.75% 11/18/30 | | 3,880,000 | 2,930,462 |
| 4.625% 3/15/29 | | 3,549,000 | 3,131,589 |
| Sun Communities Operating LP: | | | |
| 2.3% 11/1/28 | | 3,294,000 | 2,784,895 |
| 2.7% 7/15/31 | | 8,306,000 | 6,626,386 |
| Uniti Group LP / Uniti Group Finance, Inc.: | | | |
| 4.75% 4/15/28(d) | | 6,225,000 | 4,934,558 |
| 6.5% 2/15/29(d) | | 18,715,000 | 12,258,420 |
| 10.5% 2/15/28(d) | | 5,420,000 | 5,421,084 |
| Uniti Group, Inc.: | | | |
| 6% 1/15/30(d) | | 5,485,000 | 3,399,571 |
| 7.875% 2/15/25(d) | | 4,169,000 | 4,249,990 |
| Ventas Realty LP: | | | |
| 3% 1/15/30 | | 15,631,000 | 13,286,229 |
| 3.5% 2/1/25 | | 2,163,000 | 2,076,799 |
| 3.75% 5/1/24 | | 9,073,000 | 8,873,239 |
| 4% 3/1/28 | | 3,986,000 | 3,682,221 |
| 4.125% 1/15/26 | | 2,017,000 | 1,941,415 |
| 4.75% 11/15/30 | | 21,238,000 | 20,020,599 |
| VICI Properties LP: | | | |
| 4.375% 5/15/25 | | 1,727,000 | 1,662,048 |
| 4.75% 2/15/28 | | 13,710,000 | 12,933,054 |
| 4.95% 2/15/30 | | 20,675,000 | 19,302,340 |
| 5.125% 5/15/32 | | 4,986,000 | 4,626,260 |
| VICI Properties LP / VICI Note Co.: | | | |
| 3.5% 2/15/25(d) | | 90,000 | 85,015 |
| 4.125% 8/15/30(d) | | 1,285,000 | 1,109,962 |
| 4.25% 12/1/26(d) | | 130,000 | 120,556 |
| 4.625% 12/1/29(d) | | 270,000 | 241,909 |
| Vornado Realty LP 2.15% 6/1/26 | | 3,551,000 | 3,042,481 |
| WP Carey, Inc.: | | | |
| 3.85% 7/15/29 | | 2,566,000 | 2,333,534 |
| 4% 2/1/25 | | 12,346,000 | 12,043,546 |
| XHR LP 4.875% 6/1/29 (d) | | 20,000 | 17,084 |
| | | | 377,511,012 |
| Real Estate Management & Development - 0.5% | | | |
| ACCENTRO Real Estate AG 5.625% 2/13/26 (Reg. S) | EUR | 2,635,000 | 1,661,076 |
| ADLER Group SA: | | | |
| 1.875% 1/14/26 (Reg. S) | EUR | 10,200,000 | 4,636,914 |
| 2.25% 4/27/27 (Reg. S) | EUR | 900,000 | 399,811 |
| Akelius Residential Property AB 3.875% 10/5/78 (Reg. S) (e) | EUR | 1,238,000 | 1,263,576 |
| Blackstone Property Partners Europe LP: | | | |
| 1% 5/4/28 (Reg. S) | EUR | 5,365,000 | 4,202,511 |
| 1.75% 3/12/29 (Reg. S) | EUR | 2,480,000 | 1,944,118 |
| 2.625% 10/20/28 (Reg. S) | GBP | 950,000 | 884,904 |
| Brandywine Operating Partnership LP: | | | |
| 3.95% 11/15/27 | | 8,220,000 | 6,934,530 |
| 4.1% 10/1/24 | | 7,423,000 | 7,138,723 |
| 4.55% 10/1/29 | | 8,895,000 | 7,372,257 |
| 7.55% 3/15/28 | | 15,931,000 | 15,619,200 |
| CBRE Group, Inc. 2.5% 4/1/31 | | 10,439,000 | 8,482,994 |
| Deutsche Annington Finance BV 5% 10/2/23 (d) | | 2,105,000 | 2,087,737 |
| DTZ U.S. Borrower LLC 6.75% 5/15/28 (d) | | 175,000 | 164,964 |
| Essex Portfolio LP 3.875% 5/1/24 | | 3,195,000 | 3,123,513 |
| Greystar Real Estate Partners 5.75% 12/1/25 (d) | | 261,000 | 257,702 |
| GTC Aurora Luxembourg SA 2.25% 6/23/26 (Reg. S) | EUR | 2,405,000 | 1,989,386 |
| Heimstaden AB 4.375% 3/6/27 (Reg. S) | EUR | 2,400,000 | 1,830,082 |
| Howard Hughes Corp.: | | | |
| 4.125% 2/1/29(d) | | 3,030,000 | 2,537,625 |
| 4.375% 2/1/31(d) | | 1,010,000 | 822,948 |
| Kennedy-Wilson, Inc.: | | | |
| 4.75% 3/1/29 | | 580,000 | 471,439 |
| 4.75% 2/1/30 | | 4,060,000 | 3,120,242 |
| Realogy Group LLC/Realogy Co-Issuer Corp. 5.75% 1/15/29 (d) | | 750,000 | 540,000 |
| Realogy Group LLC/Realogy Co.-Issuer Corp. 5.25% 4/15/30 (d) | | 790,000 | 541,150 |
| Samhallsbyggnadsbolaget I Norden AB: | | | |
| 1% 8/12/27 (Reg. S) | EUR | 950,000 | 724,622 |
| 1.75% 1/14/25 (Reg. S) | EUR | 1,271,000 | 1,210,925 |
| Sirius Real Estate Ltd. 1.125% 6/22/26 (Reg. S) | EUR | 1,300,000 | 1,099,725 |
| Tanger Properties LP: | | | |
| 2.75% 9/1/31 | | 8,621,000 | 6,394,561 |
| 3.125% 9/1/26 | | 4,970,000 | 4,510,941 |
| Taylor Morrison Communities, Inc./Monarch Communities, Inc.: | | | |
| 5.125% 8/1/30(d) | | 615,000 | 542,738 |
| 5.875% 6/15/27(d) | | 520,000 | 498,098 |
| Tritax EuroBox PLC 0.95% 6/2/26 (Reg. S) | EUR | 840,000 | 736,424 |
| Vonovia SE 5% 11/23/30 (Reg. S) | EUR | 400,000 | 424,808 |
| | | | 94,170,244 |
TOTAL REAL ESTATE | | | 471,681,256 |
| | | | |
| UTILITIES - 1.5% | | | |
| Electric Utilities - 0.7% | | | |
| Alabama Power Co. 3.05% 3/15/32 | | 13,712,000 | 11,677,254 |
| AusNet Services Holdings Pty Ltd. 1.625% 3/11/81 (Reg. S) (e) | EUR | 650,000 | 576,954 |
| Clearway Energy Operating LLC: | | | |
| 3.75% 2/15/31(d) | | 1,290,000 | 1,049,738 |
| 4.75% 3/15/28(d) | | 580,000 | 532,266 |
| Cleco Corporate Holdings LLC 3.375% 9/15/29 | | 6,938,000 | 5,857,545 |
| Comision Federal de Electricid: | | | |
| 3.348% 2/9/31(d) | | 175,000 | 138,173 |
| 4.688% 5/15/29(d) | | 785,000 | 699,778 |
| DPL, Inc.: | | | |
| 4.125% 7/1/25 | | 1,585,000 | 1,488,833 |
| 4.35% 4/15/29 | | 210,000 | 181,650 |
| Duke Energy Corp.: | | | |
| 2.45% 6/1/30 | | 6,067,000 | 4,983,056 |
| 3.85% 6/15/34 | EUR | 2,650,000 | 2,532,711 |
| Duquesne Light Holdings, Inc.: | | | |
| 2.532% 10/1/30(d) | | 2,680,000 | 2,130,538 |
| 2.775% 1/7/32(d) | | 8,750,000 | 6,881,842 |
| Electricite de France SA 5.5% 1/25/35 (Reg. S) | GBP | 2,700,000 | 3,083,556 |
| Emera, Inc. 6.75% 6/15/76 (e) | | 20,000 | 19,189 |
| EnBW Energie Baden-Wuerttemberg AG 1.375% 8/31/81 (Reg. S) (e) | EUR | 1,900,000 | 1,562,463 |
| Enel SpA 3.375% (Reg. S) (e)(j) | EUR | 2,010,000 | 1,931,070 |
| Entergy Corp. 2.8% 6/15/30 | | 6,226,000 | 5,216,727 |
| Eskom Holdings SOC Ltd.: | | | |
| 6.35% 8/10/28(d) | | 1,080,000 | 1,010,475 |
| 6.75% 8/6/23(d) | | 880,000 | 870,760 |
| 7.125% 2/11/25(d) | | 725,000 | 712,023 |
| 8.45% 8/10/28(d) | | 410,000 | 401,288 |
| Eversource Energy 2.8% 5/1/23 | | 5,482,000 | 5,459,403 |
| Exelon Corp.: | | | |
| 2.75% 3/15/27 | | 3,035,000 | 2,751,623 |
| 3.35% 3/15/32 | | 8,005,000 | 6,835,004 |
| 4.05% 4/15/30 | | 3,689,000 | 3,383,329 |
| 4.1% 3/15/52 | | 2,730,000 | 2,168,739 |
| FirstEnergy Corp.: | | | |
| 1.6% 1/15/26 | | 500,000 | 445,272 |
| 2.05% 3/1/25 | | 500,000 | 466,425 |
| 2.65% 3/1/30 | | 20,000 | 16,585 |
| 3.4% 3/1/50 | | 2,560,000 | 1,729,768 |
| 4.15% 7/15/27 | | 40,000 | 37,312 |
| 7.375% 11/15/31 | | 14,027,000 | 15,731,281 |
| Iberdrola Finanzas SAU 7.375% 1/29/24 | GBP | 800,000 | 980,698 |
| IPALCO Enterprises, Inc. 3.7% 9/1/24 | | 3,797,000 | 3,667,420 |
| Israel Electric Corp. Ltd. 3.75% 2/22/32 (Reg. S) (d) | | 1,085,000 | 932,351 |
| Lamar Funding Ltd. 3.958% 5/7/25 (d) | | 1,085,000 | 1,025,528 |
| Mong Duong Finance Holdings BV 5.125% 5/7/29 (d) | | 1,300,000 | 1,104,838 |
| Monongahela Power Co. 4.1% 4/15/24 (d) | | 1,445,000 | 1,418,053 |
| NextEra Energy Partners LP 3.875% 10/15/26 (d) | | 20,000 | 18,100 |
| NGG Finance PLC 2.125% 9/5/82 (Reg. S) (e) | EUR | 4,745,000 | 4,263,258 |
| NRG Energy, Inc.: | | | |
| 3.375% 2/15/29(d) | | 1,830,000 | 1,485,887 |
| 3.625% 2/15/31(d) | | 930,000 | 721,100 |
| 3.875% 2/15/32(d) | | 40,000 | 31,022 |
| 5.25% 6/15/29(d) | | 1,975,000 | 1,757,750 |
| 5.75% 1/15/28 | | 20,000 | 18,852 |
| 6.625% 1/15/27 | | 1,000,000 | 997,192 |
| PG&E Corp.: | | | |
| 5% 7/1/28 | | 4,360,000 | 3,980,898 |
| 5.25% 7/1/30 | | 5,890,000 | 5,256,825 |
| Southern Co. 1.875% 9/15/81 (e) | EUR | 5,105,000 | 4,293,153 |
| Vistra Operations Co. LLC: | | | |
| 4.375% 5/1/29(d) | | 20,000 | 17,276 |
| 5% 7/31/27(d) | | 2,375,000 | 2,206,268 |
| 5.5% 9/1/26(d) | | 1,855,000 | 1,771,698 |
| 5.625% 2/15/27(d) | | 2,770,000 | 2,624,909 |
| Western Power Distribution PLC 3.625% 11/6/23 (Reg. S) | GBP | 850,000 | 1,011,012 |
| | | | 132,146,718 |
| Gas Utilities - 0.0% | | | |
| AmeriGas Partners LP/AmeriGas Finance Corp.: | | | |
| 5.5% 5/20/25 | | 20,000 | 19,011 |
| 5.875% 8/20/26 | | 20,000 | 18,848 |
| ENN Energy Holdings Ltd. 4.625% 5/17/27 (d) | | 890,000 | 858,183 |
| Ferrellgas LP/Ferrellgas Finance Corp.: | | | |
| 5.375% 4/1/26(d) | | 500,000 | 450,118 |
| 5.875% 4/1/29(d) | | 20,000 | 16,325 |
| Nakilat, Inc. 6.067% 12/31/33 (d) | | 639,428 | 665,325 |
| Suburban Propane Partners LP/Suburban Energy Finance Corp. 5.875% 3/1/27 | | 725,000 | 688,718 |
| Superior Plus LP / Superior General Partner, Inc. 4.5% 3/15/29 (d) | | 860,000 | 747,065 |
| | | | 3,463,593 |
| Independent Power and Renewable Electricity Producers - 0.4% | | | |
| Atlantica Sustainable Infrastructure PLC 4.125% 6/15/28 (d) | | 1,828,000 | 1,613,361 |
| Aydem Yenilenebilir Enerji A/S 7.75% 2/2/27 (d) | | 345,000 | 282,102 |
| Calpine Corp.: | | | |
| 4.5% 2/15/28(d) | | 20,000 | 18,006 |
| 5% 2/1/31(d) | | 40,000 | 32,913 |
| 5.125% 3/15/28(d) | | 20,000 | 17,743 |
| 5.25% 6/1/26(d) | | 20,000 | 19,169 |
| Emera U.S. Finance LP 3.55% 6/15/26 | | 2,935,000 | 2,755,201 |
| Energo-Pro A/S 8.5% 2/4/27 (d) | | 340,000 | 325,189 |
| EnfraGen Energia Sur SA 5.375% 12/30/30 (d) | | 1,715,000 | 1,117,553 |
| Investment Energy Resources Ltd. 6.25% 4/26/29 (d) | | 705,000 | 629,653 |
| RWE AG 2.75% 5/24/30 (Reg. S) | EUR | 2,510,000 | 2,420,969 |
| Termocandelaria Power Ltd. 7.875% 1/30/29 (d) | | 1,003,625 | 898,244 |
| The AES Corp.: | | | |
| 3.3% 7/15/25(d) | | 36,313,000 | 34,077,722 |
| 3.95% 7/15/30(d) | | 37,328,000 | 32,680,664 |
| | | | 76,888,489 |
| Multi-Utilities - 0.4% | | | |
| Abu Dhabi National Energy Co. PJSC: | | | |
| 4% 10/3/49(d) | | 795,000 | 663,110 |
| 4.875% 4/23/30(d) | | 305,000 | 306,487 |
| Berkshire Hathaway Energy Co. 4.05% 4/15/25 | | 26,164,000 | 25,592,186 |
| Consolidated Edison Co. of New York, Inc. 3.35% 4/1/30 | | 1,658,000 | 1,481,834 |
| NiSource, Inc.: | | | |
| 2.95% 9/1/29 | | 17,668,000 | 15,249,115 |
| 5.25% 2/15/43 | | 4,623,000 | 4,398,533 |
| 5.8% 2/1/42 | | 2,300,000 | 2,221,138 |
| 5.95% 6/15/41 | | 3,281,000 | 3,303,153 |
| Puget Energy, Inc.: | | | |
| 4.1% 6/15/30 | | 12,516,000 | 11,237,536 |
| 4.224% 3/15/32 | | 23,786,000 | 21,031,462 |
| Sempra Energy 6% 10/15/39 | | 5,447,000 | 5,518,178 |
| WEC Energy Group, Inc. 3 month U.S. LIBOR + 2.610% 6.9761% 5/15/67 (e)(h) | | 1,401,000 | 1,196,763 |
| | | | 92,199,495 |
| Water Utilities - 0.0% | | | |
| Anglian Water (Osprey) Financing PLC 2% 7/31/28 (Reg. S) | GBP | 830,000 | 795,370 |
| Severn Trent Utilities Finance PLC: | | | |
| 4.625% 11/30/34 (Reg. S) | GBP | 700,000 | 795,520 |
| 6.125% 2/26/24 | GBP | 442,000 | 536,062 |
| Southern Water Services Finance Ltd. 1.625% 3/30/27 (Reg. S) | GBP | 1,013,000 | 1,047,014 |
| Thames Water Utility Finance PLC 1.875% 1/24/24 (Reg. S) | GBP | 890,000 | 1,038,702 |
| | | | 4,212,668 |
TOTAL UTILITIES | | | 308,910,963 |
| | | | |
| TOTAL NONCONVERTIBLE BONDS | | | 7,043,234,860 |
| TOTAL CORPORATE BONDS (Cost $7,749,551,358) | | | 7,071,560,530 |
| | | | |
| U.S. Treasury Obligations - 29.0% |
| | | Principal Amount (a) | Value ($) |
| U.S. Treasury Bonds: | | | |
| 1.125% 5/15/40 | | 86,364,000 | 54,662,340 |
| 1.75% 8/15/41 | | 111,477,000 | 77,250,077 |
| 1.875% 11/15/51 | | 339,566,000 | 220,850,541 |
| 2% 11/15/41 | | 218,350,000 | 157,817,581 |
| 2% 8/15/51 | | 710,798,000 | 477,761,767 |
| 2.25% 2/15/52 | | 329,570,000 | 234,985,984 |
| 2.875% 5/15/52 | | 114,784,000 | 93,992,852 |
| 3% 2/15/47 | | 245,214,000 | 204,102,340 |
| 3% 8/15/52 | | 85,740,000 | 72,075,188 |
| 3.25% 5/15/42 (k) | | 124,471,000 | 110,015,833 |
| 3.625% 2/15/53 | | 52,184,000 | 49,680,799 |
| 4% 11/15/42 | | 2,805,000 | 2,765,116 |
| U.S. Treasury Notes: | | | |
| 0.75% 3/31/26 (k) | | 3,010,000 | 2,693,362 |
| 1.125% 8/31/28 | | 395,338,000 | 337,010,203 |
| 1.25% 5/31/28 | | 31,141,000 | 26,893,173 |
| 1.25% 9/30/28 | | 158,340,000 | 135,634,291 |
| 1.5% 11/30/28 | | 75,000,000 | 64,954,102 |
| 1.75% 1/31/29 | | 146,464,000 | 128,276,146 |
| 1.875% 2/28/27 | | 175,000,000 | 159,373,046 |
| 2.25% 3/31/24 (k) | | 5,100,000 | 4,944,211 |
| 2.5% 3/31/27 | | 80,000,000 | 74,612,500 |
| 2.625% 7/31/29 | | 200,000,000 | 183,390,624 |
| 2.75% 7/31/27 | | 450,000,000 | 422,753,904 |
| 2.75% 2/15/28 | | 54,737,100 | 51,213,399 |
| 2.75% 8/15/32 | | 683,541,000 | 621,167,775 |
| 2.875% 8/15/28 | | 78,639,600 | 73,696,978 |
| 2.875% 5/15/32 | | 197,316,000 | 181,469,059 |
| 3.125% 8/31/29 | | 225,160,000 | 212,626,680 |
| 3.5% 1/31/30 | | 100,000,000 | 96,578,125 |
| 3.5% 2/15/33 | | 50,000,000 | 48,351,563 |
| 3.875% 1/15/26 (l) | | 70,700,000 | 69,484,844 |
| 3.875% 11/30/29 | | 125,000,000 | 123,398,438 |
| 3.875% 12/31/29 | | 450,000,000 | 444,515,625 |
| 4% 10/31/29 | | 75,000,000 | 74,557,617 |
| 4.125% 10/31/27 | | 243,059,000 | 241,843,705 |
| 4.125% 11/15/32 (l) | | 208,954,000 | 212,284,204 |
| 4.375% 10/31/24 (k)(l)(m) | | 15,300,000 | 15,156,563 |
| TOTAL U.S. TREASURY OBLIGATIONS (Cost $6,761,456,242) | | | 5,762,840,555 |
| | | | |
| U.S. Government Agency - Mortgage Securities - 19.5% |
| | | Principal Amount (a) | Value ($) |
| Fannie Mae - 5.1% | | | |
| 12 month U.S. LIBOR + 1.440% 1.945% 4/1/37 (e)(h) | | 6,522 | 6,524 |
| 12 month U.S. LIBOR + 1.460% 3.85% 1/1/35 (e)(h) | | 6,747 | 6,750 |
| 12 month U.S. LIBOR + 1.480% 3.796% 7/1/34 (e)(h) | | 1,909 | 1,927 |
| 12 month U.S. LIBOR + 1.550% 3.803% 6/1/36 (e)(h) | | 5,138 | 5,219 |
| 12 month U.S. LIBOR + 1.560% 2.065% 3/1/37 (e)(h) | | 7,217 | 7,249 |
| 12 month U.S. LIBOR + 1.620% 3.584% 3/1/33 (e)(h) | | 6,825 | 6,842 |
| 12 month U.S. LIBOR + 1.620% 3.871% 5/1/35 (e)(h) | | 13,246 | 13,377 |
| 12 month U.S. LIBOR + 1.630% 3.491% 11/1/36 (e)(h) | | 3,808 | 3,842 |
| 12 month U.S. LIBOR + 1.630% 3.815% 9/1/36 (e)(h) | | 4,534 | 4,576 |
| 12 month U.S. LIBOR + 1.640% 3.274% 5/1/36 (e)(h) | | 11,507 | 11,663 |
| 12 month U.S. LIBOR + 1.640% 3.895% 6/1/47 (e)(h) | | 9,975 | 10,110 |
| 12 month U.S. LIBOR + 1.700% 3.186% 6/1/42 (e)(h) | | 13,380 | 13,627 |
| 12 month U.S. LIBOR + 1.730% 3.442% 5/1/36 (e)(h) | | 10,782 | 10,974 |
| 12 month U.S. LIBOR + 1.730% 3.854% 3/1/40 (e)(h) | | 14,046 | 14,195 |
| 12 month U.S. LIBOR + 1.750% 3.701% 7/1/35 (e)(h) | | 4,376 | 4,403 |
| 12 month U.S. LIBOR + 1.750% 4% 8/1/41 (e)(h) | | 19,991 | 20,348 |
| 12 month U.S. LIBOR + 1.780% 4.163% 2/1/36 (e)(h) | | 6,032 | 6,071 |
| 12 month U.S. LIBOR + 1.800% 4.048% 12/1/40 (e)(h) | | 474,266 | 481,447 |
| 12 month U.S. LIBOR + 1.800% 4.05% 7/1/41 (e)(h) | | 6,019 | 6,139 |
| 12 month U.S. LIBOR + 1.800% 4.055% 1/1/42 (e)(h) | | 48,643 | 49,178 |
| 12 month U.S. LIBOR + 1.810% 2.521% 2/1/42 (e)(h) | | 21,726 | 21,995 |
| 12 month U.S. LIBOR + 1.810% 4.051% 7/1/41 (e)(h) | | 8,476 | 8,672 |
| 12 month U.S. LIBOR + 1.810% 4.06% 12/1/39 (e)(h) | | 11,215 | 11,314 |
| 12 month U.S. LIBOR + 1.810% 4.068% 9/1/41 (e)(h) | | 4,439 | 4,517 |
| 12 month U.S. LIBOR + 1.820% 4.195% 12/1/35 (e)(h) | | 8,597 | 8,676 |
| 12 month U.S. LIBOR + 1.830% 4.08% 10/1/41 (e)(h) | | 3,535 | 3,515 |
| 12 month U.S. LIBOR + 1.950% 3.771% 7/1/37 (e)(h) | | 9,800 | 10,043 |
| 6 month U.S. LIBOR + 1.500% 3.727% 1/1/35 (e)(h) | | 14,711 | 14,750 |
| 6 month U.S. LIBOR + 1.530% 3.258% 12/1/34 (e)(h) | | 2,760 | 2,761 |
| 6 month U.S. LIBOR + 1.530% 3.437% 3/1/35 (e)(h) | | 3,438 | 3,442 |
| 6 month U.S. LIBOR + 1.550% 4.211% 10/1/33 (e)(h) | | 1,242 | 1,265 |
| 6 month U.S. LIBOR + 1.560% 5.64% 7/1/35 (e)(h) | | 2,159 | 2,209 |
| 6 month U.S. LIBOR + 1.740% 3.865% 12/1/34 (e)(h) | | 395 | 399 |
| 6 month U.S. LIBOR + 1.960% 3.434% 9/1/35 (e)(h) | | 2,898 | 2,936 |
| U.S. TREASURY 1 YEAR INDEX + 1.940% 3.87% 10/1/33 (e)(h) | | 19,676 | 19,927 |
| U.S. TREASURY 1 YEAR INDEX + 2.200% 2.583% 3/1/35 (e)(h) | | 4,014 | 4,071 |
| U.S. TREASURY 1 YEAR INDEX + 2.270% 4.395% 6/1/36 (e)(h) | | 9,513 | 9,679 |
| U.S. TREASURY 1 YEAR INDEX + 2.280% 4.407% 10/1/33 (e)(h) | | 7,794 | 7,928 |
| U.S. TREASURY 1 YEAR INDEX + 2.460% 3.982% 7/1/34 (e)(h) | | 14,523 | 14,815 |
| 1.5% 1/1/36 to 6/1/51 | | 32,127,054 | 27,017,811 |
| 2% 2/1/28 to 4/1/52 | | 224,066,344 | 187,286,409 |
| 2.5% 1/1/28 to 2/1/52 (k) | | 358,813,412 | 312,223,967 |
| 3% 1/1/32 to 2/1/52 | | 143,195,307 | 129,053,274 |
| 3.5% 9/1/37 to 12/1/52 | | 85,572,770 | 78,797,300 |
| 4% 3/1/36 to 9/1/52 | | 88,527,117 | 84,309,511 |
| 4.5% to 4.5% 6/1/33 to 12/1/52 | | 82,733,772 | 80,646,937 |
| 5% 6/1/23 to 3/1/53 | | 56,539,257 | 56,240,958 |
| 5.264% 8/1/41 (e) | | 347,277 | 346,894 |
| 5.5% 12/1/23 to 12/1/52 | | 36,520,402 | 36,578,535 |
| 6% to 6% 9/1/29 to 12/1/52 | | 15,246,782 | 15,480,638 |
| 6.5% 7/1/23 to 4/1/37 | | 563,004 | 581,803 |
| 6.67% 2/1/39 (e) | | 175,593 | 178,627 |
| 7% to 7% 4/1/23 to 7/1/37 | | 107,643 | 111,416 |
| 7.5% to 7.5% 6/1/25 to 11/1/31 | | 53,742 | 55,450 |
| 8% 3/1/37 | | 3,625 | 3,946 |
TOTAL FANNIE MAE | | | 1,009,750,851 |
| Freddie Mac - 3.6% | | | |
| 12 month U.S. LIBOR + 1.320% 3.575% 1/1/36 (e)(h) | | 4,873 | 4,816 |
| 12 month U.S. LIBOR + 1.370% 3.634% 3/1/36 (e)(h) | | 25,770 | 25,610 |
| 12 month U.S. LIBOR + 1.500% 3.824% 3/1/36 (e)(h) | | 15,021 | 14,978 |
| 12 month U.S. LIBOR + 1.750% 4% 12/1/40 (e)(h) | | 205,134 | 205,865 |
| 12 month U.S. LIBOR + 1.750% 4% 7/1/41 (e)(h) | | 39,642 | 40,236 |
| 12 month U.S. LIBOR + 1.750% 4% 9/1/41 (e)(h) | | 69,287 | 69,977 |
| 12 month U.S. LIBOR + 1.860% 3.239% 4/1/36 (e)(h) | | 10,164 | 10,295 |
| 12 month U.S. LIBOR + 1.880% 3.255% 4/1/41 (e)(h) | | 1,682 | 1,707 |
| 12 month U.S. LIBOR + 1.880% 4.13% 9/1/41 (e)(h) | | 6,720 | 6,793 |
| 12 month U.S. LIBOR + 1.900% 3.966% 10/1/42 (e)(h) | | 48,454 | 48,935 |
| 12 month U.S. LIBOR + 1.910% 3.22% 5/1/41 (e)(h) | | 13,371 | 13,568 |
| 12 month U.S. LIBOR + 1.910% 3.568% 5/1/41 (e)(h) | | 13,860 | 14,115 |
| 12 month U.S. LIBOR + 1.910% 3.791% 6/1/41 (e)(h) | | 16,863 | 17,184 |
| 12 month U.S. LIBOR + 1.910% 4.16% 6/1/41 (e)(h) | | 4,385 | 4,475 |
| 12 month U.S. LIBOR + 2.020% 2.93% 4/1/38 (e)(h) | | 8,786 | 8,905 |
| 12 month U.S. LIBOR + 2.030% 4.158% 3/1/33 (e)(h) | | 188 | 189 |
| 12 month U.S. LIBOR + 2.040% 4.265% 7/1/36 (e)(h) | | 13,391 | 13,643 |
| 12 month U.S. LIBOR + 2.200% 4.45% 12/1/36 (e)(h) | | 17,325 | 17,564 |
| 6 month U.S. LIBOR + 1.120% 3.029% 8/1/37 (e)(h) | | 9,749 | 9,608 |
| 6 month U.S. LIBOR + 1.580% 5.08% 12/1/35 (e)(h) | | 52 | 53 |
| 6 month U.S. LIBOR + 1.880% 3.488% 10/1/36 (e)(h) | | 25,121 | 25,252 |
| 6 month U.S. LIBOR + 1.990% 4% 10/1/35 (e)(h) | | 12,220 | 12,302 |
| 6 month U.S. LIBOR + 2.020% 5.51% 6/1/37 (e)(h) | | 5,799 | 5,928 |
| 6 month U.S. LIBOR + 2.680% 5.679% 10/1/35 (e)(h) | | 4,652 | 4,824 |
| U.S. TREASURY 1 YEAR INDEX + 2.030% 3.174% 6/1/33 (e)(h) | | 18,113 | 18,213 |
| U.S. TREASURY 1 YEAR INDEX + 2.260% 3.229% 6/1/33 (e)(h) | | 37,206 | 37,554 |
| U.S. TREASURY 1 YEAR INDEX + 2.430% 4.392% 3/1/35 (e)(h) | | 65,503 | 66,578 |
| 1.5% 7/1/35 to 6/1/51 | | 32,795,063 | 27,184,641 |
| 2% 8/1/35 to 4/1/52 | | 160,539,079 | 131,787,160 |
| 2.5% 1/1/28 to 4/1/52 | | 197,856,721 | 171,148,977 |
| 3% 4/1/32 to 4/1/52 | | 69,817,360 | 62,580,305 |
| 3.5% 1/1/32 to 12/1/52 (k)(m) | | 105,088,865 | 97,788,338 |
| 4% 5/1/37 to 10/1/52 | | 60,742,042 | 58,426,041 |
| 4% 4/1/48 | | 21,788 | 20,826 |
| 4.5% 6/1/25 to 10/1/52 | | 75,582,012 | 73,052,842 |
| 5% 8/1/33 to 3/1/53 | | 58,521,574 | 57,984,697 |
| 5.5% 10/1/52 to 1/1/53 | | 23,364,233 | 23,346,868 |
| 6% 1/1/29 to 12/1/37 | | 260,703 | 268,051 |
| 6.5% 5/1/26 to 1/1/53 | | 6,294,609 | 6,475,880 |
| 7% 3/1/26 to 9/1/36 | | 123,849 | 129,179 |
| 7.5% 1/1/27 to 11/1/31 | | 736 | 771 |
| 8% 7/1/24 to 4/1/32 | | 2,734 | 2,873 |
| 8.5% 1/1/25 to 1/1/28 | | 1,838 | 1,900 |
TOTAL FREDDIE MAC | | | 710,898,516 |
| Ginnie Mae - 3.1% | | | |
| 3.5% 9/20/40 to 7/20/46 (k) | | 27,359,640 | 25,665,238 |
| 4% 5/20/33 to 5/20/49 | | 25,924,087 | 24,949,730 |
| 4.5% 6/20/33 to 8/15/41 | | 5,702,192 | 5,602,549 |
| 5% 12/15/32 to 4/20/48 | | 6,088,832 | 6,118,959 |
| 5.5% 7/15/33 to 9/15/39 | | 185,393 | 189,141 |
| 6% to 6% 10/15/30 to 11/15/39 | | 71,700 | 73,681 |
| 7% to 7% 12/15/23 to 11/15/32 | | 130,829 | 135,021 |
| 7.5% to 7.5% 4/15/23 to 9/15/31 | | 26,219 | 26,848 |
| 8% 12/15/23 to 11/15/29 | | 5,059 | 5,183 |
| 8.5% 11/15/27 to 1/15/31 | | 2,140 | 2,263 |
| 2% 12/20/50 to 4/20/51 | | 46,719,711 | 39,389,329 |
| 2% 3/1/53 (g) | | 16,100,000 | 13,494,577 |
| 2% 3/1/53 (g) | | 25,250,000 | 21,163,856 |
| 2% 3/1/53 (g) | | 11,150,000 | 9,345,623 |
| 2% 3/1/53 (g) | | 10,750,000 | 9,010,354 |
| 2% 3/1/53 (g) | | 16,100,000 | 13,494,577 |
| 2% 3/1/53 (g) | | 64,550,000 | 54,104,035 |
| 2% 3/1/53 (g) | | 19,400,000 | 16,260,547 |
| 2% 3/1/53 (g) | | 12,950,000 | 10,854,334 |
| 2% 4/1/53 (g) | | 63,800,000 | 53,532,723 |
| 2% 4/1/53 (g) | | 47,850,000 | 40,149,543 |
| 2.5% 7/20/51 to 12/20/51 | | 19,993,623 | 17,354,444 |
| 2.5% 3/1/53 (g) | | 31,850,000 | 27,542,714 |
| 2.5% 3/1/53 (g) | | 63,300,000 | 54,739,523 |
| 2.5% 3/1/53 (g) | | 25,100,000 | 21,705,561 |
| 2.5% 3/1/53 (g) | | 21,425,000 | 18,527,556 |
| 3% 5/20/42 to 12/20/49 (k) | | 6,928,738 | 6,312,397 |
| 3% 3/1/53 (g) | | 24,900,000 | 22,212,132 |
| 3% 3/1/53 (g) | | 16,600,000 | 14,808,088 |
| 3% 3/1/53 (g) | | 33,850,000 | 30,196,011 |
| 3% 3/1/53 (g) | | 21,050,000 | 18,777,726 |
| 3.5% 3/1/53 (g) | | 9,150,000 | 8,410,707 |
| 3.5% 3/1/53 (g) | | 15,200,000 | 13,971,884 |
| 3.5% 3/1/53 (g) | | 10,625,000 | 9,766,531 |
| 3.5% 3/1/53 (g) | | 12,175,000 | 11,191,295 |
| 6.5% 3/20/31 to 6/15/37 | | 48,255 | 50,127 |
TOTAL GINNIE MAE | | | 619,134,807 |
| Uniform Mortgage Backed Securities - 7.7% | | | |
| 1.5% 3/1/38 (g) | | 1,000,000 | 864,478 |
| 1.5% 3/1/38 (g) | | 17,525,000 | 15,149,972 |
| 1.5% 3/1/38 (g) | | 22,700,000 | 19,623,644 |
| 1.5% 3/1/38 (g) | | 22,700,000 | 19,623,644 |
| 1.5% 4/1/38 (g) | | 23,700,000 | 20,518,673 |
| 1.5% 4/1/38 (g) | | 23,000,000 | 19,912,636 |
| 1.5% 3/1/53 (g) | | 44,300,000 | 34,205,815 |
| 1.5% 3/1/53 (g) | | 27,650,000 | 21,349,679 |
| 2% 3/1/38 (g) | | 26,850,000 | 23,829,885 |
| 2% 3/1/38 (g) | | 17,900,000 | 15,886,590 |
| 2% 4/1/38 (g) | | 26,350,000 | 23,414,945 |
| 2% 4/1/38 (g) | | 14,200,000 | 12,618,300 |
| 2% 3/1/53 (g) | | 78,350,000 | 63,796,817 |
| 2% 3/1/53 (g) | | 15,650,000 | 12,743,078 |
| 2% 3/1/53 (g) | | 120,150,000 | 97,832,642 |
| 2% 3/1/53 (g) | | 45,775,000 | 37,272,486 |
| 2% 3/1/53 (g) | | 1,550,000 | 1,262,094 |
| 2% 3/1/53 (g) | | 28,050,000 | 22,839,830 |
| 2% 3/1/53 (g) | | 140,400,000 | 114,321,290 |
| 2% 4/1/53 (g) | | 9,200,000 | 7,500,123 |
| 2% 4/1/53 (g) | | 156,450,000 | 127,542,859 |
| 2% 4/1/53 (g) | | 91,500,000 | 74,593,618 |
| 2.5% 3/1/53 (g) | | 60,225,000 | 51,021,921 |
| 2.5% 3/1/53 (g) | | 30,900,000 | 26,178,122 |
| 2.5% 3/1/53 (g) | | 77,500,000 | 65,657,101 |
| 2.5% 4/1/53 (g) | | 19,700,000 | 16,706,542 |
| 3% 3/1/53 (g) | | 43,700,000 | 38,437,205 |
| 3% 3/1/53 (g) | | 17,250,000 | 15,172,581 |
| 3% 3/1/53 (g) | | 58,700,000 | 51,630,753 |
| 3% 3/1/53 (g) | | 41,200,000 | 36,238,280 |
| 3% 4/1/53 (g) | | 89,000,000 | 78,351,257 |
| 3% 4/1/53 (g) | | 29,700,000 | 26,146,431 |
| 3.5% 3/1/53 (g) | | 133,975,000 | 121,980,138 |
| 3.5% 3/1/53 (g) | | 11,050,000 | 10,060,687 |
| 4% 3/1/53 (g) | | 14,625,000 | 13,717,791 |
| 4% 3/1/53 (g) | | 3,400,000 | 3,189,093 |
| 4% 3/1/53 (g) | | 3,400,000 | 3,189,093 |
| 4% 3/1/53 (g) | | 10,700,000 | 10,036,264 |
| 4% 3/1/53 (g) | | 10,700,000 | 10,036,264 |
| 4.5% 3/1/53 (g) | | 48,925,000 | 47,103,679 |
| 5% 3/1/53 (g) | | 19,000,000 | 18,670,462 |
| 5.5% 3/1/53 (g) | | 21,100,000 | 21,062,904 |
| 5.5% 3/1/53 (g) | | 21,900,000 | 21,861,498 |
| 5.5% 3/1/53 (g) | | 20,350,000 | 20,314,223 |
| 5.5% 4/1/53 (g) | | 22,300,000 | 22,250,340 |
| 6.5% 3/1/53 (g) | | 6,000,000 | 6,144,811 |
TOTAL UNIFORM MORTGAGE BACKED SECURITIES | | | 1,521,860,538 |
| TOTAL U.S. GOVERNMENT AGENCY - MORTGAGE SECURITIES (Cost $4,061,243,138) | | | 3,861,644,712 |
| | | | |
| Asset-Backed Securities - 5.4% |
| | | Principal Amount (a) | Value ($) |
| AASET Trust: | | | |
| Series 2018-1A Class A, 3.844% 1/16/38 (d) | | 4,748,854 | 3,003,704 |
| Series 2019-1 Class A, 3.844% 5/15/39 (d) | | 3,740,303 | 2,634,309 |
| Series 2019-2: | | | |
Class A, 3.376% 10/16/39 (d) | | 9,706,113 | 7,506,492 |
Class B, 4.458% 10/16/39 (d) | | 2,087,167 | 687,725 |
| Series 2021-1A Class A, 2.95% 11/16/41 (d) | | 10,692,675 | 9,381,145 |
| Series 2021-2A Class A, 2.798% 1/15/47 (d) | | 20,132,591 | 16,972,509 |
| AASET, Ltd. Series 2022-1A Class A, 6% 5/16/47 (d) | | 39,236,577 | 37,654,974 |
| Aimco Series 2021-BA Class AR, 3 month U.S. LIBOR + 1.100% 5.8924% 1/15/32 (d)(e)(h) | | 7,740,000 | 7,643,242 |
| AIMCO CLO Ltd. Series 2021-11A Class AR, 3 month U.S. LIBOR + 1.130% 5.9224% 10/17/34 (d)(e)(h) | | 8,253,000 | 8,113,021 |
| AIMCO CLO Ltd. / AIMCO CLO LLC Series 2021-14A Class A, 3 month U.S. LIBOR + 0.990% 5.7977% 4/20/34 (d)(e)(h) | | 19,226,000 | 18,850,382 |
| Allegro CLO XV, Ltd. / Allegro CLO VX LLC Series 2022-1A Class A, CME TERM SOFR 3 MONTH INDEX + 1.500% 6.139% 7/20/35 (d)(e)(h) | | 11,745,000 | 11,611,906 |
| Allegro CLO, Ltd. Series 2021-1A Class A, 3 month U.S. LIBOR + 1.140% 5.9477% 7/20/34 (d)(e)(h) | | 9,447,000 | 9,253,818 |
| American Homes 4 Rent: | | | |
| Series 2014-SFR3 Class E, 6.418% 12/17/36 (d) | | 261,000 | 257,919 |
| Series 2015-SFR1 Class E, 5.639% 4/17/52 (d) | | 595,000 | 584,729 |
| Series 2015-SFR2: | | | |
Class E, 6.07% 10/17/52 (d) | | 611,000 | 600,291 |
Class XS, 0% 10/17/52 (c)(d)(e)(n) | | 407,971 | 4 |
| Apollo Aviation Securitization Equity Trust Series 2020-1A: | | | |
| Class A, 3.351% 1/16/40 (d) | | 3,100,886 | 2,554,292 |
| Class B, 4.335% 1/16/40 (d) | | 551,865 | 243,125 |
| Ares CLO Series 2019-54A Class A, 3 month U.S. LIBOR + 1.320% 6.1124% 10/15/32 (d)(e)(h) | | 11,120,000 | 11,010,746 |
| Ares LIX CLO Ltd. Series 2021-59A Class A, 3 month U.S. LIBOR + 1.030% 5.8477% 4/25/34 (d)(e)(h) | | 15,787,000 | 15,462,356 |
| Ares LV CLO Ltd. Series 2021-55A Class A1R, 3 month U.S. LIBOR + 1.130% 5.9224% 7/15/34 (d)(e)(h) | | 12,053,000 | 11,893,418 |
| Ares LVIII CLO LLC Series 2022-58A Class AR, CME TERM SOFR 3 MONTH INDEX + 1.330% 5.9876% 1/15/35 (d)(e)(h) | | 16,982,000 | 16,686,870 |
| Ares XLI CLO Ltd. / Ares XLI CLO LLC Series 2021-41A Class AR2, 3 month U.S. LIBOR + 1.070% 5.8624% 4/15/34 (d)(e)(h) | | 27,261,000 | 26,726,684 |
| Ares XXXIV CLO Ltd. Series 2020-2A Class AR2, 3 month U.S. LIBOR + 1.250% 6.0424% 4/17/33 (d)(e)(h) | | 8,452,000 | 8,358,512 |
| Babson CLO Ltd. Series 2021-1A Class AR, 3 month U.S. LIBOR + 1.150% 5.9424% 10/15/36 (d)(e)(h) | | 8,291,000 | 8,157,258 |
| Barings CLO Ltd.: | | | |
| Series 2021-1A Class A, 3 month U.S. LIBOR + 1.020% 5.8377% 4/25/34 (d)(e)(h) | | 14,004,000 | 13,758,776 |
| Series 2021-4A Class A, 3 month U.S. LIBOR + 1.220% 6.0277% 1/20/32 (d)(e)(h) | | 15,650,000 | 15,525,176 |
| Beechwood Park CLO Ltd. Series 2022-1A Class A1R, CME TERM SOFR 3 MONTH INDEX + 1.300% 5.9576% 1/17/35 (d)(e)(h) | | 17,449,000 | 17,345,248 |
| BETHP Series 2021-1A Class A, 3 month U.S. LIBOR + 1.130% 5.9224% 1/15/35 (d)(e)(h) | | 12,522,000 | 12,285,109 |
| Blackbird Capital Aircraft: | | | |
| Series 2016-1A: | | | |
Class A, 4.213% 12/16/41 (d) | | 10,686,784 | 8,923,679 |
Class AA, 2.487% 12/16/41 (d)(e) | | 886,944 | 816,745 |
| Series 2021-1A Class A, 2.443% 7/15/46 (d) | | 14,688,559 | 12,426,117 |
| Bristol Park CLO, Ltd. Series 2020-1A Class AR, 3 month U.S. LIBOR + 0.990% 5.7824% 4/15/29 (d)(e)(h) | | 12,330,591 | 12,227,729 |
| Castlelake Aircraft Securitization Trust Series 2019-1A: | | | |
| Class A, 3.967% 4/15/39 (d) | | 7,971,466 | 6,955,423 |
| Class B, 5.095% 4/15/39 (d) | | 4,356,038 | 3,114,745 |
| Castlelake Aircraft Structured Trust: | | | |
| Series 2018-1 Class A, 4.125% 6/15/43 (d) | | 4,189,548 | 3,661,289 |
| Series 2021-1A Class A, 3.474% 1/15/46 (d) | | 2,930,241 | 2,681,170 |
| Cedar Funding Ltd.: | | | |
| Series 2021-10A Class AR, 3 month U.S. LIBOR + 1.100% 5.9077% 10/20/32 (d)(e)(h) | | 10,997,000 | 10,842,734 |
| Series 2022-15A Class A, CME TERM SOFR 3 MONTH INDEX + 1.320% 5.959% 4/20/35 (d)(e)(h) | | 16,187,000 | 16,001,788 |
| Cedar Funding XII CLO Ltd. / Cedar Funding XII CLO LLC Series 2021-12A Class A1R, 3 month U.S. LIBOR + 1.130% 5.9477% 10/25/34 (d)(e)(h) | | 7,745,000 | 7,580,055 |
| CEDF Series 2021-6A Class ARR, 3 month U.S. LIBOR + 1.050% 5.8577% 4/20/34 (d)(e)(h) | | 11,637,000 | 11,309,418 |
| Cent CLO Ltd. / Cent CLO Series 2021-29A Class AR, 3 month U.S. LIBOR + 1.170% 5.9777% 10/20/34 (d)(e)(h) | | 12,599,000 | 12,317,387 |
| Citi Mortgage Loan Trust Series 2007-1 Class 1A, 1 month U.S. LIBOR + 1.350% 5.967% 10/25/37 (d)(e)(h) | | 689,680 | 686,977 |
| Columbia Cent CLO 31 Ltd. Series 2021-31A Class A1, 3 month U.S. LIBOR + 1.200% 6.0077% 4/20/34 (d)(e)(h) | | 24,335,000 | 23,711,416 |
| Columbia Cent Clo 32 Ltd. / Coliseum Series 2022-32A Class A1, CME TERM SOFR 3 MONTH INDEX + 1.700% 6.3586% 7/24/34 (d)(e)(h) | | 17,433,000 | 17,327,025 |
| Columbia Cent CLO Ltd. / Columbia Cent CLO Corp. Series 2021-30A Class A1, 3 month U.S. LIBOR + 1.310% 6.1177% 1/20/34 (d)(e)(h) | | 20,650,000 | 20,292,301 |
| Crest Ltd. Series 2004-1A Class H1, 3 month U.S. LIBOR + 3.690% 6.4829% 1/28/40 (c)(d)(e)(h) | | 211,708 | 0 |
| DB Master Finance LLC Series 2017-1A Class A2II, 4.03% 11/20/47 (d) | | 10,145,050 | 9,420,744 |
| Diamond Infrastructure Funding LLC Series 2021-1A Class C, 3.475% 4/15/49 (d) | | 214,000 | 166,252 |
| DigitalBridge Issuer, LLC / DigitalBridge Co.-Issuer, LLC Series 2021-1A Class A2, 3.933% 9/25/51 (d) | | 557,000 | 478,460 |
| Dryden 98 CLO Ltd. Series 2022-98A Class A, CME TERM SOFR 3 MONTH INDEX + 1.300% 5.939% 4/20/35 (d)(e)(h) | | 9,084,000 | 8,914,284 |
| Dryden CLO, Ltd.: | | | |
| Series 2021-76A Class A1R, 3 month U.S. LIBOR + 1.150% 5.9577% 10/20/34 (d)(e)(h) | | 15,808,000 | 15,537,225 |
| Series 2021-83A Class A, 3 month U.S. LIBOR + 1.220% 6.0147% 1/18/32 (d)(e)(h) | | 11,752,000 | 11,627,946 |
| Dryden Senior Loan Fund: | | | |
| Series 2020-78A Class A, 3 month U.S. LIBOR + 1.180% 5.9724% 4/17/33 (d)(e)(h) | | 8,700,000 | 8,605,701 |
| Series 2021-85A Class AR, 3 month U.S. LIBOR + 1.150% 5.9424% 10/15/35 (d)(e)(h) | | 11,160,000 | 10,939,021 |
| Series 2021-90A Class A1A, 3 month U.S. LIBOR + 1.130% 6.0453% 2/20/35 (d)(e)(h) | | 6,539,000 | 6,408,809 |
| Eaton Vance CLO, Ltd.: | | | |
| Series 2021-1A Class AR, 3 month U.S. LIBOR + 1.100% 5.8924% 4/15/31 (d)(e)(h) | | 6,808,000 | 6,745,829 |
| Series 2021-2A Class AR, 3 month U.S. LIBOR + 1.150% 5.9424% 1/15/35 (d)(e)(h) | | 15,072,000 | 14,861,324 |
| Eaton Vance CLO, Ltd. / Eaton Vance CLO LLC Series 2021-1A Class A13R, 3 month U.S. LIBOR + 1.250% 6.0424% 1/15/34 (d)(e)(h) | | 3,200,000 | 3,153,389 |
| FirstKey Homes Trust: | | | |
| Series 2020-SFR1 Class F2, 4.284% 8/17/37 (d) | | 420,000 | 388,785 |
| Series 2021-SFR1 Class F1, 3.238% 8/17/38 (d) | | 265,000 | 227,078 |
| Flatiron CLO Ltd. Series 2021-1A: | | | |
| Class A1, 3 month U.S. LIBOR + 1.110% 5.9076% 7/19/34 (d)(e)(h) | | 8,589,000 | 8,426,007 |
| Class AR, 3 month U.S. LIBOR + 1.080% 5.9516% 11/16/34 (d)(e)(h) | | 12,500,000 | 12,352,013 |
| Flatiron CLO Ltd. / Flatiron CLO LLC Series 2020-1A Class A, 3 month U.S. LIBOR + 1.300% 6.2153% 11/20/33 (d)(e)(h) | | 19,341,000 | 19,082,353 |
| Home Partners of America Trust: | | | |
| Series 2019-2 Class F, 3.866% 10/19/39 (d) | | 491,064 | 417,937 |
| Series 2021-2 Class G, 4.505% 12/17/26 (d) | | 2,259,324 | 1,946,217 |
| Series 2021-3 Class F, 4.242% 1/17/41 (d) | | 331,143 | 266,302 |
| Horizon Aircraft Finance I Ltd. Series 2018-1 Class A, 4.458% 12/15/38 (d) | | 4,713,028 | 4,017,819 |
| Horizon Aircraft Finance Ltd. Series 2019-1 Class A, 3.721% 7/15/39 (d) | | 4,570,887 | 3,885,217 |
| Invesco CLO Ltd. Series 2021-3A Class A, 3 month U.S. LIBOR + 1.130% 5.9453% 10/22/34 (d)(e)(h) | | 8,865,000 | 8,720,988 |
| KKR CLO Ltd. Series 2022-41A Class A1, CME TERM SOFR 3 MONTH INDEX + 1.330% 5.9619% 4/15/35 (d)(e)(h) | | 21,121,000 | 20,668,778 |
| Lucali CLO Ltd. Series 2021-1A Class A, 3 month U.S. LIBOR + 1.210% 6.0024% 1/15/33 (d)(e)(h) | | 7,620,000 | 7,553,790 |
| Madison Park Funding Series 2020-19A Class A1R2, 3 month U.S. LIBOR + 0.920% 5.7353% 1/22/28 (d)(e)(h) | | 7,859,415 | 7,813,257 |
| Madison Park Funding L Ltd. / Madison Park Funding L LLC Series 2021-50A Class A, 3 month U.S. LIBOR + 1.140% 5.9376% 4/19/34 (d)(e)(h) | | 16,420,000 | 16,178,675 |
| Madison Park Funding LII Ltd. / Madison Park Funding LII LLC Series 2021-52A Class A, 3 month U.S. LIBOR + 1.100% 5.9153% 1/22/35 (d)(e)(h) | | 17,793,000 | 17,362,089 |
| Madison Park Funding XLV Ltd./Madison Park Funding XLV LLC Series 2021-45A Class AR, 3 month U.S. LIBOR + 1.120% 5.9124% 7/15/34 (d)(e)(h) | | 8,675,000 | 8,560,603 |
| Madison Park Funding XXXII, Ltd. / Madison Park Funding XXXII LLC Series 2021-32A Class A2R, 3 month U.S. LIBOR + 1.200% 6.0153% 1/22/31 (d)(e)(h) | | 3,536,000 | 3,455,994 |
| Magnetite CLO Ltd. Series 2021-27A Class AR, 3 month U.S. LIBOR + 1.140% 5.9477% 10/20/34 (d)(e)(h) | | 2,957,000 | 2,911,654 |
| Magnetite IX, Ltd. / Magnetite IX LLC Series 2021-30A Class A, 3 month U.S. LIBOR + 1.130% 5.9477% 10/25/34 (d)(e)(h) | | 15,155,000 | 14,921,825 |
| Magnetite XXI Ltd. Series 2021-21A Class AR, 3 month U.S. LIBOR + 1.020% 5.8277% 4/20/34 (d)(e)(h) | | 11,245,000 | 11,058,355 |
| Magnetite XXIII, Ltd. Series 2021-23A Class AR, 3 month U.S. LIBOR + 1.130% 5.9477% 1/25/35 (d)(e)(h) | | 10,754,000 | 10,571,257 |
| Magnetite XXIX, Ltd. / Magnetite XXIX LLC Series 2021-29A Class A, 3 month U.S. LIBOR + 0.990% 5.7824% 1/15/34 (d)(e)(h) | | 14,050,000 | 13,887,245 |
| Milos CLO, Ltd. Series 2020-1A Class AR, 3 month U.S. LIBOR + 1.070% 5.8777% 10/20/30 (d)(e)(h) | | 18,516,736 | 18,356,399 |
| Park Place Securities, Inc. Series 2005-WCH1 Class M4, 1 month U.S. LIBOR + 1.240% 5.862% 1/25/36 (e)(h) | | 154,983 | 151,834 |
| Peace Park CLO, Ltd. Series 2021-1A Class A, 3 month U.S. LIBOR + 1.130% 5.9377% 10/20/34 (d)(e)(h) | | 12,426,000 | 12,222,002 |
| Planet Fitness Master Issuer LLC: | | | |
| Series 2018-1A Class A2II, 4.666% 9/5/48 (d) | | 20,275,063 | 19,106,448 |
| Series 2019-1A Class A2, 3.858% 12/5/49 (d) | | 9,489,510 | 7,998,338 |
| Series 2022-1A: | | | |
Class A2I, 3.251% 12/5/51 (d) | | 10,474,845 | 9,265,660 |
Class A2II, 4.008% 12/5/51 (d) | | 9,360,268 | 7,761,946 |
| Progress Residential: | | | |
| Series 2022-SFR3 Class F, 6.6% 4/17/39 (d) | | 800,000 | 759,466 |
| Series 2022-SFR4 Class E1, 6.121% 5/17/41 (d) | | 797,000 | 721,168 |
| Series 2022-SFR5: | | | |
Class E1, 6.618% 6/17/39 (d) | | 519,000 | 484,600 |
Class E2, 6.863% 6/17/39 (d) | | 870,000 | 807,447 |
| Series 2023-SFR1: | | | |
Class E1, 6.15% 3/17/40 (d) | | 273,000 | 251,616 |
Class E2, 6.6% 3/17/40 (d) | | 290,000 | 271,625 |
| Progress Residential Trust: | | | |
| Series 2019-SFR3: | | | |
Class F, 3.867% 9/17/36 (d) | | 315,000 | 302,384 |
Class G, 4.116% 9/17/36 (d) | | 263,000 | 249,878 |
| Series 2019-SFR4 Class F, 3.684% 10/17/36 (d) | | 1,082,000 | 1,028,853 |
| Series 2020-SFR1: | | | |
Class G, 4.028% 4/17/37 (d) | | 378,000 | 350,652 |
Class H, 5.268% 4/17/37 (d) | | 105,000 | 97,514 |
| Series 2020-SFR3 Class H, 6.234% 10/17/27 (d) | | 273,000 | 255,931 |
| Series 2021-SFR2 Class H, 4.998% 4/19/38 (d) | | 401,000 | 350,296 |
| Series 2021-SFR6: | | | |
Class F, 3.422% 7/17/38 (d) | | 315,000 | 269,199 |
Class G, 4.003% 7/17/38 (d) | | 168,000 | 144,993 |
| Series 2021-SFR8: | | | |
Class F, 3.181% 10/17/38 (d) | | 203,000 | 173,452 |
Class G, 4.005% 10/17/38 (d) | | 1,347,000 | 1,141,607 |
| Series 2022-SFR2 Class E2, 4.8% 4/17/27 (d) | | 688,000 | 618,748 |
| Project Silver Series 2019-1 Class A, 3.967% 7/15/44 (d) | | 8,709,130 | 7,380,995 |
| Rockland Park CLO Ltd. Series 2021-1A Class A, 3 month U.S. LIBOR + 1.120% 5.9277% 4/20/34 (d)(e)(h) | | 15,987,000 | 15,747,563 |
| RR 7 Ltd. Series 2022-7A Class A1AB, CME TERM SOFR 3 MONTH INDEX + 1.340% 5.9976% 1/15/37 (d)(e)(h) | | 17,526,000 | 17,342,450 |
| Sapphire Aviation Finance Series 2020-1A: | | | |
| Class A, 3.228% 3/15/40 (d) | | 9,164,549 | 7,389,258 |
| Class B, 4.335% 3/15/40 (d) | | 1,071,663 | 742,447 |
| SBA Tower Trust: | | | |
| Series 2019, 2.836% 1/15/50 (d) | | 12,474,000 | 11,715,213 |
| 1.884% 7/15/50 (d) | | 4,985,000 | 4,412,828 |
| 2.328% 7/15/52 (d) | | 3,812,000 | 3,284,793 |
| Starwood Mortgage Residential Trust Series 2022-SFR3 Class F, CME Term SOFR 1 Month Index + 4.500% 9.0633% 5/17/24 (d)(e)(h) | | 1,616,000 | 1,571,121 |
| Stratus CLO, Ltd. Series 2022-1A Class A, CME TERM SOFR 3 MONTH INDEX + 1.750% 6.389% 7/20/30 (d)(e)(h) | | 2,694,665 | 2,694,059 |
| SYMP Series 2022-32A Class A1, CME TERM SOFR 3 MONTH INDEX + 1.320% 5.9735% 4/23/35 (d)(e)(h) | | 18,277,000 | 18,076,812 |
| Symphony CLO XIX, Ltd. / Symphony CLO XIX LLC Series 2018-19A Class A, 3 month U.S. LIBOR + 0.960% 5.7524% 4/16/31 (d)(e)(h) | | 7,718,000 | 7,642,958 |
| Symphony CLO XXI, Ltd. Series 2021-21A Class AR, 3 month U.S. LIBOR + 1.060% 5.8524% 7/15/32 (d)(e)(h) | | 1,661,000 | 1,640,703 |
| Symphony CLO XXV Ltd. / Symphony CLO XXV LLC Series 2021-25A Class A, 3 month U.S. LIBOR + 0.980% 5.7776% 4/19/34 (d)(e)(h) | | 14,155,000 | 13,878,496 |
| Symphony CLO XXVI Ltd. / Symphony CLO XXVI LLC Series 2021-26A Class AR, 3 month U.S. LIBOR + 1.080% 5.8877% 4/20/33 (d)(e)(h) | | 26,688,000 | 26,186,746 |
| Taberna Preferred Funding VI Ltd. Series 2006-6A Class F1, 3 month U.S. LIBOR + 4.500% 9.3061% 12/5/36 (c)(d)(e)(h) | | 410,558 | 0 |
| Terwin Mortgage Trust Series 2003-4HE Class A1, 1 month U.S. LIBOR + 0.860% 5.477% 9/25/34 (e)(h) | | 7,168 | 6,884 |
| Thunderbolt Aircraft Lease Ltd.: | | | |
| Series 2017-A Class A, 4.212% 5/17/32 (d) | | 5,145,175 | 4,547,332 |
| Series 2018-A Class A, 4.147% 9/15/38 (d)(e) | | 9,030,986 | 7,450,834 |
| Thunderbolt III Aircraft Lease Ltd. Series 2019-1 Class A, 3.671% 11/15/39 (d) | | 13,037,182 | 10,467,100 |
| Trapeza CDO XII Ltd./Trapeza CDO XII, Inc. Series 2007-12A Class B, 3 month U.S. LIBOR + 0.560% 5.3484% 4/6/42 (d)(e)(h) | | 934,000 | 711,904 |
| Tricon American Homes: | | | |
| Series 2019-SFR1 Class F, 3.745% 3/17/38 (d) | | 525,000 | 473,172 |
| Series 2020-SFR1 Class F, 4.882% 7/17/38 (d) | | 151,000 | 142,397 |
| Tricon Residential Series 2022-SFR1: | | | |
| Class E1, 5.344% 4/17/39 (d) | | 1,081,000 | 1,010,637 |
| Class E2, 5.739% 4/17/39 (d) | | 1,344,000 | 1,257,294 |
| Tricon Residential Trust Series 2021-SFR1 Class G, 4.133% 7/17/38 (d) | | 168,000 | 144,749 |
| Valley Stream Park Clo Ltd. / Vy Series 2022-1A Class A, CME TERM SOFR 3 MONTH INDEX + 2.400% 6.4714% 10/20/34 (d)(e)(h) | | 16,512,000 | 16,554,254 |
| Voya CLO Ltd. Series 2019-2A Class A, 3 month U.S. LIBOR + 1.270% 6.0777% 7/20/32 (d)(e)(h) | | 13,214,000 | 13,113,666 |
| Voya CLO Ltd./Voya CLO LLC: | | | |
| Series 2021-2A Class A1R, 3 month U.S. LIBOR + 1.160% 5.9576% 7/19/34 (d)(e)(h) | | 8,182,000 | 8,043,618 |
| Series 2021-3A Class AR, 3 month U.S. LIBOR + 1.150% 5.9577% 10/20/34 (d)(e)(h) | | 16,805,000 | 16,468,379 |
| Voya CLO, Ltd. Series 2021-1A Class AR, 3 month U.S. LIBOR + 1.150% 5.9424% 7/16/34 (d)(e)(h) | | 17,432,000 | 17,100,182 |
| TOTAL ASSET-BACKED SECURITIES (Cost $1,125,155,189) | | | 1,077,513,860 |
| | | | |
| Collateralized Mortgage Obligations - 0.6% |
| | | Principal Amount (a) | Value ($) |
| Private Sponsor - 0.3% | | | |
| Ajax Mortgage Loan Trust sequential payer Series 2021-E Class A1, 1.74% 12/25/60 (d) | | 4,469,476 | 3,637,648 |
| Brass PLC Series 2021-10A Class A1, 0.669% 4/16/69 (d)(e) | | 3,810,269 | 3,632,928 |
| Cascade Funding Mortgage Trust: | | | |
| Series 2021-HB5 Class A, 0.8006% 2/25/31 (d) | | 4,376,663 | 4,234,789 |
| Series 2021-HB6 Class A, 0.8983% 6/25/36 (d) | | 5,592,407 | 5,306,183 |
| CFMT LLC Series 2020-HB4 Class A, 0.9461% 12/26/30 (d) | | 2,882,841 | 2,800,749 |
| Citigroup Mortgage Loan Trust sequential payer Series 2014-8 Class 2A1, 3.45% 6/27/37 (d)(e) | | 130,834 | 127,883 |
| Countrywide Home Loans, Inc. Series 2003-R1 Class 2B4, 3.3614% 2/25/43 (c)(d)(e) | | 1,650 | 260 |
| CSMC: | | | |
| floater Series 2015-1R Class 6A1, 1 month U.S. LIBOR + 0.280% 4.6105% 5/27/37 (d)(e)(h) | | 441,568 | 423,583 |
| Series 2014-3R Class 2A1, 1 month U.S. LIBOR + 0.700% 0% 5/27/37 (c)(d)(e)(h) | | 87,210 | 9 |
| MFA Trust sequential payer Series 2022-RPL1 Class A1, 3.3% 8/25/61 (d) | | 16,559,748 | 14,777,955 |
| New York Mortgage Trust sequential payer Series 2021-SP1 Class A1, 1.6696% 8/25/61 (d) | | 2,566,213 | 2,300,963 |
| NYMT Loan Trust sequential payer Series 2021-CP1 Class A1, 2.0424% 7/25/61 (d) | | 2,379,045 | 2,081,185 |
| RMF Buyout Issuance Trust Series 2020-HB1 Class A1, 1.7188% 10/25/50 (d) | | 2,920,919 | 2,652,610 |
| Sequoia Mortgage Trust floater Series 2004-6 Class A3B, 6 month U.S. LIBOR + 0.880% 6.0669% 7/20/34 (e)(h) | | 1,581 | 1,413 |
| Thornburg Mortgage Securities Trust floater Series 2003-4 Class A1, 1 month U.S. LIBOR + 0.640% 5.257% 9/25/43 (e)(h) | | 789,187 | 735,850 |
| Towd Point Mortgage Trust sequential payer Series 2022-K147 Class A2, 3.75% 7/25/62 (d) | | 12,224,310 | 11,287,831 |
TOTAL PRIVATE SPONSOR | | | 54,001,839 |
| U.S. Government Agency - 0.3% | | | |
| Fannie Mae: | | | |
| floater: | | | |
Series 2002-18 Class FD, 1 month U.S. LIBOR + 0.800% 5.417% 2/25/32 (e)(h) | | 2,609 | 2,620 |
Series 2002-39 Class FD, 1 month U.S. LIBOR + 1.000% 5.5979% 3/18/32 (e)(h) | | 4,869 | 4,924 |
Series 2002-60 Class FV, 1 month U.S. LIBOR + 1.000% 5.617% 4/25/32 (e)(h) | | 5,550 | 5,605 |
Series 2002-63 Class FN, 1 month U.S. LIBOR + 1.000% 5.617% 10/25/32 (e)(h) | | 6,815 | 6,883 |
Series 2002-7 Class FC, 1 month U.S. LIBOR + 0.750% 5.367% 1/25/32 (e)(h) | | 2,487 | 2,494 |
Series 2003-118 Class S, 8.100% - 1 month U.S. LIBOR 3.483% 12/25/33 (e)(n)(o) | | 93,653 | 13,060 |
Series 2006-104 Class GI, 6.680% - 1 month U.S. LIBOR 2.063% 11/25/36 (e)(n)(o) | | 67,687 | 5,726 |
| planned amortization class: | | | |
Series 1993-207 Class H, 6.5% 11/25/23 | | 3,708 | 3,706 |
Series 1996-28 Class PK, 6.5% 7/25/25 | | 1,747 | 1,747 |
Series 1999-17 Class PG, 6% 4/25/29 | | 27,430 | 27,598 |
Series 1999-32 Class PL, 6% 7/25/29 | | 32,226 | 32,477 |
Series 1999-33 Class PK, 6% 7/25/29 | | 23,964 | 24,143 |
Series 2001-52 Class YZ, 6.5% 10/25/31 | | 3,703 | 3,783 |
Series 2003-28 Class KG, 5.5% 4/25/23 | | 79 | 79 |
Series 2005-102 Class CO 11/25/35 (p) | | 16,506 | 13,886 |
Series 2005-73 Class SA, 17.500% - 1 month U.S. LIBOR 5.5458% 8/25/35 (e)(o) | | 3,725 | 3,720 |
Series 2005-81 Class PC, 5.5% 9/25/35 | | 48,303 | 49,074 |
Series 2006-12 Class BO 10/25/35 (p) | | 74,978 | 63,743 |
Series 2006-15 Class OP 3/25/36 (p) | | 93,764 | 77,972 |
Series 2006-37 Class OW 5/25/36 (p) | | 9,370 | 7,281 |
Series 2006-45 Class OP 6/25/36 (p) | | 29,089 | 22,812 |
Series 2006-62 Class KP 4/25/36 (p) | | 44,684 | 36,060 |
Series 2012-149: | | | |
Class DA, 1.75% 1/25/43 | | 891,855 | 805,393 |
Class GA, 1.75% 6/25/42 | | 966,395 | 866,620 |
| sequential payer: | | | |
Series 1997-41 Class J, 7.5% 6/18/27 | | 5,369 | 5,454 |
Series 1999-25 Class Z, 6% 6/25/29 | | 26,250 | 26,142 |
Series 2001-20 Class Z, 6% 5/25/31 | | 30,744 | 31,041 |
Series 2001-31 Class ZC, 6.5% 7/25/31 | | 15,903 | 15,997 |
Series 2002-16 Class ZD, 6.5% 4/25/32 | | 11,528 | 11,794 |
Series 2002-74 Class SV, 7.550% - 1 month U.S. LIBOR 2.933% 11/25/32 (e)(n)(o) | | 29,137 | 833 |
Series 2012-67 Class AI, 4.5% 7/25/27 (n) | | 67,805 | 2,159 |
| Series 06-116 Class SG, 6.640% - 1 month U.S. LIBOR 2.023% 12/25/36 (e)(n)(o) | | 44,921 | 4,031 |
| Series 07-40 Class SE, 6.440% - 1 month U.S. LIBOR 1.823% 5/25/37 (e)(n)(o) | | 24,078 | 2,532 |
| Series 1993-165 Class SH, 19.800% - 1 month U.S. LIBOR 6.7404% 9/25/23 (e)(o) | | 155 | 154 |
| Series 2003-21 Class SK, 8.100% - 1 month U.S. LIBOR 3.483% 3/25/33 (e)(n)(o) | | 6,047 | 667 |
| Series 2005-72 Class ZC, 5.5% 8/25/35 | | 374,082 | 374,710 |
| Series 2005-79 Class ZC, 5.9% 9/25/35 | | 287,979 | 288,229 |
| Series 2007-57 Class SA, 40.600% - 1 month U.S. LIBOR 12.918% 6/25/37 (e)(o) | | 20,455 | 24,546 |
| Series 2007-66: | | | |
Class SA, 39.600% - 1 month U.S. LIBOR 11.898% 7/25/37 (e)(o) | | 31,123 | 37,348 |
Class SB, 39.600% - 1 month U.S. LIBOR 11.898% 7/25/37 (e)(o) | | 9,232 | 10,257 |
| Series 2007-75 Class JI, 6.540% - 1 month U.S. LIBOR 1.928% 8/25/37 (e)(n)(o) | | 943,614 | 90,607 |
| Series 2008-12 Class SG, 6.350% - 1 month U.S. LIBOR 1.733% 3/25/38 (e)(n)(o) | | 157,748 | 14,115 |
| Series 2010-135: | | | |
Class LS, 6.050% - 1 month U.S. LIBOR 1.433% 12/25/40 (e)(n)(o) | | 160,863 | 9,321 |
Class ZA, 4.5% 12/25/40 | | 499,461 | 492,679 |
| Series 2010-139 Class NI, 4.5% 2/25/40 (n) | | 38,016 | 873 |
| Series 2010-150 Class ZC, 4.75% 1/25/41 | | 893,672 | 874,199 |
| Series 2010-95 Class ZC, 5% 9/25/40 | | 2,078,302 | 2,079,252 |
| Series 2011-39 Class ZA, 6% 11/25/32 | | 109,805 | 111,857 |
| Series 2011-4 Class PZ, 5% 2/25/41 | | 294,147 | 279,659 |
| Series 2011-67 Class AI, 4% 7/25/26 (n) | | 12,625 | 339 |
| Series 2011-83 Class DI, 6% 9/25/26 (n) | | 79 | 1 |
| Series 2012-100 Class WI, 3% 9/25/27 (n) | | 425,776 | 18,413 |
| Series 2012-14 Class JS, 6.650% - 1 month U.S. LIBOR 2.033% 12/25/30 (e)(n)(o) | | 38,485 | 194 |
| Series 2012-9 Class SH, 6.550% - 1 month U.S. LIBOR 1.933% 6/25/41 (e)(n)(o) | | 35,349 | 289 |
| Series 2013-133 Class IB, 3% 4/25/32 (n) | | 139,314 | 4,150 |
| Series 2013-134 Class SA, 6.050% - 1 month U.S. LIBOR 1.433% 1/25/44 (e)(n)(o) | | 141,668 | 13,279 |
| Series 2013-51 Class GI, 3% 10/25/32 (n) | | 577,104 | 35,069 |
| Series 2013-N1 Class A, 6.720% - 1 month U.S. LIBOR 2.103% 6/25/35 (e)(n)(o) | | 131,123 | 9,428 |
| Series 2015-42 Class IL, 6% 6/25/45 (n) | | 897,130 | 155,259 |
| Series 2015-70 Class JC, 3% 10/25/45 | | 792,680 | 742,877 |
| Series 2017-30 Class AI, 5.5% 5/25/47 (n) | | 531,632 | 93,677 |
| Fannie Mae Stripped Mortgage-Backed Securities: | | | |
| Series 339 Class 5, 5.5% 7/25/33 (n) | | 23,524 | 3,833 |
| Series 343 Class 16, 5.5% 5/25/34 (n) | | 22,216 | 3,658 |
| Series 348 Class 14, 6.5% 8/25/34 (e)(n) | | 15,217 | 3,001 |
| Series 351: | | | |
Class 12, 5.5% 4/25/34 (e)(n) | | 9,522 | 1,617 |
Class 13, 6% 3/25/34 (n) | | 13,947 | 2,569 |
| Series 359 Class 19, 6% 7/25/35 (e)(n) | | 8,063 | 1,526 |
| Series 384 Class 6, 5% 7/25/37 (n) | | 92,708 | 15,824 |
| Freddie Mac: | | | |
| floater: | | | |
Series 2412 Class FK, 1 month U.S. LIBOR + 0.800% 5.3879% 1/15/32 (e)(h) | | 1,938 | 1,946 |
Series 2423 Class FA, 1 month U.S. LIBOR + 0.900% 5.4879% 3/15/32 (e)(h) | | 2,948 | 2,970 |
Series 2424 Class FM, 1 month U.S. LIBOR + 1.000% 5.5879% 3/15/32 (e)(h) | | 2,523 | 2,549 |
Series 2432: | | | |
Class FE, 1 month U.S. LIBOR + 0.900% 5.4879% 6/15/31 (e)(h) | | 4,820 | 4,851 |
Class FG, 1 month U.S. LIBOR + 0.900% 5.4879% 3/15/32 (e)(h) | | 1,633 | 1,645 |
| floater target amortization class Series 3366 Class FD, 1 month U.S. LIBOR + 0.250% 4.8379% 5/15/37 (e)(h) | | 119,150 | 117,411 |
| planned amortization class: | | | |
Series 2095 Class PE, 6% 11/15/28 | | 34,654 | 34,971 |
Series 2101 Class PD, 6% 11/15/28 | | 2,847 | 2,872 |
Series 2121 Class MG, 6% 2/15/29 | | 13,939 | 14,063 |
Series 2131 Class BG, 6% 3/15/29 | | 99,356 | 100,300 |
Series 2137 Class PG, 6% 3/15/29 | | 15,630 | 15,775 |
Series 2154 Class PT, 6% 5/15/29 | | 26,543 | 26,792 |
Series 2162 Class PH, 6% 6/15/29 | | 5,291 | 5,331 |
Series 2520 Class BE, 6% 11/15/32 | | 47,862 | 48,934 |
Series 2693 Class MD, 5.5% 10/15/33 | | 433,747 | 433,095 |
Series 2802 Class OB, 6% 5/15/34 | | 37,392 | 37,830 |
Series 3002 Class NE, 5% 7/15/35 | | 111,324 | 110,977 |
Series 3110 Class OP 9/15/35 (p) | | 27,880 | 25,471 |
Series 3119 Class PO 2/15/36 (p) | | 111,223 | 88,055 |
Series 3121 Class KO 3/15/36 (p) | | 17,404 | 14,112 |
Series 3123 Class LO 3/15/36 (p) | | 61,842 | 49,380 |
Series 3145 Class GO 4/15/36 (p) | | 65,552 | 52,585 |
Series 3189 Class PD, 6% 7/15/36 | | 95,377 | 98,059 |
Series 3225 Class EO 10/15/36 (p) | | 32,771 | 25,647 |
Series 3258 Class PM, 5.5% 12/15/36 | | 40,504 | 41,077 |
Series 3415 Class PC, 5% 12/15/37 | | 44,872 | 44,300 |
Series 3806 Class UP, 4.5% 2/15/41 | | 211,795 | 207,678 |
Series 3832 Class PE, 5% 3/15/41 | | 434,229 | 432,682 |
Series 4135 Class AB, 1.75% 6/15/42 | | 705,047 | 636,238 |
| sequential payer: | | | |
Series 2135 Class JE, 6% 3/15/29 | | 6,936 | 7,003 |
Series 2274 Class ZM, 6.5% 1/15/31 | | 9,833 | 9,892 |
Series 2281 Class ZB, 6% 3/15/30 | | 19,113 | 19,282 |
Series 2303 Class ZV, 6% 4/15/31 | | 10,130 | 10,239 |
Series 2357 Class ZB, 6.5% 9/15/31 | | 79,461 | 80,802 |
Series 2502 Class ZC, 6% 9/15/32 | | 18,740 | 19,156 |
Series 2519 Class ZD, 5.5% 11/15/32 | | 29,174 | 29,555 |
Series 2546 Class MJ, 5.5% 3/15/23 | | 93 | 93 |
Series 2601 Class TB, 5.5% 4/15/23 | | 56 | 56 |
Series 2998 Class LY, 5.5% 7/15/25 | | 9,089 | 9,071 |
Series 3871 Class KB, 5.5% 6/15/41 | | 685,641 | 704,155 |
| Series 06-3115 Class SM, 6.600% - 1 month U.S. LIBOR 2.0121% 2/15/36 (e)(n)(o) | | 32,877 | 2,590 |
| Series 2013-4281 Class AI, 4% 12/15/28 (n) | | 84,827 | 1,629 |
| Series 2017-4683 Class LM, 3% 5/15/47 | | 1,230,578 | 1,154,926 |
| Series 2933 Class ZM, 5.75% 2/15/35 | | 599,611 | 609,726 |
| Series 2935 Class ZK, 5.5% 2/15/35 | | 475,604 | 485,391 |
| Series 2947 Class XZ, 6% 3/15/35 | | 192,129 | 196,905 |
| Series 2996 Class ZD, 5.5% 6/15/35 | | 409,859 | 417,190 |
| Series 3237 Class C, 5.5% 11/15/36 | | 523,834 | 524,753 |
| Series 3244 Class SG, 6.660% - 1 month U.S. LIBOR 2.0721% 11/15/36 (e)(n)(o) | | 141,031 | 11,940 |
| Series 3287 Class SD, 6.750% - 1 month U.S. LIBOR 2.1621% 3/15/37 (e)(n)(o) | | 210,228 | 19,246 |
| Series 3297 Class BI, 6.760% - 1 month U.S. LIBOR 2.1721% 4/15/37 (e)(n)(o) | | 295,312 | 32,080 |
| Series 3336 Class LI, 6.580% - 1 month U.S. LIBOR 1.9921% 6/15/37 (e)(n)(o) | | 94,041 | 9,455 |
| Series 3949 Class MK, 4.5% 10/15/34 | | 78,095 | 76,936 |
| Series 4055 Class BI, 3.5% 5/15/31 (n) | | 133,021 | 3,598 |
| Series 4149 Class IO, 3% 1/15/33 (n) | | 314,959 | 25,287 |
| Series 4314 Class AI, 5% 3/15/34 (n) | | 38,761 | 1,227 |
| Series 4427 Class LI, 3.5% 2/15/34 (n) | | 454,165 | 27,736 |
| Series 4471 Class PA 4% 12/15/40 | | 390,756 | 379,448 |
| target amortization class Series 2156 Class TC, 6.25% 5/15/29 | | 12,350 | 12,408 |
| Freddie Mac Manufactured Housing participation certificates guaranteed: | | | |
| floater Series 1686 Class FA, 1 month U.S. LIBOR + 0.900% 5.359% 2/15/24 (e)(h) | | 961 | 962 |
| sequential payer: | | | |
Series 2043 Class ZH, 6% 4/15/28 | | 11,060 | 11,137 |
Series 2056 Class Z, 6% 5/15/28 | | 27,528 | 27,755 |
| Freddie Mac Multi-family Structured pass-thru certificates Series 4386 Class AZ, 4.5% 11/15/40 | | 1,016,716 | 982,938 |
| Ginnie Mae guaranteed REMIC pass-thru certificates: | | | |
| floater: | | | |
Series 2007-37 Class TS, 6.690% - 1 month U.S. LIBOR 2.1% 6/16/37 (e)(n)(o) | | 59,523 | 5,675 |
Series 2010-H03 Class FA, 1 month U.S. LIBOR + 0.550% 5.0673% 3/20/60 (e)(h)(q) | | 645,038 | 643,084 |
Series 2010-H17 Class FA, 1 month U.S. LIBOR + 0.330% 4.8473% 7/20/60 (e)(h)(q) | | 112,960 | 112,151 |
Series 2010-H18 Class AF, 1 month U.S. LIBOR + 0.300% 4.6916% 9/20/60 (e)(h)(q) | | 137,477 | 136,513 |
Series 2010-H19 Class FG, 1 month U.S. LIBOR + 0.300% 4.6916% 8/20/60 (e)(h)(q) | | 106,352 | 105,566 |
Series 2010-H27 Class FA, 1 month U.S. LIBOR + 0.380% 4.7716% 12/20/60 (e)(h)(q) | | 289,283 | 287,553 |
Series 2011-H05 Class FA, 1 month U.S. LIBOR + 0.500% 4.8916% 12/20/60 (e)(h)(q) | | 266,610 | 265,638 |
Series 2011-H07 Class FA, 1 month U.S. LIBOR + 0.500% 4.8916% 2/20/61 (e)(h)(q) | | 226,564 | 225,596 |
Series 2011-H12 Class FA, 1 month U.S. LIBOR + 0.490% 4.8816% 2/20/61 (e)(h)(q) | | 337,931 | 336,500 |
Series 2011-H13 Class FA, 1 month U.S. LIBOR + 0.500% 4.8916% 4/20/61 (e)(h)(q) | | 241,381 | 240,373 |
Series 2011-H14: | | | |
Class FB, 1 month U.S. LIBOR + 0.500% 4.8916% 5/20/61 (e)(h)(q) | | 400,337 | 398,876 |
Class FC, 1 month U.S. LIBOR + 0.500% 4.8916% 5/20/61 (e)(h)(q) | | 287,115 | 285,994 |
Series 2011-H17 Class FA, 1 month U.S. LIBOR + 0.530% 4.9216% 6/20/61 (e)(h)(q) | | 325,761 | 324,675 |
Series 2011-H21 Class FA, 1 month U.S. LIBOR + 0.600% 4.9916% 10/20/61 (e)(h)(q) | | 660,842 | 659,228 |
Series 2012-H01 Class FA, 1 month U.S. LIBOR + 0.700% 5.0916% 11/20/61 (e)(h)(q) | | 351,563 | 351,109 |
Series 2012-H03 Class FA, 1 month U.S. LIBOR + 0.700% 5.0916% 1/20/62 (e)(h)(q) | | 195,226 | 194,982 |
Series 2012-H06 Class FA, 1 month U.S. LIBOR + 0.630% 5.0216% 1/20/62 (e)(h)(q) | | 319,886 | 319,124 |
Series 2012-H07 Class FA, 1 month U.S. LIBOR + 0.630% 5.0216% 3/20/62 (e)(h)(q) | | 156,325 | 155,545 |
Series 2012-H21 Class DF, 1 month U.S. LIBOR + 0.650% 4.8391% 5/20/61 (e)(h)(q) | | 8,237 | 8,157 |
Series 2012-H23 Class WA, 1 month U.S. LIBOR + 0.520% 4.9116% 10/20/62 (e)(h)(q) | | 141,262 | 140,684 |
Series 2013-H07 Class BA, 1 month U.S. LIBOR + 0.360% 4.7516% 3/20/63 (e)(h)(q) | | 274,656 | 272,932 |
Series 2014-H03 Class FA, 1 month U.S. LIBOR + 0.600% 4.9916% 1/20/64 (e)(h)(q) | | 195,637 | 195,143 |
Series 2014-H05 Class FB, 1 month U.S. LIBOR + 0.600% 4.9916% 12/20/63 (e)(h)(q) | | 957,935 | 956,129 |
Series 2014-H11 Class BA, 1 month U.S. LIBOR + 0.500% 4.8916% 6/20/64 (e)(h)(q) | | 1,255,049 | 1,250,335 |
Series 2014-H20 Class BF, 1 month U.S. LIBOR + 0.500% 4.8916% 9/20/64 (e)(h)(q) | | 4,183,861 | 4,167,069 |
Series 2016-H20 Class FM, 1 month U.S. LIBOR + 0.400% 4.5967% 12/20/62 (e)(h)(q) | | 17,615 | 17,240 |
Series 2019-11 Class F, 1 month U.S. LIBOR + 0.400% 4.9979% 1/20/49 (e)(h) | | 2,251,527 | 2,226,439 |
Series 2019-128 Class FH, 1 month U.S. LIBOR + 0.500% 5.0979% 10/20/49 (e)(h) | | 703,622 | 688,700 |
Series 2019-23 Class NF, 1 month U.S. LIBOR + 0.450% 5.0479% 2/20/49 (e)(h) | | 1,390,528 | 1,373,381 |
| planned amortization class: | | | |
Series 2010-158 Class MS, 10.000% - 1 month U.S. LIBOR 0.8043% 12/20/40 (e)(o) | | 838,887 | 695,310 |
Series 2011-136 Class WI, 4.5% 5/20/40 (n) | | 21,199 | 1,475 |
Series 2016-69 Class WA, 3% 2/20/46 | | 727,074 | 672,606 |
Series 2017-134 Class BA, 2.5% 11/20/46 | | 1,018,583 | 915,327 |
| sequential payer: | | | |
Series 2004-24 Class ZM, 5% 4/20/34 | | 165,778 | 162,102 |
Series 2010-160 Class DY, 4% 12/20/40 | | 1,640,650 | 1,579,165 |
Series 2010-170 Class B, 4% 12/20/40 | | 365,137 | 351,450 |
Series 2017-139 Class BA, 3% 9/20/47 | | 3,379,231 | 3,023,441 |
| Series 2004-32 Class GS, 6.500% - 1 month U.S. LIBOR 1.91% 5/16/34 (e)(n)(o) | | 34,780 | 2,294 |
| Series 2004-73 Class AL, 7.200% - 1 month U.S. LIBOR 2.61% 8/17/34 (e)(n)(o) | | 33,876 | 3,488 |
| Series 2010-116 Class QB, 4% 9/16/40 | | 3,766,254 | 3,646,310 |
| Series 2010-H10 Class FA, 1 month U.S. LIBOR + 0.330% 4.8473% 5/20/60 (e)(h)(q) | | 357,703 | 355,363 |
| Series 2011-94 Class SA, 6.100% - 1 month U.S. LIBOR 1.5021% 7/20/41 (e)(n)(o) | | 141,483 | 12,052 |
| Series 2012-76 Class GS, 6.700% - 1 month U.S. LIBOR 2.11% 6/16/42 (e)(n)(o) | | 130,846 | 11,321 |
| Series 2013-149 Class MA, 2.5% 5/20/40 | | 1,271,188 | 1,211,291 |
| Series 2014-2 Class BA, 3% 1/20/44 | | 2,034,672 | 1,851,834 |
| Series 2014-21 Class HA, 3% 2/20/44 | | 752,670 | 686,654 |
| Series 2014-25 Class HC, 3% 2/20/44 | | 1,291,515 | 1,176,611 |
| Series 2014-5 Class A, 3% 1/20/44 | | 1,106,941 | 1,008,202 |
| Series 2015-H13 Class HA, 2.5% 8/20/64 (q) | | 12,010 | 11,173 |
| Series 2017-186 Class HK, 3% 11/16/45 | | 1,857,067 | 1,696,009 |
| Series 2017-H06 Class FA, U.S. TREASURY 1 YEAR INDEX + 0.350% 5.08% 8/20/66 (e)(h)(q) | | 2,738,934 | 2,726,924 |
TOTAL U.S. GOVERNMENT AGENCY | | | 54,701,821 |
| TOTAL COLLATERALIZED MORTGAGE OBLIGATIONS (Cost $116,279,781) | | | 108,703,660 |
| | | | |
| Commercial Mortgage Securities - 4.6% |
| | | Principal Amount (a) | Value ($) |
| Ashford Hospitality Trust floater Series 2018-ASHF Class E, 1 month U.S. LIBOR + 3.100% 7.688% 4/15/35 (d)(e)(h) | | 397,000 | 369,327 |
| Atrium Hotel Portfolio Trust floater Series 2018-ATRM Class D, 1 month U.S. LIBOR + 2.300% 6.888% 6/15/35 (d)(e)(h) | | 172,000 | 162,937 |
| BAMLL Commercial Mortgage Securities Trust: | | | |
| floater: | | | |
Series 2019-AHT Class E, 1 month U.S. LIBOR + 3.200% 7.788% 3/15/34 (d)(e)(h) | | 567,000 | 535,978 |
Series 2019-RLJ Class D, 1 month U.S. LIBOR + 1.950% 6.538% 4/15/36 (d)(e)(h) | | 1,045,000 | 1,015,136 |
Series 2021-JACX Class E, 1 month U.S. LIBOR + 3.750% 8.338% 9/15/38 (d)(e)(h) | | 627,000 | 545,894 |
Series 2022-DKLX: | | | |
| Class A, CME Term SOFR 1 Month Index + 1.150% 5.713% 1/15/39 (d)(e)(h) | | 9,488,000 | 9,349,167 |
| Class B, CME Term SOFR 1 Month Index + 1.550% 6.113% 1/15/39 (d)(e)(h) | | 1,792,000 | 1,762,296 |
| Class C, CME Term SOFR 1 Month Index + 2.150% 6.713% 1/15/39 (d)(e)(h) | | 1,279,000 | 1,246,421 |
| sequential payer Series 2019-BPR: | | | |
Class AMP, 3.287% 11/5/32 (d) | | 6,400,000 | 5,858,268 |
Class ANM, 3.112% 11/5/32 (d) | | 7,809,000 | 7,126,785 |
| Series 2015-200P Class F, 3.5958% 4/14/33 (d)(e) | | 455,000 | 377,590 |
| Series 2019-BPR: | | | |
Class BNM, 3.465% 11/5/32 (d) | | 1,753,000 | 1,467,406 |
Class CNM, 3.7186% 11/5/32 (d)(e) | | 725,000 | 574,940 |
| BANK: | | | |
| sequential payer: | | | |
Series 2019-BN21 Class A5, 2.851% 10/17/52 | | 1,355,000 | 1,176,236 |
Series 2021-BN35 Class A5, 2.285% 6/15/64 | | 1,052,000 | 851,971 |
Series 2022-BNK40, Class A4, 3.3936% 3/15/64 (e) | | 295,000 | 259,721 |
Series 2022-BNK42: | | | |
| Class D, 2.5% 6/15/55 (d) | | 531,000 | 291,591 |
| Class E, 2.5% 6/15/55 (d) | | 416,000 | 202,042 |
Series 2022-BNK42, Class A5, 4.493% 6/15/55 (e) | | 988,000 | 943,112 |
Series 2023-BNK45 Class C, 6.2796% 2/15/56 (e) | | 418,000 | 394,381 |
| Series 2017-BNK4 Class D, 3.357% 5/15/50 (d) | | 782,000 | 548,566 |
| Series 2017-BNK6 Class D, 3.1% 7/15/60 (d) | | 455,000 | 317,946 |
| Series 2017-BNK8: | | | |
Class D, 2.6% 11/15/50 (d) | | 960,000 | 610,207 |
Class E, 2.8% 11/15/50 (d) | | 609,000 | 333,234 |
| Series 2018-BN10 Class C, 4.163% 2/15/61 (e) | | 281,000 | 239,750 |
| Series 2018-BN12 Class D, 3% 5/15/61 (d) | | 487,000 | 312,995 |
| Series 2018-BN15: | | | |
Class D, 3% 11/15/61 (d) | | 430,000 | 284,264 |
Class E, 3% 11/15/61 (d) | | 430,000 | 261,303 |
| Series 2019-BN18 Class D, 3% 5/15/62 (d) | | 648,000 | 423,144 |
| Series 2019-BN19 Class D, 3% 8/15/61 (d) | | 946,000 | 579,235 |
| Series 2020-BN25 Class C, 3.3536% 1/15/63 (e) | | 775,000 | 605,196 |
| Series 2020-BN27 Class D, 2.5% 4/15/63 (d) | | 243,000 | 147,327 |
| Series 2020-BN28 Class E, 2.5% 3/15/63 (d) | | 252,000 | 135,045 |
| Series 2020-BN29 Class E, 2.5% 11/15/53 (d) | | 294,000 | 155,806 |
| Series 2020-BN30: | | | |
Class E, 2.5% 12/15/53 (d) | | 189,000 | 97,098 |
Class MCDG, 2.9182% 12/15/53 (e) | | 2,104,000 | 1,171,652 |
| Series 2021-BN33 Class XA, 1.0572% 5/15/64 (e)(n) | | 6,873,369 | 395,622 |
| Series 2021-BN38 Class C, 3.2171% 12/15/64 (e) | | 146,000 | 106,474 |
| Series 2022-BNK43 Class D, 3% 8/15/55 (d) | | 994,000 | 558,019 |
| Series 2022-BNK44 Class C, 5.7461% 11/15/55 (e) | | 2,056,000 | 1,830,746 |
| Bank of America Commercial Mortgage Securities Trust Series 2017-BNK3: | | | |
| Class C, 4.352% 2/15/50 (e) | | 347,000 | 301,815 |
| Class D, 3.25% 2/15/50 (d) | | 675,000 | 473,938 |
| Bank of America Commercial Mortgage Trust Series 2016-UB10: | | | |
| Class D, 3% 7/15/49 (d) | | 1,180,000 | 878,519 |
| Class XA, 1.7443% 7/15/49 (e)(n) | | 9,071,964 | 371,078 |
| Barclays Commercial Mortgage Securities LLC Series 2019-C5 Class D, 2.5% 11/15/52 (d) | | 188,000 | 121,051 |
| BBCMS Series 2022-C15, Class A5, 3.662% 4/15/55 | | 1,203,000 | 1,078,885 |
| BBCMS Mortgage Trust: | | | |
| sequential payer: | | | |
Series 2020-C8 Class E, 2.25% 10/15/53 (d) | | 830,000 | 434,156 |
Series 2022-C14 Class A5, 2.946% 2/15/55 | | 589,000 | 498,612 |
| Series 2016-ETC: | | | |
Class D, 3.6089% 8/14/36 (d)(e) | | 483,000 | 386,533 |
Class E, 3.6089% 8/14/36 (d)(e) | | 363,000 | 274,119 |
| Series 2019-C3 Class C, 4.178% 5/15/52 | | 273,000 | 227,019 |
| Series 2020-C6 Class E, 2.4% 2/15/53 (d) | | 348,000 | 193,568 |
| Series 2020-C7 Class D, 3.6033% 4/15/53 (d)(e) | | 210,000 | 135,386 |
| Series 2022-C16: | | | |
Class A5, 4.6% 6/15/55 | | 1,816,000 | 1,750,188 |
Class B, 4.6% 6/15/55 | | 441,000 | 387,967 |
| Series 2022-C17 Class B, 4.889% 9/15/55 | | 588,000 | 534,196 |
| Series 2022-C18, Class B, 6.1483% 12/15/55 (e) | | 756,000 | 766,505 |
| Benchmark Mortgage Trust: | | | |
| sequential payer: | | | |
Series 2018-B4 Class A5, 4.121% 7/15/51 | | 1,536,000 | 1,457,104 |
Series 2019-B14: | | | |
| Class 225D, 3.2943% 12/15/62 (d)(e) | | 399,000 | 280,457 |
| Class 225E, 3.2943% 12/15/62 (c)(d)(e) | | 269,000 | 172,334 |
Series 2020-B20 Class E, 2% 10/15/53 (d) | | 588,000 | 285,854 |
Series 2020-B22, Class A5, 1.973% 1/15/54 | | 590,000 | 467,009 |
Series 2021-B29, Class A5, 2.3879% 9/15/54 | | 1,716,000 | 1,387,303 |
Series 2022-B34 Class A5, 3.786% 4/15/55 | | 532,000 | 476,593 |
| Series 2018-B6 Class D, 3.1047% 10/10/51 (d)(e) | | 613,000 | 406,432 |
| Series 2018-B7: | | | |
Class D, 3% 5/15/53 (d)(e) | | 351,000 | 239,022 |
Class E, 3% 5/15/53 (d)(e) | | 351,000 | 220,677 |
| Series 2019-B12 Class B, 3.5702% 8/15/52 | | 462,000 | 392,242 |
| Series 2019-B13 Class D, 2.5% 8/15/57 (d) | | 672,000 | 397,260 |
| Series 2019-B14 Class XA, 0.7766% 12/15/62 (e)(n) | | 16,769,194 | 519,132 |
| Series 2020-B18: | | | |
Class AGNG, 4.3885% 7/15/53 (d)(e) | | 1,113,000 | 914,687 |
Class D, 2.25% 7/15/53 (d) | | 777,000 | 449,745 |
| Series 2020-B21: | | | |
Class D, 2% 12/17/53 (d) | | 446,000 | 247,708 |
Class E, 2% 12/17/53 (d) | | 420,000 | 205,307 |
| Series 2020-B22 Class E, 2% 1/15/54 (d) | | 502,000 | 252,773 |
| Series 2020-IG2: | | | |
Class C, 3.2931% 9/15/48 (d)(e) | | 315,000 | 190,080 |
Class D, 3.2931% 9/15/48 (d)(e) | | 1,503,000 | 597,750 |
| Series 2020-IG3 Class 825E, 3.0763% 9/15/48 (d)(e) | | 789,000 | 544,293 |
| Series 2021-B25: | | | |
Class 300D, 2.9942% 4/15/54 (d)(e) | | 850,000 | 554,043 |
Class 300E, 2.9942% 4/15/54 (d)(e) | | 282,000 | 178,356 |
| Series 2021-B27 Class XA, 1.2657% 7/15/54 (e)(n) | | 11,333,599 | 812,953 |
| Series 2022-B35 Class D, 2.5% 5/15/55 (d) | | 949,000 | 525,007 |
| Series 2022-B36 Class D, 2.5% 7/15/55 (d) | | 712,000 | 365,472 |
| Series 2022-B37 Class C, 5.7513% 11/15/55 (e) | | 823,000 | 737,771 |
| BFLD Trust floater sequential payer Series 2020-OBRK Class A, CME Term SOFR 1 Month Index + 2.160% 6.7265% 11/15/28 (d)(e)(h) | | 6,971,000 | 6,917,019 |
| BHP Trust floater Series 2019-BXHP Class F, 1 month U.S. LIBOR + 2.930% 7.526% 8/15/36 (d)(e)(h) | | 319,900 | 301,011 |
| Bmo 2023-C4 Mtg Trust Series 2023-C4: | | | |
| Class B, 5.3965% 2/15/56 (e) | | 473,000 | 467,532 |
| Class C, 5.8636% 2/15/56 (e) | | 457,000 | 414,181 |
| Class D, 5.8636% 2/15/56 (d) | | 294,000 | 227,991 |
| BMO Mortgage Trust: | | | |
| Series 2022-C1: | | | |
Class 360D, 3.9387% 2/17/55 (c)(d)(e) | | 441,000 | 257,299 |
Class 360E, 3.9387% 2/17/55 (d)(e) | | 546,000 | 345,150 |
| Series 2022-C3 Class D, 2.5% 9/15/54 (d) | | 361,000 | 181,169 |
| BPR Trust floater Series 2022-OANA: | | | |
| Class A, CME Term SOFR 1 Month Index + 1.890% 6.4605% 4/15/37 (d)(e)(h) | | 32,831,000 | 32,235,541 |
| Class B, CME Term SOFR 1 Month Index + 2.440% 7.0095% 4/15/37 (d)(e)(h) | | 10,615,000 | 10,415,838 |
| Class D, CME Term SOFR 1 Month Index + 3.690% 8.2575% 4/15/37 (d)(e)(h) | | 1,327,000 | 1,277,207 |
| Braemar Hotels & Resorts Trust floater Series 2018-PRME Class E, 1 month U.S. LIBOR + 2.400% 6.988% 6/15/35 (d)(e)(h) | | 168,000 | 157,040 |
| Bx 2021-Xl2 floater Series 2021-XL2 Class J, 1 month U.S. LIBOR + 3.890% 8.478% 10/15/38 (d)(e)(h) | | 1,015,680 | 944,765 |
| BX Commercial Mortgage Trust: | | | |
| floater: | | | |
Series 2020-VKNG Class E, CME Term SOFR 1 Month Index + 2.210% 6.777% 10/15/37 (d)(e)(h) | | 262,500 | 253,224 |
Series 2021-MC Class G, 1 month U.S. LIBOR + 3.080% 7.6748% 4/15/34 (d)(e)(h) | | 397,500 | 341,672 |
Series 2021-PAC: | | | |
| Class A, 1 month U.S. LIBOR + 0.680% 5.2771% 10/15/36 (d)(e)(h) | | 18,877,000 | 18,446,491 |
| Class B, 1 month U.S. LIBOR + 0.890% 5.4868% 10/15/36 (d)(e)(h) | | 2,565,000 | 2,479,258 |
| Class C, 1 month U.S. LIBOR + 1.090% 5.6866% 10/15/36 (d)(e)(h) | | 3,433,000 | 3,319,815 |
| Class D, 1 month U.S. LIBOR + 1.290% 5.8863% 10/15/36 (d)(e)(h) | | 3,333,000 | 3,190,475 |
| Class E, 1 month U.S. LIBOR + 1.940% 6.5355% 10/15/36 (d)(e)(h) | | 11,589,000 | 11,143,683 |
| Class G, 1 month U.S. LIBOR + 2.940% 7.5341% 10/15/36 (d)(e)(h) | | 798,000 | 756,866 |
Series 2021-VINO: | | | |
| Class F, 1 month U.S. LIBOR + 2.800% 7.3903% 5/15/38 (d)(e)(h) | | 1,100,000 | 1,039,533 |
| Class G, 1 month U.S. LIBOR + 3.950% 8.5403% 5/15/38 (d)(e)(h) | | 1,980,000 | 1,876,553 |
Series 2022-LP2: | | | |
| Class A, CME Term SOFR 1 Month Index + 1.010% 5.5754% 2/15/39 (d)(e)(h) | | 22,258,150 | 21,927,238 |
| Class B, CME Term SOFR 1 Month Index + 1.310% 5.8748% 2/15/39 (d)(e)(h) | | 6,706,689 | 6,558,866 |
| Class C, CME Term SOFR 1 Month Index + 1.560% 6.1242% 2/15/39 (d)(e)(h) | | 6,706,689 | 6,476,250 |
| Class D, CME Term SOFR 1 Month Index + 1.960% 6.5233% 2/15/39 (d)(e)(h) | | 6,706,689 | 6,353,986 |
| floater sequential payer Series 2019-CALM Class A, CME Term SOFR 1 Month Index + 0.990% 5.5525% 11/15/32 (d)(e)(h) | | 582,243 | 578,594 |
| Series 2020-VIVA: | | | |
Class D, 3.5488% 3/11/44 (d)(e) | | 2,936,000 | 2,338,267 |
Class E, 3.5488% 3/11/44 (d)(e) | | 2,839,000 | 2,195,709 |
| Bx Commercial Mortgage Trust 2 floater Series 2022-LP2 Class G, CME Term SOFR 1 Month Index + 4.100% 8.6683% 2/15/39 (d)(e)(h) | | 1,793,649 | 1,715,369 |
| BX Trust: | | | |
| floater: | | | |
Series 2017-APPL Class F, 1 month U.S. LIBOR + 4.250% 8.963% 7/15/34 (d)(e)(h) | | 404,560 | 400,752 |
Series 2018-EXCL Class D, 1 month U.S. LIBOR + 2.620% 7.213% 9/15/37 (d)(e)(h) | | 2,781,800 | 2,588,047 |
Series 2019-ATL Class E, 1 month U.S. LIBOR + 2.230% 6.8246% 10/15/36 (d)(e)(h) | | 546,000 | 517,887 |
Series 2019-IMC: | | | |
| Class B, 1 month U.S. LIBOR + 1.300% 5.888% 4/15/34 (d)(e)(h) | | 6,526,000 | 6,345,283 |
| Class C, 1 month U.S. LIBOR + 1.600% 6.188% 4/15/34 (d)(e)(h) | | 4,315,000 | 4,162,928 |
| Class D, 1 month U.S. LIBOR + 1.900% 6.488% 4/15/34 (d)(e)(h) | | 4,529,000 | 4,346,589 |
| Class G, 1 month U.S. LIBOR + 3.600% 8.188% 4/15/34 (d)(e)(h) | | 861,000 | 809,971 |
Series 2019-XL: | | | |
| Class B, CME Term SOFR 1 Month Index + 1.190% 5.757% 10/15/36 (d)(e)(h) | | 7,544,600 | 7,468,793 |
| Class C, CME Term SOFR 1 Month Index + 1.360% 5.927% 10/15/36 (d)(e)(h) | | 6,706,500 | 6,622,418 |
| Class D, CME Term SOFR 1 Month Index + 1.560% 6.127% 10/15/36 (d)(e)(h) | | 15,080,700 | 14,834,471 |
| Class E, CME Term SOFR 1 Month Index + 1.910% 6.477% 10/15/36 (d)(e)(h) | | 21,532,200 | 21,147,519 |
| Class F, CME Term SOFR 1 Month Index + 2.110% 6.677% 10/15/36 (d)(e)(h) | | 1,955,000 | 1,910,805 |
| Class J, CME Term SOFR 1 Month Index + 2.760% 7.327% 10/15/36 (d)(e)(h) | | 4,450,600 | 4,337,614 |
Series 2021-ACNT Class G, 1 month U.S. LIBOR + 3.290% 7.883% 11/15/38 (d)(e)(h) | | 672,000 | 639,043 |
Series 2021-ARIA: | | | |
| Class F, 1 month U.S. LIBOR + 2.590% 7.1815% 10/15/36 (d)(e)(h) | | 1,385,000 | 1,293,136 |
| Class G, 1 month U.S. LIBOR + 3.140% 7.7301% 10/15/36 (d)(e)(h) | | 2,109,000 | 1,948,003 |
Series 2021-BXMF Class G, 1 month U.S. LIBOR + 3.340% 7.9375% 10/15/26 (d)(e)(h) | | 1,869,000 | 1,745,833 |
Series 2021-LBA: | | | |
| Class FJV, 1 month U.S. LIBOR + 2.400% 6.988% 2/15/36 (d)(e)(h) | | 331,000 | 314,220 |
| Class FV, 1 month U.S. LIBOR + 2.400% 6.988% 2/15/36 (d)(e)(h) | | 1,094,000 | 1,038,539 |
| Class GJV, 1 month U.S. LIBOR + 3.000% 7.588% 2/15/36 (d)(e)(h) | | 1,572,000 | 1,447,029 |
Series 2021-MFM1: | | | |
| Class F, CME Term SOFR 1 Month Index + 3.110% 7.6765% 1/15/34 (d)(e)(h) | | 1,916,096 | 1,848,344 |
| Class G, CME Term SOFR 1 Month Index + 4.010% 8.5765% 1/15/34 (d)(e)(h) | | 103,084 | 97,614 |
Series 2021-SDMF Class F, 1 month U.S. LIBOR + 1.930% 6.525% 9/15/34 (d)(e)(h) | | 441,000 | 417,794 |
Series 2021-SOAR: | | | |
| Class F, 6.938% 6/15/38 (d)(e) | | 1,316,031 | 1,262,568 |
| Class G, 7.388% 6/15/38 (d)(e) | | 1,065,925 | 1,011,833 |
| Class J, 8.338% 6/15/38 (d)(e) | | 1,670,347 | 1,593,970 |
Series 2021-VOLT: | | | |
| Class E, 1 month U.S. LIBOR + 2.000% 6.5879% 9/15/36 (d)(e)(h) | | 714,000 | 685,821 |
| Class F, 1 month U.S. LIBOR + 2.400% 6.9879% 9/15/36 (d)(e)(h) | | 230,000 | 220,946 |
| Class G, 1 month U.S. LIBOR + 2.850% 7.4379% 9/15/36 (d)(e)(h) | | 1,440,000 | 1,382,504 |
Series 2022-GPA: | | | |
| Class A, CME Term SOFR 1 Month Index + 2.160% 6.7275% 10/15/39 (d)(e)(h) | | 9,932,000 | 9,913,349 |
| Class D, CME Term SOFR 1 Month Index + 4.060% 8.6235% 10/15/39 (d)(e)(h) | | 1,441,000 | 1,434,608 |
Series 2022-IND: | | | |
| Class A, CME Term SOFR 1 Month Index + 1.490% 6.0528% 4/15/37 (d)(e)(h) | | 18,696,006 | 18,655,081 |
| Class B, CME Term SOFR 1 Month Index + 1.940% 6.5018% 4/15/37 (d)(e)(h) | | 8,416,284 | 8,361,015 |
| Class C, CME Term SOFR 1 Month Index + 2.290% 6.8518% 4/15/37 (d)(e)(h) | | 1,898,915 | 1,850,817 |
| Class D, CME Term SOFR 1 Month Index + 2.830% 7.4008% 4/15/37 (d)(e)(h) | | 1,589,898 | 1,533,222 |
| Class F, CME Term SOFR 1 Month Index + 4.780% 9.3478% 4/15/37 (d)(e)(h) | | 2,178,991 | 2,100,715 |
Series 2022-LBA6: | | | |
| Class C, CME Term SOFR 1 Month Index + 1.600% 6.1625% 1/15/39 (d)(e)(h) | | 577,000 | 562,549 |
| Class F, CME Term SOFR 1 Month Index + 3.350% 7.9125% 1/15/39 (d)(e)(h) | | 1,160,000 | 1,087,306 |
| Class G, CME Term SOFR 1 Month Index + 4.200% 8.7625% 1/15/39 (d)(e)(h) | | 378,000 | 358,786 |
Series 2022-VAMF Class F, CME Term SOFR 1 Month Index + 3.290% 7.8615% 1/15/39 (d)(e)(h) | | 443,000 | 417,570 |
| floater sequential payer: | | | |
Series 2019-IMC Class A, 1 month U.S. LIBOR + 1.000% 5.588% 4/15/34 (d)(e)(h) | | 8,333,000 | 8,186,148 |
Series 2019-XL Class A, CME Term SOFR 1 Month Index + 1.030% 5.597% 10/15/36 (d)(e)(h) | | 12,531,025 | 12,468,068 |
Series 2021-LGCY Class J, 1 month U.S. LIBOR + 3.190% 7.781% 10/15/36 (d)(e)(h) | | 345,000 | 314,656 |
| sequential payer Series 2019-OC11 Class A, 3.202% 12/9/41 (d) | | 1,771,000 | 1,525,436 |
| Series 2019-OC11: | | | |
Class D, 3.944% 12/9/41 (d)(e) | | 84,000 | 69,117 |
Class E, 3.944% 12/9/41 (d)(e) | | 4,901,000 | 3,910,013 |
| BXP Trust Series 2021-601L Class E, 2.7755% 1/15/44 (d)(e) | | 189,000 | 113,017 |
| BXSC Commercial Mortgage Trust floater Series 2022-WSS Class F, 9.892% 3/15/35 (d)(e) | | 1,534,000 | 1,513,029 |
| CALI Mortgage Trust Series 2019-101C Class F, 4.3244% 3/10/39 (d)(e) | | 976,000 | 671,584 |
| CAMB Commercial Mortgage Trust floater Series 2019-LIFE: | | | |
| Class F, 1 month U.S. LIBOR + 2.550% 7.138% 12/15/37 (d)(e)(h) | | 100,000 | 97,742 |
| Class G, 1 month U.S. LIBOR + 3.250% 7.838% 12/15/37 (d)(e)(h) | | 3,620,500 | 3,531,032 |
| Camb Commercial Mortgage Trust Series 2021-CX2 Class D, 2.7712% 11/10/46 (d)(e) | | 294,000 | 207,306 |
| CD Mortgage Trust Series 2017-CD3: | | | |
| Class C, 4.5462% 2/10/50 (e) | | 813,000 | 604,422 |
| Class D, 3.25% 2/10/50 (d) | | 735,000 | 471,021 |
| CEDR Commercial Mortgage Trust floater Series 2022-SNAI Class F, CME Term SOFR 1 Month Index + 3.610% 8.176% 2/15/39 (c)(d)(e)(h) | | 2,211,000 | 1,878,078 |
| CF Hippolyta Issuer LLC sequential payer Series 2021-1A Class A1, 1.53% 3/15/61 (d) | | 17,912,466 | 15,555,033 |
| CGDB Commercial Mortgage Trust floater Series 2019-MOB: | | | |
| Class A, 1 month U.S. LIBOR + 0.950% 5.5379% 11/15/36 (d)(e)(h) | | 5,780,000 | 5,692,904 |
| Class B, 1 month U.S. LIBOR + 1.250% 5.8379% 11/15/36 (d)(e)(h) | | 1,600,000 | 1,571,873 |
| CHC Commercial Mortgage Trust floater Series 2019-CHC: | | | |
| Class A, 1 month U.S. LIBOR + 1.120% 5.708% 6/15/34 (d)(e)(h) | | 15,924,750 | 15,477,012 |
| Class B, 1 month U.S. LIBOR + 1.500% 6.088% 6/15/34 (d)(e)(h) | | 3,135,325 | 3,007,687 |
| Class C, 1 month U.S. LIBOR + 1.750% 6.338% 6/15/34 (d)(e)(h) | | 3,541,260 | 3,322,832 |
| Class E, 1 month U.S. LIBOR + 2.350% 6.938% 6/15/34 (d)(e)(h) | | 1,646,567 | 1,514,540 |
| Class F, 1 month U.S. LIBOR + 2.600% 7.1962% 6/15/34 (d)(e)(h) | | 2,125,947 | 1,935,566 |
| CIM Retail Portfolio Trust floater Series 2021-RETL: | | | |
| Class C, 1 month U.S. LIBOR + 2.300% 6.888% 8/15/36 (d)(e)(h) | | 107,830 | 108,575 |
| Class D, 1 month U.S. LIBOR + 3.050% 7.638% 8/15/36 (d)(e)(h) | | 2,245,500 | 2,250,387 |
| Citigroup Commercial Mortgage Trust: | | | |
| Series 2013-375P Class E, 3.5176% 5/10/35 (d)(e) | | 715,000 | 623,480 |
| Series 2013-GC15 Class D, 5.1699% 9/10/46 (d)(e) | | 1,200,000 | 1,133,774 |
| Series 2015-GC29 Class XA, 1.0164% 4/10/48 (e)(n) | | 18,321,206 | 311,959 |
| Series 2015-GC33 Class XA, 0.8719% 9/10/58 (e)(n) | | 29,410,954 | 517,236 |
| Series 2016-C3 Class D, 3% 11/15/49 (d) | | 829,000 | 515,522 |
| Series 2016-P4 Class D, 3.9416% 7/10/49 (d)(e) | | 965,000 | 738,468 |
| Series 2016-P6 Class XA, 0.5604% 12/10/49 (e)(n) | | 21,324,699 | 361,076 |
| Series 2019-GC41: | | | |
Class D, 3% 8/10/56 (d) | | 546,000 | 339,347 |
Class E, 3% 8/10/56 (d) | | 462,000 | 266,532 |
| Series 2019-GC43 Class E, 3% 11/10/52 (d) | | 651,000 | 384,239 |
| Series 2020-420K Class E, 3.3118% 11/10/42 (d)(e) | | 567,000 | 412,028 |
| Series 2020-GC46: | | | |
Class D, 2.6% 2/15/53 (d) | | 673,000 | 415,367 |
Class E, 2.6% 2/15/53 (d) | | 76,000 | 42,865 |
| Series 2022-GC48: | | | |
Class D, 2.5% 6/15/55 (d) | | 1,029,000 | 551,899 |
Class E, 2.5% 6/15/55 (d) | | 840,000 | 402,006 |
| COMM Mortgage Trust: | | | |
| floater Series 2018-HCLV: | | | |
Class F, 1 month U.S. LIBOR + 3.150% 7.738% 9/15/33 (d)(e)(h) | | 267,000 | 210,734 |
Class G, 1 month U.S. LIBOR + 5.150% 9.7443% 9/15/33 (d)(e)(h) | | 300,000 | 230,803 |
| sequential payer: | | | |
Series 2013-CR7 Class AM, 3.314% 3/10/46 (d) | | 3,375,249 | 3,361,887 |
Series 2013-LC6 Class E, 3.5% 1/10/46 (d) | | 527,000 | 434,743 |
Series 2014-CR18 Class A5, 3.828% 7/15/47 | | 2,605,000 | 2,528,790 |
| Series 2012-CR1: | | | |
Class C, 5.3443% 5/15/45 (e) | | 426,000 | 370,593 |
Class D, 5.3443% 5/15/45 (d)(e) | | 1,160,000 | 811,927 |
Class G, 2.462% 5/15/45 (c)(d) | | 425,000 | 122,117 |
| Series 2012-LC4 Class C, 5.2996% 12/10/44 (e) | | 94,000 | 79,823 |
| Series 2013-CR10 Class D, 4.8612% 8/10/46 (d)(e) | | 825,000 | 790,101 |
| Series 2013-CR9 Class C, 4.2908% 7/10/45 (d)(e) | | 190,538 | 182,995 |
| Series 2013-LC6 Class D, 4.0663% 1/10/46 (d)(e) | | 526,318 | 494,691 |
| Series 2014-CR15 Class D, 4.6718% 2/10/47 (d)(e) | | 173,000 | 163,162 |
| Series 2014-CR20 Class XA, 0.9434% 11/10/47 (e)(n) | | 33,704,366 | 403,222 |
| Series 2014-LC17 Class XA, 0.6616% 10/10/47 (e)(n) | | 21,015,663 | 167,894 |
| Series 2014-UBS2 Class D, 4.9813% 3/10/47 (d)(e) | | 542,000 | 484,659 |
| Series 2014-UBS6 Class XA, 0.8349% 12/10/47 (e)(n) | | 40,286,562 | 441,283 |
| Series 2015-3BP Class F, 3.2384% 2/10/35 (d)(e) | | 845,000 | 704,850 |
| Series 2015-LC19 Class D, 2.867% 2/10/48 (d) | | 1,230,000 | 1,023,884 |
| Series 2017-CD4 Class D, 3.3% 5/10/50 (d) | | 971,000 | 697,436 |
| Series 2019-CD4 Class C, 4.3497% 5/10/50 (e) | | 739,000 | 589,506 |
| COMM Trust Series 2017-COR2 Class D, 3% 9/10/50 (d) | | 202,000 | 143,834 |
| Commercial Mortgage Trust Series 2016-CD2: | | | |
| Class C, 3.9799% 11/10/49 (e) | | 352,000 | 284,881 |
| Class D, 2.7299% 11/10/49 (e) | | 299,000 | 168,337 |
| Commercial Mortgage Trust pass-thru certificates: | | | |
| Series 2012-CR2: | | | |
Class D, 4.8719% 8/15/45 (d)(e) | | 82,798 | 76,383 |
Class E, 4.8719% 8/15/45 (d)(e) | | 1,009,000 | 835,749 |
Class F, 4.25% 8/15/45 (d) | | 1,110,000 | 785,910 |
| Series 2014-CR2 Class G, 4.25% 8/15/45 (c)(d) | | 286,000 | 142,668 |
| Core Industrial Trust floater Series 2019-CORE Class E, 1 month U.S. LIBOR + 1.900% 6.488% 12/15/31 (d)(e)(h) | | 655,200 | 608,603 |
| CPT Mortgage Trust sequential payer Series 2019-CPT: | | | |
| Class E, 2.9968% 11/13/39 (d)(e) | | 714,000 | 468,289 |
| Class F, 2.9968% 11/13/39 (d)(e) | | 651,000 | 403,857 |
| Credit Suisse Commercial Mortgage Trust floater Series 2021-SOP2 Class F, 1 month U.S. LIBOR + 4.210% 8.8047% 6/15/34 (d)(h) | | 636,000 | 570,056 |
| Credit Suisse First Boston Mortgage Securities Corp. Series 1998-C1 Class H, 6% 5/17/40 (d) | | 77 | 77 |
| Credit Suisse Mortgage Trust: | | | |
| floater: | | | |
Series 2019-ICE4: | | | |
| Class B, 1 month U.S. LIBOR + 1.230% 5.818% 5/15/36 (d)(e)(h) | | 9,024,548 | 8,945,065 |
| Class C, 1 month U.S. LIBOR + 1.430% 6.018% 5/15/36 (d)(e)(h) | | 5,178,117 | 5,125,998 |
| Class F, 1 month U.S. LIBOR + 2.650% 7.238% 5/15/36 (d)(e)(h) | | 377,062 | 371,892 |
Series 2021-4SZN Class A, CME Term SOFR 1 Month Index + 3.960% 8.5295% 11/15/23 (d)(e)(h) | | 2,667,000 | 2,621,053 |
Series 2022-NWPT Class B, CME Term SOFR 1 Month Index + 4.190% 8.7535% 9/9/24 (d)(e)(h) | | 1,610,000 | 1,600,351 |
| sequential payer Series 2020-NET Class A, 2.2569% 8/15/37 (d) | | 3,999,190 | 3,592,746 |
| Series 2018-SITE: | | | |
Class A, 4.284% 4/15/36 (d) | | 7,384,000 | 7,077,592 |
Class B, 4.5349% 4/15/36 (d) | | 2,263,000 | 2,142,706 |
Class C, 4.782% 4/15/36 (d)(e) | | 1,523,000 | 1,437,452 |
Class D, 4.782% 4/15/36 (d)(e) | | 3,047,000 | 2,832,479 |
| Series 2019-UVIL Class E, 3.2833% 12/15/41 (d)(e) | | 525,000 | 347,158 |
| Series 2021-BRIT Class A, CME Term SOFR 1 Month Index + 3.570% 8.1357% 5/15/23 (d)(e)(h) | | 815,650 | 769,626 |
| CRSNT Trust floater Series 2021-MOON: | | | |
| Class F, 1 month U.S. LIBOR + 3.500% 8.09% 4/15/36 (d)(e)(h) | | 231,000 | 206,048 |
| Class G, 1 month U.S. LIBOR + 4.500% 9.09% 4/15/36 (d)(e)(h) | | 126,000 | 112,169 |
| CSAIL Commercial Mortgage Trust: | | | |
| Series 2017-C8 Class D, 4.4374% 6/15/50 (d)(e) | | 701,000 | 496,244 |
| Series 2018-CX11 Class C, 4.8406% 4/15/51 (e) | | 282,000 | 246,897 |
| Series 2019-C16 Class C, 4.2371% 6/15/52 (e) | | 630,000 | 517,645 |
| CSMC Trust floater Series 2017-CHOP Class F, 1 month U.S. LIBOR + 4.350% 8.938% 7/15/32 (d)(e)(h) | | 732,000 | 684,664 |
| DBGS Mortgage Trust: | | | |
| floater Series 2018-BIOD Class G, 1 month U.S. LIBOR + 2.500% 7.088% 5/15/35 (d)(e)(h) | | 652,427 | 628,736 |
| Series 2018-C1: | | | |
Class C, 4.6317% 10/15/51 (e) | | 189,000 | 163,152 |
Class D, 2.8817% 10/15/51 (d)(e) | | 840,000 | 572,894 |
| Series 2019-1735 Class F, 4.1946% 4/10/37 (d)(e) | | 665,000 | 415,063 |
| DBJPM Mortgage Trust Series 2020-C9 Class D, 2.25% 9/15/53 (d) | | 212,000 | 123,020 |
| DBUBS Mortgage Trust Series 2011-LC3A Class D, 5.3607% 8/10/44 (d)(e) | | 390,473 | 353,214 |
| DC Office Trust Series 2019-MTC Class E, 3.072% 9/15/45 (d)(e) | | 250,000 | 161,263 |
| Deutsche Bank Commercial Mortgage Trust Series 2016-C3 Class C, 3.4729% 8/10/49 (e) | | 218,000 | 186,392 |
| ELP Commercial Mortgage Trust floater Series 2021-ELP: | | | |
| Class A, 1 month U.S. LIBOR + 0.700% 5.289% 11/15/38 (d)(e)(h) | | 23,453,000 | 22,835,912 |
| Class F, 1 month U.S. LIBOR + 2.660% 7.255% 11/15/38 (d)(e)(h) | | 1,326,000 | 1,257,891 |
| Class G, 1 month U.S. LIBOR + 3.110% 7.704% 11/15/38 (d)(e)(h) | | 100,000 | 94,488 |
| Class J, 1 month U.S. LIBOR + 3.610% 8.2029% 11/15/38 (d)(e)(h) | | 2,118,000 | 2,002,013 |
| Extended Stay America Trust floater Series 2021-ESH: | | | |
| Class A, 1 month U.S. LIBOR + 1.080% 5.668% 7/15/38 (d)(e)(h) | | 7,387,823 | 7,276,730 |
| Class B, 1 month U.S. LIBOR + 1.380% 5.968% 7/15/38 (d)(e)(h) | | 4,207,388 | 4,139,237 |
| Class C, 1 month U.S. LIBOR + 1.700% 6.288% 7/15/38 (d)(e)(h) | | 3,101,363 | 3,039,183 |
| Class D, 1 month U.S. LIBOR + 2.250% 6.838% 7/15/38 (d)(e)(h) | | 13,524,167 | 13,219,135 |
| Class F, 1 month U.S. LIBOR + 3.700% 8.288% 7/15/38 (d)(e)(h) | | 2,504,909 | 2,413,893 |
| Freddie Mac sequential payer Series 2022-150 Class A2, 3.71% 9/25/32 | | 4,500,000 | 4,228,780 |
| GS Mortgage Securities Corp. II Series 2010-C1: | | | |
| Class B, 5.148% 8/10/43 (d) | | 47,946 | 47,508 |
| Class X, 0.4591% 8/10/43 (d)(e)(n) | | 226,321 | 302 |
| GS Mortgage Securities Corp. Trust floater: | | | |
| Series 2019-70P Class F, 1 month U.S. LIBOR + 2.650% 7.238% 10/15/36 (d)(e)(h) | | 1,717,000 | 1,565,955 |
| Series 2022-SHIP Class D, CME Term SOFR 1 Month Index + 1.600% 6.1694% 8/15/36 (d)(e)(h) | | 963,000 | 944,769 |
| GS Mortgage Securities Trust: | | | |
| floater: | | | |
Series 2018-3PCK Class A, 1 month U.S. LIBOR + 1.700% 6.538% 9/15/31 (d)(e)(h) | | 11,647,590 | 11,451,699 |
Series 2018-HART Class A, 1 month U.S. LIBOR + 1.090% 5.55% 10/15/31 (d)(e)(h) | | 10,353,000 | 9,712,195 |
Series 2021-IP: | | | |
| Class A, 1 month U.S. LIBOR + 0.950% 5.538% 10/15/36 (d)(e)(h) | | 13,201,000 | 12,520,527 |
| Class B, 1 month U.S. LIBOR + 1.150% 5.738% 10/15/36 (d)(e)(h) | | 1,550,000 | 1,447,828 |
| Class C, 1 month U.S. LIBOR + 1.550% 6.138% 10/15/36 (d)(e)(h) | | 1,277,000 | 1,181,854 |
| sequential payer Series 2019-GSA1 Class A4, 3.0479% 11/10/52 | | 1,181,000 | 1,033,128 |
| Series 2011-GC5: | | | |
Class C, 5.1538% 8/10/44 (d)(e) | | 505,077 | 364,861 |
Class D, 5.1538% 8/10/44 (d)(e) | | 342,592 | 142,095 |
Class E, 5.1538% 8/10/44 (c)(d)(e) | | 424,043 | 38,773 |
Class F, 4.5% 8/10/44 (c)(d) | | 733,782 | 2,574 |
| Series 2012-GCJ9: | | | |
Class D, 4.6117% 11/10/45 (d)(e) | | 934,057 | 863,951 |
Class E, 4.6117% 11/10/45 (d)(e) | | 510,000 | 438,130 |
| Series 2013-GC10 Class D, 4.5367% 2/10/46 (d)(e) | | 334,000 | 278,250 |
| Series 2013-GC12 Class D, 4.2984% 6/10/46 (d)(e) | | 138,482 | 135,534 |
| Series 2013-GC16: | | | |
Class C, 5.3111% 11/10/46 (e) | | 241,000 | 234,829 |
Class D, 5.3111% 11/10/46 (d)(e) | | 634,000 | 599,592 |
Class F, 3.5% 11/10/46 (d) | | 536,000 | 490,263 |
| Series 2014-GC20 Class XA, 1.0069% 4/10/47 (e)(n) | | 35,205,566 | 245,745 |
| Series 2015-GC34 Class XA, 1.2034% 10/10/48 (e)(n) | | 9,061,836 | 228,002 |
| Series 2016-GS2 Class D, 2.753% 5/10/49 (d) | | 386,000 | 288,112 |
| Series 2016-GS4 Class C, 3.9539% 11/10/49 (e) | | 264,000 | 219,145 |
| Series 2017-GS6 Class D, 3.243% 5/10/50 (d) | | 950,000 | 673,811 |
| Series 2018-GS9 Class D, 3% 3/10/51 (d) | | 476,000 | 330,146 |
| Series 2019-GC38 Class D, 3% 2/10/52 (d) | | 543,000 | 373,328 |
| Series 2019-GC39 Class D, 3% 5/10/52 (d) | | 672,000 | 435,121 |
| Series 2019-GC40 Class D, 3% 7/10/52 (d) | | 525,000 | 347,131 |
| Series 2019-GC42: | | | |
Class C, 3.6926% 9/10/52 (e) | | 350,000 | 283,530 |
Class D, 2.8% 9/10/52 (d) | | 727,000 | 446,503 |
Class E, 2.8% 9/10/52 (d) | | 609,000 | 345,744 |
| Series 2019-GS5 Class C, 4.299% 3/10/50 (e) | | 651,000 | 554,754 |
| Series 2019-GSA1 Class E, 2.8% 11/10/52 (d) | | 395,000 | 232,602 |
| Series 2020-GC45: | | | |
Class D, 2.85% 2/13/53 (d) | | 525,000 | 331,419 |
Class SWD, 3.2185% 12/13/39 (d)(e) | | 399,000 | 255,624 |
| Series 2020-GC47 Class D, 3.4543% 5/12/53 (d)(e) | | 189,000 | 125,376 |
| Series 2021-RENT Class G, 1 month U.S. LIBOR + 5.700% 10.2913% 11/21/35 (d)(e)(h) | | 1,725,126 | 1,464,839 |
| Hilton U.S.A. Trust Series 2016-HHV: | | | |
| Class E, 4.1935% 11/5/38 (d)(e) | | 1,881,000 | 1,664,688 |
| Class F, 4.1935% 11/5/38 (d)(e) | | 1,113,000 | 953,500 |
| Home Partners of America Trust Series 2019-1: | | | |
| Class E, 3.604% 9/17/39 (d) | | 321,064 | 281,500 |
| Class F, 4.101% 9/17/39 (d) | | 80,467 | 70,561 |
| Hudson Yards Mortgage Trust: | | | |
| Series 2019-30HY Class E, 3.4431% 7/10/39 (d)(e) | | 483,000 | 368,775 |
| Series 2019-55HY Class F, 2.9428% 12/10/41 (d)(e) | | 378,000 | 261,166 |
| ILPT Commercial Mortgage Trust floater Series 2022-LPF2: | | | |
| Class D, CME Term SOFR 1 Month Index + 4.190% 8.7545% 10/15/39 (d)(e)(h) | | 630,000 | 631,007 |
| Class E, CME Term SOFR 1 Month Index + 5.940% 10.5025% 10/15/39 (d)(e)(h) | | 560,000 | 560,700 |
| Independence Plaza Trust Series 2018-INDP Class E, 4.996% 7/10/35 (d) | | 592,000 | 550,656 |
| Intown Mortgage Trust: | | | |
| floater Series 2022-STAY Class E, CME Term SOFR 1 Month Index + 5.030% 9.5934% 8/15/39 (d)(e)(h) | | 614,000 | 612,464 |
| floater sequential payer Series 2022-STAY Class A, CME Term SOFR 1 Month Index + 2.480% 7.0506% 8/15/39 (d)(e)(h) | | 17,389,000 | 17,410,748 |
| J.P. Morgan Chase Commercial Mortgage Securities Trust floater Series 2022-NXSS Class D, CME Term SOFR 1 Month Index + 4.120% 8.6915% 8/15/39 (d)(e)(h) | | 934,000 | 935,456 |
| JPMBB Commercial Mortgage Securities Trust: | | | |
| Series 2014-C19 Class XA, 0.6228% 4/15/47 (e)(n) | | 3,376,868 | 14,870 |
| Series 2014-C23 Class UH5, 4.7094% 9/15/47 (d) | | 106,000 | 75,937 |
| Series 2014-C26 Class D, 3.8741% 1/15/48 (d)(e) | | 2,126,000 | 1,712,211 |
| Series 2015-C30 Class XA, 0.4319% 7/15/48 (e)(n) | | 21,951,016 | 190,530 |
| Series 2015-C32 Class C, 4.6544% 11/15/48 (e) | | 1,368,000 | 991,137 |
| JPMCC Commercial Mortgage Securities Trust Series 2016-JP4 Class D, 3.3832% 12/15/49 (d)(e) | | 696,000 | 474,645 |
| JPMDB Commercial Mortgage Securities Trust: | | | |
| Series 2016-C4: | | | |
Class C, 3.0675% 12/15/49 (e) | | 343,000 | 280,595 |
Class D, 3.0675% 12/15/49 (d)(e) | | 681,000 | 477,880 |
| Series 2017-C7 Class D, 3% 10/15/50 (d) | | 1,388,000 | 940,074 |
| Series 2018-C8 Class D, 3.3106% 6/15/51 (d)(e) | | 223,000 | 146,352 |
| Series 2019-COR6: | | | |
Class D, 2.5% 11/13/52 (d) | | 315,000 | 178,134 |
Class E, 2.5% 11/13/52 (d) | | 609,000 | 321,220 |
| Series 2020-COR7 Class D, 1.75% 5/13/53 (d) | | 399,000 | 224,918 |
| JPMorgan Chase Commercial Mortgage Securities Trust: | | | |
| floater Series 2019-MFP: | | | |
Class E, 1 month U.S. LIBOR + 2.160% 6.748% 7/15/36 (d)(e)(h) | | 567,000 | 536,049 |
Class F, 1 month U.S. LIBOR + 3.000% 7.588% 7/15/36 (d)(e)(h) | | 189,000 | 178,541 |
| Series 2011-C3: | | | |
Class E, 5.5253% 2/15/46 (d)(e) | | 637,000 | 256,501 |
Class G, 4.409% 2/15/46 (d)(e) | | 202,000 | 17,867 |
Class H, 4.409% 2/15/46 (c)(d)(e) | | 453,000 | 37,976 |
| Series 2012-CBX: | | | |
Class E, 4.6897% 6/15/45 (d)(e) | | 521,449 | 435,097 |
Class F, 4% 6/15/45 (c)(d) | | 615,000 | 218,814 |
Class G 4% 6/15/45 (d) | | 674,000 | 154,917 |
| Series 2013-LC11: | | | |
Class C, 3.9582% 4/15/46 (e) | | 584,000 | 481,575 |
Class D, 4.2869% 4/15/46 (c)(e) | | 907,000 | 675,210 |
Class F, 3.25% 4/15/46 (c)(d)(e) | | 1,014,000 | 144,191 |
| Series 2014-DSTY: | | | |
Class D, 3.8046% 6/10/27 (c)(d)(e) | | 516,000 | 1,289 |
Class E, 3.8046% 6/10/27 (c)(d)(e) | | 830,000 | 2,046 |
| Series 2018-AON Class F, 4.6132% 7/5/31 (c)(d)(e) | | 409,000 | 229,040 |
| Series 2018-WPT: | | | |
Class AFX, 4.2475% 7/5/33 (d) | | 4,763,000 | 4,286,700 |
Class CFX, 4.9498% 7/5/33 (d) | | 1,323,000 | 1,084,860 |
Class DFX, 5.3503% 7/5/33 (d) | | 2,354,000 | 1,859,660 |
Class EFX, 5.3635% 7/5/33 (d)(e) | | 2,783,000 | 2,087,250 |
Class XAFX, 1.116% 7/5/33 (d)(e)(n) | | 19,961,000 | 20,674 |
| Series 2019-OSB Class E, 3.7828% 6/5/39 (d)(e) | | 588,000 | 457,972 |
| Series 2020-NNN: | | | |
Class EFX, 3.972% 1/16/37 (d) | | 401,000 | 323,811 |
Class FFX, 4.6254% 1/16/37 (d) | | 642,000 | 499,728 |
Class GFX, 4.6882% 1/16/37 (d)(e) | | 252,000 | 185,873 |
| KNDL Mortgage Trust floater Series 2019-KNSQ Class F, 1 month U.S. LIBOR + 2.000% 6.588% 5/15/36 (d)(e)(h) | | 2,224,000 | 2,151,303 |
| KNDR Trust floater Series 2021-KIND Class F, 1 month U.S. LIBOR + 3.950% 8.538% 8/15/38 (d)(e)(h) | | 1,105,014 | 1,007,860 |
| La Quita Mortgage Trust floater Series 2022-LAQ Class F, CME Term SOFR 1 Month Index + 5.970% 10.5327% 3/15/39 (d)(e)(h) | | 519,750 | 505,325 |
| Liberty Street Trust Series 2016-225L: | | | |
| Class D, 4.6485% 2/10/36 (d)(e) | | 213,000 | 185,993 |
| Class E, 4.6485% 2/10/36 (d)(e) | | 523,000 | 433,022 |
| Life Financial Services Trust floater Series 2022-BMR2: | | | |
| Class A1, CME Term SOFR 1 Month Index + 1.290% 5.8577% 5/15/39 (d)(e)(h) | | 26,961,000 | 26,859,832 |
| Class B, CME Term SOFR 1 Month Index + 1.790% 6.3564% 5/15/39 (d)(e)(h) | | 16,119,000 | 16,055,373 |
| Class C, CME Term SOFR 1 Month Index + 2.090% 6.6556% 5/15/39 (d)(e)(h) | | 9,032,000 | 8,921,853 |
| Class D, CME Term SOFR 1 Month Index + 2.540% 7.1044% 5/15/39 (d)(e)(h) | | 8,027,000 | 7,907,846 |
| Class E, CME Term SOFR 1 Month Index + 3.240% 7.8025% 5/15/39 (d)(e)(h) | | 1,302,000 | 1,265,766 |
| LIFE Mortgage Trust floater Series 2021-BMR: | | | |
| Class A, 1 month U.S. LIBOR + 0.700% 5.288% 3/15/38 (d)(e)(h) | | 11,520,410 | 11,311,547 |
| Class B, 1 month U.S. LIBOR + 0.880% 5.468% 3/15/38 (d)(e)(h) | | 3,263,461 | 3,173,693 |
| Class C, 1 month U.S. LIBOR + 1.100% 5.688% 3/15/38 (d)(e)(h) | | 2,053,425 | 1,991,659 |
| Class D, 1 month U.S. LIBOR + 1.400% 5.988% 3/15/38 (d)(e)(h) | | 2,855,528 | 2,766,058 |
| Class E, 1 month U.S. LIBOR + 1.750% 6.338% 3/15/38 (d)(e)(h) | | 2,494,778 | 2,418,357 |
| Class F, 1 month U.S. LIBOR + 2.350% 6.938% 3/15/38 (d)(e)(h) | | 1,421,375 | 1,373,279 |
| Class G, 1 month U.S. LIBOR + 2.950% 7.538% 3/15/38 (d)(e)(h) | | 3,679,257 | 3,540,931 |
| Market Mortgage Trust Series 2020-525M Class F, 2.9406% 2/12/40 (d)(e) | | 455,000 | 250,881 |
| MED Trust floater Series 2021-MDLN: | | | |
| Class F, 1 month U.S. LIBOR + 4.000% 8.588% 11/15/38 (d)(e)(h) | | 1,075,804 | 1,014,485 |
| Class G, 1 month U.S. LIBOR + 5.250% 9.838% 11/15/38 (d)(e)(h) | | 2,525,497 | 2,367,116 |
| Merit floater Series 2021-STOR: | | | |
| Class G, 1 month U.S. LIBOR + 2.750% 7.338% 7/15/38 (d)(e)(h) | | 189,000 | 179,054 |
| Class J, 1 month U.S. LIBOR + 3.950% 8.538% 7/15/38 (d)(e)(h) | | 724,000 | 689,669 |
| MFT Trust Series 2020-B6 Class C, 3.2828% 8/10/40 (d)(e) | | 399,000 | 263,165 |
| MHC Commercial Mortgage Trust floater Series 2021-MHC: | | | |
| Class F, 1 month U.S. LIBOR + 2.600% 7.189% 4/15/38 (d)(e)(h) | | 105,000 | 101,655 |
| Class G, 1 month U.S. LIBOR + 3.200% 7.789% 4/15/38 (d)(e)(h) | | 2,520,000 | 2,412,674 |
| MHC Trust floater Series 2021-MHC2 Class F, 1 month U.S. LIBOR + 2.400% 6.988% 5/15/38 (d)(e)(h) | | 1,028,000 | 975,185 |
| MHP Commercial Mortgage Trust floater Series 2022-MHIL: | | | |
| Class F, CME Term SOFR 1 Month Index + 3.250% 7.8217% 1/15/27 (d)(e)(h) | | 208,907 | 200,536 |
| Class G, CME Term SOFR 1 Month Index + 3.950% 8.52% 1/15/27 (d)(e)(h) | | 612,145 | 579,690 |
| MOFT Trust Series 2020-ABC: | | | |
| Class D, 3.4767% 2/10/42 (d)(e) | | 263,000 | 171,387 |
| Class E, 3.4767% 2/10/42 (d)(e) | | 194,000 | 119,545 |
| Morgan Stanley BAML Trust: | | | |
| sequential payer Series 2014-C18 Class 300E, 4.6896% 8/15/31 | | 386,000 | 326,761 |
| Series 2012-C5 Class E, 4.6588% 8/15/45 (d)(e) | | 159,000 | 143,178 |
| Series 2012-C6 Class D, 4.5397% 11/15/45 (d)(e) | | 811,000 | 701,957 |
| Series 2012-C6, Class F, 4.5397% 11/15/45 (d)(e) | | 378,000 | 276,144 |
| Series 2013-C12 Class D, 4.9159% 10/15/46 (d)(e) | | 713,000 | 602,443 |
| Series 2013-C13: | | | |
Class D, 4.8899% 11/15/46 (d)(e) | | 970,000 | 899,035 |
Class E, 4.8899% 11/15/46 (d)(e) | | 435,919 | 382,744 |
| Series 2013-C7 Class C, 4.0627% 2/15/46 (e) | | 174,148 | 167,912 |
| Series 2013-C8 Class D, 3.9933% 12/15/48 (d)(e) | | 21,205 | 20,356 |
| Series 2013-C9: | | | |
Class C, 4.0011% 5/15/46 (e) | | 502,000 | 427,390 |
Class D, 4.0891% 5/15/46 (d)(e) | | 938,000 | 751,540 |
Class E, 4.0891% 5/15/46 (d)(e) | | 402,000 | 302,007 |
| Series 2014-C17 Class XA, 1.031% 8/15/47 (e)(n) | | 32,898,822 | 259,144 |
| Series 2015-C25 Class XA, 1.0381% 10/15/48 (e)(n) | | 14,410,470 | 260,877 |
| Series 2016-C30: | | | |
Class C, 4.0953% 9/15/49 (e) | | 151,000 | 128,556 |
Class D, 3% 9/15/49 (d) | | 138,000 | 86,053 |
| Series 2016-C31 Class C, 4.2655% 11/15/49 (e) | | 343,000 | 271,999 |
| Series 2016-C32 Class C, 4.2737% 12/15/49 (e) | | 236,000 | 201,221 |
| Series 2017-C33 Class D, 3.356% 5/15/50 (d) | | 520,000 | 371,905 |
| Morgan Stanley Capital I Trust: | | | |
| floater sequential payer Series 2019-NUGS Class A, 1 month U.S. LIBOR + 0.950% 5.538% 12/15/36 (d)(e)(h) | | 5,100,000 | 4,922,614 |
| sequential payer Series 2019-MEAD Class A, 3.17% 11/10/36 (d) | | 16,898,000 | 15,747,711 |
| Series 1998-CF1 Class G, 7.35% 7/15/32 (d)(e) | | 620 | 614 |
| Series 2011-C2: | | | |
Class D, 5.2113% 6/15/44 (d)(e) | | 608,690 | 570,506 |
Class F, 5.2113% 6/15/44 (c)(d)(e) | | 407,000 | 260,164 |
Class XB, 0.446% 6/15/44 (d)(e)(n) | | 1,476,343 | 5,515 |
| Series 2011-C3: | | | |
Class C, 5.0824% 7/15/49 (d)(e) | | 68,012 | 67,371 |
Class D, 5.0824% 7/15/49 (d)(e) | | 1,176,000 | 1,145,388 |
Class E, 5.0824% 7/15/49 (c)(d)(e) | | 666,000 | 575,545 |
Class F, 5.0824% 7/15/49 (d)(e) | | 182,000 | 112,917 |
Class G, 5.0824% 7/15/49 (c)(d)(e) | | 616,400 | 342,265 |
| Series 2012-C4 Class D, 5.1638% 3/15/45 (d)(e) | | 119,459 | 112,419 |
| Series 2014-150E: | | | |
Class C, 4.295% 9/9/32 (d)(e) | | 238,000 | 187,289 |
Class F, 4.295% 9/9/32 (d)(e) | | 401,000 | 276,022 |
| Series 2015-MS1: | | | |
Class C, 4.024% 5/15/48 (e) | | 266,000 | 236,029 |
Class D, 4.024% 5/15/48 (d)(e) | | 751,000 | 610,849 |
| Series 2016-BNK2: | | | |
Class C, 3% 11/15/49 (d) | | 798,000 | 563,849 |
Class D, 3.8875% 11/15/49 (e) | | 343,000 | 274,144 |
| Series 2017-H1: | | | |
Class C, 4.281% 6/15/50 | | 640,000 | 558,431 |
Class D, 2.546% 6/15/50 (d) | | 1,912,000 | 1,317,443 |
| Series 2017-HR2 Class D, 2.73% 12/15/50 | | 234,000 | 157,639 |
| Series 2018-H4 Class A4, 4.31% 12/15/51 | | 4,779,000 | 4,532,949 |
| Series 2018-MP Class E, 4.276% 7/11/40 (d)(e) | | 953,000 | 680,503 |
| Series 2019-MEAD: | | | |
Class B, 3.1771% 11/10/36 (d)(e) | | 2,441,000 | 2,216,836 |
Class C, 3.1771% 11/10/36 (d)(e) | | 2,343,000 | 2,062,108 |
| Series 2020-CNP Class D, 2.4276% 4/5/42 (d)(e) | | 252,000 | 162,414 |
| Series 2020-HR8 Class D, 2.5% 7/15/53 (d) | | 420,000 | 249,129 |
| Series 2020-L4, Class C, 3.536% 2/15/53 | | 115,000 | 89,262 |
| MSCCG Trust floater sequential payer Series 2018-SELF Class F, 1 month U.S. LIBOR + 3.050% 7.638% 10/15/37 (d)(e)(h) | | 443,228 | 431,719 |
| MSJP Commercial Securities Mortgage Trust Series 2015-HAUL Class E, 4.851% 9/5/47 (d)(e) | | 170,000 | 115,131 |
| Natixis Commercial Mortgage Securities Trust: | | | |
| Series 2018-285M Class F, 3.7904% 11/15/32 (d)(e) | | 170,000 | 132,443 |
| Series 2018-TECH Class F, 1 month U.S. LIBOR + 3.150% 7.738% 11/15/34 (d)(e)(h) | | 138,000 | 133,554 |
| Series 2019-10K: | | | |
Class E, 4.1346% 5/15/39 (d)(e) | | 753,000 | 583,774 |
Class F, 4.1346% 5/15/39 (d)(e) | | 768,000 | 557,266 |
| Series 2020-2PAC: | | | |
Class AMZ2, 3.5% 1/15/37 (d)(e) | | 399,000 | 345,361 |
Class AMZ3, 3.5% 1/15/37 (d)(e) | | 189,000 | 160,002 |
| NYT Mortgage Trust floater Series 2019-NYT Class F, 1 month U.S. LIBOR + 3.000% 7.588% 12/15/35 (d)(e)(h) | | 775,000 | 643,576 |
| OPG Trust floater Series 2021-PORT: | | | |
| Class G, 1 month U.S. LIBOR + 2.390% 6.986% 10/15/36 (d)(e)(h) | | 359,821 | 342,015 |
| Class J, 1 month U.S. LIBOR + 3.340% 7.934% 10/15/36 (d)(e)(h) | | 377,641 | 355,509 |
| PKHL Commercial Mortgage Trust floater Series 2021-MF: | | | |
| Class F, 1 month U.S. LIBOR + 3.350% 7.938% 7/15/38 (d)(e)(h) | | 553,000 | 510,663 |
| Class NR, 1 month U.S. LIBOR + 6.000% 10.588% 7/15/38 (d)(e)(h) | | 157,000 | 141,695 |
| Prima Capital CRE Securitization Ltd. Series 2020-8A Class C, 3% 12/1/70 (d) | | 1,705,000 | 1,251,302 |
| Prima Capital Ltd.: | | | |
| floater Series 2021-9A: | | | |
Class B, 1 month U.S. LIBOR + 1.800% 6.3979% 12/15/37 (d)(e)(h) | | 4,268,000 | 4,170,325 |
Class C, 1 month U.S. LIBOR + 2.350% 6.9479% 12/15/37 (d)(e)(h) | | 1,785,000 | 1,672,662 |
| floater sequential payer Series 2021-9A Class A, 1 month U.S. LIBOR + 1.450% 6.0479% 12/15/37 (d)(e)(h) | | 853,710 | 845,355 |
| Providence Place Group Ltd. Partnership Series 2000-C1 Class A2, 7.75% 7/20/28 (d) | | 100,699 | 102,617 |
| SFO Commercial Mortgage Trust floater Series 2021-555 Class F, 1 month U.S. LIBOR + 3.650% 8.238% 5/15/38 (d)(e)(h) | | 539,000 | 440,066 |
| SG Commercial Mortgage Securities Trust: | | | |
| Series 2019-PREZ Class F, 3.4771% 9/15/39 (d)(e) | | 747,000 | 543,490 |
| Series 2020-COVE: | | | |
Class F, 3.7276% 3/15/37 (d)(e) | | 1,326,000 | 1,156,275 |
Class G, 3.7276% 3/15/37 (d)(e) | | 483,000 | 405,861 |
| SLG Office Trust Series 2021-OVA Class G, 2.8506% 7/15/41 (d) | | 2,113,000 | 1,332,296 |
| SMRT Commercial Mortgage Trust floater Series 2022-MINI: | | | |
| Class E, CME Term SOFR 1 Month Index + 2.700% 7.263% 1/15/39 (d)(e)(h) | | 1,154,000 | 1,075,972 |
| Class F, CME Term SOFR 1 Month Index + 3.350% 7.913% 1/15/39 (d)(e)(h) | | 903,000 | 837,423 |
| SOHO Trust Series 2021-SOHO Class D, 2.6966% 8/10/38 (d)(e) | | 618,000 | 401,820 |
| SPGN Mortgage Trust floater Series 2022-TFLM: | | | |
| Class B, CME Term SOFR 1 Month Index + 2.000% 6.5625% 2/15/39 (d)(e)(h) | | 4,281,000 | 4,077,085 |
| Class C, CME Term SOFR 1 Month Index + 2.650% 7.2125% 2/15/39 (d)(e)(h) | | 2,226,000 | 2,111,781 |
| SREIT Trust floater: | | | |
| Series 2021-IND Class G, 1 month U.S. LIBOR + 3.260% 7.8538% 10/15/38 (d)(e)(h) | | 840,000 | 783,297 |
| Series 2021-MFP: | | | |
Class A, 1 month U.S. LIBOR + 0.730% 5.3187% 11/15/38 (d)(e)(h) | | 15,989,000 | 15,644,357 |
Class B, 1 month U.S. LIBOR + 1.070% 5.6677% 11/15/38 (d)(e)(h) | | 9,157,000 | 8,916,714 |
Class C, 1 month U.S. LIBOR + 1.320% 5.9169% 11/15/38 (d)(e)(h) | | 5,687,000 | 5,530,245 |
Class D, 1 month U.S. LIBOR + 1.570% 6.1661% 11/15/38 (d)(e)(h) | | 3,737,000 | 3,629,313 |
Class E, 1 month U.S. LIBOR + 2.020% 6.6147% 11/15/38 (d)(e)(h) | | 1,298,000 | 1,255,719 |
Class F, 1 month U.S. LIBOR + 2.620% 7.2128% 11/15/38 (d)(e)(h) | | 552,000 | 532,636 |
Class G, 1 month U.S. LIBOR + 2.970% 7.5617% 11/15/38 (d)(e)(h) | | 2,415,000 | 2,292,788 |
| Series 2021-MFP2: | | | |
Class G, 1 month U.S. LIBOR + 2.960% 7.5555% 11/15/36 (d)(e)(h) | | 615,000 | 587,263 |
Class J, 1 month U.S. LIBOR + 3.910% 8.5035% 11/15/36 (d)(e)(h) | | 1,795,000 | 1,702,962 |
| Series 2021-PALM Class G, 1 month U.S. LIBOR + 3.610% 8.2041% 10/15/34 (d)(e)(h) | | 441,000 | 408,839 |
| STWD Trust floater sequential payer Series 2021-LIH: | | | |
| Class E, 1 month U.S. LIBOR + 2.900% 7.491% 11/15/36 (d)(e)(h) | | 1,281,000 | 1,201,369 |
| Class F, 1 month U.S. LIBOR + 3.550% 8.139% 11/15/36 (d)(e)(h) | | 865,000 | 820,502 |
| Class G, 1 month U.S. LIBOR + 4.200% 8.788% 11/15/36 (d)(e)(h) | | 294,000 | 277,533 |
| SUMIT Mortgage Trust Series 2022-BVUE Class F, 2.8925% 2/12/41 (d)(e) | | 104,000 | 66,542 |
| TPGI Trust floater Series 2021-DGWD: | | | |
| Class E, 1 month U.S. LIBOR + 2.350% 6.94% 6/15/26 (d)(e)(h) | | 1,391,000 | 1,324,767 |
| Class G, 1 month U.S. LIBOR + 3.850% 8.44% 6/15/26 (d)(e)(h) | | 252,000 | 242,304 |
| Tricon Residential Trust Series 2022-SFR2 Class E, 7.507% 7/17/40 (d) | | 1,407,000 | 1,371,810 |
| UBS Commercial Mortgage Trust: | | | |
| Series 2012-C1: | | | |
Class E, 5% 5/10/45 (c)(d)(e) | | 316,541 | 123,388 |
Class F, 5% 5/10/45 (c)(d)(e) | | 418,000 | 20,008 |
| Series 2017-C7 Class XA, 1.0036% 12/15/50 (e)(n) | | 26,219,692 | 925,686 |
| Series 2018-C8 Class C, 4.6852% 2/15/51 (e) | | 189,000 | 162,373 |
| UBS-BAMLL Trust: | | | |
| Series 12-WRM Class D, 4.238% 6/10/30 (d)(e) | | 201,000 | 181,968 |
| Series 2012-WRM Class E, 4.238% 6/10/30 (d)(e) | | 478,000 | 375,802 |
| VASA Trust: | | | |
| floater Series 2021-VASA Class G, 1 month U.S. LIBOR + 5.000% 9.588% 7/15/39 (d)(e)(h) | | 168,000 | 150,004 |
| floater sequential payer Series 2021-VASA Class F, 1 month U.S. LIBOR + 3.900% 8.488% 7/15/39 (d)(e)(h) | | 767,000 | 691,079 |
| VLS Commercial Mortgage Trust: | | | |
| sequential payer Series 2020-LAB Class A, 2.13% 10/10/42 (d) | | 12,891,000 | 10,104,668 |
| Series 2020-LAB: | | | |
Class B, 2.453% 10/10/42 (d) | | 800,000 | 626,120 |
Class X, 0.4294% 10/10/42 (d)(e)(n) | | 19,300,000 | 506,251 |
| VMC Finance Ltd. floater Series 2021-HT1 Class B, 1 month U.S. LIBOR + 4.500% 9.0913% 1/18/37 (d)(e)(h) | | 2,478,000 | 2,338,245 |
| Wells Fargo Commercial Mortgage Trust: | | | |
| floater: | | | |
Series 2021-FCMT Class A, 1 month U.S. LIBOR + 1.200% 5.788% 5/15/31 (d)(e)(h) | | 8,949,000 | 8,560,250 |
Series 2021-SAVE: | | | |
| Class D, 1 month U.S. LIBOR + 2.500% 7.088% 2/15/40 (d)(e)(h) | | 197,258 | 178,715 |
| Class E, 1 month U.S. LIBOR + 3.650% 8.238% 2/15/40 (d)(e)(h) | | 140,898 | 126,309 |
| sequential payer: | | | |
Series 2020-C57 Class D, 2.5% 8/15/53 (d) | | 581,000 | 348,736 |
Series 2020-C58 Class A4, 2.092% 7/15/53 | | 1,162,000 | 933,158 |
| Series 2015-C31 Class XA, 0.954% 11/15/48 (e)(n) | | 11,569,157 | 233,051 |
| Series 2015-NXS4 Class D, 3.6855% 12/15/48 (e) | | 483,000 | 404,951 |
| Series 2016-BNK1: | | | |
Class C, 3.071% 8/15/49 | | 254,000 | 187,963 |
Class D, 3% 8/15/49 (d) | | 266,000 | 155,817 |
| Series 2016-C34 Class XA, 2.061% 6/15/49 (e)(n) | | 9,527,291 | 389,317 |
| Series 2016-LC25 Class C, 4.342% 12/15/59 (e) | | 328,000 | 286,746 |
| Series 2016-NXS6 Class D, 3.059% 11/15/49 (d) | | 733,000 | 538,448 |
| Series 2017-RB1 Class D, 3.401% 3/15/50 (d) | | 326,000 | 199,992 |
| Series 2018-C43 Class C, 4.514% 3/15/51 | | 228,000 | 193,095 |
| Series 2018-C44 Class D, 3% 5/15/51 (d) | | 1,512,000 | 1,000,722 |
| Series 2018-C46 Class XA, 0.9301% 8/15/51 (e)(n) | | 26,873,746 | 648,587 |
| Series 2018-C48 Class A5, 4.302% 1/15/52 | | 4,229,000 | 4,019,170 |
| WF-RBS Commercial Mortgage Trust: | | | |
| sequential payer Series 2011-C4I Class G, 5% 6/15/44 (c)(e) | | 203,000 | 11,993 |
| Series 2011-C3: | | | |
Class D, 5.3781% 3/15/44 (c)(d)(e) | | 736,257 | 276,097 |
Class E, 5% 3/15/44 (c)(d) | | 409,000 | 2,031 |
Class F, 5% 3/15/44 (c)(d) | | 231,431 | 18 |
| Series 2011-C4: | | | |
Class D, 4.845% 6/15/44 (d)(e) | | 258,000 | 228,330 |
Class E, 4.845% 6/15/44 (d)(e) | | 183,000 | 146,518 |
| Series 2011-C5: | | | |
Class E, 5.5721% 11/15/44 (d)(e) | | 422,592 | 400,734 |
Class F, 5.25% 11/15/44 (d)(e) | | 733,000 | 664,298 |
Class G, 5.25% 11/15/44 (d)(e) | | 205,000 | 177,375 |
| Series 2013-C11: | | | |
Class D, 4.1202% 3/15/45 (d)(e) | | 443,749 | 372,749 |
Class E, 4.1202% 3/15/45 (d)(e) | | 976,128 | 761,380 |
| Series 2013-C13 Class D, 4.1749% 5/15/45 (d)(e) | | 321,000 | 289,138 |
| Series 2013-C16 Class D, 4.987% 9/15/46 (d)(e) | | 115,000 | 105,914 |
| Series 2013-UBS1 Class D, 5.0241% 3/15/46 (d)(e) | | 455,375 | 444,601 |
| Series 2014-C21 Class XA, 0.9976% 8/15/47 (e)(n) | | 25,003,406 | 295,395 |
| Series 2014-C24 Class XA, 0.8392% 11/15/47 (e)(n) | | 10,099,106 | 105,357 |
| Series 2014-LC14 Class XA, 1.2358% 3/15/47 (e)(n) | | 14,248,332 | 94,670 |
| WFCM: | | | |
| Series 2022-C62: | | | |
Class C, 4.3507% 4/15/55 (e) | | 1,077,000 | 825,692 |
Class D, 2.5% 4/15/55 (d) | | 756,000 | 375,123 |
| Series 2022-C62, Class A4, 4% 4/15/55 | | 827,000 | 757,789 |
| Worldwide Plaza Trust Series 2017-WWP: | | | |
| Class E, 3.5955% 11/10/36 (d)(e) | | 198,000 | 98,010 |
| Class F, 3.5955% 11/10/36 (d)(e) | | 1,082,000 | 503,130 |
| WP Glimcher Mall Trust Series 2015-WPG: | | | |
| Class PR1, 3.516% 6/5/35 (d)(e) | | 289,000 | 233,216 |
| Class PR2, 3.516% 6/5/35 (d)(e) | | 755,000 | 574,429 |
| TOTAL COMMERCIAL MORTGAGE SECURITIES (Cost $980,917,656) | | | 918,415,416 |
| | | | |
| Municipal Securities - 0.4% |
| | | Principal Amount (a) | Value ($) |
| California Gen. Oblig.: | | | |
| Series 2009: | | | |
7.3% 10/1/39 | | 10,015,000 | 12,222,226 |
7.35% 11/1/39 | | 960,000 | 1,177,427 |
7.55% 4/1/39 | | 6,805,000 | 8,696,658 |
| Series 2010, 7.625% 3/1/40 | | 3,670,000 | 4,654,748 |
| Illinois Gen. Oblig.: | | | |
| Series 2003: | | | |
4.95% 6/1/23 | | 2,398,636 | 2,395,244 |
5.1% 6/1/33 | | 22,880,000 | 22,484,068 |
| Series 2010-1, 6.63% 2/1/35 | | 4,001,538 | 4,206,140 |
| Series 2010-3: | | | |
6.725% 4/1/35 | | 6,465,000 | 6,813,681 |
7.35% 7/1/35 | | 2,753,214 | 2,995,601 |
| New Jersey Econ. Dev. Auth. State Pension Fdg. Rev. Series 1997, 7.425% 2/15/29 (Nat'l. Pub. Fin. Guarantee Corp. Insured) | | 14,838,000 | 15,974,905 |
| TOTAL MUNICIPAL SECURITIES (Cost $84,909,342) | | | 81,620,698 |
| | | | |
| Foreign Government and Government Agency Obligations - 1.3% |
| | | Principal Amount (a) | Value ($) |
| Angola Republic: | | | |
| 8.25% 5/9/28 (d) | | 945,000 | 872,944 |
| 8.75% 4/14/32 (d) | | 430,000 | 388,075 |
| 9.375% 5/8/48 (d) | | 350,000 | 299,250 |
| 9.5% 11/12/25 (d) | | 1,675,000 | 1,687,563 |
| Arab Republic of Egypt: | | | |
| 7.0529% 1/15/32 (d) | | 210,000 | 146,514 |
| 7.5% 1/31/27 (d) | | 3,378,000 | 2,888,190 |
| 7.5% 2/16/61 (d) | | 1,020,000 | 599,250 |
| 7.6003% 3/1/29 (d) | | 560,000 | 436,800 |
| 7.903% 2/21/48 (d) | | 534,000 | 320,400 |
| 8.5% 1/31/47 (d) | | 904,000 | 576,300 |
| 8.7002% 3/1/49 (d) | | 930,000 | 594,038 |
| Argentine Republic: | | | |
| 0.5% 7/9/30 (i) | | 10,355,675 | 3,355,239 |
| 1% 7/9/29 | | 1,021,922 | 316,796 |
| 1.5% 7/9/35 (i) | | 6,338,814 | 1,803,393 |
| 3.5% 7/9/41 (i) | | 1,920,000 | 602,880 |
| 3.875% 1/9/38 (i) | | 4,159,773 | 1,450,201 |
| Bahamian Republic 6% 11/21/28 (d) | | 525,000 | 427,875 |
| Bahrain Kingdom 5.625% 5/18/34 (d) | | 310,000 | 270,088 |
| Barbados Government 6.5% 10/1/29 (d) | | 965,000 | 887,076 |
| Bermuda Government: | | | |
| 2.375% 8/20/30 (d) | | 280,000 | 231,403 |
| 3.375% 8/20/50 (d) | | 230,000 | 157,809 |
| 3.717% 1/25/27 (d) | | 1,185,000 | 1,116,714 |
| 4.75% 2/15/29 (d) | | 520,000 | 505,473 |
| 5% 7/15/32 (d) | | 390,000 | 378,129 |
| Brazilian Federative Republic: | | | |
| 3.875% 6/12/30 | | 1,535,000 | 1,320,868 |
| 7.125% 1/20/37 | | 840,000 | 886,883 |
| 8.25% 1/20/34 | | 1,976,000 | 2,228,928 |
| Buenos Aires Province 5.25% 9/1/37 (d)(i) | | 975,000 | 370,500 |
| Cameroon Republic 9.5% 11/19/25 (d) | | 740,000 | 719,558 |
| Chilean Republic: | | | |
| 2.45% 1/31/31 | | 2,145,000 | 1,784,104 |
| 2.75% 1/31/27 | | 425,000 | 388,955 |
| 3.25% 9/21/71 | | 250,000 | 153,250 |
| 3.5% 1/31/34 | | 280,000 | 238,578 |
| 4% 1/31/52 | | 245,000 | 189,921 |
| 4.34% 3/7/42 | | 360,000 | 306,968 |
| Colombian Republic: | | | |
| 3% 1/30/30 | | 1,800,000 | 1,350,900 |
| 3.125% 4/15/31 | | 785,000 | 568,046 |
| 3.25% 4/22/32 | | 400,000 | 282,800 |
| 4.125% 5/15/51 | | 325,000 | 189,069 |
| 5% 6/15/45 | | 1,760,000 | 1,155,330 |
| 5.2% 5/15/49 | | 900,000 | 595,013 |
| 6.125% 1/18/41 | | 60,000 | 46,830 |
| 7.375% 9/18/37 | | 205,000 | 189,728 |
| 7.5% 2/2/34 | | 395,000 | 373,670 |
| 8% 4/20/33 | | 1,250,000 | 1,234,219 |
| Costa Rican Republic: | | | |
| 5.625% 4/30/43 (d) | | 680,000 | 561,553 |
| 6.125% 2/19/31 (d) | | 300,000 | 290,119 |
| 7% 4/4/44 (d) | | 75,000 | 71,592 |
| Democratic Socialist Republic of Sri Lanka: | | | |
| 6.2% 5/11/27 (d)(f) | | 345,000 | 124,480 |
| 6.825% 7/18/26 (d)(f) | | 615,000 | 230,641 |
| 7.55% 3/28/30 (d)(f) | | 335,000 | 120,977 |
| 7.85% 3/14/29 (d)(f) | | 865,000 | 313,658 |
| Dominican Republic: | | | |
| 4.5% 1/30/30 (d) | | 855,000 | 732,521 |
| 4.875% 9/23/32 (d) | | 1,460,000 | 1,219,830 |
| 5.875% 1/30/60 (d) | | 570,000 | 425,469 |
| 5.95% 1/25/27 (d) | | 1,164,000 | 1,138,756 |
| 6% 7/19/28 (d) | | 549,000 | 528,172 |
| 6.4% 6/5/49 (d) | | 230,000 | 190,728 |
| 6.5% 2/15/48 (d) | | 300,000 | 253,650 |
| 6.85% 1/27/45 (d) | | 1,012,000 | 899,289 |
| 6.875% 1/29/26 (d) | | 1,378,000 | 1,390,747 |
| 7.05% 2/3/31 (d) | | 385,000 | 384,639 |
| 7.45% 4/30/44 (d) | | 401,000 | 383,907 |
| Ecuador Republic: | | | |
| 2.5% 7/31/35 (d)(i) | | 1,350,000 | 471,488 |
| 5.5% 7/31/30 (d)(i) | | 2,115,000 | 1,020,884 |
| El Salvador Republic: | | | |
| 6.375% 1/18/27 (d) | | 105,000 | 55,309 |
| 7.1246% 1/20/50 (d) | | 405,000 | 180,428 |
| 7.625% 2/1/41 (d) | | 120,000 | 54,323 |
| Emirate of Abu Dhabi: | | | |
| 1.7% 3/2/31 (d) | | 1,090,000 | 889,713 |
| 3% 9/15/51 (d) | | 1,015,000 | 710,500 |
| 3.125% 9/30/49 (d) | | 3,170,000 | 2,282,400 |
| 3.875% 4/16/50 (d) | | 9,890,000 | 8,134,525 |
| Emirate of Dubai: | | | |
| 3.9% 9/9/50 (Reg. S) | | 1,350,000 | 957,909 |
| 5.25% 1/30/43 (Reg. S) | | 560,000 | 509,355 |
| Gabonese Republic 7% 11/24/31 (d) | | 880,000 | 712,800 |
| Georgia Republic 2.75% 4/22/26 (d) | | 890,000 | 805,895 |
| German Federal Republic: | | | |
| 0% 10/10/25 (Reg. S) | EUR | 9,200,000 | 9,015,682 |
| 0% 2/15/32 (Reg. S) | EUR | 3,370,000 | 2,834,906 |
| 0% 5/15/35 (Reg. S) (k) | EUR | 7,075,000 | 5,407,889 |
| 2.2% 12/12/24(Reg. S) | EUR | 16,635,000 | 17,315,082 |
| Ghana Republic: | | | |
| 7.75% 4/7/29 (d) | | 810,000 | 303,750 |
| 8.627% 6/16/49 (d) | | 605,000 | 220,069 |
| 10.75% 10/14/30 (d) | | 525,000 | 374,063 |
| Guatemalan Republic: | | | |
| 4.9% 6/1/30 (d) | | 325,000 | 303,936 |
| 5.375% 4/24/32 (d) | | 490,000 | 467,123 |
| 6.125% 6/1/50 (d) | | 335,000 | 317,266 |
| Hungarian Republic: | | | |
| 2.125% 9/22/31 (d) | | 285,000 | 217,313 |
| 5.25% 6/16/29 (d) | | 610,000 | 593,988 |
| 5.5% 6/16/34 (d) | | 425,000 | 406,406 |
| 6.125% 5/22/28 (d) | | 385,000 | 390,005 |
| Indonesian Republic: | | | |
| 3.2% 9/23/61 | | 645,000 | 433,833 |
| 3.5% 2/14/50 | | 730,000 | 542,390 |
| 3.85% 10/15/30 | | 460,000 | 428,318 |
| 4.1% 4/24/28 | | 705,000 | 679,135 |
| 4.2% 10/15/50 | | 24,000,000 | 20,072,640 |
| 4.35% 1/11/48 | | 655,000 | 571,560 |
| 4.4% 6/6/27 (d) | | 480,000 | 469,853 |
| 5.125% 1/15/45 (d) | | 1,660,000 | 1,610,383 |
| 5.25% 1/17/42 (d) | | 485,000 | 476,755 |
| 5.95% 1/8/46 (d) | | 560,000 | 590,905 |
| 6.75% 1/15/44 (d) | | 380,000 | 430,392 |
| 7.75% 1/17/38 (d) | | 1,317,000 | 1,610,279 |
| 8.5% 10/12/35 (d) | | 1,910,000 | 2,421,880 |
| Islamic Republic of Pakistan: | | | |
| 6% 4/8/26 (d) | | 1,205,000 | 533,345 |
| 6.875% 12/5/27 (d) | | 350,000 | 154,039 |
| Israeli State 3.375% 1/15/50 | | 1,090,000 | 804,137 |
| Ivory Coast: | | | |
| 6.125% 6/15/33 (d) | | 1,680,000 | 1,444,800 |
| 6.375% 3/3/28 (d) | | 2,030,000 | 1,918,350 |
| Jamaican Government: | | | |
| 6.75% 4/28/28 | | 275,000 | 286,223 |
| 7.875% 7/28/45 | | 250,000 | 291,219 |
| Jordanian Kingdom: | | | |
| 4.95% 7/7/25 (d) | | 1,230,000 | 1,186,950 |
| 7.375% 10/10/47 (d) | | 155,000 | 135,557 |
| 7.75% 1/15/28 (d) | | 445,000 | 456,125 |
| Kingdom of Saudi Arabia: | | | |
| 2.25% 2/2/33 (d) | | 1,240,000 | 982,545 |
| 3.25% 10/22/30 (d) | | 5,890,000 | 5,291,061 |
| 3.45% 2/2/61 (d) | | 1,055,000 | 726,170 |
| 3.625% 3/4/28 (d) | | 425,000 | 401,094 |
| 3.75% 1/21/55 (d) | | 975,000 | 730,519 |
| 4.5% 10/26/46 (d) | | 1,150,000 | 988,138 |
| 4.5% 4/22/60 (d) | | 4,190,000 | 3,567,523 |
| 4.625% 10/4/47 (d) | | 425,000 | 370,892 |
| 5% 1/18/53 (d) | | 635,000 | 579,438 |
| Lebanese Republic: | | | |
| 5.8% 12/31/49 (f) | | 1,113,000 | 76,519 |
| 6.375% 12/31/49 (f) | | 977,000 | 67,169 |
| Ministry of Finance of the Russian Federation: | | | |
| 4.375% 3/21/29(Reg. S) (c)(f) | | 400,000 | 20,000 |
| 5.1% 3/28/35(Reg. S) (c)(f) | | 600,000 | 30,000 |
| Panamanian Republic: | | | |
| 2.252% 9/29/32 | | 580,000 | 430,578 |
| 3.298% 1/19/33 | | 615,000 | 498,073 |
| 3.87% 7/23/60 | | 1,055,000 | 671,771 |
| 4.5% 5/15/47 | | 350,000 | 268,581 |
| 4.5% 4/16/50 | | 1,090,000 | 815,661 |
| 6.4% 2/14/35 | | 840,000 | 863,258 |
| Peruvian Republic: | | | |
| 2.783% 1/23/31 | | 1,300,000 | 1,070,306 |
| 3% 1/15/34 | | 610,000 | 479,346 |
| 3.3% 3/11/41 | | 700,000 | 509,163 |
| Philippine Republic: | | | |
| 2.65% 12/10/45 | | 665,000 | 443,961 |
| 2.95% 5/5/45 | | 270,000 | 191,055 |
| 5% 7/17/33 | | 360,000 | 355,990 |
| 5.5% 1/17/48 | | 320,000 | 324,035 |
| 5.609% 4/13/33 | | 520,000 | 535,007 |
| 5.95% 10/13/47 | | 830,000 | 886,116 |
| Polish Government 5.75% 11/16/32 | | 725,000 | 758,698 |
| Province of Santa Fe 7% 3/23/23 (d) | | 570,500 | 571,570 |
| Provincia de Cordoba: | | | |
| 6.875% 12/10/25 (d) | | 1,645,009 | 1,414,708 |
| 6.99% 6/1/27 (d) | | 640,167 | 486,247 |
| Republic of Armenia 3.6% 2/2/31 (d) | | 560,000 | 429,030 |
| Republic of Iraq 5.8% 1/15/28 (Reg. S) | | 340,000 | 311,589 |
| Republic of Kenya: | | | |
| 6.3% 1/23/34 (d) | | 415,000 | 310,213 |
| 6.875% 6/24/24 (d) | | 600,000 | 558,000 |
| 7% 5/22/27 (d) | | 485,000 | 434,075 |
| Republic of Nigeria: | | | |
| 6.125% 9/28/28 (d) | | 1,095,000 | 866,419 |
| 6.375% 7/12/23 (d) | | 235,000 | 230,594 |
| 6.5% 11/28/27 (d) | | 375,000 | 309,375 |
| 7.143% 2/23/30 (d) | | 920,000 | 709,550 |
| 7.625% 11/21/25 (d) | | 1,040,000 | 936,000 |
| 7.696% 2/23/38 (d) | | 480,000 | 333,540 |
| 8.375% 3/24/29 (d) | | 230,000 | 193,775 |
| Republic of Paraguay: | | | |
| 2.739% 1/29/33 (d) | | 320,000 | 247,760 |
| 4.95% 4/28/31 (d) | | 1,050,000 | 985,556 |
| 5.4% 3/30/50 (d) | | 330,000 | 276,128 |
| Republic of Senegal 6.25% 5/23/33 (d) | | 590,000 | 486,013 |
| Republic of Serbia 2.125% 12/1/30 (d) | | 1,455,000 | 1,070,153 |
| Republic of Uzbekistan: | | | |
| 3.7% 11/25/30 (d) | | 395,000 | 316,568 |
| 3.9% 10/19/31 (d) | | 565,000 | 449,281 |
| 4.75% 2/20/24 (d) | | 315,000 | 306,495 |
| Republic of Zambia 8.97% 7/30/27 (d) | | 620,000 | 275,900 |
| Romanian Republic: | | | |
| 3% 2/27/27 (d) | | 652,000 | 581,910 |
| 3% 2/14/31 (d) | | 1,222,000 | 986,765 |
| 3.625% 3/27/32 (d) | | 652,000 | 536,270 |
| 4% 2/14/51 (d) | | 335,000 | 232,825 |
| 6.625% 2/17/28 (d) | | 385,000 | 392,700 |
| Rwanda Republic 5.5% 8/9/31 (d) | | 1,085,000 | 815,310 |
| South African Republic: | | | |
| 4.85% 9/27/27 | | 480,000 | 451,800 |
| 4.85% 9/30/29 | | 335,000 | 294,381 |
| 5% 10/12/46 | | 670,000 | 458,950 |
| 5.65% 9/27/47 | | 320,000 | 232,800 |
| 5.75% 9/30/49 | | 765,000 | 555,581 |
| 5.875% 4/20/32 | | 480,000 | 426,600 |
| State of Qatar: | | | |
| 3.75% 4/16/30 (d) | | 3,631,000 | 3,444,457 |
| 4% 3/14/29 (d) | | 775,000 | 749,231 |
| 4.4% 4/16/50 (d) | | 17,470,000 | 15,679,325 |
| 4.625% 6/2/46 (d) | | 960,000 | 892,380 |
| 4.817% 3/14/49 (d) | | 975,000 | 925,431 |
| 5.103% 4/23/48 (d) | | 1,090,000 | 1,073,650 |
| 9.75% 6/15/30 (d) | | 413,000 | 539,946 |
| Sultanate of Oman: | | | |
| 4.75% 6/15/26 (d) | | 385,000 | 372,800 |
| 5.375% 3/8/27 (d) | | 170,000 | 166,366 |
| 5.625% 1/17/28 (d) | | 2,470,000 | 2,417,204 |
| 6% 8/1/29 (d) | | 720,000 | 718,560 |
| 6.25% 1/25/31 (d) | | 520,000 | 524,160 |
| 6.5% 3/8/47 (d) | | 300,000 | 279,750 |
| 6.75% 1/17/48 (d) | | 1,661,000 | 1,592,484 |
| Turkish Republic: | | | |
| 4.25% 3/13/25 | | 1,510,000 | 1,379,763 |
| 4.25% 4/14/26 | | 1,685,000 | 1,470,163 |
| 4.75% 1/26/26 | | 1,500,000 | 1,338,750 |
| 4.875% 10/9/26 | | 1,395,000 | 1,217,138 |
| 4.875% 4/16/43 | | 1,675,000 | 1,057,344 |
| 5.125% 2/17/28 | | 755,000 | 637,975 |
| 5.25% 3/13/30 | | 315,000 | 248,456 |
| 5.75% 5/11/47 | | 937,000 | 626,619 |
| 6% 3/25/27 | | 235,000 | 209,738 |
| 6% 1/14/41 | | 490,000 | 348,513 |
| 6.125% 10/24/28 | | 510,000 | 442,425 |
| 6.375% 10/14/25 | | 220,000 | 205,975 |
| 9.375% 1/19/33 | | 550,000 | 530,750 |
| 9.875% 1/15/28 | | 1,960,000 | 1,986,734 |
| Ukraine Government: | | | |
| 0% 8/1/41 (d)(e) | | 530,000 | 143,365 |
| 6.876% 5/21/31 (d) | | 245,000 | 41,283 |
| 7.253% 3/15/35 (d) | | 1,495,000 | 253,963 |
| 7.375% 9/25/34 (d) | | 420,000 | 72,030 |
| 7.75% 9/1/24 (d) | | 955,000 | 218,038 |
| 7.75% 9/1/25 (d) | | 1,640,000 | 337,020 |
| 7.75% 9/1/26 (d) | | 2,420,000 | 442,104 |
| 7.75% 9/1/28 (d) | | 820,000 | 153,135 |
| 7.75% 9/1/29 (d) | | 170,000 | 31,801 |
| United Arab Emirates 4.05% 7/7/32 (d) | | 615,000 | 595,897 |
| United Kingdom, Great Britain and Northern Ireland: | | | |
| 1% 4/22/24(Reg. S) | GBP | 4,355,000 | 5,059,966 |
| 2.25% 9/7/23 | GBP | 10,645,000 | 12,687,409 |
| United Mexican States: | | | |
| 2.659% 5/24/31 | | 665,000 | 536,655 |
| 3.25% 4/16/30 | | 1,145,000 | 994,218 |
| 3.5% 2/12/34 | | 1,095,000 | 889,140 |
| 3.75% 1/11/28 | | 820,000 | 765,880 |
| 3.75% 4/19/71 | | 1,230,000 | 795,118 |
| 3.771% 5/24/61 | | 840,000 | 551,408 |
| 4.5% 4/22/29 | | 485,000 | 460,265 |
| 4.875% 5/19/33 | | 560,000 | 519,680 |
| 5.75% 10/12/2110 | | 1,520,000 | 1,343,110 |
| 6.05% 1/11/40 | | 980,000 | 974,978 |
| 6.35% 2/9/35 | | 780,000 | 801,060 |
| Uruguay Republic 5.1% 6/18/50 | | 1,230,000 | 1,204,170 |
| Venezuelan Republic: | | | |
| 9.25% 9/15/27 (f) | | 4,549,000 | 485,623 |
| 11.95% 8/5/31 (Reg. S) (f) | | 938,300 | 98,522 |
| 12.75% 12/31/49 (f) | | 199,600 | 20,958 |
| Vietnamese Socialist Republic 5.5% 3/12/28 | | 1,988,667 | 1,909,493 |
| TOTAL FOREIGN GOVERNMENT AND GOVERNMENT AGENCY OBLIGATIONS (Cost $288,758,335) | | | 251,518,795 |
| | | | |
| Supranational Obligations - 0.1% |
| | | Principal Amount (a) | Value ($) |
Corporacion Andina de Fomento 2.375% 5/12/23 (Cost $15,297,681) | | 15,300,000 | 15,204,216 |
| | | | |
| Common Stocks - 0.1% |
| | | Shares | Value ($) |
| COMMUNICATION SERVICES - 0.0% | | | |
| Entertainment - 0.0% | | | |
| Cineworld Group PLC warrants 11/23/25 (c)(r) | | 149,986 | 2 |
| Media - 0.0% | | | |
| Altice U.S.A., Inc. Class A (r) | | 75,200 | 297,792 |
| Charter Communications, Inc. Class A (r) | | 4,100 | 1,507,201 |
| | | | 1,804,993 |
TOTAL COMMUNICATION SERVICES | | | 1,804,995 |
| CONSUMER DISCRETIONARY - 0.0% | | | |
| Auto Components - 0.0% | | | |
| Aptiv PLC (r) | | 13,800 | 1,604,664 |
| Hotels, Restaurants & Leisure - 0.0% | | | |
| CEC Entertainment, Inc. (c)(r) | | 40,185 | 740,480 |
| Specialty Retail - 0.0% | | | |
| David's Bridal, Inc. rights (c)(r) | | 295 | 0 |
TOTAL CONSUMER DISCRETIONARY | | | 2,345,144 |
| ENERGY - 0.1% | | | |
| Energy Equipment & Services - 0.0% | | | |
| Forbes Energy Services Ltd. (r) | | 55,600 | 1 |
| Jonah Energy Parent LLC (c)(r) | | 36,493 | 1,684,882 |
| | | | 1,684,883 |
| Oil, Gas & Consumable Fuels - 0.1% | | | |
| California Resources Corp. | | 81,331 | 3,432,168 |
| California Resources Corp. warrants 10/27/24 (r) | | 3,601 | 39,431 |
| Chesapeake Energy Corp. | | 55,352 | 4,472,995 |
| Chesapeake Energy Corp. (b)(r) | | 351 | 28,364 |
| Denbury, Inc. (r) | | 15,462 | 1,289,067 |
| EP Energy Corp. (c)(r) | | 3,729 | 25,171 |
| Mesquite Energy, Inc. (c)(r) | | 66,231 | 3,791,746 |
| Nostrum Oil & Gas LP (r) | | 545,077 | 118,016 |
| | | | 13,196,958 |
TOTAL ENERGY | | | 14,881,841 |
| FINANCIALS - 0.0% | | | |
| Diversified Financial Services - 0.0% | | | |
| ACNR Holdings, Inc. (c)(r) | | 5,205 | 544,807 |
| Lime Tree Bay Ltd. (c) | | 464 | 18,560 |
| | | | 563,367 |
| INDUSTRIALS - 0.0% | | | |
| Electrical Equipment - 0.0% | | | |
| Regal Rexnord Corp. | | 10,200 | 1,607,928 |
| Machinery - 0.0% | | | |
| TNT Crane & Rigging LLC (c)(r) | | 47,366 | 389,349 |
| TNT Crane & Rigging LLC warrants 10/31/25 (c)(r) | | 2,081 | 437 |
| | | | 389,786 |
TOTAL INDUSTRIALS | | | 1,997,714 |
| INFORMATION TECHNOLOGY - 0.0% | | | |
| Electronic Equipment & Components - 0.0% | | | |
| Coherent Corp. (r) | | 9,800 | 422,674 |
| IT Services - 0.0% | | | |
| GTT Communications, Inc. (c) | | 40,553 | 500,846 |
TOTAL INFORMATION TECHNOLOGY | | | 923,520 |
| TOTAL COMMON STOCKS (Cost $12,189,893) | | | 22,516,581 |
| | | | |
| Preferred Stocks - 0.0% |
| | | Shares | Value ($) |
| Convertible Preferred Stocks - 0.0% | | | |
| REAL ESTATE - 0.0% | | | |
| Equity Real Estate Investment Trusts (REITs) - 0.0% | | | |
| RLJ Lodging Trust Series A, 1.95% | | 11,325 | 281,426 |
| | | | |
| Nonconvertible Preferred Stocks - 0.0% | | | |
| FINANCIALS - 0.0% | | | |
| Diversified Financial Services - 0.0% | | | |
| ACNR Holdings, Inc. (c)(r) | | 2,980 | 1,861,070 |
| | | | |
| Mortgage Real Estate Investment Trusts - 0.0% | | | |
| AGNC Investment Corp. Series E, 6.50% (e) | | 37,320 | 837,461 |
| Arbor Realty Trust, Inc. Series F, 6.25% (e) | | 22,800 | 487,236 |
| Dynex Capital, Inc. Series C 6.90% (e) | | 11,400 | 258,666 |
| Franklin BSP Realty Trust, Inc. 7.50% | | 18,900 | 401,436 |
| MFA Financial, Inc. Series B, 7.50% | | 13,700 | 272,356 |
| | | | 2,257,155 |
TOTAL FINANCIALS | | | 4,118,225 |
| | | | |
| REAL ESTATE - 0.0% | | | |
| Equity Real Estate Investment Trusts (REITs) - 0.0% | | | |
| Cedar Realty Trust, Inc.: | | | |
| 7.25% | | 550 | 9,143 |
| Series C, 6.50% | | 14,300 | 173,030 |
| DiamondRock Hospitality Co. 8.25% | | 7,100 | 182,044 |
| iStar Financial, Inc. Series G, 7.65% | | 19,500 | 484,380 |
| National Storage Affiliates Trust Series A, 6.00% | | 6,925 | 164,123 |
| Rexford Industrial Realty, Inc. Series B, 5.875% | | 16,525 | 389,990 |
| Spirit Realty Capital, Inc. Series A, 6.00% | | 10,200 | 243,270 |
| | | | 1,645,980 |
| Real Estate Management & Development - 0.0% | | | |
| Digitalbridge Group, Inc.: | | | |
| Series H, 7.125% | | 12,825 | 274,840 |
| Series I, 7.15% | | 17,100 | 367,650 |
| | | | 642,490 |
TOTAL REAL ESTATE | | | 2,288,470 |
| | | | |
| TOTAL NONCONVERTIBLE PREFERRED STOCKS | | | 6,406,695 |
| TOTAL PREFERRED STOCKS (Cost $5,566,378) | | | 6,688,121 |
| | | | |
| Bank Loan Obligations - 6.7% |
| | | Principal Amount (a) | Value ($) |
| COMMUNICATION SERVICES - 0.7% | | | |
| Diversified Telecommunication Services - 0.2% | | | |
| Altice France SA Tranche B14 1LN, term loan CME Term SOFR 1 Month Index + 5.500% 10.1703% 8/31/28 (e)(h)(s) | | 12,500,000 | 12,093,750 |
| Aventiv Technologies LLC Tranche B, term loan: | | | |
| 3 month U.S. LIBOR + 4.500% 9.2299% 11/1/24 (e)(h)(s) | | 3,695,395 | 2,670,847 |
| 3 month U.S. LIBOR + 8.250% 13.0753% 11/1/25 (e)(h)(s) | | 2,659,000 | 1,480,398 |
| Cablevision Lightpath LLC Tranche B 1LN, term loan 1 month U.S. LIBOR + 3.250% 7.8379% 11/30/27 (e)(h)(s) | | 695,653 | 689,566 |
| Connect U.S. Finco LLC Tranche B 1LN, term loan 1 month U.S. LIBOR + 3.500% 8.14% 12/12/26 (e)(h)(s) | | 1,028,752 | 1,009,720 |
| Consolidated Communications, Inc. Tranche B 1LN, term loan 1 month U.S. LIBOR + 3.500% 8.1875% 10/2/27 (e)(h)(s) | | 2,388,936 | 2,144,070 |
| Frontier Communications Holdings LLC Tranche B 1LN, term loan 3 month U.S. LIBOR + 3.750% 8.5% 5/1/28 (e)(h)(s) | | 7,494,824 | 7,313,299 |
| GTT Communications BV 1LN, term loan: | | | |
| 11.7176% 1/3/28 (e)(s) | | 1,957,337 | 1,593,605 |
| 13.6802% 6/3/28 (e)(s) | | 1,537,828 | 784,292 |
| Level 3 Financing, Inc. Tranche B 1LN, term loan 1 month U.S. LIBOR + 1.750% 6.3849% 3/1/27 (e)(h)(s) | | 1,530,621 | 1,393,830 |
| Northwest Fiber LLC Tranche B 1LN, term loan 1 month U.S. LIBOR + 3.750% 8.4278% 4/30/27 (e)(h)(s) | | 2,447,718 | 2,390,955 |
| Patagonia Holdco LLC Tranche B 1LN, term loan CME TERM SOFR 3 MONTH INDEX + 5.750% 10.4734% 8/1/29 (e)(h)(s) | | 3,704,475 | 3,158,065 |
| Windstream Services LLC Tranche B 1LN, term loan CME Term SOFR 1 Month Index + 6.250% 10.9114% 9/21/27 (e)(h)(s) | | 3,459,702 | 3,092,108 |
| Zayo Group Holdings, Inc. 1LN, term loan: | | | |
| 1 month U.S. LIBOR + 3.000% 7.6349% 3/9/27 (e)(h)(s) | | 9,191,809 | 7,625,893 |
| CME Term SOFR 1 Month Index + 4.250% 8.8676% 3/9/27 (e)(h)(s) | | 1,500,000 | 1,272,585 |
| | | | 48,712,983 |
| Entertainment - 0.1% | | | |
| Allen Media LLC Tranche B 1LN, term loan CME TERM SOFR 3 MONTH INDEX + 5.500% 10.2302% 2/10/27 (e)(h)(s) | | 4,959,074 | 4,118,511 |
| AP Core Holdings II LLC: | | | |
| Tranche B1 1LN, term loan 1 month U.S. LIBOR + 5.500% 10.1349% 9/1/27 (e)(h)(s) | | 689,063 | 662,361 |
| Tranche B2 1LN, term loan 1 month U.S. LIBOR + 5.500% 10.1349% 9/1/27 (e)(h)(s) | | 4,100,000 | 3,939,403 |
| Crown Finance U.S., Inc.: | | | |
| 1LN, term loan CME Term SOFR 1 Month Index + 10.000% 14.6642% 9/9/23 (e)(h)(s) | | 1,856,402 | 1,889,353 |
| Tranche B 1LN, term loan: | | | |
| 3 month U.S. LIBOR + 2.500% 3.9997% 2/28/25 (e)(h)(s) | | 2,860,397 | 434,437 |
| 3 month U.S. LIBOR + 2.750% 4.2497% 9/30/26 (e)(h)(s) | | 487,491 | 74,952 |
| Sweetwater Borrower LLC Tranche B 1LN, term loan 1 month U.S. LIBOR + 4.250% 8.9375% 8/5/28 (e)(h)(s) | | 3,429,450 | 3,223,683 |
| | | | 14,342,700 |
| Media - 0.3% | | | |
| Advantage Sales & Marketing, Inc. Tranche B 1LN, term loan 1 month U.S. LIBOR + 4.500% 9.2884% 10/28/27 (e)(h)(s) | | 5,987,658 | 4,905,629 |
| Altice Financing SA Tranche B 1LN, term loan CME Term SOFR 1 Month Index + 5.000% 9.5656% 10/31/27 (e)(h)(s) | | 2,294,646 | 2,286,041 |
| Charter Communication Operating LLC Tranche B2 1LN, term loan 1 month U.S. LIBOR + 1.750% 6.3676% 2/1/27 (e)(h)(s) | | 8,548,584 | 8,467,372 |
| Coral-U.S. Co.-Borrower LLC Tranche B, term loan 1 month U.S. LIBOR + 2.250% 6.8379% 1/31/28 (e)(h)(s) | | 4,180,000 | 4,041,182 |
| CSC Holdings LLC: | | | |
| Tranche B 5LN, term loan CME Term SOFR 1 Month Index + 2.500% 7.0879% 4/15/27 (e)(h)(s) | | 2,546,250 | 2,288,442 |
| Tranche B6 LN, term loan CME Term SOFR 1 Month Index + 4.500% 9.0625% 1/14/28 (e)(h)(s) | | 3,732,539 | 3,489,924 |
| Diamond Sports Group LLC: | | | |
| 1LN, term loan CME Term SOFR 1 Month Index + 8.000% 12.7755% 5/25/26 (e)(h)(s) | | 2,422,974 | 2,257,412 |
| 2LN, term loan CME Term SOFR 1 Month Index + 3.250% 8.0255% 8/24/26 (e)(h)(s) | | 8,456,176 | 957,916 |
| DIRECTV Financing LLC 1LN, term loan 1 month U.S. LIBOR + 5.000% 9.6349% 8/2/27 (e)(h)(s) | | 1,535,591 | 1,491,796 |
| Dotdash Meredith, Inc. Tranche B 1LN, term loan CME Term SOFR 1 Month Index + 4.000% 8.6678% 12/1/28 (e)(h)(s) | | 5,037,519 | 4,433,017 |
| Entercom Media Corp. Tranche B 2LN, term loan 1 month U.S. LIBOR + 2.500% 7.0473% 11/17/24 (e)(h)(s) | | 345,669 | 223,966 |
| Gray Television, Inc.: | | | |
| Tranche B, term loan 1 month U.S. LIBOR + 2.500% 7.0656% 1/2/26 (e)(h)(s) | | 640,000 | 630,931 |
| Tranche D 1LN, term loan 1 month U.S. LIBOR + 3.000% 7.5656% 12/1/28 (e)(h)(s) | | 2,534,550 | 2,503,324 |
| LCPR Loan Financing LLC 1LN, term loan 1 month U.S. LIBOR + 3.750% 8.3379% 9/25/28 (e)(h)(s) | | 950,000 | 938,125 |
| MJH Healthcare Holdings LLC Tranche B 1LN, term loan CME Term SOFR 1 Month Index + 3.500% 8.2176% 1/28/29 (e)(h)(s) | | 1,260,475 | 1,236,841 |
| Nexstar Broadcasting, Inc. Tranche B, term loan 1 month U.S. LIBOR + 2.500% 7.1349% 9/19/26 (e)(h)(s) | | 2,260,410 | 2,253,946 |
| Recorded Books, Inc. Tranche B 1LN, term loan CME Term SOFR 1 Month Index + 4.000% 8.6048% 8/29/25 (e)(h)(s) | | 235,231 | 233,676 |
| Scripps (E.W.) Co. Tranche B 1LN, term loan 1 month U.S. LIBOR + 2.750% 7.3197% 1/7/28 (e)(h)(s) | | 1,020,175 | 1,004,617 |
| Sinclair Television Group, Inc. Tranche B 1LN, term loan 1 month U.S. LIBOR + 2.500% 7.14% 9/30/26 (e)(h)(s) | | 1,281,938 | 1,240,275 |
| Springer Nature Deutschland GmbH Tranche B18 1LN, term loan 1 month U.S. LIBOR + 3.000% 7.7299% 8/14/26 (e)(h)(s) | | 1,636,183 | 1,632,779 |
| Univision Communications, Inc.: | | | |
| 1LN, term loan CME TERM SOFR 3 MONTH INDEX + 4.250% 8.8302% 6/10/29 (e)(h)(s) | | 671,625 | 670,228 |
| Tranche B 1LN, term loan: | | | |
| 1 month U.S. LIBOR + 3.250% 7.8849% 3/24/26 (e)(h)(s) | | 2,314,741 | 2,295,783 |
| 1 month U.S. LIBOR + 3.250% 7.8849% 1/31/29 (e)(h)(s) | | 3,781,425 | 3,724,704 |
| Virgin Media Bristol LLC Tranche N, term loan 1 month U.S. LIBOR + 2.500% 7.0879% 1/31/28 (e)(h)(s) | | 2,500,000 | 2,449,100 |
| | | | 55,657,026 |
| Wireless Telecommunication Services - 0.1% | | | |
| Crown Subsea Communications Holding, Inc.: | | | |
| 1LN, term loan CME Term SOFR 1 Month Index + 5.250% 9.5618% 4/27/27 (e)(h)(s) | | 1,371,000 | 1,345,294 |
| Tranche B 1LN, term loan CME Term SOFR 1 Month Index + 4.750% 9.3156% 4/27/27 (e)(h)(s) | | 1,552,226 | 1,523,122 |
| Intelsat Jackson Holdings SA 1LN, term loan CME TERM SOFR 6 MONTH INDEX + 4.250% 9.0817% 2/1/29 (e)(h)(s) | | 15,099,922 | 14,911,173 |
| SBA Senior Finance II, LLC Tranche B, term loan 1 month U.S. LIBOR + 1.750% 6.41% 4/11/25 (e)(h)(s) | | 1,082,812 | 1,080,560 |
| | | | 18,860,149 |
TOTAL COMMUNICATION SERVICES | | | 137,572,858 |
| CONSUMER DISCRETIONARY - 1.6% | | | |
| Auto Components - 0.1% | | | |
| American Trailer World Corp. Tranche B 1LN, term loan CME Term SOFR 1 Month Index + 3.750% 8.4676% 3/5/28 (e)(h)(s) | | 3,086,378 | 2,716,969 |
| Avis Budget Group, Inc. 1LN, term loan CME Term SOFR 1 Month Index + 3.500% 8.2176% 3/16/29 (e)(h)(s) | | 808,888 | 806,526 |
| Clarios Global LP Tranche B 1LN, term loan 1 month U.S. LIBOR + 3.250% 7.8849% 4/30/26 (e)(h)(s) | | 3,118,801 | 3,099,808 |
| Les Schwab Tire Centers Tranche B 1LN, term loan 1 month U.S. LIBOR + 3.250% 8.0636% 11/2/27 (e)(h)(s) | | 1,896,300 | 1,872,596 |
| Novae LLC 1LN, term loan CME TERM SOFR 3 MONTH INDEX + 5.000% 9.6963% 12/22/28 (e)(h)(s) | | 997,463 | 850,337 |
| PECF USS Intermediate Holding III Corp. Tranche B 1LN, term loan 1 month U.S. LIBOR + 4.250% 8.8849% 12/17/28 (e)(h)(s) | | 3,529,550 | 2,993,200 |
| Power Stop LLC 1LN, term loan 3 month U.S. LIBOR + 4.750% 9.3849% 1/26/29 (e)(h)(s) | | 1,007,388 | 706,854 |
| Rough Country LLC Tranche B 1LN, term loan 3 month U.S. LIBOR + 3.500% 8.2299% 7/28/28 (e)(h)(s) | | 723,350 | 675,609 |
| Truck Hero, Inc. Tranche B 1LN, term loan 1 month U.S. LIBOR + 3.750% 8.3849% 1/29/28 (e)(h)(s) | | 2,542,525 | 2,296,231 |
| | | | 16,018,130 |
| Automobiles - 0.0% | | | |
| Bombardier Recreational Products, Inc. Tranche B 1LN, term loan: | | | |
| 1 month U.S. LIBOR + 2.000% 6.6349% 5/23/27 (e)(h)(s) | | 680,960 | 663,084 |
| CME Term SOFR 1 Month Index + 3.500% 8.1176% 12/13/29 (e)(h)(s) | | 1,800,488 | 1,790,585 |
| CWGS Group LLC Tranche B 1LN, term loan 1 month U.S. LIBOR + 2.500% 7.0914% 6/3/28 (e)(h)(s) | | 3,963,096 | 3,518,912 |
| HarbourVest Partners LLC Tranche B 1LN, term loan 3 month U.S. LIBOR + 2.250% 7.0797% 3/1/25 (e)(h)(s) | | 1,762,036 | 1,759,287 |
| | | | 7,731,868 |
| Distributors - 0.0% | | | |
| BCPE Empire Holdings, Inc.: | | | |
| 1LN, term loan: | | | |
| CME Term SOFR 1 Month Index + 4.000% 8.6349% 6/11/26 (e)(h)(s) | | 3,577,370 | 3,519,237 |
| CME Term SOFR 1 Month Index + 4.620% 9.3426% 6/11/26 (e)(h)(s) | | 1,260,475 | 1,244,946 |
| Tranche B 1LN, term loan 1 month U.S. LIBOR + 4.000% 8.6349% 6/11/26 (e)(h)(s) | | 202,950 | 199,906 |
| Gloves Buyer, Inc. Tranche B 1LN, term loan 1 month U.S. LIBOR + 4.000% 8.6349% 1/6/28 (e)(h)(s) | | 653,361 | 615,793 |
| | | | 5,579,882 |
| Diversified Consumer Services - 0.1% | | | |
| Adtalem Global Education, Inc. Tranche B 1LN, term loan 1 month U.S. LIBOR + 4.000% 8.6349% 8/12/28 (e)(h)(s) | | 1,478,666 | 1,474,704 |
| GEMS MENASA Cayman Ltd. Tranche B 1LN, term loan 6 month U.S. LIBOR + 5.000% 8.5664% 7/30/26 (e)(h)(s) | | 3,765,079 | 3,765,079 |
| KUEHG Corp. Tranche B, term loan 1 month U.S. LIBOR + 3.750% 8.4799% 2/21/25 (e)(h)(s) | | 2,594,346 | 2,537,816 |
| Learning Care Group (U.S.) No 2, Inc. Tranche B 1LN, term loan: | | | |
| 1 month U.S. LIBOR + 8.500% 13.2652% 3/13/25 (e)(h)(s) | | 1,101,750 | 1,083,847 |
| 3 month U.S. LIBOR + 3.250% 8.0628% 3/13/25 (e)(h)(s) | | 1,011,755 | 975,919 |
| Mckissock Investment Holdings Tranche B 1LN, term loan CME Term SOFR 1 Month Index + 5.000% 8.7715% 3/10/29 (e)(h)(s) | | 1,151,300 | 1,105,248 |
| Ring Container Technologies Group LLC Tranche B 1LN, term loan 1 month U.S. LIBOR + 3.500% 8.1349% 8/12/28 (e)(h)(s) | | 1,098,900 | 1,088,603 |
| Spin Holdco, Inc. Tranche B 1LN, term loan 3 month U.S. LIBOR + 4.000% 8.765% 3/4/28 (e)(h)(s) | | 14,855,908 | 12,476,883 |
| TKC Holdings, Inc. 1LN, term loan 3 month U.S. LIBOR + 5.500% 10.14% 5/14/28 (e)(h)(s) | | 429,873 | 359,636 |
| | | | 24,867,735 |
| Hotels, Restaurants & Leisure - 0.7% | | | |
| 19Th Holdings Golf LLC Tranche B 1LN, term loan CME Term SOFR 1 Month Index + 3.250% 7.6671% 2/7/29 (e)(h)(s) | | 4,141,725 | 3,942,425 |
| Alterra Mountain Co. Tranche B 1LN, term loan 1 month U.S. LIBOR + 3.500% 8.1349% 8/17/28 (e)(h)(s) | | 2,871,328 | 2,860,561 |
| Aramark Services, Inc.: | | | |
| Tranche B 3LN, term loan 1 month U.S. LIBOR + 1.750% 6.3849% 3/11/25 (e)(h)(s) | | 1,446,000 | 1,441,488 |
| Tranche B-4 1LN, term loan 1 month U.S. LIBOR + 1.750% 6.3849% 1/15/27 (e)(h)(s) | | 2,314,825 | 2,288,783 |
| Arcis Golf LLC Tranche B 1LN, term loan 1 month U.S. LIBOR + 4.250% 8.8849% 11/24/28 (e)(h)(s) | | 972,650 | 967,787 |
| Bally's Corp. Tranche B 1LN, term loan 1 month U.S. LIBOR + 3.250% 7.8514% 10/1/28 (e)(h)(s) | | 3,276,900 | 3,118,986 |
| BRE/Everbright M6 Borrower LLC Tranche B 1LN, term loan 1 month U.S. LIBOR + 5.000% 9.5807% 9/9/26 (e)(h)(s) | | 1,494,783 | 1,482,331 |
| Burger King Worldwide, Inc. Tranche B 1LN, term loan 1 month U.S. LIBOR + 1.750% 6.3849% 11/19/26 (e)(h)(s) | | 2,697,500 | 2,671,011 |
| Caesars Entertainment, Inc. Tranche B 1LN, term loan CME Term SOFR 1 Month Index + 3.250% 7.9676% 1/26/30 (e)(h)(s) | | 12,705,000 | 12,675,016 |
| Carnival Finance LLC Tranche B 1LN, term loan: | | | |
| 6 month U.S. LIBOR + 3.000% 7.6349% 6/30/25 (e)(h)(s) | | 1,858,918 | 1,825,922 |
| 6 month U.S. LIBOR + 3.250% 7.8849% 10/18/28 (e)(h)(s) | | 6,487,456 | 6,284,723 |
| Churchill Downs, Inc. Tranche B 1LN, term loan 1 month U.S. LIBOR + 2.000% 6.64% 3/17/28 (e)(h)(s) | | 982,500 | 973,903 |
| City Football Group Ltd. Tranche B 1LN, term loan 1 month U.S. LIBOR + 3.000% 7.592% 7/21/28 (e)(h)(s) | | 10,527,199 | 9,948,203 |
| Dave & Buster's, Inc. Tranche B 1LN, term loan CME Term SOFR 1 Month Index + 5.000% 9.75% 6/29/29 (e)(h)(s) | | 1,059,675 | 1,062,589 |
| Delta 2 SARL Tranche B 1LN, term loan CME Term SOFR 1 Month Index + 3.250% 7.8676% 1/15/30 (e)(h)(s) | | 3,785,000 | 3,791,624 |
| Equinox Holdings, Inc.: | | | |
| Tranche 2LN, term loan 3 month U.S. LIBOR + 7.000% 11.7299% 9/8/24 (e)(h)(s) | | 455,000 | 284,848 |
| Tranche B-1, term loan 3 month U.S. LIBOR + 3.000% 7.7299% 3/8/24 (e)(h)(s) | | 3,457,464 | 2,895,211 |
| Fertitta Entertainment LLC NV Tranche B 1LN, term loan CME Term SOFR 1 Month Index + 4.000% 8.6176% 1/27/29 (e)(h)(s) | | 18,837,990 | 18,308,265 |
| Flutter Financing B.V. Tranche B 1LN, term loan CME Term SOFR 1 Month Index + 3.250% 8.0918% 7/4/28 (e)(h)(s) | | 3,475,050 | 3,473,764 |
| Flynn Restaurant Group LP Tranche B 1LN, term loan 1 month U.S. LIBOR + 4.250% 8.8543% 11/22/28 (e)(h)(s) | | 564,300 | 549,250 |
| Four Seasons Hotels Ltd. Tranche B 1LN, term loan CME Term SOFR 1 Month Index + 3.250% 7.9676% 11/30/29 (e)(h)(s) | | 3,179,914 | 3,190,503 |
| Golden Entertainment, Inc. Tranche B, term loan 3 month U.S. LIBOR + 3.000% 7.62% 10/20/24 (e)(h)(s) | | 3,512,647 | 3,503,866 |
| GVC Holdings Gibraltar Ltd.: | | | |
| Tranche B2 1LN, term loan CME Term SOFR 1 Month Index + 3.500% 8.1802% 10/31/29 (e)(h)(s) | | 1,260,000 | 1,258,816 |
| Tranche B4 1LN, term loan 3 month U.S. LIBOR + 2.250% 7.2299% 3/16/27 (e)(h)(s) | | 1,083,500 | 1,080,791 |
| Herschend Entertainment Co. LLC Tranche B 1LN, term loan 1 month U.S. LIBOR + 3.750% 8.38% 8/27/28 (e)(h)(s) | | 696,188 | 693,869 |
| Hilton Grand Vacations Borrower LLC Tranche B 1LN, term loan 1 month U.S. LIBOR + 3.000% 7.6349% 8/2/28 (e)(h)(s) | | 7,563,258 | 7,544,349 |
| Hilton Worldwide Finance LLC Tranche B 1LN, term loan CME TERM SOFR 3 MONTH INDEX + 1.750% 6.4548% 6/21/26 (e)(h)(s) | | 1,646,634 | 1,643,472 |
| J&J Ventures Gaming LLC 1LN, term loan 3 month U.S. LIBOR + 4.000% 8.7299% 4/26/28 (e)(h)(s) | | 1,042,060 | 1,000,899 |
| MajorDrive Holdings IV LLC 1LN, term loan 3 month U.S. LIBOR + 4.000% 8.8125% 5/12/28 (e)(h)(s) | | 1,871,500 | 1,804,987 |
| Marriott Ownership Resorts, Inc. Tranche B 1LN, term loan 1 month U.S. LIBOR + 1.750% 6.3849% 8/31/25 (e)(h)(s) | | 2,550,985 | 2,535,042 |
| Oravel Stays Singapore Pte Ltd. Tranche B 1LN, term loan 3 month U.S. LIBOR + 8.250% 12.98% 6/23/26 (e)(h)(s) | | 916,050 | 809,174 |
| Pacific Bells LLC Tranche B 1LN, term loan CME TERM SOFR 3 MONTH INDEX + 4.500% 9.3418% 10/20/28 (e)(h)(s) | | 1,156,331 | 1,109,361 |
| PCI Gaming Authority 1LN, term loan 1 month U.S. LIBOR + 2.500% 7.1349% 5/29/26 (e)(h)(s) | | 1,484,314 | 1,481,300 |
| PFC Acquisition Corp. Tranche B 1LN, term loan 3 month U.S. LIBOR + 6.500% 11.2349% 3/1/26 (e)(h)(s) | | 1,824,132 | 1,586,995 |
| Playa Resorts Holding BV Tranche B 1LN, term loan CME Term SOFR 1 Month Index + 4.250% 8.8139% 1/5/29 (e)(h)(s) | | 1,385,000 | 1,380,388 |
| PlayPower, Inc. Tranche B 1LN, term loan 3 month U.S. LIBOR + 4.500% 12% 5/10/26 (e)(h)(s) | | 446,779 | 338,158 |
| Restaurant Technologies, Inc. Tranche B 1LN, term loan CME TERM SOFR 3 MONTH INDEX + 4.250% 8.8302% 4/1/29 (e)(h)(s) | | 2,358,191 | 2,345,975 |
| Ryman Hospitality Properties, Inc. Tranche B, term loan 1 month U.S. LIBOR + 2.000% 6.64% 5/11/24 (e)(h)(s) | | 305,292 | 304,529 |
| Scientific Games Corp. 1LN, term loan CME Term SOFR 1 Month Index + 3.000% 7.6615% 4/7/29 (e)(h)(s) | | 3,164,100 | 3,148,280 |
| Scientific Games Holdings LP term loan CME TERM SOFR 3 MONTH INDEX + 3.500% 8.1028% 4/4/29 (e)(h)(s) | | 4,576,038 | 4,495,225 |
| SeaWorld Parks & Entertainment, Inc. Tranche B 1LN, term loan 1 month U.S. LIBOR + 3.000% 7.6875% 8/25/28 (e)(h)(s) | | 1,086,250 | 1,081,720 |
| Stars Group Holdings BV Tranche B 1LN, term loan 3 month U.S. LIBOR + 2.250% 6.9799% 7/16/26 (e)(h)(s) | | 2,834,846 | 2,830,027 |
| Station Casinos LLC Tranche B 1LN, term loan 1 month U.S. LIBOR + 2.250% 6.89% 2/7/27 (e)(h)(s) | | 4,198,274 | 4,170,817 |
| Travelport Finance Luxembourg SARL 1LN, term loan: | | | |
| 3 month U.S. LIBOR + 6.750% 11.4799% 5/30/26 (e)(h)(s) | | 2,178,240 | 1,225,260 |
| 3 month U.S. LIBOR + 8.750% 13.4799% 2/28/25 (e)(h)(s) | | 2,067,568 | 2,126,266 |
| United PF Holdings LLC: | | | |
| 1LN, term loan 3 month U.S. LIBOR + 4.000% 8.7299% 12/30/26 (e)(h)(s) | | 5,754,300 | 4,833,612 |
| 2LN, term loan 3 month U.S. LIBOR + 8.500% 13.2299% 12/30/27 (e)(h)(s) | | 300,000 | 218,499 |
| Tranche B 1LN, term loan 1 month U.S. LIBOR + 8.500% 13.2299% 12/30/26 (c)(e)(h)(s) | | 434,988 | 369,739 |
| Whatabrands LLC Tranche B 1LN, term loan 1 month U.S. LIBOR + 3.250% 7.8197% 8/3/28 (e)(h)(s) | | 4,774,542 | 4,695,619 |
| Wyndham Hotels & Resorts, Inc. Tranche B, term loan 3 month U.S. LIBOR + 1.750% 6.3849% 5/30/25 (e)(h)(s) | | 753,977 | 752,363 |
| | | | 144,406,591 |
| Household Durables - 0.1% | | | |
| Mattress Firm, Inc. Tranche B 1LN, term loan 6 month U.S. LIBOR + 4.250% 8.44% 9/24/28 (e)(h)(s) | | 2,766,108 | 2,603,599 |
| Osmosis Debt Merger Sub, Inc. Tranche B 1LN, term loan CME Term SOFR 1 Month Index + 4.000% 8.3137% 7/30/28 (e)(h)(s) | | 3,482,282 | 3,344,244 |
| Runner Buyer, Inc. Tranche B 1LN, term loan 3 month U.S. LIBOR + 5.500% 10.2349% 10/20/28 (e)(h)(s) | | 923,025 | 680,159 |
| TGP Holdings III LLC Tranche B 1LN, term loan 1 month U.S. LIBOR + 3.250% 8.0753% 6/29/28 (e)(h)(s) | | 732,386 | 583,668 |
| Weber-Stephen Products LLC Tranche B 1LN, term loan 1 month U.S. LIBOR + 3.250% 7.8849% 10/30/27 (e)(h)(s) | | 2,641,566 | 2,298,163 |
| | | | 9,509,833 |
| Internet & Direct Marketing Retail - 0.3% | | | |
| Bass Pro Group LLC Tranche B 1LN, term loan 1 month U.S. LIBOR + 3.750% 8.3849% 3/5/28 (e)(h)(s) | | 45,032,687 | 44,314,866 |
| CNT Holdings I Corp. Tranche B 1LN, term loan 1 month U.S. LIBOR + 3.500% 8.1254% 11/8/27 (e)(h)(s) | | 2,719,375 | 2,667,707 |
| Harbor Freight Tools U.S.A., Inc. Tranche B 1LN, term loan 1 month U.S. LIBOR + 2.750% 7.3849% 10/19/27 (e)(h)(s) | | 1,391,334 | 1,345,169 |
| Red Ventures LLC Tranche B 1LN, term loan: | | | |
| CME Term SOFR 1 Month Index + 2.500% 9.25% 11/8/24 (e)(h)(s) | | 1,869,229 | 1,866,500 |
| CME Term SOFR 1 Month Index + 3.000% 2/23/30 (h)(s)(t) | | 350,000 | 346,283 |
| Terrier Media Buyer, Inc. Tranche B 1LN, term loan 1 month U.S. LIBOR + 3.500% 8.2299% 12/17/26 (e)(h)(s) | | 5,863,914 | 5,500,351 |
| Uber Technologies, Inc. Tranche B 1LN, term loan: | | | |
| 3 month U.S. LIBOR + 3.500% 8.2349% 4/4/25 (e)(h)(s) | | 4,217,165 | 4,212,569 |
| 3 month U.S. LIBOR + 3.500% 8.2349% 2/25/27 (e)(h)(s) | | 1,896,001 | 1,899,566 |
| | | | 62,153,011 |
| Leisure Products - 0.0% | | | |
| Lids Holdings, Inc. 1LN, term loan CME TERM SOFR 3 MONTH INDEX + 5.500% 10.1517% 12/14/26 (c)(e)(h)(s) | | 1,400,000 | 1,295,000 |
| SP PF Buyer LLC Tranche B 1LN, term loan 1 month U.S. LIBOR + 4.500% 9.1349% 12/21/25 (e)(h)(s) | | 962,500 | 662,200 |
| Topgolf Callaway Brands Corp. Tranche B, term loan 1 month U.S. LIBOR + 4.500% 9.1349% 1/4/26 (e)(h)(s) | | 1,815,409 | 1,814,284 |
| | | | 3,771,484 |
| Multiline Retail - 0.0% | | | |
| Franchise Group, Inc. Tranche B 1LN, term loan: | | | |
| 3 month U.S. LIBOR + 4.750% 9.5625% 3/10/26 (e)(h)(s) | | 3,222,069 | 3,064,993 |
| CME Term SOFR 1 Month Index + 4.750% 9.6971% 3/10/26 (e)(h)(s) | | 1,045,000 | 995,363 |
| | | | 4,060,356 |
| Specialty Retail - 0.2% | | | |
| Academy Ltd. Tranche B 1LN, term loan 1 month U.S. LIBOR + 3.750% 8.3156% 11/6/27 (e)(h)(s) | | 1,982,263 | 1,980,618 |
| At Home Group, Inc. Tranche B 1LN, term loan 3 month U.S. LIBOR + 4.250% 9.0039% 7/24/28 (e)(h)(s) | | 908,500 | 743,962 |
| Driven Holdings LLC Tranche B 1LN, term loan 1 month U.S. LIBOR + 3.000% 7.7377% 11/17/28 (e)(h)(s) | | 456,550 | 445,899 |
| Empire Today LLC Tranche B 1LN, term loan 1 month U.S. LIBOR + 5.000% 9.6014% 4/1/28 (e)(h)(s) | | 1,982,343 | 1,587,857 |
| Jo-Ann Stores LLC Tranche B 1LN, term loan 3 month U.S. LIBOR + 4.750% 9.5719% 7/7/28 (e)(h)(s) | | 871,725 | 483,084 |
| LBM Acquisition LLC Tranche B 1LN, term loan 1 month U.S. LIBOR + 3.750% 8.3849% 12/18/27 (e)(h)(s) | | 4,881,939 | 4,453,256 |
| Michaels Companies, Inc. 1LN, term loan 3 month U.S. LIBOR + 4.250% 8.9799% 4/15/28 (e)(h)(s) | | 2,823,156 | 2,579,659 |
| New SK Holdco Sub LLC 1LN, term loan CME Term SOFR 1 Month Index + 8.350% 12.9133% 6/30/27 (e)(h)(s) | | 1,207,964 | 1,008,650 |
| Petco Health & Wellness Co., Inc. Tranche B 1LN, term loan CME TERM SOFR 3 MONTH INDEX + 3.250% 8.0918% 3/4/28 (e)(h)(s) | | 1,105,313 | 1,092,878 |
| RH: | | | |
| Tranche B 1LN, term loan 1 month U.S. LIBOR + 2.500% 7.1349% 10/20/28 (e)(h)(s) | | 1,683,688 | 1,614,656 |
| Tranche B2 1LN, term loan CME Term SOFR 1 Month Index + 3.250% 7.9676% 10/20/28 (e)(h)(s) | | 4,114,688 | 3,975,817 |
| RVR Dealership Holdings LLC Tranche B 1LN, term loan 1 month U.S. LIBOR + 4.000% 8.5535% 2/8/28 (e)(h)(s) | | 1,723,738 | 1,466,608 |
| Tory Burch LLC Tranche B 1LN, term loan 1 month U.S. LIBOR + 3.500% 8.1349% 4/16/28 (e)(h)(s) | | 4,556,929 | 4,347,584 |
| Victoria's Secret & Co. Tranche B 1LN, term loan 3 month U.S. LIBOR + 3.250% 7.9826% 8/2/28 (e)(h)(s) | | 2,497,855 | 2,472,876 |
| Woof Holdings LLC Tranche B 1LN, term loan 3 month U.S. LIBOR + 3.750% 8.342% 12/21/27 (e)(h)(s) | | 1,462,486 | 1,400,330 |
| | | | 29,653,734 |
| Textiles, Apparel & Luxury Goods - 0.1% | | | |
| Canada Goose, Inc. Tranche B 1LN, term loan 3 month U.S. LIBOR + 3.500% 8.2299% 10/7/27 (e)(h)(s) | | 813,436 | 799,876 |
| Crocs, Inc. Tranche B1 LN, term loan CME Term SOFR 1 Month Index + 3.500% 7.7313% 2/17/29 (e)(h)(s) | | 6,217,399 | 6,196,695 |
| Hanesbrands, Inc. Tranche B 1LN, term loan CME Term SOFR 1 Month Index + 3.750% 3/8/30 (h)(s)(t) | | 1,030,000 | 1,028,713 |
| | | | 8,025,284 |
TOTAL CONSUMER DISCRETIONARY | | | 315,777,908 |
| CONSUMER STAPLES - 0.2% | | | |
| Beverages - 0.1% | | | |
| Bengal Debt Merger Sub LLC: | | | |
| 1LN, term loan CME TERM SOFR 3 MONTH INDEX + 3.250% 7.9302% 1/24/29 (e)(h)(s) | | 3,591,950 | 3,256,713 |
| 2LN, term loan CME TERM SOFR 3 MONTH INDEX + 6.000% 10.6802% 1/24/30 (e)(h)(s) | | 700,000 | 532,000 |
| Triton Water Holdings, Inc. Tranche B 1LN, term loan 3 month U.S. LIBOR + 3.500% 8.2299% 3/31/28 (e)(h)(s) | | 6,687,865 | 6,212,224 |
| | | | 10,000,937 |
| Food & Staples Retailing - 0.1% | | | |
| 8th Avenue Food & Provisions, Inc.: | | | |
| 2LN, term loan 1 month U.S. LIBOR + 7.750% 12.3849% 10/1/26 (e)(h)(s) | | 98,000 | 61,005 |
| Tranche B 1LN, term loan 1 month U.S. LIBOR + 3.750% 8.3849% 10/1/25 (e)(h)(s) | | 277,440 | 242,588 |
| BJ's Wholesale Club, Inc. Tranche B 1LN, term loan CME Term SOFR 1 Month Index + 2.750% 7.3171% 2/3/27 (e)(h)(s) | | 1,287,699 | 1,287,699 |
| Cardenas Merger Sub, LLC 1LN, term loan CME TERM SOFR 6 MONTH INDEX + 6.750% 11.4302% 8/1/29 (e)(h)(s) | | 987,525 | 972,712 |
| Froneri U.S., Inc. Tranche B 1LN, term loan 1 month U.S. LIBOR + 2.250% 6.8849% 1/29/27 (e)(h)(s) | | 2,667,250 | 2,620,093 |
| JP Intermediate B LLC Tranche B, term loan 3 month U.S. LIBOR + 5.500% 10.3253% 11/20/25 (e)(h)(s) | | 2,373,389 | 1,508,787 |
| Shearer's Foods, Inc. Tranche B 1LN, term loan 1 month U.S. LIBOR + 3.500% 8.1349% 9/23/27 (e)(h)(s) | | 3,188,268 | 3,099,092 |
| United Natural Foods, Inc. Tranche B, term loan 1 month U.S. LIBOR + 3.250% 7.9821% 10/22/25 (e)(h)(s) | | 418,750 | 419,186 |
| | | | 10,211,162 |
| Food Products - 0.0% | | | |
| Chobani LLC Tranche B 1LN, term loan 1 month U.S. LIBOR + 3.500% 8.0697% 10/23/27 (e)(h)(s) | | 2,718,420 | 2,696,347 |
| Del Monte Foods, Inc. Tranche B 1LN, term loan CME Term SOFR 1 Month Index + 4.250% 8.9108% 5/16/29 (e)(h)(s) | | 4,732,213 | 4,629,665 |
| | | | 7,326,012 |
| Household Products - 0.0% | | | |
| Diamond BC BV Tranche B 1LN, term loan 3 month U.S. LIBOR + 2.750% 7.5748% 9/29/28 (e)(h)(s) | | 1,529,550 | 1,502,140 |
| Kronos Acquisition Holdings, Inc. Tranche B 1LN, term loan 3 month U.S. LIBOR + 3.750% 8.4849% 12/22/26 (e)(h)(s) | | 3,526,670 | 3,423,797 |
| Resideo Funding, Inc. Tranche B 1LN, term loan 1 month U.S. LIBOR + 2.250% 7.0434% 2/12/28 (e)(h)(s) | | 928,463 | 927,302 |
| | | | 5,853,239 |
| Personal Products - 0.0% | | | |
| Conair Holdings LLC Tranche B 1LN, term loan 3 month U.S. LIBOR + 3.750% 8.4799% 5/17/28 (e)(h)(s) | | 1,965,125 | 1,733,515 |
| Knowlton Development Corp., Inc. Tranche B 1LN, term loan 1 month U.S. LIBOR + 3.750% 8.3197% 12/21/25 (e)(h)(s) | | 3,438,561 | 3,379,246 |
| | | | 5,112,761 |
TOTAL CONSUMER STAPLES | | | 38,504,111 |
| ENERGY - 0.2% | | | |
| Energy Equipment & Services - 0.0% | | | |
| Bison Midstream Holdings LLC Tranche B 1LN, term loan CME Term SOFR 1 Month Index + 3.750% 2/1/30 (h)(s)(t) | | 470,000 | 466,771 |
| Oil, Gas & Consumable Fuels - 0.2% | | | |
| Apro LLC Tranche B 1LN, term loan 3 month U.S. LIBOR + 3.750% 8.33% 11/14/26 (e)(h)(s) | | 1,579,909 | 1,568,060 |
| BCP Renaissance Parent LLC Tranche B3 1LN, term loan CME TERM SOFR 3 MONTH INDEX + 3.500% 8.1176% 10/31/26 (e)(h)(s) | | 1,286,838 | 1,281,743 |
| BW Gas & Convenience Holdings LLC Tranche B 1LN, term loan 1 month U.S. LIBOR + 3.500% 8.1349% 3/17/28 (e)(h)(s) | | 935,750 | 926,393 |
| CQP Holdco LP / BIP-V Chinook Holdco LLC Tranche B 1LN, term loan 3 month U.S. LIBOR + 3.750% 8.2242% 6/4/28 (e)(h)(s) | | 7,790,400 | 7,771,781 |
| Delek U.S. Holdings, Inc. Tranche B 1LN, term loan CME Term SOFR 1 Month Index + 3.500% 8.2176% 11/19/29 (e)(h)(s) | | 3,095,000 | 3,036,969 |
| EG America LLC Tranche B 1LN, term loan: | | | |
| 3 month U.S. LIBOR + 4.000% 8.7299% 2/6/25 (e)(h)(s) | | 6,500,992 | 6,062,175 |
| 3 month U.S. LIBOR + 4.250% 8.9799% 3/10/26 (e)(h)(s) | | 1,131,737 | 1,055,345 |
| EG Finco Ltd. Tranche B, term loan 3 month U.S. LIBOR + 4.000% 9.1511% 2/6/25 (e)(h)(s) | | 2,129,374 | 1,985,642 |
| GIP II Blue Holding LP Tranche B 1LN, term loan 3 month U.S. LIBOR + 4.500% 9/29/28 (h)(s)(t) | | 4,530,768 | 4,511,331 |
| GIP III Stetson I LP Tranche B, term loan 1 month U.S. LIBOR + 4.250% 8.8849% 7/18/25 (e)(h)(s) | | 2,703,747 | 2,696,150 |
| Limetree Bay Terminals LLC Tranche B 1LN, term loan 3 month U.S. LIBOR + 4.000% 9.8418% 2/15/24 (e)(h)(s) | | 2,666,979 | 2,006,902 |
| Mesquite Energy, Inc.: | | | |
| 1LN, term loan 3 month U.S. LIBOR + 8.000% 0% (c)(f)(h)(s) | | 1,224,553 | 0 |
| term loan 3 month U.S. LIBOR + 0.000% 0% (c)(f)(h)(s) | | 528,000 | 0 |
| Oryx Midstream Services Permian Tranche B 1LN, term loan CME Term SOFR 1 Month Index + 3.250% 7.9316% 9/30/28 (e)(h)(s) | | 575,000 | 571,165 |
| Par Petroleum LLC Tranche B 1LN, term loan CME Term SOFR 1 Month Index + 4.250% 2/14/30 (h)(s)(t) | | 1,005,000 | 991,181 |
| RelaDyne, Inc. Tranche B 1LN, term loan CME Term SOFR 1 Month Index + 5.000% 9.5611% 12/23/28 (e)(h)(s) | | 1,075,000 | 1,068,281 |
| WaterBridge Operating LLC Tranche B 1LN, term loan 6 month U.S. LIBOR + 5.750% 10.5677% 6/21/26 (e)(h)(s) | | 1,088,438 | 1,078,457 |
| | | | 36,611,575 |
TOTAL ENERGY | | | 37,078,346 |
| FINANCIALS - 0.6% | | | |
| Capital Markets - 0.1% | | | |
| AssuredPartners, Inc. Tranche B 1LN, term loan: | | | |
| 1 month U.S. LIBOR + 3.500% 8.1349% 2/13/27 (e)(h)(s) | | 1,069,956 | 1,045,882 |
| 1 month U.S. LIBOR + 3.500% 8.1349% 2/13/27 (e)(h)(s) | | 2,125,200 | 2,077,914 |
| CME Term SOFR 1 Month Index + 4.250% 8.8676% 2/13/27 (e)(h)(s) | | 1,591,013 | 1,585,539 |
| Broadstreet Partners, Inc. Tranche B 1LN, term loan 1 month U.S. LIBOR + 3.250% 7.8849% 1/27/27 (e)(h)(s) | | 661,625 | 652,528 |
| Citadel Securities LP Tranche B 1LN, term loan: | | | |
| 1 month U.S. LIBOR + 2.500% 7.1759% 2/27/28 (e)(h)(s) | | 2,849,250 | 2,822,097 |
| CME Term SOFR 1 Month Index + 3.000% 7.6759% 2/2/28 (e)(h)(s) | | 1,067,325 | 1,065,991 |
| Deerfield Dakota Holding LLC Tranche B 1LN, term loan CME Term SOFR 1 Month Index + 3.750% 8.3114% 4/9/27 (e)(h)(s) | | 1,030,062 | 986,603 |
| Hightower Holding LLC Tranche B 1LN, term loan 3 month U.S. LIBOR + 4.000% 8.8153% 4/21/28 (e)(h)(s) | | 3,198,031 | 3,062,115 |
| Superannuation & Investments U.S. LLC 1LN, term loan 1 month U.S. LIBOR + 3.750% 8.3849% 12/1/28 (e)(h)(s) | | 1,660,731 | 1,651,531 |
| | | | 14,950,200 |
| Diversified Financial Services - 0.1% | | | |
| ACNR Holdings, Inc. term loan 20.8219% 9/16/25 (c)(e)(s) | | 73,967 | 74,337 |
| Agellan Portfolio 9% 8/7/25 (c)(s) | | 239,000 | 239,000 |
| Finco I LLC Tranche B 1LN, term loan 1 month U.S. LIBOR + 2.500% 7.1349% 6/27/25 (e)(h)(s) | | 594,253 | 594,253 |
| Focus Financial Partners LLC: | | | |
| Tranche B 1LN, term loan CME Term SOFR 1 Month Index + 2.500% 7.1176% 6/24/28 (e)(h)(s) | | 1,739,097 | 1,722,141 |
| Tranche B5 1LN, term loan CME Term SOFR 1 Month Index + 3.250% 7.8676% 6/30/28 (e)(h)(s) | | 2,274,300 | 2,259,722 |
| GT Polaris, Inc. Tranche B 1LN, term loan 1 month U.S. LIBOR + 3.750% 8.5753% 9/24/27 (e)(h)(s) | | 1,048,647 | 994,463 |
| LHS Borrower LLC Tranche B 1LN, term loan CME Term SOFR 1 Month Index + 4.750% 9.4676% 2/18/29 (e)(h)(s) | | 2,729,375 | 2,238,088 |
| Mhp 2022-Mhil Mezz U.S. Secured Overnight Fin. Rate (SOFR) Index + 5.000% 9.5625% 1/9/24 (c)(e)(h)(s) | | 3,692,270 | 3,507,657 |
| Nexus Buyer LLC: | | | |
| 2LN, term loan 1 month U.S. LIBOR + 6.250% 10.8849% 11/5/29 (e)(h)(s) | | 795,000 | 748,294 |
| Tranche B 1LN, term loan 1 month U.S. LIBOR + 3.750% 8.3849% 11/8/26 (e)(h)(s) | | 1,559,055 | 1,529,262 |
| Sunbelt Mezz U.S. Secured Overnight Fin. Rate (SOFR) Index + 4.450% 9.1322% 1/21/27 (c)(e)(h)(s) | | 2,258,104 | 2,258,104 |
| TransUnion LLC: | | | |
| Tranche B5 1LN, term loan 1 month U.S. LIBOR + 1.750% 6.3849% 11/16/26 (e)(h)(s) | | 1,541,208 | 1,529,325 |
| Tranche B6 1LN, term loan 1 month U.S. LIBOR + 2.250% 6.8849% 12/1/28 (e)(h)(s) | | 1,536,104 | 1,525,981 |
| UFC Holdings LLC Tranche B 1LN, term loan 3 month U.S. LIBOR + 2.750% 7.57% 4/29/26 (e)(h)(s) | | 1,214,092 | 1,209,029 |
| Veritas Multifamily Portfolio 1 month U.S. LIBOR + 0.000% 0% 11/15/23 (c)(f)(h)(s) | | 3,069,200 | 2,427,737 |
| WH Borrower LLC Tranche B 1LN, term loan: | | | |
| CME Term SOFR 1 Month Index + 5.500% 2/9/27 (h)(s)(t) | | 1,875,575 | 1,781,796 |
| CME Term SOFR 1 Month Index + 5.500% 10.1595% 2/15/27 (e)(h)(s) | | 1,390,000 | 1,334,400 |
| | | | 25,973,589 |
| Insurance - 0.4% | | | |
| Acrisure LLC Tranche B 1LN, term loan: | | | |
| 1 month U.S. LIBOR + 3.500% 8.1349% 2/13/27 (e)(h)(s) | | 5,404,576 | 5,155,587 |
| 1 month U.S. LIBOR + 4.250% 8.8849% 2/15/27 (e)(h)(s) | | 2,607,844 | 2,506,790 |
| CME Term SOFR 1 Month Index + 5.750% 10.4473% 2/15/27 (e)(h)(s) | | 3,240,000 | 3,240,000 |
| Alliant Holdings Intermediate LLC: | | | |
| Tranche B3 1LN, term loan 1 month U.S. LIBOR + 3.500% 8.092% 11/12/27 (e)(h)(s) | | 3,851,563 | 3,801,954 |
| Tranche B5 1LN, term loan CME Term SOFR 1 Month Index + 3.500% 8.06% 2/13/27 (e)(h)(s) | | 1,480,962 | 1,460,599 |
| AmWINS Group, Inc. Tranche B 1LN, term loan: | | | |
| 1 month U.S. LIBOR + 2.250% 6.8849% 2/19/28 (e)(h)(s) | | 3,632,457 | 3,570,269 |
| CME Term SOFR 1 Month Index + 2.750% 7.4125% 2/19/28 (e)(h)(s) | | 925,000 | 920,375 |
| Amynta Agency Borrower, Inc. Tranche B 1LN, term loan CME Term SOFR 1 Month Index + 5.000% 2/28/28 (h)(s)(t) | | 1,455,000 | 1,418,625 |
| Asurion LLC: | | | |
| 1LN, term loan CME TERM SOFR 3 MONTH INDEX + 4.000% 8.6802% 8/17/28 (e)(h)(s) | | 2,776,370 | 2,597,878 |
| Tranche B11 1LN, term loan CME Term SOFR 1 Month Index + 4.250% 8.9125% 8/19/28 (e)(h)(s) | | 6,814,228 | 6,408,782 |
| Tranche B3 2LN, term loan 1 month U.S. LIBOR + 5.250% 9.8849% 1/31/28 (e)(h)(s) | | 8,625,000 | 7,339,875 |
| Tranche B4 2LN, term loan 1 month U.S. LIBOR + 5.250% 9.8849% 1/20/29 (e)(h)(s) | | 1,925,000 | 1,638,175 |
| Tranche B8 1LN, term loan 1 month U.S. LIBOR + 3.250% 7.8849% 12/23/26 (e)(h)(s) | | 7,619,302 | 7,241,080 |
| Tranche B9 1LN, term loan 1 month U.S. LIBOR + 3.250% 7.8849% 7/31/27 (e)(h)(s) | | 2,033,775 | 1,893,526 |
| HUB International Ltd.: | | | |
| Tranche B 1LN, term loan: | | | |
| 1 month U.S. LIBOR + 3.250% 8.0574% 4/25/25 (e)(h)(s) | | 4,026,428 | 4,017,892 |
| CME Term SOFR 1 Month Index + 4.000% 8.7279% 11/10/29 (e)(h)(s) | | 1,020,000 | 1,018,470 |
| Tranche B, term loan 3 month U.S. LIBOR + 3.000% 7.82% 4/25/25 (e)(h)(s) | | 9,615,952 | 9,584,220 |
| Ryan Specialty Group LLC Tranche B 1LN, term loan CME Term SOFR 1 Month Index + 3.000% 7.7176% 9/1/27 (e)(h)(s) | | 1,893,150 | 1,887,243 |
| USI, Inc. 1LN, term loan: | | | |
| 1 month U.S. LIBOR + 3.250% 7.9799% 12/2/26 (e)(h)(s) | | 727,524 | 725,807 |
| CME Term SOFR 1 Month Index + 3.750% 8.3302% 11/22/29 (e)(h)(s) | | 4,592,501 | 4,579,091 |
| | | | 71,006,238 |
| Thrifts & Mortgage Finance - 0.0% | | | |
| Walker & Dunlop, Inc. Tranche B 1LN, term loan CME Term SOFR 1 Month Index + 2.250% 6.9676% 12/16/28 (e)(h)(s) | | 1,293,513 | 1,277,344 |
TOTAL FINANCIALS | | | 113,207,371 |
| HEALTH CARE - 0.5% | | | |
| Health Care Equipment & Supplies - 0.1% | | | |
| Avantor Funding, Inc. Tranche B5 1LN, term loan 1 month U.S. LIBOR + 2.250% 6.8197% 11/6/27 (e)(h)(s) | | 4,397,956 | 4,388,192 |
| Embecta Corp. Tranche B 1LN, term loan CME Term SOFR 1 Month Index + 3.000% 7.7914% 3/31/29 (e)(h)(s) | | 2,492,500 | 2,451,224 |
| ICU Medical, Inc. Tranche B 1LN, term loan CME Term SOFR 1 Month Index + 2.500% 7.2169% 1/6/29 (e)(h)(s) | | 1,205,888 | 1,197,748 |
| Insulet Corp. Tranche B 1LN, term loan CME Term SOFR 1 Month Index + 3.250% 7.9821% 5/4/28 (e)(h)(s) | | 3,902,680 | 3,892,924 |
| Maravai Intermediate Holdings LLC Tranche B 1LN, term loan CME TERM SOFR 3 MONTH INDEX + 3.000% 7.633% 10/19/27 (e)(h)(s) | | 2,741,521 | 2,730,390 |
| Mozart Borrower LP Tranche B 1LN, term loan 1 month U.S. LIBOR + 3.250% 7.8197% 10/23/28 (e)(h)(s) | | 2,669,825 | 2,571,923 |
| Packaging Coordinators Midco, Inc. Tranche B 1LN, term loan 3 month U.S. LIBOR + 3.500% 8.2299% 11/30/27 (e)(h)(s) | | 1,247,775 | 1,221,459 |
| Pathway Vet Alliance LLC Tranche B 1LN, term loan 3 month U.S. LIBOR + 3.750% 8.3849% 3/31/27 (e)(h)(s) | | 3,306,828 | 2,886,232 |
| | | | 21,340,092 |
| Health Care Providers & Services - 0.2% | | | |
| Accelerated Health Systems LLC Tranche B1 LN, term loan CME TERM SOFR 3 MONTH INDEX + 4.250% 8.9802% 2/2/29 (e)(h)(s) | | 1,656,675 | 1,075,464 |
| AHP Health Partners, Inc. Tranche B 1LN, term loan 1 month U.S. LIBOR + 3.500% 8.1349% 8/23/28 (e)(h)(s) | | 1,247,906 | 1,237,611 |
| Cano Health, Inc. Tranche B 1LN, term loan CME Term SOFR 1 Month Index + 4.000% 8.7176% 11/23/27 (e)(h)(s) | | 3,253,816 | 2,639,073 |
| Charlotte Buyer, Inc. Tranche B 1LN, term loan CME TERM SOFR 3 MONTH INDEX + 5.250% 9.81% 2/12/28 (e)(h)(s) | | 890,000 | 863,861 |
| Da Vinci Purchaser Corp. Tranche B 1LN, term loan 1 month U.S. LIBOR + 4.000% 8.9534% 12/13/26 (e)(h)(s) | | 2,783,144 | 2,652,114 |
| Electron BidCo, Inc. Tranche B 1LN, term loan 1 month U.S. LIBOR + 3.000% 7.6349% 11/1/28 (e)(h)(s) | | 1,220,775 | 1,208,372 |
| Gainwell Acquisition Corp. Tranche B 1LN, term loan 3 month U.S. LIBOR + 4.000% 8.7299% 10/1/27 (e)(h)(s) | | 16,541,459 | 15,925,289 |
| Horizon Pharma U.S.A., Inc. Tranche B 1LN, term loan 1 month U.S. LIBOR + 1.750% 6.375% 3/15/28 (e)(h)(s) | | 1,404,975 | 1,403,106 |
| Icon Luxembourg Sarl Tranche B 1LN, term loan 3 month U.S. LIBOR + 2.250% 7.0636% 7/3/28 (e)(h)(s) | | 4,399,980 | 4,392,852 |
| MED ParentCo LP: | | | |
| 1LN, term loan 1 month U.S. LIBOR + 4.250% 8.8849% 8/31/26 (e)(h)(s) | | 2,293,848 | 2,036,868 |
| 2LN, term loan 1 month U.S. LIBOR + 8.250% 12.8849% 8/30/27 (e)(h)(s) | | 485,000 | 371,835 |
| National Mentor Holdings, Inc. Tranche B 1LN, term loan 1 month U.S. LIBOR + 3.750% 8.4083% 3/2/28 (e)(h)(s) | | 582,663 | 449,018 |
| Phoenix Newco, Inc. Tranche B 1LN, term loan 1 month U.S. LIBOR + 3.250% 7.8197% 11/15/28 (e)(h)(s) | | 5,910,338 | 5,783,265 |
| Pluto Acquisition I, Inc. term loan 6 month U.S. LIBOR + 4.000% 8.9534% 6/20/26 (e)(h)(s) | | 1,329,750 | 930,825 |
| Surgery Center Holdings, Inc. 1LN, term loan 1 month U.S. LIBOR + 3.750% 8.36% 8/31/26 (e)(h)(s) | | 1,611,342 | 1,598,145 |
| U.S. Anesthesia Partners, Inc.: | | | |
| 2LN, term loan 1 month U.S. LIBOR + 7.500% 12.0656% 10/1/29 (c)(e)(h)(s) | | 285,000 | 260,775 |
| Tranche B 1LN, term loan 1 month U.S. LIBOR + 4.250% 8.8156% 10/1/28 (e)(h)(s) | | 4,773,587 | 4,572,524 |
| Upstream Newco, Inc. 1LN, term loan 1 month U.S. LIBOR + 4.250% 9.0918% 11/20/26 (e)(h)(s) | | 1,748,674 | 1,417,300 |
| | | | 48,818,297 |
| Health Care Technology - 0.1% | | | |
| Athenahealth Group, Inc.: | | | |
| Tranche B 1LN, term loan CME Term SOFR 1 Month Index + 3.500% 8.0608% 2/15/29 (e)(h)(s) | | 13,661,873 | 12,603,077 |
| Tranche DD 1LN, term loan CME Term SOFR 1 Month Index + 3.500% 2/15/29 (h)(s)(u) | | 1,674,112 | 1,544,369 |
| Imprivata, Inc. Tranche B 1LN, term loan 1 month U.S. LIBOR + 3.750% 8.3197% 12/1/27 (e)(h)(s) | | 1,572,000 | 1,527,795 |
| Virgin Pulse, Inc. Tranche B 1LN, term loan 1 month U.S. LIBOR + 4.000% 8.5697% 4/6/28 (e)(h)(s) | | 2,638,110 | 2,173,143 |
| Zelis Payments Buyer, Inc. Tranche B 1LN, term loan 1 month U.S. LIBOR + 3.500% 8.0697% 2/1/28 (e)(h)(s) | | 2,761,797 | 2,746,552 |
| | | | 20,594,936 |
| Life Sciences Tools & Services - 0.0% | | | |
| PRA Health Sciences, Inc. Tranche B 1LN, term loan 3 month U.S. LIBOR + 2.250% 7% 7/3/28 (e)(h)(s) | | 1,096,258 | 1,094,482 |
| Pharmaceuticals - 0.1% | | | |
| Elanco Animal Health, Inc. Tranche B 1LN, term loan 1 month U.S. LIBOR + 1.750% 6.3156% 8/1/27 (e)(h)(s) | | 4,865,728 | 4,761,455 |
| Jazz Financing Lux SARL Tranche B 1LN, term loan 1 month U.S. LIBOR + 3.500% 8.0697% 5/5/28 (e)(h)(s) | | 5,562,453 | 5,551,550 |
| Organon & Co. Tranche B 1LN, term loan 3 month U.S. LIBOR + 3.000% 7.75% 6/2/28 (e)(h)(s) | | 4,432,605 | 4,377,197 |
| Perrigo Investments LLC Tranche B 1LN, term loan CME Term SOFR 1 Month Index + 2.500% 7.2176% 4/20/29 (e)(h)(s) | | 880,575 | 880,575 |
| | | | 15,570,777 |
TOTAL HEALTH CARE | | | 107,418,584 |
| INDUSTRIALS - 1.1% | | | |
| Aerospace & Defense - 0.1% | | | |
| Gemini HDPE LLC Tranche B 1LN, term loan 3 month U.S. LIBOR + 3.000% 7.83% 12/31/27 (e)(h)(s) | | 917,358 | 913,918 |
| Maxar Technologies, Inc. Tranche B 1LN, term loan CME Term SOFR 1 Month Index + 4.250% 8.9676% 6/9/29 (e)(h)(s) | | 1,268,625 | 1,270,312 |
| TransDigm, Inc.: | | | |
| Tranche E 1LN, term loan 3 month U.S. LIBOR + 2.250% 7.0636% 5/30/25 (e)(h)(s) | | 620,259 | 619,043 |
| Tranche F 1LN, term loan 3 month U.S. LIBOR + 2.250% 6.9799% 12/9/25 (e)(h)(s) | | 8,248,793 | 8,226,108 |
| Tranche H 1LN, term loan CME Term SOFR 1 Month Index + 3.250% 7.8302% 2/14/27 (e)(h)(s) | | 1,377,001 | 1,374,633 |
| | | | 12,404,014 |
| Air Freight & Logistics - 0.0% | | | |
| Dynasty Acquisition Co., Inc.: | | | |
| Tranche B 1LN, term loan 1 month U.S. LIBOR + 3.500% 8.2176% 4/8/26 (e)(h)(s) | | 1,020,417 | 997,947 |
| Tranche B2 1LN, term loan 1 month U.S. LIBOR + 3.500% 8.2176% 4/4/26 (e)(h)(s) | | 548,611 | 536,531 |
| Echo Global Logistics, Inc. 1LN, term loan 1 month U.S. LIBOR + 3.500% 8.1349% 11/23/28 (e)(h)(s) | | 2,910,563 | 2,810,526 |
| Rand Parent LLC Tranche B 1LN, term loan CME Term SOFR 1 Month Index + 4.250% 2/9/30 (h)(s)(t) | | 615,000 | 596,550 |
| STG Logistics, Inc. 1LN, term loan CME Term SOFR 1 Month Index + 6.000% 10.826% 3/24/28 (e)(h)(s) | | 947,838 | 904,000 |
| | | | 5,845,554 |
| Airlines - 0.1% | | | |
| AAdvantage Loyalty IP Ltd. Tranche B 1LN, term loan 3 month U.S. LIBOR + 4.750% 9.5577% 4/20/28 (e)(h)(s) | | 5,440,000 | 5,567,350 |
| Air Canada Tranche B 1LN, term loan 3 month U.S. LIBOR + 3.500% 8.3694% 8/11/28 (e)(h)(s) | | 1,397,975 | 1,394,047 |
| Mileage Plus Holdings LLC Tranche B 1LN, term loan 3 month U.S. LIBOR + 5.250% 9.9959% 7/2/27 (e)(h)(s) | | 2,758,500 | 2,869,530 |
| SkyMiles IP Ltd. Tranche B 1LN, term loan 3 month U.S. LIBOR + 3.750% 8.5577% 10/20/27 (e)(h)(s) | | 2,869,000 | 2,967,636 |
| United Airlines, Inc. Tranche B 1LN, term loan 3 month U.S. LIBOR + 3.750% 8.5677% 4/21/28 (e)(h)(s) | | 4,897,763 | 4,882,481 |
| | | | 17,681,044 |
| Building Products - 0.1% | | | |
| Acproducts Holdings, Inc. Tranche B 1LN, term loan 1 month U.S. LIBOR + 4.250% 8.9799% 5/17/28 (e)(h)(s) | | 6,240,888 | 5,237,666 |
| APi Group DE, Inc. Tranche B 1LN, term loan: | | | |
| 1 month U.S. LIBOR + 2.500% 7.1349% 10/1/26 (e)(h)(s) | | 1,130,906 | 1,129,209 |
| 1 month U.S. LIBOR + 2.750% 7.3849% 1/3/29 (e)(h)(s) | | 2,328,119 | 2,325,790 |
| AZZ, Inc. Tranche B 1LN, term loan CME Term SOFR 1 Month Index + 4.250% 8.9676% 5/13/29 (e)(h)(s) | | 1,386,875 | 1,385,793 |
| DiversiTech Holdings, Inc. Tranche B 1LN, term loan 3 month U.S. LIBOR + 3.500% 8.2299% 12/22/28 (e)(h)(s) | | 874,154 | 826,076 |
| Foley Products Co. LLC 1LN, term loan CME TERM SOFR 3 MONTH INDEX + 4.750% 9.4802% 12/29/28 (e)(h)(s) | | 1,344,881 | 1,323,363 |
| Griffon Corp. Tranche B 1LN, term loan CME Term SOFR 1 Month Index + 2.750% 7.2048% 1/24/29 (e)(h)(s) | | 1,911,163 | 1,893,637 |
| Hunter Douglas, Inc. Tranche B 1LN, term loan CME TERM SOFR 3 MONTH INDEX + 3.500% 7.9971% 2/25/29 (e)(h)(s) | | 9,193,800 | 8,415,637 |
| Ingersoll-Rand Services Co. Tranche B 1LN, term loan CME Term SOFR 1 Month Index + 1.750% 6.4114% 2/28/27 (e)(h)(s) | | 1,643,525 | 1,637,953 |
| Oscar AcquisitionCo LLC 1LN, term loan CME TERM SOFR 3 MONTH INDEX + 4.500% 9.1802% 4/29/29 (e)(h)(s) | | 4,496,238 | 4,346,828 |
| Specialty Building Products Holdings LLC Tranche B 1LN, term loan 1 month U.S. LIBOR + 3.250% 7.867% 10/15/28 (e)(h)(s) | | 719,563 | 685,045 |
| Standard Industries, Inc./New Jersey Tranche B 1LN, term loan 6 month U.S. LIBOR + 2.250% 6.4251% 9/22/28 (e)(h)(s) | | 983,190 | 979,729 |
| | | | 30,186,726 |
| Commercial Services & Supplies - 0.4% | | | |
| ABG Intermediate Holdings 2 LLC: | | | |
| Tranche B 1LN, term loan 1 month U.S. LIBOR + 3.250% 7.8849% 9/27/24 (e)(h)(s) | | 2,825,000 | 2,820,141 |
| Tranche B 2LN, term loan CME Term SOFR 1 Month Index + 6.000% 10.7176% 12/20/29 (e)(h)(s) | | 880,000 | 809,600 |
| Tranche B1 LN, term loan CME Term SOFR 1 Month Index + 3.500% 8.2176% 12/21/28 (e)(h)(s) | | 5,845,625 | 5,725,088 |
| ADS Tactical, Inc. Tranche B 1LN, term loan 1 month U.S. LIBOR + 5.750% 10.3849% 3/19/26 (e)(h)(s) | | 3,224,625 | 2,977,393 |
| All-Star Bidco AB: | | | |
| Tranche B 1LN, term loan 3 month U.S. LIBOR + 4.000% 8.7349% 11/16/28 (e)(h)(s) | | 594,000 | 589,177 |
| Tranche B1 1LN, term loan 3 month U.S. LIBOR + 3.500% 8.2349% 11/16/28 (e)(h)(s) | | 2,643,450 | 2,607,922 |
| Allied Universal Holdco LLC Tranche B 1LN, term loan 1 month U.S. LIBOR + 3.750% 8.4676% 5/14/28 (e)(h)(s) | | 3,920,913 | 3,772,820 |
| APX Group, Inc. Tranche B 1LN, term loan 1 month U.S. LIBOR + 3.250% 7.8481% 7/9/28 (e)(h)(s) | | 2,210,320 | 2,145,049 |
| AVSC Holding Corp. Tranche B2 1LN, term loan 3 month U.S. LIBOR + 5.500% 10.3061% 10/15/26 (e)(h)(s) | | 2,540,726 | 2,459,220 |
| Brand Energy & Infrastructure Services, Inc. Tranche B, term loan 3 month U.S. LIBOR + 4.250% 9.0646% 6/21/24 (e)(h)(s) | | 13,498,446 | 12,733,489 |
| Clean Harbors, Inc. Tranche B 1LN, term loan 1 month U.S. LIBOR + 2.000% 6.6349% 10/8/28 (e)(h)(s) | | 509,850 | 510,273 |
| Congruex Group LLC Tranche B 1LN, term loan CME TERM SOFR 3 MONTH INDEX + 5.750% 10.576% 5/3/29 (e)(h)(s) | | 1,397,975 | 1,365,360 |
| Covanta Holding Corp.: | | | |
| Tranche B 1LN, term loan CME Term SOFR 1 Month Index + 2.500% 7.1176% 11/30/28 (e)(h)(s) | | 2,388,695 | 2,380,478 |
| Tranche C 1LN, term loan CME Term SOFR 1 Month Index + 2.500% 7.0614% 11/30/28 (e)(h)(s) | | 180,281 | 179,660 |
| Eagle 4 Ltd. Tranche B 1LN, term loan 1 month U.S. LIBOR + 3.250% 7.9799% 7/12/28 (e)(h)(s) | | 674,552 | 668,232 |
| Ensemble RCM LLC 1LN, term loan 3 month U.S. LIBOR + 3.750% 8.526% 8/1/26 (e)(h)(s) | | 1,666,802 | 1,664,119 |
| Filtration Group Corp.: | | | |
| Tranche B 1LN, term loan 1 month U.S. LIBOR + 3.500% 8.1349% 10/21/28 (e)(h)(s) | | 1,992,462 | 1,960,085 |
| Tranche B, term loan 3 month U.S. LIBOR + 3.000% 7.6349% 3/29/25 (e)(h)(s) | | 2,035,696 | 2,028,572 |
| Gateway Merger Sub 2021, Inc. Tranche B 1LN, term loan 1 month U.S. LIBOR + 5.250% 9.9801% 6/30/28 (e)(h)(s) | | 2,140,138 | 2,086,635 |
| Harland Clarke Holdings Corp. 1LN, term loan CME Term SOFR 1 Month Index + 7.750% 12.3302% 6/16/26 (e)(h)(s) | | 1,088,838 | 852,016 |
| Indy U.S. Bidco LLC Tranche B 1LN, term loan 1 month U.S. LIBOR + 3.750% 8.3849% 3/5/28 (e)(h)(s) | | 1,129,947 | 962,929 |
| KNS Acquisitions, Inc. Tranche B 1LN, term loan 6 month U.S. LIBOR + 6.250% 10.4199% 4/21/27 (e)(h)(s) | | 1,592,298 | 1,417,941 |
| Madison IAQ LLC Tranche B 1LN, term loan 3 month U.S. LIBOR + 3.250% 7.9883% 6/21/28 (e)(h)(s) | | 2,610,250 | 2,482,400 |
| Maverick Purchaser Sub LLC: | | | |
| Tranche B 1LN, term loan: | | | |
| 1 month U.S. LIBOR + 4.000% 8.4698% 1/23/27 (e)(h)(s) | | 2,145,000 | 2,117,287 |
| CME Term SOFR 1 Month Index + 4.000% 8.1235% 2/16/29 (e)(h)(s) | | 2,820,825 | 2,784,380 |
| Tranche B 2LN, term loan 1 month U.S. LIBOR + 8.750% 12.9199% 1/31/28 (e)(h)(s) | | 1,180,000 | 1,084,125 |
| MHI Holdings LLC Tranche B 1LN, term loan 3 month U.S. LIBOR + 5.000% 9.6349% 9/20/26 (e)(h)(s) | | 1,389,860 | 1,387,539 |
| Neptune BidCo U.S., Inc. Tranche B 1LN, term loan CME Term SOFR 1 Month Index + 5.000% 9.735% 4/11/29 (e)(h)(s) | | 12,525,000 | 11,491,688 |
| Pilot Travel Centers LLC Tranche B 1LN, term loan CME Term SOFR 1 Month Index + 2.000% 6.7176% 8/4/28 (e)(h)(s) | | 4,023,586 | 3,989,828 |
| PowerTeam Services LLC Tranche B 1LN, term loan 3 month U.S. LIBOR + 3.500% 8.2299% 3/6/25 (e)(h)(s) | | 2,741,272 | 2,330,081 |
| RLG Holdings LLC Tranche B 1LN, term loan 1 month U.S. LIBOR + 4.000% 8.6349% 7/8/28 (e)(h)(s) | | 1,014,750 | 985,261 |
| Sabert Corp. Tranche B 1LN, term loan 1 month U.S. LIBOR + 4.500% 9.1875% 12/10/26 (e)(h)(s) | | 3,824,358 | 3,805,237 |
| SuperMoose Borrower LLC Tranche B 1LN, term loan 3 month U.S. LIBOR + 3.750% 8.4799% 8/29/25 (e)(h)(s) | | 836,160 | 732,928 |
| The Brickman Group, Ltd. Tranche B 1LN, term loan CME Term SOFR 1 Month Index + 3.250% 7.9073% 4/14/29 (e)(h)(s) | | 1,416,978 | 1,382,730 |
| The GEO Group, Inc. Tranche 1B 1LN, term loan CME Term SOFR 1 Month Index + 7.120% 11.7426% 3/23/27 (e)(h)(s) | | 636,270 | 640,591 |
| WMB Holdings, Inc. Tranche B 1LN, term loan CME Term SOFR 1 Month Index + 3.250% 7.9676% 11/3/29 (e)(h)(s) | | 1,089,600 | 1,088,924 |
| WTG Holdings III Corp. Tranche B 1LN, term loan 1 month U.S. LIBOR + 2.250% 6.9375% 4/1/28 (e)(h)(s) | | 595,925 | 594,066 |
| | | | 89,613,264 |
| Construction & Engineering - 0.1% | | | |
| Fluidra Finco SL Tranche B 1LN, term loan CME Term SOFR 1 Month Index + 2.000% 6.7176% 1/27/29 (e)(h)(s) | | 1,750,000 | 1,733,043 |
| JMC Steel Group, Inc. 1LN, term loan 1 month U.S. LIBOR + 2.000% 6.729% 1/24/27 (e)(h)(s) | | 1,081,655 | 1,066,782 |
| Pike Corp. Tranche B 1LN, term loan: | | | |
| 1 month U.S. LIBOR + 3.000% 7.57% 1/21/28 (e)(h)(s) | | 1,198,630 | 1,191,139 |
| CME Term SOFR 1 Month Index + 3.500% 8.0614% 1/21/28 (e)(h)(s) | | 1,047,375 | 1,044,317 |
| Rockwood Service Corp. Tranche B 1LN, term loan 1 month U.S. LIBOR + 4.250% 8.8849% 1/23/27 (e)(h)(s) | | 1,930,862 | 1,926,035 |
| SRS Distribution, Inc. Tranche B 1LN, term loan: | | | |
| 1 month U.S. LIBOR + 3.500% 8.1349% 6/4/28 (e)(h)(s) | | 3,819,399 | 3,691,106 |
| CME TERM SOFR 3 MONTH INDEX + 3.250% 7.9676% 6/2/28 (e)(h)(s) | | 992,481 | 957,000 |
| Traverse Midstream Partners Ll Tranche B, term loan CME TERM SOFR 6 MONTH INDEX + 4.250% 8.9497% 2/16/28 (e)(h)(s) | | 800,708 | 793,702 |
| USIC Holdings, Inc. Tranche B 1LN, term loan 1 month U.S. LIBOR + 3.500% 8.1349% 5/7/28 (e)(h)(s) | | 1,328,188 | 1,286,350 |
| | | | 13,689,474 |
| Electrical Equipment - 0.1% | | | |
| Alliance Laundry Systems LLC Tranche B 1LN, term loan 3 month U.S. LIBOR + 3.500% 8.3059% 10/8/27 (e)(h)(s) | | 2,028,261 | 2,008,404 |
| Array Technologies, Inc. Tranche B 1LN, term loan 3 month U.S. LIBOR + 3.250% 8.1721% 10/14/27 (e)(h)(s) | | 4,149,952 | 4,042,302 |
| Vertiv Group Corp. Tranche B 1LN, term loan 1 month U.S. LIBOR + 2.750% 7.3243% 3/2/27 (e)(h)(s) | | 5,061,875 | 4,996,222 |
| | | | 11,046,928 |
| Machinery - 0.0% | | | |
| Ali Group North America Corp. Tranche B 1LN, term loan CME Term SOFR 1 Month Index + 2.000% 6.7321% 7/22/29 (e)(h)(s) | | 1,391,278 | 1,384,321 |
| Chart Industries, Inc. 1LN, term loan CME Term SOFR 1 Month Index + 3.750% 12/8/29 (h)(s)(t) | | 1,890,000 | 1,886,466 |
| CPM Holdings, Inc.: | | | |
| 2LN, term loan 1 month U.S. LIBOR + 8.250% 12.8156% 11/15/26 (e)(h)(s) | | 127,677 | 124,910 |
| Tranche B 1LN, term loan 1 month U.S. LIBOR + 3.500% 8.0656% 11/15/25 (c)(e)(h)(s) | | 869,697 | 867,523 |
| TNT Crane & Rigging LLC 2LN, term loan 3 month U.S. LIBOR + 8.750% 13.5039% 4/16/25 (c)(e)(h)(s) | | 432,366 | 408,067 |
| | | | 4,671,287 |
| Professional Services - 0.1% | | | |
| AlixPartners LLP Tranche B 1LN, term loan 1 month U.S. LIBOR + 2.750% 7.3849% 2/4/28 (e)(h)(s) | | 1,545,265 | 1,541,649 |
| Cast & Crew Payroll LLC Tranche B 1LN, term loan: | | | |
| 1 month U.S. LIBOR + 3.500% 8.1349% 2/7/26 (e)(h)(s) | | 2,343,129 | 2,335,326 |
| CME Term SOFR 1 Month Index + 3.750% 8.3676% 12/30/28 (e)(h)(s) | | 1,553,233 | 1,548,698 |
| CHG Healthcare Services, Inc. 1LN, term loan 1 month U.S. LIBOR + 3.250% 7.8197% 9/30/28 (e)(h)(s) | | 734,372 | 729,474 |
| CoreLogic, Inc. Tranche B 1LN, term loan 1 month U.S. LIBOR + 3.500% 8.1875% 6/2/28 (e)(h)(s) | | 5,670,974 | 4,847,265 |
| EAB Global, Inc. Tranche B 1LN, term loan 3 month U.S. LIBOR + 3.500% 8.3149% 8/16/28 (e)(h)(s) | | 628,650 | 615,687 |
| EmployBridge LLC Tranche B 1LN, term loan 3 month U.S. LIBOR + 4.750% 9.4936% 7/19/28 (e)(h)(s) | | 2,685,256 | 2,213,107 |
| Galaxy U.S. Opco, Inc. 1LN, term loan CME Term SOFR 1 Month Index + 4.750% 9.3676% 4/29/29 (e)(h)(s) | | 1,117,200 | 1,008,273 |
| Sitel Worldwide Corp. Tranche B 1LN, term loan 1 month U.S. LIBOR + 3.750% 8.39% 8/27/28 (e)(h)(s) | | 1,492,443 | 1,486,384 |
| Vaco Holdings LLC 1LN, term loan CME Term SOFR 1 Month Index + 5.000% 9.7302% 1/21/29 (e)(h)(s) | | 767,250 | 757,023 |
| | | | 17,082,886 |
| Road & Rail - 0.0% | | | |
| Genesee & Wyoming, Inc. 1LN, term loan 3 month U.S. LIBOR + 2.000% 6.7299% 12/30/26 (e)(h)(s) | | 2,945,000 | 2,935,193 |
| Uber Technologies, Inc. Tranche B 1LN, term loan CME Term SOFR 1 Month Index + 3.000% 3/1/30 (h)(s)(t) | | 3,115,000 | 3,113,692 |
| | | | 6,048,885 |
| Trading Companies & Distributors - 0.0% | | | |
| Beacon Roofing Supply, Inc. Tranche B 1LN, term loan 1 month U.S. LIBOR + 2.250% 6.8849% 5/19/28 (e)(h)(s) | | 989,925 | 987,559 |
| Transportation Infrastructure - 0.1% | | | |
| AIT Worldwide Logistics Holdings, Inc. 1LN, term loan 3 month U.S. LIBOR + 4.750% 9.33% 4/6/28 (e)(h)(s) | | 2,173,047 | 2,092,471 |
| ASP LS Acquisition Corp.: | | | |
| 2LN, term loan 6 month U.S. LIBOR + 7.500% 12.2299% 5/7/29 (c)(e)(h)(s) | | 295,000 | 188,800 |
| Tranche B 1LN, term loan 6 month U.S. LIBOR + 4.500% 9.2299% 4/30/28 (e)(h)(s) | | 1,259,063 | 1,046,596 |
| Brown Group Holding LLC Tranche B2 1LN, term loan CME Term SOFR 1 Month Index + 3.750% 8.4096% 6/9/29 (e)(h)(s) | | 1,127,175 | 1,126,239 |
| Einstein Merger Sub, Inc. 2LN, term loan 3 month U.S. LIBOR + 7.000% 11.6912% 11/23/29 (c)(e)(h)(s) | | 780,000 | 776,100 |
| First Student Bidco, Inc.: | | | |
| Tranche B 1LN, term loan: | | | |
| 3 month U.S. LIBOR + 3.000% 7.7264% 7/21/28 (e)(h)(s) | | 1,551,024 | 1,478,452 |
| CME TERM SOFR 3 MONTH INDEX + 4.000% 8.6802% 7/21/28 (e)(h)(s) | | 1,168,831 | 1,137,425 |
| Tranche C 1LN, term loan: | | | |
| 3 month U.S. LIBOR + 3.000% 7.7264% 7/21/28 (e)(h)(s) | | 578,309 | 551,250 |
| CME TERM SOFR 3 MONTH INDEX + 4.000% 8.6802% 7/21/28 (e)(h)(s) | | 81,169 | 78,988 |
| Worldwide Express, Inc. 1LN, term loan 1 month U.S. LIBOR + 4.000% 8.7299% 7/22/28 (e)(h)(s) | | 2,574,100 | 2,473,942 |
| | | | 10,950,263 |
TOTAL INDUSTRIALS | | | 220,207,884 |
| INFORMATION TECHNOLOGY - 1.1% | | | |
| Communications Equipment - 0.1% | | | |
| Anastasia Parent LLC Tranche B, term loan 3 month U.S. LIBOR + 3.750% 8.4799% 8/10/25 (e)(h)(s) | | 4,569,163 | 3,775,271 |
| Ciena Corp. Tranche B 1LN, term loan CME Term SOFR 1 Month Index + 2.500% 7.0633% 1/12/30 (e)(h)(s) | | 670,000 | 668,325 |
| CommScope, Inc. Tranche B 1LN, term loan 1 month U.S. LIBOR + 3.250% 7.8849% 4/4/26 (e)(h)(s) | | 5,870,500 | 5,691,450 |
| Eos U.S. Finco LLC 1LN, term loan CME TERM SOFR 3 MONTH INDEX + 6.000% 10.6042% 10/6/29 (e)(h)(s) | | 2,705,000 | 2,667,806 |
| Radiate Holdco LLC Tranche B 1LN, term loan 1 month U.S. LIBOR + 3.250% 7.8849% 9/25/26 (e)(h)(s) | | 5,262,063 | 4,355,988 |
| | | | 17,158,840 |
| Electronic Equipment & Components - 0.0% | | | |
| Coherent Corp. Tranche B 1LN, term loan 1 month U.S. LIBOR + 2.750% 7.3849% 7/1/29 (e)(h)(s) | | 4,235,307 | 4,208,836 |
| DG Investment Intermediate Holdings, Inc.: | | | |
| 2LN, term loan 1 month U.S. LIBOR + 6.750% 11.3849% 3/31/29 (e)(h)(s) | | 315,000 | 278,775 |
| Tranche B 1LN, term loan 1 month U.S. LIBOR + 3.750% 8.3849% 3/31/28 (e)(h)(s) | | 1,364,270 | 1,331,446 |
| Go Daddy Operating Co. LLC Tranche B 1LN, term loan 1 month U.S. LIBOR + 2.000% 6.6349% 8/10/27 (e)(h)(s) | | 1,828,125 | 1,819,222 |
| TTM Technologies, Inc. Tranche B, term loan 3 month U.S. LIBOR + 2.500% 7.075% 9/28/24 (e)(h)(s) | | 2,058,746 | 2,050,388 |
| | | | 9,688,667 |
| IT Services - 0.3% | | | |
| Acuris Finance U.S., Inc. 1LN, term loan CME TERM SOFR 3 MONTH INDEX + 4.000% 8.7302% 2/16/28 (e)(h)(s) | | 1,312,500 | 1,270,776 |
| AEA International Holdings Luxembourg SARL Tranche B 1LN, term loan 3 month U.S. LIBOR + 3.750% 8.5% 9/7/28 (e)(h)(s) | | 772,200 | 758,687 |
| Arches Buyer, Inc. Tranche B 1LN, term loan 1 month U.S. LIBOR + 3.250% 7.9676% 12/4/27 (e)(h)(s) | | 1,270,056 | 1,193,853 |
| Camelot Finance SA: | | | |
| Tranche B 1LN, term loan 1 month U.S. LIBOR + 3.000% 7.6349% 10/31/26 (e)(h)(s) | | 3,289,219 | 3,275,503 |
| Tranche B, term loan 1 month U.S. LIBOR + 3.000% 7.6349% 10/31/26 (e)(h)(s) | | 1,950,608 | 1,941,265 |
| Constant Contact, Inc. Tranche B 1LN, term loan 1 month U.S. LIBOR + 4.000% 8.8059% 2/10/28 (e)(h)(s) | | 1,250,000 | 1,178,650 |
| GoDaddy, Inc. Tranche B 1LN, term loan CME Term SOFR 1 Month Index + 3.250% 7.8676% 10/21/29 (e)(h)(s) | | 1,878,203 | 1,878,448 |
| Hunter U.S. Bidco, Inc. Tranche B 1LN, term loan 3 month U.S. LIBOR + 4.250% 8.9799% 8/19/28 (e)(h)(s) | | 1,990,506 | 1,963,973 |
| Ion Trading Finance Ltd. Tranche B 1LN, term loan 3 month U.S. LIBOR + 4.750% 9.4799% 3/26/28 (e)(h)(s) | | 5,213,987 | 4,877,268 |
| Park Place Technologies LLC 1LN, term loan CME Term SOFR 1 Month Index + 5.000% 9.7176% 11/10/27 (e)(h)(s) | | 3,770,524 | 3,650,357 |
| Peraton Corp. Tranche B 1LN, term loan 1 month U.S. LIBOR + 3.750% 8.3849% 2/1/28 (e)(h)(s) | | 12,710,072 | 12,573,057 |
| Sedgwick Claims Management Services, Inc. Tranche B 1LN, term loan CME Term SOFR 1 Month Index + 3.750% 2/16/28 (h)(s)(t) | | 885,000 | 873,938 |
| Tempo Acquisition LLC: | | | |
| 1LN, term loan U.S. Secured Overnight Fin. Rate (SOFR) Index + 3.000% 7.6176% 8/31/28 (e)(h)(s) | | 2,954,373 | 2,948,848 |
| Tranche B, term loan 1 month U.S. LIBOR + 2.750% 7.3849% 5/1/24 (e)(h)(s) | | 218,701 | 218,222 |
| Verscend Holding Corp. Tranche B 1LN, term loan 1 month U.S. LIBOR + 4.000% 8.6349% 8/27/25 (e)(h)(s) | | 5,700,749 | 5,687,523 |
| VFH Parent LLC Tranche B 1LN, term loan CME Term SOFR 1 Month Index + 3.000% 7.6608% 1/13/29 (e)(h)(s) | | 5,341,050 | 5,282,298 |
| | | | 49,572,666 |
| Semiconductors & Semiconductor Equipment - 0.0% | | | |
| Entegris, Inc. Tranche B 1LN, term loan CME Term SOFR 1 Month Index + 3.000% 7.5884% 7/6/29 (e)(h)(s) | | 4,785,000 | 4,789,976 |
| MKS Instruments, Inc. Tranche B 1LN, term loan CME Term SOFR 1 Month Index + 2.750% 7.4108% 8/17/29 (e)(h)(s) | | 3,785,513 | 3,753,184 |
| | | | 8,543,160 |
| Software - 0.7% | | | |
| A&V Holdings Midco LLC Tranche B 1LN, term loan 3 month U.S. LIBOR + 5.370% 9.5449% 3/10/27 (e)(h)(s) | | 1,625,109 | 1,588,544 |
| Applied Systems, Inc. Tranche B 1LN, term loan CME Term SOFR 1 Month Index + 4.500% 9.0802% 9/19/26 (e)(h)(s) | | 1,735,000 | 1,738,904 |
| AppLovin Corp.: | | | |
| Tranche B 1LN, term loan CME TERM SOFR 3 MONTH INDEX + 3.000% 7.5928% 10/25/28 (e)(h)(s) | | 516,344 | 510,535 |
| Tranche B, term loan CME Term SOFR 1 Month Index + 3.350% 7.9428% 8/15/25 (e)(h)(s) | | 2,822,107 | 2,800,941 |
| Aptean, Inc. 1LN, term loan 3 month U.S. LIBOR + 4.250% 8.9676% 4/23/26 (e)(h)(s) | | 2,628,423 | 2,507,963 |
| Ascend Learning LLC: | | | |
| 2LN, term loan 1 month U.S. LIBOR + 5.750% 10.3849% 12/10/29 (e)(h)(s) | | 440,380 | 381,757 |
| Tranche B 1LN, term loan 1 month U.S. LIBOR + 3.500% 8.1176% 12/10/28 (e)(h)(s) | | 7,545,106 | 7,072,481 |
| Byju's Alpha, Inc. Tranche B 1LN, term loan 3 month U.S. LIBOR + 8.000% 10.6987% 11/24/26 (e)(h)(s) | | 2,074,050 | 1,769,434 |
| Central Parent, Inc. 1LN, term loan CME TERM SOFR 3 MONTH INDEX + 4.500% 9.0802% 7/6/29 (e)(h)(s) | | 6,490,000 | 6,465,014 |
| Ceridian HCM Holding, Inc. Tranche B, term loan 1 month U.S. LIBOR + 2.500% 7.1349% 4/30/25 (e)(h)(s) | | 2,276,065 | 2,266,960 |
| ConnectWise LLC Tranche B 1LN, term loan 3 month U.S. LIBOR + 3.500% 8.1349% 9/30/28 (e)(h)(s) | | 3,361,150 | 3,186,807 |
| DCert Buyer, Inc.: | | | |
| 1LN, term loan 3 month U.S. LIBOR + 4.000% 8.6956% 10/16/26 (e)(h)(s) | | 6,826,733 | 6,717,505 |
| Tranche B 2LN, term loan 1 month U.S. LIBOR + 7.000% 11.6956% 2/19/29 (e)(h)(s) | | 1,330,000 | 1,231,913 |
| Epicor Software Corp. Tranche B 1LN, term loan 1 month U.S. LIBOR + 3.250% 7.8849% 7/31/27 (e)(h)(s) | | 3,822,817 | 3,741,199 |
| Finastra U.S.A., Inc.: | | | |
| Tranche 2LN, term loan 3 month U.S. LIBOR + 7.250% 12.0753% 6/13/25 (e)(h)(s) | | 697,000 | 590,708 |
| Tranche B 1LN, term loan 3 month U.S. LIBOR + 3.500% 8.3253% 6/13/24 (e)(h)(s) | | 3,205,494 | 3,017,171 |
| Flexera Software LLC Tranche B 1LN, term loan 1 month U.S. LIBOR + 3.750% 8.39% 3/3/28 (e)(h)(s) | | 1,344,253 | 1,322,409 |
| Gen Digital, Inc. Tranche B 1LN, term loan CME Term SOFR 1 Month Index + 2.000% 6.7176% 9/12/29 (e)(h)(s) | | 5,220,596 | 5,160,925 |
| Greeneden U.S. Holdings II LLC Tranche B 1LN, term loan 1 month U.S. LIBOR + 4.000% 8.6349% 12/1/27 (e)(h)(s) | | 2,670,132 | 2,643,431 |
| Hyland Software, Inc.: | | | |
| 2LN, term loan 1 month U.S. LIBOR + 6.250% 10.8197% 7/10/25 (e)(h)(s) | | 126,720 | 121,153 |
| Tranche B 1LN, term loan 3 month U.S. LIBOR + 3.500% 8.1349% 7/1/24 (e)(h)(s) | | 3,883,786 | 3,870,309 |
| McAfee Corp. Tranche B 1LN, term loan CME Term SOFR 1 Month Index + 3.750% 8.4178% 3/1/29 (e)(h)(s) | | 5,459,159 | 5,111,137 |
| MH Sub I LLC: | | | |
| 1LN, term loan 1 month U.S. LIBOR + 3.750% 8.3849% 9/15/24 (e)(h)(s) | | 3,532,832 | 3,503,192 |
| Tranche B 2LN, term loan CME Term SOFR 1 Month Index + 6.250% 10.8676% 2/23/29 (e)(h)(s) | | 1,660,000 | 1,525,822 |
| Tranche B, term loan 3 month U.S. LIBOR + 3.750% 8.3849% 9/15/24 (e)(h)(s) | | 4,276,798 | 4,241,001 |
| Motus Group LLC Tranche B 1LN, term loan 1 month U.S. LIBOR + 3.750% 8.3849% 12/10/28 (e)(h)(s) | | 605,425 | 575,656 |
| NAVEX TopCo, Inc.: | | | |
| 2LN, term loan 1 month U.S. LIBOR + 7.000% 11.64% 9/4/26 (e)(h)(s) | | 100,000 | 98,083 |
| Tranche B 1LN, term loan 1 month U.S. LIBOR + 3.250% 7.89% 9/5/25 (e)(h)(s) | | 717,676 | 715,882 |
| Open Text Corp. Tranche B 1LN, term loan CME Term SOFR 1 Month Index + 3.500% 8.1614% 8/25/29 (e)(h)(s) | | 6,085,000 | 6,072,647 |
| Polaris Newco LLC Tranche B 1LN, term loan 3 month U.S. LIBOR + 4.000% 8.7299% 6/2/28 (e)(h)(s) | | 10,958,190 | 10,121,094 |
| Project Boost Purchaser LLC 1LN, term loan 1 month U.S. LIBOR + 3.500% 8.1349% 5/30/26 (e)(h)(s) | | 1,712,966 | 1,691,280 |
| Proofpoint, Inc. Tranche B 1LN, term loan 3 month U.S. LIBOR + 3.250% 7.9849% 8/31/28 (e)(h)(s) | | 4,459,950 | 4,328,649 |
| Rackspace Technology Global, Inc. Tranche B 1LN, term loan 3 month U.S. LIBOR + 2.750% 7.595% 2/15/28 (e)(h)(s) | | 6,475,542 | 4,056,021 |
| RealPage, Inc. Tranche B 1LN, term loan 1 month U.S. LIBOR + 3.000% 7.6349% 4/22/28 (e)(h)(s) | | 4,011,756 | 3,880,371 |
| Red Planet Borrower LLC Tranche B 1LN, term loan 1 month U.S. LIBOR + 3.750% 8.3849% 9/30/28 (e)(h)(s) | | 1,341,710 | 966,031 |
| Renaissance Holdings Corp.: | | | |
| 1LN, term loan CME Term SOFR 1 Month Index + 4.500% 9.0655% 3/17/29 (e)(h)(s) | | 920,375 | 905,612 |
| Tranche B 1LN, term loan 3 month U.S. LIBOR + 3.250% 7.8849% 5/31/25 (e)(h)(s) | | 3,111,274 | 3,039,963 |
| Roper Industrial Products Investment Tranche B 1LN, term loan CME Term SOFR 1 Month Index + 4.500% 8.927% 11/22/29 (e)(h)(s) | | 1,030,000 | 1,015,580 |
| Sophia LP Tranche B 1LN, term loan 3 month U.S. LIBOR + 3.500% 8.2299% 10/7/27 (e)(h)(s) | | 6,942,455 | 6,828,182 |
| SS&C Technologies, Inc.: | | | |
| Tranche B 3LN, term loan 1 month U.S. LIBOR + 1.750% 6.3849% 4/16/25 (e)(h)(s) | | 1,128,485 | 1,125,901 |
| Tranche B 4LN, term loan 1 month U.S. LIBOR + 1.750% 6.3849% 4/16/25 (e)(h)(s) | | 1,000,652 | 998,360 |
| Tranche B 5LN, term loan 1 month U.S. LIBOR + 1.750% 6.3849% 4/16/25 (e)(h)(s) | | 3,685,425 | 3,677,759 |
| STG-Fairway Holdings LLC Tranche B 1LN, term loan 1 month U.S. LIBOR + 2.750% 7.3849% 1/31/27 (e)(h)(s) | | 665,216 | 662,056 |
| UKG, Inc. 1LN, term loan 1 month U.S. LIBOR + 3.750% 8.5753% 5/4/26 (e)(h)(s) | | 5,854,816 | 5,770,682 |
| Ultimate Software Group, Inc.: | | | |
| 1LN, term loan 1 month U.S. LIBOR + 3.250% 8.0319% 5/3/26 (e)(h)(s) | | 7,467,120 | 7,310,310 |
| 2LN, term loan 3 month U.S. LIBOR + 5.250% 10.0319% 5/3/27 (e)(h)(s) | | 2,665,000 | 2,587,262 |
| Veritas U.S., Inc. Tranche B 1LN, term loan 3 month U.S. LIBOR + 5.000% 9/1/25 (h)(s)(t) | | 1,050,000 | 819,000 |
| VS Buyer LLC Tranche B 1LN, term loan 1 month U.S. LIBOR + 2.000% 9.75% 2/28/27 (e)(h)(s) | | 3,203,991 | 3,159,135 |
| | | | 143,492,731 |
TOTAL INFORMATION TECHNOLOGY | | | 228,456,064 |
| MATERIALS - 0.5% | | | |
| Chemicals - 0.2% | | | |
| ARC Falcon I, Inc.: | | | |
| Tranche B 1LN, term loan 1 month U.S. LIBOR + 3.750% 8.3849% 9/30/28 (e)(h)(s) | | 2,726,515 | 2,562,242 |
| Tranche B 2LN, term loan 1 month U.S. LIBOR + 7.000% 11.6349% 9/22/29 (c)(e)(h)(s) | | 345,000 | 299,288 |
| Tranche DD 1LN, term loan 3 month U.S. LIBOR + 3.750% 9/30/28 (h)(s)(u) | | 402,052 | 377,828 |
| Aruba Investment Holdings LLC: | | | |
| 1LN, term loan CME Term SOFR 1 Month Index + 4.750% 9.3034% 11/4/27 (e)(h)(s) | | 1,080,000 | 1,055,700 |
| 2LN, term loan 1 month U.S. LIBOR + 7.750% 12.3849% 11/24/28 (e)(h)(s) | | 485,000 | 436,500 |
| Tranche B 1LN, term loan 1 month U.S. LIBOR + 3.750% 8.3849% 11/24/27 (e)(h)(s) | | 4,046,561 | 3,980,805 |
| Avient Corp. Tranche B 1LN, term loan CME Term SOFR 1 Month Index + 3.250% 7.926% 8/29/29 (e)(h)(s) | | 573,589 | 573,710 |
| Bakelite U.S. Holding Ltd. 1LN, term loan CME TERM SOFR 3 MONTH INDEX + 4.000% 8.7302% 5/27/29 (e)(h)(s) | | 885,550 | 836,845 |
| Consolidated Energy Finance SA: | | | |
| Tranche B 1LN, term loan 3 month U.S. LIBOR + 3.500% 8.1349% 5/7/25 (c)(e)(h)(s) | | 3,106,877 | 3,013,671 |
| Tranche B, term loan 3 month U.S. LIBOR + 2.500% 7.1349% 5/7/25 (e)(h)(s) | | 2,732,882 | 2,694,157 |
| Discovery Purchaser Corp. 1LN, term loan CME TERM SOFR 3 MONTH INDEX + 4.370% 8.9625% 10/4/29 (e)(h)(s) | | 5,975,000 | 5,709,352 |
| Groupe Solmax, Inc. Tranche B 1LN, term loan 3 month U.S. LIBOR + 4.750% 9.4799% 5/27/28 (e)(h)(s) | | 1,419,194 | 1,224,055 |
| Herens U.S. Holdco Corp. Tranche B 1LN, term loan 3 month U.S. LIBOR + 4.000% 8.7299% 7/3/28 (e)(h)(s) | | 1,649,146 | 1,556,678 |
| Hexion Holdings Corp. 1LN, term loan CME TERM SOFR 3 MONTH INDEX + 4.500% 9.4536% 3/15/29 (e)(h)(s) | | 3,950,150 | 3,580,534 |
| Hexion, Inc. 2LN, term loan CME Term SOFR 1 Month Index + 7.000% 12.0983% 2/9/30 (c)(e)(h)(s) | | 675,000 | 556,875 |
| INEOS U.S. Finance LLC Tranche B 1LN, term loan CME Term SOFR 1 Month Index + 3.500% 2/10/30 (h)(s)(t) | | 875,000 | 867,615 |
| INEOS U.S. Petrochem LLC Tranche B 1LN, term loan 1 month U.S. LIBOR + 2.750% 7.3849% 1/20/26 (e)(h)(s) | | 2,745,370 | 2,727,525 |
| Luxembourg Investment Co. 428 SARL Tranche B 1LN, term loan CME TERM SOFR 3 MONTH INDEX + 5.000% 9.7302% 1/3/29 (e)(h)(s) | | 734,593 | 584,611 |
| Manchester Acquisition Sub LLC Tranche B 1LN, term loan CME TERM SOFR 3 MONTH INDEX + 5.750% 10.3044% 12/1/26 (e)(h)(s) | | 1,591,431 | 1,336,802 |
| Messer Industries U.S.A., Inc. Tranche B 1LN, term loan 3 month U.S. LIBOR + 2.500% 7.2299% 3/1/26 (e)(h)(s) | | 1,159,567 | 1,155,079 |
| Olympus Water U.S. Holding Corp. Tranche B 1LN, term loan 3 month U.S. LIBOR + 3.750% 8.5% 11/9/28 (e)(h)(s) | | 2,862,568 | 2,801,080 |
| Oxea Corp. Tranche B2, term loan 3 month U.S. LIBOR + 3.250% 7.875% 10/11/24 (e)(h)(s) | | 641,749 | 627,149 |
| Starfruit U.S. Holdco LLC Tranche B, term loan 1 month U.S. LIBOR + 2.750% 7.526% 10/1/25 (e)(h)(s) | | 2,388,626 | 2,371,905 |
| The Chemours Co. LLC Tranche B 1LN, term loan 3 month U.S. LIBOR + 1.750% 6.39% 4/3/25 (e)(h)(s) | | 3,490,783 | 3,465,231 |
| U.S. Coatings Acquisition, Inc. 1LN, term loan CME Term SOFR 1 Month Index + 3.000% 7.5055% 12/20/29 (e)(h)(s) | | 710,000 | 712,535 |
| W.R. Grace Holding LLC Tranche B 1LN, term loan 3 month U.S. LIBOR + 3.750% 8.5% 9/22/28 (e)(h)(s) | | 1,553,233 | 1,542,687 |
| | | | 46,650,459 |
| Construction Materials - 0.1% | | | |
| Smyrna Ready Mix LLC Tranche B 1lN, term loan CME Term SOFR 1 Month Index + 4.250% 8.9676% 4/1/29 (e)(h)(s) | | 2,227,125 | 2,215,989 |
| VM Consolidated, Inc. Tranche B 1LN, term loan 6 month U.S. LIBOR + 3.250% 7.8849% 3/27/28 (e)(h)(s) | | 1,996,263 | 1,991,771 |
| White Capital Buyer LLC Tranche B 1LN, term loan 1 month U.S. LIBOR + 4.000% 8.3676% 10/19/27 (e)(h)(s) | | 4,106,672 | 4,038,748 |
| | | | 8,246,508 |
| Containers & Packaging - 0.2% | | | |
| AOT Packaging Products AcquisitionCo LLC 1LN, term loan 1 month U.S. LIBOR + 3.250% 7.8849% 3/3/28 (e)(h)(s) | | 3,229,016 | 3,145,352 |
| Berlin Packaging, LLC Tranche B 1LN, term loan 1 month U.S. LIBOR + 3.750% 8.3285% 3/11/28 (e)(h)(s) | | 3,044,006 | 2,977,890 |
| Berry Global, Inc. Tranche Z 1LN, term loan 1 month U.S. LIBOR + 1.750% 6.325% 7/1/26 (e)(h)(s) | | 3,493,797 | 3,482,267 |
| Canister International Group, Inc. 1LN, term loan 1 month U.S. LIBOR + 4.750% 9.3849% 12/21/26 (e)(h)(s) | | 2,017,938 | 2,012,893 |
| Charter NEX U.S., Inc. 1LN, term loan 3 month U.S. LIBOR + 3.750% 8.3197% 12/1/27 (e)(h)(s) | | 2,060,462 | 2,024,734 |
| Clydesdale Acquisition Holdings, Inc. 1LN, term loan CME Term SOFR 1 Month Index + 4.170% 8.8926% 4/13/29 (e)(h)(s) | | 10,033,957 | 9,882,645 |
| Graham Packaging Co., Inc. Tranche B 1LN, term loan 1 month U.S. LIBOR + 3.000% 7.6349% 8/4/27 (e)(h)(s) | | 3,531,420 | 3,509,348 |
| Kloeckner Pentaplast of America, Inc. Tranche B 1LN, term loan CME TERM SOFR 6 MONTH INDEX + 4.750% 8.2592% 2/9/26 (e)(h)(s) | | 1,066,013 | 980,071 |
| Pregis TopCo Corp. 1LN, term loan: | | | |
| 3 month U.S. LIBOR + 3.750% 8.3197% 8/1/26 (e)(h)(s) | | 740,625 | 730,671 |
| 3 month U.S. LIBOR + 4.000% 8.4821% 7/31/26 (e)(h)(s) | | 727,500 | 718,406 |
| Reynolds Consumer Products LLC Tranche B 1LN, term loan 1 month U.S. LIBOR + 1.750% 6.3197% 1/30/27 (e)(h)(s) | | 3,234,631 | 3,226,900 |
| Reynolds Group Holdings, Inc. Tranche B 1LN, term loan: | | | |
| 1 month U.S. LIBOR + 3.250% 7.8197% 2/5/26 (e)(h)(s) | | 904,029 | 901,064 |
| 1 month U.S. LIBOR + 3.250% 7.8849% 9/24/28 (e)(h)(s) | | 1,530,625 | 1,522,023 |
| | | | 35,114,264 |
| Metals & Mining - 0.0% | | | |
| Atkore International, Inc. Tranche B1LN, term loan 1 month U.S. LIBOR + 2.000% 6.1875% 5/26/28 (e)(h)(s) | | 1,016,425 | 1,015,154 |
| Tiger Acquisition LLC Tranche B 1LN, term loan 1 month U.S. LIBOR + 3.250% 7.8849% 6/1/28 (e)(h)(s) | | 985,000 | 959,843 |
| | | | 1,974,997 |
| Paper & Forest Products - 0.0% | | | |
| Ahlstrom-Munksjo OYJ 1LN, term loan 3 month U.S. LIBOR + 3.750% 8.4799% 2/4/28 (e)(h)(s) | | 1,750,000 | 1,709,173 |
| Journey Personal Care Corp. Tranche B 1LN, term loan 3 month U.S. LIBOR + 4.250% 8.9799% 3/1/28 (e)(h)(s) | | 617,168 | 458,377 |
| | | | 2,167,550 |
TOTAL MATERIALS | | | 94,153,778 |
| REAL ESTATE - 0.0% | | | |
| Real Estate Management & Development - 0.0% | | | |
| DTZ U.S. Borrower LLC Tranche B 1LN, term loan: | | | |
| 1 month U.S. LIBOR + 2.750% 7.3197% 8/21/25 (e)(h)(s) | | 1,836,423 | 1,824,946 |
| CME Term SOFR 1 Month Index + 3.250% 7.9676% 1/24/30 (e)(h)(s) | | 2,316,383 | 2,301,906 |
| Lightstone Holdco LLC: | | | |
| Tranche B 1LN, term loan CME Term SOFR 1 Month Index + 5.750% 10.3114% 1/30/27 (e)(h)(s) | | 1,771,477 | 1,503,541 |
| Tranche C 1LN, term loan CME Term SOFR 1 Month Index + 5.750% 10.3114% 1/30/27 (e)(h)(s) | | 100,194 | 85,040 |
| | | | 5,715,433 |
| UTILITIES - 0.2% | | | |
| Electric Utilities - 0.2% | | | |
| Brookfield WEC Holdings, Inc.: | | | |
| 1LN, term loan CME Term SOFR 1 Month Index + 3.750% 8.3676% 8/1/25 (e)(h)(s) | | 917,700 | 916,406 |
| Tranche B 1LN, term loan 1 month U.S. LIBOR + 2.750% 7.3849% 8/1/25 (e)(h)(s) | | 7,748,441 | 7,713,882 |
| ExGen Renewables IV, LLC Tranche B 1LN, term loan 3 month U.S. LIBOR + 2.500% 7.46% 12/15/27 (e)(h)(s) | | 936,311 | 933,090 |
| Granite Generation LLC 1LN, term loan 1 month U.S. LIBOR + 3.750% 8.3849% 11/1/26 (e)(h)(s) | | 595,536 | 569,481 |
| PG&E Corp. Tranche B 1LN, term loan 1 month U.S. LIBOR + 3.000% 7.6875% 6/23/25 (e)(h)(s) | | 14,278,437 | 14,207,045 |
| Vistra Operations Co. LLC Tranche B 3LN, term loan 1 month U.S. LIBOR + 1.750% 6.3782% 12/31/25 (e)(h)(s) | | 3,983,134 | 3,974,291 |
| | | | 28,314,195 |
| Independent Power and Renewable Electricity Producers - 0.0% | | | |
| Esdec Solar Group BV Tranche B 1LN, term loan 6 month U.S. LIBOR + 4.750% 8.9199% 8/27/28 (e)(h)(s) | | 1,824,038 | 1,814,918 |
| Granite Acquisition, Inc. Tranche B 1LN, term loan 3 month U.S. LIBOR + 2.750% 7.4799% 3/25/28 (e)(h)(s) | | 2,238,750 | 2,120,410 |
| Natgasoline LLC Tranche B, term loan 1 month U.S. LIBOR + 3.500% 8.1875% 11/14/25 (e)(h)(s) | | 960,000 | 948,605 |
| TerraForm Power Operating LLC Tranche B 1LN, term loan CME TERM SOFR 3 MONTH INDEX + 2.750% 7.4302% 5/20/29 (e)(h)(s) | | 1,024,850 | 1,022,934 |
| | | | 5,906,867 |
| Multi-Utilities - 0.0% | | | |
| Osmose Utilities Services, Inc. Tranche B 1LN, term loan 1 month U.S. LIBOR + 3.250% 7.8849% 6/17/28 (e)(h)(s) | | 109,446 | 105,393 |
TOTAL UTILITIES | | | 34,326,455 |
| TOTAL BANK LOAN OBLIGATIONS (Cost $1,372,466,815) | | | 1,332,418,792 |
| | | | |
| Bank Notes - 0.1% |
| | | Principal Amount (a) | Value ($) |
| Discover Bank 4.682% 8/9/28 (e) | | 5,039,000 | 4,820,601 |
| KeyBank NA 6.95% 2/1/28 | | 718,000 | 753,702 |
| Regions Bank 6.45% 6/26/37 | | 8,935,000 | 9,306,569 |
| TOTAL BANK NOTES (Cost $15,937,560) | | | 14,880,872 |
| | | | |
| Fixed-Income Funds - 0.1% |
| | | Shares | Value ($) |
iShares Broad USD High Yield Corporate Bond ETF (v) (Cost $19,150,735) | | 508,800 | 17,792,736 |
| | | | |
| Preferred Securities - 0.5% |
| | | Principal Amount (a) | Value ($) |
| COMMUNICATION SERVICES - 0.0% | | | |
| Diversified Telecommunication Services - 0.0% | | | |
| CAS Capital No 1 Ltd. 4% (Reg. S) (e)(j) | | 1,000,000 | 863,684 |
| Telefonica Europe BV 3.875% (Reg. S) (e)(j) | EUR | 2,100,000 | 2,087,985 |
| | | | 2,951,669 |
| CONSUMER DISCRETIONARY - 0.1% | | | |
| Automobiles - 0.1% | | | |
| Volkswagen International Finance NV: | | | |
| 3.375% (Reg. S) (e)(j) | EUR | 2,500,000 | 2,598,809 |
| 3.748% (Reg. S) (e)(j) | EUR | 800,000 | 740,630 |
| 3.875% (Reg. S) (e)(j) | EUR | 9,400,000 | 8,719,808 |
| 4.625% (Reg. S) (e)(j) | EUR | 5,150,000 | 5,386,018 |
| | | | 17,445,265 |
| CONSUMER STAPLES - 0.1% | | | |
| Food Products - 0.0% | | | |
| Cosan Overseas Ltd. 8.25% (j) | | 1,486,000 | 1,479,085 |
| Danone SA 1.75% (Reg. S) (e)(j) | EUR | 2,600,000 | 2,753,816 |
| Grupo Bimbo S.A.B. de CV 5.95% (d)(e)(j) | | 840,000 | 843,469 |
| | | | 5,076,370 |
| Tobacco - 0.1% | | | |
| British American Tobacco PLC 3% (Reg. S) (e)(j) | EUR | 8,710,000 | 7,522,156 |
TOTAL CONSUMER STAPLES | | | 12,598,526 |
| ENERGY - 0.0% | | | |
| Oil, Gas & Consumable Fuels - 0.0% | | | |
| Energy Transfer LP 3 month U.S. LIBOR + 4.020% 8.8916% (e)(h)(j) | | 1,120,000 | 1,065,073 |
| Gazprom PJSC Via Gaz Finance PLC 4.5985% (Reg. S) (e)(f)(j) | | 910,000 | 495,768 |
| | | | 1,560,841 |
| FINANCIALS - 0.2% | | | |
| Banks - 0.1% | | | |
| AIB Group PLC 6.25% (Reg. S) (e)(j) | EUR | 1,780,000 | 1,802,593 |
| Banco Bilbao Vizcaya Argentaria SA 5.875% (Reg. S) (e)(j) | EUR | 1,800,000 | 1,887,529 |
| Banco Do Brasil SA 6.25% (d)(e)(j) | | 805,000 | 772,537 |
| Banco Mercantil del Norte SA: | | | |
| 6.75% (d)(e)(j) | | 1,240,000 | 1,204,195 |
| 7.625% (d)(e)(j) | | 542,000 | 517,305 |
| Bank of Nova Scotia: | | | |
| 3 month U.S. LIBOR + 2.640% 7.4539% (e)(h)(j) | | 1,347,000 | 1,319,977 |
| 4.9% (e)(j) | | 905,000 | 878,666 |
| Barclays PLC: | | | |
| 5.875% (Reg. S) (e)(j) | GBP | 1,000,000 | 1,131,861 |
| 7.125% (e)(j) | GBP | 250,000 | 293,145 |
| 8.875% (e)(j) | GBP | 1,000,000 | 1,232,047 |
| BBVA Bancomer SA Texas Branch: | | | |
| 5.125% 1/18/33 (d)(e) | | 485,000 | 438,331 |
| 5.35% 11/12/29 (d)(e) | | 265,000 | 259,712 |
| BNP Paribas SA 6.625% (Reg. S) (e)(j) | | 2,230,000 | 2,249,476 |
| Emirates NBD Bank PJSC 6.125% (Reg. S) (e)(j) | | 980,000 | 1,000,002 |
| Georgia Bank Joint Stock Co. 11.125% (Reg. S) (e)(j) | | 200,000 | 202,388 |
| Itau Unibanco Holding SA U.S. TREASURY 5 YEAR INDEX + 3.980% 7.721% (d)(e)(h)(j) | | 675,000 | 659,733 |
| JPMorgan Chase & Co. 6% (e)(j) | | 785,000 | 786,469 |
| Lloyds Banking Group PLC 5.125% (e)(j) | GBP | 220,000 | 250,452 |
| NBK Tier 1 Financing 2 Ltd. 4.5% (d)(e)(j) | | 850,000 | 802,983 |
| NBK Tier 1 Ltd. 3.625% (d)(e)(j) | | 340,000 | 300,815 |
| Societe Generale 7.875% (Reg. S) (e)(j) | | 900,000 | 911,964 |
| Stichting AK Rabobank Certificaten 6.5% (Reg. S) (e)(h)(j) | EUR | 1,545,650 | 1,622,482 |
| Tinkoff Credit Systems 6% (d)(e)(j) | | 390,000 | 160,615 |
| | | | 20,685,277 |
| Capital Markets - 0.1% | | | |
| Credit Suisse Group AG 7.5% (Reg. S) (e)(j) | | 7,755,000 | 7,177,698 |
| UBS Group AG 7% (Reg. S) (e)(j) | | 644,000 | 640,963 |
| | | | 7,818,661 |
| Insurance - 0.0% | | | |
| QBE Insurance Group Ltd. 5.25% (Reg. S) (e)(j) | | 4,059,000 | 3,867,375 |
TOTAL FINANCIALS | | | 32,371,313 |
| INDUSTRIALS - 0.0% | | | |
| Marine - 0.0% | | | |
| DP World Salaam 6% (Reg. S) (e)(j) | | 1,015,000 | 1,018,582 |
| Road & Rail - 0.0% | | | |
| National Express Group PLC 4.25% (Reg. S) (e)(j) | GBP | 900,000 | 961,198 |
| Trading Companies & Distributors - 0.0% | | | |
| AerCap Holdings NV 5.875% 10/10/79 (e) | | 3,500,000 | 3,419,301 |
TOTAL INDUSTRIALS | | | 5,399,081 |
| INFORMATION TECHNOLOGY - 0.0% | | | |
| IT Services - 0.0% | | | |
| Network i2i Ltd.: | | | |
| 3.975% (d)(e)(j) | | 350,000 | 311,320 |
| 5.65% (d)(e)(j) | | 1,015,000 | 984,756 |
| | | | 1,296,076 |
| MATERIALS - 0.0% | | | |
| Construction Materials - 0.0% | | | |
| CEMEX S.A.B. de CV 5.125% (d)(e)(j) | | 2,015,000 | 1,869,182 |
| REAL ESTATE - 0.1% | | | |
| Real Estate Management & Development - 0.1% | | | |
| Aroundtown SA 3.375% (Reg. S) (e)(j) | EUR | 6,000,000 | 3,389,554 |
| AT Securities BV 5.25% (Reg. S) (e)(j) | | 5,250,000 | 2,799,591 |
| Citycon Oyj 4.496% (Reg. S) (e)(j) | EUR | 1,555,000 | 1,006,147 |
| CPI Property Group SA 3.75% (Reg. S) (e)(j) | EUR | 3,955,000 | 2,117,672 |
| Grand City Properties SA 1.5% (Reg. S) (e)(j) | EUR | 6,000,000 | 3,166,376 |
| Heimstaden Bostad AB: | | | |
| 3.248% (Reg. S) (e)(j) | EUR | 5,790,000 | 4,695,407 |
| 3.625% (Reg. S) (e)(j) | EUR | 1,410,000 | 934,585 |
| Samhallsbyggnadsbolaget I Norden AB 2.624% (Reg. S) (e)(j) | EUR | 2,605,000 | 1,230,539 |
| | | | 19,339,871 |
| UTILITIES - 0.0% | | | |
| Electric Utilities - 0.0% | | | |
| Electricite de France SA: | | | |
| 5.625% (d)(e)(j) | | 60,000 | 58,699 |
| 5.625% (Reg. S) (e)(j) | | 2,370,000 | 2,304,007 |
| SSE PLC 3.74% (Reg. S) (e)(j) | GBP | 1,920,000 | 2,215,041 |
| | | | 4,577,747 |
| Multi-Utilities - 0.0% | | | |
| ELM BV for Firmenich International SA 3.75% (Reg. S) (e)(j) | EUR | 705,000 | 724,760 |
| Veolia Environnement SA 2% (Reg. S) (e)(j) | EUR | 3,500,000 | 3,075,458 |
| | | | 3,800,218 |
TOTAL UTILITIES | | | 8,377,965 |
| TOTAL PREFERRED SECURITIES (Cost $135,033,511) | | | 103,209,789 |
| | | | |
| Money Market Funds - 5.8% |
| | | Shares | Value ($) |
| Fidelity Cash Central Fund 4.63% (w) | | 1,151,987,279 | 1,152,217,676 |
| Fidelity Securities Lending Cash Central Fund 4.63% (w)(x) | | 7,408,059 | 7,408,800 |
| TOTAL MONEY MARKET FUNDS (Cost $1,159,624,279) | | | 1,159,626,476 |
| | | | |
| Purchased Swaptions - 0.0% |
| | Expiration Date | Notional Amount (a) | Value ($) |
| Put Options - 0.0% | | | | |
| Option with an exercise rate of 4.25% on a credit default swap with Goldman Sachs Bank U.S.A. to buy protection on the 5-Year iTraxx Europe Crossover Series 38 Index expiring December 2027, paying 5% quarterly. | 3/15/23 | EUR | 19,050,000 | 99,216 |
| Option with an exercise rate of 5.00% on a credit default swap with Goldman Sachs Bank U.S.A. to buy protection on the 5-Year iTraxx Europe Crossover Series 38 Index expiring December 2027, paying 5% quarterly. | 3/15/23 | EUR | 47,700,000 | 32,658 |
| | | | | |
TOTAL PURCHASED SWAPTIONS (Cost $968,986) | | | | 131,874 |
| TOTAL INVESTMENT IN SECURITIES - 109.8% (Cost $23,904,506,879) | 21,806,287,683 |
NET OTHER ASSETS (LIABILITIES) - (9.8)% | (1,940,951,965) |
| NET ASSETS - 100.0% | 19,865,335,718 |
| | |
| TBA Sale Commitments |
| | Principal Amount (a) | Value ($) |
| Ginnie Mae | | |
| 2% 3/1/53 | (13,050,000) | (10,938,151) |
| 2% 3/1/53 | (3,100,000) | (2,598,335) |
| 2% 3/1/53 | (63,800,000) | (53,475,406) |
| 2% 3/1/53 | (47,850,000) | (40,106,554) |
| | | |
| TOTAL GINNIE MAE | | (107,118,446) |
| | | |
| Uniform Mortgage Backed Securities | | |
| 1.5% 3/1/38 | (18,700,000) | (16,165,733) |
| 1.5% 3/1/38 | (125,000) | (108,060) |
| 1.5% 3/1/38 | (23,700,000) | (20,488,121) |
| 1.5% 3/1/38 | (23,000,000) | (19,882,987) |
| 2% 3/1/38 | (4,200,000) | (3,727,580) |
| 2% 3/1/38 | (26,350,000) | (23,386,126) |
| 2% 3/1/38 | (14,200,000) | (12,602,770) |
| 2% 3/1/53 | (14,400,000) | (11,725,260) |
| 2% 3/1/53 | (19,200,000) | (15,633,681) |
| 2% 3/1/53 | (16,800,000) | (13,679,471) |
| 2% 3/1/53 | (24,200,000) | (19,704,952) |
| 2% 3/1/53 | (9,200,000) | (7,491,139) |
| 2% 3/1/53 | (156,450,000) | (127,390,070) |
| 2% 3/1/53 | (91,500,000) | (74,504,259) |
| 2.5% 3/1/53 | (1,475,000) | (1,249,603) |
| 2.5% 3/1/53 | (2,100,000) | (1,779,096) |
| 2.5% 3/1/53 | (2,200,000) | (1,863,814) |
| 2.5% 3/1/53 | (4,250,000) | (3,600,551) |
| 2.5% 3/1/53 | (11,550,000) | (9,785,026) |
| 2.5% 3/1/53 | (28,550,000) | (24,187,229) |
| 2.5% 3/1/53 | (19,700,000) | (16,689,611) |
| 2.5% 3/1/53 | (6,650,000) | (5,633,803) |
| 2.5% 3/1/53 | (12,550,000) | (10,632,214) |
| 3% 3/1/53 | (2,025,000) | (1,781,129) |
| 3% 3/1/53 | (89,000,000) | (78,281,721) |
| 3% 3/1/53 | (29,700,000) | (26,123,226) |
| 3.5% 3/1/53 | (89,325,000) | (81,327,677) |
| 3.5% 3/1/53 | (6,550,000) | (5,963,575) |
| 4.5% 3/1/53 | (48,950,000) | (47,127,748) |
| 5.5% 3/1/53 | (22,300,000) | (22,260,794) |
| 5.5% 3/1/53 | (3,475,000) | (3,468,891) |
| 6.5% 3/1/53 | (6,000,000) | (6,144,811) |
| | | |
| TOTAL UNIFORM MORTGAGE BACKED SECURITIES | | (714,390,728) |
| | | |
TOTAL TBA SALE COMMITMENTS (Proceeds $828,946,837) | | (821,509,174) |
| Futures Contracts |
| | Number of contracts | Expiration Date | Notional Amount ($) | Value ($) | Unrealized Appreciation/ (Depreciation) ($) |
| Purchased | | | | | |
| | | | | | |
| Bond Index Contracts | | | | | |
| ASX 10 Year Treasury Bond Index Contracts (Australia) | 38 | Mar 2023 | 3,008,596 | (129,957) | (129,957) |
| Eurex Euro-Bobl Contracts (Germany) | 58 | Mar 2023 | 7,065,901 | (127,893) | (127,893) |
| Eurex Euro-Bund Contracts (Germany) | 169 | Mar 2023 | 23,757,835 | (1,293,816) | (1,293,816) |
| Eurex Euro-Buxl 30 Year Bond Contracts (Germany) | 66 | Mar 2023 | 9,373,845 | (1,574,730) | (1,574,730) |
| Eurex Euro-Schatz Contracts (Germany) | 45 | Mar 2023 | 4,996,681 | (24,311) | (24,311) |
| TME 10 Year Canadian Note Contracts (Canada) | 184 | Jun 2023 | 16,381,326 | 5,560 | 5,560 |
| | | | | | |
| TOTAL BOND INDEX CONTRACTS | | | | | (3,145,147) |
| | | | | | |
| Treasury Contracts | | | | | |
| CBOT 10-Year U.S. Treasury Note Contracts (United States) | 72 | Jun 2023 | 8,039,250 | 6,036 | 6,036 |
| CBOT 2-Year U.S. Treasury Note Contracts (United States) | 761 | Jun 2023 | 155,035,914 | (242,982) | (242,982) |
| CBOT 5-Year U.S. Treasury Note Contracts (United States) | 95 | Jun 2023 | 10,170,195 | (12,808) | (12,808) |
| CBOT Long Term U.S. Treasury Bond Contracts (United States) | 304 | Jun 2023 | 38,066,500 | (4,716) | (4,716) |
| | | | | | |
| TOTAL TREASURY CONTRACTS | | | | | (254,470) |
| | | | | | |
| TOTAL PURCHASED | | | | | (3,399,617) |
| | | | | | |
| Sold | | | | | |
| | | | | | |
| Bond Index Contracts | | | | | |
| ICE Long Gilt Contracts (United Kingdom) | 149 | Jun 2023 | 17,915,296 | 115,987 | 115,987 |
| | | | | | |
| Treasury Contracts | | | | | |
| CBOT Long Term U.S. Treasury Bond Contracts (United States) | 849 | Jun 2023 | 106,310,719 | 6,529 | 6,529 |
| CBOT Ultra Long Term U.S. Treasury Bond Contracts (United States) | 30 | Jun 2023 | 4,051,875 | (23,270) | (23,270) |
| | | | | | |
| TOTAL TREASURY CONTRACTS | | | | | (16,741) |
| | | | | | |
| TOTAL SOLD | | | | | 99,246 |
| | | | | | |
| TOTAL FUTURES CONTRACTS | | | | | (3,300,371) |
| The notional amount of futures purchased as a percentage of Net Assets is 1.3% |
| The notional amount of futures sold as a percentage of Net Assets is 0.6% |
| Forward Foreign Currency Contracts |
Currency Purchased | Currency Sold | Counterparty | Settlement Date | Unrealized Appreciation/ (Depreciation) ($) |
| | | | | | | |
| USD | 548,412 | EUR | 518,000 | State Street Bank and Trust Co | 3/01/23 | 523 |
| CAD | 323,000 | USD | 239,648 | Bank of America, N.A. | 4/20/23 | (2,811) |
| CAD | 193,000 | USD | 144,256 | Brown Brothers Harriman & Co | 4/20/23 | (2,741) |
| CAD | 768,000 | USD | 564,747 | Goldman Sachs Bank USA | 4/20/23 | (1,618) |
| EUR | 483,000 | USD | 525,644 | Bank of America, N.A. | 4/20/23 | (13,260) |
| EUR | 3,447,000 | USD | 3,754,643 | Bank of America, N.A. | 4/20/23 | (97,940) |
| EUR | 260,000 | USD | 275,152 | Bank of America, N.A. | 4/20/23 | 665 |
| EUR | 3,152,000 | USD | 3,444,846 | Brown Brothers Harriman & Co | 4/20/23 | (101,090) |
| EUR | 1,206,000 | USD | 1,297,950 | Brown Brothers Harriman & Co | 4/20/23 | (18,582) |
| EUR | 874,000 | USD | 933,554 | Brown Brothers Harriman & Co | 4/20/23 | (6,383) |
| EUR | 2,934,000 | USD | 3,123,049 | JPMorgan Chase Bank, N.A. | 4/20/23 | (10,555) |
| EUR | 2,980,000 | USD | 3,251,047 | JPMorgan Chase Bank, N.A. | 4/20/23 | (89,754) |
| EUR | 1,228,000 | USD | 1,322,100 | JPMorgan Chase Bank, N.A. | 4/20/23 | (19,393) |
| EUR | 545,000 | USD | 578,698 | State Street Bank and Trust Co | 4/20/23 | (542) |
| GBP | 242,000 | USD | 298,032 | Bank of America, N.A. | 4/20/23 | (6,672) |
| GBP | 973,000 | USD | 1,209,007 | Brown Brothers Harriman & Co | 4/20/23 | (37,547) |
| GBP | 1,361,000 | USD | 1,685,682 | Brown Brothers Harriman & Co | 4/20/23 | (47,082) |
| GBP | 826,000 | USD | 1,001,644 | JPMorgan Chase Bank, N.A. | 4/20/23 | (7,167) |
| GBP | 293,000 | USD | 361,254 | JPMorgan Chase Bank, N.A. | 4/20/23 | (8,492) |
| GBP | 339,000 | USD | 412,839 | JPMorgan Chase Bank, N.A. | 4/20/23 | (4,694) |
| USD | 143,497 | AUD | 205,000 | Bank of America, N.A. | 4/20/23 | 5,306 |
| USD | 23,209 | AUD | 34,000 | State Street Bank and Trust Co | 4/20/23 | 290 |
| USD | 114,788 | CAD | 154,000 | Bank of America, N.A. | 4/20/23 | 1,869 |
| USD | 274,507 | CAD | 372,000 | Bank of America, N.A. | 4/20/23 | 1,741 |
| USD | 614,505 | CAD | 819,000 | Brown Brothers Harriman & Co | 4/20/23 | 13,981 |
| USD | 168,916 | CAD | 225,000 | Brown Brothers Harriman & Co | 4/20/23 | 3,937 |
| USD | 36,488 | CAD | 49,000 | Citibank, N. A. | 4/20/23 | 559 |
| USD | 202,529,393 | EUR | 187,034,000 | BNP Paribas S.A. | 4/20/23 | 4,116,915 |
| USD | 944,969 | EUR | 867,000 | Bank of America, N.A. | 4/20/23 | 25,224 |
| USD | 273,203 | EUR | 250,000 | Brown Brothers Harriman & Co | 4/20/23 | 7,994 |
| USD | 347,921 | EUR | 319,000 | Brown Brothers Harriman & Co | 4/20/23 | 9,514 |
| USD | 13,250,430 | EUR | 12,264,000 | Citibank, N. A. | 4/20/23 | 240,333 |
| USD | 572,339 | EUR | 526,000 | JPMorgan Chase Bank, N.A. | 4/20/23 | 14,339 |
| USD | 558,920 | EUR | 515,000 | JPMorgan Chase Bank, N.A. | 4/20/23 | 12,589 |
| USD | 420,508 | EUR | 385,000 | JPMorgan Chase Bank, N.A. | 4/20/23 | 12,086 |
| USD | 3,251,694 | EUR | 2,980,000 | JPMorgan Chase Bank, N.A. | 4/20/23 | 90,402 |
| USD | 986,039 | EUR | 897,000 | JPMorgan Chase Bank, N.A. | 4/20/23 | 34,469 |
| USD | 120,908,638 | GBP | 98,940,000 | Bank of America, N.A. | 4/20/23 | 1,788,134 |
| USD | 1,043,575 | GBP | 846,000 | Brown Brothers Harriman & Co | 4/20/23 | 25,019 |
| USD | 276,649 | GBP | 228,000 | Brown Brothers Harriman & Co | 4/20/23 | 2,144 |
| USD | 7,706,208 | GBP | 6,405,000 | Brown Brothers Harriman & Co | 4/20/23 | (5,201) |
| USD | 477,508 | GBP | 390,000 | JPMorgan Chase Bank, N.A. | 4/20/23 | 7,961 |
| USD | 410,704 | GBP | 332,000 | JPMorgan Chase Bank, N.A. | 4/20/23 | 10,987 |
| USD | 318,004 | GBP | 265,000 | JPMorgan Chase Bank, N.A. | 4/20/23 | (1,048) |
| USD | 555,475 | GBP | 456,000 | State Street Bank and Trust Co | 4/20/23 | 6,466 |
| USD | 3,242,221 | GBP | 2,615,000 | State Street Bank and Trust Co | 4/20/23 | 93,847 |
| USD | 231,044 | GBP | 192,000 | State Street Bank and Trust Co | 4/20/23 | (118) |
| | | | | | | |
| TOTAL FORWARD FOREIGN CURRENCY CONTRACTS | | 6,044,604 |
| | | | | | | |
| Unrealized Appreciation | | | 6,527,294 |
| Unrealized Depreciation | | | (482,690) |
| Credit Default Swaps |
| Underlying Reference | | Maturity Date | Clearinghouse / Counterparty | Fixed Payment Received/ (Paid) | Payment Frequency | Notional Amount (1) | Value ($) | Upfront Premium Received/ (Paid) ($) | Unrealized Appreciation/ (Depreciation) ($) |
| Buy Protection | | | | | | | | | | |
| CMBX N.A. AAA Index Series 12 | | Aug 2061 | Citigroup Global Markets Ltd. | (0.5%) | Monthly | | 24,350,000 | 234,875 | (314) | 234,561 |
| CMBX N.A. AAA Index Series 13 | | Dec 2072 | Citigroup Global Markets Ltd. | (0.5%) | Monthly | | 1,900,000 | 25,749 | (16,404) | 9,345 |
| CMBX N.A. AAA Index Series 13 | | Dec 2072 | Citigroup Global Markets Ltd. | (0.5%) | Monthly | | 3,770,000 | 51,091 | (41,531) | 9,560 |
| CMBX N.A. AAA Index Series 13 | | Dec 2072 | Citigroup Global Markets Ltd. | (0.5%) | Monthly | | 2,710,000 | 36,726 | 12,025 | 48,751 |
| CMBX N.A. AAA Index Series 13 | | Dec 2072 | Citigroup Global Markets Ltd. | (0.5%) | Monthly | | 6,700,000 | 90,799 | (137,893) | (47,094) |
| CMBX N.A. AAA Index Series 13 | | Dec 2072 | Citigroup Global Markets Ltd. | (0.5%) | Monthly | | 9,060,000 | 122,782 | (27,600) | 95,182 |
| CMBX N.A. AAA Index Series 13 | | Dec 2072 | Citigroup Global Markets Ltd. | (0.5%) | Monthly | | 4,890,000 | 66,270 | (37,513) | 28,757 |
| CMBX N.A. AAA Index Series 13 | | Dec 2072 | Citigroup Global Markets Ltd. | (0.5%) | Monthly | | 9,000,000 | 121,969 | (122,415) | (446) |
| CMBX N.A. AAA Index Series 13 | | Dec 2072 | Goldman Sachs & Co. LLC | (0.5%) | Monthly | | 5,620,000 | 76,163 | (107,050) | (30,887) |
| CMBX N.A. AAA Index Series 13 | | Dec 2072 | Goldman Sachs & Co. LLC | (0.5%) | Monthly | | 580,000 | 7,860 | (861) | 6,999 |
| CMBX N.A. AAA Index Series 13 | | Dec 2072 | Goldman Sachs & Co. LLC | (0.5%) | Monthly | | 3,760,000 | 50,956 | (44,596) | 6,360 |
| CMBX N.A. AAA Index Series 13 | | Dec 2072 | JPMorgan Securities LLC | (0.5%) | Monthly | | 2,050,000 | 27,782 | (28,574) | (792) |
| CMBX N.A. AAA Index Series 13 | | Dec 2072 | JPMorgan Securities LLC | (0.5%) | Monthly | | 2,950,000 | 39,979 | (11,734) | 28,245 |
| CMBX N.A. AAA Index Series 13 | | Dec 2072 | Morgan Stanley Capital Services LLC | (0.5%) | Monthly | | 4,000,000 | 54,208 | (27,356) | 26,852 |
| CMBX N.A. AAA Index Series 13 | | Dec 2072 | Morgan Stanley Capital Services LLC | (0.5%) | Monthly | | 2,500,000 | 33,880 | (13,413) | 20,467 |
| CMBX N.A. AAA Index Series 13 | | Dec 2072 | Morgan Stanley Capital Services LLC | (0.5%) | Monthly | | 2,390,000 | 32,390 | (17,012) | 15,378 |
| CMBX N.A. AAA Index Series 13 | | Dec 2072 | Morgan Stanley Capital Services LLC | (0.5%) | Monthly | | 1,890,000 | 25,613 | (17,838) | 7,775 |
| CMBX N.A. AAA Index Series 13 | | Dec 2072 | Morgan Stanley Capital Services LLC | (0.5%) | Monthly | | 10,660,000 | 144,465 | (182,112) | (37,647) |
| CMBX N.A. AAA Index Series 13 | | Dec 2072 | Morgan Stanley Capital Services LLC | (0.5%) | Monthly | | 1,840,000 | 24,936 | (31,168) | (6,232) |
| CMBX N.A. AAA Index Series 13 | | Dec 2072 | Morgan Stanley Capital Services LLC | (0.5%) | Monthly | | 3,740,000 | 50,685 | (51,912) | (1,227) |
| Intesa Sanpaolo SpA | | Dec 2027 | JPMorgan Chase Bank, N.A. | (1%) | Quarterly | EUR | 5,000,000 | (33,550) | (29,489) | (63,039) |
| | | | | | | | | | | |
| TOTAL CREDIT DEFAULT SWAPS | | | | | | | | 1,285,628 | (934,760) | 350,868 |
(1)Notional amount is stated in U.S. Dollars unless otherwise noted.
| Interest Rate Swaps |
| Payment Received | Payment Frequency | Payment Paid | Payment Frequency | Clearinghouse / Counterparty (1) | Maturity Date | Notional Amount (2) | Value ($) | Upfront Premium Received/ (Paid) ($) (3) | Unrealized Appreciation/ (Depreciation) ($) |
| 4.5% | Annual | U.S. Secured Overnight Fin. Rate (SOFR) Index (4) | Annual | LCH | Mar 2025 | | 26,986,000 | (431,317) | 0 | (431,317) |
| 4% | Annual | U.S. Secured Overnight Fin. Rate (SOFR) Index (4) | Annual | LCH | Mar 2028 | | 13,832,000 | (389,422) | 0 | (389,422) |
| 3.75% | Annual | U.S. Secured Overnight Fin. Rate (SOFR) Index (4) | Annual | LCH | Mar 2033 | | 202,000 | (8,011) | 0 | (8,011) |
| 3.25% | Annual | U.S. Secured Overnight Fin. Rate (SOFR) Index (4) | Annual | LCH | Mar 2053 | | 715,000 | (55,873) | 0 | (55,873) |
| TOTAL INTEREST RATE SWAPS | | | | | | | | (884,623) | 0 | (884,623) |
(1)Swaps with LCH Clearnet Group (LCH) are centrally cleared over-the-counter (OTC) swaps.
(2)Notional amount is stated in U.S. Dollars unless otherwise noted.
(3)Any premiums for centrally cleared over-the-counter (OTC) swaps are recorded periodically throughout the term of the swap to variation margin and included in unrealized appreciation (depreciation).
(4)Represents floating rate.
Currency Abbreviations
| AUD | - | Australian dollar |
| CAD | - | Canadian dollar |
| EUR | - | European Monetary Unit |
| GBP | - | British pound sterling |
| USD | - | U.S. dollar |
Security Type Abbreviations
Legend
| (a) | Amount is stated in United States dollars unless otherwise noted. |
| (b) | Restricted securities (including private placements) - Investment in securities not registered under the Securities Act of 1933 (excluding 144A issues). At the end of the period, the value of restricted securities (excluding 144A issues) amounted to $8,723,665 or 0.0% of net assets. |
| (d) | Security exempt from registration under Rule 144A of the Securities Act of 1933. These securities may be resold in transactions exempt from registration, normally to qualified institutional buyers. At the end of the period, the value of these securities amounted to $4,034,589,483 or 20.3% of net assets. |
| (e) | Coupon rates for floating and adjustable rate securities reflect the rates in effect at period end. |
| (f) | Non-income producing - Security is in default. |
| (g) | Security or a portion of the security purchased on a delayed delivery or when-issued basis. |
| (h) | Coupon is indexed to a floating interest rate which may be multiplied by a specified factor and/or subject to caps or floors. |
| (i) | Security initially issued at one coupon which converts to a higher coupon at a specified date. The rate shown is the rate at period end. |
| (j) | Security is perpetual in nature with no stated maturity date. |
| (k) | Security or a portion of the security was pledged to cover margin requirements for futures contracts. At period end, the value of securities pledged amounted to $8,549,013. |
| (l) | Security or a portion of the security has been segregated as collateral for mortgage-backed or asset-backed securities purchased on a delayed delivery or when-issued basis. At period end, the value of securities pledged amounted to $36,638,518. |
| (m) | Security or a portion of the security was pledged to cover margin requirements for centrally cleared OTC swaps. At period end, the value of securities pledged amounted to $889,973. |
| (n) | Interest Only (IO) security represents the right to receive only monthly interest payments on an underlying pool of mortgages or assets. Principal shown is the outstanding par amount of the pool as of the end of the period. |
| (o) | Coupon is inversely indexed to a floating interest rate multiplied by a specified factor. The price may be considerably more volatile than the price of a comparable fixed rate security. |
| (p) | Principal Only Strips represent the right to receive the monthly principal payments on an underlying pool of mortgage loans. |
| (q) | Represents an investment in an underlying pool of reverse mortgages which typically do not require regular principal and interest payments as repayment is deferred until a maturity event. |
| (s) | Remaining maturities of bank loan obligations may be less than the stated maturities shown as a result of contractual or optional prepayments by the borrower. Such prepayments cannot be predicted with certainty. |
| (t) | The coupon rate will be determined upon settlement of the loan after period end. |
| (u) | Position or a portion of the position represents an unfunded loan commitment. At period end, the total principal amount and market value of unfunded commitments totaled $2,134,566 and $1,976,073, respectively. |
| (v) | Security or a portion of the security is on loan at period end. |
| (w) | Affiliated fund that is generally available only to investment companies and other accounts managed by Fidelity Investments. The rate quoted is the annualized seven-day yield of the fund at period end. A complete unaudited listing of the fund's holdings as of its most recent quarter end is available upon request. In addition, each Fidelity Central Fund's financial statements are available on the SEC's website or upon request. |
| (x) | Investment made with cash collateral received from securities on loan. |
| Additional information on each restricted holding is as follows: |
| Security | Acquisition Date | Acquisition Cost ($) |
| Chesapeake Energy Corp. | 2/10/21 | 3,324 |
| | | |
| Mesquite Energy, Inc. 15% 7/15/23 | 7/10/20 - 1/18/22 | 521,057 |
| | | |
| Mesquite Energy, Inc. 15% 7/15/23 | 11/05/20 - 1/18/22 | 899,094 |
| | | |
Affiliated Central Funds
Fiscal year to date information regarding the Fund's investments in Fidelity Central Funds, including the ownership percentage, is presented below.
| Affiliate | Value, beginning of period ($) | Purchases ($) | Sales Proceeds ($) | Dividend Income ($) | Realized Gain (loss) ($) | Change in Unrealized appreciation (depreciation) ($) | Value, end of period ($) | % ownership, end of period |
| Fidelity Cash Central Fund 4.63% | 1,357,368,977 | 3,477,499,027 | 3,682,650,328 | 27,142,143 | - | - | 1,152,217,676 | 2.6% |
| Fidelity Securities Lending Cash Central Fund 4.63% | 534,738,895 | 3,345,762,866 | 3,873,092,961 | 349,221 | - | - | 7,408,800 | 0.0% |
| Total | 1,892,107,872 | 6,823,261,893 | 7,555,743,289 | 27,491,364 | - | - | 1,159,626,476 | |
| | | | | | | | | |
Amounts in the dividend income column in the above table include any capital gain distributions from underlying funds, which are presented in the corresponding line item in the Statement of Operations, if applicable.
Amount for Fidelity Securities Lending Cash Central Fund represents the income earned on investing cash collateral, less rebates paid to borrowers and any lending agent fees associated with the loan, plus any premium payments received for lending certain types of securities.
Amounts included in the purchases and sales proceeds columns may include in-kind transactions, if applicable.
Investment Valuation
The following is a summary of the inputs used, as of February 28, 2023, involving the Fund's assets and liabilities carried at fair value. The inputs or methodology used for valuing securities may not be an indication of the risk associated with investing in those securities. For more information on valuation inputs, and their aggregation into the levels used below, please refer to the Investment Valuation section in the accompanying Notes to Financial Statements.
| Valuation Inputs at Reporting Date: |
| Description | Total ($) | Level 1 ($) | Level 2 ($) | Level 3 ($) |
Investments in Securities: | | | | |
|
| Equities: | | | | |
Communication Services | 1,804,995 | 1,804,993 | - | 2 |
Consumer Discretionary | 2,345,144 | 1,604,664 | - | 740,480 |
Energy | 14,881,841 | 9,380,042 | - | 5,501,799 |
Financials | 4,681,592 | 2,257,155 | - | 2,424,437 |
Industrials | 1,997,714 | 1,607,928 | - | 389,786 |
Information Technology | 923,520 | 422,674 | - | 500,846 |
Real Estate | 2,569,896 | 2,288,470 | 281,426 | - |
|
| Corporate Bonds | 7,071,560,530 | - | 7,062,777,682 | 8,782,848 |
|
| U.S. Government and Government Agency Obligations | 5,762,840,555 | - | 5,762,840,555 | - |
|
| U.S. Government Agency - Mortgage Securities | 3,861,644,712 | - | 3,861,644,712 | - |
|
| Asset-Backed Securities | 1,077,513,860 | - | 1,077,513,856 | 4 |
|
| Collateralized Mortgage Obligations | 108,703,660 | - | 108,703,391 | 269 |
|
| Commercial Mortgage Securities | 918,415,416 | - | 912,881,498 | 5,533,918 |
|
| Municipal Securities | 81,620,698 | - | 81,620,698 | - |
|
| Foreign Government and Government Agency Obligations | 251,518,795 | - | 251,468,795 | 50,000 |
|
| Supranational Obligations | 15,204,216 | - | 15,204,216 | - |
|
| Bank Loan Obligations | 1,332,418,792 | - | 1,315,876,119 | 16,542,673 |
|
| Bank Notes | 14,880,872 | - | 14,880,872 | - |
|
| Fixed-Income Funds | 17,792,736 | 17,792,736 | - | - |
|
| Preferred Securities | 103,209,789 | - | 103,209,789 | - |
|
| Money Market Funds | 1,159,626,476 | 1,159,626,476 | - | - |
|
| Purchased Swaptions | 131,874 | - | 131,874 | - |
| Total Investments in Securities: | 21,806,287,683 | 1,196,785,138 | 20,569,035,483 | 40,467,062 |
Derivative Instruments: | | | | |
|
| Assets | | | | |
Futures Contracts | 134,112 | 134,112 | - | - |
Forward Foreign Currency Contracts | 6,527,294 | - | 6,527,294 | - |
Swaps | 1,319,178 | - | 1,319,178 | - |
| Total Assets | 7,980,584 | 134,112 | 7,846,472 | - |
|
| Liabilities | | | | |
Futures Contracts | (3,434,483) | (3,434,483) | - | - |
Forward Foreign Currency Contracts | (482,690) | - | (482,690) | - |
Swaps | (918,173) | - | (918,173) | - |
| Total Liabilities | (4,835,346) | (3,434,483) | (1,400,863) | - |
| Total Derivative Instruments: | (3,145,238) | (3,300,371) | 6,445,609 | - |
Other Financial Instruments: | | | | |
|
| TBA Sale Commitments | (821,509,174) | - | (821,509,174) | - |
| Total Other Financial Instruments: | (821,509,174) | - | (821,509,174) | - |
Value of Derivative Instruments
The following table is a summary of the Fund's value of derivative instruments by primary risk exposure as of February 28, 2023. For additional information on derivative instruments, please refer to the Derivative Instruments section in the accompanying Notes to Financial Statements.
Primary Risk Exposure / Derivative Type | Value |
| Asset ($) | Liability ($) |
| Credit Risk | | |
Purchased Swaptions (a) | 131,874 | 0 |
Swaps (b) | 1,319,178 | (33,550) |
| Total Credit Risk | 1,451,052 | (33,550) |
| Foreign Exchange Risk | | |
Forward Foreign Currency Contracts (c) | 6,527,294 | (482,690) |
| Total Foreign Exchange Risk | 6,527,294 | (482,690) |
| Interest Rate Risk | | |
Futures Contracts (d) | 134,112 | (3,434,483) |
Swaps (e) | 0 | (884,623) |
| Total Interest Rate Risk | 134,112 | (4,319,106) |
| Total Value of Derivatives | 8,112,458 | (4,835,346) |
(a)Gross value is included in the Statement of Assets and Liabilities in the investments in securities, at value line-item.
(b)For bi-lateral over-the-counter (OTC) swaps, reflects gross value which is presented in the Statement of Assets and Liabilities in the bi-lateral OTC swaps, at value line-items.
(c)Gross value is presented in the Statement of Assets and Liabilities in the unrealized appreciation/depreciation on forward foreign currency contracts line-items.
(d)Reflects gross cumulative appreciation (depreciation) on futures contracts as presented in the Schedule of Investments. In the Statement of Assets and Liabilities, the period end daily variation margin is included in receivable or payable for daily variation margin on futures contracts, and the net cumulative appreciation (depreciation) is included in Total accumulated earnings (loss).
(e)For centrally cleared over-the-counter (OTC) swaps, reflects gross cumulative appreciation (depreciation) as presented in the Schedule of Investments. In the Statement of Assets and Liabilities, the period end daily variation margin for centrally cleared OTC swaps is included in receivable or payable for daily variation margin on centrally cleared OTC swaps, and the net cumulative appreciation (depreciation) for centrally cleared OTC swaps is included in Total accumulated earnings (loss).
| Statement of Assets and Liabilities |
| | | | February 28, 2023 (Unaudited) |
| | | | | |
| Assets | | | | |
| Investment in securities, at value (including securities loaned of $7,196,826) - See accompanying schedule: | | | | |
Unaffiliated issuers (cost $22,744,882,600) | $ | 20,646,661,207 | | |
Fidelity Central Funds (cost $1,159,624,279) | | 1,159,626,476 | | |
| | | | | |
| | | | | |
| Total Investment in Securities (cost $23,904,506,879) | | | $ | 21,806,287,683 |
| Cash | | | | 4,218,169 |
| Foreign currency held at value (cost $1,772,976) | | | | 1,767,182 |
| Receivable for investments sold | | | | 195,042,024 |
| Receivable for TBA sale commitments | | | | 828,946,837 |
| Unrealized appreciation on forward foreign currency contracts | | | | 6,527,294 |
| Dividends receivable | | | | 12,154 |
| Interest receivable | | | | 149,487,311 |
| Distributions receivable from Fidelity Central Funds | | | | 4,673,542 |
| Bi-lateral OTC swaps, at value | | | | 1,319,178 |
| Prepaid expenses | | | | 12,287 |
Total assets | | | | 22,998,293,661 |
| Liabilities | | | | |
| Payable for investments purchased | | | | |
Regular delivery | $ | 191,310,284 | | |
Delayed delivery | | 2,106,622,858 | | |
| TBA sale commitments, at value | | 821,509,174 | | |
| Unrealized depreciation on forward foreign currency contracts | | 482,690 | | |
| Bi-lateral OTC swaps, at value | | 33,550 | | |
| Accrued management fee | | 4,959,582 | | |
| Payable for daily variation margin on futures contracts | | 311,797 | | |
| Payable for daily variation margin on centrally cleared OTC swaps | | 11,443 | | |
| Other payables and accrued expenses | | 307,765 | | |
| Collateral on securities loaned | | 7,408,800 | | |
| Total Liabilities | | | | 3,132,957,943 |
| Net Assets | | | $ | 19,865,335,718 |
| Net Assets consist of: | | | | |
| Paid in capital | | | $ | 22,415,426,199 |
| Total accumulated earnings (loss) | | | | (2,550,090,481) |
| Net Assets | | | $ | 19,865,335,718 |
Net Asset Value , offering price and redemption price per share ($19,865,335,718 ÷ 2,235,219,342 shares) | | | $ | 8.89 |
| Statement of Operations |
| | | | Six months ended February 28, 2023 (Unaudited) |
| Investment Income | | | | |
| Dividends | | | $ | 6,254,340 |
| Interest | | | | 390,599,270 |
| Income from Fidelity Central Funds (including $349,221 from security lending) | | | | 27,491,364 |
| Total Income | | | | 424,344,974 |
| Expenses | | | | |
| Management fee | $ | 28,658,023 | | |
| Custodian fees and expenses | | 19,072 | | |
| Independent trustees' fees and expenses | | 36,534 | | |
| Registration fees | | 235,345 | | |
| Audit | | 73,883 | | |
| Legal | | 152,019 | | |
| Miscellaneous | | 43,067 | | |
| Total expenses before reductions | | 29,217,943 | | |
| Expense reductions | | (211,169) | | |
| Total expenses after reductions | | | | 29,006,774 |
| Net Investment income (loss) | | | | 395,338,200 |
| Realized and Unrealized Gain (Loss) | | | | |
| Net realized gain (loss) on: | | | | |
| Investment Securities: | | | | |
| Unaffiliated issuers | | (238,502,515) | | |
| Forward foreign currency contracts | | (7,821,222) | | |
| Foreign currency transactions | | (1,062,507) | | |
| Futures contracts | | (1,150,835) | | |
| Swaps | | (1,117,196) | | |
| Total net realized gain (loss) | | | | (249,654,275) |
| Change in net unrealized appreciation (depreciation) on: | | | | |
| Investment Securities: | | | | |
| Unaffiliated issuers | | (358,846,788) | | |
| Forward foreign currency contracts | | (2,609,229) | | |
| Assets and liabilities in foreign currencies | | 392,511 | | |
| Futures contracts | | (3,026,108) | | |
| Swaps | | (656,147) | | |
| TBA Sale commitments | | 592,841 | | |
| Total change in net unrealized appreciation (depreciation) | | | | (364,152,920) |
| Net gain (loss) | | | | (613,807,195) |
| Net increase (decrease) in net assets resulting from operations | | | $ | (218,468,995) |
| Statement of Changes in Net Assets |
| |
| | Six months ended February 28, 2023 (Unaudited) | | Year ended August 31, 2022 |
| Increase (Decrease) in Net Assets | | | | |
| Operations | | | | |
| Net investment income (loss) | $ | 395,338,200 | $ | 494,074,323 |
| Net realized gain (loss) | | (249,654,275) | | (167,722,715) |
| Change in net unrealized appreciation (depreciation) | | (364,152,920) | | (2,503,922,391) |
| Net increase (decrease) in net assets resulting from operations | | (218,468,995) | | (2,177,570,783) |
| Distributions to shareholders | | (409,178,805) | | (614,265,594) |
| Share transactions | | | | |
| Proceeds from sales of shares | | 880,079,264 | | 3,850,235,343 |
| Reinvestment of distributions | | 409,178,804 | | 614,265,593 |
| Cost of shares redeemed | | (100,125,574) | | (275,024,770) |
Net increase (decrease) in net assets resulting from share transactions | | 1,189,132,494 | | 4,189,476,166 |
| Total increase (decrease) in net assets | | 561,484,694 | | 1,397,639,789 |
| | | | | |
| Net Assets | | | | |
| Beginning of period | | 19,303,851,024 | | 17,906,211,235 |
| End of period | $ | 19,865,335,718 | $ | 19,303,851,024 |
| | | | | |
| Other Information | | | | |
| Shares | | | | |
| Sold | | 98,190,877 | | 391,533,748 |
| Issued in reinvestment of distributions | | 46,089,211 | | 61,667,263 |
| Redeemed | | (11,381,206) | | (28,747,194) |
| Net increase (decrease) | | 132,898,882 | | 424,453,817 |
| | | | | |
Financial Highlights
| Fidelity® SAI Total Bond Fund |
| |
| | Six months ended (Unaudited) February 28, 2023 | | Years ended August 31, 2022 | | 2021 | | 2020 | | 2019 A |
Selected Per-Share Data | | | | | | | | | | |
| Net asset value, beginning of period | $ | 9.18 | $ | 10.67 | $ | 11.01 | $ | 10.76 | $ | 10.00 |
| Income from Investment Operations | | | | | | | | | | |
Net investment income (loss) B,C | | .183 | | .265 | | .283 | | .328 | | .317 |
| Net realized and unrealized gain (loss) | | (.283) | | (1.421) | | .011 | | .414 | | .734 |
| Total from investment operations | | (.100) | | (1.156) | | .294 | | .742 | | 1.051 |
| Distributions from net investment income | | (.190) | | (.264) | | (.263) | | (.317) | | (.289) |
| Distributions from net realized gain | | - | | (.070) | | (.371) | | (.175) | | (.002) |
| Total distributions | | (.190) | | (.334) | | (.634) | | (.492) | | (.291) |
| Net asset value, end of period | $ | 8.89 | $ | 9.18 | $ | 10.67 | $ | 11.01 | $ | 10.76 |
Total Return D,E | | (1.07)% | | (11.04)% | | 2.81% | | 7.16% | | 10.67% |
Ratios to Average Net Assets C,F,G | | | | | | | | | | |
| Expenses before reductions | | .31% H | | .30% | | .30% | | .31% | | .42% H |
| Expenses net of fee waivers, if any | | .30% H | | .30% | | .30% | | .31% | | .36% H |
| Expenses net of all reductions | | .30% H | | .30% | | .30% | | .31% | | .36% H |
| Net investment income (loss) | | 4.15% H | | 2.68% | | 2.66% | | 3.08% | | 3.63% H |
| Supplemental Data | | | | | | | | | | |
| Net assets, end of period (000 omitted) | $ | 19,865,336 | $ | 19,303,851 | $ | 17,906,211 | $ | 16,211,735 | $ | 14,123,236 |
Portfolio turnover rate I | | 242% H | | 132% | | 180% | | 214% | | 209% H,J |
A For the period October 25, 2018 (commencement of operations) through August 31, 2019.
B Calculated based on average shares outstanding during the period.
C Net investment income (loss) is affected by the timing of the declaration of dividends by any underlying mutual funds or exchange-traded funds (ETFs). Net investment income (loss) of any mutual funds or ETFs is not included in the Fund's net investment income (loss) ratio.
D Total returns for periods of less than one year are not annualized.
E Total returns would have been lower if certain expenses had not been reduced during the applicable periods shown.
F Fees and expenses of any underlying mutual funds or exchange-traded funds (ETFs) are not included in the Fund's expense ratio. The Fund indirectly bears its proportionate share of these expenses. For additional expense information related to investments in Fidelity Central Funds, please refer to the "Investments in Fidelity Central Funds" note found in the Notes to Financial Statements section of the most recent Annual or Semi-Annual report.
G Expense ratios reflect operating expenses of the class. Expenses before reductions do not reflect amounts reimbursed, waived, or reduced through arrangements with the investment adviser, brokerage services, or other offset arrangements, if applicable, and do not represent the amount paid by the class during periods when reimbursements, waivers or reductions occur.
H Annualized.
I Amount does not include the portfolio activity of any underlying mutual funds or exchange-traded funds (ETFs).
J Portfolio turnover rate excludes securities received or delivered in-kind.
For the period ended February 28, 2023
1. Organization.
Fidelity SAI Total Bond Fund (the Fund) is a fund of Fidelity Salem Street Trust (the Trust) and is authorized to issue an unlimited number of shares. Shares are offered exclusively to certain clients of Fidelity Management & Research Company LLC (FMR) or its affiliates. The Trust is registered under the Investment Company Act of 1940, as amended (the 1940 Act), as an open-end management investment company organized as a Massachusetts business trust.
2. Investments in Fidelity Central Funds.
Funds may invest in Fidelity Central Funds, which are open-end investment companies generally available only to other investment companies and accounts managed by the investment adviser and its affiliates. The Schedule of Investments lists any Fidelity Central Funds held as an investment as of period end, but does not include the underlying holdings of each Fidelity Central Fund. An investing fund indirectly bears its proportionate share of the expenses of the underlying Fidelity Central Funds.
Based on its investment objective, each Fidelity Central Fund may invest or participate in various investment vehicles or strategies that are similar to those of the investing fund. These strategies are consistent with the investment objectives of the investing fund and may involve certain economic risks which may cause a decline in value of each of the Fidelity Central Funds and thus a decline in the value of the investing fund.
| Fidelity Central Fund | Investment Manager | Investment Objective | Investment Practices | Expense Ratio A |
| Fidelity Money Market Central Funds | Fidelity Management & Research Company LLC (FMR) | Each fund seeks to obtain a high level of current income consistent with the preservation of capital and liquidity. | Short-term Investments | Less than .005% |
A Expenses expressed as a percentage of average net assets and are as of each underlying Central Fund's most recent annual or semi-annual shareholder report.
A complete unaudited list of holdings for each Fidelity Central Fund is available upon request or at the Securities and Exchange Commission website at www.sec.gov. In addition, the financial statements of the Fidelity Central Funds which contain the significant accounting policies (including investment valuation policies) of those funds, and are not covered by the Report of Independent Registered Public Accounting Firm, are available on the Securities and Exchange Commission website or upon request.
3. Significant Accounting Policies.
The Fund is an investment company and applies the accounting and reporting guidance of the Financial Accounting Standards Board (FASB) Accounting Standards Codification Topic 946 Financial Services - Investment Companies . The financial statements have been prepared in conformity with accounting principles generally accepted in the United States of America (GAAP), which require management to make certain estimates and assumptions at the date of the financial statements. Actual results could differ from those estimates. Subsequent events, if any, through the date that the financial statements were issued have been evaluated in the preparation of the financial statements. The Fund's Schedule of Investments lists any underlying mutual funds or exchange-traded funds (ETFs) but does not include the underlying holdings of these funds. The following summarizes the significant accounting policies of the Fund:
Investment Valuation. Investments are valued as of 4:00 p.m. Eastern time on the last calendar day of the period. The Board of Trustees (the Board) has designated the Fund's investment adviser as the valuation designee responsible for the fair valuation function and performing fair value determinations as needed. The investment adviser has established a Fair Value Committee (the Committee) to carry out the day-to-day fair valuation responsibilities and has adopted policies and procedures to govern the fair valuation process and the activities of the Committee. In accordance with these fair valuation policies and procedures, which have been approved by the Board, the Fund attempts to obtain prices from one or more third party pricing services or brokers to value its investments. When current market prices, quotations or currency exchange rates are not readily available or reliable, investments will be fair valued in good faith by the Committee, in accordance with the policies and procedures. Factors used in determining fair value vary by investment type and may include market or investment specific events, transaction data, estimated cash flows, and market observations of comparable investments. The frequency that the fair valuation procedures are used cannot be predicted and they may be utilized to a significant extent. The Committee manages the Fund's fair valuation practices and maintains the fair valuation policies and procedures. The Fund's investment adviser reports to the Board information regarding the fair valuation process and related material matters.
The Fund categorizes the inputs to valuation techniques used to value its investments into a disclosure hierarchy consisting of three levels as shown below:
Level 1 - unadjusted quoted prices in active markets for identical investments
Level 2 - other significant observable inputs (including quoted prices for similar investments, interest rates, prepayment speeds, etc.)
Level 3 - unobservable inputs (including the Fund's own assumptions based on the best information available)
Valuation techniques used to value the Fund's investments by major category are as follows:
Debt securities, including restricted securities, are valued based on evaluated prices received from third party pricing services or from brokers who make markets in such securities. Corporate bonds, bank notes, bank loan obligations, foreign government and government agency obligations, municipal securities, preferred securities, supranational obligations and U.S. government and government agency obligations are valued by pricing services who utilize matrix pricing which considers yield or price of bonds of comparable quality, coupon, maturity and type or by broker-supplied prices. Asset backed securities, collateralized mortgage obligations, commercial mortgage securities and U.S. government agency mortgage securities are valued by pricing services who utilize matrix pricing which considers prepayment speed assumptions, attributes of the collateral, yield or price of bonds of comparable quality, coupon, maturity and type or by broker-supplied prices. Swaps are marked-to-market daily based on valuations from third party pricing services, registered derivatives clearing organizations (clearinghouses) or broker-supplied valuations. These pricing sources may utilize inputs such as interest rate curves, credit spread curves, default possibilities and recovery rates. When independent prices are unavailable or unreliable, debt securities and swaps may be valued utilizing pricing methodologies which consider similar factors that would be used by third party pricing services. For foreign debt securities, when significant market or security specific events arise, valuations may be determined in good faith in accordance with procedures adopted by the Board. Debt securities and swaps are generally categorized as Level 2 in the hierarchy but may be Level 3 depending on the circumstances.
Equity securities, including restricted securities, for which market quotations are readily available, are valued at the last reported sale price or official closing price as reported by a third party pricing service on the primary market or exchange on which they are traded and are categorized as Level 1 in the hierarchy. In the event there were no sales during the day or closing prices are not available, securities are valued at the last quoted bid price or may be valued using the last available price and are generally categorized as Level 2 in the hierarchy. For foreign equity securities, when market or security specific events arise, comparisons to the valuation of American Depositary Receipts (ADRs), futures contracts, ETFs and certain indexes as well as quoted prices for similar securities may be used and would be categorized as Level 2 in the hierarchy. For equity securities, including restricted securities, where observable inputs are limited, assumptions about market activity and risk are used and these securities may be categorized as Level 3 in the hierarchy.
ETFs are valued at their last sale price or official closing price as reported by a third party pricing service on the primary market or exchange on which they are traded and are categorized as Level 1 in the hierarchy. In the event there were no sales during the day but the exchange reports a closing bid level, ETFs are valued at the closing bid and would be categorized as Level 1 in the hierarchy. In the event there was no closing bid, ETFs may be valued by another method that the Board believes reflects fair value in accordance with the Board's fair value pricing policies and may be categorized as Level 2 in the hierarchy.
The U.S. dollar value of forward foreign currency contracts is determined using currency exchange rates supplied by a pricing service and are categorized as Level 2 in the hierarchy. Futures contracts are valued at the settlement price established each day by the board of trade or exchange on which they are traded and are categorized as Level 1 in the hierarchy. Options traded over-the-counter are valued using service or broker-supplied valuations and are categorized as Level 2 in the hierarchy. Investments in open-end mutual funds, including the Fidelity Central Funds, are valued at their closing net asset value (NAV) each business day and are categorized as Level 1 in the hierarchy. Changes in valuation techniques may result in transfers in or out of an assigned level within the disclosure hierarchy. The aggregate value of investments by input level as of February 28, 2023 is included at the end of the Fund's Schedule of Investments.
Foreign Currency. Foreign-denominated assets, including investment securities, and liabilities are translated into U.S. dollars at the exchange rates at period end. Purchases and sales of investment securities, income and dividends received, and expenses denominated in foreign currencies are translated into U.S. dollars at the exchange rate in effect on the transaction date.
The effects of exchange rate fluctuations on investments are included with the net realized and unrealized gain (loss) on investment securities. Other foreign currency transactions resulting in realized and unrealized gain (loss) are disclosed separately.
Realized gains and losses on foreign currency transactions arise from the disposition of foreign currency, realized changes in the value of foreign currency between the trade and settlement dates on security transactions, and the difference between the amounts of dividends, interest and foreign withholding taxes recorded on transaction date and the U.S. dollar equivalent of the amounts actually received or paid. Unrealized gains and losses on assets and liabilities in foreign currencies arise from changes in the value of foreign currency, and from assets and liabilities denominated in foreign currencies, other than investments, which are held at period end.
Investment Transactions and Income. For financial reporting purposes, the Fund's investment holdings and NAV include trades executed through the end of the last business day of the period. The NAV per share for processing shareholder transactions is calculated as of the close of business of the New York Stock Exchange (NYSE), normally 4:00 p.m. Eastern time and includes trades executed through the end of the prior business day. Gains and losses on securities sold are determined on the basis of identified cost. Commissions paid to certain brokers with whom the investment adviser, or its affiliates, places trades on behalf of a fund include an amount in addition to trade execution, which may be rebated back to a fund. Any such rebates are included in net realized gain (loss) on investments in the Statement of Operations. Dividend income is recorded on the ex-dividend date, except for certain dividends from foreign securities where the ex-dividend date may have passed, which are recorded as soon as the Fund is informed of the ex-dividend date. Non-cash dividends included in dividend income, if any, are recorded at the fair market value of the securities received. Income and capital gain distributions from Fidelity Central Funds, if any, are recorded on the ex-dividend date. Certain distributions received by the Fund represent a return of capital or capital gain. The Fund determines the components of these distributions subsequent to the ex-dividend date, based upon receipt of tax filings or other correspondence relating to the underlying investment. These distributions are recorded as a reduction of cost of investments and/or as a realized gain. Interest income is accrued as earned and includes coupon interest and amortization of premium and accretion of discount on debt securities as applicable. Paid in Kind (PIK) income is recorded at the fair market value of the securities received. Investment income is recorded net of foreign taxes withheld where recovery of such taxes is uncertain. Debt obligations may be placed on non-accrual status and related interest income may be reduced by ceasing current accruals and writing off interest receivables when the collection of all or a portion of interest has become doubtful based on consistently applied procedures. A debt obligation is removed from non-accrual status when the issuer resumes interest payments or when collectability of interest is reasonably assured. Funds may file withholding tax reclaims in certain jurisdictions to recover a portion of amounts previously withheld. Any withholding tax reclaims income is included in the Statement of Operations in interest. Any receivables for withholding tax reclaims are included in the Statement of Assets and Liabilities in interest receivable.
Expenses. Expenses directly attributable to a fund are charged to that fund. Expenses attributable to more than one fund are allocated among the respective funds on the basis of relative net assets or other appropriate methods. Expenses included in the accompanying financial statements reflect the expenses of that fund and do not include any expenses associated with any underlying mutual funds or exchange-traded funds. Although not included in a fund's expenses, a fund indirectly bears its proportionate share of these expenses through the net asset value of each underlying mutual fund or exchange-traded fund. Expense estimates are accrued in the period to which they relate and adjustments are made when actual amounts are known.
Income Tax Information and Distributions to Shareholders. Each year, the Fund intends to qualify as a regulated investment company under Subchapter M of the Internal Revenue Code, including distributing substantially all of its taxable income and realized gains. As a result, no provision for U.S. Federal income taxes is required. The Fund files a U.S. federal tax return, in addition to state and local tax returns as required. The Fund's federal income tax returns are subject to examination by the Internal Revenue Service (IRS) for a period of three fiscal years after they are filed. State and local tax returns may be subject to examination for an additional fiscal year depending on the jurisdiction. Foreign taxes are provided for based on the Fund's understanding of the tax rules and rates that exist in the foreign markets in which it invests.
Distributions are declared and recorded daily and paid monthly from net investment income. Distributions from realized gains, if any, are declared and recorded on the ex-dividend date. Income and capital gain distributions are determined in accordance with income tax regulations, which may differ from GAAP.
Capital accounts within the financial statements are adjusted for permanent book-tax differences. These adjustments have no impact on net assets or the results of operations. Capital accounts are not adjusted for temporary book-tax differences which will reverse in a subsequent period.
Book-tax differences are primarily due to swaps, futures and options transactions, foreign currency transactions, defaulted bonds, market discount and losses deferred due to wash sales and futures contracts and excise tax regulations.
As of period end, the cost and unrealized appreciation (depreciation) in securities, and derivatives if applicable, for federal income tax purposes were as follows:
| Gross unrealized appreciation | $89,796,614 |
| Gross unrealized depreciation | (2,141,121,027) |
| Net unrealized appreciation (depreciation) | $(2,051,324,413) |
| Tax cost | $23,867,260,237 |
The Fund elected to defer to its next fiscal year approximately $283,203,199 of capital losses recognized during the period November 1, 2021 to August 31, 2022.
Delayed Delivery Transactions and When-Issued Securities. During the period, certain Funds transacted in securities on a delayed delivery or when-issued basis. Payment and delivery may take place after the customary settlement period for that security. The price of the underlying securities and the date when the securities will be delivered and paid for are fixed at the time the transaction is negotiated. Securities purchased on a delayed delivery or when-issued basis are identified as such in the Schedule of Investments. Compensation for interest forgone in the purchase of a delayed delivery or when-issued debt security may be received. With respect to purchase commitments, each applicable Fund identifies securities as segregated in its records with a value at least equal to the amount of the commitment. Payables and receivables associated with the purchases and sales of delayed delivery securities having the same coupon, settlement date and broker are offset. Delayed delivery or when-issued securities that have been purchased from and sold to different brokers are reflected as both payables and receivables in the Statement of Assets and Liabilities under the caption "Delayed delivery", as applicable. Losses may arise due to changes in the value of the underlying securities or if the counterparty does not perform under the contract's terms, or if the issuer does not issue the securities due to political, economic, or other factors.
To-Be-Announced (TBA) Securities and Mortgage Dollar Rolls. TBA securities involve buying or selling mortgage-backed securities (MBS) on a forward commitment basis. A TBA transaction typically does not designate the actual security to be delivered and only includes an approximate principal amount; however delivered securities must meet specified terms defined by industry guidelines, including issuer, rate and current principal amount outstanding on underlying mortgage pools. Funds may enter into a TBA transaction with the intent to take possession of or deliver the underlying MBS, or a fund may elect to extend the settlement by entering into either a mortgage or reverse mortgage dollar roll. Mortgage dollar rolls are transactions where a fund sells TBA securities and simultaneously agrees to repurchase MBS on a later date at a lower price and with the same counterparty. Reverse mortgage dollar rolls involve the purchase and simultaneous agreement to sell TBA securities on a later date at a lower price. Transactions in mortgage dollar rolls and reverse mortgage dollar rolls are accounted for as purchases and sales and may result in an increase to a fund's portfolio turnover rate.
Purchases and sales of TBA securities involve risks similar to those discussed above for delayed delivery and when-issued securities. Also, if the counterparty in a mortgage dollar roll or a reverse mortgage dollar roll transaction files for bankruptcy or becomes insolvent, a fund's right to repurchase or sell securities may be limited. Additionally, when a fund sells TBA securities without already owning or having the right to obtain the deliverable securities (an uncovered forward commitment to sell), it incurs a risk of loss because it could have to purchase the securities at a price that is higher than the price at which it sold them. A fund may be unable to purchase the deliverable securities if the corresponding market is illiquid.
TBA securities subject to a forward commitment to sell at period end are included at the end of the Schedule of Investments under the caption "TBA Sale Commitments." The proceeds and value of these commitments are reflected in the Statement of Assets and Liabilities as "Receivable for TBA sale commitments" and "TBA sale commitments, at value," respectively.
Restricted Securities (including Private Placements). Funds may invest in securities that are subject to legal or contractual restrictions on resale. These securities generally may be resold in transactions exempt from registration or to the public if the securities are registered. Disposal of these securities may involve time-consuming negotiations and expense, and prompt sale at an acceptable price may be difficult. Information regarding restricted securities held at period end is included at the end of the Schedule of Investments, if applicable.
Loans and Other Direct Debt Instruments. Direct debt instruments are interests in amounts owed to lenders by corporate or other borrowers. These instruments may be in the form of loans, trade claims or other receivables and may include standby financing commitments such as revolving credit facilities that obligate a fund to supply additional cash to the borrower on demand. Loans may be acquired through assignment, participation, or may be made directly to a borrower. Such instruments are presented in the Bank Loan Obligations section in the Schedule of Investments. Certain funds may also invest in unfunded loan commitments, which are contractual obligations for future funding. Information regarding unfunded commitments is included at the end of the Schedule of Investments, if applicable.
4. Derivative Instruments.
Risk Exposures and the Use of Derivative Instruments. The Fund's investment objectives allow for various types of derivative instruments, including futures contracts, forward foreign currency contracts, options and swaps. Derivatives are investments whose value is primarily derived from underlying assets, indices or reference rates and may be transacted on an exchange or over-the-counter (OTC). Derivatives may involve a future commitment to buy or sell a specified asset based on specified terms, to exchange future cash flows at periodic intervals based on a notional principal amount, or for one party to make one or more payments upon the occurrence of specified events in exchange for periodic payments from the other party.
Derivatives were used to increase returns, to gain exposure to certain types of assets, to facilitate transactions in foreign-denominated securities and to manage exposure to certain risks as defined below. The success of any strategy involving derivatives depends on analysis of numerous economic factors, and if the strategies for investment do not work as intended, the objectives may not be achieved.
Derivatives were used to increase or decrease exposure to the following risk(s):
| | |
| Credit Risk | Credit risk relates to the ability of the issuer of a financial instrument to make further principal or interest payments on an obligation or commitment that it has to a fund. |
| Foreign Exchange Risk | Foreign exchange rate risk relates to fluctuations in the value of an asset or liability due to changes in currency exchange rates. |
| Interest Rate Risk | Interest rate risk relates to the fluctuations in the value of interest-bearing securities due to changes in the prevailing levels of market interest rates. |
Funds are also exposed to additional risks from investing in derivatives, such as liquidity risk and counterparty credit risk. Liquidity risk is the risk that a fund will be unable to close out the derivative in the open market in a timely manner. Counterparty credit risk is the risk that the counterparty will not be able to fulfill its obligation to a fund. Derivative counterparty credit risk is managed through formal evaluation of the creditworthiness of all potential counterparties. On certain OTC derivatives such as forward foreign currency contracts, options and bi-lateral swaps, a fund attempts to reduce its exposure to counterparty credit risk by entering into an International Swaps and Derivatives Association, Inc. (ISDA) Master Agreement with each of its counterparties. The ISDA Master Agreement gives a fund the right to terminate all transactions traded under such agreement upon the deterioration in the credit quality of the counterparty beyond specified levels. The ISDA Master Agreement gives each party the right, upon an event of default by the other party or a termination of the agreement, to close out all transactions traded under such agreement and to net amounts owed under each transaction to one net payable by one party to the other. To mitigate counterparty credit risk on bi-lateral OTC derivatives, a fund receives collateral in the form of cash or securities once net unrealized appreciation on outstanding derivative contracts under an ISDA Master Agreement exceeds certain applicable thresholds, subject to certain minimum transfer provisions. The collateral received is held in segregated accounts with the custodian bank in accordance with the collateral agreements entered into between a fund, the counterparty and the custodian bank. A fund could experience delays and costs in gaining access to the collateral even though it is held by the custodian bank. The maximum risk of loss to a fund from counterparty credit risk related to bi-lateral OTC derivatives is generally the aggregate unrealized appreciation and unpaid counterparty payments in excess of any collateral pledged by the counterparty to a fund. A fund may be required to pledge collateral for the benefit of the counterparties on bi-lateral OTC derivatives in an amount not less than each counterparty's unrealized appreciation on outstanding derivative contracts, subject to certain minimum transfer provisions, and any such pledged collateral is identified in the Schedule of Investments. Exchange-traded contracts are not covered by the ISDA Master Agreement; however counterparty credit risk related to these contracts may be mitigated by the protection provided by the exchange on which they trade. Counterparty credit risk related to centrally cleared OTC swaps may be mitigated by the protection provided by the clearinghouse.
Investing in derivatives may involve greater risks than investing in the underlying assets directly and, to varying degrees, may involve risk of loss in excess of any initial investment and collateral received and amounts recognized in the Statement of Assets and Liabilities. In addition, there may be the risk that the change in value of the derivative contract does not correspond to the change in value of the underlying instrument.
Net Realized Gain (Loss) and Change in Net Unrealized Appreciation (Depreciation) on Derivatives. The table below, which reflects the impacts of derivatives on the financial performance, summarizes the net realized gain (loss) and change in net unrealized appreciation (depreciation) for derivatives during the period as presented in the Statement of Operations.
| Primary Risk Exposure / Derivative Type | Net Realized Gain (Loss) | Change in Net Unrealized Appreciation (Depreciation) |
| Fidelity SAI Total Bond Fund | | |
| Credit Risk | | |
| Purchased Options | $(2,480,616) | $(480,093) |
| Swaps | (171,952) | (113,923) |
| Total Credit Risk | (2,652,568) | (594,016) |
| Foreign Exchange Risk | | |
| Forward Foreign Currency Contracts | (7,821,222) | (2,609,229) |
| Total Foreign Exchange Risk | (7,821,222) | (2,609,229) |
| Interest Rate Risk | | |
| Futures Contracts | (1,150,835) | (3,026,108) |
| Swaps | (945,244) | (542,224) |
| Total Interest Rate Risk | (2,096,079) | (3,568,332) |
| Totals | $ (12,569,869) | $ (6,771,577) |
If there are any open positions at period end, a summary of the value of derivatives by primary risk exposure is included at the end of the Schedule of Investments.
Forward Foreign Currency Contracts. Forward foreign currency contracts represent obligations to purchase or sell foreign currency on a specified future date at a price fixed at the time the contracts are entered into. Forward foreign currency contracts were used to facilitate transactions in foreign-denominated securities and to manage exposure to certain foreign currencies.
Forward foreign currency contracts are valued daily and fluctuations in exchange rates on open contracts are recorded as unrealized appreciation or (depreciation) and reflected in total accumulated earnings (loss) in the Statement of Assets and Liabilities. When the contract is closed, a gain or loss is realized equal to the difference between the closing value and the value at the time it was opened. Non-deliverable forward foreign currency exchange contracts are settled with the counterparty in cash without the delivery of foreign currency. The net realized gain (loss) and change in net unrealized appreciation (depreciation) on forward foreign currency contracts during the period is presented in the Statement of Operations.
Any open forward foreign currency contracts at period end are presented in the Schedule of Investments under the caption "Forward Foreign Currency Contracts." The contract amount and unrealized appreciation (depreciation) reflects each contract's exposure to the underlying currency at period end, and is representative of volume of activity during the period unless an average contract value is presented.
Futures Contracts. A futures contract is an agreement between two parties to buy or sell a specified underlying instrument for a fixed price at a specified future date. Futures contracts were used to manage exposure to the bond market and fluctuations in interest rates.
Upon entering into a futures contract, a fund is required to deposit either cash or securities (initial margin) with a clearing broker in an amount equal to a certain percentage of the face value of the contract. Futures contracts are marked-to-market daily and subsequent daily payments are made or received by a fund depending on the daily fluctuations in the value of the futures contracts and are recorded as unrealized appreciation or (depreciation). This receivable and/or payable, if any, is included in daily variation margin on futures contracts in the Statement of Assets and Liabilities. Realized gain or (loss) is recorded upon the expiration or closing of a futures contract. The net realized gain (loss) and change in net unrealized appreciation (depreciation) on futures contracts during the period is presented in the Statement of Operations.
Any open futures contracts at period end are presented in the Schedule of Investments under the caption "Futures Contracts". The notional amount at value reflects each contract's exposure to the underlying instrument or index at period end, and is representative of volume of activity during the period unless an average notional amount is presented. Any securities deposited to meet initial margin requirements are identified in the Schedule of Investments. Any cash deposited to meet initial margin requirements is presented as segregated cash with brokers for derivative instruments in the Statement of Assets and Liabilities.
Options. Options give the purchaser the right, but not the obligation, to buy (call) or sell (put) an underlying security or financial instrument at an agreed exercise or strike price between or on certain dates. Options obligate the seller (writer) to buy (put) or sell (call) an underlying instrument at the exercise or strike price or cash settle an underlying derivative instrument if the holder exercises the option on or before the expiration date. OTC options, such as swaptions, which are options where the underlying instrument is a swap, were used to manage exposure to potential credit events.
Upon entering into an options contract, a fund will pay or receive a premium. Premiums paid on purchased options are reflected as cost of investments and premiums received on written options are reflected as a liability on the Statement of Assets and Liabilities. Certain options may be purchased or written with premiums to be paid or received on a future date. Options are valued daily and any unrealized appreciation (depreciation) is reflected in total accumulated earnings (loss) in the Statement of Assets and Liabilities. When an option is exercised, the cost or proceeds of the underlying instrument purchased or sold is adjusted by the amount of the premium. When an option is closed, a gain or loss is realized depending on whether the proceeds or amount paid for the closing sale transaction is greater or less than the premium received or paid. When an option expires, gains and losses are realized to the extent of premiums received and paid, respectively. The net realized and unrealized gains (losses) on purchased options are included in the Statement of Operations in net realized gain (loss) and change in net unrealized appreciation (depreciation) on investment securities. The net realized gain (loss) and change in net unrealized appreciation (depreciation) on written options are presented in the Statement of Operations.
Any open options at period end are presented in the Schedule of Investments under the captions "Purchased Options," "Purchased Swaptions," "Written Options" and "Written Swaptions," as applicable, and are representative of volume of activity during the period unless an average notional amount is presented.
Writing puts and buying calls tend to increase exposure to the underlying instrument while buying puts and writing calls tend to decrease exposure to the underlying instrument. For purchased options, risk of loss is limited to the premium paid, and for written options, risk of loss is the change in value in excess of the premium received.
Swaps. A swap is a contract between two parties to exchange future cash flows at periodic intervals based on a notional principal amount. A bi-lateral OTC swap is a transaction between a fund and a dealer counterparty where cash flows are exchanged between the two parties for the life of the swap. A centrally cleared OTC swap is a transaction executed between a fund and a dealer counterparty, then cleared by a futures commission merchant (FCM) through a clearinghouse. Once cleared, the clearinghouse serves as a central counterparty, with whom a fund exchanges cash flows for the life of the transaction, similar to transactions in futures contracts.
Bi-lateral OTC swaps are marked-to-market daily and changes in value are reflected in the Statement of Assets and Liabilities in the bi-lateral OTC swaps at value line items. Any upfront premiums paid or received upon entering a bi-lateral OTC swap to compensate for differences between stated terms of the swap and prevailing market conditions (e.g. credit spreads, interest rates or other factors) are recorded in total accumulated earnings (loss) in the Statement of Assets and Liabilities and amortized to realized gain or (loss) ratably over the term of the swap. Any unamortized upfront premiums are presented in the Schedule of Investments.
Centrally cleared OTC swaps require a fund to deposit either cash or securities (initial margin) with the FCM, at the instruction of and for the benefit of the clearinghouse. Any securities deposited to meet initial margin requirements are identified in the Schedule of Investments. Any cash deposited to meet initial margin requirements is presented in segregated cash with brokers for derivative instruments in the Statement of Assets and Liabilities. Centrally cleared OTC swaps are marked-to-market daily and subsequent payments (variation margin) are made or received depending on the daily fluctuations in the value of the swaps and are recorded as unrealized appreciation or (depreciation). These daily payments, if any, are included in receivable or payable for daily variation margin on centrally cleared OTC swaps in the Statement of Assets and Liabilities. Any premiums for centrally cleared OTC swaps are recorded periodically throughout the term of the swap to variation margin and included in total accumulated earnings (loss) in the Statement of Assets and Liabilities. Any premiums are recognized as realized gain (loss) upon termination or maturity of the swap.
For both bi-lateral and centrally cleared OTC swaps, payments are exchanged at specified intervals, accrued daily commencing with the effective date of the contract and recorded as realized gain or (loss). Some swaps may be terminated prior to the effective date and realize a gain or loss upon termination. The net realized gain (loss) and change in net unrealized appreciation (depreciation) on swaps during the period is presented in the Statement of Operations.
Any open swaps at period end are included in the Schedule of Investments under the caption "Swaps", and are representative of volume of activity during the period unless an average notional amount is presented.
Credit Default Swaps. Credit default swaps enable a fund to buy or sell protection against specified credit events on a single-name issuer or a traded credit index. Under the terms of a credit default swap the buyer of protection (buyer) receives credit protection in exchange for making periodic payments to the seller of protection (seller) based on a fixed percentage applied to a notional principal amount. In return for these payments, the seller will be required to make a payment upon the occurrence of one or more specified credit events. A fund enters into credit default swaps as a seller to gain credit exposure to an issuer and/or as a buyer to obtain a measure of protection against defaults of an issuer. Periodic payments are made over the life of the contract by the buyer provided that no credit event occurs.
For credit default swaps on most corporate and sovereign issuers, credit events include bankruptcy, failure to pay or repudiation/moratorium. For credit default swaps on corporate or sovereign issuers, the obligation that may be put to the seller is not limited to the specific reference obligation described in the Schedule of Investments. For credit default swaps on asset-backed securities, a credit event may be triggered by events such as failure to pay principal, maturity extension, rating downgrade or write-down. For credit default swaps on asset-backed securities, the reference obligation described represents the security that may be put to the seller. For credit default swaps on a traded credit index, a specified credit event may affect all or individual underlying securities included in the index.
As a seller, if an underlying credit event occurs, a fund will pay a net settlement amount of cash equal to the notional amount of the swap less the recovery value of the reference obligation or underlying securities comprising an index. Only in the event of the industry's inability to value the underlying asset will a fund be required to take delivery of the reference obligation or underlying securities comprising an index and pay an amount equal to the notional amount of the swap.
As a buyer, if an underlying credit event occurs, a fund will receive a net settlement amount of cash equal to the notional amount of the swap less the recovery value of the reference obligation or underlying securities comprising an index. Only in the event of the industry's inability to value the underlying asset will a fund be required to deliver the reference obligation or underlying securities comprising an index in exchange for payment of an amount equal to the notional amount of the swap.
Typically, the value of each credit default swap and credit rating disclosed for each reference obligation in the Schedule of Investments, where a fund is the seller, can be used as measures of the current payment/performance risk of the swap. As the value of the swap changes as a positive or negative percentage of the total notional amount, the payment/performance risk may decrease or increase, respectively. In addition to these measures, the investment adviser monitors a variety of factors including cash flow assumptions, market activity and market sentiment as part of its ongoing process of assessing payment/performance risk.
Interest Rate Swaps. Interest rate swaps are agreements between counterparties to exchange cash flows, one based on a fixed rate, and the other on a floating rate. A fund enters into interest rate swaps to manage its exposure to interest rate changes. Changes in interest rates can have an effect on both the value of bond holdings as well as the amount of interest income earned. In general, the value of bonds can fall when interest rates rise and can rise when interest rates fall.
5. Purchases and Sales of Investments.
Purchases and sales of securities, other than short-term securities, U.S. government securities and in-kind transactions, as applicable, are noted in the table below.
| | Purchases ($) | Sales ($) |
| Fidelity SAI Total Bond Fund | 16,673,899,968 | 16,205,227,576 |
6. Fees and Other Transactions with Affiliates.
Management Fee. Fidelity Management & Research Company LLC (the investment adviser) and its affiliates provide the Fund with investment management related services for which the Fund pays a monthly management fee. The management fee is the sum of an individual fund fee rate that is based on an annual rate of .20% of the Fund's average net assets and an annualized group fee rate that averaged .10% during the period. The group fee rate is based upon the monthly average net assets of a group of registered investment companies with which the investment adviser has management contracts. The group fee rate decreases as assets under management increase and increases as assets under management decrease. For the reporting period, the total annualized management fee rate was .30% of the Fund's average net assets.
Brokerage Commissions. A portion of portfolio transactions were placed with brokerage firms which are affiliates of the investment adviser. Brokerage commissions are included in net realized gain (loss) and change in net unrealized appreciation (depreciation) in the Statement of Operations. The commissions paid to these affiliated firms were as follows:
| | Amount |
| Fidelity SAI Total Bond Fund | $73 |
Interfund Trades. Funds may purchase from or sell securities to other Fidelity Funds under procedures adopted by the Board. The procedures have been designed to ensure these interfund trades are executed in accordance with Rule 17a-7 of the 1940 Act. Any interfund trades are included within the respective purchases and sales amounts shown in the Purchases and Sales of Investments note. Interfund trades during the period are noted in the table below.
| | Purchases ($) | Sales ($) | Realized Gain (Loss) ($) |
| Fidelity SAI Total Bond Fund | 1,320,856 | 1,142,658 | 20,576 |
Other. During the period, the investment adviser reimbursed the Fund for certain losses as follows:
| | Amount ($) |
| Fidelity SAI Total Bond Fund | 3,865 |
7. Committed Line of Credit.
Certain Funds participate with other funds managed by the investment adviser or an affiliate in a $4.25 billion credit facility (the "line of credit") to be utilized for temporary or emergency purposes to fund shareholder redemptions or for other short-term liquidity purposes. The participating funds have agreed to pay commitment fees on their pro-rata portion of the line of credit, which are reflected in Miscellaneous expenses on the Statement of Operations, and are listed below. During the period, there were no borrowings on this line of credit.
| | Amount |
| Fidelity SAI Total Bond Fund | $17,036 |
8. Security Lending.
Funds lend portfolio securities from time to time in order to earn additional income. Lending agents are used, including National Financial Services (NFS), an affiliate of the investment adviser. Pursuant to a securities lending agreement, NFS will receive a fee, which is capped at 9.9% of a fund's daily lending revenue, for its services as lending agent. A fund may lend securities to certain qualified borrowers, including NFS. On the settlement date of the loan, a fund receives collateral (in the form of U.S. Treasury obligations, letters of credit and/or cash) against the loaned securities and maintains collateral in an amount not less than 100% of the market value of the loaned securities during the period of the loan. The market value of the loaned securities is determined at the close of business of a fund and any additional required collateral is delivered to a fund on the next business day. A fund or borrower may terminate the loan at any time, and if the borrower defaults on its obligation to return the securities loaned because of insolvency or other reasons, a fund may apply collateral received from the borrower against the obligation. A fund may experience delays and costs in recovering the securities loaned. Any cash collateral received is invested in the Fidelity Securities Lending Cash Central Fund. Any loaned securities are identified as such in the Schedule of Investments, and the value of loaned securities and cash collateral at period end, as applicable, are presented in the Statement of Assets and Liabilities. Security lending income represents the income earned on investing cash collateral, less rebates paid to borrowers and any lending agent fees associated with the loan, plus any premium payments received for lending certain types of securities. Security lending income is presented in the Statement of Operations as a component of income from Fidelity Central Funds. Affiliated security lending activity, if any, was as follows:
| | Total Security Lending Fees Paid to NFS | Security Lending Income From Securities Loaned to NFS | Value of Securities Loaned to NFS at Period End |
| Fidelity SAI Total Bond Fund | $36,413 | $- | $- |
9. Expense Reductions.
Through arrangements with the Fund's custodian, credits realized as a result of certain uninvested cash balances were used to reduce the Fund's expenses by $14,314.
In addition, during the period the investment adviser or an affiliate reimbursed and/or waived a portion of operating expenses in the amount of $196,855.
10. Other.
A fund's organizational documents provide former and current trustees and officers with a limited indemnification against liabilities arising in connection with the performance of their duties to the fund. In the normal course of business, a fund may also enter into contracts that provide general indemnifications. A fund's maximum exposure under these arrangements is unknown as this would be dependent on future claims that may be made against a fund. The risk of material loss from such claims is considered remote.
At the end of the period, the following mutual funds managed by the investment adviser or its affiliates were the owners of record of 10% or more of the total outstanding shares.
| | Strategic Advisers Core Income Fund | Strategic Advisers Fidelity Core Income Fund |
| Fidelity SAI Total Bond Fund | 27% | 73% |
Mutual funds managed by the investment adviser or its affiliates, in aggregate, were the owners of record of more than 20% of the total outstanding shares.
| Fund | % of shares held |
| Fidelity SAI Total Bond Fund | 100% |
11. Risk and Uncertainties.
Many factors affect a fund's performance. Developments that disrupt global economies and financial markets, such as pandemics, epidemics, outbreaks of infectious diseases, war, terrorism, and environmental disasters, may significantly affect a fund's investment performance. The effects of these developments to a fund will be impacted by the types of securities in which a fund invests, the financial condition, industry, economic sector, and geographic location of an issuer, and a fund's level of investment in the securities of that issuer. Significant concentrations in security types, issuers, industries, sectors, and geographic locations may magnify the factors that affect a fund's performance.
As a shareholder, you incur two types of costs: (1) transaction costs, which may include sales charges (loads) on purchase payments or redemption proceeds, as applicable and (2) ongoing costs, which generally include management fees, distribution and/or service (12b-1) fees and other Fund expenses. This Example is intended to help you understand your ongoing costs (in dollars) of investing in a fund and to compare these costs with the ongoing costs of investing in other mutual funds.
| The Example is based on an investment of $1,000 invested at the beginning of the period and held for the entire period (September 1, 2022 to February 28, 2023). |
Actual Expenses
The first line of the accompanying table provides information about actual account values and actual expenses. You may use the information in this line, together with the amount you invested, to estimate the expenses that you paid over the period. Simply divide your account value by $1,000.00 (for example, an $8,600 account value divided by $1,000.00 = 8.6), then multiply the result by the number in the first line for a class/Fund under the heading entitled "Expenses Paid During Period" to estimate the expenses you paid on your account during this period. If any fund is a shareholder of any underlying mutual funds or exchange-traded funds (ETFs) (the Underlying Funds), such fund indirectly bears its proportional share of the expenses of the Underlying Funds in addition to the direct expenses incurred presented in the table. These fees and expenses are not included in the annualized expense ratio used to calculate the expense estimate in the table below.
Hypothetical Example for Comparison Purposes
The second line of the accompanying table provides information about hypothetical account values and hypothetical expenses based on the actual expense ratio and an assumed rate of return of 5% per year before expenses, which is not the actual return. The hypothetical account values and expenses may not be used to estimate the actual ending account balance or expenses you paid for the period. You may use this information to compare the ongoing costs of investing in the Fund and other funds. To do so, compare this 5% hypothetical example with the 5% hypothetical examples that appear in the shareholder reports of the other funds. If any fund is a shareholder of any Underlying Funds, such fund indirectly bears its proportional share of the expenses of the Underlying Funds in addition to the direct expenses as presented in the table. These fees and expenses are not included in the annualized expense ratio used to calculate the expense estimate in the table below.
Please note that the expenses shown in the table are meant to highlight your ongoing costs only and do not reflect any transaction costs. Therefore, the second line of the table is useful in comparing ongoing costs only, and will not help you determine the relative total costs of owning different funds. In addition, if these transactional costs were included, your costs would have been higher.
| | | | | Annualized Expense Ratio- A | | Beginning Account Value September 1, 2022 | | Ending Account Value February 28, 2023 | | Expenses Paid During Period- C September 1, 2022 to February 28, 2023 |
| | | | | | | | | | |
| Fidelity® SAI Total Bond Fund | | | | .30% | | | | | | |
| Actual | | | | | | $ 1,000 | | $ 989.30 | | $ 1.48 |
Hypothetical- B | | | | | | $ 1,000 | | $ 1,023.31 | | $ 1.51 |
| |
A Annualized expense ratio reflects expenses net of applicable fee waivers.
B 5% return per year before expenses
C Expenses are equal to the annualized expense ratio, multiplied by the average account value over the period, multiplied by 181/ 365 (to reflect the one-half year period). The fees and expenses of any Underlying Funds are not included in each annualized expense ratio.
Board Approval of Investment Advisory Contracts and Management Fees
Fidelity SAI Total Bond Fund
Each year, the Board of Trustees, including the Independent Trustees (together, the Board), votes on the renewal of the management contract with Fidelity Management & Research Company LLC (FMR) and the sub-advisory agreements (together, the Advisory Contracts) for the fund. FMR and the sub-advisers are referred to herein as the Investment Advisers. The Board, assisted by the advice of fund counsel and Independent Trustees' counsel, requests and considers a broad range of information relevant to the renewal of the Advisory Contracts throughout the year.
The Board meets regularly and, at each of its meetings, covers an extensive agenda of topics and materials and considers factors that are relevant to its annual consideration of the renewal of the fund's Advisory Contracts, including the services and support provided to the fund and its shareholders. The Board has established four standing committees (Committees) - Operations, Audit, Fair Valuation, and Governance and Nominating - each composed of and chaired by Independent Trustees with varying backgrounds, to which the Board has assigned specific subject matter responsibilities in order to enhance effective decision-making by the Board. The Operations Committee, of which all the Independent Trustees are members, meets regularly throughout the year and requests, receives and considers, among other matters, information related to the annual consideration of the renewal of the fund's Advisory Contracts before making its recommendation to the Board. The Board also meets as needed to review matters specifically related to the Board's annual consideration of the renewal of the Advisory Contracts. Members of the Board may also meet from time to time with trustees of other Fidelity funds through joint ad hoc committees to discuss certain matters relevant to all of the Fidelity funds.
At its September 2022 meeting, the Board unanimously determined to renew the fund's Advisory Contracts. In reaching its determination, the Board considered all factors it believed relevant, including (i) the nature, extent, and quality of the services provided to the fund and its shareholders (including the investment performance of the fund); (ii) the competitiveness relative to peer funds of the fund's management fee and the total expense ratio; (iii) the total costs of the services provided by and the profits realized by Fidelity from its relationships with the fund; and (iv) the extent to which, if any, economies of scale exist and are realized as the fund grows, and whether any economies of scale are appropriately shared with fund shareholders.
In considering whether to renew the Advisory Contracts for the fund, the Board reached a determination, with the assistance of fund counsel and Independent Trustees' counsel and through the exercise of its business judgment, that the renewal of the Advisory Contracts was in the best interests of the fund and its shareholders and that the compensation payable under the Advisory Contracts was fair and reasonable. The Board's decision to renew the Advisory Contracts was not based on any single factor, but rather was based on a comprehensive consideration of all the information provided to the Board at its meetings throughout the year. The Board, in reaching its determination to renew the Advisory Contracts, was aware that shareholders of the fund have a broad range of investment choices available to them, including a wide choice among funds offered by Fidelity's competitors, and that the fund's shareholders, who have the opportunity to review and weigh the disclosure provided by the fund in its prospectus and other public disclosures, have chosen to invest in this fund, which is part of the Fidelity family of funds.
Nature, Extent, and Quality of Services Provided . The Board considered Fidelity's staffing as it relates to the fund, including the backgrounds of investment personnel of Fidelity, and also considered the fund's investment objective, strategies, and related investment philosophy. The Independent Trustees also had discussions with senior management of Fidelity's investment operations and investment groups. The Board considered the structure of the investment personnel compensation program and whether this structure provides appropriate incentives to act in the best interests of the fund. Additionally, the Board considered the portfolio managers' investments, if any, in the funds that they manage. The Board also considered the steps Fidelity had taken to ensure the continued provision of high quality services to the Fidelity funds throughout the COVID-19 pandemic, including the expansion of staff in client facing positions to maintain service levels in periods of high volumes and volatility.
Resources Dedicated to Investment Management and Support Services . The Board reviewed the general qualifications and capabilities of Fidelity's investment staff, including its size, education, experience, and resources, as well as Fidelity's approach to recruiting, managing, training, and compensating investment personnel. The Board noted the resources devoted to Fidelity's global investment organization, and that Fidelity's analysts have extensive resources, tools and capabilities that allow them to conduct quantitative and fundamental analysis, as well as credit analysis of issuers, counterparties and guarantors. Further, the Board considered that Fidelity's investment professionals have sufficient access to global information and data so as to provide competitive investment results over time, and that those professionals also have access to sophisticated tools that permit them to assess portfolio construction and risk and performance attribution characteristics continuously, as well as to transmit new information and research conclusions rapidly around the world. Additionally, in its deliberations, the Board considered Fidelity's trading, risk management, compliance, cybersecurity, and technology and operations capabilities and resources, which are integral parts of the investment management process.
Shareholder and Administrative Services . The Board considered (i) the nature, extent, quality, and cost of advisory, administrative, and shareholder services performed by the Investment Advisers and their affiliates under the Advisory Contracts and under separate agreements covering transfer agency, pricing and bookkeeping, and securities lending services for the fund; (ii) the nature and extent of the supervision of third party service providers, principally custodians, subcustodians, and pricing vendors; and (iii) the resources devoted to, and the record of compliance with, the fund's compliance policies and procedures.
The Board noted that the growth of fund assets over time across the complex allows Fidelity to reinvest in the development of services designed to enhance the value and convenience of the Fidelity funds as investment vehicles. These services include 24-hour access to account information and market information over the Internet and through telephone representatives, investor education materials and asset allocation tools. The Board also considered that it reviews customer service metrics such as telephone response times, continuity of services on the website and metrics addressing services at Fidelity Investor Centers.
Investment in a Large Fund Family . The Board considered the benefits to shareholders of investing in a Fidelity fund, including the benefits of investing in a fund that is part of a large family of funds offering a variety of investment disciplines and providing a large variety of mutual fund investor services. The Board noted that Fidelity had taken, or had made recommendations to the Board that resulted in the Fidelity funds taking, a number of actions over the previous year that benefited particular funds, including: (i) continuing to dedicate additional resources to Fidelity's investment research process, which includes meetings with management of issuers of securities in which the funds invest; (ii) continuing efforts to enhance Fidelity's global research capabilities; (iii) launching new funds, ETFs, and share classes with innovative structures, strategies and pricing and making other enhancements to meet investor needs; (iv) broadening eligibility requirements for certain funds and share classes; (v) reducing management fees and total expenses for certain funds and classes; (vi) lowering expenses for certain existing funds and classes by implementing or lowering expense caps; (vii) rationalizing product lines and gaining increased efficiencies from fund mergers and liquidations; (viii) continuing to develop, acquire and implement systems and technology to improve services to the funds and shareholders, strengthen information security, and increase efficiency; and (ix) continuing to implement enhancements to further strengthen Fidelity's product line to increase investors' probability of success in achieving their investment goals, including their retirement income goals.
Investment Performance . The Board considered whether the fund has operated in accordance with its investment objective, as well as its record of compliance with its investment restrictions and its performance history.
The Board took into account discussions that occur at Board meetings throughout the year with representatives of the Investment Advisers about fund investment performance. In this regard the Board noted that as part of regularly scheduled fund reviews and other reports to the Board on fund performance, the Board considers annualized return information for the fund for different time periods, measured against an appropriate securities market index (benchmark index) and an appropriate peer group of funds with similar objectives (peer group). The Board also receives and considers information about performance attribution. In its evaluation of fund investment performance at meetings throughout the year, the Board gave particular attention to information indicating underperformance of certain Fidelity funds for specific time periods and discussed with the Investment Advisers the reasons for such underperformance.
In addition to reviewing absolute and relative fund performance, the Independent Trustees periodically consider the appropriateness of fund performance metrics in evaluating the results achieved. In general, the Independent Trustees believe that fund performance should be evaluated based on gross performance (before fees and expenses but after transaction costs) compared to appropriate benchmark indices, over appropriate time periods that may include full market cycles, and on net performance (after fees and expenses) compared to appropriate peer groups, as applicable, over the same periods, taking into account relevant factors including the following: general market conditions; expectations for interest rate levels and credit conditions; issuer-specific information including credit quality; the potential for incremental return versus the fund's benchmark index weighed against the risks involved in obtaining that incremental return, including the risk of diminished or negative total returns; and fund cash flows and other factors. The Independent Trustees generally give greater weight to fund performance over longer time periods than over shorter time periods. Depending on the circumstances, the Independent Trustees may be satisfied with a fund's performance notwithstanding that it lags its benchmark index or peer group for certain periods.
The Independent Trustees recognize that shareholders evaluate performance on a net basis over their own holding periods, for which one-, three-, and five-year periods are often used as a proxy. For this reason, the performance information reviewed by the Board also included net calendar year total return information for the fund and an appropriate benchmark index and peer group for the most recent one- and three-year periods. The Independent Trustees recognize that shareholders who are not investing through a tax-advantaged retirement account also consider tax consequences in evaluating performance.
Based on its review, the Board concluded that the nature, extent, and quality of services provided to the fund under the Advisory Contracts should continue to benefit the shareholders of the fund.
Competitiveness of Management Fee and Total Expense Ratio . The Board considered the fund's management fee and total expense ratio compared to selected groups of competitive funds and classes (referred to as "mapped groups" below) for the purpose of facilitating the Trustees' competitive analysis of management fees and total expenses. Fidelity creates "mapped groups" by combining similar investment objective categories (as classified by Lipper) that have comparable investment mandates. Combining funds with similar investment objective categories aids the Board's comparison of management fees and total expense ratios by broadening the competitive group used for such comparison.
Management Fee . The Board considered two proprietary management fee comparisons for the 12-month (or shorter) periods shown in basis points (BP) in the chart below. The group of Lipper funds used by the Board for management fee comparisons is referred to below as the "Total Mapped Group" and is broader than the Lipper peer group used by the Board for performance comparisons. The Total Mapped Group comparison focuses on a fund's standing in terms of gross management fees before expense reimbursements or caps relative to the total universe of funds with comparable investment mandates, regardless of whether their management fee structures also are comparable. Funds with comparable investment mandates offer exposure to similar types of securities. Funds with comparable management fee structures have similar management fee contractual arrangements (e.g., flat rate charged for advisory services, all-inclusive fee rate, etc.). "TMG %" represents the percentage of funds in the Total Mapped Group that had management fees that were lower than the fund's. For example, a hypothetical TMG % of 20% would mean that 80% of the funds in the Total Mapped Group had higher, and 20% had lower, management fees than the fund. The fund's actual TMG %s and the number of funds in the Total Mapped Group are in the chart below. The "Asset-Sized Peer Group" (ASPG) comparison focuses on a fund's standing relative to a subset of non-Fidelity funds within the Total Mapped Group that are similar in size and management fee structure. For example, if a fund is in the first quartile of the ASPG, the fund's management fee ranks in the least expensive or lowest 25% of funds in the ASPG. The ASPG represents at least 15% of the funds in the Total Mapped Group with comparable asset size and management fee structures, subject to a minimum of 50 funds (or all funds in the Total Mapped Group if fewer than 50). Additional information, such as the ASPG quartile in which the fund's management fee rate ranked, is also included in the chart and was considered by the Board.
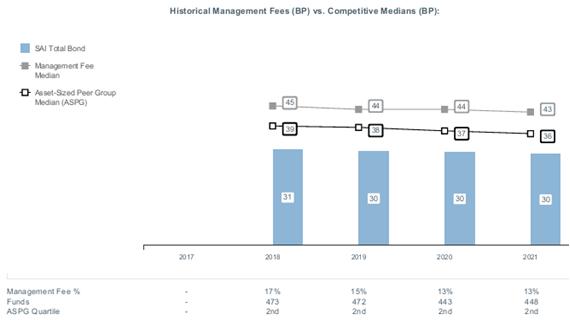
The Board noted that the fund's management fee rate ranked below the median of its Total Mapped Group and below the median of its ASPG for 2021.
Based on its review, the Board concluded that the fund's management fee is fair and reasonable in light of the services that the fund receives and the other factors considered.
Total Expense Ratio . In its review of the fund's total expense ratio, the Board considered the fund's management fee rate as well as other fund expenses, such as transfer agent fees, pricing and bookkeeping fees, and custodial, legal, and audit fees. The Board also noted that Fidelity may agree to waive fees or reimburse expenses from time to time, and the extent to which, if any, it has done so for the fund. The fund is compared to those funds and classes in the Total Mapped Group (used by the Board for management fee comparisons) that have a similar sales load structure. The Board also considered a total expense ASPG comparison, which focuses on the total expenses of the fund relative to a subset of non-Fidelity funds within the similar sales load structure group that are similar in size and management fee structure. The total expense ASPG is limited to 15 larger and 15 smaller classes of different funds, where possible. The total expense ASPG comparison excludes performance adjustments and fund-paid 12b-1 fees to eliminate variability in expenses relating to these items.
The Board noted that the fund's total net expense ratio ranked below the similar sales load structure group competitive median for 2021 and below the ASPG competitive median for 2021.
The Board further considered that FMR has contractually agreed to reimburse the fund to the extent that total operating expenses, with certain exceptions, as a percentage of its average net assets, exceed 0.36% through December 31, 2023.
Fees Charged to Other Fidelity Clients . The Board also considered Fidelity fee structures and other information with respect to clients of Fidelity, such as other funds advised or subadvised by Fidelity, pension plan clients, and other institutional clients with similar mandates. The Board noted that a joint ad hoc committee created by it and the boards of other Fidelity funds periodically reviews and compares Fidelity's institutional investment advisory business with its business of providing services to the Fidelity funds and also noted the most recent findings of the committee. The Board noted that the committee's review included a consideration of the differences in services provided, fees charged, and costs incurred, as well as competition in the markets serving the different categories of clients.
Based on its review of total expense ratios and fees charged to other Fidelity clients, the Board concluded that the fund's total expense ratio was reasonable in light of the services that the fund and its shareholders receive and the other factors considered.
Costs of the Services and Profitability . The Board considered the revenues earned and the expenses incurred by Fidelity in conducting the business of developing, marketing, distributing, managing, administering and servicing the fund and servicing the fund's shareholders. The Board also considered the level of Fidelity's profits in respect of all the Fidelity funds.
On an annual basis, Fidelity presents to the Board information about the profitability of its relationships with the fund. Fidelity calculates profitability information for each fund, as well as aggregate profitability information for groups of Fidelity funds and all Fidelity funds, using a series of detailed revenue and cost allocation methodologies which originate with the books and records of Fidelity on which Fidelity's audited financial statements are based. The Audit Committee of the Board reviews any significant changes from the prior year's methodologies and the full Board approves such changes.
A public accounting firm has been engaged annually by the Board as part of the Board's assessment of Fidelity's profitability analysis. The engagement includes the review and assessment of the methodologies used by Fidelity in determining the revenues and expenses attributable to Fidelity's mutual fund business, and completion of agreed-upon procedures in respect of the mathematical accuracy of certain fund profitability information and its conformity to established allocation methodologies. After considering the reports issued under the engagement and information provided by Fidelity, the Board concluded that while other allocation methods may also be reasonable, Fidelity's profitability methodologies are reasonable in all material respects.
The Board also reviewed Fidelity's non-fund businesses and potential indirect benefits such businesses may have received as a result of their association with Fidelity's mutual fund business (i.e., fall-out benefits) as well as cases where Fidelity's affiliates may benefit from the funds' business. The Board considered areas where potential indirect benefits to the Fidelity funds from their relationships with Fidelity may exist. The Board's consideration of these matters was informed by the findings of a joint ad hoc committee created by it and the boards of other Fidelity funds to evaluate potential fall-out benefits.
The Board considered the costs of the services provided by and the profits realized by Fidelity in connection with the operation of the fund and was satisfied that the profitability was not excessive.
Economies of Scale . The Board considered whether there have been economies of scale in respect of the management of the Fidelity funds, whether the Fidelity funds (including the fund) have appropriately benefited from any such economies of scale, and whether there is potential for realization of any further economies of scale. The Board considered the extent to which the fund will benefit from economies of scale as assets grow through increased services to the fund, through waivers or reimbursements, or through fee or expense ratio reductions. The Board also noted that a committee (the Economies of Scale Committee) created by it and the boards of other Fidelity funds periodically analyzes whether Fidelity attains economies of scale in respect of the management and servicing of the Fidelity funds, whether the Fidelity funds have appropriately benefited from such economies of scale, and whether there is potential for realization of any further economies of scale.
The Board recognized that the fund's management contract incorporates a "group fee" structure, which provides for lower group fee rates as total "group assets" increase, and for higher group fee rates as total "group assets" decrease ("group assets" as defined in the management contract). FMR calculates the group fee rates based on a tiered asset "breakpoint" schedule that varies based on asset class. The Board considered that the group fee is designed to deliver the benefits of economies of scale to fund shareholders when total Fidelity fund assets increase, even if assets of any particular fund are unchanged or have declined, because some portion of Fidelity's costs are attributable to services provided to all Fidelity funds, and all funds benefit if those costs can be allocated among more assets. The Board also considered that Fidelity agreed to impose a temporary fee waiver in the form of additional breakpoints to the current breakpoint schedule. The Board concluded that, given the group fee structure, fund shareholders will benefit from lower management fees as "group assets" increase at the fund complex level, regardless of whether Fidelity achieves any such economies of scale.
The Board concluded, taking into account the analysis of the Economies of Scale Committee, that economies of scale, if any, are being appropriately shared between fund shareholders and Fidelity.
Additional Information Requested by the Board . In order to develop fully the factual basis for consideration of the Fidelity funds' advisory contracts, the Board requested and received additional information on certain topics, including: (i) Fidelity's fund profitability methodology, profitability trends for certain funds, the allocation of various costs to different funds, and the impact of certain factors on fund profitability results; (ii) portfolio manager changes that have occurred during the past year and the amount of the investment that each portfolio manager has made in the Fidelity fund(s) that he or she manages; (iii) the extent to which current market conditions have affected retention and recruitment of personnel; (iv) the arrangements with and compensation paid to certain fund sub-advisers on behalf of the Fidelity funds and the treatment of such compensation within Fidelity's fund profitability methodology; (v) the terms of the funds' various management fee structures, including the basic group fee and the terms of Fidelity's voluntary expense limitation arrangements; (vi) Fidelity's transfer agent, pricing and bookkeeping fees, expense and service structures for different funds and classes relative to competitive trends; (vii) the impact on fund profitability of recent industry trends, such as the growth in passively managed funds and the changes in flows for different types of funds; (viii) the types of management fee and total expense comparisons provided, and the challenges and limitations associated with such information; and (ix) explanations regarding the relative total expense ratios and management fees of certain funds and classes, total expense and management fee competitive trends, and methodologies for total expense and management fee competitive comparisons. In addition, the Board considered its discussions with Fidelity regarding Fidelity's efforts to maintain the continuous investment and shareholder services necessary for the funds during the current pandemic and economic circumstances.
Based on its evaluation of all of the conclusions noted above, and after considering all factors it believed relevant, the Board concluded that the advisory fee arrangements are fair and reasonable and that the fund's Advisory Contracts should be renewed.
The Securities and Exchange Commission adopted Rule 22e-4 under the Investment Company Act of 1940 (the Liquidity Rule) to promote effective liquidity risk management throughout the open-end investment company industry, thereby reducing the risk that funds will be unable to meet their redemption obligations and mitigating dilution of the interests of fund shareholders.
The Fund has adopted and implemented a liquidity risk management program (the Program) reasonably designed to assess and manage the Fund's liquidity risk and to comply with the requirements of the Liquidity Rule. The Fund's Board of Trustees (the Board) has designated the Fund's investment adviser as administrator of the Program. The Fidelity advisers have established a Liquidity Risk Management Committee (the LRM Committee) to manage the Program for each of the Fidelity Funds. The LRM Committee monitors the adequacy and effectiveness of implementation of the Program and on a periodic basis assesses each Fund's liquidity risk based on a variety of factors including (1) the Fund's investment strategy, (2) portfolio liquidity and cash flow projections during normal and reasonably foreseeable stressed conditions, (3) shareholder redemptions, (4) borrowings and other funding sources and (5) certain factors specific to ETFs including the effect of the Fund's prices and spreads, market participants, and basket compositions on the overall liquidity of the Fund's portfolio, as applicable.
In accordance with the Program, each of the Fund's portfolio investments is classified into one of four defined liquidity categories based on a determination of a reasonable expectation for how long it would take to convert the investment to cash (or sell or dispose of the investment) without significantly changing its market value.
- Highly liquid investments - cash or convertible to cash within three business days or less
- Moderately liquid investments - convertible to cash in three to seven calendar days
- Less liquid investments - can be sold or disposed of, but not settled, within seven calendar days
- Illiquid investments - cannot be sold or disposed of within seven calendar days
Liquidity classification determinations take into account a variety of factors including various market, trading and investment-specific considerations, as well as market depth, and generally utilize analysis from a third-party liquidity metrics service.
The Liquidity Rule places a 15% limit on a fund's illiquid investments and requires funds that do not primarily hold assets that are highly liquid investments to determine and maintain a minimum percentage of the fund's net assets to be invested in highly liquid investments (highly liquid investment minimum or HLIM). The Program includes provisions reasonably designed to comply with the 15% limit on illiquid investments and for determining, periodically reviewing and complying with the HLIM requirement as applicable.
At a recent meeting of the Fund's Board of Trustees, the LRM Committee provided a written report to the Board pertaining to the operation, adequacy, and effectiveness of the Program for the period December 1, 2021 through November 30, 2022. The report concluded that the Program is operating effectively and is reasonably designed to assess and manage the Fund's liquidity risk.
1.9887628.104
STB-SANN-0423
Fidelity® Series Short-Term Credit Fund
Semi-Annual Report
February 28, 2023
Contents
To view a fund's proxy voting guidelines and proxy voting record for the 12-month period ended June 30, visit http://www.fidelity.com/proxyvotingresults or visit the Securities and Exchange Commission's (SEC) web site at http://www.sec.gov.
You may also call 1-800-544-8544 to request a free copy of the proxy voting guidelines.
Standard & Poor's, S&P and S&P 500 are registered service marks of The McGraw-Hill Companies, Inc. and have been licensed for use by Fidelity Distributors Corporation.
Other third-party marks appearing herein are the property of their respective owners.
All other marks appearing herein are registered or unregistered trademarks or service marks of FMR LLC or an affiliated company. © 2023 FMR LLC. All rights reserved.
This report and the financial statements contained herein are submitted for the general information of the shareholders of the Fund. This report is not authorized for distribution to prospective investors in the Fund unless preceded or accompanied by an effective prospectus.
A fund files its complete schedule of portfolio holdings with the SEC for the first and third quarters of each fiscal year on Form N-PORT. Forms N-PORT are available on the SEC's web site at http://www.sec.gov. A fund's Forms N-PORT may be reviewed and copied at the SEC's Public Reference Room in Washington, DC. Information regarding the operation of the SEC's Public Reference Room may be obtained by calling 1-800-SEC-0330.
For a complete list of a fund's portfolio holdings, view the most recent holdings listing, semiannual report, or annual report on Fidelity's web site at http://www.fidelity.com, http://www.institutional.fidelity.com, or http://www.401k.com, as applicable.
NOT FDIC INSURED •MAY LOSE VALUE •NO BANK GUARANTEE
Neither the Fund nor Fidelity Distributors Corporation is a bank.
Quality Diversification (% of Fund's net assets) |
|
| |
| We have used ratings from Moody's Investors Service, Inc. Where Moody's® ratings are not available, we have used S&P® ratings. All ratings are as of the date indicated and do not reflect subsequent changes. |
Asset Allocation (% of Fund's net assets) |
|
Foreign investments - 26.5% |
Futures - 10.5% |
|
Geographic Diversification (% of Fund's net assets) |
|
* Includes Short-Term investments and Net Other Assets (Liabilities). Percentages are based on country or territory of incorporation and are adjusted for the effect of derivatives, if applicable. |
| |
Showing Percentage of Net Assets
| Nonconvertible Bonds - 72.6% |
| | | Principal Amount (a) | Value ($) |
| COMMUNICATION SERVICES - 3.9% | | | |
| Diversified Telecommunication Services - 1.9% | | | |
| AT&T, Inc. 1.7% 3/25/26 | | 3,100,000 | 2,785,688 |
| NTT Finance Corp.: | | | |
| 0.583% 3/1/24 (b) | | 2,527,000 | 2,406,501 |
| 1.162% 4/3/26 (b) | | 5,299,000 | 4,679,137 |
| Verizon Communications, Inc. 2.625% 8/15/26 | | 1,460,000 | 1,340,847 |
| | | | 11,212,173 |
| Media - 0.8% | | | |
| Discovery Communications LLC 4.9% 3/11/26 | | 1,460,000 | 1,423,702 |
| Magallanes, Inc. 3.788% 3/15/25 (b) | | 3,100,000 | 2,964,476 |
| | | | 4,388,178 |
| Wireless Telecommunication Services - 1.2% | | | |
| T-Mobile U.S.A., Inc.: | | | |
| 1.5% 2/15/26 | | 1,170,000 | 1,047,533 |
| 2.25% 2/15/26 | | 1,600,000 | 1,455,309 |
| 3.5% 4/15/25 | | 4,500,000 | 4,310,378 |
| | | | 6,813,220 |
TOTAL COMMUNICATION SERVICES | | | 22,413,571 |
| CONSUMER DISCRETIONARY - 4.7% | | | |
| Automobiles - 3.8% | | | |
| American Honda Finance Corp. 1% 9/10/25 | | 3,100,000 | 2,798,135 |
| BMW U.S. Capital LLC 3.25% 4/1/25 (b) | | 3,100,000 | 2,989,535 |
| Daimler Finance North America LLC 5.5% 11/27/24 (b) | | 1,460,000 | 1,463,697 |
| General Motors Financial Co., Inc.: | | | |
| 1.05% 3/8/24 | | 1,414,000 | 1,350,536 |
| 1.25% 1/8/26 | | 4,954,000 | 4,381,695 |
| 5.25% 3/1/26 | | 3,100,000 | 3,065,562 |
| Volkswagen Group of America Finance LLC 0.875% 11/22/23 (b) | | 6,000,000 | 5,806,003 |
| | | | 21,855,163 |
| Multiline Retail - 0.3% | | | |
| Dollar General Corp. 4.25% 9/20/24 | | 1,370,000 | 1,345,914 |
| Specialty Retail - 0.6% | | | |
| AutoNation, Inc. 4.5% 10/1/25 | | 1,460,000 | 1,419,314 |
| AutoZone, Inc. 3.625% 4/15/25 | | 1,460,000 | 1,408,726 |
| Lowe's Companies, Inc. 4.4% 9/8/25 | | 716,000 | 703,634 |
| | | | 3,531,674 |
TOTAL CONSUMER DISCRETIONARY | | | 26,732,751 |
| CONSUMER STAPLES - 4.4% | | | |
| Food & Staples Retailing - 0.2% | | | |
| 7-Eleven, Inc. 0.8% 2/10/24 (b) | | 1,376,000 | 1,314,342 |
| Food Products - 1.5% | | | |
| Conagra Brands, Inc. 0.5% 8/11/23 | | 4,070,000 | 3,983,320 |
| McCormick & Co., Inc. 0.9% 2/15/26 | | 5,000,000 | 4,392,685 |
| | | | 8,376,005 |
| Tobacco - 2.7% | | | |
| BAT Capital Corp. 3.222% 8/15/24 | | 350,000 | 337,312 |
| BAT International Finance PLC 1.668% 3/25/26 | | 6,600,000 | 5,861,182 |
| Imperial Tobacco Finance PLC 3.125% 7/26/24 (b) | | 5,257,000 | 5,043,520 |
| Philip Morris International, Inc.: | | | |
| 2.75% 2/25/26 | | 1,460,000 | 1,360,803 |
| 5.125% 11/15/24 | | 3,000,000 | 2,990,625 |
| | | | 15,593,442 |
TOTAL CONSUMER STAPLES | | | 25,283,789 |
| ENERGY - 4.9% | | | |
| Oil, Gas & Consumable Fuels - 4.9% | | | |
| Canadian Natural Resources Ltd. 2.05% 7/15/25 | | 4,381,000 | 4,045,705 |
| Enbridge, Inc.: | | | |
| 2.15% 2/16/24 | | 559,000 | 541,224 |
| 2.5% 2/14/25 | | 584,000 | 551,421 |
| Energy Transfer LP 4.2% 9/15/23 | | 1,668,000 | 1,656,573 |
| Enterprise Products Operating LP 5.05% 1/10/26 | | 887,000 | 885,168 |
| EQT Corp. 5.678% 10/1/25 | | 1,129,000 | 1,114,227 |
| Equinor ASA 1.75% 1/22/26 | | 909,000 | 829,712 |
| MPLX LP: | | | |
| 1.75% 3/1/26 | | 5,000,000 | 4,471,326 |
| 4.5% 7/15/23 | | 990,000 | 986,473 |
| Occidental Petroleum Corp. 2.9% 8/15/24 | | 2,098,000 | 2,008,835 |
| Phillips 66 Co.: | | | |
| 1.3% 2/15/26 | | 1,750,000 | 1,559,989 |
| 3.85% 4/9/25 | | 3,100,000 | 3,009,318 |
| Pioneer Natural Resources Co. 0.55% 5/15/23 | | 4,724,000 | 4,677,847 |
| The Williams Companies, Inc.: | | | |
| 4% 9/15/25 | | 1,460,000 | 1,408,232 |
| 5.4% 3/2/26 | | 290,000 | 290,014 |
| | | | 28,036,064 |
| FINANCIALS - 37.4% | | | |
| Banks - 22.8% | | | |
| Bank of America Corp.: | | | |
| 0.976% 4/22/25 (c) | | 10,000,000 | 9,451,398 |
| 1.843% 2/4/25 (c) | | 5,500,000 | 5,299,745 |
| Barclays PLC: | | | |
| 1.007% 12/10/24 (c) | | 3,245,000 | 3,124,578 |
| 3.932% 5/7/25 (c) | | 10,000,000 | 9,733,173 |
| 4.338% 5/16/24 (c) | | 10,000,000 | 9,962,020 |
| Citigroup, Inc. 4.4% 6/10/25 | | 326,000 | 318,970 |
| Danske Bank A/S 3.875% 9/12/23 (b) | | 3,793,000 | 3,757,500 |
| HSBC Holdings PLC: | | | |
| 0.976% 5/24/25 (c) | | 6,000,000 | 5,644,119 |
| 1.645% 4/18/26 (c) | | 4,469,000 | 4,094,065 |
| JPMorgan Chase & Co.: | | | |
| 0.824% 6/1/25 (c) | | 9,763,000 | 9,158,882 |
| 2.083% 4/22/26 (c) | | 5,000,000 | 4,642,892 |
| 3.22% 3/1/25 (c) | | 5,000,000 | 4,879,949 |
| Lloyds Banking Group PLC 0.695% 5/11/24 (c) | | 4,010,000 | 3,965,407 |
| Mitsubishi UFJ Financial Group, Inc.: | | | |
| 0.848% 9/15/24 (c) | | 6,000,000 | 5,841,513 |
| 0.953% 7/19/25 (c) | | 5,000,000 | 4,667,823 |
| 2.193% 2/25/25 | | 6,000,000 | 5,621,640 |
| Mizuho Financial Group, Inc. 0.849% 9/8/24 (c) | | 2,945,000 | 2,867,601 |
| National Bank of Canada 0.55% 11/15/24 (c) | | 2,428,000 | 2,341,319 |
| NatWest Group PLC: | | | |
| 2.359% 5/22/24 (c) | | 3,422,000 | 3,392,085 |
| 3.875% 9/12/23 | | 5,847,000 | 5,789,944 |
| NatWest Markets PLC 0.8% 8/12/24 (b) | | 3,125,000 | 2,911,217 |
| Santander Holdings U.S.A., Inc. 3.5% 6/7/24 | | 4,731,000 | 4,605,954 |
| Societe Generale: | | | |
| 2.625% 10/16/24 (b) | | 908,000 | 861,953 |
| 3.875% 3/28/24 (b) | | 3,557,000 | 3,484,729 |
| Sumitomo Mitsui Financial Group, Inc. 1.474% 7/8/25 | | 5,000,000 | 4,549,545 |
| Wells Fargo & Co.: | | | |
| 1.654% 6/2/24 (c) | | 5,000,000 | 4,950,575 |
| 2.164% 2/11/26 (c) | | 5,000,000 | 4,672,865 |
| | | | 130,591,461 |
| Capital Markets - 6.1% | | | |
| Credit Suisse AG 0.495% 2/2/24 | | 5,000,000 | 4,713,884 |
| Deutsche Bank AG New York Branch: | | | |
| 0.898% 5/28/24 | | 1,760,000 | 1,658,393 |
| 1.447% 4/1/25 (c) | | 4,153,000 | 3,931,277 |
| 2.222% 9/18/24 (c) | | 9,466,000 | 9,253,029 |
| Morgan Stanley 0.79% 5/30/25 (c) | | 11,000,000 | 10,300,866 |
| UBS Group AG 1.008% 7/30/24 (b)(c) | | 5,345,000 | 5,238,884 |
| | | | 35,096,333 |
| Consumer Finance - 6.4% | | | |
| AerCap Ireland Capital Ltd./AerCap Global Aviation Trust: | | | |
| 1.65% 10/29/24 | | 3,012,000 | 2,794,162 |
| 1.75% 1/30/26 | | 4,184,000 | 3,698,551 |
| 4.875% 1/16/24 | | 1,464,000 | 1,449,611 |
| Ally Financial, Inc.: | | | |
| 1.45% 10/2/23 | | 789,000 | 769,015 |
| 5.125% 9/30/24 | | 4,280,000 | 4,242,596 |
| Capital One Financial Corp. 1.343% 12/6/24 (c) | | 2,500,000 | 2,409,572 |
| Hyundai Capital America 1% 9/17/24 (b) | | 5,519,000 | 5,135,200 |
| John Deere Capital Corp. 3.4% 9/11/25 | | 3,100,000 | 2,974,647 |
| Synchrony Financial: | | | |
| 4.25% 8/15/24 | | 5,352,000 | 5,222,728 |
| 4.375% 3/19/24 | | 5,198,000 | 5,125,858 |
| Toyota Motor Credit Corp. 5.4% 11/10/25 | | 3,000,000 | 3,029,415 |
| | | | 36,851,355 |
| Diversified Financial Services - 1.7% | | | |
| Athene Global Funding: | | | |
| 0.95% 1/8/24 (b) | | 5,259,000 | 5,054,151 |
| 1% 4/16/24 (b) | | 5,000,000 | 4,702,224 |
| | | | 9,756,375 |
| Insurance - 0.4% | | | |
| Great-West Lifeco U.S. Finance 2020 LP 0.904% 8/12/25 (b) | | 2,318,000 | 2,060,391 |
TOTAL FINANCIALS | | | 214,355,915 |
| HEALTH CARE - 2.9% | | | |
| Biotechnology - 1.1% | | | |
| AbbVie, Inc.: | | | |
| 3.2% 5/14/26 | | 1,460,000 | 1,371,740 |
| 3.6% 5/14/25 | | 3,100,000 | 2,983,053 |
| Amgen, Inc. 5.25% 3/2/25 (d) | | 2,000,000 | 1,995,552 |
| | | | 6,350,345 |
| Health Care Providers & Services - 0.8% | | | |
| Cigna Group 1.25% 3/15/26 | | 1,750,000 | 1,555,736 |
| CVS Health Corp.: | | | |
| 3% 8/15/26 | | 1,460,000 | 1,354,672 |
| 5% 2/20/26 | | 1,500,000 | 1,491,741 |
| | | | 4,402,149 |
| Pharmaceuticals - 1.0% | | | |
| Bayer U.S. Finance II LLC 4.25% 12/15/25 (b) | | 6,250,000 | 6,044,971 |
TOTAL HEALTH CARE | | | 16,797,465 |
| INDUSTRIALS - 5.2% | | | |
| Aerospace & Defense - 1.5% | | | |
| Raytheon Technologies Corp. 5% 2/27/26 | | 824,000 | 822,764 |
| The Boeing Co.: | | | |
| 1.95% 2/1/24 | | 5,000,000 | 4,828,929 |
| 4.875% 5/1/25 | | 3,000,000 | 2,958,003 |
| | | | 8,609,696 |
| Airlines - 0.8% | | | |
| Delta Air Lines, Inc. 2.9% 10/28/24 | | 4,794,000 | 4,561,527 |
| Building Products - 0.3% | | | |
| Carrier Global Corp. 2.242% 2/15/25 | | 1,750,000 | 1,643,574 |
| Commercial Services & Supplies - 0.9% | | | |
| Republic Services, Inc. 0.875% 11/15/25 | | 6,080,000 | 5,389,847 |
| Machinery - 0.8% | | | |
| Caterpillar Financial Services Corp. 3.65% 8/12/25 | | 3,100,000 | 3,001,109 |
| Daimler Trucks Finance North America LLC 1.625% 12/13/24 (b) | | 1,475,000 | 1,379,704 |
| | | | 4,380,813 |
| Trading Companies & Distributors - 0.8% | | | |
| Air Lease Corp.: | | | |
| 0.7% 2/15/24 | | 2,107,000 | 2,007,800 |
| 0.8% 8/18/24 | | 2,623,000 | 2,435,355 |
| | | | 4,443,155 |
| Transportation Infrastructure - 0.1% | | | |
| Avolon Holdings Funding Ltd. 2.875% 2/15/25 (b) | | 1,000,000 | 930,107 |
TOTAL INDUSTRIALS | | | 29,958,719 |
| INFORMATION TECHNOLOGY - 5.0% | | | |
| Electronic Equipment & Components - 0.8% | | | |
| Dell International LLC/EMC Corp.: | | | |
| 5.45% 6/15/23 | | 3,149,000 | 3,146,793 |
| 6.02% 6/15/26 | | 1,600,000 | 1,619,696 |
| | | | 4,766,489 |
| IT Services - 1.2% | | | |
| The Western Union Co.: | | | |
| 2.85% 1/10/25 | | 1,063,000 | 1,009,589 |
| 4.25% 6/9/23 | | 6,026,000 | 6,002,811 |
| | | | 7,012,400 |
| Semiconductors & Semiconductor Equipment - 0.8% | | | |
| Microchip Technology, Inc. 0.983% 9/1/24 | | 3,079,000 | 2,876,186 |
| NXP BV/NXP Funding LLC/NXP U.S.A., Inc. 3.875% 6/18/26 | | 1,460,000 | 1,383,832 |
| | | | 4,260,018 |
| Software - 2.2% | | | |
| Oracle Corp. 5.8% 11/10/25 | | 3,000,000 | 3,035,461 |
| VMware, Inc.: | | | |
| 0.6% 8/15/23 | | 5,987,000 | 5,856,876 |
| 1% 8/15/24 | | 3,937,000 | 3,678,562 |
| | | | 12,570,899 |
TOTAL INFORMATION TECHNOLOGY | | | 28,609,806 |
| MATERIALS - 0.9% | | | |
| Chemicals - 0.9% | | | |
| Celanese U.S. Holdings LLC: | | | |
| 5.9% 7/5/24 | | 1,500,000 | 1,498,279 |
| 6.05% 3/15/25 | | 1,460,000 | 1,454,597 |
| Nutrien Ltd. 5.9% 11/7/24 | | 782,000 | 786,174 |
| Westlake Corp. 3.6% 8/15/26 | | 1,460,000 | 1,373,746 |
| | | | 5,112,796 |
| REAL ESTATE - 0.4% | | | |
| Equity Real Estate Investment Trusts (REITs) - 0.4% | | | |
| American Tower Corp. 1.3% 9/15/25 | | 1,905,000 | 1,712,743 |
| Crown Castle International Corp. 1.35% 7/15/25 | | 444,000 | 403,257 |
| | | | 2,116,000 |
| UTILITIES - 2.9% | | | |
| Electric Utilities - 1.0% | | | |
| FirstEnergy Corp.: | | | |
| 1.6% 1/15/26 | | 476,000 | 423,899 |
| 2.05% 3/1/25 | | 2,724,000 | 2,541,082 |
| Southern Co. 0.6% 2/26/24 | | 2,247,000 | 2,139,697 |
| Tampa Electric Co. 3.875% 7/12/24 | | 881,000 | 860,593 |
| | | | 5,965,271 |
| Independent Power and Renewable Electricity Producers - 0.5% | | | |
| Emera U.S. Finance LP 0.833% 6/15/24 | | 2,827,000 | 2,652,029 |
| Multi-Utilities - 1.4% | | | |
| CenterPoint Energy, Inc. U.S. Secured Overnight Fin. Rate (SOFR) Averages Index + 0.650% 5.2048% 5/13/24 (c)(e) | | 4,294,000 | 4,273,394 |
| DTE Energy Co. 4.22% 11/1/24 | | 1,600,000 | 1,564,842 |
| NiSource, Inc. 0.95% 8/15/25 | | 1,953,000 | 1,760,797 |
| WEC Energy Group, Inc. 5% 9/27/25 | | 570,000 | 564,919 |
| | | | 8,163,952 |
TOTAL UTILITIES | | | 16,781,252 |
| TOTAL NONCONVERTIBLE BONDS (Cost $435,396,486) | | | 416,198,128 |
| | | | |
| U.S. Treasury Obligations - 8.7% |
| | | Principal Amount (a) | Value ($) |
| U.S. Treasury Notes: | | | |
| 0.75% 8/31/26 (f) | | 17,561,500 | 15,499,395 |
| 3.875% 1/15/26 | | 8,400,000 | 8,255,625 |
| 4.125% 1/31/25 (g) | | 12,000,000 | 11,843,906 |
| 4.5% 11/30/24 | | 12,000,000 | 11,913,281 |
| 4.5% 11/15/25 | | 2,250,000 | 2,246,221 |
| TOTAL U.S. TREASURY OBLIGATIONS (Cost $50,560,249) | | | 49,758,428 |
| | | | |
| U.S. Government Agency - Mortgage Securities - 0.9% |
| | | Principal Amount (a) | Value ($) |
| Fannie Mae - 0.9% | | | |
| 4.5% 3/1/39 to 9/1/49 | | 4,026,996 | 3,955,275 |
| 5.5% 11/1/34 | | 985,622 | 999,454 |
| 7.5% 11/1/31 | | 200 | 210 |
TOTAL FANNIE MAE | | | 4,954,939 |
| Freddie Mac - 0.0% | | | |
| 8.5% 5/1/26 to 7/1/28 | | 8,900 | 9,210 |
| Ginnie Mae - 0.0% | | | |
| 7% to 7% 1/15/25 to 8/15/32 | | 108,468 | 111,474 |
| TOTAL U.S. GOVERNMENT AGENCY - MORTGAGE SECURITIES (Cost $5,502,395) | | | 5,075,623 |
| | | | |
| Asset-Backed Securities - 11.2% |
| | | Principal Amount (a) | Value ($) |
| American Express Credit Account Master Trust Series 2022-4 Class A, 4.95% 10/15/27 | | 947,000 | 946,847 |
| Capital One Multi-Asset Execution Trust Series 2022-A3 Class A, 4.95% 10/15/27 | | 1,170,000 | 1,168,318 |
| Carvana Auto Receivables Trust Series 2021-P2 Class A3, 0.49% 3/10/26 | | 4,081,521 | 3,940,532 |
| Cent CLO LP Series 2021-21A Class A1R3, 3 month U.S. LIBOR + 0.970% 5.7846% 7/27/30 (b)(c)(e) | | 5,653,977 | 5,594,870 |
| Chase Issuance Trust Series 2022-A1 Class A, 3.97% 9/15/27 | | 1,450,000 | 1,411,996 |
| Countrywide Home Loans, Inc. Series 2004-2 Class 3A4, 1 month U.S. LIBOR + 0.500% 5.117% 7/25/34 (c)(e) | | 106,344 | 100,824 |
| Dell Equipment Finance Trust Series 2021-1 Class A3, 0.43% 5/22/26 (b) | | 1,796,004 | 1,768,808 |
| Donlen Fleet Lease Funding Series 2021-2 Class A2, 0.56% 12/11/34 (b) | | 1,802,801 | 1,745,936 |
| Eaton Vance CLO, Ltd. Series 2021-1A Class AR, 3 month U.S. LIBOR + 1.100% 5.8924% 4/15/31 (b)(c)(e) | | 5,850,000 | 5,796,578 |
| Enterprise Fleet Financing Series 2023-1 Class A2, 5.51% 1/22/29 (b) | | 1,056,000 | 1,056,660 |
| Enterprise Fleet Financing LLC: | | | |
| Series 2020-2 Class A2, 0.61% 7/20/26 (b) | | 1,934,867 | 1,896,178 |
| Series 2021-1 Class A2, 0.44% 12/21/26 (b) | | 947,816 | 921,204 |
| Series 2022-3 Class A2, 4.38% 7/20/29 (b) | | 258,000 | 253,383 |
| GMF Floorplan Owner Revolving Trust Series 2020-1 Class A, 0.68% 8/15/25 (b) | | 2,239,000 | 2,191,878 |
| MMAF Equipment Finance LLC Series 2019-B Class A3, 2.01% 12/12/24 (b) | | 1,586,655 | 1,560,360 |
| Niagara Park CLO, Ltd. Series 2021-1A Class AR, 3 month U.S. LIBOR + 1.000% 5.7924% 7/17/32 (b)(c)(e) | | 6,160,000 | 6,073,507 |
| Park Place Securities, Inc. Series 2005-WCH1 Class M4, 1 month U.S. LIBOR + 1.240% 5.862% 1/25/36 (c)(e) | | 122,416 | 119,929 |
| Prpm 2021-5, LLC Series 2021-5 Class A1, 1.793% 6/25/26 (b)(c) | | 3,325,848 | 3,008,314 |
| Santander Drive Auto Receivables Trust Series 2022-5 Class A3, 4.11% 8/17/26 | | 988,000 | 975,871 |
| Santander Retail Auto Lease Trust Series 2021-A Class A3, 0.51% 7/22/24 (b) | | 2,900,419 | 2,841,680 |
| Sofi Consumer Loan Program Series 2023-1S Class A, 5.81% 5/15/31 (b) | | 713,000 | 712,717 |
| TCI-Flatiron CLO Ltd. / LLC Series 2021-1A Class AR, 3 month U.S. LIBOR + 0.960% 5.8366% 11/18/30 (b)(c)(e) | | 6,095,193 | 6,040,958 |
| Terwin Mortgage Trust Series 2003-4HE Class A1, 1 month U.S. LIBOR + 0.860% 5.477% 9/25/34 (c)(e) | | 115,132 | 110,567 |
| Upstart Securitization Trust: | | | |
| Series 2021-2 Class A, 0.91% 6/20/31 (b) | | 445,765 | 441,268 |
| Series 2021-3 Class A, 0.83% 7/20/31 (b) | | 1,011,115 | 992,961 |
| VCAT Asset Securitization, LLC: | | | |
| Series 2021-NPL1 Class A1, 2.2891% 12/26/50 (b) | | 734,052 | 695,021 |
| Series 2021-NPL2 Class A1, 2.115% 3/27/51 (b) | | 3,240,849 | 3,029,929 |
| Series 2021-NPL3 Class A1, 1.743% 5/25/51 (b)(c) | | 4,137,924 | 3,775,042 |
| Voya CLO Ltd. Series 2021-1A Class A1R, 3 month U.S. LIBOR + 0.950% 5.7424% 4/17/30 (b)(c)(e) | | 5,231,145 | 5,180,675 |
| TOTAL ASSET-BACKED SECURITIES (Cost $66,074,109) | | | 64,352,811 |
| | | | |
| Collateralized Mortgage Obligations - 1.3% |
| | | Principal Amount (a) | Value ($) |
| Private Sponsor - 1.0% | | | |
| Ajax Mortgage Loan Trust sequential payer Series 2021-B Class A, 2.239% 6/25/66 (b)(c) | | 1,862,236 | 1,738,166 |
| Brass PLC Series 2021-10A Class A1, 0.669% 4/16/69 (b)(c) | | 682,580 | 650,811 |
| Cascade Funding Mortgage Trust: | | | |
| Series 2021-HB5 Class A, 0.8006% 2/25/31 (b) | | 802,805 | 776,781 |
| Series 2021-HB6 Class A, 0.8983% 6/25/36 (b) | | 1,109,654 | 1,052,861 |
| Preston Ridge Partners Mortgage Trust Series 2021-2 Class A1, 2.115% 3/25/26 (b) | | 1,677,058 | 1,579,160 |
| Sequoia Mortgage Trust floater Series 2004-6 Class A3B, 6 month U.S. LIBOR + 0.880% 6.0669% 7/20/34 (c)(e) | | 1,157 | 1,034 |
TOTAL PRIVATE SPONSOR | | | 5,798,813 |
| U.S. Government Agency - 0.3% | | | |
| Fannie Mae: | | | |
| floater Series 2015-27 Class KF, 1 month U.S. LIBOR + 0.300% 4.917% 5/25/45 (c)(e) | | 467,487 | 462,879 |
| sequential payer Series 2001-40 Class Z, 6% 8/25/31 | | 39,436 | 39,432 |
| Series 2016-27: | | | |
Class HK, 3% 1/25/41 | | 497,920 | 465,502 |
Class KG, 3% 1/25/40 | | 229,514 | 214,710 |
| Series 2016-42 Class FL, 1 month U.S. LIBOR + 0.350% 4.967% 7/25/46 (c)(e) | | 529,117 | 526,389 |
| Freddie Mac Series 3949 Class MK, 4.5% 10/15/34 | | 262,769 | 258,869 |
TOTAL U.S. GOVERNMENT AGENCY | | | 1,967,781 |
| TOTAL COLLATERALIZED MORTGAGE OBLIGATIONS (Cost $8,193,014) | | | 7,766,594 |
| | | | |
| Commercial Mortgage Securities - 4.8% |
| | | Principal Amount (a) | Value ($) |
| BAMLL Commercial Mortgage Securities Trust sequential payer Series 2019-BPR Class ANM, 3.112% 11/5/32 (b) | | 1,502,000 | 1,370,781 |
| BLOX Trust floater sequential payer Series 2021-BLOX Class A, 1 month U.S. LIBOR + 0.750% 5.338% 9/15/26 (b)(c)(e) | | 3,055,000 | 2,887,972 |
| BX Trust floater Series 2022-GPA Class A, CME Term SOFR 1 Month Index + 2.160% 6.7275% 10/15/39 (b)(c)(e) | | 330,000 | 329,380 |
| CF Hippolyta Issuer LLC sequential payer: | | | |
| Series 2020-1 Class A1, 1.69% 7/15/60 (b) | | 4,810,360 | 4,306,766 |
| Series 2021-1A Class A1, 1.53% 3/15/61 (b) | | 3,205,747 | 2,783,843 |
| CGDB Commercial Mortgage Trust floater Series 2019-MOB Class A, 1 month U.S. LIBOR + 0.950% 5.5379% 11/15/36 (b)(c)(e) | | 1,128,000 | 1,111,003 |
| Citigroup Commercial Mortgage Trust sequential payer Series 2013-GC17 Class A4, 4.131% 11/10/46 | | 2,062,000 | 2,037,923 |
| CSAIL Commercial Mortgage Trust sequential payer Series 19-C15 Class A2, 3.4505% 3/15/52 | | 2,209,309 | 2,145,222 |
| CSMC Trust Series 2017-CHOP Class A, 1 month U.S. LIBOR + 0.750% 5.338% 7/15/32 (b)(c)(e) | | 1,279,000 | 1,217,224 |
| GS Mortgage Securities Trust: | | | |
| sequential payer Series 2014-GC18 Class AAB, 3.648% 1/10/47 | | 8,881 | 8,807 |
| Series 2011-GC5 Class A/S, 5.1538% 8/10/44 (b)(c) | | 4,133,883 | 4,072,656 |
| JPMorgan Chase Commercial Mortgage Securities Trust floater Series 2019-BKWD Class A, 1 month U.S. LIBOR + 1.250% 5.838% 9/15/29 (b)(c)(e) | | 1,930,387 | 1,834,574 |
| Morgan Stanley Capital I Trust sequential payer Series 2019-MEAD Class A, 3.17% 11/10/36 (b) | | 3,286,000 | 3,062,314 |
| WF-RBS Commercial Mortgage Trust sequential payer: | | | |
| Series 2013-C14 Class ASB, 2.977% 6/15/46 | | 17,165 | 17,113 |
| Series 2013-C16 Class ASB, 3.963% 9/15/46 | | 82,547 | 82,120 |
| TOTAL COMMERCIAL MORTGAGE SECURITIES (Cost $29,406,829) | | | 27,267,698 |
| | | | |
| Money Market Funds - 2.2% |
| | | Shares | Value ($) |
| Fidelity Cash Central Fund 4.63% (h) | | 3,229,982 | 3,230,628 |
| Fidelity Securities Lending Cash Central Fund 4.63% (h)(i) | | 9,604,903 | 9,605,864 |
| TOTAL MONEY MARKET FUNDS (Cost $12,836,492) | | | 12,836,492 |
| | | | |
| TOTAL INVESTMENT IN SECURITIES - 101.7% (Cost $607,969,574) | 583,255,774 |
NET OTHER ASSETS (LIABILITIES) - (1.7)% | (9,856,906) |
| NET ASSETS - 100.0% | 573,398,868 |
| | |
| Futures Contracts |
| | Number of contracts | Expiration Date | Notional Amount ($) | Value ($) | Unrealized Appreciation/ (Depreciation) ($) |
| Purchased | | | | | |
| | | | | | |
| Treasury Contracts | | | | | |
| CBOT 2-Year U.S. Treasury Note Contracts (United States) | 196 | Jun 2023 | 39,930,406 | (90,728) | (90,728) |
| CBOT 5-Year U.S. Treasury Note Contracts (United States) | 189 | Jun 2023 | 20,233,336 | (25,481) | (25,481) |
| | | | | | |
| TOTAL FUTURES CONTRACTS | | | | | (116,209) |
| The notional amount of futures purchased as a percentage of Net Assets is 10.5% |
For the period, the average monthly notional amount at value for futures contracts in the aggregate was $57,673,867.
Legend
| (a) | Amount is stated in United States dollars unless otherwise noted. |
| (b) | Security exempt from registration under Rule 144A of the Securities Act of 1933. These securities may be resold in transactions exempt from registration, normally to qualified institutional buyers. At the end of the period, the value of these securities amounted to $152,580,461 or 26.6% of net assets. |
| (c) | Coupon rates for floating and adjustable rate securities reflect the rates in effect at period end. |
| (d) | Security or a portion of the security purchased on a delayed delivery or when-issued basis. |
| (e) | Coupon is indexed to a floating interest rate which may be multiplied by a specified factor and/or subject to caps or floors. |
| (f) | Security or a portion of the security was pledged to cover margin requirements for futures contracts. At period end, the value of securities pledged amounted to $504,856. |
| (g) | Security or a portion of the security is on loan at period end. |
| (h) | Affiliated fund that is generally available only to investment companies and other accounts managed by Fidelity Investments. The rate quoted is the annualized seven-day yield of the fund at period end. A complete unaudited listing of the fund's holdings as of its most recent quarter end is available upon request. In addition, each Fidelity Central Fund's financial statements are available on the SEC's website or upon request. |
| (i) | Investment made with cash collateral received from securities on loan. |
Affiliated Central Funds
Fiscal year to date information regarding the Fund's investments in Fidelity Central Funds, including the ownership percentage, is presented below.
| Affiliate | Value, beginning of period ($) | Purchases ($) | Sales Proceeds ($) | Dividend Income ($) | Realized Gain (loss) ($) | Change in Unrealized appreciation (depreciation) ($) | Value, end of period ($) | % ownership, end of period |
| Fidelity Cash Central Fund 4.63% | 123,298 | 97,752,202 | 94,644,872 | 71,760 | - | - | 3,230,628 | 0.0% |
| Fidelity Securities Lending Cash Central Fund 4.63% | - | 9,773,044 | 167,180 | 3,427 | - | - | 9,605,864 | 0.0% |
| Total | 123,298 | 107,525,246 | 94,812,052 | 75,187 | - | - | 12,836,492 | |
| | | | | | | | | |
Amounts in the dividend income column in the above table include any capital gain distributions from underlying funds, which are presented in the corresponding line item in the Statement of Operations, if applicable.
Amount for Fidelity Securities Lending Cash Central Fund represents the income earned on investing cash collateral, less rebates paid to borrowers and any lending agent fees associated with the loan, plus any premium payments received for lending certain types of securities.
Amounts included in the purchases and sales proceeds columns may include in-kind transactions, if applicable.
Investment Valuation
The following is a summary of the inputs used, as of February 28, 2023, involving the Fund's assets and liabilities carried at fair value. The inputs or methodology used for valuing securities may not be an indication of the risk associated with investing in those securities. For more information on valuation inputs, and their aggregation into the levels used below, please refer to the Investment Valuation section in the accompanying Notes to Financial Statements.
| Valuation Inputs at Reporting Date: |
| Description | Total ($) | Level 1 ($) | Level 2 ($) | Level 3 ($) |
Investments in Securities: | | | | |
|
| Corporate Bonds | 416,198,128 | - | 416,198,128 | - |
|
| U.S. Government and Government Agency Obligations | 49,758,428 | - | 49,758,428 | - |
|
| U.S. Government Agency - Mortgage Securities | 5,075,623 | - | 5,075,623 | - |
|
| Asset-Backed Securities | 64,352,811 | - | 64,352,811 | - |
|
| Collateralized Mortgage Obligations | 7,766,594 | - | 7,766,594 | - |
|
| Commercial Mortgage Securities | 27,267,698 | - | 27,267,698 | - |
|
| Money Market Funds | 12,836,492 | 12,836,492 | - | - |
| Total Investments in Securities: | 583,255,774 | 12,836,492 | 570,419,282 | - |
Derivative Instruments: | | | | |
|
| Liabilities | | | | |
Futures Contracts | (116,209) | (116,209) | - | - |
| Total Liabilities | (116,209) | (116,209) | - | - |
| Total Derivative Instruments: | (116,209) | (116,209) | - | - |
Value of Derivative Instruments
The following table is a summary of the Fund's value of derivative instruments by primary risk exposure as of February 28, 2023. For additional information on derivative instruments, please refer to the Derivative Instruments section in the accompanying Notes to Financial Statements.
Primary Risk Exposure / Derivative Type | Value |
| Asset ($) | Liability ($) |
| Interest Rate Risk | | |
Futures Contracts (a) | 0 | (116,209) |
| Total Interest Rate Risk | 0 | (116,209) |
| Total Value of Derivatives | 0 | (116,209) |
(a)Reflects gross cumulative appreciation (depreciation) on futures contracts as presented in the Schedule of Investments. In the Statement of Assets and Liabilities, the period end daily variation margin is included in receivable or payable for daily variation margin on futures contracts, and the net cumulative appreciation (depreciation) is included in Total accumulated earnings (loss).
| Statement of Assets and Liabilities |
| | | | February 28, 2023 (Unaudited) |
| | | | | |
| Assets | | | | |
| Investment in securities, at value (including securities loaned of $9,375,418) - See accompanying schedule: | | | | |
Unaffiliated issuers (cost $595,133,082) | $ | 570,419,282 | | |
Fidelity Central Funds (cost $12,836,492) | | 12,836,492 | | |
| | | | | |
| | | | | |
| Total Investment in Securities (cost $607,969,574) | | | $ | 583,255,774 |
| Receivable for fund shares sold | | | | 99,093 |
| Interest receivable | | | | 3,370,782 |
| Distributions receivable from Fidelity Central Funds | | | | 17,795 |
Total assets | | | | 586,743,444 |
| Liabilities | | | | |
| Payable for investments purchased | | | | |
Regular delivery | $ | 1,369,741 | | |
Delayed delivery | | 1,998,680 | | |
| Payable for fund shares redeemed | | 359,599 | | |
| Payable for daily variation margin on futures contracts | | 6,070 | | |
| Other payables and accrued expenses | | 4,622 | | |
| Collateral on securities loaned | | 9,605,864 | | |
| Total Liabilities | | | | 13,344,576 |
| Net Assets | | | $ | 573,398,868 |
| Net Assets consist of: | | | | |
| Paid in capital | | | $ | 626,879,143 |
| Total accumulated earnings (loss) | | | | (53,480,275) |
| Net Assets | | | $ | 573,398,868 |
Net Asset Value , offering price and redemption price per share ($573,398,868 ÷ 59,916,098 shares) | | | $ | 9.57 |
| Statement of Operations |
| | | | Six months ended February 28, 2023 (Unaudited) |
| Investment Income | | | | |
| Interest | | | $ | 7,195,145 |
| Income from Fidelity Central Funds (including $3,427 from security lending) | | | | 75,187 |
| Total Income | | | | 7,270,332 |
| Expenses | | | | |
| Custodian fees and expenses | $ | 5,364 | | |
| Independent trustees' fees and expenses | | 1,145 | | |
| Total expenses before reductions | | 6,509 | | |
| Expense reductions | | (407) | | |
| Total expenses after reductions | | | | 6,102 |
| Net Investment income (loss) | | | | 7,264,230 |
| Realized and Unrealized Gain (Loss) | | | | |
| Net realized gain (loss) on: | | | | |
| Investment Securities: | | | | |
| Unaffiliated issuers | | (1,993,936) | | |
| Futures contracts | | (2,120,203) | | |
| Total net realized gain (loss) | | | | (4,114,139) |
| Change in net unrealized appreciation (depreciation) on: | | | | |
| Investment Securities: | | | | |
| Unaffiliated issuers | | 550,327 | | |
| Futures contracts | | 198,497 | | |
| Total change in net unrealized appreciation (depreciation) | | | | 748,824 |
| Net gain (loss) | | | | (3,365,315) |
| Net increase (decrease) in net assets resulting from operations | | | $ | 3,898,915 |
| Statement of Changes in Net Assets |
| |
| | Six months ended February 28, 2023 (Unaudited) | | Year ended August 31, 2022 |
| Increase (Decrease) in Net Assets | | | | |
| Operations | | | | |
| Net investment income (loss) | $ | 7,264,230 | $ | 18,235,035 |
| Net realized gain (loss) | | (4,114,139) | | (23,804,615) |
| Change in net unrealized appreciation (depreciation) | | 748,824 | | (45,864,434) |
| Net increase (decrease) in net assets resulting from operations | | 3,898,915 | | (51,434,014) |
| Distributions to shareholders | | (6,496,137) | | (27,113,737) |
| Share transactions | | | | |
| Proceeds from sales of shares | | 166,841,658 | | 67,872,917 |
| Reinvestment of distributions | | 6,206,132 | | 27,111,675 |
| Cost of shares redeemed | | (200,595,210) | | (1,717,491,079) |
Net increase (decrease) in net assets resulting from share transactions | | (27,547,420) | | (1,622,506,487) |
| Total increase (decrease) in net assets | | (30,144,642) | | (1,701,054,238) |
| | | | | |
| Net Assets | | | | |
| Beginning of period | | 603,543,510 | | 2,304,597,748 |
| End of period | $ | 573,398,868 | $ | 603,543,510 |
| | | | | |
| Other Information | | | | |
| Shares | | | | |
| Sold | | 17,454,449 | | 6,866,161 |
| Issued in reinvestment of distributions | | 650,397 | | 2,719,360 |
| Redeemed | | (20,990,582) | | (173,446,146) |
| Net increase (decrease) | | (2,885,736) | | (163,860,625) |
| | | | | |
Financial Highlights
| Fidelity® Series Short-Term Credit Fund |
| |
| | Six months ended (Unaudited) February 28, 2023 | | Years ended August 31, 2022 | | 2021 | | 2020 | | 2019 | | 2018 |
Selected Per-Share Data | | | | | | | | | | | | |
| Net asset value, beginning of period | $ | 9.61 | $ | 10.17 | $ | 10.27 | $ | 10.09 | $ | 9.88 | $ | 10.01 |
| Income from Investment Operations | | | | | | | | | | | | |
Net investment income (loss) A,B | | .118 | | .136 | | .170 | | .252 | | .272 | | .214 |
| Net realized and unrealized gain (loss) | | (.052) | | (.511) | | (.073) | | .180 | | .216 | | (.133) |
| Total from investment operations | | .066 | | (.375) | | .097 | | .432 | | .488 | | .081 |
| Distributions from net investment income | | (.106) | | (.143) C | | (.169) | | (.252) | | (.278) | | (.211) |
| Distributions from net realized gain | | - | | (.042) C | | (.028) | | - | | - | | - |
| Total distributions | | (.106) | | (.185) | | (.197) | | (.252) | | (.278) | | (.211) |
| Net asset value, end of period | $ | 9.57 | $ | 9.61 | $ | 10.17 | $ | 10.27 | $ | 10.09 | $ | 9.88 |
Total Return D,E | | .69% | | (3.73)% | | .95% | | 4.35% | | 5.02% | | .82% |
Ratios to Average Net Assets B,F,G | | | | | | | | | | | | |
Expenses before reductions H | | -% I | | -% | | -% | | -% | | -% | | -% |
Expenses net of fee waivers, if any H | | -% I | | -% | | -% | | -% | | -% | | -% |
Expenses net of all reductions H | | -% I | | -% | | -% | | -% | | -% | | -% |
| Net investment income (loss) | | 2.50% I | | 1.36% | | 1.67% | | 2.49% | | 2.74% | | 2.16% |
| Supplemental Data | | | | | | | | | | | | |
| Net assets, end of period (000 omitted) | $ | 573,399 | $ | 603,544 | $ | 2,304,598 | $ | 2,393,482 | $ | 1,870,061 | $ | 2,113,392 |
Portfolio turnover rate J | | 33% I | | 36% | | 60% | | 62% K | | 67% | | 52% L |
A Calculated based on average shares outstanding during the period.
B Net investment income (loss) is affected by the timing of the declaration of dividends by any underlying mutual funds or exchange-traded funds (ETFs). Net investment income (loss) of any mutual funds or ETFs is not included in the Fund's net investment income (loss) ratio.
C The amount shown reflects reclassifications related to book to tax differences that were made in the year shown.
D Total returns for periods of less than one year are not annualized.
E Total returns would have been lower if certain expenses had not been reduced during the applicable periods shown.
F Fees and expenses of any underlying mutual funds or exchange-traded funds (ETFs) are not included in the Fund's expense ratio. The Fund indirectly bears its proportionate share of these expenses. For additional expense information related to investments in Fidelity Central Funds, please refer to the "Investments in Fidelity Central Funds" note found in the Notes to Financial Statements section of the most recent Annual or Semi-Annual report.
G Expense ratios reflect operating expenses of the class. Expenses before reductions do not reflect amounts reimbursed, waived, or reduced through arrangements with the investment adviser, brokerage services, or other offset arrangements, if applicable, and do not represent the amount paid by the class during periods when reimbursements, waivers or reductions occur.
H Amount represents less than .005%.
I Annualized.
J Amount does not include the portfolio activity of any underlying mutual funds or exchange-traded funds (ETFs).
K Portfolio turnover rate excludes securities received or delivered in-kind.
L The portfolio turnover rate does not include the assets acquired in the merger.
For the period ended February 28, 2023
1. Organization.
Fidelity Series Short-Term Credit Fund (the Fund) is a fund of Fidelity Salem Street Trust (the Trust) and is authorized to issue an unlimited number of shares. Shares are offered only to certain other Fidelity funds, Fidelity managed 529 plans, and Fidelity managed collective investment trusts. The Trust is registered under the Investment Company Act of 1940, as amended (the 1940 Act), as an open-end management investment company organized as a Massachusetts business trust.
2.Investments in Fidelity Central Funds.
Funds may invest in Fidelity Central Funds, which are open-end investment companies generally available only to other investment companies and accounts managed by the investment adviser and its affiliates. The Schedule of Investments lists any Fidelity Central Funds held as an investment as of period end, but does not include the underlying holdings of each Fidelity Central Fund. An investing fund indirectly bears its proportionate share of the expenses of the underlying Fidelity Central Funds.
Based on its investment objective, each Fidelity Central Fund may invest or participate in various investment vehicles or strategies that are similar to those of the investing fund. These strategies are consistent with the investment objectives of the investing fund and may involve certain economic risks which may cause a decline in value of each of the Fidelity Central Funds and thus a decline in the value of the investing fund.
| Fidelity Central Fund | Investment Manager | Investment Objective | Investment Practices | Expense Ratio A |
| Fidelity Money Market Central Funds | Fidelity Management & Research Company LLC (FMR) | Each fund seeks to obtain a high level of current income consistent with the preservation of capital and liquidity. | Short-term Investments | Less than .005% |
A Expenses expressed as a percentage of average net assets and are as of each underlying Central Fund's most recent annual or semi-annual shareholder report.
A complete unaudited list of holdings for each Fidelity Central Fund is available upon request or at the Securities and Exchange Commission website at www.sec.gov. In addition, the financial statements of the Fidelity Central Funds which contain the significant accounting policies (including investment valuation policies) of those funds, and are not covered by the Report of Independent Registered Public Accounting Firm, are available on the Securities and Exchange Commission website or upon request.
3. Significant Accounting Policies.
The Fund is an investment company and applies the accounting and reporting guidance of the Financial Accounting Standards Board (FASB) Accounting Standards Codification Topic 946 Financial Services - Investment Companies . The financial statements have been prepared in conformity with accounting principles generally accepted in the United States of America (GAAP), which require management to make certain estimates and assumptions at the date of the financial statements. Actual results could differ from those estimates. Subsequent events, if any, through the date that the financial statements were issued have been evaluated in the preparation of the financial statements. The Fund's Schedule of Investments lists any underlying mutual funds or exchange-traded funds (ETFs) but does not include the underlying holdings of these funds. The following summarizes the significant accounting policies of the Fund:
Investment Valuation. Investments are valued as of 4:00 p.m. Eastern time on the last calendar day of the period. The Board of Trustees (the Board) has designated the Fund's investment adviser as the valuation designee responsible for the fair valuation function and performing fair value determinations as needed. The investment adviser has established a Fair Value Committee (the Committee) to carry out the day-to-day fair valuation responsibilities and has adopted policies and procedures to govern the fair valuation process and the activities of the Committee. In accordance with these fair valuation policies and procedures, which have been approved by the Board, the Fund attempts to obtain prices from one or more third party pricing services or brokers to value its investments. When current market prices, quotations or currency exchange rates are not readily available or reliable, investments will be fair valued in good faith by the Committee, in accordance with the policies and procedures. Factors used in determining fair value vary by investment type and may include market or investment specific events, transaction data, estimated cash flows, and market observations of comparable investments. The frequency that the fair valuation procedures are used cannot be predicted and they may be utilized to a significant extent. The Committee manages the Fund's fair valuation practices and maintains the fair valuation policies and procedures. The Fund's investment adviser reports to the Board information regarding the fair valuation process and related material matters.
The Fund categorizes the inputs to valuation techniques used to value its investments into a disclosure hierarchy consisting of three levels as shown below:
Level 1 - unadjusted quoted prices in active markets for identical investments
Level 2 - other significant observable inputs (including quoted prices for similar investments, interest rates, prepayment speeds, etc.)
Level 3 - unobservable inputs (including the Fund's own assumptions based on the best information available)
Valuation techniques used to value the Fund's investments by major category are as follows:
Debt securities, including restricted securities, are valued based on evaluated prices received from third party pricing services or from brokers who make markets in such securities. Corporate bonds and U.S. government and government agency obligations are valued by pricing services who utilize matrix pricing which considers yield or price of bonds of comparable quality, coupon, maturity and type or by broker-supplied prices. Asset backed securities, collateralized mortgage obligations, commercial mortgage securities and U.S. government agency mortgage securities are valued by pricing services who utilize matrix pricing which considers prepayment speed assumptions, attributes of the collateral, yield or price of bonds of comparable quality, coupon, maturity and type or by broker-supplied prices. When independent prices are unavailable or unreliable, debt securities may be valued utilizing pricing methodologies which consider similar factors that would be used by third party pricing services. Debt securities are generally categorized as Level 2 in the hierarchy but may be Level 3 depending on the circumstances.
Futures contracts are valued at the settlement price established each day by the board of trade or exchange on which they are traded and are categorized as Level 1 in the hierarchy. Investments in open-end mutual funds, including the Fidelity Central Funds, are valued at their closing net asset value (NAV) each business day and are categorized as Level 1 in the hierarchy.
Changes in valuation techniques may result in transfers in or out of an assigned level within the disclosure hierarchy. The aggregate value of investments by input level as of February 28, 2023 is included at the end of the Fund's Schedule of Investments.
Investment Transactions and Income. For financial reporting purposes, the Fund's investment holdings and NAV include trades executed through the end of the last business day of the period. The NAV per share for processing shareholder transactions is calculated as of the close of business of the New York Stock Exchange (NYSE), normally 4:00 p.m. Eastern time and includes trades executed through the end of the prior business day. Gains and losses on securities sold are determined on the basis of identified cost. Income and capital gain distributions from Fidelity Central Funds, if any, are recorded on the ex-dividend date. Interest income is accrued as earned and includes coupon interest and amortization of premium and accretion of discount on debt securities as applicable. Debt obligations may be placed on non-accrual status and related interest income may be reduced by ceasing current accruals and writing off interest receivables when the collection of all or a portion of interest has become doubtful based on consistently applied procedures. A debt obligation is removed from non-accrual status when the issuer resumes interest payments or when collectability of interest is reasonably assured.
Expenses. Expenses directly attributable to a fund are charged to that fund. Expenses attributable to more than one fund are allocated among the respective funds on the basis of relative net assets or other appropriate methods. Expenses included in the accompanying financial statements reflect the expenses of that fund and do not include any expenses associated with any underlying mutual funds or exchange-traded funds. Although not included in a fund's expenses, a fund indirectly bears its proportionate share of these expenses through the net asset value of each underlying mutual fund or exchange-traded fund. Expense estimates are accrued in the period to which they relate and adjustments are made when actual amounts are known.
Income Tax Information and Distributions to Shareholders. Each year, the Fund intends to qualify as a regulated investment company under Subchapter M of the Internal Revenue Code, including distributing substantially all of its taxable income and realized gains. As a result, no provision for U.S. Federal income taxes is required. The Fund files a U.S. federal tax return, in addition to state and local tax returns as required. The Fund's federal income tax returns are subject to examination by the Internal Revenue Service (IRS) for a period of three fiscal years after they are filed. State and local tax returns may be subject to examination for an additional fiscal year depending on the jurisdiction.
Distributions are declared and recorded daily and paid monthly from net investment income. Distributions from realized gains, if any, are declared and recorded on the ex-dividend date. Income and capital gain distributions are determined in accordance with income tax regulations, which may differ from GAAP.
Capital accounts within the financial statements are adjusted for permanent book-tax differences. These adjustments have no impact on net assets or the results of operations. Capital accounts are not adjusted for temporary book-tax differences which will reverse in a subsequent period.
Book-tax differences are primarily due to futures contracts, market discount and losses deferred due to wash sales and excise tax regulations.
As of period end, the cost and unrealized appreciation (depreciation) in securities, and derivatives if applicable, for federal income tax purposes were as follows:
| Gross unrealized appreciation | $400,943 |
| Gross unrealized depreciation | (24,928,154) |
| Net unrealized appreciation (depreciation) | $(24,527,211) |
| Tax cost | $607,666,775 |
The Fund elected to defer to its next fiscal year approximately $24,401,111 of capital losses recognized during the period November 1 2021 to August 31, 2022.
Delayed Delivery Transactions and When-Issued Securities. During the period, certain Funds transacted in securities on a delayed delivery or when-issued basis. Payment and delivery may take place after the customary settlement period for that security. The price of the underlying securities and the date when the securities will be delivered and paid for are fixed at the time the transaction is negotiated. Securities purchased on a delayed delivery or when-issued basis are identified as such in the Schedule of Investments. Compensation for interest forgone in the purchase of a delayed delivery or when-issued debt security may be received. With respect to purchase commitments, each applicable Fund identifies securities as segregated in its records with a value at least equal to the amount of the commitment. Payables and receivables associated with the purchases and sales of delayed delivery securities having the same coupon, settlement date and broker are offset. Delayed delivery or when-issued securities that have been purchased from and sold to different brokers are reflected as both payables and receivables in the Statement of Assets and Liabilities under the caption "Delayed delivery", as applicable. Losses may arise due to changes in the value of the underlying securities or if the counterparty does not perform under the contract's terms, or if the issuer does not issue the securities due to political, economic, or other factors.
Restricted Securities (including Private Placements). Funds may invest in securities that are subject to legal or contractual restrictions on resale. These securities generally may be resold in transactions exempt from registration or to the public if the securities are registered. Disposal of these securities may involve time-consuming negotiations and expense, and prompt sale at an acceptable price may be difficult. Information regarding restricted securities held at period end is included at the end of the Schedule of Investments, if applicable.
4. Derivative Instruments.
Risk Exposures and the Use of Derivative Instruments. The Fund's investment objectives allow for various types of derivative instruments, including futures contracts. Derivatives are investments whose value is primarily derived from underlying assets, indices or reference rates and may be transacted on an exchange or over-the-counter (OTC). Derivatives may involve a future commitment to buy or sell a specified asset based on specified terms, to exchange future cash flows at periodic intervals based on a notional principal amount, or for one party to make one or more payments upon the occurrence of specified events in exchange for periodic payments from the other party.
Derivatives were used to increase returns and to manage exposure to certain risks as defined below. The success of any strategy involving derivatives depends on analysis of numerous economic factors, and if the strategies for investment do not work as intended, the objectives may not be achieved.
Derivatives were used to increase or decrease exposure to the following risk(s):
| | |
| Interest Rate Risk | Interest rate risk relates to the fluctuations in the value of interest-bearing securities due to changes in the prevailing levels of market interest rates. |
Funds are also exposed to additional risks from investing in derivatives, such as liquidity risk and counterparty credit risk. Liquidity risk is the risk that a fund will be unable to close out the derivative in the open market in a timely manner. Counterparty credit risk is the risk that the counterparty will not be able to fulfill its obligation to a fund. Counterparty credit risk related to exchange-traded contracts may be mitigated by the protection provided by the exchange on which they trade.
Investing in derivatives may involve greater risks than investing in the underlying assets directly and, to varying degrees, may involve risk of loss in excess of any initial investment and collateral received and amounts recognized in the Statement of Assets and Liabilities. In addition, there may be the risk that the change in value of the derivative contract does not correspond to the change in value of the underlying instrument.
Futures Contracts. A futures contract is an agreement between two parties to buy or sell a specified underlying instrument for a fixed price at a specified future date. Futures contracts were used to manage exposure to the bond market and fluctuations in interest rates.
Upon entering into a futures contract, a fund is required to deposit either cash or securities (initial margin) with a clearing broker in an amount equal to a certain percentage of the face value of the contract. Futures contracts are marked-to-market daily and subsequent daily payments are made or received by a fund depending on the daily fluctuations in the value of the futures contracts and are recorded as unrealized appreciation or (depreciation). This receivable and/or payable, if any, is included in daily variation margin on futures contracts in the Statement of Assets and Liabilities. Realized gain or (loss) is recorded upon the expiration or closing of a futures contract. The net realized gain (loss) and change in net unrealized appreciation (depreciation) on futures contracts during the period is presented in the Statement of Operations.
Any open futures contracts at period end are presented in the Schedule of Investments under the caption "Futures Contracts". The notional amount at value reflects each contract's exposure to the underlying instrument or index at period end, and is representative of volume of activity during the period unless an average notional amount is presented. Any securities deposited to meet initial margin requirements are identified in the Schedule of Investments. Any cash deposited to meet initial margin requirements is presented as segregated cash with brokers for derivative instruments in the Statement of Assets and Liabilities.
5. Purchases and Sales of Investments.
Purchases and sales of securities, other than short-term securities, U.S. government securities and in-kind transactions, as applicable, are noted in the table below.
| | Purchases ($) | Sales ($) |
| Fidelity Series Short-Term Credit Fund | 49,608,200 | 69,003,737 |
6. Fees and Other Transactions with Affiliates.
Management Fee. Fidelity Management & Research Company LLC (the investment adviser) and its affiliates provide the Fund with investment management related services for which the Fund does not pay a management fee. Under the management contract, the investment adviser or an affiliate pays all ordinary operating expenses of the Fund, except custody fees, fees and expenses of the independent Trustees, and certain miscellaneous expenses such as proxy and shareholder meeting expenses.
Interfund Trades. Funds may purchase from or sell securities to other Fidelity Funds under procedures adopted by the Board. The procedures have been designed to ensure these interfund trades are executed in accordance with Rule 17a-7 of the 1940 Act. Any interfund trades are included within the respective purchases and sales amounts shown in the Purchases and Sales of Investments note. During the period, there were no interfund trades.
7. Committed Line of Credit.
Certain Funds participate with other funds managed by the investment adviser or an affiliate in a $4.25 billion credit facility (the "line of credit") to be utilized for temporary or emergency purposes to fund shareholder redemptions or for other short-term liquidity purposes. The commitment fees on the pro-rata portion of the line of credit are borne by the investment adviser. During the period, there were no borrowings on this line of credit.
8. Security Lending.
Funds lend portfolio securities from time to time in order to earn additional income. Lending agents are used, including National Financial Services (NFS), an affiliate of the investment adviser. Pursuant to a securities lending agreement, NFS will receive a fee, which is capped at 9.9% of a fund's daily lending revenue, for its services as lending agent. A fund may lend securities to certain qualified borrowers, including NFS. On the settlement date of the loan, a fund receives collateral (in the form of U.S. Treasury obligations, letters of credit and/or cash) against the loaned securities and maintains collateral in an amount not less than 100% of the market value of the loaned securities during the period of the loan. The market value of the loaned securities is determined at the close of business of a fund and any additional required collateral is delivered to a fund on the next business day. A fund or borrower may terminate the loan at any time, and if the borrower defaults on its obligation to return the securities loaned because of insolvency or other reasons, a fund may apply collateral received from the borrower against the obligation. A fund may experience delays and costs in recovering the securities loaned. Any cash collateral received is invested in the Fidelity Securities Lending Cash Central Fund. Any loaned securities are identified as such in the Schedule of Investments, and the value of loaned securities and cash collateral at period end, as applicable, are presented in the Statement of Assets and Liabilities. Security lending income represents the income earned on investing cash collateral, less rebates paid to borrowers and any lending agent fees associated with the loan, plus any premium payments received for lending certain types of securities. Security lending income is presented in the Statement of Operations as a component of income from Fidelity Central Funds. Affiliated security lending activity, if any, was as follows:
| | Total Security Lending Fees Paid to NFS | Security Lending Income From Securities Loaned to NFS | Value of Securities Loaned to NFS at Period End |
| Fidelity Series Short-Term Credit Fund | $378 | $- | $- |
9. Expense Reductions.
Through arrangements with the Fund's custodian, credits realized as a result of certain uninvested cash balances were used to reduce the Fund's expenses by $407.
10. Other.
A fund's organizational documents provide former and current trustees and officers with a limited indemnification against liabilities arising in connection with the performance of their duties to the fund. In the normal course of business, a fund may also enter into contracts that provide general indemnifications. A fund's maximum exposure under these arrangements is unknown as this would be dependent on future claims that may be made against a fund. The risk of material loss from such claims is considered remote.
At the end of the period, mutual funds and accounts managed by the investment adviser or its affiliates were the owners of record of all of the outstanding shares of the Fund.
11. Risk and Uncertainties.
Many factors affect a fund's performance. Developments that disrupt global economies and financial markets, such as pandemics, epidemics, outbreaks of infectious diseases, war, terrorism, and environmental disasters, may significantly affect a fund's investment performance. The effects of these developments to a fund will be impacted by the types of securities in which a fund invests, the financial condition, industry, economic sector, and geographic location of an issuer, and a fund's level of investment in the securities of that issuer. Significant concentrations in security types, issuers, industries, sectors, and geographic locations may magnify the factors that affect a fund's performance.
As a shareholder, you incur two types of costs: (1) transaction costs, which may include sales charges (loads) on purchase payments or redemption proceeds, as applicable and (2) ongoing costs, which generally include management fees, distribution and/or service (12b-1) fees and other Fund expenses. This Example is intended to help you understand your ongoing costs (in dollars) of investing in a fund and to compare these costs with the ongoing costs of investing in other mutual funds.
| The Example is based on an investment of $1,000 invested at the beginning of the period and held for the entire period (September 1, 2022 to February 28, 2023). |
Actual Expenses
The first line of the accompanying table provides information about actual account values and actual expenses. You may use the information in this line, together with the amount you invested, to estimate the expenses that you paid over the period. Simply divide your account value by $1,000.00 (for example, an $8,600 account value divided by $1,000.00 = 8.6), then multiply the result by the number in the first line for a class/Fund under the heading entitled "Expenses Paid During Period" to estimate the expenses you paid on your account during this period. If any fund is a shareholder of any underlying mutual funds or exchange-traded funds (ETFs) (the Underlying Funds), such fund indirectly bears its proportional share of the expenses of the Underlying Funds in addition to the direct expenses incurred presented in the table. These fees and expenses are not included in the annualized expense ratio used to calculate the expense estimate in the table below.
Hypothetical Example for Comparison Purposes
The second line of the accompanying table provides information about hypothetical account values and hypothetical expenses based on the actual expense ratio and an assumed rate of return of 5% per year before expenses, which is not the actual return. The hypothetical account values and expenses may not be used to estimate the actual ending account balance or expenses you paid for the period. You may use this information to compare the ongoing costs of investing in the Fund and other funds. To do so, compare this 5% hypothetical example with the 5% hypothetical examples that appear in the shareholder reports of the other funds. If any fund is a shareholder of any Underlying Funds, such fund indirectly bears its proportional share of the expenses of the Underlying Funds in addition to the direct expenses as presented in the table. These fees and expenses are not included in the annualized expense ratio used to calculate the expense estimate in the table below.
Please note that the expenses shown in the table are meant to highlight your ongoing costs only and do not reflect any transaction costs. Therefore, the second line of the table is useful in comparing ongoing costs only, and will not help you determine the relative total costs of owning different funds. In addition, if these transactional costs were included, your costs would have been higher.
| | | | | Annualized Expense Ratio- A | | Beginning Account Value September 1, 2022 | | Ending Account Value February 28, 2023 | | Expenses Paid During Period- C September 1, 2022 to February 28, 2023 |
| | | | | | | | | | |
| Fidelity® Series Short-Term Credit Fund | | | | -%- D | | | | | | |
| Actual | | | | | | $ 1,000 | | $ 1,006.90 | | $- E |
Hypothetical- B | | | | | | $ 1,000 | | $ 1,024.79 | | $- E |
| |
A Annualized expense ratio reflects expenses net of applicable fee waivers.
B 5% return per year before expenses
C Expenses are equal to the annualized expense ratio, multiplied by the average account value over the period, multiplied by 181/ 365 (to reflect the one-half year period). The fees and expenses of any Underlying Funds are not included in each annualized expense ratio.
D Amount represents less than .005%.
E Amount represents less than $.005.
Board Approval of Investment Advisory Contracts and Management Fees
Fidelity Series Short-Term Credit Fund
Each year, the Board of Trustees, including the Independent Trustees (together, the Board), votes on the renewal of the management contract with Fidelity Management & Research Company LLC (FMR) and the sub-advisory agreements (together, the Advisory Contracts) for the fund. FMR and the sub-advisers are referred to herein as the Investment Advisers. The Board, assisted by the advice of fund counsel and Independent Trustees' counsel, requests and considers a broad range of information relevant to the renewal of the Advisory Contracts throughout the year.
The Board meets regularly and, at each of its meetings, covers an extensive agenda of topics and materials and considers factors that are relevant to its annual consideration of the renewal of the fund's Advisory Contracts, including the services and support provided to the fund and its shareholders. The Board has established four standing committees (Committees) - Operations, Audit, Fair Valuation, and Governance and Nominating - each composed of and chaired by Independent Trustees with varying backgrounds, to which the Board has assigned specific subject matter responsibilities in order to enhance effective decision-making by the Board. The Operations Committee, of which all the Independent Trustees are members, meets regularly throughout the year and requests, receives and considers, among other matters, information related to the annual consideration of the renewal of the fund's Advisory Contracts before making its recommendation to the Board. The Board also meets as needed to review matters specifically related to the Board's annual consideration of the renewal of the Advisory Contracts. Members of the Board may also meet from time to time with trustees of other Fidelity funds through joint ad hoc committees to discuss certain matters relevant to all of the Fidelity funds.
At its September 2022 meeting, the Board unanimously determined to renew the fund's Advisory Contracts. In considering whether to renew the Advisory Contracts for the fund, the Board considered all factors it believed relevant and reached a determination, with the assistance of fund counsel and Independent Trustees' counsel and through the exercise of its business judgment, that the renewal of the Advisory Contracts was in the best interests of the fund and its shareholders and the fact that no fee is payable under the management contract was fair and reasonable.
Nature, Extent, and Quality of Services Provided. The Board considered Fidelity's staffing as it relates to the fund, including the backgrounds of investment personnel of Fidelity, and also considered the fund's investment objective, strategies, and related investment philosophy. The Independent Trustees also had discussions with senior management of Fidelity's investment operations and investment groups. The Board considered the structure of the investment personnel compensation program and whether this structure provides appropriate incentives to act in the best interests of the fund. The Board also considered the steps Fidelity had taken to ensure the continued provision of high quality services to the Fidelity funds throughout the COVID-19 pandemic, including the expansion of staff in client facing positions to maintain service levels in periods of high volumes and volatility.
Resources Dedicated to Investment Management and Support Services. The Board reviewed the general qualifications and capabilities of Fidelity's investment staff, including its size, education, experience, and resources, as well as Fidelity's approach to recruiting, training, managing, and compensating investment personnel. The Board noted the resources devoted to Fidelity's global investment organization, and that Fidelity's analysts have extensive resources, tools and capabilities that allow them to conduct quantitative and fundamental analysis, as well as credit analysis of issuers, counterparties and guarantors. Further, the Board considered that Fidelity's investment professionals have sufficient access to global information and data so as to provide competitive investment results over time, and that those professionals also have access to sophisticated tools that permit them to assess portfolio construction and risk and performance attribution characteristics continuously, as well as to transmit new information and research conclusions rapidly around the world. Additionally, in its deliberations, the Board considered Fidelity's trading, risk management, compliance, cybersecurity, and technology and operations capabilities and resources, which are integral parts of the investment management process.
Administrative Services. The Board considered (i) the nature, extent, quality, and cost of advisory and administrative services performed by the Investment Advisers and their affiliates under the Advisory Contracts and under separate agreements covering transfer agency, pricing and bookkeeping, and securities lending services for the fund; (ii) the nature and extent of the supervision of third party service providers, principally custodians, subcustodians, and pricing vendors; and (iii) the resources devoted to, and the record of compliance with, the fund's compliance policies and procedures.
Investment Performance. The Board considered whether the fund has operated in accordance with its investment objective, as well as its record of compliance with its investment restrictions. The Board reviewed the fund's absolute investment performance, as well as the fund's relative investment performance. In this regard, the Board noted that the fund is designed to offer an investment option for other investment companies, collective investment trusts, and 529 plans managed by Fidelity and ultimately to enhance the performance of those investment companies, collective investment trusts, and 529 plans.
Based on its review, the Board concluded that the nature, extent, and quality of services provided to the fund under the Advisory Contracts should continue to benefit the shareholders of the fund.
Competitiveness of Management Fee and Total Expense Ratio. The Board considered that the fund does not pay FMR a management fee for investment advisory services, but that FMR receives fees for providing services to funds, collective investment trusts, and 529 plans that invest in the fund. The Board also noted that FMR or an affiliate undertakes to pay all operating expenses of the fund, except transfer agent fees, 12b-1 fees, Independent Trustee fees and expenses, custodian fees and expenses, proxy and shareholder meeting expenses, interest, taxes, and extraordinary expenses (such as litigation expenses). The Board further noted that the fund pays its non-operating expenses, including brokerage commissions and fees and expenses associated with the fund's securities lending program, if applicable.
The Board further considered that FMR has contractually agreed to reimburse the fund to the extent that total operating expenses, with certain exceptions, as a percentage of its average net assets, exceed 0.003% through December 31, 2024.
Based on its review, the Board considered that the fund does not pay a management fee and concluded that the fund's total expense ratio was reasonable in light of the services that the fund and its shareholders receive and the other factors considered.
Costs of the Services and Profitability. The Board considered the level of Fidelity's profits in respect of all the Fidelity funds.
A public accounting firm has been engaged annually by the Board as part of the Board's assessment of Fidelity's profitability analysis. The engagement includes the review and assessment of the methodologies used by Fidelity in determining the revenues and expenses attributable to Fidelity's mutual fund business, and completion of agreed-upon procedures in respect of the mathematical accuracy of certain fund profitability information and its conformity to established allocation methodologies. After considering the reports issued under the engagement and information provided by Fidelity, the Board concluded that while other allocation methods may also be reasonable, Fidelity's profitability methodologies are reasonable in all material respects.
The Board also reviewed Fidelity's non-fund businesses and potential indirect benefits such businesses may have received as a result of their association with Fidelity's mutual fund business (i.e., fall-out benefits) as well as cases where Fidelity's affiliates may benefit from the funds' business. The Board considered areas where potential indirect benefits to the Fidelity funds from their relationships with Fidelity may exist. The Board's consideration of these matters was informed by the findings of a joint ad hoc committee created by it and the boards of other Fidelity funds to evaluate potential fall-out benefits.
The Board concluded that the costs of the services provided by and the profits realized by Fidelity in connection with the operation of the fund were not relevant to the renewal of the Advisory Contracts because the fund pays no advisory fees and FMR or an affiliate bears all expenses of the fund, with limited exceptions.
Economies of Scale. The Board concluded that because the fund pays no advisory fees and FMR or an affiliate bears all expenses of the fund with certain limited exceptions, the realization of economies of scale was not a material factor in the Board's decision to renew the fund's Advisory Contracts.
Additional Information Requested by the Board. In order to develop fully the factual basis for consideration of the Fidelity funds' advisory contracts, the Board requested and received additional information on certain topics, including: (i) Fidelity's fund profitability methodology, profitability trends for certain funds, the allocation of various costs to different funds, and the impact of certain factors on fund profitability results; (ii) portfolio manager changes that have occurred during the past year and the amount of the investment that each portfolio manager has made in the Fidelity fund(s) that he or she manages; (iii) the extent to which current market conditions have affected retention and recruitment of personnel; (iv) the arrangements with and compensation paid to certain fund sub-advisers on behalf of the Fidelity funds and the treatment of such compensation within Fidelity's fund profitability methodology; (v) the terms of the funds' various management fee structures, including the basic group fee and the terms of Fidelity's voluntary expense limitation arrangements; (vi) Fidelity's transfer agent, pricing and bookkeeping fees, expense and service structures for different funds and classes relative to competitive trends; (vii) the impact on fund profitability of recent industry trends, such as the growth in passively managed funds and the changes in flows for different types of funds; (viii) the types of management fee and total expense comparisons provided, and the challenges and limitations associated with such information; and (ix) explanations regarding the relative total expense ratios and management fees of certain funds and classes, total expense and management fee competitive trends, and methodologies for total expense and management fee competitive comparisons. In addition, the Board considered its discussions with Fidelity regarding Fidelity's efforts to maintain the continuous investment and shareholder services necessary for the funds during the current pandemic and economic circumstances.
Based on its evaluation of all of the conclusions noted above, and after considering all factors it believed relevant, the Board concluded that the advisory fee arrangements are fair and reasonable and that the fund's Advisory Contracts should be renewed.
The Securities and Exchange Commission adopted Rule 22e-4 under the Investment Company Act of 1940 (the Liquidity Rule) to promote effective liquidity risk management throughout the open-end investment company industry, thereby reducing the risk that funds will be unable to meet their redemption obligations and mitigating dilution of the interests of fund shareholders.
The Fund has adopted and implemented a liquidity risk management program (the Program) reasonably designed to assess and manage the Fund's liquidity risk and to comply with the requirements of the Liquidity Rule. The Fund's Board of Trustees (the Board) has designated the Fund's investment adviser as administrator of the Program. The Fidelity advisers have established a Liquidity Risk Management Committee (the LRM Committee) to manage the Program for each of the Fidelity Funds. The LRM Committee monitors the adequacy and effectiveness of implementation of the Program and on a periodic basis assesses each Fund's liquidity risk based on a variety of factors including (1) the Fund's investment strategy, (2) portfolio liquidity and cash flow projections during normal and reasonably foreseeable stressed conditions, (3) shareholder redemptions, (4) borrowings and other funding sources and (5) certain factors specific to ETFs including the effect of the Fund's prices and spreads, market participants, and basket compositions on the overall liquidity of the Fund's portfolio, as applicable.
In accordance with the Program, each of the Fund's portfolio investments is classified into one of four defined liquidity categories based on a determination of a reasonable expectation for how long it would take to convert the investment to cash (or sell or dispose of the investment) without significantly changing its market value.
- Highly liquid investments - cash or convertible to cash within three business days or less
- Moderately liquid investments - convertible to cash in three to seven calendar days
- Less liquid investments - can be sold or disposed of, but not settled, within seven calendar days
- Illiquid investments - cannot be sold or disposed of within seven calendar days
Liquidity classification determinations take into account a variety of factors including various market, trading and investment-specific considerations, as well as market depth, and generally utilize analysis from a third-party liquidity metrics service.
The Liquidity Rule places a 15% limit on a fund's illiquid investments and requires funds that do not primarily hold assets that are highly liquid investments to determine and maintain a minimum percentage of the fund's net assets to be invested in highly liquid investments (highly liquid investment minimum or HLIM). The Program includes provisions reasonably designed to comply with the 15% limit on illiquid investments and for determining, periodically reviewing and complying with the HLIM requirement as applicable.
At a recent meeting of the Fund's Board of Trustees, the LRM Committee provided a written report to the Board pertaining to the operation, adequacy, and effectiveness of the Program for the period December 1, 2021 through November 30, 2022. The report concluded that the Program is operating effectively and is reasonably designed to assess and manage the Fund's liquidity risk.
1.9863240.107
SS1-SANN-0423
Fidelity® Short-Term Bond Index Fund
Semi-Annual Report
February 28, 2023
Contents
To view a fund's proxy voting guidelines and proxy voting record for the 12-month period ended June 30, visit http://www.fidelity.com/proxyvotingresults or visit the Securities and Exchange Commission's (SEC) web site at http://www.sec.gov.
You may also call 1-800-544-8544 to request a free copy of the proxy voting guidelines.
BLOOMBERG ® is a trademark and service mark of Bloomberg Finance L.P. and its affiliates (collectively "Bloomberg"). Bloomberg or Bloomberg's licensors own all proprietary rights in the Bloomberg Indices. Neither Bloomberg nor Bloomberg's licensors approves or endorses this material, or guarantees the accuracy or completeness of any information herein, or makes any warranty, express or implied, as to the results to be obtained therefrom and, to the maximum extent allowed by law, neither shall have any liability or responsibility for injury or damages arising in connection therewith.
Standard & Poor's, S&P and S&P 500 are registered service marks of The McGraw-Hill Companies, Inc. and have been licensed for use by Fidelity Distributors Corporation.
Other third-party marks appearing herein are the property of their respective owners.
All other marks appearing herein are registered or unregistered trademarks or service marks of FMR LLC or an affiliated company. © 2023 FMR LLC. All rights reserved.
This report and the financial statements contained herein are submitted for the general information of the shareholders of the Fund. This report is not authorized for distribution to prospective investors in the Fund unless preceded or accompanied by an effective prospectus.
A fund files its complete schedule of portfolio holdings with the SEC for the first and third quarters of each fiscal year on Form N-PORT. Forms N-PORT are available on the SEC's web site at http://www.sec.gov. A fund's Forms N-PORT may be reviewed and copied at the SEC's Public Reference Room in Washington, DC. Information regarding the operation of the SEC's Public Reference Room may be obtained by calling 1-800-SEC-0330.
For a complete list of a fund's portfolio holdings, view the most recent holdings listing, semiannual report, or annual report on Fidelity's web site at http://www.fidelity.com, http://www.institutional.fidelity.com, or http://www.401k.com, as applicable.
NOT FDIC INSURED •MAY LOSE VALUE •NO BANK GUARANTEE
Neither the Fund nor Fidelity Distributors Corporation is a bank.
Quality Diversification (% of Fund's net assets) |
|
Short-Term Investments and Net Other Assets (Liabilities) - (0.1)%* |
Percentages shown as 0.0% may reflect amounts less than 0.05%. |
*Short-term investments and Net Other Assets (Liabilities) are not available in the pie chart. |
| |
| We have used ratings from Moody's Investors Service, Inc. Where Moody's® ratings are not available, we have used S&P® ratings. All ratings are as of the date indicated and do not reflect subsequent changes. |
Asset Allocation (% of Fund's net assets) |
|
Short-Term Investments and Net Other Assets (Liabilities) - (0.1)%* |
Foreign investments - 9.2% |
Short-Term Investments and Net Other Assets (Liabilities) are not available in the pie chart. |
|
Showing Percentage of Net Assets
| Nonconvertible Bonds - 31.4% |
| | | Principal Amount (a) | Value ($) |
| COMMUNICATION SERVICES - 1.4% | | | |
| Diversified Telecommunication Services - 0.3% | | | |
| AT&T, Inc. 2.3% 6/1/27 | | 2,980,000 | 2,655,044 |
| Telefonica Emisiones S.A.U. 4.103% 3/8/27 | | 580,000 | 549,517 |
| TELUS Corp. 3.7% 9/15/27 | | 320,000 | 301,680 |
| Verizon Communications, Inc.: | | | |
| 0.75% 3/22/24 | | 1,600,000 | 1,524,643 |
| 0.85% 11/20/25 | | 1,600,000 | 1,427,903 |
| 1.45% 3/20/26 | | 1,239,000 | 1,109,874 |
| | | | 7,568,661 |
| Entertainment - 0.1% | | | |
| Activision Blizzard, Inc. 3.4% 9/15/26 | | 350,000 | 330,909 |
| The Walt Disney Co.: | | | |
| 1.75% 1/13/26 | | 760,000 | 694,239 |
| 3.35% 3/24/25 | | 1,900,000 | 1,835,769 |
| 3.375% 11/15/26 | | 310,000 | 292,165 |
| | | | 3,153,082 |
| Interactive Media & Services - 0.2% | | | |
| Alphabet, Inc.: | | | |
| 0.45% 8/15/25 | | 850,000 | 768,969 |
| 1.998% 8/15/26 | | 650,000 | 594,802 |
| Baidu, Inc.: | | | |
| 1.72% 4/9/26 | | 1,000,000 | 887,740 |
| 4.375% 5/14/24 | | 700,000 | 688,226 |
| Meta Platforms, Inc. 3.5% 8/15/27 | | 1,040,000 | 977,337 |
| | | | 3,917,074 |
| Media - 0.5% | | | |
| Charter Communications Operating LLC/Charter Communications Operating Capital Corp.: | | | |
| 3.75% 2/15/28 | | 300,000 | 270,341 |
| 4.5% 2/1/24 | | 980,000 | 967,876 |
| 4.908% 7/23/25 | | 360,000 | 352,262 |
| Comcast Corp.: | | | |
| 2.35% 1/15/27 | | 270,000 | 244,646 |
| 3.15% 3/1/26 | | 750,000 | 709,182 |
| 3.375% 2/15/25 | | 920,000 | 888,574 |
| 3.375% 8/15/25 | | 940,000 | 902,330 |
| 3.7% 4/15/24 | | 1,970,000 | 1,934,557 |
| 3.95% 10/15/25 | | 470,000 | 456,963 |
| Discovery Communications LLC: | | | |
| 3.9% 11/15/24 | | 100,000 | 96,672 |
| 4.9% 3/11/26 | | 720,000 | 702,100 |
| Fox Corp. 4.03% 1/25/24 | | 650,000 | 641,474 |
| Grupo Televisa SA de CV 6.625% 3/18/25 | | 290,000 | 293,408 |
| Magallanes, Inc.: | | | |
| 3.638% 3/15/25 (b) | | 700,000 | 667,689 |
| 3.755% 3/15/27 (b) | | 1,640,000 | 1,504,429 |
| Paramount Global: | | | |
| 2.9% 1/15/27 | | 190,000 | 172,108 |
| 4.75% 5/15/25 | | 440,000 | 431,173 |
| TCI Communications, Inc. 7.875% 2/15/26 | | 620,000 | 667,814 |
| TWDC Enterprises 18 Corp.: | | | |
| 1.85% 7/30/26 | | 120,000 | 108,099 |
| 2.95% 6/15/27 | | 820,000 | 758,820 |
| 3% 2/13/26 | | 130,000 | 122,749 |
| | | | 12,893,266 |
| Wireless Telecommunication Services - 0.3% | | | |
| Rogers Communications, Inc. 3.2% 3/15/27 (b) | | 580,000 | 533,292 |
| T-Mobile U.S.A., Inc.: | | | |
| 1.5% 2/15/26 | | 290,000 | 259,645 |
| 3.5% 4/15/25 | | 1,030,000 | 986,598 |
| 4.95% 3/15/28 | | 2,000,000 | 1,963,279 |
| 5.375% 4/15/27 | | 1,020,000 | 1,020,254 |
| Vodafone Group PLC: | | | |
| 3.75% 1/16/24 | | 1,170,000 | 1,153,740 |
| 4.125% 5/30/25 | | 190,000 | 184,908 |
| | | | 6,101,716 |
TOTAL COMMUNICATION SERVICES | | | 33,633,799 |
| CONSUMER DISCRETIONARY - 1.8% | | | |
| Auto Components - 0.0% | | | |
| Magna International, Inc. 4.15% 10/1/25 | | 360,000 | 348,972 |
| Automobiles - 0.7% | | | |
| American Honda Finance Corp.: | | | |
| 0.875% 7/7/23 | | 1,690,000 | 1,665,479 |
| 1% 9/10/25 | | 1,450,000 | 1,308,805 |
| 1.2% 7/8/25 | | 505,000 | 460,375 |
| 1.5% 1/13/25 | | 240,000 | 224,518 |
| 2.15% 9/10/24 | | 740,000 | 705,991 |
| 3.55% 1/12/24 | | 250,000 | 246,165 |
| General Motors Co. 4% 4/1/25 | | 390,000 | 377,691 |
| General Motors Financial Co., Inc.: | | | |
| 1.05% 3/8/24 | | 1,027,000 | 980,906 |
| 1.25% 1/8/26 | | 1,070,000 | 946,389 |
| 2.7% 8/20/27 | | 580,000 | 510,975 |
| 3.5% 11/7/24 | | 370,000 | 357,043 |
| 3.95% 4/13/24 | | 320,000 | 313,820 |
| 4% 1/15/25 | | 530,000 | 513,689 |
| 4% 10/6/26 | | 640,000 | 606,586 |
| 4.15% 6/19/23 | | 250,000 | 249,045 |
| 4.25% 5/15/23 | | 70,000 | 69,846 |
| 4.3% 7/13/25 | | 840,000 | 815,520 |
| 5% 4/9/27 | | 960,000 | 936,048 |
| 5.1% 1/17/24 | | 1,503,000 | 1,495,857 |
| 5.25% 3/1/26 | | 590,000 | 583,446 |
| Stellantis NV 5.25% 4/15/23 | | 620,000 | 618,338 |
| Toyota Motor Corp.: | | | |
| 0.681% 3/25/24 | | 1,230,000 | 1,172,545 |
| 1.339% 3/25/26 | | 110,000 | 98,712 |
| 2.358% 7/2/24 | | 720,000 | 692,923 |
| | | | 15,950,712 |
| Hotels, Restaurants & Leisure - 0.2% | | | |
| Expedia, Inc. 5% 2/15/26 | | 330,000 | 325,453 |
| Marriott International, Inc.: | | | |
| 3.125% 6/15/26 | | 190,000 | 177,653 |
| 3.6% 4/15/24 | | 1,430,000 | 1,399,692 |
| 5% 10/15/27 | | 450,000 | 444,706 |
| McDonald's Corp.: | | | |
| 1.45% 9/1/25 | | 110,000 | 100,530 |
| 3.3% 7/1/25 | | 1,310,000 | 1,259,515 |
| 3.5% 7/1/27 | | 240,000 | 226,314 |
| 3.7% 1/30/26 | | 110,000 | 106,120 |
| Starbucks Corp.: | | | |
| 2.45% 6/15/26 | | 350,000 | 322,765 |
| 3.1% 3/1/23 | | 100,000 | 100,000 |
| 3.8% 8/15/25 | | 583,000 | 564,946 |
| | | | 5,027,694 |
| Household Durables - 0.1% | | | |
| D.R. Horton, Inc. 1.3% 10/15/26 | | 750,000 | 646,620 |
| Lennar Corp.: | | | |
| 4.5% 4/30/24 | | 400,000 | 394,674 |
| 4.75% 5/30/25 | | 400,000 | 391,086 |
| 4.75% 11/29/27 | | 350,000 | 335,140 |
| 5.875% 11/15/24 | | 100,000 | 100,322 |
| | | | 1,867,842 |
| Internet & Direct Marketing Retail - 0.4% | | | |
| Alibaba Group Holding Ltd. 3.6% 11/28/24 | | 2,000,000 | 1,936,000 |
| Amazon.com, Inc.: | | | |
| 0.4% 6/3/23 | | 210,000 | 207,551 |
| 0.8% 6/3/25 | | 2,158,000 | 1,969,883 |
| 1% 5/12/26 | | 1,168,000 | 1,034,076 |
| 1.2% 6/3/27 | | 1,440,000 | 1,243,529 |
| 3.15% 8/22/27 | | 1,120,000 | 1,045,731 |
| 4.55% 12/1/27 | | 420,000 | 415,274 |
| eBay, Inc.: | | | |
| 1.4% 5/10/26 | | 666,000 | 591,926 |
| 3.45% 8/1/24 | | 100,000 | 97,552 |
| | | | 8,541,522 |
| Leisure Products - 0.0% | | | |
| Hasbro, Inc. 3.5% 9/15/27 | | 360,000 | 330,157 |
| Multiline Retail - 0.1% | | | |
| Dollar General Corp. 4.625% 11/1/27 | | 1,000,000 | 976,163 |
| Kohl's Corp. 9.5% 5/15/25 | | 290,000 | 304,039 |
| Target Corp.: | | | |
| 2.25% 4/15/25 | | 313,000 | 295,707 |
| 2.5% 4/15/26 | | 420,000 | 393,204 |
| 3.5% 7/1/24 | | 570,000 | 557,258 |
| | | | 2,526,371 |
| Specialty Retail - 0.3% | | | |
| AutoZone, Inc.: | | | |
| 3.125% 4/21/26 | | 270,000 | 253,199 |
| 4.5% 2/1/28 | | 160,000 | 155,122 |
| Lowe's Companies, Inc. 4% 4/15/25 | | 2,863,000 | 2,788,149 |
| Ross Stores, Inc. 4.6% 4/15/25 | | 450,000 | 443,051 |
| The Home Depot, Inc.: | | | |
| 2.125% 9/15/26 | | 480,000 | 436,648 |
| 2.8% 9/14/27 | | 1,220,000 | 1,122,400 |
| 3% 4/1/26 | | 100,000 | 94,370 |
| 3.35% 9/15/25 | | 720,000 | 691,887 |
| | | | 5,984,826 |
| Textiles, Apparel & Luxury Goods - 0.0% | | | |
| NIKE, Inc.: | | | |
| 2.4% 3/27/25 | | 836,000 | 797,432 |
| 2.75% 3/27/27 | | 550,000 | 509,861 |
| | | | 1,307,293 |
TOTAL CONSUMER DISCRETIONARY | | | 41,885,389 |
| CONSUMER STAPLES - 1.5% | | | |
| Beverages - 0.4% | | | |
| Anheuser-Busch Companies LLC / Anheuser-Busch InBev Worldwide, Inc. 3.65% 2/1/26 | | 780,000 | 747,112 |
| Constellation Brands, Inc.: | | | |
| 3.6% 5/9/24 | | 960,000 | 940,521 |
| 3.7% 12/6/26 | | 340,000 | 321,393 |
| 4.35% 5/9/27 | | 250,000 | 241,610 |
| 4.75% 11/15/24 | | 710,000 | 703,573 |
| Diageo Capital PLC 5.3% 10/24/27 | | 650,000 | 659,387 |
| Dr. Pepper Snapple Group, Inc.: | | | |
| 2.55% 9/15/26 | | 110,000 | 100,573 |
| 3.4% 11/15/25 | | 150,000 | 142,841 |
| 3.43% 6/15/27 | | 340,000 | 317,572 |
| 4.417% 5/25/25 | | 237,000 | 232,327 |
| Molson Coors Beverage Co. 3% 7/15/26 | | 840,000 | 777,040 |
| PepsiCo, Inc.: | | | |
| 2.25% 3/19/25 | | 1,870,000 | 1,771,718 |
| 2.375% 10/6/26 | | 500,000 | 461,393 |
| 3% 10/15/27 | | 1,040,000 | 967,937 |
| 3.6% 3/1/24 | | 120,000 | 118,356 |
| The Coca-Cola Co.: | | | |
| 1.45% 6/1/27 | | 610,000 | 535,549 |
| 1.75% 9/6/24 | | 510,000 | 489,538 |
| | | | 9,528,440 |
| Food & Staples Retailing - 0.3% | | | |
| Kroger Co.: | | | |
| 2.65% 10/15/26 | | 120,000 | 110,627 |
| 3.5% 2/1/26 | | 200,000 | 190,287 |
| Sysco Corp.: | | | |
| 3.25% 7/15/27 | | 340,000 | 314,069 |
| 3.3% 7/15/26 | | 590,000 | 554,650 |
| Walgreens Boots Alliance, Inc.: | | | |
| 3.45% 6/1/26 | | 360,000 | 337,911 |
| 3.8% 11/18/24 | | 910,000 | 884,300 |
| Walmart, Inc.: | | | |
| 2.85% 7/8/24 | | 370,000 | 359,422 |
| 3.05% 7/8/26 | | 1,150,000 | 1,090,990 |
| 3.4% 6/26/23 | | 1,740,000 | 1,729,800 |
| 3.55% 6/26/25 | | 280,000 | 273,073 |
| 3.95% 9/9/27 | | 800,000 | 779,192 |
| | | | 6,624,321 |
| Food Products - 0.3% | | | |
| Bunge Ltd. Finance Corp. 3.25% 8/15/26 | | 600,000 | 558,576 |
| Conagra Brands, Inc.: | | | |
| 4.3% 5/1/24 | | 700,000 | 690,270 |
| 4.6% 11/1/25 | | 230,000 | 224,970 |
| General Mills, Inc. 4% 4/17/25 | | 490,000 | 477,109 |
| Kraft Heinz Foods Co.: | | | |
| 3% 6/1/26 | | 430,000 | 400,141 |
| 3.875% 5/15/27 | | 800,000 | 760,449 |
| McCormick & Co., Inc. 3.4% 8/15/27 | | 390,000 | 362,171 |
| Tyson Foods, Inc.: | | | |
| 3.55% 6/2/27 | | 550,000 | 514,478 |
| 4% 3/1/26 | | 550,000 | 530,648 |
| Unilever Capital Corp.: | | | |
| 2% 7/28/26 | | 280,000 | 253,978 |
| 2.6% 5/5/24 | | 1,280,000 | 1,241,281 |
| 3.1% 7/30/25 | | 370,000 | 352,926 |
| 3.25% 3/7/24 | | 900,000 | 882,198 |
| | | | 7,249,195 |
| Household Products - 0.1% | | | |
| Procter & Gamble Co.: | | | |
| 0.55% 10/29/25 | | 640,000 | 573,520 |
| 1% 4/23/26 | | 550,000 | 489,772 |
| 2.85% 8/11/27 | | 1,080,000 | 1,005,546 |
| | | | 2,068,838 |
| Tobacco - 0.4% | | | |
| Altria Group, Inc.: | | | |
| 2.35% 5/6/25 | | 270,000 | 253,101 |
| 2.625% 9/16/26 | | 390,000 | 357,326 |
| 3.8% 2/14/24 | | 690,000 | 678,342 |
| 4.4% 2/14/26 | | 100,000 | 97,866 |
| BAT Capital Corp.: | | | |
| 3.215% 9/6/26 | | 200,000 | 184,462 |
| 3.222% 8/15/24 | | 1,700,000 | 1,638,374 |
| 3.557% 8/15/27 | | 1,040,000 | 947,094 |
| 4.7% 4/2/27 | | 250,000 | 241,593 |
| BAT International Finance PLC 1.668% 3/25/26 | | 680,000 | 603,879 |
| Philip Morris International, Inc.: | | | |
| 1.5% 5/1/25 | | 760,000 | 703,085 |
| 2.875% 5/1/24 | | 1,810,000 | 1,756,882 |
| 3.125% 8/17/27 | | 220,000 | 203,764 |
| 4.875% 2/15/28 | | 500,000 | 489,461 |
| 5.125% 11/17/27 | | 600,000 | 597,185 |
| Reynolds American, Inc. 4.45% 6/12/25 | | 650,000 | 632,500 |
| | | | 9,384,914 |
TOTAL CONSUMER STAPLES | | | 34,855,708 |
| ENERGY - 2.1% | | | |
| Energy Equipment & Services - 0.0% | | | |
| Baker Hughes Co. 2.061% 12/15/26 | | 660,000 | 589,934 |
| Oil, Gas & Consumable Fuels - 2.1% | | | |
| Boardwalk Pipelines LP 4.45% 7/15/27 | | 420,000 | 400,480 |
| Canadian Natural Resources Ltd.: | | | |
| 2.05% 7/15/25 | | 280,000 | 258,571 |
| 3.85% 6/1/27 | | 590,000 | 554,001 |
| Cenovus Energy, Inc. 5.375% 7/15/25 | | 280,000 | 277,609 |
| Cheniere Corpus Christi Holdings LLC: | | | |
| 5.125% 6/30/27 | | 340,000 | 335,446 |
| 5.875% 3/31/25 | | 770,000 | 772,575 |
| Chevron Corp.: | | | |
| 1.141% 5/11/23 | | 700,000 | 694,687 |
| 1.554% 5/11/25 | | 1,000,000 | 928,204 |
| 2.895% 3/3/24 | | 2,510,000 | 2,454,076 |
| 2.954% 5/16/26 | | 810,000 | 762,345 |
| 3.326% 11/17/25 | | 250,000 | 239,618 |
| Chevron U.S.A., Inc. 3.9% 11/15/24 | | 110,000 | 107,895 |
| Columbia Pipeline Group, Inc. 4.5% 6/1/25 | | 400,000 | 390,938 |
| ConocoPhillips Co. 2.4% 3/7/25 | | 1,200,000 | 1,136,365 |
| DCP Midstream Operating LP: | | | |
| 5.375% 7/15/25 | | 100,000 | 98,767 |
| 5.625% 7/15/27 | | 330,000 | 326,688 |
| Devon Energy Corp. 5.25% 9/15/24 | | 500,000 | 497,598 |
| Enbridge, Inc.: | | | |
| 1.6% 10/4/26 | | 500,000 | 438,994 |
| 3.5% 6/10/24 | | 220,000 | 214,350 |
| 3.7% 7/15/27 | | 330,000 | 308,870 |
| Energy Transfer LP: | | | |
| 2.9% 5/15/25 | | 1,010,000 | 953,177 |
| 3.9% 5/15/24 (c) | | 2,180,000 | 2,130,055 |
| 4.9% 2/1/24 | | 1,140,000 | 1,131,101 |
| 5.5% 6/1/27 | | 100,000 | 99,421 |
| 5.875% 1/15/24 | | 365,000 | 365,353 |
| 5.95% 12/1/25 | | 370,000 | 373,272 |
| Enterprise Products Operating LP: | | | |
| 3.75% 2/15/25 | | 370,000 | 359,052 |
| 5.05% 1/10/26 | | 2,000,000 | 1,995,869 |
| EOG Resources, Inc. 3.15% 4/1/25 | | 1,610,000 | 1,543,688 |
| EQT Corp.: | | | |
| 3.9% 10/1/27 | | 250,000 | 228,605 |
| 5.678% 10/1/25 | | 1,500,000 | 1,480,373 |
| Equinor ASA: | | | |
| 2.875% 4/6/25 | | 2,700,000 | 2,582,501 |
| 3.7% 3/1/24 | | 1,000,000 | 984,571 |
| Exxon Mobil Corp.: | | | |
| 2.019% 8/16/24 | | 3,230,000 | 3,087,680 |
| 2.275% 8/16/26 | | 650,000 | 596,604 |
| 2.992% 3/19/25 | | 900,000 | 864,050 |
| Hess Corp. 4.3% 4/1/27 | | 350,000 | 335,026 |
| Kinder Morgan, Inc. 1.75% 11/15/26 | | 610,000 | 534,886 |
| Marathon Oil Corp. 4.4% 7/15/27 | | 390,000 | 371,473 |
| Marathon Petroleum Corp. 4.7% 5/1/25 | | 1,675,000 | 1,651,437 |
| MPLX LP: | | | |
| 1.75% 3/1/26 | | 840,000 | 751,183 |
| 4.25% 12/1/27 | | 210,000 | 198,659 |
| ONEOK, Inc.: | | | |
| 5.85% 1/15/26 | | 520,000 | 523,951 |
| 7.5% 9/1/23 | | 670,000 | 673,099 |
| Phillips 66 Co.: | | | |
| 3.55% 10/1/26 (b) | | 390,000 | 363,182 |
| 3.85% 4/9/25 | | 1,000,000 | 970,748 |
| Pioneer Natural Resources Co. 1.125% 1/15/26 | | 270,000 | 240,425 |
| Plains All American Pipeline LP/PAA Finance Corp.: | | | |
| 3.6% 11/1/24 | | 920,000 | 890,218 |
| 4.5% 12/15/26 | | 230,000 | 220,754 |
| 4.65% 10/15/25 | | 140,000 | 136,588 |
| Sabine Pass Liquefaction LLC: | | | |
| 5% 3/15/27 | | 790,000 | 771,083 |
| 5.625% 3/1/25 | | 1,050,000 | 1,048,784 |
| 5.875% 6/30/26 | | 450,000 | 452,660 |
| Shell International Finance BV: | | | |
| 2% 11/7/24 | | 700,000 | 665,187 |
| 2.875% 5/10/26 | | 960,000 | 899,031 |
| 3.25% 5/11/25 | | 310,000 | 298,554 |
| Spectra Energy Partners LP 4.75% 3/15/24 | | 1,050,000 | 1,040,802 |
| Targa Resources Partners LP/Targa Resources Partners Finance Corp. 6.5% 7/15/27 | | 710,000 | 717,796 |
| The Williams Companies, Inc.: | | | |
| 3.75% 6/15/27 | | 980,000 | 921,043 |
| 4% 9/15/25 | | 760,000 | 733,052 |
| 4.5% 11/15/23 | | 810,000 | 805,313 |
| Total Capital International SA: | | | |
| 3.7% 1/15/24 | | 190,000 | 187,260 |
| 3.75% 4/10/24 | | 1,400,000 | 1,375,640 |
| TransCanada PipeLines Ltd. 4.875% 1/15/26 | | 340,000 | 335,284 |
| Valero Energy Corp. 2.85% 4/15/25 | | 1,000,000 | 947,181 |
| | | | 49,033,748 |
TOTAL ENERGY | | | 49,623,682 |
| FINANCIALS - 13.9% | | | |
| Banks - 8.4% | | | |
| Banco Bilbao Vizcaya Argentaria SA 6.138% 9/14/28 (c) | | 200,000 | 202,618 |
| Banco Santander SA: | | | |
| 1.722% 9/14/27 (c) | | 800,000 | 689,468 |
| 1.849% 3/25/26 | | 1,200,000 | 1,063,701 |
| 3.892% 5/24/24 | | 1,200,000 | 1,174,469 |
| 4.175% 3/24/28 (c) | | 600,000 | 560,700 |
| 5.147% 8/18/25 | | 200,000 | 197,518 |
| 5.179% 11/19/25 | | 400,000 | 393,919 |
| 5.294% 8/18/27 | | 400,000 | 391,895 |
| Bank of America Corp.: | | | |
| 3 month U.S. LIBOR + 0.640% 2.015% 2/13/26 (c)(d) | | 1,250,000 | 1,162,999 |
| U.S. Secured Overnight Fin. Rate (SOFR) Index + 1.290% 5.08% 1/20/27 (c)(d) | | 1,100,000 | 1,088,506 |
| 0.523% 6/14/24 (c) | | 1,200,000 | 1,180,908 |
| 0.81% 10/24/24 (c) | | 1,880,000 | 1,821,229 |
| 0.981% 9/25/25 (c) | | 2,000,000 | 1,856,015 |
| 1.319% 6/19/26 (c) | | 1,000,000 | 907,080 |
| 1.658% 3/11/27 (c) | | 820,000 | 730,224 |
| 1.734% 7/22/27 (c) | | 3,260,000 | 2,871,347 |
| 2.456% 10/22/25 (c) | | 1,400,000 | 1,328,550 |
| 3.419% 12/20/28 (c) | | 1,290,000 | 1,174,137 |
| 3.458% 3/15/25 (c) | | 1,500,000 | 1,466,044 |
| 3.593% 7/21/28 (c) | | 1,120,000 | 1,032,543 |
| 3.864% 7/23/24 (c) | | 100,000 | 99,261 |
| 3.875% 8/1/25 | | 2,130,000 | 2,068,737 |
| 3.95% 4/21/25 | | 580,000 | 562,211 |
| 4.2% 8/26/24 | | 320,000 | 313,812 |
| 4.25% 10/22/26 | | 2,030,000 | 1,949,636 |
| 4.376% 4/27/28 (c) | | 1,900,000 | 1,816,515 |
| 4.948% 7/22/28 (c) | | 1,200,000 | 1,173,681 |
| 6.204% 11/10/28 (c) | | 800,000 | 822,542 |
| Bank of Montreal: | | | |
| 0.949% 1/22/27 (c) | | 100,000 | 87,904 |
| 1.25% 9/15/26 | | 750,000 | 653,179 |
| 4.338% 10/5/28 (c) | | 1,650,000 | 1,624,292 |
| 4.7% 9/14/27 | | 1,180,000 | 1,153,900 |
| Bank of Nova Scotia: | | | |
| 1.05% 3/2/26 | | 590,000 | 519,922 |
| 1.3% 9/15/26 | | 110,000 | 95,564 |
| 2.2% 2/3/25 | | 350,000 | 329,765 |
| 3.4% 2/11/24 | | 1,170,000 | 1,147,776 |
| 4.5% 12/16/25 | | 1,300,000 | 1,259,967 |
| 4.75% 2/2/26 | | 1,500,000 | 1,476,162 |
| Barclays PLC: | | | |
| 2.279% 11/24/27 (c) | | 1,940,000 | 1,706,771 |
| 2.852% 5/7/26 (c) | | 400,000 | 374,517 |
| 4.375% 9/11/24 | | 1,220,000 | 1,190,548 |
| 4.375% 1/12/26 | | 520,000 | 502,572 |
| 5.2% 5/12/26 | | 200,000 | 194,755 |
| 5.501% 8/9/28 (c) | | 200,000 | 195,988 |
| 7.385% 11/2/28 (c) | | 1,000,000 | 1,051,833 |
| BB&T Corp. 3.75% 12/6/23 | | 1,190,000 | 1,178,211 |
| Canadian Imperial Bank of Commerce: | | | |
| 0.5% 12/14/23 | | 100,000 | 96,339 |
| 0.95% 6/23/23 | | 1,500,000 | 1,480,651 |
| 1.25% 6/22/26 | | 490,000 | 429,933 |
| 3.1% 4/2/24 | | 1,200,000 | 1,169,683 |
| 3.945% 8/4/25 | | 530,000 | 513,438 |
| Citigroup, Inc.: | | | |
| 3 month U.S. LIBOR + 1.020% 4.044% 6/1/24 (c)(d) | | 210,000 | 209,158 |
| 3 month U.S. LIBOR + 1.150% 3.52% 10/27/28 (c)(d) | | 1,650,000 | 1,510,205 |
| 1.122% 1/28/27 (c) | | 2,100,000 | 1,845,186 |
| 1.462% 6/9/27 (c) | | 2,200,000 | 1,923,104 |
| 3.106% 4/8/26 (c) | | 2,040,000 | 1,937,238 |
| 3.3% 4/27/25 | | 1,420,000 | 1,359,126 |
| 3.352% 4/24/25 (c) | | 1,400,000 | 1,362,135 |
| 3.668% 7/24/28 (c) | | 590,000 | 546,564 |
| 3.887% 1/10/28 (c) | | 1,130,000 | 1,061,756 |
| 4.4% 6/10/25 | | 140,000 | 136,981 |
| 4.45% 9/29/27 | | 350,000 | 334,251 |
| 4.6% 3/9/26 | | 750,000 | 730,259 |
| 5.5% 9/13/25 | | 1,500,000 | 1,502,729 |
| Comerica, Inc. 3.7% 7/31/23 | | 100,000 | 99,234 |
| Discover Bank 2.45% 9/12/24 | | 1,150,000 | 1,093,945 |
| Export-Import Bank of Korea: | | | |
| 0.625% 2/9/26 | | 1,200,000 | 1,051,143 |
| 2.375% 6/25/24 | | 710,000 | 682,276 |
| Fifth Third Bancorp: | | | |
| 2.375% 1/28/25 | | 1,280,000 | 1,208,675 |
| 3.65% 1/25/24 | | 450,000 | 443,589 |
| 6.361% 10/27/28 (c) | | 500,000 | 515,031 |
| HSBC Holdings PLC: | | | |
| 0.732% 8/17/24 (c) | | 800,000 | 780,186 |
| 0.976% 5/24/25 (c) | | 2,000,000 | 1,881,373 |
| 2.013% 9/22/28 (c) | | 3,240,000 | 2,742,711 |
| 2.251% 11/22/27 (c) | | 690,000 | 606,952 |
| 2.633% 11/7/25 (c) | | 1,600,000 | 1,515,184 |
| 2.999% 3/10/26 (c) | | 5,000,000 | 4,727,988 |
| 4.25% 3/14/24 | | 510,000 | 502,329 |
| 4.25% 8/18/25 | | 444,000 | 428,458 |
| 4.292% 9/12/26 (c) | | 300,000 | 288,795 |
| Huntington National Bank 4.552% 5/17/28 (c) | | 590,000 | 569,904 |
| ING Groep NV: | | | |
| 1.726% 4/1/27 (c) | | 484,000 | 429,606 |
| 4.017% 3/28/28 (c) | | 1,240,000 | 1,164,494 |
| Intesa Sanpaolo SpA 5.25% 1/12/24 | | 200,000 | 198,947 |
| Japan Bank International Cooperation: | | | |
| 1.875% 7/21/26 | | 5,300,000 | 4,790,610 |
| 2.5% 5/23/24 | | 200,000 | 193,071 |
| JPMorgan Chase & Co.: | | | |
| 0.768% 8/9/25 (c) | | 2,100,000 | 1,950,028 |
| 0.824% 6/1/25 (c) | | 1,000,000 | 938,122 |
| 1.04% 2/4/27 (c) | | 1,500,000 | 1,317,190 |
| 1.045% 11/19/26 (c) | | 470,000 | 416,251 |
| 1.47% 9/22/27 (c) | | 690,000 | 598,175 |
| 1.578% 4/22/27 (c) | | 3,211,000 | 2,840,652 |
| 2.083% 4/22/26 (c) | | 1,500,000 | 1,392,868 |
| 2.301% 10/15/25 (c) | | 1,200,000 | 1,134,968 |
| 3.2% 6/15/26 | | 150,000 | 141,221 |
| 3.22% 3/1/25 (c) | | 730,000 | 712,473 |
| 3.559% 4/23/24 (c) | | 100,000 | 99,669 |
| 3.625% 12/1/27 | | 450,000 | 419,866 |
| 3.797% 7/23/24 (c) | | 860,000 | 853,794 |
| 4.125% 12/15/26 | | 460,000 | 443,836 |
| 4.323% 4/26/28 (c) | | 3,000,000 | 2,876,055 |
| 4.851% 7/25/28 (c) | | 1,050,000 | 1,025,177 |
| KeyBank NA 3.3% 6/1/25 | | 1,200,000 | 1,148,729 |
| Korea Development Bank 0.4% 6/19/24 | | 2,200,000 | 2,062,830 |
| Lloyds Banking Group PLC: | | | |
| 0.695% 5/11/24 (c) | | 650,000 | 642,772 |
| 1.627% 5/11/27 (c) | | 210,000 | 183,412 |
| 2.438% 2/5/26 (c) | | 200,000 | 187,529 |
| 3.574% 11/7/28 (c) | | 1,310,000 | 1,187,937 |
| 3.75% 3/18/28 (c) | | 300,000 | 277,615 |
| 3.9% 3/12/24 | | 200,000 | 196,559 |
| 4.05% 8/16/23 | | 1,540,000 | 1,530,149 |
| 4.5% 11/4/24 | | 2,290,000 | 2,245,047 |
| 4.65% 3/24/26 | | 330,000 | 317,965 |
| Manufacturers & Traders Trust Co. 4.7% 1/27/28 | | 820,000 | 795,794 |
| Mitsubishi UFJ Financial Group, Inc.: | | | |
| 1.412% 7/17/25 | | 730,000 | 663,114 |
| 1.538% 7/20/27 (c) | | 900,000 | 787,387 |
| 2.757% 9/13/26 | | 1,110,000 | 1,016,254 |
| 2.801% 7/18/24 | | 3,500,000 | 3,371,561 |
| 3.407% 3/7/24 | | 270,000 | 264,447 |
| 3.455% 3/2/23 | | 900,000 | 900,000 |
| 5.017% 7/20/28 (c) | | 1,050,000 | 1,027,691 |
| 5.354% 9/13/28 (c) | | 300,000 | 297,068 |
| 5.422% 2/22/29 (c) | | 1,000,000 | 993,040 |
| Mizuho Financial Group, Inc.: | | | |
| 0.849% 9/8/24 (c) | | 1,708,000 | 1,663,111 |
| 1.234% 5/22/27 (c) | | 210,000 | 182,048 |
| 1.241% 7/10/24 (c) | | 880,000 | 865,729 |
| 1.554% 7/9/27 (c) | | 743,000 | 647,115 |
| 2.226% 5/25/26 (c) | | 200,000 | 184,652 |
| 2.839% 7/16/25 (c) | | 200,000 | 191,258 |
| 5.414% 9/13/28 (c) | | 200,000 | 199,172 |
| National Australia Bank Ltd. 3.905% 6/9/27 | | 1,140,000 | 1,089,641 |
| NatWest Group PLC: | | | |
| 2.359% 5/22/24 (c) | | 1,186,000 | 1,175,632 |
| 3.073% 5/22/28 (c) | | 500,000 | 451,124 |
| 3.875% 9/12/23 | | 425,000 | 420,853 |
| 4.269% 3/22/25 (c) | | 200,000 | 196,354 |
| 4.519% 6/25/24 (c) | | 400,000 | 397,842 |
| 4.8% 4/5/26 | | 990,000 | 963,979 |
| 5.125% 5/28/24 | | 490,000 | 485,989 |
| 5.516% 9/30/28 (c) | | 200,000 | 198,028 |
| 5.847% 3/2/27 (c) | | 200,000 | 200,102 |
| Oesterreichische Kontrollbank AG: | | | |
| 0.375% 9/17/25 | | 583,000 | 522,787 |
| 3.125% 11/7/23 | | 230,000 | 226,686 |
| PNC Bank NA 3.25% 6/1/25 | | 1,040,000 | 997,554 |
| PNC Financial Services Group, Inc.: | | | |
| 1.15% 8/13/26 | | 900,000 | 790,469 |
| 2.2% 11/1/24 | | 560,000 | 534,319 |
| 5.354% 12/2/28 (c) | | 160,000 | 160,430 |
| Rabobank Nederland 4.375% 8/4/25 | | 360,000 | 348,723 |
| Rabobank Nederland New York Branch 0.375% 1/12/24 | | 1,700,000 | 1,631,035 |
| Royal Bank of Canada: | | | |
| 0.875% 1/20/26 | | 2,060,000 | 1,824,399 |
| 1.2% 4/27/26 | | 500,000 | 443,943 |
| 2.05% 1/21/27 | | 600,000 | 538,041 |
| 2.55% 7/16/24 | | 1,190,000 | 1,145,970 |
| 3.625% 5/4/27 | | 520,000 | 489,007 |
| 3.7% 10/5/23 | | 560,000 | 554,820 |
| Santander Holdings U.S.A., Inc.: | | | |
| 2.49% 1/6/28 (c) | | 500,000 | 435,491 |
| 3.5% 6/7/24 | | 210,000 | 204,449 |
| 4.5% 7/17/25 | | 1,270,000 | 1,233,541 |
| Santander UK Group Holdings PLC: | | | |
| 1.089% 3/15/25 (c) | | 400,000 | 378,894 |
| 1.532% 8/21/26 (c) | | 540,000 | 482,546 |
| 1.673% 6/14/27 (c) | | 420,000 | 366,660 |
| 3.823% 11/3/28 (c) | | 400,000 | 363,448 |
| 6.534% 1/10/29 (c) | | 800,000 | 809,778 |
| Santander UK PLC 4% 3/13/24 | | 100,000 | 98,640 |
| Sumitomo Mitsui Financial Group, Inc.: | | | |
| 1.474% 7/8/25 | | 1,500,000 | 1,364,864 |
| 2.174% 1/14/27 | | 1,400,000 | 1,242,424 |
| 2.348% 1/15/25 | | 800,000 | 754,428 |
| 2.632% 7/14/26 | | 1,520,000 | 1,388,109 |
| 3.01% 10/19/26 | | 240,000 | 220,510 |
| 3.544% 1/17/28 | | 430,000 | 396,555 |
| 3.748% 7/19/23 | | 115,000 | 114,316 |
| 3.936% 10/16/23 | | 1,740,000 | 1,724,279 |
| 5.52% 1/13/28 | | 650,000 | 648,283 |
| SVB Financial Group: | | | |
| 1.8% 10/28/26 | | 360,000 | 313,839 |
| 4.345% 4/29/28 (c) | | 120,000 | 114,252 |
| Synchrony Bank 5.625% 8/23/27 | | 500,000 | 488,999 |
| The Toronto-Dominion Bank: | | | |
| 0.55% 3/4/24 | | 4,440,000 | 4,229,221 |
| 0.75% 1/6/26 | | 520,000 | 458,916 |
| 1.2% 6/3/26 | | 390,000 | 341,716 |
| 2.65% 6/12/24 | | 1,550,000 | 1,498,674 |
| 3.25% 3/11/24 | | 280,000 | 273,961 |
| 3.625% 9/15/31 (c) | | 630,000 | 585,830 |
| 4.108% 6/8/27 | | 520,000 | 498,437 |
| 5.156% 1/10/28 | | 700,000 | 696,752 |
| Truist Financial Corp.: | | | |
| 1.2% 8/5/25 | | 1,100,000 | 1,000,603 |
| 1.267% 3/2/27 (c) | | 937,000 | 833,892 |
| U.S. Bancorp: | | | |
| 2.375% 7/22/26 | | 380,000 | 348,528 |
| 3.6% 9/11/24 | | 1,360,000 | 1,327,434 |
| 3.7% 1/30/24 | | 610,000 | 600,399 |
| 3.95% 11/17/25 | | 2,530,000 | 2,454,631 |
| 5.727% 10/21/26 (c) | | 1,000,000 | 1,012,348 |
| Wells Fargo & Co.: | | | |
| 0.805% 5/19/25 (c) | | 2,500,000 | 2,360,191 |
| 2.188% 4/30/26 (c) | | 510,000 | 474,188 |
| 2.393% 6/2/28 (c) | | 2,160,000 | 1,909,620 |
| 2.406% 10/30/25 (c) | | 1,390,000 | 1,318,433 |
| 3% 2/19/25 | | 600,000 | 574,418 |
| 3% 10/23/26 | | 100,000 | 92,302 |
| 3.196% 6/17/27 (c) | | 2,580,000 | 2,393,595 |
| 3.55% 9/29/25 | | 1,350,000 | 1,292,076 |
| 3.584% 5/22/28 (c) | | 600,000 | 555,152 |
| 3.75% 1/24/24 | | 960,000 | 945,577 |
| 3.908% 4/25/26 (c) | | 1,200,000 | 1,157,469 |
| 4.1% 6/3/26 | | 460,000 | 441,549 |
| 4.54% 8/15/26 (c) | | 2,000,000 | 1,951,556 |
| Westpac Banking Corp.: | | | |
| 2.85% 5/13/26 | | 330,000 | 307,655 |
| 2.894% 2/4/30 (c) | | 630,000 | 585,667 |
| 3.3% 2/26/24 | | 2,690,000 | 2,633,926 |
| 3.35% 3/8/27 | | 360,000 | 338,345 |
| 3.65% 5/15/23 | | 60,000 | 59,812 |
| 4.043% 8/26/27 | | 560,000 | 541,750 |
| 4.322% 11/23/31 (c) | | 720,000 | 678,558 |
| 5.457% 11/18/27 | | 420,000 | 427,060 |
| | | | 196,229,731 |
| Capital Markets - 2.7% | | | |
| Ameriprise Financial, Inc. 3% 4/2/25 | | 820,000 | 784,322 |
| Ares Capital Corp.: | | | |
| 2.15% 7/15/26 | | 100,000 | 86,155 |
| 2.875% 6/15/27 | | 250,000 | 217,534 |
| 3.25% 7/15/25 | | 150,000 | 139,527 |
| 3.875% 1/15/26 | | 800,000 | 742,195 |
| 4.2% 6/10/24 | | 1,550,000 | 1,516,723 |
| Bank of New York Mellon Corp.: | | | |
| 0.75% 1/28/26 | | 540,000 | 479,199 |
| 3.4% 5/15/24 | | 730,000 | 713,645 |
| 3.65% 2/4/24 | | 2,550,000 | 2,511,523 |
| 4.414% 7/24/26 (c) | | 2,000,000 | 1,961,797 |
| 4.543% 2/1/29 (c) | | 1,000,000 | 971,693 |
| BlackRock, Inc. 3.5% 3/18/24 | | 410,000 | 403,260 |
| Brookfield Finance, Inc. 3.9% 1/25/28 | | 470,000 | 437,612 |
| Charles Schwab Corp.: | | | |
| 0.75% 3/18/24 | | 686,000 | 654,164 |
| 0.9% 3/11/26 | | 940,000 | 828,223 |
| 2.45% 3/3/27 | | 1,020,000 | 925,080 |
| 3.55% 2/1/24 | | 450,000 | 442,857 |
| 3.85% 5/21/25 | | 1,100,000 | 1,069,060 |
| CME Group, Inc. 3% 3/15/25 | | 310,000 | 298,148 |
| Credit Suisse AG: | | | |
| 0.495% 2/2/24 | | 1,200,000 | 1,131,332 |
| 1.25% 8/7/26 | | 430,000 | 351,441 |
| 2.95% 4/9/25 | | 1,500,000 | 1,362,131 |
| 5% 7/9/27 | | 520,000 | 476,631 |
| Credit Suisse Group AG: | | | |
| 3.75% 3/26/25 | | 400,000 | 365,404 |
| 4.55% 4/17/26 | | 920,000 | 821,912 |
| Deutsche Bank AG 4.5% 4/1/25 | | 500,000 | 482,115 |
| Deutsche Bank AG London Branch 3.7% 5/30/24 | | 930,000 | 910,083 |
| Deutsche Bank AG New York Branch: | | | |
| 1.686% 3/19/26 | | 400,000 | 359,020 |
| 2.129% 11/24/26 (c) | | 1,400,000 | 1,254,737 |
| 2.311% 11/16/27 (c) | | 1,610,000 | 1,397,886 |
| 2.552% 1/7/28 (c) | | 390,000 | 339,322 |
| 4.875% 12/1/32 (c) | | 220,000 | 193,268 |
| 6.119% 7/14/26 (c) | | 170,000 | 169,563 |
| Franklin Resources, Inc. 2.85% 3/30/25 | | 160,000 | 151,840 |
| GE Capital Funding LLC 3.45% 5/15/25 | | 330,000 | 315,936 |
| Goldman Sachs Group, Inc.: | | | |
| 0.855% 2/12/26 (c) | | 550,000 | 499,360 |
| 1.093% 12/9/26 (c) | | 1,400,000 | 1,232,302 |
| 1.431% 3/9/27 (c) | | 1,660,000 | 1,463,107 |
| 1.948% 10/21/27 (c) | | 3,320,000 | 2,908,139 |
| 3.272% 9/29/25 (c) | | 800,000 | 769,104 |
| 3.615% 3/15/28 (c) | | 890,000 | 825,970 |
| 3.625% 2/20/24 | | 440,000 | 432,101 |
| 3.691% 6/5/28 (c) | | 500,000 | 464,430 |
| 3.75% 2/25/26 | | 1,170,000 | 1,118,180 |
| 4.25% 10/21/25 | | 370,000 | 358,395 |
| 4.482% 8/23/28 (c) | | 1,640,000 | 1,571,744 |
| Intercontinental Exchange, Inc. 3.1% 9/15/27 | | 1,060,000 | 983,183 |
| Jefferies Financial Group, Inc. 4.85% 1/15/27 | | 300,000 | 293,991 |
| Moody's Corp. 3.75% 3/24/25 | | 450,000 | 435,238 |
| Morgan Stanley: | | | |
| U.S. Secured Overnight Fin. Rate (SOFR) Index + 0.460% 5.0208% 11/10/23 (c)(d) | | 500,000 | 499,933 |
| 0.864% 10/21/25 (c) | | 2,300,000 | 2,118,591 |
| 0.985% 12/10/26 (c) | | 1,600,000 | 1,407,358 |
| 1.512% 7/20/27 (c) | | 4,650,000 | 4,059,081 |
| 1.593% 5/4/27 (c) | | 3,080,000 | 2,719,307 |
| 2.72% 7/22/25 (c) | | 1,040,000 | 997,215 |
| 3.591% 7/22/28 (c) | | 1,350,000 | 1,246,115 |
| 4.35% 9/8/26 | | 120,000 | 115,380 |
| 5% 11/24/25 | | 1,248,000 | 1,235,066 |
| 5.123% 2/1/29 (c) | | 1,500,000 | 1,473,014 |
| 6.25% 8/9/26 | | 140,000 | 144,113 |
| NASDAQ, Inc. 3.85% 6/30/26 | | 270,000 | 258,038 |
| Nomura Holdings, Inc.: | | | |
| 1.653% 7/14/26 | | 1,160,000 | 1,013,195 |
| 1.851% 7/16/25 | | 1,000,000 | 912,277 |
| 5.386% 7/6/27 | | 240,000 | 237,677 |
| S&P Global, Inc. 2.45% 3/1/27 (b) | | 650,000 | 591,605 |
| State Street Corp.: | | | |
| 1.684% 11/18/27 (c) | | 450,000 | 397,773 |
| 3.3% 12/16/24 | | 1,790,000 | 1,733,052 |
| 3.776% 12/3/24 (c) | | 1,290,000 | 1,273,457 |
| 4.857% 1/26/26 (c) | | 1,000,000 | 990,788 |
| | | | 62,043,617 |
| Consumer Finance - 1.4% | | | |
| AerCap Ireland Capital Ltd./AerCap Global Aviation Trust: | | | |
| 1.65% 10/29/24 | | 300,000 | 278,303 |
| 1.75% 1/30/26 | | 150,000 | 132,596 |
| 2.45% 10/29/26 | | 2,512,000 | 2,214,508 |
| 2.875% 8/14/24 | | 750,000 | 713,166 |
| 3.15% 2/15/24 | | 400,000 | 390,124 |
| 3.65% 7/21/27 | | 150,000 | 135,854 |
| 4.45% 10/1/25 | | 440,000 | 422,721 |
| 4.5% 9/15/23 | | 288,000 | 286,013 |
| Ally Financial, Inc.: | | | |
| 1.45% 10/2/23 | | 400,000 | 389,868 |
| 3.05% 6/5/23 | | 1,000,000 | 993,215 |
| 5.125% 9/30/24 | | 330,000 | 327,116 |
| 5.8% 5/1/25 | | 1,900,000 | 1,901,255 |
| American Express Co.: | | | |
| 2.5% 7/30/24 | | 3,102,000 | 2,984,277 |
| 3.3% 5/3/27 | | 540,000 | 504,555 |
| 3.375% 5/3/24 | | 2,160,000 | 2,110,588 |
| 3.4% 2/22/24 | | 200,000 | 195,883 |
| 3.95% 8/1/25 | | 1,500,000 | 1,455,933 |
| 5.85% 11/5/27 | | 240,000 | 247,056 |
| Capital One Financial Corp.: | | | |
| 3.3% 10/30/24 | | 440,000 | 424,807 |
| 3.75% 7/28/26 | | 340,000 | 319,432 |
| 3.9% 1/29/24 | | 1,270,000 | 1,251,813 |
| 4.2% 10/29/25 | | 640,000 | 617,869 |
| 4.927% 5/10/28 (c) | | 1,660,000 | 1,607,270 |
| Discover Financial Services 4.5% 1/30/26 | | 100,000 | 96,805 |
| Ford Motor Credit Co. LLC 3.81% 1/9/24 | | 200,000 | 195,505 |
| GE Capital International Funding Co. 3.373% 11/15/25 | | 550,000 | 522,099 |
| John Deere Capital Corp.: | | | |
| 0.625% 9/10/24 | | 2,000,000 | 1,869,728 |
| 2.35% 3/8/27 | | 1,260,000 | 1,145,696 |
| 2.8% 9/8/27 | | 1,000,000 | 918,140 |
| 3.65% 10/12/23 | | 450,000 | 445,987 |
| Synchrony Financial: | | | |
| 3.7% 8/4/26 | | 220,000 | 204,031 |
| 4.5% 7/23/25 | | 448,000 | 431,347 |
| Toyota Motor Credit Corp.: | | | |
| 0.5% 8/14/23 | | 1,730,000 | 1,694,538 |
| 0.8% 10/16/25 | | 560,000 | 502,231 |
| 0.8% 1/9/26 | | 1,120,000 | 998,142 |
| 1.8% 2/13/25 | | 100,000 | 93,738 |
| 2.9% 3/30/23 | | 510,000 | 509,086 |
| 3% 4/1/25 | | 860,000 | 823,136 |
| 3.95% 6/30/25 | | 1,500,000 | 1,463,745 |
| 5.4% 11/10/25 | | 1,500,000 | 1,514,708 |
| | | | 33,332,884 |
| Diversified Financial Services - 0.9% | | | |
| Berkshire Hathaway, Inc. 3.125% 3/15/26 | | 1,120,000 | 1,069,819 |
| Blackstone Private Credit Fund: | | | |
| 2.625% 12/15/26 | | 200,000 | 169,872 |
| 2.7% 1/15/25 | | 960,000 | 894,644 |
| 3.25% 3/15/27 | | 360,000 | 309,998 |
| 4.7% 3/24/25 | | 1,000,000 | 964,487 |
| BP Capital Markets America, Inc.: | | | |
| 3.017% 1/16/27 | | 1,060,000 | 985,371 |
| 3.41% 2/11/26 | | 790,000 | 754,096 |
| Brixmor Operating Partnership LP: | | | |
| 3.9% 3/15/27 | | 170,000 | 157,744 |
| 4.125% 6/15/26 | | 500,000 | 470,553 |
| Corebridge Financial, Inc. 3.65% 4/5/27 (b) | | 540,000 | 503,845 |
| DH Europe Finance II SARL 2.2% 11/15/24 | | 700,000 | 666,071 |
| Jackson Financial, Inc. 5.17% 6/8/27 | | 180,000 | 178,220 |
| KfW: | | | |
| 0.375% 7/18/25 | | 1,650,000 | 1,491,385 |
| 2.5% 11/20/24 | | 1,590,000 | 1,524,047 |
| 2.625% 2/28/24 | | 2,000,000 | 1,948,452 |
| 3% 5/20/27 | | 5,800,000 | 5,492,800 |
| Landwirtschaftliche Rentenbank 2.5% 11/15/27 | | 2,460,000 | 2,266,108 |
| National Rural Utilities Cooperative Finance Corp. 4.45% 3/13/26 | | 1,500,000 | 1,468,828 |
| Voya Financial, Inc. 5.65% 5/15/53 (c) | | 310,000 | 306,900 |
| | | | 21,623,240 |
| Insurance - 0.5% | | | |
| ACE INA Holdings, Inc.: | | | |
| 3.35% 5/15/24 | | 880,000 | 859,735 |
| 3.35% 5/3/26 | | 620,000 | 590,464 |
| Allstate Corp.: | | | |
| 0.75% 12/15/25 | | 590,000 | 523,307 |
| 3.15% 6/15/23 | | 100,000 | 99,464 |
| 5.75% 8/15/53 (c) | | 320,000 | 313,588 |
| American International Group, Inc.: | | | |
| 2.5% 6/30/25 | | 1,700,000 | 1,600,169 |
| 4.125% 2/15/24 | | 620,000 | 611,810 |
| Aon PLC 3.875% 12/15/25 | | 570,000 | 549,090 |
| Athene Holding Ltd. 4.125% 1/12/28 | | 320,000 | 299,205 |
| Brighthouse Financial, Inc. 3.7% 6/22/27 | | 300,000 | 280,429 |
| Manulife Financial Corp.: | | | |
| ICE USD Swap Rate 11am NY 5Y + 1.640% 4.061% 2/24/32 (c)(d) | | 230,000 | 213,523 |
| 2.484% 5/19/27 | | 520,000 | 471,177 |
| Marsh & McLennan Companies, Inc.: | | | |
| 3.5% 3/10/25 | | 1,140,000 | 1,098,872 |
| 3.875% 3/15/24 | | 732,000 | 719,702 |
| MetLife, Inc. 3.6% 4/10/24 | | 200,000 | 195,667 |
| Pricoa Global Funding I 5.625% 6/15/43 (c) | | 1,030,000 | 1,024,850 |
| Progressive Corp. 2.5% 3/15/27 | | 350,000 | 318,889 |
| Prudential Financial, Inc.: | | | |
| 1.5% 3/10/26 | | 160,000 | 144,207 |
| 5.2% 3/15/44 (c) | | 220,000 | 215,620 |
| Willis Group North America, Inc. 4.65% 6/15/27 | | 300,000 | 289,836 |
| | | | 10,419,604 |
| Thrifts & Mortgage Finance - 0.0% | | | |
| Delta Air Lines Pass Through Trust 3.204% 10/25/25 | | 170,000 | 166,502 |
TOTAL FINANCIALS | | | 323,815,578 |
| HEALTH CARE - 2.5% | | | |
| Biotechnology - 0.5% | | | |
| AbbVie, Inc.: | | | |
| 2.6% 11/21/24 | | 1,010,000 | 963,017 |
| 2.95% 11/21/26 | | 1,830,000 | 1,688,847 |
| 3.2% 5/14/26 | | 100,000 | 93,955 |
| 3.8% 3/15/25 | | 800,000 | 776,057 |
| 3.85% 6/15/24 | | 1,845,000 | 1,810,328 |
| Amgen, Inc.: | | | |
| 1.9% 2/21/25 | | 600,000 | 561,011 |
| 3.2% 11/2/27 | | 1,460,000 | 1,348,210 |
| 3.625% 5/22/24 | | 730,000 | 713,797 |
| 5.15% 3/2/28 (e) | | 1,000,000 | 996,043 |
| Gilead Sciences, Inc.: | | | |
| 2.95% 3/1/27 | | 110,000 | 101,884 |
| 3.5% 2/1/25 | | 2,490,000 | 2,411,914 |
| 3.65% 3/1/26 | | 210,000 | 200,549 |
| | | | 11,665,612 |
| Health Care Equipment & Supplies - 0.4% | | | |
| Abbott Laboratories: | | | |
| 2.95% 3/15/25 | | 850,000 | 816,418 |
| 3.875% 9/15/25 | | 670,000 | 650,001 |
| Baxter International, Inc. 1.915% 2/1/27 | | 1,200,000 | 1,046,420 |
| Becton, Dickinson & Co.: | | | |
| 3.363% 6/6/24 | | 993,000 | 967,606 |
| 3.7% 6/6/27 | | 610,000 | 576,004 |
| Boston Scientific Corp. 3.45% 3/1/24 | | 1,498,000 | 1,470,233 |
| GE Healthcare Holding LLC 5.65% 11/15/27 (b) | | 890,000 | 901,926 |
| Stryker Corp.: | | | |
| 1.15% 6/15/25 | | 1,090,000 | 993,177 |
| 3.375% 5/15/24 | | 540,000 | 527,021 |
| Zimmer Biomet Holdings, Inc.: | | | |
| 3.05% 1/15/26 | | 250,000 | 235,105 |
| 3.55% 4/1/25 | | 870,000 | 837,171 |
| | | | 9,021,082 |
| Health Care Providers & Services - 0.8% | | | |
| Aetna, Inc. 3.5% 11/15/24 | | 980,000 | 949,471 |
| Cardinal Health, Inc. 3.41% 6/15/27 | | 730,000 | 680,102 |
| Centene Corp. 4.25% 12/15/27 | | 770,000 | 711,519 |
| Cigna Group: | | | |
| 1.25% 3/15/26 | | 1,280,000 | 1,137,910 |
| 3.25% 4/15/25 | | 800,000 | 768,502 |
| 3.75% 7/15/23 | | 707,000 | 702,115 |
| 4.5% 2/25/26 | | 130,000 | 127,036 |
| CVS Health Corp.: | | | |
| 1.3% 8/21/27 | | 1,080,000 | 910,042 |
| 2.625% 8/15/24 | | 224,000 | 215,769 |
| 2.875% 6/1/26 | | 530,000 | 492,912 |
| 3% 8/15/26 | | 560,000 | 519,600 |
| 3.375% 8/12/24 | | 1,310,000 | 1,272,103 |
| Elevance Health, Inc.: | | | |
| 2.375% 1/15/25 | | 1,560,000 | 1,476,828 |
| 3.65% 12/1/27 | | 460,000 | 431,474 |
| HCA Holdings, Inc.: | | | |
| 4.5% 2/15/27 | | 820,000 | 786,051 |
| 5.25% 4/15/25 | | 700,000 | 693,114 |
| 5.25% 6/15/26 | | 1,730,000 | 1,702,917 |
| 5.375% 9/1/26 | | 260,000 | 256,210 |
| Humana, Inc. 1.35% 2/3/27 | | 1,115,000 | 959,941 |
| Sabra Health Care LP 5.125% 8/15/26 | | 210,000 | 198,634 |
| UnitedHealth Group, Inc.: | | | |
| 1.15% 5/15/26 | | 886,000 | 785,514 |
| 2.375% 8/15/24 | | 400,000 | 383,985 |
| 3.5% 6/15/23 | | 200,000 | 199,138 |
| 5.25% 2/15/28 | | 1,250,000 | 1,267,000 |
| Universal Health Services, Inc. 1.65% 9/1/26 | | 270,000 | 234,440 |
| | | | 17,862,327 |
| Life Sciences Tools & Services - 0.0% | | | |
| PerkinElmer, Inc. 0.85% 9/15/24 | | 200,000 | 186,091 |
| Thermo Fisher Scientific, Inc. 4.8% 11/21/27 | | 360,000 | 359,785 |
| | | | 545,876 |
| Pharmaceuticals - 0.8% | | | |
| AstraZeneca Finance LLC 1.2% 5/28/26 | | 2,000,000 | 1,771,520 |
| AstraZeneca PLC 3.5% 8/17/23 | | 510,000 | 505,549 |
| Bristol-Myers Squibb Co.: | | | |
| 0.75% 11/13/25 | | 1,100,000 | 985,335 |
| 2.9% 7/26/24 | | 1,700,000 | 1,647,742 |
| 3.2% 6/15/26 | | 296,000 | 280,226 |
| GlaxoSmithKline Capital PLC 3% 6/1/24 | | 240,000 | 233,682 |
| GlaxoSmithKline Capital, Inc. 3.625% 5/15/25 | | 1,000,000 | 970,486 |
| GSK Consumer Healthcare Capital U.S. LLC 3.375% 3/24/27 | | 1,230,000 | 1,143,704 |
| Johnson & Johnson: | | | |
| 0.55% 9/1/25 | | 1,000,000 | 902,462 |
| 0.95% 9/1/27 | | 580,000 | 496,354 |
| 2.45% 3/1/26 | | 640,000 | 599,349 |
| 2.625% 1/15/25 | | 700,000 | 672,576 |
| Merck & Co., Inc. 1.7% 6/10/27 | | 2,000,000 | 1,766,263 |
| Novartis Capital Corp.: | | | |
| 1.75% 2/14/25 | | 200,000 | 187,815 |
| 3% 11/20/25 | | 1,010,000 | 961,051 |
| 3.1% 5/17/27 | | 120,000 | 112,747 |
| 3.4% 5/6/24 | | 385,000 | 377,195 |
| Pfizer, Inc.: | | | |
| 2.75% 6/3/26 | | 620,000 | 582,336 |
| 2.95% 3/15/24 | | 720,000 | 703,558 |
| 3% 12/15/26 | | 110,000 | 103,408 |
| 3.2% 9/15/23 | | 700,000 | 692,698 |
| Shire Acquisitions Investments Ireland DAC: | | | |
| 2.875% 9/23/23 | | 684,000 | 673,870 |
| 3.2% 9/23/26 | | 480,000 | 446,826 |
| Utah Acquisition Sub, Inc. 3.95% 6/15/26 | | 1,260,000 | 1,178,331 |
| Viatris, Inc. 1.65% 6/22/25 | | 240,000 | 218,465 |
| Zoetis, Inc. 3% 9/12/27 | | 480,000 | 442,788 |
| | | | 18,656,336 |
TOTAL HEALTH CARE | | | 57,751,233 |
| INDUSTRIALS - 1.9% | | | |
| Aerospace & Defense - 0.5% | | | |
| General Dynamics Corp.: | | | |
| 2.125% 8/15/26 | | 180,000 | 164,052 |
| 2.375% 11/15/24 | | 290,000 | 276,198 |
| 3.25% 4/1/25 | | 120,000 | 115,563 |
| 3.5% 5/15/25 | | 820,000 | 793,158 |
| Huntington Ingalls Industries, Inc. 3.844% 5/1/25 | | 210,000 | 201,718 |
| Lockheed Martin Corp. 3.55% 1/15/26 | | 376,000 | 363,309 |
| Northrop Grumman Corp. 2.93% 1/15/25 | | 1,460,000 | 1,397,679 |
| Raytheon Technologies Corp.: | | | |
| 3.5% 3/15/27 | | 1,010,000 | 955,945 |
| 3.65% 8/16/23 | | 18,000 | 17,851 |
| 3.95% 8/16/25 | | 1,320,000 | 1,282,783 |
| The Boeing Co.: | | | |
| 1.95% 2/1/24 | | 1,320,000 | 1,274,837 |
| 2.196% 2/4/26 | | 2,740,000 | 2,488,879 |
| 2.75% 2/1/26 | | 350,000 | 324,381 |
| 2.8% 3/1/23 | | 60,000 | 60,000 |
| 2.85% 10/30/24 | | 950,000 | 908,559 |
| 3.1% 5/1/26 | | 100,000 | 93,100 |
| 4.508% 5/1/23 | | 310,000 | 309,557 |
| 4.875% 5/1/25 | | 1,790,000 | 1,764,942 |
| | | | 12,792,511 |
| Air Freight & Logistics - 0.1% | | | |
| FedEx Corp. 3.25% 4/1/26 | | 310,000 | 293,392 |
| United Parcel Service, Inc.: | | | |
| 2.4% 11/15/26 | | 210,000 | 193,080 |
| 2.5% 4/1/23 | | 800,000 | 798,136 |
| 2.8% 11/15/24 | | 130,000 | 125,154 |
| 3.05% 11/15/27 | | 530,000 | 491,784 |
| 3.9% 4/1/25 | | 420,000 | 410,445 |
| | | | 2,311,991 |
| Airlines - 0.1% | | | |
| Southwest Airlines Co.: | | | |
| 5.125% 6/15/27 | | 870,000 | 857,522 |
| 5.25% 5/4/25 | | 980,000 | 975,942 |
| United Airlines 2020-1 Class B Pass Through Trust 4.875% 7/15/27 | | 231,520 | 224,413 |
| | | | 2,057,877 |
| Building Products - 0.1% | | | |
| Carrier Global Corp. 2.242% 2/15/25 | | 1,362,000 | 1,279,170 |
| Owens Corning 3.4% 8/15/26 | | 260,000 | 243,387 |
| | | | 1,522,557 |
| Commercial Services & Supplies - 0.1% | | | |
| FMS Wertmanagement AoeR 2.75% 1/30/24 | | 200,000 | 195,350 |
| Republic Services, Inc.: | | | |
| 2.5% 8/15/24 | | 100,000 | 95,971 |
| 2.9% 7/1/26 | | 530,000 | 492,841 |
| 3.2% 3/15/25 | | 130,000 | 124,477 |
| Waste Management, Inc.: | | | |
| 0.75% 11/15/25 | | 290,000 | 257,880 |
| 2.4% 5/15/23 | | 390,000 | 387,615 |
| | | | 1,554,134 |
| Electrical Equipment - 0.0% | | | |
| Hubbell, Inc. 3.35% 3/1/26 | | 110,000 | 103,987 |
| Industrial Conglomerates - 0.1% | | | |
| 3M Co.: | | | |
| 2.25% 9/19/26 | | 250,000 | 226,679 |
| 2.65% 4/15/25 | | 55,000 | 52,101 |
| 2.875% 10/15/27 | | 410,000 | 373,057 |
| Honeywell International, Inc.: | | | |
| 1.1% 3/1/27 | | 330,000 | 286,906 |
| 1.35% 6/1/25 | | 1,100,000 | 1,015,227 |
| 2.3% 8/15/24 | | 110,000 | 105,539 |
| 2.5% 11/1/26 | | 410,000 | 378,818 |
| | | | 2,438,327 |
| Machinery - 0.4% | | | |
| Caterpillar Financial Services Corp.: | | | |
| 0.45% 9/14/23 | | 400,000 | 390,079 |
| 0.95% 1/10/24 | | 100,000 | 96,374 |
| 1.1% 9/14/27 | | 680,000 | 581,491 |
| 1.15% 9/14/26 | | 420,000 | 368,899 |
| 1.45% 5/15/25 | | 1,120,000 | 1,036,208 |
| 1.7% 1/8/27 | | 370,000 | 333,404 |
| 2.85% 5/17/24 | | 1,180,000 | 1,147,223 |
| 3.25% 12/1/24 | | 860,000 | 834,931 |
| 3.45% 5/15/23 | | 130,000 | 129,586 |
| Caterpillar, Inc. 3.4% 5/15/24 | | 750,000 | 734,894 |
| Deere & Co. 2.75% 4/15/25 | | 460,000 | 438,758 |
| Illinois Tool Works, Inc. 3.5% 3/1/24 | | 290,000 | 286,088 |
| Ingersoll-Rand Luxembourg Finance SA 3.5% 3/21/26 | | 310,000 | 293,461 |
| Otis Worldwide Corp. 2.056% 4/5/25 | | 550,000 | 513,073 |
| Parker Hannifin Corp.: | | | |
| 2.7% 6/14/24 | | 440,000 | 424,674 |
| 4.25% 9/15/27 | | 800,000 | 765,371 |
| Stanley Black & Decker, Inc. 3.4% 3/1/26 | | 610,000 | 577,391 |
| Westinghouse Air Brake Tech Co.: | | | |
| 3.2% 6/15/25 | | 410,000 | 385,957 |
| 3.45% 11/15/26 | | 280,000 | 258,675 |
| 4.4% 3/15/24 | | 100,000 | 98,515 |
| | | | 9,695,052 |
| Professional Services - 0.0% | | | |
| Leidos, Inc. 3.625% 5/15/25 | | 210,000 | 201,858 |
| Thomson Reuters Corp. 3.35% 5/15/26 | | 260,000 | 245,139 |
| | | | 446,997 |
| Road & Rail - 0.3% | | | |
| Burlington Northern Santa Fe LLC: | | | |
| 3% 3/15/23 | | 890,000 | 889,297 |
| 3.25% 6/15/27 | | 100,000 | 94,440 |
| 3.4% 9/1/24 | | 970,000 | 944,281 |
| 3.85% 9/1/23 | | 730,000 | 725,063 |
| Canadian National Railway Co. 2.75% 3/1/26 | | 100,000 | 93,615 |
| Canadian Pacific Railway Co. 1.75% 12/2/26 | | 1,133,000 | 1,003,357 |
| CSX Corp. 3.35% 11/1/25 | | 760,000 | 725,560 |
| Norfolk Southern Corp. 2.9% 6/15/26 | | 490,000 | 455,132 |
| Union Pacific Corp.: | | | |
| 2.15% 2/5/27 | | 100,000 | 90,405 |
| 2.75% 4/15/23 | | 50,000 | 49,832 |
| 2.75% 3/1/26 | | 740,000 | 693,631 |
| 3.75% 3/15/24 | | 410,000 | 402,860 |
| 3.75% 7/15/25 | | 120,000 | 116,449 |
| | | | 6,283,922 |
| Trading Companies & Distributors - 0.2% | | | |
| Air Lease Corp.: | | | |
| 0.7% 2/15/24 | | 570,000 | 543,164 |
| 2.2% 1/15/27 | | 280,000 | 245,996 |
| 3.375% 7/1/25 | | 2,230,000 | 2,102,649 |
| 3.625% 4/1/27 | | 180,000 | 165,409 |
| 3.625% 12/1/27 | | 570,000 | 518,157 |
| 3.875% 7/3/23 | | 230,000 | 228,830 |
| 4.25% 2/1/24 | | 670,000 | 660,527 |
| | | | 4,464,732 |
TOTAL INDUSTRIALS | | | 43,672,087 |
| INFORMATION TECHNOLOGY - 2.8% | | | |
| Communications Equipment - 0.1% | | | |
| Cisco Systems, Inc.: | | | |
| 2.95% 2/28/26 | | 670,000 | 634,561 |
| 3.625% 3/4/24 | | 1,490,000 | 1,467,835 |
| | | | 2,102,396 |
| Electronic Equipment & Components - 0.2% | | | |
| Dell International LLC/EMC Corp.: | | | |
| 4% 7/15/24 | | 710,000 | 695,708 |
| 5.45% 6/15/23 | | 169,000 | 168,882 |
| 5.85% 7/15/25 | | 2,110,000 | 2,122,791 |
| 6.02% 6/15/26 | | 630,000 | 637,755 |
| 6.1% 7/15/27 | | 480,000 | 493,229 |
| Flex Ltd.: | | | |
| 3.75% 2/1/26 | | 280,000 | 266,142 |
| 4.75% 6/15/25 | | 100,000 | 97,698 |
| Teledyne Technologies, Inc. 1.6% 4/1/26 | | 180,000 | 160,810 |
| Vontier Corp. 1.8% 4/1/26 | | 210,000 | 182,652 |
| | | | 4,825,667 |
| IT Services - 0.7% | | | |
| Automatic Data Processing, Inc. 3.375% 9/15/25 | | 420,000 | 404,421 |
| CDW LLC/CDW Finance Corp.: | | | |
| 2.67% 12/1/26 | | 250,000 | 222,024 |
| 4.125% 5/1/25 | | 250,000 | 238,739 |
| 5.5% 12/1/24 | | 100,000 | 99,166 |
| Fidelity National Information Services, Inc. 1.15% 3/1/26 | | 609,000 | 533,995 |
| Fiserv, Inc.: | | | |
| 2.75% 7/1/24 | | 2,250,000 | 2,166,362 |
| 3.2% 7/1/26 | | 280,000 | 261,234 |
| 3.85% 6/1/25 | | 100,000 | 96,280 |
| Global Payments, Inc.: | | | |
| 1.2% 3/1/26 | | 1,157,000 | 1,011,412 |
| 2.15% 1/15/27 | | 200,000 | 175,262 |
| 2.65% 2/15/25 | | 290,000 | 273,566 |
| 4.95% 8/15/27 | | 160,000 | 154,753 |
| IBM Corp.: | | | |
| 1.7% 5/15/27 | | 1,110,000 | 972,983 |
| 3% 5/15/24 | | 1,400,000 | 1,361,059 |
| 3.45% 2/19/26 | | 1,290,000 | 1,229,598 |
| 4.15% 7/27/27 | | 570,000 | 550,871 |
| MasterCard, Inc.: | | | |
| 2% 3/3/25 | | 1,100,000 | 1,036,931 |
| 3.3% 3/26/27 | | 800,000 | 756,486 |
| PayPal Holdings, Inc.: | | | |
| 1.65% 6/1/25 | | 1,300,000 | 1,204,730 |
| 2.4% 10/1/24 | | 320,000 | 306,351 |
| 3.9% 6/1/27 | | 170,000 | 163,735 |
| The Western Union Co.: | | | |
| 1.35% 3/15/26 | | 330,000 | 290,384 |
| 2.85% 1/10/25 | | 100,000 | 94,975 |
| Visa, Inc.: | | | |
| 0.75% 8/15/27 | | 600,000 | 509,058 |
| 2.75% 9/15/27 | | 340,000 | 314,272 |
| 3.15% 12/14/25 | | 2,600,000 | 2,481,770 |
| | | | 16,910,417 |
| Semiconductors & Semiconductor Equipment - 0.6% | | | |
| Analog Devices, Inc. 2.95% 4/1/25 | | 570,000 | 544,897 |
| Broadcom Corp./Broadcom Cayman LP 3.875% 1/15/27 | | 450,000 | 424,414 |
| Broadcom, Inc.: | | | |
| 3.15% 11/15/25 | | 1,846,000 | 1,738,417 |
| 3.459% 9/15/26 | | 691,000 | 645,888 |
| Intel Corp.: | | | |
| 2.6% 5/19/26 | | 100,000 | 92,822 |
| 3.4% 3/25/25 | | 1,643,000 | 1,586,759 |
| 3.7% 7/29/25 | | 450,000 | 435,272 |
| 3.75% 3/25/27 | | 350,000 | 334,107 |
| 3.75% 8/5/27 | | 870,000 | 827,388 |
| 4.875% 2/10/28 | | 150,000 | 147,809 |
| Marvell Technology, Inc. 1.65% 4/15/26 | | 270,000 | 241,690 |
| Microchip Technology, Inc.: | | | |
| 2.67% 9/1/23 | | 800,000 | 787,781 |
| 4.25% 9/1/25 | | 600,000 | 581,022 |
| 4.333% 6/1/23 | | 390,000 | 388,742 |
| Micron Technology, Inc.: | | | |
| 4.185% 2/15/27 | | 330,000 | 312,373 |
| 4.975% 2/6/26 | | 210,000 | 207,456 |
| NVIDIA Corp. 0.584% 6/14/24 | | 1,500,000 | 1,414,232 |
| NXP BV/NXP Funding LLC/NXP U.S.A., Inc.: | | | |
| 2.7% 5/1/25 | | 960,000 | 899,280 |
| 3.875% 6/18/26 | | 170,000 | 161,131 |
| 4.4% 6/1/27 | | 290,000 | 277,004 |
| Qualcomm, Inc.: | | | |
| 2.9% 5/20/24 | | 1,020,000 | 992,346 |
| 3.25% 5/20/27 | | 1,050,000 | 987,596 |
| | | | 14,028,426 |
| Software - 0.6% | | | |
| Fortinet, Inc. 1% 3/15/26 | | 210,000 | 184,027 |
| Microsoft Corp.: | | | |
| 2.375% 5/1/23 | | 590,000 | 587,361 |
| 2.7% 2/12/25 | | 2,120,000 | 2,039,053 |
| 2.875% 2/6/24 | | 1,630,000 | 1,594,628 |
| 3.125% 11/3/25 | | 620,000 | 594,142 |
| 3.3% 2/6/27 | | 310,000 | 296,176 |
| Oracle Corp.: | | | |
| 1.65% 3/25/26 | | 2,766,000 | 2,472,526 |
| 2.5% 4/1/25 | | 1,700,000 | 1,602,808 |
| 2.65% 7/15/26 | | 840,000 | 767,568 |
| 2.8% 4/1/27 | | 440,000 | 399,095 |
| 5.8% 11/10/25 | | 1,250,000 | 1,264,775 |
| Roper Technologies, Inc.: | | | |
| 1% 9/15/25 | | 518,000 | 466,657 |
| 3.65% 9/15/23 | | 360,000 | 356,184 |
| 3.8% 12/15/26 | | 280,000 | 266,293 |
| VMware, Inc.: | | | |
| 0.6% 8/15/23 | | 620,000 | 606,525 |
| 1.4% 8/15/26 | | 1,177,000 | 1,016,484 |
| 3.9% 8/21/27 | | 440,000 | 410,825 |
| 4.5% 5/15/25 | | 100,000 | 97,973 |
| | | | 15,023,100 |
| Technology Hardware, Storage & Peripherals - 0.6% | | | |
| Apple, Inc.: | | | |
| 0.55% 8/20/25 | | 1,100,000 | 991,728 |
| 0.7% 2/8/26 | | 1,100,000 | 976,137 |
| 1.125% 5/11/25 | | 1,500,000 | 1,385,313 |
| 1.8% 9/11/24 | | 2,870,000 | 2,734,606 |
| 2.45% 8/4/26 | | 100,000 | 92,568 |
| 2.5% 2/9/25 | | 1,100,000 | 1,051,899 |
| 2.75% 1/13/25 | | 600,000 | 576,466 |
| 2.9% 9/12/27 | | 460,000 | 427,670 |
| 3% 6/20/27 | | 640,000 | 601,422 |
| 3% 11/13/27 | | 260,000 | 242,178 |
| 3.25% 2/23/26 | | 1,530,000 | 1,463,432 |
| 3.45% 5/6/24 | | 100,000 | 98,171 |
| Hewlett Packard Enterprise Co. 4.9% 10/15/25 (c) | | 1,310,000 | 1,299,027 |
| HP, Inc.: | | | |
| 1.45% 6/17/26 | | 1,000,000 | 877,909 |
| 3% 6/17/27 | | 200,000 | 181,874 |
| | | | 13,000,400 |
TOTAL INFORMATION TECHNOLOGY | | | 65,890,406 |
| MATERIALS - 0.4% | | | |
| Chemicals - 0.2% | | | |
| Celanese U.S. Holdings LLC 6.165% 7/15/27 | | 1,380,000 | 1,369,772 |
| Eastman Chemical Co. 3.8% 3/15/25 | | 160,000 | 154,859 |
| Ecolab, Inc. 5.25% 1/15/28 | | 570,000 | 575,523 |
| LYB International Finance III LLC 1.25% 10/1/25 | | 800,000 | 716,070 |
| PPG Industries, Inc. 1.2% 3/15/26 | | 330,000 | 292,027 |
| Sherwin-Williams Co.: | | | |
| 3.125% 6/1/24 | | 1,090,000 | 1,060,015 |
| 3.45% 6/1/27 | | 700,000 | 655,905 |
| The Mosaic Co. 4.25% 11/15/23 | | 380,000 | 377,113 |
| | | | 5,201,284 |
| Construction Materials - 0.0% | | | |
| Martin Marietta Materials, Inc. 0.65% 7/15/23 | | 250,000 | 245,759 |
| Containers & Packaging - 0.1% | | | |
| Berry Global, Inc.: | | | |
| 0.95% 2/15/24 | | 800,000 | 763,745 |
| 1.57% 1/15/26 | | 280,000 | 249,591 |
| 1.65% 1/15/27 | | 120,000 | 102,985 |
| WRKCo, Inc.: | | | |
| 3% 9/15/24 | | 190,000 | 181,655 |
| 4.65% 3/15/26 | | 340,000 | 332,931 |
| | | | 1,630,907 |
| Metals & Mining - 0.1% | | | |
| BHP Billiton Financial (U.S.A.) Ltd. 4.75% 2/28/28 | | 440,000 | 434,727 |
| Nucor Corp.: | | | |
| 2% 6/1/25 | | 240,000 | 223,279 |
| 3.95% 5/23/25 | | 440,000 | 427,878 |
| Southern Copper Corp. 3.875% 4/23/25 | | 240,000 | 231,048 |
| Vale Overseas Ltd. 6.25% 8/10/26 | | 640,000 | 650,920 |
| | | | 1,967,852 |
TOTAL MATERIALS | | | 9,045,802 |
| REAL ESTATE - 1.1% | | | |
| Equity Real Estate Investment Trusts (REITs) - 1.0% | | | |
| Alexandria Real Estate Equities, Inc. 3.45% 4/30/25 | | 520,000 | 498,648 |
| American Tower Corp.: | | | |
| 1.3% 9/15/25 | | 677,000 | 608,675 |
| 1.6% 4/15/26 | | 880,000 | 783,158 |
| 3.375% 5/15/24 | | 763,000 | 742,574 |
| 3.65% 3/15/27 | | 690,000 | 642,505 |
| 4.4% 2/15/26 | | 290,000 | 281,593 |
| AvalonBay Communities, Inc.: | | | |
| 2.95% 5/11/26 | | 430,000 | 401,318 |
| 3.45% 6/1/25 | | 620,000 | 595,075 |
| Boston Properties, Inc.: | | | |
| 2.75% 10/1/26 | | 640,000 | 577,617 |
| 3.65% 2/1/26 | | 320,000 | 303,119 |
| 3.8% 2/1/24 | | 520,000 | 510,887 |
| Crown Castle International Corp.: | | | |
| 1.05% 7/15/26 | | 250,000 | 216,444 |
| 1.35% 7/15/25 | | 439,000 | 398,716 |
| 2.9% 3/15/27 | | 560,000 | 508,723 |
| 3.65% 9/1/27 | | 370,000 | 344,212 |
| 3.7% 6/15/26 | | 480,000 | 454,384 |
| 4.45% 2/15/26 | | 260,000 | 252,801 |
| EPR Properties 4.5% 6/1/27 | | 400,000 | 355,796 |
| Equinix, Inc. 1.45% 5/15/26 | | 491,000 | 433,243 |
| Federal Realty Investment Trust 1.25% 2/15/26 | | 290,000 | 257,551 |
| Healthcare Trust of America Holdings LP 3.5% 8/1/26 | | 240,000 | 223,101 |
| Healthpeak Properties, Inc. 1.35% 2/1/27 | | 540,000 | 470,321 |
| Hudson Pacific Properties LP 3.95% 11/1/27 | | 130,000 | 112,356 |
| Kilroy Realty LP 4.375% 10/1/25 | | 300,000 | 287,947 |
| Kimco Realty Op LLC 3.3% 2/1/25 | | 1,630,000 | 1,562,243 |
| National Retail Properties, Inc. 4% 11/15/25 | | 240,000 | 231,104 |
| Office Properties Income Trust 4.5% 2/1/25 | | 730,000 | 671,617 |
| Omega Healthcare Investors, Inc. 5.25% 1/15/26 | | 500,000 | 490,142 |
| Realty Income Corp.: | | | |
| 4.6% 2/6/24 | | 450,000 | 446,271 |
| 4.625% 11/1/25 | | 1,380,000 | 1,356,089 |
| 4.875% 6/1/26 | | 340,000 | 336,824 |
| 5.05% 1/13/26 | | 500,000 | 495,198 |
| Simon Property Group LP: | | | |
| 2% 9/13/24 | | 970,000 | 922,440 |
| 3.25% 11/30/26 | | 380,000 | 354,378 |
| 3.3% 1/15/26 | | 800,000 | 758,943 |
| 3.375% 6/15/27 | | 100,000 | 93,070 |
| 3.5% 9/1/25 | | 360,000 | 345,165 |
| SITE Centers Corp. 3.625% 2/1/25 | | 320,000 | 303,632 |
| Ventas Realty LP: | | | |
| 3.5% 4/15/24 | | 100,000 | 97,273 |
| 3.5% 2/1/25 | | 931,000 | 893,897 |
| 4.125% 1/15/26 | | 120,000 | 115,503 |
| VICI Properties LP 4.75% 2/15/28 | | 550,000 | 518,832 |
| Vornado Realty LP 2.15% 6/1/26 | | 400,000 | 342,718 |
| Welltower Op: | | | |
| 3.625% 3/15/24 | | 1,080,000 | 1,057,640 |
| 4% 6/1/25 | | 320,000 | 309,325 |
| 4.25% 4/1/26 | | 140,000 | 135,051 |
| WP Carey, Inc. 4% 2/1/25 | | 570,000 | 556,036 |
| | | | 22,654,155 |
| Real Estate Management & Development - 0.1% | | | |
| Brandywine Operating Partnership LP 3.95% 11/15/27 | | 170,000 | 143,415 |
| CBRE Group, Inc. 4.875% 3/1/26 | | 250,000 | 244,618 |
| Digital Realty Trust LP 3.7% 8/15/27 | | 660,000 | 611,162 |
| Essex Portfolio LP 3.5% 4/1/25 | | 630,000 | 605,607 |
| Mid-America Apartments LP 4% 11/15/25 | | 480,000 | 463,162 |
| Tanger Properties LP 3.875% 7/15/27 | | 210,000 | 192,839 |
| | | | 2,260,803 |
TOTAL REAL ESTATE | | | 24,914,958 |
| UTILITIES - 2.0% | | | |
| Electric Utilities - 1.4% | | | |
| AEP Transmission Co. LLC 3.1% 12/1/26 | | 180,000 | 168,343 |
| American Electric Power Co., Inc.: | | | |
| 0.75% 11/1/23 | | 880,000 | 852,545 |
| 1% 11/1/25 | | 260,000 | 231,529 |
| 2.031% 3/15/24 | | 1,110,000 | 1,069,070 |
| 3.2% 11/13/27 | | 510,000 | 467,679 |
| Cleco Corporate Holdings LLC 3.743% 5/1/26 | | 220,000 | 206,448 |
| Connecticut Light & Power Co.: | | | |
| 0.75% 12/1/25 | | 100,000 | 88,796 |
| 3.2% 3/15/27 | | 230,000 | 215,985 |
| DTE Electric Co. 3.65% 3/15/24 | | 360,000 | 353,295 |
| Duke Energy Carolinas LLC 2.95% 12/1/26 | | 240,000 | 223,434 |
| Duke Energy Corp.: | | | |
| 0.9% 9/15/25 | | 100,000 | 89,424 |
| 2.65% 9/1/26 | | 340,000 | 310,492 |
| 3.25% 1/15/82 (c) | | 220,000 | 173,712 |
| 3.75% 4/15/24 | | 1,100,000 | 1,079,485 |
| 3.95% 10/15/23 | | 1,460,000 | 1,445,100 |
| Duke Energy Florida LLC 3.2% 1/15/27 | | 260,000 | 244,285 |
| Edison International: | | | |
| 4.7% 8/15/25 | | 110,000 | 107,211 |
| 5.75% 6/15/27 | | 280,000 | 281,220 |
| Entergy Corp. 0.9% 9/15/25 | | 1,100,000 | 978,016 |
| Entergy Louisiana LLC 2.4% 10/1/26 | | 490,000 | 441,785 |
| Eversource Energy: | | | |
| 2.9% 10/1/24 | | 780,000 | 749,555 |
| 2.9% 3/1/27 | | 160,000 | 146,468 |
| 3.8% 12/1/23 | | 480,000 | 473,707 |
| Exelon Corp.: | | | |
| 2.75% 3/15/27 | | 600,000 | 543,978 |
| 3.4% 4/15/26 | | 100,000 | 94,265 |
| 3.95% 6/15/25 | | 630,000 | 609,832 |
| FirstEnergy Corp. 2.05% 3/1/25 | | 340,000 | 317,169 |
| Florida Power & Light Co.: | | | |
| 2.85% 4/1/25 | | 389,000 | 372,409 |
| 3.125% 12/1/25 | | 530,000 | 504,017 |
| Fortis, Inc. 3.055% 10/4/26 | | 460,000 | 427,123 |
| Georgia Power Co. 2.1% 7/30/23 | | 910,000 | 897,821 |
| Interstate Power and Light Co. 3.25% 12/1/24 | | 200,000 | 192,541 |
| NextEra Energy Capital Holdings, Inc.: | | | |
| 0.65% 3/1/23 | | 770,000 | 770,000 |
| 1.875% 1/15/27 | | 430,000 | 378,859 |
| 4.625% 7/15/27 | | 1,130,000 | 1,098,224 |
| 4.9% 2/28/28 | | 1,500,000 | 1,482,121 |
| Oncor Electric Delivery Co. LLC: | | | |
| 0.55% 10/1/25 | | 340,000 | 303,503 |
| 2.75% 6/1/24 | | 770,000 | 745,673 |
| Pacific Gas & Electric Co.: | | | |
| 2.95% 3/1/26 | | 210,000 | 192,890 |
| 3.15% 1/1/26 | | 1,470,000 | 1,363,631 |
| 3.3% 12/1/27 | | 180,000 | 160,443 |
| 3.45% 7/1/25 | | 240,000 | 225,505 |
| 3.5% 6/15/25 | | 240,000 | 227,491 |
| 4.25% 8/1/23 | | 930,000 | 925,011 |
| 4.95% 6/8/25 | | 140,000 | 137,131 |
| 5.45% 6/15/27 | | 310,000 | 302,753 |
| Pinnacle West Capital Corp. 1.3% 6/15/25 | | 140,000 | 126,867 |
| PPL Capital Funding, Inc. 3.1% 5/15/26 | | 270,000 | 252,543 |
| Public Service Electric & Gas Co.: | | | |
| 0.95% 3/15/26 | | 180,000 | 159,329 |
| 2.25% 9/15/26 | | 260,000 | 236,375 |
| Southern California Edison Co. 3.7% 8/1/25 | | 1,680,000 | 1,613,567 |
| Southern Co.: | | | |
| 2.95% 7/1/23 | | 1,620,000 | 1,606,479 |
| 3.25% 7/1/26 | | 1,890,000 | 1,762,249 |
| 5.15% 10/6/25 | | 2,000,000 | 1,992,066 |
| Southwestern Electric Power Co. 2.75% 10/1/26 | | 320,000 | 292,151 |
| Union Electric Co. 2.95% 6/15/27 | | 170,000 | 157,440 |
| Virginia Electric & Power Co.: | | | |
| 2.95% 11/15/26 | | 420,000 | 387,495 |
| 3.15% 1/15/26 | | 360,000 | 340,844 |
| Xcel Energy, Inc.: | | | |
| 1.75% 3/15/27 | | 590,000 | 517,859 |
| 3.3% 6/1/25 | | 100,000 | 95,456 |
| | | | 32,210,694 |
| Gas Utilities - 0.1% | | | |
| Dominion Gas Holdings LLC 2.5% 11/15/24 | | 3,041,000 | 2,901,384 |
| ONE Gas, Inc. 1.1% 3/11/24 | | 114,000 | 109,007 |
| Southern California Gas Co.: | | | |
| 2.6% 6/15/26 | | 510,000 | 471,030 |
| 2.95% 4/15/27 | | 460,000 | 425,762 |
| 3.15% 9/15/24 | | 230,000 | 222,184 |
| | | | 4,129,367 |
| Independent Power and Renewable Electricity Producers - 0.1% | | | |
| Emera U.S. Finance LP 3.55% 6/15/26 | | 390,000 | 366,108 |
| Exelon Generation Co. LLC 3.25% 6/1/25 | | 1,280,000 | 1,216,788 |
| Southern Power Co. 4.15% 12/1/25 | | 380,000 | 370,907 |
| The AES Corp. 1.375% 1/15/26 | | 330,000 | 292,038 |
| | | | 2,245,841 |
| Multi-Utilities - 0.4% | | | |
| Ameren Corp. 2.5% 9/15/24 | | 400,000 | 381,136 |
| Berkshire Hathaway Energy Co. 4.05% 4/15/25 | | 1,000,000 | 978,145 |
| CenterPoint Energy, Inc. 1.45% 6/1/26 | | 370,000 | 327,625 |
| Dominion Energy, Inc. 1.45% 4/15/26 | | 1,900,000 | 1,687,467 |
| DTE Energy Co.: | | | |
| 1.05% 6/1/25 | | 920,000 | 833,258 |
| 2.85% 10/1/26 | | 100,000 | 91,775 |
| NiSource, Inc. 0.95% 8/15/25 | | 1,343,000 | 1,210,830 |
| Public Service Enterprise Group, Inc. 2.875% 6/15/24 | | 1,300,000 | 1,254,860 |
| San Diego Gas & Electric Co. 2.5% 5/15/26 | | 280,000 | 257,127 |
| Sempra Energy 3.25% 6/15/27 | | 1,150,000 | 1,060,624 |
| WEC Energy Group, Inc.: | | | |
| 0.8% 3/15/24 | | 710,000 | 676,299 |
| 4.75% 1/15/28 | | 320,000 | 313,521 |
| | | | 9,072,667 |
| Water Utilities - 0.0% | | | |
| American Water Capital Corp. 2.95% 9/1/27 | | 270,000 | 247,456 |
TOTAL UTILITIES | | | 47,906,025 |
| TOTAL NONCONVERTIBLE BONDS (Cost $779,803,714) | | | 732,994,667 |
| | | | |
| U.S. Government and Government Agency Obligations - 65.2% |
| | | Principal Amount (a) | Value ($) |
| U.S. Government Agency Obligations - 2.0% | | | |
| Fannie Mae: | | | |
| 0.375% 8/25/25 | | 1,805,000 | 1,623,032 |
| 0.5% 6/17/25 | | 16,180,000 | 14,704,504 |
| 0.625% 4/22/25 | | 6,334,000 | 5,800,145 |
| 1.625% 10/15/24 | | 800,000 | 758,325 |
| 1.75% 7/2/24 | | 860,000 | 822,653 |
| Federal Farm Credit Bank 4.125% 12/12/25 | | 8,573,000 | 8,340,452 |
| Federal Home Loan Bank: | | | |
| 0.375% 9/4/25 | | 460,000 | 413,943 |
| 0.5% 4/14/25 | | 695,000 | 635,961 |
| 0.79% 2/25/26 | | 7,900,000 | 6,994,818 |
| 1.5% 8/15/24 | | 125,000 | 118,721 |
| Freddie Mac: | | | |
| 0.375% 7/21/25 | | 1,600,000 | 1,444,201 |
| 0.375% 9/23/25 | | 1,156,000 | 1,038,905 |
| 1.5% 2/12/25 | | 1,590,000 | 1,492,583 |
| 2.75% 6/19/23 | | 195,000 | 193,636 |
| Tennessee Valley Authority 0.75% 5/15/25 | | 2,550,000 | 2,328,724 |
TOTAL U.S. GOVERNMENT AGENCY OBLIGATIONS | | | 46,710,603 |
| U.S. Treasury Obligations - 63.2% | | | |
| U.S. Treasury Bonds: | | | |
| 6.75% 8/15/26 | | 6,360,000 | 6,831,783 |
| 7.5% 11/15/24 | | 20,390,000 | 21,267,726 |
| U.S. Treasury Notes: | | | |
| 0.125% 6/30/23 | | 6,000 | 5,905 |
| 0.125% 7/31/23 | | 16,000 | 15,678 |
| 0.125% 8/15/23 | | 15,000 | 14,665 |
| 0.125% 2/15/24 | | 1,154,000 | 1,099,816 |
| 0.25% 3/15/24 | | 2,000 | 1,902 |
| 0.25% 5/15/24 | | 2,574,000 | 2,427,805 |
| 0.25% 5/31/25 | | 85,050,000 | 77,036,695 |
| 0.25% 9/30/25 | | 19,000 | 17,033 |
| 0.375% 4/15/24 | | 3,846,000 | 3,647,540 |
| 0.375% 7/15/24 | | 53,074,000 | 49,779,680 |
| 0.375% 8/15/24 | | 46,116,000 | 43,104,049 |
| 0.375% 4/30/25 | | 50,090,000 | 45,632,772 |
| 0.375% 12/31/25 | | 10,584,000 | 9,442,499 |
| 0.375% 7/31/27 | | 9,980,000 | 8,438,558 |
| 0.375% 9/30/27 | | 66,200,000 | 55,677,820 |
| 0.5% 11/30/23 | | 16,000 | 15,463 |
| 0.5% 3/31/25 | | 63,210,000 | 57,926,039 |
| 0.5% 2/28/26 | | 93,461,000 | 83,089,005 |
| 0.5% 4/30/27 | | 10,020,000 | 8,590,976 |
| 0.5% 5/31/27 | | 35,410,000 | 30,254,802 |
| 0.5% 6/30/27 | | 35,500,000 | 30,262,363 |
| 0.5% 8/31/27 | | 8,110,000 | 6,878,927 |
| 0.5% 10/31/27 | | 9,910,000 | 8,362,337 |
| 0.625% 10/15/24 | | 48,120,000 | 44,885,058 |
| 0.625% 12/31/27 | | 41,140,000 | 34,776,156 |
| 0.75% 11/15/24 | | 31,810,000 | 29,639,216 |
| 0.75% 3/31/26 | | 14,241,000 | 12,742,914 |
| 0.75% 4/30/26 | | 64,911,000 | 57,864,607 |
| 0.75% 8/31/26 | | 76,902,000 | 67,872,023 |
| 0.875% 6/30/26 | | 35,603,000 | 31,731,174 |
| 1% 12/15/24 | | 36,690,000 | 34,246,389 |
| 1.125% 1/15/25 | | 30,305,000 | 28,296,110 |
| 1.125% 2/28/25 | | 9,000 | 8,374 |
| 1.125% 10/31/26 | | 32,134,000 | 28,624,365 |
| 1.125% 2/28/27 | | 400,000 | 354,109 |
| 1.125% 2/29/28 | | 55,610,000 | 48,002,726 |
| 1.25% 8/31/24 | | 12,300,000 | 11,626,863 |
| 1.25% 12/31/26 | | 36,690,000 | 32,715,728 |
| 1.5% 2/29/24 | | 1,590,000 | 1,534,039 |
| 1.5% 9/30/24 | | 12,190,000 | 11,547,168 |
| 1.5% 11/30/24 | | 19,345,000 | 18,245,509 |
| 1.5% 1/31/27 | | 13,004,000 | 11,686,329 |
| 1.625% 11/30/26 | | 53,920,000 | 48,915,550 |
| 1.75% 6/30/24 | | 63,654,000 | 60,936,273 |
| 1.75% 12/31/24 (f) | | 29,092,000 | 27,510,123 |
| 1.75% 3/15/25 | | 29,930,000 | 28,157,480 |
| 1.875% 8/31/24 | | 27,980,000 | 26,697,948 |
| 2% 5/31/24 | | 875,000 | 842,051 |
| 2% 11/15/26 | | 44,090,000 | 40,552,466 |
| 2.125% 3/31/24 | | 1,509,000 | 1,460,960 |
| 2.125% 11/30/24 | | 33,650,000 | 32,085,801 |
| 2.125% 5/15/25 | | 9,060,000 | 8,570,194 |
| 2.25% 1/31/24 | | 7,000 | 6,820 |
| 2.25% 3/31/24 | | 820,000 | 794,952 |
| 2.5% 3/31/27 | | 25,440,000 | 23,726,775 |
| 2.625% 5/31/27 | | 9,720,000 | 9,096,173 |
| 2.75% 4/30/27 | | 39,950,000 | 37,601,377 |
| 2.75% 7/31/27 | | 70,600,000 | 66,325,390 |
| 3% 6/30/24 | | 5,490,000 | 5,341,598 |
TOTAL U.S. TREASURY OBLIGATIONS | | | 1,474,842,626 |
| TOTAL U.S. GOVERNMENT AND GOVERNMENT AGENCY OBLIGATIONS (Cost $1,578,844,523) | | | 1,521,553,229 |
| | | | |
| Foreign Government and Government Agency Obligations - 1.1% |
| | | Principal Amount (a) | Value ($) |
| Alberta Province 1% 5/20/25 | | 2,100,000 | 1,927,317 |
| British Columbia Province 2.25% 6/2/26 | | 800,000 | 742,056 |
| Chilean Republic: | | | |
| 2.75% 1/31/27 | | 760,000 | 695,543 |
| 3.125% 3/27/25 | | 320,000 | 309,360 |
| Export Development Canada: | | | |
| 2.625% 2/21/24 | | 200,000 | 194,770 |
| 2.75% 3/15/23 | | 150,000 | 149,882 |
| Hungarian Republic 5.75% 11/22/23 | | 20,000 | 19,991 |
| Italian Republic: | | | |
| 1.25% 2/17/26 | | 910,000 | 796,373 |
| 2.375% 10/17/24 | | 860,000 | 812,419 |
| 6.875% 9/27/23 | | 770,000 | 773,868 |
| Korean Republic: | | | |
| 3.875% 9/11/23 | | 1,000,000 | 993,300 |
| 5.625% 11/3/25 | | 120,000 | 120,817 |
| Manitoba Province 2.6% 4/16/24 | | 720,000 | 699,125 |
| Ontario Province: | | | |
| 0.625% 1/21/26 | | 900,000 | 800,938 |
| 2.5% 4/27/26 | | 3,690,000 | 3,447,530 |
| Panamanian Republic 3.75% 3/16/25 | | 2,100,000 | 2,026,894 |
| Peruvian Republic: | | | |
| 2.392% 1/23/26 | | 880,000 | 817,465 |
| 7.35% 7/21/25 | | 590,000 | 620,533 |
| Philippine Republic: | | | |
| 4.2% 1/21/24 | | 1,300,000 | 1,287,143 |
| 5.17% 10/13/27 | | 1,000,000 | 1,008,860 |
| 10.625% 3/16/25 | | 540,000 | 600,134 |
| Polish Government: | | | |
| 3.25% 4/6/26 | | 1,850,000 | 1,752,644 |
| 4% 1/22/24 | | 730,000 | 719,871 |
| Quebec Province: | | | |
| 2.5% 4/9/24 | | 690,000 | 670,056 |
| 2.5% 4/20/26 | | 1,250,000 | 1,170,963 |
| 2.75% 4/12/27 | | 1,000,000 | 932,480 |
| United Mexican States: | | | |
| 4.125% 1/21/26 | | 750,000 | 730,875 |
| 5.4% 2/9/28 | | 200,000 | 200,100 |
| TOTAL FOREIGN GOVERNMENT AND GOVERNMENT AGENCY OBLIGATIONS (Cost $26,412,570) | | | 25,021,307 |
| | | | |
| Supranational Obligations - 2.2% |
| | | Principal Amount (a) | Value ($) |
| African Development Bank: | | | |
| 0.875% 7/22/26 | | 1,200,000 | 1,060,147 |
| 3% 9/20/23 | | 240,000 | 237,055 |
| Asian Development Bank: | | | |
| 0.375% 9/3/25 | | 3,275,000 | 2,940,256 |
| 0.5% 2/4/26 | | 9,620,000 | 8,546,254 |
| 1.5% 10/18/24 | | 300,000 | 283,453 |
| 2.625% 1/30/24 | | 650,000 | 633,977 |
| Asian Infrastructure Investment Bank 0.5% 10/30/24 | | 3,000,000 | 2,781,977 |
| Corporacion Andina de Fomento: | | | |
| 1.625% 9/23/25 | | 1,000,000 | 909,310 |
| 3.75% 11/23/23 | | 190,000 | 187,302 |
| Council of Europe Development Bank 1.375% 2/27/25 | | 910,000 | 849,640 |
| European Investment Bank: | | | |
| 2.25% 6/24/24 | | 8,478,000 | 8,169,068 |
| 2.5% 10/15/24 | | 2,050,000 | 1,972,654 |
| 3.125% 12/14/23 | | 530,000 | 521,583 |
| Inter-American Development Bank: | | | |
| 0.625% 7/15/25 | | 750,000 | 682,093 |
| 0.875% 4/20/26 | | 3,000,000 | 2,677,772 |
| 1.5% 1/13/27 | | 3,500,000 | 3,138,203 |
| 2.625% 1/16/24 | | 400,000 | 390,896 |
| 4% 1/12/28 | | 1,900,000 | 1,873,690 |
| International Bank for Reconstruction & Development: | | | |
| 0.375% 7/28/25 | | 3,000,000 | 2,708,844 |
| 0.5% 10/28/25 | | 3,881,000 | 3,484,037 |
| 1.5% 8/28/24 | | 850,000 | 806,324 |
| 1.625% 1/15/25 | | 3,187,000 | 3,002,411 |
| 2.25% 3/28/24 | | 1,000,000 | 968,722 |
| 2.5% 3/19/24 | | 250,000 | 242,835 |
| 3% 9/27/23 | | 490,000 | 483,776 |
| International Finance Corp.: | | | |
| 0.375% 7/16/25 | | 490,000 | 443,386 |
| 1.375% 10/16/24 | | 1,706,000 | 1,607,839 |
| 2.875% 7/31/23 | | 300,000 | 297,201 |
| TOTAL SUPRANATIONAL OBLIGATIONS (Cost $55,732,577) | | | 51,900,705 |
| | | | |
| Bank Notes - 0.2% |
| | | Principal Amount (a) | Value ($) |
| Citizens Bank NA 2.25% 4/28/25 | | 945,000 | 883,297 |
| Fifth Third Bank, Cincinnati 3.85% 3/15/26 | | 420,000 | 397,442 |
| KeyBank NA 5.85% 11/15/27 | | 330,000 | 337,756 |
| PNC Bank NA 4.2% 11/1/25 | | 560,000 | 544,432 |
| Truist Bank: | | | |
| 2.636% 9/17/29 (c) | | 1,270,000 | 1,196,574 |
| 3.689% 8/2/24 (c) | | 1,510,000 | 1,498,131 |
| TOTAL BANK NOTES (Cost $5,128,399) | | | 4,857,632 |
| | | | |
| Money Market Funds - 1.3% |
| | | Shares | Value ($) |
| Fidelity Cash Central Fund 4.63% (g) | | 4,067,646 | 4,068,459 |
| Fidelity Securities Lending Cash Central Fund 4.63% (g)(h) | | 26,723,686 | 26,726,359 |
| TOTAL MONEY MARKET FUNDS (Cost $30,794,818) | | | 30,794,818 |
| | | | |
| TOTAL INVESTMENT IN SECURITIES - 101.4% (Cost $2,476,716,601) | 2,367,122,358 |
NET OTHER ASSETS (LIABILITIES) - (1.4)% | (31,991,572) |
| NET ASSETS - 100.0% | 2,335,130,786 |
| | |
Legend
| (a) | Amount is stated in United States dollars unless otherwise noted. |
| (b) | Security exempt from registration under Rule 144A of the Securities Act of 1933. These securities may be resold in transactions exempt from registration, normally to qualified institutional buyers. At the end of the period, the value of these securities amounted to $5,065,968 or 0.2% of net assets. |
| (c) | Coupon rates for floating and adjustable rate securities reflect the rates in effect at period end. |
| (d) | Coupon is indexed to a floating interest rate which may be multiplied by a specified factor and/or subject to caps or floors. |
| (e) | Security or a portion of the security purchased on a delayed delivery or when-issued basis. |
| (f) | Security or a portion of the security is on loan at period end. |
| (g) | Affiliated fund that is generally available only to investment companies and other accounts managed by Fidelity Investments. The rate quoted is the annualized seven-day yield of the fund at period end. A complete unaudited listing of the fund's holdings as of its most recent quarter end is available upon request. In addition, each Fidelity Central Fund's financial statements are available on the SEC's website or upon request. |
| (h) | Investment made with cash collateral received from securities on loan. |
Affiliated Central Funds
Fiscal year to date information regarding the Fund's investments in Fidelity Central Funds, including the ownership percentage, is presented below.
| Affiliate | Value, beginning of period ($) | Purchases ($) | Sales Proceeds ($) | Dividend Income ($) | Realized Gain (loss) ($) | Change in Unrealized appreciation (depreciation) ($) | Value, end of period ($) | % ownership, end of period |
| Fidelity Cash Central Fund 4.63% | 24,537,356 | 299,398,184 | 319,867,081 | 117,631 | - | - | 4,068,459 | 0.0% |
| Fidelity Securities Lending Cash Central Fund 4.63% | 7,932,225 | 44,225,146 | 25,431,012 | 1,182 | - | - | 26,726,359 | 0.1% |
| Total | 32,469,581 | 343,623,330 | 345,298,093 | 118,813 | - | - | 30,794,818 | |
| | | | | | | | | |
Amounts in the dividend income column in the above table include any capital gain distributions from underlying funds, which are presented in the corresponding line item in the Statement of Operations, if applicable.
Amount for Fidelity Securities Lending Cash Central Fund represents the income earned on investing cash collateral, less rebates paid to borrowers and any lending agent fees associated with the loan, plus any premium payments received for lending certain types of securities.
Amounts included in the purchases and sales proceeds columns may include in-kind transactions, if applicable.
Investment Valuation
The following is a summary of the inputs used, as of February 28, 2023, involving the Fund's assets and liabilities carried at fair value. The inputs or methodology used for valuing securities may not be an indication of the risk associated with investing in those securities. For more information on valuation inputs, and their aggregation into the levels used below, please refer to the Investment Valuation section in the accompanying Notes to Financial Statements.
| Valuation Inputs at Reporting Date: |
| Description | Total ($) | Level 1 ($) | Level 2 ($) | Level 3 ($) |
Investments in Securities: | | | | |
|
| Corporate Bonds | 732,994,667 | - | 732,994,667 | - |
|
| U.S. Government and Government Agency Obligations | 1,521,553,229 | - | 1,521,553,229 | - |
|
| Foreign Government and Government Agency Obligations | 25,021,307 | - | 25,021,307 | - |
|
| Supranational Obligations | 51,900,705 | - | 51,900,705 | - |
|
| Bank Notes | 4,857,632 | - | 4,857,632 | - |
|
| Money Market Funds | 30,794,818 | 30,794,818 | - | - |
| Total Investments in Securities: | 2,367,122,358 | 30,794,818 | 2,336,327,540 | - |
| Statement of Assets and Liabilities |
| | | | February 28, 2023 (Unaudited) |
| | | | | |
| Assets | | | | |
| Investment in securities, at value (including securities loaned of $26,128,147) - See accompanying schedule: | | | | |
Unaffiliated issuers (cost $2,445,921,783) | $ | 2,336,327,540 | | |
Fidelity Central Funds (cost $30,794,818) | | 30,794,818 | | |
| | | | | |
| | | | | |
| Total Investment in Securities (cost $2,476,716,601) | | | $ | 2,367,122,358 |
| Cash | | | | 209,112 |
| Receivable for investments sold | | | | 53,088,672 |
| Receivable for fund shares sold | | | | 3,438,466 |
| Interest receivable | | | | 11,039,945 |
| Distributions receivable from Fidelity Central Funds | | | | 18,374 |
| Other receivables | | | | 445 |
Total assets | | | | 2,434,917,372 |
| Liabilities | | | | |
| Payable for investments purchased | | | | |
Regular delivery | $ | 68,782,530 | | |
Delayed delivery | | 998,260 | | |
| Payable for fund shares redeemed | | 2,579,810 | | |
| Distributions payable | | 641,186 | | |
| Accrued management fee | | 58,441 | | |
| Collateral on securities loaned | | 26,726,359 | | |
| Total Liabilities | | | | 99,786,586 |
| Net Assets | | | $ | 2,335,130,786 |
| Net Assets consist of: | | | | |
| Paid in capital | | | $ | 2,515,347,622 |
| Total accumulated earnings (loss) | | | | (180,216,836) |
| Net Assets | | | $ | 2,335,130,786 |
Net Asset Value , offering price and redemption price per share ($2,335,130,786 ÷ 247,049,450 shares) | | | $ | 9.45 |
| Statement of Operations |
| | | | Six months ended February 28, 2023 (Unaudited) |
| Investment Income | | | | |
| Interest | | | $ | 26,899,608 |
| Income from Fidelity Central Funds (including $1,182 from security lending) | | | | 118,813 |
| Total Income | | | | 27,018,421 |
| Expenses | | | | |
| Management fee | $ | 340,674 | | |
| Independent trustees' fees and expenses | | 4,364 | | |
| Total expenses before reductions | | 345,038 | | |
| Expense reductions | | (1,122) | | |
| Total expenses after reductions | | | | 343,916 |
| Net Investment income (loss) | | | | 26,674,505 |
| Realized and Unrealized Gain (Loss) | | | | |
| Net realized gain (loss) on: | | | | |
| Investment Securities: | | | | |
| Unaffiliated issuers | | (51,293,218) | | |
| Total net realized gain (loss) | | | | (51,293,218) |
| Change in net unrealized appreciation (depreciation) on investment securities | | | | 8,427,657 |
| Net gain (loss) | | | | (42,865,561) |
| Net increase (decrease) in net assets resulting from operations | | | $ | (16,191,056) |
| Statement of Changes in Net Assets |
| |
| | Six months ended February 28, 2023 (Unaudited) | | Year ended August 31, 2022 |
| Increase (Decrease) in Net Assets | | | | |
| Operations | | | | |
| Net investment income (loss) | $ | 26,674,505 | $ | 25,039,092 |
| Net realized gain (loss) | | (51,293,218) | | (35,873,613) |
| Change in net unrealized appreciation (depreciation) | | 8,427,657 | | (128,098,793) |
| Net increase (decrease) in net assets resulting from operations | | (16,191,056) | | (138,933,314) |
| Distributions to shareholders | | (15,865,016) | | (23,456,255) |
| Share transactions | | | | |
| Proceeds from sales of shares | | 474,633,936 | | 1,348,248,841 |
| Reinvestment of distributions | | 12,284,645 | | 18,585,265 |
| Cost of shares redeemed | | (430,609,594) | | (942,969,160) |
Net increase (decrease) in net assets resulting from share transactions | | 56,308,987 | | 423,864,946 |
| Total increase (decrease) in net assets | | 24,252,915 | | 261,475,377 |
| | | | | |
| Net Assets | | | | |
| Beginning of period | | 2,310,877,871 | | 2,049,402,494 |
| End of period | $ | 2,335,130,786 | $ | 2,310,877,871 |
| | | | | |
| Other Information | | | | |
| Shares | | | | |
| Sold | | 50,052,004 | | 135,215,014 |
| Issued in reinvestment of distributions | | 1,298,793 | | 1,875,139 |
| Redeemed | | (45,511,682) | | (95,204,564) |
| Net increase (decrease) | | 5,839,115 | | 41,885,589 |
| | | | | |
Financial Highlights
| Fidelity® Short-Term Bond Index Fund |
| |
| | Six months ended (Unaudited) February 28, 2023 | | Years ended August 31, 2022 | | 2021 | | 2020 | | 2019 | | 2018 A |
Selected Per-Share Data | | | | | | | | | | | | |
| Net asset value, beginning of period | $ | 9.58 | $ | 10.28 | $ | 10.40 | $ | 10.15 | $ | 9.81 | $ | 10.00 |
| Income from Investment Operations | | | | | | | | | | | | |
Net investment income (loss) B,C | | .111 | | .109 | | .090 | | .184 | | .261 | | .201 |
| Net realized and unrealized gain (loss) | | (.175) | | (.706) | | (.071) | | .278 | | .318 | | (.233) |
| Total from investment operations | | (.064) | | (.597) | | .019 | | .462 | | .579 | | (.032) |
| Distributions from net investment income | | (.066) | | (.085) | | (.090) | | (.186) | | (.239) | | (.158) |
| Distributions from net realized gain | | - | | (.018) | | (.049) | | (.026) | | - | | - |
| Total distributions | | (.066) | | (.103) | | (.139) | | (.212) | | (.239) | | (.158) |
| Net asset value, end of period | $ | 9.45 | $ | 9.58 | $ | 10.28 | $ | 10.40 | $ | 10.15 | $ | 9.81 |
Total Return D,E | | (.66)% | | (5.84)% | | .19% | | 4.61% | | 5.98% | | (.31)% |
Ratios to Average Net Assets C,F,G | | | | | | | | | | | | |
| Expenses before reductions | | .03% H | | .03% | | .03% | | .03% | | .03% | | .03% H |
| Expenses net of fee waivers, if any | | .03% H | | .03% | | .03% | | .03% | | .03% | | .03% H |
| Expenses net of all reductions | | .03% H | | .03% | | .03% | | .03% | | .03% | | .03% H |
| Net investment income (loss) | | 2.37% H | | 1.10% | | .87% | | 1.80% | | 2.66% | | 2.36% H |
| Supplemental Data | | | | | | | | | | | | |
| Net assets, end of period (000 omitted) | $ | 2,335,131 | $ | 2,310,878 | $ | 2,049,402 | $ | 1,186,764 | $ | 492,347 | $ | 3,751 |
Portfolio turnover rate I | | 87% H | | 92% | | 44% | | 62% | | 83% | | 102% H |
A For the period October 18, 2017 (commencement of operations) through August 31, 2018.
B Calculated based on average shares outstanding during the period.
C Net investment income (loss) is affected by the timing of the declaration of dividends by any underlying mutual funds or exchange-traded funds (ETFs). Net investment income (loss) of any mutual funds or ETFs is not included in the Fund's net investment income (loss) ratio.
D Total returns for periods of less than one year are not annualized.
E Total returns would have been lower if certain expenses had not been reduced during the applicable periods shown.
F Fees and expenses of any underlying mutual funds or exchange-traded funds (ETFs) are not included in the Fund's expense ratio. The Fund indirectly bears its proportionate share of these expenses. For additional expense information related to investments in Fidelity Central Funds, please refer to the "Investments in Fidelity Central Funds" note found in the Notes to Financial Statements section of the most recent Annual or Semi-Annual report.
G Expense ratios reflect operating expenses of the class. Expenses before reductions do not reflect amounts reimbursed, waived, or reduced through arrangements with the investment adviser, brokerage services, or other offset arrangements, if applicable, and do not represent the amount paid by the class during periods when reimbursements, waivers or reductions occur.
H Annualized.
I Amount does not include the portfolio activity of any underlying mutual funds or exchange-traded funds (ETFs).
For the period ended February 28, 2023
1. Organization.
Fidelity Short-Term Bond Index Fund (the Fund) is a fund of Fidelity Salem Street Trust (the Trust) and is authorized to issue an unlimited number of shares. Share transactions on the Statement of Changes in Net Assets may contain exchanges between affiliated funds. The Trust is registered under the Investment Company Act of 1940, as amended (the 1940 Act), as an open-end management investment company organized as a Massachusetts business trust.
2. Investments in Fidelity Central Funds.
Funds may invest in Fidelity Central Funds, which are open-end investment companies generally available only to other investment companies and accounts managed by the investment adviser and its affiliates. The Schedule of Investments lists any Fidelity Central Funds held as an investment as of period end, but does not include the underlying holdings of each Fidelity Central Fund. An investing fund indirectly bears its proportionate share of the expenses of the underlying Fidelity Central Funds.
Based on its investment objective, each Fidelity Central Fund may invest or participate in various investment vehicles or strategies that are similar to those of the investing fund. These strategies are consistent with the investment objectives of the investing fund and may involve certain economic risks which may cause a decline in value of each of the Fidelity Central Funds and thus a decline in the value of the investing fund.
| Fidelity Central Fund | Investment Manager | Investment Objective | Investment Practices | Expense Ratio A |
| Fidelity Money Market Central Funds | Fidelity Management & Research Company LLC (FMR) | Each fund seeks to obtain a high level of current income consistent with the preservation of capital and liquidity. | Short-term Investments | Less than .005% |
A Expenses expressed as a percentage of average net assets and are as of each underlying Central Fund's most recent annual or semi-annual shareholder report.
A complete unaudited list of holdings for each Fidelity Central Fund is available upon request or at the Securities and Exchange Commission website at www.sec.gov. In addition, the financial statements of the Fidelity Central Funds which contain the significant accounting policies (including investment valuation policies) of those funds, and are not covered by the Report of Independent Registered Public Accounting Firm, are available on the Securities and Exchange Commission website or upon request.
3. Significant Accounting Policies.
The Fund is an investment company and applies the accounting and reporting guidance of the Financial Accounting Standards Board (FASB) Accounting Standards Codification Topic 946 Financial Services - Investment Companies . The financial statements have been prepared in conformity with accounting principles generally accepted in the United States of America (GAAP), which require management to make certain estimates and assumptions at the date of the financial statements. Actual results could differ from those estimates. Subsequent events, if any, through the date that the financial statements were issued have been evaluated in the preparation of the financial statements. The Fund's Schedule of Investments lists any underlying mutual funds or exchange-traded funds (ETFs) but does not include the underlying holdings of these funds. The following summarizes the significant accounting policies of the Fund:
Investment Valuation. Investments are valued as of 4:00 p.m. Eastern time on the last calendar day of the period. The Board of Trustees (the Board) has designated the Fund's investment adviser as the valuation designee responsible for the fair valuation function and performing fair value determinations as needed. The investment adviser has established a Fair Value Committee (the Committee) to carry out the day-to-day fair valuation responsibilities and has adopted policies and procedures to govern the fair valuation process and the activities of the Committee. In accordance with these fair valuation policies and procedures, which have been approved by the Board, the Fund attempts to obtain prices from one or more third party pricing services or brokers to value its investments. When current market prices, quotations or currency exchange rates are not readily available or reliable, investments will be fair valued in good faith by the Committee, in accordance with the policies and procedures. Factors used in determining fair value vary by investment type and may include market or investment specific events, transaction data, estimated cash flows, and market observations of comparable investments. The frequency that the fair valuation procedures are used cannot be predicted and they may be utilized to a significant extent. The Committee manages the Fund's fair valuation practices and maintains the fair valuation policies and procedures. The Fund's investment adviser reports to the Board information regarding the fair valuation process and related material matters.
The Fund categorizes the inputs to valuation techniques used to value its investments into a disclosure hierarchy consisting of three levels as shown below:
Level 1 - unadjusted quoted prices in active markets for identical investments
Level 2 - other significant observable inputs (including quoted prices for similar investments, interest rates, prepayment speeds, etc.)
Level 3 - unobservable inputs (including the Fund's own assumptions based on the best information available)
Valuation techniques used to value the Fund's investments by major category are as follows:
Debt securities, including restricted securities, are valued based on evaluated prices received from third party pricing services or from brokers who make markets in such securities. Corporate bonds, bank notes, foreign government and government agency obligations, supranational obligations and U.S. government and government agency obligations are valued by pricing services who utilize matrix pricing which considers yield or price of bonds of comparable quality, coupon, maturity and type or by broker-supplied prices. When independent prices are unavailable or unreliable, debt securities may be valued utilizing pricing methodologies which consider similar factors that would be used by third party pricing services. Debt securities are generally categorized as Level 2 in the hierarchy but may be Level 3 depending on the circumstances.
Investments in open-end mutual funds, including the Fidelity Central Funds, are valued at their closing net asset value (NAV) each business day and are categorized as Level 1 in the hierarchy.
Changes in valuation techniques may result in transfers in or out of an assigned level within the disclosure hierarchy. The aggregate value of investments by input level as of February 28, 2023 is included at the end of the Fund's Schedule of Investments.
Investment Transactions and Income. For financial reporting purposes, the Fund's investment holdings and NAV include trades executed through the end of the last business day of the period. The NAV per share for processing shareholder transactions is calculated as of the close of business of the New York Stock Exchange (NYSE), normally 4:00 p.m. Eastern time and includes trades executed through the end of the prior business day. Gains and losses on securities sold are determined on the basis of identified cost. Income and capital gain distributions from Fidelity Central Funds, if any, are recorded on the ex-dividend date. Interest income is accrued as earned and includes coupon interest and amortization of premium and accretion of discount on debt securities as applicable. Debt obligations may be placed on non-accrual status and related interest income may be reduced by ceasing current accruals and writing off interest receivables when the collection of all or a portion of interest has become doubtful based on consistently applied procedures. A debt obligation is removed from non-accrual status when the issuer resumes interest payments or when collectability of interest is reasonably assured.
Expenses. Expenses directly attributable to a fund are charged to that fund. Expenses attributable to more than one fund are allocated among the respective funds on the basis of relative net assets or other appropriate methods. Expenses included in the accompanying financial statements reflect the expenses of that fund and do not include any expenses associated with any underlying mutual funds or exchange-traded funds. Although not included in a fund's expenses, a fund indirectly bears its proportionate share of these expenses through the net asset value of each underlying mutual fund or exchange-traded fund. Expense estimates are accrued in the period to which they relate and adjustments are made when actual amounts are known.
Income Tax Information and Distributions to Shareholders. Each year, the Fund intends to qualify as a regulated investment company under Subchapter M of the Internal Revenue Code, including distributing substantially all of its taxable income and realized gains. As a result, no provision for U.S. Federal income taxes is required. The Fund files a U.S. federal tax return, in addition to state and local tax returns as required. The Fund's federal income tax returns are subject to examination by the Internal Revenue Service (IRS) for a period of three fiscal years after they are filed. State and local tax returns may be subject to examination for an additional fiscal year depending on the jurisdiction.
Distributions are declared and recorded daily and paid monthly from net investment income. Distributions from realized gains, if any, are declared and recorded on the ex-dividend date. Income and capital gain distributions are determined in accordance with income tax regulations, which may differ from GAAP.
Capital accounts within the financial statements are adjusted for permanent book-tax differences. These adjustments have no impact on net assets or the results of operations. Capital accounts are not adjusted for temporary book-tax differences which will reverse in a subsequent period.
Book-tax differences are primarily due to market discount and losses deferred due to wash sales and excise tax regulations.
As of period end, the cost and unrealized appreciation (depreciation) in securities, and derivatives if applicable, for federal income tax purposes were as follows:
| Gross unrealized appreciation | $1,422,782 |
| Gross unrealized depreciation | (101,481,170) |
| Net unrealized appreciation (depreciation) | $(100,058,388) |
| Tax cost | $2,467,180,746 |
The Fund elected to defer to its next fiscal year approximately $33,706,600 of capital losses recognized during the period November 1, 2021 to August 31, 2022.
Delayed Delivery Transactions and When-Issued Securities. During the period, certain Funds transacted in securities on a delayed delivery or when-issued basis. Payment and delivery may take place after the customary settlement period for that security. The price of the underlying securities and the date when the securities will be delivered and paid for are fixed at the time the transaction is negotiated. Securities purchased on a delayed delivery or when-issued basis are identified as such in the Schedule of Investments. Compensation for interest forgone in the purchase of a delayed delivery or when-issued debt security may be received. With respect to purchase commitments, each applicable Fund identifies securities as segregated in its records with a value at least equal to the amount of the commitment. Payables and receivables associated with the purchases and sales of delayed delivery securities having the same coupon, settlement date and broker are offset. Delayed delivery or when-issued securities that have been purchased from and sold to different brokers are reflected as both payables and receivables in the Statement of Assets and Liabilities under the caption "Delayed delivery", as applicable. Losses may arise due to changes in the value of the underlying securities or if the counterparty does not perform under the contract's terms, or if the issuer does not issue the securities due to political, economic, or other factors.
Restricted Securities (including Private Placements). Funds may invest in securities that are subject to legal or contractual restrictions on resale. These securities generally may be resold in transactions exempt from registration or to the public if the securities are registered. Disposal of these securities may involve time-consuming negotiations and expense, and prompt sale at an acceptable price may be difficult. Information regarding restricted securities held at period end is included at the end of the Schedule of Investments, if applicable.
4. Purchases and Sales of Investments.
Purchases and sales of securities, other than short-term securities, U.S. government securities and in-kind transactions, as applicable, are noted in the table below.
| | Purchases ($) | Sales ($) |
| Fidelity Short-Term Bond Index Fund | 137,776,272 | 90,299,864 |
5. Fees and Other Transactions with Affiliates.
Management Fee. Fidelity Management & Research Company LLC (the investment adviser) and its affiliates provide the Fund with investment management related services for which the Fund pays a monthly management fee. The management fee is based on an annual rate of .03% of the Fund's average net assets. Under the management contract, the investment adviser pays all other operating expenses, except the compensation of the independent Trustees and certain miscellaneous expenses such as proxy and shareholder meeting expenses.
Interfund Trades. Funds may purchase from or sell securities to other Fidelity Funds under procedures adopted by the Board. The procedures have been designed to ensure these interfund trades are executed in accordance with Rule 17a-7 of the 1940 Act. Any interfund trades are included within the respective purchases and sales amounts shown in the Purchases and Sales of Investments note. During the period, there were no interfund trades.
6. Committed Line of Credit.
Certain Funds participate with other funds managed by the investment adviser or an affiliate in a $4.25 billion credit facility (the "line of credit") to be utilized for temporary or emergency purposes to fund shareholder redemptions or for other short-term liquidity purposes. The commitment fees on the pro-rata portion of the line of credit are borne by the investment adviser. During the period, there were no borrowings on this line of credit.
7. Security Lending.
Funds lend portfolio securities from time to time in order to earn additional income. Lending agents are used, including National Financial Services (NFS), an affiliate of the investment adviser. Pursuant to a securities lending agreement, NFS will receive a fee, which is capped at 9.9% of a fund's daily lending revenue, for its services as lending agent. A fund may lend securities to certain qualified borrowers, including NFS. On the settlement date of the loan, a fund receives collateral (in the form of U.S. Treasury obligations, letters of credit and/or cash) against the loaned securities and maintains collateral in an amount not less than 100% of the market value of the loaned securities during the period of the loan. The market value of the loaned securities is determined at the close of business of a fund and any additional required collateral is delivered to a fund on the next business day. A fund or borrower may terminate the loan at any time, and if the borrower defaults on its obligation to return the securities loaned because of insolvency or other reasons, a fund may apply collateral received from the borrower against the obligation. A fund may experience delays and costs in recovering the securities loaned. Any cash collateral received is invested in the Fidelity Securities Lending Cash Central Fund. Any loaned securities are identified as such in the Schedule of Investments, and the value of loaned securities and cash collateral at period end, as applicable, are presented in the Statement of Assets and Liabilities. Security lending income represents the income earned on investing cash collateral, less rebates paid to borrowers and any lending agent fees associated with the loan, plus any premium payments received for lending certain types of securities. Security lending income is presented in the Statement of Operations as a component of income from Fidelity Central Funds. Affiliated security lending activity, if any, was as follows:
| | Total Security Lending Fees Paid to NFS | Security Lending Income From Securities Loaned to NFS | Value of Securities Loaned to NFS at Period End |
| Fidelity Short-Term Bond Index Fund | $138 | $- | $- |
8. Expense Reductions.
Through arrangements with the Fund's custodian, credits realized as a result of certain uninvested cash balances were used to reduce the Fund's expenses by $1,122.
9. Other.
A fund's organizational documents provide former and current trustees and officers with a limited indemnification against liabilities arising in connection with the performance of their duties to the fund. In the normal course of business, a fund may also enter into contracts that provide general indemnifications. A fund's maximum exposure under these arrangements is unknown as this would be dependent on future claims that may be made against a fund. The risk of material loss from such claims is considered remote.
10. Risk and Uncertainties.
Many factors affect a fund's performance. Developments that disrupt global economies and financial markets, such as pandemics, epidemics, outbreaks of infectious diseases, war, terrorism, and environmental disasters, may significantly affect a fund's investment performance. The effects of these developments to a fund will be impacted by the types of securities in which a fund invests, the financial condition, industry, economic sector, and geographic location of an issuer, and a fund's level of investment in the securities of that issuer. Significant concentrations in security types, issuers, industries, sectors, and geographic locations may magnify the factors that affect a fund's performance.
As a shareholder, you incur two types of costs: (1) transaction costs, which may include sales charges (loads) on purchase payments or redemption proceeds, as applicable and (2) ongoing costs, which generally include management fees, distribution and/or service (12b-1) fees and other Fund expenses. This Example is intended to help you understand your ongoing costs (in dollars) of investing in a fund and to compare these costs with the ongoing costs of investing in other mutual funds.
| The Example is based on an investment of $1,000 invested at the beginning of the period and held for the entire period (September 1, 2022 to February 28, 2023). |
Actual Expenses
The first line of the accompanying table provides information about actual account values and actual expenses. You may use the information in this line, together with the amount you invested, to estimate the expenses that you paid over the period. Simply divide your account value by $1,000.00 (for example, an $8,600 account value divided by $1,000.00 = 8.6), then multiply the result by the number in the first line for a class/Fund under the heading entitled "Expenses Paid During Period" to estimate the expenses you paid on your account during this period. If any fund is a shareholder of any underlying mutual funds or exchange-traded funds (ETFs) (the Underlying Funds), such fund indirectly bears its proportional share of the expenses of the Underlying Funds in addition to the direct expenses incurred presented in the table. These fees and expenses are not included in the annualized expense ratio used to calculate the expense estimate in the table below.
Hypothetical Example for Comparison Purposes
The second line of the accompanying table provides information about hypothetical account values and hypothetical expenses based on the actual expense ratio and an assumed rate of return of 5% per year before expenses, which is not the actual return. The hypothetical account values and expenses may not be used to estimate the actual ending account balance or expenses you paid for the period. You may use this information to compare the ongoing costs of investing in the Fund and other funds. To do so, compare this 5% hypothetical example with the 5% hypothetical examples that appear in the shareholder reports of the other funds. If any fund is a shareholder of any Underlying Funds, such fund indirectly bears its proportional share of the expenses of the Underlying Funds in addition to the direct expenses as presented in the table. These fees and expenses are not included in the annualized expense ratio used to calculate the expense estimate in the table below.
Please note that the expenses shown in the table are meant to highlight your ongoing costs only and do not reflect any transaction costs. Therefore, the second line of the table is useful in comparing ongoing costs only, and will not help you determine the relative total costs of owning different funds. In addition, if these transactional costs were included, your costs would have been higher.
| | | | | Annualized Expense Ratio- A | | Beginning Account Value September 1, 2022 | | Ending Account Value February 28, 2023 | | Expenses Paid During Period- C September 1, 2022 to February 28, 2023 |
| | | | | | | | | | |
| Fidelity® Short-Term Bond Index Fund | | | | .03% | | | | | | |
| Actual | | | | | | $ 1,000 | | $ 993.40 | | $ .15 |
Hypothetical- B | | | | | | $ 1,000 | | $ 1,024.65 | | $ .15 |
| |
A Annualized expense ratio reflects expenses net of applicable fee waivers.
B 5% return per year before expenses
C Expenses are equal to the annualized expense ratio, multiplied by the average account value over the period, multiplied by 181/ 365 (to reflect the one-half year period). The fees and expenses of any Underlying Funds are not included in each annualized expense ratio.
Board Approval of Investment Advisory Contracts and Management Fees
Fidelity Short-Term Bond Index Fund
Each year, the Board of Trustees, including the Independent Trustees (together, the Board), votes on the renewal of the management contract with Fidelity Management & Research Company LLC (FMR) and the sub-advisory agreements (together, the Advisory Contracts) for the fund. FMR and the sub-advisers are referred to herein as the Investment Advisers. The Board, assisted by the advice of fund counsel and Independent Trustees' counsel, requests and considers a broad range of information relevant to the renewal of the Advisory Contracts throughout the year.
The Board meets regularly and, at each of its meetings, covers an extensive agenda of topics and materials and considers factors that are relevant to its annual consideration of the renewal of the fund's Advisory Contracts, including the services and support provided to the fund and its shareholders. The Board has established four standing committees (Committees) - Operations, Audit, Fair Valuation, and Governance and Nominating - each composed of and chaired by Independent Trustees with varying backgrounds, to which the Board has assigned specific subject matter responsibilities in order to enhance effective decision-making by the Board. The Operations Committee, of which all the Independent Trustees are members, meets regularly throughout the year and requests, receives and considers, among other matters, information related to the annual consideration of the renewal of the fund's Advisory Contracts before making its recommendation to the Board. The Board also meets as needed to review matters specifically related to the Board's annual consideration of the renewal of the Advisory Contracts. Members of the Board may also meet from time to time with trustees of other Fidelity funds through joint ad hoc committees to discuss certain matters relevant to all of the Fidelity funds.
At its September 2022 meeting, the Board unanimously determined to renew the fund's Advisory Contracts. In reaching its determination, the Board considered all factors it believed relevant, including (i) the nature, extent, and quality of the services provided to the fund and its shareholders (including the investment performance of the fund); (ii) the competitiveness relative to peer funds of the fund's management fee and total expense ratio; (iii) the total costs of the services provided by and the profits realized by Fidelity from its relationships with the fund; and (iv) the extent to which, if any, economies of scale exist and are realized as the fund grows, and whether any economies of scale are appropriately shared with fund shareholders.
In considering whether to renew the Advisory Contracts for the fund, the Board reached a determination, with the assistance of fund counsel and Independent Trustees' counsel and through the exercise of its business judgment, that the renewal of the Advisory Contracts was in the best interests of the fund and its shareholders and that the compensation payable under the Advisory Contracts was fair and reasonable. The Board's decision to renew the Advisory Contracts was not based on any single factor, but rather was based on a comprehensive consideration of all the information provided to the Board at its meetings throughout the year. The Board, in reaching its determination to renew the Advisory Contracts, was aware that shareholders of the fund have a broad range of investment choices available to them, including a wide choice among funds offered by Fidelity's competitors, and that the fund's shareholders, who have the opportunity to review and weigh the disclosure provided by the fund in its prospectus and other public disclosures, have chosen to invest in this fund, which is part of the Fidelity family of funds.
Nature, Extent, and Quality of Services Provided. The Board considered Fidelity's staffing as it relates to the fund, including the backgrounds of investment personnel of Fidelity, and also considered the fund's investment objective, strategies, and related investment philosophy. The Independent Trustees also had discussions with senior management of Fidelity's investment operations and investment groups. The Board considered the structure of the investment personnel compensation program and whether this structure provides appropriate incentives to act in the best interests of the fund. Additionally, the Board considered the portfolio managers' investments, if any, in the funds that they manage. The Board also considered the steps Fidelity had taken to ensure the continued provision of high quality services to the Fidelity funds throughout the COVID-19 pandemic, including the expansion of staff in client facing positions to maintain service levels in periods of high volumes and volatility.
Resources Dedicated to Investment Management and Support Services. The Board reviewed the general qualifications and capabilities of Fidelity's investment staff, including its size, education, experience, and resources, as well as Fidelity's approach to recruiting, training, managing, and compensating investment personnel. The Board noted the resources devoted to Fidelity's global investment organization, and that Fidelity's analysts have extensive resources, tools and capabilities that allow them to conduct quantitative and fundamental analysis, as well as credit analysis of issuers, counterparties and guarantors. Further, the Board considered that Fidelity's investment professionals have sufficient access to global information and data so as to provide competitive investment results over time, and that those professionals also have access to sophisticated tools that permit them to assess portfolio construction and risk and performance attribution characteristics continuously, as well as to transmit new information and research conclusions rapidly around the world. Additionally, in its deliberations, the Board considered Fidelity's trading, risk management, compliance, cybersecurity, and technology and operations capabilities and resources, which are integral parts of the investment management process.
Shareholder and Administrative Services. The Board considered (i) the nature, extent, quality, and cost of advisory, administrative, and shareholder services performed by the Investment Advisers and their affiliates under the Advisory Contracts and under separate agreements covering transfer agency, pricing and bookkeeping, and securities lending services for the fund; (ii) the nature and extent of the supervision of third party service providers, principally custodians, subcustodians, and pricing vendors; and (iii) the resources devoted to, and the record of compliance with, the fund's compliance policies and procedures.
The Board noted that the growth of fund assets over time across the complex allows Fidelity to reinvest in the development of services designed to enhance the value and convenience of the Fidelity funds as investment vehicles. These services include 24-hour access to account information and market information over the Internet and through telephone representatives, investor education materials and asset allocation tools. The Board also considered that it reviews customer service metrics such as telephone response times, continuity of services on the website and metrics addressing services at Fidelity Investor Centers.
Investment in a Large Fund Family. The Board considered the benefits to shareholders of investing in a Fidelity fund, including the benefits of investing in a fund that is part of a large family of funds offering a variety of investment disciplines and providing a large variety of mutual fund investor services. The Board noted that Fidelity had taken, or had made recommendations to the Board that resulted in the Fidelity funds taking, a number of actions over the previous year that benefited particular funds, including: (i) continuing to dedicate additional resources to Fidelity's investment research process, which includes meetings with management of issuers of securities in which the funds invest; (ii) continuing efforts to enhance Fidelity's global research capabilities; (iii) launching new funds, ETFs, and share classes with innovative structures, strategies and pricing and making other enhancements to meet investor needs; (iv) broadening eligibility requirements for certain funds and share classes; (v) reducing management fees and total expenses for certain funds and classes; (vi) lowering expenses for certain existing funds and classes by implementing or lowering expense caps; (vii) rationalizing product lines and gaining increased efficiencies from fund mergers and liquidations; (viii) continuing to develop, acquire and implement systems and technology to improve services to the funds and shareholders, strengthen information security, and increase efficiency; and (ix) continuing to implement enhancements to further strengthen Fidelity's product line to increase investors' probability of success in achieving their investment goals, including their retirement income goals.
Investment Performance. The Board considered whether the fund has operated in accordance with its investment objective, as well as its record of compliance with its investment restrictions and its performance history.
The Board took into account discussions that occur at Board meetings throughout the year with representatives of the Investment Advisers about fund investment performance. In this regard the Board noted that as part of regularly scheduled fund reviews and other reports to the Board on fund performance, the Board considers annualized return information for the fund for different time periods, measured against the securities market index the fund seeks to track and an appropriate peer group of funds with similar objectives (peer group). The Board also periodically considers the fund's tracking error versus its benchmark index.
In addition to reviewing absolute and relative fund performance, the Independent Trustees periodically consider the appropriateness of fund performance metrics in evaluating the results achieved. In general, the Independent Trustees believe that an index fund's performance should be evaluated based on gross performance (before fees and expenses but after transaction costs) compared to the fund's benchmark index, over appropriate time periods, taking into account relevant factors including the following: general market conditions; the characteristics of the fund's benchmark index; the extent to which statistical sampling is employed; and fund cash flows and other factors. The Independent Trustees generally give greater weight to fund performance over longer time periods than over shorter time periods. Depending on the circumstances, the Independent Trustees may be satisfied with a fund's performance notwithstanding that it lags its benchmark index for certain periods.
The Independent Trustees recognize that shareholders evaluate performance on a net basis (after fees and expenses) over their own holding periods, for which one-, three-, and five-year periods are often used as a proxy. For this reason, the performance information reviewed by the Board also included net cumulative calendar year total return information for the fund and its benchmark index and peer group for the most recent one- and three-year period. The Independent Trustees recognize that shareholders who are not investing through a tax-advantaged retirement account also consider tax consequences in evaluating performance.
Based on its review, the Board concluded that the nature, extent, and quality of services provided to the fund under the Advisory Contracts should continue to benefit the shareholders of the fund.
Competitiveness of Management Fee and Total Expense Ratio. The Board considered the fund's management fee and total expense ratio compared to selected groups of competitive funds and classes (referred to as "mapped groups" below) for the purpose of facilitating the Trustees' competitive analysis of management fees and total expenses. Fidelity creates "mapped groups" by combining similar investment objective categories (as classified by Lipper) that have comparable investment mandates. Combining funds with similar investment objective categories aids the Board's comparison of management fees and total expense ratios by broadening the competitive group used for such comparison.
Management Fee. The Board considered two proprietary management fee comparisons for the 12-month (or shorter) periods shown in basis points (BP) in the chart below. The group of Lipper funds used by the Board for management fee comparisons is referred to below as the "Total Mapped Group" and is broader than the Lipper peer group used by the Board for performance comparisons. The Total Mapped Group comparison focuses on a fund's standing in terms of gross management fees before expense reimbursements or caps relative to the total universe of funds with comparable investment mandates, regardless of whether their management fee structures also are comparable. Funds with comparable investment mandates offer exposure to similar types of securities. Funds with comparable management fee structures have similar management fee contractual arrangements (e.g., flat rate charged for advisory services, all-inclusive fee rate, etc.). "TMG %" represents the percentage of funds in the Total Mapped Group that had management fees that were lower than the fund's. For example, a hypothetical TMG % of 20% would mean that 80% of the funds in the Total Mapped Group had higher, and 20% had lower, management fees than the fund. The fund's actual TMG %s and the number of funds in the Total Mapped Group are in the chart below. The "Asset-Sized Peer Group" (ASPG) comparison focuses on a fund's standing relative to a subset of non-Fidelity funds within the Total Mapped Group that are similar in size and management fee structure. For example, if a fund is in the first quartile of the ASPG, the fund's management fee ranks in the least expensive or lowest 25% of funds in the ASPG. The ASPG represents at least 15% of the funds in the Total Mapped Group with comparable asset size and management fee structures, subject to a minimum of 50 funds (or all funds in the Total Mapped Group if fewer than 50). Additional information, such as the ASPG quartile in which the fund's management fee rate ranked, is also included in the chart and was considered by the Board.
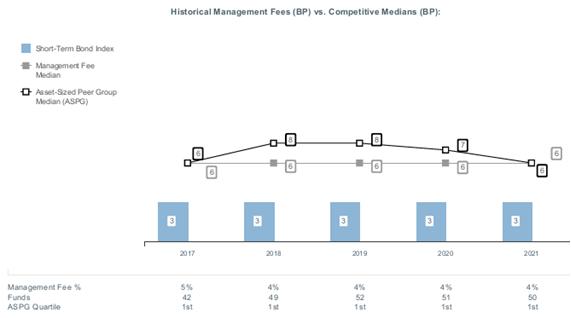
The Board noted that the fund's management fee rate ranked below the median of its Total Mapped Group and below the median of its ASPG for 2021.
Based on its review, the Board concluded that the fund's management fee is fair and reasonable in light of the services that the fund receives and the other factors considered.
Total Expense Ratio. In its review of the fund's total expense ratio, the Board considered the fund's unitary (subject to certain limited exceptions) fee rate as well as fund expenses paid by FMR under the fund's management contract, such as transfer agent fees, pricing and bookkeeping fees, and custodial, legal, and audit fees. The Board also noted that Fidelity may agree to waive fees or reimburse expenses from time to time, and the extent to which, if any, it has done so for the fund. The fund is compared to those funds and classes in the Total Mapped Group (used by the Board for management fee comparisons) that have a similar sales load structure. The Board also considered a total expense ASPG comparison, which focuses on the total expenses of the fund relative to a subset of non-Fidelity funds within the similar sales load structure group that are similar in size and management fee structure. The total expense ASPG is limited to 15 larger and 15 smaller classes of different funds, where possible. The total expense ASPG comparison excludes performance adjustments and fund-paid 12b-1 fees to eliminate variability in expenses relating to these items.
The Board noted that the fund's total net expense ratio ranked below the similar sales load structure group competitive median and below the ASPG competitive median for 2021.
Fees Charged to Other Fidelity Clients. The Board also considered Fidelity fee structures and other information with respect to clients of Fidelity, such as other funds advised or subadvised by Fidelity, pension plan clients, and other institutional clients with similar mandates. The Board noted that a joint ad hoc committee created by it and the boards of other Fidelity funds periodically reviews and compares Fidelity's institutional investment advisory business with its business of providing services to the Fidelity funds and also noted the most recent findings of the committee. The Board noted that the committee's review included a consideration of the differences in services provided, fees charged, and costs incurred, as well as competition in the markets serving the different categories of clients.
Based on its review of total expense ratios and fees charged to other Fidelity clients, the Board concluded that the fund's total expense ratio was reasonable in light of the services that the fund and its shareholders receive and the other factors considered.
Costs of the Services and Profitability. The Board considered the revenues earned and the expenses incurred by Fidelity in conducting the business of developing, marketing, distributing, managing, administering and servicing the fund and servicing the fund's shareholders. The Board also considered the level of Fidelity's profits in respect of all the Fidelity funds.
On an annual basis, Fidelity presents to the Board information about the profitability of its relationships with the fund. Fidelity calculates profitability information for each fund, as well as aggregate profitability information for groups of Fidelity funds and all Fidelity funds, using a series of detailed revenue and cost allocation methodologies which originate with the books and records of Fidelity on which Fidelity's audited financial statements are based. The Audit Committee of the Board reviews any significant changes from the prior year's methodologies and the full Board approves such changes.
A public accounting firm has been engaged annually by the Board as part of the Board's assessment of Fidelity's profitability analysis. The engagement includes the review and assessment of the methodologies used by Fidelity in determining the revenues and expenses attributable to Fidelity's mutual fund business, and completion of agreed-upon procedures in respect of the mathematical accuracy of certain fund profitability information and its conformity to established allocation methodologies. After considering the reports issued under the engagement and information provided by Fidelity, the Board concluded that while other allocation methods may also be reasonable, Fidelity's profitability methodologies are reasonable in all material respects.
The Board also reviewed Fidelity's non-fund businesses and potential indirect benefits such businesses may have received as a result of their association with Fidelity's mutual fund business (i.e., fall-out benefits) as well as cases where Fidelity's affiliates may benefit from the funds' business. The Board considered areas where potential indirect benefits to the Fidelity funds from their relationships with Fidelity may exist. The Board's consideration of these matters was informed by the findings of a joint ad hoc committee created by it and the boards of other Fidelity funds to evaluate potential fall-out benefits.
The Board considered the costs of the services provided by and the profits realized by Fidelity in connection with the operation of the fund and was satisfied that the profitability was not excessive.
Economies of Scale. The Board considered whether there have been economies of scale in respect of the management of the Fidelity funds, whether the Fidelity funds (including the fund) have appropriately benefited from any such economies of scale, and whether there is potential for realization of any further economies of scale. The Board considered the extent to which the fund will benefit from economies of scale as assets grow through increased services to the fund, through waivers or reimbursements, or through fee or expense ratio reductions. The Board recognized that, due to the fund's current contractual arrangements, its expense ratio will not decline if the fund's operating costs decrease as assets grow, or rise as assets decrease. The Board also noted that a committee (the Economies of Scale Committee) created by it and the boards of other Fidelity funds periodically analyzes whether Fidelity attains economies of scale in respect of the management and servicing of the Fidelity funds, whether the Fidelity funds have appropriately benefited from such economies of scale, and whether there is potential for realization of any further economies of scale.
The Board concluded, taking into account the analysis of the Economies of Scale Committee, that economies of scale, if any, are being appropriately shared between fund shareholders and Fidelity.
Additional Information Requested by the Board. In order to develop fully the factual basis for consideration of the Fidelity funds' advisory contracts, the Board requested and received additional information on certain topics, including: (i) Fidelity's fund profitability methodology, profitability trends for certain funds, the allocation of various costs to different funds, and the impact of certain factors on fund profitability results; (ii) portfolio manager changes that have occurred during the past year and the amount of the investment that each portfolio manager has made in the Fidelity fund(s) that he or she manages; (iii) the extent to which current market conditions have affected retention and recruitment of personnel; (iv) the arrangements with and compensation paid to certain fund sub-advisers on behalf of the Fidelity funds and the treatment of such compensation within Fidelity's fund profitability methodology; (v) the terms of the funds' various management fee structures, including the basic group fee and the terms of Fidelity's voluntary expense limitation arrangements; (vi) Fidelity's transfer agent, pricing and bookkeeping fees, expense and service structures for different funds and classes relative to competitive trends; (vii) the impact on fund profitability of recent industry trends, such as the growth in passively managed funds and the changes in flows for different types of funds; (viii) the types of management fee and total expense comparisons provided, and the challenges and limitations associated with such information; and (ix) explanations regarding the relative total expense ratios and management fees of certain funds and classes, total expense and management fee competitive trends, and methodologies for total expense and management fee competitive comparisons. In addition, the Board considered its discussions with Fidelity regarding Fidelity's efforts to maintain the continuous investment and shareholder services necessary for the funds during the current pandemic and economic circumstances.
Based on its evaluation of all of the conclusions noted above, and after considering all factors it believed relevant, the Board concluded that the advisory fee arrangements are fair and reasonable, and that the fund's Advisory Contracts should be renewed.
The Securities and Exchange Commission adopted Rule 22e-4 under the Investment Company Act of 1940 (the Liquidity Rule) to promote effective liquidity risk management throughout the open-end investment company industry, thereby reducing the risk that funds will be unable to meet their redemption obligations and mitigating dilution of the interests of fund shareholders.
The Fund has adopted and implemented a liquidity risk management program (the Program) reasonably designed to assess and manage the Fund's liquidity risk and to comply with the requirements of the Liquidity Rule. The Fund's Board of Trustees (the Board) has designated the Fund's investment adviser as administrator of the Program. The Fidelity advisers have established a Liquidity Risk Management Committee (the LRM Committee) to manage the Program for each of the Fidelity Funds. The LRM Committee monitors the adequacy and effectiveness of implementation of the Program and on a periodic basis assesses each Fund's liquidity risk based on a variety of factors including (1) the Fund's investment strategy, (2) portfolio liquidity and cash flow projections during normal and reasonably foreseeable stressed conditions, (3) shareholder redemptions, (4) borrowings and other funding sources and (5) certain factors specific to ETFs including the effect of the Fund's prices and spreads, market participants, and basket compositions on the overall liquidity of the Fund's portfolio, as applicable.
In accordance with the Program, each of the Fund's portfolio investments is classified into one of four defined liquidity categories based on a determination of a reasonable expectation for how long it would take to convert the investment to cash (or sell or dispose of the investment) without significantly changing its market value.
- Highly liquid investments - cash or convertible to cash within three business days or less
- Moderately liquid investments - convertible to cash in three to seven calendar days
- Less liquid investments - can be sold or disposed of, but not settled, within seven calendar days
- Illiquid investments - cannot be sold or disposed of within seven calendar days
Liquidity classification determinations take into account a variety of factors including various market, trading and investment-specific considerations, as well as market depth, and generally utilize analysis from a third-party liquidity metrics service.
The Liquidity Rule places a 15% limit on a fund's illiquid investments and requires funds that do not primarily hold assets that are highly liquid investments to determine and maintain a minimum percentage of the fund's net assets to be invested in highly liquid investments (highly liquid investment minimum or HLIM). The Program includes provisions reasonably designed to comply with the 15% limit on illiquid investments and for determining, periodically reviewing and complying with the HLIM requirement as applicable.
At a recent meeting of the Fund's Board of Trustees, the LRM Committee provided a written report to the Board pertaining to the operation, adequacy, and effectiveness of the Program for the period December 1, 2021 through November 30, 2022. The report concluded that the Program is operating effectively and is reasonably designed to assess and manage the Fund's liquidity risk.
1.9884850.105
SDX-I-SANN-0423
Fidelity Flex® Funds
Fidelity Flex® U.S. Bond Index Fund
Semi-Annual Report
February 28, 2023
Contents
To view a fund's proxy voting guidelines and proxy voting record for the 12-month period ended June 30, visit http://www.fidelity.com/proxyvotingresults or visit the Securities and Exchange Commission's (SEC) web site at http://www.sec.gov.
You may also call 1-800-544-3455 (for managed account clients) or 1-800-835-5092 (for retirement plan participants) to request a free copy of the proxy voting guidelines.
BLOOMBERG ® is a trademark and service mark of Bloomberg Finance L.P. and its affiliates (collectively "Bloomberg"). Bloomberg or Bloomberg's licensors own all proprietary rights in the Bloomberg Indices. Neither Bloomberg nor Bloomberg's licensors approves or endorses this material, or guarantees the accuracy or completeness of any information herein, or makes any warranty, express or implied, as to the results to be obtained therefrom and, to the maximum extent allowed by law, neither shall have any liability or responsibility for injury or damages arising in connection therewith.
Standard & Poor's, S&P and S&P 500 are registered service marks of The McGraw-Hill Companies, Inc. and have been licensed for use by Fidelity Distributors Corporation.
Other third-party marks appearing herein are the property of their respective owners.
All other marks appearing herein are registered or unregistered trademarks or service marks of FMR LLC or an affiliated company. © 2023 FMR LLC. All rights reserved.
This report and the financial statements contained herein are submitted for the general information of the shareholders of the Fund. This report is not authorized for distribution to prospective investors in the Fund unless preceded or accompanied by an effective prospectus.
A fund files its complete schedule of portfolio holdings with the SEC for the first and third quarters of each fiscal year on Form N-PORT. Forms N-PORT are available on the SEC's web site at http://www.sec.gov. A fund's Forms N-PORT may be reviewed and copied at the SEC's Public Reference Room in Washington, DC. Information regarding the operation of the SEC's Public Reference Room may be obtained by calling 1-800-SEC-0330.
For a complete list of a fund's portfolio holdings, view the most recent holdings listing, semiannual report, or annual report on Fidelity's web site at http://www.fidelity.com, http://www.institutional.fidelity.com, or http://www.401k.com, as applicable.
NOT FDIC INSURED •MAY LOSE VALUE •NO BANK GUARANTEE
Neither the Fund nor Fidelity Distributors Corporation is a bank.
Quality Diversification (% of Fund's net assets) |
|
Short-Term Investments and Net Other Assets (Liabilities) - (0.5)%* |
*Short-term investments and Net Other Assets (Liabilities) are not available in the pie chart. |
| |
| We have used ratings from Moody's Investors Service, Inc. Where Moody's® ratings are not available, we have used S&P® ratings. All ratings are as of the date indicated and do not reflect subsequent changes. |
Asset Allocation (% of Fund's net assets) |
|
Short-Term Investments and Net Other Assets (Liabilities) - (0.5)%* |
Foreign investments - 6.6% |
Short-Term Investments and Net Other Assets (Liabilities) are not available in the pie chart. |
Percentages in the above tables are adjusted for the effect of TBA Sale Commitments. |
|
Showing Percentage of Net Assets
| Nonconvertible Bonds - 25.0% |
| | | Principal Amount (a) | Value ($) |
| COMMUNICATION SERVICES - 1.9% | | | |
| Diversified Telecommunication Services - 0.7% | | | |
| AT&T, Inc.: | | | |
| 1.65% 2/1/28 | | 200,000 | 169,912 |
| 2.25% 2/1/32 | | 1,280,000 | 999,085 |
| 2.75% 6/1/31 | | 401,000 | 331,270 |
| 3.1% 2/1/43 | | 210,000 | 147,521 |
| 3.3% 2/1/52 | | 350,000 | 239,451 |
| 3.5% 6/1/41 | | 320,000 | 240,231 |
| 3.5% 9/15/53 | | 1,009,000 | 692,665 |
| 3.55% 9/15/55 | | 293,000 | 198,479 |
| 3.65% 6/1/51 | | 220,000 | 156,945 |
| 3.65% 9/15/59 | | 419,000 | 283,765 |
| 4.5% 5/15/35 | | 220,000 | 197,882 |
| 4.65% 6/1/44 | | 110,000 | 93,590 |
| 5.15% 3/15/42 | | 236,000 | 216,548 |
| 5.45% 3/1/47 | | 160,000 | 152,696 |
| Bell Canada: | | | |
| 3.2% 2/15/52 | | 100,000 | 67,443 |
| 4.464% 4/1/48 | | 130,000 | 110,627 |
| British Telecommunications PLC 9.625% 12/15/30 | | 154,000 | 186,304 |
| Deutsche Telekom International Financial BV 8.75% 6/15/30 (b) | | 210,000 | 248,893 |
| Orange SA 5.375% 1/13/42 | | 170,000 | 167,768 |
| Telefonica Emisiones S.A.U.: | | | |
| 4.103% 3/8/27 | | 300,000 | 284,233 |
| 5.213% 3/8/47 | | 160,000 | 134,496 |
| 7.045% 6/20/36 | | 100,000 | 105,604 |
| Telefonica Europe BV 8.25% 9/15/30 | | 508,000 | 575,403 |
| TELUS Corp. 4.3% 6/15/49 | | 100,000 | 83,374 |
| Verizon Communications, Inc.: | | | |
| 1.5% 9/18/30 | | 930,000 | 719,908 |
| 2.355% 3/15/32 | | 615,000 | 483,484 |
| 2.987% 10/30/56 | | 492,000 | 301,423 |
| 3.55% 3/22/51 | | 500,000 | 360,974 |
| 4.016% 12/3/29 | | 150,000 | 138,346 |
| 4.125% 3/16/27 | | 60,000 | 57,758 |
| 4.272% 1/15/36 | | 106,000 | 93,563 |
| 4.329% 9/21/28 | | 270,000 | 258,667 |
| 4.4% 11/1/34 | | 100,000 | 90,904 |
| 4.812% 3/15/39 | | 780,000 | 714,897 |
| 5.012% 4/15/49 | | 146,000 | 133,938 |
| 5.012% 8/21/54 | | 214,000 | 195,769 |
| 5.25% 3/16/37 | | 102,000 | 99,595 |
| | | | 9,733,411 |
| Entertainment - 0.1% | | | |
| Activision Blizzard, Inc. 2.5% 9/15/50 | | 100,000 | 62,355 |
| The Walt Disney Co.: | | | |
| 2% 9/1/29 | | 40,000 | 33,391 |
| 2.65% 1/13/31 | | 200,000 | 170,348 |
| 2.75% 9/1/49 | | 160,000 | 106,621 |
| 3.5% 5/13/40 | | 163,000 | 131,722 |
| 3.6% 1/13/51 | | 60,000 | 46,498 |
| 3.7% 10/15/25 | | 434,000 | 418,557 |
| 3.8% 5/13/60 | | 60,000 | 46,953 |
| 4.75% 9/15/44 | | 151,000 | 139,527 |
| 6.2% 12/15/34 | | 150,000 | 163,445 |
| | | | 1,319,417 |
| Interactive Media & Services - 0.1% | | | |
| Alphabet, Inc.: | | | |
| 0.45% 8/15/25 | | 100,000 | 90,467 |
| 1.1% 8/15/30 | | 410,000 | 323,155 |
| 2.05% 8/15/50 | | 340,000 | 205,742 |
| Baidu, Inc.: | | | |
| 3.075% 4/7/25 | | 210,000 | 198,671 |
| 4.375% 5/14/24 | | 480,000 | 471,926 |
| Meta Platforms, Inc.: | | | |
| 3.5% 8/15/27 | | 470,000 | 441,681 |
| 3.85% 8/15/32 | | 120,000 | 107,826 |
| 4.45% 8/15/52 | | 300,000 | 248,772 |
| | | | 2,088,240 |
| Media - 0.7% | | | |
| Charter Communications Operating LLC/Charter Communications Operating Capital Corp.: | | | |
| 2.8% 4/1/31 | | 100,000 | 78,371 |
| 3.5% 6/1/41 | | 280,000 | 183,213 |
| 3.75% 2/15/28 | | 150,000 | 135,171 |
| 3.85% 4/1/61 | | 300,000 | 176,684 |
| 3.95% 6/30/62 | | 100,000 | 59,974 |
| 4.4% 4/1/33 | | 140,000 | 119,745 |
| 4.4% 12/1/61 | | 120,000 | 78,182 |
| 5.125% 7/1/49 | | 200,000 | 153,824 |
| 5.375% 4/1/38 | | 110,000 | 92,026 |
| 5.375% 5/1/47 | | 100,000 | 79,665 |
| 5.5% 4/1/63 | | 110,000 | 85,502 |
| 5.75% 4/1/48 | | 250,000 | 208,785 |
| 6.484% 10/23/45 | | 100,000 | 90,475 |
| 6.834% 10/23/55 | | 140,000 | 131,671 |
| Comcast Corp.: | | | |
| 1.5% 2/15/31 | | 295,000 | 227,781 |
| 1.95% 1/15/31 | | 300,000 | 240,445 |
| 2.35% 1/15/27 | | 1,380,000 | 1,250,413 |
| 2.45% 8/15/52 | | 295,000 | 174,985 |
| 2.65% 2/1/30 | | 100,000 | 86,073 |
| 2.8% 1/15/51 | | 120,000 | 76,551 |
| 2.887% 11/1/51 | | 273,000 | 176,793 |
| 2.937% 11/1/56 | | 520,000 | 326,156 |
| 2.987% 11/1/63 | | 160,000 | 97,784 |
| 3.45% 2/1/50 | | 100,000 | 73,165 |
| 3.7% 4/15/24 | | 100,000 | 98,201 |
| 3.999% 11/1/49 | | 100,000 | 80,553 |
| 4.049% 11/1/52 | | 15,000 | 12,047 |
| 4.15% 10/15/28 | | 150,000 | 143,411 |
| 5.65% 6/15/35 | | 476,000 | 493,540 |
| 7.05% 3/15/33 | | 210,000 | 239,171 |
| Discovery Communications LLC: | | | |
| 3.625% 5/15/30 | | 200,000 | 171,151 |
| 4% 9/15/55 | | 133,000 | 86,001 |
| 4.65% 5/15/50 | | 200,000 | 146,673 |
| Fox Corp.: | | | |
| 4.709% 1/25/29 | | 70,000 | 66,842 |
| 5.476% 1/25/39 | | 164,000 | 150,712 |
| 5.576% 1/25/49 | | 56,000 | 50,987 |
| Grupo Televisa SA de CV: | | | |
| 5% 5/13/45 | | 100,000 | 86,394 |
| 6.625% 1/15/40 | | 110,000 | 113,286 |
| Magallanes, Inc.: | | | |
| 3.755% 3/15/27 (c) | | 180,000 | 165,120 |
| 4.279% 3/15/32 (c) | | 345,000 | 297,842 |
| 5.05% 3/15/42 (c) | | 330,000 | 267,345 |
| 5.141% 3/15/52 (c) | | 651,000 | 510,321 |
| Paramount Global: | | | |
| 4% 1/15/26 | | 176,000 | 168,090 |
| 4.2% 6/1/29 | | 200,000 | 179,809 |
| 4.375% 3/15/43 | | 100,000 | 69,635 |
| 4.6% 1/15/45 | | 110,000 | 79,167 |
| 4.95% 1/15/31 | | 237,000 | 212,445 |
| 5.85% 9/1/43 | | 239,000 | 200,973 |
| Time Warner Cable Enterprises 8.375% 7/15/33 | | 100,000 | 112,318 |
| Time Warner Cable LLC: | | | |
| 5.5% 9/1/41 | | 110,000 | 92,605 |
| 5.875% 11/15/40 | | 220,000 | 194,283 |
| 6.55% 5/1/37 | | 100,000 | 95,774 |
| 7.3% 7/1/38 | | 100,000 | 100,225 |
| TWDC Enterprises 18 Corp.: | | | |
| 1.85% 7/30/26 | | 470,000 | 423,387 |
| 3% 7/30/46 | | 110,000 | 77,667 |
| 3.7% 12/1/42 | | 250,000 | 201,975 |
| 4.125% 6/1/44 | | 192,000 | 165,259 |
| | | | 9,956,643 |
| Wireless Telecommunication Services - 0.3% | | | |
| America Movil S.A.B. de CV: | | | |
| 2.875% 5/7/30 | | 511,000 | 436,266 |
| 3.625% 4/22/29 | | 200,000 | 181,000 |
| 6.125% 3/30/40 | | 100,000 | 105,403 |
| Rogers Communications, Inc.: | | | |
| 2.9% 11/15/26 | | 90,000 | 82,207 |
| 4.3% 2/15/48 | | 240,000 | 184,314 |
| 4.55% 3/15/52 (c) | | 200,000 | 159,509 |
| T-Mobile U.S.A., Inc.: | | | |
| 2.05% 2/15/28 | | 200,000 | 171,651 |
| 3% 2/15/41 | | 210,000 | 146,148 |
| 3.3% 2/15/51 | | 400,000 | 268,171 |
| 3.5% 4/15/25 | | 830,000 | 795,025 |
| 3.6% 11/15/60 | | 330,000 | 219,310 |
| 4.375% 4/15/40 | | 100,000 | 84,978 |
| 5.2% 1/15/33 | | 150,000 | 146,290 |
| 5.65% 1/15/53 | | 370,000 | 362,725 |
| Vodafone Group PLC: | | | |
| 4.375% 5/30/28 | | 250,000 | 243,712 |
| 5% 5/30/38 | | 130,000 | 122,098 |
| 5.125% 6/19/59 | | 340,000 | 298,852 |
| | | | 4,007,659 |
TOTAL COMMUNICATION SERVICES | | | 27,105,370 |
| CONSUMER DISCRETIONARY - 1.5% | | | |
| Auto Components - 0.0% | | | |
| Lear Corp. 3.8% 9/15/27 | | 140,000 | 130,769 |
| Automobiles - 0.2% | | | |
| American Honda Finance Corp.: | | | |
| 1% 9/10/25 | | 240,000 | 216,630 |
| 1.2% 7/8/25 | | 400,000 | 364,654 |
| 2.15% 9/10/24 | | 120,000 | 114,485 |
| 2.9% 2/16/24 | | 100,000 | 97,604 |
| 3.55% 1/12/24 | | 428,000 | 421,435 |
| General Motors Co.: | | | |
| 4.2% 10/1/27 | | 90,000 | 85,101 |
| 5.15% 4/1/38 | | 120,000 | 103,971 |
| 5.6% 10/15/32 | | 240,000 | 228,182 |
| 5.95% 4/1/49 | | 170,000 | 152,526 |
| 6.75% 4/1/46 | | 255,000 | 251,293 |
| 6.8% 10/1/27 | | 330,000 | 344,132 |
| General Motors Financial Co., Inc.: | | | |
| 2.4% 4/10/28 | | 190,000 | 161,879 |
| 3.85% 1/5/28 | | 160,000 | 146,251 |
| 4.3% 4/6/29 | | 130,000 | 118,569 |
| 5.25% 3/1/26 | | 170,000 | 168,111 |
| 5.65% 1/17/29 | | 130,000 | 127,165 |
| Honda Motor Co. Ltd. 2.967% 3/10/32 | | 130,000 | 112,879 |
| | | | 3,214,867 |
| Diversified Consumer Services - 0.1% | | | |
| American University 3.672% 4/1/49 | | 200,000 | 158,915 |
| Duke University 2.832% 10/1/55 | | 34,000 | 23,204 |
| George Washington University 4.126% 9/15/48 | | 200,000 | 173,081 |
| Ingersoll-Rand Global Holding Co. Ltd.: | | | |
| 3.75% 8/21/28 | | 240,000 | 225,413 |
| 4.3% 2/21/48 | | 30,000 | 24,503 |
| Massachusetts Institute of Technology 2.989% 7/1/50 | | 400,000 | 297,049 |
| Northwestern University: | | | |
| 3.662% 12/1/57 | | 100,000 | 81,375 |
| 3.868% 12/1/48 | | 120,000 | 105,047 |
| University of Chicago 3% 10/1/52 | | 120,000 | 87,788 |
| University of Southern California 2.945% 10/1/51 | | 350,000 | 242,996 |
| | | | 1,419,371 |
| Hotels, Restaurants & Leisure - 0.3% | | | |
| Expedia, Inc.: | | | |
| 3.25% 2/15/30 | | 110,000 | 92,750 |
| 3.8% 2/15/28 | | 100,000 | 91,851 |
| 5% 2/15/26 | | 255,000 | 251,487 |
| Marriott International, Inc.: | | | |
| 2.75% 10/15/33 | | 100,000 | 78,132 |
| 3.125% 6/15/26 | | 320,000 | 299,205 |
| 4.625% 6/15/30 | | 123,000 | 116,091 |
| 5.75% 5/1/25 | | 110,000 | 110,853 |
| McDonald's Corp.: | | | |
| 3.3% 7/1/25 | | 280,000 | 269,209 |
| 3.6% 7/1/30 | | 810,000 | 738,939 |
| 3.625% 9/1/49 | | 30,000 | 22,567 |
| 4.45% 3/1/47 | | 153,000 | 132,114 |
| 4.45% 9/1/48 | | 44,000 | 38,335 |
| 4.7% 12/9/35 | | 100,000 | 94,655 |
| 6.3% 3/1/38 | | 100,000 | 108,076 |
| Starbucks Corp.: | | | |
| 2.55% 11/15/30 | | 400,000 | 333,971 |
| 3.75% 12/1/47 | | 100,000 | 76,002 |
| 4% 11/15/28 | | 350,000 | 331,898 |
| 4.45% 8/15/49 | | 100,000 | 85,167 |
| | | | 3,271,302 |
| Household Durables - 0.1% | | | |
| D.R. Horton, Inc. 1.3% 10/15/26 | | 130,000 | 112,081 |
| Lennar Corp.: | | | |
| 4.5% 4/30/24 | | 230,000 | 226,938 |
| 4.75% 11/29/27 | | 100,000 | 95,754 |
| | | | 434,773 |
| Internet & Direct Marketing Retail - 0.3% | | | |
| Alibaba Group Holding Ltd.: | | | |
| 2.125% 2/9/31 | | 340,000 | 270,258 |
| 3.15% 2/9/51 | | 235,000 | 147,663 |
| 4% 12/6/37 | | 140,000 | 114,794 |
| 4.5% 11/28/34 | | 230,000 | 207,357 |
| Amazon.com, Inc.: | | | |
| 0.8% 6/3/25 | | 130,000 | 118,668 |
| 1% 5/12/26 | | 200,000 | 177,068 |
| 1.5% 6/3/30 | | 160,000 | 128,336 |
| 2.1% 5/12/31 | | 360,000 | 296,139 |
| 2.5% 6/3/50 | | 430,000 | 275,901 |
| 2.8% 8/22/24 | | 117,000 | 113,214 |
| 3.1% 5/12/51 | | 200,000 | 143,298 |
| 3.15% 8/22/27 | | 290,000 | 270,770 |
| 3.875% 8/22/37 | | 280,000 | 247,330 |
| 4.05% 8/22/47 | | 228,000 | 196,956 |
| 4.1% 4/13/62 | | 380,000 | 314,356 |
| 4.25% 8/22/57 | | 100,000 | 86,501 |
| 4.6% 12/1/25 | | 690,000 | 684,928 |
| 4.8% 12/5/34 | | 230,000 | 229,993 |
| 4.95% 12/5/44 | | 200,000 | 196,058 |
| eBay, Inc.: | | | |
| 1.4% 5/10/26 | | 410,000 | 364,399 |
| 4% 7/15/42 | | 150,000 | 119,063 |
| | | | 4,703,050 |
| Leisure Products - 0.0% | | | |
| Hasbro, Inc.: | | | |
| 3.55% 11/19/26 | | 200,000 | 186,025 |
| 3.9% 11/19/29 | | 142,000 | 125,184 |
| | | | 311,209 |
| Multiline Retail - 0.1% | | | |
| Dollar General Corp.: | | | |
| 3.5% 4/3/30 | | 210,000 | 187,893 |
| 5% 11/1/32 | | 100,000 | 96,986 |
| Dollar Tree, Inc. 4% 5/15/25 | | 478,000 | 464,225 |
| Target Corp.: | | | |
| 2.5% 4/15/26 | | 100,000 | 93,620 |
| 3.375% 4/15/29 | | 310,000 | 285,885 |
| 3.9% 11/15/47 | | 160,000 | 130,758 |
| 4.8% 1/15/53 | | 200,000 | 186,892 |
| | | | 1,446,259 |
| Specialty Retail - 0.3% | | | |
| AutoNation, Inc. 3.85% 3/1/32 | | 160,000 | 134,166 |
| AutoZone, Inc. 1.65% 1/15/31 | | 180,000 | 138,797 |
| Lowe's Companies, Inc.: | | | |
| 2.8% 9/15/41 | | 100,000 | 67,684 |
| 3.375% 9/15/25 | | 210,000 | 200,654 |
| 3.65% 4/5/29 | | 620,000 | 566,402 |
| 3.7% 4/15/46 | | 100,000 | 73,799 |
| 4.05% 5/3/47 | | 132,000 | 102,571 |
| 4.45% 4/1/62 | | 270,000 | 211,509 |
| 5% 4/15/33 | | 110,000 | 105,881 |
| 5% 4/15/40 | | 330,000 | 301,992 |
| 5.625% 4/15/53 | | 100,000 | 95,717 |
| O'Reilly Automotive, Inc. 1.75% 3/15/31 | | 150,000 | 116,592 |
| The Home Depot, Inc.: | | | |
| 1.375% 3/15/31 | | 240,000 | 184,519 |
| 2.375% 3/15/51 | | 250,000 | 149,876 |
| 2.5% 4/15/27 | | 750,000 | 685,531 |
| 2.75% 9/15/51 | | 160,000 | 104,457 |
| 2.95% 6/15/29 | | 330,000 | 294,691 |
| 4.2% 4/1/43 | | 130,000 | 113,708 |
| 4.25% 4/1/46 | | 150,000 | 129,700 |
| 4.4% 3/15/45 | | 156,000 | 138,150 |
| 4.5% 12/6/48 | | 100,000 | 89,833 |
| 4.95% 9/15/52 | | 280,000 | 268,968 |
| 5.875% 12/16/36 | | 100,000 | 107,008 |
| 5.95% 4/1/41 | | 120,000 | 128,770 |
| TJX Companies, Inc. 1.6% 5/15/31 | | 250,000 | 196,885 |
| | | | 4,707,860 |
| Textiles, Apparel & Luxury Goods - 0.1% | | | |
| NIKE, Inc.: | | | |
| 2.4% 3/27/25 | | 1,100,000 | 1,049,252 |
| 2.75% 3/27/27 | | 230,000 | 213,214 |
| 3.875% 11/1/45 | | 110,000 | 94,153 |
| | | | 1,356,619 |
TOTAL CONSUMER DISCRETIONARY | | | 20,996,079 |
| CONSUMER STAPLES - 1.6% | | | |
| Beverages - 0.5% | | | |
| Anheuser-Busch Companies LLC / Anheuser-Busch InBev Worldwide, Inc.: | | | |
| 4.7% 2/1/36 | | 200,000 | 187,726 |
| 4.9% 2/1/46 | | 100,000 | 91,727 |
| Anheuser-Busch InBev Finance, Inc.: | | | |
| 4.7% 2/1/36 | | 100,000 | 93,863 |
| 4.9% 2/1/46 | | 100,000 | 91,727 |
| Anheuser-Busch InBev Worldwide, Inc.: | | | |
| 4.439% 10/6/48 | | 650,000 | 561,014 |
| 4.6% 4/15/48 | | 377,000 | 333,110 |
| 4.6% 6/1/60 | | 120,000 | 104,034 |
| 4.95% 1/15/42 | | 230,000 | 214,883 |
| 5.45% 1/23/39 | | 380,000 | 378,748 |
| 5.55% 1/23/49 | | 180,000 | 181,109 |
| 5.8% 1/23/59 (Reg. S) | | 260,000 | 268,821 |
| 8.2% 1/15/39 | | 110,000 | 136,975 |
| Coca-Cola FEMSA S.A.B. de CV 2.75% 1/22/30 | | 150,000 | 129,216 |
| Constellation Brands, Inc.: | | | |
| 2.875% 5/1/30 | | 210,000 | 178,348 |
| 3.6% 2/15/28 | | 272,000 | 251,994 |
| 4.5% 5/9/47 | | 100,000 | 84,094 |
| Diageo Capital PLC: | | | |
| 1.375% 9/29/25 | | 200,000 | 181,807 |
| 2% 4/29/30 | | 400,000 | 329,050 |
| Dr. Pepper Snapple Group, Inc.: | | | |
| 3.8% 5/1/50 | | 430,000 | 322,074 |
| 4.417% 5/25/25 | | 86,000 | 84,304 |
| Molson Coors Beverage Co.: | | | |
| 3% 7/15/26 | | 254,000 | 234,962 |
| 4.2% 7/15/46 | | 100,000 | 77,899 |
| 5% 5/1/42 | | 100,000 | 89,622 |
| PepsiCo, Inc.: | | | |
| 1.4% 2/25/31 | | 680,000 | 533,936 |
| 1.625% 5/1/30 | | 309,000 | 251,022 |
| 2.625% 10/21/41 | | 100,000 | 73,358 |
| 2.85% 2/24/26 | | 250,000 | 236,297 |
| 3% 10/15/27 | | 100,000 | 93,071 |
| 3.6% 3/1/24 | | 190,000 | 187,397 |
| 3.625% 3/19/50 | | 100,000 | 82,233 |
| 4.45% 4/14/46 | | 140,000 | 132,460 |
| 7% 3/1/29 | | 100,000 | 111,617 |
| The Coca-Cola Co.: | | | |
| 1% 3/15/28 | | 230,000 | 192,496 |
| 1.45% 6/1/27 | | 120,000 | 105,354 |
| 1.65% 6/1/30 | | 240,000 | 194,577 |
| 2.125% 9/6/29 | | 140,000 | 119,856 |
| 2.25% 1/5/32 | | 120,000 | 99,050 |
| 2.5% 6/1/40 | | 120,000 | 87,020 |
| 2.5% 3/15/51 | | 100,000 | 65,376 |
| 2.6% 6/1/50 | | 120,000 | 80,357 |
| 2.75% 6/1/60 | | 120,000 | 79,327 |
| 2.875% 5/5/41 | | 100,000 | 76,183 |
| 3.45% 3/25/30 | | 160,000 | 147,147 |
| | | | 7,555,241 |
| Food & Staples Retailing - 0.3% | | | |
| Costco Wholesale Corp.: | | | |
| 1.375% 6/20/27 | | 150,000 | 131,020 |
| 3% 5/18/27 | | 210,000 | 197,586 |
| Kroger Co.: | | | |
| 1.7% 1/15/31 | | 240,000 | 183,013 |
| 3.5% 2/1/26 | | 130,000 | 123,686 |
| 3.7% 8/1/27 | | 120,000 | 113,197 |
| 3.95% 1/15/50 | | 100,000 | 77,771 |
| 4.45% 2/1/47 | | 130,000 | 108,684 |
| 5.4% 1/15/49 | | 70,000 | 66,443 |
| Sysco Corp.: | | | |
| 3.3% 2/15/50 | | 150,000 | 102,862 |
| 6.6% 4/1/50 | | 140,000 | 153,628 |
| Walgreens Boots Alliance, Inc.: | | | |
| 3.2% 4/15/30 | | 80,000 | 67,852 |
| 3.45% 6/1/26 | | 195,000 | 183,035 |
| 4.8% 11/18/44 | | 100,000 | 82,834 |
| Walmart, Inc.: | | | |
| 2.65% 9/22/51 | | 100,000 | 67,913 |
| 2.85% 7/8/24 | | 150,000 | 145,712 |
| 3.05% 7/8/26 | | 400,000 | 379,475 |
| 3.25% 7/8/29 | | 220,000 | 203,401 |
| 3.3% 4/22/24 | | 410,000 | 401,947 |
| 3.4% 6/26/23 | | 100,000 | 99,414 |
| 3.7% 6/26/28 | | 140,000 | 133,883 |
| 5.25% 9/1/35 | | 645,000 | 677,118 |
| 5.625% 4/15/41 | | 169,000 | 178,697 |
| | | | 3,879,171 |
| Food Products - 0.4% | | | |
| Archer Daniels Midland Co.: | | | |
| 3.25% 3/27/30 | | 330,000 | 297,293 |
| 3.75% 9/15/47 | | 100,000 | 82,130 |
| Bunge Ltd. Finance Corp. 2.75% 5/14/31 | | 110,000 | 90,554 |
| Campbell Soup Co. 4.15% 3/15/28 | | 410,000 | 391,466 |
| Conagra Brands, Inc.: | | | |
| 4.85% 11/1/28 | | 510,000 | 494,076 |
| 5.3% 11/1/38 | | 31,000 | 28,900 |
| General Mills, Inc.: | | | |
| 3% 2/1/51 | | 110,000 | 77,357 |
| 4% 4/17/25 | | 130,000 | 126,580 |
| 4.2% 4/17/28 | | 200,000 | 191,885 |
| Hormel Foods Corp. 1.8% 6/11/30 | | 200,000 | 162,295 |
| JBS U.S.A. Lux SA / JBS Food Co.: | | | |
| 5.75% 4/1/33 (c) | | 500,000 | 466,360 |
| 6.5% 12/1/52 (c) | | 180,000 | 171,073 |
| Kellogg Co.: | | | |
| 2.1% 6/1/30 | | 160,000 | 130,288 |
| 3.25% 4/1/26 | | 290,000 | 273,798 |
| Kraft Heinz Foods Co.: | | | |
| 5% 6/4/42 | | 100,000 | 90,731 |
| 5.5% 6/1/50 | | 590,000 | 563,682 |
| McCormick & Co., Inc. 1.85% 2/15/31 | | 150,000 | 116,294 |
| Mondelez International, Inc. 1.875% 10/15/32 | | 370,000 | 281,573 |
| Tyson Foods, Inc.: | | | |
| 4% 3/1/26 | | 160,000 | 154,370 |
| 4.35% 3/1/29 | | 450,000 | 426,838 |
| 5.1% 9/28/48 | | 100,000 | 90,477 |
| Unilever Capital Corp.: | | | |
| 1.375% 9/14/30 | | 380,000 | 299,253 |
| 2.9% 5/5/27 | | 400,000 | 371,159 |
| | | | 5,378,432 |
| Household Products - 0.1% | | | |
| Colgate-Palmolive Co. 3.1% 8/15/27 | | 410,000 | 386,455 |
| Kimberly-Clark Corp.: | | | |
| 1.05% 9/15/27 | | 184,000 | 156,209 |
| 3.2% 7/30/46 | | 100,000 | 74,277 |
| 6.625% 8/1/37 | | 140,000 | 162,610 |
| Procter & Gamble Co.: | | | |
| 1.2% 10/29/30 | | 600,000 | 473,220 |
| 1.95% 4/23/31 | | 200,000 | 166,773 |
| 2.85% 8/11/27 | | 140,000 | 130,349 |
| 3% 3/25/30 | | 100,000 | 90,679 |
| | | | 1,640,572 |
| Personal Products - 0.0% | | | |
| Estee Lauder Companies, Inc.: | | | |
| 1.95% 3/15/31 | | 330,000 | 267,444 |
| 3.15% 3/15/27 | | 260,000 | 244,976 |
| | | | 512,420 |
| Tobacco - 0.3% | | | |
| Altria Group, Inc.: | | | |
| 2.45% 2/4/32 | | 290,000 | 218,904 |
| 3.875% 9/16/46 | | 204,000 | 136,635 |
| 4.8% 2/14/29 | | 30,000 | 28,777 |
| 5.8% 2/14/39 | | 330,000 | 304,121 |
| 5.95% 2/14/49 | | 240,000 | 214,900 |
| BAT Capital Corp.: | | | |
| 3.215% 9/6/26 | | 100,000 | 92,231 |
| 3.222% 8/15/24 | | 200,000 | 192,750 |
| 3.557% 8/15/27 | | 450,000 | 409,800 |
| 4.39% 8/15/37 | | 180,000 | 139,719 |
| 4.54% 8/15/47 | | 128,000 | 91,847 |
| 4.7% 4/2/27 | | 270,000 | 260,920 |
| 4.742% 3/16/32 | | 170,000 | 152,225 |
| 4.758% 9/6/49 | | 260,000 | 192,150 |
| 5.282% 4/2/50 | | 100,000 | 79,907 |
| Philip Morris International, Inc.: | | | |
| 2.125% 5/10/23 | | 820,000 | 815,399 |
| 4.125% 3/4/43 | | 100,000 | 78,970 |
| 4.25% 11/10/44 | | 110,000 | 87,747 |
| 4.875% 2/15/28 | | 170,000 | 166,417 |
| 4.875% 11/15/43 | | 224,000 | 195,033 |
| 5.125% 11/17/27 | | 170,000 | 169,202 |
| 5.375% 2/15/33 | | 170,000 | 167,145 |
| 5.75% 11/17/32 | | 120,000 | 121,397 |
| Reynolds American, Inc.: | | | |
| 4.45% 6/12/25 | | 140,000 | 136,231 |
| 5.7% 8/15/35 | | 110,000 | 100,020 |
| | | | 4,552,447 |
TOTAL CONSUMER STAPLES | | | 23,518,283 |
| ENERGY - 1.6% | | | |
| Energy Equipment & Services - 0.0% | | | |
| Baker Hughes Co. 4.08% 12/15/47 | | 290,000 | 229,610 |
| Halliburton Co.: | | | |
| 5% 11/15/45 | | 100,000 | 88,361 |
| 6.7% 9/15/38 | | 100,000 | 107,393 |
| 7.45% 9/15/39 | | 120,000 | 136,297 |
| | | | 561,661 |
| Oil, Gas & Consumable Fuels - 1.6% | | | |
| Boardwalk Pipelines LP 4.95% 12/15/24 | | 102,000 | 100,346 |
| Burlington Resources LLC 5.95% 10/15/36 | | 110,000 | 113,686 |
| Canadian Natural Resources Ltd.: | | | |
| 3.85% 6/1/27 | | 152,000 | 142,726 |
| 4.95% 6/1/47 | | 160,000 | 139,059 |
| Cenovus Energy, Inc. 5.4% 6/15/47 | | 286,000 | 257,461 |
| Cheniere Corpus Christi Holdings LLC 2.742% 12/31/39 | | 160,000 | 126,743 |
| Cheniere Energy Partners LP 4% 3/1/31 | | 280,000 | 241,262 |
| Chevron Corp.: | | | |
| 1.141% 5/11/23 | | 70,000 | 69,469 |
| 1.554% 5/11/25 | | 70,000 | 64,974 |
| 1.995% 5/11/27 | | 70,000 | 62,682 |
| 2.236% 5/11/30 | | 70,000 | 59,823 |
| 2.954% 5/16/26 | | 231,000 | 217,409 |
| 2.978% 5/11/40 | | 70,000 | 52,198 |
| 3.078% 5/11/50 | | 70,000 | 50,420 |
| Chevron U.S.A., Inc.: | | | |
| 4.95% 8/15/47 | | 100,000 | 93,608 |
| 5.05% 11/15/44 | | 70,000 | 65,593 |
| ConocoPhillips Co.: | | | |
| 3.8% 3/15/52 | | 100,000 | 79,392 |
| 4.025% 3/15/62 | | 230,000 | 182,049 |
| 6.5% 2/1/39 | | 120,000 | 135,231 |
| Devon Energy Corp. 5% 6/15/45 | | 315,000 | 266,823 |
| Diamondback Energy, Inc. 4.4% 3/24/51 | | 100,000 | 77,580 |
| Eastern Gas Transmission & Storage, Inc. 3.9% 11/15/49 | | 90,000 | 66,152 |
| Enbridge Energy Partners LP 7.375% 10/15/45 | | 110,000 | 124,598 |
| Enbridge, Inc.: | | | |
| 2.5% 8/1/33 | | 180,000 | 139,042 |
| 3.4% 8/1/51 | | 190,000 | 130,885 |
| 3.5% 6/10/24 | | 164,000 | 159,788 |
| Energy Transfer LP: | | | |
| 3.75% 5/15/30 | | 180,000 | 159,683 |
| 3.9% 5/15/24 (b) | | 210,000 | 205,189 |
| 4.4% 3/15/27 | | 170,000 | 162,400 |
| 4.95% 6/15/28 | | 147,000 | 141,974 |
| 5% 5/15/50 | | 330,000 | 270,415 |
| 5.25% 4/15/29 | | 310,000 | 302,336 |
| 5.3% 4/15/47 | | 50,000 | 42,441 |
| 5.4% 10/1/47 | | 80,000 | 68,779 |
| 5.8% 6/15/38 | | 50,000 | 46,847 |
| 6% 6/15/48 | | 330,000 | 303,506 |
| 6.25% 4/15/49 | | 130,000 | 123,647 |
| 7.5% 7/1/38 | | 110,000 | 118,718 |
| Enterprise Products Operating LP: | | | |
| 3.2% 2/15/52 | | 100,000 | 67,010 |
| 3.3% 2/15/53 | | 100,000 | 67,833 |
| 3.95% 2/15/27 | | 214,000 | 204,345 |
| 4.2% 1/31/50 | | 370,000 | 296,960 |
| 4.25% 2/15/48 | | 270,000 | 218,625 |
| 4.8% 2/1/49 | | 56,000 | 48,993 |
| 5.35% 1/31/33 | | 500,000 | 499,690 |
| EOG Resources, Inc. 4.95% 4/15/50 | | 100,000 | 96,175 |
| EQT Corp. 5.7% 4/1/28 | | 154,000 | 151,380 |
| Equinor ASA: | | | |
| 2.375% 5/22/30 | | 310,000 | 264,408 |
| 2.875% 4/6/25 | | 400,000 | 382,593 |
| 3.625% 9/10/28 | | 130,000 | 123,194 |
| 4.8% 11/8/43 | | 130,000 | 123,874 |
| 5.1% 8/17/40 | | 180,000 | 178,756 |
| Exxon Mobil Corp.: | | | |
| 2.995% 8/16/39 | | 350,000 | 268,675 |
| 3.452% 4/15/51 | | 450,000 | 343,211 |
| 4.114% 3/1/46 | | 200,000 | 170,773 |
| 4.327% 3/19/50 | | 100,000 | 88,766 |
| Hess Corp.: | | | |
| 5.6% 2/15/41 | | 120,000 | 112,084 |
| 7.125% 3/15/33 | | 170,000 | 182,675 |
| Kinder Morgan Energy Partners LP: | | | |
| 4.25% 9/1/24 | | 340,000 | 333,226 |
| 6.55% 9/15/40 | | 100,000 | 100,116 |
| 6.95% 1/15/38 | | 100,000 | 106,550 |
| Kinder Morgan, Inc.: | | | |
| 4.8% 2/1/33 | | 600,000 | 555,894 |
| 5.05% 2/15/46 | | 50,000 | 42,189 |
| 5.2% 3/1/48 | | 264,000 | 229,379 |
| 5.55% 6/1/45 | | 190,000 | 171,798 |
| Magellan Midstream Partners LP: | | | |
| 3.95% 3/1/50 | | 35,000 | 25,712 |
| 4.85% 2/1/49 | | 130,000 | 109,542 |
| 5% 3/1/26 | | 147,000 | 145,059 |
| Marathon Oil Corp. 6.6% 10/1/37 | | 120,000 | 119,519 |
| Marathon Petroleum Corp.: | | | |
| 4.5% 4/1/48 | | 280,000 | 224,154 |
| 4.7% 5/1/25 | | 370,000 | 364,795 |
| MPLX LP: | | | |
| 4.125% 3/1/27 | | 60,000 | 57,240 |
| 4.5% 4/15/38 | | 350,000 | 298,625 |
| 4.7% 4/15/48 | | 226,000 | 181,637 |
| 5% 3/1/33 | | 500,000 | 469,114 |
| ONEOK Partners LP 6.65% 10/1/36 | | 350,000 | 354,233 |
| ONEOK, Inc.: | | | |
| 4% 7/13/27 | | 80,000 | 75,252 |
| 4.45% 9/1/49 | | 50,000 | 37,781 |
| 5.2% 7/15/48 | | 22,000 | 18,739 |
| 6.1% 11/15/32 | | 100,000 | 100,522 |
| 7.5% 9/1/23 | | 200,000 | 200,925 |
| Ovintiv, Inc.: | | | |
| 6.5% 2/1/38 | | 70,000 | 68,647 |
| 6.625% 8/15/37 | | 100,000 | 99,468 |
| Phillips 66 Co.: | | | |
| 3.9% 3/15/28 | | 380,000 | 358,915 |
| 4.65% 11/15/34 | | 220,000 | 205,305 |
| 4.68% 2/15/45 (c) | | 100,000 | 87,213 |
| Plains All American Pipeline LP/PAA Finance Corp. 3.8% 9/15/30 | | 580,000 | 505,004 |
| Sabine Pass Liquefaction LLC: | | | |
| 4.5% 5/15/30 | | 200,000 | 187,349 |
| 5.75% 5/15/24 | | 410,000 | 409,856 |
| Shell International Finance BV: | | | |
| 2% 11/7/24 | | 1,770,000 | 1,681,973 |
| 2.375% 11/7/29 | | 100,000 | 85,824 |
| 2.5% 9/12/26 | | 270,000 | 247,936 |
| 2.875% 11/26/41 | | 210,000 | 154,384 |
| 3% 11/26/51 | | 100,000 | 69,227 |
| 3.125% 11/7/49 | | 100,000 | 71,672 |
| 3.75% 9/12/46 | | 106,000 | 84,224 |
| 4.55% 8/12/43 | | 100,000 | 91,290 |
| 5.5% 3/25/40 | | 190,000 | 195,447 |
| Spectra Energy Partners LP 4.75% 3/15/24 | | 151,000 | 149,677 |
| Suncor Energy, Inc.: | | | |
| 4% 11/15/47 | | 114,000 | 89,089 |
| 6.8% 5/15/38 | | 130,000 | 138,563 |
| Targa Resources Corp. 6.125% 3/15/33 | | 250,000 | 251,112 |
| Targa Resources Partners LP/Targa Resources Partners Finance Corp. 6.875% 1/15/29 | | 620,000 | 627,750 |
| The Williams Companies, Inc.: | | | |
| 3.75% 6/15/27 | | 460,000 | 432,326 |
| 4.85% 3/1/48 | | 50,000 | 42,936 |
| 5.1% 9/15/45 | | 100,000 | 87,902 |
| 5.4% 3/2/26 | | 160,000 | 160,008 |
| 5.65% 3/15/33 | | 80,000 | 79,922 |
| 5.8% 11/15/43 | | 100,000 | 95,862 |
| Total Capital International SA: | | | |
| 3.386% 6/29/60 | | 100,000 | 71,742 |
| 3.461% 7/12/49 | | 140,000 | 106,744 |
| 3.7% 1/15/24 | | 110,000 | 108,414 |
| 3.75% 4/10/24 | | 465,000 | 456,909 |
| Total Capital SA 3.883% 10/11/28 | | 470,000 | 450,402 |
| TransCanada PipeLines Ltd.: | | | |
| 4.1% 4/15/30 | | 270,000 | 246,275 |
| 4.875% 5/15/48 | | 80,000 | 70,251 |
| 5% 10/16/43 | | 350,000 | 313,660 |
| 6.1% 6/1/40 | | 170,000 | 171,991 |
| Transcontinental Gas Pipe Line Co. LLC: | | | |
| 3.25% 5/15/30 | | 535,000 | 465,787 |
| 3.95% 5/15/50 | | 100,000 | 77,480 |
| Valero Energy Corp.: | | | |
| 3.4% 9/15/26 | | 110,000 | 102,999 |
| 4.35% 6/1/28 | | 70,000 | 67,062 |
| 6.625% 6/15/37 | | 200,000 | 212,188 |
| | | | 23,057,740 |
TOTAL ENERGY | | | 23,619,401 |
| FINANCIALS - 8.4% | | | |
| Banks - 4.6% | | | |
| Banco Santander SA: | | | |
| 0.701% 6/30/24 (b) | | 200,000 | 196,146 |
| 3.306% 6/27/29 | | 200,000 | 177,275 |
| 3.8% 2/23/28 | | 400,000 | 366,645 |
| 5.179% 11/19/25 | | 400,000 | 393,919 |
| 5.294% 8/18/27 | | 200,000 | 195,948 |
| Bank of America Corp.: | | | |
| U.S. Secured Overnight Fin. Rate (SOFR) Index + 1.290% 5.08% 1/20/27 (b)(d) | | 1,000,000 | 989,551 |
| 0.981% 9/25/25 (b) | | 800,000 | 742,406 |
| 1.658% 3/11/27 (b) | | 340,000 | 302,776 |
| 1.734% 7/22/27 (b) | | 510,000 | 449,198 |
| 2.087% 6/14/29 (b) | | 1,210,000 | 1,017,363 |
| 2.299% 7/21/32 (b) | | 110,000 | 86,025 |
| 2.572% 10/20/32 (b) | | 1,220,000 | 971,358 |
| 2.651% 3/11/32 (b) | | 340,000 | 276,190 |
| 2.676% 6/19/41 (b) | | 760,000 | 520,596 |
| 2.687% 4/22/32 (b) | | 410,000 | 332,524 |
| 2.831% 10/24/51 (b) | | 140,000 | 89,641 |
| 2.972% 7/21/52 (b) | | 110,000 | 72,133 |
| 3.093% 10/1/25 (b) | | 400,000 | 383,980 |
| 3.194% 7/23/30 (b) | | 270,000 | 234,600 |
| 3.419% 12/20/28 (b) | | 445,000 | 405,032 |
| 3.946% 1/23/49 (b) | | 110,000 | 87,305 |
| 3.974% 2/7/30 (b) | | 65,000 | 59,460 |
| 4% 1/22/25 | | 512,000 | 498,802 |
| 4.078% 4/23/40 (b) | | 100,000 | 84,068 |
| 4.083% 3/20/51 (b) | | 100,000 | 80,287 |
| 4.244% 4/24/38 (b) | | 480,000 | 415,200 |
| 4.271% 7/23/29 (b) | | 360,000 | 337,900 |
| 4.33% 3/15/50 (b) | | 200,000 | 168,200 |
| 4.376% 4/27/28 (b) | | 1,000,000 | 956,060 |
| 6.11% 1/29/37 | | 508,000 | 522,166 |
| 6.204% 11/10/28 (b) | | 400,000 | 411,271 |
| 7.75% 5/14/38 | | 120,000 | 141,645 |
| Bank of Montreal: | | | |
| 3.088% 1/10/37 (b) | | 110,000 | 86,604 |
| 3.3% 2/5/24 | | 580,000 | 568,482 |
| 3.803% 12/15/32 (b) | | 100,000 | 89,024 |
| Bank of Nova Scotia: | | | |
| 2.45% 2/2/32 | | 110,000 | 88,502 |
| 3.4% 2/11/24 | | 560,000 | 549,363 |
| 4.85% 2/1/30 | | 210,000 | 203,737 |
| Barclays PLC: | | | |
| 2.279% 11/24/27 (b) | | 300,000 | 263,934 |
| 2.894% 11/24/32 (b) | | 520,000 | 403,744 |
| 3.564% 9/23/35 (b) | | 240,000 | 191,344 |
| 3.932% 5/7/25 (b) | | 200,000 | 194,663 |
| 4.337% 1/10/28 | | 320,000 | 298,636 |
| 4.375% 1/12/26 | | 210,000 | 202,962 |
| 4.95% 1/10/47 | | 200,000 | 178,945 |
| 5.2% 5/12/26 | | 360,000 | 350,559 |
| 5.304% 8/9/26 (b) | | 250,000 | 246,286 |
| BB&T Corp. 3.75% 12/6/23 | | 350,000 | 346,533 |
| Canadian Imperial Bank of Commerce 3.6% 4/7/32 | | 270,000 | 238,028 |
| Citigroup, Inc.: | | | |
| ��3 month U.S. LIBOR + 1.150% 3.52% 10/27/28 (b)(d) | | 770,000 | 704,762 |
| 1.122% 1/28/27 (b) | | 600,000 | 527,196 |
| 1.462% 6/9/27 (b) | | 300,000 | 262,241 |
| 1.678% 5/15/24 (b) | | 250,000 | 247,926 |
| 2.561% 5/1/32 (b) | | 600,000 | 481,784 |
| 3.2% 10/21/26 | | 80,000 | 74,423 |
| 3.878% 1/24/39 (b) | | 470,000 | 386,669 |
| 3.887% 1/10/28 (b) | | 140,000 | 131,545 |
| 3.98% 3/20/30 (b) | | 150,000 | 136,801 |
| 4.65% 7/30/45 | | 267,000 | 236,270 |
| 4.65% 7/23/48 | | 195,000 | 174,917 |
| 4.75% 5/18/46 | | 208,000 | 178,357 |
| 5.316% 3/26/41 (b) | | 230,000 | 223,319 |
| 5.61% 9/29/26 (b) | | 500,000 | 500,003 |
| 5.875% 2/22/33 | | 310,000 | 312,580 |
| 6.27% 11/17/33 (b) | | 100,000 | 104,727 |
| 6.625% 6/15/32 | | 100,000 | 105,678 |
| 6.675% 9/13/43 | | 200,000 | 220,402 |
| Export-Import Bank of Korea 0.625% 2/9/26 | | 400,000 | 350,381 |
| Fifth Third Bancorp: | | | |
| 2.55% 5/5/27 | | 100,000 | 90,558 |
| 3.95% 3/14/28 | | 50,000 | 47,403 |
| 6.361% 10/27/28 (b) | | 380,000 | 391,423 |
| HSBC Holdings PLC: | | | |
| 1.589% 5/24/27 (b) | | 240,000 | 209,956 |
| 2.013% 9/22/28 (b) | | 630,000 | 533,305 |
| 2.206% 8/17/29 (b) | | 550,000 | 455,924 |
| 2.633% 11/7/25 (b) | | 600,000 | 568,194 |
| 2.804% 5/24/32 (b) | | 340,000 | 271,407 |
| 3.973% 5/22/30 (b) | | 214,000 | 191,743 |
| 4.292% 9/12/26 (b) | | 1,600,000 | 1,540,238 |
| 4.375% 11/23/26 | | 400,000 | 383,987 |
| 4.762% 3/29/33 (b) | | 210,000 | 188,677 |
| 5.402% 8/11/33 (b) | | 200,000 | 191,686 |
| 6.5% 5/2/36 | | 100,000 | 103,380 |
| 6.5% 9/15/37 | | 140,000 | 144,580 |
| 6.8% 6/1/38 | | 100,000 | 105,319 |
| 8.113% 11/3/33 (b) | | 290,000 | 320,123 |
| Huntington Bancshares, Inc. 4.443% 8/4/28 (b) | | 290,000 | 277,008 |
| ING Groep NV: | | | |
| 2.727% 4/1/32 (b) | | 200,000 | 161,340 |
| 4.017% 3/28/28 (b) | | 200,000 | 187,822 |
| Japan Bank International Cooperation: | | | |
| 1.25% 1/21/31 | | 1,012,000 | 795,227 |
| 2.5% 5/23/24 | | 1,510,000 | 1,457,684 |
| JPMorgan Chase & Co.: | | | |
| 0.768% 8/9/25 (b) | | 700,000 | 650,009 |
| 0.969% 6/23/25 (b) | | 720,000 | 675,671 |
| 1.47% 9/22/27 (b) | | 360,000 | 312,091 |
| 1.578% 4/22/27 (b) | | 300,000 | 265,399 |
| 1.953% 2/4/32 (b) | | 300,000 | 232,964 |
| 2.069% 6/1/29 (b) | | 340,000 | 286,677 |
| 2.525% 11/19/41 (b) | | 340,000 | 228,107 |
| 2.545% 11/8/32 (b) | | 350,000 | 279,838 |
| 2.58% 4/22/32 (b) | | 300,000 | 243,097 |
| 2.7% 5/18/23 | | 470,000 | 467,476 |
| 2.95% 10/1/26 | | 190,000 | 176,685 |
| 2.956% 5/13/31 (b) | | 360,000 | 302,330 |
| 3.109% 4/22/51 (b) | | 50,000 | 34,058 |
| 3.22% 3/1/25 (b) | | 1,640,000 | 1,600,623 |
| 3.328% 4/22/52 (b) | | 320,000 | 227,018 |
| 3.559% 4/23/24 (b) | | 670,000 | 667,782 |
| 4.323% 4/26/28 (b) | | 550,000 | 527,277 |
| 4.452% 12/5/29 (b) | | 630,000 | 597,005 |
| 4.586% 4/26/33 (b) | | 550,000 | 512,589 |
| 5.5% 10/15/40 | | 430,000 | 433,182 |
| 5.6% 7/15/41 | | 325,000 | 330,823 |
| 5.625% 8/16/43 | | 247,000 | 246,260 |
| Korea Development Bank 1.625% 1/19/31 | | 250,000 | 198,193 |
| Lloyds Banking Group PLC: | | | |
| 3.369% 12/14/46 (b) | | 200,000 | 135,424 |
| 4.375% 3/22/28 | | 656,000 | 620,358 |
| 7.953% 11/15/33 (b) | | 200,000 | 218,991 |
| Mitsubishi UFJ Financial Group, Inc.: | | | |
| 1.538% 7/20/27 (b) | | 550,000 | 481,181 |
| 2.309% 7/20/32 (b) | | 550,000 | 429,418 |
| 2.757% 9/13/26 | | 1,050,000 | 961,321 |
| 2.801% 7/18/24 | | 200,000 | 192,661 |
| 3.195% 7/18/29 | | 400,000 | 351,221 |
| 3.961% 3/2/28 | | 100,000 | 94,132 |
| Mizuho Financial Group, Inc.: | | | |
| 0.849% 9/8/24 (b) | | 400,000 | 389,487 |
| 1.241% 7/10/24 (b) | | 250,000 | 245,946 |
| 1.554% 7/9/27 (b) | | 200,000 | 174,190 |
| 1.979% 9/8/31 (b) | | 280,000 | 216,975 |
| 2.226% 5/25/26 (b) | | 200,000 | 184,652 |
| 2.839% 7/16/25 (b) | | 200,000 | 191,258 |
| 5.669% 9/13/33 (b) | | 200,000 | 200,172 |
| National Australia Bank Ltd. 2.875% 4/12/23 | | 250,000 | 249,368 |
| NatWest Group PLC: | | | |
| 3.032% 11/28/35 (b) | | 200,000 | 154,625 |
| 3.754% 11/1/29 (b) | | 400,000 | 375,198 |
| 5.847% 3/2/27 (b) | | 480,000 | 480,244 |
| Oesterreichische Kontrollbank AG 0.375% 9/17/25 | | 100,000 | 89,672 |
| PNC Financial Services Group, Inc.: | | | |
| U.S. Secured Overnight Fin. Rate (SOFR) Averages Index + 0.000% 4.626% 6/6/33 (b)(d) | | 220,000 | 204,333 |
| 1.15% 8/13/26 | | 400,000 | 351,319 |
| 2.2% 11/1/24 | | 250,000 | 238,535 |
| 3.45% 4/23/29 | | 280,000 | 257,211 |
| Rabobank Nederland: | | | |
| 3.75% 7/21/26 | | 250,000 | 234,447 |
| 4.375% 8/4/25 | | 290,000 | 280,916 |
| Rabobank Nederland New York Branch: | | | |
| 0.375% 1/12/24 | | 550,000 | 527,688 |
| 3.875% 8/22/24 | | 610,000 | 597,931 |
| Royal Bank of Canada: | | | |
| 1.2% 4/27/26 | | 270,000 | 239,729 |
| 2.05% 1/21/27 | | 300,000 | 269,021 |
| 4.24% 8/3/27 | | 390,000 | 374,541 |
| 4.65% 1/27/26 | | 210,000 | 204,869 |
| Santander Holdings U.S.A., Inc.: | | | |
| 4.4% 7/13/27 | | 110,000 | 104,489 |
| 4.5% 7/17/25 | | 406,000 | 394,345 |
| Santander UK Group Holdings PLC: | | | |
| 1.532% 8/21/26 (b) | | 250,000 | 223,401 |
| 4.796% 11/15/24 (b) | | 340,000 | 336,573 |
| 6.534% 1/10/29 (b) | | 250,000 | 253,056 |
| Sumitomo Mitsui Financial Group, Inc.: | | | |
| 1.474% 7/8/25 | | 650,000 | 591,441 |
| 2.142% 9/23/30 | | 260,000 | 204,502 |
| 2.174% 1/14/27 | | 530,000 | 470,346 |
| 2.75% 1/15/30 | | 200,000 | 168,834 |
| 3.05% 1/14/42 | | 260,000 | 184,989 |
| 3.936% 10/16/23 | | 120,000 | 118,916 |
| 5.52% 1/13/28 | | 500,000 | 498,679 |
| SVB Financial Group 2.1% 5/15/28 | | 260,000 | 218,492 |
| The Toronto-Dominion Bank: | | | |
| 0.55% 3/4/24 | | 1,100,000 | 1,047,780 |
| 3.2% 3/10/32 | | 190,000 | 163,109 |
| 5.156% 1/10/28 | | 620,000 | 617,123 |
| Truist Financial Corp.: | | | |
| 1.267% 3/2/27 (b) | | 950,000 | 845,462 |
| 4.916% 7/28/33 (b) | | 250,000 | 235,969 |
| U.S. Bancorp: | | | |
| 2.491% 11/3/36 (b) | | 100,000 | 77,022 |
| 2.677% 1/27/33 (b) | | 190,000 | 157,136 |
| 4.839% 2/1/34 (b) | | 240,000 | 229,743 |
| 4.967% 7/22/33 (b) | | 150,000 | 143,067 |
| Wachovia Corp. 5.5% 8/1/35 | | 350,000 | 343,887 |
| Wells Fargo & Co.: | | | |
| 0.805% 5/19/25 (b) | | 2,910,000 | 2,747,262 |
| 2.406% 10/30/25 (b) | | 550,000 | 521,682 |
| 3% 10/23/26 | | 100,000 | 92,302 |
| 3.068% 4/30/41 (b) | | 380,000 | 275,359 |
| 3.75% 1/24/24 | | 40,000 | 39,399 |
| 3.9% 5/1/45 | | 310,000 | 245,468 |
| 3.908% 4/25/26 (b) | | 630,000 | 607,671 |
| 4.54% 8/15/26 (b) | | 500,000 | 487,889 |
| 4.611% 4/25/53 (b) | | 100,000 | 86,650 |
| 4.75% 12/7/46 | | 508,000 | 435,607 |
| 4.897% 7/25/33 (b) | | 200,000 | 191,027 |
| 4.9% 11/17/45 | | 97,000 | 85,746 |
| 5.013% 4/4/51 (b) | | 280,000 | 257,691 |
| 5.375% 11/2/43 | | 100,000 | 94,512 |
| 5.606% 1/15/44 | | 200,000 | 194,597 |
| Westpac Banking Corp.: | | | |
| U.S. TREASURY 1 YEAR INDEX + 2.680% 5.405% 8/10/33 (b)(d) | | 100,000 | 95,754 |
| 2.894% 2/4/30 (b) | | 390,000 | 362,556 |
| 3.02% 11/18/36 (b) | | 130,000 | 99,765 |
| 3.35% 3/8/27 | | 670,000 | 629,698 |
| 3.65% 5/15/23 | | 160,000 | 159,499 |
| 4.043% 8/26/27 | | 230,000 | 222,505 |
| 4.11% 7/24/34 (b) | | 270,000 | 238,785 |
| 4.322% 11/23/31 (b) | | 270,000 | 254,459 |
| | | | 66,210,413 |
| Capital Markets - 1.7% | | | |
| Ares Capital Corp.: | | | |
| 2.875% 6/15/27 | | 100,000 | 87,014 |
| 3.2% 11/15/31 | | 100,000 | 76,290 |
| 3.875% 1/15/26 | �� | 200,000 | 185,549 |
| 4.2% 6/10/24 | | 180,000 | 176,136 |
| 4.25% 3/1/25 | | 100,000 | 95,972 |
| Bank of New York Mellon Corp.: | | | |
| 0.35% 12/7/23 | | 830,000 | 799,425 |
| 1.8% 7/28/31 | | 170,000 | 132,553 |
| 2.1% 10/24/24 | | 370,000 | 351,876 |
| 3.5% 4/28/23 | | 230,000 | 229,410 |
| 4.414% 7/24/26 (b) | | 500,000 | 490,449 |
| 4.543% 2/1/29 (b) | | 560,000 | 544,148 |
| BlackRock, Inc.: | | | |
| 2.4% 4/30/30 | | 200,000 | 170,398 |
| 3.2% 3/15/27 | | 220,000 | 207,225 |
| 3.5% 3/18/24 | | 120,000 | 118,027 |
| Brookfield Finance, Inc.: | | | |
| 2.724% 4/15/31 | | 330,000 | 268,792 |
| 3.5% 3/30/51 | | 100,000 | 67,460 |
| Charles Schwab Corp.: | | | |
| 0.75% 3/18/24 | | 640,000 | 610,299 |
| 0.9% 3/11/26 | | 460,000 | 405,301 |
| 1.65% 3/11/31 | | 197,000 | 153,835 |
| 2% 3/20/28 | | 120,000 | 104,569 |
| 2.9% 3/3/32 | | 160,000 | 135,325 |
| CI Financial Corp. 3.2% 12/17/30 | | 220,000 | 166,792 |
| CME Group, Inc. 5.3% 9/15/43 | | 100,000 | 101,973 |
| Credit Suisse AG: | | | |
| 0.495% 2/2/24 | | 700,000 | 659,944 |
| 1.25% 8/7/26 | | 1,010,000 | 825,478 |
| Credit Suisse Group AG 3.8% 6/9/23 | | 500,000 | 494,000 |
| Credit Suisse U.S.A., Inc. 7.125% 7/15/32 | | 100,000 | 102,822 |
| Deutsche Bank AG 4.1% 1/13/26 | | 700,000 | 667,662 |
| Deutsche Bank AG New York Branch: | | | |
| 2.311% 11/16/27 (b) | | 250,000 | 217,063 |
| 3.547% 9/18/31 (b) | | 150,000 | 125,187 |
| 3.7% 5/30/24 | | 360,000 | 349,694 |
| 3.729% 1/14/32 (b) | | 250,000 | 196,081 |
| 4.1% 1/13/26 | | 154,000 | 147,298 |
| Goldman Sachs Group, Inc.: | | | |
| 0.855% 2/12/26 (b) | | 110,000 | 99,872 |
| 1.093% 12/9/26 (b) | | 1,000,000 | 880,216 |
| 1.948% 10/21/27 (b) | | 600,000 | 525,567 |
| 2.383% 7/21/32 (b) | | 660,000 | 518,377 |
| 2.615% 4/22/32 (b) | | 460,000 | 369,427 |
| 2.908% 7/21/42 (b) | | 470,000 | 324,087 |
| 3.102% 2/24/33 (b) | | 140,000 | 115,397 |
| 3.85% 1/26/27 | | 960,000 | 908,191 |
| 4.017% 10/31/38 (b) | | 100,000 | 82,601 |
| 4.482% 8/23/28 (b) | | 820,000 | 785,872 |
| 4.8% 7/8/44 | | 120,000 | 107,642 |
| 5.15% 5/22/45 | | 330,000 | 305,822 |
| 6.25% 2/1/41 | | 220,000 | 235,400 |
| 6.75% 10/1/37 | | 262,000 | 278,886 |
| Intercontinental Exchange, Inc.: | | | |
| 1.85% 9/15/32 | | 160,000 | 119,166 |
| 2.65% 9/15/40 | | 160,000 | 112,125 |
| 3% 9/15/60 | | 100,000 | 62,608 |
| 3.1% 9/15/27 | | 150,000 | 139,130 |
| 3.75% 9/21/28 | | 100,000 | 93,827 |
| 4.25% 9/21/48 | | 120,000 | 102,929 |
| 4.6% 3/15/33 | | 100,000 | 94,947 |
| 5.2% 6/15/62 | | 210,000 | 205,347 |
| Jefferies Financial Group, Inc.: | | | |
| 2.75% 10/15/32 | | 110,000 | 85,210 |
| 4.15% 1/23/30 | | 127,000 | 114,713 |
| Moody's Corp.: | | | |
| 2% 8/19/31 | | 140,000 | 110,379 |
| 2.55% 8/18/60 | | 100,000 | 54,800 |
| 4.875% 12/17/48 | | 120,000 | 108,337 |
| Morgan Stanley: | | | |
| 3 month U.S. LIBOR + 1.430% 4.457% 4/22/39 (b)(d) | | 250,000 | 220,652 |
| 0.79% 5/30/25 (b) | | 150,000 | 140,466 |
| 1.164% 10/21/25 (b) | | 100,000 | 92,625 |
| 1.512% 7/20/27 (b) | | 470,000 | 410,273 |
| 1.593% 5/4/27 (b) | | 1,100,000 | 971,181 |
| 1.794% 2/13/32 (b) | | 260,000 | 197,875 |
| 2.188% 4/28/26 (b) | | 200,000 | 186,412 |
| 2.239% 7/21/32 (b) | | 470,000 | 365,591 |
| 2.484% 9/16/36 (b) | | 290,000 | 216,344 |
| 3.625% 1/20/27 | | 160,000 | 151,249 |
| 3.772% 1/24/29 (b) | | 180,000 | 166,177 |
| 4.375% 1/22/47 | | 324,000 | 282,605 |
| 5.123% 2/1/29 (b) | | 500,000 | 491,005 |
| 5.297% 4/20/37 (b) | | 330,000 | 307,494 |
| 5.597% 3/24/51 (b) | | 190,000 | 196,211 |
| 6.375% 7/24/42 | | 528,000 | 580,135 |
| NASDAQ, Inc.: | | | |
| 1.65% 1/15/31 | | 160,000 | 122,324 |
| 2.5% 12/21/40 | | 100,000 | 64,926 |
| Nomura Holdings, Inc.: | | | |
| 1.851% 7/16/25 | | 666,000 | 607,577 |
| 2.999% 1/22/32 | | 290,000 | 232,575 |
| Northern Trust Corp. 1.95% 5/1/30 | | 150,000 | 122,751 |
| S&P Global, Inc.: | | | |
| 1.25% 8/15/30 | | 120,000 | 92,679 |
| 2.45% 3/1/27 (c) | | 300,000 | 273,049 |
| 2.95% 1/22/27 | | 220,000 | 205,896 |
| 3.9% 3/1/62 (c) | | 200,000 | 157,873 |
| State Street Corp.: | | | |
| 1.684% 11/18/27 (b) | | 335,000 | 296,120 |
| 3.031% 11/1/34 (b) | | 170,000 | 145,325 |
| 4.164% 8/4/33 (b) | | 110,000 | 100,940 |
| 4.821% 1/26/34 (b) | | 100,000 | 96,407 |
| | | | 23,899,659 |
| Consumer Finance - 0.8% | | | |
| AerCap Ireland Capital Ltd./AerCap Global Aviation Trust: | | | |
| 2.45% 10/29/26 | | 400,000 | 352,629 |
| 2.875% 8/14/24 | | 150,000 | 142,633 |
| 3% 10/29/28 | | 250,000 | 213,028 |
| 3.4% 10/29/33 | | 250,000 | 194,503 |
| 3.85% 10/29/41 | | 250,000 | 183,030 |
| 4.45% 10/1/25 | | 150,000 | 144,110 |
| 4.5% 9/15/23 | | 164,000 | 162,868 |
| Ally Financial, Inc.: | | | |
| 2.2% 11/2/28 | | 100,000 | 81,468 |
| 3.05% 6/5/23 | | 340,000 | 337,693 |
| 4.75% 6/9/27 | | 100,000 | 95,280 |
| 5.125% 9/30/24 | | 510,000 | 505,543 |
| 5.8% 5/1/25 | | 150,000 | 150,099 |
| 8% 11/1/31 | | 100,000 | 108,249 |
| American Express Co.: | | | |
| 2.5% 7/30/24 | | 464,000 | 446,391 |
| 3.3% 5/3/27 | | 510,000 | 476,524 |
| 3.95% 8/1/25 | | 400,000 | 388,249 |
| 4.989% 5/26/33 (b) | | 150,000 | 143,763 |
| Capital One Financial Corp.: | | | |
| 2.359% 7/29/32 (b) | | 110,000 | 80,934 |
| 3.3% 10/30/24 | | 230,000 | 222,058 |
| 3.8% 1/31/28 | | 438,000 | 405,554 |
| 5.247% 7/26/30 (b) | | 470,000 | 450,666 |
| Discover Financial Services 4.5% 1/30/26 | | 208,000 | 201,355 |
| John Deere Capital Corp.: | | | |
| 1.45% 1/15/31 | | 170,000 | 133,520 |
| 2.35% 3/8/27 | | 200,000 | 181,857 |
| 2.8% 3/6/23 | | 270,000 | 269,922 |
| 2.8% 9/8/27 | | 290,000 | 266,261 |
| 3.45% 1/10/24 | | 1,150,000 | 1,133,473 |
| 4.35% 9/15/32 | | 320,000 | 307,980 |
| Synchrony Financial: | | | |
| 3.95% 12/1/27 | | 380,000 | 345,439 |
| 4.375% 3/19/24 | | 100,000 | 98,612 |
| 5.15% 3/19/29 | | 109,000 | 102,570 |
| Toyota Motor Credit Corp.: | | | |
| 0.5% 8/14/23 | | 380,000 | 372,211 |
| 1.15% 8/13/27 | | 470,000 | 400,269 |
| 1.65% 1/10/31 | | 180,000 | 143,058 |
| 1.9% 9/12/31 | | 210,000 | 168,200 |
| 2.9% 4/17/24 | | 750,000 | 730,480 |
| 3.2% 1/11/27 | | 810,000 | 761,072 |
| | | | 10,901,551 |
| Diversified Financial Services - 0.6% | | | |
| AB Svensk Exportkredit 0.25% 9/29/23 | | 200,000 | 194,238 |
| Aon Corp. / Aon Global Holdings PLC 3.9% 2/28/52 | | 150,000 | 115,423 |
| Berkshire Hathaway, Inc.: | | | |
| 3.125% 3/15/26 | | 222,000 | 212,054 |
| 4.5% 2/11/43 | | 110,000 | 101,896 |
| Blackstone Private Credit Fund: | | | |
| 2.7% 1/15/25 | | 280,000 | 260,938 |
| 3.25% 3/15/27 | | 140,000 | 120,555 |
| 4.7% 3/24/25 | | 350,000 | 337,570 |
| BP Capital Markets America, Inc.: | | | |
| 2.939% 6/4/51 | | 220,000 | 146,031 |
| 3% 2/24/50 | | 130,000 | 88,099 |
| 3.06% 6/17/41 | | 400,000 | 296,004 |
| 3.379% 2/8/61 | | 110,000 | 75,869 |
| 4.812% 2/13/33 | | 150,000 | 147,339 |
| Brixmor Operating Partnership LP: | | | |
| 4.05% 7/1/30 | | 48,000 | 42,437 |
| 4.125% 6/15/26 | | 170,000 | 159,988 |
| 4.125% 5/15/29 | �� | 44,000 | 39,634 |
| Corebridge Financial, Inc.: | | | |
| 3.9% 4/5/32 (c) | | 110,000 | 96,251 |
| 4.4% 4/5/52 (c) | | 190,000 | 151,460 |
| DH Europe Finance II SARL: | | | |
| 2.2% 11/15/24 | | 110,000 | 104,668 |
| 2.6% 11/15/29 | | 110,000 | 94,962 |
| 3.4% 11/15/49 | | 80,000 | 60,474 |
| Equitable Holdings, Inc.: | | | |
| 3.9% 4/20/23 | | 1,030,000 | 1,027,306 |
| 5% 4/20/48 | | 120,000 | 106,049 |
| Fedex Corp. 2020-1 Class AA pass-thru Trust equipment trust certificate 1.875% 8/20/35 | | 216,580 | 176,206 |
| Jackson Financial, Inc.: | | | |
| 5.17% 6/8/27 | | 110,000 | 108,912 |
| 5.67% 6/8/32 | | 100,000 | 97,700 |
| Japan International Cooperation Agency 1.75% 4/28/31 | | 200,000 | 159,443 |
| KfW: | | | |
| 0.25% 10/19/23 | | 600,000 | 581,712 |
| 0.375% 7/18/25 | | 208,000 | 188,005 |
| 0.625% 1/22/26 | | 900,000 | 804,430 |
| 2.5% 11/20/24 | | 280,000 | 268,386 |
| 3% 5/20/27 | | 2,200,000 | 2,083,476 |
| Landwirtschaftliche Rentenbank 3.125% 11/14/23 | | 170,000 | 167,311 |
| National Rural Utilities Cooperative Finance Corp.: | | | |
| 4.15% 12/15/32 | | 340,000 | 312,858 |
| 5.8% 1/15/33 | | 110,000 | 113,246 |
| Voya Financial, Inc. 3.65% 6/15/26 | | 170,000 | 160,756 |
| | | | 9,201,686 |
| Insurance - 0.7% | | | |
| ACE INA Holdings, Inc.: | | | |
| 1.375% 9/15/30 | | 380,000 | 295,390 |
| 2.85% 12/15/51 | | 100,000 | 68,131 |
| 3.15% 3/15/25 | | 310,000 | 297,836 |
| 3.35% 5/15/24 | | 110,000 | 107,467 |
| 4.35% 11/3/45 | | 74,000 | 66,145 |
| Allstate Corp.: | | | |
| 1.45% 12/15/30 | | 500,000 | 383,387 |
| 5.75% 8/15/53 (b) | | 160,000 | 156,794 |
| American International Group, Inc.: | | | |
| 4.375% 6/30/50 | | 170,000 | 143,349 |
| 4.5% 7/16/44 | | 115,000 | 99,708 |
| 4.7% 7/10/35 | | 200,000 | 179,137 |
| 4.75% 4/1/48 | | 40,000 | 35,642 |
| 5.75% 4/1/48 (b) | | 190,000 | 183,350 |
| Aon PLC 4.75% 5/15/45 | | 140,000 | 123,999 |
| Arch Capital Group Ltd. 3.635% 6/30/50 | | 107,000 | 76,943 |
| Arthur J. Gallagher & Co. 5.75% 3/2/53 | | 100,000 | 99,403 |
| Athene Holding Ltd. 3.5% 1/15/31 | | 170,000 | 142,717 |
| Baylor Scott & White Holdings Series 2021, 2.839% 11/15/50 | | 250,000 | 168,586 |
| Berkshire Hathaway Finance Corp.: | | | |
| 1.45% 10/15/30 | | 900,000 | 714,186 |
| 2.85% 10/15/50 | | 180,000 | 121,532 |
| 3.85% 3/15/52 | | 140,000 | 113,027 |
| 4.2% 8/15/48 | | 130,000 | 114,891 |
| 4.25% 1/15/49 | | 100,000 | 88,886 |
| 5.75% 1/15/40 | | 100,000 | 107,243 |
| Brighthouse Financial, Inc. 5.625% 5/15/30 | | 199,000 | 195,306 |
| Brown & Brown, Inc. 4.2% 3/17/32 | | 140,000 | 122,445 |
| Fairfax Financial Holdings Ltd. 4.625% 4/29/30 | | 240,000 | 220,512 |
| Hartford Financial Services Group, Inc.: | | | |
| 2.8% 8/19/29 | | 490,000 | 421,926 |
| 4.4% 3/15/48 | | 30,000 | 25,340 |
| Lincoln National Corp. 4.35% 3/1/48 | | 210,000 | 163,581 |
| Manulife Financial Corp. 4.15% 3/4/26 | | 510,000 | 496,613 |
| Markel Corp. 5% 5/20/49 | | 120,000 | 107,110 |
| Marsh & McLennan Companies, Inc.: | | | |
| 3.5% 3/10/25 | | 190,000 | 183,145 |
| 3.875% 3/15/24 | | 170,000 | 167,144 |
| 4.2% 3/1/48 | | 40,000 | 33,521 |
| 4.375% 3/15/29 | | 120,000 | 114,248 |
| 4.75% 3/15/39 | | 120,000 | 111,656 |
| 4.9% 3/15/49 | | 120,000 | 110,827 |
| MetLife, Inc.: | | | |
| 4.125% 8/13/42 | | 180,000 | 153,529 |
| 4.55% 3/23/30 | | 110,000 | 108,021 |
| 4.6% 5/13/46 | | 272,000 | 243,282 |
| 5% 7/15/52 | | 120,000 | 114,972 |
| 6.4% 12/15/66 (b) | | 100,000 | 100,363 |
| Pricoa Global Funding I 5.625% 6/15/43 (b) | | 300,000 | 298,500 |
| Principal Financial Group, Inc.: | | | |
| 2.125% 6/15/30 | | 160,000 | 130,522 |
| 3.4% 5/15/25 | | 390,000 | 374,409 |
| Progressive Corp.: | | | |
| 2.5% 3/15/27 | | 270,000 | 246,000 |
| 3% 3/15/32 | | 160,000 | 138,427 |
| 3.2% 3/26/30 | | 200,000 | 179,640 |
| 4.2% 3/15/48 | | 100,000 | 85,511 |
| Prudential Financial, Inc.: | | | |
| 3% 3/10/40 | | 110,000 | 81,503 |
| 3.878% 3/27/28 | | 45,000 | 42,948 |
| 4.35% 2/25/50 | | 180,000 | 152,915 |
| 4.418% 3/27/48 | | 100,000 | 85,740 |
| 4.6% 5/15/44 | | 110,000 | 99,733 |
| 5.125% 3/1/52 (b) | | 140,000 | 127,939 |
| 5.7% 12/14/36 | | 120,000 | 125,040 |
| 5.7% 9/15/48 (b) | | 74,000 | 69,930 |
| The Chubb Corp. 6.5% 5/15/38 | | 58,000 | 65,309 |
| The Travelers Companies, Inc.: | | | |
| 2.55% 4/27/50 | | 100,000 | 63,663 |
| 3.05% 6/8/51 | | 100,000 | 69,698 |
| 4.05% 3/7/48 | | 74,000 | 61,993 |
| 6.25% 6/15/37 | | 256,000 | 285,838 |
| Unum Group 5.75% 8/15/42 | | 110,000 | 103,031 |
| Willis Group North America, Inc. 4.5% 9/15/28 | | 324,000 | 307,241 |
| | | | 10,276,820 |
TOTAL FINANCIALS | | | 120,490,129 |
| HEALTH CARE - 2.3% | | | |
| Biotechnology - 0.5% | | | |
| AbbVie, Inc.: | | | |
| 2.6% 11/21/24 | | 120,000 | 114,418 |
| 2.95% 11/21/26 | | 100,000 | 92,287 |
| 3.2% 11/21/29 | | 1,230,000 | 1,087,879 |
| 4.05% 11/21/39 | | 210,000 | 177,129 |
| 4.25% 11/14/28 | | 92,000 | 87,999 |
| 4.25% 11/21/49 | | 350,000 | 291,446 |
| 4.3% 5/14/36 | | 25,000 | 22,483 |
| 4.45% 5/14/46 | | 280,000 | 239,899 |
| 4.55% 3/15/35 | | 50,000 | 46,500 |
| 4.75% 3/15/45 | | 420,000 | 375,961 |
| Amgen, Inc.: | | | |
| 1.65% 8/15/28 | | 550,000 | 460,263 |
| 1.9% 2/21/25 | | 100,000 | 93,502 |
| 2.8% 8/15/41 | | 200,000 | 137,463 |
| 3.15% 2/21/40 | | 320,000 | 235,274 |
| 3.2% 11/2/27 | | 70,000 | 64,640 |
| 3.375% 2/21/50 | | 210,000 | 146,937 |
| 4.2% 3/1/33 | | 130,000 | 119,551 |
| 4.4% 5/1/45 | | 188,000 | 157,214 |
| 4.4% 2/22/62 | | 110,000 | 88,076 |
| 4.563% 6/15/48 | | 120,000 | 103,340 |
| 4.663% 6/15/51 | | 100,000 | 86,402 |
| 4.875% 3/1/53 | | 130,000 | 115,785 |
| 4.95% 10/1/41 | | 100,000 | 91,031 |
| 5.15% 3/2/28 (e) | | 400,000 | 398,417 |
| 5.25% 3/2/33 (e) | | 310,000 | 307,840 |
| 5.65% 3/2/53 (e) | | 340,000 | 337,201 |
| Biogen, Inc.: | | | |
| 2.25% 5/1/30 | | 100,000 | 80,961 |
| 3.15% 5/1/50 | | 100,000 | 66,275 |
| 3.25% 2/15/51 | | 150,000 | 101,512 |
| Gilead Sciences, Inc.: | | | |
| 1.65% 10/1/30 | | 590,000 | 466,868 |
| 2.8% 10/1/50 | | 180,000 | 116,891 |
| 4.15% 3/1/47 | | 112,000 | 93,705 |
| 4.6% 9/1/35 | | 100,000 | 95,109 |
| 4.75% 3/1/46 | | 240,000 | 216,788 |
| Regeneron Pharmaceuticals, Inc. 1.75% 9/15/30 | | 120,000 | 93,427 |
| | | | 6,810,473 |
| Health Care Equipment & Supplies - 0.2% | | | |
| Abbott Laboratories 5.3% 5/27/40 | | 390,000 | 401,289 |
| Baxter International, Inc.: | | | |
| 1.915% 2/1/27 | | 330,000 | 287,766 |
| 2.539% 2/1/32 | | 330,000 | 255,687 |
| Becton, Dickinson & Co.: | | | |
| 3.7% 6/6/27 | | 60,000 | 56,656 |
| 4.669% 6/6/47 | | 290,000 | 254,806 |
| Boston Scientific Corp.: | | | |
| 4% 3/1/29 | | 100,000 | 91,890 |
| 4.7% 3/1/49 | | 230,000 | 208,764 |
| GE Healthcare Holding LLC: | | | |
| 5.65% 11/15/27 (c) | | 120,000 | 121,608 |
| 5.905% 11/22/32 (c) | | 230,000 | 237,741 |
| 6.377% 11/22/52 (c) | | 100,000 | 107,903 |
| Medtronic, Inc. 4.375% 3/15/35 | | 280,000 | 265,319 |
| Stryker Corp.: | | | |
| 1.95% 6/15/30 | | 100,000 | 81,278 |
| 2.9% 6/15/50 | | 200,000 | 134,831 |
| Zimmer Biomet Holdings, Inc.: | | | |
| 3.55% 4/1/25 | | 175,000 | 168,397 |
| 3.55% 3/20/30 | | 194,000 | 170,042 |
| | | | 2,843,977 |
| Health Care Providers & Services - 1.0% | | | |
| Aetna, Inc. 3.875% 8/15/47 | | 180,000 | 135,544 |
| AHS Hospital Corp. 2.78% 7/1/51 | | 250,000 | 162,544 |
| Allina Health System, Inc. 3.887% 4/15/49 | | 40,000 | 32,385 |
| AmerisourceBergen Corp. 2.8% 5/15/30 | | 140,000 | 119,270 |
| Banner Health: | | | |
| 2.907% 1/1/42 | | 400,000 | 295,522 |
| 2.913% 1/1/51 | | 150,000 | 101,098 |
| Baptist Healthcare System Obli 3.54% 8/15/50 | | 125,000 | 94,045 |
| Bon Secours Mercy Health, Inc. 2.095% 6/1/31 | | 89,000 | 70,253 |
| Cardinal Health, Inc.: | | | |
| 3.41% 6/15/27 | | 290,000 | 270,177 |
| 4.368% 6/15/47 | | 30,000 | 23,953 |
| Centene Corp.: | | | |
| 2.625% 8/1/31 | | 300,000 | 233,764 |
| 3.375% 2/15/30 | | 400,000 | 337,512 |
| 4.25% 12/15/27 | | 410,000 | 378,861 |
| Children's Hospital of Philadelphia 2.704% 7/1/50 | | 98,000 | 64,236 |
| Cigna Group: | | | |
| 3.75% 7/15/23 | | 37,000 | 36,744 |
| 4.125% 11/15/25 | | 99,000 | 96,274 |
| 4.375% 10/15/28 | | 100,000 | 96,020 |
| 4.8% 8/15/38 | | 180,000 | 165,792 |
| 4.8% 7/15/46 | | 230,000 | 203,132 |
| 4.9% 12/15/48 | | 300,000 | 269,820 |
| 5.4% 3/15/33 | | 300,000 | 297,480 |
| CommonSpirit Health: | | | |
| 3.91% 10/1/50 | | 150,000 | 114,228 |
| 4.35% 11/1/42 | | 160,000 | 134,893 |
| CVS Health Corp.: | | | |
| 1.75% 8/21/30 | | 735,000 | 573,598 |
| 2.7% 8/21/40 | | 400,000 | 270,223 |
| 2.875% 6/1/26 | | 60,000 | 55,801 |
| 3% 8/15/26 | | 38,000 | 35,259 |
| 3.25% 8/15/29 | | 250,000 | 220,759 |
| 4.125% 4/1/40 | | 100,000 | 82,062 |
| 4.78% 3/25/38 | | 512,000 | 465,120 |
| 5.05% 3/25/48 | | 250,000 | 224,375 |
| 5.125% 7/20/45 | | 100,000 | 90,309 |
| 6.125% 9/15/39 | | 100,000 | 101,816 |
| Elevance Health, Inc.: | | | |
| 2.375% 1/15/25 | | 1,100,000 | 1,041,353 |
| 4.101% 3/1/28 | | 130,000 | 124,074 |
| 4.55% 3/1/48 | | 80,000 | 69,109 |
| 4.625% 5/15/42 | | 150,000 | 135,307 |
| 5.1% 1/15/44 | | 132,000 | 124,458 |
| 6.1% 10/15/52 | | 290,000 | 310,540 |
| Franciscan Missionaries of Our Lady Health System, Inc. 3.914% 7/1/49 | | 120,000 | 92,746 |
| HCA Holdings, Inc.: | | | |
| 4.125% 6/15/29 | | 242,000 | 220,284 |
| 5.125% 6/15/39 | | 100,000 | 88,955 |
| 5.25% 6/15/49 | | 120,000 | 103,500 |
| 5.5% 6/15/47 | | 610,000 | 548,585 |
| Humana, Inc.: | | | |
| 1.35% 2/3/27 | | 170,000 | 146,359 |
| 2.15% 2/3/32 | | 170,000 | 131,246 |
| 3.125% 8/15/29 | | 100,000 | 87,218 |
| 3.95% 8/15/49 | | 100,000 | 78,393 |
| Indiana University Health, Inc. 2.852% 11/1/51 | | 200,000 | 134,867 |
| INTEGRIS Baptist Medical Center, Inc. 3.875% 8/15/50 | | 104,000 | 77,825 |
| Kaiser Foundation Hospitals: | | | |
| 2.81% 6/1/41 | | 290,000 | 212,697 |
| 3.266% 11/1/49 | | 110,000 | 81,796 |
| 4.15% 5/1/47 | | 60,000 | 52,785 |
| Memorial Sloan-Kettring Cancer Center 2.955% 1/1/50 | | 160,000 | 110,006 |
| MidMichigan Health 3.409% 6/1/50 | | 42,000 | 29,699 |
| Novant Health, Inc. 3.168% 11/1/51 | | 110,000 | 77,536 |
| Orlando Health Obligated Group 3.327% 10/1/50 | | 68,000 | 48,936 |
| Piedmont Healthcare, Inc. 2.719% 1/1/42 | | 150,000 | 103,455 |
| Providence St. Joseph Health Obligated Group 2.7% 10/1/51 | | 280,000 | 166,500 |
| Sutter Health 3.361% 8/15/50 | | 170,000 | 121,605 |
| Trinity Health Corp. 2.632% 12/1/40 | | 50,000 | 35,546 |
| UnitedHealth Group, Inc.: | | | |
| 1.25% 1/15/26 | | 223,000 | 201,447 |
| 2% 5/15/30 | | 170,000 | 139,395 |
| 2.3% 5/15/31 | | 270,000 | 222,555 |
| 2.375% 8/15/24 | | 100,000 | 95,996 |
| 2.875% 8/15/29 | | 150,000 | 131,971 |
| 2.9% 5/15/50 | | 307,000 | 207,944 |
| 3.05% 5/15/41 | | 100,000 | 75,142 |
| 3.25% 5/15/51 | | 100,000 | 71,617 |
| 3.375% 4/15/27 | | 220,000 | 207,359 |
| 3.45% 1/15/27 | | 370,000 | 350,710 |
| 3.5% 2/15/24 | | 100,000 | 98,293 |
| 3.7% 8/15/49 | | 90,000 | 70,544 |
| 3.85% 6/15/28 | | 240,000 | 227,658 |
| 4.45% 12/15/48 | | 68,000 | 60,413 |
| 4.75% 7/15/45 | | 182,000 | 171,001 |
| 4.95% 5/15/62 | | 160,000 | 150,590 |
| 5.25% 2/15/28 | | 100,000 | 101,360 |
| 5.35% 2/15/33 | | 100,000 | 102,297 |
| 5.95% 2/15/41 | | 100,000 | 106,086 |
| 6.05% 2/15/63 | | 210,000 | 229,835 |
| 6.625% 11/15/37 | | 310,000 | 349,242 |
| 6.875% 2/15/38 | | 126,000 | 145,931 |
| West Virginia University Health System Obligated Group 3.129% 6/1/50 | | 70,000 | 46,068 |
| | | | 13,971,703 |
| Life Sciences Tools & Services - 0.0% | | | |
| Danaher Corp. 2.6% 10/1/50 | | 245,000 | 156,450 |
| PerkinElmer, Inc.: | | | |
| 0.85% 9/15/24 | | 100,000 | 93,045 |
| 2.25% 9/15/31 | | 100,000 | 77,548 |
| Thermo Fisher Scientific, Inc.: | | | |
| 2.6% 10/1/29 | | 300,000 | 259,688 |
| 2.8% 10/15/41 | | 180,000 | 129,897 |
| | | | 716,628 |
| Pharmaceuticals - 0.6% | | | |
| AstraZeneca Finance LLC: | | | |
| 1.2% 5/28/26 | | 170,000 | 150,579 |
| 2.25% 5/28/31 | | 170,000 | 141,534 |
| 4.875% 3/3/33 | | 380,000 | 376,153 |
| AstraZeneca PLC: | | | |
| 1.375% 8/6/30 | | 240,000 | 189,482 |
| 3.125% 6/12/27 | | 140,000 | 131,166 |
| 4% 9/18/42 | | 100,000 | 87,271 |
| 6.45% 9/15/37 | | 149,000 | 168,415 |
| Bayer U.S. Finance II LLC 2.85% 4/15/25 (c) | | 177,000 | 166,718 |
| Bristol-Myers Squibb Co.: | | | |
| 2.35% 11/13/40 | | 210,000 | 143,590 |
| 2.55% 11/13/50 | | 410,000 | 260,834 |
| 2.9% 7/26/24 | | 160,000 | 155,082 |
| 3.2% 6/15/26 | | 66,000 | 62,483 |
| 3.4% 7/26/29 | | 31,000 | 28,441 |
| 3.9% 2/20/28 | | 270,000 | 258,545 |
| 3.9% 3/15/62 | | 120,000 | 93,902 |
| 4.125% 6/15/39 | | 100,000 | 89,246 |
| 4.25% 10/26/49 | | 100,000 | 86,345 |
| 4.35% 11/15/47 | | 100,000 | 87,995 |
| 4.55% 2/20/48 | | 159,000 | 144,813 |
| Eli Lilly & Co.: | | | |
| 2.25% 5/15/50 | | 200,000 | 125,630 |
| 3.95% 3/15/49 | | 100,000 | 88,581 |
| 4.15% 3/15/59 | | 100,000 | 87,522 |
| 4.875% 2/27/53 | | 60,000 | 59,899 |
| GlaxoSmithKline Capital PLC 3% 6/1/24 | | 310,000 | 301,839 |
| GlaxoSmithKline Capital, Inc. 6.375% 5/15/38 | | 151,000 | 170,603 |
| GSK Consumer Healthcare Capital 3.125% 3/24/25 | | 340,000 | 323,290 |
| GSK Consumer Healthcare Capital U.S. LLC: | | | |
| 3.375% 3/24/27 | | 250,000 | 232,460 |
| 3.625% 3/24/32 | | 250,000 | 218,371 |
| Johnson & Johnson: | | | |
| 0.55% 9/1/25 | | 100,000 | 90,246 |
| 1.3% 9/1/30 | | 100,000 | 80,359 |
| 2.1% 9/1/40 | | 440,000 | 301,785 |
| 2.25% 9/1/50 | | 100,000 | 63,498 |
| 2.45% 9/1/60 | | 200,000 | 122,598 |
| 3.4% 1/15/38 | | 238,000 | 202,476 |
| 4.5% 12/5/43 | | 100,000 | 97,013 |
| Merck & Co., Inc.: | | | |
| 2.35% 6/24/40 | | 210,000 | 146,090 |
| 2.45% 6/24/50 | | 200,000 | 127,267 |
| 2.75% 12/10/51 | | 150,000 | 100,305 |
| 3.6% 9/15/42 | | 130,000 | 106,145 |
| 3.7% 2/10/45 | | 322,000 | 265,027 |
| Mylan NV: | | | |
| 5.2% 4/15/48 | | 74,000 | 56,516 |
| 5.4% 11/29/43 | | 100,000 | 80,954 |
| Novartis Capital Corp.: | | | |
| 2.75% 8/14/50 | | 150,000 | 104,200 |
| 4.4% 5/6/44 | | 120,000 | 111,298 |
| Pfizer, Inc.: | | | |
| 2.55% 5/28/40 | | 120,000 | 86,722 |
| 2.7% 5/28/50 | | 100,000 | 68,300 |
| 3.2% 9/15/23 | | 80,000 | 79,166 |
| 3.45% 3/15/29 | | 100,000 | 93,212 |
| 3.9% 3/15/39 | | 70,000 | 61,052 |
| 4% 12/15/36 | | 190,000 | 173,813 |
| 4.3% 6/15/43 | | 106,000 | 96,622 |
| 4.4% 5/15/44 | | 110,000 | 101,661 |
| 7.2% 3/15/39 | | 230,000 | 279,997 |
| Pharmacia LLC 6.6% 12/1/28 (b) | | 190,000 | 207,258 |
| Shire Acquisitions Investments Ireland DAC 3.2% 9/23/26 | | 444,000 | 413,314 |
| Takeda Pharmaceutical Co. Ltd. 3.025% 7/9/40 | | 330,000 | 241,724 |
| Viatris, Inc.: | | | |
| 2.7% 6/22/30 | | 428,000 | 339,306 |
| 3.85% 6/22/40 | | 100,000 | 68,204 |
| 4% 6/22/50 | | 70,000 | 45,151 |
| Wyeth LLC 5.95% 4/1/37 | | 50,000 | 53,607 |
| Zoetis, Inc.: | | | |
| 3% 9/12/27 | | 50,000 | 46,124 |
| 3.95% 9/12/47 | | 180,000 | 144,372 |
| | | | 9,086,171 |
TOTAL HEALTH CARE | | | 33,428,952 |
| INDUSTRIALS - 1.9% | | | |
| Aerospace & Defense - 0.5% | | | |
| General Dynamics Corp.: | | | |
| 3.25% 4/1/25 | | 1,040,000 | 1,001,549 |
| 3.75% 5/15/28 | | 100,000 | 95,071 |
| 4.25% 4/1/40 | | 104,000 | 94,387 |
| 4.25% 4/1/50 | | 30,000 | 26,777 |
| L3Harris Technologies, Inc. 1.8% 1/15/31 | | 435,000 | 339,092 |
| Lockheed Martin Corp.: | | | |
| 4.07% 12/15/42 | | 110,000 | 96,141 |
| 4.09% 9/15/52 | | 119,000 | 102,197 |
| 4.15% 6/15/53 | | 150,000 | 128,971 |
| 4.7% 5/15/46 | | 136,000 | 128,523 |
| 5.9% 11/15/63 | | 150,000 | 165,588 |
| 6.15% 9/1/36 | | 100,000 | 108,832 |
| Northrop Grumman Corp.: | | | |
| 3.25% 1/15/28 | | 100,000 | 92,327 |
| 4.03% 10/15/47 | | 178,000 | 147,185 |
| 4.75% 6/1/43 | | 110,000 | 100,645 |
| 5.15% 5/1/40 | | 150,000 | 145,478 |
| Raytheon Technologies Corp.: | | | |
| 1.9% 9/1/31 | | 470,000 | 367,424 |
| 2.82% 9/1/51 | | 210,000 | 138,105 |
| 3.65% 8/16/23 | | 13,000 | 12,892 |
| 3.75% 11/1/46 | | 100,000 | 78,731 |
| 3.95% 8/16/25 | | 80,000 | 77,744 |
| 4.125% 11/16/28 | | 400,000 | 380,735 |
| 4.35% 4/15/47 | | 100,000 | 87,089 |
| 4.45% 11/16/38 | | 360,000 | 325,630 |
| 4.5% 6/1/42 | | 40,000 | 35,956 |
| 5.7% 4/15/40 | | 160,000 | 163,608 |
| The Boeing Co.: | | | |
| 2.75% 2/1/26 | | 140,000 | 129,752 |
| 2.8% 3/1/23 | | 270,000 | 270,000 |
| 2.95% 2/1/30 | | 220,000 | 187,293 |
| 3.2% 3/1/29 | | 320,000 | 281,463 |
| 3.375% 6/15/46 | | 120,000 | 79,970 |
| 3.75% 2/1/50 | | 70,000 | 49,245 |
| 4.875% 5/1/25 | | 1,090,000 | 1,074,741 |
| 5.705% 5/1/40 | | 700,000 | 666,413 |
| 5.805% 5/1/50 | | 320,000 | 304,392 |
| 6.875% 3/15/39 | | 160,000 | 171,051 |
| | | | 7,654,997 |
| Air Freight & Logistics - 0.1% | | | |
| FedEx Corp.: | | | |
| 2.4% 5/15/31 | | 200,000 | 162,555 |
| 3.25% 5/15/41 | | 180,000 | 129,645 |
| 4.05% 2/15/48 | | 80,000 | 61,400 |
| 4.1% 2/1/45 | | 130,000 | 101,289 |
| 4.25% 5/15/30 | | 130,000 | 121,941 |
| 4.9% 1/15/34 | | 100,000 | 95,865 |
| 4.95% 10/17/48 | | 80,000 | 70,941 |
| 5.25% 5/15/50 | | 98,000 | 90,914 |
| United Parcel Service, Inc.: | | | |
| 3.05% 11/15/27 | | 150,000 | 139,184 |
| 3.9% 4/1/25 | | 350,000 | 342,038 |
| 4.45% 4/1/30 | | 150,000 | 146,742 |
| 5.2% 4/1/40 | | 100,000 | 100,711 |
| 5.3% 4/1/50 | | 82,000 | 84,699 |
| 6.2% 1/15/38 | | 234,000 | 258,729 |
| | | | 1,906,653 |
| Airlines - 0.0% | | | |
| American Airlines Pass Through Trust equipment trust certificate 2.875% 1/11/36 | | 204,370 | 168,408 |
| Southwest Airlines Co.: | | | |
| 5.125% 6/15/27 | | 251,000 | 247,400 |
| 5.25% 5/4/25 | | 130,000 | 129,462 |
| United Airlines 2020-1 Class B Pass Through Trust 4.875% 7/15/27 | | 141,806 | 137,453 |
| | | | 682,723 |
| Building Products - 0.1% | | | |
| Carrier Global Corp.: | | | |
| 2.242% 2/15/25 | | 300,000 | 281,755 |
| 2.493% 2/15/27 | | 100,000 | 90,131 |
| 2.722% 2/15/30 | | 100,000 | 84,386 |
| 3.377% 4/5/40 | | 150,000 | 112,190 |
| 3.577% 4/5/50 | | 100,000 | 72,011 |
| Johnson Controls International PLC/Tyco Fire & Security Finance SCA: | | | |
| 1.75% 9/15/30 | | 300,000 | 239,906 |
| 2% 9/16/31 | | 180,000 | 142,119 |
| Masco Corp.: | | | |
| 2% 2/15/31 | | 90,000 | 69,673 |
| 3.125% 2/15/51 | | 50,000 | 31,690 |
| Owens Corning: | | | |
| 3.4% 8/15/26 | | 100,000 | 93,611 |
| 4.3% 7/15/47 | | 110,000 | 87,841 |
| | | | 1,305,313 |
| Commercial Services & Supplies - 0.1% | | | |
| Republic Services, Inc.: | | | |
| 1.45% 2/15/31 | | 400,000 | 306,592 |
| 3.95% 5/15/28 | | 200,000 | 189,425 |
| Waste Management, Inc.: | | | |
| 1.5% 3/15/31 | | 140,000 | 107,774 |
| 2.4% 5/15/23 | | 250,000 | 248,471 |
| 2.5% 11/15/50 | | 150,000 | 94,034 |
| 3.15% 11/15/27 | | 50,000 | 46,242 |
| | | | 992,538 |
| Electrical Equipment - 0.0% | | | |
| Eaton Corp.: | | | |
| 4.15% 3/15/33 | | 230,000 | 211,909 |
| 4.15% 11/2/42 | | 100,000 | 85,160 |
| Emerson Electric Co. 2.8% 12/21/51 | | 220,000 | 141,724 |
| | | | 438,793 |
| Industrial Conglomerates - 0.2% | | | |
| 3M Co.: | | | |
| 2.25% 9/19/26 | | 330,000 | 299,216 |
| 2.375% 8/26/29 | | 270,000 | 226,660 |
| 2.875% 10/15/27 | | 210,000 | 191,078 |
| 3.25% 8/26/49 | | 100,000 | 69,524 |
| 3.375% 3/1/29 | | 110,000 | 99,467 |
| 3.7% 4/15/50 | | 96,000 | 74,344 |
| 5.7% 3/15/37 | | 100,000 | 101,403 |
| General Electric Co.: | | | |
| 4.25% 5/1/40 | | 50,000 | 41,193 |
| 4.35% 5/1/50 | | 170,000 | 142,955 |
| 4.5% 3/11/44 | | 200,000 | 173,599 |
| Honeywell International, Inc.: | | | |
| 1.35% 6/1/25 | | 100,000 | 92,293 |
| 1.95% 6/1/30 | | 100,000 | 82,675 |
| 2.3% 8/15/24 | | 190,000 | 182,294 |
| 2.7% 8/15/29 | | 110,000 | 96,670 |
| 2.8% 6/1/50 | | 200,000 | 144,413 |
| 5% 2/15/33 | | 210,000 | 212,186 |
| | | | 2,229,970 |
| Machinery - 0.3% | | | |
| Caterpillar Financial Services Corp.: | | | |
| 0.45% 9/14/23 | | 190,000 | 185,287 |
| 0.45% 5/17/24 | | 670,000 | 632,838 |
| 1.1% 9/14/27 | | 540,000 | 461,772 |
| Caterpillar, Inc.: | | | |
| 2.6% 4/9/30 | | 210,000 | 183,050 |
| 3.25% 9/19/49 | | 170,000 | 129,597 |
| 3.25% 4/9/50 | | 130,000 | 99,706 |
| Cummins, Inc. 1.5% 9/1/30 | | 190,000 | 150,325 |
| Deere & Co. 2.875% 9/7/49 | | 190,000 | 137,394 |
| Illinois Tool Works, Inc.: | | | |
| 3.5% 3/1/24 | | 450,000 | 443,930 |
| 3.9% 9/1/42 | | 100,000 | 86,402 |
| Ingersoll-Rand Luxembourg Finance SA 3.8% 3/21/29 | | 180,000 | 165,750 |
| Otis Worldwide Corp.: | | | |
| 2.565% 2/15/30 | | 100,000 | 84,259 |
| 3.362% 2/15/50 | | 80,000 | 56,772 |
| Parker Hannifin Corp.: | | | |
| 2.7% 6/14/24 | | 300,000 | 289,551 |
| 3.25% 6/14/29 | | 210,000 | 186,560 |
| 4% 6/14/49 | | 110,000 | 88,267 |
| Stanley Black & Decker, Inc.: | | | |
| 2.75% 11/15/50 | | 151,000 | 90,421 |
| 3% 5/15/32 | | 120,000 | 97,783 |
| | | | 3,569,664 |
| Professional Services - 0.1% | | | |
| Thomson Reuters Corp. 4.3% 11/23/23 | | 1,200,000 | 1,190,200 |
| Road & Rail - 0.4% | | | |
| Burlington Northern Santa Fe LLC: | | | |
| 3.05% 2/15/51 | | 30,000 | 20,694 |
| 3.25% 6/15/27 | | 550,000 | 519,417 |
| 3.3% 9/15/51 | | 140,000 | 101,843 |
| 4.05% 6/15/48 | | 182,000 | 152,423 |
| 4.15% 12/15/48 | | 100,000 | 84,821 |
| 4.45% 3/15/43 | | 151,000 | 134,634 |
| 5.15% 9/1/43 | | 100,000 | 98,054 |
| 5.75% 5/1/40 | | 100,000 | 104,048 |
| Canadian National Railway Co.: | | | |
| 2.45% 5/1/50 | | 150,000 | 91,825 |
| 3.65% 2/3/48 | | 100,000 | 80,189 |
| Canadian Pacific Railway Co.: | | | |
| 1.75% 12/2/26 | | 200,000 | 177,115 |
| 2.45% 12/2/31 | | 200,000 | 166,552 |
| 3.1% 12/2/51 | | 200,000 | 136,491 |
| 4.8% 8/1/45 | | 230,000 | 208,093 |
| CSX Corp.: | | | |
| 3.35% 11/1/25 | | 250,000 | 238,671 |
| 3.8% 3/1/28 | | 50,000 | 47,503 |
| 4.25% 3/15/29 | | 150,000 | 142,327 |
| 4.3% 3/1/48 | | 210,000 | 178,663 |
| 4.65% 3/1/68 | | 230,000 | 195,272 |
| 4.75% 11/15/48 | | 160,000 | 144,454 |
| 6.15% 5/1/37 | | 100,000 | 105,552 |
| Kansas City Southern 3.5% 5/1/50 | | 160,000 | 116,452 |
| Norfolk Southern Corp.: | | | |
| 2.9% 6/15/26 | | 370,000 | 343,671 |
| 3.155% 5/15/55 | | 100,000 | 65,793 |
| 3.8% 8/1/28 | | 72,000 | 67,254 |
| 3.95% 10/1/42 | | 305,000 | 250,690 |
| 4.1% 5/15/21 | | 200,000 | 136,655 |
| 4.15% 2/28/48 | | 100,000 | 81,592 |
| Union Pacific Corp.: | | | |
| 2.15% 2/5/27 | | 120,000 | 108,487 |
| 2.75% 3/1/26 | | 360,000 | 337,442 |
| 2.891% 4/6/36 | | 390,000 | 307,120 |
| 3.25% 2/5/50 | | 270,000 | 194,748 |
| 3.375% 2/14/42 | | 150,000 | 117,827 |
| 3.646% 2/15/24 | | 180,000 | 177,030 |
| 3.799% 4/6/71 | | 170,000 | 124,330 |
| 3.85% 2/14/72 | | 230,000 | 171,075 |
| 4% 4/15/47 | | 90,000 | 73,875 |
| 5.15% 1/20/63 | | 150,000 | 144,234 |
| | | | 5,946,916 |
| Trading Companies & Distributors - 0.1% | | | |
| Air Lease Corp.: | | | |
| 0.7% 2/15/24 | | 680,000 | 647,985 |
| 2.2% 1/15/27 | | 140,000 | 122,998 |
| 3.625% 12/1/27 | | 140,000 | 127,267 |
| 4.625% 10/1/28 | | 350,000 | 326,851 |
| W.W. Grainger, Inc. 3.75% 5/15/46 | | 120,000 | 95,134 |
| | | | 1,320,235 |
TOTAL INDUSTRIALS | | | 27,238,002 |
| INFORMATION TECHNOLOGY - 2.4% | | | |
| Communications Equipment - 0.0% | | | |
| Cisco Systems, Inc.: | | | |
| 5.5% 1/15/40 | | 192,000 | 201,810 |
| 5.9% 2/15/39 | | 100,000 | 109,392 |
| | | | 311,202 |
| Electronic Equipment & Components - 0.1% | | | |
| Corning, Inc. 5.35% 11/15/48 | | 300,000 | 287,302 |
| Dell International LLC/EMC Corp.: | | | |
| 4.9% 10/1/26 | | 450,000 | 440,092 |
| 5.3% 10/1/29 | | 90,000 | 86,958 |
| 5.45% 6/15/23 | | 60,000 | 59,958 |
| 8.1% 7/15/36 | | 310,000 | 346,425 |
| 8.35% 7/15/46 | | 92,000 | 104,438 |
| Teledyne Technologies, Inc. 2.75% 4/1/31 | | 100,000 | 81,808 |
| Vontier Corp. 1.8% 4/1/26 | | 180,000 | 156,559 |
| | | | 1,563,540 |
| IT Services - 0.5% | | | |
| CDW LLC/CDW Finance Corp. 2.67% 12/1/26 | | 430,000 | 381,882 |
| Fidelity National Information Services, Inc.: | | | |
| 1.15% 3/1/26 | | 246,000 | 215,702 |
| 2.25% 3/1/31 | | 200,000 | 157,326 |
| 5.625% 7/15/52 | | 100,000 | 93,415 |
| Fiserv, Inc.: | | | |
| 2.25% 6/1/27 | | 100,000 | 88,729 |
| 2.75% 7/1/24 | | 370,000 | 356,246 |
| 3.5% 7/1/29 | | 520,000 | 464,975 |
| 4.4% 7/1/49 | | 100,000 | 80,850 |
| Global Payments, Inc.: | | | |
| 1.2% 3/1/26 | | 350,000 | 305,959 |
| 2.9% 5/15/30 | | 310,000 | 255,098 |
| 5.95% 8/15/52 | | 100,000 | 92,456 |
| IBM Corp.: | | | |
| 1.95% 5/15/30 | | 100,000 | 80,607 |
| 2.85% 5/15/40 | | 110,000 | 78,619 |
| 2.95% 5/15/50 | | 100,000 | 65,040 |
| 3% 5/15/24 | | 100,000 | 97,219 |
| 3.5% 5/15/29 | | 170,000 | 155,040 |
| 3.625% 2/12/24 | | 1,460,000 | 1,434,631 |
| 4.15% 5/15/39 | | 200,000 | 169,598 |
| 4.7% 2/19/46 | | 204,000 | 178,365 |
| 5.6% 11/30/39 | | 180,000 | 180,204 |
| MasterCard, Inc.: | | | |
| 3.85% 3/26/50 | | 310,000 | 261,099 |
| 3.95% 2/26/48 | | 100,000 | 86,281 |
| PayPal Holdings, Inc.: | | | |
| 1.65% 6/1/25 | | 80,000 | 74,137 |
| 2.3% 6/1/30 | | 130,000 | 107,200 |
| 2.85% 10/1/29 | | 280,000 | 243,028 |
| 5.05% 6/1/52 | | 160,000 | 145,678 |
| The Western Union Co. 2.85% 1/10/25 | | 100,000 | 94,975 |
| Visa, Inc.: | | | |
| 2% 8/15/50 | | 100,000 | 59,303 |
| 2.05% 4/15/30 | | 430,000 | 363,410 |
| 2.7% 4/15/40 | | 120,000 | 89,901 |
| 3.15% 12/14/25 | | 160,000 | 152,724 |
| 4.3% 12/14/45 | | 402,000 | 362,822 |
| | | | 6,972,519 |
| Semiconductors & Semiconductor Equipment - 0.5% | | | |
| Analog Devices, Inc.: | | | |
| 2.1% 10/1/31 | | 140,000 | 113,322 |
| 2.8% 10/1/41 | | 150,000 | 108,810 |
| 2.95% 4/1/25 | | 240,000 | 229,430 |
| Applied Materials, Inc.: | | | |
| 4.35% 4/1/47 | | 90,000 | 80,799 |
| 5.1% 10/1/35 | | 120,000 | 120,334 |
| Broadcom Corp./Broadcom Cayman LP 3.875% 1/15/27 | | 100,000 | 94,314 |
| Broadcom, Inc.: | | | |
| 2.45% 2/15/31 (c) | | 160,000 | 126,782 |
| 2.6% 2/15/33 (c) | | 100,000 | 75,578 |
| 3.137% 11/15/35 (c) | | 100,000 | 73,718 |
| 3.15% 11/15/25 | | 230,000 | 216,596 |
| 3.419% 4/15/33 (c) | | 190,000 | 152,969 |
| 3.459% 9/15/26 | | 432,000 | 403,797 |
| 3.469% 4/15/34 (c) | | 230,000 | 182,038 |
| 3.75% 2/15/51 (c) | | 420,000 | 292,750 |
| 4.15% 4/15/32 (c) | | 100,000 | 88,149 |
| 4.3% 11/15/32 | | 410,000 | 363,342 |
| 4.926% 5/15/37 (c) | | 100,000 | 86,983 |
| 5% 4/15/30 | | 292,000 | 280,323 |
| Intel Corp.: | | | |
| 2% 8/12/31 | | 50,000 | 39,235 |
| 2.45% 11/15/29 | | 720,000 | 605,506 |
| 3.05% 8/12/51 | | 50,000 | 32,038 |
| 3.25% 11/15/49 | | 180,000 | 120,172 |
| 3.734% 12/8/47 | | 110,000 | 81,294 |
| 4.6% 3/25/40 | | 110,000 | 98,769 |
| 4.75% 3/25/50 | | 390,000 | 337,702 |
| 4.875% 2/10/28 | | 120,000 | 118,247 |
| 5.05% 8/5/62 | | 240,000 | 210,140 |
| 5.2% 2/10/33 | | 80,000 | 78,505 |
| 5.7% 2/10/53 | | 120,000 | 117,261 |
| Lam Research Corp. 2.875% 6/15/50 | | 150,000 | 100,074 |
| Marvell Technology, Inc. 2.45% 4/15/28 | | 120,000 | 102,653 |
| Micron Technology, Inc.: | | | |
| 4.663% 2/15/30 | | 120,000 | 110,369 |
| 5.327% 2/6/29 | | 310,000 | 302,824 |
| NVIDIA Corp.: | | | |
| 2% 6/15/31 | | 480,000 | 388,113 |
| 3.5% 4/1/50 | | 167,000 | 129,506 |
| NXP BV/NXP Funding LLC/NXP U.S.A., Inc.: | | | |
| 2.65% 2/15/32 | | 300,000 | 234,120 |
| 3.25% 5/11/41 | | 190,000 | 131,373 |
| 3.875% 6/18/26 | | 140,000 | 132,696 |
| 4.3% 6/18/29 | | 100,000 | 91,875 |
| Qualcomm, Inc.: | | | |
| 4.3% 5/20/47 | | 213,000 | 186,227 |
| 4.5% 5/20/52 | | 180,000 | 160,154 |
| 4.8% 5/20/45 | | 130,000 | 123,201 |
| Texas Instruments, Inc.: | | | |
| 2.9% 11/3/27 | | 160,000 | 148,040 |
| 3.875% 3/15/39 | | 210,000 | 185,672 |
| | | | 7,455,800 |
| Software - 0.7% | | | |
| Adobe, Inc. 2.15% 2/1/27 | | 240,000 | 218,097 |
| Microsoft Corp.: | | | |
| 2.4% 8/8/26 | | 520,000 | 482,288 |
| 2.525% 6/1/50 | | 280,000 | 186,984 |
| 2.675% 6/1/60 | | 200,000 | 129,597 |
| 2.921% 3/17/52 | | 170,000 | 122,303 |
| 3.3% 2/6/27 | | 1,650,000 | 1,576,419 |
| 3.45% 8/8/36 | | 610,000 | 534,326 |
| 3.75% 2/12/45 | | 100,000 | 85,909 |
| 5.3% 2/8/41 | | 280,000 | 299,996 |
| Oracle Corp.: | | | |
| 2.5% 4/1/25 | | 1,290,000 | 1,216,248 |
| 2.65% 7/15/26 | | 100,000 | 91,377 |
| 2.875% 3/25/31 | | 690,000 | 572,056 |
| 3.25% 11/15/27 | | 600,000 | 548,819 |
| 3.6% 4/1/40 | | 230,000 | 169,781 |
| 3.6% 4/1/50 | | 210,000 | 142,229 |
| 3.8% 11/15/37 | | 100,000 | 79,181 |
| 3.85% 4/1/60 | | 70,000 | 46,658 |
| 3.9% 5/15/35 | | 100,000 | 83,044 |
| 3.95% 3/25/51 | | 200,000 | 143,657 |
| 4% 11/15/47 | | 388,000 | 283,708 |
| 4.1% 3/25/61 | | 720,000 | 500,641 |
| 4.375% 5/15/55 | | 200,000 | 151,709 |
| 5.375% 7/15/40 | | 120,000 | 109,918 |
| 6.125% 7/8/39 | | 114,000 | 113,565 |
| 6.25% 11/9/32 | | 150,000 | 156,106 |
| Roper Technologies, Inc.: | | | |
| 1% 9/15/25 | | 60,000 | 54,053 |
| 1.4% 9/15/27 | | 60,000 | 50,890 |
| 1.75% 2/15/31 | | 60,000 | 46,271 |
| 2% 6/30/30 | | 400,000 | 322,106 |
| Salesforce.com, Inc.: | | | |
| 1.95% 7/15/31 | | 100,000 | 80,201 |
| 2.9% 7/15/51 | | 300,000 | 201,821 |
| 3.7% 4/11/28 | | 140,000 | 133,374 |
| VMware, Inc. 1.4% 8/15/26 | | 690,000 | 595,900 |
| | | | 9,529,232 |
| Technology Hardware, Storage & Peripherals - 0.6% | | | |
| Apple, Inc.: | | | |
| 0.7% 2/8/26 | | 2,500,000 | 2,218,493 |
| 1.125% 5/11/25 | | 500,000 | 461,771 |
| 1.7% 8/5/31 | | 280,000 | 222,817 |
| 2.05% 9/11/26 | | 290,000 | 264,066 |
| 2.375% 2/8/41 | | 440,000 | 311,075 |
| 2.55% 8/20/60 | | 110,000 | 68,214 |
| 2.85% 8/5/61 | | 490,000 | 318,334 |
| 2.95% 9/11/49 | | 180,000 | 129,494 |
| 3% 2/9/24 | | 650,000 | 636,882 |
| 3% 11/13/27 | | 890,000 | 828,994 |
| 3.35% 2/9/27 | | 240,000 | 228,716 |
| 3.75% 11/13/47 | | 90,000 | 75,191 |
| 4.375% 5/13/45 | | 120,000 | 110,206 |
| 4.45% 5/6/44 | | 100,000 | 95,261 |
| 4.5% 2/23/36 | | 110,000 | 107,809 |
| 4.65% 2/23/46 | | 201,000 | 191,372 |
| Hewlett Packard Enterprise Co. 4.9% 10/15/25 (b) | | 1,108,000 | 1,098,719 |
| HP, Inc.: | | | |
| 2.2% 6/17/25 | | 190,000 | 177,467 |
| 2.65% 6/17/31 | | 210,000 | 165,099 |
| 3.4% 6/17/30 | | 250,000 | 213,371 |
| 4.2% 4/15/32 | | 140,000 | 120,396 |
| 5.5% 1/15/33 | | 100,000 | 94,480 |
| | | | 8,138,227 |
TOTAL INFORMATION TECHNOLOGY | | | 33,970,520 |
| MATERIALS - 0.7% | | | |
| Chemicals - 0.4% | | | |
| Air Products & Chemicals, Inc.: | | | |
| 1.5% 10/15/25 | | 100,000 | 91,225 |
| 2.05% 5/15/30 | | 40,000 | 33,435 |
| 2.7% 5/15/40 | | 40,000 | 29,537 |
| 2.8% 5/15/50 | | 40,000 | 27,655 |
| Celanese U.S. Holdings LLC 6.165% 7/15/27 | | 520,000 | 516,146 |
| CF Industries Holdings, Inc. 5.375% 3/15/44 | | 130,000 | 114,680 |
| DuPont de Nemours, Inc.: | | | |
| 4.493% 11/15/25 | | 320,000 | 314,516 |
| 4.725% 11/15/28 | | 100,000 | 98,372 |
| 5.319% 11/15/38 | | 310,000 | 300,860 |
| Eastman Chemical Co. 4.5% 12/1/28 | | 226,000 | 215,929 |
| Ecolab, Inc.: | | | |
| 1.3% 1/30/31 | | 400,000 | 305,707 |
| 2.125% 8/15/50 | | 150,000 | 85,887 |
| International Flavors & Fragrances, Inc. 4.45% 9/26/28 | | 130,000 | 121,037 |
| Linde, Inc./Connecticut 3.2% 1/30/26 | | 230,000 | 221,322 |
| LYB International Finance BV 4% 7/15/23 | | 87,000 | 86,583 |
| LYB International Finance II BV 3.5% 3/2/27 | | 680,000 | 634,300 |
| LYB International Finance III LLC: | | | |
| 3.375% 10/1/40 | | 110,000 | 78,987 |
| 3.625% 4/1/51 | | 110,000 | 75,626 |
| 3.8% 10/1/60 | | 100,000 | 66,784 |
| Nutrien Ltd.: | | | |
| 3.95% 5/13/50 | | 170,000 | 129,589 |
| 4.125% 3/15/35 | | 150,000 | 129,716 |
| 4.2% 4/1/29 | | 32,000 | 30,184 |
| 5% 4/1/49 | | 56,000 | 50,492 |
| Rohm & Haas Co. 7.85% 7/15/29 | | 120,000 | 132,961 |
| Sherwin-Williams Co.: | | | |
| 3.125% 6/1/24 | | 160,000 | 155,599 |
| 3.45% 6/1/27 | | 210,000 | 196,772 |
| 4.5% 6/1/47 | | 200,000 | 167,579 |
| The Dow Chemical Co.: | | | |
| 2.1% 11/15/30 | | 450,000 | 363,309 |
| 3.6% 11/15/50 | | 170,000 | 122,532 |
| 5.55% 11/30/48 | | 80,000 | 76,744 |
| The Mosaic Co. 4.05% 11/15/27 | | 170,000 | 160,919 |
| Westlake Corp. 3.6% 8/15/26 | | 858,000 | 807,311 |
| | | | 5,942,295 |
| Construction Materials - 0.0% | | | |
| Martin Marietta Materials, Inc.: | | | |
| 2.5% 3/15/30 | | 110,000 | 90,955 |
| 4.25% 12/15/47 | | 120,000 | 98,636 |
| | | | 189,591 |
| Containers & Packaging - 0.1% | | | |
| International Paper Co. 5% 9/15/35 | | 328,000 | 310,335 |
| WRKCo, Inc.: | | | |
| 3.9% 6/1/28 | | 170,000 | 157,423 |
| 4.65% 3/15/26 | | 400,000 | 391,684 |
| | | | 859,442 |
| Metals & Mining - 0.2% | | | |
| Barrick North America Finance LLC 5.7% 5/30/41 | | 142,000 | 141,427 |
| Barrick PD Australia Finance Pty Ltd. 5.95% 10/15/39 | | 100,000 | 103,072 |
| BHP Billiton Financial (U.S.A.) Ltd.: | | | |
| 4.125% 2/24/42 | | 100,000 | 87,301 |
| 4.75% 2/28/28 | | 100,000 | 98,802 |
| 5% 9/30/43 | | 151,000 | 146,465 |
| Freeport-McMoRan, Inc.: | | | |
| 4.625% 8/1/30 | | 190,000 | 176,688 |
| 5.45% 3/15/43 | | 160,000 | 144,453 |
| Newmont Corp.: | | | |
| 2.25% 10/1/30 | | 160,000 | 128,839 |
| 4.875% 3/15/42 | | 100,000 | 91,090 |
| 5.45% 6/9/44 | | 100,000 | 96,061 |
| Nucor Corp.: | | | |
| 2.979% 12/15/55 | | 110,000 | 71,073 |
| 3.125% 4/1/32 | | 100,000 | 85,299 |
| Rio Tinto Finance (U.S.A.) Ltd. 5.2% 11/2/40 | | 324,000 | 323,207 |
| Southern Copper Corp.: | | | |
| 3.875% 4/23/25 | | 210,000 | 202,167 |
| 5.875% 4/23/45 | | 178,000 | 178,868 |
| 7.5% 7/27/35 | | 110,000 | 124,389 |
| Vale Overseas Ltd.: | | | |
| 3.75% 7/8/30 | | 500,000 | 432,975 |
| 6.875% 11/21/36 | | 120,000 | 123,036 |
| | | | 2,755,212 |
| Paper & Forest Products - 0.0% | | | |
| Suzano Austria GmbH: | | | |
| 2.5% 9/15/28 | | 320,000 | 267,260 |
| 6% 1/15/29 | | 230,000 | 225,228 |
| | | | 492,488 |
TOTAL MATERIALS | | | 10,239,028 |
| REAL ESTATE - 0.8% | | | |
| Equity Real Estate Investment Trusts (REITs) - 0.7% | | | |
| Alexandria Real Estate Equities, Inc.: | | | |
| 2% 5/18/32 | | 250,000 | 191,260 |
| 3.375% 8/15/31 | | 340,000 | 298,289 |
| 4.85% 4/15/49 | | 140,000 | 121,985 |
| American Homes 4 Rent LP 3.375% 7/15/51 | | 110,000 | 71,499 |
| American Tower Corp.: | | | |
| 1.3% 9/15/25 | | 120,000 | 107,889 |
| 2.1% 6/15/30 | | 120,000 | 94,997 |
| 3.1% 6/15/50 | | 120,000 | 74,649 |
| 3.6% 1/15/28 | | 70,000 | 64,069 |
| 3.8% 8/15/29 | | 100,000 | 90,147 |
| AvalonBay Communities, Inc.: | | | |
| 2.3% 3/1/30 | | 408,000 | 341,621 |
| 3.35% 5/15/27 | | 170,000 | 158,192 |
| Boston Properties, Inc.: | | | |
| 2.75% 10/1/26 | | 100,000 | 90,253 |
| 3.25% 1/30/31 | | 227,000 | 189,393 |
| 4.5% 12/1/28 | | 280,000 | 259,838 |
| Corporate Office Properties LP 2.75% 4/15/31 | | 110,000 | 82,821 |
| Crown Castle International Corp.: | | | |
| 1.35% 7/15/25 | | 90,000 | 81,741 |
| 2.25% 1/15/31 | | 100,000 | 80,006 |
| 3.25% 1/15/51 | | 190,000 | 124,976 |
| 3.65% 9/1/27 | | 464,000 | 431,661 |
| EPR Properties 4.5% 6/1/27 | | 210,000 | 186,793 |
| Equinix, Inc.: | | | |
| 1.45% 5/15/26 | | 200,000 | 176,474 |
| 2.5% 5/15/31 | | 210,000 | 168,155 |
| ERP Operating LP: | | | |
| 1.85% 8/1/31 | | 240,000 | 188,602 |
| 2.5% 2/15/30 | | 160,000 | 134,993 |
| 3.5% 3/1/28 | | 160,000 | 147,482 |
| Federal Realty Investment Trust 1.25% 2/15/26 | | 200,000 | 177,622 |
| GLP Capital LP/GLP Financing II, Inc. 5.25% 6/1/25 | | 310,000 | 303,492 |
| Healthpeak Properties, Inc.: | | | |
| 2.875% 1/15/31 | | 430,000 | 362,481 |
| 3% 1/15/30 | | 320,000 | 275,468 |
| Kilroy Realty LP 2.65% 11/15/33 | | 100,000 | 68,607 |
| Kimco Realty Op LLC: | | | |
| 1.9% 3/1/28 | | 610,000 | 514,888 |
| 2.8% 10/1/26 | | 216,000 | 197,305 |
| National Retail Properties, Inc. 3% 4/15/52 | | 200,000 | 123,853 |
| Office Properties Income Trust 2.4% 2/1/27 | | 100,000 | 73,903 |
| Omega Healthcare Investors, Inc.: | | | |
| 4.5% 4/1/27 | | 140,000 | 132,186 |
| 4.75% 1/15/28 | | 201,000 | 188,525 |
| Prologis LP: | | | |
| 1.625% 3/15/31 | | 150,000 | 117,290 |
| 1.75% 2/1/31 | | 340,000 | 268,349 |
| 2.125% 4/15/27 | | 170,000 | 152,940 |
| 2.125% 10/15/50 | | 100,000 | 56,329 |
| Realty Income Corp.: | | | |
| 2.85% 12/15/32 | | 338,000 | 277,621 |
| 3.25% 1/15/31 | | 238,000 | 207,442 |
| Regency Centers LP 3.7% 6/15/30 | | 150,000 | 132,676 |
| Simon Property Group LP: | | | |
| 2% 9/13/24 | | 420,000 | 399,407 |
| 2.2% 2/1/31 | | 250,000 | 199,687 |
| 2.65% 7/15/30 | | 138,000 | 115,914 |
| 3.375% 12/1/27 | | 150,000 | 138,554 |
| 3.5% 9/1/25 | | 230,000 | 220,522 |
| 4.25% 11/30/46 | | 116,000 | 93,603 |
| 4.75% 3/15/42 | | 110,000 | 96,756 |
| UDR, Inc.: | | | |
| 2.1% 6/15/33 | | 100,000 | 72,889 |
| 3% 8/15/31 | | 100,000 | 84,318 |
| Ventas Realty LP: | | | |
| 4% 3/1/28 | | 184,000 | 169,977 |
| 4.875% 4/15/49 | | 160,000 | 136,082 |
| VICI Properties LP: | | | |
| 4.75% 2/15/28 | | 330,000 | 311,299 |
| 5.125% 5/15/32 | | 140,000 | 129,899 |
| Welltower Op: | | | |
| 2.05% 1/15/29 | | 390,000 | 319,228 |
| 2.75% 1/15/32 | | 110,000 | 87,847 |
| 4.25% 4/15/28 | | 174,000 | 164,290 |
| Weyerhaeuser Co. 4% 11/15/29 | | 270,000 | 245,839 |
| | | | 10,574,873 |
| Real Estate Management & Development - 0.1% | | | |
| Brandywine Operating Partnership LP 7.55% 3/15/28 | | 100,000 | 98,043 |
| Digital Realty Trust LP 3.7% 8/15/27 | | 230,000 | 212,981 |
| Essex Portfolio LP: | | | |
| 2.65% 3/15/32 | | 210,000 | 166,662 |
| 3.875% 5/1/24 | | 120,000 | 117,315 |
| Mid-America Apartments LP 4.2% 6/15/28 | | 260,000 | 247,470 |
| Tanger Properties LP 3.125% 9/1/26 | | 100,000 | 90,763 |
| | | | 933,234 |
TOTAL REAL ESTATE | | | 11,508,107 |
| UTILITIES - 1.9% | | | |
| Electric Utilities - 1.4% | | | |
| AEP Texas, Inc. 3.45% 5/15/51 | | 70,000 | 49,824 |
| AEP Transmission Co. LLC: | | | |
| 2.75% 8/15/51 | | 100,000 | 64,213 |
| 3.65% 4/1/50 | | 139,000 | 107,126 |
| Alabama Power Co. 1.45% 9/15/30 | | 800,000 | 622,844 |
| American Electric Power Co., Inc.: | | | |
| 3.25% 3/1/50 | | 174,000 | 116,843 |
| 4.3% 12/1/28 | | 194,000 | 184,552 |
| Appalachian Power Co. 7% 4/1/38 | | 100,000 | 112,552 |
| Arizona Public Service Co. 3.35% 5/15/50 | | 200,000 | 135,942 |
| Baltimore Gas & Electric Co. 2.9% 6/15/50 | | 120,000 | 80,191 |
| CenterPoint Energy Houston Electric LLC: | | | |
| 3.35% 4/1/51 | | 70,000 | 51,720 |
| 4.25% 2/1/49 | | 185,000 | 161,190 |
| Cincinnati Gas & Electric Co.: | | | |
| 3.65% 2/1/29 | | 210,000 | 194,121 |
| 4.3% 2/1/49 | | 65,000 | 53,326 |
| Commonwealth Edison Co.: | | | |
| 2.75% 9/1/51 | | 200,000 | 127,487 |
| 4% 3/1/48 | | 208,000 | 170,578 |
| 6.45% 1/15/38 | | 240,000 | 268,058 |
| Connecticut Light & Power Co. 5.25% 1/15/53 | | 120,000 | 119,948 |
| Dominion Energy South Carolina 2.3% 12/1/31 | | 230,000 | 185,262 |
| DTE Electric Co.: | | | |
| 3.65% 3/1/52 | | 190,000 | 147,057 |
| 3.95% 3/1/49 | | 56,000 | 45,995 |
| 4.05% 5/15/48 | | 100,000 | 83,614 |
| Duke Energy Carolinas LLC: | | | |
| 3.75% 6/1/45 | | 150,000 | 116,901 |
| 3.875% 3/15/46 | | 240,000 | 187,724 |
| 4% 9/30/42 | | 179,000 | 147,221 |
| 4.25% 12/15/41 | | 130,000 | 111,862 |
| Duke Energy Corp.: | | | |
| 2.45% 6/1/30 | | 200,000 | 164,268 |
| 3.15% 8/15/27 | | 352,000 | 323,639 |
| 3.3% 6/15/41 | | 390,000 | 282,886 |
| 3.75% 9/1/46 | | 110,000 | 81,097 |
| 4.2% 6/15/49 | | 310,000 | 245,154 |
| 5% 8/15/52 | | 100,000 | 88,878 |
| Duke Energy Florida LLC 4.2% 7/15/48 | | 140,000 | 118,376 |
| Duke Energy Industries, Inc. 6.35% 8/15/38 | | 170,000 | 185,853 |
| Duke Energy Progress LLC: | | | |
| 2% 8/15/31 | | 270,000 | 212,628 |
| 4.2% 8/15/45 | | 180,000 | 149,838 |
| Edison International 4.125% 3/15/28 | | 100,000 | 93,230 |
| Entergy Corp.: | | | |
| 0.9% 9/15/25 | | 500,000 | 444,553 |
| 2.4% 6/15/31 | | 120,000 | 94,910 |
| 3.75% 6/15/50 | | 190,000 | 139,710 |
| Entergy Louisiana LLC: | | | |
| 3.12% 9/1/27 | | 310,000 | 284,010 |
| 4% 3/15/33 | | 190,000 | 171,116 |
| Entergy, Inc.: | | | |
| 3.35% 6/15/52 | | 100,000 | 70,874 |
| 3.55% 9/30/49 | | 194,000 | 140,842 |
| Eversource Energy: | | | |
| 2.55% 3/15/31 | | 200,000 | 163,511 |
| 3.45% 1/15/50 | | 120,000 | 86,593 |
| Exelon Corp.: | | | |
| 3.95% 6/15/25 | | 163,000 | 157,782 |
| 4.05% 4/15/30 | | 370,000 | 339,342 |
| 4.7% 4/15/50 | | 110,000 | 95,678 |
| 5.1% 6/15/45 | | 160,000 | 147,247 |
| FirstEnergy Corp.: | | | |
| 1.6% 1/15/26 | | 97,000 | 86,383 |
| 2.25% 9/1/30 | | 150,000 | 119,625 |
| 5.1% 7/15/47 | | 150,000 | 133,826 |
| Florida Power & Light Co.: | | | |
| 3.99% 3/1/49 | | 133,000 | 109,882 |
| 4.05% 6/1/42 | | 210,000 | 178,139 |
| 4.05% 10/1/44 | | 170,000 | 143,153 |
| 4.125% 2/1/42 | | 240,000 | 204,347 |
| Georgia Power Co. 2.65% 9/15/29 | | 360,000 | 305,701 |
| Indiana Michigan Power Co. 3.25% 5/1/51 | | 80,000 | 55,416 |
| Interstate Power and Light Co. 2.3% 6/1/30 | | 104,000 | 85,132 |
| Kentucky Utilities Co. 5.125% 11/1/40 | | 170,000 | 162,221 |
| MidAmerican Energy Co.: | | | |
| 3.65% 8/1/48 | | 280,000 | 217,152 |
| 3.95% 8/1/47 | | 100,000 | 82,898 |
| 4.25% 7/15/49 | | 100,000 | 86,381 |
| Mississippi Power Co. 3.95% 3/30/28 | | 120,000 | 112,998 |
| NextEra Energy Capital Holdings, Inc.: | | | |
| 1.875% 1/15/27 | | 300,000 | 264,321 |
| 2.44% 1/15/32 | | 400,000 | 316,788 |
| 4.9% 2/28/28 | | 900,000 | 889,273 |
| Northern States Power Co.: | | | |
| 2.6% 6/1/51 | | 300,000 | 192,563 |
| 4% 8/15/45 | | 110,000 | 89,951 |
| NSTAR Electric Co. 4.95% 9/15/52 | | 100,000 | 95,501 |
| Oglethorpe Power Corp.: | | | |
| 3.75% 8/1/50 | | 100,000 | 72,943 |
| 5.95% 11/1/39 | | 110,000 | 108,506 |
| Oncor Electric Delivery Co. LLC: | | | |
| 3.1% 9/15/49 | | 100,000 | 70,283 |
| 3.8% 6/1/49 | | 280,000 | 225,066 |
| 4.6% 6/1/52 | | 150,000 | 136,594 |
| Pacific Gas & Electric Co.: | | | |
| 2.5% 2/1/31 | | 320,000 | 249,387 |
| 3.15% 1/1/26 | | 110,000 | 102,040 |
| 3.3% 8/1/40 | | 100,000 | 67,633 |
| 3.5% 6/15/25 | | 506,000 | 479,627 |
| 3.75% 2/15/24 | | 320,000 | 312,814 |
| 4.2% 3/1/29 | | 200,000 | 179,638 |
| 4.55% 7/1/30 | | 603,000 | 544,522 |
| 4.75% 2/15/44 | | 100,000 | 78,309 |
| 4.95% 7/1/50 | | 230,000 | 181,584 |
| 5.9% 6/15/32 | | 300,000 | 289,927 |
| PacifiCorp: | | | |
| 2.9% 6/15/52 | | 100,000 | 66,280 |
| 4.15% 2/15/50 | | 250,000 | 206,715 |
| 6% 1/15/39 | | 100,000 | 104,403 |
| PECO Energy Co. 4.6% 5/15/52 | | 210,000 | 190,450 |
| PG&E Wildfire Recovery: | | | |
| 5.099% 6/1/54 | | 150,000 | 151,577 |
| 5.212% 12/1/49 | | 260,000 | 258,868 |
| PPL Capital Funding, Inc. 4% 9/15/47 | | 90,000 | 65,326 |
| PPL Electric Utilities Corp. 3% 10/1/49 | | 70,000 | 48,718 |
| Public Service Co. of Colorado: | | | |
| 3.2% 3/1/50 | | 110,000 | 79,009 |
| 6.25% 9/1/37 | | 130,000 | 140,726 |
| Public Service Electric & Gas Co.: | | | |
| 2.45% 1/15/30 | | 80,000 | 68,584 |
| 3% 5/15/25 | | 220,000 | 209,541 |
| 3.15% 1/1/50 | | 300,000 | 216,408 |
| 3.2% 8/1/49 | | 110,000 | 80,171 |
| Puget Sound Energy, Inc. 4.3% 5/20/45 | | 130,000 | 106,354 |
| Southern California Edison Co.: | | | |
| 2.95% 2/1/51 | | 250,000 | 160,843 |
| 3.5% 10/1/23 | | 566,000 | 559,338 |
| 3.65% 2/1/50 | | 220,000 | 161,615 |
| 3.9% 3/15/43 | | 230,000 | 181,003 |
| 4.05% 3/15/42 | | 100,000 | 80,474 |
| 4.65% 10/1/43 | | 158,000 | 137,324 |
| 6.05% 3/15/39 | | 100,000 | 102,469 |
| Southern Co.: | | | |
| 3.25% 7/1/26 | | 765,000 | 713,291 |
| 4.4% 7/1/46 | | 253,000 | 208,206 |
| Tampa Electric Co. 4.45% 6/15/49 | | 140,000 | 117,372 |
| Union Electric Co. 3.9% 4/1/52 | | 120,000 | 96,205 |
| Virginia Electric & Power Co.: | | | |
| 2.45% 12/15/50 | | 100,000 | 59,265 |
| 3.8% 4/1/28 | | 90,000 | 84,894 |
| 3.8% 9/15/47 | | 180,000 | 139,507 |
| 4.6% 12/1/48 | | 208,000 | 179,897 |
| 4.625% 5/15/52 | | 100,000 | 87,912 |
| 6% 5/15/37 | | 120,000 | 124,924 |
| Wisconsin Electric Power Co. 1.7% 6/15/28 | | 490,000 | 416,409 |
| Xcel Energy, Inc.: | | | |
| 3.35% 12/1/26 | | 316,000 | 295,080 |
| 3.4% 6/1/30 | | 73,000 | 64,685 |
| | | | 20,922,533 |
| Gas Utilities - 0.1% | | | |
| Atmos Energy Corp.: | | | |
| 2.85% 2/15/52 | | 100,000 | 65,389 |
| 4.125% 10/15/44 | | 210,000 | 175,656 |
| CenterPoint Energy Resources Corp. 1.75% 10/1/30 | | 100,000 | 78,646 |
| Dominion Gas Holdings LLC 2.5% 11/15/24 | | 80,000 | 76,327 |
| Piedmont Natural Gas Co., Inc. 3.35% 6/1/50 | | 100,000 | 68,109 |
| Southern California Gas Co.: | | | |
| 2.55% 2/1/30 | | 100,000 | 84,664 |
| 4.3% 1/15/49 | | 130,000 | 106,483 |
| Southern Co. Gas Capital Corp. 3.15% 9/30/51 | | 250,000 | 167,700 |
| | | | 822,974 |
| Independent Power and Renewable Electricity Producers - 0.0% | | | |
| Emera U.S. Finance LP 4.75% 6/15/46 | | 100,000 | 78,574 |
| Exelon Generation Co. LLC: | | | |
| 3.25% 6/1/25 | | 100,000 | 95,062 |
| 5.6% 6/15/42 | | 130,000 | 125,086 |
| | | | 298,722 |
| Multi-Utilities - 0.4% | | | |
| Ameren Corp. 3.5% 1/15/31 | | 250,000 | 219,781 |
| Ameren Illinois Co. 4.5% 3/15/49 | | 210,000 | 190,169 |
| Berkshire Hathaway Energy Co.: | | | |
| 1.65% 5/15/31 | | 160,000 | 124,063 |
| 3.25% 4/15/28 | | 250,000 | 230,880 |
| 4.45% 1/15/49 | | 100,000 | 86,326 |
| 4.5% 2/1/45 | | 180,000 | 156,345 |
| 4.6% 5/1/53 | | 100,000 | 87,480 |
| 5.95% 5/15/37 | | 120,000 | 124,038 |
| 6.125% 4/1/36 | | 110,000 | 116,823 |
| Consolidated Edison Co. of New York, Inc.: | | | |
| 3.7% 11/15/59 | | 100,000 | 72,438 |
| 3.85% 6/15/46 | | 100,000 | 77,094 |
| 3.95% 4/1/50 | | 245,000 | 193,586 |
| 4.5% 5/15/58 | | 220,000 | 182,507 |
| 4.65% 12/1/48 | | 80,000 | 70,328 |
| 6.15% 11/15/52 | | 100,000 | 106,910 |
| 6.75% 4/1/38 | | 110,000 | 122,069 |
| Consumers Energy Co.: | | | |
| 2.65% 8/15/52 | | 200,000 | 127,094 |
| 3.1% 8/15/50 | | 200,000 | 140,798 |
| Dominion Energy, Inc.: | | | |
| 3.375% 4/1/30 | | 340,000 | 297,422 |
| 4.85% 8/15/52 | | 280,000 | 243,295 |
| DTE Energy Co. 3.8% 3/15/27 | | 90,000 | 84,450 |
| NiSource, Inc.: | | | |
| 0.95% 8/15/25 | | 700,000 | 631,110 |
| 1.7% 2/15/31 | | 370,000 | 282,033 |
| 3.49% 5/15/27 | | 442,000 | 412,903 |
| 5.95% 6/15/41 | | 110,000 | 110,743 |
| Puget Energy, Inc. 4.1% 6/15/30 | | 253,000 | 227,157 |
| San Diego Gas & Electric Co. 4.1% 6/15/49 | | 130,000 | 105,588 |
| Sempra Energy: | | | |
| 3.4% 2/1/28 | | 50,000 | 45,785 |
| 3.8% 2/1/38 | | 270,000 | 221,168 |
| 4% 2/1/48 | | 136,000 | 105,465 |
| | | | 5,195,848 |
| Water Utilities - 0.0% | | | |
| American Water Capital Corp.: | | | |
| 2.3% 6/1/31 | | 220,000 | 179,475 |
| 2.95% 9/1/27 | | 310,000 | 284,116 |
| 3.75% 9/1/47 | | 213,000 | 166,042 |
| 4.3% 12/1/42 | | 100,000 | 86,695 |
| | | | 716,328 |
TOTAL UTILITIES | | | 27,956,405 |
| TOTAL NONCONVERTIBLE BONDS (Cost $419,057,887) | | | 360,070,276 |
| | | | |
| U.S. Government and Government Agency Obligations - 44.2% |
| | | Principal Amount (a) | Value ($) |
| U.S. Government Agency Obligations - 1.1% | | | |
| Fannie Mae: | | | |
| 0.375% 8/25/25 | | 238,000 | 214,006 |
| 0.5% 6/17/25 | | 650,000 | 590,725 |
| 0.625% 4/22/25 | | 90,000 | 82,414 |
| 0.75% 10/8/27 | | 250,000 | 214,354 |
| 0.875% 8/5/30 | | 108,000 | 85,687 |
| 1.75% 7/2/24 | | 930,000 | 889,613 |
| 2.875% 9/12/23 | | 150,000 | 148,162 |
| 6.625% 11/15/30 | | 1,650,000 | 1,912,344 |
| Federal Farm Credit Bank 1.4% 3/10/28 | | 2,230,000 | 1,895,986 |
| Federal Home Loan Bank: | | | |
| 0.375% 9/4/25 | | 175,000 | 157,478 |
| 0.5% 4/14/25 | | 390,000 | 356,870 |
| 0.9% 2/26/27 | | 3,290,000 | 2,845,612 |
| 1.5% 8/15/24 | | 125,000 | 118,721 |
| 2.5% 2/13/24 | | 230,000 | 223,993 |
| 3.25% 6/9/28 | | 210,000 | 199,679 |
| 3.25% 11/16/28 | | 30,000 | 28,524 |
| Freddie Mac: | | | |
| 0.25% 8/24/23 | | 450,000 | 439,475 |
| 0.25% 12/4/23 | | 958,000 | 921,736 |
| 0.375% 7/21/25 | | 480,000 | 433,260 |
| 0.375% 9/23/25 | | 370,000 | 332,522 |
| 1.5% 2/12/25 | | 630,000 | 591,401 |
| 2.75% 6/19/23 | | 50,000 | 49,650 |
| 6.25% 7/15/32 | | 830,000 | 962,991 |
| 6.75% 3/15/31 | | 390,000 | 457,972 |
| Tennessee Valley Authority: | | | |
| 0.75% 5/15/25 | | 560,000 | 511,406 |
| 2.875% 2/1/27 | | 145,000 | 135,939 |
| 4.25% 9/15/65 | | 210,000 | 186,683 |
| 5.25% 9/15/39 | | 420,000 | 441,353 |
| 5.88% 4/1/36 | | 110,000 | 122,696 |
TOTAL U.S. GOVERNMENT AGENCY OBLIGATIONS | | | 15,551,252 |
| U.S. Treasury Obligations - 43.1% | | | |
| U.S. Treasury Bonds: | | | |
| 1.125% 5/15/40 | | 2,000 | 1,266 |
| 1.125% 8/15/40 | | 76,000 | 47,865 |
| 1.25% 5/15/50 | | 2,278,000 | 1,263,667 |
| 1.375% 11/15/40 | | 4,356,000 | 2,862,198 |
| 1.375% 8/15/50 | | 3,300,000 | 1,891,570 |
| 1.625% 11/15/50 | | 6,241,000 | 3,823,831 |
| 1.75% 8/15/41 | | 7,187,000 | 4,980,366 |
| 1.875% 2/15/41 | | 14,910,000 | 10,656,573 |
| 1.875% 2/15/51 | | 9,063,000 | 5,917,148 |
| 1.875% 11/15/51 | | 4,704,000 | 3,059,437 |
| 2% 11/15/41 | | 5,180,000 | 3,743,966 |
| 2% 2/15/50 | | 683,000 | 461,985 |
| 2% 8/15/51 | | 8,892,000 | 5,976,744 |
| 2.25% 5/15/41 | | 12,975,000 | 9,858,466 |
| 2.25% 8/15/46 | | 148,000 | 106,785 |
| 2.25% 8/15/49 | | 267,000 | 191,499 |
| 2.25% 2/15/52 | | 1,610,000 | 1,147,943 |
| 2.375% 11/15/49 | | 38,000 | 28,022 |
| 2.375% 5/15/51 | | 6,825,000 | 5,010,243 |
| 2.5% 2/15/45 | | 763,000 | 582,890 |
| 2.5% 2/15/46 | | 329,000 | 250,027 |
| 2.5% 5/15/46 | | 122,000 | 92,706 |
| 2.75% 11/15/42 | | 329,000 | 267,377 |
| 2.75% 8/15/47 | | 177,000 | 140,708 |
| 2.75% 11/15/47 | | 157,000 | 124,833 |
| 2.875% 8/15/45 | | 268,000 | 218,567 |
| 2.875% 11/15/46 | | 359,000 | 292,515 |
| 2.875% 5/15/49 | | 361,000 | 295,230 |
| 2.875% 5/15/52 | | 2,960,000 | 2,423,847 |
| 3% 5/15/42 | | 238,000 | 202,551 |
| 3% 11/15/44 | | 1,614,000 | 1,350,023 |
| 3% 11/15/45 | | 76,000 | 63,356 |
| 3% 2/15/47 | | 83,000 | 69,085 |
| 3% 5/15/47 | | 197,000 | 164,049 |
| 3% 2/15/48 | | 121,000 | 100,855 |
| 3% 8/15/48 | | 188,000 | 156,907 |
| 3% 2/15/49 | | 264,000 | 220,894 |
| 3% 8/15/52 | | 10,200,000 | 8,574,375 |
| 3.125% 11/15/41 | | 229,000 | 200,160 |
| 3.125% 2/15/42 | | 264,000 | 229,752 |
| 3.125% 8/15/44 | | 1,405,000 | 1,201,440 |
| 3.125% 5/15/48 | | 48,000 | 40,974 |
| 3.25% 5/15/42 | | 6,160,000 | 5,444,622 |
| 3.375% 8/15/42 | | 14,240,000 | 12,820,450 |
| 3.375% 5/15/44 | | 856,000 | 763,445 |
| 3.375% 11/15/48 | | 68,000 | 60,841 |
| 3.625% 8/15/43 | | 86,000 | 80,071 |
| 3.625% 2/15/44 | | 1,464,000 | 1,358,489 |
| 3.625% 2/15/53 | | 2,550,000 | 2,427,680 |
| 3.75% 8/15/41 | | 225,000 | 215,938 |
| 3.75% 11/15/43 | | 94,000 | 89,080 |
| 3.875% 8/15/40 | | 126,000 | 123,613 |
| 3.875% 2/15/43 | | 960,000 | 931,350 |
| 4% 11/15/42 | | 6,940,000 | 6,841,322 |
| 4% 11/15/52 | | 4,150,000 | 4,223,922 |
| 4.375% 2/15/38 | | 81,000 | 84,841 |
| 4.375% 11/15/39 | | 5,000 | 5,230 |
| 4.375% 5/15/41 | | 433,000 | 452,231 |
| 4.5% 2/15/36 | | 223,000 | 238,061 |
| 4.5% 5/15/38 | | 69,000 | 73,199 |
| 5% 5/15/37 (f) | | 391,000 | 437,126 |
| U.S. Treasury Notes: | | | |
| 0.125% 5/15/23 | | 17,000 | 16,835 |
| 0.125% 6/30/23 | | 78,000 | 76,763 |
| 0.125% 9/15/23 | | 2,000 | 1,948 |
| 0.125% 10/15/23 | | 130,000 | 126,090 |
| 0.125% 12/15/23 | | 684,000 | 657,682 |
| 0.125% 1/15/24 | | 1,625,000 | 1,556,001 |
| 0.125% 2/15/24 | | 3,566,000 | 3,398,565 |
| 0.25% 4/15/23 | | 9,000 | 8,950 |
| 0.25% 3/15/24 | | 1,012,000 | 962,191 |
| 0.25% 5/15/24 | | 1,778,000 | 1,677,015 |
| 0.25% 5/31/25 | | 3,401,000 | 3,080,562 |
| 0.25% 6/30/25 | | 4,190,000 | 3,787,695 |
| 0.25% 7/31/25 | | 2,494,000 | 2,246,938 |
| 0.25% 8/31/25 | | 7,956,000 | 7,145,483 |
| 0.25% 9/30/25 | | 4,049,000 | 3,629,865 |
| 0.375% 4/15/24 | | 5,103,000 | 4,839,677 |
| 0.375% 8/15/24 | | 1,560,000 | 1,458,113 |
| 0.375% 9/15/24 | | 2,850,000 | 2,656,066 |
| 0.375% 4/30/25 | | 4,471,000 | 4,073,151 |
| 0.375% 11/30/25 | | 3,807,000 | 3,400,722 |
| 0.375% 12/31/25 | | 8,153,000 | 7,273,686 |
| 0.375% 1/31/26 | | 9,105,000 | 8,088,156 |
| 0.375% 7/31/27 | | 3,005,000 | 2,540,868 |
| 0.375% 9/30/27 | | 3,744,000 | 3,148,909 |
| 0.5% 3/15/23 | | 15,000 | 14,976 |
| 0.5% 3/31/25 | | 6,279,000 | 5,754,115 |
| 0.5% 2/28/26 | | 5,602,000 | 4,980,309 |
| 0.5% 4/30/27 | | 546,000 | 468,131 |
| 0.5% 5/31/27 | | 4,423,000 | 3,779,073 |
| 0.5% 6/30/27 | | 856,000 | 729,707 |
| 0.5% 8/31/27 | | 2,377,000 | 2,016,179 |
| 0.625% 10/15/24 | | 10,240,000 | 9,551,600 |
| 0.625% 7/31/26 | | 3,960,000 | 3,488,667 |
| 0.625% 3/31/27 | | 884,000 | 763,969 |
| 0.625% 11/30/27 | | 2,407,000 | 2,039,462 |
| 0.625% 12/31/27 | | 1,696,000 | 1,433,650 |
| 0.625% 5/15/30 | | 4,618,000 | 3,652,549 |
| 0.625% 8/15/30 | | 644,000 | 506,496 |
| 0.75% 11/15/24 | | 3,910,000 | 3,643,173 |
| 0.75% 3/31/26 | | 6,314,000 | 5,649,797 |
| 0.75% 4/30/26 | | 3,206,000 | 2,857,974 |
| 0.75% 5/31/26 | | 3,183,000 | 2,830,010 |
| 0.75% 8/31/26 | | 5,654,000 | 4,990,097 |
| 0.75% 1/31/28 | | 4,807,000 | 4,079,190 |
| 0.875% 6/30/26 | | 894,000 | 796,778 |
| 0.875% 9/30/26 | | 6,070,000 | 5,369,579 |
| 1% 12/15/24 | | 2,830,000 | 2,641,518 |
| 1% 7/31/28 | | 1,260,000 | 1,068,638 |
| 1.125% 1/15/25 | | 14,200,000 | 13,258,695 |
| 1.125% 2/28/25 | | 748,000 | 695,991 |
| 1.125% 10/31/26 | | 8,680,000 | 7,731,981 |
| 1.125% 2/29/28 | | 5,030,000 | 4,341,912 |
| 1.125% 8/31/28 | | 5,215,000 | 4,445,584 |
| 1.25% 8/31/24 | | 3,036,000 | 2,869,850 |
| 1.25% 11/30/26 | | 429,000 | 383,201 |
| 1.25% 12/31/26 | | 7,670,000 | 6,839,183 |
| 1.25% 3/31/28 | | 5,759,000 | 4,993,458 |
| 1.25% 4/30/28 | | 3,357,000 | 2,904,723 |
| 1.25% 5/31/28 | | 2,807,000 | 2,424,108 |
| 1.25% 6/30/28 | | 3,624,000 | 3,123,718 |
| 1.25% 9/30/28 | | 2,821,000 | 2,416,473 |
| 1.25% 8/15/31 | | 3,247,000 | 2,632,226 |
| 1.375% 1/31/25 | | 975,000 | 913,948 |
| 1.375% 8/31/26 | | 366,000 | 330,544 |
| 1.375% 10/31/28 | | 12,960,000 | 11,160,788 |
| 1.375% 12/31/28 | | 2,240,000 | 1,924,475 |
| 1.5% 9/30/24 | | 3,446,000 | 3,264,277 |
| 1.5% 10/31/24 | | 3,676,000 | 3,474,394 |
| 1.5% 11/30/24 | | 2,663,000 | 2,511,646 |
| 1.5% 2/15/25 | | 3,310,000 | 3,105,711 |
| 1.5% 8/15/26 | | 283,000 | 256,845 |
| 1.5% 1/31/27 | | 5,829,000 | 5,238,358 |
| 1.5% 11/30/28 | | 1,062,000 | 919,750 |
| 1.5% 2/15/30 | | 724,000 | 614,778 |
| 1.625% 2/15/26 | | 702,000 | 646,663 |
| 1.625% 9/30/26 | | 1,345,000 | 1,223,740 |
| 1.625% 11/30/26 | | 454,000 | 411,863 |
| 1.625% 8/15/29 | | 2,954,000 | 2,553,364 |
| 1.625% 5/15/31 | | 9,580,000 | 8,053,936 |
| 1.75% 6/30/24 | | 1,417,000 | 1,356,501 |
| 1.75% 7/31/24 | | 1,867,000 | 1,782,183 |
| 1.75% 12/31/24 | | 3,742,000 | 3,538,529 |
| 1.75% 3/15/25 | | 3,230,000 | 3,038,712 |
| 1.75% 1/31/29 | | 4,210,000 | 3,687,204 |
| 1.875% 8/31/24 | | 501,000 | 478,044 |
| 1.875% 7/31/26 | | 800,000 | 736,656 |
| 1.875% 2/28/29 | | 820,000 | 723,234 |
| 2% 5/31/24 | | 5,025,000 | 4,835,777 |
| 2% 6/30/24 | | 210,000 | 201,575 |
| 2% 11/15/26 | | 562,000 | 516,908 |
| 2.125% 2/29/24 | | 1,000 | 971 |
| 2.125% 3/31/24 | | 612,000 | 592,516 |
| 2.125% 7/31/24 | | 150,000 | 143,977 |
| 2.125% 11/30/24 | | 320,000 | 305,125 |
| 2.25% 12/31/23 | | 50,000 | 48,824 |
| 2.25% 4/30/24 | | 923,000 | 893,039 |
| 2.25% 12/31/24 | | 30,000 | 28,624 |
| 2.25% 2/15/27 | | 817,000 | 756,076 |
| 2.25% 8/15/27 | | 1,371,000 | 1,260,356 |
| 2.25% 11/15/27 | | 255,000 | 233,644 |
| 2.375% 2/29/24 | | 2,090,000 | 2,033,913 |
| 2.375% 5/15/27 | | 1,576,000 | 1,460,386 |
| 2.375% 3/31/29 | | 2,590,000 | 2,347,289 |
| 2.375% 5/15/29 | | 473,000 | 428,028 |
| 2.5% 1/31/24 | | 1,044,000 | 1,019,531 |
| 2.5% 4/30/24 | | 520,000 | 504,461 |
| 2.5% 5/31/24 | | 3,730,000 | 3,611,980 |
| 2.5% 1/31/25 | | 37,000 | 35,433 |
| 2.5% 2/28/26 | | 273,000 | 258,028 |
| 2.5% 3/31/27 | | 11,290,000 | 10,529,689 |
| 2.625% 12/31/25 | | 118,000 | 112,201 |
| 2.625% 1/31/26 | | 420,000 | 398,820 |
| 2.625% 5/31/27 | | 3,110,000 | 2,910,401 |
| 2.625% 2/15/29 | | 1,038,000 | 955,528 |
| 2.625% 7/31/29 | | 18,080,000 | 16,578,512 |
| 2.75% 4/30/23 | | 21,000 | 20,927 |
| 2.75% 2/15/24 | | 70,000 | 68,430 |
| 2.75% 2/28/25 | | 280,000 | 269,183 |
| 2.75% 5/15/25 | | 100,000 | 95,855 |
| 2.75% 6/30/25 | | 237,000 | 226,992 |
| 2.75% 8/31/25 | | 304,000 | 290,664 |
| 2.75% 4/30/27 | | 1,920,000 | 1,807,125 |
| 2.75% 7/31/27 | | 4,190,000 | 3,936,309 |
| 2.75% 2/15/28 | | 629,000 | 588,508 |
| 2.75% 8/15/32 | | 27,855,000 | 25,313,231 |
| 2.875% 4/30/25 | | 81,000 | 77,896 |
| 2.875% 6/15/25 | | 1,170,000 | 1,124,480 |
| 2.875% 7/31/25 | | 258,000 | 247,761 |
| 2.875% 11/30/25 | | 288,000 | 275,738 |
| 2.875% 5/15/28 | | 231,000 | 216,905 |
| 2.875% 8/15/28 | | 1,186,000 | 1,111,458 |
| 2.875% 4/30/29 | | 290,000 | 270,357 |
| 3% 6/30/24 | | 510,000 | 496,214 |
| 3% 7/31/24 | | 8,230,000 | 7,997,245 |
| 3% 7/15/25 | | 910,000 | 876,195 |
| 3% 10/31/25 | | 535,000 | 513,893 |
| 3.125% 8/15/25 | | 6,350,000 | 6,130,230 |
| 3.125% 8/31/27 | | 3,090,000 | 2,948,898 |
| 3.125% 11/15/28 | | 331,000 | 313,765 |
| 3.125% 8/31/29 | | 2,250,000 | 2,124,756 |
| 3.25% 8/31/24 | | 2,470,000 | 2,406,417 |
| 3.25% 6/30/27 | | 3,320,000 | 3,185,514 |
| 3.25% 6/30/29 | | 1,750,000 | 1,665,371 |
| 3.5% 9/15/25 | | 4,490,000 | 4,371,962 |
| 3.5% 1/31/28 | | 2,970,000 | 2,879,740 |
| 3.5% 1/31/30 | | 3,790,000 | 3,660,311 |
| 3.875% 1/15/26 | | 10,260,000 | 10,083,656 |
| 3.875% 11/30/27 | | 6,500,000 | 6,407,324 |
| 3.875% 12/31/27 | | 5,110,000 | 5,033,424 |
| 3.875% 9/30/29 | | 5,080,000 | 5,011,738 |
| 3.875% 11/30/29 | | 3,970,000 | 3,919,134 |
| 3.875% 12/31/29 | | 5,560,000 | 5,492,238 |
| 4% 12/15/25 | | 4,400,000 | 4,341,219 |
| 4% 2/29/28 | | 3,620,000 | 3,593,133 |
| 4% 10/31/29 | | 10,290,000 | 10,229,305 |
| 4.125% 1/31/25 | | 4,650,000 | 4,589,514 |
| 4.125% 9/30/27 | | 1,350,000 | 1,342,934 |
| 4.125% 10/31/27 | | 7,580,000 | 7,542,100 |
| 4.125% 11/15/32 | | 7,180,000 | 7,294,431 |
| 4.25% 9/30/24 | | 5,680,000 | 5,615,878 |
| 4.25% 12/31/24 | | 10,860,000 | 10,738,249 |
| 4.25% 10/15/25 | | 10,580,000 | 10,491,145 |
| 4.375% 10/31/24 | | 5,950,000 | 5,894,219 |
| 4.5% 11/30/24 | | 8,450,000 | 8,388,936 |
| 4.5% 11/15/25 | | 2,900,000 | 2,895,129 |
TOTAL U.S. TREASURY OBLIGATIONS | | | 622,346,668 |
| TOTAL U.S. GOVERNMENT AND GOVERNMENT AGENCY OBLIGATIONS (Cost $701,147,709) | | | 637,897,920 |
| | | | |
| U.S. Government Agency - Mortgage Securities - 27.3% |
| | | Principal Amount (a) | Value ($) |
| Fannie Mae - 11.5% | | | |
| 1.5% 10/1/36 to 4/1/52 | | 16,386,054 | 13,379,232 |
| 2% 6/1/27 to 6/1/52 | | 55,227,048 | 45,911,596 |
| 2.5% 4/1/30 to 7/1/52 | | 35,592,756 | 30,715,294 |
| 3% 12/1/26 to 7/1/52 | | 32,463,293 | 29,071,569 |
| 3.5% 5/1/24 to 8/1/52 | | 20,987,778 | 19,469,801 |
| 4% 4/1/26 to 10/1/52 | | 12,314,833 | 11,676,301 |
| 4.5% 10/1/39 to 11/1/52 | | 6,059,373 | 5,887,045 |
| 5% 11/1/44 to 12/1/52 | | 5,925,570 | 5,874,373 |
| 5.5% 7/1/24 to 12/1/52 | | 2,494,913 | 2,500,297 |
| 6% 12/1/52 | | 1,680,592 | 1,701,985 |
TOTAL FANNIE MAE | | | 166,187,493 |
| Freddie Mac - 8.0% | | | |
| 1.5% 10/1/36 to 2/1/52 | | 6,599,173 | 5,400,722 |
| 2% 3/1/28 to 4/1/52 | | 42,200,872 | 35,128,213 |
| 2% 9/1/35 | | 1,279,137 | 1,138,561 |
| 2% 11/1/35 | | 299,094 | 266,691 |
| 2% 11/1/35 | | 374,587 | 334,006 |
| 2.5% 2/1/30 to 11/1/52 | | 37,935,849 | 32,453,259 |
| 3% 2/1/29 to 7/1/52 | | 11,257,499 | 10,066,163 |
| 3.5% 12/1/25 to 9/1/52 | | 10,345,739 | 9,543,275 |
| 4% 6/1/34 to 11/1/52 | | 9,798,626 | 9,310,426 |
| 4% 4/1/48 | | 888 | 849 |
| 4.5% 7/1/41 to 1/1/53 | | 7,210,727 | 6,985,156 |
| 5% 8/1/48 to 1/1/53 | | 2,203,100 | 2,174,639 |
| 5.5% 6/1/49 to 3/1/53 | | 1,723,396 | 1,722,586 |
| 6% 11/1/52 to 1/1/53 | | 586,342 | 593,712 |
TOTAL FREDDIE MAC | | | 115,118,258 |
| Ginnie Mae - 5.9% | | | |
| 1.5% 4/20/51 to 5/20/51 | | 191,925 | 153,513 |
| 2% 3/20/51 to 8/20/52 | | 20,058,877 | 16,878,315 |
| 2% 3/1/53 (e) | | 500,000 | 419,086 |
| 2% 3/1/53 (e) | | 900,000 | 754,355 |
| 2.5% 3/20/47 to 6/20/52 | | 21,047,335 | 18,284,675 |
| 2.5% 3/1/53 (e) | | 750,000 | 648,573 |
| 2.5% 3/1/53 (e) | | 650,000 | 562,096 |
| 2.5% 3/1/53 (e) | | 600,000 | 518,858 |
| 3% 7/20/42 to 7/20/52 | | 15,651,622 | 14,077,263 |
| 3% 3/1/53 (e) | | 200,000 | 178,411 |
| 3% 3/1/53 (e) | | 150,000 | 133,808 |
| 3% 3/1/53 (e) | | 800,000 | 713,643 |
| 3.5% 5/20/44 to 10/20/52 | | 11,568,136 | 10,738,286 |
| 3.5% 3/1/53 (e) | | 500,000 | 459,601 |
| 3.5% 3/1/53 (e) | | 400,000 | 367,681 |
| 4% 12/20/45 to 1/20/53 | | 7,736,831 | 7,343,302 |
| 4% 3/1/53 (e) | | 600,000 | 566,947 |
| 4.5% 6/20/45 to 11/20/52 | | 5,367,363 | 5,217,594 |
| 4.5% 3/1/53 (e) | | 700,000 | 678,251 |
| 5% 11/20/45 to 11/20/52 | | 2,737,825 | 2,716,931 |
| 5% 3/1/53 (e) | | 400,000 | 395,363 |
| 5.5% 12/20/44 to 12/20/52 | | 578,892 | 582,316 |
| 5.5% 3/1/53 (e) | | 600,000 | 602,071 |
| 5.5% 3/1/53 (e) | | 900,000 | 903,106 |
| 6% 3/1/53 (e) | | 800,000 | 811,456 |
TOTAL GINNIE MAE | | | 84,705,501 |
| Uniform Mortgage Backed Securities - 1.9% | | | |
| 1.5% 3/1/38 (e) | | 1,100,000 | 950,925 |
| 1.5% 3/1/53 (e) | | 400,000 | 308,856 |
| 2% 3/1/38 (e) | | 400,000 | 355,008 |
| 2% 3/1/53 (e) | | 3,650,000 | 2,972,028 |
| 2% 3/1/53 (e) | | 750,000 | 610,691 |
| 2% 3/1/53 (e) | | 7,850,000 | 6,391,895 |
| 2% 3/1/53 (e) | | 2,000,000 | 1,628,508 |
| 2% 3/1/53 (e) | | 700,000 | 569,978 |
| 2% 4/1/53 (e) | | 6,050,000 | 4,932,146 |
| 2.5% 3/1/53 (e) | | 1,625,000 | 1,376,681 |
| 2.5% 3/1/53 (e) | | 1,675,000 | 1,419,041 |
| 2.5% 3/1/53 (e) | | 700,000 | 593,032 |
| 2.5% 4/1/53 (e) | | 550,000 | 466,426 |
| 3% 3/1/53 (e) | | 400,000 | 351,828 |
| 3% 3/1/53 (e) | | 700,000 | 615,699 |
| 3% 3/1/53 (e) | | 500,000 | 439,785 |
| 4% 3/1/53 (e) | | 800,000 | 750,375 |
| 4.5% 3/1/53 (e) | | 700,000 | 673,941 |
| 5.5% 3/1/53 (e) | | 800,000 | 798,594 |
| 6% 3/1/53 (e) | | 700,000 | 708,230 |
| 6.5% 3/1/53 (e) | | 600,000 | 614,481 |
| 6.5% 3/1/53 (e) | | 800,000 | 819,308 |
TOTAL UNIFORM MORTGAGE BACKED SECURITIES | | | 28,347,456 |
| TOTAL U.S. GOVERNMENT AGENCY - MORTGAGE SECURITIES (Cost $446,314,918) | | | 394,358,708 |
| | | | |
| Asset-Backed Securities - 0.2% |
| | | Principal Amount (a) | Value ($) |
| Capital One Multi-Asset Execution Trust: | | | |
| Series 2019-A3 Class A3, 2.06% 8/15/28 | | 111,000 | 101,128 |
| 1.39% 7/15/30 | | 280,000 | 236,517 |
| Capital One Prime Auto Receivables Series 2023-1 Class A3, 4.87% 2/15/28 | | 120,000 | 119,252 |
| CarMax Auto Owner Trust: | | | |
| Series 2021-1 Class A3, 0.34% 12/15/25 | | 236,997 | 228,923 |
| Series 2022-3 Class A2A, 3.97% 4/15/27 | | 630,000 | 615,576 |
| Citibank Credit Card Issuance Trust: | | | |
| Series 2007-A3 Class A3, 6.15% 6/15/39 | | 100,000 | 109,308 |
| Series 2018-A7 Class A7, 3.96% 10/13/30 | | 250,000 | 240,681 |
| Ford Credit Floorplan Master Owner Trust: | | | |
| Series 2018-2 Class A, 3.17% 3/15/25 | | 50,000 | 49,972 |
| Series 2018-4 Class A, 4.06% 11/15/30 | | 60,000 | 56,866 |
| GM Financial Consumer Automobile Receivables Trust Series 2021-1 Class A3, 0.35% 10/16/25 | | 214,490 | 208,260 |
| Hyundai Auto Receivables Trust 3.72% 11/16/26 | | 425,000 | 414,396 |
| Mercedes-Benz Auto Lease Trust Series 2021-A Class A3, 0.25% 1/16/24 | | 95,502 | 94,701 |
| TOTAL ASSET-BACKED SECURITIES (Cost $2,598,127) | | | 2,475,580 |
| | | | |
| Commercial Mortgage Securities - 1.3% |
| | | Principal Amount (a) | Value ($) |
| BANK sequential payer: | | | |
| Series 2017-BNK4 Class ASB, 3.419% 5/15/50 | | 224,619 | 215,609 |
| Series 2020-BN25 Class A5, 2.649% 1/15/63 | | 240,000 | 204,360 |
| Series 2020-BN28 Class A4, 1.844% 3/15/63 | | 380,000 | 301,118 |
| Series 2021-BN35 Class A5, 2.285% 6/15/64 | | 700,000 | 566,901 |
| Series 2022-BNK39 Class A4, 2.928% 2/15/55 | | 300,000 | 253,043 |
| Series 2022-BNK41 Class A4, 3.79% 4/15/65 (b) | | 950,000 | 864,515 |
| BBCMS Mortgage Trust sequential payer: | | | |
| Series 2021-C10 Class A5, 2.492% 7/15/54 | | 450,000 | 371,926 |
| Series 2021-C11 Class A5, 2.322% 9/15/54 | | 450,000 | 363,952 |
| Series 2021-C9 Class A5, 2.299% 2/15/54 | | 550,000 | 448,279 |
| Benchmark Mortgage Trust: | | | |
| sequential payer: | | | |
Series 2020-B19 Class A5, 1.85% 9/15/53 | | 350,000 | 278,533 |
Series 2021-B24 Class A5, 2.5843% 3/15/54 | | 450,000 | 371,716 |
| Series 2019-B12 Class A5, 3.1156% 8/15/52 | | 235,000 | 207,943 |
| Series 2019-B9 Class A5, 4.0156% 3/15/52 | | 160,000 | 149,774 |
| BMO Mortgage Trust sequential payer Series 2022-C1 Class A5, 3.374% 2/15/55 | | 300,000 | 261,842 |
| Citigroup Commercial Mortgage Trust sequential payer: | | | |
| Series 2015-GC29 Class A4, 3.192% 4/10/48 | | 500,000 | 473,927 |
| Series 2016-C1 Class A4, 3.209% 5/10/49 | | 480,000 | 447,777 |
| Series 2018-B2 Class A4, 4.009% 3/10/51 | | 250,000 | 233,689 |
| CSAIL Commercial Mortgage Trust sequential payer Series 2019-C17: | | | |
| Class A4, 2.7628% 9/15/52 | | 200,000 | 171,798 |
| Class A5, 3.0161% 9/15/52 | | 200,000 | 173,695 |
| Freddie Mac: | | | |
| sequential payer: | | | |
Series 2016-K057 Class A2, 2.57% 7/25/26 | | 330,000 | 308,089 |
Series 2020-K104 Class A2, 2.253% 1/25/30 | | 760,000 | 658,176 |
Series 2020-K116 Class A2, 1.378% 7/25/30 | | 640,000 | 513,926 |
Series 2020-K117 Class A2, 1.406% 8/25/30 | | 710,000 | 570,156 |
Series 2020-K118 Class A2, 1.493% 9/25/30 | | 430,000 | 346,803 |
Series 2020-K121 Class A2, 1.547% 10/25/30 | | 70,000 | 56,512 |
Series 2021-K125 Class A2, 1.846% 1/25/31 | | 450,000 | 370,124 |
Series 2021-K126 Class A2, 2.074% 1/25/31 | | 180,000 | 150,816 |
Series 2021-K128 Class A2, 2.02% 3/25/31 | | 540,000 | 449,940 |
Series 2021-K129 Class A2, 1.914% 5/25/31 | | 540,000 | 445,107 |
Series 2021-K130 Class A2, 1.723% 6/25/31 | | 650,000 | 525,896 |
Series 2021-K136 Class A2, 2.127% 11/25/31 | | 1,090,000 | 903,973 |
Series 2022-K145 Class A2, 2.58% 5/25/32 | | 2,500,000 | 2,141,973 |
| Series 2017-K064 Class A2, 3.224% 3/25/27 | | 250,000 | 236,736 |
| Series 2017-K068 Class A2, 3.244% 8/25/27 | | 570,000 | 538,636 |
| Series 2017-K727 Class A2, 2.946% 7/25/24 | | 51,655 | 50,209 |
| Series 2018-K730 Class A2, 3.59% 1/25/25 | | 48,122 | 46,822 |
| Series 2019-K094 Class A2, 2.903% 6/25/29 | | 430,000 | 391,445 |
| Series 2019-K1510 Class A2, 3.718% 1/25/31 | | 165,000 | 155,887 |
| Series 2021-K123 Class A2, 1.621% 12/25/30 | | 540,000 | 437,716 |
| GS Mortgage Securities Trust sequential payer: | | | |
| Series 2014-GC26 Class A4, 3.364% 11/10/47 | | 196,732 | 189,005 |
| Series 2020-GC45 Class A5, 2.9106% 2/13/53 | | 300,000 | 259,498 |
| JPMBB Commercial Mortgage Securities Trust sequential payer: | | | |
| Series 2014-C21 Class A5, 3.7748% 8/15/47 | | 50,000 | 48,706 |
| Series 2014-C24 Class A5, 3.6385% 11/15/47 | | 400,000 | 385,094 |
| JPMDB Commercial Mortgage Securities Trust sequential payer Series 2020-COR7 Class A5, 2.1798% 5/13/53 | | 500,000 | 396,219 |
| Morgan Stanley Capital I Trust sequential payer Series 2020-L4 Class A3, 2.698% 2/15/53 | | 150,000 | 126,728 |
| UBS Commercial Mortgage Trust sequential payer Series 2019-C16 Class A4, 3.6048% 4/15/52 | | 350,000 | 318,356 |
| Wells Fargo Commercial Mortgage Trust: | | | |
| sequential payer: | | | |
Series 2019-C52 Class A5, 2.892% 8/15/52 | | 200,000 | 173,921 |
Series 2019-C54 Class A4, 3.146% 12/15/52 | | 500,000 | 440,211 |
| Series 2018-C48 Class A5, 4.302% 1/15/52 | | 240,000 | 228,092 |
| Wells Fargo Commercial Mtg Trust 2020-C sequential payer Series 2020-C55 Class A5, 2.725% 2/15/53 | | 135,000 | 114,601 |
| TOTAL COMMERCIAL MORTGAGE SECURITIES (Cost $21,226,684) | | | 18,339,770 |
| | | | |
| Municipal Securities - 0.4% |
| | | Principal Amount (a) | Value ($) |
| American Muni. Pwr., Inc. Rev. (Combined Hydroelectric Proj.) Series 2010 B, 7.834% 2/15/41 | | 170,000 | 215,632 |
| Bay Area Toll Auth. San Francisco Bay Toll Bridge Rev.: | | | |
| Series 2009 F2, 6.263% 4/1/49 | | 55,000 | 65,568 |
| Series 2010 S1, 7.043% 4/1/50 | | 55,000 | 70,697 |
| California Gen. Oblig.: | | | |
| Series 2009, 7.55% 4/1/39 | | 160,000 | 204,477 |
| Series 2010, 7.6% 11/1/40 | | 350,000 | 451,512 |
| Series 2018, 3.5% 4/1/28 | | 175,000 | 165,237 |
| California State Univ. Rev. Series 2021 B, 2.719% 11/1/52 | | 280,000 | 195,357 |
| Charlotte-Mecklenburg Hosp. Auth. Health Care Sys. Rev. Series 2021 A, 3.204% 1/15/51 | | 150,000 | 106,151 |
| Chicago O'Hare Int'l. Arpt. Rev. Series 2010 B, 6.395% 1/1/40 | | 300,000 | 348,138 |
| Dallas Area Rapid Transit Sales Tax Rev. Series 2021 A, 2.613% 12/1/48 | | 300,000 | 207,012 |
| Dallas Fort Worth Int'l. Arpt. Rev.: | | | |
| Series 2019 A, 3.144% 11/1/45 | | 20,000 | 15,591 |
| Series 2021 C, 2.843% 11/1/46 | | 250,000 | 186,233 |
| Series 2022 A, 4.507% 11/1/51 | | 100,000 | 93,284 |
| Golden State Tobacco Securitization Corp. Tobacco Settlement Rev. Series 2021 B: | | | |
| 2.746% 6/1/34 | | 112,000 | 90,942 |
| 3.293% 6/1/42 | | 60,000 | 44,787 |
| Idaho Energy Resources Auth. Series 2021, 2.861% 9/1/46 | | 75,000 | 54,916 |
| Illinois Gen. Oblig.: | | | |
| Series 2003, 5.1% 6/1/33 | | 750,000 | 737,021 |
| Series 2010-3, 7.35% 7/1/35 | | 92,857 | 101,032 |
| Kansas St Dev. Fin. Auth. Rev. Series 2015 H, 4.927% 4/15/45 | | 140,000 | 138,341 |
| Los Angeles Dept. of Aiports (Consolidated Rental Car Facility Proj.) Series 2022 A, 4.242% 5/15/48 (Assured Guaranty Muni. Corp. Insured) | | 300,000 | 257,670 |
| Massachusetts Gen. Oblig. Series 2009 E, 5.456% 12/1/39 | | 145,000 | 149,926 |
| Massachusetts School Bldg. Auth. Dedicated Sales Tax Rev. Series 2019 B, 3.395% 10/15/40 | | 250,000 | 205,116 |
| Massachusetts Wtr. Resources Auth. Wtr. & Swr. Rev. Series 2021 C, 2.823% 8/1/41 | | 300,000 | 233,647 |
| Michigan Strategic Fund Ltd. Oblig. Rev. Series 2021 A, 3.225% 9/1/47 | | 100,000 | 74,572 |
| New Jersey Tpk. Auth. Tpk. Rev. Series 2010 A, 7.102% 1/1/41 | | 140,000 | 170,967 |
| New Jersey Trans. Trust Fund Auth. Series B: | | | |
| 4.081% 6/15/39 | | 30,000 | 25,809 |
| 4.131% 6/15/42 | | 30,000 | 25,100 |
| New York Metropolitan Trans. Auth. Rev. Series 2010 E, 6.814% 11/15/40 | | 130,000 | 140,151 |
| New York State Dorm. Auth. Series 2021 C, 2.202% 3/15/34 | | 300,000 | 233,282 |
| Port Auth. of New York & New Jersey: | | | |
| Series 180, 4.96% 8/1/46 | | 70,000 | 70,099 |
| Series 225, 3.175% 7/15/60 | | 300,000 | 210,874 |
| Texas Gen. Oblig. Series 2015 C, 3.738% 10/1/31 | | 190,000 | 178,498 |
| Univ. of California Regents Med. Ctr. Pool Rev. Series N: | | | |
| 3.006% 5/15/50 | | 150,000 | 105,503 |
| 3.256% 5/15/60 | | 150,000 | 103,853 |
| Univ. of Virginia Gen. Rev. Series 2021 B, 2.584% 11/1/51 | | 210,000 | 140,102 |
| TOTAL MUNICIPAL SECURITIES (Cost $7,272,723) | | | 5,817,097 |
| | | | |
| Foreign Government and Government Agency Obligations - 1.3% |
| | | Principal Amount (a) | Value ($) |
| Alberta Province: | | | |
| 1% 5/20/25 | | 260,000 | 238,620 |
| 2.95% 1/23/24 | | 120,000 | 117,408 |
| 3.3% 3/15/28 | | 225,000 | 212,877 |
| British Columbia Province 2.25% 6/2/26 | | 350,000 | 324,650 |
| Chilean Republic: | | | |
| 2.55% 7/27/33 | | 530,000 | 415,487 |
| 3.125% 3/27/25 | | 840,000 | 812,070 |
| 3.24% 2/6/28 | | 200,000 | 184,850 |
| 3.625% 10/30/42 | | 194,000 | 148,143 |
| Export Development Canada 2.625% 2/21/24 | | 500,000 | 486,925 |
| Hungarian Republic: | | | |
| 5.375% 3/25/24 | | 24,000 | 23,915 |
| 7.625% 3/29/41 | | 60,000 | 67,200 |
| Indonesian Republic: | | | |
| 2.85% 2/14/30 | | 200,000 | 176,288 |
| 3.5% 2/14/50 | | 400,000 | 297,200 |
| 3.85% 10/15/30 | | 750,000 | 698,344 |
| 4.35% 1/11/48 | | 250,000 | 218,153 |
| Israeli State: | | | |
| 3.25% 1/17/28 | | 760,000 | 709,677 |
| 3.375% 1/15/50 | | 275,000 | 202,879 |
| 4.5% 1/30/43 | | 200,000 | 180,350 |
| Italian Republic: | | | |
| 1.25% 2/17/26 | | 1,161,000 | 1,016,032 |
| 2.375% 10/17/24 | | 400,000 | 377,869 |
| 3.875% 5/6/51 | | 200,000 | 138,347 |
| Korean Republic 2.75% 1/19/27 | | 570,000 | 528,287 |
| Manitoba Province 2.6% 4/16/24 | | 870,000 | 844,776 |
| Ontario Province: | | | |
| 1.125% 10/7/30 | | 511,000 | 405,034 |
| 2.3% 6/15/26 | | 70,000 | 64,878 |
| 2.5% 4/27/26 | | 300,000 | 280,287 |
| 3.05% 1/29/24 | | 100,000 | 97,969 |
| Panamanian Republic: | | | |
| 3.16% 1/23/30 | | 800,000 | 685,650 |
| 4.5% 4/16/50 | | 400,000 | 299,325 |
| 6.4% 2/14/35 | | 330,000 | 339,137 |
| 6.7% 1/26/36 | | 240,000 | 253,245 |
| Peruvian Republic: | | | |
| 1.862% 12/1/32 | | 300,000 | 217,369 |
| 2.78% 12/1/60 | | 300,000 | 172,369 |
| 3.55% 3/10/51 | | 250,000 | 177,156 |
| 4.125% 8/25/27 | | 250,000 | 241,531 |
| 6.55% 3/14/37 | | 275,000 | 292,411 |
| 7.35% 7/21/25 | | 430,000 | 452,253 |
| Philippine Republic: | | | |
| 2.65% 12/10/45 | | 610,000 | 407,242 |
| 2.95% 5/5/45 | | 370,000 | 261,816 |
| 3% 2/1/28 | | 200,000 | 183,772 |
| 5.17% 10/13/27 | | 1,200,000 | 1,210,632 |
| 6.375% 10/23/34 | | 130,000 | 141,064 |
| 9.5% 2/2/30 | | 70,000 | 86,983 |
| Polish Government 5.75% 11/16/32 | | 200,000 | 209,296 |
| Quebec Province: | | | |
| 2.5% 4/9/24 | | 130,000 | 126,242 |
| 2.5% 4/20/26 | | 590,000 | 552,694 |
| 2.75% 4/12/27 | | 320,000 | 298,394 |
| United Mexican States: | | | |
| 3.25% 4/16/30 | | 400,000 | 347,325 |
| 3.5% 2/12/34 | | 1,226,000 | 995,512 |
| 4.6% 2/10/48 | | 270,000 | 214,954 |
| 4.75% 4/27/32 | | 200,000 | 186,350 |
| 5% 4/27/51 | | 755,000 | 632,690 |
| 5.4% 2/9/28 | | 200,000 | 200,100 |
| 5.55% 1/21/45 | | 250,000 | 230,438 |
| 6.05% 1/11/40 | | 120,000 | 119,385 |
| Uruguay Republic: | | | |
| 4.375% 10/27/27 | | 140,000 | 139,160 |
| 4.975% 4/20/55 | | 462,000 | 442,134 |
| 7.625% 3/21/36 | | 130,000 | 161,460 |
| TOTAL FOREIGN GOVERNMENT AND GOVERNMENT AGENCY OBLIGATIONS (Cost $22,682,546) | | | 19,546,604 |
| | | | |
| Supranational Obligations - 1.1% |
| | | Principal Amount (a) | Value ($) |
| African Development Bank: | | | |
| 0.875% 7/22/26 | | 200,000 | 176,691 |
| 3% 9/20/23 | | 80,000 | 79,018 |
| Asian Development Bank: | | | |
| 0.375% 9/3/25 | | 700,000 | 628,452 |
| 0.75% 10/8/30 | | 150,000 | 116,688 |
| 1.5% 10/18/24 | | 200,000 | 188,968 |
| 1.875% 1/24/30 | | 1,139,000 | 979,125 |
| 2.5% 11/2/27 | | 20,000 | 18,427 |
| 2.625% 1/30/24 | | 430,000 | 419,400 |
| Asian Infrastructure Investment Bank 0.25% 9/29/23 | | 600,000 | 583,229 |
| Council of Europe Development Bank 1.375% 2/27/25 | | 2,279,000 | 2,127,834 |
| European Bank for Reconstruction & Development 0.25% 7/10/23 | | 906,000 | 890,108 |
| European Investment Bank: | | | |
| 0.25% 9/15/23 | | 1,623,000 | 1,581,143 |
| 0.75% 9/23/30 | | 400,000 | 313,806 |
| 0.875% 5/17/30 | | 80,000 | 63,858 |
| 1.25% 2/14/31 | | 630,000 | 510,829 |
| 2.25% 6/24/24 | | 210,000 | 202,348 |
| 3.125% 12/14/23 | | 110,000 | 108,253 |
| Inter-American Development Bank: | | | |
| 0.625% 7/15/25 | | 140,000 | 127,324 |
| 0.875% 4/20/26 | | 400,000 | 357,036 |
| 1.5% 1/13/27 | | 1,000,000 | 896,629 |
| 4% 1/12/28 | | 1,500,000 | 1,479,229 |
| 4.375% 1/24/44 | | 190,000 | 187,690 |
| International Bank for Reconstruction & Development: | | | |
| 0.375% 7/28/25 | | 350,000 | 316,032 |
| 0.5% 10/28/25 | | 364,000 | 326,769 |
| 0.75% 8/26/30 | | 1,433,000 | 1,115,848 |
| 0.875% 5/14/30 | | 134,000 | 106,293 |
| 1.5% 8/28/24 | | 90,000 | 85,376 |
| 1.625% 1/15/25 | | 110,000 | 103,629 |
| 1.875% 10/27/26 | | 320,000 | 291,720 |
| 2.5% 3/19/24 | | 300,000 | 291,402 |
| 2.5% 3/29/32 | | 530,000 | 467,431 |
| International Finance Corp.: | | | |
| 0.375% 7/16/25 | | 160,000 | 144,779 |
| 0.75% 8/27/30 | | 100,000 | 78,184 |
| 2.875% 7/31/23 | | 39,000 | 38,636 |
| TOTAL SUPRANATIONAL OBLIGATIONS (Cost $17,002,146) | | | 15,402,184 |
| | | | |
| Bank Notes - 0.1% |
| | | Principal Amount (a) | Value ($) |
| Citizens Bank NA: | | | |
| 2.25% 4/28/25 | | 250,000 | 233,676 |
| 3.75% 2/18/26 | | 250,000 | 238,949 |
| Discover Bank 2.7% 2/6/30 | | 500,000 | 407,528 |
| TOTAL BANK NOTES (Cost $1,005,974) | | | 880,153 |
| | | | |
| Money Market Funds - 1.5% |
| | | Shares | Value ($) |
Fidelity Cash Central Fund 4.63% (g) (Cost $22,112,139) | | 22,107,717 | 22,112,139 |
| | | | |
| TOTAL INVESTMENT IN SECURITIES - 102.4% (Cost $1,660,420,853) | 1,476,900,431 |
NET OTHER ASSETS (LIABILITIES) - (2.4)% | (34,988,537) |
| NET ASSETS - 100.0% | 1,441,911,894 |
| | |
| TBA Sale Commitments |
| | Principal Amount (a) | Value ($) |
| Uniform Mortgage Backed Securities | | |
| 2% 3/1/53 | (900,000) | (732,829) |
| 2% 3/1/53 | (6,050,000) | (4,926,237) |
| 2.5% 3/1/53 | (550,000) | (465,954) |
| | | |
TOTAL TBA SALE COMMITMENTS (Proceeds $6,135,840) | | (6,125,020) |
Legend
| (a) | Amount is stated in United States dollars unless otherwise noted. |
| (b) | Coupon rates for floating and adjustable rate securities reflect the rates in effect at period end. |
| (c) | Security exempt from registration under Rule 144A of the Securities Act of 1933. These securities may be resold in transactions exempt from registration, normally to qualified institutional buyers. At the end of the period, the value of these securities amounted to $4,516,353 or 0.3% of net assets. |
| (d) | Coupon is indexed to a floating interest rate which may be multiplied by a specified factor and/or subject to caps or floors. |
| (e) | Security or a portion of the security purchased on a delayed delivery or when-issued basis. |
| (f) | Security or a portion of the security has been segregated as collateral for mortgage-backed or asset-backed securities purchased on a delayed delivery or when-issued basis. At period end, the value of securities pledged amounted to $318,904. |
| (g) | Affiliated fund that is generally available only to investment companies and other accounts managed by Fidelity Investments. The rate quoted is the annualized seven-day yield of the fund at period end. A complete unaudited listing of the fund's holdings as of its most recent quarter end is available upon request. In addition, each Fidelity Central Fund's financial statements are available on the SEC's website or upon request. |
Affiliated Central Funds
Fiscal year to date information regarding the Fund's investments in Fidelity Central Funds, including the ownership percentage, is presented below.
| Affiliate | Value, beginning of period ($) | Purchases ($) | Sales Proceeds ($) | Dividend Income ($) | Realized Gain (loss) ($) | Change in Unrealized appreciation (depreciation) ($) | Value, end of period ($) | % ownership, end of period |
| Fidelity Cash Central Fund 4.63% | 7,345,963 | 157,189,397 | 142,423,221 | 114,812 | - | - | 22,112,139 | 0.1% |
| Total | 7,345,963 | 157,189,397 | 142,423,221 | 114,812 | - | - | 22,112,139 | |
| | | | | | | | | |
Amounts in the dividend income column in the above table include any capital gain distributions from underlying funds, which are presented in the corresponding line item in the Statement of Operations, if applicable.
Amounts included in the purchases and sales proceeds columns may include in-kind transactions, if applicable.
Investment Valuation
The following is a summary of the inputs used, as of February 28, 2023, involving the Fund's assets and liabilities carried at fair value. The inputs or methodology used for valuing securities may not be an indication of the risk associated with investing in those securities. For more information on valuation inputs, and their aggregation into the levels used below, please refer to the Investment Valuation section in the accompanying Notes to Financial Statements.
| Valuation Inputs at Reporting Date: |
| Description | Total ($) | Level 1 ($) | Level 2 ($) | Level 3 ($) |
Investments in Securities: | | | | |
|
| Corporate Bonds | 360,070,276 | - | 360,070,276 | - |
|
| U.S. Government and Government Agency Obligations | 637,897,920 | - | 637,897,920 | - |
|
| U.S. Government Agency - Mortgage Securities | 394,358,708 | - | 394,358,708 | - |
|
| Asset-Backed Securities | 2,475,580 | - | 2,475,580 | - |
|
| Commercial Mortgage Securities | 18,339,770 | - | 18,339,770 | - |
|
| Municipal Securities | 5,817,097 | - | 5,817,097 | - |
|
| Foreign Government and Government Agency Obligations | 19,546,604 | - | 19,546,604 | - |
|
| Supranational Obligations | 15,402,184 | - | 15,402,184 | - |
|
| Bank Notes | 880,153 | - | 880,153 | - |
|
| Money Market Funds | 22,112,139 | 22,112,139 | - | - |
| Total Investments in Securities: | 1,476,900,431 | 22,112,139 | 1,454,788,292 | - |
Other Financial Instruments: | | | | |
|
| TBA Sale Commitments | (6,125,020) | - | (6,125,020) | - |
| Total Other Financial Instruments: | (6,125,020) | - | (6,125,020) | - |
| Statement of Assets and Liabilities |
| | | | February 28, 2023 (Unaudited) |
| | | | | |
| Assets | | | | |
| Investment in securities, at value - See accompanying schedule: | | | | |
Unaffiliated issuers (cost $1,638,308,714) | $ | 1,454,788,292 | | |
Fidelity Central Funds (cost $22,112,139) | | 22,112,139 | | |
| | | | | |
| | | | | |
| Total Investment in Securities (cost $1,660,420,853) | | | $ | 1,476,900,431 |
| Receivable for investments sold | | | | 12,020,740 |
| Receivable for TBA sale commitments | | | | 6,135,840 |
| Receivable for fund shares sold | | | | 2,889,869 |
| Interest receivable | | | | 8,156,871 |
| Distributions receivable from Fidelity Central Funds | | | | 49,100 |
Total assets | | | | 1,506,152,851 |
| Liabilities | | | | |
| Payable for investments purchased | | | | |
Regular delivery | $ | 18,221,773 | | |
Delayed delivery | | 38,681,511 | | |
| TBA sale commitments, at value | | 6,125,020 | | |
| Payable for fund shares redeemed | | 1,210,612 | | |
| Distributions payable | | 2,041 | | |
| Total Liabilities | | | | 64,240,957 |
| Net Assets | | | $ | 1,441,911,894 |
| Net Assets consist of: | | | | |
| Paid in capital | | | $ | 1,644,194,926 |
| Total accumulated earnings (loss) | | | | (202,283,032) |
| Net Assets | | | $ | 1,441,911,894 |
Net Asset Value , offering price and redemption price per share ($1,441,911,894 ÷ 160,668,524 shares) | | | $ | 8.97 |
| Statement of Operations |
| | | | Six months ended February 28, 2023 (Unaudited) |
| Investment Income | | | | |
| Interest | | | $ | 17,920,280 |
| Income from Fidelity Central Funds | | | | 114,812 |
| Total Income | | | | 18,035,092 |
| Expenses | | | | |
| Independent trustees' fees and expenses | $ | 2,510 | | |
| Total expenses before reductions | | 2,510 | | |
| Expense reductions | | (548) | | |
| Total expenses after reductions | | | | 1,962 |
| Net Investment income (loss) | | | | 18,033,130 |
| Realized and Unrealized Gain (Loss) | | | | |
| Net realized gain (loss) on: | | | | |
| Investment Securities: | | | | |
| Unaffiliated issuers | | (11,388,637) | | |
| Total net realized gain (loss) | | | | (11,388,637) |
| Change in net unrealized appreciation (depreciation) on: | | | | |
| Investment Securities: | | | | |
| Unaffiliated issuers | | (35,864,770) | | |
| TBA Sale commitments | | 10,820 | | |
| Total change in net unrealized appreciation (depreciation) | | | | (35,853,950) |
| Net gain (loss) | | | | (47,242,587) |
| Net increase (decrease) in net assets resulting from operations | | | $ | (29,209,457) |
| Statement of Changes in Net Assets |
| |
| | Six months ended February 28, 2023 (Unaudited) | | Year ended August 31, 2022 |
| Increase (Decrease) in Net Assets | | | | |
| Operations | | | | |
| Net investment income (loss) | $ | 18,033,130 | $ | 22,572,531 |
| Net realized gain (loss) | | (11,388,637) | | (8,627,130) |
| Change in net unrealized appreciation (depreciation) | | (35,853,950) | | (169,634,618) |
| Net increase (decrease) in net assets resulting from operations | | (29,209,457) | | (155,689,217) |
| Distributions to shareholders | | (16,788,377) | | (21,745,579) |
| Share transactions | | | | |
| Proceeds from sales of shares | | 322,130,935 | | 695,081,615 |
| Reinvestment of distributions | | 16,775,835 | | 21,726,836 |
| Cost of shares redeemed | | (166,370,868) | | (370,645,357) |
Net increase (decrease) in net assets resulting from share transactions | | 172,535,902 | | 346,163,094 |
| Total increase (decrease) in net assets | | 126,538,068 | | 168,728,298 |
| | | | | |
| Net Assets | | | | |
| Beginning of period | | 1,315,373,826 | | 1,146,645,528 |
| End of period | $ | 1,441,911,894 | $ | 1,315,373,826 |
| | | | | |
| Other Information | | | | |
| Shares | | | | |
| Sold | | 35,696,109 | | 69,448,630 |
| Issued in reinvestment of distributions | | 1,868,555 | | 2,196,901 |
| Redeemed | | (18,498,299) | | (37,388,337) |
| Net increase (decrease) | | 19,066,365 | | 34,257,194 |
| | | | | |
Financial Highlights
| Fidelity Flex® U.S. Bond Index Fund |
| |
| | Six months ended (Unaudited) February 28, 2023 | | Years ended August 31, 2022 | | 2021 | | 2020 | | 2019 | | 2018 |
Selected Per-Share Data | | | | | | | | | | | | |
| Net asset value, beginning of period | $ | 9.29 | $ | 10.68 | $ | 10.97 | $ | 10.57 | $ | 9.86 | $ | 10.29 |
| Income from Investment Operations | | | | | | | | | | | | |
Net investment income (loss) A,B | | .122 | | .180 | | .159 | | .256 | | .306 | | .275 |
| Net realized and unrealized gain (loss) | | (.329) | | (1.397) | | (.192) | | .420 | | .688 | | (.390) |
| Total from investment operations | | (.207) | | (1.217) | | (.033) | | .676 | | .994 | | (.115) |
| Distributions from net investment income | | (.113) | | (.173) | | (.163) | | (.256) | | (.284) | | (.258) |
| Distributions from net realized gain | | - | | - | | (.094) | | (.020) | | - | | (.057) |
| Total distributions | | (.113) | | (.173) | | (.257) | | (.276) | | (.284) | | (.315) |
| Net asset value, end of period | $ | 8.97 | $ | 9.29 | $ | 10.68 | $ | 10.97 | $ | 10.57 | $ | 9.86 |
Total Return C,D | | (2.22)% | | (11.49)% | | (.29)% | | 6.50% | | 10.28% | | (1.12)% |
Ratios to Average Net Assets B,E,F | | | | | | | | | | | | |
Expenses before reductions G | | -% H | | -% | | -% | | -% | | -% | | -% |
Expenses net of fee waivers, if any G | | -% H | | -% | | -% | | -% | | -% | | -% |
Expenses net of all reductions G | | -% H | | -% | | -% | | -% | | -% | | -% |
| Net investment income (loss) | | 2.72% H | | 1.81% | | 1.50% | | 2.40% | | 3.06% | | 2.82% |
| Supplemental Data | | | | | | | | | | | | |
| Net assets, end of period (000 omitted) | $ | 1,441,912 | $ | 1,315,374 | $ | 1,146,646 | $ | 584,965 | $ | 354,791 | $ | 229,769 |
Portfolio turnover rate I | | 40% H | | 55% | | 115% | | 79% | | 85% | | 102% |
A Calculated based on average shares outstanding during the period.
B Net investment income (loss) is affected by the timing of the declaration of dividends by any underlying mutual funds or exchange-traded funds (ETFs). Net investment income (loss) of any mutual funds or ETFs is not included in the Fund's net investment income (loss) ratio.
C Total returns for periods of less than one year are not annualized.
D Total returns would have been lower if certain expenses had not been reduced during the applicable periods shown.
E Fees and expenses of any underlying mutual funds or exchange-traded funds (ETFs) are not included in the Fund's expense ratio. The Fund indirectly bears its proportionate share of these expenses. For additional expense information related to investments in Fidelity Central Funds, please refer to the "Investments in Fidelity Central Funds" note found in the Notes to Financial Statements section of the most recent Annual or Semi-Annual report.
F Expense ratios reflect operating expenses of the class. Expenses before reductions do not reflect amounts reimbursed, waived, or reduced through arrangements with the investment adviser, brokerage services, or other offset arrangements, if applicable, and do not represent the amount paid by the class during periods when reimbursements, waivers or reductions occur.
G Amount represents less than .005%.
H Annualized.
I Amount does not include the portfolio activity of any underlying mutual funds or exchange-traded funds (ETFs).
For the period ended February 28, 2023
1. Organization.
Fidelity Flex U.S. Bond Index Fund (the Fund) is a fund of Fidelity Salem Street Trust (the Trust) and is authorized to issue an unlimited number of shares. Share transactions on the Statement of Changes in Net Assets may contain exchanges between affiliated funds. The Trust is registered under the Investment Company Act of 1940, as amended (the 1940 Act), as an open-end management investment company organized as a Massachusetts business trust. The Fund is available only to certain fee-based accounts and advisory programs offered by Fidelity.
2. Investments in Fidelity Central Funds.
Funds may invest in Fidelity Central Funds, which are open-end investment companies generally available only to other investment companies and accounts managed by the investment adviser and its affiliates. The Schedule of Investments lists any Fidelity Central Funds held as an investment as of period end, but does not include the underlying holdings of each Fidelity Central Fund. An investing fund indirectly bears its proportionate share of the expenses of the underlying Fidelity Central Funds.
Based on its investment objective, each Fidelity Central Fund may invest or participate in various investment vehicles or strategies that are similar to those of the investing fund. These strategies are consistent with the investment objectives of the investing fund and may involve certain economic risks which may cause a decline in value of each of the Fidelity Central Funds and thus a decline in the value of the investing fund.
| Fidelity Central Fund | Investment Manager | Investment Objective | Investment Practices | Expense Ratio A |
| Fidelity Money Market Central Funds | Fidelity Management & Research Company LLC (FMR) | Each fund seeks to obtain a high level of current income consistent with the preservation of capital and liquidity. | Short-term Investments | Less than .005% |
A Expenses expressed as a percentage of average net assets and are as of each underlying Central Fund's most recent annual or semi-annual shareholder report.
A complete unaudited list of holdings for each Fidelity Central Fund is available upon request or at the Securities and Exchange Commission website at www.sec.gov. In addition, the financial statements of the Fidelity Central Funds which contain the significant accounting policies (including investment valuation policies) of those funds, and are not covered by the Report of Independent Registered Public Accounting Firm, are available on the Securities and Exchange Commission website or upon request.
3. Significant Accounting Policies.
The Fund is an investment company and applies the accounting and reporting guidance of the Financial Accounting Standards Board (FASB) Accounting Standards Codification Topic 946 Financial Services - Investment Companies . The financial statements have been prepared in conformity with accounting principles generally accepted in the United States of America (GAAP), which require management to make certain estimates and assumptions at the date of the financial statements. Actual results could differ from those estimates. Subsequent events, if any, through the date that the financial statements were issued have been evaluated in the preparation of the financial statements. The Fund's Schedule of Investments lists any underlying mutual funds or exchange-traded funds (ETFs) but does not include the underlying holdings of these funds. The following summarizes the significant accounting policies of the Fund:
Investment Valuation. Investments are valued as of 4:00 p.m. Eastern time on the last calendar day of the period. The Board of Trustees (the Board) has designated the Fund's investment adviser as the valuation designee responsible for the fair valuation function and performing fair value determinations as needed. The investment adviser has established a Fair Value Committee (the Committee) to carry out the day-to-day fair valuation responsibilities and has adopted policies and procedures to govern the fair valuation process and the activities of the Committee. In accordance with these fair valuation policies and procedures, which have been approved by the Board, the Fund attempts to obtain prices from one or more third party pricing services or brokers to value its investments. When current market prices, quotations or currency exchange rates are not readily available or reliable, investments will be fair valued in good faith by the Committee, in accordance with the policies and procedures. Factors used in determining fair value vary by investment type and may include market or investment specific events, transaction data, estimated cash flows, and market observations of comparable investments. The frequency that the fair valuation procedures are used cannot be predicted and they may be utilized to a significant extent. The Committee manages the Fund's fair valuation practices and maintains the fair valuation policies and procedures. The Fund's investment adviser reports to the Board information regarding the fair valuation process and related material matters.
The Fund categorizes the inputs to valuation techniques used to value its investments into a disclosure hierarchy consisting of three levels as shown below:
Level 1 - unadjusted quoted prices in active markets for identical investments
Level 2 - other significant observable inputs (including quoted prices for similar investments, interest rates, prepayment speeds, etc.)
Level 3 - unobservable inputs (including the Fund's own assumptions based on the best information available)
Valuation techniques used to value the Fund's investments by major category are as follows:
Debt securities, including restricted securities, are valued based on evaluated prices received from third party pricing services or from brokers who make markets in such securities. Corporate bonds, bank notes, foreign government and government agency obligations, municipal securities, supranational obligations and U.S. government and government agency obligations are valued by pricing services who utilize matrix pricing which considers yield or price of bonds of comparable quality, coupon, maturity and type or by broker-supplied prices. Asset backed securities, commercial mortgage securities and U.S. government agency mortgage securities are valued by pricing services who utilize matrix pricing which considers prepayment speed assumptions, attributes of the collateral, yield or price of bonds of comparable quality, coupon, maturity and type or by broker-supplied prices. When independent prices are unavailable or unreliable, debt securities may be valued utilizing pricing methodologies which consider similar factors that would be used by third party pricing services. Debt securities are generally categorized as Level 2 in the hierarchy but may be Level 3 depending on the circumstances.
Investments in open-end mutual funds, including the Fidelity Central Funds, are valued at their closing net asset value (NAV) each business day and are categorized as Level 1 in the hierarchy.
Changes in valuation techniques may result in transfers in or out of an assigned level within the disclosure hierarchy. The aggregate value of investments by input level as of February 28, 2023 is included at the end of the Fund's Schedule of Investments.
Investment Transactions and Income. For financial reporting purposes, the Fund's investment holdings and NAV include trades executed through the end of the last business day of the period. The NAV per share for processing shareholder transactions is calculated as of the close of business of the New York Stock Exchange (NYSE), normally 4:00 p.m. Eastern time and includes trades executed through the end of the prior business day. Gains and losses on securities sold are determined on the basis of identified cost. Income and capital gain distributions from Fidelity Central Funds, if any, are recorded on the ex-dividend date. Interest income is accrued as earned and includes coupon interest and amortization of premium and accretion of discount on debt securities as applicable. Debt obligations may be placed on non-accrual status and related interest income may be reduced by ceasing current accruals and writing off interest receivables when the collection of all or a portion of interest has become doubtful based on consistently applied procedures. A debt obligation is removed from non-accrual status when the issuer resumes interest payments or when collectability of interest is reasonably assured.
Expenses. Expenses directly attributable to a fund are charged to that fund. Expenses attributable to more than one fund are allocated among the respective funds on the basis of relative net assets or other appropriate methods. Expenses included in the accompanying financial statements reflect the expenses of that fund and do not include any expenses associated with any underlying mutual funds or exchange-traded funds. Although not included in a fund's expenses, a fund indirectly bears its proportionate share of these expenses through the net asset value of each underlying mutual fund or exchange-traded fund. Expense estimates are accrued in the period to which they relate and adjustments are made when actual amounts are known.
Income Tax Information and Distributions to Shareholders. Each year, the Fund intends to qualify as a regulated investment company under Subchapter M of the Internal Revenue Code, including distributing substantially all of its taxable income and realized gains. As a result, no provision for U.S. Federal income taxes is required. The Fund files a U.S. federal tax return, in addition to state and local tax returns as required. The Fund's federal income tax returns are subject to examination by the Internal Revenue Service (IRS) for a period of three fiscal years after they are filed. State and local tax returns may be subject to examination for an additional fiscal year depending on the jurisdiction.
Distributions are declared and recorded daily and paid monthly from net investment income. Distributions from realized gains, if any, are declared and recorded on the ex-dividend date. Income and capital gain distributions are determined in accordance with income tax regulations, which may differ from GAAP.
Capital accounts within the financial statements are adjusted for permanent book-tax differences. These adjustments have no impact on net assets or the results of operations. Capital accounts are not adjusted for temporary book-tax differences which will reverse in a subsequent period.
Book-tax differences are primarily due to market discounts, capital loss carryforwards and losses deferred due to wash sales and excise tax regulations.
As of period end, the cost and unrealized appreciation (depreciation) in securities, and derivatives if applicable, for federal income tax purposes were as follows:
| Gross unrealized appreciation | $855,428 |
| Gross unrealized depreciation | (182,752,535) |
| Net unrealized appreciation (depreciation) | $(181,897,107) |
| Tax cost | $1,658,808,358 |
Capital loss carryforwards are only available to offset future capital gains of the Fund to the extent provided by regulations and may be limited. The capital loss carryforward information presented below, including any applicable limitation, is estimated as of prior fiscal period end and is subject to adjustment.
| Short-term | $(6,828,138) |
| Long-term | (2,647,961) |
| Total capital loss carryforward | $(9,476,099) |
Delayed Delivery Transactions and When-Issued Securities. During the period, certain Funds transacted in securities on a delayed delivery or when-issued basis. Payment and delivery may take place after the customary settlement period for that security. The price of the underlying securities and the date when the securities will be delivered and paid for are fixed at the time the transaction is negotiated. Securities purchased on a delayed delivery or when-issued basis are identified as such in the Schedule of Investments. Compensation for interest forgone in the purchase of a delayed delivery or when-issued debt security may be received. With respect to purchase commitments, each applicable Fund identifies securities as segregated in its records with a value at least equal to the amount of the commitment. Payables and receivables associated with the purchases and sales of delayed delivery securities having the same coupon, settlement date and broker are offset. Delayed delivery or when-issued securities that have been purchased from and sold to different brokers are reflected as both payables and receivables in the Statement of Assets and Liabilities under the caption "Delayed delivery", as applicable. Losses may arise due to changes in the value of the underlying securities or if the counterparty does not perform under the contract's terms, or if the issuer does not issue the securities due to political, economic, or other factors.
To-Be-Announced (TBA) Securities and Mortgage Dollar Rolls. TBA securities involve buying or selling mortgage-backed securities (MBS) on a forward commitment basis. A TBA transaction typically does not designate the actual security to be delivered and only includes an approximate principal amount; however delivered securities must meet specified terms defined by industry guidelines, including issuer, rate and current principal amount outstanding on underlying mortgage pools. Funds may enter into a TBA transaction with the intent to take possession of or deliver the underlying MBS, or a fund may elect to extend the settlement by entering into either a mortgage or reverse mortgage dollar roll. Mortgage dollar rolls are transactions where a fund sells TBA securities and simultaneously agrees to repurchase MBS on a later date at a lower price and with the same counterparty. Reverse mortgage dollar rolls involve the purchase and simultaneous agreement to sell TBA securities on a later date at a lower price. Transactions in mortgage dollar rolls and reverse mortgage dollar rolls are accounted for as purchases and sales and may result in an increase to a fund's portfolio turnover rate.
Purchases and sales of TBA securities involve risks similar to those discussed above for delayed delivery and when-issued securities. Also, if the counterparty in a mortgage dollar roll or a reverse mortgage dollar roll transaction files for bankruptcy or becomes insolvent, a fund's right to repurchase or sell securities may be limited. Additionally, when a fund sells TBA securities without already owning or having the right to obtain the deliverable securities (an uncovered forward commitment to sell), it incurs a risk of loss because it could have to purchase the securities at a price that is higher than the price at which it sold them. A fund may be unable to purchase the deliverable securities if the corresponding market is illiquid.
TBA securities subject to a forward commitment to sell at period end are included at the end of the Schedule of Investments under the caption "TBA Sale Commitments." The proceeds and value of these commitments are reflected in the Statement of Assets and Liabilities as "Receivable for TBA sale commitments" and "TBA sale commitments, at value," respectively.
Restricted Securities (including Private Placements). Funds may invest in securities that are subject to legal or contractual restrictions on resale. These securities generally may be resold in transactions exempt from registration or to the public if the securities are registered. Disposal of these securities may involve time-consuming negotiations and expense, and prompt sale at an acceptable price may be difficult. Information regarding restricted securities held at period end is included at the end of the Schedule of Investments, if applicable.
4. Purchases and Sales of Investments.
Purchases and sales of securities, other than short-term securities, U.S. government securities and in-kind transactions, as applicable, are noted in the table below.
| | Purchases ($) | Sales ($) |
| Fidelity Flex U.S. Bond Index Fund | 147,722,409 | 86,987,407 |
5. Fees and Other Transactions with Affiliates.
Management Fee. Fidelity Management & Research Company LLC (the investment adviser) and its affiliates provide the Fund with investment management related services and the Fund does not pay any fees for these services. Under the management contract, the investment adviser or an affiliate pays all other expenses of the Fund, excluding fees and expenses of the independent Trustees, and certain miscellaneous expenses such as proxy and shareholder meeting expenses.
Interfund Trades. Funds may purchase from or sell securities to other Fidelity Funds under procedures adopted by the Board. The procedures have been designed to ensure these interfund trades are executed in accordance with Rule 17a-7 of the 1940 Act. Any interfund trades are included within the respective purchases and sales amounts shown in the Purchases and Sales of Investments note. During the period, there were no interfund trades.
6. Committed Line of Credit.
Certain Funds participate with other funds managed by the investment adviser or an affiliate in a $4.25 billion credit facility (the "line of credit") to be utilized for temporary or emergency purposes to fund shareholder redemptions or for other short-term liquidity purposes. The commitment fees on the pro-rata portion of the line of credit are borne by the investment adviser. During the period, there were no borrowings on this line of credit.
7. Expense Reductions.
Through arrangements with the Fund's custodian, credits realized as a result of certain uninvested cash balances were used to reduce the Fund's expenses by $548.
8. Other.
A fund's organizational documents provide former and current trustees and officers with a limited indemnification against liabilities arising in connection with the performance of their duties to the fund. In the normal course of business, a fund may also enter into contracts that provide general indemnifications. A fund's maximum exposure under these arrangements is unknown as this would be dependent on future claims that may be made against a fund. The risk of material loss from such claims is considered remote.
9. Risk and Uncertainties.
Many factors affect a fund's performance. Developments that disrupt global economies and financial markets, such as pandemics, epidemics, outbreaks of infectious diseases, war, terrorism, and environmental disasters, may significantly affect a fund's investment performance. The effects of these developments to a fund will be impacted by the types of securities in which a fund invests, the financial condition, industry, economic sector, and geographic location of an issuer, and a fund's level of investment in the securities of that issuer. Significant concentrations in security types, issuers, industries, sectors, and geographic locations may magnify the factors that affect a fund's performance. Significant concentrations in security types, issuers, industries, sectors, and geographic locations may magnify the factors that affect a fund's performance.
As a shareholder, you incur two types of costs: (1) transaction costs, which may include sales charges (loads) on purchase payments or redemption proceeds, as applicable and (2) ongoing costs, which generally include management fees, distribution and/or service (12b-1) fees and other Fund expenses. This Example is intended to help you understand your ongoing costs (in dollars) of investing in a fund and to compare these costs with the ongoing costs of investing in other mutual funds.
| The Example is based on an investment of $1,000 invested at the beginning of the period and held for the entire period (September 1, 2022 to February 28, 2023). |
Actual Expenses
The first line of the accompanying table provides information about actual account values and actual expenses. You may use the information in this line, together with the amount you invested, to estimate the expenses that you paid over the period. Simply divide your account value by $1,000.00 (for example, an $8,600 account value divided by $1,000.00 = 8.6), then multiply the result by the number in the first line for a class/Fund under the heading entitled "Expenses Paid During Period" to estimate the expenses you paid on your account during this period. If any fund is a shareholder of any underlying mutual funds or exchange-traded funds (ETFs) (the Underlying Funds), such fund indirectly bears its proportional share of the expenses of the Underlying Funds in addition to the direct expenses incurred presented in the table. These fees and expenses are not included in the annualized expense ratio used to calculate the expense estimate in the table below.
Hypothetical Example for Comparison Purposes
The second line of the accompanying table provides information about hypothetical account values and hypothetical expenses based on the actual expense ratio and an assumed rate of return of 5% per year before expenses, which is not the actual return. The hypothetical account values and expenses may not be used to estimate the actual ending account balance or expenses you paid for the period. You may use this information to compare the ongoing costs of investing in the Fund and other funds. To do so, compare this 5% hypothetical example with the 5% hypothetical examples that appear in the shareholder reports of the other funds. If any fund is a shareholder of any Underlying Funds, such fund indirectly bears its proportional share of the expenses of the Underlying Funds in addition to the direct expenses as presented in the table. These fees and expenses are not included in the annualized expense ratio used to calculate the expense estimate in the table below.
Please note that the expenses shown in the table are meant to highlight your ongoing costs only and do not reflect any transaction costs. Therefore, the second line of the table is useful in comparing ongoing costs only, and will not help you determine the relative total costs of owning different funds. In addition, if these transactional costs were included, your costs would have been higher.
| | | | | Annualized Expense Ratio- A | | Beginning Account Value September 1, 2022 | | Ending Account Value February 28, 2023 | | Expenses Paid During Period- C September 1, 2022 to February 28, 2023 |
| | | | | | | | | | |
| Fidelity Flex® U.S. Bond Index Fund | | | | -%- D | | | | | | |
| Actual | | | | | | $ 1,000 | | $ 977.80 | | $- E |
Hypothetical- B | | | | | | $ 1,000 | | $ 1,024.79 | | $- E |
| |
A Annualized expense ratio reflects expenses net of applicable fee waivers.
B 5% return per year before expenses
C Expenses are equal to the annualized expense ratio, multiplied by the average account value over the period, multiplied by 181/ 365 (to reflect the one-half year period). The fees and expenses of any Underlying Funds are not included in each annualized expense ratio.
D Amount represents less than .005%.
E Amount represents less than $.005.
Board Approval of Investment Advisory Contracts and Management Fees
Fidelity Flex U.S. Bond Index Fund
Each year, the Board of Trustees, including the Independent Trustees (together, the Board), votes on the renewal of the management contract with Fidelity Management & Research Company LLC (FMR) and the sub-advisory agreements (together, the Advisory Contracts) for the fund. FMR and the sub-advisers are referred to herein as the Investment Advisers. The Board, assisted by the advice of fund counsel and Independent Trustees' counsel, requests and considers a broad range of information relevant to the renewal of the Advisory Contracts throughout the year.
The Board meets regularly and, at each of its meetings, covers an extensive agenda of topics and materials and considers factors that are relevant to its annual consideration of the renewal of the fund's Advisory Contracts, including the services and support provided to the fund and its shareholders. The Board has established four standing committees (Committees) - Operations, Audit, Fair Valuation, and Governance and Nominating - each composed of and chaired by Independent Trustees with varying backgrounds, to which the Board has assigned specific subject matter responsibilities in order to enhance effective decision-making by the Board. The Operations Committee, of which all the Independent Trustees are members, meets regularly throughout the year and requests, receives and considers, among other matters, information related to the annual consideration of the renewal of the fund's Advisory Contracts before making its recommendation to the Board. The Board also meets as needed to review matters specifically related to the Board's annual consideration of the renewal of the Advisory Contracts. Members of the Board may also meet from time to time with trustees of other Fidelity funds through joint ad hoc committees to discuss certain matters relevant to all of the Fidelity funds.
At its September 2022 meeting, the Board unanimously determined to renew the fund's Advisory Contracts. In considering whether to renew the Advisory Contracts for the fund, the Board considered all factors it believed relevant and reached a determination, with the assistance of fund counsel and Independent Trustees' counsel and through the exercise of its business judgment, that the renewal of the Advisory Contracts was in the best interests of the fund and its shareholders and the fact that no fee is payable under the management contract was fair and reasonable.
Nature, Extent, and Quality of Services Provided . The Board considered Fidelity's staffing as it relates to the fund, including the backgrounds of investment personnel of Fidelity, and also considered the fund's investment objective, strategies, and related investment philosophy. The Independent Trustees also had discussions with senior management of Fidelity's investment operations and investment groups. The Board considered the structure of the investment personnel compensation program and whether this structure provides appropriate incentives to act in the best interests of the fund. Additionally, the Board considered the portfolio managers' investments, if any, in the funds that they manage. The Board also considered the steps Fidelity had taken to ensure the continued provision of high quality services to the Fidelity funds throughout the COVID-19 pandemic, including the expansion of staff in client facing positions to maintain service levels in periods of high volumes and volatility.
Resources Dedicated to Investment Management and Support Services. The Board reviewed the general qualifications and capabilities of Fidelity's investment staff, including its size, education, experience, and resources, as well as Fidelity's approach to recruiting, training, managing, and compensating investment personnel. The Board noted the resources devoted to Fidelity's global investment organization, and that Fidelity's analysts have extensive resources, tools and capabilities that allow them to conduct quantitative and fundamental analysis, as well as credit analysis of issuers, counterparties and guarantors. Further, the Board considered that Fidelity's investment professionals have sufficient access to global information and data so as to provide competitive investment results over time, and that those professionals also have access to sophisticated tools that permit them to assess portfolio construction and risk and performance attribution characteristics continuously, as well as to transmit new information and research conclusions rapidly around the world. Additionally, in its deliberations, the Board considered Fidelity's trading, risk management, compliance, cybersecurity, and technology and operations capabilities and resources, which are integral parts of the investment management process.
Shareholder and Administrative Services. The Board considered (i) the nature, extent, quality, and cost of advisory, administrative, and shareholder services performed by the Investment Advisers and their affiliates under the Advisory Contracts and under separate agreements covering transfer agency, pricing and bookkeeping, and securities lending services for the fund; (ii) the nature and extent of the supervision of third party service providers, principally custodians, subcustodians, and pricing vendors; and (iii) the resources devoted to, and the record of compliance with, the fund's compliance policies and procedures.
The Board noted that the growth of fund assets over time across the complex allows Fidelity to reinvest in the development of services designed to enhance the value and convenience of the Fidelity funds as investment vehicles. These services include 24-hour access to account information and market information over the Internet and through telephone representatives, investor education materials and asset allocation tools. The Board also considered that it reviews customer service metrics such as telephone response times, continuity of services on the website and metrics addressing services at Fidelity Investor Centers.
Investment in a Large Fund Family . The Board considered the benefits to shareholders of investing in a Fidelity fund, including the benefits of investing in a fund that is part of a large family of funds offering a variety of investment disciplines and providing a large variety of mutual fund investor services. The Board noted that Fidelity had taken, or had made recommendations to the Board that resulted in the Fidelity funds taking, a number of actions over the previous year that benefited particular funds, including: (i) continuing to dedicate additional resources to Fidelity's investment research process, which includes meetings with management of issuers of securities in which the funds invest; (ii) continuing efforts to enhance Fidelity's global research capabilities; (iii) launching new funds, ETFs, and share classes with innovative structures, strategies and pricing and making other enhancements to meet investor needs; (iv) broadening eligibility requirements for certain funds and share classes; (v) reducing management fees and total expenses for certain funds and classes; (vi) lowering expenses for certain existing funds and classes by implementing or lowering expense caps; (vii) rationalizing product lines and gaining increased efficiencies from fund mergers and liquidations; (viii) continuing to develop, acquire and implement systems and technology to improve services to the funds and shareholders, strengthen information security, and increase efficiency; and (ix) continuing to implement enhancements to further strengthen Fidelity's product line to increase investors' probability of success in achieving their investment goals, including their retirement income goals.
Investment Performance . The Board considered whether the fund has operated in accordance with its investment objective, as well as its record of compliance with its investment restrictions. The Board reviewed the fund's absolute investment performance, as well as the fund's relative investment performance. The Board did not consider performance to be a material factor in its decision to renew the fund's Advisory Contracts as the fund is not publicly offered as a stand-alone investment product. In this regard, the Board noted that the fund is available exclusively to certain fee-based accounts and advisor programs offered by Fidelity, including certain employer-sponsored plans and discretionary investment programs. The Board noted that there was a portfolio management change for the fund in October 2020.
Based on its review, the Board concluded that the nature, extent, and quality of services provided to the fund under the Advisory Contracts should continue to benefit the shareholders of the fund.
Competitiveness of Management Fee and Total Expense Ratio. The Board noted that the fund is available exclusively through certain Fidelity fee-based accounts and advisory programs. The Board considered that the fund does not pay FMR a management fee for investment advisory services, but that FMR is indirectly compensated for its services out of Fidelity fee-based account and advisory program fees. The Board also noted that FMR or an affiliate undertakes to pay all operating expenses of the fund, except Independent Trustee fees and expenses, proxy and shareholder meeting expenses, interest, taxes, and extraordinary expenses (such as litigation expenses). The Board further noted that the fund pays its non-operating expenses, including brokerage commissions and fees and expenses associated with the fund's securities lending program, if applicable.
Based on its review, the Board considered that the fund does not pay a management fee and concluded that the fund's total expense ratio was reasonable in light of the services that the fund and its shareholders receive and the other factors considered.
Costs of the Services and Profitability. The Board considered the level of Fidelity's profits in respect of all the Fidelity funds.
A public accounting firm has been engaged annually by the Board as part of the Board's assessment of Fidelity's profitability analysis. The engagement includes the review and assessment of the methodologies used by Fidelity in determining the revenues and expenses attributable to Fidelity's mutual fund business, and completion of agreed-upon procedures in respect of the mathematical accuracy of certain fund profitability information and its conformity to established allocation methodologies. After considering the reports issued under the engagement and information provided by Fidelity, the Board concluded that while other allocation methods may also be reasonable, Fidelity's profitability methodologies are reasonable in all material respects.
The Board also reviewed Fidelity's non-fund businesses and potential indirect benefits such businesses may have received as a result of their association with Fidelity's mutual fund business (i.e., fall-out benefits) as well as cases where Fidelity's affiliates may benefit from the funds' business. The Board considered areas where potential indirect benefits to the Fidelity funds from their relationships with Fidelity may exist. The Board's consideration of these matters was informed by the findings of a joint ad hoc committee created by it and the boards of other Fidelity funds to evaluate potential fall-out benefits.
The Board concluded that the costs of the services provided by and the profits realized by Fidelity in connection with the operation of the fund were not relevant to the renewal of the Advisory Contracts because the fund pays no advisory fees and FMR or an affiliate bears all expenses of the fund, with limited exceptions.
Economies of Scale. The Board concluded that because the fund pays no advisory fees and FMR or an affiliate bears all expenses of the fund with certain limited exceptions, the realization of economies of scale was not a material factor in the Board's decision to renew the fund's Advisory Contracts.
Additional Information Requested by the Board . In order to develop fully the factual basis for consideration of the Fidelity funds' advisory contracts, the Board requested and received additional information on certain topics, including: (i) Fidelity's fund profitability methodology, profitability trends for certain funds, the allocation of various costs to different funds, and the impact of certain factors on fund profitability results; (ii) portfolio manager changes that have occurred during the past year and the amount of the investment that each portfolio manager has made in the Fidelity fund(s) that he or she manages; (iii) the extent to which current market conditions have affected retention and recruitment of personnel; (iv) the arrangements with and compensation paid to certain fund sub-advisers on behalf of the Fidelity funds and the treatment of such compensation within Fidelity's fund profitability methodology; (v) the terms of the funds' various management fee structures, including the basic group fee and the terms of Fidelity's voluntary expense limitation arrangements; (vi) Fidelity's transfer agent, pricing and bookkeeping fees, expense and service structures for different funds and classes relative to competitive trends; (vii) the impact on fund profitability of recent industry trends, such as the growth in passively managed funds and the changes in flows for different types of funds; (viii) the types of management fee and total expense comparisons provided, and the challenges and limitations associated with such information; and (ix) explanations regarding the relative total expense ratios and management fees of certain funds and classes, total expense and management fee competitive trends, and methodologies for total expense and management fee competitive comparisons. In addition, the Board considered its discussions with Fidelity regarding Fidelity's efforts to maintain the continuous investment and shareholder services necessary for the funds during the current pandemic and economic circumstances.
Based on its evaluation of all of the conclusions noted above, and after considering all factors it believed relevant, the Board concluded that the advisory fee arrangements are fair and reasonable, and that the fund's Advisory Contracts should be renewed.
The Securities and Exchange Commission adopted Rule 22e-4 under the Investment Company Act of 1940 (the Liquidity Rule) to promote effective liquidity risk management throughout the open-end investment company industry, thereby reducing the risk that funds will be unable to meet their redemption obligations and mitigating dilution of the interests of fund shareholders.
The Fund has adopted and implemented a liquidity risk management program (the Program) reasonably designed to assess and manage the Fund's liquidity risk and to comply with the requirements of the Liquidity Rule. The Fund's Board of Trustees (the Board) has designated the Fund's investment adviser as administrator of the Program. The Fidelity advisers have established a Liquidity Risk Management Committee (the LRM Committee) to manage the Program for each of the Fidelity Funds. The LRM Committee monitors the adequacy and effectiveness of implementation of the Program and on a periodic basis assesses each Fund's liquidity risk based on a variety of factors including (1) the Fund's investment strategy, (2) portfolio liquidity and cash flow projections during normal and reasonably foreseeable stressed conditions, (3) shareholder redemptions, (4) borrowings and other funding sources and (5) certain factors specific to ETFs including the effect of the Fund's prices and spreads, market participants, and basket compositions on the overall liquidity of the Fund's portfolio, as applicable.
In accordance with the Program, each of the Fund's portfolio investments is classified into one of four defined liquidity categories based on a determination of a reasonable expectation for how long it would take to convert the investment to cash (or sell or dispose of the investment) without significantly changing its market value.
- Highly liquid investments - cash or convertible to cash within three business days or less
- Moderately liquid investments - convertible to cash in three to seven calendar days
- Less liquid investments - can be sold or disposed of, but not settled, within seven calendar days
- Illiquid investments - cannot be sold or disposed of within seven calendar days
Liquidity classification determinations take into account a variety of factors including various market, trading and investment-specific considerations, as well as market depth, and generally utilize analysis from a third-party liquidity metrics service.
The Liquidity Rule places a 15% limit on a fund's illiquid investments and requires funds that do not primarily hold assets that are highly liquid investments to determine and maintain a minimum percentage of the fund's net assets to be invested in highly liquid investments (highly liquid investment minimum or HLIM). The Program includes provisions reasonably designed to comply with the 15% limit on illiquid investments and for determining, periodically reviewing and complying with the HLIM requirement as applicable.
At a recent meeting of the Fund's Board of Trustees, the LRM Committee provided a written report to the Board pertaining to the operation, adequacy, and effectiveness of the Program for the period December 1, 2021 through November 30, 2022. The report concluded that the Program is operating effectively and is reasonably designed to assess and manage the Fund's liquidity risk.
1.9881610.105
ZUB-SANN-0423
Fidelity® Series Bond Index Fund
Semi-Annual Report
February 28, 2023
Contents
To view a fund's proxy voting guidelines and proxy voting record for the 12-month period ended June 30, visit http://www.fidelity.com/proxyvotingresults or visit the Securities and Exchange Commission's (SEC) web site at http://www.sec.gov.
You may also call 1-800-544-8544 to request a free copy of the proxy voting guidelines.
BLOOMBERG ® is a trademark and service mark of Bloomberg Finance L.P. and its affiliates (collectively "Bloomberg"). Bloomberg or Bloomberg's licensors own all proprietary rights in the Bloomberg Indices. Neither Bloomberg nor Bloomberg's licensors approves or endorses this material, or guarantees the accuracy or completeness of any information herein, or makes any warranty, express or implied, as to the results to be obtained therefrom and, to the maximum extent allowed by law, neither shall have any liability or responsibility for injury or damages arising in connection therewith.
Standard & Poor's, S&P and S&P 500 are registered service marks of The McGraw-Hill Companies, Inc. and have been licensed for use by Fidelity Distributors Corporation.
Other third-party marks appearing herein are the property of their respective owners.
All other marks appearing herein are registered or unregistered trademarks or service marks of FMR LLC or an affiliated company. © 2023 FMR LLC. All rights reserved.
This report and the financial statements contained herein are submitted for the general information of the shareholders of the Fund. This report is not authorized for distribution to prospective investors in the Fund unless preceded or accompanied by an effective prospectus.
A fund files its complete schedule of portfolio holdings with the SEC for the first and third quarters of each fiscal year on Form N-PORT. Forms N-PORT are available on the SEC's web site at http://www.sec.gov. A fund's Forms N-PORT may be reviewed and copied at the SEC's Public Reference Room in Washington, DC. Information regarding the operation of the SEC's Public Reference Room may be obtained by calling 1-800-SEC-0330.
For a complete list of a fund's portfolio holdings, view the most recent holdings listing, semiannual report, or annual report on Fidelity's web site at http://www.fidelity.com, http://www.institutional.fidelity.com, or http://www.401k.com, as applicable.
NOT FDIC INSURED •MAY LOSE VALUE •NO BANK GUARANTEE
Neither the Fund nor Fidelity Distributors Corporation is a bank.
Quality Diversification (% of Fund's net assets) |
|
Short-Term Investments and Net Other Assets (Liabilities) - (0.4)%* |
*Short-term investments and Net Other Assets (Liabilities) are not available in the pie chart. |
| |
| We have used ratings from Moody's Investors Service, Inc. Where Moody's® ratings are not available, we have used S&P® ratings. All ratings are as of the date indicated and do not reflect subsequent changes. |
Asset Allocation (% of Fund's net assets) |
|
Short-Term Investments and Net Other Assets (Liabilities) - (0.4)%* |
Foreign investments - 6.8% |
Short-Term Investments and Net Other Assets (Liabilities) are not available in the pie chart. |
Percentages in the above tables are adjusted for the effect of TBA Sale Commitments. |
|
Showing Percentage of Net Assets
| Nonconvertible Bonds - 25.2% |
| | | Principal Amount (a) | Value ($) |
| COMMUNICATION SERVICES - 2.1% | | | |
| Diversified Telecommunication Services - 0.7% | | | |
| AT&T, Inc.: | | | |
| 1.65% 2/1/28 | | 8,000,000 | 6,796,461 |
| 2.25% 2/1/32 | | 3,000,000 | 2,341,605 |
| 2.55% 12/1/33 | | 7,900,000 | 6,048,629 |
| 2.75% 6/1/31 | | 3,000,000 | 2,478,327 |
| 2.95% 7/15/26 | | 1,425,000 | 1,328,687 |
| 3.5% 6/1/41 | | 1,500,000 | 1,126,082 |
| 3.55% 9/15/55 | | 11,721,000 | 7,939,845 |
| 3.65% 6/1/51 | | 1,950,000 | 1,391,105 |
| 3.65% 9/15/59 | | 8,327,000 | 5,639,403 |
| 3.8% 2/15/27 | | 1,604,000 | 1,522,220 |
| 3.85% 6/1/60 | �� | 2,670,000 | 1,868,303 |
| 4.3% 2/15/30 | | 18,240,000 | 17,110,494 |
| 4.35% 3/1/29 | | 3,665,000 | 3,474,018 |
| 4.35% 6/15/45 | | 1,141,000 | 928,960 |
| 4.5% 3/9/48 | | 1,460,000 | 1,200,370 |
| 4.65% 6/1/44 | | 1,403,000 | 1,193,698 |
| 5.45% 3/1/47 | | 1,500,000 | 1,431,525 |
| Bell Canada 4.464% 4/1/48 | | 2,540,000 | 2,161,478 |
| British Telecommunications PLC 9.625% 12/15/30 | | 3,618,000 | 4,376,941 |
| Deutsche Telekom International Financial BV 8.75% 6/15/30 (b) | | 4,399,000 | 5,213,712 |
| Orange SA 5.5% 2/6/44 | | 535,000 | 539,736 |
| Telefonica Emisiones S.A.U.: | | | |
| 4.103% 3/8/27 | | 2,388,000 | 2,262,496 |
| 4.665% 3/6/38 | | 1,050,000 | 868,176 |
| 5.213% 3/8/47 | | 3,871,000 | 3,253,951 |
| 5.52% 3/1/49 | | 600,000 | 522,385 |
| 7.045% 6/20/36 | | 1,564,000 | 1,651,649 |
| Telefonica Europe BV 8.25% 9/15/30 | | 1,000,000 | 1,132,683 |
| TELUS Corp. 3.4% 5/13/32 | | 3,000,000 | 2,557,370 |
| Verizon Communications, Inc.: | | | |
| 1.5% 9/18/30 | | 3,600,000 | 2,786,740 |
| 1.68% 10/30/30 | | 2,598,000 | 2,010,533 |
| 2.355% 3/15/32 | | 7,035,000 | 5,530,581 |
| 2.55% 3/21/31 | | 4,000,000 | 3,271,951 |
| 2.987% 10/30/56 | | 6,953,000 | 4,259,744 |
| 3.15% 3/22/30 | | 6,172,000 | 5,404,326 |
| 3.55% 3/22/51 | | 11,000,000 | 7,941,438 |
| 3.7% 3/22/61 | | 1,140,000 | 801,405 |
| 4.016% 12/3/29 | | 5,000,000 | 4,611,519 |
| 4.125% 3/16/27 | | 1,247,000 | 1,200,408 |
| 4.272% 1/15/36 | | 9,027,000 | 7,967,844 |
| 4.4% 11/1/34 | | 673,000 | 611,782 |
| 4.75% 11/1/41 | | 178,000 | 162,771 |
| 5.012% 4/15/49 | | 205,000 | 188,063 |
| 5.012% 8/21/54 | | 2,238,000 | 2,047,338 |
| 5.5% 3/16/47 | | 572,000 | 556,027 |
| | | | 137,712,779 |
| Entertainment - 0.1% | | | |
| Activision Blizzard, Inc. 2.5% 9/15/50 | | 1,800,000 | 1,122,387 |
| The Walt Disney Co.: | | | |
| 2% 9/1/29 | | 77,000 | 64,277 |
| 2.65% 1/13/31 | | 5,000,000 | 4,258,705 |
| 2.75% 9/1/49 | | 4,076,000 | 2,716,170 |
| 3.35% 3/24/25 | | 5,400,000 | 5,217,449 |
| 3.5% 5/13/40 | | 1,000,000 | 808,113 |
| 3.6% 1/13/51 | | 1,000,000 | 774,965 |
| 3.7% 10/15/25 | | 1,247,000 | 1,202,628 |
| 3.8% 5/13/60 | | 1,000,000 | 782,549 |
| 4.7% 3/23/50 | | 2,257,000 | 2,112,010 |
| 5.4% 10/1/43 | | 691,000 | 694,610 |
| 6.15% 3/1/37 | | 705,000 | 754,118 |
| 6.15% 2/15/41 | | 1,872,000 | 2,036,710 |
| | | | 22,544,691 |
| Interactive Media & Services - 0.1% | | | |
| Alphabet, Inc.: | | | |
| 0.45% 8/15/25 | | 3,400,000 | 3,075,876 |
| 1.1% 8/15/30 | | 2,700,000 | 2,128,096 |
| 1.9% 8/15/40 | | 1,792,000 | 1,192,087 |
| 1.998% 8/15/26 | | 410,000 | 375,183 |
| 2.05% 8/15/50 | | 2,700,000 | 1,633,833 |
| Baidu, Inc.: | | | |
| 1.72% 4/9/26 | | 8,500,000 | 7,545,790 |
| 4.375% 5/14/24 | | 1,000,000 | 983,180 |
| Meta Platforms, Inc.: | | | |
| 3.5% 8/15/27 | | 3,600,000 | 3,383,091 |
| 3.85% 8/15/32 | | 1,600,000 | 1,437,682 |
| 4.45% 8/15/52 | | 4,000,000 | 3,316,964 |
| | | | 25,071,782 |
| Media - 0.8% | | | |
| Charter Communications Operating LLC/Charter Communications Operating Capital Corp.: | | | |
| 3.5% 6/1/41 | | 5,200,000 | 3,402,521 |
| 3.7% 4/1/51 | | 700,000 | 428,029 |
| 3.75% 2/15/28 | | 3,250,000 | 2,928,697 |
| 3.85% 4/1/61 | | 4,200,000 | 2,473,577 |
| 4.2% 3/15/28 | | 1,961,000 | 1,802,210 |
| 4.4% 4/1/33 | | 3,300,000 | 2,822,570 |
| 4.4% 12/1/61 | | 2,040,000 | 1,329,096 |
| 4.5% 2/1/24 | | 14,500,000 | 14,320,621 |
| 4.908% 7/23/25 | | 4,223,000 | 4,132,228 |
| 5.125% 7/1/49 | | 2,445,000 | 1,880,494 |
| 5.375% 5/1/47 | | 2,900,000 | 2,310,296 |
| 5.75% 4/1/48 | | 933,000 | 779,184 |
| 6.384% 10/23/35 | | 2,397,000 | 2,300,823 |
| 6.484% 10/23/45 | | 836,000 | 756,369 |
| Comcast Corp.: | | | |
| 1.95% 1/15/31 | | 90,000 | 72,134 |
| 2.35% 1/15/27 | | 4,242,000 | 3,843,662 |
| 2.65% 2/1/30 | | 1,500,000 | 1,291,096 |
| 2.887% 11/1/51 | | 4,521,000 | 2,927,768 |
| 2.937% 11/1/56 | | 12,849,000 | 8,059,201 |
| 2.987% 11/1/63 | | 6,882,000 | 4,205,913 |
| 3.15% 3/1/26 | | 891,000 | 842,508 |
| 3.3% 2/1/27 | | 5,722,000 | 5,371,111 |
| 3.375% 8/15/25 | | 2,442,000 | 2,344,138 |
| 3.45% 2/1/50 | | 2,000,000 | 1,463,299 |
| 3.7% 4/15/24 | | 1,848,000 | 1,814,752 |
| 3.9% 3/1/38 | | 2,000,000 | 1,715,289 |
| 3.969% 11/1/47 | | 926,000 | 747,431 |
| 4% 3/1/48 | | 2,139,000 | 1,719,448 |
| 4.15% 10/15/28 | | 60,000 | 57,364 |
| 4.25% 10/15/30 | | 5,000,000 | 4,746,112 |
| 4.75% 3/1/44 | | 2,100,000 | 1,920,865 |
| 6.45% 3/15/37 | | 1,000,000 | 1,095,995 |
| Discovery Communications LLC: | | | |
| 3.625% 5/15/30 | | 3,200,000 | 2,738,422 |
| 4% 9/15/55 | | 1,031,000 | 666,672 |
| 4.65% 5/15/50 | | 2,100,000 | 1,540,065 |
| 5.2% 9/20/47 | | 1,497,000 | 1,192,057 |
| 5.3% 5/15/49 | | 800,000 | 641,749 |
| Fox Corp.: | | | |
| 4.709% 1/25/29 | | 1,850,000 | 1,766,550 |
| 5.476% 1/25/39 | | 1,478,000 | 1,358,244 |
| 5.576% 1/25/49 | | 1,660,000 | 1,511,399 |
| Grupo Televisa SA de CV: | | | |
| 5% 5/13/45 | | 1,100,000 | 950,331 |
| 5.25% 5/24/49 | | 2,360,000 | 2,125,770 |
| Magallanes, Inc.: | | | |
| 4.279% 3/15/32 (c) | | 5,299,000 | 4,574,686 |
| 5.05% 3/15/42 (c) | | 2,800,000 | 2,268,380 |
| 5.141% 3/15/52 (c) | | 8,426,000 | 6,605,173 |
| Paramount Global: | | | |
| 3.375% 2/15/28 | | 1,880,000 | 1,689,636 |
| 4% 1/15/26 | | 1,069,000 | 1,020,956 |
| 4.375% 3/15/43 | | 470,000 | 327,286 |
| 4.6% 1/15/45 | | 1,301,000 | 936,332 |
| 4.95% 1/15/31 | | 2,300,000 | 2,061,704 |
| 4.95% 5/19/50 | | 1,440,000 | 1,066,135 |
| 5.85% 9/1/43 | | 2,611,000 | 2,195,565 |
| TCI Communications, Inc. 7.125% 2/15/28 | | 7,100,000 | 7,722,577 |
| Time Warner Cable Enterprises 8.375% 7/15/33 | | 2,300,000 | 2,583,306 |
| Time Warner Cable LLC: | | | |
| 4.5% 9/15/42 | | 1,961,000 | 1,463,378 |
| 5.875% 11/15/40 | | 2,300,000 | 2,031,138 |
| 6.55% 5/1/37 | | 1,040,000 | 996,046 |
| 7.3% 7/1/38 | | 713,000 | 714,601 |
| TWDC Enterprises 18 Corp.: | | | |
| 1.85% 7/30/26 | | 911,000 | 820,649 |
| 3% 7/30/46 | | 802,000 | 566,266 |
| 3.15% 9/17/25 | | 1,688,000 | 1,605,855 |
| 4.125% 6/1/44 | | 1,016,000 | 874,494 |
| | | | 142,520,223 |
| Wireless Telecommunication Services - 0.4% | | | |
| America Movil S.A.B. de CV: | | | |
| 3.625% 4/22/29 | | 1,903,000 | 1,722,215 |
| 4.375% 7/16/42 | | 2,510,000 | 2,164,248 |
| 6.125% 11/15/37 | | 1,491,000 | 1,562,102 |
| Rogers Communications, Inc.: | | | |
| 2.9% 11/15/26 | | 445,000 | 406,466 |
| 3.625% 12/15/25 | | 356,000 | 337,700 |
| 3.7% 11/15/49 | | 1,300,000 | 916,467 |
| 4.1% 10/1/23 | | 1,860,000 | 1,846,979 |
| 4.3% 2/15/48 | | 1,850,000 | 1,420,752 |
| 4.55% 3/15/52 (c) | | 3,000,000 | 2,392,631 |
| 5.45% 10/1/43 | | 1,029,000 | 943,894 |
| T-Mobile U.S.A., Inc.: | | | |
| 2.05% 2/15/28 | | 2,700,000 | 2,317,285 |
| 3.3% 2/15/51 | | 7,500,000 | 5,028,208 |
| 3.5% 4/15/25 | | 4,990,000 | 4,779,730 |
| 3.6% 11/15/60 | | 1,200,000 | 797,490 |
| 3.75% 4/15/27 | | 10,000,000 | 9,401,360 |
| 3.875% 4/15/30 | | 7,550,000 | 6,845,941 |
| 4.95% 3/15/28 | | 1,000,000 | 981,640 |
| 5.05% 7/15/33 | | 3,400,000 | 3,276,426 |
| 5.2% 1/15/33 | | 1,750,000 | 1,706,715 |
| 5.65% 1/15/53 | | 5,400,000 | 5,293,827 |
| Vodafone Group PLC: | | | |
| 4.375% 5/30/28 | | 6,205,000 | 6,048,943 |
| 5% 5/30/38 | | 701,000 | 658,389 |
| 5.125% 6/19/59 | | 3,600,000 | 3,164,319 |
| 5.25% 5/30/48 | | 2,907,000 | 2,685,447 |
| | | | 66,699,174 |
TOTAL COMMUNICATION SERVICES | | | 394,548,649 |
| CONSUMER DISCRETIONARY - 1.5% | | | |
| Auto Components - 0.0% | | | |
| Lear Corp. 5.25% 5/15/49 | | 1,120,000 | 944,242 |
| Automobiles - 0.3% | | | |
| American Honda Finance Corp.: | | | |
| 1.2% 7/8/25 | | 1,030,000 | 938,983 |
| 1.8% 1/13/31 | | 2,300,000 | 1,838,911 |
| 2.15% 9/10/24 | | 3,830,000 | 3,653,981 |
| 2.3% 9/9/26 | | 891,000 | 811,626 |
| 3.55% 1/12/24 | | 4,350,000 | 4,283,272 |
| General Motors Co.: | | | |
| 4.2% 10/1/27 | | 1,000,000 | 945,565 |
| 4.875% 10/2/23 | | 4,100,000 | 4,098,770 |
| 5% 10/1/28 | | 248,000 | 240,153 |
| 5.15% 4/1/38 | | 1,500,000 | 1,299,633 |
| 5.2% 4/1/45 | | 761,000 | 627,537 |
| 5.95% 4/1/49 | | 2,178,000 | 1,954,133 |
| 6.6% 4/1/36 | | 2,041,000 | 2,038,008 |
| 6.75% 4/1/46 | | 3,375,000 | 3,325,938 |
| General Motors Financial Co., Inc.: | | | |
| 2.7% 8/20/27 | | 1,000,000 | 880,991 |
| 2.7% 6/10/31 | | 1,100,000 | 859,981 |
| 2.9% 2/26/25 | | 1,050,000 | 994,525 |
| 3.5% 11/7/24 | | 1,000,000 | 964,982 |
| 3.85% 1/5/28 | | 1,247,000 | 1,139,843 |
| 4% 1/15/25 | | 2,629,000 | 2,548,090 |
| 4% 10/6/26 | | 656,000 | 621,751 |
| 4.3% 7/13/25 | | 2,210,000 | 2,145,595 |
| 4.35% 1/17/27 | | 1,425,000 | 1,361,265 |
| 5% 4/9/27 | | 3,300,000 | 3,217,665 |
| 5.1% 1/17/24 | | 6,462,000 | 6,431,288 |
| 5.65% 1/17/29 | | 3,507,000 | 3,430,509 |
| Honda Motor Co. Ltd. 2.534% 3/10/27 | | 5,000,000 | 4,588,253 |
| Toyota Motor Corp. 1.339% 3/25/26 | | 1,700,000 | 1,525,548 |
| | | | 56,766,796 |
| Distributors - 0.0% | | | |
| Genuine Parts Co. 1.75% 2/1/25 | | 3,100,000 | 2,892,447 |
| Diversified Consumer Services - 0.1% | | | |
| American University 3.672% 4/1/49 | | 1,000,000 | 794,574 |
| Duke University 2.832% 10/1/55 | | 850,000 | 580,112 |
| George Washington University: | | | |
| 4.126% 9/15/48 | | 3,000,000 | 2,596,213 |
| 4.3% 9/15/44 | | 356,000 | 314,574 |
| Ingersoll-Rand Global Holding Co. Ltd.: | | | |
| 3.75% 8/21/28 | | 829,000 | 778,614 |
| 4.3% 2/21/48 | | 886,000 | 723,664 |
| Massachusetts Institute of Technology: | | | |
| 2.989% 7/1/50 | | 3,250,000 | 2,413,526 |
| 3.885% 7/1/2116 | | 504,000 | 379,140 |
| 3.959% 7/1/38 | | 842,000 | 773,682 |
| Northwestern University: | | | |
| 3.662% 12/1/57 | | 2,000,000 | 1,627,494 |
| 4.643% 12/1/44 | | 597,000 | 573,942 |
| President and Fellows of Harvard College: | | | |
| 3.3% 7/15/56 | | 865,000 | 665,211 |
| 3.619% 10/1/37 | | 178,000 | 154,773 |
| Rice University 3.774% 5/15/55 | | 340,000 | 286,202 |
| Trustees of Princeton Univ. 5.7% 3/1/39 | | 178,000 | 197,301 |
| University Notre Dame du Lac 3.438% 2/15/45 | | 593,000 | 481,623 |
| University of Chicago 3% 10/1/52 | | 1,100,000 | 804,722 |
| University of Southern California: | | | |
| 2.945% 10/1/51 | | 5,000,000 | 3,471,375 |
| 5.25% 10/1/2111 | | 356,000 | 355,348 |
| | | | 17,972,090 |
| Hotels, Restaurants & Leisure - 0.2% | | | |
| Expedia, Inc. 2.95% 3/15/31 | | 4,240,000 | 3,406,085 |
| Marriott International, Inc.: | | | |
| 3.5% 10/15/32 | | 4,080,000 | 3,453,714 |
| 5.75% 5/1/25 | | 2,800,000 | 2,821,724 |
| McDonald's Corp.: | | | |
| 3.6% 7/1/30 | | 1,350,000 | 1,231,565 |
| 3.625% 9/1/49 | | 6,943,000 | 5,222,664 |
| 3.7% 1/30/26 | | 3,007,000 | 2,900,928 |
| 4.45% 3/1/47 | | 1,013,000 | 874,713 |
| 4.875% 12/9/45 | | 968,000 | 881,734 |
| 6.3% 3/1/38 | | 1,256,000 | 1,357,432 |
| Metropolitan Museum of Art 3.4% 7/1/45 | | 535,000 | 413,899 |
| Starbucks Corp.: | | | |
| 2.25% 3/12/30 | | 2,716,000 | 2,251,965 |
| 2.45% 6/15/26 | | 1,782,000 | 1,643,337 |
| 2.55% 11/15/30 | | 1,880,000 | 1,569,665 |
| 3.5% 3/1/28 | | 1,000,000 | 931,326 |
| 3.5% 11/15/50 | | 1,700,000 | 1,234,246 |
| 3.8% 8/15/25 | | 1,239,000 | 1,200,631 |
| 3.85% 10/1/23 | | 335,000 | 332,331 |
| 4% 11/15/28 | | 2,547,000 | 2,415,269 |
| 4.5% 11/15/48 | | 837,000 | 718,652 |
| | | | 34,861,880 |
| Internet & Direct Marketing Retail - 0.3% | | | |
| Alibaba Group Holding Ltd.: | | | |
| 2.125% 2/9/31 | | 4,810,000 | 3,823,349 |
| 3.15% 2/9/51 | | 4,960,000 | 3,116,641 |
| 3.6% 11/28/24 | | 1,000,000 | 968,000 |
| 4% 12/6/37 | | 2,100,000 | 1,721,906 |
| Amazon.com, Inc.: | | | |
| 0.8% 6/3/25 | | 2,000,000 | 1,825,656 |
| 1% 5/12/26 | | 3,900,000 | 3,452,823 |
| 1.5% 6/3/30 | | 4,000,000 | 3,208,409 |
| 2.1% 5/12/31 | | 3,900,000 | 3,208,177 |
| 2.5% 6/3/50 | | 5,197,000 | 3,334,548 |
| 2.8% 8/22/24 | | 1,155,000 | 1,117,624 |
| 3.1% 5/12/51 | | 3,900,000 | 2,794,314 |
| 3.15% 8/22/27 | | 8,864,000 | 8,276,216 |
| 3.875% 8/22/37 | | 9,601,000 | 8,480,773 |
| 4.05% 8/22/47 | | 3,346,000 | 2,890,416 |
| 4.1% 4/13/62 | | 2,800,000 | 2,316,304 |
| 4.25% 8/22/57 | | 1,183,000 | 1,023,311 |
| 4.8% 12/5/34 | | 1,069,000 | 1,068,966 |
| eBay, Inc.: | | | |
| 1.4% 5/10/26 | | 2,926,000 | 2,600,566 |
| 1.9% 3/11/25 | | 6,540,000 | 6,113,427 |
| | | | 61,341,426 |
| Leisure Products - 0.0% | | | |
| Hasbro, Inc. 3.55% 11/19/26 | | 5,340,000 | 4,966,863 |
| Multiline Retail - 0.1% | | | |
| Dollar General Corp. 5% 11/1/32 | | 3,000,000 | 2,909,570 |
| Dollar Tree, Inc. 4% 5/15/25 | | 1,425,000 | 1,383,935 |
| Kohl's Corp.: | | | |
| 4.25% 7/17/25 | | 2,179,000 | 2,070,701 |
| 9.5% 5/15/25 | | 1,306,000 | 1,369,223 |
| Target Corp.: | | | |
| 2.25% 4/15/25 | | 15,000,000 | 14,171,238 |
| 3.9% 11/15/47 | | 1,549,000 | 1,265,901 |
| 4% 7/1/42 | | 1,247,000 | 1,090,529 |
| | | | 24,261,097 |
| Specialty Retail - 0.4% | | | |
| AutoZone, Inc.: | | | |
| 3.125% 7/15/23 | | 682,000 | 676,230 |
| 3.25% 4/15/25 | | 713,000 | 682,067 |
| 3.75% 6/1/27 | | 1,034,000 | 981,603 |
| 4.75% 8/1/32 | | 2,000,000 | 1,908,508 |
| Lowe's Companies, Inc.: | | | |
| 1.3% 4/15/28 | | 2,000,000 | 1,654,504 |
| 1.7% 10/15/30 | | 3,300,000 | 2,573,692 |
| 3.65% 4/5/29 | | 1,909,000 | 1,743,970 |
| 3.7% 4/15/46 | | 624,000 | 460,503 |
| 3.75% 4/1/32 | | 1,000,000 | 885,844 |
| 4.05% 5/3/47 | | 2,050,000 | 1,592,961 |
| 4.4% 9/8/25 | | 9,800,000 | 9,630,744 |
| 4.55% 4/5/49 | | 1,688,000 | 1,395,338 |
| 4.65% 4/15/42 | | 1,158,000 | 1,006,965 |
| 5% 4/15/40 | | 2,280,000 | 2,086,488 |
| 5.125% 4/15/50 | | 1,200,000 | 1,091,939 |
| 5.625% 4/15/53 | | 1,500,000 | 1,435,748 |
| O'Reilly Automotive, Inc.: | | | |
| 3.85% 6/15/23 | | 504,000 | 501,940 |
| 4.7% 6/15/32 | | 2,300,000 | 2,191,534 |
| Ross Stores, Inc. 0.875% 4/15/26 | | 1,900,000 | 1,662,650 |
| The Home Depot, Inc.: | | | |
| 1.375% 3/15/31 | | 5,900,000 | 4,536,102 |
| 2.375% 3/15/51 | | 2,500,000 | 1,498,760 |
| 2.5% 4/15/27 | | 3,300,000 | 3,016,337 |
| 2.8% 9/14/27 | | 891,000 | 819,720 |
| 2.875% 4/15/27 | | 5,000,000 | 4,645,047 |
| 2.95% 6/15/29 | | 4,000,000 | 3,572,014 |
| 3% 4/1/26 | | 1,788,000 | 1,687,340 |
| 3.125% 12/15/49 | | 1,483,000 | 1,052,535 |
| 3.625% 4/15/52 | | 2,000,000 | 1,531,456 |
| 3.75% 2/15/24 | | 1,198,000 | 1,182,317 |
| 3.9% 12/6/28 | | 1,027,000 | 982,659 |
| 3.9% 6/15/47 | | 1,529,000 | 1,266,963 |
| 4.2% 4/1/43 | | 281,000 | 245,784 |
| 4.25% 4/1/46 | | 584,000 | 504,964 |
| 4.5% 12/6/48 | | 2,879,000 | 2,586,280 |
| 4.875% 2/15/44 | | 513,000 | 488,474 |
| 5.875% 12/16/36 | | 3,154,000 | 3,375,033 |
| 5.95% 4/1/41 | | 1,300,000 | 1,395,012 |
| TJX Companies, Inc. 1.6% 5/15/31 | | 5,125,000 | 4,036,145 |
| | | | 72,586,170 |
| Textiles, Apparel & Luxury Goods - 0.1% | | | |
| NIKE, Inc.: | | | |
| 2.4% 3/27/25 | | 10,010,000 | 9,548,194 |
| 2.85% 3/27/30 | | 1,110,000 | 986,816 |
| 3.25% 3/27/40 | | 4,500,000 | 3,614,460 |
| 3.375% 11/1/46 | | 802,000 | 616,722 |
| | | | 14,766,192 |
TOTAL CONSUMER DISCRETIONARY | | | 291,359,203 |
| CONSUMER STAPLES - 1.6% | | | |
| Beverages - 0.5% | | | |
| Anheuser-Busch Companies LLC / Anheuser-Busch InBev Worldwide, Inc. 4.7% 2/1/36 | | 5,540,000 | 5,200,006 |
| Anheuser-Busch InBev Finance, Inc.: | | | |
| 4.625% 2/1/44 | | 1,025,000 | 916,271 |
| 4.7% 2/1/36 | | 868,000 | 814,730 |
| 4.9% 2/1/46 | | 3,240,000 | 2,971,968 |
| Anheuser-Busch InBev Worldwide, Inc.: | | | |
| 4.439% 10/6/48 | | 1,318,000 | 1,137,565 |
| 4.6% 4/15/48 | | 3,342,000 | 2,952,930 |
| 4.6% 6/1/60 | | 1,372,000 | 1,189,454 |
| 4.75% 4/15/58 | | 2,600,000 | 2,328,143 |
| 4.95% 1/15/42 | | 2,400,000 | 2,242,261 |
| 5.55% 1/23/49 | | 7,412,000 | 7,457,666 |
| 5.8% 1/23/59 (Reg. S) | | 5,127,000 | 5,300,951 |
| 8.2% 1/15/39 | | 499,000 | 621,369 |
| Constellation Brands, Inc.: | | | |
| 2.875% 5/1/30 | | 2,300,000 | 1,953,338 |
| 3.15% 8/1/29 | | 366,000 | 321,024 |
| 3.5% 5/9/27 | | 1,782,000 | 1,675,545 |
| 3.7% 12/6/26 | | 1,346,000 | 1,272,339 |
| 4.5% 5/9/47 | | 1,400,000 | 1,177,310 |
| Diageo Capital PLC: | | | |
| 1.375% 9/29/25 | | 2,400,000 | 2,181,679 |
| 2% 4/29/30 | | 2,600,000 | 2,138,828 |
| 5.875% 9/30/36 | | 1,300,000 | 1,371,645 |
| Dr. Pepper Snapple Group, Inc.: | | | |
| 3.8% 5/1/50 | | 2,400,000 | 1,797,621 |
| 4.417% 5/25/25 | | 3,878,000 | 3,801,539 |
| 4.5% 4/15/52 | | 1,000,000 | 836,945 |
| Molson Coors Beverage Co.: | | | |
| 3% 7/15/26 | | 3,101,000 | 2,868,573 |
| 4.2% 7/15/46 | | 2,358,000 | 1,836,862 |
| PepsiCo, Inc.: | | | |
| 1.625% 5/1/30 | | 3,571,000 | 2,900,969 |
| 2.375% 10/6/26 | | 1,203,000 | 1,110,111 |
| 3% 10/15/27 | | 45,000 | 41,882 |
| 3.6% 3/1/24 | | 7,300,000 | 7,200,000 |
| 3.875% 3/19/60 | | 2,400,000 | 2,020,532 |
| 4% 5/2/47 | | 3,200,000 | 2,829,939 |
| 4.25% 10/22/44 | | 1,069,000 | 940,393 |
| 4.45% 4/14/46 | | 1,034,000 | 978,311 |
| The Coca-Cola Co.: | | | |
| 1.65% 6/1/30 | | 1,500,000 | 1,216,109 |
| 2.25% 1/5/32 | | 5,370,000 | 4,432,508 |
| 2.5% 6/1/40 | | 1,500,000 | 1,087,753 |
| 2.5% 3/15/51 | | 1,500,000 | 980,646 |
| 2.6% 6/1/50 | | 1,500,000 | 1,004,464 |
| 2.75% 6/1/60 | | 1,500,000 | 991,589 |
| | | | 84,101,768 |
| Food & Staples Retailing - 0.2% | | | |
| Costco Wholesale Corp.: | | | |
| 1.375% 6/20/27 | | 2,000,000 | 1,746,935 |
| 2.75% 5/18/24 | | 1,069,000 | 1,037,894 |
| Kroger Co.: | | | |
| 1.7% 1/15/31 | | 4,600,000 | 3,507,741 |
| 2.65% 10/15/26 | | 508,000 | 468,320 |
| 3.5% 2/1/26 | | 713,000 | 678,372 |
| 4.45% 2/1/47 | | 2,100,000 | 1,755,670 |
| 5.15% 8/1/43 | | 485,000 | 444,158 |
| 5.4% 1/15/49 | | 1,161,000 | 1,102,011 |
| Sysco Corp.: | | | |
| 3.3% 7/15/26 | | 584,000 | 549,009 |
| 3.3% 2/15/50 | | 1,700,000 | 1,165,767 |
| 3.75% 10/1/25 | | 1,016,000 | 978,604 |
| 6.6% 4/1/40 | | 2,600,000 | 2,773,201 |
| Walgreens Boots Alliance, Inc.: | | | |
| 3.2% 4/15/30 | | 2,600,000 | 2,205,201 |
| 3.45% 6/1/26 | | 3,591,000 | 3,370,661 |
| 4.65% 6/1/46 | | 980,000 | 774,477 |
| 4.8% 11/18/44 | | 1,607,000 | 1,331,141 |
| Walmart, Inc.: | | | |
| 2.85% 7/8/24 | | 2,000,000 | 1,942,820 |
| 3.3% 4/22/24 | | 787,000 | 771,541 |
| 3.4% 6/26/23 | | 68,000 | 67,601 |
| 3.625% 12/15/47 | | 2,215,000 | 1,815,219 |
| 3.7% 6/26/28 | | 2,192,000 | 2,096,218 |
| 3.95% 9/9/27 | | 2,000,000 | 1,947,979 |
| 4.05% 6/29/48 | | 4,969,000 | 4,379,777 |
| 4.3% 4/22/44 | | 1,069,000 | 964,211 |
| 5.25% 9/1/35 | | 1,540,000 | 1,616,685 |
| 5.625% 4/1/40 | | 356,000 | 377,717 |
| 5.625% 4/15/41 | | 820,000 | 867,052 |
| 6.5% 8/15/37 | | 1,475,000 | 1,721,767 |
| | | | 42,457,749 |
| Food Products - 0.4% | | | |
| Archer Daniels Midland Co.: | | | |
| 3.25% 3/27/30 | | 6,980,000 | 6,288,193 |
| 4.5% 3/15/49 | | 1,300,000 | 1,192,217 |
| Bunge Ltd. Finance Corp. 2.75% 5/14/31 | | 2,000,000 | 1,646,438 |
| Campbell Soup Co. 4.8% 3/15/48 | | 2,496,000 | 2,216,456 |
| Conagra Brands, Inc.: | | | |
| 4.85% 11/1/28 | | 2,429,000 | 2,353,156 |
| 5.3% 11/1/38 | | 2,484,000 | 2,315,718 |
| 5.4% 11/1/48 | | 324,000 | 295,089 |
| General Mills, Inc.: | | | |
| 3% 2/1/51 | | 803,000 | 564,705 |
| 4% 4/17/25 | | 4,100,000 | 3,992,139 |
| 4.2% 4/17/28 | | 3,066,000 | 2,941,596 |
| JBS U.S.A. Lux SA / JBS Food Co.: | | | |
| 3% 5/15/32 (c) | | 2,000,000 | 1,524,689 |
| 5.75% 4/1/33 (c) | | 5,000,000 | 4,663,600 |
| Kellogg Co.: | | | |
| 3.25% 4/1/26 | | 663,000 | 625,958 |
| 4.3% 5/15/28 | | 1,069,000 | 1,036,291 |
| Kraft Heinz Foods Co.: | | | |
| 3.75% 4/1/30 | | 2,900,000 | 2,651,877 |
| 3.875% 5/15/27 | | 18,800,000 | 17,870,558 |
| 5% 7/15/35 | | 1,700,000 | 1,630,892 |
| 6.875% 1/26/39 | | 3,300,000 | 3,587,724 |
| Mondelez International, Inc.: | | | |
| 1.875% 10/15/32 | | 2,000,000 | 1,522,018 |
| 2.625% 9/4/50 | | 1,900,000 | 1,196,098 |
| Tyson Foods, Inc.: | | | |
| 4% 3/1/26 | | 1,314,000 | 1,267,766 |
| 4.35% 3/1/29 | | 4,604,000 | 4,367,022 |
| 5.1% 9/28/48 | | 2,436,000 | 2,204,031 |
| Unilever Capital Corp.: | | | |
| 1.375% 9/14/30 | | 3,597,000 | 2,832,668 |
| 1.75% 8/12/31 | | 4,100,000 | 3,247,098 |
| 2% 7/28/26 | | 284,000 | 257,606 |
| 3.1% 7/30/25 | | 517,000 | 493,142 |
| | | | 74,784,745 |
| Household Products - 0.2% | | | |
| Colgate-Palmolive Co.: | | | |
| 3.25% 3/15/24 | | 1,782,000 | 1,747,704 |
| 4% 8/15/45 | | 1,000,000 | 915,894 |
| Kimberly-Clark Corp.: | | | |
| 1.05% 9/15/27 | | 3,500,000 | 2,971,372 |
| 2.4% 6/1/23 | | 1,425,000 | 1,415,048 |
| 3.05% 8/15/25 | | 4,000,000 | 3,812,403 |
| 3.2% 4/25/29 | | 3,610,000 | 3,286,482 |
| 3.2% 7/30/46 | | 445,000 | 330,534 |
| Procter & Gamble Co.: | | | |
| 2.45% 11/3/26 | | 3,400,000 | 3,137,185 |
| 2.8% 3/25/27 | | 4,860,000 | 4,531,102 |
| 2.85% 8/11/27 | | 802,000 | 746,711 |
| 3% 3/25/30 | | 8,500,000 | 7,707,692 |
| 3.1% 8/15/23 | | 1,782,000 | 1,766,252 |
| | | | 32,368,379 |
| Personal Products - 0.0% | | | |
| Estee Lauder Companies, Inc.: | | | |
| 1.95% 3/15/31 | | 4,300,000 | 3,484,878 |
| 4.15% 3/15/47 | | 1,300,000 | 1,132,662 |
| | | | 4,617,540 |
| Tobacco - 0.3% | | | |
| Altria Group, Inc.: | | | |
| 2.45% 2/4/32 | | 1,100,000 | 830,325 |
| 3.4% 5/6/30 | | 1,570,000 | 1,352,727 |
| 3.8% 2/14/24 | | 829,000 | 814,993 |
| 4% 2/4/61 | | 1,700,000 | 1,123,795 |
| 4.25% 8/9/42 | | 1,744,000 | 1,311,332 |
| 4.8% 2/14/29 | | 2,465,000 | 2,364,538 |
| 5.375% 1/31/44 | | 1,000,000 | 872,317 |
| 5.8% 2/14/39 | | 4,010,000 | 3,695,531 |
| 5.95% 2/14/49 | | 1,854,000 | 1,660,102 |
| BAT Capital Corp.: | | | |
| 3.222% 8/15/24 | | 1,836,000 | 1,769,444 |
| 3.462% 9/6/29 | | 3,400,000 | 2,915,592 |
| 3.557% 8/15/27 | | 3,773,000 | 3,435,948 |
| 4.39% 8/15/37 | | 3,200,000 | 2,483,896 |
| 4.54% 8/15/47 | | 2,983,000 | 2,140,472 |
| 4.7% 4/2/27 | | 2,000,000 | 1,932,740 |
| 4.758% 9/6/49 | | 2,900,000 | 2,143,208 |
| 4.906% 4/2/30 | | 2,700,000 | 2,493,406 |
| BAT International Finance PLC 1.668% 3/25/26 | | 1,000,000 | 888,058 |
| Philip Morris International, Inc.: | | | |
| 2.125% 5/10/23 | | 553,000 | 549,897 |
| 2.75% 2/25/26 | | 668,000 | 622,614 |
| 3.375% 8/15/29 | | 2,800,000 | 2,519,172 |
| 3.6% 11/15/23 | | 654,000 | 647,399 |
| 3.875% 8/21/42 | | 860,000 | 654,442 |
| 4.125% 3/4/43 | | 2,532,000 | 1,999,531 |
| 4.875% 2/15/28 | | 2,200,000 | 2,153,627 |
| 4.875% 11/15/43 | | 1,069,000 | 930,761 |
| 5.125% 11/17/27 | | 2,300,000 | 2,289,209 |
| 5.375% 2/15/33 | | 2,200,000 | 2,163,050 |
| 5.75% 11/17/32 | | 1,600,000 | 1,618,627 |
| 6.375% 5/16/38 | | 258,000 | 272,208 |
| Reynolds American, Inc.: | | | |
| 4.45% 6/12/25 | | 1,259,000 | 1,225,104 |
| 4.85% 9/15/23 | | 321,000 | 319,870 |
| 5.7% 8/15/35 | | 1,000,000 | 909,270 |
| 5.85% 8/15/45 | | 756,000 | 648,884 |
| 7.25% 6/15/37 | | 1,287,000 | 1,339,062 |
| | | | 55,091,151 |
TOTAL CONSUMER STAPLES | | | 293,421,332 |
| ENERGY - 1.6% | | | |
| Energy Equipment & Services - 0.0% | | | |
| Baker Hughes Co.: | | | |
| 4.08% 12/15/47 | | 4,181,000 | 3,310,342 |
| 5.125% 9/15/40 | | 356,000 | 334,492 |
| Halliburton Co.: | | | |
| 3.8% 11/15/25 | | 46,000 | 44,487 |
| 5% 11/15/45 | | 1,344,000 | 1,187,578 |
| 6.7% 9/15/38 | | 2,780,000 | 2,985,519 |
| 7.45% 9/15/39 | | 267,000 | 303,262 |
| | | | 8,165,680 |
| Oil, Gas & Consumable Fuels - 1.6% | | | |
| Apache Corp. 5.1% 9/1/40 | | 535,000 | 440,209 |
| Boardwalk Pipelines LP 4.95% 12/15/24 | | 846,000 | 832,284 |
| BP Capital Markets PLC 3.279% 9/19/27 | | 670,000 | 624,207 |
| Canadian Natural Resources Ltd.: | | | |
| 2.95% 7/15/30 | | 4,300,000 | 3,643,547 |
| 3.9% 2/1/25 | | 335,000 | 324,203 |
| 4.95% 6/1/47 | | 1,141,000 | 991,663 |
| 6.25% 3/15/38 | | 1,221,000 | 1,230,580 |
| Cenovus Energy, Inc.: | | | |
| 2.65% 1/15/32 | | 3,000,000 | 2,374,060 |
| 4.25% 4/15/27 | | 1,693,000 | 1,616,549 |
| 5.4% 6/15/47 | | 1,676,000 | 1,508,758 |
| 6.75% 11/15/39 | | 1,556,000 | 1,626,224 |
| Cheniere Corpus Christi Holdings LLC 3.7% 11/15/29 | | 3,730,000 | 3,359,098 |
| Chevron Corp.: | | | |
| 1.554% 5/11/25 | | 1,300,000 | 1,206,666 |
| 2.236% 5/11/30 | | 100,000 | 85,462 |
| 2.895% 3/3/24 | | 4,194,000 | 4,100,556 |
| 2.954% 5/16/26 | | 1,961,000 | 1,845,628 |
| 2.978% 5/11/40 | | 1,300,000 | 969,385 |
| 3.078% 5/11/50 | | 1,300,000 | 936,372 |
| Chevron U.S.A., Inc.: | | | |
| 4.2% 10/15/49 | | 1,100,000 | 918,246 |
| 4.95% 8/15/47 | | 2,459,000 | 2,301,818 |
| Columbia Pipeline Group, Inc. 4.5% 6/1/25 | | 593,000 | 579,566 |
| ConocoPhillips Co.: | | | |
| 4.875% 10/1/47 | | 1,400,000 | 1,305,347 |
| 5.95% 3/15/46 | | 1,069,000 | 1,138,212 |
| 6.5% 2/1/39 | | 3,342,000 | 3,766,184 |
| DCP Midstream Operating LP 3.875% 3/15/23 | | 673,000 | 672,517 |
| Devon Energy Corp.: | | | |
| 5% 6/15/45 | | 4,024,000 | 3,408,559 |
| 5.6% 7/15/41 | | 513,000 | 473,042 |
| Eastern Gas Transmission & Storage, Inc. 3.9% 11/15/49 | | 2,300,000 | 1,690,545 |
| Enbridge, Inc.: | | | |
| 3.4% 8/1/51 | | 2,030,000 | 1,398,402 |
| 3.5% 6/10/24 | | 504,000 | 491,055 |
| 5.5% 12/1/46 | | 2,582,000 | 2,435,090 |
| Energy Transfer LP: | | | |
| 3.9% 5/15/24 (b) | | 1,000,000 | 977,089 |
| 3.9% 7/15/26 | | 1,340,000 | 1,264,860 |
| 4.95% 6/15/28 | | 1,681,000 | 1,623,531 |
| 5% 5/15/44 (b) | | 1,200,000 | 985,818 |
| 5% 5/15/50 | | 900,000 | 737,496 |
| 5.15% 3/15/45 | | 1,425,000 | 1,195,855 |
| 5.25% 4/15/29 | | 3,400,000 | 3,315,943 |
| 5.3% 4/1/44 | | 1,034,000 | 885,534 |
| 5.4% 10/1/47 | | 980,000 | 842,542 |
| 5.5% 6/1/27 | | 300,000 | 298,264 |
| 5.75% 2/15/33 | | 3,500,000 | 3,443,230 |
| 5.8% 6/15/38 | | 5,730,000 | 5,368,660 |
| 6% 6/15/48 | | 3,656,000 | 3,362,474 |
| 6.25% 4/15/49 | | 105,000 | 99,868 |
| Enterprise Products Operating LP: | | | |
| 3.3% 2/15/53 | | 500,000 | 339,163 |
| 3.7% 2/15/26 | | 316,000 | 303,428 |
| 3.95% 2/15/27 | | 4,613,000 | 4,404,882 |
| 3.95% 1/31/60 | | 2,310,000 | 1,693,757 |
| 4.2% 1/31/50 | | 2,500,000 | 2,006,490 |
| 4.25% 2/15/48 | | 5,064,000 | 4,100,426 |
| 4.8% 2/1/49 | | 265,000 | 231,843 |
| 4.85% 8/15/42 | | 445,000 | 398,930 |
| 4.85% 3/15/44 | | 891,000 | 791,310 |
| 4.9% 5/15/46 | | 763,000 | 668,751 |
| 5.35% 1/31/33 | | 3,000,000 | 2,998,140 |
| 5.7% 2/15/42 | | 356,000 | 349,680 |
| 7.55% 4/15/38 | | 356,000 | 400,720 |
| EOG Resources, Inc. 4.15% 1/15/26 | | 998,000 | 974,361 |
| EQT Corp. 5.7% 4/1/28 | | 2,071,000 | 2,035,760 |
| Equinor ASA: | | | |
| 2.375% 5/22/30 | | 2,880,000 | 2,456,432 |
| 3.125% 4/6/30 | | 3,353,000 | 3,020,203 |
| 3.25% 11/18/49 | | 1,250,000 | 926,360 |
| 3.625% 9/10/28 | | 2,153,000 | 2,040,281 |
| 3.7% 3/1/24 | | 651,000 | 640,956 |
| 3.7% 4/6/50 | | 3,000,000 | 2,415,596 |
| 3.95% 5/15/43 | | 1,000,000 | 846,239 |
| 5.1% 8/17/40 | | 356,000 | 353,539 |
| Exxon Mobil Corp.: | | | |
| 2.726% 3/1/23 | | 1,782,000 | 1,782,000 |
| 3.043% 3/1/26 | | 1,484,000 | 1,406,144 |
| 3.452% 4/15/51 | | 3,000,000 | 2,288,074 |
| 3.482% 3/19/30 | | 10,000,000 | 9,270,431 |
| 3.567% 3/6/45 | | 1,186,000 | 937,628 |
| 4.227% 3/19/40 | | 2,310,000 | 2,074,979 |
| Hess Corp.: | | | |
| 3.5% 7/15/24 | | 677,000 | 660,850 |
| 4.3% 4/1/27 | | 2,800,000 | 2,680,207 |
| 5.6% 2/15/41 | | 606,000 | 566,027 |
| 6% 1/15/40 | | 1,000,000 | 982,003 |
| 7.125% 3/15/33 | | 2,500,000 | 2,686,398 |
| Kinder Morgan Energy Partners LP: | | | |
| 3.5% 9/1/23 | | 356,000 | 352,951 |
| 4.7% 11/1/42 | | 677,000 | 561,543 |
| 5% 3/1/43 | | 178,000 | 151,260 |
| 5.4% 9/1/44 | | 2,700,000 | 2,420,235 |
| 5.5% 3/1/44 | | 1,247,000 | 1,126,368 |
| 5.625% 9/1/41 | | 178,000 | 162,702 |
| 6.55% 9/15/40 | | 535,000 | 535,621 |
| Kinder Morgan, Inc.: | | | |
| 4.3% 3/1/28 | | 1,776,000 | 1,693,968 |
| 5.2% 6/1/33 | | 6,800,000 | 6,474,935 |
| 5.2% 3/1/48 | | 885,000 | 768,940 |
| 5.3% 12/1/34 | | 1,524,000 | 1,429,334 |
| 5.55% 6/1/45 | | 3,400,000 | 3,074,276 |
| 7.8% 8/1/31 | | 1,200,000 | 1,335,082 |
| Magellan Midstream Partners LP: | | | |
| 3.95% 3/1/50 | | 1,590,000 | 1,168,075 |
| 4.25% 9/15/46 | | 980,000 | 754,882 |
| 5% 3/1/26 | | 535,000 | 527,935 |
| Marathon Oil Corp.: | | | |
| 4.4% 7/15/27 | | 3,070,000 | 2,924,158 |
| 5.2% 6/1/45 | | 891,000 | 750,684 |
| Marathon Petroleum Corp.: | | | |
| 4.5% 4/1/48 | | 3,210,000 | 2,569,770 |
| 6.5% 3/1/41 | | 178,000 | 184,045 |
| MPLX LP: | | | |
| 4.125% 3/1/27 | | 1,685,000 | 1,607,502 |
| 4.7% 4/15/48 | | 3,476,000 | 2,793,672 |
| 4.8% 2/15/29 | | 2,638,000 | 2,533,785 |
| 5% 3/1/33 | | 4,000,000 | 3,752,915 |
| 5.2% 3/1/47 | | 1,091,000 | 940,509 |
| 5.5% 2/15/49 | | 1,800,000 | 1,616,228 |
| ONEOK, Inc.: | | | |
| 4.45% 9/1/49 | | 1,110,000 | 838,741 |
| 4.95% 7/13/47 | | 1,043,000 | 857,421 |
| 5.2% 7/15/48 | | 538,000 | 458,248 |
| 6.1% 11/15/32 | | 1,000,000 | 1,005,223 |
| 6.35% 1/15/31 | | 5,000,000 | 5,122,109 |
| Ovintiv, Inc. 6.5% 2/1/38 | | 2,591,000 | 2,540,925 |
| Phillips 66 Co.: | | | |
| 3.15% 12/15/29 (c) | | 4,300,000 | 3,741,751 |
| 3.9% 3/15/28 | | 4,400,000 | 4,155,852 |
| 4.65% 11/15/34 | | 1,000,000 | 933,207 |
| 4.875% 11/15/44 | | 178,000 | 161,994 |
| 5.875% 5/1/42 | | 1,693,000 | 1,757,696 |
| Plains All American Pipeline LP/PAA Finance Corp.: | | | |
| 3.8% 9/15/30 | | 4,890,000 | 4,257,707 |
| 4.9% 2/15/45 | | 339,000 | 266,858 |
| 6.65% 1/15/37 | | 1,498,000 | 1,492,335 |
| Sabine Pass Liquefaction LLC 5.875% 6/30/26 | | 8,200,000 | 8,248,469 |
| Shell International Finance BV: | | | |
| 2.375% 11/7/29 | | 7,700,000 | 6,608,463 |
| 3.125% 11/7/49 | | 3,000,000 | 2,150,159 |
| 3.25% 5/11/25 | | 2,523,000 | 2,429,843 |
| 3.5% 11/13/23 | | 9,747,000 | 9,630,326 |
| 4% 5/10/46 | | 713,000 | 592,228 |
| 4.375% 5/11/45 | | 3,970,000 | 3,510,676 |
| 4.55% 8/12/43 | | 2,800,000 | 2,556,108 |
| 6.375% 12/15/38 | | 748,000 | 830,237 |
| Spectra Energy Partners LP 3.375% 10/15/26 | | 2,907,000 | 2,711,634 |
| Suncor Energy, Inc.: | | | |
| 4% 11/15/47 | | 3,021,000 | 2,360,850 |
| 6.8% 5/15/38 | | 1,505,000 | 1,604,136 |
| 6.85% 6/1/39 | | 356,000 | 379,841 |
| Targa Resources Corp. 6.125% 3/15/33 | | 6,400,000 | 6,428,468 |
| The Williams Companies, Inc.: | | | |
| 3.75% 6/15/27 | | 4,163,000 | 3,912,554 |
| 4.85% 3/1/48 | | 1,722,000 | 1,478,718 |
| 5.4% 3/2/26 | | 4,720,000 | 4,720,224 |
| 5.65% 3/15/33 | | 2,500,000 | 2,497,556 |
| 5.75% 6/24/44 | | 339,000 | 323,185 |
| Total Capital International SA: | | | |
| 3.127% 5/29/50 | | 600,000 | 429,380 |
| 3.455% 2/19/29 | | 3,803,000 | 3,514,923 |
| 3.461% 7/12/49 | | 1,500,000 | 1,143,686 |
| 3.75% 4/10/24 | | 356,000 | 349,806 |
| Total Capital SA 3.883% 10/11/28 | | 7,780,000 | 7,455,591 |
| TransCanada PipeLines Ltd.: | | | |
| 2.5% 10/12/31 | | 4,700,000 | 3,727,451 |
| 4.75% 5/15/38 | | 378,000 | 338,159 |
| 4.875% 1/15/26 | | 891,000 | 878,641 |
| 4.875% 5/15/48 | | 877,000 | 770,128 |
| 5.1% 3/15/49 | | 1,836,000 | 1,667,297 |
| 6.1% 6/1/40 | | 1,195,000 | 1,208,994 |
| Transcontinental Gas Pipe Line Co. LLC: | | | |
| 3.25% 5/15/30 | | 3,970,000 | 3,456,398 |
| 3.95% 5/15/50 | | 970,000 | 751,560 |
| 4.45% 8/1/42 | | 1,381,000 | 1,183,856 |
| 4.6% 3/15/48 | | 713,000 | 609,984 |
| Valero Energy Corp.: | | | |
| 2.8% 12/1/31 | | 2,100,000 | 1,704,987 |
| 3.4% 9/15/26 | | 2,720,000 | 2,546,888 |
| 4% 4/1/29 | | 1,836,000 | 1,731,501 |
| 6.625% 6/15/37 | | 966,000 | 1,024,866 |
| | | | 299,696,399 |
TOTAL ENERGY | | | 307,862,079 |
| FINANCIALS - 8.5% | | | |
| Banks - 4.8% | | | |
| Australia and New Zealand Banking Group Ltd. 3.7% 11/16/25 | | 944,000 | 908,089 |
| Banco Santander SA: | | | |
| 1.849% 3/25/26 | | 4,400,000 | 3,900,237 |
| 2.749% 12/3/30 | | 1,400,000 | 1,093,803 |
| 2.958% 3/25/31 | | 4,400,000 | 3,591,646 |
| 3.225% 11/22/32 (b) | | 1,000,000 | 774,801 |
| 4.175% 3/24/28 (b) | | 1,000,000 | 934,500 |
| 5.294% 8/18/27 | | 1,400,000 | 1,371,634 |
| Bank of America Corp.: | | | |
| 3 month U.S. LIBOR + 0.640% 2.015% 2/13/26 (b)(d) | | 15,400,000 | 14,328,145 |
| 1.658% 3/11/27 (b) | | 9,900,000 | 8,816,113 |
| 1.734% 7/22/27 (b) | | 7,800,000 | 6,870,094 |
| 2.087% 6/14/29 (b) | | 8,400,000 | 7,062,683 |
| 2.299% 7/21/32 (b) | | 3,700,000 | 2,893,570 |
| 2.456% 10/22/25 (b) | | 2,600,000 | 2,467,306 |
| 2.651% 3/11/32 (b) | | 9,900,000 | 8,042,013 |
| 2.676% 6/19/41 (b) | | 3,200,000 | 2,191,983 |
| 2.687% 4/22/32 (b) | | 5,100,000 | 4,136,276 |
| 2.831% 10/24/51 (b) | | 3,893,000 | 2,492,651 |
| 2.972% 7/21/52 (b) | | 2,700,000 | 1,770,543 |
| 3.194% 7/23/30 (b) | | 2,934,000 | 2,549,315 |
| 3.248% 10/21/27 | | 3,268,000 | 3,009,135 |
| 3.366% 1/23/26 (b) | | 8,569,000 | 8,202,453 |
| 3.419% 12/20/28 (b) | | 19,130,000 | 17,411,818 |
| 3.593% 7/21/28 (b) | | 1,978,000 | 1,823,544 |
| 3.705% 4/24/28 (b) | | 1,568,000 | 1,458,608 |
| 3.864% 7/23/24 (b) | | 4,331,000 | 4,298,989 |
| 3.974% 2/7/30 (b) | | 2,521,000 | 2,306,124 |
| 4% 4/1/24 | | 867,000 | 854,041 |
| 4% 1/22/25 | | 1,069,000 | 1,041,443 |
| 4.078% 4/23/40 (b) | | 5,000,000 | 4,203,380 |
| 4.083% 3/20/51 (b) | | 3,250,000 | 2,609,329 |
| 4.1% 7/24/23 | | 1,247,000 | 1,241,291 |
| 4.183% 11/25/27 | | 10,318,000 | 9,836,520 |
| 4.2% 8/26/24 | | 1,515,000 | 1,485,702 |
| 4.25% 10/22/26 | | 713,000 | 684,774 |
| 4.271% 7/23/29 (b) | | 7,550,000 | 7,086,522 |
| 4.33% 3/15/50 (b) | | 2,333,000 | 1,962,053 |
| 4.443% 1/20/48 (b) | | 2,718,000 | 2,344,686 |
| 4.45% 3/3/26 | | 2,317,000 | 2,252,676 |
| 4.948% 7/22/28 (b) | | 2,800,000 | 2,738,588 |
| 5% 1/21/44 | | 958,000 | 907,152 |
| 5.875% 2/7/42 | | 409,000 | 425,808 |
| 6.11% 1/29/37 | | 1,224,000 | 1,258,132 |
| 7.75% 5/14/38 | | 2,324,000 | 2,743,197 |
| Bank of Montreal: | | | |
| 3.3% 2/5/24 | | 11,100,000 | 10,879,563 |
| 3.803% 12/15/32 (b) | | 1,720,000 | 1,531,211 |
| 4.7% 9/14/27 | | 3,700,000 | 3,618,162 |
| Bank of Nova Scotia: | | | |
| 3.4% 2/11/24 | | 9,151,000 | 8,977,177 |
| 4.5% 12/16/25 | | 2,830,000 | 2,742,852 |
| 4.85% 2/1/30 | | 3,400,000 | 3,298,600 |
| 5.25% 12/6/24 | | 6,500,000 | 6,488,141 |
| Barclays PLC: | | | |
| 2.279% 11/24/27 (b) | | 4,700,000 | 4,134,962 |
| 2.852% 5/7/26 (b) | | 300,000 | 280,888 |
| 2.894% 11/24/32 (b) | | 4,700,000 | 3,649,221 |
| 3.564% 9/23/35 (b) | | 2,000,000 | 1,594,535 |
| 3.932% 5/7/25 (b) | | 572,000 | 556,738 |
| 4.337% 1/10/28 | | 998,000 | 931,371 |
| 4.375% 1/12/26 | | 711,000 | 687,170 |
| 4.836% 5/9/28 | | 1,711,000 | 1,603,164 |
| 4.95% 1/10/47 | | 3,320,000 | 2,970,489 |
| 4.972% 5/16/29 (b) | | 759,000 | 722,787 |
| 5.2% 5/12/26 | | 2,580,000 | 2,512,336 |
| 5.25% 8/17/45 | | 998,000 | 925,813 |
| 7.437% 11/2/33 (b) | | 1,900,000 | 2,051,317 |
| BB&T Corp. 3.875% 3/19/29 | | 5,000,000 | 4,643,705 |
| BPCE SA 4% 4/15/24 | | 284,000 | 278,999 |
| Canadian Imperial Bank of Commerce 3.6% 4/7/32 | | 4,100,000 | 3,614,506 |
| Citigroup, Inc.: | | | |
| 3 month U.S. LIBOR + 1.020% 4.044% 6/1/24 (b)(d) | | 3,565,000 | 3,550,707 |
| 3 month U.S. LIBOR + 1.150% 3.52% 10/27/28 (b)(d) | | 10,206,000 | 9,341,302 |
| 1.122% 1/28/27 (b) | | 9,700,000 | 8,523,002 |
| 1.462% 6/9/27 (b) | | 9,250,000 | 8,085,777 |
| 2.561% 5/1/32 (b) | | 3,000,000 | 2,408,922 |
| 2.904% 11/3/42 (b) | | 1,900,000 | 1,314,916 |
| 3.668% 7/24/28 (b) | | 1,351,000 | 1,251,539 |
| 3.7% 1/12/26 | | 1,984,000 | 1,902,969 |
| 3.75% 6/16/24 | | 2,000,000 | 1,959,580 |
| 3.887% 1/10/28 (b) | | 802,000 | 753,565 |
| 3.98% 3/20/30 (b) | | 5,278,000 | 4,813,557 |
| 4.125% 7/25/28 | | 2,752,000 | 2,575,509 |
| 4.3% 11/20/26 | | 2,984,000 | 2,861,354 |
| 4.4% 6/10/25 | | 713,000 | 697,625 |
| 4.6% 3/9/26 | | 1,069,000 | 1,040,863 |
| 4.65% 7/30/45 | | 2,930,000 | 2,592,779 |
| 4.75% 5/18/46 | | 1,403,000 | 1,203,049 |
| 5.3% 5/6/44 | | 356,000 | 334,385 |
| 5.316% 3/26/41 (b) | | 3,530,000 | 3,427,454 |
| 5.5% 9/13/25 | | 891,000 | 892,621 |
| 5.61% 9/29/26 (b) | | 4,000,000 | 4,000,027 |
| 5.875% 2/22/33 | | 2,000,000 | 2,016,645 |
| 5.875% 1/30/42 | | 1,298,000 | 1,350,769 |
| 6.27% 11/17/33 (b) | | 2,500,000 | 2,618,170 |
| 6.625% 6/15/32 | | 1,600,000 | 1,690,848 |
| 8.125% 7/15/39 | | 3,263,000 | 4,133,734 |
| Citizens Financial Group, Inc. 2.638% 9/30/32 | | 337,000 | 256,718 |
| Comerica, Inc. 3.8% 7/22/26 | | 651,000 | 617,962 |
| Export-Import Bank of Korea: | | | |
| 0.625% 2/9/26 | | 5,100,000 | 4,467,359 |
| 1.125% 12/29/26 | | 2,000,000 | 1,713,220 |
| 2.375% 6/25/24 | | 2,000,000 | 1,921,903 |
| 2.875% 1/21/25 | | 4,215,000 | 4,032,238 |
| Fifth Third Bancorp: | | | |
| 2.55% 5/5/27 | | 2,600,000 | 2,354,500 |
| 6.361% 10/27/28 (b) | | 3,130,000 | 3,224,093 |
| 8.25% 3/1/38 | | 371,000 | 462,741 |
| HSBC Holdings PLC: | | | |
| 2.013% 9/22/28 (b) | | 1,800,000 | 1,523,728 |
| 2.206% 8/17/29 (b) | | 5,590,000 | 4,633,846 |
| 2.633% 11/7/25 (b) | | 9,800,000 | 9,280,502 |
| 2.804% 5/24/32 (b) | | 5,730,000 | 4,574,012 |
| 2.848% 6/4/31 (b) | | 1,800,000 | 1,480,768 |
| 3.803% 3/11/25 (b) | | 9,504,000 | 9,304,322 |
| 3.9% 5/25/26 | | 1,961,000 | 1,869,137 |
| 4.25% 8/18/25 | | 998,000 | 963,066 |
| 4.292% 9/12/26 (b) | | 13,003,000 | 12,517,321 |
| 4.375% 11/23/26 | | 3,716,000 | 3,567,235 |
| 4.762% 3/29/33 (b) | | 2,100,000 | 1,886,766 |
| 5.25% 3/14/44 | | 654,000 | 590,625 |
| 6.1% 1/14/42 | | 1,400,000 | 1,493,802 |
| 6.5% 5/2/36 | | 807,000 | 824,831 |
| 6.5% 9/15/37 | | 2,564,000 | 2,562,867 |
| 6.8% 6/1/38 | | 2,600,000 | 2,667,680 |
| 7.39% 11/3/28 (b) | | 4,700,000 | 4,964,309 |
| 8.113% 11/3/33 (b) | | 1,000,000 | 1,103,872 |
| HSBC U.S.A., Inc. 3.5% 6/23/24 | | 1,247,000 | 1,215,747 |
| Huntington Bancshares, Inc. 4.443% 8/4/28 (b) | | 2,000,000 | 1,910,402 |
| ING Groep NV: | | | |
| 1.726% 4/1/27 (b) | | 2,300,000 | 2,041,514 |
| 2.727% 4/1/32 (b) | | 2,300,000 | 1,855,406 |
| 4.252% 3/28/33 (b) | | 1,000,000 | 898,817 |
| Japan Bank International Cooperation: | | | |
| 1.25% 1/21/31 | | 8,076,000 | 6,346,098 |
| 1.875% 7/21/26 | | 4,640,000 | 4,194,043 |
| 2.125% 2/10/25 | | 284,000 | 268,159 |
| 2.25% 11/4/26 | | 744,000 | 677,187 |
| 2.375% 4/20/26 | | 470,000 | 434,965 |
| 2.5% 5/23/24 | | 25,000,000 | 24,133,847 |
| 2.75% 1/21/26 | | 450,000 | 423,890 |
| 2.875% 6/1/27 | | 1,354,000 | 1,252,447 |
| 3.25% 7/20/28 | | 1,604,000 | 1,490,396 |
| 3.5% 10/31/28 | | 1,000,000 | 937,878 |
| JPMorgan Chase & Co.: | | | |
| 0.768% 8/9/25 (b) | | 11,000,000 | 10,214,433 |
| 0.969% 6/23/25 (b) | | 11,100,000 | 10,416,590 |
| 1.47% 9/22/27 (b) | | 3,400,000 | 2,947,530 |
| 1.578% 4/22/27 (b) | | 7,261,000 | 6,423,536 |
| 1.953% 2/4/32 (b) | | 10,000,000 | 7,765,468 |
| 2.545% 11/8/32 (b) | | 4,100,000 | 3,278,103 |
| 2.58% 4/22/32 (b) | | 7,281,000 | 5,899,953 |
| 2.739% 10/15/30 (b) | | 2,600,000 | 2,193,093 |
| 2.95% 10/1/26 | | 4,497,000 | 4,181,864 |
| 2.956% 5/13/31 (b) | | 5,000,000 | 4,199,025 |
| 3.109% 4/22/51 (b) | | 300,000 | 204,349 |
| 3.22% 3/1/25 (b) | | 8,329,000 | 8,129,019 |
| 3.3% 4/1/26 | | 1,604,000 | 1,517,418 |
| 3.328% 4/22/52 (b) | | 1,500,000 | 1,064,147 |
| 3.375% 5/1/23 | | 339,000 | 337,998 |
| 3.509% 1/23/29 (b) | | 11,000,000 | 10,059,176 |
| 3.54% 5/1/28 (b) | | 3,030,000 | 2,802,007 |
| 3.559% 4/23/24 (b) | | 1,782,000 | 1,776,102 |
| 3.797% 7/23/24 (b) | | 2,468,000 | 2,450,191 |
| 3.875% 9/10/24 | | 5,833,000 | 5,693,795 |
| 3.882% 7/24/38 (b) | | 2,572,000 | 2,143,917 |
| 3.9% 7/15/25 | | 3,850,000 | 3,739,552 |
| 3.964% 11/15/48 (b) | | 1,676,000 | 1,344,992 |
| 4.005% 4/23/29 (b) | | 1,686,000 | 1,566,570 |
| 4.125% 12/15/26 | | 1,047,000 | 1,010,209 |
| 4.203% 7/23/29 (b) | | 14,141,000 | 13,256,751 |
| 4.25% 10/1/27 | | 5,400,000 | 5,196,591 |
| 4.323% 4/26/28 (b) | | 1,500,000 | 1,438,028 |
| 4.586% 4/26/33 (b) | | 1,500,000 | 1,397,969 |
| 4.85% 2/1/44 | | 2,000,000 | 1,873,251 |
| 4.95% 6/1/45 | | 707,000 | 649,794 |
| 5.5% 10/15/40 | | 1,016,000 | 1,023,519 |
| 5.6% 7/15/41 | | 267,000 | 271,784 |
| 5.625% 8/16/43 | | 891,000 | 888,330 |
| 6.4% 5/15/38 | | 4,660,000 | 5,101,286 |
| KeyBank NA 3.4% 5/20/26 | | 711,000 | 664,274 |
| KeyCorp 4.789% 6/1/33 (b) | | 1,500,000 | 1,405,810 |
| Korea Development Bank: | | | |
| 0.4% 6/19/24 | | 2,500,000 | 2,344,125 |
| 1.625% 1/19/31 | | 2,750,000 | 2,180,118 |
| Lloyds Banking Group PLC: | | | |
| 4.344% 1/9/48 | | 2,674,000 | 2,066,835 |
| 4.375% 3/22/28 | | 4,000,000 | 3,782,670 |
| 4.582% 12/10/25 | | 420,000 | 403,983 |
| 4.65% 3/24/26 | | 1,533,000 | 1,477,092 |
| 4.976% 8/11/33 (b) | | 1,900,000 | 1,769,684 |
| 5.871% 3/6/29 (b) | | 4,000,000 | 4,000,773 |
| Mitsubishi UFJ Financial Group, Inc.: | | | |
| 1.538% 7/20/27 (b) | | 8,000,000 | 6,998,997 |
| 2.309% 7/20/32 (b) | | 7,850,000 | 6,128,968 |
| 2.801% 7/18/24 | | 1,294,000 | 1,246,514 |
| 3.195% 7/18/29 | | 3,113,000 | 2,733,380 |
| 3.455% 3/2/23 | | 1,000,000 | 1,000,000 |
| 3.751% 7/18/39 | | 3,286,000 | 2,764,239 |
| 3.85% 3/1/26 | | 1,173,000 | 1,119,493 |
| 5.422% 2/22/29 (b) | | 4,000,000 | 3,972,160 |
| Mizuho Financial Group, Inc.: | | | |
| 0.849% 9/8/24 (b) | | 6,800,000 | 6,621,287 |
| 1.554% 7/9/27 (b) | | 3,712,000 | 3,232,961 |
| 2.226% 5/25/26 (b) | | 1,600,000 | 1,477,218 |
| 2.26% 7/9/32 (b) | | 3,800,000 | 2,940,928 |
| 2.591% 5/25/31 (b) | | 1,400,000 | 1,145,782 |
| 2.839% 7/16/25 (b) | | 4,600,000 | 4,398,941 |
| 3.549% 3/5/23 | | 2,139,000 | 2,138,654 |
| National Australia Bank Ltd. 5.132% 11/22/24 | | 5,820,000 | 5,819,426 |
| NatWest Group PLC: | | | |
| 3 month U.S. LIBOR + 1.750% 4.892% 5/18/29 (b)(d) | | 2,600,000 | 2,485,296 |
| 3.754% 11/1/29 (b) | | 7,840,000 | 7,353,872 |
| 3.875% 9/12/23 | | 540,000 | 534,731 |
| 4.445% 5/8/30 (b) | | 252,000 | 232,374 |
| 4.519% 6/25/24 (b) | | 5,000,000 | 4,973,028 |
| 4.8% 4/5/26 | | 1,176,000 | 1,145,090 |
| 5.847% 3/2/27 (b) | | 2,120,000 | 2,121,077 |
| Oesterreichische Kontrollbank AG 0.375% 9/17/25 | | 2,083,000 | 1,867,866 |
| PNC Financial Services Group, Inc.: | | | |
| 1.15% 8/13/26 | | 15,000,000 | 13,174,477 |
| 2.2% 11/1/24 | | 3,500,000 | 3,339,493 |
| 3.5% 1/23/24 | | 630,000 | 620,110 |
| 3.9% 4/29/24 | | 1,007,000 | 990,338 |
| 5.354% 12/2/28 (b) | | 2,250,000 | 2,256,042 |
| Rabobank Nederland: | | | |
| 3.75% 7/21/26 | | 3,431,000 | 3,217,545 |
| 4.375% 8/4/25 | | 853,000 | 826,280 |
| 5.25% 5/24/41 | | 535,000 | 557,921 |
| 5.75% 12/1/43 | | 1,590,000 | 1,599,193 |
| Rabobank Nederland New York Branch: | | | |
| 0.375% 1/12/24 | | 4,650,000 | 4,461,361 |
| 3.375% 5/21/25 | | 533,000 | 512,526 |
| Royal Bank of Canada: | | | |
| 2.05% 1/21/27 | | 5,000,000 | 4,483,676 |
| 2.55% 7/16/24 | | 9,480,000 | 9,129,240 |
| 4.24% 8/3/27 | | 4,200,000 | 4,033,524 |
| 4.65% 1/27/26 | | 2,315,000 | 2,258,438 |
| 6% 11/1/27 | | 2,000,000 | 2,058,230 |
| Santander Holdings U.S.A., Inc. 2.49% 1/6/28 (b) | | 3,800,000 | 3,309,732 |
| Santander UK Group Holdings PLC: | | | |
| 6.534% 1/10/29 (b) | | 5,600,000 | 5,668,446 |
| 6.833% 11/21/26 (b) | | 6,400,000 | 6,509,321 |
| Sumitomo Mitsui Banking Corp. 3.4% 7/11/24 | | 814,000 | 791,444 |
| Sumitomo Mitsui Financial Group, Inc.: | | | |
| 1.474% 7/8/25 | | 2,000,000 | 1,819,818 |
| 2.142% 9/23/30 | | 5,967,000 | 4,693,324 |
| 2.174% 1/14/27 | | 8,300,000 | 7,365,799 |
| 2.348% 1/15/25 | | 2,000,000 | 1,886,070 |
| 2.696% 7/16/24 | | 3,600,000 | 3,465,118 |
| 2.75% 1/15/30 | | 2,000,000 | 1,688,344 |
| 3.05% 1/14/42 | | 4,100,000 | 2,917,136 |
| 3.936% 10/16/23 | | 2,794,000 | 2,768,756 |
| 5.52% 1/13/28 | | 1,600,000 | 1,595,774 |
| SVB Financial Group 2.1% 5/15/28 | | 5,143,000 | 4,321,950 |
| The Toronto-Dominion Bank: | | | |
| 2.65% 6/12/24 | | 9,030,000 | 8,730,985 |
| 3.2% 3/10/32 | | 3,700,000 | 3,176,323 |
| 3.25% 3/11/24 | | 6,720,000 | 6,575,058 |
| 3.5% 7/19/23 | | 1,782,000 | 1,770,354 |
| 4.108% 6/8/27 | | 5,000,000 | 4,792,661 |
| 4.693% 9/15/27 | | 2,000,000 | 1,956,325 |
| Truist Financial Corp. 4.26% 7/28/26 (b) | | 5,000,000 | 4,873,989 |
| U.S. Bancorp: | | | |
| 1.375% 7/22/30 | | 6,900,000 | 5,348,251 |
| 3.1% 4/27/26 | | 6,704,000 | 6,292,051 |
| 4.548% 7/22/28 (b) | | 5,900,000 | 5,737,134 |
| 5.85% 10/21/33 (b) | | 1,800,000 | 1,855,608 |
| Wells Fargo & Co.: | | | |
| 0.805% 5/19/25 (b) | | 8,900,000 | 8,402,278 |
| 2.406% 10/30/25 (b) | | 11,000,000 | 10,433,641 |
| 3% 10/23/26 | | 3,624,000 | 3,345,015 |
| 3.068% 4/30/41 (b) | | 7,000,000 | 5,072,394 |
| 3.3% 9/9/24 | | 4,985,000 | 4,839,053 |
| 3.35% 3/2/33 (b) | | 6,500,000 | 5,495,773 |
| 3.55% 9/29/25 | | 756,000 | 723,563 |
| 3.75% 1/24/24 | | 5,040,000 | 4,964,278 |
| 3.9% 5/1/45 | | 849,000 | 672,266 |
| 4.1% 6/3/26 | | 575,000 | 551,936 |
| 4.15% 1/24/29 | | 665,000 | 622,979 |
| 4.4% 6/14/46 | | 1,272,000 | 1,042,284 |
| 4.48% 1/16/24 | | 681,000 | 675,137 |
| 4.54% 8/15/26 (b) | | 10,000,000 | 9,757,781 |
| 4.75% 12/7/46 | | 3,496,000 | 2,997,802 |
| 4.808% 7/25/28 (b) | | 4,800,000 | 4,673,371 |
| 4.897% 7/25/33 (b) | | 3,100,000 | 2,960,923 |
| 4.9% 11/17/45 | | 742,000 | 655,913 |
| 5.013% 4/4/51 (b) | | 3,840,000 | 3,534,049 |
| 5.375% 11/2/43 | | 5,130,000 | 4,848,441 |
| 5.606% 1/15/44 | | 3,536,000 | 3,440,478 |
| Westpac Banking Corp.: | | | |
| U.S. TREASURY 1 YEAR INDEX + 2.680% 5.405% 8/10/33 (b)(d) | | 2,000,000 | 1,915,076 |
| 2.85% 5/13/26 | | 846,000 | 788,715 |
| 2.894% 2/4/30 (b) | | 6,140,000 | 5,707,929 |
| 3.3% 2/26/24 | | 74,000 | 72,457 |
| 3.735% 8/26/25 | | 2,000,000 | 1,929,425 |
| 4.043% 8/26/27 | | 6,800,000 | 6,578,395 |
| 4.11% 7/24/34 (b) | | 1,590,000 | 1,406,176 |
| 4.421% 7/24/39 | | 1,910,000 | 1,602,887 |
| 5.457% 11/18/27 | | 3,500,000 | 3,558,831 |
| Zions Bancorp NA 4.5% 6/13/23 | | 36,000 | 35,922 |
| | | | 919,094,280 |
| Capital Markets - 1.7% | | | |
| Affiliated Managers Group, Inc. 3.5% 8/1/25 | | 846,000 | 811,605 |
| Ares Capital Corp.: | | | |
| 2.15% 7/15/26 | | 4,800,000 | 4,135,417 |
| 3.25% 7/15/25 | | 1,000,000 | 930,181 |
| 3.875% 1/15/26 | | 1,500,000 | 1,391,616 |
| 4.2% 6/10/24 | | 2,600,000 | 2,544,180 |
| Bank of New York Mellon Corp.: | | | |
| 1.8% 7/28/31 | | 6,500,000 | 5,068,184 |
| 2.8% 5/4/26 | | 1,004,000 | 937,120 |
| 4.414% 7/24/26 (b) | | 5,000,000 | 4,904,491 |
| 5.834% 10/25/33 (b) | | 2,000,000 | 2,082,646 |
| BlackRock, Inc. 3.5% 3/18/24 | | 517,000 | 508,502 |
| Brookfield Finance, Inc. 2.724% 4/15/31 | | 6,700,000 | 5,457,302 |
| Charles Schwab Corp.: | | | |
| 0.9% 3/11/26 | | 3,900,000 | 3,436,244 |
| 1.65% 3/11/31 | | 4,520,000 | 3,529,608 |
| 2% 3/20/28 | | 1,600,000 | 1,394,254 |
| 2.45% 3/3/27 | | 4,600,000 | 4,171,931 |
| 3.85% 5/21/25 | | 1,950,000 | 1,895,151 |
| CI Financial Corp. 3.2% 12/17/30 | | 3,700,000 | 2,805,135 |
| CME Group, Inc. 5.3% 9/15/43 | | 1,840,000 | 1,876,302 |
| Credit Suisse AG: | | | |
| 3.625% 9/9/24 | | 7,519,000 | 7,106,898 |
| 5% 7/9/27 | | 1,300,000 | 1,191,576 |
| Credit Suisse Group AG: | | | |
| 3.8% 6/9/23 | | 3,565,000 | 3,522,220 |
| 4.55% 4/17/26 | | 1,515,000 | 1,353,475 |
| 4.875% 5/15/45 | | 3,199,000 | 2,332,493 |
| Deutsche Bank AG: | | | |
| 4.1% 1/13/26 | | 4,800,000 | 4,578,257 |
| 4.5% 4/1/25 | | 427,000 | 411,726 |
| Deutsche Bank AG New York Branch: | | | |
| 2.311% 11/16/27 (b) | | 3,500,000 | 3,038,882 |
| 3.7% 5/30/24 | | 1,746,000 | 1,696,014 |
| 3.729% 1/14/32 (b) | | 3,300,000 | 2,588,271 |
| 4.1% 1/13/26 | | 3,886,000 | 3,716,883 |
| 6.119% 7/14/26 (b) | | 3,000,000 | 2,992,283 |
| Eaton Vance Corp. 3.625% 6/15/23 | | 504,000 | 501,807 |
| Franklin Resources, Inc. 2.85% 3/30/25 | | 677,000 | 642,473 |
| Goldman Sachs Group, Inc.: | | | |
| 0.673% 3/8/24 (b) | | 16,400,000 | 16,350,756 |
| 0.855% 2/12/26 (b) | | 9,000,000 | 8,171,347 |
| 2.383% 7/21/32 (b) | | 12,700,000 | 9,974,836 |
| 2.615% 4/22/32 (b) | | 12,200,000 | 9,797,841 |
| 3.5% 1/23/25 | | 891,000 | 860,910 |
| 3.625% 2/20/24 | | 1,872,000 | 1,838,393 |
| 3.691% 6/5/28 (b) | | 7,900,000 | 7,337,999 |
| 3.75% 2/25/26 | | 1,038,000 | 992,026 |
| 3.8% 3/15/30 | | 1,644,000 | 1,491,893 |
| 3.85% 7/8/24 | | 677,000 | 662,509 |
| 3.85% 1/26/27 | | 5,390,000 | 5,099,112 |
| 4.017% 10/31/38 (b) | | 4,100,000 | 3,386,652 |
| 4.25% 10/21/25 | | 391,000 | 378,736 |
| 4.411% 4/23/39 (b) | | 3,500,000 | 3,044,592 |
| 4.75% 10/21/45 | | 2,813,000 | 2,518,373 |
| 5.15% 5/22/45 | | 4,190,000 | 3,883,009 |
| 5.7% 11/1/24 | | 2,000,000 | 2,011,805 |
| 5.95% 1/15/27 | | 2,674,000 | 2,722,580 |
| 6.125% 2/15/33 | | 2,400,000 | 2,533,285 |
| 6.75% 10/1/37 | | 5,170,000 | 5,503,208 |
| Intercontinental Exchange, Inc.: | | | |
| 1.85% 9/15/32 | | 4,020,000 | 2,994,036 |
| 2.65% 9/15/40 | | 4,020,000 | 2,817,151 |
| 3% 6/15/50 | | 2,892,000 | 1,940,769 |
| 3.75% 12/1/25 | | 1,025,000 | 987,345 |
| 4.6% 3/15/33 | | 3,800,000 | 3,607,974 |
| Jefferies Financial Group, Inc.: | | | |
| 2.625% 10/15/31 | | 1,000,000 | 782,617 |
| 4.15% 1/23/30 | | 3,100,000 | 2,800,072 |
| 4.85% 1/15/27 | | 1,100,000 | 1,077,966 |
| Moody's Corp.: | | | |
| 2% 8/19/31 | | 1,100,000 | 867,262 |
| 4.25% 8/8/32 | | 1,700,000 | 1,573,059 |
| 4.875% 2/15/24 | | 4,671,000 | 4,640,507 |
| 4.875% 12/17/48 | | 2,500,000 | 2,257,016 |
| Morgan Stanley: | | | |
| 3 month U.S. LIBOR + 1.430% 4.457% 4/22/39 (b)(d) | | 5,218,000 | 4,605,454 |
| 1.164% 10/21/25 (b) | | 8,200,000 | 7,595,263 |
| 1.512% 7/20/27 (b) | | 6,100,000 | 5,324,815 |
| 1.593% 5/4/27 (b) | | 17,500,000 | 15,450,608 |
| 1.794% 2/13/32 (b) | | 5,470,000 | 4,162,984 |
| 2.188% 4/28/26 (b) | | 2,320,000 | 2,162,383 |
| 2.239% 7/21/32 (b) | | 6,100,000 | 4,744,902 |
| 3.125% 7/27/26 | | 998,000 | 928,730 |
| 3.591% 7/22/28 (b) | | 1,515,000 | 1,398,418 |
| 3.7% 10/23/24 | | 1,069,000 | 1,041,345 |
| 3.772% 1/24/29 (b) | | 20,700,000 | 19,110,321 |
| 3.875% 4/29/24 | | 2,616,000 | 2,574,664 |
| 3.875% 1/27/26 | | 935,000 | 901,348 |
| 3.95% 4/23/27 | | 8,938,000 | 8,445,959 |
| 3.971% 7/22/38 (b) | | 1,114,000 | 939,008 |
| 4.3% 1/27/45 | | 356,000 | 305,961 |
| 4.375% 1/22/47 | | 1,978,000 | 1,725,284 |
| 5.123% 2/1/29 (b) | | 2,500,000 | 2,455,023 |
| 5.297% 4/20/37 (b) | | 2,500,000 | 2,329,501 |
| 5.597% 3/24/51 (b) | | 1,100,000 | 1,135,959 |
| 5.948% 1/19/38 (b) | | 1,100,000 | 1,074,786 |
| 6.296% 10/18/28 (b) | | 2,000,000 | 2,053,309 |
| 6.342% 10/18/33 (b) | | 2,000,000 | 2,108,410 |
| 6.375% 7/24/42 | | 4,162,000 | 4,572,955 |
| 7.25% 4/1/32 | | 178,000 | 201,370 |
| NASDAQ, Inc.: | | | |
| 1.65% 1/15/31 | | 3,450,000 | 2,637,602 |
| 3.85% 6/30/26 | | 1,000,000 | 955,695 |
| Nomura Holdings, Inc.: | | | |
| 1.653% 7/14/26 | | 1,000,000 | 873,444 |
| 3.103% 1/16/30 | | 6,459,000 | 5,467,037 |
| 5.386% 7/6/27 | | 2,600,000 | 2,574,838 |
| Northern Trust Corp.: | | | |
| 1.95% 5/1/30 | | 50,000 | 40,917 |
| 4% 5/10/27 | | 1,100,000 | 1,065,500 |
| 6.125% 11/2/32 | | 1,300,000 | 1,371,417 |
| S&P Global, Inc.: | | | |
| 2.45% 3/1/27 (c) | | 3,500,000 | 3,185,566 |
| 2.9% 3/1/32 (c) | | 6,200,000 | 5,306,641 |
| 3.25% 12/1/49 | | 2,000,000 | 1,467,776 |
| State Street Corp.: | | | |
| 1.684% 11/18/27 (b) | | 5,652,000 | 4,996,029 |
| 2.65% 5/19/26 | | 1,346,000 | 1,257,104 |
| 4.821% 1/26/34 (b) | | 1,600,000 | 1,542,512 |
| | | | 328,549,601 |
| Consumer Finance - 0.7% | | | |
| AerCap Ireland Capital Ltd./AerCap Global Aviation Trust: | | | |
| 2.45% 10/29/26 | | 4,000,000 | 3,526,287 |
| 2.875% 8/14/24 | | 1,567,000 | 1,490,041 |
| 3% 10/29/28 | | 3,750,000 | 3,195,422 |
| 3.4% 10/29/33 | | 2,500,000 | 1,945,028 |
| 3.65% 7/21/27 | | 802,000 | 726,366 |
| 3.85% 10/29/41 | | 2,500,000 | 1,830,296 |
| 3.875% 1/23/28 | | 2,798,000 | 2,532,190 |
| 4.45% 10/1/25 | | 1,756,000 | 1,687,042 |
| 4.5% 9/15/23 | | 3,634,000 | 3,608,924 |
| 4.875% 1/16/24 | | 3,624,000 | 3,588,380 |
| Ally Financial, Inc.: | | | |
| 3.05% 6/5/23 | | 7,050,000 | 7,002,167 |
| 4.75% 6/9/27 | | 1,100,000 | 1,048,076 |
| 5.125% 9/30/24 | | 5,600,000 | 5,551,060 |
| 8% 11/1/31 | | 1,762,000 | 1,906,360 |
| American Express Co.: | | | |
| 2.5% 7/30/24 | | 11,755,000 | 11,308,891 |
| 4.05% 12/3/42 | | 1,243,000 | 1,097,910 |
| 4.42% 8/3/33 (b) | | 1,000,000 | 935,448 |
| 5.85% 11/5/27 | | 2,000,000 | 2,058,797 |
| Capital One Financial Corp.: | | | |
| 3.3% 10/30/24 | | 3,800,000 | 3,668,785 |
| 3.75% 7/28/26 | | 1,737,000 | 1,631,923 |
| 3.75% 3/9/27 | | 4,135,000 | 3,877,234 |
| 3.8% 1/31/28 | | 2,317,000 | 2,145,362 |
| 4.25% 4/30/25 | | 5,000,000 | 4,869,468 |
| 4.927% 5/10/28 (b) | | 2,400,000 | 2,323,763 |
| 5.268% 5/10/33 (b) | | 1,000,000 | 947,094 |
| 5.817% 2/1/34 (b) | | 1,000,000 | 971,028 |
| Discover Financial Services 4.5% 1/30/26 | | 3,354,000 | 3,246,847 |
| John Deere Capital Corp.: | | | |
| 2.65% 6/24/24 | | 1,864,000 | 1,803,870 |
| 2.65% 6/10/26 | | 891,000 | 829,636 |
| 2.8% 3/6/23 | | 579,000 | 578,833 |
| 2.8% 9/8/27 | | 47,000 | 43,153 |
| 3.45% 3/13/25 | | 1,850,000 | 1,792,803 |
| 3.45% 3/7/29 | | 2,779,000 | 2,567,516 |
| 4.15% 9/15/27 | | 2,000,000 | 1,943,759 |
| 4.35% 9/15/32 | | 2,000,000 | 1,924,874 |
| Synchrony Financial: | | | |
| 3.7% 8/4/26 | | 842,000 | 780,882 |
| 4.375% 3/19/24 | | 106,000 | 104,529 |
| 5.15% 3/19/29 | | 5,225,000 | 4,916,775 |
| Toyota Motor Credit Corp.: | | | |
| 0.5% 8/14/23 | | 4,350,000 | 4,260,833 |
| 1.15% 8/13/27 | | 7,300,000 | 6,216,949 |
| 1.65% 1/10/31 | | 2,100,000 | 1,669,010 |
| 1.9% 4/6/28 | | 1,250,000 | 1,086,121 |
| 2.15% 2/13/30 | | 2,000,000 | 1,701,123 |
| 3% 4/1/25 | | 5,350,000 | 5,120,673 |
| 3.05% 3/22/27 | | 2,500,000 | 2,325,988 |
| 3.35% 1/8/24 | | 3,504,000 | 3,448,622 |
| 4.55% 9/20/27 | | 1,400,000 | 1,377,227 |
| | | | 123,213,365 |
| Diversified Financial Services - 0.6% | | | |
| AB Svensk Exportkredit: | | | |
| 0.25% 9/29/23 | | 3,316,000 | 3,220,461 |
| 1.75% 12/12/23 | | 10,000,000 | 9,722,787 |
| Aon Corp. / Aon Global Holdings PLC: | | | |
| 2.6% 12/2/31 | | 4,000,000 | 3,259,898 |
| 2.85% 5/28/27 | | 4,500,000 | 4,090,312 |
| Berkshire Hathaway, Inc.: | | | |
| 2.75% 3/15/23 | | 2,000,000 | 1,998,242 |
| 3.125% 3/15/26 | | 2,050,000 | 1,958,152 |
| 4.5% 2/11/43 | | 356,000 | 329,771 |
| Blackstone Private Credit Fund: | | | |
| 2.7% 1/15/25 | | 4,700,000 | 4,380,028 |
| 4.7% 3/24/25 | | 5,000,000 | 4,822,433 |
| BP Capital Markets America, Inc.: | | | |
| 3% 2/24/50 | | 5,290,000 | 3,584,971 |
| 3.017% 1/16/27 | | 1,693,000 | 1,573,805 |
| 3.06% 6/17/41 | | 3,600,000 | 2,664,037 |
| 3.633% 4/6/30 | | 5,000,000 | 4,581,615 |
| 4.812% 2/13/33 | | 2,700,000 | 2,652,105 |
| Brixmor Operating Partnership LP: | | | |
| 3.9% 3/15/27 | | 1,005,000 | 932,545 |
| 4.05% 7/1/30 | | 1,138,000 | 1,006,102 |
| 4.125% 6/15/26 | | 1,346,000 | 1,266,730 |
| 4.125% 5/15/29 | | 1,216,000 | 1,095,353 |
| Corebridge Financial, Inc.: | | | |
| 4.4% 4/5/52 (c) | | 2,000,000 | 1,594,317 |
| 6.875% 12/15/52 (b)(c) | | 1,800,000 | 1,779,527 |
| DH Europe Finance II SARL: | | | |
| 2.6% 11/15/29 | | 1,500,000 | 1,294,941 |
| 3.4% 11/15/49 | | 1,000,000 | 755,921 |
| Equitable Holdings, Inc. 5% 4/20/48 | | 2,150,000 | 1,900,050 |
| Japan International Cooperation Agency 1.75% 4/28/31 | | 2,622,000 | 2,090,297 |
| KfW: | | | |
| 0% 4/18/36 | | 13,551,000 | 7,814,011 |
| 0.25% 10/19/23 | | 7,000,000 | 6,786,640 |
| 0.375% 7/18/25 | | 3,680,000 | 3,326,240 |
| 2% 5/2/25 | | 682,000 | 642,758 |
| 2.5% 11/20/24 | | 5,558,000 | 5,327,454 |
| 2.625% 2/28/24 | | 6,735,000 | 6,561,411 |
| 2.875% 4/3/28 | | 2,738,000 | 2,561,505 |
| Landwirtschaftliche Rentenbank: | | | |
| 1.75% 7/27/26 | | 1,515,000 | 1,379,291 |
| 2.5% 11/15/27 | | 1,576,000 | 1,451,783 |
| 3.125% 11/14/23 | | 5,000,000 | 4,920,900 |
| National Rural Utilities Cooperative Finance Corp.: | | | |
| 4.15% 12/15/32 | | 5,800,000 | 5,336,985 |
| 5.8% 1/15/33 | | 1,700,000 | 1,750,170 |
| Voya Financial, Inc.: | | | |
| 3.65% 6/15/26 | | 2,814,000 | 2,660,990 |
| 5.7% 7/15/43 | | 668,000 | 632,930 |
| | | | 113,707,468 |
| Insurance - 0.7% | | | |
| ACE INA Holdings, Inc.: | | | |
| 1.375% 9/15/30 | | 6,000,000 | 4,664,060 |
| 3.35% 5/3/26 | | 4,752,000 | 4,525,623 |
| 4.35% 11/3/45 | | 713,000 | 637,317 |
| AFLAC, Inc.: | | | |
| 3.6% 4/1/30 | | 4,959,000 | 4,560,875 |
| 4% 10/15/46 | | 673,000 | 539,084 |
| Allstate Corp.: | | | |
| 1.45% 12/15/30 | | 7,877,000 | 6,039,884 |
| 3.28% 12/15/26 | | 841,000 | 794,211 |
| 4.2% 12/15/46 | | 1,348,000 | 1,124,907 |
| American International Group, Inc.: | | | |
| 3.875% 1/15/35 | | 481,000 | 421,319 |
| 3.9% 4/1/26 | | 336,000 | 322,232 |
| 4.2% 4/1/28 | | 3,307,000 | 3,133,830 |
| 4.375% 6/30/50 | | 2,390,000 | 2,015,323 |
| 4.5% 7/16/44 | | 1,582,000 | 1,371,631 |
| 4.7% 7/10/35 | | 1,034,000 | 926,140 |
| 4.75% 4/1/48 | | 923,000 | 822,429 |
| 5.75% 4/1/48 (b) | | 2,050,000 | 1,978,250 |
| Aon PLC: | | | |
| 3.5% 6/14/24 | | 1,456,000 | 1,420,891 |
| 4% 11/27/23 | | 535,000 | 530,176 |
| 4.6% 6/14/44 | | 285,000 | 248,666 |
| 4.75% 5/15/45 | | 1,048,000 | 928,222 |
| Arch Capital Group Ltd. 3.635% 6/30/50 | | 2,400,000 | 1,725,828 |
| Arthur J. Gallagher & Co. 5.75% 3/2/53 | | 1,300,000 | 1,292,239 |
| Athene Holding Ltd. 3.45% 5/15/52 | | 2,100,000 | 1,335,461 |
| Baylor Scott & White Holdings: | | | |
| Series 2021, 2.839% 11/15/50 | | 4,000,000 | 2,697,373 |
| 3.967% 11/15/46 | | 445,000 | 367,479 |
| Berkshire Hathaway Finance Corp.: | | | |
| 1.45% 10/15/30 | | 7,300,000 | 5,792,838 |
| 2.85% 10/15/50 | | 3,200,000 | 2,160,566 |
| 4.2% 8/15/48 | | 2,116,000 | 1,870,064 |
| 4.25% 1/15/49 | | 1,528,000 | 1,358,177 |
| 4.4% 5/15/42 | | 2,500,000 | 2,304,915 |
| 5.75% 1/15/40 | | 891,000 | 955,535 |
| Brighthouse Financial, Inc.: | | | |
| 3.7% 6/22/27 | | 1,090,000 | 1,018,890 |
| 4.7% 6/22/47 | | 1,693,000 | 1,316,809 |
| Brown & Brown, Inc. 4.95% 3/17/52 | | 1,000,000 | 841,874 |
| Fairfax Financial Holdings Ltd. 4.625% 4/29/30 | | 1,800,000 | 1,653,842 |
| Hartford Financial Services Group, Inc.: | | | |
| 2.8% 8/19/29 | | 1,256,000 | 1,081,508 |
| 3.6% 8/19/49 | | 1,107,000 | 828,293 |
| 4.4% 3/15/48 | | 1,731,000 | 1,462,113 |
| Lincoln National Corp.: | | | |
| 3.625% 12/12/26 | | 1,069,000 | 1,007,549 |
| 4.35% 3/1/48 | | 2,260,000 | 1,760,444 |
| Manulife Financial Corp. 4.15% 3/4/26 | | 6,250,000 | 6,085,938 |
| Markel Corp. 5% 5/20/49 | | 1,700,000 | 1,517,398 |
| Marsh & McLennan Companies, Inc.: | | | |
| 2.375% 12/15/31 | | 2,200,000 | 1,764,049 |
| 3.5% 6/3/24 | | 339,000 | 330,624 |
| 3.75% 3/14/26 | | 2,000,000 | 1,919,753 |
| 3.875% 3/15/24 | | 1,693,000 | 1,664,556 |
| 4.05% 10/15/23 | | 1,207,000 | 1,196,670 |
| 4.2% 3/1/48 | | 868,000 | 727,406 |
| 4.35% 1/30/47 | | 499,000 | 425,082 |
| 4.9% 3/15/49 | | 1,657,000 | 1,530,339 |
| MetLife, Inc.: | | | |
| 4.05% 3/1/45 | | 690,000 | 577,318 |
| 4.125% 8/13/42 | | 2,600,000 | 2,217,646 |
| 4.6% 5/13/46 | | 4,308,000 | 3,853,164 |
| 4.721% 12/15/44 (b) | | 891,000 | 810,432 |
| 5.875% 2/6/41 | | 341,000 | 354,713 |
| Pricoa Global Funding I 5.625% 6/15/43 (b) | | 1,000,000 | 995,000 |
| Principal Financial Group, Inc.: | | | |
| 2.125% 6/15/30 | | 1,760,000 | 1,435,740 |
| 4.3% 11/15/46 | | 1,425,000 | 1,160,483 |
| Progressive Corp.: | | | |
| 2.45% 1/15/27 | | 2,145,000 | 1,959,825 |
| 4.125% 4/15/47 | | 2,390,000 | 2,036,641 |
| 4.2% 3/15/48 | | 1,100,000 | 940,618 |
| Prudential Financial, Inc.: | | | |
| 3.878% 3/27/28 | | 740,000 | 706,254 |
| 3.905% 12/7/47 | | 2,119,000 | 1,672,807 |
| 3.935% 12/7/49 | | 1,910,000 | 1,515,601 |
| 4.35% 2/25/50 | | 2,633,000 | 2,236,802 |
| 4.418% 3/27/48 | | 1,132,000 | 970,571 |
| 4.6% 5/15/44 | | 1,400,000 | 1,269,323 |
| 5.125% 3/1/52 (b) | | 1,000,000 | 913,850 |
| 5.7% 12/14/36 | | 68,000 | 70,856 |
| 6% 9/1/52 (b) | | 1,100,000 | 1,061,129 |
| The Chubb Corp.: | | | |
| 6% 5/11/37 | | 983,000 | 1,054,894 |
| 6.5% 5/15/38 | | 626,000 | 704,885 |
| The Travelers Companies, Inc.: | | | |
| 4.1% 3/4/49 | | 200,000 | 168,848 |
| 4.3% 8/25/45 | | 261,000 | 225,985 |
| 6.25% 6/15/37 | | 5,488,000 | 6,127,656 |
| Unum Group 4.5% 12/15/49 | | 1,000,000 | 739,410 |
| Willis Group North America, Inc.: | | | |
| 2.95% 9/15/29 | | 3,000,000 | 2,562,693 |
| 4.5% 9/15/28 | | 3,479,000 | 3,299,049 |
| | | | 128,640,875 |
TOTAL FINANCIALS | | | 1,613,205,589 |
| HEALTH CARE - 2.6% | | | |
| Biotechnology - 0.5% | | | |
| AbbVie, Inc.: | | | |
| 2.95% 11/21/26 | | 13,300,000 | 12,274,136 |
| 3.2% 11/21/29 | | 4,000,000 | 3,537,817 |
| 4.05% 11/21/39 | | 7,870,000 | 6,638,127 |
| 4.25% 11/14/28 | | 1,478,000 | 1,413,718 |
| 4.25% 11/21/49 | | 4,700,000 | 3,913,704 |
| 4.3% 5/14/36 | | 1,116,000 | 1,003,633 |
| 4.4% 11/6/42 | | 851,000 | 737,972 |
| 4.45% 5/14/46 | | 1,247,000 | 1,068,407 |
| 4.55% 3/15/35 | | 3,686,000 | 3,427,999 |
| 4.7% 5/14/45 | | 1,752,000 | 1,551,019 |
| 4.75% 3/15/45 | | 1,128,000 | 1,009,723 |
| 4.875% 11/14/48 | | 1,710,000 | 1,567,450 |
| Amgen, Inc.: | | | |
| 1.65% 8/15/28 | | 1,200,000 | 1,004,210 |
| 1.9% 2/21/25 | | 2,000,000 | 1,870,036 |
| 2.6% 8/19/26 | | 1,872,000 | 1,719,731 |
| 2.77% 9/1/53 | | 1,460,000 | 880,576 |
| 2.8% 8/15/41 | | 5,000,000 | 3,436,576 |
| 3.125% 5/1/25 | | 356,000 | 339,836 |
| 3.15% 2/21/40 | | 3,890,000 | 2,860,044 |
| 3.375% 2/21/50 | | 2,500,000 | 1,749,250 |
| 4.2% 3/1/33 | | 6,330,000 | 5,821,209 |
| 4.4% 5/1/45 | | 1,770,000 | 1,480,156 |
| 4.663% 6/15/51 | | 2,224,000 | 1,921,582 |
| 4.95% 10/1/41 | | 1,200,000 | 1,092,366 |
| 5.15% 3/2/28 (e) | | 5,000,000 | 4,980,217 |
| 5.25% 3/2/33 (e) | | 3,000,000 | 2,979,099 |
| 5.65% 3/2/53 (e) | | 5,140,000 | 5,097,691 |
| Biogen, Inc. 3.15% 5/1/50 | | 3,250,000 | 2,153,926 |
| Gilead Sciences, Inc.: | | | |
| 1.65% 10/1/30 | | 3,200,000 | 2,532,166 |
| 2.8% 10/1/50 | | 1,600,000 | 1,039,033 |
| 3.65% 3/1/26 | | 1,102,000 | 1,052,407 |
| 4.15% 3/1/47 | | 2,217,000 | 1,854,858 |
| 4.75% 3/1/46 | | 4,393,000 | 3,968,132 |
| Regeneron Pharmaceuticals, Inc. 1.75% 9/15/30 | | 2,100,000 | 1,634,967 |
| | | | 89,611,773 |
| Health Care Equipment & Supplies - 0.3% | | | |
| Abbott Laboratories: | | | |
| 1.15% 1/30/28 | | 5,000,000 | 4,232,854 |
| 3.75% 11/30/26 | | 7,242,000 | 6,999,699 |
| 4.75% 11/30/36 | | 802,000 | 797,418 |
| 4.9% 11/30/46 | | 2,854,000 | 2,805,856 |
| Baxter International, Inc.: | | | |
| 1.915% 2/1/27 | | 4,700,000 | 4,098,479 |
| 2.539% 2/1/32 | | 4,700,000 | 3,641,600 |
| Becton, Dickinson & Co.: | | | |
| 2.823% 5/20/30 | | 1,900,000 | 1,625,318 |
| 3.7% 6/6/27 | | 5,003,000 | 4,724,181 |
| 4.669% 6/6/47 | | 256,000 | 224,932 |
| 4.685% 12/15/44 | | 1,937,000 | 1,718,155 |
| Boston Scientific Corp.: | | | |
| 3.45% 3/1/24 | | 829,000 | 813,634 |
| 4% 3/1/29 | | 1,925,000 | 1,768,887 |
| 4.7% 3/1/49 | | 1,257,000 | 1,140,939 |
| GE Healthcare Holding LLC: | | | |
| 5.65% 11/15/27 (c) | | 1,600,000 | 1,621,440 |
| 5.905% 11/22/32 (c) | | 3,200,000 | 3,307,697 |
| Medtronic, Inc. 4.625% 3/15/45 | | 3,404,000 | 3,175,847 |
| Stryker Corp.: | | | |
| 1.95% 6/15/30 | | 1,650,000 | 1,341,090 |
| 2.9% 6/15/50 | | 1,150,000 | 775,277 |
| 3.5% 3/15/26 | | 3,600,000 | 3,441,382 |
| Zimmer Biomet Holdings, Inc. 3.55% 4/1/25 | | 7,228,000 | 6,955,258 |
| | | | 55,209,943 |
| Health Care Providers & Services - 1.1% | | | |
| Aetna, Inc.: | | | |
| 4.125% 11/15/42 | | 2,022,000 | 1,642,289 |
| 6.625% 6/15/36 | | 1,160,000 | 1,246,655 |
| AHS Hospital Corp. 2.78% 7/1/51 | | 3,500,000 | 2,275,618 |
| Allina Health System, Inc. 3.887% 4/15/49 | | 1,239,000 | 1,003,120 |
| AmerisourceBergen Corp. 2.7% 3/15/31 | | 4,100,000 | 3,407,790 |
| Banner Health: | | | |
| 2.907% 1/1/42 | | 1,500,000 | 1,108,206 |
| 2.913% 1/1/51 | | 2,700,000 | 1,819,772 |
| Baptist Healthcare System Obli 3.54% 8/15/50 | | 3,000,000 | 2,257,074 |
| Bon Secours Mercy Health, Inc. 2.095% 6/1/31 | | 1,786,000 | 1,409,801 |
| Cardinal Health, Inc. 4.368% 6/15/47 | | 2,476,000 | 1,976,923 |
| Centene Corp.: | | | |
| 2.625% 8/1/31 | | 5,000,000 | 3,896,064 |
| 3.375% 2/15/30 | | 5,000,000 | 4,218,897 |
| Children's Hospital Medical Center 4.268% 5/15/44 | | 592,000 | 530,134 |
| Children's Hospital of Philadelphia 2.704% 7/1/50 | | 1,964,000 | 1,287,332 |
| Cigna Group: | | | |
| 1.25% 3/15/26 | | 3,645,000 | 3,240,376 |
| 2.375% 3/15/31 | | 1,500,000 | 1,221,208 |
| 3% 7/15/23 | | 82,000 | 81,221 |
| 3.75% 7/15/23 | | 99,000 | 98,316 |
| 4.375% 10/15/28 | | 8,532,000 | 8,192,465 |
| 4.8% 8/15/38 | | 4,201,000 | 3,869,393 |
| 4.8% 7/15/46 | | 2,355,000 | 2,079,896 |
| 4.9% 12/15/48 | | 2,618,000 | 2,354,626 |
| 6.125% 11/15/41 | | 535,000 | 567,325 |
| CommonSpirit Health: | | | |
| 3.91% 10/1/50 | | 3,000,000 | 2,284,567 |
| 4.35% 11/1/42 | | 356,000 | 300,137 |
| CVS Health Corp.: | | | |
| 2.7% 8/21/40 | | 3,100,000 | 2,094,229 |
| 3% 8/15/26 | | 1,016,000 | 942,703 |
| 3.75% 4/1/30 | | 3,030,000 | 2,736,808 |
| 4.1% 3/25/25 | | 735,000 | 719,844 |
| 4.3% 3/25/28 | | 4,260,000 | 4,072,570 |
| 4.875% 7/20/35 | | 553,000 | 519,600 |
| 5% 2/20/26 | | 5,000,000 | 4,972,469 |
| 5.05% 3/25/48 | | 4,884,000 | 4,383,391 |
| 5.125% 7/20/45 | | 4,500,000 | 4,063,892 |
| 5.25% 2/21/33 | | 3,000,000 | 2,953,038 |
| 5.3% 12/5/43 | | 4,832,000 | 4,504,229 |
| Elevance Health, Inc.: | | | |
| 3.65% 12/1/27 | | 4,099,000 | 3,844,812 |
| 3.7% 9/15/49 | | 1,140,000 | 859,148 |
| 4.375% 12/1/47 | | 6,457,000 | 5,491,749 |
| 4.625% 5/15/42 | | 464,000 | 418,549 |
| 4.65% 1/15/43 | | 356,000 | 319,007 |
| 5.125% 2/15/53 | | 3,300,000 | 3,128,840 |
| 5.5% 10/15/32 | | 1,800,000 | 1,829,515 |
| Franciscan Missionaries of Our Lady Health System, Inc. 3.914% 7/1/49 | | 2,400,000 | 1,854,930 |
| HCA Holdings, Inc.: | | | |
| 3.625% 3/15/32 (c) | | 5,700,000 | 4,818,430 |
| 4.125% 6/15/29 | | 1,540,000 | 1,401,807 |
| 4.5% 2/15/27 | | 5,500,000 | 5,272,292 |
| 4.625% 3/15/52 (c) | | 4,100,000 | 3,225,626 |
| 5.25% 6/15/26 | | 1,499,000 | 1,475,533 |
| 5.25% 6/15/49 | | 3,120,000 | 2,691,006 |
| Humana, Inc.: | | | |
| 1.35% 2/3/27 | | 1,800,000 | 1,549,680 |
| 2.15% 2/3/32 | | 1,900,000 | 1,466,865 |
| 3.85% 10/1/24 | | 5,351,000 | 5,222,709 |
| 3.95% 3/15/27 | | 5,493,000 | 5,251,236 |
| 4.95% 10/1/44 | | 445,000 | 398,954 |
| Indiana University Health, Inc. 2.852% 11/1/51 | | 3,600,000 | 2,427,610 |
| INTEGRIS Baptist Medical Center, Inc. 3.875% 8/15/50 | | 2,292,000 | 1,715,136 |
| Kaiser Foundation Hospitals: | | | |
| 2.81% 6/1/41 | | 1,107,000 | 811,917 |
| 3.266% 11/1/49 | | 1,900,000 | 1,412,834 |
| 4.15% 5/1/47 | | 1,136,000 | 999,389 |
| 4.875% 4/1/42 | | 321,000 | 313,567 |
| Memorial Sloan-Kettring Cancer Center 4.2% 7/1/55 | | 535,000 | 457,340 |
| MidMichigan Health 3.409% 6/1/50 | | 833,000 | 589,033 |
| New York & Presbyterian Hospital: | | | |
| 4.024% 8/1/45 | | 624,000 | 533,504 |
| 4.063% 8/1/56 | | 469,000 | 393,055 |
| Novant Health, Inc. 3.168% 11/1/51 | | 2,300,000 | 1,621,203 |
| NYU Hospitals Center 4.784% 7/1/44 | | 1,355,000 | 1,253,868 |
| Orlando Health Obligated Group 3.327% 10/1/50 | | 1,481,000 | 1,065,804 |
| Partners Healthcare System, Inc. 4.117% 7/1/55 | | 624,000 | 524,900 |
| Piedmont Healthcare, Inc. 2.719% 1/1/42 | | 2,688,000 | 1,853,922 |
| Providence St. Joseph Health Obligated Group 2.7% 10/1/51 | | 3,600,000 | 2,140,708 |
| Quest Diagnostics, Inc. 2.95% 6/30/30 | | 2,850,000 | 2,459,585 |
| Sutter Health 3.361% 8/15/50 | | 3,600,000 | 2,575,162 |
| Trinity Health Corp. 2.632% 12/1/40 | | 1,000,000 | 710,916 |
| UnitedHealth Group, Inc.: | | | |
| 1.15% 5/15/26 | | 1,800,000 | 1,595,852 |
| 1.25% 1/15/26 | | 1,100,000 | 993,685 |
| 2% 5/15/30 | | 1,500,000 | 1,229,957 |
| 2.375% 8/15/24 | | 956,000 | 917,724 |
| 2.75% 5/15/40 | | 5,332,000 | 3,882,608 |
| 2.9% 5/15/50 | | 100,000 | 67,734 |
| 3.125% 5/15/60 | | 1,300,000 | 881,195 |
| 3.25% 5/15/51 | | 1,800,000 | 1,289,113 |
| 3.375% 4/15/27 | | 963,000 | 907,667 |
| 3.5% 6/15/23 | | 1,586,000 | 1,579,163 |
| 3.7% 8/15/49 | | 1,728,000 | 1,354,454 |
| 3.75% 7/15/25 | | 5,080,000 | 4,928,614 |
| 3.75% 10/15/47 | | 1,704,000 | 1,361,531 |
| 3.875% 12/15/28 | | 371,000 | 350,544 |
| 3.875% 8/15/59 | | 1,798,000 | 1,401,583 |
| 4.2% 1/15/47 | | 642,000 | 554,694 |
| 4.25% 6/15/48 | | 370,000 | 320,208 |
| 4.375% 3/15/42 | | 2,103,000 | 1,877,098 |
| 4.625% 7/15/35 | | 1,100,000 | 1,053,815 |
| 4.625% 11/15/41 | | 1,000,000 | 925,049 |
| 4.75% 7/15/45 | | 297,000 | 279,052 |
| 4.95% 5/15/62 | | 3,100,000 | 2,917,683 |
| 5.25% 2/15/28 | | 2,400,000 | 2,432,641 |
| 5.35% 2/15/33 | | 4,400,000 | 4,501,088 |
| 5.8% 3/15/36 | | 1,100,000 | 1,151,506 |
| 5.875% 2/15/53 | | 2,400,000 | 2,588,907 |
| 6.05% 2/15/63 | | 1,000,000 | 1,094,452 |
| 6.625% 11/15/37 | | 1,100,000 | 1,239,247 |
| West Virginia University Health System Obligated Group 3.129% 6/1/50 | | 1,400,000 | 921,358 |
| | | | 203,310,341 |
| Life Sciences Tools & Services - 0.0% | | | |
| Danaher Corp. 4.375% 9/15/45 | | 422,000 | 371,518 |
| PerkinElmer, Inc. 2.25% 9/15/31 | | 1,900,000 | 1,473,420 |
| Thermo Fisher Scientific, Inc.: | | | |
| 2.6% 10/1/29 | | 788,000 | 682,114 |
| 4.8% 11/21/27 | | 7,000,000 | 6,995,824 |
| 5.3% 2/1/44 | | 1,038,000 | 1,039,703 |
| | | | 10,562,579 |
| Pharmaceuticals - 0.7% | | | |
| AstraZeneca Finance LLC: | | | |
| 1.2% 5/28/26 | | 5,100,000 | 4,517,376 |
| 2.25% 5/28/31 | | 2,100,000 | 1,748,364 |
| 4.875% 3/3/33 | | 4,700,000 | 4,652,417 |
| AstraZeneca PLC: | | | |
| 3.375% 11/16/25 | | 3,000,000 | 2,880,644 |
| 4.375% 11/16/45 | | 1,344,000 | 1,221,035 |
| 4.375% 8/17/48 | | 2,246,000 | 2,038,528 |
| 6.45% 9/15/37 | | 579,000 | 654,445 |
| Bayer U.S. Finance II LLC 3.95% 4/15/45 (c) | | 248,000 | 181,507 |
| Bristol-Myers Squibb Co.: | | | |
| 2.35% 11/13/40 | | 1,356,000 | 927,183 |
| 2.9% 7/26/24 | | 5,410,000 | 5,243,697 |
| 3.2% 6/15/26 | | 1,409,000 | 1,333,913 |
| 3.25% 8/1/42 | | 499,000 | 384,624 |
| 3.4% 7/26/29 | | 669,000 | 613,767 |
| 3.9% 2/20/28 | | 5,000,000 | 4,787,878 |
| 4.125% 6/15/39 | | 3,103,000 | 2,769,314 |
| 4.25% 10/26/49 | | 3,437,000 | 2,967,662 |
| 4.35% 11/15/47 | | 3,400,000 | 2,991,813 |
| 4.55% 2/20/48 | | 269,000 | 244,998 |
| Eli Lilly & Co.: | | | |
| 2.25% 5/15/50 | | 800,000 | 502,519 |
| 3.95% 3/15/49 | | 2,610,000 | 2,311,962 |
| 4.875% 2/27/53 | | 2,200,000 | 2,196,311 |
| GlaxoSmithKline Capital PLC 3% 6/1/24 | | 4,550,000 | 4,430,220 |
| GlaxoSmithKline Capital, Inc. 6.375% 5/15/38 | | 3,752,000 | 4,239,088 |
| GSK Consumer Healthcare Capital U.S. LLC: | | | |
| 3.375% 3/24/27 | | 2,700,000 | 2,510,570 |
| 3.625% 3/24/32 | | 6,000,000 | 5,240,906 |
| Johnson & Johnson: | | | |
| 0.55% 9/1/25 | | 100,000 | 90,246 |
| 1.3% 9/1/30 | | 400,000 | 321,437 |
| 2.1% 9/1/40 | | 5,228,000 | 3,585,758 |
| 2.45% 3/1/26 | | 997,000 | 933,674 |
| 2.45% 9/1/60 | | 1,600,000 | 980,787 |
| 3.4% 1/15/38 | | 1,663,000 | 1,414,781 |
| 3.5% 1/15/48 | | 1,069,000 | 881,214 |
| 3.625% 3/3/37 | | 713,000 | 629,691 |
| 4.5% 12/5/43 | | 1,181,000 | 1,145,723 |
| 4.85% 5/15/41 | | 760,000 | 751,000 |
| Merck & Co., Inc.: | | | |
| 2.9% 3/7/24 | | 414,000 | 404,447 |
| 2.9% 12/10/61 | | 1,600,000 | 1,026,362 |
| 3.6% 9/15/42 | | 1,356,000 | 1,107,173 |
| 3.7% 2/10/45 | | 1,141,000 | 939,118 |
| 3.9% 3/7/39 | | 4,800,000 | 4,201,424 |
| 4% 3/7/49 | | 2,900,000 | 2,477,495 |
| Mylan NV 5.2% 4/15/48 | | 2,735,000 | 2,088,805 |
| Novartis Capital Corp.: | | | |
| 1.75% 2/14/25 | | 1,000,000 | 939,074 |
| 2% 2/14/27 | | 1,400,000 | 1,267,068 |
| 2.75% 8/14/50 | | 2,900,000 | 2,014,541 |
| 3% 11/20/25 | | 1,866,000 | 1,775,566 |
| 3.1% 5/17/27 | | 49,000 | 46,038 |
| 3.7% 9/21/42 | | 504,000 | 426,547 |
| 4% 11/20/45 | | 934,000 | 815,936 |
| Pfizer, Inc.: | | | |
| 2.55% 5/28/40 | | 4,203,000 | 3,037,452 |
| 2.7% 5/28/50 | | 800,000 | 546,397 |
| 2.95% 3/15/24 | | 14,417,000 | 14,087,774 |
| 3% 12/15/26 | | 1,195,000 | 1,123,388 |
| 3.2% 9/15/23 | | 2,268,000 | 2,244,343 |
| 3.45% 3/15/29 | | 1,484,000 | 1,383,266 |
| 3.9% 3/15/39 | | 1,123,000 | 979,449 |
| 4% 12/15/36 | | 1,693,000 | 1,548,763 |
| 4.125% 12/15/46 | | 2,472,000 | 2,175,016 |
| 4.2% 9/15/48 | | 1,390,000 | 1,239,283 |
| 4.3% 6/15/43 | | 442,000 | 402,896 |
| 4.4% 5/15/44 | | 747,000 | 690,369 |
| 7.2% 3/15/39 | | 963,000 | 1,172,334 |
| Shire Acquisitions Investments Ireland DAC: | | | |
| 2.875% 9/23/23 | | 35,000 | 34,482 |
| 3.2% 9/23/26 | | 6,983,000 | 6,500,382 |
| Takeda Pharmaceutical Co. Ltd.: | | | |
| 2.05% 3/31/30 | | 3,710,000 | 3,025,135 |
| 3.025% 7/9/40 | | 3,356,000 | 2,458,263 |
| 3.175% 7/9/50 | | 300,000 | 205,164 |
| Utah Acquisition Sub, Inc.: | | | |
| 3.95% 6/15/26 | | 504,000 | 471,332 |
| 5.25% 6/15/46 | | 588,000 | 457,524 |
| Viatris, Inc.: | | | |
| 2.7% 6/22/30 | | 1,780,000 | 1,411,134 |
| 4% 6/22/50 | | 980,000 | 632,117 |
| Wyeth LLC 5.95% 4/1/37 | | 1,000,000 | 1,072,138 |
| Zoetis, Inc.: | | | |
| 3.95% 9/12/47 | | 356,000 | 285,535 |
| 4.7% 2/1/43 | | 3,132,000 | 2,824,970 |
| | | | 141,863,552 |
TOTAL HEALTH CARE | | | 500,558,188 |
| INDUSTRIALS - 1.7% | | | |
| Aerospace & Defense - 0.4% | | | |
| General Dynamics Corp.: | | | |
| 3.375% 5/15/23 | | 1,693,000 | 1,686,239 |
| 3.75% 5/15/28 | | 1,676,000 | 1,593,387 |
| 4.25% 4/1/40 | | 2,170,000 | 1,969,413 |
| 4.25% 4/1/50 | | 900,000 | 803,314 |
| L3Harris Technologies, Inc.: | | | |
| 3.85% 12/15/26 | | 1,330,000 | 1,270,548 |
| 4.4% 6/15/28 | | 5,400,000 | 5,212,845 |
| Lockheed Martin Corp.: | | | |
| 3.55% 1/15/26 | | 7,985,000 | 7,715,490 |
| 4.09% 9/15/52 | | 2,704,000 | 2,322,181 |
| 4.7% 5/15/46 | | 2,189,000 | 2,068,656 |
| 5.9% 11/15/63 | | 2,000,000 | 2,207,845 |
| Northrop Grumman Corp.: | | | |
| 3.25% 1/15/28 | | 1,497,000 | 1,382,134 |
| 3.85% 4/15/45 | | 335,000 | 265,753 |
| 4.03% 10/15/47 | | 1,456,000 | 1,203,942 |
| 4.4% 5/1/30 | | 2,958,000 | 2,825,082 |
| 4.75% 6/1/43 | | 1,713,000 | 1,567,314 |
| Raytheon Technologies Corp.: | | | |
| 1.9% 9/1/31 | | 6,600,000 | 5,159,567 |
| 3.15% 12/15/24 | | 1,586,000 | 1,527,058 |
| 3.65% 8/16/23 | | 480,000 | 476,019 |
| 3.75% 11/1/46 | | 186,000 | 146,439 |
| 4.05% 5/4/47 | | 1,448,000 | 1,203,942 |
| 4.35% 4/15/47 | | 1,176,000 | 1,024,168 |
| 4.45% 11/16/38 | | 3,300,000 | 2,984,942 |
| 4.5% 6/1/42 | | 1,315,000 | 1,182,046 |
| 4.625% 11/16/48 | | 1,247,000 | 1,131,664 |
| 4.875% 10/15/40 | | 178,000 | 166,158 |
| 5.4% 5/1/35 | | 1,060,000 | 1,058,881 |
| 5.7% 4/15/40 | | 1,356,000 | 1,386,578 |
| The Boeing Co.: | | | |
| 2.7% 2/1/27 | | 7,286,000 | 6,599,707 |
| 2.95% 2/1/30 | | 1,666,000 | 1,418,320 |
| 3.65% 3/1/47 | | 492,000 | 339,844 |
| 5.15% 5/1/30 | | 8,470,000 | 8,196,133 |
| 5.705% 5/1/40 | | 10,164,000 | 9,676,319 |
| 5.805% 5/1/50 | | 4,000,000 | 3,804,905 |
| 5.93% 5/1/60 | | 3,100,000 | 2,894,839 |
| 6.875% 3/15/39 | | 588,000 | 628,612 |
| | | | 85,100,284 |
| Air Freight & Logistics - 0.1% | | | |
| FedEx Corp.: | | | |
| 3.25% 5/15/41 | | 2,300,000 | 1,656,581 |
| 3.9% 2/1/35 | | 1,052,000 | 899,626 |
| 4.25% 5/15/30 | | 1,866,000 | 1,750,329 |
| 4.4% 1/15/47 | | 1,425,000 | 1,166,779 |
| 4.55% 4/1/46 | | 267,000 | 220,849 |
| 4.95% 10/17/48 | | 2,731,000 | 2,421,762 |
| 5.25% 5/15/50 | | 2,143,000 | 1,988,037 |
| United Parcel Service, Inc.: | | | |
| 2.4% 11/15/26 | | 1,336,000 | 1,228,358 |
| 3.4% 11/15/46 | | 473,000 | 361,403 |
| 3.75% 11/15/47 | | 1,102,000 | 906,747 |
| 4.45% 4/1/30 | | 1,840,000 | 1,800,037 |
| 5.3% 4/1/50 | | 2,145,000 | 2,215,604 |
| 6.2% 1/15/38 | | 1,645,000 | 1,818,842 |
| | | | 18,434,954 |
| Airlines - 0.1% | | | |
| American Airlines Pass Through Trust equipment trust certificate 2.875% 1/11/36 | | 2,724,928 | 2,245,445 |
| American Airlines, Inc. equipment trust certificate 3.2% 12/15/29 | | 1,000,105 | 892,050 |
| Southwest Airlines Co. 5.25% 5/4/25 | | 7,660,000 | 7,628,283 |
| United Airlines 2015-1 Class AA pass-thru trust 3.45% 6/1/29 | | 85,713 | 77,976 |
| United Airlines 2020-1 Class B Pass Through Trust 4.875% 7/15/27 | | 2,604,600 | 2,524,641 |
| United Airlines pass-thru trust equipment trust certificate 3.1% 1/7/30 | | 1,195,991 | 1,062,435 |
| United Airlines, Inc. equipment trust certificate Series 2012-2B 4% 4/29/26 | | 462,038 | 444,990 |
| | | | 14,875,820 |
| Building Products - 0.1% | | | |
| Carrier Global Corp.: | | | |
| 2.242% 2/15/25 | | 2,700,000 | 2,535,799 |
| 2.493% 2/15/27 | | 2,000,000 | 1,802,624 |
| 2.722% 2/15/30 | | 3,000,000 | 2,531,575 |
| 3.377% 4/5/40 | | 2,702,000 | 2,020,907 |
| 3.577% 4/5/50 | | 2,550,000 | 1,836,270 |
| Johnson Controls International PLC/Tyco Fire & Security Finance SCA 1.75% 9/15/30 | | 6,320,000 | 5,054,016 |
| Masco Corp.: | | | |
| 2% 2/15/31 | | 2,500,000 | 1,935,352 |
| 3.125% 2/15/51 | | 1,200,000 | 760,563 |
| Owens Corning 4.3% 7/15/47 | | 1,600,000 | 1,277,692 |
| | | | 19,754,798 |
| Commercial Services & Supplies - 0.1% | | | |
| Republic Services, Inc.: | | | |
| 1.75% 2/15/32 | | 2,300,000 | 1,761,999 |
| 2.9% 7/1/26 | | 7,752,000 | 7,208,496 |
| 3.2% 3/15/25 | | 1,509,000 | 1,444,893 |
| 3.95% 5/15/28 | | 1,872,000 | 1,773,021 |
| Waste Management, Inc.: | | | |
| 2.4% 5/15/23 | | 945,000 | 939,222 |
| 2.5% 11/15/50 | | 3,280,000 | 2,056,216 |
| 4.15% 7/15/49 | | 462,000 | 402,641 |
| | | | 15,586,488 |
| Electrical Equipment - 0.0% | | | |
| Eaton Corp.: | | | |
| 4% 11/2/32 | | 2,939,000 | 2,692,374 |
| 4.15% 3/15/33 | | 1,000,000 | 921,345 |
| 4.15% 11/2/42 | | 339,000 | 288,692 |
| | | | 3,902,411 |
| Industrial Conglomerates - 0.1% | | | |
| 3M Co.: | | | |
| 2% 2/14/25 | | 4,092,000 | 3,845,607 |
| 2.875% 10/15/27 | | 12,000 | 10,919 |
| 3.05% 4/15/30 | | 8,000,000 | 6,996,158 |
| 3.125% 9/19/46 | | 492,000 | 336,166 |
| 3.25% 8/26/49 | | 108,000 | 75,086 |
| General Electric Co.: | | | |
| 4.35% 5/1/50 | | 2,400,000 | 2,018,190 |
| 4.5% 3/11/44 | | 5,413,000 | 4,698,451 |
| Honeywell International, Inc.: | | | |
| 1.35% 6/1/25 | | 1,800,000 | 1,661,280 |
| 1.95% 6/1/30 | | 100,000 | 82,675 |
| 2.5% 11/1/26 | | 1,276,000 | 1,178,956 |
| 2.8% 6/1/50 | | 2,800,000 | 2,021,779 |
| 3.812% 11/21/47 | | 249,000 | 208,170 |
| 5% 2/15/33 | | 2,000,000 | 2,020,820 |
| | | | 25,154,257 |
| Machinery - 0.3% | | | |
| Caterpillar Financial Services Corp.: | | | |
| 0.45% 9/14/23 | | 3,800,000 | 3,705,749 |
| 1.7% 1/8/27 | | 5,500,000 | 4,956,006 |
| 2.4% 8/9/26 | | 508,000 | 467,586 |
| 3.45% 5/15/23 | | 2,496,000 | 2,488,060 |
| 3.6% 8/12/27 | | 2,000,000 | 1,909,329 |
| Caterpillar, Inc.: | | | |
| 2.6% 4/9/30 | | 4,000,000 | 3,486,664 |
| 3.25% 9/19/49 | | 1,973,000 | 1,504,083 |
| 3.803% 8/15/42 | | 445,000 | 379,541 |
| 5.3% 9/15/35 | | 1,247,000 | 1,259,997 |
| Cummins, Inc. 1.5% 9/1/30 | | 3,890,000 | 3,077,716 |
| Deere & Co.: | | | |
| 2.875% 9/7/49 | | 2,470,000 | 1,786,123 |
| 5.375% 10/16/29 | | 1,278,000 | 1,324,649 |
| Illinois Tool Works, Inc. 3.9% 9/1/42 | | 2,300,000 | 1,987,255 |
| Ingersoll-Rand Luxembourg Finance SA: | | | |
| 3.8% 3/21/29 | | 2,557,000 | 2,354,564 |
| 4.65% 11/1/44 | | 1,069,000 | 915,829 |
| Otis Worldwide Corp.: | | | |
| 2.293% 4/5/27 | | 1,400,000 | 1,257,507 |
| 2.565% 2/15/30 | | 3,000,000 | 2,527,772 |
| 3.362% 2/15/50 | | 400,000 | 283,862 |
| Parker Hannifin Corp.: | | | |
| 2.7% 6/14/24 | | 12,440,000 | 12,006,695 |
| 3.25% 3/1/27 | | 1,007,000 | 936,170 |
| 4.1% 3/1/47 | | 1,009,000 | 835,930 |
| Stanley Black & Decker, Inc. 2.3% 3/15/30 | | 6,550,000 | 5,326,690 |
| | | | 54,777,777 |
| Professional Services - 0.0% | | | |
| Thomson Reuters Corp. 3.35% 5/15/26 | | 1,247,000 | 1,175,724 |
| Road & Rail - 0.4% | | | |
| Burlington Northern Santa Fe LLC: | | | |
| 3% 3/15/23 | | 499,000 | 498,606 |
| 3.25% 6/15/27 | | 36,000 | 33,998 |
| 3.85% 9/1/23 | | 80,000 | 79,459 |
| 3.9% 8/1/46 | | 827,000 | 668,154 |
| 4.05% 6/15/48 | | 3,755,000 | 3,144,777 |
| 4.125% 6/15/47 | | 508,000 | 432,940 |
| 4.15% 4/1/45 | | 303,000 | 257,847 |
| 4.375% 9/1/42 | | 802,000 | 715,327 |
| 4.55% 9/1/44 | | 535,000 | 483,417 |
| 4.7% 9/1/45 | | 418,000 | 384,368 |
| 4.9% 4/1/44 | | 713,000 | 670,689 |
| 5.15% 9/1/43 | | 2,203,000 | 2,160,121 |
| 5.75% 5/1/40 | | 1,100,000 | 1,144,528 |
| Canadian National Railway Co.: | | | |
| 2.45% 5/1/50 | | 1,500,000 | 918,249 |
| 3.2% 8/2/46 | | 588,000 | 431,392 |
| 3.65% 2/3/48 | | 1,127,000 | 903,725 |
| 4.4% 8/5/52 | | 1,400,000 | 1,248,261 |
| Canadian Pacific Railway Co.: | | | |
| 1.75% 12/2/26 | | 8,000,000 | 7,084,605 |
| 2.45% 12/2/31 | | 3,800,000 | 3,164,479 |
| 3.1% 12/2/51 | | 1,800,000 | 1,228,422 |
| 4.8% 8/1/45 | | 1,500,000 | 1,357,131 |
| CSX Corp.: | | | |
| 2.5% 5/15/51 | | 85,000 | 52,199 |
| 3.25% 6/1/27 | | 91,000 | 84,857 |
| 3.35% 11/1/25 | | 4,900,000 | 4,677,951 |
| 3.4% 8/1/24 | | 225,000 | 218,962 |
| 3.8% 11/1/46 | | 1,019,000 | 800,456 |
| 3.95% 5/1/50 | | 637,000 | 507,079 |
| 4.1% 11/15/32 | | 5,000,000 | 4,607,788 |
| 4.1% 3/15/44 | | 1,207,000 | 1,012,708 |
| 4.25% 3/15/29 | | 3,300,000 | 3,131,200 |
| 4.3% 3/1/48 | | 1,600,000 | 1,361,241 |
| 4.5% 3/15/49 | | 1,729,000 | 1,510,753 |
| 4.75% 11/15/48 | | 1,032,000 | 931,728 |
| Kansas City Southern 3.5% 5/1/50 | | 2,100,000 | 1,528,438 |
| Norfolk Southern Corp.: | | | |
| 2.3% 5/15/31 | | 1,000,000 | 809,940 |
| 3.65% 8/1/25 | | 2,139,000 | 2,053,018 |
| 3.8% 8/1/28 | | 1,740,000 | 1,625,307 |
| 3.95% 10/1/42 | | 339,000 | 278,635 |
| 4.05% 8/15/52 | | 1,234,000 | 981,363 |
| 4.1% 5/15/21 | | 1,000,000 | 683,272 |
| 4.15% 2/28/48 | | 4,436,000 | 3,619,412 |
| 4.65% 1/15/46 | | 582,000 | 512,131 |
| Union Pacific Corp.: | | | |
| 2.15% 2/5/27 | | 1,800,000 | 1,627,299 |
| 2.75% 3/1/26 | | 1,187,000 | 1,112,621 |
| 2.891% 4/6/36 | | 7,001,000 | 5,513,200 |
| 2.973% 9/16/62 | | 1,700,000 | 1,066,722 |
| 3% 4/15/27 | | 891,000 | 829,372 |
| 3.25% 2/5/50 | | 2,100,000 | 1,514,707 |
| 3.5% 6/8/23 | | 2,000,000 | 1,990,418 |
| 3.6% 9/15/37 | | 588,000 | 495,751 |
| 3.646% 2/15/24 | | 2,975,000 | 2,925,916 |
| 3.799% 10/1/51 | | 499,000 | 396,907 |
| 3.799% 4/6/71 | | 2,083,000 | 1,523,406 |
| 3.839% 3/20/60 | | 2,844,000 | 2,168,718 |
| 4.95% 5/15/53 | | 1,200,000 | 1,148,380 |
| | | | 80,312,350 |
| Trading Companies & Distributors - 0.1% | | | |
| Air Lease Corp.: | | | |
| 3.125% 12/1/30 | | 1,120,000 | 920,857 |
| 3.375% 7/1/25 | | 2,000,000 | 1,885,784 |
| 3.625% 12/1/27 | | 4,145,000 | 3,767,998 |
| 3.75% 6/1/26 | | 3,707,000 | 3,482,802 |
| | | | 10,057,441 |
TOTAL INDUSTRIALS | | | 329,132,304 |
| INFORMATION TECHNOLOGY - 2.1% | | | |
| Communications Equipment - 0.1% | | | |
| Cisco Systems, Inc.: | | | |
| 2.2% 9/20/23 | | 39,000 | 38,392 |
| 2.5% 9/20/26 | | 91,000 | 84,217 |
| 3.5% 6/15/25 | | 761,000 | 737,633 |
| 5.9% 2/15/39 | | 4,673,000 | 5,111,910 |
| Motorola Solutions, Inc. 5.5% 9/1/44 | | 1,400,000 | 1,284,872 |
| | | | 7,257,024 |
| Electronic Equipment & Components - 0.1% | | | |
| Corning, Inc.: | | | |
| 3.9% 11/15/49 | | 3,700,000 | 2,788,216 |
| 4.75% 3/15/42 | | 891,000 | 812,688 |
| 5.35% 11/15/48 | | 1,000,000 | 957,673 |
| Dell International LLC/EMC Corp.: | | | |
| 5.3% 10/1/29 | | 6,046,000 | 5,841,668 |
| 8.1% 7/15/36 | | 3,200,000 | 3,576,000 |
| 8.35% 7/15/46 | | 1,049,000 | 1,190,824 |
| Tyco Electronics Group SA: | | | |
| 3.45% 8/1/24 | | 651,000 | 633,050 |
| 7.125% 10/1/37 | | 441,000 | 502,253 |
| Vontier Corp. 1.8% 4/1/26 | | 1,300,000 | 1,130,701 |
| | | | 17,433,073 |
| IT Services - 0.5% | | | |
| CDW LLC/CDW Finance Corp. 2.67% 12/1/26 | | 5,500,000 | 4,884,532 |
| Fidelity National Information Services, Inc.: | | | |
| 1.15% 3/1/26 | | 5,023,000 | 4,404,361 |
| 2.25% 3/1/31 | | 4,000,000 | 3,146,515 |
| Fiserv, Inc.: | | | |
| 2.75% 7/1/24 | | 10,000 | 9,628 |
| 3.5% 7/1/29 | | 2,799,000 | 2,502,816 |
| 4.4% 7/1/49 | | 2,682,000 | 2,168,391 |
| Global Payments, Inc.: | | | |
| 1.2% 3/1/26 | | 7,100,000 | 6,206,588 |
| 2.9% 5/15/30 | | 4,600,000 | 3,785,318 |
| 4.8% 4/1/26 | | 1,000,000 | 973,550 |
| 5.4% 8/15/32 | | 1,800,000 | 1,720,468 |
| IBM Corp.: | | | |
| 1.95% 5/15/30 | | 2,400,000 | 1,934,573 |
| 2.95% 5/15/50 | | 1,500,000 | 975,598 |
| 3% 5/15/24 | | 2,333,000 | 2,268,108 |
| 3.5% 5/15/29 | | 111,000 | 101,232 |
| 3.625% 2/12/24 | | 11,102,000 | 10,909,088 |
| 4% 6/20/42 | | 1,000,000 | 817,569 |
| 4.15% 7/27/27 | | 7,000,000 | 6,765,080 |
| 4.15% 5/15/39 | | 353,000 | 299,341 |
| 4.25% 5/15/49 | | 4,581,000 | 3,786,675 |
| 4.7% 2/19/46 | | 882,000 | 771,165 |
| 4.9% 7/27/52 | | 1,000,000 | 899,647 |
| MasterCard, Inc.: | | | |
| 3.3% 3/26/27 | | 1,600,000 | 1,512,972 |
| 3.8% 11/21/46 | | 677,000 | 561,729 |
| 3.85% 3/26/50 | | 4,600,000 | 3,874,370 |
| PayPal Holdings, Inc.: | | | |
| 1.65% 6/1/25 | | 4,300,000 | 3,984,878 |
| 2.3% 6/1/30 | | 2,800,000 | 2,308,927 |
| 2.4% 10/1/24 | | 1,000,000 | 957,346 |
| 2.85% 10/1/29 | | 3,160,000 | 2,742,739 |
| 5.25% 6/1/62 | | 1,400,000 | 1,281,797 |
| The Western Union Co. 2.85% 1/10/25 | | 2,130,000 | 2,022,978 |
| Visa, Inc.: | | | |
| 1.9% 4/15/27 | | 5,100,000 | 4,573,896 |
| 2.05% 4/15/30 | | 13,400,000 | 11,324,870 |
| 2.7% 4/15/40 | | 1,000,000 | 749,174 |
| 2.75% 9/15/27 | | 2,125,000 | 1,964,202 |
| 3.15% 12/14/25 | | 1,606,000 | 1,532,970 |
| 4.3% 12/14/45 | | 2,719,000 | 2,454,010 |
| | | | 101,177,101 |
| Semiconductors & Semiconductor Equipment - 0.5% | | | |
| Analog Devices, Inc.: | | | |
| 2.8% 10/1/41 | | 3,500,000 | 2,538,892 |
| 3.5% 12/5/26 | | 1,500,000 | 1,423,483 |
| Applied Materials, Inc.: | | | |
| 2.75% 6/1/50 | | 1,200,000 | 817,940 |
| 4.35% 4/1/47 | | 2,303,000 | 2,067,551 |
| Broadcom Corp./Broadcom Cayman LP: | | | |
| 3.5% 1/15/28 | | 2,347,000 | 2,144,182 |
| 3.875% 1/15/27 | | 3,047,000 | 2,873,757 |
| Broadcom, Inc.: | | | |
| 2.45% 2/15/31 (c) | | 3,200,000 | 2,535,647 |
| 2.6% 2/15/33 (c) | | 3,600,000 | 2,720,816 |
| 3.15% 11/15/25 | | 4,600,000 | 4,331,917 |
| 3.419% 4/15/33 (c) | | 2,500,000 | 2,012,744 |
| 3.459% 9/15/26 | | 3,250,000 | 3,037,825 |
| 3.469% 4/15/34 (c) | | 3,397,000 | 2,688,626 |
| 3.75% 2/15/51 (c) | | 3,200,000 | 2,230,478 |
| 4.3% 11/15/32 | | 1,700,000 | 1,506,541 |
| 4.75% 4/15/29 | | 3,167,000 | 3,029,136 |
| 5% 4/15/30 | | 4,750,000 | 4,560,051 |
| Intel Corp.: | | | |
| 3.05% 8/12/51 | | 1,100,000 | 704,835 |
| 3.25% 11/15/49 | | 2,050,000 | 1,368,624 |
| 3.734% 12/8/47 | | 583,000 | 430,859 |
| 3.75% 8/5/27 | | 1,400,000 | 1,331,430 |
| 3.9% 3/25/30 | | 4,700,000 | 4,334,375 |
| 4.1% 5/19/46 | | 1,247,000 | 1,003,865 |
| 4.1% 5/11/47 | | 428,000 | 343,134 |
| 4.6% 3/25/40 | | 1,869,000 | 1,678,174 |
| 4.75% 3/25/50 | | 4,291,000 | 3,715,584 |
| 4.875% 2/10/28 | | 3,000,000 | 2,956,170 |
| 4.95% 3/25/60 | | 1,000,000 | 875,939 |
| 5.05% 8/5/62 | | 1,500,000 | 1,313,376 |
| 5.2% 2/10/33 | | 2,360,000 | 2,315,892 |
| 5.7% 2/10/53 | | 2,210,000 | 2,159,558 |
| Lam Research Corp. 2.875% 6/15/50 | | 2,800,000 | 1,868,045 |
| Micron Technology, Inc.: | | | |
| 3.477% 11/1/51 | | 1,500,000 | 936,912 |
| 5.327% 2/6/29 | | 2,750,000 | 2,686,345 |
| NVIDIA Corp.: | | | |
| 0.584% 6/14/24 | | 2,000,000 | 1,885,643 |
| 2% 6/15/31 | | 1,200,000 | 970,282 |
| 2.85% 4/1/30 | | 88,000 | 77,543 |
| 3.5% 4/1/50 | | 2,300,000 | 1,783,618 |
| NXP BV/NXP Funding LLC 5.55% 12/1/28 | | 1,300,000 | 1,297,563 |
| NXP BV/NXP Funding LLC/NXP U.S.A., Inc.: | | | |
| 2.65% 2/15/32 | | 2,200,000 | 1,716,880 |
| 3.25% 5/11/41 | | 1,700,000 | 1,175,444 |
| 4.3% 6/18/29 | | 4,080,000 | 3,748,500 |
| Qualcomm, Inc.: | | | |
| 1.65% 5/20/32 | | 4,500,000 | 3,444,949 |
| 3.25% 5/20/27 | | 20,000 | 18,811 |
| 4.3% 5/20/47 | | 1,800,000 | 1,573,747 |
| 4.65% 5/20/35 | | 1,200,000 | 1,163,701 |
| 4.8% 5/20/45 | | 2,790,000 | 2,644,091 |
| 5.4% 5/20/33 | | 2,200,000 | 2,268,560 |
| Texas Instruments, Inc.: | | | |
| 2.9% 11/3/27 | | 2,000,000 | 1,850,505 |
| 4.15% 5/15/48 | | 1,613,000 | 1,430,915 |
| 4.6% 2/15/28 | | 5,000,000 | 4,965,681 |
| | | | 102,559,136 |
| Software - 0.6% | | | |
| Microsoft Corp.: | | | |
| 2.525% 6/1/50 | | 4,290,000 | 2,864,860 |
| 2.675% 6/1/60 | | 1,815,000 | 1,176,090 |
| 2.7% 2/12/25 | | 61,000 | 58,671 |
| 2.875% 2/6/24 | | 80,000 | 78,264 |
| 2.921% 3/17/52 | | 15,678,000 | 11,279,222 |
| 3.041% 3/17/62 | | 736,000 | 515,530 |
| 3.3% 2/6/27 | | 2,000,000 | 1,910,811 |
| 3.45% 8/8/36 | | 518,000 | 453,740 |
| 3.625% 12/15/23 | | 3,761,000 | 3,719,337 |
| 4.1% 2/6/37 | | 2,900,000 | 2,720,046 |
| 4.2% 11/3/35 | | 3,800,000 | 3,643,354 |
| Oracle Corp.: | | | |
| 2.5% 4/1/25 | | 3,370,000 | 3,177,331 |
| 2.65% 7/15/26 | | 1,604,000 | 1,465,688 |
| 2.8% 4/1/27 | | 17,700,000 | 16,054,501 |
| 2.875% 3/25/31 | | 5,200,000 | 4,311,149 |
| 3.4% 7/8/24 | | 842,000 | 819,480 |
| 3.6% 4/1/50 | | 500,000 | 338,640 |
| 3.85% 7/15/36 | | 1,805,000 | 1,468,809 |
| 3.85% 4/1/60 | | 3,600,000 | 2,399,555 |
| 3.9% 5/15/35 | | 3,200,000 | 2,657,418 |
| 3.95% 3/25/51 | | 5,200,000 | 3,735,072 |
| 4% 7/15/46 | | 1,746,000 | 1,274,621 |
| 4% 11/15/47 | | 4,491,000 | 3,283,848 |
| 4.1% 3/25/61 | | 1,520,000 | 1,056,909 |
| 4.125% 5/15/45 | | 535,000 | 402,467 |
| 4.3% 7/8/34 | | 1,691,000 | 1,484,784 |
| 4.375% 5/15/55 | | 2,781,000 | 2,109,513 |
| 5.375% 7/15/40 | | 8,098,000 | 7,417,653 |
| 6.25% 11/9/32 | | 4,100,000 | 4,266,905 |
| Roper Technologies, Inc.: | | | |
| 1% 9/15/25 | | 1,810,000 | 1,630,597 |
| 1.4% 9/15/27 | | 144,000 | 122,135 |
| 1.75% 2/15/31 | | 1,860,000 | 1,434,415 |
| 2% 6/30/30 | | 3,360,000 | 2,705,687 |
| 3.8% 12/15/26 | | 1,515,000 | 1,440,836 |
| Salesforce.com, Inc. 2.9% 7/15/51 | | 4,300,000 | 2,892,772 |
| VMware, Inc.: | | | |
| 1% 8/15/24 | | 7,800,000 | 7,287,983 |
| 1.4% 8/15/26 | | 8,200,000 | 7,081,708 |
| | | | 110,740,401 |
| Technology Hardware, Storage & Peripherals - 0.3% | | | |
| Apple, Inc.: | | | |
| 0.7% 2/8/26 | | 700,000 | 621,178 |
| 1.125% 5/11/25 | | 2,000,000 | 1,847,084 |
| 1.7% 8/5/31 | | 2,700,000 | 2,148,593 |
| 2.2% 9/11/29 | | 6,000,000 | 5,154,939 |
| 2.375% 2/8/41 | | 5,500,000 | 3,888,431 |
| 2.45% 8/4/26 | | 3,672,000 | 3,399,096 |
| 2.55% 8/20/60 | | 3,400,000 | 2,108,448 |
| 2.85% 8/5/61 | | 2,700,000 | 1,754,084 |
| 2.9% 9/12/27 | | 2,004,000 | 1,863,152 |
| 2.95% 9/11/49 | | 2,630,000 | 1,892,051 |
| 3% 11/13/27 | | 1,782,000 | 1,659,851 |
| 3.2% 5/13/25 | | 1,870,000 | 1,806,175 |
| 3.2% 5/11/27 | | 8,593,000 | 8,119,357 |
| 3.75% 11/13/47 | | 1,243,000 | 1,038,471 |
| 3.85% 5/4/43 | | 4,217,000 | 3,626,350 |
| 4.1% 8/8/62 | | 1,600,000 | 1,355,275 |
| 4.25% 2/9/47 | | 445,000 | 406,239 |
| 4.375% 5/13/45 | | 836,000 | 767,766 |
| 4.5% 2/23/36 | | 1,651,000 | 1,618,110 |
| 4.65% 2/23/46 | | 4,507,000 | 4,291,108 |
| Hewlett Packard Enterprise Co.: | | | |
| 4.9% 10/15/25 (b) | | 1,737,000 | 1,722,451 |
| 6.2% 10/15/35 (b) | | 776,000 | 799,866 |
| 6.35% 10/15/45 (b) | | 1,669,000 | 1,645,299 |
| HP, Inc.: | | | |
| 2.2% 6/17/25 | | 2,800,000 | 2,615,306 |
| 3.4% 6/17/30 | | 2,820,000 | 2,406,820 |
| 6% 9/15/41 | | 1,367,000 | 1,337,580 |
| | | | 59,893,080 |
TOTAL INFORMATION TECHNOLOGY | | | 399,059,815 |
| MATERIALS - 0.7% | | | |
| Chemicals - 0.4% | | | |
| Air Products & Chemicals, Inc.: | | | |
| 1.5% 10/15/25 | | 1,500,000 | 1,368,371 |
| 2.7% 5/15/40 | | 1,561,000 | 1,152,673 |
| Celanese U.S. Holdings LLC: | | | |
| 6.165% 7/15/27 | | 2,200,000 | 2,183,695 |
| 6.379% 7/15/32 | | 2,600,000 | 2,522,651 |
| CF Industries Holdings, Inc. 5.375% 3/15/44 | | 2,000,000 | 1,764,306 |
| DuPont de Nemours, Inc.: | | | |
| 4.725% 11/15/28 | | 1,056,000 | 1,038,804 |
| 5.319% 11/15/38 | | 3,700,000 | 3,590,906 |
| 5.419% 11/15/48 | | 1,000,000 | 957,922 |
| Eastman Chemical Co.: | | | |
| 4.5% 12/1/28 | | 2,700,000 | 2,579,686 |
| 4.65% 10/15/44 | | 535,000 | 446,862 |
| Ecolab, Inc.: | | | |
| 0.9% 12/15/23 | | 2,000,000 | 1,933,415 |
| 2.7% 11/1/26 | | 1,176,000 | 1,084,526 |
| 2.75% 8/18/55 | | 73,000 | 44,970 |
| 3.95% 12/1/47 | | 593,000 | 490,814 |
| 4.8% 3/24/30 | | 1,745,000 | 1,724,278 |
| International Flavors & Fragrances, Inc. 5% 9/26/48 | | 1,500,000 | 1,241,466 |
| Linde, Inc./Connecticut: | | | |
| 3.2% 1/30/26 | | 1,130,000 | 1,087,363 |
| 3.55% 11/7/42 | | 856,000 | 687,506 |
| LYB International Finance BV 4.875% 3/15/44 | | 1,043,000 | 883,230 |
| LYB International Finance II BV 3.5% 3/2/27 | | 4,361,000 | 4,067,914 |
| LYB International Finance III LLC: | | | |
| 3.375% 10/1/40 | | 2,000,000 | 1,436,123 |
| 4.2% 10/15/49 | | 1,500,000 | 1,129,118 |
| LyondellBasell Industries NV 4.625% 2/26/55 | | 667,000 | 531,182 |
| Nutrien Ltd.: | | | |
| 2.95% 5/13/30 | | 2,600,000 | 2,219,051 |
| 4% 12/15/26 | | 2,032,000 | 1,952,199 |
| 5% 4/1/49 | | 1,605,000 | 1,447,143 |
| 5.25% 1/15/45 | | 624,000 | 574,881 |
| 5.625% 12/1/40 | | 321,000 | 310,904 |
| PPG Industries, Inc. 1.2% 3/15/26 | | 3,600,000 | 3,185,748 |
| Sherwin-Williams Co.: | | | |
| 3.45% 6/1/27 | | 6,613,000 | 6,196,431 |
| 4.05% 8/8/24 | | 1,100,000 | 1,078,076 |
| 4.5% 6/1/47 | | 1,520,000 | 1,273,603 |
| The Dow Chemical Co.: | | | |
| 2.1% 11/15/30 | | 4,695,000 | 3,790,527 |
| 3.6% 11/15/50 | | 283,000 | 203,981 |
| 4.25% 10/1/34 | | 1,300,000 | 1,157,426 |
| 4.375% 11/15/42 | | 869,000 | 731,481 |
| 4.8% 11/30/28 | | 1,524,000 | 1,495,306 |
| 4.8% 5/15/49 | | 1,277,000 | 1,092,475 |
| 9.4% 5/15/39 | | 535,000 | 706,858 |
| The Mosaic Co.: | | | |
| 4.05% 11/15/27 | | 2,727,000 | 2,581,327 |
| 4.25% 11/15/23 | | 1,941,000 | 1,926,253 |
| 5.625% 11/15/43 | | 668,000 | 630,156 |
| Westlake Corp.: | | | |
| 3.6% 8/15/26 | | 10,080,000 | 9,484,492 |
| 5% 8/15/46 | | 356,000 | 299,194 |
| | | | 76,285,293 |
| Construction Materials - 0.0% | | | |
| Martin Marietta Materials, Inc.: | | | |
| 3.2% 7/15/51 | | 1,000,000 | 680,394 |
| 4.25% 12/15/47 | | 1,400,000 | 1,150,750 |
| | | | 1,831,144 |
| Containers & Packaging - 0.1% | | | |
| International Paper Co.: | | | |
| 4.4% 8/15/47 | | 854,000 | 722,557 |
| 5% 9/15/35 | | 2,600,000 | 2,459,975 |
| 5.15% 5/15/46 | | 2,281,000 | 2,083,382 |
| WRKCo, Inc. 3% 6/15/33 | | 2,820,000 | 2,274,905 |
| | | | 7,540,819 |
| Metals & Mining - 0.2% | | | |
| Barrick Gold Corp. 5.25% 4/1/42 | | 802,000 | 769,792 |
| Barrick North America Finance LLC 5.7% 5/30/41 | | 2,354,000 | 2,344,509 |
| Barrick PD Australia Finance Pty Ltd. 5.95% 10/15/39 | | 1,000,000 | 1,030,720 |
| BHP Billiton Financial (U.S.A.) Ltd. 5% 9/30/43 | | 3,615,000 | 3,506,420 |
| Freeport-McMoRan, Inc.: | | | |
| 4.375% 8/1/28 | | 5,673,000 | 5,265,753 |
| 4.625% 8/1/30 | | 2,300,000 | 2,138,851 |
| Newmont Corp.: | | | |
| 2.25% 10/1/30 | | 1,100,000 | 885,765 |
| 5.45% 6/9/44 | | 1,141,000 | 1,096,054 |
| 6.25% 10/1/39 | | 2,100,000 | 2,200,271 |
| Nucor Corp.: | | | |
| 2.979% 12/15/55 | | 2,013,000 | 1,300,637 |
| 4.3% 5/23/27 | | 1,800,000 | 1,744,371 |
| Rio Tinto Finance (U.S.A.) Ltd.: | | | |
| 5.2% 11/2/40 | | 3,917,000 | 3,907,411 |
| 7.125% 7/15/28 | | 2,166,000 | 2,376,682 |
| Southern Copper Corp.: | | | |
| 3.875% 4/23/25 | | 2,654,000 | 2,555,006 |
| 5.25% 11/8/42 | | 1,029,000 | 958,050 |
| 5.875% 4/23/45 | | 3,010,000 | 3,024,674 |
| Vale Overseas Ltd.: | | | |
| 3.75% 7/8/30 | | 4,600,000 | 3,983,370 |
| 6.875% 11/21/36 | | 1,700,000 | 1,743,010 |
| Vale SA 5.625% 9/11/42 | | 1,176,000 | 1,132,488 |
| | | | 41,963,834 |
| Paper & Forest Products - 0.0% | | | |
| Suzano Austria GmbH: | | | |
| 2.5% 9/15/28 | | 3,800,000 | 3,173,713 |
| 6% 1/15/29 | | 1,400,000 | 1,370,950 |
| | | | 4,544,663 |
TOTAL MATERIALS | | | 132,165,753 |
| REAL ESTATE - 0.8% | | | |
| Equity Real Estate Investment Trusts (REITs) - 0.8% | | | |
| Alexandria Real Estate Equities, Inc.: | | | |
| 2% 5/18/32 | | 2,000,000 | 1,530,083 |
| 3% 5/18/51 | | 2,250,000 | 1,449,348 |
| 4.85% 4/15/49 | | 2,300,000 | 2,004,040 |
| American Tower Corp.: | | | |
| 1.3% 9/15/25 | | 900,000 | 809,170 |
| 2.1% 6/15/30 | | 1,500,000 | 1,187,457 |
| 3.1% 6/15/50 | | 1,500,000 | 933,117 |
| 3.55% 7/15/27 | | 4,824,000 | 4,458,819 |
| 3.6% 1/15/28 | | 511,000 | 467,707 |
| 3.8% 8/15/29 | | 5,241,000 | 4,724,579 |
| AvalonBay Communities, Inc.: | | | |
| 2.45% 1/15/31 | | 2,000,000 | 1,661,852 |
| 2.95% 5/11/26 | | 4,800,000 | 4,479,823 |
| 3.45% 6/1/25 | | 8,100,000 | 7,774,369 |
| Boston Properties, Inc.: | | | |
| 2.75% 10/1/26 | | 1,247,000 | 1,125,451 |
| 2.9% 3/15/30 | | 396,000 | 325,071 |
| 3.125% 9/1/23 | | 339,000 | 334,186 |
| 3.4% 6/21/29 | | 3,600,000 | 3,089,495 |
| 3.8% 2/1/24 | | 1,628,000 | 1,599,471 |
| 4.5% 12/1/28 | | 2,800,000 | 2,598,379 |
| Corporate Office Properties LP 2.75% 4/15/31 | | 1,100,000 | 828,212 |
| Crown Castle International Corp.: | | | |
| 2.25% 1/15/31 | | 3,900,000 | 3,120,219 |
| 3.65% 9/1/27 | | 3,123,000 | 2,905,338 |
| 3.8% 2/15/28 | | 3,000,000 | 2,786,105 |
| 4.3% 2/15/29 | | 2,100,000 | 1,974,258 |
| 4.45% 2/15/26 | | 2,000,000 | 1,944,623 |
| EPR Properties: | | | |
| 4.5% 4/1/25 | | 1,000,000 | 958,367 |
| 4.5% 6/1/27 | | 2,000,000 | 1,778,981 |
| Equinix, Inc.: | | | |
| 1.45% 5/15/26 | | 4,119,000 | 3,634,480 |
| 2.5% 5/15/31 | | 3,600,000 | 2,882,658 |
| ERP Operating LP: | | | |
| 1.85% 8/1/31 | | 3,100,000 | 2,436,112 |
| 3.25% 8/1/27 | | 2,314,000 | 2,140,961 |
| Healthpeak Properties, Inc.: | | | |
| 2.875% 1/15/31 | | 3,150,000 | 2,655,385 |
| 3% 1/15/30 | | 3,700,000 | 3,185,096 |
| 3.4% 2/1/25 | | 87,000 | 83,812 |
| Kilroy Realty LP 3.05% 2/15/30 | | 3,200,000 | 2,553,411 |
| Kimco Realty Op LLC: | | | |
| 1.9% 3/1/28 | | 3,000,000 | 2,532,235 |
| 3.8% 4/1/27 | | 713,000 | 668,837 |
| 4.125% 12/1/46 | | 1,782,000 | 1,331,123 |
| 4.45% 9/1/47 | | 924,000 | 740,814 |
| National Retail Properties, Inc. 3% 4/15/52 | | 2,400,000 | 1,486,236 |
| Office Properties Income Trust 3.45% 10/15/31 | | 1,100,000 | 734,233 |
| Omega Healthcare Investors, Inc.: | | | |
| 3.375% 2/1/31 | | 1,000,000 | 788,017 |
| 4.375% 8/1/23 | | 294,000 | 292,281 |
| 4.5% 1/15/25 | | 1,428,000 | 1,392,770 |
| 4.5% 4/1/27 | | 3,693,000 | 3,486,871 |
| Prologis LP: | | | |
| 1.25% 10/15/30 | | 6,800,000 | 5,214,571 |
| 1.75% 2/1/31 | | 4,700,000 | 3,709,530 |
| 2.25% 4/15/30 | | 2,159,000 | 1,805,632 |
| 3.25% 10/1/26 | | 831,000 | 783,044 |
| Realty Income Corp.: | | | |
| 2.85% 12/15/32 | | 2,610,000 | 2,143,764 |
| 3.25% 1/15/31 | | 5,250,000 | 4,575,934 |
| Regency Centers LP 3.7% 6/15/30 | | 2,020,000 | 1,786,710 |
| Simon Property Group LP: | | | |
| 2.2% 2/1/31 | | 1,700,000 | 1,357,868 |
| 2.45% 9/13/29 | | 2,340,000 | 1,959,901 |
| 3.25% 9/13/49 | | 420,000 | 290,397 |
| 3.3% 1/15/26 | | 5,700,000 | 5,407,472 |
| 3.375% 10/1/24 | | 1,600,000 | 1,550,277 |
| 3.375% 12/1/27 | | 4,210,000 | 3,888,752 |
| 3.8% 7/15/50 | | 2,369,000 | 1,779,819 |
| UDR, Inc. 2.1% 6/15/33 | | 3,800,000 | 2,769,772 |
| Ventas Realty LP: | | | |
| 3.25% 10/15/26 | | 624,000 | 574,677 |
| 3.85% 4/1/27 | | 1,693,000 | 1,601,939 |
| 4% 3/1/28 | | 3,744,000 | 3,458,664 |
| 4.125% 1/15/26 | | 258,000 | 248,332 |
| 4.375% 2/1/45 | | 535,000 | 428,374 |
| 4.875% 4/15/49 | | 1,000,000 | 850,511 |
| VICI Properties LP: | | | |
| 4.375% 5/15/25 | | 1,100,000 | 1,058,629 |
| 4.75% 2/15/28 | | 2,000,000 | 1,886,660 |
| 5.125% 5/15/32 | | 2,000,000 | 1,855,700 |
| Vornado Realty LP 3.5% 1/15/25 | | 1,000,000 | 942,922 |
| Welltower Op: | | | |
| 4% 6/1/25 | | 2,257,000 | 2,181,710 |
| 4.95% 9/1/48 | | 1,782,000 | 1,516,797 |
| Weyerhaeuser Co. 4% 4/15/30 | | 2,460,000 | 2,236,267 |
| | | | 147,738,477 |
| Real Estate Management & Development - 0.0% | | | |
| Brandywine Operating Partnership LP 7.55% 3/15/28 | | 1,000,000 | 980,428 |
| CBRE Group, Inc. 4.875% 3/1/26 | | 1,016,000 | 994,128 |
| Digital Realty Trust LP 3.7% 8/15/27 | | 1,425,000 | 1,319,554 |
| Essex Portfolio LP 2.65% 3/15/32 | | 4,300,000 | 3,412,602 |
| Mid-America Apartments LP: | | | |
| 1.7% 2/15/31 | | 2,100,000 | 1,639,466 |
| 3.95% 3/15/29 | | 1,700,000 | 1,596,745 |
| Tanger Properties LP 3.875% 7/15/27 | | 1,105,000 | 1,014,699 |
| | | | 10,957,622 |
TOTAL REAL ESTATE | | | 158,696,099 |
| UTILITIES - 2.0% | | | |
| Electric Utilities - 1.5% | | | |
| AEP Texas, Inc. 3.45% 5/15/51 | | 1,500,000 | 1,067,655 |
| AEP Transmission Co. LLC 2.75% 8/15/51 | | 3,000,000 | 1,926,401 |
| Alabama Power Co.: | | | |
| 3.7% 12/1/47 | | 1,049,000 | 806,685 |
| 3.75% 9/1/27 | | 2,000,000 | 1,906,652 |
| 3.75% 3/1/45 | | 178,000 | 137,564 |
| 4.15% 8/15/44 | | 829,000 | 685,859 |
| 4.3% 7/15/48 | | 1,048,000 | 883,127 |
| 5.2% 6/1/41 | | 686,000 | 647,627 |
| 6% 3/1/39 | | 1,800,000 | 1,892,233 |
| American Electric Power Co., Inc.: | | | |
| 3.25% 3/1/50 | | 2,003,000 | 1,345,035 |
| 4.3% 12/1/28 | | 3,117,000 | 2,965,192 |
| Appalachian Power Co.: | | | |
| 4.45% 6/1/45 | | 1,069,000 | 892,930 |
| 4.5% 8/1/32 | | 2,000,000 | 1,866,834 |
| Arizona Public Service Co. 3.35% 5/15/50 | | 2,900,000 | 1,971,165 |
| Baltimore Gas & Electric Co.: | | | |
| 2.9% 6/15/50 | | 2,000,000 | 1,336,516 |
| 3.35% 7/1/23 | | 508,000 | 504,475 |
| 3.5% 8/15/46 | | 445,000 | 334,667 |
| CenterPoint Energy Houston Electric LLC: | | | |
| 3.35% 4/1/51 | | 3,700,000 | 2,733,759 |
| 3.55% 8/1/42 | | 339,000 | 267,618 |
| 4.45% 10/1/32 | | 2,000,000 | 1,917,724 |
| Cincinnati Gas & Electric Co. 4.3% 2/1/49 | | 2,109,000 | 1,730,219 |
| Cleco Corporate Holdings LLC 3.743% 5/1/26 | | 1,009,000 | 946,846 |
| Commonwealth Edison Co.: | | | |
| 2.75% 9/1/51 | | 3,000,000 | 1,912,304 |
| 3.1% 11/1/24 | | 1,782,000 | 1,719,390 |
| 3.2% 11/15/49 | | 1,000,000 | 707,730 |
| 3.65% 6/15/46 | | 510,000 | 389,747 |
| 3.7% 3/1/45 | | 553,000 | 429,213 |
| 3.75% 8/15/47 | | 1,096,000 | 858,846 |
| 4% 3/1/48 | | 1,217,000 | 998,045 |
| 4% 3/1/49 | | 84,000 | 68,294 |
| Connecticut Light & Power Co. 5.25% 1/15/53 | | 1,400,000 | 1,399,393 |
| Dominion Energy South Carolina 6.05% 1/15/38 | | 2,800,000 | 3,002,361 |
| DTE Electric Co.: | | | |
| 4.05% 5/15/48 | | 1,570,000 | 1,312,739 |
| 5.4% 4/1/53 | | 2,100,000 | 2,117,318 |
| Duke Energy Carolinas LLC: | | | |
| 2.95% 12/1/26 | | 1,069,000 | 995,214 |
| 3.75% 6/1/45 | | 356,000 | 277,445 |
| 3.875% 3/15/46 | | 696,000 | 544,400 |
| 3.95% 3/15/48 | | 1,100,000 | 882,949 |
| 4% 9/30/42 | | 668,000 | 549,405 |
| 5.35% 1/15/53 | | 3,000,000 | 2,956,418 |
| 6.05% 4/15/38 | | 111,000 | 118,126 |
| Duke Energy Corp.: | | | |
| 2.45% 6/1/30 | | 1,300,000 | 1,067,739 |
| 2.65% 9/1/26 | | 2,379,000 | 2,172,532 |
| 3.3% 6/15/41 | | 4,630,000 | 3,358,370 |
| 3.75% 4/15/24 | | 9,869,000 | 9,684,944 |
| 3.75% 9/1/46 | | 1,627,000 | 1,199,498 |
| 3.95% 10/15/23 | | 435,000 | 430,561 |
| 3.95% 8/15/47 | | 1,420,000 | 1,074,292 |
| 4.8% 12/15/45 | | 2,998,000 | 2,629,446 |
| Duke Energy Florida LLC: | | | |
| 3.4% 10/1/46 | | 445,000 | 318,253 |
| 5.95% 11/15/52 | | 2,800,000 | 2,986,090 |
| Duke Energy Industries, Inc. 3.25% 10/1/49 | | 3,100,000 | 2,198,586 |
| Duke Energy Progress LLC: | | | |
| 4.1% 3/15/43 | | 1,300,000 | 1,083,264 |
| 4.15% 12/1/44 | | 321,000 | 266,228 |
| 4.375% 3/30/44 | | 356,000 | 305,652 |
| Edison International: | | | |
| 2.95% 3/15/23 | | 260,000 | 259,718 |
| 5.75% 6/15/27 | | 7,890,000 | 7,924,389 |
| Entergy Corp.: | | | |
| 0.9% 9/15/25 | | 3,200,000 | 2,845,138 |
| 2.8% 6/15/30 | | 1,211,000 | 1,014,689 |
| 2.95% 9/1/26 | | 837,000 | 769,407 |
| 3.75% 6/15/50 | | 3,400,000 | 2,500,076 |
| Entergy Louisiana LLC: | | | |
| 2.35% 6/15/32 | | 1,000,000 | 793,422 |
| 4% 3/15/33 | | 2,277,000 | 2,050,695 |
| Entergy Mississippi LLC 3.85% 6/1/49 | | 1,000,000 | 770,760 |
| Entergy, Inc. 3.55% 9/30/49 | | 1,300,000 | 943,784 |
| Eversource Energy: | | | |
| 2.55% 3/15/31 | | 5,000,000 | 4,087,768 |
| 2.9% 10/1/24 | | 1,524,000 | 1,464,514 |
| 3.35% 3/15/26 | | 1,178,000 | 1,106,038 |
| 3.45% 1/15/50 | | 1,000,000 | 721,610 |
| Exelon Corp.: | | | |
| 3.4% 4/15/26 | | 2,000,000 | 1,885,295 |
| 3.95% 6/15/25 | | 3,502,000 | 3,389,893 |
| 4.45% 4/15/46 | | 1,100,000 | 917,934 |
| 5.1% 6/15/45 | | 196,000 | 180,377 |
| 5.3% 3/15/33 | | 2,000,000 | 1,974,904 |
| FirstEnergy Corp.: | | | |
| 2.25% 9/1/30 | | 1,950,000 | 1,555,125 |
| 5.1% 7/15/47 | | 1,969,000 | 1,756,683 |
| Florida Power & Light Co.: | | | |
| 2.85% 4/1/25 | | 3,700,000 | 3,542,194 |
| 2.875% 12/4/51 | | 2,600,000 | 1,732,863 |
| 3.125% 12/1/25 | | 909,000 | 864,438 |
| 3.15% 10/1/49 | | 252,000 | 178,642 |
| 3.25% 6/1/24 | | 842,000 | 820,253 |
| 3.7% 12/1/47 | | 1,100,000 | 870,713 |
| 4.05% 10/1/44 | | 3,466,000 | 2,918,632 |
| 4.125% 6/1/48 | | 2,192,000 | 1,850,755 |
| Georgia Power Co.: | | | |
| 3.25% 3/30/27 | | 2,245,000 | 2,072,069 |
| 4.3% 3/15/42 | | 2,000,000 | 1,679,617 |
| 5.125% 5/15/52 | | 1,600,000 | 1,493,734 |
| Indiana Michigan Power Co.: | | | |
| 3.2% 3/15/23 | | 495,000 | 494,635 |
| 3.25% 5/1/51 | | 1,500,000 | 1,039,049 |
| Interstate Power and Light Co. 2.3% 6/1/30 | | 2,510,000 | 2,054,629 |
| Kentucky Utilities Co. 5.125% 11/1/40 | | 1,730,000 | 1,650,841 |
| MidAmerican Energy Co. 3.65% 8/1/48 | | 4,102,000 | 3,181,276 |
| Nevada Power Co. 5.9% 5/1/53 | | 1,200,000 | 1,288,897 |
| NextEra Energy Capital Holdings, Inc.: | | | |
| 2.25% 6/1/30 | | 1,301,000 | 1,052,506 |
| 2.75% 11/1/29 | | 8,382,000 | 7,138,587 |
| 3.5% 4/1/29 | | 3,900,000 | 3,525,465 |
| 4.625% 7/15/27 | | 2,000,000 | 1,943,758 |
| 4.9% 2/28/28 | | 2,100,000 | 2,074,969 |
| Northern States Power Co.: | | | |
| 2.6% 6/1/51 | | 1,000,000 | 641,876 |
| 3.4% 8/15/42 | | 356,000 | 277,153 |
| 4.125% 5/15/44 | | 802,000 | 684,060 |
| NSTAR Electric Co.: | | | |
| 3.2% 5/15/27 | | 1,364,000 | 1,271,156 |
| 4.95% 9/15/52 | | 1,000,000 | 955,006 |
| Oncor Electric Delivery Co. LLC: | | | |
| 0.55% 10/1/25 | | 6,243,000 | 5,572,849 |
| 3.1% 9/15/49 | | 971,000 | 682,448 |
| 3.8% 9/30/47 | | 2,700,000 | 2,197,727 |
| 4.1% 11/15/48 | | 1,000,000 | 849,821 |
| 4.55% 9/15/32 | | 1,100,000 | 1,061,242 |
| Pacific Gas & Electric Co.: | | | |
| 2.5% 2/1/31 | | 4,200,000 | 3,273,201 |
| 3.25% 6/1/31 | | 1,000,000 | 815,981 |
| 3.3% 8/1/40 | | 2,850,000 | 1,927,544 |
| 3.45% 7/1/25 | | 1,000,000 | 939,604 |
| 4% 12/1/46 | | 2,822,000 | 1,923,336 |
| 4.3% 3/15/45 | | 5,099,000 | 3,676,800 |
| 4.55% 7/1/30 | | 4,496,000 | 4,059,982 |
| 6.75% 1/15/53 | | 2,700,000 | 2,683,449 |
| PacifiCorp: | | | |
| 2.9% 6/15/52 | | 1,700,000 | 1,126,755 |
| 3.6% 4/1/24 | | 713,000 | 699,708 |
| 4.125% 1/15/49 | | 2,399,000 | 1,989,083 |
| 6% 1/15/39 | | 1,104,000 | 1,152,608 |
| 6.25% 10/15/37 | | 1,100,000 | 1,183,080 |
| PECO Energy Co. 3.9% 3/1/48 | | 2,900,000 | 2,374,795 |
| PG&E Wildfire Recovery: | | | |
| 5.099% 6/1/54 | | 1,900,000 | 1,919,974 |
| 5.212% 12/1/49 | | 3,600,000 | 3,584,332 |
| Potomac Electric Power Co. 6.5% 11/15/37 | | 678,000 | 743,428 |
| PPL Capital Funding, Inc. 3.1% 5/15/26 | | 1,425,000 | 1,332,864 |
| PPL Electric Utilities Corp.: | | | |
| 3% 10/1/49 | | 2,479,000 | 1,725,308 |
| 4.15% 10/1/45 | | 624,000 | 521,365 |
| Progress Energy, Inc. 6% 12/1/39 | | 926,000 | 930,714 |
| Public Service Co. of Colorado: | | | |
| 2.9% 5/15/25 | | 1,961,000 | 1,856,506 |
| 3.8% 6/15/47 | | 825,000 | 659,660 |
| 4.5% 6/1/52 | | 2,300,000 | 2,050,547 |
| 6.25% 9/1/37 | | 1,000,000 | 1,082,504 |
| Public Service Co. of Oklahoma 2.2% 8/15/31 | | 1,500,000 | 1,192,407 |
| Public Service Electric & Gas Co.: | | | |
| 2.45% 1/15/30 | | 1,700,000 | 1,457,404 |
| 3.1% 3/15/32 | | 2,200,000 | 1,915,309 |
| 3.15% 1/1/50 | | 2,300,000 | 1,659,131 |
| 3.65% 9/1/42 | | 504,000 | 405,551 |
| 4% 6/1/44 | | 891,000 | 722,470 |
| Puget Sound Energy, Inc. 4.3% 5/20/45 | | 2,142,000 | 1,752,387 |
| Southern California Edison Co.: | | | |
| 1.2% 2/1/26 | | 2,000,000 | 1,772,713 |
| 2.25% 6/1/30 | | 2,054,000 | 1,689,258 |
| 2.95% 2/1/51 | | 4,900,000 | 3,152,524 |
| 4% 4/1/47 | | 1,782,000 | 1,396,760 |
| 4.65% 10/1/43 | | 1,805,000 | 1,568,797 |
| 5.85% 11/1/27 | | 1,300,000 | 1,330,434 |
| Southern Co.: | | | |
| 3.7% 4/30/30 | | 5,713,000 | 5,145,369 |
| 4.4% 7/1/46 | | 1,305,000 | 1,073,949 |
| Southwestern Electric Power Co. 3.85% 2/1/48 | | 1,600,000 | 1,208,081 |
| Tampa Electric Co.: | | | |
| 4.45% 6/15/49 | | 2,088,000 | 1,750,519 |
| 6.15% 5/15/37 | | 1,116,000 | 1,145,890 |
| Union Electric Co.: | | | |
| 3.9% 9/15/42 | | 659,000 | 540,219 |
| 3.9% 4/1/52 | | 1,200,000 | 962,050 |
| Virginia Electric & Power Co.: | | | |
| 3.1% 5/15/25 | | 713,000 | 679,633 |
| 3.45% 2/15/24 | | 490,000 | 480,476 |
| 3.8% 4/1/28 | | 2,657,000 | 2,506,257 |
| 3.8% 9/15/47 | | 2,543,000 | 1,970,925 |
| 4.2% 5/15/45 | | 2,128,000 | 1,734,629 |
| 4.45% 2/15/44 | | 490,000 | 421,535 |
| 4.6% 12/1/48 | | 3,452,000 | 2,985,590 |
| 6% 5/15/37 | | 356,000 | 370,607 |
| Wisconsin Electric Power Co.: | | | |
| 1.7% 6/15/28 | | 80,000 | 67,985 |
| 4.25% 6/1/44 | | 837,000 | 682,386 |
| Xcel Energy, Inc.: | | | |
| 3.35% 12/1/26 | | 535,000 | 499,582 |
| 3.4% 6/1/30 | | 1,740,000 | 1,541,804 |
| 4% 6/15/28 | | 13,000,000 | 12,296,117 |
| | | | 277,667,530 |
| Gas Utilities - 0.1% | | | |
| Atmos Energy Corp.: | | | |
| 4.125% 3/15/49 | | 2,900,000 | 2,418,205 |
| 5.45% 10/15/32 | | 1,000,000 | 1,033,477 |
| Dominion Gas Holdings LLC 2.5% 11/15/24 | | 2,000,000 | 1,908,178 |
| ONE Gas, Inc. 4.658% 2/1/44 | | 1,380,000 | 1,230,596 |
| Piedmont Natural Gas Co., Inc. 3.5% 6/1/29 | | 3,157,000 | 2,873,249 |
| Southern California Gas Co.: | | | |
| 2.6% 6/15/26 | | 2,358,000 | 2,177,820 |
| 6.35% 11/15/52 | | 1,800,000 | 1,969,869 |
| Southern Co. Gas Capital Corp.: | | | |
| 3.95% 10/1/46 | | 1,409,000 | 1,057,359 |
| 5.875% 3/15/41 | | 2,600,000 | 2,620,983 |
| | | | 17,289,736 |
| Independent Power and Renewable Electricity Producers - 0.1% | | | |
| Emera U.S. Finance LP: | | | |
| 2.639% 6/15/31 | | 1,000,000 | 786,191 |
| 3.55% 6/15/26 | | 1,000,000 | 938,740 |
| 4.75% 6/15/46 | | 929,000 | 729,956 |
| Exelon Generation Co. LLC: | | | |
| 3.25% 6/1/25 | | 1,400,000 | 1,330,862 |
| 6.25% 10/1/39 | | 1,242,000 | 1,277,900 |
| The AES Corp. 1.375% 1/15/26 | | 5,890,000 | 5,212,438 |
| | | | 10,276,087 |
| Multi-Utilities - 0.3% | | | |
| Ameren Corp. 3.5% 1/15/31 | | 8,850,000 | 7,780,257 |
| Berkshire Hathaway Energy Co.: | | | |
| 3.25% 4/15/28 | | 82,000 | 75,729 |
| 3.7% 7/15/30 | | 788,000 | 724,269 |
| 3.8% 7/15/48 | | 4,048,000 | 3,125,803 |
| 4.05% 4/15/25 | | 1,958,000 | 1,915,208 |
| 4.5% 2/1/45 | | 1,186,000 | 1,030,140 |
| 5.15% 11/15/43 | | 1,679,000 | 1,587,347 |
| CenterPoint Energy, Inc. 3.7% 9/1/49 | | 1,420,000 | 1,074,807 |
| CMS Energy Corp. 4.875% 3/1/44 | | 891,000 | 801,049 |
| Consolidated Edison Co. of New York, Inc.: | | | |
| 3.875% 6/15/47 | | 510,000 | 397,132 |
| 3.95% 4/1/50 | | 2,695,000 | 2,129,443 |
| 4.45% 3/15/44 | | 1,425,000 | 1,209,963 |
| 4.5% 5/15/58 | | 2,690,000 | 2,231,565 |
| 4.65% 12/1/48 | | 1,866,000 | 1,640,402 |
| 5.5% 12/1/39 | | 1,445,000 | 1,400,919 |
| 5.85% 3/15/36 | | 2,800,000 | 2,845,702 |
| Consumers Energy Co.: | | | |
| 2.5% 5/1/60 | | 1,100,000 | 617,427 |
| 2.65% 8/15/52 | | 1,000,000 | 635,470 |
| 4.35% 4/15/49 | | 2,410,000 | 2,100,570 |
| Delmarva Power & Light Co. 4% 6/1/42 | | 713,000 | 565,255 |
| Dominion Energy, Inc.: | | | |
| 3.9% 10/1/25 | | 2,299,000 | 2,224,163 |
| 4.35% 8/15/32 | | 2,000,000 | 1,845,423 |
| 4.85% 8/15/52 | | 2,700,000 | 2,346,062 |
| 4.9% 8/1/41 | | 356,000 | 313,243 |
| DTE Energy Co.: | | | |
| 2.85% 10/1/26 | | 1,069,000 | 981,074 |
| 3.8% 3/15/27 | | 2,408,000 | 2,259,502 |
| NiSource, Inc.: | | | |
| 0.95% 8/15/25 | | 4,288,000 | 3,866,001 |
| 1.7% 2/15/31 | | 3,300,000 | 2,515,431 |
| 2.95% 9/1/29 | | 1,420,000 | 1,225,591 |
| 3.49% 5/15/27 | | 1,364,000 | 1,274,209 |
| 3.95% 3/30/48 | | 1,782,000 | 1,388,746 |
| 4.375% 5/15/47 | | 852,000 | 712,119 |
| 4.8% 2/15/44 | | 980,000 | 868,836 |
| Puget Energy, Inc.: | | | |
| 3.65% 5/15/25 | | 1,438,000 | 1,360,489 |
| 4.1% 6/15/30 | | 2,600,000 | 2,334,419 |
| San Diego Gas & Electric Co. 4.5% 8/15/40 | | 1,378,000 | 1,244,689 |
| Sempra Energy: | | | |
| 3.25% 6/15/27 | | 1,087,000 | 1,002,520 |
| 4% 2/1/48 | | 5,578,000 | 4,325,597 |
| 6% 10/15/39 | | 178,000 | 180,326 |
| WEC Energy Group, Inc. 3 month U.S. LIBOR + 2.610% 6.9761% 5/15/67 (b)(d) | | 753,000 | 643,228 |
| | | | 66,800,125 |
| Water Utilities - 0.0% | | | |
| American Water Capital Corp.: | | | |
| 2.95% 9/1/27 | | 1,600,000 | 1,466,406 |
| 3.45% 5/1/50 | | 1,200,000 | 887,584 |
| 3.75% 9/1/28 | | 5,687,000 | 5,330,532 |
| 3.75% 9/1/47 | | 3,254,000 | 2,536,624 |
| | | | 10,221,146 |
TOTAL UTILITIES | | | 382,254,624 |
| TOTAL NONCONVERTIBLE BONDS (Cost $5,618,726,306) | | | 4,802,263,635 |
| | | | |
| U.S. Government and Government Agency Obligations - 42.8% |
| | | Principal Amount (a) | Value ($) |
| U.S. Government Agency Obligations - 0.7% | | | |
| Fannie Mae: | | | |
| 0.375% 8/25/25 | | 8,339,000 | 7,498,317 |
| 0.5% 6/17/25 | | 10,000,000 | 9,088,074 |
| 0.625% 4/22/25 | | 6,300,000 | 5,769,011 |
| 0.75% 10/8/27 | | 11,000,000 | 9,431,593 |
| 0.875% 8/5/30 | | 9,584,000 | 7,603,886 |
| 1.625% 10/15/24 | | 4,500,000 | 4,265,578 |
| 1.75% 7/2/24 | | 5,641,000 | 5,396,027 |
| 1.875% 9/24/26 | | 2,379,000 | 2,180,421 |
| 2.125% 4/24/26 | | 713,000 | 663,857 |
| 2.625% 9/6/24 | | 713,000 | 688,168 |
| 2.875% 9/12/23 | | 1,373,000 | 1,356,178 |
| 6.25% 5/15/29 | | 2,000,000 | 2,220,191 |
| 7.25% 5/15/30 | | 5,220,000 | 6,210,802 |
| Federal Home Loan Bank: | | | |
| 0.375% 9/4/25 | | 2,300,000 | 2,069,716 |
| 0.5% 4/14/25 | | 9,755,000 | 8,926,332 |
| 1.5% 8/15/24 | | 1,280,000 | 1,215,700 |
| 2.5% 2/13/24 | | 890,000 | 866,757 |
| 3.25% 6/9/28 | | 1,700,000 | 1,616,450 |
| 3.25% 11/16/28 | | 4,230,000 | 4,021,853 |
| 5.5% 7/15/36 | | 270,000 | 301,723 |
| Freddie Mac: | | | |
| 0.375% 7/21/25 | | 5,568,000 | 5,025,819 |
| 0.375% 9/23/25 | | 10,325,000 | 9,279,151 |
| 6.25% 7/15/32 | | 9,453,000 | 10,967,654 |
| 6.75% 3/15/31 | | 5,634,000 | 6,615,930 |
| Tennessee Valley Authority: | | | |
| 0.75% 5/15/25 | | 6,800,000 | 6,209,931 |
| 5.25% 9/15/39 | | 3,565,000 | 3,746,249 |
| 5.375% 4/1/56 | | 961,000 | 1,037,697 |
| 5.88% 4/1/36 | | 7,540,000 | 8,410,283 |
TOTAL U.S. GOVERNMENT AGENCY OBLIGATIONS | | | 132,683,348 |
| U.S. Treasury Obligations - 42.1% | | | |
| U.S. Treasury Bonds: | | | |
| 1.125% 5/15/40 | | 15,433,000 | 9,768,004 |
| 1.125% 8/15/40 | | 85,211,000 | 53,666,287 |
| 1.25% 5/15/50 | | 54,995,000 | 30,507,187 |
| 1.375% 11/15/40 | | 177,971,000 | 116,939,460 |
| 1.375% 8/15/50 | | 6,524,000 | 3,739,577 |
| 1.625% 11/15/50 | | 143,869,000 | 88,147,862 |
| 1.75% 8/15/41 | | 37,702,000 | 26,126,308 |
| 1.875% 2/15/41 | | 201,599,000 | 144,088,160 |
| 1.875% 2/15/51 | | 157,669,000 | 102,940,611 |
| 1.875% 11/15/51 | | 89,202,000 | 58,016,144 |
| 2% 11/15/41 | | 74,033,000 | 53,509,086 |
| 2% 2/15/50 | | 130,000 | 87,933 |
| 2% 8/15/51 | | 33,187,000 | 22,306,590 |
| 2.25% 5/15/41 | | 31,812,000 | 24,170,907 |
| 2.25% 8/15/46 | | 8,327,300 | 6,008,342 |
| 2.25% 8/15/49 | | 936,600 | 671,754 |
| 2.25% 2/15/52 | | 54,100,000 | 38,573,723 |
| 2.375% 11/15/49 | | 7,928,000 | 5,846,281 |
| 2.375% 5/15/51 | | 8,194,000 | 6,015,228 |
| 2.5% 2/15/46 | | 12,667,600 | 9,626,881 |
| 2.5% 5/15/46 | | 4,826,500 | 3,667,574 |
| 2.75% 8/15/47 | | 1,857,800 | 1,476,878 |
| 2.75% 11/15/47 | | 3,369,900 | 2,679,465 |
| 2.875% 5/15/43 | | 1,252,400 | 1,036,067 |
| 2.875% 8/15/45 | | 91,000 | 74,215 |
| 2.875% 11/15/46 | | 2,461,500 | 2,005,642 |
| 2.875% 5/15/49 | | 400 | 327 |
| 2.875% 5/15/52 | | 74,800,000 | 61,251,266 |
| 3% 11/15/44 | | 41,796,400 | 34,960,403 |
| 3% 5/15/45 | | 16,727,200 | 13,961,985 |
| 3% 2/15/47 | | 7,118,100 | 5,924,706 |
| 3% 5/15/47 | | 519,600 | 432,689 |
| 3% 2/15/48 | | 4,353,000 | 3,628,293 |
| 3% 8/15/52 | | 108,900,000 | 91,544,063 |
| 3.125% 11/15/41 | | 1,577,000 | 1,378,397 |
| 3.125% 8/15/44 | | 76,300 | 65,245 |
| 3.125% 5/15/48 | | 466,400 | 398,134 |
| 3.25% 5/15/42 | | 70,600,000 | 62,401,024 |
| 3.375% 8/15/42 | | 213,700,000 | 192,396,781 |
| 3.375% 5/15/44 | | 2,243,400 | 2,000,832 |
| 3.375% 11/15/48 | | 4,431,700 | 3,965,160 |
| 3.625% 8/15/43 | | 320,900 | 298,775 |
| 3.625% 2/15/44 | | 1,062,700 | 986,111 |
| 3.625% 2/15/53 | | 25,600,000 | 24,372,000 |
| 3.75% 11/15/43 | | 11,612,800 | 11,004,943 |
| 3.875% 8/15/40 | | 1,400 | 1,373 |
| 4% 11/15/42 | | 79,700,000 | 78,566,766 |
| 4% 11/15/52 | | 76,800,000 | 78,168,000 |
| 4.25% 5/15/39 | | 1,432,500 | 1,475,643 |
| 4.25% 11/15/40 | | 144,500 | 148,604 |
| 4.375% 11/15/39 | | 17,800 | 18,619 |
| 4.375% 5/15/40 | | 1,900 | 1,982 |
| 4.5% 2/15/36 | | 5,419,200 | 5,785,208 |
| 4.5% 5/15/38 | | 4,680,500 | 4,965,352 |
| 4.5% 8/15/39 | | 73,900 | 78,383 |
| 4.75% 2/15/37 | | 5,326,400 | 5,824,086 |
| 4.75% 2/15/41 | | 489,700 | 535,322 |
| 5% 5/15/37 | | 8,448,700 | 9,445,383 |
| 5.375% 2/15/31 (f) | | 9,530,300 | 10,420,787 |
| U.S. Treasury Notes: | | | |
| 0.125% 5/31/23 | | 1,000 | 988 |
| 0.125% 2/15/24 | | 31,088,000 | 29,628,321 |
| 0.25% 6/15/24 | | 12,074,000 | 11,346,730 |
| 0.25% 5/31/25 | | 34,270,000 | 31,041,123 |
| 0.25% 6/30/25 | | 2,937,000 | 2,655,002 |
| 0.25% 8/31/25 | | 770,000 | 691,556 |
| 0.25% 9/30/25 | | 23,754,000 | 21,295,090 |
| 0.375% 4/15/24 | | 46,275,000 | 43,887,138 |
| 0.375% 8/15/24 | | 15,500,000 | 14,487,656 |
| 0.375% 9/15/24 | | 150,900,000 | 140,631,726 |
| 0.375% 11/30/25 | | 48,770,000 | 43,565,327 |
| 0.375% 12/31/25 | | 109,512,000 | 97,700,960 |
| 0.375% 1/31/26 | | 124,970,000 | 111,013,389 |
| 0.375% 7/31/27 | | 41,405,000 | 35,009,869 |
| 0.375% 9/30/27 | | 4,380,000 | 3,683,820 |
| 0.5% 2/28/26 | | 3,914,000 | 3,479,638 |
| 0.5% 4/30/27 | | 76,857,000 | 65,895,871 |
| 0.5% 5/31/27 | | 35,607,000 | 30,423,121 |
| 0.5% 6/30/27 | | 6,547,000 | 5,581,062 |
| 0.5% 10/31/27 | | 69,435,000 | 58,591,206 |
| 0.625% 10/15/24 | | 9,400,000 | 8,768,070 |
| 0.625% 7/31/26 | | 47,986,000 | 42,274,541 |
| 0.625% 3/31/27 | | 798,000 | 689,647 |
| 0.625% 11/30/27 | | 1,471,000 | 1,246,385 |
| 0.625% 12/31/27 | | 11,851,000 | 10,017,798 |
| 0.625% 5/15/30 | | 6,869,000 | 5,432,950 |
| 0.625% 8/15/30 | | 30,836,000 | 24,252,032 |
| 0.75% 11/15/24 | | 146,270,000 | 136,288,215 |
| 0.75% 3/31/26 | | 42,400,000 | 37,939,719 |
| 0.75% 4/30/26 | | 228,803,000 | 203,965,361 |
| 0.75% 5/31/26 | | 85,730,000 | 76,222,677 |
| 0.75% 8/31/26 | | 52,800,000 | 46,600,125 |
| 0.75% 1/31/28 | | 5,976,000 | 5,071,196 |
| 0.875% 6/30/26 | | 46,368,000 | 41,325,480 |
| 0.875% 9/30/26 | | 57,100,000 | 50,511,196 |
| 1% 12/15/24 | | 15,700,000 | 14,654,356 |
| 1% 7/31/28 | | 3,300,000 | 2,798,813 |
| 1.125% 10/31/26 | | 167,200,000 | 148,938,625 |
| 1.125% 2/29/28 | | 119,508,000 | 103,159,678 |
| 1.25% 8/31/24 | | 46,487,300 | 43,943,210 |
| 1.25% 11/30/26 | | 106,012,000 | 94,694,391 |
| 1.25% 12/31/26 | | 14,400,000 | 12,840,188 |
| 1.25% 3/31/28 | | 15,582,000 | 13,510,690 |
| 1.25% 4/30/28 | | 53,309,000 | 46,126,862 |
| 1.25% 5/31/28 | | 39,296,000 | 33,935,780 |
| 1.25% 6/30/28 | | 77,172,000 | 66,518,646 |
| 1.25% 9/30/28 | | 114,316,000 | 97,923,264 |
| 1.25% 8/15/31 | | 154,327,000 | 125,107,352 |
| 1.375% 8/31/23 | | 14,100 | 13,846 |
| 1.375% 1/31/25 | | 9,913,000 | 9,292,276 |
| 1.375% 8/31/26 | | 2,670,800 | 2,412,066 |
| 1.375% 12/31/28 | | 22,700,000 | 19,502,492 |
| 1.5% 9/30/24 | | 20,957,000 | 19,851,846 |
| 1.5% 10/31/24 | | 41,850,000 | 39,554,789 |
| 1.5% 11/30/24 | | 37,250,000 | 35,132,861 |
| 1.5% 8/15/26 | | 11,644,100 | 10,567,930 |
| 1.5% 1/31/27 | | 50,200,000 | 45,113,328 |
| 1.5% 11/30/28 | | 113,349,000 | 98,166,433 |
| 1.5% 2/15/30 | | 87,477,000 | 74,280,274 |
| 1.625% 2/15/26 | | 1,812,700 | 1,669,808 |
| 1.625% 5/15/26 | | 999,900 | 916,197 |
| 1.625% 9/30/26 | | 1,274,000 | 1,159,141 |
| 1.625% 10/31/26 | | 22,470,000 | 20,405,569 |
| 1.625% 11/30/26 | | 2,021,000 | 1,833,426 |
| 1.625% 8/15/29 | | 29,838,600 | 25,791,740 |
| 1.625% 5/15/31 | | 38,120,000 | 32,047,603 |
| 1.75% 6/30/24 | | 7,244,300 | 6,935,002 |
| 1.75% 7/31/24 | | 31,872,800 | 30,424,829 |
| 1.75% 12/31/24 (g) | | 45,915,000 | 43,418,372 |
| 1.875% 6/30/26 | | 15,666,100 | 14,455,649 |
| 1.875% 7/31/26 | | 33,197,000 | 30,568,472 |
| 2% 4/30/24 | | 10,425,000 | 10,056,053 |
| 2% 5/31/24 | | 17,935,300 | 17,259,924 |
| 2% 6/30/24 | | 4,459,800 | 4,280,885 |
| 2% 2/15/25 | | 647,800 | 613,993 |
| 2% 8/15/25 | | 6,441,400 | 6,052,903 |
| 2% 11/15/26 | | 11,997,900 | 11,035,256 |
| 2.125% 2/29/24 | | 9,378,800 | 9,105,130 |
| 2.125% 3/31/24 | | 15,328,900 | 14,840,890 |
| 2.125% 7/31/24 | | 2,225,100 | 2,135,748 |
| 2.125% 9/30/24 | | 16,014,500 | 15,323,875 |
| 2.125% 11/30/24 | | 2,535,000 | 2,417,162 |
| 2.125% 5/15/25 | | 1,939,000 | 1,834,173 |
| 2.25% 12/31/23 | | 522,200 | 509,920 |
| 2.25% 1/31/24 | | 6,447,500 | 6,281,527 |
| 2.25% 3/31/24 | | 11,300,000 | 10,954,820 |
| 2.25% 10/31/24 | | 23,871,200 | 22,837,092 |
| 2.25% 11/15/24 | | 15,315,800 | 14,648,127 |
| 2.25% 12/31/24 | | 13,968,400 | 13,327,818 |
| 2.25% 11/15/25 | | 18,937,500 | 17,830,840 |
| 2.25% 2/15/27 | | 944,000 | 873,606 |
| 2.25% 8/15/27 | | 5,291,000 | 4,864,000 |
| 2.25% 11/15/27 | | 43,039,100 | 39,434,575 |
| 2.375% 2/29/24 | | 13,872,600 | 13,500,316 |
| 2.375% 8/15/24 | | 5,198,200 | 5,002,252 |
| 2.375% 5/15/27 | | 68,262,000 | 63,254,342 |
| 2.5% 1/31/24 | | 11,216,000 | 10,953,125 |
| 2.5% 4/30/24 | | 43,200,000 | 41,909,063 |
| 2.5% 5/31/24 | | 46,900,000 | 45,416,055 |
| 2.5% 1/31/25 | | 20,661,800 | 19,786,902 |
| 2.5% 2/28/26 | | 9,949,100 | 9,403,454 |
| 2.5% 3/31/27 | | 39,000,000 | 36,373,594 |
| 2.625% 3/31/25 | | 2,858,900 | 2,739,184 |
| 2.625% 4/15/25 | | 49,100,000 | 46,986,398 |
| 2.625% 12/31/25 | | 3,480,100 | 3,309,086 |
| 2.625% 1/31/26 | | 9,021,000 | 8,566,074 |
| 2.625% 5/31/27 | | 7,200,000 | 6,737,906 |
| 2.625% 2/15/29 | | 20,536,100 | 18,904,443 |
| 2.625% 7/31/29 | | 155,300,000 | 142,402,820 |
| 2.75% 5/31/23 | | 800 | 796 |
| 2.75% 7/31/23 | | 10,000 | 9,908 |
| 2.75% 11/15/23 | | 1,100 | 1,082 |
| 2.75% 2/15/24 | | 26,691,300 | 26,092,831 |
| 2.75% 2/28/25 | | 3,753,700 | 3,608,684 |
| 2.75% 6/30/25 | | 3,682,400 | 3,526,905 |
| 2.75% 4/30/27 | | 35,700,000 | 33,601,231 |
| 2.75% 7/31/27 | | 85,000,000 | 79,853,515 |
| 2.75% 8/15/32 | | 352,219,800 | 320,079,743 |
| 2.875% 9/30/23 | | 500 | 494 |
| 2.875% 11/30/23 | | 56,900 | 55,966 |
| 2.875% 4/30/25 | | 12,040,300 | 11,578,912 |
| 2.875% 6/15/25 | | 53,000,000 | 50,937,969 |
| 2.875% 5/15/28 | | 46,361,100 | 43,532,349 |
| 2.875% 8/15/28 | | 38,531,600 | 36,109,829 |
| 2.875% 4/30/29 | | 11,600,000 | 10,814,281 |
| 2.875% 5/15/32 | | 21,500,000 | 19,773,281 |
| 3% 6/30/24 | | 41,600,000 | 40,475,500 |
| 3% 7/15/25 | | 66,700,000 | 64,222,199 |
| 3% 10/31/25 | | 7,767,100 | 7,460,664 |
| 3.125% 8/31/27 | | 41,900,000 | 39,986,676 |
| 3.125% 11/15/28 | | 3,802,200 | 3,604,218 |
| 3.125% 8/31/29 | | 43,000,000 | 40,606,445 |
| 3.25% 8/31/24 | | 55,600,000 | 54,168,734 |
| 3.25% 6/30/27 | | 37,300,000 | 35,789,059 |
| 3.25% 6/30/29 | | 64,500,000 | 61,380,820 |
| 3.5% 1/31/28 (g) | | 134,900,000 | 130,800,305 |
| 3.5% 1/31/30 | | 108,600,000 | 104,883,844 |
| 3.875% 11/30/27 | | 118,900,000 | 117,204,746 |
| 3.875% 12/31/27 | | 92,900,000 | 91,507,847 |
| 3.875% 9/30/29 | | 27,400,000 | 27,031,813 |
| 3.875% 11/30/29 | | 73,000,000 | 72,064,688 |
| 3.875% 12/31/29 | | 29,300,000 | 28,942,906 |
| 4% 12/15/25 | | 75,200,000 | 74,195,375 |
| 4% 10/31/29 | | 128,400,000 | 127,642,640 |
| 4.125% 1/31/25 (g) | | 87,700,000 | 86,559,215 |
| 4.125% 9/30/27 | | 27,300,000 | 27,157,101 |
| 4.125% 10/31/27 | | 153,700,000 | 152,931,500 |
| 4.125% 11/15/32 | | 57,000,000 | 57,908,438 |
| 4.25% 9/30/24 | | 98,100,000 | 96,992,543 |
| 4.25% 12/31/24 | | 70,500,000 | 69,709,629 |
| 4.25% 10/15/25 | | 125,500,000 | 124,445,996 |
| 4.375% 10/31/24 | | 141,400,000 | 140,074,375 |
| 4.5% 11/30/24 | | 366,400,000 | 363,752,188 |
| 4.5% 11/15/25 | | 22,900,000 | 22,861,535 |
| 4.625% 2/28/25 | | 110,000,000 | 109,647,657 |
TOTAL U.S. TREASURY OBLIGATIONS | | | 8,042,333,360 |
| TOTAL U.S. GOVERNMENT AND GOVERNMENT AGENCY OBLIGATIONS (Cost $9,057,532,106) | | | 8,175,016,708 |
| | | | |
| U.S. Government Agency - Mortgage Securities - 27.4% |
| | | Principal Amount (a) | Value ($) |
| Fannie Mae - 11.9% | | | |
| 12 month U.S. LIBOR + 1.510% 3.788% 11/1/34 (b)(d) | | 344,889 | 347,276 |
| 12 month U.S. LIBOR + 1.640% 2.533% 4/1/41 (b)(d) | | 79,740 | 80,447 |
| 12 month U.S. LIBOR + 1.880% 3.944% 11/1/34 (b)(d) | | 28,691 | 29,039 |
| 1.5% 10/1/35 to 4/1/52 | | 233,476,937 | 191,836,705 |
| 2% 8/1/23 to 6/1/52 | | 702,517,014 | 585,547,152 |
| 2.5% 4/1/23 to 5/1/52 | | 561,335,748 | 483,893,120 |
| 3% 5/1/26 to 11/1/52 | | 441,903,093 | 396,552,110 |
| 3.5% 11/1/23 to 12/1/52 | | 280,723,783 | 261,065,879 |
| 4% 7/1/23 to 11/1/52 | | 193,309,655 | 184,130,951 |
| 4.5% to 4.5% 3/1/23 to 3/1/53 | | 74,493,706 | 72,806,148 |
| 5% 3/1/23 to 12/1/52 | | 59,168,658 | 58,685,705 |
| 5.5% 7/1/23 to 1/1/53 | | 22,904,386 | 23,053,510 |
| 6% to 6% 11/1/32 to 12/1/52 | | 18,864,403 | 19,144,627 |
| 6.5% 5/1/31 to 6/1/40 | | 855,693 | 894,920 |
TOTAL FANNIE MAE | | | 2,278,067,589 |
| Freddie Mac - 8.7% | | | |
| 12 month U.S. LIBOR + 1.940% 4.098% 9/1/37 (b)(d) | | 31,669 | 32,189 |
| U.S. TREASURY 1 YEAR INDEX + 1.710% 2.243% 3/1/36 (b)(d) | | 307,075 | 306,708 |
| U.S. TREASURY 1 YEAR INDEX + 2.230% 4.337% 12/1/35 (b)(d) | | 116,299 | 117,811 |
| U.S. TREASURY 1 YEAR INDEX + 2.250% 3.442% 3/1/35 (b)(d) | | 54,449 | 54,968 |
| 1.5% 5/1/36 to 1/1/52 | | 86,191,780 | 69,714,460 |
| 2% 4/1/23 to 6/1/52 | | 684,969,222 | 566,680,606 |
| 2% 9/1/35 | | 32,544,547 | 29,018,785 |
| 2% 11/1/35 | | 13,245,044 | 11,810,123 |
| 2.5% 8/1/25 to 6/1/52 | | 473,111,307 | 405,956,125 |
| 3% 10/1/26 to 8/1/52 | | 144,863,558 | 130,529,280 |
| 3% 8/1/47 | | 35,406 | 31,782 |
| 3% 5/1/49 | | 27,378 | 24,435 |
| 3.5% 5/1/23 to 11/1/52 | | 136,994,224 | 127,177,118 |
| 3.5% 8/1/47 | | 37,452 | 34,697 |
| 3.5% 9/1/47 | | 16,615 | 15,393 |
| 3.5% 9/1/47 | | 1,678,018 | 1,564,025 |
| 4% 9/1/24 to 1/1/53 | | 102,085,374 | 97,038,408 |
| 4.5% 8/1/23 to 3/1/53 | | 112,356,993 | 108,568,743 |
| 5% 4/1/23 to 3/1/53 | | 48,547,682 | 47,982,492 |
| 5.5% 5/1/23 to 3/1/53 | | 35,008,355 | 35,032,680 |
| 6% 4/1/32 to 1/1/53 | | 9,102,807 | 9,218,373 |
| 6.5% 8/1/36 to 2/1/53 | | 13,715,699 | 14,058,859 |
TOTAL FREDDIE MAC | | | 1,654,968,060 |
| Freddie Mac Multi-family Structured pass-thru certificates - 0.0% | | | |
| 2.5% 2/1/32 | | 8,965 | 8,330 |
| Ginnie Mae - 5.8% | | | |
| 3.5% 11/15/40 to 12/20/52 | | 168,943,588 | 157,337,690 |
| 4% 1/15/25 to 11/20/52 | | 110,894,385 | 105,528,060 |
| 5% 1/20/39 to 11/20/52 | | 35,419,233 | 35,160,337 |
| 1.5% 6/20/45 to 12/20/51 | | 4,074,302 | 3,258,730 |
| 2% 3/20/51 to 5/20/52 | | 283,309,870 | 238,524,364 |
| 2% 3/1/53 (e) | | 4,350,000 | 3,646,050 |
| 2.5% 10/20/42 to 8/20/52 | | 287,420,734 | 249,824,848 |
| 2.5% 3/1/53 (e) | | 6,925,000 | 5,988,487 |
| 2.5% 3/1/53 (e) | | 5,975,000 | 5,166,961 |
| 2.5% 3/1/53 (e) | | 3,900,000 | 3,372,577 |
| 3% 4/15/42 to 10/20/52 | | 219,125,681 | 197,583,437 |
| 3% 3/1/53 (e) | | 4,000,000 | 3,568,214 |
| 4.5% to 4.5% 3/20/33 to 2/20/53 | | 77,355,579 | 75,317,493 |
| 5% 3/1/53 (e) | | 5,000,000 | 4,942,033 |
| 5.5% 12/20/32 to 12/20/52 | | 20,752,178 | 20,866,515 |
| 6% to 6% 5/20/34 to 12/15/40 | | 661,063 | 683,618 |
| 6% 3/1/53 (e) | | 7,200,000 | 7,303,108 |
| 6.5% 8/20/36 to 1/15/39 | | 124,694 | 130,899 |
TOTAL GINNIE MAE | | | 1,118,203,421 |
| Uniform Mortgage Backed Securities - 1.0% | | | |
| 1.5% 3/1/38 (e) | | 4,400,000 | 3,803,702 |
| 1.5% 3/1/53 (e) | | 5,900,000 | 4,555,628 |
| 2% 3/1/38 (e) | | 6,200,000 | 5,502,618 |
| 2% 3/1/53 (e) | | 16,550,000 | 13,475,907 |
| 2% 3/1/53 (e) | | 3,300,000 | 2,687,039 |
| 2% 3/1/53 (e) | | 45,600,000 | 37,129,992 |
| 2% 3/1/53 (e) | | 9,400,000 | 7,653,989 |
| 2% 3/1/53 (e) | | 5,400,000 | 4,396,973 |
| 2% 4/1/53 (e) | | 33,850,000 | 27,595,563 |
| 2.5% 3/1/53 (e) | | 9,100,000 | 7,709,414 |
| 2.5% 3/1/53 (e) | | 3,100,000 | 2,626,284 |
| 3% 3/1/38 (e) | | 4,600,000 | 4,293,094 |
| 3% 3/1/53 (e) | | 5,000,000 | 4,397,850 |
| 3% 3/1/53 (e) | | 9,600,000 | 8,443,871 |
| 3% 3/1/53 (e) | | 3,000,000 | 2,638,710 |
| 4% 3/1/53 (e) | | 10,500,000 | 9,848,670 |
| 4% 3/1/53 (e) | | 4,700,000 | 4,408,452 |
| 5% 3/1/53 (e) | | 3,600,000 | 3,537,561 |
| 5% 3/1/53 (e) | | 6,900,000 | 6,780,326 |
| 5.5% 3/1/53 (e) | | 10,500,000 | 10,481,540 |
| 6% 3/1/53 (e) | | 11,200,000 | 11,331,685 |
TOTAL UNIFORM MORTGAGE BACKED SECURITIES | | | 183,298,868 |
| TOTAL U.S. GOVERNMENT AGENCY - MORTGAGE SECURITIES (Cost $5,995,027,299) | | | 5,234,546,268 |
| | | | |
| Asset-Backed Securities - 0.2% |
| | | Principal Amount (a) | Value ($) |
| Capital One Multi-Asset Execution Trust: | | | |
| Series 2019-A3 Class A3, 2.06% 8/15/28 | | 2,360,000 | 2,150,114 |
| 1.39% 7/15/30 | | 4,200,000 | 3,547,755 |
| Capital One Prime Auto Receivables Series 2023-1 Class A3, 4.87% 2/15/28 | | 1,690,000 | 1,679,464 |
| CarMax Auto Owner Trust: | | | |
| Series 2021-1 Class A3, 0.34% 12/15/25 | | 5,266,600 | 5,087,188 |
| Series 2022-3 Class A2A, 3.97% 4/15/27 | | 9,500,000 | 9,282,501 |
| Citibank Credit Card Issuance Trust: | | | |
| Series 2007-A3 Class A3, 6.15% 6/15/39 | | 1,400,000 | 1,530,308 |
| Series 2013-A9 Class A9, 3.72% 9/8/25 | | 834,000 | 826,835 |
| Series 2018-A7 Class A7, 3.96% 10/13/30 | | 2,750,000 | 2,647,492 |
| Discover Card Execution Note Trust Series 2017-A4 Class A4, 2.53% 10/15/26 | | 256,000 | 248,271 |
| Ford Credit Floorplan Master Owner Trust Series 2018-2 Class A, 3.17% 3/15/25 | | 3,396,000 | 3,394,125 |
| GM Financial Consumer Automobile Receivables Trust Series 2021-1 Class A3, 0.35% 10/16/25 | | 4,785,240 | 4,646,252 |
| Hyundai Auto Receivables Trust 3.72% 11/16/26 | | 6,412,000 | 6,252,015 |
| Mercedes-Benz Auto Lease Trust Series 2021-A Class A3, 0.25% 1/16/24 | | 2,122,271 | 2,104,470 |
| TOTAL ASSET-BACKED SECURITIES (Cost $45,247,994) | | | 43,396,790 |
| | | | |
| Commercial Mortgage Securities - 1.6% |
| | | Principal Amount (a) | Value ($) |
| BANK sequential payer: | | | |
| Series 2017-BNK4 Class ASB, 3.419% 5/15/50 | | 3,438,274 | 3,300,360 |
| Series 2020-BN25 Class A5, 2.649% 1/15/63 | | 4,650,000 | 3,959,468 |
| Series 2020-BN28 Class A4, 1.844% 3/15/63 | | 6,780,000 | 5,372,578 |
| Series 2021-BN35 Class A5, 2.285% 6/15/64 | | 12,700,000 | 10,285,204 |
| Series 2022-BNK39 Class A4, 2.928% 2/15/55 | | 1,800,000 | 1,518,255 |
| Series 2022-BNK41 Class A4, 3.79% 4/15/65 (b) | | 9,500,000 | 8,645,152 |
| BBCMS Mortgage Trust sequential payer: | | | |
| Series 2021-C10 Class A5, 2.492% 7/15/54 | | 11,850,000 | 9,794,052 |
| Series 2021-C9 Class A5, 2.299% 2/15/54 | | 2,000,000 | 1,630,105 |
| Benchmark Mortgage Trust: | | | |
| sequential payer: | | | |
Series 2020-B19 Class A5, 1.85% 9/15/53 | | 3,100,000 | 2,467,009 |
Series 2021-B24 Class A5, 2.5843% 3/15/54 | | 10,300,000 | 8,508,177 |
| Series 2019-B12 Class A5, 3.1156% 8/15/52 | | 4,705,000 | 4,163,291 |
| Series 2019-B9 Class A5, 4.0156% 3/15/52 | | 4,179,000 | 3,911,913 |
| BMO Mortgage Trust sequential payer Series 2022-C1 Class A5, 3.374% 2/15/55 | | 3,500,000 | 3,054,820 |
| Citigroup Commercial Mortgage Trust sequential payer: | | | |
| Series 2014-GC25 Class A4, 3.635% 10/10/47 | | 5,370,000 | 5,199,341 |
| Series 2015-GC29 Class A4, 3.192% 4/10/48 | | 2,028,000 | 1,922,249 |
| Series 2015-P1 Class A5, 3.717% 9/15/48 | | 1,045,000 | 997,779 |
| Series 2016-C1 Class A4, 3.209% 5/10/49 | | 3,308,000 | 3,085,931 |
| Series 2016-P4 Class A4, 2.902% 7/10/49 | | 3,832,000 | 3,521,400 |
| Series 2018-B2 Class A4, 4.009% 3/10/51 | | 2,641,000 | 2,468,695 |
| COMM Mortgage Trust: | | | |
| sequential payer Series 2013-CR7 Class A4, 3.213% 3/10/46 | | 168,564 | 168,323 |
| Series 2015-CR22 Class A5, 3.309% 3/10/48 | | 3,462,000 | 3,298,594 |
| CSAIL Commercial Mortgage Trust sequential payer: | | | |
| Series 2015-C3 Class A4, 3.7182% 8/15/48 | | 2,240,000 | 2,140,187 |
| Series 2019-C17: | | | |
Class A4, 2.7628% 9/15/52 | | 3,480,000 | 2,989,282 |
Class A5, 3.0161% 9/15/52 | | 3,480,000 | 3,022,287 |
| Freddie Mac: | | | |
| sequential payer: | | | |
Series 2016-K057 Class A2, 2.57% 7/25/26 | | 2,844,000 | 2,655,166 |
Series 2020-K104 Class A2, 2.253% 1/25/30 | | 16,200,000 | 14,029,540 |
Series 2020-K116 Class A2, 1.378% 7/25/30 | | 12,400,000 | 9,957,319 |
Series 2020-K117 Class A2, 1.406% 8/25/30 | | 12,400,000 | 9,957,658 |
Series 2020-K118 Class A2, 1.493% 9/25/30 | | 6,200,000 | 5,000,419 |
Series 2020-K121 Class A2, 1.547% 10/25/30 | | 8,900,000 | 7,185,136 |
Series 2021-K125 Class A2, 1.846% 1/25/31 | | 2,000,000 | 1,644,997 |
Series 2021-K126 Class A2, 2.074% 1/25/31 | | 8,200,000 | 6,870,510 |
Series 2021-K128 Class A2, 2.02% 3/25/31 | | 6,410,000 | 5,340,952 |
Series 2021-K129 Class A2, 1.914% 5/25/31 | | 6,160,000 | 5,077,512 |
Series 2021-K130 Class A2, 1.723% 6/25/31 | | 7,200,000 | 5,825,311 |
Series 2021-K136 Class A2, 2.127% 11/25/31 | | 7,800,000 | 6,468,799 |
Series 2022-151 Class A2: | | | |
| 3.78% 11/25/32 | | 7,500,000 | 7,087,779 |
| 3.8% 10/25/32 | | 1,000,000 | 946,595 |
Series K034 Class A2, 3.531% 7/25/23 | | 1,529,687 | 1,518,632 |
Series K080 Class A2, 3.926% 7/25/28 | | 2,957,000 | 2,865,350 |
| Series 2017-K064 Class A2, 3.224% 3/25/27 | | 3,075,000 | 2,911,854 |
| Series 2017-K068 Class A2, 3.244% 8/25/27 | | 4,243,000 | 4,009,532 |
| Series 2017-K727 Class A2, 2.946% 7/25/24 | | 4,106,546 | 3,991,579 |
| Series 2018-K730 Class A2, 3.59% 1/25/25 | | 6,635,011 | 6,455,881 |
| Series 2019-K094 Class A2, 2.903% 6/25/29 | | 9,484,000 | 8,633,646 |
| Series 2019-K1510 Class A2, 3.718% 1/25/31 | | 2,646,000 | 2,499,865 |
| Series 2021-K123 Class A2, 1.621% 12/25/30 | | 8,000,000 | 6,484,678 |
| Series K036 Class A2, 3.527% 10/25/23 | | 1,595,517 | 1,578,040 |
| Series K046 Class A2, 3.205% 3/25/25 | | 5,935,000 | 5,715,731 |
| Series K047 Class A2, 3.329% 5/25/25 | | 688,000 | 663,348 |
| Series K053 Class A2, 2.995% 12/25/25 | | 1,267,000 | 1,205,613 |
| Series K056 Class A2, 2.525% 5/25/26 | | 3,698,000 | 3,453,492 |
| Series K062 Class A1, 3.032% 9/25/26 | | 1,745,578 | 1,692,480 |
| Series K079 Class A2, 3.926% 6/25/28 | | 1,386,000 | 1,343,959 |
| GS Mortgage Securities Trust sequential payer: | | | |
| Series 2014-GC26 Class A4, 3.364% 11/10/47 | | 2,567,926 | 2,467,077 |
| Series 2020-GC45 Class A5, 2.9106% 2/13/53 | | 9,700,000 | 8,390,428 |
| JPMBB Commercial Mortgage Securities Trust sequential payer: | | | |
| Series 2014-C21 Class A5, 3.7748% 8/15/47 | | 6,016,000 | 5,860,304 |
| Series 2014-C23 Class A5, 3.9342% 9/15/47 | | 1,702,000 | 1,654,456 |
| Series 2014-C24 Class A5, 3.6385% 11/15/47 | | 4,646,000 | 4,472,864 |
| Series 2015-C29 Class A4, 3.6108% 5/15/48 | | 1,604,000 | 1,526,363 |
| JPMDB Commercial Mortgage Securities Trust sequential payer Series 2020-COR7 Class A5, 2.1798% 5/13/53 | | 8,000,000 | 6,339,506 |
| Morgan Stanley BAML Trust Series 2015-C20 Class A4, 3.249% 2/15/48 | | 2,625,000 | 2,506,134 |
| Morgan Stanley Capital I Trust sequential payer Series 2020-L4 Class A3, 2.698% 2/15/53 | | 4,000,000 | 3,379,418 |
| UBS Commercial Mortgage Trust sequential payer Series 2019-C16 Class A4, 3.6048% 4/15/52 | | 7,470,000 | 6,794,625 |
| Wells Fargo Commercial Mortgage Trust: | | | |
| sequential payer: | | | |
Series 2019-C52 Class A5, 2.892% 8/15/52 | | 5,667,000 | 4,928,063 |
Series 2019-C54 Class A4, 3.146% 12/15/52 | | 8,500,000 | 7,483,588 |
| Series 2018-C48 Class A5, 4.302% 1/15/52 | | 3,485,000 | 3,312,085 |
| Wells Fargo Commercial Mtg Trust 2020-C sequential payer Series 2020-C55 Class A5, 2.725% 2/15/53 | | 3,600,000 | 3,056,014 |
| WF-RBS Commercial Mortgage Trust Series 2014-C25 Class A5, 3.631% 11/15/47 | | 2,576,000 | 2,473,307 |
| TOTAL COMMERCIAL MORTGAGE SECURITIES (Cost $354,435,410) | | | 303,140,057 |
| | | | |
| Municipal Securities - 0.5% |
| | | Principal Amount (a) | Value ($) |
| American Muni. Pwr., Inc. Rev. (Combined Hydroelectric Proj.) Series 2010 B, 8.084% 2/15/50 | | 1,730,000 | 2,350,320 |
| Bay Area Toll Auth. San Francisco Bay Toll Bridge Rev.: | | | |
| Series 2009 F2, 6.263% 4/1/49 | | 900,000 | 1,072,938 |
| Series 2010 S1, 7.043% 4/1/50 | | 1,325,000 | 1,703,161 |
| California Gen. Oblig.: | | | |
| Series 2009, 7.55% 4/1/39 | | 4,410,000 | 5,635,894 |
| Series 2010, 7.6% 11/1/40 | | 6,390,000 | 8,243,324 |
| Series 2018, 3.5% 4/1/28 | | 2,300,000 | 2,171,686 |
| California State Univ. Rev. Series 2021 B, 2.719% 11/1/52 | | 3,540,000 | 2,469,875 |
| Charlotte-Mecklenburg Hosp. Auth. Health Care Sys. Rev. Series 2021 A, 3.204% 1/15/51 | | 2,200,000 | 1,556,888 |
| Chicago O'Hare Int'l. Arpt. Rev. Series 2010 B, 6.395% 1/1/40 | | 5,350,000 | 6,208,454 |
| Commonwealth Fing. Auth. Rev. Series 2016 A, 4.144% 6/1/38 | | 1,365,000 | 1,245,095 |
| Dallas Area Rapid Transit Sales Tax Rev. Series 2021 A, 2.613% 12/1/48 | | 4,750,000 | 3,277,696 |
| Dallas Fort Worth Int'l. Arpt. Rev.: | | | |
| Series 2019 A, 3.144% 11/1/45 | | 435,000 | 339,105 |
| Series 2021 C, 2.843% 11/1/46 | | 4,000,000 | 2,979,723 |
| Series 2022 A, 4.507% 11/1/51 | | 1,580,000 | 1,473,888 |
| Golden State Tobacco Securitization Corp. Tobacco Settlement Rev. Series 2021 B: | | | |
| 2.746% 6/1/34 | | 1,920,000 | 1,559,006 |
| 3.293% 6/1/42 | | 1,000,000 | 746,450 |
| Idaho Energy Resources Auth. Series 2021, 2.861% 9/1/46 | | 1,175,000 | 860,357 |
| Illinois Gen. Oblig. Series 2003, 5.1% 6/1/33 | | 12,925,000 | 12,701,337 |
| Kansas St Dev. Fin. Auth. Rev. Series 2015 H, 4.927% 4/15/45 | | 1,355,000 | 1,338,939 |
| Los Angeles Cmnty. College District Series 2008 E, 6.75% 8/1/49 | | 1,685,000 | 2,119,409 |
| Los Angeles Dept. Arpt. Rev. Series 2009 C, 6.582% 5/15/39 | | 855,000 | 948,324 |
| Massachusetts Gen. Oblig. Series F, 3.277% 6/1/46 | | 840,000 | 683,898 |
| Massachusetts School Bldg. Auth. Dedicated Sales Tax Rev. Series 2019 B, 3.395% 10/15/40 | | 2,650,000 | 2,174,228 |
| Massachusetts Wtr. Resources Auth. Wtr. & Swr. Rev. Series 2021 C, 2.823% 8/1/41 | | 3,000,000 | 2,336,475 |
| Michigan Strategic Fund Ltd. Oblig. Rev. Series 2021 A, 3.225% 9/1/47 | | 2,000,000 | 1,491,440 |
| New Jersey Tpk. Auth. Tpk. Rev. Series 2009 E, 7.414% 1/1/40 | | 837,000 | 1,049,422 |
| New Jersey Trans. Trust Fund Auth. Series B: | | | |
| 4.081% 6/15/39 | | 2,700,000 | 2,322,783 |
| 4.131% 6/15/42 | | 2,700,000 | 2,258,993 |
| New York City Muni. Wtr. Fin. Auth. Wtr. & Swr. Sys. Rev. Series 2010 DD, 5.952% 6/15/42 | | 1,610,000 | 1,813,015 |
| New York City Transitional Fin. Auth. Rev. Series 2011 A, 5.508% 8/1/37 | | 1,910,000 | 1,963,324 |
| New York Metropolitan Trans. Auth. Rev. Series 2010 A, 6.668% 11/15/39 | | 1,095,000 | 1,176,346 |
| New York State Dorm. Auth. Series 2021 C, 2.202% 3/15/34 | | 6,000,000 | 4,665,634 |
| Port Auth. of New York & New Jersey: | | | |
| Series 180, 4.96% 8/1/46 | | 920,000 | 921,304 |
| Series 2010 164, 5.647% 11/1/40 | | 930,000 | 991,527 |
| Series 225, 3.175% 7/15/60 | | 6,000,000 | 4,217,479 |
| Port of Morrow Transmission Facilities Rev. (Bonneville Coorporation Proj.) Series 2016 1, 2.987% 9/1/36 | | 1,010,000 | 839,606 |
| San Francisco Pub. Utils. Commission Wtr. Rev. Series 2010 E, 6% 11/1/40 | | 1,130,000 | 1,241,970 |
| South Carolina Pub. Svc. Auth. Rev. Series 2013 C, 5.784% 12/1/41 | | 2,016,000 | 2,040,213 |
| Univ. of California Regents Med. Ctr. Pool Rev. Series N: | | | |
| 3.006% 5/15/50 | | 3,000,000 | 2,110,065 |
| 3.256% 5/15/60 | | 3,000,000 | 2,077,052 |
| Univ. of California Revs.: | | | |
| Series 2009 R, 5.77% 5/15/43 | | 175,000 | 189,126 |
| Series 2015 AP, 3.931% 5/15/45 | | 665,000 | 601,954 |
| Univ. of Virginia Gen. Rev.: | | | |
| (Multi-Year Cap. Proj. Fing. Prog.) Series 2017 C, 4.179% 9/1/2117 | | 845,000 | 681,380 |
| Series 2021 B, 2.584% 11/1/51 | | 2,400,000 | 1,601,168 |
| TOTAL MUNICIPAL SECURITIES (Cost $126,432,869) | | | 100,450,271 |
| | | | |
| Foreign Government and Government Agency Obligations - 1.5% |
| | | Principal Amount (a) | Value ($) |
| Alberta Province: | | | |
| 1% 5/20/25 | | 35,763,000 | 32,822,209 |
| 2.95% 1/23/24 | | 5,000,000 | 4,892,000 |
| 3.3% 3/15/28 | | 696,000 | 658,500 |
| British Columbia Province 2.25% 6/2/26 | | 6,672,000 | 6,188,747 |
| Chilean Republic: | | | |
| 2.45% 1/31/31 | | 6,000,000 | 4,990,500 |
| 2.55% 7/27/33 | | 2,900,000 | 2,273,419 |
| 3.24% 2/6/28 | | 2,067,000 | 1,910,425 |
| 3.625% 10/30/42 | | 3,150,000 | 2,405,419 |
| 3.86% 6/21/47 | | 3,039,000 | 2,387,135 |
| Export Development Canada: | | | |
| 2.625% 2/21/24 | | 5,020,000 | 4,888,727 |
| 2.75% 3/15/23 | | 3,680,000 | 3,677,093 |
| Hungarian Republic: | | | |
| 5.375% 3/25/24 | | 832,000 | 829,036 |
| 5.75% 11/22/23 | | 1,544,000 | 1,543,325 |
| Indonesian Republic: | | | |
| 2.85% 2/14/30 | | 5,800,000 | 5,112,338 |
| 3.4% 9/18/29 | | 1,000,000 | 912,063 |
| 3.5% 2/14/50 | | 4,200,000 | 3,120,600 |
| 4.35% 1/11/48 | | 901,000 | 786,222 |
| 4.45% 4/15/70 | | 1,300,000 | 1,085,643 |
| 5.35% 2/11/49 | | 2,000,000 | 1,990,220 |
| Israeli State: | | | |
| 2.75% 7/3/30 | | 1,310,000 | 1,156,075 |
| 3.25% 1/17/28 | | 2,565,000 | 2,395,161 |
| 3.375% 1/15/50 | | 4,900,000 | 3,614,926 |
| 3.875% 7/3/50 | | 4,660,000 | 3,741,933 |
| Italian Republic: | | | |
| 1.25% 2/17/26 | | 4,100,000 | 3,588,055 |
| 2.375% 10/17/24 | | 1,400,000 | 1,322,543 |
| 2.875% 10/17/29 | | 4,060,000 | 3,429,011 |
| 4% 10/17/49 | | 2,982,000 | 2,177,904 |
| 6.875% 9/27/23 | | 1,069,000 | 1,074,371 |
| Jordanian Kingdom 3% 6/30/25 | | 341,000 | 326,115 |
| Korean Republic: | | | |
| 2% 6/19/24 | | 2,400,000 | 2,303,304 |
| 2.5% 6/19/29 | | 4,000,000 | 3,575,680 |
| 2.75% 1/19/27 | | 4,000,000 | 3,707,280 |
| Manitoba Province 3.05% 5/14/24 | | 267,000 | 260,132 |
| Ontario Province: | | | |
| 1.125% 10/7/30 | | 3,750,000 | 2,972,363 |
| 2.3% 6/15/26 | | 22,624,000 | 20,968,602 |
| 2.5% 4/27/26 | | 891,000 | 832,452 |
| 3.05% 1/29/24 | | 2,120,000 | 2,076,945 |
| Panamanian Republic: | | | |
| 2.252% 9/29/32 | | 2,180,000 | 1,618,378 |
| 3.16% 1/23/30 | | 3,711,000 | 3,180,559 |
| 3.75% 3/16/25 | | 11,010,000 | 10,626,714 |
| 4.3% 4/29/53 | | 1,012,000 | 728,830 |
| 4.5% 4/16/50 | | 3,012,000 | 2,253,917 |
| 4.5% 4/1/56 | | 4,200,000 | 3,060,225 |
| 6.4% 2/14/35 | | 800,000 | 822,150 |
| 6.7% 1/26/36 | | 1,760,000 | 1,857,130 |
| Peruvian Republic: | | | |
| 1.862% 12/1/32 | | 6,740,000 | 4,883,551 |
| 2.392% 1/23/26 | | 7,870,000 | 7,310,738 |
| 2.78% 12/1/60 | | 1,000,000 | 574,563 |
| 2.844% 6/20/30 | | 3,820,000 | 3,222,648 |
| 3.55% 3/10/51 | | 4,400,000 | 3,117,950 |
| 4.125% 8/25/27 | | 919,000 | 887,869 |
| 6.55% 3/14/37 | | 2,718,000 | 2,890,083 |
| Philippine Republic: | | | |
| 1.648% 6/10/31 | | 1,850,000 | 1,424,704 |
| 3% 2/1/28 | | 3,387,000 | 3,112,179 |
| 3.7% 3/1/41 | | 3,000,000 | 2,407,830 |
| 3.75% 1/14/29 | | 1,000,000 | 937,610 |
| 3.95% 1/20/40 | | 3,734,000 | 3,118,301 |
| 4.2% 1/21/24 | | 678,000 | 671,295 |
| 5.17% 10/13/27 | | 5,000,000 | 5,044,300 |
| 6.375% 10/23/34 | | 1,849,000 | 2,006,368 |
| 7.75% 1/14/31 | | 3,000,000 | 3,480,330 |
| 9.5% 2/2/30 | | 2,500,000 | 3,106,525 |
| Polish Government: | | | |
| 3.25% 4/6/26 | | 1,176,000 | 1,114,113 |
| 4% 1/22/24 | | 4,321,000 | 4,261,046 |
| Quebec Province: | | | |
| 1.5% 2/11/25 | | 6,000,000 | 5,616,018 |
| 2.5% 4/20/26 | | 1,009,000 | 945,201 |
| 2.75% 4/12/27 | | 8,846,000 | 8,248,718 |
| 2.875% 10/16/24 | | 370,000 | 356,718 |
| United Mexican States: | | | |
| 3.5% 2/12/34 | | 16,778,000 | 13,623,736 |
| 3.75% 4/19/71 | | 7,000,000 | 4,525,063 |
| 4.28% 8/14/41 | | 3,000,000 | 2,394,938 |
| 4.35% 1/15/47 | | 2,568,000 | 1,977,842 |
| 4.5% 1/31/50 | | 2,200,000 | 1,726,725 |
| 4.6% 1/23/46 | | 1,034,000 | 829,010 |
| 4.6% 2/10/48 | | 3,128,000 | 2,490,279 |
| 4.75% 4/27/32 | | 5,000,000 | 4,658,750 |
| 4.75% 3/8/44 | | 1,730,000 | 1,434,603 |
| 5.55% 1/21/45 | | 2,198,000 | 2,026,007 |
| 6.05% 1/11/40 | | 3,556,000 | 3,537,776 |
| Uruguay Republic: | | | |
| 4.125% 11/20/45 | | 846,621 | 762,382 |
| 4.375% 1/23/31 | | 2,824,181 | 2,749,340 |
| 4.975% 4/20/55 | | 5,249,811 | 5,024,069 |
| TOTAL FOREIGN GOVERNMENT AND GOVERNMENT AGENCY OBLIGATIONS (Cost $335,919,030) | | | 282,643,554 |
| | | | |
| Supranational Obligations - 1.2% |
| | | Principal Amount (a) | Value ($) |
| African Development Bank 0.875% 7/22/26 | | 4,400,000 | 3,887,206 |
| Asian Development Bank: | | | |
| 0.375% 9/3/25 | | 13,000,000 | 11,671,246 |
| 0.75% 10/8/30 | | 3,000,000 | 2,333,760 |
| 1.5% 10/18/24 | | 4,500,000 | 4,251,788 |
| 1.875% 1/24/30 | | 8,574,000 | 7,370,514 |
| 2% 4/24/26 | | 1,123,000 | 1,038,302 |
| 2.5% 11/2/27 | | 1,195,000 | 1,101,013 |
| 2.625% 1/30/24 | | 2,742,000 | 2,674,406 |
| 2.625% 1/12/27 | | 1,158,000 | 1,083,385 |
| 2.75% 3/17/23 | | 1,707,000 | 1,705,634 |
| 2.75% 1/19/28 | | 11,074,000 | 10,326,427 |
| European Investment Bank: | | | |
| 0.75% 9/23/30 | | 7,250,000 | 5,687,726 |
| 0.875% 5/17/30 | | 1,760,000 | 1,404,885 |
| 1.25% 2/14/31 | | 6,300,000 | 5,108,292 |
| 1.625% 3/14/25 | | 21,997,000 | 20,643,486 |
| 1.875% 2/10/25 | | 535,000 | 505,366 |
| 2.25% 6/24/24 | | 4,115,000 | 3,965,053 |
| 2.375% 5/24/27 | | 713,000 | 658,592 |
| 2.5% 3/15/23 | | 3,743,000 | 3,740,155 |
| 2.5% 10/15/24 | | 1,020,000 | 981,515 |
| 2.875% 8/15/23 | | 1,888,000 | 1,867,919 |
| 3.125% 12/14/23 | | 2,459,000 | 2,419,950 |
| 3.25% 1/29/24 | | 356,000 | 349,660 |
| Inter-American Development Bank: | | | |
| 0.625% 7/15/25 | | 4,000,000 | 3,637,828 |
| 1.75% 3/14/25 | | 16,400,000 | 15,413,540 |
| 2% 6/2/26 | | 713,000 | 656,462 |
| 2% 7/23/26 | | 6,000,000 | 5,521,860 |
| 2.125% 1/15/25 | | 326,000 | 309,893 |
| 2.25% 6/18/29 | | 3,189,000 | 2,832,281 |
| 2.375% 7/7/27 | | 1,200,000 | 1,105,135 |
| 3% 10/4/23 | | 637,000 | 628,239 |
| 3% 2/21/24 | | 14,887,000 | 14,561,757 |
| 4.375% 1/24/44 | | 2,313,000 | 2,284,877 |
| International Bank for Reconstruction & Development: | | | |
| 0.375% 7/28/25 | | 5,350,000 | 4,830,771 |
| 0.5% 10/28/25 | | 8,582,000 | 7,704,201 |
| 0.75% 3/11/25 | | 64,000 | 58,999 |
| 0.75% 8/26/30 | | 8,100,000 | 6,307,308 |
| 0.875% 5/14/30 | | 3,108,000 | 2,465,359 |
| 1.5% 8/28/24 | | 7,014,000 | 6,653,598 |
| 1.625% 1/15/25 | | 21,300,000 | 20,066,318 |
| 1.75% 4/19/23 | | 1,195,000 | 1,190,268 |
| 1.875% 6/19/23 | | 2,992,000 | 2,963,979 |
| 1.875% 10/27/26 | | 849,000 | 773,970 |
| 2.5% 3/19/24 | | 677,000 | 657,597 |
| 2.5% 11/25/24 | | 1,016,000 | 974,472 |
| 2.5% 7/29/25 | | 676,000 | 642,728 |
| 2.5% 3/29/32 | | 11,300,000 | 9,965,971 |
| International Finance Corp.: | | | |
| 0.375% 7/16/25 | | 19,670,000 | 17,798,793 |
| 0.75% 8/27/30 | | 2,100,000 | 1,641,872 |
| 2.875% 7/31/23 | | 767,000 | 759,844 |
| TOTAL SUPRANATIONAL OBLIGATIONS (Cost $252,594,447) | | | 227,184,200 |
| | | | |
| Bank Notes - 0.1% |
| | | Principal Amount (a) | Value ($) |
| Bank of America NA 6% 10/15/36 | | 2,144,000 | 2,219,758 |
| Citibank NA 3.65% 1/23/24 | | 4,456,000 | 4,391,143 |
| Citizens Bank NA 2.25% 4/28/25 | | 3,750,000 | 3,505,147 |
| Discover Bank: | | | |
| 2.7% 2/6/30 | | 5,000,000 | 4,075,278 |
| 3.45% 7/27/26 | | 2,273,000 | 2,116,068 |
| KeyBank NA 4.9% 8/8/32 | | 1,200,000 | 1,129,249 |
| Truist Bank: | | | |
| 1.5% 3/10/25 | | 1,500,000 | 1,392,777 |
| 2.636% 9/17/29 (b) | | 5,000,000 | 4,710,921 |
| 3.3% 5/15/26 | | 1,355,000 | 1,269,373 |
| 3.8% 10/30/26 | | 427,000 | 402,932 |
| TOTAL BANK NOTES (Cost $27,755,076) | | | 25,212,646 |
| | | | |
| Money Market Funds - 1.7% |
| | | Shares | Value ($) |
| Fidelity Cash Central Fund 4.63% (h) | | 157,733,058 | 157,764,605 |
| Fidelity Securities Lending Cash Central Fund 4.63% (h)(i) | | 159,802,770 | 159,818,750 |
| TOTAL MONEY MARKET FUNDS (Cost $317,583,355) | | | 317,583,355 |
| | | | |
| TOTAL INVESTMENT IN SECURITIES - 102.2% (Cost $22,131,253,892) | 19,511,437,484 |
NET OTHER ASSETS (LIABILITIES) - (2.2)% | (414,856,792) |
| NET ASSETS - 100.0% | 19,096,580,692 |
| | |
| TBA Sale Commitments |
| | Principal Amount (a) | Value ($) |
| Uniform Mortgage Backed Securities | | |
| 2% 3/1/53 | (33,850,000) | (27,562,505) |
| | | |
TOTAL TBA SALE COMMITMENTS (Proceeds $27,537,504) | | (27,562,505) |
Legend
| (a) | Amount is stated in United States dollars unless otherwise noted. |
| (b) | Coupon rates for floating and adjustable rate securities reflect the rates in effect at period end. |
| (c) | Security exempt from registration under Rule 144A of the Securities Act of 1933. These securities may be resold in transactions exempt from registration, normally to qualified institutional buyers. At the end of the period, the value of these securities amounted to $62,979,972 or 0.3% of net assets. |
| (d) | Coupon is indexed to a floating interest rate which may be multiplied by a specified factor and/or subject to caps or floors. |
| (e) | Security or a portion of the security purchased on a delayed delivery or when-issued basis. |
| (f) | Security or a portion of the security has been segregated as collateral for mortgage-backed or asset-backed securities purchased on a delayed delivery or when-issued basis. At period end, the value of securities pledged amounted to $3,261,786. |
| (g) | Security or a portion of the security is on loan at period end. |
| (h) | Affiliated fund that is generally available only to investment companies and other accounts managed by Fidelity Investments. The rate quoted is the annualized seven-day yield of the fund at period end. A complete unaudited listing of the fund's holdings as of its most recent quarter end is available upon request. In addition, each Fidelity Central Fund's financial statements are available on the SEC's website or upon request. |
| (i) | Investment made with cash collateral received from securities on loan. |
Affiliated Central Funds
Fiscal year to date information regarding the Fund's investments in Fidelity Central Funds, including the ownership percentage, is presented below.
| Affiliate | Value, beginning of period ($) | Purchases ($) | Sales Proceeds ($) | Dividend Income ($) | Realized Gain (loss) ($) | Change in Unrealized appreciation (depreciation) ($) | Value, end of period ($) | % ownership, end of period |
| Fidelity Cash Central Fund 4.63% | 117,282,610 | 1,379,480,989 | 1,338,998,994 | 1,162,024 | - | - | 157,764,605 | 0.4% |
| Fidelity Securities Lending Cash Central Fund 4.63% | 199,750,000 | 1,654,725,231 | 1,694,656,481 | 254,771 | - | - | 159,818,750 | 0.5% |
| Total | 317,032,610 | 3,034,206,220 | 3,033,655,475 | 1,416,795 | - | - | 317,583,355 | |
| | | | | | | | | |
Amounts in the dividend income column in the above table include any capital gain distributions from underlying funds, which are presented in the corresponding line item in the Statement of Operations, if applicable.
Amount for Fidelity Securities Lending Cash Central Fund represents the income earned on investing cash collateral, less rebates paid to borrowers and any lending agent fees associated with the loan, plus any premium payments received for lending certain types of securities.
Amounts included in the purchases and sales proceeds columns may include in-kind transactions, if applicable.
Investment Valuation
The following is a summary of the inputs used, as of February 28, 2023, involving the Fund's assets and liabilities carried at fair value. The inputs or methodology used for valuing securities may not be an indication of the risk associated with investing in those securities. For more information on valuation inputs, and their aggregation into the levels used below, please refer to the Investment Valuation section in the accompanying Notes to Financial Statements.
| Valuation Inputs at Reporting Date: |
| Description | Total ($) | Level 1 ($) | Level 2 ($) | Level 3 ($) |
Investments in Securities: | | | | |
|
| Corporate Bonds | 4,802,263,635 | - | 4,802,263,635 | - |
|
| U.S. Government and Government Agency Obligations | 8,175,016,708 | - | 8,175,016,708 | - |
|
| U.S. Government Agency - Mortgage Securities | 5,234,546,268 | - | 5,234,546,268 | - |
|
| Asset-Backed Securities | 43,396,790 | - | 43,396,790 | - |
|
| Commercial Mortgage Securities | 303,140,057 | - | 303,140,057 | - |
|
| Municipal Securities | 100,450,271 | - | 100,450,271 | - |
|
| Foreign Government and Government Agency Obligations | 282,643,554 | - | 282,643,554 | - |
|
| Supranational Obligations | 227,184,200 | - | 227,184,200 | - |
|
| Bank Notes | 25,212,646 | - | 25,212,646 | - |
|
| Money Market Funds | 317,583,355 | 317,583,355 | - | - |
| Total Investments in Securities: | 19,511,437,484 | 317,583,355 | 19,193,854,129 | - |
Other Financial Instruments: | | | | |
|
| TBA Sale Commitments | (27,562,505) | - | (27,562,505) | - |
| Total Other Financial Instruments: | (27,562,505) | - | (27,562,505) | - |
| Statement of Assets and Liabilities |
| | | | February 28, 2023 (Unaudited) |
| | | | | |
| Assets | | | | |
| Investment in securities, at value (including securities loaned of $156,015,400) - See accompanying schedule: | | | | |
Unaffiliated issuers (cost $21,813,670,537) | $ | 19,193,854,129 | | |
Fidelity Central Funds (cost $317,583,355) | | 317,583,355 | | |
| | | | | |
| | | | | |
| Total Investment in Securities (cost $22,131,253,892) | | | $ | 19,511,437,484 |
| Receivable for investments sold | | | | 96,755,879 |
| Receivable for TBA sale commitments | | | | 27,537,504 |
| Receivable for fund shares sold | | | | 138,987,005 |
| Interest receivable | | | | 111,797,485 |
| Distributions receivable from Fidelity Central Funds | | | | 320,751 |
| Other receivables | | | | 6,297 |
Total assets | | | | 19,886,842,405 |
| Liabilities | | | | |
| Payable to custodian bank | $ | 285 | | |
| Payable for investments purchased | | | | |
Regular delivery | | 368,593,152 | | |
Delayed delivery | | 233,476,786 | | |
| TBA sale commitments, at value | | 27,562,505 | | |
| Payable for fund shares redeemed | | 775,685 | | |
| Distributions payable | | 764 | | |
| Other payables and accrued expenses | | 33,786 | | |
| Collateral on securities loaned | | 159,818,750 | | |
| Total Liabilities | | | | 790,261,713 |
| Net Assets | | | $ | 19,096,580,692 |
| Net Assets consist of: | | | | |
| Paid in capital | | | $ | 22,116,199,859 |
| Total accumulated earnings (loss) | | | | (3,019,619,167) |
| Net Assets | | | $ | 19,096,580,692 |
Net Asset Value , offering price and redemption price per share ($19,096,580,692 ÷ 2,151,326,228 shares) | | | $ | 8.88 |
| Statement of Operations |
| | | | Six months ended February 28, 2023 (Unaudited) |
| Investment Income | | | | |
| Interest | | | $ | 236,846,319 |
| Income from Fidelity Central Funds (including $254,771 from security lending) | | | | 1,416,795 |
| Total Income | | | | 238,263,114 |
| Expenses | | | | |
| Custodian fees and expenses | $ | 99,318 | | |
| Independent trustees' fees and expenses | | 34,009 | | |
| Total expenses before reductions | | 133,327 | | |
| Expense reductions | | (4,512) | | |
| Total expenses after reductions | | | | 128,815 |
| Net Investment income (loss) | | | | 238,134,299 |
| Realized and Unrealized Gain (Loss) | | | | |
| Net realized gain (loss) on: | | | | |
| Investment Securities: | | | | |
| Unaffiliated issuers | | (148,128,841) | | |
| Total net realized gain (loss) | | | | (148,128,841) |
| Change in net unrealized appreciation (depreciation) on: | | | | |
| Investment Securities: | | | | |
| Unaffiliated issuers | | (474,386,908) | | |
| TBA Sale commitments | | (25,001) | | |
| Total change in net unrealized appreciation (depreciation) | | | | (474,411,909) |
| Net gain (loss) | | | | (622,540,750) |
| Net increase (decrease) in net assets resulting from operations | | | $ | (384,406,451) |
| Statement of Changes in Net Assets |
| |
| | Six months ended February 28, 2023 (Unaudited) | | Year ended August 31, 2022 |
| Increase (Decrease) in Net Assets | | | | |
| Operations | | | | |
| Net investment income (loss) | $ | 238,134,299 | $ | 353,351,790 |
| Net realized gain (loss) | | (148,128,841) | | (207,970,092) |
| Change in net unrealized appreciation (depreciation) | | (474,411,909) | | (2,571,318,776) |
| Net increase (decrease) in net assets resulting from operations | | (384,406,451) | | (2,425,937,078) |
| Distributions to shareholders | | (238,771,743) | | (361,419,121) |
| Share transactions | | | | |
| Proceeds from sales of shares | | 3,201,211,343 | | 4,789,853,135 |
| Reinvestment of distributions | | 238,182,767 | | 361,418,481 |
| Cost of shares redeemed | | (1,482,834,705) | | (5,409,612,572) |
Net increase (decrease) in net assets resulting from share transactions | | 1,956,559,405 | | (258,340,956) |
| Total increase (decrease) in net assets | | 1,333,381,211 | | (3,045,697,155) |
| | | | | |
| Net Assets | | | | |
| Beginning of period | | 17,763,199,481 | | 20,808,896,636 |
| End of period | $ | 19,096,580,692 | $ | 17,763,199,481 |
| | | | | |
| Other Information | | | | |
| Shares | | | | |
| Sold | | 359,372,330 | | 476,122,481 |
| Issued in reinvestment of distributions | | 26,809,125 | | 36,737,708 |
| Redeemed | | (166,841,127) | | (546,521,163) |
| Net increase (decrease) | | 219,340,328 | | (33,660,974) |
| | | | | |
Financial Highlights
| Fidelity® Series Bond Index |
| |
| | Six months ended (Unaudited) February 28, 2023 | | Years ended August 31, 2022 | | 2021 | | 2020 | | 2019 A |
Selected Per-Share Data | | | | | | | | | | |
| Net asset value, beginning of period | $ | 9.19 | $ | 10.59 | $ | 10.90 | $ | 10.50 | $ | 10.00 |
| Income from Investment Operations | | | | | | | | | | |
Net investment income (loss) B,C | | .118 | | .181 | | .165 | | .242 | | .098 |
| Net realized and unrealized gain (loss) | | (.310) | | (1.396) | | (.182) | | .422 | | .501 |
| Total from investment operations | | (.192) | | (1.215) | | (.017) | | .664 | | .599 |
| Distributions from net investment income | | (.118) | | (.185) | | (.174) | | (.250) | | (.099) |
| Distributions from net realized gain | | - | | - | | (.119) | | (.014) | | - |
| Total distributions | | (.118) | | (.185) | | (.293) | | (.264) | | (.099) |
| Net asset value, end of period | $ | 8.88 | $ | 9.19 | $ | 10.59 | $ | 10.90 | $ | 10.50 |
Total Return D,E | | (2.08)% | | (11.57)% | | (.14)% | | 6.42% | | 6.01% |
Ratios to Average Net Assets C,F,G | | | | | | | | | | |
Expenses before reductions H | | -% I | | -% | | -% | | -% | | -% I |
Expenses net of fee waivers, if any H | | -% I | | -% | | -% | | -% | | -% I |
Expenses net of all reductions H | | -% I | | -% | | -% | | -% | | -% I |
| Net investment income (loss) | | 2.68% I | | 1.82% | | 1.56% | | 2.29% | | 2.77% I |
| Supplemental Data | | | | | | | | | | |
| Net assets, end of period (000 omitted) | $ | 19,096,581 | $ | 17,763,199 | $ | 20,808,897 | $ | 13,160,897 | $ | 7,446,093 |
Portfolio turnover rate J | | 32% I | | 61% | | 108% | | 71% K | | 20% K,L |
A For the period April 26, 2019 (commencement of operations) through August 31, 2019.
B Calculated based on average shares outstanding during the period.
C Net investment income (loss) is affected by the timing of the declaration of dividends by any underlying mutual funds or exchange-traded funds (ETFs). Net investment income (loss) of any mutual funds or ETFs is not included in the Fund's net investment income (loss) ratio.
D Total returns for periods of less than one year are not annualized.
E Total returns would have been lower if certain expenses had not been reduced during the applicable periods shown.
F Fees and expenses of any underlying mutual funds or exchange-traded funds (ETFs) are not included in the Fund's expense ratio. The Fund indirectly bears its proportionate share of these expenses. For additional expense information related to investments in Fidelity Central Funds, please refer to the "Investments in Fidelity Central Funds" note found in the Notes to Financial Statements section of the most recent Annual or Semi-Annual report.
G Expense ratios reflect operating expenses of the class. Expenses before reductions do not reflect amounts reimbursed, waived, or reduced through arrangements with the investment adviser, brokerage services, or other offset arrangements, if applicable, and do not represent the amount paid by the class during periods when reimbursements, waivers or reductions occur.
H Amount represents less than .005%.
I Annualized.
J Amount does not include the portfolio activity of any underlying mutual funds or exchange-traded funds (ETFs).
K Portfolio turnover rate excludes securities received or delivered in-kind.
L Amount not annualized.
For the period ended February 28, 2023
1. Organization.
Fidelity Series Bond Index Fund (the Fund) is a fund of Fidelity Salem Street Trust (the Trust) and is authorized to issue an unlimited number of shares. Shares are offered only to certain other Fidelity funds, Fidelity managed 529 plans, and Fidelity managed collective investment trusts. The Trust is registered under the Investment Company Act of 1940, as amended (the 1940 Act), as an open-end management investment company organized as a Massachusetts business trust.
2. Investments in Fidelity Central Funds.
Funds may invest in Fidelity Central Funds, which are open-end investment companies generally available only to other investment companies and accounts managed by the investment adviser and its affiliates. The Schedule of Investments lists any Fidelity Central Funds held as an investment as of period end, but does not include the underlying holdings of each Fidelity Central Fund. An investing fund indirectly bears its proportionate share of the expenses of the underlying Fidelity Central Funds.
Based on its investment objective, each Fidelity Central Fund may invest or participate in various investment vehicles or strategies that are similar to those of the investing fund. These strategies are consistent with the investment objectives of the investing fund and may involve certain economic risks which may cause a decline in value of each of the Fidelity Central Funds and thus a decline in the value of the investing fund.
| Fidelity Central Fund | Investment Manager | Investment Objective | Investment Practices | Expense Ratio A |
| Fidelity Money Market Central Funds | Fidelity Management & Research Company LLC (FMR) | Each fund seeks to obtain a high level of current income consistent with the preservation of capital and liquidity. | Short-term Investments | Less than .005% |
A Expenses expressed as a percentage of average net assets and are as of each underlying Central Fund's most recent annual or semi-annual shareholder report.
A complete unaudited list of holdings for each Fidelity Central Fund is available upon request or at the Securities and Exchange Commission website at www.sec.gov. In addition, the financial statements of the Fidelity Central Funds which contain the significant accounting policies (including investment valuation policies) of those funds, and are not covered by the Report of Independent Registered Public Accounting Firm, are available on the Securities and Exchange Commission website or upon request.
3. Significant Accounting Policies.
The Fund is an investment company and applies the accounting and reporting guidance of the Financial Accounting Standards Board (FASB) Accounting Standards Codification Topic 946 Financial Services - Investment Companies . The financial statements have been prepared in conformity with accounting principles generally accepted in the United States of America (GAAP), which require management to make certain estimates and assumptions at the date of the financial statements. Actual results could differ from those estimates. Subsequent events, if any, through the date that the financial statements were issued have been evaluated in the preparation of the financial statements. The Fund's Schedule of Investments lists any underlying mutual funds or exchange-traded funds (ETFs) but does not include the underlying holdings of these funds. The following summarizes the significant accounting policies of the Fund:
Investment Valuation. Investments are valued as of 4:00 p.m. Eastern time on the last calendar day of the period. The Board of Trustees (the Board) has designated the Fund's investment adviser as the valuation designee responsible for the fair valuation function and performing fair value determinations as needed. The investment adviser has established a Fair Value Committee (the Committee) to carry out the day-to-day fair valuation responsibilities and has adopted policies and procedures to govern the fair valuation process and the activities of the Committee. In accordance with these fair valuation policies and procedures, which have been approved by the Board, the Fund attempts to obtain prices from one or more third party pricing services or brokers to value its investments. When current market prices, quotations or currency exchange rates are not readily available or reliable, investments will be fair valued in good faith by the Committee, in accordance with the policies and procedures. Factors used in determining fair value vary by investment type and may include market or investment specific events, transaction data, estimated cash flows, and market observations of comparable investments. The frequency that the fair valuation procedures are used cannot be predicted and they may be utilized to a significant extent. The Committee manages the Fund's fair valuation practices and maintains the fair valuation policies and procedures. The Fund's investment adviser reports to the Board information regarding the fair valuation process and related material matters.
The Fund categorizes the inputs to valuation techniques used to value its investments into a disclosure hierarchy consisting of three levels as shown below:
Level 1 - unadjusted quoted prices in active markets for identical investments
Level 2 - other significant observable inputs (including quoted prices for similar investments, interest rates, prepayment speeds, etc.)
Level 3 - unobservable inputs (including the Fund's own assumptions based on the best information available)
Valuation techniques used to value the Fund's investments by major category are as follows:
Debt securities, including restricted securities, are valued based on evaluated prices received from third party pricing services or from brokers who make markets in such securities. Corporate bonds, bank notes, foreign government and government agency obligations, municipal securities, supranational obligations, and U.S. government and government agency obligations are valued by pricing services who utilize matrix pricing which considers yield or price of bonds of comparable quality, coupon, maturity and type or by broker-supplied prices. Asset backed securities, commercial mortgage securities and U.S. government agency mortgage securities are valued by pricing services who utilize matrix pricing which considers prepayment speed assumptions, attributes of the collateral, yield or price of bonds of comparable quality, coupon, maturity and type or by broker-supplied prices. When independent prices are unavailable or unreliable, debt securities may be valued utilizing pricing methodologies which consider similar factors that would be used by third party pricing services. Debt securities are generally categorized as Level 2 in the hierarchy but may be Level 3 depending on the circumstances.
Investments in open-end mutual funds, including the Fidelity Central Funds, are valued at their closing net asset value (NAV) each business day and are categorized as Level 1 in the hierarchy.
Changes in valuation techniques may result in transfers in or out of an assigned level within the disclosure hierarchy. The aggregate value of investments by input level as of February 28, 2023 is included at the end of the Fund's Schedule of Investments.
Investment Transactions and Income. For financial reporting purposes, the Fund's investment holdings and NAV include trades executed through the end of the last business day of the period. The NAV per share for processing shareholder transactions is calculated as of the close of business of the New York Stock Exchange (NYSE), normally 4:00 p.m. Eastern time and includes trades executed through the end of the prior business day. Gains and losses on securities sold are determined on the basis of identified cost. Income and capital gain distributions from Fidelity Central Funds, if any, are recorded on the ex-dividend date. Interest income is accrued as earned and includes coupon interest and amortization of premium and accretion of discount on debt securities as applicable. Debt obligations may be placed on non-accrual status and related interest income may be reduced by ceasing current accruals and writing off interest receivables when the collection of all or a portion of interest has become doubtful based on consistently applied procedures. A debt obligation is removed from non-accrual status when the issuer resumes interest payments or when collectability of interest is reasonably assured.
Expenses. Expenses directly attributable to a fund are charged to that fund. Expenses attributable to more than one fund are allocated among the respective funds on the basis of relative net assets or other appropriate methods. Expenses included in the accompanying financial statements reflect the expenses of that fund and do not include any expenses associated with any underlying mutual funds or exchange-traded funds. Although not included in a fund's expenses, a fund indirectly bears its proportionate share of these expenses through the net asset value of each underlying mutual fund or exchange-traded fund. Expense estimates are accrued in the period to which they relate and adjustments are made when actual amounts are known.
Income Tax Information and Distributions to Shareholders. Each year, the Fund intends to qualify as a regulated investment company under Subchapter M of the Internal Revenue Code, including distributing substantially all of its taxable income and realized gains. As a result, no provision for U.S. Federal income taxes is required. The Fund files a U.S. federal tax return, in addition to state and local tax returns as required. The Fund's federal income tax returns are subject to examination by the Internal Revenue Service (IRS) for a period of three fiscal years after they are filed. State and local tax returns may be subject to examination for an additional fiscal year depending on the jurisdiction.
Distributions are declared and recorded daily and paid monthly from net investment income. Distributions from realized gains, if any, are declared and recorded on the ex-dividend date. Income and capital gain distributions are determined in accordance with income tax regulations, which may differ from GAAP.
Capital accounts within the financial statements are adjusted for permanent book-tax differences. These adjustments have no impact on net assets or the results of operations. Capital accounts are not adjusted for temporary book-tax differences which will reverse in a subsequent period.
Book-tax differences are primarily due to capital loss carryforwards and losses deferred due to wash sales and excise tax regulations.
As of period end, the cost and unrealized appreciation (depreciation) in securities, and derivatives if applicable, for federal income tax purposes were as follows:
| Gross unrealized appreciation | $14,330,858 |
| Gross unrealized depreciation | (2,643,047,300) |
| Net unrealized appreciation (depreciation) | $(2,628,716,442) |
| Tax cost | $22,140,153,926 |
Capital loss carryforwards are only available to offset future capital gains of the Fund to the extent provided by regulations and may be limited. The capital loss carryforward information presented below, including any applicable limitation, is estimated as of prior fiscal period end and is subject to adjustment.
| Short-term | $(143,188,019) |
| Long-term | (79,092,874) |
| Total capital loss carryforward | $(222,280,893) |
Delayed Delivery Transactions and When-Issued Securities. During the period, certain Funds transacted in securities on a delayed delivery or when-issued basis. Payment and delivery may take place after the customary settlement period for that security. The price of the underlying securities and the date when the securities will be delivered and paid for are fixed at the time the transaction is negotiated. Securities purchased on a delayed delivery or when-issued basis are identified as such in the Schedule of Investments. Compensation for interest forgone in the purchase of a delayed delivery or when-issued debt security may be received. With respect to purchase commitments, each applicable Fund identifies securities as segregated in its records with a value at least equal to the amount of the commitment. Payables and receivables associated with the purchases and sales of delayed delivery securities having the same coupon, settlement date and broker are offset. Delayed delivery or when-issued securities that have been purchased from and sold to different brokers are reflected as both payables and receivables in the Statement of Assets and Liabilities under the caption "Delayed delivery", as applicable. Losses may arise due to changes in the value of the underlying securities or if the counterparty does not perform under the contract's terms, or if the issuer does not issue the securities due to political, economic, or other factors.
To-Be-Announced (TBA) Securities and Mortgage Dollar Rolls. TBA securities involve buying or selling mortgage-backed securities (MBS) on a forward commitment basis. A TBA transaction typically does not designate the actual security to be delivered and only includes an approximate principal amount; however delivered securities must meet specified terms defined by industry guidelines, including issuer, rate and current principal amount outstanding on underlying mortgage pools. Funds may enter into a TBA transaction with the intent to take possession of or deliver the underlying MBS, or a fund may elect to extend the settlement by entering into either a mortgage or reverse mortgage dollar roll. Mortgage dollar rolls are transactions where a fund sells TBA securities and simultaneously agrees to repurchase MBS on a later date at a lower price and with the same counterparty. Reverse mortgage dollar rolls involve the purchase and simultaneous agreement to sell TBA securities on a later date at a lower price. Transactions in mortgage dollar rolls and reverse mortgage dollar rolls are accounted for as purchases and sales and may result in an increase to a fund's portfolio turnover rate.
Purchases and sales of TBA securities involve risks similar to those discussed above for delayed delivery and when-issued securities. Also, if the counterparty in a mortgage dollar roll or a reverse mortgage dollar roll transaction files for bankruptcy or becomes insolvent, a fund's right to repurchase or sell securities may be limited. Additionally, when a fund sells TBA securities without already owning or having the right to obtain the deliverable securities (an uncovered forward commitment to sell), it incurs a risk of loss because it could have to purchase the securities at a price that is higher than the price at which it sold them. A fund may be unable to purchase the deliverable securities if the corresponding market is illiquid.
TBA securities subject to a forward commitment to sell at period end are included at the end of the Schedule of Investments under the caption "TBA Sale Commitments." The proceeds and value of these commitments are reflected in the Statement of Assets and Liabilities as "Receivable for TBA sale commitments" and "TBA sale commitments, at value," respectively.
Restricted Securities (including Private Placements). Funds may invest in securities that are subject to legal or contractual restrictions on resale. These securities generally may be resold in transactions exempt from registration or to the public if the securities are registered. Disposal of these securities may involve time-consuming negotiations and expense, and prompt sale at an acceptable price may be difficult. Information regarding restricted securities held at period end is included at the end of the Schedule of Investments, if applicable.
4. Purchases and Sales of Investments.
Purchases and sales of securities, other than short-term securities, U.S. government securities and in-kind transactions, as applicable, are noted in the table below.
| | Purchases ($) | Sales ($) |
| Fidelity Series Bond Index Fund | 1,168,357,451 | 678,448,700 |
5. Fees and Other Transactions with Affiliates.
Management Fee. Fidelity Management & Research Company LLC (the investment adviser) and its affiliates provide the Fund with investment management related services for which the Fund does not pay a management fee. Under the management contract, the investment adviser or an affiliate pays all ordinary operating expenses of the Fund, except custody fees, fees and expenses of the independent Trustees, and certain miscellaneous expenses such as proxy and shareholder meeting expenses.
Interfund Trades. Funds may purchase from or sell securities to other Fidelity Funds under procedures adopted by the Board. The procedures have been designed to ensure these interfund trades are executed in accordance with Rule 17a-7 of the 1940 Act. Any interfund trades are included within the respective purchases and sales amounts shown in the Purchases and Sales of Investments note. During the period, there were no interfund trades.
Other. During the period, the investment adviser reimbursed the Fund for certain losses as follows:
| | Amount ($) |
| Fidelity Series Bond Index Fund | 6,304 |
6. Committed Line of Credit.
Certain Funds participate with other funds managed by the investment adviser or an affiliate in a $4.25 billion credit facility (the "line of credit") to be utilized for temporary or emergency purposes to fund shareholder redemptions or for other short-term liquidity purposes. The commitment fees on the pro-rata portion of the line of credit are borne by the investment adviser. During the period, there were no borrowings on this line of credit.
7. Security Lending.
Funds lend portfolio securities from time to time in order to earn additional income. Lending agents are used, including National Financial Services (NFS), an affiliate of the investment adviser. Pursuant to a securities lending agreement, NFS will receive a fee, which is capped at 9.9% of a fund's daily lending revenue, for its services as lending agent. A fund may lend securities to certain qualified borrowers, including NFS. On the settlement date of the loan, a fund receives collateral (in the form of U.S. Treasury obligations, letters of credit and/or cash) against the loaned securities and maintains collateral in an amount not less than 100% of the market value of the loaned securities during the period of the loan. The market value of the loaned securities is determined at the close of business of a fund and any additional required collateral is delivered to a fund on the next business day. A fund or borrower may terminate the loan at any time, and if the borrower defaults on its obligation to return the securities loaned because of insolvency or other reasons, a fund may apply collateral received from the borrower against the obligation. A fund may experience delays and costs in recovering the securities loaned. Any cash collateral received is invested in the Fidelity Securities Lending Cash Central Fund. Any loaned securities are identified as such in the Schedule of Investments, and the value of loaned securities and cash collateral at period end, as applicable, are presented in the Statement of Assets and Liabilities. Security lending income represents the income earned on investing cash collateral, less rebates paid to borrowers and any lending agent fees associated with the loan, plus any premium payments received for lending certain types of securities. Security lending income is presented in the Statement of Operations as a component of income from Fidelity Central Funds. Affiliated security lending activity, if any, was as follows:
| | Total Security Lending Fees Paid to NFS | Security Lending Income From Securities Loaned to NFS | Value of Securities Loaned to NFS at Period End |
| Fidelity Series Bond Index Fund | $26,811 | $- | $- |
8. Expense Reductions.
Through arrangements with the Fund's custodian, credits realized as a result of certain uninvested cash balances were used to reduce the Fund's expenses by $4,512.
9. Other.
A fund's organizational documents provide former and current trustees and officers with a limited indemnification against liabilities arising in connection with the performance of their duties to the fund. In the normal course of business, a fund may also enter into contracts that provide general indemnifications. A fund's maximum exposure under these arrangements is unknown as this would be dependent on future claims that may be made against a fund. The risk of material loss from such claims is considered remote.
At the end of the period, mutual funds and accounts managed by the investment adviser or its affiliates were the owners of record of all of the outstanding shares of the Fund.
10. Risk and Uncertainties.
Many factors affect a fund's performance. Developments that disrupt global economies and financial markets, such as pandemics, epidemics, outbreaks of infectious diseases, war, terrorism, and environmental disasters, may significantly affect a fund's investment performance. The effects of these developments to a fund will be impacted by the types of securities in which a fund invests, the financial condition, industry, economic sector, and geographic location of an issuer, and a fund's level of investment in the securities of that issuer. Significant concentrations in security types, issuers, industries, sectors, and geographic locations may magnify the factors that affect a fund's performance.
As a shareholder, you incur two types of costs: (1) transaction costs, which may include sales charges (loads) on purchase payments or redemption proceeds, as applicable and (2) ongoing costs, which generally include management fees, distribution and/or service (12b-1) fees and other Fund expenses. This Example is intended to help you understand your ongoing costs (in dollars) of investing in a fund and to compare these costs with the ongoing costs of investing in other mutual funds.
| The Example is based on an investment of $1,000 invested at the beginning of the period and held for the entire period (September 1, 2022 to February 28, 2023). |
Actual Expenses
The first line of the accompanying table provides information about actual account values and actual expenses. You may use the information in this line, together with the amount you invested, to estimate the expenses that you paid over the period. Simply divide your account value by $1,000.00 (for example, an $8,600 account value divided by $1,000.00 = 8.6), then multiply the result by the number in the first line for a class/Fund under the heading entitled "Expenses Paid During Period" to estimate the expenses you paid on your account during this period. If any fund is a shareholder of any underlying mutual funds or exchange-traded funds (ETFs) (the Underlying Funds), such fund indirectly bears its proportional share of the expenses of the Underlying Funds in addition to the direct expenses incurred presented in the table. These fees and expenses are not included in the annualized expense ratio used to calculate the expense estimate in the table below.
Hypothetical Example for Comparison Purposes
The second line of the accompanying table provides information about hypothetical account values and hypothetical expenses based on the actual expense ratio and an assumed rate of return of 5% per year before expenses, which is not the actual return. The hypothetical account values and expenses may not be used to estimate the actual ending account balance or expenses you paid for the period. You may use this information to compare the ongoing costs of investing in the Fund and other funds. To do so, compare this 5% hypothetical example with the 5% hypothetical examples that appear in the shareholder reports of the other funds. If any fund is a shareholder of any Underlying Funds, such fund indirectly bears its proportional share of the expenses of the Underlying Funds in addition to the direct expenses as presented in the table. These fees and expenses are not included in the annualized expense ratio used to calculate the expense estimate in the table below.
Please note that the expenses shown in the table are meant to highlight your ongoing costs only and do not reflect any transaction costs. Therefore, the second line of the table is useful in comparing ongoing costs only, and will not help you determine the relative total costs of owning different funds. In addition, if these transactional costs were included, your costs would have been higher.
| | | | | Annualized Expense Ratio- A | | Beginning Account Value September 1, 2022 | | Ending Account Value February 28, 2023 | | Expenses Paid During Period- C September 1, 2022 to February 28, 2023 |
| | | | | | | | | | |
| Fidelity® Series Bond Index Fund | | | | -%- D | | | | | | |
| Actual | | | | | | $ 1,000 | | $ 979.20 | | $- E |
Hypothetical- B | | | | | | $ 1,000 | | $ 1,024.79 | | $- E |
| |
A Annualized expense ratio reflects expenses net of applicable fee waivers.
B 5% return per year before expenses
C Expenses are equal to the annualized expense ratio, multiplied by the average account value over the period, multiplied by 181/ 365 (to reflect the one-half year period). The fees and expenses of any Underlying Funds are not included in each annualized expense ratio.
D Amount represents less than .005%.
E Amount represents less than $.005.
Board Approval of Investment Advisory Contracts and Management Fees
Fidelity Series Bond Index Fund
Each year, the Board of Trustees, including the Independent Trustees (together, the Board), votes on the renewal of the management contract with Fidelity Management & Research Company LLC (FMR) and the sub-advisory agreements (together, the Advisory Contracts) for the fund. FMR and the sub-advisers are referred to herein as the Investment Advisers. The Board, assisted by the advice of fund counsel and Independent Trustees' counsel, requests and considers a broad range of information relevant to the renewal of the Advisory Contracts throughout the year.
The Board meets regularly and, at each of its meetings, covers an extensive agenda of topics and materials and considers factors that are relevant to its annual consideration of the renewal of the fund's Advisory Contracts, including the services and support provided to the fund and its shareholders. The Board has established four standing committees (Committees) - Operations, Audit, Fair Valuation, and Governance and Nominating - each composed of and chaired by Independent Trustees with varying backgrounds, to which the Board has assigned specific subject matter responsibilities in order to enhance effective decision-making by the Board. The Operations Committee, of which all the Independent Trustees are members, meets regularly throughout the year and requests, receives and considers, among other matters, information related to the annual consideration of the renewal of the fund's Advisory Contracts before making its recommendation to the Board. The Board also meets as needed to review matters specifically related to the Board's annual consideration of the renewal of the Advisory Contracts. Members of the Board may also meet from time to time with trustees of other Fidelity funds through joint ad hoc committees to discuss certain matters relevant to all of the Fidelity funds.
At its September 2022 meeting, the Board unanimously determined to renew the fund's Advisory Contracts. In considering whether to renew the Advisory Contracts for the fund, the Board considered all factors it believed relevant and reached a determination, with the assistance of fund counsel and Independent Trustees' counsel and through the exercise of its business judgment, that the renewal of the Advisory Contracts was in the best interests of the fund and its shareholders and the fact that no fee is payable under the management contract was fair and reasonable.
Nature, Extent, and Quality of Services Provided. The Board considered Fidelity's staffing as it relates to the fund, including the backgrounds of investment personnel of Fidelity, and also considered the fund's investment objective, strategies, and related investment philosophy. The Independent Trustees also had discussions with senior management of Fidelity's investment operations and investment groups. The Board considered the structure of the investment personnel compensation program and whether this structure provides appropriate incentives to act in the best interests of the fund. The Board also considered the steps Fidelity had taken to ensure the continued provision of high quality services to the Fidelity funds throughout the COVID-19 pandemic, including the expansion of staff in client facing positions to maintain service levels in periods of high volumes and volatility.
Resources Dedicated to Investment Management and Support Services . The Board reviewed the general qualifications and capabilities of Fidelity's investment staff, including its size, education, experience, and resources, as well as Fidelity's approach to recruiting, training, managing, and compensating investment personnel. The Board noted the resources devoted to Fidelity's global investment organization, and that Fidelity's analysts have extensive resources, tools and capabilities that allow them to conduct quantitative and fundamental analysis, as well as credit analysis of issuers, counterparties and guarantors. Further, the Board considered that Fidelity's investment professionals have sufficient access to global information and data so as to provide competitive investment results over time, and that those professionals also have access to sophisticated tools that permit them to assess portfolio construction and risk and performance attribution characteristics continuously, as well as to transmit new information and research conclusions rapidly around the world. Additionally, in its deliberations, the Board considered Fidelity's trading, risk management, compliance, cybersecurity, and technology and operations capabilities and resources, which are integral parts of the investment management process.
Administrative Services . The Board considered (i) the nature, extent, quality, and cost of advisory and administrative services performed by the Investment Advisers and their affiliates under the Advisory Contracts and under separate agreements covering transfer agency, pricing and bookkeeping, and securities lending services for the fund; (ii) the nature and extent of the supervision of third party service providers, principally custodians, subcustodians, and pricing vendors; and (iii) the resources devoted to, and the record of compliance with, the fund's compliance policies and procedures.
Investment Performance . The Board considered whether the fund has operated in accordance with its investment objective, as well as its record of compliance with its investment restrictions. The Board reviewed the fund's absolute investment performance, as well as the fund's relative investment performance. In this regard, the Board noted that the fund is designed to offer an investment option for other investment companies, collective investment trusts, and 529 plans managed by Fidelity and ultimately to enhance the performance of those investment companies, collective investment trusts, and 529 plans.
Based on its review, the Board concluded that the nature, extent, and quality of services provided to the fund under the Advisory Contracts should continue to benefit the shareholders of the fund.
Competitiveness of Management Fee and Total Expense Ratio . The Board considered that the fund does not pay FMR a management fee for investment advisory services, but that FMR receives fees for providing services to funds, collective investment trusts, and 529 plans that invest in the fund. The Board also noted that FMR or an affiliate undertakes to pay all operating expenses of the fund, except transfer agent fees, 12b-1 fees, Independent Trustee fees and expenses, custodian fees and expenses, proxy and shareholder meeting expenses, interest, taxes, and extraordinary expenses (such as litigation expenses). The Board further noted that the fund pays its non-operating expenses, including brokerage commissions and fees and expenses associated with the fund's securities lending program, if applicable.
The Board further considered that FMR has contractually agreed to reimburse the fund to the extent that total operating expenses, with certain exceptions, as a percentage of its average net assets, exceed 0.003% through December 31, 2023.
Based on its review, the Board considered that the fund does not pay a management fee and concluded that the fund's total expense ratio was reasonable in light of the services that the fund and its shareholders receive and the other factors considered.
Costs of the Services and Profitability . The Board considered the level of Fidelity's profits in respect of all the Fidelity funds.
A public accounting firm has been engaged annually by the Board as part of the Board's assessment of Fidelity's profitability analysis. The engagement includes the review and assessment of the methodologies used by Fidelity in determining the revenues and expenses attributable to Fidelity's mutual fund business, and completion of agreed-upon procedures in respect of the mathematical accuracy of certain fund profitability information and its conformity to established allocation methodologies. After considering the reports issued under the engagement and information provided by Fidelity, the Board concluded that while other allocation methods may also be reasonable, Fidelity's profitability methodologies are reasonable in all material respects.
The Board also reviewed Fidelity's non-fund businesses and potential indirect benefits such businesses may have received as a result of their association with Fidelity's mutual fund business (i.e., fall-out benefits) as well as cases where Fidelity's affiliates may benefit from the funds' business. The Board considered areas where potential indirect benefits to the Fidelity funds from their relationships with Fidelity may exist. The Board's consideration of these matters was informed by the findings of a joint ad hoc committee created by it and the boards of other Fidelity funds to evaluate potential fall-out benefits.
The Board concluded that the costs of the services provided by and the profits realized by Fidelity in connection with the operation of the fund were not relevant to the renewal of the Advisory Contracts because the fund pays no advisory fees and FMR or an affiliate bears all expenses of the fund, with limited exceptions.
Economies of Scale . The Board concluded that because the fund pays no advisory fees and FMR or an affiliate bears all expenses of the fund with certain limited exceptions, the realization of economies of scale was not a material factor in the Board's decision to renew the fund's Advisory Contracts.
Additional Information Requested by the Board . In order to develop fully the factual basis for consideration of the Fidelity funds' advisory contracts, the Board requested and received additional information on certain topics, including: (i) Fidelity's fund profitability methodology, profitability trends for certain funds, the allocation of various costs to different funds, and the impact of certain factors on fund profitability results; (ii) portfolio manager changes that have occurred during the past year and the amount of the investment that each portfolio manager has made in the Fidelity fund(s) that he or she manages; (iii) the extent to which current market conditions have affected retention and recruitment of personnel; (iv) the arrangements with and compensation paid to certain fund sub-advisers on behalf of the Fidelity funds and the treatment of such compensation within Fidelity's fund profitability methodology; (v) the terms of the funds' various management fee structures, including the basic group fee and the terms of Fidelity's voluntary expense limitation arrangements; (vi) Fidelity's transfer agent, pricing and bookkeeping fees, expense and service structures for different funds and classes relative to competitive trends; (vii) the impact on fund profitability of recent industry trends, such as the growth in passively managed funds and the changes in flows for different types of funds; (viii) the types of management fee and total expense comparisons provided, and the challenges and limitations associated with such information; and (ix) explanations regarding the relative total expense ratios and management fees of certain funds and classes, total expense and management fee competitive trends, and methodologies for total expense and management fee competitive comparisons. In addition, the Board considered its discussions with Fidelity regarding Fidelity's efforts to maintain the continuous investment and shareholder services necessary for the funds during the current pandemic and economic circumstances.
Based on its evaluation of all of the conclusions noted above, and after considering all factors it believed relevant, the Board concluded that the advisory fee arrangements are fair and reasonable and that the fund's Advisory Contracts should be renewed.
The Securities and Exchange Commission adopted Rule 22e-4 under the Investment Company Act of 1940 (the Liquidity Rule) to promote effective liquidity risk management throughout the open-end investment company industry, thereby reducing the risk that funds will be unable to meet their redemption obligations and mitigating dilution of the interests of fund shareholders.
The Fund has adopted and implemented a liquidity risk management program (the Program) reasonably designed to assess and manage the Fund's liquidity risk and to comply with the requirements of the Liquidity Rule. The Fund's Board of Trustees (the Board) has designated the Fund's investment adviser as administrator of the Program. The Fidelity advisers have established a Liquidity Risk Management Committee (the LRM Committee) to manage the Program for each of the Fidelity Funds. The LRM Committee monitors the adequacy and effectiveness of implementation of the Program and on a periodic basis assesses each Fund's liquidity risk based on a variety of factors including (1) the Fund's investment strategy, (2) portfolio liquidity and cash flow projections during normal and reasonably foreseeable stressed conditions, (3) shareholder redemptions, (4) borrowings and other funding sources and (5) certain factors specific to ETFs including the effect of the Fund's prices and spreads, market participants, and basket compositions on the overall liquidity of the Fund's portfolio, as applicable.
In accordance with the Program, each of the Fund's portfolio investments is classified into one of four defined liquidity categories based on a determination of a reasonable expectation for how long it would take to convert the investment to cash (or sell or dispose of the investment) without significantly changing its market value.
- Highly liquid investments - cash or convertible to cash within three business days or less
- Moderately liquid investments - convertible to cash in three to seven calendar days
- Less liquid investments - can be sold or disposed of, but not settled, within seven calendar days
- Illiquid investments - cannot be sold or disposed of within seven calendar days
Liquidity classification determinations take into account a variety of factors including various market, trading and investment-specific considerations, as well as market depth, and generally utilize analysis from a third-party liquidity metrics service.
The Liquidity Rule places a 15% limit on a fund's illiquid investments and requires funds that do not primarily hold assets that are highly liquid investments to determine and maintain a minimum percentage of the fund's net assets to be invested in highly liquid investments (highly liquid investment minimum or HLIM). The Program includes provisions reasonably designed to comply with the 15% limit on illiquid investments and for determining, periodically reviewing and complying with the HLIM requirement as applicable.
At a recent meeting of the Fund's Board of Trustees, the LRM Committee provided a written report to the Board pertaining to the operation, adequacy, and effectiveness of the Program for the period December 1, 2021 through November 30, 2022. The report concluded that the Program is operating effectively and is reasonably designed to assess and manage the Fund's liquidity risk.
1.9892976.103
SBX-SANN-0423
Fidelity® Series Corporate Bond Fund
Semi-Annual Report
February 28, 2023
Contents
To view a fund's proxy voting guidelines and proxy voting record for the 12-month period ended June 30, visit http://www.fidelity.com/proxyvotingresults or visit the Securities and Exchange Commission's (SEC) web site at http://www.sec.gov.
You may also call 1-800-544-8544 to request a free copy of the proxy voting guidelines.
Standard & Poor's, S&P and S&P 500 are registered service marks of The McGraw-Hill Companies, Inc. and have been licensed for use by Fidelity Distributors Corporation.
Other third-party marks appearing herein are the property of their respective owners.
All other marks appearing herein are registered or unregistered trademarks or service marks of FMR LLC or an affiliated company. © 2023 FMR LLC. All rights reserved.
This report and the financial statements contained herein are submitted for the general information of the shareholders of the Fund. This report is not authorized for distribution to prospective investors in the Fund unless preceded or accompanied by an effective prospectus.
A fund files its complete schedule of portfolio holdings with the SEC for the first and third quarters of each fiscal year on Form N-PORT. Forms N-PORT are available on the SEC's web site at http://www.sec.gov. A fund's Forms N-PORT may be reviewed and copied at the SEC's Public Reference Room in Washington, DC. Information regarding the operation of the SEC's Public Reference Room may be obtained by calling 1-800-SEC-0330.
For a complete list of a fund's portfolio holdings, view the most recent holdings listing, semiannual report, or annual report on Fidelity's web site at http://www.fidelity.com, http://www.institutional.fidelity.com, or http://www.401k.com, as applicable.
NOT FDIC INSURED •MAY LOSE VALUE •NO BANK GUARANTEE
Neither the Fund nor Fidelity Distributors Corporation is a bank.
Quality Diversification (% of Fund's net assets) |
|
| |
| We have used ratings from Moody's Investors Service, Inc. Where Moody's® ratings are not available, we have used S&P® ratings. All ratings are as of the date indicated and do not reflect subsequent changes. |
Asset Allocation (% of Fund's net assets) |
|
Foreign investments - 19.3% |
|
Geographic Diversification (% of Fund's net assets) |
|
* Includes Short-Term investments and Net Other Assets (Liabilities). Percentages are based on country or territory of incorporation and are adjusted for the effect of derivatives, if applicable. |
| |
Showing Percentage of Net Assets
| Nonconvertible Bonds - 83.9% |
| | | Principal Amount (a) | Value ($) |
| COMMUNICATION SERVICES - 5.8% | | | |
| Diversified Telecommunication Services - 1.8% | | | |
| AT&T, Inc.: | | | |
| 2.25% 2/1/32 | | 650,000 | 507,348 |
| 3.65% 9/15/59 | | 223,000 | 151,025 |
| 3.8% 12/1/57 | | 1,354,000 | 950,594 |
| 4.35% 3/1/29 | | 900,000 | 853,101 |
| Level 3 Financing, Inc. 3.4% 3/1/27 (b) | | 670,000 | 562,355 |
| Verizon Communications, Inc.: | | | |
| 2.1% 3/22/28 | | 312,000 | 269,288 |
| 2.355% 3/15/32 | | 3,000,000 | 2,358,457 |
| 2.55% 3/21/31 | | 289,000 | 236,398 |
| 3.15% 3/22/30 | | 47,000 | 41,154 |
| 3.7% 3/22/61 | | 1,300,000 | 913,883 |
| 4.016% 12/3/29 | | 1,250,000 | 1,152,880 |
| | | | 7,996,483 |
| Entertainment - 0.6% | | | |
| The Walt Disney Co.: | | | |
| 3.8% 3/22/30 | | 600,000 | 557,891 |
| 4.7% 3/23/50 | | 700,000 | 655,032 |
| 4.75% 9/15/44 | | 320,000 | 295,686 |
| 6.65% 11/15/37 | | 970,000 | 1,099,430 |
| | | | 2,608,039 |
| Media - 2.7% | | | |
| Charter Communications Operating LLC/Charter Communications Operating Capital Corp.: | | | |
| 5.05% 3/30/29 | | 1,600,000 | 1,494,014 |
| 5.25% 4/1/53 | | 450,000 | 351,891 |
| 5.5% 4/1/63 | | 450,000 | 349,782 |
| 5.75% 4/1/48 | | 1,950,000 | 1,628,520 |
| Comcast Corp.: | | | |
| 2.937% 11/1/56 | | 679,000 | 425,885 |
| 2.987% 11/1/63 | | 2,211,000 | 1,351,246 |
| COX Communications, Inc.: | | | |
| 1.8% 10/1/30 (b) | | 740,000 | 570,495 |
| 3.15% 8/15/24 (b) | | 35,000 | 33,722 |
| Discovery Communications LLC: | | | |
| 3.625% 5/15/30 | | 1,583,000 | 1,354,663 |
| 3.95% 3/20/28 | | 600,000 | 547,939 |
| Fox Corp.: | | | |
| 4.709% 1/25/29 | | 4,000 | 3,820 |
| 5.476% 1/25/39 | | 504,000 | 463,163 |
| Magallanes, Inc.: | | | |
| 3.755% 3/15/27 (b) | | 250,000 | 229,334 |
| 4.054% 3/15/29 (b) | | 87,000 | 77,800 |
| 4.279% 3/15/32 (b) | | 219,000 | 189,065 |
| 5.05% 3/15/42 (b) | | 348,000 | 281,927 |
| 5.141% 3/15/52 (b) | | 1,040,000 | 815,260 |
| 5.391% 3/15/62 (b) | | 650,000 | 507,007 |
| Time Warner Cable LLC: | | | |
| 5.875% 11/15/40 | | 1,200,000 | 1,059,724 |
| 7.3% 7/1/38 | | 500,000 | 501,123 |
| | | | 12,236,380 |
| Wireless Telecommunication Services - 0.7% | | | |
| Rogers Communications, Inc.: | | | |
| 3.8% 3/15/32 (b) | | 238,000 | 207,888 |
| 4.55% 3/15/52 (b) | | 1,450,000 | 1,156,438 |
| 5% 3/15/44 | | 270,000 | 234,409 |
| T-Mobile U.S.A., Inc.: | | | |
| 2.4% 3/15/29 | | 381,000 | 322,010 |
| 2.7% 3/15/32 | | 1,382,000 | 1,120,219 |
| | | | 3,040,964 |
TOTAL COMMUNICATION SERVICES | | | 25,881,866 |
| CONSUMER DISCRETIONARY - 3.3% | | | |
| Automobiles - 0.8% | | | |
| Ford Motor Co. 3.25% 2/12/32 | | 1,400,000 | 1,058,104 |
| General Motors Co. 5.95% 4/1/49 | | 1,300,000 | 1,166,379 |
| General Motors Financial Co., Inc. 3.1% 1/12/32 | | 1,400,000 | 1,114,249 |
| | | | 3,338,732 |
| Distributors - 0.1% | | | |
| Genuine Parts Co. 2.75% 2/1/32 | | 747,000 | 603,878 |
| Multiline Retail - 0.2% | | | |
| Dollar Tree, Inc.: | | | |
| 3.375% 12/1/51 | | 1,000,000 | 669,457 |
| 4.2% 5/15/28 | | 375,000 | 356,588 |
| | | | 1,026,045 |
| Specialty Retail - 1.9% | | | |
| Advance Auto Parts, Inc.: | | | |
| 1.75% 10/1/27 | | 2,313,000 | 1,964,157 |
| 3.9% 4/15/30 | | 1,000,000 | 883,128 |
| AutoNation, Inc.: | | | |
| 3.85% 3/1/32 | | 1,900,000 | 1,593,225 |
| 4.75% 6/1/30 | | 20,000 | 18,579 |
| Lowe's Companies, Inc.: | | | |
| 3.5% 4/1/51 | | 975,000 | 683,155 |
| 5.625% 4/15/53 | | 600,000 | 574,299 |
| O'Reilly Automotive, Inc.: | | | |
| 4.2% 4/1/30 | | 800,000 | 749,981 |
| 4.35% 6/1/28 | | 75,000 | 72,251 |
| Ross Stores, Inc. 1.875% 4/15/31 | | 600,000 | 469,657 |
| The Home Depot, Inc. 1.375% 3/15/31 | | 575,000 | 442,078 |
| Triton Container International Ltd. 1.15% 6/7/24 (b) | | 1,200,000 | 1,121,400 |
| | | | 8,571,910 |
| Textiles, Apparel & Luxury Goods - 0.3% | | | |
| Tapestry, Inc. 3.05% 3/15/32 | | 1,515,000 | 1,203,776 |
TOTAL CONSUMER DISCRETIONARY | | | 14,744,341 |
| CONSUMER STAPLES - 7.0% | | | |
| Beverages - 1.4% | | | |
| Anheuser-Busch InBev Worldwide, Inc.: | | | |
| 4.439% 10/6/48 | | 500,000 | 431,550 |
| 4.5% 6/1/50 | | 325,000 | 286,266 |
| 4.6% 4/15/48 | | 700,000 | 618,507 |
| 4.9% 1/23/31 | | 525,000 | 525,056 |
| Constellation Brands, Inc.: | | | |
| 2.25% 8/1/31 | | 1,600,000 | 1,259,764 |
| 2.875% 5/1/30 | | 470,000 | 399,160 |
| PepsiCo, Inc. 3.9% 7/18/32 | | 3,000,000 | 2,821,409 |
| | | | 6,341,712 |
| Food & Staples Retailing - 0.0% | | | |
| Alimentation Couche-Tard, Inc. 2.95% 1/25/30 (b) | | 138,000 | 117,252 |
| Food Products - 1.7% | | | |
| JBS U.S.A. Lux SA / JBS Food Co.: | | | |
| 2.5% 1/15/27 (b) | | 1,625,000 | 1,421,973 |
| 3% 5/15/32 (b) | | 1,570,000 | 1,196,881 |
| 4.375% 2/2/52 (b) | | 680,000 | 482,886 |
| 5.5% 1/15/30 (b) | | 1,600,000 | 1,505,992 |
| JDE Peet's BV 2.25% 9/24/31 (b) | | 545,000 | 415,550 |
| Smithfield Foods, Inc. 3% 10/15/30 (b) | | 1,432,000 | 1,114,927 |
| Viterra Finance BV 4.9% 4/21/27 (b) | | 1,500,000 | 1,421,001 |
| | | | 7,559,210 |
| Tobacco - 3.9% | | | |
| Altria Group, Inc.: | | | |
| 2.45% 2/4/32 | | 1,500,000 | 1,132,261 |
| 3.4% 2/4/41 | | 1,180,000 | 790,894 |
| 4.25% 8/9/42 | | 14,000 | 10,527 |
| 4.8% 2/14/29 | | 612,000 | 587,058 |
| BAT Capital Corp.: | | | |
| 2.259% 3/25/28 | | 1,225,000 | 1,026,301 |
| 2.726% 3/25/31 | | 2,800,000 | 2,185,401 |
| 3.557% 8/15/27 | | 2,500,000 | 2,276,668 |
| Imperial Tobacco Finance PLC: | | | |
| 3.5% 7/26/26 (b) | | 500,000 | 460,401 |
| 4.25% 7/21/25 (b) | | 3,200,000 | 3,076,366 |
| Philip Morris International, Inc.: | | | |
| 5.125% 2/15/30 | | 2,200,000 | 2,153,509 |
| 5.625% 11/17/29 | | 800,000 | 810,620 |
| 5.75% 11/17/32 | | 903,000 | 913,513 |
| Reynolds American, Inc. 4.45% 6/12/25 | | 1,725,000 | 1,678,558 |
| | | | 17,102,077 |
TOTAL CONSUMER STAPLES | | | 31,120,251 |
| ENERGY - 6.8% | | | |
| Oil, Gas & Consumable Fuels - 6.8% | | | |
| Canadian Natural Resources Ltd.: | | | |
| 2.95% 7/15/30 | | 1,071,000 | 907,497 |
| 6.25% 3/15/38 | | 1,075,000 | 1,083,434 |
| Cenovus Energy, Inc.: | | | |
| 2.65% 1/15/32 | | 159,000 | 125,825 |
| 3.75% 2/15/52 | | 480,000 | 339,883 |
| 5.4% 6/15/47 | | 64,000 | 57,614 |
| 6.75% 11/15/39 | | 156,000 | 163,040 |
| Cheniere Corpus Christi Holdings LLC 5.875% 3/31/25 | | 485,000 | 486,622 |
| DCP Midstream Operating LP: | | | |
| 3.875% 3/15/23 | | 500,000 | 499,641 |
| 5.125% 5/15/29 | | 2,200,000 | 2,117,658 |
| 5.375% 7/15/25 | | 500,000 | 493,833 |
| Eastern Gas Transmission & Storage, Inc.: | | | |
| 3% 11/15/29 | | 582,000 | 503,347 |
| 3.9% 11/15/49 | | 1,000,000 | 735,019 |
| Enbridge, Inc.: | | | |
| 3.4% 8/1/51 | | 900,000 | 619,981 |
| 4.5% 6/10/44 | | 250,000 | 208,851 |
| Energy Transfer LP: | | | |
| 3.75% 5/15/30 | | 3,554,000 | 3,152,860 |
| 4.25% 3/15/23 | | 450,000 | 449,848 |
| 4.25% 4/1/24 | | 525,000 | 516,780 |
| 4.95% 6/15/28 | | 650,000 | 627,778 |
| Enterprise Products Operating LP 5.1% 2/15/45 | | 375,000 | 343,233 |
| Equinor ASA: | | | |
| 1.75% 1/22/26 | | 61,000 | 55,679 |
| 2.375% 5/22/30 | | 550,000 | 469,110 |
| Hess Corp.: | | | |
| 4.3% 4/1/27 | | 2,575,000 | 2,464,833 |
| 5.8% 4/1/47 | | 1,135,000 | 1,072,928 |
| 6% 1/15/40 | | 575,000 | 564,652 |
| Magellan Midstream Partners LP 3.25% 6/1/30 | | 500,000 | 435,395 |
| Marathon Petroleum Corp. 4.75% 9/15/44 | | 300,000 | 249,485 |
| MPLX LP: | | | |
| 2.65% 8/15/30 | | 702,000 | 576,004 |
| 4.95% 9/1/32 | | 377,000 | 354,300 |
| 5.65% 3/1/53 | | 2,300,000 | 2,117,813 |
| Occidental Petroleum Corp. 2.9% 8/15/24 | | 83,000 | 79,473 |
| Ovintiv, Inc.: | | | |
| 5.15% 11/15/41 | | 136,000 | 120,450 |
| 8.125% 9/15/30 | | 409,000 | 448,020 |
| Petroleos Mexicanos: | | | |
| 4.5% 1/23/26 | | 1,000,000 | 920,250 |
| 6.49% 1/23/27 | | 75,000 | 68,070 |
| 6.5% 3/13/27 | | 80,000 | 72,432 |
| Phillips 66 Co. 4.875% 11/15/44 | | 300,000 | 273,023 |
| Plains All American Pipeline LP/PAA Finance Corp.: | | | |
| 3.8% 9/15/30 | | 97,000 | 84,458 |
| 4.65% 10/15/25 | | 1,119,000 | 1,091,725 |
| Suncor Energy, Inc. 6.5% 6/15/38 | | 430,000 | 441,661 |
| The Williams Companies, Inc.: | | | |
| 3.5% 11/15/30 | | 913,000 | 798,959 |
| 4.65% 8/15/32 | | 394,000 | 367,105 |
| 5.3% 8/15/52 | | 89,000 | 80,410 |
| Total Capital International SA 3.127% 5/29/50 | | 800,000 | 572,507 |
| Transcontinental Gas Pipe Line Co. LLC 3.25% 5/15/30 | | 25,000 | 21,766 |
| Western Gas Partners LP: | | | |
| 3.35% 2/1/25 | | 1,500,000 | 1,421,646 |
| 4.3% 2/1/30 | | 1,870,000 | 1,656,712 |
| | | | 30,311,610 |
| FINANCIALS - 30.2% | | | |
| Banks - 16.0% | | | |
| AIB Group PLC 4.263% 4/10/25 (b)(c) | | 250,000 | 244,226 |
| Banco Santander SA 2.749% 12/3/30 | | 1,000,000 | 781,288 |
| Bank of America Corp.: | | | |
| 2.299% 7/21/32 (c) | | 1,500,000 | 1,173,069 |
| 2.676% 6/19/41 (c) | | 1,030,000 | 705,544 |
| 2.972% 2/4/33 (c) | | 2,500,000 | 2,045,854 |
| 3.483% 3/13/52 (c) | | 950,000 | 696,970 |
| 4.271% 7/23/29 (c) | | 700,000 | 657,028 |
| 4.571% 4/27/33 (c) | | 1,600,000 | 1,487,290 |
| 5.015% 7/22/33 (c) | | 2,000,000 | 1,924,207 |
| Bank of Ireland Group PLC 4.5% 11/25/23 (b) | | 200,000 | 197,381 |
| Barclays PLC: | | | |
| 1.007% 12/10/24 (c) | | 307,000 | 295,607 |
| 2.645% 6/24/31 (c) | | 450,000 | 358,344 |
| 2.894% 11/24/32 (c) | | 2,250,000 | 1,746,968 |
| 5.2% 5/12/26 | | 1,750,000 | 1,704,104 |
| 5.746% 8/9/33 (c) | | 349,000 | 336,581 |
| 7.437% 11/2/33 (c) | | 1,100,000 | 1,187,604 |
| BNP Paribas SA: | | | |
| U.S. Secured Overnight Fin. Rate (SOFR) Index + 1.000% 1.323% 1/13/27 (b)(c)(d) | | 1,182,000 | 1,046,548 |
| 3.052% 1/13/31 (b)(c) | | 875,000 | 739,275 |
| 3.132% 1/20/33 (b)(c) | | 1,250,000 | 1,011,838 |
| 4.625% 3/13/27 (b) | | 450,000 | 431,218 |
| BPCE SA: | | | |
| 2.277% 1/20/32 (b)(c) | | 600,000 | 459,425 |
| 4.875% 4/1/26 (b) | | 200,000 | 193,469 |
| 5.975% 1/18/27 (b)(c) | | 3,000,000 | 2,996,369 |
| Citigroup, Inc.: | | | |
| 4.075% 4/23/29 (c) | | 1,600,000 | 1,489,370 |
| 4.45% 9/29/27 | | 1,200,000 | 1,146,003 |
| 4.91% 5/24/33 (c) | | 599,000 | 567,662 |
| Citizens Financial Group, Inc. 2.638% 9/30/32 | | 2,015,000 | 1,534,973 |
| Commonwealth Bank of Australia 3.784% 3/14/32 (b) | | 1,280,000 | 1,074,640 |
| Credit Agricole SA 2.811% 1/11/41 (b) | | 444,000 | 291,931 |
| Fifth Third Bancorp 8.25% 3/1/38 | | 300,000 | 374,184 |
| HSBC Holdings PLC: | | | |
| 2.251% 11/22/27 (c) | | 1,076,000 | 946,493 |
| 2.357% 8/18/31 (c) | | 1,002,000 | 791,210 |
| 2.848% 6/4/31 (c) | | 1,800,000 | 1,480,768 |
| 4.762% 3/29/33 (c) | | 1,600,000 | 1,437,536 |
| 5.402% 8/11/33 (c) | | 815,000 | 781,121 |
| 7.39% 11/3/28 (c) | | 720,000 | 760,490 |
| Huntington Bancshares, Inc. 2.487% 8/15/36 (c) | | 1,287,000 | 947,441 |
| ING Groep NV 4.017% 3/28/28 (c) | | 2,000,000 | 1,878,216 |
| Intesa Sanpaolo SpA 5.71% 1/15/26 (b) | | 1,126,000 | 1,077,821 |
| JPMorgan Chase & Co.: | | | |
| 2.956% 5/13/31 (c) | | 104,000 | 87,340 |
| 3.882% 7/24/38 (c) | | 2,725,000 | 2,271,452 |
| 4.203% 7/23/29 (c) | | 600,000 | 562,482 |
| 4.912% 7/25/33 (c) | | 3,000,000 | 2,872,530 |
| 5.717% 9/14/33 (c) | | 2,500,000 | 2,484,227 |
| Lloyds Banking Group PLC: | | | |
| 4.65% 3/24/26 | | 1,000,000 | 963,530 |
| 7.953% 11/15/33 (c) | | 1,000,000 | 1,094,954 |
| Mizuho Financial Group, Inc. 1.234% 5/22/27 (c) | | 1,900,000 | 1,647,103 |
| National Australia Bank Ltd. 2.99% 5/21/31 (b) | | 1,200,000 | 961,129 |
| NatWest Group PLC 2.359% 5/22/24 (c) | | 228,000 | 226,007 |
| PNC Financial Services Group, Inc. 5.068% 1/24/34 (c) | | 2,200,000 | 2,127,285 |
| Rabobank Nederland 3.75% 7/21/26 | | 300,000 | 281,336 |
| Santander Holdings U.S.A., Inc. 2.49% 1/6/28 (c) | | 335,000 | 291,779 |
| Societe Generale: | | | |
| 1.488% 12/14/26 (b)(c) | | 3,300,000 | 2,923,670 |
| 3% 1/22/30 (b) | | 430,000 | 355,996 |
| 3.625% 3/1/41 (b) | | 1,300,000 | 875,280 |
| 3.875% 3/28/24 (b) | | 700,000 | 685,777 |
| 6.221% 6/15/33 (b)(c) | | 800,000 | 759,788 |
| 7.367% 1/10/53 (b) | | 600,000 | 605,835 |
| Standard Chartered PLC 3.785% 5/21/25 (b)(c) | | 630,000 | 614,225 |
| Sumitomo Mitsui Financial Group, Inc. 5.766% 1/13/33 | | 2,100,000 | 2,117,072 |
| SVB Financial Group: | | | |
| 2.1% 5/15/28 | | 1,050,000 | 882,374 |
| 3.125% 6/5/30 | | 170,000 | 143,428 |
| Synchrony Bank 5.625% 8/23/27 | | 326,000 | 318,827 |
| Truist Financial Corp. 5.122% 1/26/34 (c) | | 700,000 | 681,137 |
| UniCredit SpA 1.982% 6/3/27 (b)(c) | | 1,200,000 | 1,046,518 |
| Wells Fargo & Co.: | | | |
| 2.393% 6/2/28 (c) | | 800,000 | 707,267 |
| 4.478% 4/4/31 (c) | | 1,000,000 | 940,526 |
| 5.013% 4/4/51 (c) | | 700,000 | 644,228 |
| Westpac Banking Corp. U.S. TREASURY 1 YEAR INDEX + 2.680% 5.405% 8/10/33 (c)(d) | | 1,400,000 | 1,340,553 |
| Zions Bancorp NA 3.25% 10/29/29 | | 850,000 | 706,607 |
| | | | 71,220,328 |
| Capital Markets - 4.8% | | | |
| Ares Capital Corp.: | | | |
| 2.15% 7/15/26 | | 750,000 | 646,159 |
| 2.875% 6/15/27 | | 1,100,000 | 957,149 |
| 3.25% 7/15/25 | | 1,775,000 | 1,651,072 |
| 3.875% 1/15/26 | | 240,000 | 222,659 |
| 4.25% 3/1/25 | | 75,000 | 71,979 |
| Blackstone Holdings Finance Co. LLC 2.8% 9/30/50 (b) | | 523,000 | 308,037 |
| Credit Suisse Group AG: | | | |
| 1.305% 2/2/27 (b)(c) | | 800,000 | 644,671 |
| 3.091% 5/14/32 (b)(c) | | 1,200,000 | 844,363 |
| 3.75% 3/26/25 | | 1,150,000 | 1,050,537 |
| 4.194% 4/1/31 (b)(c) | | 800,000 | 634,461 |
| 6.537% 8/12/33 (b)(c) | | 500,000 | 448,995 |
| 9.016% 11/15/33 (b)(c) | | 800,000 | 840,142 |
| Deutsche Bank AG 4.5% 4/1/25 | | 3,029,000 | 2,920,655 |
| Deutsche Bank AG New York Branch: | | | |
| 2.129% 11/24/26 (c) | | 1,650,000 | 1,478,797 |
| 2.222% 9/18/24 (c) | | 1,000,000 | 977,501 |
| 6.72% 1/18/29 (c) | | 270,000 | 272,860 |
| Goldman Sachs Group, Inc.: | | | |
| 1.431% 3/9/27 (c) | | 1,850,000 | 1,630,571 |
| 4.223% 5/1/29 (c) | | 900,000 | 842,559 |
| Morgan Stanley: | | | |
| 1.794% 2/13/32 (c) | | 740,000 | 563,183 |
| 2.239% 7/21/32 (c) | | 1,500,000 | 1,166,779 |
| 4.431% 1/23/30 (c) | | 111,000 | 104,490 |
| UBS Group AG: | | | |
| 2.095% 2/11/32 (b)(c) | | 1,550,000 | 1,190,640 |
| 3.126% 8/13/30 (b)(c) | | 613,000 | 524,555 |
| 4.988% 8/5/33 (b)(c) | | 1,200,000 | 1,123,301 |
| | | | 21,116,115 |
| Consumer Finance - 3.2% | | | |
| AerCap Ireland Capital Ltd./AerCap Global Aviation Trust: | | | |
| 1.65% 10/29/24 | | 900,000 | 834,909 |
| 2.45% 10/29/26 | | 227,000 | 200,117 |
| 3% 10/29/28 | | 237,000 | 201,951 |
| 3.3% 1/30/32 | | 254,000 | 203,260 |
| 3.4% 10/29/33 | | 526,000 | 409,234 |
| 3.85% 10/29/41 | | 860,000 | 629,622 |
| Ally Financial, Inc.: | | | |
| 2.2% 11/2/28 | | 480,000 | 391,047 |
| 4.75% 6/9/27 | | 2,100,000 | 2,000,872 |
| 5.75% 11/20/25 | | 910,000 | 890,784 |
| 8% 11/1/31 | | 717,000 | 776,143 |
| Capital One Financial Corp.: | | | |
| 2.359% 7/29/32 (c) | | 1,785,000 | 1,313,332 |
| 3.8% 1/31/28 | | 11,000 | 10,185 |
| 5.247% 7/26/30 (c) | | 662,000 | 634,768 |
| 5.268% 5/10/33 (c) | | 1,300,000 | 1,231,223 |
| 5.468% 2/1/29 (c) | | 318,000 | 312,200 |
| 5.817% 2/1/34 (c) | | 552,000 | 536,008 |
| Discover Financial Services: | | | |
| 4.1% 2/9/27 | | 39,000 | 36,955 |
| 6.7% 11/29/32 | | 98,000 | 101,256 |
| Ford Motor Credit Co. LLC: | | | |
| 3.625% 6/17/31 | | 200,000 | 158,444 |
| 4.271% 1/9/27 | | 400,000 | 362,247 |
| 4.95% 5/28/27 | | 1,850,000 | 1,723,627 |
| Synchrony Financial: | | | |
| 3.95% 12/1/27 | | 75,000 | 68,179 |
| 4.25% 8/15/24 | | 858,000 | 837,276 |
| 4.375% 3/19/24 | | 407,000 | 401,351 |
| | | | 14,264,990 |
| Diversified Financial Services - 2.3% | | | |
| Aon Corp. / Aon Global Holdings PLC 2.6% 12/2/31 | | 404,000 | 329,250 |
| Athene Global Funding: | | | |
| 1.45% 1/8/26 (b) | | 1,150,000 | 1,010,701 |
| 1.985% 8/19/28 (b) | | 1,355,000 | 1,107,107 |
| 2.5% 3/24/28 (b) | | 750,000 | 637,353 |
| Blackstone Private Credit Fund: | | | |
| 2.7% 1/15/25 | | 1,500,000 | 1,397,881 |
| 4.7% 3/24/25 | | 127,000 | 122,490 |
| 7.05% 9/29/25 (b) | | 466,000 | 467,667 |
| Brixmor Operating Partnership LP: | | | |
| 2.25% 4/1/28 | | 410,000 | 344,547 |
| 4.05% 7/1/30 | | 148,000 | 130,846 |
| Corebridge Financial, Inc.: | | | |
| 3.65% 4/5/27 (b) | | 171,000 | 159,551 |
| 3.85% 4/5/29 (b) | | 168,000 | 151,755 |
| 3.9% 4/5/32 (b) | | 199,000 | 174,127 |
| 4.35% 4/5/42 (b) | | 45,000 | 37,091 |
| 4.4% 4/5/52 (b) | | 134,000 | 106,819 |
| Equitable Holdings, Inc. 4.35% 4/20/28 | | 700,000 | 664,896 |
| Jackson Financial, Inc.: | | | |
| 3.125% 11/23/31 | | 2,210,000 | 1,766,711 |
| 4% 11/23/51 | | 800,000 | 535,308 |
| 5.17% 6/8/27 | | 181,000 | 179,210 |
| 5.67% 6/8/32 | | 228,000 | 222,755 |
| Rexford Industrial Realty LP 2.15% 9/1/31 | | 599,000 | 463,413 |
| | | | 10,009,478 |
| Insurance - 3.9% | | | |
| AIA Group Ltd.: | | | |
| 3.2% 9/16/40 (b) | | 950,000 | 714,916 |
| 3.6% 4/9/29 (b) | | 1,515,000 | 1,397,385 |
| AmFam Holdings, Inc. 2.805% 3/11/31 (b) | | 950,000 | 729,034 |
| Assurant, Inc. 2.65% 1/15/32 | | 2,100,000 | 1,572,986 |
| Athene Holding Ltd.: | | | |
| 3.45% 5/15/52 | | 700,000 | 445,154 |
| 3.95% 5/25/51 | | 316,000 | 220,773 |
| 6.65% 2/1/33 | | 800,000 | 821,831 |
| Empower Finance 2020 LP: | | | |
| 1.776% 3/17/31 (b) | | 324,000 | 251,908 |
| 3.075% 9/17/51 (b) | | 540,000 | 350,029 |
| Fairfax Financial Holdings Ltd.: | | | |
| 3.375% 3/3/31 | | 571,000 | 468,093 |
| 5.625% 8/16/32 (b) | | 2,100,000 | 1,996,307 |
| Five Corners Funding Trust II 2.85% 5/15/30 (b) | | 890,000 | 751,692 |
| Guardian Life Insurance Co. of America 4.85% 1/24/77 (b) | | 400,000 | 334,347 |
| Hartford Financial Services Group, Inc. 4.3% 4/15/43 | | 1,025,000 | 850,199 |
| Intact Financial Corp. 5.459% 9/22/32 (b) | | 1,117,000 | 1,097,417 |
| Liberty Mutual Group, Inc. 5.5% 6/15/52 (b) | | 1,050,000 | 983,897 |
| Marsh & McLennan Companies, Inc.: | | | |
| 3.875% 3/15/24 | | 11,000 | 10,815 |
| 4.375% 3/15/29 | | 10,000 | 9,521 |
| 4.9% 3/15/49 | | 834,000 | 770,249 |
| Massachusetts Mutual Life Insurance Co. 3.729% 10/15/70 (b) | | 350,000 | 240,356 |
| New York Life Insurance Co. 4.45% 5/15/69 (b) | | 54,000 | 45,352 |
| Pacific LifeCorp 3.35% 9/15/50 (b) | | 700,000 | 492,738 |
| Prudential Financial, Inc. 6% 9/1/52 (c) | | 672,000 | 648,254 |
| Reliance Standard Life Global Funding II 2.75% 5/7/25 (b) | | 478,000 | 447,288 |
| Swiss Re Finance Luxembourg SA 5% 4/2/49 (b)(c) | | 600,000 | 570,000 |
| Unum Group 4.125% 6/15/51 | | 1,520,000 | 1,089,260 |
| | | | 17,309,801 |
TOTAL FINANCIALS | | | 133,920,712 |
| HEALTH CARE - 6.5% | | | |
| Biotechnology - 0.4% | | | |
| Amgen, Inc.: | | | |
| 3.375% 2/21/50 | | 700,000 | 489,790 |
| 5.25% 3/2/30 (e) | | 222,000 | 220,917 |
| 5.25% 3/2/33 (e) | | 251,000 | 249,251 |
| 5.65% 3/2/53 (e) | | 118,000 | 117,029 |
| 5.75% 3/2/63 (e) | | 216,000 | 213,020 |
| Regeneron Pharmaceuticals, Inc. 1.75% 9/15/30 | | 400,000 | 311,422 |
| | | | 1,601,429 |
| Health Care Equipment & Supplies - 0.3% | | | |
| Becton, Dickinson & Co. 2.823% 5/20/30 | | 750,000 | 641,573 |
| Boston Scientific Corp. 2.65% 6/1/30 | | 500,000 | 427,568 |
| | | | 1,069,141 |
| Health Care Providers & Services - 3.5% | | | |
| Centene Corp.: | | | |
| 2.625% 8/1/31 | | 2,645,000 | 2,061,018 |
| 3% 10/15/30 | | 1,310,000 | 1,068,106 |
| 4.25% 12/15/27 | | 1,025,000 | 947,151 |
| 4.625% 12/15/29 | | 585,000 | 534,978 |
| Cigna Group: | | | |
| 3.4% 3/15/50 | | 500,000 | 350,685 |
| 4.125% 11/15/25 | | 4,000 | 3,890 |
| 4.375% 10/15/28 | | 561,000 | 538,675 |
| 4.8% 8/15/38 | | 1,907,000 | 1,756,470 |
| 4.9% 12/15/48 | | 7,000 | 6,296 |
| CVS Health Corp. 5.125% 2/21/30 | | 2,200,000 | 2,160,233 |
| HCA Holdings, Inc.: | | | |
| 3.375% 3/15/29 (b) | | 439,000 | 384,660 |
| 3.625% 3/15/32 (b) | | 440,000 | 371,949 |
| 4.625% 3/15/52 (b) | | 660,000 | 519,247 |
| 5.125% 6/15/39 | | 1,217,000 | 1,082,577 |
| 5.25% 6/15/49 | | 240,000 | 207,000 |
| Sabra Health Care LP: | | | |
| 3.2% 12/1/31 | | 588,000 | 436,870 |
| 3.9% 10/15/29 | | 123,000 | 102,301 |
| UnitedHealth Group, Inc. 4.75% 7/15/45 | | 950,000 | 892,590 |
| Universal Health Services, Inc.: | | | |
| 2.65% 10/15/30 | | 1,704,000 | 1,387,688 |
| 2.65% 1/15/32 | | 1,072,000 | 832,334 |
| | | | 15,644,718 |
| Pharmaceuticals - 2.3% | | | |
| Bayer U.S. Finance II LLC: | | | |
| 4.25% 12/15/25 (b) | | 1,050,000 | 1,015,555 |
| 4.875% 6/25/48 (b) | | 1,150,000 | 997,969 |
| Bristol-Myers Squibb Co. 4.125% 6/15/39 | | 138,000 | 123,160 |
| Elanco Animal Health, Inc.: | | | |
| 5.772% 8/28/23 | | 700,000 | 697,438 |
| 6.4% 8/28/28 (c) | | 1,375,000 | 1,312,946 |
| Mylan NV 4.55% 4/15/28 | | 1,004,000 | 935,995 |
| Perrigo Finance PLC 4.4% 6/15/30 | | 600,000 | 515,082 |
| Utah Acquisition Sub, Inc. 5.25% 6/15/46 | | 650,000 | 505,766 |
| Viatris, Inc.: | | | |
| 1.65% 6/22/25 | | 3,427,000 | 3,119,496 |
| 2.7% 6/22/30 | | 1,328,000 | 1,052,801 |
| 4% 6/22/50 | | 105,000 | 67,727 |
| | | | 10,343,935 |
TOTAL HEALTH CARE | | | 28,659,223 |
| INDUSTRIALS - 3.1% | | | |
| Aerospace & Defense - 1.3% | | | |
| Northrop Grumman Corp. 4.03% 10/15/47 | | 1,225,000 | 1,012,932 |
| The Boeing Co.: | | | |
| 2.196% 2/4/26 | | 1,200,000 | 1,090,020 |
| 2.75% 2/1/26 | | 900,000 | 834,123 |
| 3.75% 2/1/50 | | 1,150,000 | 809,030 |
| 5.04% 5/1/27 | | 900,000 | 886,460 |
| 5.15% 5/1/30 | | 885,000 | 856,385 |
| | | | 5,488,950 |
| Airlines - 0.2% | | | |
| American Airlines 2019-1 Class B Pass Through Trust equipment trust certificate 3.85% 8/15/29 | | 157,207 | 141,244 |
| British Airways 2021-1 Class A Pass Through Trust equipment trust certificate 2.9% 9/15/36 (b) | | 292,254 | 240,555 |
| United Airlines 2019-2 Class B Pass Through Trust equipment trust certificate 3.5% 11/1/29 | | 118,006 | 105,707 |
| United Airlines, Inc. 4.55% 2/25/33 | | 161,474 | 144,698 |
| | | | 632,204 |
| Machinery - 0.5% | | | |
| Daimler Trucks Finance North America LLC 2% 12/14/26 (b) | | 1,276,000 | 1,129,000 |
| Ingersoll-Rand Luxembourg Finance SA 4.5% 3/21/49 | | 300,000 | 252,161 |
| Westinghouse Air Brake Tech Co. 4.4% 3/15/24 | | 1,000,000 | 985,154 |
| | | | 2,366,315 |
| Professional Services - 0.0% | | | |
| Booz Allen Hamilton, Inc. 3.875% 9/1/28 (b) | | 25,000 | 22,194 |
| Leidos, Inc. 3.625% 5/15/25 | | 70,000 | 67,286 |
| | | | 89,480 |
| Road & Rail - 0.3% | | | |
| Burlington Northern Santa Fe LLC 4.7% 9/1/45 | | 500,000 | 459,770 |
| Canadian Pacific Railway Co. 3.1% 12/2/51 | | 458,000 | 312,565 |
| Union Pacific Corp. 3.25% 2/5/50 | | 800,000 | 577,031 |
| | | | 1,349,366 |
| Trading Companies & Distributors - 0.5% | | | |
| Air Lease Corp.: | | | |
| 2.3% 2/1/25 | | 850,000 | 793,456 |
| 2.875% 1/15/32 | | 1,900,000 | 1,491,599 |
| | | | 2,285,055 |
| Transportation Infrastructure - 0.3% | | | |
| Avolon Holdings Funding Ltd.: | | | |
| 2.528% 11/18/27 (b) | | 1,601,000 | 1,333,996 |
| 4.375% 5/1/26 (b) | | 110,000 | 102,331 |
| | | | 1,436,327 |
TOTAL INDUSTRIALS | | | 13,647,697 |
| INFORMATION TECHNOLOGY - 5.8% | | | |
| Electronic Equipment & Components - 1.6% | | | |
| Dell International LLC/EMC Corp.: | | | |
| 3.45% 12/15/51 (b) | | 700,000 | 427,826 |
| 6.02% 6/15/26 | | 2,125,000 | 2,151,159 |
| 6.2% 7/15/30 | | 950,000 | 964,573 |
| Vontier Corp.: | | | |
| 1.8% 4/1/26 | | 3,000,000 | 2,609,310 |
| 2.95% 4/1/31 | | 1,169,000 | 890,603 |
| | | | 7,043,471 |
| IT Services - 0.3% | | | |
| CDW LLC/CDW Finance Corp. 2.67% 12/1/26 | | 1,054,000 | 936,054 |
| Fiserv, Inc. 3.5% 7/1/29 | | 271,000 | 242,323 |
| | | | 1,178,377 |
| Semiconductors & Semiconductor Equipment - 1.5% | | | |
| Broadcom, Inc.: | | | |
| 1.95% 2/15/28 (b) | | 854,000 | 723,766 |
| 2.45% 2/15/31 (b) | | 460,000 | 364,499 |
| 2.6% 2/15/33 (b) | | 1,617,000 | 1,222,100 |
| 3.5% 2/15/41 (b) | | 371,000 | 265,493 |
| 3.75% 2/15/51 (b) | | 174,000 | 121,282 |
| Marvell Technology, Inc. 2.45% 4/15/28 | | 1,500,000 | 1,283,167 |
| Micron Technology, Inc.: | | | |
| 2.703% 4/15/32 | | 1,100,000 | 834,624 |
| 4.185% 2/15/27 | | 1,250,000 | 1,183,232 |
| NVIDIA Corp. 3.7% 4/1/60 | | 1,050,000 | 800,528 |
| | | | 6,798,691 |
| Software - 2.2% | | | |
| Microsoft Corp. 3.3% 2/6/27 | | 5,000,000 | 4,777,028 |
| Oracle Corp.: | | | |
| 2.3% 3/25/28 | | 529,000 | 459,076 |
| 2.875% 3/25/31 | | 1,300,000 | 1,077,787 |
| 3.95% 3/25/51 | | 1,880,000 | 1,350,372 |
| 4% 11/15/47 | | 375,000 | 274,202 |
| Roper Technologies, Inc. 2% 6/30/30 | | 2,035,000 | 1,638,712 |
| | | | 9,577,177 |
| Technology Hardware, Storage & Peripherals - 0.2% | | | |
| Apple, Inc.: | | | |
| 2.8% 2/8/61 | | 700,000 | 449,048 |
| 3.85% 8/4/46 | | 800,000 | 676,286 |
| | | | 1,125,334 |
TOTAL INFORMATION TECHNOLOGY | | | 25,723,050 |
| MATERIALS - 1.3% | | | |
| Chemicals - 1.3% | | | |
| Celanese U.S. Holdings LLC 6.165% 7/15/27 | | 2,000,000 | 1,985,177 |
| International Flavors & Fragrances, Inc.: | | | |
| 1.832% 10/15/27 (b) | | 1,825,000 | 1,527,921 |
| 3.468% 12/1/50 (b) | | 525,000 | 345,290 |
| 5% 9/26/48 | | 850,000 | 703,498 |
| Sherwin-Williams Co. 4.5% 6/1/47 | | 375,000 | 314,211 |
| Westlake Corp. 3.375% 6/15/30 | | 900,000 | 777,362 |
| | | | 5,653,459 |
| Containers & Packaging - 0.0% | | | |
| Avery Dennison Corp. 4.875% 12/6/28 | | 50,000 | 48,900 |
TOTAL MATERIALS | | | 5,702,359 |
| REAL ESTATE - 6.0% | | | |
| Equity Real Estate Investment Trusts (REITs) - 5.7% | | | |
| Agree LP: | | | |
| 2% 6/15/28 | | 2,100,000 | 1,740,942 |
| 4.8% 10/1/32 | | 1,065,000 | 996,096 |
| Alexandria Real Estate Equities, Inc. 1.875% 2/1/33 | | 950,000 | 704,146 |
| American Homes 4 Rent LP: | | | |
| 2.375% 7/15/31 | | 44,000 | 34,592 |
| 3.375% 7/15/51 | | 68,000 | 44,200 |
| 3.625% 4/15/32 | | 183,000 | 154,605 |
| 4.3% 4/15/52 | | 127,000 | 97,331 |
| Camden Property Trust 2.8% 5/15/30 | | 58,000 | 49,815 |
| Corporate Office Properties LP: | | | |
| 2% 1/15/29 | | 904,000 | 695,885 |
| 2.25% 3/15/26 | | 52,000 | 46,374 |
| 2.75% 4/15/31 | | 414,000 | 311,709 |
| 2.9% 12/1/33 | | 1,600,000 | 1,129,308 |
| Crown Castle International Corp. 3.25% 1/15/51 | | 450,000 | 295,997 |
| Hudson Pacific Properties LP: | | | |
| 3.95% 11/1/27 | | 3,400,000 | 2,938,543 |
| 5.95% 2/15/28 | | 1,900,000 | 1,766,266 |
| Invitation Homes Operating Partnership LP: | | | |
| 2% 8/15/31 | | 600,000 | 450,059 |
| 4.15% 4/15/32 | | 269,000 | 236,631 |
| Kite Realty Group Trust: | | | |
| 4% 3/15/25 | | 14,000 | 13,266 |
| 4.75% 9/15/30 | | 277,000 | 247,931 |
| MPT Operating Partnership LP/MPT Finance Corp. 3.5% 3/15/31 | | 1,725,000 | 1,182,419 |
| Omega Healthcare Investors, Inc.: | | | |
| 3.25% 4/15/33 | | 278,000 | 198,716 |
| 3.375% 2/1/31 | | 1,402,000 | 1,104,799 |
| 4.5% 1/15/25 | | 600,000 | 585,197 |
| 4.5% 4/1/27 | | 1,000,000 | 944,184 |
| Piedmont Operating Partnership LP 2.75% 4/1/32 | | 86,000 | 60,623 |
| Realty Income Corp.: | | | |
| 2.85% 12/15/32 | | 30,000 | 24,641 |
| 3.25% 1/15/31 | | 30,000 | 26,148 |
| Spirit Realty LP 2.1% 3/15/28 | | 516,000 | 427,471 |
| Store Capital Corp. 2.7% 12/1/31 | | 1,675,000 | 1,217,997 |
| Sun Communities Operating LP: | | | |
| 2.3% 11/1/28 | | 97,000 | 82,008 |
| 2.7% 7/15/31 | | 250,000 | 199,446 |
| 4.2% 4/15/32 | | 1,800,000 | 1,596,766 |
| 5.7% 1/15/33 | | 1,100,000 | 1,082,180 |
| UDR, Inc.: | | | |
| 2.1% 8/1/32 | | 939,000 | 707,358 |
| 2.1% 6/15/33 | | 374,000 | 272,604 |
| Ventas Realty LP 2.5% 9/1/31 | | 729,000 | 574,137 |
| VICI Properties LP: | | | |
| 4.75% 2/15/28 | | 378,000 | 356,579 |
| 4.95% 2/15/30 | | 1,100,000 | 1,026,969 |
| 5.125% 5/15/32 | | 78,000 | 72,372 |
| Vornado Realty LP: | | | |
| 2.15% 6/1/26 | | 103,000 | 88,250 |
| 3.4% 6/1/31 | | 372,000 | 282,906 |
| Welltower Op: | | | |
| 3.625% 3/15/24 | | 10,000 | 9,793 |
| 4.125% 3/15/29 | | 675,000 | 622,176 |
| WP Carey, Inc.: | | | |
| 2.4% 2/1/31 | | 348,000 | 280,553 |
| 4.25% 10/1/26 | | 450,000 | 433,929 |
| | | | 25,413,917 |
| Real Estate Management & Development - 0.3% | | | |
| Brandywine Operating Partnership LP 7.55% 3/15/28 | | 412,000 | 403,936 |
| Tanger Properties LP: | | | |
| 2.75% 9/1/31 | | 596,000 | 442,078 |
| 3.125% 9/1/26 | | 497,000 | 451,094 |
| | | | 1,297,108 |
TOTAL REAL ESTATE | | | 26,711,025 |
| UTILITIES - 8.1% | | | |
| Electric Utilities - 3.9% | | | |
| Alabama Power Co. 3.05% 3/15/32 | | 380,000 | 323,611 |
| American Transmission Systems, Inc. 2.65% 1/15/32 (b) | | 1,148,000 | 940,736 |
| Cleco Corporate Holdings LLC: | | | |
| 3.743% 5/1/26 | | 2,790,000 | 2,618,138 |
| 4.973% 5/1/46 | | 750,000 | 639,594 |
| Duke Energy Corp.: | | | |
| 2.45% 6/1/30 | | 70,000 | 57,494 |
| 4.5% 8/15/32 | | 1,240,000 | 1,147,589 |
| 5% 8/15/52 | | 3,150,000 | 2,799,667 |
| Duquesne Light Holdings, Inc.: | | | |
| 2.775% 1/7/32 (b) | | 266,000 | 209,208 |
| 3.616% 8/1/27 (b) | | 1,810,000 | 1,622,392 |
| Entergy Corp. 2.8% 6/15/30 | | 72,000 | 60,328 |
| Exelon Corp.: | | | |
| 3.35% 3/15/32 | | 1,602,000 | 1,367,855 |
| 4.1% 3/15/52 | | 76,000 | 60,375 |
| 4.7% 4/15/50 | | 800,000 | 695,840 |
| 5.1% 6/15/45 | | 370,000 | 340,508 |
| FirstEnergy Corp.: | | | |
| 2.25% 9/1/30 | | 534,000 | 425,865 |
| 2.65% 3/1/30 | | 780,000 | 646,823 |
| 4.15% 7/15/27 | | 900,000 | 839,520 |
| Nevada Power Co. 3.7% 5/1/29 | | 75,000 | 69,943 |
| Southern Co.: | | | |
| 4.4% 7/1/46 | | 700,000 | 576,065 |
| 5.113% 8/1/27 (f) | | 2,050,000 | 2,024,320 |
| | | | 17,465,871 |
| Gas Utilities - 0.2% | | | |
| ONE Gas, Inc. 2% 5/15/30 | | 278,000 | 226,955 |
| Southern Co. Gas Capital Corp. 4.4% 5/30/47 | | 625,000 | 506,193 |
| | | | 733,148 |
| Independent Power and Renewable Electricity Producers - 2.1% | | | |
| Atlantica Sustainable Infrastructure PLC 4.125% 6/15/28 (b) | | 1,215,000 | 1,072,338 |
| Emera U.S. Finance LP: | | | |
| 3.55% 6/15/26 | | 2,550,000 | 2,393,786 |
| 4.75% 6/15/46 | | 1,775,000 | 1,394,696 |
| The AES Corp.: | | | |
| 1.375% 1/15/26 | | 290,000 | 256,640 |
| 2.45% 1/15/31 | | 4,120,000 | 3,272,661 |
| 3.3% 7/15/25 (b) | | 216,000 | 202,704 |
| 3.95% 7/15/30 (b) | | 593,000 | 519,172 |
| | | | 9,111,997 |
| Multi-Utilities - 1.9% | | | |
| Consolidated Edison Co. of New York, Inc. 5.2% 3/1/33 | | 1,300,000 | 1,300,138 |
| NiSource, Inc.: | | | |
| 2.95% 9/1/29 | | 229,000 | 197,648 |
| 3.6% 5/1/30 | | 950,000 | 848,034 |
| 4.375% 5/15/47 | | 650,000 | 543,283 |
| 4.8% 2/15/44 | | 500,000 | 443,284 |
| Puget Energy, Inc.: | | | |
| 2.379% 6/15/28 | | 2,000,000 | 1,702,490 |
| 4.1% 6/15/30 | | 1,023,000 | 918,504 |
| 4.224% 3/15/32 | | 1,344,000 | 1,188,358 |
| Sempra Energy 3.8% 2/1/38 | | 1,500,000 | 1,228,709 |
| | | | 8,370,448 |
TOTAL UTILITIES | | | 35,681,464 |
| TOTAL NONCONVERTIBLE BONDS (Cost $437,978,830) | | | 372,103,598 |
| | | | |
| U.S. Treasury Obligations - 8.0% |
| | | Principal Amount (a) | Value ($) |
| U.S. Treasury Bonds: | | | |
| 1.75% 8/15/41 | | 2,500,000 | 1,732,422 |
| 1.875% 2/15/41 | | 2,943,000 | 2,103,440 |
| 2% 11/15/41 | | 2,000,000 | 1,445,547 |
| 2% 8/15/51 | | 527,000 | 354,222 |
| 2.25% 2/15/52 | | 250,000 | 178,252 |
| 2.875% 5/15/52 | | 600,000 | 491,320 |
| 3.625% 2/15/53 | | 28,100,000 | 26,752,071 |
| U.S. Treasury Notes 3.5% 2/15/33 | | 2,704,000 | 2,614,853 |
| TOTAL U.S. TREASURY OBLIGATIONS (Cost $38,490,781) | | | 35,672,127 |
| | | | |
| Foreign Government and Government Agency Obligations - 0.3% |
| | | Principal Amount (a) | Value ($) |
| United Mexican States: | | | |
| 3.25% 4/16/30 | | 200,000 | 173,663 |
| 4.5% 4/22/29 | | 1,000,000 | 949,000 |
| TOTAL FOREIGN GOVERNMENT AND GOVERNMENT AGENCY OBLIGATIONS (Cost $1,312,162) | | | 1,122,663 |
| | | | |
| Preferred Securities - 0.4% |
| | | Principal Amount (a) | Value ($) |
| ENERGY - 0.2% | | | |
| Oil, Gas & Consumable Fuels - 0.2% | | | |
| Enbridge, Inc. 5.75% 7/15/80 (c) | | 753,000 | 711,598 |
| FINANCIALS - 0.2% | | | |
| Capital Markets - 0.2% | | | |
| UBS Group AG 4.875% (b)(c)(g) | | 950,000 | 834,247 |
| TOTAL PREFERRED SECURITIES (Cost $1,705,128) | | | 1,545,845 |
| | | | |
| Money Market Funds - 6.9% |
| | | Shares | Value ($) |
Fidelity Cash Central Fund 4.63% (h) (Cost $30,792,362) | | 30,786,214 | 30,792,372 |
| | | | |
| TOTAL INVESTMENT IN SECURITIES - 99.5% (Cost $510,279,263) | 441,236,605 |
NET OTHER ASSETS (LIABILITIES) - 0.5% | 2,422,514 |
| NET ASSETS - 100.0% | 443,659,119 |
| | |
Legend
| (a) | Amount is stated in United States dollars unless otherwise noted. |
| (b) | Security exempt from registration under Rule 144A of the Securities Act of 1933. These securities may be resold in transactions exempt from registration, normally to qualified institutional buyers. At the end of the period, the value of these securities amounted to $72,888,711 or 16.4% of net assets. |
| (c) | Coupon rates for floating and adjustable rate securities reflect the rates in effect at period end. |
| (d) | Coupon is indexed to a floating interest rate which may be multiplied by a specified factor and/or subject to caps or floors. |
| (e) | Security or a portion of the security purchased on a delayed delivery or when-issued basis. |
| (f) | Security initially issued at one coupon which converts to a higher coupon at a specified date. The rate shown is the rate at period end. |
| (g) | Security is perpetual in nature with no stated maturity date. |
| (h) | Affiliated fund that is generally available only to investment companies and other accounts managed by Fidelity Investments. The rate quoted is the annualized seven-day yield of the fund at period end. A complete unaudited listing of the fund's holdings as of its most recent quarter end is available upon request. In addition, each Fidelity Central Fund's financial statements are available on the SEC's website or upon request. |
Affiliated Central Funds
Fiscal year to date information regarding the Fund's investments in Fidelity Central Funds, including the ownership percentage, is presented below.
| Affiliate | Value, beginning of period ($) | Purchases ($) | Sales Proceeds ($) | Dividend Income ($) | Realized Gain (loss) ($) | Change in Unrealized appreciation (depreciation) ($) | Value, end of period ($) | % ownership, end of period |
| Fidelity Cash Central Fund 4.63% | 18,373,868 | 51,634,293 | 39,215,790 | 497,517 | - | 1 | 30,792,372 | 0.1% |
| Fidelity Securities Lending Cash Central Fund 4.63% | - | 22,944,536 | 22,944,536 | 2,216 | - | - | - | 0.0% |
| Total | 18,373,868 | 74,578,829 | 62,160,326 | 499,733 | - | 1 | 30,792,372 | |
| | | | | | | | | |
Amounts in the dividend income column in the above table include any capital gain distributions from underlying funds, which are presented in the corresponding line item in the Statement of Operations, if applicable.
Amount for Fidelity Securities Lending Cash Central Fund represents the income earned on investing cash collateral, less rebates paid to borrowers and any lending agent fees associated with the loan, plus any premium payments received for lending certain types of securities.
Amounts included in the purchases and sales proceeds columns may include in-kind transactions, if applicable.
Investment Valuation
The following is a summary of the inputs used, as of February 28, 2023, involving the Fund's assets and liabilities carried at fair value. The inputs or methodology used for valuing securities may not be an indication of the risk associated with investing in those securities. For more information on valuation inputs, and their aggregation into the levels used below, please refer to the Investment Valuation section in the accompanying Notes to Financial Statements.
| Valuation Inputs at Reporting Date: |
| Description | Total ($) | Level 1 ($) | Level 2 ($) | Level 3 ($) |
Investments in Securities: | | | | |
|
| Corporate Bonds | 372,103,598 | - | 372,103,598 | - |
|
| U.S. Government and Government Agency Obligations | 35,672,127 | - | 35,672,127 | - |
|
| Foreign Government and Government Agency Obligations | 1,122,663 | - | 1,122,663 | - |
|
| Preferred Securities | 1,545,845 | - | 1,545,845 | - |
|
| Money Market Funds | 30,792,372 | 30,792,372 | - | - |
| Total Investments in Securities: | 441,236,605 | 30,792,372 | 410,444,233 | - |
| Statement of Assets and Liabilities |
| | | | February 28, 2023 (Unaudited) |
| | | | | |
| Assets | | | | |
| Investment in securities, at value - See accompanying schedule: | | | | |
Unaffiliated issuers (cost $479,486,901) | $ | 410,444,233 | | |
Fidelity Central Funds (cost $30,792,362) | | 30,792,372 | | |
| | | | | |
| | | | | |
| Total Investment in Securities (cost $510,279,263) | | | $ | 441,236,605 |
| Receivable for fund shares sold | | | | 4,324,762 |
| Interest receivable | | | | 4,047,384 |
| Distributions receivable from Fidelity Central Funds | | | | 111,543 |
Total assets | | | | 449,720,294 |
| Liabilities | | | | |
| Payable for investments purchased | | | | |
Regular delivery | $ | 5,255,550 | | |
Delayed delivery | | 803,522 | | |
| Payable for fund shares redeemed | | 332 | | |
| Distributions payable | | 13 | | |
| Other payables and accrued expenses | | 1,758 | | |
| Total Liabilities | | | | 6,061,175 |
| Net Assets | | | $ | 443,659,119 |
| Net Assets consist of: | | | | |
| Paid in capital | | | $ | 524,857,362 |
| Total accumulated earnings (loss) | | | | (81,198,243) |
| Net Assets | | | $ | 443,659,119 |
Net Asset Value , offering price and redemption price per share ($443,659,119 ÷ 49,294,339 shares) | | | $ | 9.00 |
| Statement of Operations |
| | | | Six months ended February 28, 2023 (Unaudited) |
| Investment Income | | | | |
| Dividends | | | $ | 44,805 |
| Interest | | | | 7,424,662 |
| Income from Fidelity Central Funds (including $2,216 from security lending) | | | | 499,733 |
| Total Income | | | | 7,969,200 |
| Expenses | | | | |
| Custodian fees and expenses | $ | 2,110 | | |
| Independent trustees' fees and expenses | | 772 | | |
| Total expenses before reductions | | 2,882 | | |
| Expense reductions | | (170) | | |
| Total expenses after reductions | | | | 2,712 |
| Net Investment income (loss) | | | | 7,966,488 |
| Realized and Unrealized Gain (Loss) | | | | |
| Net realized gain (loss) on: | | | | |
| Investment Securities: | | | | |
| Unaffiliated issuers | | (2,339,869) | | |
| Total net realized gain (loss) | | | | (2,339,869) |
| Change in net unrealized appreciation (depreciation) on: | | | | |
| Investment Securities: | | | | |
| Unaffiliated issuers | | (8,076,942) | | |
| Fidelity Central Funds | | 1 | | |
| Total change in net unrealized appreciation (depreciation) | | | | (8,076,941) |
| Net gain (loss) | | | | (10,416,810) |
| Net increase (decrease) in net assets resulting from operations | | | $ | (2,450,322) |
| Statement of Changes in Net Assets |
| |
| | Six months ended February 28, 2023 (Unaudited) | | Year ended August 31, 2022 |
| Increase (Decrease) in Net Assets | | | | |
| Operations | | | | |
| Net investment income (loss) | $ | 7,966,488 | $ | 12,441,722 |
| Net realized gain (loss) | | (2,339,869) | | (8,664,638) |
| Change in net unrealized appreciation (depreciation) | | (8,076,941) | | (75,589,918) |
| Net increase (decrease) in net assets resulting from operations | | (2,450,322) | | (71,812,834) |
| Distributions to shareholders | | (7,814,886) | | (13,556,971) |
| Share transactions | | | | |
| Proceeds from sales of shares | | 89,493,869 | | 159,735,606 |
| Reinvestment of distributions | | 7,772,044 | | 13,556,971 |
| Cost of shares redeemed | | (40,959,275) | | (133,720,473) |
Net increase (decrease) in net assets resulting from share transactions | | 56,306,638 | | 39,572,104 |
| Total increase (decrease) in net assets | | 46,041,430 | | (45,797,701) |
| | | | | |
| Net Assets | | | | |
| Beginning of period | | 397,617,689 | | 443,415,390 |
| End of period | $ | 443,659,119 | $ | 397,617,689 |
| | | | | |
| Other Information | | | | |
| Shares | | | | |
| Sold | | 9,952,881 | | 15,617,775 |
| Issued in reinvestment of distributions | | 870,715 | | 1,331,839 |
| Redeemed | | (4,560,009) | | (13,369,559) |
| Net increase (decrease) | | 6,263,587 | | 3,580,055 |
| | | | | |
Financial Highlights
| Fidelity® Series Corporate Bond Fund |
| |
| | Six months ended (Unaudited) February 28, 2023 | | Years ended August 31, 2022 | | 2021 | | 2020 | | 2019 | | 2018 A |
Selected Per-Share Data | | | | | | | | | | | | |
| Net asset value, beginning of period | $ | 9.24 | $ | 11.24 | $ | 11.31 | $ | 10.84 | $ | 9.95 | $ | 10.00 |
| Income from Investment Operations | | | | | | | | | | | | |
Net investment income (loss) B,C | | .175 | | .296 | | .296 | | .353 | | .377 | | .013 |
| Net realized and unrealized gain (loss) | | (.243) | | (1.974) | | .054 | | .511 | | .917 | | (.050) |
| Total from investment operations | | (.068) | | (1.678) | | .350 | | .864 | | 1.294 | | (.037) |
| Distributions from net investment income | | (.172) | | (.295) | | (.304) | | (.356) | | (.397) | | (.013) |
| Distributions from net realized gain | | - | | (.027) | | (.116) | | (.038) | | (.007) | | - |
| Total distributions | | (.172) | | (.322) | | (.420) | | (.394) | | (.404) | | (.013) |
| Net asset value, end of period | $ | 9.00 | $ | 9.24 | $ | 11.24 | $ | 11.31 | $ | 10.84 | $ | 9.95 |
Total Return D,E | | (.71)% | | (15.16)% | | 3.18% | | 8.19% | | 13.38% | | (.37)% |
Ratios to Average Net Assets C,F,G | | | | | | | | | | | | |
| Expenses before reductions | | -% H,I | | -% H | | -% H | | -% H | | .01% | | -% H,I |
| Expenses net of fee waivers, if any | | -% H,I | | -% H | | -% H | | -% H | | .01% | | -% H,I |
| Expenses net of all reductions | | -% H,I | | -% H | | -% H | | -% H | | -% H | | -% H,I |
| Net investment income (loss) | | 3.93% I | | 2.89% | | 2.67% | | 3.26% | | 3.73% | | 3.11% I |
| Supplemental Data | | | | | | | | | | | | |
| Net assets, end of period (000 omitted) | $ | 443,659 | $ | 397,618 | $ | 443,415 | $ | 208,418 | $ | 110,465 | $ | 10,285 |
Portfolio turnover rate J | | 25% I | | 41% | | 38% | | 37% | | 32% | | 43% K |
A For the period August 17, 2018 (commencement of operations) through August 31, 2018.
B Calculated based on average shares outstanding during the period.
C Net investment income (loss) is affected by the timing of the declaration of dividends by any underlying mutual funds or exchange-traded funds (ETFs). Net investment income (loss) of any mutual funds or ETFs is not included in the Fund's net investment income (loss) ratio.
D Total returns for periods of less than one year are not annualized.
E Total returns would have been lower if certain expenses had not been reduced during the applicable periods shown.
F Fees and expenses of any underlying mutual funds or exchange-traded funds (ETFs) are not included in the Fund's expense ratio. The Fund indirectly bears its proportionate share of these expenses. For additional expense information related to investments in Fidelity Central Funds, please refer to the "Investments in Fidelity Central Funds" note found in the Notes to Financial Statements section of the most recent Annual or Semi-Annual report.
G Expense ratios reflect operating expenses of the class. Expenses before reductions do not reflect amounts reimbursed, waived, or reduced through arrangements with the investment adviser, brokerage services, or other offset arrangements, if applicable, and do not represent the amount paid by the class during periods when reimbursements, waivers or reductions occur.
H Amount represents less than .005%.
I Annualized.
J Amount does not include the portfolio activity of any underlying mutual funds or exchange-traded funds (ETFs).
K Amount not annualized.
For the period ended February 28, 2023
1. Organization.
Fidelity Series Corporate Bond Fund (the Fund) is a fund of Fidelity Salem Street Trust (the Trust) and is authorized to issue an unlimited number of shares. Shares are offered only to certain other Fidelity funds, Fidelity managed 529 plans, and Fidelity managed collective investment trusts. The Trust is registered under the Investment Company Act of 1940, as amended (the 1940 Act), as an open-end management investment company organized as a Massachusetts business trust.
2. Investments in Fidelity Central Funds.
Funds may invest in Fidelity Central Funds, which are open-end investment companies generally available only to other investment companies and accounts managed by the investment adviser and its affiliates. The Schedule of Investments lists any Fidelity Central Funds held as an investment as of period end, but does not include the underlying holdings of each Fidelity Central Fund. An investing fund indirectly bears its proportionate share of the expenses of the underlying Fidelity Central Funds.
Based on its investment objective, each Fidelity Central Fund may invest or participate in various investment vehicles or strategies that are similar to those of the investing fund. These strategies are consistent with the investment objectives of the investing fund and may involve certain economic risks which may cause a decline in value of each of the Fidelity Central Funds and thus a decline in the value of the investing fund.
| Fidelity Central Fund | Investment Manager | Investment Objective | Investment Practices | Expense Ratio A |
| Fidelity Money Market Central Funds | Fidelity Management & Research Company LLC (FMR) | Each fund seeks to obtain a high level of current income consistent with the preservation of capital and liquidity. | Short-term Investments | Less than .005% |
A Expenses expressed as a percentage of average net assets and are as of each underlying Central Fund's most recent annual or semi-annual shareholder report.
A complete unaudited list of holdings for each Fidelity Central Fund is available upon request or at the Securities and Exchange Commission website at www.sec.gov. In addition, the financial statements of the Fidelity Central Funds which contain the significant accounting policies (including investment valuation policies) of those funds, and are not covered by the Report of Independent Registered Public Accounting Firm, are available on the Securities and Exchange Commission website or upon request.
3. Significant Accounting Policies.
The Fund is an investment company and applies the accounting and reporting guidance of the Financial Accounting Standards Board (FASB) Accounting Standards Codification Topic 946 Financial Services - Investment Companies . The financial statements have been prepared in conformity with accounting principles generally accepted in the United States of America (GAAP), which require management to make certain estimates and assumptions at the date of the financial statements. Actual results could differ from those estimates. Subsequent events, if any, through the date that the financial statements were issued have been evaluated in the preparation of the financial statements. The Fund's Schedule of Investments lists any underlying mutual funds or exchange-traded funds (ETFs) but does not include the underlying holdings of these funds. The following summarizes the significant accounting policies of the Fund:
Investment Valuation. Investments are valued as of 4:00 p.m. Eastern time on the last calendar day of the period. The Board of Trustees (the Board) has designated the Fund's investment adviser as the valuation designee responsible for the fair valuation function and performing fair value determinations as needed. The investment adviser has established a Fair Value Committee (the Committee) to carry out the day-to-day fair valuation responsibilities and has adopted policies and procedures to govern the fair valuation process and the activities of the Committee. In accordance with these fair valuation policies and procedures, which have been approved by the Board, the Fund attempts to obtain prices from one or more third party pricing services or brokers to value its investments. When current market prices, quotations or currency exchange rates are not readily available or reliable, investments will be fair valued in good faith by the Committee, in accordance with the policies and procedures. Factors used in determining fair value vary by investment type and may include market or investment specific events, transaction data, estimated cash flows, and market observations of comparable investments. The frequency that the fair valuation procedures are used cannot be predicted and they may be utilized to a significant extent. The Committee manages the Fund's fair valuation practices and maintains the fair valuation policies and procedures. The Fund's investment adviser reports to the Board information regarding the fair valuation process and related material matters.
The Fund categorizes the inputs to valuation techniques used to value its investments into a disclosure hierarchy consisting of three levels as shown below:
Level 1 - unadjusted quoted prices in active markets for identical investments
Level 2 - other significant observable inputs (including quoted prices for similar investments, interest rates, prepayment speeds, etc.)
Level 3 - unobservable inputs (including the Fund's own assumptions based on the best information available)
Valuation techniques used to value the Fund's investments by major category are as follows:
Debt securities, including restricted securities, are valued based on evaluated prices received from third party pricing services or from brokers who make markets in such securities. Corporate bonds, foreign government and government agency obligations, preferred securities and U.S. government and government agency obligations are valued by pricing services who utilize matrix pricing which considers yield or price of bonds of comparable quality, coupon, maturity and type or by broker-supplied prices. When independent prices are unavailable or unreliable, debt securities may be valued utilizing pricing methodologies which consider similar factors that would be used by third party pricing services. Debt securities are generally categorized as Level 2 in the hierarchy but may be Level 3 depending on the circumstances.
Investments in open-end mutual funds, including the Fidelity Central Funds, are valued at their closing net asset value (NAV) each business day and are categorized as Level 1 in the hierarchy.
Changes in valuation techniques may result in transfers in or out of an assigned level within the disclosure hierarchy. The aggregate value of investments by input level as of February 28, 2023,is included at the end of the Fund's Schedule of Investments.
Investment Transactions and Income. For financial reporting purposes, the Fund's investment holdings and NAV include trades executed through the end of the last business day of the period. The NAV per share for processing shareholder transactions is calculated as of the close of business of the New York Stock Exchange (NYSE), normally 4:00 p.m. Eastern time and includes trades executed through the end of the prior business day. Gains and losses on securities sold are determined on the basis of identified cost. Dividend income is recorded on the ex-dividend date. Income and capital gain distributions from Fidelity Central Funds, if any, are recorded on the ex-dividend date. Interest income is accrued as earned and includes coupon interest and amortization of premium and accretion of discount on debt securities as applicable. Debt obligations may be placed on non-accrual status and related interest income may be reduced by ceasing current accruals and writing off interest receivables when the collection of all or a portion of interest has become doubtful based on consistently applied procedures. A debt obligation is removed from non-accrual status when the issuer resumes interest payments or when collectability of interest is reasonably assured.
Expenses. Expenses directly attributable to a fund are charged to that fund. Expenses attributable to more than one fund are allocated among the respective funds on the basis of relative net assets or other appropriate methods. Expenses included in the accompanying financial statements reflect the expenses of that fund and do not include any expenses associated with any underlying mutual funds or exchange-traded funds. Although not included in a fund's expenses, a fund indirectly bears its proportionate share of these expenses through the net asset value of each underlying mutual fund or exchange-traded fund. Expense estimates are accrued in the period to which they relate and adjustments are made when actual amounts are known.
Income Tax Information and Distributions to Shareholders. Each year, the Fund intends to qualify as a regulated investment company under Subchapter M of the Internal Revenue Code, including distributing substantially all of its taxable income and realized gains. As a result, no provision for U.S. Federal income taxes is required. The Fund files a U.S. federal tax return, in addition to state and local tax returns as required. The Fund's federal income tax returns are subject to examination by the Internal Revenue Service (IRS) for a period of three fiscal years after they are filed. State and local tax returns may be subject to examination for an additional fiscal year depending on the jurisdiction.
Distributions are declared and recorded daily and paid monthly from net investment income. Distributions from realized gains, if any, are declared and recorded on the ex-dividend date. Income and capital gain distributions are determined in accordance with income tax regulations, which may differ from GAAP.
Capital accounts within the financial statements are adjusted for permanent book-tax differences. These adjustments have no impact on net assets or the results of operations. Capital accounts are not adjusted for temporary book-tax differences which will reverse in a subsequent period.
Book-tax differences are primarily due to losses deferred due to wash sales and excise tax regulations.
As of period end, the cost and unrealized appreciation (depreciation) in securities, and derivatives if applicable, for federal income tax purposes were as follows:
| Gross unrealized appreciation | $386,578 |
| Gross unrealized depreciation | (69,429,622) |
| Net unrealized appreciation (depreciation) | $(69,043,044) |
| Tax cost | $510,279,649 |
The Fund elected to defer to its next fiscal year approximately $9,807,001 of capital losses recognized during the period November 1,2022 to August 31,2022.
Delayed Delivery Transactions and When-Issued Securities. During the period, certain Funds transacted in securities on a delayed delivery or when-issued basis. Payment and delivery may take place after the customary settlement period for that security. The price of the underlying securities and the date when the securities will be delivered and paid for are fixed at the time the transaction is negotiated. Securities purchased on a delayed delivery or when-issued basis are identified as such in the Schedule of Investments. Compensation for interest forgone in the purchase of a delayed delivery or when-issued debt security may be received. With respect to purchase commitments, each applicable Fund identifies securities as segregated in its records with a value at least equal to the amount of the commitment. Payables and receivables associated with the purchases and sales of delayed delivery securities having the same coupon, settlement date and broker are offset. Delayed delivery or when-issued securities that have been purchased from and sold to different brokers are reflected as both payables and receivables in the Statement of Assets and Liabilities under the caption "Delayed delivery", as applicable. Losses may arise due to changes in the value of the underlying securities or if the counterparty does not perform under the contract's terms, or if the issuer does not issue the securities due to political, economic, or other factors.
Restricted Securities (including Private Placements). Funds may invest in securities that are subject to legal or contractual restrictions on resale. These securities generally may be resold in transactions exempt from registration or to the public if the securities are registered. Disposal of these securities may involve time-consuming negotiations and expense, and prompt sale at an acceptable price may be difficult. Information regarding restricted securities held at period end is included at the end of the Schedule of Investments, if applicable.
4. Purchases and Sales of Investments.
Purchases and sales of securities, other than short-term securities, U.S. government securities and in-kind transactions, as applicable, are noted in the table below.
| | Purchases ($) | Sales ($) |
| Fidelity Series Corporate Bond Fund | 36,310,800 | 10,032,934 |
5. Fees and Other Transactions with Affiliates.
Management Fee. Fidelity Management & Research Company LLC (the investment adviser) and its affiliates provide the Fund with investment management related services for which the Fund does not pay a management fee. Under the management contract, the investment adviser or an affiliate pays all ordinary operating expenses of the Fund, except custody fees, fees and expenses of the independent Trustees, and certain miscellaneous expenses such as proxy and shareholder meeting expenses.
Interfund Trades. Funds may purchase from or sell securities to other Fidelity Funds under procedures adopted by the Board. The procedures have been designed to ensure these interfund trades are executed in accordance with Rule 17a-7 of the 1940 Act. Any interfund trades are included within the respective purchases and sales amounts shown in the Purchases and Sales of Investments note. During the period, there were no interfund trades.
Other. During the period, the investment adviser reimbursed the Fund for certain losses as follows:
| | Amount ($) |
| Fidelity Series Corporate Bond Fund | 1,544 |
6. Committed Line of Credit.
Certain Funds participate with other funds managed by the investment adviser or an affiliate in a $4.25 billion credit facility (the "line of credit") to be utilized for temporary or emergency purposes to fund shareholder redemptions or for other short-term liquidity purposes. The commitment fees on the pro-rata portion of the line of credit are borne by the investment adviser. During the period, there were no borrowings on this line of credit.
7. Security Lending .
Funds lend portfolio securities from time to time in order to earn additional income. Lending agents are used, including National Financial Services (NFS), an affiliate of the investment adviser. Pursuant to a securities lending agreement, NFS will receive a fee, which is capped at 9.9% of a fund's daily lending revenue, for its services as lending agent. A fund may lend securities to certain qualified borrowers, including NFS. On the settlement date of the loan, a fund receives collateral (in the form of U.S. Treasury obligations, letters of credit and/or cash) against the loaned securities and maintains collateral in an amount not less than 100% of the market value of the loaned securities during the period of the loan. The market value of the loaned securities is determined at the close of business of a fund and any additional required collateral is delivered to a fund on the next business day. A fund or borrower may terminate the loan at any time, and if the borrower defaults on its obligation to return the securities loaned because of insolvency or other reasons, a fund may apply collateral received from the borrower against the obligation. A fund may experience delays and costs in recovering the securities loaned. Any cash collateral received is invested in the Fidelity Securities Lending Cash Central Fund. Any loaned securities are identified as such in the Schedule of Investments, and the value of loaned securities and cash collateral at period end, as applicable, are presented in the Statement of Assets and Liabilities. Security lending income represents the income earned on investing cash collateral, less rebates paid to borrowers and any lending agent fees associated with the loan, plus any premium payments received for lending certain types of securities. Security lending income is presented in the Statement of Operations as a component of income from Fidelity Central Funds. Affiliated security lending activity, if any, was as follows:
| | Total Security Lending Fees Paid to NFS | Security Lending Income From Securities Loaned to NFS | Value of Securities Loaned to NFS at Period End |
| Fidelity Series Corporate Bond Fund | $242 | $- | $- |
8. Expense Reductions.
Through arrangements with the Fund's custodian, credits realized as a result of certain uninvested cash balances were used to reduce the Fund's expenses by $170.
9. Other.
A fund's organizational documents provide former and current trustees and officers with a limited indemnification against liabilities arising in connection with the performance of their duties to the fund. In the normal course of business, a fund may also enter into contracts that provide general indemnifications. A fund's maximum exposure under these arrangements is unknown as this would be dependent on future claims that may be made against a fund. The risk of material loss from such claims is considered remote.
At the end of the period, mutual funds and accounts managed by the investment adviser or its affiliates were the owners of record of all of the outstanding shares of the Fund.
10. Risk and Uncertainties.
Many factors affect a fund's performance. Developments that disrupt global economies and financial markets, such as pandemics, epidemics, outbreaks of infectious diseases, war, terrorism, and environmental disasters, may significantly affect a fund's investment performance. The effects of these developments to a fund will be impacted by the types of securities in which a fund invests, the financial condition, industry, economic sector, and geographic location of an issuer, and a fund's level of investment in the securities of that issuer. Significant concentrations in security types, issuers, industries, sectors, and geographic locations may magnify the factors that affect a fund's performance.
As a shareholder, you incur two types of costs: (1) transaction costs, which may include sales charges (loads) on purchase payments or redemption proceeds, as applicable and (2) ongoing costs, which generally include management fees, distribution and/or service (12b-1) fees and other Fund expenses. This Example is intended to help you understand your ongoing costs (in dollars) of investing in a fund and to compare these costs with the ongoing costs of investing in other mutual funds.
| The Example is based on an investment of $1,000 invested at the beginning of the period and held for the entire period (September 1, 2022 to February 28, 2023). |
Actual Expenses
The first line of the accompanying table provides information about actual account values and actual expenses. You may use the information in this line, together with the amount you invested, to estimate the expenses that you paid over the period. Simply divide your account value by $1,000.00 (for example, an $8,600 account value divided by $1,000.00 = 8.6), then multiply the result by the number in the first line for a class/Fund under the heading entitled "Expenses Paid During Period" to estimate the expenses you paid on your account during this period. If any fund is a shareholder of any underlying mutual funds or exchange-traded funds (ETFs) (the Underlying Funds), such fund indirectly bears its proportional share of the expenses of the Underlying Funds in addition to the direct expenses incurred presented in the table. These fees and expenses are not included in the annualized expense ratio used to calculate the expense estimate in the table below.
Hypothetical Example for Comparison Purposes
The second line of the accompanying table provides information about hypothetical account values and hypothetical expenses based on the actual expense ratio and an assumed rate of return of 5% per year before expenses, which is not the actual return. The hypothetical account values and expenses may not be used to estimate the actual ending account balance or expenses you paid for the period. You may use this information to compare the ongoing costs of investing in the Fund and other funds. To do so, compare this 5% hypothetical example with the 5% hypothetical examples that appear in the shareholder reports of the other funds. If any fund is a shareholder of any Underlying Funds, such fund indirectly bears its proportional share of the expenses of the Underlying Funds in addition to the direct expenses as presented in the table. These fees and expenses are not included in the annualized expense ratio used to calculate the expense estimate in the table below.
Please note that the expenses shown in the table are meant to highlight your ongoing costs only and do not reflect any transaction costs. Therefore, the second line of the table is useful in comparing ongoing costs only, and will not help you determine the relative total costs of owning different funds. In addition, if these transactional costs were included, your costs would have been higher.
| | | | | Annualized Expense Ratio- A | | Beginning Account Value September 1, 2022 | | Ending Account Value February 28, 2023 | | Expenses Paid During Period- C September 1, 2022 to February 28, 2023 |
| | | | | | | | | | |
| Fidelity® Series Corporate Bond Fund | | | | -%- D | | | | | | |
| Actual | | | | | | $ 1,000 | | $ 992.90 | | $- E |
Hypothetical- B | | | | | | $ 1,000 | | $ 1,024.79 | | $- E |
| |
A Annualized expense ratio reflects expenses net of applicable fee waivers.
B 5% return per year before expenses
C Expenses are equal to the annualized expense ratio, multiplied by the average account value over the period, multiplied by 181/ 365 (to reflect the one-half year period). The fees and expenses of any Underlying Funds are not included in each annualized expense ratio.
D Amount represents less than .005%.
E Amount represents less than $.005.
Board Approval of Investment Advisory Contracts and Management Fees
Fidelity Series Corporate Bond Fund
Each year, the Board of Trustees, including the Independent Trustees (together, the Board), votes on the renewal of the management contract with Fidelity Management & Research Company LLC (FMR) and the sub-advisory agreements (together, the Advisory Contracts) for the fund. FMR and the sub-advisers are referred to herein as the Investment Advisers. The Board, assisted by the advice of fund counsel and Independent Trustees' counsel, requests and considers a broad range of information relevant to the renewal of the Advisory Contracts throughout the year.
The Board meets regularly and, at each of its meetings, covers an extensive agenda of topics and materials and considers factors that are relevant to its annual consideration of the renewal of the fund's Advisory Contracts, including the services and support provided to the fund and its shareholders. The Board has established four standing committees (Committees) - Operations, Audit, Fair Valuation, and Governance and Nominating - each composed of and chaired by Independent Trustees with varying backgrounds, to which the Board has assigned specific subject matter responsibilities in order to enhance effective decision-making by the Board. The Operations Committee, of which all the Independent Trustees are members, meets regularly throughout the year and requests, receives and considers, among other matters, information related to the annual consideration of the renewal of the fund's Advisory Contracts before making its recommendation to the Board. The Board also meets as needed to review matters specifically related to the Board's annual consideration of the renewal of the Advisory Contracts. Members of the Board may also meet from time to time with trustees of other Fidelity funds through joint ad hoc committees to discuss certain matters relevant to all of the Fidelity funds.
At its September 2022 meeting, the Board unanimously determined to renew the fund's Advisory Contracts. In considering whether to renew the Advisory Contracts for the fund, the Board considered all factors it believed relevant and reached a determination, with the assistance of fund counsel and Independent Trustees' counsel and through the exercise of its business judgment, that the renewal of the Advisory Contracts was in the best interests of the fund and its shareholders and the fact that no fee is payable under the management contract was fair and reasonable.
Nature, Extent, and Quality of Services Provided . The Board considered Fidelity's staffing as it relates to the fund, including the backgrounds of investment personnel of Fidelity, and also considered the fund's investment objective, strategies, and related investment philosophy. The Independent Trustees also had discussions with senior management of Fidelity's investment operations and investment groups. The Board considered the structure of the investment personnel compensation program and whether this structure provides appropriate incentives to act in the best interests of the fund. The Board also considered the steps Fidelity had taken to ensure the continued provision of high quality services to the Fidelity funds throughout the COVID-19 pandemic, including the expansion of staff in client facing positions to maintain service levels in periods of high volumes and volatility.
Resources Dedicated to Investment Management and Support Services . The Board reviewed the general qualifications and capabilities of Fidelity's investment staff, including its size, education, experience, and resources, as well as Fidelity's approach to recruiting, training, managing, and compensating investment personnel. The Board noted the resources devoted to Fidelity's global investment organization, and that Fidelity's analysts have extensive resources, tools, and capabilities that allow them to conduct quantitative and fundamental analysis, as well as credit analysis of issuers, counterparties, and guarantors. Further, the Board considered that Fidelity's investment professionals have sufficient access to global information and data so as to provide competitive investment results over time, and that those professionals also have access to sophisticated tools that permit them to assess portfolio construction and risk and performance attribution characteristics continuously, as well as to transmit new information and research conclusions rapidly around the world. Additionally, in its deliberations, the Board considered Fidelity's trading, risk management, compliance, cybersecurity, and technology and operations capabilities and resources, which are integral parts of the investment management process.
Administrative Services . The Board considered (i) the nature, extent, quality, and cost of advisory and administrative services performed by the Investment Advisers and their affiliates under the Advisory Contracts and under separate agreements covering transfer agency, pricing and bookkeeping, and securities lending services for the fund; (ii) the nature and extent of the supervision of third party service providers, principally custodians, subcustodians, and pricing vendors; and (iii) the resources devoted to, and the record of compliance with, the fund's compliance policies and procedures.
Investment Performance . The Board considered whether the fund has operated in accordance with its investment objective, as well as its record of compliance with its investment restrictions. The Board reviewed the fund's absolute investment performance, as well as the fund's relative investment performance. In this regard, the Board noted that the fund is designed to offer an investment option for other investment companies, collective investment trusts, and 529 plans managed by Fidelity and ultimately to enhance the performance of those investment companies, collective investment trusts, and 529 plans. The Board noted there was a portfolio management change for the fund in January 2022.
Based on its review, the Board concluded that the nature, extent, and quality of services provided to the fund under the Advisory Contracts should continue to benefit the shareholders of the fund.
Competitiveness of Management Fee and Total Expense Ratio . The Board considered that the fund does not pay FMR a management fee for investment advisory services, but that FMR receives fees for providing services to funds, collective investment trusts, and 529 plans that invest in the fund. The Board also noted that FMR or an affiliate undertakes to pay all operating expenses of the fund, except transfer agent fees, 12b-1 fees, Independent Trustee fees and expenses, custodian fees and expenses, proxy and shareholder meeting expenses, interest, taxes, and extraordinary expenses (such as litigation expenses). The Board further noted that the fund pays its non-operating expenses, including brokerage commissions and fees and expenses associated with the fund's securities lending program, if applicable.
The Board further considered that FMR has contractually agreed to reimburse the fund to the extent that total operating expenses, with certain exceptions, as a percentage of its average net assets, exceed 0.003% through December 31, 2024.
Based on its review, the Board considered that the fund does not pay a management fee and concluded that the fund's total expense ratio was reasonable in light of the services that the fund and its shareholders receive and the other factors considered.
Costs of the Services and Profitability. The Board considered the level of Fidelity's profits in respect of all the Fidelity funds.
A public accounting firm has been engaged annually by the Board as part of the Board's assessment of Fidelity's profitability analysis. The engagement includes the review and assessment of the methodologies used by Fidelity in determining the revenues and expenses attributable to Fidelity's mutual fund business, and completion of agreed-upon procedures in respect of the mathematical accuracy of certain fund profitability information and its conformity to established allocation methodologies. After considering the reports issued under the engagement and information provided by Fidelity, the Board concluded that while other allocation methods may also be reasonable, Fidelity's profitability methodologies are reasonable in all material respects.
The Board also reviewed Fidelity's non-fund businesses and potential indirect benefits such businesses may have received as a result of their association with Fidelity's mutual fund business (i.e., fall-out benefits) as well as cases where Fidelity's affiliates may benefit from the funds' business. The Board considered areas where potential indirect benefits to the Fidelity funds from their relationships with Fidelity may exist. The Board's consideration of these matters was informed by the findings of a joint ad hoc committee created by it and the boards of other Fidelity funds to evaluate potential fall-out benefits.
The Board concluded that the costs of the services provided by and the profits realized by Fidelity in connection with the operation of the fund were not relevant to the renewal of the Advisory Contracts because the fund pays no advisory fees and FMR or an affiliate bears all expenses of the fund, with limited exceptions.
Economies of Scale . The Board concluded that because the fund pays no advisory fees and FMR or an affiliate bears all expenses of the fund with certain limited exceptions, the realization of economies of scale was not a material factor in the Board's decision to renew the fund's Advisory Contracts.
Additional Information Requested by the Board . In order to develop fully the factual basis for consideration of the Fidelity funds' advisory contracts, the Board requested and received additional information on certain topics, including: (i) Fidelity's fund profitability methodology, profitability trends for certain funds, the allocation of various costs to different funds, and the impact of certain factors on fund profitability results; (ii) portfolio manager changes that have occurred during the past year and the amount of the investment that each portfolio manager has made in the Fidelity fund(s) that he or she manages; (iii) the extent to which current market conditions have affected retention and recruitment of personnel; (iv) the arrangements with and compensation paid to certain fund sub-advisers on behalf of the Fidelity funds and the treatment of such compensation within Fidelity's fund profitability methodology; (v) the terms of the funds' various management fee structures, including the basic group fee and the terms of Fidelity's voluntary expense limitation arrangements; (vi) Fidelity's transfer agent, pricing and bookkeeping fees, expense and service structures for different funds and classes relative to competitive trends; (vii) the impact on fund profitability of recent industry trends, such as the growth in passively managed funds and the changes in flows for different types of funds; (viii) the types of management fee and total expense comparisons provided, and the challenges and limitations associated with such information; and (ix) explanations regarding the relative total expense ratios and management fees of certain funds and classes, total expense and management fee competitive trends, and methodologies for total expense and management fee competitive comparisons. In addition, the Board considered its discussions with Fidelity regarding Fidelity's efforts to maintain the continuous investment and shareholder services necessary for the funds during the current pandemic and economic circumstances.
Based on its evaluation of all of the conclusions noted above, and after considering all factors it believed relevant, the Board concluded that the advisory fee arrangements are fair and reasonable and that the fund's Advisory Contracts should be renewed.
The Securities and Exchange Commission adopted Rule 22e-4 under the Investment Company Act of 1940 (the Liquidity Rule) to promote effective liquidity risk management throughout the open-end investment company industry, thereby reducing the risk that funds will be unable to meet their redemption obligations and mitigating dilution of the interests of fund shareholders.
The Fund has adopted and implemented a liquidity risk management program (the Program) reasonably designed to assess and manage the Fund's liquidity risk and to comply with the requirements of the Liquidity Rule. The Fund's Board of Trustees (the Board) has designated the Fund's investment adviser as administrator of the Program. The Fidelity advisers have established a Liquidity Risk Management Committee (the LRM Committee) to manage the Program for each of the Fidelity Funds. The LRM Committee monitors the adequacy and effectiveness of implementation of the Program and on a periodic basis assesses each Fund's liquidity risk based on a variety of factors including (1) the Fund's investment strategy, (2) portfolio liquidity and cash flow projections during normal and reasonably foreseeable stressed conditions, (3) shareholder redemptions, (4) borrowings and other funding sources and (5) certain factors specific to ETFs including the effect of the Fund's prices and spreads, market participants, and basket compositions on the overall liquidity of the Fund's portfolio, as applicable.
In accordance with the Program, each of the Fund's portfolio investments is classified into one of four defined liquidity categories based on a determination of a reasonable expectation for how long it would take to convert the investment to cash (or sell or dispose of the investment) without significantly changing its market value.
- Highly liquid investments - cash or convertible to cash within three business days or less
- Moderately liquid investments - convertible to cash in three to seven calendar days
- Less liquid investments - can be sold or disposed of, but not settled, within seven calendar days
- Illiquid investments - cannot be sold or disposed of within seven calendar days
Liquidity classification determinations take into account a variety of factors including various market, trading and investment-specific considerations, as well as market depth, and generally utilize analysis from a third-party liquidity metrics service.
The Liquidity Rule places a 15% limit on a fund's illiquid investments and requires funds that do not primarily hold assets that are highly liquid investments to determine and maintain a minimum percentage of the fund's net assets to be invested in highly liquid investments (highly liquid investment minimum or HLIM). The Program includes provisions reasonably designed to comply with the 15% limit on illiquid investments and for determining, periodically reviewing and complying with the HLIM requirement as applicable.
At a recent meeting of the Fund's Board of Trustees, the LRM Committee provided a written report to the Board pertaining to the operation, adequacy, and effectiveness of the Program for the period December 1, 2021 through November 30, 2022. The report concluded that the Program is operating effectively and is reasonably designed to assess and manage the Fund's liquidity risk.
1.9891232.104
XBC-SANN-0423
Fidelity® Sustainability Bond Index Fund
Semi-Annual Report
February 28, 2023
Contents
To view a fund's proxy voting guidelines and proxy voting record for the 12-month period ended June 30, visit http://www.fidelity.com/proxyvotingresults or visit the Securities and Exchange Commission's (SEC) web site at http://www.sec.gov.
You may also call 1-800-544-8544 to request a free copy of the proxy voting guidelines.
BLOOMBERG ® is a trademark and service mark of Bloomberg Finance L.P. and its affiliates (collectively "Bloomberg"). Bloomberg or Bloomberg's licensors own all proprietary rights in the Bloomberg Indices. Neither Bloomberg nor Bloomberg's licensors approves or endorses this material, or guarantees the accuracy or completeness of any information herein, or makes any warranty, express or implied, as to the results to be obtained therefrom and, to the maximum extent allowed by law, neither shall have any liability or responsibility for injury or damages arising in connection therewith.
Standard & Poor's, S&P and S&P 500 are registered service marks of The McGraw-Hill Companies, Inc. and have been licensed for use by Fidelity Distributors Corporation.
Other third-party marks appearing herein are the property of their respective owners.
All other marks appearing herein are registered or unregistered trademarks or service marks of FMR LLC or an affiliated company. © 2023 FMR LLC. All rights reserved.
This report and the financial statements contained herein are submitted for the general information of the shareholders of the Fund. This report is not authorized for distribution to prospective investors in the Fund unless preceded or accompanied by an effective prospectus.
A fund files its complete schedule of portfolio holdings with the SEC for the first and third quarters of each fiscal year on Form N-PORT. Forms N-PORT are available on the SEC's web site at http://www.sec.gov. A fund's Forms N-PORT may be reviewed and copied at the SEC's Public Reference Room in Washington, DC. Information regarding the operation of the SEC's Public Reference Room may be obtained by calling 1-800-SEC-0330.
For a complete list of a fund's portfolio holdings, view the most recent holdings listing, semiannual report, or annual report on Fidelity's web site at http://www.fidelity.com, http://www.institutional.fidelity.com, or http://www.401k.com, as applicable.
NOT FDIC INSURED •MAY LOSE VALUE •NO BANK GUARANTEE
Neither the Fund nor Fidelity Distributors Corporation is a bank.
Quality Diversification (% of Fund's net assets) |
|
Short-Term Investments and Net Other Assets (Liabilities) - (1.2)%* |
*Short-term investments and Net Other Assets (Liabilities) are not available in the pie chart. |
| |
| We have used ratings from Moody's Investors Service, Inc. Where Moody's® ratings are not available, we have used S&P® ratings. All ratings are as of the date indicated and do not reflect subsequent changes. |
Asset Allocation (% of Fund's net assets) |
|
Short-Term Investments and Net Other Assets (Liabilities) - (1.2)%* |
Foreign investments - 8% |
Short-Term Investments and Net Other Assets (Liabilities) are not available in the pie chart. |
Percentages in the above tables are adjusted for the effect of TBA Sale Commitments. |
|
Showing Percentage of Net Assets
| Nonconvertible Bonds - 25.8% |
| | | Principal Amount (a) | Value ($) |
| COMMUNICATION SERVICES - 2.5% | | | |
| Diversified Telecommunication Services - 0.9% | | | |
| AT&T, Inc.: | | | |
| 1.65% 2/1/28 | | 650,000 | 552,212 |
| 2.75% 6/1/31 | | 150,000 | 123,916 |
| 3.5% 9/15/53 | | 321,000 | 220,362 |
| 3.55% 9/15/55 | | 254,000 | 172,060 |
| 3.65% 9/15/59 | | 125,000 | 84,655 |
| 3.85% 6/1/60 | | 115,000 | 80,470 |
| 4.65% 6/1/44 | | 20,000 | 17,016 |
| 5.15% 3/15/42 | | 60,000 | 55,055 |
| Bell Canada 3.65% 8/15/52 | | 50,000 | 36,826 |
| British Telecommunications PLC 9.625% 12/15/30 | | 55,000 | 66,537 |
| Orange SA 5.5% 2/6/44 | | 60,000 | 60,531 |
| Telefonica Emisiones S.A.U.: | | | |
| 4.103% 3/8/27 | | 150,000 | 142,117 |
| 7.045% 6/20/36 | | 106,000 | 111,940 |
| TELUS Corp. 3.4% 5/13/32 | | 50,000 | 42,623 |
| Verizon Communications, Inc.: | | | |
| 0.85% 11/20/25 | | 135,000 | 120,479 |
| 1.5% 9/18/30 | | 400,000 | 309,638 |
| 2.355% 3/15/32 | | 201,000 | 158,017 |
| 2.85% 9/3/41 | | 170,000 | 117,811 |
| 2.987% 10/30/56 | | 123,000 | 75,356 |
| 3.55% 3/22/51 | | 140,000 | 101,073 |
| 4% 3/22/50 | | 38,000 | 30,054 |
| 4.016% 12/3/29 | | 200,000 | 184,461 |
| 4.75% 11/1/41 | | 189,000 | 172,830 |
| | | | 3,036,039 |
| Entertainment - 0.2% | | | |
| The Walt Disney Co.: | | | |
| 2% 9/1/29 | | 50,000 | 41,738 |
| 2.65% 1/13/31 | | 50,000 | 42,587 |
| 3.35% 3/24/25 | | 100,000 | 96,619 |
| 3.6% 1/13/51 | | 20,000 | 15,499 |
| 3.8% 3/22/30 | | 80,000 | 74,385 |
| 4.7% 3/23/50 | | 20,000 | 18,715 |
| 6.2% 12/15/34 | | 225,000 | 245,168 |
| | | | 534,711 |
| Interactive Media & Services - 0.1% | | | |
| Alphabet, Inc.: | | | |
| 0.45% 8/15/25 | | 50,000 | 45,233 |
| 1.1% 8/15/30 | | 60,000 | 47,291 |
| 2.05% 8/15/50 | | 60,000 | 36,307 |
| Baidu, Inc. 4.125% 6/30/25 | | 200,000 | 192,826 |
| | | | 321,657 |
| Media - 0.8% | | | |
| Charter Communications Operating LLC/Charter Communications Operating Capital Corp.: | | | |
| 3.9% 6/1/52 | | 220,000 | 139,025 |
| 4.4% 4/1/33 | | 225,000 | 192,448 |
| 5.5% 4/1/63 | | 175,000 | 136,026 |
| Comcast Corp.: | | | |
| 1.5% 2/15/31 | | 300,000 | 231,642 |
| 1.95% 1/15/31 | | 180,000 | 144,267 |
| 2.45% 8/15/52 | | 100,000 | 59,317 |
| 2.65% 2/1/30 | | 100,000 | 86,073 |
| 2.937% 11/1/56 | | 190,000 | 119,173 |
| 2.987% 11/1/63 | | 95,000 | 58,059 |
| 3.25% 11/1/39 | | 40,000 | 31,188 |
| 3.4% 4/1/30 | | 30,000 | 27,081 |
| 3.45% 2/1/50 | | 100,000 | 73,165 |
| 3.75% 4/1/40 | | 10,000 | 8,190 |
| 4.65% 7/15/42 | | 50,000 | 46,152 |
| 4.95% 10/15/58 | | 50,000 | 46,327 |
| Discovery Communications LLC: | | | |
| 3.625% 5/15/30 | | 69,000 | 59,047 |
| 4% 9/15/55 | | 60,000 | 38,798 |
| 4.65% 5/15/50 | | 70,000 | 51,336 |
| 5.3% 5/15/49 | | 20,000 | 16,044 |
| Fox Corp. 4.709% 1/25/29 | | 210,000 | 200,527 |
| Grupo Televisa SA de CV 6.625% 1/15/40 | | 60,000 | 61,793 |
| Magallanes, Inc.: | | | |
| 3.755% 3/15/27 (b) | | 50,000 | 45,867 |
| 4.279% 3/15/32 (b) | | 73,000 | 63,022 |
| 5.141% 3/15/52 (b) | | 68,000 | 53,305 |
| 5.391% 3/15/62 (b) | | 125,000 | 97,501 |
| Paramount Global: | | | |
| 4.2% 5/19/32 | | 60,000 | 49,390 |
| 4.95% 1/15/31 | | 100,000 | 89,639 |
| 4.95% 5/19/50 | | 90,000 | 66,633 |
| Time Warner Cable LLC 7.3% 7/1/38 | | 95,000 | 95,213 |
| TWDC Enterprises 18 Corp. 4.125% 12/1/41 | | 55,000 | 47,675 |
| | | | 2,433,923 |
| Wireless Telecommunication Services - 0.5% | | | |
| Rogers Communications, Inc.: | | | |
| 4.3% 2/15/48 | | 100,000 | 76,797 |
| 4.55% 3/15/52 (b) | | 90,000 | 71,779 |
| T-Mobile U.S.A., Inc.: | | | |
| 3.5% 4/15/25 | | 530,000 | 507,667 |
| 3.6% 11/15/60 | | 75,000 | 49,843 |
| 3.875% 4/15/30 | | 230,000 | 208,552 |
| 4.5% 4/15/50 | | 62,000 | 51,431 |
| 5.2% 1/15/33 | | 130,000 | 126,785 |
| 5.65% 1/15/53 | | 65,000 | 63,722 |
| Vodafone Group PLC: | | | |
| 4.125% 5/30/25 | | 120,000 | 116,784 |
| 4.375% 5/30/28 | | 25,000 | 24,371 |
| 5% 5/30/38 | | 43,000 | 40,386 |
| 5.125% 6/19/59 | | 60,000 | 52,739 |
| 5.25% 5/30/48 | | 20,000 | 18,476 |
| 6.15% 2/27/37 | | 50,000 | 51,729 |
| | | | 1,461,061 |
TOTAL COMMUNICATION SERVICES | | | 7,787,391 |
| CONSUMER DISCRETIONARY - 1.8% | | | |
| Auto Components - 0.0% | | | |
| Lear Corp. 3.5% 5/30/30 | | 50,000 | 42,837 |
| Automobiles - 0.4% | | | |
| American Honda Finance Corp. 1.2% 7/8/25 | | 360,000 | 328,188 |
| General Motors Co.: | | | |
| 5.2% 4/1/45 | | 120,000 | 98,955 |
| 5.6% 10/15/32 | | 50,000 | 47,538 |
| General Motors Financial Co., Inc.: | | | |
| 1.25% 1/8/26 | | 555,000 | 490,884 |
| 2.4% 4/10/28 | | 80,000 | 68,159 |
| 2.7% 8/20/27 | | 145,000 | 127,744 |
| 5.65% 1/17/29 | | 80,000 | 78,255 |
| Toyota Motor Corp. 2.358% 7/2/24 | | 60,000 | 57,744 |
| | | | 1,297,467 |
| Diversified Consumer Services - 0.0% | | | |
| Ingersoll-Rand Global Holding Co. Ltd. 4.3% 2/21/48 | | 62,000 | 50,640 |
| Hotels, Restaurants & Leisure - 0.3% | | | |
| Expedia, Inc. 3.8% 2/15/28 | | 100,000 | 91,851 |
| Marriott International, Inc. 3.5% 10/15/32 | | 80,000 | 67,720 |
| McDonald's Corp.: | | | |
| 3.3% 7/1/25 | | 11,000 | 10,576 |
| 3.5% 7/1/27 | | 20,000 | 18,860 |
| 3.6% 7/1/30 | | 165,000 | 150,525 |
| 3.7% 1/30/26 | | 155,000 | 149,532 |
| 4.2% 4/1/50 | | 18,000 | 14,954 |
| 4.45% 9/1/48 | | 64,000 | 55,760 |
| 6.3% 3/1/38 | | 60,000 | 64,845 |
| Starbucks Corp.: | | | |
| 2% 3/12/27 | | 170,000 | 151,261 |
| 2.55% 11/15/30 | | 100,000 | 83,493 |
| 3.8% 8/15/25 | | 50,000 | 48,452 |
| 4.5% 11/15/48 | | 32,000 | 27,475 |
| | | | 935,304 |
| Internet & Direct Marketing Retail - 0.5% | | | |
| Alibaba Group Holding Ltd.: | | | |
| 2.125% 2/9/31 | | 200,000 | 158,975 |
| 3.4% 12/6/27 | | 285,000 | 261,456 |
| Amazon.com, Inc.: | | | |
| 1% 5/12/26 | | 193,000 | 170,870 |
| 2.1% 5/12/31 | | 193,000 | 158,764 |
| 2.875% 5/12/41 | | 185,000 | 137,898 |
| 3.1% 5/12/51 | | 193,000 | 138,283 |
| 3.15% 8/22/27 | | 240,000 | 224,085 |
| 3.6% 4/13/32 | | 200,000 | 183,093 |
| 4.25% 8/22/57 | | 50,000 | 43,251 |
| eBay, Inc.: | | | |
| 1.4% 5/10/26 | | 118,000 | 104,876 |
| 2.7% 3/11/30 | | 50,000 | 42,493 |
| | | | 1,624,044 |
| Leisure Products - 0.0% | | | |
| Hasbro, Inc. 3.9% 11/19/29 | | 65,000 | 57,302 |
| Multiline Retail - 0.1% | | | |
| Dollar General Corp. 5% 11/1/32 | | 60,000 | 58,191 |
| Dollar Tree, Inc. 4.2% 5/15/28 | | 50,000 | 47,545 |
| Target Corp.: | | | |
| 2.95% 1/15/52 | | 65,000 | 44,302 |
| 3.9% 11/15/47 | | 25,000 | 20,431 |
| 4% 7/1/42 | | 50,000 | 43,726 |
| | | | 214,195 |
| Specialty Retail - 0.4% | | | |
| AutoNation, Inc. 4.75% 6/1/30 | | 50,000 | 46,447 |
| AutoZone, Inc.: | | | |
| 3.75% 6/1/27 | | 50,000 | 47,466 |
| 4.5% 2/1/28 | | 55,000 | 53,323 |
| Lowe's Companies, Inc.: | | | |
| 1.7% 10/15/30 | | 100,000 | 77,991 |
| 2.8% 9/15/41 | | 90,000 | 60,916 |
| 3% 10/15/50 | | 60,000 | 38,128 |
| 3.1% 5/3/27 | | 34,000 | 31,563 |
| 4.05% 5/3/47 | | 62,000 | 48,177 |
| 4.45% 4/1/62 | | 50,000 | 39,168 |
| 4.5% 4/15/30 | | 50,000 | 47,626 |
| 5% 4/15/33 | | 75,000 | 72,191 |
| 5.125% 4/15/50 | | 20,000 | 18,199 |
| The Home Depot, Inc.: | | | |
| 2.375% 3/15/51 | | 113,000 | 67,744 |
| 2.95% 6/15/29 | | 280,000 | 250,041 |
| 3.3% 4/15/40 | | 150,000 | 119,451 |
| 4.2% 4/1/43 | | 50,000 | 43,734 |
| 4.5% 12/6/48 | | 70,000 | 62,883 |
| TJX Companies, Inc. 1.6% 5/15/31 | | 125,000 | 98,443 |
| | | | 1,223,491 |
| Textiles, Apparel & Luxury Goods - 0.1% | | | |
| NIKE, Inc.: | | | |
| 2.4% 3/27/25 | | 13,000 | 12,400 |
| 2.85% 3/27/30 | | 20,000 | 17,780 |
| 3.25% 3/27/40 | | 55,000 | 44,177 |
| 3.375% 3/27/50 | | 20,000 | 15,561 |
| | | | 89,918 |
TOTAL CONSUMER DISCRETIONARY | | | 5,535,198 |
| CONSUMER STAPLES - 1.1% | | | |
| Beverages - 0.3% | | | |
| Dr. Pepper Snapple Group, Inc.: | | | |
| 3.8% 5/1/50 | | 90,000 | 67,411 |
| 4.597% 5/25/28 | | 110,000 | 106,739 |
| PepsiCo, Inc.: | | | |
| 1.4% 2/25/31 | | 200,000 | 157,040 |
| 1.625% 5/1/30 | | 83,000 | 67,427 |
| 2.375% 10/6/26 | | 220,000 | 203,013 |
| 3.6% 8/13/42 | | 105,000 | 87,265 |
| The Coca-Cola Co.: | | | |
| 1.45% 6/1/27 | | 20,000 | 17,559 |
| 1.65% 6/1/30 | | 10,000 | 8,107 |
| 2.25% 1/5/32 | | 205,000 | 169,211 |
| 2.5% 6/1/40 | | 10,000 | 7,252 |
| 2.6% 6/1/50 | | 10,000 | 6,696 |
| 2.75% 6/1/60 | | 70,000 | 46,274 |
| 3.45% 3/25/30 | | 60,000 | 55,180 |
| 4.2% 3/25/50 | | 50,000 | 46,073 |
| | | | 1,045,247 |
| Food & Staples Retailing - 0.4% | | | |
| Costco Wholesale Corp. 1.375% 6/20/27 | | 370,000 | 323,183 |
| Kroger Co.: | | | |
| 1.7% 1/15/31 | | 100,000 | 76,255 |
| 4.65% 1/15/48 | | 30,000 | 25,674 |
| 5% 4/15/42 | | 50,000 | 45,201 |
| Sysco Corp.: | | | |
| 3.3% 2/15/50 | | 50,000 | 34,287 |
| 4.5% 4/1/46 | | 50,000 | 41,490 |
| 5.95% 4/1/30 | | 53,000 | 54,941 |
| Walgreens Boots Alliance, Inc. 3.2% 4/15/30 | | 135,000 | 114,501 |
| Walmart, Inc.: | | | |
| 2.5% 9/22/41 | | 205,000 | 146,972 |
| 3.3% 4/22/24 | | 120,000 | 117,643 |
| 4.05% 6/29/48 | | 130,000 | 114,585 |
| | | | 1,094,732 |
| Food Products - 0.3% | | | |
| Archer Daniels Midland Co. 4.016% 4/16/43 | | 75,000 | 64,101 |
| Campbell Soup Co.: | | | |
| 3.65% 3/15/23 | | 8,000 | 7,996 |
| 3.95% 3/15/25 | | 100,000 | 97,367 |
| Conagra Brands, Inc.: | | | |
| 4.3% 5/1/24 | | 30,000 | 29,583 |
| 4.85% 11/1/28 | | 55,000 | 53,283 |
| 5.4% 11/1/48 | | 22,000 | 20,037 |
| 7% 10/1/28 | | 50,000 | 53,408 |
| General Mills, Inc.: | | | |
| 2.875% 4/15/30 | | 13,000 | 11,240 |
| 3% 2/1/51 | | 50,000 | 35,162 |
| 4.2% 4/17/28 | | 60,000 | 57,565 |
| Kellogg Co. 4.3% 5/15/28 | | 50,000 | 48,470 |
| Kraft Heinz Foods Co. 5.5% 6/1/50 | | 195,000 | 186,302 |
| Mondelez International, Inc. 2.625% 9/4/50 | | 50,000 | 31,476 |
| Tyson Foods, Inc.: | | | |
| 4% 3/1/26 | | 40,000 | 38,593 |
| 4.875% 8/15/34 | | 55,000 | 52,348 |
| 5.1% 9/28/48 | | 40,000 | 36,191 |
| Unilever Capital Corp. 1.75% 8/12/31 | | 135,000 | 106,917 |
| | | | 930,039 |
| Household Products - 0.1% | | | |
| Kimberly-Clark Corp.: | | | |
| 1.05% 9/15/27 | | 53,000 | 44,995 |
| 2.875% 2/7/50 | | 55,000 | 38,604 |
| 3.1% 3/26/30 | | 7,000 | 6,279 |
| Procter & Gamble Co.: | | | |
| 3% 3/25/30 | | 36,000 | 32,644 |
| 3.6% 3/25/50 | | 180,000 | 152,041 |
| | | | 274,563 |
| Personal Products - 0.0% | | | |
| Estee Lauder Companies, Inc. 1.95% 3/15/31 | | 75,000 | 60,783 |
TOTAL CONSUMER STAPLES | | | 3,405,364 |
| ENERGY - 1.1% | | | |
| Energy Equipment & Services - 0.1% | | | |
| Baker Hughes Co. 3.337% 12/15/27 | | 150,000 | 138,465 |
| Halliburton Co.: | | | |
| 2.92% 3/1/30 | | 80,000 | 69,147 |
| 5% 11/15/45 | | 86,000 | 75,991 |
| | | | 283,603 |
| Oil, Gas & Consumable Fuels - 1.0% | | | |
| Enbridge Energy Partners LP 7.5% 4/15/38 | | 50,000 | 55,841 |
| Enbridge, Inc. 3.4% 8/1/51 | | 80,000 | 55,109 |
| Energy Transfer LP 4.95% 5/15/28 | | 55,000 | 52,967 |
| Enterprise Products Operating LP: | | | |
| 3.3% 2/15/53 | | 250,000 | 169,582 |
| 5.35% 1/31/33 | | 100,000 | 99,938 |
| 7.55% 4/15/38 | | 55,000 | 61,909 |
| Kinder Morgan, Inc. 5.2% 6/1/33 | | 30,000 | 28,566 |
| Magellan Midstream Partners LP 4.85% 2/1/49 | | 50,000 | 42,131 |
| Marathon Petroleum Corp. 4.75% 9/15/44 | | 88,000 | 73,182 |
| MPLX LP: | | | |
| 4.5% 4/15/38 | | 48,000 | 40,954 |
| 4.875% 12/1/24 | | 152,000 | 149,924 |
| 4.9% 4/15/58 | | 50,000 | 39,831 |
| 5% 3/1/33 | | 100,000 | 93,823 |
| 5.5% 2/15/49 | | 50,000 | 44,895 |
| ONEOK Partners LP 6.65% 10/1/36 | | 50,000 | 50,605 |
| ONEOK, Inc.: | | | |
| 6.35% 1/15/31 | | 187,000 | 191,567 |
| 7.5% 9/1/23 | | 119,000 | 119,550 |
| Phillips 66 Co.: | | | |
| 4.65% 11/15/34 | | 65,000 | 60,658 |
| 5.875% 5/1/42 | | 54,000 | 56,064 |
| Sabine Pass Liquefaction LLC 5% 3/15/27 | | 160,000 | 156,169 |
| Spectra Energy Partners LP 4.75% 3/15/24 | | 215,000 | 213,117 |
| Targa Resources Corp. 4.95% 4/15/52 | | 60,000 | 47,993 |
| Targa Resources Partners LP/Targa Resources Partners Finance Corp. 5% 1/15/28 | | 125,000 | 119,057 |
| The Williams Companies, Inc.: | | | |
| 3.75% 6/15/27 | | 26,000 | 24,436 |
| 4.3% 3/4/24 | | 149,000 | 147,113 |
| 5.4% 3/2/26 | | 100,000 | 100,005 |
| 5.65% 3/15/33 | | 50,000 | 49,951 |
| TransCanada PipeLines Ltd.: | | | |
| 4.1% 4/15/30 | | 300,000 | 273,639 |
| 4.625% 3/1/34 | | 50,000 | 45,563 |
| 5% 10/16/43 | | 50,000 | 44,809 |
| Transcontinental Gas Pipe Line Co. LLC: | | | |
| 3.25% 5/15/30 | | 20,000 | 17,413 |
| 3.95% 5/15/50 | | 50,000 | 38,740 |
| 4.45% 8/1/42 | | 105,000 | 90,011 |
| Valero Energy Corp.: | | | |
| 2.15% 9/15/27 | | 125,000 | 109,976 |
| 3.4% 9/15/26 | | 50,000 | 46,818 |
| 4% 4/1/29 | | 155,000 | 146,178 |
| | | | 3,158,084 |
TOTAL ENERGY | | | 3,441,687 |
| FINANCIALS - 10.9% | | | |
| Banks - 6.9% | | | |
| Banco Santander SA: | | | |
| 0.701% 6/30/24 (c) | | 400,000 | 392,292 |
| 1.849% 3/25/26 | | 200,000 | 177,284 |
| Bank of America Corp.: | | | |
| 0.981% 9/25/25 (c) | | 600,000 | 556,804 |
| 1.734% 7/22/27 (c) | | 43,000 | 37,874 |
| 2.087% 6/14/29 (c) | | 310,000 | 260,647 |
| 2.651% 3/11/32 (c) | | 80,000 | 64,986 |
| 2.676% 6/19/41 (c) | | 360,000 | 246,598 |
| 2.687% 4/22/32 (c) | | 43,000 | 34,874 |
| 2.831% 10/24/51 (c) | | 50,000 | 32,015 |
| 3.458% 3/15/25 (c) | | 120,000 | 117,284 |
| 3.55% 3/5/24 (c) | | 250,000 | 249,967 |
| 3.846% 3/8/37 (c) | | 180,000 | 151,887 |
| 3.974% 2/7/30 (c) | | 35,000 | 32,017 |
| 4.083% 3/20/51 (c) | | 130,000 | 104,373 |
| 4.183% 11/25/27 | | 95,000 | 90,567 |
| 4.244% 4/24/38 (c) | | 75,000 | 64,875 |
| 4.271% 7/23/29 (c) | | 60,000 | 56,317 |
| 4.33% 3/15/50 (c) | | 50,000 | 42,050 |
| 4.376% 4/27/28 (c) | | 100,000 | 95,606 |
| 4.75% 4/21/45 | | 55,000 | 49,740 |
| 5.875% 2/7/42 | | 135,000 | 140,548 |
| 6.204% 11/10/28 (c) | | 350,000 | 359,862 |
| Bank of Montreal: | | | |
| 3.088% 1/10/37 (c) | | 50,000 | 39,366 |
| 4.338% 10/5/28 (c) | | 170,000 | 167,351 |
| Bank of Nova Scotia: | | | |
| 2.45% 2/2/32 | | 60,000 | 48,274 |
| 2.7% 8/3/26 | | 65,000 | 59,583 |
| 4.5% 12/16/25 | | 85,000 | 82,382 |
| 4.85% 2/1/30 | | 30,000 | 29,105 |
| Barclays PLC: | | | |
| 2.852% 5/7/26 (c) | | 200,000 | 187,259 |
| 3.33% 11/24/42 (c) | | 200,000 | 142,685 |
| 3.932% 5/7/25 (c) | | 200,000 | 194,663 |
| 4.338% 5/16/24 (c) | | 400,000 | 398,481 |
| 4.836% 5/9/28 | | 215,000 | 201,450 |
| BB&T Corp. 3.875% 3/19/29 | | 80,000 | 74,299 |
| Canadian Imperial Bank of Commerce 3.6% 4/7/32 | | 64,000 | 56,422 |
| Citigroup, Inc.: | | | |
| 3 month U.S. LIBOR + 1.150% 3.52% 10/27/28 (c)(d) | | 190,000 | 173,902 |
| 2.976% 11/5/30 (c) | | 290,000 | 246,857 |
| 3.106% 4/8/26 (c) | | 110,000 | 104,459 |
| 3.2% 10/21/26 | | 191,000 | 177,685 |
| 3.875% 3/26/25 | | 430,000 | 416,310 |
| 4.125% 7/25/28 | | 154,000 | 144,124 |
| 4.65% 7/30/45 | | 42,000 | 37,166 |
| 4.65% 7/23/48 | | 115,000 | 103,156 |
| 5.875% 1/30/42 | | 65,000 | 67,643 |
| 6.625% 6/15/32 | | 60,000 | 63,407 |
| 8.125% 7/15/39 | | 85,000 | 107,682 |
| Fifth Third Bancorp: | | | |
| 3.95% 3/14/28 | | 100,000 | 94,806 |
| 6.361% 10/27/28 (c) | | 70,000 | 72,104 |
| HSBC Holdings PLC: | | | |
| 2.804% 5/24/32 (c) | | 40,000 | 31,930 |
| 4.041% 3/13/28 (c) | | 211,000 | 196,960 |
| 4.292% 9/12/26 (c) | | 850,000 | 818,251 |
| 4.755% 6/9/28 (c) | | 200,000 | 192,111 |
| 6.8% 6/1/38 | | 100,000 | 102,603 |
| 7.625% 5/17/32 | | 110,000 | 115,457 |
| HSBC U.S.A., Inc. 3.5% 6/23/24 | | 100,000 | 97,494 |
| Huntington Bancshares, Inc. 2.55% 2/4/30 | | 55,000 | 46,030 |
| ING Groep NV 3.95% 3/29/27 | | 260,000 | 245,976 |
| Japan Bank International Cooperation: | | | |
| 1.25% 1/21/31 | | 262,000 | 205,879 |
| 2.5% 5/23/24 | | 600,000 | 579,212 |
| JPMorgan Chase & Co.: | | | |
| 0.653% 9/16/24 (c) | | 1,200,000 | 1,167,107 |
| 0.969% 6/23/25 (c) | | 180,000 | 168,918 |
| 1.47% 9/22/27 (c) | | 170,000 | 147,376 |
| 2.069% 6/1/29 (c) | | 150,000 | 126,475 |
| 2.083% 4/22/26 (c) | | 20,000 | 18,572 |
| 2.525% 11/19/41 (c) | | 110,000 | 73,799 |
| 2.545% 11/8/32 (c) | | 180,000 | 143,917 |
| 2.956% 5/13/31 (c) | | 50,000 | 41,990 |
| 3.328% 4/22/52 (c) | | 80,000 | 56,755 |
| 3.559% 4/23/24 (c) | | 285,000 | 284,057 |
| 4.203% 7/23/29 (c) | | 30,000 | 28,124 |
| 4.323% 4/26/28 (c) | | 170,000 | 162,976 |
| 4.452% 12/5/29 (c) | | 185,000 | 175,311 |
| 4.493% 3/24/31 (c) | | 200,000 | 188,702 |
| 4.586% 4/26/33 (c) | | 170,000 | 158,436 |
| 4.912% 7/25/33 (c) | | 125,000 | 119,689 |
| 4.95% 6/1/45 | | 92,000 | 84,556 |
| 6.4% 5/15/38 | | 86,000 | 94,144 |
| KeyCorp 4.1% 4/30/28 | | 55,000 | 52,184 |
| Lloyds Banking Group PLC: | | | |
| 4.45% 5/8/25 | | 200,000 | 195,002 |
| 4.65% 3/24/26 | | 221,000 | 212,940 |
| 5.871% 3/6/29 (c) | | 200,000 | 200,039 |
| M&T Bank Corp. 5.053% 1/27/34 (c) | | 35,000 | 33,399 |
| Mitsubishi UFJ Financial Group, Inc.: | | | |
| 1.538% 7/20/27 (c) | | 200,000 | 174,975 |
| 2.048% 7/17/30 | | 210,000 | 167,309 |
| 2.801% 7/18/24 | | 200,000 | 192,661 |
| 3.455% 3/2/23 | | 260,000 | 260,000 |
| 3.741% 3/7/29 | | 110,000 | 100,679 |
| 4.286% 7/26/38 | | 73,000 | 65,515 |
| Mizuho Financial Group, Inc. 2.226% 5/25/26 (c) | | 400,000 | 369,305 |
| NatWest Group PLC: | | | |
| 3.875% 9/12/23 | | 200,000 | 198,048 |
| 4.519% 6/25/24 (c) | | 600,000 | 596,763 |
| 5.847% 3/2/27 (c) | | 200,000 | 200,102 |
| Oesterreichische Kontrollbank AG 0.375% 9/17/25 | | 42,000 | 37,662 |
| PNC Financial Services Group, Inc.: | | | |
| U.S. Secured Overnight Fin. Rate (SOFR) Averages Index + 0.000% 4.626% 6/6/33 (c)(d) | | 85,000 | 78,947 |
| 1.15% 8/13/26 | | 203,000 | 178,295 |
| 2.2% 11/1/24 | | 80,000 | 76,331 |
| 6.037% 10/28/33 (c) | | 50,000 | 51,962 |
| Rabobank Nederland 5.25% 5/24/41 | | 54,000 | 56,314 |
| Rabobank Nederland New York Branch 0.375% 1/12/24 | | 500,000 | 479,716 |
| Royal Bank of Canada: | | | |
| 2.3% 11/3/31 | | 55,000 | 44,134 |
| 2.55% 7/16/24 | | 100,000 | 96,300 |
| 4.9% 1/12/28 | | 220,000 | 216,808 |
| Santander Holdings U.S.A., Inc. 4.4% 7/13/27 | | 73,000 | 69,343 |
| Santander UK Group Holdings PLC 1.089% 3/15/25 (c) | | 200,000 | 189,447 |
| Sumitomo Mitsui Financial Group, Inc.: | | | |
| 1.474% 7/8/25 | | 200,000 | 181,982 |
| 2.142% 9/23/30 | | 64,000 | 50,339 |
| 2.174% 1/14/27 | | 270,000 | 239,610 |
| 2.348% 1/15/25 | | 200,000 | 188,607 |
| 3.936% 10/16/23 | | 120,000 | 118,916 |
| 5.52% 1/13/28 | | 250,000 | 249,340 |
| SVB Financial Group 2.1% 5/15/28 | | 67,000 | 56,304 |
| The Toronto-Dominion Bank: | | | |
| 0.55% 3/4/24 | | 400,000 | 381,011 |
| 3.2% 3/10/32 | | 95,000 | 81,554 |
| 3.625% 9/15/31 (c) | | 75,000 | 69,742 |
| Truist Financial Corp.: | | | |
| 1.2% 8/5/25 | | 200,000 | 181,928 |
| 1.267% 3/2/27 (c) | | 53,000 | 47,168 |
| 4.873% 1/26/29 (c) | | 35,000 | 34,349 |
| 6.123% 10/28/33 (c) | | 50,000 | 52,413 |
| U.S. Bancorp: | | | |
| 1.375% 7/22/30 | | 380,000 | 294,541 |
| 3.9% 4/26/28 | | 94,000 | 89,706 |
| Wells Fargo & Co.: | | | |
| 4.54% 8/15/26 (c) | | 1,000,000 | 975,778 |
| 4.897% 7/25/33 (c) | | 425,000 | 405,933 |
| 4.9% 11/17/45 | | 280,000 | 247,514 |
| Westpac Banking Corp.: | | | |
| 1.953% 11/20/28 | | 50,000 | 42,711 |
| 2.894% 2/4/30 (c) | | 100,000 | 92,963 |
| 3.35% 3/8/27 | | 115,000 | 108,083 |
| 4.11% 7/24/34 (c) | | 200,000 | 176,878 |
| | | | 21,683,445 |
| Capital Markets - 2.1% | | | |
| Bank of New York Mellon Corp.: | | | |
| 0.35% 12/7/23 | | 370,000 | 356,370 |
| 1.8% 7/28/31 | | 47,000 | 36,647 |
| 4.414% 7/24/26 (c) | | 200,000 | 196,180 |
| 5.834% 10/25/33 (c) | | 100,000 | 104,132 |
| BlackRock, Inc. 3.2% 3/15/27 | | 150,000 | 141,290 |
| Charles Schwab Corp.: | | | |
| 1.65% 3/11/31 | | 50,000 | 39,044 |
| 2% 3/20/28 | | 115,000 | 100,212 |
| 2.9% 3/3/32 | | 55,000 | 46,518 |
| CI Financial Corp. 3.2% 12/17/30 | | 55,000 | 41,698 |
| CME Group, Inc. 2.65% 3/15/32 | | 90,000 | 75,445 |
| Credit Suisse AG: | | | |
| 0.495% 2/2/24 | | 400,000 | 377,111 |
| 3.625% 9/9/24 | | 285,000 | 269,380 |
| Credit Suisse U.S.A., Inc. 7.125% 7/15/32 | | 50,000 | 51,411 |
| Deutsche Bank AG 4.1% 1/13/26 | | 85,000 | 81,073 |
| Deutsche Bank AG London Branch 3.7% 5/30/24 | | 85,000 | 83,180 |
| Deutsche Bank AG New York Branch: | | | |
| 2.311% 11/16/27 (c) | | 150,000 | 130,238 |
| 3.7% 5/30/24 | | 100,000 | 97,137 |
| Goldman Sachs Group, Inc.: | | | |
| 0.855% 2/12/26 (c) | | 230,000 | 208,823 |
| 1.093% 12/9/26 (c) | | 100,000 | 88,022 |
| 1.948% 10/21/27 (c) | | 260,000 | 227,746 |
| 2.383% 7/21/32 (c) | | 100,000 | 78,542 |
| 2.615% 4/22/32 (c) | | 65,000 | 52,202 |
| 3.436% 2/24/43 (c) | | 85,000 | 63,422 |
| 3.691% 6/5/28 (c) | | 260,000 | 241,504 |
| 4.017% 10/31/38 (c) | | 75,000 | 61,951 |
| 4.411% 4/23/39 (c) | | 90,000 | 78,290 |
| 6.25% 2/1/41 | | 75,000 | 80,250 |
| 6.75% 10/1/37 | | 180,000 | 191,601 |
| Intercontinental Exchange, Inc.: | | | |
| 1.85% 9/15/32 | | 140,000 | 104,270 |
| 2.65% 9/15/40 | | 225,000 | 157,676 |
| 3.75% 9/21/28 | | 20,000 | 18,765 |
| Jefferies Financial Group, Inc.: | | | |
| 4.15% 1/23/30 | | 60,000 | 54,195 |
| 4.85% 1/15/27 | | 50,000 | 48,998 |
| Moody's Corp.: | | | |
| 4.25% 2/1/29 | | 110,000 | 104,585 |
| 4.875% 12/17/48 | | 40,000 | 36,112 |
| Morgan Stanley: | | | |
| 1.512% 7/20/27 (c) | | 70,000 | 61,104 |
| 1.593% 5/4/27 (c) | | 60,000 | 52,974 |
| 1.794% 2/13/32 (c) | | 195,000 | 148,406 |
| 2.239% 7/21/32 (c) | | 70,000 | 54,450 |
| 2.484% 9/16/36 (c) | | 55,000 | 41,031 |
| 2.699% 1/22/31 (c) | | 360,000 | 300,747 |
| 3.217% 4/22/42 (c) | | 175,000 | 130,077 |
| 3.625% 1/20/27 | | 268,000 | 253,343 |
| 3.737% 4/24/24 (c) | | 200,000 | 199,411 |
| 3.772% 1/24/29 (c) | | 510,000 | 470,834 |
| 5.123% 2/1/29 (c) | | 100,000 | 98,201 |
| 5.297% 4/20/37 (c) | | 95,000 | 88,521 |
| 5.597% 3/24/51 (c) | | 50,000 | 51,634 |
| NASDAQ, Inc. 1.65% 1/15/31 | | 55,000 | 42,049 |
| Nomura Holdings, Inc. 1.653% 7/14/26 | | 215,000 | 187,790 |
| Northern Trust Corp.: | | | |
| 1.95% 5/1/30 | | 50,000 | 40,917 |
| 3.375% 5/8/32 (c) | | 30,000 | 27,189 |
| S&P Global, Inc.: | | | |
| 2.3% 8/15/60 | | 85,000 | 47,025 |
| 3.25% 12/1/49 | | 50,000 | 36,694 |
| 4.75% 8/1/28 (b) | | 70,000 | 69,429 |
| State Street Corp.: | | | |
| 1.684% 11/18/27 (c) | | 70,000 | 61,876 |
| 2.623% 2/7/33 (c) | | 60,000 | 49,287 |
| | | | 6,637,009 |
| Consumer Finance - 0.8% | | | |
| AerCap Ireland Capital Ltd./AerCap Global Aviation Trust: | | | |
| 2.45% 10/29/26 | | 150,000 | 132,236 |
| 3.4% 10/29/33 | | 150,000 | 116,702 |
| 3.5% 1/15/25 | | 150,000 | 142,898 |
| Ally Financial, Inc.: | | | |
| 3.05% 6/5/23 | | 90,000 | 89,389 |
| 5.125% 9/30/24 | | 250,000 | 247,815 |
| 5.8% 5/1/25 | | 50,000 | 50,033 |
| 8% 11/1/31 | | 65,000 | 70,362 |
| American Express Co.: | | | |
| 2.5% 7/30/24 | | 124,000 | 119,294 |
| 3.4% 2/22/24 | | 80,000 | 78,353 |
| 3.95% 8/1/25 | | 120,000 | 116,475 |
| 4.05% 12/3/42 | | 70,000 | 61,829 |
| Capital One Financial Corp.: | | | |
| 2.636% 3/3/26 (c) | | 80,000 | 75,208 |
| 3.273% 3/1/30 (c) | | 80,000 | 68,975 |
| 3.75% 7/28/26 | | 85,000 | 79,858 |
| 3.8% 1/31/28 | | 160,000 | 148,148 |
| 5.468% 2/1/29 (c) | | 45,000 | 44,179 |
| Discover Financial Services 4.5% 1/30/26 | | 102,000 | 98,741 |
| John Deere Capital Corp.: | | | |
| 3.35% 6/12/24 | | 140,000 | 136,796 |
| 3.45% 3/7/29 | | 60,000 | 55,434 |
| Synchrony Financial: | | | |
| 4.25% 8/15/24 | | 105,000 | 102,464 |
| 4.5% 7/23/25 | | 68,000 | 65,472 |
| Toyota Motor Credit Corp.: | | | |
| 2.4% 1/13/32 | | 70,000 | 57,946 |
| 3% 4/1/25 | | 330,000 | 315,855 |
| 4.625% 1/12/28 | | 145,000 | 143,126 |
| | | | 2,617,588 |
| Diversified Financial Services - 0.4% | | | |
| AB Svensk Exportkredit 0.25% 9/29/23 | | 200,000 | 194,238 |
| Brixmor Operating Partnership LP: | | | |
| 2.25% 4/1/28 | | 50,000 | 42,018 |
| 4.05% 7/1/30 | | 12,000 | 10,609 |
| 4.125% 5/15/29 | | 9,000 | 8,107 |
| Corebridge Financial, Inc. 3.9% 4/5/32 (b) | | 125,000 | 109,376 |
| DH Europe Finance II SARL: | | | |
| 2.2% 11/15/24 | | 30,000 | 28,546 |
| 2.6% 11/15/29 | | 20,000 | 17,266 |
| 3.4% 11/15/49 | | 20,000 | 15,118 |
| Equitable Holdings, Inc.: | | | |
| 4.35% 4/20/28 | | 100,000 | 94,985 |
| 5% 4/20/48 | | 16,000 | 14,140 |
| KfW: | | | |
| 0% 4/18/36 | | 125,000 | 72,080 |
| 2.625% 2/28/24 | | 230,000 | 224,072 |
| Landwirtschaftliche Rentenbank: | | | |
| 2.5% 11/15/27 | | 230,000 | 211,872 |
| 3.125% 11/14/23 | | 30,000 | 29,525 |
| National Rural Utilities Cooperative Finance Corp.: | | | |
| 4.15% 12/15/32 | | 100,000 | 92,017 |
| 5.8% 1/15/33 | | 30,000 | 30,885 |
| Voya Financial, Inc. 3.65% 6/15/26 | | 60,000 | 56,738 |
| | | | 1,251,592 |
| Insurance - 0.7% | | | |
| ACE INA Holdings, Inc.: | | | |
| 1.375% 9/15/30 | | 50,000 | 38,867 |
| 3.05% 12/15/61 | | 50,000 | 32,702 |
| 3.35% 5/3/26 | | 144,000 | 137,140 |
| Allstate Corp. 1.45% 12/15/30 | | 230,000 | 176,358 |
| American International Group, Inc.: | | | |
| 4.375% 6/30/50 | | 50,000 | 42,162 |
| 4.5% 7/16/44 | | 127,000 | 110,112 |
| 5.75% 4/1/48 (c) | | 60,000 | 57,900 |
| Aon Corp. 4.5% 12/15/28 | | 50,000 | 48,317 |
| Aon PLC 4.75% 5/15/45 | | 68,000 | 60,228 |
| Arch Capital Finance LLC 4.011% 12/15/26 | | 170,000 | 164,006 |
| Arthur J. Gallagher & Co. 5.75% 3/2/53 | | 25,000 | 24,851 |
| Athene Holding Ltd. 6.15% 4/3/30 | | 65,000 | 65,620 |
| Brighthouse Financial, Inc. 3.85% 12/22/51 | | 50,000 | 32,970 |
| Brown & Brown, Inc. 4.5% 3/15/29 | | 65,000 | 59,806 |
| Hartford Financial Services Group, Inc. 2.8% 8/19/29 | | 135,000 | 116,245 |
| Lincoln National Corp.: | | | |
| 3.8% 3/1/28 | | 76,000 | 70,324 |
| 4.375% 6/15/50 | | 80,000 | 61,789 |
| Marsh & McLennan Companies, Inc.: | | | |
| 2.9% 12/15/51 | | 50,000 | 32,990 |
| 4.75% 3/15/39 | | 55,000 | 51,176 |
| 4.9% 3/15/49 | | 33,000 | 30,477 |
| MetLife, Inc.: | | | |
| 4.125% 8/13/42 | | 60,000 | 51,176 |
| 4.55% 3/23/30 | | 200,000 | 196,402 |
| Progressive Corp.: | | | |
| 3% 3/15/32 | | 65,000 | 56,236 |
| 4.125% 4/15/47 | | 50,000 | 42,608 |
| 4.2% 3/15/48 | | 10,000 | 8,551 |
| Prudential Financial, Inc.: | | | |
| 3.7% 10/1/50 (c) | | 55,000 | 46,372 |
| 4.35% 2/25/50 | | 140,000 | 118,934 |
| 5.7% 9/15/48 (c) | | 50,000 | 47,250 |
| The Travelers Companies, Inc. 5.35% 11/1/40 | | 125,000 | 126,690 |
| Unum Group 4% 6/15/29 | | 30,000 | 27,456 |
| Willis Group North America, Inc. 2.95% 9/15/29 | | 93,000 | 79,443 |
| | | | 2,215,158 |
TOTAL FINANCIALS | | | 34,404,792 |
| HEALTH CARE - 2.6% | | | |
| Biotechnology - 0.6% | | | |
| AbbVie, Inc.: | | | |
| 2.6% 11/21/24 | | 10,000 | 9,535 |
| 2.95% 11/21/26 | | 10,000 | 9,229 |
| 3.2% 11/21/29 | | 20,000 | 17,689 |
| 3.6% 5/14/25 | | 180,000 | 173,210 |
| 4.05% 11/21/39 | | 10,000 | 8,435 |
| 4.25% 11/21/49 | | 310,000 | 258,138 |
| 4.7% 5/14/45 | | 50,000 | 44,264 |
| 4.875% 11/14/48 | | 120,000 | 109,996 |
| Amgen, Inc.: | | | |
| 2.8% 8/15/41 | | 120,000 | 82,478 |
| 3.15% 2/21/40 | | 105,000 | 77,199 |
| 3.375% 2/21/50 | | 30,000 | 20,991 |
| 4.2% 3/1/33 | | 100,000 | 91,962 |
| 4.4% 5/1/45 | | 178,000 | 148,852 |
| 4.875% 3/1/53 | | 40,000 | 35,626 |
| 5.15% 3/2/28 (e) | | 120,000 | 119,525 |
| 5.25% 3/2/33 (e) | | 60,000 | 59,582 |
| 5.65% 3/2/53 (e) | | 50,000 | 49,588 |
| Baxalta, Inc. 5.25% 6/23/45 | | 135,000 | 127,872 |
| Biogen, Inc. 3.25% 2/15/51 | | 67,000 | 45,342 |
| Gilead Sciences, Inc.: | | | |
| 2.6% 10/1/40 | | 100,000 | 69,632 |
| 2.8% 10/1/50 | | 110,000 | 71,434 |
| 3.65% 3/1/26 | | 175,000 | 167,124 |
| 4.8% 4/1/44 | | 52,000 | 47,900 |
| | | | 1,845,603 |
| Health Care Equipment & Supplies - 0.2% | | | |
| Abbott Laboratories 5.3% 5/27/40 | | 140,000 | 144,052 |
| Baxter International, Inc.: | | | |
| 1.915% 2/1/27 | | 60,000 | 52,321 |
| 2.539% 2/1/32 | | 50,000 | 38,740 |
| Becton, Dickinson & Co.: | | | |
| 2.823% 5/20/30 | | 140,000 | 119,760 |
| 3.363% 6/6/24 | | 25,000 | 24,361 |
| Boston Scientific Corp. 2.65% 6/1/30 | | 161,000 | 137,677 |
| GE Healthcare Holding LLC 5.905% 11/22/32 (b) | | 100,000 | 103,366 |
| Medtronic, Inc. 4.375% 3/15/35 | | 157,000 | 148,768 |
| Zimmer Biomet Holdings, Inc. 2.6% 11/24/31 | | 60,000 | 48,624 |
| | | | 817,669 |
| Health Care Providers & Services - 1.1% | | | |
| Aetna, Inc. 4.75% 3/15/44 | | 40,000 | 35,002 |
| Centene Corp.: | | | |
| 2.625% 8/1/31 | | 70,000 | 54,545 |
| 3.375% 2/15/30 | | 140,000 | 118,129 |
| 4.25% 12/15/27 | | 90,000 | 83,165 |
| Cigna Group: | | | |
| 1.25% 3/15/26 | | 85,000 | 75,564 |
| 2.375% 3/15/31 | | 100,000 | 81,414 |
| 3.75% 7/15/23 | | 8,000 | 7,945 |
| 4.125% 11/15/25 | | 12,000 | 11,670 |
| 4.375% 10/15/28 | | 20,000 | 19,204 |
| 4.8% 8/15/38 | | 69,000 | 63,553 |
| 4.8% 7/15/46 | | 120,000 | 105,982 |
| 4.9% 12/15/48 | | 19,000 | 17,089 |
| CVS Health Corp.: | | | |
| 2.7% 8/21/40 | | 310,000 | 209,423 |
| 4.25% 4/1/50 | | 60,000 | 47,989 |
| 4.3% 3/25/28 | | 150,000 | 143,400 |
| 4.78% 3/25/38 | | 42,000 | 38,154 |
| 4.875% 7/20/35 | | 60,000 | 56,376 |
| 5.05% 3/25/48 | | 60,000 | 53,850 |
| Elevance Health, Inc.: | | | |
| 2.375% 1/15/25 | | 190,000 | 179,870 |
| 3.125% 5/15/50 | | 50,000 | 34,548 |
| 3.65% 12/1/27 | | 240,000 | 225,117 |
| 3.7% 9/15/49 | | 10,000 | 7,536 |
| 4.101% 3/1/28 | | 100,000 | 95,442 |
| 4.65% 1/15/43 | | 65,000 | 58,246 |
| HCA Holdings, Inc.: | | | |
| 3.625% 3/15/32 (b) | | 100,000 | 84,534 |
| 4.125% 6/15/29 | | 289,000 | 263,066 |
| 4.375% 3/15/42 (b) | | 50,000 | 40,068 |
| 5.5% 6/15/47 | | 50,000 | 44,966 |
| Humana, Inc.: | | | |
| 3.125% 8/15/29 | | 50,000 | 43,609 |
| 4.875% 4/1/30 | | 114,000 | 111,588 |
| Sabra Health Care LP 5.125% 8/15/26 | | 30,000 | 28,376 |
| UnitedHealth Group, Inc.: | | | |
| 1.25% 1/15/26 | | 25,000 | 22,584 |
| 2% 5/15/30 | | 80,000 | 65,598 |
| 2.3% 5/15/31 | | 286,000 | 235,744 |
| 2.375% 8/15/24 | | 50,000 | 47,998 |
| 2.9% 5/15/50 | | 36,000 | 24,384 |
| 3.05% 5/15/41 | | 115,000 | 86,413 |
| 3.7% 8/15/49 | | 20,000 | 15,677 |
| 4.375% 3/15/42 | | 55,000 | 49,092 |
| 5.8% 3/15/36 | | 50,000 | 52,341 |
| 6.05% 2/15/63 | | 50,000 | 54,723 |
| 6.625% 11/15/37 | | 50,000 | 56,329 |
| 6.875% 2/15/38 | | 185,000 | 214,264 |
| | | | 3,364,567 |
| Life Sciences Tools & Services - 0.1% | | | |
| Danaher Corp. 2.6% 10/1/50 | | 80,000 | 51,086 |
| PerkinElmer, Inc. 2.25% 9/15/31 | | 30,000 | 23,265 |
| Thermo Fisher Scientific, Inc. 2.6% 10/1/29 | | 150,000 | 129,844 |
| | | | 204,195 |
| Pharmaceuticals - 0.6% | | | |
| AstraZeneca Finance LLC: | | | |
| 1.2% 5/28/26 | | 90,000 | 79,718 |
| 2.25% 5/28/31 | | 90,000 | 74,930 |
| 4.875% 3/3/33 | | 100,000 | 98,988 |
| AstraZeneca PLC 4.375% 8/17/48 | | 66,000 | 59,903 |
| Bristol-Myers Squibb Co.: | | | |
| 2.35% 11/13/40 | | 160,000 | 109,402 |
| 3.4% 7/26/29 | | 16,000 | 14,679 |
| 3.9% 3/15/62 | | 50,000 | 39,126 |
| 4.125% 6/15/39 | | 50,000 | 44,623 |
| 4.55% 2/20/48 | | 55,000 | 50,092 |
| Eli Lilly & Co.: | | | |
| 2.25% 5/15/50 | | 70,000 | 43,970 |
| 4.875% 2/27/53 | | 50,000 | 49,916 |
| GlaxoSmithKline Capital, Inc. 6.375% 5/15/38 | | 62,000 | 70,049 |
| GSK Consumer Healthcare Capital U.S. LLC 3.375% 3/24/27 | | 250,000 | 232,460 |
| Johnson & Johnson: | | | |
| 0.55% 9/1/25 | | 60,000 | 54,148 |
| 1.3% 9/1/30 | | 60,000 | 48,216 |
| 2.1% 9/1/40 | | 60,000 | 41,153 |
| 2.45% 9/1/60 | | 60,000 | 36,780 |
| 3.5% 1/15/48 | | 145,000 | 119,529 |
| Merck & Co., Inc.: | | | |
| 2.45% 6/24/50 | | 180,000 | 114,541 |
| 2.9% 3/7/24 | | 150,000 | 146,539 |
| 2.9% 12/10/61 | | 100,000 | 64,148 |
| Mylan NV 5.2% 4/15/48 | | 83,000 | 63,390 |
| Novartis Capital Corp. 3.7% 9/21/42 | | 110,000 | 93,096 |
| Pfizer, Inc. 2.55% 5/28/40 | | 285,000 | 205,966 |
| Viatris, Inc. 2.3% 6/22/27 | | 105,000 | 90,694 |
| | | | 2,046,056 |
TOTAL HEALTH CARE | | | 8,278,090 |
| INDUSTRIALS - 1.3% | | | |
| Air Freight & Logistics - 0.1% | | | |
| FedEx Corp.: | | | |
| 3.25% 4/1/26 | | 152,000 | 143,857 |
| 4.1% 4/15/43 | | 50,000 | 39,446 |
| 4.4% 1/15/47 | | 50,000 | 40,940 |
| 4.95% 10/17/48 | | 78,000 | 69,168 |
| United Parcel Service, Inc.: | | | |
| 3.75% 11/15/47 | | 58,000 | 47,724 |
| 5.3% 4/1/50 | | 110,000 | 113,621 |
| | | | 454,756 |
| Airlines - 0.0% | | | |
| Southwest Airlines Co. 2.625% 2/10/30 | | 60,000 | 49,977 |
| Building Products - 0.2% | | | |
| Carrier Global Corp.: | | | |
| 2.242% 2/15/25 | | 620,000 | 582,295 |
| 3.377% 4/5/40 | | 50,000 | 37,397 |
| Johnson Controls International PLC 5.125% 9/14/45 | | 50,000 | 46,465 |
| Masco Corp.: | | | |
| 2% 2/15/31 | | 29,000 | 22,450 |
| 3.125% 2/15/51 | | 14,000 | 8,873 |
| Owens Corning 3.95% 8/15/29 | | 90,000 | 82,640 |
| | | | 780,120 |
| Commercial Services & Supplies - 0.1% | | | |
| Republic Services, Inc. 1.75% 2/15/32 | | 200,000 | 153,217 |
| Waste Management, Inc.: | | | |
| 2% 6/1/29 | | 55,000 | 45,989 |
| 2.5% 11/15/50 | | 70,000 | 43,883 |
| | | | 243,089 |
| Electrical Equipment - 0.1% | | | |
| Eaton Corp.: | | | |
| 4% 11/2/32 | | 50,000 | 45,804 |
| 4.15% 3/15/33 | | 70,000 | 64,494 |
| Emerson Electric Co. 2.8% 12/21/51 | | 70,000 | 45,094 |
| | | | 155,392 |
| Industrial Conglomerates - 0.1% | | | |
| 3M Co.: | | | |
| 2.375% 8/26/29 | | 86,000 | 72,195 |
| 2.65% 4/15/25 | | 8,000 | 7,578 |
| 3.05% 4/15/30 | | 7,000 | 6,122 |
| 3.125% 9/19/46 | | 50,000 | 34,163 |
| 3.7% 4/15/50 | | 8,000 | 6,195 |
| 4% 9/14/48 | | 50,000 | 40,097 |
| General Electric Co. 5.875% 1/14/38 | | 75,000 | 77,627 |
| | | | 243,977 |
| Machinery - 0.2% | | | |
| Caterpillar Financial Services Corp.: | | | |
| 0.45% 9/14/23 | | 40,000 | 39,008 |
| 1.1% 9/14/27 | | 40,000 | 34,205 |
| 2.4% 8/9/26 | | 140,000 | 128,862 |
| Caterpillar, Inc.: | | | |
| 3.25% 9/19/49 | | 50,000 | 38,117 |
| 5.2% 5/27/41 | | 105,000 | 106,895 |
| Cummins, Inc. 2.6% 9/1/50 | | 50,000 | 31,589 |
| Deere & Co. 2.875% 9/7/49 | | 130,000 | 94,006 |
| Otis Worldwide Corp. 3.112% 2/15/40 | | 50,000 | 37,140 |
| Parker Hannifin Corp.: | | | |
| 2.7% 6/14/24 | | 60,000 | 57,910 |
| 4.2% 11/21/34 | | 75,000 | 68,083 |
| Stanley Black & Decker, Inc.: | | | |
| 2.75% 11/15/50 | | 60,000 | 35,929 |
| 3% 5/15/32 | | 50,000 | 40,743 |
| Westinghouse Air Brake Tech Co. 4.4% 3/15/24 | | 50,000 | 49,258 |
| | | | 761,745 |
| Road & Rail - 0.4% | | | |
| Canadian National Railway Co.: | | | |
| 2.45% 5/1/50 | | 40,000 | 24,487 |
| 2.75% 3/1/26 | | 141,000 | 131,998 |
| Canadian Pacific Railway Co.: | | | |
| 1.75% 12/2/26 | | 130,000 | 115,125 |
| 2.45% 12/2/31 | | 130,000 | 108,258 |
| 4.8% 8/1/45 | | 60,000 | 54,285 |
| CSX Corp.: | | | |
| 2.5% 5/15/51 | | 115,000 | 70,622 |
| 3.35% 9/15/49 | | 70,000 | 50,400 |
| 4.5% 3/15/49 | | 70,000 | 61,164 |
| Kansas City Southern 3.5% 5/1/50 | | 50,000 | 36,391 |
| Norfolk Southern Corp.: | | | |
| 2.9% 6/15/26 | | 100,000 | 92,884 |
| 3.155% 5/15/55 | | 195,000 | 128,296 |
| Union Pacific Corp.: | | | |
| 3.2% 5/20/41 | | 45,000 | 34,687 |
| 3.6% 9/15/37 | | 145,000 | 122,251 |
| 3.839% 3/20/60 | | 132,000 | 100,658 |
| 4.95% 5/15/53 | | 70,000 | 66,989 |
| | | | 1,198,495 |
| Trading Companies & Distributors - 0.1% | | | |
| Air Lease Corp.: | | | |
| 1.875% 8/15/26 | | 60,000 | 52,372 |
| 2.875% 1/15/26 | | 50,000 | 46,089 |
| 3% 2/1/30 | | 55,000 | 45,656 |
| 4.625% 10/1/28 | | 52,000 | 48,561 |
| | | | 192,678 |
TOTAL INDUSTRIALS | | | 4,080,229 |
| INFORMATION TECHNOLOGY - 2.4% | | | |
| Communications Equipment - 0.0% | | | |
| Cisco Systems, Inc. 5.5% 1/15/40 | | 135,000 | 141,897 |
| Electronic Equipment & Components - 0.2% | | | |
| Amphenol Corp. 4.35% 6/1/29 | | 50,000 | 48,620 |
| Corning, Inc. 5.35% 11/15/48 | | 20,000 | 19,153 |
| Dell International LLC/EMC Corp.: | | | |
| 4% 7/15/24 | | 144,000 | 141,101 |
| 4.9% 10/1/26 | | 30,000 | 29,339 |
| 5.3% 10/1/29 | | 80,000 | 77,296 |
| 8.1% 7/15/36 | | 40,000 | 44,700 |
| 8.35% 7/15/46 | | 134,000 | 152,117 |
| | | | 512,326 |
| IT Services - 0.4% | | | |
| CDW LLC/CDW Finance Corp. 2.67% 12/1/26 | | 60,000 | 53,286 |
| Fidelity National Information Services, Inc.: | | | |
| 1.15% 3/1/26 | | 68,000 | 59,625 |
| 2.25% 3/1/31 | | 50,000 | 39,331 |
| Fiserv, Inc.: | | | |
| 3.5% 7/1/29 | | 40,000 | 35,767 |
| 4.4% 7/1/49 | | 120,000 | 97,020 |
| Global Payments, Inc. 1.2% 3/1/26 | | 122,000 | 106,648 |
| IBM Corp.: | | | |
| 2.85% 5/15/40 | | 135,000 | 96,487 |
| 2.95% 5/15/50 | | 100,000 | 65,040 |
| 3.45% 2/19/26 | | 166,000 | 158,227 |
| MasterCard, Inc.: | | | |
| 3.3% 3/26/27 | | 13,000 | 12,293 |
| 3.35% 3/26/30 | | 18,000 | 16,490 |
| 3.85% 3/26/50 | | 65,000 | 54,747 |
| PayPal Holdings, Inc.: | | | |
| 1.65% 6/1/25 | | 20,000 | 18,534 |
| 2.3% 6/1/30 | | 50,000 | 41,231 |
| 5.25% 6/1/62 | | 55,000 | 50,356 |
| The Western Union Co. 2.85% 1/10/25 | | 20,000 | 18,995 |
| Visa, Inc.: | | | |
| 1.9% 4/15/27 | | 43,000 | 38,564 |
| 2.05% 4/15/30 | | 70,000 | 59,160 |
| 2.7% 4/15/40 | | 50,000 | 37,459 |
| 2.75% 9/15/27 | | 205,000 | 189,488 |
| 4.3% 12/14/45 | | 65,000 | 58,665 |
| | | | 1,307,413 |
| Semiconductors & Semiconductor Equipment - 0.6% | | | |
| Analog Devices, Inc.: | | | |
| 2.8% 10/1/41 | | 50,000 | 36,270 |
| 2.95% 10/1/51 | | 50,000 | 34,400 |
| Applied Materials, Inc. 4.35% 4/1/47 | | 76,000 | 68,230 |
| Broadcom, Inc.: | | | |
| 3.419% 4/15/33 (b) | | 185,000 | 148,943 |
| 3.469% 4/15/34 (b) | | 400,000 | 316,588 |
| 4.11% 9/15/28 | | 60,000 | 56,058 |
| Intel Corp.: | | | |
| 2.45% 11/15/29 | | 50,000 | 42,049 |
| 3.7% 7/29/25 | | 140,000 | 135,418 |
| 4.6% 3/25/40 | | 100,000 | 89,790 |
| 4.75% 3/25/50 | | 150,000 | 129,885 |
| 4.875% 2/10/28 | | 50,000 | 49,270 |
| 5.2% 2/10/33 | | 70,000 | 68,692 |
| 5.7% 2/10/53 | | 70,000 | 68,402 |
| Lam Research Corp. 2.875% 6/15/50 | | 50,000 | 33,358 |
| Micron Technology, Inc. 3.366% 11/1/41 | | 55,000 | 36,797 |
| NVIDIA Corp. 2% 6/15/31 | | 215,000 | 173,842 |
| NXP BV/NXP Funding LLC/NXP U.S.A., Inc.: | | | |
| 2.65% 2/15/32 | | 80,000 | 62,432 |
| 4.3% 6/18/29 | | 125,000 | 114,844 |
| Qualcomm, Inc.: | | | |
| 4.3% 5/20/47 | | 55,000 | 48,087 |
| 4.65% 5/20/35 | | 145,000 | 140,614 |
| Teledyne FLIR LLC 2.5% 8/1/30 | | 55,000 | 44,762 |
| | | | 1,898,731 |
| Software - 0.8% | | | |
| Microsoft Corp.: | | | |
| 2.4% 8/8/26 | | 540,000 | 500,838 |
| 2.525% 6/1/50 | | 180,000 | 120,204 |
| 2.921% 3/17/52 | | 276,000 | 198,563 |
| 3.3% 2/6/27 | | 350,000 | 334,392 |
| Oracle Corp.: | | | |
| 2.5% 4/1/25 | | 60,000 | 56,570 |
| 2.65% 7/15/26 | | 242,000 | 221,133 |
| 2.95% 4/1/30 | | 80,000 | 68,267 |
| 3.6% 4/1/50 | | 310,000 | 209,957 |
| 3.85% 4/1/60 | | 260,000 | 173,301 |
| 4.125% 5/15/45 | | 50,000 | 37,614 |
| 6.25% 11/9/32 | | 70,000 | 72,850 |
| Roper Technologies, Inc.: | | | |
| 1% 9/15/25 | | 30,000 | 27,026 |
| 1.4% 9/15/27 | | 30,000 | 25,445 |
| 1.75% 2/15/31 | | 30,000 | 23,136 |
| 2% 6/30/30 | | 110,000 | 88,579 |
| Salesforce.com, Inc.: | | | |
| 1.95% 7/15/31 | | 195,000 | 156,392 |
| 2.7% 7/15/41 | | 50,000 | 35,326 |
| VMware, Inc.: | | | |
| 1.4% 8/15/26 | | 97,000 | 83,771 |
| 4.7% 5/15/30 | | 70,000 | 65,527 |
| | | | 2,498,891 |
| Technology Hardware, Storage & Peripherals - 0.4% | | | |
| Apple, Inc.: | | | |
| 0.55% 8/20/25 | | 200,000 | 180,314 |
| 0.7% 2/8/26 | | 160,000 | 141,984 |
| 1.25% 8/20/30 | | 200,000 | 157,157 |
| 1.7% 8/5/31 | | 52,000 | 41,380 |
| 2.375% 2/8/41 | | 160,000 | 113,118 |
| 2.8% 2/8/61 | | 155,000 | 99,432 |
| 2.85% 5/11/24 | | 50,000 | 48,723 |
| 2.85% 8/5/61 | | 51,000 | 33,133 |
| 2.95% 9/11/49 | | 90,000 | 64,747 |
| 3% 11/13/27 | | 195,000 | 181,634 |
| 3.85% 5/4/43 | | 177,000 | 152,209 |
| HP, Inc. 6% 9/15/41 | | 170,000 | 166,341 |
| | | | 1,380,172 |
TOTAL INFORMATION TECHNOLOGY | | | 7,739,430 |
| MATERIALS - 0.6% | | | |
| Chemicals - 0.4% | | | |
| Air Products & Chemicals, Inc.: | | | |
| 1.5% 10/15/25 | | 50,000 | 45,612 |
| 2.05% 5/15/30 | | 20,000 | 16,717 |
| 2.8% 5/15/50 | | 20,000 | 13,827 |
| CF Industries Holdings, Inc. 5.15% 3/15/34 | | 50,000 | 46,519 |
| DuPont de Nemours, Inc.: | | | |
| 4.725% 11/15/28 | | 20,000 | 19,674 |
| 5.419% 11/15/48 | | 62,000 | 59,391 |
| Ecolab, Inc.: | | | |
| 1.3% 1/30/31 | | 125,000 | 95,533 |
| 2.125% 2/1/32 | | 50,000 | 39,899 |
| LYB International Finance BV: | | | |
| 4% 7/15/23 | | 77,000 | 76,631 |
| 5.25% 7/15/43 | | 50,000 | 44,223 |
| LYB International Finance II BV 3.5% 3/2/27 | | 90,000 | 83,951 |
| LYB International Finance III LLC: | | | |
| 3.375% 10/1/40 | | 50,000 | 35,903 |
| 3.625% 4/1/51 | | 50,000 | 34,376 |
| Nutrien Ltd.: | | | |
| 3.95% 5/13/50 | | 100,000 | 76,229 |
| 4.2% 4/1/29 | | 6,000 | 5,659 |
| 5% 4/1/49 | | 11,000 | 9,918 |
| Sherwin-Williams Co.: | | | |
| 3.45% 6/1/27 | | 300,000 | 281,102 |
| 4.5% 6/1/47 | | 54,000 | 45,246 |
| The Dow Chemical Co.: | | | |
| 2.1% 11/15/30 | | 100,000 | 80,735 |
| 4.25% 10/1/34 | | 55,000 | 48,968 |
| 4.8% 5/15/49 | | 40,000 | 34,220 |
| 5.55% 11/30/48 | | 30,000 | 28,779 |
| The Mosaic Co. 4.25% 11/15/23 | | 131,000 | 130,005 |
| | | | 1,353,117 |
| Construction Materials - 0.0% | | | |
| Martin Marietta Materials, Inc.: | | | |
| 2.4% 7/15/31 | | 55,000 | 43,878 |
| 2.5% 3/15/30 | | 60,000 | 49,612 |
| | | | 93,490 |
| Containers & Packaging - 0.1% | | | |
| International Paper Co.: | | | |
| 4.35% 8/15/48 | | 30,000 | 25,306 |
| 7.3% 11/15/39 | | 50,000 | 55,332 |
| WRKCo, Inc. 4% 3/15/28 | | 100,000 | 93,400 |
| | | | 174,038 |
| Metals & Mining - 0.1% | | | |
| Freeport-McMoRan, Inc. 5.45% 3/15/43 | | 85,000 | 76,741 |
| Newmont Corp.: | | | |
| 2.8% 10/1/29 | | 70,000 | 59,564 |
| 5.45% 6/9/44 | | 50,000 | 48,030 |
| Rio Tinto Finance (U.S.A.) Ltd. 5.2% 11/2/40 | | 50,000 | 49,878 |
| Rio Tinto Finance (U.S.A.) PLC 4.125% 8/21/42 | | 50,000 | 43,457 |
| | | | 277,670 |
TOTAL MATERIALS | | | 1,898,315 |
| REAL ESTATE - 0.9% | | | |
| Equity Real Estate Investment Trusts (REITs) - 0.8% | | | |
| Alexandria Real Estate Equities, Inc.: | | | |
| 2.95% 3/15/34 | | 75,000 | 60,400 |
| 3% 5/18/51 | | 100,000 | 64,415 |
| American Homes 4 Rent LP 4.9% 2/15/29 | | 75,000 | 71,126 |
| American Tower Corp.: | | | |
| 1.3% 9/15/25 | | 40,000 | 35,963 |
| 2.1% 6/15/30 | | 60,000 | 47,498 |
| 3.1% 6/15/50 | | 60,000 | 37,325 |
| 3.6% 1/15/28 | | 110,000 | 100,681 |
| AvalonBay Communities, Inc. 2.05% 1/15/32 | | 105,000 | 83,223 |
| Boston Properties, Inc.: | | | |
| 2.75% 10/1/26 | | 40,000 | 36,101 |
| 3.25% 1/30/31 | | 107,000 | 89,274 |
| Corporate Office Properties LP 2.75% 4/15/31 | | 40,000 | 30,117 |
| Crown Castle International Corp.: | | | |
| 1.35% 7/15/25 | | 23,000 | 20,889 |
| 2.25% 1/15/31 | | 145,000 | 116,008 |
| 3.15% 7/15/23 | | 100,000 | 99,208 |
| 3.25% 1/15/51 | | 47,000 | 30,915 |
| ERP Operating LP 4.5% 7/1/44 | | 50,000 | 44,074 |
| Federal Realty Investment Trust 3.5% 6/1/30 | | 50,000 | 43,376 |
| Healthpeak Properties, Inc. 2.875% 1/15/31 | | 210,000 | 177,026 |
| Hudson Pacific Properties LP 5.95% 2/15/28 | | 30,000 | 27,888 |
| Kilroy Realty LP 3.05% 2/15/30 | | 50,000 | 39,897 |
| Kimco Realty Op LLC: | | | |
| 1.9% 3/1/28 | | 110,000 | 92,849 |
| 2.8% 10/1/26 | | 150,000 | 137,017 |
| National Retail Properties, Inc. 3% 4/15/52 | | 50,000 | 30,963 |
| Omega Healthcare Investors, Inc. 3.375% 2/1/31 | | 40,000 | 31,521 |
| Prologis LP: | | | |
| 1.625% 3/15/31 | | 100,000 | 78,193 |
| 1.75% 2/1/31 | | 100,000 | 78,926 |
| 4.625% 1/15/33 | | 50,000 | 48,378 |
| Realty Income Corp.: | | | |
| 2.85% 12/15/32 | | 105,000 | 86,243 |
| 4.125% 10/15/26 | | 75,000 | 72,309 |
| Regency Centers LP 3.7% 6/15/30 | | 50,000 | 44,225 |
| Simon Property Group LP: | | | |
| 2.2% 2/1/31 | | 100,000 | 79,875 |
| 2.65% 7/15/30 | | 50,000 | 41,998 |
| 2.75% 6/1/23 | | 75,000 | 74,509 |
| 3.375% 12/1/27 | | 75,000 | 69,277 |
| 4.75% 3/15/42 | | 55,000 | 48,378 |
| Sun Communities Operating LP 2.7% 7/15/31 | | 40,000 | 31,911 |
| UDR, Inc. 2.1% 6/15/33 | | 35,000 | 25,511 |
| Ventas Realty LP 4.875% 4/15/49 | | 80,000 | 68,041 |
| VICI Properties LP 5.625% 5/15/52 | | 55,000 | 48,722 |
| Welltower Op: | | | |
| 2.7% 2/15/27 | | 120,000 | 108,285 |
| 4.95% 9/1/48 | | 36,000 | 30,642 |
| Weyerhaeuser Co. 4% 11/15/29 | | 75,000 | 68,288 |
| | | | 2,651,465 |
| Real Estate Management & Development - 0.1% | | | |
| Digital Realty Trust LP: | | | |
| 3.7% 8/15/27 | | 26,000 | 24,076 |
| 5.55% 1/15/28 | | 35,000 | 34,846 |
| Essex Portfolio LP 2.65% 3/15/32 | | 70,000 | 55,554 |
| Mid-America Apartments LP 4.2% 6/15/28 | | 75,000 | 71,386 |
| | | | 185,862 |
TOTAL REAL ESTATE | | | 2,837,327 |
| UTILITIES - 0.6% | | | |
| Electric Utilities - 0.4% | | | |
| AEP Texas, Inc. 3.8% 10/1/47 | | 45,000 | 33,409 |
| Baltimore Gas & Electric Co. 3.5% 8/15/46 | | 50,000 | 37,603 |
| CenterPoint Energy Houston Electric LLC 3.35% 4/1/51 | | 90,000 | 66,497 |
| Commonwealth Edison Co.: | | | |
| 3.8% 10/1/42 | | 125,000 | 102,090 |
| 4% 3/1/48 | | 86,000 | 70,527 |
| Eversource Energy: | | | |
| 2.55% 3/15/31 | | 125,000 | 102,194 |
| 2.9% 10/1/24 | | 70,000 | 67,268 |
| Exelon Corp.: | | | |
| 2.75% 3/15/27 | | 110,000 | 99,729 |
| 4.1% 3/15/52 | | 65,000 | 51,637 |
| 5.3% 3/15/33 | | 20,000 | 19,749 |
| NSTAR Electric Co. 4.95% 9/15/52 | | 40,000 | 38,200 |
| Oncor Electric Delivery Co. LLC: | | | |
| 0.55% 10/1/25 | | 83,000 | 74,090 |
| 4.6% 6/1/52 | | 50,000 | 45,531 |
| 5.3% 6/1/42 | | 85,000 | 85,164 |
| PECO Energy Co. 3.9% 3/1/48 | | 50,000 | 40,945 |
| PG&E Wildfire Recovery 5.212% 12/1/49 | | 110,000 | 109,521 |
| PPL Electric Utilities Corp. 3% 10/1/49 | | 30,000 | 20,879 |
| Public Service Electric & Gas Co.: | | | |
| 3.6% 12/1/47 | | 87,000 | 67,263 |
| 3.65% 9/1/42 | | 60,000 | 48,280 |
| | | | 1,180,576 |
| Gas Utilities - 0.1% | | | |
| Atmos Energy Corp.: | | | |
| 3% 6/15/27 | | 100,000 | 92,965 |
| 4.125% 10/15/44 | | 75,000 | 62,734 |
| Piedmont Natural Gas Co., Inc. 2.5% 3/15/31 | | 80,000 | 65,125 |
| Southern California Gas Co. 2.55% 2/1/30 | | 90,000 | 76,198 |
| | | | 297,022 |
| Multi-Utilities - 0.1% | | | |
| Consolidated Edison Co. of New York, Inc.: | | | |
| 3.875% 6/15/47 | | 44,000 | 34,262 |
| 3.95% 4/1/50 | | 130,000 | 102,719 |
| 4.45% 3/15/44 | | 45,000 | 38,209 |
| 5.3% 3/1/35 | | 50,000 | 49,386 |
| 5.5% 12/1/39 | | 50,000 | 48,475 |
| San Diego Gas & Electric Co. 3.75% 6/1/47 | | 85,000 | 66,145 |
| Sempra Energy: | | | |
| 3.4% 2/1/28 | | 26,000 | 23,808 |
| 3.8% 2/1/38 | | 30,000 | 24,574 |
| 4% 2/1/48 | | 86,000 | 66,691 |
| | | | 454,269 |
| Water Utilities - 0.0% | | | |
| American Water Capital Corp.: | | | |
| 3.75% 9/1/47 | | 50,000 | 38,977 |
| 6.593% 10/15/37 | | 64,000 | 69,346 |
| | | | 108,323 |
TOTAL UTILITIES | | | 2,040,190 |
| TOTAL NONCONVERTIBLE BONDS (Cost $93,593,592) | | | 81,448,013 |
| | | | |
| U.S. Government and Government Agency Obligations - 44.1% |
| | | Principal Amount (a) | Value ($) |
| U.S. Government Agency Obligations - 1.6% | | | |
| Fannie Mae: | | | |
| 0.375% 8/25/25 | | 95,000 | 85,423 |
| 0.5% 6/17/25 | | 240,000 | 218,114 |
| 0.625% 4/22/25 | | 1,682,000 | 1,540,234 |
| 0.75% 10/8/27 | | 125,000 | 107,177 |
| 0.875% 8/5/30 | | 83,000 | 65,852 |
| 1.625% 10/15/24 | | 70,000 | 66,353 |
| 1.75% 7/2/24 | | 220,000 | 210,446 |
| 2.875% 9/12/23 | | 150,000 | 148,162 |
| 6.625% 11/15/30 | | 229,000 | 265,410 |
| Federal Home Loan Bank: | | | |
| 0.375% 9/4/25 | | 70,000 | 62,991 |
| 0.5% 4/14/25 | | 105,000 | 96,080 |
| 1.25% 10/26/26 | | 930,000 | 820,860 |
| 1.5% 8/15/24 | | 50,000 | 47,488 |
| 2.5% 2/13/24 | | 80,000 | 77,911 |
| 3.25% 6/9/28 | | 55,000 | 52,297 |
| 3.25% 11/16/28 | | 10,000 | 9,508 |
| Freddie Mac: | | | |
| 0.25% 8/24/23 | | 250,000 | 244,153 |
| 0.25% 12/4/23 | | 375,000 | 360,805 |
| 0.375% 7/21/25 | | 160,000 | 144,420 |
| 0.375% 9/23/25 | | 93,000 | 83,580 |
| 1.5% 2/12/25 | | 120,000 | 112,648 |
| 6.25% 7/15/32 | | 130,000 | 150,830 |
TOTAL U.S. GOVERNMENT AGENCY OBLIGATIONS | | | 4,970,742 |
| U.S. Treasury Obligations - 42.5% | | | |
| U.S. Treasury Bonds: | | | |
| 1.125% 5/15/40 | | 108,000 | 68,356 |
| 1.125% 8/15/40 | | 1,085,000 | 683,338 |
| 1.25% 5/15/50 | | 1,382,000 | 766,632 |
| 1.375% 11/15/40 | | 1,019,000 | 669,555 |
| 1.375% 8/15/50 | | 1,239,000 | 710,199 |
| 1.625% 11/15/50 | | 1,136,000 | 696,022 |
| 1.75% 8/15/41 | | 1,632,000 | 1,130,925 |
| 1.875% 2/15/41 | | 1,509,000 | 1,078,522 |
| 1.875% 2/15/51 | | 96,000 | 62,678 |
| 1.875% 11/15/51 | | 1,189,000 | 773,314 |
| 2% 11/15/41 | | 1,046,000 | 756,021 |
| 2% 2/15/50 | | 45,000 | 30,438 |
| 2% 8/15/51 | | 719,000 | 483,275 |
| 2.25% 5/15/41 | | 2,291,000 | 1,740,713 |
| 2.25% 8/15/46 | | 6,000 | 4,329 |
| 2.25% 8/15/49 | | 34,000 | 24,386 |
| 2.25% 2/15/52 | | 410,000 | 292,333 |
| 2.375% 2/15/42 | | 1,650,000 | 1,269,154 |
| 2.375% 11/15/49 | | 1,000 | 737 |
| 2.375% 5/15/51 | | 842,000 | 618,114 |
| 2.5% 2/15/45 | | 235,000 | 179,527 |
| 2.5% 2/15/46 | | 89,000 | 67,637 |
| 2.5% 5/15/46 | | 83,000 | 63,070 |
| 2.75% 8/15/42 | | 41,000 | 33,410 |
| 2.75% 11/15/42 | | 4,000 | 3,251 |
| 2.75% 11/15/47 | | 23,000 | 18,288 |
| 2.875% 5/15/43 | | 72,000 | 59,563 |
| 2.875% 8/15/45 | | 95,000 | 77,477 |
| 2.875% 5/15/49 | | 12,000 | 9,814 |
| 2.875% 5/15/52 | | 2,450,000 | 2,006,225 |
| 3% 5/15/42 | | 13,000 | 11,064 |
| 3% 11/15/44 | | 397,000 | 332,069 |
| 3% 5/15/45 | | 121,000 | 100,997 |
| 3% 11/15/45 | | 188,000 | 156,723 |
| 3% 5/15/47 | | 17,000 | 14,156 |
| 3% 2/15/48 | | 4,000 | 3,334 |
| 3% 8/15/48 | | 28,000 | 23,369 |
| 3% 2/15/49 | | 20,000 | 16,734 |
| 3% 8/15/52 | | 2,470,000 | 2,076,344 |
| 3.125% 11/15/41 | | 75,000 | 65,555 |
| 3.125% 2/15/43 | | 125,000 | 107,710 |
| 3.125% 8/15/44 | | 238,000 | 203,518 |
| 3.125% 5/15/48 | | 57,000 | 48,657 |
| 3.25% 5/15/42 | | 1,145,000 | 1,012,028 |
| 3.375% 8/15/42 | | 2,510,000 | 2,259,784 |
| 3.375% 5/15/44 | | 198,000 | 176,591 |
| 3.375% 11/15/48 | | 32,000 | 28,631 |
| 3.625% 8/15/43 | | 137,000 | 127,554 |
| 3.75% 8/15/41 | | 48,000 | 46,067 |
| 3.75% 11/15/43 | | 39,000 | 36,959 |
| 3.875% 8/15/40 | | 20,000 | 19,621 |
| 4% 11/15/42 | | 1,510,000 | 1,488,530 |
| 4% 11/15/52 | | 1,765,000 | 1,796,439 |
| 4.375% 11/15/39 | | 24,000 | 25,104 |
| 4.375% 5/15/40 | | 45,000 | 46,939 |
| 4.5% 2/15/36 | | 1,000 | 1,068 |
| 4.5% 5/15/38 | | 45,000 | 47,739 |
| 5% 5/15/37 | | 10,000 | 11,180 |
| U.S. Treasury Notes: | | | |
| 0.125% 7/15/23 | | 4,000 | 3,927 |
| 0.125% 7/31/23 | | 46,000 | 45,075 |
| 0.125% 9/15/23 | | 1,000 | 974 |
| 0.125% 2/15/24 | | 2,240,000 | 2,134,825 |
| 0.25% 3/15/24 | | 108,000 | 102,684 |
| 0.25% 5/15/24 | | 1,055,000 | 995,079 |
| 0.25% 5/31/25 | | 1,383,000 | 1,252,695 |
| 0.25% 6/30/25 | | 277,000 | 250,404 |
| 0.25% 7/31/25 | | 2,639,000 | 2,377,574 |
| 0.25% 8/31/25 | | 753,000 | 676,288 |
| 0.25% 9/30/25 | | 1,104,000 | 989,719 |
| 0.25% 10/31/25 | | 1,359,000 | 1,213,651 |
| 0.375% 4/15/24 | | 301,000 | 285,468 |
| 0.375% 7/15/24 | | 100,000 | 93,793 |
| 0.375% 8/15/24 | | 285,000 | 266,386 |
| 0.375% 9/15/24 | | 185,000 | 172,411 |
| 0.375% 4/30/25 | | 1,070,000 | 974,787 |
| 0.375% 11/30/25 | | 1,261,000 | 1,126,428 |
| 0.375% 12/31/25 | | 497,000 | 443,398 |
| 0.375% 1/31/26 | | 781,000 | 693,778 |
| 0.375% 7/31/27 | | 1,248,000 | 1,055,243 |
| 0.375% 9/30/27 | | 563,000 | 473,514 |
| 0.5% 3/31/25 | | 222,000 | 203,442 |
| 0.5% 5/31/27 | | 1,548,000 | 1,322,633 |
| 0.5% 6/30/27 | | 1,571,000 | 1,339,216 |
| 0.5% 8/31/27 | | 1,129,000 | 957,621 |
| 0.5% 10/31/27 | | 64,000 | 54,005 |
| 0.625% 10/15/24 | | 1,190,000 | 1,110,000 |
| 0.625% 3/31/27 | | 808,000 | 698,289 |
| 0.625% 11/30/27 | | 509,000 | 431,278 |
| 0.625% 12/31/27 | | 338,000 | 285,716 |
| 0.625% 5/15/30 | | 1,415,000 | 1,119,177 |
| 0.625% 8/15/30 | | 204,000 | 160,443 |
| 0.75% 4/30/26 | | 1,041,000 | 927,995 |
| 0.75% 8/31/26 | | 1,695,000 | 1,495,970 |
| 0.75% 1/31/28 | | 263,000 | 223,180 |
| 0.875% 1/31/24 | | 1,445,000 | 1,390,079 |
| 0.875% 6/30/26 | | 430,000 | 383,238 |
| 0.875% 9/30/26 | | 1,510,000 | 1,335,760 |
| 1% 12/15/24 | | 1,025,000 | 956,733 |
| 1% 7/31/28 | | 852,000 | 722,603 |
| 1.125% 2/28/25 | | 328,000 | 305,194 |
| 1.125% 10/31/26 | | 975,000 | 868,512 |
| 1.125% 2/28/27 | | 1,000 | 885 |
| 1.125% 2/29/28 | | 1,011,000 | 872,698 |
| 1.125% 8/31/28 | | 10,000 | 8,525 |
| 1.125% 2/15/31 | | 2,000 | 1,628 |
| 1.25% 8/31/24 | | 511,000 | 483,035 |
| 1.25% 11/30/26 | | 194,000 | 173,289 |
| 1.25% 12/31/26 | | 225,000 | 200,628 |
| 1.25% 3/31/28 | | 13,000 | 11,272 |
| 1.25% 4/30/28 | | 659,000 | 570,215 |
| 1.25% 6/30/28 | | 262,000 | 225,832 |
| 1.25% 9/30/28 | | 1,345,000 | 1,152,129 |
| 1.25% 8/15/31 | | 259,000 | 209,962 |
| 1.375% 1/31/25 | | 956,000 | 896,138 |
| 1.375% 8/31/26 | | 695,000 | 627,672 |
| 1.375% 10/31/28 | | 1,360,000 | 1,171,194 |
| 1.375% 12/31/28 | | 995,000 | 854,845 |
| 1.5% 2/29/24 | | 110,000 | 106,129 |
| 1.5% 9/30/24 | | 905,000 | 857,275 |
| 1.5% 10/31/24 | | 556,000 | 525,507 |
| 1.5% 11/30/24 | | 143,000 | 134,872 |
| 1.5% 2/15/25 | | 1,150,000 | 1,079,023 |
| 1.5% 8/15/26 | | 574,000 | 520,950 |
| 1.5% 1/31/27 | | 173,000 | 155,470 |
| 1.5% 11/30/28 | | 2,379,000 | 2,060,344 |
| 1.625% 9/30/26 | | 93,000 | 84,615 |
| 1.625% 10/31/26 | | 215,000 | 195,247 |
| 1.625% 11/30/26 | | 136,000 | 123,378 |
| 1.625% 8/15/29 | | 176,000 | 152,130 |
| 1.75% 6/30/24 | | 251,000 | 240,283 |
| 1.75% 7/31/24 | | 661,000 | 630,971 |
| 1.75% 12/31/24 | | 707,000 | 668,557 |
| 1.75% 3/15/25 | | 560,000 | 526,836 |
| 1.75% 1/31/29 | | 465,000 | 407,256 |
| 1.875% 6/30/26 | | 88,000 | 81,201 |
| 1.875% 7/31/26 | | 238,000 | 219,155 |
| 1.875% 2/28/27 | | 160,000 | 145,713 |
| 1.875% 2/28/29 | | 1,065,000 | 939,322 |
| 2% 5/31/24 | | 108,000 | 103,933 |
| 2% 11/15/26 | | 110,000 | 101,174 |
| 2.125% 3/31/24 | | 269,000 | 260,436 |
| 2.25% 3/31/24 | | 205,000 | 198,738 |
| 2.25% 4/30/24 | | 309,000 | 298,970 |
| 2.25% 3/31/26 | | 92,000 | 86,225 |
| 2.25% 2/15/27 | | 134,000 | 124,008 |
| 2.25% 8/15/27 | | 535,000 | 491,824 |
| 2.25% 11/15/27 | | 100,000 | 91,625 |
| 2.375% 2/29/24 | | 247,000 | 240,372 |
| 2.375% 5/15/27 | | 22,000 | 20,386 |
| 2.375% 5/15/29 | | 16,000 | 14,479 |
| 2.5% 1/31/24 | | 495,000 | 483,398 |
| 2.5% 4/30/24 | | 1,985,000 | 1,925,683 |
| 2.5% 5/31/24 | | 1,035,000 | 1,002,252 |
| 2.625% 6/30/23 | | 10,000 | 9,927 |
| 2.625% 12/31/25 | | 5,000 | 4,754 |
| 2.625% 5/31/27 | | 670,000 | 627,000 |
| 2.625% 2/15/29 | | 57,000 | 52,471 |
| 2.625% 7/31/29 | | 2,195,000 | 2,012,712 |
| 2.75% 7/31/23 | | 2,000 | 1,982 |
| 2.75% 2/15/24 | | 742,000 | 725,363 |
| 2.75% 5/15/25 | | 4,440,000 | 4,255,983 |
| 2.75% 6/30/25 | | 82,000 | 78,537 |
| 2.75% 7/31/27 | | 1,095,000 | 1,028,701 |
| 2.75% 2/15/28 | | 492,000 | 460,328 |
| 2.75% 8/15/32 | | 5,426,000 | 4,930,878 |
| 2.875% 5/31/25 | | 10,000 | 9,610 |
| 2.875% 6/15/25 | | 620,000 | 595,878 |
| 2.875% 11/30/25 | | 31,000 | 29,680 |
| 2.875% 5/15/28 | | 323,000 | 303,292 |
| 2.875% 8/15/28 | | 61,000 | 57,166 |
| 2.875% 5/15/32 | | 265,000 | 243,717 |
| 3% 6/30/24 | | 1,100,000 | 1,070,266 |
| 3% 7/15/25 | | 1,060,000 | 1,020,623 |
| 3% 10/31/25 | | 74,000 | 71,080 |
| 3.125% 8/15/25 | | 1,675,000 | 1,617,029 |
| 3.125% 8/31/27 | | 2,265,000 | 2,161,571 |
| 3.125% 11/15/28 | | 155,000 | 146,929 |
| 3.125% 8/31/29 | | 1,435,000 | 1,355,122 |
| 3.25% 8/31/24 | | 610,000 | 594,297 |
| 3.25% 6/30/27 | | 670,000 | 642,860 |
| 3.25% 6/30/29 | | 640,000 | 609,050 |
| 3.5% 9/15/25 | | 1,630,000 | 1,587,149 |
| 3.5% 1/31/28 | | 440,000 | 426,628 |
| 3.5% 1/31/30 | | 670,000 | 647,073 |
| 3.875% 1/15/26 | | 3,440,000 | 3,380,875 |
| 3.875% 11/30/27 | | 2,005,000 | 1,976,413 |
| 3.875% 12/31/27 | | 1,190,000 | 1,172,167 |
| 3.875% 9/30/29 | | 1,175,000 | 1,159,211 |
| 3.875% 11/30/29 | | 1,850,000 | 1,826,297 |
| 3.875% 12/31/29 | | 840,000 | 829,763 |
| 4% 12/15/25 | | 1,305,000 | 1,287,566 |
| 4% 10/31/29 | | 2,710,000 | 2,694,015 |
| 4.125% 9/30/27 | | 1,175,000 | 1,168,850 |
| 4.125% 10/31/27 | | 1,765,000 | 1,756,175 |
| 4.125% 11/15/32 | | 2,465,000 | 2,504,286 |
| 4.25% 10/15/25 | | 2,235,000 | 2,216,229 |
| 4.5% 11/30/24 | | 995,000 | 987,810 |
| 4.5% 11/15/25 | | 4,340,000 | 4,332,710 |
TOTAL U.S. TREASURY OBLIGATIONS | | | 134,008,659 |
| TOTAL U.S. GOVERNMENT AND GOVERNMENT AGENCY OBLIGATIONS (Cost $151,567,513) | | | 138,979,401 |
| | | | |
| U.S. Government Agency - Mortgage Securities - 27.3% |
| | | Principal Amount (a) | Value ($) |
| Fannie Mae - 11.4% | | | |
| 1.5% 10/1/36 to 3/1/52 | | 2,657,753 | 2,236,186 |
| 2% 7/1/35 to 2/1/52 | | 12,186,942 | 10,130,140 |
| 2.5% 1/1/27 to 6/1/52 | | 8,775,453 | 7,576,570 |
| 3% 8/1/32 to 10/1/52 | | 7,626,739 | 6,821,701 |
| 3.5% 5/1/29 to 9/1/52 | | 4,887,340 | 4,526,553 |
| 4% 6/1/34 to 10/1/52 | | 1,957,424 | 1,859,773 |
| 4.5% 10/1/39 to 10/1/52 | | 1,159,192 | 1,125,634 |
| 5% 5/1/29 to 11/1/52 | | 1,132,649 | 1,124,674 |
| 5.5% 1/1/49 to 9/1/52 | | 458,284 | 458,503 |
TOTAL FANNIE MAE | | | 35,859,734 |
| Freddie Mac - 8.4% | | | |
| 1.5% 12/1/36 to 3/1/52 | | 2,548,891 | 2,029,969 |
| 2% 2/1/36 to 6/1/52 | | 10,225,722 | 8,514,596 |
| 2.5% 3/1/33 to 3/1/52 | | 7,508,645 | 6,415,072 |
| 3% 11/1/26 to 4/1/52 | | 1,923,316 | 1,732,202 |
| 3.5% 9/1/33 to 9/1/52 | | 2,123,737 | 1,963,293 |
| 4% 2/1/34 to 2/1/53 | | 2,864,559 | 2,712,946 |
| 4.5% 7/1/41 to 3/1/53 | | 1,868,267 | 1,808,257 |
| 5% 12/1/48 to 9/1/52 | | 546,638 | 538,871 |
| 5.5% 6/1/49 to 3/1/53 | | 651,621 | 651,360 |
| 6% 12/1/52 | | 197,096 | 199,605 |
TOTAL FREDDIE MAC | | | 26,566,171 |
| Ginnie Mae - 5.8% | | | |
| 1.5% 5/20/51 | | 43,542 | 34,827 |
| 2% 3/20/51 to 5/20/52 | | 4,491,200 | 3,779,090 |
| 2% 3/1/53 (e) | | 50,000 | 41,909 |
| 2% 3/1/53 (e) | | 200,000 | 167,635 |
| 2.5% 12/20/49 to 8/20/52 | | 4,719,801 | 4,099,754 |
| 2.5% 3/1/53 (e) | | 50,000 | 43,238 |
| 2.5% 3/1/53 (e) | | 50,000 | 43,238 |
| 3% 7/20/42 to 7/20/52 | | 3,590,926 | 3,229,624 |
| 3% 3/1/53 (e) | | 150,000 | 133,808 |
| 3% 3/1/53 (e) | | 100,000 | 89,205 |
| 3.5% 2/20/46 to 10/20/52 | | 2,531,877 | 2,350,247 |
| 3.5% 3/1/53 (e) | | 100,000 | 91,920 |
| 3.5% 3/1/53 (e) | | 100,000 | 91,920 |
| 4% 4/20/47 to 1/20/53 | | 1,739,204 | 1,649,945 |
| 4.5% 8/20/48 to 10/20/52 | | 1,129,057 | 1,097,438 |
| 4.5% 3/1/53 (e) | | 100,000 | 96,893 |
| 5% 12/20/47 to 10/20/52 | | 537,420 | 533,602 |
| 5% 3/1/53 (e) | | 100,000 | 98,841 |
| 5% 3/1/53 (e) | | 100,000 | 98,841 |
| 5.5% 12/20/48 to 1/20/53 | | 211,560 | 212,561 |
| 5.5% 3/1/53 (e) | | 200,000 | 200,690 |
| 6% 3/1/53 (e) | | 200,000 | 202,864 |
TOTAL GINNIE MAE | | | 18,388,090 |
| Uniform Mortgage Backed Securities - 1.7% | | | |
| 1.5% 3/1/53 (e) | | 100,000 | 77,214 |
| 2% 3/1/53 (e) | | 650,000 | 529,265 |
| 2% 3/1/53 (e) | | 150,000 | 122,138 |
| 2% 3/1/53 (e) | | 1,150,000 | 936,392 |
| 2% 3/1/53 (e) | | 500,000 | 407,127 |
| 2% 4/1/53 (e) | | 1,000,000 | 815,231 |
| 2.5% 3/1/53 (e) | | 450,000 | 381,235 |
| 2.5% 3/1/53 (e) | | 450,000 | 381,235 |
| 2.5% 3/1/53 (e) | | 200,000 | 169,438 |
| 2.5% 4/1/53 (e) | | 100,000 | 84,805 |
| 3% 3/1/53 (e) | | 100,000 | 87,957 |
| 3% 3/1/53 (e) | | 100,000 | 87,957 |
| 4% 3/1/53 (e) | | 300,000 | 281,391 |
| 5% 3/1/53 (e) | | 300,000 | 294,797 |
| 6% 3/1/53 (e) | | 200,000 | 202,352 |
| 6% 3/1/53 (e) | | 200,000 | 202,352 |
| 6.5% 3/1/53 (e) | | 100,000 | 102,414 |
| 6.5% 3/1/53 (e) | | 100,000 | 102,414 |
TOTAL UNIFORM MORTGAGE BACKED SECURITIES | | | 5,265,714 |
| TOTAL U.S. GOVERNMENT AGENCY - MORTGAGE SECURITIES (Cost $97,369,058) | | | 86,079,709 |
| | | | |
| Asset-Backed Securities - 0.2% |
| | | Principal Amount (a) | Value ($) |
| Capital One Multi-Asset Execution Trust: | | | |
| Series 2019-A3 Class A3, 2.06% 8/15/28 | | 32,000 | 29,154 |
| 1.39% 7/15/30 | | 60,000 | 50,682 |
| Capital One Prime Auto Receivables Series 2023-1 Class A3, 4.87% 2/15/28 | | 30,000 | 29,813 |
| CarMax Auto Owner Trust: | | | |
| Series 2021-1 Class A3, 0.34% 12/15/25 | | 72,416 | 69,949 |
| Series 2022-3 Class A2A, 3.97% 4/15/27 | | 130,000 | 127,024 |
| Citibank Credit Card Issuance Trust Series 2018-A7 Class A7, 3.96% 10/13/30 | | 100,000 | 96,272 |
| Ford Credit Floorplan Master Owner Trust Series 2018-4 Class A, 4.06% 11/15/30 | | 15,000 | 14,216 |
| GM Financial Consumer Automobile Receivables Trust Series 2021-1 Class A3, 0.35% 10/16/25 | | 64,649 | 62,771 |
| Hyundai Auto Receivables Trust 3.72% 11/16/26 | | 88,000 | 85,804 |
| Mercedes-Benz Auto Lease Trust Series 2021-A Class A3, 0.25% 1/16/24 | | 29,181 | 28,936 |
| TOTAL ASSET-BACKED SECURITIES (Cost $631,647) | | | 594,621 |
| | | | |
| Commercial Mortgage Securities - 1.3% |
| | | Principal Amount (a) | Value ($) |
| BANK sequential payer: | | | |
| Series 2017-BNK4 Class ASB, 3.419% 5/15/50 | | 80,221 | 77,003 |
| Series 2020-BN25 Class A5, 2.649% 1/15/63 | | 80,000 | 68,120 |
| Series 2020-BN28 Class A4, 1.844% 3/15/63 | | 120,000 | 95,090 |
| Series 2022-BNK39 Class A4, 2.928% 2/15/55 | | 100,000 | 84,348 |
| Series 2022-BNK41 Class A4, 3.79% 4/15/65 (c) | | 270,000 | 245,704 |
| BBCMS Mortgage Trust sequential payer: | | | |
| Series 2021-C11 Class A5, 2.322% 9/15/54 | | 100,000 | 80,878 |
| Series 2021-C9 Class A5, 2.299% 2/15/54 | | 200,000 | 163,011 |
| Benchmark Mortgage Trust: | | | |
| sequential payer: | | | |
Series 2020-B19 Class A5, 1.85% 9/15/53 | | 140,000 | 111,413 |
Series 2021-B24 Class A5, 2.5843% 3/15/54 | | 50,000 | 41,302 |
| Series 2019-B12 Class A5, 3.1156% 8/15/52 | | 50,000 | 44,243 |
| Series 2019-B9 Class A5, 4.0156% 3/15/52 | | 60,000 | 56,165 |
| BMO Mortgage Trust sequential payer Series 2022-C1 Class A5, 3.374% 2/15/55 | | 100,000 | 87,281 |
| Citigroup Commercial Mortgage Trust sequential payer Series 2018-B2 Class A4, 4.009% 3/10/51 | | 250,000 | 233,689 |
| CSAIL Commercial Mortgage Trust sequential payer Series 2019-C17: | | | |
| Class A4, 2.7628% 9/15/52 | | 75,000 | 64,424 |
| Class A5, 3.0161% 9/15/52 | | 75,000 | 65,136 |
| Freddie Mac: | | | |
| sequential payer: | | | |
Series 2016-K057 Class A2, 2.57% 7/25/26 | | 80,000 | 74,688 |
Series 2020-K104 Class A2, 2.253% 1/25/30 | | 200,000 | 173,204 |
Series 2020-K116 Class A2, 1.378% 7/25/30 | | 260,000 | 208,783 |
Series 2020-K117 Class A2, 1.406% 8/25/30 | | 200,000 | 160,607 |
Series 2020-K118 Class A2, 1.493% 9/25/30 | | 200,000 | 161,304 |
Series 2020-K121 Class A2, 1.547% 10/25/30 | | 40,000 | 32,293 |
Series 2021-K125 Class A2, 1.846% 1/25/31 | | 50,000 | 41,125 |
Series 2021-K128 Class A2, 2.02% 3/25/31 | | 50,000 | 41,661 |
Series 2021-K130 Class A2, 1.723% 6/25/31 | | 100,000 | 80,907 |
Series 2021-K136 Class A2, 2.127% 11/25/31 | | 100,000 | 82,933 |
Series 2022-K145 Class A2, 2.58% 5/25/32 | | 600,000 | 514,074 |
Series K080 Class A2, 3.926% 7/25/28 | | 60,000 | 58,140 |
| Series 2017-K068 Class A2, 3.244% 8/25/27 | | 70,000 | 66,148 |
| Series 2019-K094 Class A2, 2.903% 6/25/29 | | 110,000 | 100,137 |
| Series 2019-K1510 Class A2, 3.718% 1/25/31 | | 41,000 | 38,736 |
| Series 2021-K123 Class A2, 1.621% 12/25/30 | | 130,000 | 105,376 |
| GS Mortgage Securities Trust sequential payer Series 2020-GC45 Class A5, 2.9106% 2/13/53 | | 100,000 | 86,499 |
| JPMBB Commercial Mortgage Securities Trust sequential payer Series 2014-C24 Class A5, 3.6385% 11/15/47 | | 100,000 | 96,273 |
| JPMDB Commercial Mortgage Securities Trust sequential payer Series 2020-COR7 Class A5, 2.1798% 5/13/53 | | 116,000 | 91,923 |
| Morgan Stanley Capital I Trust sequential payer Series 2020-L4 Class A3, 2.698% 2/15/53 | | 30,000 | 25,346 |
| UBS Commercial Mortgage Trust sequential payer Series 2019-C16 Class A4, 3.6048% 4/15/52 | | 100,000 | 90,959 |
| Wells Fargo Commercial Mortgage Trust: | | | |
| sequential payer: | | | |
Series 2019-C52 Class A5, 2.892% 8/15/52 | | 75,000 | 65,221 |
Series 2019-C54 Class A4, 3.146% 12/15/52 | | 100,000 | 88,042 |
| Series 2018-C48 Class A5, 4.302% 1/15/52 | | 65,000 | 61,775 |
| Wells Fargo Commercial Mtg Trust 2020-C sequential payer Series 2020-C55 Class A5, 2.725% 2/15/53 | | 27,000 | 22,920 |
| TOTAL COMMERCIAL MORTGAGE SECURITIES (Cost $4,731,062) | | | 4,086,881 |
| | | | |
| Foreign Government and Government Agency Obligations - 2.1% |
| | | Principal Amount (a) | Value ($) |
| Alberta Province: | | | |
| 1.3% 7/22/30 | | 216,000 | 173,707 |
| 2.95% 1/23/24 | | 110,000 | 107,624 |
| Chilean Republic: | | | |
| 2.55% 7/27/33 | | 400,000 | 313,575 |
| 3.24% 2/6/28 | | 230,000 | 212,578 |
| Export Development Canada 2.625% 2/21/24 | | 100,000 | 97,385 |
| Hungarian Republic 5.375% 3/25/24 | | 306,000 | 304,910 |
| Indonesian Republic: | | | |
| 1.85% 3/12/31 | | 200,000 | 159,272 |
| 2.85% 2/14/30 | | 400,000 | 352,575 |
| Israeli State: | | | |
| 3.25% 1/17/28 | | 370,000 | 345,501 |
| 3.375% 1/15/50 | | 100,000 | 73,774 |
| Italian Republic 2.875% 10/17/29 | | 285,000 | 240,706 |
| Korean Republic 2.75% 1/19/27 | | 200,000 | 185,364 |
| Manitoba Province 2.6% 4/16/24 | | 180,000 | 174,781 |
| Ontario Province: | | | |
| 1.125% 10/7/30 | | 224,000 | 177,549 |
| 2.3% 6/15/26 | | 107,000 | 99,171 |
| Panamanian Republic: | | | |
| 2.252% 9/29/32 | | 200,000 | 148,475 |
| 3.16% 1/23/30 | | 400,000 | 342,825 |
| 3.75% 3/16/25 | | 460,000 | 443,986 |
| 4% 9/22/24 | | 48,000 | 46,899 |
| Peruvian Republic: | | | |
| 1.862% 12/1/32 | | 185,000 | 134,044 |
| 2.78% 12/1/60 | | 65,000 | 37,347 |
| 3.3% 3/11/41 | | 70,000 | 50,916 |
| 3.55% 3/10/51 | | 55,000 | 38,974 |
| 7.35% 7/21/25 | | 113,000 | 118,848 |
| Philippine Republic: | | | |
| 1.648% 6/10/31 | | 205,000 | 157,873 |
| 2.65% 12/10/45 | | 200,000 | 133,522 |
| 5.17% 10/13/27 | | 300,000 | 302,658 |
| 6.375% 10/23/34 | | 100,000 | 108,511 |
| Polish Government 3.25% 4/6/26 | | 283,000 | 268,107 |
| Quebec Province 2.5% 4/20/26 | | 130,000 | 121,780 |
| United Mexican States: | | | |
| 3.25% 4/16/30 | | 200,000 | 173,663 |
| 3.5% 2/12/34 | | 217,000 | 176,204 |
| 3.771% 5/24/61 | | 250,000 | 164,109 |
| 4.6% 2/10/48 | | 50,000 | 39,806 |
| 4.75% 3/8/44 | | 100,000 | 82,925 |
| 5.4% 2/9/28 | | 200,000 | 200,100 |
| 5.55% 1/21/45 | | 45,000 | 41,479 |
| 7.5% 4/8/33 | | 55,000 | 61,078 |
| Uruguay Republic: | | | |
| 4.125% 11/20/45 | | 20,000 | 18,010 |
| 4.375% 10/27/27 | | 15,000 | 14,910 |
| 4.375% 1/23/31 | | 128,116 | 124,721 |
| 4.975% 4/20/55 | | 63,000 | 60,291 |
| TOTAL FOREIGN GOVERNMENT AND GOVERNMENT AGENCY OBLIGATIONS (Cost $7,628,189) | | | 6,630,533 |
| | | | |
| Supranational Obligations - 0.8% |
| | | Principal Amount (a) | Value ($) |
| African Development Bank 0.875% 7/22/26 | | 80,000 | 70,676 |
| Asian Development Bank: | | | |
| 0.5% 2/4/26 | | 200,000 | 177,677 |
| 2.5% 11/2/27 | | 726,000 | 668,900 |
| Corporacion Andina de Fomento 1.625% 9/23/25 | | 193,000 | 175,497 |
| European Investment Bank: | | | |
| 1.25% 2/14/31 | | 83,000 | 67,300 |
| 2.25% 6/24/24 | | 50,000 | 48,178 |
| 2.875% 8/15/23 | | 90,000 | 89,043 |
| 3.125% 12/14/23 | | 90,000 | 88,571 |
| Inter-American Development Bank: | | | |
| 0.625% 7/15/25 | | 125,000 | 113,682 |
| 1.75% 3/14/25 | | 66,000 | 62,030 |
| 2.25% 6/18/29 | | 30,000 | 26,644 |
| 3.125% 9/18/28 | | 60,000 | 56,495 |
| 3.2% 8/7/42 | | 123,000 | 102,979 |
| International Bank for Reconstruction & Development: | | | |
| 0.375% 7/28/25 | | 130,000 | 117,383 |
| 0.5% 10/28/25 | | 145,000 | 130,169 |
| 0.75% 8/26/30 | | 70,000 | 54,508 |
| 0.875% 5/14/30 | | 67,000 | 53,146 |
| 1.25% 2/10/31 | | 100,000 | 80,623 |
| 1.5% 8/28/24 | | 50,000 | 47,431 |
| 1.625% 1/15/25 | | 63,000 | 59,351 |
| 1.875% 6/19/23 | | 20,000 | 19,813 |
| 2.5% 3/19/24 | | 120,000 | 116,561 |
| 2.5% 3/29/32 | | 260,000 | 229,306 |
| International Finance Corp. 0.75% 8/27/30 | | 40,000 | 31,274 |
| TOTAL SUPRANATIONAL OBLIGATIONS (Cost $2,974,299) | | | 2,687,237 |
| | | | |
| Bank Notes - 0.1% |
| | | Principal Amount (a) | Value ($) |
Citizens Bank NA 2.25% 4/28/25 (Cost $279,410) | | 279,000 | 260,783 |
| | | | |
| Money Market Funds - 1.1% |
| | | Shares | Value ($) |
Fidelity Cash Central Fund 4.63% (f) (Cost $3,546,794) | | 3,546,085 | 3,546,794 |
| | | | |
| TOTAL INVESTMENT IN SECURITIES - 102.8% (Cost $362,321,564) | 324,313,972 |
NET OTHER ASSETS (LIABILITIES) - (2.8)% | (8,880,505) |
| NET ASSETS - 100.0% | 315,433,467 |
| | |
| TBA Sale Commitments |
| | Principal Amount (a) | Value ($) |
| Uniform Mortgage Backed Securities | | |
| 2% 3/1/53 | (200,000) | (162,851) |
| 2% 3/1/53 | (1,000,000) | (814,254) |
| 2.5% 3/1/53 | (200,000) | (169,438) |
| 2.5% 3/1/53 | (100,000) | (84,719) |
| | | |
TOTAL TBA SALE COMMITMENTS (Proceeds $1,239,797) | | (1,231,262) |
Legend
| (a) | Amount is stated in United States dollars unless otherwise noted. |
| (b) | Security exempt from registration under Rule 144A of the Securities Act of 1933. These securities may be resold in transactions exempt from registration, normally to qualified institutional buyers. At the end of the period, the value of these securities amounted to $1,203,778 or 0.4% of net assets. |
| (c) | Coupon rates for floating and adjustable rate securities reflect the rates in effect at period end. |
| (d) | Coupon is indexed to a floating interest rate which may be multiplied by a specified factor and/or subject to caps or floors. |
| (e) | Security or a portion of the security purchased on a delayed delivery or when-issued basis. |
| (f) | Affiliated fund that is generally available only to investment companies and other accounts managed by Fidelity Investments. The rate quoted is the annualized seven-day yield of the fund at period end. A complete unaudited listing of the fund's holdings as of its most recent quarter end is available upon request. In addition, each Fidelity Central Fund's financial statements are available on the SEC's website or upon request. |
Affiliated Central Funds
Fiscal year to date information regarding the Fund's investments in Fidelity Central Funds, including the ownership percentage, is presented below.
| Affiliate | Value, beginning of period ($) | Purchases ($) | Sales Proceeds ($) | Dividend Income ($) | Realized Gain (loss) ($) | Change in Unrealized appreciation (depreciation) ($) | Value, end of period ($) | % ownership, end of period |
| Fidelity Cash Central Fund 4.63% | 1,931,055 | 35,275,658 | 33,659,919 | 21,579 | - | - | 3,546,794 | 0.0% |
| Total | 1,931,055 | 35,275,658 | 33,659,919 | 21,579 | - | - | 3,546,794 | |
| | | | | | | | | |
Amounts in the dividend income column in the above table include any capital gain distributions from underlying funds, which are presented in the corresponding line item in the Statement of Operations, if applicable.
Amounts included in the purchases and sales proceeds columns may include in-kind transactions, if applicable.
Investment Valuation
The following is a summary of the inputs used, as of February 28, 2023, involving the Fund's assets and liabilities carried at fair value. The inputs or methodology used for valuing securities may not be an indication of the risk associated with investing in those securities. For more information on valuation inputs, and their aggregation into the levels used below, please refer to the Investment Valuation section in the accompanying Notes to Financial Statements.
| Valuation Inputs at Reporting Date: |
| Description | Total ($) | Level 1 ($) | Level 2 ($) | Level 3 ($) |
Investments in Securities: | | | | |
|
| Corporate Bonds | 81,448,013 | - | 81,448,013 | - |
|
| U.S. Government and Government Agency Obligations | 138,979,401 | - | 138,979,401 | - |
|
| U.S. Government Agency - Mortgage Securities | 86,079,709 | - | 86,079,709 | - |
|
| Asset-Backed Securities | 594,621 | - | 594,621 | - |
|
| Commercial Mortgage Securities | 4,086,881 | - | 4,086,881 | - |
|
| Foreign Government and Government Agency Obligations | 6,630,533 | - | 6,630,533 | - |
|
| Supranational Obligations | 2,687,237 | - | 2,687,237 | - |
|
| Bank Notes | 260,783 | - | 260,783 | - |
|
| Money Market Funds | 3,546,794 | 3,546,794 | - | - |
| Total Investments in Securities: | 324,313,972 | 3,546,794 | 320,767,178 | - |
Other Financial Instruments: | | | | |
|
| TBA Sale Commitments | (1,231,262) | - | (1,231,262) | - |
| Total Other Financial Instruments: | (1,231,262) | - | (1,231,262) | - |
| Statement of Assets and Liabilities |
| | | | February 28, 2023 (Unaudited) |
| | | | | |
| Assets | | | | |
| Investment in securities, at value - See accompanying schedule: | | | | |
Unaffiliated issuers (cost $358,774,770) | $ | 320,767,178 | | |
Fidelity Central Funds (cost $3,546,794) | | 3,546,794 | | |
| | | | | |
| | | | | |
| Total Investment in Securities (cost $362,321,564) | | | $ | 324,313,972 |
| Receivable for TBA sale commitments | | | | 1,239,797 |
| Receivable for fund shares sold | | | | 244,049 |
| Interest receivable | | | | 1,835,519 |
| Distributions receivable from Fidelity Central Funds | | | | 6,254 |
Total assets | | | | 327,639,591 |
| Liabilities | | | | |
| Payable for investments purchased | | | | |
Regular delivery | $ | 3,020,643 | | |
Delayed delivery | | 7,008,273 | | |
| TBA sale commitments, at value | | 1,231,262 | | |
| Payable for fund shares redeemed | | 849,579 | | |
| Distributions payable | | 69,936 | | |
| Accrued management fee | | 26,431 | | |
| Total Liabilities | | | | 12,206,124 |
| Net Assets | | | $ | 315,433,467 |
| Net Assets consist of: | | | | |
| Paid in capital | | | $ | 359,179,803 |
| Total accumulated earnings (loss) | | | | (43,746,336) |
| Net Assets | | | $ | 315,433,467 |
Net Asset Value , offering price and redemption price per share ($315,433,467 ÷ 34,566,554 shares) | | | $ | 9.13 |
| Statement of Operations |
| | | | Six months ended February 28, 2023 (Unaudited) |
| Investment Income | | | | |
| Interest | | | $ | 4,153,030 |
| Income from Fidelity Central Funds | | | | 21,579 |
| Total Income | | | | 4,174,609 |
| Expenses | | | | |
| Management fee | $ | 149,857 | | |
| Independent trustees' fees and expenses | | 566 | | |
| Total expenses before reductions | | 150,423 | | |
| Expense reductions | | (1,041) | | |
| Total expenses after reductions | | | | 149,382 |
| Net Investment income (loss) | | | | 4,025,227 |
| Realized and Unrealized Gain (Loss) | | | | |
| Net realized gain (loss) on: | | | | |
| Investment Securities: | | | | |
| Unaffiliated issuers | | (3,721,993) | | |
| Total net realized gain (loss) | | | | (3,721,993) |
| Change in net unrealized appreciation (depreciation) on: | | | | |
| Investment Securities: | | | | |
| Unaffiliated issuers | | (7,273,981) | | |
| TBA Sale commitments | | 8,535 | | |
| Total change in net unrealized appreciation (depreciation) | | | | (7,265,446) |
| Net gain (loss) | | | | (10,987,439) |
| Net increase (decrease) in net assets resulting from operations | | | $ | (6,962,212) |
| Statement of Changes in Net Assets |
| |
| | Six months ended February 28, 2023 (Unaudited) | | Year ended August 31, 2022 |
| Increase (Decrease) in Net Assets | | | | |
| Operations | | | | |
| Net investment income (loss) | $ | 4,025,227 | $ | 4,599,674 |
| Net realized gain (loss) | | (3,721,993) | | (2,487,959) |
| Change in net unrealized appreciation (depreciation) | | (7,265,446) | | (34,425,419) |
| Net increase (decrease) in net assets resulting from operations | | (6,962,212) | | (32,313,704) |
| Distributions to shareholders | | (3,691,450) | | (4,578,414) |
| Share transactions | | | | |
| Proceeds from sales of shares | | 74,604,877 | | 157,127,726 |
| Reinvestment of distributions | | 3,304,297 | | 4,139,033 |
| Cost of shares redeemed | | (50,018,106) | | (66,796,463) |
Net increase (decrease) in net assets resulting from share transactions | | 27,891,068 | | 94,470,296 |
| Total increase (decrease) in net assets | | 17,237,406 | | 57,578,178 |
| | | | | |
| Net Assets | | | | |
| Beginning of period | | 298,196,061 | | 240,617,883 |
| End of period | $ | 315,433,467 | $ | 298,196,061 |
| | | | | |
| Other Information | | | | |
| Shares | | | | |
| Sold | | 8,100,332 | | 15,593,174 |
| Issued in reinvestment of distributions | | 361,800 | | 411,340 |
| Redeemed | | (5,459,822) | | (6,609,973) |
| Net increase (decrease) | | 3,002,310 | | 9,394,541 |
| | | | | |
Financial Highlights
| Fidelity® Sustainability Bond Index Fund |
| |
| | Six months ended (Unaudited) February 28, 2023 | | Years ended August 31, 2022 | | 2021 | | 2020 | | 2019 | | 2018 A |
Selected Per-Share Data | | | | | | | | | | | | |
| Net asset value, beginning of period | $ | 9.45 | $ | 10.85 | $ | 11.11 | $ | 10.71 | $ | 10.02 | $ | 10.00 |
| Income from Investment Operations | | | | | | | | | | | | |
Net investment income (loss) B,C | | .123 | | .174 | | .144 | | .234 | | .307 | | .058 |
| Net realized and unrealized gain (loss) | | (.330) | | (1.401) | | (.207) | | .453 | | .680 | | .018 |
| Total from investment operations | | (.207) | | (1.227) | | (.063) | | .687 | | .987 | | .076 |
| Distributions from net investment income | | (.113) | | (.165) | | (.148) | | (.239) | | (.295) | | (.056) |
| Distributions from net realized gain | | - | | (.008) | | (.049) | | (.048) | | (.002) | | - |
| Total distributions | | (.113) | | (.173) | | (.197) | | (.287) | | (.297) | | (.056) |
| Net asset value, end of period | $ | 9.13 | $ | 9.45 | $ | 10.85 | $ | 11.11 | $ | 10.71 | $ | 10.02 |
Total Return D,E | | (2.19)% | | (11.40)% | | (.56)% | | 6.53% | | 10.04% | | .76% |
Ratios to Average Net Assets C,F,G | | | | | | | | | | | | |
| Expenses before reductions | | .10% H | | .10% | | .10% | | .10% | | .10% | | .10% H |
| Expenses net of fee waivers, if any | | .10% H | | .10% | | .10% | | .10% | | .10% | | .10% H |
| Expenses net of all reductions | | .10% H | | .10% | | .10% | | .10% | | .10% | | .10% H |
| Net investment income (loss) | | 2.71% H | | 1.72% | | 1.32% | | 2.17% | | 3.03% | | 2.92% H |
| Supplemental Data | | | | | | | | | | | | |
| Net assets, end of period (000 omitted) | $ | 315,433 | $ | 298,196 | $ | 240,618 | $ | 168,955 | $ | 76,897 | $ | 8,474 |
Portfolio turnover rate I | | 46% H | | 65% | | 97% | | 92% | | 89% | | 36% J |
A For the period June 19, 2018 (commencement of operations) through August 31, 2018.
B Calculated based on average shares outstanding during the period.
C Net investment income (loss) is affected by the timing of the declaration of dividends by any underlying mutual funds or exchange-traded funds (ETFs). Net investment income (loss) of any mutual funds or ETFs is not included in the Fund's net investment income (loss) ratio.
D Total returns for periods of less than one year are not annualized.
E Total returns would have been lower if certain expenses had not been reduced during the applicable periods shown.
F Fees and expenses of any underlying mutual funds or exchange-traded funds (ETFs) are not included in the Fund's expense ratio. The Fund indirectly bears its proportionate share of these expenses. For additional expense information related to investments in Fidelity Central Funds, please refer to the "Investments in Fidelity Central Funds" note found in the Notes to Financial Statements section of the most recent Annual or Semi-Annual report.
G Expense ratios reflect operating expenses of the class. Expenses before reductions do not reflect amounts reimbursed, waived, or reduced through arrangements with the investment adviser, brokerage services, or other offset arrangements, if applicable, and do not represent the amount paid by the class during periods when reimbursements, waivers or reductions occur.
H Annualized.
I Amount does not include the portfolio activity of any underlying mutual funds or exchange-traded funds (ETFs).
J Amount not annualized.
For the period ended February 28, 2023
1. Organization.
Fidelity Sustainability Bond Index Fund (the Fund) is a fund of Fidelity Salem Street Trust (the Trust) and is authorized to issue an unlimited number of shares. Share transactions on the Statement of Changes in Net Assets may contain exchanges between affiliated funds. The Trust is registered under the Investment Company Act of 1940, as amended (the 1940 Act), as an open-end management investment company organized as a Massachusetts business trust.
2. Investments in Fidelity Central Funds.
Funds may invest in Fidelity Central Funds, which are open-end investment companies generally available only to other investment companies and accounts managed by the investment adviser and its affiliates. The Schedule of Investments lists any Fidelity Central Funds held as an investment as of period end, but does not include the underlying holdings of each Fidelity Central Fund. An investing fund indirectly bears its proportionate share of the expenses of the underlying Fidelity Central Funds.
Based on its investment objective, each Fidelity Central Fund may invest or participate in various investment vehicles or strategies that are similar to those of the investing fund. These strategies are consistent with the investment objectives of the investing fund and may involve certain economic risks which may cause a decline in value of each of the Fidelity Central Funds and thus a decline in the value of the investing fund.
| Fidelity Central Fund | Investment Manager | Investment Objective | Investment Practices | Expense Ratio A |
| Fidelity Money Market Central Funds | Fidelity Management & Research Company LLC (FMR) | Each fund seeks to obtain a high level of current income consistent with the preservation of capital and liquidity. | Short-term Investments | Less than .005% |
A Expenses expressed as a percentage of average net assets and are as of each underlying Central Fund's most recent annual or semi-annual shareholder report.
A complete unaudited list of holdings for each Fidelity Central Fund is available upon request or at the Securities and Exchange Commission website at www.sec.gov. In addition, the financial statements of the Fidelity Central Funds which contain the significant accounting policies (including investment valuation policies) of those funds, and are not covered by the Report of Independent Registered Public Accounting Firm, are available on the Securities and Exchange Commission website or upon request.
3. Significant Accounting Policies.
The Fund is an investment company and applies the accounting and reporting guidance of the Financial Accounting Standards Board (FASB) Accounting Standards Codification Topic 946 Financial Services - Investment Companies . The financial statements have been prepared in conformity with accounting principles generally accepted in the United States of America (GAAP), which require management to make certain estimates and assumptions at the date of the financial statements. Actual results could differ from those estimates. Subsequent events, if any, through the date that the financial statements were issued have been evaluated in the preparation of the financial statements. The Fund's Schedule of Investments lists any underlying mutual funds or exchange-traded funds (ETFs) but does not include the underlying holdings of these funds. The following summarizes the significant accounting policies of the Fund:
Investment Valuation. Investments are valued as of 4:00 p.m. Eastern time on the last calendar day of the period. The Board of Trustees (the Board) has designated the Fund's investment adviser as the valuation designee responsible for the fair valuation function and performing fair value determinations as needed. The investment adviser has established a Fair Value Committee (the Committee) to carry out the day-to-day fair valuation responsibilities and has adopted policies and procedures to govern the fair valuation process and the activities of the Committee. In accordance with these fair valuation policies and procedures, which have been approved by the Board, the Fund attempts to obtain prices from one or more third party pricing services or brokers to value its investments. When current market prices, quotations or currency exchange rates are not readily available or reliable, investments will be fair valued in good faith by the Committee, in accordance with the policies and procedures. Factors used in determining fair value vary by investment type and may include market or investment specific events, transaction data, estimated cash flows, and market observations of comparable investments. The frequency that the fair valuation procedures are used cannot be predicted and they may be utilized to a significant extent. The Committee manages the Fund's fair valuation practices and maintains the fair valuation policies and procedures. The Fund's investment adviser reports to the Board information regarding the fair valuation process and related material matters.
The Fund categorizes the inputs to valuation techniques used to value its investments into a disclosure hierarchy consisting of three levels as shown below:
Level 1 - unadjusted quoted prices in active markets for identical investments
Level 2 - other significant observable inputs (including quoted prices for similar investments, interest rates, prepayment speeds, etc.)
Level 3 - unobservable inputs (including the Fund's own assumptions based on the best information available)
Valuation techniques used to value the Fund's investments by major category are as follows:
Debt securities, including restricted securities, are valued based on evaluated prices received from third party pricing services or from brokers who make markets in such securities. Corporate bonds, bank notes, foreign government and government agency obligations, supranational obligations and U.S. government and government agency obligations are valued by pricing services who utilize matrix pricing which considers yield or price of bonds of comparable quality, coupon, maturity and type or by broker-supplied prices. Asset backed securities, commercial mortgage securities and U.S. government agency mortgage securities are valued by pricing services who utilize matrix pricing which considers prepayment speed assumptions, attributes of the collateral, yield or price of bonds of comparable quality, coupon, maturity and type or by broker-supplied prices. When independent prices are unavailable or unreliable, debt securities may be valued utilizing pricing methodologies which consider similar factors that would be used by third party pricing services. Debt securities are generally categorized as Level 2 in the hierarchy but may be Level 3 depending on the circumstances.
Investments in open-end mutual funds, including the Fidelity Central Funds, are valued at their closing net asset value (NAV) each business day and are categorized as Level 1 in the hierarchy.
Changes in valuation techniques may result in transfers in or out of an assigned level within the disclosure hierarchy. The aggregate value of investments by input level as of February 28, 2023 is included at the end of the Fund's Schedule of Investments.
Investment Transactions and Income. For financial reporting purposes, the Fund's investment holdings and NAV include trades executed through the end of the last business day of the period. The NAV per share for processing shareholder transactions is calculated as of the close of business of the New York Stock Exchange (NYSE), normally 4:00 p.m. Eastern time and includes trades executed through the end of the prior business day. Gains and losses on securities sold are determined on the basis of identified cost. Income and capital gain distributions from Fidelity Central Funds, if any, are recorded on the ex-dividend date. Interest income is accrued as earned and includes coupon interest and amortization of premium and accretion of discount on debt securities as applicable. Debt obligations may be placed on non-accrual status and related interest income may be reduced by ceasing current accruals and writing off interest receivables when the collection of all or a portion of interest has become doubtful based on consistently applied procedures. A debt obligation is removed from non-accrual status when the issuer resumes interest payments or when collectability of interest is reasonably assured.
Expenses. Expenses directly attributable to a fund are charged to that fund. Expenses attributable to more than one fund are allocated among the respective funds on the basis of relative net assets or other appropriate methods. Expenses included in the accompanying financial statements reflect the expenses of that fund and do not include any expenses associated with any underlying mutual funds or exchange-traded funds. Although not included in a fund's expenses, a fund indirectly bears its proportionate share of these expenses through the net asset value of each underlying mutual fund or exchange-traded fund. Expense estimates are accrued in the period to which they relate and adjustments are made when actual amounts are known.
Income Tax Information and Distributions to Shareholders. Each year, the Fund intends to qualify as a regulated investment company under Subchapter M of the Internal Revenue Code, including distributing substantially all of its taxable income and realized gains. As a result, no provision for U.S. Federal income taxes is required. The Fund files a U.S. federal tax return, in addition to state and local tax returns as required. The Fund's federal income tax returns are subject to examination by the Internal Revenue Service (IRS) for a period of three fiscal years after they are filed. State and local tax returns may be subject to examination for an additional fiscal year depending on the jurisdiction.
Distributions are declared and recorded daily and paid monthly from net investment income. Distributions from realized gains, if any, are declared and recorded on the ex-dividend date. Income and capital gain distributions are determined in accordance with income tax regulations, which may differ from GAAP.
Capital accounts within the financial statements are adjusted for permanent book-tax differences. These adjustments have no impact on net assets or the results of operations. Capital accounts are not adjusted for temporary book-tax differences which will reverse in a subsequent period.
Book-tax differences are primarily due to market discount, capital loss carryforwards and losses deferred due to wash sales.
As of period end, the cost and unrealized appreciation (depreciation) in securities, and derivatives if applicable, for federal income tax purposes were as follows:
| Gross unrealized appreciation | $149,046 |
| Gross unrealized depreciation | (37,845,839) |
| Net unrealized appreciation (depreciation) | $(37,696,793) |
| Tax cost | $362,002,230 |
Capital loss carryforwards are only available to offset future capital gains of the Fund to the extent provided by regulations and may be limited. The capital loss carryforward information presented below, including any applicable limitation, is estimated as of prior fiscal period end and is subject to adjustment.
Short-term | $(1,285,273) |
Long-term | (955,970) |
| Total capital loss carryforward | $(2,241,243) |
Delayed Delivery Transactions and When-Issued Securities. During the period, certain Funds transacted in securities on a delayed delivery or when-issued basis. Payment and delivery may take place after the customary settlement period for that security. The price of the underlying securities and the date when the securities will be delivered and paid for are fixed at the time the transaction is negotiated. Securities purchased on a delayed delivery or when-issued basis are identified as such in the Schedule of Investments. Compensation for interest forgone in the purchase of a delayed delivery or when-issued debt security may be received. With respect to purchase commitments, each applicable Fund identifies securities as segregated in its records with a value at least equal to the amount of the commitment. Payables and receivables associated with the purchases and sales of delayed delivery securities having the same coupon, settlement date and broker are offset. Delayed delivery or when-issued securities that have been purchased from and sold to different brokers are reflected as both payables and receivables in the Statement of Assets and Liabilities under the caption "Delayed delivery", as applicable. Losses may arise due to changes in the value of the underlying securities or if the counterparty does not perform under the contract's terms, or if the issuer does not issue the securities due to political, economic, or other factors.
To-Be-Announced (TBA) Securities and Mortgage Dollar Rolls. TBA securities involve buying or selling mortgage-backed securities (MBS) on a forward commitment basis. A TBA transaction typically does not designate the actual security to be delivered and only includes an approximate principal amount; however delivered securities must meet specified terms defined by industry guidelines, including issuer, rate and current principal amount outstanding on underlying mortgage pools. Funds may enter into a TBA transaction with the intent to take possession of or deliver the underlying MBS, or a fund may elect to extend the settlement by entering into either a mortgage or reverse mortgage dollar roll. Mortgage dollar rolls are transactions where a fund sells TBA securities and simultaneously agrees to repurchase MBS on a later date at a lower price and with the same counterparty. Reverse mortgage dollar rolls involve the purchase and simultaneous agreement to sell TBA securities on a later date at a lower price. Transactions in mortgage dollar rolls and reverse mortgage dollar rolls are accounted for as purchases and sales and may result in an increase to a fund's portfolio turnover rate.
Purchases and sales of TBA securities involve risks similar to those discussed above for delayed delivery and when-issued securities. Also, if the counterparty in a mortgage dollar roll or a reverse mortgage dollar roll transaction files for bankruptcy or becomes insolvent, a fund's right to repurchase or sell securities may be limited. Additionally, when a fund sells TBA securities without already owning or having the right to obtain the deliverable securities (an uncovered forward commitment to sell), it incurs a risk of loss because it could have to purchase the securities at a price that is higher than the price at which it sold them. A fund may be unable to purchase the deliverable securities if the corresponding market is illiquid.
TBA securities subject to a forward commitment to sell at period end are included at the end of the Schedule of Investments under the caption "TBA Sale Commitments." The proceeds and value of these commitments are reflected in the Statement of Assets and Liabilities as "Receivable for TBA sale commitments" and "TBA sale commitments, at value," respectively.
Restricted Securities (including Private Placements). Funds may invest in securities that are subject to legal or contractual restrictions on resale. These securities generally may be resold in transactions exempt from registration or to the public if the securities are registered. Disposal of these securities may involve time-consuming negotiations and expense, and prompt sale at an acceptable price may be difficult. Information regarding restricted securities held at period end is included at the end of the Schedule of Investments, if applicable.
4. Purchases and Sales of Investments.
Purchases and sales of securities, other than short-term securities, U.S. government securities and in-kind transactions, as applicable, are noted in the table below.
| | Purchases ($) | Sales ($) |
| Fidelity Sustainability Bond Index Fund | 30,197,170 | 16,381,460 |
5. Fees and Other Transactions with Affiliates.
Management Fee. Fidelity Management & Research Company LLC (the investment adviser) and its affiliates provide the Fund with investment management related services for which the Fund pays a monthly management fee. The management fee is based on an annual rate of .10% of the Fund's average net assets. Under the management contract, the investment adviser pays all other operating expenses, except the compensation of the independent Trustees and certain miscellaneous expenses such as proxy and shareholder meeting expenses.
Interfund Trades. Funds may purchase from or sell securities to other Fidelity Funds under procedures adopted by the Board. The procedures have been designed to ensure these interfund trades are executed in accordance with Rule 17a-7 of the 1940 Act. Any interfund trades are included within the respective purchases and sales amounts shown in the Purchases and Sales of Investments note. During the period, there were no interfund trades.
6. Committed Line of Credit.
Certain Funds participate with other funds managed by the investment adviser or an affiliate in a $4.25 billion credit facility (the "line of credit") to be utilized for temporary or emergency purposes to fund shareholder redemptions or for other short-term liquidity purposes. The commitment fees on the pro-rata portion of the line of credit are borne by the investment adviser. During the period, there were no borrowings on this line of credit.
7. Expense Reductions.
Through arrangements with the Fund's custodian, credits realized as a result of certain uninvested cash balances were used to reduce the Fund's expenses by $1,041.
8. Other.
A fund's organizational documents provide former and current trustees and officers with a limited indemnification against liabilities arising in connection with the performance of their duties to the fund. In the normal course of business, a fund may also enter into contracts that provide general indemnifications. A fund's maximum exposure under these arrangements is unknown as this would be dependent on future claims that may be made against a fund. The risk of material loss from such claims is considered remote.
9. Risk and Uncertainties.
Many factors affect a fund's performance. Developments that disrupt global economies and financial markets, such as pandemics, epidemics, outbreaks of infectious diseases, war, terrorism, and environmental disasters, may significantly affect a fund's investment performance. The effects of these developments to a fund will be impacted by the types of securities in which a fund invests, the financial condition, industry, economic sector, and geographic location of an issuer, and a fund's level of investment in the securities of that issuer. Significant concentrations in security types, issuers, industries, sectors, and geographic locations may magnify the factors that affect a fund's performance.
As a shareholder, you incur two types of costs: (1) transaction costs, which may include sales charges (loads) on purchase payments or redemption proceeds, as applicable and (2) ongoing costs, which generally include management fees, distribution and/or service (12b-1) fees and other Fund expenses. This Example is intended to help you understand your ongoing costs (in dollars) of investing in a fund and to compare these costs with the ongoing costs of investing in other mutual funds.
| The Example is based on an investment of $1,000 invested at the beginning of the period and held for the entire period (September 1, 2022 to February 28, 2023). |
Actual Expenses
The first line of the accompanying table provides information about actual account values and actual expenses. You may use the information in this line, together with the amount you invested, to estimate the expenses that you paid over the period. Simply divide your account value by $1,000.00 (for example, an $8,600 account value divided by $1,000.00 = 8.6), then multiply the result by the number in the first line for a class/Fund under the heading entitled "Expenses Paid During Period" to estimate the expenses you paid on your account during this period. If any fund is a shareholder of any underlying mutual funds or exchange-traded funds (ETFs) (the Underlying Funds), such fund indirectly bears its proportional share of the expenses of the Underlying Funds in addition to the direct expenses incurred presented in the table. These fees and expenses are not included in the annualized expense ratio used to calculate the expense estimate in the table below.
Hypothetical Example for Comparison Purposes
The second line of the accompanying table provides information about hypothetical account values and hypothetical expenses based on the actual expense ratio and an assumed rate of return of 5% per year before expenses, which is not the actual return. The hypothetical account values and expenses may not be used to estimate the actual ending account balance or expenses you paid for the period. You may use this information to compare the ongoing costs of investing in the Fund and other funds. To do so, compare this 5% hypothetical example with the 5% hypothetical examples that appear in the shareholder reports of the other funds. If any fund is a shareholder of any Underlying Funds, such fund indirectly bears its proportional share of the expenses of the Underlying Funds in addition to the direct expenses as presented in the table. These fees and expenses are not included in the annualized expense ratio used to calculate the expense estimate in the table below.
Please note that the expenses shown in the table are meant to highlight your ongoing costs only and do not reflect any transaction costs. Therefore, the second line of the table is useful in comparing ongoing costs only, and will not help you determine the relative total costs of owning different funds. In addition, if these transactional costs were included, your costs would have been higher.
| | | | | Annualized Expense Ratio- A | | Beginning Account Value September 1, 2022 | | Ending Account Value February 28, 2023 | | Expenses Paid During Period- C September 1, 2022 to February 28, 2023 |
| | | | | | | | | | |
| Fidelity® Sustainability Bond Index Fund | | | | .10% | | | | | | |
| Actual | | | | | | $ 1,000 | | $ 978.10 | | $ .49 |
Hypothetical- B | | | | | | $ 1,000 | | $ 1,024.30 | | $ .50 |
| |
A Annualized expense ratio reflects expenses net of applicable fee waivers.
B 5% return per year before expenses
C Expenses are equal to the annualized expense ratio, multiplied by the average account value over the period, multiplied by 181/ 365 (to reflect the one-half year period). The fees and expenses of any Underlying Funds are not included in each annualized expense ratio.
Board Approval of Investment Advisory Contracts and Management Fees
Fidelity Sustainability Bond Index Fund
Each year, the Board of Trustees, including the Independent Trustees (together, the Board), votes on the renewal of the management contract with Fidelity Management & Research Company LLC (FMR) and the sub-advisory agreements (together, the Advisory Contracts) for the fund. FMR and the sub-advisers are referred to herein as the Investment Advisers. The Board, assisted by the advice of fund counsel and Independent Trustees' counsel, requests and considers a broad range of information relevant to the renewal of the Advisory Contracts throughout the year.
The Board meets regularly and, at each of its meetings, covers an extensive agenda of topics and materials and considers factors that are relevant to its annual consideration of the renewal of the fund's Advisory Contracts, including the services and support provided to the fund and its shareholders. The Board has established four standing committees (Committees) - Operations, Audit, Fair Valuation, and Governance and Nominating - each composed of and chaired by Independent Trustees with varying backgrounds, to which the Board has assigned specific subject matter responsibilities in order to enhance effective decision-making by the Board. The Operations Committee, of which all the Independent Trustees are members, meets regularly throughout the year and requests, receives and considers, among other matters, information related to the annual consideration of the renewal of the fund's Advisory Contracts before making its recommendation to the Board. The Board also meets as needed to review matters specifically related to the Board's annual consideration of the renewal of the Advisory Contracts. Members of the Board may also meet from time to time with trustees of other Fidelity funds through joint ad hoc committees to discuss certain matters relevant to all of the Fidelity funds.
At its September 2022 meeting, the Board unanimously determined to renew the fund's Advisory Contracts. In reaching its determination, the Board considered all factors it believed relevant, including (i) the nature, extent, and quality of the services provided to the fund and its shareholders (including the investment performance of the fund); (ii) the competitiveness relative to peer funds of the fund's management fee and total expense ratio; (iii) the total costs of the services provided by and the profits realized by Fidelity from its relationships with the fund; and (iv) the extent to which, if any, economies of scale exist and are realized as the fund grows, and whether any economies of scale are appropriately shared with fund shareholders.
In considering whether to renew the Advisory Contracts for the fund, the Board reached a determination, with the assistance of fund counsel and Independent Trustees' counsel and through the exercise of its business judgment, that the renewal of the Advisory Contracts was in the best interests of the fund and its shareholders and that the compensation payable under the Advisory Contracts was fair and reasonable. The Board's decision to renew the Advisory Contracts was not based on any single factor, but rather was based on a comprehensive consideration of all the information provided to the Board at its meetings throughout the year. The Board, in reaching its determination to renew the Advisory Contracts, was aware that shareholders of the fund have a broad range of investment choices available to them, including a wide choice among funds offered by Fidelity's competitors, and that the fund's shareholders, who have the opportunity to review and weigh the disclosure provided by the fund in its prospectus and other public disclosures, have chosen to invest in this fund, which is part of the Fidelity family of funds.
Nature, Extent, and Quality of Services Provided. The Board considered Fidelity's staffing as it relates to the fund, including the backgrounds of investment personnel of Fidelity, and also considered the fund's investment objective, strategies, and related investment philosophy. The Independent Trustees also had discussions with senior management of Fidelity's investment operations and investment groups. The Board considered the structure of the investment personnel compensation program and whether this structure provides appropriate incentives to act in the best interests of the fund. Additionally, the Board considered the portfolio managers' investments, if any, in the funds that they manage. The Board also considered the steps Fidelity had taken to ensure the continued provision of high-quality services to the Fidelity funds throughout the COVID-19 pandemic, including the expansion of staff in client facing positions to maintain service levels in periods of high volumes and volatility.
Resources Dedicated to Investment Management and Support Services. The Board reviewed the general qualifications and capabilities of Fidelity's investment staff, including its size, education, experience, and resources, as well as Fidelity's approach to recruiting, training, managing, and compensating investment personnel. The Board noted the resources devoted to Fidelity's global investment organization, and that Fidelity's analysts have extensive resources, tools and capabilities that allow them to conduct quantitative and fundamental analysis, as well as credit analysis of issuers, counterparties and guarantors. Further, the Board considered that Fidelity's investment professionals have sufficient access to global information and data so as to provide competitive investment results over time, and that those professionals also have access to sophisticated tools that permit them to assess portfolio construction and risk and performance attribution characteristics continuously, as well as to transmit new information and research conclusions rapidly around the world. Additionally, in its deliberations, the Board considered Fidelity's trading, risk management, compliance, cybersecurity, and technology and operations capabilities and resources, which are integral parts of the investment management process.
Shareholder and Administrative Services. The Board considered (i) the nature, extent, quality, and cost of advisory, administrative, and shareholder services performed by the Investment Advisers and their affiliates under the Advisory Contracts and under separate agreements covering transfer agency, pricing and bookkeeping, and securities lending services for the fund; (ii) the nature and extent of the supervision of third party service providers, principally custodians, subcustodians, and pricing vendors; and (iii) the resources devoted to, and the record of compliance with, the fund's compliance policies and procedures.
The Board noted that the growth of fund assets over time across the complex allows Fidelity to reinvest in the development of services designed to enhance the value and convenience of the Fidelity funds as investment vehicles. These services include 24-hour access to account information and market information over the Internet and through telephone representatives, investor education materials and asset allocation tools. The Board also considered that it reviews customer service metrics such as telephone response times, continuity of services on the website and metrics addressing services at Fidelity Investor Centers.
Investment in a Large Fund Family. The Board considered the benefits to shareholders of investing in a Fidelity fund, including the benefits of investing in a fund that is part of a large family of funds offering a variety of investment disciplines and providing a large variety of mutual fund investor services. The Board noted that Fidelity had taken, or had made recommendations to the Board that resulted in the Fidelity funds taking, a number of actions over the previous year that benefited particular funds, including: (i) continuing to dedicate additional resources to Fidelity's investment research process, which includes meetings with management of issuers of securities in which the funds invest; (ii) continuing efforts to enhance Fidelity's global research capabilities; (iii) launching new funds, ETFs, and share classes with innovative structures, strategies and pricing and making other enhancements to meet investor needs; (iv) broadening eligibility requirements for certain funds and share classes; (v) reducing management fees and total expenses for certain funds and classes; (vi) lowering expenses for certain existing funds and classes by implementing or lowering expense caps; (vii) rationalizing product lines and gaining increased efficiencies from fund mergers and liquidations; (viii) continuing to develop, acquire and implement systems and technology to improve services to the funds and shareholders, strengthen information security, and increase efficiency; and (ix) continuing to implement enhancements to further strengthen Fidelity's product line to increase investors' probability of success in achieving their investment goals, including their retirement income goals.
Investment Performance. The Board considered whether the fund has operated in accordance with its investment objective, as well as its record of compliance with its investment restrictions and its performance history.
The Board took into account discussions that occur at Board meetings throughout the year with representatives of the Investment Advisers about fund investment performance. In this regard the Board noted that as part of regularly scheduled fund reviews and other reports to the Board on fund performance, the Board considers annualized return information for the fund for different time periods, measured against the securities market index the fund seeks to track and an appropriate peer group of funds with similar objectives (peer group). The Board also periodically considers the fund's tracking error versus its benchmark index.
In addition to reviewing absolute and relative fund performance, the Independent Trustees periodically consider the appropriateness of fund performance metrics in evaluating the results achieved. In general, the Independent Trustees believe that an index fund's performance should be evaluated based on gross performance (before fees and expenses but after transaction costs) compared to the fund's benchmark index, over appropriate time periods, taking into account relevant factors including the following: general market conditions; the characteristics of the fund's benchmark index; the extent to which statistical sampling is employed; and fund cash flows and other factors. The Independent Trustees generally give greater weight to fund performance over longer time periods than over shorter time periods. Depending on the circumstances, the Independent Trustees may be satisfied with a fund's performance notwithstanding that it lags its benchmark index for certain periods.
The Independent Trustees recognize that shareholders evaluate performance on a net basis (after fees and expenses) over their own holding periods, for which one-, three-, and five-year periods are often used as a proxy. For this reason, the performance information reviewed by the Board also included net cumulative calendar year total return information for the fund and its benchmark index and peer group for the most recent one- and three-year period. The Independent Trustees recognize that shareholders who are not investing through a tax-advantaged retirement account also consider tax consequences in evaluating performance.
Based on its review, the Board concluded that the nature, extent, and quality of services provided to the fund under the Advisory Contracts should continue to benefit the shareholders of the fund.
Competitiveness of Management Fee and Total Expense Ratio. The Board considered the fund's management fee and total expense ratio compared to selected groups of competitive funds and classes (referred to as "mapped groups" below) for the purpose of facilitating the Trustees' competitive analysis of management fees and total expenses. Fidelity creates "mapped groups" by combining similar investment objective categories (as classified by Lipper) that have comparable investment mandates. Combining funds with similar investment objective categories aids the Board's comparison of management fees and total expense ratios by broadening the competitive group used for such comparison.
Management Fee. The Board considered two proprietary management fee comparisons for the 12-month (or shorter) periods shown in basis points (BP) in the chart below. The group of Lipper funds used by the Board for management fee comparisons is referred to below as the "Total Mapped Group" and is broader than the Lipper peer group used by the Board for performance comparisons. The Total Mapped Group comparison focuses on a fund's standing in terms of gross management fees before expense reimbursements or caps relative to the total universe of funds with comparable investment mandates, regardless of whether their management fee structures also are comparable. Funds with comparable investment mandates offer exposure to similar types of securities. Funds with comparable management fee structures have similar management fee contractual arrangements (e.g., flat rate charged for advisory services, all-inclusive fee rate, etc.). "TMG %" represents the percentage of funds in the Total Mapped Group that had management fees that were lower than the fund's. For example, a hypothetical TMG % of 20% would mean that 80% of the funds in the Total Mapped Group had higher, and 20% had lower, management fees than the fund. The fund's actual TMG %s and the number of funds in the Total Mapped Group are in the chart below. The "Asset-Sized Peer Group" (ASPG) comparison focuses on a fund's standing relative to a subset of non-Fidelity funds within the Total Mapped Group that are similar in size and management fee structure. For example, if a fund is in the first quartile of the ASPG, the fund's management fee ranks in the least expensive or lowest 25% of funds in the ASPG. The ASPG represents at least 15% of the funds in the Total Mapped Group with comparable asset size and management fee structures, subject to a minimum of 50 funds (or all funds in the Total Mapped Group if fewer than 50). Additional information, such as the ASPG quartile in which the fund's management fee rate ranked, is also included in the chart and was considered by the Board.
The Board considered that effective August 1, 2019, the fund's management fee rate was increased from 0.09% to 0.10%, but that the fund no longer paid operating expenses under separate agreements. The Board also considered that the chart below reflects the fund's higher management fee rate for 2019, as if the higher fee rate were in effect for the entire year.
The Board noted that the fund's management fee rate ranked above the median of its Total Mapped Group and above the median of its ASPG for 2021.The Board noted that the fund has a unitary fee that covers expenses beyond portfolio management, unlike the majority of funds within the Total Mapped Group. The Board considered that there are no ESG funds in the Total Mapped Group.
Based on its review, the Board concluded that the fund's management fee is fair and reasonable in light of the services that the fund receives and the other factors considered.
Total Expense Ratio. In its review of the fund's total expense ratio, the Board considered the fund's unitary fee. The Board also considered other expenses such as transfer agent, pricing and bookkeeping fees, and custodial, legal, and audit fees, paid by FMR under the fund's unitary fee arrangement. The Board also noted that Fidelity may agree to waive fees or reimburse expenses from time to time, and the extent to which, if any, it has done so for the fund. The fund's representative class is compared to those funds and classes in the Total Mapped Group (used by the Board for management fee comparisons) that have a similar sales load structure. The Board also considered a total expense ASPG comparison for the representative class, which focuses on the total expenses of the representative class relative to a subset of non-Fidelity funds within the similar sales load structure group that are similar in size and management fee structure. The total expense ASPG is limited to 15 larger and 15 smaller classes of different funds, where possible. The total expense ASPG comparison excludes performance adjustments and fund-paid 12b-1 fees to eliminate variability in expenses relating to these items.
The Board noted that the fund's total net expense ratio ranked above the similar sales load structure group competitive median for 2021 and below the ASPG competitive median for 2021. The Board also noted that there are no other ESG funds in the Total Mapped Group. The Board further noted that, when compared to a subset of the similar sales load structure group that FMR believes is most comparable, the fund would be below the similar sales load structure group competitive median for 2021.
Fees Charged to Other Fidelity Clients. The Board also considered Fidelity fee structures and other information with respect to clients of Fidelity, such as other funds advised or subadvised by Fidelity, pension plan clients, and other institutional clients with similar mandates. The Board noted that a joint ad hoc committee created by it and the boards of other Fidelity funds periodically reviews and compares Fidelity's institutional investment advisory business with its business of providing services to the Fidelity funds and also noted the most recent findings of the committee. The Board noted that the committee's review included a consideration of the differences in services provided, fees charged, and costs incurred, as well as competition in the markets serving the different categories of clients.
Based on its review of total expense ratios and fees charged to other Fidelity clients, the Board concluded that the fund's total expense ratio was reasonable in light of the services that the fund and its shareholders receive and the other factors considered.
Costs of the Services and Profitability. The Board considered the revenues earned and the expenses incurred by Fidelity in conducting the business of developing, marketing, distributing, managing, administering and servicing the fund and servicing the fund's shareholders. The Board also considered the level of Fidelity's profits in respect of all the Fidelity funds.
On an annual basis, Fidelity presents to the Board information about the profitability of its relationships with the fund. Fidelity calculates profitability information for each fund, as well as aggregate profitability information for groups of Fidelity funds and all Fidelity funds, using a series of detailed revenue and cost allocation methodologies which originate with the books and records of Fidelity on which Fidelity's audited financial statements are based. The Audit Committee of the Board reviews any significant changes from the prior year's methodologies and the full Board approves such changes.
A public accounting firm has been engaged annually by the Board as part of the Board's assessment of Fidelity's profitability analysis. The engagement includes the review and assessment of the methodologies used by Fidelity in determining the revenues and expenses attributable to Fidelity's mutual fund business, and completion of agreed-upon procedures in respect of the mathematical accuracy of certain fund profitability information and its conformity to established allocation methodologies. After considering the reports issued under the engagement and information provided by Fidelity, the Board concluded that while other allocation methods may also be reasonable, Fidelity's profitability methodologies are reasonable in all material respects.The Board also reviewed Fidelity's non-fund businesses and potential indirect benefits such businesses may have received as a result of their association with Fidelity's mutual fund business (i.e., fall-out benefits) as well as cases where Fidelity's affiliates may benefit from the funds' business. The Board considered areas where potential indirect benefits to the Fidelity funds from their relationships with Fidelity may exist. The Board's consideration of these matters was informed by the findings of a joint ad hoc committee created by it and the boards of other Fidelity funds to evaluate potential fall-out benefits.
The Board considered the costs of the services provided by and the profits realized by Fidelity in connection with the operation of the fund and was satisfied that the profitability was not excessive.
Economies of Scale. The Board considered whether there have been economies of scale in respect of the management of the Fidelity funds, whether the Fidelity funds (including the fund) have appropriately benefited from any such economies of scale, and whether there is potential for realization of any further economies of scale. The Board considered the extent to which the fund will benefit from economies of scale as assets grow through increased services to the fund, through waivers or reimbursements, or through fee or expense ratio reductions. The Board recognized that, due to the fund's current contractual arrangements, its expense ratio will not decline if the fund's operating costs decrease as assets grow, or rise as assets decrease. The Board also noted that a committee (the Economies of Scale Committee) created by it and the boards of other Fidelity funds periodically analyzes whether Fidelity attains economies of scale in respect of the management and servicing of the Fidelity funds, whether the Fidelity funds have appropriately benefited from such economies of scale, and whether there is potential for realization of any further economies of scale.
The Board concluded, taking into account the analysis of the Economies of Scale Committee, that economies of scale, if any, are being appropriately shared between fund shareholders and Fidelity.
Additional Information Requested by the Board. In order to develop fully the factual basis for consideration of the Fidelity funds' advisory contracts, the Board requested and received additional information on certain topics, including: (i) Fidelity's fund profitability methodology, profitability trends for certain funds, the allocation of various costs to different funds, and the impact of certain factors on fund profitability results; (ii) portfolio manager changes that have occurred during the past year and the amount of the investment that each portfolio manager has made in the Fidelity fund(s) that he or she manages; (iii) the extent to which current market conditions have affected retention and recruitment of personnel; (iv) the arrangements with and compensation paid to certain fund sub-advisers on behalf of the Fidelity funds and the treatment of such compensation within Fidelity's fund profitability methodology; (v) the terms of the funds' various management fee structures, including the basic group fee and the terms of Fidelity's voluntary expense limitation arrangements; (vi) Fidelity's transfer agent, pricing and bookkeeping fees, expense and service structures for different funds and classes relative to competitive trends; (vii) the impact on fund profitability of recent industry trends, such as the growth in passively managed funds and the changes in flows for different types of funds; (viii) the types of management fee and total expense comparisons provided, and the challenges and limitations associated with such information; and (ix) explanations regarding the relative total expense ratios and management fees of certain funds and classes, total expense and management fee competitive trends, and methodologies for total expense and management fee competitive comparisons. In addition, the Board considered its discussions with Fidelity regarding Fidelity's efforts to maintain the continuous investment and shareholder services necessary for the funds during the current pandemic and economic circumstances.
Based on its evaluation of all of the conclusions noted above, and after considering all factors it believed relevant, the Board concluded that the advisory fee arrangements are fair and reasonable, and that the fund's Advisory Contracts should be renewed.
The Securities and Exchange Commission adopted Rule 22e-4 under the Investment Company Act of 1940 (the Liquidity Rule) to promote effective liquidity risk management throughout the open-end investment company industry, thereby reducing the risk that funds will be unable to meet their redemption obligations and mitigating dilution of the interests of fund shareholders.
The Fund has adopted and implemented a liquidity risk management program (the Program) reasonably designed to assess and manage the Fund's liquidity risk and to comply with the requirements of the Liquidity Rule. The Fund's Board of Trustees (the Board) has designated the Fund's investment adviser as administrator of the Program. The Fidelity advisers have established a Liquidity Risk Management Committee (the LRM Committee) to manage the Program for each of the Fidelity Funds. The LRM Committee monitors the adequacy and effectiveness of implementation of the Program and on a periodic basis assesses each Fund's liquidity risk based on a variety of factors including (1) the Fund's investment strategy, (2) portfolio liquidity and cash flow projections during normal and reasonably foreseeable stressed conditions, (3) shareholder redemptions, (4) borrowings and other funding sources and (5) certain factors specific to ETFs including the effect of the Fund's prices and spreads, market participants, and basket compositions on the overall liquidity of the Fund's portfolio, as applicable.
In accordance with the Program, each of the Fund's portfolio investments is classified into one of four defined liquidity categories based on a determination of a reasonable expectation for how long it would take to convert the investment to cash (or sell or dispose of the investment) without significantly changing its market value.
- Highly liquid investments - cash or convertible to cash within three business days or less
- Moderately liquid investments - convertible to cash in three to seven calendar days
- Less liquid investments - can be sold or disposed of, but not settled, within seven calendar days
- Illiquid investments - cannot be sold or disposed of within seven calendar days
Liquidity classification determinations take into account a variety of factors including various market, trading and investment-specific considerations, as well as market depth, and generally utilize analysis from a third-party liquidity metrics service.
The Liquidity Rule places a 15% limit on a fund's illiquid investments and requires funds that do not primarily hold assets that are highly liquid investments to determine and maintain a minimum percentage of the fund's net assets to be invested in highly liquid investments (highly liquid investment minimum or HLIM). The Program includes provisions reasonably designed to comply with the 15% limit on illiquid investments and for determining, periodically reviewing and complying with the HLIM requirement as applicable.
At a recent meeting of the Fund's Board of Trustees, the LRM Committee provided a written report to the Board pertaining to the operation, adequacy, and effectiveness of the Program for the period December 1, 2021 through November 30, 2022. The report concluded that the Program is operating effectively and is reasonably designed to assess and manage the Fund's liquidity risk.
1.9887302.104
SBI-I-SANN-0423
Fidelity® Conservative Income Bond Fund
Semi-Annual Report
February 28, 2023
Contents
To view a fund's proxy voting guidelines and proxy voting record for the 12-month period ended June 30, visit http://www.fidelity.com/proxyvotingresults or visit the Securities and Exchange Commission's (SEC) web site at http://www.sec.gov.
You may also call 1-800-544-8544 to request a free copy of the proxy voting guidelines.
Standard & Poor's, S&P and S&P 500 are registered service marks of The McGraw-Hill Companies, Inc. and have been licensed for use by Fidelity Distributors Corporation.
Other third-party marks appearing herein are the property of their respective owners.
All other marks appearing herein are registered or unregistered trademarks or service marks of FMR LLC or an affiliated company. © 2023 FMR LLC. All rights reserved.
This report and the financial statements contained herein are submitted for the general information of the shareholders of the Fund. This report is not authorized for distribution to prospective investors in the Fund unless preceded or accompanied by an effective prospectus.
A fund files its complete schedule of portfolio holdings with the SEC for the first and third quarters of each fiscal year on Form N-PORT. Forms N-PORT are available on the SEC's web site at http://www.sec.gov. A fund's Forms N-PORT may be reviewed and copied at the SEC's Public Reference Room in Washington, DC. Information regarding the operation of the SEC's Public Reference Room may be obtained by calling 1-800-SEC-0330.
For a complete list of a fund's portfolio holdings, view the most recent holdings listing, semiannual report, or annual report on Fidelity's web site at http://www.fidelity.com, http://www.institutional.fidelity.com, or http://www.401k.com, as applicable.
NOT FDIC INSURED •MAY LOSE VALUE •NO BANK GUARANTEE
Neither the Fund nor Fidelity Distributors Corporation is a bank.
| Maturity Diversification (% of Fund's Investments) |
| Days |
| 1 - 30 | 46.6 | |
| 31 - 90 | 3.5 | |
| 91 - 180 | 4.2 | |
| 181 - 397 | 13.8 | |
| > 397 | 31.9 | |
|
The date shown for securities represents the date when principal payments must be paid, taking into account any call options exercised by the issuer and any permissible maturity shortening features other than interest rate resets
Asset Allocation (% of Fund's net assets) |
|
Foreign investments - 26% |
|
Geographic Diversification (% of Fund's net assets) |
|
* Includes Short-Term investments and Net Other Assets (Liabilities). Percentages are based on country or territory of incorporation and are adjusted for the effect of derivatives, if applicable. |
| |
Showing Percentage of Net Assets
| Nonconvertible Bonds - 58.0% |
| | | Principal Amount (a) | Value ($) |
| COMMUNICATION SERVICES - 1.1% | | | |
| Diversified Telecommunication Services - 0.9% | | | |
| NTT Finance Corp. 0.373% 3/3/23 (b) | | 49,820,000 | 49,813,766 |
| Media - 0.2% | | | |
| Magallanes, Inc. U.S. Secured Overnight Fin. Rate (SOFR) Averages Index + 1.780% 6.1741% 3/15/24 (b)(c)(d) | | 12,405,000 | 12,489,825 |
TOTAL COMMUNICATION SERVICES | | | 62,303,591 |
| CONSUMER DISCRETIONARY - 3.6% | | | |
| Automobiles - 3.3% | | | |
| BMW U.S. Capital LLC: | | | |
| U.S. Secured Overnight Fin. Rate (SOFR) Averages Index + 0.530% 4.9546% 4/1/24 (b)(c)(d) | | 28,838,000 | 28,847,183 |
| U.S. Secured Overnight Fin. Rate (SOFR) Averages Index + 0.840% 5.2646% 4/1/25 (b)(c)(d) | | 26,951,000 | 27,053,144 |
| Daimler Finance North America LLC: | | | |
| 3.65% 2/22/24 (b) | | 7,099,000 | 6,977,603 |
| 5.5% 11/27/24 (b) | | 12,000,000 | 12,030,388 |
| General Motors Financial Co., Inc.: | | | |
| U.S. Secured Overnight Fin. Rate (SOFR) Averages Index + 1.300% 5.7367% 4/7/25 (c)(d) | | 20,225,000 | 20,224,607 |
| U.S. Secured Overnight Fin. Rate (SOFR) Index + 0.760% 5.1077% 3/8/24 (c)(d) | | 19,604,000 | 19,564,164 |
| U.S. Secured Overnight Fin. Rate (SOFR) Index + 1.200% 5.7531% 11/17/23 (c)(d) | | 16,700,000 | 16,712,242 |
| 4.15% 6/19/23 | | 13,857,000 | 13,804,054 |
| Volkswagen Group of America Finance LLC: | | | |
| U.S. Secured Overnight Fin. Rate (SOFR) Index + 0.950% 5.2737% 6/7/24 (b)(c)(d) | | 25,400,000 | 25,425,331 |
| 0.875% 11/22/23 (b) | | 14,300,000 | 13,837,641 |
| 4.25% 11/13/23 (b) | | 12,800,000 | 12,676,737 |
| | | | 197,153,094 |
| Hotels, Restaurants & Leisure - 0.3% | | | |
| Starbucks Corp. U.S. Secured Overnight Fin. Rate (SOFR) Averages Index + 0.420% 4.9745% 2/14/24 (c)(d) | | 16,681,000 | 16,657,203 |
TOTAL CONSUMER DISCRETIONARY | | | 213,810,297 |
| CONSUMER STAPLES - 1.0% | | | |
| Food & Staples Retailing - 0.3% | | | |
| 7-Eleven, Inc. 0.8% 2/10/24 (b) | | 19,100,000 | 18,244,139 |
| Tobacco - 0.7% | | | |
| BAT Capital Corp. 3.222% 8/15/24 | | 12,000,000 | 11,564,996 |
| Philip Morris International, Inc. 5.125% 11/15/24 | | 12,000,000 | 11,962,498 |
| Reynolds American, Inc. 4.85% 9/15/23 | | 14,700,000 | 14,648,233 |
| | | | 38,175,727 |
TOTAL CONSUMER STAPLES | | | 56,419,866 |
| ENERGY - 0.9% | | | |
| Oil, Gas & Consumable Fuels - 0.9% | | | |
| Enbridge, Inc.: | | | |
| U.S. Secured Overnight Fin. Rate (SOFR) Averages Index + 0.630% 5.1834% 2/16/24 (c)(d) | | 16,541,000 | 16,506,346 |
| 4% 10/1/23 | | 13,375,000 | 13,260,900 |
| Equinor ASA 2.65% 1/15/24 | | 19,000,000 | 18,583,043 |
| Phillips 66 Co. 0.9% 2/15/24 | | 5,000,000 | 4,786,452 |
| | | | 53,136,741 |
| FINANCIALS - 41.2% | | | |
| Banks - 25.6% | | | |
| Bank of America Corp.: | | | |
| U.S. Secured Overnight Fin. Rate (SOFR) Index + 0.660% 5.2163% 2/4/25 (c)(d) | | 28,500,000 | 28,484,325 |
| U.S. Secured Overnight Fin. Rate (SOFR) Index + 1.100% 5.6051% 4/25/25 (c)(d) | | 9,760,000 | 9,799,528 |
| 0.523% 6/14/24 (c) | | 23,400,000 | 23,027,706 |
| 0.81% 10/24/24 (c) | | 15,000,000 | 14,531,080 |
| 1.843% 2/4/25 (c) | | 9,500,000 | 9,154,104 |
| 3.458% 3/15/25 (c) | | 18,300,000 | 17,885,734 |
| 3.841% 4/25/25 (c) | | 29,200,000 | 28,596,579 |
| Bank of Montreal: | | | |
| U.S. Secured Overnight Fin. Rate (SOFR) Averages Index + 0.260% 4.6591% 9/15/23 (c)(d) | | 25,000,000 | 25,002,274 |
| U.S. Secured Overnight Fin. Rate (SOFR) Averages Index + 0.270% 4.7219% 4/14/23 (c)(d) | | 27,400,000 | 27,400,540 |
| Bank of Nova Scotia: | | | |
| U.S. Secured Overnight Fin. Rate (SOFR) Averages Index + 0.440% 4.8969% 4/15/24 (c)(d) | | 29,350,000 | 29,350,587 |
| U.S. Secured Overnight Fin. Rate (SOFR) Averages Index + 0.550% 4.9441% 9/15/23 (c)(d) | | 26,000,000 | 26,036,026 |
| U.S. Secured Overnight Fin. Rate (SOFR) Index + 0.260% 4.6541% 9/15/23 (c)(d) | | 30,450,000 | 30,447,410 |
| U.S. Secured Overnight Fin. Rate (SOFR) Index + 0.380% 4.8925% 7/31/24 (c)(d) | | 26,000,000 | 25,965,766 |
| 0.55% 9/15/23 | | 5,000,000 | 4,872,818 |
| Banque Federative du Credit Mutuel SA U.S. Secured Overnight Fin. Rate (SOFR) Averages Index + 0.410% 4.9672% 2/4/25 (b)(c)(d) | | 10,000,000 | 9,890,900 |
| Barclays PLC 1.007% 12/10/24 (c) | | 15,250,000 | 14,684,073 |
| BNP Paribas SA: | | | |
| 3.5% 3/1/23 (b) | | 16,600,000 | 16,600,000 |
| 4.705% 1/10/25 (b)(c) | | 25,144,000 | 24,881,343 |
| BPCE SA: | | | |
| 3 month U.S. LIBOR + 1.240% 5.9751% 9/12/23 (b)(c)(d) | | 14,800,000 | 14,845,594 |
| U.S. Secured Overnight Fin. Rate (SOFR) Index + 0.570% 5.0219% 1/14/25 (b)(c)(d) | | 14,031,000 | 13,905,056 |
| 2.375% 1/14/25 (b) | | 8,819,000 | 8,289,429 |
| 4% 9/12/23 (b) | | 6,110,000 | 6,046,615 |
| 5.15% 7/21/24 (b) | | 19,762,000 | 19,452,474 |
| Canadian Imperial Bank of Commerce: | | | |
| U.S. Secured Overnight Fin. Rate (SOFR) Index + 0.340% 4.753% 6/22/23 (c)(d) | | 27,203,000 | 27,206,271 |
| U.S. Secured Overnight Fin. Rate (SOFR) Index + 0.940% 5.3768% 4/7/25 (c)(d) | | 26,960,000 | 27,083,761 |
| Citigroup, Inc.: | | | |
| 3 month U.S. LIBOR + 1.020% 4.044% 6/1/24 (c)(d) | | 22,734,000 | 22,642,856 |
| U.S. Secured Overnight Fin. Rate (SOFR) Index + 1.370% 5.9232% 5/24/25 (c)(d) | | 24,955,000 | 25,134,315 |
| 0.776% 10/30/24 (c) | | 15,000,000 | 14,498,908 |
| 0.981% 5/1/25 (c) | | 8,663,000 | 8,181,364 |
| Credit Agricole SA 3.875% 4/15/24 (b) | | 9,500,000 | 9,317,973 |
| Danske Bank A/S: | | | |
| 3.875% 9/12/23 (b) | | 9,117,000 | 9,031,670 |
| 6.466% 1/9/26 (b)(c) | | 5,121,000 | 5,152,476 |
| DNB Bank ASA: | | | |
| U.S. Secured Overnight Fin. Rate (SOFR) Averages Index + 0.830% 5.2464% 3/28/25 (b)(c)(d) | | 27,000,000 | 27,045,090 |
| 0.856% 9/30/25 (b)(c) | | 16,250,000 | 15,004,655 |
| 2.968% 3/28/25 (b)(c) | | 10,200,000 | 9,876,135 |
| Federation des caisses Desjardin U.S. Secured Overnight Fin. Rate (SOFR) Index + 0.430% 4.9821% 5/21/24 (b)(c)(d) | | 25,121,000 | 25,041,469 |
| Fifth Third Bancorp 3.65% 1/25/24 | | 38,784,000 | 38,231,466 |
| HSBC Holdings PLC: | | | |
| U.S. Secured Overnight Fin. Rate (SOFR) Index + 0.580% 5.1324% 11/22/24 (c)(d) | | 20,000,000 | 19,812,314 |
| 0.732% 8/17/24 (c) | | 20,000,000 | 19,504,648 |
| 1.162% 11/22/24 (c) | | 10,636,000 | 10,261,678 |
| 3.803% 3/11/25 (c) | | 10,500,000 | 10,279,396 |
| 3.95% 5/18/24 (c) | | 22,100,000 | 22,001,936 |
| Huntington National Bank: | | | |
| U.S. Secured Overnight Fin. Rate (SOFR) Averages Index + 1.190% 5.7434% 5/16/25 (c)(d) | | 25,700,000 | 25,858,312 |
| 4.008% 5/16/25 (c) | | 9,375,000 | 9,194,411 |
| JPMorgan Chase & Co.: | | | |
| U.S. Secured Overnight Fin. Rate (SOFR) Index + 0.580% 4.9815% 3/16/24 (c)(d) | | 40,575,000 | 40,578,196 |
| U.S. Secured Overnight Fin. Rate (SOFR) Index + 0.970% 5.3569% 6/14/25 (c)(d) | | 25,155,000 | 25,243,294 |
| 0.697% 3/16/24 (c) | | 26,600,000 | 26,535,096 |
| 1.561% 12/10/25 (c) | | 7,429,000 | 6,905,203 |
| 3.22% 3/1/25 (c) | | 5,000,000 | 4,879,949 |
| 3.559% 4/23/24 (c) | | 24,785,000 | 24,702,968 |
| 3.797% 7/23/24 (c) | | 11,250,000 | 11,168,819 |
| KeyBank NA U.S. Secured Overnight Fin. Rate (SOFR) Averages Index + 0.320% 4.7069% 6/14/24 (c)(d) | | 28,390,000 | 28,325,271 |
| Lloyds Banking Group PLC 3.9% 3/12/24 | | 11,900,000 | 11,695,249 |
| M&T Bank Corp. 3 month U.S. LIBOR + 0.680% 5.5019% 7/26/23 (c)(d) | | 15,000,000 | 15,002,880 |
| Mitsubishi UFJ Financial Group, Inc.: | | | |
| 3 month U.S. LIBOR + 0.860% 5.6819% 7/26/23 (c)(d) | | 25,243,000 | 25,297,743 |
| U.S. Secured Overnight Fin. Rate (SOFR) Index + 1.380% 5.711% 9/12/25 (c)(d) | | 20,000,000 | 20,149,200 |
| U.S. Secured Overnight Fin. Rate (SOFR) Index + 1.650% 6.1046% 7/18/25 (c)(d) | | 25,000,000 | 25,301,500 |
| 0.848% 9/15/24 (c) | | 14,209,000 | 13,833,677 |
| 0.953% 7/19/25 (c) | | 24,800,000 | 23,152,403 |
| Mizuho Financial Group, Inc.: | | | |
| 0.849% 9/8/24 (c) | | 17,000,000 | 16,553,217 |
| 3.922% 9/11/24 (c) | | 18,000,000 | 17,811,557 |
| NatWest Markets PLC U.S. Secured Overnight Fin. Rate (SOFR) Index + 1.450% 5.863% 3/22/25 (b)(c)(d) | | 17,169,000 | 17,192,333 |
| Nordea Bank ABP 3.75% 8/30/23 (b) | | 9,200,000 | 9,125,217 |
| Rabobank Nederland 2.625% 7/22/24 (b) | | 12,200,000 | 11,737,585 |
| Rabobank Nederland New York Branch: | | | |
| U.S. Secured Overnight Fin. Rate (SOFR) Averages Index + 0.300% 4.7469% 1/12/24 (c)(d) | | 9,000,000 | 8,995,473 |
| 0.375% 1/12/24 | | 18,000,000 | 17,269,786 |
| Royal Bank of Canada U.S. Secured Overnight Fin. Rate (SOFR) Averages Index + 0.450% 4.9461% 10/26/23 (c)(d) | | 31,000,000 | 31,034,224 |
| Sumitomo Mitsui Financial Group, Inc.: | | | |
| 3 month U.S. LIBOR + 0.860% 5.6576% 7/19/23 (c)(d) | | 12,997,000 | 13,027,676 |
| 0.508% 1/12/24 | | 5,000,000 | 4,793,998 |
| Svenska Handelsbanken AB 0.55% 6/11/24 (b) | | 12,400,000 | 11,653,364 |
| Swedbank AB U.S. Secured Overnight Fin. Rate (SOFR) Averages Index + 0.910% 5.3362% 4/4/25 (b)(c)(d) | | 16,717,000 | 16,700,282 |
| The Toronto-Dominion Bank: | | | |
| U.S. Secured Overnight Fin. Rate (SOFR) Index + 0.220% 4.5215% 6/2/23 (c)(d) | | 30,250,000 | 30,237,789 |
| U.S. Secured Overnight Fin. Rate (SOFR) Index + 0.350% 4.6748% 3/4/24 (c)(d) | | 32,800,000 | 32,768,564 |
| U.S. Secured Overnight Fin. Rate (SOFR) Index + 0.910% 5.2577% 3/8/24 (c)(d) | | 23,752,000 | 23,857,820 |
| Truist Bank: | | | |
| U.S. Secured Overnight Fin. Rate (SOFR) Index + 0.200% 4.6546% 1/17/24 (c)(d) | | 30,450,000 | 30,387,547 |
| U.S. Secured Overnight Fin. Rate (SOFR) Index + 0.730% 5.0838% 3/9/23 (c)(d) | | 32,136,000 | 32,139,181 |
| Truist Financial Corp. U.S. Secured Overnight Fin. Rate (SOFR) Index + 0.400% 4.7538% 6/9/25 (c)(d) | | 27,500,000 | 27,286,600 |
| Wells Fargo & Co.: | | | |
| 1.654% 6/2/24 (c) | | 14,873,000 | 14,725,980 |
| 3.3% 9/9/24 | | 12,100,000 | 11,745,746 |
| 3.75% 1/24/24 | | 19,485,000 | 19,192,253 |
| | | | 1,510,518,705 |
| Capital Markets - 7.9% | | | |
| Charles Schwab Corp. U.S. Secured Overnight Fin. Rate (SOFR) Averages Index + 0.500% 4.909% 3/18/24 (c)(d) | | 11,600,000 | 11,609,519 |
| Credit Suisse AG: | | | |
| U.S. Secured Overnight Fin. Rate (SOFR) Averages Index + 0.380% 4.9354% 8/9/23 (c)(d) | | 16,400,000 | 16,267,637 |
| U.S. Secured Overnight Fin. Rate (SOFR) Averages Index + 0.390% 4.9306% 2/2/24 (c)(d) | | 50,000,000 | 48,769,000 |
| U.S. Secured Overnight Fin. Rate (SOFR) Averages Index + 1.260% 5.8127% 2/21/25 (c)(d) | | 21,200,000 | 20,275,868 |
| Deutsche Bank AG New York Branch: | | | |
| U.S. Secured Overnight Fin. Rate (SOFR) Index + 0.500% 5.0557% 11/8/23 (c)(d) | | 28,400,000 | 28,371,972 |
| 0.962% 11/8/23 | | 19,741,000 | 19,145,570 |
| Goldman Sachs Group, Inc.: | | | |
| U.S. Secured Overnight Fin. Rate (SOFR) Index + 0.700% 5.1779% 1/24/25 (c)(d) | | 27,000,000 | 26,958,876 |
| U.S. Secured Overnight Fin. Rate (SOFR) Index + 1.390% 5.7841% 3/15/24 (c)(d) | | 25,953,000 | 26,137,383 |
| 1.757% 1/24/25 (c) | | 8,800,000 | 8,470,311 |
| 4% 3/3/24 | | 18,000,000 | 17,733,131 |
| Morgan Stanley: | | | |
| U.S. Secured Overnight Fin. Rate (SOFR) Index + 0.450% 4.9583% 1/25/24 (c)(d) | | 16,992,000 | 16,981,414 |
| U.S. Secured Overnight Fin. Rate (SOFR) Index + 0.460% 5.0208% 11/10/23 (c)(d) | | 25,185,000 | 25,181,616 |
| U.S. Secured Overnight Fin. Rate (SOFR) Index + 0.620% 5.1251% 1/24/25 (c)(d) | | 27,000,000 | 26,940,330 |
| U.S. Secured Overnight Fin. Rate (SOFR) Index + 1.160% 5.6371% 4/17/25 (c)(d) | | 26,956,000 | 27,080,267 |
| 3.7% 10/23/24 | | 12,100,000 | 11,786,978 |
| 3.737% 4/24/24 (c) | | 15,000,000 | 14,955,842 |
| UBS AG London Branch: | | | |
| U.S. Secured Overnight Fin. Rate (SOFR) Index + 0.320% 4.6163% 6/1/23 (b)(c)(d) | | 23,250,000 | 23,260,229 |
| U.S. Secured Overnight Fin. Rate (SOFR) Index + 0.360% 4.9154% 2/9/24 (b)(c)(d) | | 36,650,000 | 36,627,277 |
| U.S. Secured Overnight Fin. Rate (SOFR) Index + 0.450% 5.0054% 8/9/24 (b)(c)(d) | | 17,225,000 | 17,235,208 |
| U.S. Secured Overnight Fin. Rate (SOFR) Index + 0.470% 4.9192% 1/13/25 (b)(c)(d) | | 20,750,000 | 20,702,140 |
| UBS Group AG 1.008% 7/30/24 (b)(c) | | 20,100,000 | 19,700,946 |
| | | | 464,191,514 |
| Consumer Finance - 3.9% | | | |
| AerCap Ireland Capital Ltd./AerCap Global Aviation Trust U.S. Secured Overnight Fin. Rate (SOFR) Index + 0.680% 5.1017% 9/29/23 (c)(d) | | 20,613,000 | 20,512,985 |
| American Express Co. U.S. Secured Overnight Fin. Rate (SOFR) Averages Index + 0.720% 5.2686% 5/3/24 (c)(d) | | 21,545,000 | 21,613,591 |
| Capital One Financial Corp.: | | | |
| U.S. Secured Overnight Fin. Rate (SOFR) Index + 0.690% 5.0434% 12/6/24 (c)(d) | | 24,955,000 | 24,794,040 |
| U.S. Secured Overnight Fin. Rate (SOFR) Index + 1.350% 5.9054% 5/9/25 (c)(d) | | 25,611,000 | 25,604,316 |
| 1.343% 12/6/24 (c) | | 17,000,000 | 16,385,087 |
| 3.3% 10/30/24 | | 6,000,000 | 5,792,818 |
| 4.166% 5/9/25 (c) | | 9,600,000 | 9,384,839 |
| Toyota Motor Credit Corp.: | | | |
| U.S. Secured Overnight Fin. Rate (SOFR) Averages Index + 0.650% 5.0717% 12/29/23 (c)(d) | | 25,490,000 | 25,583,548 |
| U.S. Secured Overnight Fin. Rate (SOFR) Index + 0.320% 4.7548% 4/6/23 (c)(d) | | 30,100,000 | 30,099,989 |
| U.S. Secured Overnight Fin. Rate (SOFR) Index + 0.350% 4.9% 6/13/23 (c)(d) | | 25,000,000 | 25,008,667 |
| U.S. Secured Overnight Fin. Rate (SOFR) Index + 0.620% 5.033% 3/22/24 (c)(d) | | 26,000,000 | 26,055,978 |
| | | | 230,835,858 |
| Diversified Financial Services - 1.1% | | | |
| Athene Global Funding: | | | |
| U.S. Secured Overnight Fin. Rate (SOFR) Averages Index + 0.700% 5.2511% 5/24/24 (b)(c)(d) | | 32,000,000 | 31,803,200 |
| U.S. Secured Overnight Fin. Rate (SOFR) Averages Index + 0.710% 5.1497% 1/7/25 (b)(c)(d) | | 31,450,000 | 30,886,177 |
| | | | 62,689,377 |
| Insurance - 2.7% | | | |
| Equitable Financial Life Global Funding U.S. Secured Overnight Fin. Rate (SOFR) Index + 0.390% 4.8301% 4/6/23 (b)(c)(d) | | 31,725,000 | 31,713,855 |
| Marsh & McLennan Companies, Inc. 3.875% 3/15/24 | | 11,900,000 | 11,700,072 |
| New York Life Global Funding U.S. Secured Overnight Fin. Rate (SOFR) Averages Index + 0.430% 4.755% 6/6/24 (b)(c)(d) | | 26,200,000 | 26,218,923 |
| Pacific Life Global Funding II U.S. Secured Overnight Fin. Rate (SOFR) Index + 0.380% 4.8327% 4/12/24 (b)(c)(d) | | 30,000,000 | 29,839,502 |
| Principal Life Global Funding II U.S. Secured Overnight Fin. Rate (SOFR) Index + 0.450% 4.8969% 4/12/24 (b)(c)(d) | | 19,254,000 | 19,254,000 |
| Protective Life Global Funding: | | | |
| U.S. Secured Overnight Fin. Rate (SOFR) Index + 0.550% 4.9731% 3/31/23 (b)(c)(d) | | 16,000,000 | 15,999,987 |
| U.S. Secured Overnight Fin. Rate (SOFR) Index + 0.980% 5.3964% 3/28/25 (b)(c)(d) | | 28,000,000 | 28,054,880 |
| | | | 162,781,219 |
TOTAL FINANCIALS | | | 2,431,016,673 |
| HEALTH CARE - 2.3% | | | |
| Health Care Providers & Services - 0.4% | | | |
| Humana, Inc. 0.65% 8/3/23 | | 24,164,000 | 23,689,262 |
| Life Sciences Tools & Services - 0.2% | | | |
| Thermo Fisher Scientific, Inc. U.S. Secured Overnight Fin. Rate (SOFR) Averages Index + 0.530% 4.9846% 10/18/24 (c)(d) | | 13,321,000 | 13,307,702 |
| Pharmaceuticals - 1.7% | | | |
| Bayer U.S. Finance II LLC 3.875% 12/15/23 (b) | | 25,800,000 | 25,452,038 |
| GSK Consumer Healthcare Capital U.S. LLC U.S. Secured Overnight Fin. Rate (SOFR) Index + 0.890% 5.3052% 3/24/24 (c)(d) | | 28,800,000 | 28,721,440 |
| Roche Holdings, Inc. U.S. Secured Overnight Fin. Rate (SOFR) Index + 0.330% 4.6872% 9/11/23 (b)(c)(d) | | 33,325,000 | 33,337,630 |
| Shire Acquisitions Investments Ireland DAC 2.875% 9/23/23 | | 13,000,000 | 12,807,475 |
| | | | 100,318,583 |
TOTAL HEALTH CARE | | | 137,315,547 |
| INDUSTRIALS - 3.0% | | | |
| Industrial Conglomerates - 0.8% | | | |
| Siemens Financieringsmaatschappij NV: | | | |
| U.S. Secured Overnight Fin. Rate (SOFR) Index + 0.430% 4.7901% 3/11/24 (b)(c)(d) | | 32,000,000 | 32,020,816 |
| 0.4% 3/11/23 (b) | | 19,270,000 | 19,244,701 |
| | | | 51,265,517 |
| Machinery - 2.2% | | | |
| Caterpillar Financial Services Corp.: | | | |
| U.S. Secured Overnight Fin. Rate (SOFR) Index + 0.450% 5.0048% 11/13/23 (c)(d) | | 26,000,000 | 26,028,229 |
| 0.25% 3/1/23 | | 25,350,000 | 25,350,000 |
| Daimler Trucks Finance North America LLC: | | | |
| U.S. Secured Overnight Fin. Rate (SOFR) Index + 0.500% 4.8384% 6/14/23 (b)(c)(d) | | 26,800,000 | 26,803,349 |
| U.S. Secured Overnight Fin. Rate (SOFR) Index + 1.000% 5.433% 4/5/24 (b)(c)(d) | | 20,950,000 | 20,965,679 |
| 1.125% 12/14/23 (b) | | 23,400,000 | 22,646,276 |
| 5.2% 1/17/25 (b) | | 6,190,000 | 6,150,200 |
| | | | 127,943,733 |
TOTAL INDUSTRIALS | | | 179,209,250 |
| INFORMATION TECHNOLOGY - 0.2% | | | |
| Semiconductors & Semiconductor Equipment - 0.2% | | | |
| Analog Devices, Inc. U.S. Secured Overnight Fin. Rate (SOFR) Index + 0.250% 4.6746% 10/1/24 (c)(d) | | 9,050,000 | 8,958,768 |
| REAL ESTATE - 0.2% | | | |
| Equity Real Estate Investment Trusts (REITs) - 0.2% | | | |
| Simon Property Group LP U.S. Secured Overnight Fin. Rate (SOFR) Averages Index + 0.430% 4.8747% 1/11/24 (c)(d) | | 14,294,000 | 14,259,442 |
| UTILITIES - 4.5% | | | |
| Electric Utilities - 3.7% | | | |
| Duke Energy Corp. U.S. Secured Overnight Fin. Rate (SOFR) Index + 0.250% 4.6101% 6/10/23 (c)(d) | | 14,005,000 | 13,993,138 |
| Florida Power & Light Co. U.S. Secured Overnight Fin. Rate (SOFR) Averages Index + 0.250% 4.8051% 5/10/23 (c)(d) | | 17,114,000 | 17,108,713 |
| NextEra Energy Capital Holdings, Inc.: | | | |
| U.S. Secured Overnight Fin. Rate (SOFR) Averages Index + 0.400% 4.9486% 11/3/23 (c)(d) | | 28,375,000 | 28,362,892 |
| U.S. Secured Overnight Fin. Rate (SOFR) Averages Index + 0.540% 4.8363% 3/1/23 (c)(d) | | 16,898,000 | 16,898,000 |
| PPL Electric Utilities Corp.: | | | |
| 3 month U.S. LIBOR + 0.250% 4.9739% 9/28/23 (c)(d) | | 8,800,000 | 8,775,778 |
| U.S. Secured Overnight Fin. Rate (SOFR) Index + 0.330% 4.7452% 6/24/24 (c)(d) | | 28,621,000 | 28,574,897 |
| Southern California Edison Co.: | | | |
| U.S. Secured Overnight Fin. Rate (SOFR) Averages Index + 0.640% 5.0646% 4/3/23 (c)(d) | | 25,000,000 | 24,996,316 |
| U.S. Secured Overnight Fin. Rate (SOFR) Averages Index + 0.830% 5.2546% 4/1/24 (c)(d) | | 25,000,000 | 24,967,570 |
| Southern Co.: | | | |
| U.S. Secured Overnight Fin. Rate (SOFR) Averages Index + 0.370% 4.9251% 5/10/23 (c)(d) | | 16,711,000 | 16,704,316 |
| 2.95% 7/1/23 | | 25,000,000 | 24,791,338 |
| Virginia Electric & Power Co. 3.45% 2/15/24 | | 13,385,000 | 13,124,846 |
| | | | 218,297,804 |
| Gas Utilities - 0.2% | | | |
| Atmos Energy Corp. 3 month U.S. LIBOR + 0.380% 5.1034% 3/9/23 (c)(d) | | 9,180,000 | 9,180,389 |
| Southern California Gas Co. 3 month U.S. LIBOR + 0.350% 5.1027% 9/14/23 (c)(d) | | 4,524,000 | 4,517,578 |
| | | | 13,697,967 |
| Multi-Utilities - 0.6% | | | |
| CenterPoint Energy, Inc. U.S. Secured Overnight Fin. Rate (SOFR) Averages Index + 0.650% 5.2048% 5/13/24 (c)(d) | | 20,794,000 | 20,694,215 |
| Dominion Energy, Inc. 3 month U.S. LIBOR + 0.530% 5.299% 9/15/23 (c)(d) | | 12,339,000 | 12,338,291 |
| | | | 33,032,506 |
TOTAL UTILITIES | | | 265,028,277 |
| TOTAL NONCONVERTIBLE BONDS (Cost $3,428,525,293) | | | 3,421,458,452 |
| | | | |
| U.S. Treasury Obligations - 12.9% |
| | | Principal Amount (a) | Value ($) |
| U.S. Treasury Bills, yield at date of purchase 4.59% to 4.75% 5/11/23 to 1/25/24 | | 530,143,900 | 516,205,198 |
| U.S. Treasury Notes: | | | |
| 3% 6/30/24 | | 147,000,000 | 143,026,406 |
| 4.125% 1/31/25 | | 100,250,000 | 98,945,967 |
| TOTAL U.S. TREASURY OBLIGATIONS (Cost $759,893,924) | | | 758,177,571 |
| | | | |
| Certificates of Deposit - 11.7% |
| | | Principal Amount (a) | Value ($) |
| Bank of America NA 5.12% 8/31/23 | | 16,000,000 | 15,991,338 |
| Bank of Montreal yankee U.S. Secured Overnight Fin. Rate (SOFR) Index + 0.750% 5.3% 8/1/23 (c)(d) | | 33,750,000 | 33,829,397 |
| Bank of Nova Scotia yankee U.S. Secured Overnight Fin. Rate (SOFR) Index + 0.640% 5.19% 8/23/23 (c)(d) | | 28,500,000 | 28,557,011 |
| Barclays Bank PLC yankee: | | | |
| U.S. Secured Overnight Fin. Rate (SOFR) Index + 0.650% 5.2% 6/8/23 (c)(d) | | 30,000,000 | 30,037,920 |
| U.S. Secured Overnight Fin. Rate (SOFR) Index + 0.810% 5.36% 8/11/23 (c)(d) | | 33,700,000 | 33,699,916 |
| 5.4% 11/6/23 | | 22,000,000 | 21,987,731 |
| 5.56% 11/27/23 | | 26,000,000 | 26,000,322 |
| Canadian Imperial Bank of Commerce yankee: | | | |
| U.S. Secured Overnight Fin. Rate (SOFR) Index + 0.280% 4.83% 3/3/23 (c)(d) | | 33,800,000 | 33,800,575 |
| U.S. Secured Overnight Fin. Rate (SOFR) Index + 0.760% 5.31% 8/22/23 (c)(d) | | 33,750,000 | 33,857,106 |
| Credit Suisse AG yankee: | | | |
| U.S. Secured Overnight Fin. Rate (SOFR) Averages Index + 0.320% 4.8727% 3/20/23 (c)(d) | | 35,000,000 | 34,998,670 |
| U.S. Secured Overnight Fin. Rate (SOFR) Averages Index + 0.700% 5.2514% 3/23/23 (c)(d) | | 33,800,000 | 33,805,384 |
| Lloyds Bank Corporate Markets PLC yankee: | | | |
| U.S. Secured Overnight Fin. Rate (SOFR) Index + 0.720% 5.27% 8/14/23 (c)(d) | | 28,700,000 | 28,769,626 |
| U.S. Secured Overnight Fin. Rate (SOFR) Index + 0.810% 5.36% 7/3/23 (c)(d) | | 24,000,000 | 24,054,852 |
| Mizuho Corporate Bank Ltd. yankee U.S. Secured Overnight Fin. Rate (SOFR) Index + 0.780% 5.33% 4/26/23 (c)(d) | | 24,000,000 | 24,026,153 |
| MUFG Bank Ltd. yankee U.S. Secured Overnight Fin. Rate (SOFR) Index + 0.540% 5.09% 3/17/23 (c)(d) | | 33,700,000 | 33,706,983 |
| Natexis Banques Populaires New York Branch yankee U.S. Secured Overnight Fin. Rate (SOFR) Index + 0.690% 5.24% 8/14/23 (c)(d) | | 33,700,000 | 33,776,883 |
| Nordea Bank Finland PLC yankee U.S. Secured Overnight Fin. Rate (SOFR) Index + 0.580% 5.13% 8/31/23 (c)(d) | | 33,600,000 | 33,672,028 |
| Royal Bank of Canada yankee U.S. Secured Overnight Fin. Rate (SOFR) Index + 0.580% 5.13% 9/19/23 (c)(d) | | 24,000,000 | 24,046,548 |
| Sumitomo Mitsui Banking Corp. yankee: | | | |
| U.S. Secured Overnight Fin. Rate (SOFR) Index + 0.600% 5.15% 5/3/23 (c)(d) | | 33,600,000 | 33,625,422 |
| U.S. Secured Overnight Fin. Rate (SOFR) Index + 0.650% 5.2% 7/7/23 (c)(d) | | 30,000,000 | 30,049,602 |
| U.S. Secured Overnight Fin. Rate (SOFR) Index + 0.700% 5.25% 7/11/23 (c)(d) | | 31,000,000 | 31,058,361 |
| U.S. Secured Overnight Fin. Rate (SOFR) Index + 0.800% 5.35% 8/1/23 (c)(d) | | 33,750,000 | 33,836,991 |
| Svenska Handelsbanken, Inc. yankee U.S. Secured Overnight Fin. Rate (SOFR) Index + 0.730% 5.28% 8/3/23 (c)(d) | | 30,000,000 | 30,073,935 |
| TOTAL CERTIFICATES OF DEPOSIT (Cost $686,350,000) | | | 687,262,754 |
| | | | |
| Commercial Paper - 8.5% |
| | | Principal Amount (a) | Value ($) |
| AT&T, Inc. 5.42% 12/19/23 | | 20,000,000 | 19,113,426 |
| Bank of Montreal: | | | |
| U.S. Secured Overnight Fin. Rate (SOFR) Index + 0.680% 5.23% 7/11/23 (c)(d) | | 31,000,000 | 30,998,937 |
| U.S. Secured Overnight Fin. Rate (SOFR) Index + 0.700% 5.25% 10/6/23 (c)(d) | | 24,000,000 | 24,070,584 |
| Bank of Nova Scotia U.S. Secured Overnight Fin. Rate (SOFR) Index + 0.600% 5.15% 8/25/23 (c)(d) | | 24,000,000 | 24,043,490 |
| BPCE SA yankee 5.15% 12/7/23 | | 23,500,000 | 22,535,772 |
| Cigna Group 4.92% 3/28/23 | | 28,500,000 | 28,393,268 |
| Citigroup Global Markets, Inc. U.S. Secured Overnight Fin. Rate (SOFR) Index + 0.650% 5.2% 9/22/23 (c)(d) | | 32,000,000 | 31,999,965 |
| Federation des caisses Desjardin U.S. Secured Overnight Fin. Rate (SOFR) Index + 0.680% 5.23% 4/28/23 (c)(d) | | 33,750,000 | 33,780,686 |
| General Motors Financial Co., Inc. 5.57% 4/12/23 | | 24,000,000 | 23,852,309 |
| HSBC U.S.A., Inc. yankee 5.35% 11/1/23 | | 26,000,000 | 25,069,382 |
| National Bank of Canada U.S. Secured Overnight Fin. Rate (SOFR) Index + 0.670% 5.22% 4/26/23 (c)(d) | | 33,750,000 | 33,780,898 |
| NatWest Markets PLC yankee: | | | |
| 5.28% 11/7/23 | | 26,000,000 | 25,040,860 |
| 5.34% 2/9/24 | | 23,700,000 | 22,471,337 |
| Philip Morris International, Inc. 5% 10/24/23 | | 22,000,000 | 21,278,886 |
| Royal Bank of Canada: | | | |
| U.S. Secured Overnight Fin. Rate (SOFR) Index + 0.660% 5.21% 7/7/23 (c)(d) | | 29,000,000 | 28,998,988 |
| U.S. Secured Overnight Fin. Rate (SOFR) Index + 0.750% 5.3% 7/27/23 (c)(d) | | 33,750,000 | 33,821,874 |
| Svenska Handelsbanken AB U.S. Secured Overnight Fin. Rate (SOFR) Index + 0.590% 5.14% 3/1/23 (c)(d) | | 35,000,000 | 35,000,000 |
| Svenska Handelsbanken, Inc. U.S. Secured Overnight Fin. Rate (SOFR) Index + 0.690% 5.24% 8/29/23 (c)(d) | | 19,000,000 | 19,049,166 |
| The Toronto-Dominion Bank yankee 4.97% 10/27/23 | | 22,000,000 | 21,230,178 |
| TOTAL COMMERCIAL PAPER (Cost $504,292,166) | | | 504,530,006 |
| | | | |
| Money Market Funds - 8.7% |
| | | Shares | Value ($) |
Fidelity Cash Central Fund 4.63% (e) (Cost $511,392,349) | | 511,342,956 | 511,445,224 |
| | | | |
| TOTAL INVESTMENT IN SECURITIES - 99.8% (Cost $5,890,453,732) | 5,882,874,007 |
NET OTHER ASSETS (LIABILITIES) - 0.2% | 11,132,682 |
| NET ASSETS - 100.0% | 5,894,006,689 |
| | |
Legend
| (a) | Amount is stated in United States dollars unless otherwise noted. |
| (b) | Security exempt from registration under Rule 144A of the Securities Act of 1933. These securities may be resold in transactions exempt from registration, normally to qualified institutional buyers. At the end of the period, the value of these securities amounted to $1,006,102,430 or 17.1% of net assets. |
| (c) | Coupon rates for floating and adjustable rate securities reflect the rates in effect at period end. |
| (d) | Coupon is indexed to a floating interest rate which may be multiplied by a specified factor and/or subject to caps or floors. |
| (e) | Affiliated fund that is generally available only to investment companies and other accounts managed by Fidelity Investments. The rate quoted is the annualized seven-day yield of the fund at period end. A complete unaudited listing of the fund's holdings as of its most recent quarter end is available upon request. In addition, each Fidelity Central Fund's financial statements are available on the SEC's website or upon request. |
Affiliated Central Funds
Fiscal year to date information regarding the Fund's investments in Fidelity Central Funds, including the ownership percentage, is presented below.
| Affiliate | Value, beginning of period ($) | Purchases ($) | Sales Proceeds ($) | Dividend Income ($) | Realized Gain (loss) ($) | Change in Unrealized appreciation (depreciation) ($) | Value, end of period ($) | % ownership, end of period |
| Fidelity Cash Central Fund 4.63% | 687,128,909 | 1,540,501,004 | 1,716,184,689 | 12,739,173 | - | - | 511,445,224 | 1.2% |
| Total | 687,128,909 | 1,540,501,004 | 1,716,184,689 | 12,739,173 | - | - | 511,445,224 | |
| | | | | | | | | |
Amounts in the dividend income column in the above table include any capital gain distributions from underlying funds, which are presented in the corresponding line item in the Statement of Operations, if applicable.
Amounts included in the purchases and sales proceeds columns may include in-kind transactions, if applicable.
Investment Valuation
The following is a summary of the inputs used, as of February 28, 2023, involving the Fund's assets and liabilities carried at fair value. The inputs or methodology used for valuing securities may not be an indication of the risk associated with investing in those securities. For more information on valuation inputs, and their aggregation into the levels used below, please refer to the Investment Valuation section in the accompanying Notes to Financial Statements.
| Valuation Inputs at Reporting Date: |
| Description | Total ($) | Level 1 ($) | Level 2 ($) | Level 3 ($) |
Investments in Securities: | | | | |
|
| Corporate Bonds | 3,421,458,452 | - | 3,421,458,452 | - |
|
| U.S. Government and Government Agency Obligations | 758,177,571 | - | 758,177,571 | - |
|
| Certificates of Deposit | 687,262,754 | - | 687,262,754 | - |
|
| Commercial Paper | 504,530,006 | - | 504,530,006 | - |
|
| Money Market Funds | 511,445,224 | 511,445,224 | - | - |
| Total Investments in Securities: | 5,882,874,007 | 511,445,224 | 5,371,428,783 | - |
| Statement of Assets and Liabilities |
| | | | February 28, 2023 (Unaudited) |
| | | | | |
| Assets | | | | |
| Investment in securities, at value - See accompanying schedule: | | | | |
Unaffiliated issuers (cost $5,379,061,383) | $ | 5,371,428,783 | | |
Fidelity Central Funds (cost $511,392,349) | | 511,445,224 | | |
| | | | | |
| | | | | |
| Total Investment in Securities (cost $5,890,453,732) | | | $ | 5,882,874,007 |
| Cash | | | | 1,377,258 |
| Receivable for fund shares sold | | | | 10,055,049 |
| Interest receivable | | | | 28,246,668 |
| Distributions receivable from Fidelity Central Funds | | | | 2,213,067 |
| Receivable from investment adviser for expense reductions | | | | 532,276 |
| Other receivables | | | | 15,654 |
Total assets | | | | 5,925,313,979 |
| Liabilities | | | | |
| Payable for investments purchased | $ | 13,038,512 | | |
| Payable for fund shares redeemed | | 11,649,341 | | |
| Distributions payable | | 4,831,427 | | |
| Accrued management fee | | 1,465,353 | | |
| Other affiliated payables | | 307,003 | | |
| Other payables and accrued expenses | | 15,654 | | |
| Total Liabilities | | | | 31,307,290 |
| Net Assets | | | $ | 5,894,006,689 |
| Net Assets consist of: | | | | |
| Paid in capital | | | $ | 5,906,942,223 |
| Total accumulated earnings (loss) | | | | (12,935,534) |
| Net Assets | | | $ | 5,894,006,689 |
| | | | | |
| Net Asset Value and Maximum Offering Price | | | | |
| Conservative Income Bond : | | | | |
Net Asset Value , offering price and redemption price per share ($1,506,300,918 ÷ 150,300,275 shares) | | | $ | 10.02 |
| Institutional Class : | | | | |
Net Asset Value , offering price and redemption price per share ($4,387,705,771 ÷ 437,797,731 shares) | | | $ | 10.02 |
| Statement of Operations |
| | | | Six months ended February 28, 2023 (Unaudited) |
| Investment Income | | | | |
| Interest | | | $ | 100,981,682 |
| Income from Fidelity Central Funds | | | | 12,739,173 |
| Total Income | | | | 113,720,855 |
| Expenses | | | | |
| Management fee | $ | 8,771,855 | | |
| Transfer agent fees | | 1,838,875 | | |
| Independent trustees' fees and expenses | | 11,409 | | |
| Total expenses before reductions | | 10,622,139 | | |
| Expense reductions | | (2,612,874) | | |
| Total expenses after reductions | | | | 8,009,265 |
| Net Investment income (loss) | | | | 105,711,590 |
| Realized and Unrealized Gain (Loss) | | | | |
| Net realized gain (loss) on: | | | | |
| Investment Securities: | | | | |
| Unaffiliated issuers | | (2,359,365) | | |
| Total net realized gain (loss) | | | | (2,359,365) |
| Change in net unrealized appreciation (depreciation) on investment securities | | | | 18,143,103 |
| Net gain (loss) | | | | 15,783,738 |
| Net increase (decrease) in net assets resulting from operations | | | $ | 121,495,328 |
| Statement of Changes in Net Assets |
| |
| | Six months ended February 28, 2023 (Unaudited) | | Year ended August 31, 2022 |
| Increase (Decrease) in Net Assets | | | | |
| Operations | | | | |
| Net investment income (loss) | $ | 105,711,590 | $ | 37,082,550 |
| Net realized gain (loss) | | (2,359,365) | | (2,453,592) |
| Change in net unrealized appreciation (depreciation) | | 18,143,103 | | (36,185,948) |
| Net increase (decrease) in net assets resulting from operations | | 121,495,328 | | (1,556,990) |
| Distributions to shareholders | | (105,733,751) | | (38,320,313) |
| Share transactions - net increase (decrease) | | (211,905,579) | | (1,244,820,263) |
| Total increase (decrease) in net assets | | (196,144,002) | | (1,284,697,566) |
| | | | | |
| Net Assets | | | | |
| Beginning of period | | 6,090,150,691 | | 7,374,848,257 |
| End of period | $ | 5,894,006,689 | $ | 6,090,150,691 |
| | | | | |
| | | | | |
Financial Highlights
| Fidelity® Conservative Income Bond Fund |
| |
| | Six months ended (Unaudited) February 28, 2023 | | Years ended August 31, 2022 | | 2021 | | 2020 | | 2019 | | 2018 |
Selected Per-Share Data | | | | | | | | | | | | |
| Net asset value, beginning of period | $ | 9.99 | $ | 10.05 | $ | 10.07 | $ | 10.04 | $ | 10.04 | $ | 10.04 |
| Income from Investment Operations | | | | | | | | | | | | |
Net investment income (loss) A,B | | .177 | | .049 | | .029 | | .146 | | .247 | | .180 |
| Net realized and unrealized gain (loss) | | .030 | | (.056) | | (.019) | | .031 | | - C | | (.004) |
| Total from investment operations | | .207 | | (.007) | | .010 | | .177 | | .247 | | .176 |
| Distributions from net investment income | | (.177) | | (.051) | | (.028) | | (.147) | | (.247) | | (.176) |
| Distributions from net realized gain | | - | | (.002) | | (.002) | | - | | - | | - |
| Total distributions | | (.177) | | (.053) | | (.030) | | (.147) | | (.247) | | (.176) |
| Net asset value, end of period | $ | 10.02 | $ | 9.99 | $ | 10.05 | $ | 10.07 | $ | 10.04 | $ | 10.04 |
Total Return D,E | | 2.09% | | (.07)% | | .10% | | 1.77% | | 2.49% | | 1.77% |
Ratios to Average Net Assets B,F,G | | | | | | | | | | | | |
| Expenses before reductions | | .40% H | | .40% | | .40% | | .40% | | .40% | | .40% |
| Expenses net of fee waivers, if any | | .35% H | | .35% | | .35% | | .35% | | .35% | | .35% |
| Expenses net of all reductions | | .35% H | | .35% | | .35% | | .35% | | .35% | | .35% |
| Net investment income (loss) | | 3.57% H | | .49% | | .29% | | 1.45% | | 2.46% | | 1.80% |
| Supplemental Data | | | | | | | | | | | | |
| Net assets, end of period (000 omitted) | $ | 1,506,301 | $ | 1,568,087 | $ | 2,010,520 | $ | 2,845,333 | $ | 2,757,403 | $ | 2,432,108 |
Portfolio turnover rate I | | 49% H | | 50% | | 62% J | | 56% | | 36% | | 40% |
A Calculated based on average shares outstanding during the period.
B Net investment income (loss) is affected by the timing of the declaration of dividends by any underlying mutual funds or exchange-traded funds (ETFs). Net investment income (loss) of any mutual funds or ETFs is not included in the Fund's net investment income (loss) ratio.
C Amount represents less than $.0005 per share.
D Total returns for periods of less than one year are not annualized.
E Total returns would have been lower if certain expenses had not been reduced during the applicable periods shown.
F Fees and expenses of any underlying mutual funds or exchange-traded funds (ETFs) are not included in the Fund's expense ratio. The Fund indirectly bears its proportionate share of these expenses. For additional expense information related to investments in Fidelity Central Funds, please refer to the "Investments in Fidelity Central Funds" note found in the Notes to Financial Statements section of the most recent Annual or Semi-Annual report.
G Expense ratios reflect operating expenses of the class. Expenses before reductions do not reflect amounts reimbursed, waived, or reduced through arrangements with the investment adviser, brokerage services, or other offset arrangements, if applicable, and do not represent the amount paid by the class during periods when reimbursements, waivers or reductions occur.
H Annualized.
I Amount does not include the portfolio activity of any underlying mutual funds or exchange-traded funds (ETFs).
J Portfolio turnover rate excludes securities received or delivered in-kind.
| Fidelity® Conservative Income Bond Fund Institutional Class |
| |
| | Six months ended (Unaudited) February 28, 2023 | | Years ended August 31, 2022 | | 2021 | | 2020 | | 2019 | | 2018 |
Selected Per-Share Data | | | | | | | | | | | | |
| Net asset value, beginning of period | $ | 9.99 | $ | 10.05 | $ | 10.07 | $ | 10.04 | $ | 10.04 | $ | 10.04 |
| Income from Investment Operations | | | | | | | | | | | | |
Net investment income (loss) A,B | | .182 | | .059 | | .039 | | .156 | | .257 | | .190 |
| Net realized and unrealized gain (loss) | | .030 | | (.056) | | (.019) | | .031 | | - C | | (.004) |
| Total from investment operations | | .212 | | .003 | | .020 | | .187 | | .257 | | .186 |
| Distributions from net investment income | | (.182) | | (.061) | | (.038) | | (.157) | | (.257) | | (.186) |
| Distributions from net realized gain | | - | | (.002) | | (.002) | | - | | - | | - |
| Total distributions | | (.182) | | (.063) | | (.040) | | (.157) | | (.257) | | (.186) |
| Net asset value, end of period | $ | 10.02 | $ | 9.99 | $ | 10.05 | $ | 10.07 | $ | 10.04 | $ | 10.04 |
Total Return D,E | | 2.14% | | .03% | | .20% | | 1.88% | | 2.59% | | 1.87% |
Ratios to Average Net Assets B,F,G | | | | | | | | | | | | |
| Expenses before reductions | | .35% H | | .35% | | .35% | | .35% | | .35% | | .35% |
| Expenses net of fee waivers, if any | | .25% H | | .25% | | .25% | | .25% | | .25% | | .25% |
| Expenses net of all reductions | | .25% H | | .25% | | .25% | | .25% | | .25% | | .25% |
| Net investment income (loss) | | 3.67% H | | .59% | | .39% | | 1.55% | | 2.56% | | 1.90% |
| Supplemental Data | | | | | | | | | | | | |
| Net assets, end of period (000 omitted) | $ | 4,387,706 | $ | 4,522,064 | $ | 5,364,328 | $ | 9,362,863 | $ | 9,371,991 | $ | 7,921,474 |
Portfolio turnover rate I | | 49% H | | 50% | | 62% J | | 56% | | 36% | | 40% |
A Calculated based on average shares outstanding during the period.
B Net investment income (loss) is affected by the timing of the declaration of dividends by any underlying mutual funds or exchange-traded funds (ETFs). Net investment income (loss) of any mutual funds or ETFs is not included in the Fund's net investment income (loss) ratio.
C Amount represents less than $.0005 per share.
D Total returns for periods of less than one year are not annualized.
E Total returns would have been lower if certain expenses had not been reduced during the applicable periods shown.
F Fees and expenses of any underlying mutual funds or exchange-traded funds (ETFs) are not included in the Fund's expense ratio. The Fund indirectly bears its proportionate share of these expenses. For additional expense information related to investments in Fidelity Central Funds, please refer to the "Investments in Fidelity Central Funds" note found in the Notes to Financial Statements section of the most recent Annual or Semi-Annual report.
G Expense ratios reflect operating expenses of the class. Expenses before reductions do not reflect amounts reimbursed, waived, or reduced through arrangements with the investment adviser, brokerage services, or other offset arrangements, if applicable, and do not represent the amount paid by the class during periods when reimbursements, waivers or reductions occur.
H Annualized.
I Amount does not include the portfolio activity of any underlying mutual funds or exchange-traded funds (ETFs).
J Portfolio turnover rate excludes securities received or delivered in-kind.
For the period ended February 28, 2023
1. Organization.
Fidelity Conservative Income Bond Fund (the Fund) is a fund of Fidelity Salem Street Trust (the Trust) and is authorized to issue an unlimited number of shares. The Trust is registered under the Investment Company Act of 1940, as amended (the 1940 Act), as an open-end management investment company organized as a Massachusetts business trust. The Fund offers Conservative Income Bond and Institutional Class shares, each of which has equal rights as to assets and voting privileges. Each class has exclusive voting rights with respect to matters that affect that class.
During March 2023, the Board approved the consolidation of Conservative Income Bond share class into Institutional Class. Institutional Class was then renamed Fidelity Conservative Income Bond Fund. These changes were effective April 1, 2023.
2. Investments in Fidelity Central Funds.
Funds may invest in Fidelity Central Funds, which are open-end investment companies generally available only to other investment companies and accounts managed by the investment adviser and its affiliates. The Schedule of Investments lists any Fidelity Central Funds held as an investment as of period end, but does not include the underlying holdings of each Fidelity Central Fund. An investing fund indirectly bears its proportionate share of the expenses of the underlying Fidelity Central Funds.
Based on its investment objective, each Fidelity Central Fund may invest or participate in various investment vehicles or strategies that are similar to those of the investing fund. These strategies are consistent with the investment objectives of the investing fund and may involve certain economic risks which may cause a decline in value of each of the Fidelity Central Funds and thus a decline in the value of the investing fund.
| Fidelity Central Fund | Investment Manager | Investment Objective | Investment Practices | Expense Ratio A |
| Fidelity Money Market Central Funds | Fidelity Management & Research Company LLC (FMR) | Each fund seeks to obtain a high level of current income consistent with the preservation of capital and liquidity. | Short-term Investments | Less than .005% |
A Expenses expressed as a percentage of average net assets and are as of each underlying Central Fund's most recent annual or semi-annual shareholder report.
A complete unaudited list of holdings for each Fidelity Central Fund is available upon request or at the Securities and Exchange Commission website at www.sec.gov. In addition, the financial statements of the Fidelity Central Funds which contain the significant accounting policies (including investment valuation policies) of those funds, and are not covered by the Report of Independent Registered Public Accounting Firm, are available on the Securities and Exchange Commission website or upon request.
3. Significant Accounting Policies.
The Fund is an investment company and applies the accounting and reporting guidance of the Financial Accounting Standards Board (FASB) Accounting Standards Codification Topic 946 Financial Services - Investment Companies . The financial statements have been prepared in conformity with accounting principles generally accepted in the United States of America (GAAP), which require management to make certain estimates and assumptions at the date of the financial statements. Actual results could differ from those estimates. Subsequent events, if any, through the date that the financial statements were issued have been evaluated in the preparation of the financial statements. The Fund's Schedule of Investments lists any underlying mutual funds or exchange-traded funds (ETFs) but does not include the underlying holdings of these funds. The following summarizes the significant accounting policies of the Fund:
Investment Valuation. Investments are valued as of 4:00 p.m. Eastern time on the last calendar day of the period. The Board of Trustees (the Board) has designated the Fund's investment adviser as the valuation designee responsible for the fair valuation function and performing fair value determinations as needed. The investment adviser has established a Fair Value Committee (the Committee) to carry out the day-to-day fair valuation responsibilities and has adopted policies and procedures to govern the fair valuation process and the activities of the Committee. In accordance with these fair valuation policies and procedures, which have been approved by the Board, the Fund attempts to obtain prices from one or more third party pricing services or brokers to value its investments. When current market prices, quotations or currency exchange rates are not readily available or reliable, investments will be fair valued in good faith by the Committee, in accordance with the policies and procedures. Factors used in determining fair value vary by investment type and may include market or investment specific events, transaction data, estimated cash flows, and market observations of comparable investments. The frequency that the fair valuation procedures are used cannot be predicted and they may be utilized to a significant extent. The Committee manages the Fund's fair valuation practices and maintains the fair valuation policies and procedures. The Fund's investment adviser reports to the Board information regarding the fair valuation process and related material matters.
The Fund categorizes the inputs to valuation techniques used to value its investments into a disclosure hierarchy consisting of three levels as shown below:
Level 1 - unadjusted quoted prices in active markets for identical investments
Level 2 - other significant observable inputs (including quoted prices for similar investments, interest rates, prepayment speeds, etc.)
Level 3 - unobservable inputs (including the Fund's own assumptions based on the best information available)
Valuation techniques used to value the Fund's investments by major category are as follows:
Debt securities, including restricted securities, are valued based on evaluated prices received from third party pricing services or from brokers who make markets in such securities. Corporate bonds, U.S. government and government agency obligations, commercial paper and certificates of deposit are valued by pricing services who utilize matrix pricing which considers yield or price of bonds of comparable quality, coupon, maturity and type or by broker-supplied prices. When independent prices are unavailable or unreliable, debt securities may be valued utilizing pricing methodologies which consider similar factors that would be used by third party pricing services. Debt securities are generally categorized as Level 2 in the hierarchy but may be Level 3 depending on the circumstances.
Investments in open-end mutual funds, including the Fidelity Central Funds, are valued at their closing net asset value (NAV) each business day and are categorized as Level 1 in the hierarchy.
Changes in valuation techniques may result in transfers in or out of an assigned level within the disclosure hierarchy. The aggregate value of investments by input level as of February 28, 2023 is included at the end of the Fund's Schedule of Investments.
Investment Transactions and Income. For financial reporting purposes, the Fund's investment holdings and NAV include trades executed through the end of the last business day of the period. The NAV per share for processing shareholder transactions is calculated as of the close of business of the New York Stock Exchange (NYSE), normally 4:00 p.m. Eastern time and includes trades executed through the end of the prior business day. Gains and losses on securities sold are determined on the basis of identified cost. Income and capital gain distributions from Fidelity Central Funds, if any, are recorded on the ex-dividend date. Interest income is accrued as earned and includes coupon interest and amortization of premium and accretion of discount on debt securities as applicable. Debt obligations may be placed on non-accrual status and related interest income may be reduced by ceasing current accruals and writing off interest receivables when the collection of all or a portion of interest has become doubtful based on consistently applied procedures. A debt obligation is removed from non-accrual status when the issuer resumes interest payments or when collectability of interest is reasonably assured.
Class Allocations and Expenses. Investment income, realized and unrealized capital gains and losses, common expenses of a fund, and certain fund-level expense reductions, if any, are allocated daily on a pro-rata basis to each class based on the relative net assets of each class to the total net assets of a fund. Each class differs with respect to transfer agent and distribution and service plan fees incurred, as applicable. Certain expense reductions may also differ by class, if applicable. For the reporting period, the allocated portion of income and expenses to each class as a percent of its average net assets may vary due to the timing of recording these transactions in relation to fluctuating net assets of the classes. Expenses directly attributable to a fund are charged to that fund. Expenses attributable to more than one fund are allocated among the respective funds on the basis of relative net assets or other appropriate methods. Expenses included in the accompanying financial statements reflect the expenses of that fund and do not include any expenses associated with any underlying mutual funds or exchange-traded funds. Although not included in a fund's expenses, a fund indirectly bears its proportionate share of these expenses through the net asset value of each underlying mutual fund or exchange-traded fund. Expense estimates are accrued in the period to which they relate and adjustments are made when actual amounts are known.
Deferred Trustee Compensation. Under a Deferred Compensation Plan (the Plan) for certain Funds, certain independent Trustees have elected to defer receipt of a portion of their annual compensation. Deferred amounts are invested in affiliated mutual funds, are marked-to-market and remain in a fund until distributed in accordance with the Plan. The investment of deferred amounts and the offsetting payable to the Trustees presented below are included in the accompanying Statement of Assets and Liabilities in other receivables and other payables and accrued expenses, as applicable.
| Fidelity Conservative Income Bond Fund | $15,654 |
Income Tax Information and Distributions to Shareholders. Each year, the Fund intends to qualify as a regulated investment company under Subchapter M of the Internal Revenue Code, including distributing substantially all of its taxable income and realized gains. As a result, no provision for U.S. Federal income taxes is required. The Fund files a U.S. federal tax return, in addition to state and local tax returns as required. The Fund's federal income tax returns are subject to examination by the Internal Revenue Service (IRS) for a period of three fiscal years after they are filed. State and local tax returns may be subject to examination for an additional fiscal year depending on the jurisdiction.
Distributions are declared and recorded daily and paid monthly from net investment income. Distributions from realized gains, if any, are declared and recorded on the ex-dividend date. Income and capital gain distributions are declared separately for each class. Income and capital gain distributions are determined in accordance with income tax regulations, which may differ from GAAP.
Capital accounts within the financial statements are adjusted for permanent book-tax differences. These adjustments have no impact on net assets or the results of operations. Capital accounts are not adjusted for temporary book-tax differences which will reverse in a subsequent period.
Book-tax differences are primarily due to deferred capital loss carryforwards.
As of period end, the cost and unrealized appreciation (depreciation) in securities, and derivatives if applicable, for federal income tax purposes were as follows:
| Gross unrealized appreciation | $5,584,606 |
| Gross unrealized depreciation | (13,164,331) |
| Net unrealized appreciation (depreciation) | $(7,579,725) |
| Tax cost | $5,890,453,732 |
Capital loss carryforwards are only available to offset future capital gains of the Fund to the extent provided by regulations and may be limited. The capital loss carryforward information presented below, including any applicable limitation, is estimated as of prior fiscal period end and is subject to adjustment.
Restricted Securities (including Private Placements). Funds may invest in securities that are subject to legal or contractual restrictions on resale. These securities generally may be resold in transactions exempt from registration or to the public if the securities are registered. Disposal of these securities may involve time-consuming negotiations and expense, and prompt sale at an acceptable price may be difficult. Information regarding restricted securities held at period end is included at the end of the Schedule of Investments, if applicable.
LIBOR Accounting Pronouncement. In March 2020, the Financial Accounting Standards Board (FASB) issued an Accounting Standards Update (ASU), ASU 2020-04, which provides optional, temporary relief with respect to the financial reporting of contracts subject to certain types of modifications due to the planned discontinuation of the London Interbank Offered Rate (LIBOR) and other IBOR-based reference rates. The temporary relief provided by ASU 2020-04 is effective for certain reference rate-related contract modifications that occur during the period March 12, 2020 through December 31, 2024. Management does not expect the adoption of ASU 2020-04 to have a material impact on the Fund's financial statements.
4. Purchases and Sales of Investments.
Purchases and sales of securities, other than short-term securities, U.S. government securities and in-kind transactions, as applicable, are noted in the table below.
| | Purchases ($) | Sales ($) |
| Fidelity Conservative Income Bond Fund | 544,286,802 | 956,711,000 |
5. Fees and Other Transactions with Affiliates.
Management Fee. Fidelity Management & Research Company LLC (the investment adviser) and its affiliates provide the Fund with investment management related services for which the Fund pays a monthly management fee that is based on an annual rate of .30% of the Fund's average net assets. Under the management contract, the investment adviser pays all other fund-level expenses, except the compensation of the independent Trustees and certain other expenses such as interest expense.
During March 2023, the Board approved changes to the management fee effective April 1, 2023. The Fund will pay a monthly management fee that is based on an annual rate of .20% of the Fund's average net assets. Under the management contract, the investment adviser will pay all other fund-level expenses, except the compensation of the independent Trustees, and certain other expenses such as interest expense.
Transfer Agent Fees. Fidelity Investments Institutional Operations Company LLC (FIIOC), an affiliate of the investment adviser, is the transfer, dividend disbursing and shareholder servicing agent for each class of the Fund. FIIOC receives asset-based fees of .10% and .05% of average net assets for Conservative Income Bond Class and Institutional Class, respectively. FIIOC pays for typesetting, printing and mailing of shareholder reports, except proxy statements.
For the period, transfer agent fees for each class were as follows:
| | Amount | % of Class-Level Average Net Assets A |
| Conservative Income Bond | $753,798 | .10 |
| Institutional Class | 1,085,077 | .05 |
| | $1,838,875 | |
A Annualized
During March 2023, the Board approved changes to the transfer agent fees effective April 1, 2023. Fidelity Conservative Income Bond Fund share class (formerly named Institutional Class) will pay an asset-based fee of .10% of class-level average net assets.
Interfund Trades. Funds may purchase from or sell securities to other Fidelity Funds under procedures adopted by the Board. The procedures have been designed to ensure these interfund trades are executed in accordance with Rule 17a-7 of the 1940 Act. Any interfund trades are included within the respective purchases and sales amounts shown in the Purchases and Sales of Investments note. During the period, there were no interfund trades.
6. Committed Line of Credit.
Certain Funds participate with other funds managed by the investment adviser or an affiliate in a $4.25 billion credit facility (the "line of credit") to be utilized for temporary or emergency purposes to fund shareholder redemptions or for other short-term liquidity purposes. The commitment fees on the pro-rata portion of the line of credit are borne by the investment adviser. During the period, there were no borrowings on this line of credit.
7. Expense Reductions.
The investment adviser contractually agreed to reimburse each class to the extent annual operating expenses exceeded certain levels of average net assets as noted in the table below. Some expenses, for example the compensation of the independent Trustees and certain other expenses such as interest expense are excluded from this reimbursement.
The following classes were in reimbursement during the period:
| | Expense Limitations | Reimbursement |
| Conservative Income Bond | .35% | $398,182 |
| Institutional Class | .25% | 2,214,244 |
| | | $2,612,426 |
In addition, through arrangements with the Fund's custodian, credits realized as a result of certain uninvested cash balances were used to reduce the Fund's expenses. During the period, these credits reduced the Fund's expenses by $448.
Effective April 1, 2023, the investment adviser contractually agreed to reimburse expenses of Fidelity Conservative Income Bond Fund share class (formerly named Institutional Class) to the extent annual operating expenses exceed .25% of class-level average net assets. This reimbursement will remain in place through June 30, 2024. Some expenses, for example the compensation of the independent Trustees, and certain other expenses such as interest expense, are excluded from this reimbursement.
8. Distributions to Shareholders.
Distributions to shareholders of each class were as follows:
| | Six months ended February 28, 2023 | Year ended August 31, 2022 |
| Fidelity Conservative Income Bond Fund | | |
| Distributions to shareholders | | |
| Conservative Income Bond | $26,693,710 | $8,754,163 |
| Institutional Class | 79,040,041 | 29,566,150 |
| Total | $105,733,751 | $38,320,313 |
9. Share Transactions.
Share transactions for each class were as follows and may contain in-kind transactions, automatic conversions between classes or exchanges between affiliated funds:
| | Shares | Shares | Dollars | Dollars |
| | Six months ended February 28, 2023 | Year ended August 31, 2022 | Six months ended February 28, 2023 | Year ended August 31, 2022 |
| Fidelity Conservative Income Bond Fund | | | | |
| Conservative Income Bond | | | | |
| Shares sold | 35,111,758 | 53,966,835 | $350,937,310 | $539,928,940 |
| Reinvestment of distributions | 2,302,907 | 771,853 | 23,020,032 | 7,715,519 |
| Shares redeemed | (44,011,940) | (97,830,724) | (439,778,701) | (979,511,160) |
| Net increase (decrease) | (6,597,275) | (43,092,036) | $(65,821,359) | $(431,866,701) |
| Institutional Class | | | | |
| Shares sold | 109,245,571 | 270,630,970 | $1,091,786,055 | $2,709,599,692 |
| Reinvestment of distributions | 5,789,018 | 2,071,661 | 57,867,819 | 20,714,370 |
| Shares redeemed | (129,691,480) | (353,834,362) | (1,295,738,094) | (3,543,267,624) |
| Net increase (decrease) | (14,656,891) | (81,131,731) | $(146,084,220) | $(812,953,562) |
10. Other.
A fund's organizational documents provide former and current trustees and officers with a limited indemnification against liabilities arising in connection with the performance of their duties to the fund. In the normal course of business, a fund may also enter into contracts that provide general indemnifications. A fund's maximum exposure under these arrangements is unknown as this would be dependent on future claims that may be made against a fund. The risk of material loss from such claims is considered remote.
11. Risk and Uncertainties.
Many factors affect a fund's performance. Developments that disrupt global economies and financial markets, such as pandemics, epidemics, outbreaks of infectious diseases, war, terrorism, and environmental disasters, may significantly affect a fund's investment performance. The effects of these developments to a fund will be impacted by the types of securities in which a fund invests, the financial condition, industry, economic sector, and geographic location of an issuer, and a fund's level of investment in the securities of that issuer. Significant concentrations in security types, issuers, industries, sectors, and geographic locations may magnify the factors that affect a fund's performance.
As a shareholder, you incur two types of costs: (1) transaction costs, which may include sales charges (loads) on purchase payments or redemption proceeds, as applicable and (2) ongoing costs, which generally include management fees, distribution and/or service (12b-1) fees and other Fund expenses. This Example is intended to help you understand your ongoing costs (in dollars) of investing in a fund and to compare these costs with the ongoing costs of investing in other mutual funds.
| The Example is based on an investment of $1,000 invested at the beginning of the period and held for the entire period (September 1, 2022 to February 28, 2023). |
Actual Expenses
The first line of the accompanying table provides information about actual account values and actual expenses. You may use the information in this line, together with the amount you invested, to estimate the expenses that you paid over the period. Simply divide your account value by $1,000.00 (for example, an $8,600 account value divided by $1,000.00 = 8.6), then multiply the result by the number in the first line for a class/Fund under the heading entitled "Expenses Paid During Period" to estimate the expenses you paid on your account during this period. If any fund is a shareholder of any underlying mutual funds or exchange-traded funds (ETFs) (the Underlying Funds), such fund indirectly bears its proportional share of the expenses of the Underlying Funds in addition to the direct expenses incurred presented in the table. These fees and expenses are not included in the annualized expense ratio used to calculate the expense estimate in the table below.
Hypothetical Example for Comparison Purposes
The second line of the accompanying table provides information about hypothetical account values and hypothetical expenses based on the actual expense ratio and an assumed rate of return of 5% per year before expenses, which is not the actual return. The hypothetical account values and expenses may not be used to estimate the actual ending account balance or expenses you paid for the period. You may use this information to compare the ongoing costs of investing in the Fund and other funds. To do so, compare this 5% hypothetical example with the 5% hypothetical examples that appear in the shareholder reports of the other funds. If any fund is a shareholder of any Underlying Funds, such fund indirectly bears its proportional share of the expenses of the Underlying Funds in addition to the direct expenses as presented in the table. These fees and expenses are not included in the annualized expense ratio used to calculate the expense estimate in the table below.
Please note that the expenses shown in the table are meant to highlight your ongoing costs only and do not reflect any transaction costs. Therefore, the second line of the table is useful in comparing ongoing costs only, and will not help you determine the relative total costs of owning different funds. In addition, if these transactional costs were included, your costs would have been higher.
| | | | | Annualized Expense Ratio- A | | Beginning Account Value September 1, 2022 | | Ending Account Value February 28, 2023 | | Expenses Paid During Period- C September 1, 2022 to February 28, 2023 |
| Fidelity® Conservative Income Bond Fund | | | | | | | | | | |
| Fidelity® Conservative Income Bond Fund | | | | .35% | | | | | | |
| Actual | | | | | | $ 1,000 | | $ 1,020.90 | | $ 1.75 |
Hypothetical- B | | | | | | $ 1,000 | | $ 1,023.06 | | $ 1.76 |
| Institutional Class | | | | .25% | | | | | | |
| Actual | | | | | | $ 1,000 | | $ 1,021.40 | | $ 1.25 |
Hypothetical- B | | | | | | $ 1,000 | | $ 1,023.55 | | $ 1.25 |
| |
A Annualized expense ratio reflects expenses net of applicable fee waivers.
B 5% return per year before expenses
C Expenses are equal to the annualized expense ratio, multiplied by the average account value over the period, multiplied by 181/ 365 (to reflect the one-half year period). The fees and expenses of any Underlying Funds are not included in each annualized expense ratio.
Board Approval of Investment Advisory Contracts and Management Fees
Fidelity Conservative Income Bond Fund
Each year, the Board of Trustees, including the Independent Trustees (together, the Board), votes on the renewal of the management contract with Fidelity Management & Research Company LLC (FMR) and the sub-advisory agreements (together, the Advisory Contracts) for the fund. FMR and the sub-advisers are referred to herein as the Investment Advisers. The Board, assisted by the advice of fund counsel and Independent Trustees' counsel, requests and considers a broad range of information relevant to the renewal of the Advisory Contracts throughout the year.
The Board meets regularly and, at each of its meetings, covers an extensive agenda of topics and materials and considers factors that are relevant to its annual consideration of the renewal of the fund's Advisory Contracts, including the services and support provided to the fund and its shareholders. The Board has established four standing committees (Committees) - Operations, Audit, Fair Valuation, and Governance and Nominating - each composed of and chaired by Independent Trustees with varying backgrounds, to which the Board has assigned specific subject matter responsibilities in order to enhance effective decision-making by the Board. The Operations Committee, of which all the Independent Trustees are members, meets regularly throughout the year and requests, receives and considers, among other matters, information related to the annual consideration of the renewal of the fund's Advisory Contracts before making its recommendation to the Board. The Board also meets as needed to review matters specifically related to the Board's annual consideration of the renewal of the Advisory Contracts. Members of the Board may also meet from time to time with trustees of other Fidelity funds through joint ad hoc committees to discuss certain matters relevant to all of the Fidelity funds.
At its September 2022 meeting, the Board unanimously determined to renew the fund's Advisory Contracts. In reaching its determination, the Board considered all factors it believed relevant, including (i) the nature, extent, and quality of the services provided to the fund and its shareholders (including the investment performance of the fund); (ii) the competitiveness relative to peer funds of the fund's management fee and the total expense ratio of a representative class (the retail class); (iii) the total costs of the services provided by and the profits realized by Fidelity from its relationships with the fund; and (iv) the extent to which, if any, economies of scale exist and are realized as the fund grows, and whether any economies of scale are appropriately shared with fund shareholders.
In considering whether to renew the Advisory Contracts for the fund, the Board reached a determination, with the assistance of fund counsel and Independent Trustees' counsel and through the exercise of its business judgment, that the renewal of the Advisory Contracts was in the best interests of the fund and its shareholders and that the compensation payable under the Advisory Contracts was fair and reasonable. The Board's decision to renew the Advisory Contracts was not based on any single factor, but rather was based on a comprehensive consideration of all the information provided to the Board at its meetings throughout the year. The Board, in reaching its determination to renew the Advisory Contracts, was aware that shareholders of the fund have a broad range of investment choices available to them, including a wide choice among funds offered by Fidelity's competitors, and that the fund's shareholders, who have the opportunity to review and weigh the disclosure provided by the fund in its prospectus and other public disclosures, have chosen to invest in this fund, which is part of the Fidelity family of funds.
Nature, Extent, and Quality of Services Provided . The Board considered Fidelity's staffing as it relates to the fund, including the backgrounds of investment personnel of Fidelity, and also considered the fund's investment objective, strategies, and related investment philosophy. The Independent Trustees also had discussions with senior management of Fidelity's investment operations and investment groups. The Board considered the structure of the investment personnel compensation program and whether this structure provides appropriate incentives to act in the best interests of the fund. Additionally, the Board considered the portfolio managers' investments, if any, in the funds that they manage. The Board also considered the steps Fidelity had taken to ensure the continued provision of high quality services to the Fidelity funds throughout the COVID-19 pandemic, including the expansion of staff in client facing positions to maintain service levels in periods of high volumes and volatility.
Resources Dedicated to Investment Management and Support Services. The Board reviewed the general qualifications and capabilities of Fidelity's investment staff, including its size, education, experience, and resources, as well as Fidelity's approach to recruiting, training, managing, and compensating investment personnel. The Board noted the resources devoted to Fidelity's global investment organization, and that Fidelity's analysts have extensive resources, tools, and capabilities that allow them to conduct quantitative and fundamental analysis, as well as credit analysis of issuers, counterparties, and guarantors. Further, the Board considered that Fidelity's investment professionals have sufficient access to global information and data so as to provide competitive investment results over time, and that those professionals also have access to sophisticated tools that permit them to assess portfolio construction and risk and performance attribution characteristics continuously, as well as to transmit new information and research conclusions rapidly around the world. Additionally, in its deliberations, the Board considered Fidelity's trading, risk management, compliance, cybersecurity, and technology and operations capabilities and resources, which are integral parts of the investment management process.
Shareholder and Administrative Services. The Board considered (i) the nature, extent, quality, and cost of advisory, administrative, and shareholder services performed by the Investment Advisers and their affiliates under the Advisory Contracts and under separate agreements covering transfer agency, pricing and bookkeeping, and securities lending services for the fund; (ii) the nature and extent of the supervision of third party service providers, principally custodians, subcustodians, and pricing vendors; and (iii) the resources devoted to, and the record of compliance with, the fund's compliance policies and procedures.
The Board noted that the growth of fund assets over time across the complex allows Fidelity to reinvest in the development of services designed to enhance the value and convenience of the Fidelity funds as investment vehicles. These services include 24-hour access to account information and market information over the Internet and through telephone representatives, investor education materials and asset allocation tools. The Board also considered that it reviews customer service metrics such as telephone response times, continuity of services on the website and metrics addressing services at Fidelity Investor Centers.
Investment in a Large Fund Family. The Board considered the benefits to shareholders of investing in a Fidelity fund, including the benefits of investing in a fund that is part of a large family of funds offering a variety of investment disciplines and providing a large variety of mutual fund investor services. The Board noted that Fidelity had taken, or had made recommendations to the Board that resulted in the Fidelity funds taking, a number of actions over the previous year that benefited particular funds, including: (i) continuing to dedicate additional resources to Fidelity's investment research process, which includes meetings with management of issuers of securities in which the funds invest; (ii) continuing efforts to enhance Fidelity's global research capabilities; (iii) launching new funds, ETFs, and share classes with innovative structures, strategies and pricing and making other enhancements to meet investor needs; (iv) broadening eligibility requirements for certain funds and share classes; (v) reducing management fees and total expenses for certain funds and classes; (vi) lowering expenses for certain existing funds and classes by implementing or lowering expense caps; (vii) rationalizing product lines and gaining increased efficiencies from fund mergers and liquidations; (viii) continuing to develop, acquire and implement systems and technology to improve services to the funds and shareholders, strengthen information security, and increase efficiency; and (ix) continuing to implement enhancements to further strengthen Fidelity's product line to increase investors' probability of success in achieving their investment goals, including their retirement income goals.
Investment Performance. The Board considered whether the fund has operated in accordance with its investment objective, as well as its record of compliance with its investment restrictions and its performance history.
The Board took into account discussions that occur at Board meetings throughout the year with representatives of the Investment Advisers about fund investment performance. In this regard the Board noted that as part of regularly scheduled fund reviews and other reports to the Board on fund performance, the Board considers annualized return information for the fund for different time periods, measured against an appropriate securities market index (benchmark index) and an appropriate peer group of funds with similar objectives (peer group). The Board also receives and considers information about performance attribution. In its evaluation of fund investment performance at meetings throughout the year, the Board gave particular attention to information indicating underperformance of certain Fidelity funds for specific time periods and discussed with the Investment Advisers the reasons for such underperformance.
In addition to reviewing absolute and relative fund performance, the Independent Trustees periodically consider the appropriateness of fund performance metrics in evaluating the results achieved. In general, the Independent Trustees believe that fund performance should be evaluated based on gross performance (before fees and expenses but after transaction costs) compared to appropriate benchmark indices, over appropriate time periods that may include full market cycles, and on net performance (after fees and expenses) compared to appropriate peer groups, as applicable, over the same periods, taking into account relevant factors including the following: general market conditions; expectations for interest rate levels and credit conditions; issuer-specific information including credit quality; the potential for incremental return versus the fund's benchmark index weighed against the risks involved in obtaining that incremental return, including the risk of diminished or negative total returns; and fund cash flows and other factors. The Independent Trustees generally give greater weight to fund performance over longer time periods than over shorter time periods. Depending on the circumstances, the Independent Trustees may be satisfied with a fund's performance notwithstanding that it lags its benchmark index or peer group for certain periods.
The Independent Trustees recognize that shareholders evaluate performance on a net basis over their own holding periods, for which one-, three-, and five-year periods are often used as a proxy. For this reason, the performance information reviewed by the Board also included net cumulative calendar year total return information for the representative class (the retail class) and an appropriate benchmark index and peer group for the most recent one-, three-, and five-year periods. The Independent Trustees recognize that shareholders who are not investing through a tax-advantaged retirement account also consider tax consequences in evaluating performance.
Based on its review, the Board concluded that the nature, extent, and quality of services provided to the fund under the Advisory Contracts should continue to benefit the shareholders of the fund.
Competitiveness of Management Fee and Total Expense Ratio. The Board considered the fund's management fee and total expense ratio compared to selected groups of competitive funds and classes (referred to as "mapped groups" below) for the purpose of facilitating the Trustees' competitive analysis of management fees and total expenses. Fidelity creates "mapped groups" by combining similar investment objective categories (as classified by Lipper) that have comparable investment mandates. Combining funds with similar investment objective categories aids the Board's comparison of management fees and total expense ratios by broadening the competitive group used for such comparison.
Management Fee. The Board considered two proprietary management fee comparisons for the 12-month periods shown in basis points (BP) in the chart below. The group of Lipper funds used by the Board for management fee comparisons is referred to below as the "Total Mapped Group" and is broader than the Lipper peer group used by the Board for performance comparisons. The Total Mapped Group comparison focuses on a fund's standing in terms of gross management fees before expense reimbursements or caps relative to the total universe of funds with comparable investment mandates, regardless of whether their management fee structures also are comparable. Funds with comparable investment mandates offer exposure to similar types of securities. Funds with comparable management fee structures have similar management fee contractual arrangements (e.g., flat rate charged for advisory services, all-inclusive fee rate, etc.). "TMG %" represents the percentage of funds in the Total Mapped Group that had management fees that were lower than the fund's. For example, a hypothetical TMG % of 20% would mean that 80% of the funds in the Total Mapped Group had higher, and 20% had lower, management fees than the fund. The fund's actual TMG %s and the number of funds in the Total Mapped Group are in the chart below. The "Asset-Sized Peer Group" (ASPG) comparison focuses on a fund's standing relative to a subset of non-Fidelity funds within the Total Mapped Group that are similar in size and management fee structure. For example, if a fund is in the first quartile of the ASPG, the fund's management fee ranks in the least expensive or lowest 25% of funds in the ASPG. The ASPG represents at least 15% of the funds in the Total Mapped Group with comparable asset size and management fee structures, subject to a minimum of 50 funds (or all funds in the Total Mapped Group if fewer than 50). Additional information, such as the ASPG quartile in which the fund's management fee rate ranked, is also included in the chart and was considered by the Board.
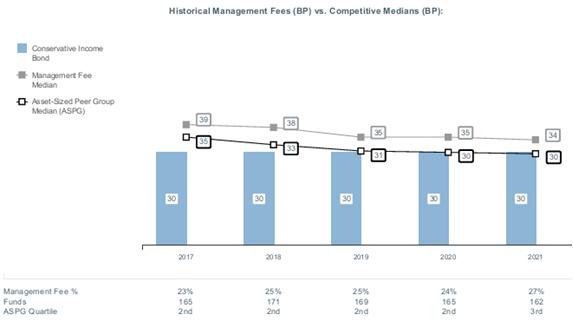
The Board noted that the fund's management fee rate ranked below the median of its Total Mapped Group and equal to the median of its ASPG for 2021.
Based on its review, the Board concluded that the fund's management fee is fair and reasonable in light of the services that the fund receives and the other factors considered.
Total Expense Ratio. In its review of the total expense ratio of the representative class (the retail class) of the fund, the Board considered the fund's management fee rate as well as other "fund-level" expenses, such as pricing and bookkeeping fees and custodial, legal, and audit fees, paid by FMR under the fund's management contract. The Board also considered other "class-level" expenses, such as transfer agent fees. The Board also noted that Fidelity may agree to waive fees or reimburse expenses from time to time, and the extent to which, if any, it has done so for the fund. The fund's representative class is compared to those funds and classes in the Total Mapped Group (used by the Board for management fee comparisons) that have a similar sales load structure. The Board also considered a total expense ASPG comparison, which focuses on the total expenses of the representative class relative to a subset of non-Fidelity funds within the similar sales load structure group that are similar in size and management fee structure. The total expense ASPG is limited to 15 larger and 15 smaller classes of different funds, where possible. The total expense ASPG comparison excludes performance adjustments and fund-paid 12b-1 fees to eliminate variability in expenses relating to these items.
The Board noted that the total net expense ratio of the retail class ranked below the similar sales load structure group competitive median for 2021 and above the ASPG competitive median for 2021. The Board considered that, when compared to a subset of the ASPG that excludes funds in a fund complex with a unique at-cost service model, the retail class would not be above the ASPG competitive median for 2021. The Board noted that the fund offers multiple classes, each of which has a different sales load and 12b-1 fee structure than the others, and that the multiple structures are intended to offer a range of pricing options for the intermediary market. The Board also noted that the total expense ratios of the classes vary primarily by the level of their 12b-1 fees, although differences in transfer agent fees may also cause expenses to vary from class to class.
The Board further considered that FMR has contractually agreed to reimburse Institutional Class and the retail class of the fund to the extent that total operating expenses, with certain exceptions, as a percentage of their respective average net assets, exceed 0.25% and 0.35% through December 31, 2023.
Fees Charged to Other Fidelity Clients. The Board also considered Fidelity fee structures and other information with respect to clients of Fidelity, such as other funds advised or subadvised by Fidelity, pension plan clients, and other institutional clients with similar mandates. The Board noted that a joint ad hoc committee created by it and the boards of other Fidelity funds periodically reviews and compares Fidelity's institutional investment advisory business with its business of providing services to the Fidelity funds and also noted the most recent findings of the committee. The Board noted that the committee's review included a consideration of the differences in services provided, fees charged, and costs incurred, as well as competition in the markets serving the different categories of clients.
Based on its review of total expense ratios and fees charged to other Fidelity clients, the Board concluded that the total expense ratio of each class of the fund was reasonable in light of the services that the fund and its shareholders receive and the other factors considered.
Costs of the Services and Profitability. The Board considered the revenues earned and the expenses incurred by Fidelity in conducting the business of developing, marketing, distributing, managing, administering and servicing the fund and servicing the fund's shareholders. The Board also considered the level of Fidelity's profits in respect of all the Fidelity funds.
On an annual basis, Fidelity presents to the Board information about the profitability of its relationships with the fund. Fidelity calculates profitability information for each fund, as well as aggregate profitability information for groups of Fidelity funds and all Fidelity funds, using a series of detailed revenue and cost allocation methodologies which originate with the books and records of Fidelity on which Fidelity's audited financial statements are based. The Audit Committee of the Board reviews any significant changes from the prior year's methodologies and the full Board approves such changes.
A public accounting firm has been engaged annually by the Board as part of the Board's assessment of Fidelity's profitability analysis. The engagement includes the review and assessment of the methodologies used by Fidelity in determining the revenues and expenses attributable to Fidelity's mutual fund business, and completion of agreed-upon procedures in respect of the mathematical accuracy of certain fund profitability information and its conformity to established allocation methodologies. After considering the reports issued under the engagement and information provided by Fidelity, the Board concluded that while other allocation methods may also be reasonable, Fidelity's profitability methodologies are reasonable in all material respects.
The Board also reviewed Fidelity's non-fund businesses and potential indirect benefits such businesses may have received as a result of their association with Fidelity's mutual fund business (i.e., fall-out benefits) as well as cases where Fidelity's affiliates may benefit from the funds' business. The Board considered areas where potential indirect benefits to the Fidelity funds from their relationships with Fidelity may exist. The Board's consideration of these matters was informed by the findings of a joint ad hoc committee created by it and the boards of other Fidelity funds to evaluate potential fall-out benefits.
The Board considered the costs of the services provided by and the profits realized by Fidelity in connection with the operation of the fund and was satisfied that the profitability was not excessive.
Economies of Scale. The Board considered whether there have been economies of scale in respect of the management of the Fidelity funds, whether the Fidelity funds (including the fund) have appropriately benefited from any such economies of scale, and whether there is potential for realization of any further economies of scale. The Board considered the extent to which the fund will benefit from economies of scale as assets grow through increased services to the fund, through waivers or reimbursements, or through fee or expense ratio reductions. The Board also noted that a committee (the Economies of Scale Committee) created by it and the boards of other Fidelity funds periodically analyzes whether Fidelity attains economies of scale in respect of the management and servicing of the Fidelity funds, whether the Fidelity funds have appropriately benefited from such economies of scale, and whether there is potential for realization of any further economies of scale.
The Board concluded, taking into account the analysis of the Economies of Scale Committee, that economies of scale, if any, are being appropriately shared between fund shareholders and Fidelity.
Additional Information Requested by the Board. In order to develop fully the factual basis for consideration of the Fidelity funds' advisory contracts, the Board requested and received additional information on certain topics, including: (i) Fidelity's fund profitability methodology, profitability trends for certain funds, the allocation of various costs to different funds, and the impact of certain factors on fund profitability results; (ii) portfolio manager changes that have occurred during the past year and the amount of the investment that each portfolio manager has made in the Fidelity fund(s) that he or she manages; (iii) the extent to which current market conditions have affected retention and recruitment of personnel; (iv) the arrangements with and compensation paid to certain fund sub-advisers on behalf of the Fidelity funds and the treatment of such compensation within Fidelity's fund profitability methodology; (v) the terms of the funds' various management fee structures, including the basic group fee and the terms of Fidelity's voluntary expense limitation arrangements; (vi) Fidelity's transfer agent, pricing and bookkeeping fees, expense and service structures for different funds and classes relative to competitive trends; (vii) the impact on fund profitability of recent industry trends, such as the growth in passively managed funds and the changes in flows for different types of funds; (viii) the types of management fee and total expense comparisons provided, and the challenges and limitations associated with such information; and (ix) explanations regarding the relative total expense ratios and management fees of certain funds and classes, total expense and management fee competitive trends, and methodologies for total expense and management fee competitive comparisons. In addition, the Board considered its discussions with Fidelity regarding Fidelity's efforts to maintain the continuous investment and shareholder services necessary for the funds during the current pandemic and economic circumstances.
Based on its evaluation of all of the conclusions noted above, and after considering all factors it believed relevant, the Board concluded that the advisory fee arrangements are fair and reasonable and that the fund's Advisory Contracts should be renewed.
The Securities and Exchange Commission adopted Rule 22e-4 under the Investment Company Act of 1940 (the Liquidity Rule) to promote effective liquidity risk management throughout the open-end investment company industry, thereby reducing the risk that funds will be unable to meet their redemption obligations and mitigating dilution of the interests of fund shareholders.
The Fund has adopted and implemented a liquidity risk management program (the Program) reasonably designed to assess and manage the Fund's liquidity risk and to comply with the requirements of the Liquidity Rule. The Fund's Board of Trustees (the Board) has designated the Fund's investment adviser as administrator of the Program. The Fidelity advisers have established a Liquidity Risk Management Committee (the LRM Committee) to manage the Program for each of the Fidelity Funds. The LRM Committee monitors the adequacy and effectiveness of implementation of the Program and on a periodic basis assesses each Fund's liquidity risk based on a variety of factors including (1) the Fund's investment strategy, (2) portfolio liquidity and cash flow projections during normal and reasonably foreseeable stressed conditions, (3) shareholder redemptions, (4) borrowings and other funding sources and (5) certain factors specific to ETFs including the effect of the Fund's prices and spreads, market participants, and basket compositions on the overall liquidity of the Fund's portfolio, as applicable.
In accordance with the Program, each of the Fund's portfolio investments is classified into one of four defined liquidity categories based on a determination of a reasonable expectation for how long it would take to convert the investment to cash (or sell or dispose of the investment) without significantly changing its market value.
- Highly liquid investments - cash or convertible to cash within three business days or less
- Moderately liquid investments - convertible to cash in three to seven calendar days
- Less liquid investments - can be sold or disposed of, but not settled, within seven calendar days
- Illiquid investments - cannot be sold or disposed of within seven calendar days
Liquidity classification determinations take into account a variety of factors including various market, trading and investment-specific considerations, as well as market depth, and generally utilize analysis from a third-party liquidity metrics service.
The Liquidity Rule places a 15% limit on a fund's illiquid investments and requires funds that do not primarily hold assets that are highly liquid investments to determine and maintain a minimum percentage of the fund's net assets to be invested in highly liquid investments (highly liquid investment minimum or HLIM). The Program includes provisions reasonably designed to comply with the 15% limit on illiquid investments and for determining, periodically reviewing and complying with the HLIM requirement as applicable.
At a recent meeting of the Fund's Board of Trustees, the LRM Committee provided a written report to the Board pertaining to the operation, adequacy, and effectiveness of the Program for the period December 1, 2021 through November 30, 2022. The report concluded that the Program is operating effectively and is reasonably designed to assess and manage the Fund's liquidity risk.
1.924092.111
FCV-SANN-0423
Fidelity® SAI Short-Term Bond Fund
Semi-Annual Report
February 28, 2023
Offered exclusively to certain clients of the Adviser, or its affiliates, including Strategic Advisers LLC (Strategic Advisers) - not available for sale to the general public. Fidelity ® SAI is a product name of Fidelity ® funds dedicated to certain programs affiliated with Strategic Advisers.
Contents
To view a fund's proxy voting guidelines and proxy voting record for the 12-month period ended June 30, visit http://www.fidelity.com/proxyvotingresults or visit the Securities and Exchange Commission's (SEC) web site at http://www.sec.gov.
You may also call 1-800-544-3455 to request a free copy of the proxy voting guidelines.
Standard & Poor's, S&P and S&P 500 are registered service marks of The McGraw-Hill Companies, Inc. and have been licensed for use by Fidelity Distributors Corporation.
Other third-party marks appearing herein are the property of their respective owners.
All other marks appearing herein are registered or unregistered trademarks or service marks of FMR LLC or an affiliated company. © 2023 FMR LLC. All rights reserved.
This report and the financial statements contained herein are submitted for the general information of the shareholders of the Fund. This report is not authorized for distribution to prospective investors in the Fund unless preceded or accompanied by an effective prospectus.
A fund files its complete schedule of portfolio holdings with the SEC for the first and third quarters of each fiscal year on Form N-PORT. Forms N-PORT are available on the SEC's web site at http://www.sec.gov. A fund's Forms N-PORT may be reviewed and copied at the SEC's Public Reference Room in Washington, DC. Information regarding the operation of the SEC's Public Reference Room may be obtained by calling 1-800-SEC-0330.
For a complete list of a fund's portfolio holdings, view the most recent holdings listing, semiannual report, or annual report on Fidelity's web site at http://www.fidelity.com, http://www.institutional.fidelity.com, or http://www.401k.com, as applicable.
NOT FDIC INSURED •MAY LOSE VALUE •NO BANK GUARANTEE
Neither the Fund nor Fidelity Distributors Corporation is a bank.
Quality Diversification (% of Fund's net assets) |
|
| |
| We have used ratings from Moody's Investors Service, Inc. Where Moody's® ratings are not available, we have used S&P® ratings. All ratings are as of the date indicated and do not reflect subsequent changes. |
Asset Allocation (% of Fund's net assets) |
|
Foreign investments - 17% |
Futures - 3.8% |
|
Geographic Diversification (% of Fund's net assets) |
|
* Includes Short-Term investments and Net Other Assets (Liabilities). Percentages are based on country or territory of incorporation and are adjusted for the effect of derivatives, if applicable. |
| |
Showing Percentage of Net Assets
| Nonconvertible Bonds - 44.0% |
| | | Principal Amount (a) | Value ($) |
| COMMUNICATION SERVICES - 1.7% | | | |
| Diversified Telecommunication Services - 0.7% | | | |
| AT&T, Inc. 0.9% 3/25/24 | | 5,000,000 | 4,768,178 |
| NTT Finance Corp.: | | | |
| 0.373% 3/3/23 (b) | | 3,840,000 | 3,839,520 |
| 0.583% 3/1/24 (b) | | 1,597,000 | 1,520,848 |
| Verizon Communications, Inc.: | | | |
| U.S. Secured Overnight Fin. Rate (SOFR) Averages Index + 0.500% 4.913% 3/22/24 (c)(d) | | 2,637,000 | 2,635,328 |
| 0.75% 3/22/24 | | 1,969,000 | 1,876,263 |
| 2.625% 8/15/26 | | 4,600,000 | 4,224,586 |
| | | | 18,864,723 |
| Media - 0.6% | | | |
| Discovery Communications LLC 4.9% 3/11/26 | | 4,500,000 | 4,388,124 |
| Magallanes, Inc.: | | | |
| 3.428% 3/15/24 (b) | | 1,045,000 | 1,019,901 |
| 3.638% 3/15/25 (b) | | 9,872,000 | 9,416,320 |
| | | | 14,824,345 |
| Wireless Telecommunication Services - 0.4% | | | |
| Rogers Communications, Inc. 2.95% 3/15/25 (b) | | 3,029,000 | 2,872,525 |
| T-Mobile U.S.A., Inc.: | | | |
| 1.5% 2/15/26 | | 4,800,000 | 4,297,573 |
| 3.5% 4/15/25 | | 3,440,000 | 3,295,044 |
| | | | 10,465,142 |
TOTAL COMMUNICATION SERVICES | | | 44,154,210 |
| CONSUMER DISCRETIONARY - 2.5% | | | |
| Automobiles - 2.2% | | | |
| BMW U.S. Capital LLC: | | | |
| 3.25% 4/1/25 (b) | | 5,600,000 | 5,400,449 |
| 3.45% 4/12/23 (b) | | 5,956,000 | 5,943,838 |
| Daimler Finance North America LLC: | | | |
| 3 month U.S. LIBOR + 0.840% 5.6461% 5/4/23 (b)(c)(d) | | 2,870,000 | 2,871,963 |
| 0.75% 3/1/24 (b) | | 3,927,000 | 3,750,583 |
| 5.5% 11/27/24 (b) | | 4,250,000 | 4,260,763 |
| General Motors Financial Co., Inc.: | | | |
| U.S. Secured Overnight Fin. Rate (SOFR) Index + 1.200% 5.7531% 11/17/23 (c)(d) | | 2,500,000 | 2,501,833 |
| 1.05% 3/8/24 | | 984,000 | 939,836 |
| 1.2% 10/15/24 | | 8,300,000 | 7,714,545 |
| 1.25% 1/8/26 | | 15,696,000 | 13,882,738 |
| Volkswagen Group of America Finance LLC: | | | |
| 0.875% 11/22/23 (b) | | 4,500,000 | 4,354,502 |
| 3.95% 6/6/25 (b) | | 5,735,000 | 5,545,167 |
| | | | 57,166,217 |
| Distributors - 0.1% | | | |
| Genuine Parts Co. 1.75% 2/1/25 | | 3,041,000 | 2,837,397 |
| Multiline Retail - 0.1% | | | |
| Dollar General Corp. 4.25% 9/20/24 | | 4,185,000 | 4,111,423 |
| Specialty Retail - 0.1% | | | |
| Lowe's Companies, Inc. 4.4% 9/8/25 | | 2,188,000 | 2,150,211 |
TOTAL CONSUMER DISCRETIONARY | | | 66,265,248 |
| CONSUMER STAPLES - 2.4% | | | |
| Beverages - 0.4% | | | |
| Constellation Brands, Inc. 3.6% 5/9/24 | | 4,900,000 | 4,800,578 |
| Dr. Pepper Snapple Group, Inc. 0.75% 3/15/24 | | 5,000,000 | 4,756,202 |
| | | | 9,556,780 |
| Food & Staples Retailing - 0.4% | | | |
| 7-Eleven, Inc.: | | | |
| 0.8% 2/10/24 (b) | | 2,817,000 | 2,690,772 |
| 0.95% 2/10/26 (b) | | 4,000,000 | 3,524,200 |
| Mondelez International Holdings Netherlands BV 0.75% 9/24/24 (b) | | 4,326,000 | 4,018,972 |
| | | | 10,233,944 |
| Food Products - 0.4% | | | |
| Conagra Brands, Inc. 0.5% 8/11/23 | | 3,008,000 | 2,943,938 |
| JDE Peet's BV 0.8% 9/24/24 (b) | | 3,828,000 | 3,523,378 |
| Mondelez International, Inc. 2.125% 3/17/24 | | 5,000,000 | 4,843,883 |
| | | | 11,311,199 |
| Tobacco - 1.2% | | | |
| Altria Group, Inc. 2.35% 5/6/25 | | 621,000 | 582,131 |
| BAT Capital Corp. 3.222% 8/15/24 | | 9,886,000 | 9,527,629 |
| BAT International Finance PLC 1.668% 3/25/26 | | 5,786,000 | 5,138,303 |
| Imperial Tobacco Finance PLC: | | | |
| 3.125% 7/26/24 (b) | | 3,612,000 | 3,465,322 |
| 3.5% 7/26/26 (b) | | 4,800,000 | 4,419,851 |
| Philip Morris International, Inc.: | | | |
| 2.875% 5/1/24 | | 3,258,000 | 3,162,388 |
| 5% 11/17/25 | | 4,157,000 | 4,132,567 |
| | | | 30,428,191 |
TOTAL CONSUMER STAPLES | | | 61,530,114 |
| ENERGY - 2.5% | | | |
| Energy Equipment & Services - 0.0% | | | |
| Baker Hughes Co. 1.231% 12/15/23 | | 959,000 | 929,258 |
| Oil, Gas & Consumable Fuels - 2.5% | | | |
| Canadian Natural Resources Ltd. 2.05% 7/15/25 | | 2,208,000 | 2,039,013 |
| ConocoPhillips Co. 2.4% 3/7/25 | | 1,906,000 | 1,804,926 |
| Enbridge, Inc.: | | | |
| 0.55% 10/4/23 | | 5,000,000 | 4,853,846 |
| 2.15% 2/16/24 | | 737,000 | 713,564 |
| 2.5% 2/14/25 | | 769,000 | 726,101 |
| 4.25% 12/1/26 | | 4,400,000 | 4,219,553 |
| Energy Transfer LP: | | | |
| 2.9% 5/15/25 | | 4,750,000 | 4,482,765 |
| 4.2% 9/15/23 | | 952,000 | 945,478 |
| 4.25% 3/15/23 | | 2,222,000 | 2,221,250 |
| Enterprise Products Operating LP: | | | |
| 3.35% 3/15/23 | | 3,500,000 | 3,497,480 |
| 5.05% 1/10/26 | | 3,360,000 | 3,353,060 |
| EQT Corp. 5.678% 10/1/25 | | 3,369,000 | 3,324,917 |
| Equinor ASA 1.75% 1/22/26 | | 690,000 | 629,814 |
| Kinder Morgan Energy Partners LP 3.5% 9/1/23 | | 1,826,000 | 1,810,362 |
| MPLX LP: | | | |
| 1.75% 3/1/26 | | 4,929,000 | 4,407,833 |
| 4.5% 7/15/23 | | 2,562,000 | 2,552,873 |
| Occidental Petroleum Corp. 2.9% 8/15/24 | | 1,348,000 | 1,290,710 |
| Phillips 66 Co.: | | | |
| 0.9% 2/15/24 | | 4,500,000 | 4,307,807 |
| 1.3% 2/15/26 | | 4,900,000 | 4,367,970 |
| 3.85% 4/9/25 | | 3,943,000 | 3,827,659 |
| Pioneer Natural Resources Co. 0.55% 5/15/23 | | 3,370,000 | 3,337,075 |
| The Williams Companies, Inc.: | | | |
| 4% 9/15/25 | | 4,400,000 | 4,243,988 |
| 5.4% 3/2/26 | | 1,283,000 | 1,283,061 |
| | | | 64,241,105 |
TOTAL ENERGY | | | 65,170,363 |
| FINANCIALS - 27.1% | | | |
| Banks - 16.1% | | | |
| Bank of America Corp.: | | | |
| U.S. Secured Overnight Fin. Rate (SOFR) Index + 1.290% 5.08% 1/20/27 (c)(d) | | 2,000,000 | 1,979,101 |
| 0.81% 10/24/24 (c) | | 3,000,000 | 2,906,216 |
| 0.976% 4/22/25 (c) | | 4,000,000 | 3,780,559 |
| 1.197% 10/24/26 (c) | | 7,800,000 | 6,940,764 |
| 1.843% 2/4/25 (c) | | 5,000,000 | 4,817,950 |
| 3.384% 4/2/26 (c) | | 9,550,000 | 9,134,136 |
| 3.559% 4/23/27 (c) | | 6,000,000 | 5,638,618 |
| 3.841% 4/25/25 (c) | | 5,250,000 | 5,141,508 |
| 4.827% 7/22/26 (c) | | 4,000,000 | 3,934,959 |
| Bank of Montreal 4.25% 9/14/24 | | 6,000,000 | 5,894,779 |
| Bank of Nova Scotia 0.8% 6/15/23 | | 5,422,000 | 5,335,527 |
| Banque Federative du Credit Mutuel SA 4.524% 7/13/25 (b) | | 3,802,000 | 3,715,372 |
| Barclays PLC: | | | |
| 1.007% 12/10/24 (c) | | 2,279,000 | 2,194,426 |
| 2.852% 5/7/26 (c) | | 6,187,000 | 5,792,843 |
| 4.338% 5/16/24 (c) | | 3,000,000 | 2,988,606 |
| 5.304% 8/9/26 (c) | | 2,300,000 | 2,265,831 |
| 7.325% 11/2/26 (c) | | 8,700,000 | 9,002,563 |
| BNP Paribas SA: | | | |
| 2.219% 6/9/26 (b)(c) | | 13,450,000 | 12,422,492 |
| 3.5% 3/1/23 (b) | | 5,101,000 | 5,101,000 |
| BPCE SA 1.625% 1/14/25 (b) | | 6,000,000 | 5,575,903 |
| Canadian Imperial Bank of Commerce: | | | |
| 0.45% 6/22/23 | | 2,000,000 | 1,970,119 |
| 0.95% 6/23/23 | | 8,205,000 | 8,099,163 |
| 3.945% 8/4/25 | | 4,246,000 | 4,113,319 |
| Citigroup, Inc.: | | | |
| 0.981% 5/1/25 (c) | | 2,294,000 | 2,166,461 |
| 2.014% 1/25/26 (c) | | 5,000,000 | 4,662,896 |
| 3.106% 4/8/26 (c) | | 7,886,000 | 7,488,755 |
| 4.14% 5/24/25 (c) | | 5,000,000 | 4,907,739 |
| 5.61% 9/29/26 (c) | | 7,300,000 | 7,300,050 |
| Danske Bank A/S: | | | |
| 1.621% 9/11/26 (b)(c) | | 7,600,000 | 6,818,832 |
| 3.875% 9/12/23 (b) | | 3,715,000 | 3,680,230 |
| 6.466% 1/9/26 (b)(c) | | 1,630,000 | 1,640,019 |
| DNB Bank ASA 0.856% 9/30/25 (b)(c) | | 5,000,000 | 4,616,817 |
| HSBC Holdings PLC: | | | |
| 0.976% 5/24/25 (c) | | 4,500,000 | 4,233,089 |
| 1.162% 11/22/24 (c) | | 5,000,000 | 4,824,031 |
| 1.645% 4/18/26 (c) | | 3,331,000 | 3,051,540 |
| 2.633% 11/7/25 (c) | | 4,750,000 | 4,498,203 |
| 4.292% 9/12/26 (c) | | 9,300,000 | 8,952,633 |
| Huntington National Bank 5.699% 11/18/25 (c) | | 4,528,000 | 4,534,202 |
| Intesa Sanpaolo SpA 3.25% 9/23/24 (b) | | 8,770,000 | 8,353,688 |
| JPMorgan Chase & Co.: | | | |
| 0.824% 6/1/25 (c) | | 3,418,000 | 3,206,500 |
| 1.045% 11/19/26 (c) | | 16,100,000 | 14,258,801 |
| 1.514% 6/1/24 (c) | | 6,888,000 | 6,820,633 |
| 3.845% 6/14/25 (c) | | 5,000,000 | 4,880,694 |
| KeyBank NA 4.15% 8/8/25 | | 1,413,000 | 1,378,094 |
| KeyCorp 3.878% 5/23/25 (c) | | 1,528,000 | 1,494,975 |
| Lloyds Banking Group PLC: | | | |
| 0.695% 5/11/24 (c) | | 2,769,000 | 2,738,208 |
| 4.716% 8/11/26 (c) | | 9,500,000 | 9,262,061 |
| Mitsubishi UFJ Financial Group, Inc.: | | | |
| 0.848% 9/15/24 (c) | | 3,944,000 | 3,839,821 |
| 0.953% 7/19/25 (c) | | 3,500,000 | 3,267,476 |
| 0.962% 10/11/25 (c) | | 5,000,000 | 4,615,882 |
| 2.193% 2/25/25 | | 4,466,000 | 4,184,374 |
| 4.788% 7/18/25 (c) | | 4,000,000 | 3,945,702 |
| Mizuho Financial Group, Inc.: | | | |
| 0.849% 9/8/24 (c) | | 2,087,000 | 2,032,151 |
| 2.651% 5/22/26 (c) | | 8,889,000 | 8,290,390 |
| 3.922% 9/11/24 (c) | | 5,000,000 | 4,947,655 |
| NatWest Group PLC: | | | |
| 1.642% 6/14/27 (c) | | 5,100,000 | 4,475,648 |
| 2.359% 5/22/24 (c) | | 2,599,000 | 2,576,280 |
| 3.875% 9/12/23 | | 6,951,000 | 6,883,171 |
| 5.847% 3/2/27 (c) | | 5,291,000 | 5,293,688 |
| NatWest Markets PLC 0.8% 8/12/24 (b) | | 2,224,000 | 2,071,855 |
| PNC Bank NA 2.5% 8/27/24 | | 5,418,000 | 5,206,097 |
| Rabobank Nederland New York Branch 3.875% 8/22/24 | | 4,000,000 | 3,920,862 |
| Regions Financial Corp. 2.25% 5/18/25 | | 1,933,000 | 1,806,734 |
| Royal Bank of Canada: | | | |
| U.S. Secured Overnight Fin. Rate (SOFR) Averages Index + 0.450% 4.9461% 10/26/23 (c)(d) | | 5,000,000 | 5,005,520 |
| 2.55% 7/16/24 | | 4,245,000 | 4,087,935 |
| Santander Holdings U.S.A., Inc.: | | | |
| 3.5% 6/7/24 | | 3,539,000 | 3,445,460 |
| 5.807% 9/9/26 (c) | | 6,909,000 | 6,907,759 |
| Societe Generale: | | | |
| 1.488% 12/14/26 (b)(c) | | 5,100,000 | 4,518,399 |
| 2.226% 1/21/26 (b)(c) | | 12,300,000 | 11,431,262 |
| 4.351% 6/13/25 (b) | | 4,200,000 | 4,099,340 |
| Sumitomo Mitsui Financial Group, Inc. 5.464% 1/13/26 | | 10,000,000 | 9,978,045 |
| Svenska Handelsbanken AB 0.625% 6/30/23 (b) | | 5,060,000 | 4,983,477 |
| The Toronto-Dominion Bank: | | | |
| 1.2% 6/3/26 | | 5,000,000 | 4,380,975 |
| 2.35% 3/8/24 | | 5,000,000 | 4,848,634 |
| Truist Financial Corp.: | | | |
| 4.26% 7/28/26 (c) | | 4,000,000 | 3,899,191 |
| 5.9% 10/28/26 (c) | | 6,200,000 | 6,294,421 |
| U.S. Bancorp 5.727% 10/21/26 (c) | | 4,500,000 | 4,555,567 |
| Wells Fargo & Co.: | | | |
| 1.654% 6/2/24 (c) | | 4,022,000 | 3,982,242 |
| 2.164% 2/11/26 (c) | | 14,358,000 | 13,418,599 |
| 2.188% 4/30/26 (c) | | 9,450,000 | 8,786,433 |
| | | | 416,495,950 |
| Capital Markets - 5.2% | | | |
| Bank of New York, New York 5.224% 11/21/25 (c) | | 3,440,000 | 3,427,963 |
| Credit Suisse AG: | | | |
| U.S. Secured Overnight Fin. Rate (SOFR) Averages Index + 1.260% 5.8127% 2/21/25 (c)(d) | | 5,000,000 | 4,782,044 |
| 0.52% 8/9/23 | | 3,750,000 | 3,628,125 |
| 1% 5/5/23 | | 3,943,000 | 3,902,429 |
| Credit Suisse Group AG 6.373% 7/15/26 (b)(c) | | 3,000,000 | 2,822,163 |
| Deutsche Bank AG New York Branch: | | | |
| 0.898% 5/28/24 | | 1,264,000 | 1,191,028 |
| 0.962% 11/8/23 | | 3,081,000 | 2,988,071 |
| 1.447% 4/1/25 (c) | | 2,890,000 | 2,735,707 |
| 2.222% 9/18/24 (c) | | 12,004,000 | 11,733,927 |
| Goldman Sachs Group, Inc.: | | | |
| 1.757% 1/24/25 (c) | | 10,000,000 | 9,625,353 |
| 5.7% 11/1/24 | | 35,000,000 | 35,206,581 |
| Intercontinental Exchange, Inc. 3.65% 5/23/25 | | 2,741,000 | 2,671,288 |
| Moody's Corp. 4.875% 2/15/24 | | 2,500,000 | 2,483,680 |
| Morgan Stanley: | | | |
| 0.731% 4/5/24 (c) | | 4,000,000 | 3,979,624 |
| 0.79% 5/30/25 (c) | | 4,350,000 | 4,073,524 |
| 0.985% 12/10/26 (c) | | 6,200,000 | 5,453,513 |
| 3.62% 4/17/25 (c) | | 4,000,000 | 3,907,439 |
| 4% 7/23/25 | | 3,286,000 | 3,202,160 |
| 4.679% 7/17/26 (c) | | 2,933,000 | 2,876,378 |
| UBS AG London Branch: | | | |
| 0.375% 6/1/23 (b) | | 4,081,000 | 4,032,937 |
| 1.375% 1/13/25 (b) | | 3,559,000 | 3,306,017 |
| UBS Group AG: | | | |
| 1.008% 7/30/24 (b)(c) | | 4,110,000 | 4,028,402 |
| 4.49% 8/5/25 (b)(c) | | 4,400,000 | 4,334,916 |
| 4.703% 8/5/27 (b)(c) | | 9,100,000 | 8,809,261 |
| | | | 135,202,530 |
| Consumer Finance - 3.4% | | | |
| AerCap Ireland Capital Ltd./AerCap Global Aviation Trust: | | | |
| U.S. Secured Overnight Fin. Rate (SOFR) Index + 0.680% 5.1017% 9/29/23 (c)(d) | | 5,000,000 | 4,975,740 |
| 1.15% 10/29/23 | | 4,000,000 | 3,881,464 |
| 1.65% 10/29/24 | | 4,707,000 | 4,366,574 |
| 1.75% 1/30/26 | | 7,716,000 | 6,820,751 |
| 4.875% 1/16/24 | | 986,000 | 976,309 |
| Ally Financial, Inc.: | | | |
| 3.05% 6/5/23 | | 2,805,000 | 2,785,969 |
| 4.75% 6/9/27 | | 4,500,000 | 4,287,583 |
| 5.125% 9/30/24 | | 3,126,000 | 3,098,681 |
| American Express Co.: | | | |
| 2.25% 3/4/25 | | 2,216,000 | 2,084,196 |
| 3.375% 5/3/24 | | 5,000,000 | 4,885,621 |
| Capital One Financial Corp.: | | | |
| 1.343% 12/6/24 (c) | | 4,000,000 | 3,855,315 |
| 2.6% 5/11/23 | | 2,196,000 | 2,185,215 |
| 4.166% 5/9/25 (c) | | 6,000,000 | 5,865,525 |
| 4.985% 7/24/26 (c) | | 10,713,000 | 10,539,556 |
| Hyundai Capital America 1% 9/17/24 (b) | | 9,287,000 | 8,641,168 |
| John Deere Capital Corp. 3.4% 6/6/25 | | 3,014,000 | 2,907,632 |
| Synchrony Financial: | | | |
| 4.25% 8/15/24 | | 4,618,000 | 4,506,457 |
| 4.375% 3/19/24 | | 3,952,000 | 3,897,151 |
| Toyota Motor Credit Corp. 5.4% 11/10/25 | | 7,275,000 | 7,346,331 |
| | | | 87,907,238 |
| Diversified Financial Services - 1.3% | | | |
| Athene Global Funding: | | | |
| 0.95% 1/8/24 (b) | | 3,290,000 | 3,161,848 |
| 1% 4/16/24 (b) | | 4,000,000 | 3,761,779 |
| 1.608% 6/29/26 (b) | | 4,900,000 | 4,218,220 |
| 1.716% 1/7/25 (b) | | 3,920,000 | 3,632,671 |
| Blackstone Private Credit Fund 4.7% 3/24/25 | | 4,526,000 | 4,365,266 |
| Corebridge Financial, Inc. 3.5% 4/4/25 (b) | | 5,028,000 | 4,809,278 |
| GA Global Funding Trust 1.25% 12/8/23 (b) | | 5,000,000 | 4,828,079 |
| Jackson Financial, Inc. 1.125% 11/22/23 | | 5,000,000 | 4,845,811 |
| | | | 33,622,952 |
| Insurance - 1.1% | | | |
| American International Group, Inc. 2.5% 6/30/25 | | 2,190,000 | 2,061,394 |
| Equitable Financial Life Global Funding: | | | |
| 0.5% 11/17/23 (b) | | 5,000,000 | 4,822,906 |
| 1.1% 11/12/24 (b) | | 5,000,000 | 4,654,587 |
| Great-West Lifeco U.S. Finance 2020 LP 0.904% 8/12/25 (b) | | 1,726,000 | 1,534,183 |
| MassMutual Global Funding II 4.15% 8/26/25 (b) | | 3,715,000 | 3,610,499 |
| Metropolitan Life Global Funding I 0.9% 6/8/23 (b) | | 2,778,000 | 2,745,253 |
| Pacific Life Global Funding II 1.2% 6/24/25 (b) | | 2,709,000 | 2,451,079 |
| Principal Life Global Funding II U.S. Secured Overnight Fin. Rate (SOFR) Index + 0.450% 4.8969% 4/12/24 (b)(c)(d) | | 1,828,000 | 1,828,000 |
| Protective Life Global Funding: | | | |
| 0.502% 4/12/23 (b) | | 5,000,000 | 4,974,352 |
| 3.218% 3/28/25 (b) | | 1,098,000 | 1,043,153 |
| | | | 29,725,406 |
TOTAL FINANCIALS | | | 702,954,076 |
| HEALTH CARE - 1.9% | | | |
| Biotechnology - 0.3% | | | |
| Amgen, Inc. 5.25% 3/2/25 (e) | | 7,525,000 | 7,508,265 |
| Health Care Providers & Services - 0.8% | | | |
| Cigna Group 0.613% 3/15/24 | | 990,000 | 942,655 |
| CVS Health Corp. 5% 2/20/26 | | 10,000,000 | 9,944,938 |
| Elevance Health, Inc. 0.45% 3/15/23 | | 4,206,000 | 4,198,960 |
| Humana, Inc. 0.65% 8/3/23 | | 4,595,000 | 4,504,724 |
| | | | 19,591,277 |
| Life Sciences Tools & Services - 0.3% | | | |
| PerkinElmer, Inc. 0.85% 9/15/24 | | 4,620,000 | 4,298,699 |
| Thermo Fisher Scientific, Inc. 1.215% 10/18/24 | | 5,000,000 | 4,685,512 |
| | | | 8,984,211 |
| Pharmaceuticals - 0.5% | | | |
| AstraZeneca Finance LLC 0.7% 5/28/24 | | 3,267,000 | 3,090,109 |
| Bayer U.S. Finance II LLC 4.25% 12/15/25 (b) | | 6,602,000 | 6,385,424 |
| GSK Consumer Healthcare Capital 3.125% 3/24/25 | | 4,740,000 | 4,507,039 |
| | | | 13,982,572 |
TOTAL HEALTH CARE | | | 50,066,325 |
| INDUSTRIALS - 2.1% | | | |
| Aerospace & Defense - 0.5% | | | |
| Raytheon Technologies Corp. 5% 2/27/26 | | 3,646,000 | 3,640,531 |
| The Boeing Co.: | | | |
| 1.95% 2/1/24 | | 1,500,000 | 1,448,679 |
| 2.75% 2/1/26 | | 2,400,000 | 2,224,328 |
| 4.875% 5/1/25 | | 6,107,000 | 6,021,508 |
| | | | 13,335,046 |
| Airlines - 0.1% | | | |
| Delta Air Lines, Inc. 2.9% 10/28/24 | | 3,718,000 | 3,537,705 |
| Commercial Services & Supplies - 0.2% | | | |
| Republic Services, Inc. 0.875% 11/15/25 | | 4,500,000 | 3,989,196 |
| Industrial Conglomerates - 0.1% | | | |
| Siemens Financieringsmaatschappij NV 0.65% 3/11/24 (b) | | 2,595,000 | 2,469,572 |
| Machinery - 0.3% | | | |
| Daimler Trucks Finance North America LLC: | | | |
| 1.625% 12/13/24 (b) | | 1,613,000 | 1,508,788 |
| 5.2% 1/17/25 (b) | | 2,360,000 | 2,344,826 |
| Parker Hannifin Corp. 3.65% 6/15/24 | | 4,730,000 | 4,623,758 |
| | | | 8,477,372 |
| Road & Rail - 0.3% | | | |
| Canadian Pacific Railway Co. 1.35% 12/2/24 | | 7,345,000 | 6,846,834 |
| Trading Companies & Distributors - 0.4% | | | |
| Air Lease Corp.: | | | |
| 0.7% 2/15/24 | | 1,322,000 | 1,259,758 |
| 0.8% 8/18/24 | | 6,745,000 | 6,262,475 |
| 3.25% 3/1/25 | | 1,900,000 | 1,803,027 |
| | | | 9,325,260 |
| Transportation Infrastructure - 0.2% | | | |
| Avolon Holdings Funding Ltd. 2.875% 2/15/25 (b) | | 6,000,000 | 5,580,643 |
TOTAL INDUSTRIALS | | | 53,561,628 |
| INFORMATION TECHNOLOGY - 1.7% | | | |
| Electronic Equipment & Components - 0.0% | | | |
| Dell International LLC/EMC Corp. 5.45% 6/15/23 | | 1,371,000 | 1,370,039 |
| IT Services - 0.4% | | | |
| The Western Union Co.: | | | |
| 1.35% 3/15/26 | | 8,000,000 | 7,039,617 |
| 2.85% 1/10/25 | | 775,000 | 736,060 |
| 4.25% 6/9/23 | | 2,949,000 | 2,937,652 |
| | | | 10,713,329 |
| Semiconductors & Semiconductor Equipment - 0.6% | | | |
| Analog Devices, Inc. U.S. Secured Overnight Fin. Rate (SOFR) Index + 0.250% 4.6746% 10/1/24 (c)(d) | | 2,353,000 | 2,329,280 |
| Broadcom Corp./Broadcom Cayman LP 3.875% 1/15/27 | | 9,300,000 | 8,771,231 |
| Microchip Technology, Inc. 0.983% 9/1/24 | | 4,503,000 | 4,206,386 |
| | | | 15,306,897 |
| Software - 0.7% | | | |
| Oracle Corp. 5.8% 11/10/25 | | 7,380,000 | 7,467,234 |
| Roper Technologies, Inc. 3.65% 9/15/23 | | 2,500,000 | 2,473,502 |
| VMware, Inc.: | | | |
| 0.6% 8/15/23 | | 4,384,000 | 4,288,717 |
| 1% 8/15/24 | | 2,883,000 | 2,693,750 |
| | | | 16,923,203 |
TOTAL INFORMATION TECHNOLOGY | | | 44,313,468 |
| MATERIALS - 0.3% | | | |
| Chemicals - 0.3% | | | |
| Celanese U.S. Holdings LLC 5.9% 7/5/24 | | 5,000,000 | 4,994,264 |
| Nutrien Ltd. 5.9% 11/7/24 | | 2,353,000 | 2,365,560 |
| | | | 7,359,824 |
| REAL ESTATE - 0.3% | | | |
| Equity Real Estate Investment Trusts (REITs) - 0.3% | | | |
| American Tower Corp. 1.3% 9/15/25 | | 1,459,000 | 1,311,754 |
| Crown Castle International Corp. 1.35% 7/15/25 | | 342,000 | 310,617 |
| Omega Healthcare Investors, Inc. 4.5% 1/15/25 | | 3,800,000 | 3,706,251 |
| Welltower Op 3.625% 3/15/24 | | 1,604,000 | 1,570,791 |
| | | | 6,899,413 |
| UTILITIES - 1.5% | | | |
| Electric Utilities - 0.8% | | | |
| Duke Energy Corp. U.S. Secured Overnight Fin. Rate (SOFR) Index + 0.250% 4.6101% 6/10/23 (c)(d) | | 3,198,000 | 3,195,291 |
| Edison International 2.95% 3/15/23 | | 5,000,000 | 4,994,580 |
| FirstEnergy Corp.: | | | |
| 1.6% 1/15/26 | | 365,000 | 325,048 |
| 2.05% 3/1/25 | | 2,028,000 | 1,891,819 |
| Florida Power & Light Co. 2.85% 4/1/25 | | 926,000 | 886,506 |
| PPL Electric Utilities Corp. 3 month U.S. LIBOR + 0.250% 4.9739% 9/28/23 (c)(d) | | 1,790,000 | 1,785,073 |
| Southern Co.: | | | |
| U.S. Secured Overnight Fin. Rate (SOFR) Averages Index + 0.370% 4.9251% 5/10/23 (c)(d) | | 3,695,000 | 3,693,522 |
| 0.6% 2/26/24 | | 1,338,000 | 1,274,106 |
| Tampa Electric Co. 3.875% 7/12/24 | | 2,786,000 | 2,721,466 |
| | | | 20,767,411 |
| Gas Utilities - 0.1% | | | |
| CenterPoint Energy Resources Corp. 3 month U.S. LIBOR + 0.500% 5.2786% 3/2/23 (c)(d) | | 2,052,000 | 2,052,000 |
| Dominion Gas Holdings LLC 2.5% 11/15/24 | | 722,000 | 688,852 |
| | | | 2,740,852 |
| Independent Power and Renewable Electricity Producers - 0.1% | | | |
| Emera U.S. Finance LP 0.833% 6/15/24 | | 2,029,000 | 1,903,420 |
| Multi-Utilities - 0.5% | | | |
| CenterPoint Energy, Inc. U.S. Secured Overnight Fin. Rate (SOFR) Averages Index + 0.650% 5.2048% 5/13/24 (c)(d) | | 3,063,000 | 3,048,301 |
| DTE Energy Co. 4.22% 11/1/24 | | 5,000,000 | 4,890,131 |
| NiSource, Inc. 0.95% 8/15/25 | | 1,507,000 | 1,358,690 |
| Sempra Energy 3.3% 4/1/25 | | 1,816,000 | 1,738,233 |
| WEC Energy Group, Inc. 5% 9/27/25 | | 1,702,000 | 1,686,829 |
| | | | 12,722,184 |
TOTAL UTILITIES | | | 38,133,867 |
| TOTAL NONCONVERTIBLE BONDS (Cost $1,170,381,208) | | | 1,140,408,536 |
| | | | |
| U.S. Treasury Obligations - 39.0% |
| | | Principal Amount (a) | Value ($) |
| U.S. Treasury Bills, yield at date of purchase 4.63% 11/2/23 | | 25,000,000 | 24,191,190 |
| U.S. Treasury Notes: | | | |
| 0.25% 7/31/25 (f) | | 281,359,800 | 253,487,599 |
| 0.25% 10/31/25 | | 65,867,100 | 58,822,408 |
| 0.375% 4/30/25 | | 18,852,700 | 17,175,104 |
| 3.875% 1/15/26 | | 97,311,300 | 95,638,762 |
| 4.125% 1/31/25 (g) | | 221,680,100 | 218,796,527 |
| 4.125% 10/31/27 | | 53,000,000 | 52,735,000 |
| 4.25% 9/30/24 | | 206,000,000 | 203,674,454 |
| 4.5% 11/30/24 | | 10,000,000 | 9,927,734 |
| 4.5% 11/15/25 | | 76,356,100 | 76,227,845 |
| TOTAL U.S. TREASURY OBLIGATIONS (Cost $1,026,573,946) | | | 1,010,676,623 |
| | | | |
| U.S. Government Agency - Mortgage Securities - 0.1% |
| | | Principal Amount (a) | Value ($) |
| Fannie Mae - 0.1% | | | |
| 4.5% 3/1/39 to 9/1/49 | | 2,978,955 | 2,925,899 |
| 5.5% 11/1/34 | | 572,299 | 580,331 |
| 7.5% 11/1/31 | | 109 | 114 |
TOTAL FANNIE MAE | | | 3,506,344 |
| Freddie Mac - 0.0% | | | |
| 8.5% 5/1/26 to 7/1/28 | | 5,364 | 5,544 |
| Ginnie Mae - 0.0% | | | |
| 7% to 7% 1/15/25 to 8/15/32 | | 65,011 | 66,796 |
| TOTAL U.S. GOVERNMENT AGENCY - MORTGAGE SECURITIES (Cost $3,995,672) | | | 3,578,684 |
| | | | |
| Asset-Backed Securities - 11.7% |
| | | Principal Amount (a) | Value ($) |
| Aimco: | | | |
| Series 2021-10A Class AR, 3 month U.S. LIBOR + 1.060% 5.8753% 7/22/32 (b)(c)(d) | | 4,510,000 | 4,452,646 |
| Series 2021-BA Class AR, 3 month U.S. LIBOR + 1.100% 5.8924% 1/15/32 (b)(c)(d) | | 4,518,000 | 4,461,520 |
| AIMCO CLO Ltd. Series 2022-12A Class AR, CME TERM SOFR 3 MONTH INDEX + 1.170% 5.8276% 1/17/32 (b)(c)(d) | | 5,435,000 | 5,392,569 |
| American Express Credit Account Master Trust: | | | |
| Series 2021-1 Class A, 0.9% 11/15/26 | | 5,630,000 | 5,245,014 |
| Series 2022-2 Class A, 3.39% 5/15/27 | | 6,000,000 | 5,784,838 |
| Series 2022-3 Class A, 3.75% 8/15/27 | | 5,000,000 | 4,853,272 |
| Series 2022-4 Class A, 4.95% 10/15/27 | | 2,840,000 | 2,839,542 |
| AmeriCredit Automobile Receivables Trust Series 2021-3 Class A3, 0.76% 8/18/26 | | 4,632,000 | 4,434,196 |
| Ares LII CLO Ltd. Series 2021-52A Class A1R, 3 month U.S. LIBOR + 1.050% 5.8653% 4/22/31 (b)(c)(d) | | 3,925,000 | 3,875,926 |
| Bank of America Credit Card Master Trust: | | | |
| Series 2020-A1 Class A1, 0.34% 5/15/26 | | 5,085,000 | 4,896,680 |
| Series 2021-A1 Class A1, 0.44% 9/15/26 | | 4,673,000 | 4,431,017 |
| Series 2022-A1 Class A1, 3.53% 11/15/27 | | 5,363,000 | 5,186,283 |
| Series 2022-A2, Class A2, 5% 4/15/28 | | 3,936,000 | 3,944,614 |
| BMW Vechicle Lease Trust 2023-1 Series 2023-1 Class A3, 5.16% 11/25/25 | | 3,286,000 | 3,281,771 |
| Capital One Multi-Asset Execution Trust: | | | |
| Series 2021-A3 Class A3, 1.04% 11/15/26 | | 5,927,000 | 5,524,450 |
| Series 2022-A1 Class A1, 2.8% 3/15/27 | | 9,460,000 | 9,024,349 |
| Series 2022-A2 Class A, 3.49% 5/15/27 | | 4,725,000 | 4,569,088 |
| Series 2022-A3 Class A, 4.95% 10/15/27 | | 3,490,000 | 3,484,982 |
| Capital One Prime Auto Receivables Series 2023-1 Class A3, 4.87% 2/15/28 | | 6,465,000 | 6,424,693 |
| CarMax Auto Owner Trust Series 2020-4 Class A3, 0.5% 8/15/25 | | 1,520,710 | 1,482,108 |
| Carmax Auto Owner Trust Series 2022-4 Class A2A, 5.34% 12/15/25 | | 3,222,000 | 3,221,453 |
| Carmax Owner Trust Series 2023-1 Class A2A, 5.23% 1/15/26 | | 3,459,000 | 3,448,948 |
| Carvana Auto Receivables Trust: | | | |
| Series 2021-P2 Class A3, 0.49% 3/10/26 | | 2,907,180 | 2,806,757 |
| Series 2021-P3 Class A3, 0.7% 11/10/26 | | 3,730,000 | 3,503,003 |
| Cedar Funding Ltd.: | | | |
| Series 2021-10A Class AR, 3 month U.S. LIBOR + 1.100% 5.9077% 10/20/32 (b)(c)(d) | | 1,244,000 | 1,226,549 |
| Series 2021-14A Class A, 3 month U.S. LIBOR + 1.100% 5.8924% 7/15/33 (b)(c)(d) | | 5,539,000 | 5,455,151 |
| Cent CLO LP Series 2021-21A Class A1R3, 3 month U.S. LIBOR + 0.970% 5.7846% 7/27/30 (b)(c)(d) | | 3,937,258 | 3,896,098 |
| Chase Issuance Trust Series 2022-A1 Class A, 3.97% 9/15/27 | | 4,436,000 | 4,319,733 |
| Countrywide Home Loans, Inc. Series 2004-2 Class 3A4, 1 month U.S. LIBOR + 0.500% 5.117% 7/25/34 (c)(d) | | 63,026 | 59,754 |
| Dell Equipment Finance Trust: | | | |
| Series 2020-2 Class A3, 0.57% 10/23/23 (b) | | 364,185 | 362,550 |
| Series 2021-1 Class A3, 0.43% 5/22/26 (b) | | 1,245,018 | 1,226,165 |
| Discover Card Execution Note Trust: | | | |
| Series 2021-A1 Class A1, 0.58% 9/15/26 | | 5,550,000 | 5,165,030 |
| Series 2022-A1 Class A1, 1.96% 2/15/27 | | 3,099,000 | 2,911,065 |
| Series 2022-A2 Class A, 3.32% 5/15/27 | | 4,680,000 | 4,510,123 |
| Series 2022-A3 Class A3, 3.56% 7/15/27 | | 4,691,000 | 4,532,133 |
| Series 2022-A4, Class A, 5.03% 10/15/27 | | 4,250,000 | 4,251,592 |
| DLLAD LLC Series 2021-1A Class A2, 0.35% 9/20/24 (b) | | 825,787 | 816,638 |
| DLLMT LLC Series 2021-1A Class A2, 0.6% 3/20/24 (b) | | 1,470,261 | 1,458,748 |
| Donlen Fleet Lease Funding Series 2021-2 Class A2, 0.56% 12/11/34 (b) | | 5,792,400 | 5,609,693 |
| Eaton Vance CLO, Ltd. Series 2021-1A Class AR, 3 month U.S. LIBOR + 1.100% 5.8924% 4/15/31 (b)(c)(d) | | 4,077,000 | 4,039,769 |
| Enterprise Fleet Financing Series 2023-1 Class A2, 5.51% 1/22/29 (b) | | 4,665,000 | 4,667,916 |
| Enterprise Fleet Financing LLC: | | | |
| Series 2020-1 Class A2, 1.78% 12/22/25 (b) | | 342,325 | 341,172 |
| Series 2020-2 Class A2, 0.61% 7/20/26 (b) | | 1,279,019 | 1,253,443 |
| Series 2021-1 Class A2, 0.44% 12/21/26 (b) | | 562,807 | 547,005 |
| Series 2021-2 Class A2, 0.48% 5/20/27 (b) | | 2,439,768 | 2,344,570 |
| Series 2022-3 Class A2, 4.38% 7/20/29 (b) | | 781,000 | 767,025 |
| Ford Credit Floorplan Master Owner Trust Series 2020-1 Class A1, 0.7% 9/15/25 | | 7,267,000 | 7,084,654 |
| Fordl 2023-A Series 2023-A Class A2A, 5.19% 6/15/25 | | 2,654,000 | 2,650,001 |
| GM Financial Automobile Leasing Trust: | | | |
| Series 2021-3 Class A3, 0.39% 10/21/24 | | 3,537,901 | 3,457,352 |
| Series 2022-2 Class A2, 2.93% 10/21/24 | | 2,919,062 | 2,883,133 |
| Series 2023-1 Class A3, 5.16% 4/20/26 | | 4,108,000 | 4,105,103 |
| GM Financial Consumer Automobile Receivables Series 2022-2 Class A3, 3.1% 2/16/27 | | 4,307,000 | 4,162,616 |
| GM Financial Consumer Automobile Receivables Trust Series 2020-4 Class A3, 0.38% 8/18/25 | | 1,551,435 | 1,511,403 |
| GMF Floorplan Owner Revolving Trust: | | | |
| Series 2020-1 Class A, 0.68% 8/15/25 (b) | | 1,575,000 | 1,541,853 |
| Series 2020-2 Class A, 0.69% 10/15/25 (b) | | 3,406,000 | 3,307,797 |
| Honda Auto Receivables Series 2023-1 Class A3, 5.04% 4/21/27 | | 4,546,000 | 4,537,022 |
| Hyundai Auto Receivables Trust Series 2020-C Class A3, 0.38% 5/15/25 | | 1,790,876 | 1,748,218 |
| Madison Park Funding XXXII, Ltd. / Madison Park Funding XXXII LLC Series 2021-32A Class A1R, 3 month U.S. LIBOR + 1.000% 5.8153% 1/22/31 (b)(c)(d) | | 3,305,000 | 3,273,903 |
| Marlette Funding Trust: | | | |
| Series 2021-3A Class A, 0.65% 12/15/31 (b) | | 346,518 | 343,355 |
| Series 2022-1A Class A, 1.36% 4/15/32 (b) | | 1,065,943 | 1,052,778 |
| Series 2022-2A Class A, 4.25% 8/15/32 (b) | | 2,701,368 | 2,667,645 |
| Mercedes-Benz Auto Receivables Series 2023-1 Class A2, 5.09% 1/15/26 | | 3,173,000 | 3,165,432 |
| MMAF Equipment Finance LLC: | | | |
| Series 2019-B Class A3, 2.01% 12/12/24 (b) | | 1,094,102 | 1,075,970 |
| Series 2022-B Class A2, 5.57% 9/9/25 (b) | | 2,568,000 | 2,565,636 |
| Niagara Park CLO, Ltd. Series 2021-1A Class AR, 3 month U.S. LIBOR + 1.000% 5.7924% 7/17/32 (b)(c)(d) | | 4,380,000 | 4,318,500 |
| OneMain Direct Auto Receivables Trust Series 2021-1A Class A, 0.87% 7/14/28 (b) | | 4,502,000 | 4,207,021 |
| Palmer Square Loan Funding, Ltd. Series 2021-2A Class A1, 3 month U.S. LIBOR + 0.800% 5.7153% 5/20/29 (b)(c)(d) | | 2,814,232 | 2,793,418 |
| Palmer Square Loan Funding, Ltd. / Palmer Square Loan Funding LLC Series 2022-1A Class A1, CME TERM SOFR 3 MONTH INDEX + 1.050% 5.6819% 4/15/30 (b)(c)(d) | | 4,390,305 | 4,340,765 |
| Park Place Securities, Inc. Series 2005-WCH1 Class M4, 1 month U.S. LIBOR + 1.240% 5.862% 1/25/36 (c)(d) | | 71,984 | 70,522 |
| Prpm 2021-5, LLC Series 2021-5 Class A1, 1.793% 6/25/26 (b)(c) | | 2,371,558 | 2,145,135 |
| Santander Consumer Auto Receivables Trust Series 2021-AA Class A3, 0.33% 10/15/25 (b) | | 1,163,517 | 1,144,972 |
| Santander Drive Auto Receivables Trust Series 2022-5 Class A3, 4.11% 8/17/26 | | 2,994,000 | 2,957,244 |
| Santander Retail Auto Lease Trust: | | | |
| Series 2020-B Class A3, 0.57% 4/22/24 (b) | | 2,591,401 | 2,558,680 |
| Series 2021-A Class A3, 0.51% 7/22/24 (b) | | 2,018,074 | 1,977,204 |
| Sofi Consumer Loan Program Series 2023-1S Class A, 5.81% 5/15/31 (b) | | 3,113,000 | 3,111,764 |
| Symphony CLO XXI, Ltd. Series 2021-21A Class AR, 3 month U.S. LIBOR + 1.060% 5.8524% 7/15/32 (b)(c)(d) | | 3,398,000 | 3,356,476 |
| Symphony CLO XXIII Ltd. Series 2021-23A Class AR, 3 month U.S. LIBOR + 1.020% 5.8124% 1/15/34 (b)(c)(d) | | 4,807,000 | 4,758,829 |
| TCI-Flatiron CLO Ltd. / LLC Series 2021-1A Class AR, 3 month U.S. LIBOR + 0.960% 5.8366% 11/18/30 (b)(c)(d) | | 4,231,129 | 4,193,480 |
| TCI-Symphony CLO Series 2021-1A Class AR, 3 month U.S. LIBOR + 0.920% 5.7224% 7/15/30 (b)(c)(d) | | 5,079,504 | 5,028,175 |
| Terwin Mortgage Trust Series 2003-4HE Class A1, 1 month U.S. LIBOR + 0.860% 5.477% 9/25/34 (c)(d) | | 68,627 | 65,905 |
| Tesla Auto Lease Trust Series 2021-A Class A3, 0.56% 3/20/25 (b) | | 3,226,000 | 3,151,345 |
| Toyota Auto Loan Extended Note Trust Series 2020-1A Class A, 1.35% 5/25/33 (b) | | 2,401,000 | 2,202,066 |
| Upstart Securitization Trust: | | | |
| Series 2021-2 Class A, 0.91% 6/20/31 (b) | | 316,536 | 313,343 |
| Series 2021-3 Class A, 0.83% 7/20/31 (b) | | 742,504 | 729,173 |
| Series 2021-4 Class A, 0.84% 9/20/31 (b) | | 1,361,522 | 1,327,039 |
| Series 2021-5 Class A, 1.31% 11/20/31 (b) | | 1,852,901 | 1,801,873 |
| 3.12% 3/20/32 (b) | | 2,993,016 | 2,915,144 |
| VCAT Asset Securitization, LLC: | | | |
| Series 2021-NPL1 Class A1, 2.2891% 12/26/50 (b) | | 458,636 | 434,249 |
| Series 2021-NPL2 Class A1, 2.115% 3/27/51 (b) | | 2,253,851 | 2,107,166 |
| Series 2021-NPL3 Class A1, 1.743% 5/25/51 (b)(c) | | 2,963,492 | 2,703,604 |
| Verizon Master Trust: | | | |
| Series 2021-1 Class A, 0.5% 5/20/27 | | 3,250,000 | 3,068,957 |
| Series 2021-2 Class A, 0.99% 4/20/28 | | 4,700,000 | 4,392,741 |
| Series 2022-5 Class A1A, 3.72% 7/20/27 | | 2,405,000 | 2,372,027 |
| Voya CLO Ltd. Series 2021-1A Class A1R, 3 month U.S. LIBOR + 0.950% 5.7424% 4/17/30 (b)(c)(d) | | 3,748,987 | 3,712,817 |
| Voya CLO Ltd./Voya CLO LLC Series 2021-2A Class A1R, 3 month U.S. LIBOR + 1.160% 5.9576% 7/19/34 (b)(c)(d) | | 4,500,000 | 4,423,892 |
| Wheels SPV LLC Series 2021-1A Class A, 1 month U.S. LIBOR + 0.280% 4.8713% 8/20/29 (b)(c)(d) | | 1,733,601 | 1,718,812 |
| World Omni Auto Receivables Trust Series 2021-D Class A2, 0.35% 12/16/24 | | 1,156,404 | 1,149,163 |
| World Omni Automobile Lease Securitization Trust Series 2020-B Class A3, 0.45% 2/15/24 | | 384,791 | 384,191 |
| TOTAL ASSET-BACKED SECURITIES (Cost $311,163,782) | | | 303,401,204 |
| | | | |
| Collateralized Mortgage Obligations - 1.7% |
| | | Principal Amount (a) | Value ($) |
| Private Sponsor - 1.5% | | | |
| Ajax Mortgage Loan Trust sequential payer Series 2021-B Class A, 2.239% 6/25/66 (b)(c) | | 1,104,716 | 1,031,115 |
| Angel Oak Mortgage Trust Series 2021-8 Class A1, 1.82% 11/25/66 (b) | | 3,027,307 | 2,542,713 |
| Brass PLC Series 2021-10A Class A1, 0.669% 4/16/69 (b)(c) | | 476,112 | 453,952 |
| Cascade Funding Mortgage Trust: | | | |
| Series 2021-EBO1 Class A, 0.9849% 11/25/50 (b)(c) | | 826,280 | 776,051 |
| Series 2021-HB5 Class A, 0.8006% 2/25/31 (b) | | 481,850 | 466,230 |
| Series 2021-HB6 Class A, 0.8983% 6/25/36 (b) | | 793,853 | 753,223 |
| Series 2021-HB7 Class A, 1.1512% 10/27/31 (b) | | 1,073,171 | 1,006,997 |
| CFMT 2022-EBO2 sequential payer Series 2022-EBO2 Class A, 3.169% 7/25/54 (b) | | 841,023 | 812,874 |
| CFMT 2022-Hb8 LLC sequential payer Series 2022-HB8 Class A, 3.75% 4/25/25 (b) | | 3,956,656 | 3,774,211 |
| CSMC 2021-Rpl9 Trust sequential payer Series 2021-RPL9 Class A1, 2.4364% 2/25/61 (b) | | 4,368,034 | 4,016,169 |
| Finance of America HECM Buyout sequential payer Series 2022-HB1 Class A, 2.6948% 2/25/32 (b)(c) | | 3,588,900 | 3,463,664 |
| GCAT Trust sequential payer Series 2021-NQM7 Class A1, 1.915% 8/25/66 (b) | | 1,637,845 | 1,421,672 |
| Legacy Mortgage Asset Trust Series 2021-GS5 Class A1, 2.25% 7/25/67 (b)(c) | | 3,475,165 | 3,122,312 |
| New York Mortgage Trust sequential payer Series 2021-SP1 Class A1, 1.6696% 8/25/61 (b) | | 1,133,143 | 1,016,019 |
| Oceanview Mortgage Loan Trust sequential payer Series 2020-1 Class A1A, 1.7329% 5/28/50 (b) | | 1,175,558 | 1,042,429 |
| Oceanview Trust sequential payer Series 2021-1 Class A, 1.2187% 12/29/51 (b)(c) | | 1,243,339 | 1,192,274 |
| Preston Ridge Partners Mortgage Trust: | | | |
| sequential payer Series 2021-8 Class A1, 1.743% 9/25/26 (b)(c) | | 2,929,923 | 2,616,992 |
| Series 2021-2 Class A1, 2.115% 3/25/26 (b) | | 3,880,475 | 3,653,952 |
| Series 2021-RPL1 Class A1, 1.319% 7/25/51 (b) | | 462,258 | 404,637 |
| Series 2021-RPL2 Class A1, 1.455% 10/25/51 (b)(c) | | 633,555 | 558,539 |
| PRET LLC Series 2022-RN1 Class A1, 3.721% 7/25/51 (b) | | 2,288,107 | 2,094,762 |
| RMF Buyout Issuance Trust sequential payer: | | | |
| Series 2021-HB1 Class A, 1.2586% 11/25/31 (b) | | 1,318,689 | 1,243,959 |
| Series 2022-HB1 Class A, 4.272% 4/25/32 (b) | | 688,322 | 663,907 |
| Sequoia Mortgage Trust floater Series 2004-6 Class A3B, 6 month U.S. LIBOR + 0.880% 6.0669% 7/20/34 (c)(d) | | 763 | 682 |
TOTAL PRIVATE SPONSOR | | | 38,129,335 |
| U.S. Government Agency - 0.2% | | | |
| Fannie Mae: | | | |
| floater Series 2015-27 Class KF, 1 month U.S. LIBOR + 0.300% 4.917% 5/25/45 (c)(d) | | 1,343,609 | 1,330,364 |
| sequential payer Series 2001-40 Class Z, 6% 8/25/31 | | 23,804 | 23,801 |
| Series 2016-27: | | | |
Class HK, 3% 1/25/41 | | 1,430,670 | 1,337,523 |
Class KG, 3% 1/25/40 | | 659,768 | 617,212 |
| Series 2016-42 Class FL, 1 month U.S. LIBOR + 0.350% 4.967% 7/25/46 (c)(d) | | 1,520,405 | 1,512,565 |
| Freddie Mac Series 3949 Class MK, 4.5% 10/15/34 | | 151,265 | 149,020 |
TOTAL U.S. GOVERNMENT AGENCY | | | 4,970,485 |
| TOTAL COLLATERALIZED MORTGAGE OBLIGATIONS (Cost $46,546,695) | | | 43,099,820 |
| | | | |
| Commercial Mortgage Securities - 3.4% |
| | | Principal Amount (a) | Value ($) |
| BAMLL Commercial Mortgage Securities Trust: | | | |
| floater Series 2022-DKLX Class A, CME Term SOFR 1 Month Index + 1.150% 5.713% 1/15/39 (b)(c)(d) | | 1,181,000 | 1,163,719 |
| sequential payer Series 2019-BPR Class ANM, 3.112% 11/5/32 (b) | | 1,099,000 | 1,002,988 |
| Benchmark Mortgage Trust: | | | |
| sequential payer Series 2021-B31 Class A1, 1.357% 12/15/54 | | 3,321,007 | 3,055,951 |
| Series 2018-B7 Class A1, 3.436% 5/15/53 | | 222,486 | 220,751 |
| BLOX Trust floater sequential payer Series 2021-BLOX Class A, 1 month U.S. LIBOR + 0.750% 5.338% 9/15/26 (b)(c)(d) | | 2,278,000 | 2,153,453 |
| BPR Trust floater Series 2022-OANA Class A, CME Term SOFR 1 Month Index + 1.890% 6.4605% 4/15/37 (b)(c)(d) | | 4,067,000 | 3,993,236 |
| BX Commercial Mortgage Trust floater: | | | |
| Series 2021-PAC Class A, 1 month U.S. LIBOR + 0.680% 5.2771% 10/15/36 (b)(c)(d) | | 2,101,000 | 2,053,085 |
| Series 2021-VINO Class A, 1 month U.S. LIBOR + 0.650% 5.2403% 5/15/38 (b)(c)(d) | | 1,700,000 | 1,663,782 |
| Series 2022-LP2 Class A, CME Term SOFR 1 Month Index + 1.010% 5.5754% 2/15/39 (b)(c)(d) | | 2,722,039 | 2,681,571 |
| BX Trust: | | | |
| floater: | | | |
Series 2021-ACNT Class A, 1 month U.S. LIBOR + 0.850% 5.438% 11/15/38 (b)(c)(d) | | 2,082,000 | 2,046,807 |
Series 2021-BXMF Class A, 1 month U.S. LIBOR + 0.630% 5.2239% 10/15/26 (b)(c)(d) | | 1,935,000 | 1,887,848 |
Series 2022-GPA Class A, CME Term SOFR 1 Month Index + 2.160% 6.7275% 10/15/39 (b)(c)(d) | | 1,009,000 | 1,007,105 |
| floater sequential payer: | | | |
Series 2019-IMC Class A, 1 month U.S. LIBOR + 1.000% 5.588% 4/15/34 (b)(c)(d) | | 2,104,341 | 2,067,256 |
Series 2019-XL Class A, CME Term SOFR 1 Month Index + 1.030% 5.597% 10/15/36 (b)(c)(d) | | 3,026,978 | 3,011,770 |
Series 2021-SOAR Class A, 5.258% 6/15/38 (b)(c) | | 1,883,730 | 1,850,439 |
| CF Hippolyta Issuer LLC sequential payer: | | | |
| Series 2020-1 Class A1, 1.69% 7/15/60 (b) | | 3,656,311 | 3,273,534 |
| Series 2021-1A Class A1, 1.53% 3/15/61 (b) | | 2,224,164 | 1,931,445 |
| CGDB Commercial Mortgage Trust floater Series 2019-MOB Class A, 1 month U.S. LIBOR + 0.950% 5.5379% 11/15/36 (b)(c)(d) | | 821,166 | 808,792 |
| CHC Commercial Mortgage Trust floater Series 2019-CHC Class A, 1 month U.S. LIBOR + 1.120% 5.708% 6/15/34 (b)(c)(d) | | 3,038,602 | 2,953,169 |
| Citigroup Commercial Mortgage Trust: | | | |
| sequential payer: | | | |
Series 2014-GC21 Class AAB, 3.477% 5/10/47 | | 233,847 | 230,720 |
Series 2016-GC36 Class AAB, 3.368% 2/10/49 | | 968,934 | 933,898 |
| Series 2015-GC33 Class AAB, 3.522% 9/10/58 | | 1,476,474 | 1,429,813 |
| COMM Mortgage Trust sequential payer: | | | |
| Series 2014-CR18 Class ASB, 3.452% 7/15/47 | | 447,892 | 445,500 |
| Series 2020-SBX Class A, 1.67% 1/10/38 (b) | | 4,412,000 | 3,907,193 |
| Credit Suisse Mortgage Trust: | | | |
| floater Series 2019-ICE4 Class A, 1 month U.S. LIBOR + 0.980% 5.568% 5/15/36 (b)(c)(d) | | 3,917,254 | 3,897,587 |
| sequential payer Series 2020-NET Class A, 2.2569% 8/15/37 (b) | | 525,072 | 471,709 |
| CSAIL 2018-CX12 Commercial Mortgage Trust sequential payer Series 2018-CX12 Class ASB, 4.1628% 8/15/51 | | 2,156,000 | 2,064,805 |
| CSMC Trust Series 2017-CHOP Class A, 1 month U.S. LIBOR + 0.750% 5.338% 7/15/32 (b)(c)(d) | | 3,675,000 | 3,497,496 |
| ELP Commercial Mortgage Trust floater Series 2021-ELP Class A, 1 month U.S. LIBOR + 0.700% 5.289% 11/15/38 (b)(c)(d) | | 2,887,000 | 2,811,038 |
| Extended Stay America Trust floater Series 2021-ESH Class A, 1 month U.S. LIBOR + 1.080% 5.668% 7/15/38 (b)(c)(d) | | 902,978 | 889,399 |
| GS Mortgage Securities Trust: | | | |
| floater Series 2021-IP Class A, 1 month U.S. LIBOR + 0.950% 5.538% 10/15/36 (b)(c)(d) | | 1,243,000 | 1,178,927 |
| Series 2011-GC5 Class A/S, 5.1538% 8/10/44 (b)(c) | | 2,628,583 | 2,589,651 |
| JPMBB Commercial Mortgage Securities Trust sequential payer Series 2014-C21 Class A4, 3.4927% 8/15/47 | | 3,603,446 | 3,509,901 |
| JPMorgan Chase Commercial Mortgage Securities Trust: | | | |
| floater Series 2019-BKWD Class A, 1 month U.S. LIBOR + 1.250% 5.838% 9/15/29 (b)(c)(d) | | 1,364,955 | 1,297,207 |
| Series 2013-LC11 Class A/S, 3.216% 4/15/46 | | 2,432,813 | 2,232,601 |
| Life Financial Services Trust floater Series 2022-BMR2 Class A1, CME Term SOFR 1 Month Index + 1.290% 5.8577% 5/15/39 (b)(c)(d) | | 3,413,000 | 3,400,193 |
| LIFE Mortgage Trust floater Series 2021-BMR Class A, 1 month U.S. LIBOR + 0.700% 5.288% 3/15/38 (b)(c)(d) | | 1,683,828 | 1,653,300 |
| Merit floater Series 2021-STOR Class A, 1 month U.S. LIBOR + 0.700% 5.288% 7/15/38 (b)(c)(d) | | 995,000 | 974,480 |
| Morgan Stanley BAML Trust sequential payer Series 2016-C28 Class A3, 3.272% 1/15/49 | | 802,735 | 755,262 |
| Morgan Stanley Capital I Trust: | | | |
| sequential payer Series 2019-MEAD Class A, 3.17% 11/10/36 (b) | | 2,396,136 | 2,233,025 |
| Series 2019-H7 Class A1, 2.327% 7/15/52 | | 735,295 | 716,302 |
| OPG Trust floater Series 2021-PORT Class A, 1 month U.S. LIBOR + 0.480% 5.072% 10/15/36 (b)(c)(d) | | 3,214,405 | 3,121,012 |
| SREIT Trust floater Series 2021-MFP Class A, 1 month U.S. LIBOR + 0.730% 5.3187% 11/15/38 (b)(c)(d) | | 2,005,000 | 1,961,782 |
| Wells Fargo Commercial Mortgage Trust sequential payer: | | | |
| Series 2015-LC22 Class ASB, 3.571% 9/15/58 | | 1,167,427 | 1,130,699 |
| Series 2017-RC1 Class ASB, 3.453% 1/15/60 | | 1,599,974 | 1,541,999 |
| WF-RBS Commercial Mortgage Trust sequential payer: | | | |
| Series 2013-C14 Class ASB, 2.977% 6/15/46 | | 49,300 | 49,150 |
| Series 2014-C20 Class ASB, 3.638% 5/15/47 | | 221,316 | 218,395 |
| TOTAL COMMERCIAL MORTGAGE SECURITIES (Cost $91,627,755) | | | 87,969,745 |
| | | | |
| Money Market Funds - 9.2% |
| | | Shares | Value ($) |
| Fidelity Cash Central Fund 4.63% (h) | | 14,544,261 | 14,547,170 |
| Fidelity Securities Lending Cash Central Fund 4.63% (h)(i) | | 224,120,293 | 224,142,705 |
| TOTAL MONEY MARKET FUNDS (Cost $238,689,875) | | | 238,689,875 |
| | | | |
| TOTAL INVESTMENT IN SECURITIES - 109.1% (Cost $2,888,978,933) | 2,827,824,487 |
NET OTHER ASSETS (LIABILITIES) - (9.1)% | (236,708,341) |
| NET ASSETS - 100.0% | 2,591,116,146 |
| | |
| Futures Contracts |
| | Number of contracts | Expiration Date | Notional Amount ($) | Value ($) | Unrealized Appreciation/ (Depreciation) ($) |
| Purchased | | | | | |
| | | | | | |
| Treasury Contracts | | | | | |
| CBOT 2-Year U.S. Treasury Note Contracts (United States) | 484 | Jun 2023 | 98,603,656 | (224,042) | (224,042) |
| | | | | | |
| The notional amount of futures purchased as a percentage of Net Assets is 3.8% |
For the period, the average monthly notional amount at value for futures contracts in the aggregate was $70,479,926.
Legend
| (a) | Amount is stated in United States dollars unless otherwise noted. |
| (b) | Security exempt from registration under Rule 144A of the Securities Act of 1933. These securities may be resold in transactions exempt from registration, normally to qualified institutional buyers. At the end of the period, the value of these securities amounted to $504,869,247 or 19.5% of net assets. |
| (c) | Coupon rates for floating and adjustable rate securities reflect the rates in effect at period end. |
| (d) | Coupon is indexed to a floating interest rate which may be multiplied by a specified factor and/or subject to caps or floors. |
| (e) | Security or a portion of the security purchased on a delayed delivery or when-issued basis. |
| (f) | Security or a portion of the security was pledged to cover margin requirements for futures contracts. At period end, the value of securities pledged amounted to $565,796. |
| (g) | Security or a portion of the security is on loan at period end. |
| (h) | Affiliated fund that is generally available only to investment companies and other accounts managed by Fidelity Investments. The rate quoted is the annualized seven-day yield of the fund at period end. A complete unaudited listing of the fund's holdings as of its most recent quarter end is available upon request. In addition, each Fidelity Central Fund's financial statements are available on the SEC's website or upon request. |
| (i) | Investment made with cash collateral received from securities on loan. |
Affiliated Central Funds
Fiscal year to date information regarding the Fund's investments in Fidelity Central Funds, including the ownership percentage, is presented below.
| Affiliate | Value, beginning of period ($) | Purchases ($) | Sales Proceeds ($) | Dividend Income ($) | Realized Gain (loss) ($) | Change in Unrealized appreciation (depreciation) ($) | Value, end of period ($) | % ownership, end of period |
| Fidelity Cash Central Fund 4.63% | 7,113,819 | 425,110,655 | 417,677,304 | 340,038 | - | - | 14,547,170 | 0.0% |
| Fidelity Securities Lending Cash Central Fund 4.63% | - | 496,223,463 | 272,080,758 | 47,512 | - | - | 224,142,705 | 0.7% |
| Total | 7,113,819 | 921,334,118 | 689,758,062 | 387,550 | - | - | 238,689,875 | |
| | | | | | | | | |
Amounts in the dividend income column in the above table include any capital gain distributions from underlying funds, which are presented in the corresponding line item in the Statement of Operations, if applicable.
Amount for Fidelity Securities Lending Cash Central Fund represents the income earned on investing cash collateral, less rebates paid to borrowers and any lending agent fees associated with the loan, plus any premium payments received for lending certain types of securities.
Amounts included in the purchases and sales proceeds columns may include in-kind transactions, if applicable.
Investment Valuation
The following is a summary of the inputs used, as of February 28, 2023, involving the Fund's assets and liabilities carried at fair value. The inputs or methodology used for valuing securities may not be an indication of the risk associated with investing in those securities. For more information on valuation inputs, and their aggregation into the levels used below, please refer to the Investment Valuation section in the accompanying Notes to Financial Statements.
| Valuation Inputs at Reporting Date: |
| Description | Total ($) | Level 1 ($) | Level 2 ($) | Level 3 ($) |
Investments in Securities: | | | | |
|
| Corporate Bonds | 1,140,408,536 | - | 1,140,408,536 | - |
|
| U.S. Government and Government Agency Obligations | 1,010,676,623 | - | 1,010,676,623 | - |
|
| U.S. Government Agency - Mortgage Securities | 3,578,684 | - | 3,578,684 | - |
|
| Asset-Backed Securities | 303,401,204 | - | 303,401,204 | - |
|
| Collateralized Mortgage Obligations | 43,099,820 | - | 43,099,820 | - |
|
| Commercial Mortgage Securities | 87,969,745 | - | 87,969,745 | - |
|
| Money Market Funds | 238,689,875 | 238,689,875 | - | - |
| Total Investments in Securities: | 2,827,824,487 | 238,689,875 | 2,589,134,612 | - |
Derivative Instruments: | | | | |
|
| Liabilities | | | | |
Futures Contracts | (224,042) | (224,042) | - | - |
| Total Liabilities | (224,042) | (224,042) | - | - |
| Total Derivative Instruments: | (224,042) | (224,042) | - | - |
Value of Derivative Instruments
The following table is a summary of the Fund's value of derivative instruments by primary risk exposure as of February 28, 2023. For additional information on derivative instruments, please refer to the Derivative Instruments section in the accompanying Notes to Financial Statements.
Primary Risk Exposure / Derivative Type | Value |
| Asset ($) | Liability ($) |
| Interest Rate Risk | | |
Futures Contracts (a) | 0 | (224,042) |
| Total Interest Rate Risk | 0 | (224,042) |
| Total Value of Derivatives | 0 | (224,042) |
(a)Reflects gross cumulative appreciation (depreciation) on futures contracts as presented in the Schedule of Investments. In the Statement of Assets and Liabilities, the period end daily variation margin is included in receivable or payable for daily variation margin on futures contracts, and the net cumulative appreciation (depreciation) is included in Total accumulated earnings (loss).
| Statement of Assets and Liabilities |
| | | | February 28, 2023 (Unaudited) |
| | | | | |
| Assets | | | | |
| Investment in securities, at value (including securities loaned of $218,713,036) - See accompanying schedule: | | | | |
Unaffiliated issuers (cost $2,650,289,058) | $ | 2,589,134,612 | | |
Fidelity Central Funds (cost $238,689,875) | | 238,689,875 | | |
| | | | | |
| | | | | |
| Total Investment in Securities (cost $2,888,978,933) | | | $ | 2,827,824,487 |
| Receivable for investments sold | | | | 45,089,743 |
| Receivable for fund shares sold | | | | 4,527,552 |
| Interest receivable | | | | 15,875,637 |
| Distributions receivable from Fidelity Central Funds | | | | 106,594 |
| Prepaid expenses | | | | 1,316 |
| Other receivables | | | | 1,573 |
Total assets | | | | 2,893,426,902 |
| Liabilities | | | | |
| Payable for investments purchased | | | | |
Regular delivery | $ | 65,973,272 | | |
Delayed delivery | | 7,520,034 | | |
| Payable for fund shares redeemed | | 3,894,345 | | |
| Distributions payable | | 61,273 | | |
| Accrued management fee | | 607,868 | | |
| Payable for daily variation margin on futures contracts | | 11,344 | | |
| Other payables and accrued expenses | | 99,915 | | |
| Collateral on securities loaned | | 224,142,705 | | |
| Total Liabilities | | | | 302,310,756 |
| Net Assets | | | $ | 2,591,116,146 |
| Net Assets consist of: | | | | |
| Paid in capital | | | $ | 2,688,113,708 |
| Total accumulated earnings (loss) | | | | (96,997,562) |
| Net Assets | | | $ | 2,591,116,146 |
Net Asset Value , offering price and redemption price per share ($2,591,116,146 ÷ 273,321,251 shares) | | | $ | 9.48 |
| Statement of Operations |
| | | | Six months ended February 28, 2023 (Unaudited) |
| Investment Income | | | | |
| Interest | | | $ | 30,462,661 |
| Income from Fidelity Central Funds (including $47,512 from security lending) | | | | 387,550 |
| Total Income | | | | 30,850,211 |
| Expenses | | | | |
| Management fee | $ | 3,101,816 | | |
| Custodian fees and expenses | | 12,695 | | |
| Independent trustees' fees and expenses | | 3,737 | | |
| Registration fees | | 63,731 | | |
| Audit | | 51,561 | | |
| Legal | | 1,353 | | |
| Miscellaneous | | 3,890 | | |
| Total expenses before reductions | | 3,238,783 | | |
| Expense reductions | | (21,667) | | |
| Total expenses after reductions | | | | 3,217,116 |
| Net Investment income (loss) | | | | 27,633,095 |
| Realized and Unrealized Gain (Loss) | | | | |
| Net realized gain (loss) on: | | | | |
| Investment Securities: | | | | |
| Unaffiliated issuers | | (18,845,890) | | |
| Futures contracts | | (1,530,553) | | |
| Total net realized gain (loss) | | | | (20,376,443) |
| Change in net unrealized appreciation (depreciation) on: | | | | |
| Investment Securities: | | | | |
| Unaffiliated issuers | | 2,203,016 | | |
| Futures contracts | | (125,638) | | |
| Total change in net unrealized appreciation (depreciation) | | | | 2,077,378 |
| Net gain (loss) | | | | (18,299,065) |
| Net increase (decrease) in net assets resulting from operations | | | $ | 9,334,030 |
| Statement of Changes in Net Assets |
| |
| | Six months ended February 28, 2023 (Unaudited) | | Year ended August 31, 2022 |
| Increase (Decrease) in Net Assets | | | | |
| Operations | | | | |
| Net investment income (loss) | $ | 27,633,095 | $ | 14,653,531 |
| Net realized gain (loss) | | (20,376,443) | | (26,823,287) |
| Change in net unrealized appreciation (depreciation) | | 2,077,378 | | (66,229,170) |
| Net increase (decrease) in net assets resulting from operations | | 9,334,030 | | (78,398,926) |
| Distributions to shareholders | | (19,678,252) | | (11,782,706) |
| Share transactions | | | | |
| Proceeds from sales of shares | | 1,125,220,122 | | 1,096,941,723 |
| Reinvestment of distributions | | 19,370,853 | | 11,575,013 |
| Cost of shares redeemed | | (386,216,117) | | (1,020,474,991) |
Net increase (decrease) in net assets resulting from share transactions | | 758,374,858 | | 88,041,745 |
| Total increase (decrease) in net assets | | 748,030,636 | | (2,139,887) |
| | | | | |
| Net Assets | | | | |
| Beginning of period | | 1,843,085,510 | | 1,845,225,397 |
| End of period | $ | 2,591,116,146 | $ | 1,843,085,510 |
| | | | | |
| Other Information | | | | |
| Shares | | | | |
| Sold | | 118,980,237 | | 112,706,091 |
| Issued in reinvestment of distributions | | 2,043,375 | | 1,190,192 |
| Redeemed | | (40,771,729) | | (105,165,453) |
| Net increase (decrease) | | 80,251,883 | | 8,730,830 |
| | | | | |
Financial Highlights
| Fidelity® SAI Short-Term Bond Fund |
| |
| | Six months ended (Unaudited) February 28, 2023 | | Years ended August 31, 2022 | | 2021 A |
Selected Per-Share Data | | | | | | |
| Net asset value, beginning of period | $ | 9.55 | $ | 10.01 | $ | 10.00 |
| Income from Investment Operations | | | | | | |
Net investment income (loss) B,C | | .126 | | .075 | | .047 |
| Net realized and unrealized gain (loss) | | (.109) | | (.475) | | .007 |
| Total from investment operations | | .017 | | (.400) | | .054 |
| Distributions from net investment income | | (.087) | | (.056) | | (.044) |
| Distributions from net realized gain | | - | | (.004) | | - |
| Total distributions | | (.087) | | (.060) | | (.044) |
| Net asset value, end of period | $ | 9.48 | $ | 9.55 | $ | 10.01 |
Total Return D,E | | .19% | | (4.01)% | | .54% |
Ratios to Average Net Assets C,F,G | | | | | | |
| Expenses before reductions | | .31% H | | .31% | | .34% H |
| Expenses net of fee waivers, if any | | .31% H | | .30% | | .34% H |
| Expenses net of all reductions | | .31% H | | .30% | | .34% H |
| Net investment income (loss) | | 2.68% H | | .77% | | .49% H |
| Supplemental Data | | | | | | |
| Net assets, end of period (000 omitted) | $ | 2,591,116 | $ | 1,843,086 | $ | 1,845,225 |
Portfolio turnover rate I | | 59% H | | 74% | | 70% J,K |
A For the period September 15, 2020 (commencement of operations) through August 31, 2021.
B Calculated based on average shares outstanding during the period.
C Net investment income (loss) is affected by the timing of the declaration of dividends by any underlying mutual funds or exchange-traded funds (ETFs). Net investment income (loss) of any mutual funds or ETFs is not included in the Fund's net investment income (loss) ratio.
D Total returns for periods of less than one year are not annualized.
E Total returns would have been lower if certain expenses had not been reduced during the applicable periods shown.
F Fees and expenses of any underlying mutual funds or exchange-traded funds (ETFs) are not included in the Fund's expense ratio. The Fund indirectly bears its proportionate share of these expenses. For additional expense information related to investments in Fidelity Central Funds, please refer to the "Investments in Fidelity Central Funds" note found in the Notes to Financial Statements section of the most recent Annual or Semi-Annual report.
G Expense ratios reflect operating expenses of the class. Expenses before reductions do not reflect amounts reimbursed, waived, or reduced through arrangements with the investment adviser, brokerage services, or other offset arrangements, if applicable, and do not represent the amount paid by the class during periods when reimbursements, waivers or reductions occur.
H Annualized.
I Amount does not include the portfolio activity of any underlying mutual funds or exchange-traded funds (ETFs).
J Amount not annualized.
K Portfolio turnover rate excludes securities received or delivered in-kind.
For the period ended February 28, 2023
1. Organization.
Fidelity SAI Short-Term Bond Fund (the Fund) is a fund of Fidelity Salem Street Trust (the Trust) and is authorized to issue an unlimited number of shares. Shares are offered exclusively to certain clients of Fidelity Management & Research Company LLC (FMR) or its affiliates. The Trust is registered under the Investment Company Act of 1940, as amended (the 1940 Act), as an open-end management investment company organized as a Massachusetts business trust.
2. Investments in Fidelity Central Funds.
Funds may invest in Fidelity Central Funds, which are open-end investment companies generally available only to other investment companies and accounts managed by the investment adviser and its affiliates. The Schedule of Investments lists any Fidelity Central Funds held as an investment as of period end, but does not include the underlying holdings of each Fidelity Central Fund. An investing fund indirectly bears its proportionate share of the expenses of the underlying Fidelity Central Funds.
Based on its investment objective, each Fidelity Central Fund may invest or participate in various investment vehicles or strategies that are similar to those of the investing fund. These strategies are consistent with the investment objectives of the investing fund and may involve certain economic risks which may cause a decline in value of each of the Fidelity Central Funds and thus a decline in the value of the investing fund.
| Fidelity Central Fund | Investment Manager | Investment Objective | Investment Practices | Expense Ratio A |
| Fidelity Money Market Central Funds | Fidelity Management & Research Company LLC (FMR) | Each fund seeks to obtain a high level of current income consistent with the preservation of capital and liquidity. | Short-term Investments | Less than .005% |
A Expenses expressed as a percentage of average net assets and are as of each underlying Central Fund's most recent annual or semi-annual shareholder report.
A complete unaudited list of holdings for each Fidelity Central Fund is available upon request or at the Securities and Exchange Commission website at www.sec.gov. In addition, the financial statements of the Fidelity Central Funds which contain the significant accounting policies (including investment valuation policies) of those funds, and are not covered by the Report of Independent Registered Public Accounting Firm, are available on the Securities and Exchange Commission website or upon request.
3. Significant Accounting Policies.
The Fund is an investment company and applies the accounting and reporting guidance of the Financial Accounting Standards Board (FASB) Accounting Standards Codification Topic 946 Financial Services - Investment Companies . The financial statements have been prepared in conformity with accounting principles generally accepted in the United States of America (GAAP), which require management to make certain estimates and assumptions at the date of the financial statements. Actual results could differ from those estimates. Subsequent events, if any, through the date that the financial statements were issued have been evaluated in the preparation of the financial statements. The Fund's Schedule of Investments lists any underlying mutual funds or exchange-traded funds (ETFs) but does not include the underlying holdings of these funds. The following summarizes the significant accounting policies of the Fund:
Investment Valuation. Investments are valued as of 4:00 p.m. Eastern time on the last calendar day of the period. The Board of Trustees (the Board) has designated the Fund's investment adviser as the valuation designee responsible for the fair valuation function and performing fair value determinations as needed. The investment adviser has established a Fair Value Committee (the Committee) to carry out the day-to-day fair valuation responsibilities and has adopted policies and procedures to govern the fair valuation process and the activities of the Committee. In accordance with these fair valuation policies and procedures, which have been approved by the Board, the Fund attempts to obtain prices from one or more third party pricing services or brokers to value its investments. When current market prices, quotations or currency exchange rates are not readily available or reliable, investments will be fair valued in good faith by the Committee, in accordance with the policies and procedures. Factors used in determining fair value vary by investment type and may include market or investment specific events, transaction data, estimated cash flows, and market observations of comparable investments. The frequency that the fair valuation procedures are used cannot be predicted and they may be utilized to a significant extent. The Committee manages the Fund's fair valuation practices and maintains the fair valuation policies and procedures. The Fund's investment adviser reports to the Board information regarding the fair valuation process and related material matters.
The Fund categorizes the inputs to valuation techniques used to value its investments into a disclosure hierarchy consisting of three levels as shown below:
Level 1 - unadjusted quoted prices in active markets for identical investments
Level 2 - other significant observable inputs (including quoted prices for similar investments, interest rates, prepayment speeds, etc.)
Level 3 - unobservable inputs (including the Fund's own assumptions based on the best information available)
Valuation techniques used to value the Fund's investments by major category are as follows:
Debt securities, including restricted securities, are valued based on evaluated prices received from third party pricing services or from brokers who make markets in such securities. Corporate bonds and U.S. government and government agency obligations are valued by pricing services who utilize matrix pricing which considers yield or price of bonds of comparable quality, coupon, maturity and type or by broker-supplied prices. Asset backed securities, collateralized mortgage obligations, commercial mortgage securities and U.S. government agency mortgage securities are valued by pricing services who utilize matrix pricing which considers prepayment speed assumptions, attributes of the collateral, yield or price of bonds of comparable quality, coupon, maturity and type or by broker-supplied prices. When independent prices are unavailable or unreliable, debt securities may be valued utilizing pricing methodologies which consider similar factors that would be used by third party pricing services. Debt securities are generally categorized as Level 2 in the hierarchy but may be Level 3 depending on the circumstances.
Futures contracts are valued at the settlement price established each day by the board of trade or exchange on which they are traded and are categorized as Level 1 in the hierarchy. Investments in open-end mutual funds, including the Fidelity Central Funds, are valued at their closing net asset value (NAV) each business day and are categorized as Level 1 in the hierarchy.
Changes in valuation techniques may result in transfers in or out of an assigned level within the disclosure hierarchy. The aggregate value of investments by input level as of February 28, 2023 is included at the end of the Fund's Schedule of Investments.
Investment Transactions and Income. For financial reporting purposes, the Fund's investment holdings and NAV include trades executed through the end of the last business day of the period. The NAV per share for processing shareholder transactions is calculated as of the close of business of the New York Stock Exchange (NYSE), normally 4:00 p.m. Eastern time and includes trades executed through the end of the prior business day. Gains and losses on securities sold are determined on the basis of identified cost. Income and capital gain distributions from Fidelity Central Funds, if any, are recorded on the ex-dividend date. Interest income is accrued as earned and includes coupon interest and amortization of premium and accretion of discount on debt securities as applicable. Debt obligations may be placed on non-accrual status and related interest income may be reduced by ceasing current accruals and writing off interest receivables when the collection of all or a portion of interest has become doubtful based on consistently applied procedures. A debt obligation is removed from non-accrual status when the issuer resumes interest payments or when collectability of interest is reasonably assured.
Expenses. Expenses directly attributable to a fund are charged to that fund. Expenses attributable to more than one fund are allocated among the respective funds on the basis of relative net assets or other appropriate methods. Expenses included in the accompanying financial statements reflect the expenses of that fund and do not include any expenses associated with any underlying mutual funds or exchange-traded funds. Although not included in a fund's expenses, a fund indirectly bears its proportionate share of these expenses through the net asset value of each underlying mutual fund or exchange-traded fund. Expense estimates are accrued in the period to which they relate and adjustments are made when actual amounts are known.
Income Tax Information and Distributions to Shareholders. Each year, the Fund intends to qualify as a regulated investment company under Subchapter M of the Internal Revenue Code, including distributing substantially all of its taxable income and realized gains. As a result, no provision for U.S. Federal income taxes is required. The Fund files a U.S. federal tax return, in addition to state and local tax returns as required. The Fund's federal income tax returns are subject to examination by the Internal Revenue Service (IRS) for a period of three fiscal years after they are filed. State and local tax returns may be subject to examination for an additional fiscal year depending on the jurisdiction.
Distributions are declared and recorded daily and paid monthly from net investment income. Distributions from realized gains, if any, are declared and recorded on the ex-dividend date. Income and capital gain distributions are determined in accordance with income tax regulations, which may differ from GAAP.
Capital accounts within the financial statements are adjusted for permanent book-tax differences. These adjustments have no impact on net assets or the results of operations. Capital accounts are not adjusted for temporary book-tax differences which will reverse in a subsequent period.
Book-tax differences are primarily due to futures contracts, market discount, capital loss carryforwards and losses deferred due to wash sales.
As of period end, the cost and unrealized appreciation (depreciation) in securities, and derivatives if applicable, for federal income tax purposes were as follows:
| Gross unrealized appreciation | $3,509,504 |
| Gross unrealized depreciation | (56,448,418) |
| Net unrealized appreciation (depreciation) | $(52,938,914) |
| Tax cost | $2,880,539,359 |
Capital loss carryforwards are only available to offset future capital gains of the Fund to the extent provided by regulations and may be limited. The capital loss carryforward information presented below, including any applicable limitation, is estimated as of prior fiscal period end and is subject to adjustment.
| Short-term | $(5,983,330) |
| Long-term | (17,629,285) |
| Total capital loss carryforward | $(23,612,615) |
Delayed Delivery Transactions and When-Issued Securities. During the period, certain Funds transacted in securities on a delayed delivery or when-issued basis. Payment and delivery may take place after the customary settlement period for that security. The price of the underlying securities and the date when the securities will be delivered and paid for are fixed at the time the transaction is negotiated. Securities purchased on a delayed delivery or when-issued basis are identified as such in the Schedule of Investments. Compensation for interest forgone in the purchase of a delayed delivery or when-issued debt security may be received. With respect to purchase commitments, each applicable Fund identifies securities as segregated in its records with a value at least equal to the amount of the commitment. Payables and receivables associated with the purchases and sales of delayed delivery securities having the same coupon, settlement date and broker are offset. Delayed delivery or when-issued securities that have been purchased from and sold to different brokers are reflected as both payables and receivables in the Statement of Assets and Liabilities under the caption "Delayed delivery", as applicable. Losses may arise due to changes in the value of the underlying securities or if the counterparty does not perform under the contract's terms, or if the issuer does not issue the securities due to political, economic, or other factors.
Restricted Securities (including Private Placements). Funds may invest in securities that are subject to legal or contractual restrictions on resale. These securities generally may be resold in transactions exempt from registration or to the public if the securities are registered. Disposal of these securities may involve time-consuming negotiations and expense, and prompt sale at an acceptable price may be difficult. Information regarding restricted securities held at period end is included at the end of the Schedule of Investments, if applicable.
4. Derivative Instruments.
Risk Exposures and the Use of Derivative Instruments. The Fund's investment objectives allow for various types of derivative instruments, including futures contracts. Derivatives are investments whose value is primarily derived from underlying assets, indices or reference rates and may be transacted on an exchange or over-the-counter (OTC). Derivatives may involve a future commitment to buy or sell a specified asset based on specified terms, to exchange future cash flows at periodic intervals based on a notional principal amount, or for one party to make one or more payments upon the occurrence of specified events in exchange for periodic payments from the other party.
Derivatives were used to increase returns and to manage exposure to certain risks as defined below. The success of any strategy involving derivatives depends on analysis of numerous economic factors, and if the strategies for investment do not work as intended, the objectives may not be achieved.
Derivatives were used to increase or decrease exposure to the following risk(s):
| | |
| Interest Rate Risk | Interest rate risk relates to the fluctuations in the value of interest-bearing securities due to changes in the prevailing levels of market interest rates. |
Funds are also exposed to additional risks from investing in derivatives, such as liquidity risk and counterparty credit risk. Liquidity risk is the risk that a fund will be unable to close out the derivative in the open market in a timely manner. Counterparty credit risk is the risk that the counterparty will not be able to fulfill its obligation to a fund. Counterparty credit risk related to exchange-traded contracts may be mitigated by the protection provided by the exchange on which they trade.
Investing in derivatives may involve greater risks than investing in the underlying assets directly and, to varying degrees, may involve risk of loss in excess of any initial investment and collateral received and amounts recognized in the Statement of Assets and Liabilities. In addition, there may be the risk that the change in value of the derivative contract does not correspond to the change in value of the underlying instrument.
Futures Contracts. A futures contract is an agreement between two parties to buy or sell a specified underlying instrument for a fixed price at a specified future date. Futures contracts were used to manage exposure to the bond market and fluctuations in interest rates.
Upon entering into a futures contract, a fund is required to deposit either cash or securities (initial margin) with a clearing broker in an amount equal to a certain percentage of the face value of the contract. Futures contracts are marked-to-market daily and subsequent daily payments are made or received by a fund depending on the daily fluctuations in the value of the futures contracts and are recorded as unrealized appreciation or (depreciation). This receivable and/or payable, if any, is included in daily variation margin on futures contracts in the Statement of Assets and Liabilities. Realized gain or (loss) is recorded upon the expiration or closing of a futures contract. The net realized gain (loss) and change in net unrealized appreciation (depreciation) on futures contracts during the period is presented in the Statement of Operations.
Any open futures contracts at period end are presented in the Schedule of Investments under the caption "Futures Contracts". The notional amount at value reflects each contract's exposure to the underlying instrument or index at period end, and is representative of volume of activity during the period unless an average notional amount is presented. Any securities deposited to meet initial margin requirements are identified in the Schedule of Investments. Any cash deposited to meet initial margin requirements is presented as segregated cash with brokers for derivative instruments in the Statement of Assets and Liabilities.
5. Purchases and Sales of Investments.
Purchases and sales of securities, other than short-term securities, U.S. government securities and in-kind transactions, as applicable, are noted in the table below.
| | Purchases ($) | Sales ($) |
| Fidelity SAI Short-Term Bond Fund | 483,593,486 | 118,228,016 |
6. Fees and Other Transactions with Affiliates.
Management Fee. Fidelity Management & Research Company LLC (the investment adviser) and its affiliates provide the Fund with investment management related services for which the Fund pays a monthly management fee. The management fee is the sum of an individual fund fee rate that is based on an annual rate of .20% of the Fund's average net assets and an annualized group fee rate that averaged .10% during the period. The group fee rate is based upon the monthly average net assets of a group of registered investment companies with which the investment adviser has management contracts. The group fee rate decreases as assets under management increase and increases as assets under management decrease. For the reporting period, the total annualized management fee rate was .30% of the Fund's average net assets.
During March 2023, the Board approved changes to the management fee effective April 1, 2023. The Fund will pay a monthly management fee that is based on an annual rate of .20% of the Fund's average net assets.
Interfund Trades. Funds may purchase from or sell securities to other Fidelity Funds under procedures adopted by the Board. The procedures have been designed to ensure these interfund trades are executed in accordance with Rule 17a-7 of the 1940 Act. Any interfund trades are included within the respective purchases and sales amounts shown in the Purchases and Sales of Investments note. During the period, there were no interfund trades.
Other. During the period, the investment adviser reimbursed the Fund for certain losses as follows:
| | Amount ($) |
| Fidelity SAI Short-Term Bond Fund | 1,574 |
7. Committed Line of Credit.
Certain Funds participate with other funds managed by the investment adviser or an affiliate in a $4.25 billion credit facility (the "line of credit") to be utilized for temporary or emergency purposes to fund shareholder redemptions or for other short-term liquidity purposes. The participating funds have agreed to pay commitment fees on their pro-rata portion of the line of credit, which are reflected in Miscellaneous expenses on the Statement of Operations, and are listed below. During the period, there were no borrowings on this line of credit.
| | Amount |
| Fidelity SAI Short-Term Bond Fund | $1,751 |
8. Security Lending.
Funds lend portfolio securities from time to time in order to earn additional income. Lending agents are used, including National Financial Services (NFS), an affiliate of the investment adviser. Pursuant to a securities lending agreement, NFS will receive a fee, which is capped at 9.9% of a fund's daily lending revenue, for its services as lending agent. A fund may lend securities to certain qualified borrowers, including NFS. On the settlement date of the loan, a fund receives collateral (in the form of U.S. Treasury obligations, letters of credit and/or cash) against the loaned securities and maintains collateral in an amount not less than 100% of the market value of the loaned securities during the period of the loan. The market value of the loaned securities is determined at the close of business of a fund and any additional required collateral is delivered to a fund on the next business day. A fund or borrower may terminate the loan at any time, and if the borrower defaults on its obligation to return the securities loaned because of insolvency or other reasons, a fund may apply collateral received from the borrower against the obligation. A fund may experience delays and costs in recovering the securities loaned. Any cash collateral received is invested in the Fidelity Securities Lending Cash Central Fund. Any loaned securities are identified as such in the Schedule of Investments, and the value of loaned securities and cash collateral at period end, as applicable, are presented in the Statement of Assets and Liabilities. Security lending income represents the income earned on investing cash collateral, less rebates paid to borrowers and any lending agent fees associated with the loan, plus any premium payments received for lending certain types of securities. Security lending income is presented in the Statement of Operations as a component of income from Fidelity Central Funds. Affiliated security lending activity, if any, was as follows:
| | Total Security Lending Fees Paid to NFS | Security Lending Income From Securities Loaned to NFS | Value of Securities Loaned to NFS at Period End |
| Fidelity SAI Short-Term Bond Fund | $5,326 | $- | $- |
9. Expense Reductions.
Through arrangements with the Fund's custodian, credits realized as a result of certain uninvested cash balances were used to reduce the Fund's expenses by $915.
In addition, during the period the investment adviser or an affiliate reimbursed and/or waived a portion of operating expenses in the amount of $20,752.
Effective April 1, 2023, the investment adviser agreed to remove the contractual expense limitation of .36% of average net assets.
10. Other.
A fund's organizational documents provide former and current trustees and officers with a limited indemnification against liabilities arising in connection with the performance of their duties to the fund. In the normal course of business, a fund may also enter into contracts that provide general indemnifications. A fund's maximum exposure under these arrangements is unknown as this would be dependent on future claims that may be made against a fund. The risk of material loss from such claims is considered remote.
At the end of the period, the following mutual funds managed by the investment adviser or its affiliates were the owners of record of 10% or more of the total outstanding shares.
| | Strategic Advisers Fidelity Core Income Fund |
| Fidelity SAI Short-Term Bond Fund | 11% |
11. Risk and Uncertainties.
Many factors affect a fund's performance. Developments that disrupt global economies and financial markets, such as pandemics, epidemics, outbreaks of infectious diseases, war, terrorism, and environmental disasters, may significantly affect a fund's investment performance. The effects of these developments to a fund will be impacted by the types of securities in which a fund invests, the financial condition, industry, economic sector, and geographic location of an issuer, and a fund's level of investment in the securities of that issuer. Significant concentrations in security types, issuers, industries, sectors, and geographic locations may magnify the factors that affect a fund's performance.
As a shareholder, you incur two types of costs: (1) transaction costs, which may include sales charges (loads) on purchase payments or redemption proceeds, as applicable and (2) ongoing costs, which generally include management fees, distribution and/or service (12b-1) fees and other Fund expenses. This Example is intended to help you understand your ongoing costs (in dollars) of investing in a fund and to compare these costs with the ongoing costs of investing in other mutual funds.
| The Example is based on an investment of $1,000 invested at the beginning of the period and held for the entire period (September 1, 2022 to February 28, 2023). |
Actual Expenses
The first line of the accompanying table provides information about actual account values and actual expenses. You may use the information in this line, together with the amount you invested, to estimate the expenses that you paid over the period. Simply divide your account value by $1,000.00 (for example, an $8,600 account value divided by $1,000.00 = 8.6), then multiply the result by the number in the first line for a class/Fund under the heading entitled "Expenses Paid During Period" to estimate the expenses you paid on your account during this period. If any fund is a shareholder of any underlying mutual funds or exchange-traded funds (ETFs) (the Underlying Funds), such fund indirectly bears its proportional share of the expenses of the Underlying Funds in addition to the direct expenses incurred presented in the table. These fees and expenses are not included in the annualized expense ratio used to calculate the expense estimate in the table below.
Hypothetical Example for Comparison Purposes
The second line of the accompanying table provides information about hypothetical account values and hypothetical expenses based on the actual expense ratio and an assumed rate of return of 5% per year before expenses, which is not the actual return. The hypothetical account values and expenses may not be used to estimate the actual ending account balance or expenses you paid for the period. You may use this information to compare the ongoing costs of investing in the Fund and other funds. To do so, compare this 5% hypothetical example with the 5% hypothetical examples that appear in the shareholder reports of the other funds. If any fund is a shareholder of any Underlying Funds, such fund indirectly bears its proportional share of the expenses of the Underlying Funds in addition to the direct expenses as presented in the table. These fees and expenses are not included in the annualized expense ratio used to calculate the expense estimate in the table below.
Please note that the expenses shown in the table are meant to highlight your ongoing costs only and do not reflect any transaction costs. Therefore, the second line of the table is useful in comparing ongoing costs only, and will not help you determine the relative total costs of owning different funds. In addition, if these transactional costs were included, your costs would have been higher.
| | | | | Annualized Expense Ratio- A | | Beginning Account Value September 1, 2022 | | Ending Account Value February 28, 2023 | | Expenses Paid During Period- C September 1, 2022 to February 28, 2023 |
| | | | | | | | | | |
Fidelity® SAI Short-Term Bond Fund ** | | | | .31% | | | | | | |
| Actual | | | | | | $ 1,000 | | $ 1,001.90 | | $ 1.54 |
Hypothetical- B | | | | | | $ 1,000 | | $ 1,023.26 | | $ 1.56 |
| |
A Annualized expense ratio reflects expenses net of applicable fee waivers.
B 5% return per year before expenses
C Expenses are equal to the annualized expense ratio, multiplied by the average account value over the period, multiplied by 181/ 365 (to reflect the one-half year period). The fees and expenses of any Underlying Funds are not included in each annualized expense ratio.
** If fees and changes to the expense contract and/or expense cap, effective April 1, 2023, had been in effect during the current period, the restated annualized expense ratio and the expenses paid in the actual and hypothetical examples above would have been as shown in table below:
| | | | | Annualized Expense Ratio- A | | Expenses Paid |
| | | | | | |
| Fidelity® SAI Short-Term Bond Fund | | | | .21% | | |
| Actual | | | | | | $ 1.04 |
Hypothetical - B | | | | | | $ 1.05 |
| | | | | | | |
| A Annualized expense ratio reflects expenses net of applicable fee waivers. | | | | | | |
| B 5% return per year before expenses | | | | | | |
Board Approval of Investment Advisory Contracts and Management Fees
Fidelity SAI Short-Term Bond Fund
Each year, the Board of Trustees, including the Independent Trustees (together, the Board), votes on the renewal of the management contract with Fidelity Management & Research Company LLC (FMR) and the sub-advisory agreements (together, the Advisory Contracts) for the fund. FMR and the sub-advisers are referred to herein as the Investment Advisers. The Board, assisted by the advice of fund counsel and Independent Trustees' counsel, requests and considers a broad range of information relevant to the renewal of the Advisory Contracts throughout the year.
The Board meets regularly and, at each of its meetings, covers an extensive agenda of topics and materials and considers factors that are relevant to its annual consideration of the renewal of the fund's Advisory Contracts, including the services and support provided to the fund and its shareholders. The Board has established four standing committees (Committees) - Operations, Audit, Fair Valuation, and Governance and Nominating - each composed of and chaired by Independent Trustees with varying backgrounds, to which the Board has assigned specific subject matter responsibilities in order to enhance effective decision-making by the Board. The Operations Committee, of which all the Independent Trustees are members, meets regularly throughout the year and requests, receives and considers, among other matters, information related to the annual consideration of the renewal of the fund's Advisory Contracts before making its recommendation to the Board. The Board also meets as needed to review matters specifically related to the Board's annual consideration of the renewal of the Advisory Contracts. Members of the Board may also meet from time to time with trustees of other Fidelity funds through joint ad hoc committees to discuss certain matters relevant to all of the Fidelity funds.
At its September 2022 meeting, the Board unanimously determined to renew the fund's Advisory Contracts. In reaching its determination, the Board considered all factors it believed relevant, including (i) the nature, extent, and quality of the services provided to the fund and its shareholders (including the investment performance of the fund); (ii) the competitiveness relative to peer funds of the fund's management fee and the total expense ratio; (iii) the total costs of the services provided by and the profits realized by Fidelity from its relationships with the fund; and (iv) the extent to which, if any, economies of scale exist and are realized as the fund grows, and whether any economies of scale are appropriately shared with fund shareholders.
In considering whether to renew the Advisory Contracts for the fund, the Board reached a determination, with the assistance of fund counsel and Independent Trustees' counsel and through the exercise of its business judgment, that the renewal of the Advisory Contracts was in the best interests of the fund and its shareholders and that the compensation payable under the Advisory Contracts was fair and reasonable. The Board's decision to renew the Advisory Contracts was not based on any single factor, but rather was based on a comprehensive consideration of all the information provided to the Board at its meetings throughout the year. The Board, in reaching its determination to renew the Advisory Contracts, was aware that shareholders of the fund have a broad range of investment choices available to them, including a wide choice among funds offered by Fidelity's competitors, and that the fund's shareholders, who have the opportunity to review and weigh the disclosure provided by the fund in its prospectus and other public disclosures, have chosen to invest in this fund, which is part of the Fidelity family of funds.
Nature, Extent, and Quality of Services Provided . The Board considered Fidelity's staffing as it relates to the fund, including the backgrounds of investment personnel of Fidelity, and also considered the fund's investment objective, strategies, and related investment philosophy. The Independent Trustees also had discussions with senior management of Fidelity's investment operations and investment groups. The Board considered the structure of the investment personnel compensation program and whether this structure provides appropriate incentives to act in the best interests of the fund. Additionally, the Board considered the portfolio managers' investments, if any, in the funds that they manage. The Board also considered the steps Fidelity had taken to ensure the continued provision of high quality services to the Fidelity funds throughout the COVID-19 pandemic, including the expansion of staff in client facing positions to maintain service levels in periods of high volumes and volatility.
Resources Dedicated to Investment Management and Support Services . The Board reviewed the general qualifications and capabilities of Fidelity's investment staff, including its size, education, experience, and resources, as well as Fidelity's approach to recruiting, managing, training, and compensating investment personnel. The Board noted the resources devoted to Fidelity's global investment organization, and that Fidelity's analysts have extensive resources, tools and capabilities that allow them to conduct quantitative and fundamental analysis, as well as credit analysis of issuers, counterparties and guarantors. Further, the Board considered that Fidelity's investment professionals have sufficient access to global information and data so as to provide competitive investment results over time, and that those professionals also have access to sophisticated tools that permit them to assess portfolio construction and risk and performance attribution characteristics continuously, as well as to transmit new information and research conclusions rapidly around the world. Additionally, in its deliberations, the Board considered Fidelity's trading, risk management, compliance, cybersecurity, and technology and operations capabilities and resources, which are integral parts of the investment management process.
Shareholder and Administrative Services . The Board considered (i) the nature, extent, quality, and cost of advisory, administrative, and shareholder services performed by the Investment Advisers and their affiliates under the Advisory Contracts and under separate agreements covering transfer agency, pricing and bookkeeping, and securities lending services for the fund; (ii) the nature and extent of the supervision of third party service providers, principally custodians, subcustodians, and pricing vendors; and (iii) the resources devoted to, and the record of compliance with, the fund's compliance policies and procedures.
The Board noted that the growth of fund assets over time across the complex allows Fidelity to reinvest in the development of services designed to enhance the value and convenience of the Fidelity funds as investment vehicles. These services include 24-hour access to account information and market information over the Internet and through telephone representatives, investor education materials and asset allocation tools. The Board also considered that it reviews customer service metrics such as telephone response times, continuity of services on the website and metrics addressing services at Fidelity Investor Centers.
Investment in a Large Fund Family. The Board considered the benefits to shareholders of investing in a Fidelity fund, including the benefits of investing in a fund that is part of a large family of funds offering a variety of investment disciplines and providing a large variety of mutual fund investor services. The Board noted that Fidelity had taken, or had made recommendations to the Board that resulted in the Fidelity funds taking, a number of actions over the previous year that benefited particular funds, including: (i) continuing to dedicate additional resources to Fidelity's investment research process, which includes meetings with management of issuers of securities in which the funds invest; (ii) continuing efforts to enhance Fidelity's global research capabilities; (iii) launching new funds, ETFs, and share classes with innovative structures, strategies and pricing and making other enhancements to meet investor needs; (iv) broadening eligibility requirements for certain funds and share classes; (v) reducing management fees and total expenses for certain funds and classes; (vi) lowering expenses for certain existing funds and classes by implementing or lowering expense caps; (vii) rationalizing product lines and gaining increased efficiencies from fund mergers and liquidations; (viii) continuing to develop, acquire and implement systems and technology to improve services to the funds and shareholders, strengthen information security, and increase efficiency; and (ix) continuing to implement enhancements to further strengthen Fidelity's product line to increase investors' probability of success in achieving their investment goals, including their retirement income goals.
Investment Performance . The Board considered whether the fund has operated in accordance with its investment objective, as well as its record of compliance with its investment restrictions and its performance history.
The Board took into account discussions that occur at Board meetings throughout the year with representatives of the Investment Advisers about fund investment performance. In this regard the Board noted that as part of regularly scheduled fund reviews and other reports to the Board on fund performance, the Board considers annualized return information for the fund for different time periods, measured against an appropriate securities market index (benchmark index). The Board also receives and considers information about performance attribution. In its evaluation of fund investment performance at meetings throughout the year, the Board gave particular attention to information indicating underperformance of certain Fidelity funds for specific time periods and discussed with the Investment Advisers the reasons for such underperformance.
In addition to reviewing absolute and relative fund performance, the Independent Trustees periodically consider the appropriateness of fund performance metrics in evaluating the results achieved. In general, the Independent Trustees believe that fund performance should be evaluated based on gross performance (before fees and expenses but after transaction costs) compared to appropriate benchmark indices, over appropriate time periods that may include full market cycles, taking into account relevant factors including the following: general market conditions; expectations for interest rate levels and credit conditions; issuer-specific information including credit quality; the potential for incremental return versus the fund's benchmark index weighed against the risks involved in obtaining that incremental return, including the risk of diminished or negative total returns; and fund cash flows and other factors. The Independent Trustees generally give greater weight to fund performance over longer time periods than over shorter time periods. Depending on the circumstances, the Independent Trustees may be satisfied with a fund's performance notwithstanding that it lags its benchmark index for certain periods.
The Independent Trustees recognize that shareholders evaluate performance on a net basis over their own holding periods, for which one-, three-, and five-year periods are often used as a proxy. For this reason, the performance information reviewed by the Board also included net calendar year total return information for the fund and an appropriate benchmark index group for the most recent one-year period. No performance peer group information was considered by the Board as Fidelity advised the Board that competitor funds have different and/or broader investment mandates compared with the fund's more specialized strategies. The Independent Trustees recognize that shareholders who are not investing through a tax-advantaged retirement account also consider tax consequences in evaluating performance.
Based on its review, the Board concluded that the nature, extent, and quality of services provided to the fund under the Advisory Contracts should continue to benefit the shareholders of the fund.
Competitiveness of Management Fee and Total Expense Ratio . The Board considered the fund's management fee and total expense ratio compared to selected groups of competitive funds and classes (referred to as "mapped groups" below) for the purpose of facilitating the Trustees' competitive analysis of management fees and total expenses. Fidelity creates "mapped groups" by combining similar investment objective categories (as classified by Lipper) that have comparable investment mandates. Combining funds with similar investment objective categories aids the Board's comparison of management fees and total expense ratios by broadening the competitive group used for such comparison.
Management Fee . The Board considered two proprietary management fee comparisons for the period of the fund's operations shown in basis points (BP) in the chart below. The group of Lipper funds used by the Board for management fee comparisons is referred to below as the "Total Mapped Group." The Total Mapped Group comparison focuses on a fund's standing in terms of gross management fees before expense reimbursements or caps relative to the total universe of funds with comparable investment mandates, regardless of whether their management fee structures also are comparable. Funds with comparable investment mandates offer exposure to similar types of securities. Funds with comparable management fee structures have similar management fee contractual arrangements (e.g., flat rate charged for advisory services, all-inclusive fee rate, etc.). "TMG %" represents the percentage of funds in the Total Mapped Group that had management fees that were lower than the fund's. For example, a hypothetical TMG % of 20% would mean that 80% of the funds in the Total Mapped Group had higher, and 20% had lower, management fees than the fund. The fund's actual TMG % and the number of funds in the Total Mapped Group are in the chart below. The "Asset-Sized Peer Group" (ASPG) comparison focuses on a fund's standing relative to a subset of non-Fidelity funds within the Total Mapped Group that are similar in size and management fee structure. For example, if a fund is in the first quartile of the ASPG, the fund's management fee ranks in the least expensive or lowest 25% of funds in the ASPG. The ASPG represents at least 15% of the funds in the Total Mapped Group with comparable asset size and management fee structures, subject to a minimum of 50 funds (or all funds in the Total Mapped Group if fewer than 50). Additional information, such as the ASPG quartile in which the fund's management fee rate ranked, is also included in the chart and was considered by the Board.
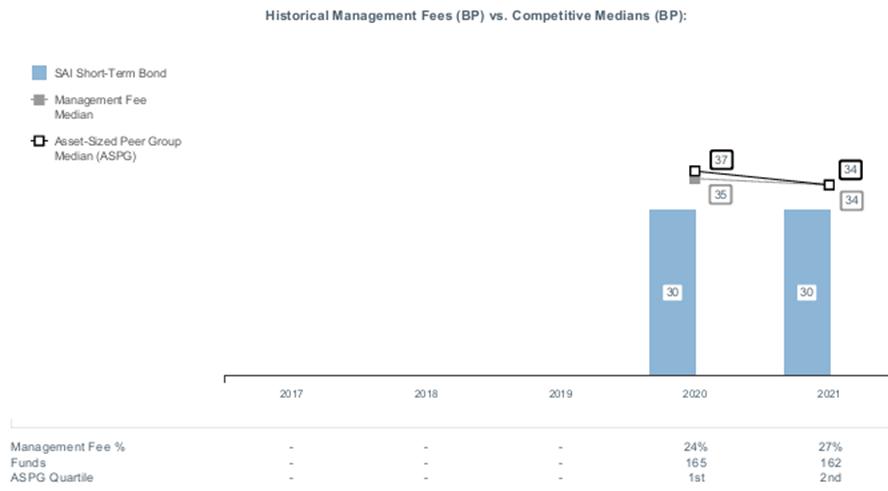
The Board noted that the fund's management fee rate ranked below the median of its Total Mapped Group and below the median of its ASPG for 2021.
Based on its review, the Board concluded that the fund's management fee is fair and reasonable in light of the services that the fund receives and the other factors considered.
Total Expense Ratio . In its review of the fund's total expense ratio, the Board considered the fund's management fee rate as well as other fund expenses, such as custodial, legal, and audit fees. The Board also noted that Fidelity may agree to waive fees or reimburse expenses from time to time, and the extent to which, if any, it has done so for the fund. The fund is compared to those funds and classes in the Total Mapped Group (used by the Board for management fee comparisons) that have a similar sales load structure. The Board also considered a total expense ASPG comparison, which focuses on the total expenses of the fund relative to a subset of non-Fidelity funds within the similar sales load structure group that are similar in size and management fee structure. The total expense ASPG is limited to 15 larger and 15 smaller classes of different funds, where possible. The total expense ASPG comparison excludes performance adjustments and fund-paid 12b-1 fees to eliminate variability in expenses relating to these items.
The Board noted that the fund's total net expense ratio ranked below the similar sales load structure group competitive median for 2021 and below the ASPG competitive median for 2021.
The Board further considered that FMR has contractually agreed to reimburse the fund to the extent that total operating expenses, with certain exceptions, as a percentage of its average net assets, exceed 0.36% through December 31, 2023.
Fees Charged to Other Fidelity Clients. The Board also considered Fidelity fee structures and other information with respect to clients of Fidelity, such as other funds advised or subadvised by Fidelity, pension plan clients, and other institutional clients with similar mandates. The Board noted that a joint ad hoc committee created by it and the boards of other Fidelity funds periodically reviews and compares Fidelity's institutional investment advisory business with its business of providing services to the Fidelity funds and also noted the most recent findings of the committee. The Board noted that the committee's review included a consideration of the differences in services provided, fees charged, and costs incurred, as well as competition in the markets serving the different categories of clients.
Based on its review of total expense ratios and fees charged to other Fidelity clients, the Board concluded that the fund's total expense ratio was reasonable in light of the services that the fund and its shareholders receive and the other factors considered.
Costs of the Services and Profitability . The Board considered the revenues earned and the expenses incurred by Fidelity in conducting the business of developing, marketing, distributing, managing, administering and servicing the fund and servicing the fund's shareholders. The Board also considered the level of Fidelity's profits in respect of all the Fidelity funds.
On an annual basis, Fidelity presents to the Board information about the profitability of its relationships with the fund. Fidelity calculates profitability information for each fund, as well as aggregate profitability information for groups of Fidelity funds and all Fidelity funds, using a series of detailed revenue and cost allocation methodologies which originate with the books and records of Fidelity on which Fidelity's audited financial statements are based. The Audit Committee of the Board reviews any significant changes from the prior year's methodologies and the full Board approves such changes.
A public accounting firm has been engaged annually by the Board as part of the Board's assessment of Fidelity's profitability analysis. The engagement includes the review and assessment of the methodologies used by Fidelity in determining the revenues and expenses attributable to Fidelity's mutual fund business, and completion of agreed-upon procedures in respect of the mathematical accuracy of certain fund profitability information and its conformity to established allocation methodologies. After considering the reports issued under the engagement and information provided by Fidelity, the Board concluded that while other allocation methods may also be reasonable, Fidelity's profitability methodologies are reasonable in all material respects.
The Board also reviewed Fidelity's non-fund businesses and potential indirect benefits such businesses may have received as a result of their association with Fidelity's mutual fund business (i.e., fall-out benefits) as well as cases where Fidelity's affiliates may benefit from the funds' business. The Board considered areas where potential indirect benefits to the Fidelity funds from their relationships with Fidelity may exist. The Board's consideration of these matters was informed by the findings of a joint ad hoc committee created by it and the boards of other Fidelity funds to evaluate potential fall-out benefits.
The Board considered the costs of the services provided by and the profits realized by Fidelity in connection with the operation of the fund and was satisfied that the profitability was not excessive.
Economies of Scale . The Board considered whether there have been economies of scale in respect of the management of the Fidelity funds, whether the Fidelity funds (including the fund) have appropriately benefited from any such economies of scale, and whether there is potential for realization of any further economies of scale. The Board considered the extent to which the fund will benefit from economies of scale as assets grow through increased services to the fund, through waivers or reimbursements, or through fee or expense ratio reductions. The Board also noted that a committee (the Economies of Scale Committee) created by it and the boards of other Fidelity funds periodically analyzes whether Fidelity attains economies of scale in respect of the management and servicing of the Fidelity funds, whether the Fidelity funds have appropriately benefited from such economies of scale, and whether there is potential for realization of any further economies of scale.
The Board recognized that the fund's management contract incorporates a "group fee" structure, which provides for lower group fee rates as total "group assets" increase, and for higher group fee rates as total "group assets" decrease ("group assets" as defined in the management contract). FMR calculates the group fee rates based on a tiered asset "breakpoint" schedule that varies based on asset class. The Board considered that the group fee is designed to deliver the benefits of economies of scale to fund shareholders when total Fidelity fund assets increase, even if assets of any particular fund are unchanged or have declined, because some portion of Fidelity's costs are attributable to services provided to all Fidelity funds, and all funds benefit if those costs can be allocated among more assets. The Board also considered that Fidelity agreed to impose a temporary fee waiver in the form of additional breakpoints to the current breakpoint schedule. The Board concluded that, given the group fee structure, fund shareholders will benefit from lower management fees as "group assets" increase at the fund complex level, regardless of whether Fidelity achieves any such economies of scale.
The Board concluded, taking into account the analysis of the Economies of Scale Committee, that economies of scale, if any, are being appropriately shared between fund shareholders and Fidelity.
Additional Information Requested by the Board . In order to develop fully the factual basis for consideration of the Fidelity funds' advisory contracts, the Board requested and received additional information on certain topics, including: (i) Fidelity's fund profitability methodology, profitability trends for certain funds, the allocation of various costs to different funds, and the impact of certain factors on fund profitability results; (ii) portfolio manager changes that have occurred during the past year and the amount of the investment that each portfolio manager has made in the Fidelity fund(s) that he or she manages; (iii) the extent to which current market conditions have affected retention and recruitment of personnel; (iv) the arrangements with and compensation paid to certain fund sub-advisers on behalf of the Fidelity funds and the treatment of such compensation within Fidelity's fund profitability methodology; (v) the terms of the funds' various management fee structures, including the basic group fee and the terms of Fidelity's voluntary expense limitation arrangements; (vi) Fidelity's transfer agent, pricing and bookkeeping fees, expense and service structures for different funds and classes relative to competitive trends; (vii) the impact on fund profitability of recent industry trends, such as the growth in passively managed funds and the changes in flows for different types of funds; (viii) the types of management fee and total expense comparisons provided, and the challenges and limitations associated with such information; and (ix) explanations regarding the relative total expense ratios and management fees of certain funds and classes, total expense and management fee competitive trends, and methodologies for total expense and management fee competitive comparisons. In addition, the Board considered its discussions with Fidelity regarding Fidelity's efforts to maintain the continuous investment and shareholder services necessary for the funds during the current pandemic and economic circumstances.
Based on its evaluation of all of the conclusions noted above, and after considering all factors it believed relevant, the Board concluded that the advisory fee arrangements are fair and reasonable and that the fund's Advisory Contracts should be renewed.
The Securities and Exchange Commission adopted Rule 22e-4 under the Investment Company Act of 1940 (the Liquidity Rule) to promote effective liquidity risk management throughout the open-end investment company industry, thereby reducing the risk that funds will be unable to meet their redemption obligations and mitigating dilution of the interests of fund shareholders.
The Fund has adopted and implemented a liquidity risk management program (the Program) reasonably designed to assess and manage the Fund's liquidity risk and to comply with the requirements of the Liquidity Rule. The Fund's Board of Trustees (the Board) has designated the Fund's investment adviser as administrator of the Program. The Fidelity advisers have established a Liquidity Risk Management Committee (the LRM Committee) to manage the Program for each of the Fidelity Funds. The LRM Committee monitors the adequacy and effectiveness of implementation of the Program and on a periodic basis assesses each Fund's liquidity risk based on a variety of factors including (1) the Fund's investment strategy, (2) portfolio liquidity and cash flow projections during normal and reasonably foreseeable stressed conditions, (3) shareholder redemptions, (4) borrowings and other funding sources and (5) certain factors specific to ETFs including the effect of the Fund's prices and spreads, market participants, and basket compositions on the overall liquidity of the Fund's portfolio, as applicable.
In accordance with the Program, each of the Fund's portfolio investments is classified into one of four defined liquidity categories based on a determination of a reasonable expectation for how long it would take to convert the investment to cash (or sell or dispose of the investment) without significantly changing its market value.
- Highly liquid investments - cash or convertible to cash within three business days or less
- Moderately liquid investments - convertible to cash in three to seven calendar days
- Less liquid investments - can be sold or disposed of, but not settled, within seven calendar days
- Illiquid investments - cannot be sold or disposed of within seven calendar days
Liquidity classification determinations take into account a variety of factors including various market, trading and investment-specific considerations, as well as market depth, and generally utilize analysis from a third-party liquidity metrics service.
The Liquidity Rule places a 15% limit on a fund's illiquid investments and requires funds that do not primarily hold assets that are highly liquid investments to determine and maintain a minimum percentage of the fund's net assets to be invested in highly liquid investments (highly liquid investment minimum or HLIM). The Program includes provisions reasonably designed to comply with the 15% limit on illiquid investments and for determining, periodically reviewing and complying with the HLIM requirement as applicable.
At a recent meeting of the Fund's Board of Trustees, the LRM Committee provided a written report to the Board pertaining to the operation, adequacy, and effectiveness of the Program for the period December 1, 2021 through November 30, 2022. The report concluded that the Program is operating effectively and is reasonably designed to assess and manage the Fund's liquidity risk.
1.9900846.102
SST-SANN-0423
Fidelity Flex® Funds
Fidelity Flex® Conservative Income Bond Fund
Semi-Annual Report
February 28, 2023
Contents
To view a fund's proxy voting guidelines and proxy voting record for the 12-month period ended June 30, visit http://www.fidelity.com/proxyvotingresults or visit the Securities and Exchange Commission's (SEC) web site at http://www.sec.gov.
You may also call 1-800-544-3455 (for managed account clients) or 1-800-835-5092 (for retirement plan participants) to request a free copy of the proxy voting guidelines.
Standard & Poor's, S&P and S&P 500 are registered service marks of The McGraw-Hill Companies, Inc. and have been licensed for use by Fidelity Distributors Corporation.
Other third-party marks appearing herein are the property of their respective owners.
All other marks appearing herein are registered or unregistered trademarks or service marks of FMR LLC or an affiliated company. © 2023 FMR LLC. All rights reserved.
This report and the financial statements contained herein are submitted for the general information of the shareholders of the Fund. This report is not authorized for distribution to prospective investors in the Fund unless preceded or accompanied by an effective prospectus.
A fund files its complete schedule of portfolio holdings with the SEC for the first and third quarters of each fiscal year on Form N-PORT. Forms N-PORT are available on the SEC's web site at http://www.sec.gov. A fund's Forms N-PORT may be reviewed and copied at the SEC's Public Reference Room in Washington, DC. Information regarding the operation of the SEC's Public Reference Room may be obtained by calling 1-800-SEC-0330.
For a complete list of a fund's portfolio holdings, view the most recent holdings listing, semiannual report, or annual report on Fidelity's web site at http://www.fidelity.com, http://www.institutional.fidelity.com, or http://www.401k.com, as applicable.
NOT FDIC INSURED •MAY LOSE VALUE •NO BANK GUARANTEE
Neither the Fund nor Fidelity Distributors Corporation is a bank.
Quality Diversification (% of Fund's net assets) |
|
| |
| We have used ratings from Moody's Investors Service, Inc. Where Moody's® ratings are not available, we have used S&P® ratings. All ratings are as of the date indicated and do not reflect subsequent changes. |
| Maturity Diversification (% of Fund's Investments) |
| Days |
| 0 - 30 | 40.0 | |
| 31 - 90 | 5.2 | |
| 91 - 180 | 5.3 | |
| 181 - 397 | 16.5 | |
| > 397 | 33.0 | |
|
The date shown for securities represents the date when principal payments must be paid, taking into account any call options exercised by the issuer and any permissible maturity shortening features other than interest rate resets
Asset Allocation (% of Fund's net assets) |
|
Foreign investments - 26.8% |
|
Geographic Diversification (% of Fund's net assets) |
|
* Includes Short-Term investments and Net Other Assets (Liabilities). Percentages are based on country or territory of incorporation and are adjusted for the effect of derivatives, if applicable. |
| |
Showing Percentage of Net Assets
| Nonconvertible Bonds - 58.5% |
| | | Principal Amount (a) | Value ($) |
| COMMUNICATION SERVICES - 0.8% | | | |
| Diversified Telecommunication Services - 0.6% | | | |
| NTT Finance Corp. 0.373% 3/3/23 (b) | | 1,000,000 | 999,875 |
| Verizon Communications, Inc. U.S. Secured Overnight Fin. Rate (SOFR) Averages Index + 0.500% 4.913% 3/22/24 (c)(d) | | 902,000 | 901,428 |
| | | | 1,901,303 |
| Media - 0.2% | | | |
| Magallanes, Inc. U.S. Secured Overnight Fin. Rate (SOFR) Averages Index + 1.780% 6.1741% 3/15/24 (b)(c)(d) | | 475,000 | 478,248 |
TOTAL COMMUNICATION SERVICES | | | 2,379,551 |
| CONSUMER DISCRETIONARY - 3.3% | | | |
| Automobiles - 3.1% | | | |
| BMW U.S. Capital LLC: | | | |
| U.S. Secured Overnight Fin. Rate (SOFR) Averages Index + 0.530% 4.9546% 4/1/24 (b)(c)(d) | | 624,000 | 624,199 |
| U.S. Secured Overnight Fin. Rate (SOFR) Averages Index + 0.840% 5.2646% 4/1/25 (b)(c)(d) | | 1,000,000 | 1,003,790 |
| 3.8% 4/6/23 (b) | | 1,000,000 | 998,635 |
| Daimler Finance North America LLC: | | | |
| 3.65% 2/22/24 (b) | | 370,000 | 363,673 |
| 5.5% 11/27/24 (b) | | 500,000 | 501,266 |
| General Motors Financial Co., Inc.: | | | |
| U.S. Secured Overnight Fin. Rate (SOFR) Averages Index + 1.300% 5.7367% 4/7/25 (c)(d) | | 775,000 | 774,985 |
| U.S. Secured Overnight Fin. Rate (SOFR) Index + 0.760% 5.1077% 3/8/24 (c)(d) | | 1,032,000 | 1,029,903 |
| U.S. Secured Overnight Fin. Rate (SOFR) Index + 1.200% 5.7531% 11/17/23 (c)(d) | | 400,000 | 400,293 |
| 4.15% 6/19/23 | | 610,000 | 607,669 |
| Volkswagen Group of America Finance LLC: | | | |
| U.S. Secured Overnight Fin. Rate (SOFR) Index + 0.950% 5.2737% 6/7/24 (b)(c)(d) | | 1,000,000 | 1,000,997 |
| 0.875% 11/22/23 (b) | | 700,000 | 677,367 |
| 4.25% 11/13/23 (b) | | 1,060,000 | 1,049,792 |
| | | | 9,032,569 |
| Hotels, Restaurants & Leisure - 0.2% | | | |
| Starbucks Corp. U.S. Secured Overnight Fin. Rate (SOFR) Averages Index + 0.420% 4.9745% 2/14/24 (c)(d) | | 621,000 | 620,114 |
TOTAL CONSUMER DISCRETIONARY | | | 9,652,683 |
| CONSUMER STAPLES - 0.8% | | | |
| Food & Staples Retailing - 0.3% | | | |
| 7-Eleven, Inc. 0.8% 2/10/24 (b) | | 900,000 | 859,671 |
| Tobacco - 0.5% | | | |
| BAT Capital Corp. 3.222% 8/15/24 | | 500,000 | 481,875 |
| Philip Morris International, Inc. 5.125% 11/15/24 | | 500,000 | 498,437 |
| Reynolds American, Inc. 4.85% 9/15/23 | | 630,000 | 627,781 |
| | | | 1,608,093 |
TOTAL CONSUMER STAPLES | | | 2,467,764 |
| ENERGY - 1.0% | | | |
| Oil, Gas & Consumable Fuels - 1.0% | | | |
| Chevron Corp. 3 month U.S. LIBOR + 0.900% 5.7726% 5/11/23 (c)(d) | | 400,000 | 400,532 |
| Enbridge, Inc.: | | | |
| U.S. Secured Overnight Fin. Rate (SOFR) Averages Index + 0.630% 5.1834% 2/16/24 (c)(d) | | 616,000 | 614,709 |
| 4% 10/1/23 | | 600,000 | 594,882 |
| Equinor ASA 2.65% 1/15/24 | | 1,000,000 | 978,055 |
| Phillips 66 Co. 0.9% 2/15/24 | | 500,000 | 478,645 |
| | | | 3,066,823 |
| FINANCIALS - 43.2% | | | |
| Banks - 27.9% | | | |
| Bank of America Corp.: | | | |
| U.S. Secured Overnight Fin. Rate (SOFR) Index + 0.660% 5.2163% 2/4/25 (c)(d) | | 1,000,000 | 999,450 |
| U.S. Secured Overnight Fin. Rate (SOFR) Index + 0.730% 5.2301% 10/24/24 (c)(d) | | 500,000 | 500,363 |
| U.S. Secured Overnight Fin. Rate (SOFR) Index + 1.100% 5.6051% 4/25/25 (c)(d) | | 1,300,000 | 1,305,265 |
| 0.523% 6/14/24 (c) | | 600,000 | 590,454 |
| 0.81% 10/24/24 (c) | | 700,000 | 678,117 |
| 0.981% 9/25/25 (c) | | 740,000 | 686,726 |
| 1.843% 2/4/25 (c) | | 500,000 | 481,795 |
| 3.458% 3/15/25 (c) | | 800,000 | 781,890 |
| 3.841% 4/25/25 (c) | | 1,800,000 | 1,762,803 |
| Bank of Montreal: | | | |
| U.S. Secured Overnight Fin. Rate (SOFR) Averages Index + 0.260% 4.6591% 9/15/23 (c)(d) | | 650,000 | 650,059 |
| U.S. Secured Overnight Fin. Rate (SOFR) Averages Index + 0.270% 4.7219% 4/14/23 (c)(d) | | 1,100,000 | 1,100,022 |
| Bank of Nova Scotia: | | | |
| U.S. Secured Overnight Fin. Rate (SOFR) Averages Index + 0.440% 4.8969% 4/15/24 (c)(d) | | 1,300,000 | 1,300,026 |
| U.S. Secured Overnight Fin. Rate (SOFR) Averages Index + 0.550% 4.9441% 9/15/23 (c)(d) | | 1,000,000 | 1,001,386 |
| U.S. Secured Overnight Fin. Rate (SOFR) Index + 0.260% 4.6541% 9/15/23 (c)(d) | | 850,000 | 849,928 |
| U.S. Secured Overnight Fin. Rate (SOFR) Index + 0.380% 4.8925% 7/31/24 (c)(d) | | 700,000 | 699,078 |
| Barclays PLC: | | | |
| 1.007% 12/10/24 (c) | | 750,000 | 722,168 |
| 3.932% 5/7/25 (c) | | 560,000 | 545,058 |
| 4.338% 5/16/24 (c) | | 800,000 | 796,962 |
| BNP Paribas SA: | | | |
| 3.5% 3/1/23 (b) | | 1,400,000 | 1,400,000 |
| 3.8% 1/10/24 (b) | | 560,000 | 550,435 |
| 4.705% 1/10/25 (b)(c) | | 1,100,000 | 1,088,509 |
| BPCE SA: | | | |
| 3 month U.S. LIBOR + 1.240% 5.9751% 9/12/23 (b)(c)(d) | | 1,550,000 | 1,554,775 |
| U.S. Secured Overnight Fin. Rate (SOFR) Index + 0.570% 5.0219% 1/14/25 (b)(c)(d) | | 506,000 | 501,458 |
| 2.375% 1/14/25 (b) | | 439,000 | 412,639 |
| 4% 9/12/23 (b) | | 304,000 | 300,846 |
| 5.15% 7/21/24 (b) | | 750,000 | 738,253 |
| 5.7% 10/22/23 (b) | | 800,000 | 797,546 |
| Canadian Imperial Bank of Commerce: | | | |
| U.S. Secured Overnight Fin. Rate (SOFR) Index + 0.340% 4.753% 6/22/23 (c)(d) | | 1,432,000 | 1,432,172 |
| U.S. Secured Overnight Fin. Rate (SOFR) Index + 0.800% 5.2168% 3/17/23 (c)(d) | | 650,000 | 650,163 |
| U.S. Secured Overnight Fin. Rate (SOFR) Index + 0.940% 5.3768% 4/7/25 (c)(d) | | 1,000,000 | 1,004,591 |
| Citigroup, Inc.: | | | |
| 3 month U.S. LIBOR + 1.020% 4.044% 6/1/24 (c)(d) | | 900,000 | 896,392 |
| U.S. Secured Overnight Fin. Rate (SOFR) Index + 0.660% 5.1852% 5/1/25 (c)(d) | | 800,000 | 797,624 |
| U.S. Secured Overnight Fin. Rate (SOFR) Index + 1.370% 5.9232% 5/24/25 (c)(d) | | 1,000,000 | 1,007,186 |
| 0.776% 10/30/24 (c) | | 1,140,000 | 1,101,917 |
| 0.981% 5/1/25 (c) | | 600,000 | 566,642 |
| Credit Agricole SA: | | | |
| 3.75% 4/24/23 (b) | | 1,000,000 | 997,811 |
| 3.875% 4/15/24 (b) | | 500,000 | 490,420 |
| Danske Bank A/S: | | | |
| 3.773% 3/28/25 (b)(c) | | 1,360,000 | 1,330,888 |
| 3.875% 9/12/23 (b) | | 500,000 | 495,320 |
| 5.375% 1/12/24 (b) | | 550,000 | 548,131 |
| 6.466% 1/9/26 (b)(c) | | 255,000 | 256,567 |
| DNB Bank ASA: | | | |
| U.S. Secured Overnight Fin. Rate (SOFR) Averages Index + 0.830% 5.2464% 3/28/25 (b)(c)(d) | | 1,000,000 | 1,001,670 |
| 0.856% 9/30/25 (b)(c) | | 750,000 | 692,523 |
| 2.968% 3/28/25 (b)(c) | | 450,000 | 435,712 |
| Federation des caisses Desjardin U.S. Secured Overnight Fin. Rate (SOFR) Index + 0.430% 4.9821% 5/21/24 (b)(c)(d) | | 1,110,000 | 1,106,486 |
| Fifth Third Bancorp 3.65% 1/25/24 | | 2,350,000 | 2,316,521 |
| HSBC Holdings PLC: | | | |
| U.S. Secured Overnight Fin. Rate (SOFR) Index + 0.580% 5.1324% 11/22/24 (c)(d) | | 700,000 | 693,431 |
| 0.732% 8/17/24 (c) | | 1,000,000 | 975,232 |
| 1.162% 11/22/24 (c) | | 1,010,000 | 974,454 |
| 3.803% 3/11/25 (c) | | 860,000 | 841,931 |
| 3.95% 5/18/24 (c) | | 900,000 | 896,006 |
| Huntington National Bank: | | | |
| U.S. Secured Overnight Fin. Rate (SOFR) Averages Index + 1.190% 5.7434% 5/16/25 (c)(d) | | 1,000,000 | 1,006,160 |
| 4.008% 5/16/25 (c) | | 500,000 | 490,369 |
| JPMorgan Chase & Co.: | | | |
| U.S. Secured Overnight Fin. Rate (SOFR) Index + 0.580% 4.9815% 3/16/24 (c)(d) | | 700,000 | 700,055 |
| U.S. Secured Overnight Fin. Rate (SOFR) Index + 0.970% 5.3569% 6/14/25 (c)(d) | | 1,000,000 | 1,003,510 |
| 0.563% 2/16/25 (c) | | 720,000 | 682,752 |
| 0.697% 3/16/24 (c) | | 700,000 | 698,292 |
| 1.561% 12/10/25 (c) | | 600,000 | 557,696 |
| 3.559% 4/23/24 (c) | | 700,000 | 697,683 |
| 3.797% 7/23/24 (c) | | 300,000 | 297,835 |
| 4.023% 12/5/24 (c) | | 560,000 | 552,704 |
| KeyBank NA: | | | |
| U.S. Secured Overnight Fin. Rate (SOFR) Averages Index + 0.320% 4.7069% 6/14/24 (c)(d) | | 1,330,000 | 1,326,968 |
| U.S. Secured Overnight Fin. Rate (SOFR) Averages Index + 0.340% 4.7646% 1/3/24 (c)(d) | | 650,000 | 649,875 |
| Lloyds Banking Group PLC: | | | |
| 0.695% 5/11/24 (c) | | 800,000 | 791,104 |
| 3.9% 3/12/24 | | 600,000 | 589,676 |
| M&T Bank Corp. 3 month U.S. LIBOR + 0.680% 5.5019% 7/26/23 (c)(d) | | 1,590,000 | 1,590,305 |
| Mitsubishi UFJ Financial Group, Inc.: | | | |
| 3 month U.S. LIBOR + 0.740% 5.5186% 3/2/23 (c)(d) | | 500,000 | 500,000 |
| 3 month U.S. LIBOR + 0.860% 5.6819% 7/26/23 (c)(d) | | 1,050,000 | 1,052,277 |
| U.S. Secured Overnight Fin. Rate (SOFR) Index + 1.380% 5.711% 9/12/25 (c)(d) | | 800,000 | 805,968 |
| U.S. Secured Overnight Fin. Rate (SOFR) Index + 1.650% 6.1046% 7/18/25 (c)(d) | | 1,000,000 | 1,012,060 |
| 0.848% 9/15/24 (c) | | 400,000 | 389,434 |
| 0.953% 7/19/25 (c) | | 1,200,000 | 1,120,278 |
| Mizuho Financial Group, Inc.: | | | |
| 0.849% 9/8/24 (c) | | 1,383,000 | 1,346,653 |
| 3.549% 3/5/23 | | 500,000 | 499,919 |
| 3.922% 9/11/24 (c) | | 800,000 | 791,625 |
| NatWest Group PLC 4.519% 6/25/24 (c) | | 800,000 | 795,684 |
| NatWest Markets PLC: | | | |
| U.S. Secured Overnight Fin. Rate (SOFR) Index + 0.530% 5.0848% 8/12/24 (b)(c)(d) | | 640,000 | 633,108 |
| U.S. Secured Overnight Fin. Rate (SOFR) Index + 1.450% 5.863% 3/22/25 (b)(c)(d) | | 656,000 | 656,892 |
| Nordea Bank ABP 3.75% 8/30/23 (b) | | 800,000 | 793,497 |
| PNC Financial Services Group, Inc. 3.5% 1/23/24 | | 500,000 | 492,151 |
| Rabobank Nederland 2.625% 7/22/24 (b) | | 600,000 | 577,258 |
| Rabobank Nederland New York Branch: | | | |
| U.S. Secured Overnight Fin. Rate (SOFR) Averages Index + 0.300% 4.7469% 1/12/24 (c)(d) | | 297,000 | 296,851 |
| 0.375% 1/12/24 | | 1,000,000 | 959,433 |
| Royal Bank of Canada: | | | |
| U.S. Secured Overnight Fin. Rate (SOFR) Averages Index + 0.340% 4.7767% 10/7/24 (c)(d) | | 640,000 | 638,560 |
| U.S. Secured Overnight Fin. Rate (SOFR) Averages Index + 0.450% 4.9461% 10/26/23 (c)(d) | | 1,600,000 | 1,601,766 |
| Societe Generale 3.875% 3/28/24 (b) | | 800,000 | 783,746 |
| Sumitomo Mitsui Financial Group, Inc.: | | | |
| 3 month U.S. LIBOR + 0.860% 5.6576% 7/19/23 (c)(d) | | 1,150,000 | 1,152,714 |
| 0.508% 1/12/24 | | 500,000 | 479,400 |
| Svenska Handelsbanken AB 0.55% 6/11/24 (b) | | 600,000 | 563,872 |
| Swedbank AB U.S. Secured Overnight Fin. Rate (SOFR) Averages Index + 0.910% 5.3362% 4/4/25 (b)(c)(d) | | 645,000 | 644,355 |
| The Toronto-Dominion Bank: | | | |
| U.S. Secured Overnight Fin. Rate (SOFR) Index + 0.220% 4.5215% 6/2/23 (c)(d) | | 750,000 | 749,697 |
| U.S. Secured Overnight Fin. Rate (SOFR) Index + 0.350% 4.6748% 3/4/24 (c)(d) | | 1,340,000 | 1,338,716 |
| U.S. Secured Overnight Fin. Rate (SOFR) Index + 0.450% 4.8664% 9/28/23 (c)(d) | | 650,000 | 650,501 |
| U.S. Secured Overnight Fin. Rate (SOFR) Index + 0.910% 5.2577% 3/8/24 (c)(d) | | 906,000 | 910,036 |
| Truist Bank: | | | |
| U.S. Secured Overnight Fin. Rate (SOFR) Index + 0.200% 4.6546% 1/17/24 (c)(d) | | 850,000 | 848,257 |
| U.S. Secured Overnight Fin. Rate (SOFR) Index + 0.730% 5.0838% 3/9/23 (c)(d) | | 523,000 | 523,052 |
| Truist Financial Corp. U.S. Secured Overnight Fin. Rate (SOFR) Index + 0.400% 4.7538% 6/9/25 (c)(d) | | 1,000,000 | 992,240 |
| Wells Fargo & Co.: | | | |
| 3.3% 9/9/24 | | 600,000 | 582,434 |
| 3.75% 1/24/24 | | 815,000 | 802,755 |
| | | | 81,925,974 |
| Capital Markets - 7.4% | | | |
| Charles Schwab Corp. U.S. Secured Overnight Fin. Rate (SOFR) Averages Index + 0.500% 4.909% 3/18/24 (c)(d) | | 500,000 | 500,410 |
| Credit Suisse AG: | | | |
| U.S. Secured Overnight Fin. Rate (SOFR) Averages Index + 0.380% 4.9354% 8/9/23 (c)(d) | | 600,000 | 595,157 |
| U.S. Secured Overnight Fin. Rate (SOFR) Averages Index + 0.390% 4.9306% 2/2/24 (c)(d) | | 1,000,000 | 975,380 |
| U.S. Secured Overnight Fin. Rate (SOFR) Averages Index + 1.260% 5.8127% 2/21/25 (c)(d) | | 800,000 | 765,127 |
| 0.495% 2/2/24 | | 1,000,000 | 942,777 |
| Credit Suisse Group AG 3.8% 6/9/23 | | 500,000 | 494,000 |
| Deutsche Bank AG New York Branch: | | | |
| U.S. Secured Overnight Fin. Rate (SOFR) Index + 0.500% 5.0557% 11/8/23 (c)(d) | | 1,150,000 | 1,148,865 |
| 0.962% 11/8/23 | | 800,000 | 775,870 |
| Goldman Sachs Group, Inc.: | | | |
| U.S. Secured Overnight Fin. Rate (SOFR) Index + 0.700% 5.1779% 1/24/25 (c)(d) | | 1,000,000 | 998,477 |
| U.S. Secured Overnight Fin. Rate (SOFR) Index + 1.390% 5.7841% 3/15/24 (c)(d) | | 1,500,000 | 1,510,657 |
| 0.925% 10/21/24 (c) | | 1,000,000 | 967,918 |
| 1.757% 1/24/25 (c) | | 369,000 | 355,176 |
| 4% 3/3/24 | | 1,000,000 | 985,174 |
| Morgan Stanley: | | | |
| U.S. Secured Overnight Fin. Rate (SOFR) Index + 0.450% 4.9583% 1/25/24 (c)(d) | | 337,000 | 336,790 |
| U.S. Secured Overnight Fin. Rate (SOFR) Index + 0.460% 5.0208% 11/10/23 (c)(d) | | 410,000 | 409,945 |
| U.S. Secured Overnight Fin. Rate (SOFR) Index + 0.620% 5.1251% 1/24/25 (c)(d) | | 1,000,000 | 997,790 |
| U.S. Secured Overnight Fin. Rate (SOFR) Index + 1.160% 5.6371% 4/17/25 (c)(d) | | 1,000,000 | 1,004,610 |
| 0.791% 1/22/25 (c) | | 1,300,000 | 1,243,118 |
| 3.7% 10/23/24 | | 600,000 | 584,478 |
| 3.737% 4/24/24 (c) | | 400,000 | 398,822 |
| State Street Corp. 3.776% 12/3/24 (c) | | 500,000 | 493,588 |
| UBS AG London Branch: | | | |
| U.S. Secured Overnight Fin. Rate (SOFR) Index + 0.320% 4.6163% 6/1/23 (b)(c)(d) | | 1,250,000 | 1,250,550 |
| U.S. Secured Overnight Fin. Rate (SOFR) Index + 0.360% 4.9154% 2/9/24 (b)(c)(d) | | 1,300,000 | 1,299,194 |
| U.S. Secured Overnight Fin. Rate (SOFR) Index + 0.450% 5.0054% 8/9/24 (b)(c)(d) | | 1,000,000 | 1,000,593 |
| U.S. Secured Overnight Fin. Rate (SOFR) Index + 0.470% 4.9192% 1/13/25 (b)(c)(d) | | 750,000 | 748,270 |
| UBS Group AG 1.008% 7/30/24 (b)(c) | | 1,000,000 | 980,147 |
| | | | 21,762,883 |
| Consumer Finance - 3.8% | | | |
| AerCap Ireland Capital Ltd./AerCap Global Aviation Trust U.S. Secured Overnight Fin. Rate (SOFR) Index + 0.680% 5.1017% 9/29/23 (c)(d) | | 651,000 | 647,841 |
| American Express Co.: | | | |
| U.S. Secured Overnight Fin. Rate (SOFR) Averages Index + 0.230% 4.7786% 11/3/23 (c)(d) | | 650,000 | 648,847 |
| U.S. Secured Overnight Fin. Rate (SOFR) Averages Index + 0.720% 5.2686% 5/3/24 (c)(d) | | 1,367,000 | 1,371,352 |
| Capital One Financial Corp.: | | | |
| U.S. Secured Overnight Fin. Rate (SOFR) Index + 0.690% 5.0434% 12/6/24 (c)(d) | | 1,000,000 | 993,550 |
| U.S. Secured Overnight Fin. Rate (SOFR) Index + 1.350% 5.9054% 5/9/25 (c)(d) | | 1,000,000 | 999,739 |
| 1.343% 12/6/24 (c) | | 1,180,000 | 1,137,318 |
| 3.3% 10/30/24 | | 520,000 | 502,044 |
| 4.166% 5/9/25 (c) | | 960,000 | 938,484 |
| Toyota Motor Credit Corp.: | | | |
| U.S. Secured Overnight Fin. Rate (SOFR) Averages Index + 0.650% 5.0717% 12/29/23 (c)(d) | | 1,000,000 | 1,003,670 |
| U.S. Secured Overnight Fin. Rate (SOFR) Index + 0.320% 4.7548% 4/6/23 (c)(d) | | 900,000 | 900,000 |
| U.S. Secured Overnight Fin. Rate (SOFR) Index + 0.350% 4.9% 6/13/23 (c)(d) | | 1,000,000 | 1,000,347 |
| U.S. Secured Overnight Fin. Rate (SOFR) Index + 0.620% 5.033% 3/22/24 (c)(d) | | 1,000,000 | 1,002,153 |
| | | | 11,145,345 |
| Diversified Financial Services - 1.8% | | | |
| Athene Global Funding: | | | |
| U.S. Secured Overnight Fin. Rate (SOFR) Averages Index + 0.700% 5.2511% 5/24/24 (b)(c)(d) | | 1,300,000 | 1,292,005 |
| U.S. Secured Overnight Fin. Rate (SOFR) Averages Index + 0.710% 5.1497% 1/7/25 (b)(c)(d) | | 1,150,000 | 1,129,383 |
| 0.95% 1/8/24 (b) | | 800,000 | 768,838 |
| 2.75% 6/25/24 (b) | | 560,000 | 533,416 |
| GA Global Funding Trust: | | | |
| 1% 4/8/24 (b) | | 720,000 | 679,295 |
| 1.25% 12/8/23 (b) | | 500,000 | 482,808 |
| Jackson Financial, Inc. 1.125% 11/22/23 | | 500,000 | 484,581 |
| | | | 5,370,326 |
| Insurance - 2.3% | | | |
| Equitable Financial Life Global Funding U.S. Secured Overnight Fin. Rate (SOFR) Index + 0.390% 4.8301% 4/6/23 (b)(c)(d) | | 700,000 | 699,754 |
| Marsh & McLennan Companies, Inc. 3.875% 3/15/24 | | 600,000 | 589,920 |
| New York Life Global Funding: | | | |
| U.S. Secured Overnight Fin. Rate (SOFR) Averages Index + 0.430% 4.755% 6/6/24 (b)(c)(d) | | 1,100,000 | 1,100,794 |
| U.S. Secured Overnight Fin. Rate (SOFR) Index + 0.310% 4.8061% 4/26/24 (b)(c)(d) | | 550,000 | 550,262 |
| Pacific Life Global Funding II U.S. Secured Overnight Fin. Rate (SOFR) Index + 0.380% 4.8327% 4/12/24 (b)(c)(d) | | 700,000 | 696,255 |
| Principal Life Global Funding II U.S. Secured Overnight Fin. Rate (SOFR) Index + 0.450% 4.8969% 4/12/24 (b)(c)(d) | | 438,000 | 438,000 |
| Protective Life Global Funding: | | | |
| U.S. Secured Overnight Fin. Rate (SOFR) Index + 0.550% 4.9731% 3/31/23 (b)(c)(d) | | 768,000 | 767,999 |
| U.S. Secured Overnight Fin. Rate (SOFR) Index + 0.980% 5.3964% 3/28/25 (b)(c)(d) | | 1,000,000 | 1,001,960 |
| 0.502% 4/12/23 (b) | | 1,000,000 | 994,870 |
| | | | 6,839,814 |
TOTAL FINANCIALS | | | 127,044,342 |
| HEALTH CARE - 2.6% | | | |
| Health Care Providers & Services - 0.5% | | | |
| Humana, Inc. 0.65% 8/3/23 | | 1,600,000 | 1,568,566 |
| Life Sciences Tools & Services - 0.4% | | | |
| Thermo Fisher Scientific, Inc. U.S. Secured Overnight Fin. Rate (SOFR) Averages Index + 0.530% 4.9846% 10/18/24 (c)(d) | | 1,124,000 | 1,122,878 |
| Pharmaceuticals - 1.7% | | | |
| Bayer U.S. Finance II LLC 3.875% 12/15/23 (b) | | 2,000,000 | 1,973,026 |
| GSK Consumer Healthcare Capital U.S. LLC U.S. Secured Overnight Fin. Rate (SOFR) Index + 0.890% 5.3052% 3/24/24 (c)(d) | | 1,051,000 | 1,048,133 |
| Roche Holdings, Inc. U.S. Secured Overnight Fin. Rate (SOFR) Index + 0.330% 4.6872% 9/11/23 (b)(c)(d) | | 1,300,000 | 1,300,493 |
| Shire Acquisitions Investments Ireland DAC 2.875% 9/23/23 | | 550,000 | 541,855 |
| | | | 4,863,507 |
TOTAL HEALTH CARE | | | 7,554,951 |
| INDUSTRIALS - 2.4% | | | |
| Industrial Conglomerates - 0.5% | | | |
| Siemens Financieringsmaatschappij NV: | | | |
| U.S. Secured Overnight Fin. Rate (SOFR) Index + 0.430% 4.7901% 3/11/24 (b)(c)(d) | | 500,000 | 500,325 |
| 0.4% 3/11/23 (b) | | 902,000 | 900,816 |
| | | | 1,401,141 |
| Machinery - 1.9% | | | |
| Caterpillar Financial Services Corp.: | | | |
| U.S. Secured Overnight Fin. Rate (SOFR) Index + 0.450% 5.0048% 11/13/23 (c)(d) | | 1,200,000 | 1,201,303 |
| 0.25% 3/1/23 | | 500,000 | 500,000 |
| Daimler Trucks Finance North America LLC: | | | |
| U.S. Secured Overnight Fin. Rate (SOFR) Index + 0.500% 4.8384% 6/14/23 (b)(c)(d) | | 700,000 | 700,087 |
| U.S. Secured Overnight Fin. Rate (SOFR) Index + 1.000% 5.433% 4/5/24 (b)(c)(d) | | 1,440,000 | 1,441,078 |
| 1.125% 12/14/23 (b) | | 1,633,000 | 1,580,400 |
| 5.2% 1/17/25 (b) | | 290,000 | 288,135 |
| | | | 5,711,003 |
TOTAL INDUSTRIALS | | | 7,112,144 |
| INFORMATION TECHNOLOGY - 0.3% | | | |
| Semiconductors & Semiconductor Equipment - 0.3% | | | |
| Analog Devices, Inc. U.S. Secured Overnight Fin. Rate (SOFR) Index + 0.250% 4.6746% 10/1/24 (c)(d) | | 274,000 | 271,238 |
| Microchip Technology, Inc. 2.67% 9/1/23 | | 550,000 | 541,600 |
| | | | 812,838 |
| REAL ESTATE - 0.4% | | | |
| Equity Real Estate Investment Trusts (REITs) - 0.4% | | | |
| Simon Property Group LP U.S. Secured Overnight Fin. Rate (SOFR) Averages Index + 0.430% 4.8747% 1/11/24 (c)(d) | | 1,151,000 | 1,148,217 |
| UTILITIES - 3.7% | | | |
| Electric Utilities - 3.1% | | | |
| Duke Energy Corp. U.S. Secured Overnight Fin. Rate (SOFR) Index + 0.250% 4.6101% 6/10/23 (c)(d) | | 341,000 | 340,711 |
| Florida Power & Light Co. U.S. Secured Overnight Fin. Rate (SOFR) Averages Index + 0.250% 4.8051% 5/10/23 (c)(d) | | 399,000 | 398,877 |
| Mississippi Power Co. U.S. Secured Overnight Fin. Rate (SOFR) Index + 0.300% 4.7164% 6/28/24 (c)(d) | | 650,000 | 641,180 |
| NextEra Energy Capital Holdings, Inc.: | | | |
| U.S. Secured Overnight Fin. Rate (SOFR) Averages Index + 0.400% 4.9486% 11/3/23 (c)(d) | | 900,000 | 899,616 |
| U.S. Secured Overnight Fin. Rate (SOFR) Averages Index + 0.540% 4.8363% 3/1/23 (c)(d) | | 997,000 | 997,000 |
| 0.65% 3/1/23 | | 800,000 | 800,000 |
| PPL Electric Utilities Corp.: | | | |
| 3 month U.S. LIBOR + 0.250% 4.9739% 9/28/23 (c)(d) | | 145,000 | 144,601 |
| U.S. Secured Overnight Fin. Rate (SOFR) Index + 0.330% 4.7452% 6/24/24 (c)(d) | | 1,026,000 | 1,024,347 |
| Southern California Edison Co.: | | | |
| U.S. Secured Overnight Fin. Rate (SOFR) Averages Index + 0.640% 5.0646% 4/3/23 (c)(d) | | 500,000 | 499,926 |
| U.S. Secured Overnight Fin. Rate (SOFR) Averages Index + 0.830% 5.2546% 4/1/24 (c)(d) | | 1,150,000 | 1,148,508 |
| Southern Co.: | | | |
| U.S. Secured Overnight Fin. Rate (SOFR) Averages Index + 0.370% 4.9251% 5/10/23 (c)(d) | | 584,000 | 583,766 |
| 2.95% 7/1/23 | | 1,000,000 | 991,654 |
| Virginia Electric & Power Co. 3.45% 2/15/24 | | 600,000 | 588,338 |
| | | | 9,058,524 |
| Gas Utilities - 0.4% | | | |
| Atmos Energy Corp. 3 month U.S. LIBOR + 0.380% 5.1034% 3/9/23 (c)(d) | | 1,000,000 | 1,000,042 |
| Southern California Gas Co. 3 month U.S. LIBOR + 0.350% 5.1027% 9/14/23 (c)(d) | | 72,000 | 71,898 |
| | | | 1,071,940 |
| Multi-Utilities - 0.2% | | | |
| CenterPoint Energy, Inc. U.S. Secured Overnight Fin. Rate (SOFR) Averages Index + 0.650% 5.2048% 5/13/24 (c)(d) | | 585,000 | 582,193 |
| Dominion Energy, Inc. 3 month U.S. LIBOR + 0.530% 5.299% 9/15/23 (c)(d) | | 186,000 | 185,989 |
| | | | 768,182 |
TOTAL UTILITIES | | | 10,898,646 |
| TOTAL NONCONVERTIBLE BONDS (Cost $172,373,324) | | | 172,137,959 |
| | | | |
| U.S. Treasury Obligations - 14.1% |
| | | Principal Amount (a) | Value ($) |
| U.S. Treasury Bills, yield at date of purchase 4.59% to 4.75% 5/11/23 to 1/25/24 | | 29,316,500 | 28,588,651 |
| U.S. Treasury Notes: | | | |
| 3% 6/30/24 | | 7,400,000 | 7,199,969 |
| 4.125% 1/31/25 | | 5,750,000 | 5,675,205 |
| TOTAL U.S. TREASURY OBLIGATIONS (Cost $41,555,828) | | | 41,463,825 |
| | | | |
| Certificates of Deposit - 9.9% |
| | | Principal Amount (a) | Value ($) |
| Bank of America NA 5.12% 8/31/23 | | 1,000,000 | 999,459 |
| Bank of Montreal yankee U.S. Secured Overnight Fin. Rate (SOFR) Index + 0.750% 5.3% 8/1/23 (c)(d) | | 1,250,000 | 1,252,941 |
| Bank of Nova Scotia yankee U.S. Secured Overnight Fin. Rate (SOFR) Index + 0.640% 5.19% 8/23/23 (c)(d) | | 1,500,000 | 1,503,001 |
| Barclays Bank PLC yankee: | | | |
| U.S. Secured Overnight Fin. Rate (SOFR) Index + 0.650% 5.2% 6/8/23 (c)(d) | | 1,200,000 | 1,201,517 |
| U.S. Secured Overnight Fin. Rate (SOFR) Index + 0.810% 5.36% 8/11/23 (c)(d) | | 1,300,000 | 1,299,997 |
| 5.4% 11/6/23 | | 1,000,000 | 999,442 |
| 5.56% 11/27/23 | | 1,300,000 | 1,300,016 |
| Canadian Imperial Bank of Commerce yankee: | | | |
| U.S. Secured Overnight Fin. Rate (SOFR) Index + 0.280% 4.83% 3/3/23 (c)(d) | | 1,200,000 | 1,200,020 |
| U.S. Secured Overnight Fin. Rate (SOFR) Index + 0.760% 5.31% 8/22/23 (c)(d) | | 1,250,000 | 1,253,967 |
| Credit Suisse AG yankee: | | | |
| U.S. Secured Overnight Fin. Rate (SOFR) Averages Index + 0.320% 4.8727% 3/20/23 (c)(d) | | 1,200,000 | 1,199,954 |
| U.S. Secured Overnight Fin. Rate (SOFR) Averages Index + 0.700% 5.2514% 3/23/23 (c)(d) | | 1,200,000 | 1,200,191 |
| Lloyds Bank Corporate Markets PLC yankee: | | | |
| U.S. Secured Overnight Fin. Rate (SOFR) Index + 0.720% 5.27% 8/14/23 (c)(d) | | 1,300,000 | 1,303,154 |
| U.S. Secured Overnight Fin. Rate (SOFR) Index + 0.810% 5.36% 7/3/23 (c)(d) | | 1,000,000 | 1,002,286 |
| Mizuho Corporate Bank Ltd. yankee: | | | |
| U.S. Secured Overnight Fin. Rate (SOFR) Index + 0.780% 5.33% 4/26/23 (c)(d) | | 1,000,000 | 1,001,090 |
| U.S. Secured Overnight Fin. Rate (SOFR) Index + 0.810% 5.36% 11/30/23 (c)(d) | | 1,000,000 | 1,004,117 |
| MUFG Bank Ltd. yankee U.S. Secured Overnight Fin. Rate (SOFR) Index + 0.540% 5.09% 3/17/23 (c)(d) | | 1,300,000 | 1,300,269 |
| Natexis Banques Populaires New York Branch yankee U.S. Secured Overnight Fin. Rate (SOFR) Index + 0.690% 5.24% 8/14/23 (c)(d) | | 1,300,000 | 1,302,966 |
| Nordea Bank Finland PLC yankee U.S. Secured Overnight Fin. Rate (SOFR) Index + 0.580% 5.13% 8/31/23 (c)(d) | | 1,400,000 | 1,403,001 |
| Royal Bank of Canada yankee U.S. Secured Overnight Fin. Rate (SOFR) Index + 0.580% 5.13% 9/19/23 (c)(d) | | 1,000,000 | 1,001,940 |
| Sumitomo Mitsui Banking Corp. yankee: | | | |
| U.S. Secured Overnight Fin. Rate (SOFR) Index + 0.600% 5.15% 5/3/23 (c)(d) | | 1,400,000 | 1,401,059 |
| U.S. Secured Overnight Fin. Rate (SOFR) Index + 0.650% 5.2% 7/7/23 (c)(d) | | 1,200,000 | 1,201,984 |
| U.S. Secured Overnight Fin. Rate (SOFR) Index + 0.700% 5.25% 7/11/23 (c)(d) | | 1,300,000 | 1,302,447 |
| U.S. Secured Overnight Fin. Rate (SOFR) Index + 0.800% 5.35% 8/1/23 (c)(d) | | 1,250,000 | 1,253,222 |
| Svenska Handelsbanken, Inc. yankee U.S. Secured Overnight Fin. Rate (SOFR) Index + 0.730% 5.28% 8/3/23 (c)(d) | | 1,250,000 | 1,253,081 |
| TOTAL CERTIFICATES OF DEPOSIT (Cost $29,100,295) | | | 29,141,121 |
| | | | |
| Commercial Paper - 7.7% |
| | | Principal Amount (a) | Value ($) |
| AT&T, Inc. 5.42% 12/19/23 | | 1,000,000 | 955,671 |
| Bank of Montreal: | | | |
| U.S. Secured Overnight Fin. Rate (SOFR) Index + 0.680% 5.23% 7/11/23 (c)(d) | | 1,300,000 | 1,299,955 |
| U.S. Secured Overnight Fin. Rate (SOFR) Index + 0.700% 5.25% 10/6/23 (c)(d) | | 1,000,000 | 1,002,941 |
| Bank of Nova Scotia U.S. Secured Overnight Fin. Rate (SOFR) Index + 0.600% 5.15% 8/25/23 (c)(d) | | 1,000,000 | 1,001,812 |
| BPCE SA yankee 5.15% 12/7/23 | | 1,500,000 | 1,438,454 |
| Cigna Group 4.92% 3/28/23 | | 1,500,000 | 1,494,383 |
| Citigroup Global Markets, Inc. U.S. Secured Overnight Fin. Rate (SOFR) Index + 0.650% 5.2% 9/22/23 (c)(d) | | 1,500,000 | 1,499,998 |
| Federation des caisses Desjardin U.S. Secured Overnight Fin. Rate (SOFR) Index + 0.680% 5.23% 4/28/23 (c)(d) | | 1,250,000 | 1,251,137 |
| General Motors Financial Co., Inc. 5.57% 4/12/23 | | 1,000,000 | 993,846 |
| HSBC U.S.A., Inc. yankee 5.35% 11/1/23 | | 1,250,000 | 1,205,259 |
| National Bank of Canada U.S. Secured Overnight Fin. Rate (SOFR) Index + 0.670% 5.22% 4/26/23 (c)(d) | | 1,250,000 | 1,251,144 |
| NatWest Markets PLC yankee: | | | |
| 5.28% 11/7/23 | | 1,300,000 | 1,252,043 |
| 5.34% 2/9/24 | | 1,300,000 | 1,232,605 |
| Philip Morris International, Inc. 5% 10/24/23 | | 1,000,000 | 967,222 |
| Royal Bank of Canada: | | | |
| U.S. Secured Overnight Fin. Rate (SOFR) Index + 0.660% 5.21% 7/7/23 (c)(d) | | 1,200,000 | 1,199,958 |
| U.S. Secured Overnight Fin. Rate (SOFR) Index + 0.750% 5.3% 7/27/23 (c)(d) | | 1,250,000 | 1,252,662 |
| Svenska Handelsbanken AB U.S. Secured Overnight Fin. Rate (SOFR) Index + 0.590% 5.14% 3/1/23 (c)(d) | | 1,300,000 | 1,300,000 |
| Svenska Handelsbanken, Inc. U.S. Secured Overnight Fin. Rate (SOFR) Index + 0.690% 5.24% 8/29/23 (c)(d) | | 1,000,000 | 1,002,588 |
| The Toronto-Dominion Bank yankee 4.97% 10/27/23 | | 1,000,000 | 965,008 |
| TOTAL COMMERCIAL PAPER (Cost $22,557,608) | | | 22,566,686 |
| | | | |
| Money Market Funds - 9.4% |
| | | Shares | Value ($) |
Fidelity Cash Central Fund 4.63% (e) (Cost $27,809,821) | | 27,804,260 | 27,809,821 |
| | | | |
| TOTAL INVESTMENT IN SECURITIES - 99.6% (Cost $293,396,876) | 293,119,412 |
NET OTHER ASSETS (LIABILITIES) - 0.4% | 1,078,605 |
| NET ASSETS - 100.0% | 294,198,017 |
| | |
Legend
| (a) | Amount is stated in United States dollars unless otherwise noted. |
| (b) | Security exempt from registration under Rule 144A of the Securities Act of 1933. These securities may be resold in transactions exempt from registration, normally to qualified institutional buyers. At the end of the period, the value of these securities amounted to $53,008,983 or 18.0% of net assets. |
| (c) | Coupon rates for floating and adjustable rate securities reflect the rates in effect at period end. |
| (d) | Coupon is indexed to a floating interest rate which may be multiplied by a specified factor and/or subject to caps or floors. |
| (e) | Affiliated fund that is generally available only to investment companies and other accounts managed by Fidelity Investments. The rate quoted is the annualized seven-day yield of the fund at period end. A complete unaudited listing of the fund's holdings as of its most recent quarter end is available upon request. In addition, each Fidelity Central Fund's financial statements are available on the SEC's website or upon request. |
Affiliated Central Funds
Fiscal year to date information regarding the Fund's investments in Fidelity Central Funds, including the ownership percentage, is presented below.
| Affiliate | Value, beginning of period ($) | Purchases ($) | Sales Proceeds ($) | Dividend Income ($) | Realized Gain (loss) ($) | Change in Unrealized appreciation (depreciation) ($) | Value, end of period ($) | % ownership, end of period |
| Fidelity Cash Central Fund 4.63% | 34,197,255 | 82,344,913 | 88,732,347 | 732,236 | - | - | 27,809,821 | 0.1% |
| Total | 34,197,255 | 82,344,913 | 88,732,347 | 732,236 | - | - | 27,809,821 | |
| | | | | | | | | |
Amounts in the dividend income column in the above table include any capital gain distributions from underlying funds, which are presented in the corresponding line item in the Statement of Operations, if applicable.
Amounts included in the purchases and sales proceeds columns may include in-kind transactions, if applicable.
Investment Valuation
The following is a summary of the inputs used, as of February 28, 2023, involving the Fund's assets and liabilities carried at fair value. The inputs or methodology used for valuing securities may not be an indication of the risk associated with investing in those securities. For more information on valuation inputs, and their aggregation into the levels used below, please refer to the Investment Valuation section in the accompanying Notes to Financial Statements.
| Valuation Inputs at Reporting Date: |
| Description | Total ($) | Level 1 ($) | Level 2 ($) | Level 3 ($) |
Investments in Securities: | | | | |
|
| Corporate Bonds | 172,137,959 | - | 172,137,959 | - |
|
| U.S. Government and Government Agency Obligations | 41,463,825 | - | 41,463,825 | - |
|
| Certificates of Deposit | 29,141,121 | - | 29,141,121 | - |
|
| Commercial Paper | 22,566,686 | - | 22,566,686 | - |
|
| Money Market Funds | 27,809,821 | 27,809,821 | - | - |
| Total Investments in Securities: | 293,119,412 | 27,809,821 | 265,309,591 | - |
| Statement of Assets and Liabilities |
| | | | February 28, 2023 (Unaudited) |
| | | | | |
| Assets | | | | |
| Investment in securities, at value - See accompanying schedule: | | | | |
Unaffiliated issuers (cost $265,587,055) | $ | 265,309,591 | | |
Fidelity Central Funds (cost $27,809,821) | | 27,809,821 | | |
| | | | | |
| | | | | |
| Total Investment in Securities (cost $293,396,876) | | | $ | 293,119,412 |
| Receivable for fund shares sold | | | | 549,298 |
| Interest receivable | | | | 1,423,128 |
| Distributions receivable from Fidelity Central Funds | | | | 126,070 |
Total assets | | | | 295,217,908 |
| Liabilities | | | | |
| Payable to custodian bank | $ | 6,019 | | |
| Payable for investments purchased | | 665,233 | | |
| Payable for fund shares redeemed | | 348,109 | | |
| Distributions payable | | 530 | | |
| Total Liabilities | | | | 1,019,891 |
| Net Assets | | | $ | 294,198,017 |
| Net Assets consist of: | | | | |
| Paid in capital | | | $ | 294,747,016 |
| Total accumulated earnings (loss) | | | | (548,999) |
| Net Assets | | | $ | 294,198,017 |
Net Asset Value , offering price and redemption price per share ($294,198,017 ÷ 29,440,895 shares) | | | $ | 9.99 |
| Statement of Operations |
| | | | Six months ended February 28, 2023 (Unaudited) |
| Investment Income | | | | |
| Interest | | | $ | 4,542,844 |
| Income from Fidelity Central Funds | | | | 732,236 |
| Total Income | | | | 5,275,080 |
| Expenses | | | | |
| Independent trustees' fees and expenses | $ | 512 | | |
| Total Expenses | | | | 512 |
| Net Investment income (loss) | | | | 5,274,568 |
| Realized and Unrealized Gain (Loss) | | | | |
| Net realized gain (loss) on: | | | | |
| Investment Securities: | | | | |
| Unaffiliated issuers | | (194,625) | | |
| Total net realized gain (loss) | | | | (194,625) |
| Change in net unrealized appreciation (depreciation) on investment securities | | | | 874,364 |
| Net gain (loss) | | | | 679,739 |
| Net increase (decrease) in net assets resulting from operations | | | $ | 5,954,307 |
| Statement of Changes in Net Assets |
| |
| | Six months ended February 28, 2023 (Unaudited) | | Year ended August 31, 2022 |
| Increase (Decrease) in Net Assets | | | | |
| Operations | | | | |
| Net investment income (loss) | $ | 5,274,568 | $ | 2,045,662 |
| Net realized gain (loss) | | (194,625) | | (73,772) |
| Change in net unrealized appreciation (depreciation) | | 874,364 | | (1,369,367) |
| Net increase (decrease) in net assets resulting from operations | | 5,954,307 | | 602,523 |
| Distributions to shareholders | | (5,275,770) | | (2,060,079) |
| Share transactions | | | | |
| Proceeds from sales of shares | | 75,241,841 | | 165,995,696 |
| Reinvestment of distributions | | 5,272,891 | | 2,058,814 |
| Cost of shares redeemed | | (56,084,148) | | (110,374,386) |
Net increase (decrease) in net assets resulting from share transactions | | 24,430,584 | | 57,680,124 |
| Total increase (decrease) in net assets | | 25,109,121 | | 56,222,568 |
| | | | | |
| Net Assets | | | | |
| Beginning of period | | 269,088,896 | | 212,866,328 |
| End of period | $ | 294,198,017 | $ | 269,088,896 |
| | | | | |
| Other Information | | | | |
| Shares | | | | |
| Sold | | 7,547,196 | | 16,617,311 |
| Issued in reinvestment of distributions | | 528,680 | | 206,355 |
| Redeemed | | (5,629,064) | | (11,056,320) |
| Net increase (decrease) | | 2,446,812 | | 5,767,346 |
| | | | | |
Financial Highlights
| Fidelity Flex® Conservative Income Bond Fund |
| |
| | Six months ended (Unaudited) February 28, 2023 | | Years ended August 31, 2022 | | 2021 | | 2020 | | 2019 | | 2018 A |
Selected Per-Share Data | | | | | | | | | | | | |
| Net asset value, beginning of period | $ | 9.97 | $ | 10.03 | $ | 10.04 | $ | 10.01 | $ | 10.02 | $ | 10.00 |
| Income from Investment Operations | | | | | | | | | | | | |
Net investment income (loss) B,C | | .194 | | .083 | | .053 | | .169 | | .275 | | .059 |
| Net realized and unrealized gain (loss) | | .019 | | (.062) | | (.006) | | .039 | | .002 | | .007 |
| Total from investment operations | | .213 | | .021 | | .047 | | .208 | | .277 | | .066 |
| Distributions from net investment income | | (.193) | | (.080) | | (.055) | | (.178) | | (.287) | | (.046) |
| Distributions from net realized gain | | - | | (.001) | | (.002) | | - | | - | | - |
| Total distributions | | (.193) | | (.081) | | (.057) | | (.178) | | (.287) | | (.046) |
| Net asset value, end of period | $ | 9.99 | $ | 9.97 | $ | 10.03 | $ | 10.04 | $ | 10.01 | $ | 10.02 |
Total Return D | | 2.16% | | .22% | | .47% | | 2.10% | | 2.80% | | .66% |
Ratios to Average Net Assets C,E,F | | | | | | | | | | | | |
Expenses before reductions G | | -% H | | -% | | -% | | -% | | -% | | -% H |
Expenses net of fee waivers, if any G | | -% H | | -% | | -% | | -% | | -% | | -% H |
Expenses net of all reductions G | | -% H | | -% | | -% | | -% | | -% | | -% H |
| Net investment income (loss) | | 3.92% H | | .83% | | .53% | | 1.69% | | 2.76% | | 2.32% H |
| Supplemental Data | | | | | | | | | | | | |
| Net assets, end of period (000 omitted) | $ | 294,198 | $ | 269,089 | $ | 212,866 | $ | 123,307 | $ | 75,592 | $ | 50,887 |
Portfolio turnover rate I | | 52% H | | 60% | | 40% | | 44% | | 12% | | 10% J |
A For the period May 31, 2018 (commencement of operations) through August 31, 2018.
B Calculated based on average shares outstanding during the period.
C Net investment income (loss) is affected by the timing of the declaration of dividends by any underlying mutual funds or exchange-traded funds (ETFs). Net investment income (loss) of any mutual funds or ETFs is not included in the Fund's net investment income (loss) ratio.
D Total returns for periods of less than one year are not annualized.
E Fees and expenses of any underlying mutual funds or exchange-traded funds (ETFs) are not included in the Fund's expense ratio. The Fund indirectly bears its proportionate share of these expenses. For additional expense information related to investments in Fidelity Central Funds, please refer to the "Investments in Fidelity Central Funds" note found in the Notes to Financial Statements section of the most recent Annual or Semi-Annual report.
F Expense ratios reflect operating expenses of the class. Expenses before reductions do not reflect amounts reimbursed, waived, or reduced through arrangements with the investment adviser, brokerage services, or other offset arrangements, if applicable, and do not represent the amount paid by the class during periods when reimbursements, waivers or reductions occur.
G Amount represents less than .005%.
H Annualized.
I Amount does not include the portfolio activity of any underlying mutual funds or exchange-traded funds (ETFs).
J Amount not annualized.
For the period ended February 28, 2023
1. Organization.
Fidelity Flex Conservative Income Bond Fund (the Fund) is a fund of Fidelity Salem Street Trust (the Trust) and is authorized to issue an unlimited number of shares. Share transactions on the Statement of Changes in Net Assets may contain exchanges between affiliated funds. The Trust is registered under the Investment Company Act of 1940, as amended (the 1940 Act), as an open-end management investment company organized as a Massachusetts business trust. The Fund is available only to certain fee-based accounts and advisory programs offered by Fidelity.
2. Investments in Fidelity Central Funds.
Funds may invest in Fidelity Central Funds, which are open-end investment companies generally available only to other investment companies and accounts managed by the investment adviser and its affiliates. The Schedule of Investments lists any Fidelity Central Funds held as an investment as of period end, but does not include the underlying holdings of each Fidelity Central Fund. An investing fund indirectly bears its proportionate share of the expenses of the underlying Fidelity Central Funds.
Based on its investment objective, each Fidelity Central Fund may invest or participate in various investment vehicles or strategies that are similar to those of the investing fund. These strategies are consistent with the investment objectives of the investing fund and may involve certain economic risks which may cause a decline in value of each of the Fidelity Central Funds and thus a decline in the value of the investing fund.
| Fidelity Central Fund | Investment Manager | Investment Objective | Investment Practices | Expense Ratio A |
| Fidelity Money Market Central Funds | Fidelity Management & Research Company LLC (FMR) | Each fund seeks to obtain a high level of current income consistent with the preservation of capital and liquidity. | Short-term Investments | Less than .005% |
A Expenses expressed as a percentage of average net assets and are as of each underlying Central Fund's most recent annual or semi-annual shareholder report.
A complete unaudited list of holdings for each Fidelity Central Fund is available upon request or at the Securities and Exchange Commission website at www.sec.gov. In addition, the financial statements of the Fidelity Central Funds which contain the significant accounting policies (including investment valuation policies) of those funds, and are not covered by the Report of Independent Registered Public Accounting Firm, are available on the Securities and Exchange Commission website or upon request.
3. Significant Accounting Policies.
The Fund is an investment company and applies the accounting and reporting guidance of the Financial Accounting Standards Board (FASB) Accounting Standards Codification Topic 946 Financial Services - Investment Companies . The financial statements have been prepared in conformity with accounting principles generally accepted in the United States of America (GAAP), which require management to make certain estimates and assumptions at the date of the financial statements. Actual results could differ from those estimates. Subsequent events, if any, through the date that the financial statements were issued have been evaluated in the preparation of the financial statements. The Fund's Schedule of Investments lists any underlying mutual funds or exchange-traded funds (ETFs) but does not include the underlying holdings of these funds. The following summarizes the significant accounting policies of the Fund:
Investment Valuation. Investments are valued as of 4:00 p.m. Eastern time on the last calendar day of the period. The Board of Trustees (the Board) has designated the Fund's investment adviser as the valuation designee responsible for the fair valuation function and performing fair value determinations as needed. The investment adviser has established a Fair Value Committee (the Committee) to carry out the day-to-day fair valuation responsibilities and has adopted policies and procedures to govern the fair valuation process and the activities of the Committee. In accordance with these fair valuation policies and procedures, which have been approved by the Board, the Fund attempts to obtain prices from one or more third party pricing services or brokers to value its investments. When current market prices, quotations or currency exchange rates are not readily available or reliable, investments will be fair valued in good faith by the Committee, in accordance with the policies and procedures. Factors used in determining fair value vary by investment type and may include market or investment specific events, transaction data, estimated cash flows, and market observations of comparable investments. The frequency that the fair valuation procedures are used cannot be predicted and they may be utilized to a significant extent. The Committee manages the Fund's fair valuation practices and maintains the fair valuation policies and procedures. The Fund's investment adviser reports to the Board information regarding the fair valuation process and related material matters.
The Fund categorizes the inputs to valuation techniques used to value its investments into a disclosure hierarchy consisting of three levels as shown below:
Level 1 - unadjusted quoted prices in active markets for identical investments
Level 2 - other significant observable inputs (including quoted prices for similar investments, interest rates, prepayment speeds, etc.)
Level 3 - unobservable inputs (including the Fund's own assumptions based on the best information available)
Valuation techniques used to value the Fund's investments by major category are as follows:
Debt securities, including restricted securities, are valued based on evaluated prices received from third party pricing services or from brokers who make markets in such securities. Corporate bonds, U.S. government and government agency obligations, commercial paper and certificates of deposit are valued by pricing services who utilize matrix pricing which considers yield or price of bonds of comparable quality, coupon, maturity and type or by broker-supplied prices. When independent prices are unavailable or unreliable, debt securities may be valued utilizing pricing methodologies which consider similar factors that would be used by third party pricing services. Debt securities are generally categorized as Level 2 in the hierarchy but may be Level 3 depending on the circumstances.
Investments in open-end mutual funds, including the Fidelity Central Funds, are valued at their closing net asset value (NAV) each business day and are categorized as Level 1 in the hierarchy.
Changes in valuation techniques may result in transfers in or out of an assigned level within the disclosure hierarchy. The aggregate value of investments by input level as of February 28, 2023 is included at the end of the Fund's Schedule of Investments.
Investment Transactions and Income. For financial reporting purposes, the Fund's investment holdings and NAV include trades executed through the end of the last business day of the period. The NAV per share for processing shareholder transactions is calculated as of the close of business of the New York Stock Exchange (NYSE), normally 4:00 p.m. Eastern time and includes trades executed through the end of the prior business day. Gains and losses on securities sold are determined on the basis of identified cost. Income and capital gain distributions from Fidelity Central Funds, if any, are recorded on the ex-dividend date. Interest income is accrued as earned and includes coupon interest and amortization of premium and accretion of discount on debt securities as applicable.
Expenses. Expenses directly attributable to a fund are charged to that fund. Expenses attributable to more than one fund are allocated among the respective funds on the basis of relative net assets or other appropriate methods. Expenses included in the accompanying financial statements reflect the expenses of that fund and do not include any expenses associated with any underlying mutual funds or exchange-traded funds. Although not included in a fund's expenses, a fund indirectly bears its proportionate share of these expenses through the net asset value of each underlying mutual fund or exchange-traded fund. Expense estimates are accrued in the period to which they relate and adjustments are made when actual amounts are known.
Income Tax Information and Distributions to Shareholders. Each year, the Fund intends to qualify as a regulated investment company under Subchapter M of the Internal Revenue Code, including distributing substantially all of its taxable income and realized gains. As a result, no provision for U.S. Federal income taxes is required. The Fund files a U.S. federal tax return, in addition to state and local tax returns as required. The Fund's federal income tax returns are subject to examination by the Internal Revenue Service (IRS) for a period of three fiscal years after they are filed. State and local tax returns may be subject to examination for an additional fiscal year depending on the jurisdiction.
Distributions are declared and recorded daily and paid monthly from net investment income. Distributions from realized gains, if any, are declared and recorded on the ex-dividend date. Income and capital gain distributions are determined in accordance with income tax regulations, which may differ from GAAP.
Capital accounts within the financial statements are adjusted for permanent book-tax differences. These adjustments have no impact on net assets or the results of operations. Capital accounts are not adjusted for temporary book-tax differences which will reverse in a subsequent period.
Book-tax differences are primarily due to capital loss carryforwards
As of period end, the cost and unrealized appreciation (depreciation) in securities, and derivatives if applicable, for federal income tax purposes were as follows:
| Gross unrealized appreciation | $320,793 |
| Gross unrealized depreciation | (598,257) |
| Net unrealized appreciation (depreciation) | $(277,464) |
| Tax cost | $293,396,876 |
Capital loss carryforwards are only available to offset future capital gains of the Fund to the extent provided by regulations and may be limited. The capital loss carryforward information presented below, including any applicable limitation, is estimated as of prior fiscal period end and is subject to adjustment.
Short-term | $(73,772) |
Long-term | (-) |
| Total capital loss carryforward | $(73,772) |
Restricted Securities (including Private Placements). Funds may invest in securities that are subject to legal or contractual restrictions on resale. These securities generally may be resold in transactions exempt from registration or to the public if the securities are registered. Disposal of these securities may involve time-consuming negotiations and expense, and prompt sale at an acceptable price may be difficult. Information regarding restricted securities held at period end is included at the end of the Schedule of Investments, if applicable.
LIBOR Accounting Pronouncement. In March 2020, the Financial Accounting Standards Board (FASB) issued an Accounting Standards Update (ASU), ASU 2020-04, which provides optional, temporary relief with respect to the financial reporting of contracts subject to certain types of modifications due to the planned discontinuation of the London Interbank Offered Rate (LIBOR) and other IBOR-based reference rates. The temporary relief provided by ASU 2020-04 is effective for certain reference rate-related contract modifications that occur during the period March 12, 2020 through December 31, 2024. Management does not expect the adoption of ASU 2020-04 to have a material impact on the Fund's financial statements.
4. Purchases and Sales of Investments.
Purchases and sales of securities, other than short-term securities, U.S. government securities and in-kind transactions, as applicable, are noted in the table below.
| | Purchases ($) | Sales ($) |
| Fidelity Flex Conservative Income Bond Fund | 39,225,409 | 33,359,000 |
5. Fees and Other Transactions with Affiliates.
Management Fee. Fidelity Management & Research Company LLC (the investment adviser) and its affiliates provide the Fund with investment management related services and the Fund does not pay any fees for these services. Under the management contract, the investment adviser or an affiliate pays all other expenses of the Fund, excluding fees and expenses of the independent Trustees, and certain miscellaneous expenses such as proxy and shareholder meeting expenses.
Interfund Trades. Funds may purchase from or sell securities to other Fidelity Funds under procedures adopted by the Board. The procedures have been designed to ensure these interfund trades are executed in accordance with Rule 17a-7 of the 1940 Act. Any interfund trades are included within the respective purchases and sales amounts shown in the Purchases and Sales of Investments note. During the period, there were no interfund trades.
6. Committed Line of Credit.
Certain Funds participate with other funds managed by the investment adviser or an affiliate in a $4.25 billion credit facility (the "line of credit") to be utilized for temporary or emergency purposes to fund shareholder redemptions or for other short-term liquidity purposes. The commitment fees on the pro-rata portion of the line of credit are borne by the investment adviser. During the period, there were no borrowings on this line of credit.
7. Other.
A fund's organizational documents provide former and current trustees and officers with a limited indemnification against liabilities arising in connection with the performance of their duties to the fund. In the normal course of business, a fund may also enter into contracts that provide general indemnifications. A fund's maximum exposure under these arrangements is unknown as this would be dependent on future claims that may be made against a fund. The risk of material loss from such claims is considered remote.
8. Risk and Uncertainties.
Many factors affect a fund's performance. Developments that disrupt global economies and financial markets, such as pandemics, epidemics, outbreaks of infectious diseases, war, terrorism, and environmental disasters, may significantly affect a fund's investment performance. The effects of these developments to a fund will be impacted by the types of securities in which a fund invests, the financial condition, industry, economic sector, and geographic location of an issuer, and a fund's level of investment in the securities of that issuer. Significant concentrations in security types, issuers, industries, sectors, and geographic locations may magnify the factors that affect a fund's performance.
As a shareholder, you incur two types of costs: (1) transaction costs, which may include sales charges (loads) on purchase payments or redemption proceeds, as applicable and (2) ongoing costs, which generally include management fees, distribution and/or service (12b-1) fees and other Fund expenses. This Example is intended to help you understand your ongoing costs (in dollars) of investing in a fund and to compare these costs with the ongoing costs of investing in other mutual funds.
| The Example is based on an investment of $1,000 invested at the beginning of the period and held for the entire period (September 1, 2022 to February 28, 2023). |
Actual Expenses
The first line of the accompanying table provides information about actual account values and actual expenses. You may use the information in this line, together with the amount you invested, to estimate the expenses that you paid over the period. Simply divide your account value by $1,000.00 (for example, an $8,600 account value divided by $1,000.00 = 8.6), then multiply the result by the number in the first line for a class/Fund under the heading entitled "Expenses Paid During Period" to estimate the expenses you paid on your account during this period. If any fund is a shareholder of any underlying mutual funds or exchange-traded funds (ETFs) (the Underlying Funds), such fund indirectly bears its proportional share of the expenses of the Underlying Funds in addition to the direct expenses incurred presented in the table. These fees and expenses are not included in the annualized expense ratio used to calculate the expense estimate in the table below.
Hypothetical Example for Comparison Purposes
The second line of the accompanying table provides information about hypothetical account values and hypothetical expenses based on the actual expense ratio and an assumed rate of return of 5% per year before expenses, which is not the actual return. The hypothetical account values and expenses may not be used to estimate the actual ending account balance or expenses you paid for the period. You may use this information to compare the ongoing costs of investing in the Fund and other funds. To do so, compare this 5% hypothetical example with the 5% hypothetical examples that appear in the shareholder reports of the other funds. If any fund is a shareholder of any Underlying Funds, such fund indirectly bears its proportional share of the expenses of the Underlying Funds in addition to the direct expenses as presented in the table. These fees and expenses are not included in the annualized expense ratio used to calculate the expense estimate in the table below.
Please note that the expenses shown in the table are meant to highlight your ongoing costs only and do not reflect any transaction costs. Therefore, the second line of the table is useful in comparing ongoing costs only, and will not help you determine the relative total costs of owning different funds. In addition, if these transactional costs were included, your costs would have been higher.
| | | | | Annualized Expense Ratio- A | | Beginning Account Value September 1, 2022 | | Ending Account Value February 28, 2023 | | Expenses Paid During Period- C September 1, 2022 to February 28, 2023 |
| | | | | | | | | | |
| Fidelity Flex® Conservative Income Bond Fund | | | | -%- D | | | | | | |
| Actual | | | | | | $ 1,000 | | $ 1,021.60 | | $- E |
Hypothetical- B | | | | | | $ 1,000 | | $ 1,024.79 | | $- E |
| |
A Annualized expense ratio reflects expenses net of applicable fee waivers.
B 5% return per year before expenses
C Expenses are equal to the annualized expense ratio, multiplied by the average account value over the period, multiplied by 181/ 365 (to reflect the one-half year period). The fees and expenses of any Underlying Funds are not included in each annualized expense ratio.
D Amount represents less than .005%.
E Amount represents less than $.005.
Board Approval of Investment Advisory Contracts and Management Fees
Fidelity Flex Conservative Income Bond Fund
Each year, the Board of Trustees, including the Independent Trustees (together, the Board), votes on the renewal of the management contract with Fidelity Management & Research Company LLC (FMR) and the sub-advisory agreements (together, the Advisory Contracts) for the fund. FMR and the sub-advisers are referred to herein as the Investment Advisers. The Board, assisted by the advice of fund counsel and Independent Trustees' counsel, requests and considers a broad range of information relevant to the renewal of the Advisory Contracts throughout the year.
The Board meets regularly and, at each of its meetings, covers an extensive agenda of topics and materials and considers factors that are relevant to its annual consideration of the renewal of the fund's Advisory Contracts, including the services and support provided to the fund and its shareholders. The Board has established four standing committees (Committees) - Operations, Audit, Fair Valuation, and Governance and Nominating - each composed of and chaired by Independent Trustees with varying backgrounds, to which the Board has assigned specific subject matter responsibilities in order to enhance effective decision-making by the Board. The Operations Committee, of which all the Independent Trustees are members, meets regularly throughout the year and requests, receives and considers, among other matters, information related to the annual consideration of the renewal of the fund's Advisory Contracts before making its recommendation to the Board. The Board also meets as needed to review matters specifically related to the Board's annual consideration of the renewal of the Advisory Contracts. Members of the Board may also meet from time to time with trustees of other Fidelity funds through joint ad hoc committees to discuss certain matters relevant to all of the Fidelity funds.
At its September 2022 meeting, the Board unanimously determined to renew the fund's Advisory Contracts. In considering whether to renew the Advisory Contracts for the fund, the Board considered all factors it believed relevant and reached a determination, with the assistance of fund counsel and Independent Trustees' counsel and through the exercise of its business judgment, that the renewal of the Advisory Contracts was in the best interests of the fund and its shareholders and the fact that no fee is payable under the management contract was fair and reasonable.
Nature, Extent, and Quality of Services Provided. The Board considered Fidelity's staffing as it relates to the fund, including the backgrounds of investment personnel of Fidelity, and also considered the fund's investment objective, strategies, and related investment philosophy. The Independent Trustees also had discussions with senior management of Fidelity's investment operations and investment groups. The Board considered the structure of the investment personnel compensation program and whether this structure provides appropriate incentives to act in the best interests of the fund. Additionally, the Board considered the portfolio managers' investments, if any, in the funds that they manage. The Board also considered the steps Fidelity had taken to ensure the continued provision of high quality services to the Fidelity funds throughout the COVID-19 pandemic, including the expansion of staff in client facing positions to maintain service levels in periods of high volumes and volatility.
Resources Dedicated to Investment Management and Support Services. The Board reviewed the general qualifications and capabilities of Fidelity's investment staff, including its size, education, experience, and resources, as well as Fidelity's approach to recruiting, training, managing, and compensating investment personnel. The Board noted the resources devoted to Fidelity's global investment organization, and that Fidelity's analysts have extensive resources, tools and capabilities that allow them to conduct quantitative and fundamental analysis, as well as credit analysis of issuers, counterparties and guarantors. Further, the Board considered that Fidelity's investment professionals have sufficient access to global information and data so as to provide competitive investment results over time, and that those professionals also have access to sophisticated tools that permit them to assess portfolio construction and risk and performance attribution characteristics continuously, as well as to transmit new information and research conclusions rapidly around the world. Additionally, in its deliberations, the Board considered Fidelity's trading, risk management, compliance, cybersecurity, and technology and operations capabilities and resources, which are integral parts of the investment management process.
Shareholder and Administrative Services. The Board considered (i) the nature, extent, quality, and cost of advisory, administrative, and shareholder services performed by the Investment Advisers and their affiliates under the Advisory Contracts and under separate agreements covering transfer agency, pricing and bookkeeping, and securities lending services for the fund; (ii) the nature and extent of the supervision of third party service providers, principally custodians, subcustodians, and pricing vendors; and (iii) the resources devoted to, and the record of compliance with, the fund's compliance policies and procedures.
The Board noted that the growth of fund assets over time across the complex allows Fidelity to reinvest in the development of services designed to enhance the value and convenience of the Fidelity funds as investment vehicles. These services include 24-hour access to account information and market information over the Internet and through telephone representatives, investor education materials and asset allocation tools. The Board also considered that it reviews customer service metrics such as telephone response times, continuity of services on the website and metrics addressing services at Fidelity Investor Centers.
Investment in a Large Fund Family. The Board considered the benefits to shareholders of investing in a Fidelity fund, including the benefits of investing in a fund that is part of a large family of funds offering a variety of investment disciplines and providing a large variety of mutual fund investor services. The Board noted that Fidelity had taken, or had made recommendations to the Board that resulted in the Fidelity funds taking, a number of actions over the previous year that benefited particular funds, including: (i) continuing to dedicate additional resources to Fidelity's investment research process, which includes meetings with management of issuers of securities in which the funds invest; (ii) continuing efforts to enhance Fidelity's global research capabilities; (iii) launching new funds, ETFs, and share classes with innovative structures, strategies and pricing and making other enhancements to meet investor needs; (iv) broadening eligibility requirements for certain funds and share classes; (v) reducing management fees and total expenses for certain funds and classes; (vi) lowering expenses for certain existing funds and classes by implementing or lowering expense caps; (vii) rationalizing product lines and gaining increased efficiencies from fund mergers and liquidations; (viii) continuing to develop, acquire and implement systems and technology to improve services to the funds and shareholders, strengthen information security, and increase efficiency; and (ix) continuing to implement enhancements to further strengthen Fidelity's product line to increase investors' probability of success in achieving their investment goals, including their retirement income goals.
Investment Performance. The Board considered whether the fund has operated in accordance with its investment objective, as well as its record of compliance with its investment restrictions. The Board reviewed the fund's absolute investment performance, as well as the fund's relative investment performance. The Board did not consider performance to be a material factor in its decision to renew the fund's Advisory Contracts as the fund is not publicly offered as a stand-alone investment product. In this regard, the Board noted that the fund is available exclusively to certain fee-based accounts and advisor programs offered by Fidelity, including certain employer-sponsored plans and discretionary investment programs.
Based on its review, the Board concluded that the nature, extent, and quality of services provided to the fund under the Advisory Contracts should continue to benefit the shareholders of the fund.
Competitiveness of Management Fee and Total Expense Ratio. The Board noted that the fund is available exclusively through certain Fidelity fee-based accounts and advisory programs. The Board considered that the fund does not pay FMR a management fee for investment advisory services, but that FMR is indirectly compensated for its services out of Fidelity fee-based account and advisory program fees. The Board also noted that FMR or an affiliate undertakes to pay all operating expenses of the fund, except Independent Trustee fees and expenses, proxy and shareholder meeting expenses, interest, taxes, and extraordinary expenses (such as litigation expenses). The Board further noted that the fund pays its non-operating expenses, including brokerage commissions and fees and expenses associated with the fund's securities lending program, if applicable.
Based on its review, the Board considered that the fund does not pay a management fee and concluded that the fund's total expense ratio was reasonable in light of the services that the fund and its shareholders receive and the other factors considered.
Costs of the Services and Profitability. The Board considered the level of Fidelity's profits in respect of all the Fidelity funds.
A public accounting firm has been engaged annually by the Board as part of the Board's assessment of Fidelity's profitability analysis. The engagement includes the review and assessment of the methodologies used by Fidelity in determining the revenues and expenses attributable to Fidelity's mutual fund business, and completion of agreed-upon procedures in respect of the mathematical accuracy of certain fund profitability information and its conformity to established allocation methodologies. After considering the reports issued under the engagement and information provided by Fidelity, the Board concluded that while other allocation methods may also be reasonable, Fidelity's profitability methodologies are reasonable in all material respects.
The Board also reviewed Fidelity's non-fund businesses and potential indirect benefits such businesses may have received as a result of their association with Fidelity's mutual fund business (i.e., fall-out benefits) as well as cases where Fidelity's affiliates may benefit from the funds' business. The Board considered areas where potential indirect benefits to the Fidelity funds from their relationships with Fidelity may exist. The Board's consideration of these matters was informed by the findings of a joint ad hoc committee created by it and the boards of other Fidelity funds to evaluate potential fall-out benefits.
The Board concluded that the costs of the services provided by and the profits realized by Fidelity in connection with the operation of the fund were not relevant to the renewal of the Advisory Contracts because the fund pays no advisory fees and FMR or an affiliate bears all expenses of the fund, with limited exceptions.
Economies of Scale. The Board concluded that because the fund pays no advisory fees and FMR or an affiliate bears all expenses of the fund with certain limited exceptions, the realization of economies of scale was not a material factor in the Board's decision to renew the fund's Advisory Contracts.
Additional Information Requested by the Board. In order to develop fully the factual basis for consideration of the Fidelity funds' advisory contracts, the Board requested and received additional information on certain topics, including: (i) Fidelity's fund profitability methodology, profitability trends for certain funds, the allocation of various costs to different funds, and the impact of certain factors on fund profitability results; (ii) portfolio manager changes that have occurred during the past year and the amount of the investment that each portfolio manager has made in the Fidelity fund(s) that he or she manages; (iii) the extent to which current market conditions have affected retention and recruitment of personnel; (iv) the arrangements with and compensation paid to certain fund sub-advisers on behalf of the Fidelity funds and the treatment of such compensation within Fidelity's fund profitability methodology; (v) the terms of the funds' various management fee structures, including the basic group fee and the terms of Fidelity's voluntary expense limitation arrangements; (vi) Fidelity's transfer agent, pricing and bookkeeping fees, expense and service structures for different funds and classes relative to competitive trends; (vii) the impact on fund profitability of recent industry trends, such as the growth in passively managed funds and the changes in flows for different types of funds; (viii) the types of management fee and total expense comparisons provided, and the challenges and limitations associated with such information; and (ix) explanations regarding the relative total expense ratios and management fees of certain funds and classes, total expense and management fee competitive trends, and methodologies for total expense and management fee competitive comparisons. In addition, the Board considered its discussions with Fidelity regarding Fidelity's efforts to maintain the continuous investment and shareholder services necessary for the funds during the current pandemic and economic circumstances.
Based on its evaluation of all of the conclusions noted above, and after considering all factors it believed relevant, the Board concluded that the advisory fee arrangements are fair and reasonable, and that the fund's Advisory Contracts should be renewed.
The Securities and Exchange Commission adopted Rule 22e-4 under the Investment Company Act of 1940 (the Liquidity Rule) to promote effective liquidity risk management throughout the open-end investment company industry, thereby reducing the risk that funds will be unable to meet their redemption obligations and mitigating dilution of the interests of fund shareholders.
The Fund has adopted and implemented a liquidity risk management program (the Program) reasonably designed to assess and manage the Fund's liquidity risk and to comply with the requirements of the Liquidity Rule. The Fund's Board of Trustees (the Board) has designated the Fund's investment adviser as administrator of the Program. The Fidelity advisers have established a Liquidity Risk Management Committee (the LRM Committee) to manage the Program for each of the Fidelity Funds. The LRM Committee monitors the adequacy and effectiveness of implementation of the Program and on a periodic basis assesses each Fund's liquidity risk based on a variety of factors including (1) the Fund's investment strategy, (2) portfolio liquidity and cash flow projections during normal and reasonably foreseeable stressed conditions, (3) shareholder redemptions, (4) borrowings and other funding sources and (5) certain factors specific to ETFs including the effect of the Fund's prices and spreads, market participants, and basket compositions on the overall liquidity of the Fund's portfolio, as applicable.
In accordance with the Program, each of the Fund's portfolio investments is classified into one of four defined liquidity categories based on a determination of a reasonable expectation for how long it would take to convert the investment to cash (or sell or dispose of the investment) without significantly changing its market value.
- Highly liquid investments - cash or convertible to cash within three business days or less
- Moderately liquid investments - convertible to cash in three to seven calendar days
- Less liquid investments - can be sold or disposed of, but not settled, within seven calendar days
- Illiquid investments - cannot be sold or disposed of within seven calendar days
Liquidity classification determinations take into account a variety of factors including various market, trading and investment-specific considerations, as well as market depth, and generally utilize analysis from a third-party liquidity metrics service.
The Liquidity Rule places a 15% limit on a fund's illiquid investments and requires funds that do not primarily hold assets that are highly liquid investments to determine and maintain a minimum percentage of the fund's net assets to be invested in highly liquid investments (highly liquid investment minimum or HLIM). The Program includes provisions reasonably designed to comply with the 15% limit on illiquid investments and for determining, periodically reviewing and complying with the HLIM requirement as applicable.
At a recent meeting of the Fund's Board of Trustees, the LRM Committee provided a written report to the Board pertaining to the operation, adequacy, and effectiveness of the Program for the period December 1, 2021 through November 30, 2022. The report concluded that the Program is operating effectively and is reasonably designed to assess and manage the Fund's liquidity risk.
1.9887610.104
ZCI-SANN-0423
Fidelity® SAI Sustainable Low Duration Income Fund
Semi-Annual Report
February 28, 2023
Offered exclusively to certain clients of the Adviser, or its affiliates, including Strategic Advisers LLC (Strategic Advisers) - not available for sale to the general public. Fidelity ® SAI is a product name of Fidelity ® funds dedicated to certain programs affiliated with Strategic Advisers.
Contents
To view a fund's proxy voting guidelines and proxy voting record for the 12-month period ended June 30, visit http://www.fidelity.com/proxyvotingresults or visit the Securities and Exchange Commission's (SEC) web site at http://www.sec.gov.
You may also call 1-800-544-3455 to request a free copy of the proxy voting guidelines.
Standard & Poor's, S&P and S&P 500 are registered service marks of The McGraw-Hill Companies, Inc. and have been licensed for use by Fidelity Distributors Corporation.
Other third-party marks appearing herein are the property of their respective owners.
All other marks appearing herein are registered or unregistered trademarks or service marks of FMR LLC or an affiliated company. © 2023 FMR LLC. All rights reserved.
This report and the financial statements contained herein are submitted for the general information of the shareholders of the Fund. This report is not authorized for distribution to prospective investors in the Fund unless preceded or accompanied by an effective prospectus.
A fund files its complete schedule of portfolio holdings with the SEC for the first and third quarters of each fiscal year on Form N-PORT. Forms N-PORT are available on the SEC's web site at http://www.sec.gov. A fund's Forms N-PORT may be reviewed and copied at the SEC's Public Reference Room in Washington, DC. Information regarding the operation of the SEC's Public Reference Room may be obtained by calling 1-800-SEC-0330.
For a complete list of a fund's portfolio holdings, view the most recent holdings listing, semiannual report, or annual report on Fidelity's web site at http://www.fidelity.com, http://www.institutional.fidelity.com, or http://www.401k.com, as applicable.
NOT FDIC INSURED •MAY LOSE VALUE •NO BANK GUARANTEE
Neither the Fund nor Fidelity Distributors Corporation is a bank.
Quality Diversification (% of Fund's net assets) |
|
| |
| We have used ratings from Moody's Investors Service, Inc. Where Moody's® ratings are not available, we have used S&P® ratings. All ratings are as of the date indicated and do not reflect subsequent changes. |
Asset Allocation (% of Fund's net assets) |
|
Foreign investments - 10.8% |
|
Geographic Diversification (% of Fund's net assets) |
|
* Includes Short-Term investments and Net Other Assets (Liabilities). Percentages are based on country or territory of incorporation and are adjusted for the effect of derivatives, if applicable. |
| |
Showing Percentage of Net Assets
| Nonconvertible Bonds - 56.5% |
| | | Principal Amount (a) | Value ($) |
| COMMUNICATION SERVICES - 3.2% | | | |
| Diversified Telecommunication Services - 2.0% | | | |
| AT&T, Inc.: | | | |
| U.S. Secured Overnight Fin. Rate (SOFR) Averages Index + 0.640% 5.0552% 3/25/24 (b)(c) | | 25,000 | 25,001 |
| 0.9% 3/25/24 | | 35,000 | 33,377 |
| Verizon Communications, Inc.: | | | |
| U.S. Secured Overnight Fin. Rate (SOFR) Averages Index + 0.500% 4.913% 3/22/24 (b)(c) | | 50,000 | 49,968 |
| 0.75% 3/22/24 | | 25,000 | 23,823 |
| | | | 132,169 |
| Media - 1.2% | | | |
| Discovery Communications LLC 3.8% 3/13/24 | | 25,000 | 24,528 |
| Magallanes, Inc.: | | | |
| U.S. Secured Overnight Fin. Rate (SOFR) Averages Index + 1.780% 6.1741% 3/15/24 (b)(c)(d) | | 25,000 | 25,171 |
| 3.428% 3/15/24 (d) | | 25,000 | 24,400 |
| | | | 74,099 |
TOTAL COMMUNICATION SERVICES | | | 206,268 |
| CONSUMER DISCRETIONARY - 3.5% | | | |
| Automobiles - 1.2% | | | |
| General Motors Financial Co., Inc.: | | | |
| U.S. Secured Overnight Fin. Rate (SOFR) Index + 0.000% 5.0719% 10/15/24 (b)(c) | | 25,000 | 24,804 |
| U.S. Secured Overnight Fin. Rate (SOFR) Index + 0.760% 5.1077% 3/8/24 (b)(c) | | 50,000 | 49,898 |
| | | | 74,702 |
| Hotels, Restaurants & Leisure - 0.4% | | | |
| Starbucks Corp. U.S. Secured Overnight Fin. Rate (SOFR) Averages Index + 0.420% 4.9745% 2/14/24 (b)(c) | | 25,000 | 24,964 |
| Specialty Retail - 1.9% | | | |
| AutoZone, Inc. 3.125% 7/15/23 | | 25,000 | 24,788 |
| The Home Depot, Inc.: | | | |
| 2.7% 4/1/23 | | 75,000 | 74,843 |
| 3.75% 2/15/24 | | 25,000 | 24,673 |
| | | | 124,304 |
TOTAL CONSUMER DISCRETIONARY | | | 223,970 |
| ENERGY - 0.8% | | | |
| Oil, Gas & Consumable Fuels - 0.8% | | | |
| Chevron Corp. 1.141% 5/11/23 | | 50,000 | 49,621 |
| FINANCIALS - 30.7% | | | |
| Banks - 19.1% | | | |
| Bank of America Corp. U.S. Secured Overnight Fin. Rate (SOFR) Index + 0.730% 5.2301% 10/24/24 (b)(c) | | 75,000 | 75,054 |
| Bank of Montreal: | | | |
| U.S. Secured Overnight Fin. Rate (SOFR) Averages Index + 0.460% 4.9036% 1/10/25 (b)(c) | | 50,000 | 49,914 |
| 3.3% 2/5/24 | | 25,000 | 24,504 |
| Bank of Nova Scotia: | | | |
| U.S. Secured Overnight Fin. Rate (SOFR) Index + 0.380% 4.8925% 7/31/24 (b)(c) | | 50,000 | 49,934 |
| 3.4% 2/11/24 | | 25,000 | 24,525 |
| BNP Paribas SA 3.25% 3/3/23 | | 50,000 | 49,998 |
| Canadian Imperial Bank of Commerce U.S. Secured Overnight Fin. Rate (SOFR) Index + 0.800% 5.2168% 3/17/23 (b)(c) | | 75,000 | 75,019 |
| Citigroup, Inc.: | | | |
| 3 month U.S. LIBOR + 1.020% 4.044% 6/1/24 (b)(c) | | 35,000 | 34,860 |
| 0.981% 5/1/25 (b) | | 50,000 | 47,220 |
| 3.375% 3/1/23 | | 50,000 | 50,000 |
| Fifth Third Bancorp: | | | |
| 1.625% 5/5/23 | | 25,000 | 24,840 |
| 3.65% 1/25/24 | | 25,000 | 24,644 |
| JPMorgan Chase & Co.: | | | |
| U.S. Secured Overnight Fin. Rate (SOFR) Index + 0.580% 4.9815% 3/16/24 (b)(c) | | 75,000 | 75,006 |
| 0.563% 2/16/25 (b) | | 25,000 | 23,707 |
| 3.375% 5/1/23 | | 25,000 | 24,926 |
| 4.023% 12/5/24 (b) | | 25,000 | 24,674 |
| Mitsubishi UFJ Financial Group, Inc.: | | | |
| 3 month U.S. LIBOR + 0.740% 5.5186% 3/2/23 (b)(c) | | 75,000 | 75,000 |
| 3.455% 3/2/23 | | 75,000 | 75,000 |
| PNC Financial Services Group, Inc. 3.5% 1/23/24 | | 25,000 | 24,608 |
| Royal Bank of Canada: | | | |
| U.S. Secured Overnight Fin. Rate (SOFR) Averages Index + 0.340% 4.7767% 10/7/24 (b)(c) | | 50,000 | 49,888 |
| U.S. Secured Overnight Fin. Rate (SOFR) Averages Index + 0.360% 4.8666% 7/29/24 (b)(c) | | 50,000 | 49,925 |
| U.S. Secured Overnight Fin. Rate (SOFR) Averages Index + 0.450% 4.9461% 10/26/23 (b)(c) | | 50,000 | 50,055 |
| The Toronto-Dominion Bank: | | | |
| U.S. Secured Overnight Fin. Rate (SOFR) Index + 0.350% 4.6748% 3/4/24 (b)(c) | | 50,000 | 49,952 |
| 0.75% 6/12/23 | | 50,000 | 49,406 |
| 2.35% 3/8/24 | | 25,000 | 24,243 |
| Truist Financial Corp. U.S. Secured Overnight Fin. Rate (SOFR) Index + 0.400% 4.7538% 6/9/25 (b)(c) | | 25,000 | 24,806 |
| Wells Fargo & Co.: | | | |
| 1.654% 6/2/24 (b) | | 50,000 | 49,506 |
| 4.125% 8/15/23 | | 35,000 | 34,841 |
| | | | 1,236,055 |
| Capital Markets - 3.8% | | | |
| Bank of New York Mellon Corp. U.S. Secured Overnight Fin. Rate (SOFR) Index + 0.200% 4.6912% 10/25/24 (b)(c) | | 50,000 | 49,726 |
| Goldman Sachs Group, Inc.: | | | |
| U.S. Secured Overnight Fin. Rate (SOFR) Index + 1.390% 5.7841% 3/15/24 (b)(c) | | 75,000 | 75,533 |
| 1.757% 1/24/25 (b) | | 50,000 | 48,127 |
| Morgan Stanley: | | | |
| 0.791% 1/22/25 (b) | | 25,000 | 23,906 |
| 3.62% 4/17/25 (b) | | 25,000 | 24,422 |
| State Street Corp. 3.7% 11/20/23 | | 25,000 | 24,715 |
| | | | 246,429 |
| Consumer Finance - 4.4% | | | |
| Ally Financial, Inc.: | | | |
| 1.45% 10/2/23 | | 25,000 | 24,367 |
| 3.875% 5/21/24 | | 25,000 | 24,478 |
| American Express Co. U.S. Secured Overnight Fin. Rate (SOFR) Averages Index + 0.230% 4.7786% 11/3/23 (b)(c) | | 50,000 | 49,911 |
| Capital One Financial Corp.: | | | |
| U.S. Secured Overnight Fin. Rate (SOFR) Index + 1.350% 5.9054% 5/9/25 (b)(c) | | 15,000 | 14,996 |
| 1.343% 12/6/24 (b) | | 25,000 | 24,096 |
| 2.6% 5/11/23 | | 25,000 | 24,877 |
| 3.9% 1/29/24 | | 25,000 | 24,642 |
| Toyota Motor Credit Corp.: | | | |
| U.S. Secured Overnight Fin. Rate (SOFR) Averages Index + 0.330% 4.7747% 1/11/24 (b)(c) | | 50,000 | 49,978 |
| U.S. Secured Overnight Fin. Rate (SOFR) Averages Index + 0.650% 5.0717% 12/29/23 (b)(c) | | 20,000 | 20,073 |
| 2.9% 3/30/23 | | 25,000 | 24,955 |
| | | | 282,373 |
| Diversified Financial Services - 1.1% | | | |
| Athene Global Funding U.S. Secured Overnight Fin. Rate (SOFR) Averages Index + 0.700% 5.2511% 5/24/24 (b)(c)(d) | | 25,000 | 24,846 |
| Equitable Holdings, Inc. 3.9% 4/20/23 | | 25,000 | 24,935 |
| Jackson Financial, Inc. 1.125% 11/22/23 | | 25,000 | 24,229 |
| | | | 74,010 |
| Insurance - 2.3% | | | |
| Equitable Financial Life Global Funding U.S. Secured Overnight Fin. Rate (SOFR) Index + 0.390% 4.8301% 4/6/23 (b)(c)(d) | | 75,000 | 74,974 |
| Marsh & McLennan Companies, Inc. 3.875% 3/15/24 | | 25,000 | 24,580 |
| New York Life Global Funding 1.1% 5/5/23 (d) | | 50,000 | 49,606 |
| | | | 149,160 |
TOTAL FINANCIALS | | | 1,988,027 |
| HEALTH CARE - 4.0% | | | |
| Biotechnology - 1.1% | | | |
| AbbVie, Inc.: | | | |
| 2.85% 5/14/23 | | 25,000 | 24,891 |
| 3.85% 6/15/24 | | 25,000 | 24,530 |
| Amgen, Inc. 5.25% 3/2/25 (e) | | 20,000 | 19,956 |
| | | | 69,377 |
| Health Care Providers & Services - 2.4% | | | |
| Cigna Group: | | | |
| 0.613% 3/15/24 | | 35,000 | 33,326 |
| 3.75% 7/15/23 | | 25,000 | 24,827 |
| Elevance Health, Inc. 0.45% 3/15/23 | | 25,000 | 24,958 |
| UnitedHealth Group, Inc. 2.875% 3/15/23 | | 75,000 | 74,938 |
| | | | 158,049 |
| Life Sciences Tools & Services - 0.5% | | | |
| Thermo Fisher Scientific, Inc. U.S. Secured Overnight Fin. Rate (SOFR) Averages Index + 0.530% 4.9846% 10/18/24 (b)(c) | | 30,000 | 29,970 |
TOTAL HEALTH CARE | | | 257,396 |
| INDUSTRIALS - 1.1% | | | |
| Machinery - 1.1% | | | |
| Caterpillar Financial Services Corp. U.S. Secured Overnight Fin. Rate (SOFR) Index + 0.270% 4.6365% 9/13/24 (b)(c) | | 75,000 | 74,821 |
| INFORMATION TECHNOLOGY - 2.8% | | | |
| Electronic Equipment & Components - 0.4% | | | |
| Dell International LLC/EMC Corp. 5.45% 6/15/23 | | 25,000 | 24,982 |
| Semiconductors & Semiconductor Equipment - 0.7% | | | |
| Analog Devices, Inc. U.S. Secured Overnight Fin. Rate (SOFR) Index + 0.250% 4.6746% 10/1/24 (b)(c) | | 50,000 | 49,496 |
| Software - 1.7% | | | |
| Microsoft Corp. 2.375% 5/1/23 | | 50,000 | 49,776 |
| Roper Technologies, Inc.: | | | |
| 2.35% 9/15/24 | | 25,000 | 23,865 |
| 3.65% 9/15/23 | | 35,000 | 34,629 |
| | | | 108,270 |
TOTAL INFORMATION TECHNOLOGY | | | 182,748 |
| MATERIALS - 0.4% | | | |
| Chemicals - 0.4% | | | |
| The Mosaic Co. 4.25% 11/15/23 | | 25,000 | 24,810 |
| REAL ESTATE - 1.1% | | | |
| Equity Real Estate Investment Trusts (REITs) - 1.1% | | | |
| Simon Property Group LP U.S. Secured Overnight Fin. Rate (SOFR) Averages Index + 0.430% 4.8747% 1/11/24 (b)(c) | | 75,000 | 74,819 |
| UTILITIES - 8.9% | | | |
| Electric Utilities - 7.8% | | | |
| Duke Energy Carolinas LLC 3.05% 3/15/23 | | 75,000 | 74,938 |
| Duke Energy Corp.: | | | |
| U.S. Secured Overnight Fin. Rate (SOFR) Index + 0.250% 4.6101% 6/10/23 (b)(c) | | 25,000 | 24,979 |
| 3.75% 4/15/24 | | 25,000 | 24,534 |
| Edison International 2.95% 3/15/23 | | 25,000 | 24,973 |
| Eversource Energy U.S. Secured Overnight Fin. Rate (SOFR) Averages Index + 0.250% 4.8037% 8/15/23 (b)(c) | | 50,000 | 49,901 |
| Mississippi Power Co. U.S. Secured Overnight Fin. Rate (SOFR) Index + 0.300% 4.7164% 6/28/24 (b)(c) | | 50,000 | 49,322 |
| NextEra Energy Capital Holdings, Inc. U.S. Secured Overnight Fin. Rate (SOFR) Averages Index + 0.400% 4.9486% 11/3/23 (b)(c) | | 50,000 | 49,979 |
| Southern California Edison Co. U.S. Secured Overnight Fin. Rate (SOFR) Averages Index + 0.830% 5.2546% 4/1/24 (b)(c) | | 75,000 | 74,903 |
| Southern Co.: | | | |
| U.S. Secured Overnight Fin. Rate (SOFR) Averages Index + 0.370% 4.9251% 5/10/23 (b)(c) | | 25,000 | 24,990 |
| 2.95% 7/1/23 | | 25,000 | 24,791 |
| Tampa Electric Co. 3.875% 7/12/24 | | 7,000 | 6,838 |
| Virginia Electric & Power Co.: | | | |
| 2.75% 3/15/23 | | 50,000 | 49,953 |
| 3.45% 2/15/24 | | 25,000 | 24,514 |
| | | | 504,615 |
| Gas Utilities - 0.7% | | | |
| Southern California Gas Co. 3 month U.S. LIBOR + 0.350% 5.1027% 9/14/23 (b)(c) | | 50,000 | 49,929 |
| Multi-Utilities - 0.4% | | | |
| CenterPoint Energy, Inc. U.S. Secured Overnight Fin. Rate (SOFR) Averages Index + 0.650% 5.2048% 5/13/24 (b)(c) | | 25,000 | 24,880 |
TOTAL UTILITIES | | | 579,424 |
| TOTAL NONCONVERTIBLE BONDS (Cost $3,665,339) | | | 3,661,904 |
| | | | |
| U.S. Treasury Obligations - 38.8% |
| | | Principal Amount (a) | Value ($) |
| U.S. Treasury Bills, yield at date of purchase 3.2% to 5.03% 6/15/23 to 1/25/24 | | 2,100,000 | 2,027,845 |
| U.S. Treasury Notes 3% 6/30/24 | | 500,000 | 486,484 |
| TOTAL U.S. TREASURY OBLIGATIONS (Cost $2,521,086) | | | 2,514,329 |
| | | | |
| Asset-Backed Securities - 4.6% |
| | | Principal Amount (a) | Value ($) |
| BMW Vechicle Lease Trust 2023-1 Series 2023-1 Class A2, 5.27% 2/25/25 | | 11,000 | 10,996 |
| BMW Vehicle Owner Trust Series 2022-A Class A2B, U.S. 30-Day Avg. Secured Overnight Fin. Rate (SOFR) Index + 0.950% 5.0041% 12/26/24 (b)(c) | | 16,166 | 16,174 |
| BMWLT 2021 Series 2021-2 Class A3, 0.33% 12/26/24 | | 15,976 | 15,659 |
| Capital One Prime Auto Receivables Series 2023-1 Class A2, 5.2% 5/15/26 | | 20,000 | 19,981 |
| CarMax Auto Owner Trust: | | | |
| Series 2021-1 Class A3, 0.34% 12/15/25 | | 6,583 | 6,359 |
| Series 2022-2 Class A2B, U.S. 30-Day Avg. Secured Overnight Fin. Rate (SOFR) Index + 0.600% 5.0012% 5/15/25 (b)(c) | | 4,946 | 4,947 |
| Series 2022-3 Class A2A, 3.81% 9/15/25 | | 11,691 | 11,595 |
| DLLAD Series 2023-1A Class A2, 5.19% 4/20/26 (d) | | 13,000 | 12,922 |
| Ford Credit Auto Lease Trust Series 2022-A Class A2B, U.S. 30-Day Avg. Secured Overnight Fin. Rate (SOFR) Index + 0.600% 5.0012% 10/15/24 (b)(c) | | 5,492 | 5,495 |
| Ford Credit Auto Owner Trust Series 2022-C Class A2A, 4.52% 4/15/25 | | 10,000 | 9,957 |
| Fordl 2023-A Series 2023-A Class A2A, 5.19% 6/15/25 | | 7,000 | 6,989 |
| FORDO Series 2022-B Class A2B, U.S. 30-Day Avg. Secured Overnight Fin. Rate (SOFR) Index + 1.840% 5.0012% 2/15/25 (b)(c) | | 8,684 | 8,689 |
| GM Financial Automobile Leasing Trust: | | | |
| Series 2021-3 Class A3, 0.39% 10/21/24 | | 24,741 | 24,177 |
| Series 2022-2 Class A2, 2.93% 10/21/24 | | 7,225 | 7,136 |
| Series 2023-A Class A2A, 5.27% 6/20/25 | | 16,000 | 15,997 |
| GM Financial Consumer Automobile Receivables Trust: | | | |
| Series 2022-3 Class A2A, 3.5% 9/16/25 | | 21,385 | 21,170 |
| Series 2022-4 Class A2A, 4.6% 11/17/25 | | 9,000 | 8,949 |
| Series 2023-1 Class A2A, 5.19% 3/16/26 | | 7,000 | 6,991 |
| Hyundai Auto Receivables Trust: | | | |
| Series 2022-B Class A2A, 3.64% 5/15/25 | | 13,482 | 13,357 |
| Series 2022-C, Class A2A, 5.35% 11/17/25 | | 18,000 | 17,997 |
| Mercedes-Benz Auto Receivables Series 2023-1 Class A2, 5.09% 1/15/26 | | 9,000 | 8,979 |
| Toyota Auto Receivables Series 2022-D Class A2A, 5.27% 1/15/26 | | 20,000 | 19,989 |
| Toyota Auto Receivables Owner Trust Series 2023-A Class A2, 5.05% 1/15/26 | | 14,000 | 13,968 |
| World Omni Auto Receivables Trust Series 2022-B, Class A2B, U.S. 30-Day Avg. Secured Overnight Fin. Rate (SOFR) Index + 1.050% 4.9712% 10/15/25 (b)(c) | | 9,335 | 9,338 |
| TOTAL ASSET-BACKED SECURITIES (Cost $298,579) | | | 297,811 |
| | | | |
| Money Market Funds - 1.5% |
| | | Shares | Value ($) |
Fidelity Cash Central Fund 4.63% (f) (Cost $97,139) | | 97,120 | 97,139 |
| | | | |
| TOTAL INVESTMENT IN SECURITIES - 101.4% (Cost $6,582,143) | 6,571,183 |
NET OTHER ASSETS (LIABILITIES) - (1.4)% | (89,891) |
| NET ASSETS - 100.0% | 6,481,292 |
| | |
Legend
| (a) | Amount is stated in United States dollars unless otherwise noted. |
| (b) | Coupon rates for floating and adjustable rate securities reflect the rates in effect at period end. |
| (c) | Coupon is indexed to a floating interest rate which may be multiplied by a specified factor and/or subject to caps or floors. |
| (d) | Security exempt from registration under Rule 144A of the Securities Act of 1933. These securities may be resold in transactions exempt from registration, normally to qualified institutional buyers. At the end of the period, the value of these securities amounted to $211,919 or 3.3% of net assets. |
| (e) | Security or a portion of the security purchased on a delayed delivery or when-issued basis. |
| (f) | Affiliated fund that is generally available only to investment companies and other accounts managed by Fidelity Investments. The rate quoted is the annualized seven-day yield of the fund at period end. A complete unaudited listing of the fund's holdings as of its most recent quarter end is available upon request. In addition, each Fidelity Central Fund's financial statements are available on the SEC's website or upon request. |
Affiliated Central Funds
Fiscal year to date information regarding the Fund's investments in Fidelity Central Funds, including the ownership percentage, is presented below.
| Affiliate | Value, beginning of period ($) | Purchases ($) | Sales Proceeds ($) | Dividend Income ($) | Realized Gain (loss) ($) | Change in Unrealized appreciation (depreciation) ($) | Value, end of period ($) | % ownership, end of period |
| Fidelity Cash Central Fund 4.63% | 500,597 | 2,255,970 | 2,659,428 | 4,149 | - | - | 97,139 | 0.0% |
| Total | 500,597 | 2,255,970 | 2,659,428 | 4,149 | - | - | 97,139 | |
| | | | | | | | | |
Amounts in the dividend income column in the above table include any capital gain distributions from underlying funds, which are presented in the corresponding line item in the Statement of Operations, if applicable.
Amounts included in the purchases and sales proceeds columns may include in-kind transactions, if applicable.
Investment Valuation
The following is a summary of the inputs used, as of February 28, 2023, involving the Fund's assets and liabilities carried at fair value. The inputs or methodology used for valuing securities may not be an indication of the risk associated with investing in those securities. For more information on valuation inputs, and their aggregation into the levels used below, please refer to the Investment Valuation section in the accompanying Notes to Financial Statements.
| Valuation Inputs at Reporting Date: |
| Description | Total ($) | Level 1 ($) | Level 2 ($) | Level 3 ($) |
Investments in Securities: | | | | |
|
| Corporate Bonds | 3,661,904 | - | 3,661,904 | - |
|
| U.S. Government and Government Agency Obligations | 2,514,329 | - | 2,514,329 | - |
|
| Asset-Backed Securities | 297,811 | - | 297,811 | - |
|
| Money Market Funds | 97,139 | 97,139 | - | - |
| Total Investments in Securities: | 6,571,183 | 97,139 | 6,474,044 | - |
| Statement of Assets and Liabilities |
| | | | February 28, 2023 (Unaudited) |
| | | | | |
| Assets | | | | |
| Investment in securities, at value - See accompanying schedule: | | | | |
Unaffiliated issuers (cost $6,485,004) | $ | 6,474,044 | | |
Fidelity Central Funds (cost $97,139) | | 97,139 | | |
| | | | | |
| | | | | |
| Total Investment in Securities (cost $6,582,143) | | | $ | 6,571,183 |
| Cash | | | | 48,716 |
| Receivable for fund shares sold | | | | 14,192 |
| Interest receivable | | | | 31,966 |
| Distributions receivable from Fidelity Central Funds | | | | 1,064 |
| Prepaid expenses | | | | 2,484 |
| Receivable from investment adviser for expense reductions | | | | 6,991 |
Total assets | | | | 6,676,596 |
| Liabilities | | | | |
| Payable for investments purchased | | | | |
Regular delivery | $ | 146,006 | | |
Delayed delivery | | 19,987 | | |
| Distributions payable | | 119 | | |
| Accrued management fee | | 1,573 | | |
| Audit fee payable | | 26,994 | | |
| Other payables and accrued expenses | | 625 | | |
| Total Liabilities | | | | 195,304 |
| Net Assets | | | $ | 6,481,292 |
| Net Assets consist of: | | | | |
| Paid in capital | | | $ | 6,465,614 |
| Total accumulated earnings (loss) | | | | 15,678 |
| Net Assets | | | $ | 6,481,292 |
Net Asset Value , offering price and redemption price per share ($6,481,292 ÷ 646,893 shares) | | | $ | 10.02 |
| Statement of Operations |
| | | | Six months ended February 28, 2023 (Unaudited) |
| Investment Income | | | | |
| Interest | | | $ | 96,553 |
| Income from Fidelity Central Funds | | | | 4,149 |
| Total Income | | | | 100,702 |
| Expenses | | | | |
| Management fee | $ | 8,446 | | |
| Custodian fees and expenses | | 646 | | |
| Independent trustees' fees and expenses | | 10 | | |
| Registration fees | | 18,768 | | |
| Audit | | 26,019 | | |
| Legal | | 4 | | |
| Miscellaneous | | 35 | | |
| Total expenses before reductions | | 53,928 | | |
| Expense reductions | | (47,041) | | |
| Total expenses after reductions | | | | 6,887 |
| Net Investment income (loss) | | | | 93,815 |
| Realized and Unrealized Gain (Loss) | | | | |
| Net realized gain (loss) on: | | | | |
| Investment Securities: | | | | |
| Unaffiliated issuers | | (3,433) | | |
| Total net realized gain (loss) | | | | (3,433) |
| Change in net unrealized appreciation (depreciation) on investment securities | | | | 12,522 |
| Net gain (loss) | | | | 9,089 |
| Net increase (decrease) in net assets resulting from operations | | | $ | 102,904 |
| Statement of Changes in Net Assets |
| |
| | Six months ended February 28, 2023 (Unaudited) | | For the period April 13, 2022 (commencement of operations) through August 31, 2022 |
| Increase (Decrease) in Net Assets | | | | |
| Operations | | | | |
| Net investment income (loss) | $ | 93,815 | $ | 29,673 |
| Net realized gain (loss) | | (3,433) | | (100) |
| Change in net unrealized appreciation (depreciation) | | 12,522 | | (23,482) |
| Net increase (decrease) in net assets resulting from operations | | 102,904 | | 6,091 |
| Distributions to shareholders | | (68,743) | | (24,574) |
| Share transactions | | | | |
| Proceeds from sales of shares | | 1,366,763 | | 5,036,643 |
| Reinvestment of distributions | | 68,397 | | 24,571 |
| Cost of shares redeemed | | (22,671) | | (8,089) |
Net increase (decrease) in net assets resulting from share transactions | | 1,412,489 | | 5,053,125 |
| Total increase (decrease) in net assets | | 1,446,650 | | 5,034,642 |
| | | | | |
| Net Assets | | | | |
| Beginning of period | | 5,034,642 | | - |
| End of period | $ | 6,481,292 | $ | 5,034,642 |
| | | | | |
| Other Information | | | | |
| Shares | | | | |
| Sold | | 136,975 | | 503,682 |
| Issued in reinvestment of distributions | | 6,853 | | 2,467 |
| Redeemed | | (2,272) | | (812) |
| Net increase (decrease) | | 141,556 | | 505,337 |
| | | | | |
Financial Highlights
| Fidelity SAI Sustainable Low Duration Income Fund |
| |
| | Six months ended (Unaudited) February 28, 2023 | | Years ended August 31, 2022 A |
Selected Per-Share Data | | | | |
| Net asset value, beginning of period | $ | 9.96 | $ | 10.00 |
| Income from Investment Operations | | | | |
Net investment income (loss) B,C | | .166 | | .059 |
| Net realized and unrealized gain (loss) | | .015 | | (.050) |
| Total from investment operations | | .181 | | .009 |
| Distributions from net investment income | | (.121) | | (.049) |
| Total distributions | | (.121) | | (.049) |
| Net asset value, end of period | $ | 10.02 | $ | 9.96 |
Total Return D,E | | 1.83% | | .09% |
Ratios to Average Net Assets C,F,G | | | | |
| Expenses before reductions | | 1.93% H | | 1.88% H,I |
| Expenses net of fee waivers, if any | | .25% H | | .25% H |
| Expenses net of all reductions | | .25% H | | .25% H |
| Net investment income (loss) | | 3.36% H | | 1.54% H |
| Supplemental Data | | | | |
| Net assets, end of period (000 omitted) | $ | 6,481 | $ | 5,035 |
Portfolio turnover rate J | | 14% H | | 6% K |
A For the period April 13, 2022 (commencement of operations) through August 31, 2022.
B Calculated based on average shares outstanding during the period.
C Net investment income (loss) is affected by the timing of the declaration of dividends by any underlying mutual funds or exchange-traded funds (ETFs). Net investment income (loss) of any mutual funds or ETFs is not included in the Fund's net investment income (loss) ratio.
D Total returns for periods of less than one year are not annualized.
E Total returns would have been lower if certain expenses had not been reduced during the applicable periods shown.
F Fees and expenses of any underlying mutual funds or exchange-traded funds (ETFs) are not included in the Fund's expense ratio. The Fund indirectly bears its proportionate share of these expenses. For additional expense information related to investments in Fidelity Central Funds, please refer to the "Investments in Fidelity Central Funds" note found in the Notes to Financial Statements section of the most recent Annual or Semi-Annual report.
G Expense ratios reflect operating expenses of the class. Expenses before reductions do not reflect amounts reimbursed, waived, or reduced through arrangements with the investment adviser, brokerage services, or other offset arrangements, if applicable, and do not represent the amount paid by the class during periods when reimbursements, waivers or reductions occur.
H Annualized.
I Audit fees are not annualized.
J Amount does not include the portfolio activity of any underlying mutual funds or exchange-traded funds (ETFs).
K Amount not annualized.
For the period ended February 28, 2023
1 . Organization.
Fidelity SAI Sustainable Low Duration Income Fund (the Fund) is a fund of Fidelity Salem Street Trust (the Trust) and is authorized to issue an unlimited number of shares. Shares are offered exclusively to certain clients of Fidelity Management & Research Company LLC (FMR) or its affiliates. The Trust is registered under the Investment Company Act of 1940, as amended (the 1940 Act), as an open-end management investment company organized as a Massachusetts business trust.
2. Investments in Fidelity Central Funds.
Funds may invest in Fidelity Central Funds, which are open-end investment companies generally available only to other investment companies and accounts managed by the investment adviser and its affiliates. The Schedule of Investments lists any Fidelity Central Funds held as an investment as of period end, but does not include the underlying holdings of each Fidelity Central Fund. An investing fund indirectly bears its proportionate share of the expenses of the underlying Fidelity Central Funds.
Based on its investment objective, each Fidelity Central Fund may invest or participate in various investment vehicles or strategies that are similar to those of the investing fund. These strategies are consistent with the investment objectives of the investing fund and may involve certain economic risks which may cause a decline in value of each of the Fidelity Central Funds and thus a decline in the value of the investing fund.
| Fidelity Central Fund | Investment Manager | Investment Objective | Investment Practices | Expense Ratio A |
| Fidelity Money Market Central Funds | Fidelity Management & Research Company LLC (FMR) | Each fund seeks to obtain a high level of current income consistent with the preservation of capital and liquidity. | Short-term Investments | Less than .005% |
A Expenses expressed as a percentage of average net assets and are as of each underlying Central Fund's most recent annual or semi-annual shareholder report.
A complete unaudited list of holdings for each Fidelity Central Fund is available upon request or at the Securities and Exchange Commission website at www.sec.gov. In addition, the financial statements of the Fidelity Central Funds which contain the significant accounting policies (including investment valuation policies) of those funds, and are not covered by the Report of Independent Registered Public Accounting Firm, are available on the Securities and Exchange Commission website or upon request.
3. Significant Accounting Policies.
The Fund is an investment company and applies the accounting and reporting guidance of the Financial Accounting Standards Board (FASB) Accounting Standards Codification Topic 946 Financial Services - Investment Companies . The financial statements have been prepared in conformity with accounting principles generally accepted in the United States of America (GAAP), which require management to make certain estimates and assumptions at the date of the financial statements. Actual results could differ from those estimates. Subsequent events, if any, through the date that the financial statements were issued have been evaluated in the preparation of the financial statements. The Fund's Schedule of Investments lists any underlying mutual funds or exchange-traded funds (ETFs) but does not include the underlying holdings of these funds. The following summarizes the significant accounting policies of the Fund:
Investment Valuation. Investments are valued as of 4:00 p.m. Eastern time on the last calendar day of the period. The Board of Trustees (the Board) has designated the Fund's investment adviser as the valuation designee responsible for the fair valuation function and performing fair value determinations as needed. The investment adviser has established a Fair Value Committee (the Committee) to carry out the day-to-day fair valuation responsibilities and has adopted policies and procedures to govern the fair valuation process and the activities of the Committee. In accordance with these fair valuation policies and procedures, which have been approved by the Board, the Fund attempts to obtain prices from one or more third party pricing services or brokers to value its investments. When current market prices, quotations or currency exchange rates are not readily available or reliable, investments will be fair valued in good faith by the Committee, in accordance with the policies and procedures. Factors used in determining fair value vary by investment type and may include market or investment specific events, transaction data, estimated cash flows, and market observations of comparable investments. The frequency that the fair valuation procedures are used cannot be predicted and they may be utilized to a significant extent. The Committee manages the Fund's fair valuation practices and maintains the fair valuation policies and procedures. The Fund's investment adviser reports to the Board information regarding the fair valuation process and related material matters.
The Fund categorizes the inputs to valuation techniques used to value its investments into a disclosure hierarchy consisting of three levels as shown below:
Level 1 - unadjusted quoted prices in active markets for identical investments
Level 2 - other significant observable inputs (including quoted prices for similar investments, interest rates, prepayment speeds, etc.)
Level 3 - unobservable inputs (including the Fund's own assumptions based on the best information available)
Valuation techniques used to value the Fund's investments by major category are as follows:
Debt securities, including restricted securities, are valued based on evaluated prices received from third party pricing services or from brokers who make markets in such securities. Corporate bonds and U.S. government and government agency obligations are valued by pricing services who utilize matrix pricing which considers yield or price of bonds of comparable quality, coupon, maturity and type or by broker-supplied prices. Asset backed securities are valued by pricing services who utilize matrix pricing which considers prepayment speed assumptions, attributes of the collateral, yield or price of bonds of comparable quality, coupon, maturity and type or by broker-supplied prices. When independent prices are unavailable or unreliable, debt securities may be valued utilizing pricing methodologies which consider similar factors that would be used by third party pricing services. Debt securities are generally categorized as Level 2 in the hierarchy but may be Level 3 depending on the circumstances.
Investments in open-end mutual funds, including the Fidelity Central Funds, are valued at their closing net asset value (NAV) each business day and are categorized as Level 1 in the hierarchy.
Changes in valuation techniques may result in transfers in or out of an assigned level within the disclosure hierarchy. The aggregate value of investments by input level as of February 28, 2023 is included at the end of the Fund's Schedule of Investments.
Investment Transactions and Income. For financial reporting purposes, the Fund's investment holdings and NAV include trades executed through the end of the last business day of the period. The NAV per share for processing shareholder transactions is calculated as of the close of business of the New York Stock Exchange (NYSE), normally 4:00 p.m. Eastern time and includes trades executed through the end of the prior business day. Gains and losses on securities sold are determined on the basis of identified cost. Income and capital gain distributions from Fidelity Central Funds, if any, are recorded on the ex-dividend date. Interest income is accrued as earned and includes coupon interest and amortization of premium and accretion of discount on debt securities as applicable. Debt obligations may be placed on non-accrual status and related interest income may be reduced by ceasing current accruals and writing off interest receivables when the collection of all or a portion of interest has become doubtful based on consistently applied procedures. A debt obligation is removed from non-accrual status when the issuer resumes interest payments or when collectability of interest is reasonably assured.
Expenses. Expenses directly attributable to a fund are charged to that fund. Expenses attributable to more than one fund are allocated among the respective funds on the basis of relative net assets or other appropriate methods. Expenses included in the accompanying financial statements reflect the expenses of that fund and do not include any expenses associated with any underlying mutual funds or exchange-traded funds. Although not included in a fund's expenses, a fund indirectly bears its proportionate share of these expenses through the net asset value of each underlying mutual fund or exchange-traded fund. Expense estimates are accrued in the period to which they relate and adjustments are made when actual amounts are known.
Income Tax Information and Distributions to Shareholders. Each year, the Fund intends to qualify as a regulated investment company under Subchapter M of the Internal Revenue Code, including distributing substantially all of its taxable income and realized gains. As a result, no provision for U.S. Federal income taxes is required. The Fund files a U.S. federal tax return, in addition to state and local tax returns as required. The Fund's federal income tax returns are subject to examination by the Internal Revenue Service (IRS) for a period of three fiscal years after they are filed. State and local tax returns may be subject to examination for an additional fiscal year depending on the jurisdiction.
Distributions are declared and recorded daily and paid monthly from net investment income. Distributions from realized gains, if any, are declared and recorded on the ex-dividend date. Income and capital gain distributions are determined in accordance with income tax regulations, which may differ from GAAP.
Capital accounts within the financial statements are adjusted for permanent book-tax differences. These adjustments have no impact on net assets or the results of operations. Capital accounts are not adjusted for temporary book-tax differences which will reverse in a subsequent period.
Book-tax differences are primarily due to market discount.
As of period end, the cost and unrealized appreciation (depreciation) in securities, and derivatives if applicable, for federal income tax purposes were as follows:
| Gross unrealized appreciation | $18,785 |
| Gross unrealized depreciation | (5,735) |
| Net unrealized appreciation (depreciation) | $13,050 |
| Tax cost | $6,558,133 |
Delayed Delivery Transactions and When-Issued Securities. During the period, certain Funds transacted in securities on a delayed delivery or when-issued basis. Payment and delivery may take place after the customary settlement period for that security. The price of the underlying securities and the date when the securities will be delivered and paid for are fixed at the time the transaction is negotiated. Securities purchased on a delayed delivery or when-issued basis are identified as such in the Schedule of Investments. Compensation for interest forgone in the purchase of a delayed delivery or when-issued debt security may be received. With respect to purchase commitments, each applicable Fund identifies securities as segregated in its records with a value at least equal to the amount of the commitment. Payables and receivables associated with the purchases and sales of delayed delivery securities having the same coupon, settlement date and broker are offset. Delayed delivery or when-issued securities that have been purchased from and sold to different brokers are reflected as both payables and receivables in the Statement of Assets and Liabilities under the caption "Delayed delivery", as applicable. Losses may arise due to changes in the value of the underlying securities or if the counterparty does not perform under the contract's terms, or if the issuer does not issue the securities due to political, economic, or other factors.
Restricted Securities (including Private Placements). Funds may invest in securities that are subject to legal or contractual restrictions on resale. These securities generally may be resold in transactions exempt from registration or to the public if the securities are registered. Disposal of these securities may involve time-consuming negotiations and expense, and prompt sale at an acceptable price may be difficult. Information regarding restricted securities held at period end is included at the end of the Schedule of Investments, if applicable.
4. Purchases and Sales of Investments.
Purchases and sales of securities, other than short-term securities, U.S. government securities and in-kind transactions, as applicable, are noted in the table below.
| | Purchases ($) | Sales ($) |
| Fidelity SAI Sustainable Low Duration Income Fund | 1,045,495 | 179,674 |
5. Fees and Other Transactions with Affiliates.
Management Fee. Fidelity Management & Research Company LLC (the investment adviser) and its affiliates provide the Fund with investment management related services for which the Fund pays a monthly management fee that is based on an annual rate of .30% of the Fund's average net assets.
During March 2023, the Board approved changes to the management fee effective April 1, 2023. The Fund will pay a monthly management fee that is based on an annual rate of .20% of the Fund's average net assets.
Interfund Trades. Funds may purchase from or sell securities to other Fidelity Funds under procedures adopted by the Board. The procedures have been designed to ensure these interfund trades are executed in accordance with Rule 17a-7 of the 1940 Act. Any interfund trades are included within the respective purchases and sales amounts shown in the Purchases and Sales of Investments note. During the period, there were no interfund trades.
6. Expense Reductions.
The investment adviser contractually agreed to reimburse the Fund to the extent annual operating expenses exceeded .25% of average net assets. Some expenses, for example the compensation of the independent Trustees, and certain miscellaneous expenses such as proxy and shareholder meeting expenses, are excluded from this reimbursement. During the period this reimbursement reduced the Fund's expenses by $46,944.
Through arrangements with the Fund's custodian, credits realized as a result of certain uninvested cash balances were used to reduce the Fund's expenses by $97.
Effective April 1, 2023, the investment adviser contractually agreed to reimburse the Fund to the extent annual operating expenses exceed .20% of average net assets. This reimbursement will remain in place through December 31, 2024. Some expenses, for example the compensation of the independent Trustees, and certain miscellaneous expenses such as proxy and shareholder meeting expenses, are excluded from this reimbursement.
7. Other.
A fund's organizational documents provide former and current trustees and officers with a limited indemnification against liabilities arising in connection with the performance of their duties to the fund. In the normal course of business, a fund may also enter into contracts that provide general indemnifications. A fund's maximum exposure under these arrangements is unknown as this would be dependent on future claims that may be made against a fund. The risk of material loss from such claims is considered remote.
At the end of the period, the investment adviser or its affiliates were owners of record of more than 10% of the outstanding shares as follows:
| Fund | Affiliated % |
Fidelity SAI Sustainable Low Duration Income Fund | 79% |
8. Risk and Uncertainties.
Many factors affect a fund's performance. Developments that disrupt global economies and financial markets, such as pandemics, epidemics, outbreaks of infectious diseases, war, terrorism, and environmental disasters, may significantly affect a fund's investment performance. The effects of these developments to a fund will be impacted by the types of securities in which a fund invests, the financial condition, industry, economic sector, and geographic location of an issuer, and a fund's level of investment in the securities of that issuer. Significant concentrations in security types, issuers, industries, sectors, and geographic locations may magnify the factors that affect a fund's performance.
As a shareholder, you incur two types of costs: (1) transaction costs, which may include sales charges (loads) on purchase payments or redemption proceeds, as applicable and (2) ongoing costs, which generally include management fees, distribution and/or service (12b-1) fees and other Fund expenses. This Example is intended to help you understand your ongoing costs (in dollars) of investing in a fund and to compare these costs with the ongoing costs of investing in other mutual funds.
| The Example is based on an investment of $1,000 invested at the beginning of the period and held for the entire period (September 1, 2022 to February 28, 2023). |
Actual Expenses
The first line of the accompanying table provides information about actual account values and actual expenses. You may use the information in this line, together with the amount you invested, to estimate the expenses that you paid over the period. Simply divide your account value by $1,000.00 (for example, an $8,600 account value divided by $1,000.00 = 8.6), then multiply the result by the number in the first line for a class/Fund under the heading entitled "Expenses Paid During Period" to estimate the expenses you paid on your account during this period. If any fund is a shareholder of any underlying mutual funds or exchange-traded funds (ETFs) (the Underlying Funds), such fund indirectly bears its proportional share of the expenses of the Underlying Funds in addition to the direct expenses incurred presented in the table. These fees and expenses are not included in the annualized expense ratio used to calculate the expense estimate in the table below.
Hypothetical Example for Comparison Purposes
The second line of the accompanying table provides information about hypothetical account values and hypothetical expenses based on the actual expense ratio and an assumed rate of return of 5% per year before expenses, which is not the actual return. The hypothetical account values and expenses may not be used to estimate the actual ending account balance or expenses you paid for the period. You may use this information to compare the ongoing costs of investing in the Fund and other funds. To do so, compare this 5% hypothetical example with the 5% hypothetical examples that appear in the shareholder reports of the other funds. If any fund is a shareholder of any Underlying Funds, such fund indirectly bears its proportional share of the expenses of the Underlying Funds in addition to the direct expenses as presented in the table. These fees and expenses are not included in the annualized expense ratio used to calculate the expense estimate in the table below.
Please note that the expenses shown in the table are meant to highlight your ongoing costs only and do not reflect any transaction costs. Therefore, the second line of the table is useful in comparing ongoing costs only, and will not help you determine the relative total costs of owning different funds. In addition, if these transactional costs were included, your costs would have been higher.
| | | | | Annualized Expense Ratio- A | | Beginning Account Value September 1, 2022 | | Ending Account Value February 28, 2023 | | Expenses Paid During Period- C September 1, 2022 to February 28, 2023 |
| | | | | | | | | | |
Fidelity® SAI Sustainable Low Duration Income Fund ** | | | | .25% | | | | | | |
| Actual | | | | | | $ 1,000 | | $ 1,018.30 | | $ 1.25 |
Hypothetical- B | | | | | | $ 1,000 | | $ 1,023.55 | | $ 1.25 |
| |
A Annualized expense ratio reflects expenses net of applicable fee waivers.
B 5% return per year before expenses
C Expenses are equal to the annualized expense ratio, multiplied by the average account value over the period, multiplied by 181/ 365 (to reflect the one-half year period). The fees and expenses of any Underlying Funds are not included in each annualized expense ratio.
** If fees and changes to the expense contract and/or expense cap, effective April 1, 2023, had been in effect during the current period, the restated annualized expense ratio and the expenses paid in the actual and hypothetical examples above would have been as shown in table below:
| | | | | Annualized Expense Ratio- A | | Expenses Paid |
| | | | | | |
| Fidelity® SAI Sustainable Low Duration Income Fund | | | | .20% | | |
| Actual | | | | | | $ 1.00 |
Hypothetical - B | | | | | | $ 1.00 |
| | | | | | | |
| A Annualized expense ratio reflects expenses net of applicable fee waivers. | | | | | | |
| B 5% return per year before expenses | | | | | | |
The Securities and Exchange Commission adopted Rule 22e-4 under the Investment Company Act of 1940 (the Liquidity Rule) to promote effective liquidity risk management throughout the open-end investment company industry, thereby reducing the risk that funds will be unable to meet their redemption obligations and mitigating dilution of the interests of fund shareholders.
The Fund has adopted and implemented a liquidity risk management program (the Program) reasonably designed to assess and manage the Fund's liquidity risk and to comply with the requirements of the Liquidity Rule. The Fund's Board of Trustees (the Board) has designated the Fund's investment adviser as administrator of the Program. The Fidelity advisers have established a Liquidity Risk Management Committee (the LRM Committee) to manage the Program for each of the Fidelity Funds. The LRM Committee monitors the adequacy and effectiveness of implementation of the Program and on a periodic basis assesses each Fund's liquidity risk based on a variety of factors including (1) the Fund's investment strategy, (2) portfolio liquidity and cash flow projections during normal and reasonably foreseeable stressed conditions, (3) shareholder redemptions, (4) borrowings and other funding sources and (5) certain factors specific to ETFs including the effect of the Fund's prices and spreads, market participants, and basket compositions on the overall liquidity of the Fund's portfolio, as applicable.
In accordance with the Program, each of the Fund's portfolio investments is classified into one of four defined liquidity categories based on a determination of a reasonable expectation for how long it would take to convert the investment to cash (or sell or dispose of the investment) without significantly changing its market value.
- Highly liquid investments - cash or convertible to cash within three business days or less
- Moderately liquid investments - convertible to cash in three to seven calendar days
- Less liquid investments - can be sold or disposed of, but not settled, within seven calendar days
- Illiquid investments - cannot be sold or disposed of within seven calendar days
Liquidity classification determinations take into account a variety of factors including various market, trading and investment-specific considerations, as well as market depth, and generally utilize analysis from a third-party liquidity metrics service.
The Liquidity Rule places a 15% limit on a fund's illiquid investments and requires funds that do not primarily hold assets that are highly liquid investments to determine and maintain a minimum percentage of the fund's net assets to be invested in highly liquid investments (highly liquid investment minimum or HLIM). The Program includes provisions reasonably designed to comply with the 15% limit on illiquid investments and for determining, periodically reviewing and complying with the HLIM requirement as applicable.
At a recent meeting of the Fund's Board of Trustees, the LRM Committee provided a written report to the Board pertaining to the operation, adequacy, and effectiveness of the Program for the period December 1, 2021 through November 30, 2022. The report concluded that the Program is operating effectively and is reasonably designed to assess and manage the Fund's liquidity risk.
1.9904915.100
SLO-SANN-0423
Fidelity® Intermediate Bond Fund
Semi-Annual Report
February 28, 2023
Contents
To view a fund's proxy voting guidelines and proxy voting record for the 12-month period ended June 30, visit http://www.fidelity.com/proxyvotingresults or visit the Securities and Exchange Commission's (SEC) web site at http://www.sec.gov.
You may also call 1-800-544-8544 to request a free copy of the proxy voting guidelines.
Standard & Poor's, S&P and S&P 500 are registered service marks of The McGraw-Hill Companies, Inc. and have been licensed for use by Fidelity Distributors Corporation.
Other third-party marks appearing herein are the property of their respective owners.
All other marks appearing herein are registered or unregistered trademarks or service marks of FMR LLC or an affiliated company. © 2023 FMR LLC. All rights reserved.
This report and the financial statements contained herein are submitted for the general information of the shareholders of the Fund. This report is not authorized for distribution to prospective investors in the Fund unless preceded or accompanied by an effective prospectus.
A fund files its complete schedule of portfolio holdings with the SEC for the first and third quarters of each fiscal year on Form N-PORT. Forms N-PORT are available on the SEC's web site at http://www.sec.gov. A fund's Forms N-PORT may be reviewed and copied at the SEC's Public Reference Room in Washington, DC. Information regarding the operation of the SEC's Public Reference Room may be obtained by calling 1-800-SEC-0330.
For a complete list of a fund's portfolio holdings, view the most recent holdings listing, semiannual report, or annual report on Fidelity's web site at http://www.fidelity.com, http://www.institutional.fidelity.com, or http://www.401k.com, as applicable.
NOT FDIC INSURED •MAY LOSE VALUE •NO BANK GUARANTEE
Neither the Fund nor Fidelity Distributors Corporation is a bank.
Quality Diversification (% of Fund's net assets) |
|
| |
| We have used ratings from Moody's Investors Service, Inc. Where Moody's® ratings are not available, we have used S&P® ratings. All ratings are as of the date indicated and do not reflect subsequent changes. |
Securities rated BB or below were rated investment grade at the time of acquisition.
Asset Allocation (% of Fund's net assets) |
|
Foreign investments - 14.7% |
Futures - 3.8% |
|
Geographic Diversification (% of Fund's net assets) |
|
* Includes Short-Term investments and Net Other Assets (Liabilities). Percentages are based on country or territory of incorporation and are adjusted for the effect of derivatives, if applicable. |
| |
Showing Percentage of Net Assets
| Nonconvertible Bonds - 38.9% |
| | | Principal Amount (a) (000s) | Value ($) (000s) |
| COMMUNICATION SERVICES - 1.8% | | | |
| Diversified Telecommunication Services - 1.0% | | | |
| AT&T, Inc.: | | | |
| 1.65% 2/1/28 | | 4,281 | 3,637 |
| 4.3% 2/15/30 | | 6,552 | 6,146 |
| NTT Finance Corp.: | | | |
| 1.162% 4/3/26 (b) | | 4,930 | 4,353 |
| 1.591% 4/3/28 (b) | | 6,814 | 5,769 |
| Verizon Communications, Inc.: | | | |
| 2.1% 3/22/28 | | 5,134 | 4,431 |
| 2.355% 3/15/32 | | 1,666 | 1,310 |
| | | | 25,646 |
| Media - 0.4% | | | |
| Charter Communications Operating LLC/Charter Communications Operating Capital Corp.: | | | |
| 4.2% 3/15/28 | | 3,276 | 3,011 |
| 4.908% 7/23/25 | | 3,158 | 3,090 |
| Discovery Communications LLC 3.625% 5/15/30 | | 1,082 | 926 |
| Magallanes, Inc.: | | | |
| 3.755% 3/15/27 (b) | | 3,181 | 2,918 |
| 4.054% 3/15/29 (b) | | 535 | 478 |
| | | | 10,423 |
| Wireless Telecommunication Services - 0.4% | | | |
| Rogers Communications, Inc. 3.2% 3/15/27 (b) | | 1,663 | 1,529 |
| T-Mobile U.S.A., Inc.: | | | |
| 2.4% 3/15/29 | | 2,296 | 1,941 |
| 2.625% 4/15/26 | | 5,569 | 5,103 |
| 3.5% 4/15/25 | | 2,752 | 2,636 |
| | | | 11,209 |
TOTAL COMMUNICATION SERVICES | | | 47,278 |
| CONSUMER DISCRETIONARY - 2.3% | | | |
| Automobiles - 1.1% | | | |
| General Motors Co. 6.125% 10/1/25 | | 3,276 | 3,311 |
| General Motors Financial Co., Inc.: | | | |
| 1.05% 3/8/24 | | 1,318 | 1,259 |
| 1.25% 1/8/26 | | 3,715 | 3,286 |
| 2.35% 2/26/27 | | 2,686 | 2,374 |
| 4.15% 6/19/23 | | 3,946 | 3,931 |
| 4.35% 4/9/25 | | 3,931 | 3,818 |
| Volkswagen Group of America Finance LLC: | | | |
| 1.25% 11/24/25 (b) | | 8,052 | 7,210 |
| 3.125% 5/12/23 (b) | | 1,548 | 1,541 |
| 4.35% 6/8/27 (b) | | 2,839 | 2,724 |
| | | | 29,454 |
| Household Durables - 0.2% | | | |
| Toll Brothers Finance Corp.: | | | |
| 4.875% 11/15/25 | | 2,883 | 2,844 |
| 4.875% 3/15/27 | | 1,404 | 1,347 |
| | | | 4,191 |
| Multiline Retail - 0.3% | | | |
| Dollar Tree, Inc. 4% 5/15/25 | | 7,993 | 7,763 |
| Specialty Retail - 0.7% | | | |
| AutoZone, Inc.: | | | |
| 3.625% 4/15/25 | | 354 | 342 |
| 4% 4/15/30 | | 3,276 | 3,010 |
| Lowe's Companies, Inc.: | | | |
| 1.7% 9/15/28 | | 3,276 | 2,736 |
| 4.5% 4/15/30 | | 4,586 | 4,368 |
| O'Reilly Automotive, Inc.: | | | |
| 3.9% 6/1/29 | | 3,276 | 3,034 |
| 4.2% 4/1/30 | | 367 | 344 |
| Ross Stores, Inc. 0.875% 4/15/26 | | 5,302 | 4,640 |
| The Home Depot, Inc. 2.5% 4/15/27 | | 234 | 214 |
| | | | 18,688 |
TOTAL CONSUMER DISCRETIONARY | | | 60,096 |
| CONSUMER STAPLES - 2.0% | | | |
| Beverages - 0.1% | | | |
| Anheuser-Busch InBev Worldwide, Inc. 3.5% 6/1/30 | | 1,111 | 1,012 |
| Molson Coors Beverage Co. 3% 7/15/26 | | 2,948 | 2,727 |
| | | | 3,739 |
| Food & Staples Retailing - 0.1% | | | |
| 7-Eleven, Inc. 0.95% 2/10/26 (b) | | 1,515 | 1,335 |
| Alimentation Couche-Tard, Inc. 2.95% 1/25/30 (b) | | 1,785 | 1,517 |
| | | | 2,852 |
| Food Products - 0.6% | | | |
| JBS U.S.A. Lux SA / JBS Food Co.: | | | |
| 2.5% 1/15/27 (b) | | 3,770 | 3,299 |
| 3% 2/2/29 (b) | | 3,276 | 2,724 |
| 5.125% 2/1/28 (b) | | 7,862 | 7,473 |
| JDE Peet's BV 1.375% 1/15/27 (b) | | 1,001 | 851 |
| | | | 14,347 |
| Tobacco - 1.2% | | | |
| Altria Group, Inc.: | | | |
| 2.35% 5/6/25 | | 658 | 617 |
| 4.8% 2/14/29 | | 1,001 | 960 |
| BAT Capital Corp.: | | | |
| 3.222% 8/15/24 | | 1,965 | 1,894 |
| 4.7% 4/2/27 | | 4,143 | 4,004 |
| BAT International Finance PLC 1.668% 3/25/26 | | 8,124 | 7,215 |
| Imperial Tobacco Finance PLC 3.125% 7/26/24 (b) | | 5,438 | 5,217 |
| Philip Morris International, Inc. 5.125% 11/17/27 | | 10,400 | 10,351 |
| | | | 30,258 |
TOTAL CONSUMER STAPLES | | | 51,196 |
| ENERGY - 3.1% | | | |
| Energy Equipment & Services - 0.0% | | | |
| Baker Hughes Co. 2.061% 12/15/26 | | 1,245 | 1,113 |
| Oil, Gas & Consumable Fuels - 3.1% | | | |
| Canadian Natural Resources Ltd. 3.9% 2/1/25 | | 2,228 | 2,156 |
| Cenovus Energy, Inc. 4.25% 4/15/27 | | 7,207 | 6,882 |
| DCP Midstream Operating LP: | | | |
| 3.875% 3/15/23 | | 2,313 | 2,311 |
| 5.375% 7/15/25 | | 3,931 | 3,883 |
| Eastern Gas Transmission & Storage, Inc. 3% 11/15/29 | | 3,603 | 3,116 |
| Energy Transfer LP: | | | |
| 2.9% 5/15/25 | | 3,931 | 3,710 |
| 4.2% 9/15/23 | | 1,088 | 1,081 |
| 4.5% 4/15/24 | | 5,330 | 5,261 |
| 4.95% 6/15/28 | | 3,276 | 3,164 |
| 5.875% 1/15/24 | | 3,953 | 3,957 |
| EQT Corp.: | | | |
| 3.9% 10/1/27 | | 1,965 | 1,797 |
| 5.7% 4/1/28 | | 352 | 346 |
| Equinor ASA 1.75% 1/22/26 | | 723 | 660 |
| Hess Corp. 4.3% 4/1/27 | | 12,776 | 12,229 |
| Hess Midstream Partners LP 5.625% 2/15/26 (b) | | 5,241 | 5,100 |
| Kinder Morgan Energy Partners LP 3.5% 9/1/23 | | 1,980 | 1,963 |
| MPLX LP: | | | |
| 1.75% 3/1/26 | | 3,210 | 2,871 |
| 4% 2/15/25 | | 328 | 318 |
| 4% 3/15/28 | | 3,276 | 3,067 |
| 4.5% 7/15/23 | | 649 | 647 |
| Occidental Petroleum Corp. 2.9% 8/15/24 | | 4,024 | 3,853 |
| Petroleos Mexicanos 6.7% 2/16/32 | | 3,107 | 2,460 |
| Plains All American Pipeline LP/PAA Finance Corp. 3.85% 10/15/23 | | 1,736 | 1,718 |
| Southeast Supply Header LLC 4.25% 6/15/24 (b) | | 2,009 | 1,893 |
| The Williams Companies, Inc.: | | | |
| 4.3% 3/4/24 | | 1,631 | 1,610 |
| 4.55% 6/24/24 | | 1,669 | 1,646 |
| 5.4% 3/2/26 | | 1,301 | 1,301 |
| | | | 79,000 |
TOTAL ENERGY | | | 80,113 |
| FINANCIALS - 20.3% | | | |
| Banks - 11.3% | | | |
| Bank of America Corp.: | | | |
| 1.197% 10/24/26 (c) | | 11,465 | 10,202 |
| 1.319% 6/19/26 (c) | | 3,734 | 3,387 |
| 2.496% 2/13/31 (c) | | 3,276 | 2,701 |
| 3.384% 4/2/26 (c) | | 5,798 | 5,546 |
| 3.97% 3/5/29 (c) | | 3,276 | 3,042 |
| 3.974% 2/7/30 (c) | | 4,455 | 4,075 |
| 4.25% 10/22/26 | | 3,873 | 3,720 |
| 4.271% 7/23/29 (c) | | 2,293 | 2,152 |
| 4.45% 3/3/26 | | 2,283 | 2,220 |
| 4.948% 7/22/28 (c) | | 5,700 | 5,575 |
| Bank of Nova Scotia 4.5% 12/16/25 | | 4,193 | 4,064 |
| Barclays PLC: | | | |
| 1.007% 12/10/24 (c) | | 2,582 | 2,486 |
| 2.279% 11/24/27 (c) | | 8,576 | 7,545 |
| 2.852% 5/7/26 (c) | | 6,455 | 6,044 |
| 3.932% 5/7/25 (c) | | 5,916 | 5,758 |
| 5.304% 8/9/26 (c) | | 2,635 | 2,596 |
| BNP Paribas SA: | | | |
| U.S. Secured Overnight Fin. Rate (SOFR) Index + 1.000% 1.323% 1/13/27 (b)(c)(d) | | 3,654 | 3,235 |
| 2.219% 6/9/26 (b)(c) | | 2,279 | 2,105 |
| Capital One NA 2.28% 1/28/26 (c) | | 3,728 | 3,499 |
| Citigroup, Inc.: | | | |
| 3.106% 4/8/26 (c) | | 3,669 | 3,484 |
| 4.6% 3/9/26 | | 2,180 | 2,123 |
| Danske Bank A/S 3.875% 9/12/23 (b) | | 1,965 | 1,947 |
| DNB Bank ASA: | | | |
| 1.535% 5/25/27 (b)(c) | | 2,813 | 2,454 |
| 1.605% 3/30/28 (b)(c) | | 6,094 | 5,207 |
| First Citizens Bank & Trust Co. 3.929% 6/19/24 (c) | | 495 | 492 |
| HSBC Holdings PLC: | | | |
| 0.976% 5/24/25 (c) | | 1,638 | 1,541 |
| 1.645% 4/18/26 (c) | | 8,191 | 7,504 |
| 2.251% 11/22/27 (c) | | 9,709 | 8,540 |
| 2.999% 3/10/26 (c) | | 5,241 | 4,956 |
| 4.292% 9/12/26 (c) | | 3,276 | 3,154 |
| 5.21% 8/11/28 (c) | | 4,111 | 4,020 |
| Huntington Bancshares, Inc. 4.443% 8/4/28 (c) | | 3,284 | 3,137 |
| ING Groep NV 1.726% 4/1/27 (c) | | 2,376 | 2,109 |
| Intesa Sanpaolo SpA 5.71% 1/15/26 (b) | | 3,236 | 3,098 |
| JPMorgan Chase & Co.: | | | |
| 1.045% 11/19/26 (c) | | 3,826 | 3,388 |
| 1.47% 9/22/27 (c) | | 6,480 | 5,618 |
| 2.069% 6/1/29 (c) | | 4,914 | 4,143 |
| 2.083% 4/22/26 (c) | | 4,652 | 4,320 |
| 2.522% 4/22/31 (c) | | 3,276 | 2,709 |
| 2.947% 2/24/28 (c) | | 11,853 | 10,750 |
| 2.956% 5/13/31 (c) | | 4,616 | 3,877 |
| 3.797% 7/23/24 (c) | | 3,171 | 3,148 |
| 3.875% 9/10/24 | | 3,386 | 3,305 |
| 4.125% 12/15/26 | | 3,322 | 3,205 |
| 4.25% 10/1/27 | | 2,621 | 2,522 |
| Mitsubishi UFJ Financial Group, Inc.: | | | |
| 1.64% 10/13/27 (c) | | 7,999 | 6,940 |
| 2.193% 2/25/25 | | 4,678 | 4,383 |
| 4.05% 9/11/28 | | 3,276 | 3,137 |
| 5.017% 7/20/28 (c) | | 8,910 | 8,721 |
| Mizuho Financial Group, Inc.: | | | |
| 1.234% 5/22/27 (c) | | 6,552 | 5,680 |
| 4.254% 9/11/29 (c) | | 1,965 | 1,833 |
| NatWest Group PLC: | | | |
| 1.642% 6/14/27 (c) | | 2,293 | 2,012 |
| 2.359% 5/22/24 (c) | | 2,714 | 2,690 |
| 3.073% 5/22/28 (c) | | 2,293 | 2,069 |
| 4.519% 6/25/24 (c) | | 4,506 | 4,482 |
| 5.847% 3/2/27 (c) | | 5,364 | 5,367 |
| Rabobank Nederland 1.98% 12/15/27 (b)(c) | | 2,686 | 2,340 |
| Santander Holdings U.S.A., Inc. 2.49% 1/6/28 (c) | | 5,891 | 5,131 |
| Societe Generale: | | | |
| 1.792% 6/9/27 (b)(c) | | 4,104 | 3,586 |
| 4.25% 4/14/25 (b) | | 1,994 | 1,912 |
| 4.677% 6/15/27 (b) | | 5,569 | 5,430 |
| 4.75% 11/24/25 (b) | | 4,777 | 4,603 |
| Sumitomo Mitsui Financial Group, Inc. 1.402% 9/17/26 | | 5,765 | 5,003 |
| SVB Financial Group: | | | |
| 2.1% 5/15/28 | | 1,007 | 846 |
| 3.125% 6/5/30 | | 1,934 | 1,632 |
| The Toronto-Dominion Bank 2.8% 3/10/27 | | 4,990 | 4,561 |
| Truist Financial Corp. 4.26% 7/28/26 (c) | | 5,759 | 5,614 |
| Wells Fargo & Co.: | | | |
| 2.164% 2/11/26 (c) | | 5,575 | 5,210 |
| 3.526% 3/24/28 (c) | | 3,510 | 3,250 |
| 4.3% 7/22/27 | | 6,407 | 6,198 |
| Westpac Banking Corp.: | | | |
| U.S. TREASURY 1 YEAR INDEX + 2.680% 5.405% 8/10/33 (c)(d) | | 4,259 | 4,078 |
| 4.11% 7/24/34 (c) | | 1,178 | 1,042 |
| | | | 288,453 |
| Capital Markets - 3.2% | | | |
| Ares Capital Corp. 3.25% 7/15/25 | | 9,000 | 8,372 |
| Credit Suisse Group AG: | | | |
| 1.305% 2/2/27 (b)(c) | | 5,890 | 4,746 |
| 2.593% 9/11/25 (b)(c) | | 3,276 | 2,968 |
| 4.207% 6/12/24 (b)(c) | | 8,845 | 8,715 |
| 4.55% 4/17/26 | | 3,276 | 2,927 |
| 6.373% 7/15/26 (b)(c) | | 4,455 | 4,191 |
| Deutsche Bank AG 4.5% 4/1/25 | | 4,541 | 4,379 |
| Deutsche Bank AG New York Branch: | | | |
| 1.447% 4/1/25 (c) | | 3,868 | 3,661 |
| 2.129% 11/24/26 (c) | | 6,434 | 5,766 |
| 2.222% 9/18/24 (c) | | 4,403 | 4,304 |
| 2.311% 11/16/27 (c) | | 4,775 | 4,146 |
| Goldman Sachs Group, Inc. 4.482% 8/23/28 (c) | | 3,462 | 3,318 |
| Moody's Corp.: | | | |
| 3.25% 1/15/28 | | 4,586 | 4,215 |
| 3.75% 3/24/25 | | 2,605 | 2,520 |
| Morgan Stanley: | | | |
| 0.79% 5/30/25 (c) | | 1,638 | 1,534 |
| 2.188% 4/28/26 (c) | | 3,603 | 3,358 |
| 3.737% 4/24/24 (c) | | 3,733 | 3,722 |
| 3.875% 1/27/26 | | 3,014 | 2,906 |
| S&P Global, Inc. 2.45% 3/1/27 (b) | | 4,586 | 4,174 |
| State Street Corp. 2.901% 3/30/26 (c) | | 199 | 189 |
| UBS Group AG 1.008% 7/30/24 (b)(c) | | 2,724 | 2,670 |
| | | | 82,781 |
| Consumer Finance - 2.8% | | | |
| AerCap Ireland Capital Ltd./AerCap Global Aviation Trust: | | | |
| 1.75% 1/30/26 | | 3,495 | 3,089 |
| 2.45% 10/29/26 | | 1,390 | 1,225 |
| 3% 10/29/28 | | 1,456 | 1,241 |
| 6.5% 7/15/25 | | 1,093 | 1,097 |
| Ally Financial, Inc.: | | | |
| 1.45% 10/2/23 | | 640 | 624 |
| 2.2% 11/2/28 | | 4,939 | 4,024 |
| 3.05% 6/5/23 | | 2,817 | 2,798 |
| 4.625% 3/30/25 | | 1,965 | 1,923 |
| 4.75% 6/9/27 | | 7,141 | 6,804 |
| 5.125% 9/30/24 | | 6,421 | 6,365 |
| 5.75% 11/20/25 | | 1,336 | 1,308 |
| Capital One Financial Corp.: | | | |
| 1.878% 11/2/27 (c) | | 11,269 | 9,848 |
| 2.359% 7/29/32 (c) | | 6,552 | 4,821 |
| 2.636% 3/3/26 (c) | | 3,276 | 3,080 |
| 3.2% 2/5/25 | | 2,293 | 2,197 |
| 4.985% 7/24/26 (c) | | 2,495 | 2,455 |
| Discover Financial Services 4.5% 1/30/26 | | 1,591 | 1,540 |
| Ford Motor Credit Co. LLC: | | | |
| 2.3% 2/10/25 | | 2,621 | 2,409 |
| 3.375% 11/13/25 | | 8,189 | 7,543 |
| Synchrony Financial: | | | |
| 4.25% 8/15/24 | | 3,276 | 3,197 |
| 4.375% 3/19/24 | | 4,395 | 4,334 |
| | | | 71,922 |
| Diversified Financial Services - 1.7% | | | |
| Athene Global Funding: | | | |
| 0.95% 1/8/24 (b) | | 4,427 | 4,255 |
| 1.73% 10/2/26 (b) | | 4,452 | 3,834 |
| 2.646% 10/4/31 (b) | | 6,486 | 5,046 |
| Blackstone Private Credit Fund 4.7% 3/24/25 | | 10,119 | 9,760 |
| Brixmor Operating Partnership LP: | | | |
| 3.85% 2/1/25 | | 1,919 | 1,840 |
| 4.125% 6/15/26 | | 882 | 830 |
| Corebridge Financial, Inc.: | | | |
| 3.65% 4/5/27 (b) | | 1,815 | 1,693 |
| 3.85% 4/5/29 (b) | | 1,139 | 1,029 |
| 3.9% 4/5/32 (b) | | 1,356 | 1,187 |
| Equitable Holdings, Inc. 4.35% 4/20/28 | | 7,076 | 6,721 |
| Jackson Financial, Inc.: | | | |
| 5.17% 6/8/27 | | 1,257 | 1,245 |
| 5.67% 6/8/32 | | 4,927 | 4,814 |
| | | | 42,254 |
| Insurance - 1.3% | | | |
| AFLAC, Inc. 3.6% 4/1/30 | | 735 | 676 |
| AIA Group Ltd.: | | | |
| 3.375% 4/7/30 (b) | | 2,279 | 2,055 |
| 3.9% 4/6/28 (b) | | 5,569 | 5,258 |
| American International Group, Inc. 2.5% 6/30/25 | | 2,446 | 2,302 |
| Aon PLC 3.875% 12/15/25 | | 4,072 | 3,923 |
| Equitable Financial Life Global Funding: | | | |
| 1.3% 7/12/26 (b) | | 3,276 | 2,854 |
| 1.4% 8/27/27 (b) | | 3,276 | 2,746 |
| 1.7% 11/12/26 (b) | | 4,175 | 3,638 |
| Five Corners Funding Trust II 2.85% 5/15/30 (b) | | 2,963 | 2,503 |
| Marsh & McLennan Companies, Inc. 3.875% 3/15/24 | | 1,585 | 1,558 |
| Teachers Insurance & Annuity Association of America 4.9% 9/15/44 (b) | | 2,819 | 2,598 |
| Willis Group North America, Inc. 4.5% 9/15/28 | | 3,603 | 3,417 |
| | | | 33,528 |
TOTAL FINANCIALS | | | 518,938 |
| HEALTH CARE - 1.7% | | | |
| Biotechnology - 0.1% | | | |
| Amgen, Inc.: | | | |
| 5.15% 3/2/28 (e) | | 1,419 | 1,413 |
| 5.25% 3/2/30 (e) | | 1,295 | 1,289 |
| | | | 2,702 |
| Health Care Equipment & Supplies - 0.1% | | | |
| Alcon Finance Corp. 2.75% 9/23/26 (b) | | 2,685 | 2,461 |
| Health Care Providers & Services - 1.1% | | | |
| Centene Corp.: | | | |
| 2.45% 7/15/28 | | 2,742 | 2,298 |
| 4.25% 12/15/27 | | 3,276 | 3,027 |
| Cigna Group 3.4% 3/1/27 | | 2,948 | 2,760 |
| HCA Holdings, Inc.: | | | |
| 3.125% 3/15/27 (b) | | 8,583 | 7,810 |
| 3.5% 9/1/30 | | 1,638 | 1,408 |
| 5.625% 9/1/28 | | 3,276 | 3,239 |
| 5.875% 2/1/29 | | 1,806 | 1,805 |
| Humana, Inc.: | | | |
| 1.35% 2/3/27 | | 3,931 | 3,384 |
| 3.7% 3/23/29 | | 1,041 | 944 |
| Sabra Health Care LP: | | | |
| 3.2% 12/1/31 | | 2,600 | 1,932 |
| 3.9% 10/15/29 | | 885 | 736 |
| | | | 29,343 |
| Pharmaceuticals - 0.4% | | | |
| Elanco Animal Health, Inc. 5.772% 8/28/23 | | 420 | 418 |
| GSK Consumer Healthcare Capital U.S. LLC 3.375% 3/24/27 | | 7,000 | 6,509 |
| Mylan NV 4.55% 4/15/28 | | 1,002 | 934 |
| Viatris, Inc.: | | | |
| 1.65% 6/22/25 | | 290 | 264 |
| 2.7% 6/22/30 | | 1,005 | 797 |
| | | | 8,922 |
TOTAL HEALTH CARE | | | 43,428 |
| INDUSTRIALS - 2.0% | | | |
| Aerospace & Defense - 0.5% | | | |
| BAE Systems Holdings, Inc. 3.8% 10/7/24 (b) | | 1,416 | 1,378 |
| BAE Systems PLC 3.4% 4/15/30 (b) | | 1,006 | 896 |
| The Boeing Co.: | | | |
| 2.7% 2/1/27 | | 3,276 | 2,967 |
| 5.04% 5/1/27 | | 6,027 | 5,936 |
| 5.15% 5/1/30 | | 2,752 | 2,663 |
| | | | 13,840 |
| Airlines - 0.5% | | | |
| American Airlines 2019-1 Class B Pass Through Trust equipment trust certificate 3.85% 8/15/29 | | 2,708 | 2,433 |
| Delta Air Lines, Inc.: | | | |
| 2.9% 10/28/24 | | 3,603 | 3,428 |
| 3.8% 4/19/23 | | 1,834 | 1,826 |
| United Airlines 2019-2 Class B Pass Through Trust equipment trust certificate 3.5% 11/1/29 | | 1,976 | 1,770 |
| United Airlines, Inc. equipment trust certificate 4.6% 9/1/27 | | 2,207 | 2,109 |
| | | | 11,566 |
| Building Products - 0.0% | | | |
| Carrier Global Corp. 2.493% 2/15/27 | | 983 | 886 |
| Machinery - 0.3% | | | |
| Daimler Trucks Finance North America LLC 2% 12/14/26 (b) | | 4,559 | 4,034 |
| Otis Worldwide Corp. 2.056% 4/5/25 | | 3,400 | 3,172 |
| | | | 7,206 |
| Trading Companies & Distributors - 0.3% | | | |
| Air Lease Corp.: | | | |
| 0.7% 2/15/24 | | 1,801 | 1,716 |
| 0.8% 8/18/24 | | 2,701 | 2,508 |
| 2.2% 1/15/27 | | 2,524 | 2,217 |
| 4.25% 2/1/24 | | 1,937 | 1,910 |
| | | | 8,351 |
| Transportation Infrastructure - 0.4% | | | |
| Avolon Holdings Funding Ltd.: | | | |
| 2.875% 2/15/25 (b) | | 4,665 | 4,339 |
| 3.25% 2/15/27 (b) | | 1,829 | 1,616 |
| 3.95% 7/1/24 (b) | | 1,996 | 1,930 |
| 4.375% 5/1/26 (b) | | 670 | 623 |
| 5.5% 1/15/26 (b) | | 1,203 | 1,164 |
| | | | 9,672 |
TOTAL INDUSTRIALS | | | 51,521 |
| INFORMATION TECHNOLOGY - 0.9% | | | |
| Electronic Equipment & Components - 0.1% | | | |
| Dell International LLC/EMC Corp. 5.25% 2/1/28 | | 2,009 | 1,977 |
| Semiconductors & Semiconductor Equipment - 0.3% | | | |
| Broadcom, Inc. 1.95% 2/15/28 (b) | | 3,276 | 2,776 |
| Micron Technology, Inc. 4.185% 2/15/27 | | 5,602 | 5,303 |
| | | | 8,079 |
| Software - 0.5% | | | |
| Oracle Corp. 1.65% 3/25/26 | | 2,045 | 1,828 |
| Roper Technologies, Inc.: | | | |
| 1.4% 9/15/27 | | 3,276 | 2,779 |
| 2% 6/30/30 | | 3,754 | 3,023 |
| VMware, Inc.: | | | |
| 1% 8/15/24 | | 4,004 | 3,741 |
| 1.4% 8/15/26 | | 1,758 | 1,518 |
| | | | 12,889 |
TOTAL INFORMATION TECHNOLOGY | | | 22,945 |
| MATERIALS - 0.4% | | | |
| Chemicals - 0.4% | | | |
| International Flavors & Fragrances, Inc.: | | | |
| 1.23% 10/1/25 (b) | | 655 | 580 |
| 1.832% 10/15/27 (b) | | 3,276 | 2,743 |
| LYB International Finance III LLC 1.25% 10/1/25 | | 3,156 | 2,825 |
| The Mosaic Co. 4.25% 11/15/23 | | 3,338 | 3,313 |
| | | | 9,461 |
| REAL ESTATE - 1.9% | | | |
| Equity Real Estate Investment Trusts (REITs) - 1.9% | | | |
| American Homes 4 Rent LP 3.625% 4/15/32 | | 1,247 | 1,054 |
| Boston Properties, Inc. 3.2% 1/15/25 | | 1,965 | 1,877 |
| Corporate Office Properties LP 2% 1/15/29 | | 2,376 | 1,829 |
| Federal Realty Investment Trust 3.95% 1/15/24 | | 4,586 | 4,518 |
| Hudson Pacific Properties LP 4.65% 4/1/29 | | 4,167 | 3,540 |
| Kite Realty Group Trust 4% 3/15/25 | | 1,572 | 1,490 |
| LXP Industrial Trust (REIT) 4.4% 6/15/24 | | 780 | 756 |
| Omega Healthcare Investors, Inc.: | | | |
| 4.375% 8/1/23 | | 412 | 410 |
| 4.5% 1/15/25 | | 728 | 710 |
| 4.5% 4/1/27 | | 8,385 | 7,917 |
| 4.95% 4/1/24 | | 723 | 711 |
| 5.25% 1/15/26 | | 5,346 | 5,241 |
| Piedmont Operating Partnership LP 2.75% 4/1/32 | | 493 | 348 |
| SITE Centers Corp.: | | | |
| 3.625% 2/1/25 | | 890 | 844 |
| 4.25% 2/1/26 | | 1,471 | 1,394 |
| Spirit Realty LP 2.1% 3/15/28 | | 3,099 | 2,567 |
| Sun Communities Operating LP 2.3% 11/1/28 | | 561 | 474 |
| Ventas Realty LP: | | | |
| 2.65% 1/15/25 | | 2,611 | 2,467 |
| 3% 1/15/30 | | 1,365 | 1,160 |
| 3.5% 4/15/24 | | 1,559 | 1,516 |
| 4% 3/1/28 | | 765 | 707 |
| VICI Properties LP 5.125% 5/15/32 | | 577 | 535 |
| Vornado Realty LP 2.15% 6/1/26 | | 613 | 525 |
| Welltower Op 3.625% 3/15/24 | | 1,673 | 1,638 |
| WP Carey, Inc.: | | | |
| 3.85% 7/15/29 | | 415 | 377 |
| 4.6% 4/1/24 | | 3,389 | 3,346 |
| | | | 47,951 |
| Real Estate Management & Development - 0.0% | | | |
| Brandywine Operating Partnership LP 4.1% 10/1/24 | | 247 | 238 |
TOTAL REAL ESTATE | | | 48,189 |
| UTILITIES - 2.5% | | | |
| Electric Utilities - 1.3% | | | |
| Cleco Corporate Holdings LLC 3.743% 5/1/26 | | 3,931 | 3,689 |
| Cleveland Electric Illuminating Co. 3.5% 4/1/28 (b) | | 6,190 | 5,662 |
| Edison International 2.95% 3/15/23 | | 790 | 789 |
| Eversource Energy 2.8% 5/1/23 | | 3,065 | 3,052 |
| Exelon Corp.: | | | |
| 2.75% 3/15/27 | | 510 | 462 |
| 3.35% 3/15/32 | | 5,206 | 4,445 |
| FirstEnergy Corp.: | | | |
| 1.6% 1/15/26 | | 379 | 338 |
| 2.05% 3/1/25 | | 2,124 | 1,981 |
| IPALCO Enterprises, Inc. 3.7% 9/1/24 | | 803 | 776 |
| Pacific Gas & Electric Co. 3.25% 2/16/24 | | 1,002 | 980 |
| Southern Co. 5.113% 8/1/27 (f) | | 3,276 | 3,235 |
| Virginia Electric & Power Co. 2.4% 3/30/32 | | 3,276 | 2,647 |
| Vistra Operations Co. LLC 5% 7/31/27 (b) | | 6,060 | 5,629 |
| | | | 33,685 |
| Independent Power and Renewable Electricity Producers - 0.6% | | | |
| The AES Corp.: | | | |
| 1.375% 1/15/26 | | 7,207 | 6,378 |
| 3.3% 7/15/25 (b) | | 3,979 | 3,734 |
| 3.95% 7/15/30 (b) | | 4,292 | 3,758 |
| | | | 13,870 |
| Multi-Utilities - 0.6% | | | |
| Berkshire Hathaway Energy Co.: | | | |
| 3.25% 4/15/28 | | 3,931 | 3,630 |
| 3.7% 7/15/30 | | 306 | 281 |
| NiSource, Inc.: | | | |
| 0.95% 8/15/25 | | 1,575 | 1,420 |
| 2.95% 9/1/29 | | 3,931 | 3,393 |
| Puget Energy, Inc.: | | | |
| 3.65% 5/15/25 | | 1,965 | 1,859 |
| 4.224% 3/15/32 | | 3,276 | 2,897 |
| WEC Energy Group, Inc. 3 month U.S. LIBOR + 2.610% 6.9761% 5/15/67 (c)(d) | | 2,216 | 1,893 |
| | | | 15,373 |
TOTAL UTILITIES | | | 62,928 |
| TOTAL NONCONVERTIBLE BONDS (Cost $1,083,359) | | | 996,093 |
| | | | |
| U.S. Treasury Obligations - 43.6% |
| | | Principal Amount (a) (000s) | Value ($) (000s) |
| U.S. Treasury Notes: | | | |
| 0.625% 7/31/26 | | 27,290 | 24,042 |
| 1.125% 8/31/28 (g) | | 32,033 | 27,307 |
| 1.25% 9/30/28 | | 17,505 | 14,995 |
| 1.375% 10/31/28 | | 9,435 | 8,125 |
| 1.5% 1/31/27 | | 26,945 | 24,214 |
| 1.625% 9/30/26 | | 52,120 | 47,421 |
| 1.75% 3/15/25 | | 8 | 8 |
| 1.875% 2/28/27 | | 28,931 | 26,347 |
| 2.125% 5/15/25 | | 656 | 620 |
| 2.25% 8/15/27 | | 9,273 | 8,525 |
| 2.375% 3/31/29 | | 57,612 | 52,213 |
| 2.625% 7/31/29 | | 79,145 | 72,572 |
| 2.75% 8/15/32 | | 200,486 | 182,189 |
| 3.125% 11/15/28 | | 153,205 | 145,228 |
| 3.125% 8/31/29 | | 83,837 | 79,170 |
| 3.25% 6/30/29 | | 50,454 | 48,014 |
| 3.5% 9/15/25 | | 42,649 | 41,527 |
| 3.5% 1/31/30 | | 11,867 | 11,461 |
| 3.5% 2/15/33 | | 14,521 | 14,043 |
| 3.875% 1/15/26 | | 59,500 | 58,477 |
| 3.875% 12/31/29 | | 53,282 | 52,633 |
| 4% 12/15/25 | | 37,437 | 36,937 |
| 4% 2/15/26 | | 6,461 | 6,372 |
| 4% 10/31/29 | | 49,898 | 49,604 |
| 4.125% 1/31/25 (h) | | 16,127 | 15,918 |
| 4.125% 9/30/27 | | 32,339 | 32,170 |
| 4.25% 10/15/25 | | 35,041 | 34,746 |
| TOTAL U.S. TREASURY OBLIGATIONS (Cost $1,195,475) | | | 1,114,878 |
| | | | |
| U.S. Government Agency - Mortgage Securities - 0.7% |
| | | Principal Amount (a) (000s) | Value ($) (000s) |
| Fannie Mae - 0.7% | | | |
| 2.5% 10/1/31 to 1/1/33 | | 2,756 | 2,550 |
| 3% 11/1/32 to 12/1/32 | | 9,502 | 8,958 |
| 3.5% 9/1/34 to 10/1/34 | | 3,338 | 3,199 |
| 4.5% 3/1/39 to 8/1/39 | | 793 | 780 |
| 5.5% 11/1/34 to 6/1/36 | | 728 | 738 |
| 6.5% 7/1/32 to 8/1/36 | | 447 | 463 |
| 7% 8/1/25 to 2/1/32 | | 2 | 2 |
| 7.5% 8/1/23 to 8/1/29 | | 11 | 11 |
TOTAL FANNIE MAE | | | 16,701 |
| Freddie Mac - 0.0% | | | |
| 5.5% 3/1/34 to 7/1/35 | | 1,242 | 1,262 |
| 7.5% 7/1/27 to 9/1/31 | | 2 | 2 |
TOTAL FREDDIE MAC | | | 1,264 |
| Ginnie Mae - 0.0% | | | |
| 7% to 7% 1/15/28 to 11/15/32 | | 407 | 421 |
| TOTAL U.S. GOVERNMENT AGENCY - MORTGAGE SECURITIES (Cost $19,776) | | | 18,386 |
| | | | |
| Asset-Backed Securities - 6.9% |
| | | Principal Amount (a) (000s) | Value ($) (000s) |
| AASET Trust: | | | |
| Series 2019-1 Class A, 3.844% 5/15/39 (b) | | 604 | 426 |
| Series 2019-2 Class A, 3.376% 10/16/39 (b) | | 1,439 | 1,113 |
| Series 2021-1A Class A, 2.95% 11/16/41 (b) | | 1,868 | 1,639 |
| Series 2021-2A Class A, 2.798% 1/15/47 (b) | | 3,494 | 2,946 |
| Aimco: | | | |
| Series 2021-10A Class AR, 3 month U.S. LIBOR + 1.060% 5.8753% 7/22/32 (b)(c)(d) | | 7,490 | 7,395 |
| Series 2021-BA Class AR, 3 month U.S. LIBOR + 1.100% 5.8924% 1/15/32 (b)(c)(d) | | 5,700 | 5,629 |
| Apollo Aviation Securitization Equity Trust Series 2020-1A Class A, 3.351% 1/16/40 (b) | | 455 | 375 |
| Ares LII CLO Ltd. Series 2021-52A Class A1R, 3 month U.S. LIBOR + 1.050% 5.8653% 4/22/31 (b)(c)(d) | | 5,438 | 5,370 |
| Bear Stearns Asset Backed Securities I Trust Series 2005-HE2 Class M2, 1 month U.S. LIBOR + 1.120% 5.742% 2/25/35 (c)(d) | | 266 | 262 |
| Blackbird Capital Aircraft Series 2021-1A Class A, 2.443% 7/15/46 (b) | | 2,530 | 2,141 |
| Castlelake Aircraft Securitization Trust: | | | |
| Series 2019-1A Class A, 3.967% 4/15/39 (b) | | 1,791 | 1,562 |
| Series 2021-1R Class A, 2.741% 8/15/41 (b) | | 3,596 | 3,202 |
| Castlelake Aircraft Structured Trust Series 2021-1A Class A, 3.474% 1/15/46 (b) | | 5,831 | 5,335 |
| Cedar Funding Ltd. Series 2021-14A Class A, 3 month U.S. LIBOR + 1.100% 5.8924% 7/15/33 (b)(c)(d) | | 6,373 | 6,276 |
| Cent CLO LP Series 2021-21A Class A1R3, 3 month U.S. LIBOR + 0.970% 5.7846% 7/27/30 (b)(c)(d) | | 10,345 | 10,237 |
| DB Master Finance LLC Series 2021-1A Class A2I, 2.045% 11/20/51 (b) | | 7,699 | 6,720 |
| Dell Equipment Finance Trust Series 2020-2 Class A3, 0.57% 10/23/23 (b) | | 448 | 446 |
| Dominos Pizza Master Issuer LLC Series 2018-1A Class A2I, 4.116% 7/25/48 (b) | | 4,900 | 4,665 |
| Eaton Vance CLO, Ltd. Series 2021-1A Class AR, 3 month U.S. LIBOR + 1.100% 5.8924% 4/15/31 (b)(c)(d) | | 5,454 | 5,404 |
| GMF Floorplan Owner Revolving Trust Series 2020-1 Class A, 0.68% 8/15/25 (b) | | 1,813 | 1,775 |
| Horizon Aircraft Finance Ltd. Series 2019-1 Class A, 3.721% 7/15/39 (b) | | 734 | 624 |
| Madison Park Funding XXIII, Ltd. Series 2021-23A Class AR, 3 month U.S. LIBOR + 0.970% 5.7846% 7/27/31 (b)(c)(d) | | 4,633 | 4,607 |
| Madison Park Funding XXVI Ltd. Series 2017-26A Class AR, 3 month U.S. LIBOR + 1.200% 6.0024% 7/29/30 (b)(c)(d) | | 3,498 | 3,482 |
| Madison Park Funding XXXII, Ltd. / Madison Park Funding XXXII LLC Series 2021-32A Class A1R, 3 month U.S. LIBOR + 1.000% 5.8153% 1/22/31 (b)(c)(d) | | 7,929 | 7,854 |
| Metlife Securitization Trust Series 2019-1A Class A1A, 3.75% 4/25/58 (b) | | 266 | 257 |
| MMAF Equipment Finance LLC Series 2019-B Class A3, 2.01% 12/12/24 (b) | | 1,147 | 1,128 |
| Morgan Stanley ABS Capital I Trust Series 2004-HE7 Class B3, 1 month U.S. LIBOR + 5.250% 9.867% 8/25/34 (c)(d) | | 103 | 127 |
| Niagara Park CLO, Ltd. Series 2021-1A Class AR, 3 month U.S. LIBOR + 1.000% 5.7924% 7/17/32 (b)(c)(d) | | 6,158 | 6,072 |
| Palmer Square Loan Funding, Ltd. Series 2021-2A Class A1, 3 month U.S. LIBOR + 0.800% 5.7153% 5/20/29 (b)(c)(d) | | 3,756 | 3,728 |
| Park Place Securities, Inc. Series 2005-WCH1 Class M4, 1 month U.S. LIBOR + 1.240% 5.862% 1/25/36 (c)(d) | | 126 | 123 |
| Prpm 2021-5, LLC Series 2021-5 Class A1, 1.793% 6/25/26 (b)(c) | | 3,356 | 3,036 |
| Santander Drive Auto Receivables Trust Series 2022-5 Class A3, 4.11% 8/17/26 | | 4,854 | 4,794 |
| Sapphire Aviation Finance Series 2020-1A Class A, 3.228% 3/15/40 (b) | | 2,972 | 2,396 |
| SBA Tower Trust: | | | |
| Series 2019, 2.836% 1/15/50 (b) | | 1,874 | 1,760 |
| 1.631% 5/15/51 (b) | | 9,827 | 8,389 |
| 1.884% 7/15/50 (b) | | 703 | 622 |
| Symphony CLO XXI, Ltd. Series 2021-21A Class AR, 3 month U.S. LIBOR + 1.060% 5.8524% 7/15/32 (b)(c)(d) | | 4,706 | 4,648 |
| Symphony CLO XXIII Ltd. Series 2021-23A Class AR, 3 month U.S. LIBOR + 1.020% 5.8124% 1/15/34 (b)(c)(d) | | 6,583 | 6,517 |
| TCI-Flatiron CLO Ltd. / LLC Series 2021-1A Class AR, 3 month U.S. LIBOR + 0.960% 5.8366% 11/18/30 (b)(c)(d) | | 5,666 | 5,616 |
| TCI-Symphony CLO Series 2021-1A Class AR, 3 month U.S. LIBOR + 0.920% 5.7224% 7/15/30 (b)(c)(d) | | 7,020 | 6,949 |
| Terwin Mortgage Trust Series 2003-4HE Class A1, 1 month U.S. LIBOR + 0.860% 5.477% 9/25/34 (c)(d) | | 75 | 72 |
| Thunderbolt Aircraft Lease Ltd. Series 2017-A Class A, 4.212% 5/17/32 (b) | | 1,138 | 1,006 |
| Thunderbolt III Aircraft Lease Ltd. Series 2019-1 Class A, 3.671% 11/15/39 (b) | | 1,688 | 1,355 |
| Trapeza CDO XII Ltd./Trapeza CDO XII, Inc. Series 2007-12A Class B, 3 month U.S. LIBOR + 0.560% 5.3484% 4/6/42 (b)(c)(d) | | 1,143 | 871 |
| Upstart Securitization Trust: | | | |
| Series 2021-3 Class A, 0.83% 7/20/31 (b) | | 1,028 | 1,010 |
| Series 2021-4 Class A, 0.84% 9/20/31 (b) | | 1,883 | 1,836 |
| Series 2021-5 Class A, 1.31% 11/20/31 (b) | | 2,801 | 2,724 |
| 3.12% 3/20/32 (b) | | 4,728 | 4,605 |
| VCAT Asset Securitization, LLC: | | | |
| Series 2021-NPL1 Class A1, 2.2891% 12/26/50 (b) | | 622 | 589 |
| Series 2021-NPL2 Class A1, 2.115% 3/27/51 (b) | | 3,020 | 2,823 |
| Series 2021-NPL3 Class A1, 1.743% 5/25/51 (b)(c) | | 4,160 | 3,795 |
| Verizon Master Trust Series 2021-1 Class B, 0.69% 5/20/27 | | 6,025 | 5,662 |
| Voya CLO Ltd. Series 2021-1A Class A1R, 3 month U.S. LIBOR + 0.950% 5.7424% 4/17/30 (b)(c)(d) | | 5,569 | 5,516 |
| TOTAL ASSET-BACKED SECURITIES (Cost $186,584) | | | 177,511 |
| | | | |
| Collateralized Mortgage Obligations - 2.6% |
| | | Principal Amount (a) (000s) | Value ($) (000s) |
| Private Sponsor - 2.5% | | | |
| Ajax Mortgage Loan Trust sequential payer: | | | |
| Series 2021-B Class A, 2.239% 6/25/66 (b)(c) | | 1,704 | 1,590 |
| Series 2021-C Class A, 2.115% 1/25/61 (b) | | 1,426 | 1,332 |
| Angel Oak Mortgage Trust Series 2021-8 Class A1, 1.82% 11/25/66 (b) | | 4,168 | 3,500 |
| Binom Securitization Trust 202 Series 2022-RPL1 Class A1, 3% 2/25/61 (b) | | 2,138 | 1,898 |
| BRAVO Residential Funding Trust sequential payer: | | | |
| Series 2020-RPL2 Class A1, 2% 5/25/59 (b) | | 1,896 | 1,640 |
| Series 2022-RPL1 Class A1, 2.75% 9/25/61 (b) | | 8,193 | 6,963 |
| Cascade Funding Mortgage Trust: | | | |
| Series 2021-EBO1 Class A, 0.9849% 11/25/50 (b)(c) | | 1,218 | 1,144 |
| Series 2021-HB5 Class A, 0.8006% 2/25/31 (b) | | 715 | 692 |
| Series 2021-HB6 Class A, 0.8983% 6/25/36 (b) | | 1,171 | 1,111 |
| Series 2021-HB7 Class A, 1.1512% 10/27/31 (b) | | 1,578 | 1,481 |
| CFMT 2022-Hb8 LLC sequential payer Series 2022-HB8 Class A, 3.75% 4/25/25 (b) | | 5,703 | 5,440 |
| CFMT LLC Series 2020-HB4 Class A, 0.9461% 12/26/30 (b) | | 407 | 395 |
| CSMC 2021-Rpl9 Trust sequential payer Series 2021-RPL9 Class A1, 2.4364% 2/25/61 (b) | | 6,651 | 6,115 |
| CSMC Trust sequential payer Series 2020-RPL4 Class A1, 2% 1/25/60 (b) | | 529 | 457 |
| Finance of America HECM Buyout sequential payer Series 2022-HB1 Class A, 2.6948% 2/25/32 (b)(c) | | 4,989 | 4,815 |
| GCAT Trust sequential payer Series 2021-NQM7 Class A1, 1.915% 8/25/66 (b) | | 2,260 | 1,962 |
| Legacy Mortgage Asset Trust Series 2021-GS5 Class A1, 2.25% 7/25/67 (b)(c) | | 4,759 | 4,276 |
| New Residential Mortgage Loan Trust: | | | |
| Series 2019-5A Class A1B, 3.5% 8/25/59 (b) | | 850 | 785 |
| Series 2020-1A Class A1B, 3.5% 10/25/59 (b) | | 742 | 674 |
| New York Mortgage Trust sequential payer Series 2021-SP1 Class A1, 1.6696% 8/25/61 (b) | | 1,568 | 1,406 |
| Oceanview Mortgage Loan Trust sequential payer Series 2020-1 Class A1A, 1.7329% 5/28/50 (b) | | 116 | 102 |
| Oceanview Trust sequential payer Series 2021-1 Class A, 1.2187% 12/29/51 (b)(c) | | 1,718 | 1,647 |
| Preston Ridge Partners Mortgage Trust: | | | |
| sequential payer Series 2021-8 Class A1, 1.743% 9/25/26 (b)(c) | | 4,049 | 3,616 |
| Series 2021-2 Class A1, 2.115% 3/25/26 (b) | | 4,902 | 4,615 |
| Series 2021-RPL1 Class A1, 1.319% 7/25/51 (b) | | 645 | 564 |
| Series 2021-RPL2 Class A1, 1.455% 10/25/51 (b)(c) | | 891 | 786 |
| PRET LLC Series 2022-RN1 Class A1, 3.721% 7/25/51 (b) | | 3,166 | 2,898 |
| RMF Buyout Issuance Trust sequential payer: | | | |
| Series 2021-HB1 Class A, 1.2586% 11/25/31 (b) | | 1,806 | 1,704 |
| Series 2022-HB1 Class A, 4.272% 4/25/32 (b) | | 1,038 | 1,001 |
| Sequoia Mortgage Trust floater Series 2004-6 Class A3B, 6 month U.S. LIBOR + 0.880% 6.0669% 7/20/34 (c)(d) | | 1 | 1 |
TOTAL PRIVATE SPONSOR | | | 64,610 |
| U.S. Government Agency - 0.1% | | | |
| Fannie Mae Series 2013-16 Class GP, 3% 3/25/33 | | 1,101 | 1,056 |
| Freddie Mac Series 3949 Class MK, 4.5% 10/15/34 | | 200 | 197 |
TOTAL U.S. GOVERNMENT AGENCY | | | 1,253 |
| TOTAL COLLATERALIZED MORTGAGE OBLIGATIONS (Cost $72,387) | | | 65,863 |
| | | | |
| Commercial Mortgage Securities - 5.9% |
| | | Principal Amount (a) (000s) | Value ($) (000s) |
| BAMLL Commercial Mortgage Securities Trust: | | | |
| floater Series 2022-DKLX Class A, CME Term SOFR 1 Month Index + 1.150% 5.713% 1/15/39 (b)(c)(d) | | 1,605 | 1,582 |
| sequential payer Series 2019-BPR Class ANM, 3.112% 11/5/32 (b) | | 1,164 | 1,062 |
| BANK: | | | |
| sequential payer: | | | |
Series 2018-BN14 Class ASB, 4.185% 9/15/60 | | 4,259 | 4,108 |
Series 2018-BN15 Class ASB, 4.285% 11/15/61 | | 2,621 | 2,529 |
| Series 2021-BN33 Class XA, 1.0572% 5/15/64 (c)(i) | | 12,424 | 715 |
| Barclays Commercial Mortgage Securities LLC sequential payer Series 2019-C5 Class ASB, 2.99% 11/15/52 | | 3,603 | 3,319 |
| BCP Trust floater Series 2021-330N Class A, 1 month U.S. LIBOR + 0.790% 5.387% 6/15/38 (b)(c)(d) | | 7,993 | 7,483 |
| Benchmark Mortgage Trust: | | | |
| Series 2018-B7 Class A2, 4.377% 5/15/53 | | 2,126 | 2,103 |
| Series 2019-B12 Class XA, 1.0324% 8/15/52 (c)(i) | | 16,184 | 654 |
| Series 2019-B14 Class XA, 0.7766% 12/15/62 (c)(i) | | 16,210 | 502 |
| Series 2020-B17 Class XA, 1.4159% 3/15/53 (c)(i) | | 32,093 | 1,902 |
| Series 2020-B19 Class XA, 1.7699% 9/15/53 (c)(i) | | 21,210 | 1,628 |
| BFLD Trust floater sequential payer Series 2020-OBRK Class A, CME Term SOFR 1 Month Index + 2.160% 6.7265% 11/15/28 (b)(c)(d) | | 504 | 500 |
| BLOX Trust floater sequential payer Series 2021-BLOX Class A, 1 month U.S. LIBOR + 0.750% 5.338% 9/15/26 (b)(c)(d) | | 3,158 | 2,985 |
| BX Commercial Mortgage Trust floater: | | | |
| Series 2021-PAC Class A, 1 month U.S. LIBOR + 0.680% 5.2771% 10/15/36 (b)(c)(d) | | 2,970 | 2,903 |
| Series 2021-VINO Class A, 1 month U.S. LIBOR + 0.650% 5.2403% 5/15/38 (b)(c)(d) | | 2,359 | 2,309 |
| BX Trust: | | | |
| floater: | | | |
Series 2021-ACNT Class A, 1 month U.S. LIBOR + 0.850% 5.438% 11/15/38 (b)(c)(d) | | 2,945 | 2,895 |
Series 2021-BXMF Class A, 1 month U.S. LIBOR + 0.630% 5.2239% 10/15/26 (b)(c)(d) | | 2,757 | 2,690 |
Series 2022-GPA Class A, CME Term SOFR 1 Month Index + 2.160% 6.7275% 10/15/39 (b)(c)(d) | | 1,627 | 1,624 |
| floater sequential payer: | | | |
Series 2019-XL Class A, CME Term SOFR 1 Month Index + 1.030% 5.597% 10/15/36 (b)(c)(d) | | 3,550 | 3,532 |
Series 2021-MFM1 Class A, CME Term SOFR 1 Month Index + 0.810% 5.3765% 1/15/34 (b)(c)(d) | | 943 | 928 |
Series 2021-SOAR Class A, 5.258% 6/15/38 (b)(c) | | 2,648 | 2,601 |
| CD Mortgage Trust sequential payer Series 2017-CD5 Class AAB, 3.22% 8/15/50 | | 1,453 | 1,376 |
| CF Hippolyta Issuer LLC sequential payer: | | | |
| Series 2020-1 Class A1, 1.69% 7/15/60 (b) | | 4,147 | 3,713 |
| Series 2021-1A Class A1, 1.53% 3/15/61 (b) | | 2,981 | 2,588 |
| CGDB Commercial Mortgage Trust floater Series 2019-MOB Class A, 1 month U.S. LIBOR + 0.950% 5.5379% 11/15/36 (b)(c)(d) | | 870 | 857 |
| CHC Commercial Mortgage Trust floater Series 2019-CHC Class A, 1 month U.S. LIBOR + 1.120% 5.708% 6/15/34 (b)(c)(d) | | 2,767 | 2,690 |
| Citigroup Commercial Mortgage Trust sequential payer: | | | |
| Series 2014-GC23 Class A3, 3.356% 7/10/47 | | 1,912 | 1,848 |
| Series 2016-GC37 Class AAB, 3.098% 4/10/49 | | 405 | 389 |
| COMM Mortgage Trust: | | | |
| sequential payer Series 2013-CR7 Class AM, 3.314% 3/10/46 (b) | | 1,000 | 996 |
| Series 2013-CR13 Class AM, 4.449% 11/10/46 | | 5,021 | 4,935 |
| Credit Suisse Mortgage Trust: | | | |
| sequential payer Series 2020-NET Class A, 2.2569% 8/15/37 (b) | | 955 | 858 |
| Series 2018-SITE Class A, 4.284% 4/15/36 (b) | | 1,224 | 1,174 |
| CSAIL Commercial Mortgage Trust sequential payer: | | | |
| Series 19-C15 Class A2, 3.4505% 3/15/52 | | 2,091 | 2,030 |
| Series 2020-C19 Class ASB, 2.5501% 3/15/53 | | 12,447 | 11,076 |
| ELP Commercial Mortgage Trust floater Series 2021-ELP Class A, 1 month U.S. LIBOR + 0.700% 5.289% 11/15/38 (b)(c)(d) | | 4,100 | 3,992 |
| Extended Stay America Trust floater Series 2021-ESH Class A, 1 month U.S. LIBOR + 1.080% 5.668% 7/15/38 (b)(c)(d) | | 1,273 | 1,254 |
| GS Mortgage Securities Trust: | | | |
| floater Series 2021-IP Class A, 1 month U.S. LIBOR + 0.950% 5.538% 10/15/36 (b)(c)(d) | | 1,714 | 1,626 |
| sequential payer Series 2016-GC34 Class AAB, 3.278% 10/10/48 | | 472 | 456 |
| Series 2011-GC5 Class A/S, 5.1538% 8/10/44 (b)(c) | | 3,241 | 3,193 |
| Series 2013-GC13 Class A/S, 4.0794% 7/10/46 (b)(c) | | 8,756 | 8,693 |
| Series 2013-GC16 Class A/S, 4.649% 11/10/46 | | 8,768 | 8,648 |
| Series 2015-GC30 Class A/S, 3.777% 5/10/50 | | 539 | 509 |
| JPMBB Commercial Mortgage Securities Trust sequential payer Series 2014-C22 Class A4, 3.8012% 9/15/47 | | 1,623 | 1,576 |
| JPMorgan Chase Commercial Mortgage Securities Trust: | | | |
| floater Series 2019-BKWD Class A, 1 month U.S. LIBOR + 1.250% 5.838% 9/15/29 (b)(c)(d) | | 1,415 | 1,345 |
| sequential payer Series 2013-LC11 Class A5, 2.9599% 4/15/46 | | 930 | 925 |
| Series 2013-C16 Class A/S, 4.5169% 12/15/46 | | 2,687 | 2,648 |
| Series 2013-LC11 Class A/S, 3.216% 4/15/46 | | 669 | 614 |
| Series 2018-AON Class D, 4.6132% 7/5/31 (b)(c) | | 3,508 | 2,666 |
| Series 2018-WPT Class AFX, 4.2475% 7/5/33 (b) | | 2,058 | 1,852 |
| LIFE Mortgage Trust floater Series 2021-BMR Class A, 1 month U.S. LIBOR + 0.700% 5.288% 3/15/38 (b)(c)(d) | | 2,260 | 2,219 |
| Merit floater Series 2021-STOR Class A, 1 month U.S. LIBOR + 0.700% 5.288% 7/15/38 (b)(c)(d) | | 1,380 | 1,351 |
| Morgan Stanley BAML Trust: | | | |
| sequential payer Series 2013-C11 Class A4, 4.1567% 8/15/46 (c) | | 1,081 | 1,070 |
| Series 2014-C17 Class ASB, 3.477% 8/15/47 | | 1,167 | 1,149 |
| Morgan Stanley Capital I Trust: | | | |
| sequential payer Series 2019-MEAD Class A, 3.17% 11/10/36 (b) | | 2,542 | 2,369 |
| Series 2021-L6 Class XA, 1.227% 6/15/54 (c)(i) | | 4,402 | 275 |
| OPG Trust floater Series 2021-PORT Class A, 1 month U.S. LIBOR + 0.480% 5.072% 10/15/36 (b)(c)(d) | | 4,441 | 4,312 |
| SREIT Trust floater Series 2021-MFP Class A, 1 month U.S. LIBOR + 0.730% 5.3187% 11/15/38 (b)(c)(d) | | 2,759 | 2,699 |
| UBS Commercial Mortgage Trust: | | | |
| sequential payer Series 2018-C8 Class ASB, 3.903% 2/15/51 | | 2,811 | 2,697 |
| Series 2017-C7 Class XA, 1.0036% 12/15/50 (c)(i) | | 52,468 | 1,852 |
| VLS Commercial Mortgage Trust: | | | |
| sequential payer Series 2020-LAB Class A, 2.13% 10/10/42 (b) | | 1,920 | 1,505 |
| Series 2020-LAB Class X, 0.4294% 10/10/42 (b)(c)(i) | | 60,125 | 1,577 |
| Wells Fargo Commercial Mortgage Trust sequential payer: | | | |
| Series 2017-C41 Class ASB, 3.39% 11/15/50 | | 310 | 297 |
| Series 2017-RC1 Class ASB, 3.453% 1/15/60 | | 1,675 | 1,614 |
| TOTAL COMMERCIAL MORTGAGE SECURITIES (Cost $162,347) | | | 150,067 |
| | | | |
| Municipal Securities - 0.1% |
| | | Principal Amount (a) (000s) | Value ($) (000s) |
| New York City Transitional Fin. Auth. Rev. Series 2017 E, 2.85% 2/1/24 | | 995 | 973 |
| New York Urban Dev. Corp. Rev. Series 2017 B, 2.67% 3/15/23 | | 2,500 | 2,498 |
| TOTAL MUNICIPAL SECURITIES (Cost $3,495) | | | 3,471 |
| | | | |
| Foreign Government and Government Agency Obligations - 0.2% |
| | | Principal Amount (a) (000s) | Value ($) (000s) |
| United Mexican States: | | | |
| 3.25% 4/16/30 | | 2,368 | 2,056 |
| 3.5% 2/12/34 | | 1,965 | 1,596 |
| TOTAL FOREIGN GOVERNMENT AND GOVERNMENT AGENCY OBLIGATIONS (Cost $4,314) | | | 3,652 |
| | | | |
| Bank Notes - 0.3% |
| | | Principal Amount (a) (000s) | Value ($) (000s) |
| First Citizens Bank & Trust Co. 2.969% 9/27/25 (c) | | 4,416 | 4,203 |
| Truist Bank 2.75% 5/1/23 | | 2,817 | 2,805 |
| TOTAL BANK NOTES (Cost $7,233) | | | 7,008 |
| | | | |
| Money Market Funds - 2.4% |
| | | Shares | Value ($) (000s) |
| Fidelity Cash Central Fund 4.63% (j) | | 9,682,846 | 9,685 |
| Fidelity Securities Lending Cash Central Fund 4.63% (j)(k) | | 51,956,874 | 51,962 |
| TOTAL MONEY MARKET FUNDS (Cost $61,647) | | | 61,647 |
| | | | |
| TOTAL INVESTMENT IN SECURITIES - 101.6% (Cost $2,796,617) | 2,598,576 |
NET OTHER ASSETS (LIABILITIES) - (1.6)% | (39,694) |
| NET ASSETS - 100.0% | 2,558,882 |
| | |
| Futures Contracts |
| | Number of contracts | Expiration Date | Notional Amount ($) (000s) | Value ($) (000s) | Unrealized Appreciation/ (Depreciation) ($) (000s) |
| Purchased | | | | | |
| | | | | | |
| Treasury Contracts | | | | | |
| CBOT 2-Year U.S. Treasury Note Contracts (United States) | 479 | Jun 2023 | 97,585 | (222) | (222) |
| | | | | | |
| The notional amount of futures purchased as a percentage of Net Assets is 3.8% |
Any values shown as $0 in the Schedule of Investments may reflect amounts less than $500.
Legend
| (a) | Amount is stated in United States dollars unless otherwise noted. |
| (b) | Security exempt from registration under Rule 144A of the Securities Act of 1933. These securities may be resold in transactions exempt from registration, normally to qualified institutional buyers. At the end of the period, the value of these securities amounted to $526,844,000 or 20.6% of net assets. |
| (c) | Coupon rates for floating and adjustable rate securities reflect the rates in effect at period end. |
| (d) | Coupon is indexed to a floating interest rate which may be multiplied by a specified factor and/or subject to caps or floors. |
| (e) | Security or a portion of the security purchased on a delayed delivery or when-issued basis. |
| (f) | Security initially issued at one coupon which converts to a higher coupon at a specified date. The rate shown is the rate at period end. |
| (g) | Security or a portion of the security was pledged to cover margin requirements for futures contracts. At period end, the value of securities pledged amounted to $530,000. |
| (h) | Security or a portion of the security is on loan at period end. |
| (i) | Interest Only (IO) security represents the right to receive only monthly interest payments on an underlying pool of mortgages or assets. Principal shown is the outstanding par amount of the pool as of the end of the period. |
| (j) | Affiliated fund that is generally available only to investment companies and other accounts managed by Fidelity Investments. The rate quoted is the annualized seven-day yield of the fund at period end. A complete unaudited listing of the fund's holdings as of its most recent quarter end is available upon request. In addition, each Fidelity Central Fund's financial statements are available on the SEC's website or upon request. |
| (k) | Investment made with cash collateral received from securities on loan. |
Affiliated Central Funds
Fiscal year to date information regarding the Fund's investments in Fidelity Central Funds, including the ownership percentage, is presented below.
| Affiliate (Amounts in thousands) | Value, beginning of period ($) | Purchases ($) | Sales Proceeds ($) | Dividend Income ($) | Realized Gain (loss) ($) | Change in Unrealized appreciation (depreciation) ($) | Value, end of period ($) | % ownership, end of period |
| Fidelity Cash Central Fund 4.63% | 30,227 | 288,806 | 309,348 | 421 | - | - | 9,685 | 0.0% |
| Fidelity Securities Lending Cash Central Fund 4.63% | 267,407 | 1,058,517 | 1,273,962 | 81 | - | - | 51,962 | 0.2% |
| Fidelity Specialized High Income Central Fund | 38 | - | 38 | - | (7) | 7 | - | 0.0% |
| Total | 297,672 | 1,347,323 | 1,583,348 | 502 | (7) | 7 | 61,647 | |
| | | | | | | | | |
Amounts in the dividend income column in the above table include any capital gain distributions from underlying funds, which are presented in the corresponding line item in the Statement of Operations, if applicable.
Amount for Fidelity Securities Lending Cash Central Fund represents the income earned on investing cash collateral, less rebates paid to borrowers and any lending agent fees associated with the loan, plus any premium payments received for lending certain types of securities.
Amounts included in the purchases and sales proceeds columns may include in-kind transactions, if applicable.
Investment Valuation
The following is a summary of the inputs used, as of February 28, 2023, involving the Fund's assets and liabilities carried at fair value. The inputs or methodology used for valuing securities may not be an indication of the risk associated with investing in those securities. For more information on valuation inputs, and their aggregation into the levels used below, please refer to the Investment Valuation section in the accompanying Notes to Financial Statements.
| Valuation Inputs at Reporting Date: |
Description (Amounts in thousands) | Total ($) | Level 1 ($) | Level 2 ($) | Level 3 ($) |
Investments in Securities: | | | | |
|
| Corporate Bonds | 996,093 | - | 996,093 | - |
|
| U.S. Government and Government Agency Obligations | 1,114,878 | - | 1,114,878 | - |
|
| U.S. Government Agency - Mortgage Securities | 18,386 | - | 18,386 | - |
|
| Asset-Backed Securities | 177,511 | - | 177,511 | - |
|
| Collateralized Mortgage Obligations | 65,863 | - | 65,863 | - |
|
| Commercial Mortgage Securities | 150,067 | - | 150,067 | - |
|
| Municipal Securities | 3,471 | - | 3,471 | - |
|
| Foreign Government and Government Agency Obligations | 3,652 | - | 3,652 | - |
|
| Bank Notes | 7,008 | - | 7,008 | - |
|
| Money Market Funds | 61,647 | 61,647 | - | - |
| Total Investments in Securities: | 2,598,576 | 61,647 | 2,536,929 | - |
Derivative Instruments: | | | | |
|
| Liabilities | | | | |
Futures Contracts | (222) | (222) | - | - |
| Total Liabilities | (222) | (222) | - | - |
| Total Derivative Instruments: | (222) | (222) | - | - |
Value of Derivative Instruments
The following table is a summary of the Fund's value of derivative instruments by primary risk exposure as of February 28, 2023. For additional information on derivative instruments, please refer to the Derivative Instruments section in the accompanying Notes to Financial Statements.
Primary Risk Exposure / Derivative Type | Value |
| (Amounts in thousands) | Asset ($) | Liability ($) |
| Interest Rate Risk | | |
Futures Contracts (a) | 0 | (222) |
| Total Interest Rate Risk | 0 | (222) |
| Total Value of Derivatives | 0 | (222) |
(a)Reflects gross cumulative appreciation (depreciation) on futures contracts as presented in the Schedule of Investments. In the Statement of Assets and Liabilities, the period end daily variation margin is included in receivable or payable for daily variation margin on futures contracts, and the net cumulative appreciation (depreciation) is included in Total accumulated earnings (loss).
| Statement of Assets and Liabilities |
| Amounts in thousands (except per-share amount) | | | | February 28, 2023 (Unaudited) |
| | | | | |
| Assets | | | | |
| Investment in securities, at value (including securities loaned of $50,715) - See accompanying schedule: | | | | |
Unaffiliated issuers (cost $2,734,970) | $ | 2,536,929 | | |
Fidelity Central Funds (cost $61,647) | | 61,647 | | |
| | | | | |
| | | | | |
| Total Investment in Securities (cost $2,796,617) | | | $ | 2,598,576 |
| Receivable for investments sold | | | | 35,851 |
| Receivable for fund shares sold | | | | 3,990 |
| Interest receivable | | | | 17,627 |
| Distributions receivable from Fidelity Central Funds | | | | 106 |
| Other receivables | | | | 10 |
Total assets | | | | 2,656,160 |
| Liabilities | | | | |
| Payable for investments purchased | | | | |
Regular delivery | $ | 38,536 | | |
Delayed delivery | | 2,709 | | |
| Payable for fund shares redeemed | | 2,428 | | |
| Distributions payable | | 657 | | |
| Accrued management fee | | 639 | | |
| Payable for daily variation margin on futures contracts | | 11 | | |
| Other affiliated payables | | 327 | | |
| Other payables and accrued expenses | | 9 | | |
| Collateral on securities loaned | | 51,962 | | |
| Total Liabilities | | | | 97,278 |
| Net Assets | | | $ | 2,558,882 |
| Net Assets consist of: | | | | |
| Paid in capital | | | $ | 3,033,009 |
| Total accumulated earnings (loss) | | | | (474,127) |
| Net Assets | | | $ | 2,558,882 |
Net Asset Value , offering price and redemption price per share ($2,558,882 ÷ 259,211 shares) | | | $ | 9.87 |
| Statement of Operations |
| Amounts in thousands | | | | Six months ended February 28, 2023 (Unaudited) |
| Investment Income | | | | |
| Interest | | | $ | 48,462 |
| Income from Fidelity Central Funds (including $81 from security lending) | | | | 502 |
| Total Income | | | | 48,964 |
| Expenses | | | | |
| Management fee | $ | 4,750 | | |
| Transfer agent fees | | 1,593 | | |
| Fund wide operations fee | | 817 | | |
| Independent trustees' fees and expenses | | 6 | | |
| Total expenses before reductions | | 7,166 | | |
| Expense reductions | | (1) | | |
| Total expenses after reductions | | | | 7,165 |
| Net Investment income (loss) | | | | 41,799 |
| Realized and Unrealized Gain (Loss) | | | | |
| Net realized gain (loss) on: | | | | |
| Investment Securities: | | | | |
| Unaffiliated issuers | | (66,587) | | |
| Redemptions in-kind | | (130,619) | | |
| Fidelity Central Funds | | (7) | | |
| Futures contracts | | (5,912) | | |
| Total net realized gain (loss) | | | | (203,125) |
| Change in net unrealized appreciation (depreciation) on: | | | | |
| Investment Securities: | | | | |
| Unaffiliated issuers | | 80,811 | | |
| Fidelity Central Funds | | 7 | | |
| Futures contracts | | 822 | | |
| Total change in net unrealized appreciation (depreciation) | | | | 81,640 |
| Net gain (loss) | | | | (121,485) |
| Net increase (decrease) in net assets resulting from operations | | | $ | (79,686) |
| Statement of Changes in Net Assets |
| |
| Amount in thousands | | Six months ended February 28, 2023 (Unaudited) | | Year ended August 31, 2022 |
| Increase (Decrease) in Net Assets | | | | |
| Operations | | | | |
| Net investment income (loss) | $ | 41,799 | $ | 71,653 |
| Net realized gain (loss) | | (203,125) | | (78,980) |
| Change in net unrealized appreciation (depreciation) | | 81,640 | | (375,346) |
| Net increase (decrease) in net assets resulting from operations | | (79,686) | | (382,673) |
| Distributions to shareholders | | (40,623) | | (77,324) |
| Share transactions | | | | |
| Proceeds from sales of shares | | 425,913 | | 2,196,367 |
| Reinvestment of distributions | | 33,748 | | 71,813 |
| Cost of shares redeemed | | (2,326,566) | | (1,176,514) |
Net increase (decrease) in net assets resulting from share transactions | | (1,866,905) | | 1,091,666 |
| Total increase (decrease) in net assets | | (1,987,214) | | 631,669 |
| | | | | |
| Net Assets | | | | |
| Beginning of period | | 4,546,096 | | 3,914,427 |
| End of period | $ | 2,558,882 | $ | 4,546,096 |
| | | | | |
| Other Information | | | | |
| Shares | | | | |
| Sold | | 42,898 | | 207,472 |
| Issued in reinvestment of distributions | | 3,421 | | 6,760 |
| Redeemed | | (237,718) | | (111,782) |
| Net increase (decrease) | | (191,399) | | 102,450 |
| | | | | |
Financial Highlights
| Fidelity® Intermediate Bond Fund |
| |
| | Six months ended (Unaudited) February 28, 2023 | | Years ended August 31, 2022 | | 2021 | | 2020 | | 2019 | | 2018 |
Selected Per-Share Data | | | | | | | | | | | | |
| Net asset value, beginning of period | $ | 10.09 | $ | 11.24 | $ | 11.58 | $ | 11.16 | $ | 10.58 | $ | 10.95 |
| Income from Investment Operations | | | | | | | | | | | | |
Net investment income (loss) A,B | | .130 | | .180 | | .199 | | .267 | | .292 | | .263 |
| Net realized and unrealized gain (loss) | | (.219) | | (1.134) | | (.102) | | .413 | | .560 | | (.380) |
| Total from investment operations | | (.089) | | (.954) | | .097 | | .680 | | .852 | | (.117) |
| Distributions from net investment income | | (.131) | | (.173) | | (.196) | | (.260) | | (.272) | | (.253) |
| Distributions from net realized gain | | - | | (.023) | | (.241) | | - | | - | | - |
| Total distributions | | (.131) | | (.196) | | (.437) | | (.260) | | (.272) | | (.253) |
| Net asset value, end of period | $ | 9.87 | $ | 10.09 | $ | 11.24 | $ | 11.58 | $ | 11.16 | $ | 10.58 |
Total Return C,D | | (.88)% | | (8.57)% | | .86% | | 6.18% | | 8.18% | | (1.07)% |
Ratios to Average Net Assets B,E,F | | | | | | | | | | | | |
| Expenses before reductions | | .45% G | | .45% | | .45% | | .45% | | .45% | | .45% |
| Expenses net of fee waivers, if any | | .45% G | | .45% | | .45% | | .45% | | .45% | | .45% |
| Expenses net of all reductions | | .45% G | | .45% | | .45% | | .45% | | .45% | | .45% |
| Net investment income (loss) | | 2.64% G | | 1.69% | | 1.76% | | 2.37% | | 2.72% | | 2.46% |
| Supplemental Data | | | | | | | | | | | | |
| Net assets, end of period (in millions) | $ | 2,559 | $ | 4,546 | $ | 3,914 | $ | 2,958 | $ | 2,717 | $ | 2,719 |
Portfolio turnover rate H | | 61% G,I | | 80% | | 102% | | 99% | | 34% | | 49% |
A Calculated based on average shares outstanding during the period.
B Net investment income (loss) is affected by the timing of the declaration of dividends by any underlying mutual funds or exchange-traded funds (ETFs). Net investment income (loss) of any mutual funds or ETFs is not included in the Fund's net investment income (loss) ratio.
C Total returns for periods of less than one year are not annualized.
D Total returns would have been lower if certain expenses had not been reduced during the applicable periods shown.
E Fees and expenses of any underlying mutual funds or exchange-traded funds (ETFs) are not included in the Fund's expense ratio. The Fund indirectly bears its proportionate share of these expenses. For additional expense information related to investments in Fidelity Central Funds, please refer to the "Investments in Fidelity Central Funds" note found in the Notes to Financial Statements section of the most recent Annual or Semi-Annual report.
F Expense ratios reflect operating expenses of the class. Expenses before reductions do not reflect amounts reimbursed, waived, or reduced through arrangements with the investment adviser, brokerage services, or other offset arrangements, if applicable, and do not represent the amount paid by the class during periods when reimbursements, waivers or reductions occur.
G Annualized.
H Amount does not include the portfolio activity of any underlying mutual funds or exchange-traded funds (ETFs).
I Portfolio turnover rate excludes securities received or delivered in-kind.
For the period ended February 28, 2023
( Amounts in thousands except percentages)
1. Organization.
Fidelity Intermediate Bond Fund (the Fund) is a fund of Fidelity Salem Street Trust (the Trust) and is authorized to issue an unlimited number of shares. Share transactions on the Statement of Changes in Net Assets may contain exchanges between affiliated funds. The Trust is registered under the Investment Company Act of 1940, as amended (the 1940 Act), as an open-end management investment company organized as a Massachusetts business trust.
2. Investments in Fidelity Central Funds.
Funds may invest in Fidelity Central Funds, which are open-end investment companies generally available only to other investment companies and accounts managed by the investment adviser and its affiliates. The Schedule of Investments lists any Fidelity Central Funds held as an investment as of period end, but does not include the underlying holdings of each Fidelity Central Fund. An investing fund indirectly bears its proportionate share of the expenses of the underlying Fidelity Central Funds.
Based on its investment objective, each Fidelity Central Fund may invest or participate in various investment vehicles or strategies that are similar to those of the investing fund. These strategies are consistent with the investment objectives of the investing fund and may involve certain economic risks which may cause a decline in value of each of the Fidelity Central Funds and thus a decline in the value of the investing fund.
| Fidelity Central Fund | Investment Manager | Investment Objective | Investment Practices | Expense Ratio A |
| Fidelity Money Market Central Funds | Fidelity Management & Research Company LLC (FMR) | Each fund seeks to obtain a high level of current income consistent with the preservation of capital and liquidity. | Short-term Investments | Less than .005% |
A Expenses expressed as a percentage of average net assets and are as of each underlying Central Fund's most recent annual or semi-annual shareholder report.
A complete unaudited list of holdings for each Fidelity Central Fund is available upon request or at the Securities and Exchange Commission website at www.sec.gov. In addition, the financial statements of the Fidelity Central Funds which contain the significant accounting policies (including investment valuation policies) of those funds, and are not covered by the Report of Independent Registered Public Accounting Firm, are available on the Securities and Exchange Commission website or upon request.
3. Significant Accounting Policies.
The Fund is an investment company and applies the accounting and reporting guidance of the Financial Accounting Standards Board (FASB) Accounting Standards Codification Topic 946 Financial Services - Investment Companies . The financial statements have been prepared in conformity with accounting principles generally accepted in the United States of America (GAAP), which require management to make certain estimates and assumptions at the date of the financial statements. Actual results could differ from those estimates. Subsequent events, if any, through the date that the financial statements were issued have been evaluated in the preparation of the financial statements. The Fund's Schedule of Investments lists any underlying mutual funds or exchange-traded funds (ETFs) but does not include the underlying holdings of these funds. The following summarizes the significant accounting policies of the Fund:
Investment Valuation. Investments are valued as of 4:00 p.m. Eastern time on the last calendar day of the period. The Board of Trustees (the Board) has designated the Fund's investment adviser as the valuation designee responsible for the fair valuation function and performing fair value determinations as needed. The investment adviser has established a Fair Value Committee (the Committee) to carry out the day-to-day fair valuation responsibilities and has adopted policies and procedures to govern the fair valuation process and the activities of the Committee. In accordance with these fair valuation policies and procedures, which have been approved by the Board, the Fund attempts to obtain prices from one or more third party pricing services or brokers to value its investments. When current market prices, quotations or currency exchange rates are not readily available or reliable, investments will be fair valued in good faith by the Committee, in accordance with the policies and procedures. Factors used in determining fair value vary by investment type and may include market or investment specific events, transaction data, estimated cash flows, and market observations of comparable investments. The frequency that the fair valuation procedures are used cannot be predicted and they may be utilized to a significant extent. The Committee manages the Fund's fair valuation practices and maintains the fair valuation policies and procedures. The Fund's investment adviser reports to the Board information regarding the fair valuation process and related material matters.
The Fund categorizes the inputs to valuation techniques used to value its investments into a disclosure hierarchy consisting of three levels as shown below:
Level 1 - unadjusted quoted prices in active markets for identical investments
Level 2 - other significant observable inputs (including quoted prices for similar investments, interest rates, prepayment speeds, etc.)
Level 3 - unobservable inputs (including the Fund's own assumptions based on the best information available)
Valuation techniques used to value the Fund's investments by major category are as follows:
Debt securities, including restricted securities, are valued based on evaluated prices received from third party pricing services or from brokers who make markets in such securities. Corporate bonds, bank notes, foreign government and government agency obligations, municipal securities and U.S. government and government agency obligations are valued by pricing services who utilize matrix pricing which considers yield or price of bonds of comparable quality, coupon, maturity and type or by broker-supplied prices. Asset backed securities, collateralized mortgage obligations, commercial mortgage securities and U.S. government agency mortgage securities are valued by pricing services who utilize matrix pricing which considers prepayment speed assumptions, attributes of the collateral, yield or price of bonds of comparable quality, coupon, maturity and type or by broker-supplied prices. When independent prices are unavailable or unreliable, debt securities may be valued utilizing pricing methodologies which consider similar factors that would be used by third party pricing services. Debt securities are generally categorized as Level 2 in the hierarchy but may be Level 3 depending on the circumstances.
Futures contracts are valued at the settlement price established each day by the board of trade or exchange on which they are traded and are categorized as Level 1 in the hierarchy. Investments in open-end mutual funds, including the Fidelity Central Funds, are valued at their closing net asset value (NAV) each business day and are categorized as Level 1 in the hierarchy.
Changes in valuation techniques may result in transfers in or out of an assigned level within the disclosure hierarchy. The aggregate value of investments by input level as of February 28, 2023 is included at the end of the Fund's Schedule of Investments.
Investment Transactions and Income. For financial reporting purposes, the Fund's investment holdings and NAV include trades executed through the end of the last business day of the period. The NAV per share for processing shareholder transactions is calculated as of the close of business of the New York Stock Exchange (NYSE), normally 4:00 p.m. Eastern time and includes trades executed through the end of the prior business day. Gains and losses on securities sold are determined on the basis of identified cost and include proceeds received from litigation. Income and capital gain distributions from Fidelity Central Funds, if any, are recorded on the ex-dividend date. Interest income is accrued as earned and includes coupon interest and amortization of premium and accretion of discount on debt securities as applicable. Debt obligations may be placed on non-accrual status and related interest income may be reduced by ceasing current accruals and writing off interest receivables when the collection of all or a portion of interest has become doubtful based on consistently applied procedures. A debt obligation is removed from non-accrual status when the issuer resumes interest payments or when collectability of interest is reasonably assured.
Expenses. Expenses directly attributable to a fund are charged to that fund. Expenses attributable to more than one fund are allocated among the respective funds on the basis of relative net assets or other appropriate methods. Expenses included in the accompanying financial statements reflect the expenses of that fund and do not include any expenses associated with any underlying mutual funds or exchange-traded funds. Although not included in a fund's expenses, a fund indirectly bears its proportionate share of these expenses through the net asset value of each underlying mutual fund or exchange-traded fund. Expense estimates are accrued in the period to which they relate and adjustments are made when actual amounts are known.
Deferred Trustee Compensation. Under a Deferred Compensation Plan (the Plan) for certain Funds, certain independent Trustees have elected to defer receipt of a portion of their annual compensation. Deferred amounts are invested in affiliated mutual funds, are marked-to-market and remain in a fund until distributed in accordance with the Plan. The investment of deferred amounts and the offsetting payable to the Trustees presented below are included in the accompanying Statement of Assets and Liabilities in other receivables and other payables and accrued expenses, as applicable.
| Fidelity Intermediate Bond Fund | $10 |
Income Tax Information and Distributions to Shareholders. Each year, the Fund intends to qualify as a regulated investment company under Subchapter M of the Internal Revenue Code, including distributing substantially all of its taxable income and realized gains. As a result, no provision for U.S. Federal income taxes is required. The Fund files a U.S. federal tax return, in addition to state and local tax returns as required. The Fund's federal income tax returns are subject to examination by the Internal Revenue Service (IRS) for a period of three fiscal years after they are filed. State and local tax returns may be subject to examination for an additional fiscal year depending on the jurisdiction.
Distributions are declared and recorded daily and paid monthly from net investment income. Distributions from realized gains, if any, are declared and recorded on the ex-dividend date. Income and capital gain distributions are determined in accordance with income tax regulations, which may differ from GAAP.
Capital accounts within the financial statements are adjusted for permanent book-tax differences. These adjustments have no impact on net assets or the results of operations. Capital accounts are not adjusted for temporary book-tax differences which will reverse in a subsequent period.
Book-tax differences are primarily due to futures contracts, market discount, deferred Trustee compensation, capital loss carryforwards and losses deferred due to wash sales and futures contracts.
As of period end, the cost and unrealized appreciation (depreciation) in securities, and derivatives if applicable, for federal income tax purposes were as follows:
| Gross unrealized appreciation | $1,472 |
| Gross unrealized depreciation | (197,427) |
| Net unrealized appreciation (depreciation) | $(195,955) |
| Tax cost | $2,794,309 |
Capital loss carryforwards are only available to offset future capital gains of the Fund to the extent provided by regulations and may be limited. The capital loss carryforward information presented below, including any applicable limitation, is estimated as of prior fiscal period end and is subject to adjustment.
| Short-term | $(74,292) |
| Long-term | (-) |
| Total capital loss carryforward | $(74,292) |
Delayed Delivery Transactions and When-Issued Securities. During the period, certain Funds transacted in securities on a delayed delivery or when-issued basis. Payment and delivery may take place after the customary settlement period for that security. The price of the underlying securities and the date when the securities will be delivered and paid for are fixed at the time the transaction is negotiated. Securities purchased on a delayed delivery or when-issued basis are identified as such in the Schedule of Investments. Compensation for interest forgone in the purchase of a delayed delivery or when-issued debt security may be received. With respect to purchase commitments, each applicable Fund identifies securities as segregated in its records with a value at least equal to the amount of the commitment. Payables and receivables associated with the purchases and sales of delayed delivery securities having the same coupon, settlement date and broker are offset. Delayed delivery or when-issued securities that have been purchased from and sold to different brokers are reflected as both payables and receivables in the Statement of Assets and Liabilities under the caption "Delayed delivery", as applicable. Losses may arise due to changes in the value of the underlying securities or if the counterparty does not perform under the contract's terms, or if the issuer does not issue the securities due to political, economic, or other factors.
Restricted Securities (including Private Placements). Funds may invest in securities that are subject to legal or contractual restrictions on resale. These securities generally may be resold in transactions exempt from registration or to the public if the securities are registered. Disposal of these securities may involve time-consuming negotiations and expense, and prompt sale at an acceptable price may be difficult. Information regarding restricted securities held at period end is included at the end of the Schedule of Investments, if applicable.
4. Derivative Instruments.
Risk Exposures and the Use of Derivative Instruments. The Fund's investment objectives allow for various types of derivative instruments, including futures contracts. Derivatives are investments whose value is primarily derived from underlying assets, indices or reference rates and may be transacted on an exchange or over-the-counter (OTC). Derivatives may involve a future commitment to buy or sell a specified asset based on specified terms, to exchange future cash flows at periodic intervals based on a notional principal amount, or for one party to make one or more payments upon the occurrence of specified events in exchange for periodic payments from the other party.
Derivatives were used to increase returns and to manage exposure to certain risks as defined below. The success of any strategy involving derivatives depends on analysis of numerous economic factors, and if the strategies for investment do not work as intended, the objectives may not be achieved.
Derivatives were used to increase or decrease exposure to the following risk(s):
| | |
| Interest Rate Risk | Interest rate risk relates to the fluctuations in the value of interest-bearing securities due to changes in the prevailing levels of market interest rates. |
Funds are also exposed to additional risks from investing in derivatives, such as liquidity risk and counterparty credit risk. Liquidity risk is the risk that a fund will be unable to close out the derivative in the open market in a timely manner. Counterparty credit risk is the risk that the counterparty will not be able to fulfill its obligation to a fund. Counterparty credit risk related to exchange-traded contracts may be mitigated by the protection provided by the exchange on which they trade.
Investing in derivatives may involve greater risks than investing in the underlying assets directly and, to varying degrees, may involve risk of loss in excess of any initial investment and collateral received and amounts recognized in the Statement of Assets and Liabilities. In addition, there may be the risk that the change in value of the derivative contract does not correspond to the change in value of the underlying instrument.
Futures Contracts. A futures contract is an agreement between two parties to buy or sell a specified underlying instrument for a fixed price at a specified future date. Futures contracts were used to manage exposure to the bond market and fluctuations in interest rates.
Upon entering into a futures contract, a fund is required to deposit either cash or securities (initial margin) with a clearing broker in an amount equal to a certain percentage of the face value of the contract. Futures contracts are marked-to-market daily and subsequent daily payments are made or received by a fund depending on the daily fluctuations in the value of the futures contracts and are recorded as unrealized appreciation or (depreciation). This receivable and/or payable, if any, is included in daily variation margin on futures contracts in the Statement of Assets and Liabilities. Realized gain or (loss) is recorded upon the expiration or closing of a futures contract. The net realized gain (loss) and change in net unrealized appreciation (depreciation) on futures contracts during the period is presented in the Statement of Operations.
Any open futures contracts at period end are presented in the Schedule of Investments under the caption "Futures Contracts". The notional amount at value reflects each contract's exposure to the underlying instrument or index at period end, and is representative of volume of activity during the period unless an average notional amount is presented. Any securities deposited to meet initial margin requirements are identified in the Schedule of Investments. Any cash deposited to meet initial margin requirements is presented as segregated cash with brokers for derivative instruments in the Statement of Assets and Liabilities.
5. Purchases and Sales of Investments.
Purchases and sales of securities, other than short-term securities, U.S. government securities and in-kind transactions, as applicable, are noted in the table below.
| | Purchases ($) | Sales ($) |
| Fidelity Intermediate Bond Fund | 50,052 | 305,023 |
6. Fees and Other Transactions with Affiliates.
Management Fee. Fidelity Management & Research Company LLC (the investment adviser) and its affiliates provide the Fund with investment management related services for which the Fund pays a monthly management fee. The management fee is the sum of an individual fund fee rate that is based on an annual rate of .20% of the Fund's average net assets and an annualized group fee rate that averaged .10% during the period. The group fee rate is based upon the monthly average net assets of a group of registered investment companies with which the investment adviser has management contracts. The group fee rate decreases as assets under management increase and increases as assets under management decrease. For the reporting period, the total annualized management fee rate was .30% of the Fund's average net assets.
Transfer Agent Fees. Fidelity Investments Institutional Operations Company LLC (FIIOC), an affiliate of the investment adviser, is the Fund's transfer, dividend disbursing and shareholder servicing agent. FIIOC receives an asset-based fee of .10% of the Fund's average net assets. FIIOC pays for typesetting, printing and mailing of shareholder reports, except proxy statements.
Fund Wide Operations Fee. Pursuant to the Fund Wide Operations and Expense Agreement (FWOE), the investment adviser has agreed to provide for fund-level expenses (which may not include transfer agent, the compensation of the independent Trustees, interest, taxes or extraordinary expenses, as applicable) in return for a FWOE fee equal to .35% of fund-level average net assets less the total amount of the management fee. The FWOE paid by a fund is reduced by an amount equal to the fees and expenses paid to the independent Trustees. For the period, the FWOE fees were equivalent to the following annualized rate expressed as a percentage of average net assets:
| Fidelity Intermediate Bond Fund | .05% |
Interfund Trades. Funds may purchase from or sell securities to other Fidelity Funds under procedures adopted by the Board. The procedures have been designed to ensure these interfund trades are executed in accordance with Rule 17a-7 of the 1940 Act. Any interfund trades are included within the respective purchases and sales amounts shown in the Purchases and Sales of Investments note. During the period, there were no interfund trades.
Affiliated Redemptions In-Kind. Shares that were redeemed in-kind for investments, including accrued interest and cash, if any, are shown in the table below. The net realized gain or loss on investments delivered through in-kind redemptions is included in the "Net realized gain (loss) on: Redemptions in-kind" line in the accompanying Statement of Operations. The amount of the in-kind redemptions is included in share transactions in the accompanying Statement of Changes in Net Assets. There was no gain or loss for federal income tax purposes.
| | Shares | Total net realized gain or loss ($) | Total Proceeds ($) |
| Fidelity Intermediate Bond Fund | 153,557 | (130,619) | 1,495,644 |
Other. During the period, the investment adviser reimbursed the Fund for certain losses as follows:
| | Amount ($) |
| Fidelity Intermediate Bond Fund | 4 |
7. Committed Line of Credit.
Certain Funds participate with other funds managed by the investment adviser or an affiliate in a $4.25 billion credit facility (the "line of credit") to be utilized for temporary or emergency purposes to fund shareholder redemptions or for other short-term liquidity purposes. The commitment fees on the pro-rata portion of the line of credit are borne by the investment adviser. During the period, there were no borrowings on this line of credit.
8. Security Lending.
Funds lend portfolio securities from time to time in order to earn additional income. Lending agents are used, including National Financial Services (NFS), an affiliate of the investment adviser. Pursuant to a securities lending agreement, NFS will receive a fee, which is capped at 9.9% of a fund's daily lending revenue, for its services as lending agent. A fund may lend securities to certain qualified borrowers, including NFS. On the settlement date of the loan, a fund receives collateral (in the form of U.S. Treasury obligations, letters of credit and/or cash) against the loaned securities and maintains collateral in an amount not less than 100% of the market value of the loaned securities during the period of the loan. The market value of the loaned securities is determined at the close of business of a fund and any additional required collateral is delivered to a fund on the next business day. A fund or borrower may terminate the loan at any time, and if the borrower defaults on its obligation to return the securities loaned because of insolvency or other reasons, a fund may apply collateral received from the borrower against the obligation. A fund may experience delays and costs in recovering the securities loaned. Any cash collateral received is invested in the Fidelity Securities Lending Cash Central Fund. Any loaned securities are identified as such in the Schedule of Investments, and the value of loaned securities and cash collateral at period end, as applicable, are presented in the Statement of Assets and Liabilities. Security lending income represents the income earned on investing cash collateral, less rebates paid to borrowers and any lending agent fees associated with the loan, plus any premium payments received for lending certain types of securities. Security lending income is presented in the Statement of Operations as a component of income from Fidelity Central Funds. Affiliated security lending activity, if any, was as follows:
| | Total Security Lending Fees Paid to NFS | Security Lending Income From Securities Loaned to NFS | Value of Securities Loaned to NFS at Period End |
| Fidelity Intermediate Bond Fund | $9 | $- | $- |
9. Expense Reductions.
Through arrangements with the Fund's custodian, credits realized as a result of certain uninvested cash balances were used to reduce the Fund's expenses by $1.
10. Other.
A fund's organizational documents provide former and current trustees and officers with a limited indemnification against liabilities arising in connection with the performance of their duties to the fund. In the normal course of business, a fund may also enter into contracts that provide general indemnifications. A fund's maximum exposure under these arrangements is unknown as this would be dependent on future claims that may be made against a fund. The risk of material loss from such claims is considered remote.
11. Credit Risk.
The Fund invests a significant portion of its assets in structured securities of issuers backed by commercial and residential mortgage loans, credit card receivables and automotive loans. The value and related income of these securities is sensitive to changes in economic conditions, including delinquencies and/or defaults.
12. Risk and Uncertainties.
Many factors affect a fund's performance. Developments that disrupt global economies and financial markets, such as pandemics, epidemics, outbreaks of infectious diseases, war, terrorism, and environmental disasters, may significantly affect a fund's investment performance. The effects of these developments to a fund will be impacted by the types of securities in which a fund invests, the financial condition, industry, economic sector, and geographic location of an issuer, and a fund's level of investment in the securities of that issuer. Significant concentrations in security types, issuers, industries, sectors, and geographic locations may magnify the factors that affect a fund's performance.
As a shareholder, you incur two types of costs: (1) transaction costs, which may include sales charges (loads) on purchase payments or redemption proceeds, as applicable and (2) ongoing costs, which generally include management fees, distribution and/or service (12b-1) fees and other Fund expenses. This Example is intended to help you understand your ongoing costs (in dollars) of investing in a fund and to compare these costs with the ongoing costs of investing in other mutual funds.
| The Example is based on an investment of $1,000 invested at the beginning of the period and held for the entire period (September 1, 2022 to February 28, 2023). |
Actual Expenses
The first line of the accompanying table provides information about actual account values and actual expenses. You may use the information in this line, together with the amount you invested, to estimate the expenses that you paid over the period. Simply divide your account value by $1,000.00 (for example, an $8,600 account value divided by $1,000.00 = 8.6), then multiply the result by the number in the first line for a class/Fund under the heading entitled "Expenses Paid During Period" to estimate the expenses you paid on your account during this period. If any fund is a shareholder of any underlying mutual funds or exchange-traded funds (ETFs) (the Underlying Funds), such fund indirectly bears its proportional share of the expenses of the Underlying Funds in addition to the direct expenses incurred presented in the table. These fees and expenses are not included in the annualized expense ratio used to calculate the expense estimate in the table below.
Hypothetical Example for Comparison Purposes
The second line of the accompanying table provides information about hypothetical account values and hypothetical expenses based on the actual expense ratio and an assumed rate of return of 5% per year before expenses, which is not the actual return. The hypothetical account values and expenses may not be used to estimate the actual ending account balance or expenses you paid for the period. You may use this information to compare the ongoing costs of investing in the Fund and other funds. To do so, compare this 5% hypothetical example with the 5% hypothetical examples that appear in the shareholder reports of the other funds. If any fund is a shareholder of any Underlying Funds, such fund indirectly bears its proportional share of the expenses of the Underlying Funds in addition to the direct expenses as presented in the table. These fees and expenses are not included in the annualized expense ratio used to calculate the expense estimate in the table below.
Please note that the expenses shown in the table are meant to highlight your ongoing costs only and do not reflect any transaction costs. Therefore, the second line of the table is useful in comparing ongoing costs only, and will not help you determine the relative total costs of owning different funds. In addition, if these transactional costs were included, your costs would have been higher.
| | | | | Annualized Expense Ratio- A | | Beginning Account Value September 1, 2022 | | Ending Account Value February 28, 2023 | | Expenses Paid During Period- C September 1, 2022 to February 28, 2023 |
| | | | | | | | | | |
| Fidelity® Intermediate Bond Fund | | | | .45% | | | | | | |
| Actual | | | | | | $ 1,000 | | $ 991.20 | | $ 2.22 |
Hypothetical- B | | | | | | $ 1,000 | | $ 1,022.56 | | $ 2.26 |
| |
A Annualized expense ratio reflects expenses net of applicable fee waivers.
B 5% return per year before expenses
C Expenses are equal to the annualized expense ratio, multiplied by the average account value over the period, multiplied by 181/ 365 (to reflect the one-half year period). The fees and expenses of any Underlying Funds are not included in each annualized expense ratio.
Board Approval of Investment Advisory Contracts and Management Fees
Fidelity Intermediate Bond Fund
Each year, the Board of Trustees, including the Independent Trustees (together, the Board), votes on the renewal of the management contract with Fidelity Management & Research Company LLC (FMR) and the sub-advisory agreements (together, the Advisory Contracts) for the fund. FMR and the sub-advisers are referred to herein as the Investment Advisers. The Board, assisted by the advice of fund counsel and Independent Trustees' counsel, requests and considers a broad range of information relevant to the renewal of the Advisory Contracts throughout the year.
The Board meets regularly and, at each of its meetings, covers an extensive agenda of topics and materials and considers factors that are relevant to its annual consideration of the renewal of the fund's Advisory Contracts, including the services and support provided to the fund and its shareholders. The Board has established four standing committees (Committees) - Operations, Audit, Fair Valuation, and Governance and Nominating - each composed of and chaired by Independent Trustees with varying backgrounds, to which the Board has assigned specific subject matter responsibilities in order to enhance effective decision-making by the Board. The Operations Committee, of which all the Independent Trustees are members, meets regularly throughout the year and requests, receives and considers, among other matters, information related to the annual consideration of the renewal of the fund's Advisory Contracts before making its recommendation to the Board. The Board also meets as needed to review matters specifically related to the Board's annual consideration of the renewal of the Advisory Contracts. Members of the Board may also meet from time to time with trustees of other Fidelity funds through joint ad hoc committees to discuss certain matters relevant to all of the Fidelity funds.
At its September 2022 meeting, the Board unanimously determined to renew the fund's Advisory Contracts. In reaching its determination, the Board considered all factors it believed relevant, including (i) the nature, extent, and quality of the services provided to the fund and its shareholders (including the investment performance of the fund); (ii) the competitiveness relative to peer funds of the fund's management fee and the total expense ratio; (iii) the total costs of the services provided by and the profits realized by Fidelity from its relationships with the fund; and (iv) the extent to which, if any, economies of scale exist and are realized as the fund grows, and whether any economies of scale are appropriately shared with fund shareholders.
In considering whether to renew the Advisory Contracts for the fund, the Board reached a determination, with the assistance of fund counsel and Independent Trustees' counsel and through the exercise of its business judgment, that the renewal of the Advisory Contracts was in the best interests of the fund and its shareholders and that the compensation payable under the Advisory Contracts was fair and reasonable. The Board's decision to renew the Advisory Contracts was not based on any single factor, but rather was based on a comprehensive consideration of all the information provided to the Board at its meetings throughout the year. The Board, in reaching its determination to renew the Advisory Contracts, was aware that shareholders of the fund have a broad range of investment choices available to them, including a wide choice among funds offered by Fidelity's competitors, and that the fund's shareholders, who have the opportunity to review and weigh the disclosure provided by the fund in its prospectus and other public disclosures, have chosen to invest in this fund, which is part of the Fidelity family of funds.
Nature, Extent, and Quality of Services Provided . The Board considered Fidelity's staffing as it relates to the fund, including the backgrounds of investment personnel of Fidelity, and also considered the fund's investment objective, strategies, and related investment philosophy. The Independent Trustees also had discussions with senior management of Fidelity's investment operations and investment groups. The Board considered the structure of the investment personnel compensation program and whether this structure provides appropriate incentives to act in the best interests of the fund. Additionally, the Board considered the portfolio managers' investments, if any, in the funds that they manage. The Board also considered the steps Fidelity had taken to ensure the continued provision of high quality services to the Fidelity funds throughout the COVID-19 pandemic, including the expansion of staff in client facing positions to maintain service levels in periods of high volumes and volatility.
Resources Dedicated to Investment Management and Support Services . The Board reviewed the general qualifications and capabilities of Fidelity's investment staff, including its size, education, experience, and resources, as well as Fidelity's approach to recruiting, managing, training and compensating investment personnel. The Board noted the resources devoted to Fidelity's global investment organization, and that Fidelity's analysts have extensive resources, tools and capabilities that allow them to conduct quantitative and fundamental analysis, as well as credit analysis of issuers, counterparties and guarantors. Further, the Board considered that Fidelity's investment professionals have sufficient access to global information and data so as to provide competitive investment results over time, and that those professionals also have access to sophisticated tools that permit them to assess portfolio construction and risk and performance attribution characteristics continuously, as well as to transmit new information and research conclusions rapidly around the world. Additionally, in its deliberations, the Board considered Fidelity's trading, risk management, compliance, cybersecurity, and technology and operations capabilities and resources, which are integral parts of the investment management process.
Shareholder and Administrative Services . The Board considered (i) the nature, extent, quality, and cost of advisory, administrative, and shareholder services performed by the Investment Advisers and their affiliates under the Advisory Contracts and under separate agreements covering transfer agency, pricing and bookkeeping, and securities lending services for the fund; (ii) the nature and extent of the supervision of third party service providers, principally custodians, subcustodians, and pricing vendors; and (iii) the resources devoted to, and the record of compliance with, the fund's compliance policies and procedures.
The Board noted that the growth of fund assets over time across the complex allows Fidelity to reinvest in the development of services designed to enhance the value and convenience of the Fidelity funds as investment vehicles. These services include 24-hour access to account information and market information over the Internet and through telephone representatives, investor education materials and asset allocation tools. The Board also considered that it reviews customer service metrics such as telephone response times, continuity of services on the website and metrics addressing services at Fidelity Investor Centers.
Investment in a Large Fund Family. The Board considered the benefits to shareholders of investing in a Fidelity fund, including the benefits of investing in a fund that is part of a large family of funds offering a variety of investment disciplines and providing a large variety of mutual fund investor services. The Board noted that Fidelity had taken, or had made recommendations to the Board that resulted in the Fidelity funds taking, a number of actions over the previous year that benefited particular funds, including: (i) continuing to dedicate additional resources to Fidelity's investment research process, which includes meetings with management of issuers of securities in which the funds invest; (ii) continuing efforts to enhance Fidelity's global research capabilities; (iii) launching new funds, ETFs, and share classes with innovative structures, strategies and pricing and making other enhancements to meet investor needs; (iv) broadening eligibility requirements for certain funds and share classes; (v) reducing management fees and total expenses for certain funds and classes; (vi) lowering expenses for certain existing funds and classes by implementing or lowering expense caps; (vii) rationalizing product lines and gaining increased efficiencies from fund mergers and liquidations; (viii) continuing to develop, acquire and implement systems and technology to improve services to the funds and shareholders, strengthen information security, and increase efficiency; and (ix) continuing to implement enhancements to further strengthen Fidelity's product line to increase investors' probability of success in achieving their investment goals, including their retirement income goals.
Investment Performance. The Board considered whether the fund has operated in accordance with its investment objective, as well as its record of compliance with its investment restrictions and its performance history.
The Board took into account discussions that occur at Board meetings throughout the year with representatives of the Investment Advisers about fund investment performance. In this regard the Board noted that as part of regularly scheduled fund reviews and other reports to the Board on fund performance, the Board considers annualized return information for the fund for different time periods, measured against an appropriate securities market index (benchmark index) and an appropriate peer group of funds with similar objectives (peer group). The Board also receives and considers information about performance attribution. In its evaluation of fund investment performance at meetings throughout the year, the Board gave particular attention to information indicating underperformance of certain Fidelity funds for specific time periods and discussed with the Investment Advisers the reasons for such underperformance.
In addition to reviewing absolute and relative fund performance, the Independent Trustees periodically consider the appropriateness of fund performance metrics in evaluating the results achieved. In general, the Independent Trustees believe that fund performance should be evaluated based on gross performance (before fees and expenses but after transaction costs) compared to appropriate benchmark indices, over appropriate time periods that may include full market cycles, and on net performance (after fees and expenses) compared to appropriate peer groups, as applicable, over the same periods, taking into account relevant factors including the following: general market conditions; expectations for interest rate levels and credit conditions; issuer-specific information including credit quality; the potential for incremental return versus the fund's benchmark index weighed against the risks involved in obtaining that incremental return, including the risk of diminished or negative total returns; and fund cash flows and other factors. The Independent Trustees generally give greater weight to fund performance over longer time periods than over shorter time periods. Depending on the circumstances, the Independent Trustees may be satisfied with a fund's performance notwithstanding that it lags its benchmark index or peer group for certain periods.
The Independent Trustees recognize that shareholders evaluate performance on a net basis over their own holding periods, for which one-, three-, and five-year periods are often used as a proxy. For this reason, the performance information reviewed by the Board also included net cumulative calendar year total return information for the fund and an appropriate benchmark index and peer group for the most recent one-, three-, and five-year periods. The Independent Trustees recognize that shareholders who are not investing through a tax-advantaged retirement account also consider tax consequences in evaluating performance.
Based on its review, the Board concluded that the nature, extent, and quality of services provided to the fund under the Advisory Contracts should continue to benefit the shareholders of the fund.
Competitiveness of Management Fee and Total Expense Ratio. The Board considered the fund's management fee and total expense ratio compared to selected groups of competitive funds and classes (referred to as "mapped groups" below) for the purpose of facilitating the Trustees' competitive analysis of management fees and total expenses. Fidelity creates "mapped groups" by combining similar investment objective categories (as classified by Lipper) that have comparable investment mandates. Combining funds with similar investment objective categories aids the Board's comparison of management fees and total expense ratios by broadening the competitive group used for such comparison.
Management Fee . The Board considered two proprietary management fee comparisons for the 12-month periods shown in basis points (BP) in the chart below. The group of Lipper funds used by the Board for management fee comparisons is referred to below as the "Total Mapped Group" and is broader than the Lipper peer group used by the Board for performance comparisons. The Total Mapped Group comparison focuses on a fund's standing in terms of gross management fees before expense reimbursements or caps relative to the total universe of funds with comparable investment mandates, regardless of whether their management fee structures also are comparable. Funds with comparable investment mandates offer exposure to similar types of securities. Funds with comparable management fee structures have similar management fee contractual arrangements (e.g., flat rate charged for advisory services, all-inclusive fee rate, etc.). "TMG %" represents the percentage of funds in the Total Mapped Group that had management fees that were lower than the fund's. For example, a hypothetical TMG % of 20% would mean that 80% of the funds in the Total Mapped Group had higher, and 20% had lower, management fees than the fund. The fund's actual TMG %s and the number of funds in the Total Mapped Group are in the chart below. The "Asset-Sized Peer Group" (ASPG) comparison focuses on a fund's standing relative to a subset of non-Fidelity funds within the Total Mapped Group that are similar in size and management fee structure. For example, if a fund is in the first quartile of the ASPG, the fund's management fee ranks in the least expensive or lowest 25% of funds in the ASPG. The ASPG represents at least 15% of the funds in the Total Mapped Group with comparable asset size and management fee structures, subject to a minimum of 50 funds (or all funds in the Total Mapped Group if fewer than 50). Additional information, such as the ASPG quartile in which the fund's management fee rate ranked, is also included in the chart and was considered by the Board.
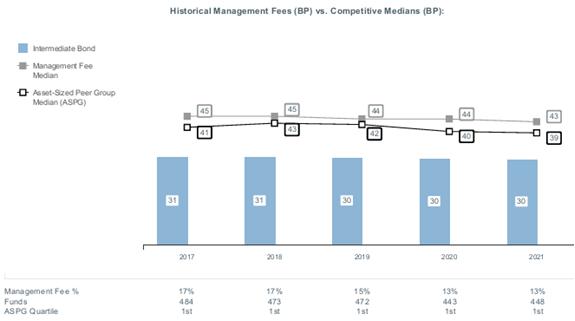
The Board noted that the fund's management fee rate ranked below the median of its Total Mapped Group and below the median of its ASPG for 2021.
Based on its review, the Board concluded that the fund's management fee is fair and reasonable in light of the services that the fund receives and the other factors considered.
Total Expense Ratio . In its review of the fund's total expense ratio, the Board considered the fund's management fee rate as well as other fund expenses, such as transfer agent fees, pricing and bookkeeping fees, and custodial, legal, and audit fees. The Board also noted that Fidelity may agree to waive fees or reimburse expenses from time to time, and the extent to which, if any, it has done so for the fund. The fund is compared to those funds and classes in the Total Mapped Group (used by the Board for management fee comparisons) that have a similar sales load structure. The Board also considered a total expense ASPG comparison, which focuses on the total expenses of the fund relative to a subset of non-Fidelity funds within the similar sales load structure group that are similar in size and management fee structure. The total expense ASPG is limited to 15 larger and 15 smaller classes of different funds, where possible. The total expense ASPG comparison excludes performance adjustments and fund-paid 12b-1 fees to eliminate variability in expenses relating to these items.
The Board noted that the fund's total net expense ratio ranked below the similar sales group structure competitive median and below the ASPG competitive median for 2021.
The Board considered that the current contractual arrangements for the fund have the effect of setting the total "fund-level" expenses (including, among certain other "fund-level" expenses, the management fee) at 0.35%. These contractual arrangements may not be amended to increase the fees or expenses payable except by a vote of a majority of the Board.
The Board recognized that the fund's management contract incorporates a "group fee" structure, which provides for lower group fee rates as total "group assets" increase, and for higher group fee rates as total "group assets" decrease ("group assets" as defined in the management contract). FMR calculates the group fee rates based on a tiered asset "breakpoint" schedule that varies based on asset class. The Board considered that Fidelity agreed to impose a temporary fee waiver in the form of additional breakpoints to the current breakpoint schedule. The Board noted, however, that because the current contractual arrangements set the total "fund-level" expenses at 0.35%, increases or decreases in the management fee due to changes in the group fee rate will not impact the total expense ratio.
Fees Charged to Other Fidelity Clients . The Board also considered Fidelity fee structures and other information with respect to clients of Fidelity, such as other funds advised or subadvised by Fidelity, pension plan clients, and other institutional clients with similar mandates. The Board noted that a joint ad hoc committee created by it and the boards of other Fidelity funds periodically reviews and compares Fidelity's institutional investment advisory business with its business of providing services to the Fidelity funds and also noted the most recent findings of the committee. The Board noted that the committee's review included a consideration of the differences in services provided, fees charged, and costs incurred, as well as competition in the markets serving the different categories of clients.
Based on its review of total expense ratios and fees charged to other Fidelity clients, the Board concluded that the fund's total expense ratio was reasonable in light of the services that the fund and its shareholders receive and the other factors considered.
Costs of the Services and Profitability. The Board considered the revenues earned and the expenses incurred by Fidelity in conducting the business of developing, marketing, distributing, managing, administering and servicing the fund and servicing the fund's shareholders. The Board also considered the level of Fidelity's profits in respect of all the Fidelity funds.
On an annual basis, Fidelity presents to the Board information about the profitability of its relationships with the fund. Fidelity calculates profitability information for each fund, as well as aggregate profitability information for groups of Fidelity funds and all Fidelity funds, using a series of detailed revenue and cost allocation methodologies which originate with the books and records of Fidelity on which Fidelity's audited financial statements are based. The Audit Committee of the Board reviews any significant changes from the prior year's methodologies and the full Board approves such changes.
A public accounting firm has been engaged annually by the Board as part of the Board's assessment of Fidelity's profitability analysis. The engagement includes the review and assessment of the methodologies used by Fidelity in determining the revenues and expenses attributable to Fidelity's mutual fund business, and completion of agreed-upon procedures in respect of the mathematical accuracy of certain fund profitability information and its conformity to established allocation methodologies. After considering the reports issued under the engagement and information provided by Fidelity, the Board concluded that while other allocation methods may also be reasonable, Fidelity's profitability methodologies are reasonable in all material respects.
The Board also reviewed Fidelity's non-fund businesses and potential indirect benefits such businesses may have received as a result of their association with Fidelity's mutual fund business (i.e., fall-out benefits) as well as cases where Fidelity's affiliates may benefit from the funds' business. The Board considered areas where potential indirect benefits to the Fidelity funds from their relationships with Fidelity may exist. The Board's consideration of these matters was informed by the findings of a joint ad hoc committee created by it and the boards of other Fidelity funds to evaluate potential fall-out benefits.
The Board considered the costs of the services provided by and the profits realized by Fidelity in connection with the operation of the fund and was satisfied that the profitability was not excessive.
Economies of Scale. The Board considered whether there have been economies of scale in respect of the management of the Fidelity funds, whether the Fidelity funds (including the fund) have appropriately benefited from any such economies of scale, and whether there is potential for realization of any further economies of scale. The Board considered the extent to which the fund will benefit from economies of scale as assets grow through increased services to the fund, through waivers or reimbursements, or through fee or expense ratio reductions. The Board also noted that a committee (the Economies of Scale Committee) created by it and the boards of other Fidelity funds periodically analyzes whether Fidelity attains economies of scale in respect of the management and servicing of the Fidelity funds, whether the Fidelity funds have appropriately benefited from such economies of scale, and whether there is potential for realization of any further economies of scale.
The Board concluded, taking into account the analysis of the Economies of Scale Committee, that economies of scale, if any, are being appropriately shared between fund shareholders and Fidelity.
Additional Information Requested by the Board . In order to develop fully the factual basis for consideration of the Fidelity funds' advisory contracts, the Board requested and received additional information on certain topics, including: (i) Fidelity's fund profitability methodology, profitability trends for certain funds, the allocation of various costs to different funds, and the impact of certain factors on fund profitability results; (ii) portfolio manager changes that have occurred during the past year and the amount of the investment that each portfolio manager has made in the Fidelity fund(s) that he or she manages; (iii) the extent to which current market conditions have affected retention and recruitment of personnel; (iv) the arrangements with and compensation paid to certain fund sub-advisers on behalf of the Fidelity funds and the treatment of such compensation within Fidelity's fund profitability methodology; (v) the terms of the funds' various management fee structures, including the basic group fee and the terms of Fidelity's voluntary expense limitation arrangements; (vi) Fidelity's transfer agent, pricing and bookkeeping fees, expense and service structures for different funds and classes relative to competitive trends; (vii) the impact on fund profitability of recent industry trends, such as the growth in passively managed funds and the changes in flows for different types of funds; (viii) the types of management fee and total expense comparisons provided, and the challenges and limitations associated with such information; and (ix) explanations regarding the relative total expense ratios and management fees of certain funds and classes, total expense and management fee competitive trends, and methodologies for total expense and management fee competitive comparisons. In addition, the Board considered its discussions with Fidelity regarding Fidelity's efforts to maintain the continuous investment and shareholder services necessary for the funds during the current pandemic and economic circumstances.
Based on its evaluation of all of the conclusions noted above, and after considering all factors it believed relevant, the Board concluded that the advisory fee arrangements are fair and reasonable and that the fund's Advisory Contracts should be renewed.
The Securities and Exchange Commission adopted Rule 22e-4 under the Investment Company Act of 1940 (the Liquidity Rule) to promote effective liquidity risk management throughout the open-end investment company industry, thereby reducing the risk that funds will be unable to meet their redemption obligations and mitigating dilution of the interests of fund shareholders.
The Fund has adopted and implemented a liquidity risk management program (the Program) reasonably designed to assess and manage the Fund's liquidity risk and to comply with the requirements of the Liquidity Rule. The Fund's Board of Trustees (the Board) has designated the Fund's investment adviser as administrator of the Program. The Fidelity advisers have established a Liquidity Risk Management Committee (the LRM Committee) to manage the Program for each of the Fidelity Funds. The LRM Committee monitors the adequacy and effectiveness of implementation of the Program and on a periodic basis assesses each Fund's liquidity risk based on a variety of factors including (1) the Fund's investment strategy, (2) portfolio liquidity and cash flow projections during normal and reasonably foreseeable stressed conditions, (3) shareholder redemptions, (4) borrowings and other funding sources and (5) certain factors specific to ETFs including the effect of the Fund's prices and spreads, market participants, and basket compositions on the overall liquidity of the Fund's portfolio, as applicable.
In accordance with the Program, each of the Fund's portfolio investments is classified into one of four defined liquidity categories based on a determination of a reasonable expectation for how long it would take to convert the investment to cash (or sell or dispose of the investment) without significantly changing its market value.
- Highly liquid investments - cash or convertible to cash within three business days or less
- Moderately liquid investments - convertible to cash in three to seven calendar days
- Less liquid investments - can be sold or disposed of, but not settled, within seven calendar days
- Illiquid investments - cannot be sold or disposed of within seven calendar days
Liquidity classification determinations take into account a variety of factors including various market, trading and investment-specific considerations, as well as market depth, and generally utilize analysis from a third-party liquidity metrics service.
The Liquidity Rule places a 15% limit on a fund's illiquid investments and requires funds that do not primarily hold assets that are highly liquid investments to determine and maintain a minimum percentage of the fund's net assets to be invested in highly liquid investments (highly liquid investment minimum or HLIM). The Program includes provisions reasonably designed to comply with the 15% limit on illiquid investments and for determining, periodically reviewing and complying with the HLIM requirement as applicable.
At a recent meeting of the Fund's Board of Trustees, the LRM Committee provided a written report to the Board pertaining to the operation, adequacy, and effectiveness of the Program for the period December 1, 2021 through November 30, 2022. The report concluded that the Program is operating effectively and is reasonably designed to assess and manage the Fund's liquidity risk.
1.538685.125
IBF-SANN-0423
Fidelity® U.S. Bond Index Fund
Semi-Annual Report
February 28, 2023
Contents
To view a fund's proxy voting guidelines and proxy voting record for the 12-month period ended June 30, visit http://www.fidelity.com/proxyvotingresults or visit the Securities and Exchange Commission's (SEC) web site at http://www.sec.gov.
You may also call 1-800-544-8544 to request a free copy of the proxy voting guidelines.
BLOOMBERG ® is a trademark and service mark of Bloomberg Finance L.P. and its affiliates (collectively "Bloomberg"). Bloomberg or Bloomberg's licensors own all proprietary rights in the Bloomberg Indices. Neither Bloomberg nor Bloomberg's licensors approves or endorses this material, or guarantees the accuracy or completeness of any information herein, or makes any warranty, express or implied, as to the results to be obtained therefrom and, to the maximum extent allowed by law, neither shall have any liability or responsibility for injury or damages arising in connection therewith.
Standard & Poor's, S&P and S&P 500 are registered service marks of The McGraw-Hill Companies, Inc. and have been licensed for use by Fidelity Distributors Corporation.
Other third-party marks appearing herein are the property of their respective owners.
All other marks appearing herein are registered or unregistered trademarks or service marks of FMR LLC or an affiliated company. © 2023 FMR LLC. All rights reserved.
This report and the financial statements contained herein are submitted for the general information of the shareholders of the Fund. This report is not authorized for distribution to prospective investors in the Fund unless preceded or accompanied by an effective prospectus.
A fund files its complete schedule of portfolio holdings with the SEC for the first and third quarters of each fiscal year on Form N-PORT. Forms N-PORT are available on the SEC's web site at http://www.sec.gov. A fund's Forms N-PORT may be reviewed and copied at the SEC's Public Reference Room in Washington, DC. Information regarding the operation of the SEC's Public Reference Room may be obtained by calling 1-800-SEC-0330.
For a complete list of a fund's portfolio holdings, view the most recent holdings listing, semiannual report, or annual report on Fidelity's web site at http://www.fidelity.com, http://www.institutional.fidelity.com, or http://www.401k.com, as applicable.
NOT FDIC INSURED •MAY LOSE VALUE •NO BANK GUARANTEE
Neither the Fund nor Fidelity Distributors Corporation is a bank.
Quality Diversification (% of Fund's net assets) |
|
Short-Term Investments and Net Other Assets (Liabilities) - (0.7)%* |
*Short-term investments and Net Other Assets (Liabilities) are not available in the pie chart. |
| |
| We have used ratings from Moody's Investors Service, Inc. Where Moody's® ratings are not available, we have used S&P® ratings. All ratings are as of the date indicated and do not reflect subsequent changes. |
Asset Allocation (% of Fund's net assets) |
|
Short-Term Investments and Net Other Assets (Liabilities) - (0.7)%* |
Foreign investments - 5.4% |
Short-Term Investments and Net Other Assets (Liabilities) are not available in the pie chart. |
Percentages in the above tables are adjusted for the effect of TBA Sale Commitments. |
|
Showing Percentage of Net Assets
| Nonconvertible Bonds - 25.0% |
| | | Principal Amount (a) (000s) | Value ($) (000s) |
| COMMUNICATION SERVICES - 1.9% | | | |
| Diversified Telecommunication Services - 0.7% | | | |
| AT&T, Inc.: | | | |
| 1.65% 2/1/28 | | 8,216 | 6,980 |
| 2.25% 2/1/32 | | 13,533 | 10,563 |
| 2.75% 6/1/31 | | 14,741 | 12,178 |
| 2.95% 7/15/26 | | 6,356 | 5,926 |
| 3.3% 2/1/52 | | 14,016 | 9,589 |
| 3.5% 6/1/41 | | 7,559 | 5,675 |
| 3.5% 9/15/53 | | 25,048 | 17,195 |
| 3.55% 9/15/55 | | 54,468 | 36,897 |
| 3.65% 6/1/51 | | 11,600 | 8,275 |
| 3.65% 9/15/59 | | 31,190 | 21,123 |
| 3.8% 2/15/27 | | 7,149 | 6,785 |
| 4.35% 6/15/45 | | 5,085 | 4,140 |
| 4.5% 3/9/48 | | 6,502 | 5,346 |
| 4.65% 6/1/44 | | 6,251 | 5,318 |
| British Telecommunications PLC 9.625% 12/15/30 | | 12,479 | 15,097 |
| Orange SA 5.5% 2/6/44 | | 2,383 | 2,404 |
| Telefonica Emisiones S.A.U.: | | | |
| 4.103% 3/8/27 | | 10,645 | 10,086 |
| 4.895% 3/6/48 | | 3,000 | 2,391 |
| 5.213% 3/8/47 | | 5,203 | 4,374 |
| 5.52% 3/1/49 | | 2,700 | 2,351 |
| 7.045% 6/20/36 | | 2,065 | 2,181 |
| Verizon Communications, Inc.: | | | |
| 1.5% 9/18/30 | | 3,190 | 2,469 |
| 1.68% 10/30/30 | | 2,665 | 2,062 |
| 2.355% 3/15/32 | | 46,571 | 36,612 |
| 2.55% 3/21/31 | | 41,913 | 34,284 |
| 2.987% 10/30/56 | | 69,319 | 42,468 |
| 3.55% 3/22/51 | | 8,661 | 6,253 |
| 4.125% 3/16/27 | | 5,561 | 5,353 |
| 4.272% 1/15/36 | | 19,285 | 17,022 |
| 4.329% 9/21/28 | | 12,151 | 11,641 |
| 4.4% 11/1/34 | | 2,999 | 2,726 |
| 4.75% 11/1/41 | | 795 | 727 |
| 5.012% 4/15/49 | | 913 | 838 |
| 5.012% 8/21/54 | | 9,975 | 9,125 |
| | | | 366,454 |
| Entertainment - 0.1% | | | |
| The Walt Disney Co.: | | | |
| 2% 9/1/29 | | 8,297 | 6,926 |
| 2.65% 1/13/31 | | 12,615 | 10,745 |
| 2.75% 9/1/49 | | 8,288 | 5,523 |
| 3.5% 5/13/40 | | 5,423 | 4,382 |
| 3.6% 1/13/51 | | 5,404 | 4,188 |
| 3.7% 10/15/25 | | 5,561 | 5,363 |
| 3.8% 5/13/60 | | 5,423 | 4,244 |
| 4.7% 3/23/50 | | 3,867 | 3,619 |
| 5.4% 10/1/43 | | 3,078 | 3,094 |
| 6.15% 3/1/37 | | 3,142 | 3,361 |
| 6.15% 2/15/41 | | 8,340 | 9,074 |
| | | | 60,519 |
| Interactive Media & Services - 0.1% | | | |
| Alphabet, Inc.: | | | |
| 0.45% 8/15/25 | | 5,896 | 5,334 |
| 1.1% 8/15/30 | | 11,696 | 9,219 |
| 1.998% 8/15/26 | | 1,827 | 1,672 |
| 2.05% 8/15/50 | | 11,696 | 7,078 |
| Baidu, Inc. 3.425% 4/7/30 | | 9,666 | 8,547 |
| Meta Platforms, Inc.: | | | |
| 3.5% 8/15/27 | | 6,820 | 6,409 |
| 3.85% 8/15/32 | | 7,620 | 6,847 |
| 4.45% 8/15/52 | | 12,000 | 9,951 |
| | | | 55,057 |
| Media - 0.7% | | | |
| Charter Communications Operating LLC/Charter Communications Operating Capital Corp.: | | | |
| 2.8% 4/1/31 | | 20,299 | 15,908 |
| 3.5% 6/1/41 | | 26,758 | 17,509 |
| 3.7% 4/1/51 | | 7,027 | 4,297 |
| 4.2% 3/15/28 | | 8,737 | 8,030 |
| 4.908% 7/23/25 | | 6,338 | 6,202 |
| 5.05% 3/30/29 | | 4,833 | 4,513 |
| 5.125% 7/1/49 | | 9,816 | 7,550 |
| 5.375% 5/1/47 | | 4,534 | 3,612 |
| 5.75% 4/1/48 | | 4,154 | 3,469 |
| 6.384% 10/23/35 | | 10,684 | 10,255 |
| 6.484% 10/23/45 | | 3,725 | 3,370 |
| Comcast Corp.: | | | |
| 1.5% 2/15/31 | | 11,310 | 8,733 |
| 1.95% 1/15/31 | | 2,030 | 1,627 |
| 2.35% 1/15/27 | | 18,905 | 17,130 |
| 2.45% 8/15/52 | | 11,310 | 6,709 |
| 2.65% 2/1/30 | | 6,264 | 5,392 |
| 2.8% 1/15/51 | | 6,476 | 4,131 |
| 2.887% 11/1/51 | | 15,309 | 9,914 |
| 2.937% 11/1/56 | | 57,662 | 36,167 |
| 2.987% 11/1/63 | | 9,051 | 5,531 |
| 3.15% 3/1/26 | | 3,972 | 3,756 |
| 3.3% 2/1/27 | | 9,461 | 8,881 |
| 3.375% 8/15/25 | | 10,882 | 10,446 |
| 3.4% 4/1/30 | | 5,800 | 5,236 |
| 3.45% 2/1/50 | | 5,896 | 4,314 |
| 3.7% 4/15/24 | | 8,238 | 8,090 |
| 3.75% 4/1/40 | | 4,644 | 3,803 |
| 3.969% 11/1/47 | | 4,131 | 3,334 |
| 4% 3/1/48 | | 9,532 | 7,662 |
| 4.15% 10/15/28 | | 14,973 | 14,315 |
| Discovery Communications LLC: | | | |
| 3.625% 5/15/30 | | 9,512 | 8,140 |
| 4% 9/15/55 | | 9,083 | 5,873 |
| 4.65% 5/15/50 | | 9,512 | 6,976 |
| 5.2% 9/20/47 | | 6,673 | 5,314 |
| Fox Corp.: | | | |
| 4.03% 1/25/24 | | 3,734 | 3,685 |
| 4.709% 1/25/29 | | 8,245 | 7,873 |
| 5.476% 1/25/39 | | 3,027 | 2,782 |
| 5.576% 1/25/49 | | 7,398 | 6,736 |
| Magallanes, Inc.: | | | |
| 3.755% 3/15/27 (b) | | 8,767 | 8,042 |
| 4.279% 3/15/32 (b) | | 14,937 | 12,895 |
| 5.05% 3/15/42 (b) | | 8,564 | 6,938 |
| 5.141% 3/15/52 (b) | | 23,164 | 18,158 |
| Paramount Global: | | | |
| 3.375% 2/15/28 | | 8,381 | 7,532 |
| 4% 1/15/26 | | 4,766 | 4,552 |
| 4.2% 6/1/29 | | 7,143 | 6,422 |
| 4.375% 3/15/43 | | 2,093 | 1,457 |
| 4.6% 1/15/45 | | 5,799 | 4,174 |
| 4.95% 1/15/31 | | 13,185 | 11,819 |
| Time Warner Cable LLC: | | | |
| 4.5% 9/15/42 | | 8,737 | 6,520 |
| 6.55% 5/1/37 | | 7,500 | 7,183 |
| 7.3% 7/1/38 | | 3,177 | 3,184 |
| TWDC Enterprises 18 Corp.: | | | |
| 1.85% 7/30/26 | | 4,059 | 3,656 |
| 3% 7/30/46 | | 3,575 | 2,524 |
| 3.15% 9/17/25 | | 7,522 | 7,156 |
| 4.125% 6/1/44 | | 4,528 | 3,897 |
| | | | 413,374 |
| Wireless Telecommunication Services - 0.3% | | | |
| America Movil S.A.B. de CV: | | | |
| 3.625% 4/22/29 | | 6,667 | 6,034 |
| 6.125% 11/15/37 | | 6,645 | 6,962 |
| Rogers Communications, Inc.: | | | |
| 2.9% 11/15/26 | | 1,986 | 1,814 |
| 3.625% 12/15/25 | | 1,589 | 1,507 |
| 3.7% 11/15/49 | | 4,833 | 3,407 |
| 3.8% 3/15/32 (b) | | 23,199 | 20,264 |
| 4.1% 10/1/23 | | 3,833 | 3,806 |
| 5.45% 10/1/43 | | 4,588 | 4,209 |
| T-Mobile U.S.A., Inc.: | | | |
| 2.05% 2/15/28 | | 11,928 | 10,237 |
| 3.3% 2/15/51 | | 11,928 | 7,997 |
| 3.5% 4/15/25 | | 10,079 | 9,654 |
| 3.75% 4/15/27 | | 6,689 | 6,289 |
| 3.875% 4/15/30 | | 6,689 | 6,065 |
| 4.375% 4/15/40 | | 6,689 | 5,684 |
| 4.5% 4/15/50 | | 11,522 | 9,558 |
| 4.95% 3/15/28 | | 14,700 | 14,430 |
| 5.2% 1/15/33 | | 7,265 | 7,085 |
| 5.65% 1/15/53 | | 18,310 | 17,950 |
| Vodafone Group PLC: | | | |
| 4.375% 5/30/28 | | 20,333 | 19,822 |
| 5.125% 6/19/59 | | 5,220 | 4,588 |
| 5.25% 5/30/48 | | 18,988 | 17,541 |
| | | | 184,903 |
TOTAL COMMUNICATION SERVICES | | | 1,080,307 |
| CONSUMER DISCRETIONARY - 1.4% | | | |
| Auto Components - 0.0% | | | |
| Lear Corp. 3.55% 1/15/52 | | 2,600 | 1,626 |
| Automobiles - 0.3% | | | |
| American Honda Finance Corp.: | | | |
| 1.2% 7/8/25 | | 9,305 | 8,483 |
| 2% 3/24/28 | | 2,000 | 1,729 |
| 2.25% 1/12/29 | | 1,900 | 1,630 |
| 2.3% 9/9/26 | | 3,972 | 3,618 |
| 2.9% 2/16/24 | | 2,000 | 1,952 |
| 3.55% 1/12/24 | | 21,383 | 21,055 |
| Daimler Finance North America LLC 8.5% 1/18/31 | | 2,000 | 2,476 |
| General Motors Co.: | | | |
| 5% 10/1/28 | | 5,463 | 5,290 |
| 5.15% 4/1/38 | | 1,300 | 1,126 |
| 5.2% 4/1/45 | | 3,392 | 2,797 |
| 5.6% 10/15/32 | | 2,000 | 1,902 |
| 5.95% 4/1/49 | | 5,027 | 4,510 |
| 6.6% 4/1/36 | | 4,639 | 4,632 |
| 6.75% 4/1/46 | | 5,684 | 5,601 |
| 6.8% 10/1/27 | | 10,536 | 10,987 |
| General Motors Financial Co., Inc.: | | | |
| 2.35% 1/8/31 | | 2,000 | 1,536 |
| 2.4% 4/10/28 | | 2,000 | 1,704 |
| 2.4% 10/15/28 | | 1,700 | 1,423 |
| 3.85% 1/5/28 | | 5,561 | 5,083 |
| 4% 1/15/25 | | 4,902 | 4,751 |
| 4% 10/6/26 | | 2,923 | 2,770 |
| 4.3% 7/13/25 | | 9,850 | 9,563 |
| 4.35% 1/17/27 | | 6,356 | 6,072 |
| 5.65% 1/17/29 | | 16,996 | 16,625 |
| Honda Motor Co. Ltd. 2.534% 3/10/27 | | 14,164 | 12,998 |
| Toyota Motor Corp.: | | | |
| 0.681% 3/25/24 | | 22,010 | 20,982 |
| 2.358% 7/2/24 | | 4,930 | 4,745 |
| 2.362% 3/25/31 | | 10,633 | 8,976 |
| | | | 175,016 |
| Distributors - 0.0% | | | |
| Genuine Parts Co. 2.75% 2/1/32 | | 2,000 | 1,617 |
| Diversified Consumer Services - 0.1% | | | |
| American University 3.672% 4/1/49 | | 1,903 | 1,512 |
| Duke University 2.832% 10/1/55 | | 3,714 | 2,535 |
| George Washington University: | | | |
| 4.126% 9/15/48 | | 5,575 | 4,825 |
| 4.3% 9/15/44 | | 1,589 | 1,404 |
| Ingersoll-Rand Global Holding Co. Ltd.: | | | |
| 3.75% 8/21/28 | | 3,694 | 3,469 |
| 4.3% 2/21/48 | | 3,948 | 3,225 |
| Massachusetts Institute of Technology: | | | |
| 2.989% 7/1/50 | | 3,722 | 2,764 |
| 3.885% 7/1/2116 | | 2,248 | 1,691 |
| 3.959% 7/1/38 | | 3,753 | 3,448 |
| Northwestern University: | | | |
| 3.662% 12/1/57 | | 4,398 | 3,579 |
| 4.643% 12/1/44 | | 2,661 | 2,558 |
| President and Fellows of Harvard College: | | | |
| 3.3% 7/15/56 | | 3,852 | 2,962 |
| 3.619% 10/1/37 | | 795 | 691 |
| Rice University 3.774% 5/15/55 | | 1,510 | 1,271 |
| Trustees of Princeton Univ. 5.7% 3/1/39 | | 795 | 881 |
| University Notre Dame du Lac 3.438% 2/15/45 | | 2,646 | 2,149 |
| University of Chicago 3% 10/1/52 | | 5,027 | 3,678 |
| University of Southern California: | | | |
| 2.945% 10/1/51 | | 9,096 | 6,315 |
| 5.25% 10/1/2111 | | 1,589 | 1,586 |
| | | | 50,543 |
| Hotels, Restaurants & Leisure - 0.2% | | | |
| Expedia, Inc.: | | | |
| 2.95% 3/15/31 | | 2,000 | 1,607 |
| 3.25% 2/15/30 | | 6,863 | 5,787 |
| 4.625% 8/1/27 | | 2,000 | 1,909 |
| Marriott International, Inc. 2.85% 4/15/31 | | 17,100 | 14,104 |
| McDonald's Corp.: | | | |
| 3.3% 7/1/25 | | 4,790 | 4,605 |
| 3.5% 7/1/27 | | 7,617 | 7,183 |
| 3.6% 7/1/30 | | 5,684 | 5,185 |
| 3.625% 9/1/49 | | 9,831 | 7,395 |
| 3.7% 1/30/26 | | 13,400 | 12,927 |
| 4.2% 4/1/50 | | 4,766 | 3,960 |
| 4.45% 3/1/47 | | 4,511 | 3,895 |
| 4.875% 12/9/45 | | 4,313 | 3,929 |
| 6.3% 3/1/38 | | 5,596 | 6,048 |
| Metropolitan Museum of Art 3.4% 7/1/45 | | 2,383 | 1,844 |
| Starbucks Corp.: | | | |
| 2% 3/12/27 | | 9,502 | 8,455 |
| 2.45% 6/15/26 | | 7,944 | 7,326 |
| 3% 2/14/32 | | 4,900 | 4,162 |
| 3.5% 11/15/50 | | 3,287 | 2,386 |
| 3.8% 8/15/25 | | 5,520 | 5,349 |
| 3.85% 10/1/23 | | 1,489 | 1,477 |
| 4% 11/15/28 | | 5,561 | 5,273 |
| 4.5% 11/15/48 | | 3,734 | 3,206 |
| | | | 118,012 |
| Household Durables - 0.0% | | | |
| D.R. Horton, Inc. 1.3% 10/15/26 | | 2,000 | 1,724 |
| Lennar Corp. 4.75% 11/29/27 | | 6,283 | 6,016 |
| | | | 7,740 |
| Internet & Direct Marketing Retail - 0.3% | | | |
| Alibaba Group Holding Ltd.: | | | |
| 2.125% 2/9/31 | | 16,568 | 13,169 |
| 3.15% 2/9/51 | | 17,076 | 10,730 |
| Amazon.com, Inc.: | | | |
| 0.8% 6/3/25 | | 8,758 | 7,995 |
| 1% 5/12/26 | | 5,087 | 4,504 |
| 1.5% 6/3/30 | | 15,466 | 12,405 |
| 2.1% 5/12/31 | | 7,251 | 5,965 |
| 2.5% 6/3/50 | | 5,085 | 3,263 |
| 2.8% 8/22/24 | | 5,147 | 4,980 |
| 2.875% 5/12/41 | | 27,600 | 20,573 |
| 3.1% 5/12/51 | | 5,251 | 3,762 |
| 3.15% 8/22/27 | | 8,309 | 7,758 |
| 3.6% 4/13/32 | | 2,000 | 1,831 |
| 3.875% 8/22/37 | | 8,728 | 7,710 |
| 4.05% 8/22/47 | | 15,112 | 13,054 |
| 4.25% 8/22/57 | | 7,208 | 6,235 |
| 4.55% 12/1/27 | | 10,000 | 9,887 |
| 4.7% 12/1/32 | | 28,300 | 27,976 |
| 4.8% 12/5/34 | | 6,766 | 6,766 |
| eBay, Inc.: | | | |
| 1.9% 3/11/25 | | 10,000 | 9,348 |
| 2.6% 5/10/31 | | 2,000 | 1,643 |
| 2.7% 3/11/30 | | 2,000 | 1,700 |
| 5.95% 11/22/27 | | 8,000 | 8,216 |
| | | | 189,470 |
| Leisure Products - 0.0% | | | |
| Hasbro, Inc.: | | | |
| 3.9% 11/19/29 | | 2,000 | 1,763 |
| 5.1% 5/15/44 | | 3,400 | 2,850 |
| | | | 4,613 |
| Multiline Retail - 0.1% | | | |
| Dollar General Corp. 5% 11/1/32 | | 9,230 | 8,952 |
| Dollar Tree, Inc.: | | | |
| 4% 5/15/25 | | 6,356 | 6,173 |
| 4.2% 5/15/28 | | 8,178 | 7,776 |
| Kohl's Corp.: | | | |
| 4.25% 7/17/25 | | 2,900 | 2,756 |
| 5.55% 7/17/45 | | 1,500 | 968 |
| 9.5% 5/15/25 | | 1,257 | 1,318 |
| Target Corp.: | | | |
| 3.9% 11/15/47 | | 11,736 | 9,591 |
| 4% 7/1/42 | | 5,561 | 4,863 |
| 4.4% 1/15/33 | | 8,300 | 7,872 |
| | | | 50,269 |
| Specialty Retail - 0.4% | | | |
| AutoNation, Inc.: | | | |
| 2.4% 8/1/31 | | 1,000 | 750 |
| 3.85% 3/1/32 | | 6,090 | 5,107 |
| AutoZone, Inc.: | | | |
| 3.125% 7/15/23 | | 3,038 | 3,012 |
| 3.25% 4/15/25 | | 3,177 | 3,039 |
| 3.625% 4/15/25 | | 9,202 | 8,879 |
| 3.75% 6/1/27 | | 4,611 | 4,377 |
| 4% 4/15/30 | | 9,521 | 8,749 |
| Lowe's Companies, Inc.: | | | |
| 1.3% 4/15/28 | | 6,380 | 5,278 |
| 1.7% 10/15/30 | | 9,666 | 7,539 |
| 3.65% 4/5/29 | | 10,507 | 9,599 |
| 3.7% 4/15/46 | | 2,780 | 2,052 |
| 3.75% 4/1/32 | | 32,063 | 28,403 |
| 4.05% 5/3/47 | | 9,135 | 7,098 |
| 4.5% 4/15/30 | | 9,618 | 9,161 |
| 5.625% 4/15/53 | | 5,000 | 4,786 |
| O'Reilly Automotive, Inc.: | | | |
| 3.85% 6/15/23 | | 2,244 | 2,235 |
| 4.7% 6/15/32 | | 8,100 | 7,718 |
| The Home Depot, Inc.: | | | |
| 2.375% 3/15/51 | | 5,207 | 3,122 |
| 2.5% 4/15/27 | | 9,637 | 8,809 |
| 2.8% 9/14/27 | | 3,972 | 3,654 |
| 2.95% 6/15/29 | | 16,616 | 14,838 |
| 3% 4/1/26 | | 7,967 | 7,518 |
| 3.125% 12/15/49 | | 5,317 | 3,774 |
| 3.3% 4/15/40 | | 6,833 | 5,441 |
| 3.75% 2/15/24 | | 5,343 | 5,273 |
| 3.9% 12/6/28 | | 4,575 | 4,377 |
| 3.9% 6/15/47 | | 6,813 | 5,645 |
| 4.2% 4/1/43 | | 1,251 | 1,094 |
| 4.25% 4/1/46 | | 2,606 | 2,253 |
| 4.5% 12/6/48 | | 5,934 | 5,331 |
| 4.875% 2/15/44 | | 2,283 | 2,174 |
| 5.875% 12/16/36 | | 13,741 | 14,704 |
| | | | 205,789 |
| Textiles, Apparel & Luxury Goods - 0.0% | | | |
| NIKE, Inc.: | | | |
| 2.4% 3/27/25 | | 4,969 | 4,740 |
| 2.85% 3/27/30 | | 4,775 | 4,245 |
| 3.25% 3/27/40 | | 9,666 | 7,764 |
| 3.375% 11/1/46 | | 3,575 | 2,749 |
| 3.375% 3/27/50 | | 4,775 | 3,715 |
| Tapestry, Inc. 3.05% 3/15/32 | | 2,320 | 1,843 |
| | | | 25,056 |
TOTAL CONSUMER DISCRETIONARY | | | 829,751 |
| CONSUMER STAPLES - 1.5% | | | |
| Beverages - 0.5% | | | |
| Anheuser-Busch Companies LLC / Anheuser-Busch InBev Worldwide, Inc. 4.7% 2/1/36 | | 10,000 | 9,386 |
| Anheuser-Busch InBev Finance, Inc.: | | | |
| 4.625% 2/1/44 | | 4,567 | 4,083 |
| 4.7% 2/1/36 | | 3,868 | 3,631 |
| 4.9% 2/1/46 | | 14,442 | 13,247 |
| Anheuser-Busch InBev Worldwide, Inc.: | | | |
| 3.5% 6/1/30 | | 5,000 | 4,553 |
| 4.439% 10/6/48 | | 5,873 | 5,069 |
| 4.6% 4/15/48 | | 14,894 | 13,160 |
| 5.55% 1/23/49 | | 33,724 | 33,932 |
| 5.8% 1/23/59 (Reg. S) | | 11,081 | 11,457 |
| 8.2% 1/15/39 | | 3,624 | 4,513 |
| Constellation Brands, Inc.: | | | |
| 3.5% 5/9/27 | | 7,944 | 7,469 |
| 3.7% 12/6/26 | | 5,997 | 5,669 |
| 4.75% 5/9/32 | | 5,000 | 4,756 |
| 5.25% 11/15/48 | | 5,751 | 5,365 |
| Diageo Capital PLC: | | | |
| 1.375% 9/29/25 | | 11,020 | 10,018 |
| 2% 4/29/30 | | 11,793 | 9,701 |
| 2.125% 4/29/32 | | 10,633 | 8,467 |
| Dr. Pepper Snapple Group, Inc.: | | | |
| 2.25% 3/15/31 | | 2,000 | 1,603 |
| 3.2% 5/1/30 | | 2,000 | 1,740 |
| 3.8% 5/1/50 | | 2,513 | 1,882 |
| 4.05% 4/15/32 | | 11,200 | 10,136 |
| 4.417% 5/25/25 | | 10,000 | 9,803 |
| Molson Coors Beverage Co.: | | | |
| 3% 7/15/26 | | 13,822 | 12,786 |
| 4.2% 7/15/46 | | 10,509 | 8,186 |
| PepsiCo, Inc.: | | | |
| 1.4% 2/25/31 | | 12,450 | 9,776 |
| 1.625% 5/1/30 | | 34,299 | 27,863 |
| 2.375% 10/6/26 | | 5,362 | 4,948 |
| 3% 10/15/27 | | 14,466 | 13,464 |
| 3.6% 8/13/42 | | 2,383 | 1,981 |
| 3.875% 3/19/60 | | 4,833 | 4,069 |
| 4.25% 10/22/44 | | 4,766 | 4,193 |
| 4.45% 4/14/46 | | 4,607 | 4,359 |
| The Coca-Cola Co.: | | | |
| 1.375% 3/15/31 | | 9,666 | 7,524 |
| 1.45% 6/1/27 | | 6,650 | 5,838 |
| 1.65% 6/1/30 | | 6,660 | 5,400 |
| 2.5% 6/1/40 | | 6,660 | 4,830 |
| 2.5% 3/15/51 | | 4,833 | 3,160 |
| 2.6% 6/1/50 | | 6,660 | 4,460 |
| 2.75% 6/1/60 | | 6,660 | 4,403 |
| | | | 306,880 |
| Food & Staples Retailing - 0.2% | | | |
| Costco Wholesale Corp.: | | | |
| 1.375% 6/20/27 | | 13,997 | 12,226 |
| 1.6% 4/20/30 | | 2,000 | 1,634 |
| 1.75% 4/20/32 | | 2,000 | 1,577 |
| 2.75% 5/18/24 | | 4,766 | 4,627 |
| Kroger Co.: | | | |
| 1.7% 1/15/31 | | 5,315 | 4,053 |
| 2.65% 10/15/26 | | 2,264 | 2,087 |
| 3.5% 2/1/26 | | 3,177 | 3,023 |
| 3.95% 1/15/50 | | 2,900 | 2,255 |
| 5.15% 8/1/43 | | 2,165 | 1,983 |
| 5.4% 1/15/49 | | 5,171 | 4,908 |
| Sysco Corp.: | | | |
| 3.3% 7/15/26 | | 2,606 | 2,450 |
| 3.3% 2/15/50 | | 11,213 | 7,689 |
| 3.75% 10/1/25 | | 4,528 | 4,361 |
| 6.6% 4/1/40 | | 7,830 | 8,352 |
| Walgreens Boots Alliance, Inc.: | | | |
| 3.2% 4/15/30 | | 9,966 | 8,453 |
| 3.45% 6/1/26 | | 3,972 | 3,728 |
| 4.65% 6/1/46 | | 4,369 | 3,453 |
| Walmart, Inc.: | | | |
| 2.95% 9/24/49 | | 5,027 | 3,651 |
| 3.3% 4/22/24 | | 15,092 | 14,796 |
| 3.4% 6/26/23 | | 7,435 | 7,391 |
| 3.7% 6/26/28 | | 9,771 | 9,344 |
| 4.05% 6/29/48 | | 14,433 | 12,722 |
| 4.3% 4/22/44 | | 4,766 | 4,299 |
| 5.625% 4/1/40 | | 1,589 | 1,686 |
| 5.625% 4/15/41 | | 3,654 | 3,864 |
| 6.5% 8/15/37 | | 6,573 | 7,673 |
| | | | 142,285 |
| Food Products - 0.3% | | | |
| Bunge Ltd. Finance Corp. 2.75% 5/14/31 | | 2,000 | 1,646 |
| Campbell Soup Co. 4.8% 3/15/48 | | 11,120 | 9,875 |
| Conagra Brands, Inc.: | | | |
| 4.3% 5/1/24 | | 7,126 | 7,027 |
| 4.85% 11/1/28 | | 10,827 | 10,489 |
| 5.3% 11/1/38 | | 3,936 | 3,669 |
| 5.4% 11/1/48 | | 7,130 | 6,494 |
| General Mills, Inc.: | | | |
| 2.875% 4/15/30 | | 5,778 | 4,996 |
| 3% 2/1/51 | | 4,854 | 3,414 |
| 4.2% 4/17/28 | | 13,662 | 13,108 |
| JBS U.S.A. Lux SA / JBS Food Co.: | | | |
| 3% 5/15/32 (b) | | 8,000 | 6,099 |
| 5.75% 4/1/33 (b) | | 13,250 | 12,359 |
| Kellogg Co.: | | | |
| 3.25% 4/1/26 | | 2,955 | 2,790 |
| 4.3% 5/15/28 | | 4,766 | 4,620 |
| Kraft Heinz Foods Co.: | | | |
| 3.875% 5/15/27 | | 28,999 | 27,565 |
| 4.375% 6/1/46 | | 14,500 | 11,827 |
| 5% 7/15/35 | | 1,000 | 959 |
| 5% 6/4/42 | | 9,800 | 8,892 |
| 6.875% 1/26/39 | | 2,000 | 2,174 |
| Tyson Foods, Inc.: | | | |
| 3.95% 8/15/24 | | 6,017 | 5,894 |
| 4% 3/1/26 | | 5,854 | 5,648 |
| 4.35% 3/1/29 | | 7,149 | 6,781 |
| 5.1% 9/28/48 | | 7,408 | 6,703 |
| Unilever Capital Corp.: | | | |
| 1.375% 9/14/30 | | 14,582 | 11,483 |
| 1.75% 8/12/31 | | 2,000 | 1,584 |
| 2% 7/28/26 | | 1,716 | 1,557 |
| 3.1% 7/30/25 | | 2,383 | 2,273 |
| | | | 179,926 |
| Household Products - 0.2% | | | |
| Colgate-Palmolive Co.: | | | |
| 3.1% 8/15/25 | | 2,000 | 1,921 |
| 3.25% 3/15/24 | | 7,944 | 7,791 |
| 3.25% 8/15/32 | | 2,000 | 1,809 |
| Kimberly-Clark Corp.: | | | |
| 1.05% 9/15/27 | | 16,774 | 14,241 |
| 2.4% 6/1/23 | | 6,356 | 6,312 |
| 3.1% 3/26/30 | | 3,346 | 3,001 |
| 3.2% 7/30/46 | | 1,986 | 1,475 |
| 3.95% 11/1/28 | | 6,766 | 6,486 |
| 6.625% 8/1/37 | | 1,200 | 1,394 |
| Procter & Gamble Co.: | | | |
| 1% 4/23/26 | | 9,135 | 8,135 |
| 1.95% 4/23/31 | | 14,500 | 12,091 |
| 2.3% 2/1/32 | | 2,000 | 1,688 |
| 2.85% 8/11/27 | | 3,575 | 3,329 |
| 3% 3/25/30 | | 9,868 | 8,948 |
| 3.1% 8/15/23 | | 7,944 | 7,874 |
| 5.55% 3/5/37 | | 2,000 | 2,145 |
| | | | 88,640 |
| Personal Products - 0.0% | | | �� |
| Estee Lauder Companies, Inc. 1.95% 3/15/31 | | 13,533 | 10,968 |
| Tobacco - 0.3% | | | |
| Altria Group, Inc.: | | | |
| 3.4% 2/4/41 | | 10,000 | 6,702 |
| 3.8% 2/14/24 | | 3,694 | 3,632 |
| 3.875% 9/16/46 | | 7,944 | 5,321 |
| 4.25% 8/9/42 | | 7,768 | 5,841 |
| 4.8% 2/14/29 | | 10,541 | 10,111 |
| 5.8% 2/14/39 | | 7,428 | 6,845 |
| 5.95% 2/14/49 | | 8,261 | 7,397 |
| BAT Capital Corp.: | | | |
| 3.222% 8/15/24 | | 8,182 | 7,885 |
| 3.557% 8/15/27 | | 16,817 | 15,315 |
| 4.39% 8/15/37 | | 8,622 | 6,693 |
| 4.54% 8/15/47 | | 13,298 | 9,542 |
| 4.758% 9/6/49 | | 9,666 | 7,144 |
| Philip Morris International, Inc.: | | | |
| 2.125% 5/10/23 | | 2,462 | 2,448 |
| 2.75% 2/25/26 | | 2,979 | 2,777 |
| 3.6% 11/15/23 | | 2,916 | 2,887 |
| 3.875% 8/21/42 | | 3,833 | 2,917 |
| 4.125% 3/4/43 | | 7,944 | 6,273 |
| 4.875% 2/15/28 | | 6,100 | 5,971 |
| 4.875% 11/15/43 | | 4,766 | 4,150 |
| 5.125% 11/17/27 | | 8,330 | 8,291 |
| 5.375% 2/15/33 | | 6,430 | 6,322 |
| 5.75% 11/17/32 | | 5,880 | 5,948 |
| 6.375% 5/16/38 | | 1,152 | 1,215 |
| Reynolds American, Inc.: | | | |
| 4.45% 6/12/25 | | 5,607 | 5,456 |
| 4.85% 9/15/23 | | 1,430 | 1,425 |
| 5.85% 8/15/45 | | 3,368 | 2,891 |
| 7.25% 6/15/37 | | 5,735 | 5,967 |
| | | | 157,366 |
TOTAL CONSUMER STAPLES | | | 886,065 |
| ENERGY - 1.6% | | | |
| Energy Equipment & Services - 0.0% | | | |
| Baker Hughes Co.: | | | |
| 4.08% 12/15/47 | | 19,106 | 15,127 |
| 5.125% 9/15/40 | | 1,589 | 1,493 |
| Halliburton Co.: | | | |
| 2.92% 3/1/30 | | 7,656 | 6,617 |
| 3.8% 11/15/25 | | 203 | 196 |
| 5% 11/15/45 | | 5,989 | 5,292 |
| 7.45% 9/15/39 | | 1,192 | 1,354 |
| | | | 30,079 |
| Oil, Gas & Consumable Fuels - 1.6% | | | |
| Apache Corp. 5.1% 9/1/40 | | 2,383 | 1,961 |
| Boardwalk Pipelines LP: | | | |
| 3.4% 2/15/31 | | 2,000 | 1,696 |
| 4.95% 12/15/24 | | 3,774 | 3,713 |
| BP Capital Markets PLC 3.279% 9/19/27 | | 10,121 | 9,429 |
| Canadian Natural Resources Ltd.: | | | |
| 3.9% 2/1/25 | | 1,489 | 1,441 |
| 4.95% 6/1/47 | | 5,084 | 4,419 |
| 5.85% 2/1/35 | | 9,570 | 9,212 |
| 6.25% 3/15/38 | | 5,441 | 5,484 |
| Cenovus Energy, Inc.: | | | |
| 2.65% 1/15/32 | | 5,664 | 4,482 |
| 4.25% 4/15/27 | | 7,547 | 7,206 |
| 5.4% 6/15/47 | | 7,466 | 6,721 |
| 6.75% 11/15/39 | | 1,589 | 1,661 |
| Chevron Corp.: | | | |
| 1.141% 5/11/23 | | 6,206 | 6,159 |
| 1.554% 5/11/25 | | 5,916 | 5,491 |
| 1.995% 5/11/27 | | 4,949 | 4,432 |
| 2.236% 5/11/30 | | 5,916 | 5,056 |
| 2.895% 3/3/24 | | 18,691 | 18,275 |
| 2.954% 5/16/26 | | 8,737 | 8,223 |
| 2.978% 5/11/40 | | 4,949 | 3,690 |
| 3.078% 5/11/50 | | 5,916 | 4,261 |
| Chevron U.S.A., Inc.: | | | |
| 4.2% 10/15/49 | | 3,480 | 2,905 |
| 4.95% 8/15/47 | | 10,963 | 10,262 |
| Columbia Pipeline Group, Inc. 4.5% 6/1/25 | | 2,641 | 2,581 |
| ConocoPhillips Co.: | | | |
| 5.95% 3/15/46 | | 4,766 | 5,075 |
| 6.5% 2/1/39 | | 5,981 | 6,740 |
| DCP Midstream Operating LP: | | | |
| 3.25% 2/15/32 | | 1,000 | 828 |
| 8.125% 8/16/30 | | 2,000 | 2,215 |
| Devon Energy Corp.: | | | |
| 5% 6/15/45 | | 13,220 | 11,198 |
| 5.6% 7/15/41 | | 2,283 | 2,105 |
| Eastern Gas Transmission & Storage, Inc. 3.9% 11/15/49 | | 9,666 | 7,105 |
| Enbridge, Inc.: | | | |
| 3.5% 6/10/24 | | 2,244 | 2,186 |
| 5.5% 12/1/46 | | 11,511 | 10,856 |
| Energy Transfer LP: | | | |
| 3.75% 5/15/30 | | 13,291 | 11,791 |
| 3.9% 7/15/26 | | 5,974 | 5,639 |
| 4.95% 6/15/28 | | 7,490 | 7,234 |
| 5% 5/15/50 | | 14,074 | 11,533 |
| 5.15% 3/15/45 | | 6,356 | 5,334 |
| 5.3% 4/1/44 | | 4,607 | 3,946 |
| 5.4% 10/1/47 | | 4,369 | 3,756 |
| 5.8% 6/15/38 | | 6,960 | 6,521 |
| 6% 6/15/48 | | 15,589 | 14,337 |
| 6.25% 4/15/49 | | 2,315 | 2,202 |
| Enterprise Products Operating LP: | | | |
| 3.3% 2/15/53 | | 3,026 | 2,053 |
| 3.7% 2/15/26 | | 1,405 | 1,349 |
| 3.95% 2/15/27 | | 20,557 | 19,630 |
| 4.2% 1/31/50 | | 4,727 | 3,794 |
| 4.25% 2/15/48 | | 15,839 | 12,825 |
| 4.8% 2/1/49 | | 5,834 | 5,104 |
| 4.85% 8/15/42 | | 1,986 | 1,780 |
| 4.85% 3/15/44 | | 3,972 | 3,528 |
| 4.9% 5/15/46 | | 3,400 | 2,980 |
| 5.35% 1/31/33 | | 7,800 | 7,795 |
| 5.7% 2/15/42 | | 1,589 | 1,561 |
| 7.55% 4/15/38 | | 1,589 | 1,789 |
| EOG Resources, Inc. 4.15% 1/15/26 | | 4,448 | 4,343 |
| EQT Corp. 5.7% 4/1/28 | | 6,471 | 6,361 |
| Equinor ASA: | | | |
| 2.375% 5/22/30 | | 9,144 | 7,799 |
| 3.125% 4/6/30 | | 7,926 | 7,139 |
| 3.625% 9/10/28 | | 9,596 | 9,094 |
| 3.7% 3/1/24 | | 2,899 | 2,854 |
| 3.7% 4/6/50 | | 12,681 | 10,211 |
| 5.1% 8/17/40 | | 1,589 | 1,578 |
| Exxon Mobil Corp.: | | | |
| 1.571% 4/15/23 | | 28,999 | 28,870 |
| 2.726% 3/1/23 | | 7,944 | 7,944 |
| 3.043% 3/1/26 | | 6,618 | 6,271 |
| 3.452% 4/15/51 | | 3,316 | 2,529 |
| 3.482% 3/19/30 | | 19,333 | 17,923 |
| 3.567% 3/6/45 | | 5,282 | 4,176 |
| Hess Corp.: | | | |
| 3.5% 7/15/24 | | 3,019 | 2,947 |
| 5.6% 2/15/41 | | 2,701 | 2,523 |
| 5.8% 4/1/47 | | 3,383 | 3,198 |
| 6% 1/15/40 | | 2,000 | 1,964 |
| Kinder Morgan Energy Partners LP: | | | |
| 3.5% 9/1/23 | | 1,589 | 1,575 |
| 4.25% 9/1/24 | | 11,915 | 11,678 |
| 4.7% 11/1/42 | | 3,019 | 2,504 |
| 5% 3/1/43 | | 795 | 676 |
| 5.5% 3/1/44 | | 5,558 | 5,020 |
| 5.625% 9/1/41 | | 795 | 727 |
| 6.55% 9/15/40 | | 2,383 | 2,386 |
| Kinder Morgan, Inc.: | | | |
| 4.3% 3/1/28 | | 7,919 | 7,553 |
| 4.8% 2/1/33 | | 2,000 | 1,853 |
| 5.2% 6/1/33 | | 5,970 | 5,685 |
| 5.2% 3/1/48 | | 6,974 | 6,059 |
| 5.3% 12/1/34 | | 6,792 | 6,370 |
| 5.55% 6/1/45 | | 7,733 | 6,992 |
| Magellan Midstream Partners LP: | | | |
| 4.25% 9/15/46 | | 4,369 | 3,365 |
| 5% 3/1/26 | | 2,383 | 2,352 |
| Marathon Oil Corp.: | | | |
| 5.2% 6/1/45 | | 3,972 | 3,346 |
| 6.6% 10/1/37 | | 2,000 | 1,992 |
| Marathon Petroleum Corp.: | | | |
| 4.5% 4/1/48 | | 4,630 | 3,707 |
| 4.7% 5/1/25 | | 17,399 | 17,154 |
| 6.5% 3/1/41 | | 795 | 822 |
| MPLX LP: | | | |
| 4.125% 3/1/27 | | 7,506 | 7,161 |
| 4.7% 4/15/48 | | 15,489 | 12,449 |
| 4.8% 2/15/29 | | 7,300 | 7,012 |
| 5.2% 3/1/47 | | 4,861 | 4,190 |
| 5.5% 2/15/49 | | 6,892 | 6,188 |
| ONEOK, Inc.: | | | |
| 3.1% 3/15/30 | | 2,000 | 1,697 |
| 3.4% 9/1/29 | | 1,300 | 1,128 |
| 4.35% 3/15/29 | | 2,000 | 1,857 |
| 4.45% 9/1/49 | | 4,640 | 3,506 |
| 4.95% 7/13/47 | | 4,647 | 3,820 |
| 5.2% 7/15/48 | | 2,399 | 2,043 |
| 6.1% 11/15/32 | | 8,780 | 8,826 |
| Ovintiv, Inc. 6.5% 2/1/38 | | 7,055 | 6,919 |
| Phillips 66 Co.: | | | |
| 0.9% 2/15/24 | | 2,000 | 1,915 |
| 3.85% 4/9/25 | | 2,000 | 1,941 |
| 3.9% 3/15/28 | | 2,000 | 1,889 |
| 4.65% 11/15/34 | | 2,000 | 1,866 |
| 4.875% 11/15/44 | | 795 | 724 |
| 5.875% 5/1/42 | | 7,547 | 7,835 |
| Plains All American Pipeline LP/PAA Finance Corp.: | | | |
| 3.55% 12/15/29 | | 1,000 | 867 |
| 3.6% 11/1/24 | | 5,719 | 5,534 |
| 4.65% 10/15/25 | | 9,730 | 9,493 |
| 4.9% 2/15/45 | | 1,509 | 1,188 |
| 6.65% 1/15/37 | | 4,220 | 4,204 |
| Sabine Pass Liquefaction LLC 4.5% 5/15/30 | | 15,000 | 14,051 |
| Shell International Finance BV: | | | |
| 2% 11/7/24 | | 7,830 | 7,441 |
| 2.375% 11/7/29 | | 26,293 | 22,566 |
| 3.125% 11/7/49 | | 11,116 | 7,967 |
| 3.25% 5/11/25 | | 11,249 | 10,834 |
| 3.5% 11/13/23 | | 5,561 | 5,494 |
| 3.875% 11/13/28 | | 6,766 | 6,459 |
| 4% 5/10/46 | | 3,177 | 2,639 |
| 4.375% 5/11/45 | | 10,565 | 9,343 |
| 6.375% 12/15/38 | | 5,337 | 5,924 |
| Spectra Energy Partners LP: | | | |
| 3.375% 10/15/26 | | 12,956 | 12,085 |
| 4.75% 3/15/24 | | 3,833 | 3,799 |
| Suncor Energy, Inc.: | | | |
| 4% 11/15/47 | | 3,972 | 3,104 |
| 6.8% 5/15/38 | | 6,708 | 7,150 |
| 6.85% 6/1/39 | | 1,589 | 1,695 |
| Targa Resources Corp.: | | | |
| 4.95% 4/15/52 | | 6,000 | 4,799 |
| 6.125% 3/15/33 | | 9,100 | 9,140 |
| Targa Resources Partners LP/Targa Resources Partners Finance Corp.: | | | |
| 4% 1/15/32 | | 2,000 | 1,695 |
| 4.875% 2/1/31 | | 2,000 | 1,816 |
| 5% 1/15/28 | | 1,300 | 1,238 |
| 5.5% 3/1/30 | | 2,000 | 1,894 |
| The Williams Companies, Inc.: | | | |
| 3.75% 6/15/27 | | 18,557 | 17,441 |
| 3.9% 1/15/25 | | 2,800 | 2,718 |
| 4.55% 6/24/24 | | 4,507 | 4,445 |
| 4.85% 3/1/48 | | 6,697 | 5,751 |
| 5.4% 3/2/26 | | 3,600 | 3,600 |
| 5.65% 3/15/33 | | 2,610 | 2,607 |
| 5.75% 6/24/44 | | 1,509 | 1,439 |
| Total Capital International SA: | | | |
| 3.127% 5/29/50 | | 2,832 | 2,027 |
| 3.455% 2/19/29 | | 16,952 | 15,668 |
| 3.461% 7/12/49 | | 5,181 | 3,950 |
| 3.75% 4/10/24 | | 1,589 | 1,561 |
| TransCanada PipeLines Ltd.: | | | |
| 4.625% 3/1/34 | | 10,000 | 9,113 |
| 4.75% 5/15/38 | | 8,334 | 7,456 |
| 4.875% 1/15/26 | | 3,972 | 3,917 |
| 4.875% 5/15/48 | | 3,908 | 3,432 |
| 5.1% 3/15/49 | | 2,778 | 2,523 |
| 6.1% 6/1/40 | | 5,321 | 5,383 |
| Transcontinental Gas Pipe Line Co. LLC: | | | |
| 3.25% 5/15/30 | | 4,640 | 4,040 |
| 3.95% 5/15/50 | | 4,640 | 3,595 |
| 4.45% 8/1/42 | | 6,157 | 5,278 |
| 4.6% 3/15/48 | | 3,177 | 2,718 |
| Valero Energy Corp.: | | | |
| 2.85% 4/15/25 | | 13,126 | 12,433 |
| 4% 4/1/29 | | 7,408 | 6,986 |
| 4% 6/1/52 | | 5,100 | 3,846 |
| 6.625% 6/15/37 | | 7,605 | 8,068 |
| | | | 918,469 |
TOTAL ENERGY | | | 948,548 |
| FINANCIALS - 8.5% | | | |
| Banks - 4.9% | | | |
| Australia and New Zealand Banking Group Ltd. 3.7% 11/16/25 | | 5,696 | 5,479 |
| Banco Bilbao Vizcaya Argentaria SA 6.138% 9/14/28 (c) | | 2,000 | 2,026 |
| Banco Santander SA: | | | |
| 1.849% 3/25/26 | | 13,000 | 11,523 |
| 2.749% 12/3/30 | | 1,000 | 781 |
| 2.958% 3/25/31 | | 14,400 | 11,754 |
| 3.225% 11/22/32 (c) | | 7,800 | 6,043 |
| 4.175% 3/24/28 (c) | | 6,000 | 5,607 |
| 5.294% 8/18/27 | | 2,000 | 1,959 |
| Bank of America Corp.: | | | |
| 3 month U.S. LIBOR + 0.640% 2.015% 2/13/26 (c)(d) | | 20,058 | 18,662 |
| U.S. Secured Overnight Fin. Rate (SOFR) Index + 0.650% 1.53% 12/6/25 (c)(d) | | 39,149 | 36,392 |
| U.S. Secured Overnight Fin. Rate (SOFR) Index + 1.290% 5.08% 1/20/27 (c)(d) | | 22,900 | 22,661 |
| 1.658% 3/11/27 (c) | | 15,408 | 13,721 |
| 1.734% 7/22/27 (c) | | 19,987 | 17,604 |
| 2.087% 6/14/29 (c) | | 4,543 | 3,820 |
| 2.299% 7/21/32 (c) | | 7,772 | 6,078 |
| 2.482% 9/21/36 (c) | | 2,100 | 1,573 |
| 2.651% 3/11/32 (c) | | 14,674 | 11,920 |
| 2.676% 6/19/41 (c) | | 18,560 | 12,713 |
| 2.687% 4/22/32 (c) | | 7,115 | 5,771 |
| 2.831% 10/24/51 (c) | | 7,984 | 5,112 |
| 2.972% 7/21/52 (c) | | 7,772 | 5,097 |
| 3.194% 7/23/30 (c) | | 38,178 | 33,172 |
| 3.248% 10/21/27 | | 2,979 | 2,743 |
| 3.311% 4/22/42 (c) | | 15,200 | 11,302 |
| 3.366% 1/23/26 (c) | | 20,987 | 20,089 |
| 3.419% 12/20/28 (c) | | 24,064 | 21,903 |
| 3.593% 7/21/28 (c) | | 8,818 | 8,129 |
| 3.705% 4/24/28 (c) | | 6,991 | 6,503 |
| 3.824% 1/20/28 (c) | | 17,200 | 16,143 |
| 3.846% 3/8/37 (c) | | 5,703 | 4,812 |
| 3.864% 7/23/24 (c) | | 19,303 | 19,160 |
| 3.97% 3/5/29 (c) | | 17,399 | 16,154 |
| 3.974% 2/7/30 (c) | | 11,231 | 10,274 |
| 4% 4/1/24 | | 3,864 | 3,806 |
| 4% 1/22/25 | | 4,766 | 4,643 |
| 4.083% 3/20/51 (c) | | 5,027 | 4,036 |
| 4.1% 7/24/23 | | 5,561 | 5,536 |
| 4.183% 11/25/27 | | 12,307 | 11,733 |
| 4.2% 8/26/24 | | 6,752 | 6,621 |
| 4.244% 4/24/38 (c) | | 2,000 | 1,730 |
| 4.25% 10/22/26 | | 3,177 | 3,051 |
| 4.271% 7/23/29 (c) | | 14,306 | 13,428 |
| 4.33% 3/15/50 (c) | | 10,398 | 8,745 |
| 4.443% 1/20/48 (c) | | 12,114 | 10,450 |
| 4.45% 3/3/26 | | 10,327 | 10,040 |
| 4.948% 7/22/28 (c) | | 5,000 | 4,890 |
| 5% 1/21/44 | | 4,265 | 4,039 |
| 5.015% 7/22/33 (c) | | 8,900 | 8,563 |
| 5.875% 2/7/42 | | 2,610 | 2,717 |
| 6.11% 1/29/37 | | 6,621 | 6,806 |
| 6.204% 11/10/28 (c) | | 7,700 | 7,917 |
| 7.75% 5/14/38 | | 3,317 | 3,915 |
| Bank of Montreal: | | | |
| 3.3% 2/5/24 | | 12,876 | 12,620 |
| 3.803% 12/15/32 (c) | | 9,260 | 8,244 |
| 4.7% 9/14/27 | | 9,700 | 9,485 |
| Bank of Nova Scotia: | | | |
| 3.4% 2/11/24 | | 32,120 | 31,510 |
| 4.5% 12/16/25 | | 12,615 | 12,227 |
| 4.75% 2/2/26 | | 3,500 | 3,444 |
| 4.85% 2/1/30 | | 12,240 | 11,875 |
| Barclays PLC: | | | |
| 2.279% 11/24/27 (c) | | 14,500 | 12,757 |
| 2.852% 5/7/26 (c) | | 10,633 | 9,956 |
| 2.894% 11/24/32 (c) | | 15,080 | 11,709 |
| 3.564% 9/23/35 (c) | | 7,500 | 5,980 |
| 3.932% 5/7/25 (c) | | 12,593 | 12,257 |
| 4.337% 1/10/28 | | 4,602 | 4,295 |
| 4.375% 1/12/26 | | 4,289 | 4,145 |
| 4.836% 5/9/28 | | 7,626 | 7,145 |
| 4.95% 1/10/47 | | 12,837 | 11,486 |
| 5.25% 8/17/45 | | 4,602 | 4,269 |
| BB&T Corp. 3.75% 12/6/23 | | 13,978 | 13,840 |
| BPCE SA 4% 4/15/24 | | 1,716 | 1,686 |
| Canadian Imperial Bank of Commerce 3.6% 4/7/32 | | 11,525 | 10,160 |
| Citigroup, Inc.: | | | |
| 3 month U.S. LIBOR + 1.020% 4.044% 6/1/24 (c)(d) | | 15,887 | 15,823 |
| 3 month U.S. LIBOR + 1.150% 3.52% 10/27/28 (c)(d) | | 18,312 | 16,761 |
| 1.122% 1/28/27 (c) | | 14,113 | 12,401 |
| 2.561% 5/1/32 (c) | | 11,986 | 9,624 |
| 2.904% 11/3/42 (c) | | 9,400 | 6,505 |
| 3.106% 4/8/26 (c) | | 24,746 | 23,499 |
| 3.668% 7/24/28 (c) | | 32,410 | 30,024 |
| 3.7% 1/12/26 | | 10,841 | 10,398 |
| 3.785% 3/17/33 (c) | | 11,300 | 9,824 |
| 3.887% 1/10/28 (c) | | 3,575 | 3,359 |
| 3.98% 3/20/30 (c) | | 28,276 | 25,788 |
| 4.125% 7/25/28 | | 17,365 | 16,251 |
| 4.4% 6/10/25 | | 3,177 | 3,108 |
| 4.412% 3/31/31 (c) | | 7,733 | 7,188 |
| 4.45% 9/29/27 | | 28,129 | 26,863 |
| 4.6% 3/9/26 | | 4,766 | 4,641 |
| 4.65% 7/23/48 | | 11,261 | 10,101 |
| 4.75% 5/18/46 | | 6,251 | 5,360 |
| 5.3% 5/6/44 | | 1,589 | 1,493 |
| 5.5% 9/13/25 | | 3,972 | 3,979 |
| 5.875% 1/30/42 | | 4,328 | 4,504 |
| 8.125% 7/15/39 | | 6,356 | 8,052 |
| Citizens Financial Group, Inc. 2.638% 9/30/32 | | 3,302 | 2,515 |
| Comerica, Inc. 3.8% 7/22/26 | | 2,899 | 2,752 |
| Commonwealth Bank of Australia New York Branch 5.079% 1/10/25 | | 2,900 | 2,896 |
| Discover Bank 4.2% 8/8/23 | | 5,753 | 5,720 |
| Export-Import Bank of Korea: | | | |
| 0.625% 2/9/26 | | 20,831 | 18,247 |
| 1.125% 12/29/26 | | 3,300 | 2,827 |
| 2.375% 6/25/24 | | 3,000 | 2,883 |
| 2.875% 1/21/25 | | 6,037 | 5,775 |
| Fifth Third Bancorp: | | | |
| 2.55% 5/5/27 | | 11,793 | 10,679 |
| 4.772% 7/28/30 (c) | | 6,100 | 5,848 |
| 8.25% 3/1/38 | | 3,651 | 4,554 |
| HSBC Holdings PLC: | | | |
| 1.589% 5/24/27 (c) | | 2,000 | 1,750 |
| 1.645% 4/18/26 (c) | | 2,000 | 1,832 |
| 2.013% 9/22/28 (c) | | 38,714 | 32,772 |
| 2.099% 6/4/26 (c) | | 14,500 | 13,343 |
| 2.251% 11/22/27 (c) | | 2,000 | 1,759 |
| 2.804% 5/24/32 (c) | | 11,000 | 8,781 |
| 3.803% 3/11/25 (c) | | 25,805 | 25,263 |
| 3.9% 5/25/26 | | 8,737 | 8,328 |
| 4.25% 3/14/24 | | 5,200 | 5,122 |
| 4.25% 8/18/25 | | 4,602 | 4,441 |
| 4.292% 9/12/26 (c) | | 38,971 | 37,515 |
| 4.375% 11/23/26 | | 22,797 | 21,884 |
| 4.755% 6/9/28 (c) | | 7,000 | 6,724 |
| 4.762% 3/29/33 (c) | | 8,100 | 7,278 |
| 4.95% 3/31/30 | | 11,528 | 11,108 |
| 5.21% 8/11/28 (c) | | 2,000 | 1,956 |
| 5.25% 3/14/44 | | 3,946 | 3,564 |
| 6.5% 9/15/37 | | 8,340 | 8,336 |
| 6.8% 6/1/38 | | 4,833 | 4,959 |
| HSBC U.S.A., Inc. 3.5% 6/23/24 | | 5,561 | 5,422 |
| Huntington Bancshares, Inc. 4.443% 8/4/28 (c) | | 3,100 | 2,961 |
| Huntington National Bank 4.552% 5/17/28 (c) | | 10,000 | 9,659 |
| ING Groep NV: | | | |
| 1.726% 4/1/27 (c) | | 7,323 | 6,500 |
| 2.727% 4/1/32 (c) | | 7,404 | 5,973 |
| 4.252% 3/28/33 (c) | | 7,800 | 7,011 |
| Japan Bank International Cooperation: | | | |
| 1.25% 1/21/31 | | 31,080 | 24,423 |
| 1.875% 7/21/26 | | 3,260 | 2,947 |
| 2.125% 2/10/25 | | 1,716 | 1,620 |
| 2.25% 11/4/26 | | 4,486 | 4,083 |
| 2.375% 4/20/26 | | 10,372 | 9,599 |
| 2.75% 1/21/26 | | 2,720 | 2,562 |
| 2.875% 6/1/27 | | 6,038 | 5,585 |
| 3.25% 7/20/28 | | 7,150 | 6,644 |
| 3.375% 10/31/23 | | 25,810 | 25,461 |
| JPMorgan Chase & Co.: | | | |
| 0.768% 8/9/25 (c) | | 35,959 | 33,391 |
| 1.47% 9/22/27 (c) | | 23,779 | 20,615 |
| 1.953% 2/4/32 (c) | | 12,760 | 9,909 |
| 2.083% 4/22/26 (c) | | 29,270 | 27,179 |
| 2.522% 4/22/31 (c) | | 9,521 | 7,872 |
| 2.545% 11/8/32 (c) | | 18,588 | 14,862 |
| 2.95% 10/1/26 | | 20,041 | 18,637 |
| 2.956% 5/13/31 (c) | | 9,908 | 8,321 |
| 3.109% 4/22/51 (c) | | 11,841 | 8,066 |
| 3.22% 3/1/25 (c) | | 13,853 | 13,520 |
| 3.3% 4/1/26 | | 7,149 | 6,763 |
| 3.375% 5/1/23 | | 1,509 | 1,505 |
| 3.509% 1/23/29 (c) | | 25,133 | 22,983 |
| 3.54% 5/1/28 (c) | | 13,504 | 12,488 |
| 3.559% 4/23/24 (c) | | 7,944 | 7,918 |
| 3.797% 7/23/24 (c) | | 11,002 | 10,923 |
| 3.875% 9/10/24 | | 25,995 | 25,375 |
| 3.882% 7/24/38 (c) | | 13,575 | 11,316 |
| 3.9% 7/15/25 | | 17,158 | 16,666 |
| 3.96% 1/29/27 (c) | | 9,666 | 9,256 |
| 3.964% 11/15/48 (c) | | 7,466 | 5,991 |
| 4.005% 4/23/29 (c) | | 16,311 | 15,156 |
| 4.125% 12/15/26 | | 4,667 | 4,503 |
| 4.203% 7/23/29 (c) | | 34,701 | 32,531 |
| 4.323% 4/26/28 (c) | | 9,454 | 9,063 |
| 4.452% 12/5/29 (c) | | 9,705 | 9,197 |
| 4.586% 4/26/33 (c) | | 9,454 | 8,811 |
| 4.85% 2/1/44 | | 3,972 | 3,720 |
| 4.912% 7/25/33 (c) | | 20,900 | 20,012 |
| 4.95% 6/1/45 | | 7,581 | 6,968 |
| 5.5% 10/15/40 | | 4,528 | 4,562 |
| 5.6% 7/15/41 | | 1,192 | 1,213 |
| 5.625% 8/16/43 | | 3,972 | 3,960 |
| 6.4% 5/15/38 | | 10,000 | 10,947 |
| KeyBank NA 3.4% 5/20/26 | | 4,289 | 4,007 |
| KeyCorp 4.789% 6/1/33 (c) | | 7,300 | 6,842 |
| Korea Development Bank: | | | |
| 0.4% 6/19/24 | | 8,700 | 8,158 |
| 1.625% 1/19/31 | | 10,633 | 8,430 |
| Lloyds Banking Group PLC: | | | |
| 3.574% 11/7/28 (c) | | 2,000 | 1,814 |
| 3.75% 3/18/28 (c) | | 2,000 | 1,851 |
| 3.87% 7/9/25 (c) | | 4,310 | 4,198 |
| 4.344% 1/9/48 | | 11,915 | 9,210 |
| 4.582% 12/10/25 | | 9,260 | 8,907 |
| 4.65% 3/24/26 | | 6,831 | 6,582 |
| 4.716% 8/11/26 (c) | | 2,000 | 1,950 |
| 4.976% 8/11/33 (c) | | 2,000 | 1,863 |
| 5.871% 3/6/29 (c) | | 10,800 | 10,802 |
| Mitsubishi UFJ Financial Group, Inc.: | | | |
| 1 year U.S. Treasury Index + 1.630% 5.441% 2/22/34 (c)(d) | | 6,660 | 6,546 |
| 1.538% 7/20/27 (c) | | 8,941 | 7,822 |
| 2.309% 7/20/32 (c) | | 8,700 | 6,793 |
| 2.801% 7/18/24 | | 6,482 | 6,244 |
| 3.195% 7/18/29 | | 11,297 | 9,919 |
| 3.455% 3/2/23 | | 14,568 | 14,568 |
| 3.751% 7/18/39 | | 6,297 | 5,297 |
| 3.85% 3/1/26 | | 538 | 513 |
| 3.961% 3/2/28 | | 17,476 | 16,451 |
| 5.133% 7/20/33 (c) | | 6,600 | 6,372 |
| 5.422% 2/22/29 (c) | | 12,500 | 12,413 |
| Mizuho Financial Group, Inc.: | | | |
| 1.554% 7/9/27 (c) | | 9,183 | 7,998 |
| 2.226% 5/25/26 (c) | | 10,826 | 9,995 |
| 2.26% 7/9/32 (c) | | 9,086 | 7,032 |
| 2.591% 5/25/31 (c) | | 13,146 | 10,759 |
| 3.549% 3/5/23 | | 9,532 | 9,530 |
| National Australia Bank Ltd. 5.132% 11/22/24 | | 9,111 | 9,110 |
| NatWest Group PLC: | | | |
| 3 month U.S. LIBOR + 1.750% 4.892% 5/18/29 (c)(d) | | 6,766 | 6,468 |
| 3.754% 11/1/29 (c) | | 10,246 | 9,611 |
| 3.875% 9/12/23 | | 3,260 | 3,228 |
| 4.445% 5/8/30 (c) | | 5,748 | 5,300 |
| 4.8% 4/5/26 | | 10,366 | 10,094 |
| 5.516% 9/30/28 (c) | | 9,700 | 9,604 |
| Oesterreichische Kontrollbank AG 0.375% 9/17/25 | | 8,660 | 7,766 |
| PNC Financial Services Group, Inc.: | | | |
| U.S. Secured Overnight Fin. Rate (SOFR) Averages Index + 0.000% 4.626% 6/6/33 (c)(d) | | 5,000 | 4,644 |
| 1.15% 8/13/26 | | 10,008 | 8,790 |
| 2.2% 11/1/24 | | 5,355 | 5,109 |
| 2.6% 7/23/26 | | 19,333 | 17,852 |
| 3.5% 1/23/24 | | 13,891 | 13,673 |
| 3.9% 4/29/24 | | 4,488 | 4,414 |
| 5.354% 12/2/28 (c) | | 11,710 | 11,741 |
| Rabobank Nederland: | | | |
| 3.75% 7/21/26 | | 15,291 | 14,340 |
| 4.375% 8/4/25 | | 5,147 | 4,986 |
| 5.25% 5/24/41 | | 2,383 | 2,485 |
| Rabobank Nederland New York Branch 3.375% 5/21/25 | | 3,217 | 3,093 |
| Royal Bank of Canada: | | | |
| 1.2% 4/27/26 | | 8,922 | 7,922 |
| 2.05% 1/21/27 | | 16,433 | 14,736 |
| 3.625% 5/4/27 | | 7,900 | 7,429 |
| 4.65% 1/27/26 | | 10,319 | 10,067 |
| 6% 11/1/27 | | 10,000 | 10,291 |
| Santander Holdings U.S.A., Inc.: | | | |
| 2.49% 1/6/28 (c) | | 2,000 | 1,742 |
| 4.26% 6/9/25 (c) | | 10,000 | 9,717 |
| 4.4% 7/13/27 | | 4,600 | 4,370 |
| Santander UK Group Holdings PLC: | | | |
| 2.469% 1/11/28 (c) | | 9,666 | 8,463 |
| 2.896% 3/15/32 (c) | | 1,600 | 1,271 |
| 6.534% 1/10/29 (c) | | 8,050 | 8,148 |
| Sumitomo Mitsui Banking Corp. 3.4% 7/11/24 | | 4,911 | 4,775 |
| Sumitomo Mitsui Financial Group, Inc.: | | | |
| 1.474% 7/8/25 | | 11,310 | 10,291 |
| 2.142% 9/23/30 | | 11,020 | 8,668 |
| 2.174% 1/14/27 | | 22,619 | 20,073 |
| 2.348% 1/15/25 | | 7,153 | 6,746 |
| 2.75% 1/15/30 | | 6,766 | 5,712 |
| 3.05% 1/14/42 | | 11,600 | 8,253 |
| 3.936% 10/16/23 | | 12,456 | 12,343 |
| 5.52% 1/13/28 | | 13,700 | 13,664 |
| 5.766% 1/13/33 | | 7,800 | 7,863 |
| SVB Financial Group: | | | |
| 4.345% 4/29/28 (c) | | 1,200 | 1,143 |
| 4.57% 4/29/33 (c) | | 4,700 | 4,243 |
| The Toronto-Dominion Bank: | | | |
| 2.65% 6/12/24 | | 18,463 | 17,852 |
| 3.25% 3/11/24 | | 24,166 | 23,645 |
| 3.5% 7/19/23 | | 7,944 | 7,892 |
| 4.108% 6/8/27 | | 9,800 | 9,394 |
| 4.693% 9/15/27 | | 10,000 | 9,782 |
| 5.156% 1/10/28 | | 22,920 | 22,814 |
| Truist Financial Corp.: | | | |
| 1.267% 3/2/27 (c) | | 26,042 | 23,176 |
| 4.916% 7/28/33 (c) | | 4,850 | 4,578 |
| 5.122% 1/26/34 (c) | | 7,900 | 7,687 |
| U.S. Bancorp: | | | |
| 1.375% 7/22/30 | | 9,666 | 7,492 |
| 2.677% 1/27/33 (c) | | 6,900 | 5,707 |
| 3% 7/30/29 | | 8,603 | 7,542 |
| 3.1% 4/27/26 | | 7,149 | 6,710 |
| 4.839% 2/1/34 (c) | | 12,000 | 11,487 |
| Wells Fargo & Co.: | | | |
| 2.164% 2/11/26 (c) | | 31,482 | 29,422 |
| 2.188% 4/30/26 (c) | | 23,344 | 21,705 |
| 2.406% 10/30/25 (c) | | 40,463 | 38,380 |
| 2.572% 2/11/31 (c) | | 18,666 | 15,537 |
| 3% 10/23/26 | | 16,149 | 14,906 |
| 3.068% 4/30/41 (c) | | 14,113 | 10,227 |
| 3.3% 9/9/24 | | 3,673 | 3,565 |
| 3.35% 3/2/33 (c) | | 4,543 | 3,841 |
| 3.526% 3/24/28 (c) | | 5,000 | 4,630 |
| 3.55% 9/29/25 | | 3,368 | 3,223 |
| 3.584% 5/22/28 (c) | | 8,313 | 7,692 |
| 3.75% 1/24/24 | | 34,064 | 33,552 |
| 3.9% 5/1/45 | | 3,781 | 2,994 |
| 4.1% 6/3/26 | | 2,562 | 2,459 |
| 4.4% 6/14/46 | | 5,672 | 4,648 |
| 4.48% 1/16/24 | | 3,030 | 3,004 |
| 4.54% 8/15/26 (c) | | 10,000 | 9,758 |
| 4.75% 12/7/46 | | 12,709 | 10,898 |
| 4.897% 7/25/33 (c) | | 19,800 | 18,912 |
| 4.9% 11/17/45 | | 7,663 | 6,774 |
| 5.013% 4/4/51 (c) | | 4,814 | 4,430 |
| 5.375% 11/2/43 | | 5,336 | 5,043 |
| 5.606% 1/15/44 | | 9,040 | 8,796 |
| Westpac Banking Corp.: | | | |
| U.S. TREASURY 1 YEAR INDEX + 2.680% 5.405% 8/10/33 (c)(d) | | 2,000 | 1,915 |
| 1.953% 11/20/28 | | 5,800 | 4,955 |
| 2.668% 11/15/35 (c) | | 2,000 | 1,536 |
| 2.85% 5/13/26 | | 3,774 | 3,518 |
| 3.02% 11/18/36 (c) | | 2,000 | 1,535 |
| 3.3% 2/26/24 | | 25,805 | 25,267 |
| 4.11% 7/24/34 (c) | | 11,666 | 10,317 |
| 4.421% 7/24/39 | | 6,630 | 5,564 |
| 5.35% 10/18/24 | | 4,800 | 4,809 |
| 5.457% 11/18/27 | | 10,000 | 10,168 |
| Zions Bancorp NA 4.5% 6/13/23 | | 165 | 165 |
| | | | 2,823,049 |
| Capital Markets - 1.8% | | | |
| Affiliated Managers Group, Inc. 3.5% 8/1/25 | | 3,774 | 3,621 |
| Ares Capital Corp.: | | | |
| 2.15% 7/15/26 | | 20,441 | 17,611 |
| 3.25% 7/15/25 | | 5,027 | 4,676 |
| Bank of New York Mellon Corp.: | | | |
| 1.8% 7/28/31 | | 16,619 | 12,958 |
| 2.8% 5/4/26 | | 4,472 | 4,174 |
| 4.414% 7/24/26 (c) | | 17,300 | 16,970 |
| 4.543% 2/1/29 (c) | | 7,200 | 6,996 |
| Bank of New York, New York 5.224% 11/21/25 (c) | | 10,000 | 9,965 |
| BlackRock, Inc.: | | | |
| 2.1% 2/25/32 | | 11,503 | 9,202 |
| 3.5% 3/18/24 | | 2,303 | 2,265 |
| Brookfield Finance, Inc. 2.724% 4/15/31 | | 19,988 | 16,281 |
| Charles Schwab Corp.: | | | |
| 0.75% 3/18/24 | | 22,246 | 21,214 |
| 2% 3/20/28 | | 16,771 | 14,614 |
| 2.45% 3/3/27 | | 19,333 | 17,534 |
| 2.9% 3/3/32 | | 7,200 | 6,090 |
| CI Financial Corp. 3.2% 12/17/30 | | 2,000 | 1,516 |
| CME Group, Inc.: | | | |
| 2.65% 3/15/32 | | 2,803 | 2,350 |
| 5.3% 9/15/43 | | 4,930 | 5,027 |
| Credit Suisse AG: | | | |
| 3.625% 9/9/24 | | 7,884 | 7,452 |
| 5% 7/9/27 | | 2,000 | 1,833 |
| Credit Suisse Group AG: | | | |
| 3.8% 6/9/23 | | 15,887 | 15,696 |
| 4.55% 4/17/26 | | 8,685 | 7,759 |
| 4.875% 5/15/45 | | 8,979 | 6,547 |
| Deutsche Bank AG: | | | |
| 4.1% 1/13/26 | | 9,570 | 9,128 |
| 4.5% 4/1/25 | | 2,573 | 2,481 |
| Deutsche Bank AG New York Branch: | | | |
| 2.311% 11/16/27 (c) | | 4,949 | 4,297 |
| 3.035% 5/28/32 (c) | | 9,100 | 7,169 |
| 3.7% 5/30/24 | | 7,785 | 7,562 |
| 3.729% 1/14/32 (c) | | 10,100 | 7,922 |
| 4.1% 1/13/26 | | 17,316 | 16,562 |
| Eaton Vance Corp. 3.625% 6/15/23 | | 2,244 | 2,234 |
| Franklin Resources, Inc.: | | | |
| 1.6% 10/30/30 | | 2,000 | 1,548 |
| 2.85% 3/30/25 | | 3,019 | 2,865 |
| GE Capital Funding LLC 4.4% 5/15/30 | | 5,000 | 4,589 |
| Goldman Sachs Group, Inc.: | | | |
| 0.855% 2/12/26 (c) | | 13,639 | 12,383 |
| 1.093% 12/9/26 (c) | | 33,156 | 29,184 |
| 2.383% 7/21/32 (c) | | 22,445 | 17,629 |
| 2.6% 2/7/30 | | 9,666 | 8,131 |
| 2.615% 4/22/32 (c) | | 24,562 | 19,726 |
| 2.65% 10/21/32 (c) | | 12,566 | 10,019 |
| 3.102% 2/24/33 (c) | | 5,000 | 4,121 |
| 3.272% 9/29/25 (c) | | 4,833 | 4,646 |
| 3.436% 2/24/43 (c) | | 5,063 | 3,778 |
| 3.5% 1/23/25 | | 41,477 | 40,076 |
| 3.625% 2/20/24 | | 8,340 | 8,190 |
| 3.691% 6/5/28 (c) | | 14,113 | 13,109 |
| 3.75% 2/25/26 | | 4,622 | 4,417 |
| 3.85% 7/8/24 | | 3,019 | 2,954 |
| 3.85% 1/26/27 | | 24,021 | 22,725 |
| 4% 3/3/24 | | 4,833 | 4,761 |
| 4.017% 10/31/38 (c) | | 1,000 | 826 |
| 4.25% 10/21/25 | | 3,972 | 3,847 |
| 4.411% 4/23/39 (c) | | 5,770 | 5,019 |
| 4.75% 10/21/45 | | 12,534 | 11,221 |
| 5.95% 1/15/27 | | 11,915 | 12,131 |
| 6.25% 2/1/41 | | 5,900 | 6,313 |
| 6.75% 10/1/37 | | 20,049 | 21,341 |
| Intercontinental Exchange, Inc.: | | | |
| 1.85% 9/15/32 | | 8,990 | 6,696 |
| 2.65% 9/15/40 | | 10,990 | 7,702 |
| 3.75% 12/1/25 | | 4,567 | 4,399 |
| 3.75% 9/21/28 | | 7,411 | 6,954 |
| 4% 9/15/27 | | 11,200 | 10,885 |
| 4.25% 9/21/48 | | 8,390 | 7,196 |
| 4.6% 3/15/33 | | 10,800 | 10,254 |
| Jefferies Financial Group, Inc.: | | | |
| 2.625% 10/15/31 | | 1,933 | 1,513 |
| 4.15% 1/23/30 | | 11,213 | 10,128 |
| Moody's Corp.: | | | |
| 2% 8/19/31 | | 1,400 | 1,104 |
| 3.25% 1/15/28 | | 12,663 | 11,639 |
| 3.75% 3/24/25 | | 1,000 | 967 |
| 4.25% 8/8/32 | | 1,000 | 925 |
| 4.875% 12/17/48 | | 8,233 | 7,433 |
| Morgan Stanley: | | | |
| 3 month U.S. LIBOR + 1.430% 4.457% 4/22/39 (c)(d) | | 6,005 | 5,300 |
| 1.164% 10/21/25 (c) | | 23,310 | 21,591 |
| 1.512% 7/20/27 (c) | | 7,810 | 6,818 |
| 1.593% 5/4/27 (c) | | 11,397 | 10,062 |
| 2.188% 4/28/26 (c) | | 19,478 | 18,155 |
| 2.239% 7/21/32 (c) | | 7,395 | 5,752 |
| 2.475% 1/21/28 (c) | | 2,000 | 1,784 |
| 2.484% 9/16/36 (c) | | 1,600 | 1,194 |
| 2.511% 10/20/32 (c) | | 3,963 | 3,137 |
| 2.72% 7/22/25 (c) | | 15,080 | 14,460 |
| 3.125% 7/27/26 | | 4,448 | 4,139 |
| 3.217% 4/22/42 (c) | | 14,442 | 10,735 |
| 3.591% 7/22/28 (c) | | 47,701 | 44,030 |
| 3.7% 10/23/24 | | 4,766 | 4,643 |
| 3.772% 1/24/29 (c) | | 9,753 | 9,004 |
| 3.875% 4/29/24 | | 11,662 | 11,478 |
| 3.875% 1/27/26 | | 6,171 | 5,949 |
| 3.95% 4/23/27 | | 27,155 | 25,660 |
| 3.971% 7/22/38 (c) | | 18,965 | 15,986 |
| 4.3% 1/27/45 | | 1,589 | 1,366 |
| 4.375% 1/22/47 | | 8,818 | 7,691 |
| 5.123% 2/1/29 (c) | | 14,400 | 14,141 |
| 5.297% 4/20/37 (c) | | 9,400 | 8,759 |
| 5.597% 3/24/51 (c) | | 10,295 | 10,632 |
| 5.948% 1/19/38 (c) | | 2,720 | 2,658 |
| 6.296% 10/18/28 (c) | | 24,000 | 24,640 |
| 6.342% 10/18/33 (c) | | 8,900 | 9,382 |
| 6.375% 7/24/42 | | 2,303 | 2,530 |
| 7.25% 4/1/32 | | 795 | 899 |
| NASDAQ, Inc. 2.5% 12/21/40 | | 2,000 | 1,299 |
| Nomura Holdings, Inc.: | | | |
| 2.608% 7/14/31 | | 1,000 | 785 |
| 3.103% 1/16/30 | | 19,128 | 16,190 |
| 5.099% 7/3/25 | | 2,000 | 1,983 |
| 5.605% 7/6/29 | | 7,500 | 7,434 |
| Northern Trust Corp. 1.95% 5/1/30 | | 17,158 | 14,041 |
| S&P Global, Inc.: | | | |
| 2.9% 3/1/32 (b) | | 34,219 | 29,288 |
| 2.95% 1/22/27 | | 4,833 | 4,523 |
| State Street Corp.: | | | |
| 1.684% 11/18/27 (c) | | 15,869 | 14,027 |
| 2.65% 5/19/26 | | 5,997 | 5,601 |
| 4.821% 1/26/34 (c) | | 5,200 | 5,013 |
| | | | 1,035,809 |
| Consumer Finance - 0.7% | | | |
| AerCap Ireland Capital Ltd./AerCap Global Aviation Trust: | | | |
| 1.65% 10/29/24 | | 18,269 | 16,948 |
| 2.45% 10/29/26 | | 10,778 | 9,502 |
| 2.875% 8/14/24 | | 11,390 | 10,831 |
| 3% 10/29/28 | | 5,800 | 4,942 |
| 3.4% 10/29/33 | | 5,896 | 4,587 |
| 3.65% 7/21/27 | | 3,698 | 3,349 |
| 3.85% 10/29/41 | | 5,896 | 4,317 |
| 3.875% 1/23/28 | | 12,472 | 11,287 |
| 4.45% 10/1/25 | | 7,824 | 7,517 |
| 4.875% 1/16/24 | | 6,792 | 6,725 |
| Ally Financial, Inc.: | | | |
| 2.2% 11/2/28 | | 11,270 | 9,181 |
| 3.05% 6/5/23 | | 4,978 | 4,944 |
| 5.8% 5/1/25 | | 14,790 | 14,800 |
| 8% 11/1/31 | | 2,000 | 2,165 |
| American Express Co.: | | | |
| 2.5% 7/30/24 | | 30,845 | 29,674 |
| 3.95% 8/1/25 | | 18,100 | 17,568 |
| 4.05% 12/3/42 | | 5,541 | 4,894 |
| Capital One Financial Corp.: | | | |
| 2.359% 7/29/32 (c) | | 3,300 | 2,428 |
| 3.3% 10/30/24 | | 11,544 | 11,145 |
| 3.75% 7/28/26 | | 7,746 | 7,277 |
| 3.75% 3/9/27 | | 28,095 | 26,344 |
| 3.8% 1/31/28 | | 10,327 | 9,562 |
| 3.9% 1/29/24 | | 13,552 | 13,358 |
| 5.247% 7/26/30 (c) | | 5,600 | 5,370 |
| 5.817% 2/1/34 (c) | | 3,450 | 3,350 |
| Discover Financial Services 4.5% 1/30/26 | | 14,948 | 14,470 |
| GE Capital International Funding Co. 3.373% 11/15/25 | | 22,877 | 21,716 |
| John Deere Capital Corp.: | | | |
| 2.65% 6/24/24 | | 8,309 | 8,041 |
| 2.65% 6/10/26 | | 3,972 | 3,698 |
| 2.8% 9/8/27 | | 5,561 | 5,106 |
| 3.45% 3/7/29 | | 15,887 | 14,678 |
| Synchrony Financial: | | | |
| 3.7% 8/4/26 | | 3,752 | 3,480 |
| 4.375% 3/19/24 | | 8,940 | 8,816 |
| 5.15% 3/19/29 | | 21,635 | 20,359 |
| Toyota Motor Credit Corp.: | | | |
| 0.5% 8/14/23 | | 14,500 | 14,203 |
| 1.15% 8/13/27 | | 16,723 | 14,242 |
| 1.9% 1/13/27 | | 8,796 | 7,859 |
| 3% 4/1/25 | | 2,000 | 1,914 |
| 3.05% 3/22/27 | | 11,570 | 10,765 |
| 3.35% 1/8/24 | | 11,112 | 10,936 |
| 4.45% 6/29/29 | | 2,000 | 1,953 |
| | | | 404,301 |
| Diversified Financial Services - 0.5% | | | |
| Aon Corp. / Aon Global Holdings PLC 2.6% 12/2/31 | | 15,853 | 12,920 |
| Berkshire Hathaway, Inc.: | | | |
| 3.125% 3/15/26 | | 9,135 | 8,726 |
| 4.5% 2/11/43 | | 1,589 | 1,472 |
| Blackstone Private Credit Fund: | | | |
| 2.7% 1/15/25 | | 12,663 | 11,801 |
| 4.7% 3/24/25 | | 16,881 | 16,281 |
| BP Capital Markets America, Inc.: | | | |
| 2.721% 1/12/32 | | 28,999 | 24,300 |
| 3% 2/24/50 | | 11,116 | 7,533 |
| 3.017% 1/16/27 | | 7,547 | 7,016 |
| 3.06% 6/17/41 | | 6,766 | 5,007 |
| 4.812% 2/13/33 | | 5,950 | 5,844 |
| Brixmor Operating Partnership LP: | | | |
| 3.9% 3/15/27 | | 4,480 | 4,157 |
| 4.05% 7/1/30 | | 4,868 | 4,304 |
| 4.125% 6/15/26 | | 5,997 | 5,644 |
| 4.125% 5/15/29 | | 5,363 | 4,831 |
| Corebridge Financial, Inc.: | | | |
| 3.9% 4/5/32 (b) | | 4,549 | 3,980 |
| 6.875% 12/15/52 (b)(c) | | 5,300 | 5,240 |
| DH Europe Finance II SARL: | | | |
| 2.2% 11/15/24 | | 6,563 | 6,245 |
| 2.6% 11/15/29 | | 7,675 | 6,626 |
| 3.4% 11/15/49 | | 8,313 | 6,284 |
| Equitable Holdings, Inc.: | | | |
| ��4.35% 4/20/28 | | 6,519 | 6,192 |
| 5% 4/20/48 | | 2,000 | 1,767 |
| Jackson Financial, Inc. 5.17% 6/8/27 | | 9,500 | 9,406 |
| Japan International Cooperation Agency 1.75% 4/28/31 | | 7,910 | 6,306 |
| KfW: | | | |
| 0.25% 10/19/23 | | 11,696 | 11,340 |
| 0.375% 7/18/25 | | 13,678 | 12,363 |
| 0.625% 1/22/26 | | 42,629 | 38,102 |
| 2% 5/2/25 | | 3,038 | 2,863 |
| 2.5% 11/20/24 | | 8,281 | 7,938 |
| 2.625% 2/28/24 | | 16,206 | 15,788 |
| 2.875% 4/3/28 | | 12,201 | 11,415 |
| Landwirtschaftliche Rentenbank: | | | |
| 1.75% 7/27/26 | | 6,752 | 6,147 |
| 2.5% 11/15/27 | | 7,022 | 6,469 |
| National Rural Utilities Cooperative Finance Corp.: | | | |
| 4.15% 12/15/32 | | 14,810 | 13,628 |
| 5.8% 1/15/33 | | 5,500 | 5,662 |
| Voya Financial, Inc.: | | | |
| 3.65% 6/15/26 | | 12,542 | 11,860 |
| 5.7% 7/15/43 | | 2,979 | 2,823 |
| | | | 318,280 |
| Insurance - 0.6% | | | |
| ACE INA Holdings, Inc.: | | | |
| 1.375% 9/15/30 | | 21,411 | 16,644 |
| 3.35% 5/3/26 | | 7,152 | 6,811 |
| 4.35% 11/3/45 | | 3,177 | 2,840 |
| AFLAC, Inc.: | | | |
| 3.6% 4/1/30 | | 4,833 | 4,445 |
| 4% 10/15/46 | | 3,003 | 2,405 |
| Allstate Corp.: | | | |
| 3.28% 12/15/26 | | 3,750 | 3,541 |
| 4.2% 12/15/46 | | 6,005 | 5,011 |
| American International Group, Inc.: | | | |
| 3.875% 1/15/35 | | 2,145 | 1,879 |
| 3.9% 4/1/26 | | 1,497 | 1,436 |
| 4.2% 4/1/28 | | 14,734 | 13,962 |
| 4.375% 6/30/50 | | 4,543 | 3,831 |
| 4.5% 7/16/44 | | 7,050 | 6,113 |
| 4.7% 7/10/35 | | 4,607 | 4,126 |
| 4.75% 4/1/48 | | 7,808 | 6,957 |
| Aon Corp. 3.75% 5/2/29 | | 1,800 | 1,648 |
| Aon PLC: | | | |
| 3.5% 6/14/24 | | 6,458 | 6,302 |
| 4% 11/27/23 | | 2,383 | 2,362 |
| 4.6% 6/14/44 | | 1,271 | 1,109 |
| 4.75% 5/15/45 | | 4,671 | 4,137 |
| Arthur J. Gallagher & Co. 5.75% 3/2/53 | | 4,060 | 4,036 |
| Assurant, Inc. 4.9% 3/27/28 | | 3,900 | 3,759 |
| Athene Holding Ltd.: | | | |
| 3.5% 1/15/31 | | 5,413 | 4,544 |
| 3.95% 5/25/51 | | 2,000 | 1,397 |
| 4.125% 1/12/28 | | 2,000 | 1,870 |
| Baylor Scott & White Holdings: | | | |
| Series 2021, 2.839% 11/15/50 | | 14,016 | 9,452 |
| 3.967% 11/15/46 | | 1,986 | 1,640 |
| Berkshire Hathaway Finance Corp.: | | | |
| 1.45% 10/15/30 | | 7,588 | 6,021 |
| 2.85% 10/15/50 | | 10,633 | 7,179 |
| 2.875% 3/15/32 | | 2,000 | 1,722 |
| 4.2% 8/15/48 | | 9,429 | 8,333 |
| 5.75% 1/15/40 | | 11,222 | 12,035 |
| Brighthouse Financial, Inc. 4.7% 6/22/47 | | 7,547 | 5,870 |
| Brown & Brown, Inc. 4.2% 3/17/32 | | 6,283 | 5,495 |
| Fairfax Financial Holdings Ltd.: | | | |
| 4.625% 4/29/30 | | 5,123 | 4,707 |
| 4.85% 4/17/28 | | 1,700 | 1,630 |
| 5.625% 8/16/32 (b) | | 1,900 | 1,806 |
| Hartford Financial Services Group, Inc.: | | | |
| 2.8% 8/19/29 | | 5,649 | 4,864 |
| 3.6% 8/19/49 | | 6,760 | 5,058 |
| 4.4% 3/15/48 | | 7,713 | 6,515 |
| Lincoln National Corp.: | | | |
| 3.625% 12/12/26 | | 4,766 | 4,492 |
| 4.35% 3/1/48 | | 2,417 | 1,883 |
| 4.375% 6/15/50 | | 4,833 | 3,733 |
| Manulife Financial Corp. 4.15% 3/4/26 | | 9,666 | 9,412 |
| Markel Corp.: | | | |
| 3.35% 9/17/29 | | 4,833 | 4,256 |
| 3.5% 11/1/27 | | 4,000 | 3,713 |
| Marsh & McLennan Companies, Inc.: | | | |
| 3.5% 6/3/24 | | 1,509 | 1,472 |
| 3.875% 3/15/24 | | 7,547 | 7,420 |
| 4.05% 10/15/23 | | 5,382 | 5,336 |
| 4.2% 3/1/48 | | 3,868 | 3,241 |
| 4.35% 1/30/47 | | 2,224 | 1,895 |
| 4.375% 3/15/29 | | 6,116 | 5,823 |
| 4.9% 3/15/49 | | 7,388 | 6,823 |
| MetLife, Inc.: | | | |
| 3.6% 11/13/25 | | 9,666 | 9,307 |
| 4.125% 8/13/42 | | 6,959 | 5,936 |
| 4.55% 3/23/30 | | 8,990 | 8,828 |
| 4.6% 5/13/46 | | 3,589 | 3,210 |
| 4.721% 12/15/44 (c) | | 3,972 | 3,613 |
| 5.875% 2/6/41 | | 2,059 | 2,142 |
| 6.375% 6/15/34 | | 2,000 | 2,234 |
| Principal Financial Group, Inc. 4.3% 11/15/46 | | 6,356 | 5,176 |
| Progressive Corp.: | | | |
| 2.45% 1/15/27 | | 3,765 | 3,440 |
| 2.5% 3/15/27 | | 7,346 | 6,693 |
| 3% 3/15/32 | | 13,862 | 11,993 |
| 4.2% 3/15/48 | | 4,398 | 3,761 |
| Prudential Financial, Inc.: | | | |
| 3.878% 3/27/28 | | 3,305 | 3,154 |
| 3.905% 12/7/47 | | 437 | 345 |
| 3.935% 12/7/49 | | 8,515 | 6,757 |
| 4.35% 2/25/50 | | 9,924 | 8,431 |
| 4.418% 3/27/48 | | 5,044 | 4,325 |
| 5.125% 3/1/52 (c) | | 3,335 | 3,048 |
| 5.7% 12/14/36 | | 302 | 315 |
| 6% 9/1/52 (c) | | 5,360 | 5,171 |
| The Chubb Corp. 6.5% 5/15/38 | | 2,788 | 3,139 |
| The Travelers Companies, Inc.: | | | |
| 4.1% 3/4/49 | | 4,833 | 4,080 |
| 4.3% 8/25/45 | | 1,159 | 1,004 |
| 6.25% 6/15/37 | | 6,633 | 7,406 |
| Willis Group North America, Inc. 4.65% 6/15/27 | | 5,827 | 5,630 |
| | | | 372,129 |
TOTAL FINANCIALS | | | 4,953,568 |
| HEALTH CARE - 2.6% | | | |
| Biotechnology - 0.5% | | | |
| AbbVie, Inc.: | | | |
| 2.6% 11/21/24 | | 12,276 | 11,705 |
| 2.95% 11/21/26 | | 8,990 | 8,297 |
| 3.2% 11/21/29 | | 15,370 | 13,594 |
| 3.6% 5/14/25 | | 7,149 | 6,879 |
| 3.8% 3/15/25 | | 7,006 | 6,796 |
| 4.05% 11/21/39 | | 8,990 | 7,583 |
| 4.25% 11/14/28 | | 6,585 | 6,299 |
| 4.25% 11/21/49 | | 14,886 | 12,396 |
| 4.3% 5/14/36 | | 4,972 | 4,471 |
| 4.4% 11/6/42 | | 3,793 | 3,289 |
| 4.45% 5/14/46 | | 5,561 | 4,765 |
| 4.5% 5/14/35 | | 10,000 | 9,282 |
| 4.55% 3/15/35 | | 5,282 | 4,912 |
| 4.7% 5/14/45 | | 10,467 | 9,266 |
| 4.75% 3/15/45 | | 5,028 | 4,501 |
| 4.875% 11/14/48 | | 4,630 | 4,244 |
| Amgen, Inc.: | | | |
| 1.65% 8/15/28 | | 15,418 | 12,902 |
| 1.9% 2/21/25 | | 6,476 | 6,055 |
| 2.3% 2/25/31 | | 16,400 | 13,301 |
| 2.6% 8/19/26 | | 8,340 | 7,662 |
| 2.8% 8/15/41 | | 15,756 | 10,829 |
| 3.125% 5/1/25 | | 1,589 | 1,517 |
| 3.35% 2/22/32 | | 5,640 | 4,891 |
| 3.375% 2/21/50 | | 8,893 | 6,222 |
| 4.4% 5/1/45 | | 7,888 | 6,596 |
| 4.663% 6/15/51 | | 9,908 | 8,561 |
| 4.875% 3/1/53 | | 8,280 | 7,375 |
| 5.15% 3/2/28 (e) | | 12,880 | 12,829 |
| 5.25% 3/2/33 (e) | | 8,730 | 8,669 |
| 5.65% 3/2/53 (e) | | 15,743 | 15,613 |
| Biogen, Inc.: | | | |
| 2.25% 5/1/30 | | 1,600 | 1,295 |
| 4.05% 9/15/25 | | 10,000 | 9,681 |
| Gilead Sciences, Inc.: | | | |
| 1.65% 10/1/30 | | 11,928 | 9,439 |
| 2.8% 10/1/50 | | 11,832 | 7,684 |
| 3.65% 3/1/26 | | 4,909 | 4,688 |
| 4.15% 3/1/47 | | 9,882 | 8,268 |
| 4.75% 3/1/46 | | 8,737 | 7,892 |
| Regeneron Pharmaceuticals, Inc. 1.75% 9/15/30 | | 2,000 | 1,557 |
| | | | 291,805 |
| Health Care Equipment & Supplies - 0.3% | | | |
| Abbott Laboratories: | | | |
| 3.75% 11/30/26 | | 5,539 | 5,354 |
| 4.75% 11/30/36 | | 3,575 | 3,555 |
| 4.9% 11/30/46 | | 8,261 | 8,122 |
| Baxter International, Inc.: | | | |
| 1.915% 2/1/27 | | 11,725 | 10,224 |
| 2.539% 2/1/32 | | 12,914 | 10,006 |
| Becton, Dickinson & Co.: | | | |
| 2.823% 5/20/30 | | 6,989 | 5,979 |
| 3.363% 6/6/24 | | 3,600 | 3,508 |
| 3.7% 6/6/27 | | 22,048 | 20,819 |
| 4.685% 12/15/44 | | 8,630 | 7,655 |
| Boston Scientific Corp.: | | | |
| 3.45% 3/1/24 | | 17,246 | 16,926 |
| 4% 3/1/29 | | 8,579 | 7,883 |
| 4.7% 3/1/49 | | 13,845 | 12,567 |
| GE Healthcare Holding LLC: | | | |
| 5.65% 11/15/27 (b) | | 5,180 | 5,249 |
| 5.905% 11/22/32 (b) | | 10,170 | 10,512 |
| Medtronic, Inc. 4.625% 3/15/45 | | 10,267 | 9,579 |
| Stryker Corp.: | | | |
| 1.95% 6/15/30 | | 7,395 | 6,011 |
| 2.9% 6/15/50 | | 7,395 | 4,985 |
| Zimmer Biomet Holdings, Inc. 3.55% 4/1/25 | | 9,040 | 8,699 |
| | | | 157,633 |
| Health Care Providers & Services - 1.1% | | | |
| Aetna, Inc.: | | | |
| 2.8% 6/15/23 | | 11,915 | 11,830 |
| 3.875% 8/15/47 | | 4,157 | 3,130 |
| 4.125% 11/15/42 | | 9,013 | 7,320 |
| Allina Health System, Inc. 3.887% 4/15/49 | | 5,269 | 4,266 |
| Banner Health: | | | |
| 2.907% 1/1/42 | | 1,305 | 964 |
| 2.913% 1/1/51 | | 10,923 | 7,362 |
| Baptist Healthcare System Obli 3.54% 8/15/50 | | 10,657 | 8,018 |
| Bon Secours Mercy Health, Inc. 2.095% 6/1/31 | | 7,302 | 5,764 |
| Cardinal Health, Inc. 4.368% 6/15/47 | | 11,033 | 8,809 |
| Centene Corp.: | | | |
| 2.625% 8/1/31 | | 14,500 | 11,299 |
| 3.375% 2/15/30 | | 16,200 | 13,669 |
| Children's Hospital Medical Center 4.268% 5/15/44 | | 2,637 | 2,361 |
| Children's Hospital of Philadelphia 2.704% 7/1/50 | | 8,032 | 5,265 |
| Cigna Group: | | | |
| 3% 7/15/23 | | 7,944 | 7,869 |
| 3.75% 7/15/23 | | 5,357 | 5,320 |
| 4.125% 11/15/25 | | 7,829 | 7,613 |
| 4.375% 10/15/28 | | 21,090 | 20,251 |
| 4.5% 2/25/26 | | 9,262 | 9,051 |
| 4.8% 8/15/38 | | 18,723 | 17,245 |
| 4.8% 7/15/46 | | 6,037 | 5,332 |
| 4.9% 12/15/48 | | 6,764 | 6,084 |
| 6.125% 11/15/41 | | 2,383 | 2,527 |
| CommonSpirit Health: | | | |
| 3.91% 10/1/50 | | 12,300 | 9,367 |
| 4.35% 11/1/42 | | 1,589 | 1,340 |
| CVS Health Corp.: | | | |
| 2.7% 8/21/40 | | 12,035 | 8,130 |
| 2.875% 6/1/26 | | 5,958 | 5,541 |
| 3% 8/15/26 | | 13,153 | 12,204 |
| 3.25% 8/15/29 | | 13,963 | 12,330 |
| 3.875% 7/20/25 | | 3,701 | 3,586 |
| 4.1% 3/25/25 | | 3,272 | 3,205 |
| 4.3% 3/25/28 | | 18,985 | 18,150 |
| 4.875% 7/20/35 | | 2,462 | 2,313 |
| 5.05% 3/25/48 | | 21,765 | 19,534 |
| 5.125% 7/20/45 | | 6,997 | 6,319 |
| 5.25% 2/21/33 | | 7,500 | 7,383 |
| 5.3% 12/5/43 | | 3,489 | 3,252 |
| 5.625% 2/21/53 | | 5,700 | 5,516 |
| Elevance Health, Inc.: | | | |
| 2.55% 3/15/31 | | 1,100 | 911 |
| 3.125% 5/15/50 | | 6,766 | 4,675 |
| 3.65% 12/1/27 | | 27,589 | 25,878 |
| 4.1% 5/15/32 | | 9,100 | 8,355 |
| 4.375% 12/1/47 | | 8,311 | 7,069 |
| 4.55% 3/1/48 | | 3,741 | 3,232 |
| 4.625% 5/15/42 | | 2,065 | 1,863 |
| 4.65% 1/15/43 | | 1,589 | 1,424 |
| 4.75% 2/15/33 | | 10,000 | 9,606 |
| Franciscan Missionaries of Our Lady Health System, Inc. 3.914% 7/1/49 | | 8,468 | 6,545 |
| HCA Holdings, Inc.: | | | |
| 3.625% 3/15/32 (b) | | 2,000 | 1,691 |
| 4.125% 6/15/29 | | 11,900 | 10,832 |
| 4.375% 3/15/42 (b) | | 10,000 | 8,014 |
| 5.25% 6/15/49 | | 18,865 | 16,271 |
| Humana, Inc.: | | | |
| 1.35% 2/3/27 | | 10,039 | 8,643 |
| 2.15% 2/3/32 | | 10,063 | 7,769 |
| 3.125% 8/15/29 | | 6,457 | 5,632 |
| 4.95% 10/1/44 | | 1,986 | 1,780 |
| INTEGRIS Baptist Medical Center, Inc. 3.875% 8/15/50 | | 9,083 | 6,797 |
| Kaiser Foundation Hospitals: | | | |
| 3.266% 11/1/49 | | 7,259 | 5,398 |
| 4.15% 5/1/47 | | 5,204 | 4,578 |
| 4.875% 4/1/42 | | 1,430 | 1,397 |
| Memorial Sloan-Kettring Cancer Center 4.2% 7/1/55 | | 2,383 | 2,037 |
| MidMichigan Health 3.409% 6/1/50 | | 3,730 | 2,638 |
| New York & Presbyterian Hospital: | | | |
| 4.024% 8/1/45 | | 2,780 | 2,377 |
| 4.063% 8/1/56 | | 2,089 | 1,751 |
| Novant Health, Inc. 3.168% 11/1/51 | | 6,588 | 4,644 |
| NYU Hospitals Center 4.784% 7/1/44 | | 6,037 | 5,586 |
| Orlando Health Obligated Group 3.327% 10/1/50 | | 6,016 | 4,329 |
| Partners Healthcare System, Inc. 4.117% 7/1/55 | | 2,780 | 2,338 |
| Piedmont Healthcare, Inc. 2.719% 1/1/42 | | 1,208 | 833 |
| Providence St. Joseph Health Obligated Group 2.7% 10/1/51 | | 2,136 | 1,270 |
| Sabra Health Care LP 3.2% 12/1/31 | | 2,000 | 1,486 |
| Sutter Health 3.361% 8/15/50 | | 14,596 | 10,441 |
| Trinity Health Corp. 2.632% 12/1/40 | | 3,512 | 2,497 |
| UnitedHealth Group, Inc.: | | | |
| 1.15% 5/15/26 | | 3,155 | 2,797 |
| 1.25% 1/15/26 | | 6,254 | 5,650 |
| 2% 5/15/30 | | 2,900 | 2,378 |
| 2.3% 5/15/31 | | 2,662 | 2,194 |
| 2.375% 8/15/24 | | 7,834 | 7,520 |
| 2.9% 5/15/50 | | 6,273 | 4,249 |
| 3.05% 5/15/41 | | 16,300 | 12,248 |
| 3.25% 5/15/51 | | 3,045 | 2,181 |
| 3.375% 4/15/27 | | 4,289 | 4,043 |
| 3.5% 6/15/23 | | 7,070 | 7,040 |
| 3.7% 8/15/49 | | 8,334 | 6,532 |
| 3.75% 7/15/25 | | 2,780 | 2,697 |
| 3.75% 10/15/47 | | 7,594 | 6,068 |
| 3.85% 6/15/28 | | 9,222 | 8,748 |
| 3.875% 12/15/28 | | 11,908 | 11,251 |
| 3.875% 8/15/59 | | 9,958 | 7,762 |
| 4.2% 1/15/47 | | 2,859 | 2,470 |
| 4.375% 3/15/42 | | 9,373 | 8,366 |
| 4.625% 7/15/35 | | 7,300 | 6,994 |
| 4.75% 7/15/45 | | 1,327 | 1,247 |
| 5.25% 2/15/28 | | 8,360 | 8,474 |
| 5.35% 2/15/33 | | 7,610 | 7,785 |
| 5.8% 3/15/36 | | 1,000 | 1,047 |
| 5.875% 2/15/53 | | 7,600 | 8,198 |
| 6.625% 11/15/37 | | 2,000 | 2,253 |
| 6.875% 2/15/38 | | 1,300 | 1,506 |
| Universal Health Services, Inc. 2.65% 10/15/30 | | 4,000 | 3,257 |
| West Virginia University Health System Obligated Group 3.129% 6/1/50 | | 4,940 | 3,251 |
| | | | 628,312 |
| Life Sciences Tools & Services - 0.0% | | | |
| Danaher Corp. 4.375% 9/15/45 | | 1,883 | 1,658 |
| PerkinElmer, Inc.: | | | |
| 0.85% 9/15/24 | | 4,476 | 4,165 |
| 2.25% 9/15/31 | | 5,519 | 4,280 |
| Thermo Fisher Scientific, Inc.: | | | |
| 2.6% 10/1/29 | | 12,965 | 11,223 |
| 5.3% 2/1/44 | | 4,622 | 4,630 |
| | | | 25,956 |
| Pharmaceuticals - 0.7% | | | |
| AstraZeneca Finance LLC: | | | |
| 1.2% 5/28/26 | | 7,201 | 6,378 |
| 2.25% 5/28/31 | | 7,008 | 5,835 |
| 4.875% 3/3/33 | | 4,110 | 4,068 |
| AstraZeneca PLC: | | | |
| 4.375% 11/16/45 | | 5,989 | 5,441 |
| 4.375% 8/17/48 | | 9,825 | 8,917 |
| 6.45% 9/15/37 | | 4,582 | 5,179 |
| Bayer U.S. Finance II LLC: | | | |
| 2.85% 4/15/25 (b) | �� | 3,038 | 2,862 |
| 3.95% 4/15/45 (b) | | 1,104 | 808 |
| Bristol-Myers Squibb Co.: | | | |
| 2.9% 7/26/24 | | 9,043 | 8,765 |
| 3.2% 6/15/26 | | 2,128 | 2,015 |
| 3.25% 8/1/42 | | 2,224 | 1,714 |
| 3.4% 7/26/29 | | 4,508 | 4,136 |
| 3.55% 3/15/42 | | 18,866 | 15,330 |
| 4.125% 6/15/39 | | 3,769 | 3,364 |
| 4.25% 10/26/49 | | 9,631 | 8,316 |
| 4.35% 11/15/47 | | 5,317 | 4,679 |
| 4.55% 2/20/48 | | 11,255 | 10,251 |
| Eli Lilly & Co.: | | | |
| 2.25% 5/15/50 | | 17,138 | 10,765 |
| 4.875% 2/27/53 | | 4,640 | 4,632 |
| GlaxoSmithKline Capital PLC 3% 6/1/24 | | 9,260 | 9,016 |
| GlaxoSmithKline Capital, Inc. 6.375% 5/15/38 | | 5,734 | 6,478 |
| GSK Consumer Healthcare Capital U.S. LLC: | | | |
| 3.375% 3/24/27 | | 14,422 | 13,410 |
| 3.625% 3/24/32 | | 14,451 | 12,623 |
| Johnson & Johnson: | | | |
| 0.55% 9/1/25 | | 6,409 | 5,784 |
| 1.3% 9/1/30 | | 6,409 | 5,150 |
| 2.1% 9/1/40 | | 7,409 | 5,082 |
| 2.45% 3/1/26 | | 4,440 | 4,158 |
| 2.45% 9/1/60 | | 6,409 | 3,929 |
| 3.4% 1/15/38 | | 7,411 | 6,305 |
| 3.5% 1/15/48 | | 4,766 | 3,929 |
| 3.625% 3/3/37 | | 3,177 | 2,806 |
| 4.375% 12/5/33 | | 2,600 | 2,568 |
| 4.5% 9/1/40 | | 1,800 | 1,731 |
| 4.5% 12/5/43 | | 5,262 | 5,105 |
| 4.85% 5/15/41 | | 3,383 | 3,343 |
| Merck & Co., Inc.: | | | |
| 2.35% 6/24/40 | | 10,000 | 6,957 |
| 2.45% 6/24/50 | | 4,418 | 2,811 |
| 2.75% 2/10/25 | | 5,729 | 5,495 |
| 2.9% 3/7/24 | | 9,121 | 8,911 |
| 3.6% 9/15/42 | | 1,589 | 1,297 |
| 3.7% 2/10/45 | | 5,084 | 4,184 |
| 3.9% 3/7/39 | | 11,666 | 10,211 |
| Mylan NV 5.2% 4/15/48 | | 2,383 | 1,820 |
| Novartis Capital Corp.: | | | |
| 1.75% 2/14/25 | | 7,443 | 6,990 |
| 2.75% 8/14/50 | | 10,923 | 7,588 |
| 3% 11/20/25 | | 8,317 | 7,914 |
| 3.1% 5/17/27 | | 4,679 | 4,396 |
| 3.7% 9/21/42 | | 2,244 | 1,899 |
| 4% 11/20/45 | | 4,162 | 3,636 |
| Pfizer, Inc.: | | | |
| 2.55% 5/28/40 | | 7,297 | 5,273 |
| 2.7% 5/28/50 | | 3,596 | 2,456 |
| 2.95% 3/15/24 | | 3,734 | 3,649 |
| 3% 12/15/26 | | 5,321 | 5,002 |
| 3.2% 9/15/23 | | 10,103 | 9,998 |
| 3.45% 3/15/29 | | 6,618 | 6,169 |
| 3.9% 3/15/39 | | 5,004 | 4,364 |
| 4% 12/15/36 | | 9,447 | 8,642 |
| 4.1% 9/15/38 | | 2,000 | 1,807 |
| 4.125% 12/15/46 | | 2,613 | 2,299 |
| 4.2% 9/15/48 | | 6,196 | 5,524 |
| 4.4% 5/15/44 | | 3,328 | 3,076 |
| 7.2% 3/15/39 | | 4,289 | 5,221 |
| Shire Acquisitions Investments Ireland DAC: | | | |
| 2.875% 9/23/23 | | 3,003 | 2,959 |
| 3.2% 9/23/26 | | 31,123 | 28,972 |
| Takeda Pharmaceutical Co. Ltd. 2.05% 3/31/30 | | 12,000 | 9,785 |
| Utah Acquisition Sub, Inc.: | | | |
| 3.95% 6/15/26 | | 2,248 | 2,102 |
| 5.25% 6/15/46 | | 2,622 | 2,040 |
| Viatris, Inc.: | | | |
| 1.65% 6/22/25 | | 1,800 | 1,638 |
| 2.7% 6/22/30 | | 12,760 | 10,116 |
| 4% 6/22/50 | | 7,250 | 4,676 |
| Wyeth LLC 5.95% 4/1/37 | | 2,000 | 2,144 |
| Zoetis, Inc.: | | | |
| 3.95% 9/12/47 | | 1,589 | 1,274 |
| 4.7% 2/1/43 | | 1,032 | 931 |
| | | | 409,098 |
TOTAL HEALTH CARE | | | 1,512,804 |
| INDUSTRIALS - 1.6% | | | |
| Aerospace & Defense - 0.4% | | | |
| General Dynamics Corp.: | | | |
| 3.375% 5/15/23 | | 7,547 | 7,517 |
| 3.75% 5/15/28 | | 7,466 | 7,098 |
| 4.25% 4/1/50 | | 3,867 | 3,452 |
| Huntington Ingalls Industries, Inc. 4.2% 5/1/30 | | 2,000 | 1,826 |
| L3Harris Technologies, Inc.: | | | |
| 2.9% 12/15/29 | | 1,000 | 858 |
| 3.832% 4/27/25 | | 5,000 | 4,831 |
| Lockheed Martin Corp.: | | | |
| 3.55% 1/15/26 | | 3,017 | 2,915 |
| 4.09% 9/15/52 | | 12,077 | 10,372 |
| 4.95% 10/15/25 | | 10,000 | 10,017 |
| 5.25% 1/15/33 | | 10,000 | 10,248 |
| 5.7% 11/15/54 | | 5,000 | 5,411 |
| Northrop Grumman Corp.: | | | |
| 3.25% 1/15/28 | | 6,673 | 6,161 |
| 3.85% 4/15/45 | | 1,489 | 1,181 |
| 4.03% 10/15/47 | | 14,958 | 12,369 |
| 4.75% 6/1/43 | | 3,177 | 2,907 |
| Raytheon Technologies Corp.: | | | |
| 1.9% 9/1/31 | | 9,570 | 7,481 |
| 3.15% 12/15/24 | | 7,070 | 6,807 |
| 3.65% 8/16/23 | | 526 | 522 |
| 3.75% 11/1/46 | | 5,929 | 4,668 |
| 4.05% 5/4/47 | | 1,851 | 1,539 |
| 4.125% 11/16/28 | | 11,685 | 11,122 |
| 4.35% 4/15/47 | | 5,243 | 4,566 |
| 4.45% 11/16/38 | | 4,215 | 3,813 |
| 4.5% 6/1/42 | | 5,863 | 5,270 |
| 4.625% 11/16/48 | | 10,491 | 9,521 |
| 4.875% 10/15/40 | | 795 | 742 |
| 5.4% 5/1/35 | | 1,800 | 1,798 |
| 5.7% 4/15/40 | | 1,589 | 1,625 |
| The Boeing Co.: | | | |
| 2.5% 3/1/25 | | 3,654 | 3,429 |
| 2.7% 2/1/27 | | 6,297 | 5,704 |
| 2.8% 3/1/23 | | 3,925 | 3,925 |
| 2.95% 2/1/30 | | 8,056 | 6,858 |
| 3.625% 3/1/48 | | 3,177 | 2,159 |
| 3.65% 3/1/47 | | 2,192 | 1,514 |
| 3.75% 2/1/50 | | 12,276 | 8,636 |
| 4.875% 5/1/25 | | 13,891 | 13,697 |
| 5.15% 5/1/30 | | 9,666 | 9,353 |
| 5.705% 5/1/40 | | 31,541 | 30,028 |
| 5.805% 5/1/50 | | 14,268 | 13,572 |
| 6.875% 3/15/39 | | 2,622 | 2,803 |
| | | | 248,315 |
| Air Freight & Logistics - 0.1% | | | |
| FedEx Corp.: | | | |
| 2.4% 5/15/31 | | 6,900 | 5,608 |
| 3.1% 8/5/29 | | 5,027 | 4,433 |
| 3.9% 2/1/35 | | 4,686 | 4,007 |
| 4.05% 2/15/48 | | 2,900 | 2,226 |
| 4.4% 1/15/47 | | 6,356 | 5,204 |
| 4.55% 4/1/46 | | 1,192 | 986 |
| 4.95% 10/17/48 | | 6,273 | 5,563 |
| 5.25% 5/15/50 | | 3,383 | 3,138 |
| United Parcel Service, Inc.: | | | |
| 2.4% 11/15/26 | | 5,958 | 5,478 |
| 3.4% 11/15/46 | | 2,104 | 1,608 |
| 3.75% 11/15/47 | | 6,842 | 5,630 |
| 4.25% 3/15/49 | | 3,190 | 2,835 |
| 4.45% 4/1/30 | | 4,833 | 4,728 |
| 5.3% 4/1/50 | | 4,669 | 4,823 |
| 6.2% 1/15/38 | | 6,986 | 7,724 |
| | | | 63,991 |
| Airlines - 0.0% | | | |
| American Airlines Pass Through Trust equipment trust certificate 2.875% 1/11/36 | | 6,415 | 5,286 |
| American Airlines, Inc. equipment trust certificate 3.2% 12/15/29 | | 4,458 | 3,976 |
| Southwest Airlines Co.: | | | |
| 2.625% 2/10/30 | | 2,000 | 1,666 |
| 5.125% 6/15/27 | | 8,833 | 8,706 |
| United Airlines 2015-1 Class AA pass-thru trust 3.45% 6/1/29 | | 385 | 351 |
| United Airlines pass-thru trust equipment trust certificate 3.1% 1/7/30 | | 8,827 | 7,841 |
| United Airlines, Inc. equipment trust certificate Series 2012-2B 4% 4/29/26 | | 2,061 | 1,985 |
| | | | 29,811 |
| Building Products - 0.1% | | | |
| Carrier Global Corp.: | | | |
| 2.242% 2/15/25 | | 10,053 | 9,442 |
| 2.493% 2/15/27 | | 7,105 | 6,404 |
| 2.722% 2/15/30 | | 12,373 | 10,441 |
| 3.377% 4/5/40 | | 4,959 | 3,709 |
| 3.577% 4/5/50 | | 11,213 | 8,075 |
| Johnson Controls International PLC/Tyco Fire & Security Finance SCA 4.9% 12/1/32 | | 11,850 | 11,661 |
| Masco Corp.: | | | |
| 2% 2/15/31 | | 7,383 | 5,715 |
| 3.125% 2/15/51 | | 3,735 | 2,367 |
| Owens Corning 3.95% 8/15/29 | | 5,413 | 4,970 |
| | | | 62,784 |
| Commercial Services & Supplies - 0.1% | | | |
| Republic Services, Inc.: | | | |
| 1.45% 2/15/31 | | 17,786 | 13,633 |
| 2.9% 7/1/26 | | 3,352 | 3,117 |
| 3.2% 3/15/25 | | 8,957 | 8,576 |
| 3.95% 5/15/28 | | 8,340 | 7,899 |
| Waste Management, Inc.: | | | |
| 2.4% 5/15/23 | | 4,210 | 4,184 |
| 4.15% 7/15/49 | | 10,186 | 8,877 |
| | | | 46,286 |
| Electrical Equipment - 0.0% | | | |
| Eaton Corp.: | | | |
| 4% 11/2/32 | | 1,509 | 1,382 |
| 4.15% 11/2/42 | | 1,509 | 1,285 |
| | | | 2,667 |
| Industrial Conglomerates - 0.1% | | | |
| 3M Co.: | | | |
| 2% 2/14/25 | | 5,027 | 4,724 |
| 2.375% 8/26/29 | | 8,822 | 7,406 |
| 2.65% 4/15/25 | | 3,613 | 3,423 |
| 2.875% 10/15/27 | | 3,177 | 2,891 |
| 3.05% 4/15/30 | | 2,912 | 2,547 |
| 3.125% 9/19/46 | | 2,192 | 1,498 |
| 3.25% 8/26/49 | | 6,797 | 4,726 |
| 3.7% 4/15/50 | | 3,595 | 2,784 |
| 5.7% 3/15/37 | | 1,900 | 1,927 |
| General Electric Co.: | | | |
| 3.625% 5/1/30 | | 9,492 | 8,422 |
| 6.875% 1/10/39 | | 119 | 134 |
| Honeywell International, Inc.: | | | |
| 1.35% 6/1/25 | | 8,120 | 7,494 |
| 1.95% 6/1/30 | | 8,796 | 7,272 |
| 2.5% 11/1/26 | | 5,688 | 5,255 |
| 2.8% 6/1/50 | | 8,168 | 5,898 |
| 3.812% 11/21/47 | | 1,113 | 930 |
| | | | 67,331 |
| Machinery - 0.2% | | | |
| Caterpillar Financial Services Corp.: | | | |
| 0.45% 9/14/23 | | 11,068 | 10,793 |
| 1.1% 9/14/27 | | 11,416 | 9,762 |
| 2.4% 8/9/26 | | 2,264 | 2,084 |
| 3.45% 5/15/23 | | 11,120 | 11,085 |
| Caterpillar, Inc.: | | | |
| 3.25% 9/19/49 | | 13,214 | 10,073 |
| 3.803% 8/15/42 | | 1,986 | 1,694 |
| 5.3% 9/15/35 | | 5,561 | 5,619 |
| Cummins, Inc. 1.5% 9/1/30 | | 4,833 | 3,824 |
| Deere & Co.: | | | |
| 2.875% 9/7/49 | | 9,579 | 6,927 |
| 5.375% 10/16/29 | | 795 | 824 |
| Ingersoll-Rand Luxembourg Finance SA: | | | |
| 3.8% 3/21/29 | | 11,400 | 10,497 |
| 4.65% 11/1/44 | | 4,766 | 4,083 |
| Otis Worldwide Corp.: | | | |
| 2.565% 2/15/30 | | 10,633 | 8,959 |
| 3.362% 2/15/50 | | 8,091 | 5,742 |
| Parker Hannifin Corp.: | | | |
| 3.25% 3/1/27 | | 4,488 | 4,172 |
| 4% 6/14/49 | | 4,727 | 3,793 |
| 4.1% 3/1/47 | | 4,496 | 3,725 |
| 4.5% 9/15/29 | | 2,000 | 1,910 |
| Stanley Black & Decker, Inc.: | | | |
| 2.3% 2/24/25 | | 2,000 | 1,886 |
| 4.25% 11/15/28 | | 4,000 | 3,773 |
| 5.2% 9/1/40 | | 7,100 | 6,637 |
| | | | 117,862 |
| Professional Services - 0.0% | | | |
| Leidos, Inc. 2.3% 2/15/31 | | 1,300 | 1,014 |
| Thomson Reuters Corp.: | | | |
| 3.35% 5/15/26 | | 5,561 | 5,243 |
| 5.5% 8/15/35 | | 2,000 | 1,942 |
| | | | 8,199 |
| Road & Rail - 0.5% | | | |
| Burlington Northern Santa Fe LLC: | | | |
| 3% 4/1/25 | | 10,000 | 9,576 |
| 3.05% 2/15/51 | | 3,499 | 2,414 |
| 3.25% 6/15/27 | | 5,958 | 5,627 |
| 3.55% 2/15/50 | | 4,833 | 3,715 |
| 3.85% 9/1/23 | | 2,000 | 1,986 |
| 3.9% 8/1/46 | | 3,686 | 2,978 |
| 4.05% 6/15/48 | | 13,373 | 11,200 |
| 4.125% 6/15/47 | | 2,264 | 1,929 |
| 4.15% 4/1/45 | | 1,350 | 1,149 |
| 4.375% 9/1/42 | | 3,575 | 3,189 |
| 4.45% 3/15/43 | | 2,000 | 1,783 |
| 4.55% 9/1/44 | | 2,383 | 2,153 |
| 4.9% 4/1/44 | | 3,177 | 2,988 |
| 6.15% 5/1/37 | | 2,000 | 2,200 |
| Canadian National Railway Co.: | | | |
| 2.45% 5/1/50 | | 13,253 | 8,113 |
| 3.2% 8/2/46 | | 2,622 | 1,924 |
| 3.85% 8/5/32 | | 2,000 | 1,835 |
| Canadian Pacific Railway Co.: | | | |
| 1.75% 12/2/26 | | 8,990 | 7,961 |
| 2.05% 3/5/30 | | 1,800 | 1,479 |
| 2.45% 12/2/31 | | 20,546 | 17,110 |
| 3.1% 12/2/51 | | 9,405 | 6,419 |
| CSX Corp.: | | | |
| 3.25% 6/1/27 | | 3,972 | 3,704 |
| 3.4% 8/1/24 | | 3,673 | 3,574 |
| 3.8% 11/1/46 | | 4,544 | 3,569 |
| 3.95% 5/1/50 | | 2,840 | 2,261 |
| 4.1% 11/15/32 | | 13,500 | 12,441 |
| 4.1% 3/15/44 | | 5,382 | 4,516 |
| 4.5% 3/15/49 | | 10,963 | 9,579 |
| 4.75% 11/15/48 | | 4,599 | 4,152 |
| Norfolk Southern Corp.: | | | |
| 3% 3/15/32 | | 4,000 | 3,375 |
| 3.65% 8/1/25 | | 9,532 | 9,149 |
| 3.8% 8/1/28 | | 9,444 | 8,821 |
| 3.95% 10/1/42 | | 1,509 | 1,240 |
| 4.05% 8/15/52 | | 6,859 | 5,455 |
| 4.45% 3/1/33 | | 22,050 | 20,707 |
| 4.65% 1/15/46 | | 2,589 | 2,278 |
| Union Pacific Corp.: | | | |
| 2.15% 2/5/27 | | 7,153 | 6,467 |
| 2.375% 5/20/31 | | 2,000 | 1,656 |
| 2.4% 2/5/30 | | 2,000 | 1,703 |
| 2.75% 3/1/26 | | 5,290 | 4,959 |
| 2.8% 2/14/32 | | 11,666 | 9,865 |
| 2.891% 4/6/36 | | 7,292 | 5,742 |
| 3% 4/15/27 | | 3,972 | 3,697 |
| 3.25% 2/5/50 | | 10,720 | 7,732 |
| 3.35% 8/15/46 | | 3,750 | 2,740 |
| 3.375% 2/14/42 | | 4,000 | 3,142 |
| 3.6% 9/15/37 | | 2,622 | 2,211 |
| 3.799% 10/1/51 | | 2,224 | 1,769 |
| 3.839% 3/20/60 | | 11,170 | 8,518 |
| 3.95% 9/10/28 | | 2,000 | 1,911 |
| 4.5% 1/20/33 | | 10,000 | 9,624 |
| 4.95% 5/15/53 | | 3,730 | 3,570 |
| | | | 267,855 |
| Trading Companies & Distributors - 0.1% | | | |
| Air Lease Corp.: | | | |
| 2.2% 1/15/27 | | 6,863 | 6,030 |
| 2.3% 2/1/25 | | 5,000 | 4,667 |
| 3% 2/1/30 | | 1,900 | 1,577 |
| 3.125% 12/1/30 | | 9,666 | 7,947 |
| 3.625% 12/1/27 | | 7,593 | 6,902 |
| 4.25% 2/1/24 | | 10,455 | 10,307 |
| | | | 37,430 |
TOTAL INDUSTRIALS | | | 952,531 |
| INFORMATION TECHNOLOGY - 2.3% | | | |
| Communications Equipment - 0.0% | | | |
| Cisco Systems, Inc.: | | | |
| 2.2% 9/20/23 | | 5,965 | 5,872 |
| 2.5% 9/20/26 | | 3,972 | 3,676 |
| 3.5% 6/15/25 | | 3,392 | 3,288 |
| 5.9% 2/15/39 | | 9,863 | 10,789 |
| | | | 23,625 |
| Electronic Equipment & Components - 0.2% | | | |
| Corning, Inc.: | | | |
| 3.9% 11/15/49 | | 4,833 | 3,642 |
| 4.75% 3/15/42 | | 3,972 | 3,623 |
| Dell International LLC/EMC Corp.: | | | |
| 4% 7/15/24 | | 9,135 | 8,951 |
| 4.9% 10/1/26 | | 7,506 | 7,341 |
| 5.3% 10/1/29 | | 19,994 | 19,318 |
| 6.02% 6/15/26 | | 12,821 | 12,979 |
| 8.1% 7/15/36 | | 8,303 | 9,279 |
| 8.35% 7/15/46 | | 9,542 | 10,832 |
| Tyco Electronics Group SA: | | | |
| 3.45% 8/1/24 | | 2,899 | 2,819 |
| 3.7% 2/15/26 | | 4,253 | 4,104 |
| 7.125% 10/1/37 | | 1,966 | 2,239 |
| Vontier Corp. 2.95% 4/1/31 | | 3,500 | 2,666 |
| | | | 87,793 |
| IT Services - 0.5% | | | |
| CDW LLC/CDW Finance Corp. 2.67% 12/1/26 | | 11,406 | 10,130 |
| Fidelity National Information Services, Inc.: | | | |
| 1.15% 3/1/26 | | 16,937 | 14,851 |
| 2.25% 3/1/31 | | 16,065 | 12,637 |
| Fiserv, Inc.: | | | |
| 3.5% 7/1/29 | | 8,797 | 7,866 |
| 4.4% 7/1/49 | | 14,614 | 11,815 |
| Global Payments, Inc.: | | | |
| 1.2% 3/1/26 | | 23,465 | 20,512 |
| 2.15% 1/15/27 | | 10,000 | 8,763 |
| 2.9% 5/15/30 | | 2,000 | 1,646 |
| 4.45% 6/1/28 | | 2,000 | 1,868 |
| 5.95% 8/15/52 | | 5,500 | 5,085 |
| IBM Corp.: | | | |
| 1.95% 5/15/30 | | 11,102 | 8,949 |
| 2.95% 5/15/50 | | 11,005 | 7,158 |
| 3% 5/15/24 | | 9,538 | 9,273 |
| 3.3% 5/15/26 | | 9,666 | 9,134 |
| 3.5% 5/15/29 | | 13,474 | 12,288 |
| 3.625% 2/12/24 | | 7,944 | 7,806 |
| 4.25% 5/15/49 | | 8,612 | 7,119 |
| 4.4% 7/27/32 | | 8,100 | 7,586 |
| 4.7% 2/19/46 | | 3,932 | 3,438 |
| 5.6% 11/30/39 | | 1,000 | 1,001 |
| MasterCard, Inc.: | | | |
| 3.3% 3/26/27 | | 5,744 | 5,432 |
| 3.35% 3/26/30 | | 7,992 | 7,322 |
| 3.8% 11/21/46 | | 3,019 | 2,505 |
| 3.85% 3/26/50 | | 14,152 | 11,920 |
| PayPal Holdings, Inc.: | | | |
| 1.65% 6/1/25 | | 10,855 | 10,059 |
| 2.3% 6/1/30 | | 12,566 | 10,362 |
| 4.4% 6/1/32 | | 10,000 | 9,408 |
| The Western Union Co. 2.85% 1/10/25 | | 8,700 | 8,263 |
| Visa, Inc.: | | | |
| 1.1% 2/15/31 | | 16,240 | 12,451 |
| 1.9% 4/15/27 | | 11,387 | 10,212 |
| 2.05% 4/15/30 | | 16,761 | 14,165 |
| 2.7% 4/15/40 | | 9,473 | 7,097 |
| 2.75% 9/15/27 | | 9,468 | 8,752 |
| 3.15% 12/14/25 | | 9,257 | 8,836 |
| 4.3% 12/14/45 | | 5,275 | 4,761 |
| | | | 300,470 |
| Semiconductors & Semiconductor Equipment - 0.6% | | | |
| Analog Devices, Inc.: | | | |
| 2.8% 10/1/41 | | 11,812 | 8,568 |
| 3.5% 12/5/26 | | 1,700 | 1,613 |
| Applied Materials, Inc. 4.35% 4/1/47 | | 10,263 | 9,214 |
| Broadcom Corp./Broadcom Cayman LP: | | | |
| 3.5% 1/15/28 | | 5,561 | 5,080 |
| 3.875% 1/15/27 | | 3,043 | 2,870 |
| Broadcom, Inc.: | | | |
| 2.45% 2/15/31 (b) | | 28,182 | 22,331 |
| 2.6% 2/15/33 (b) | | 9,400 | 7,104 |
| 3.187% 11/15/36 (b) | | 1,000 | 724 |
| 3.419% 4/15/33 (b) | | 11,000 | 8,856 |
| 3.459% 9/15/26 | | 10,027 | 9,372 |
| 3.469% 4/15/34 (b) | | 3,391 | 2,684 |
| 3.75% 2/15/51 (b) | | 17,216 | 12,000 |
| 4.3% 11/15/32 | | 9,956 | 8,823 |
| 4.75% 4/15/29 | | 13,584 | 12,993 |
| Intel Corp.: | | | |
| 2% 8/12/31 | | 7,124 | 5,590 |
| 2.45% 11/15/29 | | 10,216 | 8,591 |
| 2.8% 8/12/41 | | 10,000 | 6,809 |
| 3.05% 8/12/51 | | 7,124 | 4,565 |
| 3.25% 11/15/49 | | 8,313 | 5,550 |
| 3.734% 12/8/47 | | 2,594 | 1,917 |
| 3.9% 3/25/30 | | 9,048 | 8,344 |
| 4% 8/5/29 | | 2,000 | 1,869 |
| 4.1% 5/19/46 | | 5,561 | 4,477 |
| 4.1% 5/11/47 | | 1,906 | 1,528 |
| 4.15% 8/5/32 | | 2,000 | 1,842 |
| 4.6% 3/25/40 | | 2,000 | 1,796 |
| 4.75% 3/25/50 | | 9,512 | 8,236 |
| 4.875% 2/10/28 | | 10,180 | 10,031 |
| 5.7% 2/10/53 | | 8,000 | 7,817 |
| Lam Research Corp. 2.875% 6/15/50 | | 11,648 | 7,771 |
| Marvell Technology, Inc. 2.95% 4/15/31 | | 2,000 | 1,609 |
| Micron Technology, Inc.: | | | |
| 2.703% 4/15/32 | | 8,400 | 6,373 |
| 4.663% 2/15/30 | | 6,573 | 6,045 |
| NVIDIA Corp.: | | | |
| 2% 6/15/31 | | 20,182 | 16,319 |
| 2.85% 4/1/30 | | 8,603 | 7,581 |
| 3.5% 4/1/50 | | 4,785 | 3,711 |
| NXP BV/NXP Funding LLC/NXP U.S.A., Inc.: | | | |
| 2.65% 2/15/32 | | 17,641 | 13,767 |
| 5% 1/15/33 | | 8,500 | 7,938 |
| Qualcomm, Inc.: | | | |
| 1.65% 5/20/32 | | 14,000 | 10,718 |
| 3.45% 5/20/25 | | 2,000 | 1,931 |
| 4.3% 5/20/47 | | 8,023 | 7,015 |
| 4.8% 5/20/45 | | 2,000 | 1,895 |
| 5.4% 5/20/33 | | 18,000 | 18,561 |
| Texas Instruments, Inc.: | | | |
| 1.9% 9/15/31 | | 2,000 | 1,618 |
| 3.65% 8/16/32 | | 2,000 | 1,838 |
| 4.15% 5/15/48 | | 5,526 | 4,902 |
| 4.6% 2/15/28 | | 10,000 | 9,931 |
| | | | 320,717 |
| Software - 0.6% | | | |
| Fortinet, Inc. 2.2% 3/15/31 | | 2,000 | 1,595 |
| Microsoft Corp.: | | | |
| 2.525% 6/1/50 | | 32,153 | 21,472 |
| 2.675% 6/1/60 | | 5,334 | 3,456 |
| 2.7% 2/12/25 | | 13,643 | 13,122 |
| 2.875% 2/6/24 | | 9,260 | 9,059 |
| 2.921% 3/17/52 | | 36,922 | 26,563 |
| 3.041% 3/17/62 | | 3,278 | 2,296 |
| 3.45% 8/8/36 | | 2,307 | 2,021 |
| 3.625% 12/15/23 | | 20,772 | 20,542 |
| 4.2% 11/3/35 | | 1,700 | 1,630 |
| Oracle Corp.: | | | |
| 1.65% 3/25/26 | | 9,109 | 8,143 |
| 2.5% 4/1/25 | | 8,564 | 8,074 |
| 2.65% 7/15/26 | | 7,149 | 6,533 |
| 2.875% 3/25/31 | | 11,675 | 9,679 |
| 2.95% 5/15/25 | | 3,972 | 3,766 |
| 2.95% 4/1/30 | | 12,477 | 10,647 |
| 3.25% 11/15/27 | | 13,584 | 12,425 |
| 3.4% 7/8/24 | | 3,753 | 3,653 |
| 3.6% 4/1/40 | | 13,600 | 10,039 |
| 3.6% 4/1/50 | | 12,383 | 8,387 |
| 3.85% 7/15/36 | | 8,047 | 6,548 |
| 3.85% 4/1/60 | | 14,393 | 9,594 |
| 3.95% 3/25/51 | | 10,575 | 7,596 |
| 4% 7/15/46 | | 7,785 | 5,683 |
| 4% 11/15/47 | | 13,899 | 10,163 |
| 4.125% 5/15/45 | | 2,383 | 1,793 |
| 4.3% 7/8/34 | | 3,078 | 2,703 |
| 4.9% 2/6/33 | | 15,000 | 14,167 |
| 5.375% 7/15/40 | | 19,029 | 17,430 |
| 6.125% 7/8/39 | | 1,800 | 1,793 |
| 6.25% 11/9/32 | | 10,150 | 10,563 |
| Roper Technologies, Inc.: | | | |
| 1% 9/15/25 | | 7,443 | 6,705 |
| 1.4% 9/15/27 | | 7,250 | 6,149 |
| 1.75% 2/15/31 | | 7,250 | 5,591 |
| 2% 6/30/30 | | 14,306 | 11,520 |
| 3.8% 12/15/26 | | 6,752 | 6,421 |
| Salesforce.com, Inc.: | | | |
| 1.95% 7/15/31 | | 10,300 | 8,261 |
| 2.7% 7/15/41 | | 12,000 | 8,478 |
| VMware, Inc.: | | | |
| 1.4% 8/15/26 | | 22,344 | 19,297 |
| 4.65% 5/15/27 | | 2,000 | 1,930 |
| 4.7% 5/15/30 | | 2,000 | 1,872 |
| | | | 347,359 |
| Technology Hardware, Storage & Peripherals - 0.4% | | | |
| Apple, Inc.: | | | |
| 0.55% 8/20/25 | | 14,113 | 12,724 |
| 0.7% 2/8/26 | | 10,933 | 9,702 |
| 1.125% 5/11/25 | | 10,000 | 9,235 |
| 1.2% 2/8/28 | | 10,000 | 8,476 |
| 1.25% 8/20/30 | | 13,098 | 10,292 |
| 1.7% 8/5/31 | | 7,886 | 6,275 |
| 2.375% 2/8/41 | | 13,368 | 9,451 |
| 2.45% 8/4/26 | | 16,363 | 15,147 |
| 2.55% 8/20/60 | | 5,162 | 3,201 |
| 2.65% 5/11/50 | | 4,157 | 2,791 |
| 2.85% 8/5/61 | | 7,887 | 5,124 |
| 2.9% 9/12/27 | | 11,161 | 10,377 |
| 2.95% 9/11/49 | | 21,247 | 15,285 |
| 3% 11/13/27 | | 7,944 | 7,399 |
| 3.2% 5/13/25 | | 8,332 | 8,048 |
| 3.2% 5/11/27 | | 13,008 | 12,291 |
| 3.35% 8/8/32 | | 7,000 | 6,312 |
| 3.75% 9/12/47 | | 4,833 | 4,044 |
| 3.75% 11/13/47 | | 5,541 | 4,629 |
| 3.85% 5/4/43 | | 10,327 | 8,881 |
| 4.25% 2/9/47 | | 1,986 | 1,813 |
| 4.375% 5/13/45 | | 3,725 | 3,421 |
| 4.5% 2/23/36 | | 7,355 | 7,208 |
| 4.65% 2/23/46 | | 4,488 | 4,273 |
| Hewlett Packard Enterprise Co.: | | | |
| 1.45% 4/1/24 | | 2,000 | 1,913 |
| 4.45% 10/2/23 | | 2,000 | 1,987 |
| 4.9% 10/15/25 (c) | | 7,746 | 7,681 |
| 6.2% 10/15/35 (c) | | 6,390 | 6,587 |
| 6.35% 10/15/45 (c) | | 1,493 | 1,472 |
| HP, Inc.: | | | |
| 2.2% 6/17/25 | | 11,261 | 10,518 |
| 4.2% 4/15/32 | | 6,450 | 5,547 |
| 5.5% 1/15/33 | | 2,000 | 1,890 |
| 6% 9/15/41 | | 3,192 | 3,123 |
| | | | 227,117 |
TOTAL INFORMATION TECHNOLOGY | | | 1,307,081 |
| MATERIALS - 0.7% | | | |
| Chemicals - 0.4% | | | |
| Air Products & Chemicals, Inc.: | | | |
| 1.5% 10/15/25 | | 4,785 | 4,365 |
| 2.05% 5/15/30 | | 5,220 | 4,363 |
| 2.7% 5/15/40 | | 4,495 | 3,319 |
| 2.8% 5/15/50 | | 5,346 | 3,696 |
| Celanese U.S. Holdings LLC: | | | |
| 6.33% 7/15/29 | | 2,000 | 1,962 |
| 6.379% 7/15/32 | | 7,400 | 7,180 |
| CF Industries Holdings, Inc. 4.95% 6/1/43 | | 5,900 | 4,951 |
| DuPont de Nemours, Inc.: | | | |
| 4.725% 11/15/28 | | 13,619 | 13,397 |
| 5.319% 11/15/38 | | 8,458 | 8,209 |
| Eastman Chemical Co. 4.65% 10/15/44 | | 2,383 | 1,990 |
| Ecolab, Inc.: | | | |
| 1.3% 1/30/31 | | 6,356 | 4,858 |
| 2.7% 11/1/26 | | 5,243 | 4,835 |
| 2.75% 8/18/55 | | 8,768 | 5,401 |
| Linde, Inc./Connecticut: | | | |
| 3.2% 1/30/26 | | 5,036 | 4,846 |
| 3.55% 11/7/42 | | 1,589 | 1,276 |
| LYB International Finance BV: | | | |
| 4% 7/15/23 | | 2,533 | 2,521 |
| 4.875% 3/15/44 | | 4,647 | 3,935 |
| LYB International Finance II BV 3.5% 3/2/27 | | 19,438 | 18,132 |
| LYB International Finance III LLC: | | | |
| 3.375% 10/1/40 | | 7,366 | 5,289 |
| 3.625% 4/1/51 | | 7,366 | 5,064 |
| LyondellBasell Industries NV 4.625% 2/26/55 | | 2,970 | 2,365 |
| Nutrien Ltd.: | | | |
| 4% 12/15/26 | | 9,055 | 8,699 |
| 4.2% 4/1/29 | | 4,109 | 3,876 |
| 5% 4/1/49 | | 7,152 | 6,449 |
| 5.25% 1/15/45 | | 2,780 | 2,561 |
| 5.625% 12/1/40 | | 1,430 | 1,385 |
| Sherwin-Williams Co.: | | | |
| 2.95% 8/15/29 | | 2,000 | 1,734 |
| 3.45% 6/1/27 | | 17,609 | 16,500 |
| 3.8% 8/15/49 | | 2,919 | 2,179 |
| 4.5% 6/1/47 | | 6,776 | 5,678 |
| The Dow Chemical Co.: | | | |
| 2.1% 11/15/30 | | 6,863 | 5,541 |
| 3.6% 11/15/50 | | 7,056 | 5,086 |
| 4.375% 11/15/42 | | 3,872 | 3,259 |
| 4.8% 11/30/28 | | 6,792 | 6,664 |
| 4.8% 5/15/49 | | 6,112 | 5,229 |
| 9.4% 5/15/39 | | 2,383 | 3,148 |
| The Mosaic Co.: | | | |
| 4.05% 11/15/27 | | 4,575 | 4,331 |
| 4.25% 11/15/23 | | 8,649 | 8,583 |
| 5.625% 11/15/43 | | 2,979 | 2,810 |
| Westlake Corp.: | | | |
| 0.875% 8/15/24 | | 4,300 | 4,012 |
| 5% 8/15/46 | | 1,589 | 1,335 |
| | | | 211,013 |
| Construction Materials - 0.0% | | | |
| Martin Marietta Materials, Inc. 3.5% 12/15/27 | | 2,000 | 1,874 |
| Containers & Packaging - 0.0% | | | |
| International Paper Co.: | | | |
| 4.4% 8/15/47 | | 6,908 | 5,845 |
| 5.15% 5/15/46 | | 1,438 | 1,313 |
| WRKCo, Inc.: | | | |
| 3% 6/15/33 | | 2,000 | 1,613 |
| 3.375% 9/15/27 | | 2,000 | 1,844 |
| 4.2% 6/1/32 | | 4,833 | 4,368 |
| | | | 14,983 |
| Metals & Mining - 0.2% | | | |
| Barrick Gold Corp. 5.25% 4/1/42 | | 3,575 | 3,431 |
| Barrick North America Finance LLC 5.75% 5/1/43 | | 2,000 | 2,012 |
| Barrick PD Australia Finance Pty Ltd. 5.95% 10/15/39 | | 2,000 | 2,061 |
| BHP Billiton Financial (U.S.A.) Ltd.: | | | |
| 4.75% 2/28/28 | | 7,460 | 7,371 |
| 4.9% 2/28/33 | | 8,000 | 7,968 |
| 5% 9/30/43 | | 3,783 | 3,669 |
| Freeport-McMoRan, Inc. 4.625% 8/1/30 | | 32,382 | 30,113 |
| Newmont Corp.: | | | |
| 2.25% 10/1/30 | | 14,340 | 11,547 |
| 2.8% 10/1/29 | | 2,707 | 2,303 |
| 5.45% 6/9/44 | | 5,093 | 4,892 |
| Nucor Corp.: | | | |
| 2.7% 6/1/30 | | 3,900 | 3,327 |
| 2.979% 12/15/55 | | 3,177 | 2,053 |
| 6.4% 12/1/37 | | 4,833 | 5,263 |
| Rio Tinto Finance (U.S.A.) Ltd.: | | | |
| 5.2% 11/2/40 | | 10,343 | 10,318 |
| 7.125% 7/15/28 | | 1,589 | 1,744 |
| Southern Copper Corp.: | | | |
| 3.875% 4/23/25 | | 2,915 | 2,806 |
| 5.25% 11/8/42 | | 4,588 | 4,272 |
| 7.5% 7/27/35 | | 4,833 | 5,465 |
| Vale Overseas Ltd.: | | | |
| 3.75% 7/8/30 | | 19,333 | 16,741 |
| 6.25% 8/10/26 | | 2,417 | 2,458 |
| Vale SA 5.625% 9/11/42 | | 5,243 | 5,049 |
| | | | 134,863 |
| Paper & Forest Products - 0.1% | | | |
| Suzano Austria GmbH: | | | |
| 2.5% 9/15/28 | | 11,930 | 9,964 |
| 6% 1/15/29 | | 9,570 | 9,371 |
| | | | 19,335 |
TOTAL MATERIALS | | | 382,068 |
| REAL ESTATE - 0.7% | | | |
| Equity Real Estate Investment Trusts (REITs) - 0.7% | | | |
| Alexandria Real Estate Equities, Inc.: | | | |
| 2% 5/18/32 | | 7,371 | 5,639 |
| 3% 5/18/51 | | 5,582 | 3,596 |
| 4.85% 4/15/49 | | 9,154 | 7,976 |
| American Homes 4 Rent LP 4.25% 2/15/28 | | 7,636 | 7,131 |
| American Tower Corp.: | | | |
| 1.3% 9/15/25 | | 7,221 | 6,492 |
| 2.1% 6/15/30 | | 12,189 | 9,649 |
| 3.1% 6/15/50 | | 4,456 | 2,772 |
| 3.55% 7/15/27 | | 6,792 | 6,278 |
| 3.7% 10/15/49 | | 4,833 | 3,373 |
| AvalonBay Communities, Inc.: | | | |
| 2.05% 1/15/32 | | 2,000 | 1,585 |
| 2.3% 3/1/30 | | 4,833 | 4,047 |
| 5% 2/15/33 | | 3,800 | 3,781 |
| Boston Properties, Inc.: | | | |
| 2.55% 4/1/32 | | 1,100 | 841 |
| 2.75% 10/1/26 | | 5,561 | 5,019 |
| 2.9% 3/15/30 | | 1,400 | 1,149 |
| 3.125% 9/1/23 | | 1,509 | 1,488 |
| 3.25% 1/30/31 | | 15,176 | 12,662 |
| Camden Property Trust 4.1% 10/15/28 | | 2,000 | 1,895 |
| Corporate Office Properties LP 2.75% 4/15/31 | | 4,000 | 3,012 |
| Crown Castle International Corp.: | | | |
| 1.35% 7/15/25 | | 21,460 | 19,491 |
| 2.25% 1/15/31 | | 5,771 | 4,617 |
| 3.25% 1/15/51 | | 5,220 | 3,434 |
| EPR Properties: | | | |
| 4.5% 6/1/27 | | 2,000 | 1,779 |
| 4.95% 4/15/28 | | 4,000 | 3,557 |
| ERP Operating LP: | | | |
| 1.85% 8/1/31 | | 14,500 | 11,395 |
| 3.25% 8/1/27 | | 10,314 | 9,543 |
| Healthpeak Properties, Inc.: | | | |
| 3% 1/15/30 | | 9,937 | 8,554 |
| 3.4% 2/1/25 | | 387 | 373 |
| Hudson Pacific Properties LP: | | | |
| 3.25% 1/15/30 | | 2,000 | 1,507 |
| 4.65% 4/1/29 | | 1,700 | 1,444 |
| Invitation Homes Operating Partnership LP 4.15% 4/15/32 | | 6,186 | 5,442 |
| Kimco Realty Op LLC: | | | |
| 1.9% 3/1/28 | | 8,216 | 6,935 |
| 3.8% 4/1/27 | | 3,177 | 2,980 |
| 4.125% 12/1/46 | | 7,944 | 5,934 |
| 4.45% 9/1/47 | | 4,114 | 3,298 |
| Kite Realty Group Trust 4% 3/15/25 | | 1,400 | 1,327 |
| LXP Industrial Trust (REIT) 2.375% 10/1/31 | | 2,417 | 1,833 |
| National Retail Properties, Inc. 3% 4/15/52 | | 6,766 | 4,190 |
| Office Properties Income Trust: | | | |
| 2.65% 6/15/26 | | 1,600 | 1,267 |
| 3.45% 10/15/31 | | 2,000 | 1,335 |
| 4.5% 2/1/25 | | 2,000 | 1,840 |
| Omega Healthcare Investors, Inc.: | | | |
| 3.375% 2/1/31 | | 3,093 | 2,437 |
| 4.375% 8/1/23 | | 1,309 | 1,301 |
| 4.5% 1/15/25 | | 6,362 | 6,205 |
| 4.5% 4/1/27 | | 7,547 | 7,126 |
| Piedmont Operating Partnership LP 4.45% 3/15/24 | | 2,000 | 1,971 |
| Prologis LP: | | | |
| 1.625% 3/15/31 | | 11,425 | 8,934 |
| 1.75% 2/1/31 | | 23,383 | 18,455 |
| 2.125% 4/15/27 | | 9,502 | 8,548 |
| 3.25% 10/1/26 | | 3,701 | 3,487 |
| Realty Income Corp.: | | | |
| 3.95% 8/15/27 | | 6,200 | 5,905 |
| 4.85% 3/15/30 | | 15,000 | 14,550 |
| 5.05% 1/13/26 | | 4,500 | 4,457 |
| Simon Property Group LP: | | | |
| 2.2% 2/1/31 | | 21,169 | 16,909 |
| 3.25% 9/13/49 | | 9,260 | 6,403 |
| 3.375% 12/1/27 | | 15,851 | 14,641 |
| Spirit Realty LP 3.4% 1/15/30 | | 2,000 | 1,690 |
| UDR, Inc. 2.1% 6/15/33 | | 12,929 | 9,424 |
| Ventas Realty LP: | | | |
| 3.25% 10/15/26 | | 2,780 | 2,560 |
| 3.5% 2/1/25 | | 3,177 | 3,050 |
| 3.85% 4/1/27 | | 7,547 | 7,141 |
| 4% 3/1/28 | | 17,202 | 15,891 |
| 4.125% 1/15/26 | | 1,152 | 1,109 |
| 4.375% 2/1/45 | | 2,383 | 1,908 |
| 4.875% 4/15/49 | | 2,262 | 1,924 |
| VICI Properties LP: | | | |
| 4.375% 5/15/25 | | 2,000 | 1,925 |
| 4.75% 2/15/28 | | 11,117 | 10,487 |
| 5.125% 5/15/32 | | 5,838 | 5,417 |
| Vornado Realty LP 3.4% 6/1/31 | | 2,000 | 1,521 |
| Welltower Op 4.95% 9/1/48 | | 7,944 | 6,762 |
| Weyerhaeuser Co. 4% 4/15/30 | | 9,183 | 8,348 |
| WP Carey, Inc. 2.45% 2/1/32 | | 2,000 | 1,580 |
| | | | 392,526 |
| Real Estate Management & Development - 0.0% | | | |
| CBRE Group, Inc. 4.875% 3/1/26 | | 4,528 | 4,431 |
| Digital Realty Trust LP 3.7% 8/15/27 | | 8,356 | 7,738 |
| Essex Portfolio LP: | | | |
| 1.65% 1/15/31 | | 2,000 | 1,504 |
| 1.7% 3/1/28 | | 2,000 | 1,671 |
| 2.55% 6/15/31 | | 2,000 | 1,597 |
| 3% 1/15/30 | | 1,477 | 1,256 |
| 3.375% 4/15/26 | | 2,000 | 1,871 |
| 4% 3/1/29 | | 4,833 | 4,439 |
| Mid-America Apartments LP 3.95% 3/15/29 | | 5,510 | 5,175 |
| Tanger Properties LP 3.875% 7/15/27 | | 4,925 | 4,523 |
| | | | 34,205 |
TOTAL REAL ESTATE | | | 426,731 |
| UTILITIES - 2.2% | | | |
| Electric Utilities - 1.5% | | | |
| AEP Texas, Inc.: | | | |
| 3.8% 10/1/47 | | 3,383 | 2,512 |
| 4.7% 5/15/32 | | 4,000 | 3,794 |
| AEP Transmission Co. LLC 2.75% 8/15/51 | | 5,703 | 3,662 |
| Alabama Power Co.: | | | |
| 1.45% 9/15/30 | | 14,500 | 11,289 |
| 3.7% 12/1/47 | | 4,679 | 3,598 |
| 3.75% 3/1/45 | | 795 | 614 |
| 4.15% 8/15/44 | | 3,694 | 3,056 |
| 4.3% 7/15/48 | | 4,671 | 3,936 |
| 5.2% 6/1/41 | | 3,058 | 2,887 |
| American Electric Power Co., Inc.: | | | |
| 3.25% 3/1/50 | | 2,494 | 1,675 |
| 4.3% 12/1/28 | | 13,893 | 13,216 |
| Appalachian Power Co.: | | | |
| 4.45% 6/1/45 | | 4,766 | 3,981 |
| 4.5% 3/1/49 | | 7,259 | 6,095 |
| Arizona Public Service Co.: | | | |
| 2.95% 9/15/27 | | 5,861 | 5,316 |
| 6.35% 12/15/32 | | 4,000 | 4,251 |
| Baltimore Gas & Electric Co.: | | | |
| 2.25% 6/15/31 | | 2,000 | 1,618 |
| 2.9% 6/15/50 | | 6,360 | 4,250 |
| 3.35% 7/1/23 | | 2,264 | 2,248 |
| 3.5% 8/15/46 | | 1,986 | 1,494 |
| CenterPoint Energy Houston Electric LLC: | | | |
| 3.35% 4/1/51 | | 9,077 | 6,707 |
| 3.55% 8/1/42 | | 1,509 | 1,191 |
| 4.25% 2/1/49 | | 2,068 | 1,802 |
| Cincinnati Gas & Electric Co. 4.3% 2/1/49 | | 21,562 | 17,689 |
| Cleco Corporate Holdings LLC 3.743% 5/1/26 | | 4,496 | 4,219 |
| Commonwealth Edison Co.: | | | |
| 3.1% 11/1/24 | | 7,944 | 7,665 |
| 3.2% 11/15/49 | | 13,533 | 9,578 |
| 3.65% 6/15/46 | | 2,272 | 1,736 |
| 3.7% 3/1/45 | | 2,462 | 1,911 |
| 3.75% 8/15/47 | | 4,885 | 3,828 |
| 4% 3/1/48 | | 5,426 | 4,450 |
| 4% 3/1/49 | | 4,762 | 3,872 |
| Dayton Power & Light Co. 3.95% 6/15/49 | | 1,400 | 1,117 |
| DTE Electric Co.: | | | |
| 1.9% 4/1/28 | | 7,800 | 6,716 |
| 3.95% 3/1/49 | | 2,900 | 2,382 |
| 5.4% 4/1/53 | | 4,690 | 4,729 |
| Duke Energy Carolinas LLC: | | | |
| 2.85% 3/15/32 | | 2,417 | 2,025 |
| 2.95% 12/1/26 | | 4,766 | 4,437 |
| 3.2% 8/15/49 | | 6,345 | 4,486 |
| 3.75% 6/1/45 | | 1,589 | 1,238 |
| 3.875% 3/15/46 | | 3,097 | 2,422 |
| 4% 9/30/42 | | 2,979 | 2,450 |
| 4.95% 1/15/33 | | 8,000 | 7,877 |
| 6% 1/15/38 | | 1,800 | 1,915 |
| Duke Energy Corp.: | | | |
| 2.45% 6/1/30 | | 5,220 | 4,287 |
| 2.65% 9/1/26 | | 10,605 | 9,685 |
| 3.75% 4/15/24 | | 4,766 | 4,677 |
| 3.75% 9/1/46 | | 7,253 | 5,347 |
| 3.95% 10/15/23 | | 1,941 | 1,921 |
| 4.2% 6/15/49 | | 7,520 | 5,947 |
| 4.5% 8/15/32 | | 1,000 | 925 |
| 4.8% 12/15/45 | | 2,216 | 1,944 |
| 5% 8/15/52 | | 1,600 | 1,422 |
| Duke Energy Florida LLC 3.4% 10/1/46 | | 1,986 | 1,420 |
| Duke Energy Progress LLC: | | | |
| 3.4% 4/1/32 | | 9,666 | 8,501 |
| 4.15% 12/1/44 | | 1,430 | 1,186 |
| 4.375% 3/30/44 | | 1,589 | 1,364 |
| Edison International: | | | |
| 4.125% 3/15/28 | | 2,000 | 1,865 |
| 5.75% 6/15/27 | | 2,000 | 2,009 |
| Entergy Corp.: | | | |
| 0.9% 9/15/25 | | 13,436 | 11,946 |
| 2.95% 9/1/26 | | 3,734 | 3,432 |
| 3.75% 6/15/50 | | 3,287 | 2,417 |
| Entergy Louisiana LLC: | | | |
| 2.35% 6/15/32 | | 18,700 | 14,837 |
| 3.12% 9/1/27 | | 1,600 | 1,466 |
| 4.2% 9/1/48 | | 2,526 | 2,113 |
| Entergy, Inc.: | | | |
| 3.55% 9/30/49 | | 3,211 | 2,331 |
| 4% 3/30/29 | | 14,040 | 13,166 |
| 5.15% 1/15/33 | | 3,100 | 3,084 |
| Eversource Energy: | | | |
| 2.55% 3/15/31 | | 12,735 | 10,412 |
| 2.9% 10/1/24 | | 6,792 | 6,527 |
| 3.35% 3/15/26 | | 5,251 | 4,930 |
| 3.45% 1/15/50 | | 3,548 | 2,560 |
| Exelon Corp.: | | | |
| 3.95% 6/15/25 | | 15,612 | 15,112 |
| 4.05% 4/15/30 | | 2,000 | 1,834 |
| 5.1% 6/15/45 | | 874 | 804 |
| 5.3% 3/15/33 | | 12,280 | 12,126 |
| FirstEnergy Corp.: | | | |
| 1.6% 1/15/26 | | 9,970 | 8,879 |
| 2.25% 9/1/30 | | 10,730 | 8,557 |
| 3.4% 3/1/50 | | 2,900 | 1,960 |
| 4.15% 7/15/27 | | 6,752 | 6,298 |
| 5.1% 7/15/47 | | 3,732 | 3,330 |
| Florida Power & Light Co.: | | | |
| 2.45% 2/3/32 | | 2,000 | 1,645 |
| 3.125% 12/1/25 | | 4,051 | 3,852 |
| 3.15% 10/1/49 | | 5,556 | 3,939 |
| 3.25% 6/1/24 | | 3,753 | 3,656 |
| 4.05% 10/1/44 | | 4,304 | 3,624 |
| 4.125% 6/1/48 | | 9,771 | 8,250 |
| 5.1% 4/1/33 | | 10,000 | 9,923 |
| Georgia Power Co.: | | | |
| 3.25% 3/30/27 | | 6,781 | 6,259 |
| 4.7% 5/15/32 | | 4,000 | 3,804 |
| Indiana Michigan Power Co. 3.25% 5/1/51 | | 3,867 | 2,679 |
| Interstate Power and Light Co.: | | | |
| 2.3% 6/1/30 | | 11,051 | 9,046 |
| 3.25% 12/1/24 | | 2,000 | 1,925 |
| ITC Holdings Corp. 3.35% 11/15/27 | | 2,000 | 1,843 |
| NextEra Energy Capital Holdings, Inc.: | | | |
| 1.875% 1/15/27 | | 13,726 | 12,094 |
| 1.9% 6/15/28 | | 9,666 | 8,172 |
| 2.44% 1/15/32 | | 13,630 | 10,795 |
| 2.94% 3/21/24 | | 2,000 | 1,948 |
| 4.9% 2/28/28 | | 3,500 | 3,458 |
| 5% 7/15/32 | | 8,800 | 8,471 |
| Northern States Power Co.: | | | |
| 2.6% 6/1/51 | | 10,440 | 6,701 |
| 2.9% 3/1/50 | | 9,483 | 6,437 |
| 3.4% 8/15/42 | | 1,589 | 1,237 |
| 4.125% 5/15/44 | | 3,575 | 3,049 |
| NSTAR Electric Co.: | | | |
| 3.2% 5/15/27 | | 6,076 | 5,662 |
| 4.95% 9/15/52 | | 3,710 | 3,543 |
| Oglethorpe Power Corp. 5.05% 10/1/48 | | 2,000 | 1,751 |
| Oncor Electric Delivery Co. LLC: | | | |
| 0.55% 10/1/25 | | 25,429 | 22,699 |
| 3.1% 9/15/49 | | 15,204 | 10,686 |
| 3.8% 9/30/47 | | 7,733 | 6,294 |
| Pacific Gas & Electric Co.: | | | |
| 3.15% 1/1/26 | | 11,600 | 10,760 |
| 3.25% 6/1/31 | | 4,833 | 3,944 |
| 3.45% 7/1/25 | | 4,833 | 4,541 |
| 3.5% 6/15/25 | | 9,666 | 9,162 |
| 4.2% 3/1/29 | | 1,000 | 898 |
| 4.2% 6/1/41 | | 24,166 | 18,141 |
| 4.55% 7/1/30 | | 30,062 | 27,147 |
| 4.75% 2/15/44 | | 967 | 757 |
| 5.45% 6/15/27 | | 1,100 | 1,074 |
| PacifiCorp: | | | |
| 3.6% 4/1/24 | | 3,177 | 3,118 |
| 4.125% 1/15/49 | | 10,692 | 8,865 |
| 4.15% 2/15/50 | | 2,900 | 2,398 |
| 6% 1/15/39 | | 4,919 | 5,136 |
| PG&E Wildfire Recovery: | | | |
| 5.081% 6/1/43 | | 1,000 | 984 |
| 5.099% 6/1/54 | | 5,100 | 5,154 |
| 5.212% 12/1/49 | | 11,120 | 11,072 |
| Potomac Electric Power Co. 6.5% 11/15/37 | | 3,024 | 3,316 |
| PPL Capital Funding, Inc. 3.1% 5/15/26 | | 6,356 | 5,945 |
| PPL Electric Utilities Corp.: | | | |
| 3% 10/1/49 | | 10,557 | 7,347 |
| 4.15% 10/1/45 | | 2,780 | 2,323 |
| Progress Energy, Inc. 6% 12/1/39 | | 4,131 | 4,152 |
| Public Service Co. of Colorado: | | | |
| 2.9% 5/15/25 | | 8,737 | 8,271 |
| 3.8% 6/15/47 | | 3,678 | 2,941 |
| 4.1% 6/1/32 | | 2,000 | 1,883 |
| 4.1% 6/15/48 | | 2,000 | 1,659 |
| 6.25% 9/1/37 | | 2,000 | 2,165 |
| Public Service Electric & Gas Co.: | | | |
| 2.45% 1/15/30 | | 8,071 | 6,919 |
| 3.15% 1/1/50 | | 9,135 | 6,590 |
| 3.65% 9/1/42 | | 2,244 | 1,806 |
| 4% 6/1/44 | | 3,972 | 3,221 |
| Puget Sound Energy, Inc. 4.3% 5/20/45 | | 5,092 | 4,166 |
| Southern California Edison Co.: | | | |
| 2.25% 6/1/30 | | 7,198 | 5,920 |
| 2.95% 2/1/51 | | 15,950 | 10,262 |
| 3.7% 8/1/25 | | 2,000 | 1,921 |
| 4% 4/1/47 | | 7,944 | 6,227 |
| 4.125% 3/1/48 | | 5,606 | 4,454 |
| 5.85% 11/1/27 | | 9,900 | 10,132 |
| Southern Co.: | | | |
| 3.25% 7/1/26 | | 10,737 | 10,011 |
| 3.7% 4/30/30 | | 10,000 | 9,006 |
| 4.4% 7/1/46 | | 5,814 | 4,785 |
| 5.15% 10/6/25 | | 8,000 | 7,968 |
| Southwestern Electric Power Co. 1.65% 3/15/26 | | 10,000 | 8,944 |
| Tampa Electric Co.: | | | |
| 4.45% 6/15/49 | | 9,306 | 7,802 |
| 6.15% 5/15/37 | | 4,972 | 5,105 |
| Union Electric Co.: | | | |
| 3.9% 9/15/42 | | 2,940 | 2,410 |
| 5.45% 3/15/53 (e) | | 5,900 | 5,899 |
| Virginia Electric & Power Co.: | | | |
| 3.1% 5/15/25 | | 3,177 | 3,028 |
| 3.3% 12/1/49 | | 5,800 | 4,185 |
| 3.45% 2/15/24 | | 2,185 | 2,143 |
| 3.8% 4/1/28 | | 11,844 | 11,172 |
| 3.8% 9/15/47 | | 6,522 | 5,055 |
| 4.2% 5/15/45 | | 8,383 | 6,833 |
| 4.45% 2/15/44 | | 2,185 | 1,880 |
| 4.6% 12/1/48 | | 5,624 | 4,864 |
| 6% 5/15/37 | | 1,589 | 1,654 |
| Wisconsin Electric Power Co. 4.25% 6/1/44 | | 3,734 | 3,044 |
| Xcel Energy, Inc.: | | | |
| 3.35% 12/1/26 | | 2,383 | 2,225 |
| 4% 6/15/28 | | 1,900 | 1,797 |
| 4.6% 6/1/32 | | 11,300 | 10,715 |
| | | | 885,293 |
| Gas Utilities - 0.1% | | | |
| Atmos Energy Corp.: | | | |
| 1.5% 1/15/31 | | 2,000 | 1,553 |
| 5.45% 10/15/32 | | 13,820 | 14,283 |
| CenterPoint Energy Resources Corp.: | | | |
| 4% 4/1/28 | | 7,400 | 7,041 |
| 4.4% 7/1/32 | | 2,000 | 1,882 |
| Dominion Gas Holdings LLC 2.5% 11/15/24 | | 8,816 | 8,411 |
| Piedmont Natural Gas Co., Inc. 3.5% 6/1/29 | | 10,000 | 9,101 |
| Southern California Gas Co. 2.6% 6/15/26 | | 10,509 | 9,706 |
| Southern Co. Gas Capital Corp. 3.95% 10/1/46 | | 10,740 | 8,060 |
| | | | 60,037 |
| Independent Power and Renewable Electricity Producers - 0.0% | | | |
| Emera U.S. Finance LP 4.75% 6/15/46 | | 4,138 | 3,251 |
| Exelon Generation Co. LLC: | | | |
| 3.25% 6/1/25 | | 15,566 | 14,797 |
| 6.25% 10/1/39 | | 2,000 | 2,058 |
| | | | 20,106 |
| Multi-Utilities - 0.5% | | | |
| Ameren Corp. 1.95% 3/15/27 | | 8,995 | 7,922 |
| Ameren Illinois Co.: | | | |
| 3.8% 5/15/28 | | 1,500 | 1,423 |
| 4.5% 3/15/49 | | 5,993 | 5,427 |
| Berkshire Hathaway Energy Co.: | | | |
| 3.25% 4/15/28 | | 7,944 | 7,336 |
| 3.7% 7/15/30 | | 7,954 | 7,311 |
| 3.8% 7/15/48 | | 7,944 | 6,134 |
| 4.25% 10/15/50 | | 6,859 | 5,675 |
| 4.5% 2/1/45 | | 5,282 | 4,588 |
| 5.15% 11/15/43 | | 6,144 | 5,809 |
| CenterPoint Energy, Inc. 3.7% 9/1/49 | | 4,833 | 3,658 |
| CMS Energy Corp. 4.875% 3/1/44 | | 3,972 | 3,571 |
| Consolidated Edison Co. of New York, Inc.: | | | |
| 3.875% 6/15/47 | | 2,272 | 1,769 |
| 4.45% 3/15/44 | | 6,356 | 5,397 |
| 4.5% 5/15/58 | | 7,530 | 6,247 |
| 4.65% 12/1/48 | | 8,317 | 7,311 |
| 5.2% 3/1/33 | | 30,000 | 30,003 |
| 5.5% 12/1/39 | | 1,986 | 1,925 |
| Consumers Energy Co.: | | | |
| 2.65% 8/15/52 | | 9,956 | 6,327 |
| 3.5% 8/1/51 | | 2,900 | 2,206 |
| Delmarva Power & Light Co. 4% 6/1/42 | | 3,177 | 2,519 |
| Dominion Energy, Inc.: | | | |
| 3.375% 4/1/30 | | 20,308 | 17,765 |
| 3.9% 10/1/25 | | 10,247 | 9,913 |
| 4.35% 8/15/32 | | 2,000 | 1,845 |
| 4.9% 8/1/41 | | 1,589 | 1,398 |
| DTE Energy Co.: | | | |
| 2.85% 10/1/26 | | 4,766 | 4,374 |
| 3.8% 3/15/27 | | 10,732 | 10,070 |
| 4.22% 11/1/24 | | 6,090 | 5,956 |
| NiSource, Inc.: | | | |
| 0.95% 8/15/25 | | 10,826 | 9,761 |
| 1.7% 2/15/31 | | 12,856 | 9,800 |
| 3.49% 5/15/27 | | 6,076 | 5,676 |
| 3.95% 3/30/48 | | 7,944 | 6,191 |
| 4.375% 5/15/47 | | 3,797 | 3,174 |
| 4.8% 2/15/44 | | 4,369 | 3,873 |
| Public Service Enterprise Group, Inc. 2.45% 11/15/31 | | 5,100 | 4,079 |
| Puget Energy, Inc.: | | | |
| 3.65% 5/15/25 | | 6,411 | 6,065 |
| 4.1% 6/15/30 | | 11,406 | 10,241 |
| San Diego Gas & Electric Co. 4.5% 8/15/40 | | 795 | 718 |
| Sempra Energy: | | | |
| 3.25% 6/15/27 | | 4,846 | 4,469 |
| 3.8% 2/1/38 | | 6,737 | 5,519 |
| 4% 2/1/48 | | 17,508 | 13,577 |
| 6% 10/15/39 | | 795 | 805 |
| WEC Energy Group, Inc. 3 month U.S. LIBOR + 2.610% 6.9761% 5/15/67 (c)(d) | | 3,359 | 2,869 |
| | | | 260,696 |
| Water Utilities - 0.1% | | | |
| American Water Capital Corp.: | | | |
| 2.8% 5/1/30 | | 2,000 | 1,729 |
| 2.95% 9/1/27 | | 4,833 | 4,429 |
| 3.45% 6/1/29 | | 4,833 | 4,382 |
| 4.45% 6/1/32 | | 12,000 | 11,425 |
| 6.593% 10/15/37 | | 5,173 | 5,605 |
| | | | 27,570 |
TOTAL UTILITIES | | | 1,253,702 |
| TOTAL NONCONVERTIBLE BONDS (Cost $16,557,399) | | | 14,533,156 |
| | | | |
| U.S. Government and Government Agency Obligations - 44.1% |
| | | Principal Amount (a) (000s) | Value ($) (000s) |
| U.S. Government Agency Obligations - 0.7% | | | |
| Fannie Mae: | | | |
| 0.375% 8/25/25 | | 28,421 | 25,556 |
| 0.5% 6/17/25 | | 31,957 | 29,043 |
| 0.625% 4/22/25 | | 33,907 | 31,049 |
| 0.75% 10/8/27 | | 16,844 | 14,442 |
| 0.875% 8/5/30 | | 40,385 | 32,041 |
| 1.625% 10/15/24 | | 17,834 | 16,905 |
| 1.75% 7/2/24 | | 22,928 | 21,932 |
| 1.875% 9/24/26 | | 10,605 | 9,720 |
| 2.125% 4/24/26 | | 3,177 | 2,958 |
| 2.625% 9/6/24 | | 3,177 | 3,066 |
| 6.625% 11/15/30 | | 9,666 | 11,203 |
| Federal Home Loan Bank: | | | |
| 0.375% 9/4/25 | | 7,170 | 6,452 |
| 0.5% 4/14/25 | | 44,410 | 40,637 |
| 1.5% 8/15/24 | | 3,935 | 3,737 |
| 2.5% 2/13/24 | | 3,955 | 3,852 |
| 3.25% 11/16/28 | | 18,830 | 17,903 |
| 5.5% 7/15/36 | | 1,190 | 1,330 |
| Freddie Mac: | | | |
| 0.25% 12/4/23 | | 42,351 | 40,748 |
| 0.375% 7/21/25 | | 20,972 | 18,930 |
| 0.375% 9/23/25 | | 23,695 | 21,295 |
| 6.25% 7/15/32 | | 6,116 | 7,096 |
| 6.75% 3/15/31 | | 20,653 | 24,253 |
| Tennessee Valley Authority: | | | |
| 0.75% 5/15/25 | | 27,394 | 25,017 |
| 4.25% 9/15/65 | | 5,896 | 5,241 |
| 5.25% 9/15/39 | | 15,887 | 16,695 |
| 5.375% 4/1/56 | | 4,286 | 4,628 |
TOTAL U.S. GOVERNMENT AGENCY OBLIGATIONS | | | 435,729 |
| U.S. Treasury Obligations - 43.4% | | | |
| U.S. Treasury Bonds: | | | |
| 1.125% 5/15/40 | | 286,912 | 181,595 |
| 1.125% 8/15/40 | | 145,541 | 91,663 |
| 1.25% 5/15/50 | | 23,148 | 12,841 |
| 1.375% 11/15/40 | | 168,518 | 110,728 |
| 1.375% 8/15/50 | | 65,948 | 37,801 |
| 1.625% 11/15/50 | | 165,229 | 101,235 |
| 1.75% 8/15/41 | | 185,755 | 128,723 |
| 1.875% 2/15/41 | | 60,554 | 43,280 |
| 1.875% 2/15/51 | | 176,269 | 115,085 |
| 1.875% 11/15/51 | | 107,574 | 69,965 |
| 2% 11/15/41 | | 67,944 | 49,108 |
| 2% 2/15/50 | | 17,590 | 11,898 |
| 2% 8/15/51 | | 360,300 | 242,175 |
| 2.25% 5/15/41 | | 172,934 | 131,396 |
| 2.25% 8/15/46 | | 50,830 | 36,675 |
| 2.25% 8/15/49 | | 15,290 | 10,966 |
| 2.25% 2/15/52 | | 109,990 | 78,424 |
| 2.375% 2/15/42 | | 48,988 | 37,681 |
| 2.375% 11/15/49 | | 186,821 | 137,766 |
| 2.375% 5/15/51 | | 217,870 | 159,939 |
| 2.5% 2/15/45 | | 80,939 | 61,833 |
| 2.5% 2/15/46 | | 111,548 | 84,772 |
| 2.5% 5/15/46 | | 110,361 | 83,861 |
| 2.75% 11/15/42 | | 1,066 | 866 |
| 2.75% 8/15/47 | | 78,639 | 62,515 |
| 2.75% 11/15/47 | | 27,659 | 21,992 |
| 2.875% 5/15/43 | | 89,344 | 73,911 |
| 2.875% 8/15/45 | | 92,594 | 75,515 |
| 2.875% 11/15/46 | | 97,649 | 79,565 |
| 2.875% 5/15/52 | | 167,800 | 137,406 |
| 3% 11/15/44 | | 77,013 | 64,417 |
| 3% 5/15/45 | | 119,853 | 100,040 |
| 3% 11/15/45 | | 16,313 | 13,599 |
| 3% 2/15/47 | | 33,113 | 27,562 |
| 3% 5/15/47 | | 37,396 | 31,141 |
| 3% 2/15/48 | | 36,450 | 30,382 |
| 3% 8/15/52 | | 402,000 | 337,931 |
| 3.125% 2/15/43 | | 23,007 | 19,824 |
| 3.125% 8/15/44 | | 72,478 | 61,977 |
| 3.125% 5/15/48 | | 10,277 | 8,773 |
| 3.25% 5/15/42 | | 271,300 | 239,793 |
| 3.375% 8/15/42 | | 273,700 | 246,416 |
| 3.375% 5/15/44 | | 147,527 | 131,575 |
| 3.375% 11/15/48 | | 4,631 | 4,144 |
| 3.625% 8/15/43 | | 65,327 | 60,823 |
| 3.625% 2/15/44 | | 41,523 | 38,531 |
| 3.75% 11/15/43 | | 35,570 | 33,708 |
| 3.875% 8/15/40 | | 17,791 | 17,454 |
| 4% 11/15/42 | | 195,000 | 192,227 |
| 4% 11/15/52 | | 250,400 | 254,860 |
| 4.25% 5/15/39 | | 6,384 | 6,576 |
| 4.25% 11/15/40 | | 644 | 663 |
| 4.375% 2/15/38 | | 20,955 | 21,949 |
| 4.375% 11/15/39 | | 80 | 83 |
| 4.375% 5/15/40 | | 6,355 | 6,629 |
| 4.375% 5/15/41 | | 6,610 | 6,904 |
| 4.5% 2/15/36 | | 20,270 | 21,639 |
| 4.5% 5/15/38 | | 28,610 | 30,351 |
| 4.5% 8/15/39 | | 4,450 | 4,719 |
| 4.625% 2/15/40 | | 8,282 | 8,920 |
| 4.75% 2/15/41 | | 4,765 | 5,209 |
| 5.375% 2/15/31 | | 42,474 | 46,442 |
| 6.25% 5/15/30 (f) | | 48,578 | 55,214 |
| U.S. Treasury Notes: | | | |
| 0.125% 1/15/24 (g) | | 146,940 | 140,701 |
| 0.25% 9/30/23 | | 9,959 | 9,683 |
| 0.25% 3/15/24 | | 80,400 | 76,443 |
| 0.25% 5/31/25 | | 51,361 | 46,522 |
| 0.25% 6/30/25 | | 291,695 | 263,688 |
| 0.25% 7/31/25 | | 236,802 | 213,344 |
| 0.25% 9/30/25 | | 174,616 | 156,541 |
| 0.25% 10/31/25 | | 181,873 | 162,421 |
| 0.375% 11/30/25 | | 352,530 | 314,908 |
| 0.375% 12/31/25 | | 242,294 | 216,163 |
| 0.375% 1/31/26 | | 13 | 11 |
| 0.375% 7/31/27 | | 251,927 | 213,016 |
| 0.375% 9/30/27 | | 49,874 | 41,947 |
| 0.5% 11/30/23 | | 15 | 15 |
| 0.5% 3/31/25 | | 430,431 | 394,450 |
| 0.5% 2/28/26 | | 136,549 | 121,395 |
| 0.5% 10/31/27 | | 354,566 | 299,193 |
| 0.625% 10/15/24 | | 176,807 | 164,921 |
| 0.625% 7/31/26 | | 184,631 | 162,655 |
| 0.625% 11/30/27 | | 37,166 | 31,491 |
| 0.625% 12/31/27 | | 42,643 | 36,047 |
| 0.625% 5/15/30 | | 387,412 | 306,418 |
| 0.625% 8/15/30 | | 30,689 | 24,136 |
| 0.75% 12/31/23 | | 71 | 68 |
| 0.75% 11/15/24 | | 266,502 | 248,315 |
| 0.75% 5/31/26 | | 102,419 | 91,061 |
| 0.75% 8/31/26 | | 301,288 | 265,910 |
| 0.875% 1/31/24 | | 98,272 | 94,537 |
| 0.875% 6/30/26 | | 74,538 | 66,432 |
| 0.875% 9/30/26 | | 318,314 | 281,583 |
| 1% 12/15/24 | | 410,627 | 383,279 |
| 1.125% 10/31/26 | | 125,566 | 111,852 |
| 1.125% 2/28/27 | | 163,063 | 144,355 |
| 1.125% 2/29/28 | | 262,029 | 226,184 |
| 1.125% 8/31/28 | | 64,238 | 54,760 |
| 1.25% 8/31/24 | | 73,115 | 69,114 |
| 1.25% 11/30/26 | | 60,243 | 53,812 |
| 1.25% 12/31/26 | | 307,004 | 273,749 |
| 1.25% 5/31/28 | | 78,201 | 67,534 |
| 1.25% 6/30/28 | | 372,283 | 320,890 |
| 1.25% 8/15/31 | | 366,124 | 296,804 |
| 1.375% 1/31/25 | | 239,575 | 224,574 |
| 1.375% 8/31/26 | | 46,589 | 42,076 |
| 1.375% 10/31/28 | | 8,868 | 7,637 |
| 1.375% 12/31/28 | | 106,427 | 91,436 |
| 1.5% 2/29/24 | | 348,800 | 336,524 |
| 1.5% 9/30/24 | | 66,647 | 63,132 |
| 1.5% 10/31/24 | | 220,791 | 208,682 |
| 1.5% 11/30/24 | | 94,437 | 89,069 |
| 1.5% 2/15/25 | | 226,659 | 212,670 |
| 1.5% 8/15/26 | | 104,698 | 95,022 |
| 1.5% 1/31/27 | | 506,645 | 455,308 |
| 1.5% 11/30/28 | | 41,895 | 36,283 |
| 1.5% 2/15/30 | | 723,990 | 614,769 |
| 1.625% 2/15/26 | | 0 | 0 |
| 1.625% 5/15/26 | | 4,456 | 4,083 |
| 1.625% 11/30/26 | | 45,785 | 41,535 |
| 1.625% 8/15/29 | | 41,698 | 36,043 |
| 1.625% 5/15/31 | | 30,670 | 25,784 |
| 1.75% 6/30/24 | | 53,508 | 51,223 |
| 1.75% 7/31/24 | | 179,586 | 171,427 |
| 1.75% 12/31/24 (g) | | 337,175 | 318,841 |
| 1.75% 3/15/25 | | 8,800 | 8,279 |
| 1.75% 1/31/29 | | 110,873 | 97,105 |
| 1.875% 6/30/26 | | 21,678 | 20,003 |
| 1.875% 2/28/27 | | 166,929 | 152,022 |
| 2% 4/30/24 | | 46,461 | 44,817 |
| 2% 5/31/24 | | 78,426 | 75,473 |
| 2% 6/30/24 | | 77,711 | 74,593 |
| 2% 2/15/25 | | 2,888 | 2,737 |
| 2% 8/15/25 | | 28,708 | 26,976 |
| 2% 11/15/26 | | 37,465 | 34,459 |
| 2.125% 2/29/24 | | 41,799 | 40,579 |
| 2.125% 3/31/24 | | 326,602 | 316,204 |
| 2.125% 7/31/24 | | 9,917 | 9,518 |
| 2.125% 9/30/24 | | 71,372 | 68,294 |
| 2.125% 11/30/24 | | 43,800 | 41,764 |
| 2.125% 5/15/25 | | 46,354 | 43,848 |
| 2.25% 12/31/23 | | 2,328 | 2,273 |
| 2.25% 1/31/24 | | 60,386 | 58,832 |
| 2.25% 4/30/24 | | 144,770 | 140,070 |
| 2.25% 10/31/24 | | 106,387 | 101,778 |
| 2.25% 11/15/24 | | 68,258 | 65,283 |
| 2.25% 12/31/24 | | 32,384 | 30,899 |
| 2.25% 11/15/25 | | 84,400 | 79,467 |
| 2.25% 2/15/27 | | 182,101 | 168,522 |
| 2.25% 8/15/27 | | 337,064 | 309,862 |
| 2.25% 11/15/27 | | 240,949 | 220,769 |
| 2.375% 2/29/24 | | 96,660 | 94,066 |
| 2.375% 8/15/24 | | 12,786 | 12,304 |
| 2.375% 3/31/29 | | 92,700 | 84,013 |
| 2.375% 5/15/29 | | 20,544 | 18,590 |
| 2.5% 4/30/24 | | 164,800 | 159,875 |
| 2.5% 5/15/24 | | 7,963 | 7,718 |
| 2.5% 1/31/25 | | 27,780 | 26,603 |
| 2.5% 2/28/26 | | 72,343 | 68,375 |
| 2.5% 3/31/27 | | 5,000 | 4,663 |
| 2.625% 3/31/25 | | 12,741 | 12,208 |
| 2.625% 12/31/25 | | 106,891 | 101,638 |
| 2.625% 5/31/27 | | 39,800 | 37,246 |
| 2.625% 2/15/29 | | 56,726 | 52,219 |
| 2.625% 7/31/29 | | 603,100 | 553,014 |
| 2.75% 2/15/24 (g) | | 130,482 | 127,556 |
| 2.75% 2/28/25 | | 16,729 | 16,083 |
| 2.75% 5/15/25 | | 39,400 | 37,767 |
| 2.75% 6/30/25 | | 16,411 | 15,718 |
| 2.75% 4/30/27 | | 243,000 | 228,714 |
| 2.75% 7/31/27 | | 362,200 | 340,270 |
| 2.75% 2/15/28 | | 102,640 | 96,033 |
| 2.75% 5/31/29 | | 32,300 | 29,876 |
| 2.75% 8/15/32 | | 1,227,886 | 1,115,841 |
| 2.875% 4/30/25 | | 53,661 | 51,604 |
| 2.875% 5/31/25 | | 95,918 | 92,178 |
| 2.875% 6/15/25 | | 44,500 | 42,769 |
| 2.875% 5/15/28 | | 139,625 | 131,106 |
| 2.875% 8/15/28 | | 150,635 | 141,168 |
| 2.875% 4/30/29 | | 33,500 | 31,231 |
| 2.875% 5/15/32 | | 220,700 | 202,975 |
| 3% 6/30/24 | | 70,800 | 68,886 |
| 3% 7/31/24 | | 249,700 | 242,638 |
| 3% 7/15/25 | | 461,100 | 443,971 |
| 3% 10/31/25 | | 22,858 | 21,956 |
| 3.125% 8/15/25 | | 250,700 | 242,023 |
| 3.125% 8/31/27 | | 155,400 | 148,304 |
| 3.125% 11/15/28 | | 19,870 | 18,835 |
| 3.125% 8/31/29 | | 59,600 | 56,282 |
| 3.25% 8/31/24 | | 42,800 | 41,698 |
| 3.25% 6/30/27 | | 95,500 | 91,632 |
| 3.25% 6/30/29 | | 36,500 | 34,735 |
| 3.5% 9/15/25 | | 178,800 | 174,100 |
| 3.5% 1/31/28 (g) | | 414,100 | 401,515 |
| 3.5% 1/31/30 | | 125,900 | 121,592 |
| 3.5% 2/15/33 | | 119,500 | 115,560 |
| 3.875% 1/15/26 (f)(g) | | 187,800 | 184,572 |
| 3.875% 11/30/27 | | 166,800 | 164,422 |
| 3.875% 12/31/27 | | 234,000 | 230,493 |
| 3.875% 9/30/29 | | 73,200 | 72,216 |
| 3.875% 11/30/29 | | 51,600 | 50,939 |
| 3.875% 12/31/29 | | 36,600 | 36,154 |
| 4% 12/15/25 | | 333,700 | 329,242 |
| 4% 10/31/29 | | 154,800 | 153,887 |
| 4.125% 1/31/25 (g) | | 107,400 | 106,003 |
| 4.125% 9/30/27 | | 282,400 | 280,922 |
| 4.125% 10/31/27 | | 396,200 | 394,219 |
| 4.25% 12/31/24 | | 3,000 | 2,966 |
| 4.25% 10/15/25 | | 224,000 | 222,119 |
| 4.375% 10/31/24 | | 99,100 | 98,171 |
| 4.5% 11/30/24 | | 7,100 | 7,049 |
| 4.5% 11/15/25 | | 200,500 | 200,163 |
| 4.625% 2/28/25 | | 157,300 | 156,796 |
TOTAL U.S. TREASURY OBLIGATIONS | | | 25,256,028 |
| TOTAL U.S. GOVERNMENT AND GOVERNMENT AGENCY OBLIGATIONS (Cost $28,375,250) | | | 25,691,757 |
| | | | |
| U.S. Government Agency - Mortgage Securities - 27.6% |
| | | Principal Amount (a) (000s) | Value ($) (000s) |
| Fannie Mae - 11.5% | | | |
| 12 month U.S. LIBOR + 1.510% 3.788% 11/1/34 (c)(d) | | 1,537 | 1,548 |
| 12 month U.S. LIBOR + 1.640% 2.533% 4/1/41 (c)(d) | | 355 | 359 |
| 12 month U.S. LIBOR + 1.880% 3.944% 11/1/34 (c)(d) | | 128 | 129 |
| 1.5% 8/1/31 to 11/1/51 | | 465,818 | 382,268 |
| 2% 5/1/23 to 2/1/52 | | 2,334,924 | 1,951,722 |
| 2.5% 7/1/26 to 7/1/52 | | 1,583,001 | 1,366,131 |
| 3% 3/1/26 to 10/1/52 | | 1,162,097 | 1,045,961 |
| 3.5% 6/1/25 to 12/1/52 | | 748,139 | 694,810 |
| 4% 5/1/24 to 1/1/53 | | 676,396 | 643,855 |
| 4% 11/1/41 | | 7 | 6 |
| 4.5% to 4.5% 3/1/23 to 1/1/53 | | 282,341 | 275,069 |
| 5% 3/1/23 to 1/1/53 | | 190,280 | 188,386 |
| 5.5% 7/1/23 to 2/1/53 | | 64,063 | 64,763 |
| 6% to 6% 11/1/32 to 12/1/52 | | 67,551 | 68,592 |
| 6.5% 7/1/24 to 6/1/40 | | 3,855 | 4,032 |
TOTAL FANNIE MAE | | | 6,687,631 |
| Freddie Mac - 8.5% | | | |
| 12 month U.S. LIBOR + 1.940% 4.098% 9/1/37 (c)(d) | | 141 | 143 |
| U.S. TREASURY 1 YEAR INDEX + 1.710% 2.243% 3/1/36 (c)(d) | | 1,369 | 1,367 |
| U.S. TREASURY 1 YEAR INDEX + 2.230% 4.337% 12/1/35 (c)(d) | | 518 | 525 |
| U.S. TREASURY 1 YEAR INDEX + 2.250% 3.442% 3/1/35 (c)(d) | | 243 | 245 |
| 1.5% 7/1/35 to 2/1/52 | | 500,262 | 408,742 |
| 2% 6/1/23 to 4/1/52 | | 1,704,417 | 1,408,312 |
| 2% 9/1/35 | | 7,714 | 6,878 |
| 2% 10/1/35 | | 50,370 | 44,913 |
| 2.5% 2/1/27 to 6/1/52 | | 1,487,468 | 1,276,139 |
| 3% 10/1/26 to 10/1/52 | | 638,073 | 572,293 |
| 3% 8/1/47 | | 158 | 142 |
| 3.5% 9/1/25 to 11/1/52 | | 465,118 | 431,224 |
| 3.5% 8/1/47 | | 167 | 155 |
| 3.5% 9/1/47 | | 100 | 93 |
| 3.5% 9/1/47 | | 7,479 | 6,971 |
| 3.5% 10/1/48 | | 292 | 270 |
| 4% 9/1/24 to 11/1/52 | | 244,151 | 232,583 |
| 4.5% 5/1/23 to 1/1/53 | | 272,243 | 263,733 |
| 5% 4/1/23 to 3/1/53 | | 135,074 | 133,222 |
| 5.5% 5/1/23 to 3/1/53 | | 113,073 | 113,229 |
| 6% 4/1/32 to 1/1/53 | | 11,487 | 11,633 |
| 6.5% 8/1/36 to 12/1/37 | | 70 | 73 |
TOTAL FREDDIE MAC | | | 4,912,885 |
| Freddie Mac Multi-family Structured pass-thru certificates - 0.0% | | | |
| 2.5% 12/1/31 | | 43 | 40 |
| 2.5% 12/1/31 | | 3 | 3 |
| 2.5% 1/1/32 | | 28 | 26 |
| 2.5% 2/1/32 | | 55 | 51 |
TOTAL FREDDIE MAC MULTI-FAMILY STRUCTURED PASS-THRU CERTIFICATES | | | 120 |
| Ginnie Mae - 5.8% | | | |
| 3.5% 10/15/40 to 9/20/52 | | 499,429 | 465,337 |
| 4% 1/15/25 to 2/20/53 | | 343,738 | 327,421 |
| 5% 1/20/39 to 12/20/52 | | 98,568 | 97,935 |
| 1.5% 10/20/43 to 3/20/52 | | 11,386 | 9,111 |
| 2% 10/20/50 to 8/20/52 | | 837,190 | 704,716 |
| 2% 3/1/53 (e) | | 35,100 | 29,420 |
| 2.5% 10/20/42 to 6/20/52 | | 888,109 | 771,667 |
| 2.5% 3/1/53 (e) | | 38,000 | 32,861 |
| 3% 4/15/42 to 6/20/52 | | 655,920 | 591,628 |
| 3% 3/1/53 (e) | | 6,200 | 5,531 |
| 3% 3/1/53 (e) | | 4,150 | 3,702 |
| 3% 3/1/53 (e) | | 18,700 | 16,681 |
| 3.5% 3/1/53 (e) | | 20,900 | 19,211 |
| 4.5% to 4.5% 3/20/33 to 11/20/52 | | 219,756 | 214,231 |
| 5% 3/1/53 (e) | | 24,300 | 24,018 |
| 5.5% 10/20/32 to 12/20/52 | | 24,898 | 25,119 |
| 5.5% 3/1/53 (e) | | 25,200 | 25,287 |
| 6% to 6% 5/20/34 to 12/15/40 | | 2,961 | 3,062 |
| 6% 3/1/53 (e) | | 26,400 | 26,778 |
| 6.5% 8/20/36 to 1/15/39 | | 561 | 589 |
TOTAL GINNIE MAE | | | 3,394,305 |
| Uniform Mortgage Backed Securities - 1.8% | | | |
| 1.5% 3/1/53 (e) | | 22,500 | 17,373 |
| 2% 3/1/38 (e) | | 60,800 | 53,961 |
| 2% 3/1/53 (e) | | 134,450 | 109,476 |
| 2% 3/1/53 (e) | | 26,900 | 21,903 |
| 2% 3/1/53 (e) | | 288,900 | 235,238 |
| 2% 3/1/53 (e) | | 73,600 | 59,929 |
| 2% 4/1/53 (e) | | 221,300 | 180,411 |
| 2.5% 3/1/53 (e) | | 42,400 | 35,921 |
| 2.5% 3/1/53 (e) | | 43,800 | 37,107 |
| 2.5% 3/1/53 (e) | | 68,700 | 58,202 |
| 2.5% 4/1/53 (e) | | 14,350 | 12,169 |
| 3% 3/1/53 (e) | | 15,400 | 13,545 |
| 3% 3/1/53 (e) | | 29,900 | 26,299 |
| 3.5% 3/1/53 (e) | | 28,200 | 25,675 |
| 4% 3/1/53 (e) | | 50,200 | 47,086 |
| 4.5% 3/1/53 (e) | | 24,500 | 23,588 |
| 5% 3/1/53 (e) | | 16,500 | 16,214 |
| 5.5% 3/1/53 (e) | | 29,500 | 29,448 |
| 6% 3/1/53 (e) | | 27,300 | 27,621 |
| 6.5% 3/1/53 (e) | | 32,000 | 32,772 |
TOTAL UNIFORM MORTGAGE BACKED SECURITIES | | | 1,063,938 |
| TOTAL U.S. GOVERNMENT AGENCY - MORTGAGE SECURITIES (Cost $18,263,187) | | | 16,058,879 |
| | | | |
| Asset-Backed Securities - 0.2% |
| | | Principal Amount (a) (000s) | Value ($) (000s) |
| Capital One Multi-Asset Execution Trust: | | | |
| Series 2019-A3 Class A3, 2.06% 8/15/28 | | 8,197 | 7,468 |
| 1.39% 7/15/30 | | 13,710 | 11,581 |
| Capital One Prime Auto Receivables Series 2023-1 Class A3, 4.87% 2/15/28 | | 5,000 | 4,969 |
| CarMax Auto Owner Trust: | | | |
| Series 2021-1 Class A3, 0.34% 12/15/25 | | 18,410 | 17,783 |
| Series 2022-3 Class A2A, 3.97% 4/15/27 | | 25,810 | 25,219 |
| Citibank Credit Card Issuance Trust: | | | |
| Series 2007-A3 Class A3, 6.15% 6/15/39 | | 3,435 | 3,755 |
| Series 2013-A9 Class A9, 3.72% 9/8/25 | | 3,713 | 3,681 |
| Series 2018-A7 Class A7, 3.96% 10/13/30 | | 12,808 | 12,331 |
| Discover Card Execution Note Trust Series 2017-A4 Class A4, 2.53% 10/15/26 | | 1,544 | 1,497 |
| Ford Credit Floorplan Master Owner Trust Series 2018-2 Class A, 3.17% 3/15/25 | | 15,132 | 15,124 |
| GM Financial Consumer Automobile Receivables Trust Series 2021-1 Class A3, 0.35% 10/16/25 | | 12,894 | 12,519 |
| Hyundai Auto Receivables Trust 3.72% 11/16/26 | | 17,422 | 16,987 |
| Mercedes-Benz Auto Lease Trust Series 2021-A Class A3, 0.25% 1/16/24 | | 7,419 | 7,356 |
| TOTAL ASSET-BACKED SECURITIES (Cost $146,763) | | | 140,270 |
| | | | |
| Commercial Mortgage Securities - 1.7% |
| | | Principal Amount (a) (000s) | Value ($) (000s) |
| BANK sequential payer: | | | |
| Series 2017-BNK4 Class ASB, 3.419% 5/15/50 | | 15,321 | 14,707 |
| Series 2020-BN25 Class A5, 2.649% 1/15/63 | | 13,398 | 11,408 |
| Series 2020-BN28 Class A4, 1.844% 3/15/63 | | 33,272 | 26,365 |
| Series 2021-BN35 Class A5, 2.285% 6/15/64 | | 16,433 | 13,308 |
| Series 2022-BNK39 Class A4, 2.928% 2/15/55 | | 6,000 | 5,061 |
| Series 2022-BNK41 Class A4, 3.79% 4/15/65 (c) | | 27,916 | 25,404 |
| BBCMS Mortgage Trust sequential payer: | | | |
| Series 2021-C11 Class A5, 2.322% 9/15/54 | | 20,928 | 16,926 |
| Series 2021-C9 Class A5, 2.299% 2/15/54 | | 7,000 | 5,705 |
| Benchmark Mortgage Trust: | | | |
| sequential payer: | | | |
Series 2020-B19 Class A5, 1.85% 9/15/53 | | 13,581 | 10,808 |
Series 2021-B24 Class A5, 2.5843% 3/15/54 | | 20,299 | 16,768 |
| Series 2019-B12 Class A5, 3.1156% 8/15/52 | | 21,039 | 18,617 |
| Series 2019-B9 Class A5, 4.0156% 3/15/52 | | 18,628 | 17,438 |
| BMO Mortgage Trust sequential payer Series 2022-C1 Class A5, 3.374% 2/15/55 | | 9,440 | 8,239 |
| Citigroup Commercial Mortgage Trust sequential payer: | | | |
| Series 2014-GC25 Class A4, 3.635% 10/10/47 | | 23,932 | 23,171 |
| Series 2015-GC29 Class A4, 3.192% 4/10/48 | | 9,038 | 8,567 |
| Series 2015-P1 Class A5, 3.717% 9/15/48 | | 4,659 | 4,449 |
| Series 2016-C1 Class A4, 3.209% 5/10/49 | | 14,743 | 13,753 |
| Series 2016-P4 Class A4, 2.902% 7/10/49 | | 17,079 | 15,694 |
| COMM Mortgage Trust: | | | |
| sequential payer Series 2013-CR7 Class A4, 3.213% 3/10/46 | | 751 | 750 |
| Series 2015-CR22 Class A5, 3.309% 3/10/48 | | 15,430 | 14,702 |
| CSAIL Commercial Mortgage Trust sequential payer: | | | |
| Series 2015-C3 Class A4, 3.7182% 8/15/48 | | 9,981 | 9,536 |
| Series 2019-C17: | | | |
Class A4, 2.7628% 9/15/52 | | 14,978 | 12,866 |
Class A5, 3.0161% 9/15/52 | | 14,978 | 13,008 |
| Freddie Mac: | | | |
| sequential payer: | | | |
Series 2016-K057 Class A2, 2.57% 7/25/26 | | 12,674 | 11,833 |
Series 2020-K104 Class A2, 2.253% 1/25/30 | | 59,506 | 51,534 |
Series 2020-K116 Class A2, 1.378% 7/25/30 | | 50,584 | 40,620 |
Series 2020-K117 Class A2, 1.406% 8/25/30 | | 25,809 | 20,726 |
Series 2020-K118 Class A2, 1.493% 9/25/30 | | 12,257 | 9,885 |
Series 2020-K121 Class A2, 1.547% 10/25/30 | | 17,206 | 13,891 |
Series 2021-K125 Class A2, 1.846% 1/25/31 | | 6,670 | 5,486 |
Series 2021-K126 Class A2, 2.074% 1/25/31 | | 9,492 | 7,953 |
Series 2021-K130 Class A2, 1.723% 6/25/31 | | 8,168 | 6,609 |
Series 2021-K136 Class A2, 2.127% 11/25/31 | | 22,339 | 18,526 |
Series 2022-151 Class A2: | | | |
| 3.78% 11/25/32 | | 30,500 | 28,824 |
| 3.8% 10/25/32 | | 4,000 | 3,786 |
Series 2022-K145 Class A2, 2.58% 5/25/32 | | 6,900 | 5,912 |
Series 2023-K-153 Class A2, 3.82% 12/25/32 | | 15,000 | 14,222 |
Series K034 Class A2, 3.531% 7/25/23 | | 6,818 | 6,769 |
Series K080 Class A2, 3.926% 7/25/28 | | 13,178 | 12,770 |
| Series 2017-K064 Class A2, 3.224% 3/25/27 | | 13,702 | 12,975 |
| Series 2017-K068 Class A2, 3.244% 8/25/27 | | 18,911 | 17,871 |
| Series 2017-K727 Class A2, 2.946% 7/25/24 | | 18,300 | 17,788 |
| Series 2018-K730 Class A2, 3.59% 1/25/25 | | 29,571 | 28,773 |
| Series 2019-K094 Class A2, 2.903% 6/25/29 | | 40,856 | 37,193 |
| Series 2019-K1510 Class A2, 3.718% 1/25/31 | | 11,797 | 11,145 |
| Series 2021-K123 Class A2, 1.621% 12/25/30 | | 22,648 | 18,358 |
| Series K036 Class A2, 3.527% 10/25/23 | | 7,109 | 7,031 |
| Series K046 Class A2, 3.205% 3/25/25 | | 26,452 | 25,475 |
| Series K047 Class A2, 3.329% 5/25/25 | | 3,066 | 2,956 |
| Series K053 Class A2, 2.995% 12/25/25 | | 5,649 | 5,375 |
| Series K056 Class A2, 2.525% 5/25/26 | | 16,483 | 15,393 |
| Series K062 Class A1, 3.032% 9/25/26 | | 7,780 | 7,543 |
| Series K079 Class A2, 3.926% 6/25/28 | | 6,181 | 5,993 |
| GS Mortgage Securities Trust sequential payer: | | | |
| Series 2014-GC26 Class A4, 3.364% 11/10/47 | | 11,445 | 10,995 |
| Series 2020-GC45 Class A5, 2.9106% 2/13/53 | | 36,094 | 31,221 |
| JPMBB Commercial Mortgage Securities Trust sequential payer: | | | |
| Series 2014-C21 Class A5, 3.7748% 8/15/47 | | 26,809 | 26,115 |
| Series 2014-C23 Class A5, 3.9342% 9/15/47 | | 7,586 | 7,374 |
| Series 2014-C24 Class A5, 3.6385% 11/15/47 | | 20,704 | 19,933 |
| Series 2015-C29 Class A4, 3.6108% 5/15/48 | | 7,149 | 6,803 |
| Morgan Stanley BAML Trust Series 2015-C20 Class A4, 3.249% 2/15/48 | | 11,696 | 11,167 |
| Morgan Stanley Capital I Trust sequential payer Series 2020-L4 Class A3, 2.698% 2/15/53 | | 14,132 | 11,940 |
| Wells Fargo Commercial Mortgage Trust: | | | |
| sequential payer: | | | |
Series 2019-C52 Class A5, 2.892% 8/15/52 | | 25,720 | 22,367 |
Series 2019-C54 Class A4, 3.146% 12/15/52 | | 1,837 | 1,617 |
| Series 2018-C48 Class A5, 4.302% 1/15/52 | | 15,529 | 14,759 |
| Wells Fargo Commercial Mtg Trust 2020-C sequential payer Series 2020-C55 Class A5, 2.725% 2/15/53 | | 12,719 | 10,797 |
| WF-RBS Commercial Mortgage Trust Series 2014-C25 Class A5, 3.631% 11/15/47 | | 11,478 | 11,020 |
| TOTAL COMMERCIAL MORTGAGE SECURITIES (Cost $1,094,325) | | | 966,573 |
| | | | |
| Municipal Securities - 0.5% |
| | | Principal Amount (a) (000s) | Value ($) (000s) |
| American Muni. Pwr., Inc. Rev. (Combined Hydroelectric Proj.) Series 2010 B, 8.084% 2/15/50 | | 7,725 | 10,495 |
| Bay Area Toll Auth. San Francisco Bay Toll Bridge Rev.: | | | |
| Series 2009 F2, 6.263% 4/1/49 | | 3,750 | 4,471 |
| Series 2010 S1, 7.043% 4/1/50 | | 5,635 | 7,243 |
| California Gen. Oblig.: | | | |
| Series 2009, 7.55% 4/1/39 | | 19,660 | 25,125 |
| Series 2010, 7.6% 11/1/40 | | 10,305 | 13,294 |
| Series 2018, 3.5% 4/1/28 | | 10,235 | 9,664 |
| California State Univ. Rev. Series 2021 B, 2.719% 11/1/52 | | 6,750 | 4,710 |
| Chicago O'Hare Int'l. Arpt. Rev. Series 2010 B, 6.395% 1/1/40 | | 7,250 | 8,413 |
| Commonwealth Fing. Auth. Rev. Series 2016 A, 4.144% 6/1/38 | | 6,095 | 5,560 |
| Dallas Area Rapid Transit Sales Tax Rev. Series 2021 A, 2.613% 12/1/48 | | 12,565 | 8,670 |
| Dallas Fort Worth Int'l. Arpt. Rev.: | | | |
| Series 2019 A, 3.144% 11/1/45 | | 1,850 | 1,442 |
| Series 2021 C, 2.843% 11/1/46 | | 11,600 | 8,641 |
| Series 2022 A, 4.507% 11/1/51 | | 4,485 | 4,184 |
| Golden State Tobacco Securitization Corp. Tobacco Settlement Rev. Series 2021 B: | | | |
| 2.746% 6/1/34 | | 5,025 | 4,080 |
| 3.293% 6/1/42 | | 2,435 | 1,818 |
| Idaho Energy Resources Auth. Series 2021, 2.861% 9/1/46 | | 2,955 | 2,164 |
| Illinois Gen. Oblig. Series 2003, 5.1% 6/1/33 | | 21,745 | 21,369 |
| Kansas St Dev. Fin. Auth. Rev. Series 2015 H, 4.927% 4/15/45 | | 6,035 | 5,963 |
| Los Angeles Cmnty. College District Series 2008 E, 6.75% 8/1/49 | | 7,505 | 9,440 |
| Los Angeles Dept. Arpt. Rev. Series 2009 C, 6.582% 5/15/39 | | 3,800 | 4,215 |
| Massachusetts Gen. Oblig. Series F, 3.277% 6/1/46 | | 3,750 | 3,053 |
| Massachusetts Wtr. Resources Auth. Wtr. & Swr. Rev. Series 2021 C, 2.823% 8/1/41 | | 4,445 | 3,462 |
| Michigan Strategic Fund Ltd. Oblig. Rev. Series 2021 A, 3.225% 9/1/47 | | 6,815 | 5,082 |
| New Jersey Econ. Dev. Auth. State Pension Fdg. Rev. Series 1997, 7.425% 2/15/29 (Nat'l. Pub. Fin. Guarantee Corp. Insured) | | 967 | 1,041 |
| New Jersey Tpk. Auth. Tpk. Rev. Series 2009 E, 7.414% 1/1/40 | | 3,734 | 4,682 |
| New Jersey Trans. Trust Fund Auth. Series B: | | | |
| 4.081% 6/15/39 | | 11,375 | 9,786 |
| 4.131% 6/15/42 | | 11,375 | 9,517 |
| New York City Muni. Wtr. Fin. Auth. Wtr. & Swr. Sys. Rev. Series 2010 DD, 5.952% 6/15/42 | | 7,170 | 8,074 |
| New York City Transitional Fin. Auth. Rev. Series 2011 A, 5.508% 8/1/37 | | 8,520 | 8,758 |
| New York Metropolitan Trans. Auth. Rev. Series 2010 A, 6.668% 11/15/39 | | 4,895 | 5,259 |
| New York State Dorm. Auth. Series 2021 C, 2.202% 3/15/34 | | 16,190 | 12,589 |
| Port Auth. of New York & New Jersey: | | | |
| Series 180, 4.96% 8/1/46 | | 4,115 | 4,121 |
| Series 2010 164, 5.647% 11/1/40 | | 4,135 | 4,409 |
| Series 225, 3.175% 7/15/60 | | 18,365 | 12,909 |
| Port of Morrow Transmission Facilities Rev. (Bonneville Coorporation Proj.) Series 2016 1, 2.987% 9/1/36 | | 4,495 | 3,737 |
| San Francisco Pub. Utils. Commission Wtr. Rev. Series 2010 E, 6% 11/1/40 | | 5,015 | 5,512 |
| South Carolina Pub. Svc. Auth. Rev. Series 2013 C, 5.784% 12/1/41 | | 8,986 | 9,094 |
| Univ. of California Regents Med. Ctr. Pool Rev. Series N: | | | |
| 3.006% 5/15/50 | | 10,465 | 7,361 |
| 3.256% 5/15/60 | | 10,635 | 7,363 |
| Univ. of California Revs.: | | | |
| Series 2009 R, 5.77% 5/15/43 | | 795 | 859 |
| Series 2015 AP, 3.931% 5/15/45 | | 2,970 | 2,688 |
| Univ. of Virginia Gen. Rev.: | | | |
| (Multi-Year Cap. Proj. Fing. Prog.) Series 2017 C, 4.179% 9/1/2117 | | 3,775 | 3,044 |
| Series 2021 B, 2.584% 11/1/51 | | 1,885 | 1,258 |
| TOTAL MUNICIPAL SECURITIES (Cost $346,661) | | | 294,619 |
| | | | |
| Foreign Government and Government Agency Obligations - 1.1% |
| | | Principal Amount (a) (000s) | Value ($) (000s) |
| Alberta Province: | | | |
| 1% 5/20/25 | | 28,032 | 25,727 |
| 3.3% 3/15/28 | | 7,930 | 7,503 |
| British Columbia Province 2.25% 6/2/26 | | 18,944 | 17,572 |
| Chilean Republic: | | | |
| 2.55% 7/27/33 | | 24,746 | 19,399 |
| 3.125% 1/21/26 | | 1,000 | 952 |
| 3.24% 2/6/28 | | 9,215 | 8,517 |
| 3.625% 10/30/42 | | 10,385 | 7,930 |
| 3.86% 6/21/47 | | 4,931 | 3,873 |
| Export Development Canada 2.625% 2/21/24 | | 9,260 | 9,018 |
| Hungarian Republic: | | | |
| 5.75% 11/22/23 | | 2,498 | 2,497 |
| 7.625% 3/29/41 | | 5,792 | 6,487 |
| Indonesian Republic: | | | |
| 2.85% 2/14/30 | | 27,839 | 24,538 |
| 3.5% 2/14/50 | | 21,266 | 15,801 |
| Israeli State: | | | |
| 3.25% 1/17/28 | | 11,430 | 10,673 |
| 3.375% 1/15/50 | | 23,561 | 17,382 |
| Italian Republic: | | | |
| 2.375% 10/17/24 | | 5,000 | 4,723 |
| 2.875% 10/17/29 | | 21,266 | 17,961 |
| 4% 10/17/49 | | 4,800 | 3,506 |
| Jordanian Kingdom 3% 6/30/25 | | 2,059 | 1,969 |
| Manitoba Province 3.05% 5/14/24 | | 1,192 | 1,161 |
| Ontario Province: | | | |
| 0.625% 1/21/26 | | 2,030 | 1,807 |
| 1.125% 10/7/30 | | 19,052 | 15,101 |
| 2.3% 6/15/26 | | 11,337 | 10,507 |
| 2.5% 4/27/26 | | 3,972 | 3,711 |
| 3.05% 1/29/24 | | 9,260 | 9,072 |
| Panamanian Republic: | | | |
| 3.16% 1/23/30 | | 14,972 | 12,832 |
| 3.75% 3/16/25 | | 3,260 | 3,147 |
| 4.3% 4/29/53 | | 4,663 | 3,358 |
| 4.5% 4/16/50 | | 10,235 | 7,659 |
| 4.5% 4/1/56 | | 15,853 | 11,551 |
| 6.4% 2/14/35 | | 7,870 | 8,088 |
| Peruvian Republic: | | | |
| 1.862% 12/1/32 | | 19,951 | 14,456 |
| 2.392% 1/23/26 | | 3,867 | 3,592 |
| 2.78% 12/1/60 | | 3,287 | 1,889 |
| 2.844% 6/20/30 | | 12,979 | 10,949 |
| ��3.55% 3/10/51 | | 14,983 | 10,617 |
| 4.125% 8/25/27 | | 11,485 | 11,096 |
| 6.55% 3/14/37 | | 2,443 | 2,598 |
| 7.35% 7/21/25 | | 3,867 | 4,067 |
| Philippine Republic: | | | |
| 1.648% 6/10/31 | | 14,500 | 11,167 |
| 2.65% 12/10/45 | | 18,269 | 12,197 |
| 3% 2/1/28 | | 15,092 | 13,867 |
| 3.95% 1/20/40 | | 12,692 | 10,599 |
| 4.2% 1/21/24 | | 4,087 | 4,047 |
| 5.17% 10/13/27 | | 6,800 | 6,860 |
| 6.375% 10/23/34 | | 8,242 | 8,943 |
| Polish Government: | | | |
| 3.25% 4/6/26 | | 5,243 | 4,967 |
| 4% 1/22/24 | | 28,744 | 28,345 |
| Quebec Province: | | | |
| 1.5% 2/11/25 | | 22,909 | 21,443 |
| 2.5% 4/20/26 | | 9,329 | 8,739 |
| 2.75% 4/12/27 | | 10,154 | 9,468 |
| 2.875% 10/16/24 | | 1,648 | 1,589 |
| United Mexican States: | | | |
| 3.25% 4/16/30 | | 10,605 | 9,208 |
| 3.5% 2/12/34 | | 32,290 | 26,219 |
| 4.28% 8/14/41 | | 34,799 | 27,780 |
| 4.35% 1/15/47 | | 11,447 | 8,816 |
| 4.5% 1/31/50 | | 7,346 | 5,766 |
| 4.6% 1/23/46 | | 4,766 | 3,821 |
| 4.6% 2/10/48 | | 13,941 | 11,099 |
| 4.75% 3/8/44 | | 7,704 | 6,389 |
| 5.55% 1/21/45 | | 3,111 | 2,868 |
| 6.05% 1/11/40 | | 3,812 | 3,792 |
| Uruguay Republic: | | | |
| 4.125% 11/20/45 | | 3,773 | 3,398 |
| 4.375% 10/27/27 | | 967 | 961 |
| 4.375% 1/23/31 | | 12,587 | 12,253 |
| 4.975% 4/20/55 | | 9,319 | 8,918 |
| TOTAL FOREIGN GOVERNMENT AND GOVERNMENT AGENCY OBLIGATIONS (Cost $756,756) | | | 626,805 |
| | | | |
| Supranational Obligations - 0.8% |
| | | Principal Amount (a) (000s) | Value ($) (000s) |
| African Development Bank 0.875% 7/22/26 | | 12,141 | 10,726 |
| Asian Development Bank: | | | |
| 0.375% 9/3/25 | | 31,972 | 28,704 |
| 0.5% 2/4/26 | | 17,689 | 15,715 |
| 0.75% 10/8/30 | | 15,466 | 12,031 |
| 1.5% 10/18/24 | | 17,883 | 16,897 |
| 2% 4/24/26 | | 5,004 | 4,627 |
| 2.5% 11/2/27 | | 5,321 | 4,903 |
| 2.625% 1/30/24 | | 11,946 | 11,652 |
| 2.625% 1/12/27 | | 5,164 | 4,831 |
| 2.75% 1/19/28 | | 29,894 | 27,876 |
| European Investment Bank: | | | |
| 0.75% 9/23/30 | | 22,088 | 17,328 |
| 0.875% 5/17/30 | | 5,299 | 4,230 |
| 1.25% 2/14/31 | | 9,586 | 7,773 |
| 1.875% 2/10/25 | | 2,383 | 2,251 |
| 2.25% 6/24/24 | | 17,965 | 17,310 |
| 2.375% 5/24/27 | | 3,177 | 2,935 |
| 2.5% 10/15/24 | | 4,548 | 4,376 |
| 3.125% 12/14/23 | | 10,963 | 10,789 |
| 3.25% 1/29/24 | | 1,589 | 1,561 |
| Inter-American Development Bank: | | | |
| 0.625% 7/15/25 | | 17,588 | 15,996 |
| 0.875% 4/20/26 | | 40,212 | 35,893 |
| 1.75% 3/14/25 | | 14,635 | 13,755 |
| 2% 6/2/26 | | 3,177 | 2,925 |
| 2.125% 1/15/25 | | 1,454 | 1,382 |
| 2.25% 6/18/29 | | 15,187 | 13,488 |
| 2.375% 7/7/27 | | 5,346 | 4,923 |
| 3% 10/4/23 | | 2,840 | 2,801 |
| 4.375% 1/24/44 | | 6,926 | 6,842 |
| International Bank for Reconstruction & Development: | | | |
| 0.375% 7/28/25 | | 20,783 | 18,766 |
| 0.5% 10/28/25 | | 26,222 | 23,540 |
| 0.75% 8/26/30 | | 13,146 | 10,237 |
| 0.875% 5/14/30 | | 16,078 | 12,754 |
| 1.25% 2/10/31 | | 14,403 | 11,612 |
| 1.5% 8/28/24 | | 15,743 | 14,934 |
| 1.625% 1/15/25 | | 14,127 | 13,309 |
| 1.875% 10/27/26 | | 3,781 | 3,447 |
| 2.5% 3/19/24 | | 3,019 | 2,932 |
| 2.5% 11/25/24 | | 4,528 | 4,343 |
| 2.5% 7/29/25 | | 3,010 | 2,862 |
| 2.5% 3/29/32 | | 28,960 | 25,541 |
| International Finance Corp. 0.75% 8/27/30 | | 8,767 | 6,854 |
| TOTAL SUPRANATIONAL OBLIGATIONS (Cost $512,336) | | | 455,651 |
| | | | |
| Bank Notes - 0.1% |
| | | Principal Amount (a) (000s) | Value ($) (000s) |
| Bank of America NA 6% 10/15/36 | | 4,075 | 4,219 |
| Citibank NA 3.65% 1/23/24 | | 19,859 | 19,570 |
| Citizens Bank NA: | | | |
| 2.25% 4/28/25 | | 10,391 | 9,713 |
| 3.75% 2/18/26 | | 10,723 | 10,249 |
| Discover Bank 3.45% 7/27/26 | | 10,127 | 9,428 |
| KeyBank NA: | | | |
| 3.9% 4/13/29 | | 1,400 | 1,260 |
| 4.9% 8/8/32 | | 2,000 | 1,882 |
| Truist Bank: | | | |
| 2.636% 9/17/29 (c) | | 9,000 | 8,480 |
| 3.3% 5/15/26 | | 6,037 | 5,656 |
| 3.8% 10/30/26 | | 2,573 | 2,428 |
| U.S. Bank NA, Cincinnati 3.4% 7/24/23 | | 7,944 | 7,887 |
| TOTAL BANK NOTES (Cost $83,972) | | | 80,772 |
| | | | |
| Money Market Funds - 2.7% |
| | | Shares | Value ($) (000s) |
| Fidelity Cash Central Fund 4.63% (h) | | 773,974,352 | 774,129 |
| Fidelity Securities Lending Cash Central Fund 4.63% (h)(i) | | 781,618,716 | 781,697 |
| TOTAL MONEY MARKET FUNDS (Cost $1,555,826) | | | 1,555,826 |
| | | | |
| TOTAL INVESTMENT IN SECURITIES - 103.8% (Cost $67,692,475) | 60,404,308 |
NET OTHER ASSETS (LIABILITIES) - (3.8)% | (2,224,437) |
| NET ASSETS - 100.0% | 58,179,871 |
| | |
| TBA Sale Commitments |
| | Principal Amount (a) (000s) | Value ($) (000s) |
| Uniform Mortgage Backed Securities | | |
| 2% 3/1/53 | (35,100) | (28,580) |
| 2% 3/1/53 | (221,300) | (180,195) |
| 2.5% 3/1/53 | (14,350) | (12,157) |
| 2.5% 3/1/53 | (38,000) | (32,193) |
| | | |
TOTAL TBA SALE COMMITMENTS (Proceeds $253,910) | | (253,125) |
Any values shown as $0 in the Schedule of Investments may reflect amounts less than $500.
Legend
| (a) | Amount is stated in United States dollars unless otherwise noted. |
| (b) | Security exempt from registration under Rule 144A of the Securities Act of 1933. These securities may be resold in transactions exempt from registration, normally to qualified institutional buyers. At the end of the period, the value of these securities amounted to $207,904,000 or 0.4% of net assets. |
| (c) | Coupon rates for floating and adjustable rate securities reflect the rates in effect at period end. |
| (d) | Coupon is indexed to a floating interest rate which may be multiplied by a specified factor and/or subject to caps or floors. |
| (e) | Security or a portion of the security purchased on a delayed delivery or when-issued basis. |
| (f) | Security or a portion of the security has been segregated as collateral for mortgage-backed or asset-backed securities purchased on a delayed delivery or when-issued basis. At period end, the value of securities pledged amounted to $22,939,000. |
| (g) | Security or a portion of the security is on loan at period end. |
| (h) | Affiliated fund that is generally available only to investment companies and other accounts managed by Fidelity Investments. The rate quoted is the annualized seven-day yield of the fund at period end. A complete unaudited listing of the fund's holdings as of its most recent quarter end is available upon request. In addition, each Fidelity Central Fund's financial statements are available on the SEC's website or upon request. |
| (i) | Investment made with cash collateral received from securities on loan. |
Affiliated Central Funds
Fiscal year to date information regarding the Fund's investments in Fidelity Central Funds, including the ownership percentage, is presented below.
| Affiliate (Amounts in thousands) | Value, beginning of period ($) | Purchases ($) | Sales Proceeds ($) | Dividend Income ($) | Realized Gain (loss) ($) | Change in Unrealized appreciation (depreciation) ($) | Value, end of period ($) | % ownership, end of period |
| Fidelity Cash Central Fund 4.63% | 292,425 | 4,158,017 | 3,676,313 | 3,805 | - | - | 774,129 | 1.8% |
| Fidelity Securities Lending Cash Central Fund 4.63% | 343,250 | 4,300,709 | 3,862,262 | 583 | - | - | 781,697 | 2.5% |
| Total | 635,675 | 8,458,726 | 7,538,575 | 4,388 | - | - | 1,555,826 | |
| | | | | | | | | |
Amounts in the dividend income column in the above table include any capital gain distributions from underlying funds, which are presented in the corresponding line item in the Statement of Operations, if applicable.
Amount for Fidelity Securities Lending Cash Central Fund represents the income earned on investing cash collateral, less rebates paid to borrowers and any lending agent fees associated with the loan, plus any premium payments received for lending certain types of securities.
Amounts included in the purchases and sales proceeds columns may include in-kind transactions, if applicable.
Investment Valuation
The following is a summary of the inputs used, as of February 28, 2023, involving the Fund's assets and liabilities carried at fair value. The inputs or methodology used for valuing securities may not be an indication of the risk associated with investing in those securities. For more information on valuation inputs, and their aggregation into the levels used below, please refer to the Investment Valuation section in the accompanying Notes to Financial Statements.
| Valuation Inputs at Reporting Date: |
Description (Amounts in thousands) | Total ($) | Level 1 ($) | Level 2 ($) | Level 3 ($) |
Investments in Securities: | | | | |
|
| Corporate Bonds | 14,533,156 | - | 14,533,156 | - |
|
| U.S. Government and Government Agency Obligations | 25,691,757 | - | 25,691,757 | - |
|
| U.S. Government Agency - Mortgage Securities | 16,058,879 | - | 16,058,879 | - |
|
| Asset-Backed Securities | 140,270 | - | 140,270 | - |
|
| Commercial Mortgage Securities | 966,573 | - | 966,573 | - |
|
| Municipal Securities | 294,619 | - | 294,619 | - |
|
| Foreign Government and Government Agency Obligations | 626,805 | - | 626,805 | - |
|
| Supranational Obligations | 455,651 | - | 455,651 | - |
|
| Bank Notes | 80,772 | - | 80,772 | - |
|
| Money Market Funds | 1,555,826 | 1,555,826 | - | - |
| Total Investments in Securities: | 60,404,308 | 1,555,826 | 58,848,482 | - |
Other Financial Instruments: | | | | |
|
| TBA Sale Commitments | (253,125) | - | (253,125) | - |
| Total Other Financial Instruments: | (253,125) | - | (253,125) | - |
| Statement of Assets and Liabilities |
| Amounts in thousands (except per-share amount) | | | | February 28, 2023 (Unaudited) |
| | | | | |
| Assets | | | | |
| Investment in securities, at value (including securities loaned of $764,097) - See accompanying schedule: | | | | |
Unaffiliated issuers (cost $66,136,649) | $ | 58,848,482 | | |
Fidelity Central Funds (cost $1,555,826) | | 1,555,826 | | |
| | | | | |
| | | | | |
| Total Investment in Securities (cost $67,692,475) | | | $ | 60,404,308 |
| Receivable for investments sold | | | | 427,223 |
| Receivable for TBA sale commitments | | | | 253,910 |
| Receivable for fund shares sold | | | | 69,334 |
| Interest receivable | | | | 315,430 |
| Distributions receivable from Fidelity Central Funds | | | | 1,533 |
| Other receivables | | | | 506 |
Total assets | | | | 61,472,244 |
| Liabilities | | | | |
| Payable for investments purchased | | | | |
Regular delivery | $ | 884,473 | | |
Delayed delivery | | 1,312,226 | | |
| TBA sale commitments, at value | | 253,125 | | |
| Payable for fund shares redeemed | | 50,803 | | |
| Distributions payable | | 7,826 | | |
| Accrued management fee | | 1,217 | | |
| Other payables and accrued expenses | | 1,006 | | |
| Collateral on securities loaned | | 781,697 | | |
| Total Liabilities | | | | 3,292,373 |
| Net Assets | | | $ | 58,179,871 |
| Net Assets consist of: | | | | |
| Paid in capital | | | $ | 66,014,704 |
| Total accumulated earnings (loss) | | | | (7,834,833) |
| Net Assets | | | $ | 58,179,871 |
Net Asset Value , offering price and redemption price per share ($58,179,871 ÷ 5,711,418 shares) | | | $ | 10.19 |
| Statement of Operations |
| Amounts in thousands | | | | Six months ended February 28, 2023 (Unaudited) |
| Investment Income | | | | |
| Interest | | | $ | 786,112 |
| Income from Fidelity Central Funds (including $583 from security lending) | | | | 4,388 |
| Total Income | | | | 790,500 |
| Expenses | | | | |
| Management fee | $ | 6,841 | | |
| Independent trustees' fees and expenses | | 105 | | |
| Total expenses before reductions | | 6,946 | | |
| Expense reductions | | (4) | | |
| Total expenses after reductions | | | | 6,942 |
| Net Investment income (loss) | | | | 783,558 |
| Realized and Unrealized Gain (Loss) | | | | |
| Net realized gain (loss) on: | | | | |
| Investment Securities: | | | | |
| Unaffiliated issuers | | (230,787) | | |
| Total net realized gain (loss) | | | | (230,787) |
| Change in net unrealized appreciation (depreciation) on: | | | | |
| Investment Securities: | | | | |
| Unaffiliated issuers | | (1,797,834) | | |
| TBA Sale commitments | | (2,663) | | |
| Total change in net unrealized appreciation (depreciation) | | | | (1,800,497) |
| Net gain (loss) | | | | (2,031,284) |
| Net increase (decrease) in net assets resulting from operations | | | $ | (1,247,726) |
| Statement of Changes in Net Assets |
| |
| Amount in thousands | | Six months ended February 28, 2023 (Unaudited) | | Year ended August 31, 2022 |
| Increase (Decrease) in Net Assets | | | | |
| Operations | | | | |
| Net investment income (loss) | $ | 783,558 | $ | 1,185,438 |
| Net realized gain (loss) | | (230,787) | | (472,301) |
| Change in net unrealized appreciation (depreciation) | | (1,800,497) | | (7,735,016) |
| Net increase (decrease) in net assets resulting from operations | | (1,247,726) | | (7,021,879) |
| Distributions to shareholders | | (738,895) | | (1,305,021) |
| Share transactions | | | | |
| Proceeds from sales of shares | | 11,716,413 | | 25,027,315 |
| Reinvestment of distributions | | 692,314 | | 1,228,470 |
| Cost of shares redeemed | | (7,818,766) | | (22,196,653) |
Net increase (decrease) in net assets resulting from share transactions | | 4,589,961 | | 4,059,132 |
| Total increase (decrease) in net assets | | 2,603,340 | | (4,267,768) |
| | | | | |
| Net Assets | | | | |
| Beginning of period | | 55,576,531 | | 59,844,299 |
| End of period | $ | 58,179,871 | $ | 55,576,531 |
| | | | | |
| Other Information | | | | |
| Shares | | | | |
| Sold | | 1,144,381 | | 2,219,444 |
| Issued in reinvestment of distributions | | 67,933 | | 107,973 |
| Redeemed | | (766,433) | | (1,966,022) |
| Net increase (decrease) | | 445,881 | | 361,395 |
| | | | | |
Financial Highlights
| Fidelity® U.S. Bond Index Fund |
| |
| | Six months ended (Unaudited) February 28, 2023 | | Years ended August 31, 2022 | | 2021 | | 2020 | | 2019 | | 2018 |
Selected Per-Share Data | | | | | | | | | | | | |
| Net asset value, beginning of period | $ | 10.55 | $ | 12.20 | $ | 12.57 | $ | 12.08 | $ | 11.26 | $ | 11.71 |
| Income from Investment Operations | | | | | | | | | | | | |
Net investment income (loss) A,B | | .144 | | .236 | | .222 | | .291 | | .328 | | .302 |
| Net realized and unrealized gain (loss) | | (.368) | | (1.626) | | (.245) | | .481 | | .813 | | (.445) |
| Total from investment operations | | (.224) | | (1.390) | | (.023) | | .772 | | 1.141 | | (.143) |
| Distributions from net investment income | | (.136) | | (.230) | | (.224) | | (.282) | | (.321) | | (.300) |
| Distributions from net realized gain | | - | | (.030) | | (.123) | | - | | - | | (.007) |
| Total distributions | | (.136) | | (.260) | | (.347) | | (.282) | | (.321) | | (.307) |
| Net asset value, end of period | $ | 10.19 | $ | 10.55 | $ | 12.20 | $ | 12.57 | $ | 12.08 | $ | 11.26 |
Total Return C,D | | (2.11)% | | (11.52)% | | (.17)% | | 6.48% | | 10.33% | | (1.22)% |
Ratios to Average Net Assets B,E,F | | | | | | | | | | | | |
| Expenses before reductions | | .03% G | | .02% H | | .03% | | .03% | | .03% | | .03% |
| Expenses net of fee waivers, if any | | .03% G | | .02% H | | .03% | | .03% | | .03% | | .03% |
| Expenses net of all reductions | | .03% G | | .02% H | | .02% | | .03% | | .03% | | .03% |
| Net investment income (loss) | | 2.84% G | | 2.08% | | 1.81% | | 2.38% | | 2.87% | | 2.66% |
| Supplemental Data | | | | | | | | | | | | |
| Net assets, end of period (in millions) | $ | 58,180 | $ | 55,577 | $ | 59,844 | $ | 55,526 | $ | 44,339 | $ | 20,283 |
Portfolio turnover rate I | | 29% G | | 50% J | | 76% | | 59% J | | 35% J | | 43% |
A Calculated based on average shares outstanding during the period.
B Net investment income (loss) is affected by the timing of the declaration of dividends by any underlying mutual funds or exchange-traded funds (ETFs). Net investment income (loss) of any mutual funds or ETFs is not included in the Fund's net investment income (loss) ratio.
C Total returns for periods of less than one year are not annualized.
D Total returns would have been lower if certain expenses had not been reduced during the applicable periods shown.
E Fees and expenses of any underlying mutual funds or exchange-traded funds (ETFs) are not included in the Fund's expense ratio. The Fund indirectly bears its proportionate share of these expenses. For additional expense information related to investments in Fidelity Central Funds, please refer to the "Investments in Fidelity Central Funds" note found in the Notes to Financial Statements section of the most recent Annual or Semi-Annual report.
F Expense ratios reflect operating expenses of the class. Expenses before reductions do not reflect amounts reimbursed, waived, or reduced through arrangements with the investment adviser, brokerage services, or other offset arrangements, if applicable, and do not represent the amount paid by the class during periods when reimbursements, waivers or reductions occur.
G Annualized.
H The size and fluctuation of net assets and expense amounts may cause ratios to differ from contractual rates.
I Amount does not include the portfolio activity of any underlying mutual funds or exchange-traded funds (ETFs).
J Portfolio turnover rate excludes securities received or delivered in-kind.
For the period ended February 28, 2023
( Amounts in thousands except percentages)
1. Organization.
Fidelity U.S. Bond Index Fund (the Fund) is a fund of Fidelity Salem Street Trust (the Trust) and is authorized to issue an unlimited number of shares. Share transactions on the Statement of Changes in Net Assets may contain exchanges between affiliated funds. The Trust is registered under the Investment Company Act of 1940, as amended (the 1940 Act), as an open-end management investment company organized as a Massachusetts business trust.
2. Investments in Fidelity Central Funds.
Funds may invest in Fidelity Central Funds, which are open-end investment companies generally available only to other investment companies and accounts managed by the investment adviser and its affiliates. The Schedule of Investments lists any Fidelity Central Funds held as an investment as of period end, but does not include the underlying holdings of each Fidelity Central Fund. An investing fund indirectly bears its proportionate share of the expenses of the underlying Fidelity Central Funds.
Based on its investment objective, each Fidelity Central Fund may invest or participate in various investment vehicles or strategies that are similar to those of the investing fund. These strategies are consistent with the investment objectives of the investing fund and may involve certain economic risks which may cause a decline in value of each of the Fidelity Central Funds and thus a decline in the value of the investing fund.
| Fidelity Central Fund | Investment Manager | Investment Objective | Investment Practices | Expense Ratio A |
| Fidelity Money Market Central Funds | Fidelity Management & Research Company LLC (FMR) | Each fund seeks to obtain a high level of current income consistent with the preservation of capital and liquidity. | Short-term Investments | Less than .005% |
A Expenses expressed as a percentage of average net assets and are as of each underlying Central Fund's most recent annual or semi-annual shareholder report.
A complete unaudited list of holdings for each Fidelity Central Fund is available upon request or at the Securities and Exchange Commission website at www.sec.gov. In addition, the financial statements of the Fidelity Central Funds which contain the significant accounting policies (including investment valuation policies) of those funds, and are not covered by the Report of Independent Registered Public Accounting Firm, are available on the Securities and Exchange Commission website or upon request.
3. Significant Accounting Policies.
The Fund is an investment company and applies the accounting and reporting guidance of the Financial Accounting Standards Board (FASB) Accounting Standards Codification Topic 946 Financial Services - Investment Companies . The financial statements have been prepared in conformity with accounting principles generally accepted in the United States of America (GAAP), which require management to make certain estimates and assumptions at the date of the financial statements. Actual results could differ from those estimates. Subsequent events, if any, through the date that the financial statements were issued have been evaluated in the preparation of the financial statements. The Fund's Schedule of Investments lists any underlying mutual funds or exchange-traded funds (ETFs) but does not include the underlying holdings of these funds. The following summarizes the significant accounting policies of the Fund:
Investment Valuation. Investments are valued as of 4:00 p.m. Eastern time on the last calendar day of the period. The Board of Trustees (the Board) has designated the Fund's investment adviser as the valuation designee responsible for the fair valuation function and performing fair value determinations as needed. The investment adviser has established a Fair Value Committee (the Committee) to carry out the day-to-day fair valuation responsibilities and has adopted policies and procedures to govern the fair valuation process and the activities of the Committee. In accordance with these fair valuation policies and procedures, which have been approved by the Board, the Fund attempts to obtain prices from one or more third party pricing services or brokers to value its investments. When current market prices, quotations or currency exchange rates are not readily available or reliable, investments will be fair valued in good faith by the Committee, in accordance with the policies and procedures. Factors used in determining fair value vary by investment type and may include market or investment specific events, transaction data, estimated cash flows, and market observations of comparable investments. The frequency that the fair valuation procedures are used cannot be predicted and they may be utilized to a significant extent. The Committee manages the Fund's fair valuation practices and maintains the fair valuation policies and procedures. The Fund's investment adviser reports to the Board information regarding the fair valuation process and related material matters.
The Fund categorizes the inputs to valuation techniques used to value its investments into a disclosure hierarchy consisting of three levels as shown below:
Level 1 - unadjusted quoted prices in active markets for identical investments
Level 2 - other significant observable inputs (including quoted prices for similar investments, interest rates, prepayment speeds, etc.)
Level 3 - unobservable inputs (including the Fund's own assumptions based on the best information available)
Valuation techniques used to value the Fund's investments by major category are as follows:
Debt securities, including restricted securities, are valued based on evaluated prices received from third party pricing services or from brokers who make markets in such securities. Corporate bonds, bank notes, foreign government and government agency obligations, municipal securities, supranational obligations and U.S. government and government agency obligations are valued by pricing services who utilize matrix pricing which considers yield or price of bonds of comparable quality, coupon, maturity and type or by broker-supplied prices. Asset backed securities, commercial mortgage and U.S. government agency mortgage securities are valued by pricing services who utilize matrix pricing which considers prepayment speed assumptions, attributes of the collateral, yield or price of bonds of comparable quality, coupon, maturity and type or by broker-supplied prices. When independent prices are unavailable or unreliable, debt securities may be valued utilizing pricing methodologies which consider similar factors that would be used by third party pricing services. Debt securities are generally categorized as Level 2 in the hierarchy but may be Level 3 depending on the circumstances.
Investments in open-end mutual funds, including the Fidelity Central Funds, are valued at their closing net asset value (NAV) each business day and are categorized as Level 1 in the hierarchy.
Changes in valuation techniques may result in transfers in or out of an assigned level within the disclosure hierarchy. The aggregate value of investments by input level as of February 28, 2023 is included at the end of the Fund's Schedule of Investments.
Investment Transactions and Income. For financial reporting purposes, the Fund's investment holdings and NAV include trades executed through the end of the last business day of the period. The NAV per share for processing shareholder transactions is calculated as of the close of business of the New York Stock Exchange (NYSE), normally 4:00 p.m. Eastern time and includes trades executed through the end of the prior business day. Gains and losses on securities sold are determined on the basis of identified cost and include proceeds received from litigation. Income and capital gain distributions from Fidelity Central Funds, if any, are recorded on the ex-dividend date. Interest income is accrued as earned and includes coupon interest and amortization of premium and accretion of discount on debt securities as applicable. Debt obligations may be placed on non-accrual status and related interest income may be reduced by ceasing current accruals and writing off interest receivables when the collection of all or a portion of interest has become doubtful based on consistently applied procedures. A debt obligation is removed from non-accrual status when the issuer resumes interest payments or when collectability of interest is reasonably assured.
Expenses. Expenses directly attributable to a fund are charged to that fund. Expenses attributable to more than one fund are allocated among the respective funds on the basis of relative net assets or other appropriate methods. Expenses included in the accompanying financial statements reflect the expenses of that fund and do not include any expenses associated with any underlying mutual funds or exchange-traded funds. Although not included in a fund's expenses, a fund indirectly bears its proportionate share of these expenses through the net asset value of each underlying mutual fund or exchange-traded fund. Expense estimates are accrued in the period to which they relate and adjustments are made when actual amounts are known.
Deferred Trustee Compensation. Under a Deferred Compensation Plan (the Plan) for certain Funds, certain independent Trustees have elected to defer receipt of a portion of their annual compensation. Deferred amounts are invested in affiliated mutual funds, are marked-to-market and remain in a fund until distributed in accordance with the Plan. The investment of deferred amounts and the offsetting payable to the Trustees presented below are included in the accompanying Statement of Assets and Liabilities in other receivables and other payables and accrued expenses, as applicable.
| Fidelity U.S. Bond Index Fund | $505 |
Income Tax Information and Distributions to Shareholders. Each year, the Fund intends to qualify as a regulated investment company under Subchapter M of the Internal Revenue Code, including distributing substantially all of its taxable income and realized gains. As a result, no provision for U.S. Federal income taxes is required. The Fund files a U.S. federal tax return, in addition to state and local tax returns as required. The Fund's federal income tax returns are subject to examination by the Internal Revenue Service (IRS) for a period of three fiscal years after they are filed. State and local tax returns may be subject to examination for an additional fiscal year depending on the jurisdiction.
Distributions are declared and recorded daily and paid monthly from net investment income. Distributions from realized gains, if any, are declared and recorded on the ex-dividend date. Income and capital gain distributions are determined in accordance with income tax regulations, which may differ from GAAP.
Capital accounts within the financial statements are adjusted for permanent book-tax differences. These adjustments have no impact on net assets or the results of operations. Capital accounts are not adjusted for temporary book-tax differences which will reverse in a subsequent period.
Book-tax differences are primarily due to market discount and losses deferred due to wash sales and excise tax regulations.
As of period end, the cost and unrealized appreciation (depreciation) in securities, and derivatives if applicable, for federal income tax purposes were as follows:
| Gross unrealized appreciation | $57,892 |
| Gross unrealized depreciation | (7,272,827) |
| Net unrealized appreciation (depreciation) | $(7,214,935) |
| Tax cost | $67,620,028 |
Capital loss carryforwards are only available to offset future capital gains of the Fund to the extent provided by regulations and may be limited. The capital loss carryforward information presented below, including any applicable limitation, is estimated as of prior fiscal period end and is subject to adjustment.
| Short-term | $(251,037) |
| Long-term | (102,330) |
| Total capital loss carryforward | $(353,367) |
Delayed Delivery Transactions and When-Issued Securities. During the period, certain Funds transacted in securities on a delayed delivery or when-issued basis. Payment and delivery may take place after the customary settlement period for that security. The price of the underlying securities and the date when the securities will be delivered and paid for are fixed at the time the transaction is negotiated. Securities purchased on a delayed delivery or when-issued basis are identified as such in the Schedule of Investments. Compensation for interest forgone in the purchase of a delayed delivery or when-issued debt security may be received. With respect to purchase commitments, each applicable Fund identifies securities as segregated in its records with a value at least equal to the amount of the commitment. Payables and receivables associated with the purchases and sales of delayed delivery securities having the same coupon, settlement date and broker are offset. Delayed delivery or when-issued securities that have been purchased from and sold to different brokers are reflected as both payables and receivables in the Statement of Assets and Liabilities under the caption "Delayed delivery", as applicable. Losses may arise due to changes in the value of the underlying securities or if the counterparty does not perform under the contract's terms, or if the issuer does not issue the securities due to political, economic, or other factors.
To-Be-Announced (TBA) Securities and Mortgage Dollar Rolls. TBA securities involve buying or selling mortgage-backed securities (MBS) on a forward commitment basis. A TBA transaction typically does not designate the actual security to be delivered and only includes an approximate principal amount; however delivered securities must meet specified terms defined by industry guidelines, including issuer, rate and current principal amount outstanding on underlying mortgage pools. Funds may enter into a TBA transaction with the intent to take possession of or deliver the underlying MBS, or a fund may elect to extend the settlement by entering into either a mortgage or reverse mortgage dollar roll. Mortgage dollar rolls are transactions where a fund sells TBA securities and simultaneously agrees to repurchase MBS on a later date at a lower price and with the same counterparty. Reverse mortgage dollar rolls involve the purchase and simultaneous agreement to sell TBA securities on a later date at a lower price. Transactions in mortgage dollar rolls and reverse mortgage dollar rolls are accounted for as purchases and sales and may result in an increase to a fund's portfolio turnover rate.
Purchases and sales of TBA securities involve risks similar to those discussed above for delayed delivery and when-issued securities. Also, if the counterparty in a mortgage dollar roll or a reverse mortgage dollar roll transaction files for bankruptcy or becomes insolvent, a fund's right to repurchase or sell securities may be limited. Additionally, when a fund sells TBA securities without already owning or having the right to obtain the deliverable securities (an uncovered forward commitment to sell), it incurs a risk of loss because it could have to purchase the securities at a price that is higher than the price at which it sold them. A fund may be unable to purchase the deliverable securities if the corresponding market is illiquid.
TBA securities subject to a forward commitment to sell at period end are included at the end of the Schedule of Investments under the caption "TBA Sale Commitments." The proceeds and value of these commitments are reflected in the Statement of Assets and Liabilities as "Receivable for TBA sale commitments" and "TBA sale commitments, at value," respectively.
Restricted Securities (including Private Placements). Funds may invest in securities that are subject to legal or contractual restrictions on resale. These securities generally may be resold in transactions exempt from registration or to the public if the securities are registered. Disposal of these securities may involve time-consuming negotiations and expense, and prompt sale at an acceptable price may be difficult. Information regarding restricted securities held at period end is included at the end of the Schedule of Investments, if applicable.
4. Purchases and Sales of Investments.
Purchases and sales of securities, other than short-term securities, U.S. government securities and in-kind transactions, as applicable, are noted in the table below.
| | Purchases ($) | Sales ($) |
| Fidelity U.S. Bond Index Fund | 4,869,635 | 3,408,948 |
5. Fees and Other Transactions with Affiliates.
Management Fee and Expense Contract. Fidelity Management & Research Company LLC (the investment adviser) and its affiliates provide the Fund with investment management related services for which the Fund pays a monthly management fee. The management fee is based on an annual rate of .025% of the Fund's average net assets. The management fee is reduced by an amount equal to the fees and expenses paid by the Fund to the independent Trustees. Under the management contract, the investment adviser pays all other operating expenses, except the compensation of the independent Trustees and certain other expenses such as interest expense.
Under the expense contract, the investment adviser pays all other operating expenses, except the compensation of the independent Trustees, as necessary so that the total expenses do not exceed .025% of average net assets. This expense contract will remain in place through October 31, 2022.
Interfund Trades. Funds may purchase from or sell securities to other Fidelity Funds under procedures adopted by the Board. The procedures have been designed to ensure these interfund trades are executed in accordance with Rule 17a-7 of the 1940 Act. Any interfund trades are included within the respective purchases and sales amounts shown in the Purchases and Sales of Investments note. During the period, there were no interfund trades.
Prior Fiscal Year Affiliated Redemptions In-Kind. Shares that were redeemed in-kind for investments, including accrued interest and cash, if any, are shown in the table below; along with realized gain or loss on investments delivered through in-kind redemptions. The amount of the in-kind redemptions is included in share transactions in the accompanying Statement of Changes in Net Assets. There was no gain or loss for federal income tax purposes.
| | Shares | Total net realized gain or loss ($) | Total Proceeds ($) |
| Fidelity U.S. Bond Index Fund | 170,078 | (109,302) | 1,852,154 |
Other. During the period, the investment adviser reimbursed the Fund for certain losses as follows:
| | Amount ($) |
| Fidelity U.S. Bond Index Fund | 33 |
6. Committed Line of Credit.
Certain Funds participate with other funds managed by the investment adviser or an affiliate in a $4.25 billion credit facility (the "line of credit") to be utilized for temporary or emergency purposes to fund shareholder redemptions or for other short-term liquidity purposes. The commitment fees on the pro-rata portion of the line of credit are borne by the investment adviser. During the period, there were no borrowings on this line of credit.
7. Security Lending.
Funds lend portfolio securities from time to time in order to earn additional income. Lending agents are used, including National Financial Services (NFS), an affiliate of the investment adviser. Pursuant to a securities lending agreement, NFS will receive a fee, which is capped at 9.9% of a fund's daily lending revenue, for its services as lending agent. A fund may lend securities to certain qualified borrowers, including NFS. On the settlement date of the loan, a fund receives collateral (in the form of U.S. Treasury obligations, letters of credit and/or cash) against the loaned securities and maintains collateral in an amount not less than 100% of the market value of the loaned securities during the period of the loan. The market value of the loaned securities is determined at the close of business of a fund and any additional required collateral is delivered to a fund on the next business day. A fund or borrower may terminate the loan at any time, and if the borrower defaults on its obligation to return the securities loaned because of insolvency or other reasons, a fund may apply collateral received from the borrower against the obligation. A fund may experience delays and costs in recovering the securities loaned. Any cash collateral received is invested in the Fidelity Securities Lending Cash Central Fund. Any loaned securities are identified as such in the Schedule of Investments, and the value of loaned securities and cash collateral at period end, as applicable, are presented in the Statement of Assets and Liabilities. Security lending income represents the income earned on investing cash collateral, less rebates paid to borrowers and any lending agent fees associated with the loan, plus any premium payments received for lending certain types of securities. Security lending income is presented in the Statement of Operations as a component of income from Fidelity Central Funds. Affiliated security lending activity, if any, was as follows:
| | Total Security Lending Fees Paid to NFS | Security Lending Income From Securities Loaned to NFS | Value of Securities Loaned to NFS at Period End |
| Fidelity U.S. Bond Index Fund | $63 | $- | $- |
8. Expense Reductions.
Through arrangements with the Fund's custodian, credits realized as a result of certain uninvested cash balances were used to reduce the Fund's expenses by $4.
9. Other.
A fund's organizational documents provide former and current trustees and officers with a limited indemnification against liabilities arising in connection with the performance of their duties to the fund. In the normal course of business, a fund may also enter into contracts that provide general indemnifications. A fund's maximum exposure under these arrangements is unknown as this would be dependent on future claims that may be made against a fund. The risk of material loss from such claims is considered remote.
10. Risk and Uncertainties.
Many factors affect a fund's performance. Developments that disrupt global economies and financial markets, such as pandemics, epidemics, outbreaks of infectious diseases, war, terrorism, and environmental disasters, may significantly affect a fund's investment performance. The effects of these developments to a fund will be impacted by the types of securities in which a fund invests, the financial condition, industry, economic sector, and geographic location of an issuer, and a fund's level of investment in the securities of that issuer. Significant concentrations in security types, issuers, industries, sectors, and geographic locations may magnify the factors that affect a fund's performance.
As a shareholder, you incur two types of costs: (1) transaction costs, which may include sales charges (loads) on purchase payments or redemption proceeds, as applicable and (2) ongoing costs, which generally include management fees, distribution and/or service (12b-1) fees and other Fund expenses. This Example is intended to help you understand your ongoing costs (in dollars) of investing in a fund and to compare these costs with the ongoing costs of investing in other mutual funds.
| The Example is based on an investment of $1,000 invested at the beginning of the period and held for the entire period (September 1, 2022 to February 28, 2023). |
Actual Expenses
The first line of the accompanying table provides information about actual account values and actual expenses. You may use the information in this line, together with the amount you invested, to estimate the expenses that you paid over the period. Simply divide your account value by $1,000.00 (for example, an $8,600 account value divided by $1,000.00 = 8.6), then multiply the result by the number in the first line for a class/Fund under the heading entitled "Expenses Paid During Period" to estimate the expenses you paid on your account during this period. If any fund is a shareholder of any underlying mutual funds or exchange-traded funds (ETFs) (the Underlying Funds), such fund indirectly bears its proportional share of the expenses of the Underlying Funds in addition to the direct expenses incurred presented in the table. These fees and expenses are not included in the annualized expense ratio used to calculate the expense estimate in the table below.
Hypothetical Example for Comparison Purposes
The second line of the accompanying table provides information about hypothetical account values and hypothetical expenses based on the actual expense ratio and an assumed rate of return of 5% per year before expenses, which is not the actual return. The hypothetical account values and expenses may not be used to estimate the actual ending account balance or expenses you paid for the period. You may use this information to compare the ongoing costs of investing in the Fund and other funds. To do so, compare this 5% hypothetical example with the 5% hypothetical examples that appear in the shareholder reports of the other funds. If any fund is a shareholder of any Underlying Funds, such fund indirectly bears its proportional share of the expenses of the Underlying Funds in addition to the direct expenses as presented in the table. These fees and expenses are not included in the annualized expense ratio used to calculate the expense estimate in the table below.
Please note that the expenses shown in the table are meant to highlight your ongoing costs only and do not reflect any transaction costs. Therefore, the second line of the table is useful in comparing ongoing costs only, and will not help you determine the relative total costs of owning different funds. In addition, if these transactional costs were included, your costs would have been higher.
| | | | | Annualized Expense Ratio- A | | Beginning Account Value September 1, 2022 | | Ending Account Value February 28, 2023 | | Expenses Paid During Period- C September 1, 2022 to February 28, 2023 |
| | | | | | | | | | |
| Fidelity® U.S. Bond Index Fund | | | | .03% | | | | | | |
| Actual | | | | | | $ 1,000 | | $ 978.90 | | $ .15 |
Hypothetical- B | | | | | | $ 1,000 | | $ 1,024.65 | | $ .15 |
| |
A Annualized expense ratio reflects expenses net of applicable fee waivers.
B 5% return per year before expenses
C Expenses are equal to the annualized expense ratio, multiplied by the average account value over the period, multiplied by 181/ 365 (to reflect the one-half year period). The fees and expenses of any Underlying Funds are not included in each annualized expense ratio.
Board Approval of Investment Advisory Contracts and Management Fees
Fidelity U.S. Bond Index Fund
Each year, the Board of Trustees, including the Independent Trustees (together, the Board), votes on the renewal of the management contract with Fidelity Management & Research Company LLC (FMR) and the sub-advisory agreements (together, the Advisory Contracts) for the fund. FMR and the sub-advisers are referred to herein as the Investment Advisers. The Board, assisted by the advice of fund counsel and Independent Trustees' counsel, requests and considers a broad range of information relevant to the renewal of the Advisory Contracts throughout the year.
The Board meets regularly and, at each of its meetings, covers an extensive agenda of topics and materials and considers factors that are relevant to its annual consideration of the renewal of the fund's Advisory Contracts, including the services and support provided to the fund and its shareholders. The Board has established four standing committees (Committees) - Operations, Audit, Fair Valuation, and Governance and Nominating - each composed of and chaired by Independent Trustees with varying backgrounds, to which the Board has assigned specific subject matter responsibilities in order to enhance effective decision-making by the Board. The Operations Committee, of which all the Independent Trustees are members, meets regularly throughout the year and requests, receives and considers, among other matters, information related to the annual consideration of the renewal of the fund's Advisory Contracts before making its recommendation to the Board. The Board also meets as needed to review matters specifically related to the Board's annual consideration of the renewal of the Advisory Contracts. Members of the Board may also meet from time to time with trustees of other Fidelity funds through joint ad hoc committees to discuss certain matters relevant to all of the Fidelity funds.
At its September 2022 meeting, the Board unanimously determined to renew the fund's Advisory Contracts. In reaching its determination, the Board considered all factors it believed relevant, including (i) the nature, extent, and quality of the services provided to the fund and its shareholders (including the investment performance of the fund); (ii) the competitiveness relative to peer funds of the fund's management fee and total expense ratio; (iii) the total costs of the services provided by and the profits realized by Fidelity from its relationships with the fund; and (iv) the extent to which, if any, economies of scale exist and are realized as the fund grows, and whether any economies of scale are appropriately shared with fund shareholders.
In considering whether to renew the Advisory Contracts for the fund, the Board reached a determination, with the assistance of fund counsel and Independent Trustees' counsel and through the exercise of its business judgment, that the renewal of the Advisory Contracts was in the best interests of the fund and its shareholders and that the compensation payable under the Advisory Contracts was fair and reasonable. The Board's decision to renew the Advisory Contracts was not based on any single factor, but rather was based on a comprehensive consideration of all the information provided to the Board at its meetings throughout the year. The Board, in reaching its determination to renew the Advisory Contracts, was aware that shareholders of the fund have a broad range of investment choices available to them, including a wide choice among funds offered by Fidelity's competitors, and that the fund's shareholders, who have the opportunity to review and weigh the disclosure provided by the fund in its prospectus and other public disclosures, have chosen to invest in this fund, which is part of the Fidelity family of funds.
Nature, Extent, and Quality of Services Provided. The Board considered Fidelity's staffing as it relates to the fund, including the backgrounds of investment personnel of Fidelity, and also considered the fund's investment objective, strategies, and related investment philosophy. The Independent Trustees also had discussions with senior management of Fidelity's investment operations and investment groups. The Board considered the structure of the investment personnel compensation program and whether this structure provides appropriate incentives to act in the best interests of the fund. Additionally, the Board considered the portfolio managers' investments, if any, in the funds that they manage. The Board also considered the steps Fidelity had taken to ensure the continued provision of high-quality services to the Fidelity funds throughout the COVID-19 pandemic, including the expansion of staff in client facing positions to maintain service levels in periods of high volumes and volatility.
Resources Dedicated to Investment Management and Support Services. The Board reviewed the general qualifications and capabilities of Fidelity's investment staff, including its size, education, experience, and resources, as well as Fidelity's approach to recruiting, training, managing, and compensating investment personnel. The Board noted the resources devoted to Fidelity's global investment organization, and that Fidelity's analysts have extensive resources, tools and capabilities that allow them to conduct quantitative and fundamental analysis, as well as credit analysis of issuers, counterparties and guarantors. Further, the Board considered that Fidelity's investment professionals have sufficient access to global information and data so as to provide competitive investment results over time, and that those professionals also have access to sophisticated tools that permit them to assess portfolio construction and risk and performance attribution characteristics continuously, as well as to transmit new information and research conclusions rapidly around the world. Additionally, in its deliberations, the Board considered Fidelity's trading, risk management, compliance, cybersecurity, and technology and operations capabilities and resources, which are integral parts of the investment management process.
Shareholder and Administrative Services. The Board considered (i) the nature, extent, quality, and cost of advisory, administrative, and shareholder services performed by the Investment Advisers and their affiliates under the Advisory Contracts and under separate agreements covering transfer agency, pricing and bookkeeping, and securities lending services for the fund; (ii) the nature and extent of the supervision of third party service providers, principally custodians, subcustodians, and pricing vendors; and (iii) the resources devoted to, and the record of compliance with, the fund's compliance policies and procedures.
The Board noted that the growth of fund assets over time across the complex allows Fidelity to reinvest in the development of services designed to enhance the value and convenience of the Fidelity funds as investment vehicles. These services include 24-hour access to account information and market information over the Internet and through telephone representatives, investor education materials and asset allocation tools. The Board also considered that it reviews customer service metrics such as telephone response times, continuity of services on the website and metrics addressing services at Fidelity Investor Centers.
Investment in a Large Fund Family. The Board considered the benefits to shareholders of investing in a Fidelity fund, including the benefits of investing in a fund that is part of a large family of funds offering a variety of investment disciplines and providing a large variety of mutual fund investor services. The Board noted that Fidelity had taken, or had made recommendations to the Board that resulted in the Fidelity funds taking, a number of actions over the previous year that benefited particular funds, including: (i) continuing to dedicate additional resources to Fidelity's investment research process, which includes meetings with management of issuers of securities in which the funds invest; (ii) continuing efforts to enhance Fidelity's global research capabilities; (iii) launching new funds, ETFs, and share classes with innovative structures, strategies and pricing and making other enhancements to meet investor needs; (iv) broadening eligibility requirements for certain funds and share classes; (v) reducing management fees and total expenses for certain funds and classes; (vi) lowering expenses for certain existing funds and classes by implementing or lowering expense caps; (vii) rationalizing product lines and gaining increased efficiencies from fund mergers and liquidations; (viii) continuing to develop, acquire and implement systems and technology to improve services to the funds and shareholders, strengthen information security, and increase efficiency; and (ix) continuing to implement enhancements to further strengthen Fidelity's product line to increase investors' probability of success in achieving their investment goals, including their retirement income goals.
Investment Performance. The Board considered whether the fund has operated in accordance with its investment objective, as well as its record of compliance with its investment restrictions and its performance history.
The Board took into account discussions that occur at Board meetings throughout the year with representatives of the Investment Advisers about fund investment performance. In this regard the Board noted that as part of regularly scheduled fund reviews and other reports to the Board on fund performance, the Board considers annualized return information for the fund for different time periods, measured against the securities market index the fund seeks to track and an appropriate peer group of funds with similar objectives (peer group). The Board also periodically considers the fund's tracking error versus its benchmark index.
In addition to reviewing absolute and relative fund performance, the Independent Trustees periodically consider the appropriateness of fund performance metrics in evaluating the results achieved. In general, the Independent Trustees believe that an index fund's performance should be evaluated based on gross performance (before fees and expenses but after transaction costs) compared to the fund's benchmark index, over appropriate time periods, taking into account relevant factors including the following: general market conditions; the characteristics of the fund's benchmark index; the extent to which statistical sampling is employed; and fund cash flows and other factors. The Independent Trustees generally give greater weight to fund performance over longer time periods than over shorter time periods. Depending on the circumstances, the Independent Trustees may be satisfied with a fund's performance notwithstanding that it lags its benchmark index for certain periods.
The Independent Trustees recognize that shareholders evaluate performance on a net basis (after fees and expenses) over their own holding periods, for which one-, three-, and five-year periods are often used as a proxy. For this reason, the performance information reviewed by the Board also included net cumulative calendar year total return information for the fund and its benchmark index and peer group for the most recent one-, three-, and five-year periods. The Independent Trustees recognize that shareholders who are not investing through a tax-advantaged retirement account also consider tax consequences in evaluating performance.
Based on its review, the Board concluded that the nature, extent, and quality of services provided to the fund under the Advisory Contracts should continue to benefit the shareholders of the fund.
Competitiveness of Management Fee and Total Expense Ratio. The Board considered the fund's management fee and total expense ratio compared to selected groups of competitive funds and classes (referred to as "mapped groups" below) for the purpose of facilitating the Trustees' competitive analysis of management fees and total expenses. Fidelity creates "mapped groups" by combining similar investment objective categories (as classified by Lipper) that have comparable investment mandates. Combining funds with similar investment objective categories aids the Board's comparison of management fees and total expense ratios by broadening the competitive group used for such comparison.
Management Fee. The Board considered two proprietary management fee comparisons for the 12-month periods shown in basis points (BP) in the chart below. The group of Lipper funds used by the Board for management fee comparisons is referred to below as the "Total Mapped Group" and is broader than the Lipper peer group used by the Board for performance comparisons. The Total Mapped Group comparison focuses on a fund's standing in terms of gross management fees before expense reimbursements or caps relative to the total universe of funds with comparable investment mandates, regardless of whether their management fee structures also are comparable. Funds with comparable investment mandates offer exposure to similar types of securities. Funds with comparable management fee structures have similar management fee contractual arrangements (e.g., flat rate charged for advisory services, all-inclusive fee rate, etc.). "TMG %" represents the percentage of funds in the Total Mapped Group that had management fees that were lower than the fund's. For example, a hypothetical TMG % of 20% would mean that 80% of the funds in the Total Mapped Group had higher, and 20% had lower, management fees than the fund. The fund's actual TMG %s and the number of funds in the Total Mapped Group are in the chart below. The "Asset-Sized Peer Group" (ASPG) comparison focuses on a fund's standing relative to a subset of non-Fidelity funds within the Total Mapped Group that are similar in size and management fee structure. For example, if a fund is in the first quartile of the ASPG, the fund's management fee ranks in the least expensive or lowest 25% of funds in the ASPG. The ASPG represents at least 15% of the funds in the Total Mapped Group with comparable asset size and management fee structures, subject to a minimum of 50 funds (or all funds in the Total Mapped Group if fewer than 50). Additional information, such as the ASPG quartile in which the fund's management fee rate ranked, is also included in the chart and was considered by the Board.
The Board considered that effective August 1, 2017, the fund's management fee rate was reduced from 0.03% to 0.025%. The Board considered that the chart below reflects the fund's lower management fee rates for 2017, as if the lower fee rate was in effect for the entire year.
The Board noted that the fund's management fee rate ranked below the median of its Total Mapped Group and below the median of its ASPG for 2021.
Based on its review, the Board concluded that the fund's management fee is fair and reasonable in light of the services that the fund receives and the other factors considered.
Total Expense Ratio. In its review of the fund's total expense ratio, the Board considered the fund's unitary (subject to certain limited exceptions) fee rate. The Board also considered other expenses such as transfer agent fees, pricing and bookkeeping fees, and custodial, legal, and audit fees paid by FMR under the unitary fee arrangement. The Board also noted that Fidelity may agree to waive fees or reimburse expenses from time to time, and the extent to which, if any, it has done so for the fund. The fund is compared to those funds and classes in the Total Mapped Group (used by the Board for management fee comparisons) that have a similar sales load structure. The Board also considered a total expense ASPG comparison, which focuses on the total expenses of the fund relative to a subset of non-Fidelity funds within the similar sales load structure group that are similar in size and management fee structure. The total expense ASPG is limited to 15 larger and 15 smaller classes of different funds, where possible. The total expense ASPG comparison excludes performance adjustments and fund-paid 12b-1 fees to eliminate variability in expenses relating to these items.
The Board noted that the fund's total net expense ratio ranked below the similar sales load structure group competitive median for 2021 and below the ASPG competitive median for 2021.
The Board considered that current contractual arrangements for the fund oblige FMR to pay all "class-level" expenses of the fund to the extent necessary to limit total operating expenses, with certain exceptions, to 0.025%. These contractual arrangements terminate on October 31, 2023 and may not be amended to increase the fees or expenses payable by the fund except by a vote of a majority of the Board.
Fees Charged to Other Fidelity Clients. The Board also considered Fidelity fee structures and other information with respect to clients of Fidelity, such as other funds advised or subadvised by Fidelity, pension plan clients, and other institutional clients with similar mandates. The Board noted that a joint ad hoc committee created by it and the boards of other Fidelity funds periodically reviews and compares Fidelity's institutional investment advisory business with its business of providing services to the Fidelity funds and also noted the most recent findings of the committee. The Board noted that the committee's review included a consideration of the differences in services provided, fees charged, and costs incurred, as well as competition in the markets serving the different categories of clients.
Based on its review of total expense ratios and fees charged to other Fidelity clients, the Board concluded that the fund's total expense ratio was reasonable in light of the services that the fund and its shareholders receive and the other factors considered.
Costs of the Services and Profitability. The Board considered the revenues earned and the expenses incurred by Fidelity in conducting the business of developing, marketing, distributing, managing, administering and servicing the fund and servicing the fund's shareholders. The Board also considered the level of Fidelity's profits in respect of all the Fidelity funds.
On an annual basis, Fidelity presents to the Board information about the profitability of its relationships with the fund. Fidelity calculates profitability information for each fund, as well as aggregate profitability information for groups of Fidelity funds and all Fidelity funds, using a series of detailed revenue and cost allocation methodologies which originate with the books and records of Fidelity on which Fidelity's audited financial statements are based. The Audit Committee of the Board reviews any significant changes from the prior year's methodologies and the full Board approves such changes.
A public accounting firm has been engaged annually by the Board as part of the Board's assessment of Fidelity's profitability analysis. The engagement includes the review and assessment of the methodologies used by Fidelity in determining the revenues and expenses attributable to Fidelity's mutual fund business, and completion of agreed-upon procedures in respect of the mathematical accuracy of certain fund profitability information and its conformity to established allocation methodologies. After considering the reports issued under the engagement and information provided by Fidelity, the Board concluded that while other allocation methods may also be reasonable, Fidelity's profitability methodologies are reasonable in all material respects.
The Board also reviewed Fidelity's non-fund businesses and potential indirect benefits such businesses may have received as a result of their association with Fidelity's mutual fund business (i.e., fall-out benefits) as well as cases where Fidelity's affiliates may benefit from the funds' business. The Board considered areas where potential indirect benefits to the Fidelity funds from their relationships with Fidelity may exist. The Board's consideration of these matters was informed by the findings of a joint ad hoc committee created by it and the boards of other Fidelity funds to evaluate potential fall-out benefits.
The Board considered the costs of the services provided by and the profits realized by Fidelity in connection with the operation of the fund and was satisfied that the profitability was not excessive.
Economies of Scale. The Board considered whether there have been economies of scale in respect of the management of the Fidelity funds, whether the Fidelity funds (including the fund) have appropriately benefited from any such economies of scale, and whether there is potential for realization of any further economies of scale. The Board considered the extent to which the fund will benefit from economies of scale as assets grow through increased services to the fund, through waivers or reimbursements, or through fee or expense ratio reductions. The Board recognized that, due to the fund's current contractual arrangements, its expense ratio will not decline if the fund's operating costs decrease as assets grow, or rise as assets decrease. The Board also noted that a committee (the Economies of Scale Committee) created by it and the boards of other Fidelity funds periodically analyzes whether Fidelity attains economies of scale in respect of the management and servicing of the Fidelity funds, whether the Fidelity funds have appropriately benefited from such economies of scale, and whether there is potential for realization of any further economies of scale.
The Board concluded, taking into account the analysis of the Economies of Scale Committee, that economies of scale, if any, are being appropriately shared between fund shareholders and Fidelity.
Additional Information Requested by the Board. In order to develop fully the factual basis for consideration of the Fidelity funds' advisory contracts, the Board requested and received additional information on certain topics, including: (i) Fidelity's fund profitability methodology, profitability trends for certain funds, the allocation of various costs to different funds, and the impact of certain factors on fund profitability results; (ii) portfolio manager changes that have occurred during the past year and the amount of the investment that each portfolio manager has made in the Fidelity fund(s) that he or she manages; (iii) the extent to which current market conditions have affected retention and recruitment of personnel; (iv) the arrangements with and compensation paid to certain fund sub-advisers on behalf of the Fidelity funds and the treatment of such compensation within Fidelity's fund profitability methodology; (v) the terms of the funds' various management fee structures, including the basic group fee and the terms of Fidelity's voluntary expense limitation arrangements; (vi) Fidelity's transfer agent, pricing and bookkeeping fees, expense and service structures for different funds and classes relative to competitive trends; (vii) the impact on fund profitability of recent industry trends, such as the growth in passively managed funds and the changes in flows for different types of funds; (viii) the types of management fee and total expense comparisons provided, and the challenges and limitations associated with such information; and (ix) explanations regarding the relative total expense ratios and management fees of certain funds and classes, total expense and management fee competitive trends, and methodologies for total expense and management fee competitive comparisons. In addition, the Board considered its discussions with Fidelity regarding Fidelity's efforts to maintain the continuous investment and shareholder services necessary for the funds during the current pandemic and economic circumstances.
Based on its evaluation of all of the conclusions noted above, and after considering all factors it believed relevant, the Board concluded that the advisory fee arrangements are fair and reasonable and that the fund's Advisory Contracts should be renewed.
The Securities and Exchange Commission adopted Rule 22e-4 under the Investment Company Act of 1940 (the Liquidity Rule) to promote effective liquidity risk management throughout the open-end investment company industry, thereby reducing the risk that funds will be unable to meet their redemption obligations and mitigating dilution of the interests of fund shareholders.
The Fund has adopted and implemented a liquidity risk management program (the Program) reasonably designed to assess and manage the Fund's liquidity risk and to comply with the requirements of the Liquidity Rule. The Fund's Board of Trustees (the Board) has designated the Fund's investment adviser as administrator of the Program. The Fidelity advisers have established a Liquidity Risk Management Committee (the LRM Committee) to manage the Program for each of the Fidelity Funds. The LRM Committee monitors the adequacy and effectiveness of implementation of the Program and on a periodic basis assesses each Fund's liquidity risk based on a variety of factors including (1) the Fund's investment strategy, (2) portfolio liquidity and cash flow projections during normal and reasonably foreseeable stressed conditions, (3) shareholder redemptions, (4) borrowings and other funding sources and (5) certain factors specific to ETFs including the effect of the Fund's prices and spreads, market participants, and basket compositions on the overall liquidity of the Fund's portfolio, as applicable.
In accordance with the Program, each of the Fund's portfolio investments is classified into one of four defined liquidity categories based on a determination of a reasonable expectation for how long it would take to convert the investment to cash (or sell or dispose of the investment) without significantly changing its market value.
- Highly liquid investments - cash or convertible to cash within three business days or less
- Moderately liquid investments - convertible to cash in three to seven calendar days
- Less liquid investments - can be sold or disposed of, but not settled, within seven calendar days
- Illiquid investments - cannot be sold or disposed of within seven calendar days
Liquidity classification determinations take into account a variety of factors including various market, trading and investment-specific considerations, as well as market depth, and generally utilize analysis from a third-party liquidity metrics service.
The Liquidity Rule places a 15% limit on a fund's illiquid investments and requires funds that do not primarily hold assets that are highly liquid investments to determine and maintain a minimum percentage of the fund's net assets to be invested in highly liquid investments (highly liquid investment minimum or HLIM). The Program includes provisions reasonably designed to comply with the 15% limit on illiquid investments and for determining, periodically reviewing and complying with the HLIM requirement as applicable.
At a recent meeting of the Fund's Board of Trustees, the LRM Committee provided a written report to the Board pertaining to the operation, adequacy, and effectiveness of the Program for the period December 1, 2021 through November 30, 2022. The report concluded that the Program is operating effectively and is reasonably designed to assess and manage the Fund's liquidity risk.
1.925933.111
UII-UDV-SANN-0423
Item 2.
Code of Ethics
Not applicable.
Item 3.
Audit Committee Financial Expert
Not applicable.
Item 4.
Principal Accountant Fees and Services
Not applicable.
Item 5.
Audit Committee of Listed Registrants
Not applicable.
Item 6.
Investments
(a)
Not applicable.
(b)
Not applicable
Item 7.
Disclosure of Proxy Voting Policies and Procedures for Closed-End Management Investment Companies
Not applicable.
Item 8.
Portfolio Managers of Closed-End Management Investment Companies
Not applicable.
Item 9.
Purchase of Equity Securities by Closed-End Management Investment Company and Affiliated Purchasers
Not applicable.
Item 10.
Submission of Matters to a Vote of Security Holders
There were no material changes to the procedures by which shareholders may recommend nominees to the Fidelity Salem Street Trust’s Board of Trustees.
Item 11.
Controls and Procedures
(a)(i) The President and Treasurer and the Chief Financial Officer have concluded that the Fidelity Salem Street Trust’s (the “Trust”) disclosure controls and procedures (as defined in Rule 30a-3(c) under the Investment Company Act) provide reasonable assurances that material information relating to the Trust is made known to them by the appropriate persons, based on their evaluation of these controls and procedures as of a date within 90 days of the filing date of this report.
(a)(ii) There was no change in the Trust’s internal control over financial reporting (as defined in Rule 30a-3(d) under the Investment Company Act) that occurred during the period covered by this report that has materially affected, or is reasonably likely to materially affect, the Trust’s internal control over financial reporting.
Item 12.
Disclosure of Securities Lending Activities for Closed-End Management
Investment Companies
Not applicable.
Item 13.
Exhibits
SIGNATURES
Pursuant to the requirements of the Securities Exchange Act of 1934 and the Investment Company Act of 1940, the registrant has duly caused this report to be signed on its behalf by the undersigned, thereunto duly authorized.
Fidelity Salem Street Trust
| |
By: | /s/Laura M. Del Prato |
| Laura M. Del Prato |
| President and Treasurer |
|
|
Date: | April 20, 2023 |
Pursuant to the requirements of the Securities Exchange Act of 1934 and the Investment Company Act of 1940, this report has been signed below by the following persons on behalf of the registrant and in the capacities and on the dates indicated.
| |
By: | /s/Laura M. Del Prato |
| Laura M. Del Prato |
| President and Treasurer |
|
|
Date: | April 20, 2023 |
| |
By: | /s/John J. Burke III |
| John J. Burke III |
| Chief Financial Officer |
|
|
Date: | April 20, 2023 |