UNITED STATES
SECURITIES AND EXCHANGE COMMISSION
Washington, D.C. 20549
FORM N-CSR
CERTIFIED SHAREHOLDER REPORT OF REGISTERED
MANAGEMENT INVESTMENT COMPANIES
Investment Company Act file number 811-02105
Fidelity Salem Street Trust
(Exact name of registrant as specified in charter)
245 Summer St., Boston, MA 02210
(Address of principal executive offices) (Zip code)
Margaret Carey, Secretary
245 Summer St.
Boston, Massachusetts 02210
(Name and address of agent for service)
Registrant's telephone number, including area code:
617-563-7000
| |
Date of fiscal year end: | September 30 |
|
|
Date of reporting period: | March 31, 2023 |
Item 1.
Reports to Stockholders
Fidelity® Strategic Real Return Fund
Semi-Annual Report
March 31, 2023
Includes Fidelity and Fidelity Advisor share classes
Contents
To view a fund's proxy voting guidelines and proxy voting record for the 12-month period ended June 30, visit http://www.fidelity.com/proxyvotingresults or visit the Securities and Exchange Commission's (SEC) web site at http://www.sec.gov.
You may also call 1-800-544-8544 if you're an individual investing directly with Fidelity, call 1-800-835-5092 if you're a plan sponsor or participant with Fidelity as your recordkeeper or call 1-877-208-0098 on institutional accounts or if you're an advisor or invest through one to request a free copy of the proxy voting guidelines.
Standard & Poor's, S&P and S&P 500 are registered service marks of The McGraw-Hill Companies, Inc. and have been licensed for use by Fidelity Distributors Corporation.
Other third-party marks appearing herein are the property of their respective owners.
All other marks appearing herein are registered or unregistered trademarks or service marks of FMR LLC or an affiliated company. © 2023 FMR LLC. All rights reserved.
This report and the financial statements contained herein are submitted for the general information of the shareholders of the Fund. This report is not authorized for distribution to prospective investors in the Fund unless preceded or accompanied by an effective prospectus.
A fund files its complete schedule of portfolio holdings with the SEC for the first and third quarters of each fiscal year on Form N-PORT. Forms N-PORT are available on the SEC's web site at http://www.sec.gov. A fund's Forms N-PORT may be reviewed and copied at the SEC's Public Reference Room in Washington, DC. Information regarding the operation of the SEC's Public Reference Room may be obtained by calling 1-800-SEC-0330.
For a complete list of a fund's portfolio holdings, view the most recent holdings listing, semiannual report, or annual report on Fidelity's web site at http://www.fidelity.com, http://www.institutional.fidelity.com, or http://www.401k.com, as applicable.
NOT FDIC INSURED •MAY LOSE VALUE •NO BANK GUARANTEE
Neither the Fund nor Fidelity Distributors Corporation is a bank.
The information in the following tables is based on the combined Investments of the Fund and it's pro-rata share of investments in Fidelity's Central Funds, other than the Commodity Strategy and Money Market Central Funds.
Quality Diversification (% of Fund's net assets) |
|
| |
| We have used ratings from Moody's Investors Service, Inc. Where Moody's® ratings are not available, we have used S&P® ratings. All ratings are as of the date indicated and do not reflect subsequent changes. |
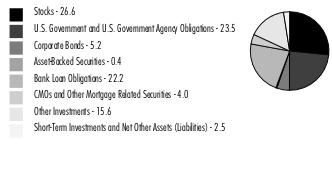
Asset Allocation (% of Fund's net assets) |
|
U.S. Treasury Inflation-Indexed Securities - 23.5% |
|
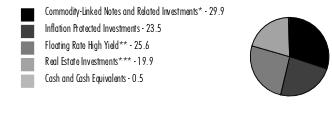
Holdings Distribution (% of Fund's net assets) |
|
|
* Includes investment in Fidelity® Commodity Strategy Central Fund
** Includes investment in Fidelity® Floating Rate Central Fund
*** Includes investment in Fidelity® Real Estate Equity Central Fund
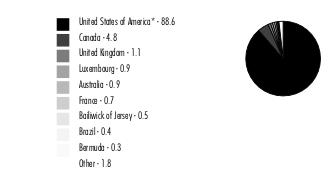
Geographic Diversification (% of Fund's net assets) |
|
* Includes Short-Term investments and Net Other Assets (Liabilities). Percentages are based on country or territory of incorporation and are adjusted for the effect of derivatives, if applicable. |
| |
Equities and Other Investments percentages above include Fidelity Commodity Strategy Central Fund of 15.0%.
An unaudited holdings list for the Fund, which presents direct holdings as well as the pro-rata share of any securities and other investments held indirectly through its investment in underlying Fidelity Central Funds, other than the Commodity Strategy and Money Market Central Funds, is available at fidelity.com and/or institutional.fidelity.com, as applicable.
Showing Percentage of Net Assets
| Corporate Bonds - 3.7% |
| | | Principal Amount (a) | Value ($) |
| Convertible Bonds - 0.0% | | | |
| FINANCIALS - 0.0% | | | |
| Mortgage Real Estate Investment Trusts - 0.0% | | | |
| MFA Financial, Inc. 6.25% 6/15/24 | | 285,000 | 270,814 |
| | | | |
| Nonconvertible Bonds - 3.7% | | | |
| CONSUMER DISCRETIONARY - 0.4% | | | |
| Hotels, Restaurants & Leisure - 0.4% | | | |
| Caesars Entertainment, Inc. 8.125% 7/1/27 (b) | | 535,000 | 545,700 |
| Hilton Domestic Operating Co., Inc. 4% 5/1/31 (b) | | 350,000 | 306,495 |
| Hilton Grand Vacations Borrower Escrow LLC 4.875% 7/1/31 (b) | | 935,000 | 798,499 |
| Marriott Ownership Resorts, Inc. 4.5% 6/15/29 (b) | | 1,000,000 | 851,250 |
| Times Square Hotel Trust 8.528% 8/1/26 (b) | | 218,488 | 216,914 |
| | | | 2,718,858 |
| Household Durables - 0.0% | | | |
| LGI Homes, Inc. 4% 7/15/29 (b) | | 170,000 | 138,098 |
| M/I Homes, Inc. 3.95% 2/15/30 | | 100,000 | 84,770 |
| TRI Pointe Homes, Inc. 5.25% 6/1/27 | | 100,000 | 95,000 |
| | | | 317,868 |
TOTAL CONSUMER DISCRETIONARY | | | 3,036,726 |
| | | | |
| ENERGY - 0.0% | | | |
| Oil, Gas & Consumable Fuels - 0.0% | | | |
| Global Partners LP/GLP Finance Corp. 7% 8/1/27 | | 100,000 | 95,952 |
| | | | |
| FINANCIALS - 0.1% | | | |
| Banks - 0.0% | | | |
| HAT Holdings I LLC/HAT Holdings II LLC 3.75% 9/15/30 (b) | | 100,000 | 75,500 |
| | | | |
| Diversified Financial Services - 0.1% | | | |
| Brixmor Operating Partnership LP 4.05% 7/1/30 | | 350,000 | 315,979 |
| | | | |
TOTAL FINANCIALS | | | 391,479 |
| | | | |
| HEALTH CARE - 0.0% | | | |
| Health Care Providers & Services - 0.0% | | | |
| Sabra Health Care LP 3.2% 12/1/31 | | 250,000 | 183,366 |
| | | | |
| INDUSTRIALS - 0.1% | | | |
| Trading Companies & Distributors - 0.1% | | | |
| Williams Scotsman International, Inc. 4.625% 8/15/28 (b) | | 600,000 | 545,809 |
| | | | |
| REAL ESTATE - 3.1% | | | |
| Equity Real Estate Investment Trusts (REITs) - 2.7% | | | |
| American Finance Trust, Inc./American Finance Operating Partnership LP 4.5% 9/30/28 (b) | | 545,000 | 407,536 |
| American Homes 4 Rent LP: | | | |
| 2.375% 7/15/31 | | 750,000 | 597,691 |
| 3.625% 4/15/32 | | 1,000,000 | 865,905 |
| American Tower Corp.: | | | |
| 2.7% 4/15/31 | | 750,000 | 628,980 |
| 3.8% 8/15/29 | | 1,250,000 | 1,161,682 |
| 4.05% 3/15/32 | | 750,000 | 686,142 |
| Boston Properties, Inc.: | | | |
| 2.55% 4/1/32 | | 500,000 | 356,444 |
| 3.25% 1/30/31 | | 1,000,000 | 791,067 |
| CBL & Associates LP 5.95% 12/15/26 (c)(d) | | 132,000 | 0 |
| Crown Castle International Corp.: | | | |
| 2.25% 1/15/31 | | 1,250,000 | 1,035,970 |
| 3.8% 2/15/28 | | 100,000 | 94,901 |
| CTR Partnership LP/CareTrust Capital Corp. 3.875% 6/30/28 (b) | | 225,000 | 192,375 |
| EPR Properties: | | | |
| 3.6% 11/15/31 | | 250,000 | 187,031 |
| 4.95% 4/15/28 | | 250,000 | 208,742 |
| Equinix, Inc.: | | | |
| 2.15% 7/15/30 | | 500,000 | 408,827 |
| 3.2% 11/18/29 | | 750,000 | 669,489 |
| 3.9% 4/15/32 | | 250,000 | 227,270 |
| GLP Capital LP/GLP Financing II, Inc.: | | | |
| 3.25% 1/15/32 | | 250,000 | 202,840 |
| 4% 1/15/31 | | 500,000 | 428,905 |
| 5.3% 1/15/29 | | 1,000,000 | 954,150 |
| Hudson Pacific Properties LP 4.65% 4/1/29 | | 450,000 | 315,791 |
| Invitation Homes Operating Partnership LP: | | | |
| 2% 8/15/31 | | 750,000 | 575,291 |
| 4.15% 4/15/32 | | 1,000,000 | 896,396 |
| MPT Operating Partnership LP/MPT Finance Corp.: | | | |
| 4.625% 8/1/29 | | 915,000 | 675,956 |
| 5% 10/15/27 | | 205,000 | 168,613 |
| Office Properties Income Trust 4.25% 5/15/24 | | 80,000 | 74,584 |
| Omega Healthcare Investors, Inc.: | | | |
| 3.375% 2/1/31 | | 500,000 | 394,923 |
| 4.5% 4/1/27 | | 83,000 | 77,429 |
| Park Intermediate Holdings LLC 4.875% 5/15/29 (b) | | 500,000 | 430,150 |
| RLJ Lodging Trust LP 3.75% 7/1/26 (b) | | 100,000 | 91,540 |
| SBA Communications Corp. 3.125% 2/1/29 | | 500,000 | 434,970 |
| Senior Housing Properties Trust: | | | |
| 4.75% 2/15/28 | | 100,000 | 67,510 |
| 9.75% 6/15/25 | | 200,000 | 193,500 |
| Spirit Realty LP 4% 7/15/29 | | 250,000 | 224,017 |
| Sun Communities Operating LP: | | | |
| 2.7% 7/15/31 | | 1,000,000 | 808,798 |
| 4.2% 4/15/32 | | 4,000 | 3,575 |
| Uniti Group LP / Uniti Group Finance, Inc.: | | | |
| 6.5% 2/15/29(b) | | 1,080,000 | 658,811 |
| 10.5% 2/15/28(b) | | 235,000 | 227,950 |
| Uniti Group, Inc. 6% 1/15/30 (b) | | 105,000 | 61,425 |
| Ventas Realty LP 4.75% 11/15/30 | | 250,000 | 238,838 |
| VICI Properties LP 5.125% 5/15/32 | | 1,250,000 | 1,177,675 |
| VICI Properties LP / VICI Note Co. 4.625% 12/1/29 (b) | | 500,000 | 455,157 |
| Vornado Realty LP 3.4% 6/1/31 | | 500,000 | 345,880 |
| Welltower Op LLC 3.85% 6/15/32 | | 500,000 | 441,639 |
| Weyerhaeuser Co. 4% 4/15/30 | | 250,000 | 233,606 |
| XHR LP 4.875% 6/1/29 (b) | | 250,000 | 212,022 |
| | | | 19,591,993 |
| Real Estate Management & Development - 0.4% | | | |
| DTZ U.S. Borrower LLC 6.75% 5/15/28 (b) | | 1,035,000 | 926,610 |
| Extra Space Storage LP 2.35% 3/15/32 | | 500,000 | 392,896 |
| Howard Hughes Corp.: | | | |
| 4.125% 2/1/29(b) | | 40,000 | 33,877 |
| 4.375% 2/1/31(b) | | 385,000 | 309,925 |
| 5.375% 8/1/28(b) | | 380,000 | 346,032 |
| Kennedy-Wilson, Inc.: | | | |
| 4.75% 3/1/29 | | 430,000 | 341,850 |
| 4.75% 2/1/30 | | 225,000 | 165,998 |
| 5% 3/1/31 | | 590,000 | 432,939 |
| Realogy Group LLC/Realogy Co-Issuer Corp. 5.75% 1/15/29 (b) | | 285,000 | 212,681 |
| | | | 3,162,808 |
TOTAL REAL ESTATE | | | 22,754,801 |
| | | | |
| TOTAL NONCONVERTIBLE BONDS | | | 27,008,133 |
| TOTAL CORPORATE BONDS (Cost $30,252,497) | | | 27,278,947 |
| | | | |
| U.S. Treasury Inflation-Protected Obligations - 23.5% |
| | | Principal Amount (a) | Value ($) |
| U.S. Treasury Inflation-Indexed Bonds: | | | |
| 0.125% 2/15/51 | | 3,888,554 | 2,697,117 |
| 0.125% 2/15/52 | | 2,364,340 | 1,644,149 |
| 0.25% 2/15/50 | | 2,048,042 | 1,487,698 |
| 0.625% 2/15/43 | | 3,119,072 | 2,635,972 |
| 0.75% 2/15/42 | | 2,923,370 | 2,555,570 |
| 0.75% 2/15/45 | | 2,274,123 | 1,939,081 |
| 0.875% 2/15/47 | | 1,428,971 | 1,238,591 |
| 1% 2/15/46 | | 382,574 | 342,527 |
| 1% 2/15/48 | | 1,345,439 | 1,199,739 |
| 1% 2/15/49 | | 2,692,859 | 2,398,130 |
| 1.375% 2/15/44 | | 3,517,256 | 3,410,415 |
| 1.75% 1/15/28 | | 2,444,804 | 2,501,762 |
| 2% 1/15/26 | | 1,982,139 | 2,010,759 |
| 2.125% 2/15/40 | | 1,099,015 | 1,214,384 |
| 2.125% 2/15/41 | | 1,851,106 | 2,045,274 |
| 2.375% 1/15/25 | | 2,441,021 | 2,470,278 |
| 2.375% 1/15/27 | | 1,663,004 | 1,723,990 |
| 2.5% 1/15/29 | | 3,036,284 | 3,251,573 |
| 3.375% 4/15/32 | | 691,039 | 817,683 |
| 3.625% 4/15/28 | | 2,349,119 | 2,622,711 |
| U.S. Treasury Inflation-Indexed Notes: | | | |
| 0.125% 7/15/24 | | 5,047,360 | 4,948,152 |
| 0.125% 10/15/24 | | 4,183,823 | 4,085,825 |
| 0.125% 4/15/25 | | 4,344,483 | 4,208,767 |
| 0.125% 10/15/25 | | 4,351,422 | 4,215,439 |
| 0.125% 4/15/26 | | 3,532,996 | 3,390,361 |
| 0.125% 7/15/26 | | 5,200,791 | 5,009,738 |
| 0.125% 10/15/26 | | 4,910,313 | 4,715,050 |
| 0.125% 4/15/27 | | 6,081,989 | 5,793,618 |
| 0.125% 1/15/30 | | 6,038,420 | 5,629,206 |
| 0.125% 7/15/30 | | 4,310,344 | 4,012,082 |
| 0.125% 1/15/31 | | 7,056,456 | 6,524,482 |
| 0.125% 7/15/31 | | 5,018,525 | 4,624,190 |
| 0.125% 1/15/32 | | 6,982,748 | 6,381,442 |
| 0.25% 1/15/25 | | 7,655,649 | 7,469,367 |
| 0.25% 7/15/29 | | 5,712,229 | 5,413,972 |
| 0.375% 7/15/23 | | 8,999 | 9,023 |
| 0.375% 7/15/25 | | 5,491,571 | 5,371,109 |
| 0.375% 1/15/27 | | 6,307,681 | 6,079,481 |
| 0.375% 7/15/27 | | 6,541,880 | 6,320,067 |
| 0.5% 4/15/24 | | 4,725,821 | 4,648,879 |
| 0.5% 1/15/28 | | 7,576,736 | 7,313,319 |
| 0.625% 1/15/26 | | 6,260,096 | 6,120,102 |
| 0.625% 7/15/32 | | 6,837,009 | 6,534,228 |
| 0.75% 7/15/28 | | 4,261,984 | 4,179,973 |
| 0.875% 1/15/29 | | 4,612,504 | 4,532,644 |
| 1.125% 1/15/33 | | 4,469,313 | 4,460,628 |
| 1.5% 2/15/53 | | 261,677 | 265,445 |
| TOTAL U.S. TREASURY INFLATION-PROTECTED OBLIGATIONS (Cost $185,661,174) | | | 172,463,992 |
| | | | |
| Asset-Backed Securities - 0.4% |
| | | Principal Amount (a) | Value ($) |
| American Homes 4 Rent Series 2015-SFR2 Class XS, 0% 10/17/52 (b)(d)(e)(f) | | 135,491 | 1 |
| Conseco Finance Securitizations Corp. Series 2002-1 Class M2, 9.546% 12/1/33 | | 284,000 | 259,611 |
| DigitalBridge Issuer, LLC / DigitalBridge Co.-Issuer, LLC Series 2021-1A Class A2, 3.933% 9/25/51 (b) | | 85,000 | 73,080 |
| FirstKey Homes Trust Series 2021-SFR2 Class F1, 2.908% 9/17/38 (b) | | 100,000 | 85,734 |
| Home Partners of America Trust: | | | |
| Series 2021-1 Class F, 3.325% 9/17/41 (b) | | 86,806 | 66,912 |
| Series 2021-2 Class G, 4.505% 12/17/26 (b) | | 182,999 | 157,970 |
| New Residential Mortgage Loan Trust Series 2022-SFR2 Class E1, 4% 9/4/39 (b) | | 100,000 | 84,893 |
| Progress Residential: | | | |
| Series 2022-SFR3 Class F, 6.6% 4/17/39 (b) | | 250,000 | 231,727 |
| Series 2022-SFR4 Class E1, 6.121% 5/17/41 (b) | | 221,000 | 204,473 |
| Series 2022-SFR5: | | | |
Class E1, 6.618% 6/17/39 (b) | | 201,000 | 190,729 |
Class E2, 6.863% 6/17/39 (b) | | 336,000 | 316,674 |
| Progress Residential Trust: | | | |
| Series 2021-SFR6 Class F, 3.422% 7/17/38 (b) | | 100,000 | 86,505 |
| Series 2022-SFR2 Class E2, 4.8% 4/17/27 (b) | | 100,000 | 90,871 |
| Starwood Mortgage Residential Trust Series 2022-SFR3 Class F, CME Term SOFR 1 Month Index + 4.500% 9.1911% 5/17/24 (b)(e)(g) | | 500,000 | 482,210 |
| Tricon Residential Series 2022-SFR1: | | | |
| Class E1, 5.344% 4/17/39 (b) | | 238,000 | 225,836 |
| Class E2, 5.739% 4/17/39 (b) | | 295,000 | 280,042 |
| TOTAL ASSET-BACKED SECURITIES (Cost $3,016,676) | | | 2,837,268 |
| | | | |
| Commercial Mortgage Securities - 4.0% |
| | | Principal Amount (a) | Value ($) |
| BAMLL Commercial Mortgage Securities Trust floater Series 2021-JACX Class E, 1 month U.S. LIBOR + 3.750% 8.434% 9/15/38 (b)(e)(g) | | 106,000 | 89,503 |
| BANK: | | | |
| sequential payer Series 2022-BNK42: | | | |
Class D, 2.5% 6/15/55 (b) | | 180,000 | 92,900 |
Class E, 2.5% 6/15/55 (b) | | 141,000 | 60,060 |
| Series 2020-BN30 Class MCDG, 2.9182% 12/15/53 (d)(e) | | 264,000 | 128,831 |
| Series 2021-BN38 Class C, 3.2172% 12/15/64 (e) | | 554,000 | 385,491 |
| Series 2022-BNK41, Class C, 3.7901% 4/15/65 (e) | | 567,000 | 411,210 |
| Series 2022-BNK42 Class C, 4.7218% 6/15/55 (e) | | 500,000 | 390,452 |
| Series 2022-BNK43 Class D, 3% 8/15/55 (b) | | 350,000 | 184,605 |
| BBCMS Mortgage Trust: | | | |
| sequential payer Series 2022-C17 Class D, 2.5% 9/15/55 (b) | | 163,000 | 82,608 |
| Series 2020-C7 Class C, 3.6033% 4/15/53 (e) | | 500,000 | 380,746 |
| Series 2022-C16 Class C, 4.6% 6/15/55 (e) | | 750,000 | 574,108 |
| Benchmark Mortgage Trust: | | | |
| Series 2018-B6 Class D, 3.1049% 10/10/51 (b)(e) | | 235,000 | 150,169 |
| Series 2019-B13 Class D, 2.5% 8/15/57 (b) | | 252,000 | 144,631 |
| Series 2020-B18 Class AGNG, 4.3885% 7/15/53 (b)(e) | | 63,000 | 53,049 |
| Series 2020-IG2 Class D, 3.2931% 9/15/48 (b)(e) | | 417,000 | 158,378 |
| Series 2022-B35 Class D, 2.5% 5/15/55 (b) | | 500,000 | 257,119 |
| Series 2022-B36 Class D, 2.5% 7/15/55 (b)(d) | | 250,000 | 121,389 |
| BMO Mortgage Trust Series 2022-C1: | | | |
| Class 360D, 3.9387% 2/17/55 (b)(d)(e) | | 84,000 | 45,129 |
| Class 360E, 3.9387% 2/17/55 (b)(e) | | 105,000 | 60,782 |
| BPR Trust floater Series 2021-TY Class E, 1 month U.S. LIBOR + 3.600% 8.284% 9/15/38 (b)(e)(g) | | 100,000 | 93,810 |
| BX Commercial Mortgage Trust: | | | |
| floater: | | | |
Series 2021-CIP Class F, 1 month U.S. LIBOR + 3.210% 7.903% 12/15/38 (b)(e)(g) | | 210,000 | 193,817 |
Series 2021-PAC Class G, 1 month U.S. LIBOR + 2.940% 7.6311% 10/15/36 (b)(e)(g) | | 198,000 | 177,241 |
Series 2021-VINO: | | | |
| Class F, 1 month U.S. LIBOR + 2.800% 7.4863% 5/15/38 (b)(e)(g) | | 333,000 | 299,590 |
| Class G, 1 month U.S. LIBOR + 3.950% 8.6363% 5/15/38 (b)(e)(g) | | 401,000 | 364,847 |
| Series 2020-VIVA Class E, 3.5488% 3/11/44 (b)(e) | | 789,000 | 589,134 |
| Bx Commercial Mortgage Trust 2 floater Series 2022-LP2 Class G, CME Term SOFR 1 Month Index + 4.100% 8.9329% 2/15/39 (b)(e)(g) | | 464,195 | 425,517 |
| BX Trust: | | | |
| floater: | | | |
Series 2019-XL: | | | |
| Class G, CME Term SOFR 1 Month Index + 2.410% 7.2416% 10/15/36 (b)(e)(g) | | 386,750 | 372,126 |
| Class J, CME Term SOFR 1 Month Index + 2.760% 7.5916% 10/15/36 (b)(e)(g) | | 145,350 | 138,903 |
Series 2021-ACNT Class G, 1 month U.S. LIBOR + 3.290% 7.98% 11/15/38 (b)(e)(g) | | 126,000 | 115,707 |
Series 2021-ARIA Class F, 1 month U.S. LIBOR + 2.590% 7.2775% 10/15/36 (b)(e)(g) | | 27,000 | 23,751 |
Series 2021-BXMF Class G, 1 month U.S. LIBOR + 3.340% 8.0335% 10/15/26 (b)(e)(g) | | 126,000 | 111,310 |
Series 2021-MFM1: | | | |
| Class F, CME Term SOFR 1 Month Index + 3.110% 7.9415% 1/15/34 (b)(e)(g) | | 303,826 | 278,613 |
| Class G, CME Term SOFR 1 Month Index + 4.010% 8.8415% 1/15/34 (b)(e)(g) | | 153,722 | 140,077 |
Series 2021-SDMF Class F, 1 month U.S. LIBOR + 1.930% 6.621% 9/15/34 (b)(e)(g) | | 100,000 | 91,558 |
Series 2021-SOAR: | | | |
| Class F, 7.035% 6/15/38 (b)(e)(g) | | 471,402 | 435,065 |
| Class J, 8.435% 6/15/38 (b)(e)(g) | | 590,482 | 542,025 |
Series 2021-VOLT: | | | |
| Class F, 1 month U.S. LIBOR + 2.400% 7.0844% 9/15/36 (b)(e)(g) | | 100,000 | 91,976 |
| Class G, 1 month U.S. LIBOR + 2.850% 7.5344% 9/15/36 (b)(e)(g) | | 105,000 | 95,994 |
Series 2022-GPA Class D, CME Term SOFR 1 Month Index + 4.060% 8.8881% 10/15/39 (b)(e)(g) | | 510,000 | 499,846 |
Series 2022-IND Class F, CME Term SOFR 1 Month Index + 4.780% 9.6131% 4/15/37 (b)(e)(g) | | 466,793 | 436,959 |
Series 2022-LBA6: | | | |
| Class F, CME Term SOFR 1 Month Index + 3.350% 8.1771% 1/15/39 (b)(e)(g) | | 100,000 | 91,297 |
| Class G, CME Term SOFR 1 Month Index + 4.200% 9.0271% 1/15/39 (b)(e)(g) | | 100,000 | 91,426 |
Series 2022-VAMF Class F, CME Term SOFR 1 Month Index + 3.290% 8.1261% 1/15/39 (b)(e)(g) | | 157,000 | 144,395 |
| floater sequential payer Series 2021-LGCY Class J, 1 month U.S. LIBOR + 3.190% 7.877% 10/15/36 (b)(e)(g) | | 200,000 | 173,887 |
| sequential payer Series 2019-OC11 Class A, 3.202% 12/9/41 (b) | | 500,000 | 426,505 |
| Series 2019-OC11 Class E, 3.944% 12/9/41 (b)(e) | | 284,000 | 224,622 |
| Camb Commercial Mortgage Trust sequential payer Series 2021-CX2 Class A, 2.7% 11/10/46 (b) | | 500,000 | 396,133 |
| Citigroup Commercial Mortgage Trust Series 2022-GC48 Class D, 2.5% 6/15/55 (b) | | 378,000 | 190,491 |
| COMM Mortgage Trust: | | | |
| sequential payer Series 2013-LC6 Class E, 3.5% 1/10/46 (b) | | 150,000 | 123,727 |
| Series 2012-CR1 Class G, 2.462% 5/15/45 (b)(d) | | 100,000 | 29,982 |
| Series 2015-LC19 Class D, 2.867% 2/10/48 (b) | | 462,000 | 377,002 |
| Series 2017-CD4 Class D, 3.3% 5/10/50 (b)(d) | | 313,000 | 212,020 |
| Series 2019-CD4 Class C, 4.3497% 5/10/50 (e) | | 232,000 | 181,629 |
| Series 2020-CX Class E, 2.6835% 11/10/46 (b)(e) | | 195,000 | 119,561 |
| Credit Suisse Commercial Mortgage Trust floater Series 2021-SOP2 Class F, 1 month U.S. LIBOR + 4.210% 8.9013% 6/15/34 (b)(g) | | 80,000 | 69,492 |
| Credit Suisse Mortgage Trust: | | | |
| floater: | | | |
Series 2019-ICE4 Class E, 1 month U.S. LIBOR + 2.150% 6.834% 5/15/36 (b)(e)(g) | | 99,752 | 96,529 |
Series 2021-4SZN Class A, CME Term SOFR 1 Month Index + 3.960% 8.7945% 11/15/23 (b)(e)(g) | | 141,000 | 137,462 |
| Series 2020-NET Class E, 3.7042% 8/15/37 (b)(e) | | 100,000 | 84,307 |
| CSAIL Commercial Mortgage Trust: | | | |
| Series 2017-C8 Class D, 4.4382% 6/15/50 (b)(e) | | 156,000 | 104,399 |
| Series 2019-C16 Class C, 4.2371% 6/15/52 (e) | | 750,000 | 589,424 |
| ELP Commercial Mortgage Trust floater Series 2021-ELP: | | | |
| Class F, 1 month U.S. LIBOR + 2.660% 7.352% 11/15/38 (b)(e)(g) | | 479,000 | 438,553 |
| Class J, 1 month U.S. LIBOR + 3.610% 8.2999% 11/15/38 (b)(e)(g) | | 210,000 | 190,353 |
| Extended Stay America Trust floater Series 2021-ESH Class F, 1 month U.S. LIBOR + 3.700% 8.385% 7/15/38 (b)(e)(g) | | 426,596 | 400,118 |
| GS Mortgage Securities Corp. Trust floater: | | | |
| Series 2019-70P: | | | |
Class E, 1 month U.S. LIBOR + 2.200% 6.884% 10/15/36 (b)(e)(g) | | 139,000 | 125,076 |
Class F, 1 month U.S. LIBOR + 2.650% 7.334% 10/15/36 (b)(e)(g) | | 218,000 | 195,808 |
| Series 2022-SHIP Class D, CME Term SOFR 1 Month Index + 1.600% 6.434% 8/15/36 (b)(e)(g) | | 357,000 | 347,872 |
| GS Mortgage Securities Trust: | | | |
| Series 2011-GC5: | | | |
Class E, 5.1558% 8/10/44 (b)(d)(e) | | 63,000 | 5,584 |
Class F, 4.5% 8/10/44 (b)(d) | | 42,000 | 147 |
| Series 2013-GC16 Class F, 3.5% 11/10/46 (b) | | 269,000 | 244,609 |
| Hilton U.S.A. Trust Series 2016-HHV: | | | |
| Class E, 4.1935% 11/5/38 (b)(e) | | 900,000 | 778,782 |
| Class F, 4.1935% 11/5/38 (b)(e) | | 163,000 | 136,646 |
| ILPT Commercial Mortgage Trust floater Series 2022-LPF2 Class D, CME Term SOFR 1 Month Index + 4.190% 9.0191% 10/15/39 (b)(e)(g) | | 231,000 | 227,910 |
| Independence Plaza Trust Series 2018-INDP Class E, 4.996% 7/10/35 (b) | | 100,000 | 90,642 |
| J.P. Morgan Chase Commercial Mortgage Securities Trust floater Series 2022-NXSS Class D, CME Term SOFR 1 Month Index + 4.120% 8.9561% 9/15/39 (b)(e)(g) | | 330,000 | 324,207 |
| JPMBB Commercial Mortgage Securities Trust Series 2014-C23 Class UH5, 4.7094% 9/15/47 (b) | | 54,000 | 37,706 |
| JPMDB Commercial Mortgage Securities Trust Series 2017-C7 Class D, 3% 10/15/50 (b) | | 154,000 | 81,979 |
| JPMorgan Chase Commercial Mortgage Securities Trust: | | | |
| floater Series 2021-MHC Class F, 1 month U.S. LIBOR + 2.950% 7.634% 4/15/38 (b)(e)(g) | | 210,000 | 196,631 |
| sequential payer Series 2021-1MEM Class E, 2.6535% 10/9/42 (b)(e) | | 100,000 | 57,603 |
| Series 2011-C3 Class E, 5.5264% 2/15/46 (b)(e) | | 200,000 | 79,435 |
| Series 2012-CBX Class G 4% 6/15/45 (b)(d) | | 151,000 | 34,203 |
| Series 2019-OSB Class C, 3.749% 6/5/39 (b)(e) | | 500,000 | 413,384 |
| KNDL Mortgage Trust floater Series 2019-KNSQ: | | | |
| Class E, 1 month U.S. LIBOR + 1.800% 6.484% 5/15/36 (b)(e)(g) | | 500,000 | 486,872 |
| Class F, 1 month U.S. LIBOR + 2.000% 6.684% 5/15/36 (b)(e)(g) | | 250,000 | 239,267 |
| KNDR Trust floater Series 2021-KIND Class F, CME Term SOFR 1 Month Index + 4.060% 8.8915% 8/15/38 (b)(e)(g) | | 99,282 | 89,277 |
| LIFE Mortgage Trust floater Series 2021-BMR: | | | |
| Class F, CME Term SOFR 1 Month Index + 2.460% 7.2915% 3/15/38 (b)(e)(g) | | 982,970 | 914,643 |
| Class G, CME Term SOFR 1 Month Index + 3.060% 7.8915% 3/15/38 (b)(e)(g) | | 393,188 | 358,629 |
| MED Trust floater Series 2021-MDLN Class G, 1 month U.S. LIBOR + 5.250% 9.935% 11/15/38 (b)(e)(g) | | 431,717 | 393,527 |
| Merit floater Series 2021-STOR: | | | |
| Class G, 1 month U.S. LIBOR + 2.750% 7.434% 7/15/38 (b)(e)(g) | | 105,000 | 95,460 |
| Class J, 1 month U.S. LIBOR + 3.950% 8.634% 7/15/38 (b)(e)(g) | | 100,000 | 90,825 |
| MHC Commercial Mortgage Trust floater Series 2021-MHC: | | | |
| Class F, 1 month U.S. LIBOR + 2.600% 7.285% 4/15/38 (b)(e)(g) | | 100,000 | 92,983 |
| Class G, 1 month U.S. LIBOR + 3.200% 7.885% 4/15/38 (b)(e)(g) | | 400,000 | 368,677 |
| MHP Commercial Mortgage Trust floater Series 2022-MHIL: | | | |
| Class F, CME Term SOFR 1 Month Index + 3.250% 8.0863% 1/15/27 (b)(e)(g) | | 97,166 | 88,400 |
| Class G, CME Term SOFR 1 Month Index + 3.950% 8.7846% 1/15/27 (b)(e)(g) | | 102,024 | 92,955 |
| Morgan Stanley Capital I Trust: | | | |
| sequential payer Series 2021-L5 Class C, 3.156% 5/15/54 | | 513,000 | 355,682 |
| Series 1998-CF1 Class G, 7.35% 7/15/32 (b)(e) | | 866 | 860 |
| Series 2011-C2: | | | |
Class D, 5.2126% 6/15/44 (b)(e) | | 219,330 | 200,283 |
Class F, 5.2126% 6/15/44 (b)(d)(e) | | 343,000 | 214,703 |
Class XB, 0.4474% 6/15/44 (b)(e)(f) | | 5,437,487 | 20,190 |
| Series 2011-C3: | | | |
Class C, 5.0835% 7/15/49 (b)(e) | | 14,262 | 14,122 |
Class G, 5.0835% 7/15/49 (b)(d)(e) | | 112,000 | 56,917 |
| Series 2017-H1: | | | |
Class C, 4.281% 6/15/50 | | 231,000 | 202,876 |
Class D, 2.546% 6/15/50 (b) | | 661,000 | 410,665 |
| Series 2020-L4, Class C, 3.536% 2/15/53 | | 542,000 | 409,324 |
| MSCCG Trust floater Series 2018-SELF Class E, 1 month U.S. LIBOR + 2.150% 6.835% 10/15/37 (b)(e)(g) | | 159,928 | 148,841 |
| OPG Trust floater Series 2021-PORT: | | | |
| Class G, 1 month U.S. LIBOR + 2.390% 7.082% 10/15/36 (b)(e)(g) | | 213,837 | 192,929 |
| Class J, 1 month U.S. LIBOR + 3.340% 8.03% 10/15/36 (b)(e)(g) | | 63,740 | 57,529 |
| PKHL Commercial Mortgage Trust floater Series 2021-MF: | | | |
| Class E, 1 month U.S. LIBOR + 2.600% 7.285% 7/15/38 (b)(e)(g) | | 100,000 | 91,693 |
| Class G, 1 month U.S. LIBOR + 4.350% 9.035% 7/15/38 (b)(e)(g) | | 100,000 | 90,820 |
| Prima Capital CRE Securitization Ltd. Series 2020-8A Class C, 3% 12/1/70 (b)(d) | | 350,000 | 265,353 |
| Prima Capital Ltd. floater Series 2021-9A Class C, 1 month U.S. LIBOR + 2.350% 7.1114% 12/15/37 (b)(e)(g) | | 250,000 | 233,123 |
| Providence Place Group Ltd. Partnership Series 2000-C1 Class A2, 7.75% 7/20/28 (b) | | 173,755 | 178,079 |
| SG Commercial Mortgage Securities Trust Series 2020-COVE: | | | |
| Class F, 3.7276% 3/15/37 (b)(e) | | 150,000 | 131,800 |
| Class G, 3.7276% 3/15/37 (b)(e) | | 100,000 | 85,016 |
| SMRT Commercial Mortgage Trust floater Series 2022-MINI: | | | |
| Class E, CME Term SOFR 1 Month Index + 2.700% 7.528% 1/15/39 (b)(e)(g) | | 868,000 | 780,946 |
| Class F, CME Term SOFR 1 Month Index + 3.350% 8.178% 1/15/39 (b)(e)(g) | | 168,000 | 150,026 |
| SREIT Trust floater: | | | |
| Series 2021-IND Class G, 1 month U.S. LIBOR + 3.260% 7.9498% 10/15/38 (b)(e)(g) | | 198,000 | 176,182 |
| Series 2021-MFP Class G, 1 month U.S. LIBOR + 2.970% 7.6582% 11/15/38 (b)(e)(g) | | 126,000 | 112,631 |
| Series 2021-MFP2: | | | |
Class F, 1 month U.S. LIBOR + 2.610% 7.3022% 11/15/36 (b)(e)(g) | | 100,000 | 92,479 |
Class J, 1 month U.S. LIBOR + 3.910% 8.5995% 11/15/36 (b)(e)(g) | | 128,000 | 119,323 |
| Series 2021-PALM Class G, 1 month U.S. LIBOR + 3.610% 8.3001% 10/15/34 (b)(e)(g) | | 164,000 | 144,173 |
| STWD Trust floater sequential payer Series 2021-LIH: | | | |
| Class F, 1 month U.S. LIBOR + 3.550% 8.235% 11/15/36 (b)(e)(g) | | 100,000 | 90,725 |
| Class G, 1 month U.S. LIBOR + 4.200% 8.884% 11/15/36 (b)(e)(g) | | 42,000 | 38,088 |
| TPGI Trust floater Series 2021-DGWD Class E, 1 month U.S. LIBOR + 2.350% 7.03% 6/15/26 (b)(e)(g) | | 503,000 | 457,584 |
| Tricon Residential Trust Series 2022-SFR2 Class E, 7.507% 7/17/40 (b) | | 500,000 | 491,377 |
| TTAN floater Series 2021-MHC Class F, 1 month U.S. LIBOR + 2.900% 7.585% 3/15/38 (b)(e)(g) | | 261,294 | 243,634 |
| VMC Finance Ltd. floater Series 2021-HT1 Class B, 1 month U.S. LIBOR + 4.500% 9.2614% 1/18/37 (b)(e)(g) | | 147,000 | 138,251 |
| Wells Fargo Commercial Mortgage Trust: | | | |
| Series 2018-C44 Class D, 3% 5/15/51 (b) | | 535,000 | 329,656 |
| Series 2019-C52: | | | |
Class B, 3.375% 8/15/52 | | 785,000 | 646,567 |
Class C, 3.561% 8/15/52 | | 100,000 | 76,941 |
| Series 2020-C58 Class C, 3.162% 7/15/53 | | 1,000,000 | 711,386 |
| WF-RBS Commercial Mortgage Trust Series 2013-C11 Class E, 4.147% 3/15/45 (b)(e) | | 220,000 | 150,700 |
| WFCM Series 2022-C62: | | | |
| Class C, 4.3508% 4/15/55 (e) | | 500,000 | 370,822 |
| Class D, 2.5% 4/15/55 (b) | | 294,000 | 139,430 |
| WP Glimcher Mall Trust Series 2015-WPG Class PR1, 3.516% 6/5/35 (b)(e) | | 140,000 | 114,011 |
| TOTAL COMMERCIAL MORTGAGE SECURITIES (Cost $33,783,907) | | | 29,807,816 |
| | | | |
| Common Stocks - 14.8% |
| | | Shares | Value ($) |
| CONSUMER STAPLES - 1.1% | | | |
| Food Products - 1.1% | | | |
| Archer Daniels Midland Co. | | 39,670 | 3,160,112 |
| Bunge Ltd. | | 22,390 | 2,138,693 |
| Darling Ingredients, Inc. (h) | | 28,150 | 1,643,960 |
| Golden Agri-Resources Ltd. | | 107,400 | 23,072 |
| Wilmar International Ltd. | | 221,740 | 702,497 |
| | | | 7,668,334 |
| ENERGY - 5.6% | | | |
| Energy Equipment & Services - 0.5% | | | |
| Diamond Offshore Drilling, Inc. (h) | | 57,700 | 694,708 |
| Noble Corp. PLC | | 21,030 | 830,054 |
| NOV, Inc. | | 15,390 | 284,869 |
| Schlumberger Ltd. | | 20,260 | 994,766 |
| Seadrill Ltd. | | 1,400 | 54,256 |
| Weatherford International PLC (h) | | 10,210 | 605,964 |
| | | | 3,464,617 |
| Oil, Gas & Consumable Fuels - 5.1% | | | |
| Antero Resources Corp. (h) | | 78,461 | 1,811,664 |
| Canadian Natural Resources Ltd. | | 56,320 | 3,116,665 |
| Cenovus Energy, Inc. (Canada) | | 349,350 | 6,095,208 |
| Coterra Energy, Inc. | | 50,040 | 1,227,982 |
| Energy Transfer LP | | 90,690 | 1,130,904 |
| Enterprise Products Partners LP | | 42,850 | 1,109,815 |
| Exxon Mobil Corp. | | 104,190 | 11,425,475 |
| Hess Corp. | | 4,670 | 618,028 |
| Ovintiv, Inc. | | 72,770 | 2,625,542 |
| Petroleo Brasileiro SA - Petrobras (ON) | | 128,900 | 673,689 |
| Range Resources Corp. | | 21,500 | 569,105 |
| Shell PLC (London) | | 107,590 | 3,066,165 |
| Targa Resources Corp. | | 12,030 | 877,589 |
| TotalEnergies SE (i) | | 61,910 | 3,650,444 |
| | | | 37,998,275 |
TOTAL ENERGY | | | 41,462,892 |
| HEALTH CARE - 0.1% | | | |
| Pharmaceuticals - 0.1% | | | |
| Bayer AG | | 9,340 | 596,654 |
| INDUSTRIALS - 0.2% | | | |
| Electrical Equipment - 0.1% | | | |
| GrafTech International Ltd. | | 124,163 | 603,432 |
| Machinery - 0.0% | | | |
| Epiroc AB (A Shares) | | 7,600 | 150,860 |
| Sandvik AB | | 6,900 | 146,124 |
| | | | 296,984 |
| Marine - 0.1% | | | |
| Kirby Corp. (h) | | 7,680 | 535,296 |
TOTAL INDUSTRIALS | | | 1,435,712 |
| MATERIALS - 7.8% | | | |
| Chemicals - 1.9% | | | |
| CF Industries Holdings, Inc. | | 10,670 | 773,468 |
| Corteva, Inc. | | 86,640 | 5,225,258 |
| FMC Corp. | | 20,230 | 2,470,690 |
| Icl Group Ltd. | | 41,810 | 280,547 |
| Nutrien Ltd. | | 69,910 | 5,162,943 |
| OCI NV | | 11,830 | 401,054 |
| | | | 14,313,960 |
| Containers & Packaging - 0.2% | | | |
| Crown Holdings, Inc. | | 13,480 | 1,114,931 |
| Smurfit Kappa Group PLC | | 8,871 | 320,655 |
| | | | 1,435,586 |
| Metals & Mining - 5.2% | | | |
| Agnico Eagle Mines Ltd. (Canada) | | 35,205 | 1,794,765 |
| Alamos Gold, Inc. | | 54,480 | 665,128 |
| Anglo American Platinum Ltd. ADR | | 9,960 | 91,483 |
| Anglo American PLC (United Kingdom) | | 56,400 | 1,875,949 |
| Antofagasta PLC | | 23,800 | 464,177 |
| Barrick Gold Corp. (Canada) | | 38,750 | 719,377 |
| BHP Group Ltd. (London) | | 109,403 | 3,454,289 |
| Capstone Copper Corp. (h) | | 12,500 | 56,419 |
| Champion Iron Ltd. | | 398,200 | 1,921,024 |
| First Quantum Minerals Ltd. | | 128,325 | 2,950,098 |
| Franco-Nevada Corp. | | 2,210 | 322,351 |
| Freeport-McMoRan, Inc. | | 73,910 | 3,023,658 |
| Glencore PLC | | 605,150 | 3,482,166 |
| IGO Ltd. | | 18,913 | 162,182 |
| Impala Platinum Holdings Ltd. | | 24,240 | 223,041 |
| Ivanhoe Mines Ltd. (h) | | 55,493 | 501,346 |
| Newcrest Mining Ltd. | | 42,712 | 762,426 |
| Newmont Corp. | | 5,270 | 258,335 |
| Reliance Steel & Aluminum Co. | | 10,640 | 2,731,714 |
| Rio Tinto PLC | | 19,471 | 1,321,652 |
| Sigma Lithium Corp. (h) | | 7,055 | 265,409 |
| Teck Resources Ltd. Class B (sub. vtg.) | | 134,470 | 4,910,170 |
| Vale SA | | 119,560 | 1,893,966 |
| Wheaton Precious Metals Corp. | | 88,870 | 4,280,095 |
| | | | 38,131,220 |
| Paper & Forest Products - 0.5% | | | |
| Mondi PLC | | 1,550 | 24,513 |
| Nine Dragons Paper (Holdings) Ltd. | | 286,280 | 214,439 |
| UPM-Kymmene Corp. | | 58,180 | 1,952,828 |
| West Fraser Timber Co. Ltd. | | 17,740 | 1,265,361 |
| | | | 3,457,141 |
TOTAL MATERIALS | | | 57,337,907 |
| TOTAL COMMON STOCKS (Cost $102,426,652) | | | 108,501,499 |
| | | | |
| Preferred Stocks - 2.4% |
| | | Shares | Value ($) |
| Convertible Preferred Stocks - 0.1% | | | |
| FINANCIALS - 0.1% | | | |
| Mortgage Real Estate Investment Trusts - 0.1% | | | |
| Great Ajax Corp. 7.25% | | 16,367 | 387,898 |
| Ready Capital Corp. 7.00% | | 6,400 | 159,680 |
| | | | 547,578 |
| REAL ESTATE - 0.0% | | | |
| Equity Real Estate Investment Trusts (REITs) - 0.0% | | | |
| Braemar Hotels & Resorts, Inc. 5.50% | | 2,700 | 42,471 |
| RLJ Lodging Trust Series A, 1.95% | | 400 | 10,024 |
| | | | 52,495 |
| TOTAL CONVERTIBLE PREFERRED STOCKS | | | 600,073 |
| Nonconvertible Preferred Stocks - 2.3% | | | |
| FINANCIALS - 0.9% | | | |
| Mortgage Real Estate Investment Trusts - 0.9% | | | |
| AG Mortgage Investment Trust, Inc.: | | | |
| 8.00% | | 9,779 | 159,031 |
| Series C, 8.00%(e) | | 3,900 | 68,289 |
| AGNC Investment Corp.: | | | |
| 6.125%(e) | | 7,000 | 137,200 |
| Series C, 7.00%(e)(g) | | 14,200 | 335,262 |
| Series E, 6.50%(e) | | 17,400 | 358,788 |
| Series G, 7.75%(e) | | 16,000 | 344,640 |
| Annaly Capital Management, Inc.: | | | |
| 6.75%(e) | | 8,600 | 193,930 |
| Series F, 6.95%(e)(g) | | 23,800 | 560,490 |
| Series G, 6.50%(e) | | 23,000 | 549,470 |
| Arbor Realty Trust, Inc.: | | | |
| Series D, 6.375% | | 1,500 | 26,175 |
| Series F, 6.25%(e) | | 13,000 | 222,300 |
| Armour Residential REIT, Inc. Series C 7.00% | | 1,000 | 19,783 |
| Cherry Hill Mortgage Investment Corp. Series A, 8.20% | | 4,000 | 85,400 |
| Chimera Investment Corp.: | | | |
| 8.00%(e) | | 5,000 | 95,000 |
| Series B, 8.00%(e) | | 23,587 | 450,983 |
| Series C, 7.75%(e) | | 8,700 | 168,606 |
| Dynex Capital, Inc. Series C 6.90% (e) | | 23,400 | 509,886 |
| Ellington Financial LLC 6.75% (e) | | 2,000 | 41,580 |
| Franklin BSP Realty Trust, Inc. 7.50% | | 3,000 | 57,750 |
| KKR Real Estate Finance Trust, Inc. 6.50% | | 1,300 | 21,125 |
| MFA Financial, Inc.: | | | |
| 6.50%(e) | | 9,300 | 157,356 |
| Series B, 7.50% | | 18,486 | 354,746 |
| PennyMac Mortgage Investment Trust: | | | |
| 6.75% | | 1,300 | 24,310 |
| 8.125%(e) | | 5,700 | 134,577 |
| Series B, 8.00%(e) | | 9,300 | 213,900 |
| Rithm Capital Corp.: | | | |
| 7.125%(e) | | 6,200 | 133,114 |
| Series A, 7.50%(e) | | 17,700 | 392,232 |
| Series C, 6.375%(e) | | 10,300 | 194,979 |
| Series D, 7.00%(e) | | 2,700 | 53,001 |
| Two Harbors Investment Corp.: | | | |
| Series A, 8.125%(e) | | 6,938 | 150,416 |
| Series B, 7.625%(e) | | 6,320 | 128,549 |
| | | | 6,342,868 |
| MATERIALS - 0.2% | | | |
| Chemicals - 0.2% | | | |
| Sociedad Quimica y Minera de Chile SA (PN-B) | | 15,609 | 1,252,820 |
| | | | |
| REAL ESTATE - 1.2% | | | |
| Equity Real Estate Investment Trusts (REITs) - 1.0% | | | |
| Agree Realty Corp. 4.375% | | 1,300 | 22,932 |
| American Homes 4 Rent Series G, 5.875% | | 5,000 | 118,000 |
| Armada Hoffler Properties, Inc. 6.75% | | 6,000 | 124,680 |
| Ashford Hospitality Trust, Inc.: | | | |
| Series G, 7.375% | | 300 | 5,028 |
| Series H, 7.50% | | 2,500 | 39,925 |
| Series I, 7.50% | | 2,500 | 42,475 |
| Cedar Realty Trust, Inc.: | | | |
| 7.25% | | 1,673 | 25,731 |
| Series C, 6.50% | | 4,900 | 57,453 |
| City Office REIT, Inc. Series A, 6.625% | | 2,079 | 37,401 |
| CTO Realty Growth, Inc. 6.375% | | 1,000 | 19,640 |
| DiamondRock Hospitality Co. 8.25% | | 11,337 | 297,143 |
| Digital Realty Trust, Inc.: | | | |
| 5.25% | | 5,800 | 125,570 |
| Series L, 5.20% | | 12,700 | 272,733 |
| Gladstone Commercial Corp.: | | | |
| 6.625% | | 3,600 | 71,964 |
| Series G, 6.00% | | 18,200 | 335,062 |
| Global Medical REIT, Inc. Series A, 7.50% | | 2,100 | 52,731 |
| Global Net Lease, Inc.: | | | |
| Series A, 7.25% | | 9,300 | 194,835 |
| Series B 6.875% | | 2,200 | 45,738 |
| Healthcare Trust, Inc.: | | | |
| 7.125% | | 2,000 | 40,380 |
| Series A 7.375% | | 4,200 | 83,034 |
| Hudson Pacific Properties, Inc. Series C, 4.75% | | 32,100 | 327,420 |
| Kimco Realty Corp.: | | | |
| 5.125% | | 11,600 | 228,868 |
| Series M, 5.25% | | 16,500 | 328,845 |
| Necessity Retail (REIT), Inc./The: | | | |
| 7.50% | | 17,100 | 358,929 |
| Series C 7.375% | | 10,000 | 206,606 |
| Pebblebrook Hotel Trust: | | | |
| 6.30% | | 10,273 | 188,510 |
| 6.375% | | 8,700 | 160,950 |
| 6.375% | | 17,200 | 322,930 |
| Series H, 5.70% | | 10,600 | 171,190 |
| Pennsylvania (REIT): | | | |
| Series B, 7.375%(h) | | 4,082 | 6,858 |
| Series D, 6.875%(h) | | 2,500 | 4,100 |
| Plymouth Industrial REIT, Inc. Series A, 7.50% | | 2,500 | 62,541 |
| Public Storage: | | | |
| 4.00% | | 5,400 | 100,224 |
| 4.00% | | 1,200 | 22,176 |
| Series F, 5.15% | | 3,200 | 76,704 |
| Series G, 5.05% | | 6,000 | 141,300 |
| Series I, 4.875% | | 6,000 | 132,120 |
| Series J, 4.70% | | 12,400 | 267,344 |
| Series K, 4.75% | | 12,000 | 261,120 |
| Series L, 4.625% | | 28,400 | 589,300 |
| Series M, 4.125% | | 1,000 | 18,480 |
| Series S, 4.10% | | 13,000 | 240,760 |
| Rexford Industrial Realty, Inc.: | | | |
| Series B, 5.875% | | 1,000 | 22,750 |
| Series C, 5.625% | | 4,400 | 95,744 |
| Saul Centers, Inc. Series D, 6.125% | | 1,300 | 27,937 |
| SITE Centers Corp. 6.375% | | 5,300 | 124,974 |
| Sotherly Hotels, Inc. Series C, 7.875% | | 1,700 | 40,868 |
| Spirit Realty Capital, Inc. Series A, 6.00% | | 6,700 | 154,904 |
| Summit Hotel Properties, Inc.: | | | |
| Series E, 6.25% | | 6,800 | 131,308 |
| Series F, 5.875% | | 4,000 | 73,960 |
| Sunstone Hotel Investors, Inc.: | | | |
| Series H, 6.125% | | 3,500 | 70,980 |
| Series I, 5.70% | | 9,600 | 184,512 |
| UMH Properties, Inc. Series D, 6.375% | | 3,300 | 72,105 |
| Urstadt Biddle Properties, Inc.: | | | |
| Series H, 6.25% | | 4,500 | 98,325 |
| Series K 5.875% | | 2,000 | 41,600 |
| Vornado Realty Trust: | | | |
| Series L, 5.40% | | 1,000 | 13,960 |
| Series M, 5.25% | | 4,800 | 64,704 |
| Series N, 5.25% | | 6,200 | 80,600 |
| Series O, 4.45% | | 1,600 | 18,464 |
| | | | 7,547,425 |
| Real Estate Management & Development - 0.2% | | | |
| Digitalbridge Group, Inc.: | | | |
| Series H, 7.125% | | 22,830 | 432,172 |
| Series I, 7.15% | | 32,600 | 619,400 |
| Series J, 7.15% | | 30,200 | 570,780 |
| | | | 1,622,352 |
TOTAL REAL ESTATE | | | 9,169,777 |
| | | | |
| TOTAL NONCONVERTIBLE PREFERRED STOCKS | | | 16,765,465 |
| TOTAL PREFERRED STOCKS (Cost $19,928,540) | | | 17,365,538 |
| | | | |
| Bank Loan Obligations - 0.3% |
| | | Principal Amount (a) | Value ($) |
| COMMUNICATION SERVICES - 0.0% | | | |
| Wireless Telecommunication Services - 0.0% | | | |
| SBA Senior Finance II, LLC Tranche B, term loan 1 month U.S. LIBOR + 1.750% 6.6% 4/11/25 (e)(g)(j) | | 270,750 | 270,385 |
| CONSUMER DISCRETIONARY - 0.2% | | | |
| Hotels, Restaurants & Leisure - 0.2% | | | |
| Bally's Corp. Tranche B 1LN, term loan 1 month U.S. LIBOR + 3.250% 7.9586% 10/1/28 (e)(g)(j) | | 197,500 | 188,156 |
| BRE/Everbright M6 Borrower LLC Tranche B 1LN, term loan 1 month U.S. LIBOR + 5.000% 9.719% 9/9/26 (e)(g)(j) | | 50,240 | 49,738 |
| Hilton Grand Vacations Borrower LLC Tranche B 1LN, term loan 1 month U.S. LIBOR + 3.000% 7.8403% 8/2/28 (e)(g)(j) | | 119,370 | 119,191 |
| Playa Resorts Holding BV Tranche B 1LN, term loan CME Term SOFR 1 Month Index + 4.250% 8.9934% 1/5/29 (e)(g)(j) | | 58,339 | 57,920 |
| Station Casinos LLC Tranche B 1LN, term loan 1 month U.S. LIBOR + 2.250% 7.1% 2/7/27 (e)(g)(j) | | 496,118 | 491,380 |
| Wyndham Hotels & Resorts, Inc. Tranche B, term loan 3 month U.S. LIBOR + 1.750% 6.5903% 5/30/25 (e)(g)(j) | | 250,000 | 249,688 |
| | | | 1,156,073 |
| FINANCIALS - 0.0% | | | |
| Financial Services - 0.0% | | | |
| Walker & Dunlop, Inc. Tranche B 1LN, term loan CME Term SOFR 1 Month Index + 2.250% 7.157% 12/16/28 (e)(g)(j) | | 4,938 | 4,826 |
| INDUSTRIALS - 0.0% | | | |
| Commercial Services & Supplies - 0.0% | | | |
| Pilot Travel Centers LLC Tranche B 1LN, term loan CME Term SOFR 1 Month Index + 2.000% 6.907% 8/4/28 (e)(g)(j) | | 147,375 | 146,760 |
| REAL ESTATE - 0.1% | | | |
| Real Estate Management & Development - 0.1% | | | |
| DTZ U.S. Borrower LLC Tranche B 1LN, term loan: | | | |
| 1 month U.S. LIBOR + 2.750% 7.5903% 8/21/25 (e)(g)(j) | | 377,567 | 367,467 |
| CME Term SOFR 1 Month Index + 3.250% 8.157% 1/24/30 (e)(g)(j) | | 476,246 | 458,387 |
| | | | 825,854 |
| TOTAL BANK LOAN OBLIGATIONS (Cost $2,416,512) | | | 2,403,898 |
| | | | |
| Equity Funds - 24.2% |
| | | Shares | Value ($) |
| Fidelity Commodity Strategy Central Fund (k) | | 1,136,284 | 109,901,356 |
| Fidelity Real Estate Equity Central Fund (k) | | 564,006 | 67,968,340 |
| TOTAL EQUITY FUNDS (Cost $216,175,193) | | | 177,869,696 |
| | | | |
| Fixed-Income Funds - 25.6% |
| | | Shares | Value ($) |
Fidelity Floating Rate Central Fund (k) (Cost $194,201,369) | | 1,955,344 | 188,260,551 |
| | | | |
| Preferred Securities - 0.0% |
| | | Principal Amount (a) | Value ($) |
| FINANCIALS - 0.0% | | | |
| Financial Services - 0.0% | | | |
Crest Clarendon Street 2002-1 Ltd. Series 2002-1A Class PS, 12/28/35 (b)(d) (Cost $594,368) | | 500,000 | 0 |
| | | | |
| Money Market Funds - 0.5% |
| | | Shares | Value ($) |
| Fidelity Cash Central Fund 4.86% (l) | | 1,672,280 | 1,672,615 |
| Fidelity Securities Lending Cash Central Fund 4.87% (l)(m) | | 2,186,344 | 2,186,563 |
| TOTAL MONEY MARKET FUNDS (Cost $3,859,178) | | | 3,859,178 |
| | | | |
| TOTAL INVESTMENT IN SECURITIES - 99.4% (Cost $792,316,066) | 730,648,383 |
NET OTHER ASSETS (LIABILITIES) - 0.6% | 4,386,103 |
| NET ASSETS - 100.0% | 735,034,486 |
| | |
Legend
| (a) | Amount is stated in United States dollars unless otherwise noted. |
| (b) | Security exempt from registration under Rule 144A of the Securities Act of 1933. These securities may be resold in transactions exempt from registration, normally to qualified institutional buyers. At the end of the period, the value of these securities amounted to $34,614,340 or 4.7% of net assets. |
| (c) | Non-income producing - Security is in default. |
| (e) | Coupon rates for floating and adjustable rate securities reflect the rates in effect at period end. |
| (f) | Interest Only (IO) security represents the right to receive only monthly interest payments on an underlying pool of mortgages or assets. Principal shown is the outstanding par amount of the pool as of the end of the period. |
| (g) | Coupon is indexed to a floating interest rate which may be multiplied by a specified factor and/or subject to caps or floors. |
| (i) | Security or a portion of the security is on loan at period end. |
| (j) | Remaining maturities of bank loan obligations may be less than the stated maturities shown as a result of contractual or optional prepayments by the borrower. Such prepayments cannot be predicted with certainty. |
| (k) | Affiliated fund that is generally available only to investment companies and other accounts managed by Fidelity Investments. A complete unaudited schedule of portfolio holdings for each Fidelity Central Fund is filed with the SEC for the first and third quarters of each fiscal year on Form N-PORT and is available upon request or at the SEC's website at www.sec.gov. An unaudited holdings listing for the Fund, which presents direct holdings as well as the pro-rata share of securities and other investments held indirectly through its investment in underlying non-money market Fidelity Central Funds, other than the Commodity Strategy Central Fund, is available at fidelity.com and/or institutional.fidelity.com, as applicable. In addition, each Fidelity Central Fund's financial statements are available on the SEC's website or upon request. |
| (l) | Affiliated fund that is generally available only to investment companies and other accounts managed by Fidelity Investments. The rate quoted is the annualized seven-day yield of the fund at period end. A complete unaudited listing of the fund's holdings as of its most recent quarter end is available upon request. In addition, each Fidelity Central Fund's financial statements are available on the SEC's website or upon request. |
| (m) | Investment made with cash collateral received from securities on loan. |
Affiliated Central Funds
Fiscal year to date information regarding the Fund's investments in Fidelity Central Funds, including the ownership percentage, is presented below.
| Affiliate | Value, beginning of period ($) | Purchases ($) | Sales Proceeds ($) | Dividend Income ($) | Realized Gain (loss) ($) | Change in Unrealized appreciation (depreciation) ($) | Value, end of period ($) | % ownership, end of period |
| Fidelity Cash Central Fund 4.86% | 2,251,280 | 103,034,081 | 103,612,746 | 168,568 | - | - | 1,672,615 | 0.0% |
| Fidelity Commodity Strategy Central Fund | 131,037,841 | 3,876,404 | 19,419,103 | 1,348,383 | (7,248,200) | 1,654,414 | 109,901,356 | 23.7% |
| Fidelity Floating Rate Central Fund | 227,782,537 | 11,417,424 | 55,791,274 | 8,914,543 | (3,748,159) | 8,600,023 | 188,260,551 | 10.1% |
| Fidelity Real Estate Equity Central Fund | 76,562,386 | 3,017,549 | 18,281,083 | 974,302 | (3,015,585) | 9,685,073 | 67,968,340 | 7.1% |
| Fidelity Securities Lending Cash Central Fund 4.87% | - | 10,667,182 | 8,480,619 | 1,147 | - | - | 2,186,563 | 0.0% |
| Total | 437,634,044 | 132,012,640 | 205,584,825 | 11,406,943 | (14,011,944) | 19,939,510 | 369,989,425 | |
| | | | | | | | | |
Amounts in the dividend income column in the above table include any capital gain distributions from underlying funds, which are presented in the corresponding line item in the Statement of Operations, if applicable.
Amounts in the dividend income column for Fidelity Securities Lending Cash Central Fund represents the income earned on investing cash collateral, less rebates paid to borrowers and any lending agent fees associated with the loan, plus any premium payments received for lending certain types of securities.
Amounts included in the purchases and sales proceeds columns may include in-kind transactions, if applicable.
Investment Valuation
The following is a summary of the inputs used, as of March 31, 2023, involving the Fund's assets and liabilities carried at fair value. The inputs or methodology used for valuing securities may not be an indication of the risk associated with investing in those securities. For more information on valuation inputs, and their aggregation into the levels used below, please refer to the Investment Valuation section in the accompanying Notes to Financial Statements.
| Valuation Inputs at Reporting Date: |
| Description | Total ($) | Level 1 ($) | Level 2 ($) | Level 3 ($) |
Investments in Securities: | | | | |
|
| Equities: | | | | |
Consumer Staples | 7,668,334 | 6,942,765 | 725,569 | - |
Energy | 41,462,892 | 34,746,283 | 6,716,609 | - |
Financials | 6,890,446 | 6,342,868 | 547,578 | - |
Health Care | 596,654 | - | 596,654 | - |
Industrials | 1,435,712 | 1,284,852 | 150,860 | - |
Materials | 58,590,727 | 50,986,352 | 7,604,375 | - |
Real Estate | 9,222,272 | 9,164,749 | 57,523 | - |
|
| Corporate Bonds | 27,278,947 | - | 27,278,947 | - |
|
| U.S. Government and Government Agency Obligations | 172,463,992 | - | 172,463,992 | - |
|
| Asset-Backed Securities | 2,837,268 | - | 2,837,267 | 1 |
|
| Commercial Mortgage Securities | 29,807,816 | - | 28,693,558 | 1,114,258 |
|
| Bank Loan Obligations | 2,403,898 | - | 2,403,898 | - |
|
| Equity Funds | 177,869,696 | 177,869,696 | - | - |
|
| Fixed-Income Funds | 188,260,551 | 188,260,551 | - | - |
|
| Preferred Securities | - | - | - | - |
|
| Money Market Funds | 3,859,178 | 3,859,178 | - | - |
| Total Investments in Securities: | 730,648,383 | 479,457,294 | 250,076,830 | 1,114,259 |
| Statement of Assets and Liabilities |
| | | | March 31, 2023 (Unaudited) |
| | | | | |
| Assets | | | | |
| Investment in securities, at value (including securities loaned of $2,060,057) - See accompanying schedule: | | | | |
Unaffiliated issuers (cost $378,080,326) | $ | 360,658,958 | | |
Fidelity Central Funds (cost $414,235,740) | | 369,989,425 | | |
| | | | | |
| | | | | |
| Total Investment in Securities (cost $792,316,066) | | | $ | 730,648,383 |
| Foreign currency held at value (cost $93,776) | | | | 93,253 |
| Receivable for investments sold | | | | 15,632,335 |
| Receivable for fund shares sold | | | | 364,457 |
| Dividends receivable | | | | 366,013 |
| Interest receivable | | | | 773,564 |
| Distributions receivable from Fidelity Central Funds | | | | 29,775 |
| Prepaid expenses | | | | 439 |
| Receivable from investment adviser for expense reductions | | | | 65,007 |
| Other receivables | | | | 58 |
Total assets | | | | 747,973,284 |
| Liabilities | | | | |
| Payable to custodian bank | $ | 2,329,108 | | |
| Payable for investments purchased | | 6,514,156 | | |
| Payable for fund shares redeemed | | 1,354,655 | | |
| Accrued management fee | | 344,891 | | |
| Distribution and service plan fees payable | | 27,717 | | |
| Other affiliated payables | | 107,776 | | |
| Other payables and accrued expenses | | 73,932 | | |
| Collateral on securities loaned | | 2,186,563 | | |
| Total Liabilities | | | | 12,938,798 |
| Net Assets | | | $ | 735,034,486 |
| Net Assets consist of: | | | | |
| Paid in capital | | | $ | 1,049,999,246 |
| Total accumulated earnings (loss) | | | | (314,964,760) |
| Net Assets | | | $ | 735,034,486 |
| | | | | |
| Net Asset Value and Maximum Offering Price | | | | |
| Class A : | | | | |
Net Asset Value and redemption price per share ($69,599,654 ÷ 8,278,142 shares) (a) | | | $ | 8.41 |
| Maximum offering price per share (100/96.00 of $8.41) | | | $ | 8.76 |
| Class M : | | | | |
Net Asset Value and redemption price per share ($10,653,364 ÷ 1,265,504 shares) (a) | | | $ | 8.42 |
| Maximum offering price per share (100/96.00 of $8.42) | | | $ | 8.77 |
| Class C : | | | | |
Net Asset Value and offering price per share ($13,013,481 ÷ 1,575,291 shares) (a) | | | $ | 8.26 |
| Strategic Real Return : | | | | |
Net Asset Value , offering price and redemption price per share ($328,300,119 ÷ 38,824,733 shares) | | | $ | 8.46 |
| Class K6 : | | | | |
Net Asset Value , offering price and redemption price per share ($99,733,437 ÷ 11,752,477 shares) | | | $ | 8.49 |
| Class I : | | | | |
Net Asset Value , offering price and redemption price per share ($142,719,491 ÷ 16,927,665 shares) | | | $ | 8.43 |
| Class Z : | | | | |
Net Asset Value , offering price and redemption price per share ($71,014,940 ÷ 8,415,425 shares) | | | $ | 8.44 |
(a)Redemption price per share is equal to net asset value less any applicable contingent deferred sales charge. |
| Statement of Operations |
| | | | Six months ended March 31, 2023 (Unaudited) |
| Investment Income | | | | |
| Dividends | | | $ | 2,286,392 |
| Interest | | | | 4,231,447 |
| Income from Fidelity Central Funds (including $1,147 from security lending) | | | | 11,406,943 |
| Total Income | | | | 17,924,782 |
| Expenses | | | | |
| Management fee | $ | 2,274,123 | | |
| Transfer agent fees | | 508,755 | | |
| Distribution and service plan fees | | 176,375 | | |
| Accounting fees | | 172,894 | | |
| Custodian fees and expenses | | 34,517 | | |
| Independent trustees' fees and expenses | | 1,743 | | |
| Registration fees | | 55,993 | | |
| Audit | | 57,612 | | |
| Legal | | 1,777 | | |
| Miscellaneous | | 2,089 | | |
| Total expenses before reductions | | 3,285,878 | | |
| Expense reductions | | (347,618) | | |
| Total expenses after reductions | | | | 2,938,260 |
| Net Investment income (loss) | | | | 14,986,522 |
| Realized and Unrealized Gain (Loss) | | | | |
| Net realized gain (loss) on: | | | | |
| Investment Securities: | | | | |
| Unaffiliated issuers (net of foreign taxes of $50) | | (8,327,912) | | |
| Fidelity Central Funds | | (14,011,944) | | |
| Foreign currency transactions | | (11,323) | | |
| Total net realized gain (loss) | | | | (22,351,179) |
| Change in net unrealized appreciation (depreciation) on: | | | | |
| Investment Securities: | | | | |
| Unaffiliated issuers (net of decrease in deferred foreign taxes of $50) | | 26,919,230 | | |
| Fidelity Central Funds | | 19,939,510 | | |
| Assets and liabilities in foreign currencies | | 10,978 | | |
| Total change in net unrealized appreciation (depreciation) | | | | 46,869,718 |
| Net gain (loss) | | | | 24,518,539 |
| Net increase (decrease) in net assets resulting from operations | | | $ | 39,505,061 |
| Statement of Changes in Net Assets |
| |
| | Six months ended March 31, 2023 (Unaudited) | | Year ended September 30, 2022 |
| Increase (Decrease) in Net Assets | | | | |
| Operations | | | | |
| Net investment income (loss) | $ | 14,986,522 | $ | 54,923,514 |
| Net realized gain (loss) | | (22,351,179) | | (35,123,250) |
| Change in net unrealized appreciation (depreciation) | | 46,869,718 | | (87,906,882) |
| Net increase (decrease) in net assets resulting from operations | | 39,505,061 | | (68,106,618) |
| Distributions to shareholders | | (50,728,414) | | (29,458,119) |
| Share transactions - net increase (decrease) | | (115,699,841) | | 546,656,759 |
| Total increase (decrease) in net assets | | (126,923,194) | | 449,092,022 |
| | | | | |
| Net Assets | | | | |
| Beginning of period | | 861,957,680 | | 412,865,658 |
| End of period | $ | 735,034,486 | $ | 861,957,680 |
| | | | | |
| | | | | |
Financial Highlights
| Fidelity Advisor® Strategic Real Return Fund Class A |
| |
| | Six months ended (Unaudited) March 31, 2023 | | Years ended September 30, 2022 | | 2021 | | 2020 | | 2019 | | 2018 |
Selected Per-Share Data | | | | | | | | | | | | |
| Net asset value, beginning of period | $ | 8.53 | $ | 9.42 | $ | 8.07 | $ | 8.39 | $ | 8.88 | $ | 8.80 |
| Income from Investment Operations | | | | | | | | | | | | |
Net investment income (loss) A,B | | .143 | | .719 | | .568 | | .257 | | .216 | | .266 |
| Net realized and unrealized gain (loss) | | .232 | | (1.078) C | | .950 | | (.365) | | .012 | | .008 D |
| Total from investment operations | | .375 | | (.359) | | 1.518 | | (.108) | | .228 | | .274 |
| Distributions from net investment income | | (.495) | | (.531) | | (.168) | | (.212) | | (.293) | | (.183) |
| Distributions from net realized gain | | - | | - | | - | | - | | (.425) | | (.011) |
| Total distributions | | (.495) | | (.531) | | (.168) | | (.212) | | (.718) | | (.194) |
| Net asset value, end of period | $ | 8.41 | $ | 8.53 | $ | 9.42 | $ | 8.07 | $ | 8.39 | $ | 8.88 |
Total Return E,F,G | | 4.52% | | (4.09)% C | | 19.05% | | (1.28)% | | 2.86% | | 3.15% D |
Ratios to Average Net Assets B,H,I | | | | | | | | | | | | |
| Expenses before reductions | | 1.04% J | | 1.06% | | 1.11% | | 1.12% | | 1.10% | | 1.07% |
| Expenses net of fee waivers, if any | | .95% J | | .96% | | 1.00% | | 1.00% | | 1.09% | | 1.07% |
| Expenses net of all reductions | | .95% J | | .96% | | 1.00% | | 1.00% | | 1.09% | | 1.07% |
| Net investment income (loss) | | 3.38% J | | 7.81% | | 6.40% | | 3.22% | | 2.60% | | 3.01% |
| Supplemental Data | | | | | | | | | | | | |
| Net assets, end of period (000 omitted) | $ | 69,600 | $ | 76,811 | $ | 37,357 | $ | 25,212 | $ | 29,652 | $ | 29,288 |
Portfolio turnover rate K | | 34% J | | 32% | | 13% | | 47% | | 19% | | 23% |
A Calculated based on average shares outstanding during the period.
B Net investment income (loss) is affected by the timing of the declaration of dividends by any underlying mutual funds or exchange-traded funds (ETFs). Net investment income (loss) of any mutual funds or ETFs is not included in the Fund's net investment income (loss) ratio.
C Amount includes a reimbursement from the investment adviser for an operational error which amounted to less than $.01 per share. Excluding this reimbursement, the total return would have been (4.12)%.
D Net realized and unrealized gain (loss) per share reflects proceeds received from litigation which amounted to $.01 per share. Excluding these litigation proceeds, the total return would have been 2.99%.
E Total returns for periods of less than one year are not annualized.
F Total returns would have been lower if certain expenses had not been reduced during the applicable periods shown.
G Total returns do not include the effect of the sales charges.
H Fees and expenses of any underlying mutual funds or exchange-traded funds (ETFs) are not included in the Fund's expense ratio. The Fund indirectly bears its proportionate share of these expenses. For additional expense information related to investments in Fidelity Central Funds, please refer to the "Investments in Fidelity Central Funds" note found in the Notes to Financial Statements section of the most recent Annual or Semi-Annual report.
I Expense ratios reflect operating expenses of the class. Expenses before reductions do not reflect amounts reimbursed, waived, or reduced through arrangements with the investment adviser, brokerage services, or other offset arrangements, if applicable, and do not represent the amount paid by the class during periods when reimbursements, waivers or reductions occur.
J Annualized.
K Amount does not include the portfolio activity of any underlying mutual funds or exchange-traded funds (ETFs).
| Fidelity Advisor® Strategic Real Return Fund Class M |
| |
| | Six months ended (Unaudited) March 31, 2023 | | Years ended September 30, 2022 | | 2021 | | 2020 | | 2019 | | 2018 |
Selected Per-Share Data | | | | | | | | | | | | |
| Net asset value, beginning of period | $ | 8.54 | $ | 9.43 | $ | 8.07 | $ | 8.39 | $ | 8.89 | $ | 8.81 |
| Income from Investment Operations | | | | | | | | | | | | |
Net investment income (loss) A,B | | .143 | | .721 | | .567 | | .257 | | .215 | | .264 |
| Net realized and unrealized gain (loss) | | .232 | | (1.080) C | | .960 | | (.365) | | .002 | | .008 D |
| Total from investment operations | | .375 | | (.359) | | 1.527 | | (.108) | | .217 | | .272 |
| Distributions from net investment income | | (.495) | | (.531) | | (.167) | | (.212) | | (.292) | | (.181) |
| Distributions from net realized gain | | - | | - | | - | | - | | (.425) | | (.011) |
| Total distributions | | (.495) | | (.531) | | (.167) | | (.212) | | (.717) | | (.192) |
| Net asset value, end of period | $ | 8.42 | $ | 8.54 | $ | 9.43 | $ | 8.07 | $ | 8.39 | $ | 8.89 |
Total Return E,F,G | | 4.51% | | (4.09)% C | | 19.17% | | (1.28)% | | 2.73% | | 3.12% D |
Ratios to Average Net Assets B,H,I | | | | | | | | | | | | |
| Expenses before reductions | | 1.04% J | | 1.06% | | 1.12% | | 1.14% | | 1.12% | | 1.11% |
| Expenses net of fee waivers, if any | | .95% J | | .96% | | 1.00% | | 1.00% | | 1.10% | | 1.10% |
| Expenses net of all reductions | | .95% J | | .96% | | 1.00% | | 1.00% | | 1.10% | | 1.10% |
| Net investment income (loss) | | 3.39% J | | 7.81% | | 6.40% | | 3.22% | | 2.59% | | 2.98% |
| Supplemental Data | | | | | | | | | | | | |
| Net assets, end of period (000 omitted) | $ | 10,653 | $ | 11,557 | $ | 7,293 | $ | 6,141 | $ | 7,903 | $ | 8,391 |
Portfolio turnover rate K | | 34% J | | 32% | | 13% | | 47% | | 19% | | 23% |
A Calculated based on average shares outstanding during the period.
B Net investment income (loss) is affected by the timing of the declaration of dividends by any underlying mutual funds or exchange-traded funds (ETFs). Net investment income (loss) of any mutual funds or ETFs is not included in the Fund's net investment income (loss) ratio.
C Amount includes a reimbursement from the investment adviser for an operational error which amounted to less than $.01 per share. Excluding this reimbursement, the total return would have been (4.12)%.
D Net realized and unrealized gain (loss) per share reflects proceeds received from litigation which amounted to $.01 per share. Excluding these litigation proceeds, the total return would have been 2.96%.
E Total returns for periods of less than one year are not annualized.
F Total returns would have been lower if certain expenses had not been reduced during the applicable periods shown.
G Total returns do not include the effect of the sales charges.
H Fees and expenses of any underlying mutual funds or exchange-traded funds (ETFs) are not included in the Fund's expense ratio. The Fund indirectly bears its proportionate share of these expenses. For additional expense information related to investments in Fidelity Central Funds, please refer to the "Investments in Fidelity Central Funds" note found in the Notes to Financial Statements section of the most recent Annual or Semi-Annual report.
I Expense ratios reflect operating expenses of the class. Expenses before reductions do not reflect amounts reimbursed, waived, or reduced through arrangements with the investment adviser, brokerage services, or other offset arrangements, if applicable, and do not represent the amount paid by the class during periods when reimbursements, waivers or reductions occur.
J Annualized.
K Amount does not include the portfolio activity of any underlying mutual funds or exchange-traded funds (ETFs).
| Fidelity Advisor® Strategic Real Return Fund Class C |
| |
| | Six months ended (Unaudited) March 31, 2023 | | Years ended September 30, 2022 | | 2021 | | 2020 | | 2019 | | 2018 |
Selected Per-Share Data | | | | | | | | | | | | |
| Net asset value, beginning of period | $ | 8.39 | $ | 9.28 | $ | 7.95 | $ | 8.26 | $ | 8.77 | $ | 8.70 |
| Income from Investment Operations | | | | | | | | | | | | |
Net investment income (loss) A,B | | .109 | | .639 | | .491 | | .195 | | .151 | | .197 |
| Net realized and unrealized gain (loss) | | .224 | | (1.057) C | | .946 | | (.358) | | .004 | | .011 D |
| Total from investment operations | | .333 | | (.418) | | 1.437 | | (.163) | | .155 | | .208 |
| Distributions from net investment income | | (.463) | | (.472) | | (.107) | | (.147) | | (.240) | | (.127) |
| Distributions from net realized gain | | - | | - | | - | | - | | (.425) | | (.011) |
| Total distributions | | (.463) | | (.472) | | (.107) | | (.147) | | (.665) | | (.138) |
| Net asset value, end of period | $ | 8.26 | $ | 8.39 | $ | 9.28 | $ | 7.95 | $ | 8.26 | $ | 8.77 |
Total Return E,F,G | | 4.07% | | (4.78)% C | | 18.24% | | (2.00)% | | 1.99% | | 2.41% D |
Ratios to Average Net Assets B,H,I | | | | | | | | | | | | |
| Expenses before reductions | | 1.79% J | | 1.79% | | 1.88% | | 1.89% | | 1.86% | | 1.83% |
| Expenses net of fee waivers, if any | | 1.70% J | | 1.71% | | 1.75% | | 1.75% | | 1.85% | | 1.83% |
| Expenses net of all reductions | | 1.70% J | | 1.71% | | 1.75% | | 1.75% | | 1.85% | | 1.83% |
| Net investment income (loss) | | 2.63% J | | 7.07% | | 5.65% | | 2.47% | | 1.83% | | 2.25% |
| Supplemental Data | | | | | | | | | | | | |
| Net assets, end of period (000 omitted) | $ | 13,013 | $ | 13,730 | $ | 4,549 | $ | 5,694 | $ | 8,555 | $ | 18,962 |
Portfolio turnover rate K | | 34% J | | 32% | | 13% | | 47% | | 19% | | 23% |
A Calculated based on average shares outstanding during the period.
B Net investment income (loss) is affected by the timing of the declaration of dividends by any underlying mutual funds or exchange-traded funds (ETFs). Net investment income (loss) of any mutual funds or ETFs is not included in the Fund's net investment income (loss) ratio.
C Amount includes a reimbursement from the investment adviser for an operational error which amounted to less than $.01 per share. Excluding this reimbursement, the total return would have been (4.81)%.
D Net realized and unrealized gain (loss) per share reflects proceeds received from litigation which amounted to $.01 per share. Excluding these litigation proceeds, the total return would have been 2.25%.
E Total returns for periods of less than one year are not annualized.
F Total returns would have been lower if certain expenses had not been reduced during the applicable periods shown.
G Total returns do not include the effect of the contingent deferred sales charge.
H Fees and expenses of any underlying mutual funds or exchange-traded funds (ETFs) are not included in the Fund's expense ratio. The Fund indirectly bears its proportionate share of these expenses. For additional expense information related to investments in Fidelity Central Funds, please refer to the "Investments in Fidelity Central Funds" note found in the Notes to Financial Statements section of the most recent Annual or Semi-Annual report.
I Expense ratios reflect operating expenses of the class. Expenses before reductions do not reflect amounts reimbursed, waived, or reduced through arrangements with the investment adviser, brokerage services, or other offset arrangements, if applicable, and do not represent the amount paid by the class during periods when reimbursements, waivers or reductions occur.
J Annualized.
K Amount does not include the portfolio activity of any underlying mutual funds or exchange-traded funds (ETFs).
| Fidelity® Strategic Real Return Fund |
| |
| | Six months ended (Unaudited) March 31, 2023 | | Years ended September 30, 2022 | | 2021 | | 2020 | | 2019 | | 2018 |
Selected Per-Share Data | | | | | | | | | | | | |
| Net asset value, beginning of period | $ | 8.58 | $ | 9.47 | $ | 8.10 | $ | 8.43 | $ | 8.92 | $ | 8.84 |
| Income from Investment Operations | | | | | | | | | | | | |
Net investment income (loss) A,B | | .154 | | .749 | | .593 | | .278 | | .239 | | .291 |
| Net realized and unrealized gain (loss) | | .233 | | (1.087) C | | .965 | | (.376) | | .009 | | .008 D |
| Total from investment operations | | .387 | | (.338) | | 1.558 | | (.098) | | .248 | | .299 |
| Distributions from net investment income | | (.507) | | (.552) | | (.188) | | (.232) | | (.313) | | (.208) |
| Distributions from net realized gain | | - | | - | | - | | - | | (.425) | | (.011) |
| Total distributions | | (.507) | | (.552) | | (.188) | | (.232) | | (.738) | | (.219) |
| Net asset value, end of period | $ | 8.46 | $ | 8.58 | $ | 9.47 | $ | 8.10 | $ | 8.43 | $ | 8.92 |
Total Return E,F | | 4.64% | | (3.85)% C | | 19.51% | | (1.14)% | | 3.10% | | 3.43% D |
Ratios to Average Net Assets B,G,H | | | | | | | | | | | | |
| Expenses before reductions | | .78% I | | .78% | | .85% | | .87% | | .83% | | .81% |
| Expenses net of fee waivers, if any | | .70% I | | .71% | | .75% | | .75% | | .83% | | .81% |
| Expenses net of all reductions | | .70% I | | .71% | | .75% | | .75% | | .83% | | .81% |
| Net investment income (loss) | | 3.64% I | | 8.06% | | 6.64% | | 3.47% | | 2.86% | | 3.27% |
| Supplemental Data | | | | | | | | | | | | |
| Net assets, end of period (000 omitted) | $ | 328,300 | $ | 387,040 | $ | 236,076 | $ | 158,896 | $ | 197,152 | $ | 262,063 |
Portfolio turnover rate J | | 34% I | | 32% | | 13% | | 47% | | 19% | | 23% |
A Calculated based on average shares outstanding during the period.
B Net investment income (loss) is affected by the timing of the declaration of dividends by any underlying mutual funds or exchange-traded funds (ETFs). Net investment income (loss) of any mutual funds or ETFs is not included in the Fund's net investment income (loss) ratio.
C Amount includes a reimbursement from the investment adviser for an operational error which amounted to less than $.01 per share. Excluding this reimbursement, the total return would have been (3.88)%.
D Net realized and unrealized gain (loss) per share reflects proceeds received from litigation which amounted to $.01 per share. Excluding these litigation proceeds, the total return would have been 3.27%.
E Total returns for periods of less than one year are not annualized.
F Total returns would have been lower if certain expenses had not been reduced during the applicable periods shown.
G Fees and expenses of any underlying mutual funds or exchange-traded funds (ETFs) are not included in the Fund's expense ratio. The Fund indirectly bears its proportionate share of these expenses. For additional expense information related to investments in Fidelity Central Funds, please refer to the "Investments in Fidelity Central Funds" note found in the Notes to Financial Statements section of the most recent Annual or Semi-Annual report.
H Expense ratios reflect operating expenses of the class. Expenses before reductions do not reflect amounts reimbursed, waived, or reduced through arrangements with the investment adviser, brokerage services, or other offset arrangements, if applicable, and do not represent the amount paid by the class during periods when reimbursements, waivers or reductions occur.
I Annualized.
J Amount does not include the portfolio activity of any underlying mutual funds or exchange-traded funds (ETFs).
| Fidelity® Strategic Real Return Fund Class K6 |
| |
| | Six months ended (Unaudited) March 31, 2023 | | Years ended September 30, 2022 | | 2021 | | 2020 A |
Selected Per-Share Data | | | | | | | | |
| Net asset value, beginning of period | $ | 8.60 | $ | 9.48 | $ | 8.11 | $ | 8.34 |
| Income from Investment Operations | | | | | | | | |
Net investment income (loss) B,C | | .162 | | .760 | | .616 | | .281 |
| Net realized and unrealized gain (loss) | | .241 | | (1.082) D | | .948 | | (.352) |
| Total from investment operations | | .403 | | (.322) | | 1.564 | | (.071) |
| Distributions from net investment income | | (.513) | | (.558) | | (.194) | | (.159) |
| Total distributions | | (.513) | | (.558) | | (.194) | | (.159) |
| Net asset value, end of period | $ | 8.49 | $ | 8.60 | $ | 9.48 | $ | 8.11 |
Total Return E,F | | 4.82% | | (3.68)% D | | 19.57% | | (.81)% |
Ratios to Average Net Assets C,G,H | | | | | | | | |
| Expenses before reductions | | .64% I | | .66% | | .69% | | .71% I |
| Expenses net of fee waivers, if any | | .51% I | | .52% | | .56% | | .56% I |
| Expenses net of all reductions | | .51% I | | .52% | | .56% | | .56% I |
| Net investment income (loss) | | 3.83% I | | 8.25% | | 6.83% | | 3.66% I |
| Supplemental Data | | | | | | | | |
| Net assets, end of period (000 omitted) | $ | 99,733 | $ | 99,831 | $ | 20,606 | $ | 6,331 |
Portfolio turnover rate J | | 34% I | | 32% | | 13% | | 47% I |
A For the period October 8, 2019 (commencement of sale of shares) through September 30, 2020.
B Calculated based on average shares outstanding during the period.
C Net investment income (loss) is affected by the timing of the declaration of dividends by any underlying mutual funds or exchange-traded funds (ETFs). Net investment income (loss) of any mutual funds or ETFs is not included in the Fund's net investment income (loss) ratio.
D Amount includes a reimbursement from the investment adviser for an operational error which amounted to less than $.01 per share. Excluding this reimbursement, the total return would have been (3.71)%.
E Total returns for periods of less than one year are not annualized.
F Total returns would have been lower if certain expenses had not been reduced during the applicable periods shown.
G Fees and expenses of any underlying mutual funds or exchange-traded funds (ETFs) are not included in the Fund's expense ratio. The Fund indirectly bears its proportionate share of these expenses. For additional expense information related to investments in Fidelity Central Funds, please refer to the "Investments in Fidelity Central Funds" note found in the Notes to Financial Statements section of the most recent Annual or Semi-Annual report.
H Expense ratios reflect operating expenses of the class. Expenses before reductions do not reflect amounts reimbursed, waived, or reduced through arrangements with the investment adviser, brokerage services, or other offset arrangements, if applicable, and do not represent the amount paid by the class during periods when reimbursements, waivers or reductions occur.
I Annualized.
J Amount does not include the portfolio activity of any underlying mutual funds or exchange-traded funds (ETFs).
| Fidelity Advisor® Strategic Real Return Fund Class I |
| |
| | Six months ended (Unaudited) March 31, 2023 | | Years ended September 30, 2022 | | 2021 | | 2020 | | 2019 | | 2018 |
Selected Per-Share Data | | | | | | | | | | | | |
| Net asset value, beginning of period | $ | 8.55 | $ | 9.44 | $ | 8.08 | $ | 8.40 | $ | 8.90 | $ | 8.82 |
| Income from Investment Operations | | | | | | | | | | | | |
Net investment income (loss) A,B | | .154 | | .741 | | .594 | | .280 | | .240 | | .291 |
| Net realized and unrealized gain (loss) | | .233 | | (1.079) C | | .955 | | (.369) | | - D | | .008 E |
| Total from investment operations | | .387 | | (.338) | | 1.549 | | (.089) | | .240 | | .299 |
| Distributions from net investment income | | (.507) | | (.552) | | (.189) | | (.231) | | (.315) | | (.208) |
| Distributions from net realized gain | | - | | - | | - | | - | | (.425) | | (.011) |
| Total distributions | | (.507) | | (.552) | | (.189) | | (.231) | | (.740) | | (.219) |
| Net asset value, end of period | $ | 8.43 | $ | 8.55 | $ | 9.44 | $ | 8.08 | $ | 8.40 | $ | 8.90 |
Total Return F,G | | 4.65% | | (3.86)% C | | 19.45% | | (1.04)% | | 3.01% | | 3.44% E |
Ratios to Average Net Assets B,H,I | | | | | | | | | | | | |
| Expenses before reductions | | .78% J | | .79% | | .83% | | .83% | | .81% | | .79% |
| Expenses net of fee waivers, if any | | .70% J | | .71% | | .75% | | .75% | | .81% | | .79% |
| Expenses net of all reductions | | .70% J | | .71% | | .75% | | .75% | | .81% | | .79% |
| Net investment income (loss) | | 3.64% J | | 8.07% | | 6.64% | | 3.47% | | 2.88% | | 3.29% |
| Supplemental Data | | | | | | | | | | | | |
| Net assets, end of period (000 omitted) | $ | 142,719 | $ | 185,361 | $ | 49,988 | $ | 26,872 | $ | 116,302 | $ | 158,776 |
Portfolio turnover rate K | | 34% J | | 32% | | 13% | | 47% | | 19% | | 23% |
A Calculated based on average shares outstanding during the period.
B Net investment income (loss) is affected by the timing of the declaration of dividends by any underlying mutual funds or exchange-traded funds (ETFs). Net investment income (loss) of any mutual funds or ETFs is not included in the Fund's net investment income (loss) ratio.
C Amount includes a reimbursement from the investment adviser for an operational error which amounted to less than $.01 per share. Excluding this reimbursement, the total return would have been (3.89)%.
D Amount represents less than $.0005 per share.
E Net realized and unrealized gain (loss) per share reflects proceeds received from litigation which amounted to $.01 per share. Excluding these litigation proceeds, the total return would have been 3.28%.
F Total returns for periods of less than one year are not annualized.
G Total returns would have been lower if certain expenses had not been reduced during the applicable periods shown.
H Fees and expenses of any underlying mutual funds or exchange-traded funds (ETFs) are not included in the Fund's expense ratio. The Fund indirectly bears its proportionate share of these expenses. For additional expense information related to investments in Fidelity Central Funds, please refer to the "Investments in Fidelity Central Funds" note found in the Notes to Financial Statements section of the most recent Annual or Semi-Annual report.
I Expense ratios reflect operating expenses of the class. Expenses before reductions do not reflect amounts reimbursed, waived, or reduced through arrangements with the investment adviser, brokerage services, or other offset arrangements, if applicable, and do not represent the amount paid by the class during periods when reimbursements, waivers or reductions occur.
J Annualized.
K Amount does not include the portfolio activity of any underlying mutual funds or exchange-traded funds (ETFs).
| Fidelity Advisor® Strategic Real Return Fund Class Z |
| |
| | Six months ended (Unaudited) March 31, 2023 | | Years ended September 30, 2022 | | 2021 | | 2020 | | 2019 A |
Selected Per-Share Data | | | | | | | | | | |
| Net asset value, beginning of period | $ | 8.56 | $ | 9.45 | $ | 8.08 | $ | 8.40 | $ | 8.93 |
| Income from Investment Operations | | | | | | | | | | |
Net investment income (loss) B,C | | .158 | | .755 | | .610 | | .282 | | .244 |
| Net realized and unrealized gain (loss) | | .233 | | (1.087) D | | .952 | | (.365) | | (.026) |
| Total from investment operations | | .391 | | (.332) | | 1.562 | | (.083) | | .218 |
| Distributions from net investment income | | (.511) | | (.558) | | (.192) | | (.237) | | (.323) |
| Distributions from net realized gain | | - | | - | | - | | - | | (.425) |
| Total distributions | | (.511) | | (.558) | | (.192) | | (.237) | | (.748) |
| Net asset value, end of period | $ | 8.44 | $ | 8.56 | $ | 9.45 | $ | 8.08 | $ | 8.40 |
Total Return E,F | | 4.70% | | (3.79)% D | | 19.61% | | (.96)% | | 2.76% |
Ratios to Average Net Assets C,G,H | | | | | | | | | | |
| Expenses before reductions | | .68% I | | .70% | | .73% | | .74% | | .71% I |
| Expenses net of fee waivers, if any | | .61% I | | .62% | | .66% | | .66% | | .71% I |
| Expenses net of all reductions | | .61% I | | .62% | | .66% | | .66% | | .71% I |
| Net investment income (loss) | | 3.73% I | | 8.15% | | 6.73% | | 3.56% | | 2.97% I |
| Supplemental Data | | | | | | | | | | |
| Net assets, end of period (000 omitted) | $ | 71,015 | $ | 87,627 | $ | 56,997 | $ | 9,511 | $ | 9,369 |
Portfolio turnover rate J | | 34% I | | 32% | | 13% | | 47% | | 19% I |
A For the period October 2, 2018 (commencement of sale of shares) through September 30, 2019.
B Calculated based on average shares outstanding during the period.
C Net investment income (loss) is affected by the timing of the declaration of dividends by any underlying mutual funds or exchange-traded funds (ETFs). Net investment income (loss) of any mutual funds or ETFs is not included in the Fund's net investment income (loss) ratio.
D Amount includes a reimbursement from the investment adviser for an operational error which amounted to less than $.01 per share. Excluding this reimbursement, the total return would have been (3.82)%.
E Total returns for periods of less than one year are not annualized.
F Total returns would have been lower if certain expenses had not been reduced during the applicable periods shown.
G Fees and expenses of any underlying mutual funds or exchange-traded funds (ETFs) are not included in the Fund's expense ratio. The Fund indirectly bears its proportionate share of these expenses. For additional expense information related to investments in Fidelity Central Funds, please refer to the "Investments in Fidelity Central Funds" note found in the Notes to Financial Statements section of the most recent Annual or Semi-Annual report.
H Expense ratios reflect operating expenses of the class. Expenses before reductions do not reflect amounts reimbursed, waived, or reduced through arrangements with the investment adviser, brokerage services, or other offset arrangements, if applicable, and do not represent the amount paid by the class during periods when reimbursements, waivers or reductions occur.
I Annualized.
J Amount does not include the portfolio activity of any underlying mutual funds or exchange-traded funds (ETFs).
For the period ended March 31, 2023
1. Organization.
Fidelity Strategic Real Return Fund (the Fund) is a fund of Fidelity Salem Street Trust (the Trust) and is authorized to issue an unlimited number of shares. The Trust is registered under the Investment Company Act of 1940, as amended (the 1940 Act), as an open-end management investment company organized as a Massachusetts business trust. The Fund offers Class A, Class M, Class C, Strategic Real Return, Class K6, Class I and Class Z shares, each of which has equal rights as to assets and voting privileges. Class A, Class M, Class C, Class I and Class Z are Fidelity Advisor classes. Each class has exclusive voting rights with respect to matters that affect that class. Class C shares will automatically convert to Class A shares after a holding period of eight years from the initial date of purchase, with certain exceptions.
2. Investments in Fidelity Central Funds.
Funds may invest in Fidelity Central Funds, which are open-end investment companies generally available only to other investment companies and accounts managed by the investment adviser and its affiliates. The Schedule of Investments lists any Fidelity Central Funds held as an investment as of period end, but does not include the underlying holdings of each Fidelity Central Fund. An investing fund indirectly bears its proportionate share of the expenses of the underlying Fidelity Central Funds.
Based on its investment objective, each Fidelity Central Fund may invest or participate in various investment vehicles or strategies that are similar to those of the investing fund. These strategies are consistent with the investment objectives of the investing fund and may involve certain economic risks which may cause a decline in value of each of the Fidelity Central Funds and thus a decline in the value of the investing fund.
| Fidelity Central Fund | Investment Manager | Investment Objective | Investment Practices | Expense Ratio A |
| Fidelity Commodity Strategy Central Fund | Geode Capital Management, LLC (Geode) | Seeks to provide investment returns that correspond to the performance of the commodities market. | Investment in commodity-related investments through a wholly-owned subsidiary organized under the laws of the Cayman Islands Futures | Less than .005% |
| Fidelity Floating Rate Central Fund | Fidelity Management & Research Company LLC (FMR) | Seeks a high level of income by normally investing in floating rate loans and other floating rate securities. | Foreign Securities Loans & Direct Debt Instruments Restricted Securities | Less than .005% |
| Fidelity Real Estate Equity Central Fund | Fidelity Management & Research Company LLC (FMR) | Seeks above-average income and long-term capital growth by investing primarily in equity securities of issuers in the real estate industry. | Loans & Direct Debt Instruments | Less than .005% |
| Fidelity Money Market Central Funds | Fidelity Management & Research Company LLC (FMR) | Each fund seeks to obtain a high level of current income consistent with the preservation of capital and liquidity. | Short-term Investments | Less than .005% |
A Expenses expressed as a percentage of average net assets and are as of each underlying Central Fund's most recent annual or semi-annual shareholder report.
An unaudited holdings listing for the investing fund, which presents direct holdings as well as the pro-rata share of any securities and other investments held indirectly through its investment in underlying non-money market Fidelity Central Funds, is available at fidelity.com and/or institutional.fidelity.com, as applicable. A complete unaudited list of holdings for each Fidelity Central Fund is available upon request or at the Securities and Exchange Commission website at www.sec.gov. In addition, the financial statements of the Fidelity Central Funds which contain the significant accounting policies (including investment valuation policies) of those funds, and are not covered by the Report of Independent Registered Public Accounting Firm, are available on the Securities and Exchange Commission website or upon request.
3. Significant Accounting Policies.
The Fund is an investment company and applies the accounting and reporting guidance of the Financial Accounting Standards Board (FASB) Accounting Standards Codification Topic 946 Financial Services - Investment Companies . The financial statements have been prepared in conformity with accounting principles generally accepted in the United States of America (GAAP), which require management to make certain estimates and assumptions at the date of the financial statements. Actual results could differ from those estimates. Subsequent events, if any, through the date that the financial statements were issued have been evaluated in the preparation of the financial statements. The Fund's Schedule of Investments lists any underlying mutual funds or exchange-traded funds (ETFs) but does not include the underlying holdings of these funds. The following summarizes the significant accounting policies of the Fund:
Investment Valuation. Investments are valued as of 4:00 p.m. Eastern time on the last calendar day of the period. The Board of Trustees (the Board) has designated the Fund's investment adviser as the valuation designee responsible for the fair valuation function and performing fair value determinations as needed. The investment adviser has established a Fair Value Committee (the Committee) to carry out the day-to-day fair valuation responsibilities and has adopted policies and procedures to govern the fair valuation process and the activities of the Committee. In accordance with these fair valuation policies and procedures, which have been approved by the Board, the Fund attempts to obtain prices from one or more third party pricing services or brokers to value its investments. When current market prices, quotations or currency exchange rates are not readily available or reliable, investments will be fair valued in good faith by the Committee, in accordance with the policies and procedures. Factors used in determining fair value vary by investment type and may include market or investment specific events, transaction data, estimated cash flows, and market observations of comparable investments. The frequency that the fair valuation procedures are used cannot be predicted and they may be utilized to a significant extent. The Committee manages the Fund's fair valuation practices and maintains the fair valuation policies and procedures. The Fund's investment adviser reports to the Board information regarding the fair valuation process and related material matters.
The Fund categorizes the inputs to valuation techniques used to value its investments into a disclosure hierarchy consisting of three levels as shown below:
Level 1 - unadjusted quoted prices in active markets for identical investments
Level 2 - other significant observable inputs (including quoted prices for similar investments, interest rates, prepayment speeds, etc.)
Level 3 - unobservable inputs (including the Fund's own assumptions based on the best information available)
Valuation techniques used to value the Fund's investments by major category are as follows:
Debt securities, including restricted securities, are valued based on evaluated prices received from third party pricing services or from brokers who make markets in such securities. Corporate bonds, bank loan obligations, preferred securities and U.S. government and government agency obligations are valued by pricing services who utilize matrix pricing which considers yield or price of bonds of comparable quality, coupon, maturity and type or by broker-supplied prices. Asset backed securities and commercial mortgage securities are valued by pricing services who utilize matrix pricing which considers prepayment speed assumptions, attributes of the collateral, yield or price of bonds of comparable quality, coupon, maturity and type or by broker-supplied prices. When independent prices are unavailable or unreliable, debt securities may be valued utilizing pricing methodologies which consider similar factors that would be used by third party pricing services. Debt securities are generally categorized as Level 2 in the hierarchy but may be Level 3 depending on the circumstances. The Fund invests a significant portion of its assets in below investment grade securities. The value of these securities can be more volatile due to changes in the credit quality of the issuer and is sensitive to changes in economic, market and regulatory conditions.
Equity securities, including restricted securities, for which market quotations are readily available, are valued at the last reported sale price or official closing price as reported by a third party pricing service on the primary market or exchange on which they are traded and are categorized as Level 1 in the hierarchy. In the event there were no sales during the day or closing prices are not available, securities are valued at the last quoted bid price or may be valued using the last available price and are generally categorized as Level 2 in the hierarchy. For foreign equity securities, when market or security specific events arise, comparisons to the valuation of American Depositary Receipts (ADRs), futures contracts, ETFs and certain indexes as well as quoted prices for similar securities may be used and would be categorized as Level 2 in the hierarchy. For equity securities, including restricted securities, where observable inputs are limited, assumptions about market activity and risk are used and these securities may be categorized as Level 3 in the hierarchy.
Investments in open-end mutual funds, including the Fidelity Central Funds, are valued at their closing net asset value (NAV) each business day and are categorized as Level 1 in the hierarchy.
Changes in valuation techniques may result in transfers in or out of an assigned level within the disclosure hierarchy. The aggregate value of investments by input level as of March 31, 2023 is included at the end of the Fund's Schedule of Investments.
Foreign Currency. Certain Funds may use foreign currency contracts to facilitate transactions in foreign-denominated securities. Gains and losses from these transactions may arise from changes in the value of the foreign currency or if the counterparties do not perform under the contracts' terms.
Foreign-denominated assets, including investment securities, and liabilities are translated into U.S. dollars at the exchange rates at period end. Purchases and sales of investment securities, income and dividends received, and expenses denominated in foreign currencies are translated into U.S. dollars at the exchange rate in effect on the transaction date.
The effects of exchange rate fluctuations on investments are included with the net realized and unrealized gain (loss) on investment securities. Other foreign currency transactions resulting in realized and unrealized gain (loss) are disclosed separately.
Investment Transactions and Income. For financial reporting purposes, the Fund's investment holdings and NAV include trades executed through the end of the last business day of the period. The NAV per share for processing shareholder transactions is calculated as of the close of business of the New York Stock Exchange (NYSE), normally 4:00 p.m. Eastern time and includes trades executed through the end of the prior business day. Gains and losses on securities sold are determined on the basis of identified cost. Commissions paid to certain brokers with whom the investment adviser, or its affiliates, places trades on behalf of a fund include an amount in addition to trade execution, which may be rebated back to a fund. Any such rebates are included in net realized gain (loss) on investments in the Statement of Operations. Dividend income is recorded on the ex-dividend date, except for certain dividends from foreign securities where the ex-dividend date may have passed, which are recorded as soon as the Fund is informed of the ex-dividend date. Non-cash dividends included in dividend income, if any, are recorded at the fair market value of the securities received. Income and capital gain distributions from Fidelity Central Funds, if any, are recorded on the ex-dividend date. Certain distributions received by the Fund represent a return of capital or capital gain. The Fund determines the components of these distributions subsequent to the ex-dividend date, based upon receipt of tax filings or other correspondence relating to the underlying investment. These distributions are recorded as a reduction of cost of investments and/or as a realized gain. Interest income is accrued as earned and includes coupon interest and amortization of premium and accretion of discount on debt securities as applicable. For Treasury Inflation-Protected Securities (TIPS) the principal amount is adjusted daily to keep pace with inflation. Interest is accrued based on the adjusted principal amount. The adjustments to principal due to inflation are reflected as increases or decreases to Interest in the accompanying Statement of Operations. Such adjustments may result in negative Interest and may have a significant impact on the Fund's distributions. Investment income is recorded net of foreign taxes withheld where recovery of such taxes is uncertain. Debt obligations may be placed on non-accrual status and related interest income may be reduced by ceasing current accruals and writing off interest receivables when the collection of all or a portion of interest has become doubtful based on consistently applied procedures. A debt obligation is removed from non-accrual status when the issuer resumes interest payments or when collectability of interest is reasonably assured. Funds may file withholding tax reclaims in certain jurisdictions to recover a portion of amounts previously withheld. Any withholding tax reclaims income is included in the Statement of Operations in dividends. Any receivables for withholding tax reclaims are included in the Statement of Assets and Liabilities in dividends receivable.
Class Allocations and Expenses. Investment income, realized and unrealized capital gains and losses, common expenses of a fund, and certain fund-level expense reductions, if any, are allocated daily on a pro-rata basis to each class based on the relative net assets of each class to the total net assets of a fund. Each class differs with respect to transfer agent and distribution and service plan fees incurred, as applicable. Certain expense reductions may also differ by class, if applicable. For the reporting period, the allocated portion of income and expenses to each class as a percent of its average net assets may vary due to the timing of recording these transactions in relation to fluctuating net assets of the classes. Expenses directly attributable to a fund are charged to that fund. Expenses attributable to more than one fund are allocated among the respective funds on the basis of relative net assets or other appropriate methods. Expenses included in the accompanying financial statements reflect the expenses of that fund and do not include any expenses associated with any underlying mutual funds or exchange-traded funds. Although not included in a fund's expenses, a fund indirectly bears its proportionate share of these expenses through the net asset value of each underlying mutual fund or exchange-traded fund. Expense estimates are accrued in the period to which they relate and adjustments are made when actual amounts are known.
Income Tax Information and Distributions to Shareholders. Each year, the Fund intends to qualify as a regulated investment company under Subchapter M of the Internal Revenue Code, including distributing substantially all of its taxable income and realized gains. As a result, no provision for U.S. Federal income taxes is required. The Fund files a U.S. federal tax return, in addition to state and local tax returns as required. The Fund's federal income tax returns are subject to examination by the Internal Revenue Service (IRS) for a period of three fiscal years after they are filed. State and local tax returns may be subject to examination for an additional fiscal year depending on the jurisdiction. Foreign taxes are provided for based on the Fund's understanding of the tax rules and rates that exist in the foreign markets in which it invests. The Fund is subject to a tax imposed on capital gains by certain countries in which it invests. An estimated deferred tax liability for net unrealized appreciation on the applicable securities is included in Other payables and accrued expenses on the Statement of Assets & Liabilities.
Distributions are declared and recorded on the ex-dividend date. Income and capital gain distributions are declared separately for each class. Income and capital gain distributions are determined in accordance with income tax regulations, which may differ from GAAP.
Capital accounts within the financial statements are adjusted for permanent book-tax differences. These adjustments have no impact on net assets or the results of operations. Capital accounts are not adjusted for temporary book-tax differences which will reverse in a subsequent period.
Book-tax differences are primarily due to foreign currency transactions, passive foreign investment companies (PFIC), market discount, partnerships, equity-debt classifications, certain conversion ratio adjustments, capital loss carryforwards and losses deferred due to wash sales.
As of period end, the cost and unrealized appreciation (depreciation) in securities, and derivatives if applicable, for federal income tax purposes were as follows:
| Gross unrealized appreciation | $13,271,242 |
| Gross unrealized depreciation | (91,522,930) |
| Net unrealized appreciation (depreciation) | $(78,251,688) |
| Tax cost | $808,900,071 |
Capital loss carryforwards are only available to offset future capital gains of the Fund to the extent provided by regulations and may be limited. The capital loss carryforward information presented below, including any applicable limitation, is estimated as of prior fiscal period end and is subject to adjustment.
Short-term | $(7,398,616) |
Long-term | (185,868,607) |
| Total capital loss carryforward | $(193,267,223) |
Restricted Securities (including Private Placements). Funds may invest in securities that are subject to legal or contractual restrictions on resale. These securities generally may be resold in transactions exempt from registration or to the public if the securities are registered. Disposal of these securities may involve time-consuming negotiations and expense, and prompt sale at an acceptable price may be difficult. Information regarding restricted securities held at period end is included at the end of the Schedule of Investments, if applicable.
Loans and Other Direct Debt Instruments. Direct debt instruments are interests in amounts owed to lenders by corporate or other borrowers. These instruments may be in the form of loans, trade claims or other receivables and may include standby financing commitments such as revolving credit facilities that obligate a fund to supply additional cash to the borrower on demand. Loans may be acquired through assignment, participation, or may be made directly to a borrower. Such instruments are presented in the Bank Loan Obligations section in the Schedule of Investments. Certain funds may also invest in unfunded loan commitments, which are contractual obligations for future funding. Information regarding unfunded commitments is included at the end of the Schedule of Investments, if applicable.
4. Purchases and Sales of Investments.
Purchases and sales of securities, other than short-term securities and in-kind transactions, as applicable, are noted in the table below.
| | Purchases ($) | Sales ($) |
| Fidelity Strategic Real Return Fund | 115,651,669 | 232,258,005 |
5. Fees and Other Transactions with Affiliates.
Management Fee. Fidelity Management & Research Company LLC (the investment adviser) and its affiliates provide the Fund with investment management related services for which the Fund pays a monthly management fee. The management fee is the sum of an individual fund fee rate that is based on an annual rate of .45% of the Fund's average net assets and an annualized group fee rate that averaged .10% during the period. The group fee rate is based upon the monthly average net assets of a group of registered investment companies with which the investment adviser has management contracts. The group fee rate decreases as assets under management increase and increases as assets under management decrease. For the reporting period, the total annualized management fee rate was .55% of the Fund's average net assets.
Distribution and Service Plan Fees. In accordance with Rule 12b-1 of the 1940 Act, the Fund has adopted separate Distribution and Service Plans for each class of shares. Certain classes pay Fidelity Distributors Company LLC (FDC), an affiliate of the investment adviser, separate Distribution and Service Fees, each of which is based on an annual percentage of each class' average net assets. In addition, FDC may pay financial intermediaries for selling shares of the Fund and providing shareholder support services. For the period, the Distribution and Service Fee rates, total fees and amounts retained by FDC were as follows:
| | Distribution Fee | Service Fee | Total Fees | Retained by FDC |
| Class A | - % | .25% | $92,963 | $6,901 |
| Class M | - % | .25% | 14,385 | 85 |
| Class C | .75% | .25% | 69,027 | 28,314 |
| | | | $176,375 | $35,300 |
Sales Load. FDC may receive a front-end sales charge of up to 4.00% for selling Class A shares and Class M shares, some of which is paid to financial intermediaries for selling shares of the Fund. Depending on the holding period, FDC may receive contingent deferred sales charges levied on Class A, Class M and Class C redemptions. The deferred sales charges are 1.00% for Class C shares, 1.00% for certain purchases of Class A shares and .25% for certain purchases of Class M shares.
For the period, sales charge amounts retained by FDC were as follows:
| | Retained by FDC |
| Class A | $12,927 |
| Class M | 1,709 |
Class C A | 1,625 |
| | $16,261 |
A When Class C shares are initially sold, FDC pays commissions from its own resources to financial intermediaries through which the sales are made.
Transfer Agent Fees. Fidelity Investments Institutional Operations Company LLC (FIIOC), an affiliate of the investment adviser, is the transfer, dividend disbursing and shareholder servicing agent for each class of the Fund. FIIOC receives account fees and asset-based fees that vary according to the account size and type of account of the shareholders of the respective classes of the Fund, except for Class K6 and Class Z. FIIOC receives an asset-based fee of Class K6's and Class Z's average net assets. FIIOC pays for typesetting, printing and mailing of shareholder reports, except proxy statements.
For the period, transfer agent fees for each class were as follows:
| | Amount | % of Class-Level Average Net Assets A |
| Class A | 57,914 | .16 |
| Class M | 9,372 | .16 |
| Class C | 11,048 | .16 |
| Strategic Real Return | 271,323 | .15 |
| Class K6 | 5,090 | .01 |
| Class I | 132,633 | .15 |
| Class Z | 21,375 | .05 |
| | $508,755 | |
A Annualized
Accounting Fees. Fidelity Service Company, Inc. (FSC), an affiliate of the investment adviser, maintains the Fund's accounting records. The accounting fee is based on the level of average net assets for each month. For the period, the fees were equivalent to the following annualized rates:
| | % of Average Net Assets |
| Fidelity Strategic Real Return Fund | .04 |
Brokerage Commissions. A portion of portfolio transactions were placed with brokerage firms which are affiliates of the investment adviser. Brokerage commissions are included in net realized gain (loss) and change in net unrealized appreciation (depreciation) in the Statement of Operations. The commissions paid to these affiliated firms were as follows:
| | Amount |
| Fidelity Strategic Real Return Fund | $1,299 |
Interfund Trades. Funds may purchase from or sell securities to other Fidelity Funds under procedures adopted by the Board. The procedures have been designed to ensure these interfund trades are executed in accordance with Rule 17a-7 of the 1940 Act. Any interfund trades are included within the respective purchases and sales amounts shown in the Purchases and Sales of Investments note. Interfund trades during the period are noted in the table below.
| | Purchases ($) | Sales ($) | Realized Gain (Loss) ($) |
| Fidelity Strategic Real Return Fund | 8,949,588 | 6,995,917 | (162,024) |
6. Committed Line of Credit.
Certain Funds participate with other funds managed by the investment adviser or an affiliate in a $4.25 billion credit facility (the "line of credit") to be utilized for temporary or emergency purposes to fund shareholder redemptions or for other short-term liquidity purposes. The participating funds have agreed to pay commitment fees on their pro-rata portion of the line of credit, which are reflected in Miscellaneous expenses on the Statement of Operations, and are listed below. During the period, there were no borrowings on this line of credit.
| | Amount |
| Fidelity Strategic Real Return Fund | $1,209 |
7. Security Lending.
Funds lend portfolio securities from time to time in order to earn additional income. Lending agents are used, including National Financial Services (NFS), an affiliate of the investment adviser. Pursuant to a securities lending agreement, NFS will receive a fee, which is capped at 9.9% of a fund's daily lending revenue, for its services as lending agent. A fund may lend securities to certain qualified borrowers, including NFS. On the settlement date of the loan, a fund receives collateral (in the form of U.S. Treasury obligations, letters of credit and/or cash) against the loaned securities and maintains collateral in an amount not less than 100% of the market value of the loaned securities during the period of the loan. The market value of the loaned securities is determined at the close of business of a fund and any additional required collateral is delivered to a fund on the next business day. A fund or borrower may terminate the loan at any time, and if the borrower defaults on its obligation to return the securities loaned because of insolvency or other reasons, a fund may apply collateral received from the borrower against the obligation. A fund may experience delays and costs in recovering the securities loaned. Any cash collateral received is invested in the Fidelity Securities Lending Cash Central Fund. Any loaned securities are identified as such in the Schedule of Investments, and the value of loaned securities and cash collateral at period end, as applicable, are presented in the Statement of Assets and Liabilities. Security lending income represents the income earned on investing cash collateral, less rebates paid to borrowers and any lending agent fees associated with the loan, plus any premium payments received for lending certain types of securities. Security lending income is presented in the Statement of Operations as a component of income from Fidelity Central Funds. Affiliated security lending activity, if any, was as follows:
| | Total Security Lending Fees Paid to NFS | Security Lending Income From Securities Loaned to NFS | Value of Securities Loaned to NFS at Period End |
| Fidelity Strategic Real Return Fund | $127 | $- | $- |
8. Expense Reductions.
The investment adviser contractually agreed to reimburse expenses of each class to the extent annual operating expenses exceeded certain levels of class-level average net assets as noted in the table below. This reimbursement will remain in place through January 31, 2024. Some expenses, for example the compensation of the independent Trustees, and certain miscellaneous expenses such as proxy and shareholder meeting expenses, are excluded from this reimbursement.
The following classes were in reimbursement during the period:
| | Expense Limitations | Reimbursement |
| Class A | .95% | $30,497 |
| Class M | .95% | 5,135 |
| Class C | 1.70% | 5,950 |
| Strategic Real Return | .70% | 135,902 |
| Class K6 | .51% | 64,360 |
| Class I | .70% | 68,353 |
| Class Z | .61% | 28,354 |
| | | $338,551 |
Through arrangements with each class' transfer agent, credits realized as a result of certain uninvested cash balances were used to reduce the Fund's expenses. During the period, transfer agent credits reduced each class' expenses as noted in the table below.
| | Expense reduction |
| | |
| Class M | $55 |
| Class K6 | 24 |
| | $79 |
In addition, during the period the investment adviser or an affiliate reimbursed and/or waived a portion of fund-level operating expenses in the amount of $8,988.
9. Distributions to Shareholders.
Distributions to shareholders of each class were as follows:
| | Six months ended March 31, 2023 | Year ended September 30, 2022 |
| Fidelity Strategic Real Return Fund | | |
| Distributions to shareholders | | |
| Class A | $ 4,411,776 | $2,558,277 |
| Class M | 673,085 | 452,232 |
| Class C | 764,393 | 302,603 |
| Strategic Real Return | 22,669,965 | 16,405,632 |
| Class K6 | 5,985,937 | 1,664,840 |
| Class I | 10,969,130 | 4,305,706 |
| Class Z | 5,254,128 | 3,768,829 |
Total | $50,728,414 | $29,458,119 |
10. Share Transactions.
Share transactions for each class were as follows and may contain in-kind transactions, automatic conversions between classes or exchanges between affiliated funds:
| | Shares | Shares | Dollars | Dollars |
| | Six months ended March 31, 2023 | Year ended September 30, 2022 | Six months ended March 31, 2023 | Year ended September 30, 2022 |
| Fidelity Strategic Real Return Fund | | | | |
| Class A | | | | |
| Shares sold | 950,831 | 6,550,405 | $8,009,340 | $61,426,775 |
| Reinvestment of distributions | 523,605 | 274,905 | 4,350,811 | 2,493,534 |
| Shares redeemed | (2,202,139) | (1,785,091) | (18,583,123) | (16,220,042) |
| Net increase (decrease) | (727,703) | 5,040,219 | $(6,222,972) | $47,700,267 |
| Class M | | | | |
| Shares sold | 162,584 | 795,336 | $1,374,954 | $7,458,038 |
| Reinvestment of distributions | 79,879 | 47,902 | 664,588 | 435,685 |
| Shares redeemed | (330,375) | (263,111) | (2,803,474) | (2,416,336) |
| Net increase (decrease) | (87,912) | 580,127 | $(763,932) | $5,477,387 |
| Class C | | | | |
| Shares sold | 319,013 | 1,731,586 | $2,654,586 | $15,968,842 |
| Reinvestment of distributions | 93,143 | 33,750 | 761,712 | 301,201 |
| Shares redeemed | (473,809) | (618,530) | (3,944,280) | (5,591,663) |
| Net increase (decrease) | (61,653) | 1,146,806 | $(527,982) | $10,678,380 |
| Strategic Real Return | | | | |
| Shares sold | 3,802,936 | 42,988,022 | $32,327,567 | $408,715,107 |
| Reinvestment of distributions | 2,439,496 | 1,684,332 | 20,374,156 | 15,374,384 |
| Shares redeemed | (12,545,066) | (24,480,044) | (106,415,511) | (224,776,864) |
| Net increase (decrease) | (6,302,634) | 20,192,310 | $(53,713,788) | $199,312,627 |
| Class K6 | | | | |
| Shares sold | 1,390,443 | 12,174,362 | $11,870,719 | $112,370,449 |
| Reinvestment of distributions | 714,202 | 182,287 | 5,985,937 | 1,664,840 |
| Shares redeemed | (1,955,571) | (2,925,773) | (16,595,703) | (26,962,436) |
| Net increase (decrease) | 149,074 | 9,430,876 | $1,260,953 | $87,072,853 |
| Class I | | | | |
| Shares sold | 4,978,094 | 23,043,950 | $42,306,580 | $215,368,359 |
| Reinvestment of distributions | 1,294,332 | 468,668 | 10,781,464 | 4,255,520 |
| Shares redeemed | (11,017,429) | (7,133,819) | (93,491,569) | (64,767,338) |
| Net increase (decrease) | (4,745,003) | 16,378,799 | $(40,403,525) | $154,856,541 |
| Class Z | | | | |
| Shares sold | 1,098,236 | 10,676,613 | $9,301,600 | $100,797,420 |
| Reinvestment of distributions | 502,804 | 369,813 | 4,189,936 | 3,368,369 |
| Shares redeemed | (3,422,113) | (6,842,448) | (28,820,131) | (62,607,085) |
| Net increase (decrease) | (1,821,073) | 4,203,978 | $(15,328,595) | $41,558,704 |
11. Other.
A fund's organizational documents provide former and current trustees and officers with a limited indemnification against liabilities arising in connection with the performance of their duties to the fund. In the normal course of business, a fund may also enter into contracts that provide general indemnifications. A fund's maximum exposure under these arrangements is unknown as this would be dependent on future claims that may be made against a fund. The risk of material loss from such claims is considered remote.
12. Risk and Uncertainties.
Many factors affect a fund's performance. Developments that disrupt global economies and financial markets, such as pandemics, epidemics, outbreaks of infectious diseases, war, terrorism, and environmental disasters, may significantly affect a fund's investment performance. The effects of these developments to a fund will be impacted by the types of securities in which a fund invests, the financial condition, industry, economic sector, and geographic location of an issuer, and a fund's level of investment in the securities of that issuer. Significant concentrations in security types, issuers, industries, sectors, and geographic locations may magnify the factors that affect a fund's performance.
As a shareholder, you incur two types of costs: (1) transaction costs, which may include sales charges (loads) on purchase payments or redemption proceeds, as applicable and (2) ongoing costs, which generally include management fees, distribution and/or service (12b-1) fees and other Fund expenses. This Example is intended to help you understand your ongoing costs (in dollars) of investing in a fund and to compare these costs with the ongoing costs of investing in other mutual funds.
| The Example is based on an investment of $1,000 invested at the beginning of the period and held for the entire period (October 1, 2022 to March 31, 2023). |
Actual Expenses
The first line of the accompanying table provides information about actual account values and actual expenses. You may use the information in this line, together with the amount you invested, to estimate the expenses that you paid over the period. Simply divide your account value by $1,000.00 (for example, an $8,600 account value divided by $1,000.00 = 8.6), then multiply the result by the number in the first line for a class/Fund under the heading entitled "Expenses Paid During Period" to estimate the expenses you paid on your account during this period. If any fund is a shareholder of any underlying mutual funds or exchange-traded funds (ETFs) (the Underlying Funds), such fund indirectly bears its proportional share of the expenses of the Underlying Funds in addition to the direct expenses incurred presented in the table. These fees and expenses are not included in the annualized expense ratio used to calculate the expense estimate in the table below.
Hypothetical Example for Comparison Purposes
The second line of the accompanying table provides information about hypothetical account values and hypothetical expenses based on the actual expense ratio and an assumed rate of return of 5% per year before expenses, which is not the actual return. The hypothetical account values and expenses may not be used to estimate the actual ending account balance or expenses you paid for the period. You may use this information to compare the ongoing costs of investing in the Fund and other funds. To do so, compare this 5% hypothetical example with the 5% hypothetical examples that appear in the shareholder reports of the other funds. If any fund is a shareholder of any Underlying Funds, such fund indirectly bears its proportional share of the expenses of the Underlying Funds in addition to the direct expenses as presented in the table. These fees and expenses are not included in the annualized expense ratio used to calculate the expense estimate in the table below.
Please note that the expenses shown in the table are meant to highlight your ongoing costs only and do not reflect any transaction costs. Therefore, the second line of the table is useful in comparing ongoing costs only, and will not help you determine the relative total costs of owning different funds. In addition, if these transactional costs were included, your costs would have been higher.
| | | | | Annualized Expense Ratio- A | | Beginning Account Value October 1, 2022 | | Ending Account Value March 31, 2023 | | Expenses Paid During Period- C October 1, 2022 to March 31, 2023 |
| Fidelity® Strategic Real Return Fund | | | | | | | | | | |
| Class A | | | | .95% | | | | | | |
| Actual | | | | | | $ 1,000 | | $ 1,045.20 | | $ 4.84 |
Hypothetical- B | | | | | | $ 1,000 | | $ 1,020.19 | | $ 4.78 |
| Class M | | | | .95% | | | | | | |
| Actual | | | | | | $ 1,000 | | $ 1,045.10 | | $ 4.84 |
Hypothetical- B | | | | | | $ 1,000 | | $ 1,020.19 | | $ 4.78 |
| Class C | | | | 1.70% | | | | | | |
| Actual | | | | | | $ 1,000 | | $ 1,040.70 | | $ 8.65 |
Hypothetical- B | | | | | | $ 1,000 | | $ 1,016.45 | | $ 8.55 |
| Fidelity® Strategic Real Return Fund | | | | .70% | | | | | | |
| Actual | | | | | | $ 1,000 | | $ 1,046.40 | | $ 3.57 |
Hypothetical- B | | | | | | $ 1,000 | | $ 1,021.44 | | $ 3.53 |
| Class K6 | | | | .51% | | | | | | |
| Actual | | | | | | $ 1,000 | | $ 1,048.20 | | $ 2.60 |
Hypothetical- B | | | | | | $ 1,000 | | $ 1,022.39 | | $ 2.57 |
| Class I | | | | .70% | | | | | | |
| Actual | | | | | | $ 1,000 | | $ 1,046.50 | | $ 3.57 |
Hypothetical- B | | | | | | $ 1,000 | | $ 1,021.44 | | $ 3.53 |
| Class Z | | | | .61% | | | | | | |
| Actual | | | | | | $ 1,000 | | $ 1,047.00 | | $ 3.11 |
Hypothetical- B | | | | | | $ 1,000 | | $ 1,021.89 | | $ 3.07 |
| |
A Annualized expense ratio reflects expenses net of applicable fee waivers.
B 5% return per year before expenses
C Expenses are equal to the annualized expense ratio, multiplied by the average account value over the period, multiplied by 182/ 365 (to reflect the one-half year period). The fees and expenses of any Underlying Funds are not included in each annualized expense ratio.
The Securities and Exchange Commission adopted Rule 22e-4 under the Investment Company Act of 1940 (the Liquidity Rule) to promote effective liquidity risk management throughout the open-end investment company industry, thereby reducing the risk that funds will be unable to meet their redemption obligations and mitigating dilution of the interests of fund shareholders.
The Fund has adopted and implemented a liquidity risk management program (the Program) reasonably designed to assess and manage the Fund's liquidity risk and to comply with the requirements of the Liquidity Rule. The Fund's Board of Trustees (the Board) has designated the Fund's investment adviser as administrator of the Program. The Fidelity advisers have established a Liquidity Risk Management Committee (the LRM Committee) to manage the Program for each of the Fidelity Funds. The LRM Committee monitors the adequacy and effectiveness of implementation of the Program and on a periodic basis assesses each Fund's liquidity risk based on a variety of factors including (1) the Fund's investment strategy, (2) portfolio liquidity and cash flow projections during normal and reasonably foreseeable stressed conditions, (3) shareholder redemptions, (4) borrowings and other funding sources and (5) certain factors specific to ETFs including the effect of the Fund's prices and spreads, market participants, and basket compositions on the overall liquidity of the Fund's portfolio, as applicable.
In accordance with the Program, each of the Fund's portfolio investments is classified into one of four defined liquidity categories based on a determination of a reasonable expectation for how long it would take to convert the investment to cash (or sell or dispose of the investment) without significantly changing its market value.
- Highly liquid investments - cash or convertible to cash within three business days or less
- Moderately liquid investments - convertible to cash in three to seven calendar days
- Less liquid investments - can be sold or disposed of, but not settled, within seven calendar days
- Illiquid investments - cannot be sold or disposed of within seven calendar days
Liquidity classification determinations take into account a variety of factors including various market, trading and investment-specific considerations, as well as market depth, and generally utilize analysis from a third-party liquidity metrics service.
The Liquidity Rule places a 15% limit on a fund's illiquid investments and requires funds that do not primarily hold assets that are highly liquid investments to determine and maintain a minimum percentage of the fund's net assets to be invested in highly liquid investments (highly liquid investment minimum or HLIM). The Program includes provisions reasonably designed to comply with the 15% limit on illiquid investments and for determining, periodically reviewing and complying with the HLIM requirement as applicable.
At a recent meeting of the Fund's Board of Trustees, the LRM Committee provided a written report to the Board pertaining to the operation, adequacy, and effectiveness of the Program for the period December 1, 2021 through November 30, 2022. The report concluded that the Program is operating effectively and is reasonably designed to assess and manage the Fund's liquidity risk.
1.814963.117
RRS-SANN-0523
Item 2.
Code of Ethics
Not applicable.
Item 3.
Audit Committee Financial Expert
Not applicable.
Item 4.
Principal Accountant Fees and Services
Not applicable.
Item 5.
Audit Committee of Listed Registrants
Not applicable.
Item 6.
Investments
(a)
Not applicable.
(b)
Not applicable
Item 7.
Disclosure of Proxy Voting Policies and Procedures for Closed-End Management Investment Companies
Not applicable.
Item 8.
Portfolio Managers of Closed-End Management Investment Companies
Not applicable.
Item 9.
Purchase of Equity Securities by Closed-End Management Investment Company and Affiliated Purchasers
Not applicable.
Item 10.
Submission of Matters to a Vote of Security Holders
There were no material changes to the procedures by which shareholders may recommend nominees to the Fidelity Salem Street Trust’s Board of Trustees.
Item 11.
Controls and Procedures
(a)(i) The President and Treasurer and the Chief Financial Officer have concluded that the Fidelity Salem Street Trust’s (the “Trust”) disclosure controls and procedures (as
defined in Rule 30a-3(c) under the Investment Company Act) provide reasonable assurances that material information relating to the Trust is made known to them by the appropriate persons, based on their evaluation of these controls and procedures as of a date within 90 days of the filing date of this report.
(a)(ii) There was no change in the Trust’s internal control over financial reporting (as defined in Rule 30a-3(d) under the Investment Company Act) that occurred during the period covered by this report that has materially affected, or is reasonably likely to materially affect, the Trust’s internal control over financial reporting.
Item 12.
Disclosure of Securities Lending Activities for Closed-End Management
Investment Companies
Not applicable.
Item 13.
Exhibits
SIGNATURES
Pursuant to the requirements of the Securities Exchange Act of 1934 and the Investment Company Act of 1940, the registrant has duly caused this report to be signed on its behalf by the undersigned, thereunto duly authorized.
Fidelity Salem Street Trust
| |
By: | /s/Laura M. Del Prato |
| Laura M. Del Prato |
| President and Treasurer |
|
|
Date: | May 19, 2023 |
Pursuant to the requirements of the Securities Exchange Act of 1934 and the Investment Company Act of 1940, this report has been signed below by the following persons on behalf of the registrant and in the capacities and on the dates indicated.
| |
By: | /s/Laura M. Del Prato |
| Laura M. Del Prato |
| President and Treasurer |
|
|
Date: | May 19, 2023 |
| |
By: | /s/John J. Burke III |
| John J. Burke III |
| Chief Financial Officer |
|
|
Date: | May 19, 2023 |