UNITED STATES
SECURITIES AND EXCHANGE COMMISSION
Washington, D.C. 20549
FORM N-CSR
CERTIFIED SHAREHOLDER REPORT OF REGISTERED
MANAGEMENT INVESTMENT COMPANIES
Investment Company Act file number 811-02105
Fidelity Salem Street Trust
(Exact name of registrant as specified in charter)
245 Summer St., Boston, MA 02210
(Address of principal executive offices) (Zip code)
Margaret Carey, Secretary
245 Summer St.
Boston, Massachusetts 02210
(Name and address of agent for service)
Registrant's telephone number, including area code:
617-563-7000
| |
Date of fiscal year end: | December 31 |
|
|
Date of reporting period: | June 30, 2023 |
Item 1.
Reports to Stockholders
Fidelity® Inflation-Protected Bond Index Fund
Semi-Annual Report
June 30, 2023
Contents
To view a fund's proxy voting guidelines and proxy voting record for the 12-month period ended June 30, visit http://www.fidelity.com/proxyvotingresults or visit the Securities and Exchange Commission's (SEC) web site at http://www.sec.gov.
You may also call 1-800-544-8544 to request a free copy of the proxy voting guidelines.
BLOOMBERG ® is a trademark and service mark of Bloomberg Finance L.P. and its affiliates (collectively "Bloomberg"). Bloomberg or Bloomberg's licensors own all proprietary rights in the Bloomberg Indices. Neither Bloomberg nor Bloomberg's licensors approves or endorses this material, or guarantees the accuracy or completeness of any information herein, or makes any warranty, express or implied, as to the results to be obtained therefrom and, to the maximum extent allowed by law, neither shall have any liability or responsibility for injury or damages arising in connection therewith.
Standard & Poor's, S&P and S&P 500 are registered service marks of The McGraw-Hill Companies, Inc. and have been licensed for use by Fidelity Distributors Corporation.
Other third-party marks appearing herein are the property of their respective owners.
All other marks appearing herein are registered or unregistered trademarks or service marks of FMR LLC or an affiliated company. © 2023 FMR LLC. All rights reserved.
This report and the financial statements contained herein are submitted for the general information of the shareholders of the Fund. This report is not authorized for distribution to prospective investors in the Fund unless preceded or accompanied by an effective prospectus.
A fund files its complete schedule of portfolio holdings with the SEC for the first and third quarters of each fiscal year on Form N-PORT. Forms N-PORT are available on the SEC's web site at http://www.sec.gov. A fund's Forms N-PORT may be reviewed and copied at the SEC's Public Reference Room in Washington, DC. Information regarding the operation of the SEC's Public Reference Room may be obtained by calling 1-800-SEC-0330.
For a complete list of a fund's portfolio holdings, view the most recent holdings listing, semiannual report, or annual report on Fidelity's web site at http://www.fidelity.com, http://www.institutional.fidelity.com, or http://www.401k.com, as applicable.
NOT FDIC INSURED •MAY LOSE VALUE •NO BANK GUARANTEE
Neither the Fund nor Fidelity Distributors Corporation is a bank.
| Coupon Distribution (% of Fund's Investments) |
| |
| 0.01 - 0.99% | 77.5 | |
| 1 - 1.99% | 10.6 | |
| 2 - 2.99% | 6.7 | |
| 3 - 3.99% | 5.1 | |
| Coupon distribution shows the range of stated interest rates on the fund's investments, excluding short-term investments. |
The coupon rates on inflation-protected securities tend to be lower than their nominal bond counterparts since inflation-protected securities get adjusted for actual inflation, while nominal bond coupon rates include a component for expected inflation. Please refer to the fund's prospectus for more information.
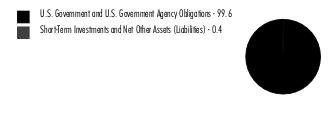
Asset Allocation (% of Fund's net assets) |
|
|
Inflation Protected Securities - 99.6%
Showing Percentage of Net Assets
| U.S. Treasury Inflation-Protected Obligations - 99.6% |
| | | Principal Amount (a) | Value ($) |
| U.S. Treasury Inflation-Indexed Bonds: | | | |
| 0.125% 2/15/51 | | 172,192,403 | 115,028,543 |
| 0.125% 2/15/52 | | 162,265,264 | 107,786,794 |
| 0.25% 2/15/50 | | 167,785,592 | 117,481,261 |
| 0.625% 2/15/43 | | 132,591,906 | 108,863,792 |
| 0.75% 2/15/42 | | 158,275,905 | 134,592,186 |
| 0.75% 2/15/45 | | 181,089,537 | 149,792,777 |
| 0.875% 2/15/47 | | 112,739,094 | 94,678,603 |
| 1% 2/15/46 | | 89,510,313 | 77,720,551 |
| 1% 2/15/48 | | 62,845,997 | 54,111,339 |
| 1% 2/15/49 | | 33,688,448 | 28,999,776 |
| 1.375% 2/15/44 | | 158,179,025 | 149,116,629 |
| 1.75% 1/15/28 | | 165,062,911 | 163,172,735 |
| 2.125% 2/15/40 | | 88,263,645 | 94,762,604 |
| 2.125% 2/15/41 | | 68,862,269 | 73,940,577 |
| 2.375% 1/15/25 | | 227,753,020 | 225,362,319 |
| 2.375% 1/15/27 | | 131,660,849 | 132,335,779 |
| 2.5% 1/15/29 | | 95,126,119 | 97,984,777 |
| 3.375% 4/15/32 | | 36,482,235 | 41,500,639 |
| 3.625% 4/15/28 | | 293,977,176 | 315,587,986 |
| 3.875% 4/15/29 | | 109,916,427 | 121,459,868 |
| U.S. Treasury Inflation-Indexed Notes: | | | |
| 0.125% 7/15/24 | | 240,229,008 | 233,010,403 |
| 0.125% 10/15/24 | | 362,439,890 | 349,573,227 |
| 0.125% 4/15/25 | | 202,721,192 | 192,843,534 |
| 0.125% 10/15/25 | | 255,835,591 | 242,549,390 |
| 0.125% 4/15/26 | | 160,412,766 | 150,422,642 |
| 0.125% 7/15/26 | | 257,615,907 | 242,002,605 |
| 0.125% 10/15/26 | | 345,572,607 | 323,088,540 |
| 0.125% 4/15/27 | | 364,127,716 | 337,072,499 |
| 0.125% 1/15/30 | | 249,667,350 | 224,017,138 |
| 0.125% 7/15/30 | | 308,009,441 | 276,300,917 |
| 0.125% 1/15/31 | | 347,969,504 | 309,352,520 |
| 0.125% 7/15/31 | | 318,744,226 | 282,747,841 |
| 0.125% 1/15/32 | | 355,560,813 | 313,133,431 |
| 0.25% 1/15/25 | | 280,160,911 | 268,559,709 |
| 0.25% 7/15/29 | | 275,895,759 | 251,985,937 |
| 0.375% 7/15/23 | | 110,803 | 110,707 |
| 0.375% 7/15/25 | | 363,242,756 | 347,605,449 |
| 0.375% 1/15/27 | | 303,477,408 | 284,777,746 |
| 0.375% 7/15/27 | | 359,200,766 | 336,760,617 |
| 0.5% 4/15/24 | | 6,014 | 5,868 |
| 0.5% 1/15/28 | | 335,999,939 | 314,333,769 |
| 0.625% 1/15/26 | | 356,175,515 | 339,630,080 |
| 0.625% 7/15/32 | | 376,401,655 | 346,105,136 |
| 0.75% 7/15/28 | | 216,059,156 | 204,776,618 |
| 0.875% 1/15/29 | | 253,552,190 | 240,050,069 |
| 1.125% 1/15/33 | | 364,288,834 | 349,193,595 |
| 1.25% 4/15/28 | | 123,388,360 | 119,413,241 |
| 1.5% 2/15/53 | | 9,389,060 | 9,123,014 |
| 1.625% 10/15/27 | | 38,300,592 | 37,743,203 |
| TOTAL U.S. TREASURY INFLATION-PROTECTED OBLIGATIONS (Cost $10,205,604,648) | | | 9,330,568,980 |
| | | | |
| Money Market Funds - 0.1% |
| | | Shares | Value ($) |
Fidelity Cash Central Fund 5.14% (b) (Cost $10,705,018) | | 10,702,877 | 10,705,018 |
| | | | |
| TOTAL INVESTMENT IN SECURITIES - 99.7% (Cost $10,216,309,666) | 9,341,273,998 |
NET OTHER ASSETS (LIABILITIES) - 0.3% | 27,097,892 |
| NET ASSETS - 100.0% | 9,368,371,890 |
| | |
Legend
| (a) | Amount is stated in United States dollars unless otherwise noted. |
| (b) | Affiliated fund that is generally available only to investment companies and other accounts managed by Fidelity Investments. The rate quoted is the annualized seven-day yield of the fund at period end. A complete unaudited listing of the fund's holdings as of its most recent quarter end is available upon request. In addition, each Fidelity Central Fund's financial statements are available on the SEC's website or upon request. |
Affiliated Central Funds
Fiscal year to date information regarding the Fund's investments in Fidelity Central Funds, including the ownership percentage, is presented below.
| Affiliate | Value, beginning of period ($) | Purchases ($) | Sales Proceeds ($) | Dividend Income ($) | Realized Gain (loss) ($) | Change in Unrealized appreciation (depreciation) ($) | Value, end of period ($) | % ownership, end of period |
| Fidelity Cash Central Fund 5.14% | 37,622,311 | 430,701,842 | 457,619,135 | 503,121 | - | - | 10,705,018 | 0.0% |
| Fidelity Securities Lending Cash Central Fund 5.14% | 265,125,000 | 508,056,591 | 773,181,591 | 218,470 | - | - | - | 0.0% |
| Total | 302,747,311 | 938,758,433 | 1,230,800,726 | 721,591 | - | - | 10,705,018 | |
| | | | | | | | | |
Amounts in the dividend income column in the above table include any capital gain distributions from underlying funds, which are presented in the corresponding line item in the Statement of Operations, if applicable.
Amounts in the dividend income column for Fidelity Securities Lending Cash Central Fund represents the income earned on investing cash collateral, less rebates paid to borrowers and any lending agent fees associated with the loan, plus any premium payments received for lending certain types of securities.
Amounts included in the purchases and sales proceeds columns may include in-kind transactions, if applicable.
Investment Valuation
The following is a summary of the inputs used, as of June 30, 2023, involving the Fund's assets and liabilities carried at fair value. The inputs or methodology used for valuing securities may not be an indication of the risk associated with investing in those securities. For more information on valuation inputs, and their aggregation into the levels used below, please refer to the Investment Valuation section in the accompanying Notes to Financial Statements.
| Valuation Inputs at Reporting Date: |
| Description | Total ($) | Level 1 ($) | Level 2 ($) | Level 3 ($) |
Investments in Securities: | | | | |
|
| U.S. Government and Government Agency Obligations | 9,330,568,980 | - | 9,330,568,980 | - |
|
| Money Market Funds | 10,705,018 | 10,705,018 | - | - |
| Total Investments in Securities: | 9,341,273,998 | 10,705,018 | 9,330,568,980 | - |
| Statement of Assets and Liabilities |
| | | | June 30, 2023 (Unaudited) |
| | | | | |
| Assets | | | | |
| Investment in securities, at value - See accompanying schedule: | | | | |
Unaffiliated issuers (cost $10,205,604,648) | $ | 9,330,568,980 | | |
Fidelity Central Funds (cost $10,705,018) | | 10,705,018 | | |
| | | | | |
| | | | | |
| Total Investment in Securities (cost $10,216,309,666) | | | $ | 9,341,273,998 |
| Receivable for investments sold | | | | 97,780,280 |
| Receivable for fund shares sold | | | | 42,094,254 |
| Interest receivable | | | | 25,598,475 |
| Distributions receivable from Fidelity Central Funds | | | | 48,009 |
| Other receivables | | | | 29,098 |
Total assets | | | | 9,506,824,114 |
| Liabilities | | | | |
| Payable for investments purchased | $ | 115,572,687 | | |
| Payable for fund shares redeemed | | 22,372,822 | | |
| Distributions payable | | 87,264 | | |
| Accrued management fee | | 390,359 | | |
| Other payables and accrued expenses | | 29,092 | | |
| Total Liabilities | | | | 138,452,224 |
| Net Assets | | | $ | 9,368,371,890 |
| Net Assets consist of: | | | | |
| Paid in capital | | | $ | 10,474,128,161 |
| Total accumulated earnings (loss) | | | | (1,105,756,271) |
| Net Assets | | | $ | 9,368,371,890 |
Net Asset Value , offering price and redemption price per share ($9,368,371,890 ÷ 1,018,741,249 shares) | | | $ | 9.20 |
| Statement of Operations |
| | | | Six months ended June 30, 2023 (Unaudited) |
| Investment Income | | | | |
| Interest | | | $ | 189,355,667 |
| Income from Fidelity Central Funds (including $218,470 from security lending) | | | | 721,591 |
| Total Income | | | | 190,077,258 |
| Expenses | | | | |
| Management fee | $ | 2,351,976 | | |
| Independent trustees' fees and expenses | | 16,610 | | |
| Total expenses before reductions | | 2,368,586 | | |
| Expense reductions | | (201) | | |
| Total expenses after reductions | | | | 2,368,385 |
| Net Investment income (loss) | | | | 187,708,873 |
| Realized and Unrealized Gain (Loss) | | | | |
| Net realized gain (loss) on: | | | | |
| Investment Securities: | | | | |
| Unaffiliated issuers | | (117,188,339) | | |
| Total net realized gain (loss) | | | | (117,188,339) |
| Change in net unrealized appreciation (depreciation) on investment securities | | | | 113,643,676 |
| Net gain (loss) | | | | (3,544,663) |
| Net increase (decrease) in net assets resulting from operations | | | $ | 184,164,210 |
| Statement of Changes in Net Assets |
| |
| | Six months ended June 30, 2023 (Unaudited) | | Year ended December 31, 2022 |
| Increase (Decrease) in Net Assets | | | | |
| Operations | | | | |
| Net investment income (loss) | $ | 187,708,873 | $ | 770,363,608 |
| Net realized gain (loss) | | (117,188,339) | | (292,666,217) |
| Change in net unrealized appreciation (depreciation) | | 113,643,676 | | (1,875,046,947) |
| Net increase (decrease) in net assets resulting from operations | | 184,164,210 | | (1,397,349,556) |
| Distributions to shareholders | | (3,554,125) | | (772,691,228) |
| | | | | |
| Share transactions | | | | |
| Proceeds from sales of shares | | 1,716,935,749 | | 4,604,531,508 |
| Reinvestment of distributions | | 3,279,093 | | 714,010,214 |
| Cost of shares redeemed | | (1,788,503,611) | | (5,664,287,113) |
| | | | | |
Net increase (decrease) in net assets resulting from share transactions | | (68,288,769) | | (345,745,391) |
| Total increase (decrease) in net assets | | 112,321,316 | | (2,515,786,175) |
| | | | | |
| Net Assets | | | | |
| Beginning of period | | 9,256,050,574 | | 11,771,836,749 |
| End of period | $ | 9,368,371,890 | $ | 9,256,050,574 |
| | | | | |
| Other Information | | | | |
| Shares | | | | |
| Sold | | 186,260,072 | | 439,922,023 |
| Issued in reinvestment of distributions | | 354,519 | | 78,722,208 |
| Redeemed | | (193,941,417) | | (547,695,637) |
| Net increase (decrease) | | (7,326,826) | | (29,051,406) |
| | | | | |
| Fidelity® Inflation-Protected Bond Index Fund |
| |
| | Six months ended (Unaudited) June 30, 2023 | | Years ended December 31, 2022 | | 2021 | | 2020 | | 2019 | | 2018 |
Selected Per-Share Data | | | | | | | | | | | | |
| Net asset value, beginning of period | $ | 9.02 | $ | 11.16 | $ | 11.04 | $ | 10.08 | $ | 9.49 | $ | 9.84 |
| Income from Investment Operations | | | | | | | | | | | | |
Net investment income (loss) A,B | | .184 | | .748 | | .593 | | .157 | | .233 | | .262 |
| Net realized and unrealized gain (loss) | | (.001) | | (2.088) | | .058 | | .940 | | .555 | | (.398) |
| Total from investment operations | | .183 | | (1.340) | | .651 | | 1.097 | | .788 | | (.136) |
| Distributions from net investment income | | (.003) | | (.800) | | (.531) | | (.027) | | (.041) | | (.031) |
| Distributions from net realized gain | | - | | - | | - | | (.110) | | (.157) | | (.183) |
| Total distributions | | (.003) | | (.800) | | (.531) | | (.137) | | (.198) | | (.214) |
| Net asset value, end of period | $ | 9.20 | $ | 9.02 | $ | 11.16 | $ | 11.04 | $ | 10.08 | $ | 9.49 |
Total Return C,D | | 2.03% | | (12.05)% | | 5.93% | | 10.90% | | 8.31% | | (1.37)% |
Ratios to Average Net Assets B,E,F | | | | | | | | | | | | |
| Expenses before reductions | | .05% G | | .05% | | .05% | | .05% | | .05% | | .05% |
| Expenses net of fee waivers, if any | | .05% G | | .05% | | .05% | | .05% | | .05% | | .05% |
| Expenses net of all reductions | | .05% G | | .05% | | .05% | | .05% | | .05% | | .05% |
| Net investment income (loss) | | 4.02% G | | 7.22% | | 5.27% | | 1.47% | | 2.34% | | 2.71% |
| Supplemental Data | | | | | | | | | | | | |
| Net assets, end of period (000 omitted) | $ | 9,368,372 | $ | 9,256,051 | $ | 11,771,837 | $ | 8,950,534 | $ | 7,066,927 | $ | 4,929,939 |
Portfolio turnover rate H | | 31% G | | 28% | | 22% | | 31% | | 33% | | 41% I,J |
A Calculated based on average shares outstanding during the period.
B Net investment income (loss) is affected by the timing of the declaration of dividends by any underlying mutual funds or exchange-traded funds (ETFs). Net investment income (loss) of any mutual funds or ETFs is not included in the Fund's net investment income (loss) ratio.
C Total returns for periods of less than one year are not annualized.
D Total returns would have been lower if certain expenses had not been reduced during the applicable periods shown.
E Fees and expenses of any underlying mutual funds or exchange-traded funds (ETFs) are not included in the Fund's expense ratio. The Fund indirectly bears its proportionate share of these expenses. For additional expense information related to investments in Fidelity Central Funds, please refer to the "Investments in Fidelity Central Funds" note found in the Notes to Financial Statements section of the most recent Annual or Semi-Annual report.
F Expense ratios reflect operating expenses of the class. Expenses before reductions do not reflect amounts reimbursed, waived, or reduced through arrangements with the investment adviser, brokerage services, or other offset arrangements, if applicable, and do not represent the amount paid by the class during periods when reimbursements, waivers or reductions occur.
G Annualized.
H Amount does not include the portfolio activity of any underlying mutual funds or exchange-traded funds (ETFs).
I Portfolio turnover rate excludes securities received or delivered in-kind.
J The portfolio turnover rate does not include the assets acquired in the merger.
For the period ended June 30, 2023
1. Organization.
Fidelity Inflation-Protected Bond Index Fund (the Fund) is a fund of Fidelity Salem Street Trust (the Trust) and is authorized to issue an unlimited number of shares. Share transactions on the Statement of Changes in Net Assets may contain exchanges between affiliated funds. The Trust is registered under the Investment Company Act of 1940, as amended (the 1940 Act), as an open-end management investment company organized as a Massachusetts business trust.
2. Investments in Fidelity Central Funds.
Funds may invest in Fidelity Central Funds, which are open-end investment companies generally available only to other investment companies and accounts managed by the investment adviser and its affiliates. The Schedule of Investments lists any Fidelity Central Funds held as an investment as of period end, but does not include the underlying holdings of each Fidelity Central Fund. An investing fund indirectly bears its proportionate share of the expenses of the underlying Fidelity Central Funds.
Based on its investment objective, each Fidelity Central Fund may invest or participate in various investment vehicles or strategies that are similar to those of the investing fund. These strategies are consistent with the investment objectives of the investing fund and may involve certain economic risks which may cause a decline in value of each of the Fidelity Central Funds and thus a decline in the value of the investing fund.
| Fidelity Central Fund | Investment Manager | Investment Objective | Investment Practices | Expense Ratio A |
| Fidelity Money Market Central Funds | Fidelity Management & Research Company LLC (FMR) | Each fund seeks to obtain a high level of current income consistent with the preservation of capital and liquidity. | Short-term Investments | Less than .005% |
A Expenses expressed as a percentage of average net assets and are as of each underlying Central Fund's most recent annual or semi-annual shareholder report.
A complete unaudited list of holdings for each Fidelity Central Fund is available upon request or at the Securities and Exchange Commission website at www.sec.gov. In addition, the financial statements of the Fidelity Central Funds which contain the significant accounting policies (including investment valuation policies) of those funds, and are not covered by the Report of Independent Registered Public Accounting Firm, are available on the Securities and Exchange Commission website or upon request.
3. Significant Accounting Policies.
The Fund is an investment company and applies the accounting and reporting guidance of the Financial Accounting Standards Board (FASB) Accounting Standards Codification Topic 946 Financial Services - Investment Companies . The financial statements have been prepared in conformity with accounting principles generally accepted in the United States of America (GAAP), which require management to make certain estimates and assumptions at the date of the financial statements. Actual results could differ from those estimates. Subsequent events, if any, through the date that the financial statements were issued have been evaluated in the preparation of the financial statements. The Fund's Schedule of Investments lists any underlying mutual funds or exchange-traded funds (ETFs) but does not include the underlying holdings of these funds. The following summarizes the significant accounting policies of the Fund:
Investment Valuation. Investments are valued as of 4:00 p.m. Eastern time on the last calendar day of the period. The Board of Trustees (the Board) has designated the Fund's investment adviser as the valuation designee responsible for the fair valuation function and performing fair value determinations as needed. The investment adviser has established a Fair Value Committee (the Committee) to carry out the day-to-day fair valuation responsibilities and has adopted policies and procedures to govern the fair valuation process and the activities of the Committee. In accordance with these fair valuation policies and procedures, which have been approved by the Board, the Fund attempts to obtain prices from one or more third party pricing services or brokers to value its investments. When current market prices, quotations or currency exchange rates are not readily available or reliable, investments will be fair valued in good faith by the Committee, in accordance with the policies and procedures. Factors used in determining fair value vary by investment type and may include market or investment specific events, transaction data, estimated cash flows, and market observations of comparable investments. The frequency that the fair valuation procedures are used cannot be predicted and they may be utilized to a significant extent. The Committee manages the Fund's fair valuation practices and maintains the fair valuation policies and procedures. The Fund's investment adviser reports to the Board information regarding the fair valuation process and related material matters.
The Fund categorizes the inputs to valuation techniques used to value its investments into a disclosure hierarchy consisting of three levels as shown below:
Level 1 - unadjusted quoted prices in active markets for identical investments
Level 2 - other significant observable inputs (including quoted prices for similar investments, interest rates, prepayment speeds, etc.)
Level 3 - unobservable inputs (including the Fund's own assumptions based on the best information available)
Valuation techniques used to value the Fund's investments by major category are as follows:
Debt securities, including restricted securities, are valued based on evaluated prices received from third party pricing services or from brokers who make markets in such securities. U.S. government and government agency obligations are valued by pricing services who utilize matrix pricing which considers yield or price of bonds of comparable quality, coupon, maturity and type or by broker-supplied prices. When independent prices are unavailable or unreliable, debt securities may be valued utilizing pricing methodologies which consider similar factors that would be used by third party pricing services. Debt securities are generally categorized as Level 2 in the hierarchy but may be Level 3 depending on the circumstances.
Investments in open-end mutual funds, including the Fidelity Central Funds, are valued at their closing net asset value (NAV) each business day and are categorized as Level 1 in the hierarchy.
Changes in valuation techniques may result in transfers in or out of an assigned level within the disclosure hierarchy. The aggregate value of investments by input level as of June 30, 2023 is included at the end of the Fund's Schedule of Investments.
Investment Transactions and Income. For financial reporting purposes, the Fund's investment holdings and NAV include trades executed through the end of the last business day of the period. The NAV per share for processing shareholder transactions is calculated as of the close of business of the New York Stock Exchange (NYSE), normally 4:00 p.m. Eastern time and includes trades executed through the end of the prior business day. Gains and losses on securities sold are determined on the basis of identified cost. Income and capital gain distributions from Fidelity Central Funds, if any, are recorded on the ex-dividend date. Interest income is accrued as earned and includes coupon interest and amortization of premium and accretion of discount on debt securities as applicable. For Treasury Inflation-Protected Securities (TIPS) the principal amount is adjusted daily to keep pace with inflation. Interest is accrued based on the adjusted principal amount. The adjustments to principal due to inflation are reflected as increases or decreases to Interest in the accompanying Statement of Operations. Such adjustments may result in negative Interest and may have a significant impact on the Fund's distributions.
Expenses. Expenses directly attributable to a fund are charged to that fund. Expenses attributable to more than one fund are allocated among the respective funds on the basis of relative net assets or other appropriate methods. Expenses included in the accompanying financial statements reflect the expenses of that fund and do not include any expenses associated with any underlying mutual funds or exchange-traded funds. Although not included in a fund's expenses, a fund indirectly bears its proportionate share of these expenses through the net asset value of each underlying mutual fund or exchange-traded fund. Expense estimates are accrued in the period to which they relate and adjustments are made when actual amounts are known.
Deferred Trustee Compensation. Under a Deferred Compensation Plan (the Plan) for certain Funds, certain independent Trustees have elected to defer receipt of a portion of their annual compensation. Deferred amounts are invested in affiliated mutual funds, are marked-to-market and remain in a fund until distributed in accordance with the Plan. The investment of deferred amounts and the offsetting payable to the Trustees presented below are included in the accompanying Statement of Assets and Liabilities in other receivables and other payables and accrued expenses, as applicable.
| Fidelity Inflation-Protected Bond Index Fund | $29,092 |
Income Tax Information and Distributions to Shareholders. Each year, the Fund intends to qualify as a regulated investment company under Subchapter M of the Internal Revenue Code, including distributing substantially all of its taxable income and realized gains. As a result, no provision for U.S. Federal income taxes is required. The Fund files a U.S. federal tax return, in addition to state and local tax returns as required. The Fund's federal income tax returns are subject to examination by the Internal Revenue Service (IRS) for a period of three fiscal years after they are filed. State and local tax returns may be subject to examination for an additional fiscal year depending on the jurisdiction.
Distributions are declared and recorded daily and paid monthly from net investment income. Distributions from realized gains, if any, are declared and recorded on the ex-dividend date. Income and capital gain distributions are determined in accordance with income tax regulations, which may differ from GAAP.
Capital accounts within the financial statements are adjusted for permanent book-tax differences. These adjustments have no impact on net assets or the results of operations. Capital accounts are not adjusted for temporary book-tax differences which will reverse in a subsequent period.
Book-tax differences are primarily due to market discount, capital loss carryforwards and losses deferred due to wash sales.
As of period end, the cost and unrealized appreciation (depreciation) in securities, and derivatives if applicable, for federal income tax purposes were as follows:
| Gross unrealized appreciation | $3,570,455 |
| Gross unrealized depreciation | (872,492,492) |
| Net unrealized appreciation (depreciation) | $(868,922,037) |
| Tax cost | $10,210,196,035 |
Capital loss carryforwards are only available to offset future capital gains of the Fund to the extent provided by regulations and may be limited. The capital loss carryforward information presented below, including any applicable limitation, is estimated as of prior fiscal period end and is subject to adjustment.
| Short-term | $(157,662,968) |
| Long-term | (106,828,631) |
| Total capital loss carryforward | $(264,491,599) |
4. Fees and Other Transactions with Affiliates.
Management Fee. Fidelity Management & Research Company LLC (the investment adviser) and its affiliates provide the Fund with investment management related services for which the Fund pays a monthly management fee. The management fee is based on an annual rate of .05% of the Fund's average net assets. Under the management contract, the investment adviser pays all other operating expenses, except the compensation of the independent Trustees and certain other expenses such as interest expense.
Interfund Trades. Funds may purchase from or sell securities to other Fidelity Funds under procedures adopted by the Board. The procedures have been designed to ensure these interfund trades are executed in accordance with Rule 17a-7 of the 1940 Act. Any interfund trades are included within the respective purchases and sales amounts shown in the Purchases and Sales of Investments note. During the period, there were no interfund trades.
5. Committed Line of Credit.
Certain Funds participate with other funds managed by the investment adviser or an affiliate in a $4.25 billion credit facility (the "line of credit") to be utilized for temporary or emergency purposes to fund shareholder redemptions or for other short-term liquidity purposes. The commitment fees on the pro-rata portion of the line of credit are borne by the investment adviser. During the period, there were no borrowings on this line of credit.
6. Security Lending.
Funds lend portfolio securities from time to time in order to earn additional income. Lending agents are used, including National Financial Services (NFS), an affiliate of the investment adviser. Pursuant to a securities lending agreement, NFS will receive a fee, which is capped at 9.9% of a fund's daily lending revenue, for its services as lending agent. A fund may lend securities to certain qualified borrowers, including NFS. On the settlement date of the loan, a fund receives collateral (in the form of U.S. Treasury obligations, letters of credit and/or cash) against the loaned securities and maintains collateral in an amount not less than 100% of the market value of the loaned securities during the period of the loan. The market value of the loaned securities is determined at the close of business of a fund and any additional required collateral is delivered to a fund on the next business day. A fund or borrower may terminate the loan at any time, and if the borrower defaults on its obligation to return the securities loaned because of insolvency or other reasons, a fund may apply collateral received from the borrower against the obligation. A fund may experience delays and costs in recovering the securities loaned. Any cash collateral received is invested in the Fidelity Securities Lending Cash Central Fund. Any loaned securities are identified as such in the Schedule of Investments, and the value of loaned securities and cash collateral at period end, as applicable, are presented in the Statement of Assets and Liabilities. Security lending income represents the income earned on investing cash collateral, less rebates paid to borrowers and any lending agent fees associated with the loan, plus any premium payments received for lending certain types of securities. Security lending income is presented in the Statement of Operations as a component of income from Fidelity Central Funds. Affiliated security lending activity, if any, was as follows:
| | Total Security Lending Fees Paid to NFS | Security Lending Income From Securities Loaned to NFS | Value of Securities Loaned to NFS at Period End |
| Fidelity Inflation-Protected Bond Index Fund | $23,102 | $- | $- |
7. Expense Reductions.
Through arrangements with the Fund's custodian, credits realized as a result of certain uninvested cash balances were used to reduce the Fund's expenses by $201.
8. Other.
A fund's organizational documents provide former and current trustees and officers with a limited indemnification against liabilities arising in connection with the performance of their duties to the fund. In the normal course of business, a fund may also enter into contracts that provide general indemnifications. A fund's maximum exposure under these arrangements is unknown as this would be dependent on future claims that may be made against a fund. The risk of material loss from such claims is considered remote.
9. Risk and Uncertainties.
Many factors affect a fund's performance. Developments that disrupt global economies and financial markets, such as pandemics, epidemics, outbreaks of infectious diseases, war, terrorism, and environmental disasters, may significantly affect a fund's investment performance. The effects of these developments to a fund will be impacted by the types of securities in which a fund invests, the financial condition, industry, economic sector, and geographic location of an issuer, and a fund's level of investment in the securities of that issuer. Significant concentrations in security types, issuers, industries, sectors, and geographic locations may magnify the factors that affect a fund's performance.
As a shareholder, you incur two types of costs: (1) transaction costs, which may include sales charges (loads) on purchase payments or redemption proceeds, as applicable and (2) ongoing costs, which generally include management fees, distribution and/or service (12b-1) fees and other Fund expenses. This Example is intended to help you understand your ongoing costs (in dollars) of investing in a fund and to compare these costs with the ongoing costs of investing in other mutual funds.
| The Example is based on an investment of $1,000 invested at the beginning of the period and held for the entire period (January 1, 2023 to June 30, 2023). |
Actual Expenses
The first line of the accompanying table provides information about actual account values and actual expenses. You may use the information in this line, together with the amount you invested, to estimate the expenses that you paid over the period. Simply divide your account value by $1,000.00 (for example, an $8,600 account value divided by $1,000.00 = 8.6), then multiply the result by the number in the first line for a class/Fund under the heading entitled "Expenses Paid During Period" to estimate the expenses you paid on your account during this period. If any fund is a shareholder of any underlying mutual funds or exchange-traded funds (ETFs) (the Underlying Funds), such fund indirectly bears its proportional share of the expenses of the Underlying Funds in addition to the direct expenses incurred presented in the table. These fees and expenses are not included in the annualized expense ratio used to calculate the expense estimate in the table below.
Hypothetical Example for Comparison Purposes
The second line of the accompanying table provides information about hypothetical account values and hypothetical expenses based on the actual expense ratio and an assumed rate of return of 5% per year before expenses, which is not the actual return. The hypothetical account values and expenses may not be used to estimate the actual ending account balance or expenses you paid for the period. You may use this information to compare the ongoing costs of investing in the Fund and other funds. To do so, compare this 5% hypothetical example with the 5% hypothetical examples that appear in the shareholder reports of the other funds. If any fund is a shareholder of any Underlying Funds, such fund indirectly bears its proportional share of the expenses of the Underlying Funds in addition to the direct expenses as presented in the table. These fees and expenses are not included in the annualized expense ratio used to calculate the expense estimate in the table below.
Please note that the expenses shown in the table are meant to highlight your ongoing costs only and do not reflect any transaction costs. Therefore, the second line of the table is useful in comparing ongoing costs only, and will not help you determine the relative total costs of owning different funds. In addition, if these transactional costs were included, your costs would have been higher.
| | | | | Annualized Expense Ratio- A | | Beginning Account Value January 1, 2023 | | Ending Account Value June 30, 2023 | | Expenses Paid During Period- C January 1, 2023 to June 30, 2023 |
| | | | | | | | | | |
| Fidelity® Inflation-Protected Bond Index Fund | | | | .05% | | | | | | |
| Actual | | | | | | $ 1,000 | | $ 1,020.30 | | $ .25 |
Hypothetical- B | | | | | | $ 1,000 | | $ 1,024.55 | | $ .25 |
| |
A Annualized expense ratio reflects expenses net of applicable fee waivers.
B 5% return per year before expenses
C Expenses are equal to the annualized expense ratio, multiplied by the average account value over the period, multiplied by 181/ 365 (to reflect the one-half year period). The fees and expenses of any Underlying Funds are not included in each annualized expense ratio.
The Securities and Exchange Commission adopted Rule 22e-4 under the Investment Company Act of 1940 (the Liquidity Rule) to promote effective liquidity risk management throughout the open-end investment company industry, thereby reducing the risk that funds will be unable to meet their redemption obligations and mitigating dilution of the interests of fund shareholders.
The Fund has adopted and implemented a liquidity risk management program (the Program) reasonably designed to assess and manage the Fund's liquidity risk and to comply with the requirements of the Liquidity Rule. The Fund's Board of Trustees (the Board) has designated the Fund's investment adviser as administrator of the Program. The Fidelity advisers have established a Liquidity Risk Management Committee (the LRM Committee) to manage the Program for each of the Fidelity Funds. The LRM Committee monitors the adequacy and effectiveness of implementation of the Program and on a periodic basis assesses each Fund's liquidity risk based on a variety of factors including (1) the Fund's investment strategy, (2) portfolio liquidity and cash flow projections during normal and reasonably foreseeable stressed conditions, (3) shareholder redemptions, (4) borrowings and other funding sources and (5) certain factors specific to ETFs including the effect of the Fund's prices and spreads, market participants, and basket compositions on the overall liquidity of the Fund's portfolio, as applicable.
In accordance with the Program, each of the Fund's portfolio investments is classified into one of four defined liquidity categories based on a determination of a reasonable expectation for how long it would take to convert the investment to cash (or sell or dispose of the investment) without significantly changing its market value.
- Highly liquid investments - cash or convertible to cash within three business days or less
- Moderately liquid investments - convertible to cash in three to seven calendar days
- Less liquid investments - can be sold or disposed of, but not settled, within seven calendar days
- Illiquid investments - cannot be sold or disposed of within seven calendar days
Liquidity classification determinations take into account a variety of factors including various market, trading and investment-specific considerations, as well as market depth, and generally utilize analysis from a third-party liquidity metrics service.
The Liquidity Rule places a 15% limit on a fund's illiquid investments and requires funds that do not primarily hold assets that are highly liquid investments to determine and maintain a minimum percentage of the fund's net assets to be invested in highly liquid investments (highly liquid investment minimum or HLIM). The Program includes provisions reasonably designed to comply with the 15% limit on illiquid investments and for determining, periodically reviewing and complying with the HLIM requirement as applicable.
At a recent meeting of the Fund's Board of Trustees, the LRM Committee provided a written report to the Board pertaining to the operation, adequacy, and effectiveness of the Program for the period December 1, 2021 through November 30, 2022. The report concluded that the Program is operating effectively and is reasonably designed to assess and manage the Fund's liquidity risk.
1.939241.110
PIB-I-PIB-AI-SANN-0823
Fidelity® Series 0-5 Year Inflation-Protected Bond Index Fund
Fidelity® Series 5+ Year Inflation-Protected Bond Index Fund
Semi-Annual Report
June 30, 2023
Contents
To view a fund's proxy voting guidelines and proxy voting record for the 12-month period ended June 30, visit http://www.fidelity.com/proxyvotingresults or visit the Securities and Exchange Commission's (SEC) web site at http://www.sec.gov.
You may also call 1-800-544-8544 to request a free copy of the proxy voting guidelines.
BLOOMBERG ® is a trademark and service mark of Bloomberg Finance L.P. and its affiliates (collectively "Bloomberg"). Bloomberg or Bloomberg's licensors own all proprietary rights in the Bloomberg Indices. Neither Bloomberg nor Bloomberg's licensors approves or endorses this material, or guarantees the accuracy or completeness of any information herein, or makes any warranty, express or implied, as to the results to be obtained therefrom and, to the maximum extent allowed by law, neither shall have any liability or responsibility for injury or damages arising in connection therewith.
Standard & Poor's, S&P and S&P 500 are registered service marks of The McGraw-Hill Companies, Inc. and have been licensed for use by Fidelity Distributors Corporation.
Other third-party marks appearing herein are the property of their respective owners.
All other marks appearing herein are registered or unregistered trademarks or service marks of FMR LLC or an affiliated company. © 2023 FMR LLC. All rights reserved.
This report and the financial statements contained herein are submitted for the general information of the shareholders of the Funds. This report is not authorized for distribution to prospective investors in the Funds unless preceded or accompanied by an effective prospectus.
A fund files its complete schedule of portfolio holdings with the SEC for the first and third quarters of each fiscal year on Form N-PORT. Forms N-PORT are available on the SEC's web site at http://www.sec.gov. A fund's Forms N-PORT may be reviewed and copied at the SEC's Public Reference Room in Washington, DC. Information regarding the operation of the SEC's Public Reference Room may be obtained by calling 1-800-SEC-0330.
For a complete list of a fund's portfolio holdings, view the most recent holdings listing, semiannual report, or annual report on Fidelity's web site at http://www.fidelity.com, http://www.institutional.fidelity.com, or http://www.401k.com, as applicable.
NOT FDIC INSURED •MAY LOSE VALUE •NO BANK GUARANTEE
Neither the Funds nor Fidelity Distributors Corporation is a bank.
| Coupon Distribution (% of Fund's Investments) |
| |
| 0.01 - 0.99% | 80.8 | |
| 1 - 1.99% | 12.6 | |
| 2 - 2.99% | 6.3 | |
| 3 - 3.99% | 0.3 | |
| Coupon distribution shows the range of stated interest rates on the fund's investments, excluding short-term investments. |
The coupon rates on inflation-protected securities tend to be lower than their nominal bond counterparts since inflation-protected securities get adjusted for actual inflation, while nominal bond coupon rates include a component for expected inflation. Please refer to the fund's prospectus for more information.
Asset Allocation (% of Fund's net assets) |
|
|
Inflation Protected Securities - 99.7%.
Fidelity® Series 0-5 Year Inflation-Protected Bond Index Fund
| U.S. Treasury Inflation-Protected Obligations - 99.7% |
| | | Principal Amount (a) | Value ($) |
| U.S. Treasury Inflation-Indexed Bonds: | | | |
| 1.75% 1/15/28 | | 166,671,706 | 164,763,107 |
| 2% 1/15/26 | | 78,840,508 | 77,791,546 |
| 2.375% 1/15/25 | | 239,961,294 | 237,442,443 |
| 2.375% 1/15/27 | | 123,713,632 | 124,347,822 |
| 3.625% 4/15/28 | | 18,381,076 | 19,732,303 |
| U.S. Treasury Inflation-Indexed Notes: | | | |
| 0.125% 7/15/24 | | 414,219,049 | 401,772,242 |
| 0.125% 10/15/24 | | 293,580,816 | 283,158,658 |
| 0.125% 4/15/25 | | 367,464,692 | 349,559,853 |
| 0.125% 10/15/25 | | 427,361,184 | 405,167,217 |
| 0.125% 4/15/26 | | 199,230,613 | 186,823,005 |
| 0.125% 7/15/26 | | 331,127,449 | 311,058,841 |
| 0.125% 10/15/26 | | 347,809,600 | 325,179,987 |
| 0.125% 4/15/27 | | 572,031,856 | 529,529,061 |
| 0.25% 1/15/25 | | 421,578,906 | 404,121,717 |
| 0.375% 7/15/23 | | 421,259,101 | 420,896,484 |
| 0.375% 7/15/25 | | 368,832,652 | 352,954,704 |
| 0.375% 1/15/27 | | 309,303,297 | 290,244,655 |
| 0.375% 7/15/27 | | 514,724,258 | 482,568,176 |
| 0.5% 4/15/24 | | 198,732,655 | 193,904,549 |
| 0.5% 1/15/28 | | 179,004,668 | 167,461,970 |
| 0.625% 1/15/24 | | 406,283,349 | 399,348,883 |
| 0.625% 1/15/26 | | 112,350,466 | 107,131,446 |
| 1.25% 4/15/28 | | 519,040,216 | 502,318,650 |
| 1.625% 10/15/27 | | 208,195,464 | 205,165,594 |
| TOTAL U.S. TREASURY INFLATION-PROTECTED OBLIGATIONS (Cost $7,349,267,947) | | | 6,942,442,913 |
| | | | |
| TOTAL INVESTMENT IN SECURITIES - 99.7% (Cost $7,349,267,947) | 6,942,442,913 |
NET OTHER ASSETS (LIABILITIES) - 0.3% | 19,503,736 |
| NET ASSETS - 100.0% | 6,961,946,649 |
| | |
Legend
| (a) | Amount is stated in United States dollars unless otherwise noted. |
Affiliated Central Funds
Fiscal year to date information regarding the Fund's investments in Fidelity Central Funds, including the ownership percentage, is presented below.
| Affiliate | Value, beginning of period ($) | Purchases ($) | Sales Proceeds ($) | Dividend Income ($) | Realized Gain (loss) ($) | Change in Unrealized appreciation (depreciation) ($) | Value, end of period ($) | % ownership, end of period |
| Fidelity Cash Central Fund 5.14% | 44,118,348 | 1,232,992,446 | 1,277,110,794 | 1,914,411 | - | - | - | 0.0% |
| Total | 44,118,348 | 1,232,992,446 | 1,277,110,794 | 1,914,411 | - | - | - | |
| | | | | | | | | |
Amounts in the dividend income column in the above table include any capital gain distributions from underlying funds, which are presented in the corresponding line item in the Statement of Operations, if applicable.
Amounts included in the purchases and sales proceeds columns may include in-kind transactions, if applicable.
Investment Valuation
The following is a summary of the inputs used, as of June 30, 2023, involving the Fund's assets and liabilities carried at fair value. The inputs or methodology used for valuing securities may not be an indication of the risk associated with investing in those securities. For more information on valuation inputs, and their aggregation into the levels used below, please refer to the Investment Valuation section in the accompanying Notes to Financial Statements.
| Valuation Inputs at Reporting Date: |
| Description | Total ($) | Level 1 ($) | Level 2 ($) | Level 3 ($) |
Investments in Securities: | | | | |
|
| U.S. Government and Government Agency Obligations | 6,942,442,913 | - | 6,942,442,913 | - |
| | | | | |
| Total Investments in Securities: | 6,942,442,913 | - | 6,942,442,913 | - |
Fidelity® Series 0-5 Year Inflation-Protected Bond Index Fund
| Statement of Assets and Liabilities |
| | | | June 30, 2023 (Unaudited) |
| | | | | |
| Assets | | | | |
Investment in securities, at value - See accompanying schedule Unaffiliated issuers (cost $7,349,267,947): | | | $ | 6,942,442,913 |
| Receivable for investments sold | | | | 49,267,604 |
| Receivable for fund shares sold | | | | 149,382,349 |
| Interest receivable | | | | 14,287,361 |
| Distributions receivable from Fidelity Central Funds | | | | 29,037 |
Total assets | | | | 7,155,409,264 |
| Liabilities | | | | |
| Payable to custodian bank | $ | 1,289,699 | | |
| Payable for investments purchased | | 191,661,391 | | |
| Payable for fund shares redeemed | | 504,004 | | |
| Other payables and accrued expenses | | 7,521 | | |
| Total Liabilities | | | | 193,462,615 |
| Net Assets | | | $ | 6,961,946,649 |
| Net Assets consist of: | | | | |
| Paid in capital | | | $ | 7,373,028,622 |
| Total accumulated earnings (loss) | | | | (411,081,973) |
| Net Assets | | | $ | 6,961,946,649 |
Net Asset Value , offering price and redemption price per share ($6,961,946,649 ÷ 738,205,426 shares) | | | $ | 9.43 |
| Statement of Operations |
| | | | Six months ended June 30, 2023 (Unaudited) |
| Investment Income | | | | |
| Interest | | | $ | 94,217,721 |
| Income from Fidelity Central Funds | | | | 1,914,411 |
| Total Income | | | | 96,132,132 |
| Expenses | | | | |
| Custodian fees and expenses | $ | 13,968 | | |
| Independent trustees' fees and expenses | | 11,604 | | |
| Total expenses before reductions | | 25,572 | | |
| Expense reductions | | (10,507) | | |
| Total expenses after reductions | | | | 15,065 |
| Net Investment income (loss) | | | | 96,117,067 |
| Realized and Unrealized Gain (Loss) | | | | |
| Net realized gain (loss) on: | | | | |
| Investment Securities: | | | | |
| Unaffiliated issuers | | (29,426,154) | | |
| Total net realized gain (loss) | | | | (29,426,154) |
| Change in net unrealized appreciation (depreciation) on investment securities | | | | 36,879,121 |
| Net gain (loss) | | | | 7,452,967 |
| Net increase (decrease) in net assets resulting from operations | | | $ | 103,570,034 |
| Statement of Changes in Net Assets |
| |
| | Six months ended June 30, 2023 (Unaudited) | | Year ended December 31, 2022 |
| Increase (Decrease) in Net Assets | | | | |
| Operations | | | | |
| Net investment income (loss) | $ | 96,117,067 | $ | 325,376,783 |
| Net realized gain (loss) | | (29,426,154) | | (74,330,381) |
| Change in net unrealized appreciation (depreciation) | | 36,879,121 | | (438,607,987) |
| Net increase (decrease) in net assets resulting from operations | | 103,570,034 | | (187,561,585) |
| Distributions to shareholders | | - | | (321,403,836) |
| Distributions to shareholders from tax return of capital | | - | | (7,063,045) |
| | | | | |
| Total Distributions | | - | | (328,466,881) |
| Share transactions | | | | |
| Proceeds from sales of shares | | 794,619,823 | | 5,984,686,737 |
| Reinvestment of distributions | | - | | 328,466,347 |
| Cost of shares redeemed | | (443,693,234) | | (3,489,663,060) |
| | | | | |
Net increase (decrease) in net assets resulting from share transactions | | 350,926,589 | | 2,823,490,024 |
| Total increase (decrease) in net assets | | 454,496,623 | | 2,307,461,558 |
| | | | | |
| Net Assets | | | | |
| Beginning of period | | 6,507,450,026 | | 4,199,988,468 |
| End of period | $ | 6,961,946,649 | $ | 6,507,450,026 |
| | | | | |
| Other Information | | | | |
| Shares | | | | |
| Sold | | 84,415,878 | | 600,008,830 |
| Issued in reinvestment of distributions | | - | | 35,243,170 |
| Redeemed | | (47,258,514) | | (352,053,102) |
| Net increase (decrease) | | 37,157,364 | | 283,198,898 |
| | | | | |
| Fidelity® Series 0-5 Year Inflation-Protected Bond Index Fund |
| |
| | Six months ended (Unaudited) June 30, 2023 | | Years ended December 31, 2022 | | 2021 A |
Selected Per-Share Data | | | | | | |
| Net asset value, beginning of period | $ | 9.28 | $ | 10.05 | $ | 10.00 |
| Income from Investment Operations | | | | | | |
Net investment income (loss) B,C | | .134 | | .531 | | .127 |
| Net realized and unrealized gain (loss) | | .016 | | (.814) | | .005 |
| Total from investment operations | | .150 | | (.283) | | .132 |
| Distributions from net investment income | | - | | (.477) | | (.071) |
| Tax return of capital | | - | | (.010) | | (.011) |
| Total distributions | | - | | (.487) | | (.082) |
| Net asset value, end of period | $ | 9.43 | $ | 9.28 | $ | 10.05 |
Total Return D,E | | 1.62% | | (2.84)% | | 1.33% |
Ratios to Average Net Assets C,F,G | | | | | | |
Expenses before reductions H | | -% I | | -% | | -% I |
Expenses net of fee waivers, if any H | | -% I | | -% | | -% I |
Expenses net of all reductions H | | -% I | | -% | | -% I |
| Net investment income (loss) | | 2.88% I | | 5.38% | | 3.33% I |
| Supplemental Data | | | | | | |
| Net assets, end of period (000 omitted) | $ | 6,961,947 | $ | 6,507,450 | $ | 4,199,988 |
Portfolio turnover rate J | | 30% I | | 21% K | | 33% K |
A For the period August 13, 2021 (commencement of operations) through December 31, 2021.
B Calculated based on average shares outstanding during the period.
C Net investment income (loss) is affected by the timing of the declaration of dividends by any underlying mutual funds or exchange-traded funds (ETFs). Net investment income (loss) of any mutual funds or ETFs is not included in the Fund's net investment income (loss) ratio.
D Total returns for periods of less than one year are not annualized.
E Total returns would have been lower if certain expenses had not been reduced during the applicable periods shown.
F Fees and expenses of any underlying mutual funds or exchange-traded funds (ETFs) are not included in the Fund's expense ratio. The Fund indirectly bears its proportionate share of these expenses. For additional expense information related to investments in Fidelity Central Funds, please refer to the "Investments in Fidelity Central Funds" note found in the Notes to Financial Statements section of the most recent Annual or Semi-Annual report.
G Expense ratios reflect operating expenses of the class. Expenses before reductions do not reflect amounts reimbursed, waived, or reduced through arrangements with the investment adviser, brokerage services, or other offset arrangements, if applicable, and do not represent the amount paid by the class during periods when reimbursements, waivers or reductions occur.
H Amount represents less than .005%.
I Annualized.
J Amount does not include the portfolio activity of any underlying mutual funds or exchange-traded funds (ETFs).
K Portfolio turnover rate excludes securities received or delivered in-kind.
| Coupon Distribution (% of Fund's Investments) |
| |
| 0.01 - 0.99% | 71.9 | |
| 1 - 1.99% | 18.0 | |
| 2 - 2.99% | 5.5 | |
| 3 - 3.99% | 4.6 | |
| Coupon distribution shows the range of stated interest rates on the fund's investments, excluding short-term investments. |
The coupon rates on inflation-protected securities tend to be lower than their nominal bond counterparts since inflation-protected securities get adjusted for actual inflation, while nominal bond coupon rates include a component for expected inflation. Please refer to the fund's prospectus for more information.
Asset Allocation (% of Fund's net assets) |
|
|
Inflation Protected Securities - 99.5%.
Fidelity® Series 5+ Year Inflation-Protected Bond Index Fund
| U.S. Treasury Inflation-Protected Obligations - 99.5% |
| | | Principal Amount (a) | Value ($) |
| U.S. Treasury Inflation-Indexed Bonds: | | | |
| 0.125% 2/15/51 | | 237,186,652 | 158,446,217 |
| 0.125% 2/15/52 | | 427,839,776 | 284,198,087 |
| 0.25% 2/15/50 | | 198,148,323 | 138,740,845 |
| 0.625% 2/15/43 | | 309,676,678 | 254,258,185 |
| 0.75% 2/15/42 | | 360,347,133 | 306,426,353 |
| 0.75% 2/15/45 | | 279,344,602 | 231,066,932 |
| 0.875% 2/15/47 | | 182,563,714 | 153,317,512 |
| 1% 2/15/46 | | 288,721,428 | 250,692,773 |
| 1% 2/15/48 | | 223,079,547 | 192,074,811 |
| 1% 2/15/49 | | 153,150,791 | 131,835,656 |
| 1.375% 2/15/44 | | 295,757,979 | 278,813,407 |
| 1.75% 1/15/28 | | 5,910,257 | 5,842,577 |
| 2.125% 2/15/40 | | 108,549,153 | 116,541,758 |
| 2.125% 2/15/41 | | 215,491,386 | 231,382,986 |
| 2.375% 1/15/27 | | 125,007 | 125,648 |
| 2.5% 1/15/29 | | 157,855,750 | 162,599,511 |
| 3.375% 4/15/32 | | 214,805,268 | 244,353,334 |
| 3.625% 4/15/28 | | 224,324 | 240,815 |
| 3.875% 4/15/29 | | 166,371,958 | 183,844,367 |
| U.S. Treasury Inflation-Indexed Notes: | | | |
| 0.125% 1/15/30 | | 589,729,223 | 529,141,887 |
| 0.125% 7/15/30 | | 611,232,601 | 548,308,284 |
| 0.125% 1/15/31 | | 721,455,614 | 641,389,862 |
| 0.125% 7/15/31 | | 659,225,145 | 584,777,608 |
| 0.125% 1/15/32 | | 695,275,148 | 612,311,270 |
| 0.25% 7/15/29 | | 578,574,872 | 528,434,115 |
| 0.375% 1/15/27 | | 48,476 | 45,489 |
| 0.375% 7/15/27 | | 731,440 | 685,746 |
| 0.625% 7/15/32 | | 693,080,218 | 637,294,283 |
| 0.75% 7/15/28 | | 486,798,703 | 461,378,237 |
| 0.875% 1/15/29 | | 583,334,032 | 552,270,420 |
| 1.125% 1/15/33 | | 772,267,886 | 740,266,993 |
| 1.5% 2/15/53 | | 64,090,540 | 62,274,489 |
| TOTAL U.S. TREASURY INFLATION-PROTECTED OBLIGATIONS (Cost $10,844,992,754) | | | 9,223,380,457 |
| | | | |
| TOTAL INVESTMENT IN SECURITIES - 99.5% (Cost $10,844,992,754) | 9,223,380,457 |
NET OTHER ASSETS (LIABILITIES) - 0.5% | 43,215,100 |
| NET ASSETS - 100.0% | 9,266,595,557 |
| | |
Legend
| (a) | Amount is stated in United States dollars unless otherwise noted. |
Affiliated Central Funds
Fiscal year to date information regarding the Fund's investments in Fidelity Central Funds, including the ownership percentage, is presented below.
| Affiliate | Value, beginning of period ($) | Purchases ($) | Sales Proceeds ($) | Dividend Income ($) | Realized Gain (loss) ($) | Change in Unrealized appreciation (depreciation) ($) | Value, end of period ($) | % ownership, end of period |
| Fidelity Cash Central Fund 5.14% | 10,966,988 | 219,848,592 | 230,815,580 | 296,867 | - | - | - | 0.0% |
| Total | 10,966,988 | 219,848,592 | 230,815,580 | 296,867 | - | - | - | |
| | | | | | | | | |
Amounts in the dividend income column in the above table include any capital gain distributions from underlying funds, which are presented in the corresponding line item in the Statement of Operations, if applicable.
Amounts included in the purchases and sales proceeds columns may include in-kind transactions, if applicable.
Investment Valuation
The following is a summary of the inputs used, as of June 30, 2023, involving the Fund's assets and liabilities carried at fair value. The inputs or methodology used for valuing securities may not be an indication of the risk associated with investing in those securities. For more information on valuation inputs, and their aggregation into the levels used below, please refer to the Investment Valuation section in the accompanying Notes to Financial Statements.
| Valuation Inputs at Reporting Date: |
| Description | Total ($) | Level 1 ($) | Level 2 ($) | Level 3 ($) |
Investments in Securities: | | | | |
|
| U.S. Government and Government Agency Obligations | 9,223,380,457 | - | 9,223,380,457 | - |
| | | | | |
| Total Investments in Securities: | 9,223,380,457 | - | 9,223,380,457 | - |
Fidelity® Series 5+ Year Inflation-Protected Bond Index Fund
| Statement of Assets and Liabilities |
| | | | June 30, 2023 (Unaudited) |
| | | | | |
| Assets | | | | |
Investment in securities, at value - See accompanying schedule Unaffiliated issuers (cost $10,844,992,754): | | | $ | 9,223,380,457 |
| Receivable for fund shares sold | | | | 281,139,412 |
| Interest receivable | | | | 26,841,234 |
| Distributions receivable from Fidelity Central Funds | | | | 22,171 |
Total assets | | | | 9,531,383,274 |
| Liabilities | | | | |
| Payable to custodian bank | $ | 2,841,132 | | |
| Payable for investments purchased | | 257,865,668 | | |
| Payable for fund shares redeemed | | 4,072,186 | | |
| Other payables and accrued expenses | | 8,731 | | |
| Total Liabilities | | | | 264,787,717 |
| Net Assets | | | $ | 9,266,595,557 |
| Net Assets consist of: | | | | |
| Paid in capital | | | $ | 11,218,294,860 |
| Total accumulated earnings (loss) | | | | (1,951,699,303) |
| Net Assets | | | $ | 9,266,595,557 |
Net Asset Value , offering price and redemption price per share ($9,266,595,557 ÷ 1,172,877,905 shares) | | | $ | 7.90 |
| Statement of Operations |
| | | | Six months ended June 30, 2023 (Unaudited) |
| Investment Income | | | | |
| Interest | | | $ | 173,496,584 |
| Income from Fidelity Central Funds | | | | 296,867 |
| Total Income | | | | 173,793,451 |
| Expenses | | | | |
| Custodian fees and expenses | $ | 17,553 | | |
| Independent trustees' fees and expenses | | 15,419 | | |
| Total expenses before reductions | | 32,972 | | |
| Expense reductions | | (1,203) | | |
| Total expenses after reductions | | | | 31,769 |
| Net Investment income (loss) | | | | 173,761,682 |
| Realized and Unrealized Gain (Loss) | | | | |
| Net realized gain (loss) on: | | | | |
| Investment Securities: | | | | |
| Unaffiliated issuers | | (302,622,278) | | |
| Total net realized gain (loss) | | | | (302,622,278) |
| Change in net unrealized appreciation (depreciation) on investment securities | | | | 348,917,171 |
| Net gain (loss) | | | | 46,294,893 |
| Net increase (decrease) in net assets resulting from operations | | | $ | 220,056,575 |
| Statement of Changes in Net Assets |
| |
| | Six months ended June 30, 2023 (Unaudited) | | Year ended December 31, 2022 |
| Increase (Decrease) in Net Assets | | | | |
| Operations | | | | |
| Net investment income (loss) | $ | 173,761,682 | $ | 539,846,813 |
| Net realized gain (loss) | | (302,622,278) | | (201,908,106) |
| Change in net unrealized appreciation (depreciation) | | 348,917,171 | | (2,017,121,699) |
| Net increase (decrease) in net assets resulting from operations | | 220,056,575 | | (1,679,182,992) |
| Distributions to shareholders | | (1,344,592) | | (540,451,982) |
| | | | | |
| Share transactions | | | | |
| Proceeds from sales of shares | | 1,056,206,260 | | 5,669,086,598 |
| Reinvestment of distributions | | 1,344,592 | | 540,451,919 |
| Cost of shares redeemed | | (593,955,417) | | (2,623,869,524) |
| | | | | |
Net increase (decrease) in net assets resulting from share transactions | | 463,595,435 | | 3,585,668,993 |
| Total increase (decrease) in net assets | | 682,307,418 | | 1,366,034,019 |
| | | | | |
| Net Assets | | | | |
| Beginning of period | | 8,584,288,139 | | 7,218,254,120 |
| End of period | $ | 9,266,595,557 | $ | 8,584,288,139 |
| | | | | |
| Other Information | | | | |
| Shares | | | | |
| Sold | | 133,130,844 | | 617,190,370 |
| Issued in reinvestment of distributions | | 169,366 | | 68,307,939 |
| Redeemed | | (74,748,238) | | (283,952,822) |
| Net increase (decrease) | | 58,551,972 | | 401,545,487 |
| | | | | |
| Fidelity® Series 5+ Year Inflation-Protected Bond Index Fund |
| |
| | Six months ended (Unaudited) June 30, 2023 | | Years ended December 31, 2022 | | 2021 A |
Selected Per-Share Data | | | | | | |
| Net asset value, beginning of period | $ | 7.70 | $ | 10.13 | $ | 10.00 |
| Income from Investment Operations | | | | | | |
Net investment income (loss) B,C | | .153 | | .579 | | .158 |
| Net realized and unrealized gain (loss) | | .048 | | (2.494) | | .061 |
| Total from investment operations | | .201 | | (1.915) | | .219 |
| Distributions from net investment income | | (.001) | | (.514) | | (.089) |
| Distributions from net realized gain | | - | | (.001) | | - |
| Total distributions | | (.001) | | (.515) | | (.089) |
| Net asset value, end of period | $ | 7.90 | $ | 7.70 | $ | 10.13 |
Total Return D,E | | 2.61% | | (19.04)% | | 2.21% |
Ratios to Average Net Assets C,F,G | | | | | | |
Expenses before reductions H | | -% I | | -% | | -% I |
Expenses net of fee waivers, if any H | | -% I | | -% | | -% I |
Expenses net of all reductions H | | -% I | | -% | | -% I |
| Net investment income (loss) | | 3.90% I | | 6.57% | | 4.16% I |
| Supplemental Data | | | | | | |
| Net assets, end of period (000 omitted) | $ | 9,266,596 | $ | 8,584,288 | $ | 7,218,254 |
Portfolio turnover rate J | | 44% I | | 31% K | | 31% K |
A For the period August 13, 2021 (commencement of operations) through December 31, 2021.
B Calculated based on average shares outstanding during the period.
C Net investment income (loss) is affected by the timing of the declaration of dividends by any underlying mutual funds or exchange-traded funds (ETFs). Net investment income (loss) of any mutual funds or ETFs is not included in the Fund's net investment income (loss) ratio.
D Total returns for periods of less than one year are not annualized.
E Total returns would have been lower if certain expenses had not been reduced during the applicable periods shown.
F Fees and expenses of any underlying mutual funds or exchange-traded funds (ETFs) are not included in the Fund's expense ratio. The Fund indirectly bears its proportionate share of these expenses. For additional expense information related to investments in Fidelity Central Funds, please refer to the "Investments in Fidelity Central Funds" note found in the Notes to Financial Statements section of the most recent Annual or Semi-Annual report.
G Expense ratios reflect operating expenses of the class. Expenses before reductions do not reflect amounts reimbursed, waived, or reduced through arrangements with the investment adviser, brokerage services, or other offset arrangements, if applicable, and do not represent the amount paid by the class during periods when reimbursements, waivers or reductions occur.
H Amount represents less than .005%.
I Annualized.
J Amount does not include the portfolio activity of any underlying mutual funds or exchange-traded funds (ETFs).
K Portfolio turnover rate excludes securities received or delivered in-kind.
For the period ended June 30, 2023
1. Organization.
Fidelity Series 0-5 Year Inflation-Protected Bond Index Fund and Fidelity Series 5+ Year Inflation-Protected Bond Index Fund (the Funds) are funds of Fidelity Salem Street Trust (the Trust). The Trust is registered under the Investment Company Act of 1940, as amended (the 1940 Act), as an open-end management investment company organized as a Massachusetts business trust. Each Fund is authorized to issue an unlimited number of shares. Shares are offered only to certain other Fidelity funds, Fidelity managed 529 plans, and Fidelity managed collective investment trusts.
2. Investments in Fidelity Central Funds.
Funds may invest in Fidelity Central Funds, which are open-end investment companies generally available only to other investment companies and accounts managed by the investment adviser and its affiliates. The Schedule of Investments lists any Fidelity Central Funds held as an investment as of period end, but does not include the underlying holdings of each Fidelity Central Fund. An investing fund indirectly bears its proportionate share of the expenses of the underlying Fidelity Central Funds.
Based on its investment objective, each Fidelity Central Fund may invest or participate in various investment vehicles or strategies that are similar to those of the investing fund. These strategies are consistent with the investment objectives of the investing fund and may involve certain economic risks which may cause a decline in value of each of the Fidelity Central Funds and thus a decline in the value of the investing fund.
| Fidelity Central Fund | Investment Manager | Investment Objective | Investment Practices | Expense Ratio A |
| Fidelity Money Market Central Funds | Fidelity Management & Research Company LLC (FMR) | Each fund seeks to obtain a high level of current income consistent with the preservation of capital and liquidity. | Short-term Investments | Less than .005% |
A Expenses expressed as a percentage of average net assets and are as of each underlying Central Fund's most recent annual or semi-annual shareholder report.
A complete unaudited list of holdings for each Fidelity Central Fund is available upon request or at the Securities and Exchange Commission website at www.sec.gov. In addition, the financial statements of the Fidelity Central Funds which contain the significant accounting policies (including investment valuation policies) of those funds, and are not covered by the Report of Independent Registered Public Accounting Firm, are available on the Securities and Exchange Commission website or upon request.
3. Significant Accounting Policies.
Each Fund is an investment company and applies the accounting and reporting guidance of the Financial Accounting Standards Board (FASB) Accounting Standards Codification Topic 946 Financial Services - Investment Companies . The financial statements have been prepared in conformity with accounting principles generally accepted in the United States of America (GAAP), which require management to make certain estimates and assumptions at the date of the financial statements. Actual results could differ from those estimates. Subsequent events, if any, through the date that the financial statements were issued have been evaluated in the preparation of the financial statements. Each Fund's Schedule of Investments lists any underlying mutual funds or exchange-traded funds (ETFs) but does not include the underlying holdings of these funds. The following summarizes the significant accounting policies of each Fund:
Investment Valuation. Investments are valued as of 4:00 p.m. Eastern time on the last calendar day of the period. The Board of Trustees (the Board) has designated each Fund's investment adviser as the valuation designee responsible for the fair valuation function and performing fair value determinations as needed. The investment adviser has established a Fair Value Committee (the Committee) to carry out the day-to-day fair valuation responsibilities and has adopted policies and procedures to govern the fair valuation process and the activities of the Committee. In accordance with these fair valuation policies and procedures, which have been approved by the Board, each Fund attempts to obtain prices from one or more third party pricing services or brokers to value its investments. When current market prices, quotations or currency exchange rates are not readily available or reliable, investments will be fair valued in good faith by the Committee, in accordance with the policies and procedures. Factors used in determining fair value vary by investment type and may include market or investment specific events, transaction data, estimated cash flows, and market observations of comparable investments. The frequency that the fair valuation procedures are used cannot be predicted and they may be utilized to a significant extent. The Committee manages each Fund's fair valuation practices and maintains the fair valuation policies and procedures. Each Fund's investment adviser reports to the Board information regarding the fair valuation process and related material matters.
Each Fund categorizes the inputs to valuation techniques used to value its investments into a disclosure hierarchy consisting of three levels as shown below:
Level 1 - unadjusted quoted prices in active markets for identical investments
Level 2 - other significant observable inputs (including quoted prices for similar investments, interest rates, prepayment speeds, etc.)
Level 3 - unobservable inputs (including the Fund's own assumptions based on the best information available)
Valuation techniques used to value each Fund's investments by major category are as follows:
Debt securities, including restricted securities, are valued based on evaluated prices received from third party pricing services or from brokers who make markets in such securities. U.S. government and government agency obligations are valued by pricing services who utilize matrix pricing which considers yield or price of bonds of comparable quality, coupon, maturity and type or by broker-supplied prices. When independent prices are unavailable or unreliable, debt securities may be valued utilizing pricing methodologies which consider similar factors that would be used by third party pricing services. Debt securities are generally categorized as Level 2 in the hierarchy but may be Level 3 depending on the circumstances.
Changes in valuation techniques may result in transfers in or out of an assigned level within the disclosure hierarchy. The aggregate value of investments by input level as of June 30, 2023 is included at the end of each Fund's Schedule of Investments.
Investment Transactions and Income. For financial reporting purposes, the Funds' investment holdings and NAV include trades executed through the end of the last business day of the period. The NAV per share for processing shareholder transactions is calculated as of the close of business of the New York Stock Exchange (NYSE), normally 4:00 p.m. Eastern time and includes trades executed through the end of the prior business day. Gains and losses on securities sold are determined on the basis of identified cost. Income and capital gain distributions from Fidelity Central Funds, if any, are recorded on the ex-dividend date. Interest income is accrued as earned and includes coupon interest and amortization of premium and accretion of discount on debt securities as applicable. For Treasury Inflation-Protected Securities (TIPS) the principal amount is adjusted daily to keep pace with inflation. Interest is accrued based on the adjusted principal amount. The adjustments to principal due to inflation are reflected as increases or decreases to Interest in the accompanying Statement of Operations. Such adjustments may result in negative Interest and may have a significant impact on the Fund's distributions.
Expenses. Expenses directly attributable to a fund are charged to that fund. Expenses attributable to more than one fund are allocated among the respective funds on the basis of relative net assets or other appropriate methods. Expenses included in the accompanying financial statements reflect the expenses of that fund and do not include any expenses associated with any underlying mutual funds or exchange-traded funds. Although not included in a fund's expenses, a fund indirectly bears its proportionate share of these expenses through the net asset value of each underlying mutual fund or exchange-traded fund. Expense estimates are accrued in the period to which they relate and adjustments are made when actual amounts are known.
Income Tax Information and Distributions to Shareholders. Each year, each Fund intends to qualify as a regulated investment company under Subchapter M of the Internal Revenue Code, including distributing substantially all of its taxable income and realized gains. As a result, no provision for U.S. Federal income taxes is required. Each Fund files a U.S. federal tax return, in addition to state and local tax returns as required. Each Fund's federal income tax returns are subject to examination by the Internal Revenue Service (IRS) for a period of three fiscal years after they are filed. State and local tax returns may be subject to examination for an additional fiscal year depending on the jurisdiction.
Distributions are declared and recorded daily and paid monthly from net investment income. Distributions from realized gains, if any, are declared and recorded on the ex-dividend date. Income and capital gain distributions are determined in accordance with income tax regulations, which may differ from GAAP.
Capital accounts within the financial statements are adjusted for permanent book-tax differences. These adjustments have no impact on net assets or the results of operations. Capital accounts are not adjusted for temporary book-tax differences which will reverse in a subsequent period.
Book-tax differences are primarily due to tax return of capital distribution, market discount, capital loss carryforwards and losses deferred due to wash sales.
As of period end, the cost and unrealized appreciation (depreciation) in securities, and derivatives if applicable, for federal income tax purposes were as follows for each Fund:
| | Tax cost | Gross unrealized appreciation | Gross unrealized depreciation | Net unrealized appreciation (depreciation) |
Fidelity Series 0-5 Year Inflation-Protected Bond Index Fund | $7,357,821,168 | $1,201 | $(415,379,456) | $(415,378,255) |
Fidelity Series 5+ Year Inflation-Protected Bond Index Fund | 10,911,119,669 | 2,326,139 | (1,690,065,351) | (1,687,739,212) |
Capital loss carryforwards are only available to offset future capital gains of the Funds to the extent provided by regulations and may be limited. The capital loss carryforward information presented below, including any applicable limitation, is estimated as of prior fiscal period end and is subject to adjustment.
| | Short-term | Long-term | Total capital loss carryforward |
Fidelity Series 0-5 Year Inflation-Protected Bond Index Fund | $(61,780,061) | $(-) | $(61,780,061) |
Fidelity Series 5+ Year Inflation-Protected Bond Index Fund | (159,114,575) | (2,720,803) | (161,835,378) |
4. Fees and Other Transactions with Affiliates.
Management Fee. Fidelity Management & Research Company LLC (the investment adviser) and its affiliates provide the Funds with investment management related services for which the Funds do not pay a management fee. Under the management contract, the investment adviser or an affiliate pays all ordinary operating expenses of the Funds, except custody fees, fees and expenses of the independent Trustees, and certain miscellaneous expenses such as proxy and shareholder meeting expenses.
Interfund Trades. Funds may purchase from or sell securities to other Fidelity Funds under procedures adopted by the Board. The procedures have been designed to ensure these interfund trades are executed in accordance with Rule 17a-7 of the 1940 Act. During the period, there were no interfund trades.
Prior Fiscal Year Affiliated Exchanges In-Kind. Shares that were exchanged for investments, including accrued interest and cash, if any, are shown in the table below. The amount of in-kind exchanges is included in share transactions in the accompanying Statement of Changes in Net Assets.
| | Shares | Total Proceeds ($) |
| Fidelity Series 0-5 Year Inflation-Protected Bond Index Fund | 168,043,611 | 1,682,449,262 |
| Fidelity Series 5+ Year Inflation-Protected Bond Index Fund | 121,238,925 | 1,140,434,136 |
5. Committed Line of Credit.
Certain Funds participate with other funds managed by the investment adviser or an affiliate in a $4.25 billion credit facility (the "line of credit") to be utilized for temporary or emergency purposes to fund shareholder redemptions or for other short-term liquidity purposes. The commitment fees on the pro-rata portion of the line of credit are borne by the investment adviser. During the period, there were no borrowings on this line of credit.
6. Expense Reductions.
Through arrangements with each applicable Fund's custodian, credits realized as a result of certain uninvested cash balances were used to reduce each applicable Fund's expenses. All of the applicable expense reductions are noted in the table below.
| | Custodian credits |
Fidelity Series 0-5 Year Inflation-Protected Bond Index Fund | $10,507 |
Fidelity Series 5+ Year Inflation-Protected Bond Index Fund | 1,203 |
7. Other.
A fund's organizational documents provide former and current trustees and officers with a limited indemnification against liabilities arising in connection with the performance of their duties to the fund. In the normal course of business, a fund may also enter into contracts that provide general indemnifications. A fund's maximum exposure under these arrangements is unknown as this would be dependent on future claims that may be made against a fund. The risk of material loss from such claims is considered remote.
At the end of the period, mutual funds and accounts managed by the investment adviser or its affiliates were the owners of record of all of the outstanding shares of the Funds.
8. Risk and Uncertainties.
Many factors affect a fund's performance. Developments that disrupt global economies and financial markets, such as pandemics, epidemics, outbreaks of infectious diseases, war, terrorism, and environmental disasters, may significantly affect a fund's investment performance. The effects of these developments to a fund will be impacted by the types of securities in which a fund invests, the financial condition, industry, economic sector, and geographic location of an issuer, and a fund's level of investment in the securities of that issuer. Significant concentrations in security types, issuers, industries, sectors, and geographic locations may magnify the factors that affect a fund's performance.
As a shareholder, you incur two types of costs: (1) transaction costs, which may include sales charges (loads) on purchase payments or redemption proceeds, as applicable and (2) ongoing costs, which generally include management fees, distribution and/or service (12b-1) fees and other Fund expenses. This Example is intended to help you understand your ongoing costs (in dollars) of investing in a fund and to compare these costs with the ongoing costs of investing in other mutual funds.
| The Example is based on an investment of $1,000 invested at the beginning of the period and held for the entire period (January 1, 2023 to June 30, 2023). |
Actual Expenses
The first line of the accompanying table provides information about actual account values and actual expenses. You may use the information in this line, together with the amount you invested, to estimate the expenses that you paid over the period. Simply divide your account value by $1,000.00 (for example, an $8,600 account value divided by $1,000.00 = 8.6), then multiply the result by the number in the first line for a class/Fund under the heading entitled "Expenses Paid During Period" to estimate the expenses you paid on your account during this period. If any fund is a shareholder of any underlying mutual funds or exchange-traded funds (ETFs) (the Underlying Funds), such fund indirectly bears its proportional share of the expenses of the Underlying Funds in addition to the direct expenses incurred presented in the table. These fees and expenses are not included in the annualized expense ratio used to calculate the expense estimate in the table below.
Hypothetical Example for Comparison Purposes
The second line of the accompanying table provides information about hypothetical account values and hypothetical expenses based on the actual expense ratio and an assumed rate of return of 5% per year before expenses, which is not the actual return. The hypothetical account values and expenses may not be used to estimate the actual ending account balance or expenses you paid for the period. You may use this information to compare the ongoing costs of investing in the Fund and other funds. To do so, compare this 5% hypothetical example with the 5% hypothetical examples that appear in the shareholder reports of the other funds. If any fund is a shareholder of any Underlying Funds, such fund indirectly bears its proportional share of the expenses of the Underlying Funds in addition to the direct expenses as presented in the table. These fees and expenses are not included in the annualized expense ratio used to calculate the expense estimate in the table below.
Please note that the expenses shown in the table are meant to highlight your ongoing costs only and do not reflect any transaction costs. Therefore, the second line of the table is useful in comparing ongoing costs only, and will not help you determine the relative total costs of owning different funds. In addition, if these transactional costs were included, your costs would have been higher.
| | | | | Annualized Expense Ratio- A | | Beginning Account Value January 1, 2023 | | Ending Account Value June 30, 2023 | | Expenses Paid During Period- C January 1, 2023 to June 30, 2023 |
| | | | | | | | | | |
| Fidelity® Series 0-5 Year Inflation-Protected Bond Index Fund | | | | -%- D | | | | | | |
| Actual | | | | | | $ 1,000 | | $ 1,016.20 | | $- E |
Hypothetical- B | | | | | | $ 1,000 | | $ 1,024.79 | | $- E |
| | | | | | | | | | |
| Fidelity® Series 5+ Year Inflation-Protected Bond Index Fund | | | | -%- D | | | | | | |
| Actual | | | | | | $ 1,000 | | $ 1,026.10 | | $- E |
Hypothetical- B | | | | | | $ 1,000 | | $ 1,024.79 | | $- E |
| |
A Annualized expense ratio reflects expenses net of applicable fee waivers.
B 5% return per year before expenses
C Expenses are equal to the annualized expense ratio, multiplied by the average account value over the period, multiplied by 181/ 365 (to reflect the one-half year period). The fees and expenses of any Underlying Funds are not included in each annualized expense ratio.
D Amount represents less than .005%.
E Amount represents less than $.005.
The Securities and Exchange Commission adopted Rule 22e-4 under the Investment Company Act of 1940 (the Liquidity Rule) to promote effective liquidity risk management throughout the open-end investment company industry, thereby reducing the risk that funds will be unable to meet their redemption obligations and mitigating dilution of the interests of fund shareholders.
The Funds have adopted and implemented a liquidity risk management program (the Program) reasonably designed to assess and manage each Fund's liquidity risk and to comply with the requirements of the Liquidity Rule. Each Fund's Board of Trustees (the Board) has designated each Fund's investment adviser as administrator of the Program. The Fidelity advisers have established a Liquidity Risk Management Committee (the LRM Committee) to manage the Program for each of the Fidelity Funds. The LRM Committee monitors the adequacy and effectiveness of implementation of the Program and on a periodic basis assesses each Fund's liquidity risk based on a variety of factors including (1) the Fund's investment strategy, (2) portfolio liquidity and cash flow projections during normal and reasonably foreseeable stressed conditions, (3) shareholder redemptions, (4) borrowings and other funding sources and (5) certain factor specific to ETFs including the effect of the Fund's prices and spreads, market participants, and basket compositions on the overall liquidity of the Fund's portfolio, as applicable.
In accordance with the Program, each of the Fund's portfolio investments is classified into one of four defined liquidity categories based on a determination of a reasonable expectation for how long it would take to convert the investment to cash (or sell or dispose of the investment) without significantly changing its market value.
- Highly liquid investments - cash or convertible to cash within three business days or less
- Moderately liquid investments - convertible to cash in three to seven calendar days
- Less liquid investments - can be sold or disposed of, but not settled, within seven calendar days
- Illiquid investments - cannot be sold or disposed of within seven calendar days
Liquidity classification determinations take into account a variety of factors including various market, trading and investment-specific considerations, as well as market depth, and generally utilize analysis from a third-party liquidity metrics service.
The Liquidity Rule places a 15% limit on a fund's illiquid investments and requires funds that do not primarily hold assets that are highly liquid investments to determine and maintain a minimum percentage of the fund's net assets to be invested in highly liquid investments (highly liquid investment minimum or HLIM). The Program includes provisions reasonably designed to comply with the 15% limit on illiquid investments and for determining, periodically reviewing and complying with the HLIM requirement as applicable.
At a recent meeting of the Fund's Board of Trustees, the LRM Committee provided a written report to the Board pertaining to the operation, adequacy, and effectiveness of the Program for the period December 1, 2021 through November 30, 2022. The report concluded that the Program is operating effectively and is reasonably designed to assess and manage the Fund's liquidity risk.
1.9901940.101
SYI-SANN-0823
Fidelity® SAI Municipal Income Fund
Semi-Annual Report
June 30, 2023
Offered exclusively to certain clients of the Adviser, or its affiliates, including Strategic Advisers LLC (Strategic Advisers) - not available for sale to the general public. Fidelity ® SAI is a product name of Fidelity ® funds dedicated to certain programs affiliated with Strategic Advisers.
Contents
To view a fund's proxy voting guidelines and proxy voting record for the 12-month period ended June 30, visit http://www.fidelity.com/proxyvotingresults or visit the Securities and Exchange Commission's (SEC) web site at http://www.sec.gov.
You may also call 1-800-544-3455 to request a free copy of the proxy voting guidelines.
Standard & Poor's, S&P and S&P 500 are registered service marks of The McGraw-Hill Companies, Inc. and have been licensed for use by Fidelity Distributors Corporation.
Other third-party marks appearing herein are the property of their respective owners.
All other marks appearing herein are registered or unregistered trademarks or service marks of FMR LLC or an affiliated company. © 2023 FMR LLC. All rights reserved.
This report and the financial statements contained herein are submitted for the general information of the shareholders of the Fund. This report is not authorized for distribution to prospective investors in the Fund unless preceded or accompanied by an effective prospectus.
A fund files its complete schedule of portfolio holdings with the SEC for the first and third quarters of each fiscal year on Form N-PORT. Forms N-PORT are available on the SEC's web site at http://www.sec.gov. A fund's Forms N-PORT may be reviewed and copied at the SEC's Public Reference Room in Washington, DC. Information regarding the operation of the SEC's Public Reference Room may be obtained by calling 1-800-SEC-0330.
For a complete list of a fund's portfolio holdings, view the most recent holdings listing, semiannual report, or annual report on Fidelity's web site at http://www.fidelity.com, http://www.institutional.fidelity.com, or http://www.401k.com, as applicable.
NOT FDIC INSURED •MAY LOSE VALUE •NO BANK GUARANTEE
Neither the Fund nor Fidelity Distributors Corporation is a bank.
| Top Five States (% of Fund's net assets) |
| | |
| Illinois | 10.4 |
| New York | 8.8 |
| Other | 7.9 |
| New Jersey | 7.6 |
| Pennsylvania | 5.7 |
| | |
| Revenue Sources (% of Fund's net assets) |
| General Obligations | 19.6 | |
| Transportation | 17.3 | |
| Health Care | 12.9 | |
| Special Tax | 9.0 | |
| Housing | 7.9 | |
| Education | 7.8 | |
| State G.O. | 6.8 | |
| Others* (Individually Less Than 5%) | 18.7 | |
| | 100.0 | |
| |
| *Includes net other assets | | |
Quality Diversification (% of Fund's net assets) |
|
| |
| We have used ratings from Moody's Investors Service, Inc. Where Moody's® ratings are not available, we have used S&P® ratings. All ratings are as of the date indicated and do not reflect subsequent changes. |
Showing Percentage of Net Assets
| Municipal Bonds - 92.1% |
| | | Principal Amount (a) | Value ($) |
| Alabama - 3.8% | | | |
| Auburn Univ. Gen. Fee Rev. Series 2018 A, 5% 6/1/43 | | 155,000 | 164,242 |
| Black Belt Energy Gas District Bonds: | | | |
| Series 2022 B1, 4%, tender 10/1/27 (b) | | 4,705,000 | 4,650,593 |
| Series 2022 C1, 5.25%, tender 6/1/29 (b) | | 19,000,000 | 19,889,553 |
| Series 2022 F, 5.5%, tender 12/1/28 (b) | | 15,000,000 | 15,834,261 |
| Infirmary Health Systems Spl. Care Facilities Fing. Auth. Rev.: | | | |
| Series 2016 A, 5% 2/1/26 | | 1,840,000 | 1,892,241 |
| Series 2021 A, 3% 2/1/46 | | 1,000,000 | 733,251 |
| Jefferson County Gen. Oblig. Series 2018 A, 5% 4/1/26 | | 145,000 | 151,918 |
| Lower Alabama Gas District Bonds (No. 2 Proj.) Series 2020, 4%, tender 12/1/25 (b) | | 2,080,000 | 2,067,971 |
| Mobile Indl. Dev. Board Poll. Cont. Rev. Bonds (Alabama Pwr. Co. Barry Plant Proj.) Series 2007 C, 4.13%, tender 6/16/26 (b) | | 795,000 | 795,000 |
| Montgomery Med. Clinic Facilities Series 2015: | | | |
| 5% 3/1/33 | | 255,000 | 249,822 |
| 5% 3/1/36 | | 460,000 | 434,996 |
| Southeast Energy Auth. Rev. Bonds Bonds Series 2022 A1, 5.5%, tender 12/1/29 (b) | | 7,400,000 | 7,868,766 |
TOTAL ALABAMA | | | 54,732,614 |
| Alaska - 0.2% | | | |
| Alaska Hsg. Fin. Corp. Series 2021 A: | | | |
| 4% 6/1/26 | | 175,000 | 178,643 |
| 4% 12/1/29 | | 290,000 | 305,819 |
| 5% 12/1/28 | | 400,000 | 439,086 |
| 5% 6/1/29 | | 300,000 | 331,957 |
| Alaska Hsg. Fin. Corp. Mtg. Rev. Series 2022 A, 3% 6/1/51 | | 230,000 | 220,384 |
| Alaska Muni. Bond Bank Series 2016 4, 5% 12/1/29 (c) | | 1,690,000 | 1,751,024 |
TOTAL ALASKA | | | 3,226,913 |
| Arizona - 2.5% | | | |
| Arizona Health Facilities Auth. Rev.: | | | |
| (Banner Health Sys. Proj.) Series 2007 B, 3 month U.S. LIBOR + 0.810% 4.278%, tender 1/1/37 (b)(d) | | 150,000 | 140,613 |
| (Scottsdale Lincoln Hospitals Proj.) Series 2014 A, 5% 12/1/39 | | 230,000 | 231,396 |
| Arizona Indl. Dev. Auth. Hosp. Rev.: | | | |
| Series 2020 A, 3% 2/1/45 | | 3,625,000 | 2,801,105 |
| Series 2021 A, 5% 2/1/29 | | 410,000 | 451,639 |
| Arizona Indl. Dev. Auth. Rev. (Provident Group-Eastern Michigan Univ. Parking Proj.) Series 2018: | | | |
| 5% 5/1/48 | | 55,000 | 33,000 |
| 5% 5/1/51 | | 55,000 | 33,000 |
| Arizona State Univ. Revs. Series 2021 C: | | | |
| 5% 7/1/37 | | 340,000 | 382,222 |
| 5% 7/1/38 | | 550,000 | 615,345 |
| Chandler Indl. Dev. Auth. Indl. Dev. Rev.: | | | |
| (Intel Corp. Proj.) Series 2022 2, 5%, tender 9/1/27 (b)(c) | | 10,695,000 | 10,944,646 |
| Bonds (Intel Corp. Proj.) Series 2007, 2.7%, tender 8/14/23 (b)(c) | | 370,000 | 369,297 |
| Coconino County Poll. Cont. Corp. Rev. Bonds: | | | |
| (Navada Pwr. Co. Proj.) Series 2017 B, 3.75%, tender 3/31/26 (b) | | 900,000 | 902,842 |
| (Navada Pwr. Co. Projs.) Series 2017 A, 4.125%, tender 3/31/26 (b)(c) | | 545,000 | 547,116 |
| Glendale Gen. Oblig. Series 2017: | | | |
| 5% 7/1/30 | | 130,000 | 140,355 |
| 5% 7/1/31 | | 190,000 | 204,391 |
| Glendale Indl. Dev. Auth. (Terraces of Phoenix Proj.) Series 2018 A: | | | |
| 5% 7/1/38 | | 15,000 | 12,995 |
| 5% 7/1/48 | | 20,000 | 15,923 |
| Maricopa County Indl. Dev. Auth.: | | | |
| (Creighton Univ. Proj.) Series 2020, 5% 7/1/47 | | 175,000 | 183,853 |
| Series 2021 A, 4% 9/1/51 | | 295,000 | 270,640 |
| Maricopa County Indl. Dev. Auth. Sr. Living Facilities Series 2016: | | | |
| 5.75% 1/1/36 (e) | | 250,000 | 201,340 |
| 6% 1/1/48 (e) | | 395,000 | 285,176 |
| Maricopa County Rev.: | | | |
| Bonds: | | | |
Series 2023 A1, 5%, tender 5/15/26 (b) | | 2,110,000 | 2,204,232 |
Series 2023 A2, 5%, tender 5/15/28 (b) | | 2,180,000 | 2,349,737 |
| Series 2016 A, 5% 1/1/33 | | 305,000 | 321,261 |
| Series 2017 D, 3% 1/1/48 | | 1,260,000 | 967,826 |
| Series 2019 E, 3% 1/1/49 | | 745,000 | 567,530 |
| Phoenix Civic Impt. Board Arpt. Rev.: | | | |
| Series 2017 A: | | | |
5% 7/1/33 (c) | | 55,000 | 58,014 |
5% 7/1/36 (c) | | 90,000 | 93,938 |
5% 7/1/37 (c) | | 65,000 | 67,534 |
| Series 2017 B: | | | |
5% 7/1/29 | | 125,000 | 134,762 |
5% 7/1/33 | | 175,000 | 187,959 |
5% 7/1/36 | | 205,000 | 217,789 |
5% 7/1/37 | | 125,000 | 132,190 |
| Series 2019 B, 5% 7/1/35 (c) | | 720,000 | 770,286 |
| Phoenix Civic Impt. Corp. Wtr. Sys. Rev. Series 2021 A, 5% 7/1/45 | | 410,000 | 449,790 |
| Pima County Indl. Dev. Auth. Rev. Series 2021 A: | | | |
| 3% 4/1/51 | | 8,100,000 | 5,736,634 |
| 4% 4/1/46 | | 1,905,000 | 1,747,520 |
| Salt Verde Finl. Corp. Sr. Gas Rev. Series 2007, 5.5% 12/1/29 | | 450,000 | 483,702 |
| Tempe Indl. Dev. Auth. Rev. (Friendship Village of Tempe Proj.) Series 2021 A, 4% 12/1/46 | | 480,000 | 343,923 |
TOTAL ARIZONA | | | 35,601,521 |
| California - 2.6% | | | |
| ABC Unified School District Series 1997 C, 0% 8/1/28 (Nat'l. Pub. Fin. Guarantee Corp. Insured) | | 200,000 | 170,103 |
| Bay Area Toll Auth. San Francisco Bay Toll Bridge Rev. Bonds Series 2021 A, 2%, tender 4/1/28 (b) | | 1,000,000 | 920,488 |
| California Gen. Oblig.: | | | |
| Series 2004, 5.25% 12/1/33 | | 10,000 | 10,021 |
| Series 2016, 5% 9/1/29 | | 110,000 | 117,053 |
| Series 2020, 4% 11/1/37 | | 575,000 | 595,210 |
| Series 2022: | | | |
4.75% 12/1/42 | | 1,825,000 | 1,949,047 |
5% 4/1/47 | | 3,050,000 | 3,393,192 |
| California Hsg. Fin. Agcy.: | | | |
| Series 2021 1, 3.5% 11/20/35 | | 1,857,077 | 1,737,513 |
| Series 2023 A1, 4.375% 9/20/36 | | 2,618,620 | 2,613,197 |
| California Pub. Works Board Lease Rev. (Various Cap. Projs.): | | | |
| Series 2021 B, 4% 5/1/46 | | 1,685,000 | 1,667,983 |
| Series 2022 C: | | | |
5% 8/1/31 | | 190,000 | 224,168 |
5% 8/1/34 | | 350,000 | 408,752 |
| California Statewide Cmntys. Dev. Auth. Rev. Series 2015, 5% 2/1/45 | | 195,000 | 117,000 |
| Folsom Cordova Union School District No. 4 Series A, 0% 10/1/31 (Nat'l. Pub. Fin. Guarantee Corp. Insured) | | 90,000 | 67,509 |
| Fresno Arpt. Rev. Series 2023 A, 5% 7/1/33 (Build America Mutual Assurance Insured) (c) | | 1,000,000 | 1,128,622 |
| Kern Cmnty. College District Gen. Oblig. Series 2006: | | | |
| 0% 11/1/28 (Assured Guaranty Muni. Corp. Insured) | | 250,000 | 211,097 |
| 0% 11/1/30 (Assured Guaranty Muni. Corp. Insured) | | 255,000 | 200,571 |
| Long Beach Unified School District Series 2009, 5.5% 8/1/29 | | 10,000 | 10,016 |
| Los Angeles Dept. Arpt. Rev. Series 2019 F, 5% 5/15/31 (c) | | 1,330,000 | 1,439,048 |
| Los Angeles Dept. of Wtr. & Pwr. Rev. Series B, 5% 7/1/50 | | 1,435,000 | 1,558,707 |
| Los Angeles Dept. of Wtr. & Pwr. Wtrwks. Rev. Series 2020 A, 5% 7/1/40 | | 30,000 | 33,224 |
| Los Angeles Hbr. Dept. Rev. Series 2019 A, 5% 8/1/25 (c) | | 255,000 | 263,508 |
| Monrovia Unified School District Series B, 0% 8/1/29 (Nat'l. Pub. Fin. Guarantee Corp. Insured) | | 230,000 | 185,820 |
| Mount Diablo Unified School District Series 2022 B: | | | |
| 4% 8/1/31 | | 285,000 | 310,100 |
| 4% 8/1/32 | | 400,000 | 434,663 |
| Oakland Unified School District Alameda County Series 2015 A, 5% 8/1/29 | | 90,000 | 93,735 |
| Poway Unified School District: | | | |
| (District #2007-1 School Facilities Proj.) Series 2008 A, 0% 8/1/32 | | 300,000 | 220,736 |
| Series 2011, 0% 8/1/46 | | 60,000 | 20,332 |
| Series B: | | | |
0% 8/1/37 | | 395,000 | 225,909 |
0% 8/1/39 | | 1,200,000 | 621,461 |
0% 8/1/41 | | 200,000 | 92,803 |
| Poway Unified School District Pub. Fing. Series 2015 A: | | | |
| 5% 9/1/24 | | 50,000 | 50,633 |
| 5% 9/1/26 | | 65,000 | 66,842 |
| 5% 9/1/29 | | 135,000 | 139,023 |
| 5% 9/1/31 | | 60,000 | 61,593 |
| Sacramento City Fing. Auth. Rev. Series A, 0% 12/1/26 (Nat'l. Pub. Fin. Guarantee Corp. Insured) | | 255,000 | 226,383 |
| San Diego County Wtr. Auth. Fing. Agcy. Wtr. Rev. Series 2022 A: | | | |
| 5% 5/1/47 | | 685,000 | 758,869 |
| 5% 5/1/52 | | 1,160,000 | 1,275,666 |
| San Diego Unified School District: | | | |
| Series 2008 C, 0% 7/1/34 | | 180,000 | 123,742 |
| Series 2008 E, 0% 7/1/47 (f) | | 440,000 | 323,802 |
| San Francisco City & County Arpts. Commission Int'l. Arpt. Rev.: | | | |
| Series 2019 A: | | | |
5% 1/1/35 (c) | | 360,000 | 385,150 |
5% 5/1/49 (c) | | 3,960,000 | 4,083,393 |
| Series 2019 B, 5% 5/1/49 | | 275,000 | 290,950 |
| Series 2019 E, 5% 5/1/50 (c) | | 395,000 | 406,950 |
| Series 2022 A: | | | |
5% 5/1/26 (c) | | 920,000 | 956,126 |
5% 5/1/27 (c) | | 930,000 | 978,997 |
5% 5/1/28 (c) | | 1,245,000 | 1,328,037 |
5% 5/1/29 (c) | | 835,000 | 902,627 |
| Series 2022 B, 5% 5/1/52 | | 2,525,000 | 2,723,432 |
| San Marcos Unified School District Series 2010 B, 0% 8/1/47 | | 1,075,000 | 370,938 |
| San Mateo County Cmnty. College District Series A, 0% 9/1/26 (Nat'l. Pub. Fin. Guarantee Corp. Insured) | | 275,000 | 250,123 |
| Washington Township Health Care District Gen. Oblig. Series 2013 A, 5.5% 8/1/38 | | 230,000 | 235,242 |
TOTAL CALIFORNIA | | | 36,980,106 |
| Colorado - 3.4% | | | |
| Arkansas River Pwr. Auth. Rev. Series 2018 A: | | | |
| 5% 10/1/38 | | 125,000 | 126,447 |
| 5% 10/1/43 | | 160,000 | 159,780 |
| Colorado Health Facilities Auth. Rev. Bonds: | | | |
| (Parkview Med. Ctr., Inc. Proj.) Series 2016: | | | |
4% 9/1/35 | | 85,000 | 84,424 |
4% 9/1/36 | | 65,000 | 63,704 |
5% 9/1/46 | | 370,000 | 374,289 |
| Bonds Series 2023 A1, 5%, tender 11/15/28 (b)(g) | | 2,860,000 | 3,124,026 |
| Series 2019 A: | | | |
5% 11/1/25 | | 540,000 | 559,303 |
5% 11/15/39 | | 700,000 | 756,639 |
| Series 2019 A1, 4% 8/1/44 | | 4,960,000 | 4,632,923 |
| Series 2019 A2: | | | |
3.25% 8/1/49 | | 1,070,000 | 780,291 |
4% 8/1/49 | | 1,240,000 | 1,133,532 |
5% 8/1/44 | | 4,585,000 | 4,733,281 |
| Series 2020 A, 4% 9/1/50 | | 305,000 | 268,422 |
| Series 2022 A, 5% 5/15/47 | | 2,030,000 | 2,171,666 |
| Colorado Hsg. & Fin. Auth.: | | | |
| Series 2019 F, 4.25% 11/1/49 | | 135,000 | 134,717 |
| Series 2019 H, 4.25% 11/1/49 | | 240,000 | 239,648 |
| Series 2021 E, 3% 11/1/51 | | 625,000 | 602,190 |
| Series 2022 F, 5.25% 11/1/52 | | 605,000 | 626,771 |
| Colorado Reg'l. Trans. District Sales Tax Rev. (Fastracks Proj.) Series 2021 B, 5% 11/1/28 | | 1,030,000 | 1,143,913 |
| Denver City & County Arpt. Rev.: | | | |
| Series 2017 A: | | | |
5% 11/15/26 (c) | | 175,000 | 182,951 |
5% 11/15/27 (c) | | 150,000 | 159,135 |
| Series 2018 A: | | | |
4% 12/1/43 (c) | | 9,260,000 | 8,860,213 |
5% 12/1/30 (c) | | 390,000 | 428,272 |
5% 12/1/34 (c) | | 260,000 | 293,122 |
5% 12/1/36 (c) | | 255,000 | 268,160 |
5% 12/1/37 (c) | | 505,000 | 528,454 |
| Series 2022 A, 5% 11/15/33 (c) | | 3,815,000 | 4,263,937 |
| Denver City & County Board Wtr. Rev.: | | | |
| Series 2020 A: | | | |
5% 9/15/45 | | 1,550,000 | 1,692,368 |
5% 9/15/46 | | 2,375,000 | 2,588,844 |
| Series 2020 B: | | | |
5% 9/15/28 | | 770,000 | 854,932 |
5% 9/15/29 | | 1,430,000 | 1,620,001 |
| Denver Health & Hosp. Auth. Healthcare Rev. Series 2019 A: | | | |
| 4% 12/1/38 | | 1,250,000 | 1,133,535 |
| 4% 12/1/39 | | 1,720,000 | 1,542,087 |
| E-470 Pub. Hwy. Auth. Rev. Series 2020 A: | | | |
| 5% 9/1/36 | | 705,000 | 783,251 |
| 5% 9/1/40 | | 820,000 | 828,536 |
| Univ. of Colorado Enterprise Sys. Rev. Bonds: | | | |
| Series 2021 C3A, 2%, tender 10/15/25 (b) | | 305,000 | 293,184 |
| Series 2021 C3B, 2%, tender 10/15/26 (b) | | 260,000 | 246,441 |
| Vauxmont Metropolitan District: | | | |
| Series 2019, 5% 12/15/32 (Assured Guaranty Muni. Corp. Insured) | | 47,000 | 49,524 |
| Series 2020, 5% 12/1/33 (Assured Guaranty Muni. Corp. Insured) | | 75,000 | 82,554 |
TOTAL COLORADO | | | 48,415,467 |
| Connecticut - 2.4% | | | |
| Connecticut Gen. Oblig.: | | | |
| Series 2015 B, 5% 6/15/32 | | 145,000 | 149,856 |
| Series 2016 B, 5% 5/15/26 | | 365,000 | 385,079 |
| Series 2018 A, 5% 4/15/37 | | 680,000 | 728,257 |
| Series 2018 F: | | | |
5% 9/15/23 | | 130,000 | 130,458 |
5% 9/15/24 | | 165,000 | 168,795 |
5% 9/15/25 | | 165,000 | 171,730 |
| Series 2021 A: | | | |
3% 1/15/39 | | 380,000 | 326,904 |
3% 1/15/40 | | 295,000 | 249,348 |
| Series 2021 D, 5% 7/15/24 | | 335,000 | 341,619 |
| Series 2022 B, 4% 1/15/36 | | 535,000 | 558,546 |
| Series 2022 D, 5% 9/15/28 | | 295,000 | 326,333 |
| Connecticut Health & Edl. Facilities Auth. Rev.: | | | |
| (Sacred Heart Univ., CT. Proj.) Series 2017 I-1: | | | |
5% 7/1/26 | | 25,000 | 26,199 |
5% 7/1/27 | | 20,000 | 21,290 |
5% 7/1/28 | | 30,000 | 31,867 |
5% 7/1/29 | | 20,000 | 21,290 |
| Bonds: | | | |
Series 2017 B2, 3.2%, tender 7/1/26 (b)(g) | | 1,640,000 | 1,641,189 |
Series 2017 C2, 2.8%, tender 2/3/26 (b) | | 5,250,000 | 5,145,120 |
| Series 2016 K, 4% 7/1/46 | | 445,000 | 396,381 |
| Series 2019 A: | | | |
4% 7/1/49 | | 1,000,000 | 843,015 |
5% 7/1/26 (e) | | 350,000 | 342,874 |
5% 7/1/26 | | 2,875,000 | 2,946,193 |
5% 7/1/27 (e) | | 205,000 | 200,497 |
5% 7/1/49 (e) | | 420,000 | 358,862 |
| Series 2019 Q-1, 5% 11/1/26 | | 255,000 | 271,102 |
| Series 2020 A, 4% 7/1/40 | | 390,000 | 371,592 |
| Series 2021 G: | | | |
4% 3/1/46 | | 305,000 | 294,929 |
4% 3/1/51 | | 490,000 | 469,818 |
| Series 2021 S, 4% 6/1/51 | | 380,000 | 339,250 |
| Series 2022 M: | | | |
4% 7/1/39 | | 585,000 | 551,508 |
4% 7/1/52 | | 570,000 | 511,264 |
| Series 2023 E, 5% 7/15/41 | | 1,750,000 | 1,859,806 |
| Series K1: | | | |
5% 7/1/27 | | 25,000 | 25,205 |
5% 7/1/29 | | 65,000 | 65,939 |
5% 7/1/30 | | 50,000 | 50,690 |
5% 7/1/31 | | 410,000 | 415,194 |
5% 7/1/33 | | 80,000 | 80,894 |
5% 7/1/34 | | 580,000 | 586,540 |
| Series K3, 5% 7/1/43 | | 605,000 | 573,486 |
| Connecticut Hsg. Fin. Auth.: | | | |
| Series 2021 B1, 3% 11/15/49 | | 390,000 | 374,938 |
| Series 2023 A, 5.25% 11/15/53 | | 6,740,000 | 7,124,380 |
| Series C: | | | |
5% 11/15/23 (c) | | 350,000 | 351,640 |
5% 5/15/24 (c) | | 630,000 | 636,833 |
5% 11/15/24 (c) | | 295,000 | 300,186 |
5% 11/15/25 (c) | | 260,000 | 267,751 |
| Connecticut State Revolving Fund Gen. Rev. Series 2017 A, 5% 5/1/35 | | 190,000 | 204,627 |
| Hbr. Point Infrastructure Impt. District Series 2017: | | | |
| 5% 4/1/30 (e) | | 230,000 | 233,427 |
| 5% 4/1/39 (e) | | 295,000 | 294,812 |
| New Britain Gen. Oblig. Series 2017 C, 5% 3/1/29 (Assured Guaranty Muni. Corp. Insured) | | 55,000 | 58,718 |
| Steelpointe Hbr. Infrastructure Impt. District (Steelpointe Hbr. Proj.) Series 2021, 4% 4/1/51 (e) | | 655,000 | 489,660 |
| Univ. of Connecticut Gen. Oblig. Series 2019 A: | | | |
| 5% 11/1/25 | | 260,000 | 271,247 |
| 5% 11/1/36 | | 1,500,000 | 1,625,782 |
TOTAL CONNECTICUT | | | 34,212,920 |
| Delaware - 0.1% | | | |
| Delaware Gen. Oblig.: | | | |
| Series 2019, 5% 2/1/30 | | 294,000 | 330,655 |
| Series 2020 A, 5% 1/1/31 | | 294,000 | 335,802 |
TOTAL DELAWARE | | | 666,457 |
| District Of Columbia - 0.8% | | | |
| District of Columbia Gen. Oblig.: | | | |
| Series 2021 D: | | | |
4% 2/1/27 | | 380,000 | 394,661 |
5% 2/1/28 | | 380,000 | 417,097 |
5% 2/1/29 | | 505,000 | 564,805 |
| Series 2021 E: | | | |
5% 2/1/27 | | 1,285,000 | 1,380,632 |
5% 2/1/29 | | 1,070,000 | 1,196,716 |
| District of Columbia Rev. Series 2018, 5% 10/1/48 | | 2,100,000 | 2,137,864 |
| Metropolitan Washington Arpts. Auth. Dulles Toll Road Rev. (Dulles Metrorail and Cap. Impt. Projs.): | | | |
| Series 2019 A: | | | |
5% 10/1/31 | | 210,000 | 226,342 |
5% 10/1/32 | | 265,000 | 285,264 |
| Series 2019 B, 3% 10/1/50 (Assured Guaranty Muni. Corp. Insured) | | 1,290,000 | 968,118 |
| Metropolitan Washington DC Arpts. Auth. Sys. Rev.: | | | |
| Series 2017 A: | | | |
5% 10/1/28 (c) | | 335,000 | 354,131 |
5% 10/1/30 (c) | | 415,000 | 439,550 |
5% 10/1/31 (c) | | 75,000 | 79,434 |
5% 10/1/32 (c) | | 115,000 | 121,719 |
5% 10/1/33 (c) | | 55,000 | 58,160 |
5% 10/1/35 (c) | | 125,000 | 131,207 |
5% 10/1/42 (c) | | 255,000 | 262,956 |
| Series 2019 A, 5% 10/1/25 (c) | | 180,000 | 184,989 |
| Series 2020 A: | | | |
5% 10/1/26 (c) | | 650,000 | 678,184 |
5% 10/1/27 (c) | | 225,000 | 238,069 |
5% 10/1/28 (c) | | 115,000 | 123,550 |
| Washington Metropolitan Area Transit Auth. Series 2023 A, 5% 7/15/33 | | 1,145,000 | 1,363,075 |
TOTAL DISTRICT OF COLUMBIA | | | 11,606,523 |
| Florida - 2.4% | | | |
| Brevard County School Board Ctfs. of Prtn. Series 2015 C, 5% 7/1/28 | | 90,000 | 92,920 |
| Broward County Arpt. Sys. Rev.: | | | |
| Series 2012 Q1, 5% 10/1/25 | | 265,000 | 265,255 |
| Series 2015 C, 5% 10/1/24 (c) | | 130,000 | 131,834 |
| Series 2017: | | | |
5% 10/1/25 (c) | | 15,000 | 15,403 |
5% 10/1/26 (c) | | 50,000 | 52,121 |
5% 10/1/27 (c) | | 50,000 | 52,823 |
5% 10/1/29 (c) | | 135,000 | 142,917 |
5% 10/1/30 (c) | | 35,000 | 37,070 |
5% 10/1/32 (c) | | 175,000 | 184,801 |
5% 10/1/33 (c) | | 65,000 | 68,577 |
5% 10/1/34 (c) | | 65,000 | 68,401 |
5% 10/1/35 (c) | | 75,000 | 78,544 |
5% 10/1/36 (c) | | 100,000 | 104,218 |
5% 10/1/37 (c) | | 115,000 | 119,335 |
5% 10/1/42 (c) | | 655,000 | 671,088 |
5% 10/1/47 (c) | | 305,000 | 311,702 |
| Series 2019 A, 5% 10/1/49 (c) | | 705,000 | 728,336 |
| Series A: | | | |
5% 10/1/28 (c) | | 150,000 | 153,962 |
5% 10/1/30 (c) | | 175,000 | 179,853 |
5% 10/1/31 (c) | | 150,000 | 154,157 |
5% 10/1/32 (c) | | 140,000 | 143,828 |
| Broward County School Board Ctfs. of Prtn.: | | | |
| (Broward County School District Proj.) Series 2016 A, 5% 7/1/28 | | 35,000 | 36,791 |
| Series 2015 A, 5% 7/1/27 | | 50,000 | 51,739 |
| Series 2015 B, 5% 7/1/24 | | 140,000 | 142,318 |
| Series 2016, 5% 7/1/32 | | 110,000 | 114,800 |
| Cap. Projs. Fin. Auth. Student Hsg. Rev. (Cap. Projs. Ln. Prog. - Florida Univs.) Series 2020 A, 5% 10/1/30 | | 220,000 | 230,454 |
| Duval County School Board Ctfs. of Prtn.: | | | |
| Series 2015 B: | | | |
5% 7/1/28 | | 105,000 | 108,427 |
5% 7/1/32 | | 620,000 | 638,788 |
| Series 2016 A, 5% 7/1/33 | | 70,000 | 72,852 |
| Escambia County Health Facilities Auth. Health Facilities Rev. Series 2020 A: | | | |
| 3% 8/15/50 (Assured Guaranty Muni. Corp. Insured) | | 710,000 | 509,277 |
| 4% 8/15/45 | | 215,000 | 192,206 |
| Florida Hsg. Fin. Corp. Multi-family Mtg. Rev. Bonds Series 2023 C, 5%, tender 12/1/25 (b) | | 625,000 | 641,448 |
| Florida Mid-Bay Bridge Auth. Rev.: | | | |
| Series 2015 A, 5% 10/1/35 | | 325,000 | 329,498 |
| Series 2015 C: | | | |
5% 10/1/30 | | 165,000 | 167,799 |
5% 10/1/40 | | 100,000 | 100,082 |
| Florida Muni. Pwr. Agcy. Rev.: | | | |
| (Requirements Pwr. Supply Proj.) Series 2016 A: | | | |
5% 10/1/30 | | 110,000 | 116,080 |
5% 10/1/31 | | 120,000 | 126,406 |
| Series 2015 B: | | | |
5% 10/1/28 | | 50,000 | 51,811 |
5% 10/1/30 | | 90,000 | 92,965 |
| Greater Orlando Aviation Auth. Arpt. Facilities Rev.: | | | |
| Series 2016 A, 5% 10/1/46 (c) | | 50,000 | 50,849 |
| Series 2016: | | | |
5% 10/1/24 (c) | | 150,000 | 152,207 |
5% 10/1/26 (c) | | 85,000 | 88,606 |
5% 10/1/27 (c) | | 50,000 | 52,823 |
| Series 2017 A: | | | |
5% 10/1/25 (c) | | 15,000 | 15,354 |
5% 10/1/25 (Escrowed to Maturity) (c) | | 35,000 | 36,031 |
5% 10/1/27 (c) | | 25,000 | 26,331 |
5% 10/1/27 (Escrowed to Maturity) (c) | | 80,000 | 85,296 |
5% 10/1/29 (Pre-Refunded to 10/1/27 @ 100) (c) | | 150,000 | 160,851 |
5% 10/1/30 (Pre-Refunded to 10/1/27 @ 100) (c) | | 165,000 | 176,936 |
5% 10/1/31 (c) | | 435,000 | 459,662 |
5% 10/1/34 (c) | | 305,000 | 320,958 |
5% 10/1/37 (c) | | 315,000 | 326,873 |
| Series 2019 A, 5% 10/1/54 (c) | | 2,460,000 | 2,539,608 |
| Halifax Hosp. Med. Ctr. Rev. Series 2015, 5% 6/1/24 | | 15,000 | 15,192 |
| Hillsborough County Port District Series 2018 B, 5% 6/1/38 (c) | | 155,000 | 160,536 |
| Miami-Dade County Aviation Rev.: | | | |
| Series 2012 A, 5% 10/1/23 (c) | | 390,000 | 390,476 |
| Series 2014 A, 5% 10/1/28 (c) | | 255,000 | 257,556 |
| Series 2015 A: | | | |
5% 10/1/29 (c) | | 80,000 | 81,764 |
5% 10/1/31 (c) | | 70,000 | 71,531 |
5% 10/1/35 (c) | | 275,000 | 276,549 |
5% 10/1/38 (c) | | 95,000 | 95,781 |
| Series 2016 A: | | | |
5% 10/1/29 | | 75,000 | 79,100 |
5% 10/1/31 | | 90,000 | 94,669 |
| Series 2017 B, 5% 10/1/40 (c) | | 875,000 | 897,517 |
| Series 2020 A, 4% 10/1/39 | | 490,000 | 490,396 |
| Miami-Dade County Cap. Asset Acquisition Series 2009, 0% 10/1/37 | | 3,000,000 | 1,692,115 |
| Miami-Dade County Expressway Auth.: | | | |
| Series 2014 A, 5% 7/1/44 | | 175,000 | 175,543 |
| Series 2014 B, 5% 7/1/28 | | 50,000 | 50,599 |
| Series 2016 A: | | | |
5% 7/1/32 | | 215,000 | 223,204 |
5% 7/1/33 | | 185,000 | 191,794 |
| Miami-Dade County School Board Ctfs. of Prtn.: | | | |
| Series 2015 A, 5% 5/1/29 | | 205,000 | 210,221 |
| Series 2016 A: | | | |
5% 5/1/30 | | 380,000 | 397,838 |
5% 5/1/32 | | 505,000 | 524,692 |
| Miami-Dade County Wtr. & Swr. Rev. Series 2021, 5% 10/1/32 | | 205,000 | 236,896 |
| Orange County Health Facilities Auth. Series 2016 A, 5% 10/1/44 | | 115,000 | 118,254 |
| Palm Beach County Arpt. Sys. Rev. Series 2016: | | | |
| 5% 10/1/24 (c) | | 70,000 | 70,945 |
| 5% 10/1/27 (c) | | 50,000 | 51,837 |
| 5% 10/1/29 (c) | | 55,000 | 57,164 |
| 5% 10/1/30 (c) | | 95,000 | 98,745 |
| 5% 10/1/31 (c) | | 65,000 | 67,561 |
| 5% 10/1/32 (c) | | 100,000 | 103,887 |
| 5% 10/1/33 (c) | | 215,000 | 223,196 |
| 5% 10/1/34 (c) | | 230,000 | 238,289 |
| 5% 10/1/35 (c) | | 240,000 | 247,714 |
| Palm Beach County Health Facilities Auth. Hosp. Rev.: | | | |
| (Jupiter Med. Ctr. Proj.) Series 2022: | | | |
5% 11/1/31 | | 200,000 | 213,623 |
5% 11/1/33 | | 350,000 | 373,024 |
5% 11/1/36 | | 370,000 | 386,240 |
5% 11/1/38 | | 400,000 | 412,722 |
5% 11/1/40 | | 400,000 | 409,030 |
5% 11/1/42 | | 500,000 | 507,510 |
| Series 2019, 4% 8/15/49 | | 3,740,000 | 3,418,588 |
| Palm Beach County Health Facilities Auth. Rev. Series 2021 C, 4% 5/15/28 | | 1,280,000 | 1,141,461 |
| Palm Beach County School Board Ctfs. of Prtn. Series 2015 D: | | | |
| 5% 8/1/28 | | 240,000 | 247,813 |
| 5% 8/1/29 | | 300,000 | 309,645 |
| Pinellas County Hsg. Fin. Auth. Bonds Series 2021 B, 0.65%, tender 7/1/24 (b) | | 430,000 | 413,425 |
| South Florida Wtr. Mgmt. District Ctfs. of Prtn. Series 2015: | | | |
| 5% 10/1/29 | | 255,000 | 267,919 |
| 5% 10/1/32 | | 315,000 | 329,438 |
| South Miami Health Facilities Auth. Hosp. Rev. (Baptist Med. Ctr., FL. Proj.) Series 2017: | | | |
| 4% 8/15/33 | | 125,000 | 126,741 |
| 5% 8/15/26 | | 170,000 | 178,293 |
| 5% 8/15/27 | | 115,000 | 122,856 |
| 5% 8/15/28 | | 75,000 | 80,358 |
| 5% 8/15/30 | | 165,000 | 175,396 |
| 5% 8/15/31 | | 160,000 | 170,092 |
| 5% 8/15/32 | | 115,000 | 122,176 |
| 5% 8/15/34 | | 325,000 | 343,390 |
| 5% 8/15/35 | | 215,000 | 225,851 |
| 5% 8/15/42 | | 335,000 | 345,041 |
| 5% 8/15/47 | | 495,000 | 508,020 |
| Tallahassee Health Facilities Rev.: | | | |
| (Tallahassee Memorial Healthcare, Inc. Proj.) Series 2016 A, 5% 12/1/41 | | 55,000 | 54,774 |
| Series 2015 A, 5% 12/1/40 | | 110,000 | 110,020 |
| Tampa Hosp. Rev. (H. Lee Moffitt Cancer Ctr. Proj.) Series 2020 B: | | | |
| 4% 7/1/45 | | 1,230,000 | 1,139,099 |
| 5% 7/1/50 | | 1,320,000 | 1,345,394 |
| Tampa Tax Allocation (H. Lee Moffitt Cancer Ctr. Proj.) Series 2020 A: | | | |
| 0% 9/1/37 | | 235,000 | 123,509 |
| 0% 9/1/49 | | 765,000 | 206,687 |
| Volusia County Edl. Facilities Auth. Rev. (Embry-Riddle Aeronautical Univ., Inc. Proj.) Series 2020 A: | | | |
| 5% 10/15/44 | | 65,000 | 68,070 |
| 5% 10/15/49 | | 125,000 | 129,995 |
| Volusia County School Board Ctfs. of Prtn. (Florida Master Lease Prog.) Series 2016 A: | | | |
| 5% 8/1/29 (Build America Mutual Assurance Insured) | | 50,000 | 52,142 |
| 5% 8/1/32 (Build America Mutual Assurance Insured) | | 255,000 | 265,222 |
TOTAL FLORIDA | | | 34,188,396 |
| Georgia - 4.1% | | | |
| Atlanta Arpt. Rev.: | | | |
| Series 2014 C, 5% 1/1/29 (c) | | 170,000 | 170,780 |
| Series 2019 B, 5% 7/1/25 (c) | | 140,000 | 143,375 |
| Series 2022 B, 5% 7/1/34 (c) | | 1,005,000 | 1,116,846 |
| Burke County Indl. Dev. Auth. Poll. Cont. Rev.: | | | |
| (Georgia Transmission Corp. Proj.) Series 2012, 2.75% 1/1/52 (b) | | 930,000 | 613,672 |
| Bonds (Georgia Pwr. Co. Plant Vogtle Proj.): | | | |
Series 1994 9, 3.8%, tender 5/21/26 (b) | | 1,700,000 | 1,703,795 |
Series 2013 1st, 2.925%, tender 3/12/24 (b) | | 1,555,000 | 1,537,476 |
| Columbus Med. Ctr. Hosp. Auth. Bonds (Piedmont Healthcare, Inc. Proj.) Series 2019 B, 5%, tender 7/1/29 (b) | | 500,000 | 541,276 |
| Coweta County Dev. Auth. Rev. (Piedmont Healthcare, Inc. Proj.) Series 2019 A, 5% 7/1/44 | | 1,470,000 | 1,520,922 |
| Fayette County Hosp. Auth. Rev. Bonds (Piedmont Healthcare, Inc. Proj.) Series 2019 A, 5%, tender 7/1/24 (b) | | 265,000 | 266,675 |
| Fulton County Dev. Auth. Rev. Series 2019, 4% 6/15/49 | | 110,000 | 108,096 |
| Gainesville & Hall County Hosp. Auth. Rev. Series 2020 A, 3% 2/15/47 | | 2,845,000 | 2,148,803 |
| Georgia Gen. Oblig.: | | | |
| Series 2021 A, 4% 7/1/34 | | 3,325,000 | 3,590,693 |
| Series 2022 A, 5% 7/1/33 | | 1,025,000 | 1,222,362 |
| Georgia Muni. Elec. Auth. Pwr. Rev. Series 2021 A: | | | |
| 4% 1/1/35 (Assured Guaranty Muni. Corp. Insured) | | 325,000 | 331,209 |
| 4% 1/1/37 (Assured Guaranty Muni. Corp. Insured) | | 190,000 | 190,638 |
| 4% 1/1/39 (Assured Guaranty Muni. Corp. Insured) | | 295,000 | 293,777 |
| 4% 1/1/39 (Assured Guaranty Muni. Corp. Insured) | | 180,000 | 178,231 |
| 4% 1/1/40 (Assured Guaranty Muni. Corp. Insured) | | 210,000 | 207,568 |
| 4% 1/1/41 (Assured Guaranty Muni. Corp. Insured) | | 150,000 | 147,328 |
| 5% 1/1/31 (Assured Guaranty Muni. Corp. Insured) | | 155,000 | 171,765 |
| 5% 1/1/33 (Assured Guaranty Muni. Corp. Insured) | | 295,000 | 324,849 |
| 5% 1/1/33 (Assured Guaranty Muni. Corp. Insured) | | 175,000 | 192,707 |
| 5% 1/1/34 (Assured Guaranty Muni. Corp. Insured) | | 260,000 | 286,276 |
| 5% 1/1/34 (Assured Guaranty Muni. Corp. Insured) | | 180,000 | 198,191 |
| Georgia Road & Thruway Auth. Rev. Series 2020: | | | |
| 5% 6/1/31 | | 585,000 | 669,146 |
| 5% 6/1/32 | | 880,000 | 1,003,270 |
| Glynn-Brunswick Memorial Hosp. Auth. Rev. (Southeast Georgia Health Sys. Proj.) Series 2017: | | | |
| 4% 8/1/43 | | 115,000 | 101,813 |
| 5% 8/1/39 | | 105,000 | 105,331 |
| 5% 8/1/43 | | 140,000 | 138,591 |
| Hosp. Auth. of Savannah Auth. Rev. Series 2019 A: | | | |
| 4% 7/1/36 | | 415,000 | 414,281 |
| 4% 7/1/43 | | 435,000 | 415,351 |
| Main Street Natural Gas, Inc.: | | | |
| Bonds: | | | |
Series 2018 C, 4%, tender 12/1/23 (b) | | 1,295,000 | 1,295,300 |
Series 2021 A, 4%, tender 9/1/27 (b) | | 14,680,000 | 14,631,442 |
Series 2022 B, 5%, tender 6/1/29 (b) | | 1,790,000 | 1,846,544 |
Series 2022 E, 4%, tender 12/1/29 (b) | | 5,470,000 | 5,367,918 |
Series 2023 A, 5%, tender 6/1/30 (b) | | 6,860,000 | 7,102,570 |
Series 2023 C, 5%, tender 9/1/30 (b) | | 5,550,000 | 5,826,771 |
| Series 2023 C, 5% 9/1/23 | | 285,000 | 285,340 |
| Private Colleges & Univs. Auth. Rev.: | | | |
| (The Savannah College of Art & Design Projs.): | | | |
Series 2014, 5% 4/1/24 (Escrowed to Maturity) | | 255,000 | 258,500 |
Series 2021: | | | |
4% 4/1/37 | | 295,000 | 302,441 |
5% 4/1/30 | | 160,000 | 178,865 |
5% 4/1/36 | | 165,000 | 185,146 |
| Series 2020 B: | | | |
4% 9/1/37 | | 395,000 | 411,890 |
4% 9/1/38 | | 515,000 | 528,864 |
5% 9/1/25 | | 365,000 | 380,287 |
5% 9/1/32 | | 370,000 | 424,712 |
TOTAL GEORGIA | | | 59,081,683 |
| Hawaii - 0.6% | | | |
| Hawaii Arpts. Sys. Rev. Series 2018 A: | | | |
| 5% 7/1/29 (c) | | 65,000 | 69,422 |
| 5% 7/1/30 (c) | | 75,000 | 80,156 |
| 5% 7/1/31 (c) | | 75,000 | 80,173 |
| 5% 7/1/32 (c) | | 75,000 | 80,111 |
| 5% 7/1/33 (c) | | 75,000 | 80,054 |
| 5% 7/1/48 (c) | | 4,170,000 | 4,287,135 |
| Hawaii Gen. Oblig. Series 2020 A, 4% 7/1/36 (c) | | 60,000 | 59,958 |
| Honolulu City & County Gen. Oblig. Series 2022 A: | | | |
| 5% 11/1/24 | | 250,000 | 256,216 |
| 5% 11/1/25 | | 110,000 | 114,960 |
| Honolulu City & County Multi-family housing Rev. Bonds Series 2023, 5%, tender 6/1/26 (b) | | 3,130,000 | 3,247,788 |
TOTAL HAWAII | | | 8,355,973 |
| Idaho - 0.0% | | | |
| Idaho Hsg. & Fin. Assoc. Single Family Mtg. Series 2019 A, 4% 1/1/50 | | 30,000 | 29,754 |
| Illinois - 10.4% | | | |
| Chicago Board of Ed.: | | | |
| Series 2012 A, 5% 12/1/42 | | 465,000 | 458,728 |
| Series 2015 C, 5.25% 12/1/39 | | 85,000 | 85,189 |
| Series 2016 B, 6.5% 12/1/46 | | 100,000 | 104,752 |
| Series 2017 A, 7% 12/1/46 (e) | | 140,000 | 151,204 |
| Series 2017 C: | | | |
5% 12/1/24 | | 290,000 | 293,258 |
5% 12/1/25 | | 165,000 | 168,971 |
5% 12/1/26 | | 100,000 | 103,376 |
5% 12/1/30 | | 130,000 | 133,766 |
| Series 2017 D: | | | |
5% 12/1/23 | | 150,000 | 150,536 |
5% 12/1/24 | | 100,000 | 101,124 |
5% 12/1/31 | | 150,000 | 153,871 |
| Series 2018 A: | | | |
5% 12/1/25 | | 100,000 | 102,406 |
5% 12/1/26 | | 100,000 | 103,376 |
5% 12/1/28 | | 240,000 | 251,614 |
5% 12/1/30 | | 350,000 | 363,319 |
5% 12/1/32 | | 100,000 | 103,681 |
5% 12/1/35 | | 100,000 | 102,508 |
| Series 2018 C, 5% 12/1/46 | | 1,585,000 | 1,554,914 |
| Series 2019 A: | | | |
5% 12/1/28 | | 165,000 | 172,985 |
5% 12/1/30 | | 340,000 | 356,978 |
5% 12/1/31 | | 190,000 | 198,983 |
5% 12/1/33 | | 455,000 | 475,137 |
| Series 2022 A: | | | |
4% 12/1/47 | | 1,500,000 | 1,311,800 |
5% 12/1/47 | | 780,000 | 777,782 |
| Series 2022 B: | | | |
4% 12/1/35 | | 585,000 | 555,599 |
4% 12/1/36 | | 1,005,000 | 945,901 |
| Chicago Gen. Oblig.: | | | |
| Series 2017 A, 6% 1/1/38 | | 295,000 | 313,834 |
| Series 2019 A, 5% 1/1/40 | | 700,000 | 720,666 |
| Series 2020 A: | | | |
5% 1/1/29 | | 870,000 | 929,279 |
5% 1/1/30 | | 1,605,000 | 1,728,843 |
| Series 2021 A: | | | |
5% 1/1/32 | | 1,530,000 | 1,657,965 |
5% 1/1/34 | | 260,000 | 281,048 |
| Series 2023 A: | | | |
5.25% 1/1/37 | | 1,950,000 | 2,125,445 |
5.5% 1/1/43 | | 5,725,000 | 6,117,062 |
| Chicago Midway Arpt. Rev.: | | | |
| Series 2013 A, 5.5% 1/1/29 (c) | | 235,000 | 235,179 |
| Series 2014 A: | | | |
5% 1/1/33 (c) | | 270,000 | 270,983 |
5% 1/1/34 (c) | | 130,000 | 130,453 |
| Series 2016 A: | | | |
4% 1/1/33 (c) | | 375,000 | 376,168 |
5% 1/1/28 (c) | | 100,000 | 102,677 |
| Series 2016 B: | | | |
4% 1/1/35 | | 80,000 | 80,383 |
5% 1/1/36 | | 100,000 | 103,392 |
5% 1/1/37 | | 135,000 | 139,166 |
| Chicago O'Hare Int'l. Arpt. Rev.: | | | |
| Series 2015 A, 5% 1/1/31 (c) | | 305,000 | 309,832 |
| Series 2015 C, 5% 1/1/46 (c) | | 120,000 | 120,325 |
| Series 2016 B, 5% 1/1/34 | | 310,000 | 322,346 |
| Series 2016 C: | | | |
5% 1/1/33 | | 140,000 | 145,753 |
5% 1/1/34 | | 160,000 | 166,372 |
| Series 2016 G: | | | |
5% 1/1/37 (c) | | 100,000 | 103,256 |
5% 1/1/42 (c) | | 100,000 | 101,800 |
5.25% 1/1/29 (c) | | 20,000 | 21,079 |
5.25% 1/1/31 (c) | | 20,000 | 21,110 |
| Series 2017 A, 5% 1/1/31 | | 180,000 | 191,262 |
| Series 2017 B: | | | |
5% 1/1/35 | | 105,000 | 111,027 |
5% 1/1/37 | | 430,000 | 449,559 |
| Series 2017 C: | | | |
5% 1/1/30 | | 30,000 | 31,867 |
5% 1/1/31 | | 30,000 | 31,877 |
5% 1/1/32 | | 30,000 | 31,870 |
| Series 2017 D: | | | |
5% 1/1/28 (c) | | 150,000 | 156,519 |
5% 1/1/29 (c) | | 125,000 | 130,725 |
5% 1/1/32 (c) | | 135,000 | 141,367 |
5% 1/1/34 (c) | | 205,000 | 214,335 |
5% 1/1/35 (c) | | 150,000 | 156,145 |
5% 1/1/36 (c) | | 190,000 | 196,985 |
5% 1/1/37 (c) | | 100,000 | 103,256 |
| Series 2018 A: | | | |
5% 1/1/37 (c) | | 1,030,000 | 1,085,972 |
5% 1/1/39 (c) | | 1,005,000 | 1,049,742 |
5% 1/1/48 (c) | | 165,000 | 169,722 |
5% 1/1/53 (c) | | 285,000 | 292,001 |
| Series 2022 A: | | | |
5% 1/1/30 (c) | | 225,000 | 244,382 |
5% 1/1/31 (c) | | 230,000 | 252,647 |
| Series 2022 C: | | | |
5% 1/1/28 (c) | | 690,000 | 729,372 |
5% 1/1/29 (c) | | 500,000 | 536,092 |
5% 1/1/30 (c) | | 810,000 | 879,775 |
5% 1/1/31 (c) | | 600,000 | 659,080 |
| Chicago O'Hare Int'l. Arpt. Spl. Facilities Rev. Series 2018: | | | |
| 5% 7/1/38 (c) | | 135,000 | 137,405 |
| 5% 7/1/48 (c) | | 1,140,000 | 1,140,632 |
| Chicago Transit Auth.: | | | |
| Series 2017, 5% 12/1/46 | | 205,000 | 210,021 |
| Series 2022 A, 4% 12/1/49 | | 6,000,000 | 5,674,541 |
| Chicago Transit Auth. Cap. Grant Receipts Rev. Series 2017: | | | |
| 5% 6/1/25 | | 15,000 | 15,378 |
| 5% 6/1/26 | | 10,000 | 10,418 |
| Cook County Gen. Oblig.: | | | |
| Series 2016 A: | | | |
5% 11/15/26 | | 290,000 | 305,905 |
5% 11/15/27 | | 140,000 | 147,313 |
5% 11/15/28 | | 185,000 | 194,604 |
5% 11/15/29 | | 230,000 | 242,015 |
5% 11/15/30 | | 255,000 | 268,238 |
| Series 2021 A, 5% 11/15/33 | | 550,000 | 613,555 |
| Series 2021 B: | | | |
4% 11/15/25 | | 215,000 | 219,001 |
4% 11/15/26 | | 110,000 | 113,033 |
4% 11/15/27 | | 110,000 | 114,111 |
4% 11/15/28 | | 55,000 | 57,481 |
| Illinois Fin. Auth.: | | | |
| Bonds Series 2022 B1, 5%, tender 8/15/25 (b) | | 2,905,000 | 2,985,418 |
| Series 2020 A: | | | |
3% 5/15/50 | | 2,650,000 | 1,822,933 |
3% 5/15/50 (Build America Mutual Assurance Insured) | | 1,045,000 | 753,643 |
3.25% 8/15/49 | | 465,000 | 362,443 |
4% 5/15/50 | | 1,760,000 | 1,559,782 |
| Series 2022 A: | | | |
5% 10/1/35 | | 330,000 | 328,440 |
5.5% 10/1/39 | | 750,000 | 752,288 |
| Series 2023 A: | | | |
5% 5/15/33 | | 400,000 | 475,606 |
5% 5/15/34 | | 450,000 | 531,071 |
| Illinois Fin. Auth. Health Svcs. Facility Lease Rev. (Provident Group - UIC Surgery Ctr. LLC - Univ. of Illinois Health Svcs. Facility Proj.) Series 2020, 4% 10/1/55 | | 2,785,000 | 2,392,797 |
| Illinois Fin. Auth. Rev.: | | | |
| (Bradley Univ. Proj.) Series 2017 C: | | | |
5% 8/1/29 | | 60,000 | 61,844 |
5% 8/1/30 | | 45,000 | 46,357 |
5% 8/1/32 | | 60,000 | 61,640 |
| (Depaul Univ. Proj.) Series 2016 A: | | | |
4% 10/1/34 | | 50,000 | 50,414 |
5% 10/1/29 | | 50,000 | 52,733 |
5% 10/1/30 | | 50,000 | 52,706 |
| (OSF Healthcare Sys.) Series 2018 A: | | | |
4.125% 5/15/47 | | 1,585,000 | 1,456,299 |
5% 5/15/43 | | 2,105,000 | 2,138,461 |
| (Presence Health Proj.) Series 2016 C: | | | |
3.625% 2/15/32 | | 60,000 | 60,387 |
4% 2/15/33 | | 15,000 | 15,237 |
5% 2/15/29 | | 310,000 | 329,271 |
5% 2/15/36 | | 70,000 | 73,410 |
| (Rosalind Franklin Univ. Research Bldg. Proj.) Series 2017 C, 5% 8/1/46 | | 50,000 | 49,131 |
| (Rush Univ. Med. Ctr. Proj.) Series 2015 A, 5% 11/15/34 | | 25,000 | 25,519 |
| Series 2013: | | | |
5% 11/15/28 | | 145,000 | 145,089 |
5% 11/15/29 | | 70,000 | 70,046 |
| Series 2015 C: | | | |
4.125% 8/15/37 | | 45,000 | 42,693 |
5% 8/15/35 | | 375,000 | 382,388 |
5% 8/15/44 | | 1,845,000 | 1,846,844 |
| Series 2016 A: | | | |
5% 8/15/25 (Escrowed to Maturity) | | 120,000 | 124,274 |
5% 7/1/28 (Pre-Refunded to 7/1/26 @ 100) | | 60,000 | 63,475 |
5% 2/15/29 | | 260,000 | 271,800 |
5% 2/15/30 | | 275,000 | 288,337 |
5% 7/1/30 (Pre-Refunded to 7/1/26 @ 100) | | 35,000 | 37,027 |
5% 2/15/31 | | 220,000 | 230,718 |
5% 7/1/31 (Pre-Refunded to 7/1/26 @ 100) | | 65,000 | 68,764 |
5% 2/15/32 | | 215,000 | 225,424 |
5% 7/1/33 (Pre-Refunded to 7/1/26 @ 100) | | 30,000 | 31,737 |
5% 7/1/34 (Pre-Refunded to 7/1/26 @ 100) | | 255,000 | 269,768 |
5% 8/15/35 (Pre-Refunded to 8/15/26 @ 100) | | 25,000 | 26,398 |
5% 7/1/36 (Pre-Refunded to 7/1/26 @ 100) | | 130,000 | 137,529 |
5% 8/15/36 (Pre-Refunded to 8/15/26 @ 100) | | 105,000 | 110,870 |
5.25% 8/15/31 (Pre-Refunded to 8/15/26 @ 100) | | 30,000 | 31,898 |
| Series 2016 B: | | | |
5% 8/15/31 | | 375,000 | 397,255 |
5% 8/15/32 | | 305,000 | 321,852 |
5% 8/15/34 | | 380,000 | 399,969 |
5% 8/15/36 | | 530,000 | 552,652 |
| Series 2016 C: | | | |
3.75% 2/15/34 | | 75,000 | 75,640 |
4% 2/15/36 | | 315,000 | 317,208 |
4% 2/15/41 | | 1,855,000 | 1,803,644 |
4% 2/15/41 (Pre-Refunded to 2/15/27 @ 100) | | 40,000 | 41,309 |
5% 2/15/24 | | 5,000 | 5,049 |
5% 2/15/31 | | 1,415,000 | 1,501,977 |
5% 2/15/32 | | 225,000 | 238,521 |
5% 2/15/34 | | 180,000 | 189,982 |
| Series 2016 D, 4% 2/15/46 (Pre-Refunded to 2/15/26 @ 100) | | 2,315,000 | 2,371,539 |
| Series 2016: | | | |
4% 2/15/41 (Pre-Refunded to 2/15/27 @ 100) | | 5,000 | 5,164 |
5% 5/15/29 | | 65,000 | 67,631 |
5% 12/1/29 | | 85,000 | 88,478 |
5% 5/15/30 | | 135,000 | 140,169 |
5% 12/1/33 | | 115,000 | 118,997 |
5% 12/1/46 | | 1,300,000 | 1,306,599 |
| Series 2017 A, 5% 8/1/42 | | 45,000 | 44,958 |
| Series 2017: | | | |
5% 1/1/29 | | 170,000 | 182,927 |
5% 7/1/34 | | 285,000 | 304,494 |
5% 7/1/35 | | 240,000 | 255,873 |
| Series 2019, 4% 9/1/35 | | 145,000 | 126,246 |
| Illinois Gen. Oblig.: | | | |
| Series 2014: | | | |
5% 2/1/25 | | 185,000 | 186,233 |
5% 2/1/26 | | 140,000 | 140,944 |
5% 4/1/28 | | 115,000 | 116,199 |
5% 5/1/28 | | 110,000 | 111,280 |
5% 2/1/39 | | 865,000 | 867,680 |
5.25% 2/1/31 | | 20,000 | 20,194 |
| Series 2016: | | | |
5% 6/1/26 | | 60,000 | 62,523 |
5% 2/1/27 | | 340,000 | 358,173 |
| Series 2017 C, 5% 11/1/29 | | 870,000 | 928,003 |
| Series 2017 D, 5% 11/1/27 | | 1,050,000 | 1,119,752 |
| Series 2020 C, 4.125% 10/1/36 | | 3,000,000 | 3,017,292 |
| Series 2020, 5.5% 5/1/39 | | 2,000,000 | 2,185,163 |
| Series 2021 A: | | | |
5% 3/1/34 | | 1,035,000 | 1,138,779 |
5% 3/1/46 | | 2,165,000 | 2,251,358 |
| Series 2022 A: | | | |
5% 3/1/29 | | 645,000 | 702,077 |
5% 3/1/31 | | 705,000 | 786,927 |
5% 3/1/36 | | 1,820,000 | 1,984,868 |
| Series 2023 B: | | | |
5.25% 5/1/39 | | 3,810,000 | 4,142,061 |
5.25% 5/1/41 | | 1,330,000 | 1,434,724 |
| Series 2023 D: | �� | | |
4% 7/1/37 | | 9,500,000 | 9,383,719 |
5% 7/1/29 | | 3,210,000 | 3,515,447 |
| Series June 2016, 3.5% 6/1/29 | | 1,375,000 | 1,334,599 |
| Illinois Hsg. Dev. Auth. Series 2021, 3% 4/1/51 | | 865,000 | 831,024 |
| Illinois Hsg. Dev. Auth. Multi-family Hsg. Rev.: | | | |
| Bonds Series 2023, 4%, tender 6/1/25 (b) | | 1,665,000 | 1,667,179 |
| Series 2019, 2.9% 7/1/35 | | 431,991 | 389,132 |
| Illinois Hsg. Dev. Auth. Rev. Series D, 3.75% 4/1/50 | | 70,000 | 68,990 |
| Illinois Muni. Elec. Agcy. Pwr. Supply Series 2015 A, 5% 2/1/31 | | 205,000 | 210,431 |
| Illinois Toll Hwy. Auth. Toll Hwy. Rev.: | | | |
| Series 2016 A, 5% 12/1/31 | | 355,000 | 368,968 |
| Series 2019 A, 5% 1/1/44 | | 140,000 | 147,871 |
| Series 2021 A, 5% 1/1/43 | | 4,670,000 | 5,052,132 |
| Series A: | | | |
5% 1/1/40 | | 335,000 | 371,874 |
5% 1/1/41 | | 880,000 | 964,830 |
5% 1/1/45 | | 2,975,000 | 3,173,464 |
| Kendall, Kane & Will Counties Cmnty. Unit School District #308 Series 2016: | | | |
| 5% 2/1/34 | | 355,000 | 367,899 |
| 5% 2/1/35 | | 255,000 | 263,440 |
| 5% 2/1/36 | | 435,000 | 447,350 |
| Metropolitan Pier & Exposition: | | | |
| (McCormick Place Expansion Proj.): | | | |
Series 2010 B1: | | | |
0% 6/15/43 (Assured Guaranty Muni. Corp. Insured) | | 3,150,000 | 1,242,233 |
0% 6/15/45 (Assured Guaranty Muni. Corp. Insured) | | 1,540,000 | 544,800 |
0% 6/15/47 (Assured Guaranty Muni. Corp. Insured) | | 185,000 | 58,810 |
Series 2012 B, 0% 12/15/51 | | 660,000 | 160,147 |
| Series 1994, 0% 6/15/28 (Nat'l. Pub. Fin. Guarantee Corp. Insured) | | 335,000 | 277,780 |
| Series 1996 A, 0% 6/15/24 | | 155,000 | 149,322 |
| Series 2002 A, 0% 6/15/35 (Nat'l. Pub. Fin. Guarantee Corp. Insured) | | 260,000 | 159,478 |
| Series 2002, 0% 12/15/36 (Nat'l. Pub. Fin. Guarantee Corp. Insured) | | 2,445,000 | 1,375,374 |
| Series 2017 B: | | | |
5% 12/15/25 | | 50,000 | 51,322 |
5% 12/15/26 | | 165,000 | 171,093 |
5% 12/15/27 | | 20,000 | 20,988 |
5% 12/15/31 | | 35,000 | 36,700 |
5% 12/15/34 | | 20,000 | 20,856 |
| Series 2020 A, 5% 6/15/50 | | 560,000 | 569,301 |
| Series 2020 B, 5% 6/15/42 | | 675,000 | 696,916 |
| Series 2022 A: | | | |
0% 12/15/36 | | 65,000 | 35,850 |
0% 12/15/39 | | 515,000 | 240,817 |
0% 12/15/40 | | 430,000 | 190,001 |
0% 12/15/41 | | 1,225,000 | 512,180 |
4% 6/15/52 | | 5,875,000 | 5,273,225 |
| Northern Illinois Univ. Revs. Series 2020 B, 5% 4/1/34 (Build America Mutual Assurance Insured) | | 395,000 | 418,556 |
| Peoria County Gen. Oblig. Series 2023 A, 4% 1/1/39 (Assured Guaranty Muni. Corp. Insured) | | 1,145,000 | 1,112,267 |
| Railsplitter Tobacco Settlement Auth. Rev. Series 2017: | | | |
| 5% 6/1/27 | | 1,275,000 | 1,339,141 |
| 5% 6/1/28 | | 140,000 | 147,303 |
| Sales Tax Securitization Corp.: | | | |
| Series 2023 C: | | | |
5% 1/1/24 (g) | | 2,540,000 | 2,549,213 |
5% 1/1/33 (g) | | 2,235,000 | 2,537,818 |
| Series 2023 D: | | | |
5% 1/1/24 (g) | | 1,270,000 | 1,274,607 |
5% 1/1/35 (g) | | 1,255,000 | 1,396,568 |
| Univ. of Illinois Rev.: | | | |
| Series 2013: | | | |
6% 10/1/42 | | 275,000 | 276,768 |
6.25% 10/1/38 | | 275,000 | 276,970 |
| Series 2018 A, 5% 4/1/30 | | 210,000 | 227,929 |
| Will County Cmnty. Unit School District #365-U Series 2007 B, 0% 11/1/26 (Assured Guaranty Muni. Corp. Insured) | | 310,000 | 274,828 |
| Will County Illinois Series 2016: | | | |
| 5% 11/15/32 (Pre-Refunded to 11/15/25 @ 100) | | 65,000 | 67,782 |
| 5% 11/15/33 (Pre-Refunded to 11/15/25 @ 100) | | 75,000 | 78,210 |
| 5% 11/15/34 (Pre-Refunded to 11/15/25 @ 100) | | 75,000 | 78,210 |
TOTAL ILLINOIS | | | 148,872,388 |
| Indiana - 0.4% | | | |
| Indiana Fin. Auth. Envir. Facilities Rev. Bonds (Indianapolis Pwr. & Lt. Co. Proj.): | | | |
| Series 2020 A, 0.75%, tender 4/1/26 (b) | | 90,000 | 80,094 |
| Series 2020 B, 0.95%, tender 4/1/26 (b)(c) | | 140,000 | 125,648 |
| Indiana Fin. Auth. Health Sys. Rev. Bonds Series 2023 B1, 5%, tender 7/1/28 (b)(g) | | 2,010,000 | 2,186,392 |
| Indiana Fin. Auth. Rev.: | | | |
| Series 2015 A, 5.25% 2/1/32 | | 355,000 | 368,391 |
| Series 2016: | | | |
5% 9/1/26 | | 65,000 | 68,604 |
5% 9/1/27 | | 30,000 | 31,683 |
5% 9/1/28 | | 155,000 | 163,586 |
5% 9/1/29 | | 75,000 | 79,043 |
5% 9/1/30 | | 70,000 | 73,695 |
| Indiana Fin. Auth. Wastewtr. Util. Rev.: | | | |
| (CWA Auth. Proj.) Series 2015 A, 5% 10/1/30 | | 245,000 | 250,007 |
| Series 2021 2, 5% 10/1/41 | | 515,000 | 565,436 |
| Indiana Hsg. & Cmnty. Dev. Auth.: | | | |
| (Glasswater Creek of Whitestown Proj.) Series 2020, 5.375% 10/1/40 (e) | | 180,000 | 148,140 |
| Series 2021 B, 3% 7/1/50 | | 140,000 | 134,956 |
| Indianapolis Local Pub. Impt.: | | | |
| (Courthouse and Jail Proj.) Series 2019 A, 5% 2/1/49 | | 340,000 | 357,403 |
| Series 2016: | | | |
4% 1/1/32 (c) | | 50,000 | 50,069 |
4% 1/1/33 (c) | | 50,000 | 50,045 |
4% 1/1/34 (c) | | 65,000 | 65,183 |
4% 1/1/35 (c) | | 140,000 | 140,052 |
5% 1/1/26 (c) | | 55,000 | 56,605 |
| Purdue Univ. Rev. Series 2018 DD: | | | |
| 5% 7/1/34 | | 60,000 | 66,037 |
| 5% 7/1/35 | | 120,000 | 131,338 |
| 5% 7/1/36 | | 130,000 | 141,478 |
| 5% 7/1/37 | | 120,000 | 129,862 |
| Saint Joseph County Econ. Dev. Auth. Rev. (St. Mary's College Proj.): | | | |
| Series 2019, 5% 4/1/43 | | 495,000 | 513,471 |
| Series 2020, 4% 4/1/37 | | 245,000 | 239,846 |
TOTAL INDIANA | | | 6,217,064 |
| Iowa - 0.5% | | | |
| Iowa Fin. Auth. Rev. Series A: | | | |
| 5% 5/15/43 | | 70,000 | 53,732 |
| 5% 5/15/48 | | 710,000 | 518,115 |
| Iowa Fin. Auth. Single Family Mtg. (Mtg.-Backed Securities Prog.) Series 2023 A, 5.25% 7/1/53 | | 4,590,000 | 4,804,603 |
| Iowa Student Ln. Liquidity Corp. Student Ln. Rev. Series 2019 B, 5% 12/1/29 (c) | | 310,000 | 336,365 |
| Tobacco Settlement Auth. Tobacco Settlement Rev.: | | | |
| Series 2021 A2: | | | |
4% 6/1/34 | | 295,000 | 301,010 |
4% 6/1/36 | | 295,000 | 295,185 |
4% 6/1/39 | | 295,000 | 286,207 |
5% 6/1/32 | | 265,000 | 292,237 |
| Series 2021 B1, 4% 6/1/49 | | 355,000 | 351,033 |
TOTAL IOWA | | | 7,238,487 |
| Kentucky - 0.7% | | | |
| Ashland Med. Ctr. Rev. Series 2019, 3% 2/1/40 (Assured Guaranty Muni. Corp. Insured) | | 655,000 | 530,453 |
| Kenton County Arpt. Board Arpt. Rev. Series 2016: | | | |
| 5% 1/1/28 | | 80,000 | 83,885 |
| 5% 1/1/31 | | 75,000 | 78,490 |
| 5% 1/1/32 | | 75,000 | 78,387 |
| Kentucky Econ. Dev. Fin. Auth. Series 2019 A2, 5% 8/1/49 | | 930,000 | 952,623 |
| Kentucky Econ. Dev. Fin. Auth. Hosp. Rev. Series 2017 A, 5.25% 6/1/41 | | 1,750,000 | 1,790,530 |
| Kentucky State Property & Buildings Commission Rev.: | | | |
| (Proj. No. 119) Series 2018: | | | |
5% 5/1/26 | | 50,000 | 52,457 |
5% 5/1/29 | | 275,000 | 299,232 |
5% 5/1/32 | | 70,000 | 76,152 |
5% 5/1/33 | | 55,000 | 59,612 |
5% 5/1/34 | | 65,000 | 70,292 |
5% 5/1/35 | | 40,000 | 42,881 |
5% 5/1/36 | | 30,000 | 31,917 |
| Series B, 5% 8/1/23 | | 355,000 | 355,377 |
| Kentucky, Inc. Pub. Energy: | | | |
| Bonds Series A, 4%, tender 6/1/26 (b) | | 2,760,000 | 2,754,368 |
| Series A, 4% 6/1/24 | | 145,000 | 145,281 |
| Louisville & Jefferson County: | | | |
| Bonds: | | | |
Series 2020 C, 5%, tender 10/1/26 (b) | | 130,000 | 134,670 |
Series 2020 D, 5%, tender 10/1/29 (b) | | 155,000 | 165,965 |
| Series 2013 A, 5.5% 10/1/33 | | 170,000 | 170,398 |
| Series 2020 A: | | | |
3% 10/1/43 | | 1,770,000 | 1,361,142 |
5% 10/1/37 | | 360,000 | 377,204 |
TOTAL KENTUCKY | | | 9,611,316 |
| Louisiana - 0.7% | | | |
| Louisiana Pub. Facilities Auth. Hosp. Rev. (Franciscan Missionaries of Our Lady Health Sys. Proj.) Series 2017 A, 5% 7/1/47 | | 145,000 | 146,701 |
| Louisiana Pub. Facilities Auth. Rev.: | | | |
| (Ochsner Clinic Foundation Proj.) Series 2020 A, 4% 5/15/49 | | 6,440,000 | 5,981,676 |
| (Tulane Univ. of Louisiana Proj.) Series 2016 A: | | | |
5% 12/15/24 | | 75,000 | 76,734 |
5% 12/15/25 | | 155,000 | 162,002 |
5% 12/15/26 | | 65,000 | 69,350 |
5% 12/15/28 | | 100,000 | 106,181 |
5% 12/15/29 | | 70,000 | 74,301 |
5% 12/15/30 | | 140,000 | 148,651 |
| New Orleans Aviation Board Rev.: | | | |
| (North Term. Proj.): | | | |
Series 2015 B: | | | |
5% 1/1/29 (c) | | 265,000 | 268,826 |
5% 1/1/31 (c) | | 125,000 | 126,854 |
Series 2017 B: | | | |
5% 1/1/27 (c) | | 20,000 | 20,886 |
5% 1/1/28 (c) | | 10,000 | 10,435 |
5% 1/1/32 (c) | | 20,000 | 20,863 |
5% 1/1/33 (c) | | 35,000 | 36,491 |
5% 1/1/34 (c) | | 10,000 | 10,415 |
5% 1/1/35 (c) | | 20,000 | 20,793 |
5% 1/1/37 (c) | | 295,000 | 303,927 |
| Series 2017 D2: | | | |
5% 1/1/27 (c) | | 25,000 | 26,107 |
5% 1/1/28 (c) | | 35,000 | 36,521 |
5% 1/1/31 (c) | | 30,000 | 31,301 |
5% 1/1/33 (c) | | 50,000 | 52,130 |
5% 1/1/34 (c) | | 60,000 | 62,492 |
5% 1/1/36 (c) | | 45,000 | 46,550 |
5% 1/1/37 (c) | | 80,000 | 82,421 |
| St. John Baptist Parish Rev. Bonds (Marathon Oil Corp.) Series 2017, 4.05%, tender 7/1/26 (b) | | 1,470,000 | 1,463,452 |
TOTAL LOUISIANA | | | 9,386,060 |
| Maine - 0.3% | | | |
| City of South Portland Series 2022 C, 2.5% 7/15/32 | | 1,355,000 | 1,260,622 |
| Maine Health & Higher Edl. Facilities Auth. Rev.: | | | |
| (Eastern Maine Healthcare Systems Proj.) Series 2013, 5% 7/1/43 (Pre-Refunded to 7/1/23 @ 100) | | 235,000 | 235,000 |
| Series 2016 A: | | | |
4% 7/1/41 | | 120,000 | 106,313 |
4% 7/1/46 | | 165,000 | 138,927 |
5% 7/1/41 | | 525,000 | 514,376 |
5% 7/1/46 | | 1,400,000 | 1,283,834 |
| Series 2017 B: | | | |
4% 7/1/25 | | 20,000 | 20,202 |
4% 7/1/31 | | 35,000 | 35,670 |
4% 7/1/32 | | 25,000 | 25,416 |
4% 7/1/34 | | 50,000 | 50,693 |
5% 7/1/26 | | 15,000 | 15,685 |
5% 7/1/28 | | 25,000 | 26,556 |
5% 7/1/29 | | 20,000 | 21,198 |
5% 7/1/33 | | 50,000 | 52,950 |
5% 7/1/35 | | 40,000 | 42,034 |
| Maine Hsg. Auth. Mtg. Series 2022 E, 5% 11/15/52 | | 390,000 | 402,608 |
| Maine Tpk. Auth. Tpk. Rev. Series 2015: | | | |
| 5% 7/1/32 | | 55,000 | 56,784 |
| 5% 7/1/36 | | 130,000 | 133,662 |
| 5% 7/1/38 | | 35,000 | 35,891 |
TOTAL MAINE | | | 4,458,421 |
| Maryland - 1.8% | | | |
| Anne Arundel County Gen. Oblig. Series 2021: | | | |
| 3% 10/1/37 | | 1,710,000 | 1,554,901 |
| 5% 4/1/28 | | 1,240,000 | 1,365,951 |
| Baltimore Proj. Rev. (Wtr. Projs.) Series 2020 A: | | | |
| 4% 7/1/45 | | 585,000 | 573,935 |
| 5% 7/1/50 | | 645,000 | 692,357 |
| City of Westminster Series 2016: | | | |
| 5% 11/1/27 | | 130,000 | 135,293 |
| 5% 11/1/28 | | 140,000 | 145,940 |
| 5% 11/1/29 | | 145,000 | 151,403 |
| 5% 11/1/30 | | 155,000 | 161,656 |
| Hsg. Opportunities Commission of Montgomery County Series 2021 C, 0.8% 7/1/25 | | 145,000 | 136,422 |
| Maryland Cmnty. Dev. Admin Dept. Hsg. & Cmnty. Dev.: | | | |
| Series 2019 B, 4% 9/1/49 | | 495,000 | 490,929 |
| Series 2019 C, 3.5% 3/1/50 | | 1,165,000 | 1,141,397 |
| Maryland Dept. of Trans. Series 2021 B: | | | |
| 4% 8/1/51 (c) | | 530,000 | 489,482 |
| 5% 8/1/46 (c) | | 1,175,000 | 1,227,378 |
| Maryland Econ. Dev. Auth. Rev. (Ports America Chesapeake LLC. Proj.) Series 2017 A: | | | |
| 5% 6/1/30 | | 65,000 | 68,406 |
| 5% 6/1/35 | | 100,000 | 104,370 |
| Maryland Gen. Oblig. Series 2022 2C, 4% 3/1/29 | | 1,260,000 | 1,347,975 |
| Maryland Health & Higher Edl.: | | | |
| Bonds Series 2020, 5%, tender 7/1/25 (b) | | 1,540,000 | 1,572,711 |
| Series 2021 A: | | | |
3% 7/1/46 | | 3,970,000 | 3,019,574 |
3% 7/1/51 | | 1,385,000 | 1,004,731 |
4% 6/1/55 | | 200,000 | 169,393 |
5% 6/1/29 | | 55,000 | 58,680 |
5% 6/1/33 | | 130,000 | 139,972 |
| Series 2023, 5% 7/1/26 | | 600,000 | 625,833 |
| Maryland Health & Higher Edl. Facilities Auth. Rev. Series 2016 A: | | | |
| 4% 7/1/42 | | 85,000 | 78,310 |
| 5% 7/1/35 | | 35,000 | 36,017 |
| Maryland Stadium Auth. Series 2022 A: | | | |
| 5% 6/1/47 | | 1,935,000 | 2,119,084 |
| 5% 6/1/52 | | 455,000 | 494,969 |
| Maryland Stadium Auth. Built to Learn Rev. Series 2021, 4% 6/1/46 | | 260,000 | 250,201 |
| Maryland Stadium Auth. Rev. Series 2018 A, 5% 5/1/33 | | 1,000,000 | 1,088,062 |
| Maryland Trans. Auth. Passenger Facility Charge Rev. Series 2012 B: | | | |
| 2.5% 6/1/26 (c) | | 1,940,000 | 1,835,448 |
| 2.625% 6/1/27 (c) | | 1,590,000 | 1,494,358 |
| Prince Georges County Ctfs. of Prtn. Series 2021: | | | |
| 5% 10/1/27 | | 720,000 | 780,413 |
| 5% 10/1/28 | | 1,055,000 | 1,165,911 |
TOTAL MARYLAND | | | 25,721,462 |
| Massachusetts - 4.8% | | | |
| Massachusetts Bay Trans. Auth. Sales Tax Rev. Series 2021 A1, 5% 7/1/34 | | 1,100,000 | 1,272,720 |
| Massachusetts Commonwealth Trans. Fund Rev.: | | | |
| (Rail Enhacement Prog.) Series 2022 A, 5% 6/1/50 | | 12,350,000 | 13,437,781 |
| (Rail Enhancement Prog.) Series 2021 B, 5% 6/1/37 | | 1,500,000 | 1,622,072 |
| Massachusetts Dev. Fin. Agcy. Rev.: | | | |
| (Lesley Univ. Proj.) Series 2016, 5% 7/1/39 | | 85,000 | 85,476 |
| (Newbridge On The Charles Proj.) Series 2017, 5% 10/1/57 (e) | | 1,750,000 | 1,535,529 |
| (Partners Healthcare Sys., Inc. Proj.): | | | |
Series 2017 S: | | | |
5% 7/1/30 | | 195,000 | 212,063 |
5% 7/1/34 | | 215,000 | 232,150 |
Series 2017, 4% 7/1/41 | | 505,000 | 495,203 |
| (Univ. of Massachusetts Health Cr., Inc. Proj.) Series 2017 L, 4% 7/1/44 | | 50,000 | 45,506 |
| (Wentworth Institute of Technology Proj.) Series 2017: | | | |
5% 10/1/27 | | 50,000 | 51,133 |
5% 10/1/28 | | 55,000 | 56,323 |
5% 10/1/29 | | 55,000 | 56,353 |
5% 10/1/31 | | 60,000 | 61,388 |
5% 10/1/32 | | 65,000 | 66,410 |
| Series 2016: | | | |
5% 10/1/29 | | 50,000 | 52,529 |
5% 10/1/30 | | 75,000 | 78,752 |
5% 7/1/31 | | 85,000 | 88,290 |
5% 10/1/31 | | 80,000 | 83,975 |
5% 10/1/43 | | 440,000 | 429,553 |
| Series 2019 A, 5% 7/1/26 | | 795,000 | 810,652 |
| Series 2019, 5% 9/1/59 | | 1,185,000 | 1,232,631 |
| Series 2020 A: | | | |
4% 7/1/45 | | 930,000 | 811,090 |
5% 10/15/29 | | 1,470,000 | 1,684,312 |
| Series 2021 V, 5% 7/1/55 | | 1,595,000 | 1,859,029 |
| Series 2022, 5% 10/1/38 | | 2,500,000 | 2,851,723 |
| Series J2, 5% 7/1/53 | | 2,055,000 | 2,105,063 |
| Series M: | | | |
4% 10/1/50 | | 930,000 | 759,693 |
5% 10/1/45 | | 700,000 | 701,559 |
| Massachusetts Edl. Fing. Auth. Rev.: | | | |
| Series 2016, 5% 7/1/24 (c) | | 410,000 | 414,195 |
| Series 2019 B, 5% 7/1/27 (c) | | 200,000 | 209,014 |
| Massachusetts Gen. Oblig.: | | | |
| Series 2019 A, 5% 1/1/49 | | 295,000 | 312,291 |
| Series 2019 C, 5% 5/1/49 | | 460,000 | 488,404 |
| Series 2022 C, 5.25% 10/1/47 | | 16,975,000 | 19,011,499 |
| Series D, 5% 7/1/45 | | 1,110,000 | 1,200,155 |
| Series E, 5% 11/1/45 | | 5,645,000 | 6,122,314 |
| Massachusetts Hsg. Fin. Auth. Series 2021 223, 3% 6/1/47 | | 780,000 | 750,482 |
| Massachusetts Port Auth. Rev.: | | | |
| Series 2016 A: | | | |
5% 7/1/33 | | 105,000 | 111,469 |
5% 7/1/34 | | 55,000 | 58,311 |
5% 7/1/38 | | 80,000 | 83,756 |
| Series 2016 B, 5% 7/1/43 (c) | | 435,000 | 444,674 |
| Series 2019 A, 5% 7/1/40 (c) | | 145,000 | 151,967 |
| Series 2021 E: | | | |
5% 7/1/37 (c) | | 1,205,000 | 1,299,151 |
5% 7/1/41 (c) | | 2,040,000 | 2,164,829 |
5% 7/1/46 (c) | | 390,000 | 409,124 |
5% 7/1/51 (c) | | 2,645,000 | 2,756,137 |
| Massachusetts Port Auth. Spl. Facilities Rev. (Bosfuel Proj.) Series 2019 A, 5% 7/1/49 (c) | | 435,000 | 448,920 |
TOTAL MASSACHUSETTS | | | 69,215,650 |
| Michigan - 2.0% | | | |
| Detroit Downtown Dev. Auth. Tax Series A, 5% 7/1/37 (Assured Guaranty Muni. Corp. Insured) | | 120,000 | 120,764 |
| Detroit Gen. Oblig. Series 2021 A, 5% 4/1/46 | | 160,000 | 155,146 |
| Grand Traverse County Hosp. Fin. Auth. Series 2021, 3% 7/1/51 | | 605,000 | 423,466 |
| Great Lakes Wtr. Auth. Sew Disp. Sys. Series 2018 A: | | | |
| 5% 7/1/43 | | 125,000 | 130,716 |
| 5% 7/1/48 | | 535,000 | 553,907 |
| Kalamazoo Hosp. Fin. Auth. Hosp. Facilities Rev. Series 2016, 5% 5/15/28 | | 120,000 | 124,984 |
| Lansing Board of Wtr. & Lt. Util. Rev. Bonds Series 2021 B, 2%, tender 7/1/26 (b) | | 3,560,000 | 3,346,804 |
| Michigan Bldg. Auth. Rev. Series 2015 I: | | | |
| 5% 4/15/30 | | 240,000 | 250,429 |
| 5% 4/15/30 (Pre-Refunded to 10/15/25 @ 100) | | 10,000 | 10,433 |
| Michigan Fin. Auth. Rev.: | | | |
| (Charter County of Wayne Criminal Justice Ctr. Proj.) Series 2018, 5% 11/1/43 | | 155,000 | 161,976 |
| Series 2015 MI, 5% 12/1/24 | | 225,000 | 230,616 |
| Series 2018 B, 5% 10/1/33 | | 4,435,000 | 4,926,028 |
| Series 2019 A, 3% 12/1/49 | | 815,000 | 603,970 |
| Series 2020 A, 4% 6/1/49 | | 1,725,000 | 1,547,521 |
| Series 2021: | | | |
4% 9/1/39 | | 175,000 | 168,405 |
4% 9/1/40 | | 175,000 | 165,301 |
4% 9/1/41 | | 145,000 | 135,767 |
| Michigan Hosp. Fin. Auth. Rev. Series 2008 C: | | | |
| 5% 12/1/32 | | 70,000 | 75,089 |
| 5% 12/1/32 (Pre-Refunded to 12/1/27 @ 100) | | 5,000 | 5,453 |
| Michigan Hsg. Dev. Auth. Single Family Mtg. Rev. Series A, 3.5% 12/1/50 | | 1,490,000 | 1,457,870 |
| Michigan Trunk Line Fund Rev. Series 2020 B, 4% 11/15/45 | | 9,250,000 | 9,086,154 |
| Oakland Univ. Rev. Series 2019: | | | |
| 5% 3/1/40 | | 300,000 | 315,542 |
| 5% 3/1/41 | | 315,000 | 330,557 |
| 5% 3/1/44 | | 615,000 | 643,068 |
| 5% 3/1/50 | | 1,000,000 | 1,039,640 |
| Portage Pub. Schools Series 2016: | | | |
| 5% 11/1/30 | | 145,000 | 152,006 |
| 5% 11/1/31 | | 130,000 | 135,852 |
| 5% 11/1/36 | | 15,000 | 15,544 |
| Univ. of Michigan Rev. Series 2020 A, 4% 4/1/45 | | 440,000 | 433,580 |
| Wayne County Arpt. Auth. Rev.: | | | |
| Series 2015 G, 5% 12/1/28 (c) | | 275,000 | 282,532 |
| Series 2017 A: | | | |
4% 12/1/33 (Assured Guaranty Muni. Corp. Insured) | | 75,000 | 76,685 |
4% 12/1/34 (Assured Guaranty Muni. Corp. Insured) | | 60,000 | 61,199 |
4% 12/1/35 (Assured Guaranty Muni. Corp. Insured) | | 60,000 | 60,864 |
4% 12/1/36 (Assured Guaranty Muni. Corp. Insured) | | 65,000 | 65,731 |
5% 12/1/31 | | 20,000 | 21,426 |
5% 12/1/32 | | 20,000 | 21,412 |
5% 12/1/34 | | 35,000 | 37,426 |
5% 12/1/35 | | 30,000 | 31,856 |
5% 12/1/37 | | 20,000 | 21,035 |
| Series 2017 B: | | | |
5% 12/1/29 (c) | | 30,000 | 31,639 |
5% 12/1/30 (c) | | 35,000 | 36,855 |
5% 12/1/31 (c) | | 40,000 | 42,063 |
5% 12/1/32 (c) | | 25,000 | 26,449 |
5% 12/1/32 (c) | | 30,000 | 31,526 |
5% 12/1/34 (c) | | 30,000 | 31,601 |
5% 12/1/35 (c) | | 30,000 | 31,443 |
5% 12/1/37 (c) | | 45,000 | 46,736 |
5% 12/1/42 (c) | | 50,000 | 51,273 |
| Series 2018 B, 5% 12/1/48 (c) | | 295,000 | 303,891 |
| Series 2018 D, 5% 12/1/29 (c) | | 235,000 | 251,553 |
TOTAL MICHIGAN | | | 28,311,783 |
| Minnesota - 1.1% | | | |
| Maple Grove Health Care Sys. Rev.: | | | |
| Series 2015, 5% 9/1/29 | | 140,000 | 143,674 |
| Series 2017, 5% 5/1/25 | | 40,000 | 40,742 |
| Minnesota Higher Ed. Facilities Auth. Rev. Series 2018 A: | | | |
| 5% 10/1/30 | | 40,000 | 42,639 |
| 5% 10/1/45 | | 85,000 | 85,766 |
| Minnesota Hsg. Fin. Agcy.: | | | |
| Series 2022 M, 6% 1/1/53 | | 7,200,000 | 7,743,235 |
| Series 2023 F, 5.75% 7/1/53 (g) | | 320,000 | 343,239 |
| Minnesota Office of Higher Ed. Series 2023: | | | |
| 5% 11/1/27 (c) | | 1,125,000 | 1,190,005 |
| 5% 11/1/28 (c) | | 1,400,000 | 1,493,314 |
| 5% 11/1/29 (c) | | 2,000,000 | 2,147,983 |
| Moorhead Edl. Facilities Rev. (The Concordia College Corp. Proj.) Series 2016, 5% 12/1/25 | | 45,000 | 45,522 |
| Sauk Rapids Minn Independent School District # 47 Series 2020 A, 2.5% 2/1/37 | | 2,785,000 | 2,302,739 |
| Shakopee Sr. Hsg. Rev. Bonds Series 2018, 5.85%, tender 11/1/25 (b)(e) | | 370,000 | 364,152 |
TOTAL MINNESOTA | | | 15,943,010 |
| Mississippi - 0.3% | | | |
| Mississippi Bus. finance Corp. Exempt Facilities Rev. Bonds (Enviva, Inc. Proj.) Series 2022, 7.75%, tender 7/15/32 (b)(c) | | 5,100,000 | 3,818,552 |
| Mississippi Home Corp. Series 2021 B: | | | |
| 3% 6/1/51 | | 380,000 | 365,497 |
| 5% 6/1/27 | | 210,000 | 224,064 |
TOTAL MISSISSIPPI | | | 4,408,113 |
| Missouri - 0.2% | | | |
| Cape Girardeau County Indl. Dev. Auth. (Southeast Hosp. Proj.) Series 2017 A: | | | |
| 5% 3/1/30 | | 35,000 | 35,912 |
| 5% 3/1/31 | | 80,000 | 81,971 |
| 5% 3/1/36 | | 155,000 | 157,761 |
| Kansas City Indl. Dev. Auth. (Kansas City Int'l. Arpt. Term. Modernization Proj.) Series 2019 B, 5% 3/1/38 (c) | | 145,000 | 151,697 |
| Missouri Health & Edl. Facilities Rev. Series 2015 B: | | | |
| 3.125% 2/1/27 | | 50,000 | 49,675 |
| 3.25% 2/1/28 | | 50,000 | 49,867 |
| 5% 2/1/29 | | 65,000 | 66,831 |
| 5% 2/1/31 | | 130,000 | 133,616 |
| 5% 2/1/33 | | 145,000 | 148,785 |
| 5% 2/1/36 | | 135,000 | 138,157 |
| Missouri Hsg. Dev. Commission Single Family Mtg. Rev.: | | | |
| Series 2019, 4% 5/1/50 | | 35,000 | 34,723 |
| Series 2021 A, 3% 5/1/52 | | 705,000 | 677,956 |
| Saint Louis County Indl. Dev. Auth. Sr. Living Facilities Rev. Series 2018 A: | | | |
| 5.125% 9/1/48 | | 75,000 | 64,112 |
| 5.25% 9/1/53 | | 1,335,000 | 1,141,892 |
TOTAL MISSOURI | | | 2,932,955 |
| Montana - 0.2% | | | |
| Montana Board Hsg. Single Family: | | | |
| Series 2017 B, 4% 12/1/48 (c) | | 20,000 | 19,871 |
| Series 2019 B, 4% 6/1/50 | | 20,000 | 19,858 |
| Series 2022 C, 6% 6/1/53 | | 2,150,000 | 2,327,372 |
| Montana Facility Fin. Auth. Series 2021 A, 3% 6/1/50 | | 930,000 | 675,472 |
TOTAL MONTANA | | | 3,042,573 |
| Nebraska - 0.7% | | | |
| Central Plains Energy Proj. Gas Supply Bonds Series 2019, 4%, tender 8/1/25 (b) | | 6,790,000 | 6,791,636 |
| Douglas County Neb Edl. Facilities Rev.: | | | |
| (Creighton Univ. Proj.) Series 2017: | | | |
4% 7/1/34 | | 50,000 | 50,935 |
5% 7/1/36 | | 35,000 | 36,982 |
| (Creighton Univ. Projs.) Series 2021 A, 3% 7/1/51 | | 440,000 | 315,438 |
| Nebraska Invt. Fin. Auth. Single Family Hsg. Rev.: | | | |
| Series 2019 B, 4% 9/1/49 (c) | | 95,000 | 93,579 |
| Series 2019 E, 3.75% 9/1/49 (c) | | 115,000 | 113,078 |
| Series 2020 A, 3.5% 9/1/50 | | 1,645,000 | 1,609,724 |
| Nebraska Pub. Pwr. District Rev. Series 2016 B: | | | |
| 5% 1/1/37 | | 125,000 | 128,467 |
| 5% 1/1/40 | | 55,000 | 56,381 |
| Omaha Arpt. Auth. Arpt. Rev. Series 2017 A: | | | |
| 5% 12/15/25 (c) | | 15,000 | 15,463 |
| 5% 12/15/25 (Escrowed to Maturity) (c) | | 5,000 | 5,205 |
| 5% 12/15/26 (c) | | 40,000 | 41,875 |
| 5% 12/15/26 (Escrowed to Maturity) (c) | | 35,000 | 37,148 |
| 5% 12/15/27 (c) | | 30,000 | 31,284 |
| 5% 12/15/27 (Pre-Refunded to 12/15/26 @ 100) (c) | | 20,000 | 21,227 |
| 5% 12/15/30 (c) | | 40,000 | 41,753 |
| 5% 12/15/30 (Pre-Refunded to 12/15/26 @ 100) (c) | | 35,000 | 37,148 |
| 5% 12/15/31 (c) | | 20,000 | 20,873 |
| 5% 12/15/31 (Pre-Refunded to 12/15/26 @ 100) (c) | | 20,000 | 21,227 |
| 5% 12/15/33 (c) | | 20,000 | 20,842 |
| 5% 12/15/33 (Pre-Refunded to 12/15/26 @ 100) (c) | | 20,000 | 21,227 |
| 5% 12/15/35 (c) | | 55,000 | 56,935 |
| 5% 12/15/35 (Pre-Refunded to 12/15/26 @ 100) (c) | | 45,000 | 47,761 |
| 5% 12/15/36 (c) | | 15,000 | 15,470 |
| 5% 12/15/36 (Pre-Refunded to 12/15/26 @ 100) (c) | | 10,000 | 10,614 |
TOTAL NEBRASKA | | | 9,642,272 |
| Nevada - 0.2% | | | |
| Clark County Arpt. Rev.: | | | |
| Series 2014 A2, 5% 7/1/30 | | 140,000 | 142,233 |
| Series 2019 A, 5% 7/1/26 | | 570,000 | 602,676 |
| Las Vegas Valley Wtr. District Wtr. Impt. Gen. Oblig. Series 2016 B, 5% 6/1/36 | | 230,000 | 239,882 |
| Nevada Hsg. Division Single Family Mtg. Rev.: | | | |
| Series 2019 B, 4% 10/1/49 | | 60,000 | 59,522 |
| Series 2021 B, 3% 10/1/51 | | 2,460,000 | 2,355,241 |
TOTAL NEVADA | | | 3,399,554 |
| New Hampshire - 0.5% | | | |
| Nat'l. Fin. Auth. Hosp. Rev. (St. Luke's Univ. Health Network Proj.) Series 2021 B: | | | |
| 3% 8/15/51 (Assured Guaranty Muni. Corp. Insured) | | 780,000 | 561,214 |
| 5% 8/15/26 | | 190,000 | 197,160 |
| Nat'l. Finnance Auth. Series 2020 1, 4.125% 1/20/34 | | 420,726 | 410,337 |
| New Hampshire Health & Ed. Facilities Auth.: | | | |
| (Dartmouth-Hitchcock Oblgtd Grp Proj.) Series 2018 A: | | | |
5% 8/1/28 | | 60,000 | 63,807 |
5% 8/1/29 | | 55,000 | 58,647 |
5% 8/1/30 | | 50,000 | 53,259 |
| (Partners Healthcare Sys., Inc. Proj.) Series 2017: | | | |
5% 7/1/30 | | 130,000 | 141,376 |
5% 7/1/32 | | 195,000 | 211,441 |
5% 7/1/33 | | 175,000 | 189,477 |
5% 7/1/34 | | 270,000 | 291,538 |
5% 7/1/35 | | 285,000 | 306,298 |
5% 7/1/36 | | 300,000 | 320,765 |
5% 7/1/37 | | 260,000 | 276,578 |
| Series 2017, 5% 7/1/44 | | 665,000 | 636,914 |
| New Hampshire Health & Ed. Facilities Auth. Rev.: | | | |
| Series 2012: | | | |
4% 7/1/32 | | 140,000 | 139,999 |
5% 7/1/24 | | 50,000 | 50,040 |
5% 7/1/25 | | 60,000 | 60,049 |
5% 7/1/27 | | 25,000 | 25,022 |
| Series 2016: | | | |
4% 10/1/38 | | 120,000 | 107,939 |
5% 10/1/24 | | 105,000 | 106,634 |
5% 10/1/25 | | 105,000 | 108,276 |
5% 10/1/29 | | 340,000 | 351,695 |
5% 10/1/31 | | 265,000 | 272,584 |
5% 10/1/33 | | 205,000 | 209,360 |
5% 10/1/38 | | 375,000 | 375,791 |
| New Hampshire Nat'l. Fin. Auth. Series 2022 2, 4% 10/20/36 | | 2,407,889 | 2,280,424 |
TOTAL NEW HAMPSHIRE | | | 7,806,624 |
| New Jersey - 7.6% | | | |
| Atlantic County Impt. Auth. (Atlantic City Campus Proj.) Series 2016 A: | | | |
| 5% 7/1/28 (Assured Guaranty Muni. Corp. Insured) | | 55,000 | 58,024 |
| 5% 7/1/30 (Assured Guaranty Muni. Corp. Insured) | | 130,000 | 137,469 |
| 5% 7/1/32 (Assured Guaranty Muni. Corp. Insured) | | 65,000 | 68,767 |
| 5% 7/1/33 (Assured Guaranty Muni. Corp. Insured) | | 65,000 | 68,736 |
| New Jersey Econ. Dev. Auth.: | | | |
| (White Horse HMT Urban Renewal LLC Proj.) Series 2020, 5% 1/1/40 (e) | | 100,000 | 71,918 |
| Series 2015, 5.25% 6/15/27 | | 400,000 | 414,126 |
| Series 2023 RRR, 5% 3/1/25 | | 3,750,000 | 3,843,058 |
| Series A: | | | |
5% 11/1/31 | | 665,000 | 729,891 |
5% 11/1/36 | | 745,000 | 796,964 |
| Series QQQ: | | | |
4% 6/15/46 | | 850,000 | 809,560 |
4% 6/15/50 | | 4,215,000 | 3,973,166 |
| New Jersey Econ. Dev. Auth. Rev.: | | | |
| (Black Horse EHT Urban Renewal LLC Proj.) Series 2019 A, 5% 10/1/39 (e) | | 100,000 | 72,473 |
| Series 2014 PP, 5% 6/15/26 | | 325,000 | 330,615 |
| Series 2014 RR, 5% 6/15/32 (Pre-Refunded to 6/15/24 @ 100) | | 70,000 | 71,209 |
| Series 2014 UU, 5% 6/15/30 (Pre-Refunded to 6/15/24 @ 100) | | 90,000 | 91,303 |
| Series LLL, 5% 6/15/44 | | 335,000 | 352,363 |
| New Jersey Econ. Dev. Auth. Wtr. Facilities Rev. Bonds (New Jersey- American Wtr. Co., INC. Proj.) Series 2020 B, 3.75%, tender 6/1/28 (b)(c) | | 6,160,000 | 6,125,617 |
| New Jersey Edl. Facility Series 2016 A: | | | |
| 5% 7/1/31 | | 105,000 | 108,883 |
| 5% 7/1/32 | | 120,000 | 124,378 |
| New Jersey Gen. Oblig.: | | | |
| Series 2020 A, 5% 6/1/29 | | 325,000 | 362,973 |
| Series 2021, 2% 6/1/36 | | 525,000 | 406,677 |
| New Jersey Health Care Facilities Fing. Auth. Rev.: | | | |
| Series 2016 A: | | | |
5% 7/1/25 (Escrowed to Maturity) | | 100,000 | 103,537 |
5% 7/1/26 (Escrowed to Maturity) | | 55,000 | 58,105 |
5% 7/1/26 (Escrowed to Maturity) | | 20,000 | 21,129 |
5% 7/1/27 | | 40,000 | 42,186 |
5% 7/1/28 | | 20,000 | 21,123 |
5% 7/1/28 (Pre-Refunded to 7/1/26 @ 100) | | 2,730,000 | 2,884,099 |
5% 7/1/29 (Pre-Refunded to 7/1/26 @ 100) | | 35,000 | 36,976 |
5% 7/1/30 | | 50,000 | 52,829 |
| Series 2016: | | | |
4% 7/1/48 | | 1,610,000 | 1,376,162 |
5% 7/1/41 | | 185,000 | 185,079 |
| Series 2021, 3% 7/1/39 | | 590,000 | 491,037 |
| New Jersey Higher Ed. Student Assistance Auth. Student Ln. Rev.: | | | |
| Series 2017 1A: | | | |
5% 12/1/24 (c) | | 2,600,000 | 2,638,368 |
5% 12/1/25 (c) | | 2,500,000 | 2,566,951 |
5% 12/1/26 (c) | | 1,970,000 | 2,039,862 |
| Series 2018 B: | | | |
5% 12/1/25 (c) | | 215,000 | 220,758 |
5% 12/1/26 (c) | | 305,000 | 315,816 |
5% 12/1/27 (c) | | 750,000 | 785,601 |
5% 12/1/28 (c) | | 1,000,000 | 1,053,781 |
| Series 2019 A: | | | |
5% 12/1/23 | | 90,000 | 90,604 |
5% 12/1/24 | | 55,000 | 56,190 |
5% 12/1/25 | | 95,000 | 98,563 |
| Series 2020: | | | |
5% 12/1/24 (c) | | 425,000 | 431,272 |
5% 12/1/24 (c) | | 205,000 | 208,025 |
5% 12/1/27 (c) | | 165,000 | 172,832 |
5% 12/1/28 (c) | | 295,000 | 312,197 |
| Series 2022 A, 5% 12/1/26 (c) | | 205,000 | 212,270 |
| Series 2022 B, 5% 12/1/26 (c) | | 2,100,000 | 2,174,472 |
| Series 2023 B, 5% 12/1/31 (c) | | 7,590,000 | 8,211,936 |
| New Jersey Hsg. & Mtg. Fin. Agcy. Multi-family Rev. Series 2023 C: | | | |
| 5% 5/1/26 (c) | | 1,675,000 | 1,705,561 |
| 5% 5/1/27 (c) | | 1,765,000 | 1,804,672 |
| 5% 11/1/27 (c) | | 1,795,000 | 1,842,189 |
| 5% 5/1/28 (c) | | 1,835,000 | 1,887,531 |
| New Jersey Tobacco Settlement Fing. Corp.: | | | |
| Series 2018 A, 5.25% 6/1/46 | | 3,225,000 | 3,347,516 |
| Series 2018 B, 5% 6/1/46 | | 6,170,000 | 6,193,663 |
| New Jersey Tpk. Auth. Tpk. Rev.: | | | |
| Series 2015 E, 5% 1/1/34 | | 235,000 | 240,863 |
| Series 2022 B, 5% 1/1/46 | | 15,000,000 | 16,486,638 |
| Series D, 5% 1/1/28 | | 245,000 | 258,308 |
| New Jersey Trans. Trust Fund Auth.: | | | |
| (Trans. Prog.) Series 2019 AA, 5.25% 6/15/43 | | 1,460,000 | 1,536,764 |
| Series 2006 C: | | | |
0% 12/15/25 | | 2,500,000 | 2,288,615 |
0% 12/15/30 (FGIC Insured) | | 1,305,000 | 994,432 |
0% 12/15/33 (Assured Guaranty Muni. Corp. Insured) | | 1,650,000 | 1,119,642 |
0% 12/15/36 (AMBAC Insured) | | 3,000,000 | 1,725,771 |
| Series 2010 A, 0% 12/15/27 | | 690,000 | 590,491 |
| Series 2014 BB2, 5% 6/15/33 | | 1,280,000 | 1,432,393 |
| Series 2016 A: | | | |
5% 6/15/27 | | 135,000 | 141,242 |
5% 6/15/29 | | 115,000 | 120,394 |
| Series 2018 A, 5% 12/15/34 | | 195,000 | 209,972 |
| Series 2019 BB, 4% 6/15/50 | | 3,540,000 | 3,336,894 |
| Series 2021 A: | | | |
4% 6/15/34 | | 170,000 | 175,594 |
5% 6/15/32 | | 360,000 | 404,366 |
| Series 2022 A: | | | |
4% 6/15/40 | | 220,000 | 215,293 |
4% 6/15/41 | | 945,000 | 919,680 |
| Series 2022 AA: | | | |
5% 6/15/29 | | 295,000 | 324,634 |
5% 6/15/30 | | 1,625,000 | 1,812,552 |
5% 6/15/33 | | 380,000 | 430,151 |
| Series 2022 BB: | | | |
4% 6/15/46 | | 1,750,000 | 1,666,740 |
4% 6/15/50 | | 1,205,000 | 1,135,864 |
| Series AA: | | | |
4% 6/15/36 | | 280,000 | 283,381 |
4% 6/15/45 | | 2,510,000 | 2,399,642 |
4% 6/15/50 | | 3,210,000 | 3,025,828 |
5% 6/15/38 | | 315,000 | 337,274 |
| Series BB, 5% 6/15/33 | | 1,265,000 | 1,367,750 |
| South Jersey Trans. Auth. Trans. Sys. Rev. Series 2022 A, 5% 11/1/39 | | 750,000 | 797,260 |
TOTAL NEW JERSEY | | | 108,439,490 |
| New Mexico - 0.2% | | | |
| New Mexico Edl. Assistance Foundation Series 2021 1A: | | | |
| 5% 9/1/23 (c) | | 530,000 | 530,441 |
| 5% 9/1/24 (c) | | 295,000 | 299,038 |
| 5% 9/1/26 (c) | | 945,000 | 980,958 |
| 5% 9/1/27 (c) | | 445,000 | 468,148 |
| 5% 9/1/29 (c) | | 175,000 | 188,318 |
| New Mexico Mtg. Fin. Auth. Series 2019 D, 3.75% 1/1/50 | | 85,000 | 83,807 |
| Santa Fe Retirement Fac. Series 2019 A: | | | |
| 5% 5/15/34 | | 20,000 | 18,954 |
| 5% 5/15/39 | | 15,000 | 13,351 |
| 5% 5/15/44 | | 15,000 | 12,814 |
| 5% 5/15/49 | | 30,000 | 24,624 |
TOTAL NEW MEXICO | | | 2,620,453 |
| New York - 8.8% | | | |
| Dorm. Auth. New York Univ. Rev.: | | | |
| (Fordham Univ. Proj.) Series 2017: | | | |
4% 7/1/33 | | 65,000 | 66,845 |
4% 7/1/34 | | 65,000 | 66,753 |
| Series 2017: | | | |
5% 12/1/23 (e) | | 100,000 | 100,012 |
5% 12/1/24 (e) | | 100,000 | 100,200 |
5% 12/1/25 (e) | | 100,000 | 100,326 |
| Long Island Pwr. Auth. Elec. Sys. Rev. Bonds Series 2021 B, 1.5%, tender 9/1/26 (b) | | 630,000 | 583,565 |
| MTA Hudson Rail Yards Trust Oblig. Series 2016 A, 5% 11/15/56 | | 1,300,000 | 1,300,956 |
| New York City Edl. Construction Fund Series 2021 B, 5% 4/1/46 | | 760,000 | 814,865 |
| New York City Gen. Oblig.: | | | |
| ��Bonds Series 2015 F4, 5%, tender 6/1/44 (h) | | 500,000 | 515,592 |
| Series 2016 E, 5% 8/1/28 | | 220,000 | 232,418 |
| Series 2023 C: | | | |
5% 8/1/25 | | 3,000,000 | 3,114,751 |
5% 8/1/26 | | 3,600,000 | 3,820,590 |
| Series 2023 D, 5% 8/1/25 | | 2,000,000 | 2,076,501 |
| Series 2023 F1: | | | |
5% 8/1/25 | | 1,550,000 | 1,609,288 |
5% 8/1/27 | | 4,000,000 | 4,327,498 |
| Series A, 5% 8/1/26 | | 295,000 | 313,076 |
| New York City Hsg. Dev. Corp. Multifamily Hsg. Bonds: | | | |
| Series 2021 C2, 0.7%, tender 7/1/25 (b) | | 355,000 | 331,393 |
| Series 2021 K2, 0.9%, tender 1/1/26 (b) | | 2,435,000 | 2,230,710 |
| Series 2021, 0.6%, tender 7/1/25 (b) | | 500,000 | 462,659 |
| Series 2022 F 2B, 3.4%, tender 12/22/26 (b) | | 4,100,000 | 4,051,178 |
| Series 2023 A2: | | | |
3.7%, tender 12/30/27 (b) | | 2,045,000 | 2,045,334 |
3.73%, tender 12/29/28 (b) | | 2,280,000 | 2,282,954 |
| New York City Muni. Wtr. Fin. Auth. Wtr. & Swr. Sys. Rev.: | | | |
| Series 2022 EE, 5% 6/15/45 | | 3,785,000 | 4,165,278 |
| Series GG 1, 5% 6/15/48 | | 5,265,000 | 5,664,931 |
| New York City Transitional Fin. Auth. Bldg. Aid Rev. Series 2015 S2, 5% 7/15/35 | | 90,000 | 93,182 |
| New York City Transitional Fin. Auth. Rev.: | | | |
| Series 2018 A2, 5% 8/1/39 | | 585,000 | 619,701 |
| Series 2018 B, 5% 8/1/45 | | 1,860,000 | 1,951,174 |
| New York City Trust Cultural Resources Rev. Series 2021, 5% 7/1/31 | | 1,000,000 | 1,168,044 |
| New York Dorm. Auth. Rev.: | | | |
| Series 2022 A: | | | |
5% 7/15/37 | | 120,000 | 124,165 |
5% 7/15/42 | | 340,000 | 344,249 |
5% 7/15/50 | | 880,000 | 876,875 |
| Series 2022: | | | |
4% 7/1/36 | | 445,000 | 452,599 |
4% 7/1/38 | | 140,000 | 139,293 |
4% 7/1/40 | | 235,000 | 228,966 |
5% 7/1/34 | | 295,000 | 337,234 |
5% 7/1/35 | | 295,000 | 334,629 |
5% 7/1/37 | | 485,000 | 539,810 |
5% 7/1/39 | | 145,000 | 159,553 |
5% 7/1/41 | | 260,000 | 284,054 |
5% 7/1/57 | | 2,190,000 | 2,154,815 |
| New York Metropolitan Trans. Auth. Rev.: | | | |
| Series 2014 B, 5% 11/15/44 | | 505,000 | 506,087 |
| Series 2015 A1: | | | |
5% 11/15/29 | | 145,000 | 148,111 |
5% 11/15/45 | | 375,000 | 376,150 |
| Series 2017 C1, 5% 11/15/30 | | 990,000 | 1,051,715 |
| Series 2017 D, 5% 11/15/30 | | 2,120,000 | 2,251,918 |
| Series 2020 D, 4% 11/15/46 | | 3,440,000 | 3,233,889 |
| New York State Dorm. Auth.: | | | |
| Series 2018 A, 5.25% 3/15/38 | | 585,000 | 639,128 |
| Series 2019 D, 3% 2/15/49 | | 4,140,000 | 3,243,151 |
| Series 2021 A, 4% 3/15/39 | | 9,000,000 | 9,055,206 |
| Series 2021 E, 3% 3/15/50 | | 675,000 | 524,533 |
| Series 2022 A, 5% 3/15/41 | | 295,000 | 326,880 |
| New York State Hsg. Fin. Agcy. Rev.: | | | |
| Bonds: | | | |
Series 2021 J2: | | | |
1%, tender 11/1/26 (b) | | 355,000 | 322,088 |
1.1%, tender 5/1/27 (b) | | 1,310,000 | 1,160,536 |
Series 2023 C2, 3.8%, tender 5/1/29 (b) | | 6,565,000 | 6,572,430 |
| Series J, 0.75% 5/1/25 | | 415,000 | 387,223 |
| New York State Mtg. Agcy. Homeowner Mtg. Series 221, 3.5% 10/1/32 (c) | | 50,000 | 48,587 |
| New York State Urban Dev. Corp.: | | | |
| Series 2020 A, 3% 3/15/50 | | 7,910,000 | 6,054,487 |
| Series 2020 E: | | | |
3% 3/15/48 | | 8,915,000 | 6,935,285 |
3% 3/15/50 | | 955,000 | 730,978 |
4% 3/15/44 | | 2,555,000 | 2,527,590 |
4% 3/15/45 | | 2,055,000 | 2,025,057 |
| Series 2022 A, 5% 3/15/40 | | 12,000,000 | 13,436,882 |
| New York State Urban Eev Corp. Series 2019 A: | | | |
| 3% 3/15/49 | | 1,000,000 | 775,789 |
| 5% 3/15/37 | | 1,315,000 | 1,444,885 |
| New York Trans. Dev. Corp.: | | | |
| (Laguardia Arpt. Term. Redev. Proj.) Series 2016 A, 5% 7/1/41 (c) | | 215,000 | 214,887 |
| (Term. 4 John F. Kennedy Int'l. Arpt. Proj.) Series 2022: | | | |
5% 12/1/32 (c) | | 415,000 | 452,139 |
5% 12/1/33 (c) | | 640,000 | 693,630 |
5% 12/1/34 (c) | | 700,000 | 754,061 |
5% 12/1/35 (c) | | 350,000 | 374,572 |
5% 12/1/36 (c) | | 240,000 | 254,396 |
5% 12/1/37 (c) | | 635,000 | 667,843 |
5% 12/1/38 (c) | | 1,550,000 | 1,625,051 |
5% 12/1/39 (c) | | 1,185,000 | 1,236,798 |
5% 12/1/40 (c) | | 1,000,000 | 1,038,948 |
5% 12/1/41 (c) | | 910,000 | 942,130 |
5% 12/1/42 (c) | | 455,000 | 469,193 |
| New York Urban Dev. Corp. Rev.: | | | |
| (New York State Gen. Oblig. Proj.) Series 2017 A, 5% 3/15/34 | | 320,000 | 342,450 |
| Gen. Oblig. (New York State Gen. Oblig. Proj.) Series 2017 A, 5% 3/15/32 | | 275,000 | 294,741 |
| Niagara Area Dev. Corp. Rev. (Catholic Health Sys., Inc. Proj.) Series 2022, 4.5% 7/1/52 | | 600,000 | 435,730 |
| Onondaga Civic Dev. Corp. (Le Moyne College Proj.) Series 2018, 5% 1/1/43 | | 50,000 | 50,640 |
| Schenectady County Cap. Resources Corp. Rev. (Union College Proj.) Series 2017, 5% 1/1/40 | | 785,000 | 821,849 |
| Suffolk County Econ. Dev. Corp. Rev. Series 2021: | | | |
| 4.625% 11/1/31 (e) | | 100,000 | 88,854 |
| 5.375% 11/1/54 (e) | | 260,000 | 196,885 |
| Triborough Bridge & Tunnel Auth. Revs. Series 2015 A, 5.25% 11/15/45 | | 255,000 | 261,714 |
TOTAL NEW YORK | | | 125,181,112 |
| New York And New Jersey - 0.9% | | | |
| Port Auth. of New York & New Jersey: | | | |
| Series 194, 5.25% 10/15/55 | | 330,000 | 339,670 |
| Series 2021 227, 2% 10/1/34 (c) | | 2,390,000 | 1,861,432 |
| Series 2022 236, 5% 1/15/47 (c) | | 10,480,000 | 11,045,069 |
TOTAL NEW YORK AND NEW JERSEY | | | 13,246,171 |
| North Carolina - 0.8% | | | |
| Charlotte Int'l. Arpt. Rev.: | | | |
| Series 2017 A: | | | |
5% 7/1/30 | | 80,000 | 86,233 |
5% 7/1/33 | | 75,000 | 80,554 |
5% 7/1/37 | | 180,000 | 190,353 |
| Series 2017 B: | | | |
5% 7/1/23 (c) | | 10,000 | 10,000 |
5% 7/1/25 (c) | | 5,000 | 5,121 |
5% 7/1/26 (c) | | 5,000 | 5,197 |
5% 7/1/27 (c) | | 10,000 | 10,549 |
5% 7/1/28 (c) | | 10,000 | 10,535 |
5% 7/1/29 (c) | | 10,000 | 10,553 |
5% 7/1/30 (c) | | 15,000 | 15,839 |
5% 7/1/31 (c) | | 25,000 | 26,402 |
5% 7/1/32 (c) | | 25,000 | 26,385 |
5% 7/1/33 (c) | | 25,000 | 26,370 |
5% 7/1/34 (c) | | 30,000 | 31,589 |
5% 7/1/35 (c) | | 20,000 | 20,964 |
5% 7/1/36 (c) | | 15,000 | 15,651 |
5% 7/1/37 (c) | | 20,000 | 20,772 |
5% 7/1/42 (c) | | 60,000 | 61,663 |
| Series 2017 C, 4% 7/1/32 | | 75,000 | 76,723 |
| Charlotte-Mecklenburg Hosp. Auth. Health Care Sys. Rev. Bonds Series 2018 C, 3.45%, tender 10/31/25 (b) | | 2,620,000 | 2,611,559 |
| New Hanover County Hosp. Rev. Series 2017: | | | |
| 5% 10/1/27 (Escrowed to Maturity) | | 20,000 | 21,778 |
| 5% 10/1/47 (Pre-Refunded to 10/1/27 @ 100) | | 165,000 | 179,670 |
| North Carolina Hsg. Fin. Agcy. Home Ownership Rev. Series 2020 45, 3% 7/1/51 | | 7,385,000 | 7,124,583 |
| North Carolina Med. Care Commission Health Care Facilities Rev.: | | | |
| Bonds Series 2019 C, 2.55%, tender 6/1/26 (b) | | 875,000 | 852,385 |
| Series 2020 A, 3% 7/1/45 | | 565,000 | 449,227 |
TOTAL NORTH CAROLINA | | | 11,970,655 |
| North Dakota - 0.6% | | | |
| Grand Forks Health Care Sys. Rev. Series 2021: | | | |
| 4% 12/1/35 | | 530,000 | 491,502 |
| 4% 12/1/36 | | 335,000 | 305,297 |
| 4% 12/1/37 | | 405,000 | 361,280 |
| 4% 12/1/38 | | 365,000 | 324,069 |
| 5% 12/1/33 | | 550,000 | 575,103 |
| 5% 12/1/34 | | 660,000 | 686,798 |
| North Dakota Hsg. Fin. Agcy.: | | | |
| Series 2019 C, 3.2% 7/1/39 | | 2,765,000 | 2,466,979 |
| Series 2021 A, 3% 1/1/52 | | 235,000 | 226,406 |
| Series 2021 B, 3% 7/1/52 | | 755,000 | 722,886 |
| Series 2022, 5% 1/1/53 | | 945,000 | 975,525 |
| Univ. of North Dakota Series 2021 A, 3% 6/1/61 (Assured Guaranty Muni. Corp. Insured) | | 1,345,000 | 932,695 |
TOTAL NORTH DAKOTA | | | 8,068,540 |
| Ohio - 2.1% | | | |
| Akron Bath Copley Hosp. District Rev. Series 2016, 5.25% 11/15/46 | | 715,000 | 724,191 |
| Allen County Hosp. Facilities Rev.: | | | |
| (Mercy Health) Series 2017 A: | | | |
5% 8/1/25 | | 150,000 | 154,974 |
5% 8/1/26 | | 100,000 | 105,194 |
5% 8/1/27 | | 125,000 | 133,991 |
5% 8/1/28 | | 145,000 | 157,198 |
5% 8/1/29 | | 265,000 | 286,767 |
5% 8/1/30 | | 215,000 | 232,799 |
| Series 2020 A, 4% 12/1/40 | | 1,175,000 | 1,149,380 |
| American Muni. Pwr., Inc. Rev. (Greenup Hydroelectric Proj.) Series 2016, 5% 2/15/46 | | 620,000 | 627,482 |
| Buckeye Tobacco Settlement Fing. Auth.: | | | |
| Series 2020 A2: | | | |
3% 6/1/48 | | 9,705,000 | 7,476,819 |
4% 6/1/48 | | 260,000 | 240,639 |
5% 6/1/32 | | 685,000 | 744,639 |
5% 6/1/33 | | 2,275,000 | 2,470,278 |
| Series 2020 B2, 5% 6/1/55 | | 2,130,000 | 1,994,770 |
| Chillicothe Hosp. Facilities Rev. (Adena Health Sys. Oblig. Group Proj.) Series 2017, 5% 12/1/47 | | 295,000 | 297,724 |
| Columbus City School District Series 2016 A, 5% 12/1/29 | | 105,000 | 110,911 |
| Franklin County Convention Facilities Auth. (Greater Columbus Convention Ctr. Hotel Expansion Proj.) Series 2019: | | | |
| 5% 12/1/46 | | 325,000 | 342,836 |
| 5% 12/1/51 | | 485,000 | 508,765 |
| Franklin County Hosp. Facilities Rev. (Ohiohealth Corp. Proj.) Series 2015, 5% 5/15/40 | | 340,000 | 345,734 |
| Lancaster Port Auth. Gas Rev. Bonds Series 2019, 5%, tender 2/1/25 (b) | | 685,000 | 695,458 |
| Middleburg Heights Hosp. Rev. Series 2021 A, 4% 8/1/41 | | 645,000 | 596,027 |
| Montgomery County Hosp. Rev. (Kettering Health Network Obligated Group Proj.) Series 2021, 5% 8/1/30 | | 410,000 | 454,013 |
| Muskingum County Hosp. Facilities (Genesis Healthcare Sys. Obligated Group Proj.) Series 2013, 5% 2/15/33 | | 225,000 | 224,149 |
| Ohio Gen. Oblig.: | | | |
| Series 2021 A: | | | |
5% 3/1/29 | | 195,000 | 218,572 |
5% 3/1/29 | | 260,000 | 291,430 |
5% 3/1/30 | | 240,000 | 274,173 |
5% 3/1/30 | | 355,000 | 405,547 |
| Series 2021 B: | | | |
5% 2/1/29 | | 475,000 | 531,513 |
5% 2/1/30 | | 395,000 | 450,570 |
| Series 2021 C: | | | |
5% 3/15/29 | | 595,000 | 667,461 |
5% 3/15/30 | | 595,000 | 680,195 |
| Ohio Higher Edl. Facility Commission Rev. (Univ. of Dayton Proj.) Series 2018 B, 5% 12/1/36 | | 345,000 | 365,413 |
| Ohio Hosp. Facilities Rev. Series 2021 B: | | | |
| 5% 1/1/25 | | 350,000 | 359,073 |
| 5% 1/1/26 | | 415,000 | 433,028 |
| 5% 1/1/27 | | 955,000 | 1,015,653 |
| Ohio Hosp. Rev.: | | | |
| Bonds Series 2019 C, 2.75%, tender 5/1/28 (b) | | 635,000 | 620,520 |
| Series 2020 A, 4% 1/15/50 | | 75,000 | 69,181 |
| Ohio Hsg. Fin. Agcy. Residential Mtg. Rev. (Mtg. Backed Securities Prog.) Series 2019 B, 4.5% 3/1/50 | | 30,000 | 30,084 |
| Ohio Major New State Infrastructure Rev. Series 2021 1A: | | | |
| 5% 12/15/29 | | 585,000 | 663,908 |
| 5% 12/15/30 | | 530,000 | 611,921 |
| Ohio Tpk. Commission Tpk. Rev.: | | | |
| (Infrastructure Proj.) Series 2005 A, 0% 2/15/42 | | 130,000 | 55,892 |
| (Infrastructure Projs.) Series 2022 A, 5% 2/15/39 | | 195,000 | 219,773 |
| Scioto County Hosp. Facilities Rev.: | | | |
| Series 2016: | | | |
5% 2/15/29 | | 110,000 | 113,375 |
5% 2/15/34 | | 20,000 | 20,418 |
| Series 2019, 5% 2/15/29 | | 145,000 | 151,109 |
| Univ. of Akron Gen. Receipts Series 2016 A, 5% 1/1/35 | | 230,000 | 234,399 |
| Washington County Hosp. Rev. Series 2022: | | | |
| 6% 12/1/28 | | 260,000 | 263,493 |
| 6% 12/1/29 | | 270,000 | 275,069 |
| 6% 12/1/30 | | 290,000 | 295,975 |
| 6% 12/1/31 | | 310,000 | 316,555 |
TOTAL OHIO | | | 29,709,038 |
| Oklahoma - 0.2% | | | |
| Norman Reg'l. Hosp. Auth. Hosp. Rev. Series 2019, 3.25% 9/1/38 | | 2,015,000 | 1,578,195 |
| Oklahoma City Arpt. Trust Series 33, 5% 7/1/47 (c) | | 115,000 | 118,351 |
| Oklahoma City Pub. Property Auth. Hotel Tax Rev. Series 2015: | | | |
| 5% 10/1/28 | | 65,000 | 67,483 |
| 5% 10/1/29 | | 70,000 | 72,643 |
| 5% 10/1/36 | | 50,000 | 51,713 |
| 5% 10/1/39 | | 100,000 | 103,054 |
| Oklahoma Dev. Fin. Auth. Rev. (Oklahoma City Univ. Proj.) Series 2019, 5% 8/1/44 | | 180,000 | 176,616 |
TOTAL OKLAHOMA | | | 2,168,055 |
| Oregon - 1.9% | | | |
| Beaverton School District Series 2022 A: | | | |
| 0% 6/15/41 | | 4,250,000 | 1,851,631 |
| 0% 6/15/42 | | 4,155,000 | 1,714,562 |
| Oregon Gen. Oblig. Series 2022 A: | | | |
| 5% 5/1/40 | | 3,330,000 | 3,747,259 |
| 5% 12/1/52 | | 655,000 | 675,833 |
| Oregon State Hsg. & Cmnty. Svcs. Dept.: | | | |
| (Single Family Mtg. Prog.) Series A, 3.5% 1/1/51 | | 235,000 | 230,062 |
| Series 2019 A, 4% 7/1/50 | | 420,000 | 416,584 |
| Series 2020 A, 3% 7/1/52 | | 1,165,000 | 1,121,247 |
| Port of Portland Arpt. Rev.: | | | |
| Series 2020 27A, 5% 7/1/45 (c) | | 785,000 | 815,860 |
| Series 2022 28: | | | |
5% 7/1/41 (c) | | 1,760,000 | 1,865,297 |
5% 7/1/52 (c) | | 1,480,000 | 1,539,068 |
| Series 2023 29: | | | |
5% 7/1/34 (c) | | 4,270,000 | 4,777,947 |
5% 7/1/35 (c) | | 3,650,000 | 4,043,405 |
5% 7/1/37 (c) | | 2,910,000 | 3,159,097 |
| Salem Hosp. Facility Auth. Rev.: | | | |
| (Salem Health Projs.) Series 2019 A, 3% 5/15/49 | | 1,380,000 | 982,741 |
| Series 2016 A, 4% 5/15/41 | | 260,000 | 252,414 |
TOTAL OREGON | | | 27,193,007 |
| Pennsylvania - 5.7% | | | |
| Allegheny County Arpt. Auth. Rev. Series 2021 A: | | | |
| 5% 1/1/32 (c) | | 3,940,000 | 4,309,912 |
| 5% 1/1/33 (c) | | 4,640,000 | 5,073,470 |
| 5% 1/1/51 (c) | | 2,730,000 | 2,833,334 |
| 5% 1/1/56 (c) | | 1,655,000 | 1,714,564 |
| Allegheny County Indl. Dev. Auth. Rev. Series 2021: | | | |
| 3.5% 12/1/31 | | 220,000 | 182,295 |
| 4% 12/1/41 | | 335,000 | 246,125 |
| 4.25% 12/1/50 | | 375,000 | 260,026 |
| Bucks County Indl. Dev. Auth. Hosp. Rev. Series 2021: | | | |
| 5% 7/1/32 | | 150,000 | 145,155 |
| 5% 7/1/34 | | 20,000 | 19,226 |
| 5% 7/1/38 | | 395,000 | 370,552 |
| Butler County Hosp. Auth. Hosp. Rev. (Butler Health Sys. Proj.) Series 2015 A, 5% 7/1/35 | | 730,000 | 719,043 |
| Cap. Region Wtr. Wtr. Rev. Series 2018: | | | |
| 5% 7/15/27 | | 50,000 | 53,868 |
| 5% 7/15/29 | | 80,000 | 87,527 |
| 5% 7/15/32 | | 50,000 | 54,391 |
| Commonwealth Fing. Auth. Rev. Series 2020 A: | | | |
| 5% 6/1/26 | | 515,000 | 540,181 |
| 5% 6/1/28 | | 275,000 | 299,155 |
| Dauphin County Gen. Auth. (Pinnacle Health Sys. Proj.) Series 2016 A: | | | |
| 5% 6/1/28 | | 55,000 | 57,324 |
| 5% 6/1/29 | | 60,000 | 62,470 |
| Delaware County Auth. Rev.: | | | |
| (Cabrini College) Series 2017, 5% 7/1/47 | | 815,000 | 775,225 |
| Series 2017: | | | |
5% 7/1/28 | | 105,000 | 106,511 |
5% 7/1/29 | | 400,000 | 406,906 |
| Doylestown Hosp. Auth. Hosp. Rev.: | | | |
| Series 2016 A, 5% 7/1/46 | | 75,000 | 62,685 |
| Series 2019, 5% 7/1/49 | | 285,000 | 231,704 |
| Dubois Hosp. Auth. Hosp. Rev. (Penn Highlands Healthcare Proj.) Series 2018: | | | |
| 4% 7/15/33 | | 125,000 | 125,732 |
| 4% 7/15/35 | | 130,000 | 130,348 |
| 4% 7/15/37 | | 255,000 | 249,177 |
| 5% 7/15/25 | | 20,000 | 20,446 |
| 5% 7/15/26 | | 65,000 | 67,350 |
| 5% 7/15/27 | | 105,000 | 110,068 |
| 5% 7/15/28 | | 80,000 | 84,577 |
| 5% 7/15/29 | | 85,000 | 89,780 |
| 5% 7/15/30 | | 110,000 | 116,021 |
| 5% 7/15/31 | | 75,000 | 79,021 |
| 5% 7/15/32 | | 80,000 | 84,230 |
| 5% 7/15/34 | | 85,000 | 89,355 |
| 5% 7/15/36 | | 255,000 | 265,223 |
| 5% 7/15/38 | | 305,000 | 312,734 |
| 5% 7/15/43 | | 355,000 | 363,357 |
| Lehigh County Gen. Purp. Auth. Rev.: | | | |
| (Muhlenberg College Proj.) Series 2017, 5% 2/1/39 | | 130,000 | 134,125 |
| Series 2021 A, 4% 11/1/51 | | 3,835,000 | 3,202,307 |
| Lehigh County Gen. Purp. Hosp. Rev. Series 2019 A, 4% 7/1/49 | | 5,000,000 | 4,628,917 |
| Monroe County Hosp. Auth. Rev. Series 2016: | | | |
| 5% 7/1/26 | | 50,000 | 52,066 |
| 5% 7/1/27 | | 50,000 | 52,209 |
| 5% 7/1/28 | | 50,000 | 52,182 |
| 5% 7/1/34 | | 185,000 | 190,249 |
| 5% 7/1/36 | | 100,000 | 102,064 |
| Montgomery County Higher Ed. & Health Auth. Rev.: | | | |
| Series 2014 A: | | | |
5% 10/1/23 | | 20,000 | 20,005 |
5% 10/1/24 | | 60,000 | 60,161 |
5% 10/1/25 | | 55,000 | 55,077 |
5% 10/1/27 | | 25,000 | 25,084 |
| Series 2016 A: | | | |
5% 10/1/28 | | 75,000 | 75,672 |
5% 10/1/29 | | 130,000 | 131,352 |
5% 10/1/31 | | 230,000 | 232,404 |
5% 10/1/36 | | 415,000 | 412,230 |
5% 10/1/40 | | 205,000 | 192,416 |
| Northampton County Gen. Purp. Auth. Hosp. Rev.: | | | |
| (St. Luke's Univ. Health Network Proj.): | | | |
Series 2016 A, 5% 8/15/36 | | 40,000 | 41,284 |
Series 2018 A, 4% 8/15/48 | | 645,000 | 580,040 |
| Series 2016 A, 5% 8/15/46 | | 1,515,000 | 1,519,285 |
| Pennsylvania Econ. Dev. Fing. Auth. Solid Waste Disp. Rev. Bonds Series 2011, 2.15%, tender 7/1/24 (b)(c) | | 935,000 | 918,123 |
| Pennsylvania Higher Edl. Facilities Auth. Rev.: | | | |
| (Drexel Univ. Proj.): | | | |
Series 2016, 5% 5/1/35 | | 175,000 | 181,661 |
Series 2017: | | | |
5% 5/1/35 | | 65,000 | 68,401 |
5% 5/1/37 | | 80,000 | 83,228 |
5% 5/1/41 | | 360,000 | 370,335 |
| Series 2016: | | | |
5% 5/1/28 | | 25,000 | 26,098 |
5% 5/1/32 | | 65,000 | 67,708 |
5% 5/1/33 | | 85,000 | 88,480 |
| Pennsylvania Hsg. Fin. Agcy.: | | | |
| Series 2020 13 2A, 3.5% 4/1/51 | | 90,000 | 88,637 |
| Series 2021 134 A, 3% 10/1/49 | | 4,555,000 | 4,416,218 |
| Series 2021 134B, 5% 4/1/27 (c) | | 395,000 | 412,976 |
| Series 2021 137, 3% 10/1/51 | | 1,120,000 | 1,065,342 |
| Series 2023 142A: | | | |
4.5% 10/1/38 | | 985,000 | 994,871 |
5% 10/1/43 | | 710,000 | 739,802 |
| Pennsylvania Tpk. Commission Tpk. Rev.: | | | |
| Series 2021 B, 5% 12/1/46 | | 2,645,000 | 2,819,147 |
| Series 2021 C: | | | |
5% 12/1/27 | | 220,000 | 238,989 |
5% 12/1/28 | | 215,000 | 238,271 |
| Series 2023: | | | |
5% 12/1/36 | | 620,000 | 691,752 |
5% 12/1/38 | | 2,500,000 | 2,810,164 |
5% 12/1/39 | | 3,000,000 | 3,364,185 |
5% 12/1/40 | | 2,375,000 | 2,635,837 |
| Philadelphia Arpt. Rev.: | | | |
| Series 2017 A: | | | |
5% 7/1/25 | | 50,000 | 51,603 |
5% 7/1/26 | | 50,000 | 52,574 |
5% 7/1/27 | | 40,000 | 42,905 |
| Series 2017 B: | | | |
5% 7/1/23 (c) | | 75,000 | 75,000 |
5% 7/1/26 (c) | | 150,000 | 155,379 |
5% 7/1/27 (c) | | 125,000 | 131,201 |
5% 7/1/28 (c) | | 150,000 | 157,619 |
5% 7/1/29 (c) | | 115,000 | 121,099 |
5% 7/1/32 (c) | | 150,000 | 157,970 |
5% 7/1/33 (c) | | 115,000 | 121,039 |
5% 7/1/34 (c) | | 205,000 | 215,393 |
5% 7/1/37 (c) | | 230,000 | 238,365 |
5% 7/1/42 (c) | | 685,000 | 700,955 |
5% 7/1/47 (c) | | 1,165,000 | 1,188,434 |
| Series 2021: | | | |
5% 7/1/26 (c) | | 3,765,000 | 3,903,259 |
5% 7/1/27 (c) | | 5,190,000 | 5,463,207 |
5% 7/1/28 (c) | | 550,000 | 584,853 |
5% 7/1/34 (c) | | 1,100,000 | 1,204,221 |
5% 7/1/35 (c) | | 590,000 | 640,527 |
5% 7/1/51 (c) | | 1,000,000 | 1,039,966 |
| Philadelphia Auth. for Indl. Dev. Series 2017, 5% 11/1/47 | | 400,000 | 401,434 |
| Philadelphia School District: | | | |
| Series 2016 D: | | | |
5% 9/1/25 | | 445,000 | 459,400 |
5% 9/1/26 | | 465,000 | 487,214 |
5% 9/1/27 | | 490,000 | 515,208 |
5% 9/1/28 | | 410,000 | 430,841 |
| Series 2016 F: | | | |
5% 9/1/28 | | 710,000 | 744,569 |
5% 9/1/29 | | 460,000 | 481,834 |
| Series 2018 A: | | | |
5% 9/1/36 | | 95,000 | 101,811 |
5% 9/1/37 | | 55,000 | 58,628 |
5% 9/1/38 | | 90,000 | 95,328 |
| Series 2018 B, 5% 9/1/43 | | 130,000 | 136,674 |
| Series 2019 A: | | | |
4% 9/1/35 | | 385,000 | 391,040 |
5% 9/1/30 | | 400,000 | 438,617 |
5% 9/1/31 | | 320,000 | 348,118 |
5% 9/1/34 (Assured Guaranty Muni. Corp. Insured) | | 185,000 | 201,260 |
| Series F, 5% 9/1/30 | | 345,000 | 360,219 |
| Philadelphia Wtr. & Wastewtr. Rev. Series 2018 A, 5% 10/1/34 | | 1,055,000 | 1,153,601 |
| Pittsburgh Wtr. & Swr. Auth. Wtr. & Swr. Sys. Rev. Series 2019 A, 5% 9/1/38 (Assured Guaranty Muni. Corp. Insured) | | 200,000 | 217,905 |
| Southcentral Pennsylvania Gen. Auth. Rev. Series 2019 A: | | | |
| 4% 6/1/44 | | 140,000 | 134,299 |
| 4% 6/1/49 | | 335,000 | 314,075 |
| 5% 6/1/44 | | 245,000 | 255,970 |
| 5% 6/1/49 | | 390,000 | 404,779 |
| State Pub. School Bldg. Auth. Lease Rev. (The School District of Philadelphia Proj.) Series 2015 A, 5% 6/1/26 | | 65,000 | 66,724 |
| Union County Hosp. Auth. Rev. Series 2018 B: | | | |
| 5% 8/1/43 | | 280,000 | 282,787 |
| 5% 8/1/48 | | 1,225,000 | 1,229,529 |
TOTAL PENNSYLVANIA | | | 80,835,855 |
| Puerto Rico - 1.8% | | | |
| Puerto Rico Commonwealth Aqueduct & Swr. Auth.: | | | |
| Series 2021 A, 5% 7/1/37 (e) | | 3,250,000 | 3,264,852 |
| Series 2021 B: | | | |
5% 7/1/33 (e) | | 400,000 | 410,164 |
5% 7/1/37 (e) | | 1,695,000 | 1,702,746 |
| Series 2022 A, 4% 7/1/42 (e) | | 1,690,000 | 1,474,904 |
| Puerto Rico Commonwealth Hwys & Tra Series 2022 B, 0% 7/1/32 | | 1,500,000 | 954,150 |
| Puerto Rico Commonwealth Pub. Impt. Gen. Oblig. Series 2021 A1: | | | |
| 0% 7/1/33 | | 8,240,022 | 5,037,776 |
| 4% 7/1/33 | | 1,927,686 | 1,831,425 |
| 4% 7/1/35 | | 695,000 | 645,959 |
| 4% 7/1/37 | | 850,000 | 762,812 |
| 5.625% 7/1/27 | | 201,149 | 211,801 |
| 5.625% 7/1/29 | | 1,000,434 | 1,071,400 |
| Puerto Rico Sales Tax Fing. Corp. Sales Tax Rev.: | | | |
| Series 2018 A1, 0% 7/1/31 | | 8,088,000 | 5,769,931 |
| Series 2019 A2, 4.329% 7/1/40 | | 2,000,000 | 1,902,061 |
TOTAL PUERTO RICO | | | 25,039,981 |
| Rhode Island - 1.4% | | | |
| Rhode Island Health & Edl. Bldg. Corp. Higher Ed. Facilities Rev.: | | | |
| Series 2016 B: | | | |
5% 9/1/31 | | 420,000 | 414,861 |
5% 9/1/36 | | 355,000 | 334,460 |
| Series 2016, 5% 5/15/39 | | 320,000 | 321,111 |
| Rhode Island Health and Edl. Bldg. Corp. Higher Ed. Facility Rev. Series 2022 A, 5% 9/1/33 | | 7,000,000 | 8,409,029 |
| Rhode Island Hsg. & Mtg. Fin. Corp.: | | | |
| Series 2019 70, 4% 10/1/49 | | 75,000 | 74,383 |
| Series 2021 74, 3% 4/1/49 | | 640,000 | 618,310 |
| Rhode Island Hsg. & Mtg. Fin. Corp. Rev. Series 72 A, 3.5% 10/1/50 | | 720,000 | 705,430 |
| Rhode Island Student Ln. Auth. Student Ln. Rev.: | | | |
| Series 2023 A: | | | |
5% 12/1/28 (c) | | 2,940,000 | 3,129,124 |
5% 12/1/29 (c) | | 4,380,000 | 4,700,532 |
| Series A: | | | |
3.5% 12/1/34 (c) | | 70,000 | 67,826 |
5% 12/1/24 (c) | | 225,000 | 228,783 |
5% 12/1/28 (c) | | 500,000 | 535,455 |
TOTAL RHODE ISLAND | | | 19,539,304 |
| South Carolina - 0.4% | | | |
| Charleston County Arpt. District Series 2019, 5% 7/1/43 | | 145,000 | 154,080 |
| Scago Edl. Facilities Corp. for Colleton School District (School District of Colleton County Proj.) Series 2015: | | | |
| 5% 12/1/25 | | 140,000 | 144,193 |
| 5% 12/1/28 | | 285,000 | 293,569 |
| South Carolina Hsg. Fin. & Dev. Auth. Mtg. Rev. Series 2019 A, 4% 1/1/50 | | 105,000 | 104,204 |
| South Carolina Jobs-Econ. Dev. Auth. Series 2019 C, 5% 7/1/33 | | 365,000 | 389,157 |
| South Carolina Ports Auth. Ports Rev. Series 2015, 5.25% 7/1/55 (Pre-Refunded to 7/1/25 @ 100) (c) | | 55,000 | 57,209 |
| South Carolina Pub. Svc. Auth. Rev.: | | | |
| Series 2016 A: | | | |
5% 12/1/29 | | 150,000 | 155,716 |
5% 12/1/38 | | 15,000 | 15,289 |
| Series 2016 B: | | | |
5% 12/1/31 | | 55,000 | 57,357 |
5% 12/1/41 | | 765,000 | 777,304 |
| Series A, 5% 12/1/23 (Escrowed to Maturity) | | 385,000 | 387,694 |
| Spartanburg County Reg'l. Health Series 2017 A: | | | |
| 4% 4/15/43 | | 945,000 | 862,482 |
| 4% 4/15/48 | | 660,000 | 584,769 |
| 5% 4/15/48 | | 2,265,000 | 2,311,373 |
TOTAL SOUTH CAROLINA | | | 6,294,396 |
| South Dakota - 0.0% | | | |
| South Dakota Health & Edl. Facilities Auth. Rev.: | | | |
| (Avera Health Proj.) Series 2017, 5% 7/1/31 | | 35,000 | 37,651 |
| Series 2017: | | | |
5% 7/1/26 | | 15,000 | 15,715 |
5% 7/1/28 | | 15,000 | 16,149 |
5% 7/1/29 | | 30,000 | 32,366 |
| Series 2020 A, 3% 9/1/45 | | 730,000 | 564,069 |
TOTAL SOUTH DAKOTA | | | 665,950 |
| Tennessee - 1.6% | | | |
| Chattanooga Health Ed. & Hsg. Facility Board Rev. Series 2019 A1, 4% 8/1/44 | | 610,000 | 569,775 |
| Jackson Hosp. Rev. Series 2018 A: | | | |
| 5% 4/1/41 | | 560,000 | 573,054 |
| 5% 4/1/41 (Pre-Refunded to 10/1/28 @ 100) | | 30,000 | 33,138 |
| Memphis-Shelby County Arpt. Auth. Arpt. Rev. Series 2018, 5% 7/1/37 (c) | | 235,000 | 244,515 |
| Metropolitan Nashville Arpt. Auth. Rev.: | | | |
| Series 2015 B, 4% 7/1/25 (c) | | 130,000 | 130,441 |
| Series 2019 B: | | | |
5% 7/1/38 (c) | | 965,000 | 1,022,349 |
5% 7/1/54 (c) | | 300,000 | 309,635 |
| Series 2022 B: | | | |
5% 7/1/52 (c) | | 3,250,000 | 3,384,597 |
5.5% 7/1/39 (c) | | 2,000,000 | 2,225,239 |
5.5% 7/1/40 (c) | | 2,000,000 | 2,215,517 |
5.5% 7/1/42 (c) | | 3,500,000 | 3,849,448 |
| Nashville and Davidson County Metropolitan Govt. Gen. Oblig. Series 2021 C: | | | |
| 5% 1/1/27 | | 3,010,000 | 3,221,763 |
| 5% 1/1/30 | | 3,525,000 | 4,008,164 |
| Nashville and Davidson County Metropolitan Govt. Health & Edl. Facilities Board Rev. (Lipscomb Univ. Proj.) Series 2019 A, 4% 10/1/49 | | 485,000 | 383,613 |
| Tennessee Hsg. Dev. Agcy. Residential: | | | |
| Series 2021 1, 3% 7/1/51 | | 755,000 | 728,569 |
| Series 2021 3A, 3% 1/1/52 | | 285,000 | 273,557 |
TOTAL TENNESSEE | | | 23,173,374 |
| Texas - 5.3% | | | |
| Austin Arpt. Sys. Rev.: | | | |
| Series 2014: | | | |
5% 11/15/26 (c) | | 50,000 | 50,599 |
5% 11/15/27 (c) | | 65,000 | 65,788 |
5% 11/15/28 (c) | | 75,000 | 75,932 |
5% 11/15/39 (c) | | 275,000 | 276,289 |
| Series 2017 B: | | | |
5% 11/15/28 (c) | | 50,000 | 52,037 |
5% 11/15/30 (c) | | 80,000 | 83,268 |
5% 11/15/32 (c) | | 60,000 | 62,412 |
5% 11/15/35 (c) | | 65,000 | 67,131 |
5% 11/15/36 (c) | | 105,000 | 108,017 |
5% 11/15/37 (c) | | 70,000 | 71,776 |
5% 11/15/41 (c) | | 290,000 | 295,419 |
| Austin Wtr. & Wastewtr. Sys. Rev. Series 2022: | | | |
| 5% 11/15/37 | | 1,000,000 | 1,141,851 |
| 5% 11/15/38 | | 1,250,000 | 1,417,064 |
| 5% 11/15/39 | | 1,750,000 | 1,968,895 |
| 5% 11/15/40 | | 2,000,000 | 2,231,321 |
| 5% 11/15/41 | | 2,000,000 | 2,218,385 |
| 5% 11/15/42 | | 3,000,000 | 3,306,721 |
| Board of Regents of The Texas A&M Univ. Sys. Permanent Univ. Fund Series 2023, 5% 7/1/38 | | 1,785,000 | 2,028,854 |
| Central Reg'l. Mobility Auth.: | | | |
| Series 2015 A: | | | |
5% 1/1/28 | | 65,000 | 67,045 |
5% 1/1/31 (Pre-Refunded to 7/1/25 @ 100) | | 25,000 | 25,914 |
5% 1/1/32 (Pre-Refunded to 7/1/25 @ 100) | | 50,000 | 51,827 |
5% 1/1/40 (Pre-Refunded to 7/1/25 @ 100) | | 295,000 | 305,782 |
| Series 2021 C, 5% 1/1/27 | | 1,055,000 | 1,098,887 |
| City of Denton Series 2020, 2% 2/15/38 | | 1,530,000 | 1,119,473 |
| Dallas Fort Worth Int'l. Arpt. Rev. Series 2022 B, 5% 11/1/37 | | 3,000,000 | 3,355,589 |
| Dallas Wtrwks. & Swr. Sys. Rev. Series 2017, 5% 10/1/46 | | 585,000 | 616,452 |
| El Paso Independent School District Series 2020: | | | |
| 5% 8/15/25 | | 220,000 | 228,821 |
| 5% 8/15/26 | | 380,000 | 403,740 |
| El Paso Wtr. & Swr. Rev. Series 2022, 5% 3/1/36 | | 1,000,000 | 1,122,432 |
| Fort Bend Independent School District Bonds Series 2021 B, 0.72%, tender 8/1/26 (b) | | 525,000 | 465,631 |
| Grand Parkway Trans. Corp. Series 2018 A, 5% 10/1/38 | | 160,000 | 170,992 |
| Harris County Cultural Ed. Facilities Fin. Corp. Rev.: | | | |
| (Texas Childrens Hosp., Proj.) Series 2015-1 5% 10/1/29 | | 70,000 | 73,010 |
| Series 2021 A, 3% 10/1/51 | | 1,000,000 | 746,313 |
| Harris County Flood Cont. District Series 2021 A: | | | |
| 5% 10/1/28 | | 500,000 | 554,363 |
| 5% 10/1/29 | | 500,000 | 564,438 |
| Harris County Gen. Oblig. Series 2002: | | | |
| 0% 8/15/25 (Nat'l. Pub. Fin. Guarantee Corp. Insured) | | 150,000 | 139,742 |
| 0% 8/15/28 (Nat'l. Pub. Fin. Guarantee Corp. Insured) | | 255,000 | 216,549 |
| Harris County Toll Road Rev. Series 2018 A, 5% 8/15/43 | | 585,000 | 614,407 |
| Houston Arpt. Sys. Rev.: | | | |
| Series 2018 A, 5% 7/1/41 (c) | | 880,000 | 909,620 |
| Series 2018 C: | | | |
5% 7/1/29 (c) | | 100,000 | 106,803 |
5% 7/1/30 (c) | | 105,000 | 112,219 |
5% 7/1/31 (c) | | 75,000 | 79,960 |
5% 7/1/32 (c) | | 90,000 | 95,879 |
| Houston Gen. Oblig. Series 2017 A: | | | |
| 5% 3/1/31 | | 235,000 | 252,554 |
| 5% 3/1/32 | | 100,000 | 107,290 |
| Houston Util. Sys. Rev.: | | | |
| Series 2016 B, 5% 11/15/33 | | 140,000 | 148,178 |
| Series 2020 C: | | | |
4% 11/15/43 | | 1,030,000 | 1,029,969 |
4% 11/15/49 | | 1,030,000 | 1,017,398 |
5% 11/15/45 | | 1,030,000 | 1,116,811 |
| Irving Hosp. Auth. Hosp. Rev. Series 2017 A: | | | |
| 5% 10/15/28 | | 25,000 | 26,009 |
| 5% 10/15/30 | | 95,000 | 98,583 |
| 5% 10/15/32 | | 50,000 | 51,758 |
| 5% 10/15/36 | | 35,000 | 35,813 |
| 5% 10/15/37 | | 55,000 | 56,060 |
| 5% 10/15/38 | | 80,000 | 81,360 |
| 5% 10/15/44 | | 80,000 | 80,094 |
| Katy Independent School District Series 2023, 5% 2/15/40 | | 1,170,000 | 1,296,045 |
| Love Field Arpt. Modernization Rev.: | | | |
| Series 2015: | | | |
5% 11/1/26 (c) | | 50,000 | 51,165 |
5% 11/1/27 (c) | | 110,000 | 112,717 |
5% 11/1/28 (c) | | 165,000 | 169,348 |
5% 11/1/29 (c) | | 100,000 | 102,735 |
5% 11/1/32 (c) | | 185,000 | 190,026 |
| Series 2017: | | | |
5% 11/1/24 (c) | | 50,000 | 50,691 |
5% 11/1/25 (c) | | 50,000 | 51,393 |
5% 11/1/26 (c) | | 50,000 | 52,095 |
5% 11/1/27 (c) | | 50,000 | 51,877 |
5% 11/1/28 (c) | | 90,000 | 93,475 |
5% 11/1/29 (c) | | 65,000 | 67,602 |
5% 11/1/30 (c) | | 50,000 | 52,020 |
5% 11/1/31 (c) | | 115,000 | 119,636 |
5% 11/1/32 (c) | | 130,000 | 135,170 |
5% 11/1/33 (c) | | 50,000 | 51,946 |
5% 11/1/34 (c) | | 50,000 | 51,829 |
5% 11/1/36 (c) | | 50,000 | 51,429 |
| Lower Colorado River Auth. Rev.: | | | |
| (LCRA Transmission Svcs. Corp. Proj.) Series 2020: | | | |
5% 5/15/25 | | 295,000 | 304,459 |
5% 5/15/26 | | 370,000 | 388,589 |
5% 5/15/27 | | 440,000 | 471,041 |
| Series 2015 D: | | | |
5% 5/15/28 | | 110,000 | 113,423 |
5% 5/15/30 | | 255,000 | 262,853 |
| Mission Econ. Dev. Corp. Solid Waste Disp. Rev. Bonds (Republic Svcs., Inc. Proj.) Series 2020 A, 3.875%, tender 8/1/23 (b)(c) | | 10,400,000 | 10,399,751 |
| New Hope Cultural Ed. Facilities Fin. Corp. (Childrens Med. Ctr. of Dallas) Series 2017 A: | | | |
| 5% 8/15/27 | | 40,000 | 42,908 |
| 5% 8/15/29 | | 100,000 | 107,638 |
| 5% 8/15/47 | | 115,000 | 117,938 |
| Newark Higher Ed. Fin. Corp. (Abilene Christian Univ. Proj.) Series 2016 A: | | | |
| 5% 4/1/27 | | 35,000 | 36,391 |
| 5% 4/1/30 | | 175,000 | 182,766 |
| North Texas Tollway Auth. Rev.: | | | |
| (Sr. Lien Proj.) Series 2017 A: | | | |
5% 1/1/31 | | 50,000 | 52,327 |
5% 1/1/33 | | 60,000 | 63,605 |
5% 1/1/34 | | 75,000 | 79,348 |
5% 1/1/34 | | 150,000 | 173,471 |
5% 1/1/35 | | 110,000 | 115,942 |
5% 1/1/36 | | 305,000 | 320,175 |
5% 1/1/37 | | 405,000 | 423,422 |
| (Sub Lien Proj.) Series 2017 B: | | | |
5% 1/1/30 | | 20,000 | 20,950 |
5% 1/1/31 | | 30,000 | 31,396 |
| Series 2015 A, 5% 1/1/32 | | 170,000 | 173,964 |
| Series 2016 A, 5% 1/1/36 | | 65,000 | 67,346 |
| Series 2017 A: | | | |
5% 1/1/38 | | 20,000 | 20,010 |
5% 1/1/39 | | 1,650,000 | 1,727,794 |
| Series 2018: | | | |
4% 1/1/37 | | 625,000 | 629,645 |
4% 1/1/38 | | 1,280,000 | 1,280,756 |
| Northside Independent School District Bonds: | | | |
| Series 2020, 0.7%, tender 6/1/25 (b) | | 730,000 | 689,333 |
| Series 2023 B, 3%, tender 8/1/29 (b) | | 5,165,000 | 5,078,467 |
| San Antonio Independent School District Series 2016, 5% 8/15/31 | | 220,000 | 233,273 |
| San Antonio Wtr. Sys. Rev. Series 2020 A, 5% 5/15/50 | | 625,000 | 670,518 |
| Southwest Higher Ed. Auth. Rev. (Southern Methodist Univ., TX. Proj.) Series 2017: | | | |
| 5% 10/1/29 | | 20,000 | 21,557 |
| 5% 10/1/30 | | 35,000 | 37,628 |
| 5% 10/1/31 | | 30,000 | 32,189 |
| 5% 10/1/39 | | 65,000 | 68,633 |
| 5% 10/1/40 | | 50,000 | 52,712 |
| Tarrant County Cultural Ed. Facilities Fin. Corp. Rev. Series 2016 A, 4% 2/15/35 | | 255,000 | 256,010 |
| Tarrant County Tex Hosp. District Series 2023, 5% 8/15/33 | | 1,000,000 | 1,168,673 |
| Texas Dept. of Hsg. & Cmnty. Affairs Multi-family Hsg. Rev. Series 2019, 2.95% 7/1/36 | | 1,067,359 | 954,534 |
| Texas Dept. of Hsg. & Cmnty. Affairs Single Family Mtg. Rev.: | | | |
| Series 2019 A, 4% 3/1/50 | | 230,000 | 228,415 |
| Series A, 3.5% 3/1/51 | | 275,000 | 268,561 |
| Texas Private Activity Bond Surface Trans. Corp.: | | | |
| (LBJ Infrastructure Group LLC I-635 Managed Lanes Proj.) Series 2020 A: | | | |
4% 6/30/36 | | 210,000 | 203,234 |
4% 6/30/39 | | 530,000 | 497,356 |
4% 6/30/40 | | 440,000 | 408,755 |
| Series 2013, 6.75% 6/30/43 (c) | | 760,000 | 762,953 |
| Texas State Univ. Sys. Fing. Rev. Series 2017 A, 5% 3/15/31 | | 165,000 | 176,433 |
| Texas Trans. Commission Hwy. Impt. Gen. Oblig. Bonds Series 2014 B, 0.65%, tender 4/1/26 (b) | | 3,195,000 | 2,896,219 |
| Texas Wtr. Dev. Board Rev.: | | | |
| Series 2018 A, 5% 10/15/43 | | 585,000 | 619,827 |
| Series 2020: | | | |
3% 10/15/38 | | 1,000,000 | 892,662 |
5% 8/1/30 | | 295,000 | 338,490 |
| Series 2022, 4.45% 10/15/36 | | 3,000,000 | 3,273,739 |
| Univ. of Houston Univ. Revs. Series 2017 A: | | | |
| 5% 2/15/33 | | 205,000 | 214,255 |
| 5% 2/15/34 | | 255,000 | 266,448 |
| 5% 2/15/36 | | 150,000 | 156,504 |
| Univ. of North Texas Univ. Rev. Series 2017 A, 5% 4/15/32 | | 105,000 | 112,887 |
| Univ. of Texas Board of Regents Sys. Rev. Series 2020 C, 5% 8/15/31 | | 880,000 | 1,029,036 |
| Univ. of Texas Permanent Univ. Fund Rev. Series 2016 B, 5% 7/1/29 | | 105,000 | 110,558 |
| Weatherford Independent School District Series 2002, 0% 2/15/33 | | 350,000 | 250,762 |
TOTAL TEXAS | | | 75,199,252 |
| Utah - 0.3% | | | |
| Salt Lake City Arpt. Rev.: | | | |
| Series 2017 A: | | | |
5% 7/1/25 (c) | | 100,000 | 102,430 |
5% 7/1/27 (c) | | 215,000 | 226,318 |
5% 7/1/29 (c) | | 190,000 | 200,076 |
5% 7/1/30 (c) | | 140,000 | 147,507 |
5% 7/1/31 (c) | | 265,000 | 279,255 |
5% 7/1/33 (c) | | 205,000 | 215,765 |
5% 7/1/35 (c) | | 205,000 | 214,415 |
5% 7/1/36 (c) | | 275,000 | 286,309 |
5% 7/1/37 (c) | | 690,000 | 715,094 |
5% 7/1/42 (c) | | 1,240,000 | 1,268,882 |
| Series 2018 A: | | | |
5% 7/1/33 (c) | | 485,000 | 516,309 |
5.25% 7/1/48 (c) | | 355,000 | 368,107 |
| Utah County Hosp. Rev. Series 2020 A, 5% 5/15/50 | | 295,000 | 308,854 |
TOTAL UTAH | | | 4,849,321 |
| Vermont - 0.2% | | | |
| Vermont Edl. & Health Bldg. Fin. Agcy. Rev.: | | | |
| (Champlain College Proj.) Series 2016 A: | | | |
5% 10/15/41 | | 230,000 | 221,078 |
5% 10/15/46 | | 290,000 | 270,742 |
| (Middlebury College Proj.) Series 2020, 5% 11/1/49 | | 625,000 | 658,628 |
| Vermont Hsg. Fin. Agcy. Series 2021 B, 3% 11/1/51 | | 371,000 | 353,064 |
| Vermont Student Assistant Corp. Ed. Ln. Rev.: | | | |
| Series 2019 A: | | | |
5% 6/15/27 (c) | | 295,000 | 309,529 |
5% 6/15/29 (c) | | 500,000 | 523,399 |
| Series 2020 A, 5% 6/15/28 (c) | | 295,000 | 306,710 |
TOTAL VERMONT | | | 2,643,150 |
| Virginia - 0.7% | | | |
| Arlington County Series 2021, 5% 6/15/28 | | 1,340,000 | 1,485,393 |
| Chesapeake Wtr. & Swr. Sys. Series 2021: | | | |
| 2% 7/1/35 | | 1,345,000 | 1,083,103 |
| 2% 7/1/36 | | 1,370,000 | 1,067,540 |
| Fredericksburg Econ. Dev. Auth. Rev. Series 2014: | | | |
| 5% 6/15/25 | | 235,000 | 237,013 |
| 5% 6/15/30 | | 65,000 | 65,609 |
| Lynchburg Econ. Dev. Series 2021, 3% 1/1/51 | | 2,250,000 | 1,587,912 |
| Stafford County Econ. Dev. Auth. Hosp. Facilities Rev.: | | | |
| (Mary Washington Hosp. Proj.) Series 2016, 3% 6/15/29 | | 30,000 | 29,172 |
| Series 2016: | | | |
4% 6/15/37 | | 35,000 | 34,053 |
5% 6/15/27 | | 75,000 | 78,254 |
5% 6/15/30 | | 30,000 | 31,225 |
5% 6/15/33 | | 20,000 | 20,784 |
5% 6/15/34 | | 40,000 | 41,492 |
5% 6/15/35 | | 110,000 | 113,722 |
| Virginia Commonwealth Trans. Board Rev. (Virginia Gen. Oblig. Proj.) Series 2017 A, 5% 5/15/32 | | 45,000 | 48,926 |
| Virginia Pub. Bldg. Auth. Pub. Facilities Rev. Series 2019 A, 4% 8/1/36 | | 675,000 | 697,495 |
| Virginia Small Bus. Fing. Auth. (Elizabeth River Crossings OpCo, LLC Proj.) Series 2022: | | | |
| 4% 1/1/35 (c) | | 955,000 | 951,823 |
| 4% 7/1/35 (c) | | 720,000 | 713,267 |
| Virginia St Pub. School Auth. Spl. O Series 2023, 5% 8/1/39 | | 1,235,000 | 1,423,224 |
| Winchester Econ. Dev. Auth. Series 2015: | | | |
| 5% 1/1/31 | | 125,000 | 129,630 |
| 5% 1/1/34 | | 75,000 | 77,551 |
| 5% 1/1/35 | | 75,000 | 77,430 |
| 5% 1/1/44 | | 50,000 | 50,727 |
| Wise County Indl. Dev. Auth. Waste & Sewage Rev. Bonds (Virginia Elec. and Pwr. Co. Proj.) Series 2010 A, 1.2%, tender 5/31/24 (b) | | 240,000 | 232,825 |
TOTAL VIRGINIA | | | 10,278,170 |
| Washington - 2.1% | | | |
| City of Olympia Series 2019, 2% 12/1/30 | | 1,265,000 | 1,128,507 |
| King County Hsg. Auth. Rev. Series 2021: | | | |
| 4% 6/1/26 | | 165,000 | 166,835 |
| 4% 6/1/28 | | 105,000 | 107,214 |
| Port of Seattle Rev.: | | | |
| Series 2015 B, 5% 3/1/25 | | 85,000 | 86,629 |
| Series 2016 B: | | | |
5% 10/1/28 (c) | | 175,000 | 180,837 |
5% 10/1/30 (c) | | 100,000 | 102,915 |
| Series 2019 A, 4% 4/1/44 (c) | | 185,000 | 170,566 |
| Series 2019: | | | |
5% 4/1/35 (c) | | 2,200,000 | 2,338,590 |
5% 4/1/44 (c) | | 440,000 | 455,558 |
| Series 2021 C: | | | |
5% 8/1/24 (c) | | 575,000 | 582,777 |
5% 8/1/25 (c) | | 465,000 | 476,946 |
5% 8/1/26 (c) | | 640,000 | 665,441 |
5% 8/1/27 (c) | | 395,000 | 416,599 |
5% 8/1/28 (c) | | 1,105,000 | 1,180,550 |
| Seattle Hsg. Auth. Rev. (Northgate Plaza Proj.) Series 2021, 1% 6/1/26 | | 255,000 | 233,272 |
| Washington Convention Ctr. Pub. Facilities: | | | |
| Series 2021 B, 3% 7/1/58 (Assured Guaranty Muni. Corp. Insured) | | 1,940,000 | 1,355,933 |
| Series 2021, 4% 7/1/31 | | 4,190,000 | 4,009,445 |
| Washington Gen. Oblig.: | | | |
| Series 2015 C, 5% 2/1/34 | | 210,000 | 215,950 |
| Series 2017 D, 5% 2/1/33 | | 180,000 | 191,880 |
| Series 2018 C, 5% 8/1/30 | | 340,000 | 367,430 |
| Series 2022 C, 5% 2/1/41 | | 3,225,000 | 3,594,627 |
| Series 2022 D: | | | |
4% 7/1/36 | | 850,000 | 890,745 |
4% 7/1/37 | | 590,000 | 612,383 |
| Series 2023 A, 5% 8/1/41 | | 2,985,000 | 3,344,155 |
| Series R-2017 A, 5% 8/1/30 | | 105,000 | 111,243 |
| Washington Health Care Facilities Auth. Rev.: | | | |
| (Overlake Hosp. Med. Ctr., WA. Proj.) Series 2017 B: | | | |
5% 7/1/25 | | 40,000 | 40,489 |
5% 7/1/27 | | 80,000 | 82,085 |
5% 7/1/28 | | 95,000 | 95,794 |
5% 7/1/29 | | 35,000 | 35,235 |
5% 7/1/30 | | 45,000 | 45,275 |
5% 7/1/31 | | 55,000 | 55,347 |
5% 7/1/32 | | 100,000 | 100,521 |
5% 7/1/33 | | 145,000 | 145,661 |
5% 7/1/34 | | 35,000 | 35,121 |
5% 7/1/42 | | 485,000 | 478,714 |
| (Providence Health Systems Proj.) Series 2012 A, 5% 10/1/25 | | 260,000 | 260,206 |
| Series 2015 B, 5% 10/1/38 | | 2,050,000 | 2,195,403 |
| Series 2015, 5% 1/1/27 (Pre-Refunded to 7/1/25 @ 100) | | 115,000 | 119,293 |
| Series 2017, 4% 8/15/42 | | 605,000 | 533,282 |
| Series 2019 A2, 5% 8/1/44 | | 340,000 | 350,813 |
| Washington Higher Ed. Facilities Auth. Rev.: | | | |
| (Gonzaga Univ. Proj.) Series 2019 A, 3% 4/1/49 | | 1,270,000 | 959,034 |
| (Whitworth Univ. Proj.): | | | |
Series 2016 A: | | | |
5% 10/1/27 | | 110,000 | 113,873 |
5% 10/1/28 | | 110,000 | 114,130 |
5% 10/1/35 | | 115,000 | 117,922 |
5% 10/1/36 | | 175,000 | 178,767 |
5% 10/1/40 | | 170,000 | 171,823 |
Series 2019, 4% 10/1/49 | | 735,000 | 619,039 |
TOTAL WASHINGTON | | | 29,834,854 |
| West Virginia - 0.5% | | | |
| West Virginia Hosp. Fin. Auth. Hosp. Rev.: | | | |
| Series 2018 A: | | | |
5% 1/1/31 | | 80,000 | 82,814 |
5% 1/1/32 | | 70,000 | 72,267 |
| Series 2023 A: | | | |
5% 6/1/39 | | 1,125,000 | 1,214,674 |
5% 6/1/40 | | 1,030,000 | 1,106,779 |
5% 6/1/41 | | 1,030,000 | 1,102,714 |
5% 6/1/43 | | 1,830,000 | 1,947,528 |
| West Virginia Parkways Auth. Series 2021: | | | |
| 5% 6/1/25 | | 295,000 | 304,918 |
| 5% 6/1/26 | | 295,000 | 311,608 |
| 5% 6/1/27 | | 295,000 | 318,473 |
| 5% 6/1/28 | | 440,000 | 484,971 |
TOTAL WEST VIRGINIA | | | 6,946,746 |
| Wisconsin - 1.3% | | | |
| Pub. Fin. Auth. Edl. Facilities: | | | |
| Series 2018 A: | | | |
5.25% 10/1/43 | | 470,000 | 464,177 |
5.25% 10/1/48 | | 470,000 | 454,204 |
| Series 2022 A: | | | |
5.25% 3/1/42 | | 295,000 | 298,304 |
5.25% 3/1/47 | | 2,175,000 | 2,177,242 |
| Pub. Fin. Auth. Hosp. Rev. Series 2019 A, 5% 10/1/44 | | 690,000 | 712,272 |
| Pub. Fin. Auth. Sr. Living Rev. (Mary's Woods At Marylhurst, Inc. Proj.) Series 2017 A: | | | |
| 5% 5/15/25 (e) | | 45,000 | 44,745 |
| 5% 5/15/28 (e) | | 70,000 | 68,754 |
| 5.25% 5/15/37 (e) | | 20,000 | 18,997 |
| 5.25% 5/15/42 (e) | | 415,000 | 378,792 |
| 5.25% 5/15/47 (e) | | 25,000 | 22,060 |
| 5.25% 5/15/52 (e) | | 45,000 | 39,015 |
| Pub. Fin. Auth. Wisconsin Retirement Facility Rev. Series 2018: | | | |
| 5% 10/1/43 (e) | | 45,000 | 39,715 |
| 5% 10/1/48 (e) | | 60,000 | 51,139 |
| 5% 10/1/53 (e) | | 90,000 | 74,896 |
| Roseman Univ. of Health: | | | |
| Series 2018 A, 5% 12/1/27 | | 1,000,000 | 1,016,261 |
| Series 2020, 5% 4/1/40 (e) | | 100,000 | 97,884 |
| Series 2021 A: | | | |
3% 7/1/50 | | 655,000 | 472,371 |
4.5% 6/1/56 (e) | | 2,640,000 | 1,951,880 |
| Series 2021 B, 6.5% 6/1/56 (e) | | 625,000 | 503,984 |
| Wisconsin Gen. Oblig. Series 2021 A, 5% 5/1/36 | | 1,840,000 | 2,005,216 |
| Wisconsin Health & Edl. Facilities: | | | |
| (Ascension Health Cr. Group Proj.) Series 2016 A, 5% 11/15/36 | | 255,000 | 263,876 |
| Series 2013 A, 5% 11/15/43 (Pre-Refunded to 11/15/23 @ 100) | | 3,375,000 | 3,393,456 |
| Series 2014, 4% 5/1/33 | | 180,000 | 180,349 |
| Series 2015, 3.15% 8/15/27 | | 1,000,000 | 972,003 |
| Series 2016 A: | | | |
5% 2/15/28 | | 120,000 | 123,449 |
5% 2/15/29 | | 155,000 | 159,522 |
5% 2/15/30 | | 170,000 | 174,881 |
| Series 2017 A: | | | |
5% 9/1/29 (Pre-Refunded to 9/1/27 @ 100) | | 295,000 | 318,254 |
5% 9/1/31 (Pre-Refunded to 9/1/27 @ 100) | | 50,000 | 53,941 |
5% 9/1/33 (Pre-Refunded to 9/1/27 @ 100) | | 85,000 | 91,700 |
5% 9/1/35 (Pre-Refunded to 9/1/27 @ 100) | | 95,000 | 102,489 |
| Series 2018, 5% 4/1/34 | | 585,000 | 635,059 |
| Series 2019 A: | | | |
5% 11/1/26 | | 105,000 | 101,809 |
5% 11/1/46 | | 300,000 | 242,418 |
| Series 2019 B1, 2.825% 11/1/28 | | 100,000 | 88,648 |
| Series 2019 B2, 2.55% 11/1/27 | | 25,000 | 23,488 |
| Series 2019: | | | |
5% 10/1/30 | | 120,000 | 131,445 |
5% 10/1/32 | | 250,000 | 272,841 |
| Wisconsin Hsg. & Econ. Dev. Auth. Series 2021 C, 3% 9/1/52 | | 430,000 | 412,677 |
| Wisconsin Hsg. & Econ. Dev. Auth. Hsg. Rev. Bonds Series 2021 C: | | | |
| 0.61%, tender 5/1/24 (b) | | 80,000 | 77,298 |
| 0.81%, tender 5/1/25 (b) | | 265,000 | 251,211 |
TOTAL WISCONSIN | | | 18,962,722 |
| TOTAL MUNICIPAL BONDS (Cost $1,337,674,638) | | | 1,316,165,655 |
| | | | |
| Municipal Notes - 1.0% |
| | | Principal Amount (a) | Value ($) |
| California - 1.0% | | | |
Los Angeles Gen. Oblig. TRAN Series 2023, 5% 6/27/24 (g) (Cost $14,234,920) | | 14,000,000 | 14,232,183 |
| | | | |
| Money Market Funds - 7.9% |
| | | Shares | Value ($) |
Fidelity Municipal Cash Central Fund 4.23% (i)(j) (Cost $112,358,570) | | 112,336,114 | 112,358,561 |
| | | | |
| TOTAL INVESTMENT IN SECURITIES - 101.0% (Cost $1,464,268,128) | 1,442,756,399 |
NET OTHER ASSETS (LIABILITIES) - (1.0)% | (13,877,775) |
| NET ASSETS - 100.0% | 1,428,878,624 |
| | |
Security Type Abbreviations
| TRAN | - | TAX AND REVENUE ANTICIPATION NOTE |
Legend
| (a) | Amount is stated in United States dollars unless otherwise noted. |
| (b) | Coupon rates for floating and adjustable rate securities reflect the rates in effect at period end. |
| (c) | Private activity obligations whose interest is subject to the federal alternative minimum tax for individuals. |
| (d) | Coupon is indexed to a floating interest rate which may be multiplied by a specified factor and/or subject to caps or floors. |
| (e) | Security exempt from registration under Rule 144A of the Securities Act of 1933. These securities may be resold in transactions exempt from registration, normally to qualified institutional buyers. At the end of the period, the value of these securities amounted to $15,480,868 or 1.1% of net assets. |
| (f) | Security initially issued in zero coupon form which converts to coupon form at a specified rate and date. The rate shown is the rate at period end. |
| (g) | Security or a portion of the security purchased on a delayed delivery or when-issued basis. |
| (h) | Security initially issued at one coupon which converts to a higher coupon at a specified date. The rate shown is the rate at period end. |
| (i) | Information in this report regarding holdings by state and security types does not reflect the holdings of the Fidelity Municipal Cash Central Fund. |
| (j) | Affiliated fund that is generally available only to investment companies and other accounts managed by Fidelity Investments. The rate quoted is the annualized seven-day yield of the fund at period end. A complete unaudited listing of the fund's holdings as of its most recent quarter end is available upon request. In addition, each Fidelity Central Fund's financial statements are available on the SEC's website or upon request. |
Affiliated Central Funds
Fiscal year to date information regarding the Fund's investments in Fidelity Central Funds, including the ownership percentage, is presented below.
| Affiliate | Value, beginning of period ($) | Purchases ($) | Sales Proceeds ($) | Dividend Income ($) | Realized Gain (loss) ($) | Change in Unrealized appreciation (depreciation) ($) | Value, end of period ($) | % ownership, end of period |
| Fidelity Municipal Cash Central Fund 4.23% | 119,418,566 | 180,297,998 | 187,358,000 | 2,011,246 | - | (3) | 112,358,561 | 4.2% |
| Total | 119,418,566 | 180,297,998 | 187,358,000 | 2,011,246 | - | (3) | 112,358,561 | |
| | | | | | | | | |
Amounts in the dividend income column in the above table include any capital gain distributions from underlying funds, which are presented in the corresponding line item in the Statement of Operations, if applicable.
Amounts included in the purchases and sales proceeds columns may include in-kind transactions, if applicable.
Investment Valuation
The following is a summary of the inputs used, as of June 30, 2023, involving the Fund's assets and liabilities carried at fair value. The inputs or methodology used for valuing securities may not be an indication of the risk associated with investing in those securities. For more information on valuation inputs, and their aggregation into the levels used below, please refer to the Investment Valuation section in the accompanying Notes to Financial Statements.
| Valuation Inputs at Reporting Date: |
| Description | Total ($) | Level 1 ($) | Level 2 ($) | Level 3 ($) |
Investments in Securities: | | | | |
|
| Municipal Securities | 1,330,397,838 | - | 1,330,397,838 | - |
|
| Money Market Funds | 112,358,561 | 112,358,561 | - | - |
| Total Investments in Securities: | 1,442,756,399 | 112,358,561 | 1,330,397,838 | - |
| Statement of Assets and Liabilities |
| | | | June 30, 2023 (Unaudited) |
| | | | | |
| Assets | | | | |
| Investment in securities, at value - See accompanying schedule: | | | | |
Unaffiliated issuers (cost $1,351,909,558) | $ | 1,330,397,838 | | |
Fidelity Central Funds (cost $112,358,570) | | 112,358,561 | | |
| | | | | |
| | | | | |
| Total Investment in Securities (cost $1,464,268,128) | | | $ | 1,442,756,399 |
| Cash | | | | 842,233 |
| Receivable for investments sold | | | | 3,440 |
| Receivable for fund shares sold | | | | 5,906,613 |
| Interest receivable | | | | 14,937,524 |
| Distributions receivable from Fidelity Central Funds | | | | 343,281 |
| Receivable from investment adviser for expense reductions | | | | 1,398 |
| Other receivables | | | | 58 |
Total assets | | | | 1,464,790,946 |
| Liabilities | | | | |
| Payable for investments purchased | | | | |
Regular delivery | $ | 1,731,872 | | |
Delayed delivery | | 29,281,084 | | |
| Payable for fund shares redeemed | | 993,779 | | |
| Distributions payable | | 3,470,463 | | |
| Accrued management fee | | 399,078 | | |
| Other payables and accrued expenses | | 36,046 | | |
| Total Liabilities | | | | 35,912,322 |
| Net Assets | | | $ | 1,428,878,624 |
| Net Assets consist of: | | | | |
| Paid in capital | | | $ | 1,464,815,723 |
| Total accumulated earnings (loss) | | | | (35,937,099) |
| Net Assets | | | $ | 1,428,878,624 |
Net Asset Value , offering price and redemption price per share ($1,428,878,624 ÷ 146,460,423 shares) | | | $ | 9.76 |
| Statement of Operations |
| | | | Six months ended June 30, 2023 (Unaudited) |
| Investment Income | | | | |
| Interest | | | $ | 19,562,486 |
| Income from Fidelity Central Funds | | | | 2,011,246 |
| Total Income | | | | 21,573,732 |
| Expenses | | | | |
| Management fee | $ | 2,206,073 | | |
| Custodian fees and expenses | | 9,929 | | |
| Independent trustees' fees and expenses | | 1,996 | | |
| Registration fees | | 56,786 | | |
| Audit | | 37,404 | | |
| Legal | | 870 | | |
| Miscellaneous | | 2,788 | | |
| Total expenses before reductions | | 2,315,846 | | |
| Expense reductions | | (58,859) | | |
| Total expenses after reductions | | | | 2,256,987 |
| Net Investment income (loss) | | | | 19,316,745 |
| Realized and Unrealized Gain (Loss) | | | | |
| Net realized gain (loss) on: | | | | |
| Investment Securities: | | | | |
| Unaffiliated issuers | | (186,360) | | |
| Total net realized gain (loss) | | | | (186,360) |
| Change in net unrealized appreciation (depreciation) on: | | | | |
| Investment Securities: | | | | |
| Unaffiliated issuers | | 20,470,657 | | |
| Fidelity Central Funds | | (3) | | |
| Total change in net unrealized appreciation (depreciation) | | | | 20,470,654 |
| Net gain (loss) | | | | 20,284,294 |
| Net increase (decrease) in net assets resulting from operations | | | $ | 39,601,039 |
| Statement of Changes in Net Assets |
| |
| | Six months ended June 30, 2023 (Unaudited) | | Year ended December 31, 2022 |
| Increase (Decrease) in Net Assets | | | | |
| Operations | | | | |
| Net investment income (loss) | $ | 19,316,745 | $ | 32,988,574 |
| Net realized gain (loss) | | (186,360) | | (141,936,091) |
| Change in net unrealized appreciation (depreciation) | | 20,470,654 | | (149,981,087) |
| Net increase (decrease) in net assets resulting from operations | | 39,601,039 | | (258,928,604) |
| Distributions to shareholders | | (18,725,490) | | (32,731,153) |
| | | | | |
| Share transactions | | | | |
| Proceeds from sales of shares | | 465,150,901 | | 4,264,535,013 |
| Reinvestment of distributions | | 14,840 | | 9,870,551 |
| Cost of shares redeemed | | (163,568,059) | | (5,389,446,258) |
| | | | | |
Net increase (decrease) in net assets resulting from share transactions | | 301,597,682 | | (1,115,040,694) |
| Total increase (decrease) in net assets | | 322,473,231 | | (1,406,700,451) |
| | | | | |
| Net Assets | | | | |
| Beginning of period | | 1,106,405,393 | | 2,513,105,844 |
| End of period | $ | 1,428,878,624 | $ | 1,106,405,393 |
| | | | | |
| Other Information | | | | |
| Shares | | | | |
| Sold | | 47,767,140 | | 430,605,180 |
| Issued in reinvestment of distributions | | 1,519 | | 983,117 |
| Redeemed | | (16,813,081) | | (547,031,720) |
| Net increase (decrease) | | 30,955,578 | | (115,443,423) |
| | | | | |
| Fidelity® SAI Municipal Income Fund |
| |
| | Six months ended (Unaudited) June 30, 2023 | | Years ended December 31, 2022 | | 2021 | | 2020 | | 2019 | | 2018 A |
Selected Per-Share Data | | | | | | | | | | | | |
| Net asset value, beginning of period | $ | 9.58 | $ | 10.88 | $ | 10.85 | $ | 10.70 | $ | 10.20 | $ | 10.00 |
| Income from Investment Operations | | | | | | | | | | | | |
Net investment income (loss) B,C | | .148 | | .218 | | .203 | | .265 | | .296 | | .074 |
| Net realized and unrealized gain (loss) | | .176 | | (1.297) | | .048 | | .183 | | .564 | | .193 |
| Total from investment operations | | .324 | | (1.079) | | .251 | | .448 | | .860 | | .267 |
| Distributions from net investment income | | (.144) | | (.221) | | (.207) | | (.266) | | (.296) | | (.066) |
| Distributions from net realized gain | | - | | - | | (.014) | | (.032) | | (.064) | | (.001) |
| Total distributions | | (.144) | | (.221) | | (.221) | | (.298) | | (.360) | | (.067) |
| Net asset value, end of period | $ | 9.76 | $ | 9.58 | $ | 10.88 | $ | 10.85 | $ | 10.70 | $ | 10.20 |
Total Return D,E | | 3.39% | | (9.94)% | | 2.33% | | 4.27% | | 8.51% | | 2.67% |
Ratios to Average Net Assets C,F,G | | | | | | | | | | | | |
| Expenses before reductions | | .37% H | | .38% | | .36% | | .37% | | .44% | | .59% H,I |
| Expenses net of fee waivers, if any | | .36% H | | .36% | | .36% | | .36% | | .36% | | .36% H |
| Expenses net of all reductions | | .36% H | | .36% | | .36% | | .36% | | .36% | | .36% H |
| Net investment income (loss) | | 3.06% H | | 2.16% | | 1.87% | | 2.49% | | 2.80% | | 2.90% H |
| Supplemental Data | | | | | | | | | | | | |
| Net assets, end of period (000 omitted) | $ | 1,428,879 | $ | 1,106,405 | $ | 2,513,106 | $ | 1,586,052 | $ | 1,258,733 | $ | 1,108,493 |
Portfolio turnover rate J | | 3% H | | 26% K | | 4% | | 17% | | 21% | | 7% K,L |
A For the period October 2, 2018 (commencement of operations) through December 31, 2018.
B Calculated based on average shares outstanding during the period.
C Net investment income (loss) is affected by the timing of the declaration of dividends by any underlying mutual funds or exchange-traded funds (ETFs). Net investment income (loss) of any mutual funds or ETFs is not included in the Fund's net investment income (loss) ratio.
D Total returns for periods of less than one year are not annualized.
E Total returns would have been lower if certain expenses had not been reduced during the applicable periods shown.
F Fees and expenses of any underlying mutual funds or exchange-traded funds (ETFs) are not included in the Fund's expense ratio. The Fund indirectly bears its proportionate share of these expenses. For additional expense information related to investments in Fidelity Central Funds, please refer to the "Investments in Fidelity Central Funds" note found in the Notes to Financial Statements section of the most recent Annual or Semi-Annual report.
G Expense ratios reflect operating expenses of the class. Expenses before reductions do not reflect amounts reimbursed, waived, or reduced through arrangements with the investment adviser, brokerage services, or other offset arrangements, if applicable, and do not represent the amount paid by the class during periods when reimbursements, waivers or reductions occur.
H Annualized.
I Audit fees are not annualized.
J Amount does not include the portfolio activity of any underlying mutual funds or exchange-traded funds (ETFs).
K Portfolio turnover rate excludes securities received or delivered in-kind.
L Amount not annualized.
For the period ended June 30, 2023
1. Organization.
Fidelity SAI Municipal Income Fund (the Fund) is a fund of Fidelity Salem Street Trust (the Trust) and is authorized to issue an unlimited number of shares. Shares are offered exclusively to certain clients of Fidelity Management & Research Company LLC (FMR) or its affiliates. The Trust is registered under the Investment Company Act of 1940, as amended (the 1940 Act), as an open-end management investment company organized as a Massachusetts business trust.
2. Investments in Fidelity Central Funds.
Funds may invest in Fidelity Central Funds, which are open-end investment companies generally available only to other investment companies and accounts managed by the investment adviser and its affiliates. The Schedule of Investments lists any Fidelity Central Funds held as an investment as of period end, but does not include the underlying holdings of each Fidelity Central Fund. An investing fund indirectly bears its proportionate share of the expenses of the underlying Fidelity Central Funds.
Based on its investment objective, each Fidelity Central Fund may invest or participate in various investment vehicles or strategies that are similar to those of the investing fund. These strategies are consistent with the investment objectives of the investing fund and may involve certain economic risks which may cause a decline in value of each of the Fidelity Central Funds and thus a decline in the value of the investing fund.
| Fidelity Central Fund | Investment Manager | Investment Objective | Investment Practices | Expense Ratio A |
| Fidelity Money Market Central Funds | Fidelity Management & Research Company LLC (FMR) | Each fund seeks to obtain a high level of current income consistent with the preservation of capital and liquidity. | Short-term Investments | Less than .005% |
A Expenses expressed as a percentage of average net assets and are as of each underlying Central Fund's most recent annual or semi-annual shareholder report.
A complete unaudited list of holdings for each Fidelity Central Fund is available upon request or at the Securities and Exchange Commission website at www.sec.gov. In addition, the financial statements of the Fidelity Central Funds which contain the significant accounting policies (including investment valuation policies) of those funds, and are not covered by the Report of Independent Registered Public Accounting Firm, are available on the Securities and Exchange Commission website or upon request.
3. Significant Accounting Policies.
The Fund is an investment company and applies the accounting and reporting guidance of the Financial Accounting Standards Board (FASB) Accounting Standards Codification Topic 946 Financial Services - Investment Companies . The financial statements have been prepared in conformity with accounting principles generally accepted in the United States of America (GAAP), which require management to make certain estimates and assumptions at the date of the financial statements. Actual results could differ from those estimates. Subsequent events, if any, through the date that the financial statements were issued have been evaluated in the preparation of the financial statements. The Fund's Schedule of Investments lists any underlying mutual funds or exchange-traded funds (ETFs) but does not include the underlying holdings of these funds. The following summarizes the significant accounting policies of the Fund:
Investment Valuation. Investments are valued as of 4:00 p.m. Eastern time on the last calendar day of the period. The Board of Trustees (the Board) has designated the Fund's investment adviser as the valuation designee responsible for the fair valuation function and performing fair value determinations as needed. The investment adviser has established a Fair Value Committee (the Committee) to carry out the day-to-day fair valuation responsibilities and has adopted policies and procedures to govern the fair valuation process and the activities of the Committee. In accordance with these fair valuation policies and procedures, which have been approved by the Board, the Fund attempts to obtain prices from one or more third party pricing services or brokers to value its investments. When current market prices, quotations or currency exchange rates are not readily available or reliable, investments will be fair valued in good faith by the Committee, in accordance with the policies and procedures. Factors used in determining fair value vary by investment type and may include market or investment specific events, transaction data, estimated cash flows, and market observations of comparable investments. The frequency that the fair valuation procedures are used cannot be predicted and they may be utilized to a significant extent. The Committee manages the Fund's fair valuation practices and maintains the fair valuation policies and procedures. The Fund's investment adviser reports to the Board information regarding the fair valuation process and related material matters.
The Fund categorizes the inputs to valuation techniques used to value its investments into a disclosure hierarchy consisting of three levels as shown below:
Level 1 - unadjusted quoted prices in active markets for identical investments
Level 2 - other significant observable inputs (including quoted prices for similar investments, interest rates, prepayment speeds, etc.)
Level 3 - unobservable inputs (including the Fund's own assumptions based on the best information available)
Valuation techniques used to value the Fund's investments by major category are as follows:
Debt securities, including restricted securities, are valued based on evaluated prices received from third party pricing services or from brokers who make markets in such securities. Municipal securities are valued by pricing services who utilize matrix pricing which considers yield or price of bonds of comparable quality, coupon, maturity and type or by broker-supplied prices. When independent prices are unavailable or unreliable, debt securities may be valued utilizing pricing methodologies which consider similar factors that would be used by third party pricing services. Debt securities are generally categorized as Level 2 in the hierarchy but may be Level 3 depending on the circumstances.
Investments in open-end mutual funds, including the Fidelity Central Funds, are valued at their closing net asset value (NAV) each business day and are categorized as Level 1 in the hierarchy.
Changes in valuation techniques may result in transfers in or out of an assigned level within the disclosure hierarchy. The aggregate value of investments by input level as of June 30, 2023 is included at the end of the Fund's Schedule of Investments.
Investment Transactions and Income. For financial reporting purposes, the Fund's investment holdings and NAV include trades executed through the end of the last business day of the period. The NAV per share for processing shareholder transactions is calculated as of the close of business of the New York Stock Exchange (NYSE), normally 4:00 p.m. Eastern time and includes trades executed through the end of the prior business day. Gains and losses on securities sold are determined on the basis of identified cost. Income and capital gain distributions from Fidelity Central Funds, if any, are recorded on the ex-dividend date. Interest income is accrued as earned and includes coupon interest and amortization of premium and accretion of discount on debt securities as applicable. Debt obligations may be placed on non-accrual status and related interest income may be reduced by ceasing current accruals and writing off interest receivables when the collection of all or a portion of interest has become doubtful based on consistently applied procedures. A debt obligation is removed from non-accrual status when the issuer resumes interest payments or when collectability of interest is reasonably assured.
Expenses. Expenses directly attributable to a fund are charged to that fund. Expenses attributable to more than one fund are allocated among the respective funds on the basis of relative net assets or other appropriate methods. Expenses included in the accompanying financial statements reflect the expenses of that fund and do not include any expenses associated with any underlying mutual funds or exchange-traded funds. Although not included in a fund's expenses, a fund indirectly bears its proportionate share of these expenses through the net asset value of each underlying mutual fund or exchange-traded fund. Expense estimates are accrued in the period to which they relate and adjustments are made when actual amounts are known.
Income Tax Information and Distributions to Shareholders. Each year, the Fund intends to qualify as a regulated investment company under Subchapter M of the Internal Revenue Code, including distributing substantially all of its taxable income and realized gains. As a result, no provision for U.S. Federal income taxes is required. The Fund files a U.S. federal tax return, in addition to state and local tax returns as required. The Fund's federal income tax returns are subject to examination by the Internal Revenue Service (IRS) for a period of three fiscal years after they are filed. State and local tax returns may be subject to examination for an additional fiscal year depending on the jurisdiction.
Distributions are declared and recorded daily and paid monthly from net investment income. Distributions from realized gains, if any, are declared and recorded on the ex-dividend date. Income and capital gain distributions are determined in accordance with income tax regulations, which may differ from GAAP.
Capital accounts within the financial statements are adjusted for permanent book-tax differences. These adjustments have no impact on net assets or the results of operations. Capital accounts are not adjusted for temporary book-tax differences which will reverse in a subsequent period.
Book-tax differences are primarily due to market discount, redemptions in kind and capital loss carryforwards.
The Fund purchases municipal securities whose interest, in the opinion of the issuer, is free from federal income tax. There is no assurance that the IRS will agree with this opinion. In the event the IRS determines that the issuer does not comply with relevant tax requirements, interest payments from a security could become federally taxable, possibly retroactively to the date the security was issued.
As of period end, the cost and unrealized appreciation (depreciation) in securities, and derivatives if applicable, for federal income tax purposes were as follows:
| Gross unrealized appreciation | $25,386,081 |
| Gross unrealized depreciation | (46,051,450) |
| Net unrealized appreciation (depreciation) | $(20,665,369) |
| Tax cost | $1,463,421,768 |
Capital loss carryforwards are only available to offset future capital gains of the Fund to the extent provided by regulations and may be limited. The capital loss carryforward information presented below, including any applicable limitation, is estimated as of prior fiscal period end and is subject to adjustment.
| Short-term | $(8,962,728) |
| Long-term | (6,134,825) |
| Total capital loss carryforward | $(15,097,553) |
Delayed Delivery Transactions and When-Issued Securities. During the period, certain Funds transacted in securities on a delayed delivery or when-issued basis. Payment and delivery may take place after the customary settlement period for that security. The price of the underlying securities and the date when the securities will be delivered and paid for are fixed at the time the transaction is negotiated. Securities purchased on a delayed delivery or when-issued basis are identified as such in the Schedule of Investments. Compensation for interest forgone in the purchase of a delayed delivery or when-issued debt security may be received. With respect to purchase commitments, each applicable Fund identifies securities as segregated in its records with a value at least equal to the amount of the commitment. Payables and receivables associated with the purchases and sales of delayed delivery securities having the same coupon, settlement date and broker are offset. Delayed delivery or when-issued securities that have been purchased from and sold to different brokers are reflected as both payables and receivables in the Statement of Assets and Liabilities under the caption "Delayed delivery", as applicable. Losses may arise due to changes in the value of the underlying securities or if the counterparty does not perform under the contract's terms, or if the issuer does not issue the securities due to political, economic, or other factors.
Restricted Securities (including Private Placements). Funds may invest in securities that are subject to legal or contractual restrictions on resale. These securities generally may be resold in transactions exempt from registration or to the public if the securities are registered. Disposal of these securities may involve time-consuming negotiations and expense, and prompt sale at an acceptable price may be difficult. Information regarding restricted securities held at period end is included at the end of the Schedule of Investments, if applicable.
4. Purchases and Sales of Investments.
Purchases and sales of securities, other than short-term securities and in-kind transactions, as applicable, are noted in the table below.
| | Purchases ($) | Sales ($) |
| Fidelity SAI Municipal Income Fund | 329,087,503 | 17,785,656 |
5. Fees and Other Transactions with Affiliates.
Management Fee. Fidelity Management & Research Company LLC (the investment adviser) and its affiliates provide the Fund with investment management related services for which the Fund pays a monthly management fee. The management fee is the sum of an individual fund fee rate that is based on an annual rate of .25% of the Fund's average net assets and an annualized group fee rate that averaged .10% during the period. The group fee rate is based upon the monthly average net assets of a group of registered investment companies with which the investment adviser has management contracts. The group fee rate decreases as assets under management increase and increases as assets under management decrease. For the reporting period, the total annualized management fee rate was .35% of the Fund's average net assets.
Interfund Trades. Funds may purchase from or sell securities to other Fidelity Funds under procedures adopted by the Board. The procedures have been designed to ensure these interfund trades are executed in accordance with Rule 17a-7 of the 1940 Act. Any interfund trades are included within the respective purchases and sales amounts shown in the Purchases and Sales of Investments note. Interfund trades during the period are noted in the table below.
| | Purchases ($) | Sales ($) | Realized Gain (Loss) ($) |
| Fidelity SAI Municipal Income Fund | - | 1,100,000 | - |
Prior Fiscal Year Affiliated Redemptions In-Kind. Shares that were redeemed in-kind for investments, including accrued interest and cash, if any, are shown in the table below; along with realized gain or loss on investments delivered through in-kind redemptions. The amount of the in-kind redemptions is included in share transactions in the accompanying Statement of Changes in Net Assets. There was no gain or loss for federal income tax purposes.
| | Shares | Total net realized gain or loss ($) | Total Proceeds ($) |
| Fidelity SAI Municipal Income Fund | 157,700,518 | (126,836,694) | 1,510,770,968 |
6. Committed Line of Credit.
Certain Funds participate with other funds managed by the investment adviser or an affiliate in a $4.25 billion credit facility (the "line of credit") to be utilized for temporary or emergency purposes to fund shareholder redemptions or for other short-term liquidity purposes. The participating funds have agreed to pay commitment fees on their pro-rata portion of the line of credit, which are reflected in Miscellaneous expenses on the Statement of Operations, and are listed below. During the period, there were no borrowings on this line of credit.
| | Amount |
| Fidelity SAI Municipal Income Fund | $1,068 |
7. Expense Reductions.
The investment adviser contractually agreed to reimburse the Fund to the extent annual operating expenses exceeded .36% of average net assets. This reimbursement will remain in place through April 30, 2024. Some expenses, for example the compensation of the independent Trustees, and certain miscellaneous expenses such as proxy and shareholder meeting expenses, are excluded from this reimbursement. During the period this reimbursement reduced the Fund's expenses by $43,826.
Through arrangements with the Fund's custodian, credits realized as a result of certain uninvested cash balances were used to reduce the Fund's expenses by $429.
In addition, during the period the investment adviser or an affiliate reimbursed and/or waived a portion of operating expenses in the amount of $14,604.
8. Other.
A fund's organizational documents provide former and current trustees and officers with a limited indemnification against liabilities arising in connection with the performance of their duties to the fund. In the normal course of business, a fund may also enter into contracts that provide general indemnifications. A fund's maximum exposure under these arrangements is unknown as this would be dependent on future claims that may be made against a fund. The risk of material loss from such claims is considered remote.
9. Risk and Uncertainties.
Many factors affect a fund's performance. Developments that disrupt global economies and financial markets, such as pandemics, epidemics, outbreaks of infectious diseases, war, terrorism, and environmental disasters, may significantly affect a fund's investment performance. The effects of these developments to a fund will be impacted by the types of securities in which a fund invests, the financial condition, industry, economic sector, and geographic location of an issuer, and a fund's level of investment in the securities of that issuer. Significant concentrations in security types, issuers, industries, sectors, and geographic locations may magnify the factors that affect a fund's performance.
As a shareholder, you incur two types of costs: (1) transaction costs, which may include sales charges (loads) on purchase payments or redemption proceeds, as applicable and (2) ongoing costs, which generally include management fees, distribution and/or service (12b-1) fees and other Fund expenses. This Example is intended to help you understand your ongoing costs (in dollars) of investing in a fund and to compare these costs with the ongoing costs of investing in other mutual funds.
| The Example is based on an investment of $1,000 invested at the beginning of the period and held for the entire period (January 1, 2023 to June 30, 2023). |
Actual Expenses
The first line of the accompanying table provides information about actual account values and actual expenses. You may use the information in this line, together with the amount you invested, to estimate the expenses that you paid over the period. Simply divide your account value by $1,000.00 (for example, an $8,600 account value divided by $1,000.00 = 8.6), then multiply the result by the number in the first line for a class/Fund under the heading entitled "Expenses Paid During Period" to estimate the expenses you paid on your account during this period. If any fund is a shareholder of any underlying mutual funds or exchange-traded funds (ETFs) (the Underlying Funds), such fund indirectly bears its proportional share of the expenses of the Underlying Funds in addition to the direct expenses incurred presented in the table. These fees and expenses are not included in the annualized expense ratio used to calculate the expense estimate in the table below.
Hypothetical Example for Comparison Purposes
The second line of the accompanying table provides information about hypothetical account values and hypothetical expenses based on the actual expense ratio and an assumed rate of return of 5% per year before expenses, which is not the actual return. The hypothetical account values and expenses may not be used to estimate the actual ending account balance or expenses you paid for the period. You may use this information to compare the ongoing costs of investing in the Fund and other funds. To do so, compare this 5% hypothetical example with the 5% hypothetical examples that appear in the shareholder reports of the other funds. If any fund is a shareholder of any Underlying Funds, such fund indirectly bears its proportional share of the expenses of the Underlying Funds in addition to the direct expenses as presented in the table. These fees and expenses are not included in the annualized expense ratio used to calculate the expense estimate in the table below.
Please note that the expenses shown in the table are meant to highlight your ongoing costs only and do not reflect any transaction costs. Therefore, the second line of the table is useful in comparing ongoing costs only, and will not help you determine the relative total costs of owning different funds. In addition, if these transactional costs were included, your costs would have been higher.
| | | | | Annualized Expense Ratio- A | | Beginning Account Value January 1, 2023 | | Ending Account Value June 30, 2023 | | Expenses Paid During Period- C January 1, 2023 to June 30, 2023 |
| | | | | | | | | | |
| Fidelity® SAI Municipal Income Fund | | | | .36% | | | | | | |
| Actual | | | | | | $ 1,000 | | $ 1,033.90 | | $ 1.82 |
Hypothetical- B | | | | | | $ 1,000 | | $ 1,023.01 | | $ 1.81 |
| |
A Annualized expense ratio reflects expenses net of applicable fee waivers.
B 5% return per year before expenses
C Expenses are equal to the annualized expense ratio, multiplied by the average account value over the period, multiplied by 181/ 365 (to reflect the one-half year period). The fees and expenses of any Underlying Funds are not included in each annualized expense ratio.
The Securities and Exchange Commission adopted Rule 22e-4 under the Investment Company Act of 1940 (the Liquidity Rule) to promote effective liquidity risk management throughout the open-end investment company industry, thereby reducing the risk that funds will be unable to meet their redemption obligations and mitigating dilution of the interests of fund shareholders.
The Fund has adopted and implemented a liquidity risk management program (the Program) reasonably designed to assess and manage the Fund's liquidity risk and to comply with the requirements of the Liquidity Rule. The Fund's Board of Trustees (the Board) has designated the Fund's investment adviser as administrator of the Program. The Fidelity advisers have established a Liquidity Risk Management Committee (the LRM Committee) to manage the Program for each of the Fidelity Funds. The LRM Committee monitors the adequacy and effectiveness of implementation of the Program and on a periodic basis assesses each Fund's liquidity risk based on a variety of factors including (1) the Fund's investment strategy, (2) portfolio liquidity and cash flow projections during normal and reasonably foreseeable stressed conditions, (3) shareholder redemptions, (4) borrowings and other funding sources and (5) certain factors specific to ETFs including the effect of the Fund's prices and spreads, market participants, and basket compositions on the overall liquidity of the Fund's portfolio, as applicable.
In accordance with the Program, each of the Fund's portfolio investments is classified into one of four defined liquidity categories based on a determination of a reasonable expectation for how long it would take to convert the investment to cash (or sell or dispose of the investment) without significantly changing its market value.
- Highly liquid investments - cash or convertible to cash within three business days or less
- Moderately liquid investments - convertible to cash in three to seven calendar days
- Less liquid investments - can be sold or disposed of, but not settled, within seven calendar days
- Illiquid investments - cannot be sold or disposed of within seven calendar days
Liquidity classification determinations take into account a variety of factors including various market, trading and investment-specific considerations, as well as market depth, and generally utilize analysis from a third-party liquidity metrics service.
The Liquidity Rule places a 15% limit on a fund's illiquid investments and requires funds that do not primarily hold assets that are highly liquid investments to determine and maintain a minimum percentage of the fund's net assets to be invested in highly liquid investments (highly liquid investment minimum or HLIM). The Program includes provisions reasonably designed to comply with the 15% limit on illiquid investments and for determining, periodically reviewing and complying with the HLIM requirement as applicable.
At a recent meeting of the Fund's Board of Trustees, the LRM Committee provided a written report to the Board pertaining to the operation, adequacy, and effectiveness of the Program for the period December 1, 2021 through November 30, 2022. The report concluded that the Program is operating effectively and is reasonably designed to assess and manage the Fund's liquidity risk.
1.9887614.104
SIM-SANN-0823
Fidelity® International Bond Index Fund
Semi-Annual Report
June 30, 2023
Contents
To view a fund's proxy voting guidelines and proxy voting record for the 12-month period ended June 30, visit http://www.fidelity.com/proxyvotingresults or visit the Securities and Exchange Commission's (SEC) web site at http://www.sec.gov.
You may also call 1-800-544-8544 to request a free copy of the proxy voting guidelines.
BLOOMBERG ® is a trademark and service mark of Bloomberg Finance L.P. and its affiliates (collectively "Bloomberg"). Bloomberg or Bloomberg's licensors own all proprietary rights in the Bloomberg Indices. Neither Bloomberg nor Bloomberg's licensors approves or endorses this material, or guarantees the accuracy or completeness of any information herein, or makes any warranty, express or implied, as to the results to be obtained therefrom and, to the maximum extent allowed by law, neither shall have any liability or responsibility for injury or damages arising in connection therewith.
Standard & Poor's, S&P and S&P 500 are registered service marks of The McGraw-Hill Companies, Inc. and have been licensed for use by Fidelity Distributors Corporation.
Other third-party marks appearing herein are the property of their respective owners.
All other marks appearing herein are registered or unregistered trademarks or service marks of FMR LLC or an affiliated company. © 2023 FMR LLC. All rights reserved.
This report and the financial statements contained herein are submitted for the general information of the shareholders of the Fund. This report is not authorized for distribution to prospective investors in the Fund unless preceded or accompanied by an effective prospectus.
A fund files its complete schedule of portfolio holdings with the SEC for the first and third quarters of each fiscal year on Form N-PORT. Forms N-PORT are available on the SEC's web site at http://www.sec.gov. A fund's Forms N-PORT may be reviewed and copied at the SEC's Public Reference Room in Washington, DC. Information regarding the operation of the SEC's Public Reference Room may be obtained by calling 1-800-SEC-0330.
For a complete list of a fund's portfolio holdings, view the most recent holdings listing, semiannual report, or annual report on Fidelity's web site at http://www.fidelity.com, http://www.institutional.fidelity.com, or http://www.401k.com, as applicable.
NOT FDIC INSURED •MAY LOSE VALUE •NO BANK GUARANTEE
Neither the Fund nor Fidelity Distributors Corporation is a bank.
Quality Diversification (% of Fund's net assets) |
|
Percentages shown as 0.0% may reflect amounts less than 0.05%. |
| |
| We have used ratings from Moody's Investors Service, Inc. Where Moody's® ratings are not available, we have used S&P® ratings. All ratings are as of the date indicated and do not reflect subsequent changes. |
Asset Allocation (% of Fund's net assets) |
|
Futures - 0.7% |
Forward foreign currency contracts - (98.7)% |
|
Geographic Diversification (% of Fund's net assets) |
|
* Includes Short-Term investments and Net Other Assets (Liabilities). Percentages are adjusted for the effect of derivatives, if applicable. |
| |
Showing Percentage of Net Assets
| Nonconvertible Bonds - 26.1% |
| | | Principal Amount (a) | Value ($) |
| Australia - 1.0% | | | |
| Amcor UK Finance PLC 1.125% 6/23/27 | EUR | 1,384,000 | 1,334,433 |
| APT Pipelines Ltd. 2% 7/15/30 (Reg. S) | EUR | 110,000 | 102,075 |
| Australia & New Zealand Banking Group Ltd.: | | | |
| 1.55% 8/29/24 (Reg. S) | AUD | 870,000 | 556,971 |
| 5.906% 8/12/32 (b) | AUD | 330,000 | 216,385 |
| Commonwealth Bank of Australia 0.125% 10/15/29 (Reg. S) | EUR | 120,000 | 105,898 |
| National Australia Bank Ltd.: | | | |
| 2.125% 5/24/28 (Reg. S) | EUR | 160,000 | 162,006 |
| 2.347% 8/30/29 | EUR | 130,000 | 132,171 |
| 6.163% 3/9/33 (b) | AUD | 120,000 | 79,141 |
| New South Wales Treasury Corp.: | | | |
| 1% 2/8/24 | AUD | 1,099,000 | 717,148 |
| 1.25% 3/20/25 (Reg. S) | AUD | 803,000 | 506,495 |
| 2% 3/20/31 | AUD | 1,106,000 | 616,909 |
| 3% 4/20/29 (Reg. S) | AUD | 860,000 | 533,317 |
| Western Australia Treasury Corp.: | | | |
| 2.5% 7/23/24 | AUD | 1,531,000 | 999,038 |
| 3% 10/21/26 | AUD | 1,842,000 | 1,178,950 |
TOTAL AUSTRALIA | | | 7,240,937 |
| Austria - 0.2% | | | |
| Autobahn Schnell AG 0.1% 7/16/35 (Reg. S) | EUR | 710,000 | 543,876 |
| BAWAG PSK Bank fuer Arbeit und Wirtschaft und Oesterreichische Postsparkasse AG 0.1% 5/12/31 | EUR | 300,000 | 254,243 |
| Erste Group Bank AG 0.25% 9/14/29 (Reg. S) | EUR | 100,000 | 86,284 |
| Oesterreichische Kontrollbank AG 0.5% 12/15/25 (Reg. S) | GBP | 152,000 | 169,315 |
| OMV AG 2.375% 4/9/32 (Reg. S) | EUR | 76,000 | 74,814 |
| Raiffeisen International Bank-Holding AG: | | | |
| 1% 12/4/23 (Reg. S) | EUR | 200,000 | 215,036 |
| 1.5% 3/12/30 (Reg. S) (b) | EUR | 100,000 | 93,458 |
TOTAL AUSTRIA | | | 1,437,026 |
| Belgium - 0.2% | | | |
| Anheuser-Busch InBev SA NV: | | | |
| 1.5% 4/18/30 (Reg. S) | EUR | 49,000 | 46,908 |
| 2% 3/17/28 (Reg. S) | EUR | 32,000 | 32,651 |
| 2.25% 5/24/29 (Reg. S) | GBP | 53,000 | 56,412 |
| 2.85% 5/25/37 (Reg. S) | GBP | 200,000 | 191,309 |
| 3.7% 4/2/40 (Reg. S) | EUR | 131,000 | 135,738 |
| Belfius Bank SA/NV 0% 8/28/26 (Reg. S) | EUR | 100,000 | 96,133 |
| Fluvius System Operator CVBA 0.25% 6/14/28 (Reg. S) | EUR | 100,000 | 91,770 |
| KBC Group NV: | | | |
| 0.125% 1/14/29 (Reg. S) (b) | EUR | 100,000 | 90,015 |
| 0.5% 12/3/29 (b) | EUR | 100,000 | 101,033 |
| 1.125% 1/25/24 (Reg. S) | EUR | 500,000 | 536,865 |
| 4.375% 4/19/30 (Reg. S) (b) | EUR | 100,000 | 108,101 |
TOTAL BELGIUM | | | 1,486,935 |
| Canada - 2.3% | | | |
| 407 International, Inc.: | | | |
| 2.84% 3/7/50 | CAD | 73,000 | 40,014 |
| 3.65% 9/8/44 | CAD | 295,000 | 192,361 |
| Altalink LP 3.717% 12/3/46 | CAD | 338,000 | 222,382 |
| Bank of Montreal 3.19% 3/1/28 | CAD | 65,000 | 45,782 |
| Bank of Nova Scotia: | | | |
| 0.25% 1/11/24 (Reg. S) | EUR | 797,000 | 853,688 |
| 1.375% 12/5/23 (Reg. S) | GBP | 134,000 | 166,742 |
| 3.1% 2/2/28 | CAD | 85,000 | 59,691 |
| Bell Canada 4.45% 2/27/47 | CAD | 40,000 | 26,692 |
| Canada Housing Trust No. 1: | | | |
| 1.6% 12/15/31 (c) | CAD | 320,000 | 204,232 |
| 1.9% 9/15/26 (c) | CAD | 480,000 | 336,973 |
| Canadian Imperial Bank of Commerce: | | | |
| 0.01% 4/30/29 (Reg. S) | EUR | 3,019,000 | 2,695,087 |
| 1.7% 7/15/26 | CAD | 498,000 | 337,918 |
| Canadian National Railway Co. 3.6% 8/1/47 | CAD | 229,000 | 145,843 |
| Choice Properties REIT 4.178% 3/8/28 | CAD | 128,000 | 91,577 |
| CI Financial Corp. 3.759% 5/26/25 | CAD | 513,000 | 370,148 |
| CPPIB Capital, Inc.: | | | |
| 1.25% 12/7/27 (Reg. S) | GBP | 544,000 | 576,053 |
| 3% 6/15/28 | CAD | 1,310,000 | 941,687 |
| CU, Inc. 3.548% 11/22/47 | CAD | 280,000 | 176,101 |
| Enbridge Gas, Inc. 3.65% 4/1/50 | CAD | 290,000 | 176,808 |
| Enbridge Pipelines, Inc. 4.13% 8/9/46 | CAD | 406,000 | 251,400 |
| EPCOR Utilities, Inc. 3.554% 11/27/47 | CAD | 571,000 | 360,022 |
| Fairfax Financial Holdings Ltd. 4.7% 12/16/26 | CAD | 234,000 | 169,496 |
| Greater Toronto Airports Authority 2.75% 10/17/39 | CAD | 516,000 | 306,500 |
| Hydro One, Inc.: | | | |
| 1.69% 1/16/31 | CAD | 417,000 | 258,290 |
| 3.02% 4/5/29 | CAD | 30,000 | 21,020 |
| Hydro-Quebec: | | | |
| 4% 2/15/55 | CAD | 220,000 | 165,589 |
| 4% 2/15/63 | CAD | 270,000 | 204,574 |
| 5% 2/15/50 | CAD | 50,000 | 43,475 |
| Inter Pipeline Ltd. 4.232% 6/1/27 | CAD | 1,526,000 | 1,095,760 |
| Keyera Corp. 3.959% 5/29/30 | CAD | 761,000 | 526,780 |
| North West Redwater Partnership/NWR Financing Co. Ltd. 4.35% 1/10/39 | CAD | 591,000 | 415,348 |
| Nova Scotia Province 3.45% 6/1/45 | CAD | 150,000 | 100,158 |
| Ontario Power Generation, Inc.: | | | |
| 2.893% 4/8/25 | CAD | 390,000 | 282,166 |
| 3.215% 4/8/30 | CAD | 100,000 | 68,857 |
| Ontario Teachers' Finance Trust 0.95% 11/24/51 (Reg. S) | EUR | 110,000 | 64,086 |
| Pembina Pipeline Corp. 4.74% 1/21/47 | CAD | 402,000 | 265,658 |
| PSP Capital, Inc. 3.29% 4/4/24 | CAD | 520,000 | 387,467 |
| Rogers Communications, Inc. 2.9% 12/9/30 | CAD | 968,000 | 619,198 |
| Royal Bank of Canada: | | | |
| 0.25% 1/29/24 (Reg. S) | EUR | 779,000 | 833,348 |
| 0.625% 9/10/25 (Reg. S) | EUR | 756,000 | 768,895 |
| 2.609% 11/1/24 | CAD | 102,000 | 73,958 |
| TELUS Corp. 3.95% 2/16/50 | CAD | 33,000 | 19,601 |
| The Toronto-Dominion Bank: | | | |
| 1.707% 7/28/25 (Reg. S) | EUR | 360,000 | 375,508 |
| 1.943% 3/13/25 | CAD | 252,000 | 178,908 |
| 2.496% 12/2/24 | CAD | 60,000 | 43,283 |
| 3.631% 12/13/29 (Reg. S) | EUR | 320,000 | 336,594 |
| Toronto Hydro Corp. 2.43% 12/11/29 | CAD | 80,000 | 53,488 |
| TransCanada PipeLines Ltd.: | | | |
| 3% 9/18/29 | CAD | 30,000 | 20,049 |
| 4.18% 7/3/48 | CAD | 33,000 | 20,225 |
| 4.35% 6/6/46 | CAD | 456,000 | 289,503 |
TOTAL CANADA | | | 16,278,983 |
| China - 3.0% | | | |
| Agricultural Development Bank of China: | | | |
| 2.99% 8/11/26 | CNY | 31,790,000 | 4,452,330 |
| 3.52% 5/24/31 | CNY | 38,250,000 | 5,517,103 |
| Export-Import Bank of China: | | | |
| 3.22% 5/14/26 | CNY | 50,670,000 | 7,139,022 |
| 3.38% 7/16/31 | CNY | 27,740,000 | 3,969,330 |
TOTAL CHINA | | | 21,077,785 |
| Czech Republic - 0.1% | | | |
| CPI Property Group SA 2.75% 5/12/26 (Reg. S) | EUR | 153,000 | 135,162 |
| EP Infrastructure A/S 1.659% 4/26/24 (Reg. S) | EUR | 110,000 | 113,924 |
TOTAL CZECH REPUBLIC | | | 249,086 |
| Denmark - 0.2% | | | |
| Danske Bank A/S: | | | |
| 0.01% 11/10/24 (Reg. S) (b) | EUR | 261,000 | 280,628 |
| 0.5% 8/27/25 (Reg. S) (b) | EUR | 140,000 | 145,171 |
| 2.5% 6/21/29 (Reg. S) (b) | EUR | 126,000 | 132,614 |
| 4% 1/12/27 (Reg. S) (b) | EUR | 210,000 | 225,661 |
| Nykredit Realkredit A/S: | | | |
| 0.125% 7/10/24 (Reg. S) | EUR | 130,000 | 135,594 |
| 0.5% 7/10/25 (Reg. S) | EUR | 144,000 | 145,560 |
| ORSTED A/S: | | | |
| 2.125% 5/17/27 (Reg. S) | GBP | 104,000 | 114,176 |
| 2.5% 5/16/33 (Reg. S) | GBP | 104,000 | 98,809 |
TOTAL DENMARK | | | 1,278,213 |
| Finland - 0.2% | | | |
| Nordea Bank ABP: | | | |
| 0.5% 3/19/31 (Reg. S) | EUR | 120,000 | 103,545 |
| 1% 6/27/29 (Reg. S) (b) | EUR | 135,000 | 140,612 |
| 2.5% 5/23/29 (Reg. S) | EUR | 144,000 | 143,231 |
| Nordea Mortgage Bank PLC: | | | |
| 1% 11/5/24 (Reg. S) | EUR | 180,000 | 189,050 |
| 2.5% 9/14/32 (Reg. S) | EUR | 110,000 | 113,297 |
| OP Mortgage Bank PLC: | | | |
| 0.01% 11/19/30 (Reg. S) | EUR | 180,000 | 154,982 |
| 1% 11/28/24 (Reg. S) | EUR | 170,000 | 178,128 |
| Pohjola Bank PLC: | | | |
| 0.1% 11/16/27 (Reg. S) | EUR | 130,000 | 120,124 |
| 1.375% 9/4/26 (Reg. S) | GBP | 160,000 | 170,790 |
TOTAL FINLAND | | | 1,313,759 |
| France - 3.6% | | | |
| Aeroports de Paris SA 2.125% 10/2/26 (Reg. S) | EUR | 500,000 | 519,034 |
| Airbus Group NV 2.375% 6/9/40 (Reg. S) | EUR | 166,000 | 142,903 |
| Arkea Public Sector SCF SA 0.875% 3/31/28 (Reg. S) | EUR | 200,000 | 193,889 |
| Autoroutes du Sud de la France 2.75% 9/2/32 (Reg. S) | EUR | 300,000 | 304,728 |
| AXA SA: | | | |
| 1.875% 7/10/42 (Reg. S) (b) | EUR | 153,000 | 125,670 |
| 3.375% 7/6/47 (Reg. S) (b) | EUR | 100,000 | 101,690 |
| Banque Federative du Credit Mutuel SA: | | | |
| 0.625% 11/19/27 (Reg. S) | EUR | 100,000 | 92,672 |
| 0.875% 12/7/27 (Reg. S) | GBP | 600,000 | 603,269 |
| 1% 7/16/26 (Reg. S) | GBP | 100,000 | 107,791 |
| 1.125% 11/19/31 (Reg. S) | EUR | 100,000 | 80,270 |
| 1.25% 5/26/27 (Reg. S) | EUR | 100,000 | 97,820 |
| 1.25% 6/3/30 (Reg. S) | EUR | 100,000 | 88,575 |
| 2.5% 5/25/28 (Reg. S) | EUR | 300,000 | 295,211 |
| 2.625% 11/6/29 (Reg. S) | EUR | 100,000 | 98,087 |
| BNP Paribas SA: | | | |
| 0.625% 12/3/32 (Reg. S) | EUR | 100,000 | 78,484 |
| 0.875% 7/11/30 (Reg. S) (b) | EUR | 100,000 | 88,046 |
| 1.25% 7/13/31 (Reg. S) | GBP | 100,000 | 87,071 |
| 1.625% 7/2/31 (Reg. S) | EUR | 100,000 | 85,690 |
| 1.875% 12/14/27 (Reg. S) | GBP | 200,000 | 206,972 |
| 2% 5/24/31 (Reg. S) (b) | GBP | 200,000 | 213,221 |
| 2% 9/13/36 (Reg. S) | GBP | 100,000 | 79,429 |
| 2.5% 3/31/32 (Reg. S) (b) | EUR | 100,000 | 97,009 |
| 3.375% 1/23/26 (Reg. S) | GBP | 550,000 | 641,991 |
| Bouygues SA 2.25% 6/29/29 (Reg. S) | EUR | 100,000 | 100,127 |
| BPCE SA: | | | |
| Eur Swap Annual 5Y Index + 2.250% 2.25% 3/2/32 (Reg. S) (b)(d) | EUR | 100,000 | 96,563 |
| 0.25% 1/15/26 (Reg. S) | EUR | 100,000 | 98,825 |
| 0.25% 1/14/31 (Reg. S) | EUR | 200,000 | 164,137 |
| 0.625% 9/26/24 (Reg. S) | EUR | 500,000 | 521,486 |
| 1% 1/14/32 (Reg. S) | EUR | 200,000 | 169,159 |
| 1.625% 1/31/28 (Reg. S) | EUR | 100,000 | 96,333 |
| 2.5% 11/30/32 (Reg. S) (b) | GBP | 100,000 | 100,343 |
| BPCE SFH 0.01% 10/16/28 (Reg. S) | EUR | 500,000 | 456,174 |
| Caisse d'Amort de la Dette Sociale: | | | |
| 0% 2/25/28 (Reg. S) | EUR | 600,000 | 564,802 |
| 0% 11/25/30 (Reg. S) | EUR | 900,000 | 782,020 |
| 0% 5/25/31 (Reg. S) | EUR | 300,000 | 257,207 |
| 0.125% 10/25/23 (Reg. S) | EUR | 300,000 | 323,759 |
| 1.75% 11/25/27 (Reg. S) | EUR | 500,000 | 512,884 |
| Caisse Francaise de Finance: | | | |
| 0.125% 6/30/31 (Reg. S) | EUR | 1,200,000 | 1,018,920 |
| 0.125% 2/15/36 (Reg. S) | EUR | 900,000 | 659,033 |
| Carrefour Banque SA 0.107% 6/14/25 (Reg. S) | EUR | 500,000 | 503,395 |
| CNP Assurances 2.5% 6/30/51 (Reg. S) (b) | EUR | 100,000 | 87,057 |
| Compagnie Financiere du Credit Mutuel: | | | |
| 0.875% 10/25/31 (Reg. S) | EUR | 100,000 | 83,609 |
| 1.875% 10/25/29 (b) | EUR | 100,000 | 103,625 |
| Credit Agricole Assurances SA 1.5% 10/6/31 (Reg. S) | EUR | 100,000 | 82,559 |
| Credit Agricole Home Loan SFH: | | | |
| 0.05% 12/6/29 (Reg. S) | EUR | 200,000 | 176,932 |
| 1.5% 9/28/38 | EUR | 300,000 | 255,715 |
| Credit Agricole SA: | | | |
| 0.375% 4/20/28 (Reg. S) | EUR | 100,000 | 91,160 |
| 1% 9/18/25 (Reg. S) | EUR | 200,000 | 204,702 |
| 1.125% 7/12/32 (Reg. S) | EUR | 300,000 | 255,269 |
| 1.625% 6/5/30 (Reg. S) (b) | EUR | 100,000 | 100,979 |
| 1.874% 12/9/31 (b) | GBP | 200,000 | 206,956 |
| 2.625% 3/17/27 (Reg. S) | EUR | 107,000 | 108,898 |
| 3.875% 11/28/34 (Reg. S) | EUR | 100,000 | 108,057 |
| 4.875% 10/23/29 (Reg. S) | GBP | 100,000 | 118,075 |
| Credit Commercial de France: | | | |
| 0.1% 9/3/27 (Reg. S) | EUR | 200,000 | 187,023 |
| 1.375% 9/4/28 (Reg. S) | EUR | 300,000 | 292,335 |
| CTE Co. 1.5% 7/29/28 (Reg.S) | EUR | 100,000 | 96,703 |
| Dexia Credit Local SA: | | | |
| 0.625% 2/3/24 (Reg. S) | EUR | 100,000 | 107,103 |
| 0.625% 1/17/26 (Reg. S) | EUR | 500,000 | 505,248 |
| Electricite de France SA: | | | |
| 1% 11/29/33 (Reg. S) | EUR | 100,000 | 78,657 |
| 2% 12/9/49 (Reg. S) | EUR | 400,000 | 260,693 |
| Engie SA 0.875% 3/27/24 (Reg. S) | EUR | 300,000 | 320,171 |
| Gecina SA 1.375% 1/26/28 (Reg. S) | EUR | 200,000 | 197,215 |
| ICADE 1.625% 2/28/28 (Reg. S) | EUR | 100,000 | 95,453 |
| Klepierre SA 0.875% 2/17/31 (Reg. S) | EUR | 100,000 | 82,929 |
| La Banque Postale: | | | |
| 1% 2/9/28 (Reg. S) (b) | EUR | 100,000 | 94,885 |
| 5.625% 9/21/28 (Reg. S) (b) | GBP | 100,000 | 118,174 |
| La Mondiale 0.75% 4/20/26 (Reg. S) | EUR | 100,000 | 98,741 |
| La Poste 1.375% 4/21/32 (Reg. S) | EUR | 400,000 | 359,624 |
| MACIF 0.625% 6/21/27 (Reg. S) | EUR | 100,000 | 93,057 |
| Orange SA 0.75% 6/29/34 (Reg. S) | EUR | 500,000 | 404,677 |
| Oseo SA: | | | |
| 0.125% 11/25/23 (Reg. S) | EUR | 100,000 | 107,522 |
| 0.125% 3/25/25 (Reg. S) | EUR | 200,000 | 205,403 |
| 0.25% 3/29/30 (Reg. S) | EUR | 100,000 | 89,584 |
| 0.625% 5/25/26 (Reg. S) | EUR | 200,000 | 201,498 |
| 0.75% 11/25/24 | EUR | 200,000 | 209,506 |
| 2.125% 11/29/27 (Reg. S) | EUR | 200,000 | 207,614 |
| RCI Banque SA 1.625% 5/26/26 (Reg. S) | EUR | 37,000 | 37,137 |
| Reseau Ferre de France 0.875% 1/22/29 (Reg. S) | EUR | 300,000 | 288,067 |
| RTE EdF Transport SA: | | | |
| 0% 9/9/27 (Reg. S) | EUR | 100,000 | 94,059 |
| 0.625% 7/8/32 (Reg. S) | EUR | 200,000 | 167,265 |
| Societe Des Autoroutes Paris-Rhin-Rhone 1.875% 1/6/31 (Reg. S) | EUR | 200,000 | 195,102 |
| Societe du Grand Paris EPIC: | | | |
| 0% 11/25/30 (Reg. S) | EUR | 200,000 | 171,956 |
| 1.7% 5/25/50 (Reg. S) | EUR | 500,000 | 365,182 |
| Societe Generale: | | | |
| 1% 11/24/30 (b) | EUR | 100,000 | 96,416 |
| 1.25% 2/15/24 (Reg. S) | EUR | 500,000 | 536,270 |
| 1.25% 12/7/27 | GBP | 300,000 | 300,239 |
| 1.25% 6/12/30 (Reg. S) | EUR | 100,000 | 87,696 |
| 1.5% 5/30/25 (Reg. S) (b) | EUR | 500,000 | 530,095 |
| 4.25% 11/16/32 (Reg. S) | EUR | 100,000 | 110,371 |
| Societe Generale SFH: | | | |
| 0.25% 9/11/23 (Reg. S) | EUR | 100,000 | 108,446 |
| 3.125% 2/24/26 (Reg. S) | EUR | 1,000,000 | 1,075,760 |
| Societe Nationale des Chemins de Fer Francais 0.625% 4/17/30 (Reg. S) | EUR | 300,000 | 273,372 |
| Suez SACA: | | | |
| 1.875% 5/24/27 (Reg. S) | EUR | 100,000 | 100,465 |
| 2.375% 5/24/30 (Reg. S) | EUR | 100,000 | 98,095 |
| Total Capital International SA 1.491% 4/8/27 (Reg. S) | EUR | 100,000 | 100,646 |
| UNEDIC: | | | |
| 0% 11/25/28 (Reg. S) | EUR | 200,000 | 184,528 |
| 0.25% 11/25/29 (Reg. S) | EUR | 600,000 | 548,439 |
| 0.25% 7/16/35 (Reg. S) | EUR | 400,000 | 308,967 |
| 0.875% 5/25/28 (Reg. S) | EUR | 400,000 | 391,212 |
| 1.25% 10/21/27 (Reg. S) | EUR | 100,000 | 100,499 |
| 1.5% 4/20/32 (Reg. S) | EUR | 100,000 | 96,331 |
| Unibail-Rodamco: | | | |
| 0.75% 10/25/28 (Reg. S) | EUR | 200,000 | 176,075 |
| 1% 2/27/27 (Reg. S) | EUR | 600,000 | 574,954 |
| Veolia Environnement SA: | | | |
| 0.892% 1/14/24 (Reg. S) | EUR | 1,000,000 | 1,073,346 |
| 1.25% 4/15/28 (Reg. S) | EUR | 100,000 | 97,466 |
TOTAL FRANCE | | | 25,540,553 |
| Germany - 3.2% | | | |
| Aareal Bank AG 0.05% 9/2/26 (Reg. S) | EUR | 100,000 | 89,807 |
| Allianz Finance II BV 1.5% 1/15/30 (Reg. S) | EUR | 200,000 | 196,179 |
| Allianz SE: | | | |
| 1.301% 9/25/49 (Reg. S) (b) | EUR | 100,000 | 86,940 |
| 4.252% 7/5/52 (Reg. S) (b) | EUR | 100,000 | 101,204 |
| Amprion GmbH 3.45% 9/22/27 (Reg. S) | EUR | 100,000 | 106,840 |
| Aroundtown SA 0.375% 4/15/27 (Reg. S) | EUR | 200,000 | 156,407 |
| BASF AG 4.25% 3/8/32 (Reg. S) | EUR | 100,000 | 111,850 |
| Bayer AG 1.375% 7/6/32 (Reg. S) | EUR | 300,000 | 259,873 |
| Bayerische Landesbank 1% 12/20/24 (Reg. S) | GBP | 800,000 | 941,536 |
| Berlin Hannoversche Hypothekenbank AG 0.25% 5/19/33 (Reg. S) | EUR | 1,020,000 | 843,752 |
| BMV Finance NV: | | | |
| 0.625% 10/6/23 (Reg. S) | EUR | 32,000 | 34,620 |
| 1.5% 2/6/29 (Reg. S) | EUR | 86,000 | 84,716 |
| 3.25% 7/22/30 (Reg. S) | EUR | 250,000 | 267,692 |
| Bremen Freie Hansestadt 0.4% 8/20/49 (Reg. S) | EUR | 29,000 | 16,133 |
| Commerzbank AG: | | | |
| 0.01% 3/11/30 | EUR | 183,000 | 161,649 |
| 0.5% 12/4/26 (Reg. S) | EUR | 58,000 | 56,522 |
| 1.25% 1/9/34 | EUR | 58,000 | 52,475 |
| 1.5% 8/28/28 (Reg. S) | EUR | 100,000 | 97,884 |
| 1.875% 2/28/28 (Reg. S) | EUR | 100,000 | 96,739 |
| Daimler International Finance BV: | | | |
| 0.375% 11/8/26 (Reg. S) | EUR | 23,000 | 22,659 |
| 1.375% 6/26/26 (Reg. S) | EUR | 44,000 | 44,940 |
| 2.625% 4/7/25 (Reg. S) | EUR | 472,000 | 505,197 |
| Deutsche Annington Finance BV: | | | |
| 0.625% 10/7/27 (Reg. S) | EUR | 200,000 | 180,196 |
| 0.75% 1/15/24 (Reg. S) | EUR | 200,000 | 213,590 |
| 1.625% 4/7/24 (Reg. S) | EUR | 400,000 | 426,034 |
| Deutsche Bahn Finance BV: | | | |
| 0.375% 12/3/26 (Reg. S) | GBP | 214,000 | 227,073 |
| 0.625% 12/8/50 (Reg. S) | EUR | 144,000 | 78,831 |
| 0.875% 6/23/39 (Reg. S) | EUR | 198,000 | 147,676 |
| 1.375% 7/7/25 (Reg. S) | GBP | 28,000 | 32,547 |
| 1.875% 2/13/26 (Reg. S) | GBP | 171,000 | 196,517 |
| Deutsche Bank AG: | | | |
| 3 month EURIBOR EURO INTER + 1.870% 1.875% 2/23/28 (Reg. S) (b)(d) | EUR | 200,000 | 192,976 |
| 1.375% 9/3/26 (Reg. S) (b) | EUR | 200,000 | 200,324 |
| 1.625% 1/20/27 (Reg. S) | EUR | 300,000 | 290,267 |
| 2.625% 12/16/24 (Reg. S) | GBP | 200,000 | 235,993 |
| 4% 6/24/32 (Reg. S) (b) | EUR | 100,000 | 95,744 |
| Deutsche Borse AG 0.125% 2/22/31 (Reg. S) | EUR | 100,000 | 85,918 |
| Deutsche Telekom AG 3.125% 2/6/34 (Reg. S) | GBP | 60,000 | 61,342 |
| DZ HYP AG 0.5% 6/16/26 (Reg. S) | EUR | 1,200,000 | 1,196,116 |
| E.ON International Finance BV: | | | |
| 1% 4/13/25 (Reg. S) | EUR | 660,000 | 685,983 |
| 1.5% 7/31/29 (Reg. S) | EUR | 115,000 | 110,318 |
| 5.75% 2/14/33 (Reg. S) | EUR | 130,000 | 161,950 |
| E.ON SE: | | | |
| 0.25% 10/24/26 (Reg. S) | EUR | 69,000 | 67,498 |
| 0.75% 2/20/28 (Reg. S) | EUR | 99,000 | 95,162 |
| 0.875% 8/20/31 (Reg. S) | EUR | 100,000 | 87,958 |
| 0.875% 10/18/34 (Reg. S) | EUR | 117,000 | 94,991 |
| 3.5% 1/12/28 (Reg. S) | EUR | 140,000 | 151,407 |
| EnBW Energie Baden-Wuerttemberg AG 1.375% 8/31/81 (Reg. S) (b) | EUR | 100,000 | 86,750 |
| EnBW International Finance BV 0.5% 3/1/33 (Reg. S) | EUR | 81,000 | 63,644 |
| Grand City Properties SA 1.375% 8/3/26 (Reg. S) | EUR | 400,000 | 369,583 |
| Hannover Reuck SE 1.75% 10/8/40 (Reg. S) (b) | EUR | 100,000 | 86,391 |
| KfW: | | | |
| 0% 9/30/26 (Reg. S) | EUR | 273,000 | 268,455 |
| 0% 9/15/28 (Reg. S) | EUR | 442,000 | 412,302 |
| 0% 9/17/30 (Reg. S) | EUR | 261,000 | 230,249 |
| 0.01% 5/5/27 (Reg. S) | EUR | 38,000 | 36,726 |
| 0.05% 9/29/34 (Reg. S) | EUR | 1,284,000 | 1,010,194 |
| 0.125% 12/30/26 (Reg. S) | GBP | 1,064,000 | 1,122,779 |
| 0.625% 2/22/27 | EUR | 283,000 | 281,373 |
| 0.625% 1/7/28 | EUR | 1,834,000 | 1,793,022 |
| 0.75% 6/28/28 | EUR | 72,000 | 70,219 |
| 0.875% 9/15/26 (Reg. S) | GBP | 43,000 | 47,201 |
| 0.875% 7/4/39 (Reg. S) | EUR | 110,000 | 86,531 |
| 1.375% 12/9/24 (Reg. S) | GBP | 151,000 | 180,025 |
| 1.375% 2/2/28 | SEK | 310,000 | 26,022 |
| 1.5% 7/24/24 | AUD | 82,000 | 52,841 |
| 3.2% 9/11/26 | AUD | 118,000 | 75,470 |
| Landesbank Baden-Wurttemberg 0.375% 5/7/29 (Reg. S) | EUR | 100,000 | 86,227 |
| Landwirtschaftliche Rentenbank: | | | |
| 0.05% 12/18/29 (Reg. S) | EUR | 42,000 | 37,845 |
| 0.875% 12/15/26 (Reg. S) | GBP | 19,000 | 20,611 |
| 1.375% 9/8/25 (Reg. S) | GBP | 1,512,000 | 1,740,525 |
| 2.6% 3/23/27 (Reg. S) | AUD | 60,000 | 37,298 |
| LEG Immobilien AG: | | | |
| 0.375% 1/17/26 (Reg. S) | EUR | 100,000 | 97,713 |
| 0.875% 1/17/29 (Reg. S) | EUR | 100,000 | 86,820 |
| Mercedes-Benz Group AG: | | | |
| 1.125% 8/8/34 (Reg. S) | EUR | 267,000 | 228,944 |
| 1.5% 7/3/29 (Reg. S) | EUR | 44,000 | 43,077 |
| Merck KGaA 1.625% 6/25/79 (Reg. S) (b) | EUR | 100,000 | 103,479 |
| Muenchener Hypothekenbank eG: | | | |
| 0.5% 12/11/24 (Reg. S) | GBP | 800,000 | 937,549 |
| 1.875% 8/25/32 (Reg. S) | EUR | 60,000 | 58,945 |
| Muenchener Rueckversicherungs-Gesellschaft AG in Muenchen 1.25% 5/26/41 (Reg. S) (b) | EUR | 100,000 | 83,106 |
| NRW.BANK 0.875% 4/12/34 | EUR | 387,000 | 335,559 |
| Robert Bosch GmbH 4.375% 6/2/43 (Reg. S) | EUR | 100,000 | 111,698 |
| RWE AG: | | | |
| 2.5% 8/24/25 (Reg. S) | EUR | 430,000 | 454,857 |
| 2.75% 5/24/30 (Reg. S) | EUR | 120,000 | 120,289 |
| Siemens Financieringsmaatschappij NV: | | | |
| 0.125% 9/5/29 (Reg. S) | EUR | 24,000 | 22,226 |
| 1.75% 2/28/39 (Reg. S) | EUR | 23,000 | 19,679 |
| 3% 9/8/33 (Reg. S) | EUR | 100,000 | 105,638 |
| UniCredit Bank AG: | | | |
| 0.25% 1/15/32 (Reg. S) | EUR | 39,000 | 33,326 |
| 0.375% 1/17/33 (Reg. S) | EUR | 200,000 | 168,448 |
| 0.85% 5/22/34 (Reg. S) | EUR | 102,000 | 87,583 |
| Vier Gas Transport GmbH 1.5% 9/25/28 (Reg. S) | EUR | 100,000 | 96,347 |
| Volkswagen Bank GmbH 2.5% 7/31/26 (Reg. S) | EUR | 100,000 | 103,280 |
| Volkswagen Financial Services AG: | | | |
| 0.875% 1/31/28 (Reg. S) | EUR | 630,000 | 587,412 |
| 1.5% 10/1/24 (Reg. S) | EUR | 36,000 | 38,047 |
| 2.25% 4/12/25 (Reg. S) | GBP | 26,000 | 30,840 |
| 3.375% 4/6/28 (Reg. S) | EUR | 32,000 | 33,686 |
| Volkswagen International Finance NV: | | | |
| 1.125% 10/2/23 (Reg. S) | EUR | 100,000 | 108,289 |
| 1.625% 1/16/30 (Reg. S) | EUR | 45,000 | 41,887 |
| 3.25% 11/18/30 (Reg. S) | EUR | 200,000 | 202,992 |
| 4.125% 11/16/38 (Reg. S) | EUR | 200,000 | 208,107 |
| Vonovia SE 1% 6/16/33 (Reg. S) | EUR | 400,000 | 295,924 |
TOTAL GERMANY | | | 22,720,055 |
| Ireland - 0.1% | | | |
| AIB Group PLC 4.625% 7/23/29 (Reg. S) (b) | EUR | 100,000 | 107,055 |
| Bank of Ireland Group PLC 1% 11/25/25 (Reg. S) (b) | EUR | 100,000 | 103,647 |
| ESB Finance Ltd. 1.125% 6/11/30 (Reg. S) | EUR | 135,000 | 125,249 |
TOTAL IRELAND | | | 335,951 |
| Italy - 0.6% | | | |
| A2A SpA 0.625% 7/15/31 (Reg. S) | EUR | 140,000 | 114,109 |
| ACEA SpA 1.5% 6/8/27 (Reg. S) | EUR | 117,000 | 116,285 |
| Amco - Asset Management Co. SpA 1.375% 1/27/25 (Reg. S) | EUR | 110,000 | 114,087 |
| Assicurazioni Generali SpA: | | | |
| 2.124% 10/1/30 (Reg. S) | EUR | 130,000 | 116,638 |
| 5.5% 10/27/47 (Reg. S) (b) | EUR | 100,000 | 109,616 |
| Autostrade per L'italia SpA 1.875% 9/26/29 (Reg. S) | EUR | 220,000 | 201,157 |
| Credit Agricole Italia SpA 0.375% 1/20/32 (Reg. S) | EUR | 200,000 | 164,900 |
| ENEL Finance International NV: | | | |
| 0.375% 6/17/27 (Reg. S) | EUR | 220,000 | 209,343 |
| 2.875% 4/11/29 (Reg. S) | GBP | 636,000 | 669,871 |
| Eni SpA: | | | |
| 3.625% 5/19/27 (Reg. S) | EUR | 100,000 | 107,308 |
| 4.25% 5/19/33 (Reg. S) | EUR | 120,000 | 129,716 |
| Ferrovie dello Stato FS SpA 1.5% 6/27/25 (Reg. S) | EUR | 144,000 | 149,139 |
| Intesa Sanpaolo SpA: | | | |
| 0.75% 3/16/28 (Reg. S) | EUR | 260,000 | 241,578 |
| 2.125% 5/26/25 (Reg. S) | EUR | 323,000 | 337,421 |
| 4.875% 5/19/30 (Reg. S) | EUR | 100,000 | 108,914 |
| Mediobanca SpA 1.625% 1/7/25 (Reg. S) | EUR | 280,000 | 292,964 |
| Snam SpA: | | | |
| 0% 5/12/24 (Reg. S) | EUR | 110,000 | 115,862 |
| 0.75% 6/20/29 (Reg. S) | EUR | 190,000 | 171,436 |
| Terna - Rete Elettrica Nazionale: | | | |
| 0.375% 6/23/29 (Reg. S) | EUR | 120,000 | 107,167 |
| 1.375% 7/26/27 (Reg. S) | EUR | 150,000 | 149,610 |
| UniCredit SpA 2.2% 7/22/27 (Reg. S) (b) | EUR | 490,000 | 493,346 |
TOTAL ITALY | | | 4,220,467 |
| Japan - 0.0% | | | |
| Takeda Pharmaceutical Co. Ltd. 2% 7/9/40 | EUR | 157,000 | 126,520 |
| Korea (South) - 0.0% | | | |
| Korea Housing Finance Corp. 0.01% 7/7/25 (Reg. S) | EUR | 160,000 | 160,358 |
| Luxembourg - 0.2% | | | |
| Blackstone Property Partners Europe LP: | | | |
| 1.25% 4/26/27 (Reg. S) | EUR | 153,000 | 133,124 |
| 2% 2/15/24 (Reg. S) | EUR | 180,000 | 191,025 |
| JAB Holdings BV 2.5% 6/25/29 | EUR | 100,000 | 98,777 |
| Logicor Financing SARL 0.75% 7/15/24 (Reg. S) | EUR | 558,000 | 579,441 |
| Prologis International Funding II SA 1.75% 3/15/28 (Reg. S) | EUR | 144,000 | 138,805 |
| SELP Finance SARL 1.5% 11/20/25 (Reg. S) | EUR | 100,000 | 100,041 |
TOTAL LUXEMBOURG | | | 1,241,213 |
| Mexico - 0.1% | | | |
| America Movil S.A.B. de CV: | | | |
| 0.75% 6/26/27 | EUR | 100,000 | 96,249 |
| 1.5% 3/10/24 | EUR | 100,000 | 107,024 |
| 2.125% 3/10/28 | EUR | 200,000 | 200,851 |
| Petroleos Mexicanos 4.75% 2/26/29 (Reg. S) | EUR | 100,000 | 85,305 |
TOTAL MEXICO | | | 489,429 |
| Multi-National - 0.0% | | | |
| EUROFIMA 0.15% 10/10/34 (Reg. S) | EUR | 191,000 | 149,227 |
| Netherlands - 1.2% | | | |
| ABN AMRO Bank NV: | | | |
| 0.375% 1/14/35 (Reg. S) | EUR | 200,000 | 158,969 |
| 0.5% 9/23/29 (Reg. S) | EUR | 100,000 | 86,901 |
| 0.6% 1/15/27 (Reg. S) | EUR | 300,000 | 287,327 |
| 1.375% 1/12/37 (Reg. S) | EUR | 400,000 | 348,564 |
| 4.5% 11/21/34 (Reg. S) | EUR | 100,000 | 110,450 |
| Bank Nederlandse Gemeenten NV: | | | |
| 0.75% 1/24/29 (Reg. S) | EUR | 2,004,000 | 1,914,565 |
| 3.3% 7/17/28 (Reg. S) | AUD | 97,000 | 60,511 |
| CTP BV 0.75% 2/18/27 (Reg. S) | EUR | 108,000 | 94,434 |
| Eneco Holding NV 0% 11/16/26 (Reg. S) | EUR | 117,000 | 112,502 |
| Euronext NV 1% 4/18/25 (Reg. S) | EUR | 240,000 | 247,034 |
| ING Groep NV: | | | |
| 0.25% 2/18/29 (Reg. S) (b) | EUR | 500,000 | 446,549 |
| 1.125% 2/14/25 (Reg. S) | EUR | 300,000 | 311,325 |
| 2.125% 5/26/31 (Reg. S) (b) | EUR | 400,000 | 396,126 |
| 3% 2/18/26 (Reg. S) | GBP | 100,000 | 115,371 |
| 4.875% 11/14/27 (Reg. S) (b) | EUR | 200,000 | 219,696 |
| LeasePlan Corp. NV 2.125% 5/6/25 (Reg. S) | EUR | 130,000 | 135,579 |
| Nationale-Nederlanden Bank NV 1% 9/25/28 (Reg. S) | EUR | 700,000 | 677,552 |
| Nederlandse Waterschapsbank NV: | | | |
| 0.75% 10/4/41 (Reg. S) | EUR | 748,000 | 535,133 |
| 3.3% 5/2/29 (Reg. S) | AUD | 40,000 | 24,624 |
| NIBC Bank NV 2% 4/9/24 (Reg. S) | EUR | 200,000 | 213,185 |
| NN Group NV 4.625% 1/13/48 (Reg. S) (b) | EUR | 180,000 | 189,247 |
| Rabobank Nederland: | | | |
| 0.25% 10/30/26 (Reg. S) | EUR | 500,000 | 487,903 |
| 0.75% 8/29/23 (Reg. S) | EUR | 300,000 | 325,844 |
| 1.125% 5/7/31 (Reg. S) | EUR | 100,000 | 87,494 |
| 1.25% 3/23/26 (Reg. S) | EUR | 79,000 | 80,899 |
| Royal Schiphol Group NV 2% 4/6/29 (Reg. S) | EUR | 117,000 | 117,166 |
| Shell International Finance BV 0.5% 11/8/31 (Reg. S) | EUR | 310,000 | 260,441 |
| Stellantis NV 2.75% 4/1/32 (Reg. S) | EUR | 200,000 | 192,497 |
| TenneT Holding BV 0.875% 6/16/35 (Reg. S) | EUR | 234,000 | 197,817 |
TOTAL NETHERLANDS | | | 8,435,705 |
| New Zealand - 0.1% | | | |
| Westpac Securities NZ Ltd. London Branch 0.01% 6/8/28 (Reg. S) | EUR | 998,000 | 907,261 |
| Norway - 0.4% | | | |
| DNB Bank ASA: | | | |
| 0.05% 11/14/23 (Reg. S) | EUR | 400,000 | 430,268 |
| 3.125% 9/21/27 (Reg. S) (b) | EUR | 170,000 | 179,634 |
| 4% 8/17/27 (Reg. S) (b) | GBP | 100,000 | 116,080 |
| Equinor ASA 1.375% 5/22/32 (Reg. S) | EUR | 241,000 | 218,091 |
| Kommunalbanken A/S: | | | |
| 0.6% 6/1/26 | AUD | 500,000 | 295,542 |
| 1.5% 12/15/23 (Reg. S) | GBP | 100,000 | 124,576 |
| Sparebank 1 Boligkreditt A/S 0.01% 9/22/27 (Reg. S) | EUR | 1,151,000 | 1,082,984 |
| Telenor ASA: | | | |
| 0% 9/25/23 (Reg. S) | EUR | 253,000 | 273,688 |
| 0.75% 5/31/26 (Reg. S) | EUR | 100,000 | 99,718 |
| 1.125% 5/31/29 (Reg. S) | EUR | 157,000 | 148,192 |
TOTAL NORWAY | | | 2,968,773 |
| Portugal - 0.0% | | | |
| EDP Finance BV 1.875% 9/21/29 (Reg. S) | EUR | 100,000 | 97,186 |
| Spain - 0.6% | | | |
| Abertis Infraestructuras SA 2.375% 9/27/27 (Reg. S) | EUR | 400,000 | 407,607 |
| Banco Bilbao Vizcaya Argentaria SA: | | | |
| 2.575% 2/22/29 (Reg. S) (b) | EUR | 100,000 | 106,919 |
| 4.375% 10/14/29 (Reg. S) | EUR | 300,000 | 331,848 |
| Banco Santander SA: | | | |
| 0.2% 2/11/28 (Reg. S) | EUR | 300,000 | 273,758 |
| 1.375% 1/5/26 (Reg. S) | EUR | 300,000 | 303,877 |
| 2.125% 2/8/28 (Reg. S) | EUR | 100,000 | 97,849 |
| 3.125% 1/19/27 (Reg. S) | EUR | 100,000 | 103,912 |
| 5.75% 8/23/33 (Reg. S) (b) | EUR | 100,000 | 108,317 |
| CaixaBank SA: | | | |
| 0.75% 5/26/28 (Reg. S) (b) | EUR | 100,000 | 93,708 |
| 1.5% 12/3/26 (Reg. S) (b) | GBP | 200,000 | 219,254 |
| 2.25% 4/17/30 (Reg. S) (b) | EUR | 100,000 | 101,171 |
| 2.375% 2/1/24 (Reg. S) | EUR | 800,000 | 864,339 |
| 3.75% 2/15/29 (Reg. S) (b) | EUR | 100,000 | 107,470 |
| Comunidad de Madrid 1.571% 4/30/29 (Reg. S) | EUR | 316,000 | 310,561 |
| Iberdrola Finanzas SAU 3.375% 11/22/32 (Reg. S) | EUR | 100,000 | 107,882 |
| Naturgy Finance BV 1.25% 1/15/26 (Reg. S) | EUR | 200,000 | 203,166 |
| Telefonica Emisiones S.A.U. 1.93% 10/17/31 (Reg. S) | EUR | 300,000 | 285,970 |
TOTAL SPAIN | | | 4,027,608 |
| Sweden - 1.3% | | | |
| Akelius Residential Property AB 1.125% 3/14/24 (Reg. S) | EUR | 297,000 | 314,305 |
| Fastighets AB Balder 1.25% 1/28/28 (Reg. S) | EUR | 108,000 | 82,057 |
| Heimstaden Bostad Treasury BV: | | | |
| 0.625% 7/24/25 (Reg. S) | EUR | 160,000 | 145,152 |
| 1.375% 7/24/28 (Reg. S) | EUR | 135,000 | 98,966 |
| Kommuninvest I Sverige AB: | | | |
| 1% 10/2/24 (Reg. S) | SEK | 8,080,000 | 720,877 |
| 1% 5/12/25 (Reg. S) | SEK | 9,970,000 | 874,813 |
| 1% 11/12/26 (Reg. S) | SEK | 6,710,000 | 568,969 |
| Lansforsakringar Hypotek AB: | | | |
| 1.25% 9/17/25 | SEK | 400,000 | 34,899 |
| 1.5% 9/16/26 (Reg. S) | SEK | 5,600,000 | 480,271 |
| Nordea Hypotek AB 1% 9/17/25 | SEK | 1,700,000 | 147,510 |
| Sagax AB 2.25% 3/13/25 (Reg. S) | EUR | 120,000 | 123,468 |
| Samhallsbyggnadsbolaget I Norden AB 1% 8/12/27 (Reg. S) | EUR | 108,000 | 75,782 |
| Skandinaviska Enskilda Banken AB: | | | |
| 0.75% 11/15/27 (Reg. S) | EUR | 100,000 | 97,137 |
| 1.75% 11/11/26 (Reg. S) | EUR | 210,000 | 212,351 |
| 3.25% 5/4/28 (Reg. S) | EUR | 250,000 | 270,601 |
| 3.75% 2/7/28 (Reg. S) | EUR | 160,000 | 169,170 |
| Stadshypotek AB: | | | |
| 0.375% 3/13/26 (Reg. S) | EUR | 500,000 | 498,978 |
| 1.5% 3/1/24 (Reg. S) | SEK | 1,000,000 | 91,326 |
| 1.5% 12/3/24 (Reg. S) | SEK | 8,000,000 | 715,753 |
| Svenska Handelsbanken AB: | | | |
| 1% 4/15/25 (Reg. S) | EUR | 220,000 | 227,483 |
| 1.625% 12/15/23 (Reg. S) | GBP | 656,000 | 816,318 |
| 1.625% 3/5/29 (Reg. S) (b) | EUR | 130,000 | 137,773 |
| Swedbank AB: | | | |
| 0.3% 5/20/27 (Reg. S) (b) | EUR | 240,000 | 230,461 |
| 2.1% 5/25/27 (Reg. S) | EUR | 108,000 | 109,030 |
| Swedbank Hypotek AB: | | | |
| 0.45% 8/23/23 (Reg. S) | EUR | 190,000 | 206,443 |
| 1% 9/18/24 (Reg. S) | SEK | 800,000 | 71,508 |
| 3.125% 7/5/28 (Reg. S) | EUR | 390,000 | 419,295 |
| Swedish Covered Bond Corp. 2% 6/17/26 (Reg. S) | SEK | 11,000,000 | 962,754 |
| Telia Co. AB 0.125% 11/27/30 (Reg. S) | EUR | 310,000 | 260,501 |
| Vattenfall AB 0.125% 2/12/29 (Reg. S) | EUR | 108,000 | 97,582 |
TOTAL SWEDEN | | | 9,261,533 |
| Switzerland - 0.9% | | | |
| Demeter Investments BV 2.75% 2/19/49 (Reg. S) (b) | EUR | 120,000 | 114,517 |
| Pfandbrief Schweiz Hypo: | | | |
| 0% 7/29/24 (Reg. S) | CHF | 40,000 | 43,766 |
| 0% 8/26/49 (Reg. S) | CHF | 520,000 | 387,393 |
| 0.125% 12/19/31 (Reg. S) | CHF | 1,270,000 | 1,239,564 |
| Pfandbriefbank Schweizerischer Hypothekarinstitute AG: | | | |
| 0% 3/13/28 (Reg. S) | CHF | 750,000 | 769,566 |
| 0% 7/25/31 (Reg. S) | CHF | 110,000 | 106,848 |
| 0.1% 12/3/31 (Reg. S) | CHF | 195,000 | 189,965 |
| 0.5% 11/24/28 (Reg. S) | CHF | 40,000 | 41,724 |
| UBS Group AG: | | | |
| 0.25% 1/29/26 (Reg. S) (b) | EUR | 669,000 | 672,520 |
| 0.65% 1/14/28 (Reg. S) (b) | EUR | 100,000 | 93,669 |
| 1% 3/21/25 (Reg. S) (b) | EUR | 300,000 | 317,277 |
| 1% 6/24/27 (Reg. S) (b) | EUR | 150,000 | 144,916 |
| 1.25% 4/17/25 (Reg. S) (b) | EUR | 1,014,000 | 1,070,419 |
| 1.25% 7/17/25 (Reg. S) (b) | EUR | 307,000 | 320,342 |
| 3.25% 4/2/26 (Reg. S) (b) | EUR | 605,000 | 635,670 |
TOTAL SWITZERLAND | | | 6,148,156 |
| United Kingdom - 1.2% | | | |
| AA Bond Co. Ltd.: | | | |
| 7.375% 7/31/50 (Reg. S) | GBP | 120,000 | 137,521 |
| 8.45% 7/31/50 (Reg. S) | GBP | 130,000 | 159,873 |
| Annington Funding PLC 2.308% 10/6/32 (Reg. S) | GBP | 104,000 | 91,575 |
| Barclays PLC: | | | |
| 3.25% 1/17/33 | GBP | 299,000 | 283,909 |
| 3.375% 4/2/25 (Reg. S) (b) | EUR | 701,000 | 755,784 |
| BAT Netherlands Finance BV: | | | |
| 3.125% 4/7/28 (Reg. S) | EUR | 100,000 | 103,874 |
| 5.375% 2/16/31 (Reg. S) | EUR | 110,000 | 119,721 |
| BP Capital Markets BV 0.933% 12/4/40 (Reg. S) | EUR | 290,000 | 189,211 |
| BP Capital Markets PLC 1.637% 6/26/29 (Reg. S) | EUR | 100,000 | 96,374 |
| Heathrow Funding Ltd. 3.661% 1/13/33 | CAD | 215,000 | 145,483 |
| HSBC Holdings PLC: | | | |
| Eur Swap Annual 5Y Index + 3.300% 6.364% 11/16/32 (Reg. S) (b)(d) | EUR | 270,000 | 299,703 |
| 1.5% 12/4/24 (Reg. S) (b) | EUR | 930,000 | 1,003,135 |
| 3% 7/22/28 (b) | GBP | 110,000 | 119,782 |
| LCR Finance PLC 5.1% 3/7/51 | GBP | 93,000 | 124,750 |
| Lloyds Bank PLC 0.125% 9/23/29 (Reg. S) | EUR | 100,000 | 88,963 |
| Lloyds Banking Group PLC: | | | |
| 0.5% 11/12/25 (Reg. S) (b) | EUR | 130,000 | 134,055 |
| 1.985% 12/15/31 (b) | GBP | 104,000 | 109,086 |
| 2.25% 10/16/24 | GBP | 100,000 | 120,109 |
| 3.5% 4/1/26 (Reg. S) (b) | EUR | 404,000 | 431,027 |
| London & Quadrant Housing Trust 2% 3/31/32 (Reg. S) | GBP | 112,000 | 105,226 |
| M&G PLC 5.625% 10/20/51 (Reg. S) (b) | GBP | 104,000 | 116,605 |
| National Grid Electricity Transmission PLC: | | | |
| 0.823% 7/7/32 (Reg. S) | EUR | 140,000 | 116,177 |
| 1.375% 9/16/26 (Reg. S) | GBP | 200,000 | 218,884 |
| National Grid PLC 2.179% 6/30/26 (Reg. S) | EUR | 430,000 | 445,095 |
| Nationwide Building Society 0.625% 3/25/27 (Reg. S) | EUR | 903,000 | 881,704 |
| NatWest Group PLC: | | | |
| 3 month EURIBOR EURO INTER + 1.080% 1.75% 3/2/26 (Reg. S) (b)(d) | EUR | 110,000 | 113,901 |
| 3.622% 8/14/30 (Reg. S) (b) | GBP | 411,000 | 480,273 |
| NatWest Markets PLC 6.375% 11/8/27 (Reg. S) | GBP | 280,000 | 349,019 |
| NIE Finance PLC 2.5% 10/27/25 (Reg. S) | GBP | 200,000 | 230,938 |
| Santander UK PLC 0.05% 1/12/27 (Reg. S) | EUR | 200,000 | 191,723 |
| Segro Capital SARL 1.25% 3/23/26 (Reg. S) | EUR | 160,000 | 158,021 |
| Standard Chartered PLC 0.85% 1/27/28 (Reg. S) (b) | EUR | 107,000 | 101,545 |
| Thames Water Utility Finance PLC 2.375% 4/22/40 (Reg. S) | GBP | 190,000 | 140,123 |
| Vodafone International Financing DAC 3.75% 12/2/34 (Reg. S) | EUR | 330,000 | 348,344 |
TOTAL UNITED KINGDOM | | | 8,511,513 |
| United States of America - 5.4% | | | |
| ACE INA Holdings, Inc. 1.55% 3/15/28 | EUR | 639,000 | 622,771 |
| Air Products & Chemicals, Inc. 0.5% 5/5/28 | EUR | 1,223,000 | 1,142,404 |
| Altria Group, Inc.: | | | |
| 2.2% 6/15/27 | EUR | 398,000 | 402,789 |
| 3.125% 6/15/31 | EUR | 174,000 | 163,282 |
| American Honda Finance Corp. 1.95% 10/18/24 | EUR | 1,294,000 | 1,374,989 |
| Apple, Inc. 0.5% 11/15/31 | EUR | 911,000 | 799,764 |
| AT&T, Inc.: | | | |
| 0.25% 3/4/26 | EUR | 100,000 | 98,738 |
| 2.9% 12/4/26 | GBP | 2,720,000 | 3,072,827 |
| Athene Global Funding 0.832% 1/8/27 (Reg. S) | EUR | 140,000 | 130,660 |
| Bank of America Corp. 0.694% 3/22/31 (Reg. S) (b) | EUR | 486,000 | 418,665 |
| Becton Dickinson Euro Finance SARL 1.208% 6/4/26 | EUR | 1,553,000 | 1,568,956 |
| Berkshire Hathaway, Inc. 2.15% 3/15/28 | EUR | 797,000 | 808,678 |
| Citigroup, Inc.: | | | |
| 2.75% 1/24/24 | GBP | 204,000 | 254,173 |
| 4.112% 9/22/33 (Reg. S) (b) | EUR | 220,000 | 234,888 |
| Comcast Corp. 1.875% 2/20/36 | GBP | 405,000 | 343,177 |
| DH Europe Finance II SARL: | | | |
| 0.2% 3/18/26 | EUR | 2,894,000 | 2,860,405 |
| 0.75% 9/18/31 | EUR | 456,000 | 393,492 |
| 1.35% 9/18/39 | EUR | 192,000 | 145,914 |
| Digital Dutch Finco BV 1.5% 3/15/30 (Reg. S) | EUR | 100,000 | 85,477 |
| Digital Intrepid Holding BV 0.625% 7/15/31 (Reg. S) | EUR | 100,000 | 75,623 |
| DXC Technology Co. 1.75% 1/15/26 | EUR | 914,000 | 923,516 |
| FedEx Corp. 0.95% 5/4/33 | EUR | 371,000 | 297,051 |
| Fidelity National Information Services, Inc. 1.5% 5/21/27 | EUR | 758,000 | 750,600 |
| Fiserv, Inc. 2.25% 7/1/25 | GBP | 925,000 | 1,077,166 |
| Ford Motor Credit Co. LLC 2.33% 11/25/25 | EUR | 100,000 | 102,300 |
| General Electric Co.: | | | |
| 0.875% 5/17/25 | EUR | 2,219,000 | 2,282,144 |
| 2.125% 5/17/37 | EUR | 110,000 | 94,459 |
| Goldman Sachs Group, Inc.: | | | |
| 1.375% 5/15/24 (Reg. S) | EUR | 1,230,000 | 1,310,898 |
| 1.875% 12/16/30 (Reg. S) | GBP | 100,000 | 93,990 |
| 2% 11/1/28 (Reg. S) | EUR | 51,000 | 50,217 |
| 3.125% 7/25/29 (Reg. S) | GBP | 27,000 | 28,601 |
| 3.375% 3/27/25 (Reg. S) | EUR | 488,000 | 525,023 |
| IBM Corp. 1.2% 2/11/40 | EUR | 272,000 | 197,196 |
| Illinois Tool Works, Inc. 0.25% 12/5/24 | EUR | 2,734,000 | 2,827,312 |
| Johnson Controls International PLC 1.375% 2/25/25 | EUR | 1,296,000 | 1,352,579 |
| JPMorgan Chase & Co. 0.389% 2/24/28 (Reg. S) (b) | EUR | 792,000 | 749,360 |
| Marsh & McLennan Companies, Inc. 1.349% 9/21/26 | EUR | 768,000 | 768,338 |
| McKesson Corp. 3.125% 2/17/29 | GBP | 573,000 | 617,459 |
| Medtronic Global Holdings SCA: | | | |
| 0.25% 7/2/25 | EUR | 100,000 | 101,271 |
| 1.75% 7/2/49 (Reg. S) | EUR | 227,000 | 156,866 |
| Metropolitan Life Global Funding I 1.75% 5/25/25 (Reg. S) | EUR | 350,000 | 364,199 |
| Morgan Stanley: | | | |
| 1.102% 4/29/33 (b) | EUR | 243,000 | 200,855 |
| 5.789% 11/18/33 (b) | GBP | 170,000 | 206,587 |
| Nestle Finance International Ltd.: | | | |
| 0% 6/14/26 (Reg. S) | EUR | 540,000 | 532,501 |
| 1.25% 11/2/29 (Reg. S) | EUR | 30,000 | 28,883 |
| New York Life Global Funding 0.125% 7/23/30 (Reg. S) | CHF | 215,000 | 205,958 |
| Philip Morris International, Inc.: | | | |
| 1.45% 8/1/39 | EUR | 100,000 | 66,890 |
| 2% 5/9/36 | EUR | 210,000 | 165,102 |
| PPG Industries, Inc. 0.875% 11/3/25 | EUR | 744,000 | 755,145 |
| Procter & Gamble Co.: | | | |
| 1.375% 5/3/25 | GBP | 221,000 | 259,697 |
| 1.8% 5/3/29 | GBP | 381,000 | 400,499 |
| Prologis LP 2.25% 6/30/29 | GBP | 619,000 | 629,437 |
| Public Storage 0.875% 1/24/32 | EUR | 245,000 | 200,806 |
| Realty Income Corp. 1.75% 7/13/33 | GBP | 413,000 | 349,637 |
| Schlumberger Finance BV 2% 5/6/32 (Reg. S) | EUR | 230,000 | 217,736 |
| The Coca-Cola Co. 0.375% 3/15/33 | EUR | 906,000 | 735,116 |
| The Dow Chemical Co. 1.875% 3/15/40 | EUR | 232,000 | 175,720 |
| Thermo Fisher Scientific, Inc.: | | | |
| 0.125% 3/1/25 | EUR | 100,000 | 102,358 |
| 1.875% 10/1/49 | EUR | 106,000 | 74,431 |
| Verizon Communications, Inc.: | | | |
| 1.375% 10/27/26 | EUR | 762,000 | 767,388 |
| 3.375% 10/27/36 | GBP | 486,000 | 468,451 |
| 4.05% 2/17/25 | AUD | 680,000 | 444,340 |
| VF Corp. 0.25% 2/25/28 | EUR | 606,000 | 549,518 |
| Wells Fargo & Co. 2.125% 9/24/31 (Reg. S) | GBP | 350,000 | 328,092 |
| Whirlpool EMEA Finance SARL 0.5% 2/20/28 | EUR | 170,000 | 158,747 |
| WPC Eurobond BV 2.25% 4/9/26 | EUR | 110,000 | 111,926 |
TOTAL UNITED STATES OF AMERICA | | | 37,804,037 |
| TOTAL NONCONVERTIBLE BONDS (Cost $208,718,033) | | | 183,508,269 |
| | | | |
| Government Obligations - 68.3% |
| | | Principal Amount (a) | Value ($) |
| Australia - 1.9% | | | |
| Australian Commonwealth: | | | |
| 0.25% 11/21/24 (Reg. S) | AUD | 493,000 | 310,729 |
| 0.25% 11/21/25 (Reg. S) | AUD | 211,000 | 128,372 |
| 1% 12/21/30 (Reg. S) | AUD | 1,482,000 | 797,303 |
| 1.25% 5/21/32 | AUD | 3,826,000 | 2,024,062 |
| 1.75% 11/21/32 (Reg. S) | AUD | 1,280,000 | 701,815 |
| 1.75% 6/21/51 (Reg. S) | AUD | 809,000 | 313,330 |
| 2.25% 5/21/28 (Reg. S) | AUD | 1,320,000 | 813,038 |
| 2.75% 4/21/24 | AUD | 30,000 | 19,731 |
| 2.75% 11/21/28 | AUD | 729,000 | 457,307 |
| 2.75% 11/21/29 (Reg. S) | AUD | 1,280,000 | 793,934 |
| 2.75% 5/21/41(Reg. S) | AUD | 1,224,000 | 657,287 |
| 3% 3/21/47 | AUD | 468,000 | 249,518 |
| 3.25% 4/21/25 (Reg. S) | AUD | 56,000 | 36,679 |
| 3.25% 4/21/29(Reg. S) | AUD | 70,000 | 44,896 |
| 4.5% 4/21/33 | AUD | 1,080,000 | 746,387 |
| 4.75% 4/21/27(Reg. S) | AUD | 2,430,000 | 1,661,394 |
| Queensland Treasury Corp.: | | | |
| 1.75% 8/21/31 (Reg. S) (c) | AUD | 2,631,000 | 1,429,272 |
| 3.25% 7/21/26 (Reg. S) (c) | AUD | 247,000 | 159,502 |
| 3.25% 7/21/28 (Reg. S) (c) | AUD | 154,000 | 97,777 |
| 3.5% 8/21/30 (Reg. S) (c) | AUD | 58,000 | 36,522 |
| Treasury Corp. of Victoria: | | | |
| 0.5% 11/20/25 | AUD | 110,000 | 66,833 |
| 1.25% 11/19/27 | AUD | 952,000 | 557,050 |
| 1.5% 11/20/30 | AUD | 1,347,000 | 729,432 |
| 2.5% 10/22/29 | AUD | 424,000 | 252,701 |
TOTAL AUSTRALIA | | | 13,084,871 |
| Austria - 0.7% | | | |
| Austrian Republic: | | | |
| 0% 2/20/30 (Reg. S) (c) | EUR | 542,000 | 486,907 |
| 0% 10/20/40 (Reg. S) (c) | EUR | 628,000 | 405,901 |
| 0.5% 4/20/27 (Reg. S) (c) | EUR | 821,000 | 815,363 |
| 0.5% 2/20/29 (Reg. S) (c) | EUR | 677,000 | 644,797 |
| 0.75% 10/20/26 (Reg. S) (c) | EUR | 185,000 | 187,395 |
| 0.75% 2/20/28 (Reg. S) (c) | EUR | 355,000 | 349,994 |
| 0.75% 3/20/51 (Reg. S) (c) | EUR | 1,090,000 | 688,858 |
| 0.9% 2/20/32 (Reg. S) (c) | EUR | 744,000 | 683,885 |
| 1.2% 10/20/25 (Reg. S) (c) | EUR | 77,000 | 80,368 |
| 1.5% 2/20/47 (Reg. S) (c) | EUR | 483,000 | 387,539 |
| 2.4% 5/23/34(Reg. S) (c) | EUR | 40,000 | 41,016 |
| 3.15% 6/20/44(Reg. S) (c) | EUR | 10,000 | 11,048 |
| 4.15% 3/15/37 (c) | EUR | 20,000 | 24,307 |
TOTAL AUSTRIA | | | 4,807,378 |
| Belgium - 1.3% | | | |
| Belgian Kingdom: | | | |
| 0% 10/22/27 (Reg. S) (c) | EUR | 1,690,000 | 1,626,868 |
| 0% 10/22/31 (c) | EUR | 622,000 | 533,009 |
| 0.1% 6/22/30 (Reg. S) (c) | EUR | 405,000 | 365,288 |
| 0.35% 6/22/32 (c) | EUR | 549,000 | 475,686 |
| 0.4% 6/22/40 (c) | EUR | 1,212,000 | 827,602 |
| 0.5% 10/22/24 (Reg. S) (c) | EUR | 544,000 | 571,536 |
| 0.8% 6/22/25 (Reg. S) (c) | EUR | 105,000 | 109,330 |
| 0.8% 6/22/27 (c) | EUR | 39,000 | 39,116 |
| 0.9% 6/22/29 (c) | EUR | 1,373,000 | 1,338,840 |
| 1% 6/22/26 (Reg. S) (c) | EUR | 161,000 | 165,539 |
| 1.25% 4/22/33 (Reg. S) (c) | EUR | 1,521,000 | 1,421,300 |
| 1.4% 6/22/53 (Reg. S) (c) | EUR | 982,000 | 682,518 |
| 1.45% 6/22/37 (Reg. S) (c) | EUR | 84,000 | 73,804 |
| 1.6% 6/22/47 (c) | EUR | 38,000 | 29,641 |
| 1.7% 6/22/50 (c) | EUR | 23,000 | 17,812 |
| 1.9% 6/22/38(Reg. S) (c) | EUR | 101,000 | 92,695 |
| 2.25% 6/22/57 (Reg. S) (c) | EUR | 124,000 | 106,108 |
| 3.3% 6/22/54 (Reg. S) (c) | EUR | 110,000 | 117,471 |
| 3.75% 6/22/45(Reg. S) | EUR | 20,000 | 23,214 |
| 4% 3/28/32 | EUR | 30,000 | 35,227 |
| 4.25% 3/28/41 (c) | EUR | 195,000 | 239,422 |
| 5.5% 3/28/28 | EUR | 40,000 | 48,601 |
| Flemish Community 3.25% 4/5/33 (Reg. S) | EUR | 300,000 | 324,142 |
| Walloon Region 1.05% 6/22/40 (Reg. S) | EUR | 100,000 | 72,627 |
TOTAL BELGIUM | | | 9,337,396 |
| Bulgaria - 0.0% | | | |
| Bulgarian Republic 4.625% 9/23/34(Reg. S) | EUR | 190,000 | 205,703 |
| Canada - 4.1% | | | |
| Alberta Province: | | | |
| 0.5% 4/16/25 (Reg. S) | EUR | 100,000 | 103,043 |
| 0.625% 4/18/25 (Reg. S) | EUR | 330,000 | 340,597 |
| 2.05% 6/1/30 | CAD | 260,000 | 173,250 |
| 3.05% 12/1/48 | CAD | 724,000 | 450,479 |
| 3.1% 6/1/50 | CAD | 231,000 | 145,108 |
| British Columbia Province: | | | |
| 2.3% 6/18/26 | CAD | 210,000 | 149,228 |
| 2.75% 6/18/52 | CAD | 140,000 | 83,091 |
| 2.95% 6/18/50 | CAD | 924,000 | 569,933 |
| Canada Housing Trust No. 1: | | | |
| 1.75% 6/15/30 (c) | CAD | 730,000 | 482,233 |
| 1.8% 12/15/24 (c) | CAD | 3,265,000 | 2,357,233 |
| 2.1% 9/15/29 (c) | CAD | 70,000 | 47,825 |
| 3.15% 9/15/23 (c) | CAD | 740,000 | 556,713 |
| 3.6% 12/15/27 (c) | CAD | 1,910,000 | 1,420,198 |
| Canadian Government: | | | |
| 0.25% 3/1/26 | CAD | 548,000 | 372,499 |
| 0.5% 12/1/30 | CAD | 161,000 | 98,807 |
| 1% 6/1/27 | CAD | 58,000 | 39,532 |
| 1.25% 3/1/27 | CAD | 1,460,000 | 1,003,501 |
| 1.25% 6/1/30 | CAD | 16,000 | 10,499 |
| 1.5% 9/1/24 | CAD | 18,000 | 13,066 |
| 1.5% 12/1/31 | CAD | 480,000 | 313,976 |
| 1.75% 12/1/53 | CAD | 830,000 | 461,997 |
| 2% 6/1/28 | CAD | 50,000 | 35,191 |
| 2% 6/1/32 | CAD | 2,410,000 | 1,636,271 |
| 2% 12/1/51 | CAD | 410,000 | 244,604 |
| 2.5% 12/1/32 | CAD | 2,160,000 | 1,526,819 |
| 2.75% 12/1/48 | CAD | 630,000 | 443,299 |
| 3% 11/1/24 | CAD | 1,820,000 | 1,341,353 |
| 3.5% 3/1/28 | CAD | 855,000 | 640,377 |
| City of Montreal 2.3% 9/1/29 | CAD | 140,000 | 94,907 |
| City of Ottawa 4.6% 7/14/42 | CAD | 70,000 | 53,803 |
| City of Toronto 2.8% 11/22/49 | CAD | 180,000 | 102,755 |
| Manitoba Province: | | | |
| 3.2% 3/5/50 | CAD | 256,000 | 162,439 |
| 3.4% 9/5/48 | CAD | 310,000 | 203,927 |
| New Brunswick Province: | | | |
| 3.05% 8/14/50 | CAD | 227,000 | 140,091 |
| 3.55% 6/3/43 | CAD | 100,000 | 68,121 |
| Newfoundland Province: | | | |
| 2.65% 10/17/50 | CAD | 167,000 | 90,092 |
| 3.3% 10/17/46 | CAD | 50,000 | 31,057 |
| 3.7% 10/17/48 | CAD | 70,000 | 46,456 |
| Nova Scotia Province 3.15% 12/1/51 | CAD | 80,000 | 50,473 |
| Ontario Province: | | | |
| 0.25% 12/15/26 (Reg. S) | GBP | 638,000 | 670,536 |
| 0.375% 6/14/24 (Reg. S) | EUR | 100,000 | 105,493 |
| 0.375% 4/8/27 (Reg. S) | EUR | 283,000 | 274,692 |
| 1.05% 9/8/27 | CAD | 460,000 | 306,709 |
| 1.75% 9/8/25 | CAD | 401,000 | 284,131 |
| 2.05% 6/2/30 | CAD | 59,000 | 39,365 |
| 2.15% 6/2/31 | CAD | 170,000 | 112,328 |
| 2.3% 9/8/24 | CAD | 53,000 | 38,753 |
| 2.4% 6/2/26 | CAD | 49,000 | 34,936 |
| 2.6% 6/2/25 | CAD | 3,000,000 | 2,174,969 |
| 2.65% 12/2/50 | CAD | 49,000 | 28,410 |
| 2.7% 6/2/29 | CAD | 1,703,000 | 1,199,267 |
| 2.8% 6/2/48 | CAD | 1,868,000 | 1,124,494 |
| 2.9% 6/2/49 | CAD | 885,000 | 540,633 |
| 3.65% 6/2/33 | CAD | 1,050,000 | 769,118 |
| Quebec Province: | | | |
| 0% 10/29/30 (Reg. S) | EUR | 1,050,000 | 899,678 |
| 0.5% 1/25/32 (Reg. S) | EUR | 330,000 | 283,597 |
| 0.75% 12/13/24 (Reg. S) | GBP | 192,000 | 226,287 |
| 1.5% 9/1/31 | CAD | 1,966,000 | 1,227,743 |
| 1.9% 9/1/30 | CAD | 131,000 | 86,113 |
| 2.25% 2/22/24 | CAD | 290,000 | 215,109 |
| 2.25% 9/15/26 (Reg. S) | GBP | 112,000 | 127,684 |
| 2.3% 9/1/29 | CAD | 1,179,000 | 808,733 |
| 2.5% 9/1/26 | CAD | 423,000 | 302,184 |
| 2.85% 12/1/53 | CAD | 110,000 | 66,350 |
| 3.1% 12/1/51 | CAD | 230,000 | 146,603 |
| 3.5% 12/1/45 | CAD | 130,000 | 88,855 |
| 3.65% 5/20/32 | CAD | 410,000 | 302,427 |
| 5% 12/1/38 | CAD | 90,000 | 74,314 |
| 5% 12/1/41 | CAD | 420,000 | 351,088 |
| Saskatchewan Province 3.1% 6/2/50 | CAD | 293,000 | 184,780 |
TOTAL CANADA | | | 29,200,222 |
| Chile - 0.1% | | | |
| Chilean Republic: | | | |
| 1.25% 1/29/40 | EUR | 114,000 | 82,224 |
| 1.875% 5/27/30 | EUR | 100,000 | 95,403 |
| 2.3% 10/1/28 (Reg. S) (c) | CLP | 245,000,000 | 264,884 |
| 5.1% 7/15/50 | CLP | 120,000,000 | 148,232 |
TOTAL CHILE | | | 590,743 |
| China - 14.5% | | | |
| Agricultural Development Bank of China 3.3% 11/5/31 | CNY | 18,910,000 | 2,686,915 |
| China Development Bank: | | | |
| 2.83% 9/10/26 | CNY | 59,070,000 | 8,237,556 |
| 3% 1/17/32 | CNY | 10,000,000 | 1,388,087 |
| 3.34% 7/14/25 | CNY | 19,020,000 | 2,674,736 |
| 3.41% 6/7/31 | CNY | 2,540,000 | 364,116 |
| 3.48% 1/8/29 | CNY | 62,240,000 | 8,910,707 |
| 3.5% 11/4/46 | CNY | 820,000 | 119,968 |
| 3.68% 2/26/26 | CNY | 27,100,000 | 3,856,210 |
| 3.7% 10/20/30 | CNY | 17,030,000 | 2,485,686 |
| 3.8% 1/25/36 | CNY | 550,000 | 82,169 |
| Peoples Republic of China: | | | |
| 2.18% 8/25/25 | CNY | 20,460,000 | 2,819,081 |
| 2.24% 5/25/25 | CNY | 8,680,000 | 1,197,829 |
| 2.26% 2/24/25 | CNY | 6,980,000 | 963,684 |
| 2.28% 3/17/24 | CNY | 14,710,000 | 2,035,548 |
| 2.37% 1/20/27 | CNY | 5,670,000 | 781,600 |
| 2.44% 10/15/27 | CNY | 4,120,000 | 568,397 |
| 2.48% 4/15/27 | CNY | 6,860,000 | 948,424 |
| 2.5% 7/25/27 | CNY | 21,290,000 | 2,944,828 |
| 2.6% 9/1/32 | CNY | 15,220,000 | 2,075,624 |
| 2.62% 9/25/29 | CNY | 13,690,000 | 1,888,067 |
| 2.64% 1/15/28 | CNY | 20,000,000 | 2,780,822 |
| 2.68% 5/21/30 | CNY | 1,760,000 | 243,084 |
| 2.7% 11/3/26 | CNY | 20,270,000 | 2,827,524 |
| 2.75% 6/15/29 | CNY | 11,830,000 | 1,644,351 |
| 2.75% 2/17/32 | CNY | 9,650,000 | 1,334,345 |
| 2.76% 5/15/32 | CNY | 37,100,000 | 5,127,283 |
| 2.79% 12/15/29 | CNY | 8,320,000 | 1,156,907 |
| 2.8% 3/24/29 | CNY | 7,560,000 | 1,055,678 |
| 2.8% 11/15/32 | CNY | 12,110,000 | 1,681,764 |
| 2.84% 4/8/24 | CNY | 22,610,000 | 3,138,842 |
| 2.88% 2/25/33 | CNY | 5,620,000 | 786,378 |
| 2.91% 10/14/28 | CNY | 13,650,000 | 1,919,758 |
| 3.02% 10/22/25 | CNY | 41,220,000 | 5,790,925 |
| 3.02% 5/27/31 | CNY | 2,210,000 | 312,471 |
| 3.12% 10/25/52 | CNY | 8,420,000 | 1,172,854 |
| 3.25% 6/6/26 | CNY | 18,000,000 | 2,554,864 |
| 3.27% 11/19/30 | CNY | 54,840,000 | 7,916,667 |
| 3.32% 4/15/52 | CNY | 19,390,000 | 2,790,792 |
| 3.53% 10/18/51 | CNY | 2,230,000 | 331,194 |
| 3.81% 9/14/50 | CNY | 41,140,000 | 6,383,842 |
| 3.86% 7/22/49 | CNY | 22,330,000 | 3,485,177 |
| 4.12% 8/2/42 | CNY | 3,320,000 | 533,407 |
TOTAL CHINA | | | 101,998,161 |
| Colombia - 0.3% | | | |
| Colombian Republic: | | | |
| 5.75% 11/3/27 | COP | 2,000,000,000 | 412,241 |
| 7% 3/26/31 | COP | 3,780,000,000 | 762,232 |
| 7% 6/30/32 | COP | 873,300,000 | 171,200 |
| 7.25% 10/18/34 | COP | 2,346,200,000 | 451,923 |
| 10% 7/24/24 | COP | 1,080,000,000 | 258,841 |
TOTAL COLOMBIA | | | 2,056,437 |
| Croatia - 0.0% | | | |
| Croatia Republic: | | | |
| 1.125% 6/19/29 (Reg. S) | EUR | 151,000 | 144,002 |
| 2.7% 6/15/28 | EUR | 200,000 | 210,743 |
TOTAL CROATIA | | | 354,745 |
| Cyprus - 0.0% | | | |
| Republic of Cyprus: | | | |
| 2.25% 4/16/50 (Reg. S) | EUR | 189,000 | 150,813 |
| 2.375% 9/25/28 (Reg. S) | EUR | 84,000 | 86,447 |
| 2.75% 6/27/24 (Reg. S) | EUR | 32,000 | 34,653 |
| 3.75% 7/26/23 (Reg. S) | EUR | 44,000 | 47,889 |
TOTAL CYPRUS | | | 319,802 |
| Czech Republic - 0.3% | | | |
| Czech Republic: | | | |
| 0% 12/12/24 | CZK | 19,800,000 | 838,037 |
| 0.25% 2/10/27 | CZK | 10,030,000 | 391,299 |
| 1.2% 3/13/31 | CZK | 5,250,000 | 190,956 |
| 1.25% 2/14/25 | CZK | 170,000 | 7,302 |
| 1.5% 4/24/40 | CZK | 10,600,000 | 314,879 |
| 1.75% 6/23/32 | CZK | 7,650,000 | 284,299 |
| 2% 10/13/33 | CZK | 2,230,000 | 82,324 |
| 5.7% 5/25/24 | CZK | 850,000 | 38,959 |
TOTAL CZECH REPUBLIC | | | 2,148,055 |
| Denmark - 0.2% | | | |
| Danish Kingdom: | | | |
| 0.25% 11/15/52 (Reg. S) | DKK | 3,501,000 | 270,420 |
| 0.5% 11/15/29(Reg. S) | DKK | 5,314,000 | 678,488 |
| 4.5% 11/15/39 | DKK | 1,760,000 | 317,679 |
TOTAL DENMARK | | | 1,266,587 |
| Finland - 0.4% | | | |
| Finnish Government: | | | |
| 0% 9/15/23 (Reg. S) (c) | EUR | 19,000 | 20,593 |
| 0% 9/15/24 (c) | EUR | 84,000 | 87,930 |
| 0.125% 4/15/36 (Reg. S) (c) | EUR | 452,000 | 339,228 |
| 0.125% 4/15/52 (Reg. S) (c) | EUR | 354,000 | 180,580 |
| 0.25% 9/15/40 (Reg. S) (c) | EUR | 433,000 | 294,246 |
| 0.5% 4/15/26 (Reg. S) (c) | EUR | 44,000 | 44,701 |
| 0.5% 9/15/28 (Reg. S) (c) | EUR | 400,000 | 385,808 |
| 0.5% 4/15/43(Reg. S) (c) | EUR | 63,000 | 42,727 |
| 1.125% 4/15/34 (Reg. S) (c) | EUR | 166,000 | 149,896 |
| 1.5% 9/15/32(Reg. S) (c) | EUR | 270,000 | 260,120 |
| 2.625% 7/4/42 (c) | EUR | 20,000 | 20,482 |
| 4% 7/4/25 (c) | EUR | 710,000 | 785,079 |
TOTAL FINLAND | | | 2,611,390 |
| France - 5.7% | | | |
| French Government: | | | |
| 0% 2/25/25(Reg. S) | EUR | 4,883,000 | 5,044,010 |
| 0% 3/25/25(Reg. S) | EUR | 14,000 | 14,431 |
| 0% 2/25/26 (Reg. S) | EUR | 3,683,000 | 3,703,058 |
| 0% 2/25/27 (Reg. S) | EUR | 315,000 | 308,686 |
| 0% 11/25/29 (Reg. S) | EUR | 3,307,000 | 3,017,192 |
| 0% 11/25/30 (Reg. S) | EUR | 839,000 | 743,748 |
| 0% 11/25/31 (Reg. S) | EUR | 747,000 | 643,544 |
| 0% 5/25/32 (Reg. S) | EUR | 883,000 | 748,874 |
| 0.25% 11/25/26(Reg. S) | EUR | 1,615,000 | 1,606,091 |
| 0.5% 5/25/26 | EUR | 33,000 | 33,457 |
| 0.5% 5/25/29 (Reg. S) | EUR | 1,326,000 | 1,264,288 |
| 0.5% 5/25/40 (Reg. S) (c) | EUR | 3,627,000 | 2,580,561 |
| 0.5% 6/25/44(Reg. S) (c) | EUR | 770,000 | 496,966 |
| 0.75% 2/25/28(Reg. S) | EUR | 3,330,000 | 3,294,672 |
| 0.75% 5/25/28 (Reg. S) | EUR | 823,000 | 810,987 |
| 0.75% 5/25/52 (Reg. S) | EUR | 2,316,000 | 1,374,100 |
| 0.75% 5/25/53 (Reg. S) (c) | EUR | 2,538,000 | 1,472,735 |
| 1% 11/25/25(Reg. S) | EUR | 36,000 | 37,337 |
| 1% 5/25/27 | EUR | 3,126,000 | 3,165,731 |
| 1.25% 5/25/34(Reg. S) | EUR | 137,000 | 125,489 |
| 1.25% 5/25/36(Reg. S) (c) | EUR | 2,368,000 | 2,085,934 |
| 1.5% 5/25/31(Reg. S) | EUR | 2,633,000 | 2,608,974 |
| 1.5% 5/25/50 (Reg. S) (c) | EUR | 354,000 | 268,143 |
| 1.75% 6/25/39 (Reg. S) (c) | EUR | 655,000 | 592,676 |
| 1.75% 5/25/66 (c) | EUR | 33,000 | 24,534 |
| 2% 11/25/32(Reg. S) | EUR | 2,970,000 | 3,003,263 |
| 2% 5/25/48 (c) | EUR | 124,000 | 106,839 |
| 2.5% 5/25/43(Reg. S) (c) | EUR | 500,000 | 485,077 |
| 3% 5/25/33 (Reg. S) | EUR | 400,000 | 438,804 |
| 4.75% 4/25/35 | EUR | 100,000 | 127,259 |
TOTAL FRANCE | | | 40,227,460 |
| Germany - 4.8% | | | |
| Free & Hanseatic City of Hamburg 0.25% 2/18/41 (Reg. S) | EUR | 190,000 | 126,138 |
| Free State of Saxony 0.01% 12/17/35 (Reg. S) | EUR | 490,000 | 364,787 |
| German Federal Republic: | | | |
| 0% 4/11/25 (Reg. S) | EUR | 5,000 | 5,159 |
| 0% 10/10/25 (Reg. S) (e) | EUR | 4,388,000 | 4,469,149 |
| 0% 4/10/26 (Reg. S) | EUR | 2,590,000 | 2,609,014 |
| 0% 8/15/26(Reg. S) | EUR | 57,000 | 57,037 |
| 0% 8/15/29(Reg. S) (e) | EUR | 4,375,000 | 4,117,059 |
| 0% 2/15/30 (Reg. S) | EUR | 451,000 | 420,001 |
| 0% 8/15/30 (Reg. S) | EUR | 4,361,000 | 4,020,778 |
| 0% 2/15/32 (Reg. S) | EUR | 8,000 | 7,141 |
| 0% 8/15/50 | EUR | 1,270,000 | 743,445 |
| 0% 8/15/52 (Reg. S) | EUR | 200,000 | 111,633 |
| 0.25% 2/15/29 | EUR | 6,000 | 5,790 |
| 0.5% 2/15/28 | EUR | 7,000 | 6,958 |
| 1.25% 8/15/48 (e)(f) | EUR | 2,043,000 | 1,768,735 |
| 1.8% 8/15/53(Reg. S) | EUR | 830,000 | 791,048 |
| 2.1% 11/15/29(Reg. S) | EUR | 3,720,000 | 3,970,163 |
| 2.3% 2/15/33(Reg. S) | EUR | 2,990,000 | 3,235,206 |
| 2.5% 7/4/44 | EUR | 20,000 | 21,994 |
| 3.25% 7/4/42 (e) | EUR | 2,530,000 | 3,072,644 |
| 4% 1/4/37 | EUR | 40,000 | 51,188 |
| 4.75% 7/4/40 | EUR | 20,000 | 28,539 |
| Land Niedersachsen: | | | |
| 0.01% 11/25/27 (Reg. S) | EUR | 430,000 | 408,056 |
| 1.125% 9/12/33 (Reg. S) | EUR | 70,000 | 63,718 |
| Land Nordrhein-Westfalen: | | | |
| 0.2% 3/31/27 (Reg. S) | EUR | 1,513,000 | 1,470,876 |
| 0.2% 4/9/30 (Reg. S) | EUR | 725,000 | 654,250 |
| 0.2% 1/27/51 (Reg. S) | EUR | 50,000 | 25,081 |
| 0.5% 11/25/39 (Reg. S) | EUR | 72,000 | 51,736 |
| 0.625% 7/21/31 (Reg. S) | EUR | 24,000 | 21,718 |
| 0.8% 7/30/49 (Reg. S) | EUR | 104,000 | 65,981 |
| 1.25% 5/12/36 (Reg. S) | EUR | 226,000 | 197,423 |
| 1.55% 6/16/48 (Reg. S) | EUR | 178,000 | 140,626 |
| 1.65% 2/22/38 (Reg. S) | EUR | 607,000 | 545,264 |
| 1.95% 9/26/78 (Reg. S) | EUR | 270,000 | 199,535 |
TOTAL GERMANY | | | 33,847,870 |
| Hong Kong - 0.0% | | | |
| Hong Kong Government SAR 1.59% 3/4/36 | HKD | 1,050,000 | 103,687 |
| Hungary - 0.2% | | | |
| Hungarian Republic: | | | |
| 1% 11/26/25 | HUF | 30,380,000 | 74,176 |
| 1.5% 4/22/26 | HUF | 43,280,000 | 104,005 |
| 1.625% 4/28/32 (Reg. S) | EUR | 246,000 | 203,171 |
| 2.5% 10/24/24 | HUF | 3,780,000 | 9,991 |
| 2.75% 12/22/26 | HUF | 30,520,000 | 74,185 |
| 3% 6/26/24 | HUF | 7,530,000 | 20,509 |
| 3% 8/21/30 | HUF | 64,320,000 | 146,604 |
| 3% 4/25/41 | HUF | 227,580,000 | 405,797 |
| 4.5% 3/23/28 | HUF | 112,000,000 | 286,838 |
TOTAL HUNGARY | | | 1,325,276 |
| Indonesia - 0.8% | | | |
| Indonesian Republic: | | | |
| 1.45% 9/18/26 | EUR | 100,000 | 100,183 |
| 2.15% 7/18/24 (Reg. S) | EUR | 129,000 | 137,517 |
| 5.125% 4/15/27 | IDR | 9,200,000,000 | 600,140 |
| 5.5% 4/15/26 | IDR | 1,000,000 | 66 |
| 6.375% 4/15/42 | IDR | 900,000,000 | 57,956 |
| 6.5% 6/15/25 | IDR | 717,000,000 | 48,411 |
| 6.5% 2/15/31 | IDR | 4,193,000,000 | 282,190 |
| 7% 9/15/30 | IDR | 15,924,000,000 | 1,103,023 |
| 7% 2/15/33 | IDR | 24,508,000,000 | 1,721,322 |
| 7.125% 6/15/42 | IDR | 2,600,000,000 | 181,251 |
| 7.375% 5/15/48 | IDR | 8,728,000,000 | 615,632 |
| 7.5% 6/15/35 | IDR | 1,449,000,000 | 104,477 |
| 7.5% 5/15/38 | IDR | 1,631,000,000 | 117,436 |
| 7.5% 4/15/40 | IDR | 9,622,000,000 | 691,205 |
| 8.375% 4/15/39 | IDR | 1,794,000,000 | 138,925 |
TOTAL INDONESIA | | | 5,899,734 |
| Ireland - 0.4% | | | |
| Irish Republic: | | | |
| 0.2% 5/15/27 (Reg. S) | EUR | 225,000 | 220,614 |
| 0.2% 10/18/30 (Reg. S) | EUR | 86,000 | 77,858 |
| 0.35% 10/18/32 (Reg. S) | EUR | 190,000 | 165,880 |
| 0.4% 5/15/35 (Reg. S) | EUR | 355,000 | 289,207 |
| 0.55% 4/22/41 (Reg. S) | EUR | 130,000 | 92,116 |
| 0.9% 5/15/28 (Reg. S) | EUR | 32,000 | 31,841 |
| 1% 5/15/26(Reg. S) | EUR | 188,000 | 193,743 |
| 1.1% 5/15/29 (Reg. S) | EUR | 279,000 | 275,818 |
| 1.3% 5/15/33 | EUR | 570,000 | 537,867 |
| 1.5% 5/15/50 (Reg. S) | EUR | 310,000 | 236,753 |
| 1.7% 5/15/37 | EUR | 380,000 | 349,256 |
| 3.4% 3/18/24 (Reg.S) | EUR | 28,000 | 30,561 |
TOTAL IRELAND | | | 2,501,514 |
| Israel - 0.3% | | | |
| Israeli State: | | | |
| 1% 3/31/30 | ILS | 1,452,000 | 328,498 |
| 1.3% 4/30/32 | ILS | 840,000 | 185,214 |
| 1.5% 1/16/29 (Reg. S) | EUR | 335,000 | 324,836 |
| 1.5% 5/31/37 | ILS | 1,208,000 | 242,540 |
| 1.75% 8/31/25 | ILS | 1,890,000 | 484,050 |
| 2.8% 11/29/52 | ILS | 930,000 | 193,498 |
| 3.75% 3/31/47 | ILS | 476,000 | 122,406 |
TOTAL ISRAEL | | | 1,881,042 |
| Italy - 5.2% | | | |
| Italian Republic: | | | |
| 0% 12/15/24 (Reg. S) | EUR | 3,196,000 | 3,303,867 |
| 0.35% 2/1/25 | EUR | 191,000 | 197,523 |
| 0.45% 2/15/29(Reg. S) | EUR | 190,000 | 172,984 |
| 0.85% 1/15/27 (Reg. S) | EUR | 81,000 | 80,107 |
| 0.9% 4/1/31 | EUR | 82,000 | 72,048 |
| 0.95% 9/15/27 (Reg. S) | EUR | 1,948,000 | 1,900,610 |
| 0.95% 8/1/30 (Reg. S) | EUR | 142,000 | 127,648 |
| 0.95% 6/1/32 (Reg. S) | EUR | 701,000 | 597,258 |
| 1.1% 4/1/27 (Reg. S) | EUR | 2,024,000 | 2,008,977 |
| 1.35% 4/1/30 (Reg. S) | EUR | 1,950,000 | 1,820,865 |
| 1.45% 11/15/24 (Reg. S) | EUR | 245,000 | 259,139 |
| 1.45% 5/15/25 | EUR | 80,000 | 83,691 |
| 1.45% 3/1/36 (Reg. S) (c) | EUR | 1,347,000 | 1,087,392 |
| 1.6% 6/1/26 | EUR | 179,000 | 183,873 |
| 1.65% 3/1/32 (c) | EUR | 575,000 | 526,297 |
| 1.7% 9/1/51 (Reg. S) (c) | EUR | 536,000 | 350,269 |
| 1.8% 3/1/41 (Reg. S) (c) | EUR | 2,851,000 | 2,185,983 |
| 2.05% 8/1/27 | EUR | 213,000 | 218,036 |
| 2.1% 7/15/26 | EUR | 1,186,000 | 1,233,908 |
| 2.15% 9/1/52 (Reg. S) (c) | EUR | 962,000 | 687,188 |
| 2.15% 3/1/72 (Reg. S) (c) | EUR | 279,000 | 180,492 |
| 2.2% 6/1/27 (Reg. S) | EUR | 1,612,000 | 1,664,242 |
| 2.25% 9/1/36 (Reg. S) (c) | EUR | 639,000 | 565,949 |
| 2.45% 9/1/33 (c) | EUR | 897,000 | 853,680 |
| 2.45% 9/1/50 (Reg. S) (c) | EUR | 77,000 | 60,082 |
| 2.5% 12/1/24 | EUR | 680,000 | 729,191 |
| 2.5% 11/15/25 | EUR | 2,093,000 | 2,220,390 |
| 2.5% 12/1/32(Reg. S) | EUR | 260,000 | 252,277 |
| 2.65% 12/1/27(Reg. S) | EUR | 640,000 | 668,426 |
| 2.7% 3/1/47 (c) | EUR | 116,000 | 98,225 |
| 2.8% 6/15/29(Reg. S) | EUR | 1,740,000 | 1,800,427 |
| 2.95% 9/1/38 (c) | EUR | 433,000 | 407,166 |
| 3% 8/1/29 | EUR | 2,038,000 | 2,133,910 |
| 3.1% 3/1/40 (Reg. S) (c) | EUR | 1,208,000 | 1,139,737 |
| 3.35% 3/1/35 (c) | EUR | 1,808,000 | 1,831,828 |
| 3.45% 3/1/48 (c) | EUR | 261,000 | 250,410 |
| 3.7% 6/15/30 (Reg. S) | EUR | 980,000 | 1,058,885 |
| 3.75% 9/1/24 | EUR | 80,000 | 87,234 |
| 3.85% 12/15/29(Reg. S) | EUR | 1,770,000 | 1,935,407 |
| 3.85% 9/1/49 (c) | EUR | 679,000 | 691,141 |
| 4.4% 5/1/33(Reg. S) | EUR | 760,000 | 857,731 |
| 4.5% 3/1/26 (c) | EUR | 50,000 | 55,553 |
| 5% 3/1/25 (c) | EUR | 80,000 | 88,883 |
| 5% 8/1/34 (c) | EUR | 20,000 | 23,572 |
| 5% 8/1/39 (c) | EUR | 20,000 | 23,701 |
| 6.5% 11/1/27 | EUR | 50,000 | 60,689 |
TOTAL ITALY | | | 36,836,891 |
| Japan - 11.3% | | | |
| Japan Government: | | | |
| 0.005% 5/1/24 | JPY | 11,000,000 | 76,326 |
| 0.005% 11/1/24 | JPY | 151,900,000 | 1,054,547 |
| 0.005% 1/1/25 | JPY | 131,350,000 | 911,754 |
| 0.005% 2/1/25 | JPY | 305,850,000 | 2,122,880 |
| 0.005% 4/1/25 | JPY | 205,250,000 | 1,424,510 |
| 0.005% 3/20/27 | JPY | 121,200,000 | 841,181 |
| 0.005% 6/20/27 | JPY | 230,000,000 | 1,595,567 |
| 0.1% 9/20/23 | JPY | 350,000 | 2,427 |
| 0.1% 9/20/24 | JPY | 30,100,000 | 209,147 |
| 0.1% 12/20/24 | JPY | 4,300,000 | 29,889 |
| 0.1% 3/20/25 | JPY | 50,000 | 348 |
| 0.1% 9/20/25 | JPY | 15,500,000 | 107,849 |
| 0.1% 3/20/26 | JPY | 19,900,000 | 138,561 |
| 0.1% 9/20/26 | JPY | 63,300,000 | 440,825 |
| 0.1% 12/20/26 | JPY | 70,150,000 | 488,612 |
| 0.1% 3/20/27 | JPY | 295,100,000 | 2,055,260 |
| 0.1% 6/20/27 | JPY | 32,450,000 | 225,961 |
| 0.1% 9/20/27 | JPY | 177,000,000 | 1,231,744 |
| 0.1% 9/20/27 | JPY | 13,700,000 | 95,338 |
| 0.1% 12/20/27 | JPY | 75,800,000 | 526,988 |
| 0.1% 3/20/28 | JPY | 53,650,000 | 372,369 |
| 0.1% 6/20/28 | JPY | 30,400,000 | 210,977 |
| 0.1% 9/20/28 | JPY | 231,650,000 | 1,606,355 |
| 0.1% 12/20/28 | JPY | 69,800,000 | 483,799 |
| 0.1% 3/20/29 | JPY | 23,050,000 | 159,648 |
| 0.1% 6/20/29 | JPY | 119,650,000 | 828,176 |
| 0.1% 12/20/29 | JPY | 617,250,000 | 4,264,049 |
| 0.1% 3/20/30 | JPY | 15,400,000 | 106,273 |
| 0.1% 6/20/30 | JPY | 393,950,000 | 2,714,445 |
| 0.1% 9/20/30 | JPY | 210,300,000 | 1,445,465 |
| 0.2% 12/20/27 | JPY | 169,000,000 | 1,179,902 |
| 0.2% 3/20/32 | JPY | 28,000,000 | 192,046 |
| 0.2% 6/20/32 | JPY | 84,300,000 | 577,273 |
| 0.2% 9/20/32 | JPY | 53,150,000 | 363,293 |
| 0.2% 6/20/36 | JPY | 340,000,000 | 2,230,906 |
| 0.3% 12/20/25 | JPY | 821,250,000 | 5,744,624 |
| 0.3% 6/20/39 | JPY | 158,200,000 | 1,011,068 |
| 0.3% 9/20/39 | JPY | 56,150,000 | 357,520 |
| 0.3% 12/20/39 | JPY | 61,650,000 | 391,228 |
| 0.3% 6/20/46 | JPY | 153,200,000 | 893,103 |
| 0.4% 6/20/25 | JPY | 12,550,000 | 87,794 |
| 0.4% 9/20/25 | JPY | 44,650,000 | 312,734 |
| 0.4% 3/20/36 | JPY | 192,500,000 | 1,299,827 |
| 0.4% 3/20/40 | JPY | 51,800,000 | 333,115 |
| 0.4% 6/20/40 | JPY | 10,450,000 | 67,005 |
| 0.4% 9/20/40 | JPY | 138,350,000 | 883,678 |
| 0.4% 9/20/49 | JPY | 5,450,000 | 30,973 |
| 0.4% 3/20/50 | JPY | 35,400,000 | 199,859 |
| 0.4% 3/20/56 | JPY | 521,900,000 | 2,762,730 |
| 0.5% 3/20/33 | JPY | 124,950,000 | 874,178 |
| 0.5% 9/20/36 | JPY | 93,750,000 | 637,860 |
| 0.5% 12/20/38 | JPY | 15,550,000 | 103,262 |
| 0.5% 3/20/49 | JPY | 10,450,000 | 61,448 |
| 0.6% 6/20/37 | JPY | 204,850,000 | 1,402,341 |
| 0.6% 12/20/37 | JPY | 6,700,000 | 45,662 |
| 0.6% 6/20/50 | JPY | 27,350,000 | 162,345 |
| 0.7% 3/20/37 | JPY | 22,050,000 | 153,275 |
| 0.7% 9/20/38 | JPY | 1,033,250,000 | 7,088,713 |
| 0.7% 6/20/48 | JPY | 13,100,000 | 81,896 |
| 0.7% 12/20/48 | JPY | 10,800,000 | 67,027 |
| 0.8% 3/20/42 | JPY | 149,000,000 | 1,005,305 |
| 0.8% 9/20/47 | JPY | 10,200,000 | 65,842 |
| 0.9% 6/20/42 | JPY | 345,000,000 | 2,364,181 |
| 0.9% 9/20/48 | JPY | 249,150,000 | 1,626,127 |
| 0.9% 3/20/57 | JPY | 212,650,000 | 1,315,248 |
| 1% 12/20/35 | JPY | 735,450,000 | 5,343,232 |
| 1% 3/20/52 | JPY | 170,000,000 | 1,106,829 |
| 1.1% 9/20/42 | JPY | 219,650,000 | 1,555,322 |
| 1.1% 3/20/43 | JPY | 90,250,000 | 636,288 |
| 1.2% 3/20/35 | JPY | 19,650,000 | 146,112 |
| 1.3% 6/20/52 | JPY | 232,000,000 | 1,625,294 |
| 1.4% 12/20/42 | JPY | 193,650,000 | 1,439,139 |
| 1.4% 12/20/45 | JPY | 368,200,000 | 2,714,593 |
| 1.4% 9/20/52 | JPY | 52,050,000 | 373,669 |
| 1.4% 3/20/53 | JPY | 87,050,000 | 624,115 |
| 1.4% 3/20/55 | JPY | 5,500,000 | 39,309 |
| 1.6% 6/20/30 | JPY | 4,600,000 | 35,006 |
| 1.6% 3/20/33 | JPY | 4,300,000 | 33,195 |
| 1.6% 12/20/52 | JPY | 170,150,000 | 1,279,377 |
| 1.9% 3/20/53 | JPY | 42,450,000 | 341,018 |
| 2% 3/20/42 | JPY | 110,000,000 | 898,494 |
| 2.3% 5/20/32 | JPY | 1,000,000 | 8,125 |
TOTAL JAPAN | | | 79,943,775 |
| Korea (South) - 2.1% | | | |
| Korean Republic: | | | |
| 1.125% 9/10/25 | KRW | 359,480,000 | 258,018 |
| 1.125% 9/10/39 | KRW | 321,370,000 | 167,486 |
| 1.25% 3/10/26 | KRW | 2,172,900,000 | 1,546,410 |
| 1.375% 9/10/24 | KRW | 836,330,000 | 618,322 |
| 1.375% 12/10/29 | KRW | 41,420,000 | 27,191 |
| 1.375% 6/10/30 | KRW | 368,030,000 | 239,401 |
| 1.5% 12/10/26 | KRW | 32,000,000 | 22,582 |
| 1.5% 12/10/30 | KRW | 1,148,560,000 | 746,388 |
| 1.5% 9/10/40 | KRW | 2,069,710,000 | 1,130,739 |
| 1.875% 3/10/51 | KRW | 2,378,220,000 | 1,232,001 |
| 2% 6/10/31 | KRW | 1,103,570,000 | 738,418 |
| 2% 3/10/49 | KRW | 381,850,000 | 207,697 |
| 2.125% 6/10/27 | KRW | 1,520,000,000 | 1,087,856 |
| 2.125% 3/10/47 | KRW | 29,200,000 | 16,618 |
| 2.25% 6/10/25 | KRW | 150,000,000 | 110,694 |
| 2.375% 12/10/27 | KRW | 50,660,000 | 36,391 |
| 2.375% 12/10/28 | KRW | 514,930,000 | 365,058 |
| 2.375% 12/10/31 | KRW | 600,000,000 | 411,071 |
| 2.375% 9/10/38 | KRW | 415,730,000 | 266,726 |
| 2.5% 3/10/52 | KRW | 1,040,000,000 | 620,223 |
| 2.625% 6/10/28 | KRW | 940,310,000 | 679,158 |
| 2.625% 3/10/48 | KRW | 622,670,000 | 389,251 |
| 3.25% 3/10/28 | KRW | 1,690,020,000 | 1,258,094 |
| 3.25% 6/10/33 | KRW | 613,510,000 | 449,899 |
| 3.25% 9/10/42 | KRW | 799,120,000 | 567,160 |
| 3.25% 3/10/53 | KRW | 1,089,840,000 | 757,499 |
| 3.375% 9/10/23 | KRW | 41,520,000 | 31,498 |
| 3.375% 6/10/32 | KRW | 838,210,000 | 619,507 |
TOTAL KOREA (SOUTH) | | | 14,601,356 |
| Latvia - 0.1% | | | |
| Latvian Republic: | | | |
| 1.375% 9/23/25 (Reg. S) | EUR | 100,000 | 103,146 |
| 2.875% 4/30/24 (Reg. S) | EUR | 319,000 | 345,197 |
TOTAL LATVIA | | | 448,343 |
| Lithuania - 0.0% | | | |
| Lithuanian Republic: | | | |
| 0.5% 6/19/29 (Reg. S) | EUR | 32,000 | 28,898 |
| 2.125% 10/22/35 (Reg. S) | EUR | 57,000 | 52,240 |
| 3.875% 6/14/33 (Reg. S) | EUR | 90,000 | 98,640 |
TOTAL LITHUANIA | | | 179,778 |
| Luxembourg - 0.2% | | | |
| Grand Duchy of Luxembourg: | | | |
| 0% 4/28/25 (Reg. S) | EUR | 35,000 | 35,777 |
| 0% 11/13/26 (Reg. S) | EUR | 910,000 | 889,502 |
| 0% 9/14/32 (Reg. S) | EUR | 210,000 | 174,840 |
TOTAL LUXEMBOURG | | | 1,100,119 |
| Malaysia - 0.7% | | | |
| Malaysian Government: | | | |
| 3.519% 4/20/28 | MYR | 3,380,000 | 720,811 |
| 3.582% 7/15/32 | MYR | 2,240,000 | 469,553 |
| 3.757% 5/22/40 | MYR | 2,310,000 | 471,606 |
| 3.828% 7/5/34 | MYR | 420,000 | 88,612 |
| 3.899% 11/16/27 | MYR | 3,032,000 | 658,108 |
| 3.9% 11/30/26 | MYR | 2,999,000 | 649,480 |
| 3.906% 7/15/26 | MYR | 171,000 | 37,076 |
| 4.059% 9/30/24 | MYR | 219,000 | 47,347 |
| 4.065% 6/15/50 | MYR | 2,823,000 | 587,964 |
| 4.119% 11/30/34 | MYR | 831,000 | 179,857 |
| 4.128% 8/15/25 | MYR | 405,000 | 87,922 |
| 4.504% 4/30/29 | MYR | 560,000 | 124,683 |
| 4.696% 10/15/42 | MYR | 950,000 | 219,378 |
| 4.724% 6/15/33 | MYR | 2,083,000 | 474,049 |
| 4.736% 3/15/46 | MYR | 90,000 | 20,637 |
| 4.921% 7/6/48 | MYR | 50,000 | 11,814 |
| 4.935% 9/30/43 | MYR | 150,000 | 35,238 |
TOTAL MALAYSIA | | | 4,884,135 |
| Mexico - 0.9% | | | |
| United Mexican States: | | | |
| 1.125% 1/17/30 | EUR | 100,000 | 89,747 |
| 2.125% 10/25/51 | EUR | 100,000 | 62,014 |
| 2.25% 8/12/36 | EUR | 130,000 | 104,495 |
| 2.875% 4/8/39 | EUR | 185,000 | 151,511 |
| 5.5% 3/4/27 | MXN | 19,600,000 | 1,016,338 |
| 5.75% 3/5/26 | MXN | 26,769,000 | 1,425,093 |
| 7.5% 6/3/27 | MXN | 2,000,000 | 110,969 |
| 7.5% 5/26/33 | MXN | 10,860,000 | 584,846 |
| 7.75% 11/13/42 | MXN | 5,000,000 | 262,022 |
| 8% 9/5/24 | MXN | 17,600,000 | 995,261 |
| 8% 11/7/47 | MXN | 13,363,000 | 713,258 |
| 8.5% 5/31/29 | MXN | 10,000,000 | 578,016 |
TOTAL MEXICO | | | 6,093,570 |
| Multi-National - 0.3% | | | |
| European Stability Mechanism 0.5% 3/5/29 (Reg. S) | EUR | 2,229,000 | 2,105,916 |
| Netherlands - 1.2% | | | |
| Dutch Government: | | | |
| 0% 1/15/24(Reg. S) (c) | EUR | 15,000 | 16,072 |
| 0% 1/15/27 (Reg. S) (c) | EUR | 1,052,000 | 1,037,261 |
| 0% 7/15/30 (Reg. S) (c) | EUR | 168,000 | 152,115 |
| 0% 1/15/52 (Reg. S) (c) | EUR | 625,000 | 331,206 |
| 0.25% 7/15/25 (c) | EUR | 91,000 | 93,642 |
| 0.25% 7/15/29(Reg. S) (c) | EUR | 1,336,000 | 1,259,956 |
| 0.5% 7/15/26(Reg. S) (c) | EUR | 714,000 | 723,483 |
| 0.5% 7/15/32 (Reg. S) (c) | EUR | 1,061,000 | 956,493 |
| 0.5% 1/15/40 (Reg. S) (c) | EUR | 1,722,000 | 1,321,962 |
| 0.75% 7/15/27 (Reg. S) (c) | EUR | 866,000 | 870,587 |
| 0.75% 7/15/28 (c) | EUR | 740,000 | 731,293 |
| 2.5% 1/15/33 (c) | EUR | 80,000 | 85,886 |
| 2.5% 7/15/33(Reg. S) (c) | EUR | 480,000 | 512,719 |
| 3.75% 1/15/42 (c) | EUR | 130,000 | 162,568 |
| 4% 1/15/37 (c) | EUR | 30,000 | 37,168 |
TOTAL NETHERLANDS | | | 8,292,411 |
| New Zealand - 0.2% | | | |
| New Zealand Government: | | | |
| 1.5% 5/15/31 | NZD | 1,322,000 | 647,629 |
| 1.75% 5/15/41 | NZD | 582,000 | 225,976 |
| 2.75% 4/15/25 | NZD | 485,000 | 285,024 |
| 2.75% 4/15/37 (Reg. S) | NZD | 410,000 | 200,340 |
TOTAL NEW ZEALAND | | | 1,358,969 |
| Norway - 0.3% | | | |
| Kingdom of Norway: | | | |
| 1.5% 2/19/26 (Reg. S) (c) | NOK | 9,430,000 | 823,526 |
| 1.75% 3/13/25 (Reg. S) (c) | NOK | 7,640,000 | 684,095 |
| 1.75% 2/17/27 (Reg. S) (c) | NOK | 8,340,000 | 720,844 |
| 3% 3/14/24 (c) | NOK | 220,000 | 20,346 |
TOTAL NORWAY | | | 2,248,811 |
| Peru - 0.2% | | | |
| Peruvian Republic: | | | |
| 5.4% 8/12/34(Reg. S) | PEN | 550,000 | 134,146 |
| 5.94% 2/12/29 | PEN | 956,000 | 258,471 |
| 6.15% 8/12/32 | PEN | 2,364,000 | 623,033 |
| 6.7142% 2/12/55 | PEN | 500,000 | 131,677 |
TOTAL PERU | | | 1,147,327 |
| Poland - 0.4% | | | |
| Polish Government: | | | |
| 0% 2/10/25 (Reg. S) | EUR | 41,000 | 41,933 |
| 0.75% 4/25/25 | PLN | 830,000 | 186,907 |
| 1% 3/7/29 (Reg. S) | EUR | 309,000 | 294,595 |
| 1.25% 10/25/30 | PLN | 396,000 | 72,477 |
| 1.75% 4/25/32 | PLN | 3,150,000 | 564,474 |
| 2% 3/8/49 (Reg. S) | EUR | 17,000 | 12,430 |
| 2.5% 7/25/27 | PLN | 3,047,000 | 664,690 |
| 2.75% 10/25/29 | PLN | 2,390,000 | 501,260 |
| 3.875% 2/14/33 (Reg. S) | EUR | 220,000 | 237,920 |
| 4% 10/25/23 | PLN | 97,000 | 23,690 |
| 4% 4/25/47 | PLN | 96,000 | 17,922 |
TOTAL POLAND | | | 2,618,298 |
| Portugal - 0.5% | | | |
| Portugal Obrigacoes Do Tesouro: | | | |
| 0.475% 10/18/30 (Reg. S) (c) | EUR | 258,000 | 235,114 |
| 0.7% 10/15/27 (Reg. S) (c) | EUR | 350,000 | 347,573 |
| 0.9% 10/12/35 (Reg. S) (c) | EUR | 734,000 | 601,132 |
| 1% 4/12/52 (Reg. S) (c) | EUR | 220,000 | 131,551 |
| 1.65% 7/16/32 (Reg. S) (c) | EUR | 3,000 | 2,894 |
| 1.95% 6/15/29 (Reg. S) (c) | EUR | 458,000 | 471,669 |
| 2.875% 10/15/25 (Reg. S) (c) | EUR | 22,000 | 23,913 |
| 2.875% 7/21/26(Reg. S) (c) | EUR | 33,000 | 35,905 |
| 3.875% 2/15/30(Reg. S) (c) | EUR | 760,000 | 872,005 |
| 4.125% 4/14/27 (Reg. S) (c) | EUR | 524,000 | 595,061 |
| Portuguese Republic 2.25% 4/18/34 (c) | EUR | 260,000 | 257,381 |
TOTAL PORTUGAL | | | 3,574,198 |
| Romania - 0.4% | | | |
| Romanian Republic: | | | |
| 1.375% 12/2/29(Reg. S) | EUR | 567,000 | 478,337 |
| 2.125% 3/7/28(Reg. S) | EUR | 470,000 | 444,222 |
| 2.5% 10/25/27 | RON | 2,330,000 | 434,778 |
| 2.875% 5/26/28 (Reg. S) | EUR | 32,000 | 31,232 |
| 2.875% 4/13/42(Reg. S) | EUR | 60,000 | 40,183 |
| 3.375% 1/28/50 (Reg. S) | EUR | 54,000 | 36,789 |
| 3.5% 11/25/25 | RON | 4,230,000 | 872,260 |
| 3.75% 2/7/34(Reg. S) | EUR | 110,000 | 96,681 |
| 4.125% 3/11/39 | EUR | 145,000 | 122,794 |
| 7.2% 10/30/33 | RON | 500,000 | 113,430 |
TOTAL ROMANIA | | | 2,670,706 |
| Russia - 0.0% | | | |
| Ministry of Finance of the Russian Federation 7.6% (g)(h) | RUB | 4,237,000 | 2,367 |
| Saudi Arabia - 0.0% | | | |
| Kingdom of Saudi Arabia 2% 7/9/39 (Reg. S) | EUR | 163,000 | 126,824 |
| Singapore - 0.3% | | | |
| Republic of Singapore: | | | |
| , yield at date of purchase 2.3106% to 2.7941% 10/1/51 | SGD | 330,000 | 218,070 |
| 2.125% 6/1/26 | SGD | 271,000 | 193,371 |
| 2.25% 8/1/36 | SGD | 768,000 | 522,733 |
| 2.375% 7/1/39 | SGD | 325,000 | 227,964 |
| 2.625% 5/1/28 | SGD | 1,016,000 | 734,857 |
| 2.625% 8/1/32 | SGD | 310,000 | 221,190 |
| 2.75% 4/1/42 | SGD | 160,000 | 121,546 |
| 2.75% 3/1/46 | SGD | 20,000 | 15,299 |
TOTAL SINGAPORE | | | 2,255,030 |
| Slovakia - 0.2% | | | |
| Slovakia Republic: | | | |
| 0.125% 6/17/27 (Reg. S) | EUR | 288,000 | 274,671 |
| 0.25% 5/14/25 (Reg. S) | EUR | 84,000 | 85,861 |
| 0.75% 4/9/30 (Reg. S) | EUR | 400,000 | 363,340 |
| 1% 10/9/30 (Reg. S) | EUR | 110,000 | 100,097 |
| 1.625% 1/21/31 (Reg. S) | EUR | 348,000 | 329,798 |
| 1.875% 3/9/37 (Reg. S) | EUR | 185,000 | 159,428 |
TOTAL SLOVAKIA | | | 1,313,195 |
| Slovenia - 0.1% | | | |
| Republic of Slovenia: | | | |
| 0.125% 7/1/31(Reg. S) | EUR | 288,000 | 246,059 |
| 1.1875% 3/14/29 (Reg. S) | EUR | 110,000 | 106,593 |
| 1.25% 3/22/27 (Reg. S) | EUR | 84,000 | 84,862 |
| 1.75% 11/3/40 (Reg. S) | EUR | 89,000 | 73,742 |
| 2.125% 7/28/25 (Reg. S) | EUR | 64,000 | 68,571 |
| 2.25% 3/3/32 (Reg. S) | EUR | 230,000 | 232,168 |
| 3.625% 3/11/33(Reg. S) | EUR | 110,000 | 123,903 |
TOTAL SLOVENIA | | | 935,898 |
| Spain - 3.6% | | | |
| Spanish Kingdom: | | | |
| 0% 5/31/24 (c) | EUR | 4,000 | 4,222 |
| 0% 5/31/25 (Reg. S) (c) | EUR | 920,000 | 939,921 |
| 0% 1/31/26 (c) | EUR | 3,427,000 | 3,432,526 |
| 0% 1/31/27 (c) | EUR | 880,000 | 854,426 |
| 0% 1/31/28 (c) | EUR | 330,000 | 310,892 |
| 0.25% 7/30/24(Reg. S) (c) | EUR | 1,340,000 | 1,409,817 |
| 0.5% 4/30/30 (Reg. S) (c) | EUR | 143,000 | 130,225 |
| 0.5% 10/31/31 (Reg. S) (c) | EUR | 756,000 | 659,161 |
| 0.6% 10/31/29 (Reg. S) (c) | EUR | 574,000 | 533,534 |
| 0.7% 4/30/32 (Reg. S) (c) | EUR | 140,000 | 122,650 |
| 0.8% 7/30/27 (Reg. S) (c) | EUR | 1,203,000 | 1,190,466 |
| 0.85% 7/30/37 (Reg. S) (c) | EUR | 1,258,000 | 956,326 |
| 1% 7/30/42(Reg. S) (c) | EUR | 171,000 | 117,256 |
| 1% 10/31/50 (Reg. S) (c) | EUR | 1,856,000 | 1,080,399 |
| 1.2% 10/31/40 (Reg. S) (c) | EUR | 2,179,000 | 1,618,945 |
| 1.25% 10/31/30 (Reg. S) (c) | EUR | 1,376,000 | 1,306,892 |
| 1.3% 10/31/26 (c) | EUR | 150,000 | 153,530 |
| 1.4% 4/30/28 (Reg. S) (c) | EUR | 100,000 | 100,279 |
| 1.45% 10/31/27 (c) | EUR | 100,000 | 101,214 |
| 1.45% 4/30/29 (Reg. S) (c) | EUR | 2,826,000 | 2,797,394 |
| 1.5% 4/30/27 (Reg. S) (c) | EUR | 157,000 | 160,515 |
| 1.6% 4/30/25 (c) | EUR | 243,000 | 256,523 |
| 1.85% 7/30/35 (Reg. S) (c) | EUR | 480,000 | 439,036 |
| 1.9% 10/31/52 (Reg. S) (c) | EUR | 480,000 | 345,994 |
| 1.95% 4/30/26 (Reg. S) (c) | EUR | 2,222,000 | 2,333,965 |
| 1.95% 7/30/30 (Reg. S) (c) | EUR | 26,000 | 26,072 |
| 2.15% 10/31/25 (Reg. S) (c) | EUR | 44,000 | 46,742 |
| 2.35% 7/30/33 (Reg. S) (c) | EUR | 292,000 | 290,304 |
| 2.55% 10/31/32(Reg. S) (c) | EUR | 2,490,000 | 2,545,346 |
| 2.7% 10/31/48 (c) | EUR | 189,000 | 169,609 |
| 3.15% 4/30/33 (Reg. S) (c) | EUR | 510,000 | 545,037 |
| 3.45% 7/30/43(Reg. S) (c) | EUR | 470,000 | 486,213 |
| 5.15% 10/31/28 (c) | EUR | 80,000 | 95,284 |
TOTAL SPAIN | | | 25,560,715 |
| Sweden - 0.2% | | | |
| Sweden Kingdom: | | | |
| 0.5% 11/24/45 | SEK | 2,680,000 | 160,084 |
| 0.75% 5/12/28 | SEK | 13,880,000 | 1,168,505 |
| 1.75% 11/11/33(Reg. S) | SEK | 2,500,000 | 215,665 |
TOTAL SWEDEN | | | 1,544,254 |
| Switzerland - 0.8% | | | |
| Switzerland Confederation: | | | |
| 0% 6/22/29 (Reg. S) | CHF | 2,642,000 | 2,781,696 |
| 0% 6/26/34 (Reg. S) | CHF | 24,000 | 24,122 |
| 0% 7/24/39 (Reg. S) | CHF | 273,000 | 260,211 |
| 0.5% 5/24/55(Reg. S) | CHF | 150,000 | 149,348 |
| 1.25% 5/28/26 | CHF | 1,625,000 | 1,820,625 |
| 1.5% 4/30/42 | CHF | 200,000 | 244,274 |
| 3.5% 4/8/33 | CHF | 45,000 | 62,091 |
TOTAL SWITZERLAND | | | 5,342,367 |
| Thailand - 0.8% | | | |
| Kingdom of Thailand: | | | |
| 0.95% 6/17/25 | THB | 36,870,000 | 1,013,827 |
| 1.45% 12/17/24 | THB | 5,595,000 | 155,889 |
| 1.6% 12/17/29 | THB | 12,408,000 | 332,088 |
| 1.6% 6/17/35 | THB | 14,678,000 | 366,720 |
| 2% 6/17/42 | THB | 7,800,000 | 187,942 |
| 2.125% 12/17/26 | THB | 69,582,000 | 1,950,777 |
| 2.75% 6/17/52 | THB | 13,277,000 | 334,310 |
| 2.875% 6/17/46 | THB | 9,832,000 | 262,560 |
| 3.3% 6/17/38 | THB | 13,193,000 | 390,755 |
| 3.4% 6/17/36 | THB | 3,260,000 | 97,494 |
| 3.65% 6/20/31 | THB | 2,464,000 | 75,398 |
| 3.775% 6/25/32 | THB | 13,170,000 | 408,688 |
| 3.85% 12/12/25 | THB | 1,091,000 | 31,926 |
TOTAL THAILAND | | | 5,608,374 |
| United Kingdom - 2.3% | | | |
| United Kingdom, Great Britain and Northern Ireland: | | | |
| 0.25% 7/31/31 (Reg. S) | GBP | 1,617,000 | 1,482,487 |
| 0.375% 10/22/30 (Reg. S) | GBP | 1,337,000 | 1,273,124 |
| 0.5% 1/31/29(Reg. S) | GBP | 872,000 | 880,747 |
| 0.625% 7/31/35 (Reg. S) | GBP | 2,162,000 | 1,775,538 |
| 0.625% 10/22/50 (Reg. S) | GBP | 1,885,000 | 971,134 |
| 0.875% 1/31/46 (Reg. S) | GBP | 665,000 | 415,860 |
| 1.25% 7/22/27 | GBP | 42,000 | 46,321 |
| 1.25% 10/22/41 (Reg. S) | GBP | 4,399,076 | 3,351,781 |
| 1.25% 7/31/51(Reg. S) (e) | GBP | 2,070,000 | 1,302,594 |
| 1.5% 7/22/47 | GBP | 195,000 | 139,972 |
| 1.625% 10/22/28 | GBP | 37,000 | 40,336 |
| 1.625% 10/22/54 (Reg. S) | GBP | 409,000 | 279,760 |
| 1.75% 9/7/37 (Reg. S) | GBP | 227,000 | 206,037 |
| 1.75% 1/22/49(Reg. S) | GBP | 742,000 | 557,771 |
| 1.75% 7/22/57 (Reg. S) | GBP | 1,444,000 | 1,017,327 |
| 3.25% 1/31/33(Reg. S) | GBP | 1,030,000 | 1,192,686 |
| 3.75% 10/22/53(Reg. S) | GBP | 840,000 | 948,157 |
| 4.25% 9/7/39 | GBP | 13,000 | 16,015 |
| 4.25% 12/7/40 | GBP | 19,000 | 23,363 |
| 4.25% 12/7/55 | GBP | 30,000 | 37,424 |
| 4.5% 12/7/42 | GBP | 330,000 | 418,671 |
TOTAL UNITED KINGDOM | | | 16,377,105 |
| TOTAL GOVERNMENT OBLIGATIONS (Cost $558,176,222) | | | 480,938,805 |
| | | | |
| Supranational Obligations - 3.9% |
| | | Principal Amount (a) | Value ($) |
| African Development Bank: | | | |
| 0.125% 10/7/26 | EUR | 41,000 | 40,193 |
| 0.875% 5/24/28 | EUR | 87,000 | 84,828 |
| 1.1% 12/16/26 | AUD | 260,000 | 153,471 |
| 1.125% 6/18/25 (Reg. S) | GBP | 80,000 | 92,706 |
| Agence Francaise de Developpement: | | | |
| 0% 3/25/25 (Reg. S) | EUR | 1,600,000 | 1,639,436 |
| 0.125% 9/29/31 | EUR | 200,000 | 169,010 |
| Asian Development Bank: | | | |
| 1.125% 12/15/25 | GBP | 32,000 | 36,292 |
| 1.375% 3/7/25 | GBP | 25,000 | 29,543 |
| 1.625% 1/28/25 | CAD | 290,000 | 207,916 |
| 2.45% 1/17/24 | AUD | 65,000 | 42,791 |
| 3.3% 8/8/28 (Reg. S) | AUD | 55,000 | 34,419 |
| 3.7% 6/17/25 | AUD | 430,000 | 281,243 |
| 4.65% 2/16/27 | CAD | 700,000 | 534,198 |
| Corporacion Andina de Fomento 1.625% 6/3/25 (Reg. S) | EUR | 198,000 | 204,619 |
| Council of Europe Development Bank 0% 4/9/27 (Reg. S) | EUR | 33,000 | 31,803 |
| European Financial Stability Facility: | | | |
| 0% 10/13/27 (Reg. S) | EUR | 85,000 | 80,942 |
| 0.05% 10/17/29 (Reg. S) | EUR | 23,000 | 20,801 |
| 0.05% 1/18/52 | EUR | 225,000 | 100,604 |
| 0.125% 10/17/23 (Reg. S) | EUR | 250,000 | 270,270 |
| 0.625% 10/16/26 (Reg. S) | EUR | 466,000 | 466,442 |
| 0.7% 1/20/50 (Reg. S) | EUR | 176,000 | 106,016 |
| 0.75% 5/3/27 (Reg. S) | EUR | 43,000 | 42,778 |
| 0.875% 4/10/35 (Reg. S) | EUR | 610,000 | 517,173 |
| 1.25% 5/24/33 (Reg. S) | EUR | 299,000 | 276,002 |
| 1.45% 9/5/40 (Reg. S) | EUR | 1,125,000 | 947,314 |
| European Investment Bank: | | | |
| 0% 6/17/27 | EUR | 215,000 | 206,960 |
| 0% 9/9/30 (Reg. S) | EUR | 109,000 | 95,954 |
| 0.01% 5/15/41 (Reg. S) | EUR | 330,000 | 204,629 |
| 0.05% 11/15/29 (Reg. S) | EUR | 2,750,000 | 2,487,933 |
| 0.05% 10/13/34 (Reg. S) | EUR | 1,627,000 | 1,266,043 |
| 0.125% 6/20/29 (Reg. S) | EUR | 578,000 | 530,988 |
| 0.375% 7/16/25 | EUR | 577,000 | 591,467 |
| 0.375% 4/14/26 (Reg. S) | EUR | 413,000 | 415,297 |
| 0.875% 12/15/23 (Reg. S) | GBP | 145,000 | 180,246 |
| 1% 9/21/26 (Reg. S) | GBP | 226,000 | 249,284 |
| 1% 4/14/32 | EUR | 736,000 | 677,860 |
| 1.125% 4/13/33 (Reg. S) | EUR | 265,000 | 242,508 |
| 1.375% 3/7/25 (Reg. S) | GBP | 504,000 | 596,043 |
| 1.5% 1/26/24 | NOK | 740,000 | 67,747 |
| 1.75% 7/30/24 (Reg. S) | CAD | 69,000 | 50,228 |
| 1.75% 11/12/26 (Reg. S) | SEK | 240,000 | 20,893 |
| European Stability Mechanism: | | | |
| 0.01% 3/4/30 | EUR | 35,000 | 31,204 |
| 0.75% 3/15/27 | EUR | 184,000 | 183,473 |
| 0.75% 9/5/28 (Reg. S) | EUR | 48,000 | 46,470 |
| 0.875% 7/18/42 (Reg. S) | EUR | 266,000 | 190,845 |
| 1.125% 5/3/32 (Reg. S) | EUR | 47,000 | 43,697 |
| 1.2% 5/23/33 (Reg. S) | EUR | 37,000 | 34,044 |
| 1.625% 11/17/36 (Reg. S) | EUR | 218,000 | 197,385 |
| 1.85% 12/1/55 (Reg. S) | EUR | 186,000 | 145,121 |
| European Union: | | | |
| 0% 11/4/25 (Reg. S) | EUR | 1,426,000 | 1,440,471 |
| 0% 10/4/30 (Reg. S) | EUR | 169,000 | 148,681 |
| 0% 7/4/35 (Reg. S) | EUR | 1,357,000 | 1,021,566 |
| 0.1% 10/4/40 (Reg. S) | EUR | 946,000 | 612,641 |
| 0.3% 11/4/50 (Reg. S) | EUR | 442,000 | 235,778 |
| 0.45% 7/4/41 (Reg. S) | EUR | 162,000 | 110,001 |
| 0.45% 5/2/46 (Reg. S) | EUR | 50,000 | 30,842 |
| 0.8% 7/4/25 (Reg. S) | EUR | 1,760,000 | 1,822,067 |
| 0.875% 3/11/37 (Reg. S) | EUR | 100,000 | 81,804 |
| 1.125% 4/4/36 (Reg. S) | EUR | 94,000 | 81,381 |
| 1.25% 4/4/33 (Reg. S) | EUR | 1,418,000 | 1,309,279 |
| 1.25% 2/4/43 (Reg. S) | EUR | 172,000 | 134,870 |
| 2% 10/4/27 (Reg. S) | EUR | 860,000 | 894,808 |
| 3% 3/4/53 (Reg. S) | EUR | 840,000 | 870,193 |
| Inter-American Development Bank: | | | |
| 1.25% 12/15/25 | GBP | 308,000 | 350,107 |
| 1.7% 10/10/24 | CAD | 100,000 | 72,298 |
| 3.15% 6/26/29 | AUD | 120,000 | 73,449 |
| International Bank for Reconstruction & Development: | | | |
| 0% 1/15/27 | EUR | 1,828,000 | 1,773,779 |
| 0.01% 4/24/28 | EUR | 687,000 | 643,554 |
| 1% 12/21/29 | GBP | 248,000 | 247,238 |
| 1.2% 8/8/34 | EUR | 23,000 | 20,613 |
| 1.8% 7/26/24 | CAD | 7,000 | 5,097 |
| 2.2% 2/27/24 | AUD | 207,000 | 135,708 |
| 2.5% 8/3/23 | CAD | 68,000 | 51,307 |
| International Development Association 0.7% 1/17/42 (Reg. S) | EUR | 207,000 | 146,441 |
| International Finance Corp.: | | | |
| 1.375% 9/13/24 | CAD | 196,000 | 141,670 |
| 3.15% 6/26/29 (Reg. S) | AUD | 90,000 | 55,232 |
| Nordic Investment Bank 1.125% 12/15/23 (Reg. S) | GBP | 40,000 | 49,770 |
| TOTAL SUPRANATIONAL OBLIGATIONS (Cost $33,143,555) | | | 27,727,774 |
| | | | |
| Preferred Securities - 0.3% |
| | | Principal Amount (a) | Value ($) |
| France - 0.1% | | | |
| Engie SA: | | | |
| 1.5% (Reg. S) (b)(i) | EUR | 300,000 | 270,464 |
| 1.625% (Reg. S) (b)(i) | EUR | 300,000 | 307,633 |
| TotalEnergies SE 2.125% (Reg. S) (b)(i) | EUR | 160,000 | 127,179 |
| Veolia Environnement SA 1.625% (Reg. S) (b)(i) | EUR | 100,000 | 96,485 |
TOTAL FRANCE | | | 801,761 |
| Germany - 0.0% | | | |
| Aroundtown SA 3.375% (Reg. S) (b)(i) | EUR | 100,000 | 46,977 |
| Italy - 0.0% | | | |
| Enel SpA 1.375% (Reg. S) (b)(i) | EUR | 150,000 | 134,815 |
| Eni SpA 3.375% (Reg. S) (b)(i) | EUR | 110,000 | 103,724 |
TOTAL ITALY | | | 238,539 |
| Spain - 0.1% | | | |
| Iberdrola Finanzas SAU 1.575% (Reg. S) (b)(i) | EUR | 100,000 | 92,730 |
| Iberdrola International BV: | | | |
| 1.825% (Reg. S) (b)(i) | EUR | 100,000 | 85,055 |
| 2.625% (Reg. S) (b)(i) | EUR | 100,000 | 108,108 |
| 3.25% (Reg. S) (b)(i) | EUR | 100,000 | 107,091 |
| Repsol International Finance BV 4.247% (b)(i) | EUR | 100,000 | 100,653 |
TOTAL SPAIN | | | 493,637 |
| United Kingdom - 0.1% | | | |
| SSE PLC 3.74% (Reg. S) (b)(i) | GBP | 216,000 | 249,561 |
| TOTAL PREFERRED SECURITIES (Cost $1,830,474) | | | 1,830,475 |
| | | | |
| Money Market Funds - 0.6% |
| | | Shares | Value ($) |
Fidelity Cash Central Fund 5.14% (j) (Cost $4,275,739) | | 4,274,884 | 4,275,739 |
| | | | |
| TOTAL INVESTMENT IN SECURITIES - 99.2% (Cost $806,144,023) | 698,281,062 |
NET OTHER ASSETS (LIABILITIES) - 0.8% | 5,840,632 |
| NET ASSETS - 100.0% | 704,121,694 |
| | |
| Futures Contracts |
| | Number of contracts | Expiration Date | Notional Amount ($) | Value ($) | Unrealized Appreciation/ (Depreciation) ($) |
| Purchased | | | | | |
| | | | | | |
| Bond Index Contracts | | | | | |
| Eurex Euro-Bobl Contracts (Germany) | 28 | Sep 2023 | 3,535,357 | (49,434) | (49,434) |
| ICE Long Gilt Contracts (United Kingdom) | 12 | Sep 2023 | 1,452,372 | (11,724) | (11,724) |
| | | | | | |
| TOTAL FUTURES CONTRACTS | | | | | (61,158) |
| The notional amount of futures purchased as a percentage of Net Assets is 0.7% |
| Forward Foreign Currency Contracts |
Currency Purchased
| Currency Sold | Counterparty | Settlement Date | Unrealized Appreciation/ (Depreciation) ($) |
| | | | | | | |
| AUD | 217,000 | USD | 141,655 | BNP Paribas S.A. | 7/03/23 | 2,900 |
| CLP | 1,443,878,000 | USD | 1,798,821 | Bank of America, N.A. | 7/03/23 | 2,075 |
| CLP | 1,443,878,000 | USD | 1,803,720 | State Street Bank and Trust Co | 7/03/23 | (2,823) |
| CNY | 839,354,000 | USD | 116,241,137 | BNP Paribas S.A. | 7/03/23 | (504,888) |
| CNY | 839,354,000 | USD | 116,640,125 | BNP Paribas S.A. | 7/03/23 | (903,875) |
| CZK | 94,000 | USD | 4,252 | State Street Bank and Trust Co | 7/03/23 | 62 |
| EUR | 1,931,000 | USD | 2,076,109 | BNP Paribas S.A. | 7/03/23 | 30,998 |
| GBP | 737,000 | USD | 910,860 | State Street Bank and Trust Co | 7/03/23 | 25,130 |
| IDR | 84,803,400,000 | USD | 5,634,777 | State Street Bank and Trust Co | 7/03/23 | 21,611 |
| IDR | 84,803,400,000 | USD | 5,653,560 | State Street Bank and Trust Co | 7/03/23 | 2,828 |
| KRW | 18,216,500,000 | USD | 14,049,870 | BNP Paribas S.A. | 7/03/23 | (224,040) |
| KRW | 18,216,500,000 | USD | 13,876,066 | JPMorgan Chase Bank, N.A. | 7/03/23 | (50,236) |
| MYR | 23,959,000 | USD | 5,141,416 | Goldman Sachs Bank USA | 7/03/23 | (8,262) |
| MYR | 23,959,000 | USD | 5,135,135 | Goldman Sachs Bank USA | 7/03/23 | (1,980) |
| PEN | 4,119,000 | USD | 1,134,211 | Citibank, N. A. | 7/03/23 | 1,204 |
| PEN | 4,119,000 | USD | 1,131,593 | State Street Bank and Trust Co | 7/03/23 | 3,821 |
| SEK | 259,000 | USD | 23,996 | BNP Paribas S.A. | 7/03/23 | 18 |
| THB | 165,816,000 | USD | 4,702,666 | JPMorgan Chase Bank, N.A. | 7/03/23 | (9,650) |
| USD | 1,782,125 | CLP | 1,443,878,000 | Bank of America, N.A. | 7/03/23 | (18,771) |
| USD | 1,798,821 | CLP | 1,443,878,000 | State Street Bank and Trust Co | 7/03/23 | (2,075) |
| USD | 116,241,137 | CNY | 839,354,000 | BNP Paribas S.A. | 7/03/23 | 504,888 |
| USD | 119,131,657 | CNY | 839,354,000 | BNP Paribas S.A. | 7/03/23 | 3,395,407 |
| USD | 5,662,998 | IDR | 84,803,400,000 | State Street Bank and Trust Co | 7/03/23 | 6,610 |
| USD | 5,653,560 | IDR | 84,803,400,000 | State Street Bank and Trust Co | 7/03/23 | (2,828) |
| USD | 13,876,066 | KRW | 18,216,500,000 | BNP Paribas S.A. | 7/03/23 | 50,236 |
| USD | 13,755,777 | KRW | 18,216,500,000 | JPMorgan Chase Bank, N.A. | 7/03/23 | (70,054) |
| USD | 5,135,135 | MYR | 23,959,000 | Goldman Sachs Bank USA | 7/03/23 | 1,980 |
| USD | 5,222,670 | MYR | 23,959,000 | Goldman Sachs Bank USA | 7/03/23 | 89,516 |
| USD | 1,109,405 | PEN | 4,119,000 | Citibank, N. A. | 7/03/23 | (26,009) |
| USD | 1,134,211 | PEN | 4,119,000 | State Street Bank and Trust Co | 7/03/23 | (1,204) |
| USD | 4,793,791 | THB | 165,816,000 | JPMorgan Chase Bank, N.A. | 7/03/23 | 100,775 |
| AUD | 29,771,000 | USD | 19,732,219 | BNP Paribas S.A. | 7/05/23 | 99,733 |
| AUD | 31,000 | USD | 21,082 | Brown Brothers Harriman & Co | 7/05/23 | (431) |
| AUD | 428,615 | USD | 285,543 | State Street Bank and Trust Co | 7/05/23 | (21) |
| CAD | 122,000 | USD | 91,364 | BNP Paribas S.A. | 7/05/23 | 729 |
| CAD | 1,210,000 | USD | 891,246 | Bank of America, N.A. | 7/05/23 | 22,134 |
| CAD | 174,000 | USD | 130,228 | JPMorgan Chase Bank, N.A. | 7/05/23 | 1,118 |
| CAD | 48,265,768 | USD | 36,426,995 | Royal Bank of Canada | 7/05/23 | 6,874 |
| CAD | 144,000 | USD | 107,310 | Royal Bank of Canada | 7/05/23 | 1,390 |
| CAD | 1,249,653 | USD | 943,377 | State Street Bank and Trust Co | 7/05/23 | (64) |
| CAD | 242,000 | USD | 177,908 | State Street Bank and Trust Co | 7/05/23 | 4,768 |
| CAD | 299,000 | USD | 226,734 | State Street Bank and Trust Co | 7/05/23 | (1,031) |
| CHF | 7,524,000 | USD | 8,373,025 | State Street Bank and Trust Co | 7/05/23 | 33,210 |
| CNY | 42,266,000 | USD | 5,841,072 | Bank of America, N.A. | 7/05/23 | (13,128) |
| COP | 8,430,000,000 | USD | 2,011,319 | Citibank, N. A. | 7/05/23 | 9,399 |
| COP | 8,430,000,000 | USD | 2,009,535 | Goldman Sachs Bank USA | 7/05/23 | 11,183 |
| DKK | 8,792,000 | USD | 1,284,066 | Bank of America, N.A. | 7/05/23 | 4,422 |
| EUR | 4,109,000 | USD | 4,483,893 | BNP Paribas S.A. | 7/05/23 | (152) |
| EUR | 293,591,000 | USD | 319,603,163 | Bank of America, N.A. | 7/05/23 | 763,336 |
| EUR | 1,007,000 | USD | 1,082,405 | Bank of America, N.A. | 7/05/23 | 16,433 |
| EUR | 869,000 | USD | 936,149 | Bank of America, N.A. | 7/05/23 | 12,104 |
| EUR | 290,000 | USD | 318,744 | Brown Brothers Harriman & Co | 7/05/23 | (2,296) |
| EUR | 1,166,000 | USD | 1,247,967 | Canadian Imperial Bk. of Comm. | 7/05/23 | 24,372 |
| EUR | 162,000 | USD | 176,541 | Canadian Imperial Bk. of Comm. | 7/05/23 | 234 |
| EUR | 158,000 | USD | 172,560 | Citibank, N. A. | 7/05/23 | (150) |
| GBP | 33,207,000 | USD | 41,907,234 | BNP Paribas S.A. | 7/05/23 | 265,656 |
| GBP | 1,171,000 | USD | 1,487,252 | Citibank, N. A. | 7/05/23 | (82) |
| GBP | 1,188,000 | USD | 1,475,431 | Royal Bank of Canada | 7/05/23 | 33,329 |
| HKD | 3,011,000 | USD | 384,126 | BNP Paribas S.A. | 7/05/23 | 126 |
| HUF | 437,127,100 | USD | 1,277,878 | BNP Paribas S.A. | 7/05/23 | 2,554 |
| ILS | 6,672,880 | USD | 1,803,160 | Citibank, N. A. | 7/05/23 | (2,842) |
| JPY | 11,747,838,128 | USD | 81,109,073 | State Street Bank and Trust Co | 7/05/23 | 306,348 |
| MXN | 1,951,000 | USD | 113,404 | Brown Brothers Harriman & Co | 7/05/23 | 577 |
| MXN | 98,445,000 | USD | 5,751,076 | State Street Bank and Trust Co | 7/05/23 | 224 |
| NOK | 25,575,000 | USD | 2,370,909 | State Street Bank and Trust Co | 7/05/23 | 11,795 |
| NZD | 2,637,000 | USD | 1,601,160 | Bank of America, N.A. | 7/05/23 | 17,167 |
| PLN | 8,338,000 | USD | 2,041,631 | BNP Paribas S.A. | 7/05/23 | 9,058 |
| PLN | 6,105,000 | USD | 1,460,501 | HSBC Bank | 7/05/23 | 40,993 |
| RON | 6,001,000 | USD | 1,314,465 | Goldman Sachs Bank USA | 7/05/23 | 6,367 |
| RON | 539,810 | USD | 118,775 | Goldman Sachs Bank USA | 7/05/23 | 38 |
| SEK | 68,586,000 | USD | 6,324,496 | Bank of America, N.A. | 7/05/23 | 34,685 |
| SEK | 442,000 | USD | 41,506 | Brown Brothers Harriman & Co | 7/05/23 | (525) |
| SGD | 3,277,141 | USD | 2,418,197 | State Street Bank and Trust Co | 7/05/23 | 5,007 |
| THB | 36,246,000 | USD | 1,017,103 | JPMorgan Chase Bank, N.A. | 7/05/23 | 8,751 |
| USD | 253,149 | AUD | 368,000 | BNP Paribas S.A. | 7/05/23 | 8,005 |
| USD | 19,343,097 | AUD | 29,651,000 | State Street Bank and Trust Co | 7/05/23 | (408,917) |
| USD | 1,010,379 | CAD | 1,358,000 | Bank of America, N.A. | 7/05/23 | (14,720) |
| USD | 87,683 | CAD | 117,000 | JPMorgan Chase Bank, N.A. | 7/05/23 | (635) |
| USD | 36,052,797 | CAD | 48,988,000 | Royal Bank of Canada | 7/05/23 | (926,255) |
| USD | 1,913,093 | CHF | 1,734,000 | BNP Paribas S.A. | 7/05/23 | (24,229) |
| USD | 6,431,025 | CHF | 5,790,000 | HSBC Bank | 7/05/23 | (37,887) |
| USD | 5,955,827 | CNY | 42,266,000 | BNP Paribas S.A. | 7/05/23 | 127,882 |
| USD | 1,863,276 | COP | 8,430,000,000 | Citibank, N. A. | 7/05/23 | (157,442) |
| USD | 2,011,319 | COP | 8,430,000,000 | Goldman Sachs Bank USA | 7/05/23 | (9,399) |
| USD | 1,268,830 | DKK | 8,792,000 | Bank of America, N.A. | 7/05/23 | (19,659) |
| USD | 309,820,940 | EUR | 288,323,000 | Bank of America, N.A. | 7/05/23 | (4,797,117) |
| USD | 1,347,573 | EUR | 1,258,000 | Bank of America, N.A. | 7/05/23 | (25,156) |
| USD | 1,630,094 | EUR | 1,520,000 | JPMorgan Chase Bank, N.A. | 7/05/23 | (28,530) |
| USD | 5,588,621 | EUR | 5,230,000 | Royal Bank of Canada | 7/05/23 | (118,355) |
| USD | 3,180,104 | EUR | 2,970,000 | State Street Bank and Trust Co | 7/05/23 | (60,760) |
| USD | 28,556 | GBP | 23,000 | Bank of America, N.A. | 7/05/23 | (654) |
| USD | 165,227 | GBP | 132,000 | Bank of America, N.A. | 7/05/23 | (2,413) |
| USD | 25,569 | GBP | 20,000 | Bank of America, N.A. | 7/05/23 | 169 |
| USD | 236,698 | GBP | 190,000 | JPMorgan Chase Bank, N.A. | 7/05/23 | (4,602) |
| USD | 42,929,065 | GBP | 34,589,000 | State Street Bank and Trust Co | 7/05/23 | (998,965) |
| USD | 445,546 | GBP | 358,000 | State Street Bank and Trust Co | 7/05/23 | (9,114) |
| USD | 384,628 | HKD | 3,011,000 | State Street Bank and Trust Co | 7/05/23 | 376 |
| USD | 1,255,893 | HUF | 437,353,000 | BNP Paribas S.A. | 7/05/23 | (25,201) |
| USD | 3,222 | ILS | 12,000 | Bank of America, N.A. | 7/05/23 | (16) |
| USD | 498,863 | ILS | 1,859,000 | Canadian Imperial Bk. of Comm. | 7/05/23 | (2,688) |
| USD | 1,301,774 | ILS | 4,820,000 | Citibank, N. A. | 7/05/23 | 1,356 |
| USD | 68,262 | JPY | 9,800,000 | BNP Paribas S.A. | 7/05/23 | 346 |
| USD | 1,692,364 | JPY | 235,200,000 | Canadian Imperial Bk. of Comm. | 7/05/23 | 62,370 |
| USD | 82,748,842 | JPY | 11,502,900,000 | Royal Bank of Canada | 7/05/23 | 3,030,903 |
| USD | 5,630,685 | MXN | 100,396,000 | Royal Bank of Canada | 7/05/23 | (234,596) |
| USD | 2,288,173 | NOK | 25,575,000 | Bank of America, N.A. | 7/05/23 | (94,532) |
| USD | 1,593,579 | NZD | 2,637,000 | Bank of America, N.A. | 7/05/23 | (24,748) |
| USD | 3,404,445 | PLN | 14,443,000 | Bank of America, N.A. | 7/05/23 | (147,738) |
| USD | 1,294,016 | RON | 6,001,000 | BNP Paribas S.A. | 7/05/23 | (26,816) |
| USD | 6,380,064 | SEK | 69,287,000 | State Street Bank and Trust Co | 7/05/23 | (44,114) |
| USD | 2,430,217 | SGD | 3,281,000 | State Street Bank and Trust Co | 7/05/23 | 4,160 |
| USD | 1,048,512 | THB | 36,246,000 | JPMorgan Chase Bank, N.A. | 7/05/23 | 22,657 |
| CNY | 40,888,770 | USD | 5,616,831 | Citibank, N. A. | 7/06/23 | 21,856 |
| USD | 2,794,661 | CNY | 20,363,334 | Citibank, N. A. | 7/06/23 | (13,506) |
| CZK | 52,001,525 | USD | 2,385,557 | BNP Paribas S.A. | 7/07/23 | 1,175 |
| USD | 2,359,366 | CZK | 52,242,000 | BNP Paribas S.A. | 7/07/23 | (38,404) |
| AUD | 60,000 | USD | 40,005 | State Street Bank and Trust Co | 8/02/23 | 0 |
| CLP | 1,073,258,000 | USD | 1,334,881 | Citibank, N. A. | 8/02/23 | (1,831) |
| EUR | 1,334,000 | USD | 1,457,818 | Brown Brothers Harriman & Co | 8/02/23 | 40 |
| USD | 19,808,456 | AUD | 29,863,000 | BNP Paribas S.A. | 8/02/23 | (102,787) |
| USD | 784,981 | AUD | 1,174,000 | State Street Bank and Trust Co | 8/02/23 | 2,213 |
| USD | 36,570,717 | CAD | 48,437,000 | Royal Bank of Canada | 8/02/23 | (9,186) |
| USD | 626,822 | CAD | 830,000 | State Street Bank and Trust Co | 8/02/23 | 1 |
| USD | 8,349,887 | CHF | 7,482,000 | State Street Bank and Trust Co | 8/02/23 | (35,670) |
| USD | 1,757,804 | CLP | 1,413,538,000 | State Street Bank and Trust Co | 8/02/23 | 2,105 |
| USD | 116,931,284 | CNY | 840,619,000 | BNP Paribas S.A. | 8/02/23 | 649,018 |
| USD | 3,239,016 | CNY | 23,444,000 | Bank of America, N.A. | 8/02/23 | (3,977) |
| USD | 5,867,192 | CNY | 42,411,000 | Bank of America, N.A. | 8/02/23 | 507 |
| USD | 2,101,318 | COP | 8,901,500,000 | Goldman Sachs Bank USA | 8/02/23 | (11,168) |
| USD | 2,392,283 | CZK | 52,211,000 | BNP Paribas S.A. | 8/02/23 | (1,065) |
| USD | 1,304,173 | DKK | 8,915,000 | Bank of America, N.A. | 8/02/23 | (4,705) |
| USD | 4,521,730 | EUR | 4,138,000 | BNP Paribas S.A. | 8/02/23 | (473) |
| USD | 320,840,412 | EUR | 294,322,000 | Bank of America, N.A. | 8/02/23 | (808,601) |
| USD | 41,912,712 | GBP | 33,204,000 | BNP Paribas S.A. | 8/02/23 | (265,759) |
| USD | 1,232,220 | GBP | 970,000 | Citibank, N. A. | 8/02/23 | 46 |
| USD | 381,953 | HKD | 2,992,000 | BNP Paribas S.A. | 8/02/23 | (104) |
| USD | 1,288,311 | HUF | 444,052,000 | BNP Paribas S.A. | 8/02/23 | (1,656) |
| USD | 5,717,079 | IDR | 86,113,500,000 | State Street Bank and Trust Co | 8/02/23 | (25,314) |
| USD | 1,826,798 | ILS | 6,755,000 | Citibank, N. A. | 8/02/23 | 2,855 |
| USD | 81,381,474 | JPY | 11,737,650,000 | State Street Bank and Trust Co | 8/02/23 | (342,161) |
| USD | 13,826,581 | KRW | 17,910,400,000 | BNP Paribas S.A. | 8/02/23 | 213,782 |
| USD | 5,784,822 | MXN | 99,550,000 | State Street Bank and Trust Co | 8/02/23 | 3,126 |
| USD | 5,125,469 | MYR | 23,918,000 | Goldman Sachs Bank USA | 8/02/23 | (9,685) |
| USD | 2,356,863 | NOK | 25,399,000 | State Street Bank and Trust Co | 8/02/23 | (12,092) |
| USD | 1,580,875 | NZD | 2,604,000 | Bank of America, N.A. | 8/02/23 | (16,998) |
| USD | 1,164,753 | PEN | 4,251,000 | State Street Bank and Trust Co | 8/02/23 | (3,741) |
| USD | 2,045,015 | PLN | 8,364,000 | BNP Paribas S.A. | 8/02/23 | (8,793) |
| USD | 1,325,336 | RON | 6,056,000 | Goldman Sachs Bank USA | 8/02/23 | (6,356) |
| USD | 135,854 | RON | 618,000 | Goldman Sachs Bank USA | 8/02/23 | (42) |
| USD | 6,348,394 | SEK | 68,762,000 | Bank of America, N.A. | 8/02/23 | (35,969) |
| USD | 2,414,496 | SGD | 3,269,000 | State Street Bank and Trust Co | 8/02/23 | (5,311) |
| USD | 1,014,915 | THB | 36,098,000 | JPMorgan Chase Bank, N.A. | 8/02/23 | (9,891) |
| USD | 4,634,343 | THB | 163,013,000 | JPMorgan Chase Bank, N.A. | 8/02/23 | 6,474 |
| | | | | | | |
| TOTAL FORWARD FOREIGN CURRENCY CONTRACTS | | (1,712,325) |
| | | | | | | |
| Unrealized Appreciation | | | 10,155,595 |
| Unrealized Depreciation | | | (11,867,920) |
For the period, the average contract value for forward foreign currency contracts was $2,359,043,811. Contract value represents contract amount in United States dollars plus or minus unrealized appreciation or depreciation, respectively.
Currency Abbreviations
| AUD | - | Australian dollar |
| CAD | - | Canadian dollar |
| CHF | - | Swiss franc |
| CLP | - | Chilean peso |
| CNY | - | Chinese yuan |
| COP | - | Colombian peso |
| CZK | - | Czech koruna |
| DKK | - | Danish krone |
| EUR | - | European Monetary Unit |
| GBP | - | British pound sterling |
| HKD | - | Hong Kong dollar |
| HUF | - | Hungarian forint |
| IDR | - | Indonesian rupiah |
| ILS | - | Israeli shekel |
| JPY | - | Japanese yen |
| KRW | - | Korean won |
| MXN | - | Mexican peso |
| MYR | - | Malaysian ringgit |
| NOK | - | Norwegian krone |
| NZD | - | New Zealand dollar |
| PEN | - | Peruvian new sol |
| PLN | - | Polish zloty |
| RON | - | Romanian leu (new) |
| RUB | - | Russian ruble |
| SEK | - | Swedish krona |
| SGD | - | Singapore dollar |
| THB | - | Thai baht |
| USD | - | U.S. dollar |
Legend
| (a) | Amount is stated in United States dollars unless otherwise noted. |
| (b) | Coupon rates for floating and adjustable rate securities reflect the rates in effect at period end. |
| (c) | Security exempt from registration under Rule 144A of the Securities Act of 1933. These securities may be resold in transactions exempt from registration, normally to qualified institutional buyers. At the end of the period, the value of these securities amounted to $82,542,865 or 11.7% of net assets. |
| (d) | Coupon is indexed to a floating interest rate which may be multiplied by a specified factor and/or subject to caps or floors. |
| (e) | Security or a portion of the security has been segregated as collateral for open forward foreign currency contracts. At period end, the value of securities pledged amounted to $6,659,614. |
| (f) | Security or a portion of the security was pledged to cover margin requirements for futures contracts. At period end, the value of securities pledged amounted to $194,806. |
| (g) | Non-income producing - Security is in default. |
| (i) | Security is perpetual in nature with no stated maturity date. |
| (j) | Affiliated fund that is generally available only to investment companies and other accounts managed by Fidelity Investments. The rate quoted is the annualized seven-day yield of the fund at period end. A complete unaudited listing of the fund's holdings as of its most recent quarter end is available upon request. In addition, each Fidelity Central Fund's financial statements are available on the SEC's website or upon request. |
Affiliated Central Funds
Fiscal year to date information regarding the Fund's investments in Fidelity Central Funds, including the ownership percentage, is presented below.
| Affiliate | Value, beginning of period ($) | Purchases ($) | Sales Proceeds ($) | Dividend Income ($) | Realized Gain (loss) ($) | Change in Unrealized appreciation (depreciation) ($) | Value, end of period ($) | % ownership, end of period |
| Fidelity Cash Central Fund 5.14% | 2,826,784 | 99,405,913 | 97,956,958 | 99,939 | - | - | 4,275,739 | 0.0% |
| Total | 2,826,784 | 99,405,913 | 97,956,958 | 99,939 | - | - | 4,275,739 | |
| | | | | | | | | |
Amounts in the dividend income column in the above table include any capital gain distributions from underlying funds, which are presented in the corresponding line item in the Statement of Operations, if applicable.
Amounts included in the purchases and sales proceeds columns may include in-kind transactions, if applicable.
Investment Valuation
The following is a summary of the inputs used, as of June 30, 2023, involving the Fund's assets and liabilities carried at fair value. The inputs or methodology used for valuing securities may not be an indication of the risk associated with investing in those securities. For more information on valuation inputs, and their aggregation into the levels used below, please refer to the Investment Valuation section in the accompanying Notes to Financial Statements.
| Valuation Inputs at Reporting Date: |
| Description | Total ($) | Level 1 ($) | Level 2 ($) | Level 3 ($) |
Investments in Securities: | | | | |
|
| Corporate Bonds | 183,508,269 | - | 183,508,269 | - |
|
| Government Obligations | 480,938,805 | - | 480,936,438 | 2,367 |
|
| Supranational Obligations | 27,727,774 | - | 27,727,774 | - |
|
| Preferred Securities | 1,830,475 | - | 1,830,475 | - |
|
| Money Market Funds | 4,275,739 | 4,275,739 | - | - |
| Total Investments in Securities: | 698,281,062 | 4,275,739 | 694,002,956 | 2,367 |
Derivative Instruments: | | | | |
|
| Assets | | | | |
Forward Foreign Currency Contracts | 10,155,595 | - | 10,155,595 | - |
| Total Assets | 10,155,595 | - | 10,155,595 | - |
|
| Liabilities | | | | |
Futures Contracts | (61,158) | (61,158) | - | - |
Forward Foreign Currency Contracts | (11,867,920) | - | (11,867,920) | - |
| Total Liabilities | (11,929,078) | (61,158) | (11,867,920) | - |
| Total Derivative Instruments: | (1,773,483) | (61,158) | (1,712,325) | - |
Value of Derivative Instruments
The following table is a summary of the Fund's value of derivative instruments by primary risk exposure as of June 30, 2023. For additional information on derivative instruments, please refer to the Derivative Instruments section in the accompanying Notes to Financial Statements.
Primary Risk Exposure / Derivative Type | Value |
| Asset ($) | Liability ($) |
| Foreign Exchange Risk | | |
Forward Foreign Currency Contracts (a) | 10,155,595 | (11,867,920) |
| Total Foreign Exchange Risk | 10,155,595 | (11,867,920) |
| Interest Rate Risk | | |
Futures Contracts (b) | 0 | (61,158) |
| Total Interest Rate Risk | 0 | (61,158) |
| Total Value of Derivatives | 10,155,595 | (11,929,078) |
(a)Gross value is presented in the Statement of Assets and Liabilities in the unrealized appreciation/depreciation on forward foreign currency contracts line-items.
(b)Reflects gross cumulative appreciation (depreciation) on futures contracts as presented in the Schedule of Investments. In the Statement of Assets and Liabilities, the period end daily variation margin is included in receivable or payable for daily variation margin on futures contracts, and the net cumulative appreciation (depreciation) is included in Total accumulated earnings (loss).
| Statement of Assets and Liabilities |
| | | | June 30, 2023 (Unaudited) |
| | | | | |
| Assets | | | | |
| Investment in securities, at value - See accompanying schedule: | | | | |
Unaffiliated issuers (cost $801,868,284) | $ | 694,005,323 | | |
Fidelity Central Funds (cost $4,275,739) | | 4,275,739 | | |
| | | | | |
| | | | | |
| Total Investment in Securities (cost $806,144,023) | | | $ | 698,281,062 |
| Cash | | | | 5 |
| Foreign currency held at value (cost $288,948) | | | | 288,758 |
| Receivable for investments sold | | | | 11,171,000 |
| Unrealized appreciation on forward foreign currency contracts | | | | 10,155,595 |
| Receivable for fund shares sold | | | | 10,028,104 |
| Interest receivable | | | | 4,427,838 |
| Distributions receivable from Fidelity Central Funds | | | | 5,844 |
Total assets | | | | 734,358,206 |
| Liabilities | | | | |
| Payable for investments purchased | $ | 18,184,967 | | |
| Unrealized depreciation on forward foreign currency contracts | | 11,867,920 | | |
| Payable for fund shares redeemed | | 106,796 | | |
| Accrued management fee | | 34,478 | | |
| Payable for daily variation margin on futures contracts | | 25,487 | | |
| Other payables and accrued expenses | | 16,864 | | |
| Total Liabilities | | | | 30,236,512 |
| Net Assets | | | $ | 704,121,694 |
| Net Assets consist of: | | | | |
| Paid in capital | | | $ | 769,726,959 |
| Total accumulated earnings (loss) | | | | (65,605,265) |
| Net Assets | | | $ | 704,121,694 |
Net Asset Value , offering price and redemption price per share ($704,121,694 ÷ 78,103,336 shares) | | | $ | 9.02 |
| Statement of Operations |
| | | | Six months ended June 30, 2023 (Unaudited) |
| Investment Income | | | | |
| Dividends | | | $ | 18,286 |
| Interest | | | | 5,985,908 |
| Income from Fidelity Central Funds | | | | 99,939 |
| Total Income | | | | 6,104,133 |
| Expenses | | | | |
| Management fee | $ | 201,994 | | |
| Independent trustees' fees and expenses | | 1,139 | | |
| Total expenses before reductions | | 203,133 | | |
| Expense reductions | | (100) | | |
| Total expenses after reductions | | | | 203,033 |
| Net Investment income (loss) | | | | 5,901,100 |
| Realized and Unrealized Gain (Loss) | | | | |
| Net realized gain (loss) on: | | | | |
| Investment Securities: | | | | |
| Unaffiliated issuers (net of foreign taxes of $1,995) | | (5,947,305) | | |
| Forward foreign currency contracts | | (9,679,218) | | |
| Foreign currency transactions | | 294,708 | | |
| Futures contracts | | (209,591) | | |
| Total net realized gain (loss) | | | | (15,541,406) |
| Change in net unrealized appreciation (depreciation) on: | | | | |
| Investment Securities: | | | | |
| Unaffiliated issuers(net of increase in deferred foreign taxes of $16,858) | | 8,692,923 | | |
| Forward foreign currency contracts | | 21,278,185 | | |
| Assets and liabilities in foreign currencies | | (100,776) | | |
| Futures contracts | | 146,701 | | |
| Total change in net unrealized appreciation (depreciation) | | | | 30,017,033 |
| Net gain (loss) | | | | 14,475,627 |
| Net increase (decrease) in net assets resulting from operations | | | $ | 20,376,727 |
| Statement of Changes in Net Assets |
| |
| | Six months ended June 30, 2023 (Unaudited) | | Year ended December 31, 2022 |
| Increase (Decrease) in Net Assets | | | | |
| Operations | | | | |
| Net investment income (loss) | $ | 5,901,100 | $ | 7,372,592 |
| Net realized gain (loss) | | (15,541,406) | | 50,724,908 |
| Change in net unrealized appreciation (depreciation) | | 30,017,033 | | (128,338,797) |
| Net increase (decrease) in net assets resulting from operations | | 20,376,727 | | (70,241,297) |
| Distributions to shareholders | | (5,684,405) | | (5,966,263) |
| | | | | |
| Share transactions | | | | |
| Proceeds from sales of shares | | 120,096,217 | | 276,251,223 |
| Reinvestment of distributions | | 5,388,696 | | 5,731,984 |
| Cost of shares redeemed | | (62,118,687) | | (177,849,202) |
| | | | | |
Net increase (decrease) in net assets resulting from share transactions | | 63,366,226 | | 104,134,005 |
| Total increase (decrease) in net assets | | 78,058,548 | | 27,926,445 |
| | | | | |
| Net Assets | | | | |
| Beginning of period | | 626,063,146 | | 598,136,701 |
| End of period | $ | 704,121,694 | $ | 626,063,146 |
| | | | | |
| Other Information | | | | |
| Shares | | | | |
| Sold | | 13,374,105 | | 29,771,106 |
| Issued in reinvestment of distributions | | 598,744 | | 635,781 |
| Redeemed | | (6,931,588) | | (19,301,789) |
| Net increase (decrease) | | 7,041,261 | | 11,105,098 |
| | | | | |
| Fidelity® International Bond Index Fund |
| |
| | Six months ended (Unaudited) June 30, 2023 | | Years ended December 31, 2022 | | 2021 | | 2020 | | 2019 A |
Selected Per-Share Data | | | | | | | | | | |
| Net asset value, beginning of period | $ | 8.81 | $ | 9.98 | $ | 10.22 | $ | 9.87 | $ | 10.00 |
| Income from Investment Operations | | | | | | | | | | |
Net investment income (loss) B,C | | .079 | | .113 | | .079 | | .054 | | .010 |
| Net realized and unrealized gain (loss) | | .207 | | (1.193) | | (.257) | | .372 | | (.123) |
| Total from investment operations | | .286 | | (1.080) | | (.178) | | .426 | | (.113) |
| Distributions from net investment income | | (.076) | | (.090) | | (.062) | | (.076) | | (.009) |
| Distributions from net realized gain | | - | | - | | - | | - | | (.008) |
| Total distributions | | (.076) | | (.090) | | (.062) | | (.076) | | (.017) |
| Net asset value, end of period | $ | 9.02 | $ | 8.81 | $ | 9.98 | $ | 10.22 | $ | 9.87 |
Total Return D,E | | 3.25% | | (10.84)% | | (1.74)% | | 4.33% | | (1.13)% |
Ratios to Average Net Assets C,F,G | | | | | | | | | | |
| Expenses before reductions | | .06% H | | .06% | | .06% | | .06% | | .06% H |
| Expenses net of fee waivers, if any | | .06% H | | .06% | | .06% | | .06% | | .06% H |
| Expenses net of all reductions | | .06% H | | .06% | | .06% | | .06% | | .06% H |
| Net investment income (loss) | | 1.77% H | | 1.23% | | .79% | | .54% | | .45% H |
| Supplemental Data | | | | | | | | | | |
| Net assets, end of period (000 omitted) | $ | 704,122 | $ | 626,063 | $ | 598,137 | $ | 184,632 | $ | 16,121 |
Portfolio turnover rate I | | 21% H | | 22% | | 18% | | 5% | | 3% J |
A For the period October 10, 2019 (commencement of operations) through December 31, 2019.
B Calculated based on average shares outstanding during the period.
C Net investment income (loss) is affected by the timing of the declaration of dividends by any underlying mutual funds or exchange-traded funds (ETFs). Net investment income (loss) of any mutual funds or ETFs is not included in the Fund's net investment income (loss) ratio.
D Total returns for periods of less than one year are not annualized.
E Total returns would have been lower if certain expenses had not been reduced during the applicable periods shown.
F Fees and expenses of any underlying mutual funds or exchange-traded funds (ETFs) are not included in the Fund's expense ratio. The Fund indirectly bears its proportionate share of these expenses. For additional expense information related to investments in Fidelity Central Funds, please refer to the "Investments in Fidelity Central Funds" note found in the Notes to Financial Statements section of the most recent Annual or Semi-Annual report.
G Expense ratios reflect operating expenses of the class. Expenses before reductions do not reflect amounts reimbursed, waived, or reduced through arrangements with the investment adviser, brokerage services, or other offset arrangements, if applicable, and do not represent the amount paid by the class during periods when reimbursements, waivers or reductions occur.
H Annualized.
I Amount does not include the portfolio activity of any underlying mutual funds or exchange-traded funds (ETFs).
J Amount not annualized.
For the period ended June 30, 2023
1. Organization.
Fidelity International Bond Index Fund (the Fund) is a non-diversified fund of Fidelity Salem Street Trust (the Trust) and is authorized to issue an unlimited number of shares. Share transactions on the Statement of Changes in Net Assets may contain exchanges between affiliated funds. The Trust is registered under the Investment Company Act of 1940, as amended (the 1940 Act), as an open-end management investment company organized as a Massachusetts business trust. The Fund's investments in emerging markets can be subject to social, economic, regulatory, and political uncertainties and can be extremely volatile.
2. Investments in Fidelity Central Funds.
Funds may invest in Fidelity Central Funds, which are open-end investment companies generally available only to other investment companies and accounts managed by the investment adviser and its affiliates. The Schedule of Investments lists any Fidelity Central Funds held as an investment as of period end, but does not include the underlying holdings of each Fidelity Central Fund. An investing fund indirectly bears its proportionate share of the expenses of the underlying Fidelity Central Funds.
Based on its investment objective, each Fidelity Central Fund may invest or participate in various investment vehicles or strategies that are similar to those of the investing fund. These strategies are consistent with the investment objectives of the investing fund and may involve certain economic risks which may cause a decline in value of each of the Fidelity Central Funds and thus a decline in the value of the investing fund.
| Fidelity Central Fund | Investment Manager | Investment Objective | Investment Practices | Expense Ratio A |
| Fidelity Money Market Central Funds | Fidelity Management & Research Company LLC (FMR) | Each fund seeks to obtain a high level of current income consistent with the preservation of capital and liquidity. | Short-term Investments | Less than .005% |
A Expenses expressed as a percentage of average net assets and are as of each underlying Central Fund's most recent annual or semi-annual shareholder report.
A complete unaudited list of holdings for each Fidelity Central Fund is available upon request or at the Securities and Exchange Commission website at www.sec.gov. In addition, the financial statements of the Fidelity Central Funds which contain the significant accounting policies (including investment valuation policies) of those funds, and are not covered by the Report of Independent Registered Public Accounting Firm, are available on the Securities and Exchange Commission website or upon request.
3. Significant Accounting Policies.
The Fund is an investment company and applies the accounting and reporting guidance of the Financial Accounting Standards Board (FASB) Accounting Standards Codification Topic 946 Financial Services - Investment Companies . The financial statements have been prepared in conformity with accounting principles generally accepted in the United States of America (GAAP), which require management to make certain estimates and assumptions at the date of the financial statements. Actual results could differ from those estimates. Subsequent events, if any, through the date that the financial statements were issued have been evaluated in the preparation of the financial statements. The Fund's Schedule of Investments lists any underlying mutual funds or exchange-traded funds (ETFs) but does not include the underlying holdings of these funds. The following summarizes the significant accounting policies of the Fund:
Investment Valuation. Investments are valued as of 4:00 p.m. Eastern time on the last calendar day of the period. The Board of Trustees (the Board) has designated the Fund's investment adviser as the valuation designee responsible for the fair valuation function and performing fair value determinations as needed. The investment adviser has established a Fair Value Committee (the Committee) to carry out the day-to-day fair valuation responsibilities and has adopted policies and procedures to govern the fair valuation process and the activities of the Committee. In accordance with these fair valuation policies and procedures, which have been approved by the Board, the Fund attempts to obtain prices from one or more third party pricing services or brokers to value its investments. When current market prices, quotations or currency exchange rates are not readily available or reliable, investments will be fair valued in good faith by the Committee, in accordance with the policies and procedures. Factors used in determining fair value vary by investment type and may include market or investment specific events, transaction data, estimated cash flows, and market observations of comparable investments. The frequency that the fair valuation procedures are used cannot be predicted and they may be utilized to a significant extent. The Committee manages the Fund's fair valuation practices and maintains the fair valuation policies and procedures. The Fund's investment adviser reports to the Board information regarding the fair valuation process and related material matters.
The Fund categorizes the inputs to valuation techniques used to value its investments into a disclosure hierarchy consisting of three levels as shown below:
Level 1 - unadjusted quoted prices in active markets for identical investments
Level 2 - other significant observable inputs (including quoted prices for similar investments, interest rates, prepayment speeds, etc.)
Level 3 - unobservable inputs (including the Fund's own assumptions based on the best information available)
Valuation techniques used to value the Fund's investments by major category are as follows:
Debt securities, including restricted securities, are valued based on evaluated prices received frocm third party pricing services or from brokers who make markets in such securities. Corporate bonds, preferred securities, supranational obligations and U.S. government and government agency obligations are valued by pricing services who utilize matrix pricing which considers yield or price of bonds of comparable quality, coupon, maturity and type or by broker-supplied prices. When independent prices are unavailable or unreliable, debt securities may be valued utilizing pricing methodologies which consider similar factors that would be used by third party pricing services. Debt securities are generally categorized as Level 2 in the hierarchy but may be Level 3 depending on the circumstances.
The U.S. dollar value of forward foreign currency contracts is determined using currency exchange rates supplied by a pricing service and are categorized as Level 2 in the hierarchy. Futures contracts are valued at the settlement price established each day by the board of trade or exchange on which they are traded and are categorized as Level 1 in the hierarchy. Investments in open-end mutual funds, including the Fidelity Central Funds, are valued at their closing net asset value (NAV) each business day and are categorized as Level 1 in the hierarchy.
Changes in valuation techniques may result in transfers in or out of an assigned level within the disclosure hierarchy. The aggregate value of investments by input level as of June 30, 2023 is included at the end of the Fund's Schedule of Investments.
Foreign Currency. Foreign-denominated assets, including investment securities, and liabilities are translated into U.S. dollars at the exchange rates at period end. Purchases and sales of investment securities, income and dividends received, and expenses denominated in foreign currencies are translated into U.S. dollars at the exchange rate in effect on the transaction date.
The effects of exchange rate fluctuations on investments are included with the net realized and unrealized gain (loss) on investment securities. Other foreign currency transactions resulting in realized and unrealized gain (loss) are disclosed separately.
Realized gains and losses on foreign currency transactions arise from the disposition of foreign currency, realized changes in the value of foreign currency between the trade and settlement dates on security transactions, and the difference between the amounts of dividends, interest and foreign withholding taxes recorded on transaction date and the U.S. dollar equivalent of the amounts actually received or paid. Unrealized gains and losses on assets and liabilities in foreign currencies arise from changes in the value of foreign currency, and from assets and liabilities denominated in foreign currencies, other than investments, which are held at period end.
Investment Transactions and Income. For financial reporting purposes, the Fund's investment holdings and NAV include trades executed through the end of the last business day of the period. The NAV per share for processing shareholder transactions is calculated as of the close of business of the New York Stock Exchange (NYSE), normally 4:00 p.m. Eastern time and includes trades executed through the end of the prior business day. Gains and losses on securities sold are determined on the basis of identified cost. Dividend income is recorded on the ex-dividend date. Income and capital gain distributions from Fidelity Central Funds, if any, are recorded on the ex-dividend date. Interest income is accrued as earned and includes coupon interest and amortization of premium and accretion of discount on debt securities as applicable. Investment income is recorded net of foreign taxes withheld where recovery of such taxes is uncertain. Debt obligations may be placed on non-accrual status and related interest income may be reduced by ceasing current accruals and writing off interest receivables when the collection of all or a portion of interest has become doubtful based on consistently applied procedures. A debt obligation is removed from non-accrual status when the issuer resumes interest payments or when collectability of interest is reasonably assured.
Expenses. Expenses directly attributable to a fund are charged to that fund. Expenses attributable to more than one fund are allocated among the respective funds on the basis of relative net assets or other appropriate methods. Expenses included in the accompanying financial statements reflect the expenses of that fund and do not include any expenses associated with any underlying mutual funds or exchange-traded funds. Although not included in a fund's expenses, a fund indirectly bears its proportionate share of these expenses through the net asset value of each underlying mutual fund or exchange-traded fund. Expense estimates are accrued in the period to which they relate and adjustments are made when actual amounts are known.
Income Tax Information and Distributions to Shareholders. Each year, the Fund intends to qualify as a regulated investment company under Subchapter M of the Internal Revenue Code, including distributing substantially all of its taxable income and realized gains. As a result, no provision for U.S. Federal income taxes is required. The Fund files a U.S. federal tax return, in addition to state and local tax returns as required. The Fund's federal income tax returns are subject to examination by the Internal Revenue Service (IRS) for a period of three fiscal years after they are filed. State and local tax returns may be subject to examination for an additional fiscal year depending on the jurisdiction. Foreign taxes are provided for based on the Fund's understanding of the tax rules and rates that exist in the foreign markets in which it invests. The Fund is subject to a tax imposed on capital gains by certain countries in which it invests. An estimated deferred tax liability for net unrealized appreciation on the applicable securities is included in Other payables and accrued expenses on the Statement of Assets & Liabilities.
Distributions are declared and recorded daily and paid monthly from net investment income. Distributions from realized gains, if any, are declared and recorded on the ex-dividend date. Income and capital gain distributions are determined in accordance with income tax regulations, which may differ from GAAP.
Capital accounts within the financial statements are adjusted for permanent book-tax differences. These adjustments have no impact on net assets or the results of operations. Capital accounts are not adjusted for temporary book-tax differences which will reverse in a subsequent period.
Book-tax differences are primarily due to foreign currency transactions, certain foreign taxes, market discount, capital loss carryforwards, futures contracts, and losses deferred due to wash sales and excise tax regulations.
As of period end, the cost and unrealized appreciation (depreciation) in securities, and derivatives if applicable, for federal income tax purposes were as follows:
| Gross unrealized appreciation | $16,833,228 |
| Gross unrealized depreciation | (124,283,839) |
| Net unrealized appreciation (depreciation) | $(107,450,611) |
| Tax cost | $803,958,190 |
Capital loss carryforwards are only available to offset future capital gains of the Fund to the extent provided by regulations and may be limited. The capital loss carryforward information presented below, including any applicable limitation, is estimated as of prior fiscal period end and is subject to adjustment.
Short-term | $(4,972,552) |
Long-term | (2,442,371) |
| Total capital loss carryforward | $(7,414,923) |
Restricted Securities (including Private Placements). Funds may invest in securities that are subject to legal or contractual restrictions on resale. These securities generally may be resold in transactions exempt from registration or to the public if the securities are registered. Disposal of these securities may involve time-consuming negotiations and expense, and prompt sale at an acceptable price may be difficult. Information regarding restricted securities held at period end is included at the end of the Schedule of Investments, if applicable.
4. Derivative Instruments.
Risk Exposures and the Use of Derivative Instruments. The Fund's investment objectives allow for various types of derivative instruments, including futures contracts and forward foreign currency contracts. Derivatives are investments whose value is primarily derived from underlying assets, indices or reference rates and may be transacted on an exchange or over-the-counter (OTC). Derivatives may involve a future commitment to buy or sell a specified asset based on specified terms, to exchange future cash flows at periodic intervals based on a notional principal amount, or for one party to make one or more payments upon the occurrence of specified events in exchange for periodic payments from the other party.
Derivatives were used to increase returns, to facilitate transactions in foreign-denominated securities and to manage exposure to certain risks as defined below. The success of any strategy involving derivatives depends on analysis of numerous economic factors, and if the strategies for investment do not work as intended, the objectives may not be achieved.
Derivatives were used to increase or decrease exposure to the following risk(s):
| Foreign Exchange Risk | Foreign exchange rate risk relates to fluctuations in the value of an asset or liability due to changes in currency exchange rates. |
| Interest Rate Risk | Interest rate risk relates to the fluctuations in the value of interest-bearing securities due to changes in the prevailing levels of market interest rates. |
Funds are also exposed to additional risks from investing in derivatives, such as liquidity risk and counterparty credit risk. Liquidity risk is the risk that a fund will be unable to close out the derivative in the open market in a timely manner. Counterparty credit risk is the risk that the counterparty will not be able to fulfill its obligation to a fund. Derivative counterparty credit risk is managed through formal evaluation of the creditworthiness of all potential counterparties. On certain OTC derivatives such as forward foreign currency contracts, a fund attempts to reduce its exposure to counterparty credit risk by entering into an International Swaps and Derivatives Association, Inc. (ISDA) Master Agreement with each of its counterparties. The ISDA Master Agreement gives a fund the right to terminate all transactions traded under such agreement upon the deterioration in the credit quality of the counterparty beyond specified levels. The ISDA Master Agreement gives each party the right, upon an event of default by the other party or a termination of the agreement, to close out all transactions traded under such agreement and to net amounts owed under each transaction to one net payable by one party to the other. To mitigate counterparty credit risk on bi-lateral OTC derivatives, a fund receives collateral in the form of cash or securities once net unrealized appreciation on outstanding derivative contracts under an ISDA Master Agreement exceeds certain applicable thresholds, subject to certain minimum transfer provisions. The collateral received is held in segregated accounts with the custodian bank in accordance with the collateral agreements entered into between a fund, the counterparty and the custodian bank. A fund could experience delays and costs in gaining access to the collateral even though it is held by the custodian bank. The maximum risk of loss to a fund from counterparty credit risk related to bi-lateral OTC derivatives is generally the aggregate unrealized appreciation and unpaid counterparty payments in excess of any collateral pledged by the counterparty to a fund. A fund may be required to pledge collateral for the benefit of the counterparties on bi-lateral OTC derivatives in an amount not less than each counterparty's unrealized appreciation on outstanding derivative contracts, subject to certain minimum transfer provisions, and any such pledged collateral is identified in the Schedule of Investments. Exchange-traded contracts are not covered by the ISDA Master Agreement; however counterparty credit risk related to these contracts may be mitigated by the protection provided by the exchange on which they trade.
Investing in derivatives may involve greater risks than investing in the underlying assets directly and, to varying degrees, may involve risk of loss in excess of any initial investment and collateral received and amounts recognized in the Statement of Assets and Liabilities. In addition, there may be the risk that the change in value of the derivative contract does not correspond to the change in value of the underlying instrument.
Net Realized Gain (Loss) and Change in Net Unrealized Appreciation (Depreciation) on Derivatives. The table below, which reflects the impacts of derivatives on the financial performance, summarizes the net realized gain (loss) and change in net unrealized appreciation (depreciation) for derivatives during the period as presented in the Statement of Operations.
| Primary Risk Exposure / Derivative Type | Net Realized Gain (Loss) | Change in Net Unrealized Appreciation (Depreciation) |
| Fidelity International Bond Index Fund | | |
| Foreign Exchange Risk | | |
| Forward Foreign Currency Contracts | $(9,679,218) | $21,278,185 |
| Total Foreign Exchange Risk | (9,679,218) | 21,278,185 |
| Interest Rate Risk | | |
| Futures Contracts | (209,591) | 146,701 |
| Total Interest Rate Risk | (209,591) | 146,701 |
| Totals | $(9,888,809) | $21,424,886 |
If there are any open positions at period end, a summary of the value of derivatives by primary risk exposure is included at the end of the Schedule of Investments.
Forward Foreign Currency Contracts. Forward foreign currency contracts represent obligations to purchase or sell foreign currency on a specified future date at a price fixed at the time the contracts are entered into. Forward foreign currency contracts were used to facilitate transactions in foreign-denominated securities and to manage exposure to certain foreign currencies.
Forward foreign currency contracts are valued daily and fluctuations in exchange rates on open contracts are recorded as unrealized appreciation or (depreciation) and reflected in total accumulated earnings (loss) in the Statement of Assets and Liabilities. When the contract is closed, a gain or loss is realized equal to the difference between the closing value and the value at the time it was opened. Non-deliverable forward foreign currency exchange contracts are settled with the counterparty in cash without the delivery of foreign currency. The net realized gain (loss) and change in net unrealized appreciation (depreciation) on forward foreign currency contracts during the period is presented in the Statement of Operations.
Any open forward foreign currency contracts at period end are presented in the Schedule of Investments under the caption "Forward Foreign Currency Contracts." The contract amount and unrealized appreciation (depreciation) reflects each contract's exposure to the underlying currency at period end, and is representative of volume of activity during the period unless an average contract value is presented.
Futures Contracts. A futures contract is an agreement between two parties to buy or sell a specified underlying instrument for a fixed price at a specified future date. Futures contracts were used to manage exposure to the bond market and fluctuations in interest rates.
Upon entering into a futures contract, a fund is required to deposit either cash or securities (initial margin) with a clearing broker in an amount equal to a certain percentage of the face value of the contract. Futures contracts are marked-to-market daily and subsequent daily payments are made or received by a fund depending on the daily fluctuations in the value of the futures contracts and are recorded as unrealized appreciation or (depreciation). This receivable and/or payable, if any, is included in daily variation margin on futures contracts in the Statement of Assets and Liabilities. Realized gain or (loss) is recorded upon the expiration or closing of a futures contract. The net realized gain (loss) and change in net unrealized appreciation (depreciation) on futures contracts during the period is presented in the Statement of Operations.
Any open futures contracts at period end are presented in the Schedule of Investments under the caption "Futures Contracts". The notional amount at value reflects each contract's exposure to the underlying instrument or index at period end, and is representative of volume of activity during the period unless an average notional amount is presented. Any securities deposited to meet initial margin requirements are identified in the Schedule of Investments. Any cash deposited to meet initial margin requirements is presented as segregated cash with brokers for derivative instruments in the Statement of Assets and Liabilities.
5. Purchases and Sales of Investments.
Purchases and sales of securities, other than short-term securities and in-kind transactions, as applicable, are noted in the table below.
| | Purchases ($) | Sales ($) |
| Fidelity International Bond Index Fund | 133,021,924 | 67,441,557 |
6. Fees and Other Transactions with Affiliates.
Management Fee. Fidelity Management & Research Company LLC (the investment adviser) and its affiliates provide the Fund with investment management related services for which the Fund pays a monthly management fee. The management fee is based on an annual rate of .06% of the Fund's average net assets. Under the management contract, the investment adviser pays all other operating expenses, except the compensation of the independent Trustees and certain miscellaneous expenses such as proxy and shareholder meeting expenses.
Interfund Trades. Funds may purchase from or sell securities to other Fidelity Funds under procedures adopted by the Board. The procedures have been designed to ensure these interfund trades are executed in accordance with Rule 17a-7 of the 1940 Act. Any interfund trades are included within the respective purchases and sales amounts shown in the Purchases and Sales of Investments note. During the period, there were no interfund trades.
7. Committed Line of Credit.
Certain Funds participate with other funds managed by the investment adviser or an affiliate in a $4.25 billion credit facility (the "line of credit") to be utilized for temporary or emergency purposes to fund shareholder redemptions or for other short-term liquidity purposes. The commitment fees on the pro-rata portion of the line of credit are borne by the investment adviser. During the period, there were no borrowings on this line of credit.
8. Expense Reductions.
Through arrangements with the Fund's custodian, credits realized as a result of certain uninvested cash balances were used to reduce the Fund's expenses by $100.
9. Other.
A fund's organizational documents provide former and current trustees and officers with a limited indemnification against liabilities arising in connection with the performance of their duties to the fund. In the normal course of business, a fund may also enter into contracts that provide general indemnifications. A fund's maximum exposure under these arrangements is unknown as this would be dependent on future claims that may be made against a fund. The risk of material loss from such claims is considered remote.
At the end of the period, the following mutual funds managed by the investment adviser or its affiliates were the owners of record of 10% or more of the total outstanding shares.
| | Fidelity Multi-Asset Index Fund |
| Fidelity International Bond Index Fund | 32% |
Mutual funds managed by the investment adviser or its affiliates, in aggregate, were the owners of record of more than 20% of the total outstanding shares.
| Fund | % of shares held |
| Fidelity International Bond Index Fund | 49% |
10. Risk and Uncertainties.
Many factors affect a fund's performance. Developments that disrupt global economies and financial markets, such as pandemics, epidemics, outbreaks of infectious diseases, war, terrorism, and environmental disasters, may significantly affect a fund's investment performance. The effects of these developments to a fund will be impacted by the types of securities in which a fund invests, the financial condition, industry, economic sector, and geographic location of an issuer, and a fund's level of investment in the securities of that issuer. Significant concentrations in security types, issuers, industries, sectors, and geographic locations may magnify the factors that affect a fund's performance.
As a shareholder, you incur two types of costs: (1) transaction costs, which may include sales charges (loads) on purchase payments or redemption proceeds, as applicable and (2) ongoing costs, which generally include management fees, distribution and/or service (12b-1) fees and other Fund expenses. This Example is intended to help you understand your ongoing costs (in dollars) of investing in a fund and to compare these costs with the ongoing costs of investing in other mutual funds.
| The Example is based on an investment of $1,000 invested at the beginning of the period and held for the entire period (January 1, 2023 to June 30, 2023). |
Actual Expenses
The first line of the accompanying table provides information about actual account values and actual expenses. You may use the information in this line, together with the amount you invested, to estimate the expenses that you paid over the period. Simply divide your account value by $1,000.00 (for example, an $8,600 account value divided by $1,000.00 = 8.6), then multiply the result by the number in the first line for a class/Fund under the heading entitled "Expenses Paid During Period" to estimate the expenses you paid on your account during this period. If any fund is a shareholder of any underlying mutual funds or exchange-traded funds (ETFs) (the Underlying Funds), such fund indirectly bears its proportional share of the expenses of the Underlying Funds in addition to the direct expenses incurred presented in the table. These fees and expenses are not included in the annualized expense ratio used to calculate the expense estimate in the table below.
Hypothetical Example for Comparison Purposes
The second line of the accompanying table provides information about hypothetical account values and hypothetical expenses based on the actual expense ratio and an assumed rate of return of 5% per year before expenses, which is not the actual return. The hypothetical account values and expenses may not be used to estimate the actual ending account balance or expenses you paid for the period. You may use this information to compare the ongoing costs of investing in the Fund and other funds. To do so, compare this 5% hypothetical example with the 5% hypothetical examples that appear in the shareholder reports of the other funds. If any fund is a shareholder of any Underlying Funds, such fund indirectly bears its proportional share of the expenses of the Underlying Funds in addition to the direct expenses as presented in the table. These fees and expenses are not included in the annualized expense ratio used to calculate the expense estimate in the table below.
Please note that the expenses shown in the table are meant to highlight your ongoing costs only and do not reflect any transaction costs. Therefore, the second line of the table is useful in comparing ongoing costs only, and will not help you determine the relative total costs of owning different funds. In addition, if these transactional costs were included, your costs would have been higher.
| | | | | Annualized Expense Ratio- A | | Beginning Account Value January 1, 2023 | | Ending Account Value June 30, 2023 | | Expenses Paid During Period- C January 1, 2023 to June 30, 2023 |
| | | | | | | | | | |
| Fidelity® International Bond Index Fund | | | | .06% | | | | | | |
| Actual | | | | | | $ 1,000 | | $ 1,032.50 | | $ .30 |
Hypothetical- B | | | | | | $ 1,000 | | $ 1,024.50 | | $ .30 |
| |
A Annualized expense ratio reflects expenses net of applicable fee waivers.
B 5% return per year before expenses
C Expenses are equal to the annualized expense ratio, multiplied by the average account value over the period, multiplied by 181/ 365 (to reflect the one-half year period). The fees and expenses of any Underlying Funds are not included in each annualized expense ratio.
The Securities and Exchange Commission adopted Rule 22e-4 under the Investment Company Act of 1940 (the Liquidity Rule) to promote effective liquidity risk management throughout the open-end investment company industry, thereby reducing the risk that funds will be unable to meet their redemption obligations and mitigating dilution of the interests of fund shareholders.
The Fund has adopted and implemented a liquidity risk management program (the Program) reasonably designed to assess and manage the Fund's liquidity risk and to comply with the requirements of the Liquidity Rule. The Fund's Board of Trustees (the Board) has designated the Fund's investment adviser as administrator of the Program. The Fidelity advisers have established a Liquidity Risk Management Committee (the LRM Committee) to manage the Program for each of the Fidelity Funds. The LRM Committee monitors the adequacy and effectiveness of implementation of the Program and on a periodic basis assesses each Fund's liquidity risk based on a variety of factors including (1) the Fund's investment strategy, (2) portfolio liquidity and cash flow projections during normal and reasonably foreseeable stressed conditions, (3) shareholder redemptions, (4) borrowings and other funding sources and (5) certain factors specific to ETFs including the effect of the Fund's prices and spreads, market participants, and basket compositions on the overall liquidity of the Fund's portfolio, as applicable.
In accordance with the Program, each of the Fund's portfolio investments is classified into one of four defined liquidity categories based on a determination of a reasonable expectation for how long it would take to convert the investment to cash (or sell or dispose of the investment) without significantly changing its market value.
- Highly liquid investments - cash or convertible to cash within three business days or less
- Moderately liquid investments - convertible to cash in three to seven calendar days
- Less liquid investments - can be sold or disposed of, but not settled, within seven calendar days
- Illiquid investments - cannot be sold or disposed of within seven calendar days
Liquidity classification determinations take into account a variety of factors including various market, trading and investment-specific considerations, as well as market depth, and generally utilize analysis from a third-party liquidity metrics service.
The Liquidity Rule places a 15% limit on a fund's illiquid investments and requires funds that do not primarily hold assets that are highly liquid investments to determine and maintain a minimum percentage of the fund's net assets to be invested in highly liquid investments (highly liquid investment minimum or HLIM). The Program includes provisions reasonably designed to comply with the 15% limit on illiquid investments and for determining, periodically reviewing and complying with the HLIM requirement as applicable.
At a recent meeting of the Fund's Board of Trustees, the LRM Committee provided a written report to the Board pertaining to the operation, adequacy, and effectiveness of the Program for the period December 1, 2021 through November 30, 2022. The report concluded that the Program is operating effectively and is reasonably designed to assess and manage the Fund's liquidity risk.
1.9896132.103
IBI-SANN-0823
Fidelity SAI International Credit Fund
Semi-Annual Report
June 30, 2023
Offered exclusively to certain clients of the Adviser, or its affiliates, including Strategic Advisers LLC (Strategic Advisers) - not available for sale to the general public. Fidelity ® SAI is a product name of Fidelity ® funds dedicated to certain programs affiliated with Strategic Advisers.
Contents
To view a fund's proxy voting guidelines and proxy voting record for the 12-month period ended June 30, visit http://www.fidelity.com/proxyvotingresults or visit the Securities and Exchange Commission's (SEC) web site at http://www.sec.gov.
You may also call 1-800-544-3455 to request a free copy of the proxy voting guidelines.
Standard & Poor's, S&P and S&P 500 are registered service marks of The McGraw-Hill Companies, Inc. and have been licensed for use by Fidelity Distributors Corporation.
Other third-party marks appearing herein are the property of their respective owners.
All other marks appearing herein are registered or unregistered trademarks or service marks of FMR LLC or an affiliated company. © 2023 FMR LLC. All rights reserved.
This report and the financial statements contained herein are submitted for the general information of the shareholders of the Fund. This report is not authorized for distribution to prospective investors in the Fund unless preceded or accompanied by an effective prospectus.
A fund files its complete schedule of portfolio holdings with the SEC for the first and third quarters of each fiscal year on Form N-PORT. Forms N-PORT are available on the SEC's web site at http://www.sec.gov. A fund's Forms N-PORT may be reviewed and copied at the SEC's Public Reference Room in Washington, DC. Information regarding the operation of the SEC's Public Reference Room may be obtained by calling 1-800-SEC-0330.
For a complete list of a fund's portfolio holdings, view the most recent holdings listing, semiannual report, or annual report on Fidelity's web site at http://www.fidelity.com, http://www.institutional.fidelity.com, or http://www.401k.com, as applicable.
NOT FDIC INSURED •MAY LOSE VALUE •NO BANK GUARANTEE
Neither the Fund nor Fidelity Distributors Corporation is a bank.
This report and the financial statements contained herein are submitted for the general information of the shareholders of the Fund. This report is not authorized for distribution to prospective investors in the Fund unless preceded or accompanied by an effective prospectus.
A fund files its complete schedule of portfolio holdings with the SEC for the first and third quarters of each fiscal year on Form N-PORT. Forms N-PORT are available on the SEC's web site at http://www.sec.gov. A fund's Forms N-PORT may be reviewed and copied at the SEC's Public Reference Room in Washington, DC. Information regarding the operation of the SEC's Public Reference Room may be obtained by calling 1-800-SEC-0330.
For a complete list of a fund's portfolio holdings, view the most recent holdings listing, semiannual report, or annual report on Fidelity's web site at http://www.fidelity.com, http://www.institutional.fidelity.com, or http://www.401k.com, as applicable.
NOT FDIC INSURED •MAY LOSE VALUE •NO BANK GUARANTEE
Neither the Fund nor Fidelity Distributors Corporation is a bank.
Quality Diversification (% of Fund's net assets) |
|
| |
| We have used ratings from Moody's Investors Service, Inc. Where Moody's® ratings are not available, we have used S&P® ratings. All ratings are as of the date indicated and do not reflect subsequent changes. |
Asset Allocation (% of Fund's net assets) |
|
Futures and Swaps - 16.6% |
Forward foreign currency contracts - (64.8)% |
|
Geographic Diversification (% of Fund's net assets) |
|
* Includes Short-Term investments and Net Other Assets (Liabilities). Percentages are adjusted for the effect of derivatives, if applicable. |
| |
Forward foreign currency contracts and other assets and liabilities are included within United States of America, as applicable.
Showing Percentage of Net Assets
| Nonconvertible Bonds - 50.9% |
| | | Principal Amount (a) | Value ($) |
| Australia - 1.3% | | | |
| AusNet Services Holdings Pty Ltd. 1.625% 3/11/81 (Reg. S) (b) | EUR | 685,000 | 635,351 |
| Leighton Finance U.S.A. Pty Ltd. 1.5% 5/28/29 (Reg. S) | EUR | 1,459,000 | 1,238,665 |
| QBE Insurance Group Ltd.: | | | |
| 2.5% 9/13/38 (Reg. S) (b) | GBP | 1,529,000 | 1,479,643 |
| 6.75% 12/2/44 (Reg. S) (b) | | 298,000 | 294,275 |
TOTAL AUSTRALIA | | | 3,647,934 |
| Canada - 0.7% | | | |
| Royal Bank of Canada 4.125% 7/5/28 (Reg. S) | EUR | 1,700,000 | 1,843,253 |
| Denmark - 2.5% | | | |
| Danske Bank A/S: | | | |
| 2.25% 1/14/28 (Reg. S) (b) | GBP | 2,330,000 | 2,473,201 |
| 4.75% 6/21/30 (Reg. S) (b) | EUR | 3,150,000 | 3,423,593 |
| Jyske Bank A/S 5% 10/26/28 (b) | EUR | 810,000 | 874,459 |
TOTAL DENMARK | | | 6,771,253 |
| Finland - 0.7% | | | |
| Nordea Bank ABP 4.125% 5/5/28 (Reg. S) | EUR | 1,745,000 | 1,884,920 |
| France - 6.4% | | | |
| BNP Paribas SA: | | | |
| 2.159% 9/15/29 (b)(c) | | 2,230,000 | 1,857,018 |
| 2.5% 3/31/32 (Reg. S) (b) | EUR | 1,300,000 | 1,261,114 |
| 4.125% 5/24/33 (Reg. S) | EUR | 1,000,000 | 1,089,978 |
| BPCE SA: | | | |
| 1.5% 1/13/42 (Reg. S) (b) | EUR | 2,800,000 | 2,567,987 |
| 4.75% 6/14/34 (Reg. S) (b) | EUR | 500,000 | 546,783 |
| Credit Agricole Assurances SA 4.75% 9/27/48 (b) | EUR | 600,000 | 627,884 |
| Credit Agricole SA: | | | |
| UK Government Bonds 1 Year + 2.180% 6.375% 6/14/31 (Reg. S) (b)(d) | GBP | 1,200,000 | 1,500,738 |
| 4.875% 10/23/29 (Reg. S) | GBP | 500,000 | 590,375 |
| Electricite de France SA: | | | |
| 5.5% 1/25/35 (Reg. S) | GBP | 1,000,000 | 1,132,352 |
| 5.7% 5/23/28 (c) | | 750,000 | 748,868 |
| 6.25% 5/23/33 (c) | | 1,880,000 | 1,911,169 |
| Lagardere S.C.A. 2.125% 10/16/26 (Reg. S) | EUR | 100,000 | 106,392 |
| Societe Generale: | | | |
| 4.75% 11/24/25 (c) | | 255,000 | 242,884 |
| 6.691% 1/10/34 (b)(c) | | 2,410,000 | 2,453,538 |
| Technip Energies NV 1.125% 5/28/28 | EUR | 883,000 | 820,504 |
| Valeo SA 1% 8/3/28 (Reg. S) | EUR | 100,000 | 88,314 |
TOTAL FRANCE | | | 17,545,898 |
| Germany - 4.8% | | | |
| AGPS BondCo PLC: | | | |
| 4.625% 1/14/26 (Reg. S) (b) | EUR | 700,000 | 293,696 |
| 5% 4/27/27 (Reg. S) (b) | EUR | 100,000 | 37,974 |
| Bayer AG: | | | |
| 3.75% 7/1/74 (Reg. S) (b) | EUR | 168,000 | 177,966 |
| 4.625% 5/26/33 (Reg. S) | EUR | 750,000 | 830,193 |
| Commerzbank AG 8.625% 2/28/33 (Reg. S) (b) | GBP | 700,000 | 853,982 |
| Deutsche Annington Finance BV 5% 10/2/23 (c) | | 96,000 | 95,315 |
| Deutsche Bank AG: | | | |
| 3.25% 5/24/28 (Reg. S) (b) | EUR | 100,000 | 100,577 |
| 4% 6/24/32 (Reg. S) (b) | EUR | 2,500,000 | 2,393,601 |
| 6.125% 12/12/30 (Reg. S) (b) | GBP | 1,700,000 | 1,979,087 |
| EnBW Energie Baden-Wuerttemberg AG 1.375% 8/31/81 (Reg. S) (b) | EUR | 2,200,000 | 1,908,509 |
| Robert Bosch GmbH: | | | |
| 4% 6/2/35 (Reg. S) | EUR | 1,700,000 | 1,880,640 |
| 4.375% 6/2/43 (Reg. S) | EUR | 400,000 | 446,793 |
| Sirius Real Estate Ltd. 1.125% 6/22/26 (Reg. S) | EUR | 500,000 | 448,865 |
| Vonovia SE 5% 11/23/30 (Reg. S) | EUR | 500,000 | 531,928 |
| ZF Europe Finance BV 2% 2/23/26 (Reg. S) | EUR | 900,000 | 892,465 |
| ZF Finance GmbH 2% 5/6/27 (Reg. S) | EUR | 300,000 | 284,394 |
TOTAL GERMANY | | | 13,155,985 |
| Greece - 0.3% | | | |
| Alpha Bank SA 4.25% 2/13/30 (Reg. S) (b) | EUR | 965,000 | 931,858 |
| Hong Kong - 0.6% | | | |
| Prudential Funding Asia PLC 2.95% 11/3/33 (Reg. S) (b) | | 1,828,000 | 1,537,805 |
| Ireland - 3.6% | | | |
| AIB Group PLC: | | | |
| 1.875% 11/19/29 (Reg. S) (b) | EUR | 244,000 | 250,198 |
| 2.25% 4/4/28 (Reg. S) (b) | EUR | 3,392,000 | 3,355,726 |
| 2.875% 5/30/31 (Reg. S) (b) | EUR | 995,000 | 983,628 |
| Avolon Holdings Funding Ltd.: | | | |
| 4.25% 4/15/26 (c) | | 166,000 | 154,648 |
| 4.375% 5/1/26 (c) | | 11,000 | 10,278 |
| Bank of Ireland Group PLC: | | | |
| 1.375% 8/11/31 (Reg. S) (b) | EUR | 2,494,000 | 2,362,522 |
| 2.029% 9/30/27 (b)(c) | | 2,880,000 | 2,489,432 |
| Cloverie PLC 4.5% 9/11/44 (Reg. S) (b) | | 441,000 | 419,606 |
TOTAL IRELAND | | | 10,026,038 |
| Italy - 0.9% | | | |
| Enel SpA 3.375% (Reg. S) (b)(e) | EUR | 735,000 | 734,698 |
| UniCredit SpA: | | | |
| 2.731% 1/15/32 (Reg. S) (b) | EUR | 1,189,000 | 1,131,627 |
| 5.861% 6/19/32 (b)(c) | | 815,000 | 740,975 |
TOTAL ITALY | | | 2,607,300 |
| Luxembourg - 1.7% | | | |
| Blackstone Property Partners Europe LP: | | | |
| 1% 5/4/28 (Reg. S) | EUR | 5,434,000 | 4,438,256 |
| 1.75% 3/12/29 (Reg. S) | EUR | 122,000 | 98,743 |
TOTAL LUXEMBOURG | | | 4,536,999 |
| Mexico - 0.5% | | | |
| Petroleos Mexicanos 6.5% 3/13/27 | | 1,689,000 | 1,498,988 |
| Netherlands - 3.7% | | | |
| Demeter Investments BV: | | | |
| 5.625% 8/15/52 (Reg. S) (b) | | 3,590,000 | 3,374,600 |
| 5.75% 8/15/50 (Reg. S) (b) | | 382,000 | 367,236 |
| ING Groep NV: | | | |
| 3% 2/18/26 (Reg. S) | GBP | 600,000 | 692,224 |
| 4.75% 5/23/34 (Reg. S) (b) | EUR | 3,000,000 | 3,273,842 |
| Rabobank Nederland 4% 1/10/30 (Reg. S) | EUR | 1,200,000 | 1,283,160 |
| Universal Music Group NV 4% 6/13/31 (Reg. S) | EUR | 1,000,000 | 1,086,885 |
TOTAL NETHERLANDS | | | 10,077,947 |
| Poland - 0.2% | | | |
| GTC Aurora Luxembourg SA 2.25% 6/23/26 (Reg. S) | EUR | 748,000 | 621,337 |
| Portugal - 0.1% | | | |
| Fidelidade-Companhia de Seguros SA 4.25% 9/4/31 (Reg. S) (b) | EUR | 400,000 | 375,534 |
| Spain - 0.9% | | | |
| Telefonica Emisiones S.A.U. 5.375% 2/2/26 | GBP | 515,000 | 633,912 |
| Werfenlife SA 4.625% 6/6/28 (Reg. S) | EUR | 1,700,000 | 1,829,125 |
TOTAL SPAIN | | | 2,463,037 |
| Sweden - 0.9% | | | |
| Heimstaden AB 4.375% 3/6/27 (Reg. S) | EUR | 1,800,000 | 1,171,130 |
| Samhallsbyggnadsbolaget I Norden AB 1% 8/12/27 (Reg. S) | EUR | 1,870,000 | 1,312,143 |
TOTAL SWEDEN | | | 2,483,273 |
| Switzerland - 2.3% | | | |
| UBS Group AG: | | | |
| 1% 3/21/25 (Reg. S) (b) | EUR | 605,000 | 639,843 |
| 2.125% 11/15/29 (Reg. S) (b) | GBP | 153,000 | 151,528 |
| 4.988% 8/5/33 (Reg. S) (b) | | 1,330,000 | 1,232,419 |
| 6.537% 8/12/33 (b)(c) | | 1,115,000 | 1,142,220 |
| 7.375% 9/7/33 (Reg. S) (b) | GBP | 1,099,000 | 1,457,857 |
| Zurich Finance (Ireland) DAC 3.5% 5/2/52 (Reg. S) (b) | | 2,050,000 | 1,623,949 |
TOTAL SWITZERLAND | | | 6,247,816 |
| United Kingdom - 15.7% | | | |
| Admiral Group PLC 8.5% 1/6/34 (Reg. S) | GBP | 600,000 | 770,893 |
| Anglian Water (Osprey) Financing PLC 2% 7/31/28 (Reg. S) | GBP | 615,000 | 584,514 |
| Barclays PLC: | | | |
| 3.375% 4/2/25 (Reg. S) (b) | EUR | 185,000 | 199,458 |
| 5.262% 1/29/34 (Reg. S) (b) | EUR | 1,370,000 | 1,491,694 |
| 7.437% 11/2/33 (b) | | 1,135,000 | 1,227,945 |
| 8.407% 11/14/32 (Reg. S) (b) | GBP | 945,000 | 1,189,207 |
| BAT Capital Corp. 2.125% 8/15/25 | GBP | 560,000 | 643,517 |
| Heathrow Funding Ltd. 2.625% 3/16/28 (Reg. S) | GBP | 1,688,000 | 1,738,157 |
| HSBC Holdings PLC: | | | |
| 4.787% 3/10/32 (Reg. S) (b) | EUR | 820,000 | 897,094 |
| 4.856% 5/23/33 (Reg. S) (b) | EUR | 1,630,000 | 1,786,151 |
| 6.254% 3/9/34 (b) | | 1,200,000 | 1,230,059 |
| 7.39% 11/3/28 (b) | | 460,000 | 485,476 |
| 8.201% 11/16/34 (Reg. S) (b) | GBP | 485,000 | 623,624 |
| Imperial Brands Finance Netherlands BV 5.25% 2/15/31 (Reg. S) | EUR | 1,150,000 | 1,234,639 |
| Imperial Tobacco Finance PLC: | | | |
| 4.875% 6/7/32 (Reg. S) | GBP | 1,200,000 | 1,273,893 |
| 8.125% 3/15/24 | GBP | 510,000 | 653,299 |
| Inchcape PLC 6.5% 6/9/28 (Reg. S) | GBP | 1,200,000 | 1,479,499 |
| John Lewis PLC 6.125% 1/21/25 | GBP | 2,031,000 | 2,478,001 |
| Lloyds Banking Group PLC: | | | |
| 1.985% 12/15/31 (b) | GBP | 1,172,000 | 1,229,311 |
| 4.5% 1/11/29 (Reg. S) (b) | EUR | 1,145,000 | 1,230,550 |
| 4.976% 8/11/33 (b) | | 2,640,000 | 2,469,459 |
| National Grid Gas Finance PLC 4.25% 7/5/29 (Reg. S) | EUR | 1,150,000 | 1,247,075 |
| Nationwide Building Society 3% 5/6/26 (Reg. S) | GBP | 430,000 | 498,116 |
| NatWest Group PLC: | | | |
| 2.105% 11/28/31 (Reg. S) (b) | GBP | 589,000 | 615,350 |
| 3.619% 3/29/29 (Reg. S) (b) | GBP | 1,333,000 | 1,452,398 |
| 7.416% 6/6/33 (Reg. S) (b) | GBP | 1,455,000 | 1,788,020 |
| NatWest Markets PLC 0.125% 11/12/25 (Reg. S) | EUR | 345,000 | 340,707 |
| NGG Finance PLC 2.125% 9/5/82 (Reg. S) (b) | EUR | 2,006,000 | 1,879,758 |
| Rolls-Royce PLC 3.375% 6/18/26 | GBP | 1,620,000 | 1,811,849 |
| Santander UK Group Holdings PLC 3.625% 1/14/26 (Reg. S) | GBP | 550,000 | 637,869 |
| Severn Trent Utilities Finance PLC 4.625% 11/30/34 (Reg. S) | GBP | 530,000 | 597,971 |
| Southern Water Services Finance Ltd. 1.625% 3/30/27 (Reg. S) | GBP | 345,000 | 362,112 |
| Tesco Corporate Treasury Services PLC 5.5% 2/27/35 (Reg. S) | GBP | 1,570,000 | 1,838,456 |
| Thames Water Utility Finance PLC 4% 6/19/25 (Reg. S) | GBP | 520,000 | 589,848 |
| The Berkeley Group PLC 2.5% 8/11/31 (Reg. S) | GBP | 2,182,000 | 1,800,109 |
| Travis Perkins PLC 3.75% 2/17/26 (Reg. S) | GBP | 765,000 | 869,537 |
| Tritax EuroBox PLC 0.95% 6/2/26 (Reg. S) | EUR | 630,000 | 579,743 |
| Virgin Money UK PLC 5.125% 12/11/30 (Reg. S) (b) | GBP | 442,000 | 503,850 |
| Vodafone Group PLC 4.875% 10/3/78 (Reg. S) (b) | GBP | 525,000 | 623,411 |
| Whitbread PLC 2.375% 5/31/27 (Reg. S) | GBP | 235,000 | 248,061 |
TOTAL UNITED KINGDOM | | | 43,200,680 |
| United States of America - 3.1% | | | |
| Air Lease Corp. 3.125% 12/1/30 | | 84,000 | 69,974 |
| American Airlines, Inc. 3.75% 4/15/27 | | 35,458 | 32,394 |
| Ares Capital Corp.: | | | |
| 2.15% 7/15/26 | | 92,000 | 79,771 |
| 3.25% 7/15/25 | | 115,000 | 106,369 |
| 4.25% 3/1/25 | | 198,000 | 188,900 |
| Bank of America Corp. 2.3% 7/25/25 (Reg. S) | GBP | 545,000 | 635,001 |
| Blackstone Private Credit Fund 4.875% 4/14/26 | GBP | 1,069,000 | 1,199,607 |
| Capital One Financial Corp.: | | | |
| 5.468% 2/1/29 (b) | | 19,000 | 18,201 |
| 5.817% 2/1/34 (b) | | 34,000 | 32,439 |
| Centene Corp.: | | | |
| 4.25% 12/15/27 | | 174,000 | 162,682 |
| 4.625% 12/15/29 | | 124,000 | 114,134 |
| Citigroup, Inc. 5.875% 7/1/24 (Reg. S) | GBP | 500,000 | 627,292 |
| Discover Financial Services 6.7% 11/29/32 | | 6,000 | 6,181 |
| Duke Energy Corp. 3.85% 6/15/34 | EUR | 1,238,000 | 1,231,305 |
| Ford Motor Credit Co. LLC 6.86% 6/5/26 | GBP | 1,000,000 | 1,237,628 |
| General Motors Financial Co., Inc.: | | | |
| 2.25% 9/6/24 (Reg. S) | GBP | 540,000 | 650,084 |
| 5.15% 8/15/26 (Reg. S) | GBP | 310,000 | 373,049 |
| Hudson Pacific Properties LP 3.95% 11/1/27 | | 214,000 | 155,636 |
| Level 3 Financing, Inc. 3.4% 3/1/27 (c) | | 153,000 | 129,821 |
| MPT Operating Partnership LP/MPT Finance Corp.: | | | |
| 2.5% 3/24/26 | GBP | 385,000 | 381,821 |
| 3.5% 3/15/31 | | 118,000 | 81,305 |
| NextEra Energy Partners LP 4.25% 9/15/24 (c) | | 15,000 | 14,325 |
| Southern Co. 1.875% 9/15/81 (b) | EUR | 1,211,000 | 1,031,897 |
| Western Gas Partners LP 4.3% 2/1/30 | | 115,000 | 103,253 |
TOTAL UNITED STATES OF AMERICA | | | 8,663,069 |
| TOTAL NONCONVERTIBLE BONDS (Cost $139,600,572) | | | 140,120,924 |
| | | | |
| U.S. Government and Government Agency Obligations - 19.2% |
| | | Principal Amount (a) | Value ($) |
| U.S. Treasury Obligations - 19.2% | | | |
| U.S. Treasury Bonds: | | | |
| 2.25% 5/15/41 | | 23,900,000 | 18,406,734 |
| 3.25% 5/15/42 | | 580,200 | 517,738 |
| 4% 11/15/42 (f) | | 6,000,000 | 5,961,563 |
| 6.25% 5/15/30 | | 10,700,000 | 12,136,977 |
| U.S. Treasury Notes 4.625% 2/28/25 | | 16,000,000 | 15,875,625 |
| | | | |
| TOTAL U.S. GOVERNMENT AND GOVERNMENT AGENCY OBLIGATIONS (Cost $53,480,508) | | | 52,898,637 |
| | | | |
| Foreign Government and Government Agency Obligations - 17.6% |
| | | Principal Amount (a) | Value ($) |
| Germany - 15.3% | | | |
| German Federal Republic: | | | |
| 1% 5/15/38(Reg. S) | EUR | 12,810,000 | 11,397,855 |
| 1.8% 8/15/53(Reg. S) | EUR | 1,650,000 | 1,572,564 |
| 2.5% 3/13/25(Reg. S) | EUR | 27,000,000 | 29,092,940 |
TOTAL GERMANY | | | 42,063,359 |
| Japan - 2.3% | | | |
| Japan Government -0.1848% 11/10/23 | JPY | 936,200,000 | 6,491,565 |
| TOTAL FOREIGN GOVERNMENT AND GOVERNMENT AGENCY OBLIGATIONS (Cost $47,969,258) | | | 48,554,924 |
| | | | |
| Preferred Securities - 5.6% |
| | | Principal Amount (a) | Value ($) |
| Australia - 0.4% | | | |
| QBE Insurance Group Ltd. 5.25% (Reg. S) (b)(e) | | 1,045,000 | 966,118 |
| Canada - 0.1% | | | |
| Bank of Nova Scotia: | | | |
| 3 month U.S. LIBOR + 2.640% 7.8459% (b)(d)(e) | | 90,000 | 76,130 |
| 4.9% (b)(e) | | 63,000 | 59,695 |
TOTAL CANADA | | | 135,825 |
| Czech Republic - 0.2% | | | |
| CPI Property Group SA 3.75% (Reg. S) (b)(e) | EUR | 1,740,000 | 635,735 |
| Finland - 0.2% | | | |
| Citycon Oyj 4.496% (Reg. S) (b)(e) | EUR | 637,000 | 456,386 |
| France - 0.3% | | | |
| Veolia Environnement SA 2% (Reg. S) (b)(e) | EUR | 900,000 | 822,834 |
| Germany - 1.8% | | | |
| Aroundtown SA 3.375% (Reg. S) (b)(e) | EUR | 2,700,000 | 1,268,381 |
| AT Securities BV 5.25% (Reg. S) (b)(e) | | 250,000 | 109,906 |
| Grand City Properties SA 1.5% (Reg. S) (b)(e) | EUR | 800,000 | 347,951 |
| Volkswagen International Finance NV: | | | |
| 3.375% (Reg. S) (b)(e) | EUR | 100,000 | 105,211 |
| 3.748% (Reg. S) (b)(e) | EUR | 100,000 | 96,856 |
| 3.875% (Reg. S) (b)(e) | EUR | 2,900,000 | 2,650,886 |
| 4.625% (Reg. S) (b)(e) | EUR | 351,000 | 369,144 |
TOTAL GERMANY | | | 4,948,335 |
| Ireland - 0.4% | | | |
| AerCap Holdings NV 5.875% 10/10/79 (b) | | 718,000 | 686,615 |
| AIB Group PLC 6.25% (Reg. S) (b)(e) | EUR | 410,000 | 422,232 |
TOTAL IRELAND | | | 1,108,847 |
| Netherlands - 0.0% | | | |
| Stichting AK Rabobank Certificaten Netherlands Government 10 Year Bond Index + 1.500% 6.5% (Reg. S) (b)(d)(e) | EUR | 30,250 | 30,627 |
| Spain - 0.2% | | | |
| Banco Bilbao Vizcaya Argentaria SA 5.875% (Reg. S) (b)(e) | EUR | 200,000 | 216,303 |
| Telefonica Europe BV 3.875% (Reg. S) (b)(e) | EUR | 400,000 | 416,026 |
TOTAL SPAIN | | | 632,329 |
| Sweden - 0.5% | | | |
| Heimstaden Bostad AB: | | | |
| 3.248% (Reg. S) (b)(e) | EUR | 275,000 | 181,634 |
| 3.625% (Reg. S) (b)(e) | EUR | 2,155,000 | 1,179,964 |
| Samhallsbyggnadsbolaget I Norden AB 2.624% (Reg. S) (b)(e) | EUR | 647,000 | 137,288 |
TOTAL SWEDEN | | | 1,498,886 |
| Switzerland - 0.1% | | | |
| Credit Suisse Group AG 7.5% (Reg. S) (b)(e)(g) | | 611,000 | 21,385 |
| UBS Group AG 7% (Reg. S) (b)(e) | | 250,000 | 243,622 |
TOTAL SWITZERLAND | | | 265,007 |
| United Kingdom - 1.4% | | | |
| Barclays PLC 7.125% (b)(e) | GBP | 425,000 | 490,195 |
| British American Tobacco PLC 3% (Reg. S) (b)(e) | EUR | 2,767,000 | 2,573,295 |
| National Express Group PLC 4.25% (Reg. S) (b)(e) | GBP | 340,000 | 382,491 |
| SSE PLC 3.74% (Reg. S) (b)(e) | GBP | 337,000 | 389,361 |
TOTAL UNITED KINGDOM | | | 3,835,342 |
| TOTAL PREFERRED SECURITIES (Cost $16,585,400) | | | 15,336,271 |
| | | | |
| Money Market Funds - 4.8% |
| | | Shares | Value ($) |
Fidelity Cash Central Fund 5.14% (h) (Cost $13,080,696) | | 13,078,081 | 13,080,696 |
| | | | |
| Purchased Swaptions - 0.0% |
| | Expiration Date | Notional Amount (a) | Value ($) |
| Put Options - 0.0% | | | | |
Option with an exercise rate of 4.625% on a credit default swap with Goldman Sachs Bank U.S.A. to buy protection on the 5-Year iTraxx Europe Crossover Series 39 Index expiring June 2028, paying 5% quarterly. (Cost $242,776) | 8/16/23 | EUR | 18,700,000 | 63,404 |
| | | | | |
For the period, the average monthly notional amount at value for purchased swaptions in the aggregate was $14,818,652.
| TOTAL INVESTMENT IN SECURITIES - 98.1% (Cost $270,959,210) | 270,054,856 |
NET OTHER ASSETS (LIABILITIES) - 1.9% | 5,264,345 |
| NET ASSETS - 100.0% | 275,319,201 |
| | |
| Futures Contracts |
| | Number of contracts | Expiration Date | Notional Amount ($) | Value ($) | Unrealized Appreciation/ (Depreciation) ($) |
| Purchased | | | | | |
| | | | | | |
| Bond Index Contracts | | | | | |
| Eurex Euro-Bobl Contracts (Germany) | 19 | Sep 2023 | 2,398,992 | (244) | (244) |
| Eurex Euro-Bund Contracts (Germany) | 3 | Sep 2023 | 437,811 | (297) | (297) |
| Eurex Euro-Schatz Contracts (Germany) | 12 | Sep 2023 | 1,372,948 | (12,434) | (12,434) |
| TME 10 Year Canadian Note Contracts (Canada) | 97 | Sep 2023 | 8,971,814 | (42,692) | (42,692) |
| | | | | | |
| TOTAL BOND INDEX CONTRACTS | | | | | (55,667) |
| | | | | | |
| Treasury Contracts | | | | | |
| ASX 10 Year Treasury Bond Index Contracts (Australia) | 24 | Sep 2023 | 1,857,316 | (10,430) | (10,430) |
| CBOT 2-Year U.S. Treasury Note Contracts (United States) | 190 | Sep 2023 | 38,635,313 | (509,420) | (509,420) |
| CBOT Long Term U.S. Treasury Bond Contracts (United States) | 15 | Sep 2023 | 1,903,594 | (4,376) | (4,376) |
| | | | | | |
| TOTAL TREASURY CONTRACTS | | | | | (524,226) |
| | | | | | |
| TOTAL PURCHASED | | | | | (579,893) |
| | | | | | |
| Sold | | | | | |
| | | | | | |
| Bond Index Contracts | | | | | |
| ICE Long Gilt Contracts (United Kingdom) | 62 | Sep 2023 | 7,503,922 | 51,355 | 51,355 |
| | | | | | |
| TOTAL FUTURES CONTRACTS | | | | | (528,538) |
| The notional amount of futures purchased as a percentage of Net Assets is 20.3% |
| The notional amount of futures sold as a percentage of Net Assets is 2.7% |
For the period, the average monthly notional amount at value for futures contracts in the aggregate was $51,969,550.
| Forward Foreign Currency Contracts |
Currency Purchased
| Currency Sold | Counterparty | Settlement Date | Unrealized Appreciation/ (Depreciation) ($) |
| | | | | | | |
| EUR | 706,000 | USD | 773,093 | BNP Paribas S.A. | 9/15/23 | 123 |
| EUR | 661,000 | USD | 726,959 | Brown Brothers Harriman & Co | 9/15/23 | (3,028) |
| GBP | 100,000 | USD | 126,412 | BNP Paribas S.A. | 9/15/23 | 615 |
| GBP | 115,000 | USD | 144,990 | Brown Brothers Harriman & Co | 9/15/23 | 1,092 |
| GBP | 126,000 | USD | 160,243 | JPMorgan Chase Bank, N.A. | 9/15/23 | (187) |
| GBP | 125,000 | USD | 159,428 | Royal Bank of Canada | 9/15/23 | (643) |
| USD | 187,517 | AUD | 272,000 | Bank of America, N.A. | 9/15/23 | 5,948 |
| USD | 247,762 | CAD | 327,000 | Royal Bank of Canada | 9/15/23 | 638 |
| USD | 126,434,349 | EUR | 115,002,000 | Bank of America, N.A. | 9/15/23 | 483,399 |
| USD | 48,117,114 | GBP | 37,515,000 | BNP Paribas S.A. | 9/15/23 | 462,571 |
| USD | 6,735,563 | JPY | 937,600,000 | Bank of America, N.A. | 9/15/23 | 162,974 |
| | | | | | | |
| TOTAL FORWARD FOREIGN CURRENCY CONTRACTS | | 1,113,502 |
| | | | | | | |
| Unrealized Appreciation | | | 1,117,360 |
| Unrealized Depreciation | | | (3,858) |
For the period, the average contract value for forward foreign currency contracts was $127,369,361. Contract value represents contract amount in United States dollars plus or minus unrealized appreciation or depreciation, respectively.
| Credit Default Swaps |
| Underlying Reference | | Maturity Date | Clearinghouse / Counterparty | Fixed Payment Received/ (Paid) | Payment Frequency | Notional Amount (1) | Value ($) | Upfront Premium Received/ (Paid) ($) | Unrealized Appreciation/ (Depreciation) ($) |
| Buy Protection | | | | | | | | | | |
| Intesa Sanpaolo SpA | | Jun 2028 | JPMorgan Chase Bank, N.A. | (1%) | Quarterly | EUR | 2,350,000 | (59) | 3,388 | 3,329 |
| | | | | | | | | | | |
(1)Notional amount is stated in U.S. Dollars unless otherwise noted.
Currency Abbreviations
| AUD | - | Australian dollar |
| CAD | - | Canadian dollar |
| EUR | - | European Monetary Unit |
| GBP | - | British pound sterling |
| JPY | - | Japanese yen |
| USD | - | U.S. dollar |
Legend
| (a) | Amount is stated in United States dollars unless otherwise noted. |
| (b) | Coupon rates for floating and adjustable rate securities reflect the rates in effect at period end. |
| (c) | Security exempt from registration under Rule 144A of the Securities Act of 1933. These securities may be resold in transactions exempt from registration, normally to qualified institutional buyers. At the end of the period, the value of these securities amounted to $11,990,491 or 4.4% of net assets. |
| (d) | Coupon is indexed to a floating interest rate which may be multiplied by a specified factor and/or subject to caps or floors. |
| (e) | Security is perpetual in nature with no stated maturity date. |
| (f) | Security or a portion of the security was pledged to cover margin requirements for futures contracts. At period end, the value of securities pledged amounted to $1,100,909. |
| (g) | Non-income producing - Security is in default. |
| (h) | Affiliated fund that is generally available only to investment companies and other accounts managed by Fidelity Investments. The rate quoted is the annualized seven-day yield of the fund at period end. A complete unaudited listing of the fund's holdings as of its most recent quarter end is available upon request. In addition, each Fidelity Central Fund's financial statements are available on the SEC's website or upon request. |
Affiliated Central Funds
Fiscal year to date information regarding the Fund's investments in Fidelity Central Funds, including the ownership percentage, is presented below.
| Affiliate | Value, beginning of period ($) | Purchases ($) | Sales Proceeds ($) | Dividend Income ($) | Realized Gain (loss) ($) | Change in Unrealized appreciation (depreciation) ($) | Value, end of period ($) | % ownership, end of period |
| Fidelity Cash Central Fund 5.14% | - | 246,880,649 | 233,799,953 | 296,907 | - | - | 13,080,696 | 0.0% |
| Total | - | 246,880,649 | 233,799,953 | 296,907 | - | - | 13,080,696 | |
| | | | | | | | | |
Amounts in the dividend income column in the above table include any capital gain distributions from underlying funds, which are presented in the corresponding line item in the Statement of Operations, if applicable.
Amounts included in the purchases and sales proceeds columns may include in-kind transactions, if applicable.
Investment Valuation
The following is a summary of the inputs used, as of June 30, 2023, involving the Fund's assets and liabilities carried at fair value. The inputs or methodology used for valuing securities may not be an indication of the risk associated with investing in those securities. For more information on valuation inputs, and their aggregation into the levels used below, please refer to the Investment Valuation section in the accompanying Notes to Financial Statements.
| Valuation Inputs at Reporting Date: |
| Description | Total ($) | Level 1 ($) | Level 2 ($) | Level 3 ($) |
Investments in Securities: | | | | |
|
| Corporate Bonds | 140,120,924 | - | 140,120,924 | - |
|
| U.S. Government and Government Agency Obligations | 52,898,637 | - | 52,898,637 | - |
|
| Foreign Government and Government Agency Obligations | 48,554,924 | - | 48,554,924 | - |
|
| Preferred Securities | 15,336,271 | - | 15,336,271 | - |
|
| Money Market Funds | 13,080,696 | 13,080,696 | - | - |
|
| Purchased Swaptions | 63,404 | - | 63,404 | - |
| Total Investments in Securities: | 270,054,856 | 13,080,696 | 256,974,160 | - |
Derivative Instruments: | | | | |
|
| Assets | | | | |
Futures Contracts | 51,355 | 51,355 | - | - |
Forward Foreign Currency Contracts | 1,117,360 | - | 1,117,360 | - |
| Total Assets | 1,168,715 | 51,355 | 1,117,360 | - |
|
| Liabilities | | | | |
Futures Contracts | (579,893) | (579,893) | - | - |
Forward Foreign Currency Contracts | (3,858) | - | (3,858) | - |
Swaps | (59) | - | (59) | - |
| Total Liabilities | (583,810) | (579,893) | (3,917) | - |
| Total Derivative Instruments: | 584,905 | (528,538) | 1,113,443 | - |
Value of Derivative Instruments
The following table is a summary of the Fund's value of derivative instruments by primary risk exposure as of June 30, 2023. For additional information on derivative instruments, please refer to the Derivative Instruments section in the accompanying Notes to Financial Statements.
Primary Risk Exposure / Derivative Type | Value |
| Asset ($) | Liability ($) |
| Credit Risk | | |
Purchased Swaptions (a) | 63,404 | 0 |
Swaps (d) | 0 | (59) |
| Total Credit Risk | 63,404 | (59) |
| Foreign Exchange Risk | | |
Forward Foreign Currency Contracts (b) | 1,117,360 | (3,858) |
| Total Foreign Exchange Risk | 1,117,360 | (3,858) |
| Interest Rate Risk | | |
Futures Contracts (c) | 51,355 | (579,893) |
| Total Interest Rate Risk | 51,355 | (579,893) |
| Total Value of Derivatives | 1,232,119 | (583,810) |
(a)Gross value is included in the Statement of Assets and Liabilities in the investments in securities, at value line-item.
(b)Gross value is presented in the Statement of Assets and Liabilities in the unrealized appreciation/depreciation on forward foreign currency contracts line-items.
(c)Reflects gross cumulative appreciation (depreciation) on futures contracts as presented in the Schedule of Investments. In the Statement of Assets and Liabilities, the period end daily variation margin is included in receivable or payable for daily variation margin on futures contracts, and the net cumulative appreciation (depreciation) is included in Total accumulated earnings (loss).
(d)For bi-lateral over-the-counter (OTC) swaps, reflects gross value which is presented in the Statement of Assets and Liabilities in the bi-lateral OTC swaps, at value line-items.
| Statement of Assets and Liabilities |
| | | | June 30, 2023 (Unaudited) |
| | | | | |
| Assets | | | | |
| Investment in securities, at value - See accompanying schedule: | | | | |
Unaffiliated issuers (cost $257,878,514) | $ | 256,974,160 | | |
Fidelity Central Funds (cost $13,080,696) | | 13,080,696 | | |
| | | | | |
| | | | | |
| Total Investment in Securities (cost $270,959,210) | | | $ | 270,054,856 |
| Foreign currency held at value (cost $2,481,132) | | | | 2,477,671 |
| Receivable for investments sold | | | | 2,699,961 |
| Unrealized appreciation on forward foreign currency contracts | | | | 1,117,360 |
| Dividends receivable | | | | 926 |
| Interest receivable | | | | 2,755,434 |
| Distributions receivable from Fidelity Central Funds | | | | 53,040 |
| Receivable for daily variation margin on futures contracts | | | | 118,177 |
| Prepaid expenses | | | | 18,728 |
| Receivable from investment adviser for expense reductions | | | | 12,393 |
| Other receivables | | | | 166 |
Total assets | | | | 279,308,712 |
| Liabilities | | | | |
| Payable for investments purchased | $ | 3,861,515 | | |
| Unrealized depreciation on forward foreign currency contracts | | 3,858 | | |
| Bi-lateral OTC swaps, at value | | 59 | | |
| Accrued management fee | | 88,673 | | |
| Other payables and accrued expenses | | 35,406 | | |
| Total Liabilities | | | | 3,989,511 |
| Net Assets | | | $ | 275,319,201 |
| Net Assets consist of: | | | | |
| Paid in capital | | | $ | 275,904,299 |
| Total accumulated earnings (loss) | | | | (585,098) |
| Net Assets | | | $ | 275,319,201 |
Net Asset Value , offering price and redemption price per share ($275,319,201 ÷ 27,535,485 shares) | | | $ | 10.00 |
| Statement of Operations |
| | | | For the period March 1, 2023 (commencement of operations) through June 30, 2023 (Unaudited) |
| Investment Income | | | | |
| Dividends | | | $ | 296,377 |
| Interest | | | | 2,255,095 |
| Income from Fidelity Central Funds | | | | 296,907 |
| Income before foreign taxes withheld | | | $ | 2,848,379 |
| Less foreign taxes withheld | | | | (434) |
| Total Income | | | | 2,847,945 |
| Expenses | | | | |
| Management fee | $ | 225,566 | | |
| Custodian fees and expenses | | 5,239 | | |
| Independent trustees' fees and expenses | | 91 | | |
| Registration fees | | 14,474 | | |
| Audit | | 29,786 | | |
| Legal | | 2 | | |
| Miscellaneous | | 317 | | |
| Total expenses before reductions | | 275,475 | | |
| Expense reductions | | (39,630) | | |
| Total expenses after reductions | | | | 235,845 |
| Net Investment income (loss) | | | | 2,612,100 |
| Realized and Unrealized Gain (Loss) | | | | |
| Net realized gain (loss) on: | | | | |
| Investment Securities: | | | | |
| Unaffiliated issuers | | 256,873 | | |
| Forward foreign currency contracts | | (4,344,392) | | |
| Foreign currency transactions | | 361,535 | | |
| Futures contracts | | 1,081,054 | | |
| Swaps | | (933) | | |
| Total net realized gain (loss) | | | | (2,645,863) |
| Change in net unrealized appreciation (depreciation) on: | | | | |
| Investment Securities: | | | | |
| Unaffiliated issuers | | (904,354) | | |
| Forward foreign currency contracts | | 1,113,502 | | |
| Assets and liabilities in foreign currencies | | 28,625 | | |
| Futures contracts | | (528,538) | | |
| Swaps | | 3,329 | | |
| Total change in net unrealized appreciation (depreciation) | | | | (287,436) |
| Net gain (loss) | | | | (2,933,299) |
| Net increase (decrease) in net assets resulting from operations | | | $ | (321,199) |
| Statement of Changes in Net Assets |
| |
| | For the period March 1, 2023 (commencement of operations) through June 30, 2023 (Unaudited) |
| Increase (Decrease) in Net Assets | | |
| Operations | | |
| Net investment income (loss) | $ | 2,612,100 |
| Net realized gain (loss) | | (2,645,863) |
| Change in net unrealized appreciation (depreciation) | | (287,436) |
| Net increase (decrease) in net assets resulting from operations | | (321,199) |
| Distributions to shareholders | | (263,899) |
| | | |
| Share transactions | | |
| Proceeds from sales of shares | | 275,640,551 |
| Reinvestment of distributions | | 263,899 |
| Cost of shares redeemed | | (151) |
| | | |
Net increase (decrease) in net assets resulting from share transactions | | 275,904,299 |
| Total increase (decrease) in net assets | | 275,319,201 |
| | | |
| Net Assets | | |
| Beginning of period | | - |
| End of period | $ | 275,319,201 |
| | | |
| Other Information | | |
| Shares | | |
| Sold | | 27,509,500 |
| Issued in reinvestment of distributions | | 26,000 |
| Redeemed | | (15) |
| Net increase (decrease) | | 27,535,485 |
| | | |
| Fidelity SAI International Credit Fund |
| |
| | Six months ended (Unaudited) June 30, 2023 A |
Selected Per-Share Data | | |
| Net asset value, beginning of period | $ | 10.00 |
| Income from Investment Operations | | |
Net investment income (loss) B,C | | .152 |
Net realized and unrealized gain (loss) D | | (.131) |
| Total from investment operations | | .021 |
| Distributions from net investment income | | (.021) |
| Total distributions | | (.021) |
| Net asset value, end of period | $ | 10.00 |
Total Return E,F | | .21% |
Ratios to Average Net Assets C,G,H | | |
| Expenses before reductions | | .49% I |
| Expenses net of fee waivers, if any | | .42% I,J |
| Expenses net of all reductions | | .42% I,J |
| Net investment income (loss) | | 4.62% I |
| Supplemental Data | | |
| Net assets, end of period (000 omitted) | $ | 275,319 |
Portfolio turnover rate K,L,M | | 20% |
A For the period March 1, 2023 (commencement of operations) through June 30, 2023.
B Calculated based on average shares outstanding during the period.
C Net investment income (loss) is affected by the timing of the declaration of dividends by any underlying mutual funds or exchange-traded funds (ETFs). Net investment income (loss) of any mutual funds or ETFs is not included in the Fund's net investment income (loss) ratio.
D The amount shown for a share outstanding does not correspond with the aggregate net gain (loss) on investments for the period due to the timing of sales and repurchases of shares in relation to fluctuating market values of the investments of the Fund.
E Total returns for periods of less than one year are not annualized.
F Total returns would have been lower if certain expenses had not been reduced during the applicable periods shown.
G Fees and expenses of any underlying mutual funds or exchange-traded funds (ETFs) are not included in the Fund's expense ratio. The Fund indirectly bears its proportionate share of these expenses. For additional expense information related to investments in Fidelity Central Funds, please refer to the "Investments in Fidelity Central Funds" note found in the Notes to Financial Statements section of the most recent Annual or Semi-Annual report.
H Expense ratios reflect operating expenses of the class. Expenses before reductions do not reflect amounts reimbursed, waived, or reduced through arrangements with the investment adviser, brokerage services, or other offset arrangements, if applicable, and do not represent the amount paid by the class during periods when reimbursements, waivers or reductions occur.
I Annualized.
J The size and fluctuation of net assets and expense amounts may cause ratios to differ from contractual rates.
K Amount not annualized.
L Portfolio turnover rate excludes securities received or delivered in-kind.
M Amount does not include the portfolio activity of any underlying mutual funds or exchange-traded funds (ETFs).
For the period ended June 30, 2023
1. Organization.
Fidelity SAI International Credit Fund (the Fund) is a fund of Fidelity Salem Street Trust (the Trust) and is authorized to issue an unlimited number of shares. Shares are offered exclusively to certain clients of Fidelity Management & Research Company LLC (FMR) or its affiliates. The Trust is registered under the Investment Company Act of 1940, as amended (the 1940 Act), as an open-end management investment company organized as a Massachusetts business trust.
2. Investments in Fidelity Central Funds.
Funds may invest in Fidelity Central Funds, which are open-end investment companies generally available only to other investment companies and accounts managed by the investment adviser and its affiliates. The Schedule of Investments lists any Fidelity Central Funds held as an investment as of period end, but does not include the underlying holdings of each Fidelity Central Fund. An investing fund indirectly bears its proportionate share of the expenses of the underlying Fidelity Central Funds.
Based on its investment objective, each Fidelity Central Fund may invest or participate in various investment vehicles or strategies that are similar to those of the investing fund. These strategies are consistent with the investment objectives of the investing fund and may involve certain economic risks which may cause a decline in value of each of the Fidelity Central Funds and thus a decline in the value of the investing fund.
| Fidelity Central Fund | Investment Manager | Investment Objective | Investment Practices | Expense Ratio A |
| Fidelity Money Market Central Funds | Fidelity Management & Research Company LLC (FMR) | Each fund seeks to obtain a high level of current income consistent with the preservation of capital and liquidity. | Short-term Investments | Less than .005% |
A Expenses expressed as a percentage of average net assets and are as of each underlying Central Fund's most recent annual or semi-annual shareholder report.
A complete unaudited list of holdings for each Fidelity Central Fund is available upon request or at the Securities and Exchange Commission website at www.sec.gov. In addition, the financial statements of the Fidelity Central Funds which contain the significant accounting policies (including investment valuation policies) of those funds, and are not covered by the Report of Independent Registered Public Accounting Firm, are available on the Securities and Exchange Commission website or upon request.
3. Significant Accounting Policies.
The Fund is an investment company and applies the accounting and reporting guidance of the Financial Accounting Standards Board (FASB) Accounting Standards Codification Topic 946 Financial Services - Investment Companies . The financial statements have been prepared in conformity with accounting principles generally accepted in the United States of America (GAAP), which require management to make certain estimates and assumptions at the date of the financial statements. Actual results could differ from those estimates. Subsequent events, if any, through the date that the financial statements were issued have been evaluated in the preparation of the financial statements. The Fund's Schedule of Investments lists any underlying mutual funds or exchange-traded funds (ETFs) but does not include the underlying holdings of these funds. The following summarizes the significant accounting policies of the Fund:
Investment Valuation. Investments are valued as of 4:00 p.m. Eastern time on the last calendar day of the period. The Board of Trustees (the Board) has designated the Fund's investment adviser as the valuation designee responsible for the fair valuation function and performing fair value determinations as needed. The investment adviser has established a Fair Value Committee (the Committee) to carry out the day-to-day fair valuation responsibilities and has adopted policies and procedures to govern the fair valuation process and the activities of the Committee. In accordance with these fair valuation policies and procedures, which have been approved by the Board, the Fund attempts to obtain prices from one or more third party pricing services or brokers to value its investments. When current market prices, quotations or currency exchange rates are not readily available or reliable, investments will be fair valued in good faith by the Committee, in accordance with the policies and procedures. Factors used in determining fair value vary by investment type and may include market or investment specific events, transaction data, estimated cash flows, and market observations of comparable investments. The frequency that the fair valuation procedures are used cannot be predicted and they may be utilized to a significant extent. The Committee manages the Fund's fair valuation practices and maintains the fair valuation policies and procedures. The Fund's investment adviser reports to the Board information regarding the fair valuation process and related material matters.
The Fund categorizes the inputs to valuation techniques used to value its investments into a disclosure hierarchy consisting of three levels as shown below:
Level 1 - unadjusted quoted prices in active markets for identical investments
Level 2 - other significant observable inputs (including quoted prices for similar investments, interest rates, prepayment speeds, etc.)
Level 3 - unobservable inputs (including the Fund's own assumptions based on the best information available)
Valuation techniques used to value the Fund's investments by major category are as follows:
Debt securities, including restricted securities, are valued based on evaluated prices received from third party pricing services or from brokers who make markets in such securities. Corporate bonds, foreign government and government agency obligations, preferred securities and U.S. government and government agency obligations are valued by pricing services who utilize matrix pricing which considers yield or price of bonds of comparable quality, coupon, maturity and type or by broker-supplied prices. Swaps are marked-to-market daily based on valuations from third party pricing services, registered derivatives clearing organizations (clearinghouses) or broker-supplied valuations. These pricing sources may utilize inputs such as interest rate curves, credit spread curves, default possibilities and recovery rates. When independent prices are unavailable or unreliable, debt securities and swaps may be valued utilizing pricing methodologies which consider similar factors that would be used by third party pricing services. For foreign debt securities, when significant market or security specific events arise, valuations may be determined in good faith in accordance with procedures adopted by the Board. Debt securities and swaps are generally categorized as Level 2 in the hierarchy but may be Level 3 depending on the circumstances.
The U.S. dollar value of forward foreign currency contracts is determined using currency exchange rates supplied by a pricing service and are categorized as Level 2 in the hierarchy. Futures contracts are valued at the settlement price established each day by the board of trade or exchange on which they are traded and are categorized as Level 1 in the hierarchy. Options traded over-the-counter are valued using service or broker-supplied valuations and are categorized as Level 2 in the hierarchy. Investments in open-end mutual funds, including the Fidelity Central Funds, are valued at their closing net asset value (NAV) each business day and are categorized as Level 1 in the hierarchy.
Changes in valuation techniques may result in transfers in or out of an assigned level within the disclosure hierarchy. The aggregate value of investments by input level as of June 30, 2023 is included at the end of the Fund's Schedule of Investments.
Foreign Currency. Foreign-denominated assets, including investment securities, and liabilities are translated into U.S. dollars at the exchange rates at period end. Purchases and sales of investment securities, income and dividends received, and expenses denominated in foreign currencies are translated into U.S. dollars at the exchange rate in effect on the transaction date.
The effects of exchange rate fluctuations on investments are included with the net realized and unrealized gain (loss) on investment securities. Other foreign currency transactions resulting in realized and unrealized gain (loss) are disclosed separately.
Realized gains and losses on foreign currency transactions arise from the disposition of foreign currency, realized changes in the value of foreign currency between the trade and settlement dates on security transactions, and the difference between the amounts of dividends, interest and foreign withholding taxes recorded on transaction date and the U.S. dollar equivalent of the amounts actually received or paid. Unrealized gains and losses on assets and liabilities in foreign currencies arise from changes in the value of foreign currency, and from assets and liabilities denominated in foreign currencies, other than investments, which are held at period end.
Investment Transactions and Income. For financial reporting purposes, the Fund's investment holdings and NAV include trades executed through the end of the last business day of the period. The NAV per share for processing shareholder transactions is calculated as of the close of business of the New York Stock Exchange (NYSE), normally 4:00 p.m. Eastern time and includes trades executed through the end of the prior business day. Gains and losses on securities sold are determined on the basis of identified cost. Dividend income is recorded on the ex-dividend date. Non-cash dividends included in dividend income, if any, are recorded at the fair market value of the securities received. Income and capital gain distributions from Fidelity Central Funds, if any, are recorded on the ex-dividend date. Interest income is accrued as earned and includes coupon interest and amortization of premium and accretion of discount on debt securities as applicable. Investment income is recorded net of foreign taxes withheld where recovery of such taxes is uncertain. Debt obligations may be placed on non-accrual status and related interest income may be reduced by ceasing current accruals and writing off interest receivables when the collection of all or a portion of interest has become doubtful based on consistently applied procedures. A debt obligation is removed from non-accrual status when the issuer resumes interest payments or when collectability of interest is reasonably assured.
Expenses. Expenses directly attributable to a fund are charged to that fund. Expenses attributable to more than one fund are allocated among the respective funds on the basis of relative net assets or other appropriate methods. Expenses included in the accompanying financial statements reflect the expenses of that fund and do not include any expenses associated with any underlying mutual funds or exchange-traded funds. Although not included in a fund's expenses, a fund indirectly bears its proportionate share of these expenses through the net asset value of each underlying mutual fund or exchange-traded fund. Expense estimates are accrued in the period to which they relate and adjustments are made when actual amounts are known.
Income Tax Information and Distributions to Shareholders. Each year, the Fund intends to qualify as a regulated investment company under Subchapter M of the Internal Revenue Code, including distributing substantially all of its taxable income and realized gains. As a result, no provision for U.S. Federal income taxes is required. The Fund files a U.S. federal tax return, in addition to state and local tax returns as required. The Fund's federal income tax returns are subject to examination by the Internal Revenue Service (IRS) for a period of three fiscal years after they are filed. State and local tax returns may be subject to examination for an additional fiscal year depending on the jurisdiction. Foreign taxes are provided for based on the Fund's understanding of the tax rules and rates that exist in the foreign markets in which it invests.
Distributions are declared and recorded on the ex-dividend date. Income and capital gain distributions are determined in accordance with income tax regulations, which may differ from GAAP.
Capital accounts within the financial statements are adjusted for permanent book-tax differences. These adjustments have no impact on net assets or the results of operations. Capital accounts are not adjusted for temporary book-tax differences which will reverse in a subsequent period.
As of period end, the cost and unrealized appreciation (depreciation) in securities, and derivatives if applicable, for federal income tax purposes were as follows:
| Gross unrealized appreciation | $4,181,170 |
| Gross unrealized depreciation | (3,977,691) |
| Net unrealized appreciation (depreciation) | $203,479 |
| Tax cost | $270,439,670 |
Restricted Securities (including Private Placements). Funds may invest in securities that are subject to legal or contractual restrictions on resale. These securities generally may be resold in transactions exempt from registration or to the public if the securities are registered. Disposal of these securities may involve time-consuming negotiations and expense, and prompt sale at an acceptable price may be difficult. Information regarding restricted securities held at period end is included at the end of the Schedule of Investments, if applicable.
4. Derivative Instruments.
Risk Exposures and the Use of Derivative Instruments. The Fund's investment objectives allow for various types of derivative instruments, including futures contracts, forward foreign currency contracts, options and swaps. Derivatives are investments whose value is primarily derived from underlying assets, indices or reference rates and may be transacted on an exchange or over-the-counter (OTC). Derivatives may involve a future commitment to buy or sell a specified asset based on specified terms, to exchange future cash flows at periodic intervals based on a notional principal amount, or for one party to make one or more payments upon the occurrence of specified events in exchange for periodic payments from the other party.
Derivatives were used to increase returns, to gain exposure to certain types of assets, to facilitate transactions in foreign-denominated securities and to manage exposure to certain risks as defined below. The success of any strategy involving derivatives depends on analysis of numerous economic factors, and if the strategies for investment do not work as intended, the objectives may not be achieved.
Derivatives were used to increase or decrease exposure to the following risk(s):
| | |
| Credit Risk | Credit risk relates to the ability of the issuer of a financial instrument to make further principal or interest payments on an obligation or commitment that it has to a fund. |
| Foreign Exchange Risk | Foreign exchange rate risk relates to fluctuations in the value of an asset or liability due to changes in currency exchange rates. |
| Interest Rate Risk | Interest rate risk relates to the fluctuations in the value of interest-bearing securities due to changes in the prevailing levels of market interest rates. |
Funds are also exposed to additional risks from investing in derivatives, such as liquidity risk and counterparty credit risk. Liquidity risk is the risk that a fund will be unable to close out the derivative in the open market in a timely manner. Counterparty credit risk is the risk that the counterparty will not be able to fulfill its obligation to a fund. Derivative counterparty credit risk is managed through formal evaluation of the creditworthiness of all potential counterparties. On certain OTC derivatives such as forward foreign currency contracts, options and bi-lateral swaps, a fund attempts to reduce its exposure to counterparty credit risk by entering into an International Swaps and Derivatives Association, Inc. (ISDA) Master Agreement with each of its counterparties. The ISDA Master Agreement gives a fund the right to terminate all transactions traded under such agreement upon the deterioration in the credit quality of the counterparty beyond specified levels. The ISDA Master Agreement gives each party the right, upon an event of default by the other party or a termination of the agreement, to close out all transactions traded under such agreement and to net amounts owed under each transaction to one net payable by one party to the other. To mitigate counterparty credit risk on bi-lateral OTC derivatives, a fund receives collateral in the form of cash or securities once net unrealized appreciation on outstanding derivative contracts under an ISDA Master Agreement exceeds certain applicable thresholds, subject to certain minimum transfer provisions. The collateral received is held in segregated accounts with the custodian bank in accordance with the collateral agreements entered into between a fund, the counterparty and the custodian bank. A fund could experience delays and costs in gaining access to the collateral even though it is held by the custodian bank. The maximum risk of loss to a fund from counterparty credit risk related to bi-lateral OTC derivatives is generally the aggregate unrealized appreciation and unpaid counterparty payments in excess of any collateral pledged by the counterparty to a fund. A fund may be required to pledge collateral for the benefit of the counterparties on bi-lateral OTC derivatives in an amount not less than each counterparty's unrealized appreciation on outstanding derivative contracts, subject to certain minimum transfer provisions, and any such pledged collateral is identified in the Schedule of Investments. Exchange-traded contracts are not covered by the ISDA Master Agreement; however counterparty credit risk related to these contracts may be mitigated by the protection provided by the exchange on which they trade.
Investing in derivatives may involve greater risks than investing in the underlying assets directly and, to varying degrees, may involve risk of loss in excess of any initial investment and collateral received and amounts recognized in the Statement of Assets and Liabilities. In addition, there may be the risk that the change in value of the derivative contract does not correspond to the change in value of the underlying instrument.
Net Realized Gain (Loss) and Change in Net Unrealized Appreciation (Depreciation) on Derivatives. The table below, which reflects the impacts of derivatives on the financial performance, summarizes the net realized gain (loss) and change in net unrealized appreciation (depreciation) for derivatives during the period as presented in the Statement of Operations.
| Primary Risk Exposure / Derivative Type | Net Realized Gain (Loss) | Change in Net Unrealized Appreciation (Depreciation) |
| Fidelity SAI International Credit Fund | | |
| Credit Risk | | |
| Purchased Options | $39,334 | $(179,372) |
| Swaps | (933) | 3,329 |
| Total Credit Risk | 38,401 | (176,043) |
| Foreign Exchange Risk | | |
| Forward Foreign Currency Contracts | (4,344,392) | 1,113,502 |
| Total Foreign Exchange Risk | (4,344,392) | 1,113,502 |
| Interest Rate Risk | | |
| Futures Contracts | 1,081,054 | (528,538) |
| Total Interest Rate Risk | 1,081,054 | (528,538) |
| Totals | $(3,224,937) | $408,921 |
If there are any open positions at period end, a summary of the value of derivatives by primary risk exposure is included at the end of the Schedule of Investments.
Forward Foreign Currency Contracts. Forward foreign currency contracts represent obligations to purchase or sell foreign currency on a specified future date at a price fixed at the time the contracts are entered into. Forward foreign currency contracts were used to facilitate transactions in foreign-denominated securities and to manage exposure to certain foreign currencies.
Forward foreign currency contracts are valued daily and fluctuations in exchange rates on open contracts are recorded as unrealized appreciation or (depreciation) and reflected in total accumulated earnings (loss) in the Statement of Assets and Liabilities. When the contract is closed, a gain or loss is realized equal to the difference between the closing value and the value at the time it was opened. Non-deliverable forward foreign currency exchange contracts are settled with the counterparty in cash without the delivery of foreign currency. The net realized gain (loss) and change in net unrealized appreciation (depreciation) on forward foreign currency contracts during the period is presented in the Statement of Operations.
Any open forward foreign currency contracts at period end are presented in the Schedule of Investments under the caption "Forward Foreign Currency Contracts." The contract amount and unrealized appreciation (depreciation) reflects each contract's exposure to the underlying currency at period end, and is representative of volume of activity during the period unless an average contract value is presented.
Futures Contracts. A futures contract is an agreement between two parties to buy or sell a specified underlying instrument for a fixed price at a specified future date. Futures contracts were used to manage exposure to the bond market and fluctuations in interest rates.
Upon entering into a futures contract, a fund is required to deposit either cash or securities (initial margin) with a clearing broker in an amount equal to a certain percentage of the face value of the contract. Futures contracts are marked-to-market daily and subsequent daily payments are made or received by a fund depending on the daily fluctuations in the value of the futures contracts and are recorded as unrealized appreciation or (depreciation). This receivable and/or payable, if any, is included in daily variation margin on futures contracts in the Statement of Assets and Liabilities. Realized gain or (loss) is recorded upon the expiration or closing of a futures contract. The net realized gain (loss) and change in net unrealized appreciation (depreciation) on futures contracts during the period is presented in the Statement of Operations.
Any open futures contracts at period end are presented in the Schedule of Investments under the caption "Futures Contracts". The notional amount at value reflects each contract's exposure to the underlying instrument or index at period end, and is representative of volume of activity during the period unless an average notional amount is presented. Any securities deposited to meet initial margin requirements are identified in the Schedule of Investments. Any cash deposited to meet initial margin requirements is presented as segregated cash with brokers for derivative instruments in the Statement of Assets and Liabilities.
Options. Options give the purchaser the right, but not the obligation, to buy (call) or sell (put) an underlying security or financial instrument at an agreed exercise or strike price between or on certain dates. Options obligate the seller (writer) to buy (put) or sell (call) an underlying instrument at the exercise or strike price or cash settle an underlying derivative instrument if the holder exercises the option on or before the expiration date. OTC options, such as swaptions, which are options where the underlying instrument is a swap, were used to manage exposure to potential credit events.
Upon entering into an options contract, a fund will pay or receive a premium. Premiums paid on purchased options are reflected as cost of investments and premiums received on written options are reflected as a liability on the Statement of Assets and Liabilities. Certain options may be purchased or written with premiums to be paid or received on a future date. Options are valued daily and any unrealized appreciation (depreciation) is reflected in total accumulated earnings (loss) in the Statement of Assets and Liabilities. When an option is exercised, the cost or proceeds of the underlying instrument purchased or sold is adjusted by the amount of the premium. When an option is closed, a gain or loss is realized depending on whether the proceeds or amount paid for the closing sale transaction is greater or less than the premium received or paid. When an option expires, gains and losses are realized to the extent of premiums received and paid, respectively. The net realized and unrealized gains (losses) on purchased options are included in the Statement of Operations in net realized gain (loss) and change in net unrealized appreciation (depreciation) on investment securities. The net realized gain (loss) and change in net unrealized appreciation (depreciation) on written options are presented in the Statement of Operations.
Any open options at period end are presented in the Schedule of Investments under the captions "Purchased Options," "Purchased Swaptions," "Written Options" and "Written Swaptions," as applicable, and are representative of volume of activity during the period unless an average notional amount is presented.
Writing puts and buying calls tend to increase exposure to the underlying instrument while buying puts and writing calls tend to decrease exposure to the underlying instrument. For purchased options, risk of loss is limited to the premium paid, and for written options, risk of loss is the change in value in excess of the premium received.
Swaps. A swap is a contract between two parties to exchange future cash flows at periodic intervals based on a notional principal amount. A bi-lateral OTC swap is a transaction between a fund and a dealer counterparty where cash flows are exchanged between the two parties for the life of the swap.
Bi-lateral OTC swaps are marked-to-market daily and changes in value are reflected in the Statement of Assets and Liabilities in the bi-lateral OTC swaps at value line items. Any upfront premiums paid or received upon entering a bi-lateral OTC swap to compensate for differences between stated terms of the swap and prevailing market conditions (e.g. credit spreads, interest rates or other factors) are recorded in total accumulated earnings (loss) in the Statement of Assets and Liabilities and amortized to realized gain or (loss) ratably over the term of the swap. Any unamortized upfront premiums are presented in the Schedule of Investments.
Payments are exchanged at specified intervals, accrued daily commencing with the effective date of the contract and recorded as realized gain or (loss). Some swaps may be terminated prior to the effective date and realize a gain or loss upon termination. The net realized gain (loss) and change in net unrealized appreciation (depreciation) on swaps during the period is presented in the Statement of Operations.
Any open swaps at period end are included in the Schedule of Investments under the caption "Swaps", and are representative of volume of activity during the period unless an average notional amount is presented.
Credit Default Swaps. Credit default swaps enable a fund to buy or sell protection against specified credit events on a single-name issuer or a traded credit index. Under the terms of a credit default swap the buyer of protection (buyer) receives credit protection in exchange for making periodic payments to the seller of protection (seller) based on a fixed percentage applied to a notional principal amount. In return for these payments, the seller will be required to make a payment upon the occurrence of one or more specified credit events. A fund enters into credit default swaps as a seller to gain credit exposure to an issuer and/or as a buyer to obtain a measure of protection against defaults of an issuer. Periodic payments are made over the life of the contract by the buyer provided that no credit event occurs.
For credit default swaps on most corporate and sovereign issuers, credit events include bankruptcy, failure to pay or repudiation/moratorium. For credit default swaps on corporate or sovereign issuers, the obligation that may be put to the seller is not limited to the specific reference obligation described in the Schedule of Investments. For credit default swaps on asset-backed securities, a credit event may be triggered by events such as failure to pay principal, maturity extension, rating downgrade or write-down. For credit default swaps on asset-backed securities, the reference obligation described represents the security that may be put to the seller. For credit default swaps on a traded credit index, a specified credit event may affect all or individual underlying securities included in the index.
As a seller, if an underlying credit event occurs, a fund will pay a net settlement amount of cash equal to the notional amount of the swap less the recovery value of the reference obligation or underlying securities comprising an index. Only in the event of the industry's inability to value the underlying asset will a fund be required to take delivery of the reference obligation or underlying securities comprising an index and pay an amount equal to the notional amount of the swap.
As a buyer, if an underlying credit event occurs, a fund will receive a net settlement amount of cash equal to the notional amount of the swap less the recovery value of the reference obligation or underlying securities comprising an index. Only in the event of the industry's inability to value the underlying asset will a fund be required to deliver the reference obligation or underlying securities comprising an index in exchange for payment of an amount equal to the notional amount of the swap.
Typically, the value of each credit default swap and credit rating disclosed for each reference obligation in the Schedule of Investments, where a fund is the seller, can be used as measures of the current payment/performance risk of the swap. As the value of the swap changes as a positive or negative percentage of the total notional amount, the payment/performance risk may decrease or increase, respectively. In addition to these measures, the investment adviser monitors a variety of factors including cash flow assumptions, market activity and market sentiment as part of its ongoing process of assessing payment/performance risk.
5. Purchases and Sales of Investments.
Purchases and sales of securities, other than short-term securities, U.S. government securities and in-kind transactions, as applicable, are noted in the table below.
| | Purchases ($) | Sales ($) |
| Fidelity SAI International Credit Fund | 212,326,744 | 34,402,813 |
6. Fees and Other Transactions with Affiliates.
Management Fee. Fidelity Management & Research Company LLC (the investment adviser) and its affiliates provide the Fund with investment management related services for which the Fund pays a monthly management fee that is based on an annual rate of .40% of the Fund's average net assets.
Interfund Trades. Funds may purchase from or sell securities to other Fidelity Funds under procedures adopted by the Board. The procedures have been designed to ensure these interfund trades are executed in accordance with Rule 17a-7 of the 1940 Act. Any interfund trades are included within the respective purchases and sales amounts shown in the Purchases and Sales of Investments note. During the period, there were no interfund trades.
Affiliated Exchanges In-Kind. Shares that were exchanged for investments, including accrued interest and cash, if any, are shown in the table below. The amount of in-kind exchanges is included in share transactions in the accompanying Statement of Changes in Net Assets.
| | Shares | Total Proceeds ($) |
| Fidelity SAI International Credit Fund | 2,565,606 | 25,630,401 |
7. Committed Line of Credit.
Certain Funds participate with other funds managed by the investment adviser or an affiliate in a $4.25 billion credit facility (the "line of credit") to be utilized for temporary or emergency purposes to fund shareholder redemptions or for other short-term liquidity purposes. The participating funds have agreed to pay commitment fees on their pro-rata portion of the line of credit, which are reflected in Miscellaneous expenses on the Statement of Operations, and are listed below. During the period, there were no borrowings on this line of credit.
| | Amount |
| Fidelity SAI International Credit Fund | $14 |
8. Expense Reductions.
The investment adviser contractually agreed to reimburse the Fund to the extent annual operating expenses exceeded .41% of average net assets. This reimbursement will remain in place through April 30, 2024. Some expenses, for example the compensation of the independent Trustees, and certain miscellaneous expenses such as proxy and shareholder meeting expenses, are excluded from this reimbursement. During the period this reimbursement reduced the Fund's expenses by $39,630.
9. Other.
A fund's organizational documents provide former and current trustees and officers with a limited indemnification against liabilities arising in connection with the performance of their duties to the fund. In the normal course of business, a fund may also enter into contracts that provide general indemnifications. A fund's maximum exposure under these arrangements is unknown as this would be dependent on future claims that may be made against a fund. The risk of material loss from such claims is considered remote.
At the end of the period, the following mutual funds managed by the investment adviser or its affiliates were the owners of record of 10% or more of the total outstanding shares.
| | Strategic Advisers Fidelity Core Income Fund |
| Fidelity SAI International Credit Fund | 100% |
10. Risk and Uncertainties.
Many factors affect a fund's performance. Developments that disrupt global economies and financial markets, such as pandemics, epidemics, outbreaks of infectious diseases, war, terrorism, and environmental disasters, may significantly affect a fund's investment performance. The effects of these developments to a fund will be impacted by the types of securities in which a fund invests, the financial condition, industry, economic sector, and geographic location of an issuer, and a fund's level of investment in the securities of that issuer. Significant concentrations in security types, issuers, industries, sectors, and geographic locations may magnify the factors that affect a fund's performance.
As a shareholder, you incur two types of costs: (1) transaction costs, which may include sales charges (loads) on purchase payments or redemption proceeds, as applicable and (2) ongoing costs, which generally include management fees, distribution and/or service (12b-1) fees and other Fund expenses. This Example is intended to help you understand your ongoing costs (in dollars) of investing in a fund and to compare these costs with the ongoing costs of investing in other mutual funds.
| The actual expense Example is based on an investment of $1,000 invested at the beginning of the period and held for the entire period (March 1, 2023 to June 30, 2023). The hypothetical expense Example is based on an investment of $1,000 invested for the one-half year period (January 1, 2023 to June 30, 2023). |
Actual Expenses
The first line of the accompanying table provides information about actual account values and actual expenses. You may use the information in this line, together with the amount you invested, to estimate the expenses that you paid over the period. Simply divide your account value by $1,000.00 (for example, an $8,600 account value divided by $1,000.00 = 8.6), then multiply the result by the number in the first line for a class/Fund under the heading entitled "Expenses Paid During Period" to estimate the expenses you paid on your account during this period. If any fund is a shareholder of any underlying mutual funds or exchange-traded funds (ETFs) (the Underlying Funds), such fund indirectly bears its proportional share of the expenses of the Underlying Funds in addition to the direct expenses incurred presented in the table. These fees and expenses are not included in the annualized expense ratio used to calculate the expense estimate in the table below.
Hypothetical Example for Comparison Purposes
The second line of the accompanying table provides information about hypothetical account values and hypothetical expenses based on the actual expense ratio and an assumed rate of return of 5% per year before expenses, which is not the actual return. The hypothetical account values and expenses may not be used to estimate the actual ending account balance or expenses you paid for the period. You may use this information to compare the ongoing costs of investing in the Fund and other funds. To do so, compare this 5% hypothetical example with the 5% hypothetical examples that appear in the shareholder reports of the other funds. If any fund is a shareholder of any Underlying Funds, such fund indirectly bears its proportional share of the expenses of the Underlying Funds in addition to the direct expenses as presented in the table. These fees and expenses are not included in the annualized expense ratio used to calculate the expense estimate in the table below.
Please note that the expenses shown in the table are meant to highlight your ongoing costs only and do not reflect any transaction costs. Therefore, the second line of the table is useful in comparing ongoing costs only, and will not help you determine the relative total costs of owning different funds. In addition, if these transactional costs were included, your costs would have been higher.
| | | | | Annualized Expense Ratio- A | | Beginning Account Value | | Ending Account Value June 30, 2023 | | Expenses Paid During Period |
| | | | | | | | | | |
| Fidelity SAI International Credit Fund | | | | .42% | | | | | | |
| Actual | | | | | | $ 1,000 | | $ 1,002.10 | | $ 1.41 C |
Hypothetical- B | | | | | | $ 1,000 | | $ 1,022.71 | | $ 2.11 D |
| |
A Annualized expense ratio reflects expenses net of applicable fee waivers.
B 5% return per year before expenses
C Actual expenses are equal to the annualized expense ratio, multiplied by the average account value over the period, multiplied by 122 / 365 (to reflect the period March 1, 2023 to June 30, 2023).
D Hypothetical expenses are equal to the annualized expense ratio, multiplied by the average account value over the period, multiplied by 181/365 (to reflect the one-half year period).
Board Approval of Investment Advisory Contracts and Management Fees
Fidelity SAI International Credit Fund
At its November 2022 meeting, the Board of Trustees, including the Independent Trustees (together, the Board), voted to approve the management contract with Fidelity Management & Research Company LLC (FMR) and the sub-advisory agreements with affiliates of FMR (together, the Advisory Contracts) for the fund. FMR and the sub-advisers are collectively referred to herein as the Investment Advisers. The Board, assisted by the advice of fund counsel and Independent Trustees' counsel, considered a broad range of information.
Nature, Extent, and Quality of Services Provided. The Board considered Fidelity's staffing as it relates to the fund, including the backgrounds of investment personnel of Fidelity, and also considered the fund's investment objective, strategies, and related investment philosophy. The Board considered the structure of the investment personnel compensation program and whether this structure provides appropriate incentives to act in the best interests of the fund.
Resources Dedicated to Investment Management and Support Services . The Board reviewed the general qualifications and capabilities of Fidelity's investment staff, including its size, education, experience, and resources, as well as Fidelity's approach to recruiting, managing, and compensating investment personnel. The Board noted the resources devoted to Fidelity's global investment organization and that Fidelity's analysts have extensive resources, tools and capabilities that allow them to conduct sophisticated quantitative and fundamental analysis, as well as credit analysis of issuers, counterparties and guarantors. Further, the Board considered that Fidelity's investment professionals have sufficient access to global information and data so as to provide competitive investment results over time, and that those professionals also have access to sophisticated tools that permit them to assess portfolio construction and risk and performance attribution characteristics continuously, as well as to transmit new information and research conclusions rapidly around the world. Additionally, in its deliberations, the Board considered Fidelity's trading, risk management, compliance, cybersecurity, and technology and operations capabilities and resources, which are integral parts of the investment management process.
Shareholder and Administrative Services . The Board considered the nature, extent, quality, and cost of advisory, administrative, and shareholder services to be performed by the Investment Advisers and their affiliates under the Advisory Contracts and under separate agreements covering transfer agency, pricing and bookkeeping, and securities lending services for the fund. The Board also considered the nature and extent of the supervision of third party service providers, principally custodians, subcustodians, and pricing vendors.
The Board noted that the growth of fund assets over time across the complex allows Fidelity to reinvest in the development of services designed to enhance the value and convenience of the Fidelity funds as investment vehicles. These services include 24-hour access to account information and market information over the Internet and through telephone representatives, investor education materials and asset allocation tools. The Board also considered that it reviews customer service metrics such as telephone response times, continuity of services on the website and metrics addressing services at Fidelity Investor Centers.
Investment Performance . The fund is a new fund and therefore had no historical performance for the Board to review at the time it approved the fund's Advisory Contracts. The Board considered the Investment Advisers' strength in fundamental, research-driven security selection, which the Board is familiar with through its supervision of other Fidelity funds. The Board also considered the fact that it oversees funds managed by FMR that have similar investment objectives and policies as the fund.
Based on its review, the Board concluded that the nature, extent, and quality of services to be provided to the fund under the Advisory Contracts should benefit the shareholders of the fund.
Competitiveness of Management Fee and Total Expense Ratio . In reviewing the Advisory Contracts, the Board considered the fund's proposed management fee rate and the projected total expense ratio of the fund. The Board noted that the fund's proposed management fee rate is below the median fee rate of funds with similar Lipper investment objective categories and comparable investment mandates, regardless of whether their management fee structures are comparable. The Board also considered that the projected total net expense ratio of the fund is below the median of those funds and classes used by the Board for management fee comparisons that have a similar sales load structure.
The Board also noted that FMR has contractually agreed to reimburse the fund to the extent that total operating expenses (excluding interest, certain taxes, fees and expenses of the Independent Trustees, proxy and shareholder meeting expenses, extraordinary expenses, and acquired fund fees and expenses (including fees and expenses associated with a wholly owned subsidiary), if any, as well as non-operating expenses such as brokerage commissions and fees and expenses associated with the fund's securities lending program, if applicable), as a percentage of its average net assets exceed 0.41% through April 30, 2024.
Based on its review, the Board concluded the fund's management fee and projected total expense ratio were reasonable in light of the services that the fund and its shareholders will receive and the other factors considered.
Costs of the Services and Profitability. The fund is a new fund and therefore no revenue, cost, or profitability data were available for the Board to review in respect of the fund at the time it approved the Advisory Contracts. In connection with its consideration of future renewals of the fund's Advisory Contracts, the Board will consider the revenues earned and the expenses incurred by Fidelity in conducting the business of developing, marketing, distributing, managing, administering and servicing the fund and servicing each fund's shareholders.
Economies of Scale. The Board will consider economies of scale when there is operating experience to permit assessment thereof. It noted that, notwithstanding the entrepreneurial risk associated with a new fund, the management fee was at a level normally associated with very high fund net assets, and Fidelity asserted to the Board that the level of the fee anticipated economies of scale at lower asset levels even before, if ever, economies of scale are achieved. The Board also noted that the fund and its shareholders would have access to the very considerable number and variety of services available through Fidelity and its affiliates.
Based on its evaluation of all of the conclusions noted above, and after considering all factors it believed relevant, the Board concluded that the advisory fee arrangements are fair and reasonable, and that the fund's Advisory Contracts should be approved.
1.9908915.100
ICR-SANN-0823
Item 2.
Code of Ethics
Not applicable.
Item 3.
Audit Committee Financial Expert
Not applicable.
Item 4.
Principal Accountant Fees and Services
Not applicable.
Item 5.
Audit Committee of Listed Registrants
Not applicable.
Item 6.
Investments
(a)
Not applicable.
(b)
Not applicable
Item 7.
Disclosure of Proxy Voting Policies and Procedures for Closed-End Management Investment Companies
Not applicable.
Item 8.
Portfolio Managers of Closed-End Management Investment Companies
Not applicable.
Item 9.
Purchase of Equity Securities by Closed-End Management Investment Company and Affiliated Purchasers
Not applicable.
Item 10.
Submission of Matters to a Vote of Security Holders
There were no material changes to the procedures by which shareholders may recommend nominees to the Fidelity Salem Street Trust’s Board of Trustees.
Item 11.
Controls and Procedures
(a)(i) The President and Treasurer and the Chief Financial Officer have concluded that the Fidelity Salem Street Trust’s (the “Trust”) disclosure controls and procedures (as
defined in Rule 30a-3(c) under the Investment Company Act) provide reasonable assurances that material information relating to the Trust is made known to them by the appropriate persons, based on their evaluation of these controls and procedures as of a date within 90 days of the filing date of this report.
(a)(ii) There was no change in the Trust’s internal control over financial reporting (as defined in Rule 30a-3(d) under the Investment Company Act) that occurred during the period covered by this report that has materially affected, or is reasonably likely to materially affect, the Trust’s internal control over financial reporting.
Item 12.
Disclosure of Securities Lending Activities for Closed-End Management
Investment Companies
Not applicable.
Item 13.
Exhibits
SIGNATURES
Pursuant to the requirements of the Securities Exchange Act of 1934 and the Investment Company Act of 1940, the registrant has duly caused this report to be signed on its behalf by the undersigned, thereunto duly authorized.
Fidelity Salem Street Trust
| |
By: | /s/Laura M. Del Prato |
| Laura M. Del Prato |
| President and Treasurer |
|
|
Date: | August 22, 2023 |
Pursuant to the requirements of the Securities Exchange Act of 1934 and the Investment Company Act of 1940, this report has been signed below by the following persons on behalf of the registrant and in the capacities and on the dates indicated.
| |
By: | /s/Laura M. Del Prato |
| Laura M. Del Prato |
| President and Treasurer |
|
|
Date: | August 22, 2023 |
| |
By: | /s/John J. Burke III |
| John J. Burke III |
| Chief Financial Officer |
|
|
Date: | August 22, 2023 |