UNITED STATES
SECURITIES AND EXCHANGE COMMISSION
Washington, D.C. 20549
FORM N-CSR
CERTIFIED SHAREHOLDER REPORT OF REGISTERED
MANAGEMENT INVESTMENT COMPANIES
Investment Company Act file number 811-02105
Fidelity Salem Street Trust
(Exact name of registrant as specified in charter)
245 Summer St., Boston, MA 02210
(Address of principal executive offices) (Zip code)
Margaret Carey, Secretary
245 Summer St.
Boston, Massachusetts 02210
(Name and address of agent for service)
Registrant's telephone number, including area code:
617-563-7000
| |
Date of fiscal year end: | January 31 |
|
|
Date of reporting period: | July 31, 2023 |
Item 1.
Reports to Stockholders
Fidelity® Sustainable Intermediate Municipal Income Fund
Semi-Annual Report
July 31, 2023
Includes Fidelity and Fidelity Advisor share classes
Contents
To view a fund's proxy voting guidelines and proxy voting record for the 12-month period ended June 30, visit http://www.fidelity.com/proxyvotingresults or visit the Securities and Exchange Commission's (SEC) web site at http://www.sec.gov.
You may also call 1-800-544-8544 if you're an individual investing directly with Fidelity, call 1-800-835-5092 if you're a plan sponsor or participant with Fidelity as your recordkeeper or call 1-877-208-0098 on institutional accounts or if you're an advisor or invest through one to request a free copy of the proxy voting guidelines.
Standard & Poor's, S&P and S&P 500 are registered service marks of The McGraw-Hill Companies, Inc. and have been licensed for use by Fidelity Distributors Corporation.
Other third-party marks appearing herein are the property of their respective owners.
All other marks appearing herein are registered or unregistered trademarks or service marks of FMR LLC or an affiliated company. © 2023 FMR LLC. All rights reserved.
This report and the financial statements contained herein are submitted for the general information of the shareholders of the Fund. This report is not authorized for distribution to prospective investors in the Fund unless preceded or accompanied by an effective prospectus.
A fund files its complete schedule of portfolio holdings with the SEC for the first and third quarters of each fiscal year on Form N-PORT. Forms N-PORT are available on the SEC's web site at http://www.sec.gov. A fund's Forms N-PORT may be reviewed and copied at the SEC's Public Reference Room in Washington, DC. Information regarding the operation of the SEC's Public Reference Room may be obtained by calling 1-800-SEC-0330.
For a complete list of a fund's portfolio holdings, view the most recent holdings listing, semiannual report, or annual report on Fidelity's web site at http://www.fidelity.com, http://www.institutional.fidelity.com, or http://www.401k.com, as applicable.
NOT FDIC INSURED •MAY LOSE VALUE •NO BANK GUARANTEE
Neither the Fund nor Fidelity Distributors Corporation is a bank.
| Top Five States (% of Fund's net assets) |
| | |
| New York | 11.8 |
| Georgia | 7.2 |
| Florida | 7.1 |
| California | 6.9 |
| Massachusetts | 6.4 |
| | |
| Revenue Sources (% of Fund's net assets) |
| General Obligations | 23.5 | |
| Health Care | 14.8 | |
| Education | 12.5 | |
| Special Tax | 12.5 | |
| Electric Utilities | 11.8 | |
| Others* (Individually Less Than 5%) | 24.9 | |
| | 100.0 | |
| |
| *Includes net other assets | | |
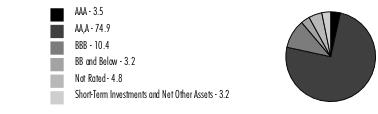
Quality Diversification (% of Fund's net assets) |
|
| |
| We have used ratings from Moody's Investors Service, Inc. Where Moody's® ratings are not available, we have used S&P® ratings. All ratings are as of the date indicated and do not reflect subsequent changes. |
Showing Percentage of Net Assets
| Municipal Bonds - 93.1% |
| | | Principal Amount (a) | Value ($) |
| Alabama - 1.7% | | | |
| Black Belt Energy Gas District Bonds: | | | |
| Series 2022 D1, 4%, tender 6/1/27 (b) | | 10,000 | 9,962 |
| Series 2022 F, 5.5%, tender 12/1/28 (b) | | 100,000 | 105,444 |
| Mobile Indl. Dev. Board Poll. Cont. Rev. Bonds (Alabama Pwr. Co. Barry Plant Proj.) Series 2007 C, 3.78%, tender 6/16/26 (b) | | 100,000 | 99,975 |
| Southeast Energy Auth. Rev. Bonds Bonds Series 2022 B1, 5%, tender 8/1/28 (b) | | 20,000 | 20,632 |
TOTAL ALABAMA | | | 236,013 |
| Arizona - 2.6% | | | |
| Chandler Indl. Dev. Auth. Indl. Dev. Rev. (Intel Corp. Proj.) Series 2022 2, 5%, tender 9/1/27 (b)(c) | | 50,000 | 51,385 |
| Maricopa County Unified School District #48 Scottsdale Series D, 4% 7/1/24 | | 80,000 | 80,525 |
| Phoenix Civic Impt. Corp. Wastewtr. Sys. Rev. Series 2016, 5% 7/1/30 | | 50,000 | 52,781 |
| Salt Verde Finl. Corp. Sr. Gas Rev. Series 2007 1, 5% 12/1/32 | | 165,000 | 174,838 |
TOTAL ARIZONA | | | 359,529 |
| California - 6.9% | | | |
| California Health Facilities Fing. Auth. Rev. Bonds Series 2019 C, 5%, tender 10/1/25 (b) | | 150,000 | 153,715 |
| California Hsg. Fin. Agcy. Series 2021 1, 3.5% 11/20/35 | | 106,197 | 99,436 |
| California Muni. Fin. Auth. Rev. Series 2018, 5% 10/1/25 | | 15,000 | 15,299 |
| California Statewide Cmntys. Dev. Auth. Rev. Series 2016, 5% 10/1/33 | | 25,000 | 26,012 |
| Los Angeles Dept. Arpt. Rev. Series 2023 A, 5.25% 5/15/39 (c) | | 300,000 | 332,758 |
| Los Angeles Dept. of Wtr. & Pwr. Wtrwks. Rev.: | | | |
| Series 2017 A, 5% 7/1/32 | | 15,000 | 16,150 |
| Series 2022 B: | | | |
5% 7/1/31 | | 30,000 | 35,519 |
5% 7/1/32 | | 100,000 | 118,983 |
| Riverside Elec. Rev. Series 2019 A, 5% 10/1/43 | | 5,000 | 5,416 |
| San Francisco Bay Area Rapid Transit District Sales Tax Rev. Series 2015 A, 5% 7/1/27 | | 10,000 | 10,409 |
| San Francisco Bay Area Rapid Transit Fing. Auth. Series 2019 F1, 5% 8/1/23 | | 125,000 | 125,000 |
TOTAL CALIFORNIA | | | 938,697 |
| Colorado - 3.6% | | | |
| Colorado Ctfs. of Prtn. Series 2020 A, 4% 12/15/38 | | 10,000 | 10,136 |
| Colorado Health Facilities Auth. Rev. Bonds Series 2019 A2, 5% 8/1/33 | | 125,000 | 134,469 |
| Vauxmont Metropolitan District Series 2020, 5% 12/1/28 (Assured Guaranty Muni. Corp. Insured) | | 325,000 | 353,938 |
TOTAL COLORADO | | | 498,543 |
| Connecticut - 3.4% | | | |
| Connecticut Gen. Oblig.: | | | |
| Series 2019 A, 5% 4/15/33 | | 25,000 | 27,764 |
| Series 2021 D, 5% 7/15/28 | | 75,000 | 82,456 |
| Connecticut Health & Edl. Facilities Auth. Rev. Series 2016 A, 2%, tender 7/1/26 (b) | | 35,000 | 33,155 |
| Connecticut Hsg. Fin. Auth. Series 2021 D1: | | | |
| 5% 11/15/27 | | 10,000 | 10,693 |
| 5% 11/15/28 | | 25,000 | 27,142 |
| Connecticut Spl. Tax Oblig. Trans. Infrastructure Rev.: | | | |
| Series 2021 A, 4% 5/1/36 | | 130,000 | 135,407 |
| Series A: | | | |
5% 9/1/26 | | 100,000 | 106,031 |
5% 5/1/29 | | 20,000 | 22,404 |
| South Central Reg'l. Wtr. Auth. Wtr. Sys. Rev. Series 32 B, 5% 8/1/32 | | 25,000 | 26,484 |
TOTAL CONNECTICUT | | | 471,536 |
| District Of Columbia - 0.2% | | | |
| District of Columbia Univ. Rev. Series 2017: | | | |
| 5% 4/1/29 | | 20,000 | 21,191 |
| 5% 4/1/33 | | 10,000 | 10,606 |
TOTAL DISTRICT OF COLUMBIA | | | 31,797 |
| Florida - 7.1% | | | |
| Broward County School Board Ctfs. of Prtn.: | | | |
| Series 2015 A, 5% 7/1/26 | | 30,000 | 30,908 |
| Series 2020 A, 5% 7/1/33 | | 25,000 | 28,110 |
| Duval County School Board Ctfs. of Prtn. Series 2022 A, 5% 7/1/34 (Assured Guaranty Muni. Corp. Insured) | | 250,000 | 280,272 |
| Escambia County Health Facilities Auth. Health Facilities Rev. Series 2020 A, 5% 8/15/34 | | 200,000 | 210,427 |
| Florida Hsg. Fin. Corp. Rev. Series 2020 1, 3.5% 7/1/51 | | 70,000 | 68,478 |
| JEA Wtr. & Swr. Sys. Rev. Series 2017 A, 5% 10/1/29 | | 25,000 | 27,201 |
| Miami-Dade County Wtr. & Swr. Rev. Series 2017 B, 5% 10/1/27 | | 60,000 | 64,676 |
| Palm Beach County Health Facilities Auth. Hosp. Rev. (Jupiter Med. Ctr. Proj.) Series 2022, 5% 11/1/35 | | 100,000 | 105,493 |
| Palm Beach County School Board Ctfs. of Prtn.: | | | |
| Series 2018 A, 5% 8/1/24 | | 20,000 | 20,340 |
| Series 2021 A, 5% 8/1/38 | | 125,000 | 138,484 |
TOTAL FLORIDA | | | 974,389 |
| Georgia - 5.7% | | | |
| Bartow County Dev. Auth. Poll. Cont. Rev. Bonds (Georgia Pwr. Co. Plant Bowen Proj.): | | | |
| Series 2009, 3.95%, tender 3/8/28 (b) | | 100,000 | 99,352 |
| Series 2013, 2.875%, tender 8/19/25 (b) | | 100,000 | 96,904 |
| Fulton County Dev. Auth. Rev. Series 2019, 5% 6/15/44 | | 10,000 | 10,718 |
| Main Street Natural Gas, Inc. Bonds: | | | |
| Series 2019 B, 4%, tender 12/2/24 (b) | | 135,000 | 135,242 |
| Series 2021 A, 4%, tender 9/1/27 (b) | | 100,000 | 99,597 |
| Series 2022 B, 5%, tender 6/1/29 (b) | | 15,000 | 15,498 |
| Metropolitan Atlanta Rapid Transit Auth. Sales Tax Rev. Series 2023 A, 5% 7/1/39 | | 100,000 | 113,850 |
| Monroe County Dev. Auth. Poll. Cont. Rev. Bonds (Georgia Pwr. Co. Plant Scherer Proj.) Series 2009, 3.875%, tender 3/6/26 (b) | | 100,000 | 99,391 |
| Private Colleges & Univs. Auth. Rev. Series 2019 A, 5% 9/1/39 | | 100,000 | 108,682 |
TOTAL GEORGIA | | | 779,234 |
| Hawaii - 0.1% | | | |
| Honolulu City & County Gen. Oblig. Series 2019 A, 5% 9/1/27 | | 10,000 | 10,834 |
| Illinois - 6.1% | | | |
| Illinois Fin. Auth. Series 2022 A, 5% 10/1/32 | | 100,000 | 104,493 |
| Illinois Fin. Auth. Academic Facilities: | | | |
| (Provident Group - UIUC Properties LLC - Univ. of Illinois at Urbana-Champaign Proj.) Series 2019 A, 5% 10/1/29 | | 250,000 | 274,002 |
| (Provident Group UIUC Properties LLC Univ. of Illinois at Urbana-Champaign Proj.) Series 2019 A: | | | |
5% 10/1/32 | | 10,000 | 10,860 |
5% 10/1/38 | | 100,000 | 104,436 |
| Illinois Fin. Auth. Rev.: | | | |
| (Presence Health Proj.) Series 2016 C, 5% 2/15/36 | | 30,000 | 31,448 |
| Series 2014 A, 5% 10/1/26 | | 40,000 | 40,768 |
| Series 2016 A, 5% 7/1/31 (Pre-Refunded to 7/1/26 @ 100) | | 50,000 | 52,767 |
| Illinois Gen. Oblig.: | | | |
| Series 2014, 5% 2/1/39 | | 100,000 | 100,282 |
| Series 2023 C, 5% 5/1/29 | | 50,000 | 54,442 |
| Illinois Hsg. Dev. Auth. Rev. Series D, 3.75% 4/1/50 | | 20,000 | 19,691 |
| McHenry County Conservation District Gen. Oblig. Series 2014, 5% 2/1/24 | | 40,000 | 40,321 |
TOTAL ILLINOIS | | | 833,510 |
| Indiana - 1.0% | | | |
| Indiana Dev. Fin. Auth. Envir. Rev. Bonds Series 2022 A1, 4.5%, tender 6/1/32 (b)(c) | | 100,000 | 100,171 |
| Indiana Hsg. & Cmnty. Dev. Auth.: | | | |
| Series 2021 B, Series 2021 B, 5% 1/1/28 | | 15,000 | 16,108 |
| Series A, 5% 7/1/28 | | 25,000 | 27,331 |
TOTAL INDIANA | | | 143,610 |
| Iowa - 0.8% | | | |
| Iowa Student Ln. Liquidity Corp. Student Ln. Rev. Series 2022 B, 5% 12/1/29 (c) | | 100,000 | 108,076 |
| Kentucky - 1.8% | | | |
| Kentucky Bond Dev. Corp. Edl. Facilities Series 2021: | | | |
| 4% 6/1/33 | | 5,000 | 5,113 |
| 4% 6/1/35 | | 15,000 | 15,081 |
| Kentucky Econ. Dev. Fin. Auth. Solid Waste Disp. Rev. Bonds (Republic Svcs., Inc. Proj.) Series A, 4.05%, tender 9/1/23 (b)(c) | | 100,000 | 99,962 |
| Kentucky State Property & Buildings Commission Rev.: | | | |
| Series A: | | | |
5% 11/1/31 | | 30,000 | 32,824 |
5% 11/1/33 | | 15,000 | 16,373 |
| Series B, 5% 8/1/26 | | 75,000 | 78,878 |
TOTAL KENTUCKY | | | 248,231 |
| Louisiana - 0.7% | | | |
| St. John Baptist Parish Rev. Bonds (Marathon Oil Corp.) Series 2017, 4.05%, tender 7/1/26 (b) | | 100,000 | 99,346 |
| Maine - 0.1% | | | |
| Maine Health & Higher Edl. Facilities Auth. Rev. Series 2017 B, 5% 7/1/28 | | 10,000 | 10,601 |
| Maryland - 2.7% | | | |
| Baltimore County Gen. Oblig. Series 2023, 5% 3/1/40 | | 100,000 | 114,092 |
| Baltimore Proj. Rev. (Wtr. Projs.) Series 2014 A, 5% 7/1/24 | | 150,000 | 152,120 |
| Maryland Dept. of Trans.: | | | |
| Series 2016, 4% 9/1/27 | | 15,000 | 15,688 |
| Series 2021 A, 2% 10/1/34 | | 15,000 | 12,733 |
| Maryland Gen. Oblig. Series A, 5% 8/1/34 | | 15,000 | 17,199 |
| Montgomery County Gen. Oblig. Ctfs. of Prtn. Series 2020 A, 5% 10/1/27 | | 50,000 | 54,367 |
TOTAL MARYLAND | | | 366,199 |
| Massachusetts - 6.4% | | | |
| Arlington Gen. Oblig. Series 2021: | | | |
| 2% 9/15/34 | | 275,000 | 233,408 |
| 2% 9/15/35 | | 100,000 | 82,521 |
| Foxborough Gen. Oblig. Series 2016, 3% 5/15/46 | | 25,000 | 20,376 |
| Massachusetts Bay Trans. Auth. Sales Tax Rev.: | | | |
| Series 2015 B, 5% 7/1/26 (Pre-Refunded to 7/1/25 @ 100) | | 10,000 | 10,357 |
| Series 2016 A, 0% 7/1/29 | | 5,000 | 4,038 |
| Series 2021 A1, 5% 7/1/35 | | 45,000 | 51,713 |
| Massachusetts Commonwealth Trans. Fund Rev. Series 2021 A, 5% 6/1/51 | | 100,000 | 107,267 |
| Massachusetts Dev. Fin. Agcy. Rev.: | | | |
| (Partners Healthcare Sys., Inc. Proj.) Series 2017 S, 5% 7/1/32 | | 15,000 | 16,273 |
| Bonds Series A1, 5%, tender 1/31/30 (b) | | 20,000 | 22,148 |
| Series 2015 O1, 4% 7/1/45 | | 30,000 | 28,722 |
| Series 2018 L, 5% 10/1/33 | | 35,000 | 35,971 |
| Series 2020 A: | | | |
5% 10/15/29 | | 35,000 | 39,942 |
5% 10/15/30 | | 20,000 | 23,255 |
| Series 2021 G, 4% 7/1/46 | | 75,000 | 71,010 |
| Massachusetts Gen. Oblig.: | | | |
| Series 2017 A, 5% 4/1/36 | | 15,000 | 15,994 |
| Series 2017 D, 5% 7/1/27 | | 25,000 | 27,112 |
| Series A, 5% 7/1/31 | | 10,000 | 10,568 |
| Massachusetts School Bldg. Auth. Dedicated Sales Tax Rev. Series A, 5% 8/15/32 | | 10,000 | 11,487 |
| Univ. of Massachusetts Bldg. Auth. Rev. Series 2021 1, 5% 11/1/32 | | 50,000 | 57,728 |
TOTAL MASSACHUSETTS | | | 869,890 |
| Michigan - 1.7% | | | |
| Grand Rapids San. Swr. Sys. Rev.: | | | |
| Series 2018, 5% 1/1/35 | | 5,000 | 5,407 |
| Series 2018, 5% 1/1/29 | | 25,000 | 27,371 |
| Great Lakes Wtr. Auth. Sew Disp. Sys. Series 2018 B, 5% 7/1/29 | | 45,000 | 50,423 |
| Kalamazoo Hosp. Fin. Auth. Hosp. Facilities Rev. Series 2016, 4% 5/15/36 | | 10,000 | 9,871 |
| Lake Orion Cmnty. School District Series 2016, 5% 5/1/25 | | 10,000 | 10,314 |
| Michigan Fin. Auth. Rev.: | | | |
| Bonds Series 2019 B, 5%, tender 11/16/26 (b) | | 10,000 | 10,370 |
| Series 2016: | | | |
5% 11/15/28 | | 15,000 | 15,634 |
5% 11/15/30 | | 35,000 | 36,554 |
5% 11/15/34 | | 15,000 | 15,619 |
| Series 2022, 5% 12/1/32 | | 25,000 | 26,393 |
| Michigan Hosp. Fin. Auth. Rev. Series 2010 F4, 5% 11/15/47 | | 10,000 | 10,447 |
| Univ. of Michigan Rev. Series 2020 A, 5% 4/1/39 | | 10,000 | 11,036 |
TOTAL MICHIGAN | | | 229,439 |
| Minnesota - 3.1% | | | |
| Anoka-Hennepin Independent School District #11 Series 2020 A, 4% 2/1/29 | | 10,000 | 10,495 |
| Hennepin County Sales Tax Rev. (Ballpark Proj.) Series 2017 A, 5% 12/15/24 | | 265,000 | 271,141 |
| Minnesota Gen. Oblig. Series 2019 A, 5% 8/1/30 | | 15,000 | 16,919 |
| Minnesota Hsg. Fin. Agcy.: | | | |
| Series 2022 A, 5% 8/1/32 | | 100,000 | 115,951 |
| Series B, 4% 8/1/36 | | 15,000 | 15,396 |
TOTAL MINNESOTA | | | 429,902 |
| Nebraska - 1.4% | | | |
| Central Plains Energy Proj. Gas Supply Bonds Series 2019, 4%, tender 8/1/25 (b) | | 50,000 | 49,955 |
| Douglas County Hosp. Auth. #2 Health Facilities Rev. Series 2020 A, 5% 11/15/30 | | 125,000 | 139,389 |
TOTAL NEBRASKA | | | 189,344 |
| New Hampshire - 1.6% | | | |
| Nat'l. Fin. Auth. Solid Bonds (Waste Mgmt., Inc. Proj.) Series 2020 A3, 4%, tender 9/1/23 (b)(c) | | 100,000 | 99,986 |
| New Hampshire Health & Ed. Facilities Auth.: | | | |
| (Concord Hosp.) Series 2017, 5% 10/1/42 | | 15,000 | 15,431 |
| (Partners Healthcare Sys., Inc. Proj.) Series 2017, 5% 7/1/25 | | 5,000 | 5,165 |
| New Hampshire Nat'l. Fin. Auth. Series 2022 2, 4% 10/20/36 | | 98,987 | 94,543 |
TOTAL NEW HAMPSHIRE | | | 215,125 |
| New Jersey - 5.0% | | | |
| New Jersey Econ. Dev. Auth. Series 2024 SSS, 5% 6/15/27 (d) | | 100,000 | 103,770 |
| New Jersey Edl. Facility Series A, 5% 7/1/36 | | 15,000 | 15,798 |
| New Jersey Health Care Facilities Fing. Auth. Rev. Series 2016 A, 5% 7/1/33 | | 10,000 | 10,558 |
| New Jersey Trans. Trust Fund Auth.: | | | |
| Series 2018 A, 5% 12/15/32 | | 100,000 | 108,658 |
| Series 2021 A, 5% 6/15/33 | | 95,000 | 106,502 |
| Series 2022 A, 4% 6/15/39 | | 30,000 | 29,733 |
| Series 2022 BB, 5% 6/15/31 | | 135,000 | 152,477 |
| Series 2022 CC, 5% 6/15/33 | | 100,000 | 114,088 |
| Series A, 0% 12/15/31 | | 50,000 | 36,769 |
TOTAL NEW JERSEY | | | 678,353 |
| New York - 11.8% | | | |
| Dutchess County Local Dev. Corp. Rev. (Vassar College Proj.) Series 2020, 5% 7/1/45 | | 25,000 | 26,711 |
| Long Island Pwr. Auth. Elec. Sys. Rev.: | | | |
| Series 2018, 5% 9/1/27 | | 15,000 | 16,293 |
| Series 2020 A, 5% 9/1/38 | | 165,000 | 182,192 |
| Series 2022 A, 5% 9/1/33 | | 100,000 | 118,424 |
| New York City Transitional Fin. Auth. Bldg. Aid Rev. Series 2017 S1, 5% 7/15/28 | | 50,000 | 54,100 |
| New York Dorm. Auth. Rev. Series 2022 A, 5% 7/1/34 | | 200,000 | 217,326 |
| New York Dorm. Auth. Sales Tax Rev. Series 2015 A, 5% 3/15/24 (Escrowed to Maturity) | | 25,000 | 25,279 |
| New York Metropolitan Trans. Auth. Rev.: | | | |
| Series 2017 C1: | | | |
5% 11/15/27 | | 20,000 | 21,167 |
5% 11/15/29 | | 50,000 | 53,249 |
5% 11/15/31 | | 140,000 | 149,064 |
| Series 2019 C, 5% 11/15/39 | | 70,000 | 73,697 |
| New York State Dorm. Auth.: | | | |
| Series 2017 A, 5% 2/15/31 | | 10,000 | 10,676 |
| Series 2019 D, 4% 2/15/36 | | 15,000 | 15,510 |
| New York State Urban Dev. Corp. Series 2020 E, 4% 3/15/35 | | 30,000 | 31,161 |
| New York State Urban Eev Corp. Series 2019 A, 5% 3/15/37 | | 80,000 | 87,515 |
| New York Thruway Auth. Personal Income Tax Rev. Series 2021 A1, 5% 3/15/34 | | 205,000 | 235,721 |
| Saratoga County Cap. Resources Rev. (Skidmore College Proj.) Series 2020 A, 5% 7/1/45 | | 85,000 | 91,084 |
| Suffolk County Gen. Oblig. Series 2017 D, 4% 2/1/28 (Build America Mutual Assurance Insured) | | 100,000 | 105,125 |
| Triborough Bridge & Tunnel Auth. Series 2023 A, 4% 11/15/34 | | 100,000 | 107,604 |
TOTAL NEW YORK | | | 1,621,898 |
| North Carolina - 1.0% | | | |
| Charlotte-Mecklenburg Hosp. Auth. Health Care Sys. Rev. Bonds Series 2021 C, 5%, tender 12/1/28 (b) | | 25,000 | 27,303 |
| Univ. of North Carolina at Chapel Hill Rev. Series 2021 B, 5% 12/1/38 | | 100,000 | 112,715 |
TOTAL NORTH CAROLINA | | | 140,018 |
| Ohio - 2.3% | | | |
| Ohio Air Quality Dev. Auth. Rev. Bonds Series 2022 B, 4.25%, tender 6/1/27 (b)(c) | | 150,000 | 148,632 |
| Ohio Gen. Oblig. Series 2019 A, 5% 5/1/30 | | 20,000 | 21,509 |
| Ohio Higher Edl. Facility Commission Rev. (Univ. of Dayton Proj.) Series 2018 B, 5% 12/1/29 | | 25,000 | 26,914 |
| Ohio Hsg. Fin. Agcy. Residential Mtg. Rev. (Mtg. Backed Securities Prog.) Series 2019 B, 4.5% 3/1/50 | | 90,000 | 90,230 |
| Ohio Spl. Oblig. Series 2021 A, 5% 4/1/41 | | 20,000 | 21,857 |
| Ohio State Univ. Gen. Receipts (Multiyear Debt Issuance Prog.) Series 2020 A, 5% 12/1/29 | | 10,000 | 11,328 |
TOTAL OHIO | | | 320,470 |
| Oklahoma - 0.4% | | | |
| Grand River Dam Auth. Rev. Series 2014 A, 5% 6/1/26 | | 40,000 | 40,454 |
| Oklahoma State Univ. Agricultural And Mechanical College Series 2020 A, 5% 9/1/32 | | 10,000 | 11,351 |
TOTAL OKLAHOMA | | | 51,805 |
| Oregon - 1.6% | | | |
| Medford Hosp. Facilities Auth. Rev. (Asante Projs.) Series 2020 A, 5% 8/15/38 | | 10,000 | 10,642 |
| Oregon Facilities Auth. Rev. Series 2022 B, 5% 6/1/30 | | 30,000 | 32,921 |
| Salem Hosp. Facility Auth. Rev. Series 2016 A, 4% 5/15/41 | | 25,000 | 24,248 |
| Union County Hosp. Facility Auth. (Grande Ronde Hosp. Proj.) Series 2022, 5% 7/1/25 | | 150,000 | 152,447 |
TOTAL OREGON | | | 220,258 |
| Pennsylvania - 0.8% | | | |
| Cumberland County Muni. Auth. Rev. (Dickinson Proj.) Series 2017, 5% 5/1/37 | | 5,000 | 5,276 |
| Dubois Hosp. Auth. Hosp. Rev. (Penn Highlands Healthcare Proj.) Series 2018: | | | |
| 5% 7/15/27 | | 50,000 | 52,305 |
| 5% 7/15/28 | | 35,000 | 36,934 |
| Montgomery County Higher Ed. & Health Auth. Rev. Series 2019, 5% 9/1/31 | | 10,000 | 10,826 |
TOTAL PENNSYLVANIA | | | 105,341 |
| Rhode Island - 0.8% | | | |
| Rhode Island Student Ln. Auth. Student Ln. Rev. Series 2021 A, 5% 12/1/30 (c) | | 100,000 | 108,447 |
| Tennessee - 0.6% | | | |
| Knox County Health Edl. & Hsg. Facilities Board Rev. Series 2017, 5% 4/1/27 | | 20,000 | 20,770 |
| Nashville and Davidson County Metropolitan Govt. Gen. Oblig. Series 2021 C, 5% 1/1/28 | | 50,000 | 54,554 |
TOTAL TENNESSEE | | | 75,324 |
| Texas - 2.6% | | | |
| Alvin Independent School District Series 2016 A, 5% 2/15/28 | | 25,000 | 26,179 |
| Cypress-Fairbanks Independent School District Series 2016, 5% 2/15/25 | | 15,000 | 15,417 |
| Georgetown Util. Sys. Rev. Series 2022, 5% 8/15/27 (Assured Guaranty Muni. Corp. Insured) | | 100,000 | 107,134 |
| Harris County Cultural Ed. Facilities Fin. Corp. Rev. Series 2014 A, 5% 12/1/26 | | 90,000 | 92,155 |
| San Antonio Wtr. Sys. Rev.: | | | |
| Series 2018 A, 5% 5/15/33 | | 5,000 | 5,453 |
| Series 2020 A, 5% 5/15/27 | | 10,000 | 10,742 |
| Tarrant Reg'l. Wtr. District (City of Dallas Proj.) Series 2021 A, 4% 9/1/25 | | 45,000 | 45,829 |
| Wichita Falls Independent School District Series 2021, 4% 2/1/28 | | 50,000 | 52,175 |
TOTAL TEXAS | | | 355,084 |
| Virginia - 3.6% | | | |
| Louisa Indl. Dev. Auth. Poll. Cont. Rev. Bonds (Virginia Elec. and Pwr. Co. Proj.) Series 2008 B, 0.75%, tender 9/2/25 (b) | | 105,000 | 96,415 |
| Virginia College Bldg. Auth. Edl. Facilities Rev.: | | | |
| (21st Century College and Equip. Progs.) Series 2017 E, 5% 2/1/31 | | 10,000 | 10,913 |
| (Virginia Gen. Oblig.) Series 2017 E, 5% 2/1/30 | | 15,000 | 16,393 |
| Virginia Commonwealth Trans. Board Rev.: | | | |
| (Virginia Gen. Oblig. Proj.) Series 2017 A, 5% 5/15/29 | | 60,000 | 65,311 |
| (Virginia Gen. Oblig.) Series 2017 A, 5% 5/15/27 | | 15,000 | 16,185 |
| Virginia Commonwealth Univ. Health Sys. Auth. Series 2017 A, 5% 7/1/28 | | 270,000 | 288,789 |
TOTAL VIRGINIA | | | 494,006 |
| Washington - 3.7% | | | |
| Energy Northwest Elec. Rev. Series 2020 A, 5% 7/1/34 | | 95,000 | 108,282 |
| Washington Gen. Oblig.: | | | |
| Series 2018 A, 5% 8/1/27 | | 50,000 | 54,076 |
| Series 2018 C, 5% 8/1/30 | | 25,000 | 26,959 |
| Series 2018 D, 5% 8/1/33 | | 20,000 | 21,474 |
| Series 2020 A, 5% 8/1/27 | | 65,000 | 70,298 |
| Series 2020 C, 5% 2/1/37 | | 15,000 | 16,623 |
| Series R-2017 A, 5% 8/1/30 | | 10,000 | 10,552 |
| Washington Health Care Facilities Auth. Rev.: | | | |
| (Overlake Hosp. Med. Ctr., WA. Proj.) Series 2017 B, 5% 7/1/27 | | 25,000 | 25,606 |
| (Providence Health Systems Proj.) Series 2018 B, 5% 10/1/33 | | 45,000 | 47,439 |
| Series 2017 A, 4% 7/1/37 | | 125,000 | 116,368 |
| Series 2019 A2, 5% 8/1/33 | | 10,000 | 10,758 |
TOTAL WASHINGTON | | | 508,435 |
| Wisconsin - 0.2% | | | |
| Wisconsin St Gen. Fund Annual Appropriation Series 2019 A: | | | |
| 5% 5/1/25 (Escrowed to Maturity) | | 10,000 | 10,314 |
| 5% 5/1/26 (Escrowed to Maturity) | | 20,000 | 21,058 |
TOTAL WISCONSIN | | | 31,372 |
| TOTAL MUNICIPAL BONDS (Cost $12,777,150) | | | 12,754,656 |
| | | | |
| Municipal Notes - 2.2% |
| | | Principal Amount (a) | Value ($) |
| Delaware - 0.7% | | | |
| Delaware Econ. Dev. Auth. Rev. (Delmarva Pwr. & Lt. Co. Proj.) Series 1994, 4.81% 8/1/23, VRDN (b)(c) | | 100,000 | 100,000 |
| Georgia - 1.5% | | | |
| Burke County Indl. Dev. Auth. Poll. Cont. Rev. (Georgia Pwr. Co. Plant Vogtle Proj.) Series 2018, 4.95% 8/1/23, VRDN (b) | | 200,000 | 200,000 |
| TOTAL MUNICIPAL NOTES (Cost $300,000) | | | 300,000 |
| | | | |
| Money Market Funds - 3.9% |
| | | Shares | Value ($) |
Fidelity Municipal Cash Central Fund 4.30% (e)(f) (Cost $543,994) | | 543,891 | 544,007 |
| | | | |
| TOTAL INVESTMENT IN SECURITIES - 99.2% (Cost $13,621,144) | 13,598,663 |
NET OTHER ASSETS (LIABILITIES) - 0.8% | 104,613 |
| NET ASSETS - 100.0% | 13,703,276 |
| | |
Security Type Abbreviations
| VRDN | - | VARIABLE RATE DEMAND NOTE (A debt instrument that is payable upon demand, either daily, weekly or monthly) |
Legend
| (a) | Amount is stated in United States dollars unless otherwise noted. |
| (b) | Coupon rates for floating and adjustable rate securities reflect the rates in effect at period end. |
| (c) | Private activity obligations whose interest is subject to the federal alternative minimum tax for individuals. |
| (d) | Security or a portion of the security purchased on a delayed delivery or when-issued basis. |
| (e) | Information in this report regarding holdings by state and security types does not reflect the holdings of the Fidelity Municipal Cash Central Fund. |
| (f) | Affiliated fund that is generally available only to investment companies and other accounts managed by Fidelity Investments. The rate quoted is the annualized seven-day yield of the fund at period end. A complete unaudited listing of the fund's holdings as of its most recent quarter end is available upon request. In addition, each Fidelity Central Fund's financial statements are available on the SEC's website or upon request. |
Affiliated Central Funds
Fiscal year to date information regarding the Fund's investments in Fidelity Central Funds, including the ownership percentage, is presented below.
| Affiliate | Value, beginning of period ($) | Purchases ($) | Sales Proceeds ($) | Dividend Income ($) | Realized Gain (loss) ($) | Change in Unrealized appreciation (depreciation) ($) | Value, end of period ($) | % ownership, end of period |
| Fidelity Municipal Cash Central Fund 4.30% | 385,996 | 1,306,991 | 1,149,000 | 3,032 | - | 20 | 544,007 | 0.0% |
| Total | 385,996 | 1,306,991 | 1,149,000 | 3,032 | - | 20 | 544,007 | |
| | | | | | | | | |
Amounts in the dividend income column in the above table include any capital gain distributions from underlying funds, which are presented in the corresponding line item in the Statement of Operations, if applicable.
Amounts included in the purchases and sales proceeds columns may include in-kind transactions, if applicable.
Investment Valuation
The following is a summary of the inputs used, as of July 31, 2023, involving the Fund's assets and liabilities carried at fair value. The inputs or methodology used for valuing securities may not be an indication of the risk associated with investing in those securities. For more information on valuation inputs, and their aggregation into the levels used below, please refer to the Investment Valuation section in the accompanying Notes to Financial Statements.
| Valuation Inputs at Reporting Date: |
| Description | Total ($) | Level 1 ($) | Level 2 ($) | Level 3 ($) |
Investments in Securities: | | | | |
|
| Municipal Securities | 13,054,656 | - | 13,054,656 | - |
|
| Money Market Funds | 544,007 | 544,007 | - | - |
| Total Investments in Securities: | 13,598,663 | 544,007 | 13,054,656 | - |
| Statement of Assets and Liabilities |
| | | | July 31, 2023 (Unaudited) |
| | | | | |
| Assets | | | | |
| Investment in securities, at value - See accompanying schedule: | | | | |
Unaffiliated issuers (cost $13,077,150) | $ | 13,054,656 | | |
Fidelity Central Funds (cost $543,994) | | 544,007 | | |
| | | | | |
| | | | | |
| Total Investment in Securities (cost $13,621,144) | | | $ | 13,598,663 |
| Cash | | | | 100,515 |
| Receivable for fund shares sold | | | | 561 |
| Interest receivable | | | | 136,227 |
| Distributions receivable from Fidelity Central Funds | | | | 958 |
| Prepaid expenses | | | | 10 |
| Receivable from investment adviser for expense reductions | | | | 5,623 |
| Other receivables | | | | 40 |
Total assets | | | | 13,842,597 |
| Liabilities | | | | |
| Payable for investments purchased on a delayed delivery basis | $ | 103,754 | | |
| Payable for fund shares redeemed | | 149 | | |
| Distributions payable | | 3,748 | | |
| Accrued management fee | | 3,946 | | |
| Distribution and service plan fees payable | | 1,437 | | |
| Other affiliated payables | | 1,561 | | |
| Audit fee payable | | 24,603 | | |
| Other payables and accrued expenses | | 123 | | |
| Total Liabilities | | | | 139,321 |
| Net Assets | | | $ | 13,703,276 |
| Net Assets consist of: | | | | |
| Paid in capital | | | $ | 13,722,870 |
| Total accumulated earnings (loss) | | | | (19,594) |
| Net Assets | | | $ | 13,703,276 |
| | | | | |
| Net Asset Value and Maximum Offering Price | | | | |
| Class A : | | | | |
Net Asset Value and redemption price per share ($1,557,183 ÷ 156,015 shares)(a) | | | $ | 9.98 |
| Maximum offering price per share (100/96.00 of $9.98) | | | $ | 10.40 |
| Class M : | | | | |
Net Asset Value and redemption price per share ($1,118,388 ÷ 112,051 shares)(a) | | | $ | 9.98 |
| Maximum offering price per share (100/96.00 of $9.98) | | | $ | 10.40 |
| Class C : | | | | |
Net Asset Value and offering price per share ($1,057,449 ÷ 106,983 shares)(a) | | | $ | 9.88 |
| Fidelity Sustainable Intermediate Municipal Income Fund : | | | | |
Net Asset Value, offering price and redemption price per share ($7,904,438 ÷ 791,918 shares) | | | $ | 9.98 |
| Class I : | | | | |
Net Asset Value, offering price and redemption price per share ($1,032,507 ÷ 103,443 shares) | | | $ | 9.98 |
| Class Z : | | | | |
Net Asset Value, offering price and redemption price per share ($1,033,311 ÷ 103,522 shares) | | | $ | 9.98 |
(a)Redemption price per share is equal to net asset value less any applicable contingent deferred sales charge. |
| Statement of Operations |
| | | | Six months ended July 31, 2023 (Unaudited) |
| Investment Income | | | | |
| Interest | | | $ | 210,965 |
| Income from Fidelity Central Funds | | | | 3,032 |
| Total Income | | | | 213,997 |
| Expenses | | | | |
| Management fee | $ | 23,175 | | |
| Transfer agent fees | | 7,263 | | |
| Distribution and service plan fees | | 8,608 | | |
| Accounting fees and expenses | | 1,731 | | |
| Custodian fees and expenses | | 3,057 | | |
| Independent trustees' fees and expenses | | 22 | | |
| Registration fees | | 100,287 | | |
| Audit | | 25,149 | | |
| Legal | | 30 | | |
| Miscellaneous | | 18 | | |
| Total expenses before reductions | | 169,340 | | |
| Expense reductions | | (136,830) | | |
| Total expenses after reductions | | | | 32,510 |
| Net Investment income (loss) | | | | 181,487 |
| Realized and Unrealized Gain (Loss) | | | | |
| Net realized gain (loss) on: | | | | |
| Investment Securities: | | | | |
| Unaffiliated issuers | | 12,708 | | |
| Total net realized gain (loss) | | | | 12,708 |
| Change in net unrealized appreciation (depreciation) on: | | | | |
| Investment Securities: | | | | |
| Unaffiliated issuers | | (226,818) | | |
| Fidelity Central Funds | | 20 | | |
| Total change in net unrealized appreciation (depreciation) | | | | (226,798) |
| Net gain (loss) | | | | (214,090) |
| Net increase (decrease) in net assets resulting from operations | | | $ | (32,603) |
| Statement of Changes in Net Assets |
| |
| | Six months ended July 31, 2023 (Unaudited) | | For the period April 13, 2022 (commencement of operations) through January 31, 2023 |
| Increase (Decrease) in Net Assets | | | | |
| Operations | | | | |
| Net investment income (loss) | $ | 181,487 | $ | 215,330 |
| Net realized gain (loss) | | 12,708 | | (4,493) |
| Change in net unrealized appreciation (depreciation) | | (226,798) | | 204,317 |
| Net increase (decrease) in net assets resulting from operations | | (32,603) | | 415,154 |
| Distributions to shareholders | | (181,830) | | (220,316) |
| | | | | |
| Share transactions - net increase (decrease) | | 791,162 | | 12,931,709 |
| Total increase (decrease) in net assets | | 576,729 | | 13,126,547 |
| | | | | |
| Net Assets | | | | |
| Beginning of period | | 13,126,547 | | - |
| End of period | $ | 13,703,276 | $ | 13,126,547 |
| | | | | |
| | | | | |
| Fidelity® Advisor Sustainable Intermediate Municipal Income Fund Class A |
| |
| | Six months ended (Unaudited) July 31, 2023 | | Years ended January 31, 2023 A |
Selected Per-Share Data | | | | |
| Net asset value, beginning of period | $ | 10.14 | $ | 10.00 |
| Income from Investment Operations | | | | |
Net investment income (loss) B,C | | .130 | | .181 |
| Net realized and unrealized gain (loss) | | (.163) | | .137 |
| Total from investment operations | | (.033) | | .318 |
| Distributions from net investment income | | (.127) | | (.178) |
| Total distributions | | (.127) | | (.178) |
| Net asset value, end of period | $ | 9.98 | $ | 10.14 |
Total Return D,E,F | | (.32)% | | 3.24% |
Ratios to Average Net Assets C,G,H | | | | |
| Expenses before reductions | | 2.72% I | | 2.34% I,J |
| Expenses net of fee waivers, if any | | .62% I | | .62% I |
| Expenses net of all reductions | | .62% I | | .61% I |
| Net investment income (loss) | | 2.61% I | | 2.26% I |
| Supplemental Data | | | | |
| Net assets, end of period (000 omitted) | $ | 1,557 | $ | 1,563 |
Portfolio turnover rate K | | 26% I | | 14% I |
AFor the period April 13, 2022 (commencement of operations) through January 31, 2023
BCalculated based on average shares outstanding during the period.
CNet investment income (loss) is affected by the timing of the declaration of dividends by any underlying mutual funds or exchange-traded funds (ETFs). Net investment income (loss) of any mutual funds or ETFs is not included in the Fund's net investment income (loss) ratio.
DTotal returns for periods of less than one year are not annualized.
ETotal returns would have been lower if certain expenses had not been reduced during the applicable periods shown.
FTotal returns do not include the effect of the sales charges.
GFees and expenses of any underlying mutual funds or exchange-traded funds (ETFs) are not included in the Fund's expense ratio. The Fund indirectly bears its proportionate share of these expenses. For additional expense information related to investments in Fidelity Central Funds, please refer to the "Investments in Fidelity Central Funds" note found in the Notes to Financial Statements section of the most recent Annual or Semi-Annual report.
HExpense ratios reflect operating expenses of the class. Expenses before reductions do not reflect amounts reimbursed, waived, or reduced through arrangements with the investment adviser, brokerage services, or other offset arrangements, if applicable, and do not represent the amount paid by the class during periods when reimbursements, waivers or reductions occur.
IAnnualized.
JAudit fees are not annualized.
KAmount does not include the portfolio activity of any underlying mutual funds or exchange-traded funds (ETFs).
| Fidelity® Advisor Sustainable Intermediate Municipal Income Fund Class M |
| |
| | Six months ended (Unaudited) July 31, 2023 | | Years ended January 31, 2023 A |
Selected Per-Share Data | | | | |
| Net asset value, beginning of period | $ | 10.14 | $ | 10.00 |
| Income from Investment Operations | | | | |
Net investment income (loss) B,C | | .130 | | .181 |
| Net realized and unrealized gain (loss) | | (.163) | | .137 |
| Total from investment operations | | (.033) | | .318 |
| Distributions from net investment income | | (.127) | | (.178) |
| Total distributions | | (.127) | | (.178) |
| Net asset value, end of period | $ | 9.98 | $ | 10.14 |
Total Return D,E,F | | (.32)% | | 3.24% |
Ratios to Average Net Assets C,G,H | | | | |
| Expenses before reductions | | 2.76% I | | 2.36% I,J |
| Expenses net of fee waivers, if any | | .62% I | | .62% I |
| Expenses net of all reductions | | .62% I | | .61% I |
| Net investment income (loss) | | 2.61% I | | 2.26% I |
| Supplemental Data | | | | |
| Net assets, end of period (000 omitted) | $ | 1,118 | $ | 1,122 |
Portfolio turnover rate K | | 26% I | | 14% I |
AFor the period April 13, 2022 (commencement of operations) through January 31, 2023
BCalculated based on average shares outstanding during the period.
CNet investment income (loss) is affected by the timing of the declaration of dividends by any underlying mutual funds or exchange-traded funds (ETFs). Net investment income (loss) of any mutual funds or ETFs is not included in the Fund's net investment income (loss) ratio.
DTotal returns for periods of less than one year are not annualized.
ETotal returns would have been lower if certain expenses had not been reduced during the applicable periods shown.
FTotal returns do not include the effect of the sales charges.
GFees and expenses of any underlying mutual funds or exchange-traded funds (ETFs) are not included in the Fund's expense ratio. The Fund indirectly bears its proportionate share of these expenses. For additional expense information related to investments in Fidelity Central Funds, please refer to the "Investments in Fidelity Central Funds" note found in the Notes to Financial Statements section of the most recent Annual or Semi-Annual report.
HExpense ratios reflect operating expenses of the class. Expenses before reductions do not reflect amounts reimbursed, waived, or reduced through arrangements with the investment adviser, brokerage services, or other offset arrangements, if applicable, and do not represent the amount paid by the class during periods when reimbursements, waivers or reductions occur.
IAnnualized.
JAudit fees are not annualized.
KAmount does not include the portfolio activity of any underlying mutual funds or exchange-traded funds (ETFs).
| Fidelity® Advisor Sustainable Intermediate Municipal Income Fund Class C |
| |
| | Six months ended (Unaudited) July 31, 2023 | | Years ended January 31, 2023 A |
Selected Per-Share Data | | | | |
| Net asset value, beginning of period | $ | 10.08 | $ | 10.00 |
| Income from Investment Operations | | | | |
Net investment income (loss) B,C | | .092 | | .120 |
| Net realized and unrealized gain (loss) | | (.166) | | .137 |
| Total from investment operations | | (.074) | | .257 |
| Distributions from net investment income | | (.126) | | (.177) |
| Total distributions | | (.126) | | (.177) |
| Net asset value, end of period | $ | 9.88 | $ | 10.08 |
Total Return D,E,F | | (.73)% | | 2.62% |
Ratios to Average Net Assets C,G,H | | | | |
| Expenses before reductions | | 3.52% I | | 3.08% I,J |
| Expenses net of fee waivers, if any | | 1.37% I | | 1.37% I |
| Expenses net of all reductions | | 1.37% I | | 1.36% I |
| Net investment income (loss) | | 1.86% I | | 1.51% I |
| Supplemental Data | | | | |
| Net assets, end of period (000 omitted) | $ | 1,057 | $ | 1,065 |
Portfolio turnover rate K | | 26% I | | 14% I |
AFor the period April 13, 2022 (commencement of operations) through January 31, 2023
BCalculated based on average shares outstanding during the period.
CNet investment income (loss) is affected by the timing of the declaration of dividends by any underlying mutual funds or exchange-traded funds (ETFs). Net investment income (loss) of any mutual funds or ETFs is not included in the Fund's net investment income (loss) ratio.
DTotal returns for periods of less than one year are not annualized.
ETotal returns would have been lower if certain expenses had not been reduced during the applicable periods shown.
FTotal returns do not include the effect of the contingent deferred sales charge.
GFees and expenses of any underlying mutual funds or exchange-traded funds (ETFs) are not included in the Fund's expense ratio. The Fund indirectly bears its proportionate share of these expenses. For additional expense information related to investments in Fidelity Central Funds, please refer to the "Investments in Fidelity Central Funds" note found in the Notes to Financial Statements section of the most recent Annual or Semi-Annual report.
HExpense ratios reflect operating expenses of the class. Expenses before reductions do not reflect amounts reimbursed, waived, or reduced through arrangements with the investment adviser, brokerage services, or other offset arrangements, if applicable, and do not represent the amount paid by the class during periods when reimbursements, waivers or reductions occur.
IAnnualized.
JAudit fees are not annualized.
KAmount does not include the portfolio activity of any underlying mutual funds or exchange-traded funds (ETFs).
| Fidelity® Sustainable Intermediate Municipal Income Fund |
| |
| | Six months ended (Unaudited) July 31, 2023 | | Years ended January 31, 2023 A |
Selected Per-Share Data | | | | |
| Net asset value, beginning of period | $ | 10.14 | $ | 10.00 |
| Income from Investment Operations | | | | |
Net investment income (loss) B,C | | .142 | | .200 |
| Net realized and unrealized gain (loss) | | (.163) | | .138 |
| Total from investment operations | | (.021) | | .338 |
| Distributions from net investment income | | (.139) | | (.198) |
| Total distributions | | (.139) | | (.198) |
| Net asset value, end of period | $ | 9.98 | $ | 10.14 |
Total Return D,E | | (.20)% | | 3.44% |
Ratios to Average Net Assets C,F,G | | | | |
| Expenses before reductions | | 2.39% H | | 2.03% H,I |
| Expenses net of fee waivers, if any | | .37% H | | .37% H |
| Expenses net of all reductions | | .37% H | | .36% H |
| Net investment income (loss) | | 2.86% H | | 2.51% H |
| Supplemental Data | | | | |
| Net assets, end of period (000 omitted) | $ | 7,904 | $ | 7,307 |
Portfolio turnover rate J | | 26% H | | 14% H |
AFor the period April 13, 2022 (commencement of operations) through January 31, 2023
BCalculated based on average shares outstanding during the period.
CNet investment income (loss) is affected by the timing of the declaration of dividends by any underlying mutual funds or exchange-traded funds (ETFs). Net investment income (loss) of any mutual funds or ETFs is not included in the Fund's net investment income (loss) ratio.
DTotal returns for periods of less than one year are not annualized.
ETotal returns would have been lower if certain expenses had not been reduced during the applicable periods shown.
FFees and expenses of any underlying mutual funds or exchange-traded funds (ETFs) are not included in the Fund's expense ratio. The Fund indirectly bears its proportionate share of these expenses. For additional expense information related to investments in Fidelity Central Funds, please refer to the "Investments in Fidelity Central Funds" note found in the Notes to Financial Statements section of the most recent Annual or Semi-Annual report.
GExpense ratios reflect operating expenses of the class. Expenses before reductions do not reflect amounts reimbursed, waived, or reduced through arrangements with the investment adviser, brokerage services, or other offset arrangements, if applicable, and do not represent the amount paid by the class during periods when reimbursements, waivers or reductions occur.
HAnnualized.
IAudit fees are not annualized.
JAmount does not include the portfolio activity of any underlying mutual funds or exchange-traded funds (ETFs).
| Fidelity® Advisor Sustainable Intermediate Municipal Income Fund Class I |
| |
| | Six months ended (Unaudited) July 31, 2023 | | Years ended January 31, 2023 A |
Selected Per-Share Data | | | | |
| Net asset value, beginning of period | $ | 10.14 | $ | 10.00 |
| Income from Investment Operations | | | | |
Net investment income (loss) B,C | | .142 | | .201 |
| Net realized and unrealized gain (loss) | | (.163) | | .137 |
| Total from investment operations | | (.021) | | .338 |
| Distributions from net investment income | | (.139) | | (.198) |
| Total distributions | | (.139) | | (.198) |
| Net asset value, end of period | $ | 9.98 | $ | 10.14 |
Total Return D,E | | (.20)% | | 3.44% |
Ratios to Average Net Assets C,F,G | | | | |
| Expenses before reductions | | 2.52% H | | 2.12% H,I |
| Expenses net of fee waivers, if any | | .37% H | | .37% H |
| Expenses net of all reductions | | .37% H | | .36% H |
| Net investment income (loss) | | 2.86% H | | 2.51% H |
| Supplemental Data | | | | |
| Net assets, end of period (000 omitted) | $ | 1,033 | $ | 1,035 |
Portfolio turnover rate J | | 26% H | | 14% H |
AFor the period April 13, 2022 (commencement of operations) through January 31, 2023
BCalculated based on average shares outstanding during the period.
CNet investment income (loss) is affected by the timing of the declaration of dividends by any underlying mutual funds or exchange-traded funds (ETFs). Net investment income (loss) of any mutual funds or ETFs is not included in the Fund's net investment income (loss) ratio.
DTotal returns for periods of less than one year are not annualized.
ETotal returns would have been lower if certain expenses had not been reduced during the applicable periods shown.
FFees and expenses of any underlying mutual funds or exchange-traded funds (ETFs) are not included in the Fund's expense ratio. The Fund indirectly bears its proportionate share of these expenses. For additional expense information related to investments in Fidelity Central Funds, please refer to the "Investments in Fidelity Central Funds" note found in the Notes to Financial Statements section of the most recent Annual or Semi-Annual report.
GExpense ratios reflect operating expenses of the class. Expenses before reductions do not reflect amounts reimbursed, waived, or reduced through arrangements with the investment adviser, brokerage services, or other offset arrangements, if applicable, and do not represent the amount paid by the class during periods when reimbursements, waivers or reductions occur.
HAnnualized.
IAudit fees are not annualized.
JAmount does not include the portfolio activity of any underlying mutual funds or exchange-traded funds (ETFs).
| Fidelity Advisor Sustainable Intermediate Municipal Income Fund Class Z |
| |
| | Six months ended (Unaudited) July 31, 2023 | | Years ended January 31, 2023 A |
Selected Per-Share Data | | | | |
| Net asset value, beginning of period | $ | 10.14 | $ | 10.00 |
| Income from Investment Operations | | | | |
Net investment income (loss) B,C | | .145 | | .205 |
| Net realized and unrealized gain (loss) | | (.163) | | .137 |
| Total from investment operations | | (.018) | | .342 |
| Distributions from net investment income | | (.142) | | (.202) |
| Total distributions | | (.142) | | (.202) |
| Net asset value, end of period | $ | 9.98 | $ | 10.14 |
Total Return D,E | | (.17)% | | 3.49% |
Ratios to Average Net Assets C,F,G | | | | |
| Expenses before reductions | | 2.38% H | | 2.04% H,I |
| Expenses net of fee waivers, if any | | .31% H | | .31% H |
| Expenses net of all reductions | | .31% H | | .30% H |
| Net investment income (loss) | | 2.92% H | | 2.57% H |
| Supplemental Data | | | | |
| Net assets, end of period (000 omitted) | $ | 1,033 | $ | 1,035 |
Portfolio turnover rate J | | 26% H | | 14% H |
AFor the period April 13, 2022 (commencement of operations) through January 31, 2023
BCalculated based on average shares outstanding during the period.
CNet investment income (loss) is affected by the timing of the declaration of dividends by any underlying mutual funds or exchange-traded funds (ETFs). Net investment income (loss) of any mutual funds or ETFs is not included in the Fund's net investment income (loss) ratio.
DTotal returns for periods of less than one year are not annualized.
ETotal returns would have been lower if certain expenses had not been reduced during the applicable periods shown.
FFees and expenses of any underlying mutual funds or exchange-traded funds (ETFs) are not included in the Fund's expense ratio. The Fund indirectly bears its proportionate share of these expenses. For additional expense information related to investments in Fidelity Central Funds, please refer to the "Investments in Fidelity Central Funds" note found in the Notes to Financial Statements section of the most recent Annual or Semi-Annual report.
GExpense ratios reflect operating expenses of the class. Expenses before reductions do not reflect amounts reimbursed, waived, or reduced through arrangements with the investment adviser, brokerage services, or other offset arrangements, if applicable, and do not represent the amount paid by the class during periods when reimbursements, waivers or reductions occur.
HAnnualized.
IAudit fees are not annualized.
JAmount does not include the portfolio activity of any underlying mutual funds or exchange-traded funds (ETFs).
For the period ended July 31, 2023
1. Organization.
Fidelity Sustainable Intermediate Municipal Income Fund (the Fund) is a fund of Fidelity Salem Street Trust (the Trust) and is authorized to issue an unlimited number of shares. The Trust is registered under the Investment Company Act of 1940, as amended (the 1940 Act), as an open-end management investment company organized as a Massachusetts business trust. The Fund offers Class A, Class M, Class C, Fidelity Sustainable Intermediate Municipal Income Fund, Class I and Class Z shares, each of which has equal rights as to assets and voting privileges. Class A, Class M, Class C, Class I and Class Z are Fidelity Advisor classes. Each class has exclusive voting rights with respect to matters that affect that class. Class C shares will automatically convert to Class A shares after a holding period of eight years from the initial date of purchase, with certain exceptions.
2. Investments in Fidelity Central Funds.
Funds may invest in Fidelity Central Funds, which are open-end investment companies generally available only to other investment companies and accounts managed by the investment adviser and its affiliates. The Schedule of Investments lists any Fidelity Central Funds held as an investment as of period end, but does not include the underlying holdings of each Fidelity Central Fund. An investing fund indirectly bears its proportionate share of the expenses of the underlying Fidelity Central Funds.
Based on its investment objective, each Fidelity Central Fund may invest or participate in various investment vehicles or strategies that are similar to those of the investing fund. These strategies are consistent with the investment objectives of the investing fund and may involve certain economic risks which may cause a decline in value of each of the Fidelity Central Funds and thus a decline in the value of the investing fund.
| Fidelity Central Fund | Investment Manager | Investment Objective | Investment Practices | Expense RatioA |
| Fidelity Money Market Central Funds | Fidelity Management & Research Company LLC (FMR) | Each fund seeks to obtain a high level of current income consistent with the preservation of capital and liquidity. | Short-term Investments | Less than .005% |
A Expenses expressed as a percentage of average net assets and are as of each underlying Central Fund's most recent annual or semi-annual shareholder report.
A complete unaudited list of holdings for each Fidelity Central Fund is available upon request or at the Securities and Exchange Commission website at www.sec.gov. In addition, the financial statements of the Fidelity Central Funds which contain the significant accounting policies (including investment valuation policies) of those funds, and are not covered by the Report of Independent Registered Public Accounting Firm, are available on the Securities and Exchange Commission website or upon request.
3. Significant Accounting Policies.
The Fund is an investment company and applies the accounting and reporting guidance of the Financial Accounting Standards Board (FASB) Accounting Standards Codification Topic 946 Financial Services - Investment Companies. The financial statements have been prepared in conformity with accounting principles generally accepted in the United States of America (GAAP), which require management to make certain estimates and assumptions at the date of the financial statements. Actual results could differ from those estimates. Subsequent events, if any, through the date that the financial statements were issued have been evaluated in the preparation of the financial statements. The Fund's Schedule of Investments lists any underlying mutual funds or exchange-traded funds (ETFs) but does not include the underlying holdings of these funds. The following summarizes the significant accounting policies of the Fund:
Investment Valuation. Investments are valued as of 4:00 p.m. Eastern time on the last calendar day of the period. The Board of Trustees (the Board) has designated the Fund's investment adviser as the valuation designee responsible for the fair valuation function and performing fair value determinations as needed. The investment adviser has established a Fair Value Committee (the Committee) to carry out the day-to-day fair valuation responsibilities and has adopted policies and procedures to govern the fair valuation process and the activities of the Committee. In accordance with these fair valuation policies and procedures, which have been approved by the Board, the Fund attempts to obtain prices from one or more third party pricing services or brokers to value its investments. When current market prices, quotations or currency exchange rates are not readily available or reliable, investments will be fair valued in good faith by the Committee, in accordance with the policies and procedures. Factors used in determining fair value vary by investment type and may include market or investment specific events, transaction data, estimated cash flows, and market observations of comparable investments. The frequency that the fair valuation procedures are used cannot be predicted and they may be utilized to a significant extent. The Committee manages the Fund's fair valuation practices and maintains the fair valuation policies and procedures. The Fund's investment adviser reports to the Board information regarding the fair valuation process and related material matters.
The Fund categorizes the inputs to valuation techniques used to value its investments into a disclosure hierarchy consisting of three levels as shown below:
Level 1 - unadjusted quoted prices in active markets for identical investments
Level 2 - other significant observable inputs (including quoted prices for similar investments, interest rates, prepayment speeds, etc.)
Level 3 - unobservable inputs (including the Fund's own assumptions based on the best information available)
Valuation techniques used to value the Fund's investments by major category are as follows:
Debt securities, including restricted securities, are valued based on evaluated prices received from third party pricing services or from brokers who make markets in such securities. Municipal securities are valued by pricing services who utilize matrix pricing which considers yield or price of bonds of comparable quality, coupon, maturity and type or by broker-supplied prices. When independent prices are unavailable or unreliable, debt securities may be valued utilizing pricing methodologies which consider similar factors that would be used by third party pricing services. Debt securities are generally categorized as Level 2 in the hierarchy but may be Level 3 depending on the circumstances.
Investments in open-end mutual funds, including the Fidelity Central Funds, are valued at their closing net asset value (NAV) each business day and are categorized as Level 1 in the hierarchy.
Changes in valuation techniques may result in transfers in or out of an assigned level within the disclosure hierarchy. The aggregate value of investments by input level as of July 31, 2023 is included at the end of the Fund's Schedule of Investments.
Investment Transactions and Income. For financial reporting purposes, the Fund's investment holdings and NAV include trades executed through the end of the last business day of the period. The NAV per share for processing shareholder transactions is calculated as of the close of business of the New York Stock Exchange (NYSE), normally 4:00 p.m. Eastern time and includes trades executed through the end of the prior business day. Gains and losses on securities sold are determined on the basis of identified cost. Income and capital gain distributions from Fidelity Central Funds, if any, are recorded on the ex-dividend date. Interest income is accrued as earned and includes coupon interest and amortization of premium and accretion of discount on debt securities as applicable.
Class Allocations and Expenses. Investment income, realized and unrealized capital gains and losses, common expenses of a fund, and certain fund-level expense reductions, if any, are allocated daily on a pro-rata basis to each class based on the relative net assets of each class to the total net assets of a fund. Each class differs with respect to transfer agent and distribution and service plan fees incurred, as applicable. Certain expense reductions may also differ by class, if applicable. For the reporting period, the allocated portion of income and expenses to each class as a percent of its average net assets may vary due to the timing of recording these transactions in relation to fluctuating net assets of the classes. Expenses directly attributable to a fund are charged to that fund. Expenses attributable to more than one fund are allocated among the respective funds on the basis of relative net assets or other appropriate methods. Expenses included in the accompanying financial statements reflect the expenses of that fund and do not include any expenses associated with any underlying mutual funds or exchange-traded funds (ETFs). Although not included in a fund's expenses, a fund indirectly bears its proportionate share of these expenses through the net asset value of each underlying mutual fund or exchange-traded fund (ETF). Expense estimates are accrued in the period to which they relate and adjustments are made when actual amounts are known.
Income Tax Information and Distributions to Shareholders. Each year, the Fund intends to qualify as a regulated investment company under Subchapter M of the Internal Revenue Code, including distributing substantially all of its taxable income and realized gains. As a result, no provision for U.S. Federal income taxes is required. The Fund files a U.S. federal tax return, in addition to state and local tax returns as required. The Fund's federal income tax returns are subject to examination by the Internal Revenue Service (IRS) for a period of three fiscal years after they are filed. State and local tax returns may be subject to examination for an additional fiscal year depending on the jurisdiction.
Distributions are declared and recorded daily and paid monthly from net investment income. Distributions from realized gains, if any, are declared and recorded on the ex-dividend date. Income and capital gain distributions are declared separately for each class. Income and capital gain distributions are determined in accordance with income tax regulations, which may differ from GAAP.
Capital accounts within the financial statements are adjusted for permanent book-tax differences. These adjustments have no impact on net assets or the results of operations. Capital accounts are not adjusted for temporary book-tax differences which will reverse in a subsequent period.
Book-tax differences are primarily due to market discount and capital loss carryforwards.
The Fund purchases municipal securities whose interest, in the opinion of the issuer, is free from federal income tax. There is no assurance that the IRS will agree with this opinion. In the event the IRS determines that the issuer does not comply with relevant tax requirements, interest payments from a security could become federally taxable, possibly retroactively to the date the security was issued.
As of period end, the cost and unrealized appreciation (depreciation) in securities, and derivatives if applicable, for federal income tax purposes were as follows:
| Gross unrealized appreciation | $99,240 |
| Gross unrealized depreciation | (116,925) |
| Net unrealized appreciation (depreciation) | $(17,685) |
| Tax cost | $13,616,348 |
Capital loss carryforwards are only available to offset future capital gains of the Fund to the extent provided by regulations and may be limited. The capital loss carryforward information presented below, including any applicable limitation, is estimated as of prior fiscal period end and is subject to adjustment.
Short-term | $(4,491) |
| Total capital loss carryforward | $(4,491) |
Delayed Delivery Transactions and When-Issued Securities. During the period, certain Funds transacted in securities on a delayed delivery or when-issued basis. Payment and delivery may take place after the customary settlement period for that security. The price of the underlying securities and the date when the securities will be delivered and paid for are fixed at the time the transaction is negotiated. Securities purchased on a delayed delivery or when-issued basis are identified as such in the Schedule of Investments. Compensation for interest forgone in the purchase of a delayed delivery or when-issued debt security may be received. With respect to purchase commitments, each applicable Fund identifies securities as segregated in its records with a value at least equal to the amount of the commitment. Payables and receivables associated with the purchases and sales of delayed delivery securities having the same coupon, settlement date and broker are offset. Delayed delivery or when-issued securities that have been purchased from and sold to different brokers are reflected as both payables and receivables in the Statement of Assets and Liabilities under the caption "Delayed delivery", as applicable. Losses may arise due to changes in the value of the underlying securities or if the counterparty does not perform under the contract's terms, or if the issuer does not issue the securities due to political, economic, or other factors.
4. Purchases and Sales of Investments.
Purchases and sales of securities, other than short-term securities and in-kind transactions, as applicable, are noted in the table below.
| | Purchases ($) | Sales ($) |
| Fidelity Sustainable Intermediate Municipal Income Fund | 2,456,891 | 1,642,119 |
5. Fees and Other Transactions with Affiliates.
Management Fee. Fidelity Management & Research Company LLC (the investment adviser) and its affiliates provide the Fund with investment management related services for which the Fund pays a monthly management fee. The management fee is the sum of an individual fund fee rate that is based on an annual rate of .25% of the Fund's average net assets and an annualized group fee rate that averaged .10% during the period. The group fee rate is based upon the monthly average net assets of a group of registered investment companies with which the investment adviser has management contracts. The group fee rate decreases as assets under management increase and increases as assets under management decrease. For the reporting period, the total annualized management fee rate was .35% of the Fund's average net assets.
Distribution and Service Plan Fees. In accordance with Rule 12b-1 of the 1940 Act, the Fund has adopted separate Distribution and Service Plans for each class of shares. Certain classes pay Fidelity Distributors Company LLC (FDC), an affiliate of the investment adviser, separate Distribution and Service Fees, each of which is based on an annual percentage of each class' average net assets. In addition, FDC may pay financial intermediaries for selling shares of the Fund and providing shareholder support services. For the period, the Distribution and Service Fee rates, total fees and amounts retained by FDC were as follows:
| | Distribution Fee | Service Fee | Total Fees | Retained by FDC |
| Class A | -% | .25% | $1,938 | $1,340 |
| Class M | -% | .25% | 1,393 | 1,283 |
| Class C | .75% | .25% | 5,277 | 5,267 |
| | | | $8,608 | $7,890 |
Sales Load. FDC may receive a front-end sales charge of up to 4.00% for selling Class A shares and Class M shares, some of which is paid to financial intermediaries for selling shares of the Fund. Depending on the holding period, FDC may receive contingent deferred sales charges levied on Class A, Class M and Class C redemptions. The deferred sales charges are 1.00% for Class C shares, .75% for certain purchases of Class A shares and .25% for certain purchases of Class M shares. For the period, there were no sales charge amounts retained by FDC.
Transfer Agent Fees. Fidelity Investments Institutional Operations Company LLC (FIIOC), an affiliate of the investment adviser, is the transfer, dividend disbursing and shareholder servicing agent for each class of the Fund. FIIOC receives account fees and asset-based fees that vary according to the account size and type of account of the shareholders of the respective classes of the Fund, except for Class Z. FIIOC receives an asset-based fee of Class Z's average net assets. FIIOC pays for typesetting, printing and mailing of shareholder reports, except proxy statements.
For the period, transfer agent fees for each class were as follows:
| | Amount | % of Class-Level Average Net AssetsA |
| Class A | $1,073 | .14 |
| Class M | 962 | .17 |
| Class C | 956 | .18 |
| Fidelity Sustainable Intermediate Municipal Income Fund | 3,078 | .08 |
| Class I | 937 | .18 |
| Class Z | 257 | .05 |
| | $7,263 | |
A Annualized
Accounting Fees. Fidelity Service Company, Inc. (FSC), an affiliate of the investment adviser, maintains the Fund's accounting records. The accounting fee is based on the level of average net assets for each month. For the period, the fees were equivalent to the following annualized rates:
| | % of Average Net Assets |
| Fidelity Sustainable Intermediate Municipal Income Fund | .03 |
Interfund Trades. Funds may purchase from or sell securities to other Fidelity Funds under procedures adopted by the Board. The procedures have been designed to ensure these interfund trades are executed in accordance with Rule 17a-7 of the 1940 Act. Any interfund trades are included within the respective purchases and sales amounts shown in the Purchases and Sales of Investments note. During the period, there were no interfund trades.
6. Committed Line of Credit.
Certain Funds participate with other funds managed by the investment adviser or an affiliate in a $4.25 billion credit facility (the "line of credit") to be utilized for temporary or emergency purposes to fund shareholder redemptions or for other short-term liquidity purposes. The participating funds have agreed to pay commitment fees on their pro-rata portion of the line of credit, which are reflected in Miscellaneous expenses on the Statement of Operations, and are listed below. During the period, there were no borrowings on this line of credit.
| | Amount |
| Fidelity Sustainable Intermediate Municipal Income Fund | $7 |
7. Expense Reductions.
The investment adviser contractually agreed to reimburse expenses of each class to the extent annual operating expenses exceeded certain levels of class-level average net assets as noted in the table below. This reimbursement will remain in place through May 31, 2024. Some expenses, for example the compensation of the independent Trustees, and certain miscellaneous expenses such as proxy and shareholder meeting expenses, are excluded from this reimbursement.
The following classes were in reimbursement during the period:
| | Expense Limitations | Reimbursement |
| Class A | .62% | $16,110 |
| Class M | .62% | 11,802 |
| Class C | 1.37% | 11,267 |
| Fidelity Sustainable Intermediate Municipal Income Fund | .37% | 75,883 |
| Class I | .37% | 10,954 |
| Class Z | .31% | 10,554 |
| | | $136,570 |
Through arrangements with the Fund's custodian and each class' transfer agent, credits realized as a result of certain uninvested cash balances were used to reduce the Fund's expenses. During the period, custodian credits reduced the Fund's expenses by $40.
In addition, during the period the investment adviser or an affiliate reimbursed and/or waived a portion of fund-level operating expenses in the amount of $220.
8. Distributions to Shareholders.
Distributions to shareholders of each class were as follows:
| | Six months ended July 31, 2023 | Year ended January 31, 2023A |
| Fidelity Sustainable Intermediate Municipal Income Fund | | |
| Distributions to shareholders | | |
| Class A | $19,661 | $20,582 |
| Class M | 14,128 | 18,384 |
| Class C | 13,418 | 17,991 |
| Fidelity Sustainable Intermediate Municipal Income Fund | 105,679 | 123,006 |
| Class I | 14,323 | 19,937 |
| Class Z | 14,621 | 20,416 |
Total | $181,830 | $220,316 |
A For the period April 13, 2022 (commencement of operations) through January 31, 2023.
9. Share Transactions.
Share transactions for each class were as follows and may contain in-kind transactions, automatic conversions between classes or exchanges between affiliated funds:
| | Shares | Shares | Dollars | Dollars |
| | Six months ended July 31, 2023 | Year ended January 31, 2023A | Six months ended July 31, 2023 | Year ended January 31, 2023A |
| Fidelity Sustainable Intermediate Municipal Income Fund | | | | |
| Class A | | | | |
| Shares sold | 1,269 | 152,415 | $12,750 | $1,510,973 |
| Reinvestment of distributions | 1,968 | 2,073 | 19,657 | 20,582 |
| Shares redeemed | (1,382) | (328) | (13,830) | (3,253) |
| Net increase (decrease) | 1,855 | 154,160 | $18,577 | $1,528,302 |
| Class M | | | | |
| Shares sold | - | 108,784 | $ - | $1,085,981 |
| Reinvestment of distributions | 1,414 | 1,853 | 14,128 | 18,384 |
| Net increase (decrease) | 1,414 | 110,637 | $14,128 | $1,104,365 |
| Class C | | | | |
| Shares sold | 2 | 104,646 | $22 | $1,046,011 |
| Reinvestment of distributions | 1,354 | 1,821 | 13,418 | 17,991 |
| Shares redeemed | (4) | (836) | (44) | (8,058) |
| Net increase (decrease) | 1,352 | 105,631 | $13,396 | $1,055,944 |
| Fidelity Sustainable Intermediate Municipal Income Fund | | | | |
| Shares sold | 76,599 | 731,710 | $768,022 | $7,308,238 |
| Reinvestment of distributions | 8,453 | 10,931 | 84,448 | 108,350 |
| Shares redeemed | (13,554) | (22,221) | (136,341) | (213,843) |
| Net increase (decrease) | 71,498 | 720,420 | $716,129 | $7,202,745 |
| Class I | | | | |
| Shares sold | 299 | 100,000 | $3,000 | $1,000,000 |
| Reinvestment of distributions | 1,434 | 2,010 | 14,323 | 19,937 |
| Shares redeemed | (300) | - | (3,012) | - |
| Net increase (decrease) | 1,433 | 102,010 | $14,311 | $1,019,937 |
| Class Z | | | | |
| Shares sold | - | 100,000 | $ - | $1,000,000 |
| Reinvestment of distributions | 1,463 | 2,059 | 14,621 | 20,416 |
| Net increase (decrease) | 1,463 | 102,059 | $14,621 | $1,020,416 |
A For the period April 13, 2022 (commencement of operations) through January 31, 2023.
10. Other.
A fund's organizational documents provide former and current trustees and officers with a limited indemnification against liabilities arising in connection with the performance of their duties to the fund. In the normal course of business, a fund may also enter into contracts that provide general indemnifications. A fund's maximum exposure under these arrangements is unknown as this would be dependent on future claims that may be made against a fund. The risk of material loss from such claims is considered remote.
At the end of the period, the investment adviser or its affiliates were owners of record of more than 10% of the outstanding shares as follows:
| Fund | Affiliated % |
Fidelity Sustainable Intermediate Municipal Income Fund | 75% |
11. Risk and Uncertainties.
Many factors affect a fund's performance. Developments that disrupt global economies and financial markets, such as pandemics, epidemics, outbreaks of infectious diseases, war, terrorism, and environmental disasters, may significantly affect a fund's investment performance. The effects of these developments to a fund will be impacted by the types of securities in which a fund invests, the financial condition, industry, economic sector, and geographic location of an issuer, and a fund's level of investment in the securities of that issuer. Significant concentrations in security types, issuers, industries, sectors, and geographic locations may magnify the factors that affect a fund's performance.
As a shareholder, you incur two types of costs: (1) transaction costs, which may include sales charges (loads) on purchase payments or redemption proceeds, as applicable and (2) ongoing costs, which generally include management fees, distribution and/or service (12b-1) fees and other Fund expenses. This Example is intended to help you understand your ongoing costs (in dollars) of investing in a fund and to compare these costs with the ongoing costs of investing in other mutual funds.
| The Example is based on an investment of $1,000 invested at the beginning of the period and held for the entire period (February 1, 2023 to July 31, 2023). |
Actual Expenses
The first line of the accompanying table provides information about actual account values and actual expenses. You may use the information in this line, together with the amount you invested, to estimate the expenses that you paid over the period. Simply divide your account value by $1,000.00 (for example, an $8,600 account value divided by $1,000.00 = 8.6), then multiply the result by the number in the first line for a class/Fund under the heading entitled "Expenses Paid During Period" to estimate the expenses you paid on your account during this period. If any fund is a shareholder of any underlying mutual funds or exchange-traded funds (ETFs) (the Underlying Funds), such fund indirectly bears its proportional share of the expenses of the Underlying Funds in addition to the direct expenses incurred presented in the table. These fees and expenses are not included in the annualized expense ratio used to calculate the expense estimate in the table below.
Hypothetical Example for Comparison Purposes
The second line of the accompanying table provides information about hypothetical account values and hypothetical expenses based on the actual expense ratio and an assumed rate of return of 5% per year before expenses, which is not the actual return. The hypothetical account values and expenses may not be used to estimate the actual ending account balance or expenses you paid for the period. You may use this information to compare the ongoing costs of investing in the Fund and other funds. To do so, compare this 5% hypothetical example with the 5% hypothetical examples that appear in the shareholder reports of the other funds. If any fund is a shareholder of any Underlying Funds, such fund indirectly bears its proportional share of the expenses of the Underlying Funds in addition to the direct expenses as presented in the table. These fees and expenses are not included in the annualized expense ratio used to calculate the expense estimate in the table below.
Please note that the expenses shown in the table are meant to highlight your ongoing costs only and do not reflect any transaction costs. Therefore, the second line of the table is useful in comparing ongoing costs only, and will not help you determine the relative total costs of owning different funds. In addition, if these transactional costs were included, your costs would have been higher.
| | | | | Annualized Expense Ratio- A | | Beginning Account Value February 1, 2023 | | Ending Account Value July 31, 2023 | | Expenses Paid During Period- C February 1, 2023 to July 31, 2023 |
| Fidelity® Sustainable Intermediate Municipal Income Fund | | | | | | | | | | |
| Class A | | | | .62% | | | | | | |
| Actual | | | | | | $ 1,000 | | $ 996.80 | | $ 3.07 |
Hypothetical-B | | | | | | $ 1,000 | | $ 1,021.72 | | $ 3.11 |
| Class M | | | | .62% | | | | | | |
| Actual | | | | | | $ 1,000 | | $ 996.80 | | $ 3.07 |
Hypothetical-B | | | | | | $ 1,000 | | $ 1,021.72 | | $ 3.11 |
| Class C | | | | 1.37% | | | | | | |
| Actual | | | | | | $ 1,000 | | $ 992.70 | | $ 6.77 |
Hypothetical-B | | | | | | $ 1,000 | | $ 1,018.00 | | $ 6.85 |
| Fidelity® Sustainable Intermediate Municipal Income Fund | | | | .37% | | | | | | |
| Actual | | | | | | $ 1,000 | | $ 998.00 | | $ 1.83 |
Hypothetical-B | | | | | | $ 1,000 | | $ 1,022.96 | | $ 1.86 |
| Class I | | | | .37% | | | | | | |
| Actual | | | | | | $ 1,000 | | $ 998.00 | | $ 1.83 |
Hypothetical-B | | | | | | $ 1,000 | | $ 1,022.96 | | $ 1.86 |
| Class Z | | | | .31% | | | | | | |
| Actual | | | | | | $ 1,000 | | $ 998.30 | | $ 1.54 |
Hypothetical-B | | | | | | $ 1,000 | | $ 1,023.26 | | $ 1.56 |
| |
A Annualized expense ratio reflects expenses net of applicable fee waivers.
B 5% return per year before expenses
C Expenses are equal to the annualized expense ratio, multiplied by the average account value over the period, multiplied by 181/ 365 (to reflect the one-half year period). The fees and expenses of any Underlying Funds are not included in each annualized expense ratio.
1.9904922.101
SNT-SANN-0923
Fidelity® Municipal Core Plus Bond Fund
Semi-Annual Report
July 31, 2023
Includes Fidelity and Fidelity Advisor share classes
Contents
To view a fund's proxy voting guidelines and proxy voting record for the 12-month period ended June 30, visit http://www.fidelity.com/proxyvotingresults or visit the Securities and Exchange Commission's (SEC) web site at http://www.sec.gov.
You may also call 1-800-544-8544 if you're an individual investing directly with Fidelity, call 1-800-835-5092 if you're a plan sponsor or participant with Fidelity as your recordkeeper or call 1-877-208-0098 on institutional accounts or if you're an advisor or invest through one to request a free copy of the proxy voting guidelines.
Standard & Poor's, S&P and S&P 500 are registered service marks of The McGraw-Hill Companies, Inc. and have been licensed for use by Fidelity Distributors Corporation.
Other third-party marks appearing herein are the property of their respective owners.
All other marks appearing herein are registered or unregistered trademarks or service marks of FMR LLC or an affiliated company. © 2023 FMR LLC. All rights reserved.
This report and the financial statements contained herein are submitted for the general information of the shareholders of the Fund. This report is not authorized for distribution to prospective investors in the Fund unless preceded or accompanied by an effective prospectus.
A fund files its complete schedule of portfolio holdings with the SEC for the first and third quarters of each fiscal year on Form N-PORT. Forms N-PORT are available on the SEC's web site at http://www.sec.gov. A fund's Forms N-PORT may be reviewed and copied at the SEC's Public Reference Room in Washington, DC. Information regarding the operation of the SEC's Public Reference Room may be obtained by calling 1-800-SEC-0330.
For a complete list of a fund's portfolio holdings, view the most recent holdings listing, semiannual report, or annual report on Fidelity's web site at http://www.fidelity.com, http://www.institutional.fidelity.com, or http://www.401k.com, as applicable.
NOT FDIC INSURED •MAY LOSE VALUE •NO BANK GUARANTEE
Neither the Fund nor Fidelity Distributors Corporation is a bank.
| Top Five States (% of Fund's net assets) |
| | |
| New Jersey | 12.8 |
| Illinois | 11.9 |
| New York | 10.3 |
| California | 10.0 |
| Connecticut | 5.8 |
| | |
| Revenue Sources (% of Fund's net assets) |
| General Obligations | 26.3 | |
| Health Care | 15.9 | |
| Transportation | 10.4 | |
| Education | 9.5 | |
| Special Tax | 9.4 | |
| Housing | 8.4 | |
| Others* (Individually Less Than 5%) | 20.1 | |
| | 100.0 | |
| |
| *Includes net other assets | | |
Quality Diversification (% of Fund's net assets) |
|
| |
| We have used ratings from Moody's Investors Service, Inc. Where Moody's® ratings are not available, we have used S&P® ratings. All ratings are as of the date indicated and do not reflect subsequent changes. |
Showing Percentage of Net Assets
| Municipal Bonds - 95.6% |
| | | Principal Amount (a) | Value ($) |
| Alabama - 1.9% | | | |
| Black Belt Energy Gas District Bonds: | | | |
| Series 2022 C1, 5.25%, tender 6/1/29 (b) | | 630,000 | 661,390 |
| Series 2022 E, 5%, tender 6/1/28 (b) | | 65,000 | 67,449 |
TOTAL ALABAMA | | | 728,839 |
| Arizona - 1.2% | | | |
| Coconino County Poll. Cont. Corp. Rev. Bonds (Navada Pwr. Co. Proj.) Series 2017 B, 3.75%, tender 3/31/26 (b) | | 100,000 | 100,282 |
| Phoenix Civic Impt. Board Arpt. Rev. Series 2023, 5% 7/1/24 (c) | | 100,000 | 101,053 |
| Salt Verde Finl. Corp. Sr. Gas Rev. Series 2007, 5% 12/1/37 | | 260,000 | 271,754 |
TOTAL ARIZONA | | | 473,089 |
| California - 5.6% | | | |
| California Gen. Oblig.: | | | |
| Series 2020, 4% 11/1/37 | | 50,000 | 51,756 |
| Series 2022, 4.75% 12/1/42 | | 250,000 | 266,645 |
| California Hsg. Fin. Agcy.: | | | |
| Series 2021 1, 3.5% 11/20/35 | | 579,257 | 542,377 |
| Series 2023 A1, 4.375% 9/20/36 | | 99,891 | 99,310 |
| California Muni. Fin. Auth. Rev. Series 2017 A: | | | |
| 3.5% 6/1/34 | | 50,000 | 48,717 |
| 3.75% 6/1/37 | | 40,000 | 38,086 |
| Fresno Arpt. Rev. Series 2023 A, 5% 7/1/53 (Build America Mutual Assurance Insured) (c) | | 500,000 | 523,449 |
| Los Angeles Dept. Arpt. Rev.: | | | |
| Series 2019 A, 5% 5/15/35 (c) | | 10,000 | 10,734 |
| Series 2019 C, 5% 5/15/25 (Escrowed to Maturity) | | 25,000 | 25,913 |
| Los Angeles Unified School District: | | | |
| Series 2016 B, 2% 7/1/29 | | 10,000 | 9,191 |
| Series 2020 C, 3% 7/1/35 | | 5,000 | 4,665 |
| San Diego Unified School District Series 2012 R1, 0% 7/1/31 | | 10,000 | 7,841 |
| San Francisco City & County Arpts. Commission Int'l. Arpt. Rev. Series 2023 A, 5% 5/1/38 (c) | | 500,000 | 541,462 |
| San Mateo County Cmnty. College District Series 2019, 5% 9/1/38 | | 5,000 | 5,545 |
TOTAL CALIFORNIA | | | 2,175,691 |
| Colorado - 1.7% | | | |
| Colorado Health Facilities Auth. Rev. Bonds: | | | |
| (Parkview Med. Ctr., Inc. Proj.) Series 2016, 4% 9/1/36 | | 15,000 | 14,714 |
| (Parkview Med. Ctr., INC. Proj.) Series 2017, 5% 9/1/26 | | 325,000 | 333,495 |
| Bonds Series 2023 A1, 5%, tender 11/15/28 (b) | | 90,000 | 97,956 |
| Series 2019 A, 4% 11/1/39 | | 45,000 | 44,434 |
| Series 2019 A1, 4% 8/1/39 | | 185,000 | 178,700 |
TOTAL COLORADO | | | 669,299 |
| Connecticut - 5.8% | | | |
| Connecticut Gen. Oblig.: | | | |
| Series 2016 A, 5% 3/15/26 | | 50,000 | 52,448 |
| Series 2018 A, 5% 4/15/37 | | 1,000,000 | 1,071,503 |
| Series 2021 A, 3% 1/15/36 | | 20,000 | 18,372 |
| Connecticut Health & Edl. Facilities Auth. Rev.: | | | |
| Series 2019 A: | | | |
5% 7/1/25 | | 190,000 | 192,646 |
5% 7/1/26 | | 500,000 | 511,513 |
| Series 2020 A: | | | |
4% 7/1/36 | | 5,000 | 4,966 |
5% 7/1/32 | | 5,000 | 5,438 |
| Series R, 5% 6/1/40 | | 30,000 | 31,916 |
| Connecticut Hsg. Fin. Auth. Series 2023 A, 5.25% 11/15/53 | | 260,000 | 274,332 |
| Stamford Gen. Oblig. Series 2016, 4% 8/1/26 | | 5,000 | 5,091 |
| Steelpointe Hbr. Infrastructure Impt. District (Steelpointe Hbr. Proj.) Series 2021, 4% 4/1/51 (d) | | 100,000 | 81,736 |
TOTAL CONNECTICUT | | | 2,249,961 |
| District Of Columbia - 1.9% | | | |
| District of Columbia Gen. Oblig. Series 2016 A, 3% 6/1/41 | | 145,000 | 121,261 |
| District of Columbia Income Tax Rev. Series 2019 A, 5% 3/1/35 | | 15,000 | 16,772 |
| Metropolitan Washington DC Arpts. Auth. Sys. Rev.: | | | |
| Series 2018 A, 5% 10/1/23 (c) | | 270,000 | 270,507 |
| Series 2021 A: | | | |
4% 10/1/40 (c) | | 100,000 | 97,517 |
5% 10/1/26 (c) | | 200,000 | 208,802 |
TOTAL DISTRICT OF COLUMBIA | | | 714,859 |
| Florida - 0.2% | | | |
| Florida Higher Edl. Facilities Fing. Auth. (Rollins College Proj.) Series 2020 A, 3% 12/1/48 | | 100,000 | 71,818 |
| Florida Hsg. Fin. Corp. Multi-family Mtg. Rev. Bonds Series 2023 C, 5%, tender 12/1/25 (b) | | 15,000 | 15,364 |
TOTAL FLORIDA | | | 87,182 |
| Georgia - 2.8% | | | |
| Burke County Indl. Dev. Auth. Poll. Cont. Rev. Bonds (Georgia Pwr. Co. Plant Vogtle Proj.) Series 1994 4, 3.8%, tender 5/21/26 (b) | | 340,000 | 337,047 |
| Main Street Natural Gas, Inc. Bonds: | | | |
| Series 2022 E, 4%, tender 12/1/29 (b) | | 200,000 | 196,506 |
| Series 2023 A, 5%, tender 6/1/30 (b) | | 200,000 | 206,877 |
| Series 2023 B, 5%, tender 3/1/30 (b) | | 250,000 | 262,113 |
| Series 2023 C, 5%, tender 9/1/30 (b) | | 55,000 | 57,815 |
| Private Colleges & Univs. Auth. Rev. (The Savannah College of Art & Design Projs.) Series 2021, 4% 4/1/38 | | 5,000 | 5,081 |
TOTAL GEORGIA | | | 1,065,439 |
| Hawaii - 0.9% | | | |
| Honolulu City & County Gen. Oblig. Series 2020 F, 5% 7/1/34 | | 5,000 | 5,682 |
| Honolulu City & County Multi-family housing Rev. Bonds Series 2023, 5%, tender 6/1/26 (b) | | 340,000 | 352,080 |
TOTAL HAWAII | | | 357,762 |
| Illinois - 11.9% | | | |
| Chicago Board of Ed.: | | | |
| Series 2017 D, 5% 12/1/31 | | 100,000 | 102,040 |
| Series 2022 B, 4% 12/1/41 | | 100,000 | 89,761 |
| Chicago Midway Arpt. Rev. Series 2016 A, 5% 1/1/29 (c) | | 20,000 | 20,494 |
| Chicago O'Hare Int'l. Arpt. Rev.: | | | |
| Series 2015 A, 5% 1/1/28 (c) | | 5,000 | 5,055 |
| Series 2016 G, 5% 1/1/42 (c) | | 5,000 | 5,086 |
| Illinois Fin. Auth. Academic Facilities (Provident Group UIUC Properties LLC Univ. of Illinois at Urbana-Champaign Proj.) Series 2019 A, 5% 10/1/38 | | 350,000 | 365,526 |
| Illinois Fin. Auth. Rev.: | | | |
| Series 2015 A, 5% 11/15/25 | | 60,000 | 61,886 |
| Series 2016 A, 3% 10/1/37 | | 20,000 | 17,084 |
| Series 2016: | | | |
3.125% 5/15/37 | | 35,000 | 30,933 |
4% 5/15/35 | | 10,000 | 10,009 |
5% 12/1/46 | | 5,000 | 5,023 |
| Series 2017 C, 5% 3/1/26 | | 15,000 | 15,484 |
| Series 2019, 5% 4/1/35 | | 15,000 | 15,918 |
| Illinois Gen. Oblig.: | | | |
| Series 2017 D, 5% 11/1/28 | | 25,000 | 26,607 |
| Series 2021 A, 5% 3/1/30 | | 120,000 | 131,878 |
| Series 2022 A, 5% 3/1/36 | | 40,000 | 43,729 |
| Series 2023 B, 5% 5/1/37 | | 500,000 | 541,239 |
| Series 2023 D, 4% 7/1/37 | | 300,000 | 297,777 |
| Series June 2016, 3.5% 6/1/29 | | 500,000 | 485,795 |
| Illinois Hsg. Dev. Auth. Multi-family Hsg. Rev. Bonds Series 2023, 4%, tender 6/1/25 (b) | | 350,000 | 350,023 |
| Illinois Toll Hwy. Auth. Toll Hwy. Rev. Series A, 5% 1/1/45 | | 20,000 | 21,269 |
| Metropolitan Pier & Exposition: | | | |
| (McCormick Place Expansion Proj.) Series A, 0% 12/15/38 (Nat'l. Pub. Fin. Guarantee Corp. Insured) | | 15,000 | 7,701 |
| Series 2002 A, 0% 12/15/33 (Nat'l. Pub. Fin. Guarantee Corp. Insured) | | 20,000 | 13,398 |
| Series 2022 A, 0% 6/15/41 | | 300,000 | 132,821 |
| Railsplitter Tobacco Settlement Auth. Rev. Series 2017: | | | |
| 5% 6/1/26 | | 5,000 | 5,221 |
| 5% 6/1/27 | | 300,000 | 314,238 |
| Sales Tax Securitization Corp.: | | | |
| Series 2023 A, 3% 1/1/27 | | 264,000 | 256,903 |
| Series 2023 C, 5% 1/1/35 (e) | | 1,000,000 | 1,110,162 |
| Schaumburg Village Gen. Oblig. Series 2023, 4% 12/1/30 | | 100,000 | 104,692 |
TOTAL ILLINOIS | | | 4,587,752 |
| Indiana - 0.0% | | | |
| Indiana Fin. Auth. Edl. Facilities Rev. (Butler Univ. Proj.) Series 2021, 4% 2/1/30 | | 10,000 | 10,389 |
| Iowa - 0.7% | | | |
| Des Moines Iowa Series 2020 A, 2% 6/1/31 | | 10,000 | 8,780 |
| Iowa Fin. Auth. Single Family Mtg. (Mtg.-Backed Securities Prog.) Series 2023 A, 5.25% 7/1/53 | | 260,000 | 272,454 |
TOTAL IOWA | | | 281,234 |
| Kentucky - 2.8% | | | |
| Ashland Med. Ctr. Rev. (Ashland Hosp. Corp. D/B/A Kings Daughters Med. Ctr. Proj.) Series 2016 A, 4% 2/1/36 | | 350,000 | 339,958 |
| Kentucky Econ. Dev. Fin. Auth. Hosp. Rev. Series 2017 A, 5.25% 6/1/41 | | 200,000 | 204,491 |
| Kentucky, Inc. Pub. Energy Bonds Series A, 4%, tender 6/1/26 (b) | | 95,000 | 94,784 |
| Louisville & Jefferson County: | | | |
| Bonds Series 2020 C, 5%, tender 10/1/26 (b) | | 350,000 | 361,902 |
| Series 2020 A, 3% 10/1/43 | | 85,000 | 65,108 |
| Louisville & Jefferson County Visitors & Convention Commission Rev. (Kentucky Int'l. Convention Ctr. Expansion Proj.) Series 2016, 3.125% 6/1/46 (Assured Guaranty Muni. Corp. Insured) | | 20,000 | 16,084 |
TOTAL KENTUCKY | | | 1,082,327 |
| Louisiana - 0.8% | | | |
| New Orleans Aviation Board Rev. Series 2017 D2, 5% 1/1/38 (c) | | 60,000 | 61,442 |
| St. John Baptist Parish Rev. Bonds (Marathon Oil Corp.) Series 2017, 4.05%, tender 7/1/26 (b) | | 260,000 | 258,300 |
TOTAL LOUISIANA | | | 319,742 |
| Maryland - 1.5% | | | |
| Maryland Health & Higher Edl. Bonds Series 2020, 5%, tender 7/1/25 (b) | | 300,000 | 305,657 |
| Univ. of Maryland Sys. Auxiliary Facility & Tuition Rev. Series 2014 A, 5% 4/1/25 | | 255,000 | 258,140 |
TOTAL MARYLAND | | | 563,797 |
| Massachusetts - 2.8% | | | |
| Amesbury Gen. Oblig. Series 2020, 2% 6/1/34 | | 25,000 | 20,819 |
| Massachusetts Dev. Fin. Agcy. Rev.: | | | |
| Series 2016, 5% 7/1/28 | | 30,000 | 30,769 |
| Series 2019 K, 5% 7/1/35 | | 15,000 | 16,127 |
| Series 2021 G, 4% 7/1/46 | | 510,000 | 482,871 |
| Massachusetts Edl. Fing. Auth. Rev. Series 2020 C, 5% 7/1/26 (c) | | 100,000 | 102,911 |
| Massachusetts Hsg. Fin. Agcy. Multi-Family Rev. Series 2018 A, 3.7% 12/1/38 | | 370,000 | 347,819 |
| Massachusetts Port Auth. Rev. Series 2019 A, 5% 7/1/34 (c) | | 30,000 | 32,394 |
| Worcester Gen. Oblig. Series 2021, 2% 2/15/35 (Assured Guaranty Muni. Corp. Insured) | | 60,000 | 49,040 |
TOTAL MASSACHUSETTS | | | 1,082,750 |
| Michigan - 0.4% | | | |
| Detroit Gen. Oblig. Series 2021 A, 5% 4/1/38 | | 100,000 | 102,714 |
| Michigan Fin. Auth. Rev. Series 2022, 5% 12/1/32 | | 25,000 | 26,393 |
| Rochester Cmnty. School District Series 2019 II, 3% 5/1/31 | | 5,000 | 4,846 |
TOTAL MICHIGAN | | | 133,953 |
| Minnesota - 2.1% | | | |
| Minneapolis Health Care Sys. Rev. Bonds Series 2023 A, 5%, tender 11/15/28 (b) | | 300,000 | 322,685 |
| Minnesota Higher Ed. Facilities Auth. Rev.: | | | |
| Series 2018 A, 5% 10/1/33 | | 150,000 | 159,067 |
| Series 2023, 4.25% 10/1/38 | | 300,000 | 291,959 |
| Minnesota Hsg. Fin. Agcy. Series 2023 F, 5.75% 7/1/53 | | 10,000 | 10,738 |
| Saint Cloud Health Care Rev. Series 2016 A, 3% 5/1/32 | | 15,000 | 14,052 |
TOTAL MINNESOTA | | | 798,501 |
| Mississippi - 0.2% | | | |
| Mississippi Bus. finance Corp. Exempt Facilities Rev. Bonds (Enviva, Inc. Proj.) Series 2022, 7.75%, tender 7/15/32 (b)(c) | | 100,000 | 74,854 |
| Nevada - 4.6% | | | |
| Clark County Arpt. Rev. Series 2021 B, 5% 7/1/25 (c) | | 1,740,000 | 1,777,723 |
| New Hampshire - 0.2% | | | |
| Nat'l. Finnance Auth. Series 2023 2A, 3.875% 1/20/38 | | 100,000 | 93,152 |
| New Jersey - 12.8% | | | |
| Essex County Gen. Oblig. Series 2021 B, 2% 8/15/33 | | 450,000 | 389,456 |
| New Jersey Econ. Dev. Auth. Series 2024 SSS, 5.25% 6/15/38 (e) | | 1,000,000 | 1,082,891 |
| New Jersey Econ. Dev. Auth. Motor Vehicle Rev. Series 2017 A, 4% 7/1/34 | | 10,000 | 10,045 |
| New Jersey Econ. Dev. Auth. Wtr. Facilities Rev. Bonds (New Jersey- American Wtr. Co., INC. Proj.) Series 2020 B, 3.75%, tender 6/1/28 (b)(c) | | 340,000 | 338,381 |
| New Jersey Gen. Oblig. Series 2020, 2.375% 6/1/36 | | 55,000 | 45,538 |
| New Jersey Higher Ed. Student Assistance Auth. Student Ln. Rev.: | | | |
| Series 2021 B, 5% 12/1/25 (c) | | 655,000 | 670,614 |
| Series 2023 A, 5% 12/1/30 (c) | | 300,000 | 322,746 |
| New Jersey Hsg. & Mtg. Fin. Agcy. Multi-family Rev. Series 2023 C, 5% 11/1/26 (c) | | 500,000 | 509,473 |
| New Jersey Tobacco Settlement Fing. Corp. Series 2018 B, 5% 6/1/46 | | 560,000 | 559,946 |
| New Jersey Trans. Trust Fund Auth.: | | | |
| Series 2006 C: | | | |
0% 12/15/24 | | 150,000 | 142,745 |
0% 12/15/31 (FGIC Insured) | | 15,000 | 11,058 |
0% 12/15/34 | | 80,000 | 52,186 |
| Series 2022 AA, 5% 6/15/25 | | 250,000 | 257,321 |
| Series AA, 5% 6/15/38 | | 35,000 | 37,641 |
| Salem County Indl. Poll. Cont. Fing. Auth. Poll. Cont. Rev. Bonds (Philadelphia Elec. Co. Proj.) Series 1993 A, 4.45%, tender 3/1/25 (b)(c) | | 500,000 | 499,983 |
TOTAL NEW JERSEY | | | 4,930,024 |
| New Mexico - 0.0% | | | |
| New Mexico Mtg. Fin. Auth. Series 2018 A1, 4% 1/1/49 | | 15,000 | 14,879 |
| New York - 10.3% | | | |
| Genesee County Fdg. Corp. (Rochester Reg'l. Health Proj.) Series 2022 A, 5% 12/1/30 | | 250,000 | 265,340 |
| Long Island Pwr. Auth. Elec. Sys. Rev. Series 2020 A, 5% 9/1/34 | | 5,000 | 5,723 |
| New York City Gen. Oblig.: | | | |
| Bonds Series 2015 F4, 5%, tender 6/1/44 (f) | | 100,000 | 102,877 |
| Series 2023 1, 5% 8/1/28 | | 1,000,000 | 1,100,938 |
| Series 2023 D, 5% 8/1/25 | | 1,000,000 | 1,037,663 |
| New York City Hsg. Dev. Corp. Multifamily Hsg. Series 2019 J, 3.05% 11/1/49 | | 15,000 | 11,332 |
| New York Metropolitan Trans. Auth. Rev. Series 2020 D, 4% 11/15/47 | | 15,000 | 14,029 |
| New York State Hsg. Fin. Agcy. Rev. Bonds Series 2023 C2, 3.8%, tender 5/1/29 (b) | | 370,000 | 370,241 |
| New York State Urban Dev. Corp.: | | | |
| Series 2020 A, 5% 3/15/37 | | 5,000 | 5,568 |
| Series 2020 C, 4% 3/15/37 | | 5,000 | 5,089 |
| New York State Urban Eev Corp. Series 2019 A, 3% 3/15/49 | | 1,000,000 | 773,134 |
| New York Trans. Dev. Corp.: | | | |
| (Delta Air Lines, Inc. - LaGuardia Arpt. Termindals C&D Redev. Proj.) Series 2020, 4% 10/1/30 (c) | | 20,000 | 19,892 |
| (Term. 4 JFK Int'l. Arpt. Proj.) Series 2020 A, 5% 12/1/28 (c) | | 20,000 | 21,176 |
| (Term. 4 John F. Kennedy Int'l. Arpt. Proj.) Series 2022, 5% 12/1/34 (c) | | 35,000 | 38,048 |
| Suffolk Tobacco Asset Securitization Corp. Series 2021 B1, 4% 6/1/50 | | 225,000 | 219,637 |
TOTAL NEW YORK | | | 3,990,687 |
| North Carolina - 0.1% | | | |
| Charlotte-Mecklenburg Hosp. Auth. Health Care Sys. Rev. Bonds Series 2018 C, 3.45%, tender 10/31/25 (b) | | 45,000 | 44,805 |
| North Dakota - 1.3% | | | |
| Grand Forks Health Care Sys. Rev. Series 2021, 5% 12/1/28 | | 500,000 | 515,514 |
| Ohio - 1.2% | | | |
| American Muni. Pwr., Inc. Rev. Series 2016 A, 3% 2/15/36 | | 10,000 | 8,950 |
| Buckeye Tobacco Settlement Fing. Auth.: | | | |
| Series 2020 A2, 3% 6/1/48 | | 200,000 | 153,207 |
| Series 2020 B2, 5% 6/1/55 | | 250,000 | 232,356 |
| Cuyahoga County Econ. Dev. Rev. (The Cleveland Orchestra Proj.) Series 2019, 5% 1/1/34 | | 5,000 | 5,478 |
| Montgomery County Hosp. Rev. (Kettering Health Network Obligated Group Proj.) Series 2021, 5% 8/1/32 | | 25,000 | 27,236 |
| Ohio Higher Edl. Facility Commission Rev.: | | | |
| (Kenyon College 2020 Proj.) Series 2020, 5% 7/1/35 | | 30,000 | 32,976 |
| (Xavier Univ. 2015 Proj.) Series 2015 C, 3.75% 5/1/38 | | 5,000 | 4,563 |
TOTAL OHIO | | | 464,766 |
| Oregon - 0.0% | | | |
| Medford Hosp. Facilities Auth. Rev. (Asante Projs.) Series 2020 A, 5% 8/15/36 | | 10,000 | 10,783 |
| Pennsylvania - 3.5% | | | |
| Centre County Pennsylvania Hosp. Auth. Rev. (Mount Nittany Med. Ctr. Proj.) Series 2018 A, 3.375% 11/15/31 | | 10,000 | 9,975 |
| Dubois Hosp. Auth. Hosp. Rev. (Penn Highlands Healthcare Proj.) Series 2018: | | | |
| 5% 7/15/28 | | 580,000 | 612,047 |
| 5% 7/15/29 | | 220,000 | 231,976 |
| Geisinger Auth. Health Sys. Rev.: | | | |
| Bonds Series 2020 B, 5%, tender 2/15/27 (b) | | 50,000 | 52,285 |
| Series 2017 A2, 5% 2/15/31 | | 10,000 | 10,497 |
| Pennsylvania Gen. Oblig.: | | | |
| Series 2020 1, 3% 5/1/36 | | 310,000 | 284,207 |
| Series 2021, 3% 5/15/34 | | 40,000 | 38,066 |
| Pennsylvania Tpk. Commission Tpk. Rev.: | | | |
| Series 2016 A1, 5% 12/1/27 | | 5,000 | 5,212 |
| Series 2021 B, 5% 12/1/33 | | 25,000 | 28,583 |
| Philadelphia Gas Works Rev. Series 15, 5% 8/1/24 | | 50,000 | 50,772 |
| Southcentral Pennsylvania Gen. Auth. Rev. Series 2019 A, 5% 6/1/39 | | 10,000 | 10,554 |
TOTAL PENNSYLVANIA | | | 1,334,174 |
| Puerto Rico - 5.5% | | | |
| Puerto Rico Commonwealth Aqueduct & Swr. Auth. Series 2021 A, 5% 7/1/37 (d) | | 250,000 | 251,450 |
| Puerto Rico Commonwealth Hwys & Tra Series 2022 B, 0% 7/1/32 | | 250,000 | 159,025 |
| Puerto Rico Commonwealth Pub. Impt. Gen. Oblig. Series 2021 A1: | | | |
| 0% 7/1/33 | | 500,000 | 304,674 |
| 4% 7/1/37 | | 250,000 | 223,981 |
| Puerto Rico Sales Tax Fing. Corp. Sales Tax Rev. Series 2019 A2, 4.329% 7/1/40 | | 1,250,000 | 1,176,668 |
TOTAL PUERTO RICO | | | 2,115,798 |
| Rhode Island - 3.0% | | | |
| Rhode Island Health and Edl. Bldg. Corp. Higher Ed. Facility Rev. Series 2023, 5% 11/1/47 | | 500,000 | 536,248 |
| Rhode Island Student Ln. Auth. Student Ln. Rev. Series 2019 A, 5% 12/1/25 (c) | | 600,000 | 616,324 |
TOTAL RHODE ISLAND | | | 1,152,572 |
| Tennessee - 0.9% | | | |
| Memphis-Shelby County Arpt. Auth. Arpt. Rev. Series 2018, 5% 7/1/38 (c) | | 5,000 | 5,168 |
| Nashville and Davidson County Metropolitan Govt. Gen. Oblig. Series 2021 C, 3% 1/1/35 | | 350,000 | 334,157 |
| Shelby County Health Edl. & Hsg. Facilities Board Rev. Series 2017 A, 3.375% 5/1/32 | | 5,000 | 4,971 |
| Tennessee Hsg. Dev. Agcy. Series 2015 A, 3.5% 7/1/45 | | 10,000 | 9,857 |
TOTAL TENNESSEE | | | 354,153 |
| Texas - 4.2% | | | |
| Houston Hsg. Fin. Corp. Multi-family Hsg. Rev. Bonds Series 2023, 5%, tender 8/1/26 (b) | | 25,000 | 25,740 |
| Lower Colorado River Auth. Rev. (LCRA Transmission Svcs. Corp. Proj.) Series 2019, 5% 5/15/34 | | 5,000 | 5,514 |
| Mission Econ. Dev. Corp. Solid Waste Disp. Rev. Bonds (Republic Svcs., Inc. Proj.) Series 2020 A, 3.875%, tender 8/1/23 (b)(c) | | 300,000 | 300,000 |
| Northside Independent School District Bonds Series 2023 B, 3%, tender 8/1/29 (b) | | 1,000,000 | 982,596 |
| Southwest Higher Ed. Auth. Rev. (Southern Methodist Univ., TX. Proj.) Series 2017, 5% 10/1/39 | | 5,000 | 5,267 |
| Tarrant County Cultural Ed. Facilities Fin. Corp. Hosp. Rev. Series 2022, 5% 10/1/40 | | 50,000 | 54,030 |
| Texas Wtr. Dev. Board Rev.: | | | |
| Series 2019, 5% 8/1/35 | | 5,000 | 5,517 |
| Series 2020, 3% 10/15/38 | | 250,000 | 225,612 |
| Waco Gen. Oblig. Series 2020, 2.375% 2/1/40 | | 40,000 | 31,085 |
TOTAL TEXAS | | | 1,635,361 |
| Washington - 1.2% | | | |
| Port of Seattle Rev.: | | | |
| Series 2018 A, 5% 5/1/37 (c) | | 5,000 | 5,175 |
| Series 2019: | | | |
5% 4/1/35 (c) | | 30,000 | 32,057 |
5% 4/1/36 (c) | | 5,000 | 5,307 |
| Washington Gen. Oblig. Series 2021 A, 5% 6/1/38 | | 15,000 | 16,562 |
| Washington Health Care Facilities Auth. Rev.: | | | |
| (Overlake Hosp. Med. Ctr., WA. Proj.) Series 2017 B: | | | |
5% 7/1/27 | | 150,000 | 153,634 |
5% 7/1/36 | | 155,000 | 154,730 |
| (Providence Health Systems Proj.) Series 2018 B, 5% 10/1/33 | | 15,000 | 15,813 |
| (Virginia Mason Med. Ctr. Proj.) Series 2017, 5% 8/15/27 | | 75,000 | 78,236 |
| Series 2015 A, 5% 8/15/27 | | 5,000 | 5,138 |
| Series 2019 A1, 5% 8/1/36 | | 10,000 | 10,567 |
TOTAL WASHINGTON | | | 477,219 |
| West Virginia - 0.6% | | | |
| Monongalia Cty W Bld Cm Rev. Series 2015, 5% 7/1/29 | | 220,000 | 221,843 |
| Wisconsin - 1.0% | | | |
| Howard Suamico Scd Series 2021, 2% 3/1/38 | | 15,000 | 11,267 |
| Milwaukee Gen. Oblig. Series 2017 N4, 5% 4/1/26 | | 5,000 | 5,155 |
| Pub. Fin. Auth. Hosp. Rev. Series 2020 A, 3% 6/1/45 | | 100,000 | 74,439 |
| Roseman Univ. of Health Series 2021 A, 4.5% 6/1/56 (d) | | 115,000 | 86,037 |
| Wisconsin Gen. Oblig. Series 2014 4, 5% 5/1/25 | | 25,000 | 25,571 |
| Wisconsin Health & Edl. Facilities: | | | |
| Series 2013 A, 5% 11/15/43 (Pre-Refunded to 11/15/23 @ 100) | | 100,000 | 100,397 |
| Series 2015, 3.15% 8/15/27 | | 80,000 | 77,895 |
TOTAL WISCONSIN | | | 380,761 |
| TOTAL MUNICIPAL BONDS (Cost $36,826,776) | | | 36,971,634 |
| | | | |
| Municipal Notes - 5.1% |
| | | Principal Amount (a) | Value ($) |
| Alabama - 0.7% | | | |
| Walker County Econ. & Indl. Dev. Auth. Solid Waste Disp. Rev. (Alabama Pwr. Co. Plant Gorgas Proj.) Series 2007, 4.65% 8/1/23, VRDN (b)(c) | | 300,000 | 300,000 |
| California - 4.4% | | | |
| California Statewide Cmntys. Dev. Auth. Multi-family Hsg. Rev. Participating VRDN Series MIZ 91 22, 5% 8/1/23 (Liquidity Facility Mizuho Cap. Markets LLC) (b)(c)(g)(h) | | 700,000 | 700,000 |
| Los Angeles Cmnty. Redev. Agcy. Multi-family Hsg. Rev. Participating VRDN Series 2022 MIZ 90 90, 5% 8/1/23 (Liquidity Facility Mizuho Cap. Markets LLC) (b)(c)(g)(h) | | 1,000,000 | 1,000,000 |
TOTAL CALIFORNIA | | | 1,700,000 |
| TOTAL MUNICIPAL NOTES (Cost $2,000,000) | | | 2,000,000 |
| | | | |
| Money Market Funds - 3.9% |
| | | Shares | Value ($) |
Fidelity Municipal Cash Central Fund 4.30% (i)(j) (Cost $1,502,000) | | 1,501,700 | 1,502,000 |
| | | | |
| TOTAL INVESTMENT IN SECURITIES - 104.6% (Cost $40,328,776) | 40,473,634 |
NET OTHER ASSETS (LIABILITIES) - (4.6)% | (1,793,277) |
| NET ASSETS - 100.0% | 38,680,357 |
| | |
Security Type Abbreviations
| VRDN | - | VARIABLE RATE DEMAND NOTE (A debt instrument that is payable upon demand, either daily, weekly or monthly) |
Legend
| (a) | Amount is stated in United States dollars unless otherwise noted. |
| (b) | Coupon rates for floating and adjustable rate securities reflect the rates in effect at period end. |
| (c) | Private activity obligations whose interest is subject to the federal alternative minimum tax for individuals. |
| (d) | Security exempt from registration under Rule 144A of the Securities Act of 1933. These securities may be resold in transactions exempt from registration, normally to qualified institutional buyers. At the end of the period, the value of these securities amounted to $419,223 or 1.1% of net assets. |
| (e) | Security or a portion of the security purchased on a delayed delivery or when-issued basis. |
| (f) | Security initially issued at one coupon which converts to a higher coupon at a specified date. The rate shown is the rate at period end. |
| (g) | Provides evidence of ownership in one or more underlying municipal bonds. |
| (h) | Coupon rates are determined by re-marketing agents based on current market conditions. |
| (i) | Information in this report regarding holdings by state and security types does not reflect the holdings of the Fidelity Municipal Cash Central Fund. |
| (j) | Affiliated fund that is generally available only to investment companies and other accounts managed by Fidelity Investments. The rate quoted is the annualized seven-day yield of the fund at period end. A complete unaudited listing of the fund's holdings as of its most recent quarter end is available upon request. In addition, each Fidelity Central Fund's financial statements are available on the SEC's website or upon request. |
Affiliated Central Funds
Fiscal year to date information regarding the Fund's investments in Fidelity Central Funds, including the ownership percentage, is presented below.
| Affiliate | Value, beginning of period ($) | Purchases ($) | Sales Proceeds ($) | Dividend Income ($) | Realized Gain (loss) ($) | Change in Unrealized appreciation (depreciation) ($) | Value, end of period ($) | % ownership, end of period |
| Fidelity Municipal Cash Central Fund 4.30% | - | 28,985,000 | 27,483,000 | 53,001 | - | - | 1,502,000 | 0.1% |
| Total | - | 28,985,000 | 27,483,000 | 53,001 | - | - | 1,502,000 | |
| | | | | | | | | |
Amounts in the dividend income column in the above table include any capital gain distributions from underlying funds, which are presented in the corresponding line item in the Statement of Operations, if applicable.
Amounts included in the purchases and sales proceeds columns may include in-kind transactions, if applicable.
Investment Valuation
The following is a summary of the inputs used, as of July 31, 2023, involving the Fund's assets and liabilities carried at fair value. The inputs or methodology used for valuing securities may not be an indication of the risk associated with investing in those securities. For more information on valuation inputs, and their aggregation into the levels used below, please refer to the Investment Valuation section in the accompanying Notes to Financial Statements.
| Valuation Inputs at Reporting Date: |
| Description | Total ($) | Level 1 ($) | Level 2 ($) | Level 3 ($) |
Investments in Securities: | | | | |
|
| Municipal Securities | 38,971,634 | - | 38,971,634 | - |
|
| Money Market Funds | 1,502,000 | 1,502,000 | - | - |
| Total Investments in Securities: | 40,473,634 | 1,502,000 | 38,971,634 | - |
| Statement of Assets and Liabilities |
| | | | July 31, 2023 (Unaudited) |
| | | | | |
| Assets | | | | |
| Investment in securities, at value - See accompanying schedule: | | | | |
Unaffiliated issuers (cost $38,826,776) | $ | 38,971,634 | | |
Fidelity Central Funds (cost $1,502,000) | | 1,502,000 | | |
| | | | | |
| | | | | |
| Total Investment in Securities (cost $40,328,776) | | | $ | 40,473,634 |
| Cash | | | | 37,308 |
| Receivable for investments sold | | | | 106 |
| Receivable for fund shares sold | | | | 200 |
| Interest receivable | | | | 324,118 |
| Distributions receivable from Fidelity Central Funds | | | | 3,544 |
| Prepaid expenses | | | | 60,039 |
| Receivable from investment adviser for expense reductions | | | | 17,189 |
Total assets | | | | 40,916,138 |
| Liabilities | | | | |
| Payable for investments purchased on a delayed delivery basis | $ | 2,189,720 | | |
| Payable for fund shares redeemed | | 741 | | |
| Distributions payable | | 6,670 | | |
| Accrued management fee | | 11,008 | | |
| Distribution and service plan fees payable | | 2,606 | | |
| Other affiliated payables | | 3,265 | | |
| Other payables and accrued expenses | | 21,771 | | |
| Total Liabilities | | | | 2,235,781 |
| Net Assets | | | $ | 38,680,357 |
| Net Assets consist of: | | | | |
| Paid in capital | | | $ | 38,501,393 |
| Total accumulated earnings (loss) | | | | 178,964 |
| Net Assets | | | $ | 38,680,357 |
| | | | | |
| Net Asset Value and Maximum Offering Price | | | | |
| Class A : | | | | |
Net Asset Value and redemption price per share ($2,325,517 ÷ 230,610 shares)(a) | | | $ | 10.08 |
| Maximum offering price per share (100/96.00 of $10.08) | | | $ | 10.50 |
| Class M : | | | | |
Net Asset Value and redemption price per share ($2,045,844 ÷ 202,876 shares)(a) | | | $ | 10.08 |
| Maximum offering price per share (100/96.00 of $10.08) | | | $ | 10.50 |
| Class C : | | | | |
Net Asset Value and offering price per share ($2,038,895 ÷ 202,873 shares)(a) | | | $ | 10.05 |
| Fidelity Municipal Core Plus Bond Fund : | | | | |
Net Asset Value, offering price and redemption price per share ($27,595,317 ÷ 2,736,607 shares) | | | $ | 10.08 |
| Class I : | | | | |
Net Asset Value, offering price and redemption price per share ($2,051,013 ÷ 203,388 shares) | | | $ | 10.08 |
| Class Z : | | | | |
Net Asset Value, offering price and redemption price per share ($2,623,771 ÷ 260,190 shares) | | | $ | 10.08 |
(a)Redemption price per share is equal to net asset value less any applicable contingent deferred sales charge. |
| Statement of Operations |
| | | | For the period February 16, 2023 (commencement of operations) through July 31, 2023 (Unaudited) |
| Investment Income | | | | |
| Interest | | | $ | 520,199 |
| Income from Fidelity Central Funds | | | | 53,001 |
| Total Income | | | | 573,200 |
| Expenses | | | | |
| Management fee | $ | 50,227 | | |
| Transfer agent fees | | 12,081 | | |
| Distribution and service plan fees | | 13,840 | | |
| Accounting fees and expenses | | 3,752 | | |
| Custodian fees and expenses | | 667 | | |
| Independent trustees' fees and expenses | | 38 | | |
| Registration fees | | 63,821 | | |
| Audit | | 23,490 | | |
| Legal | | 54 | | |
| Miscellaneous | | 128 | | |
| Total expenses before reductions | | 168,098 | | |
| Expense reductions | | (101,678) | | |
| Total expenses after reductions | | | | 66,420 |
| Net Investment income (loss) | | | | 506,780 |
| Realized and Unrealized Gain (Loss) | | | | |
| Net realized gain (loss) on: | | | | |
| Investment Securities: | | | | |
| Unaffiliated issuers | | 15,596 | | |
| Total net realized gain (loss) | | | | 15,596 |
| Change in net unrealized appreciation (depreciation) on investment securities | | | | 144,858 |
| Net gain (loss) | | | | 160,454 |
| Net increase (decrease) in net assets resulting from operations | | | $ | 667,234 |
| Statement of Changes in Net Assets |
| |
| | For the period February 16, 2023 (commencement of operations) through July 31, 2023 (Unaudited) |
| Increase (Decrease) in Net Assets | | |
| Operations | | |
| Net investment income (loss) | $ | 506,780 |
| Net realized gain (loss) | | 15,596 |
| Change in net unrealized appreciation (depreciation) | | 144,858 |
| Net increase (decrease) in net assets resulting from operations | | 667,234 |
| Distributions to shareholders | | (488,270) |
| | | |
| Share transactions - net increase (decrease) | | 38,501,393 |
| Total increase (decrease) in net assets | | 38,680,357 |
| | | |
| Net Assets | | |
| Beginning of period | | - |
| End of period | $ | 38,680,357 |
| | | |
| | | |
| Fidelity Advisor Municipal Core Plus Bond Fund Class A |
| |
| | Six months ended (Unaudited) July 31, 2023 A |
Selected Per-Share Data | | |
| Net asset value, beginning of period | $ | 10.00 |
| Income from Investment Operations | | |
Net investment income (loss) B,C | | .152 |
| Net realized and unrealized gain (loss) | | .072 D |
| Total from investment operations | | .224 |
| Distributions from net investment income | | (.144) |
| Total distributions | | (.144) |
| Net asset value, end of period | $ | 10.08 |
Total Return E,F,G | | 2.25% D |
Ratios to Average Net Assets C,H,I | | |
| Expenses before reductions | | 1.41% J |
| Expenses net of fee waivers, if any | | .62% J |
| Expenses net of all reductions | | .62% J |
| Net investment income (loss) | | 3.32% J |
| Supplemental Data | | |
| Net assets, end of period (000 omitted) | $ | 2,326 |
Portfolio turnover rate K | | 22% L |
AFor the period February 16, 2023 (commencement of operations) through July 31, 2023.
BCalculated based on average shares outstanding during the period.
CNet investment income (loss) is affected by the timing of the declaration of dividends by any underlying mutual funds or exchange-traded funds (ETFs). Net investment income (loss) of any mutual funds or ETFs is not included in the Fund's net investment income (loss) ratio.
DAmount includes a reimbursement from the investment adviser for an operational error which amounted to less than $.01 per share. Excluding this reimbursement, the total return would have been 2.22%.
ETotal returns for periods of less than one year are not annualized.
FTotal returns would have been lower if certain expenses had not been reduced during the applicable periods shown.
GTotal returns do not include the effect of the sales charges.
HFees and expenses of any underlying mutual funds or exchange-traded funds (ETFs) are not included in the Fund's expense ratio. The Fund indirectly bears its proportionate share of these expenses. For additional expense information related to investments in Fidelity Central Funds, please refer to the "Investments in Fidelity Central Funds" note found in the Notes to Financial Statements section of the most recent Annual or Semi-Annual report.
IExpense ratios reflect operating expenses of the class. Expenses before reductions do not reflect amounts reimbursed, waived, or reduced through arrangements with the investment adviser, brokerage services, or other offset arrangements, if applicable, and do not represent the amount paid by the class during periods when reimbursements, waivers or reductions occur.
JAnnualized.
KAmount does not include the portfolio activity of any underlying mutual funds or exchange-traded funds (ETFs).
LAmount not annualized.
| Fidelity Advisor Municipal Core Plus Bond Fund Class M |
| |
| | Six months ended (Unaudited) July 31, 2023 A |
Selected Per-Share Data | | |
| Net asset value, beginning of period | $ | 10.00 |
| Income from Investment Operations | | |
Net investment income (loss) B,C | | .152 |
| Net realized and unrealized gain (loss) | | .072 D |
| Total from investment operations | | .224 |
| Distributions from net investment income | | (.144) |
| Total distributions | | (.144) |
| Net asset value, end of period | $ | 10.08 |
Total Return E,F,G | | 2.25% D |
Ratios to Average Net Assets C,H,I | | |
| Expenses before reductions | | 1.42% J |
| Expenses net of fee waivers, if any | | .62% J |
| Expenses net of all reductions | | .62% J |
| Net investment income (loss) | | 3.33% J |
| Supplemental Data | | |
| Net assets, end of period (000 omitted) | $ | 2,046 |
Portfolio turnover rate K | | 22% L |
AFor the period February 16, 2023 (commencement of operations) through July 31, 2023.
BCalculated based on average shares outstanding during the period.
CNet investment income (loss) is affected by the timing of the declaration of dividends by any underlying mutual funds or exchange-traded funds (ETFs). Net investment income (loss) of any mutual funds or ETFs is not included in the Fund's net investment income (loss) ratio.
DAmount includes a reimbursement from the investment adviser for an operational error which amounted to less than $.01 per share. Excluding this reimbursement, the total return would have been 2.22%.
ETotal returns for periods of less than one year are not annualized.
FTotal returns would have been lower if certain expenses had not been reduced during the applicable periods shown.
GTotal returns do not include the effect of the sales charges.
HFees and expenses of any underlying mutual funds or exchange-traded funds (ETFs) are not included in the Fund's expense ratio. The Fund indirectly bears its proportionate share of these expenses. For additional expense information related to investments in Fidelity Central Funds, please refer to the "Investments in Fidelity Central Funds" note found in the Notes to Financial Statements section of the most recent Annual or Semi-Annual report.
IExpense ratios reflect operating expenses of the class. Expenses before reductions do not reflect amounts reimbursed, waived, or reduced through arrangements with the investment adviser, brokerage services, or other offset arrangements, if applicable, and do not represent the amount paid by the class during periods when reimbursements, waivers or reductions occur.
JAnnualized.
KAmount does not include the portfolio activity of any underlying mutual funds or exchange-traded funds (ETFs).
LAmount not annualized.
| Fidelity Advisor Municipal Core Plus Bond Fund Class C |
| |
| | Six months ended (Unaudited) July 31, 2023 A |
Selected Per-Share Data | | |
| Net asset value, beginning of period | $ | 10.00 |
| Income from Investment Operations | | |
Net investment income (loss) B,C | | .118 |
| Net realized and unrealized gain (loss) | | .076 D |
| Total from investment operations | | .194 |
| Distributions from net investment income | | (.144) |
| Total distributions | | (.144) |
| Net asset value, end of period | $ | 10.05 |
Total Return E,F,G | | 1.94% D |
Ratios to Average Net Assets C,H,I | | |
| Expenses before reductions | | 2.16% J |
| Expenses net of fee waivers, if any | | 1.37% J |
| Expenses net of all reductions | | 1.37% J |
| Net investment income (loss) | | 2.58% J |
| Supplemental Data | | |
| Net assets, end of period (000 omitted) | $ | 2,039 |
Portfolio turnover rate K | | 22% L |
AFor the period February 16, 2023 (commencement of operations) through July 31, 2023.
BCalculated based on average shares outstanding during the period.
CNet investment income (loss) is affected by the timing of the declaration of dividends by any underlying mutual funds or exchange-traded funds (ETFs). Net investment income (loss) of any mutual funds or ETFs is not included in the Fund's net investment income (loss) ratio.
DAmount includes a reimbursement from the investment adviser for an operational error which amounted to less than $.01 per share. Excluding this reimbursement, the total return would have been 1.91%.
ETotal returns for periods of less than one year are not annualized.
FTotal returns would have been lower if certain expenses had not been reduced during the applicable periods shown.
GTotal returns do not include the effect of the contingent deferred sales charge.
HFees and expenses of any underlying mutual funds or exchange-traded funds (ETFs) are not included in the Fund's expense ratio. The Fund indirectly bears its proportionate share of these expenses. For additional expense information related to investments in Fidelity Central Funds, please refer to the "Investments in Fidelity Central Funds" note found in the Notes to Financial Statements section of the most recent Annual or Semi-Annual report.
IExpense ratios reflect operating expenses of the class. Expenses before reductions do not reflect amounts reimbursed, waived, or reduced through arrangements with the investment adviser, brokerage services, or other offset arrangements, if applicable, and do not represent the amount paid by the class during periods when reimbursements, waivers or reductions occur.
JAnnualized.
KAmount does not include the portfolio activity of any underlying mutual funds or exchange-traded funds (ETFs).
LAmount not annualized.
| Fidelity Municipal Core Plus Bond Fund |
| |
| | Six months ended (Unaudited) July 31, 2023 A |
Selected Per-Share Data | | |
| Net asset value, beginning of period | $ | 10.00 |
| Income from Investment Operations | | |
Net investment income (loss) B,C | | .162 |
| Net realized and unrealized gain (loss) | | .073 D |
| Total from investment operations | | .235 |
| Distributions from net investment income | | (.155) |
| Total distributions | | (.155) |
| Net asset value, end of period | $ | 10.08 |
Total Return E,F | | 2.36% D |
Ratios to Average Net Assets C,G,H | | |
| Expenses before reductions | | 1.02% I |
| Expenses net of fee waivers, if any | | .37% I |
| Expenses net of all reductions | | .36% I |
| Net investment income (loss) | | 3.58% I |
| Supplemental Data | | |
| Net assets, end of period (000 omitted) | $ | 27,595 |
Portfolio turnover rate J | | 22% K |
AFor the period February 16, 2023 (commencement of operations) through July 31, 2023.
BCalculated based on average shares outstanding during the period.
CNet investment income (loss) is affected by the timing of the declaration of dividends by any underlying mutual funds or exchange-traded funds (ETFs). Net investment income (loss) of any mutual funds or ETFs is not included in the Fund's net investment income (loss) ratio.
DAmount includes a reimbursement from the investment adviser for an operational error which amounted to less than $.01 per share. Excluding this reimbursement, the total return would have been 2.33%.
ETotal returns for periods of less than one year are not annualized.
FTotal returns would have been lower if certain expenses had not been reduced during the applicable periods shown.
GFees and expenses of any underlying mutual funds or exchange-traded funds (ETFs) are not included in the Fund's expense ratio. The Fund indirectly bears its proportionate share of these expenses. For additional expense information related to investments in Fidelity Central Funds, please refer to the "Investments in Fidelity Central Funds" note found in the Notes to Financial Statements section of the most recent Annual or Semi-Annual report.
HExpense ratios reflect operating expenses of the class. Expenses before reductions do not reflect amounts reimbursed, waived, or reduced through arrangements with the investment adviser, brokerage services, or other offset arrangements, if applicable, and do not represent the amount paid by the class during periods when reimbursements, waivers or reductions occur.
IAnnualized.
JAmount does not include the portfolio activity of any underlying mutual funds or exchange-traded funds (ETFs).
KAmount not annualized.
| Fidelity Advisor Municipal Core Plus Bond Fund Class I |
| |
| | Six months ended (Unaudited) July 31, 2023 A |
Selected Per-Share Data | | |
| Net asset value, beginning of period | $ | 10.00 |
| Income from Investment Operations | | |
Net investment income (loss) B,C | | .164 |
| Net realized and unrealized gain (loss) | | .071 D |
| Total from investment operations | | .235 |
| Distributions from net investment income | | (.155) |
| Total distributions | | (.155) |
| Net asset value, end of period | $ | 10.08 |
Total Return E,F | | 2.37% D |
Ratios to Average Net Assets C,G,H | | |
| Expenses before reductions | | 1.17% I |
| Expenses net of fee waivers, if any | | .37% I |
| Expenses net of all reductions | | .37% I |
| Net investment income (loss) | | 3.58% I |
| Supplemental Data | | |
| Net assets, end of period (000 omitted) | $ | 2,051 |
Portfolio turnover rate J | | 22% K |
AFor the period February 16, 2023 (commencement of operations) through July 31, 2023.
BCalculated based on average shares outstanding during the period.
CNet investment income (loss) is affected by the timing of the declaration of dividends by any underlying mutual funds or exchange-traded funds (ETFs). Net investment income (loss) of any mutual funds or ETFs is not included in the Fund's net investment income (loss) ratio.
DAmount includes a reimbursement from the investment adviser for an operational error which amounted to less than $.01 per share. Excluding this reimbursement, the total return would have been 2.34%.
ETotal returns for periods of less than one year are not annualized.
FTotal returns would have been lower if certain expenses had not been reduced during the applicable periods shown.
GFees and expenses of any underlying mutual funds or exchange-traded funds (ETFs) are not included in the Fund's expense ratio. The Fund indirectly bears its proportionate share of these expenses. For additional expense information related to investments in Fidelity Central Funds, please refer to the "Investments in Fidelity Central Funds" note found in the Notes to Financial Statements section of the most recent Annual or Semi-Annual report.
HExpense ratios reflect operating expenses of the class. Expenses before reductions do not reflect amounts reimbursed, waived, or reduced through arrangements with the investment adviser, brokerage services, or other offset arrangements, if applicable, and do not represent the amount paid by the class during periods when reimbursements, waivers or reductions occur.
IAnnualized.
JAmount does not include the portfolio activity of any underlying mutual funds or exchange-traded funds (ETFs).
KAmount not annualized.
| Fidelity Advisor Municipal Core Plus Bond Fund Class Z |
| |
| | Six months ended (Unaudited) July 31, 2023 A |
Selected Per-Share Data | | |
| Net asset value, beginning of period | $ | 10.00 |
| Income from Investment Operations | | |
Net investment income (loss) B,C | | .166 |
| Net realized and unrealized gain (loss) | | .072 D |
| Total from investment operations | | .238 |
| Distributions from net investment income | | (.158) |
| Total distributions | | (.158) |
| Net asset value, end of period | $ | 10.08 |
Total Return E,F | | 2.39% D |
Ratios to Average Net Assets C,G,H | | |
| Expenses before reductions | | 1.03% I |
| Expenses net of fee waivers, if any | | .31% I |
| Expenses net of all reductions | | .31% I |
| Net investment income (loss) | | 3.63% I |
| Supplemental Data | | |
| Net assets, end of period (000 omitted) | $ | 2,624 |
Portfolio turnover rate J | | 22% K |
AFor the period February 16, 2023 (commencement of operations) through July 31, 2023.
BCalculated based on average shares outstanding during the period.
CNet investment income (loss) is affected by the timing of the declaration of dividends by any underlying mutual funds or exchange-traded funds (ETFs). Net investment income (loss) of any mutual funds or ETFs is not included in the Fund's net investment income (loss) ratio.
DAmount includes a reimbursement from the investment adviser for an operational error which amounted to less than $.01 per share. Excluding this reimbursement, the total return would have been 2.36%.
ETotal returns for periods of less than one year are not annualized.
FTotal returns would have been lower if certain expenses had not been reduced during the applicable periods shown.
GFees and expenses of any underlying mutual funds or exchange-traded funds (ETFs) are not included in the Fund's expense ratio. The Fund indirectly bears its proportionate share of these expenses. For additional expense information related to investments in Fidelity Central Funds, please refer to the "Investments in Fidelity Central Funds" note found in the Notes to Financial Statements section of the most recent Annual or Semi-Annual report.
HExpense ratios reflect operating expenses of the class. Expenses before reductions do not reflect amounts reimbursed, waived, or reduced through arrangements with the investment adviser, brokerage services, or other offset arrangements, if applicable, and do not represent the amount paid by the class during periods when reimbursements, waivers or reductions occur.
IAnnualized.
JAmount does not include the portfolio activity of any underlying mutual funds or exchange-traded funds (ETFs).
KAmount not annualized.
For the period ended July 31, 2023
1. Organization.
Fidelity Municipal Core Plus Bond Fund (the Fund) is a fund of Fidelity Salem Street Trust (the Trust) and is authorized to issue an unlimited number of shares. The Trust is registered under the Investment Company Act of 1940, as amended (the 1940 Act), as an open-end management investment company organized as a Massachusetts business trust. The Fund offers Class A, Class M, Class C, Fidelity Municipal Core Plus Bond Fund, Class I and Class Z shares, each of which has equal rights as to assets and voting privileges. Class A, Class M, Class C, Class I and Class Z are Fidelity Advisor classes. Each class has exclusive voting rights with respect to matters that affect that class. Class C shares will automatically convert to Class A shares after a holding period of eight years from the initial date of purchase, with certain exceptions.
2. Investments in Fidelity Central Funds.
Funds may invest in Fidelity Central Funds, which are open-end investment companies generally available only to other investment companies and accounts managed by the investment adviser and its affiliates. The Schedule of Investments lists any Fidelity Central Funds held as an investment as of period end, but does not include the underlying holdings of each Fidelity Central Fund. An investing fund indirectly bears its proportionate share of the expenses of the underlying Fidelity Central Funds.
Based on its investment objective, each Fidelity Central Fund may invest or participate in various investment vehicles or strategies that are similar to those of the investing fund. These strategies are consistent with the investment objectives of the investing fund and may involve certain economic risks which may cause a decline in value of each of the Fidelity Central Funds and thus a decline in the value of the investing fund.
| Fidelity Central Fund | Investment Manager | Investment Objective | Investment Practices | Expense RatioA |
| Fidelity Money Market Central Funds | Fidelity Management & Research Company LLC (FMR) | Each fund seeks to obtain a high level of current income consistent with the preservation of capital and liquidity. | Short-term Investments | Less than .005% |
A Expenses expressed as a percentage of average net assets and are as of each underlying Central Fund's most recent annual or semi-annual shareholder report.
A complete unaudited list of holdings for each Fidelity Central Fund is available upon request or at the Securities and Exchange Commission website at www.sec.gov. In addition, the financial statements of the Fidelity Central Funds which contain the significant accounting policies (including investment valuation policies) of those funds, and are not covered by the Report of Independent Registered Public Accounting Firm, are available on the Securities and Exchange Commission website or upon request.
3. Significant Accounting Policies.
The Fund is an investment company and applies the accounting and reporting guidance of the Financial Accounting Standards Board (FASB) Accounting Standards Codification Topic 946 Financial Services - Investment Companies. The financial statements have been prepared in conformity with accounting principles generally accepted in the United States of America (GAAP), which require management to make certain estimates and assumptions at the date of the financial statements. Actual results could differ from those estimates. Subsequent events, if any, through the date that the financial statements were issued have been evaluated in the preparation of the financial statements. The Fund's Schedule of Investments lists any underlying mutual funds or exchange-traded funds (ETFs) but does not include the underlying holdings of these funds. The following summarizes the significant accounting policies of the Fund:
Investment Valuation. Investments are valued as of 4:00 p.m. Eastern time on the last calendar day of the period. The Board of Trustees (the Board) has designated the Fund's investment adviser as the valuation designee responsible for the fair valuation function and performing fair value determinations as needed. The investment adviser has established a Fair Value Committee (the Committee) to carry out the day-to-day fair valuation responsibilities and has adopted policies and procedures to govern the fair valuation process and the activities of the Committee. In accordance with these fair valuation policies and procedures, which have been approved by the Board, the Fund attempts to obtain prices from one or more third party pricing services or brokers to value its investments. When current market prices, quotations or currency exchange rates are not readily available or reliable, investments will be fair valued in good faith by the Committee, in accordance with the policies and procedures. Factors used in determining fair value vary by investment type and may include market or investment specific events, transaction data, estimated cash flows, and market observations of comparable investments. The frequency that the fair valuation procedures are used cannot be predicted and they may be utilized to a significant extent. The Committee manages the Fund's fair valuation practices and maintains the fair valuation policies and procedures. The Fund's investment adviser reports to the Board information regarding the fair valuation process and related material matters.
The Fund categorizes the inputs to valuation techniques used to value its investments into a disclosure hierarchy consisting of three levels as shown below:
Level 1 - unadjusted quoted prices in active markets for identical investments
Level 2 - other significant observable inputs (including quoted prices for similar investments, interest rates, prepayment speeds, etc.)
Level 3 - unobservable inputs (including the Fund's own assumptions based on the best information available)
Valuation techniques used to value the Fund's investments by major category are as follows:
Debt securities, including restricted securities, are valued based on evaluated prices received from third party pricing services or from brokers who make markets in such securities. Municipal securities are valued by pricing services who utilize matrix pricing which considers yield or price of bonds of comparable quality, coupon, maturity and type or by broker-supplied prices. When independent prices are unavailable or unreliable, debt securities may be valued utilizing pricing methodologies which consider similar factors that would be used by third party pricing services. Debt securities and swaps are generally categorized as Level 2 in the hierarchy but may be Level 3 depending on the circumstances.
Investments in open-end mutual funds, including the Fidelity Central Funds, are valued at their closing net asset value (NAV) each business day and are categorized as Level 1 in the hierarchy.
Changes in valuation techniques may result in transfers in or out of an assigned level within the disclosure hierarchy. The aggregate value of investments by input level as of July 31, 2023, is included at the end of the Fund's Schedule of Investments.
Investment Transactions and Income. For financial reporting purposes, the Fund's investment holdings and NAV include trades executed through the end of the last business day of the period. The NAV per share for processing shareholder transactions is calculated as of the close of business of the New York Stock Exchange (NYSE), normally 4:00 p.m. Eastern time and includes trades executed through the end of the prior business day. Gains and losses on securities sold are determined on the basis of identified cost. Income and capital gain distributions from Fidelity Central Funds, if any, are recorded on the ex-dividend date. Interest income is accrued as earned and includes coupon interest and amortization of premium and accretion of discount on debt securities as applicable. Debt obligations may be placed on non-accrual status and related interest income may be reduced by ceasing current accruals and writing off interest receivables when the collection of all or a portion of interest has become doubtful based on consistently applied procedures. A debt obligation is removed from non-accrual status when the issuer resumes interest payments or when collectability of interest is reasonably assured.
Class Allocations and Expenses. Investment income, realized and unrealized capital gains and losses, common expenses of a fund, and certain fund-level expense reductions, if any, are allocated daily on a pro-rata basis to each class based on the relative net assets of each class to the total net assets of a fund. Each class differs with respect to transfer agent and distribution and service plan fees incurred, as applicable. Certain expense reductions may also differ by class, if applicable. For the reporting period, the allocated portion of income and expenses to each class as a percent of its average net assets may vary due to the timing of recording these transactions in relation to fluctuating net assets of the classes. Expenses directly attributable to a fund are charged to that fund. Expenses attributable to more than one fund are allocated among the respective funds on the basis of relative net assets or other appropriate methods. Expenses included in the accompanying financial statements reflect the expenses of that fund and do not include any expenses associated with any underlying mutual funds or exchange-traded funds (ETFs). Although not included in a fund's expenses, a fund indirectly bears its proportionate share of these expenses through the net asset value of each underlying mutual fund or exchange-traded fund (ETF). Expense estimates are accrued in the period to which they relate and adjustments are made when actual amounts are known.
Income Tax Information and Distributions to Shareholders. Each year, the Fund intends to qualify as a regulated investment company under Subchapter M of the Internal Revenue Code, including distributing substantially all of its taxable income and realized gains. As a result, no provision for U.S. Federal income taxes is required. The Fund files a U.S. federal tax return, in addition to state and local tax returns as required. The Fund's federal income tax returns are subject to examination by the Internal Revenue Service (IRS) for a period of three fiscal years after they are filed. State and local tax returns may be subject to examination for an additional fiscal year depending on the jurisdiction.
Distributions are declared and recorded daily and paid monthly from net investment income. Distributions from realized gains, if any, are declared and recorded on the ex-dividend date. Income and capital gain distributions are declared separately for each class. Income and capital gain distributions are determined in accordance with income tax regulations, which may differ from GAAP.
Capital accounts within the financial statements are adjusted for permanent book-tax differences. These adjustments have no impact on net assets or the results of operations. Capital accounts are not adjusted for temporary book-tax differences which will reverse in a subsequent period.
The Fund purchases municipal securities whose interest, in the opinion of the issuer, is free from federal income tax. There is no assurance that the IRS will agree with this opinion. In the event the IRS determines that the issuer does not comply with relevant tax requirements, interest payments from a security could become federally taxable, possibly retroactively to the date the security was issued.
As of period end, the cost and unrealized appreciation (depreciation) in securities, and derivatives if applicable, for federal income tax purposes were as follows:
| Gross unrealized appreciation | $302,366 |
| Gross unrealized depreciation | (140,785) |
| Net unrealized appreciation (depreciation) | $161,581 |
| Tax cost | $40,312,053 |
Delayed Delivery Transactions and When-Issued Securities. During the period, certain Funds transacted in securities on a delayed delivery or when-issued basis. Payment and delivery may take place after the customary settlement period for that security. The price of the underlying securities and the date when the securities will be delivered and paid for are fixed at the time the transaction is negotiated. Securities purchased on a delayed delivery or when-issued basis are identified as such in the Schedule of Investments. Compensation for interest forgone in the purchase of a delayed delivery or when-issued debt security may be received. With respect to purchase commitments, each applicable Fund identifies securities as segregated in its records with a value at least equal to the amount of the commitment. Payables and receivables associated with the purchases and sales of delayed delivery securities having the same coupon, settlement date and broker are offset. Delayed delivery or when-issued securities that have been purchased from and sold to different brokers are reflected as both payables and receivables in the Statement of Assets and Liabilities under the caption "Delayed delivery", as applicable. Losses may arise due to changes in the value of the underlying securities or if the counterparty does not perform under the contract's terms, or if the issuer does not issue the securities due to political, economic, or other factors.
Restricted Securities (including Private Placements). Funds may invest in securities that are subject to legal or contractual restrictions on resale. These securities generally may be resold in transactions exempt from registration or to the public if the securities are registered. Disposal of these securities may involve time-consuming negotiations and expense, and prompt sale at an acceptable price may be difficult. Information regarding restricted securities held at period end is included at the end of the Schedule of Investments, if applicable.
4. Purchases and Sales of Investments.
Purchases and sales of securities, other than short-term securities and in-kind transactions, as applicable, are noted in the table below.
| | Purchases ($) | Sales ($) |
| Fidelity Municipal Core Plus Bond Fund | 42,959,586 | 6,374,321 |
5. Fees and Other Transactions with Affiliates.
Management Fee. Fidelity Management & Research Company LLC (the investment adviser) and its affiliates provide the Fund with investment management related services for which the Fund pays a monthly management fee. The management fee is the sum of an individual fund fee rate that is based on an annual rate of .25% of the Fund's average net assets and an annualized group fee rate that averaged .10% during the period. The group fee rate is based upon the monthly average net assets of a group of registered investment companies with which the investment adviser has management contracts. The group fee rate decreases as assets under management increase and increases as assets under management decrease. For the reporting period, the total annualized management fee rate was .35% of the Fund's average net assets.
Distribution and Service Plan Fees. In accordance with Rule 12b-1 of the 1940 Act, the Fund has adopted separate Distribution and Service Plans for each class of shares. Certain classes pay Fidelity Distributors Company LLC (FDC), an affiliate of the investment adviser, separate Distribution and Service Fees, each of which is based on an annual percentage of each class' average net assets. In addition, FDC may pay financial intermediaries for selling shares of the Fund and providing shareholder support services. For the period, the Distribution and Service Fee rates, total fees and amounts retained by FDC were as follows:
| | Distribution Fee | Service Fee | Total Fees | Retained by FDC |
| Class A | - % | .25% | $2,407 | $2,407 |
| Class M | - % | .25% | 2,290 | 2,290 |
| Class C | .75% | .25% | 9,143 | 9,143 |
| | | | $13,840 | $13,840 |
Sales Load. FDC may receive a front-end sales charge of up to 4.00% for selling Class A shares and Class M shares, some of which is paid to financial intermediaries for selling shares of the Fund. Depending on the holding period, FDC may receive contingent deferred sales charges levied on Class A, Class M and Class C redemptions. The deferred sales charges are 1.00% for Class C shares, .75% for certain purchases of Class A shares and .25% for certain purchases of Class M shares.
For the period, sales charge amounts retained by FDC were as follows:
| | Retained by FDC |
| Class A | $ 68 |
Transfer Agent Fees. Fidelity Investments Institutional Operations Company LLC (FIIOC), an affiliate of the investment adviser, is the transfer, dividend disbursing and shareholder servicing agent for each class of the Fund. FIIOC receives account fees and asset-based fees that vary according to the account size and type of account of the shareholders of the respective classes of the Fund, except for Class Z. FIIOC receives an asset-based fee of Class Z's average net assets. FIIOC pays for typesetting, printing and mailing of shareholder reports, except proxy statements.
For the period, transfer agent fees for each class were as follows:
| | Amount | % of Class-Level Average Net AssetsA |
| Class A | $ 1,671 | .17 |
| Class M | 1,648 | .18 |
| Class C | 1,645 | .18 |
| Fidelity Municipal Core Plus Bond Fund | 4,982 | .05 |
| Class I | 1,657 | .18 |
| Class Z | 478 | .05 |
| | $12,081 | |
A Annualized
Accounting Fees. Fidelity Service Company, Inc. (FSC), an affiliate of the investment adviser, maintains the Fund's accounting records. The accounting fee is based on the level of average net assets for each month. For the period, the fees were equivalent to the following annualized rates:
| | % of Average Net Assets |
| Fidelity Municipal Core Plus Bond Fund | .03 |
Interfund Trades. Funds may purchase from or sell securities to other Fidelity Funds under procedures adopted by the Board. The procedures have been designed to ensure these interfund trades are executed in accordance with Rule 17a-7 of the 1940 Act. Any interfund trades are included within the respective purchases and sales amounts shown in the Purchases and Sales of Investments note. During the period, there were no interfund trades.
Other. During the period, FMR reimbursed the Fund $11,011 for an operational error which is included in Net Realized Gain (Loss) in the accompanying Statement of Operations.
6. Committed Line of Credit.
Certain Funds participate with other funds managed by the investment adviser or an affiliate in a $4.25 billion credit facility (the "line of credit") to be utilized for temporary or emergency purposes to fund shareholder redemptions or for other short-term liquidity purposes. The participating funds have agreed to pay commitment fees on their pro-rata portion of the line of credit, which are reflected in Miscellaneous expenses on the Statement of Operations, and are listed below. During the period, there were no borrowings on this line of credit.
| | Amount |
| Fidelity Municipal Core Plus Bond Fund | $17 |
7. Expense Reductions.
The investment adviser contractually agreed to reimburse expenses of each class to the extent annual operating expenses exceeded certain levels of class-level average net assets as noted in the table below. This reimbursement will remain in place through May 31, 2024. Some expenses, for example the compensation of the independent Trustees, and certain other expenses such as interest expense, are excluded from this reimbursement.
The following classes were in reimbursement during the period:
| | Expense Limitations | Reimbursement |
| Class A | .62% | $ 7,636 |
| Class M | .62% | 7,362 |
| Class C | 1.37% | 7,307 |
| Fidelity Municipal Core Plus Bond Fund | .37% | 64,241 |
| Class I | .37% | 7,391 |
| Class Z | .31% | 6,946 |
| | | $100,883 |
Through arrangements with the Fund's custodian, credits realized as a result of certain uninvested cash balances were used to reduce the Fund's expenses. During the period, custodian credits reduced the Fund's expenses by $383.
In addition, during the period the investment adviser or an affiliate reimbursed and/or waived a portion of fund-level operating expenses in the amount of $412.
8. Distributions to Shareholders.
Distributions to shareholders of each class were as follows:
| | Six months ended July 31, 2023A |
| Fidelity Municipal Core Plus Bond Fund | |
| Distributions to shareholders | |
| Class A | $ 30,480 |
| Class M | 28,966 |
| Class C | 28,872 |
| Fidelity Municipal Core Plus Bond Fund | 335,482 |
| Class I | 31,300 |
| Class Z | 33,170 |
Total | $488,270 |
A For the period February 16, 2023 (commencement of operations) through July 31, 2023.
9. Share Transactions.
Share transactions for each class were as follows and may contain in-kind transactions, automatic conversions between classes or exchanges between affiliated funds:
| | Shares | Dollars |
| | Six months ended July 31, 2023A | Six months ended July 31, 2023 A |
| Fidelity Municipal Core Plus Bond Fund | | |
| Class A | | |
| Shares sold | 228,029 | $2,280,638 |
| Reinvestment of distributions | 3,026 | 30,480 |
| Shares redeemed | (445) | (4,472) |
| Net increase (decrease) | 230,610 | $2,306,646 |
| Class M | | |
| Shares sold | 200,000 | $2,000,000 |
| Reinvestment of distributions | 2,876 | 28,966 |
| Net increase (decrease) | 202,876 | $2,028,966 |
| Class C | | |
| Shares sold | 200,000 | $2,000,000 |
| Reinvestment of distributions | 2,873 | 28,872 |
| Net increase (decrease) | 202,873 | $2,028,872 |
| Fidelity Municipal Core Plus Bond Fund | | |
| Shares sold | 2,739,066 | $27,520,241 |
| Reinvestment of distributions | 32,108 | 323,421 |
| Shares redeemed | (34,567) | (347,373) |
| Net increase (decrease) | 2,736,607 | $27,496,289 |
| Class I | | |
| Shares sold | 200,281 | $2,002,843 |
| Reinvestment of distributions | 3,107 | 31,300 |
| Net increase (decrease) | 203,388 | $2,034,143 |
| Class Z | | |
| Shares sold | 257,015 | $2,574,500 |
| Reinvestment of distributions | 3,175 | 31,977 |
| Net increase (decrease) | 260,190 | $2,606,477 |
A For the period February 16, 2023 (commencement of operations) through July 31, 2023.
10. Other.
A fund's organizational documents provide former and current trustees and officers with a limited indemnification against liabilities arising in connection with the performance of their duties to the fund. In the normal course of business, a fund may also enter into contracts that provide general indemnifications. A fund's maximum exposure under these arrangements is unknown as this would be dependent on future claims that may be made against a fund. The risk of material loss from such claims is considered remote.
At the end of the period, the investment adviser or its affiliates were owners of record of more than 10% of the outstanding shares as follows:
| Fund | Affiliated % |
Fidelity Municipal Core Plus Bond Fund | 53% |
11. Risk and Uncertainties.
Many factors affect a fund's performance. Developments that disrupt global economies and financial markets, such as pandemics, epidemics, outbreaks of infectious diseases, war, terrorism, and environmental disasters, may significantly affect a fund's investment performance. The effects of these developments to a fund will be impacted by the types of securities in which a fund invests, the financial condition, industry, economic sector, and geographic location of an issuer, and a fund's level of investment in the securities of that issuer. Significant concentrations in security types, issuers, industries, sectors, and geographic locations may magnify the factors that affect a fund's performance.
As a shareholder, you incur two types of costs: (1) transaction costs, which may include sales charges (loads) on purchase payments or redemption proceeds, as applicable and (2) ongoing costs, which generally include management fees, distribution and/or service (12b-1) fees and other Fund expenses. This Example is intended to help you understand your ongoing costs (in dollars) of investing in a fund and to compare these costs with the ongoing costs of investing in other mutual funds.
| The actual expense Example is based on an investment of $1,000 invested at the beginning of the period and held for the entire period (February 16, 2023 to July 31, 2023). The hypothetical expense Example is based on an investment of $1,000 invested for the one-half year period (February 1, 2023 to July 31, 2023). |
Actual Expenses
The first line of the accompanying table provides information about actual account values and actual expenses. You may use the information in this line, together with the amount you invested, to estimate the expenses that you paid over the period. Simply divide your account value by $1,000.00 (for example, an $8,600 account value divided by $1,000.00 = 8.6), then multiply the result by the number in the first line for a class/Fund under the heading entitled "Expenses Paid During Period" to estimate the expenses you paid on your account during this period. If any fund is a shareholder of any underlying mutual funds or exchange-traded funds (ETFs) (the Underlying Funds), such fund indirectly bears its proportional share of the expenses of the Underlying Funds in addition to the direct expenses incurred presented in the table. These fees and expenses are not included in the annualized expense ratio used to calculate the expense estimate in the table below.
Hypothetical Example for Comparison Purposes
The second line of the accompanying table provides information about hypothetical account values and hypothetical expenses based on the actual expense ratio and an assumed rate of return of 5% per year before expenses, which is not the actual return. The hypothetical account values and expenses may not be used to estimate the actual ending account balance or expenses you paid for the period. You may use this information to compare the ongoing costs of investing in the Fund and other funds. To do so, compare this 5% hypothetical example with the 5% hypothetical examples that appear in the shareholder reports of the other funds. If any fund is a shareholder of any Underlying Funds, such fund indirectly bears its proportional share of the expenses of the Underlying Funds in addition to the direct expenses as presented in the table. These fees and expenses are not included in the annualized expense ratio used to calculate the expense estimate in the table below.
Please note that the expenses shown in the table are meant to highlight your ongoing costs only and do not reflect any transaction costs. Therefore, the second line of the table is useful in comparing ongoing costs only, and will not help you determine the relative total costs of owning different funds. In addition, if these transactional costs were included, your costs would have been higher.
| | | | | Annualized Expense Ratio- A | | Beginning Account Value | | Ending Account Value July 31, 2023 | | Expenses Paid During Period |
| Fidelity® Municipal Core Plus Bond Fund | | | | | | | | | | |
| Class A | | | | .62% | | | | | | |
| Actual | | | | | | $ 1,000 | | $ 1,022.50 | | $ 2.85C |
Hypothetical-B | | | | | | $ 1,000 | | $ 1,021.72 | | $ 3.11D |
| Class M | | | | .62% | | | | | | |
| Actual | | | | | | $ 1,000 | | $ 1,022.50 | | $ 2.85C |
Hypothetical-B | | | | | | $ 1,000 | | $ 1,021.72 | | $ 3.11D |
| Class C | | | | 1.37% | | | | | | |
| Actual | | | | | | $ 1,000 | | $ 1,019.40 | | $ 6.29C |
Hypothetical-B | | | | | | $ 1,000 | | $ 1,018.00 | | $ 6.85D |
| Fidelity® Municipal Core Plus Bond Fund | | | | .37% | | | | | | |
| Actual | | | | | | $ 1,000 | | $ 1,023.60 | | $ 1.70C |
Hypothetical-B | | | | | | $ 1,000 | | $ 1,022.96 | | $ 1.86D |
| Class I | | | | .37% | | | | | | |
| Actual | | | | | | $ 1,000 | | $ 1,023.70 | | $ 1.70C |
Hypothetical-B | | | | | | $ 1,000 | | $ 1,022.96 | | $ 1.86D |
| Class Z | | | | .31% | | | | | | |
| Actual | | | | | | $ 1,000 | | $ 1,023.90 | | $ 1.43C |
Hypothetical-B | | | | | | $ 1,000 | | $ 1,023.26 | | $ 1.56D |
| |
A Annualized expense ratio reflects expenses net of applicable fee waivers.
B 5% return per year before expenses
C Actual expenses are equal to the annualized expense ratio, multiplied by the average account value over the period, multiplied by 166 / 365 (to reflect the period February 16, 2023 to July 31, 2023).
D Hypothetical expenses are equal to the annualized expense ratio, multiplied by the average account value over the period, multiplied by 181/365 (to reflect the one-half year period).
Board Approval of Investment Advisory Contracts and Management Fees
Fidelity Municipal Core Plus Bond Fund
At its November 2022 meeting, the Board of Trustees, including the Independent Trustees (together, the Board), voted to approve the management contract with Fidelity Management & Research Company LLC (FMR) and the sub-advisory agreements with affiliates of FMR (together, the Advisory Contracts) for the fund. FMR and the sub-advisers are collectively referred to herein as the Investment Advisers. The Board, assisted by the advice of fund counsel and Independent Trustees' counsel, considered a broad range of information.
Nature, Extent, and Quality of Services Provided. The Board considered Fidelity's staffing as it relates to the fund, including the backgrounds of investment personnel of Fidelity, and also considered the fund's investment objective, strategies, and related investment philosophy. The Board considered the structure of the investment personnel compensation program and whether this structure provides appropriate incentives to act in the best interests of the fund.
Resources Dedicated to Investment Management and Support Services. The Board reviewed the general qualifications and capabilities of Fidelity's investment staff, including its size, education, experience, and resources, as well as Fidelity's approach to recruiting, training, managing, and compensating investment personnel. The Board noted the resources devoted to Fidelity's global investment organization and that Fidelity's analysts have extensive resources, tools and capabilities that allow them to conduct sophisticated quantitative and fundamental analysis, as well as credit analysis of issuers, counterparties and guarantors. Further, the Board considered that Fidelity's investment professionals have sufficient access to global information and data so as to provide competitive investment results over time, and that those professionals also have access to sophisticated tools that permit them to assess portfolio construction and risk and performance attribution characteristics continuously, as well as to transmit new information and research conclusions rapidly around the world. Additionally, in its deliberations, the Board considered Fidelity's trading, risk management, compliance, cybersecurity, and technology and operations capabilities and resources, which are integral parts of the investment management process.
Shareholder and Administrative Services. The Board considered the nature, extent, quality, and cost of advisory, administrative, and shareholder services to be performed by the Investment Advisers and their affiliates under the Advisory Contracts and under separate agreements covering transfer agency and pricing and bookkeeping services for the fund. The Board also considered the nature and extent of the supervision of third party service providers, principally custodians, subcustodians, and pricing vendors.
The Board noted that the growth of fund assets over time across the complex allows Fidelity to reinvest in the development of services designed to enhance the value and convenience of the Fidelity funds as investment vehicles. These services include 24-hour access to account information and market information over the Internet and through telephone representatives, investor education materials and asset allocation tools. The Board also considered that it reviews customer service metrics such as telephone response times, continuity of services on the website and metrics addressing services at Fidelity Investor Centers.
Investment Performance. The fund is a new fund and therefore had no historical performance for the Board to review at the time it approved the fund's Advisory Contract. The Board considered the Investment Advisers' strength in fundamental, research-driven security selection, which the Board is familiar with through its supervision of other Fidelity funds. The Board also considered the fact that it oversees funds managed by FMR that have similar investment objectives and policies as the fund.
Based on its review, the Board concluded that the nature, extent, and quality of services to be provided to the fund under the Advisory Contracts should benefit the shareholders of the fund.
Competitiveness of Management Fee and Total Expense Ratio. In reviewing the Advisory Contracts, the Board considered the fund's proposed management fee rate and the projected total expense ratio of each class of the fund. The Board noted that the fund's proposed management fee rate is below the median fee rate of funds with similar Lipper investment objective categories and comparable investment mandates, regardless of whether their management fee structures are comparable. The Board also considered that the projected net total expense ratio of each class of the fund is below the median of those funds and classes used by the Board for management fee comparisons that have a similar sales load structure.
The Board also noted that FMR has contractually agreed to reimburse each class of the fund to the extent that total operating expenses (excluding interest, certain taxes, fees and expenses of the Independent Trustees, proxy and shareholder meeting expenses, extraordinary expenses, and acquired fund fees and expenses (including fees and expenses associated with a wholly owned subsidiary), if any, as well as non-operating expenses such as brokerage commissions and fees and expenses associated with the fund's securities lending program, if applicable), as a percentage of its average net assets exceed a certain limit through May 31, 2024.
Based on its review, the Board concluded that the management fee and the projected total expense ratio of each class of the fund were reasonable in light of the services that the fund and its shareholders will receive and the other factors considered.
Costs of the Services and Profitability. The fund is a new fund and therefore no revenue, cost, or profitability data were available for the Board to review in respect of the fund at the time it approved the Advisory Contracts. In connection with its consideration of future renewals of the fund's Advisory Contracts, the Board will consider the revenues earned and the expenses incurred by Fidelity in conducting the business of developing, marketing, distributing, managing, administering and servicing the fund and servicing the fund's shareholders.
Economies of Scale. The Board will consider economies of scale when there is operating experience to permit assessment thereof. It noted that, notwithstanding the entrepreneurial risk associated with a new fund, the management fee was at a level normally associated with very high fund net assets, and Fidelity asserted to the Board that the level of the fee anticipated economies of scale at lower asset levels even before, if ever, economies of scale are achieved. The Board also noted that the fund and its shareholders would have access to the very considerable number and variety of services available through Fidelity and its affiliates.
Based on its evaluation of all of the conclusions noted above, and after considering all factors it believed relevant, the Board concluded that the advisory fee arrangements are fair and reasonable, and that the fund's Advisory Contracts should be approved.
1.9907252.100
MUC-SANN-0923
Fidelity® SAI Tax-Free Bond Fund
Semi-Annual Report
July 31, 2023
Offered exclusively to certain clients of the Adviser, or its affiliates, including Strategic Advisers LLC (Strategic Advisers) - not available for sale to the general public. Fidelity® SAI is a product name of Fidelity® funds dedicated to certain programs affiliated with Strategic Advisers.
Contents
To view a fund's proxy voting guidelines and proxy voting record for the 12-month period ended June 30, visit http://www.fidelity.com/proxyvotingresults or visit the Securities and Exchange Commission's (SEC) web site at http://www.sec.gov.
You may also call 1-800-544-3455 to request a free copy of the proxy voting guidelines.
Standard & Poor's, S&P and S&P 500 are registered service marks of The McGraw-Hill Companies, Inc. and have been licensed for use by Fidelity Distributors Corporation.
Other third-party marks appearing herein are the property of their respective owners.
All other marks appearing herein are registered or unregistered trademarks or service marks of FMR LLC or an affiliated company. © 2023 FMR LLC. All rights reserved.
This report and the financial statements contained herein are submitted for the general information of the shareholders of the Fund. This report is not authorized for distribution to prospective investors in the Fund unless preceded or accompanied by an effective prospectus.
A fund files its complete schedule of portfolio holdings with the SEC for the first and third quarters of each fiscal year on Form N-PORT. Forms N-PORT are available on the SEC's web site at http://www.sec.gov. A fund's Forms N-PORT may be reviewed and copied at the SEC's Public Reference Room in Washington, DC. Information regarding the operation of the SEC's Public Reference Room may be obtained by calling 1-800-SEC-0330.
For a complete list of a fund's portfolio holdings, view the most recent holdings listing, semiannual report, or annual report on Fidelity's web site at http://www.fidelity.com, http://www.institutional.fidelity.com, or http://www.401k.com, as applicable.
NOT FDIC INSURED •MAY LOSE VALUE •NO BANK GUARANTEE
Neither the Fund nor Fidelity Distributors Corporation is a bank.
| Top Five States (% of Fund's net assets) |
| | |
| New York | 13.1 |
| Illinois | 12.6 |
| Texas | 6.9 |
| California | 6.0 |
| New Jersey | 4.8 |
| | |
| Revenue Sources (% of Fund's net assets) |
| General Obligations | 27.9 | |
| Health Care | 17.3 | |
| Transportation | 10.9 | |
| Special Tax | 10.1 | |
| Education | 9.6 | |
| Housing | 6.9 | |
| State G.O. | 5.3 | |
| Others* (Individually Less Than 5%) | 12.0 | |
| | 100.0 | |
| |
| *Includes net other assets | | |
Quality Diversification (% of Fund's net assets) |
|
| |
| We have used ratings from Moody's Investors Service, Inc. Where Moody's® ratings are not available, we have used S&P® ratings. All ratings are as of the date indicated and do not reflect subsequent changes. |
Showing Percentage of Net Assets
| Municipal Bonds - 96.5% |
| | | Principal Amount (a) | Value ($) |
| Alabama - 1.6% | | | |
| Black Belt Energy Gas District Bonds Series 2022 E, 5%, tender 6/1/28 (b) | | 14,780,000 | 15,336,808 |
| Homewood Edl. Bldg. Auth. Rev. Series 2019 A: | | | |
| 4% 12/1/36 | | 960,000 | 950,787 |
| 4% 12/1/38 | | 1,595,000 | 1,538,962 |
| 4% 12/1/41 | | 1,260,000 | 1,169,213 |
| 4% 12/1/44 | | 1,125,000 | 1,023,380 |
| 4% 12/1/49 | | 1,355,000 | 1,194,937 |
| Infirmary Health Systems Spl. Care Facilities Fing. Auth. Rev.: | | | |
| Series 2016 A, 5% 2/1/26 | | 3,585,000 | 3,679,695 |
| Series 2021 A, 3% 2/1/46 | | 4,230,000 | 3,085,391 |
| Lower Alabama Gas District Bonds (No. 2 Proj.) Series 2020, 4%, tender 12/1/25 (b) | | 7,960,000 | 7,897,775 |
| Mobile Indl. Dev. Board Poll. Cont. Rev. Bonds (Alabama Pwr. Co. Barry Plant Proj.): | | | |
| Series 2007 C, 3.78%, tender 6/16/26 (b) | | 1,510,000 | 1,509,628 |
| Series 2008, 2.9%, tender 12/12/23 (b) | | 3,745,000 | 3,730,298 |
| Montgomery Med. Clinic Facilities Series 2015: | | | |
| 5% 3/1/25 | | 1,310,000 | 1,304,332 |
| 5% 3/1/36 | | 1,310,000 | 1,223,819 |
TOTAL ALABAMA | | | 43,645,025 |
| Alaska - 0.2% | | | |
| Alaska Hsg. Fin. Corp. Series 2021 A: | | | |
| 4% 6/1/30 | | 1,030,000 | 1,085,957 |
| 5% 6/1/27 | | 700,000 | 746,348 |
| 5% 12/1/27 | | 935,000 | 1,006,462 |
| 5% 6/1/28 | | 1,230,000 | 1,334,911 |
| Alaska Hsg. Fin. Corp. Mtg. Rev. Series 2022 A, 3% 6/1/51 | | 635,000 | 608,080 |
| Alaska Int'l. Arpts. Revs. Series 2016 A, 5% 10/1/26 | | 1,325,000 | 1,369,189 |
TOTAL ALASKA | | | 6,150,947 |
| Arizona - 1.6% | | | |
| Arizona Health Facilities Auth. Rev. (Scottsdale Lincoln Hospitals Proj.) Series 2014 A, 5% 12/1/39 | | 620,000 | 624,109 |
| Arizona State Univ. Revs. Series 2021 C, 5% 7/1/40 | | 1,445,000 | 1,598,479 |
| Chandler Indl. Dev. Auth. Indl. Dev. Rev. Bonds (Intel Corp. Proj.) Series 2005, 2.4%, tender 8/14/23 (b) | | 250,000 | 249,847 |
| Maricopa County Indl. Dev. Auth.: | | | |
| (Creighton Univ. Proj.) Series 2020, 5% 7/1/47 | | 560,000 | 587,683 |
| Bonds Series 2019 B, 5%, tender 9/1/24 (b) | | 610,000 | 618,107 |
| Maricopa County Indl. Dev. Auth. Sr. Living Facilities: | | | |
| (Christian Care Mesa II, Inc.) Series 2014 A, 4.5% 1/1/39 (Pre-Refunded to 1/1/24 @ 100) | | 420,000 | 421,794 |
| Series 2016: | | | |
5.75% 1/1/36 (c) | | 910,000 | 731,616 |
6% 1/1/48 (c) | | 1,250,000 | 899,778 |
| Maricopa County Rev.: | | | |
| Bonds: | | | |
Series 2023 A1, 5%, tender 5/15/26 (b) | | 4,075,000 | 4,247,571 |
Series 2023 A2, 5%, tender 5/15/28 (b) | | 4,220,000 | 4,539,507 |
| Series 2017 D, 3% 1/1/48 | | 3,090,000 | 2,356,630 |
| Series 2019 E, 3% 1/1/49 | | 1,835,000 | 1,385,759 |
| Maricopa County Spl. Health Care District Gen. Oblig. Series 2018 C, 5% 7/1/36 | | 2,150,000 | 2,312,668 |
| Mesa Util. Sys. Rev. Series 2021, 4% 7/1/35 | | 3,665,000 | 3,824,963 |
| Phoenix Civic Impt. Board Arpt. Rev. Series 2019 A, 5% 7/1/44 | | 1,590,000 | 1,697,117 |
| Phoenix Civic Impt. Corp. Series 2019 A: | | | |
| 4% 7/1/45 | | 5,000,000 | 4,734,850 |
| 5% 7/1/32 | | 810,000 | 884,980 |
| 5% 7/1/39 | | 470,000 | 498,673 |
| 5% 7/1/45 | | 2,400,000 | 2,512,074 |
| Phoenix IDA Student Hsg. Rev. (Downtown Phoenix Student Hsg. II LLC Arizona State Univ. Proj.) Series 2019 A, 5% 7/1/59 | | 1,000,000 | 983,561 |
| Salt Verde Finl. Corp. Sr. Gas Rev. Series 2007, 5% 12/1/37 | | 5,415,000 | 5,659,805 |
| Tempe Indl. Dev. Auth. Rev. (Friendship Village of Tempe Proj.) Series 2021 A, 4% 12/1/46 | | 2,020,000 | 1,442,323 |
TOTAL ARIZONA | | | 42,811,894 |
| California - 5.0% | | | |
| Bay Area Toll Auth. San Francisco Bay Toll Bridge Rev. Bonds Series 2021 A, 2%, tender 4/1/28 (b) | | 1,635,000 | 1,504,993 |
| California Edl. Facilities Auth. Rev. Series 2018 A, 5% 10/1/42 | | 1,255,000 | 1,308,853 |
| California Gen. Oblig.: | | | |
| Series 2021: | | | |
5% 12/1/35 | | 3,630,000 | 4,159,523 |
5% 12/1/36 | | 3,600,000 | 4,084,768 |
| Series 2022, 5% 4/1/42 | | 12,055,000 | 12,865,485 |
| Series 2023, 5% 10/1/39 | | 490,000 | 566,038 |
| California Hsg. Fin. Agcy.: | | | |
| Series 2021 1, 3.5% 11/20/35 | | 4,431,315 | 4,149,188 |
| Series 2023 A1, 4.375% 9/20/36 | | 4,914,655 | 4,886,038 |
| California Muni. Fin. Auth. Rev. Series 2017 A: | | | |
| 5% 7/1/42 | | 935,000 | 952,945 |
| 5.25% 11/1/36 | | 480,000 | 483,193 |
| California Muni. Fin. Auth. Student Hsg. (CHF-Davis I, LLC - West Village Student Hsg. Proj.) Series 2018: | | | |
| 5% 5/15/34 | | 2,465,000 | 2,593,254 |
| 5% 5/15/39 | | 1,100,000 | 1,130,755 |
| California Pub. Works Board Lease Rev. (Various Cap. Projs.) Series 2022 C: | | | |
| 5% 8/1/30 | | 520,000 | 600,221 |
| 5% 8/1/33 | | 965,000 | 1,133,165 |
| California Statewide Cmntys. Dev. Auth. Rev. Series 2015, 5% 2/1/45 | | 750,000 | 525,000 |
| Golden State Tobacco Securitization Corp. Tobacco Settlement Rev. Series 2017 A1, 5% 6/1/28 (Pre-Refunded to 6/1/27 @ 100) | | 935,000 | 1,013,426 |
| Long Beach Arpt. Rev.: | | | |
| Series 2022 A: | | | |
5% 6/1/33 | | 470,000 | 559,556 |
5% 6/1/34 | | 375,000 | 444,595 |
5% 6/1/35 | | 280,000 | 329,364 |
5% 6/1/36 | | 750,000 | 873,406 |
5% 6/1/37 | | 655,000 | 754,863 |
5% 6/1/38 | | 935,000 | 1,066,221 |
5% 6/1/39 | | 470,000 | 533,586 |
| Series 2022 B: | | | |
5% 6/1/33 | | 420,000 | 500,028 |
5% 6/1/34 | | 375,000 | 444,595 |
5% 6/1/35 | | 280,000 | 329,364 |
5% 6/1/36 | | 280,000 | 326,072 |
5% 6/1/37 | | 470,000 | 541,658 |
5% 6/1/38 | | 280,000 | 320,224 |
5% 6/1/39 | | 530,000 | 601,703 |
| Los Angeles Dept. Arpt. Rev. Series B, 5% 5/15/45 | | 8,425,000 | 9,308,363 |
| Los Angeles Dept. of Wtr. & Pwr. Rev.: | | | |
| Series 2021 C, 5% 7/1/40 | | 3,695,000 | 4,155,505 |
| Series 2022 C: | | | |
5% 7/1/38 | | 2,350,000 | 2,690,523 |
5% 7/1/39 | | 2,100,000 | 2,394,042 |
5% 7/1/40 | | 10,400,000 | 11,751,239 |
5% 7/1/41 | | 5,000,000 | 5,611,314 |
| Middle Fork Proj. Fin. Auth. Series 2020: | | | |
| 5% 4/1/24 | | 2,570,000 | 2,584,070 |
| 5% 4/1/25 | | 2,700,000 | 2,741,802 |
| 5% 4/1/26 | | 1,900,000 | 1,953,627 |
| Mount Diablo Unified School District Series 2022 B: | | | |
| 4% 8/1/31 | | 785,000 | 851,485 |
| 4% 8/1/32 | | 1,105,000 | 1,197,197 |
| Sacramento City Unified School District Series 2022 A: | | | |
| 5% 8/1/35 | | 1,000,000 | 1,128,853 |
| 5% 8/1/39 | | 2,090,000 | 2,297,158 |
| 5% 8/1/40 | | 3,000,000 | 3,286,078 |
| San Diego Assoc. of Governments (Mid-Coast Corridor Transit Proj.) Series 2019 A: | | | |
| 5% 11/15/25 | | 1,870,000 | 1,913,568 |
| 5% 11/15/26 | | 1,870,000 | 1,953,633 |
| San Diego County Reg'l. Arpt. Auth. Arpt. Rev. Series 2019 A, 5% 7/1/49 | | 2,665,000 | 2,807,343 |
| San Diego County Wtr. Auth. Fing. Agcy. Wtr. Rev. Series 2022 A: | | | |
| 5% 5/1/47 | | 2,050,000 | 2,267,732 |
| 5% 5/1/52 | | 3,480,000 | 3,821,406 |
| San Francisco City & County Arpts. Commission Int'l. Arpt. Rev.: | | | |
| Series 2019 B, 5% 5/1/49 | | 435,000 | 460,158 |
| Series 2022 B, 5% 5/1/52 | | 6,820,000 | 7,356,696 |
| Univ. of California Revs.: | | | |
| Series 2023 BM, 5% 5/15/36 | | 670,000 | 800,440 |
| Series 2023 BN, 5% 5/15/25 | | 10,895,000 | 11,309,445 |
| Washington Township Health Care District Rev.: | | | |
| Series 2017 A, 5% 7/1/35 | | 750,000 | 766,844 |
| Series 2017 B: | | | |
5% 7/1/29 | | 455,000 | 470,055 |
5% 7/1/30 | | 910,000 | 941,022 |
TOTAL CALIFORNIA | | | 136,401,678 |
| Colorado - 2.8% | | | |
| Colorado Health Facilities Auth. Rev. Bonds: | | | |
| Bonds: | | | |
Series 2018 B, 5%, tender 11/20/25 (b) | | 935,000 | 969,214 |
Series 2019 B, 5%, tender 8/1/26 (b) | | 705,000 | 725,992 |
Series 2022 C, 5%, tender 8/15/28 (b) | | 2,425,000 | 2,645,621 |
Series 2023 A1, 5%, tender 11/15/28 (b) | | 5,520,000 | 6,007,989 |
| Series 2018 A, 4% 11/15/48 | | 900,000 | 860,219 |
| Series 2019 A: | | | |
4% 11/1/39 | | 845,000 | 834,363 |
5% 11/1/26 | | 1,400,000 | 1,471,959 |
5% 11/15/39 | | 1,170,000 | 1,262,957 |
| Series 2019 A1, 4% 8/1/44 | | 13,820,000 | 12,816,990 |
| Series 2019 A2: | | | |
3.25% 8/1/49 | | 2,195,000 | 1,594,324 |
4% 8/1/49 | | 3,360,000 | 3,057,566 |
| Series 2019 B, 4% 1/1/40 | | 1,560,000 | 1,555,459 |
| Series 2020 A, 4% 9/1/50 | | 805,000 | 707,481 |
| Series 2022 A, 5% 5/15/47 | | 6,000,000 | 6,410,836 |
| Colorado Hsg. & Fin. Auth.: | | | |
| Series 2019 F, 4.25% 11/1/49 | | 255,000 | 254,186 |
| Series 2019 H, 4.25% 11/1/49 | | 150,000 | 149,575 |
| Series 2021 E, 3% 11/1/51 | | 1,195,000 | 1,149,634 |
| Series 2022 F, 5.25% 11/1/52 | | 1,775,000 | 1,835,429 |
| Colorado Reg'l. Trans. District Sales Tax Rev. (Fastracks Proj.) Series 2021 B, 5% 11/1/28 | | 3,535,000 | 3,925,513 |
| Colorado State Bldg. Excellent Schools Today Ctfs. of Prtn. Series 2018 N: | | | |
| 5% 3/15/37 | | 1,870,000 | 1,999,982 |
| 5% 3/15/38 | | 1,870,000 | 1,981,636 |
| Denver City & County Board Wtr. Rev. Series 2020 A: | | | |
| 5% 9/15/45 | | 5,070,000 | 5,528,042 |
| 5% 9/15/46 | | 7,770,000 | 8,457,926 |
| Univ. of Colorado Enterprise Sys. Rev. Bonds: | | | |
| Series 2019 C, 2%, tender 10/15/24 (b) | | 6,295,000 | 6,140,894 |
| Series 2021 C3A, 2%, tender 10/15/25 (b) | | 830,000 | 797,881 |
| Series 2021 C3B, 2%, tender 10/15/26 (b) | | 700,000 | 663,516 |
| Vauxmont Metropolitan District: | | | |
| Series 2019, 5% 12/15/26 (Assured Guaranty Muni. Corp. Insured) | | 126,000 | 132,549 |
| Series 2020, 5% 12/1/50 (Assured Guaranty Muni. Corp. Insured) | | 1,404,000 | 1,486,256 |
TOTAL COLORADO | | | 75,423,989 |
| Connecticut - 3.4% | | | |
| Bridgeport Gen. Oblig. Series 2019 A, 5% 2/1/25 (Build America Mutual Assurance Insured) | | 625,000 | 640,980 |
| Connecticut Gen. Oblig.: | | | |
| Series 2015 B, 5% 6/15/32 | | 250,000 | 258,256 |
| Series 2016 B: | | | |
5% 5/15/25 | | 935,000 | 964,783 |
5% 5/15/26 | | 510,000 | 536,735 |
| Series 2017 A, 5% 4/15/33 | | 230,000 | 246,979 |
| Series 2018 A, 5% 4/15/38 | | 935,000 | 995,898 |
| Series 2019 A, 5% 4/15/26 | | 615,000 | 646,093 |
| Series 2020 A: | | | |
4% 1/15/34 | | 2,105,000 | 2,237,330 |
5% 1/15/40 | | 1,870,000 | 2,016,821 |
| Series 2021 A: | | | |
3% 1/15/39 | | 785,000 | 672,068 |
3% 1/15/40 | | 950,000 | 796,197 |
| Series 2022 B, 4% 1/15/37 | | 9,400,000 | 9,741,777 |
| Connecticut Health & Edl. Facilities Auth. Rev.: | | | |
| (Sacred Heart Univ., CT. Proj.) Series 2017 I-1, 5% 7/1/42 | | 3,120,000 | 3,213,758 |
| Bonds: | | | |
Series 2017 B2, 3.2%, tender 7/1/26 (b) | | 3,140,000 | 3,142,416 |
Series 2017 C2, 2.8%, tender 2/3/26 (b) | | 8,750,000 | 8,569,852 |
Series 2020 B: | | | |
5%, tender 1/1/25 (b) | | 2,250,000 | 2,283,725 |
5%, tender 1/1/27 (b) | | 1,665,000 | 1,740,068 |
| Series 2019 A: | | | |
4% 7/1/49 | | 1,635,000 | 1,416,644 |
5% 7/1/26 | | 5,455,000 | 5,580,609 |
5% 7/1/27 (c) | | 555,000 | 542,281 |
5% 7/1/34 (c) | | 685,000 | 659,087 |
| Series 2019 Q-1: | | | |
5% 11/1/24 | | 430,000 | 439,002 |
5% 11/1/26 | | 470,000 | 498,174 |
| Series 2020 K: | | | |
4% 7/1/45 | | 2,680,000 | 2,478,003 |
5% 7/1/40 | | 985,000 | 1,048,593 |
| Series 2021 G: | | | |
4% 3/1/46 | | 865,000 | 827,941 |
4% 3/1/51 | | 1,390,000 | 1,320,734 |
| Series 2021 S, 4% 6/1/51 | | 855,000 | 761,935 |
| Series 2022 M: | | | |
4% 7/1/39 | | 1,040,000 | 990,308 |
4% 7/1/40 | | 1,075,000 | 1,013,413 |
4% 7/1/52 | | 5,490,000 | 4,914,702 |
5% 7/1/32 | | 1,485,000 | 1,642,819 |
| Series 2023 E, 5.25% 7/15/48 | | 3,700,000 | 3,980,201 |
| Series A, 5% 7/1/26 | | 935,000 | 945,697 |
| Series K1: | | | |
5% 7/1/32 | | 985,000 | 999,280 |
5% 7/1/33 | | 765,000 | 775,800 |
5% 7/1/35 | | 1,030,000 | 1,037,606 |
| Series K3, 5% 7/1/43 | | 330,000 | 312,358 |
| Series R: | | | |
4% 7/1/36 | | 935,000 | 936,721 |
5% 6/1/32 | | 515,000 | 574,325 |
5% 6/1/33 | | 350,000 | 388,966 |
5% 6/1/34 | | 540,000 | 599,870 |
5% 6/1/35 | | 815,000 | 898,112 |
| Connecticut Hsg. Fin. Auth. Series 2021 B1, 3% 11/15/49 | | 1,280,000 | 1,229,676 |
| Connecticut Spl. Tax Oblig. Trans. Infrastructure Rev.: | | | |
| Series 2020 A, 5% 5/1/40 | | 8,000,000 | 8,738,230 |
| Series A, 5% 9/1/33 | | 4,680,000 | 4,755,239 |
| Stratford Gen. Oblig. Series 2019, 5% 1/1/28 | | 3,640,000 | 3,858,440 |
| Univ. of Connecticut Gen. Oblig. Series 2019 A, 5% 11/1/25 | | 465,000 | 483,593 |
TOTAL CONNECTICUT | | | 93,352,095 |
| District Of Columbia - 1.5% | | | |
| District of Columbia Gen. Oblig.: | | | |
| Series 2017 D, 5% 6/1/42 | | 470,000 | 492,655 |
| Series 2023 A: | | | |
5% 1/1/40 | | 1,120,000 | 1,271,591 |
5% 1/1/41 | | 6,860,000 | 7,760,136 |
| District of Columbia Rev. Series 2018: | | | |
| 5% 10/1/23 | | 330,000 | 330,741 |
| 5% 10/1/25 | | 465,000 | 477,587 |
| 5% 10/1/26 | | 775,000 | 807,691 |
| 5% 10/1/27 | | 845,000 | 895,219 |
| 5% 10/1/43 | | 2,880,000 | 2,981,389 |
| District of Columbia Wtr. & Swr. Auth. Pub. Util. Rev. Bonds Series 2019 C, 1.75%, tender 10/1/24 (b) | | 3,020,000 | 2,936,081 |
| Metropolitan Washington Arpts. Auth. Dulles Toll Road Rev.: | | | |
| (Dulles Metrorail and Cap. Impt. Projs.): | | | |
Series 2019 A: | | | |
5% 10/1/38 | | 1,405,000 | 1,478,245 |
5% 10/1/44 | | 7,485,000 | 7,798,849 |
Series 2019 B: | | | |
3% 10/1/50 (Assured Guaranty Muni. Corp. Insured) | | 6,425,000 | 4,826,227 |
5% 10/1/47 | | 7,020,000 | 7,323,904 |
| Series 2009 B, 0% 10/1/32 (Assured Guaranty Corp. Insured) | | 1,665,000 | 1,199,758 |
| Metropolitan Washington DC Arpts. Auth. Sys. Rev. Series 2019 B, 5% 10/1/25 | | 1,500,000 | 1,558,035 |
TOTAL DISTRICT OF COLUMBIA | | | 42,138,108 |
| Florida - 3.4% | | | |
| Atlantic Beach Health Care Facilities Series A, 5% 11/15/43 | | 790,000 | 697,104 |
| Broward County School Board Ctfs. of Prtn.: | | | |
| Series 2016, 5% 7/1/26 | | 1,375,000 | 1,447,943 |
| Series 2022 A, 5% 7/1/25 | | 1,550,000 | 1,598,938 |
| Cap. Projs. Fin. Auth. Student Hsg. Rev. (Cap. Projs. Ln. Prog. - Florida Univs.) Series 2020 A, 5% 10/1/30 | | 750,000 | 783,914 |
| Central Florida Expressway Auth. Sr. Lien Rev.: | | | |
| Orlando & Orange County Expressway Auth. Rev. Series 2017, 5% 7/1/39 | | 1,870,000 | 1,967,060 |
| Series 2021: | | | |
4% 7/1/38 (Assured Guaranty Muni. Corp. Insured) | | 1,065,000 | 1,086,951 |
4% 7/1/39 (Assured Guaranty Muni. Corp. Insured) | | 930,000 | 943,224 |
5% 7/1/32 (Assured Guaranty Muni. Corp. Insured) | | 2,810,000 | 3,264,323 |
5% 7/1/33 (Assured Guaranty Muni. Corp. Insured) | | 2,490,000 | 2,881,320 |
| Escambia County Health Facilities Auth. Health Facilities Rev. Series 2020 A: | | | |
| 3% 8/15/50 (Assured Guaranty Muni. Corp. Insured) | | 1,805,000 | 1,317,129 |
| 4% 8/15/45 | | 3,670,000 | 3,272,419 |
| Florida Higher Edl. Facilities Fing. Auth.: | | | |
| (Rollins College Proj.) Series 2020 A, 3% 12/1/48 | | 5,285,000 | 3,795,606 |
| (St. Leo Univ. Proj.) Series 2019: | | | |
5% 3/1/24 | | 235,000 | 234,565 |
5% 3/1/25 | | 625,000 | 621,978 |
| Series 2019, 5% 10/1/23 | | 235,000 | 235,216 |
| Florida Hsg. Fin. Corp. Multi-family Mtg. Rev. Bonds: | | | |
| Series 2023 B, 5%, tender 2/1/26 (b) | | 1,685,000 | 1,731,933 |
| Series 2023 C, 5%, tender 12/1/25 (b) | | 1,220,000 | 1,249,630 |
| Florida Hsg. Fin. Corp. Rev. Series 2019 1, 4% 7/1/50 | | 5,745,000 | 5,692,410 |
| Florida Mid-Bay Bridge Auth. Rev. Series 2015 A: | | | |
| 5% 10/1/29 | | 2,315,000 | 2,357,265 |
| 5% 10/1/35 | | 935,000 | 947,906 |
| Hillsborough County Aviation Auth. Rev. Series 2018 F: | | | |
| 5% 10/1/37 | | 1,415,000 | 1,526,636 |
| 5% 10/1/43 | | 1,870,000 | 1,980,285 |
| Hillsborough County School Board Ctfs. of Prtn. Series 2020 A, 5% 7/1/27 | | 4,680,000 | 4,989,315 |
| Jacksonville Spl. Rev. Series 2022 A: | | | |
| 5% 10/1/23 | | 205,000 | 205,504 |
| 5% 10/1/24 | | 465,000 | 473,933 |
| 5% 10/1/25 | | 360,000 | 373,699 |
| 5% 10/1/26 | | 255,000 | 270,224 |
| 5% 10/1/27 | | 205,000 | 221,896 |
| 5% 10/1/28 | | 405,000 | 447,540 |
| 5% 10/1/29 | | 350,000 | 391,895 |
| 5% 10/1/30 | | 330,000 | 375,777 |
| 5% 10/1/32 | | 305,000 | 357,327 |
| Lee County School Board Ctfs. Series 2019 A: | | | |
| 5% 8/1/27 | | 3,750,000 | 4,030,696 |
| 5% 8/1/28 | | 1,890,000 | 2,072,459 |
| Lee Memorial Health Sys. Hosp. Rev. Series 2019 A1: | | | |
| 5% 4/1/26 | | 935,000 | 970,996 |
| 5% 4/1/44 | | 3,030,000 | 3,138,557 |
| Manatee County School District Series 2017, 5% 10/1/28 (Assured Guaranty Muni. Corp. Insured) | | 2,340,000 | 2,501,116 |
| Miami-Dade County Aviation Rev. Series 2020 A, 4% 10/1/37 | | 1,870,000 | 1,888,070 |
| Miami-Dade County School Board Ctfs. of Prtn. Series 2015 B, 5% 5/1/28 | | 1,605,000 | 1,642,512 |
| Miami-Dade County School District Series 2015, 5% 3/15/26 | | 1,445,000 | 1,483,818 |
| Miami-Dade County Wtr. & Swr. Rev. Series 2019 B, 4% 10/1/49 | | 3,745,000 | 3,609,411 |
| Orange County Health Facilities Auth. Series 2022, 4% 10/1/52 | | 1,365,000 | 1,272,014 |
| Orange County School Board Ctfs. of Prtn. Series 2015 D, 5% 8/1/30 (Pre-Refunded to 8/1/25 @ 100) | | 820,000 | 849,109 |
| Palm Beach County Health Facilities Auth. Hosp. Rev. (Jupiter Med. Ctr. Proj.) Series 2022, 5% 11/1/52 | | 2,850,000 | 2,812,063 |
| Pasco County Tax Alloc Series 2023 A: | | | |
| 5.25% 9/1/36 (Assured Guaranty Muni. Corp. Insured) | | 500,000 | 569,782 |
| 5.5% 9/1/40 (Assured Guaranty Muni. Corp. Insured) | | 1,000,000 | 1,132,483 |
| 5.5% 9/1/41 (Assured Guaranty Muni. Corp. Insured) | | 500,000 | 564,195 |
| Pasco County School Board Ctfs. of Prtn. Series 2018 A, 5% 8/1/35 (Build America Mutual Assurance Insured) | | 1,870,000 | 2,027,139 |
| Pinellas County Hsg. Fin. Auth. Bonds Series 2021 B, 0.65%, tender 7/1/24 (b) | | 1,165,000 | 1,122,135 |
| South Miami Health Facilities Auth. Hosp. Rev. (Baptist Med. Ctr., FL. Proj.) Series 2017, 5% 8/15/28 | | 1,450,000 | 1,550,461 |
| St. Johns County School Board (School Board of St. Johns County, Florida Master Lease Prog.) Series 2019 A: | | | |
| 5% 7/1/24 | | 750,000 | 761,277 |
| 5% 7/1/25 | | 1,360,000 | 1,405,497 |
| Tallahassee Health Facilities Rev.: | | | |
| (Tallahassee Memorial Healthcare, Inc. Proj.) Series 2016 A, 5% 12/1/55 | | 955,000 | 953,351 |
| Series 2015 A, 5% 12/1/40 | | 1,570,000 | 1,570,050 |
| Tampa Hosp. Rev. (H. Lee Moffitt Cancer Ctr. Proj.): | | | |
| Series 2016 B, 5% 7/1/37 | | 900,000 | 920,251 |
| Series 2020 B: | | | |
4% 7/1/45 | | 2,810,000 | 2,598,204 |
5% 7/1/40 | | 655,000 | 679,206 |
| Tampa Tax Allocation (H. Lee Moffitt Cancer Ctr. Proj.) Series 2020 A: | | | |
| 0% 9/1/38 | | 935,000 | 461,633 |
| 0% 9/1/39 | | 795,000 | 370,977 |
| 0% 9/1/40 | | 935,000 | 412,126 |
| 0% 9/1/41 | | 935,000 | 389,523 |
| 0% 9/1/42 | | 935,000 | 367,187 |
| 0% 9/1/45 | | 1,730,000 | 574,914 |
| Volusia County Edl. Facilities Auth. Rev. (Embry-Riddle Aeronautical Univ., Inc. Proj.) Series 2020 A: | | | |
| 5% 10/15/44 | | 230,000 | 241,739 |
| 5% 10/15/49 | | 425,000 | 443,680 |
TOTAL FLORIDA | | | 93,127,496 |
| Georgia - 4.4% | | | |
| Brookhaven Dev. Auth. Rev. Series 2019 A, 5% 7/1/36 | | 935,000 | 1,019,319 |
| Burke County Indl. Dev. Auth. Poll. Cont. Rev.: | | | |
| (Georgia Transmission Corp. Proj.) Series 2012, 2.75% 1/1/52 (b) | | 2,230,000 | 1,469,037 |
| Bonds (Georgia Pwr. Co. Plant Vogtle Proj.): | | | |
Series 1994 9, 3.8%, tender 5/21/26 (b) | | 3,200,000 | 3,172,205 |
Series 1994, 2.15%, tender 6/13/24 (b) | | 5,950,000 | 5,817,023 |
Series 2013 1st, 2.925%, tender 3/12/24 (b) | | 2,170,000 | 2,145,546 |
| Coweta County Dev. Auth. Rev. (Piedmont Healthcare, Inc. Proj.) Series 2019 A, 5% 7/1/44 | | 4,680,000 | 4,861,728 |
| Fayette County Hosp. Auth. Rev. Bonds (Piedmont Healthcare, Inc. Proj.) Series 2019 A, 5%, tender 7/1/24 (b) | | 750,000 | 753,771 |
| Fulton County Dev. Auth. Rev.: | | | |
| Series 2019 C, 5% 7/1/28 | | 1,265,000 | 1,388,397 |
| Series 2019, 4% 6/15/49 | | 180,000 | 174,497 |
| Gainesville & Hall County Hosp. Auth. Rev. Series 2020 A, 3% 2/15/47 | | 6,980,000 | 5,240,442 |
| Georgia Muni. Elec. Auth. Pwr. Rev. Series 2019 A: | | | |
| 4% 1/1/49 | | 1,735,000 | 1,594,420 |
| 5% 1/1/26 | | 1,145,000 | 1,182,952 |
| 5% 1/1/30 | | 385,000 | 416,190 |
| 5% 1/1/39 | | 1,135,000 | 1,178,716 |
| 5% 1/1/44 | | 1,490,000 | 1,522,529 |
| Hosp. Auth. of Savannah Auth. Rev. Series 2019 A: | | | |
| 4% 7/1/36 | | 1,385,000 | 1,383,851 |
| 4% 7/1/43 | | 1,445,000 | 1,377,553 |
| Main Street Natural Gas, Inc.: | | | |
| Bonds: | | | |
Series 2019 B, 4%, tender 12/2/24 (b) | | 2,470,000 | 2,474,436 |
Series 2021 A, 4%, tender 9/1/27 (b) | | 37,435,000 | 37,284,275 |
Series 2022 B, 5%, tender 6/1/29 (b) | | 5,210,000 | 5,383,137 |
Series 2022 E, 4%, tender 12/1/29 (b) | | 12,405,000 | 12,188,306 |
Series 2023 A, 5%, tender 6/1/30 (b) | | 14,040,000 | 14,522,795 |
| Series 2023 C, 5% 9/1/23 | | 540,000 | 540,321 |
| Monroe County Dev. Auth. Poll. Cont. Rev. (Georgia Pwr. Co. Plant Scherer Proj.) Series 1995, 2.25% 7/1/25 | | 1,040,000 | 989,066 |
| Paulding County Hosp. Auth. Rev. Series 2022 A: | | | |
| 5% 4/1/26 | | 200,000 | 207,803 |
| 5% 4/1/27 | | 165,000 | 174,179 |
| 5% 4/1/28 | | 375,000 | 402,001 |
| 5% 4/1/29 | | 325,000 | 353,304 |
| 5% 4/1/30 | | 235,000 | 258,498 |
| 5% 4/1/31 | | 280,000 | 310,947 |
| 5% 4/1/32 | | 185,000 | 207,616 |
| Private Colleges & Univs. Auth. Rev.: | | | |
| (The Savannah College of Art & Design Projs.) Series 2021: | | | |
4% 4/1/38 | | 815,000 | 828,146 |
5% 4/1/27 | | 375,000 | 397,189 |
5% 4/1/31 | | 560,000 | 634,021 |
5% 4/1/36 | | 450,000 | 504,884 |
| Series 2020 B: | | | |
4% 9/1/38 | | 2,810,000 | 2,881,010 |
4% 9/1/39 | | 1,370,000 | 1,392,525 |
5% 9/1/31 | | 1,295,000 | 1,481,160 |
| Series A, 5% 6/1/24 | | 650,000 | 657,486 |
TOTAL GEORGIA | | | 118,771,281 |
| Hawaii - 0.2% | | | |
| Hawaii Gen. Oblig.: | | | |
| Series 2020 C, 4% 7/1/40 | | 870,000 | 871,649 |
| Series FG, 5% 10/1/27 | | 935,000 | 991,110 |
| Honolulu City & County Gen. Oblig.: | | | |
| Series 2018 A, 5% 9/1/41 | | 1,870,000 | 1,999,290 |
| Series 2019 A, 5% 9/1/24 | | 715,000 | 728,462 |
| Honolulu City and County Wastewtr. Sys. Series 2015 A, 5% 7/1/40 (Pre-Refunded to 7/1/25 @ 100) | | 830,000 | 858,861 |
TOTAL HAWAII | | | 5,449,372 |
| Idaho - 0.2% | | | |
| Idaho Hsg. & Fin. Assoc. Single Family Mtg.: | | | |
| Series 2019 A, 4% 1/1/50 | | 65,000 | 64,411 |
| Series 2021 A: | | | |
5% 7/15/29 | | 2,810,000 | 3,133,144 |
5% 7/15/30 | | 935,000 | 1,054,215 |
5% 7/15/31 | | 600,000 | 686,610 |
5% 7/15/32 | | 1,170,000 | 1,344,610 |
TOTAL IDAHO | | | 6,282,990 |
| Illinois - 12.6% | | | |
| Champaign County Cmnty. Unit: | | | |
| Series 2019: | | | |
4% 6/1/26 | | 95,000 | 97,067 |
4% 6/1/27 | | 775,000 | 799,029 |
4% 6/1/28 | | 585,000 | 607,985 |
4% 6/1/29 | | 1,450,000 | 1,518,867 |
4% 6/1/30 | | 935,000 | 980,108 |
4% 6/1/31 | | 1,170,000 | 1,225,026 |
4% 6/1/34 | | 935,000 | 969,557 |
4% 6/1/35 | | 1,205,000 | 1,235,725 |
4% 6/1/36 | | 1,475,000 | 1,495,014 |
| Series 2020 A: | | | |
5% 1/1/29 | | 630,000 | 688,101 |
5% 1/1/30 | | 585,000 | 638,056 |
5% 1/1/31 | | 795,000 | 865,965 |
5% 1/1/33 | | 1,545,000 | 1,677,796 |
| Chicago Board of Ed.: | | | |
| Series 2012 A, 5% 12/1/42 | | 50,000 | 49,145 |
| Series 2015 C: | | | |
5.25% 12/1/35 | | 1,870,000 | 1,875,334 |
5.25% 12/1/39 | | 40,000 | 40,068 |
| Series 2016 A, 7% 12/1/44 | | 2,995,000 | 3,138,274 |
| Series 2017 C, 5% 12/1/25 | | 290,000 | 296,571 |
| Series 2017 D, 5% 12/1/31 | | 865,000 | 882,642 |
| Series 2017 H, 5% 12/1/36 | | 650,000 | 655,304 |
| Series 2018 A, 5% 12/1/27 | | 185,000 | 192,221 |
| Series 2018 C: | | | |
5% 12/1/24 | | 100,000 | 101,050 |
5% 12/1/25 | | 505,000 | 516,442 |
5% 12/1/27 | | 505,000 | 524,710 |
5% 12/1/46 | | 4,695,000 | 4,599,530 |
| Series 2019 A: | | | |
5% 12/1/23 | | 2,010,000 | 2,015,775 |
5% 12/1/28 | | 240,000 | 250,751 |
5% 12/1/29 | | 750,000 | 787,452 |
5% 12/1/30 | | 575,000 | 601,932 |
5% 12/1/31 | | 600,000 | 626,802 |
| Series 2021 A, 5% 12/1/38 | | 1,200,000 | 1,219,833 |
| Series 2021 B, 5% 12/1/31 | | 1,250,000 | 1,316,494 |
| Series 2022 A, 5% 12/1/47 | | 2,085,000 | 2,061,707 |
| Series 2022 B: | | | |
4% 12/1/35 | | 1,760,000 | 1,665,835 |
4% 12/1/36 | | 2,915,000 | 2,733,786 |
| Chicago Gen. Oblig.: | | | |
| Series 2003 B, 5.5% 1/1/30 | | 1,685,000 | 1,721,821 |
| Series 2019 A: | | | |
5% 1/1/28 | | 1,070,000 | 1,131,572 |
5% 1/1/28 (Escrowed to Maturity) | | 180,000 | 196,159 |
5% 1/1/40 | | 2,200,000 | 2,265,454 |
| Series 2020 A: | | | |
5% 1/1/26 | | 1,955,000 | 2,017,221 |
5% 1/1/27 | | 1,425,000 | 1,492,709 |
5% 1/1/30 | | 1,860,000 | 2,002,071 |
5% 1/1/32 | | 1,215,000 | 1,303,178 |
| Series 2021 A: | | | |
5% 1/1/31 | | 1,400,000 | 1,519,611 |
5% 1/1/32 | | 4,485,000 | 4,854,686 |
5% 1/1/34 | | 795,000 | 858,243 |
| Series 2021 B: | | | |
4% 1/1/32 | | 1,193,000 | 1,191,281 |
4% 1/1/38 | | 2,890,000 | 2,748,656 |
| Chicago Midway Arpt. Rev. Series 2013 B, 5% 1/1/25 | | 580,000 | 580,780 |
| Chicago O'Hare Int'l. Arpt. Rev.: | | | |
| Series 2015 B, 5% 1/1/32 | | 935,000 | 946,964 |
| Series 2018 B: | | | |
4% 1/1/44 | | 1,990,000 | 1,941,131 |
5% 1/1/36 | | 2,105,000 | 2,281,316 |
5% 1/1/37 | | 3,040,000 | 3,273,181 |
5% 1/1/48 | | 9,830,000 | 10,314,798 |
5% 1/1/53 | | 360,000 | 375,391 |
| Series 2020 A: | | | |
4% 1/1/37 | | 3,105,000 | 3,147,981 |
4% 1/1/38 | | 655,000 | 658,474 |
| Series 2022 D: | | | |
5% 1/1/36 | | 2,000,000 | 2,248,373 |
5% 1/1/37 | | 2,400,000 | 2,672,433 |
| Cook County Cmnty. Consolidated School District No. 59 Series 2020: | | | |
| 4% 3/1/24 | | 840,000 | 843,395 |
| 5% 3/1/25 | | 795,000 | 818,029 |
| 5% 3/1/26 | | 1,155,000 | 1,214,678 |
| 5% 3/1/27 | | 1,165,000 | 1,253,257 |
| 5% 3/1/28 | | 1,265,000 | 1,391,999 |
| Cook County Gen. Oblig.: | | | |
| Series 2021 A: | | | |
5% 11/15/31 | | 3,415,000 | 3,791,630 |
5% 11/15/32 | | 2,245,000 | 2,488,860 |
5% 11/15/33 | | 2,200,000 | 2,437,738 |
| Series 2021 B: | | | |
4% 11/15/25 | | 580,000 | 589,841 |
4% 11/15/26 | | 295,000 | 302,609 |
4% 11/15/27 | | 300,000 | 310,804 |
4% 11/15/28 | | 150,000 | 156,539 |
| Series 2022 A, 5% 11/15/29 | | 940,000 | 1,040,474 |
| Cook County Sales Tax Rev. Series 2022 A, 5% 11/15/42 | | 10,000,000 | 10,562,759 |
| DuPage & Cook Counties Cmnty. Unit School District #205 Series 2022, 4% 9/15/42 | | 7,900,000 | 7,724,897 |
| Illinois Fin. Auth.: | | | |
| (Bradley Univ. Proj.) Series 2021 A, 4% 8/1/38 | | 1,125,000 | 1,027,839 |
| Bonds Series 2022 B1, 5%, tender 8/15/25 (b) | | 6,035,000 | 6,182,809 |
| Series 2016, 3.25% 5/15/39 | | 2,075,000 | 1,774,197 |
| Series 2020 A: | | | |
3% 5/15/50 | | 5,655,000 | 3,978,006 |
3% 5/15/50 (Build America Mutual Assurance Insured) | | 2,620,000 | 1,883,564 |
3.25% 8/15/49 | | 1,025,000 | 791,224 |
| Series 2021 A, 3% 8/15/48 | | 7,430,000 | 5,511,933 |
| Series 2022 A: | | | |
5.25% 10/1/52 | | 4,525,000 | 4,479,688 |
5.5% 10/1/47 | | 1,010,000 | 1,029,973 |
| Illinois Fin. Auth. Academic Facilities (Provident Group UIUC Properties LLC Univ. of Illinois at Urbana-Champaign Proj.) Series 2019 A: | | | |
| 5% 10/1/27 | | 225,000 | 239,450 |
| 5% 10/1/28 | | 185,000 | 200,265 |
| 5% 10/1/44 | | 935,000 | 962,919 |
| 5% 10/1/49 | | 1,170,000 | 1,198,780 |
| 5% 10/1/51 | | 935,000 | 955,729 |
| Illinois Fin. Auth. Rev.: | | | |
| (Bradley Univ. Proj.) Series 2017 C, 5% 8/1/31 | | 200,000 | 206,426 |
| (Northwestern Memorial Hosp.,IL. Proj.) Series 2017 A, 5% 7/15/25 | | 280,000 | 288,778 |
| (OSF Healthcare Sys.) Series 2018 A: | | | |
4.125% 5/15/47 | | 4,820,000 | 4,527,519 |
5% 5/15/43 | | 45,000 | 45,680 |
| (Presence Health Proj.) Series 2016 C, 5% 2/15/36 | | 935,000 | 980,137 |
| Series 2015 A, 5% 11/15/45 | | 9,360,000 | 9,421,145 |
| Series 2016 A: | | | |
3% 10/1/37 | | 1,455,000 | 1,242,860 |
5% 2/15/24 | | 795,000 | 801,213 |
5% 8/15/25 | | 1,100,000 | 1,134,428 |
| Series 2016 C, 5% 2/15/31 | | 2,340,000 | 2,480,315 |
| Series 2016: | | | |
4% 12/1/35 | | 335,000 | 335,647 |
5% 12/1/40 | | 2,010,000 | 2,036,085 |
5% 12/1/46 | | 11,605,000 | 11,659,022 |
| Series 2018 A, 5% 10/1/41 | | 2,810,000 | 2,935,066 |
| Series 2019, 4% 9/1/35 | | 420,000 | 366,940 |
| Illinois Gen. Oblig.: | | | |
| Series 2006, 5.5% 1/1/28 | | 4,680,000 | 5,087,137 |
| Series 2014, 5% 2/1/26 | | 515,000 | 517,914 |
| Series 2016: | | | |
4% 2/1/30 (Assured Guaranty Muni. Corp. Insured) | | 2,590,000 | 2,639,861 |
5% 2/1/26 | | 4,930,000 | 5,109,240 |
5% 2/1/27 | | 575,000 | 604,634 |
| Series 2017 C, 5% 11/1/29 | | 2,440,000 | 2,595,417 |
| Series 2017 D: | | | |
5% 11/1/25 | | 1,110,000 | 1,145,748 |
5% 11/1/27 | | 2,835,000 | 3,015,526 |
| Series 2018 A: | | | |
5% 10/1/24 | | 470,000 | 477,532 |
5% 10/1/28 | | 935,000 | 1,009,771 |
5% 10/1/29 | | 1,495,000 | 1,612,884 |
| Series 2018 B, 5% 10/1/26 | | 935,000 | 979,474 |
| Series 2019 B, 5% 9/1/24 | | 470,000 | 476,938 |
| Series 2020 B: | | | |
4% 10/1/32 | | 2,570,000 | 2,647,425 |
5% 10/1/28 | | 4,060,000 | 4,384,676 |
| Series 2020, 5.5% 5/1/39 | | 5,925,000 | 6,475,658 |
| Series 2021 A: | | | |
4% 3/1/39 | | 2,135,000 | 2,093,370 |
5% 3/1/28 | | 4,000,000 | 4,278,506 |
5% 3/1/32 | | 180,000 | 199,250 |
5% 3/1/33 | | 935,000 | 1,029,197 |
5% 3/1/34 | | 935,000 | 1,026,327 |
5% 3/1/46 | | 1,870,000 | 1,951,876 |
| Series 2021 B, 4% 12/1/34 | | 1,655,000 | 1,679,776 |
| Series 2022 A: | | | |
5% 3/1/29 | | 2,060,000 | 2,236,945 |
5% 3/1/32 | | 1,000,000 | 1,119,127 |
5% 3/1/34 | | 3,640,000 | 4,035,817 |
5.25% 3/1/37 | | 1,600,000 | 1,764,476 |
| Series 2022 B, 5% 3/1/32 | | 2,060,000 | 2,305,402 |
| Series 2023 B: | | | |
5% 5/1/37 | | 4,730,000 | 5,120,125 |
5.25% 5/1/40 | | 1,160,000 | 1,256,606 |
5.25% 5/1/41 | | 1,520,000 | 1,640,938 |
| Series 2023 D: | | | |
5% 7/1/29 | | 6,485,000 | 7,076,372 |
5% 7/1/36 | | 2,945,000 | 3,215,443 |
| Illinois Toll Hwy. Auth. Toll Hwy. Rev.: | | | |
| Series 2019 A, 5% 1/1/44 | | 460,000 | 485,242 |
| Series A: | | | |
5% 1/1/38 | | 945,000 | 1,031,337 |
5% 1/1/41 | | 205,000 | 221,418 |
| Kane & DeKalb Counties Cmnty. Unit School District #302 Series 2018, 5% 2/1/26 | | 1,880,000 | 1,961,061 |
| Kane County School District No. 131 Series 2020 A: | | | |
| 4% 12/1/30 (Assured Guaranty Muni. Corp. Insured) | | 430,000 | 451,361 |
| 4% 12/1/31 (Assured Guaranty Muni. Corp. Insured) | | 575,000 | 601,597 |
| 4% 12/1/33 (Assured Guaranty Muni. Corp. Insured) | | 240,000 | 249,620 |
| 4% 12/1/35 (Assured Guaranty Muni. Corp. Insured) | | 255,000 | 260,240 |
| 4% 12/1/36 (Assured Guaranty Muni. Corp. Insured) | | 235,000 | 237,121 |
| 4% 12/1/38 (Assured Guaranty Muni. Corp. Insured) | | 545,000 | 541,729 |
| Metropolitan Pier & Exposition: | | | |
| (McCormick Place Expansion Proj.) Series 2010 B1: | | | |
0% 6/15/43 (Assured Guaranty Muni. Corp. Insured) | | 2,995,000 | 1,234,019 |
0% 6/15/46 (Assured Guaranty Muni. Corp. Insured) | | 7,485,000 | 2,639,757 |
0% 6/15/47 (Assured Guaranty Muni. Corp. Insured) | | 2,365,000 | 792,271 |
| Series 2002 A, 0% 6/15/35 (Nat'l. Pub. Fin. Guarantee Corp. Insured) | | 750,000 | 466,890 |
| Series 2002, 0% 12/15/36 (Nat'l. Pub. Fin. Guarantee Corp. Insured) | | 7,050,000 | 4,044,898 |
| Series 2010 B1, 0% 6/15/26 (Assured Guaranty Muni. Corp. Insured) | | 1,055,000 | 947,026 |
| Series 2017 A, 5% 6/15/57 | | 6,200,000 | 6,257,633 |
| Series 2020 A: | | | |
4% 6/15/50 | | 8,380,000 | 7,700,565 |
5% 6/15/50 | | 6,840,000 | 6,938,600 |
| Series 2020 B, 5% 6/15/42 | | 2,520,000 | 2,599,898 |
| Series 2022 A: | | | |
0% 12/15/35 | | 730,000 | 440,735 |
0% 12/15/36 | | 970,000 | 552,177 |
0% 12/15/37 | | 1,175,000 | 628,763 |
0% 6/15/40 | | 985,000 | 460,055 |
0% 6/15/41 | | 1,355,000 | 599,907 |
| Northern Illinois Univ. Revs. Series 2020 B: | | | |
| 4% 4/1/36 (Build America Mutual Assurance Insured) | | 1,215,000 | 1,207,463 |
| 4% 4/1/38 (Build America Mutual Assurance Insured) | | 1,215,000 | 1,180,080 |
| 4% 4/1/40 (Build America Mutual Assurance Insured) | | 815,000 | 774,196 |
| Railsplitter Tobacco Settlement Auth. Rev. Series 2017: | | | |
| 5% 6/1/26 | | 1,000,000 | 1,044,292 |
| 5% 6/1/27 | | 1,245,000 | 1,304,088 |
| Sales Tax Securitization Corp.: | | | |
| Series 2023 A, 3% 1/1/27 | | 1,420,000 | 1,381,826 |
| Series 2023 C: | | | |
5% 1/1/34 (d) | | 10,000,000 | 11,164,472 |
5% 1/1/35 (d) | | 4,000,000 | 4,440,647 |
| Series 2023 D, 5% 1/1/30 (d) | | 2,000,000 | 2,191,371 |
| Univ. of Illinois Rev. Series 2018 A, 5% 4/1/29 | | 95,000 | 102,689 |
TOTAL ILLINOIS | | | 342,243,016 |
| Indiana - 0.7% | | | |
| Indiana Fin. Auth. Health Sys. Rev. Bonds: | | | |
| Series 2019 B, 2.25%, tender 7/1/25 (b) | | 545,000 | 529,413 |
| Series 2023 B1, 5%, tender 7/1/28 (b) | | 3,870,000 | 4,191,825 |
| Indiana Hsg. & Cmnty. Dev. Auth.: | | | |
| (Glasswater Creek of Whitestown Proj.) Series 2020, 5.375% 10/1/40 (c) | | 695,000 | 570,489 |
| Series 2019 B, 3.5% 1/1/49 | | 415,000 | 406,182 |
| Series 2021 C1, 3% 1/1/52 | | 510,000 | 487,842 |
| Series A: | | | |
3.75% 1/1/49 | | 2,070,000 | 2,038,292 |
5% 1/1/28 | | 305,000 | 330,141 |
5% 7/1/28 | | 305,000 | 333,435 |
5% 1/1/29 | | 305,000 | 334,219 |
5% 7/1/29 | | 255,000 | 281,195 |
| Purdue Univ. Rev. Series 2023 A: | | | |
| 5% 7/1/36 | | 900,000 | 1,045,137 |
| 5% 7/1/37 | | 1,000,000 | 1,149,054 |
| 5% 7/1/38 | | 1,110,000 | 1,262,862 |
| 5% 7/1/39 | | 2,000,000 | 2,267,974 |
| 5% 7/1/40 | | 2,250,000 | 2,539,815 |
| Saint Joseph County Econ. Dev. Auth. Rev. (St. Mary's College Proj.): | | | |
| Series 2019, 5% 4/1/43 | | 1,455,000 | 1,507,748 |
| Series 2020, 5% 4/1/32 | | 715,000 | 774,328 |
TOTAL INDIANA | | | 20,049,951 |
| Iowa - 0.5% | | | |
| Iowa Fin. Auth. Rev.: | | | |
| Series 2018 B, 5% 2/15/48 | | 935,000 | 960,077 |
| Series 2019 A1, 5% 5/15/55 | | 3,635,000 | 2,589,567 |
| Series A, 5% 5/15/48 | | 2,505,000 | 1,860,371 |
| Iowa Higher Ed. Ln. Auth. Rev. (Grinnell College Proj.) Series 2017, 5% 12/1/46 | | 5,545,000 | 5,741,401 |
| Tobacco Settlement Auth. Tobacco Settlement Rev.: | | | |
| Series 2021 A2, 4% 6/1/49 | | 1,125,000 | 1,009,407 |
| Series 2021 B1, 4% 6/1/49 | | 1,180,000 | 1,166,820 |
TOTAL IOWA | | | 13,327,643 |
| Kentucky - 2.9% | | | |
| Ashland Med. Ctr. Rev. Series 2019: | | | |
| 3% 2/1/40 (Assured Guaranty Muni. Corp. Insured) | | 1,350,000 | 1,087,646 |
| 4% 2/1/36 | | 710,000 | 689,629 |
| 4% 2/1/37 | | 540,000 | 514,714 |
| 5% 2/1/24 | | 1,105,000 | 1,110,932 |
| 5% 2/1/25 | | 885,000 | 897,392 |
| Boyle County Edl. Facilities Rev. Series 2017, 5% 6/1/37 | | 300,000 | 311,517 |
| Carroll County Poll. Ctlr Rev. Bonds (Kentucky Utils. Co. Proj.) Series 2016 A, 1.55%, tender 9/1/26 (b) | | 6,250,000 | 5,682,233 |
| Kenton County Arpt. Board Arpt. Rev. Series 2019: | | | |
| 5% 1/1/38 | | 685,000 | 732,981 |
| 5% 1/1/39 | | 645,000 | 687,520 |
| 5% 1/1/49 | | 2,340,000 | 2,449,697 |
| Kentucky Econ. Dev. Fin. Auth. Series 2019 A2, 5% 8/1/49 | | 3,180,000 | 3,254,890 |
| Kentucky State Property & Buildings Commission Rev.: | | | |
| (Proj. No. 112) Series 2016 B, 5% 11/1/27 | | 1,025,000 | 1,085,140 |
| (Proj. No. 119) Series 2018: | | | |
5% 5/1/28 | | 935,000 | 1,012,289 |
5% 5/1/38 | | 3,745,000 | 3,955,769 |
| Series 2017: | | | |
5% 4/1/25 | | 3,205,000 | 3,285,286 |
5% 4/1/26 | | 3,245,000 | 3,396,045 |
| Series A: | | | |
4% 11/1/34 | | 1,170,000 | 1,194,777 |
4% 11/1/35 | | 375,000 | 380,636 |
4% 11/1/36 | | 935,000 | 942,877 |
4% 11/1/37 | | 1,170,000 | 1,172,279 |
5% 8/1/27 | | 375,000 | 387,209 |
5% 11/1/29 | | 1,035,000 | 1,132,929 |
| Series B: | | | |
5% 8/1/25 | | 2,775,000 | 2,870,787 |
5% 8/1/26 | | 1,785,000 | 1,877,285 |
5% 5/1/27 | | 1,870,000 | 1,991,214 |
| Kentucky, Inc. Pub. Energy: | | | |
| Bonds: | | | |
Series A, 4%, tender 6/1/26 (b) | | 10,775,000 | 10,750,502 |
Series C1, 4%, tender 6/1/25 (b) | | 1,870,000 | 1,861,212 |
| Series A: | | | |
4% 12/1/24 | | 470,000 | 470,654 |
4% 6/1/25 | | 545,000 | 544,750 |
| Louisville & Jefferson County: | | | |
| Bonds: | | | |
Series 2020 C, 5%, tender 10/1/26 (b) | | 490,000 | 506,663 |
Series 2020 D, 5%, tender 10/1/29 (b) | | 590,000 | 630,662 |
Series 2023 B, 5%, tender 10/1/29 (b)(d) | | 15,240,000 | 16,519,691 |
| Series 2016 A, 5% 10/1/31 | | 90,000 | 93,588 |
| Series 2020 A: | | | |
3% 10/1/43 | | 4,225,000 | 3,236,259 |
4% 10/1/39 | | 1,405,000 | 1,359,932 |
TOTAL KENTUCKY | | | 78,077,586 |
| Louisiana - 0.5% | | | |
| Calcasieu Parish Memorial Hosp. (Lake Charles Memorial Hosp. Proj.) Series 2019: | | | |
| 4% 12/1/23 | | 1,135,000 | 1,133,555 |
| 4% 12/1/24 | | 1,145,000 | 1,135,201 |
| Louisiana Pub. Facilities Auth. Hosp. Rev. (Franciscan Missionaries of Our Lady Health Sys. Proj.) Series 2017 A, 5% 7/1/47 | | 1,890,000 | 1,916,411 |
| Louisiana Pub. Facilities Auth. Rev.: | | | |
| (Ochsner Clinic Foundation Proj.) Series 2017, 5% 5/15/27 | | 830,000 | 872,066 |
| Series 2018 E: | | | |
5% 7/1/32 | | 1,375,000 | 1,486,762 |
5% 7/1/33 | | 1,120,000 | 1,210,535 |
5% 7/1/34 | | 1,295,000 | 1,396,356 |
| St. John Baptist Parish Rev.: | | | |
| (Marathon Oil Corp.) Series 2017, 2.2% 6/1/37 (b) | | 1,400,000 | 1,320,626 |
| Bonds (Marathon Oil Corp.) Series 2017: | | | |
2.1%, tender 7/1/24 (b) | | 635,000 | 623,211 |
4.05%, tender 7/1/26 (b) | | 2,770,000 | 2,751,887 |
TOTAL LOUISIANA | | | 13,846,610 |
| Maine - 0.2% | | | |
| Brunswick Series 2020, 2.25% 11/1/35 | | 685,000 | 573,804 |
| Maine Health & Higher Edl. Facilities Auth. Rev.: | | | |
| Series 2017 B, 5% 7/1/33 | | 260,000 | 275,076 |
| Series 2021 A, 4% 7/1/46 | | 2,865,000 | 2,663,543 |
| Maine Hsg. Auth. Mtg.: | | | |
| Series 2022 E, 5% 11/15/52 | | 1,125,000 | 1,159,388 |
| Series C, 3.5% 11/15/46 | | 1,430,000 | 1,417,334 |
| Maine Tpk. Auth. Tpk. Rev. Series 2018, 5% 7/1/47 | | 470,000 | 493,445 |
TOTAL MAINE | | | 6,582,590 |
| Maryland - 3.3% | | | |
| Baltimore County Gen. Oblig. Series 2021, 5% 3/1/34 | | 6,895,000 | 8,001,078 |
| Hsg. Opportunities Commission of Montgomery County Series 2021 C, 0.8% 7/1/25 | | 375,000 | 353,211 |
| Maryland Cmnty. Dev. Admin Dept. Hsg. & Cmnty. Dev.: | | | |
| Series 2019 B, 4% 9/1/49 | | 310,000 | 307,486 |
| Series 2019 C: | | | |
3.5% 3/1/50 | | 2,280,000 | 2,232,925 |
5% 9/1/27 | | 680,000 | 725,880 |
5% 9/1/28 | | 110,000 | 119,454 |
| Maryland Econ. Dev. Auth. Rev. (Ports America Chesapeake LLC. Proj.) Series 2017 A, 5% 6/1/24 | | 935,000 | 945,002 |
| Maryland Gen. Oblig.: | | | |
| Series 2019 A, 5% 8/1/25 | | 5,400,000 | 5,605,508 |
| Series 2022 A: | | | |
5% 6/1/35 | | 15,000,000 | 17,580,270 |
5% 6/1/36 | | 3,895,000 | 4,519,413 |
5% 6/1/37 | | 10,000,000 | 11,491,192 |
| Maryland Health & Higher Edl.: | | | |
| Bonds Series 2020, 5%, tender 7/1/25 (b) | | 2,965,000 | 3,020,910 |
| Series 2021 A: | | | |
3% 7/1/51 | | 3,325,000 | 2,342,184 |
4% 6/1/55 | | 585,000 | 503,021 |
5% 6/1/31 | | 330,000 | 359,598 |
| Series 2023: | | | |
5% 7/1/25 | | 475,000 | 487,773 |
5% 7/1/28 | | 625,000 | 669,080 |
5% 7/1/39 | | 2,000,000 | 2,129,166 |
| Maryland Health & Higher Edl. Facilities Auth. Rev. Series 2020 B: | | | |
| 5% 4/15/24 | | 660,000 | 666,499 |
| 5% 4/15/25 | | 860,000 | 882,107 |
| Maryland Stadium Auth. Series 2022 A: | | | |
| 5% 6/1/47 | | 5,725,000 | 6,260,885 |
| 5% 6/1/52 | | 1,350,000 | 1,466,543 |
| Maryland Stadium Auth. Built to Learn Rev.: | | | |
| Series 2021, 4% 6/1/46 | | 675,000 | 648,597 |
| Series 2022 A, 4% 6/1/35 | | 2,340,000 | 2,442,899 |
| Maryland Trans. Auth. Trans. Facility Projs. Rev.: | | | |
| Series 2020, 5% 7/1/40 | | 4,615,000 | 5,065,179 |
| Series 2021 A, 2.5% 7/1/47 | | 1,650,000 | 1,137,193 |
| Washington Metropolitan Area Transit Auth. Series 2021 A, 5% 7/15/41 | | 8,150,000 | 8,996,879 |
TOTAL MARYLAND | | | 88,959,932 |
| Massachusetts - 1.9% | | | |
| Massachusetts Commonwealth Trans. Fund Rev. (Rail Enhancement Prog.) Series 2021 B, 5% 6/1/37 | | 4,170,000 | 4,505,321 |
| Massachusetts Dev. Fin. Agcy. Rev.: | | | |
| (Newbridge On The Charles Proj.) Series 2017, 5% 10/1/47 (c) | | 1,250,000 | 1,122,290 |
| Caregroup, Inc. Series 2015 H-1, 5% 7/1/25 | | 1,285,000 | 1,319,794 |
| Series 2016, 5% 10/1/41 | | 1,000,000 | 990,514 |
| Series 2017 A, 5% 1/1/36 | | 2,260,000 | 2,329,558 |
| Series 2017, 5% 7/1/47 | | 885,000 | 886,277 |
| Series 2018, 5% 1/1/43 | | 1,250,000 | 1,260,151 |
| Series 2019 A, 5% 7/1/26 | | 1,640,000 | 1,669,649 |
| Series 2019 K: | | | |
5% 7/1/25 | | 770,000 | 790,849 |
5% 7/1/26 | | 1,015,000 | 1,059,619 |
5% 7/1/27 | | 1,220,000 | 1,295,553 |
| Series 2019: | | | |
5% 7/1/25 | | 615,000 | 624,129 |
5% 7/1/26 | | 345,000 | 355,812 |
5% 7/1/28 | | 515,000 | 542,505 |
5% 7/1/29 | | 470,000 | 500,482 |
5% 9/1/59 | | 3,490,000 | 3,626,870 |
| Series 2020 A, 4% 7/1/45 | | 3,425,000 | 3,004,349 |
| Series 2021 V, 5% 7/1/55 | | 4,980,000 | 5,832,605 |
| Series J2, 5% 7/1/53 | | 3,535,000 | 3,618,204 |
| Series M: | | | |
4% 10/1/50 | | 3,485,000 | 2,856,270 |
5% 10/1/45 | | 2,625,000 | 2,579,258 |
| Massachusetts Gen. Oblig.: | | | |
| Series 2019 C, 5% 5/1/49 | | 1,525,000 | 1,615,618 |
| Series E, 5% 11/1/50 | | 3,175,000 | 3,411,257 |
| Massachusetts Hsg. Fin. Auth. Series 2021 223, 3% 6/1/47 | | 2,095,000 | 2,014,418 |
| Somerville Gen. Oblig. Series 2020, 2% 10/15/37 | | 1,000,000 | 773,870 |
| Stoneham Gen. Oblig. Series 2022, 2.125% 1/15/38 | | 1,000,000 | 772,188 |
| Waltham Gen. Oblig. Series 2020, 2% 10/15/37 | | 2,570,000 | 1,969,127 |
TOTAL MASSACHUSETTS | | | 51,326,537 |
| Michigan - 2.0% | | | |
| Detroit Downtown Dev. Auth. Tax Series A, 5% 7/1/37 (Assured Guaranty Muni. Corp. Insured) | | 140,000 | 140,661 |
| Detroit Gen. Oblig. Series 2021 A, 5% 4/1/50 | | 800,000 | 799,458 |
| Flint Hosp. Bldg. Auth. Rev. Series 2020: | | | |
| 4% 7/1/41 | | 990,000 | 833,724 |
| 5% 7/1/25 | | 435,000 | 436,926 |
| 5% 7/1/26 | | 400,000 | 404,393 |
| 5% 7/1/27 | | 620,000 | 631,889 |
| 5% 7/1/28 | | 865,000 | 888,926 |
| Grand Rapids Pub. Schools Series 2019, 5% 11/1/26 (Assured Guaranty Muni. Corp. Insured) | | 860,000 | 906,917 |
| Grand Traverse County Hosp. Fin. Auth. Series 2021, 3% 7/1/51 | | 1,020,000 | 706,798 |
| Great Lakes Wtr. Auth. Sew Disp. Sys. Series 2022 A: | | | |
| 5% 7/1/37 | | 3,175,000 | 3,534,175 |
| 5% 7/1/38 | | 1,325,000 | 1,454,185 |
| Great Lakes Wtr. Auth. Wtr. Supply Sys. Rev. Series 2022 A: | | | |
| 5% 7/1/37 | | 750,000 | 836,060 |
| 5% 7/1/38 | | 1,000,000 | 1,093,526 |
| Lake Orion Cmnty. School District Series 2019, 5% 5/1/24 | | 470,000 | 475,667 |
| Lansing Board of Wtr. & Lt. Util. Rev. Bonds Series 2021 B, 2%, tender 7/1/26 (b) | | 6,940,000 | 6,532,157 |
| Lansing Cmnty. College Series 2019, 5% 5/1/44 | | 4,745,000 | 5,056,458 |
| Michigan Fin. Auth. Rev.: | | | |
| (Henry Ford Health Sys. Proj.) Series 2016, 5% 11/15/25 | | 3,950,000 | 4,059,249 |
| (Trinity Health Proj.) Series 2017, 5% 12/1/37 | | 935,000 | 981,039 |
| Bonds: | | | |
Series 2019 B, 5%, tender 11/16/26 (b) | | 1,235,000 | 1,280,735 |
Series 2019 MI2, 5%, tender 2/1/25 (b) | | 695,000 | 711,745 |
| Series 2015: | | | |
5% 11/15/28 | | 1,025,000 | 1,043,273 |
5% 11/15/28 (Pre-Refunded to 5/15/25 @ 100) | | 290,000 | 299,313 |
| Series 2016, 5% 11/15/26 | | 795,000 | 829,908 |
| Series 2019 A: | | | |
3% 12/1/49 | | 2,045,000 | 1,502,263 |
4% 12/1/49 | | 745,000 | 698,006 |
5% 11/15/48 | | 270,000 | 279,232 |
| Series 2020 A, 4% 6/1/49 | | 810,000 | 733,531 |
| Series 2020, 5% 6/1/40 | | 470,000 | 491,365 |
| Michigan Hsg. Dev. Auth. Single Family Mtg. Rev.: | | | |
| Series 2016 B, 3.5% 6/1/47 | | 1,430,000 | 1,409,734 |
| Series A, 3.5% 12/1/50 | | 2,620,000 | 2,561,318 |
| Oakland Univ. Rev.: | | | |
| Series 2016, 5% 3/1/41 | | 760,000 | 771,793 |
| Series 2019 A, 5% 3/1/31 | | 545,000 | 598,187 |
| Series 2019: | | | |
5% 3/1/32 | | 610,000 | 667,656 |
5% 3/1/33 | | 585,000 | 636,803 |
5% 3/1/34 | | 655,000 | 711,316 |
5% 3/1/35 | | 655,000 | 708,944 |
5% 3/1/36 | | 750,000 | 806,525 |
5% 3/1/37 | | 840,000 | 894,727 |
5% 3/1/38 | | 1,240,000 | 1,308,078 |
5% 3/1/39 | | 840,000 | 883,051 |
| Royal Oak Hosp. Fin. Auth. Hosp. Rev. Series 2014 D, 5% 9/1/23 (Escrowed to Maturity) | | 490,000 | 490,548 |
| Univ. of Michigan Rev. Series 2020 A, 5% 4/1/50 | | 3,745,000 | 4,045,136 |
TOTAL MICHIGAN | | | 54,135,395 |
| Minnesota - 0.9% | | | |
| City of White Bear Lake (YMCA of Greater Twin Cities Proj.) Series 2018, 5% 6/1/27 | | 470,000 | 489,050 |
| Duluth Econ. Dev. Auth. Health Care Facilities Rev. Series 2018 A, 5% 2/15/43 | | 470,000 | 480,841 |
| Hennepin County Reg'l. Railroad Auth. Series 2019, 5% 12/1/28 | | 1,985,000 | 2,228,999 |
| Minneapolis Health Care Sys. Rev. Bonds Series 2023 A, 5%, tender 11/15/28 (b) | | 9,830,000 | 10,573,321 |
| Minnesota Higher Ed. Facilities Auth. Rev.: | | | |
| Series 2016 A, 5% 5/1/46 | | 1,365,000 | 1,231,069 |
| Series 2018 A, 5% 10/1/45 | | 5,000 | 5,042 |
| Minnesota Hsg. Fin. Agcy. Series 2023 F, 5.75% 7/1/53 | | 625,000 | 671,114 |
| Mounds View Independent School District #621 (Minnesota School District Cr. Enhancement Prog.) Series 2018 A: | | | |
| 3.45% 2/1/37 | | 1,155,000 | 1,117,887 |
| 3.55% 2/1/38 | | 1,205,000 | 1,148,127 |
| Saint Cloud Health Care Rev. Series 2019: | | | |
| 4% 5/1/49 | | 505,000 | 472,047 |
| 5% 5/1/48 | | 630,000 | 651,306 |
| Sauk Rapids Minn Independent School District # 47 Series 2020 A, 2.5% 2/1/38 | | 1,855,000 | 1,533,581 |
| Shakopee Sr. Hsg. Rev. Bonds Series 2018, 5.85%, tender 11/1/25 (b)(c) | | 1,340,000 | 1,318,620 |
| St. Paul Hsg. & Redev. Auth. Health Care Facilities Rev. Series 2015 A, 5% 7/1/29 | | 2,095,000 | 2,145,752 |
| West Saint Paul Independent School District #197 (Minnesota School District Cr. Enhancement Prog.) Series 2018 A: | | | |
| 3.6% 2/1/37 | | 845,000 | 826,789 |
| 3.65% 2/1/38 | | 885,000 | 842,489 |
TOTAL MINNESOTA | | | 25,736,034 |
| Mississippi - 0.1% | | | |
| Mississippi Hosp. Equip. & Facilities Auth.: | | | |
| Bonds Series II, 5%, tender 3/1/27 (b) | | 565,000 | 588,781 |
| Series I: | | | |
5% 10/1/23 | | 515,000 | 515,985 |
5% 10/1/24 | | 500,000 | 507,142 |
5% 10/1/26 | | 610,000 | 636,102 |
5% 10/1/28 | | 935,000 | 1,003,413 |
TOTAL MISSISSIPPI | | | 3,251,423 |
| Missouri - 0.9% | | | |
| Kansas City Wtr. Rev. Series 2020 A: | | | |
| 4% 12/1/32 | | 630,000 | 669,048 |
| 4% 12/1/34 | | 375,000 | 396,762 |
| 4% 12/1/36 | | 655,000 | 677,546 |
| 4% 12/1/37 | | 470,000 | 480,294 |
| 4% 12/1/40 | | 470,000 | 473,125 |
| 5% 12/1/28 | | 545,000 | 605,954 |
| 5% 12/1/29 | | 330,000 | 374,854 |
| 5% 12/1/30 | | 620,000 | 718,521 |
| 5% 12/1/35 | | 560,000 | 641,689 |
| Missouri Health & Edl. Facilities Rev.: | | | |
| Series 2017 A, 5% 10/1/42 | | 2,200,000 | 2,303,266 |
| Series 2019 A: | | | |
4% 10/1/48 | | 4,480,000 | 4,430,031 |
5% 10/1/46 | | 430,000 | 457,413 |
| Missouri Hsg. Dev. Commission Single Family Mtg. Rev.: | | | |
| Series 2019, 4% 5/1/50 | | 115,000 | 113,953 |
| Series 2021 A, 3% 5/1/52 | | 2,315,000 | 2,224,648 |
| Saint Louis Arpt. Rev.: | | | |
| Series 2019 C: | | | |
5% 7/1/26 | | 1,350,000 | 1,416,232 |
5% 7/1/27 | | 2,275,000 | 2,434,011 |
| Series A, 5.25% 7/1/26 (Assured Guaranty Muni. Corp. Insured) | | 2,610,000 | 2,765,012 |
| Saint Louis County Indl. Dev. Auth. Sr. Living Facilities Rev. Series 2018 A: | | | |
| 5.125% 9/1/48 | | 55,000 | 46,843 |
| 5.25% 9/1/53 | | 3,910,000 | 3,331,158 |
TOTAL MISSOURI | | | 24,560,360 |
| Montana - 0.2% | | | |
| Montana Board Hsg. Single Family Series 2019 B, 4% 6/1/50 | | 55,000 | 54,552 |
| Montana Facility Fin. Auth.: | | | |
| Series 2018 B, 5% 7/1/28 | | 645,000 | 670,938 |
| Series 2021 A, 3% 6/1/50 | | 4,950,000 | 3,502,931 |
TOTAL MONTANA | | | 4,228,421 |
| Nebraska - 0.6% | | | |
| Central Plains Energy Proj. Gas Supply Bonds Series 2019, 4%, tender 8/1/25 (b) | | 12,540,000 | 12,528,812 |
| Douglas County Neb Edl. Facilities Rev. (Creighton Univ. Projs.) Series 2021 A, 3% 7/1/51 | | 940,000 | 667,039 |
| Nebraska Invt. Fin. Auth. Single Family Hsg. Rev. Series 2020 A, 3.5% 9/1/50 | | 3,230,000 | 3,157,934 |
TOTAL NEBRASKA | | | 16,353,785 |
| Nevada - 1.0% | | | |
| Clark County Arpt. Rev.: | | | |
| Series 2014 A2, 5% 7/1/30 | | 395,000 | 401,312 |
| Series 2019 A, 5% 7/1/26 | | 1,175,000 | 1,239,348 |
| Clark County School District: | | | |
| Series 2015 C, 5% 6/15/26 | | 2,810,000 | 2,921,125 |
| Series 2016 B, 5% 6/15/26 | | 1,570,000 | 1,647,786 |
| Series 2017 A: | | | |
5% 6/15/24 | | 235,000 | 238,047 |
5% 6/15/25 | | 5,565,000 | 5,731,030 |
5% 6/15/26 | | 200,000 | 209,909 |
| Series A, 5% 6/15/27 | | 1,220,000 | 1,306,401 |
| Las Vegas Valley Wtr. District Wtr. Impt. Gen. Oblig. Series 2022 A, 4% 6/1/40 | | 1,245,000 | 1,253,362 |
| Nevada Hsg. Division Single Family Mtg. Rev.: | | | |
| Series 2019 A, 4% 4/1/49 | | 1,515,000 | 1,502,787 |
| Series 2019 B, 4% 10/1/49 | | 160,000 | 158,531 |
| Series 2021 A, 3% 4/1/51 | | 1,620,000 | 1,555,963 |
| Series 2021 B, 3% 10/1/51 | | 6,590,000 | 6,306,389 |
| Nevada Hwy. Impt. Rev. Series 2020 A, 2% 12/1/32 | | 3,020,000 | 2,593,218 |
TOTAL NEVADA | | | 27,065,208 |
| New Hampshire - 0.8% | | | |
| Nat'l. Fin. Auth. Hosp. Rev. (St. Luke's Univ. Health Network Proj.) Series 2021 B, 3% 8/15/51 (Assured Guaranty Muni. Corp. Insured) | | 1,755,000 | 1,248,368 |
| Nat'l. Finnance Auth.: | | | |
| Series 2020 1, 4.125% 1/20/34 | | 1,611,229 | 1,577,843 |
| Series 2022 1, 4.375% 9/20/36 | | 2,268,729 | 2,241,204 |
| Series 2023 2A, 3.875% 1/20/38 | | 6,290,000 | 5,859,287 |
| New Hampshire Health & Ed. Facilities Auth.: | | | |
| (Dartmouth-Hitchcock Oblgtd Grp Proj.) Series 2018 A, 5% 8/1/34 | | 295,000 | 311,782 |
| Series 2017, 5% 7/1/44 | | 2,185,000 | 2,102,691 |
| New Hampshire Health & Ed. Facilities Auth. Rev. Series 2016, 5% 10/1/23 | | 160,000 | 160,258 |
| New Hampshire Nat'l. Fin. Auth. Series 2022 2, 4% 10/20/36 | | 7,661,577 | 7,317,617 |
TOTAL NEW HAMPSHIRE | | | 20,819,050 |
| New Jersey - 4.8% | | | |
| Camden County Impt. Auth. Health Care Redev. Rev. Series 2014 A, 5% 2/15/26 | | 935,000 | 938,403 |
| New Jersey Econ. Dev. Auth.: | | | |
| (White Horse HMT Urban Renewal LLC Proj.) Series 2020, 5% 1/1/40 (c) | | 310,000 | 222,452 |
| Series 2024 SSS: | | | |
5% 6/15/33 (d) | | 750,000 | 823,532 |
5.25% 6/15/36 (d) | | 1,055,000 | 1,162,858 |
| Series A, 5% 11/1/31 | | 2,560,000 | 2,810,694 |
| Series QQQ, 4% 6/15/46 | | 740,000 | 720,524 |
| New Jersey Econ. Dev. Auth. Lease Rev. (State House Proj.) Series 2017 B: | | | |
| 5% 6/15/26 | | 935,000 | 976,880 |
| 5% 6/15/35 | | 545,000 | 585,138 |
| New Jersey Econ. Dev. Auth. Rev.: | | | |
| (Black Horse EHT Urban Renewal LLC Proj.) Series 2019 A, 5% 10/1/39 (c) | | 220,000 | 159,108 |
| (Provident Montclair Proj.) Series 2017, 5% 6/1/25 (Assured Guaranty Muni. Corp. Insured) | | 970,000 | 995,646 |
| Series 2014 PP, 5% 6/15/26 | | 935,000 | 949,007 |
| Series 2014 RR, 5% 6/15/32 (Pre-Refunded to 6/15/24 @ 100) | | 195,000 | 198,005 |
| Series 2014 UU, 5% 6/15/30 (Pre-Refunded to 6/15/24 @ 100) | | 245,000 | 248,038 |
| Series 2016 A, 5% 7/15/27 | | 935,000 | 980,044 |
| Series 2018 EEE: | | | |
5% 6/15/28 | | 550,000 | 592,973 |
5% 6/15/34 (Pre-Refunded to 12/15/28 @ 100) | | 1,405,000 | 1,569,161 |
| Series LLL: | | | |
4% 6/15/44 | | 2,745,000 | 2,684,100 |
4% 6/15/49 | | 2,515,000 | 2,417,988 |
| Series MMM: | | | |
4% 6/15/35 | | 1,085,000 | 1,108,019 |
4% 6/15/36 | | 420,000 | 425,597 |
| New Jersey Edl. Facility Series A: | | | |
| 5% 7/1/38 | | 1,980,000 | 2,059,035 |
| 5% 7/1/39 | | 2,080,000 | 2,156,573 |
| New Jersey Gen. Oblig. Series 2020 A: | | | |
| 5% 6/1/28 | | 935,000 | 1,021,774 |
| 5% 6/1/29 | | 1,120,000 | 1,247,784 |
| New Jersey Health Care Facilities Fing. Auth. Rev.: | | | |
| Bonds: | | | |
Series 2019 B2, 5%, tender 7/1/25 (b) | | 1,560,000 | 1,602,823 |
Series 2019 B3, 5%, tender 7/1/26 (b) | | 1,585,000 | 1,647,084 |
| Series 2016 A: | | | |
5% 7/1/28 (Pre-Refunded to 7/1/26 @ 100) | | 1,260,000 | 1,327,922 |
5% 7/1/29 (Pre-Refunded to 7/1/26 @ 100) | | 2,050,000 | 2,160,509 |
5% 7/1/30 (Pre-Refunded to 7/1/26 @ 100) | | 2,000,000 | 2,107,813 |
| Series 2016: | | | |
4% 7/1/48 | | 3,355,000 | 2,863,869 |
5% 7/1/28 | | 1,095,000 | 1,120,937 |
5% 7/1/41 | | 85,000 | 85,014 |
| Series 2021, 3% 7/1/39 | | 1,910,000 | 1,581,079 |
| New Jersey Higher Ed. Student Assistance Auth. Student Ln. Rev. Series 2019 A: | | | |
| 5% 12/1/23 | | 185,000 | 185,925 |
| 5% 12/1/24 | | 110,000 | 112,110 |
| 5% 12/1/25 | | 200,000 | 207,024 |
| New Jersey Tobacco Settlement Fing. Corp.: | | | |
| Series 2018 A, 5% 6/1/28 | | 935,000 | 1,006,683 |
| Series 2018 B, 5% 6/1/46 | | 2,830,000 | 2,829,728 |
| New Jersey Tpk. Auth. Tpk. Rev.: | | | |
| Series 2015 E, 5% 1/1/34 | | 630,000 | 644,810 |
| Series 2022 B, 5% 1/1/46 | | 11,000,000 | 12,118,908 |
| Series D, 5% 1/1/28 | | 1,000,000 | 1,052,118 |
| New Jersey Trans. Trust Fund Auth.: | | | |
| (Trans. Prog.) Series 2019 AA, 5.25% 6/15/43 | | 1,820,000 | 1,925,022 |
| Series 2006 C: | | | |
0% 12/15/25 | | 5,025,000 | 4,606,838 |
0% 12/15/31 (FGIC Insured) | | 5,400,000 | 3,980,907 |
0% 12/15/33 (Assured Guaranty Muni. Corp. Insured) | | 3,190,000 | 2,176,518 |
| Series 2010 A: | | | |
0% 12/15/27 | | 1,130,000 | 968,301 |
0% 12/15/30 | | 1,000,000 | 765,791 |
| Series 2018 A: | | | |
5% 12/15/32 | | 630,000 | 684,548 |
5% 12/15/34 | | 1,915,000 | 2,064,829 |
| Series 2019 BB, 4% 6/15/50 | | 1,360,000 | 1,286,153 |
| Series 2021 A: | | | |
4% 6/15/34 | | 550,000 | 568,664 |
4% 6/15/38 | | 750,000 | 748,702 |
5% 6/15/32 | | 1,095,000 | 1,231,543 |
5% 6/15/33 | | 4,230,000 | 4,742,134 |
| Series 2022 A, 4% 6/15/40 | | 3,125,000 | 3,078,047 |
| Series 2022 AA: | | | |
5% 6/15/30 | | 1,845,000 | 2,059,192 |
5% 6/15/31 | | 4,485,000 | 5,065,615 |
5% 6/15/33 | | 1,250,000 | 1,417,975 |
| Series 2022 BB: | | | |
4% 6/15/46 | | 5,350,000 | 5,170,913 |
4% 6/15/50 | | 3,600,000 | 3,404,521 |
| Series A: | | | |
0% 12/15/31 | | 1,615,000 | 1,187,655 |
4% 12/15/39 | | 935,000 | 924,278 |
4.25% 12/15/38 | | 2,355,000 | 2,377,970 |
| Series AA: | | | |
4% 6/15/39 | | 975,000 | 966,308 |
4% 6/15/45 | | 5,915,000 | 5,744,930 |
4% 6/15/50 | | 6,105,000 | 5,773,501 |
5% 6/15/36 | | 1,075,000 | 1,170,008 |
5% 6/15/50 | | 470,000 | 494,992 |
| Series BB, 4% 6/15/44 | | 1,215,000 | 1,184,731 |
| Newark Port Auth. Hsg. Auth. Rev. Series 2007, 5.25% 1/1/26 (Nat'l. Pub. Fin. Guarantee Corp. Insured) | | 935,000 | 961,094 |
| Ocean City Gen. Oblig. Series 2020 B, 2% 10/15/30 | | 635,000 | 566,403 |
| South Jersey Trans. Auth. Trans. Sys. Rev. Series 2022 A: | | | |
| 5% 11/1/38 | | 1,000,000 | 1,065,833 |
| 5% 11/1/40 | | 1,350,000 | 1,428,345 |
TOTAL NEW JERSEY | | | 129,499,950 |
| New Mexico - 0.5% | | | |
| Albuquerque Wtr. Util. Auth. Series 2018, 5% 7/1/28 | | 935,000 | 987,276 |
| New Mexico Hosp. Equip. Ln. Council Rev. Bonds Series 2019 B, 5%, tender 8/1/25 (b) | | 1,365,000 | 1,401,722 |
| New Mexico Mtg. Fin. Auth.: | | | |
| Series 2018 A1, 4% 1/1/49 | | 1,140,000 | 1,130,808 |
| Series 2019 C, 4% 1/1/50 | | 595,000 | 589,583 |
| Series 2019 D, 3.75% 1/1/50 | | 225,000 | 221,551 |
| Series 2023 C, I 5.75% 3/1/54 (d) | | 1,915,000 | 2,065,003 |
| New Mexico Muni. Energy Acquisition Auth. Gas Supply Rev.: | | | |
| Bonds Series 2019 A, 5%, tender 5/1/25 (b) | | 4,680,000 | 4,787,619 |
| Series 2019 A: | | | |
4% 11/1/23 | | 185,000 | 185,191 |
4% 5/1/24 | | 630,000 | 631,881 |
| Santa Fe Retirement Fac. Series 2019 A: | | | |
| 5% 5/15/34 | | 65,000 | 61,466 |
| 5% 5/15/39 | | 45,000 | 39,940 |
| 5% 5/15/44 | | 45,000 | 38,314 |
| 5% 5/15/49 | | 100,000 | 81,776 |
TOTAL NEW MEXICO | | | 12,222,130 |
| New York - 13.1% | | | |
| Dorm. Auth. New York Univ. Rev. Series 2017 A, 5% 7/1/46 (Pre-Refunded to 7/1/27 @ 100) | | 1,185,000 | 1,282,830 |
| Hudson Yards Infrastructure Corp. New York Rev. Series 2017 A, 5% 2/15/42 | | 3,465,000 | 3,623,609 |
| Long Island Pwr. Auth. Elec. Sys. Rev.: | | | |
| Bonds Series 2019 B, 1.65%, tender 9/1/24 (b) | | 2,435,000 | 2,376,779 |
| Series 2018, 5% 9/1/36 | | 235,000 | 256,287 |
| MTA Hudson Rail Yards Trust Oblig. Series 2016 A, 5% 11/15/56 | | 280,000 | 280,040 |
| Nassau County Gen. Oblig. Series 2023 B: | | | |
| 5% 4/1/38 | | 2,000,000 | 2,290,832 |
| 5% 4/1/39 | | 1,800,000 | 2,048,724 |
| New York City Edl. Construction Fund Series 2021 B, 5% 4/1/46 | | 2,055,000 | 2,200,653 |
| New York City Gen. Oblig.: | | | |
| Bonds Series 2015 F4, 5%, tender 6/1/44 (e) | | 990,000 | 1,018,482 |
| Series 2021 A1, 5% 8/1/31 | | 3,990,000 | 4,557,923 |
| Series 2021 F1, 5% 3/1/50 | | 3,080,000 | 3,316,283 |
| Series 2022 A1: | | | |
5% 9/1/39 | | 9,105,000 | 10,237,345 |
5% 8/1/47 | | 3,645,000 | 3,950,859 |
| Series 2023 1, 5% 8/1/28 | | 1,000,000 | 1,100,938 |
| Series 2023 E1: | | | |
5% 4/1/38 | | 2,000,000 | 2,278,363 |
5% 4/1/39 | | 2,800,000 | 3,167,113 |
5% 4/1/40 | | 9,000,000 | 10,118,703 |
5% 4/1/41 | | 1,000,000 | 1,119,259 |
| Series 2023 F1, 5% 8/1/25 | | 2,950,000 | 3,061,106 |
| Series B: | | | |
5% 10/1/42 | | 1,870,000 | 2,011,437 |
5% 10/1/43 | | 2,540,000 | 2,728,691 |
| New York City Hsg. Dev. Corp. Multifamily Hsg.: | | | |
| Bonds: | | | |
Series 2021 C2, 0.7%, tender 7/1/25 (b) | | 1,185,000 | 1,107,767 |
Series 2021 K2, 0.9%, tender 1/1/26 (b) | | 6,590,000 | 6,045,402 |
Series 2021, 0.6%, tender 7/1/25 (b) | | 1,545,000 | 1,432,121 |
Series 2022 F 2B, 3.4%, tender 12/22/26 (b) | | 8,400,000 | 8,291,966 |
Series 2023 A2: | | | |
3.7%, tender 12/30/27 (b) | | 3,955,000 | 3,951,366 |
3.73%, tender 12/29/28 (b) | | 4,410,000 | 4,412,670 |
| Series 2019 J, 3.05% 11/1/49 | | 1,150,000 | 868,795 |
| Series 2021 C1, 2.5% 11/1/51 | | 4,155,000 | 2,600,460 |
| Series 2021 F1: | | | |
2.25% 11/1/41 | | 6,515,000 | 4,591,489 |
2.4% 11/1/46 | | 1,445,000 | 950,071 |
| New York City Muni. Wtr. Fin. Auth. Wtr. & Swr. Sys. Rev. Series 2022 CC1, 5% 6/15/52 | | 15,440,000 | 16,656,550 |
| New York City Transitional Fin. Auth. Bldg. Aid Rev.: | | | |
| (New York State Gen. Oblig. Proj.) Series 2015 S-1, 5% 7/15/35 | | 6,550,000 | 6,702,610 |
| Series 2018 S2, 5% 7/15/35 | | 1,005,000 | 1,081,194 |
| New York City Transitional Fin. Auth. Rev.: | | | |
| Series 2018 A2, 5% 8/1/39 | | 1,685,000 | 1,784,549 |
| Series 2018 B, 5% 8/1/45 | | 6,690,000 | 7,020,038 |
| Series 2022 B1, 5.25% 11/1/37 | | 5,880,000 | 6,868,811 |
| Series 2023 E, 5% 11/1/25 | | 7,135,000 | 7,420,294 |
| New York City Trust Cultural Resources Rev. Series 2021, 5% 7/1/31 | | 3,370,000 | 3,931,863 |
| New York Dorm. Auth. Rev.: | | | |
| Bonds: | | | |
Series 2019 B2, 5%, tender 5/1/24 (b) | | 825,000 | 827,406 |
Series 2019 B3, 5%, tender 5/1/26 (b) | | 595,000 | 612,523 |
| Series 2022 A: | | | |
5% 7/1/36 | | 750,000 | 827,750 |
5% 7/15/37 | | 380,000 | 393,135 |
5% 7/1/40 | | 935,000 | 986,252 |
5% 7/1/41 | | 935,000 | 982,862 |
5% 7/15/42 | | 1,075,000 | 1,087,423 |
5% 7/15/50 | | 2,775,000 | 2,761,025 |
| Series 2022: | | | |
5% 7/1/30 | | 1,540,000 | 1,629,458 |
5% 7/1/31 | | 1,615,000 | 1,717,900 |
5% 7/1/38 | | 780,000 | 798,263 |
5% 7/1/39 | | 1,225,000 | 1,248,199 |
5% 7/1/40 | | 2,760,000 | 2,800,702 |
5% 7/1/41 | | 2,900,000 | 2,932,730 |
5% 7/1/42 | | 1,520,000 | 1,530,909 |
5% 7/1/57 | | 6,385,000 | 6,191,685 |
| New York Metropolitan Trans. Auth. Dedicated Tax Fund Rev. Series 2012 A, 0% 11/15/32 | | 5,160,000 | 3,701,618 |
| New York Metropolitan Trans. Auth. Rev.: | | | |
| Series 2015 A1, 5% 11/15/29 | | 400,000 | 408,412 |
| Series 2015 D1, 5% 11/15/28 | | 2,310,000 | 2,376,947 |
| Series 2017 C1, 5% 11/15/34 | | 2,230,000 | 2,365,426 |
| Series 2017 D: | | | |
5% 11/15/30 | | 8,760,000 | 9,321,073 |
5% 11/15/35 | | 1,870,000 | 1,973,436 |
| Series 2020 D, 4% 11/15/46 | | 12,660,000 | 11,905,187 |
| New York State Dorm. Auth.: | | | |
| Series 2017 A, 5% 2/15/31 | | 935,000 | 998,165 |
| Series 2019 D, 3% 2/15/49 | | 3,920,000 | 3,048,890 |
| Series 2021 A, 4% 3/15/38 | | 4,000,000 | 4,048,334 |
| Series 2021 E: | | | |
3% 3/15/50 | | 2,340,000 | 1,805,236 |
4% 3/15/39 | | 4,000,000 | 4,021,179 |
4% 3/15/45 | | 5,435,000 | 5,340,514 |
4% 3/15/47 | | 3,830,000 | 3,741,296 |
| Series 2022 A, 5% 3/15/41 | | 12,850,000 | 14,210,589 |
| New York State Hsg. Fin. Agcy. Rev. Bonds: | | | |
| Series 2021 J2: | | | |
1%, tender 11/1/26 (b) | | 960,000 | 871,849 |
1.1%, tender 5/1/27 (b) | | 3,545,000 | 3,143,592 |
| Series 2023 C2, 3.8%, tender 5/1/29 (b) | | 12,625,000 | 12,633,239 |
| New York State Mtg. Agcy. Homeowner Mtg. Series 2020 225, 2.45% 10/1/45 | | 10,000,000 | 6,866,072 |
| New York State Urban Dev. Corp.: | | | |
| Series 2020 A: | | | |
4% 3/15/45 | | 1,170,000 | 1,143,105 |
4% 3/15/49 | | 7,380,000 | 7,141,693 |
5% 3/15/37 | | 11,380,000 | 12,673,047 |
| Series 2020 C: | | | |
4% 3/15/39 | | 3,315,000 | 3,321,710 |
5% 3/15/43 | | 4,680,000 | 5,081,155 |
5% 3/15/47 | | 9,360,000 | 10,081,954 |
| Series 2020 E: | | | |
3% 3/15/50 | | 1,525,000 | 1,167,654 |
4% 3/15/44 | | 8,705,000 | 8,525,170 |
4% 3/15/45 | | 7,020,000 | 6,858,631 |
| New York State Urban Eev Corp. Series 2019 A, 5% 3/15/37 | | 3,540,000 | 3,872,528 |
| New York Trans. Dev. Corp. (Term. 4 JFK Int'l. Arpt. Proj.) Series 2020 C, 5% 12/1/33 | | 325,000 | 356,723 |
| Niagara Area Dev. Corp. Rev. (Catholic Health Sys., Inc. Proj.) Series 2022, 4.5% 7/1/52 | | 1,775,000 | 1,291,161 |
| Oneida County Local Dev. Corp. Rev. (Mohawk Valley Health Sys. Proj.) Series 2019 A, 5% 12/1/26 (Assured Guaranty Muni. Corp. Insured) | | 1,520,000 | 1,529,648 |
| Suffolk County Econ. Dev. Corp. Rev. Series 2021: | | | |
| 4.625% 11/1/31 (c) | | 250,000 | 221,881 |
| 5.375% 11/1/54 (c) | | 935,000 | 705,444 |
| Triborough Bridge & Tunnel Auth.: | | | |
| Series 2021 B, 4% 5/15/56 | | 1,645,000 | 1,572,411 |
| Series 2022 A, 5% 5/15/57 | | 8,425,000 | 9,088,560 |
| Triborough Bridge & Tunnel Auth. Revs.: | | | |
| Series 2018 A, 5% 11/15/44 | | 3,745,000 | 3,968,387 |
| Series 2021 A, 5% 11/15/51 | | 3,135,000 | 3,344,535 |
| Series 2022 A: | | | |
5% 11/15/40 | | 2,280,000 | 2,546,317 |
5% 11/15/41 | | 1,750,000 | 1,944,468 |
TOTAL NEW YORK | | | 355,289,730 |
| New York And New Jersey - 0.2% | | | |
| Port Auth. of New York & New Jersey: | | | |
| (H. Lee Moffitt Cancer Ctr. Proj.) Series 2016, 5% 11/15/41 | | 4,680,000 | 4,837,030 |
| Series 194, 5.25% 10/15/55 | | 935,000 | 960,385 |
TOTAL NEW YORK AND NEW JERSEY | | | 5,797,415 |
| North Carolina - 1.3% | | | |
| Charlotte Ctfs. of Prtn. (Convention Facility Projs.) Series 2019 A, 4% 6/1/39 | | 820,000 | 830,763 |
| Charlotte-Mecklenburg Hosp. Auth. Health Care Sys. Rev. Bonds Series 2018 C, 3.45%, tender 10/31/25 (b) | | 5,130,000 | 5,107,750 |
| New Hanover County Hosp. Rev. Series 2017: | | | |
| 5% 10/1/27 (Escrowed to Maturity) | | 50,000 | 54,305 |
| 5% 10/1/42 (Pre-Refunded to 10/1/27 @ 100) | | 435,000 | 472,456 |
| North Carolina Hsg. Fin. Agcy. Home Ownership Rev. Series 2020 45, 3% 7/1/51 | | 14,300,000 | 13,761,646 |
| North Carolina Med. Care Commission Health Care Facilities Rev.: | | | |
| Bonds Series 2019 C, 2.55%, tender 6/1/26 (b) | | 1,260,000 | 1,226,810 |
| Series 2020 A, 3% 7/1/45 | | 1,335,000 | 1,051,630 |
| North Carolina Tpk. Auth. Triangle Expressway Sys. Series 2019, 5% 1/1/49 | | 13,100,000 | 13,566,524 |
TOTAL NORTH CAROLINA | | | 36,071,884 |
| North Dakota - 0.3% | | | |
| North Dakota Hsg. Fin. Agcy.: | | | |
| Series 2021 A, 3% 1/1/52 | | 790,000 | 759,566 |
| Series 2021 B, 3% 7/1/52 | | 2,080,000 | 1,988,024 |
| Series 2022, 5% 1/1/53 | | 2,745,000 | 2,828,833 |
| Univ. of North Dakota Series 2021 A, 3% 6/1/61 (Assured Guaranty Muni. Corp. Insured) | | 2,865,000 | 1,952,266 |
TOTAL NORTH DAKOTA | | | 7,528,689 |
| Ohio - 2.5% | | | |
| Akron Bath Copley Hosp. District Rev.: | | | |
| Series 2016, 5.25% 11/15/46 | | 3,495,000 | 3,525,160 |
| Series 2020, 5% 11/15/31 | | 360,000 | 384,065 |
| American Muni. Pwr., Inc. Rev. (Greenup Hydroelectric Proj.): | | | |
| Series 2016 A, 5% 2/15/41 | | 935,000 | 950,269 |
| Series 2016, 5% 2/15/46 | | 1,625,000 | 1,644,527 |
| Buckeye Tobacco Settlement Fing. Auth.: | | | |
| Series 2020 A2: | | | |
3% 6/1/48 | | 2,030,000 | 1,555,048 |
4% 6/1/48 | | 660,000 | 607,399 |
| Series 2020 B2, 5% 6/1/55 | | 5,430,000 | 5,046,761 |
| Chillicothe Hosp. Facilities Rev. (Adena Health Sys. Oblig. Group Proj.) Series 2017, 5% 12/1/47 | | 935,000 | 946,378 |
| Cleveland Arpt. Sys. Rev. Series 2016 A, 5% 1/1/25 (Assured Guaranty Muni. Corp. Insured) | | 685,000 | 700,008 |
| Cleveland-Cuyahoga County Port Auth. Rev. (Euclid Avenue Dev. Corp. Proj.) Series 2022 A: | | | |
| 5% 8/1/39 | | 1,250,000 | 1,311,242 |
| 5.25% 8/1/40 | | 1,320,000 | 1,405,229 |
| 5.25% 8/1/41 | | 1,390,000 | 1,485,311 |
| 5.25% 8/1/42 | | 1,465,000 | 1,555,684 |
| Columbus Gen. Oblig. Series 2016 2, 5% 7/1/25 | | 1,780,000 | 1,842,903 |
| Fairfield County Hosp. Facilities Rev. (Fairfield Med. Ctr. Proj.) Series 2013, 4.25% 6/15/24 | | 360,000 | 357,172 |
| Hamilton County Healthcare Rev. (Life Enriching Cmntys. Proj.) Series 2016, 5% 1/1/51 | | 935,000 | 821,293 |
| Hamilton County Hosp. Facilities Rev. (Trihealth, Inc. Obligated Group Proj.) Series 2017 A, 5% 8/15/33 | | 770,000 | 812,322 |
| Lancaster Port Auth. Gas Rev. Bonds Series 2019, 5%, tender 2/1/25 (b) | | 4,130,000 | 4,192,028 |
| Miami County Hosp. Facilities Rev. (Kettering Health Network Obligated Group Proj.) Series 2019: | | | |
| 5% 8/1/23 | | 405,000 | 405,000 |
| 5% 8/1/45 | | 3,320,000 | 3,403,698 |
| Middleburg Heights Hosp. Rev. Series 2021 A, 4% 8/1/41 | | 1,590,000 | 1,467,873 |
| Ohio Higher Edl. Facility Commission Rev.: | | | |
| (Kenyon College 2020 Proj.) Series 2020: | | | |
4% 7/1/40 | | 685,000 | 663,331 |
5% 7/1/35 | | 2,455,000 | 2,698,564 |
5% 7/1/42 | | 4,235,000 | 4,491,331 |
| (Kenyon College, Oh. Proj.) Series 2017, 5% 7/1/42 | | 1,590,000 | 1,652,334 |
| Ohio Hosp. Rev.: | | | |
| Bonds Series 2019 C, 2.75%, tender 5/1/28 (b) | | 1,255,000 | 1,225,277 |
| Series 2020 A, 4% 1/15/50 | | 265,000 | 245,235 |
| Ohio Hsg. Fin. Agcy. Residential Mtg. Rev. (Mtg. Backed Securities Prog.) Series 2019 B, 4.5% 3/1/50 | | 80,000 | 80,205 |
| Ohio Major New State Infrastructure Rev. Series 2021 1A: | | | |
| 5% 12/15/31 | | 1,310,000 | 1,533,650 |
| 5% 12/15/32 | | 1,625,000 | 1,922,211 |
| Ohio Spl. Oblig.: | | | |
| (Trans. Bldg. Fund Projs.) Series 2023 A, 5% 4/1/36 | | 1,000,000 | 1,150,121 |
| Series 2020 A, 5% 2/1/26 | | 1,070,000 | 1,118,756 |
| Ohio Tpk. Commission Tpk. Rev. (Infrastructure Projs.) Series 2022 A, 5% 2/15/39 | | 590,000 | 670,627 |
| Ross County Hosp. Facilities Rev. (Adena Health Sys. Obligated Group Proj.) Series 2019: | | | |
| 5% 12/1/23 | | 470,000 | 471,883 |
| 5% 12/1/24 | | 490,000 | 498,118 |
| 5% 12/1/25 | | 430,000 | 443,639 |
| 5% 12/1/26 | | 560,000 | 587,696 |
| Scioto County Hosp. Facilities Rev.: | | | |
| Series 2016: | | | |
5% 2/15/26 | | 1,815,000 | 1,867,930 |
5% 2/15/27 | | 1,510,000 | 1,557,541 |
| Series 2019, 5% 2/15/29 | | 505,000 | 525,441 |
| Univ. of Akron Gen. Receipts Series 2019 A, 5% 1/1/26 | | 1,685,000 | 1,751,545 |
| Univ. of Cincinnati Gen. Receipts Series 2016 C, 5% 6/1/41 | | 4,680,000 | 4,815,796 |
| Washington County Hosp. Rev. Series 2022: | | | |
| 6% 12/1/28 | | 830,000 | 840,074 |
| 6% 12/1/29 | | 880,000 | 895,523 |
| 6% 12/1/30 | | 930,000 | 948,436 |
| 6% 12/1/31 | | 995,000 | 1,015,438 |
TOTAL OHIO | | | 68,090,072 |
| Oklahoma - 0.0% | | | |
| Oklahoma Dev. Fin. Auth. Rev. (Oklahoma City Univ. Proj.) Series 2019: | | | |
| 5% 8/1/26 | | 335,000 | 340,042 |
| 5% 8/1/44 | | 620,000 | 607,386 |
TOTAL OKLAHOMA | | | 947,428 |
| Oregon - 0.6% | | | |
| Medford Hosp. Facilities Auth. Rev. (Asante Projs.) Series 2020 A: | | | |
| 5% 8/15/36 | | 1,215,000 | 1,310,088 |
| 5% 8/15/38 | | 3,465,000 | 3,687,593 |
| Oregon Gen. Oblig.: | | | |
| (Article XI-M, XI-N and XI-P State Grant Programs) Series 2023 D, 5% 6/1/42 | | 1,040,000 | 1,175,318 |
| Series 2022 A, 5% 12/1/52 | | 1,895,000 | 1,951,958 |
| Oregon State Hsg. & Cmnty. Svcs. Dept. Series 2019 A, 4% 7/1/50 | | 6,650,000 | 6,596,202 |
| Salem Hosp. Facility Auth. Rev. (Salem Health Projs.) Series 2019 A, 3% 5/15/49 | | 3,125,000 | 2,208,128 |
TOTAL OREGON | | | 16,929,287 |
| Pennsylvania - 3.4% | | | |
| Allegheny County Arpt. Auth. Rev. Series 2021 B, 5% 1/1/51 | | 7,525,000 | 7,962,875 |
| Allegheny County Indl. Dev. Auth. Rev. Series 2021: | | | |
| 3.5% 12/1/31 | | 545,000 | 451,283 |
| 4% 12/1/41 | | 995,000 | 728,992 |
| 4.25% 12/1/50 | | 1,110,000 | 766,833 |
| Bucks County Indl. Dev. Auth. Hosp. Rev. Series 2021: | | | |
| 5% 7/1/36 | | 565,000 | 538,696 |
| 5% 7/1/38 | | 1,130,000 | 1,059,260 |
| Commonwealth Fing. Auth. Rev.: | | | |
| Series 2019 B, 5% 6/1/26 | | 635,000 | 664,526 |
| Series 2020 A: | | | |
5% 6/1/29 | | 1,640,000 | 1,810,424 |
5% 6/1/32 | | 2,810,000 | 3,133,695 |
| Dauphin County Gen. Auth. (Pinnacle Health Sys. Proj.) Series 2016 A, 5% 6/1/34 | | 1,065,000 | 1,104,424 |
| Delaware County Auth. Rev.: | | | |
| (Cabrini College) Series 2017, 5% 7/1/47 | | 1,640,000 | 1,557,773 |
| Series 2017, 5% 7/1/30 | | 1,345,000 | 1,367,947 |
| Doylestown Hosp. Auth. Hosp. Rev. Series 2019, 5% 7/1/49 | | 955,000 | 815,726 |
| Lehigh County Gen. Purp. Hosp. Rev. Series 2019 A: | | | |
| 5% 7/1/24 | | 1,590,000 | 1,609,030 |
| 5% 7/1/26 | | 1,780,000 | 1,853,227 |
| 5% 7/1/27 | | 1,870,000 | 1,979,463 |
| 5% 7/1/28 | | 1,945,000 | 2,094,027 |
| Monroeville Fin. Auth. UPMC Rev. Series 2023 C, 5% 5/15/35 | | 380,000 | 426,761 |
| Montgomery County Higher Ed. & Health Auth. Rev.: | | | |
| Series 2016 A, 5% 10/1/40 | | 2,515,000 | 2,359,220 |
| Series 2019: | | | |
4% 9/1/36 | | 700,000 | 688,025 |
4% 9/1/37 | | 700,000 | 683,207 |
4% 9/1/38 | | 1,590,000 | 1,546,854 |
4% 9/1/39 | | 1,030,000 | 998,264 |
4% 9/1/44 | | 235,000 | 223,412 |
5% 9/1/23 | | 470,000 | 470,368 |
5% 9/1/24 | | 630,000 | 637,838 |
| Series 2020: | | | |
5% 4/1/24 | | 340,000 | 341,307 |
5% 4/1/25 | | 260,000 | 262,606 |
5% 4/1/26 | | 310,000 | 313,734 |
5% 4/1/27 | | 590,000 | 601,587 |
| Montgomery County Indl. Dev. Auth. Series 2015 A, 5.25% 1/15/36 (Pre-Refunded to 1/15/25 @ 100) | | 990,000 | 1,018,177 |
| Pennsylvania Econ. Dev. Fing. Auth.: | | | |
| Series 2020 A: | | | |
5% 4/15/24 | | 515,000 | 520,071 |
5% 4/15/25 | | 700,000 | 717,994 |
5% 4/15/26 | | 2,340,000 | 2,437,280 |
| Series 2023 A2, 5% 5/15/35 | | 500,000 | 566,401 |
| Series 2023 B, 5% 5/15/35 | | 500,000 | 566,401 |
| Pennsylvania Higher Edl. Facilities Auth. Rev.: | | | |
| Series 2012, 5% 11/1/42 | | 1,280,000 | 1,250,659 |
| Series 2016, 5% 5/1/34 | | 1,495,000 | 1,554,484 |
| Pennsylvania Hsg. Fin. Agcy.: | | | |
| Series 2021 137, 3% 10/1/51 | | 2,985,000 | 2,846,359 |
| Series 2023 142A: | | | |
4.5% 10/1/38 | | 1,940,000 | 1,963,861 |
5% 10/1/43 | | 1,400,000 | 1,453,860 |
| Pennsylvania State Univ. Series 2020 A, 4% 9/1/50 | | 1,385,000 | 1,315,850 |
| Pennsylvania Tpk. Commission Tpk. Rev.: | | | |
| Series 2016, 5% 6/1/36 | | 1,870,000 | 1,936,896 |
| Series 2021 A: | | | |
4% 12/1/43 | | 2,810,000 | 2,751,703 |
4% 12/1/46 | | 4,680,000 | 4,549,597 |
4% 12/1/50 | | 935,000 | 893,959 |
| Philadelphia Auth. for Indl. Dev.: | | | |
| Series 2015 1, 5% 4/1/33 | | 495,000 | 506,432 |
| Series 2017, 5% 11/1/47 | | 975,000 | 983,053 |
| Philadelphia Gen. Oblig.: | | | |
| Series 2019 A, 5% 8/1/26 | | 1,090,000 | 1,149,227 |
| Series 2019 B: | | | |
5% 2/1/34 | | 2,105,000 | 2,328,863 |
5% 2/1/35 | | 2,575,000 | 2,829,317 |
5% 2/1/36 | | 2,260,000 | 2,462,475 |
| Philadelphia School District: | | | |
| Series 2018 A, 5% 9/1/26 | | 1,310,000 | 1,369,715 |
| Series 2019 A: | | | |
4% 9/1/35 | | 1,170,000 | 1,186,196 |
5% 9/1/23 | | 620,000 | 620,546 |
5% 9/1/26 | | 1,870,000 | 1,955,242 |
5% 9/1/30 | | 1,250,000 | 1,368,637 |
5% 9/1/32 | | 935,000 | 1,021,492 |
5% 9/1/34 (Assured Guaranty Muni. Corp. Insured) | | 580,000 | 630,973 |
5% 9/1/44 | | 1,355,000 | 1,421,502 |
| Series 2019 B: | | | |
5% 9/1/25 | | 1,275,000 | 1,313,321 |
5% 9/1/26 | | 1,035,000 | 1,082,179 |
| Philadelphia Wtr. & Wastewtr. Rev. Series 2022 C: | | | |
| 5% 6/1/33 | | 650,000 | 752,161 |
| 5% 6/1/34 | | 800,000 | 923,243 |
| Pittsburgh Wtr. & Swr. Auth. Wtr. & Swr. Sys. Rev. Series 2019 A, 5% 9/1/44 (Assured Guaranty Muni. Corp. Insured) | | 420,000 | 448,536 |
| Southcentral Pennsylvania Gen. Auth. Rev. Series 2019 A: | | | |
| 4% 6/1/44 | | 220,000 | 210,681 |
| 4% 6/1/49 | | 520,000 | 486,773 |
| 5% 6/1/44 | | 380,000 | 396,558 |
| 5% 6/1/49 | | 605,000 | 627,330 |
| State Pub. School Bldg. Auth. Lease Rev. (The School District of Philadelphia Proj.) Series 2016 A, 5% 6/1/32 (Assured Guaranty Muni. Corp. Insured) | | 830,000 | 869,183 |
| Union County Hosp. Auth. Rev. Series 2018 B, 5% 8/1/48 | | 1,340,000 | 1,343,505 |
TOTAL PENNSYLVANIA | | | 93,682,076 |
| Puerto Rico - 1.2% | | | |
| Puerto Rico Commonwealth Aqueduct & Swr. Auth.: | | | |
| Series 2021 B: | | | |
4% 7/1/42 (c) | | 1,750,000 | 1,537,472 |
5% 7/1/33 (c) | | 835,000 | 852,469 |
5% 7/1/37 (c) | | 3,500,000 | 3,520,301 |
| Series 2022 A, 4% 7/1/42 (c) | | 1,750,000 | 1,537,472 |
| Puerto Rico Commonwealth Pub. Impt. Gen. Oblig. Series 2021 A1: | | | |
| 0% 7/1/33 | | 8,638,773 | 5,264,019 |
| 4% 7/1/33 | | 5,651,810 | 5,362,466 |
| 4% 7/1/35 | | 2,035,000 | 1,879,788 |
| 5.625% 7/1/27 | | 589,592 | 619,601 |
| 5.625% 7/1/29 | | 4,000,136 | 4,274,153 |
| Puerto Rico Sales Tax Fing. Corp. Sales Tax Rev. Series 2019 A2, 4.329% 7/1/40 | | 9,120,000 | 8,584,971 |
TOTAL PUERTO RICO | | | 33,432,712 |
| Rhode Island - 0.5% | | | |
| Pub. Bldgs Authr (Cap. Impt. Prog. Projs.) Series 2020 A, 5% 9/15/39 (Assured Guaranty Muni. Corp. Insured) | | 1,490,000 | 1,572,878 |
| Rhode Island Health & Edl. Bldg. Corp. Higher Ed. Facilities Rev. Series 2016 B, 5% 9/1/31 | | 855,000 | 844,278 |
| Rhode Island Health and Edl. Bldg. Corp. Higher Ed. Facility Rev. Series 2023: | | | |
| 5% 11/1/36 | | 225,000 | 252,959 |
| 5% 11/1/39 | | 255,000 | 280,837 |
| 5% 11/1/41 | | 750,000 | 818,964 |
| 5% 11/1/42 | | 1,000,000 | 1,086,925 |
| 5% 11/1/43 | | 1,300,000 | 1,409,175 |
| 5% 11/1/47 | | 5,500,000 | 5,898,723 |
| Rhode Island Hsg. & Mtg. Fin. Corp. Series 2019 70, 4% 10/1/49 | | 150,000 | 148,782 |
| Rhode Island Hsg. & Mtg. Fin. Corp. Rev. Series 72 A, 3.5% 10/1/50 | | 1,050,000 | 1,027,316 |
TOTAL RHODE ISLAND | | | 13,340,837 |
| South Carolina - 0.5% | | | |
| Charleston County Arpt. District Series 2019, 5% 7/1/48 | | 1,755,000 | 1,848,660 |
| Patriots Energy Group Fing. Agcy. Bonds Series 2018 A, 4%, tender 2/1/24 (b) | | 505,000 | 505,423 |
| South Carolina Hsg. Fin. & Dev. Auth. Mtg. Rev. Series 2019 A, 4% 1/1/50 | | 220,000 | 218,148 |
| South Carolina Jobs-Econ. Dev. Auth. Series 2019 C, 5% 7/1/33 | | 1,220,000 | 1,299,899 |
| South Carolina Jobs-Econ. Dev. Auth. Econ. Dev. Rev. Series 2022 A, 4% 4/1/52 | | 2,900,000 | 2,667,467 |
| South Carolina Pub. Svc. Auth. Rev.: | | | |
| Series 2014 C, 5% 12/1/26 | | 95,000 | 96,479 |
| Series 2016 A, 5% 12/1/33 | | 205,000 | 211,592 |
| Series 2020 A, 5% 12/1/32 | | 1,580,000 | 1,720,319 |
| Series A, 5% 12/1/23 (Escrowed to Maturity) | | 740,000 | 743,921 |
| Series B, 5% 12/1/24 | | 2,360,000 | 2,402,177 |
| Spartanburg County Reg'l. Health Series 2017 A, 5% 4/15/48 | | 2,310,000 | 2,355,593 |
TOTAL SOUTH CAROLINA | | | 14,069,678 |
| South Dakota - 0.1% | | | |
| South Dakota Health & Edl. Facilities Auth. Rev.: | | | |
| Bonds Series 2019 A, 5%, tender 7/1/24 (b) | | 1,495,000 | 1,505,530 |
| Series 2020 A, 3% 9/1/45 | | 1,730,000 | 1,329,503 |
TOTAL SOUTH DAKOTA | | | 2,835,033 |
| Tennessee - 0.8% | | | |
| Chattanooga Health Ed. & Hsg. Facility Board Rev.: | | | |
| Series 2019 A1: | | | |
4% 8/1/44 | | 7,770,000 | 7,206,079 |
5% 8/1/25 | | 575,000 | 586,907 |
| Series 2019 A2, 5% 8/1/44 | | 2,105,000 | 2,169,845 |
| Jackson Hosp. Rev. Series 2018 A: | | | |
| 5% 4/1/27 | | 560,000 | 588,588 |
| 5% 4/1/27 (Escrowed to Maturity) | | 30,000 | 32,064 |
| 5% 4/1/28 | | 375,000 | 398,999 |
| 5% 4/1/28 (Escrowed to Maturity) | | 20,000 | 21,819 |
| 5% 4/1/41 | | 445,000 | 455,083 |
| 5% 4/1/41 (Pre-Refunded to 10/1/28 @ 100) | | 25,000 | 27,550 |
| Johnson City Health & Edl. Hosp. Rev. Series 2023 A, 5% 7/1/24 | | 1,250,000 | 1,263,949 |
| Nashville and Davidson County Metropolitan Govt. Health & Edl. Facilities Board Rev. (Lipscomb Univ. Proj.) Series 2019 A: | | | |
| 4% 10/1/49 | | 2,150,000 | 1,726,399 |
| 5.25% 10/1/58 | | 1,145,000 | 1,116,160 |
| Tennergy Corp. Gas Rev. Bonds Series 2019 A, 5%, tender 10/1/24 (b) | | 1,895,000 | 1,917,227 |
| Tennessee Hsg. Dev. Agcy. Series 2015 A, 3.5% 7/1/45 | | 735,000 | 724,507 |
| Tennessee Hsg. Dev. Agcy. Residential: | | | |
| Series 2021 1, 3% 7/1/51 | | 2,550,000 | 2,455,791 |
| Series 2021 3A, 3% 1/1/52 | | 825,000 | 790,361 |
TOTAL TENNESSEE | | | 21,481,328 |
| Texas - 6.9% | | | |
| Austin Wtr. & Wastewtr. Sys. Rev. Series 2016, 5% 11/15/33 | | 1,870,000 | 1,991,714 |
| Bell County Gen. Oblig. Series 2021: | | | |
| 2% 2/15/34 | | 2,500,000 | 2,057,765 |
| 2% 2/15/35 | | 1,000,000 | 802,559 |
| Brazos County Gen. Oblig. Series 2020: | | | |
| 1.75% 9/1/33 | | 1,355,000 | 1,100,922 |
| 1.875% 9/1/35 | | 705,000 | 548,804 |
| Central Reg'l. Mobility Auth.: | | | |
| Series 2018, 5% 1/1/25 | | 935,000 | 955,485 |
| Series 2020 B: | | | |
4% 1/1/34 | | 260,000 | 266,761 |
4% 1/1/35 | | 210,000 | 214,186 |
4% 1/1/36 | | 230,000 | 232,756 |
4% 1/1/37 | | 330,000 | 330,831 |
4% 1/1/38 | | 435,000 | 429,579 |
4% 1/1/39 | | 560,000 | 548,208 |
4% 1/1/40 | | 215,000 | 208,833 |
5% 1/1/27 | | 185,000 | 193,644 |
5% 1/1/28 | | 215,000 | 228,331 |
5% 1/1/29 | | 795,000 | 857,576 |
5% 1/1/30 | | 375,000 | 410,419 |
5% 1/1/31 | | 185,000 | 202,664 |
5% 1/1/32 | | 185,000 | 202,515 |
5% 1/1/33 | | 280,000 | 305,948 |
| Series 2021 B: | | | |
5% 1/1/30 | | 935,000 | 1,023,312 |
5% 1/1/32 | | 1,195,000 | 1,323,712 |
5% 1/1/39 | | 1,215,000 | 1,294,934 |
5% 1/1/46 | | 3,275,000 | 3,429,782 |
| Series 2021 C, 5% 1/1/27 | | 3,525,000 | 3,656,693 |
| Collin County Series 2019, 5% 2/15/26 | | 2,165,000 | 2,267,657 |
| Coppell Tex Series 2020, 1.625% 2/1/37 | | 1,495,000 | 1,073,328 |
| Dallas Fort Worth Int'l. Arpt. Rev.: | | | |
| Series 2020 B: | | | |
4% 11/1/34 | | 1,320,000 | 1,370,605 |
4% 11/1/35 | | 1,175,000 | 1,208,942 |
| Series 2021 B, 5% 11/1/43 | | 975,000 | 1,048,289 |
| Dallas Independent School District Series 2019: | | | |
| 5% 2/15/24 | | 655,000 | 661,198 |
| 5% 2/15/25 | | 935,000 | 961,707 |
| Dallas Wtrwks. & Swr. Sys. Rev. Series 2017, 5% 10/1/46 | | 470,000 | 494,662 |
| Denton County Gen. Oblig. Series 2020, 4% 5/15/27 | | 1,810,000 | 1,876,504 |
| Denton Independent School District Bonds Series 2014 B: | | | |
| 2%, tender 8/1/24 (b) | | 455,000 | 445,966 |
| 2%, tender 8/1/24 (b) | | 90,000 | 88,747 |
| 2%, tender 8/1/24 (b) | | 85,000 | 83,817 |
| Fort Worth Gen. Oblig. Series 2016: | | | |
| 5% 3/1/25 | | 935,000 | 961,064 |
| 5% 3/1/27 | | 935,000 | 978,884 |
| Frisco Texas: | | | |
| Series 2020: | | | |
2% 2/15/34 | | 1,545,000 | 1,309,683 |
2% 2/15/35 | | 1,575,000 | 1,304,292 |
2% 2/15/36 | | 1,610,000 | 1,293,035 |
2% 2/15/37 | | 1,640,000 | 1,274,729 |
| Series 2022: | | | |
2% 2/15/35 | | 4,460,000 | 3,693,423 |
2% 2/15/36 | | 4,550,000 | 3,654,230 |
| Harris County Toll Road Rev. Series 2018 A, 5% 8/15/43 | | 470,000 | 493,038 |
| Hays Consolidated Independent School District Series 2022: | | | |
| 4% 2/15/38 | | 1,000,000 | 1,017,048 |
| 4% 2/15/39 | | 2,000,000 | 2,023,393 |
| 4% 2/15/40 | | 2,000,000 | 2,020,887 |
| 4% 2/15/41 | | 2,000,000 | 2,019,267 |
| 5% 2/15/33 | | 1,300,000 | 1,495,827 |
| Houston Arpt. Sys. Rev. Series 2018 D, 5% 7/1/39 | | 2,035,000 | 2,148,452 |
| Houston Convention and Entertainment Facilities Dept. Hotel Occupancy Tax and Spl. Rev. Series 2019, 5% 9/1/33 | | 715,000 | 773,547 |
| Houston Gen. Oblig. Series 2017 A, 5% 3/1/31 | | 1,170,000 | 1,252,445 |
| Houston Independent School District Bonds Series 2023 C, 4%, tender 6/1/25 (b) | | 6,860,000 | 6,926,885 |
| Houston Util. Sys. Rev.: | | | |
| Series 2017 B, 5% 11/15/35 | | 935,000 | 1,005,756 |
| Series 2020 C, 5% 11/15/28 | | 2,245,000 | 2,475,235 |
| Series 2021 A: | | | |
5% 11/15/26 | | 355,000 | 376,699 |
5% 11/15/28 | | 1,480,000 | 1,631,781 |
| Irving Hosp. Auth. Hosp. Rev. Series 2017 A, 5% 10/15/35 | | 385,000 | 395,598 |
| Katy Independent School District Series 2023: | | | |
| 5% 2/15/38 | | 500,000 | 559,809 |
| 5% 2/15/39 | | 1,500,000 | 1,668,691 |
| 5% 2/15/40 | | 330,000 | 365,117 |
| Lower Colorado River Auth. Rev. (LCRA Transmission Svcs. Corp. Proj.): | | | |
| Series 2018: | | | |
5% 5/15/43 | | 1,405,000 | 1,471,013 |
5% 5/15/48 | | 1,590,000 | 1,660,110 |
| Series 2020, 5% 5/15/28 | | 2,105,000 | 2,287,510 |
| Series 2023: | | | |
5% 5/15/26 | | 5,505,000 | 5,783,039 |
5% 5/15/36 | | 3,000,000 | 3,393,383 |
5% 5/15/37 | | 1,400,000 | 1,565,008 |
5% 5/15/38 | | 1,500,000 | 1,661,040 |
5% 5/15/39 | | 1,915,000 | 2,106,744 |
5% 5/15/40 | | 2,500,000 | 2,738,969 |
| Midlothian Independent School District Bonds Series 2013 C, 2%, tender 8/1/24 (b) | | 530,000 | 519,578 |
| Newark Higher Ed. Fin. Corp. (Abilene Christian Univ. Proj.) Series 2016 A, 5% 4/1/28 | | 1,450,000 | 1,508,178 |
| North East Texas Independent School District Bonds Series 2019, 2.2%, tender 8/1/24 (b) | | 325,000 | 319,954 |
| North Texas Tollway Auth. Rev.: | | | |
| Series 2016 A, 5% 1/1/30 | | 700,000 | 733,002 |
| Series 2017 A, 5% 1/1/39 | | 3,745,000 | 3,928,011 |
| Series 2018: | | | |
4% 1/1/38 | | 1,715,000 | 1,706,617 |
5% 1/1/35 | | 470,000 | 501,995 |
| Series 2019 A, 5% 1/1/38 | | 4,680,000 | 4,969,919 |
| Series 2019 B, 5% 1/1/25 | | 605,000 | 619,013 |
| Series 2021 B, 4% 1/1/33 | | 1,870,000 | 1,954,348 |
| Northside Independent School District Bonds: | | | |
| Series 2020, 0.7%, tender 6/1/25 (b) | | 1,510,000 | 1,427,359 |
| Series 2023 B, 3%, tender 8/1/29 (b) | | 10,345,000 | 10,164,959 |
| Pasadena Independent School District Bonds Series 2015 B, 1.5%, tender 8/15/24 (b) | | 2,175,000 | 2,119,343 |
| Plano Gen. Oblig.: | | | |
| Series 2018, 3.37% 9/1/37 | | 840,000 | 775,016 |
| Series 2023, 5% 9/1/40 | | 1,000,000 | 1,113,924 |
| Prosper Independent School District: | | | |
| Bonds Series 2019 B, 4%, tender 8/15/26 (b)(d) | | 1,825,000 | 1,852,713 |
| Series 2021 A, 3% 2/15/37 | | 1,480,000 | 1,326,047 |
| San Antonio Elec. & Gas Sys. Rev.: | | | |
| Bonds Series 2020, 1.75%, tender 12/1/25 (b) | | 10,060,000 | 9,433,532 |
| Series 2021 A, 5% 2/1/46 | | 3,690,000 | 3,966,671 |
| Tarrant County Series 2022, 5% 7/15/35 | | 1,640,000 | 1,870,103 |
| Tarrant County Cultural Ed. Facilities Fin. Corp. Hosp. Rev.: | | | |
| Series 2020, 5% 12/1/24 | | 515,000 | 526,023 |
| Series 2022: | | | |
4% 10/1/42 | | 1,185,000 | 1,154,103 |
4% 10/1/47 | | 1,265,000 | 1,209,245 |
4% 10/1/52 | | 2,810,000 | 2,640,515 |
5% 10/1/36 | | 515,000 | 568,969 |
5% 10/1/40 | | 1,870,000 | 2,020,738 |
| Tarrant County Cultural Ed. Facilities Fin. Corp. Retirement Facility Rev. (Buckner Retirement Svcs., Inc.) Series 2016 B, 5% 11/15/40 | | 890,000 | 890,889 |
| Tarrant County Cultural Ed. Facilities Fin. Corp. Rev. Series 2016 A, 5% 2/15/47 | | 7,485,000 | 7,646,493 |
| Texas Dept. of Hsg. & Cmnty. Affairs Multi-family Hsg. Rev. Series 2019, 2.95% 7/1/36 | | 702,812 | 629,877 |
| Texas Dept. of Hsg. & Cmnty. Affairs Single Family Mtg. Rev. Series 2019 A, 4% 3/1/50 | | 605,000 | 600,182 |
| Texas Private Activity Bond Surface Trans. Corp. (LBJ Infrastructure Group LLC I-635 Managed Lanes Proj.) Series 2020 A: | | | |
| 4% 6/30/36 | | 770,000 | 745,934 |
| 4% 6/30/38 | | 1,965,000 | 1,855,935 |
| 4% 12/31/39 | | 1,640,000 | 1,533,456 |
| Texas Pub. Fin. Auth. Lease Rev. Series 2019, 5% 2/1/25 | | 1,075,000 | 1,104,231 |
| Texas State Univ. Sys. Fing. Rev. Series 2019 A, 5% 3/15/25 | | 1,405,000 | 1,445,209 |
| Texas Trans. Commission Series 2019 A, 0% 8/1/41 | | 1,405,000 | 588,727 |
| Texas Trans. Commission Hwy. Impt. Gen. Oblig. Bonds Series 2014 B, 0.65%, tender 4/1/26 (b) | | 8,695,000 | 7,893,378 |
| Texas Wtr. Dev. Board Rev.: | | | |
| Series 2018 A, 5% 10/15/43 | | 935,000 | 987,279 |
| Series 2018 B, 5% 4/15/49 | | 935,000 | 984,896 |
| Waco Gen. Oblig. Series 2020: | | | |
| 2.25% 2/1/36 | | 1,935,000 | 1,623,315 |
| 2.375% 2/1/40 | | 710,000 | 551,763 |
TOTAL TEXAS | | | 188,196,425 |
| Utah - 0.5% | | | |
| Salt Lake City Arpt. Rev. Series 2021 B: | | | |
| 5% 7/1/46 | | 2,305,000 | 2,474,595 |
| 5% 7/1/51 | | 9,285,000 | 9,856,246 |
| Utah Gen. Oblig. Series 2020, 5% 7/1/26 | | 935,000 | 990,228 |
TOTAL UTAH | | | 13,321,069 |
| Vermont - 0.1% | | | |
| Vermont Hsg. Fin. Agcy.: | | | |
| Series 2021 B, 3% 11/1/51 | | 996,000 | 950,150 |
| Series 2022 A, 5.25% 11/1/52 | | 1,000,000 | 1,045,852 |
| Series A, 3.75% 11/1/50 | | 1,271,000 | 1,251,881 |
TOTAL VERMONT | | | 3,247,883 |
| Virginia - 0.3% | | | |
| Lynchburg Econ. Dev. Series 2021, 3% 1/1/51 | | 1,550,000 | 1,092,154 |
| Roanoke Econ. Dev. Auth. Edl. Facilities Series 2018 A, 5% 9/1/27 | | 470,000 | 487,671 |
| Salem Econ. Dev. Auth. Series 2020: | | | |
| 4% 4/1/38 | | 260,000 | 240,461 |
| 4% 4/1/39 | | 235,000 | 214,780 |
| 4% 4/1/40 | | 260,000 | 235,085 |
| 4% 4/1/45 | | 700,000 | 607,821 |
| 5% 4/1/24 | | 280,000 | 281,624 |
| 5% 4/1/26 | | 330,000 | 337,718 |
| 5% 4/1/27 | | 330,000 | 341,446 |
| 5% 4/1/28 | | 410,000 | 428,690 |
| 5% 4/1/29 | | 540,000 | 569,879 |
| 5% 4/1/49 | | 935,000 | 938,780 |
| Virginia Port Auth. Commonwealth Port Rev. Series 2023 A, 5% 7/1/40 | | 1,165,000 | 1,332,948 |
TOTAL VIRGINIA | | | 7,109,057 |
| Washington - 2.7% | | | |
| King County Gen. Oblig. Series 2021 A, 2% 1/1/36 | | 2,200,000 | 1,749,846 |
| King County Hsg. Auth. Rev. Series 2021, 4% 12/1/29 | | 675,000 | 695,043 |
| King County Swr. Rev. Bonds Series 2020 B, 0.875%, tender 1/1/26 (b) | | 2,150,000 | 2,006,540 |
| Port of Seattle Rev. Series 2015 B, 5% 3/1/25 | | 235,000 | 239,010 |
| Spokane Pub. Facilities District Hotel/Motel Tax & Sales/Use Tax Rev. Series 2017, 5% 12/1/38 | | 1,100,000 | 1,128,805 |
| Washington Convention Ctr. Pub. Facilities Series 2021, 4% 7/1/31 | | 9,195,000 | 8,855,595 |
| Washington Gen. Oblig.: | | | |
| Series 2016 C, 5% 2/1/39 | | 2,395,000 | 2,480,195 |
| Series 2017 D, 5% 2/1/35 | | 470,000 | 498,847 |
| Series 2018 C, 5% 2/1/41 | | 935,000 | 992,812 |
| Series 2021 A, 5% 8/1/43 | | 840,000 | 914,738 |
| Series 2021 E, 5% 6/1/37 | | 4,780,000 | 5,375,260 |
| Series 2022 A, 5% 8/1/35 | | 8,445,000 | 9,677,736 |
| Series 2023 A, 5% 8/1/41 | | 6,875,000 | 7,692,093 |
| Washington Health Care Facilities Auth. Rev.: | | | |
| (Overlake Hosp. Med. Ctr., WA. Proj.) Series 2017 B: | | | |
5% 7/1/27 | | 810,000 | 829,622 |
5% 7/1/31 | | 40,000 | 40,376 |
5% 7/1/42 | | 525,000 | 517,460 |
| (Virginia Mason Med. Ctr. Proj.) Series 2017: | | | |
5% 8/15/25 | | 230,000 | 233,886 |
5% 8/15/26 | | 210,000 | 216,170 |
| Series 2015 B, 5% 10/1/38 | | 3,950,000 | 4,225,286 |
| Series 2017 A, 4% 7/1/42 | | 5,410,000 | 4,851,485 |
| Series 2017: | | | |
4% 8/15/42 | | 6,550,000 | 5,766,950 |
5% 8/15/36 | | 470,000 | 477,449 |
| Series 2020: | | | |
5% 9/1/38 | | 1,870,000 | 1,987,195 |
5% 9/1/45 | | 2,105,000 | 2,202,947 |
5% 9/1/50 | | 2,340,000 | 2,442,746 |
| Washington Higher Ed. Facilities Auth. Rev.: | | | |
| (Gonzaga Univ. Proj.) Series 2019 A, 3% 4/1/49 | | 2,625,000 | 1,966,092 |
| (Whitworth Univ. Proj.): | | | |
Series 2016 A: | | | |
5% 10/1/25 | | 400,000 | 407,571 |
5% 10/1/26 | | 1,880,000 | 1,938,275 |
5% 10/1/34 | | 1,415,000 | 1,454,972 |
Series 2019, 4% 10/1/49 | | 1,515,000 | 1,274,320 |
TOTAL WASHINGTON | | | 73,139,322 |
| West Virginia - 0.4% | | | |
| West Virginia Hosp. Fin. Auth. Hosp. Rev. Series 2023 A: | | | |
| 5% 6/1/37 | | 1,400,000 | 1,528,314 |
| 5% 6/1/38 | | 500,000 | 541,756 |
| 5% 6/1/40 | | 1,970,000 | 2,114,770 |
| 5% 6/1/41 | | 1,970,000 | 2,106,889 |
| 5% 6/1/43 | | 3,505,000 | 3,725,067 |
TOTAL WEST VIRGINIA | | | 10,016,796 |
| Wisconsin - 2.3% | | | |
| Howard Suamico Scd Series 2021, 2% 3/1/38 | | 1,065,000 | 799,950 |
| Pub. Fin. Auth. Edl. Facilities: | | | |
| Series 2018 A: | | | |
5.25% 10/1/43 | | 495,000 | 488,143 |
5.25% 10/1/48 | | 495,000 | 477,701 |
| Series 2022 A: | | | |
5.25% 3/1/42 | | 935,000 | 944,668 |
5.25% 3/1/47 | | 6,175,000 | 6,176,996 |
| Pub. Fin. Auth. Hosp. Rev.: | | | |
| (Renown Reg'l. Med. Ctr. Proj.) Series 2020 A, 5% 6/1/30 | | 765,000 | 821,615 |
| Series 2019 A, 5% 10/1/44 | | 1,350,000 | 1,392,201 |
| Series 2020 A, 3% 6/1/45 | | 4,855,000 | 3,614,037 |
| Pub. Fin. Auth. Sr. Living Rev. (Mary's Woods At Marylhurst, Inc. Proj.) Series 2017 A: | | | |
| 5.25% 5/15/37 (c) | | 2,190,000 | 2,074,556 |
| 5.25% 5/15/42 (c) | | 840,000 | 764,220 |
| 5.25% 5/15/47 (c) | | 1,225,000 | 1,076,967 |
| Roseman Univ. of Health: | | | |
| Series 2020, 5% 4/1/50 (c) | | 395,000 | 366,472 |
| Series 2021 A: | | | |
3% 7/1/50 | | 1,385,000 | 990,129 |
4.5% 6/1/56 (c) | | 5,935,000 | 4,440,244 |
| Series 2021 B, 6.5% 6/1/56 (c) | | 1,815,000 | 1,477,365 |
| Wisconsin Gen. Oblig.: | | | |
| Series 2014 4, 5% 5/1/25 | | 1,160,000 | 1,186,498 |
| Series 2021 A: | | | |
5% 5/1/33 | | 475,000 | 523,734 |
5% 5/1/36 | | 5,320,000 | 5,773,920 |
| Series 2022 A, 5% 5/1/34 | | 3,745,000 | 4,341,358 |
| Wisconsin Health & Edl. Facilities: | | | |
| Series 2013 A, 5% 11/15/43 (Pre-Refunded to 11/15/23 @ 100) | | 6,400,000 | 6,425,376 |
| Series 2018, 5% 4/1/34 | | 1,870,000 | 2,028,644 |
| Series 2019 A: | | | |
5% 11/1/25 | | 225,000 | 220,314 |
5% 11/1/29 | | 160,000 | 151,034 |
5% 12/1/30 | | 280,000 | 303,085 |
5% 12/1/31 | | 280,000 | 303,063 |
5% 12/1/32 | | 330,000 | 356,910 |
5% 12/1/33 | | 330,000 | 356,527 |
5% 12/1/34 | | 330,000 | 355,773 |
5% 12/1/35 | | 420,000 | 450,161 |
5% 7/1/44 | | 470,000 | 481,233 |
5% 11/1/46 | | 1,350,000 | 1,087,144 |
5% 7/1/49 | | 1,870,000 | 1,908,149 |
| Series 2019 B, 5% 7/1/38 | | 330,000 | 340,491 |
| Series 2019 B1, 2.825% 11/1/28 | | 340,000 | 301,442 |
| Series 2019 B2, 2.55% 11/1/27 | | 65,000 | 61,059 |
| Series 2019: | | | |
5% 10/1/24 | | 255,000 | 259,489 |
5% 10/1/26 | | 515,000 | 542,877 |
| Wisconsin Health & Edl. Facilities Auth. Rev. Series 2021: | | | |
| 3% 10/15/37 | | 1,545,000 | 1,313,746 |
| 3% 8/15/51 | | 3,200,000 | 2,304,623 |
| 5% 8/15/35 | | 1,550,000 | 1,671,710 |
| Wisconsin Hsg. & Econ. Dev. Auth.: | | | |
| Series 2021 A, 3% 3/1/52 | | 760,000 | 729,944 |
| Series 2021 C, 3% 9/1/52 | | 1,150,000 | 1,103,158 |
| Wisconsin Hsg. & Econ. Dev. Auth. Hsg. Rev. Bonds Series 2021 C: | | | |
| 0.61%, tender 5/1/24 (b) | | 215,000 | 208,196 |
| 0.81%, tender 5/1/25 (b) | | 715,000 | 678,435 |
TOTAL WISCONSIN | | | 61,673,357 |
| Wyoming - 0.1% | | | |
| Wyoming Cmnty. Dev. Auth. Hsg. Rev. Series 2019 3, 3.75% 12/1/49 | | 1,690,000 | 1,671,953 |
| TOTAL MUNICIPAL BONDS (Cost $2,726,094,301) | | | 2,623,712,527 |
| | | | |
| Municipal Notes - 1.0% |
| | | Principal Amount (a) | Value ($) |
| California - 1.0% | | | |
Los Angeles Gen. Oblig. TRAN Series 2023, 5% 6/27/24 (Cost $26,410,252) | | 26,000,000 | 26,421,561 |
| | | | |
| Money Market Funds - 3.1% |
| | | Shares | Value ($) |
Fidelity Tax-Free Cash Central Fund 4.28% (f)(g) (Cost $86,080,777) | | 86,055,228 | 86,089,638 |
| | | | |
| TOTAL INVESTMENT IN SECURITIES - 100.6% (Cost $2,838,585,330) | 2,736,223,726 |
NET OTHER ASSETS (LIABILITIES) - (0.6)% | (16,566,807) |
| NET ASSETS - 100.0% | 2,719,656,919 |
| | |
Security Type Abbreviations
| TRAN | - | TAX AND REVENUE ANTICIPATION NOTE |
Legend
| (a) | Amount is stated in United States dollars unless otherwise noted. |
| (b) | Coupon rates for floating and adjustable rate securities reflect the rates in effect at period end. |
| (c) | Security exempt from registration under Rule 144A of the Securities Act of 1933. These securities may be resold in transactions exempt from registration, normally to qualified institutional buyers. At the end of the period, the value of these securities amounted to $24,800,584 or 0.9% of net assets. |
| (d) | Security or a portion of the security purchased on a delayed delivery or when-issued basis. |
| (e) | Security initially issued at one coupon which converts to a higher coupon at a specified date. The rate shown is the rate at period end. |
| (f) | Information in this report regarding holdings by state and security types does not reflect the holdings of the Fidelity Tax-Free Cash Central Fund. |
| (g) | Affiliated fund that is generally available only to investment companies and other accounts managed by Fidelity Investments. The rate quoted is the annualized seven-day yield of the fund at period end. A complete unaudited listing of the fund's holdings as of its most recent quarter end is available upon request. In addition, each Fidelity Central Fund's financial statements are available on the SEC's website or upon request. |
Affiliated Central Funds
Fiscal year to date information regarding the Fund's investments in Fidelity Central Funds, including the ownership percentage, is presented below.
| Affiliate | Value, beginning of period ($) | Purchases ($) | Sales Proceeds ($) | Dividend Income ($) | Realized Gain (loss) ($) | Change in Unrealized appreciation (depreciation) ($) | Value, end of period ($) | % ownership, end of period |
| Fidelity Tax-Free Cash Central Fund 4.28% | 198,073,458 | 327,094,006 | 439,088,000 | 2,749,360 | 3,347 | 6,827 | 86,089,638 | 8.2% |
| Total | 198,073,458 | 327,094,006 | 439,088,000 | 2,749,360 | 3,347 | 6,827 | 86,089,638 | |
| | | | | | | | | |
Amounts in the dividend income column in the above table include any capital gain distributions from underlying funds, which are presented in the corresponding line item in the Statement of Operations, if applicable.
Amounts included in the purchases and sales proceeds columns may include in-kind transactions, if applicable.
Investment Valuation
The following is a summary of the inputs used, as of July 31, 2023, involving the Fund's assets and liabilities carried at fair value. The inputs or methodology used for valuing securities may not be an indication of the risk associated with investing in those securities. For more information on valuation inputs, and their aggregation into the levels used below, please refer to the Investment Valuation section in the accompanying Notes to Financial Statements.
| Valuation Inputs at Reporting Date: |
| Description | Total ($) | Level 1 ($) | Level 2 ($) | Level 3 ($) |
Investments in Securities: | | | | |
|
| Municipal Securities | 2,650,134,088 | - | 2,650,134,088 | - |
|
| Money Market Funds | 86,089,638 | 86,089,638 | - | - |
| Total Investments in Securities: | 2,736,223,726 | 86,089,638 | 2,650,134,088 | - |
| Statement of Assets and Liabilities |
| | | | July 31, 2023 (Unaudited) |
| | | | | |
| Assets | | | | |
| Investment in securities, at value - See accompanying schedule: | | | | |
Unaffiliated issuers (cost $2,752,504,553) | $ | 2,650,134,088 | | |
Fidelity Central Funds (cost $86,080,777) | | 86,089,638 | | |
| | | | | |
| | | | | |
| Total Investment in Securities (cost $2,838,585,330) | | | $ | 2,736,223,726 |
| Cash | | | | 102,018 |
| Receivable for investments sold | | | | 1,852 |
| Receivable for fund shares sold | | | | 5,932,432 |
| Interest receivable | | | | 26,243,992 |
| Distributions receivable from Fidelity Central Funds | | | | 268,036 |
| Prepaid expenses | | | | 1,990 |
| Receivable from investment adviser for expense reductions | | | | 218,902 |
| Other receivables | | | | 305 |
Total assets | | | | 2,768,993,253 |
| Liabilities | | | | |
| Payable for investments purchased on a delayed delivery basis | $ | 40,414,299 | | |
| Payable for fund shares redeemed | | 1,766,173 | | |
| Distributions payable | | 6,340,074 | | |
| Accrued management fee | | 777,764 | | |
| Other payables and accrued expenses | | 38,024 | | |
| Total Liabilities | | | | 49,336,334 |
| Net Assets | | | $ | 2,719,656,919 |
| Net Assets consist of: | | | | |
| Paid in capital | | | $ | 2,851,374,676 |
| Total accumulated earnings (loss) | | | | (131,717,757) |
| Net Assets | | | $ | 2,719,656,919 |
Net Asset Value, offering price and redemption price per share ($2,719,656,919 ÷ 275,316,297 shares) | | | $ | 9.88 |
| Statement of Operations |
| | | | Six months ended July 31, 2023 (Unaudited) |
| Investment Income | | | | |
| Interest | | | $ | 35,908,513 |
| Income from Fidelity Central Funds | | | | 2,749,360 |
| Total Income | | | | 38,657,873 |
| Expenses | | | | |
| Management fee | $ | 4,433,176 | | |
| Custodian fees and expenses | | 12,999 | | |
| Independent trustees' fees and expenses | | 4,202 | | |
| Registration fees | | 62,932 | | |
| Audit | | 32,335 | | |
| Legal | | 5,605 | | |
| Miscellaneous | | 5,993 | | |
| Total expenses before reductions | | 4,557,242 | | |
| Expense reductions | | (1,426,227) | | |
| Total expenses after reductions | | | | 3,131,015 |
| Net Investment income (loss) | | | | 35,526,858 |
| Realized and Unrealized Gain (Loss) | | | | |
| Net realized gain (loss) on: | | | | |
| Investment Securities: | | | | |
| Unaffiliated issuers | | (303,032) | | |
| Fidelity Central Funds | | 3,347 | | |
| Total net realized gain (loss) | | | | (299,685) |
| Change in net unrealized appreciation (depreciation) on: | | | | |
| Investment Securities: | | | | |
| Unaffiliated issuers | | (29,301,870) | | |
| Fidelity Central Funds | | 6,827 | | |
| Total change in net unrealized appreciation (depreciation) | | | | (29,295,043) |
| Net gain (loss) | | | | (29,594,728) |
| Net increase (decrease) in net assets resulting from operations | | | $ | 5,932,130 |
| Statement of Changes in Net Assets |
| |
| | Six months ended July 31, 2023 (Unaudited) | | Year ended January 31, 2023 |
| Increase (Decrease) in Net Assets | | | | |
| Operations | | | | |
| Net investment income (loss) | $ | 35,526,858 | $ | 50,574,529 |
| Net realized gain (loss) | | (299,685) | | (40,035,448) |
| Change in net unrealized appreciation (depreciation) | | (29,295,043) | | (91,702,603) |
| Net increase (decrease) in net assets resulting from operations | | 5,932,130 | | (81,163,522) |
| Distributions to shareholders | | (34,847,443) | | (50,249,974) |
| | | | | |
| Share transactions | | | | |
| Proceeds from sales of shares | | 702,208,654 | | 7,092,031,431 |
| Reinvestment of distributions | | 639 | | 1,421,586 |
| Cost of shares redeemed | | (363,762,524) | | (6,717,430,416) |
| | | | | |
Net increase (decrease) in net assets resulting from share transactions | | 338,446,769 | | 376,022,601 |
| Total increase (decrease) in net assets | | 309,531,456 | | 244,609,105 |
| | | | | |
| Net Assets | | | | |
| Beginning of period | | 2,410,125,463 | | 2,165,516,358 |
| End of period | $ | 2,719,656,919 | $ | 2,410,125,463 |
| | | | | |
| Other Information | | | | |
| Shares | | | | |
| Sold | | 71,244,095 | | 715,122,762 |
| Issued in reinvestment of distributions | | 65 | | 141,280 |
| Redeemed | | (36,932,498) | | (678,388,942) |
| Net increase (decrease) | | 34,311,662 | | 36,875,100 |
| | | | | |
| Fidelity® SAI Tax-Free Bond Fund |
| |
| | Six months ended (Unaudited) July 31, 2023 | | Years ended January 31, 2023 | | 2022 | | 2021 | | 2020 | | 2019 A |
Selected Per-Share Data | | | | | | | | | | | | |
| Net asset value, beginning of period | $ | 10.00 | $ | 10.61 | $ | 10.97 | $ | 10.89 | $ | 10.19 | $ | 10.00 |
| Income from Investment Operations | | | | | | | | | | | | |
Net investment income (loss) B,C | | .137 | | .230 | | .194 | | .215 | | .241 | | .081 |
| Net realized and unrealized gain (loss) | | (.122) | | (.613) | | (.359) | | .085 | | .735 | | .176 |
| Total from investment operations | | .015 | | (.383) | | (.165) | | .300 | | .976 | | .257 |
| Distributions from net investment income | | (.135) | | (.227) | | (.194) | | (.216) | | (.248) | | (.067) |
| Distributions from net realized gain | | - | | - | | (.001) | | (.004) | | (.028) | | - |
| Total distributions | | (.135) | | (.227) | | (.195) | | (.220) | | (.276) | | (.067) |
| Net asset value, end of period | $ | 9.88 | $ | 10.00 | $ | 10.61 | $ | 10.97 | $ | 10.89 | $ | 10.19 |
Total Return D,E | | .16% | | (3.55)% | | (1.53)% | | 2.83% | | 9.68% | | 2.58% |
Ratios to Average Net Assets C,F,G | | | | | | | | | | | | |
| Expenses before reductions | | .36% H | | .38% | | .36% | | .36% | | .43% | | .60% H,I |
| Expenses net of fee waivers, if any | | .25% H | | .25% | | .25% | | .25% | | .25% | | .25% H |
| Expenses net of all reductions | | .25% H | | .25% | | .25% | | .25% | | .25% | | .25% H |
| Net investment income (loss) | | 2.80% H | | 2.33% | | 1.78% | | 2.02% | | 2.28% | | 2.38% H |
| Supplemental Data | | | | | | | | | | | | |
| Net assets, end of period (000 omitted) | $ | 2,719,657 | $ | 2,410,125 | $ | 2,165,516 | $ | 1,797,621 | $ | 1,603,522 | $ | 489,517 |
Portfolio turnover rate J | | 2% H | | 23% K | | 6% | | 32% | | 12% | | 2% L |
AFor the period October 2, 2018 (commencement of operations) through January 31, 2019.
BCalculated based on average shares outstanding during the period.
CNet investment income (loss) is affected by the timing of the declaration of dividends by any underlying mutual funds or exchange-traded funds (ETFs). Net investment income (loss) of any mutual funds or ETFs is not included in the Fund's net investment income (loss) ratio.
DTotal returns for periods of less than one year are not annualized.
ETotal returns would have been lower if certain expenses had not been reduced during the applicable periods shown.
FFees and expenses of any underlying mutual funds or exchange-traded funds (ETFs) are not included in the Fund's expense ratio. The Fund indirectly bears its proportionate share of these expenses. For additional expense information related to investments in Fidelity Central Funds, please refer to the "Investments in Fidelity Central Funds" note found in the Notes to Financial Statements section of the most recent Annual or Semi-Annual report.
GExpense ratios reflect operating expenses of the class. Expenses before reductions do not reflect amounts reimbursed, waived, or reduced through arrangements with the investment adviser, brokerage services, or other offset arrangements, if applicable, and do not represent the amount paid by the class during periods when reimbursements, waivers or reductions occur.
HAnnualized.
IAudit fees are not annualized.
JAmount does not include the portfolio activity of any underlying mutual funds or exchange-traded funds (ETFs).
KPortfolio turnover rate excludes securities received or delivered in-kind.
LAmount not annualized.
For the period ended July 31, 2023
1. Organization.
Fidelity SAI Tax-Free Bond Fund (the Fund) is a fund of Fidelity Salem Street Trust (the Trust) and is authorized to issue an unlimited number of shares. Shares are offered exclusively to certain clients of Fidelity Management & Research Company LLC (FMR) or its affiliates. The Trust is registered under the Investment Company Act of 1940, as amended (the 1940 Act), as an open-end management investment company organized as a Massachusetts business trust.
2. Investments in Fidelity Central Funds.
Funds may invest in Fidelity Central Funds, which are open-end investment companies generally available only to other investment companies and accounts managed by the investment adviser and its affiliates. The Schedule of Investments lists any Fidelity Central Funds held as an investment as of period end, but does not include the underlying holdings of each Fidelity Central Fund. An investing fund indirectly bears its proportionate share of the expenses of the underlying Fidelity Central Funds.
Based on its investment objective, each Fidelity Central Fund may invest or participate in various investment vehicles or strategies that are similar to those of the investing fund. These strategies are consistent with the investment objectives of the investing fund and may involve certain economic risks which may cause a decline in value of each of the Fidelity Central Funds and thus a decline in the value of the investing fund.
| Fidelity Central Fund | Investment Manager | Investment Objective | Investment Practices | Expense RatioA |
| Fidelity Money Market Central Funds | Fidelity Management & Research Company LLC (FMR) | Each fund seeks to obtain a high level of current income consistent with the preservation of capital and liquidity. | Short-term Investments | Less than .005% |
A Expenses expressed as a percentage of average net assets and are as of each underlying Central Fund's most recent annual or semi-annual shareholder report.
A complete unaudited list of holdings for each Fidelity Central Fund is available upon request or at the Securities and Exchange Commission website at www.sec.gov. In addition, the financial statements of the Fidelity Central Funds which contain the significant accounting policies (including investment valuation policies) of those funds, and are not covered by the Report of Independent Registered Public Accounting Firm, are available on the Securities and Exchange Commission website or upon request.
3. Significant Accounting Policies.
The Fund is an investment company and applies the accounting and reporting guidance of the Financial Accounting Standards Board (FASB) Accounting Standards Codification Topic 946 Financial Services - Investment Companies. The financial statements have been prepared in conformity with accounting principles generally accepted in the United States of America (GAAP), which require management to make certain estimates and assumptions at the date of the financial statements. Actual results could differ from those estimates. Subsequent events, if any, through the date that the financial statements were issued have been evaluated in the preparation of the financial statements. The Fund's Schedule of Investments lists any underlying mutual funds or exchange-traded funds (ETFs) but does not include the underlying holdings of these funds. The following summarizes the significant accounting policies of the Fund:
Investment Valuation. Investments are valued as of 4:00 p.m. Eastern time on the last calendar day of the period. The Board of Trustees (the Board) has designated the Fund's investment adviser as the valuation designee responsible for the fair valuation function and performing fair value determinations as needed. The investment adviser has established a Fair Value Committee (the Committee) to carry out the day-to-day fair valuation responsibilities and has adopted policies and procedures to govern the fair valuation process and the activities of the Committee. In accordance with these fair valuation policies and procedures, which have been approved by the Board, the Fund attempts to obtain prices from one or more third party pricing services or brokers to value its investments. When current market prices, quotations or currency exchange rates are not readily available or reliable, investments will be fair valued in good faith by the Committee, in accordance with the policies and procedures. Factors used in determining fair value vary by investment type and may include market or investment specific events, transaction data, estimated cash flows, and market observations of comparable investments. The frequency that the fair valuation procedures are used cannot be predicted and they may be utilized to a significant extent. The Committee manages the Fund's fair valuation practices and maintains the fair valuation policies and procedures. The Fund's investment adviser reports to the Board information regarding the fair valuation process and related material matters.
The Fund categorizes the inputs to valuation techniques used to value its investments into a disclosure hierarchy consisting of three levels as shown below:
Level 1 - unadjusted quoted prices in active markets for identical investments
Level 2 - other significant observable inputs (including quoted prices for similar investments, interest rates, prepayment speeds, etc.)
Level 3 - unobservable inputs (including the Fund's own assumptions based on the best information available)
Valuation techniques used to value the Fund's investments by major category are as follows:
Debt securities, including restricted securities, are valued based on evaluated prices received from third party pricing services or from brokers who make markets in such securities. Municipal securities are valued by pricing services who utilize matrix pricing which considers yield or price of bonds of comparable quality, coupon, maturity and type or by broker-supplied prices. When independent prices are unavailable or unreliable, debt securities may be valued utilizing pricing methodologies which consider similar factors that would be used by third party pricing services. Debt securities are generally categorized as Level 2 in the hierarchy but may be Level 3 depending on the circumstances.
Investments in open-end mutual funds, including the Fidelity Central Funds, are valued at their closing net asset value (NAV) each business day and are categorized as Level 1 in the hierarchy.
Changes in valuation techniques may result in transfers in or out of an assigned level within the disclosure hierarchy. The aggregate value of investments by input level as of July 31, 2023, is included at the end of the Fund's Schedule of Investments.
Investment Transactions and Income. For financial reporting purposes, the Fund's investment holdings and NAV include trades executed through the end of the last business day of the period. The NAV per share for processing shareholder transactions is calculated as of the close of business of the New York Stock Exchange (NYSE), normally 4:00 p.m. Eastern time and includes trades executed through the end of the prior business day. Gains and losses on securities sold are determined on the basis of identified cost. Income and capital gain distributions from Fidelity Central Funds, if any, are recorded on the ex-dividend date. Interest income is accrued as earned and includes coupon interest and amortization of premium and accretion of discount on debt securities as applicable. Debt obligations may be placed on non-accrual status and related interest income may be reduced by ceasing current accruals and writing off interest receivables when the collection of all or a portion of interest has become doubtful based on consistently applied procedures. A debt obligation is removed from non-accrual status when the issuer resumes interest payments or when collectability of interest is reasonably assured.
Expenses. Expenses directly attributable to a fund are charged to that fund. Expenses attributable to more than one fund are allocated among the respective funds on the basis of relative net assets or other appropriate methods. Expenses included in the accompanying financial statements reflect the expenses of that fund and do not include any expenses associated with any underlying mutual funds or exchange-traded funds. Although not included in a fund's expenses, a fund indirectly bears its proportionate share of these expenses through the net asset value of each underlying mutual fund or exchange-traded fund. Expense estimates are accrued in the period to which they relate and adjustments are made when actual amounts are known.
Income Tax Information and Distributions to Shareholders. Each year, the Fund intends to qualify as a regulated investment company under Subchapter M of the Internal Revenue Code, including distributing substantially all of its taxable income and realized gains. As a result, no provision for U.S. Federal income taxes is required. The Fund files a U.S. federal tax return, in addition to state and local tax returns as required. The Fund's federal income tax returns are subject to examination by the Internal Revenue Service (IRS) for a period of three fiscal years after they are filed. State and local tax returns may be subject to examination for an additional fiscal year depending on the jurisdiction.
Distributions are declared and recorded daily and paid monthly from net investment income. Distributions from realized gains, if any, are declared and recorded on the ex-dividend date. Income and capital gain distributions are determined in accordance with income tax regulations, which may differ from GAAP.
Capital accounts within the financial statements are adjusted for permanent book-tax differences. These adjustments have no impact on net assets or the results of operations. Capital accounts are not adjusted for temporary book-tax differences which will reverse in a subsequent period.
Book-tax differences are primarily due to redemptions in-kind, market discount, capital loss carryforwards and losses deferred due to excise tax regulations.
As of period end, the cost and unrealized appreciation (depreciation) in securities, and derivatives if applicable, for federal income tax purposes were as follows:
| Gross unrealized appreciation | $22,583,663 |
| Gross unrealized depreciation | (123,936,966) |
| Net unrealized appreciation (depreciation) | $(101,353,303) |
| Tax cost | $2,837,577,029 |
Capital loss carryforwards are only available to offset future capital gains of the Fund to the extent provided by regulations and may be limited. The capital loss carryforward information presented below, including any applicable limitation, is estimated as of prior fiscal period end and is subject to adjustment.
Short-term | $(8,864,320) |
Long-term | (21,147,446) |
| Total capital loss carryforward | $(30,011,766) |
Delayed Delivery Transactions and When-Issued Securities. During the period, certain Funds transacted in securities on a delayed delivery or when-issued basis. Payment and delivery may take place after the customary settlement period for that security. The price of the underlying securities and the date when the securities will be delivered and paid for are fixed at the time the transaction is negotiated. Securities purchased on a delayed delivery or when-issued basis are identified as such in the Schedule of Investments. Compensation for interest forgone in the purchase of a delayed delivery or when-issued debt security may be received. With respect to purchase commitments, each applicable Fund identifies securities as segregated in its records with a value at least equal to the amount of the commitment. Payables and receivables associated with the purchases and sales of delayed delivery securities having the same coupon, settlement date and broker are offset. Delayed delivery or when-issued securities that have been purchased from and sold to different brokers are reflected as both payables and receivables in the Statement of Assets and Liabilities under the caption "Delayed delivery", as applicable. Losses may arise due to changes in the value of the underlying securities or if the counterparty does not perform under the contract's terms, or if the issuer does not issue the securities due to political, economic, or other factors.
Restricted Securities (including Private Placements). Funds may invest in securities that are subject to legal or contractual restrictions on resale. These securities generally may be resold in transactions exempt from registration or to the public if the securities are registered. Disposal of these securities may involve time-consuming negotiations and expense, and prompt sale at an acceptable price may be difficult. Information regarding restricted securities held at period end is included at the end of the Schedule of Investments, if applicable.
4. Purchases and Sales of Investments.
Purchases and sales of securities, other than short-term securities and in-kind transactions, as applicable, are noted in the table below.
| | Purchases ($) | Sales ($) |
| Fidelity SAI Tax-Free Bond Fund | 487,242,367 | 28,032,778 |
5. Fees and Other Transactions with Affiliates.
Management Fee. Fidelity Management & Research Company LLC (the investment adviser) and its affiliates provide the Fund with investment management related services for which the Fund pays a monthly management fee. The management fee is the sum of an individual fund fee rate that is based on an annual rate of .25% of the Fund's average net assets and an annualized group fee rate that averaged .10% during the period. The group fee rate is based upon the monthly average net assets of a group of registered investment companies with which the investment adviser has management contracts. The group fee rate decreases as assets under management increase and increases as assets under management decrease. For the reporting period, the total annualized management fee rate was .35% of the Fund's average net assets.
Interfund Trades. Funds may purchase from or sell securities to other Fidelity Funds under procedures adopted by the Board. The procedures have been designed to ensure these interfund trades are executed in accordance with Rule 17a-7 of the 1940 Act. Any interfund trades are included within the respective purchases and sales amounts shown in the Purchases and Sales of Investments note. During the period, there were no interfund trades.
Prior Fiscal Year Affiliated Redemptions In-Kind. Shares that were redeemed in-kind for investments, including accrued interest and cash, if any, are shown in the table below; along with realized gain or loss on investments delivered through in-kind redemptions. The amount of the in-kind redemptions is included in share transactions in the accompanying Statement of Changes in Net Assets. There was no gain or loss for federal income tax purposes.
| | Shares | Total net realized gain or loss ($) | Total Proceeds ($) |
| Fidelity SAI Tax-Free Bond Fund | 13,577,568 | (10,160,414) | 131,430,855 |
6. Committed Line of Credit.
Certain Funds participate with other funds managed by the investment adviser or an affiliate in a $4.25 billion credit facility (the "line of credit") to be utilized for temporary or emergency purposes to fund shareholder redemptions or for other short-term liquidity purposes. The participating funds have agreed to pay commitment fees on their pro-rata portion of the line of credit, which are reflected in Miscellaneous expenses on the Statement of Operations, and are listed below. During the period, there were no borrowings on this line of credit.
| | Amount |
| Fidelity SAI Tax-Free Bond Fund | $2,367 |
7. Expense Reductions.
The investment adviser contractually agreed to reimburse the Fund to the extent annual operating expenses exceeded .25% of average net assets. This reimbursement will remain in place through May 31, 2024. Some expenses, for example the compensation of the independent Trustees, and certain miscellaneous expenses such as proxy and shareholder meeting expenses, are excluded from this reimbursement. During the period this reimbursement reduced the Fund's expenses by $1,383,226.
Through arrangements with the Fund's custodian, credits realized as a result of certain uninvested cash balances were used to reduce the Fund's expenses by $891.
In addition, during the period the investment advisor or an affiliate reimbursed and/or waived a portion of operating expenses in the amount of $42,110.
8. Other.
A fund's organizational documents provide former and current trustees and officers with a limited indemnification against liabilities arising in connection with the performance of their duties to the fund. In the normal course of business, a fund may also enter into contracts that provide general indemnifications. A fund's maximum exposure under these arrangements is unknown as this would be dependent on future claims that may be made against a fund. The risk of material loss from such claims is considered remote.
9. Risk and Uncertainties.
Many factors affect a fund's performance. Developments that disrupt global economies and financial markets, such as pandemics, epidemics, outbreaks of infectious diseases, war, terrorism, and environmental disasters, may significantly affect a fund's investment performance. The effects of these developments to a fund will be impacted by the types of securities in which a fund invests, the financial condition, industry, economic sector, and geographic location of an issuer, and a fund's level of investment in the securities of that issuer. Significant concentrations in security types, issuers, industries, sectors, and geographic locations may magnify the factors that affect a fund's performance.
As a shareholder, you incur two types of costs: (1) transaction costs, which may include sales charges (loads) on purchase payments or redemption proceeds, as applicable and (2) ongoing costs, which generally include management fees, distribution and/or service (12b-1) fees and other Fund expenses. This Example is intended to help you understand your ongoing costs (in dollars) of investing in a fund and to compare these costs with the ongoing costs of investing in other mutual funds.
| The Example is based on an investment of $1,000 invested at the beginning of the period and held for the entire period (February 1, 2023 to July 31, 2023). |
Actual Expenses
The first line of the accompanying table provides information about actual account values and actual expenses. You may use the information in this line, together with the amount you invested, to estimate the expenses that you paid over the period. Simply divide your account value by $1,000.00 (for example, an $8,600 account value divided by $1,000.00 = 8.6), then multiply the result by the number in the first line for a class/Fund under the heading entitled "Expenses Paid During Period" to estimate the expenses you paid on your account during this period. If any fund is a shareholder of any underlying mutual funds or exchange-traded funds (ETFs) (the Underlying Funds), such fund indirectly bears its proportional share of the expenses of the Underlying Funds in addition to the direct expenses incurred presented in the table. These fees and expenses are not included in the annualized expense ratio used to calculate the expense estimate in the table below.
Hypothetical Example for Comparison Purposes
The second line of the accompanying table provides information about hypothetical account values and hypothetical expenses based on the actual expense ratio and an assumed rate of return of 5% per year before expenses, which is not the actual return. The hypothetical account values and expenses may not be used to estimate the actual ending account balance or expenses you paid for the period. You may use this information to compare the ongoing costs of investing in the Fund and other funds. To do so, compare this 5% hypothetical example with the 5% hypothetical examples that appear in the shareholder reports of the other funds. If any fund is a shareholder of any Underlying Funds, such fund indirectly bears its proportional share of the expenses of the Underlying Funds in addition to the direct expenses as presented in the table. These fees and expenses are not included in the annualized expense ratio used to calculate the expense estimate in the table below.
Please note that the expenses shown in the table are meant to highlight your ongoing costs only and do not reflect any transaction costs. Therefore, the second line of the table is useful in comparing ongoing costs only, and will not help you determine the relative total costs of owning different funds. In addition, if these transactional costs were included, your costs would have been higher.
| | | | | Annualized Expense Ratio- A | | Beginning Account Value February 1, 2023 | | Ending Account Value July 31, 2023 | | Expenses Paid During Period- C February 1, 2023 to July 31, 2023 |
| | | | | | | | | | |
| Fidelity® SAI Tax-Free Bond Fund | | | | .25% | | | | | | |
| Actual | | | | | | $ 1,000 | | $ 1,001.60 | | $ 1.24 |
Hypothetical-B | | | | | | $ 1,000 | | $ 1,023.55 | | $ 1.25 |
| |
A Annualized expense ratio reflects expenses net of applicable fee waivers.
B 5% return per year before expenses
C Expenses are equal to the annualized expense ratio, multiplied by the average account value over the period, multiplied by 181/ 365 (to reflect the one-half year period). The fees and expenses of any Underlying Funds are not included in each annualized expense ratio.
1.9887621.104
STF-SANN-0923
Fidelity® SAI Sustainable Municipal Income Fund
Semi-Annual Report
July 31, 2023
Offered exclusively to certain clients of the Adviser, or its affiliates, including Strategic Advisers LLC (Strategic Advisers) - not available for sale to the general public. Fidelity® SAI is a product name of Fidelity® funds dedicated to certain programs affiliated with Strategic Advisers.
Contents
To view a fund's proxy voting guidelines and proxy voting record for the 12-month period ended June 30, visit http://www.fidelity.com/proxyvotingresults or visit the Securities and Exchange Commission's (SEC) web site at http://www.sec.gov.
You may also call 1-800-544-3455 to request a free copy of the proxy voting guidelines.
Standard & Poor's, S&P and S&P 500 are registered service marks of The McGraw-Hill Companies, Inc. and have been licensed for use by Fidelity Distributors Corporation.
Other third-party marks appearing herein are the property of their respective owners.
All other marks appearing herein are registered or unregistered trademarks or service marks of FMR LLC or an affiliated company. © 2023 FMR LLC. All rights reserved.
This report and the financial statements contained herein are submitted for the general information of the shareholders of the Fund. This report is not authorized for distribution to prospective investors in the Fund unless preceded or accompanied by an effective prospectus.
A fund files its complete schedule of portfolio holdings with the SEC for the first and third quarters of each fiscal year on Form N-PORT. Forms N-PORT are available on the SEC's web site at http://www.sec.gov. A fund's Forms N-PORT may be reviewed and copied at the SEC's Public Reference Room in Washington, DC. Information regarding the operation of the SEC's Public Reference Room may be obtained by calling 1-800-SEC-0330.
For a complete list of a fund's portfolio holdings, view the most recent holdings listing, semiannual report, or annual report on Fidelity's web site at http://www.fidelity.com, http://www.institutional.fidelity.com, or http://www.401k.com, as applicable.
NOT FDIC INSURED •MAY LOSE VALUE •NO BANK GUARANTEE
Neither the Fund nor Fidelity Distributors Corporation is a bank.
| Top Five States (% of Fund's net assets) |
| | |
| Massachusetts | 13.6 |
| New York | 10.0 |
| California | 9.4 |
| Illinois | 8.7 |
| Florida | 5.6 |
| | |
| Revenue Sources (% of Fund's net assets) |
| General Obligations | 27.8 | |
| Health Care | 19.9 | |
| Education | 13.0 | |
| Water & Sewer | 11.6 | |
| Other | 7.0 | |
| Special Tax | 6.5 | |
| Electric Utilities | 5.1 | |
| Others* (Individually Less Than 5%) | 9.1 | |
| | 100.0 | |
| |
| *Includes net other assets | | |
Quality Diversification (% of Fund's net assets) |
|
| |
| We have used ratings from Moody's Investors Service, Inc. Where Moody's® ratings are not available, we have used S&P® ratings. All ratings are as of the date indicated and do not reflect subsequent changes. |
Showing Percentage of Net Assets
| Municipal Bonds - 91.4% |
| | | Principal Amount (a) | Value ($) |
| Alabama - 1.8% | | | |
| Black Belt Energy Gas District Bonds Series 2022 F, 5.5%, tender 12/1/28 (b) | | 100,000 | 105,444 |
| Southeast Energy Auth. Rev. Bonds Bonds Series 2022 A1, 5.5%, tender 12/1/29 (b) | | 100,000 | 106,543 |
TOTAL ALABAMA | | | 211,987 |
| Arizona - 3.3% | | | |
| Phoenix Civic Impt. Corp. Wtr. Sys. Rev. Series 2021 A, 5% 7/1/45 | | 195,000 | 212,919 |
| Salt Verde Finl. Corp. Sr. Gas Rev. Series 2007 1, 5% 12/1/32 | | 170,000 | 180,136 |
TOTAL ARIZONA | | | 393,055 |
| California - 9.4% | | | |
| California Edl. Facilities Auth. Rev. Series T1, 5% 3/15/39 | | 30,000 | 35,552 |
| California Hsg. Fin. Agcy. Series 2021 1, 3.5% 11/20/35 | | 96,543 | 90,396 |
| California Infrastructure and Econ. Dev. Bank Rev. Series 2017, 5% 5/15/47 | | 25,000 | 26,520 |
| California Muni. Fin. Auth. Rev.: | | | |
| (Pomona College Proj.) Series 2017, 5% 1/1/33 (Pre-Refunded to 1/1/28 @ 100) | | 25,000 | 27,528 |
| Series 2018: | | | |
5% 10/1/25 | | 15,000 | 15,299 |
5% 10/1/35 | | 5,000 | 5,200 |
| California Statewide Cmntys. Dev. Auth. Rev. Series 2016, 5% 10/1/33 | | 20,000 | 20,810 |
| Los Angeles Dept. of Wtr. & Pwr. Wtrwks. Rev.: | | | |
| Series 2017 A, 5% 7/1/32 | | 10,000 | 10,767 |
| Series 2020 A, 5% 7/1/40 | | 400,000 | 445,270 |
| Series 2020 B, 4% 7/1/29 | | 55,000 | 58,877 |
| San Diego Unified School District: | | | |
| (Convention Ctr. Proj.) Series 2012, 0% 7/1/45 | | 10,000 | 4,073 |
| Series 2010 C, 0% 7/1/44 | | 100,000 | 42,744 |
| Sanger Unified School District Series 2018 C, 3% 8/1/48 | | 200,000 | 154,496 |
| Santa Clara County Fing. Auth. Lease Rev. Series 2019 A, 3% 5/1/37 | | 200,000 | 182,100 |
| Univ. of California Revs. Series 2020 BE, 5% 5/15/42 | | 10,000 | 11,045 |
TOTAL CALIFORNIA | | | 1,130,677 |
| Colorado - 2.0% | | | |
| Colorado Ctfs. of Prtn. Series 2020 A, 4% 12/15/38 | | 10,000 | 10,136 |
| Colorado Health Facilities Auth. Rev. Bonds: | | | |
| Series 2019 A1, 5% 8/1/36 | | 15,000 | 15,850 |
| Series 2019 A2: | | | |
5% 8/1/33 | | 125,000 | 134,469 |
5% 8/1/39 | | 10,000 | 10,422 |
| Series 2021 A, 3% 11/15/51 | | 100,000 | 75,387 |
TOTAL COLORADO | | | 246,264 |
| Connecticut - 2.8% | | | |
| Connecticut Gen. Oblig.: | | | |
| Series 2019 A, 5% 4/15/33 | | 30,000 | 33,317 |
| Series 2021 B, 4% 6/1/34 | | 10,000 | 10,652 |
| Series 2021 D, 5% 7/15/28 | | 75,000 | 82,456 |
| Connecticut Hsg. Fin. Auth. Series 2021 D1, 5% 11/15/28 | | 25,000 | 27,142 |
| Connecticut Spl. Tax Oblig. Trans. Infrastructure Rev.: | | | |
| Series 2021 A, 4% 5/1/36 | | 130,000 | 135,407 |
| Series A, 5% 5/1/29 | | 15,000 | 16,803 |
| South Central Reg'l. Wtr. Auth. Wtr. Sys. Rev. Series 32 B, 5% 8/1/32 | | 25,000 | 26,484 |
TOTAL CONNECTICUT | | | 332,261 |
| District Of Columbia - 0.1% | | | |
| District of Columbia Univ. Rev. Series 2017, 5% 4/1/33 | | 10,000 | 10,606 |
| Florida - 5.6% | | | |
| Broward County School Board Ctfs. of Prtn.: | | | |
| Series 2015 A, 5% 7/1/26 | | 30,000 | 30,908 |
| Series 2020 A, 5% 7/1/33 | | 30,000 | 33,732 |
| Escambia County Health Facilities Auth. Health Facilities Rev. Series 2020 A, 5% 8/15/34 | | 195,000 | 205,166 |
| JEA Wtr. & Swr. Sys. Rev. Series 2017 A, 5% 10/1/29 | | 25,000 | 27,201 |
| Lakeland Hosp. Sys. Rev. Series 2016, 5% 11/15/29 | | 15,000 | 15,700 |
| Miami-Dade County Wtr. & Swr. Rev. Series 2017 B, 5% 10/1/27 | | 55,000 | 59,287 |
| Palm Beach County Health Facilities Auth. Hosp. Rev. (Jupiter Med. Ctr. Proj.) Series 2022, 5% 11/1/35 | | 150,000 | 158,239 |
| Palm Beach County School Board Ctfs. of Prtn. Series 2021 A, 5% 8/1/38 | | 130,000 | 144,024 |
TOTAL FLORIDA | | | 674,257 |
| Georgia - 5.5% | | | |
| Burke County Indl. Dev. Auth. Poll. Cont. Rev. Bonds (Georgia Pwr. Co. Plant Vogtle Proj.) Series 1995 4, 3.8%, tender 5/21/26 (b) | | 300,000 | 297,394 |
| Fulton County Dev. Auth. Rev.: | | | |
| Series 2019 A, 3% 7/1/44 | | 175,000 | 136,338 |
| Series 2019, 5% 6/15/44 | | 15,000 | 16,077 |
| Main Street Natural Gas, Inc. Bonds Series 2021 A, 4%, tender 9/1/27 (b) | | 100,000 | 99,597 |
| Private Colleges & Univs. Auth. Rev. Series 2019 A, 5% 9/1/39 | | 100,000 | 108,682 |
TOTAL GEORGIA | | | 658,088 |
| Illinois - 8.7% | | | |
| Illinois Fin. Auth. Series 2022 A, 5% 10/1/35 | | 150,000 | 154,074 |
| Illinois Fin. Auth. Academic Facilities (Provident Group UIUC Properties LLC Univ. of Illinois at Urbana-Champaign Proj.) Series 2019 A: | | | |
| 5% 10/1/32 | | 15,000 | 16,291 |
| 5% 10/1/38 | | 300,000 | 313,308 |
| Illinois Fin. Auth. Health Svcs. Facility Lease Rev. (Provident Group - UIC Surgery Ctr. LLC - Univ. of Illinois Health Svcs. Facility Proj.) Series 2020, 4% 10/1/55 | | 100,000 | 85,781 |
| Illinois Fin. Auth. Rev.: | | | |
| (Presence Health Proj.) Series 2016 C, 5% 2/15/36 | | 30,000 | 31,448 |
| Series 2015 A, 5% 10/1/35 | | 5,000 | 5,147 |
| Series 2016 A, 5% 7/1/31 (Pre-Refunded to 7/1/26 @ 100) | | 50,000 | 52,767 |
| Illinois Gen. Oblig.: | | | |
| Series 2017 C, 5% 11/1/29 | | 125,000 | 132,962 |
| Series 2021 A, 5% 3/1/46 | | 50,000 | 52,189 |
| Series 2023 D, 4% 7/1/37 | | 200,000 | 198,518 |
TOTAL ILLINOIS | | | 1,042,485 |
| Indiana - 0.4% | | | |
| Indiana Hsg. & Cmnty. Dev. Auth.: | | | |
| Series 2021 B, Series 2021 B, 5% 1/1/28 | | 15,000 | 16,108 |
| Series A, 5% 7/1/28 | | 25,000 | 27,331 |
TOTAL INDIANA | | | 43,439 |
| Kentucky - 0.3% | | | |
| Kentucky Bond Dev. Corp. Edl. Facilities Series 2021, 4% 6/1/35 | | 20,000 | 20,108 |
| Kentucky State Property & Buildings Commission Rev. Series A, 5% 11/1/33 | | 20,000 | 21,831 |
TOTAL KENTUCKY | | | 41,939 |
| Maine - 2.6% | | | |
| Maine Health & Higher Edl. Facilities Auth. Rev.: | | | |
| Series 2017 B: | | | |
5% 7/1/28 | | 30,000 | 31,804 |
5% 7/1/29 | | 10,000 | 10,579 |
| Series 2018 A, 5% 7/1/30 | | 250,000 | 266,690 |
TOTAL MAINE | | | 309,073 |
| Maryland - 0.6% | | | |
| Baltimore Proj. Rev. (Wastewtr. Projs.) Series 2017 B, 5% 7/1/32 | | 25,000 | 26,706 |
| Maryland Dept. of Trans.: | | | |
| Series 2016, 4% 9/1/27 | | 10,000 | 10,459 |
| Series 2020, 5% 10/1/33 | | 10,000 | 11,466 |
| Series 2021 A, 2% 10/1/34 | | 10,000 | 8,489 |
| Montgomery County Gen. Oblig. Ctfs. of Prtn. Series 2020 A, 5% 10/1/27 | | 15,000 | 16,310 |
TOTAL MARYLAND | | | 73,430 |
| Massachusetts - 13.6% | | | |
| Arlington Gen. Oblig. Series 2021, 2% 9/15/35 | | 100,000 | 82,521 |
| Foxborough Gen. Oblig. Series 2016, 3% 5/15/46 | | 25,000 | 20,376 |
| Massachusetts Bay Trans. Auth. Sales Tax Rev. Series 2021 A1, 5% 7/1/35 | | 45,000 | 51,713 |
| Massachusetts Commonwealth Trans. Fund Rev. (Rail Enhancement & Accelerated Bridge Programs) Series 2019 A, 5% 6/1/49 | | 215,000 | 228,751 |
| Massachusetts Dev. Fin. Agcy. Rev.: | | | |
| (Partners Healthcare Sys., Inc. Proj.) Series 2017 S, 5% 7/1/32 | | 15,000 | 16,273 |
| Bonds Series A1, 5%, tender 1/31/30 (b) | | 20,000 | 22,148 |
| Series 2015 O1, 4% 7/1/45 | | 50,000 | 47,870 |
| Series 2018 L, 5% 10/1/33 | | 35,000 | 35,971 |
| Series 2020 A: | | | |
5% 10/15/29 | | 30,000 | 34,236 |
5% 10/15/30 | | 25,000 | 29,069 |
| Series 2021 G, 4% 7/1/46 | | 75,000 | 71,010 |
| Massachusetts Gen. Oblig.: | | | |
| Series 2017 A, 5% 4/1/36 | | 15,000 | 15,994 |
| Series 2017 D, 5% 7/1/27 | | 25,000 | 27,112 |
| Series 2020 D, 5% 7/1/48 | | 10,000 | 10,737 |
| Series D, 5% 7/1/45 | | 340,000 | 367,123 |
| Series E, 5% 11/1/45 | | 375,000 | 406,167 |
| Massachusetts School Bldg. Auth. Dedicated Sales Tax Rev. Series A: | | | |
| 5% 8/15/34 | | 5,000 | 5,707 |
| 5% 8/15/45 | | 100,000 | 108,944 |
| Univ. of Massachusetts Bldg. Auth. Rev. Series 2021 1, 5% 11/1/32 | | 50,000 | 57,728 |
TOTAL MASSACHUSETTS | | | 1,639,450 |
| Michigan - 5.2% | | | |
| Grand Rapids San. Swr. Sys. Rev.: | | | |
| Series 2018, 5% 1/1/35 | | 15,000 | 16,220 |
| Series 2018, 5% 1/1/29 | | 30,000 | 32,845 |
| Great Lakes Wtr. Auth. Wtr. Supply Sys. Rev. Series 2020 B, 5% 7/1/45 | | 430,000 | 453,291 |
| Michigan Fin. Auth. Rev.: | | | |
| Series 2016: | | | |
5% 11/15/26 | | 20,000 | 20,878 |
5% 11/15/30 | | 30,000 | 31,332 |
5% 11/15/34 | | 15,000 | 15,619 |
| Series 2022, 5% 12/1/32 | | 25,000 | 26,393 |
| Michigan Hosp. Fin. Auth. Rev. Series 2010 F4, 5% 11/15/47 | | 10,000 | 10,447 |
| Univ. of Michigan Rev. Series 2020 A, 5% 4/1/39 | | 15,000 | 16,555 |
TOTAL MICHIGAN | | | 623,580 |
| Minnesota - 0.2% | | | |
| Minnesota Gen. Oblig. Series 2019 A, 5% 8/1/30 | | 10,000 | 11,280 |
| Minnesota Hsg. Fin. Agcy. Series B, 4% 8/1/36 | | 15,000 | 15,396 |
TOTAL MINNESOTA | | | 26,676 |
| Nebraska - 1.6% | | | |
| Central Plains Energy Proj. Gas Supply Bonds Series 2019, 4%, tender 8/1/25 (b) | | 50,000 | 49,955 |
| Douglas County Hosp. Auth. #2 Health Facilities Rev. Series 2020 A, 5% 11/15/30 | | 125,000 | 139,389 |
TOTAL NEBRASKA | | | 189,344 |
| New Jersey - 3.7% | | | |
| New Jersey Trans. Trust Fund Auth.: | | | |
| Series 2018 A, 5% 12/15/32 | | 100,000 | 108,658 |
| Series 2021 A, 5% 6/15/33 | | 95,000 | 106,502 |
| Series 2022 A, 4% 6/15/39 | | 50,000 | 49,554 |
| Series 2022 BB, 5% 6/15/31 | | 130,000 | 146,829 |
| Series A, 0% 12/15/31 | | 50,000 | 36,769 |
TOTAL NEW JERSEY | | | 448,312 |
| New York - 10.0% | | | |
| Dorm. Auth. New York Univ. Rev. Series 2018 A, 5% 7/1/36 | | 10,000 | 10,865 |
| Dutchess County Local Dev. Corp. Rev. (Vassar College Proj.) Series 2020, 5% 7/1/45 | | 60,000 | 64,107 |
| Long Island Pwr. Auth. Elec. Sys. Rev. Series 2020 A: | | | |
| 5% 9/1/35 | | 10,000 | 11,356 |
| 5% 9/1/38 | | 170,000 | 187,713 |
| New York Dorm. Auth. Rev.: | | | |
| Series 2015 A, 3.75% 7/1/46 | | 10,000 | 8,402 |
| Series 2022 A, 5% 7/1/34 | | 200,000 | 217,326 |
| New York Metropolitan Trans. Auth. Rev.: | | | |
| Series 2017 C1: | | | |
5% 11/15/27 | | 20,000 | 21,167 |
5% 11/15/29 | | 50,000 | 53,249 |
5% 11/15/31 | | 135,000 | 143,740 |
| Series 2019 C, 5% 11/15/39 | | 70,000 | 73,697 |
| New York State Dorm. Auth.: | | | |
| Series 2017 A, 5% 2/15/31 | | 15,000 | 16,013 |
| Series 2021 E, 3% 3/15/50 | | 100,000 | 77,147 |
| New York State Urban Dev. Corp. Series 2020 E, 4% 3/15/35 | | 30,000 | 31,161 |
| New York State Urban Eev Corp. Series 2019 A, 5% 3/15/37 | | 85,000 | 92,984 |
| Saratoga County Cap. Resources Rev. (Skidmore College Proj.) Series 2020 A, 5% 7/1/45 | | 90,000 | 96,442 |
| Suffolk County Gen. Oblig. Series 2017 D, 4% 2/1/28 (Build America Mutual Assurance Insured) | | 100,000 | 105,125 |
TOTAL NEW YORK | | | 1,210,494 |
| North Carolina - 1.2% | | | |
| Charlotte-Mecklenburg Hosp. Auth. Health Care Sys. Rev. Bonds Series 2021 C, 5%, tender 12/1/28 (b) | | 25,000 | 27,303 |
| Univ. of North Carolina at Chapel Hill Rev. Series 2021 B, 5% 12/1/38 | | 100,000 | 112,715 |
TOTAL NORTH CAROLINA | | | 140,018 |
| Ohio - 0.6% | | | |
| Allen County Hosp. Facilities Rev. (Mercy Health) Series 2017 A, 5% 8/1/29 | | 10,000 | 10,800 |
| Ohio Gen. Oblig. Series 2019 A, 5% 5/1/30 | | 20,000 | 21,509 |
| Ohio Higher Edl. Facility Commission Rev. (Univ. of Dayton Proj.) Series 2018 B, 5% 12/1/29 | | 25,000 | 26,914 |
| Ohio Hsg. Fin. Agcy. Residential Mtg. Rev. (Mtg.-Backed Securities Prog.) Series 2022 A, 5% 3/1/30 | | 15,000 | 16,481 |
TOTAL OHIO | | | 75,704 |
| Oklahoma - 0.1% | | | |
| Oklahoma State Univ. Agricultural And Mechanical College Series 2020 A, 5% 9/1/32 | | 15,000 | 17,026 |
| Oregon - 2.5% | | | |
| Medford Hosp. Facilities Auth. Rev. (Asante Projs.) Series 2020 A, 5% 8/15/38 | | 15,000 | 15,964 |
| Oregon Facilities Auth. Rev. Series 2022 B, 5% 6/1/30 | | 30,000 | 32,921 |
| Salem Hosp. Facility Auth. Rev. (Salem Health Projs.) Series 2019 A, 3% 5/15/49 | | 350,000 | 247,310 |
TOTAL OREGON | | | 296,195 |
| Pennsylvania - 0.7% | | | |
| Dubois Hosp. Auth. Hosp. Rev. (Penn Highlands Healthcare Proj.) Series 2018: | | | |
| 5% 7/15/27 | | 45,000 | 47,074 |
| 5% 7/15/28 | | 30,000 | 31,658 |
| Montgomery County Higher Ed. & Health Auth. Rev. Series 2019, 5% 9/1/31 | | 10,000 | 10,826 |
TOTAL PENNSYLVANIA | | | 89,558 |
| Tennessee - 0.2% | | | |
| Knox County Health Edl. & Hsg. Facilities Board Rev. Series 2017, 5% 4/1/27 | | 25,000 | 25,962 |
| Texas - 1.2% | | | |
| Alvin Independent School District Series 2016 A, 5% 2/15/28 | | 20,000 | 20,943 |
| Cypress-Fairbanks Independent School District Series 2016, 5% 2/15/25 | | 15,000 | 15,417 |
| San Antonio Wtr. Sys. Rev.: | | | |
| Series 2018 A, 5% 5/15/33 | | 15,000 | 16,360 |
| Series 2020 A, 5% 5/15/27 | | 10,000 | 10,742 |
| Univ. of Houston Univ. Revs. Series 2021 A, 2% 2/15/33 | | 35,000 | 30,002 |
| Wichita Falls Independent School District Series 2021, 4% 2/1/28 | | 50,000 | 52,175 |
TOTAL TEXAS | | | 145,639 |
| Utah - 0.3% | | | |
| Utah County Hosp. Rev. Series 2016 B, 3% 5/15/47 | | 40,000 | 31,567 |
| Virginia - 2.1% | | | |
| Virginia College Bldg. Auth. Edl. Facilities Rev. (21st Century College and Equip. Progs.) Series 2017 E, 5% 2/1/31 | | 10,000 | 10,913 |
| Virginia Commonwealth Trans. Board Rev.: | | | |
| (Virginia Gen. Oblig. Proj.) Series 2017 A, 5% 5/15/29 | | 60,000 | 65,311 |
| (Virginia Gen. Oblig.) Series 2017 A, 5% 5/15/27 | | 20,000 | 21,580 |
| Virginia Commonwealth Univ. Health Sys. Auth. Series 2017 A, 5% 7/1/28 | | 5,000 | 5,348 |
| Virginia Pub. Bldg. Auth. Pub. Facilities Rev. Series 2019 A, 4% 8/1/36 | | 150,000 | 155,012 |
TOTAL VIRGINIA | | | 258,164 |
| Washington - 5.0% | | | |
| Energy Northwest Elec. Rev. Series 2020 A, 5% 7/1/34 | | 100,000 | 113,981 |
| Washington Gen. Oblig.: | | | |
| Series 2018 A, 5% 8/1/27 | | 50,000 | 54,076 |
| Series 2018 C, 5% 8/1/30 | | 30,000 | 32,351 |
| Series 2020 A, 5% 8/1/27 | | 60,000 | 64,891 |
| Series 2020 C, 5% 2/1/37 | | 10,000 | 11,082 |
| Series 2021 A, 5% 8/1/43 | | 85,000 | 92,563 |
| Series 2022 A, 5% 8/1/42 | | 40,000 | 44,127 |
| Washington Health Care Facilities Auth. Rev.: | | | |
| (Overlake Hosp. Med. Ctr., WA. Proj.) Series 2017 B, 5% 7/1/27 | | 25,000 | 25,606 |
| (Providence Health Systems Proj.) Series 2018 B, 5% 10/1/33 | | 40,000 | 42,168 |
| Series 2017 A, 4% 7/1/37 | | 130,000 | 121,023 |
TOTAL WASHINGTON | | | 601,868 |
| Wisconsin - 0.1% | | | |
| Wisconsin St Gen. Fund Annual Appropriation Series 2019 A, 5% 5/1/26 (Escrowed to Maturity) | | 15,000 | 15,793 |
| TOTAL MUNICIPAL BONDS (Cost $11,055,766) | | | 11,002,911 |
| | | | |
| Municipal Notes - 1.6% |
| | | Principal Amount (a) | Value ($) |
| Texas - 1.6% | | | |
Harris County Health Facilities Dev. Corp. Rev. (Methodist Hosp. Proj.) Series A1, 4.5% 8/1/23, VRDN (b) (Cost $200,000) | | 200,000 | 200,000 |
| | | | |
| Money Market Funds - 5.1% |
| | | Shares | Value ($) |
Fidelity Municipal Cash Central Fund 4.30% (c)(d) (Cost $613,996) | | 613,877 | 614,002 |
| | | | |
| TOTAL INVESTMENT IN SECURITIES - 98.1% (Cost $11,869,762) | 11,816,913 |
NET OTHER ASSETS (LIABILITIES) - 1.9% | 224,080 |
| NET ASSETS - 100.0% | 12,040,993 |
| | |
Security Type Abbreviations
| VRDN | - | VARIABLE RATE DEMAND NOTE (A debt instrument that is payable upon demand, either daily, weekly or monthly) |
Legend
| (a) | Amount is stated in United States dollars unless otherwise noted. |
| (b) | Coupon rates for floating and adjustable rate securities reflect the rates in effect at period end. |
| (c) | Information in this report regarding holdings by state and security types does not reflect the holdings of the Fidelity Municipal Cash Central Fund. |
| (d) | Affiliated fund that is generally available only to investment companies and other accounts managed by Fidelity Investments. The rate quoted is the annualized seven-day yield of the fund at period end. A complete unaudited listing of the fund's holdings as of its most recent quarter end is available upon request. In addition, each Fidelity Central Fund's financial statements are available on the SEC's website or upon request. |
Affiliated Central Funds
Fiscal year to date information regarding the Fund's investments in Fidelity Central Funds, including the ownership percentage, is presented below.
| Affiliate | Value, beginning of period ($) | Purchases ($) | Sales Proceeds ($) | Dividend Income ($) | Realized Gain (loss) ($) | Change in Unrealized appreciation (depreciation) ($) | Value, end of period ($) | % ownership, end of period |
| Fidelity Municipal Cash Central Fund 4.30% | 232,000 | 1,209,996 | 828,000 | 3,896 | - | 6 | 614,002 | 0.0% |
| Total | 232,000 | 1,209,996 | 828,000 | 3,896 | - | 6 | 614,002 | |
| | | | | | | | | |
Amounts in the dividend income column in the above table include any capital gain distributions from underlying funds, which are presented in the corresponding line item in the Statement of Operations, if applicable.
Amounts included in the purchases and sales proceeds columns may include in-kind transactions, if applicable.
Investment Valuation
The following is a summary of the inputs used, as of July 31, 2023, involving the Fund's assets and liabilities carried at fair value. The inputs or methodology used for valuing securities may not be an indication of the risk associated with investing in those securities. For more information on valuation inputs, and their aggregation into the levels used below, please refer to the Investment Valuation section in the accompanying Notes to Financial Statements.
| Valuation Inputs at Reporting Date: |
| Description | Total ($) | Level 1 ($) | Level 2 ($) | Level 3 ($) |
Investments in Securities: | | | | |
|
| Municipal Securities | 11,202,911 | - | 11,202,911 | - |
|
| Money Market Funds | 614,002 | 614,002 | - | - |
| Total Investments in Securities: | 11,816,913 | 614,002 | 11,202,911 | - |
| Statement of Assets and Liabilities |
| | | | July 31, 2023 (Unaudited) |
| | | | | |
| Assets | | | | |
| Investment in securities, at value - See accompanying schedule: | | | | |
Unaffiliated issuers (cost $11,255,766) | $ | 11,202,911 | | |
Fidelity Central Funds (cost $613,996) | | 614,002 | | |
| | | | | |
| | | | | |
| Total Investment in Securities (cost $11,869,762) | | | $ | 11,816,913 |
| Cash | | | | 137,766 |
| Interest receivable | | | | 112,192 |
| Distributions receivable from Fidelity Central Funds | | | | 1,271 |
| Prepaid expenses | | | | 9 |
| Receivable from investment adviser for expense reductions | | | | 4,457 |
| Other receivables | | | | 21 |
Total assets | | | | 12,072,629 |
| Liabilities | | | | |
| Distributions payable | $ | 4,075 | | |
| Accrued management fee | | 3,433 | | |
| Audit fee payable | | 24,055 | | |
| Other payables and accrued expenses | | 73 | | |
| Total Liabilities | | | | 31,636 |
| Net Assets | | | $ | 12,040,993 |
| Net Assets consist of: | | | | |
| Paid in capital | | | $ | 12,082,767 |
| Total accumulated earnings (loss) | | | | (41,774) |
| Net Assets | | | $ | 12,040,993 |
Net Asset Value, offering price and redemption price per share ($12,040,993 ÷ 1,209,779 shares) | | | $ | 9.95 |
| Statement of Operations |
| | | | Six months ended July 31, 2023 (Unaudited) |
| Investment Income | | | | |
| Interest | | | $ | 194,666 |
| Income from Fidelity Central Funds | | | | 3,896 |
| Total Income | | | | 198,562 |
| Expenses | | | | |
| Management fee | $ | 20,038 | | |
| Transfer agent fees | | 17 | | |
| Custodian fees and expenses | | 2,950 | | |
| Independent trustees' fees and expenses | | 19 | | |
| Registration fees | | 23,610 | | |
| Audit | | 26,581 | | |
| Legal | | 26 | | |
| Miscellaneous | | 16 | | |
| Total expenses before reductions | | 73,257 | | |
| Expense reductions | | (52,850) | | |
| Total expenses after reductions | | | | 20,407 |
| Net Investment income (loss) | | | | 178,155 |
| Realized and Unrealized Gain (Loss) | | | | |
| Net realized gain (loss) on: | | | | |
| Investment Securities: | | | | |
| Unaffiliated issuers | | 7,188 | | |
| Total net realized gain (loss) | | | | 7,188 |
| Change in net unrealized appreciation (depreciation) on: | | | | |
| Investment Securities: | | | | |
| Unaffiliated issuers | | (206,082) | | |
| Fidelity Central Funds | | 6 | | |
| Total change in net unrealized appreciation (depreciation) | | | | (206,076) |
| Net gain (loss) | | | | (198,888) |
| Net increase (decrease) in net assets resulting from operations | | | $ | (20,733) |
| Statement of Changes in Net Assets |
| |
| | Six months ended July 31, 2023 (Unaudited) | | For the period April 13, 2022 (commencement of operations) through January 31, 2023 |
| Increase (Decrease) in Net Assets | | | | |
| Operations | | | | |
| Net investment income (loss) | $ | 178,155 | $ | 223,541 |
| Net realized gain (loss) | | 7,188 | | 139 |
| Change in net unrealized appreciation (depreciation) | | (206,076) | | 153,227 |
| Net increase (decrease) in net assets resulting from operations | | (20,733) | | 376,907 |
| Distributions to shareholders | | (174,673) | | (223,275) |
| | | | | |
| Share transactions | | | | |
| Proceeds from sales of shares | | 842,476 | | 11,106,399 |
| Reinvestment of distributions | | 155,157 | | 219,718 |
| Cost of shares redeemed | | (227,313) | | (13,670) |
| | | | | |
Net increase (decrease) in net assets resulting from share transactions | | 770,320 | | 11,312,447 |
| Total increase (decrease) in net assets | | 574,914 | | 11,466,079 |
| | | | | |
| Net Assets | | | | |
| Beginning of period | | 11,466,079 | | - |
| End of period | $ | 12,040,993 | $ | 11,466,079 |
| | | | | |
| Other Information | | | | |
| Shares | | | | |
| Sold | | 84,906 | | 1,111,389 |
| Issued in reinvestment of distributions | | 15,596 | | 22,288 |
| Redeemed | | (23,029) | | (1,371) |
| Net increase (decrease) | | 77,473 | | 1,132,306 |
| | | | | |
| Fidelity® SAI Sustainable Municipal Income Fund |
| |
| | Six months ended (Unaudited) July 31, 2023 | | Years ended January 31, 2023 A |
Selected Per-Share Data | | | | |
| Net asset value, beginning of period | $ | 10.13 | $ | 10.00 |
| Income from Investment Operations | | | | |
Net investment income (loss) B,C | | .154 | | .218 |
| Net realized and unrealized gain (loss) | | (.183) | | .130 |
| Total from investment operations | | (.029) | | .348 |
| Distributions from net investment income | | (.151) | | (.218) |
| Total distributions | | (.151) | | (.218) |
| Net asset value, end of period | $ | 9.95 | $ | 10.13 |
Total Return D,E | | (.28)% | | 3.56% |
Ratios to Average Net Assets C,F,G | | | | |
| Expenses before reductions | | 1.28% H | | 1.18% H,I |
| Expenses net of fee waivers, if any | | .36% H | | .36% H |
| Expenses net of all reductions | | .36% H | | .35% H |
| Net investment income (loss) | | 3.11% H | | 2.74% H |
| Supplemental Data | | | | |
| Net assets, end of period (000 omitted) | $ | 12,041 | $ | 11,466 |
Portfolio turnover rate J | | 5% H | | -% H |
AFor the period April 13, 2022 (commencement of operations) through January 31, 2023.
BCalculated based on average shares outstanding during the period.
CNet investment income (loss) is affected by the timing of the declaration of dividends by any underlying mutual funds or exchange-traded funds (ETFs). Net investment income (loss) of any mutual funds or ETFs is not included in the Fund's net investment income (loss) ratio.
DTotal returns for periods of less than one year are not annualized.
ETotal returns would have been lower if certain expenses had not been reduced during the applicable periods shown.
FFees and expenses of any underlying mutual funds or exchange-traded funds (ETFs) are not included in the Fund's expense ratio. The Fund indirectly bears its proportionate share of these expenses. For additional expense information related to investments in Fidelity Central Funds, please refer to the "Investments in Fidelity Central Funds" note found in the Notes to Financial Statements section of the most recent Annual or Semi-Annual report.
GExpense ratios reflect operating expenses of the class. Expenses before reductions do not reflect amounts reimbursed, waived, or reduced through arrangements with the investment adviser, brokerage services, or other offset arrangements, if applicable, and do not represent the amount paid by the class during periods when reimbursements, waivers or reductions occur.
HAnnualized.
IAudit fees are not annualized.
JAmount does not include the portfolio activity of any underlying mutual funds or exchange-traded funds (ETFs).
For the period ended July 31, 2023
1. Organization.
Fidelity SAI Sustainable Municipal Income Fund (the Fund) is a fund of Fidelity Salem Street Trust (the Trust) and is authorized to issue an unlimited number of shares. Shares are offered exclusively to certain clients of Fidelity Management & Research Company LLC (FMR) or its affiliates. The Trust is registered under the Investment Company Act of 1940, as amended (the 1940 Act), as an open-end management investment company organized as a Massachusetts business trust.
2. Investments in Fidelity Central Funds.
Funds may invest in Fidelity Central Funds, which are open-end investment companies generally available only to other investment companies and accounts managed by the investment adviser and its affiliates. The Schedule of Investments lists any Fidelity Central Funds held as an investment as of period end, but does not include the underlying holdings of each Fidelity Central Fund. An investing fund indirectly bears its proportionate share of the expenses of the underlying Fidelity Central Funds.
Based on its investment objective, each Fidelity Central Fund may invest or participate in various investment vehicles or strategies that are similar to those of the investing fund. These strategies are consistent with the investment objectives of the investing fund and may involve certain economic risks which may cause a decline in value of each of the Fidelity Central Funds and thus a decline in the value of the investing fund.
| Fidelity Central Fund | Investment Manager | Investment Objective | Investment Practices | Expense RatioA |
| Fidelity Money Market Central Funds | Fidelity Management & Research Company LLC (FMR) | Each fund seeks to obtain a high level of current income consistent with the preservation of capital and liquidity. | Short-term Investments | Less than .005% |
A Expenses expressed as a percentage of average net assets and are as of each underlying Central Fund's most recent annual or semi-annual shareholder report.
A complete unaudited list of holdings for each Fidelity Central Fund is available upon request or at the Securities and Exchange Commission website at www.sec.gov. In addition, the financial statements of the Fidelity Central Funds which contain the significant accounting policies (including investment valuation policies) of those funds, and are not covered by the Report of Independent Registered Public Accounting Firm, are available on the Securities and Exchange Commission website or upon request.
3. Significant Accounting Policies.
The Fund is an investment company and applies the accounting and reporting guidance of the Financial Accounting Standards Board (FASB) Accounting Standards Codification Topic 946 Financial Services - Investment Companies. The financial statements have been prepared in conformity with accounting principles generally accepted in the United States of America (GAAP), which require management to make certain estimates and assumptions at the date of the financial statements. Actual results could differ from those estimates. Subsequent events, if any, through the date that the financial statements were issued have been evaluated in the preparation of the financial statements. The Fund's Schedule of Investments lists any underlying mutual funds or exchange-traded funds (ETFs) but does not include the underlying holdings of these funds. The following summarizes the significant accounting policies of the Fund:
Investment Valuation. Investments are valued as of 4:00 p.m. Eastern time on the last calendar day of the period. The Board of Trustees (the Board) has designated the Fund's investment adviser as the valuation designee responsible for the fair valuation function and performing fair value determinations as needed. The investment adviser has established a Fair Value Committee (the Committee) to carry out the day-to-day fair valuation responsibilities and has adopted policies and procedures to govern the fair valuation process and the activities of the Committee. In accordance with these fair valuation policies and procedures, which have been approved by the Board, the Fund attempts to obtain prices from one or more third party pricing services or brokers to value its investments. When current market prices, quotations or currency exchange rates are not readily available or reliable, investments will be fair valued in good faith by the Committee, in accordance with the policies and procedures. Factors used in determining fair value vary by investment type and may include market or investment specific events, transaction data, estimated cash flows, and market observations of comparable investments. The frequency that the fair valuation procedures are used cannot be predicted and they may be utilized to a significant extent. The Committee manages the Fund's fair valuation practices and maintains the fair valuation policies and procedures. The Fund's investment adviser reports to the Board information regarding the fair valuation process and related material matters.
The Fund categorizes the inputs to valuation techniques used to value its investments into a disclosure hierarchy consisting of three levels as shown below:
Level 1 - unadjusted quoted prices in active markets for identical investments
Level 2 - other significant observable inputs (including quoted prices for similar investments, interest rates, prepayment speeds, etc.)
Level 3 - unobservable inputs (including the Fund's own assumptions based on the best information available)
Valuation techniques used to value the Fund's investments by major category are as follows:
Debt securities, including restricted securities, are valued based on evaluated prices received from third party pricing services or from brokers who make markets in such securities. Municipal securities are valued by pricing services who utilize matrix pricing which considers yield or price of bonds of comparable quality, coupon, maturity and type or by broker-supplied prices. When independent prices are unavailable or unreliable, debt securities may be valued utilizing pricing methodologies which consider similar factors that would be used by third party pricing services. Debt securities are generally categorized as Level 2 in the hierarchy but may be Level 3 depending on the circumstances.
Investments in open-end mutual funds, including the Fidelity Central Funds, are valued at their closing net asset value (NAV) each business day and are categorized as Level 1 in the hierarchy.
Changes in valuation techniques may result in transfers in or out of an assigned level within the disclosure hierarchy. The aggregate value of investments by input level as of July 31, 2023 is included at the end of the Fund's Schedule of Investments.
Investment Transactions and Income. For financial reporting purposes, the Fund's investment holdings and NAV include trades executed through the end of the last business day of the period. The NAV per share for processing shareholder transactions is calculated as of the close of business of the New York Stock Exchange (NYSE), normally 4:00 p.m. Eastern time and includes trades executed through the end of the prior business day. Gains and losses on securities sold are determined on the basis of identified cost. Income and capital gain distributions from Fidelity Central Funds, if any, are recorded on the ex-dividend date. Interest income is accrued as earned and includes coupon interest and amortization of premium and accretion of discount on debt securities as applicable. Debt obligations may be placed on non-accrual status and related interest income may be reduced by ceasing current accruals and writing off interest receivables when the collection of all or a portion of interest has become doubtful based on consistently applied procedures. A debt obligation is removed from non-accrual status when the issuer resumes interest payments or when collectability of interest is reasonably assured.
Expenses. Expenses directly attributable to a fund are charged to that fund. Expenses attributable to more than one fund are allocated among the respective funds on the basis of relative net assets or other appropriate methods. Expenses included in the accompanying financial statements reflect the expenses of that fund and do not include any expenses associated with any underlying mutual funds or exchange-traded funds. Although not included in a fund's expenses, a fund indirectly bears its proportionate share of these expenses through the net asset value of each underlying mutual fund or exchange-traded fund. Expense estimates are accrued in the period to which they relate and adjustments are made when actual amounts are known.
Income Tax Information and Distributions to Shareholders. Each year, the Fund intends to qualify as a regulated investment company under Subchapter M of the Internal Revenue Code, including distributing substantially all of its taxable income and realized gains. As a result, no provision for U.S. Federal income taxes is required. The Fund files a U.S. federal tax return, in addition to state and local tax returns as required. The Fund's federal income tax returns are subject to examination by the Internal Revenue Service (IRS) for a period of three fiscal years after they are filed. State and local tax returns may be subject to examination for an additional fiscal year depending on the jurisdiction.
Distributions are declared and recorded daily and paid monthly from net investment income. Distributions from realized gains, if any, are declared and recorded on the ex-dividend date. Income and capital gain distributions are determined in accordance with income tax regulations, which may differ from GAAP.
Capital accounts within the financial statements are adjusted for permanent book-tax differences. These adjustments have no impact on net assets or the results of operations. Capital accounts are not adjusted for temporary book-tax differences which will reverse in a subsequent period.
Book-tax differences are primarily due to market discount.
The Fund purchases municipal securities whose interest, in the opinion of the issuer, is free from federal income tax. There is no assurance that the IRS will agree with this opinion. In the event the IRS determines that the issuer does not comply with relevant tax requirements, interest payments from a security could become federally taxable, possibly retroactively to the date the security was issued.
As of period end, the cost and unrealized appreciation (depreciation) in securities, and derivatives if applicable, for federal income tax purposes were as follows:
| Gross unrealized appreciation | $96,700 |
| Gross unrealized depreciation | (145,428) |
| Net unrealized appreciation (depreciation) | $(48,728) |
| Tax cost | $11,865,641 |
4. Purchases and Sales of Investments.
Purchases and sales of securities, other than short-term securities and in-kind transactions, as applicable, are noted in the table below.
| | Purchases ($) | Sales ($) |
| Fidelity SAI Sustainable Municipal Income Fund | 1,121,369 | 243,053 |
5. Fees and Other Transactions with Affiliates.
Management Fee. Fidelity Management & Research Company LLC (the investment adviser) and its affiliates provide the Fund with investment management related services for which the Fund pays a monthly management fee. The management fee is the sum of an individual fund fee rate that is based on an annual rate of .25% of the Fund's average net assets and an annualized group fee rate that averaged .10% during the period. The group fee rate is based upon the monthly average net assets of a group of registered investment companies with which the investment adviser has management contracts. The group fee rate decreases as assets under management increase and increases as assets under management decrease. For the reporting period, the total annualized management fee rate was .35% of the Fund's average net assets.
Interfund Trades. Funds may purchase from or sell securities to other Fidelity Funds under procedures adopted by the Board. The procedures have been designed to ensure these interfund trades are executed in accordance with Rule 17a-7 of the 1940 Act. Any interfund trades are included within the respective purchases and sales amounts shown in the Purchases and Sales of Investments note. During the period, there were no interfund trades.
6. Committed Line of Credit.
Certain Funds participate with other funds managed by the investment adviser or an affiliate in a $4.25 billion credit facility (the "line of credit") to be utilized for temporary or emergency purposes to fund shareholder redemptions or for other short-term liquidity purposes. The participating funds have agreed to pay commitment fees on their pro-rata portion of the line of credit, which are reflected in Miscellaneous expenses on the Statement of Operations, and are listed below. During the period, there were no borrowings on this line of credit.
| | Amount |
| Fidelity SAI Sustainable Municipal Income Fund | $6 |
7. Expense Reductions.
The investment adviser contractually agreed to reimburse the Fund to the extent annual operating expenses exceeded .36% of average net assets. This reimbursement will remain in place through May 31, 2024. Some expenses, for example the compensation of the independent Trustees, and certain miscellaneous expenses such as proxy and shareholder meeting expenses, are excluded from this reimbursement. During the period this reimbursement reduced the Fund's expenses by $52,620.
Through arrangements with the Fund's custodian, credits realized as a result of certain uninvested cash balances were used to reduce the Fund's expenses by $41.
In addition, during the period the investment adviser or an affiliate reimbursed and/or waived a portion of operating expenses in the amount of $189.
8. Other.
A fund's organizational documents provide former and current trustees and officers with a limited indemnification against liabilities arising in connection with the performance of their duties to the fund. In the normal course of business, a fund may also enter into contracts that provide general indemnifications. A fund's maximum exposure under these arrangements is unknown as this would be dependent on future claims that may be made against a fund. The risk of material loss from such claims is considered remote.
At the end of the period, the investment adviser or its affiliates were owners of record of more than 10% of the outstanding shares as follows:
| Fund | Affiliated % |
Fidelity SAI Sustainable Municipal Income Fund | 86% |
9. Risk and Uncertainties.
Many factors affect a fund's performance. Developments that disrupt global economies and financial markets, such as pandemics, epidemics, outbreaks of infectious diseases, war, terrorism, and environmental disasters, may significantly affect a fund's investment performance. The effects of these developments to a fund will be impacted by the types of securities in which a fund invests, the financial condition, industry, economic sector, and geographic location of an issuer, and a fund's level of investment in the securities of that issuer. Significant concentrations in security types, issuers, industries, sectors, and geographic locations may magnify the factors that affect a fund's performance.
As a shareholder, you incur two types of costs: (1) transaction costs, which may include sales charges (loads) on purchase payments or redemption proceeds, as applicable and (2) ongoing costs, which generally include management fees, distribution and/or service (12b-1) fees and other Fund expenses. This Example is intended to help you understand your ongoing costs (in dollars) of investing in a fund and to compare these costs with the ongoing costs of investing in other mutual funds.
| The Example is based on an investment of $1,000 invested at the beginning of the period and held for the entire period (February 1, 2023 to July 31, 2023). |
Actual Expenses
The first line of the accompanying table provides information about actual account values and actual expenses. You may use the information in this line, together with the amount you invested, to estimate the expenses that you paid over the period. Simply divide your account value by $1,000.00 (for example, an $8,600 account value divided by $1,000.00 = 8.6), then multiply the result by the number in the first line for a class/Fund under the heading entitled "Expenses Paid During Period" to estimate the expenses you paid on your account during this period. If any fund is a shareholder of any underlying mutual funds or exchange-traded funds (ETFs) (the Underlying Funds), such fund indirectly bears its proportional share of the expenses of the Underlying Funds in addition to the direct expenses incurred presented in the table. These fees and expenses are not included in the annualized expense ratio used to calculate the expense estimate in the table below.
Hypothetical Example for Comparison Purposes
The second line of the accompanying table provides information about hypothetical account values and hypothetical expenses based on the actual expense ratio and an assumed rate of return of 5% per year before expenses, which is not the actual return. The hypothetical account values and expenses may not be used to estimate the actual ending account balance or expenses you paid for the period. You may use this information to compare the ongoing costs of investing in the Fund and other funds. To do so, compare this 5% hypothetical example with the 5% hypothetical examples that appear in the shareholder reports of the other funds. If any fund is a shareholder of any Underlying Funds, such fund indirectly bears its proportional share of the expenses of the Underlying Funds in addition to the direct expenses as presented in the table. These fees and expenses are not included in the annualized expense ratio used to calculate the expense estimate in the table below.
Please note that the expenses shown in the table are meant to highlight your ongoing costs only and do not reflect any transaction costs. Therefore, the second line of the table is useful in comparing ongoing costs only, and will not help you determine the relative total costs of owning different funds. In addition, if these transactional costs were included, your costs would have been higher.
| | | | | Annualized Expense Ratio- A | | Beginning Account Value February 1, 2023 | | Ending Account Value July 31, 2023 | | Expenses Paid During Period- C February 1, 2023 to July 31, 2023 |
| | | | | | | | | | |
| Fidelity® SAI Sustainable Municipal Income Fund | | | | .36% | | | | | | |
| Actual | | | | | | $ 1,000 | | $ 997.20 | | $ 1.78 |
Hypothetical-B | | | | | | $ 1,000 | | $ 1,023.01 | | $ 1.81 |
| |
A Annualized expense ratio reflects expenses net of applicable fee waivers.
B 5% return per year before expenses
C Expenses are equal to the annualized expense ratio, multiplied by the average account value over the period, multiplied by 181/ 365 (to reflect the one-half year period). The fees and expenses of any Underlying Funds are not included in each annualized expense ratio.
1.9904936.101
MNI-SANN-0923
Fidelity® Series Large Cap Value Index Fund
Semi-Annual Report
July 31, 2023
Contents
To view a fund's proxy voting guidelines and proxy voting record for the 12-month period ended June 30, visit http://www.fidelity.com/proxyvotingresults or visit the Securities and Exchange Commission's (SEC) web site at http://www.sec.gov.
You may also call 1-800-544-8544 to request a free copy of the proxy voting guidelines.
A fund is not in any way connected to or sponsored, endorsed, sold or promoted by the London Stock Exchange Group plc and its group undertakings (collectively, the "LSE Group"). The LSE Group does not accept any liability whatsoever to any person arising out of the use of a fund or the underlying data.
Standard & Poor's, S&P and S&P 500 are registered service marks of The McGraw-Hill Companies, Inc. and have been licensed for use by Fidelity Distributors Corporation.
Other third-party marks appearing herein are the property of their respective owners.
All other marks appearing herein are registered or unregistered trademarks or service marks of FMR LLC or an affiliated company. © 2023 FMR LLC. All rights reserved.
This report and the financial statements contained herein are submitted for the general information of the shareholders of the Fund. This report is not authorized for distribution to prospective investors in the Fund unless preceded or accompanied by an effective prospectus.
A fund files its complete schedule of portfolio holdings with the SEC for the first and third quarters of each fiscal year on Form N-PORT. Forms N-PORT are available on the SEC's web site at http://www.sec.gov. A fund's Forms N-PORT may be reviewed and copied at the SEC's Public Reference Room in Washington, DC. Information regarding the operation of the SEC's Public Reference Room may be obtained by calling 1-800-SEC-0330.
For a complete list of a fund's portfolio holdings, view the most recent holdings listing, semiannual report, or annual report on Fidelity's web site at http://www.fidelity.com, http://www.institutional.fidelity.com, or http://www.401k.com, as applicable.
NOT FDIC INSURED •MAY LOSE VALUE •NO BANK GUARANTEE
Neither the Fund nor Fidelity Distributors Corporation is a bank.
Top Holdings (% of Fund's net assets) |
| |
| Berkshire Hathaway, Inc. Class B | 3.2 | |
| JPMorgan Chase & Co. | 2.3 | |
| Johnson & Johnson | 2.2 | |
| Exxon Mobil Corp. | 2.2 | |
| Procter & Gamble Co. | 1.5 | |
| Chevron Corp. | 1.4 | |
| Walmart, Inc. | 1.1 | |
| Bank of America Corp. | 1.1 | |
| Merck & Co., Inc. | 1.1 | |
| Cisco Systems, Inc. | 1.1 | |
| | 17.2 | |
| |
| Market Sectors (% of Fund's net assets) |
| |
| Financials | 20.6 | |
| Health Care | 15.3 | |
| Industrials | 13.3 | |
| Information Technology | 9.1 | |
| Consumer Staples | 8.3 | |
| Energy | 8.2 | |
| Consumer Discretionary | 5.2 | |
| Utilities | 5.1 | |
| Communication Services | 4.9 | |
| Materials | 4.9 | |
| Real Estate | 4.8 | |
| |
Asset Allocation (% of Fund's net assets) |
|
Futures - 0.3% |
|
Showing Percentage of Net Assets
| Common Stocks - 99.7% |
| | | Shares | Value ($) |
| COMMUNICATION SERVICES - 4.9% | | | |
| Diversified Telecommunication Services - 1.2% | | | |
| AT&T, Inc. | | 2,156,801 | 31,316,751 |
| Frontier Communications Parent, Inc. (a)(b) | | 73,673 | 1,341,585 |
| Iridium Communications, Inc. | | 2,375 | 124,806 |
| Verizon Communications, Inc. | | 1,267,798 | 43,206,556 |
| | | | 75,989,698 |
| Entertainment - 1.8% | | | |
| Activision Blizzard, Inc. | | 234,723 | 21,772,905 |
| AMC Entertainment Holdings, Inc. Class A (a)(b) | | 156,149 | 776,061 |
| Electronic Arts, Inc. | | 82,487 | 11,247,102 |
| Liberty Media Corp. Liberty Formula One: | | | |
| Class A (a) | | 7,192 | 462,302 |
| Series C (a) | | 58,345 | 4,235,847 |
| Live Nation Entertainment, Inc. (a) | | 36,459 | 3,199,277 |
| Madison Square Garden Sports Corp. | | 5,592 | 1,189,698 |
| Playtika Holding Corp. (a) | | 1,102 | 13,158 |
| Roku, Inc. Class A (a) | | 32,489 | 3,127,716 |
| Take-Two Interactive Software, Inc. (a) | | 49,647 | 7,593,012 |
| The Walt Disney Co. (a) | | 550,904 | 48,969,857 |
| Warner Bros Discovery, Inc. (a) | | 663,393 | 8,670,547 |
| | | | 111,257,482 |
| Interactive Media & Services - 0.1% | | | |
| IAC, Inc. (a) | | 23,136 | 1,610,266 |
| Match Group, Inc. (a) | | 8,304 | 386,219 |
| TripAdvisor, Inc. (a)(b) | | 33,415 | 623,190 |
| Zoominfo Technologies, Inc. (a) | | 45,345 | 1,159,472 |
| | | | 3,779,147 |
| Media - 1.4% | | | |
| Cable One, Inc. (b) | | 1,576 | 1,140,929 |
| Comcast Corp. Class A | | 1,245,739 | 56,382,147 |
| DISH Network Corp. Class A (a)(b) | | 74,471 | 590,555 |
| Fox Corp.: | | | |
| Class A | | 88,043 | 2,945,038 |
| Class B | | 40,442 | 1,270,283 |
| Interpublic Group of Companies, Inc. (b) | | 116,041 | 3,972,083 |
| Liberty Broadband Corp.: | | | |
| Class A (a) | | 3,960 | 351,767 |
| Class C (a)(b) | | 27,772 | 2,475,318 |
| Liberty Media Corp. Liberty SiriusXM: | | | |
| Series A (a) | | 22,347 | 708,400 |
| Series C (a) | | 46,211 | 1,470,896 |
| News Corp.: | | | |
| Class A | | 114,596 | 2,271,293 |
| Class B | | 35,029 | 704,433 |
| Nexstar Broadcasting Group, Inc. Class A | | 6,763 | 1,262,787 |
| Omnicom Group, Inc. (b) | | 59,396 | 5,026,090 |
| Paramount Global: | | | |
| Class A (b) | | 2,953 | 56,875 |
| Class B (b) | | 173,375 | 2,779,201 |
| Sirius XM Holdings, Inc. (b) | | 193,819 | 988,477 |
| The New York Times Co. Class A (b) | | 48,597 | 1,980,814 |
| | | | 86,377,386 |
| Wireless Telecommunication Services - 0.4% | | | |
| T-Mobile U.S., Inc. (a) | | 163,614 | 22,541,101 |
TOTAL COMMUNICATION SERVICES | | | 299,944,814 |
| CONSUMER DISCRETIONARY - 5.2% | | | |
| Automobile Components - 0.3% | | | |
| Aptiv PLC (a) | | 81,492 | 8,922,559 |
| BorgWarner, Inc. (b) | | 70,200 | 3,264,300 |
| Gentex Corp. | | 70,518 | 2,367,994 |
| Lear Corp. | | 17,669 | 2,734,454 |
| Phinia, Inc. (b) | | 14,036 | 398,201 |
| QuantumScape Corp. Class A (a)(b) | | 88,531 | 1,178,348 |
| | | | 18,865,856 |
| Automobiles - 0.7% | | | |
| Ford Motor Co. | | 1,181,837 | 15,612,067 |
| General Motors Co. | | 417,680 | 16,026,382 |
| Harley-Davidson, Inc. | | 39,423 | 1,522,122 |
| Lucid Group, Inc. Class A (a)(b) | | 224,199 | 1,706,154 |
| Rivian Automotive, Inc. (a)(b) | | 155,305 | 4,292,630 |
| Thor Industries, Inc. (b) | | 15,416 | 1,780,394 |
| | | | 40,939,749 |
| Broadline Retail - 0.2% | | | |
| eBay, Inc. | | 150,932 | 6,717,983 |
| Etsy, Inc. (a) | | 16,213 | 1,648,051 |
| Kohl's Corp. (b) | | 33,256 | 946,133 |
| Macy's, Inc. (b) | | 81,416 | 1,350,691 |
| Nordstrom, Inc. (b) | | 34,338 | 793,551 |
| Ollie's Bargain Outlet Holdings, Inc. (a) | | 12,588 | 917,413 |
| | | | 12,373,822 |
| Distributors - 0.2% | | | |
| Genuine Parts Co. | | 42,227 | 6,575,588 |
| LKQ Corp. | | 80,183 | 4,393,227 |
| | | | 10,968,815 |
| Diversified Consumer Services - 0.1% | | | |
| ADT, Inc. (b) | | 63,228 | 403,395 |
| Bright Horizons Family Solutions, Inc. (a)(b) | | 15,139 | 1,468,937 |
| Grand Canyon Education, Inc. (a)(b) | | 6,555 | 711,545 |
| H&R Block, Inc. | | 16,080 | 540,449 |
| Mister Car Wash, Inc. (a)(b) | | 22,495 | 223,375 |
| Service Corp. International | | 28,483 | 1,898,392 |
| | | | 5,246,093 |
| Hotels, Restaurants & Leisure - 1.5% | | | |
| ARAMARK Holdings Corp. | | 70,473 | 2,844,995 |
| Boyd Gaming Corp. (b) | | 22,099 | 1,509,804 |
| Caesars Entertainment, Inc. (a) | | 36,587 | 2,159,365 |
| Carnival Corp. (a)(b) | | 299,191 | 5,636,758 |
| Darden Restaurants, Inc. | | 19,370 | 3,271,980 |
| Doordash, Inc. (a)(b) | | 19,711 | 1,789,562 |
| Expedia, Inc. (a) | | 11,586 | 1,419,633 |
| Hilton Worldwide Holdings, Inc. | | 41,959 | 6,524,205 |
| Hyatt Hotels Corp. Class A (b) | | 13,999 | 1,768,774 |
| Las Vegas Sands Corp. | | 6,772 | 405,033 |
| Marriott Vacations Worldwide Corp. (b) | | 10,987 | 1,411,939 |
| McDonald's Corp. | | 128,968 | 37,813,418 |
| MGM Resorts International | | 90,276 | 4,583,313 |
| Norwegian Cruise Line Holdings Ltd. (a)(b) | | 96,558 | 2,131,035 |
| Penn Entertainment, Inc. (a) | | 46,123 | 1,212,574 |
| Planet Fitness, Inc. (a) | | 13,410 | 905,711 |
| Royal Caribbean Cruises Ltd. (a) | | 49,252 | 5,373,886 |
| Travel+Leisure Co. | | 12,214 | 497,476 |
| Vail Resorts, Inc. | | 10,846 | 2,554,125 |
| Wyndham Hotels & Resorts, Inc. | | 23,502 | 1,831,276 |
| Wynn Resorts Ltd. | | 29,355 | 3,199,108 |
| Yum! Brands, Inc. | | 10,301 | 1,418,139 |
| | | | 90,262,109 |
| Household Durables - 0.8% | | | |
| D.R. Horton, Inc. | | 93,694 | 11,901,012 |
| Garmin Ltd. (b) | | 46,255 | 4,897,942 |
| Leggett & Platt, Inc. (b) | | 39,869 | 1,166,567 |
| Lennar Corp.: | | | |
| Class A | | 74,919 | 9,501,977 |
| Class B (b) | | 4,094 | 470,442 |
| Mohawk Industries, Inc. (a) | | 15,914 | 1,692,295 |
| Newell Brands, Inc. | | 114,473 | 1,277,519 |
| NVR, Inc. (a) | | 810 | 5,108,216 |
| PulteGroup, Inc. | | 66,771 | 5,634,805 |
| Tempur Sealy International, Inc. | | 40,017 | 1,785,959 |
| Toll Brothers, Inc. | | 33,228 | 2,669,205 |
| TopBuild Corp. (a)(b) | | 8,914 | 2,441,812 |
| Whirlpool Corp. | | 16,101 | 2,322,730 |
| | | | 50,870,481 |
| Leisure Products - 0.1% | | | |
| Brunswick Corp. | | 19,627 | 1,694,006 |
| Hasbro, Inc. | | 39,324 | 2,538,757 |
| Mattel, Inc. (a) | | 105,935 | 2,256,416 |
| Polaris, Inc. (b) | | 14,791 | 2,009,209 |
| | | | 8,498,388 |
| Specialty Retail - 0.8% | | | |
| Advance Auto Parts, Inc. | | 17,866 | 1,329,052 |
| AutoNation, Inc. (a)(b) | | 9,166 | 1,475,543 |
| AutoZone, Inc. (a) | | 912 | 2,263,329 |
| Bath & Body Works, Inc. | | 68,953 | 2,555,398 |
| Best Buy Co., Inc. | | 50,612 | 4,203,327 |
| CarMax, Inc. (a)(b) | | 44,879 | 3,707,454 |
| Dick's Sporting Goods, Inc. | | 16,749 | 2,361,609 |
| GameStop Corp. Class A (a)(b) | | 80,595 | 1,789,209 |
| Gap, Inc. (b) | | 58,483 | 602,375 |
| Lithia Motors, Inc. Class A (sub. vtg.) (b) | | 8,144 | 2,528,956 |
| Lowe's Companies, Inc. | | 48,000 | 11,244,960 |
| Murphy U.S.A., Inc. | | 322 | 98,864 |
| O'Reilly Automotive, Inc. (a) | | 2,794 | 2,586,657 |
| Penske Automotive Group, Inc. (b) | | 6,037 | 974,493 |
| Petco Health & Wellness Co., Inc. (a)(b) | | 24,660 | 201,226 |
| RH (a) | | 4,092 | 1,588,392 |
| Ross Stores, Inc. | | 6,772 | 776,342 |
| Valvoline, Inc. | | 38,113 | 1,447,151 |
| Victoria's Secret & Co. (a)(b) | | 13,032 | 267,026 |
| Wayfair LLC Class A (a)(b) | | 16,089 | 1,252,850 |
| Williams-Sonoma, Inc. (b) | | 17,082 | 2,368,248 |
| | | | 45,622,461 |
| Textiles, Apparel & Luxury Goods - 0.5% | | | |
| Capri Holdings Ltd. (a) | | 36,820 | 1,359,026 |
| Carter's, Inc. (b) | | 11,068 | 830,211 |
| Columbia Sportswear Co. | | 10,751 | 845,136 |
| NIKE, Inc. Class B | | 167,294 | 18,467,585 |
| PVH Corp. | | 18,766 | 1,682,184 |
| Ralph Lauren Corp. | | 12,230 | 1,606,166 |
| Skechers U.S.A., Inc. Class A (sub. vtg.) (a) | | 38,412 | 2,134,939 |
| Tapestry, Inc. | | 66,481 | 2,868,655 |
| Under Armour, Inc.: | | | |
| Class A (sub. vtg.) (a) | | 56,458 | 455,051 |
| Class C (non-vtg.) (a)(b) | | 55,974 | 415,327 |
| VF Corp. | | 105,206 | 2,084,131 |
| | | | 32,748,411 |
TOTAL CONSUMER DISCRETIONARY | | | 316,396,185 |
| CONSUMER STAPLES - 8.3% | | | |
| Beverages - 1.4% | | | |
| Boston Beer Co., Inc. Class A (a) | | 220 | 81,717 |
| Brown-Forman Corp.: | | | |
| Class A (b) | | 3,029 | 217,815 |
| Class B (non-vtg.) | | 11,403 | 805,052 |
| Constellation Brands, Inc. Class A (sub. vtg.) | | 41,456 | 11,309,197 |
| Keurig Dr. Pepper, Inc. | | 287,019 | 9,761,516 |
| Molson Coors Beverage Co. Class B | | 52,609 | 3,670,530 |
| PepsiCo, Inc. | | 128,238 | 24,039,495 |
| The Coca-Cola Co. | | 591,338 | 36,621,562 |
| | | | 86,506,884 |
| Consumer Staples Distribution & Retail - 1.8% | | | |
| Albertsons Companies, Inc. | | 114,579 | 2,489,802 |
| BJ's Wholesale Club Holdings, Inc. (a) | | 26,180 | 1,735,996 |
| Casey's General Stores, Inc. | | 9,594 | 2,424,020 |
| Dollar Tree, Inc. (a) | | 62,791 | 9,690,535 |
| Grocery Outlet Holding Corp. (a)(b) | | 28,553 | 955,098 |
| Kroger Co. | | 196,473 | 9,556,447 |
| Performance Food Group Co. (a) | | 24,440 | 1,460,534 |
| U.S. Foods Holding Corp. (a) | | 68,192 | 2,913,844 |
| Walgreens Boots Alliance, Inc. | | 215,677 | 6,463,840 |
| Walmart, Inc. | | 430,001 | 68,739,960 |
| | | | 106,430,076 |
| Food Products - 1.9% | | | |
| Archer Daniels Midland Co. | | 163,337 | 13,877,112 |
| Bunge Ltd. | | 44,949 | 4,884,608 |
| Campbell Soup Co. | | 57,567 | 2,637,720 |
| Conagra Brands, Inc. | | 143,199 | 4,698,359 |
| Darling Ingredients, Inc. (a) | | 47,691 | 3,302,602 |
| Flowers Foods, Inc. | | 56,535 | 1,396,980 |
| Freshpet, Inc. (a)(b) | | 9,963 | 732,679 |
| General Mills, Inc. | | 176,910 | 13,222,253 |
| Hormel Foods Corp. (b) | | 87,130 | 3,561,874 |
| Ingredion, Inc. (b) | | 19,848 | 2,208,288 |
| Kellogg Co. | | 78,219 | 5,232,069 |
| Lamb Weston Holdings, Inc. | | 2,449 | 253,790 |
| McCormick & Co., Inc. (non-vtg.) | | 75,653 | 6,769,430 |
| Mondelez International, Inc. | | 409,657 | 30,367,873 |
| Pilgrim's Pride Corp. (a) | | 12,355 | 306,033 |
| Post Holdings, Inc. (a)(b) | | 16,093 | 1,372,733 |
| Seaboard Corp. | | 77 | 277,585 |
| The Hershey Co. | | 11,443 | 2,646,880 |
| The J.M. Smucker Co. | | 31,034 | 4,675,272 |
| The Kraft Heinz Co. | | 241,892 | 8,751,653 |
| Tyson Foods, Inc. Class A | | 83,640 | 4,660,421 |
| | | | 115,836,214 |
| Household Products - 1.8% | | | |
| Church & Dwight Co., Inc. | | 7,646 | 731,493 |
| Colgate-Palmolive Co. | | 247,207 | 18,852,006 |
| Kimberly-Clark Corp. | | 5,988 | 773,051 |
| Procter & Gamble Co. | | 575,901 | 90,013,326 |
| Reynolds Consumer Products, Inc. | | 16,338 | 452,236 |
| Spectrum Brands Holdings, Inc. (b) | | 12,077 | 946,958 |
| | | | 111,769,070 |
| Personal Care Products - 0.2% | | | |
| Coty, Inc. Class A (a)(b) | | 108,442 | 1,305,642 |
| Estee Lauder Companies, Inc. Class A | | 47,431 | 8,537,580 |
| Olaplex Holdings, Inc. (a) | | 38,634 | 139,082 |
| | | | 9,982,304 |
| Tobacco - 1.2% | | | |
| Altria Group, Inc. | | 538,071 | 24,439,185 |
| Philip Morris International, Inc. | | 467,516 | 46,620,696 |
| | | | 71,059,881 |
TOTAL CONSUMER STAPLES | | | 501,584,429 |
| ENERGY - 8.2% | | | |
| Energy Equipment & Services - 0.8% | | | |
| Baker Hughes Co. Class A | | 305,029 | 10,916,988 |
| Halliburton Co. (b) | | 216,134 | 8,446,517 |
| NOV, Inc. (b) | | 118,052 | 2,370,484 |
| Schlumberger Ltd. | | 429,162 | 25,037,311 |
| TechnipFMC PLC (b) | | 132,099 | 2,422,696 |
| | | | 49,193,996 |
| Oil, Gas & Consumable Fuels - 7.4% | | | |
| Antero Midstream GP LP | | 67,923 | 811,001 |
| Antero Resources Corp. (a) | | 85,097 | 2,276,345 |
| APA Corp. | | 10,643 | 430,935 |
| Chesapeake Energy Corp. (b) | | 38,181 | 3,220,186 |
| Chevron Corp. | | 520,936 | 85,256,386 |
| ConocoPhillips Co. | | 365,272 | 42,999,820 |
| Coterra Energy, Inc. | | 227,939 | 6,277,440 |
| Devon Energy Corp. | | 192,987 | 10,421,298 |
| Diamondback Energy, Inc. | | 54,544 | 8,035,422 |
| DT Midstream, Inc. (b) | | 29,199 | 1,562,730 |
| EOG Resources, Inc. | | 177,028 | 23,461,521 |
| EQT Corp. | | 108,510 | 4,576,952 |
| Exxon Mobil Corp. | | 1,223,732 | 131,233,020 |
| Hess Corp. | | 36,988 | 5,612,189 |
| HF Sinclair Corp. | | 42,485 | 2,213,044 |
| Kinder Morgan, Inc. | | 590,591 | 10,459,367 |
| Marathon Oil Corp. | | 187,092 | 4,914,907 |
| Marathon Petroleum Corp. | | 132,938 | 17,683,413 |
| Occidental Petroleum Corp. | | 210,082 | 13,262,477 |
| ONEOK, Inc. | | 127,166 | 8,525,209 |
| Ovintiv, Inc. (b) | | 40,668 | 1,874,388 |
| PDC Energy, Inc. | | 26,088 | 1,979,818 |
| Phillips 66 Co. | | 138,770 | 15,479,794 |
| Pioneer Natural Resources Co. | | 70,099 | 15,819,241 |
| Range Resources Corp. | | 70,446 | 2,214,118 |
| Southwestern Energy Co. (a) | | 330,114 | 2,139,139 |
| The Williams Companies, Inc. | | 366,730 | 12,633,849 |
| Valero Energy Corp. | | 108,554 | 13,993,696 |
| | | | 449,367,705 |
TOTAL ENERGY | | | 498,561,701 |
| FINANCIALS - 20.6% | | | |
| Banks - 6.7% | | | |
| Bank of America Corp. | | 2,098,397 | 67,148,704 |
| Bank OZK (b) | | 33,159 | 1,450,043 |
| BOK Financial Corp. | | 8,522 | 759,140 |
| Citigroup, Inc. | | 585,903 | 27,924,137 |
| Citizens Financial Group, Inc. | | 145,350 | 4,688,991 |
| Columbia Banking Systems, Inc. | | 62,558 | 1,398,171 |
| Comerica, Inc. | | 39,596 | 2,136,600 |
| Commerce Bancshares, Inc. | | 34,390 | 1,828,860 |
| Cullen/Frost Bankers, Inc. | | 17,811 | 1,933,918 |
| East West Bancorp, Inc. | | 42,262 | 2,629,119 |
| Fifth Third Bancorp | | 204,352 | 5,946,643 |
| First Citizens Bancshares, Inc. | | 2,910 | 4,165,083 |
| First Hawaiian, Inc. | | 38,256 | 791,517 |
| First Horizon National Corp. | | 160,804 | 2,191,759 |
| FNB Corp., Pennsylvania | | 107,549 | 1,375,552 |
| Huntington Bancshares, Inc. | | 432,987 | 5,299,761 |
| JPMorgan Chase & Co. | | 880,773 | 139,126,903 |
| KeyCorp | | 280,425 | 3,452,032 |
| M&T Bank Corp. | | 49,796 | 6,964,469 |
| New York Community Bancorp, Inc. | | 214,299 | 2,972,327 |
| Nu Holdings Ltd. (a) | | 218,750 | 1,741,250 |
| Pinnacle Financial Partners, Inc. | | 22,639 | 1,718,300 |
| PNC Financial Services Group, Inc. | | 119,952 | 16,420,229 |
| Popular, Inc. | | 21,174 | 1,536,174 |
| Prosperity Bancshares, Inc. | | 26,208 | 1,659,491 |
| Regions Financial Corp. | | 281,372 | 5,731,548 |
| Synovus Financial Corp. | | 43,515 | 1,475,159 |
| Truist Financial Corp. | | 399,458 | 13,269,995 |
| U.S. Bancorp | | 461,584 | 18,315,653 |
| Webster Financial Corp. | | 52,240 | 2,471,997 |
| Wells Fargo & Co. | | 1,138,594 | 52,557,499 |
| Western Alliance Bancorp. | | 32,531 | 1,689,985 |
| Wintrust Financial Corp. | | 18,299 | 1,543,704 |
| Zions Bancorp NA | | 43,781 | 1,674,623 |
| | | | 405,989,336 |
| Capital Markets - 5.0% | | | |
| Affiliated Managers Group, Inc. (b) | | 10,728 | 1,487,330 |
| Bank of New York Mellon Corp. | | 237,933 | 10,792,641 |
| BlackRock, Inc. Class A | | 44,779 | 33,084,964 |
| Blue Owl Capital, Inc. Class A | | 114,437 | 1,409,864 |
| Carlyle Group LP | | 63,487 | 2,263,312 |
| Cboe Global Markets, Inc. | | 31,659 | 4,422,129 |
| Charles Schwab Corp. | | 446,481 | 29,512,394 |
| CME Group, Inc. | | 108,152 | 21,517,922 |
| Coinbase Global, Inc. (a)(b) | | 50,164 | 4,946,672 |
| Evercore, Inc. Class A (b) | | 10,711 | 1,446,628 |
| Franklin Resources, Inc. (b) | | 85,661 | 2,504,728 |
| Goldman Sachs Group, Inc. | | 97,261 | 34,612,272 |
| Houlihan Lokey | | 13,853 | 1,383,222 |
| Interactive Brokers Group, Inc. | | 30,029 | 2,622,433 |
| Intercontinental Exchange, Inc. | | 166,922 | 19,162,646 |
| Invesco Ltd. | | 111,631 | 1,875,401 |
| Janus Henderson Group PLC (b) | | 40,281 | 1,182,247 |
| Jefferies Financial Group, Inc. | | 60,470 | 2,224,691 |
| KKR & Co. LP (b) | | 146,635 | 8,707,186 |
| Lazard Ltd. Class A | | 32,935 | 1,156,019 |
| Moody's Corp. | | 4,206 | 1,483,667 |
| Morgan Stanley | | 362,185 | 33,161,659 |
| MSCI, Inc. | | 11,704 | 6,414,728 |
| NASDAQ, Inc. | | 102,822 | 5,191,483 |
| Northern Trust Corp. | | 61,675 | 4,941,401 |
| Raymond James Financial, Inc. (b) | | 58,833 | 6,475,748 |
| Robinhood Markets, Inc. (a) | | 199,785 | 2,569,235 |
| S&P Global, Inc. | | 88,620 | 34,961,476 |
| SEI Investments Co. | | 30,616 | 1,928,502 |
| State Street Corp. | | 100,481 | 7,278,844 |
| Stifel Financial Corp. (b) | | 30,888 | 1,962,624 |
| T. Rowe Price Group, Inc. | | 66,406 | 8,185,204 |
| TPG, Inc. (b) | | 13,699 | 403,162 |
| Tradeweb Markets, Inc. Class A | | 22,554 | 1,844,692 |
| Virtu Financial, Inc. Class A | | 26,881 | 498,911 |
| XP, Inc. Class A (a) | | 91,665 | 2,475,872 |
| | | | 306,091,909 |
| Consumer Finance - 0.9% | | | |
| Ally Financial, Inc. | | 81,429 | 2,486,842 |
| American Express Co. | | 119,770 | 20,226,758 |
| Capital One Financial Corp. | | 114,154 | 13,358,301 |
| Credit Acceptance Corp. (a)(b) | | 1,927 | 1,072,568 |
| Discover Financial Services | | 76,314 | 8,054,943 |
| OneMain Holdings, Inc. (b) | | 33,755 | 1,535,177 |
| SLM Corp. (b) | | 43,936 | 710,884 |
| SoFi Technologies, Inc. (a)(b) | | 276,049 | 3,160,761 |
| Synchrony Financial | | 128,437 | 4,436,214 |
| | | | 55,042,448 |
| Financial Services - 4.2% | | | |
| Affirm Holdings, Inc. (a)(b) | | 65,467 | 1,269,405 |
| Berkshire Hathaway, Inc. Class B (a) | | 551,661 | 194,162,575 |
| Block, Inc. Class A (a) | | 102,521 | 8,256,016 |
| Corebridge Financial, Inc. (b) | | 44,492 | 832,445 |
| Euronet Worldwide, Inc. (a) | | 7,112 | 624,931 |
| Fidelity National Information Services, Inc. | | 178,257 | 10,763,158 |
| Fiserv, Inc. (a) | | 134,479 | 16,972,595 |
| FleetCor Technologies, Inc. (a) | | 1,514 | 376,850 |
| Global Payments, Inc. | | 78,773 | 8,684,723 |
| Jack Henry & Associates, Inc. | | 14,952 | 2,505,507 |
| MGIC Investment Corp. | | 86,705 | 1,451,442 |
| PayPal Holdings, Inc. (a) | | 31,794 | 2,410,621 |
| Rocket Companies, Inc. (a)(b) | | 24,165 | 264,123 |
| TFS Financial Corp. (b) | | 15,013 | 217,839 |
| The Western Union Co. | | 96,065 | 1,170,072 |
| UWM Holdings Corp. Class A (b) | | 17,578 | 115,312 |
| Voya Financial, Inc. (b) | | 29,484 | 2,189,482 |
| WEX, Inc. (a) | | 6,976 | 1,320,906 |
| | | | 253,588,002 |
| Insurance - 3.7% | | | |
| AFLAC, Inc. | | 181,235 | 13,110,540 |
| Allstate Corp. | | 78,975 | 8,898,903 |
| American Financial Group, Inc. | | 21,894 | 2,662,529 |
| American International Group, Inc. | | 220,930 | 13,317,660 |
| Aon PLC | | 60,898 | 19,396,013 |
| Arch Capital Group Ltd. (a) | | 92,497 | 7,186,092 |
| Arthur J. Gallagher & Co. (b) | | 60,189 | 12,928,597 |
| Assurant, Inc. | | 15,915 | 2,140,727 |
| Assured Guaranty Ltd. (b) | | 17,093 | 1,021,820 |
| Axis Capital Holdings Ltd. | | 23,386 | 1,289,036 |
| Brighthouse Financial, Inc. (a) | | 18,005 | 938,601 |
| Brown & Brown, Inc. | | 43,538 | 3,067,252 |
| Chubb Ltd. | | 124,165 | 25,380,568 |
| Cincinnati Financial Corp. | | 46,215 | 4,971,810 |
| CNA Financial Corp. | | 7,829 | 306,584 |
| Everest Re Group Ltd. | | 11,020 | 3,972,820 |
| Fidelity National Financial, Inc. (b) | | 78,081 | 3,058,433 |
| First American Financial Corp. (b) | | 30,155 | 1,911,224 |
| Globe Life, Inc. | | 26,706 | 2,995,612 |
| Hanover Insurance Group, Inc. | | 10,680 | 1,211,966 |
| Hartford Financial Services Group, Inc. | | 91,685 | 6,590,318 |
| Kemper Corp. (b) | | 18,113 | 923,220 |
| Lincoln National Corp. | | 46,124 | 1,293,317 |
| Loews Corp. | | 56,975 | 3,569,484 |
| Markel Group, Inc. (a) | | 3,955 | 5,733,603 |
| Marsh & McLennan Companies, Inc. | | 29,670 | 5,590,421 |
| MetLife, Inc. | | 194,778 | 12,265,171 |
| Old Republic International Corp. | | 81,809 | 2,255,474 |
| Primerica, Inc. | | 3,830 | 814,641 |
| Principal Financial Group, Inc. | | 72,780 | 5,812,939 |
| Progressive Corp. | | 44,189 | 5,566,930 |
| Prudential Financial, Inc. | | 110,522 | 10,664,268 |
| Reinsurance Group of America, Inc. | | 20,009 | 2,808,263 |
| RenaissanceRe Holdings Ltd. | | 10,863 | 2,028,774 |
| RLI Corp. | | 9,427 | 1,257,656 |
| The Travelers Companies, Inc. | | 69,423 | 11,983,104 |
| Unum Group | | 59,136 | 2,874,601 |
| W.R. Berkley Corp. | | 64,015 | 3,949,085 |
| White Mountains Insurance Group Ltd. (b) | | 745 | 1,152,530 |
| Willis Towers Watson PLC | | 28,075 | 5,933,090 |
| | | | 222,833,676 |
| Mortgage Real Estate Investment Trusts - 0.1% | | | |
| AGNC Investment Corp. (b) | | 172,567 | 1,758,458 |
| Annaly Capital Management, Inc. (b) | | 148,585 | 2,985,073 |
| Rithm Capital Corp. | | 144,986 | 1,461,459 |
| Starwood Property Trust, Inc. (b) | | 88,675 | 1,839,120 |
| | | | 8,044,110 |
TOTAL FINANCIALS | | | 1,251,589,481 |
| HEALTH CARE - 15.3% | | | |
| Biotechnology - 1.7% | | | |
| Alnylam Pharmaceuticals, Inc. (a) | | 7,342 | 1,434,627 |
| Amgen, Inc. | | 51,497 | 12,058,023 |
| Biogen, Inc. (a) | | 43,380 | 11,720,842 |
| BioMarin Pharmaceutical, Inc. (a) | | 49,682 | 4,368,538 |
| Exact Sciences Corp. (a)(b) | | 35,093 | 3,422,971 |
| Exelixis, Inc. (a) | | 25,278 | 498,229 |
| Gilead Sciences, Inc. | | 376,525 | 28,668,614 |
| Horizon Therapeutics PLC (a) | | 7,817 | 783,811 |
| Incyte Corp. (a) | | 14,533 | 926,043 |
| Ionis Pharmaceuticals, Inc. (a) | | 5,954 | 246,674 |
| Karuna Therapeutics, Inc. (a) | | 1,134 | 226,539 |
| Mirati Therapeutics, Inc. (a) | | 13,730 | 415,607 |
| Moderna, Inc. (a) | | 101,274 | 11,915,899 |
| Regeneron Pharmaceuticals, Inc. (a) | | 29,088 | 21,580,678 |
| Repligen Corp. (a)(b) | | 9,324 | 1,599,625 |
| Roivant Sciences Ltd. (a) | | 4,052 | 48,543 |
| United Therapeutics Corp. (a) | | 13,586 | 3,297,594 |
| Vertex Pharmaceuticals, Inc. (a) | | 6,596 | 2,324,035 |
| | | | 105,536,892 |
| Health Care Equipment & Supplies - 3.6% | | | |
| Abbott Laboratories | | 488,642 | 54,400,514 |
| Baxter International, Inc. | | 152,197 | 6,883,870 |
| Becton, Dickinson & Co. | | 85,370 | 23,785,789 |
| Boston Scientific Corp. (a) | | 432,510 | 22,425,644 |
| Dentsply Sirona, Inc. | | 63,619 | 2,641,461 |
| Enovis Corp. (a) | | 15,775 | 1,008,023 |
| Envista Holdings Corp. (a)(b) | | 49,268 | 1,695,312 |
| GE Healthcare Holding LLC | | 108,488 | 8,462,064 |
| Globus Medical, Inc. (a)(b) | | 23,849 | 1,437,379 |
| Hologic, Inc. (a) | | 73,143 | 5,809,017 |
| ICU Medical, Inc. (a)(b) | | 6,084 | 1,084,047 |
| Integra LifeSciences Holdings Corp. (a) | | 21,491 | 977,196 |
| Medtronic PLC | | 400,136 | 35,115,935 |
| QuidelOrtho Corp. (a) | | 16,077 | 1,404,487 |
| STERIS PLC | | 29,860 | 6,734,923 |
| Stryker Corp. | | 79,832 | 22,625,187 |
| Tandem Diabetes Care, Inc. (a)(b) | | 16,771 | 585,643 |
| Teleflex, Inc. | | 14,141 | 3,551,795 |
| The Cooper Companies, Inc. | | 14,626 | 5,722,569 |
| Zimmer Biomet Holdings, Inc. | | 63,226 | 8,734,672 |
| | | | 215,085,527 |
| Health Care Providers & Services - 3.0% | | | |
| Acadia Healthcare Co., Inc. (a) | | 26,990 | 2,133,020 |
| agilon health, Inc. (a)(b) | | 8,888 | 170,205 |
| Amedisys, Inc. (a) | | 9,637 | 875,425 |
| Cardinal Health, Inc. | | 37,900 | 3,466,713 |
| Centene Corp. (a) | | 165,100 | 11,241,659 |
| Chemed Corp. | | 1,258 | 655,531 |
| Cigna Group | | 81,442 | 24,033,534 |
| CVS Health Corp. | | 385,745 | 28,811,294 |
| Elevance Health, Inc. | | 61,916 | 29,201,443 |
| Encompass Health Corp. | | 27,694 | 1,828,635 |
| HCA Holdings, Inc. | | 48,840 | 13,324,040 |
| Henry Schein, Inc. (a) | | 39,226 | 3,090,617 |
| Humana, Inc. | | 21,298 | 9,729,565 |
| Laboratory Corp. of America Holdings | | 26,636 | 5,698,239 |
| McKesson Corp. | | 25,544 | 10,278,906 |
| Molina Healthcare, Inc. (a) | | 7,930 | 2,414,606 |
| Premier, Inc. | | 35,670 | 989,843 |
| Quest Diagnostics, Inc. | | 33,712 | 4,558,200 |
| R1 RCM, Inc. (a) | | 45,972 | 794,396 |
| Tenet Healthcare Corp. (a) | | 30,376 | 2,269,998 |
| UnitedHealth Group, Inc. | | 44,525 | 22,546,124 |
| Universal Health Services, Inc. Class B | | 18,236 | 2,534,075 |
| | | | 180,646,068 |
| Health Care Technology - 0.0% | | | |
| Certara, Inc. (a) | | 22,920 | 446,252 |
| Doximity, Inc. (a)(b) | | 18,463 | 659,683 |
| Teladoc Health, Inc. (a)(b) | | 49,036 | 1,459,802 |
| | | | 2,565,737 |
| Life Sciences Tools & Services - 1.8% | | | |
| Agilent Technologies, Inc. | | 16,631 | 2,025,157 |
| Avantor, Inc. (a)(b) | | 203,101 | 4,177,788 |
| Azenta, Inc. (a) | | 20,493 | 962,761 |
| Bio-Rad Laboratories, Inc. Class A (a) | | 6,324 | 2,563,497 |
| Bio-Techne Corp. | | 2,668 | 222,511 |
| Charles River Laboratories International, Inc. (a) | | 15,275 | 3,200,724 |
| Danaher Corp. | | 198,277 | 50,572,532 |
| Fortrea Holdings, Inc. | | 26,620 | 850,775 |
| ICON PLC (a)(b) | | 20,878 | 5,248,938 |
| Illumina, Inc. (a) | | 33,419 | 6,421,461 |
| IQVIA Holdings, Inc. (a) | | 4,052 | 906,676 |
| Maravai LifeSciences Holdings, Inc. (a) | | 13,835 | 156,474 |
| QIAGEN NV (a) | | 68,442 | 3,204,454 |
| Revvity, Inc. | | 38,011 | 4,673,452 |
| Sotera Health Co. (a) | | 8,763 | 166,322 |
| Syneos Health, Inc. (a) | | 31,043 | 1,316,534 |
| Thermo Fisher Scientific, Inc. | | 44,629 | 24,486,147 |
| | | | 111,156,203 |
| Pharmaceuticals - 5.2% | | | |
| Bristol-Myers Squibb Co. | | 633,291 | 39,384,367 |
| Catalent, Inc. (a) | | 54,126 | 2,626,194 |
| Elanco Animal Health, Inc. (a) | | 147,471 | 1,779,975 |
| Jazz Pharmaceuticals PLC (a) | | 8,852 | 1,154,478 |
| Johnson & Johnson | | 783,620 | 131,279,859 |
| Merck & Co., Inc. | | 624,415 | 66,593,860 |
| Organon & Co. | | 76,878 | 1,689,778 |
| Perrigo Co. PLC | | 40,598 | 1,487,511 |
| Pfizer, Inc. | | 1,702,210 | 61,381,693 |
| Royalty Pharma PLC | | 111,769 | 3,507,311 |
| Viatris, Inc. | | 360,097 | 3,791,821 |
| | | | 314,676,847 |
TOTAL HEALTH CARE | | | 929,667,274 |
| INDUSTRIALS - 13.3% | | | |
| Aerospace & Defense - 2.5% | | | |
| BWX Technologies, Inc. | | 22,778 | 1,571,682 |
| Curtiss-Wright Corp. | | 11,478 | 2,196,430 |
| General Dynamics Corp. | | 73,722 | 16,482,765 |
| HEICO Corp. (b) | | 1,357 | 238,805 |
| HEICO Corp. Class A | | 2,363 | 331,647 |
| Hexcel Corp. | | 25,360 | 1,792,445 |
| Howmet Aerospace, Inc. | | 114,180 | 5,839,165 |
| Huntington Ingalls Industries, Inc. | | 11,795 | 2,708,958 |
| L3Harris Technologies, Inc. | | 56,957 | 10,792,782 |
| Mercury Systems, Inc. (a)(b) | | 14,915 | 566,472 |
| Northrop Grumman Corp. | | 40,661 | 18,094,145 |
| Raytheon Technologies Corp. | | 440,222 | 38,708,720 |
| Spirit AeroSystems Holdings, Inc. Class A | | 28,215 | 897,801 |
| Textron, Inc. | | 60,612 | 4,713,795 |
| The Boeing Co. (a) | | 145,137 | 34,665,972 |
| TransDigm Group, Inc. | | 13,117 | 11,801,627 |
| Woodward, Inc. | | 17,800 | 2,142,764 |
| | | | 153,545,975 |
| Air Freight & Logistics - 0.9% | | | |
| C.H. Robinson Worldwide, Inc. | | 7,645 | 765,876 |
| Expeditors International of Washington, Inc. | | 40,041 | 5,097,219 |
| FedEx Corp. | | 69,848 | 18,855,468 |
| GXO Logistics, Inc. (a) | | 35,214 | 2,361,803 |
| United Parcel Service, Inc. Class B | | 157,728 | 29,515,641 |
| | | | 56,596,007 |
| Building Products - 1.1% | | | |
| A.O. Smith Corp. | | 32,979 | 2,395,265 |
| Allegion PLC | | 1,980 | 231,383 |
| Armstrong World Industries, Inc. | | 9,538 | 737,860 |
| Builders FirstSource, Inc. (a) | | 38,324 | 5,535,135 |
| Carlisle Companies, Inc. (b) | | 15,249 | 4,227,023 |
| Carrier Global Corp. (b) | | 250,870 | 14,939,309 |
| Fortune Brands Home & Security, Inc. (b) | | 38,043 | 2,703,716 |
| Hayward Holdings, Inc. (a)(b) | | 33,224 | 443,873 |
| Johnson Controls International PLC | | 206,896 | 14,389,617 |
| Lennox International, Inc. | | 9,619 | 3,534,405 |
| Masco Corp. | | 67,679 | 4,106,762 |
| Owens Corning | | 27,023 | 3,782,950 |
| The AZEK Co., Inc. (a) | | 36,889 | 1,150,937 |
| Trane Technologies PLC | | 48,339 | 9,640,730 |
| | | | 67,818,965 |
| Commercial Services & Supplies - 0.4% | | | |
| Cintas Corp. | | 2,870 | 1,440,855 |
| Clean Harbors, Inc. (a) | | 15,446 | 2,568,052 |
| Driven Brands Holdings, Inc. (a) | | 18,693 | 483,588 |
| MSA Safety, Inc. (b) | | 9,215 | 1,529,690 |
| RB Global, Inc. | | 12,845 | 828,246 |
| Republic Services, Inc. | | 62,191 | 9,397,682 |
| Stericycle, Inc. (a) | | 27,710 | 1,177,398 |
| Tetra Tech, Inc. | | 13,061 | 2,210,052 |
| Waste Management, Inc. | | 12,372 | 2,026,410 |
| | | | 21,661,973 |
| Construction & Engineering - 0.3% | | | |
| AECOM | | 39,398 | 3,427,626 |
| EMCOR Group, Inc. | | 9,227 | 1,984,174 |
| MasTec, Inc. (a) | | 18,706 | 2,202,632 |
| MDU Resources Group, Inc. | | 60,801 | 1,344,918 |
| Quanta Services, Inc. | | 31,895 | 6,430,670 |
| Valmont Industries, Inc. | | 5,831 | 1,543,757 |
| Willscot Mobile Mini Holdings (a) | | 44,273 | 2,122,890 |
| | | | 19,056,667 |
| Electrical Equipment - 1.2% | | | |
| Acuity Brands, Inc. | | 9,577 | 1,582,503 |
| AMETEK, Inc. | | 69,251 | 10,983,209 |
| Eaton Corp. PLC | | 119,962 | 24,630,598 |
| Emerson Electric Co. | | 171,905 | 15,703,522 |
| Generac Holdings, Inc. (a) | | 18,303 | 2,813,171 |
| Hubbell, Inc. Class B | | 8,772 | 2,736,864 |
| nVent Electric PLC | | 49,505 | 2,617,824 |
| Plug Power, Inc. (a)(b) | | 156,336 | 2,051,128 |
| Regal Rexnord Corp. | | 19,904 | 3,108,607 |
| Sensata Technologies, Inc. PLC | | 45,391 | 1,917,770 |
| Sunrun, Inc. (a) | | 63,500 | 1,205,230 |
| Vertiv Holdings Co. | | 90,173 | 2,345,400 |
| | | | 71,695,826 |
| Ground Transportation - 1.3% | | | |
| Avis Budget Group, Inc. (a) | | 4,032 | 888,209 |
| CSX Corp. | | 543,621 | 18,113,452 |
| Hertz Global Holdings, Inc. (a) | | 40,401 | 680,757 |
| J.B. Hunt Transport Services, Inc. | | 19,896 | 4,057,590 |
| Knight-Swift Transportation Holdings, Inc. Class A | | 47,001 | 2,855,311 |
| Landstar System, Inc. | | 2,194 | 446,676 |
| Norfolk Southern Corp. | | 68,433 | 15,985,264 |
| Old Dominion Freight Lines, Inc. | | 2,049 | 859,535 |
| Ryder System, Inc. | | 13,808 | 1,410,487 |
| Saia, Inc. (a) | | 7,113 | 3,009,795 |
| Schneider National, Inc. Class B (b) | | 16,473 | 507,533 |
| U-Haul Holding Co. (b) | | 1,553 | 94,516 |
| U-Haul Holding Co. (non-vtg.) (b) | | 15,091 | 863,356 |
| Union Pacific Corp. | | 105,036 | 24,370,453 |
| XPO, Inc. (a)(b) | | 34,278 | 2,373,409 |
| | | | 76,516,343 |
| Industrial Conglomerates - 1.5% | | | |
| 3M Co. | | 165,621 | 18,466,742 |
| General Electric Co. | | 326,600 | 37,310,784 |
| Honeywell International, Inc. | | 174,697 | 33,913,929 |
| | | | 89,691,455 |
| Machinery - 2.5% | | | |
| AGCO Corp. | | 18,832 | 2,506,539 |
| Allison Transmission Holdings, Inc. | | 24,684 | 1,448,704 |
| Caterpillar, Inc. | | 38,894 | 10,313,522 |
| CNH Industrial NV (b) | | 294,192 | 4,224,597 |
| Crane Co. (b) | | 14,436 | 1,352,509 |
| Crane Nxt Co. (b) | | 14,469 | 855,841 |
| Cummins, Inc. | | 42,693 | 11,134,334 |
| Deere & Co. | | 5,340 | 2,294,064 |
| Donaldson Co., Inc. | | 21,315 | 1,339,221 |
| Dover Corp. | | 41,994 | 6,129,864 |
| ESAB Corp. | | 16,979 | 1,166,457 |
| Flowserve Corp. (b) | | 39,360 | 1,486,234 |
| Fortive Corp. | | 106,471 | 8,342,003 |
| Gates Industrial Corp. PLC (a) | | 35,624 | 485,199 |
| Graco, Inc. | | 29,721 | 2,357,767 |
| IDEX Corp. | | 20,914 | 4,722,590 |
| Illinois Tool Works, Inc. | | 16,899 | 4,449,845 |
| Ingersoll Rand, Inc. | | 121,857 | 7,953,606 |
| ITT, Inc. | | 24,867 | 2,476,753 |
| Lincoln Electric Holdings, Inc. (b) | | 1,091 | 218,975 |
| Middleby Corp. (a) | | 16,006 | 2,430,511 |
| Nordson Corp. | | 17,213 | 4,330,963 |
| Oshkosh Corp. | | 19,616 | 1,806,045 |
| Otis Worldwide Corp. | | 117,131 | 10,654,236 |
| PACCAR, Inc. | | 154,385 | 13,297,180 |
| Parker Hannifin Corp. | | 38,481 | 15,777,595 |
| Pentair PLC | | 49,379 | 3,431,841 |
| RBC Bearings, Inc. (a) | | 8,507 | 1,923,007 |
| Snap-On, Inc. | | 15,665 | 4,267,773 |
| Stanley Black & Decker, Inc. (b) | | 46,084 | 4,574,759 |
| Timken Co. (b) | | 18,806 | 1,746,325 |
| Westinghouse Air Brake Tech Co. | | 53,678 | 6,357,622 |
| Xylem, Inc. | | 62,899 | 7,091,862 |
| | | | 152,948,343 |
| Marine Transportation - 0.0% | | | |
| Kirby Corp. (a) | | 17,924 | 1,460,448 |
| Passenger Airlines - 0.4% | | | |
| Alaska Air Group, Inc. (a) | | 37,722 | 1,834,421 |
| American Airlines Group, Inc. (a) | | 122,964 | 2,059,647 |
| Delta Air Lines, Inc. | | 183,351 | 8,481,817 |
| Southwest Airlines Co. | | 178,950 | 6,112,932 |
| United Airlines Holdings, Inc. (a) | | 98,332 | 5,340,411 |
| | | | 23,829,228 |
| Professional Services - 0.7% | | | |
| Automatic Data Processing, Inc. | | 17,691 | 4,374,277 |
| Broadridge Financial Solutions, Inc. | | 5,785 | 971,417 |
| CACI International, Inc. Class A (a) | | 6,790 | 2,379,488 |
| Ceridian HCM Holding, Inc. (a) | | 40,574 | 2,873,045 |
| Clarivate Analytics PLC (a)(b) | | 141,628 | 1,346,882 |
| Concentrix Corp. | | 13,208 | 1,099,434 |
| Dun & Bradstreet Holdings, Inc. (b) | | 81,931 | 968,424 |
| Equifax, Inc. | | 11,300 | 2,306,104 |
| FTI Consulting, Inc. (a)(b) | | 8,161 | 1,429,481 |
| Genpact Ltd. (b) | | 40,520 | 1,462,367 |
| Jacobs Solutions, Inc. | | 37,872 | 4,749,528 |
| KBR, Inc. | | 25,887 | 1,591,792 |
| Leidos Holdings, Inc. | | 41,088 | 3,842,961 |
| Manpower, Inc. | | 15,158 | 1,195,663 |
| Paycor HCM, Inc. (a)(b) | | 8,996 | 241,633 |
| Robert Half, Inc. | | 31,650 | 2,346,848 |
| Science Applications International Corp. (b) | | 16,172 | 1,962,310 |
| SS&C Technologies Holdings, Inc. | | 65,411 | 3,810,191 |
| TransUnion Holding Co., Inc. (b) | | 58,128 | 4,632,220 |
| | | | 43,584,065 |
| Trading Companies & Distributors - 0.5% | | | |
| Air Lease Corp. Class A | | 31,129 | 1,318,002 |
| Core & Main, Inc. (a)(b) | | 25,507 | 806,276 |
| Fastenal Co. | | 43,150 | 2,529,022 |
| Ferguson PLC (b) | | 58,770 | 9,498,407 |
| MSC Industrial Direct Co., Inc. Class A (b) | | 13,820 | 1,394,714 |
| SiteOne Landscape Supply, Inc. (a)(b) | | 9,068 | 1,541,560 |
| United Rentals, Inc. | | 16,421 | 7,630,510 |
| Univar Solutions, Inc. (a) | | 46,679 | 1,686,979 |
| Watsco, Inc. (b) | | 7,504 | 2,837,938 |
| WESCO International, Inc. | | 13,315 | 2,337,715 |
| | | | 31,581,123 |
TOTAL INDUSTRIALS | | | 809,986,418 |
| INFORMATION TECHNOLOGY - 9.1% | | | |
| Communications Equipment - 1.2% | | | |
| Ciena Corp. (a)(b) | | 44,637 | 1,883,681 |
| Cisco Systems, Inc. | | 1,235,257 | 64,282,774 |
| F5, Inc. (a) | | 18,139 | 2,870,315 |
| Juniper Networks, Inc. | | 95,792 | 2,663,018 |
| Lumentum Holdings, Inc. (a)(b) | | 20,560 | 1,076,522 |
| Motorola Solutions, Inc. | | 3,980 | 1,140,787 |
| Ubiquiti, Inc. (b) | | 198 | 35,175 |
| ViaSat, Inc. (a)(b) | | 21,636 | 669,418 |
| | | | 74,621,690 |
| Electronic Equipment, Instruments & Components - 0.9% | | | |
| Amphenol Corp. Class A | | 87,263 | 7,706,196 |
| Arrow Electronics, Inc. (a) | | 17,242 | 2,457,675 |
| Avnet, Inc. | | 27,345 | 1,326,233 |
| CDW Corp. | | 2,359 | 441,298 |
| Cognex Corp. | | 51,984 | 2,839,366 |
| Coherent Corp. (a)(b) | | 35,865 | 1,698,566 |
| Corning, Inc. | | 229,003 | 7,772,362 |
| IPG Photonics Corp. (a) | | 9,024 | 1,186,205 |
| Jabil, Inc. | | 14,480 | 1,602,502 |
| Keysight Technologies, Inc. (a) | | 39,748 | 6,402,608 |
| Littelfuse, Inc. | | 7,281 | 2,217,793 |
| National Instruments Corp. | | 8,592 | 506,928 |
| TD SYNNEX Corp. | | 12,504 | 1,234,270 |
| Teledyne Technologies, Inc. (a) | | 14,027 | 5,393,802 |
| Trimble, Inc. (a) | | 74,169 | 3,990,292 |
| Vontier Corp. | | 30,983 | 958,304 |
| Zebra Technologies Corp. Class A (a) | | 12,634 | 3,890,767 |
| | | | 51,625,167 |
| IT Services - 1.2% | | | |
| Akamai Technologies, Inc. (a) | | 46,319 | 4,377,146 |
| Amdocs Ltd. | | 35,804 | 3,352,687 |
| Cognizant Technology Solutions Corp. Class A | | 152,962 | 10,100,081 |
| DXC Technology Co. (a) | | 68,355 | 1,890,016 |
| GoDaddy, Inc. (a)(b) | | 18,279 | 1,409,128 |
| IBM Corp. | | 273,728 | 39,466,103 |
| Kyndryl Holdings, Inc. (a) | | 61,690 | 842,685 |
| Okta, Inc. (a) | | 42,311 | 3,252,023 |
| Twilio, Inc. Class A (a) | | 42,544 | 2,809,180 |
| VeriSign, Inc. (a) | | 25,804 | 5,443,354 |
| | | | 72,942,403 |
| Semiconductors & Semiconductor Equipment - 3.8% | | | |
| Advanced Micro Devices, Inc. (a) | | 208,123 | 23,809,271 |
| Analog Devices, Inc. | | 152,289 | 30,386,224 |
| Applied Materials, Inc. | | 39,415 | 5,974,920 |
| Cirrus Logic, Inc. (a) | | 16,611 | 1,342,169 |
| Entegris, Inc. | | 42,610 | 4,674,743 |
| First Solar, Inc. (a) | | 32,036 | 6,644,266 |
| GlobalFoundries, Inc. (a)(b) | | 23,604 | 1,503,339 |
| Intel Corp. | | 1,257,664 | 44,986,641 |
| Lam Research Corp. | | 2,142 | 1,539,006 |
| Marvell Technology, Inc. | | 257,338 | 16,760,424 |
| Microchip Technology, Inc. | | 46,481 | 4,366,425 |
| Micron Technology, Inc. | | 329,225 | 23,503,373 |
| MKS Instruments, Inc. | | 19,972 | 2,180,343 |
| ON Semiconductor Corp. (a) | | 129,827 | 13,988,859 |
| Qorvo, Inc. (a) | | 29,994 | 3,299,940 |
| Qualcomm, Inc. | | 43,018 | 5,685,689 |
| Skyworks Solutions, Inc. | | 47,863 | 5,474,091 |
| Teradyne, Inc. | | 7,833 | 884,659 |
| Texas Instruments, Inc. | | 161,890 | 29,140,200 |
| Universal Display Corp. | | 7,704 | 1,123,860 |
| Wolfspeed, Inc. (a)(b) | | 37,315 | 2,459,059 |
| | | | 229,727,501 |
| Software - 1.6% | | | |
| ANSYS, Inc. (a) | | 4,573 | 1,564,423 |
| AppLovin Corp. (a)(b) | | 50,935 | 1,599,359 |
| Aspen Technology, Inc. (a)(b) | | 8,396 | 1,498,686 |
| Bentley Systems, Inc. Class B (b) | | 4,220 | 227,374 |
| Bill Holdings, Inc. (a)(b) | | 30,870 | 3,869,246 |
| Black Knight, Inc. (a) | | 46,660 | 3,281,131 |
| CCC Intelligent Solutions Holdings, Inc. Class A (a)(b) | | 60,518 | 666,908 |
| Dolby Laboratories, Inc. Class A | | 17,803 | 1,577,524 |
| Dropbox, Inc. Class A (a) | | 8,744 | 235,651 |
| Gen Digital, Inc. | | 140,728 | 2,737,160 |
| Guidewire Software, Inc. (a) | | 24,545 | 2,081,907 |
| HashiCorp, Inc. (a) | | 8,827 | 261,367 |
| Informatica, Inc. (a)(b) | | 11,776 | 224,215 |
| nCino, Inc. (a)(b) | | 19,122 | 618,597 |
| NCR Corp. (a)(b) | | 38,384 | 1,031,762 |
| Nutanix, Inc. Class A (a) | | 52,332 | 1,580,426 |
| Oracle Corp. | | 269,798 | 31,628,420 |
| PTC, Inc. (a) | | 15,611 | 2,276,240 |
| Roper Technologies, Inc. | | 31,833 | 15,695,261 |
| Salesforce, Inc. (a) | | 70,146 | 15,783,551 |
| SentinelOne, Inc. (a)(b) | | 49,036 | 817,430 |
| Tyler Technologies, Inc. (a) | | 3,056 | 1,212,101 |
| UiPath, Inc. Class A (a) | | 26,333 | 476,101 |
| Unity Software, Inc. (a)(b) | | 52,420 | 2,402,933 |
| Zoom Video Communications, Inc. Class A (a) | | 74,419 | 5,458,634 |
| | | | 98,806,407 |
| Technology Hardware, Storage & Peripherals - 0.4% | | | |
| Hewlett Packard Enterprise Co. | | 389,391 | 6,767,616 |
| HP, Inc. | | 207,084 | 6,798,568 |
| NetApp, Inc. | | 38,755 | 3,023,278 |
| Pure Storage, Inc. Class A (a) | | 18,446 | 682,318 |
| Western Digital Corp. (a) | | 96,166 | 4,092,825 |
| | | | 21,364,605 |
TOTAL INFORMATION TECHNOLOGY | | | 549,087,773 |
| MATERIALS - 4.9% | | | |
| Chemicals - 3.0% | | | |
| Air Products & Chemicals, Inc. | | 66,803 | 20,396,960 |
| Albemarle Corp. | | 35,246 | 7,482,021 |
| Ashland, Inc. | | 15,114 | 1,380,815 |
| Axalta Coating Systems Ltd. (a) | | 59,461 | 1,902,752 |
| Celanese Corp. Class A (b) | | 29,746 | 3,729,851 |
| CF Industries Holdings, Inc. | | 58,850 | 4,830,408 |
| Corteva, Inc. | | 214,806 | 12,121,503 |
| Dow, Inc. (b) | | 213,114 | 12,034,548 |
| DuPont de Nemours, Inc. | | 138,248 | 10,732,192 |
| Eastman Chemical Co. | | 35,686 | 3,054,008 |
| Ecolab, Inc. | | 16,610 | 3,041,955 |
| Element Solutions, Inc. | | 67,156 | 1,407,590 |
| FMC Corp. | | 31,984 | 3,077,820 |
| Ginkgo Bioworks Holdings, Inc. Class A (a)(b) | | 419,961 | 1,054,102 |
| Huntsman Corp. (b) | | 52,547 | 1,564,324 |
| International Flavors & Fragrances, Inc. | | 76,871 | 6,504,055 |
| Linde PLC | | 133,893 | 52,307,978 |
| LyondellBasell Industries NV Class A | | 77,891 | 7,700,304 |
| NewMarket Corp. | | 1,874 | 846,486 |
| Olin Corp. | | 38,859 | 2,241,387 |
| PPG Industries, Inc. | | 52,934 | 7,617,203 |
| RPM International, Inc. | | 30,964 | 3,198,891 |
| Sherwin-Williams Co. | | 11,964 | 3,308,046 |
| The Chemours Co. LLC (b) | | 44,732 | 1,654,189 |
| The Mosaic Co. | | 99,608 | 4,060,022 |
| Westlake Corp. (b) | | 9,737 | 1,338,838 |
| | | | 178,588,248 |
| Construction Materials - 0.3% | | | |
| Eagle Materials, Inc. | | 3,672 | 677,007 |
| Martin Marietta Materials, Inc. | | 18,586 | 8,297,906 |
| Vulcan Materials Co. | | 31,110 | 6,859,755 |
| | | | 15,834,668 |
| Containers & Packaging - 0.6% | | | |
| Amcor PLC | | 445,451 | 4,570,327 |
| Aptargroup, Inc. | | 19,685 | 2,390,940 |
| Ardagh Group SA (a) | | 5,448 | 32,307 |
| Ardagh Metal Packaging SA | | 3,091 | 11,684 |
| Avery Dennison Corp. | | 16,308 | 3,000,835 |
| Ball Corp. (b) | | 92,743 | 5,443,087 |
| Berry Global Group, Inc. (b) | | 36,546 | 2,396,321 |
| Crown Holdings, Inc. | | 31,927 | 2,961,549 |
| Graphic Packaging Holding Co. (b) | | 42,599 | 1,030,896 |
| International Paper Co. | | 104,239 | 3,758,858 |
| Packaging Corp. of America | | 26,630 | 4,083,711 |
| Sealed Air Corp. | | 19,334 | 882,017 |
| Silgan Holdings, Inc. | | 25,132 | 1,102,038 |
| Sonoco Products Co. (b) | | 29,420 | 1,725,189 |
| WestRock Co. | | 76,453 | 2,545,120 |
| | | | 35,934,879 |
| Metals & Mining - 1.0% | | | |
| Alcoa Corp. (b) | | 53,499 | 1,936,129 |
| Cleveland-Cliffs, Inc. (a) | | 152,942 | 2,699,426 |
| Freeport-McMoRan, Inc. | | 430,260 | 19,211,109 |
| MP Materials Corp. (a)(b) | | 31,286 | 746,171 |
| Newmont Corp. | | 239,619 | 10,284,447 |
| Nucor Corp. | | 75,803 | 13,044,938 |
| Reliance Steel & Aluminum Co. | | 17,599 | 5,154,043 |
| Royal Gold, Inc. | | 19,731 | 2,370,482 |
| SSR Mining, Inc. (b) | | 62,061 | 903,608 |
| Steel Dynamics, Inc. | | 48,357 | 5,153,889 |
| United States Steel Corp. (b) | | 67,690 | 1,726,095 |
| | | | 63,230,337 |
| Paper & Forest Products - 0.0% | | | |
| Louisiana-Pacific Corp. (b) | | 19,335 | 1,471,974 |
TOTAL MATERIALS | | | 295,060,106 |
| REAL ESTATE - 4.8% | | | |
| Equity Real Estate Investment Trusts (REITs) - 4.5% | | | |
| Agree Realty Corp. | | 26,779 | 1,734,744 |
| Alexandria Real Estate Equities, Inc. | | 51,635 | 6,489,487 |
| American Homes 4 Rent Class A (b) | | 100,219 | 3,756,208 |
| Americold Realty Trust | | 81,266 | 2,634,644 |
| Apartment Income (REIT) Corp. | | 44,762 | 1,546,079 |
| AvalonBay Communities, Inc. | | 42,072 | 7,936,883 |
| Boston Properties, Inc. | | 47,207 | 3,145,402 |
| Brixmor Property Group, Inc. | | 90,084 | 2,048,510 |
| Camden Property Trust (SBI) | | 31,229 | 3,406,772 |
| Cousins Properties, Inc. (b) | | 45,520 | 1,112,054 |
| Crown Castle International Corp. | | 116,488 | 12,614,486 |
| CubeSmart | | 67,315 | 2,918,778 |
| Digital Realty Trust, Inc. | | 87,534 | 10,908,487 |
| EastGroup Properties, Inc. | | 13,198 | 2,338,422 |
| EPR Properties | | 22,323 | 996,499 |
| Equinix, Inc. | | 14,003 | 11,341,310 |
| Equity Lifestyle Properties, Inc. | | 35,986 | 2,561,483 |
| Equity Residential (SBI) | | 112,302 | 7,405,194 |
| Essex Property Trust, Inc. | | 19,217 | 4,680,300 |
| Extra Space Storage, Inc. | | 62,963 | 8,787,746 |
| Federal Realty Investment Trust (SBI) | | 24,331 | 2,470,083 |
| First Industrial Realty Trust, Inc. | | 39,721 | 2,053,576 |
| Gaming & Leisure Properties | | 75,737 | 3,594,478 |
| Healthcare Trust of America, Inc. | | 114,303 | 2,232,338 |
| Healthpeak Properties, Inc. | | 164,694 | 3,595,270 |
| Highwoods Properties, Inc. (SBI) | | 31,290 | 790,698 |
| Host Hotels & Resorts, Inc. | | 212,801 | 3,915,538 |
| Invitation Homes, Inc. | | 184,003 | 6,532,107 |
| Iron Mountain, Inc. | | 44,026 | 2,703,196 |
| Kilroy Realty Corp. | | 35,103 | 1,253,177 |
| Kimco Realty Corp. | | 182,129 | 3,689,934 |
| Lamar Advertising Co. Class A | | 5,987 | 590,917 |
| Medical Properties Trust, Inc. (b) | | 178,620 | 1,802,276 |
| Mid-America Apartment Communities, Inc. | | 34,953 | 5,231,066 |
| National Storage Affiliates Trust | | 24,006 | 811,163 |
| NNN (REIT), Inc. | | 54,596 | 2,330,157 |
| Omega Healthcare Investors, Inc. | | 70,481 | 2,248,344 |
| Park Hotels & Resorts, Inc. | | 66,068 | 900,507 |
| Prologis (REIT), Inc. | | 277,918 | 34,670,271 |
| Public Storage | | 19,770 | 5,570,198 |
| Rayonier, Inc. | | 44,173 | 1,463,010 |
| Realty Income Corp. | | 199,039 | 12,135,408 |
| Regency Centers Corp. | | 51,242 | 3,357,888 |
| Rexford Industrial Realty, Inc. | | 60,291 | 3,321,431 |
| SBA Communications Corp. Class A | | 29,066 | 6,364,001 |
| Simon Property Group, Inc. | | 76,405 | 9,520,063 |
| Spirit Realty Capital, Inc. | | 42,401 | 1,710,032 |
| Stag Industrial, Inc. | | 54,034 | 1,961,434 |
| Sun Communities, Inc. | | 28,928 | 3,769,318 |
| UDR, Inc. | | 93,228 | 3,811,161 |
| Ventas, Inc. | | 120,277 | 5,835,840 |
| VICI Properties, Inc. | | 302,255 | 9,514,987 |
| Vornado Realty Trust | | 53,190 | 1,195,711 |
| Welltower, Inc. | | 149,630 | 12,292,105 |
| Weyerhaeuser Co. | | 220,500 | 7,510,230 |
| WP Carey, Inc. | | 63,811 | 4,309,157 |
| | | | 273,420,558 |
| Real Estate Management & Development - 0.3% | | | |
| CBRE Group, Inc. (a) | | 93,270 | 7,770,324 |
| CoStar Group, Inc. (a) | | 69,379 | 5,825,755 |
| Howard Hughes Corp. (a) | | 10,125 | 854,854 |
| Jones Lang LaSalle, Inc. (a)(b) | | 14,260 | 2,375,003 |
| Zillow Group, Inc.: | | | |
| Class A (a) | | 16,652 | 886,219 |
| Class C (a) | | 46,470 | 2,516,815 |
| | | | 20,228,970 |
TOTAL REAL ESTATE | | | 293,649,528 |
| UTILITIES - 5.1% | | | |
| Electric Utilities - 3.3% | | | |
| Alliant Energy Corp. | | 75,636 | 4,064,679 |
| American Electric Power Co., Inc. | | 155,121 | 13,144,954 |
| Avangrid, Inc. (b) | | 21,373 | 792,511 |
| Constellation Energy Corp. | | 98,656 | 9,535,102 |
| Duke Energy Corp. | | 232,193 | 21,737,909 |
| Edison International | | 113,807 | 8,189,552 |
| Entergy Corp. | | 63,726 | 6,544,660 |
| Evergy, Inc. | | 67,029 | 4,019,729 |
| Eversource Energy | | 104,955 | 7,591,395 |
| Exelon Corp. | | 299,364 | 12,531,377 |
| FirstEnergy Corp. | | 163,961 | 6,458,424 |
| Hawaiian Electric Industries, Inc. (b) | | 32,981 | 1,266,141 |
| IDACORP, Inc. | | 15,195 | 1,562,350 |
| NextEra Energy, Inc. | | 609,848 | 44,701,858 |
| NRG Energy, Inc. | | 69,458 | 2,638,709 |
| OGE Energy Corp. | | 60,167 | 2,175,037 |
| PG&E Corp. (a) | | 542,438 | 9,552,333 |
| Pinnacle West Capital Corp. | | 34,076 | 2,822,174 |
| PPL Corp. | | 222,209 | 6,117,414 |
| Southern Co. | | 328,250 | 23,745,605 |
| Xcel Energy, Inc. | | 165,910 | 10,407,534 |
| | | | 199,599,447 |
| Gas Utilities - 0.1% | | | |
| Atmos Energy Corp. | | 43,390 | 5,280,997 |
| National Fuel Gas Co. | | 26,730 | 1,419,630 |
| UGI Corp. | | 62,871 | 1,696,888 |
| | | | 8,397,515 |
| Independent Power and Renewable Electricity Producers - 0.1% | | | |
| Brookfield Renewable Corp. (b) | | 38,426 | 1,197,738 |
| Clearway Energy, Inc.: | | | |
| Class A | | 10,575 | 260,885 |
| Class C | | 24,494 | 646,887 |
| The AES Corp. | | 78,220 | 1,691,899 |
| Vistra Corp. | | 80,107 | 2,247,802 |
| | | | 6,045,211 |
| Multi-Utilities - 1.4% | | | |
| Ameren Corp. | | 78,845 | 6,754,651 |
| CenterPoint Energy, Inc. | | 190,006 | 5,717,281 |
| CMS Energy Corp. | | 87,563 | 5,347,472 |
| Consolidated Edison, Inc. | | 104,478 | 9,910,783 |
| Dominion Energy, Inc. | | 251,747 | 13,481,052 |
| DTE Energy Co. | | 62,029 | 7,089,915 |
| NiSource, Inc. | | 124,433 | 3,464,215 |
| Public Service Enterprise Group, Inc. | | 149,734 | 9,451,210 |
| Sempra Energy | | 94,875 | 14,138,273 |
| WEC Energy Group, Inc. | | 95,013 | 8,537,868 |
| | | | 83,892,720 |
| Water Utilities - 0.2% | | | |
| American Water Works Co., Inc. | | 58,666 | 8,649,128 |
| Essential Utilities, Inc. | | 73,068 | 3,090,046 |
| | | | 11,739,174 |
TOTAL UTILITIES | | | 309,674,067 |
| TOTAL COMMON STOCKS (Cost $4,511,506,401) | | | 6,055,201,776 |
| | | | |
| U.S. Treasury Obligations - 0.0% |
| | | Principal Amount (c) | Value ($) |
U.S. Treasury Bills, yield at date of purchase 5.18% 9/7/23 (d) (Cost $994,728) | | 1,000,000 | 994,590 |
| | | | |
| Money Market Funds - 2.8% |
| | | Shares | Value ($) |
| Fidelity Cash Central Fund 5.32% (e) | | 9,508,743 | 9,510,644 |
| Fidelity Securities Lending Cash Central Fund 5.32% (e)(f) | | 157,677,710 | 157,693,478 |
| TOTAL MONEY MARKET FUNDS (Cost $167,203,745) | | | 167,204,122 |
| | | | |
| TOTAL INVESTMENT IN SECURITIES - 102.5% (Cost $4,679,704,874) | 6,223,400,488 |
NET OTHER ASSETS (LIABILITIES) - (2.5)% | (152,840,565) |
| NET ASSETS - 100.0% | 6,070,559,923 |
| | |
| Futures Contracts |
| | Number of contracts | Expiration Date | Notional Amount ($) | Value ($) | Unrealized Appreciation/ (Depreciation) ($) |
| Purchased | | | | | |
| | | | | | |
| Equity Index Contracts | | | | | |
| CME E-mini S&P 500 Index Contracts (United States) | 35 | Sep 2023 | 8,075,375 | 387,926 | 387,926 |
| CME E-mini S&P MidCap 400 Index Contracts (United States) | 32 | Sep 2023 | 8,778,880 | 513,462 | 513,462 |
| | | | | | |
| TOTAL FUTURES CONTRACTS | | | | | 901,388 |
| The notional amount of futures purchased as a percentage of Net Assets is 0.3% |
Legend
| (b) | Security or a portion of the security is on loan at period end. |
| (c) | Amount is stated in United States dollars unless otherwise noted. |
| (d) | Security or a portion of the security was pledged to cover margin requirements for futures contracts. At period end, the value of securities pledged amounted to $885,185. |
| (e) | Affiliated fund that is generally available only to investment companies and other accounts managed by Fidelity Investments. The rate quoted is the annualized seven-day yield of the fund at period end. A complete unaudited listing of the fund's holdings as of its most recent quarter end is available upon request. In addition, each Fidelity Central Fund's financial statements are available on the SEC's website or upon request. |
| (f) | Investment made with cash collateral received from securities on loan. |
Affiliated Central Funds
Fiscal year to date information regarding the Fund's investments in Fidelity Central Funds, including the ownership percentage, is presented below.
| Affiliate | Value, beginning of period ($) | Purchases ($) | Sales Proceeds ($) | Dividend Income ($) | Realized Gain (loss) ($) | Change in Unrealized appreciation (depreciation) ($) | Value, end of period ($) | % ownership, end of period |
| Fidelity Cash Central Fund 5.32% | 26,168,658 | 637,491,108 | 654,149,122 | 578,016 | - | - | 9,510,644 | 0.0% |
| Fidelity Securities Lending Cash Central Fund 5.32% | 159,869,302 | 467,206,435 | 469,382,259 | 843,493 | - | - | 157,693,478 | 0.5% |
| Total | 186,037,960 | 1,104,697,543 | 1,123,531,381 | 1,421,509 | - | - | 167,204,122 | |
| | | | | | | | | |
Amounts in the dividend income column in the above table include any capital gain distributions from underlying funds, which are presented in the corresponding line item in the Statement of Operations, if applicable.
Amounts in the dividend income column for Fidelity Securities Lending Cash Central Fund represents the income earned on investing cash collateral, less rebates paid to borrowers and any lending agent fees associated with the loan, plus any premium payments received for lending certain types of securities.
Amounts included in the purchases and sales proceeds columns may include in-kind transactions, if applicable.
Investment Valuation
The following is a summary of the inputs used, as of July 31, 2023, involving the Fund's assets and liabilities carried at fair value. The inputs or methodology used for valuing securities may not be an indication of the risk associated with investing in those securities. For more information on valuation inputs, and their aggregation into the levels used below, please refer to the Investment Valuation section in the accompanying Notes to Financial Statements.
| Valuation Inputs at Reporting Date: |
| Description | Total ($) | Level 1 ($) | Level 2 ($) | Level 3 ($) |
Investments in Securities: | | | | |
|
| Equities: | | | | |
Communication Services | 299,944,814 | 299,944,814 | - | - |
Consumer Discretionary | 316,396,185 | 316,396,185 | - | - |
Consumer Staples | 501,584,429 | 501,584,429 | - | - |
Energy | 498,561,701 | 498,561,701 | - | - |
Financials | 1,251,589,481 | 1,251,589,481 | - | - |
Health Care | 929,667,274 | 929,667,274 | - | - |
Industrials | 809,986,418 | 809,986,418 | - | - |
Information Technology | 549,087,773 | 549,087,773 | - | - |
Materials | 295,060,106 | 295,060,106 | - | - |
Real Estate | 293,649,528 | 293,649,528 | - | - |
Utilities | 309,674,067 | 309,674,067 | - | - |
|
| U.S. Government and Government Agency Obligations | 994,590 | - | 994,590 | - |
|
| Money Market Funds | 167,204,122 | 167,204,122 | - | - |
| Total Investments in Securities: | 6,223,400,488 | 6,222,405,898 | 994,590 | - |
Derivative Instruments: | | | | |
|
| Assets | | | | |
Futures Contracts | 901,388 | 901,388 | - | - |
| Total Assets | 901,388 | 901,388 | - | - |
| Total Derivative Instruments: | 901,388 | 901,388 | - | - |
Value of Derivative Instruments
The following table is a summary of the Fund's value of derivative instruments by primary risk exposure as of July 31, 2023. For additional information on derivative instruments, please refer to the Derivative Instruments section in the accompanying Notes to Financial Statements.
Primary Risk Exposure / Derivative Type | Value |
| Asset ($) | Liability ($) |
| Equity Risk | | |
Futures Contracts (a) | 901,388 | 0 |
| Total Equity Risk | 901,388 | 0 |
| Total Value of Derivatives | 901,388 | 0 |
(a)Reflects gross cumulative appreciation (depreciation) on futures contracts as presented in the Schedule of Investments. In the Statement of Assets and Liabilities, the period end daily variation margin is included in receivable or payable for daily variation margin on futures contracts, and the net cumulative appreciation (depreciation) is included in Total accumulated earnings (loss).
| Statement of Assets and Liabilities |
| | | | July 31, 2023 (Unaudited) |
| | | | | |
| Assets | | | | |
| Investment in securities, at value (including securities loaned of $156,081,576) - See accompanying schedule: | | | | |
Unaffiliated issuers (cost $4,512,501,129) | $ | 6,056,196,366 | | |
Fidelity Central Funds (cost $167,203,745) | | 167,204,122 | | |
| | | | | |
| | | | | |
| Total Investment in Securities (cost $4,679,704,874) | | | $ | 6,223,400,488 |
| Receivable for investments sold | | | | 34,102,951 |
| Receivable for fund shares sold | | | | 7,171,296 |
| Dividends receivable | | | | 6,434,140 |
| Distributions receivable from Fidelity Central Funds | | | | 256,733 |
| Receivable for daily variation margin on futures contracts | | | | 51,669 |
| Other receivables | | | | 13,888 |
Total assets | | | | 6,271,431,165 |
| Liabilities | | | | |
| Payable to custodian bank | $ | 20,180 | | |
| Payable for fund shares redeemed | | 43,144,390 | | |
| Other payables and accrued expenses | | 24,000 | | |
| Collateral on securities loaned | | 157,682,672 | | |
| Total Liabilities | | | | 200,871,242 |
| Net Assets | | | $ | 6,070,559,923 |
| Net Assets consist of: | | | | |
| Paid in capital | | | $ | 4,383,301,322 |
| Total accumulated earnings (loss) | | | | 1,687,258,601 |
| Net Assets | | | $ | 6,070,559,923 |
Net Asset Value, offering price and redemption price per share ($6,070,559,923 ÷ 405,361,553 shares) | | | $ | 14.98 |
| Statement of Operations |
| | | | Six months ended July 31, 2023 (Unaudited) |
| Investment Income | | | | |
| Dividends | | | $ | 65,716,487 |
| Interest | | | | 39,365 |
| Income from Fidelity Central Funds (including $843,493 from security lending) | | | | 1,421,509 |
| Total Income | | | | 67,177,361 |
| Expenses | | | | |
| Custodian fees and expenses | $ | 51,047 | | |
| Independent trustees' fees and expenses | | 9,449 | | |
| Interest | | 2,070 | | |
| Total expenses before reductions | | 62,566 | | |
| Expense reductions | | (1,774) | | |
| Total expenses after reductions | | | | 60,792 |
| Net Investment income (loss) | | | | 67,116,569 |
| Realized and Unrealized Gain (Loss) | | | | |
| Net realized gain (loss) on: | | | | |
| Investment Securities: | | | | |
| Unaffiliated issuers | | 119,896,722 | | |
| Futures contracts | | 3,346,519 | | |
| Total net realized gain (loss) | | | | 123,243,241 |
| Change in net unrealized appreciation (depreciation) on: | | | | |
| Investment Securities: | | | | |
| Unaffiliated issuers | | 35,907,174 | | |
| Futures contracts | | (1,012,591) | | |
| Total change in net unrealized appreciation (depreciation) | | | | 34,894,583 |
| Net gain (loss) | | | | 158,137,824 |
| Net increase (decrease) in net assets resulting from operations | | | $ | 225,254,393 |
| Statement of Changes in Net Assets |
| |
| | Six months ended July 31, 2023 (Unaudited) | | Year ended January 31, 2023 |
| Increase (Decrease) in Net Assets | | | | |
| Operations | | | | |
| Net investment income (loss) | $ | 67,116,569 | $ | 121,301,361 |
| Net realized gain (loss) | | 123,243,241 | | 134,542,912 |
| Change in net unrealized appreciation (depreciation) | | 34,894,583 | | (292,840,981) |
| Net increase (decrease) in net assets resulting from operations | | 225,254,393 | | (36,996,708) |
| Distributions to shareholders | | (12,972,017) | | (223,483,250) |
| | | | | |
| Share transactions | | | | |
| Proceeds from sales of shares | | 614,497,235 | | 1,009,067,447 |
| Reinvestment of distributions | | 12,972,017 | | 223,483,250 |
| Cost of shares redeemed | | (425,724,956) | | (1,275,321,799) |
| | | | | |
Net increase (decrease) in net assets resulting from share transactions | | 201,744,296 | | (42,771,102) |
| Total increase (decrease) in net assets | | 414,026,672 | | (303,251,060) |
| | | | | |
| Net Assets | | | | |
| Beginning of period | | 5,656,533,251 | | 5,959,784,311 |
| End of period | $ | 6,070,559,923 | $ | 5,656,533,251 |
| | | | | |
| Other Information | | | | |
| Shares | | | | |
| Sold | | 44,146,730 | | 71,082,789 |
| Issued in reinvestment of distributions | | 965,180 | | 15,931,648 |
| Redeemed | | (29,713,765) | | (89,125,886) |
| Net increase (decrease) | | 15,398,145 | | (2,111,449) |
| | | | | |
| Fidelity® Series Large Cap Value Index Fund |
| |
| | Six months ended (Unaudited) July 31, 2023 | | Years ended January 31, 2023 | | 2022 | | 2021 | | 2020 | | 2019 |
Selected Per-Share Data | | | | | | | | | | | | |
| Net asset value, beginning of period | $ | 14.51 | $ | 15.20 | $ | 13.09 | $ | 12.91 | $ | 12.02 | $ | 13.22 |
| Income from Investment Operations | | | | | | | | | | | | |
Net investment income (loss) A,B | | .17 | | .32 | | .30 | | .29 | | .33 | | .32 |
| Net realized and unrealized gain (loss) | | .33 | | (.40) | | 2.76 | | .23 | | 1.46 | | (.96) |
| Total from investment operations | | .50 | | (.08) | | 3.06 | | .52 | | 1.79 | | (.64) |
| Distributions from net investment income | | (.01) | | (.33) | | (.30) | | (.29) | | (.34) | | (.33) |
| Distributions from net realized gain | | (.02) | | (.28) | | (.65) | | (.05) | | (.57) | | (.22) |
| Total distributions | | (.03) | | (.61) | | (.95) | | (.34) | | (.90) C | | (.56) C |
| Net asset value, end of period | $ | 14.98 | $ | 14.51 | $ | 15.20 | $ | 13.09 | $ | 12.91 | $ | 12.02 |
Total Return D,E | | 3.49% | | (.40)% | | 23.41% | | 4.14% | | 14.94% | | (4.73)% |
Ratios to Average Net Assets B,F,G | | | | | | | | | | | | |
Expenses before reductions H | | -% I | | -% | | -% | | -% | | -% | | -% |
Expenses net of fee waivers, if any H | | -% I | | -% | | -% | | -% | | -% | | -% |
Expenses net of all reductions H | | -% I | | -% | | -% | | -% | | -% | | -% |
| Net investment income (loss) | | 2.36% I | | 2.21% | | 1.93% | | 2.49% | | 2.58% | | 2.52% |
| Supplemental Data | | | | | | | | | | | | |
| Net assets, end of period (000 omitted) | $ | 6,070,560 | $ | 5,656,533 | $ | 5,959,784 | $ | 5,344,271 | $ | 4,036,878 | $ | 3,698,418 |
Portfolio turnover rate J | | 34% I | | 24% | | 27% | | 21% | | 31% | | 19% |
ACalculated based on average shares outstanding during the period.
BNet investment income (loss) is affected by the timing of the declaration of dividends by any underlying mutual funds or exchange-traded funds (ETFs). Net investment income (loss) of any mutual funds or ETFs is not included in the Fund's net investment income (loss) ratio.
CTotal distributions per share do not sum due to rounding.
DTotal returns for periods of less than one year are not annualized.
ETotal returns would have been lower if certain expenses had not been reduced during the applicable periods shown.
FFees and expenses of any underlying mutual funds or exchange-traded funds (ETFs) are not included in the Fund's expense ratio. The Fund indirectly bears its proportionate share of these expenses. For additional expense information related to investments in Fidelity Central Funds, please refer to the "Investments in Fidelity Central Funds" note found in the Notes to Financial Statements section of the most recent Annual or Semi-Annual report.
GExpense ratios reflect operating expenses of the class. Expenses before reductions do not reflect amounts reimbursed, waived, or reduced through arrangements with the investment adviser, brokerage services, or other offset arrangements, if applicable, and do not represent the amount paid by the class during periods when reimbursements, waivers or reductions occur.
HAmount represents less than $.005 per share.
IAnnualized.
JAmount does not include the portfolio activity of any underlying mutual funds or exchange-traded funds (ETFs).
For the period ended July 31, 2023
1. Organization.
Fidelity Series Large Cap Value Index Fund (the Fund) is a fund of Fidelity Salem Street Trust (the Trust) and is authorized to issue an unlimited number of shares. Shares are offered only to certain other Fidelity funds, Fidelity managed 529 plans, and Fidelity managed collective investment trusts. The Trust is registered under the Investment Company Act of 1940, as amended (the 1940 Act), as an open-end management investment company organized as a Massachusetts business trust.
2. Investments in Fidelity Central Funds.
Funds may invest in Fidelity Central Funds, which are open-end investment companies generally available only to other investment companies and accounts managed by the investment adviser and its affiliates. The Schedule of Investments lists any Fidelity Central Funds held as an investment as of period end, but does not include the underlying holdings of each Fidelity Central Fund. An investing fund indirectly bears its proportionate share of the expenses of the underlying Fidelity Central Funds.
Based on its investment objective, each Fidelity Central Fund may invest or participate in various investment vehicles or strategies that are similar to those of the investing fund. These strategies are consistent with the investment objectives of the investing fund and may involve certain economic risks which may cause a decline in value of each of the Fidelity Central Funds and thus a decline in the value of the investing fund.
| Fidelity Central Fund | Investment Manager | Investment Objective | Investment Practices | Expense RatioA |
| Fidelity Money Market Central Funds | Fidelity Management & Research Company LLC (FMR) | Each fund seeks to obtain a high level of current income consistent with the preservation of capital and liquidity. | Short-term Investments | Less than .005% |
A Expenses expressed as a percentage of average net assets and are as of each underlying Central Fund's most recent annual or semi-annual shareholder report.
A complete unaudited list of holdings for each Fidelity Central Fund is available upon request or at the Securities and Exchange Commission website at www.sec.gov. In addition, the financial statements of the Fidelity Central Funds which contain the significant accounting policies (including investment valuation policies) of those funds, and are not covered by the Report of Independent Registered Public Accounting Firm, are available on the Securities and Exchange Commission website or upon request.
3. Significant Accounting Policies.
The Fund is an investment company and applies the accounting and reporting guidance of the Financial Accounting Standards Board (FASB) Accounting Standards Codification Topic 946 Financial Services - Investment Companies. The financial statements have been prepared in conformity with accounting principles generally accepted in the United States of America (GAAP), which require management to make certain estimates and assumptions at the date of the financial statements. Actual results could differ from those estimates. Subsequent events, if any, through the date that the financial statements were issued have been evaluated in the preparation of the financial statements. The Fund's Schedule of Investments lists any underlying mutual funds or exchange-traded funds (ETFs) but does not include the underlying holdings of these funds. The following summarizes the significant accounting policies of the Fund:
Investment Valuation. Investments are valued as of 4:00 p.m. Eastern time on the last calendar day of the period. The Board of Trustees (the Board) has designated the Fund's investment adviser as the valuation designee responsible for the fair valuation function and performing fair value determinations as needed. The investment adviser has established a Fair Value Committee (the Committee) to carry out the day-to-day fair valuation responsibilities and has adopted policies and procedures to govern the fair valuation process and the activities of the Committee. In accordance with these fair valuation policies and procedures, which have been approved by the Board, the Fund attempts to obtain prices from one or more third party pricing services or brokers to value its investments. When current market prices, quotations or currency exchange rates are not readily available or reliable, investments will be fair valued in good faith by the Committee, in accordance with the policies and procedures. Factors used in determining fair value vary by investment type and may include market or investment specific events, transaction data, estimated cash flows, and market observations of comparable investments. The frequency that the fair valuation procedures are used cannot be predicted and they may be utilized to a significant extent. The Committee manages the Fund's fair valuation practices and maintains the fair valuation policies and procedures. The Fund's investment adviser reports to the Board information regarding the fair valuation process and related material matters.
The Fund categorizes the inputs to valuation techniques used to value its investments into a disclosure hierarchy consisting of three levels as shown below:
Level 1 - unadjusted quoted prices in active markets for identical investments
Level 2 - other significant observable inputs (including quoted prices for similar investments, interest rates, prepayment speeds, etc.)
Level 3 - unobservable inputs (including the Fund's own assumptions based on the best information available)
Valuation techniques used to value the Fund's investments by major category are as follows:
Equity securities, including restricted securities, for which market quotations are readily available, are valued at the last reported sale price or official closing price as reported by a third party pricing service on the primary market or exchange on which they are traded and are categorized as Level 1 in the hierarchy. In the event there were no sales during the day or closing prices are not available, securities are valued at the last quoted bid price or may be valued using the last available price and are generally categorized as Level 2 in the hierarchy. For foreign equity securities, when market or security specific events arise, comparisons to the valuation of American Depositary Receipts (ADRs), futures contracts, ETFs and certain indexes as well as quoted prices for similar securities may be used and would be categorized as Level 2 in the hierarchy. For equity securities, including restricted securities, where observable inputs are limited, assumptions about market activity and risk are used and these securities may be categorized as Level 3 in the hierarchy.
Debt securities, including restricted securities, are valued based on evaluated prices received from third party pricing services or from brokers who make markets in such securities. U.S. government and government agency obligations are valued by pricing services who utilize matrix pricing which considers yield or price of bonds of comparable quality, coupon, maturity and type or by broker-supplied prices. When independent prices are unavailable or unreliable, debt securities may be valued utilizing pricing methodologies which consider similar factors that would be used by third party pricing services. Debt securities are generally categorized as Level 2 in the hierarchy but may be Level 3 depending on the circumstances.
Futures contracts are valued at the settlement price established each day by the board of trade or exchange on which they are traded and are categorized as Level 1 in the hierarchy. Investments in open-end mutual funds, including the Fidelity Central Funds, are valued at their closing net asset value (NAV) each business day and are categorized as Level 1 in the hierarchy.
Changes in valuation techniques may result in transfers in or out of an assigned level within the disclosure hierarchy. The aggregate value of investments by input level as of July 31, 2023 is included at the end of the Fund's Schedule of Investments.
Investment Transactions and Income. For financial reporting purposes, the Fund's investment holdings and NAV include trades executed through the end of the last business day of the period. The NAV per share for processing shareholder transactions is calculated as of the close of business of the New York Stock Exchange (NYSE), normally 4:00 p.m. Eastern time and includes trades executed through the end of the prior business day. Gains and losses on securities sold are determined on the basis of identified cost and include proceeds received from litigation. Commissions paid to certain brokers with whom the investment adviser, or its affiliates, places trades on behalf of a fund include an amount in addition to trade execution, which may be rebated back to a fund. Any such rebates are included in net realized gain (loss) on investments in the Statement of Operations. Dividend income is recorded on the ex-dividend date, except for certain dividends from foreign securities where the ex-dividend date may have passed, which are recorded as soon as the Fund is informed of the ex-dividend date. Non-cash dividends included in dividend income, if any, are recorded at the fair market value of the securities received. Income and capital gain distributions from Fidelity Central Funds, if any, are recorded on the ex-dividend date. Certain distributions received by the Fund represent a return of capital or capital gain. The Fund determines the components of these distributions subsequent to the ex-dividend date, based upon receipt of tax filings or other correspondence relating to the underlying investment. These distributions are recorded as a reduction of cost of investments and/or as a realized gain. Interest income is accrued as earned and includes coupon interest and amortization of premium and accretion of discount on debt securities as applicable.
Expenses. Expenses directly attributable to a fund are charged to that fund. Expenses attributable to more than one fund are allocated among the respective funds on the basis of relative net assets or other appropriate methods. Expenses included in the accompanying financial statements reflect the expenses of that fund and do not include any expenses associated with any underlying mutual funds or exchange-traded funds. Although not included in a fund's expenses, a fund indirectly bears its proportionate share of these expenses through the net asset value of each underlying mutual fund or exchange-traded fund. Expense estimates are accrued in the period to which they relate and adjustments are made when actual amounts are known.
Income Tax Information and Distributions to Shareholders. Each year, the Fund intends to qualify as a regulated investment company under Subchapter M of the Internal Revenue Code, including distributing substantially all of its taxable income and realized gains. As a result, no provision for U.S. Federal income taxes is required. The Fund files a U.S. federal tax return, in addition to state and local tax returns as required. The Fund's federal income tax returns are subject to examination by the Internal Revenue Service (IRS) for a period of three fiscal years after they are filed. State and local tax returns may be subject to examination for an additional fiscal year depending on the jurisdiction.
Distributions are declared and recorded on the ex-dividend date. Income and capital gain distributions are determined in accordance with income tax regulations, which may differ from GAAP.
Capital accounts within the financial statements are adjusted for permanent book-tax differences. These adjustments have no impact on net assets or the results of operations. Capital accounts are not adjusted for temporary book-tax differences which will reverse in a subsequent period.
Book-tax differences are primarily due to the certain deemed distributions, futures contracts, passive foreign investment companies (PFIC), partnerships and losses deferred due to wash sales.
As of period end, the cost and unrealized appreciation (depreciation) in securities, and derivatives if applicable, for federal income tax purposes were as follows:
| Gross unrealized appreciation | $1,767,735,983 |
| Gross unrealized depreciation | (266,890,202) |
| Net unrealized appreciation (depreciation) | $1,500,845,781 |
| Tax cost | $4,723,456,095 |
4. Derivative Instruments.
Risk Exposures and the Use of Derivative Instruments. The Fund's investment objectives allow for various types of derivative instruments, including futures contracts. Derivatives are investments whose value is primarily derived from underlying assets, indices or reference rates and may be transacted on an exchange or over-the-counter (OTC). Derivatives may involve a future commitment to buy or sell a specified asset based on specified terms, to exchange future cash flows at periodic intervals based on a notional principal amount, or for one party to make one or more payments upon the occurrence of specified events in exchange for periodic payments from the other party.
Derivatives were used to increase returns and to manage exposure to certain risks as defined below. The success of any strategy involving derivatives depends on analysis of numerous economic factors, and if the strategies for investment do not work as intended, the objectives may not be achieved.
Derivatives were used to increase or decrease exposure to the following risk(s):
| | |
| Equity Risk | Equity risk relates to the fluctuations in the value of financial instruments as a result of changes in market prices (other than those arising from interest rate risk or foreign exchange risk), whether caused by factors specific to an individual investment, its issuer, or all factors affecting all instruments traded in a market or market segment. |
Funds are also exposed to additional risks from investing in derivatives, such as liquidity risk and counterparty credit risk. Liquidity risk is the risk that a fund will be unable to close out the derivative in the open market in a timely manner. Counterparty credit risk is the risk that the counterparty will not be able to fulfill its obligation to a fund. Counterparty credit risk related to exchange-traded contracts may be mitigated by the protection provided by the exchange on which they trade.
Investing in derivatives may involve greater risks than investing in the underlying assets directly and, to varying degrees, may involve risk of loss in excess of any initial investment and collateral received and amounts recognized in the Statement of Assets and Liabilities. In addition, there may be the risk that the change in value of the derivative contract does not correspond to the change in value of the underlying instrument.
Futures Contracts. A futures contract is an agreement between two parties to buy or sell a specified underlying instrument for a fixed price at a specified future date. Futures contracts were used to manage exposure to the stock market.
Upon entering into a futures contract, a fund is required to deposit either cash or securities (initial margin) with a clearing broker in an amount equal to a certain percentage of the face value of the contract. Futures contracts are marked-to-market daily and subsequent daily payments are made or received by a fund depending on the daily fluctuations in the value of the futures contracts and are recorded as unrealized appreciation or (depreciation). This receivable and/or payable, if any, is included in daily variation margin on futures contracts in the Statement of Assets and Liabilities. Realized gain or (loss) is recorded upon the expiration or closing of a futures contract. The net realized gain (loss) and change in net unrealized appreciation (depreciation) on futures contracts during the period is presented in the Statement of Operations.
Any open futures contracts at period end are presented in the Schedule of Investments under the caption "Futures Contracts". The notional amount at value reflects each contract's exposure to the underlying instrument or index at period end, and is representative of volume of activity during the period unless an average notional amount is presented. Any securities deposited to meet initial margin requirements are identified in the Schedule of Investments. Any cash deposited to meet initial margin requirements is presented as segregated cash with brokers for derivative instruments in the Statement of Assets and Liabilities.
5. Purchases and Sales of Investments.
Purchases and sales of securities, other than short-term securities, U.S. government securities and in-kind transactions, as applicable, are noted in the table below.
| | Purchases ($) | Sales ($) |
| Fidelity Series Large Cap Value Index Fund | 1,245,127,978 | 965,644,264 |
6. Fees and Other Transactions with Affiliates.
Management Fee. Fidelity Management & Research Company LLC (the investment adviser) and its affiliates provide the Fund with investment management related services for which the Fund does not pay a management fee. Under the management contract, the investment adviser or an affiliate pays all ordinary operating expenses of the Fund, except custody fees, fees and expenses of the independent Trustees, and certain miscellaneous expenses such as proxy and shareholder meeting expenses.
Sub-Adviser. Geode Capital Management, LLC (Geode), serves as sub-adviser for the Fund. Geode provides discretionary investment advisory services to the Fund and is paid by the investment adviser for providing these services.
Interfund Lending Program. Pursuant to an Exemptive Order issued by the Securities and Exchange Commission (the SEC), the Fund, along with other registered investment companies having management contracts with Fidelity Management & Research Company LLC (FMR), or other affiliated entities of FMR, may participate in an interfund lending program. This program provides an alternative credit facility allowing the Fund to borrow from, or lend money to, other participating affiliated funds. At period end, there were no interfund loans outstanding. Activity in this program during the period for which loans were outstanding was as follows:
| | Borrower or Lender | Average Loan Balance | Weighted Average Interest Rate | Interest Expense |
| Fidelity Series Large Cap Value Index Fund | Borrower | $14,018,000 | 5.32% | $2,070 |
Interfund Trades. Funds may purchase from or sell securities to other Fidelity Funds under procedures adopted by the Board. The procedures have been designed to ensure these interfund trades are executed in accordance with Rule 17a-7 of the 1940 Act. Any interfund trades are included within the respective purchases and sales amounts shown in the Purchases and Sales of Investments note. During the period, there were no interfund trades.
7. Committed Line of Credit.
Certain Funds participate with other funds managed by the investment adviser or an affiliate in a $4.25 billion credit facility (the "line of credit") to be utilized for temporary or emergency purposes to fund shareholder redemptions or for other short-term liquidity purposes. The commitment fees on the pro-rata portion of the line of credit are borne by the investment adviser. During the period, there were no borrowings on this line of credit.
8. Security Lending.
Funds lend portfolio securities from time to time in order to earn additional income. Lending agents are used, including National Financial Services (NFS), an affiliate of the investment adviser. Pursuant to a securities lending agreement, NFS will receive a fee, which is capped at 9.9% of a fund's daily lending revenue, for its services as lending agent. A fund may lend securities to certain qualified borrowers, including NFS. On the settlement date of the loan, a fund receives collateral (in the form of U.S. Treasury obligations, letters of credit and/or cash) against the loaned securities and maintains collateral in an amount not less than 100% of the market value of the loaned securities during the period of the loan. The market value of the loaned securities is determined at the close of business of a fund and any additional required collateral is delivered to a fund on the next business day. A fund or borrower may terminate the loan at any time, and if the borrower defaults on its obligation to return the securities loaned because of insolvency or other reasons, a fund may apply collateral received from the borrower against the obligation. A fund may experience delays and costs in recovering the securities loaned. Any cash collateral received is invested in the Fidelity Securities Lending Cash Central Fund. Any loaned securities are identified as such in the Schedule of Investments, and the value of loaned securities and cash collateral at period end, as applicable, are presented in the Statement of Assets and Liabilities. Security lending income represents the income earned on investing cash collateral, less rebates paid to borrowers and any lending agent fees associated with the loan, plus any premium payments received for lending certain types of securities. Security lending income is presented in the Statement of Operations as a component of income from Fidelity Central Funds. Affiliated security lending activity, if any, was as follows:
| | Total Security Lending Fees Paid to NFS | Security Lending Income From Securities Loaned to NFS | Value of Securities Loaned to NFS at Period End |
| Fidelity Series Large Cap Value Index Fund | $92,142 | $6,889 | $28,023 |
9. Expense Reductions.
Through arrangements with the Fund's custodian, credits realized as a result of certain uninvested cash balances were used to reduce the Fund's expenses by $1,774.
10. Other.
A fund's organizational documents provide former and current trustees and officers with a limited indemnification against liabilities arising in connection with the performance of their duties to the fund. In the normal course of business, a fund may also enter into contracts that provide general indemnifications. A fund's maximum exposure under these arrangements is unknown as this would be dependent on future claims that may be made against a fund. The risk of material loss from such claims is considered remote.
At the end of the period, mutual funds and accounts managed by the investment adviser or its affiliates were the owners of record of all of the outstanding shares of the Fund.
11. Risk and Uncertainties.
Many factors affect a fund's performance. Developments that disrupt global economies and financial markets, such as pandemics, epidemics, outbreaks of infectious diseases, war, terrorism, and environmental disasters, may significantly affect a fund's investment performance. The effects of these developments to a fund will be impacted by the types of securities in which a fund invests, the financial condition, industry, economic sector, and geographic location of an issuer, and a fund's level of investment in the securities of that issuer. Significant concentrations in security types, issuers, industries, sectors, and geographic locations may magnify the factors that affect a fund's performance.
As a shareholder, you incur two types of costs: (1) transaction costs, which may include sales charges (loads) on purchase payments or redemption proceeds, as applicable and (2) ongoing costs, which generally include management fees, distribution and/or service (12b-1) fees and other Fund expenses. This Example is intended to help you understand your ongoing costs (in dollars) of investing in a fund and to compare these costs with the ongoing costs of investing in other mutual funds.
| The Example is based on an investment of $1,000 invested at the beginning of the period and held for the entire period (February 1, 2023 to July 31, 2023). |
Actual Expenses
The first line of the accompanying table provides information about actual account values and actual expenses. You may use the information in this line, together with the amount you invested, to estimate the expenses that you paid over the period. Simply divide your account value by $1,000.00 (for example, an $8,600 account value divided by $1,000.00 = 8.6), then multiply the result by the number in the first line for a class/Fund under the heading entitled "Expenses Paid During Period" to estimate the expenses you paid on your account during this period. If any fund is a shareholder of any underlying mutual funds or exchange-traded funds (ETFs) (the Underlying Funds), such fund indirectly bears its proportional share of the expenses of the Underlying Funds in addition to the direct expenses incurred presented in the table. These fees and expenses are not included in the annualized expense ratio used to calculate the expense estimate in the table below.
Hypothetical Example for Comparison Purposes
The second line of the accompanying table provides information about hypothetical account values and hypothetical expenses based on the actual expense ratio and an assumed rate of return of 5% per year before expenses, which is not the actual return. The hypothetical account values and expenses may not be used to estimate the actual ending account balance or expenses you paid for the period. You may use this information to compare the ongoing costs of investing in the Fund and other funds. To do so, compare this 5% hypothetical example with the 5% hypothetical examples that appear in the shareholder reports of the other funds. If any fund is a shareholder of any Underlying Funds, such fund indirectly bears its proportional share of the expenses of the Underlying Funds in addition to the direct expenses as presented in the table. These fees and expenses are not included in the annualized expense ratio used to calculate the expense estimate in the table below.
Please note that the expenses shown in the table are meant to highlight your ongoing costs only and do not reflect any transaction costs. Therefore, the second line of the table is useful in comparing ongoing costs only, and will not help you determine the relative total costs of owning different funds. In addition, if these transactional costs were included, your costs would have been higher.
| | | | | Annualized Expense Ratio- A | | Beginning Account Value February 1, 2023 | | Ending Account Value July 31, 2023 | | Expenses Paid During Period- C February 1, 2023 to July 31, 2023 |
| | | | | | | | | | |
| Fidelity® Series Large Cap Value Index Fund | | | | -%-D | | | | | | |
| Actual | | | | | | $ 1,000 | | $ 1,034.90 | | $-E |
Hypothetical-B | | | | | | $ 1,000 | | $ 1,024.79 | | $-E |
| |
A Annualized expense ratio reflects expenses net of applicable fee waivers.
B 5% return per year before expenses
C Expenses are equal to the annualized expense ratio, multiplied by the average account value over the period, multiplied by 181/ 365 (to reflect the one-half year period). The fees and expenses of any Underlying Funds are not included in each annualized expense ratio.
D Amount represents less than .005%.
E Amount represents less than $.005.
1.967966.109
XS6-SANN-0923
Fidelity® SAI Sustainable Conservative Income Municipal Bond Fund
Semi-Annual Report
July 31, 2023
Offered exclusively to certain clients of the Adviser, or its affiliates, including Strategic Advisers LLC (Strategic Advisers) - not available for sale to the general public. Fidelity® SAI is a product name of Fidelity® funds dedicated to certain programs affiliated with Strategic Advisers.
Contents
To view a fund's proxy voting guidelines and proxy voting record for the 12-month period ended June 30, visit http://www.fidelity.com/proxyvotingresults or visit the Securities and Exchange Commission's (SEC) web site at http://www.sec.gov.
You may also call 1-800-544-3455 to request a free copy of the proxy voting guidelines.
Standard & Poor's, S&P and S&P 500 are registered service marks of The McGraw-Hill Companies, Inc. and have been licensed for use by Fidelity Distributors Corporation.
Other third-party marks appearing herein are the property of their respective owners.
All other marks appearing herein are registered or unregistered trademarks or service marks of FMR LLC or an affiliated company. © 2023 FMR LLC. All rights reserved.
This report and the financial statements contained herein are submitted for the general information of the shareholders of the Fund. This report is not authorized for distribution to prospective investors in the Fund unless preceded or accompanied by an effective prospectus.
A fund files its complete schedule of portfolio holdings with the SEC for the first and third quarters of each fiscal year on Form N-PORT. Forms N-PORT are available on the SEC's web site at http://www.sec.gov. A fund's Forms N-PORT may be reviewed and copied at the SEC's Public Reference Room in Washington, DC. Information regarding the operation of the SEC's Public Reference Room may be obtained by calling 1-800-SEC-0330.
For a complete list of a fund's portfolio holdings, view the most recent holdings listing, semiannual report, or annual report on Fidelity's web site at http://www.fidelity.com, http://www.institutional.fidelity.com, or http://www.401k.com, as applicable.
NOT FDIC INSURED •MAY LOSE VALUE •NO BANK GUARANTEE
Neither the Fund nor Fidelity Distributors Corporation is a bank.
| Top Five States (% of Fund's net assets) |
| | |
| New York | 12.6 |
| Alabama | 12.0 |
| Georgia | 6.6 |
| Illinois | 6.4 |
| Kentucky | 6.0 |
| | |
| Revenue Sources (% of Fund's net assets) |
| Synthetics | 20.2 | |
| General Obligations | 16.4 | |
| Health Care | 16.1 | |
| Electric Utilities | 13.0 | |
| Resource Recovery | 10.3 | |
| Industrial Development | 7.3 | |
| State G.O. | 5.6 | |
| Others* (Individually Less Than 5%) | 11.1 | |
| | 100.0 | |
| |
| *Includes net other assets | | |
Quality Diversification (% of Fund's net assets) |
|
| |
| We have used ratings from Moody's Investors Service, Inc. Where Moody's® ratings are not available, we have used S&P® ratings. All ratings are as of the date indicated and do not reflect subsequent changes. |
| Maturity Diversification (% of Fund's Investments) |
| Days |
| 1 - 7 | 45.7 | |
| 8 - 30 | 5.7 | |
| 31 - 60 | 5.6 | |
| 61 - 90 | 3.6 | |
| 91 - 180 | 4.2 | |
| > 180 | 35.3 | |
| The date shown for securities represents the date when principal payments must be paid, taking into account any call options exercised by the issuer and any permissible maturity shortening features other than interest rate resets. |
Showing Percentage of Net Assets
| Municipal Bonds - 49.7% |
| | | Principal Amount (a) | Value ($) |
| Alabama - 2.8% | | | |
| Black Belt Energy Gas District: | | | |
| Bonds Series 2018 A, 4%, tender 12/1/23 (b) | | 100,000 | 99,966 |
| Series 2021 C1, 4% 12/1/23 | | 10,000 | 9,999 |
| Series 2022 C1: | | | |
5.25% 12/1/24 | | 5,000 | 5,072 |
5.25% 12/1/25 | | 5,000 | 5,132 |
| Series 2022 E: | | | |
5% 6/1/24 | | 50,000 | 50,445 |
5% 6/1/25 | | 50,000 | 50,904 |
5% 6/1/26 | | 50,000 | 51,410 |
| Southeast Alabama Gas Supply District Bonds (Proj. No. 2) Series 2018 A, 4%, tender 6/1/24 (b) | | 35,000 | 34,917 |
TOTAL ALABAMA | | | 307,845 |
| Arizona - 2.0% | | | |
| Chandler Indl. Dev. Auth. Indl. Dev. Rev. Bonds (Intel Corp. Proj.) Series 2019, 5%, tender 6/3/24 (b)(c) | | 80,000 | 80,396 |
| Salt River Proj. Agricultural Impt. & Pwr. District Elec. Sys. Rev. Series 2017 A, 5% 1/1/25 | | 140,000 | 143,536 |
TOTAL ARIZONA | | | 223,932 |
| California - 4.6% | | | |
| California Muni. Fin. Auth. Solid Waste Disp. Rev. Bonds (Republic Svcs., Inc. Proj.) Series 2021 A, 4.1%, tender 10/2/23 (b)(c) | | 100,000 | 99,967 |
| California Poll. Cont. Fing. Auth. Solid Waste Disp. Rev.: | | | |
| (Republic Svcs., Inc. Proj.) Series 2010 A, 3.875% 8/1/23 (b)(c)(d) | | 100,000 | 100,000 |
| Bonds (Republic Svcs. INC. Proj.) Series 2023, 4.25%, tender 8/15/23 (b)(c)(d) | | 100,000 | 99,983 |
| Los Angeles Dept. Arpt. Rev. Series 2023 A, 5% 5/15/26 (c) | | 200,000 | 208,253 |
TOTAL CALIFORNIA | | | 508,203 |
| Connecticut - 1.2% | | | |
| Connecticut Gen. Oblig.: | | | |
| Series 2016 B, 5% 5/15/25 | | 10,000 | 10,319 |
| Series 2018 F, 5% 9/15/23 | | 75,000 | 75,143 |
| Connecticut Health & Edl. Facilities Auth. Rev. Bonds Series 2010 A3, 0.25%, tender 2/9/24 (b) | | 50,000 | 49,024 |
TOTAL CONNECTICUT | | | 134,486 |
| District Of Columbia - 0.9% | | | |
| Washington Metropolitan Area Transit Auth. Series 2023 A, 5% 7/15/24 | | 100,000 | 101,611 |
| Florida - 0.9% | | | |
| Duval County School Board Ctfs. of Prtn. Series 2022 A, 5% 7/1/26 (Assured Guaranty Muni. Corp. Insured) | | 100,000 | 105,048 |
| Georgia - 3.5% | | | |
| Bartow County Dev. Auth. Poll. Cont. Rev. Bonds (Georgia Pwr. Co. Plant Bowen Proj.) Series 2013, 2.875%, tender 8/19/25 (b) | | 100,000 | 96,904 |
| Burke County Indl. Dev. Auth. Poll. Cont. Rev. Bonds (Georgia Pwr. Co. Plant Vogtle Proj.) Series 1994 9, 3.8%, tender 5/21/26 (b) | | 100,000 | 99,131 |
| Main Street Natural Gas, Inc. Bonds Series 2018 C, 4%, tender 12/1/23 (b) | | 100,000 | 100,107 |
| Monroe County Dev. Auth. Poll. Cont. Rev. Bonds (Georgia Pwr. Co. Plant Scherer Proj.) Series 2009, 3.875%, tender 3/6/26 (b) | | 90,000 | 89,452 |
TOTAL GEORGIA | | | 385,594 |
| Hawaii - 1.4% | | | |
| Honolulu City & County Gen. Oblig. Bonds (Honolulu Rail Transit Proj.) Series 2019 E, 5%, tender 9/1/23 (b) | | 55,000 | 55,055 |
| Honolulu City & County Multi-family housing Rev. Bonds Series 2023, 5%, tender 6/1/26 (b) | | 100,000 | 103,553 |
TOTAL HAWAII | | | 158,608 |
| Illinois - 6.4% | | | |
| Illinois Dev. Fin. Auth. Solid Waste Disp. Rev. Bonds (Waste Mgmt., Inc. Proj.) Series 2019, 4.4%, tender 11/1/23 (b)(c) | | 100,000 | 100,062 |
| Illinois Fin. Auth. Series 2022 A, 5% 10/1/24 | | 100,000 | 100,251 |
| Illinois Gen. Oblig.: | | | |
| Series 2012, 5% 8/1/23 | | 100,000 | 100,000 |
| Series 2017 D: | | | |
5% 11/1/23 | | 100,000 | 100,313 |
5% 11/1/26 | | 5,000 | 5,245 |
| Series 2018 A, 5% 10/1/23 | | 100,000 | 100,205 |
| Series 2019 B, 5% 9/1/23 | | 100,000 | 100,100 |
| Series 2023 C, 5% 5/1/25 | | 100,000 | 102,449 |
TOTAL ILLINOIS | | | 708,625 |
| Indiana - 0.4% | | | |
| Indiana Dev. Fin. Auth. Solid Waste Disp. Rev. Bonds (Waste Mgmt., Inc. Proj.) Series 2001, 4%, tender 10/2/23 (b)(c) | | 50,000 | 49,987 |
| Kentucky - 1.5% | | | |
| Kentucky Econ. Dev. Fin. Auth. Solid Waste Disp. Rev. Bonds (Republic Svcs., Inc. Proj.) Series A, 4.05%, tender 9/1/23 (b)(c) | | 100,000 | 99,962 |
| Kentucky State Property & Buildings Commission Rev. Series 2013 A, 5% 10/1/23 | | 50,000 | 50,112 |
| Kentucky, Inc. Pub. Energy Bonds Series 2018 A, 4%, tender 4/1/24 (b) | | 15,000 | 14,990 |
TOTAL KENTUCKY | | | 165,064 |
| Maine - 0.9% | | | |
| Maine Hsg. Auth. Mtg. Bonds Series 2023 B, 3.125%, tender 5/1/24 (b) | | 100,000 | 99,514 |
| Massachusetts - 0.9% | | | |
| Massachusetts Edl. Fing. Auth. Rev. Series 2018 B, 5% 7/1/25 (c) | | 100,000 | 101,853 |
| Michigan - 1.3% | | | |
| Coopersville Area Pub. Schools Series 2022 I: | | | |
| 4% 5/1/26 | | 30,000 | 30,674 |
| 5% 5/1/25 | | 110,000 | 113,230 |
TOTAL MICHIGAN | | | 143,904 |
| Minnesota - 0.2% | | | |
| Minnesota Hsg. Fin. Agcy. Series 2022 A, 5% 8/1/23 | | 25,000 | 25,000 |
| Nebraska - 0.9% | | | |
| Central Plains Energy Proj. Gas Supply Bonds Series 2019, 4%, tender 8/1/25 (b) | | 105,000 | 104,906 |
| Nevada - 1.8% | | | |
| Nevada Dept. of Bus. & Industry Bonds Series 2023 A, 3.7%, tender 1/31/24 (b)(c)(d) | | 200,000 | 199,197 |
| New Hampshire - 0.9% | | | |
| Nat'l. Fin. Auth. Solid Bonds (Waste Mgmt., Inc. Proj.) Series 2019 A1, 2.15%, tender 7/1/24 (b)(c) | | 100,000 | 98,183 |
| New Jersey - 3.0% | | | |
| New Jersey Econ. Dev. Auth. Series 2024 SSS, 5% 6/15/26 (e) | | 100,000 | 102,400 |
| New Jersey Econ. Dev. Auth. Rev. Series 2019, 5.25% 9/1/24 (d) | | 100,000 | 101,868 |
| New Jersey Edl. Facility (Stevens Institute of Techonolgy Proj.) Series 2017 A, 5% 7/1/25 | | 75,000 | 76,321 |
| New Jersey Trans. Trust Fund Auth. Series 2010 D, 5.25% 12/15/23 | | 55,000 | 55,339 |
TOTAL NEW JERSEY | | | 335,928 |
| New York - 2.3% | | | |
| New York City Hsg. Dev. Corp. Multifamily Hsg. Bonds Series 2021 K2, 0.9%, tender 1/1/26 (b) | | 165,000 | 151,364 |
| New York Metropolitan Trans. Auth. Rev. Bonds Series 2020 A2, 5%, tender 5/15/24 (b) | | 100,000 | 100,893 |
TOTAL NEW YORK | | | 252,257 |
| Oregon - 2.1% | | | |
| Oregon Bus. Dev. Commission Recovery Zone Facility Bonds (Intel Corp. Proj.) Series 232, 2.4%, tender 8/14/23 (b) | | 100,000 | 99,939 |
| Union County Hosp. Facility Auth. Series 2022, 5% 7/1/24 | | 135,000 | 135,998 |
TOTAL OREGON | | | 235,937 |
| Pennsylvania - 0.9% | | | |
| Pennsylvania Econ. Dev. Fing. Auth. Solid Waste Disp. Rev. Bonds (Republic Svcs., Inc. Proj.) Series 2014, 4.1%, tender 10/2/23 (b)(c) | | 100,000 | 99,974 |
| Tennessee - 0.9% | | | |
| Tennergy Corp. Gas Rev. Bonds Series 2019 A, 5%, tender 10/1/24 (b) | | 95,000 | 96,114 |
| Texas - 3.6% | | | |
| Magnolia Independent School District Series 2023, 5% 8/15/24 | | 150,000 | 152,688 |
| Mission Econ. Dev. Corp. Solid Waste Disp. Rev. Bonds: | | | |
| (Republic Svcs., Inc. Proj.) Series 2020 A, 3.875%, tender 8/1/23 (b)(c) | | 100,000 | 100,000 |
| (Waste Mgmt., Inc. Proj.) Series 2020 A, 4%, tender 9/1/23 (b)(c) | | 100,000 | 99,986 |
| Pflugerville Independent School District Bonds Series 2019 B, 2.5%, tender 8/15/23 (b) | | 35,000 | 34,978 |
| Tarrant County Cultural Ed. Facilities Fin. Corp. Hosp. Rev. Bonds (Baylor Scott & White Health Proj.) Series 2022 E, 5%, tender 5/15/26 (b) | | 15,000 | 15,551 |
TOTAL TEXAS | | | 403,203 |
| Virginia - 1.7% | | | |
| Gloucester County Indl. Dev. Auth. Bonds Series 2003 A, 3.95%, tender 5/1/24 (b)(c) | | 100,000 | 99,900 |
| Louisa Indl. Dev. Auth. Poll. Cont. Rev. Bonds (Virginia Elec. and Pwr. Co. Proj.) Series 2008 B, 0.75%, tender 9/2/25 (b) | | 95,000 | 87,232 |
TOTAL VIRGINIA | | | 187,132 |
| Wisconsin - 2.7% | | | |
| Pub. Fin. Auth. Health Care Sys. Rev. Series 2023 A, 5% 10/1/24 | | 200,000 | 203,819 |
| Pub. Fin. Auth. Solid Waste Bonds (Waste Mgmt., Inc. Proj.) Series 2017 A2, 3.875%, tender 8/1/23 (b)(c) | | 100,000 | 100,000 |
TOTAL WISCONSIN | | | 303,819 |
| TOTAL MUNICIPAL BONDS (Cost $5,569,573) | | | 5,535,924 |
| | | | |
| Municipal Notes - 50.8% |
| | | Principal Amount (a) | Value ($) |
| Alabama - 9.2% | | | |
| Black Belt Energy Gas District Participating VRDN Series ZL 03 97, 4.28% 8/7/23 (Liquidity Facility Morgan Stanley Bank, West Valley City Utah) (b)(f)(g) | | 330,000 | 330,000 |
| Health Care Auth. for Baptist Health Series 2013 B, 5.27% 8/7/23, VRDN (b) | | 300,000 | 300,000 |
| Southeast Energy Auth. Rev. Bonds Participating VRDN Series XG 04 10, 4.28% 8/7/23 (Liquidity Facility Morgan Stanley Bank, West Valley City Utah) (b)(f)(g) | | 300,000 | 300,000 |
| West Jefferson Indl. Dev. Board Solid Waste Disp. Rev. (Alabama Pwr. Co. Miller Plant Proj.) Series 2008, 4.65% 8/1/23, VRDN (b)(c) | | 100,000 | 100,000 |
TOTAL ALABAMA | | | 1,030,000 |
| Colorado - 1.8% | | | |
| Colorado Health Facilities Auth. Rev. Bonds Participating VRDN Series 2022 004, 4.28% 9/11/23 (Liquidity Facility Barclays Bank PLC) (b)(f)(g) | | 200,000 | 200,000 |
| Delaware - 2.5% | | | |
| Delaware Econ. Dev. Auth. Rev. (Delmarva Pwr. & Lt. Co. Proj.) Series 1994, 4.81% 8/1/23, VRDN (b)(c) | | 280,000 | 280,000 |
| Georgia - 3.1% | | | |
| Bartow County Dev. Auth. (Georgia Pwr. Co. Plant Bowen Proj.) Series 2022, 4.77% 8/1/23, VRDN (b)(c) | | 350,000 | 350,000 |
| Indiana - 1.8% | | | |
| Indiana Dev. Fin. Auth. Envir. Rev. (PSI Energy Proj.) Series 2003 A, 4.3% 8/7/23, VRDN (b)(c) | | 200,000 | 200,000 |
| Kentucky - 4.5% | | | |
| Kentucky Tpk. Auth. Econ. Dev. Road Rev. Participating VRDN Series XF 24 84, 4.14% 8/7/23 (Liquidity Facility Morgan Stanley Bank, West Valley City Utah) (b)(f)(g) | | 300,000 | 300,000 |
| Meade County Indl. Bldg. Rev. (Nucor Steel Brandenburg Proj.) Series 2020 A1, 5.44% 8/1/23, VRDN (b)(c) | | 200,000 | 200,000 |
TOTAL KENTUCKY | | | 500,000 |
| Louisiana - 3.9% | | | |
| Saint James Parish Gen. Oblig. (Nucor Steel Louisiana LLC Proj.): | | | |
| Series 2010 A1, 4.41% 8/7/23, VRDN (b) | | 100,000 | 100,000 |
| Series 2010 B1, 4.3% 8/7/23, VRDN (b) | | 330,000 | 330,000 |
TOTAL LOUISIANA | | | 430,000 |
| Missouri - 1.2% | | | |
| Missouri Health & Edl. Facilities Auth. Edl. Facilities Rev. Participating VRDN Series XG 01 76, 4.11% 8/7/23 (Liquidity Facility Royal Bank of Canada) (b)(f)(g) | | 130,000 | 130,000 |
| New York - 10.3% | | | |
| New York City Gen. Oblig. Series 2012 2, 4.18% 8/8/23, VRDN (b) | | 400,000 | 400,000 |
| New York Dorm. Auth. Rev. Participating VRDN Series XF 13 28, 4.5% 8/7/23 (Liquidity Facility JPMorgan Chase Bank) (b)(f)(g) | | 450,000 | 450,000 |
| New York Metropolitan Trans. Auth. Rev. Participating VRDN Series XF 13 55, 4.3% 8/7/23 (Liquidity Facility JPMorgan Chase Bank) (b)(f)(g) | | 300,000 | 300,000 |
TOTAL NEW YORK | | | 1,150,000 |
| Ohio - 4.5% | | | |
| Allen County Hosp. Facilities Rev. Series 2012 B, 4.35% 8/7/23 (Liquidity Facility Ohio Gen. Oblig.), VRDN (b) | | 500,000 | 500,003 |
| Pennsylvania - 0.9% | | | |
| Montgomery County Higher Ed. & Health Auth. Rev. Series 2018 D, 4.42% 8/6/26, VRDN (b) | | 100,000 | 100,000 |
| South Carolina - 0.5% | | | |
| Greenville Hosp. Sys. Facilities Rev. Participating VRDN Series XF 01 45, 4.18% 8/7/23 (Liquidity Facility Toronto-Dominion Bank) (b)(f)(g) | | 50,000 | 50,000 |
| Tennessee - 2.7% | | | |
| Chattanooga Health Ed. & Hsg. Facility Board Rev. (Catholic Health Initiatives Proj.) Series C, 4.3% 8/7/23, VRDN (b) | | 300,000 | 300,000 |
| Virginia - 1.7% | | | |
| Lynchburg Econ. Dev. Participating VRDN Series XL 00 75, 4.28% 8/7/23 (Liquidity Facility JPMorgan Chase Bank) (b)(f)(g) | | 185,000 | 185,000 |
| West Virginia - 2.2% | | | |
| West Virginia Hosp. Fin. Auth. Hosp. Rev. Series 2018 E, 4.43% 8/6/26, VRDN (b) | | 250,000 | 250,000 |
| TOTAL MUNICIPAL NOTES (Cost $5,655,004) | | | 5,655,003 |
| | | | |
| TOTAL INVESTMENT IN SECURITIES - 100.5% (Cost $11,224,577) | 11,190,927 |
NET OTHER ASSETS (LIABILITIES) - (0.5)% | (51,505) |
| NET ASSETS - 100.0% | 11,139,422 |
| | |
Security Type Abbreviations
| VRDN | - | VARIABLE RATE DEMAND NOTE (A debt instrument that is payable upon demand, either daily, weekly or monthly) |
Legend
| (a) | Amount is stated in United States dollars unless otherwise noted. |
| (b) | Coupon rates for floating and adjustable rate securities reflect the rates in effect at period end. |
| (c) | Private activity obligations whose interest is subject to the federal alternative minimum tax for individuals. |
| (d) | Security exempt from registration under Rule 144A of the Securities Act of 1933. These securities may be resold in transactions exempt from registration, normally to qualified institutional buyers. At the end of the period, the value of these securities amounted to $501,048 or 4.5% of net assets. |
| (e) | Security or a portion of the security purchased on a delayed delivery or when-issued basis. |
| (f) | Provides evidence of ownership in one or more underlying municipal bonds. |
| (g) | Coupon rates are determined by re-marketing agents based on current market conditions. |
Affiliated Central Funds
Fiscal year to date information regarding the Fund's investments in Fidelity Central Funds, including the ownership percentage, is presented below.
| Affiliate | Value, beginning of period ($) | Purchases ($) | Sales Proceeds ($) | Dividend Income ($) | Realized Gain (loss) ($) | Change in Unrealized appreciation (depreciation) ($) | Value, end of period ($) | % ownership, end of period |
| Fidelity Municipal Cash Central Fund 4.30% | - | 366,000 | 366,000 | 205 | - | - | - | 0.0% |
| Total | - | 366,000 | 366,000 | 205 | - | - | - | |
| | | | | | | | | |
Amounts in the dividend income column in the above table include any capital gain distributions from underlying funds, which are presented in the corresponding line item in the Statement of Operations, if applicable.
Amounts included in the purchases and sales proceeds columns may include in-kind transactions, if applicable.
Investment Valuation
The following is a summary of the inputs used, as of July 31, 2023, involving the Fund's assets and liabilities carried at fair value. The inputs or methodology used for valuing securities may not be an indication of the risk associated with investing in those securities. For more information on valuation inputs, and their aggregation into the levels used below, please refer to the Investment Valuation section in the accompanying Notes to Financial Statements.
| Valuation Inputs at Reporting Date: |
| Description | Total ($) | Level 1 ($) | Level 2 ($) | Level 3 ($) |
Investments in Securities: | | | | |
|
| Municipal Securities | 11,190,927 | - | 11,190,927 | - |
| | | | | |
| Total Investments in Securities: | 11,190,927 | - | 11,190,927 | - |
| Statement of Assets and Liabilities |
| | | | July 31, 2023 (Unaudited) |
| | | | | |
| Assets | | | | |
Investment in securities, at value - See accompanying schedule Unaffiliated issuers (cost $11,224,577): | | | $ | 11,190,927 |
| Interest receivable | | | | 82,781 |
| Prepaid expenses | | | | 8 |
| Receivable from investment adviser for expense reductions | | | | 4,470 |
| Other receivables | | | | 2 |
Total assets | | | | 11,278,188 |
| Liabilities | | | | |
| Payable to custodian bank | $ | 9,960 | | |
| Payable for investments purchased on a delayed delivery basis | | 102,520 | | |
| Distributions payable | | 2,120 | | |
| Accrued management fee | | 1,838 | | |
| Audit fee payable | | 22,193 | | |
| Other payables and accrued expenses | | 135 | | |
| Total Liabilities | | | | 138,766 |
| Net Assets | | | $ | 11,139,422 |
| Net Assets consist of: | | | | |
| Paid in capital | | | $ | 11,166,060 |
| Total accumulated earnings (loss) | | | | (26,638) |
| Net Assets | | | $ | 11,139,422 |
Net Asset Value, offering price and redemption price per share ($11,139,422 ÷ 1,116,913 shares) | | | $ | 9.97 |
| Statement of Operations |
| | | | Six months ended July 31, 2023 (Unaudited) |
| Investment Income | | | | |
| Interest | | | $ | 178,157 |
| Income from Fidelity Central Funds | | | | 205 |
| Total Income | | | | 178,362 |
| Expenses | | | | |
| Management fee | $ | 12,466 | | |
| Transfer agent fees | | 17 | | |
| Custodian fees and expenses | | 5,992 | | |
| Independent trustees' fees and expenses | | 18 | | |
| Registration fees | | 26,422 | | |
| Audit | | 24,317 | | |
| Legal | | 24 | | |
| Miscellaneous | | 16 | | |
| Total expenses before reductions | | 69,272 | | |
| Expense reductions | | (57,781) | | |
| Total expenses after reductions | | | | 11,491 |
| Net Investment income (loss) | | | | 166,871 |
| Realized and Unrealized Gain (Loss) | | | | |
| Net realized gain (loss) on: | | | | |
| Investment Securities: | | | | |
| Unaffiliated issuers | | 731 | | |
| Total net realized gain (loss) | | | | 731 |
| Change in net unrealized appreciation (depreciation) on investment securities | | | | (26,132) |
| Net gain (loss) | | | | (25,401) |
| Net increase (decrease) in net assets resulting from operations | | | $ | 141,470 |
| Statement of Changes in Net Assets |
| |
| | Six months ended July 31, 2023 (Unaudited) | | For the period June 16, 2022 (commencement of operations) through January 31, 2023 |
| Increase (Decrease) in Net Assets | | | | |
| Operations | | | | |
| Net investment income (loss) | $ | 166,871 | $ | 118,510 |
| Net realized gain (loss) | | 731 | | 103 |
| Change in net unrealized appreciation (depreciation) | | (26,132) | | (7,518) |
| Net increase (decrease) in net assets resulting from operations | | 141,470 | | 111,095 |
| Distributions to shareholders | | (161,375) | | (117,828) |
| | | | | |
| Share transactions | | | | |
| Proceeds from sales of shares | | 536,906 | | 10,386,249 |
| Reinvestment of distributions | | 152,964 | | 116,752 |
| Cost of shares redeemed | | (22,318) | | (4,493) |
| | | | | |
Net increase (decrease) in net assets resulting from share transactions | | 667,552 | | 10,498,508 |
| Total increase (decrease) in net assets | | 647,647 | | 10,491,775 |
| | | | | |
| Net Assets | | | | |
| Beginning of period | | 10,491,775 | | - |
| End of period | $ | 11,139,422 | $ | 10,491,775 |
| | | | | |
| Other Information | | | | |
| Shares | | | | |
| Sold | | 53,846 | | 1,038,704 |
| Issued in reinvestment of distributions | | 15,342 | | 11,709 |
| Redeemed | | (2,238) | | (450) |
| Net increase (decrease) | | 66,950 | | 1,049,963 |
| | | | | |
| Fidelity® SAI Sustainable Conservative Income Municipal Bond Fund |
| |
| | Six months ended (Unaudited) July 31, 2023 | | Years ended January 31, 2023 A |
Selected Per-Share Data | | | | |
| Net asset value, beginning of period | $ | 9.99 | $ | 10.00 |
| Income from Investment Operations | | | | |
Net investment income (loss) B,C | | .155 | | .117 |
| Net realized and unrealized gain (loss) | | (.025) | | (.011) |
| Total from investment operations | | .130 | | .106 |
| Distributions from net investment income | | (.150) | | (.116) |
| Total distributions | | (.150) | | (.116) |
| Net asset value, end of period | $ | 9.97 | $ | 9.99 |
Total Return D,E | | 1.31% | | 1.07% |
Ratios to Average Net Assets C,F,G | | | | |
| Expenses before reductions | | 1.30% H | | 1.03% H,I |
| Expenses net of fee waivers, if any | | .22% H | | .25% H |
| Expenses net of all reductions | | .22% H | | .24% H |
| Net investment income (loss) | | 3.14% H | | 1.86% H |
| Supplemental Data | | | | |
| Net assets, end of period (000 omitted) | $ | 11,139 | $ | 10,492 |
Portfolio turnover rate J | | 81% H | | 42% H |
AFor the period June 16, 2022 (commencement of operations) through January 31, 2023.
BCalculated based on average shares outstanding during the period.
CNet investment income (loss) is affected by the timing of the declaration of dividends by any underlying mutual funds or exchange-traded funds (ETFs). Net investment income (loss) of any mutual funds or ETFs is not included in the Fund's net investment income (loss) ratio.
DTotal returns for periods of less than one year are not annualized.
ETotal returns would have been lower if certain expenses had not been reduced during the applicable periods shown.
FFees and expenses of any underlying mutual funds or exchange-traded funds (ETFs) are not included in the Fund's expense ratio. The Fund indirectly bears its proportionate share of these expenses. For additional expense information related to investments in Fidelity Central Funds, please refer to the "Investments in Fidelity Central Funds" note found in the Notes to Financial Statements section of the most recent Annual or Semi-Annual report.
GExpense ratios reflect operating expenses of the class. Expenses before reductions do not reflect amounts reimbursed, waived, or reduced through arrangements with the investment adviser, brokerage services, or other offset arrangements, if applicable, and do not represent the amount paid by the class during periods when reimbursements, waivers or reductions occur.
HAnnualized.
IAudit fees are not annualized.
JAmount does not include the portfolio activity of any underlying mutual funds or exchange-traded funds (ETFs).
For the period ended July 31, 2023
1. Organization.
Fidelity SAI Sustainable Conservative Income Municipal Bond Fund (the Fund) is a fund of Fidelity Salem Street Trust (the Trust) and is authorized to issue an unlimited number of shares. Shares are offered exclusively to certain clients of Fidelity Management & Research Company LLC (FMR) or its affiliates. The Trust is registered under the Investment Company Act of 1940, as amended (the 1940 Act), as an open-end management investment company organized as a Massachusetts business trust.
2. Investments in Fidelity Central Funds.
Funds may invest in Fidelity Central Funds, which are open-end investment companies generally available only to other investment companies and accounts managed by the investment adviser and its affiliates. The Schedule of Investments lists any Fidelity Central Funds held as an investment as of period end, but does not include the underlying holdings of each Fidelity Central Fund. An investing fund indirectly bears its proportionate share of the expenses of the underlying Fidelity Central Funds.
Based on its investment objective, each Fidelity Central Fund may invest or participate in various investment vehicles or strategies that are similar to those of the investing fund. These strategies are consistent with the investment objectives of the investing fund and may involve certain economic risks which may cause a decline in value of each of the Fidelity Central Funds and thus a decline in the value of the investing fund.
| Fidelity Central Fund | Investment Manager | Investment Objective | Investment Practices | Expense RatioA |
| Fidelity Money Market Central Funds | Fidelity Management & Research Company LLC (FMR) | Each fund seeks to obtain a high level of current income consistent with the preservation of capital and liquidity. | Short-term Investments | Less than .005% |
A Expenses expressed as a percentage of average net assets and are as of each underlying Central Fund's most recent annual or semi-annual shareholder report.
A complete unaudited list of holdings for each Fidelity Central Fund is available upon request or at the Securities and Exchange Commission website at www.sec.gov. In addition, the financial statements of the Fidelity Central Funds which contain the significant accounting policies (including investment valuation policies) of those funds, and are not covered by the Report of Independent Registered Public Accounting Firm, are available on the Securities and Exchange Commission website or upon request.
3. Significant Accounting Policies.
The Fund is an investment company and applies the accounting and reporting guidance of the Financial Accounting Standards Board (FASB) Accounting Standards Codification Topic 946 Financial Services - Investment Companies. The financial statements have been prepared in conformity with accounting principles generally accepted in the United States of America (GAAP), which require management to make certain estimates and assumptions at the date of the financial statements. Actual results could differ from those estimates. Subsequent events, if any, through the date that the financial statements were issued have been evaluated in the preparation of the financial statements. The Fund's Schedule of Investments lists any underlying mutual funds or exchange-traded funds (ETFs) but does not include the underlying holdings of these funds. The following summarizes the significant accounting policies of the Fund:
Investment Valuation. Investments are valued as of 4:00 p.m. Eastern time on the last calendar day of the period. The Board of Trustees (the Board) has designated the Fund's investment adviser as the valuation designee responsible for the fair valuation function and performing fair value determinations as needed. The investment adviser has established a Fair Value Committee (the Committee) to carry out the day-to-day fair valuation responsibilities and has adopted policies and procedures to govern the fair valuation process and the activities of the Committee. In accordance with these fair valuation policies and procedures, which have been approved by the Board, the Fund attempts to obtain prices from one or more third party pricing services or brokers to value its investments. When current market prices, quotations or currency exchange rates are not readily available or reliable, investments will be fair valued in good faith by the Committee, in accordance with the policies and procedures. Factors used in determining fair value vary by investment type and may include market or investment specific events, transaction data, estimated cash flows, and market observations of comparable investments. The frequency that the fair valuation procedures are used cannot be predicted and they may be utilized to a significant extent. The Committee manages the Fund's fair valuation practices and maintains the fair valuation policies and procedures. The Fund's investment adviser reports to the Board information regarding the fair valuation process and related material matters.
The Fund categorizes the inputs to valuation techniques used to value its investments into a disclosure hierarchy consisting of three levels as shown below:
Level 1 - unadjusted quoted prices in active markets for identical investments
Level 2 - other significant observable inputs (including quoted prices for similar investments, interest rates, prepayment speeds, etc.)
Level 3 - unobservable inputs (including the Fund's own assumptions based on the best information available)
Valuation techniques used to value the Fund's investments by major category are as follows:
Debt securities, including restricted securities, are valued based on evaluated prices received from third party pricing services or from brokers who make markets in such securities. Municipal securities are valued by pricing services who utilize matrix pricing which considers yield or price of bonds of comparable quality, coupon, maturity and type or by broker-supplied prices. When independent prices are unavailable or unreliable, debt securities may be valued utilizing pricing methodologies which consider similar factors that would be used by third party pricing services. Debt securities are generally categorized as Level 2 in the hierarchy but may be Level 3 depending on the circumstances.
Investments in open-end mutual funds, including the Fidelity Central Funds, are valued at their closing net asset value (NAV) each business day and are categorized as Level 1 in the hierarchy.
Changes in valuation techniques may result in transfers in or out of an assigned level within the disclosure hierarchy. The aggregate value of investments by input level as of July 31, 2023 is included at the end of the Fund's Schedule of Investments.
Investment Transactions and Income. For financial reporting purposes, the Fund's investment holdings and NAV include trades executed through the end of the last business day of the period. The NAV per share for processing shareholder transactions is calculated as of the close of business of the New York Stock Exchange (NYSE), normally 4:00 p.m. Eastern time and includes trades executed through the end of the prior business day. Gains and losses on securities sold are determined on the basis of identified cost. Income and capital gain distributions from Fidelity Central Funds, if any, are recorded on the ex-dividend date. Interest income is accrued as earned and includes coupon interest and amortization of premium and accretion of discount on debt securities as applicable.
Expenses. Expenses directly attributable to a fund are charged to that fund. Expenses attributable to more than one fund are allocated among the respective funds on the basis of relative net assets or other appropriate methods. Expenses included in the accompanying financial statements reflect the expenses of that fund and do not include any expenses associated with any underlying mutual funds or exchange-traded funds. Although not included in a fund's expenses, a fund indirectly bears its proportionate share of these expenses through the net asset value of each underlying mutual fund or exchange-traded fund. Expense estimates are accrued in the period to which they relate and adjustments are made when actual amounts are known.
Income Tax Information and Distributions to Shareholders. Each year, the Fund intends to qualify as a regulated investment company under Subchapter M of the Internal Revenue Code, including distributing substantially all of its taxable income and realized gains. As a result, no provision for U.S. Federal income taxes is required. The Fund files a U.S. federal tax return, in addition to state and local tax returns as required. The Fund's federal income tax returns are subject to examination by the Internal Revenue Service (IRS) for a period of three fiscal years after they are filed. State and local tax returns may be subject to examination for an additional fiscal year depending on the jurisdiction.
Distributions are declared and recorded daily and paid monthly from net investment income. Distributions from realized gains, if any, are declared and recorded on the ex-dividend date. Income and capital gain distributions are determined in accordance with income tax regulations, which may differ from GAAP.
Capital accounts within the financial statements are adjusted for permanent book-tax differences. These adjustments have no impact on net assets or the results of operations. Capital accounts are not adjusted for temporary book-tax differences which will reverse in a subsequent period.
Book-tax differences are primarily due to market discount.
The Fund purchases municipal securities whose interest, in the opinion of the issuer, is free from federal income tax. There is no assurance that the IRS will agree with this opinion. In the event the IRS determines that the issuer does not comply with relevant tax requirements, interest payments from a security could become federally taxable, possibly retroactively to the date the security was issued.
As of period end, the cost and unrealized appreciation (depreciation) in securities, and derivatives if applicable, for federal income tax purposes were as follows:
| Gross unrealized appreciation | $1,904 |
| Gross unrealized depreciation | (34,186) |
| Net unrealized appreciation (depreciation) | $(32,282) |
| Tax cost | $11,223,209 |
Delayed Delivery Transactions and When-Issued Securities. During the period, certain Funds transacted in securities on a delayed delivery or when-issued basis. Payment and delivery may take place after the customary settlement period for that security. The price of the underlying securities and the date when the securities will be delivered and paid for are fixed at the time the transaction is negotiated. Securities purchased on a delayed delivery or when-issued basis are identified as such in the Schedule of Investments. Compensation for interest forgone in the purchase of a delayed delivery or when-issued debt security may be received. With respect to purchase commitments, each applicable Fund identifies securities as segregated in its records with a value at least equal to the amount of the commitment. Payables and receivables associated with the purchases and sales of delayed delivery securities having the same coupon, settlement date and broker are offset. Delayed delivery or when-issued securities that have been purchased from and sold to different brokers are reflected as both payables and receivables in the Statement of Assets and Liabilities under the caption "Delayed delivery", as applicable. Losses may arise due to changes in the value of the underlying securities or if the counterparty does not perform under the contract's terms, or if the issuer does not issue the securities due to political, economic, or other factors.
Restricted Securities (including Private Placements). Funds may invest in securities that are subject to legal or contractual restrictions on resale. These securities generally may be resold in transactions exempt from registration or to the public if the securities are registered. Disposal of these securities may involve time-consuming negotiations and expense, and prompt sale at an acceptable price may be difficult. Information regarding restricted securities held at period end is included at the end of the Schedule of Investments, if applicable.
4. Purchases and Sales of Investments.
Purchases and sales of securities, other than short-term securities, and in-kind transactions, as applicable, are noted in the table below.
| | Purchases ($) | Sales ($) |
| Fidelity SAI Sustainable Conservative Income Municipal Bond Fund | 2,918,480 | 1,995,000 |
5. Fees and Other Transactions with Affiliates.
Management Fee. Fidelity Management & Research Company LLC (the investment adviser) and its affiliates provide the Fund with investment management related services for which the Fund pays a monthly management fee. Effective April 1, 2023 the Fund pays a monthly management fee that is based on an annual rate of .20% of the Fund's average net assets. Prior to April 1, 2023, the Fund paid a monthly management fee that was based on an annual rate of .30% of the Fund's average net assets. For the reporting period, the total annualized management fee rate was .23% of the Fund's average net assets.
Interfund Trades. Funds may purchase from or sell securities to other Fidelity Funds under procedures adopted by the Board. The procedures have been designed to ensure these interfund trades are executed in accordance with Rule 17a-7 of the 1940 Act. Any interfund trades are included within the respective purchases and sales amounts shown in the Purchases and Sales of Investments note. Interfund trades during the period are noted in the table below.
| | Purchases ($) | Sales ($) | Realized Gain (Loss) ($) |
| Fidelity SAI Sustainable Conservative Income Municipal Bond Fund | - | 400,000 | - |
6. Committed Line of Credit.
Certain Funds participate with other funds managed by the investment adviser or an affiliate in a $4.25 billion credit facility (the "line of credit") to be utilized for temporary or emergency purposes to fund shareholder redemptions or for other short-term liquidity purposes. The participating funds have agreed to pay commitment fees on their pro-rata portion of the line of credit, which are reflected in Miscellaneous expenses on the Statement of Operations, and are listed below. During the period, there were no borrowings on this line of credit.
| | Amount |
| Fidelity SAI Sustainable Conservative Income Municipal Bond Fund | $6 |
7. Expense Reductions.
Effective April 1, 2023, the investment adviser contractually agreed to reimburse the Fund to the extent annual operating expenses exceeded .20% of average net assets (.25% prior to April 1, 2023). This reimbursement will remain in place through May 31, 2024. Some expenses, for example the compensation of the independent Trustees, and certain miscellaneous expenses such as proxy and shareholder meeting expenses, are excluded from this reimbursement. During the period this reimbursement reduced the Fund's expenses by $57,781.
8. Other.
A fund's organizational documents provide former and current trustees and officers with a limited indemnification against liabilities arising in connection with the performance of their duties to the fund. In the normal course of business, a fund may also enter into contracts that provide general indemnifications. A fund's maximum exposure under these arrangements is unknown as this would be dependent on future claims that may be made against a fund. The risk of material loss from such claims is considered remote.
At the end of the period, the investment adviser or its affiliates were owners of record of more than 10% of the outstanding shares as follows:
| Fund | Affiliated % |
Fidelity SAI Sustainable Conservative Income Municipal Bond Fund | 92% |
9. Risk and Uncertainties.
Many factors affect a fund's performance. Developments that disrupt global economies and financial markets, such as pandemics, epidemics, outbreaks of infectious diseases, war, terrorism, and environmental disasters, may significantly affect a fund's investment performance. The effects of these developments to a fund will be impacted by the types of securities in which a fund invests, the financial condition, industry, economic sector, and geographic location of an issuer, and a fund's level of investment in the securities of that issuer. Significant concentrations in security types, issuers, industries, sectors, and geographic locations may magnify the factors that affect a fund's performance.
As a shareholder, you incur two types of costs: (1) transaction costs, which may include sales charges (loads) on purchase payments or redemption proceeds, as applicable and (2) ongoing costs, which generally include management fees, distribution and/or service (12b-1) fees and other Fund expenses. This Example is intended to help you understand your ongoing costs (in dollars) of investing in a fund and to compare these costs with the ongoing costs of investing in other mutual funds.
| The Example is based on an investment of $1,000 invested at the beginning of the period and held for the entire period (February 1, 2023 to July 31, 2023). |
Actual Expenses
The first line of the accompanying table provides information about actual account values and actual expenses. You may use the information in this line, together with the amount you invested, to estimate the expenses that you paid over the period. Simply divide your account value by $1,000.00 (for example, an $8,600 account value divided by $1,000.00 = 8.6), then multiply the result by the number in the first line for a class/Fund under the heading entitled "Expenses Paid During Period" to estimate the expenses you paid on your account during this period. If any fund is a shareholder of any underlying mutual funds or exchange-traded funds (ETFs) (the Underlying Funds), such fund indirectly bears its proportional share of the expenses of the Underlying Funds in addition to the direct expenses incurred presented in the table. These fees and expenses are not included in the annualized expense ratio used to calculate the expense estimate in the table below.
Hypothetical Example for Comparison Purposes
The second line of the accompanying table provides information about hypothetical account values and hypothetical expenses based on the actual expense ratio and an assumed rate of return of 5% per year before expenses, which is not the actual return. The hypothetical account values and expenses may not be used to estimate the actual ending account balance or expenses you paid for the period. You may use this information to compare the ongoing costs of investing in the Fund and other funds. To do so, compare this 5% hypothetical example with the 5% hypothetical examples that appear in the shareholder reports of the other funds. If any fund is a shareholder of any Underlying Funds, such fund indirectly bears its proportional share of the expenses of the Underlying Funds in addition to the direct expenses as presented in the table. These fees and expenses are not included in the annualized expense ratio used to calculate the expense estimate in the table below.
Please note that the expenses shown in the table are meant to highlight your ongoing costs only and do not reflect any transaction costs. Therefore, the second line of the table is useful in comparing ongoing costs only, and will not help you determine the relative total costs of owning different funds. In addition, if these transactional costs were included, your costs would have been higher.
| | | | | Annualized Expense Ratio- A | | Beginning Account Value February 1, 2023 | | Ending Account Value July 31, 2023 | | Expenses Paid During Period- C February 1, 2023 to July 31, 2023 |
| | | | | | | | | | |
| Fidelity® SAI Sustainable Conservative Income Municipal Bond Fund | | | | .22% | | | | | | |
| Actual | | | | | | $ 1,000 | | $ 1,013.10 | | $ 1.10 |
Hypothetical-B | | | | | | $ 1,000 | | $ 1,023.70 | | $ 1.10 |
| |
A Annualized expense ratio reflects expenses net of applicable fee waivers.
B 5% return per year before expenses
C Expenses are equal to the annualized expense ratio, multiplied by the average account value over the period, multiplied by 181/ 365 (to reflect the one-half year period). The fees and expenses of any Underlying Funds are not included in each annualized expense ratio.
Board Approval of Investment Advisory Contracts and Management Fees
Fidelity SAI Sustainable Conservative Income Municipal Bond Fund
At its March 2023 meeting, the Board of Trustees, including the Independent Trustees (together, the Board), voted to approve an amended and restated management contract with Fidelity Management & Research Company LLC (FMR) for the fund (the Amended Contract) that will charge a flat management fee of 20 basis points. As a result, the Amended Contract will decrease the management fee paid by the fund by approximately 10 basis points, effective April 1, 2023. The Board, assisted by the advice of fund counsel and Independent Trustees' counsel, considered a broad range of information.
Nature, Extent, and Quality of Services Provided. The Board previously received and considered materials relating to the nature, extent and quality of services provided by FMR to the fund, including the resources dedicated to investment management and support services, shareholder and administrative services, the benefits to shareholders of investment in a large fund family and the investment performance of the fund in connection with the annual renewal of the fund's current management contract (Current Management Contract). At its September 2022 meeting, the Board concluded that the nature, extent and quality of the services to be provided to the fund under the Current Management Contract should continue to benefit the fund's shareholders. In connection with its approval of the Amended Contract at its March 2023 meeting, the Board noted that such approval would not change the fund's portfolio managers, the investment processes, the level or nature of services provided, the resources and personnel allocated or trading and compliance operations. The Board concluded that the nature, extent, and quality of services to be provided to the fund under the Amended Contract will continue to benefit the fund's shareholders.
Competitiveness of Management Fee and Total Expense Ratio. The Board considered that it received and reviewed information regarding the fund's management fee rate and total expense ratio compared to "mapped groups" of competitive funds and classes at the current management fee and expense levels in connection with the annual renewal of the Current Management Contract. Based on its review, the Board concluded at its September 2022 meeting that the fund's current management fee and the total expense ratio of the fund are fair and reasonable in light of the services that the fund and its shareholders receive and the other factors considered.
In reviewing the Amended Contract, the Board considered the fund's proposed management fee rate out of which FMR will pay all operating expenses of the fund, with certain limited exceptions, and the projected total expense ratio of the fund. The Board considered that the Amended Contract will decrease the management fee paid by the fund by approximately 10 basis points, based on the average group assets for December 2022. The Board noted that the fund's proposed management fee rate is lower than the median fee rate of funds with similar Lipper investment objective categories and comparable investment mandates, regardless of whether their management fee structures are comparable. The Board also considered that the projected total net expense ratio of the fund is below the median of those funds and classes used by the Board for management fee comparisons that have a similar sales load structure.
The Board also noted that, in conjunction with the approval of the lower management fee rate under the Amended Contract, FMR has contractually agreed to reimburse the fund to the extent that total operating expenses (with certain exceptions), as a percentage of its average net assets exceed 20 basis points through: May 31, 2024.
Based on its review, the Board concluded that the fund's management fee and projected total expense ratio continue to be fair and reasonable in light of the services that the fund receives and the other factors considered.
Costs of the Services and Profitability. The Board considered that it previously reviewed information regarding the revenues earned, the expenses incurred by Fidelity in providing services to the fund and the level of Fidelity's profitability. At its September 2022 meeting, the Board concluded that it was satisfied that the profitability of Fidelity in connection with the operation of the fund was not excessive. Because the Board was approving an arrangement under which the management fees were being reduced, the Board did not consider Fidelity's costs of services, revenues, or profitability to be significant factors in its decision to approve the Amended Contract.
Economies of Scale. The Board considered that it previously received and reviewed information regarding whether there have been economies of scale in respect of the management of the Fidelity funds, whether the Fidelity funds (including the fund) have appropriately benefited from any such economies of scale, and whether there is potential for realization of any further economies of scale and that it concluded, at its September 2022 meeting, that economies of scale, if any, are being appropriately shared between fund shareholders and Fidelity. In connection with the approval of the fund's Amended Contract, the Board did not consider economies of scale because the proposed fee arrangement lowers the fund's management fee and FMR will continue to contractually limit expenses. The Board will continue to review economies of scale in connection with its consideration of future renewals of the Amended Contract.
Based on its evaluation of all of the conclusions noted above, and after considering all factors it believed relevant, the Board ultimately concluded that the advisory fee structure is fair and reasonable, and that the fund's Amended Contract should be approved.
1.9905583.101
SMB-SANN-0923
Fidelity® Tax-Free Bond Fund
Semi-Annual Report
July 31, 2023
Contents
To view a fund's proxy voting guidelines and proxy voting record for the 12-month period ended June 30, visit http://www.fidelity.com/proxyvotingresults or visit the Securities and Exchange Commission's (SEC) web site at http://www.sec.gov.
You may also call 1-800-544-8544 to request a free copy of the proxy voting guidelines.
Standard & Poor's, S&P and S&P 500 are registered service marks of The McGraw-Hill Companies, Inc. and have been licensed for use by Fidelity Distributors Corporation.
Other third-party marks appearing herein are the property of their respective owners.
All other marks appearing herein are registered or unregistered trademarks or service marks of FMR LLC or an affiliated company. © 2023 FMR LLC. All rights reserved.
This report and the financial statements contained herein are submitted for the general information of the shareholders of the Fund. This report is not authorized for distribution to prospective investors in the Fund unless preceded or accompanied by an effective prospectus.
A fund files its complete schedule of portfolio holdings with the SEC for the first and third quarters of each fiscal year on Form N-PORT. Forms N-PORT are available on the SEC's web site at http://www.sec.gov. A fund's Forms N-PORT may be reviewed and copied at the SEC's Public Reference Room in Washington, DC. Information regarding the operation of the SEC's Public Reference Room may be obtained by calling 1-800-SEC-0330.
For a complete list of a fund's portfolio holdings, view the most recent holdings listing, semiannual report, or annual report on Fidelity's web site at http://www.fidelity.com, http://www.institutional.fidelity.com, or http://www.401k.com, as applicable.
NOT FDIC INSURED •MAY LOSE VALUE •NO BANK GUARANTEE
Neither the Fund nor Fidelity Distributors Corporation is a bank.
| Top Five States (% of Fund's net assets) |
| | |
| Illinois | 15.6 |
| New York | 6.8 |
| Texas | 6.6 |
| Pennsylvania | 6.2 |
| Florida | 5.9 |
| | |
| Revenue Sources (% of Fund's net assets) |
| Health Care | 24.4 | |
| General Obligations | 22.0 | |
| Transportation | 16.8 | |
| Education | 9.0 | |
| Special Tax | 8.0 | |
| State G.O. | 5.1 | |
| Others* (Individually Less Than 5%) | 14.7 | |
| | 100.0 | |
| |
| *Includes net other assets | | |
Quality Diversification (% of Fund's net assets) |
|
| |
| We have used ratings from Moody's Investors Service, Inc. Where Moody's® ratings are not available, we have used S&P® ratings. All ratings are as of the date indicated and do not reflect subsequent changes. |
Showing Percentage of Net Assets
| Municipal Bonds - 96.9% |
| | | Principal Amount (a) | Value ($) |
| Alabama - 2.1% | | | |
| Auburn Univ. Gen. Fee Rev. Series 2018 A, 5% 6/1/43 | | 1,700,000 | 1,796,653 |
| Homewood Edl. Bldg. Auth. Rev. Series 2019 A: | | | |
| 4% 12/1/33 | | 270,000 | 274,383 |
| 4% 12/1/35 | | 880,000 | 884,581 |
| 4% 12/1/37 | | 1,180,000 | 1,152,729 |
| 4% 12/1/38 | | 225,000 | 217,095 |
| 4% 12/1/39 | | 1,605,000 | 1,518,527 |
| 4% 12/1/41 | | 3,845,000 | 3,567,957 |
| 4% 12/1/44 | | 2,265,000 | 2,060,406 |
| 4% 12/1/49 | | 530,000 | 467,392 |
| Lower Alabama Gas District Bonds (No. 2 Proj.) Series 2020, 4%, tender 12/1/25 (b) | | 23,020,000 | 22,840,048 |
| Mobile Indl. Dev. Board Poll. Cont. Rev. Bonds (Alabama Pwr. Co. Barry Plant Proj.) Series 2007 C, 3.78%, tender 6/16/26 (b) | | 1,615,000 | 1,614,602 |
| Montgomery Med. Clinic Facilities Series 2015: | | | |
| 5% 3/1/26 | | 55,000 | 54,518 |
| 5% 3/1/27 | | 110,000 | 108,676 |
| 5% 3/1/28 | | 120,000 | 118,465 |
| 5% 3/1/29 | | 100,000 | 98,583 |
| 5% 3/1/30 | | 120,000 | 117,973 |
| 5% 3/1/36 | | 2,315,000 | 2,162,702 |
| Southeast Energy Auth. Rev. Bonds: | | | |
| (Proj. No. 2) Series 2021 B1: | | | |
4% 6/1/29 | | 1,260,000 | 1,261,844 |
4% 6/1/30 | | 955,000 | 951,543 |
4% 6/1/31 | | 825,000 | 813,996 |
| Bonds (Proj. No. 2) Series 2021 B1, 4%, tender 12/1/31 (b) | | 20,155,000 | 19,621,626 |
TOTAL ALABAMA | | | 61,704,299 |
| Alaska - 0.1% | | | |
| Alaska Int'l. Arpts. Revs. Series 2016 B: | | | |
| 5% 10/1/31 | | 1,590,000 | 1,648,540 |
| 5% 10/1/33 | | 2,075,000 | 2,144,391 |
TOTAL ALASKA | | | 3,792,931 |
| Arizona - 2.2% | | | |
| Arizona Board of Regents Ctfs. of Prtn. (Univ. of Arizona Univ. Revs.) Series 2018 B: | | | |
| 5% 6/1/27 | | 470,000 | 503,048 |
| 5% 6/1/30 | | 1,390,000 | 1,515,368 |
| Arizona Health Facilities Auth. Rev. (Banner Health Sys. Proj.) Series 2007 B, 3 month U.S. LIBOR + 0.810% 4.517%, tender 1/1/37 (b)(c) | | 945,000 | 871,792 |
| Arizona Indl. Dev. Auth. Hosp. Rev. Series 2021 A: | | | |
| 4% 2/1/38 | | 1,415,000 | 1,409,568 |
| 4% 2/1/39 | | 1,415,000 | 1,399,445 |
| Arizona Indl. Dev. Auth. Lease Rev. Series 2020 A: | | | |
| 4% 9/1/37 | | 385,000 | 382,630 |
| 4% 9/1/38 | | 420,000 | 412,737 |
| 4% 9/1/39 | | 380,000 | 369,154 |
| 4% 9/1/40 | | 410,000 | 395,014 |
| 4% 9/1/46 | | 945,000 | 871,041 |
| 5% 9/1/31 | | 185,000 | 202,249 |
| 5% 9/1/32 | | 285,000 | 309,595 |
| 5% 9/1/33 | | 390,000 | 420,598 |
| 5% 9/1/34 | | 330,000 | 354,414 |
| Arizona Indl. Dev. Auth. Rev. (Provident Group-Eastern Michigan Univ. Parking Proj.) Series 2018: | | | |
| 5% 5/1/37 (d) | | 1,030,000 | 618,000 |
| 5% 5/1/43 (d) | | 945,000 | 567,000 |
| Arizona State Univ. Revs. Series 2021 C: | | | |
| 5% 7/1/32 | | 1,150,000 | 1,327,080 |
| 5% 7/1/34 | | 1,180,000 | 1,357,304 |
| 5% 7/1/35 | | 945,000 | 1,078,783 |
| Glendale Indl. Dev. Auth. (Terraces of Phoenix Proj.) Series 2018 A: | | | |
| 5% 7/1/38 | | 145,000 | 125,921 |
| 5% 7/1/48 | | 190,000 | 151,695 |
| Maricopa County Indl. Dev. Auth. (Creighton Univ. Proj.) Series 2020, 5% 7/1/47 | | 1,890,000 | 1,983,430 |
| Maricopa County Indl. Dev. Auth. Sr. Living Facilities Series 2016: | | | |
| 5.75% 1/1/36 (e) | | 1,735,000 | 1,394,895 |
| 6% 1/1/48 (e) | | 3,290,000 | 2,368,215 |
| Maricopa County Rev.: | | | |
| Series 2017 D, 3% 1/1/48 | | 4,000,000 | 3,050,654 |
| Series 2019 E, 3% 1/1/49 | | 2,375,000 | 1,793,557 |
| Maricopa County Unified School District #48 Scottsdale Series 2017 B: | | | |
| 5% 7/1/31 | | 755,000 | 812,969 |
| 5% 7/1/32 | | 3,070,000 | 3,303,357 |
| Phoenix Civic Impt. Board Arpt. Rev.: | | | |
| Series 2017 B: | | | |
5% 7/1/30 | | 2,475,000 | 2,667,990 |
5% 7/1/34 | | 1,890,000 | 2,024,650 |
5% 7/1/35 | | 1,890,000 | 2,016,431 |
| Series 2019 A, 5% 7/1/44 | | 5,300,000 | 5,657,058 |
| Phoenix Civic Impt. Corp. Series 2019 A: | | | |
| 5% 7/1/30 | | 1,040,000 | 1,140,202 |
| 5% 7/1/32 | | 335,000 | 366,010 |
| 5% 7/1/36 | | 560,000 | 602,708 |
| 5% 7/1/37 | | 490,000 | 523,795 |
| 5% 7/1/38 | | 785,000 | 835,508 |
| 5% 7/1/45 | | 6,800,000 | 7,117,542 |
| Phoenix Civic Impt. Corp. District Rev. (Plaza Expansion Proj.) Series 2005 B, 5.5% 7/1/38 (Nat'l. Pub. Fin. Guarantee Corp. Insured) | | 4,720,000 | 5,726,263 |
| Phoenix IDA Student Hsg. Rev. (Downtown Phoenix Student Hsg. II LLC Arizona State Univ. Proj.) Series 2019 A: | | | |
| 5% 7/1/49 | | 1,060,000 | 1,060,491 |
| 5% 7/1/54 | | 3,335,000 | 3,308,899 |
| Salt Verde Finl. Corp. Sr. Gas Rev. Series 2007, 5.25% 12/1/23 | | 2,360,000 | 2,365,139 |
TOTAL ARIZONA | | | 64,762,199 |
| California - 3.0% | | | |
| California Gen. Oblig. Series 2004: | | | |
| 5.25% 12/1/33 | | 35,000 | 35,077 |
| 5.5% 4/1/30 | | 5,000 | 5,012 |
| California Hsg. Fin. Agcy.: | | | |
| Series 2021 1, 3.5% 11/20/35 | | 2,372,057 | 2,221,036 |
| Series 2023 A1, 4.375% 9/20/36 | | 5,553,960 | 5,521,621 |
| California Muni. Fin. Auth. Student Hsg. (CHF-Davis I, LLC - West Village Student Hsg. Proj.) Series 2018: | | | |
| 5% 5/15/35 | | 2,020,000 | 2,113,310 |
| 5% 5/15/38 | | 2,830,000 | 2,917,201 |
| 5% 5/15/43 | | 3,775,000 | 3,850,209 |
| California Pub. Works Board Lease Rev. (Various Cap. Projs.) Series 2022 C, 5% 8/1/32 | | 2,190,000 | 2,573,029 |
| California Statewide Cmntys. Dev. Auth. Series 2016: | | | |
| 5% 5/15/25 | | 945,000 | 961,404 |
| 5% 5/15/26 | | 945,000 | 973,397 |
| 5% 5/15/27 | | 945,000 | 977,947 |
| 5% 5/15/28 | | 945,000 | 977,694 |
| 5% 5/15/32 | | 1,180,000 | 1,218,927 |
| 5% 5/15/33 | | 1,415,000 | 1,459,409 |
| 5% 5/15/40 | | 945,000 | 959,405 |
| California Statewide Cmntys. Dev. Auth. Rev. Series 2015, 5% 2/1/45 | | 2,150,000 | 1,505,000 |
| Mount Diablo Unified School District Series 2022 B: | | | |
| 4% 8/1/29 | | 1,800,000 | 1,923,513 |
| 4% 8/1/32 | | 1,100,000 | 1,191,780 |
| 4% 8/1/33 | | 1,425,000 | 1,541,986 |
| Poway Unified School District: | | | |
| (District #2007-1 School Facilities Proj.) Series 2008 A, 0% 8/1/32 | | 1,225,000 | 907,938 |
| Series B: | | | |
0% 8/1/33 | | 4,105,000 | 2,926,155 |
0% 8/1/37 | | 7,555,000 | 4,411,112 |
0% 8/1/38 | | 3,990,000 | 2,207,797 |
0% 8/1/39 | | 6,815,000 | 3,573,535 |
0% 8/1/41 | | 4,625,000 | 2,192,033 |
| Poway Unified School District Pub. Fing. Series 2015 A: | | | |
| 5% 9/1/27 | | 990,000 | 1,019,290 |
| 5% 9/1/30 | | 1,295,000 | 1,327,961 |
| Sacramento City Fing. Auth. Rev. Series A, 0% 12/1/26 (Nat'l. Pub. Fin. Guarantee Corp. Insured) | | 1,510,000 | 1,342,497 |
| San Diego Cmnty. College District Series 2011, 0% 8/1/35 | | 2,830,000 | 1,877,740 |
| San Diego Unified School District: | | | |
| Series 2008 C: | | | |
0% 7/1/34 | | 1,225,000 | 857,781 |
0% 7/1/37 | | 4,820,000 | 2,901,822 |
| Series 2008 E, 0% 7/1/47 (f) | | 2,455,000 | 1,809,324 |
| San Francisco City & County Arpts. Commission Int'l. Arpt. Rev.: | | | |
| Series 2019 B, 5% 5/1/49 | | 2,765,000 | 2,924,915 |
| Series 2022 B, 5% 5/1/52 | | 14,945,000 | 16,121,088 |
| San Marcos Unified School District Series 2010 B, 0% 8/1/47 | | 3,495,000 | 1,259,087 |
| Santa Rosa Wastewtr. Rev. Series 2002 B, 0% 9/1/25 (AMBAC Insured) | | 1,605,000 | 1,502,263 |
| Tobacco Securitization Auth. Southern California Tobacco Settlement Series 2019 A1: | | | |
| 5% 6/1/27 | | 945,000 | 1,006,489 |
| 5% 6/1/28 | | 1,425,000 | 1,542,800 |
| 5% 6/1/29 | | 945,000 | 1,036,889 |
| Univ. of California Revs. Series 2017 AV, 5% 5/15/36 | | 1,520,000 | 1,636,996 |
TOTAL CALIFORNIA | | | 87,312,469 |
| Colorado - 0.9% | | | |
| Arkansas River Pwr. Auth. Rev. Series 2018 A: | | | |
| 5% 10/1/38 | | 1,370,000 | 1,385,107 |
| 5% 10/1/43 | | 5,485,000 | 5,469,005 |
| Colorado Health Facilities Auth. Rev. Bonds: | | | |
| (Parkview Episcopal Med. Ctr., Co. Proj.) Series 2017: | | | |
5% 9/1/23 | | 255,000 | 255,214 |
5% 9/1/24 | | 210,000 | 212,169 |
5% 9/1/25 | | 245,000 | 248,914 |
5% 9/1/28 | | 2,075,000 | 2,177,416 |
| (Parkview Med. Ctr., Inc. Proj.) Series 2016, 5% 9/1/46 | | 3,495,000 | 3,533,640 |
| Series 2019 A, 4% 11/1/39 | | 2,815,000 | 2,779,566 |
| Series 2019 A2: | | | |
3.25% 8/1/49 | | 2,700,000 | 1,961,127 |
4% 8/1/49 | | 4,390,000 | 3,994,855 |
| Series 2020 A, 4% 9/1/50 | | 1,020,000 | 896,436 |
| Colorado Hsg. & Fin. Auth.: | | | |
| Series 2019 H, 4.25% 11/1/49 | | 765,000 | 762,833 |
| Series 2021 E, 3% 11/1/51 | | 1,280,000 | 1,231,407 |
TOTAL COLORADO | | | 24,907,689 |
| Connecticut - 2.4% | | | |
| Connecticut Gen. Oblig.: | | | |
| Series 2018 F, 5% 9/15/27 | | 945,000 | 1,023,498 |
| Series 2020 A: | | | |
4% 1/15/34 | | 6,615,000 | 7,030,850 |
5% 1/15/40 | | 2,610,000 | 2,814,921 |
| Series 2021 A: | | | |
3% 1/15/35 | | 1,000,000 | 953,852 |
3% 1/15/39 | | 960,000 | 821,892 |
3% 1/15/40 | | 1,230,000 | 1,030,865 |
| Series 2021 B, 3% 6/1/40 | | 1,000,000 | 839,988 |
| Series 2022 B, 3% 1/15/40 | | 2,625,000 | 2,203,350 |
| Connecticut Health & Edl. Facilities Auth. Rev.: | | | |
| (Sacred Heart Univ., CT. Proj.) Series 2017 I-1: | | | |
5% 7/1/34 | | 990,000 | 1,050,016 |
5% 7/1/35 | | 1,135,000 | 1,197,651 |
5% 7/1/36 | | 380,000 | 398,286 |
5% 7/1/37 | | 1,470,000 | 1,531,884 |
5% 7/1/42 | | 3,570,000 | 3,677,280 |
| Bonds Series 2020 B, 5%, tender 1/1/27 (b) | | 4,445,000 | 4,645,408 |
| Series 2016 K, 4% 7/1/46 | | 4,215,000 | 3,842,518 |
| Series 2019 A: | | | |
5% 7/1/34 (e) | | 1,325,000 | 1,274,876 |
5% 7/1/49 (e) | | 1,925,000 | 1,642,740 |
| Series 2020 A, 4% 7/1/39 | | 2,830,000 | 2,705,561 |
| Series 2020 C, 4% 7/1/45 | | 3,985,000 | 3,729,136 |
| Series 2020 K: | | | |
5% 7/1/37 | | 945,000 | 1,019,277 |
5% 7/1/38 | | 1,415,000 | 1,516,883 |
5% 7/1/39 | | 1,465,000 | 1,564,855 |
5% 7/1/44 (e) | | 1,295,000 | 1,221,231 |
| Series 2021 S, 4% 6/1/51 | | 1,120,000 | 998,090 |
| Series 2022 M: | | | |
4% 7/1/37 | | 3,305,000 | 3,232,182 |
4% 7/1/52 | | 1,680,000 | 1,503,952 |
| Series G, 5% 7/1/50 (e) | | 1,100,000 | 1,006,726 |
| Series K1: | | | |
5% 7/1/31 | | 1,415,000 | 1,436,452 |
5% 7/1/35 | | 1,210,000 | 1,218,935 |
| Series N: | | | |
4% 7/1/39 | | 1,165,000 | 983,416 |
4% 7/1/49 | | 1,395,000 | 1,055,829 |
5% 7/1/32 | | 520,000 | 525,545 |
5% 7/1/33 | | 470,000 | 473,808 |
5% 7/1/34 | | 235,000 | 236,304 |
| Connecticut Hsg. Fin. Auth. Series 2019 B1, 4% 5/15/49 | | 1,010,000 | 1,002,075 |
| Connecticut State Revolving Fund Gen. Rev. Series 2017 A, 5% 5/1/35 | | 2,195,000 | 2,362,451 |
| Hbr. Point Infrastructure Impt. District Series 2017: | | | |
| 5% 4/1/30 (e) | | 2,095,000 | 2,128,478 |
| 5% 4/1/39 (e) | | 2,950,000 | 2,955,668 |
| New Haven Gen. Oblig. Series 2016 A, 5% 8/15/25 (Assured Guaranty Muni. Corp. Insured) | | 540,000 | 556,149 |
TOTAL CONNECTICUT | | | 69,412,878 |
| District Of Columbia - 0.9% | | | |
| District of Columbia Gen. Oblig. Series 2017 A, 5% 6/1/33 | | 2,170,000 | 2,341,894 |
| District of Columbia Hosp. Rev. Series 2015: | | | |
| 5% 7/15/29 | | 3,775,000 | 3,926,448 |
| 5% 7/15/30 | | 6,130,000 | 6,365,074 |
| Metropolitan Washington Arpts. Auth. Dulles Toll Road Rev. (Dulles Metrorail and Cap. Impt. Projs.): | | | |
| Series 2019 A: | | | |
5% 10/1/33 | | 1,180,000 | 1,267,396 |
5% 10/1/34 | | 1,890,000 | 2,023,884 |
5% 10/1/36 | | 1,890,000 | 2,003,370 |
| Series 2019 B, 3% 10/1/50 (Assured Guaranty Muni. Corp. Insured) | | 4,210,000 | 3,162,400 |
| Washington D.C. Metropolitan Transit Auth. Rev. Series 2017 B, 5% 7/1/33 | | 4,290,000 | 4,621,917 |
TOTAL DISTRICT OF COLUMBIA | | | 25,712,383 |
| Florida - 5.9% | | | |
| Brevard County Health Facilities Auth. Rev. Series 2023 A, 5% 4/1/32 | | 2,220,000 | 2,456,209 |
| Broward County School Board Ctfs. of Prtn.: | | | |
| (Broward County School District Proj.) Series 2016 A, 5% 7/1/28 | | 1,505,000 | 1,578,409 |
| Series 2016, 5% 7/1/32 | | 965,000 | 1,004,971 |
| Cap. Projs. Fin. Auth. Student Hsg. Rev. (Cap. Projs. Ln. Prog. - Florida Univs.) Series 2020 A, 5% 10/1/29 | | 1,650,000 | 1,718,210 |
| Central Florida Expressway Auth. Sr. Lien Rev. Series 2021: | | | |
| 4% 7/1/34 (Assured Guaranty Muni. Corp. Insured) | | 4,015,000 | 4,286,388 |
| 4% 7/1/35 (Assured Guaranty Muni. Corp. Insured) | | 3,890,000 | 4,126,424 |
| 4% 7/1/37 (Assured Guaranty Muni. Corp. Insured) | | 4,320,000 | 4,441,284 |
| 4% 7/1/38 (Assured Guaranty Muni. Corp. Insured) | | 2,700,000 | 2,755,649 |
| 4% 7/1/39 (Assured Guaranty Muni. Corp. Insured) | | 2,175,000 | 2,205,927 |
| Duval County School Board Ctfs. of Prtn. Series 2015 B, 5% 7/1/29 | | 6,025,000 | 6,203,922 |
| Escambia County Health Facilities Auth. Health Facilities Rev. Series 2020 A, 4% 8/15/45 | | 2,255,000 | 2,010,710 |
| Florida Higher Edl. Facilities Fing. Auth.: | | | |
| (St. Leo Univ. Proj.) Series 2019, 5% 3/1/49 | | 4,530,000 | 3,888,519 |
| Series 2019, 5% 10/1/27 | | 615,000 | 634,433 |
| Florida Hsg. Fin. Corp. Multi-family Mtg. Rev. Bonds Series 2023 C, 5%, tender 12/1/25 (b) | | 1,305,000 | 1,336,695 |
| Florida Hsg. Fin. Corp. Rev. Series 2019 1, 4% 7/1/50 | | 2,795,000 | 2,769,415 |
| Florida Mid-Bay Bridge Auth. Rev.: | | | |
| Series 2015 A, 5% 10/1/35 | | 2,455,000 | 2,488,887 |
| Series 2015 C, 5% 10/1/35 | | 1,890,000 | 1,911,803 |
| Florida Muni. Pwr. Agcy. Rev.: | | | |
| (Pwr. Supply Proj.) Series 2017 A, 5% 10/1/28 | | 380,000 | 417,994 |
| (Requirements Pwr. Supply Proj.) Series 2016 A: | | | |
5% 10/1/30 | | 930,000 | 974,908 |
5% 10/1/31 | | 1,015,000 | 1,062,149 |
| Series 2015 B, 5% 10/1/29 | | 1,180,000 | 1,217,403 |
| Gainesville Utils. Sys. Rev. Series 2017 A, 5% 10/1/35 | | 4,720,000 | 5,072,941 |
| Halifax Hosp. Med. Ctr. Rev. Series 2015: | | | |
| 5% 6/1/24 | | 790,000 | 798,451 |
| 5% 6/1/28 (Pre-Refunded to 6/1/25 @ 100) | | 620,000 | 639,956 |
| Hillsborough County School Board Ctfs. of Prtn. Series 2015 A, 5% 7/1/26 | | 7,555,000 | 7,768,041 |
| Jacksonville Health Care Facilities (Baptist Med. Ctr. Proj.) Series 2017: | | | |
| 5% 8/15/26 | | 1,890,000 | 1,988,630 |
| 5% 8/15/34 | | 2,595,000 | 2,782,423 |
| Miami Beach Health Facilities Auth. Hosp. Rev. Series 2014 A, 5% 11/15/39 | | 1,445,000 | 1,452,818 |
| Miami-Dade County Aviation Rev. Series 2020 A: | | | |
| 4% 10/1/35 | | 1,510,000 | 1,551,430 |
| 4% 10/1/41 | | 1,135,000 | 1,108,843 |
| 5% 10/1/31 | | 2,020,000 | 2,281,013 |
| Miami-Dade County Expressway Auth.: | | | |
| Series 2010 A, 5% 7/1/40 | | 3,115,000 | 3,131,041 |
| Series 2014 A: | | | |
5% 7/1/25 | | 1,350,000 | 1,366,400 |
5% 7/1/27 | | 945,000 | 954,272 |
5% 7/1/28 | | 2,100,000 | 2,120,794 |
5% 7/1/29 | | 955,000 | 964,199 |
5% 7/1/44 | | 15,860,000 | 15,886,964 |
| Series 2014 B, 5% 7/1/30 | | 2,360,000 | 2,381,041 |
| Miami-Dade County Gen. Oblig. Series 2020, 2.25% 7/1/38 | | 1,000,000 | 769,484 |
| Miami-Dade County School Board Ctfs. of Prtn.: | | | |
| Series 2015 A, 5% 5/1/29 | | 11,680,000 | 11,950,989 |
| Series 2016 A, 5% 5/1/32 | | 9,440,000 | 9,787,537 |
| Series 2016 B, 5% 8/1/26 | | 4,255,000 | 4,465,039 |
| Palm Beach County School Board Ctfs. of Prtn.: | | | |
| Series 2015 D, 5% 8/1/28 | | 1,870,000 | 1,926,498 |
| Series 2018 A, 5% 8/1/24 | | 720,000 | 732,254 |
| Pinellas County Idr (Drs. Kiran & Pallavi Patel 2017 Foundation for Global Understanding, Inc. Proj.) Series 2019: | | | |
| 5% 7/1/29 | | 200,000 | 204,433 |
| 5% 7/1/39 | | 400,000 | 401,404 |
| Saint Lucie County School Board Ctfs. of Prtn. Series 2013 A, 5% 7/1/26 | | 2,375,000 | 2,384,227 |
| South Florida Wtr. Mgmt. District Ctfs. of Prtn. Series 2015: | | | |
| 5% 10/1/27 | | 470,000 | 492,859 |
| 5% 10/1/28 | | 3,775,000 | 3,959,591 |
| 5% 10/1/30 | | 1,890,000 | 1,975,018 |
| 5% 10/1/32 | | 3,125,000 | 3,259,071 |
| South Miami Health Facilities Auth. Hosp. Rev. (Baptist Med. Ctr., FL. Proj.) Series 2017: | | | |
| 5% 8/15/29 | | 1,395,000 | 1,479,580 |
| 5% 8/15/32 | | 3,700,000 | 3,926,167 |
| 5% 8/15/35 | | 665,000 | 698,547 |
| 5% 8/15/37 | | 4,720,000 | 4,891,682 |
| 5% 8/15/42 | | 3,210,000 | 3,303,287 |
| 5% 8/15/47 | | 4,910,000 | 5,035,185 |
| Tallahassee Health Facilities Rev.: | | | |
| (Tallahassee Memorial Healthcare, Inc. Proj.) Series 2016 A: | | | |
5% 12/1/29 | | 1,345,000 | 1,382,335 |
5% 12/1/36 | | 1,040,000 | 1,047,573 |
| Series 2015 A, 5% 12/1/40 | | 945,000 | 945,030 |
| Volusia County Edl. Facilities Auth. Rev. (Embry-Riddle Aeronautical Univ., Inc. Proj.) Series 2020 A: | | | |
| 5% 10/15/44 | | 720,000 | 756,749 |
| 5% 10/15/49 | | 1,340,000 | 1,398,898 |
| Volusia County School Board Ctfs. of Prtn. (Florida Master Lease Prog.) Series 2016 A: | | | |
| 5% 8/1/30 (Build America Mutual Assurance Insured) | | 1,095,000 | 1,138,473 |
| 5% 8/1/31 (Build America Mutual Assurance Insured) | | 2,090,000 | 2,170,433 |
TOTAL FLORIDA | | | 172,221,909 |
| Georgia - 3.7% | | | |
| Brookhaven Dev. Auth. Rev. Series 2019 A, 5% 7/1/36 | | 1,435,000 | 1,564,409 |
| Burke County Indl. Dev. Auth. Poll. Cont. Rev.: | | | |
| (Georgia Transmission Corp. Proj.) Series 2012, 2.75% 1/1/52 (b) | | 2,900,000 | 1,910,407 |
| Bonds (Georgia Pwr. Co. Plant Vogtle Proj.) Series 2013 1st, 2.925%, tender 3/12/24 (b) | | 9,065,000 | 8,962,846 |
| Coweta County Dev. Auth. Rev. (Piedmont Healthcare, Inc. Proj.) Series 2019 A, 5% 7/1/44 | | 6,080,000 | 6,316,091 |
| DeKalb Private Hosp. Auth. Rev. Series 2019 B, 5% 7/1/35 | | 1,285,000 | 1,410,984 |
| Fulton County Dev. Auth. Rev.: | | | |
| Series 2019 C, 5% 7/1/38 | | 1,160,000 | 1,250,569 |
| Series 2019, 4% 6/15/49 | | 1,115,000 | 1,080,910 |
| Gainesville & Hall County Hosp. Auth. Rev. Series 2020 A, 3% 2/15/47 | | 9,015,000 | 6,768,278 |
| Georgia Muni. Elec. Auth. Pwr. Rev. Series 2019 A: | | | |
| 4% 1/1/49 | | 5,760,000 | 5,293,290 |
| 5% 1/1/30 | | 390,000 | 421,595 |
| 5% 1/1/32 | | 885,000 | 954,138 |
| 5% 1/1/34 | | 1,815,000 | 1,951,609 |
| 5% 1/1/35 | | 875,000 | 936,158 |
| 5% 1/1/36 | | 1,075,000 | 1,143,104 |
| 5% 1/1/37 | | 1,055,000 | 1,111,919 |
| 5% 1/1/38 | | 1,085,000 | 1,134,879 |
| 5% 1/1/44 | | 2,825,000 | 2,886,673 |
| Hosp. Auth. of Savannah Auth. Rev. Series 2019 A: | | | |
| 4% 7/1/35 | | 4,620,000 | 4,651,735 |
| 4% 7/1/39 | | 2,360,000 | 2,303,806 |
| 4% 7/1/43 | | 2,470,000 | 2,354,710 |
| Main Street Natural Gas, Inc. Bonds: | | | |
| Series 2019 B, 4%, tender 12/2/24 (b) | | 5,705,000 | 5,715,247 |
| Series 2021 A, 4%, tender 9/1/27 (b) | | 21,715,000 | 21,627,569 |
| Series 2021 C, 4%, tender 12/1/28 (b) | | 20,380,000 | 20,121,614 |
| Private Colleges & Univs. Auth. Rev.: | | | |
| (The Savannah College of Art & Design Projs.) Series 2021: | | | |
4% 4/1/38 | | 500,000 | 508,065 |
4% 4/1/40 | | 1,320,000 | 1,332,614 |
5% 4/1/36 | | 1,060,000 | 1,189,283 |
| Series 2020 B: | | | |
5% 9/1/31 | | 1,060,000 | 1,212,378 |
5% 9/1/33 | | 2,360,000 | 2,699,719 |
TOTAL GEORGIA | | | 108,814,599 |
| Hawaii - 0.1% | | | |
| Hawaii Gen. Oblig. Series 2020 C: | | | |
| 4% 7/1/37 | | 1,040,000 | 1,057,013 |
| 4% 7/1/38 | | 1,180,000 | 1,193,710 |
TOTAL HAWAII | | | 2,250,723 |
| Idaho - 0.2% | | | |
| Idaho Health Facilities Auth. Rev. Series 2015 ID: | | | |
| 5% 12/1/24 | | 470,000 | 480,492 |
| 5.5% 12/1/27 | | 3,070,000 | 3,175,624 |
| Idaho Hsg. & Fin. Assoc. Single Family Mtg.: | | | |
| (Idaho St Garvee Proj.) Series 2017 A: | | | |
5% 7/15/24 | | 665,000 | 675,335 |
5% 7/15/25 | | 665,000 | 687,122 |
5% 7/15/26 | | 470,000 | 494,802 |
| Series 2019 A, 4% 1/1/50 | | 1,560,000 | 1,545,873 |
TOTAL IDAHO | | | 7,059,248 |
| Illinois - 15.6% | | | |
| Chicago Board of Ed.: | | | |
| Series 2012 A, 5% 12/1/42 | | 2,660,000 | 2,614,524 |
| Series 2015 C, 5.25% 12/1/39 | | 755,000 | 756,287 |
| Series 2016 B, 6.5% 12/1/46 | | 400,000 | 418,235 |
| Series 2017 A, 7% 12/1/46 (e) | | 1,400,000 | 1,508,587 |
| Series 2017 C: | | | |
5% 12/1/24 | | 1,735,000 | 1,753,223 |
5% 12/1/25 | | 2,670,000 | 2,730,498 |
5% 12/1/26 | | 500,000 | 515,773 |
| Series 2017 D: | | | |
5% 12/1/24 | | 1,705,000 | 1,722,908 |
5% 12/1/31 | | 1,845,000 | 1,882,630 |
| Series 2017 H, 5% 12/1/36 | | 440,000 | 443,590 |
| Series 2018 A: | | | |
5% 12/1/24 | | 1,590,000 | 1,606,700 |
5% 12/1/29 | | 4,195,000 | 4,363,515 |
5% 12/1/31 | | 850,000 | 880,389 |
| Series 2018 C, 5% 12/1/46 | | 8,210,000 | 8,043,055 |
| Series 2019 A: | | | |
5% 12/1/25 | | 2,360,000 | 2,413,474 |
5% 12/1/26 | | 1,985,000 | 2,047,619 |
5% 12/1/29 | | 2,920,000 | 3,065,812 |
5% 12/1/30 | | 3,820,000 | 3,998,925 |
5% 12/1/32 | | 1,700,000 | 1,774,536 |
| Chicago Gen. Oblig.: | | | |
| Series 2020 A: | | | |
5% 1/1/26 | | 1,565,000 | 1,614,808 |
5% 1/1/27 | | 7,225,000 | 7,568,296 |
5% 1/1/29 | | 3,645,000 | 3,890,062 |
5% 1/1/30 | | 7,320,000 | 7,879,120 |
| Series 2021 A, 5% 1/1/32 | | 4,405,000 | 4,768,092 |
| Chicago Midway Arpt. Rev. Series 2016 B: | | | |
| 4% 1/1/35 | | 770,000 | 773,885 |
| 5% 1/1/36 | | 4,250,000 | 4,391,491 |
| 5% 1/1/37 | | 5,005,000 | 5,155,563 |
| Chicago O'Hare Int'l. Arpt. Rev.: | | | |
| Series 2016 B, 5% 1/1/34 | | 2,675,000 | 2,778,802 |
| Series 2016 C: | | | |
5% 1/1/32 | | 4,485,000 | 4,664,941 |
5% 1/1/33 | | 1,230,000 | 1,278,965 |
5% 1/1/34 | | 1,425,000 | 1,480,297 |
| Series 2017 B: | | | |
5% 1/1/34 | | 1,430,000 | 1,512,923 |
5% 1/1/35 | | 2,400,000 | 2,533,170 |
5% 1/1/36 | | 1,560,000 | 1,636,820 |
5% 1/1/37 | | 6,045,000 | 6,315,458 |
5% 1/1/38 | | 2,125,000 | 2,212,405 |
| Series 2018 B: | | | |
4% 1/1/44 | | 2,510,000 | 2,448,361 |
5% 1/1/48 | | 1,055,000 | 1,107,031 |
5% 1/1/53 | | 1,060,000 | 1,105,317 |
| Series 2020 A, 4% 1/1/37 | | 6,305,000 | 6,392,278 |
| Chicago Transit Auth. Series 2017, 5% 12/1/46 | | 1,795,000 | 1,835,761 |
| Chicago Transit Auth. Cap. Grant Receipts Rev. Series 2017: | | | |
| 5% 6/1/25 | | 705,000 | 721,247 |
| 5% 6/1/26 | | 1,505,000 | 1,564,637 |
| Cook County Ccsd 034 Glenview Series 2021 A, 2% 12/1/37 | | 2,010,000 | 1,535,424 |
| Cook County Gen. Oblig. Series 2016 A, 5% 11/15/29 | | 5,770,000 | 6,058,082 |
| Grundy & Will Counties Cmnty. School Gen. Oblig. Series 2018, 5% 2/1/29 | | 635,000 | 681,001 |
| Illinois Fin. Auth.: | | | |
| Series 2020 A: | | | |
3% 5/15/50 | | 7,190,000 | 5,057,800 |
3% 5/15/50 (Build America Mutual Assurance Insured) | | 3,390,000 | 2,437,130 |
3.25% 8/15/49 | | 1,340,000 | 1,034,380 |
| Series 2020, 5% 7/1/36 | | 4,150,000 | 4,666,249 |
| Illinois Fin. Auth. Academic Facilities (Provident Group UIUC Properties LLC Univ. of Illinois at Urbana-Champaign Proj.) Series 2019 A: | | | |
| 5% 10/1/31 | | 190,000 | 207,511 |
| 5% 10/1/32 | | 275,000 | 298,661 |
| 5% 10/1/33 | | 470,000 | 507,084 |
| 5% 10/1/35 | | 285,000 | 304,558 |
| 5% 10/1/36 | | 285,000 | 301,507 |
| 5% 10/1/37 | | 330,000 | 346,496 |
| 5% 10/1/38 | | 355,000 | 370,748 |
| 5% 10/1/39 | | 610,000 | 634,663 |
| Illinois Fin. Auth. Rev.: | | | |
| (Bradley Univ. Proj.) Series 2017 C, 5% 8/1/31 | | 2,230,000 | 2,301,651 |
| (Depaul Univ. Proj.) Series 2016 A: | | | |
4% 10/1/31 | | 1,395,000 | 1,409,295 |
5% 10/1/33 | | 1,415,000 | 1,483,950 |
| (Northwestern Memorial Hosp.,IL. Proj.) Series 2017 A: | | | |
5% 7/15/25 | | 750,000 | 773,512 |
5% 7/15/27 | | 1,225,000 | 1,311,678 |
5% 7/15/30 | | 1,405,000 | 1,524,498 |
| (OSF Healthcare Sys.) Series 2018 A: | | | |
4.125% 5/15/47 | | 10,465,000 | 9,829,975 |
5% 5/15/43 | | 9,440,000 | 9,582,615 |
| (Presence Health Proj.) Series 2016 C: | | | |
5% 2/15/29 | | 3,260,000 | 3,456,033 |
5% 2/15/36 | | 2,255,000 | 2,363,859 |
| (Rosalind Franklin Univ. Research Bldg. Proj.) Series 2017 C, 5% 8/1/49 | | 465,000 | 454,618 |
| (Rush Univ. Med. Ctr. Proj.) Series 2015 A, 5% 11/15/34 | | 1,135,000 | 1,157,983 |
| Series 2015 A, 5% 11/15/31 | | 3,305,000 | 3,406,605 |
| Series 2015 C: | | | |
5% 8/15/35 | | 3,155,000 | 3,216,414 |
5% 8/15/44 | | 15,205,000 | 15,216,389 |
| Series 2016 A: | | | |
5% 7/1/33 (Pre-Refunded to 7/1/26 @ 100) | | 1,745,000 | 1,841,563 |
5% 7/1/34 (Pre-Refunded to 7/1/26 @ 100) | | 945,000 | 997,294 |
5% 7/1/36 (Pre-Refunded to 7/1/26 @ 100) | | 1,445,000 | 1,524,962 |
5.25% 8/15/29 (Pre-Refunded to 8/15/26 @ 100) | | 960,000 | 1,018,271 |
| Series 2016 B: | | | |
5% 8/15/30 | | 2,830,000 | 2,999,375 |
5% 8/15/33 | | 4,330,000 | 4,555,007 |
5% 8/15/34 | | 2,280,000 | 2,398,777 |
| Series 2016 C: | | | |
3.75% 2/15/34 | | 685,000 | 690,909 |
4% 2/15/36 | | 2,915,000 | 2,936,462 |
4% 2/15/41 | | 8,645,000 | 8,398,336 |
4% 2/15/41 (Pre-Refunded to 2/15/27 @ 100) | | 395,000 | 407,172 |
5% 2/15/31 | | 1,965,000 | 2,082,829 |
| Series 2016: | | | |
4% 2/15/41 (Pre-Refunded to 2/15/27 @ 100) | | 20,000 | 20,616 |
5% 12/1/29 | | 970,000 | 1,008,236 |
5% 12/1/46 | | 2,510,000 | 2,521,684 |
| Series 2017 A, 5% 8/1/47 | | 405,000 | 398,076 |
| Series 2017: | | | |
5% 7/1/33 | | 3,175,000 | 3,399,319 |
5% 7/1/34 | | 2,610,000 | 2,789,131 |
5% 7/1/35 | | 530,000 | 564,344 |
| Series 2019: | | | |
4% 9/1/37 | | 380,000 | 318,018 |
4% 9/1/39 | | 945,000 | 766,063 |
5% 9/1/30 | | 180,000 | 179,992 |
5% 9/1/38 | | 850,000 | 792,743 |
| Illinois Gen. Oblig.: | | | |
| Series 2006, 5.5% 1/1/31 | | 1,835,000 | 2,093,752 |
| Series 2013 A, 5% 4/1/35 | | 850,000 | 850,217 |
| Series 2014: | | | |
5% 2/1/25 | | 2,120,000 | 2,131,506 |
5% 2/1/27 | | 1,155,000 | 1,162,252 |
5% 4/1/28 | | 550,000 | 555,017 |
5% 5/1/28 | | 3,140,000 | 3,172,360 |
5% 5/1/32 | | 1,320,000 | 1,331,907 |
5% 5/1/33 | | 1,510,000 | 1,523,617 |
5.25% 2/1/29 | | 2,830,000 | 2,853,770 |
5.25% 2/1/30 | | 2,550,000 | 2,571,786 |
5.25% 2/1/31 | | 1,230,000 | 1,239,972 |
| Series 2016: | | | |
5% 2/1/26 | | 945,000 | 979,357 |
5% 6/1/26 | | 575,000 | 599,110 |
5% 2/1/27 | | 3,535,000 | 3,717,187 |
5% 2/1/28 | | 3,300,000 | 3,476,248 |
5% 2/1/29 | | 3,100,000 | 3,265,221 |
| Series 2017 A, 5% 12/1/26 | | 3,165,000 | 3,324,382 |
| Series 2018 A: | | | |
5% 10/1/26 | | 1,415,000 | 1,482,306 |
5% 10/1/28 | | 3,305,000 | 3,569,299 |
| Series 2020 B, 4% 10/1/32 | | 5,055,000 | 5,207,288 |
| Series 2021 A: | | | |
5% 3/1/32 | | 100,000 | 110,694 |
5% 3/1/35 | | 710,000 | 774,743 |
5% 3/1/36 | | 565,000 | 612,353 |
5% 3/1/37 | | 710,000 | 764,069 |
5% 3/1/46 | | 2,830,000 | 2,953,908 |
| Series 2021 B, 4% 12/1/34 | | 3,355,000 | 3,405,225 |
| Series 2022 A: | | | |
5% 3/1/32 | | 1,755,000 | 1,964,069 |
5% 3/1/36 | | 7,365,000 | 8,051,586 |
5.25% 3/1/37 | | 1,605,000 | 1,769,990 |
| Series 2022 B: | | | |
5% 3/1/29 | | 3,495,000 | 3,795,205 |
5% 3/1/32 | | 1,550,000 | 1,734,647 |
| Series 2023 B: | | | |
5% 5/1/36 | | 1,450,000 | 1,583,856 |
5.25% 5/1/38 | | 6,750,000 | 7,375,269 |
5.25% 5/1/40 | | 3,005,000 | 3,255,259 |
| Series 2023 C, 5% 5/1/29 | | 3,945,000 | 4,295,441 |
| Series 2023 D, 5% 7/1/28 | | 3,305,000 | 3,555,124 |
| Illinois Hsg. Dev. Auth. Series 2021, 3% 4/1/51 | | 6,355,000 | 6,102,856 |
| Illinois Hsg. Dev. Auth. Multi-family Hsg. Rev. Series 2019, 2.9% 7/1/35 | | 4,491,421 | 4,041,385 |
| Illinois Muni. Elec. Agcy. Pwr. Supply Series 2015 A, 5% 2/1/31 | | 1,785,000 | 1,828,518 |
| Illinois Sales Tax Rev. Series 2021 A, 3% 6/15/33 (Build America Mutual Assurance Insured) | | 2,720,000 | 2,507,371 |
| Illinois Toll Hwy. Auth. Toll Hwy. Rev.: | | | |
| Series 2016 A, 5% 12/1/31 | | 890,000 | 922,591 |
| Series 2019 A, 5% 1/1/44 | | 1,060,000 | 1,118,165 |
| Kane, McHenry, Cook & DeKalb Counties Unit School District #300: | | | |
| Series 2015 5% 1/1/28 | | 2,625,000 | 2,664,708 |
| Series 2017, 5% 1/1/29 | | 970,000 | 1,024,013 |
| Kendall, Kane & Will Counties Cmnty. Unit School District #308 Series 2016, 5% 2/1/33 | | 10,270,000 | 10,645,284 |
| Lake County Cmnty. Consolidated School District #73 Gen. Oblig. Series 2021, 2.25% 1/1/40 | | 1,245,000 | 931,010 |
| McHenry County Cmnty. School District #200 Series 2006 B: | | | |
| 0% 1/15/24 | | 2,165,000 | 2,126,065 |
| 0% 1/15/25 | | 4,190,000 | 3,956,152 |
| 0% 1/15/26 | | 3,150,000 | 2,868,934 |
| Metropolitan Pier & Exposition: | | | |
| (McCormick Place Expansion Proj.): | | | |
Series 2010 B1: | | | |
0% 6/15/43 (Assured Guaranty Muni. Corp. Insured) | | 30,875,000 | 12,721,318 |
0% 6/15/45 (Assured Guaranty Muni. Corp. Insured) | | 11,465,000 | 4,256,918 |
0% 6/15/47 (Assured Guaranty Muni. Corp. Insured) | | 10,015,000 | 3,355,007 |
Series 2012 B, 0% 12/15/51 | | 5,570,000 | 1,425,610 |
| Series 2002 A, 0% 6/15/35 (Nat'l. Pub. Fin. Guarantee Corp. Insured) | | 1,310,000 | 815,502 |
| Series 2002, 0% 12/15/36 (Nat'l. Pub. Fin. Guarantee Corp. Insured) | | 12,285,000 | 7,048,450 |
| Series 2017 B: | | | |
5% 12/15/28 | | 1,890,000 | 1,975,164 |
5% 12/15/32 | | 850,000 | 889,631 |
| Series 2020 A, 5% 6/15/50 | | 21,945,000 | 22,261,342 |
| Series 2022 A, 4% 12/15/42 | | 5,405,000 | 5,221,352 |
| Sales Tax Securitization Corp. Series 2023 C, 5% 1/1/32 (g) | | 4,695,000 | 5,274,897 |
| Schaumburg Village Gen. Oblig. Series 2023, 4% 12/1/30 | | 2,940,000 | 3,077,959 |
| Univ. of Illinois Rev.: | | | |
| Series 2013: | | | |
6% 10/1/42 | | 1,825,000 | 1,832,989 |
6.25% 10/1/38 | | 1,795,000 | 1,803,773 |
| Series 2018 A, 5% 4/1/29 | | 3,720,000 | 4,021,104 |
| Will County Cmnty. Unit School District #365-U Series 2007 B, 0% 11/1/26 (Assured Guaranty Muni. Corp. Insured) | | 3,000,000 | 2,663,663 |
TOTAL ILLINOIS | | | 453,199,281 |
| Indiana - 1.2% | | | |
| Beech Grove School Bldg. Corp. Series 1996, 5.625% 7/5/24 (Escrowed to Maturity) | | 275,000 | 278,278 |
| Indiana Fin. Auth. Hosp. Rev. (Parkview Health Sys. Proj.) Series 2017 A: | | | |
| 5% 11/1/28 | | 425,000 | 466,281 |
| 5% 11/1/29 | | 1,320,000 | 1,474,510 |
| 5% 11/1/30 | | 295,000 | 334,913 |
| Indiana Fin. Auth. Rev.: | | | |
| (Butler Univ. Proj.) Series 2019, 4% 2/1/44 | | 2,450,000 | 2,232,797 |
| Series 2015 A, 5.25% 2/1/32 | | 2,775,000 | 2,883,014 |
| Series 2015, 5% 3/1/36 | | 4,250,000 | 4,344,382 |
| Series 2016: | | | |
5% 9/1/27 | | 1,745,000 | 1,837,373 |
5% 9/1/31 | | 1,735,000 | 1,821,647 |
| Indiana Hsg. & Cmnty. Dev. Auth.: | | | |
| (Glasswater Creek of Whitestown Proj.) Series 2020, 5.375% 10/1/40 (e) | | 1,660,000 | 1,362,606 |
| Series 2021 B, 3% 7/1/50 | | 1,015,000 | 976,277 |
| Indiana Muni. Pwr. Agcy. Pwr. Supply Sys. Rev. Series 2017 A: | | | |
| 5% 1/1/32 | | 3,775,000 | 4,095,104 |
| 5% 1/1/34 | | 1,890,000 | 2,044,097 |
| Indianapolis Local Pub. Impt. (Courthouse and Jail Proj.) Series 2019 A, 5% 2/1/49 | | 3,090,000 | 3,244,728 |
| Saint Joseph County Econ. Dev. Auth. Rev. (St. Mary's College Proj.): | | | |
| Series 2019: | | | |
4% 4/1/39 | | 945,000 | 896,480 |
4% 4/1/46 | | 2,115,000 | 1,897,097 |
5% 4/1/40 | | 2,115,000 | 2,204,278 |
| Series 2020: | | | |
4% 4/1/37 | | 1,565,000 | 1,533,016 |
5% 4/1/29 | | 970,000 | 1,049,788 |
TOTAL INDIANA | | | 34,976,666 |
| Iowa - 0.3% | | | |
| Iowa Fin. Auth. Rev.: | | | |
| Series 2018 B, 5% 2/15/48 | | 2,360,000 | 2,423,297 |
| Series A: | | | |
5% 5/15/43 | | 775,000 | 604,708 |
5% 5/15/48 | | 1,355,000 | 1,006,309 |
| Tobacco Settlement Auth. Tobacco Settlement Rev.: | | | |
| Series 2021 A2, 4% 6/1/49 | | 2,645,000 | 2,373,229 |
| Series 2021 B1, 4% 6/1/49 | | 2,765,000 | 2,734,116 |
TOTAL IOWA | | | 9,141,659 |
| Kentucky - 3.2% | | | |
| Ashland Med. Ctr. Rev.: | | | |
| (Ashland Hosp. Corp. d/b/a King's Daughters Med. Ctr. Proj.) Series 2016 A, 5% 2/1/40 | | 1,135,000 | 1,143,886 |
| Series 2019: | | | |
3% 2/1/40 (Assured Guaranty Muni. Corp. Insured) | | 1,665,000 | 1,341,430 |
5% 2/1/28 | | 45,000 | 47,318 |
5% 2/1/32 | | 60,000 | 63,233 |
| Boyle County Edl. Facilities Rev. Series 2017, 5% 6/1/37 | | 1,585,000 | 1,645,849 |
| Kenton County Arpt. Board Arpt. Rev.: | | | |
| Series 2016: | | | |
5% 1/1/24 | | 755,000 | 759,979 |
5% 1/1/27 | | 1,415,000 | 1,476,890 |
5% 1/1/33 | | 1,225,000 | 1,278,112 |
| Series 2019, 5% 1/1/44 | | 2,120,000 | 2,235,953 |
| Kentucky Econ. Dev. Fin. Auth.: | | | |
| Series 2019 A1: | | | |
5% 8/1/33 | | 945,000 | 1,016,588 |
5% 8/1/44 | | 945,000 | 974,111 |
| Series 2019 A2, 5% 8/1/49 | | 2,360,000 | 2,415,579 |
| Kentucky Econ. Dev. Fin. Auth. Hosp. Rev.: | | | |
| Series 2015 A: | | | |
5% 6/1/25 | | 45,000 | 45,750 |
5% 6/1/26 | | 50,000 | 50,814 |
5% 6/1/27 | | 50,000 | 50,809 |
5% 6/1/28 | | 55,000 | 55,886 |
5% 6/1/29 | | 60,000 | 60,928 |
5% 6/1/30 | | 60,000 | 60,854 |
| Series 2017 B: | | | |
5% 8/15/32 | | 2,530,000 | 2,665,108 |
5% 8/15/33 | | 1,250,000 | 1,316,299 |
5% 8/15/35 | | 1,415,000 | 1,483,673 |
| Kentucky State Property & Buildings Commission Rev.: | | | |
| (Proj. No. 119) Series 2018: | | | |
5% 5/1/29 | | 1,760,000 | 1,910,878 |
5% 5/1/30 | | 1,180,000 | 1,281,875 |
5% 5/1/31 | | 505,000 | 551,894 |
5% 5/1/32 | | 265,000 | 288,121 |
5% 5/1/33 | | 595,000 | 646,360 |
5% 5/1/34 | | 680,000 | 738,566 |
5% 5/1/35 | | 400,000 | 431,123 |
5% 5/1/36 | | 340,000 | 364,039 |
| Series A: | | | |
4% 11/1/38 | | 600,000 | 598,556 |
5% 11/1/29 | | 3,625,000 | 3,967,990 |
5% 11/1/30 | | 2,030,000 | 2,222,080 |
| Kentucky, Inc. Pub. Energy Bonds Series A, 4%, tender 6/1/26 (b) | | 29,720,000 | 29,652,429 |
| Louisville & Jefferson County: | | | |
| Bonds: | | | |
Series 2020 C, 5%, tender 10/1/26 (b) | | 1,360,000 | 1,406,248 |
Series 2020 D, 5%, tender 10/1/29 (b) | | 1,635,000 | 1,747,683 |
| Series 2013 A, 5.5% 10/1/33 | | 1,205,000 | 1,209,055 |
| Series 2016 A: | | | |
5% 10/1/31 | | 6,045,000 | 6,285,966 |
5% 10/1/32 | | 7,310,000 | 7,597,961 |
5% 10/1/33 | | 4,155,000 | 4,314,414 |
| Series 2020 A: | | | |
3% 10/1/43 | | 5,505,000 | 4,216,711 |
4% 10/1/40 | | 1,090,000 | 1,048,725 |
5% 10/1/37 | | 2,715,000 | 2,843,179 |
TOTAL KENTUCKY | | | 93,512,902 |
| Louisiana - 0.2% | | | |
| Louisiana Pub. Facilities Auth. Hosp. Rev. (Franciscan Missionaries of Our Lady Health Sys. Proj.) Series 2017 A, 5% 7/1/47 | | 1,605,000 | 1,627,428 |
| Louisiana Pub. Facilities Auth. Rev. (Tulane Univ. of Louisiana Proj.) Series 2016 A: | | | |
| 5% 12/15/25 | | 420,000 | 437,585 |
| 5% 12/15/27 | | 1,890,000 | 2,005,495 |
| 5% 12/15/29 | | 1,135,000 | 1,201,520 |
TOTAL LOUISIANA | | | 5,272,028 |
| Maine - 1.1% | | | |
| Brunswick Series 2020: | | | |
| 2.375% 11/1/37 | | 130,000 | 105,039 |
| 2.5% 11/1/39 | | 335,000 | 267,423 |
| Lewiston 52850C Series 2021: | | | |
| 1.25% 2/15/31 | | 2,455,000 | 1,992,481 |
| 1.25% 2/15/32 | | 2,595,000 | 2,057,255 |
| Maine Health & Higher Edl. Facilities Auth. Rev.: | | | |
| Series 2016 A: | | | |
4% 7/1/41 | | 1,120,000 | 991,353 |
4% 7/1/46 | | 1,665,000 | 1,399,858 |
5% 7/1/41 | | 455,000 | 445,390 |
5% 7/1/46 | | 310,000 | 283,914 |
| Series 2018 A: | | | |
5% 7/1/30 | | 1,120,000 | 1,194,770 |
5% 7/1/31 | | 1,040,000 | 1,108,366 |
5% 7/1/34 | | 1,890,000 | 2,011,278 |
5% 7/1/35 | | 2,590,000 | 2,744,901 |
5% 7/1/36 | | 3,070,000 | 3,233,898 |
5% 7/1/37 | | 2,830,000 | 2,963,950 |
5% 7/1/38 | | 2,150,000 | 2,243,497 |
5% 7/1/43 | | 4,250,000 | 4,410,358 |
| Maine Tpk. Auth. Tpk. Rev. Series 2018: | | | |
| 5% 7/1/33 | | 660,000 | 724,171 |
| 5% 7/1/34 | | 945,000 | 1,035,973 |
| 5% 7/1/35 | | 1,040,000 | 1,134,428 |
| 5% 7/1/36 | | 1,890,000 | 2,045,470 |
TOTAL MAINE | | | 32,393,773 |
| Maryland - 1.1% | | | |
| Anne Arundel County Gen. Oblig.: | | | |
| Series 2012, 3% 10/1/36 | | 2,595,000 | 2,410,486 |
| Series 2021, 3% 10/1/37 | | 1,000,000 | 909,422 |
| Baltimore Gen. Oblig. Series 2022 A, 5% 10/15/37 | | 735,000 | 839,916 |
| City of Westminster Series 2016, 5% 11/1/31 | | 1,865,000 | 1,941,676 |
| Maryland Cmnty. Dev. Admin Dept. Hsg. & Cmnty. Dev.: | | | |
| Series 2019 B, 4% 9/1/49 | | 1,590,000 | 1,577,104 |
| Series 2019 C, 3.5% 3/1/50 | | 1,755,000 | 1,718,765 |
| Maryland Health & Higher Edl. Series 2021 A, 3% 7/1/51 | | 4,320,000 | 3,043,078 |
| Maryland Health & Higher Edl. Facilities Auth. Rev.: | | | |
| Series 2015, 5% 7/1/40 | | 1,890,000 | 1,913,150 |
| Series 2016 A: | | | |
4% 7/1/42 | | 735,000 | 676,254 |
5% 7/1/35 | | 1,940,000 | 1,996,108 |
5% 7/1/38 | | 1,060,000 | 1,075,287 |
| Maryland Stadium Auth. Built to Learn Rev.: | | | |
| Series 2021, 4% 6/1/46 | | 850,000 | 816,751 |
| Series 2022 A: | | | |
4% 6/1/37 | | 2,240,000 | 2,278,369 |
4% 6/1/38 | | 2,455,000 | 2,477,618 |
| Washington Metropolitan Area Transit Auth. Series 2020 A, 5% 7/15/38 | | 7,100,000 | 7,846,530 |
TOTAL MARYLAND | | | 31,520,514 |
| Massachusetts - 1.8% | | | |
| Massachusetts Dev. Fin. Agcy. Rev.: | | | |
| (Lesley Univ. Proj.) Series 2016, 5% 7/1/39 | | 960,000 | 964,954 |
| (Univ. of Massachusetts Health Cr., Inc. Proj.) Series 2017 L, 4% 7/1/44 | | 9,440,000 | 8,577,827 |
| (Wentworth Institute of Technology Proj.) Series 2017: | | | |
5% 10/1/30 | | 1,100,000 | 1,125,582 |
5% 10/1/33 | | 1,280,000 | 1,305,330 |
| Series 2015 D, 5% 7/1/44 | | 2,430,000 | 2,451,513 |
| Series 2019, 5% 9/1/59 | | 11,260,000 | 11,701,594 |
| Series 2020 A, 4% 7/1/45 | | 9,790,000 | 8,587,615 |
| Series J2, 5% 7/1/53 | | 2,360,000 | 2,415,548 |
| Series M: | | | |
4% 10/1/50 | | 9,975,000 | 8,175,408 |
5% 10/1/45 | | 7,515,000 | 7,384,046 |
TOTAL MASSACHUSETTS | | | 52,689,417 |
| Michigan - 1.9% | | | |
| Detroit Downtown Dev. Auth. Tax Series A, 5% 7/1/37 (Assured Guaranty Muni. Corp. Insured) | | 975,000 | 979,601 |
| Detroit Gen. Oblig. Series 2021 A, 5% 4/1/46 | | 1,840,000 | 1,849,233 |
| Grand Traverse County Hosp. Fin. Auth. Series 2021, 3% 7/1/51 | | 1,860,000 | 1,288,867 |
| Great Lakes Wtr. Auth. Sew Disp. Sys. Series 2018 A: | | | |
| 5% 7/1/43 | | 1,415,000 | 1,477,984 |
| 5% 7/1/48 | | 6,135,000 | 6,345,775 |
| Jackson County Series 2019: | | | |
| 4% 5/1/32 (Build America Mutual Assurance Insured) | | 2,050,000 | 2,150,457 |
| 4% 5/1/33 (Build America Mutual Assurance Insured) | | 2,110,000 | 2,205,178 |
| Kalamazoo Hosp. Fin. Auth. Hosp. Facilities Rev. Series 2016: | | | |
| 5% 5/15/28 | | 1,365,000 | 1,419,246 |
| 5% 5/15/28 (Pre-Refunded to 5/15/26 @ 100) | | 10,000 | 10,495 |
| Michigan Fin. Auth. Rev.: | | | |
| (Charter County of Wayne Criminal Justice Ctr. Proj.) Series 2018, 5% 11/1/43 | | 1,740,000 | 1,835,621 |
| Series 2016, 5% 11/15/32 | | 4,545,000 | 4,744,716 |
| Series 2019 A: | | | |
3% 12/1/49 | | 2,645,000 | 1,943,025 |
5% 11/15/48 | | 1,555,000 | 1,608,167 |
| Series 2020 A, 4% 6/1/49 | | 2,070,000 | 1,874,579 |
| Michigan Hosp. Fin. Auth. Rev. Series 2008 C: | | | |
| 5% 12/1/32 | | 290,000 | 310,703 |
| 5% 12/1/32 (Pre-Refunded to 12/1/27 @ 100) | | 40,000 | 43,514 |
| Michigan State Hsg. Dev. Auth. Series 2021 A, 2.45% 10/1/46 | | 1,000,000 | 674,687 |
| Portage Pub. Schools Series 2016: | | | |
| 5% 11/1/33 | | 945,000 | 981,799 |
| 5% 11/1/36 | | 1,180,000 | 1,220,315 |
| 5% 11/1/37 | | 945,000 | 976,786 |
| Warren Consolidated School District Series 2016: | | | |
| 5% 5/1/28 | | 3,870,000 | 4,052,779 |
| 5% 5/1/29 | | 3,995,000 | 4,178,320 |
| Wayne County Arpt. Auth. Rev.: | | | |
| Series 2015 D: | | | |
5% 12/1/30 | | 1,225,000 | 1,273,409 |
5% 12/1/31 | | 2,170,000 | 2,255,686 |
| Series 2015 G: | | | |
5% 12/1/31 | | 1,415,000 | 1,470,874 |
5% 12/1/32 | | 1,415,000 | 1,469,454 |
5% 12/1/33 | | 1,890,000 | 1,957,583 |
| Series 2015, 5% 12/1/29 | | 1,510,000 | 1,569,032 |
| Series 2017 A: | | | |
5% 12/1/28 | | 565,000 | 606,496 |
5% 12/1/29 | | 520,000 | 557,053 |
5% 12/1/30 | | 660,000 | 706,162 |
5% 12/1/33 | | 330,000 | 353,978 |
5% 12/1/37 | | 470,000 | 493,526 |
5% 12/1/37 | | 255,000 | 267,972 |
| Series 2017 C, 5% 12/1/28 | | 1,040,000 | 1,119,875 |
TOTAL MICHIGAN | | | 56,272,947 |
| Minnesota - 1.8% | | | |
| Duluth Econ. Dev. Auth. Health Care Facilities Rev. Series 2018 A: | | | |
| 5% 2/15/48 | | 6,685,000 | 6,750,256 |
| 5% 2/15/58 | | 11,185,000 | 11,211,565 |
| Maple Grove Health Care Sys. Rev.: | | | |
| Series 2015, 5% 9/1/27 | | 1,215,000 | 1,245,541 |
| Series 2017, 5% 5/1/24 | | 1,135,000 | 1,143,743 |
| Minneapolis & Saint Paul Hsg. & Redev. Auth. Health Care Sys. Rev. (Allina Health Sys. Proj.) Series 2017 A, 5% 11/15/25 | | 1,290,000 | 1,335,998 |
| Minnesota Higher Ed. Facilities Auth. Rev. Series 2018 A: | | | |
| 5% 10/1/29 | | 945,000 | 1,006,019 |
| 5% 10/1/32 | | 675,000 | 716,907 |
| 5% 10/1/33 | | 825,000 | 874,871 |
| 5% 10/1/45 | | 975,000 | 983,229 |
| Minnesota Hsg. Fin. Agcy.: | | | |
| Series 2023 F, 5.75% 7/1/53 | | 665,000 | 714,065 |
| Series B, 4% 8/1/41 | | 1,270,000 | 1,255,218 |
| Series D: | | | |
4% 8/1/38 | | 2,265,000 | 2,278,031 |
4% 8/1/40 | | 2,455,000 | 2,441,762 |
4% 8/1/41 | | 1,610,000 | 1,591,260 |
4% 8/1/43 | | 1,820,000 | 1,768,047 |
| Mounds View Independent School District #621 (Minnesota School District Cr. Enhancement Prog.) Series 2018 A: | | | |
| 3.45% 2/1/37 | | 1,235,000 | 1,195,317 |
| 3.55% 2/1/38 | | 1,290,000 | 1,229,115 |
| Saint Cloud Health Care Rev. Series 2019: | | | |
| 4% 5/1/49 | | 3,265,000 | 3,051,947 |
| 5% 5/1/48 | | 4,085,000 | 4,223,149 |
| Sauk Rapids Minn Independent School District # 47 Series 2020 A, 2% 2/1/33 | | 2,545,000 | 2,191,522 |
| Shakopee Sr. Hsg. Rev. Bonds Series 2018, 5.85%, tender 11/1/25 (b)(e) | | 3,150,000 | 3,099,741 |
| West Saint Paul Independent School District #197 (Minnesota School District Cr. Enhancement Prog.) Series 2018 A: | | | |
| 3.6% 2/1/37 | | 900,000 | 880,603 |
| 3.65% 2/1/38 | | 945,000 | 899,607 |
TOTAL MINNESOTA | | | 52,087,513 |
| Mississippi - 0.1% | | | |
| Mississippi Home Corp. Series 2021 B: | | | |
| 3% 6/1/51 | | 2,730,000 | 2,624,032 |
| 5% 6/1/28 | | 705,000 | 762,828 |
TOTAL MISSISSIPPI | | | 3,386,860 |
| Missouri - 1.0% | | | |
| Cape Girardeau County Indl. Dev. Auth. Series 2017 A: | | | |
| 5% 3/1/27 | | 30,000 | 30,726 |
| 5% 3/1/29 | | 1,390,000 | 1,425,372 |
| Kansas City San. Swr. Sys. Rev. Series 2018 B: | | | |
| 5% 1/1/26 | | 225,000 | 235,485 |
| 5% 1/1/28 | | 470,000 | 513,623 |
| 5% 1/1/33 | | 450,000 | 491,604 |
| Kansas City Wtr. Rev. Series 2020 A, 4% 12/1/39 | | 1,190,000 | 1,202,279 |
| Missouri Health & Edl. Facilities Rev.: | | | |
| Series 2015 B: | | | |
3.125% 2/1/27 | | 380,000 | 377,157 |
3.25% 2/1/28 | | 380,000 | 378,742 |
5% 2/1/34 | | 2,940,000 | 3,015,420 |
5% 2/1/36 | | 1,135,000 | 1,160,976 |
| Series 2019 A: | | | |
4% 10/1/48 | | 2,030,000 | 2,007,358 |
5% 10/1/46 | | 3,990,000 | 4,244,369 |
| Missouri Hsg. Dev. Commission Single Family Mtg. Rev. Series 2019, 4% 5/1/50 | | 440,000 | 435,995 |
| Saint Louis Arpt. Rev.: | | | |
| Series 2019 A: | | | |
5% 7/1/44 | | 1,320,000 | 1,390,297 |
5% 7/1/49 | | 1,085,000 | 1,135,383 |
| Series A, 5.25% 7/1/26 (Assured Guaranty Muni. Corp. Insured) | | 2,830,000 | 2,998,078 |
| Saint Louis County Indl. Dev. Auth. Sr. Living Facilities Rev. Series 2018 A, 5.125% 9/1/48 | | 2,510,000 | 2,137,731 |
| The Indl. Dev. Auth. of Hannibal (Hannibal Reg'l. Healthcare Sys. Proj.) Series 2017: | | | |
| 5% 10/1/42 | | 3,235,000 | 3,294,485 |
| 5% 10/1/47 | | 2,005,000 | 2,033,845 |
TOTAL MISSOURI | | | 28,508,925 |
| Montana - 0.1% | | | |
| Montana Board Hsg. Single Family Series 2019 B, 4% 6/1/50 | | 245,000 | 243,003 |
| Montana Facility Fin. Auth. Series 2021 A, 3% 6/1/50 | | 2,665,000 | 1,885,921 |
TOTAL MONTANA | | | 2,128,924 |
| Nebraska - 1.1% | | | |
| Central Plains Energy Proj. Gas Supply Bonds Series 2019, 4%, tender 8/1/25 (b) | | 13,495,000 | 13,482,960 |
| Douglas County Neb Edl. Facilities Rev. (Creighton Univ. Projs.): | | | |
| Series 2017, 4% 7/1/33 | | 730,000 | 743,916 |
| Series 2021 A, 3% 7/1/51 | | 1,190,000 | 844,443 |
| Lincoln Elec. Sys. Rev. Series 2018: | | | |
| 5% 9/1/31 | | 1,890,000 | 2,023,264 |
| 5% 9/1/32 | | 3,525,000 | 3,769,059 |
| 5% 9/1/33 | | 2,115,000 | 2,259,137 |
| Nebraska Invt. Fin. Auth. Single Family Hsg. Rev. Series 2020 A, 3.5% 9/1/50 | | 1,150,000 | 1,124,342 |
| Nebraska Pub. Pwr. District Rev.: | | | |
| Series 2016 A: | | | |
5% 1/1/32 | | 1,575,000 | 1,626,468 |
5% 1/1/34 | | 945,000 | 970,371 |
| Series 2016 B, 5% 1/1/32 | | 4,720,000 | 4,874,240 |
TOTAL NEBRASKA | | | 31,718,200 |
| Nevada - 0.6% | | | |
| Carson City Hosp. Rev. (Carson Tahoe Hosp. Proj.) Series 2017: | | | |
| 5% 9/1/37 | | 2,555,000 | 2,608,006 |
| 5% 9/1/42 | | 6,295,000 | 6,362,028 |
| Clark County School District Series 2020 B, 3% 6/15/39 | | 2,630,000 | 2,211,273 |
| Las Vegas Valley Wtr. District Wtr. Impt. Gen. Oblig. Series 2016 B, 5% 6/1/36 | | 2,550,000 | 2,653,840 |
| Nevada Hsg. Division Single Family Mtg. Rev. Series 2019 B, 4% 10/1/49 | | 695,000 | 688,621 |
| Tahoe-Douglas Visitors Auth. Series 2020, 5% 7/1/51 | | 2,830,000 | 2,746,226 |
TOTAL NEVADA | | | 17,269,994 |
| New Hampshire - 1.4% | | | |
| Nat'l. Fin. Auth. Hosp. Rev. (St. Luke's Univ. Health Network Proj.) Series 2021 B, 3% 8/15/51 (Assured Guaranty Muni. Corp. Insured) | | 2,300,000 | 1,636,038 |
| Nat'l. Finnance Auth.: | | | |
| Series 2020 1, 4.125% 1/20/34 | | 4,660,142 | 4,563,580 |
| Series 2023 2A, 3.875% 1/20/38 | | 6,760,000 | 6,297,104 |
| New Hampshire Health & Ed. Facilities Auth.: | | | |
| (Dartmouth-Hitchcock Oblgtd Grp Proj.): | | | |
Series 2018 A: | | | |
5% 8/1/31 | | 1,225,000 | 1,301,377 |
5% 8/1/32 | | 235,000 | 249,080 |
5% 8/1/34 | | 2,830,000 | 2,990,989 |
5% 8/1/36 | | 1,890,000 | 1,976,605 |
5% 8/1/37 | | 2,265,000 | 2,356,305 |
Series 2018, 5% 8/1/35 | | 2,595,000 | 2,729,355 |
| (Partners Healthcare Sys., Inc. Proj.) Series 2017, 5% 7/1/41 | | 1,985,000 | 2,076,621 |
| Series 2017: | | | |
5% 7/1/36 | | 1,135,000 | 1,157,235 |
5% 7/1/44 | | 1,790,000 | 1,722,571 |
| New Hampshire Health & Ed. Facilities Auth. Rev.: | | | |
| Series 2012, 4% 7/1/32 | | 850,000 | 849,992 |
| Series 2016: | | | |
4% 10/1/38 | | 1,100,000 | 988,836 |
5% 10/1/28 | | 2,830,000 | 2,927,605 |
5% 10/1/32 | | 4,870,000 | 4,988,639 |
5% 10/1/38 | | 3,555,000 | 3,561,431 |
TOTAL NEW HAMPSHIRE | | | 42,373,363 |
| New Jersey - 5.7% | | | |
| New Jersey Econ. Dev. Auth.: | | | |
| (White Horse HMT Urban Renewal LLC Proj.) Series 2020, 5% 1/1/40 (e) | | 855,000 | 613,538 |
| Series A, 5% 11/1/36 | | 4,895,000 | 5,243,192 |
| Series QQQ: | | | |
4% 6/15/34 | | 755,000 | 782,172 |
4% 6/15/36 | | 1,040,000 | 1,057,769 |
4% 6/15/39 | | 945,000 | 945,771 |
4% 6/15/41 | | 945,000 | 937,569 |
4% 6/15/46 | | 1,415,000 | 1,377,759 |
4% 6/15/50 | | 1,890,000 | 1,801,792 |
5% 6/15/31 | | 1,040,000 | 1,164,843 |
5% 6/15/33 | | 190,000 | 211,577 |
| New Jersey Econ. Dev. Auth. Rev.: | | | |
| (Black Horse EHT Urban Renewal LLC Proj.) Series 2019 A, 5% 10/1/39 (e) | | 750,000 | 542,412 |
| (Provident Montclair Proj.) Series 2017: | | | |
5% 6/1/27 (Assured Guaranty Muni. Corp. Insured) | | 40,000 | 42,278 |
5% 6/1/28 (Assured Guaranty Muni. Corp. Insured) | | 55,000 | 58,123 |
5% 6/1/29 (Assured Guaranty Muni. Corp. Insured) | | 40,000 | 42,072 |
| Series 2014 PP, 5% 6/15/26 | | 5,665,000 | 5,749,866 |
| Series 2016 AAA, 5% 6/15/41 (Pre-Refunded to 12/15/26 @ 100) | | 2,370,000 | 2,525,067 |
| Series LLL, 4% 6/15/49 | | 2,655,000 | 2,552,587 |
| Series MMM, 4% 6/15/36 | | 755,000 | 765,061 |
| New Jersey Edl. Facility Series 2016 A, 5% 7/1/29 | | 2,480,000 | 2,569,188 |
| New Jersey Gen. Oblig.: | | | |
| Series 2020 A, 5% 6/1/29 | | 3,000,000 | 3,342,280 |
| Series 2021: | | | |
2% 6/1/34 | | 4,435,000 | 3,661,172 |
2% 6/1/36 | | 1,140,000 | 885,304 |
| New Jersey Health Care Facilities Fing. Auth. Rev.: | | | |
| Series 2016 A: | | | |
5% 7/1/25 (Escrowed to Maturity) | | 995,000 | 1,027,724 |
5% 7/1/25 (Escrowed to Maturity) | | 465,000 | 480,293 |
5% 7/1/26 (Escrowed to Maturity) | | 145,000 | 152,816 |
5% 7/1/28 (Pre-Refunded to 7/1/26 @ 100) | | 35,000 | 36,887 |
5% 7/1/30 | | 945,000 | 996,836 |
| Series 2016: | | | |
4% 7/1/48 | | 1,700,000 | 1,451,141 |
5% 7/1/41 | | 2,070,000 | 2,070,353 |
| New Jersey Higher Ed. Student Assistance Auth. Student Ln. Rev. Series 2019 A: | | | |
| 5% 12/1/24 | | 550,000 | 560,548 |
| 5% 12/1/25 | | 1,005,000 | 1,040,296 |
| New Jersey Tpk. Auth. Tpk. Rev. Series 2022 B: | | | |
| 4.25% 1/1/43 | | 6,000,000 | 6,148,199 |
| 5% 1/1/46 | | 8,000,000 | 8,813,751 |
| New Jersey Trans. Trust Fund Auth.: | | | |
| (Trans. Prog.) Series 2019 AA, 5.25% 6/15/43 | | 15,160,000 | 16,034,799 |
| Series 2006 C: | | | |
0% 12/15/31 (FGIC Insured) | | 5,300,000 | 3,907,187 |
0% 12/15/36 (AMBAC Insured) | | 10,000,000 | 5,797,875 |
| Series 2008 A, 0% 12/15/38 (Build America Mutual Assurance Insured) | | 3,575,000 | 1,868,837 |
| Series 2010 A, 0% 12/15/27 | | 6,980,000 | 5,981,184 |
| Series 2014 BB2, 5% 6/15/34 | | 5,370,000 | 5,985,199 |
| Series 2016 A: | | | |
5% 6/15/27 | | 890,000 | 930,943 |
5% 6/15/29 | | 3,350,000 | 3,515,041 |
| Series 2018 A: | | | |
5% 12/15/32 | | 3,025,000 | 3,286,917 |
5% 12/15/34 | | 945,000 | 1,018,937 |
| Series 2019 BB, 4% 6/15/50 | | 1,770,000 | 1,673,890 |
| Series 2021 A: | | | |
4% 6/15/38 | | 510,000 | 509,117 |
5% 6/15/32 | | 3,360,000 | 3,778,983 |
5% 6/15/33 | | 945,000 | 1,059,413 |
| Series 2022 A: | | | |
4% 6/15/41 | | 4,625,000 | 4,548,206 |
4% 6/15/42 | | 3,105,000 | 3,044,723 |
| Series 2022 AA: | | | |
5% 6/15/29 | | 7,555,000 | 8,316,116 |
5% 6/15/35 | | 590,000 | 658,701 |
5% 6/15/36 | | 6,915,000 | 7,631,987 |
5% 6/15/37 | | 3,195,000 | 3,500,132 |
| Series A: | | | |
4% 12/15/39 | | 945,000 | 934,163 |
4.25% 12/15/38 | | 2,345,000 | 2,367,873 |
| Series AA: | | | |
4% 6/15/38 | | 2,660,000 | 2,655,397 |
4% 6/15/45 | | 6,365,000 | 6,181,992 |
4% 6/15/50 | | 895,000 | 846,402 |
5% 6/15/37 | | 2,830,000 | 3,060,531 |
5% 6/15/50 | | 3,160,000 | 3,328,033 |
| South Jersey Trans. Auth. Trans. Sys. Rev. Series 2022 A: | | | |
| 4.5% 11/1/42 | | 1,500,000 | 1,514,719 |
| 4.625% 11/1/47 | | 2,500,000 | 2,535,631 |
TOTAL NEW JERSEY | | | 166,123,164 |
| New Mexico - 0.1% | | | |
| New Mexico Mtg. Fin. Auth. Series 2019 D, 3.75% 1/1/50 | | 960,000 | 945,284 |
| Santa Fe Retirement Fac. Series 2019 A: | | | |
| 5% 5/15/34 | | 215,000 | 203,310 |
| 5% 5/15/39 | | 160,000 | 142,010 |
| 5% 5/15/44 | | 170,000 | 144,742 |
| 5% 5/15/49 | | 335,000 | 273,950 |
TOTAL NEW MEXICO | | | 1,709,296 |
| New York - 6.8% | | | |
| Dorm. Auth. New York Univ. Rev.: | | | |
| (Memorial Sloan-Kettring Cancer Ctr.) Series 2017 1, 5% 7/1/42 | | 1,470,000 | 1,543,965 |
| Series 2016 A: | | | |
5% 7/1/25 | | 65,000 | 66,663 |
5% 7/1/32 | | 2,360,000 | 2,472,484 |
| Hempstead Local Dev. Corp. Rev. (Hofstra Univ. Proj.) Series 2021 A, 3% 7/1/51 | | 2,285,000 | 1,627,462 |
| Hudson Yards Infrastructure Corp. New York Rev. Series 2017 A, 5% 2/15/33 | | 3,395,000 | 3,610,456 |
| Long Island Pwr. Auth. Elec. Sys. Rev. Series 2017: | | | |
| 5% 9/1/33 | | 470,000 | 510,952 |
| 5% 9/1/35 | | 1,890,000 | 2,041,640 |
| 5% 9/1/36 | | 1,070,000 | 1,149,855 |
| MTA Hudson Rail Yards Trust Oblig. Series 2016 A, 5% 11/15/56 | | 16,100,000 | 16,102,323 |
| New York City Edl. Construction Fund Series 2021 B, 5% 4/1/46 | | 4,505,000 | 4,824,302 |
| New York City Gen. Oblig.: | | | |
| Series 2021 A1, 5% 8/1/31 | | 6,010,000 | 6,865,442 |
| Series 2022 B1, 5% 8/1/32 | | 1,000,000 | 1,175,915 |
| New York City Hsg. Dev. Corp. Multifamily Hsg.: | | | |
| Series 2019 J, 3.05% 11/1/49 | | 1,240,000 | 936,788 |
| Series 2021 F1, 2.4% 11/1/46 | | 1,725,000 | 1,134,168 |
| New York City Transitional Fin. Auth. Rev.: | | | |
| Series 2016 A, 5% 5/1/40 | | 1,840,000 | 1,902,865 |
| Series 2017 B, 5% 8/1/40 | | 1,890,000 | 1,962,476 |
| Series 2019 B1, 5% 8/1/34 | | 1,890,000 | 2,069,907 |
| Series 2024 A1, 5% 5/1/42 | | 5,130,000 | 5,693,878 |
| New York Convention Ctr. Dev. Corp. Rev. Series 2015: | | | |
| 5% 11/15/28 | | 6,805,000 | 7,028,109 |
| 5% 11/15/29 | | 4,720,000 | 4,874,659 |
| New York Dorm. Auth. Rev. Series 2022 A: | | | |
| 5% 7/1/33 | | 660,000 | 747,425 |
| 5% 7/1/34 | | 1,370,000 | 1,544,698 |
| 5% 7/15/37 | | 570,000 | 589,702 |
| 5% 7/1/38 | | 1,785,000 | 1,912,801 |
| 5% 7/1/42 | | 1,180,000 | 1,235,325 |
| 5% 7/15/42 | | 1,605,000 | 1,623,548 |
| 5% 7/15/50 | | 4,150,000 | 4,129,100 |
| New York Dorm. Auth. Sales Tax Rev.: | | | |
| Series 2016 A, 5% 3/15/32 | | 1,835,000 | 1,939,425 |
| Series 2018 C, 5% 3/15/38 | | 7,820,000 | 8,355,524 |
| New York Metropolitan Trans. Auth. Rev.: | | | |
| Series 2016 C1, 5% 11/15/56 | | 1,890,000 | 1,895,790 |
| Series 2017 C-2: | | | |
0% 11/15/29 | | 2,150,000 | 1,706,007 |
0% 11/15/33 | | 5,285,000 | 3,542,417 |
| Series 2017 D, 5% 11/15/30 | | 4,720,000 | 5,022,313 |
| Series 2020 D: | | | |
4% 11/15/46 | | 31,520,000 | 29,640,718 |
4% 11/15/47 | | 2,205,000 | 2,062,258 |
| New York State Dorm. Auth.: | | | |
| Series 2019 D, 3% 2/15/49 | | 5,070,000 | 3,943,334 |
| Series 2021 E, 3% 3/15/50 | | 5,030,000 | 3,880,485 |
| New York State Hsg. Fin. Agcy. Rev. Bonds Series 2023 C2, 3.8%, tender 5/1/29 (b) | | 13,520,000 | 13,528,823 |
| New York State Urban Dev. Corp. Series 2020 E: | | | |
| 4% 3/15/44 | | 22,920,000 | 22,446,514 |
| 4% 3/15/45 | | 8,600,000 | 8,402,311 |
| New York Urban Dev. Corp. Rev.: | | | |
| (New York State Gen. Oblig. Proj.) Series 2017 A, 5% 3/15/34 | | 3,495,000 | 3,729,028 |
| Gen. Oblig. (New York State Gen. Oblig. Proj.) Series 2017 A, 5% 3/15/32 | | 2,955,000 | 3,158,220 |
| Oneida County Local Dev. Corp. Rev. (Mohawk Valley Health Sys. Proj.) Series 2019 A: | | | |
| 4% 12/1/32 (Assured Guaranty Muni. Corp. Insured) | | 945,000 | 962,996 |
| 5% 12/1/25 (Assured Guaranty Muni. Corp. Insured) | | 595,000 | 598,673 |
| 5% 12/1/30 (Assured Guaranty Muni. Corp. Insured) | | 1,415,000 | 1,570,617 |
| Suffolk County Econ. Dev. Corp. Rev. Series 2021: | | | |
| 5.125% 11/1/41 (e) | | 600,000 | 480,280 |
| 5.375% 11/1/54 (e) | | 1,020,000 | 769,575 |
TOTAL NEW YORK | | | 197,012,216 |
| North Carolina - 1.5% | | | |
| Charlotte Ctfs. of Prtn. (Convention Facility Projs.) Series 2019 A, 5% 6/1/46 | | 2,245,000 | 2,393,108 |
| Charlotte Int'l. Arpt. Rev.: | | | |
| Series 2017 A: | | | |
5% 7/1/35 | | 1,890,000 | 2,016,431 |
5% 7/1/42 | | 2,715,000 | 2,837,482 |
| Series 2017 C: | | | |
4% 7/1/36 | | 1,415,000 | 1,432,977 |
4% 7/1/37 | | 1,415,000 | 1,421,043 |
| New Hanover County Hosp. Rev. Series 2017, 5% 10/1/27 (Escrowed to Maturity) | | 210,000 | 228,082 |
| North Carolina Grant Anticipation Rev. Series 2021, 2% 3/1/36 | | 3,505,000 | 2,760,527 |
| North Carolina Med. Care Commission Health Care Facilities Rev.: | | | |
| Series 2019 A: | | | |
5% 12/1/29 | | 1,310,000 | 1,419,131 |
5% 12/1/30 | | 1,360,000 | 1,474,581 |
5% 12/1/32 | | 1,035,000 | 1,121,392 |
5% 12/1/33 | | 755,000 | 817,265 |
| Series 2020 A, 3% 7/1/45 | | 1,730,000 | 1,362,786 |
| Series 2021 A: | | | |
4% 3/1/36 | | 850,000 | 717,375 |
4% 3/1/51 | | 1,790,000 | 1,233,281 |
| North Carolina Muni. Pwr. Agcy. #1 Catawba Elec. Rev. Series 2015 C, 5% 1/1/29 | | 7,555,000 | 7,821,022 |
| North Carolina Tpk. Auth. Triangle Expressway Sys. Series 2019: | | | |
| 4% 1/1/55 | | 3,045,000 | 2,766,201 |
| 5% 1/1/43 | | 4,250,000 | 4,443,509 |
| 5% 1/1/44 | | 5,295,000 | 5,521,815 |
| 5% 1/1/49 | | 1,890,000 | 1,957,308 |
TOTAL NORTH CAROLINA | | | 43,745,316 |
| North Dakota - 0.1% | | | |
| Univ. of North Dakota Series 2021 A, 3% 6/1/61 (Assured Guaranty Muni. Corp. Insured) | | 3,620,000 | 2,466,738 |
| Ohio - 2.6% | | | |
| Akron Bath Copley Hosp. District Rev. Series 2016, 5.25% 11/15/46 | | 3,965,000 | 3,999,216 |
| American Muni. Pwr., Inc. (Solar Electricity Prepayment Proj.) Series 2019 A: | | | |
| 5% 2/15/38 | | 1,415,000 | 1,492,875 |
| 5% 2/15/39 | | 945,000 | 994,062 |
| 5% 2/15/44 | | 2,975,000 | 3,095,930 |
| American Muni. Pwr., Inc. Rev. (Greenup Hydroelectric Proj.): | | | |
| Series 2016 A, 5% 2/15/41 | | 3,775,000 | 3,836,646 |
| Series 2016, 5% 2/15/46 | | 1,210,000 | 1,224,540 |
| Buckeye Tobacco Settlement Fing. Auth.: | | | |
| Series 2020 A2: | | | |
3% 6/1/48 | | 2,570,000 | 1,968,706 |
4% 6/1/48 | | 850,000 | 782,256 |
5% 6/1/27 | | 2,125,000 | 2,228,832 |
5% 6/1/29 | | 3,870,000 | 4,156,688 |
5% 6/1/34 | | 1,140,000 | 1,232,961 |
| Series 2020 B2, 5% 6/1/55 | | 7,005,000 | 6,510,601 |
| Cleveland Arpt. Sys. Rev. Series 2016 A: | | | |
| 5% 1/1/26 (Assured Guaranty Muni. Corp. Insured) | | 470,000 | 481,240 |
| 5% 1/1/27 (Assured Guaranty Muni. Corp. Insured) | | 2,055,000 | 2,108,433 |
| 5% 1/1/31 (Assured Guaranty Muni. Corp. Insured) | | 945,000 | 969,577 |
| Cleveland Income Tax Rev. Series 2018 A: | | | |
| 5% 10/1/35 | | 1,890,000 | 2,043,714 |
| 5% 10/1/37 | | 1,180,000 | 1,262,121 |
| 5% 10/1/38 | | 1,415,000 | 1,509,604 |
| Columbus City School District Series 2016 A, 5% 12/1/32 | | 945,000 | 989,200 |
| Fairfield County Hosp. Facilities Rev. (Fairfield Med. Ctr. Proj.) Series 2013: | | | |
| 5% 6/15/25 | | 65,000 | 64,975 |
| 5% 6/15/26 | | 70,000 | 69,962 |
| 5% 6/15/27 | | 75,000 | 74,904 |
| 5% 6/15/28 | | 80,000 | 79,752 |
| 5.25% 6/15/43 | | 4,720,000 | 4,300,380 |
| Lake County Hosp. Facilities Rev. Series 2015, 5% 8/15/27 (Pre-Refunded to 8/15/25 @ 100) | | 60,000 | 61,691 |
| Lancaster Port Auth. Gas Rev. Bonds Series 2019, 5%, tender 2/1/25 (b) | | 10,450,000 | 10,606,948 |
| Muskingum County Hosp. Facilities (Genesis Healthcare Sys. Obligated Group Proj.) Series 2013, 5% 2/15/27 | | 160,000 | 159,997 |
| Ohio Higher Edl. Facility Commission Rev. Series 2019, 4% 10/1/44 | | 1,675,000 | 1,529,089 |
| Ohio Hosp. Facilities Rev. Series 2017 A, 5% 1/1/31 | | 130,000 | 141,379 |
| Ohio Hosp. Rev. Series 2020 A, 4% 1/15/50 | | 780,000 | 721,825 |
| Ohio Hsg. Fin. Agcy. Residential Mtg. Rev. (Mtg. Backed Securities Prog.) Series 2019 B, 4.5% 3/1/50 | | 340,000 | 340,870 |
| Ohio Tpk. Commission Tpk. Rev. (Infrastructure Proj.) Series 2005 A, 0% 2/15/42 | | 5,475,000 | 2,356,928 |
| Scioto County Hosp. Facilities Rev.: | | | |
| Series 2016, 5% 2/15/29 | | 1,195,000 | 1,229,985 |
| Series 2019, 5% 2/15/29 | | 2,230,000 | 2,320,265 |
| Univ. of Akron Gen. Receipts Series 2019 A: | | | |
| 4% 1/1/28 | | 3,495,000 | 3,556,061 |
| 5% 1/1/30 | | 1,700,000 | 1,886,447 |
| Washington County Hosp. Rev. Series 2022: | | | |
| 6% 12/1/28 | | 1,075,000 | 1,088,047 |
| 6% 12/1/29 | | 1,140,000 | 1,160,109 |
| 6% 12/1/30 | | 1,205,000 | 1,228,888 |
| 6% 12/1/31 | | 1,280,000 | 1,306,293 |
TOTAL OHIO | | | 75,171,997 |
| Oklahoma - 0.1% | | | |
| Oklahoma City Pub. Property Auth. Hotel Tax Rev. Series 2015: | | | |
| 5% 10/1/24 | | 1,045,000 | 1,065,316 |
| 5% 10/1/32 | | 1,040,000 | 1,075,603 |
| Oklahoma Dev. Fin. Auth. Rev. (Oklahoma City Univ. Proj.) Series 2019, 5% 8/1/44 | | 1,590,000 | 1,557,652 |
TOTAL OKLAHOMA | | | 3,698,571 |
| Oregon - 0.8% | | | |
| Clackamas County Series 2020, 1.625% 6/1/36 | | 1,050,000 | 772,250 |
| Lake Oswego Ore Series 2019 A, 2.8% 6/1/39 | | 2,075,000 | 1,719,676 |
| Oregon Gen. Oblig. (Article XI-M, XI-N and XI-P State Grant Programs) Series 2023 D, 5% 6/1/42 | | 1,410,000 | 1,593,460 |
| Oregon State Hsg. & Cmnty. Svcs. Dept. Series 2019 A, 4% 7/1/50 | | 3,905,000 | 3,873,409 |
| Polk Marion & Benton School District # 13J Series B, 0% 12/15/38 | | 1,995,000 | 1,061,899 |
| Salem Hosp. Facility Auth. Rev. (Salem Health Projs.) Series 2019 A, 3% 5/15/49 | | 3,960,000 | 2,798,139 |
| Washington, Multnomah & Yamhill County School District #1J Series 2017: | | | |
| 5% 6/15/33 | | 1,020,000 | 1,091,082 |
| 5% 6/15/35 | | 2,960,000 | 3,155,141 |
| 5% 6/15/36 | | 2,830,000 | 3,001,737 |
| 5% 6/15/38 | | 2,830,000 | 2,978,602 |
TOTAL OREGON | | | 22,045,395 |
| Pennsylvania - 6.2% | | | |
| Allegheny County Arpt. Auth. Rev. Series 2021 B: | | | |
| 5% 1/1/51 | | 5,350,000 | 5,661,313 |
| 5% 1/1/56 | | 11,795,000 | 12,459,318 |
| Allegheny County Hosp. Dev. Auth. Rev. Series 2019 A, 4% 7/15/36 | | 2,360,000 | 2,366,950 |
| Allegheny County Indl. Dev. Auth. Rev. Series 2021: | | | |
| 3.5% 12/1/31 | | 1,265,000 | 1,047,473 |
| 4% 12/1/41 | | 2,135,000 | 1,564,219 |
| 4.25% 12/1/50 | | 2,375,000 | 1,640,747 |
| Bucks County Indl. Dev. Auth. Hosp. Rev. Series 2021: | | | |
| 5% 7/1/37 | | 1,390,000 | 1,313,845 |
| 5% 7/1/39 | | 2,765,000 | 2,576,042 |
| Cap. Region Wtr. Wtr. Rev. Series 2018: | | | |
| 5% 7/15/26 | | 945,000 | 994,869 |
| 5% 7/15/38 | | 945,000 | 994,640 |
| Coatesville Area School District Series 2017, 5% 8/1/23 (Assured Guaranty Muni. Corp. Insured) | | 425,000 | 425,000 |
| Dauphin County Gen. Auth. (Pinnacle Health Sys. Proj.) Series 2016 A, 5% 6/1/29 | | 1,255,000 | 1,304,538 |
| Delaware County Auth. Rev. Series 2017, 5% 7/1/26 | | 1,115,000 | 1,120,303 |
| Doylestown Hosp. Auth. Hosp. Rev. Series 2016 A, 5% 7/1/46 | | 785,000 | 682,611 |
| Lancaster County Hosp. Auth. Health Ctr. Rev. Series 2021, 5% 11/1/51 | | 3,110,000 | 3,225,903 |
| Lehigh County Gen. Purp. Hosp. Rev. Series 2019 A: | | | |
| 4% 7/1/37 | | 1,890,000 | 1,879,856 |
| 4% 7/1/38 | | 2,060,000 | 2,040,477 |
| 4% 7/1/39 | | 2,360,000 | 2,319,941 |
| 5% 7/1/44 | | 2,360,000 | 2,390,038 |
| Monroeville Fin. Auth. UPMC Rev. Series 2012, 5% 2/15/26 | | 1,605,000 | 1,666,771 |
| Montgomery County Higher Ed. & Health Auth. Rev.: | | | |
| Series 2014 A, 5% 10/1/23 | | 2,225,000 | 2,224,764 |
| Series 2016 A: | | | |
5% 10/1/28 | | 40,000 | 40,323 |
5% 10/1/29 | | 40,000 | 40,385 |
5% 10/1/30 | | 4,105,000 | 4,145,923 |
5% 10/1/32 | | 130,000 | 131,247 |
5% 10/1/36 | | 4,395,000 | 4,368,859 |
5% 10/1/40 | | 2,405,000 | 2,256,034 |
| Series 2019, 4% 9/1/44 | | 4,875,000 | 4,634,616 |
| Northampton County Gen. Purp. Auth. Hosp. Rev. (St. Luke's Univ. Health Network Proj.) Series 2018 A, 4% 8/15/48 | | 6,835,000 | 6,136,624 |
| Pennsylvania Ctfs. Prtn. Series 2018 A: | | | |
| 5% 7/1/35 | | 710,000 | 766,857 |
| 5% 7/1/37 | | 755,000 | 798,161 |
| 5% 7/1/38 | | 710,000 | 749,845 |
| 5% 7/1/43 | | 1,890,000 | 1,972,364 |
| Pennsylvania Higher Edl. Facilities Auth. Rev.: | | | |
| (Drexel Univ. Proj.) Series 2016, 5% 5/1/35 | | 1,495,000 | 1,551,251 |
| Series 2016: | | | |
5% 5/1/29 | | 945,000 | 985,659 |
5% 5/1/31 | | 945,000 | 984,000 |
| Pennsylvania Hsg. Fin. Agcy. Series 2023 142A: | | | |
| 4.5% 10/1/38 | | 2,075,000 | 2,100,521 |
| 5% 10/1/43 | | 1,495,000 | 1,552,515 |
| Pennsylvania Pub. School Bldg. Auth. School Rev. (The School District of The City of Harrisburg Proj.) Series 2016 A: | | | |
| 5% 12/1/29 | | 4,595,000 | 4,842,996 |
| 5% 12/1/29 (Pre-Refunded to 12/1/26 @ 100) | | 720,000 | 766,587 |
| Pennsylvania State Univ. Series 2020 A, 4% 9/1/50 | | 2,050,000 | 1,947,648 |
| Pennsylvania Tpk. Commission Tpk. Rev. Series 2021 A, 4% 12/1/50 | | 16,995,000 | 16,249,015 |
| Philadelphia Arpt. Rev. Series 2017 A: | | | |
| 5% 7/1/28 | | 470,000 | 502,707 |
| 5% 7/1/29 | | 470,000 | 500,239 |
| 5% 7/1/30 | | 520,000 | 553,012 |
| 5% 7/1/31 | | 565,000 | 601,040 |
| 5% 7/1/32 | | 520,000 | 552,872 |
| 5% 7/1/33 | | 565,000 | 599,465 |
| 5% 7/1/42 | | 2,255,000 | 2,333,470 |
| Philadelphia Auth. for Indl. Dev. Series 2017, 5% 11/1/47 | | 10,470,000 | 10,556,477 |
| Philadelphia Gas Works Rev.: | | | |
| Series 16 A, 4% 8/1/45 (Assured Guaranty Muni. Corp. Insured) | | 2,185,000 | 2,146,660 |
| Series 2015: | | | |
5% 8/1/26 | | 945,000 | 969,688 |
5% 8/1/27 | | 945,000 | 970,606 |
5% 8/1/28 | | 1,890,000 | 1,941,947 |
| Philadelphia Gen. Oblig. Series 2019 B: | | | |
| 5% 2/1/33 | | 1,510,000 | 1,672,809 |
| 5% 2/1/36 | | 1,400,000 | 1,525,427 |
| 5% 2/1/37 | | 1,810,000 | 1,961,260 |
| Philadelphia School District: | | | |
| Series 2016 F, 5% 9/1/29 | | 3,280,000 | 3,428,538 |
| Series 2018 A: | | | |
5% 9/1/34 | | 1,370,000 | 1,475,559 |
5% 9/1/35 | | 945,000 | 1,018,624 |
| Series 2018 B, 5% 9/1/43 | | 1,315,000 | 1,380,882 |
| Series 2019 A: | | | |
4% 9/1/35 | | 2,175,000 | 2,205,108 |
4% 9/1/36 | | 1,890,000 | 1,893,663 |
5% 9/1/31 | | 1,100,000 | 1,195,203 |
5% 9/1/33 | | 6,485,000 | 7,144,588 |
5% 9/1/33 (Assured Guaranty Muni. Corp. Insured) | | 1,945,000 | 2,148,490 |
| Pittsburgh & Allegheny County Parking Sys. Series 2017: | | | |
| 5% 12/15/35 | | 1,060,000 | 1,134,004 |
| 5% 12/15/37 | | 470,000 | 499,118 |
| Pittsburgh Wtr. & Swr. Auth. Wtr. & Swr. Sys. Rev. Series 2019 B, 5% 9/1/32 (Assured Guaranty Muni. Corp. Insured) | | 1,890,000 | 2,205,224 |
| Pocono Mountains Indl. Park Auth. (St. Luke's Hosp. - Monroe Proj.) Series 2015 A, 5% 8/15/40 | | 1,695,000 | 1,700,074 |
| Southcentral Pennsylvania Gen. Auth. Rev. Series 2019 A: | | | |
| 4% 6/1/44 | | 1,405,000 | 1,345,487 |
| 4% 6/1/49 | | 3,345,000 | 3,131,258 |
| 5% 6/1/44 | | 2,450,000 | 2,556,757 |
| 5% 6/1/49 | | 3,915,000 | 4,059,500 |
| State Pub. School Bldg. Auth. Lease Rev. (The School District of Philadelphia Proj.) Series 2015 A, 5% 6/1/26 | | 695,000 | 711,884 |
| Union County Hosp. Auth. Rev. Series 2018 B: | | | |
| 5% 8/1/33 | | 945,000 | 981,337 |
| 5% 8/1/38 | | 3,025,000 | 3,097,416 |
| 5% 8/1/48 | | 2,690,000 | 2,697,037 |
TOTAL PENNSYLVANIA | | | 180,318,478 |
| Puerto Rico - 1.3% | | | |
| Puerto Rico Commonwealth Aqueduct & Swr. Auth.: | | | |
| Series 2021 B: | | | |
4% 7/1/42 (e) | | 2,165,000 | 1,902,072 |
5% 7/1/33 (e) | | 1,030,000 | 1,051,548 |
5% 7/1/37 (e) | | 4,335,000 | 4,360,144 |
| Series 2022 A, 4% 7/1/42 (e) | | 2,165,000 | 1,902,072 |
| Puerto Rico Commonwealth Pub. Impt. Gen. Oblig. Series 2021 A1: | | | |
| 0% 7/1/33 | | 10,912,493 | 6,649,506 |
| 4% 7/1/33 | | 8,345,792 | 7,918,529 |
| 4% 7/1/35 | | 3,005,000 | 2,775,805 |
| 5.625% 7/1/27 | | 1,085,763 | 1,141,026 |
| 5.625% 7/1/29 | | 1,260,915 | 1,347,290 |
| Puerto Rico Sales Tax Fing. Corp. Sales Tax Rev. Series 2019 A2, 4.329% 7/1/40 | | 10,165,000 | 9,568,665 |
TOTAL PUERTO RICO | | | 38,616,657 |
| Rhode Island - 0.5% | | | |
| Rhode Island Health & Edl. Bldg. Corp. Higher Ed. Facilities Rev.: | | | |
| Series 2016 B: | | | |
5% 9/1/31 | | 4,605,000 | 4,547,250 |
5% 9/1/36 | | 185,000 | 174,486 |
| Series 2016, 5% 5/15/39 | | 3,100,000 | 3,109,633 |
| Rhode Island Hsg. & Mtg. Fin. Corp.: | | | |
| Series 2019 70, 4% 10/1/49 | | 785,000 | 778,623 |
| Series 2021 74, 3% 4/1/49 | | 5,090,000 | 4,914,854 |
| Rhode Island Hsg. & Mtg. Fin. Corp. Rev. Series 72 A, 3.5% 10/1/50 | | 1,120,000 | 1,095,804 |
TOTAL RHODE ISLAND | | | 14,620,650 |
| South Carolina - 1.9% | | | |
| Charleston County Arpt. District Series 2019: | | | |
| 5% 7/1/43 | | 1,510,000 | 1,602,438 |
| 5% 7/1/48 | | 11,330,000 | 11,934,654 |
| South Carolina Hsg. Fin. & Dev. Auth. Mtg. Rev.: | | | |
| Series 2019 A, 4% 1/1/50 | | 1,155,000 | 1,145,277 |
| Series 2022 A: | | | |
5% 1/1/29 | | 285,000 | 308,605 |
5% 7/1/29 | | 470,000 | 512,970 |
5% 1/1/30 | | 470,000 | 515,245 |
5% 7/1/30 | | 520,000 | 573,951 |
5% 1/1/31 | | 520,000 | 572,184 |
5% 7/1/31 | | 535,000 | 591,972 |
| South Carolina Jobs-Econ. Dev. Auth. Series 2019 C, 5% 7/1/32 | | 4,080,000 | 4,349,135 |
| South Carolina Pub. Svc. Auth. Rev.: | | | |
| Series 2016 B: | | | |
5% 12/1/35 | | 3,425,000 | 3,532,176 |
5% 12/1/36 | | 5,140,000 | 5,278,547 |
| Series 2016 C: | | | |
5% 12/1/24 | | 485,000 | 493,668 |
5% 12/1/25 | | 565,000 | 583,561 |
5% 12/1/26 | | 945,000 | 990,218 |
| Spartanburg County Reg'l. Health Series 2017 A: | | | |
| 4% 4/15/43 | | 9,360,000 | 8,714,418 |
| 4% 4/15/48 | | 6,530,000 | 5,885,459 |
| 5% 4/15/48 | | 8,855,000 | 9,029,772 |
TOTAL SOUTH CAROLINA | | | 56,614,250 |
| South Dakota - 0.1% | | | |
| South Dakota Health & Edl. Facilities Auth. Rev.: | | | |
| Series 2017: | | | |
5% 7/1/30 | | 805,000 | 867,461 |
5% 7/1/35 | | 685,000 | 724,611 |
| Series 2020 A, 3% 9/1/45 | | 2,245,000 | 1,725,279 |
TOTAL SOUTH DAKOTA | | | 3,317,351 |
| Tennessee - 0.7% | | | |
| Chattanooga Health Ed. & Hsg. Facility Board Rev.: | | | |
| Series 2019 A1, 4% 8/1/44 | | 1,700,000 | 1,576,620 |
| Series 2019 A2: | | | |
5% 8/1/37 | | 810,000 | 850,107 |
5% 8/1/44 | | 1,125,000 | 1,159,656 |
| Nashville and Davidson County Metropolitan Govt. Health & Edl. Facilities Board Rev. (Lipscomb Univ. Proj.) Series 2019 A: | | | |
| 4% 10/1/49 | | 2,445,000 | 1,963,277 |
| 5.25% 10/1/58 | | 7,340,000 | 7,155,120 |
| Shelby County Health Edl. & Hsg. Facilities Board Rev. (Methodist Le Bonheur Health Proj.) Series 2017 A: | | | |
| 5% 5/1/25 | | 1,225,000 | 1,254,676 |
| 5% 5/1/27 | | 1,160,000 | 1,229,712 |
| 5% 5/1/29 | | 1,170,000 | 1,237,152 |
| 5% 5/1/30 | | 2,260,000 | 2,390,792 |
| 5% 5/1/31 | | 1,190,000 | 1,258,482 |
| Tennessee Hsg. Dev. Agcy. Series 2015 A, 3.5% 7/1/45 | | 790,000 | 778,722 |
TOTAL TENNESSEE | | | 20,854,316 |
| Texas - 6.6% | | | |
| Board of Regents of The Texas A&M Univ. Sys. Permanent Univ. Fund Series 2023, 5% 7/1/38 | | 4,245,000 | 4,817,470 |
| Bryan Tex For Previous Issuess Series 2020, 2.125% 8/15/34 | | 740,000 | 623,679 |
| Central Reg'l. Mobility Auth.: | | | |
| Series 2020 A, 5% 1/1/49 | | 3,720,000 | 3,860,911 |
| Series 2020 B, 5% 1/1/45 | | 1,650,000 | 1,721,412 |
| Collin County Series 2022, 4% 2/15/39 | | 1,275,000 | 1,287,258 |
| Coppell Tex Series 2020, 1.375% 2/1/35 | | 1,470,000 | 1,095,849 |
| Dallas Area Rapid Transit Sales Tax Rev. Series 2020 A, 5% 12/1/45 | | 1,355,000 | 1,453,461 |
| Dallas Fort Worth Int'l. Arpt. Rev.: | | | |
| Series 2020 B: | | | |
4% 11/1/34 | | 3,220,000 | 3,343,445 |
4% 11/1/35 | | 2,860,000 | 2,942,617 |
| Series 2021 B, 5% 11/1/43 | | 2,325,000 | 2,499,766 |
| Garland Elec. Util. Sys. Rev. Series 2021 A: | | | |
| 4% 3/1/46 | | 1,700,000 | 1,608,338 |
| 4% 3/1/51 | | 2,125,000 | 1,956,556 |
| Grand Parkway Trans. Corp.: | | | |
| Series 2018 A: | | | |
5% 10/1/36 | | 4,720,000 | 5,082,698 |
5% 10/1/37 | | 9,440,000 | 10,113,812 |
5% 10/1/43 | | 5,195,000 | 5,474,184 |
| Series 2020 C, 4% 10/1/49 | | 2,740,000 | 2,628,224 |
| Greenville Gen. Oblig. Series 2021, 2% 2/15/33 | | 1,055,000 | 878,045 |
| Harris County Toll Road Rev. (Harris County Toll Road Auth. Proj.) Series 2018 A, 5% 8/15/33 | | 1,890,000 | 2,046,951 |
| Houston Arpt. Sys. Rev. Series 2018 D: | | | |
| 5% 7/1/29 | | 1,795,000 | 1,960,775 |
| 5% 7/1/30 | | 2,360,000 | 2,578,792 |
| 5% 7/1/31 | | 2,125,000 | 2,312,674 |
| 5% 7/1/32 | | 1,890,000 | 2,051,069 |
| 5% 7/1/39 | | 6,685,000 | 7,057,692 |
| Houston Util. Sys. Rev. Series 2016 B, 5% 11/15/33 | | 1,320,000 | 1,391,070 |
| Irving Hosp. Auth. Hosp. Rev. Series 2017 A: | | | |
| 5% 10/15/33 | | 995,000 | 1,027,751 |
| 5% 10/15/34 | | 1,575,000 | 1,624,250 |
| 5% 10/15/35 | | 1,145,000 | 1,176,519 |
| 5% 10/15/44 | | 790,000 | 790,604 |
| Lower Colorado River Auth. Rev.: | | | |
| (LCRA Transmission Svcs. Corp. Proj.) Series 2018: | | | |
5% 5/15/33 | | 4,260,000 | 4,634,425 |
5% 5/15/35 | | 2,005,000 | 2,168,212 |
| Series 2015 B: | | | |
5% 5/15/30 | | 4,250,000 | 4,374,744 |
5% 5/15/31 | | 6,800,000 | 6,994,853 |
| Mansfield Tex Series 2020: | | | |
| 2.125% 2/15/34 | | 1,355,000 | 1,173,745 |
| 2.375% 2/15/36 | | 850,000 | 724,804 |
| New Hope Cultural Ed. Facilities Fin. Corp. (Childrens Med. Ctr. of Dallas) Series 2017 A: | | | |
| 5% 8/15/28 | | 1,415,000 | 1,516,919 |
| 5% 8/15/47 | | 1,140,000 | 1,168,216 |
| Newark Higher Ed. Fin. Corp. (Abilene Christian Univ. Proj.) Series 2016 A, 5% 4/1/29 | | 1,985,000 | 2,068,198 |
| North Texas Tollway Auth. Rev.: | | | |
| (Sr. Lien Proj.) Series 2017 A: | | | |
5% 1/1/30 | | 1,345,000 | 1,408,411 |
5% 1/1/34 | | 945,000 | 998,858 |
5% 1/1/35 | | 1,225,000 | 1,291,351 |
5% 1/1/36 | | 1,135,000 | 1,191,638 |
5% 1/1/37 | | 4,440,000 | 4,641,555 |
| (Sub Lien Proj.) Series 2017 B: | | | |
5% 1/1/30 | | 250,000 | 261,786 |
5% 1/1/31 | | 350,000 | 366,227 |
5% 1/1/33 | | 1,415,000 | 1,498,114 |
| Series 2014, 5% 1/1/24 | | 170,000 | 171,114 |
| Series 2015 A, 5% 1/1/32 | | 1,465,000 | 1,492,434 |
| Series 2016 A: | | | |
5% 1/1/32 | | 2,830,000 | 2,957,616 |
5% 1/1/39 | | 945,000 | 971,846 |
| Series 2018, 0% 1/1/29 (Assured Guaranty Corp. Insured) | | 14,265,000 | 11,868,952 |
| Series 2021 B, 3% 1/1/46 | | 4,000,000 | 3,066,998 |
| Plano Gen. Oblig. Series 2018, 3.37% 9/1/37 | | 900,000 | 830,374 |
| Prosper Independent School District Series 2021 A, 3% 2/15/37 | | 1,585,000 | 1,420,125 |
| San Antonio Elec. & Gas Sys. Rev. Series 2017: | | | |
| 5% 2/1/32 | | 1,180,000 | 1,273,890 |
| 5% 2/1/34 | | 1,415,000 | 1,523,822 |
| San Antonio Independent School District Series 2016, 5% 8/15/31 | | 1,900,000 | 2,009,881 |
| Southwest Higher Ed. Auth. Rev. (Southern Methodist Univ., TX. Proj.) Series 2017: | | | |
| 5% 10/1/32 | | 710,000 | 759,187 |
| 5% 10/1/41 | | 1,415,000 | 1,486,318 |
| Tarrant County Cultural Ed. Facilities Fin. Corp. Hosp. Rev. Series 2015, 5% 9/1/30 | | 4,720,000 | 4,801,045 |
| Tarrant County Cultural Ed. Facilities Fin. Corp. Rev.: | | | |
| Series 2016 A, 5% 2/15/41 | | 7,620,000 | 7,841,854 |
| Series 2018 B, 5% 7/1/43 | | 1,320,000 | 1,371,742 |
| Texas Dept. of Hsg. & Cmnty. Affairs Multi-family Hsg. Rev. Series 2019, 2.95% 7/1/36 | | 3,462,176 | 3,102,886 |
| Texas Dept. of Hsg. & Cmnty. Affairs Single Family Mtg. Rev.: | | | |
| Series 2019 A, 4% 3/1/50 | | 2,565,000 | 2,544,574 |
| Series A, 3.5% 3/1/51 | | 2,430,000 | 2,370,783 |
| Texas Private Activity Bond Surface Trans. Corp. (LBJ Infrastructure Group LLC I-635 Managed Lanes Proj.) Series 2020 A: | | | |
| 4% 12/31/36 | | 1,920,000 | 1,845,639 |
| 4% 6/30/37 | | 2,830,000 | 2,698,713 |
| 4% 12/31/37 | | 3,775,000 | 3,579,271 |
| 4% 12/31/38 | | 2,125,000 | 2,004,290 |
| Texas State Univ. Sys. Fing. Rev.: | | | |
| Series 2017 A, 5% 3/15/31 | | 1,890,000 | 2,015,842 |
| Series 2019 A: | | | |
4% 3/15/34 | | 2,125,000 | 2,192,495 |
4% 3/15/35 | | 1,890,000 | 1,936,978 |
| Texas Wtr. Dev. Board Rev.: | | | |
| Series 2018 B, 5% 4/15/49 | | 1,765,000 | 1,859,189 |
| Series 2021, 2.5% 10/15/39 | | 2,000,000 | 1,602,869 |
| Univ. of Houston Univ. Revs. Series 2017 A, 5% 2/15/33 | | 3,305,000 | 3,435,462 |
| Univ. of Texas Permanent Univ. Fund Rev.: | | | |
| Series 2016 B, 5% 7/1/29 | | 885,000 | 929,678 |
| Series 2023 A, 5% 7/1/40 | | 1,880,000 | 2,123,842 |
| Waco Gen. Oblig. Series 2020: | | | |
| 2.125% 2/1/35 | | 1,230,000 | 1,044,148 |
| 2.25% 2/1/36 | | 1,610,000 | 1,350,665 |
TOTAL TEXAS | | | 192,372,450 |
| Utah - 1.2% | | | |
| Salt Lake City Arpt. Rev.: | | | |
| Series 2017 B: | | | |
5% 7/1/34 | | 1,550,000 | 1,642,796 |
5% 7/1/35 | | 1,415,000 | 1,494,699 |
5% 7/1/36 | | 1,415,000 | 1,487,308 |
5% 7/1/37 | | 945,000 | 988,630 |
| Series 2021 B: | | | |
5% 7/1/46 | | 5,225,000 | 5,609,440 |
5% 7/1/51 | | 21,060,000 | 22,355,685 |
| Weber School District Utah (Utah School District Bond Guaranty Prog.) Series 2019, 2.375% 6/15/36 | | 730,000 | 609,223 |
TOTAL UTAH | | | 34,187,781 |
| Vermont - 0.2% | | | |
| Vermont Edl. & Health Bldg. Fin. Agcy. Rev. (Champlain College Proj.) Series 2016 A: | | | |
| 5% 10/15/41 | | 2,265,000 | 2,175,353 |
| 5% 10/15/46 | | 2,645,000 | 2,466,197 |
TOTAL VERMONT | | | 4,641,550 |
| Virginia - 1.5% | | | |
| Chesapeake Gen. Oblig. Series 2020 A: | | | |
| 5% 8/1/34 | | 1,120,000 | 1,286,480 |
| 5% 8/1/35 | | 1,230,000 | 1,403,510 |
| Fredericksburg Econ. Dev. Auth. Rev. Series 2014, 5% 6/15/26 | | 1,850,000 | 1,866,066 |
| Lynchburg Econ. Dev. Series 2021, 3% 1/1/51 | | 2,010,000 | 1,416,278 |
| Stafford County Econ. Dev. Auth. Hosp. Facilities Rev.: | | | |
| (Mary Washington Hosp. Proj.) Series 2016, 3% 6/15/29 | | 350,000 | 340,000 |
| Series 2016: | | | |
4% 6/15/37 | | 325,000 | 316,369 |
5% 6/15/28 | | 945,000 | 983,833 |
5% 6/15/33 | | 210,000 | 218,032 |
5% 6/15/36 | | 945,000 | 971,829 |
| Virginia College Bldg. Auth. Edl. Facilities Rev.: | | | |
| (21St Century Collage and Equip. Programs) Series 2021 A, 4% 2/1/35 | | 16,100,000 | 16,855,976 |
| (21st Century College and Equip. Programs): | | | |
Series 2023 A, 5% 2/1/37 | | 2,750,000 | 3,163,421 |
Series 2023 B, 5% 2/1/34 | | 6,750,000 | 7,976,966 |
| Virginia Commonwealth Trans. Board Rev. (Virginia Gen. Oblig. Proj.) Series 2017 A: | | | |
| 5% 5/15/32 | | 450,000 | 488,504 |
| 5% 5/15/33 | | 1,890,000 | 2,050,937 |
| Virginia St Pub. School Auth. Spl. O Series 2023, 5% 8/1/38 | | 2,810,000 | 3,254,113 |
| Winchester Econ. Dev. Auth. Series 2015, 5% 1/1/44 | | 2,360,000 | 2,392,554 |
TOTAL VIRGINIA | | | 44,984,868 |
| Washington - 3.0% | | | |
| Chelan County Pub. Util. District #1 Columbia River-Rock Island Hydro-Elec. Sys. Rev. Series A, 0% 6/1/28 (Nat'l. Pub. Fin. Guarantee Corp. Insured) | | 1,395,000 | 1,192,978 |
| King County Gen. Oblig. Series 2021 A, 2% 1/1/37 | | 535,000 | 411,575 |
| Pierce County Gen. Oblig. Series 2019 A, 2.35% 7/1/33 | | 3,795,000 | 3,381,259 |
| Port of Seattle Rev. Series 2016: | | | |
| 5% 2/1/25 | | 1,180,000 | 1,207,562 |
| 5% 2/1/28 | | 1,890,000 | 1,971,955 |
| Tacoma Elec. Sys. Rev. Series 2017: | | | |
| 5% 1/1/37 | | 945,000 | 989,774 |
| 5% 1/1/38 | | 945,000 | 989,154 |
| Washington Convention Ctr. Pub. Facilities Series 2021, 4% 7/1/31 | | 11,755,000 | 11,321,101 |
| Washington Gen. Oblig.: | | | |
| Series 2015 C, 5% 2/1/34 | | 905,000 | 927,471 |
| Series 2017 D, 5% 2/1/33 | | 1,985,000 | 2,114,287 |
| Series 2021 A, 5% 6/1/35 | | 4,000,000 | 4,520,044 |
| Series R-2017 A: | | | |
5% 8/1/28 | | 890,000 | 938,882 |
5% 8/1/30 | | 890,000 | 939,144 |
| Washington Health Care Facilities Auth. Rev.: | | | |
| (Overlake Hosp. Med. Ctr., WA. Proj.) Series 2017 B: | | | |
5% 7/1/29 | | 380,000 | 383,038 |
5% 7/1/31 | | 810,000 | 817,611 |
5% 7/1/34 | | 2,495,000 | 2,512,148 |
5% 7/1/35 | | 2,220,000 | 2,226,139 |
5% 7/1/36 | | 2,125,000 | 2,121,301 |
5% 7/1/42 | | 8,705,000 | 8,579,974 |
| (Providence Health Systems Proj.) Series 2018 B: | | | |
5% 10/1/30 | | 1,135,000 | 1,203,432 |
5% 10/1/31 | | 1,415,000 | 1,497,080 |
5% 10/1/32 | | 975,000 | 1,028,490 |
5% 10/1/33 | | 2,360,000 | 2,487,906 |
| (Virginia Mason Med. Ctr. Proj.) Series 2017: | | | |
5% 8/15/29 | | 2,125,000 | 2,221,984 |
5% 8/15/30 | | 945,000 | 988,988 |
| Series 2017 B, 4% 8/15/41 | | 6,845,000 | 6,407,470 |
| Series 2019 A1: | | | |
5% 8/1/34 | | 1,790,000 | 1,917,317 |
5% 8/1/37 | | 945,000 | 991,792 |
| Series 2019 A2: | | | |
5% 8/1/35 | | 2,695,000 | 2,868,691 |
5% 8/1/39 | | 1,055,000 | 1,099,534 |
| Series 2020, 5% 9/1/55 | | 9,515,000 | 9,899,622 |
| Washington Higher Ed. Facilities Auth. Rev.: | | | |
| (Gonzaga Univ. Proj.) Series 2019 A, 3% 4/1/49 | | 3,245,000 | 2,430,464 |
| (Whitworth Univ. Proj.) Series 2016 A: | | | |
5% 10/1/34 | | 1,510,000 | 1,552,656 |
5% 10/1/35 | | 945,000 | 969,040 |
5% 10/1/40 | | 1,535,000 | 1,550,804 |
| Washington Hsg. Fin. Commission Nonprofit Hsg. Rev. (Judson Park Proj.) Series 2018: | | | |
| 4% 7/1/28 (e) | | 100,000 | 92,073 |
| 5% 7/1/33 (e) | | 325,000 | 298,678 |
| 5% 7/1/38 (e) | | 100,000 | 86,755 |
| 5% 7/1/48 (e) | | 300,000 | 241,060 |
TOTAL WASHINGTON | | | 87,379,233 |
| West Virginia - 0.1% | | | |
| West Virginia Hosp. Fin. Auth. Hosp. Rev. Series 2018 A, 5% 1/1/33 | | 1,735,000 | 1,789,642 |
| Wisconsin - 1.9% | | | |
| Blue Ridge Healthcare Pub. Fin. Auth. Series 2020 A, 4% 1/1/45 | | 1,415,000 | 1,329,111 |
| Howard Suamico Scd Series 2021, 2% 3/1/38 | | 1,165,000 | 875,063 |
| Kohler Wis School District Series 2021, 2% 3/1/38 | | 620,000 | 459,411 |
| Mauston School District Series 2021, 1.8% 3/1/37 | | 2,840,000 | 2,021,934 |
| Pub. Fin. Auth. Edl. Facilities Series 2018 A: | | | |
| 5.25% 10/1/43 | | 575,000 | 567,034 |
| 5.25% 10/1/48 | | 575,000 | 554,905 |
| Pub. Fin. Auth. Hosp. Rev.: | | | |
| Series 2019 A, 5% 10/1/44 | | 5,820,000 | 6,001,932 |
| Series 2020 A, 3% 6/1/45 | | 3,000,000 | 2,233,184 |
| Pub. Fin. Auth. Sr. Living Rev. (Mary's Woods At Marylhurst, Inc. Proj.) Series 2017 A: | | | |
| 5% 5/15/25 (e) | | 500,000 | 497,016 |
| 5% 5/15/28 (e) | | 550,000 | 539,650 |
| 5.25% 5/15/37 (e) | | 180,000 | 170,511 |
| 5.25% 5/15/42 (e) | | 220,000 | 200,153 |
| 5.25% 5/15/47 (e) | | 220,000 | 193,414 |
| 5.25% 5/15/52 (e) | | 410,000 | 354,055 |
| Pub. Fin. Auth. Wisconsin Retirement Facility Rev. Series 2018: | | | |
| 5% 10/1/43 (e) | | 485,000 | 429,186 |
| 5% 10/1/48 (e) | | 625,000 | 534,239 |
| 5% 10/1/53 (e) | | 1,615,000 | 1,348,022 |
| Roseman Univ. of Health: | | | |
| Series 2020: | | | |
5% 4/1/50 (e) | | 985,000 | 913,861 |
5% 4/1/50 (Pre-Refunded to 4/1/30 @ 100) (e) | | 100,000 | 113,191 |
| Series 2021 A: | | | |
3% 7/1/50 | | 1,740,000 | 1,243,916 |
4.5% 6/1/56 (e) | | 12,205,000 | 9,131,116 |
| Series 2021 B, 6.5% 6/1/56 (e) | | 3,990,000 | 3,247,761 |
| Westosha Cent High School District Series 2021: | | | |
| 1.75% 3/1/34 | | 1,850,000 | 1,496,641 |
| 2% 3/1/41 | | 1,575,000 | 1,092,194 |
| Wisconsin Health & Edl. Facilities: | | | |
| Series 2014: | | | |
4% 5/1/33 | | 1,395,000 | 1,397,452 |
5% 5/1/25 | | 730,000 | 736,058 |
| Series 2015, 5% 12/15/44 | | 7,315,000 | 7,353,027 |
| Series 2017 A: | | | |
5% 9/1/30 (Pre-Refunded to 9/1/27 @ 100) | | 1,200,000 | 1,291,431 |
5% 9/1/32 (Pre-Refunded to 9/1/27 @ 100) �� | | 1,040,000 | 1,119,240 |
| Series 2019 A, 5% 11/1/39 | | 3,975,000 | 3,406,740 |
| Series 2019 B1, 2.825% 11/1/28 | | 1,125,000 | 997,419 |
| Series 2019 B2, 2.55% 11/1/27 | | 215,000 | 201,963 |
| Wisconsin Health & Edl. Facilities Auth. Rev. Series 2012, 5% 6/1/39 | | 1,125,000 | 1,115,634 |
| Wisconsin Rapids School District Series 2021, 2% 4/1/36 | | 1,110,000 | 868,280 |
TOTAL WISCONSIN | | | 54,034,744 |
| TOTAL MUNICIPAL BONDS (Cost $2,941,682,795) | | | 2,820,108,956 |
| | | | |
| Money Market Funds - 2.3% |
| | | Shares | Value ($) |
Fidelity Tax-Free Cash Central Fund 4.28% (h)(i) (Cost $68,080,704) | | 68,060,479 | 68,087,715 |
| | | | |
| TOTAL INVESTMENT IN SECURITIES - 99.2% (Cost $3,009,763,499) | 2,888,196,671 |
NET OTHER ASSETS (LIABILITIES) - 0.8% | 23,938,163 |
| NET ASSETS - 100.0% | 2,912,134,834 |
| | |
Legend
| (a) | Amount is stated in United States dollars unless otherwise noted. |
| (b) | Coupon rates for floating and adjustable rate securities reflect the rates in effect at period end. |
| (c) | Coupon is indexed to a floating interest rate which may be multiplied by a specified factor and/or subject to caps or floors. |
| (e) | Security exempt from registration under Rule 144A of the Securities Act of 1933. These securities may be resold in transactions exempt from registration, normally to qualified institutional buyers. At the end of the period, the value of these securities amounted to $49,976,145 or 1.7% of net assets. |
| (f) | Security initially issued in zero coupon form which converts to coupon form at a specified rate and date. The rate shown is the rate at period end. |
| (g) | Security or a portion of the security purchased on a delayed delivery or when-issued basis. |
| (h) | Information in this report regarding holdings by state and security types does not reflect the holdings of the Fidelity Tax-Free Cash Central Fund. |
| (i) | Affiliated fund that is generally available only to investment companies and other accounts managed by Fidelity Investments. The rate quoted is the annualized seven-day yield of the fund at period end. A complete unaudited listing of the fund's holdings as of its most recent quarter end is available upon request. In addition, each Fidelity Central Fund's financial statements are available on the SEC's website or upon request. |
Affiliated Central Funds
Fiscal year to date information regarding the Fund's investments in Fidelity Central Funds, including the ownership percentage, is presented below.
| Affiliate | Value, beginning of period ($) | Purchases ($) | Sales Proceeds ($) | Dividend Income ($) | Realized Gain (loss) ($) | Change in Unrealized appreciation (depreciation) ($) | Value, end of period ($) | % ownership, end of period |
| Fidelity Tax-Free Cash Central Fund 4.28% | 93,599,434 | 121,306,988 | 146,829,600 | 1,565,306 | 4,663 | 6,230 | 68,087,715 | 6.5% |
| Total | 93,599,434 | 121,306,988 | 146,829,600 | 1,565,306 | 4,663 | 6,230 | 68,087,715 | |
| | | | | | | | | |
Amounts in the dividend income column in the above table include any capital gain distributions from underlying funds, which are presented in the corresponding line item in the Statement of Operations, if applicable.
Amounts included in the purchases and sales proceeds columns may include in-kind transactions, if applicable.
Investment Valuation
The following is a summary of the inputs used, as of July 31, 2023, involving the Fund's assets and liabilities carried at fair value. The inputs or methodology used for valuing securities may not be an indication of the risk associated with investing in those securities. For more information on valuation inputs, and their aggregation into the levels used below, please refer to the Investment Valuation section in the accompanying Notes to Financial Statements.
| Valuation Inputs at Reporting Date: |
| Description | Total ($) | Level 1 ($) | Level 2 ($) | Level 3 ($) |
Investments in Securities: | | | | |
|
| Municipal Securities | 2,820,108,956 | - | 2,818,923,956 | 1,185,000 |
|
| Money Market Funds | 68,087,715 | 68,087,715 | - | - |
| Total Investments in Securities: | 2,888,196,671 | 68,087,715 | 2,818,923,956 | 1,185,000 |
| Statement of Assets and Liabilities |
| | | | July 31, 2023 (Unaudited) |
| | | | | |
| Assets | | | | |
| Investment in securities, at value - See accompanying schedule: | | | | |
Unaffiliated issuers (cost $2,941,682,795) | $ | 2,820,108,956 | | |
Fidelity Central Funds (cost $68,080,704) | | 68,087,715 | | |
| | | | | |
| | | | | |
| Total Investment in Securities (cost $3,009,763,499) | | | $ | 2,888,196,671 |
| Cash | | | | 99,784 |
| Receivable for investments sold | | | | |
Regular delivery | | | | 9,123 |
Delayed delivery | | | | 3,151,997 |
| Receivable for fund shares sold | | | | 3,788,941 |
| Interest receivable | | | | 28,825,170 |
| Distributions receivable from Fidelity Central Funds | | | | 180,085 |
| Prepaid expenses | | | | 2,005 |
| Receivable from investment adviser for expense reductions | | | | 488,936 |
| Other receivables | | | | 359 |
Total assets | | | | 2,924,743,071 |
| Liabilities | | | | |
| Payable for investments purchased | | | | |
Regular delivery | $ | 680,040 | | |
Delayed delivery | | 5,281,030 | | |
| Payable for fund shares redeemed | | 2,609,678 | | |
| Distributions payable | | 2,904,999 | | |
| Accrued management fee | | 834,755 | | |
| Other affiliated payables | | 258,757 | | |
| Other payables and accrued expenses | | 38,978 | | |
| Total Liabilities | | | | 12,608,237 |
| Net Assets | | | $ | 2,912,134,834 |
| Net Assets consist of: | | | | |
| Paid in capital | | | $ | 3,081,009,696 |
| Total accumulated earnings (loss) | | | | (168,874,862) |
| Net Assets | | | $ | 2,912,134,834 |
Net Asset Value, offering price and redemption price per share ($2,912,134,834 ÷ 268,904,110 shares) | | | $ | 10.83 |
| Statement of Operations |
| | | | Six months ended July 31, 2023 (Unaudited) |
| Investment Income | | | | |
| Interest | | | $ | 44,554,051 |
| Income from Fidelity Central Funds | | | | 1,565,306 |
| Total Income | | | | 46,119,357 |
| Expenses | | | | |
| Management fee | $ | 4,980,536 | | |
| Transfer agent fees | | 1,302,276 | | |
| Accounting fees and expenses | | 249,799 | | |
| Custodian fees and expenses | | 14,112 | | |
| Independent trustees' fees and expenses | | 4,855 | | |
| Registration fees | | 83,007 | | |
| Audit | | 32,961 | | |
| Legal | | 6,546 | | |
| Miscellaneous | | 8,170 | | |
| Total expenses before reductions | | 6,682,262 | | |
| Expense reductions | | (3,165,780) | | |
| Total expenses after reductions | | | | 3,516,482 |
| Net Investment income (loss) | | | | 42,602,875 |
| Realized and Unrealized Gain (Loss) | | | | |
| Net realized gain (loss) on: | | | | |
| Investment Securities: | | | | |
| Unaffiliated issuers | | (1,979,011) | | |
| Fidelity Central Funds | | 4,663 | | |
| Total net realized gain (loss) | | | | (1,974,348) |
| Change in net unrealized appreciation (depreciation) on: | | | | |
| Investment Securities: | | | | |
| Unaffiliated issuers | | (32,484,212) | | |
| Fidelity Central Funds | | 6,230 | | |
| Total change in net unrealized appreciation (depreciation) | | | | (32,477,982) |
| Net gain (loss) | | | | (34,452,330) |
| Net increase (decrease) in net assets resulting from operations | | | $ | 8,150,545 |
| Statement of Changes in Net Assets |
| |
| | Six months ended July 31, 2023 (Unaudited) | | Year ended January 31, 2023 |
| Increase (Decrease) in Net Assets | | | | |
| Operations | | | | |
| Net investment income (loss) | $ | 42,602,875 | $ | 90,309,171 |
| Net realized gain (loss) | | (1,974,348) | | (56,391,120) |
| Change in net unrealized appreciation (depreciation) | | (32,477,982) | | (252,367,742) |
| Net increase (decrease) in net assets resulting from operations | | 8,150,545 | | (218,449,691) |
| Distributions to shareholders | | (42,047,310) | | (90,744,332) |
| | | | | |
| Share transactions | | | | |
| Proceeds from sales of shares | | 312,451,048 | | 1,285,693,354 |
| Reinvestment of distributions | | 25,198,551 | | 50,620,037 |
| Cost of shares redeemed | | (268,994,445) | | (2,668,009,654) |
| | | | | |
Net increase (decrease) in net assets resulting from share transactions | | 68,655,154 | | (1,331,696,263) |
| Total increase (decrease) in net assets | | 34,758,389 | | (1,640,890,286) |
| | | | | |
| Net Assets | | | | |
| Beginning of period | | 2,877,376,445 | | 4,518,266,731 |
| End of period | $ | 2,912,134,834 | $ | 2,877,376,445 |
| | | | | |
| Other Information | | | | |
| Shares | | | | |
| Sold | | 28,857,048 | | 118,888,176 |
| Issued in reinvestment of distributions | | 2,332,590 | | 4,670,605 |
| Redeemed | | (24,892,337) | | (244,286,870) |
| Net increase (decrease) | | 6,297,301 | | (120,728,089) |
| | | | | |
| Fidelity® Tax-Free Bond Fund |
| |
| | Six months ended (Unaudited) July 31, 2023 | | Years ended January 31, 2023 | | 2022 | | 2021 | | 2020 | | 2019 |
Selected Per-Share Data | | | | | | | | | | | | |
| Net asset value, beginning of period | $ | 10.96 | $ | 11.79 | $ | 12.25 | $ | 12.13 | $ | 11.37 | $ | 11.39 |
| Income from Investment Operations | | | | | | | | | | | | |
Net investment income (loss) A,B | | .161 | | .304 | | .291 | | .312 | | .337 | | .340 |
| Net realized and unrealized gain (loss) | | (.133) | | (.828) | | (.427) | | .152 | | .772 | | .003 |
| Total from investment operations | | .028 | | (.524) | | (.136) | | .464 | | 1.109 | | .343 |
| Distributions from net investment income | | (.158) | | (.304) | | (.291) | | (.312) | | (.337) | | (.340) |
| Distributions from net realized gain | | - | | (.002) | | (.033) | | (.032) | | (.012) | | (.023) |
| Total distributions | | (.158) | | (.306) | | (.324) | | (.344) | | (.349) | | (.363) |
| Net asset value, end of period | $ | 10.83 | $ | 10.96 | $ | 11.79 | $ | 12.25 | $ | 12.13 | $ | 11.37 |
Total Return C,D | | .27% | | (4.38)% | | (1.16)% | | 3.94% | | 9.87% | | 3.09% |
Ratios to Average Net Assets B,E,F | | | | | | | | | | | | |
| Expenses before reductions | | .47% G | | .46% | | .46% | | .46% | | .46% | | .46% |
| Expenses net of fee waivers, if any | | .25% G | | .25% | | .25% | | .25% | | .25% | | .25% |
| Expenses net of all reductions | | .25% G | | .25% | | .25% | | .25% | | .25% | | .25% |
| Net investment income (loss) | | 2.99% G | | 2.78% | | 2.39% | | 2.62% | | 2.86% | | 3.02% |
| Supplemental Data | | | | | | | | | | | | |
| Net assets, end of period (000 omitted) | $ | 2,912,135 | $ | 2,877,376 | $ | 4,518,267 | $ | 4,474,910 | $ | 4,458,835 | $ | 3,611,503 |
Portfolio turnover rate H | | 3% G | | 11% I | | 8% | | 19% | | 8% | | 23% |
ACalculated based on average shares outstanding during the period.
BNet investment income (loss) is affected by the timing of the declaration of dividends by any underlying mutual funds or exchange-traded funds (ETFs). Net investment income (loss) of any mutual funds or ETFs is not included in the Fund's net investment income (loss) ratio.
CTotal returns for periods of less than one year are not annualized.
DTotal returns would have been lower if certain expenses had not been reduced during the applicable periods shown.
EFees and expenses of any underlying mutual funds or exchange-traded funds (ETFs) are not included in the Fund's expense ratio. The Fund indirectly bears its proportionate share of these expenses. For additional expense information related to investments in Fidelity Central Funds, please refer to the "Investments in Fidelity Central Funds" note found in the Notes to Financial Statements section of the most recent Annual or Semi-Annual report.
FExpense ratios reflect operating expenses of the class. Expenses before reductions do not reflect amounts reimbursed, waived, or reduced through arrangements with the investment adviser, brokerage services, or other offset arrangements, if applicable, and do not represent the amount paid by the class during periods when reimbursements, waivers or reductions occur.
GAnnualized.
HAmount does not include the portfolio activity of any underlying mutual funds or exchange-traded funds (ETFs).
IPortfolio turnover rate excludes securities received or delivered in-kind.
For the period ended July 31, 2023
1. Organization.
Fidelity Tax-Free Bond Fund (the Fund) is a fund of Fidelity Salem Street Trust (the Trust) and is authorized to issue an unlimited number of shares. Share transactions on the Statement of Changes in Net Assets may contain exchanges between affiliated funds. The Trust is registered under the Investment Company Act of 1940, as amended (the 1940 Act), as an open-end management investment company organized as a Massachusetts business trust.
2. Investments in Fidelity Central Funds.
Funds may invest in Fidelity Central Funds, which are open-end investment companies generally available only to other investment companies and accounts managed by the investment adviser and its affiliates. The Schedule of Investments lists any Fidelity Central Funds held as an investment as of period end, but does not include the underlying holdings of each Fidelity Central Fund. An investing fund indirectly bears its proportionate share of the expenses of the underlying Fidelity Central Funds.
Based on its investment objective, each Fidelity Central Fund may invest or participate in various investment vehicles or strategies that are similar to those of the investing fund. These strategies are consistent with the investment objectives of the investing fund and may involve certain economic risks which may cause a decline in value of each of the Fidelity Central Funds and thus a decline in the value of the investing fund.
| Fidelity Central Fund | Investment Manager | Investment Objective | Investment Practices | Expense RatioA |
| Fidelity Money Market Central Funds | Fidelity Management & Research Company LLC (FMR) | Each fund seeks to obtain a high level of current income consistent with the preservation of capital and liquidity. | Short-term Investments | Less than .005% |
A Expenses expressed as a percentage of average net assets and are as of each underlying Central Fund's most recent annual or semi-annual shareholder report.
A complete unaudited list of holdings for each Fidelity Central Fund is available upon request or at the Securities and Exchange Commission website at www.sec.gov. In addition, the financial statements of the Fidelity Central Funds which contain the significant accounting policies (including investment valuation policies) of those funds, and are not covered by the Report of Independent Registered Public Accounting Firm, are available on the Securities and Exchange Commission website or upon request.
3. Significant Accounting Policies.
The Fund is an investment company and applies the accounting and reporting guidance of the Financial Accounting Standards Board (FASB) Accounting Standards Codification Topic 946 Financial Services - Investment Companies. The financial statements have been prepared in conformity with accounting principles generally accepted in the United States of America (GAAP), which require management to make certain estimates and assumptions at the date of the financial statements. Actual results could differ from those estimates. Subsequent events, if any, through the date that the financial statements were issued have been evaluated in the preparation of the financial statements. The Fund's Schedule of Investments lists any underlying mutual funds or exchange-traded funds (ETFs) but does not include the underlying holdings of these funds. The following summarizes the significant accounting policies of the Fund:
Investment Valuation. Investments are valued as of 4:00 p.m. Eastern time on the last calendar day of the period. The Board of Trustees (the Board) has designated the Fund's investment adviser as the valuation designee responsible for the fair valuation function and performing fair value determinations as needed. The investment adviser has established a Fair Value Committee (the Committee) to carry out the day-to-day fair valuation responsibilities and has adopted policies and procedures to govern the fair valuation process and the activities of the Committee. In accordance with these fair valuation policies and procedures, which have been approved by the Board, the Fund attempts to obtain prices from one or more third party pricing services or brokers to value its investments. When current market prices, quotations or currency exchange rates are not readily available or reliable, investments will be fair valued in good faith by the Committee, in accordance with the policies and procedures. Factors used in determining fair value vary by investment type and may include market or investment specific events, transaction data, estimated cash flows, and market observations of comparable investments. The frequency that the fair valuation procedures are used cannot be predicted and they may be utilized to a significant extent. The Committee manages the Fund's fair valuation practices and maintains the fair valuation policies and procedures. The Fund's investment adviser reports to the Board information regarding the fair valuation process and related material matters.
The Fund categorizes the inputs to valuation techniques used to value its investments into a disclosure hierarchy consisting of three levels as shown below:
Level 1 - unadjusted quoted prices in active markets for identical investments
Level 2 - other significant observable inputs (including quoted prices for similar investments, interest rates, prepayment speeds, etc.)
Level 3 - unobservable inputs (including the Fund's own assumptions based on the best information available)
Valuation techniques used to value the Fund's investments by major category are as follows:
Debt securities, including restricted securities, are valued based on evaluated prices received from third party pricing services or from brokers who make markets in such securities. Municipal securities are valued by pricing services who utilize matrix pricing which considers prepayment speed assumptions, attributes of the collateral, yield or price of bonds of comparable quality, coupon, maturity and type or by broker-supplied prices. When independent prices are unavailable or unreliable, debt securities may be valued utilizing pricing methodologies which consider similar factors that would be used by third party pricing services. Debt securities are generally categorized as Level 2 in the hierarchy but may be Level 3 depending on the circumstances.
Investments in open-end mutual funds, including the Fidelity Central Funds, are valued at their closing net asset value (NAV) each business day and are categorized as Level 1 in the hierarchy.
Changes in valuation techniques may result in transfers in or out of an assigned level within the disclosure hierarchy. The aggregate value of investments by input level as of July 31, 2023 is included at the end of the Fund's Schedule of Investments.
Investment Transactions and Income. For financial reporting purposes, the Fund's investment holdings and NAV include trades executed through the end of the last business day of the period. The NAV per share for processing shareholder transactions is calculated as of the close of business of the New York Stock Exchange (NYSE), normally 4:00 p.m. Eastern time and includes trades executed through the end of the prior business day. Gains and losses on securities sold are determined on the basis of identified cost. Income and capital gain distributions from Fidelity Central Funds, if any, are recorded on the ex-dividend date. Interest income is accrued as earned and includes coupon interest and amortization of premium and accretion of discount on debt securities as applicable. Debt obligations may be placed on non-accrual status and related interest income may be reduced by ceasing current accruals and writing off interest receivables when the collection of all or a portion of interest has become doubtful based on consistently applied procedures. A debt obligation is removed from non-accrual status when the issuer resumes interest payments or when collectability of interest is reasonably assured.
Expenses. Expenses directly attributable to a fund are charged to that fund. Expenses attributable to more than one fund are allocated among the respective funds on the basis of relative net assets or other appropriate methods. Expenses included in the accompanying financial statements reflect the expenses of that fund and do not include any expenses associated with any underlying mutual funds or exchange-traded funds. Although not included in a fund's expenses, a fund indirectly bears its proportionate share of these expenses through the net asset value of each underlying mutual fund or exchange-traded fund. Expense estimates are accrued in the period to which they relate and adjustments are made when actual amounts are known.
Income Tax Information and Distributions to Shareholders. Each year, the Fund intends to qualify as a regulated investment company under Subchapter M of the Internal Revenue Code, including distributing substantially all of its taxable income and realized gains. As a result, no provision for U.S. Federal income taxes is required. The Fund files a U.S. federal tax return, in addition to state and local tax returns as required. The Fund's federal income tax returns are subject to examination by the Internal Revenue Service (IRS) for a period of three fiscal years after they are filed. State and local tax returns may be subject to examination for an additional fiscal year depending on the jurisdiction.
Distributions are declared and recorded daily and paid monthly from net investment income. Distributions from realized gains, if any, are declared and recorded on the ex-dividend date. Income and capital gain distributions are determined in accordance with income tax regulations, which may differ from GAAP.
Capital accounts within the financial statements are adjusted for permanent book-tax differences. These adjustments have no impact on net assets or the results of operations. Capital accounts are not adjusted for temporary book-tax differences which will reverse in a subsequent period.
Book-tax differences are primarily due to market discount, redemption in-kind and capital loss carryforwards.
The Fund purchases municipal securities whose interest, in the opinion of the issuer, is free from federal income tax. There is no assurance that the IRS will agree with this opinion. In the event the IRS determines that the issuer does not comply with relevant tax requirements, interest payments from a security could become federally taxable, possibly retroactively to the date the security was issued.
As of period end, the cost and unrealized appreciation (depreciation) in securities, and derivatives if applicable, for federal income tax purposes were as follows:
| Gross unrealized appreciation | $28,438,591 |
| Gross unrealized depreciation | (148,975,279) |
| Net unrealized appreciation (depreciation) | $(120,536,688) |
| Tax cost | $3,008,733,359 |
Capital loss carryforwards are only available to offset future capital gains of the Fund to the extent provided by regulations and may be limited. The capital loss carryforward information presented below, including any applicable limitation, is estimated as of prior fiscal period end and is subject to adjustment.
Short-term | $(35,814,736) |
Long-term | (10,369,613) |
| Total capital loss carryforward | $(46,184,349) |
Delayed Delivery Transactions and When-Issued Securities. During the period, certain Funds transacted in securities on a delayed delivery or when-issued basis. Payment and delivery may take place after the customary settlement period for that security. The price of the underlying securities and the date when the securities will be delivered and paid for are fixed at the time the transaction is negotiated. Securities purchased on a delayed delivery or when-issued basis are identified as such in the Schedule of Investments. Compensation for interest forgone in the purchase of a delayed delivery or when-issued debt security may be received. With respect to purchase commitments, each applicable Fund identifies securities as segregated in its records with a value at least equal to the amount of the commitment. Payables and receivables associated with the purchases and sales of delayed delivery securities having the same coupon, settlement date and broker are offset. Delayed delivery or when-issued securities that have been purchased from and sold to different brokers are reflected as both payables and receivables in the Statement of Assets and Liabilities under the caption "Delayed delivery", as applicable. Losses may arise due to changes in the value of the underlying securities or if the counterparty does not perform under the contract's terms, or if the issuer does not issue the securities due to political, economic, or other factors.
Restricted Securities (including Private Placements). Funds may invest in securities that are subject to legal or contractual restrictions on resale. These securities generally may be resold in transactions exempt from registration or to the public if the securities are registered. Disposal of these securities may involve time-consuming negotiations and expense, and prompt sale at an acceptable price may be difficult. Information regarding restricted securities held at period end is included at the end of the Schedule of Investments, if applicable.
4 Purchases and Sales of Investments.
Purchases and sales of securities, other than short-term securities and in-kind transactions, as applicable, are noted in the table below.
| | Purchases ($) | Sales ($) |
| Fidelity Tax-Free Bond Fund | 157,264,418 | 35,465,761 |
5. Fees and Other Transactions with Affiliates.
Management Fee. Fidelity Management & Research Company LLC (the investment adviser) and its affiliates provide the Fund with investment management related services for which the Fund pays a monthly management fee. The management fee is the sum of an individual fund fee rate that is based on an annual rate of .25% of the Fund's average net assets and an annualized group fee rate that averaged .10% during the period. The group fee rate is based upon the monthly average net assets of a group of registered investment companies with which the investment adviser has management contracts. The group fee rate decreases as assets under management increase and increases as assets under management decrease. For the reporting period, the total annualized management fee rate was .35% of the Fund's average net assets.
Transfer Agent Fees. Fidelity Investments Institutional Operations Company LLC (FIIOC), an affiliate of the investment adviser, is the transfer, dividend disbursing and shareholder servicing agent for the Fund. FIIOC receives account fees and asset-based fees that vary according to account size and type of account. FIIOC pays for typesetting, printing and mailing of shareholder reports, except proxy statements. For the period, transfer agent fees were equivalent to an annualized rate of .09% of average net assets.
Accounting Fees. Fidelity Service Company, Inc. (FSC), an affiliate of the investment adviser, maintains the Fund's accounting records. The accounting fee is based on the level of average net assets for each month. For the period, the fees were equivalent to the following annualized rates:
| | % of Average Net Assets |
| Fidelity Tax-Free Bond Fund | .02 |
Interfund Trades. Funds may purchase from or sell securities to other Fidelity Funds under procedures adopted by the Board. The procedures have been designed to ensure these interfund trades are executed in accordance with Rule 17a-7 of the 1940 Act. Any interfund trades are included within the respective purchases and sales amounts shown in the Purchases and Sales of Investments note. Interfund trades during the period are noted in the table below.
| | Purchases ($) | Sales ($) | Realized Gain (Loss) ($) |
| Fidelity Tax-Free Bond Fund | - | 5,300,000 | - |
Prior Fiscal Year Affiliated Redemptions In-Kind. Shares that were redeemed in-kind for investments, including accrued interest and cash, if any, are shown in the table below; along with realized gain or loss on investments delivered through in-kind redemptions. The amount of the in-kind redemptions is included in share transactions in the accompanying Statement of Changes in Net Assets. There was no gain or loss for federal income tax purposes.
| | Shares | Total net realized gain or loss ($) | Total Proceeds ($) |
| Fidelity Tax-Free Bond Fund | 16,954,008 | (10,197,768) | 180,390,645 |
6. Committed Line of Credit.
Certain Funds participate with other funds managed by the investment adviser or an affiliate in a $4.25 billion credit facility (the "line of credit") to be utilized for temporary or emergency purposes to fund shareholder redemptions or for other short-term liquidity purposes. The participating funds have agreed to pay commitment fees on their pro-rata portion of the line of credit, which are reflected in Miscellaneous expenses on the Statement of Operations, and are listed below. During the period, there were no borrowings on this line of credit.
| | Amount |
| Fidelity Tax-Free Bond Fund | $2,736 |
7. Expense Reductions.
The investment adviser contractually agreed to reimburse the Fund to the extent annual operating expenses exceeded .25% of average net assets. This reimbursement will remain in place through May 31, 2024. Some expenses, for example the compensation of the independent Trustees, and certain miscellaneous expenses such as proxy and shareholder meeting expenses, are excluded from this reimbursement. During the period this reimbursement reduced the Fund's expenses by $3,117,814.
Through arrangements with the Fund's custodian, credits realized as a result of certain uninvested cash balances were used to reduce the Fund's expenses by $879.
In addition, during the period the investment adviser or an affiliate reimbursed and/or waived a portion of operating expenses in the amount of $47,087.
8. Other.
A fund's organizational documents provide former and current trustees and officers with a limited indemnification against liabilities arising in connection with the performance of their duties to the fund. In the normal course of business, a fund may also enter into contracts that provide general indemnifications. A fund's maximum exposure under these arrangements is unknown as this would be dependent on future claims that may be made against a fund. The risk of material loss from such claims is considered remote.
9. Risk and Uncertainties.
Many factors affect a fund's performance. Developments that disrupt global economies and financial markets, such as pandemics, epidemics, outbreaks of infectious diseases, war, terrorism, and environmental disasters, may significantly affect a fund's investment performance. The effects of these developments to a fund will be impacted by the types of securities in which a fund invests, the financial condition, industry, economic sector, and geographic location of an issuer, and a fund's level of investment in the securities of that issuer. Significant concentrations in security types, issuers, industries, sectors, and geographic locations may magnify the factors that affect a fund's performance.
As a shareholder, you incur two types of costs: (1) transaction costs, which may include sales charges (loads) on purchase payments or redemption proceeds, as applicable and (2) ongoing costs, which generally include management fees, distribution and/or service (12b-1) fees and other Fund expenses. This Example is intended to help you understand your ongoing costs (in dollars) of investing in a fund and to compare these costs with the ongoing costs of investing in other mutual funds.
| The Example is based on an investment of $1,000 invested at the beginning of the period and held for the entire period (February 1, 2023 to July 31, 2023). |
Actual Expenses
The first line of the accompanying table provides information about actual account values and actual expenses. You may use the information in this line, together with the amount you invested, to estimate the expenses that you paid over the period. Simply divide your account value by $1,000.00 (for example, an $8,600 account value divided by $1,000.00 = 8.6), then multiply the result by the number in the first line for a class/Fund under the heading entitled "Expenses Paid During Period" to estimate the expenses you paid on your account during this period. If any fund is a shareholder of any underlying mutual funds or exchange-traded funds (ETFs) (the Underlying Funds), such fund indirectly bears its proportional share of the expenses of the Underlying Funds in addition to the direct expenses incurred presented in the table. These fees and expenses are not included in the annualized expense ratio used to calculate the expense estimate in the table below.
Hypothetical Example for Comparison Purposes
The second line of the accompanying table provides information about hypothetical account values and hypothetical expenses based on the actual expense ratio and an assumed rate of return of 5% per year before expenses, which is not the actual return. The hypothetical account values and expenses may not be used to estimate the actual ending account balance or expenses you paid for the period. You may use this information to compare the ongoing costs of investing in the Fund and other funds. To do so, compare this 5% hypothetical example with the 5% hypothetical examples that appear in the shareholder reports of the other funds. If any fund is a shareholder of any Underlying Funds, such fund indirectly bears its proportional share of the expenses of the Underlying Funds in addition to the direct expenses as presented in the table. These fees and expenses are not included in the annualized expense ratio used to calculate the expense estimate in the table below.
Please note that the expenses shown in the table are meant to highlight your ongoing costs only and do not reflect any transaction costs. Therefore, the second line of the table is useful in comparing ongoing costs only, and will not help you determine the relative total costs of owning different funds. In addition, if these transactional costs were included, your costs would have been higher.
| | | | | Annualized Expense Ratio- A | | Beginning Account Value February 1, 2023 | | Ending Account Value July 31, 2023 | | Expenses Paid During Period- C February 1, 2023 to July 31, 2023 |
| | | | | | | | | | |
| Fidelity® Tax-Free Bond Fund | | | | .25% | | | | | | |
| Actual | | | | | | $ 1,000 | | $ 1,002.70 | | $ 1.24 |
Hypothetical-B | | | | | | $ 1,000 | | $ 1,023.55 | | $ 1.25 |
| |
A Annualized expense ratio reflects expenses net of applicable fee waivers.
B 5% return per year before expenses
C Expenses are equal to the annualized expense ratio, multiplied by the average account value over the period, multiplied by 181/ 365 (to reflect the one-half year period). The fees and expenses of any Underlying Funds are not included in each annualized expense ratio.
1.762414.122
SFB-SANN-0923
Item 2.
Code of Ethics
Not applicable.
Item 3.
Audit Committee Financial Expert
Not applicable.
Item 4.
Principal Accountant Fees and Services
Not applicable.
Item 5.
Audit Committee of Listed Registrants
Not applicable.
Item 6.
Investments
(a)
Not applicable.
(b)
Not applicable
Item 7.
Disclosure of Proxy Voting Policies and Procedures for Closed-End Management Investment Companies
Not applicable.
Item 8.
Portfolio Managers of Closed-End Management Investment Companies
Not applicable.
Item 9.
Purchase of Equity Securities by Closed-End Management Investment Company and Affiliated Purchasers
Not applicable.
Item 10.
Submission of Matters to a Vote of Security Holders
There were no material changes to the procedures by which shareholders may recommend nominees to the Fidelity Salem Street Trust’s Board of Trustees.
Item 11.
Controls and Procedures
(a)(i) The President and Treasurer and the Chief Financial Officer have concluded that the Fidelity Salem Street Trust’s (the “Trust”) disclosure controls and procedures (as
defined in Rule 30a-3(c) under the Investment Company Act) provide reasonable assurances that material information relating to the Trust is made known to them by the appropriate persons, based on their evaluation of these controls and procedures as of a date within 90 days of the filing date of this report.
(a)(ii) There was no change in the Trust’s internal control over financial reporting (as defined in Rule 30a-3(d) under the Investment Company Act) that occurred during the period covered by this report that has materially affected, or is reasonably likely to materially affect, the Trust’s internal control over financial reporting.
Item 12.
Disclosure of Securities Lending Activities for Closed-End Management
Investment Companies
Not applicable.
Item 13.
Exhibits
SIGNATURES
Pursuant to the requirements of the Securities Exchange Act of 1934 and the Investment Company Act of 1940, the registrant has duly caused this report to be signed on its behalf by the undersigned, thereunto duly authorized.
Fidelity Salem Street Trust
| |
By: | /s/Laura M. Del Prato |
| Laura M. Del Prato |
| President and Treasurer |
|
|
Date: | September 21, 2023 |
Pursuant to the requirements of the Securities Exchange Act of 1934 and the Investment Company Act of 1940, this report has been signed below by the following persons on behalf of the registrant and in the capacities and on the dates indicated.
| |
By: | /s/Laura M. Del Prato |
| Laura M. Del Prato |
| President and Treasurer |
|
|
Date: | September 21, 2023 |
| |
By: | /s/John J. Burke III |
| John J. Burke III |
| Chief Financial Officer |
|
|
Date: | September 21, 2023 |