UNITED STATES
SECURITIES AND EXCHANGE COMMISSION
Washington, D.C. 20549
FORM N-CSR
CERTIFIED SHAREHOLDER REPORT OF REGISTERED
MANAGEMENT INVESTMENT COMPANIES
Investment Company Act file number 811-02105
Fidelity Salem Street Trust
(Exact name of registrant as specified in charter)
245 Summer St., Boston, MA 02210
(Address of principal executive offices) (Zip code)
Margaret Carey, Secretary
245 Summer St.
Boston, Massachusetts 02210
(Name and address of agent for service)
Registrant's telephone number, including area code:
617-563-7000
| |
Date of fiscal year end: | March 31 |
|
|
Date of reporting period: | September 30, 2023 |
Item 1.
Reports to Stockholders
Fidelity® SAI Municipal Money Market Fund
Semi-Annual Report
September 30, 2023
Offered exclusively to certain clients of the Adviser, or its affiliates, including Strategic Advisers LLC (Strategic Advisers) - not available for sale to the general public. Fidelity® SAI is a product name of Fidelity® funds dedicated to certain programs affiliated with Strategic Advisers.
Contents
To view a fund's proxy voting guidelines and proxy voting record for the 12-month period ended June 30, visit http://www.fidelity.com/proxyvotingresults or visit the Securities and Exchange Commission's (SEC) web site at http://www.sec.gov.
You may also call 1-800-544-3455 to request a free copy of the proxy voting guidelines.
Standard & Poor's, S&P and S&P 500 are registered service marks of The McGraw-Hill Companies, Inc. and have been licensed for use by Fidelity Distributors Corporation.
Other third-party marks appearing herein are the property of their respective owners.
All other marks appearing herein are registered or unregistered trademarks or service marks of FMR LLC or an affiliated company. © 2023 FMR LLC. All rights reserved.
This report and the financial statements contained herein are submitted for the general information of the shareholders of the Fund. This report is not authorized for distribution to prospective investors in the Fund unless preceded or accompanied by an effective prospectus.
A fund files its complete schedule of portfolio holdings with the SEC for the first and third quarters of each fiscal year on Form N-PORT. Forms N-PORT are available on the SEC's web site at http://www.sec.gov. A fund's Forms N-PORT may be reviewed and copied at the SEC's Public Reference Room in Washington, DC. Information regarding the operation of the SEC's Public Reference Room may be obtained by calling 1-800-SEC-0330.
For a complete list of a fund's portfolio holdings, view the most recent holdings listing, semiannual report, or annual report on Fidelity's web site at http://www.fidelity.com, http://www.institutional.fidelity.com, or http://www.401k.com, as applicable.
NOT FDIC INSURED •MAY LOSE VALUE •NO BANK GUARANTEE
Neither the Fund nor Fidelity Distributors Corporation is a bank.
| Current 7-Day Yields |
| | | |
| Fidelity® SAI Municipal Money Market Fund | 4.09% | |
| | | |
Yield refers to the income paid by the Fund over a given period. Yield for money market funds is usually for seven-day periods, as it is here, though it is expressed as an annual percentage rate. Past performance is no guarantee of future results. Yield will vary and it's possible to lose money investing in the Fund. A portion of the Fund's expenses was reimbursed and/or waived. Absent such reimbursements and/or waivers the yield for the period ending September 30, 2023, the most recent period shown in the table, would have been 4.00% for Fidelity® SAI Municipal Money Market Fund. | |
| Effective Maturity Diversification (% of Fund's Investments) |
| Days |
| 1 - 7 | 83.3 | |
| 8 - 30 | 0.5 | |
| 31 - 60 | 7.8 | |
| 61 - 90 | 4.7 | |
| 91 - 180 | 2.2 | |
| > 180 | 1.5 | |
| Effective maturity is determined in accordance with the requirements of Rule 2a-7 under the Investment Company Act of 1940. |
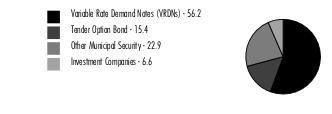
Asset Allocation (% of Fund's net assets) |
|
Net Other Assets (Liabilities) - (1.1)% |
|
Showing Percentage of Net Assets
| Variable Rate Demand Note - 56.2% |
| | | Principal Amount (a) | Value ($) |
| Alabama - 5.1% | | | |
| Walker County Econ. & Indl. Dev. Auth. Solid Waste Disp. Rev. (Alabama Pwr. Co. Plant Gorgas Proj.) Series 2023, 4.78% 10/2/23, VRDN (b)(c) | | 800,000 | 800,000 |
| West Jefferson Indl. Dev. Board Solid Waste Disp. Rev.: | | | |
| (Alabama Pwr. Co. Miller Plant Proj.) Series 2008, 4.78% 10/2/23, VRDN (b)(c) | | 2,800,000 | 2,800,000 |
| (Alabama Pwr. Co. Plant Miller Proj.) Series 2023, 4.35% 10/6/23, VRDN (b)(c) | | 400,000 | 400,000 |
| Wilsonville Indl. Dev. Board Poll. Cont. Rev. (Alabama Pwr. Co. Gaston Plant Proj.) Series 2008, 4.78% 10/2/23, VRDN (b)(c) | | 1,600,000 | 1,600,000 |
TOTAL ALABAMA | | | 5,600,000 |
| Alaska - 1.2% | | | |
| Valdez Marine Term. Rev. (ConocoPhillips Proj.) Series 1994 A, 3.95% 10/6/23 (ConocoPhillips Co. Guaranteed), VRDN (b) | | 1,300,000 | 1,300,000 |
| Arizona - 1.6% | | | |
| Maricopa County Poll. Cont. Rev.: | | | |
| Series 2009 B, 4.24% 10/6/23, VRDN (b) | | 1,400,000 | 1,400,000 |
| Series 2009 C, 4% 10/6/23, VRDN (b) | | 400,000 | 400,000 |
TOTAL ARIZONA | | | 1,800,000 |
| Colorado - 1.0% | | | |
| Colorado Health Facilities Auth. Rev. (Boulder Cmnty. Hosp. Proj.) Series 2000, 4.13% 10/6/23, LOC JPMorgan Chase Bank, VRDN (b) | | 570,000 | 570,000 |
| Colorado Health Facilities Auth. Rev. Bonds Series 2020 B, 4.1% 10/6/23, LOC The Toronto-Dominion Bank, VRDN (b) | | 550,000 | 550,000 |
TOTAL COLORADO | | | 1,120,000 |
| Connecticut - 0.5% | | | |
| Connecticut Hsg. Fin. Auth. Series 2019 B2, 3.88% 10/6/23 (Liquidity Facility Bank of America NA), VRDN (b)(c) | | 505,000 | 505,000 |
| Delaware - 0.5% | | | |
| Delaware Econ. Dev. Auth. Rev. (Delmarva Pwr. & Lt. Co. Proj.): | | | |
| Series 1993 C, 3.86% 10/6/23, VRDN (b) | | 200,000 | 200,000 |
| Series 1999 B, 4.35% 10/6/23, VRDN (b)(c) | | 400,000 | 400,000 |
TOTAL DELAWARE | | | 600,000 |
| Florida - 4.1% | | | |
| Bay County Indl. Rev. Dev. (Gulf Pwr. Co. Proj.) Series 2020, 4% 10/6/23, VRDN (b)(c) | | 900,000 | 900,000 |
| Broward County Indl. Dev. Rev. (Florida Pwr. & Lt. Co. Proj.) Series 2018 B, 4.2% 10/6/23, VRDN (b)(c) | | 200,000 | 200,000 |
| Escambia County Solid Waste Disp. Rev. (Gulf Pwr. Co. Proj.) Series 2009, 3.9% 10/6/23, VRDN (b) | | 100,000 | 100,000 |
| Florida Keys Aqueduct Auth. Wtr. Rev. Series 2008, 4.13% 10/6/23, LOC TD Banknorth, NA, VRDN (b) | | 100,000 | 100,000 |
| Lee County Indl. Dev. Auth. Rev. (Florida Pwr. & Lt. Co. Proj.) Series 2016 A, 4.56% 10/6/23, VRDN (b)(c) | | 300,000 | 300,000 |
| Martin County Rev. (Florida Pwr. & Lt. Co. Proj.) Series 2022, 4.17% 10/6/23, VRDN (b) | | 750,000 | 750,000 |
| Miami-Dade County Indl. Dev. Auth. Rev. (Florida Pwr. & Lt. Co. Proj.) Series 2021, 4.1% 10/6/23, VRDN (b)(c) | | 200,000 | 200,000 |
| Pinellas County Health Facilities Auth. Rev. (Suncoast Hospice Proj.) Series 2004, 3.95% 10/6/23, LOC Wells Fargo Bank NA, VRDN (b) | | 2,020,000 | 2,020,000 |
TOTAL FLORIDA | | | 4,570,000 |
| Georgia - 0.5% | | | |
| Monroe County Dev. Auth. Poll. Cont. Rev. (Gulf Pwr. Co. Plant Scherer Proj.) Series 2010, 4.1% 10/6/23, VRDN (b) | | 100,000 | 100,000 |
| Monroe County Dev. Auth. Rev. (Florida Pwr. & Lt. Co. Proj.) Series 2019, 4% 10/6/23, VRDN (b)(c) | | 500,000 | 500,000 |
TOTAL GEORGIA | | | 600,000 |
| Illinois - 0.4% | | | |
| Illinois Dev. Fin. Auth. Rev. (Glenwood School for Boys Proj.) Series 1998, 4.18% 10/6/23, LOC Northern Trust Co., VRDN (b) | | 100,000 | 100,000 |
| FHLMC Illinois Hsg. Dev. Auth. Multi-family Hsg. Rev. Series 2008, 4.12% 10/6/23, LOC Freddie Mac, VRDN (b) | | 300,000 | 300,000 |
TOTAL ILLINOIS | | | 400,000 |
| Indiana - 2.5% | | | |
| Indiana Dev. Fin. Auth. Envir. Rev.: | | | |
| (Duke Energy Indiana, Inc. Proj.) Series 2009 A3, 3.75% 10/6/23, LOC Mizuho Bank Ltd., VRDN (b) | | 100,000 | 100,000 |
| (PSI Energy Proj.): | | | |
Series 2003 A, 4.3% 10/6/23, VRDN (b)(c) | | 2,000,000 | 2,000,000 |
Series 2003 B, 3.89% 10/6/23, VRDN (b)(c) | | 450,000 | 450,000 |
| Indiana Fin. Auth. Hosp. Rev. (Parkview Health Sys. Oblig. Group Proj.) Series 2009 C, 4.2% 10/6/23, LOC Sumitomo Mitsui Banking Corp., VRDN (b) | | 200,000 | 200,000 |
TOTAL INDIANA | | | 2,750,000 |
| Iowa - 5.0% | | | |
| Iowa Fin. Auth. Solid Disp. Waste Rev. (MidAmerican Energy Co. Proj.) Series 2016 B, 4.3% 10/6/23, VRDN (b)(c) | | 5,500,000 | 5,500,000 |
| Kansas - 1.2% | | | |
| Burlington Envir. Impt. Rev. (Kansas City Pwr. and Lt. Co. Proj.): | | | |
| Series 2007 A, 4.03% 10/6/23, VRDN (b) | | 100,000 | 100,000 |
| Series 2007 B, 4.03% 10/6/23, VRDN (b) | | 600,000 | 600,000 |
| Wamego Kansas Poll. Cont. Rfdg. Rev. (Western Resources, Inc. Proj.) Series 1994, 3.9% 10/6/23, VRDN (b) | | 600,000 | 600,000 |
TOTAL KANSAS | | | 1,300,000 |
| Louisiana - 3.7% | | | |
| Saint James Parish Gen. Oblig. (Nucor Steel Louisiana LLC Proj.) Series 2010 B1, 4.3% 10/6/23, VRDN (b) | | 3,700,000 | 3,700,000 |
| FHLMC Louisiana Hsg. Fin. Auth. Multi-family Hsg. Rev. (The Reserve at Jefferson Proj.) Series 2008, 4% 10/6/23, LOC Freddie Mac, VRDN (b) | | 400,000 | 400,000 |
TOTAL LOUISIANA | | | 4,100,000 |
| Mississippi - 5.6% | | | |
| Mississippi Bus. Fin. Corp. Rev. (Gulf Pwr. Co. Proj.) Series 2019, 4.56% 10/6/23, VRDN (b)(c) | | 700,000 | 700,000 |
| Mississippi Bus. Fin. Corp. Solid Waste Disp. Rev. (Waste Mgmt., Inc. Proj.) Series 2003, 4.1% 10/6/23, LOC Bank of America NA, VRDN (b)(c) | | 5,500,000 | 5,500,000 |
TOTAL MISSISSIPPI | | | 6,200,000 |
| Nebraska - 0.2% | | | |
| Stanton County Indl. Dev. Rev. Series 1998, 4.3% 10/6/23, VRDN (b)(c) | | 200,000 | 200,000 |
| New York - 1.6% | | | |
| New York City Muni. Wtr. Fin. Auth. Wtr. & Swr. Sys. Rev. Series 2014 AA, 4.5% 10/2/23 (Liquidity Facility Mizuho Corporate Bank Ltd.), VRDN (b) | | 1,600,000 | 1,600,000 |
| New York Hsg. Fin. Agcy. Rev. Series 2010 A, 4.15% 10/6/23, LOC Landesbank Hessen-Thuringen, VRDN (b) | | 200,000 | 200,000 |
TOTAL NEW YORK | | | 1,800,000 |
| North Carolina - 0.8% | | | |
| Cumberland County Indl. Facilities & Poll. Cont. Fing. Auth. (Cargill, Inc. Proj.) Series 2022, 4.02% 10/6/23, VRDN (b)(c) | | 600,000 | 600,000 |
| Lower Cape Fear Wtr. & Swr. Auth. Rev. (Bladen Bluffs Proj.) Series 2010, 3.98% 10/6/23, LOC Rabobank Nederland New York Branch, VRDN (b) | | 250,000 | 250,000 |
TOTAL NORTH CAROLINA | | | 850,000 |
| Ohio - 0.7% | | | |
| Franklin County Hosp. Facilities Rev. Series 1998, 4.08% 10/6/23, LOC Northern Trust Co., VRDN (b) | | 300,000 | 300,000 |
| Hamilton County Hosp. Facilities Rev. (Elizabeth Gamble Deaconess Home Assoc. Proj.) Series 2002 B, 3.94% 10/6/23, LOC PNC Bank NA, VRDN (b) | | 500,000 | 500,000 |
TOTAL OHIO | | | 800,000 |
| Pennsylvania - 1.0% | | | |
| Philadelphia Auth. for Indl. Dev. Rev. (The Franklin Institute Proj.) Series 2006, 3.89% 10/6/23, LOC Bank of America NA, VRDN (b) | | 865,000 | 865,000 |
| FNMA Montgomery County Redev. Auth. Multi-family Hsg. Rev. (Kingswood Apts. Proj.) Series 2001 A, 4.06% 10/6/23, LOC Fannie Mae, VRDN (b) | | 200,000 | 200,000 |
TOTAL PENNSYLVANIA | | | 1,065,000 |
| Tennessee - 5.8% | | | |
| Loudon County Indl. Dev. Board Exempt Facilities Rev. (Kimberly-Clark Corp. Proj.) Series 1999, 4% 10/6/23, VRDN (b)(c) | | 6,400,000 | 6,400,000 |
| Texas - 1.6% | | | |
| Harris County Cultural Ed. Facilities Fin. Corp. Rev. Series 2019 F, 4.11% 10/6/23, VRDN (b) | | 500,000 | 500,000 |
| Tarrant County Cultural Ed. Facilities Fin. Corp. Rev. (Christus Health Proj.): | | | |
| Series 2008 C1, 4.05% 10/6/23, LOC Sumitomo Mitsui Banking Corp., VRDN (b) | | 200,000 | 200,000 |
| Series 2008 C4, 4.05% 10/6/23, LOC Bank of Montreal, VRDN (b) | | 250,000 | 250,000 |
| Texas Gen. Oblig.: | | | |
| (Texas Veterans Land Board Proj.) Series 2017, 4.1% 10/6/23 (Liquidity Facility Sumitomo Mitsui Banking Corp.), VRDN (b) | | 300,000 | 300,000 |
| Series 2003 A, 4% 10/6/23 (Liquidity Facility State Street Bank & Trust Co., Boston), VRDN (b)(c) | | 500,000 | 500,000 |
TOTAL TEXAS | | | 1,750,000 |
| Virginia - 0.3% | | | |
| Fairfax County Indl. Dev. Auth. (Inova Health Sys. Proj.) Series 2018 C, 4.09% 10/6/23, VRDN (b) | | 350,000 | 350,000 |
| Washington - 4.5% | | | |
| Port of Seattle Rev. Series 2008, 4.15% 10/6/23, LOC Bank of America NA, VRDN (b)(c) | | 4,000,000 | 4,000,000 |
| FHLMC Washington Hsg. Fin. Commission Multi-family Hsg. Rev.: | | | |
| (Interurban Sr. Living Apts. Proj.) Series 2012, 4.12% 10/6/23, LOC Freddie Mac, VRDN (b) | | 200,000 | 200,000 |
| (Urban Ctr. Apts. Proj.) Series 2012, 4.1% 10/6/23, LOC Freddie Mac, VRDN (b) | | 600,000 | 600,000 |
| FNMA Washington Hsg. Fin. Commission Multi-family Hsg. Rev. (New Haven Apts. Proj.) Series 2009, 4.1% 10/6/23, LOC Fannie Mae, VRDN (b) | | 200,000 | 200,000 |
TOTAL WASHINGTON | | | 5,000,000 |
| West Virginia - 2.4% | | | |
| West Virginia Econ. Dev. Auth. Solid Waste Disp. Facilities Rev. (Appalachian Pwr. Co.- Mountaineer Proj.) Series 2008 A, 4.01% 10/6/23, VRDN (b)(c) | | 2,600,000 | 2,600,000 |
| Wisconsin - 4.4% | | | |
| Green Bay Redev. Auth. (Green Bay Packaging, Inc. Proj.) Series 2019, 3.95% 10/6/23, LOC Wells Fargo Bank NA, VRDN (b)(c)(d) | | 4,900,000 | 4,900,000 |
| TOTAL VARIABLE RATE DEMAND NOTE (Cost $62,060,000) | | | 62,060,000 |
| | | | |
| Tender Option Bond - 15.4% |
| | | Principal Amount (a) | Value ($) |
| Arizona - 0.1% | | | |
| Arizona Indl. Dev. Auth. Hosp. Rev. Participating VRDN Series XM 10 13, 4.1% 10/6/23 (Liquidity Facility JPMorgan Chase Bank) (b)(e)(f) | | 75,000 | 75,000 |
| Colorado - 0.6% | | | |
| Denver City & County Arpt. Rev. Participating VRDN Series Floaters XG 01 96, 4.06% 10/6/23 (Liquidity Facility Toronto-Dominion Bank) (b)(c)(e)(f) | | 620,000 | 620,000 |
| Connecticut - 0.4% | | | |
| Connecticut Spl. Tax Oblig. Trans. Infrastructure Rev.: | | | |
| Bonds Series Floaters G 110, 4.16%, tender (b)(e)(f)(g) | | 200,000 | 200,000 |
| Participating VRDN Series Floaters YX 10 77, 3.8% 10/6/23 (Liquidity Facility Barclays Bank PLC) (b)(e)(f) | | 200,000 | 200,000 |
TOTAL CONNECTICUT | | | 400,000 |
| Florida - 0.7% | | | |
| Broward County Convention Ctr. Bonds Series MS 00 11, 3.83%, tender 11/2/23 (Liquidity Facility Morgan Stanley Bank, West Valley City Utah) (b)(e)(f)(g) | | 600,000 | 600,000 |
| County of Broward Tourist Dev. Tax Rev. Participating VRDN Series XL 04 29, 4.09% 10/6/23 (Liquidity Facility Wells Fargo Bank NA) (b)(e)(f) | | 100,000 | 100,000 |
| Greater Orlando Aviation Auth. Arpt. Facilities Rev. Bonds Series Floaters G 25, 4.23%, tender (b)(c)(e)(f)(g) | | 100,000 | 100,000 |
TOTAL FLORIDA | | | 800,000 |
| Georgia - 2.6% | | | |
| Fulton County Dev. Auth. Rev. Participating VRDN Series XL 02 68, 4.08% 10/6/23 (Liquidity Facility Bank of America NA) (b)(e)(f) | | 90,000 | 90,000 |
| Hosp. Auth. of Savannah Auth. Rev. Participating VRDN Series BAML 5042, 4.5% 10/2/23 (Liquidity Facility Bank of America NA) (b)(e)(f) | | 2,800,000 | 2,800,000 |
TOTAL GEORGIA | | | 2,890,000 |
| Louisiana - 1.0% | | | |
| New Orleans Aviation Board Rev. Participating VRDN Series XF 31 48, 4.03% 10/6/23 (Liquidity Facility Barclays Bank PLC) (b)(c)(e)(f) | | 100,000 | 100,000 |
| RIB Floater Trust Various States Participating VRDN Series Floater 2023, 4.02% 10/6/23 (Liquidity Facility Barclays Bank PLC) (b)(e)(f) | | 1,000,000 | 1,000,000 |
TOTAL LOUISIANA | | | 1,100,000 |
| Maryland - 0.1% | | | |
| Maryland Stadium Auth. Rev. Bonds Series 2023, 4.18%, tender 11/1/23 (Liquidity Facility Royal Bank of Canada) (b)(e)(f) | | 100,000 | 100,000 |
| Michigan - 0.1% | | | |
| Mclaren Health Care Corp. Participating VRDN Series XL 02 71, 4.08% 10/6/23 (Liquidity Facility Bank of America NA) (b)(e)(f) | | 90,000 | 90,000 |
| Missouri - 0.2% | | | |
| Kansas City Indl. Dev. Auth. Participating VRDN Series XG 03 96, 4.06% 10/6/23 (Liquidity Facility Toronto-Dominion Bank) (b)(c)(e)(f) | | 200,000 | 200,000 |
| New York - 3.6% | | | |
| New York Dorm. Auth. Rev. Bonds Series MS 00 09, 4.13%, tender 10/26/23 (Liquidity Facility Morgan Stanley Bank, West Valley City Utah) (b)(e)(f) | | 200,000 | 200,000 |
| New York Trans. Dev. Corp. Participating VRDN Series 2022 E 154, 4.08% 10/6/23 (Liquidity Facility Royal Bank of Canada) (b)(c)(e)(f) | | 3,800,000 | 3,800,000 |
TOTAL NEW YORK | | | 4,000,000 |
| North Carolina - 2.2% | | | |
| Charlotte Int'l. Arpt. Rev. Participating VRDN Series XG 05 27, 0% 10/6/23 (Liquidity Facility Bank of America NA) (b)(c)(e)(f) | | 130,000 | 130,000 |
| Greater Asheville Reg'l. Arpt. Auth. Participating VRDN Series XM 10 11, 4.05% 10/6/23 (Liquidity Facility Royal Bank of Canada) (b)(c)(e)(f) | | 2,100,000 | 2,100,000 |
| North Carolina Hsg. Fin. Agcy. Home Ownership Rev. Participating VRDN Series YX 13 16, 4.01% 10/6/23 (Liquidity Facility Barclays Bank PLC) (b)(e)(f) | | 200,000 | 200,000 |
TOTAL NORTH CAROLINA | | | 2,430,000 |
| Ohio - 0.4% | | | |
| Cuyahoga County Ctfs. of Prtn. Participating VRDN Series Floaters XG 02 06, 4.08% 10/6/23 (Liquidity Facility Bank of America NA) (b)(e)(f) | | 400,000 | 400,000 |
| Pennsylvania - 0.5% | | | |
| Lehigh County Gen. Purp. Hosp. Rev. Participating VRDN Series BAML 23 50 39, 4.06% 11/3/23 (Liquidity Facility Bank of America NA) (b)(e)(f) | | 100,000 | 100,000 |
| Pennsylvania Econ. Dev. Fing. Auth. Participating VRDN Series XM 10 83, 4.06% 10/6/23 (Liquidity Facility Royal Bank of Canada) (b)(c)(e)(f) | | 500,000 | 500,000 |
TOTAL PENNSYLVANIA | | | 600,000 |
| South Carolina - 0.1% | | | |
| South Carolina Trans. Infrastructure Bank Rev. Bonds Series Floaters G 109, 4.18%, tender (b)(e)(f)(g) | | 100,000 | 100,000 |
| Texas - 0.5% | | | |
| El Paso Wtr. & Swr. Rev. Bonds Series 2022 MS 00 10, 4.15%, tender 10/5/23 (Liquidity Facility Morgan Stanley Bank, West Valley City Utah) (b)(e)(f) | | 500,000 | 500,000 |
| Texas Private Activity Bond Surface Trans. Corp. Participating VRDN Series XM 11 23, 4.05% 10/6/23 (Liquidity Facility Royal Bank of Canada) (b)(c)(e)(f) | | 100,000 | 100,000 |
TOTAL TEXAS | | | 600,000 |
| Utah - 0.8% | | | |
| Salt Lake City Arpt. Rev. Participating VRDN: | | | |
| Series Floaters XM 06 99, 4.03% 10/6/23 (Liquidity Facility UBS AG) (b)(c)(e)(f) | | 400,000 | 400,000 |
| Series XL 04 59, 4.03% 10/6/23 (Liquidity Facility Barclays Bank PLC) (b)(c)(e)(f) | | 480,000 | 480,000 |
TOTAL UTAH | | | 880,000 |
| Washington - 1.5% | | | |
| Central Puget Sound Reg'l. Trans. Auth. Sales & Use Tax Rev. Bonds Series G 123, 4.18%, tender 11/1/23 (Liquidity Facility Royal Bank of Canada) (b)(e)(f)(g) | | 100,000 | 100,000 |
| Port of Seattle Rev. Participating VRDN: | | | |
| Series 2022 ZL 03 16, 4.05% 10/6/23 (Liquidity Facility Barclays Bank PLC) (b)(c)(e)(f) | | 400,000 | 400,000 |
| Series Floaters XM 06 65, 4.08% 10/6/23 (Liquidity Facility JPMorgan Chase Bank) (b)(c)(e)(f) | | 500,000 | 500,000 |
| Series XF 13 71, 4.12% 10/6/23 (Liquidity Facility JPMorgan Chase Bank) (b)(c)(e)(f) | | 300,000 | 300,000 |
| Series XM 08 75, 3.91% 10/6/23 (Liquidity Facility JPMorgan Chase Bank) (b)(c)(e)(f) | | 90,000 | 90,000 |
| Washington Health Care Facilities Auth. Rev. Participating VRDN Series YX 12 10, 4.08% 10/6/23 (Liquidity Facility Barclays Bank PLC) (b)(e)(f) | | 300,000 | 300,000 |
TOTAL WASHINGTON | | | 1,690,000 |
| TOTAL TENDER OPTION BOND (Cost $16,975,000) | | | 16,975,000 |
| | | | |
| Other Municipal Security - 22.9% |
| | | Principal Amount (a) | Value ($) |
| Guam - 0.7% | | | |
| Guam Int'l. Arpt. Auth. Rev. Bonds Series 2019 A, 5% 10/1/23 (Escrowed to Maturity) (c) | | 825,000 | 825,000 |
| Alabama - 0.6% | | | |
| Black Belt Energy Gas District Bonds Series 2018 A, 4%, tender 11/30/23 (b) | | 700,000 | 699,993 |
| Alaska - 0.2% | | | |
| Anchorage Gen. Oblig. TAN Series 2023, 4.25% 12/15/23 | | 250,000 | 250,105 |
| Arizona - 0.3% | | | |
| Arizona Health Facilities Auth. Rev. Bonds Series 2015 A, 5% 1/1/24 | | 310,000 | 310,673 |
| Colorado - 1.4% | | | |
| Colorado Ctfs. of Prtn. Bonds Series 2020 A, 5% 12/15/23 | | 210,000 | 210,318 |
| Colorado Health Facilities Auth. Rev. Bonds Series 2013 A, 5% 1/1/24 (Pre-Refunded to 1/1/24 @ 100) | | 275,000 | 275,631 |
| Colorado Health Facilities Auth. Rev. Bonds Bonds: | | | |
| Series 2016 B, 5% 11/15/23 | | 100,000 | 100,099 |
| Series 2016 C, 5%, tender 11/15/23 (b) | | 130,000 | 130,146 |
| Denver City & County Arpt. Rev. Bonds: | | | |
| Series 2012 A, 5% 11/15/23 (c) | | 200,000 | 200,063 |
| Series 2012 B, 5% 11/15/23 | | 250,000 | 250,300 |
| Series 2016 A, 5% 11/15/23 | | 175,000 | 175,210 |
| Series 2020 A1, 5% 11/15/23 | | 150,000 | 150,180 |
| Series 2022 C, 5% 11/15/23 | | 100,000 | 100,120 |
TOTAL COLORADO | | | 1,592,067 |
| Connecticut - 1.5% | | | |
| Connecticut Gen. Oblig. Bonds Series 2013 A, 5% 10/15/23 (Escrowed to Maturity) | | 115,000 | 115,035 |
| Connecticut Spl. Tax Oblig. Trans. Infrastructure Rev. Bonds Series 2013 A, 5% 10/1/23 | | 450,000 | 450,000 |
| Danbury Gen. Oblig. BAN Series 2023, 5% 1/24/24 | | 500,000 | 501,402 |
| North Haven Gen. Oblig. BAN Series 2022 B, 4.25% 11/2/23 | | 485,000 | 485,107 |
| Univ. of Connecticut Gen. Oblig. Bonds Series 2020 A, 5% 2/15/24 | | 100,000 | 100,289 |
TOTAL CONNECTICUT | | | 1,651,833 |
| District Of Columbia - 1.8% | | | |
| District of Columbia Income Tax Rev. Bonds Series 2020 B, 5% 10/1/23 | | 250,000 | 250,000 |
| Metropolitan Washington DC Arpts. Auth. Sys. Rev. Bonds: | | | |
| Series 2014 A, 5% 10/1/23 (c) | | 810,000 | 810,000 |
| Series 2018 A, 5% 10/1/23 (c) | | 600,000 | 600,000 |
| Series 2019 B, 5% 10/1/23 | | 200,000 | 200,000 |
| Series 2020 A, 5% 10/1/23 (c) | | 100,000 | 100,000 |
TOTAL DISTRICT OF COLUMBIA | | | 1,960,000 |
| Florida - 3.4% | | | |
| Broward County Arpt. Sys. Rev. Bonds: | | | |
| Series 2013 A: | | | |
5.25% 10/1/23 (Pre-Refunded to 10/1/23 @ 100) (c) | | 1,000,000 | 1,000,000 |
5.25% 10/1/23 (Pre-Refunded to 10/1/23 @ 100) (c) | | 335,000 | 335,000 |
| Series 2013 C: | | | |
5.25% 10/1/23 (Pre-Refunded to 10/1/23 @ 100) | | 175,000 | 175,000 |
5.25% 10/1/23 (Pre-Refunded to 10/1/23 @ 100) | | 100,000 | 100,000 |
| Gainesville Utils. Sys. Rev. Bonds Series 2017 A, 5% 10/1/23 | | 200,000 | 200,000 |
| Greater Orlando Aviation Auth. Arpt. Facilities Rev. Bonds Series 2019 A, 5% 10/1/23 (c) | | 300,000 | 300,000 |
| Hillsborough County Aviation Auth. Rev. Bonds Series 2013 A, 5.5% 10/1/23 (Pre-Refunded to 10/1/23 @ 100) (c) | | 100,000 | 100,000 |
| Miami-Dade County Bonds Series 2013 B, 6% 10/1/23 (Pre-Refunded to 10/1/23 @ 100) (c) | | 200,000 | 200,000 |
| Miami-Dade County School Board Ctfs. of Prtn. Bonds: | | | |
| Series 2014 D, 5% 11/1/23 | | 310,000 | 310,199 |
| Series 2015 D, 5% 2/1/24 | | 560,000 | 561,636 |
| Miami-Dade County Wtr. & Swr. Rev. Bonds: | | | |
| Series 2013 B, 5% 10/1/23 (Pre-Refunded to 10/1/23 @ 100) | | 255,000 | 255,000 |
| Series 2015, 5% 10/1/23 | | 120,000 | 120,000 |
| Series 2017 B, 5% 10/1/23 | | 150,000 | 150,000 |
TOTAL FLORIDA | | | 3,806,835 |
| Georgia - 0.6% | | | |
| Atlanta Arpt. Rev. Bonds Series 2023 C, 5% 7/1/24 (c) | | 380,000 | 381,917 |
| Cobb County School District TAN Series 2023, 4% 12/14/23 | | 255,000 | 254,981 |
TOTAL GEORGIA | | | 636,898 |
| Illinois - 1.9% | | | |
| Cook County Gen. Oblig. Bonds: | | | |
| Series 2013 B, 5% 11/15/23 | | 325,000 | 325,321 |
| Series 2021 B, 4% 11/15/23 | | 405,000 | 404,862 |
| Series 2022 A, 5% 11/15/23 | | 560,000 | 560,513 |
| Cook County Sales Tax Rev. Bonds Series 2022 A, 5% 11/15/23 | | 125,000 | 125,123 |
| Illinois Fin. Auth. Rev. Bonds Series 2014 A, 5% 10/1/23 | | 100,000 | 100,000 |
| Illinois Gen. Oblig. Bonds: | | | |
| Series 2016, 5% 2/1/24 | | 100,000 | 100,220 |
| Series 2017 D, 5% 11/1/23 | | 200,000 | 200,086 |
| Southwestern Dev. Auth. Heath Facility Rev. Bonds Series 2013: | | | |
| 7.125% 11/1/23 (Pre-Refunded to 11/1/23 @ 100) | | 165,000 | 165,338 |
| 7.625% 11/1/23 (Pre-Refunded to 11/1/23 @ 100) | | 145,000 | 145,352 |
TOTAL ILLINOIS | | | 2,126,815 |
| Kentucky - 1.3% | | | |
| Kentucky State Property & Buildings Commission Rev. Bonds: | | | |
| Series 2013 A, 5% 10/1/23 | | 150,000 | 150,000 |
| Series 2016 B, 5% 11/1/23 | | 715,000 | 715,381 |
| Series 2016, 5% 11/1/23 | | 575,000 | 575,397 |
TOTAL KENTUCKY | | | 1,440,778 |
| Maryland - 0.1% | | | |
| Baltimore Proj. Rev. Bonds Series 2013 C, 5% 1/1/24 (Pre-Refunded to 1/1/24 @ 100) | | 150,000 | 150,363 |
| Massachusetts - 0.4% | | | |
| Massachusetts Gen. Oblig. Bonds Series 2021 B, 5% 11/1/23 | | 400,000 | 400,340 |
| Michigan - 1.6% | | | |
| Kent Hosp. Fin. Auth. Hosp. Facilities Rev. Bonds (Spectrum Health Sys. Proj.) Series 2015 A, SIFMA Municipal Swap Index + 0.250% 4.23%, tender 4/26/24 (b)(h) | | 100,000 | 100,000 |
| Michigan Fin. Auth. Rev. Bonds: | | | |
| (Trinity Health Proj.) Series 2017, 5% 12/1/23 | | 575,000 | 575,832 |
| Series 2015 MI, 5% 12/1/23 | | 150,000 | 150,202 |
| Series 2016 E1, 4%, tender 8/15/24 (b) | | 110,000 | 109,677 |
| Michigan Hosp. Fin. Auth. Rev. Bonds: | | | |
| Series 2005 A4, 5% 11/1/23 | | 275,000 | 275,157 |
| Series 2008 C, 5% 12/1/23 | | 250,000 | 250,362 |
| Royal Oak Hosp. Fin. Auth. Hosp. Rev. Bonds Series 2014 D, 5% 3/1/24 (Pre-Refunded to 3/1/24 @ 100) | | 275,000 | 275,946 |
TOTAL MICHIGAN | | | 1,737,176 |
| Minnesota - 0.3% | | | |
| Minnesota Gen. Oblig. Bonds: | | | |
| Series 2013 D, 5% 10/1/23 | | 100,000 | 100,000 |
| Series 2017 A, 5% 10/1/23 | | 200,000 | 200,000 |
TOTAL MINNESOTA | | | 300,000 |
| Nevada - 0.2% | | | |
| Clark County Fuel Tax Bonds: | | | |
| Series 2016 A, 5% 11/1/23 | | 105,000 | 105,070 |
| Series 2016 B, 5% 11/1/23 | | 135,000 | 135,099 |
TOTAL NEVADA | | | 240,169 |
| New Jersey - 0.1% | | | |
| Jefferson Township Gen. Oblig. BAN Series 2023, 5% 6/14/24 | | 100,000 | 100,491 |
| North Carolina - 0.1% | | | |
| North Carolina Ltd. Oblig. Bonds Series 2021 A, 5% 5/1/24 | | 135,000 | 135,774 |
| Ohio - 0.6% | | | |
| Cuyahoga County Ohio Excise Tax Bonds (Sports Facilities Impt. Proj.) Series 2015, 5% 12/1/23 (Pre-Refunded to 12/1/23 @ 100) | | 100,000 | 100,166 |
| Ohio Cap. Facilities Lease Bonds (Administrative Bldg. Fund Projs.) Series 2017 B, 5% 10/1/23 | | 150,000 | 150,000 |
| Ohio Gen. Oblig. Bonds Series 2016 A, 5% 12/15/23 | | 105,000 | 105,224 |
| Ohio State Univ. Gen. Receipts Bonds (Multiyear Debt Issuance Prog.) Series 2020 A, 5% 12/1/23 | | 150,000 | 150,263 |
| Ohio Wtr. Dev. Auth. Wtr. Poll. Cont. Rev. Bonds Series 2014, 5% 12/1/23 | | 100,000 | 100,163 |
TOTAL OHIO | | | 605,816 |
| Oregon - 0.9% | | | |
| Oregon Dept. of Trans. Hwy. User Tax Rev. Bonds Series 2013 A, 5% 11/15/23 (Pre-Refunded to 11/15/23 @ 100) | | 145,000 | 145,172 |
| Oregon Gen. Oblig. Bonds Series 2019 M, 5% 11/1/23 | | 350,000 | 350,283 |
| Port of Portland Arpt. Rev. Bonds Series 2017 B, 5% 7/1/24 (c) | | 510,000 | 511,755 |
TOTAL OREGON | | | 1,007,210 |
| Pennsylvania - 1.1% | | | |
| Allegheny County Bonds Series 2013 C72, 5.25% 12/1/23 (Pre-Refunded to 12/1/23 @ 100) | | 245,000 | 245,503 |
| Pennsylvania Gen. Oblig. Bonds Series 2013, 5% 10/15/23 | | 230,000 | 230,060 |
| Pennsylvania Hsg. Fin. Agcy. Bonds Series 2022 138, 5% 10/1/23 | | 115,000 | 115,000 |
| Pennsylvania Tpk. Commission Tpk. Rev. Bonds Series 2013 C, 5% 12/1/23 (Pre-Refunded to 12/1/23 @ 100) | | 585,000 | 585,779 |
TOTAL PENNSYLVANIA | | | 1,176,342 |
| South Carolina - 0.3% | | | |
| Charleston Edl. Excellence Fing. Corp. Rev. Bonds Series 2013 B, 5% 12/1/23 (Pre-Refunded to 12/1/23 @ 100) | | 125,000 | 125,207 |
| Greenville County School District Bonds Series 2023 B, 5% 6/25/24 | | 155,000 | 156,338 |
TOTAL SOUTH CAROLINA | | | 281,545 |
| Texas - 1.6% | | | |
| Dallas Wtrwks. & Swr. Sys. Rev. Bonds Series 2012 A, 5% 10/1/23 | | 125,000 | 125,000 |
| Harris County Cultural Ed. Facilities Fin. Corp. Rev. Bonds Series 2023 B2, 3.7% tender 12/1/23, CP mode | | 400,000 | 399,882 |
| Harris County Metropolitan Trans. Auth. Bonds Series 2017 A, 5% 11/1/23 | | 125,000 | 125,079 |
| Houston Util. Sys. Rev. Bonds: | | | |
| Series 2002 C, 5% 11/15/23 | | 100,000 | 100,094 |
| Series 2013 B, 4% 11/15/23 | | 100,000 | 99,970 |
| Series 2016 B, 5% 11/15/23 | | 110,000 | 110,103 |
| Series 2021 A, 4% 11/15/23 | | 100,000 | 99,970 |
| Texas Gen. Oblig. Bonds: | | | |
| Series 2014 A, 5% 10/1/23 | | 540,000 | 540,000 |
| Series 2014, 5% 10/1/23 | | 115,000 | 115,000 |
| Univ. of Texas Board of Regents Sys. Rev. Series 2023 A, 3.68% 10/31/23 (Liquidity Facility Univ. of Texas Invt. Mgmt. Co.), CP | | 100,000 | 99,985 |
TOTAL TEXAS | | | 1,815,083 |
| Virginia - 0.1% | | | |
| Virginia College Bldg. Auth. Edl. Facilities Rev. Bonds Series 2017 A, 5% 2/1/24 | | 125,000 | 125,378 |
| Washington - 1.2% | | | |
| Central Puget Sound Reg'l. Trans. Auth. Sales & Use Tax Rev. Bonds Series 2016 S1, 5% 11/1/23 | | 115,000 | 115,071 |
| King County #405 Bellevue School District Bonds (Washington St. School District Cr. Enhancement Prog.) Series 2016, 5% 12/1/23 (Washington Gen. Oblig. Guaranteed) | | 495,000 | 495,845 |
| King County Highline School District # 401 Bonds: | | | |
| Series 2022 B, 5% 12/1/23 (Washington Gen. Oblig. Guaranteed) | | 225,000 | 225,377 |
| Series 2023, 5% 12/1/23 (Washington Gen. Oblig. Guaranteed) | | 150,000 | 150,251 |
| King County School District 210 Bonds Series 2015, 4% 12/1/23 (Washington Gen. Oblig. Guaranteed) | | 145,000 | 145,018 |
| Port of Seattle Rev. Bonds Series 2022 B, 5% 8/1/24 (c) | | 195,000 | 196,149 |
TOTAL WASHINGTON | | | 1,327,711 |
| Wisconsin - 0.6% | | | |
| Wisconsin Gen. Oblig. Bonds: | | | |
| Series 2016 1, 5% 11/1/23 | | 100,000 | 100,076 |
| Series 2016 2, 5% 11/1/23 | | 205,000 | 205,156 |
| Series 2017 2, 5% 11/1/23 | | 100,000 | 100,076 |
| Series 2022 3, 5% 11/1/23 | | 100,000 | 100,076 |
| Wisconsin Health & Edl. Facilities Bonds Series 2018 B, 5%, tender 1/31/24 (b) | | 100,000 | 100,253 |
TOTAL WISCONSIN | | | 605,637 |
| TOTAL OTHER MUNICIPAL SECURITY (Cost $25,318,724) | | | 25,310,032 |
| | | | |
| Investment Company - 6.6% |
| | | Shares | Value ($) |
Fidelity Municipal Cash Central Fund 4.2% (i)(j) (Cost $7,329,874) | | 7,328,562 | 7,330,028 |
| | | | |
| TOTAL INVESTMENT IN SECURITIES - 101.1% (Cost $111,683,598) | 111,675,060 |
NET OTHER ASSETS (LIABILITIES) - (1.1)% | (1,231,448) |
| NET ASSETS - 100.0% | 110,443,612 |
| | |
Security Type Abbreviations
| BAN | - | BOND ANTICIPATION NOTE |
| CP | - | COMMERCIAL PAPER |
| TAN | - | TAX ANTICIPATION NOTE |
| VRDN | - | VARIABLE RATE DEMAND NOTE (A debt instrument that is payable upon demand, either daily, weekly or monthly) |
The date shown for securities represents the date when principal payments must be paid, taking into account any call options exercised by the issuer and any permissible maturity shortening features other than interest rate resets.
Legend
| (a) | Amount is stated in United States dollars unless otherwise noted. |
| (b) | Coupon rates for floating and adjustable rate securities reflect the rates in effect at period end. |
| (c) | Private activity obligations whose interest is subject to the federal alternative minimum tax for individuals. |
| (d) | Security exempt from registration under Rule 144A of the Securities Act of 1933. These securities may be resold in transactions exempt from registration, normally to qualified institutional buyers. At the end of the period, the value of these securities amounted to $4,900,000 or 4.4% of net assets. |
| (e) | Provides evidence of ownership in one or more underlying municipal bonds. |
| (f) | Coupon rates are determined by re-marketing agents based on current market conditions. |
| (g) | Restricted securities (including private placements) - Investment in securities not registered under the Securities Act of 1933 (excluding 144A issues). At the end of the period, the value of restricted securities (excluding 144A issues) amounted to $1,100,000 or 1.0% of net assets. |
| (h) | Coupon is indexed to a floating interest rate which may be multiplied by a specified factor and/or subject to caps or floors. |
| (i) | Information in this report regarding holdings by state and security types does not reflect the holdings of the Fidelity Municipal Cash Central Fund. |
| (j) | Affiliated fund that is generally available only to investment companies and other accounts managed by Fidelity Investments. The rate quoted is the annualized seven-day yield of the fund at period end. A complete unaudited listing of the fund's holdings as of its most recent quarter end is available upon request. In addition, each Fidelity Central Fund's financial statements are available on the SEC's website or upon request. |
| Additional information on each restricted holding is as follows: |
| Security | Acquisition Date | Cost ($) |
| Broward County Convention Ctr. Bonds Series MS 00 11, 3.83%, tender 11/2/23 (Liquidity Facility Morgan Stanley Bank, West Valley City Utah) | 1/19/23 | 600,000 |
| | | |
| Central Puget Sound Reg'l. Trans. Auth. Sales & Use Tax Rev. Bonds Series G 123, 4.18%, tender 11/1/23 (Liquidity Facility Royal Bank of Canada) | 2/09/23 | 100,000 |
| | | |
| Connecticut Spl. Tax Oblig. Trans. Infrastructure Rev. Bonds Series Floaters G 110, 4.16%, tender 10/5/23 (Liquidity Facility Royal Bank of Canada) | 4/01/21 | 200,000 |
| | | |
| Greater Orlando Aviation Auth. Arpt. Facilities Rev. Bonds Series Floaters G 25, 4.23%, tender 10/5/23 (Liquidity Facility Royal Bank of Canada) | 4/01/21 | 100,000 |
| | | |
| South Carolina Trans. Infrastructure Bank Rev. Bonds Series Floaters G 109, 4.18%, tender 10/5/23 (Liquidity Facility Royal Bank of Canada) | 4/01/21 | 100,000 |
| | | |
Affiliated Central Funds
Fiscal year to date information regarding the Fund's investments in Fidelity Central Funds, including the ownership percentage, is presented below.
| Affiliate | Value, beginning of period ($) | Purchases ($) | Sales Proceeds ($) | Dividend Income ($) | Realized Gain (loss) ($) | Change in Unrealized appreciation (depreciation) ($) | Value, end of period ($) | % ownership, end of period |
| Fidelity Municipal Cash Central Fund 4.42% | 7,744,028 | 36,832,000 | 37,246,000 | 154,514 | - | - | 7,330,028 | 0.3% |
| Total | 7,744,028 | 36,832,000 | 37,246,000 | 154,514 | - | - | 7,330,028 | |
| | | | | | | | | |
Amounts in the dividend income column in the above table include any capital gain distributions from underlying funds, which are presented in the corresponding line item in the Statement of Operations, if applicable.
Amounts included in the purchases and sales proceeds columns may include in-kind transactions, if applicable.
Investment Valuation
The following is a summary of the inputs used, as of September 30, 2023, involving the Fund's assets and liabilities carried at fair value. The inputs or methodology used for valuing securities may not be an indication of the risk associated with investing in those securities. For more information on valuation inputs, and their aggregation into the levels used below, please refer to the Investment Valuation section in the accompanying Notes to Financial Statements.
| Valuation Inputs at Reporting Date: |
| Description | Total ($) | Level 1 ($) | Level 2 ($) | Level 3 ($) |
Investments in Securities: | | | | |
|
| Variable Rate Demand Note | 62,060,000 | - | 62,060,000 | - |
|
| Tender Option Bond | 16,975,000 | - | 16,975,000 | - |
|
| Other Municipal Security | 25,310,032 | - | 25,310,032 | - |
|
| Investment Company | 7,330,028 | 7,330,028 | - | - |
| Total Investments in Securities: | 111,675,060 | 7,330,028 | 104,345,032 | - |
| Statement of Assets and Liabilities |
| | | | September 30, 2023 (Unaudited) |
| | | | | |
| Assets | | | | |
| Investment in securities, at value - See accompanying schedule: | | | | |
Unaffiliated issuers (cost $104,353,724) | $ | 104,345,032 | | |
Fidelity Central Funds (cost $7,329,874) | | 7,330,028 | | |
| | | | | |
| | | | | |
| Total Investment in Securities (cost $111,683,598) | | | $ | 111,675,060 |
| Receivable for investments sold | | | | 2,205,000 |
| Receivable for fund shares sold | | | | 223 |
| Interest receivable | | | | 834,585 |
| Distributions receivable from Fidelity Central Funds | | | | 19,412 |
| Prepaid expenses | | | | 199 |
| Receivable from investment adviser for expense reductions | | | | 4,194 |
| Other receivables | | | | 8 |
Total assets | | | | 114,738,681 |
| Liabilities | | | | |
| Payable to custodian bank | $ | 1,253,085 | | |
| Payable for investments purchased | | 1,017,291 | | |
| Payable for fund shares redeemed | | 1,988,423 | | |
| Accrued management fee | | 13,522 | | |
| Other payables and accrued expenses | | 22,748 | | |
| Total Liabilities | | | | 4,295,069 |
| Net Assets | | | $ | 110,443,612 |
| Net Assets consist of: | | | | |
| Paid in capital | | | $ | 110,477,818 |
| Total accumulated earnings (loss) | | | | (34,206) |
| Net Assets | | | $ | 110,443,612 |
Net Asset Value, offering price and redemption price per share ($110,443,612 ÷ 110,424,892 shares) | | | $ | 1.0002 |
| Statement of Operations |
| | | | Six months ended September 30, 2023 (Unaudited) |
| Investment Income | | | | |
| Interest | | | $ | 2,341,228 |
| Income from Fidelity Central Funds | | | | 154,514 |
| Total Income | | | | 2,495,742 |
| Expenses | | | | |
| Management fee | $ | 98,859 | | |
| Custodian fees and expenses | | 2,939 | | |
| Independent trustees' fees and expenses | | 273 | | |
| Registration fees | | 6,795 | | |
| Audit | | 20,713 | | |
| Legal | | 62 | | |
| Miscellaneous | | 238 | | |
| Total expenses before reductions | | 129,879 | | |
| Expense reductions | | (30,380) | | |
| Total expenses after reductions | | | | 99,499 |
| Net Investment income (loss) | | | | 2,396,243 |
| Realized and Unrealized Gain (Loss) | | | | |
| Net realized gain (loss) on: | | | | |
| Investment Securities: | | | | |
| Unaffiliated issuers | | (1,048) | | |
| Total net realized gain (loss) | | | | (1,048) |
| Change in net unrealized appreciation (depreciation) on investment securities | | | | (36,135) |
| Net gain (loss) | | | | (37,183) |
| Net increase in net assets resulting from operations | | | $ | 2,359,060 |
| Statement of Changes in Net Assets |
| |
| | Six months ended September 30, 2023 (Unaudited) | | Year ended March 31, 2023 |
| Increase (Decrease) in Net Assets | | | | |
| Operations | | | | |
| Net investment income (loss) | $ | 2,396,243 | $ | 5,336,986 |
| Net realized gain (loss) | | (1,048) | | (26,537) |
| Change in net unrealized appreciation (depreciation) | | (36,135) | | 209,645 |
Net increase in net assets resulting from operations | | 2,359,060 | | 5,520,094 |
| Distributions to shareholders | | (2,394,467) | | (5,339,450) |
| | | | | |
| Share transactions | | | | |
| Proceeds from sales of shares | | 11,905,930 | | 53,902,848 |
| Reinvestment of distributions | | 2,394,467 | | 5,339,450 |
| Cost of shares redeemed | | (64,305,677) | | (436,349,504) |
| | | | | |
Net increase (decrease) in net assets and shares resulting from share transactions | | (50,005,280) | | (377,107,206) |
| Total increase (decrease) in net assets | | (50,040,687) | | (376,926,562) |
| | | | | |
| Net Assets | | | | |
| Beginning of period | | 160,484,299 | | 537,410,861 |
| End of period | $ | 110,443,612 | $ | 160,484,299 |
| | | | | |
| Other Information | | | | |
| Shares | | | | |
| Sold | | 11,902,468 | | 53,885,181 |
| Issued in reinvestment of distributions | | 2,394,007 | | 5,337,763 |
| Redeemed | | (64,287,276) | | (436,220,379) |
| Net increase (decrease) | | (49,990,801) | | (376,997,435) |
| | | | | |
Financial Highlights
| Fidelity® SAI Municipal Money Market Fund |
| |
| | Six months ended (Unaudited) September 30, 2023 | | Years ended March 31, 2023 | | 2022 | | 2021 | | 2020 | | 2019 |
Selected Per-Share Data | | | | | | | | | | | | |
| Net asset value, beginning of period | $ | 1.0004 | $ | 1.0000 | $ | 1.0004 | $ | 1.0002 | $ | 1.0001 | $ | .9999 |
| Income from Investment Operations | | | | | | | | | | | | |
Net investment income (loss) A | | .0170 | | .0180 | | .0003 | | .0013 | | .0142 | | .0146 |
| Net realized and unrealized gain (loss) | | (.0002) | | .0004 | | (.0003) | | .0002 | | .0001 | | .0002 |
| Total from investment operations | | .0168 | | .0184 | | - | | .0015 | | .0143 | | .0148 |
| Distributions from net investment income | | (.0170) | | (.0180) | | (.0003) | | (.0013) | | (.0142) | | (.0146) |
| Distributions from net realized gain | | - | | - | | (.0001) | | (.0001) | | - | | - |
| Total distributions | | (.0170) | | (.0180) | | (.0004) | | (.0013) B | | (.0142) | | (.0146) |
| Net asset value, end of period | $ | 1.0002 | $ | 1.0004 | $ | 1.0000 | $ | 1.0004 | $ | 1.0002 | $ | 1.0001 |
Total Return C,D | | 1.69% | | 1.85% | | -% | | .15% | | 1.44% | | 1.49% |
Ratios to Average Net Assets A,E,F | | | | | | | | | | | | |
| Expenses before reductions | | .18% G | | .16% | | .16% | | .16% | | .19% | | .21% |
| Expenses net of fee waivers, if any | | .14% G | | .14% | | .09% | | .12% | | .14% | | .14% |
| Expenses net of all reductions | | .14% G | | .14% | | .09% | | .12% | | .14% | | .14% |
| Net investment income (loss) | | 3.38% G | | 1.57% | | .03% | | .08% | | 1.41% | | 1.46% |
| Supplemental Data | | | | | | | | | | | | |
| Net assets, end of period (000 omitted) | $ | 110,444 | $ | 160,484 | $ | 537,411 | $ | 445,828 | $ | 134,798 | $ | 295,510 |
ANet investment income (loss) is affected by the timing of the declaration of dividends by any underlying mutual funds or exchange-traded funds (ETFs). Net investment income (loss) of any mutual funds or ETFs is not included in the Fund's net investment income (loss) ratio.
BTotal distributions per share do not sum due to rounding.
CTotal returns for periods of less than one year are not annualized.
DTotal returns would have been lower if certain expenses had not been reduced during the applicable periods shown.
EFees and expenses of any underlying mutual funds or exchange-traded funds (ETFs) are not included in the Fund's expense ratio. The Fund indirectly bears its proportionate share of these expenses. For additional expense information related to investments in Fidelity Central Funds, please refer to the "Investments in Fidelity Central Funds" note found in the Notes to Financial Statements section of the most recent Annual or Semi-Annual report.
FExpense ratios reflect operating expenses of the class. Expenses before reductions do not reflect amounts reimbursed, waived, or reduced through arrangements with the investment adviser, brokerage services, or other offset arrangements, if applicable, and do not represent the amount paid by the class during periods when reimbursements, waivers or reductions occur.
GAnnualized.
For the period ended September 30, 2023
1. Organization.
Fidelity SAI Municipal Money Market Fund (the Fund) is a fund of Fidelity Salem Street Trust (the Trust) and is authorized to issue an unlimited number of shares. Shares are offered exclusively to certain clients of Fidelity Management & Research Company LLC (FMR) or its affiliates. The Trust is registered under the Investment Company Act of 1940, as amended (the 1940 Act), as an open-end management investment company organized as a Massachusetts business trust. The Fund has been designated an institutional money market fund, and the value of the Fund's shares are calculated to four decimal places that fluctuates based upon changes in the value of the Fund's investments.
2. Investments in Fidelity Central Funds.
Funds may invest in Fidelity Central Funds, which are open-end investment companies generally available only to other investment companies and accounts managed by the investment adviser and its affiliates. The Schedule of Investments lists any Fidelity Central Funds held as an investment as of period end, but does not include the underlying holdings of each Fidelity Central Fund. An investing fund indirectly bears its proportionate share of the expenses of the underlying Fidelity Central Funds.
Based on its investment objective, each Fidelity Central Fund may invest or participate in various investment vehicles or strategies that are similar to those of the investing fund. These strategies are consistent with the investment objectives of the investing fund and may involve certain economic risks which may cause a decline in value of each of the Fidelity Central Funds and thus a decline in the value of the investing fund.
| Fidelity Central Fund | Investment Manager | Investment Objective | Investment Practices | Expense RatioA |
| Fidelity Money Market Central Funds | Fidelity Management & Research Company LLC (FMR) | Each fund seeks to obtain a high level of current income consistent with the preservation of capital and liquidity. | Short-term Investments | Less than .005% |
A Expenses expressed as a percentage of average net assets and are as of each underlying Central Fund's most recent annual or semi-annual shareholder report.
A complete unaudited list of holdings for each Fidelity Central Fund is available upon request or at the Securities and Exchange Commission website at www.sec.gov. In addition, the financial statements of the Fidelity Central Funds which contain the significant accounting policies (including investment valuation policies) of those funds, and are not covered by the Report of Independent Registered Public Accounting Firm, are available on the Securities and Exchange Commission website or upon request.
3. Significant Accounting Policies.
The Fund is an investment company and applies the accounting and reporting guidance of the Financial Accounting Standards Board (FASB) Accounting Standards Codification Topic 946 Financial Services - Investment Companies. The financial statements have been prepared in conformity with accounting principles generally accepted in the United States of America (GAAP), which require management to make certain estimates and assumptions at the date of the financial statements. Actual results could differ from those estimates. Subsequent events, if any, through the date that the financial statements were issued have been evaluated in the preparation of the financial statements. The Fund's Schedule of Investments lists any underlying mutual funds or exchange-traded funds (ETFs) but does not include the underlying holdings of these funds. The following summarizes the significant accounting policies of the Fund:
Investment Valuation. Investments are valued as of 4:00 p.m. Eastern time on the last calendar day of the period. The Board of Trustees (the Board) has designated the Fund's investment adviser as the valuation designee responsible for the fair valuation function and performing fair value determinations as needed. The investment adviser has established a Fair Value Committee (the Committee) to carry out the day-to-day fair valuation responsibilities and has adopted policies and procedures to govern the fair valuation process and the activities of the Committee. In accordance with these fair valuation policies and procedures, which have been approved by the Board, the Fund attempts to obtain prices from one or more third party pricing services or brokers to value its investments. When current market prices, quotations or currency exchange rates are not readily available or reliable, investments will be fair valued in good faith by the Committee, in accordance with the policies and procedures. Factors used in determining fair value vary by investment type and may include market or investment specific events, transaction data, estimated cash flows, and market observations of comparable investments. The frequency that the fair valuation procedures are used cannot be predicted and they may be utilized to a significant extent. The Committee manages the Fund's fair valuation practices and maintains the fair valuation policies and procedures. The Fund's investment adviser reports to the Board information regarding the fair valuation process and related material matters.
The Fund categorizes the inputs to valuation techniques used to value its investments into a disclosure hierarchy consisting of three levels as shown below:
Level 1 - unadjusted quoted prices in active markets for identical investments
Level 2 - other significant observable inputs (including quoted prices for similar investments, interest rates, prepayment speeds, etc.)
Level 3 - unobservable inputs (including the Fund's own assumptions based on the best information available)
Valuation techniques used to value the Fund's investments by major category are as follows:
Debt securities, including restricted securities, are valued based on evaluated prices received from third party pricing services or from brokers who make markets in such securities. Municipal securities are valued by pricing services who utilize matrix pricing which considers yield or price of bonds of comparable quality, coupon, maturity and type or by broker-supplied prices. When independent prices are unavailable or unreliable, debt securities may be valued utilizing pricing methodologies which consider similar factors that would be used by third party pricing services. Debt securities are generally categorized as Level 2 in the hierarchy but may be Level 3 depending on the circumstances.
Investments in the Fidelity Central Funds are valued at their closing net asset value (NAV) each business day and are categorized as Level 1 in the hierarchy.
Securities held by a money market fund are generally high quality and liquid; however, they are reflected as Level 2 because the inputs used to determine fair value are not quoted prices in an active market.
The aggregate value of investments by input level as of September 30, 2023 is included at the end of the Fund's Schedule of Investments.
Investment Transactions and Income. The net asset value per share for processing shareholder transactions is calculated as of the close of business of the New York Stock Exchange (NYSE), normally 4:00 p.m. Eastern time. Security transactions, including the Fund's investment activity in the Fidelity Central Funds, are accounted for as of trade date. Gains and losses on securities sold are determined on the basis of identified cost. Income and capital gain distributions from Fidelity Central Funds, if any, are recorded on the ex-dividend date. Interest income is accrued as earned and includes coupon interest and amortization of premium and accretion of discount on debt securities as applicable.
Expenses. Expenses directly attributable to a fund are charged to that fund. Expenses attributable to more than one fund are allocated among the respective funds on the basis of relative net assets or other appropriate methods. Expenses included in the accompanying financial statements reflect the expenses of that fund and do not include any expenses associated with any underlying mutual funds or exchange-traded funds. Although not included in a fund's expenses, a fund indirectly bears its proportionate share of these expenses through the net asset value of each underlying mutual fund or exchange-traded fund. Expense estimates are accrued in the period to which they relate and adjustments are made when actual amounts are known.
Income Tax Information and Distributions to Shareholders. Each year, the Fund intends to qualify as a regulated investment company under Subchapter M of the Internal Revenue Code, including distributing substantially all of its taxable income and realized gains. As a result, no provision for U.S. Federal income taxes is required. The Fund files a U.S. federal tax return, in addition to state and local tax returns as required. The Fund's federal income tax returns are subject to examination by the Internal Revenue Service (IRS) for a period of three fiscal years after they are filed. State and local tax returns may be subject to examination for an additional fiscal year depending on the jurisdiction.
Distributions are declared and recorded daily and paid monthly from net investment income. Distributions from realized gains, if any, are declared and recorded on the ex-dividend date. Income and capital gain distributions are determined in accordance with income tax regulations, which may differ from GAAP.
Capital accounts within the financial statements are adjusted for permanent book-tax differences. These adjustments have no impact on net assets or the results of operations. Capital accounts are not adjusted for temporary book-tax differences which will reverse in a subsequent period.
Book-tax differences are primarily due to capital loss carryforwards.
The Fund purchases municipal securities whose interest, in the opinion of the issuer, is free from federal income tax. There is no assurance that the IRS will agree with this opinion. In the event the IRS determines that the issuer does not comply with relevant tax requirements, interest payments from a security could become federally taxable, possibly retroactively to the date the security was issued.
As of period end, the cost and unrealized appreciation (depreciation) in securities for federal income tax purposes were as follows:
| Gross unrealized appreciation | $1,481 |
| Gross unrealized depreciation | (10,019) |
| Net unrealized appreciation (depreciation) | $(8,538) |
| Tax cost | $111,683,598 |
Capital loss carryforwards are only available to offset future capital gains of the Fund to the extent provided by regulations and may be limited. The capital loss carryforward information presented below, including any applicable limitation, is estimated as of prior fiscal period end and is subject to adjustment.
Short-term | $(26,476) |
Long-term | - |
| Total capital loss carryforward | $(26,476) |
Restricted Securities (including Private Placements). Funds may invest in securities that are subject to legal or contractual restrictions on resale. These securities generally may be resold in transactions exempt from registration or to the public if the securities are registered. Disposal of these securities may involve time-consuming negotiations and expense, and prompt sale at an acceptable price may be difficult. Information regarding restricted securities held at period end is included at the end of the Schedule of Investments, if applicable.
4. Fees and Other Transactions with Affiliates.
Management Fee. Fidelity Management & Research Company LLC (the investment adviser) and its affiliates provide the Fund with investment management related services for which the Fund pays a monthly management fee that is based on an annual rate of .14% of the Fund's average net assets.
Interfund Trades. Funds may purchase from or sell securities to other Fidelity Funds under procedures adopted by the Board. The procedures have been designed to ensure these interfund trades are executed in accordance with Rule 17a-7 of the 1940 Act. Interfund trades during the period are noted in the table below.
| | Purchases ($) | Sales ($) | Realized Gain (Loss) ($) |
| Fidelity SAI Municipal Money Market Fund | 513,344 | 27,510,000 | - |
5. Expense Reductions.
The investment adviser contractually agreed to reimburse the Fund to the extent annual operating expenses exceeded .14% of average net assets. This reimbursement will remain in place through July 31, 2024. Some expenses, for example the compensation of the independent Trustees, and certain miscellaneous expenses such as proxy and shareholder meeting expenses, are excluded from this reimbursement. During the period this reimbursement reduced the Fund's expenses by $30,380.
6. Other.
A fund's organizational documents provide former and current trustees and officers with a limited indemnification against liabilities arising in connection with the performance of their duties to the fund. In the normal course of business, a fund may also enter into contracts that provide general indemnifications. A fund's maximum exposure under these arrangements is unknown as this would be dependent on future claims that may be made against a fund. The risk of material loss from such claims is considered remote.
At the end of the period, the following mutual funds managed by the investment adviser or its affiliates were the owners of record of 10% or more of the total outstanding shares.
| | Strategic Advisers Tax-Sensitive Short Duration Fund |
| Fidelity SAI Municipal Money Market Fund | 99% |
Mutual funds managed by the investment adviser or its affiliates, in aggregate, were the owners of record of more than 20% of the total outstanding shares.
| Fund | % of shares held |
| Fidelity SAI Municipal Money Market Fund | 100% |
7. Risk and Uncertainties.
Many factors affect a fund's performance. Developments that disrupt global economies and financial markets, such as pandemics, epidemics, outbreaks of infectious diseases, war, terrorism, and environmental disasters, may significantly affect a fund's investment performance. The effects of these developments to a fund will be impacted by the types of securities in which a fund invests, the financial condition, industry, economic sector, and geographic location of an issuer, and a fund's level of investment in the securities of that issuer. Significant concentrations in security types, issuers, industries, sectors, and geographic locations may magnify the factors that affect a fund's performance.
As a shareholder, you incur two types of costs: (1) transaction costs, which may include sales charges (loads) on purchase payments or redemption proceeds, as applicable and (2) ongoing costs, which generally include management fees, distribution and/or service (12b-1) fees and other Fund expenses. This Example is intended to help you understand your ongoing costs (in dollars) of investing in a fund and to compare these costs with the ongoing costs of investing in other mutual funds.
| The Example is based on an investment of $1,000 invested at the beginning of the period and held for the entire period (April 1, 2023 to September 30, 2023). |
Actual Expenses
The first line of the accompanying table provides information about actual account values and actual expenses. You may use the information in this line, together with the amount you invested, to estimate the expenses that you paid over the period. Simply divide your account value by $1,000.00 (for example, an $8,600 account value divided by $1,000.00 = 8.6), then multiply the result by the number in the first line for a class/Fund under the heading entitled "Expenses Paid During Period" to estimate the expenses you paid on your account during this period. If any fund is a shareholder of any underlying mutual funds or exchange-traded funds (ETFs) (the Underlying Funds), such fund indirectly bears its proportional share of the expenses of the Underlying Funds in addition to the direct expenses incurred presented in the table. These fees and expenses are not included in the annualized expense ratio used to calculate the expense estimate in the table below.
Hypothetical Example for Comparison Purposes
The second line of the accompanying table provides information about hypothetical account values and hypothetical expenses based on the actual expense ratio and an assumed rate of return of 5% per year before expenses, which is not the actual return. The hypothetical account values and expenses may not be used to estimate the actual ending account balance or expenses you paid for the period. You may use this information to compare the ongoing costs of investing in the Fund and other funds. To do so, compare this 5% hypothetical example with the 5% hypothetical examples that appear in the shareholder reports of the other funds. If any fund is a shareholder of any Underlying Funds, such fund indirectly bears its proportional share of the expenses of the Underlying Funds in addition to the direct expenses as presented in the table. These fees and expenses are not included in the annualized expense ratio used to calculate the expense estimate in the table below.
Please note that the expenses shown in the table are meant to highlight your ongoing costs only and do not reflect any transaction costs. Therefore, the second line of the table is useful in comparing ongoing costs only, and will not help you determine the relative total costs of owning different funds. In addition, if these transactional costs were included, your costs would have been higher.
| | | | | Annualized Expense Ratio- A | | Beginning Account Value April 1, 2023 | | Ending Account Value September 30, 2023 | | Expenses Paid During Period- C April 1, 2023 to September 30, 2023 |
| | | | | | | | | | |
| Fidelity® SAI Municipal Money Market Fund | | | | .14% | | | | | | |
| Actual | | | | | | $ 1,000 | | $ 1,016.90 | | $ .71 |
Hypothetical-B | | | | | | $ 1,000 | | $ 1,024.30 | | $ .71 |
| |
A Annualized expense ratio reflects expenses net of applicable fee waivers.
B 5% return per year before expenses
C Expenses are equal to the annualized expense ratio, multiplied by the average account value over the period, multiplied by 183/ 366 (to reflect the one-half year period). The fees and expenses of any Underlying Funds are not included in each annualized expense ratio.
Board Approval of Investment Advisory Contracts and Management Fees
Fidelity SAI Municipal Money Market Fund
Each year, the Board of Trustees, including the Independent Trustees (together, the Board), considers the renewal of the fund's management contract with Fidelity Management & Research Company LLC (FMR) and the sub-advisory agreements (together, the Advisory Contracts) for the fund. FMR and the sub-advisers are referred to herein as the Investment Advisers. The Board, assisted by the advice of fund counsel and Independent Trustees' counsel, requests and considers a broad range of information relevant to the renewal of the Advisory Contracts throughout the year.
The Board meets regularly and, at each of its meetings, covers an extensive agenda of topics and materials and considers factors that are relevant to its annual consideration of the renewal of the fund's Advisory Contracts, including the services and support provided to the fund and its shareholders. The Board's Operations Committee, of which all the Independent Trustees are members, meets regularly throughout the year and requests, receives and considers, among other matters, information related to the annual consideration of the renewal of the fund's Advisory Contracts before making its recommendation to the Board. The Board also meets as needed to review matters specifically related to the Board's annual consideration of the renewal of the Advisory Contracts. Members of the Board may also meet from time to time with trustees of other Fidelity funds through joint ad hoc committees to discuss certain matters relevant to all of the Fidelity funds.
At its September 2023 meeting, the Board unanimously determined to renew the fund's Advisory Contracts. In reaching its determination, the Board considered all factors it believed relevant, including (i) the nature, extent, and quality of the services provided to the fund and its shareholders (including the investment performance of the fund); (ii) the competitiveness relative to peer funds of the fund's management fee and total expense ratio; (iii) the total costs of the services provided by and the profits realized by FMR and its affiliates (Fidelity) from its relationships with the fund; and (iv) the extent to which, if any, economies of scale exist and are realized as the fund grows, and whether any economies of scale are appropriately shared with fund shareholders. The Board also considered the broad range of investment choices available to shareholders from FMR's competitors and that the fund's shareholders have chosen to invest in the fund, which is part of the Fidelity family of funds. The Board's decision to renew the Advisory Contracts was not based on any single factor.
The Board reached a determination, with the assistance of fund counsel and Independent Trustees' counsel and through the exercise of its business judgment, that the renewal of the Advisory Contracts was in the best interests of the fund and its shareholders and that the compensation payable under the Advisory Contracts was fair and reasonable in light of all of the surrounding circumstances.
Nature, Extent, and Quality of Services Provided. The Board considered the Investment Advisers' staffing as it relates to the fund, including the backgrounds and experience of investment personnel, and also considered the Investment Advisers' implementation of the fund's investment program. The Independent Trustees also had discussions with senior management of Fidelity's investment operations and investment groups. The Board considered the structure of the investment personnel compensation program and whether this structure provides appropriate incentives to act in the best interests of the fund. Additionally, the Board considered the portfolio managers' investments, if any, in the funds that they manage.
Resources Dedicated to Investment Management and Support Services. The Board reviewed the general qualifications and capabilities of Fidelity's investment staff, including its size, education, experience, and resources, as well as Fidelity's approach to recruiting, managing, training, and compensating investment personnel. The Board noted the resources devoted to Fidelity's global investment organization, and that Fidelity's analysts have extensive resources, tools and capabilities that allow them to conduct quantitative and fundamental analysis, as well as credit analysis of issuers, counterparties and guarantors. Further, the Board considered that Fidelity's investment professionals have sufficient access to global information and data so as to provide competitive investment results over time, and that those professionals also have access to sophisticated tools that permit them to assess portfolio construction and risk and performance attribution characteristics continuously, as well as to transmit new information and research conclusions rapidly around the world. Additionally, in its deliberations, the Board considered Fidelity's trading, risk management, compliance, cybersecurity, and technology and operations capabilities and resources, which are integral parts of the investment management process.
Shareholder and Administrative Services. The Board considered (i) the nature, extent, quality, and cost of advisory, administrative, and shareholder services performed by the Investment Advisers and their affiliates under the Advisory Contracts and under separate agreements covering transfer agency and pricing and bookkeeping services for the fund; (ii) the nature and extent of Fidelity's supervision of third party service providers, principally custodians, subcustodians, and pricing vendors; and (iii) the resources devoted by Fidelity to, and the record of compliance with, the fund's compliance policies and procedures.
The Board noted that the growth of fund assets over time across the complex allows Fidelity to reinvest in the development of services designed to enhance the value and convenience of the Fidelity funds as investment vehicles. These services include 24-hour access to account information and market information over the Internet and through telephone representatives, investor education materials and asset allocation tools. The Board also considered that it reviews customer service metrics such as telephone response times, continuity of services on the website and metrics addressing services at Fidelity Investor Centers.
Investment in a Large Fund Family. The Board considered the benefits to shareholders of investing in a fund that is part of a large family of funds offering a variety of investment disciplines and providing a large variety of fund investor services. The Board noted that Fidelity had taken, or had made recommendations to the Board that resulted in the Fidelity funds taking, a number of actions over the previous year that benefited particular funds and/or the Fidelity funds in general.
Investment Performance. The Board took into account discussions with representatives of the Investment Advisers that occur, and reports that it receives, at Board meetings throughout the year relating to fund investment performance. In this regard, the Board noted that as part of regularly scheduled fund reviews and other reports to the Board on fund performance, the Board considered annualized return information for the fund for different time periods, measured against an appropriate peer group of funds with similar objectives (peer group). In its evaluation of fund investment performance at meetings throughout the year, the Board gave particular attention to information indicating underperformance of certain Fidelity funds over different time periods and discussed with the Investment Advisers the reasons for such underperformance.
In addition to reviewing absolute and relative fund performance, the Independent Trustees periodically consider the appropriateness of fund performance metrics in evaluating the results achieved. The Independent Trustees generally give greater weight to fund performance over longer time periods than over shorter time periods.
The Board recognizes that in interest rate environments where many competitors waive fees to maintain a minimum yield, relative money market fund performance on a net basis (after fees and expenses) may not be particularly meaningful due to miniscule performance differences among competitor funds. Depending on the circumstances, the Independent Trustees may be satisfied with a fund's performance notwithstanding that it lags its peer group for certain periods.
Based on its review, the Board concluded that the nature, extent, and quality of services provided to the fund under the Advisory Contracts should continue to benefit the shareholders of the fund.
Competitiveness of Management Fee and Total Expense Ratio. The Board was provided with information regarding industry trends in management fees and expenses. In its review of the fund's management fee and total expense ratio, the Board considered the fund's management fee rate as well as other fund or class expenses, as applicable, such as transfer agent fees, pricing and bookkeeping fees, and custodial, legal, and audit fees. The Board also noted that Fidelity may agree to waive fees or reimburse expenses from time to time, and the extent to which, if any, it has done so for the fund.
Comparisons of Management Fees and Total Expense Ratios. Among other things, the Board reviewed data for selected groups of competitive funds and classes (referred to as "mapped groups") that were compiled by Fidelity based on combining similar investment objective categories (as classified by Lipper) that have comparable investment mandates. The data reviewed by the Board included (i) gross management fee comparisons (before taking into account expense reimbursements or caps) relative to the total universe of funds within the mapped group; (ii) gross management fee comparisons relative to a subset of non-Fidelity funds in the mapped group that are similar in size and management fee structure to the fund (referred to as the "asset size peer group"); (iii) total expense comparisons of the fund relative to funds and classes in the mapped group that have a similar sales load structure to the fund (referred to as the "similar sales load structure group"); and (iv) total expense comparisons of the fund relative to funds and classes in the similar sales load structure group that are similar in size and management fee structure to the fund (referred to as the "total expense asset size peer group").
The information provided to the Board indicated that the fund's management fee rate ranked below the competitive median of the mapped group for 2022 and below the competitive median of the asset size peer group for 2022. Further, the information provided to the Board indicated that the total expense ratio of the fund ranked below the competitive median of the similar sales load structure group for 2022 and above the competitive median of the total expense asset size peer group for 2022.
In the information provided to the Board, Fidelity noted that competitor comparisons for money market funds are challenging in part due to the frequent imposition of reimbursements and waivers on money market funds in recent years. The Board considered that Fidelity believes that excluding fee waivers and reimbursements provides a better total expense comparison until such waivers are less prevalent in competitor data. When fee waivers and reimbursements are excluded from competitor data, the fund's total expense ratio ranked below the total expense asset size peer group competitive median for 2022.
Other Contractual Arrangements. The Board further considered that FMR has contractually agreed to reimburse the fund to the extent that total operating expenses, with certain exceptions, as a percentage of its average net assets, exceed 0.14% through July 31, 2024.
Fees Charged to Other Fidelity Clients. The Board also considered Fidelity fee structures and other information with respect to clients of Fidelity, such as other funds advised or subadvised by Fidelity, pension plan clients, and other institutional clients with similar mandates. The Board noted that a joint ad hoc committee created by it and the boards of other Fidelity funds periodically reviews and compares Fidelity's institutional investment advisory business with its business of providing services to the Fidelity funds and also noted the most recent findings of the committee. The Board noted that the committee's review included a consideration of the differences in services provided, fees charged, and costs incurred, as well as competition in the markets serving the different categories of clients.
Based on its review, the Board concluded that the fund's management fee is fair and reasonable in light of the services that the fund receives and the other factors considered. Further, based on its review of total expense ratios and fees charged to other Fidelity clients, the Board concluded that the fund's total expense ratio was reasonable in light of the services that the fund and its shareholders receive and the other factors considered.
Costs of the Services and Profitability. The Board considered the revenues earned and the expenses incurred by Fidelity in conducting the business of developing, marketing, distributing, managing, administering and servicing the fund and servicing the fund's shareholders. The Board also considered the level of Fidelity's profits in respect of all the Fidelity funds.
On an annual basis, Fidelity presents to the Board information about the profitability of its relationships with the fund. Fidelity calculates profitability information for each fund, as well as aggregate profitability information for groups of Fidelity funds and all Fidelity funds, using a series of detailed revenue and cost allocation methodologies which originate with the books and records of Fidelity on which Fidelity's audited financial statements are based. The Audit Committee of the Board reviews any significant changes from the prior year's methodologies and the full Board approves such changes.
A public accounting firm has been engaged annually by the Board as part of the Board's assessment of Fidelity's profitability analysis. The engagement includes the review and assessment of the methodologies used by Fidelity in determining the revenues and expenses attributable to Fidelity's fund business, and completion of agreed-upon procedures in respect of the mathematical accuracy of certain fund profitability information and its conformity to established allocation methodologies. After considering the reports issued under the engagement and information provided by Fidelity, the Board concluded that while other allocation methods may also be reasonable, Fidelity's profitability methodologies are reasonable in all material respects.
The Board also reviewed Fidelity's non-fund businesses and potential indirect benefits such businesses may have received as a result of their association with Fidelity's fund business (i.e., fall-out benefits) as well as cases where Fidelity's affiliates may benefit from the funds' business. The Board considered areas where potential indirect benefits to the Fidelity funds from their relationships with Fidelity may exist. The Board's consideration of these matters was informed by the findings of a joint ad hoc committee created by it and the boards of other Fidelity funds to evaluate potential fall-out benefits.
The Board considered the costs of the services provided by and the profits realized by Fidelity in connection with the operation of the fund and was satisfied that the profitability was not excessive.
Economies of Scale. The Board considered whether there have been economies of scale in respect of the management of the Fidelity funds, whether the Fidelity funds (including the fund) have appropriately benefited from any such economies of scale, and whether there is potential for realization of any further economies of scale. The Board considered the extent to which the fund will benefit from economies of scale as assets grow through increased services to the fund, through waivers or reimbursements, or through fee or expense ratio reductions. The Board also noted that a committee created by it and the boards of other Fidelity funds periodically analyzes whether Fidelity attains economies of scale in respect of the management and servicing of the Fidelity funds, whether the Fidelity funds have appropriately benefited from such economies of scale, and whether there is potential for realization of any further economies of scale.
The Board concluded, taking into account the analysis of the committee, that economies of scale, if any, are being appropriately shared between fund shareholders and Fidelity.
Additional Information Requested by the Board. In order to develop fully the factual basis for consideration of the Fidelity funds' advisory contracts, the Board requested and received additional information on certain topics, including: (i) Fidelity's fund profitability methodology, profitability trends for certain funds, the allocation of various costs to different funds, and the impact of certain factors on fund profitability results; (ii) portfolio manager changes that have occurred during the past year and Fidelity's views regarding portfolio manager investment in the Fidelity funds that they manage; (iii) hiring, training, and retaining personnel; (iv) the arrangements with and compensation paid to certain fund sub-advisers and the treatment of such compensation within Fidelity's fund profitability methodology; (v) the terms of the funds' various management fee structures, including the basic group fee and the terms of Fidelity's voluntary expense limitation arrangements; (vi) Fidelity's transfer agent, pricing and bookkeeping fees, expense and service structures for different funds and classes relative to competitive trends and market conditions; (vii) the impact on fund profitability of recent industry trends, such as the growth in passively managed funds and the changes in flows for different types of funds; (viii) the types of management fee and total expense comparisons provided, and the challenges and limitations associated with such information; (ix) explanations regarding the relative total expense ratios and management fees of certain funds and classes, total expense and management fee competitive trends, and methodologies for total expense and management fee competitive comparisons; (x) information concerning expense limitations applicable to certain funds; and (xi) matters related to money market funds, exchange-traded funds, and target date funds.
Conclusion. Based on its evaluation of all of the conclusions noted above, and after considering all factors it believed relevant, the Board, including the Independent Trustees, concluded that the advisory and sub-advisory fee arrangements are fair and reasonable in light of all of the surrounding circumstances and that the fund's Advisory Contracts should be renewed through September 30, 2024.
1.9885509.105
OMM-SANN-1123
Item 2.
Code of Ethics
Not applicable.
Item 3.
Audit Committee Financial Expert
Not applicable.
Item 4.
Principal Accountant Fees and Services
Not applicable.
Item 5.
Audit Committee of Listed Registrants
Not applicable.
Item 6.
Investments
(a)
Not applicable.
(b)
Not applicable
Item 7.
Disclosure of Proxy Voting Policies and Procedures for Closed-End Management Investment Companies
Not applicable.
Item 8.
Portfolio Managers of Closed-End Management Investment Companies
Not applicable.
Item 9.
Purchase of Equity Securities by Closed-End Management Investment Company and Affiliated Purchasers
Not applicable.
Item 10.
Submission of Matters to a Vote of Security Holders
There were no material changes to the procedures by which shareholders may recommend nominees to the Fidelity Salem Street Trust’s Board of Trustees.
Item 11.
Controls and Procedures
(a)(i) The President and Treasurer and the Chief Financial Officer have concluded that the Fidelity Salem Street Trust’s (the “Trust”) disclosure controls and procedures (as defined in Rule 30a-3(c) under the Investment Company Act) provide reasonable assurances that material information relating to the Trust is made known to them by the appropriate persons, based on their evaluation of these controls and procedures as of a date within 90 days of the filing date of this report.
(a)(ii) There was no change in the Trust’s internal control over financial reporting (as defined in Rule 30a-3(d) under the Investment Company Act) that occurred during the period covered by this report that has materially affected, or is reasonably likely to materially affect, the Trust’s internal control over financial reporting.
Item 12.
Disclosure of Securities Lending Activities for Closed-End Management
Investment Companies
Not applicable.
Item 13.
Exhibits
SIGNATURES
Pursuant to the requirements of the Securities Exchange Act of 1934 and the Investment Company Act of 1940, the registrant has duly caused this report to be signed on its behalf by the undersigned, thereunto duly authorized.
Fidelity Salem Street Trust
| |
By: | /s/Laura M. Del Prato |
| Laura M. Del Prato |
| President and Treasurer |
|
|
Date: | November 21, 2023 |
Pursuant to the requirements of the Securities Exchange Act of 1934 and the Investment Company Act of 1940, this report has been signed below by the following persons on behalf of the registrant and in the capacities and on the dates indicated.
| |
By: | /s/Laura M. Del Prato |
| Laura M. Del Prato |
| President and Treasurer |
|
|
Date: | November 21, 2023 |
| |
By: | /s/John J. Burke III |
| John J. Burke III |
| Chief Financial Officer |
|
|
Date: | November 21, 2023 |