Fidelity® Defined Maturity Funds Fidelity® Municipal Income 2019 Fund
Fidelity® Municipal Income 2021 Fund
Fidelity® Municipal Income 2023 Fund
Fidelity® Municipal Income 2025 Fund
Annual Report June 30, 2019 Includes Fidelity and Fidelity Advisor share classes |
 |
Beginning on January 1, 2021, as permitted by regulations adopted by the Securities and Exchange Commission, paper copies of a fund’s shareholder reports will no longer be sent by mail, unless you specifically request paper copies of the reports from the fund or from your financial intermediary, such as a financial advisor, broker-dealer or bank. Instead, the reports will be made available on a website, and you will be notified by mail each time a report is posted and provided with a website link to access the report.
If you already elected to receive shareholder reports electronically, you will not be affected by this change and you need not take any action. You may elect to receive shareholder reports and other communications from a fund electronically, by contacting your financial intermediary. For Fidelity customers, visit Fidelity's web site or call Fidelity using the contact information listed below.
You may elect to receive all future reports in paper free of charge. If you wish to continue receiving paper copies of your shareholder reports, you may contact your financial intermediary or, if you are a Fidelity customer, visit Fidelity’s website, or call Fidelity at the applicable toll-free number listed below. Your election to receive reports in paper will apply to all funds held with the fund complex/your financial intermediary.
| Account Type | Website | Phone Number |
| Brokerage, Mutual Fund, or Annuity Contracts: | fidelity.com/mailpreferences | 1-800-343-3548 |
| Employer Provided Retirement Accounts: | netbenefits.fidelity.com/preferences (choose 'no' under Required Disclosures to continue to print) | 1-800-343-0860 |
| Advisor Sold Accounts Serviced Through Your Financial Intermediary: | Contact Your Financial Intermediary | Your Financial Intermediary's phone number |
| Advisor Sold Accounts Serviced by Fidelity: | institutional.fidelity.com | 1-877-208-0098 |
Contents
To view a fund's proxy voting guidelines and proxy voting record for the 12-month period ended June 30, visit http://www.fidelity.com/proxyvotingresults or visit the Securities and Exchange Commission's (SEC) web site at http://www.sec.gov.
You may also call 1-800-544-8544 if you’re an individual investing directly with Fidelity, call 1-800-835-5092 if you’re a plan sponsor or participant with Fidelity as your recordkeeper or call 1-877-208-0098 on institutional accounts or if you’re an advisor or invest through one to request a free copy of the proxy voting guidelines.
Standard & Poor's, S&P and S&P 500 are registered service marks of The McGraw-Hill Companies, Inc. and have been licensed for use by Fidelity Distributors Corporation.
Other third-party marks appearing herein are the property of their respective owners.
All other marks appearing herein are registered or unregistered trademarks or service marks of FMR LLC or an affiliated company. © 2019 FMR LLC. All rights reserved.
This report and the financial statements contained herein are submitted for the general information of the shareholders of the Funds. This report is not authorized for distribution to prospective investors in the Funds unless preceded or accompanied by an effective prospectus.
A fund files its complete schedule of portfolio holdings with the SEC for the first and third quarters of each fiscal year on Form N-PORT. Forms N-PORT are available on the SEC’s web site at http://www.sec.gov. A fund's Forms N-PORT may be reviewed and copied at the SEC’s Public Reference Room in Washington, DC. Information regarding the operation of the SEC's Public Reference Room may be obtained by calling 1-800-SEC-0330.
For a complete list of a fund's portfolio holdings, view the most recent holdings listing, semiannual report, or annual report on Fidelity's web site at http://www.fidelity.com, http://www.institutional.fidelity.com, or http://www.401k.com, as applicable.
NOT FDIC INSURED •MAY LOSE VALUE •NO BANK GUARANTEE
Neither the Funds nor Fidelity Distributors Corporation is a bank.
Fidelity® Municipal Income 2019 Fund
Performance: The Bottom Line
Average annual total return reflects the change in the value of an investment, assuming reinvestment of distributions from dividend income and capital gains (the profits earned upon the sale of securities that have grown in value, if any) and assuming a constant rate of performance each year. The hypothetical investment and the average annual total returns do not reflect the deduction of taxes that a shareholder would pay on fund distributions or the redemption of fund shares. During periods of reimbursement by Fidelity, a fund’s total return will be greater than it would be had the reimbursement not occurred. How a fund did yesterday is no guarantee of how it will do tomorrow.
Average Annual Total Returns
| For the periods ended June 30, 2019 | Past 1 year | Past 5 years | Life of fundA |
| Class A (incl. 2.75% sales charge) | ( 1.72)% | 0.39% | 1.85% |
| Fidelity® Municipal Income 2019 Fund | 1.31% | 1.21% | 2.46% |
| Class I | 1.31% | 1.21% | 2.46% |
A From May 19, 2011
$10,000 Over Life of Fund
Let's say hypothetically that $10,000 was invested in Fidelity® Municipal Income 2019 Fund, a class of the fund, on May 19, 2011, when the fund started.
The chart shows how the value of your investment would have changed, and also shows how the Bloomberg Barclays Municipal Bond Index performed over the same period.

| Period Ending Values |
| $12,180 | Fidelity® Municipal Income 2019 Fund |
| $14,047 | Bloomberg Barclays Municipal Bond Index |
Fidelity® Municipal Income 2021 Fund
Performance: The Bottom Line
Average annual total return reflects the change in the value of an investment, assuming reinvestment of distributions from dividend income and capital gains (the profits earned upon the sale of securities that have grown in value, if any) and assuming a constant rate of performance each year. The hypothetical investment and the average annual total returns do not reflect the deduction of taxes that a shareholder would pay on fund distributions or the redemption of fund shares. During periods of reimbursement by Fidelity, a fund’s total return will be greater than it would be had the reimbursement not occurred. How a fund did yesterday is no guarantee of how it will do tomorrow.
Average Annual Total Returns
| For the periods ended June 30, 2019 | Past 1 year | Past 5 years | Life of fundA |
| Class A (incl. 2.75% sales charge) | (0.13)% | 1.31% | 2.81% |
| Fidelity® Municipal Income 2021 Fund | 2.95% | 2.13% | 3.42% |
| Class I | 2.95% | 2.13% | 3.42% |
A From May 19, 2011
$10,000 Over Life of Fund
Let's say hypothetically that $10,000 was invested in Fidelity® Municipal Income 2021 Fund, a class of the fund, on May 19, 2011, when the fund started.
The chart shows how the value of your investment would have changed, and also shows how the Bloomberg Barclays Municipal Bond Index performed over the same period.

| Period Ending Values |
| $13,138 | Fidelity® Municipal Income 2021 Fund |
| $14,047 | Bloomberg Barclays Municipal Bond Index |
Fidelity® Municipal Income 2023 Fund
Performance: The Bottom Line
Average annual total return reflects the change in the value of an investment, assuming reinvestment of distributions from dividend income and capital gains (the profits earned upon the sale of securities that have grown in value, if any) and assuming a constant rate of performance each year. The hypothetical investment and the average annual total returns do not reflect the deduction of taxes that a shareholder would pay on fund distributions or the redemption of fund shares. During periods of reimbursement by Fidelity, a fund’s total return will be greater than it would be had the reimbursement not occurred. How a fund did yesterday is no guarantee of how it will do tomorrow.
Average Annual Total Returns
| For the periods ended June 30, 2019 | Past 1 year | Past 5 years | Life of fundA |
| Class A (incl. 2.75% sales charge) | 1.63% | 2.20% | 1.96% |
| Fidelity® Municipal Income 2023 Fund | 4.76% | 3.03% | 2.68% |
| Class I | 4.76% | 3.03% | 2.68% |
A From April 23, 2013
$10,000 Over Life of Fund
Let's say hypothetically that $10,000 was invested in Fidelity® Municipal Income 2023 Fund, a class of the fund, on April 23, 2013, when the fund started.
The chart shows how the value of your investment would have changed, and also shows how the Bloomberg Barclays Municipal Bond Index performed over the same period.

| Period Ending Values |
| $11,779 | Fidelity® Municipal Income 2023 Fund |
| $12,211 | Bloomberg Barclays Municipal Bond Index |
Fidelity® Municipal Income 2025 Fund
Performance: The Bottom Line
Average annual total return reflects the change in the value of an investment, assuming reinvestment of distributions from dividend income and capital gains (the profits earned upon the sale of securities that have grown in value, if any) and assuming a constant rate of performance each year. The hypothetical investment and the average annual total returns do not reflect the deduction of taxes that a shareholder would pay on fund distributions or the redemption of fund shares. During periods of reimbursement by Fidelity, a fund’s total return will be greater than it would be had the reimbursement not occurred. How a fund did yesterday is no guarantee of how it will do tomorrow.
Average Annual Total Returns
| For the periods ended June 30, 2019 | Past 1 year | Life of fundA |
| Class A (incl. 2.75% sales charge) | 4.30% | 1.70% |
| Fidelity® Municipal Income 2025 Fund | 7.52% | 3.32% |
| Class I | 7.52% | 3.32% |
A From May 25, 2017
$10,000 Over Life of Fund
Let's say hypothetically that $10,000 was invested in Fidelity® Municipal Income 2025 Fund, a class of the fund, on May 25, 2017, when the fund started.
The chart shows how the value of your investment would have changed, and also shows how the Bloomberg Barclays Municipal Bond Index performed over the same period.
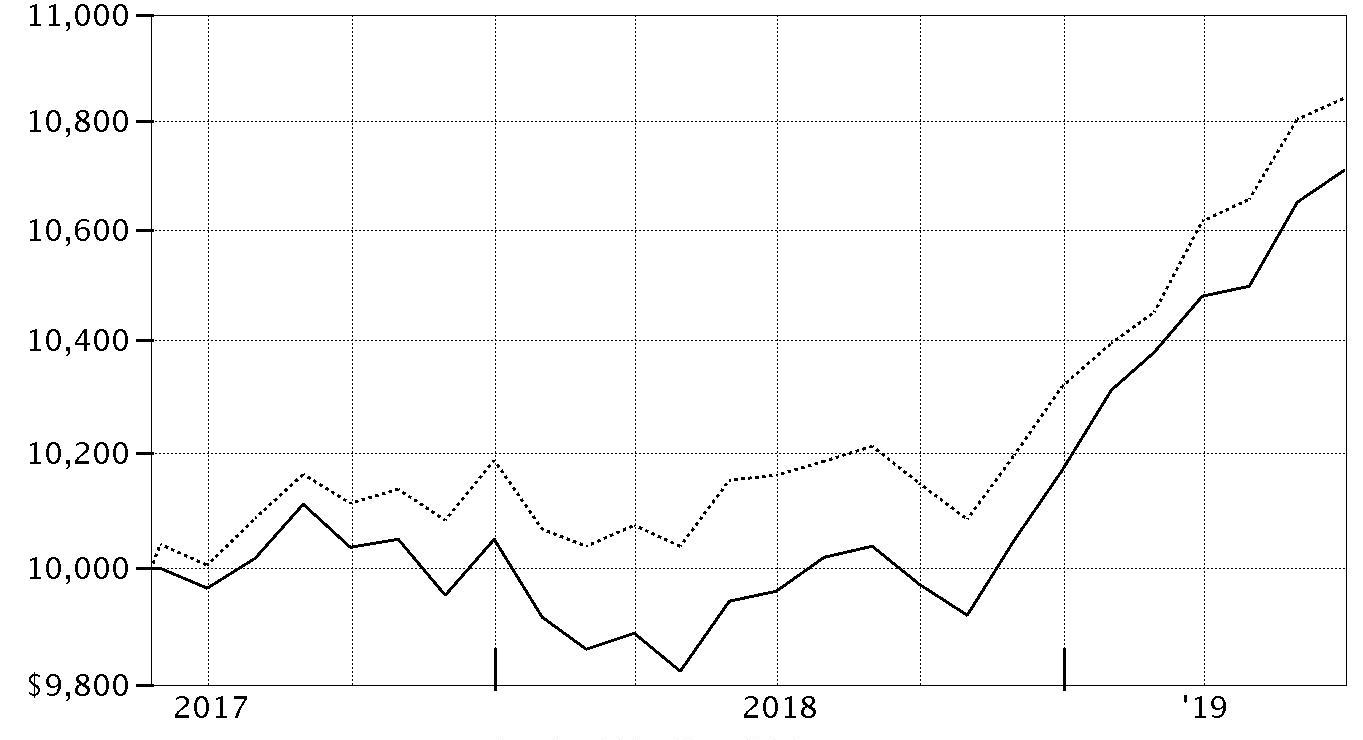
| Period Ending Values |
| $10,709 | Fidelity® Municipal Income 2025 Fund |
| $10,843 | Bloomberg Barclays Municipal Bond Index |
Management's Discussion of Fund Performance
Market Recap: Tax-exempt municipal bonds posted a healthy gain for the 12 months ending June 30, 2019, supported by below-average bond issuance and strong investor demand. The Bloomberg Barclays Municipal Bond Index returned 6.71% for the year. Gross municipal bond issuance remained below the long-term historical average due to the elimination of tax-exempt advance refundings under the new tax law, historically a significant source of supply. Despite stable municipal finances and fairly benign inflation, the municipal market experienced volatility in September into October 2018, due to concerns that the U.S. Federal Reserve would continue to raise interest rates despite evidence of an international economic slowdown. Munis then rebounded in late 2018 and the first half of 2019 amid a pause in Fed interest rate hikes. Demand for fixed-income assets, in general, was strong, amid increased market volatility due to slowing global economic growth and rising international trade tension. In particular, demand for tax-exempt debt increased as wealthy taxpayers felt the full impact of tax reform passed in late 2017. The cap on the federal deduction for state and local taxes made tax-exempt debt more attractive, particularly in high-tax states. For the period, general obligation bonds gained 6.65%, with local bonds moderately outperforming state-backed bonds.
Comments from Co-Portfolio Managers Cormac Cullen, Elizah McLaughlin and Kevin Ramundo: For the fiscal year, the share classes (excluding sales charges) of the 2021, 2023 and 2025 funds posted progressively higher gains that were in line with their respective Bloomberg Barclays benchmarks. In managing the fund, we continued to focus on longer-term objectives and sought to generate attractive tax-exempt income and competitive risk-adjusted returns over time. The funds benefited from overweightings in lower-rated investment-grade municipal bonds. These securities, typically rated A or BB, posted better returns than higher quality securities. Overweighting health care bonds also added value; it helped that the bonds of several hospital we favored performed quite well. On a relative basis, differences in the way the funds’ holdings and their respective index components were priced significantly helped the 2025 fund, hurt the 2023 portfolio, but negligibly impacted the 2021 fund. The funds maintained less sensitivity to interest rates, as measure by their durations, than their benchmarks, which detracted as the muni market rallied.
The views expressed above reflect those of the portfolio manager(s) only through the end of the period as stated on the cover of this report and do not necessarily represent the views of Fidelity or any other person in the Fidelity organization. Any such views are subject to change at any time based upon market or other conditions and Fidelity disclaims any responsibility to update such views. These views may not be relied on as investment advice and, because investment decisions for a Fidelity fund are based on numerous factors, may not be relied on as an indication of trading intent on behalf of any Fidelity fund.
Note to shareholders: On July 5, 2019, the 2019 fund reached its target date and was liquidated, distributing its assets in cash to shareholders.
Fidelity® Municipal Income 2019 Fund
Investment Summary (Unaudited)
Top Five States as of June 30, 2019
| | % of fund's net assets |
| Pennsylvania | 16.9 |
| Florida | 15.3 |
| New Jersey | 8.2 |
| Arizona | 5.3 |
| Connecticut | 5.0 |
Top Five Sectors as of June 30, 2019
| | % of fund's net assets |
| General Obligations | 22.5 |
| Escrowed/Pre-Refund | 13.4 |
| Education | 7.2 |
| Health Care | 7.2 |
| Transportation | 7.2 |
Quality Diversification (% of fund's net assets)
| As of June 30, 2019 |
| | AAA | 0.4% |
| | AA,A | 49.0% |
| | BBB | 3.0% |
| | Not Rated | 11.3% |
| | Short-Term Investments and Net Other Assets | 36.3% |

We have used ratings from Moody's Investors Service, Inc. Where Moody's® ratings are not available, we have used S&P® ratings. All ratings are as of the date indicated and do not reflect subsequent changes.
Fidelity® Municipal Income 2019 Fund
Schedule of Investments June 30, 2019
Showing Percentage of Net Assets
| Municipal Bonds - 63.7% | | | |
| | | Principal Amount | Value |
| Arizona - 5.3% | | | |
| Dysart Unified School District #89 Gen. Oblig. Series 2014, 5% 7/1/19 | | 350,000 | 350,000 |
| Glendale Gen. Oblig. Series 2015, 4% 7/1/19 (FSA Insured) | | 1,000,000 | 1,000,000 |
| Maricopa County Indl. Dev. Auth. Health Facilities Rev. (Catholic Health Care West Proj.) Series 2009 A, 5% 7/1/19 | | 645,000 | 645,000 |
| Univ. Med. Ctr. Corp. Hosp. Rev.: | | | |
| Series 2009, 6.5% 7/1/39 (Pre-Refunded to 7/1/19 @ 100) | | $450,000 | $450,000 |
| Series 2011, 5% 7/1/19 (Escrowed to Maturity) | | 500,000 | 500,000 |
|
| TOTAL ARIZONA | | | 2,945,000 |
|
| Connecticut - 5.0% | | | |
| Connecticut Health & Edl. Facilities Auth. Rev.: | | | |
| (Lawrence & Memorial Hosp. Proj.) Series 2011 F, 5% 7/1/19 (Escrowed to Maturity) | | 1,825,000 | 1,825,000 |
| (Sacred Heart Univ., CT. Proj.) Series 2017 I-1, 5% 7/1/19 | | 500,000 | 500,000 |
| Series 2012 J, 4% 7/1/19 | | 450,000 | 450,000 |
|
| TOTAL CONNECTICUT | | | 2,775,000 |
|
| Florida - 15.3% | | | |
| Broward County School Board Ctfs. of Prtn.: | | | |
| Series 2011 A, 5% 7/1/19 | | 2,860,000 | 2,860,000 |
| Series 2012 A, 5% 7/1/19 | | 1,000,000 | 1,000,000 |
| Duval County School Board Ctfs. of Prtn. Series 2015 B, 5% 7/1/19 | | 500,000 | 500,000 |
| Florida Board of Ed. Lottery Rev. Series 2011 A, 5% 7/1/19 | | 500,000 | 500,000 |
| Florida Dept. of Envir. Protection Rev. Series 2011 B, 5% 7/1/19 | | 935,000 | 935,000 |
| Hillsborough County School Board Ctfs. of Prtn.: | | | |
| Series 2016, 5% 7/1/19 | | 650,000 | 650,000 |
| Series 2017 A, 5% 7/1/19 | | 500,000 | 500,000 |
| Miami-Dade County Expressway Auth.: | | | |
| (Waste Mgmt., Inc. of Florida Proj.) Series 2013, 5% 7/1/19 | | 315,000 | 315,000 |
| Series 2014 B, 5% 7/1/19 | | 250,000 | 250,000 |
| Orlando & Orange County Expressway Auth. Rev. Series 2012, 5% 7/1/19 | | 1,000,000 | 1,000,000 |
|
| TOTAL FLORIDA | | | 8,510,000 |
|
| Indiana - 0.4% | | | |
| Purdue Univ. Rev. Series A, 5% 7/1/19 | | 250,000 | 250,000 |
| Louisiana - 0.4% | | | |
| Louisiana Pub. Facilities Auth. Rev. Series 2009 A, 5% 7/1/19 (Escrowed to Maturity) | | 250,000 | 250,000 |
| Maryland - 1.4% | | | |
| Maryland Health & Higher Edl. Facilities Auth. Rev. 5% 7/1/21 (Pre-Refunded to 7/1/19 @ 100) | | 800,000 | 800,000 |
| Massachusetts - 1.9% | | | |
| Massachusetts Dev. Fin. Agcy. Rev.: | | | |
| Series 2015 O2, 5% 7/1/19 | | 505,000 | 505,000 |
| Series 2016, 5% 7/1/19 | | 575,000 | 575,000 |
|
| TOTAL MASSACHUSETTS | | | 1,080,000 |
|
| New Jersey - 8.2% | | | |
| Gloucester County Impt. Auth. Rev. (Rowan Univ. Proj.) Series 2015 B, 5% 7/1/19 | | 1,700,000 | 1,700,000 |
| New Jersey Edl. Facilities Auth. Rev. Series 2011 A, 5% 7/1/19 | | 605,000 | 605,000 |
| New Jersey Edl. Facility: | | | |
| (Ramapo College, Proj.) Series 2017 A, 3% 7/1/19 (FSA Insured) | | 325,000 | 325,000 |
| (Stevens Institute of Technolgy Proj.) Series 2017 A, 5% 7/1/19 | | 305,000 | 305,000 |
| New Jersey Health Care Facilities Fing. Auth. Rev.: | | | |
| (Chilton Memorial Hosp. Proj.) Series 2009, 5.75% 7/1/39 (Pre-Refunded to 7/1/19 @ 100) | | 1,000,000 | 1,000,000 |
| Series 2011, 5% 7/1/19 | | 500,000 | 500,000 |
| Series 2016 A, 5% 7/1/19 | | 140,000 | 140,000 |
|
| TOTAL NEW JERSEY | | | 4,575,000 |
|
| New Mexico - 1.1% | | | |
| New Mexico Severance Tax Rev. Series 2010 B, 5% 7/1/19 | | 600,000 | 600,000 |
| New York - 3.4% | | | |
| Buffalo and Erie County Indl. Land Rev. (Catholic Health Sys., Inc. Proj.) Series 2015, 5% 7/1/19 | | 275,000 | 275,000 |
| Nassau County Local Econ. Assistance Corp. (Catholic Health Svcs. of Long Island Obligated Group Proj.) Series 2014, 4% 7/1/19 | | 250,000 | 250,000 |
| New York Dorm. Auth. Revs. Series 2009, 5.25% 7/1/33 (Pre-Refunded to 7/1/19 @ 100) | | 1,000,000 | 1,000,000 |
| Saratoga County Cap. Resources Rev. Series A, 5% 7/1/19 | | 350,000 | 350,000 |
|
| TOTAL NEW YORK | | | 1,875,000 |
|
| North Carolina - 0.8% | | | |
| Charlotte Int'l. Arpt. Rev. Series 2017 C, 4% 7/1/19 | | 425,000 | 425,000 |
| Oregon - 1.8% | | | |
| Port of Portland Arpt. Rev. Series 22, 4% 7/1/19 (a) | | 1,000,000 | 1,000,000 |
| Pennsylvania - 16.9% | | | |
| Butler County Hosp. Auth. Hosp. Rev. (Butler Memorial Hosp., Proj.) Series 2009 B, 7.25% 7/1/39 (Pre-Refunded to 7/1/19 @ 100) | | 1,700,000 | 1,700,000 |
| Pennsylvania Gen. Oblig.: | | | |
| Series 2004, 5.375% 7/1/19 | | 650,000 | 650,000 |
| Series 2009, 5% 7/1/19 | | 5,000,000 | 5,000,000 |
| Philadelphia Gas Works Rev. (1998 Gen. Ordinance Proj.) Tenth Series B, 5% 7/1/19 (FSA Insured) | | 100,000 | 100,000 |
| Philadelphia Wtr. & Wastewtr. Rev. Series A, 5% 7/1/19 | | 1,000,000 | 1,000,000 |
| Shamokin-Coal Township Jt Swr. Auth. Series 2015 B, 4% 7/1/19 | | 270,000 | 270,000 |
| Westmoreland County Indl. Dev. Auth. Rev. (Excela Health Proj.) Series 2010 A, 5% 7/1/19 | | 670,000 | 670,000 |
|
| TOTAL PENNSYLVANIA | | | 9,390,000 |
|
| Texas - 1.8% | | | |
| Houston Arpt. Sys. Rev. Series 2018 C, 5% 7/1/19 (a) | | 1,000,000 | 1,000,000 |
| TOTAL MUNICIPAL BONDS | | | |
| (Cost $35,475,000) | | | 35,475,000 |
| | | Shares | Value |
|
| Money Market Funds - 34.4% | | | |
| Fidelity Municipal Cash Central Fund 2.00% (b)(c) | | | |
| (Cost $19,140,000) | | 19,138,086 | 19,140,000 |
| TOTAL INVESTMENT IN SECURITIES - 98.1% | | | |
| (Cost $54,615,000) | | | 54,615,000 |
| NET OTHER ASSETS (LIABILITIES) - 1.9% | | | 1,045,225 |
| NET ASSETS - 100% | | | $55,660,225 |
Legend
(a) Private activity obligations whose interest is subject to the federal alternative minimum tax for individuals.
(b) Information in this report regarding holdings by state and security types does not reflect the holdings of the Fidelity Municipal Cash Central Fund.
(c) Affiliated fund that is available only to investment companies and other accounts managed by Fidelity Investments. The rate quoted is the annualized seven-day yield of the fund at period end. A complete unaudited listing of the fund's holdings as of its most recent quarter end is available upon request. In addition, each Fidelity Central Fund's financial statements, which are not covered by the Fund's Report of Independent Registered Public Accounting Firm, are available on the SEC's website or upon request.
Affiliated Central Funds
Information regarding fiscal year to date income earned by the Fund from investments in Fidelity Central Funds is as follows:
| Fund | Income earned |
| Fidelity Municipal Cash Central Fund | $31,626 |
| Total | $31,626 |
Amounts in the income column in the above table include any capital gain distributions from underlying funds, which are presented in the corresponding line-item in the Statement of Operations, if applicable.
Investment Valuation
The following is a summary of the inputs used, as of June 30, 2019, involving the Fund's assets and liabilities carried at fair value. The inputs or methodology used for valuing securities may not be an indication of the risk associated with investing in those securities. For more information on valuation inputs, and their aggregation into the levels used below, please refer to the Investment Valuation section in the accompanying Notes to Financial Statements.
| | Valuation Inputs at Reporting Date: |
| Description | Total | Level 1 | Level 2 | Level 3 |
| Investments in Securities: | | | | |
| Municipal Securities | $35,475,000 | $-- | $35,475,000 | $-- |
| Money Market Funds | 19,140,000 | 19,140,000 | -- | -- |
| Total Investments in Securities: | $54,615,000 | $19,140,000 | $35,475,000 | $-- |
Other Information
The distribution of municipal securities by revenue source, as a percentage of total Net Assets, is as follows (Unaudited):
| General Obligations | 22.5% |
| Escrowed/Pre-Refunded | 13.4% |
| Education | 7.2% |
| Health Care | 7.2% |
| Transportation | 7.2% |
| Others* | 42.5% |
| | 100.0% |
* Includes net other assets
See accompanying notes which are an integral part of the financial statements.
Fidelity® Municipal Income 2019 Fund
Financial Statements
Statement of Assets and Liabilities
| | | June 30, 2019 |
| Assets | | |
Investment in securities, at value — See accompanying schedule:
Unaffiliated issuers (cost $35,475,000) | $35,475,000 | |
| Fidelity Central Funds (cost $19,140,000) | 19,140,000 | |
| Total Investment in Securities (cost $54,615,000) | | $54,615,000 |
| Cash | | 215,310 |
| Interest receivable | | 893,455 |
| Distributions receivable from Fidelity Central Funds | | 24,765 |
| Other receivables | | 135 |
| Total assets | | 55,748,665 |
| Liabilities | | |
| Payable for fund shares redeemed | 56,372 | |
| Distributions payable | 11,860 | |
| Accrued management fee | 14,515 | |
| Transfer agent fee payable | 4,840 | |
| Distribution and service plan fees payable | 853 | |
| Total liabilities | | 88,440 |
| Net Assets | | $55,660,225 |
| Net Assets consist of: | | |
| Paid in capital | | $55,723,706 |
| Total distributable earnings (loss) | | (63,481) |
| Net Assets | | $55,660,225 |
| Net Asset Value and Maximum Offering Price | | |
| Class A: | | |
| Net Asset Value and redemption price per share ($3,489,552 ÷ 330,153 shares)(a) | | $10.57 |
| Maximum offering price per share (100/97.25 of $10.57) | | $10.87 |
| Municipal Income 2019: | | |
| Net Asset Value, offering price and redemption price per share ($43,456,407 ÷ 4,111,600 shares) | | $10.57 |
| Class I: | | |
| Net Asset Value, offering price and redemption price per share ($8,714,266 ÷ 824,448 shares) | | $10.57 |
(a) Redemption price per share is equal to net asset value less any applicable contingent deferred sales charge.
See accompanying notes which are an integral part of the financial statements.
Statement of Operations
| | | Year ended June 30, 2019 |
| Investment Income | | |
| Interest | | $1,237,594 |
| Income from Fidelity Central Funds | | 31,626 |
| Total income | | 1,269,220 |
| Expenses | | |
| Management fee | $225,928 | |
| Transfer agent fees | 75,309 | |
| Distribution and service plan fees | 14,781 | |
| Independent trustees' fees and expenses | 349 | |
| Commitment fees | 238 | |
| Total expenses before reductions | 316,605 | |
| Expense reductions | (498) | |
| Total expenses after reductions | | 316,107 |
| Net investment income (loss) | | 953,113 |
| Realized and Unrealized Gain (Loss) | | |
| Net realized gain (loss) on: | | |
| Investment securities: | | |
| Unaffiliated issuers | (18,899) | |
| Total net realized gain (loss) | | (18,899) |
| Change in net unrealized appreciation (depreciation) on investment securities | | 17,782 |
| Net gain (loss) | | (1,117) |
| Net increase (decrease) in net assets resulting from operations | | $951,996 |
See accompanying notes which are an integral part of the financial statements.
Statement of Changes in Net Assets
| | Year ended June 30, 2019 | Year ended June 30, 2018 |
| Increase (Decrease) in Net Assets | | |
| Operations | | |
| Net investment income (loss) | $953,113 | $1,405,339 |
| Net realized gain (loss) | (18,899) | (24,388) |
| Change in net unrealized appreciation (depreciation) | 17,782 | (592,040) |
| Net increase (decrease) in net assets resulting from operations | 951,996 | 788,911 |
| Distributions to shareholders | (973,657) | – |
| Distributions to shareholders from net investment income | – | (1,405,235) |
| Distributions to shareholders from net realized gain | – | (73,596) |
| Total distributions | (973,657) | (1,478,831) |
| Share transactions - net increase (decrease) | (47,696,294) | (9,052,743) |
| Total increase (decrease) in net assets | (47,717,955) | (9,742,663) |
| Net Assets | | |
| Beginning of period | 103,378,180 | 113,120,843 |
| End of period | $55,660,225 | $103,378,180 |
| Other Information | | |
| Undistributed net investment income end of period | | $350 |
See accompanying notes which are an integral part of the financial statements.
Financial Highlights
Fidelity Municipal Income 2019 Fund Class A
| Years ended June 30, | 2019 | 2018 | 2017 | 2016 | 2015 |
| Selected Per–Share Data | | | | | |
| Net asset value, beginning of period | $10.57 | $10.63 | $10.80 | $10.69 | $10.74 |
| Income from Investment Operations | | | | | |
| Net investment income (loss)A | .109 | .112 | .123 | .144 | .157 |
| Net realized and unrealized gain (loss) | .002 | (.053) | (.156) | .122 | (.052) |
| Total from investment operations | .111 | .059 | (.033) | .266 | .105 |
| Distributions from net investment income | (.111) | (.112) | (.125) | (.144) | (.155) |
| Distributions from net realized gain | – | (.007) | (.012) | (.012) | – |
| Total distributions | (.111) | (.119) | (.137) | (.156) | (.155) |
| Redemption fees added to paid in capitalA | – | – | –B | –B | –B |
| Net asset value, end of period | $10.57 | $10.57 | $10.63 | $10.80 | $10.69 |
| Total ReturnC,D | 1.06% | .56% | (.31)% | 2.51% | .98% |
| Ratios to Average Net AssetsE,F | | | | | |
| Expenses before reductions | .65% | .65% | .65% | .65% | .65% |
| Expenses net of fee waivers, if any | .65% | .65% | .65% | .65% | .65% |
| Expenses net of all reductions | .65% | .65% | .65% | .65% | .65% |
| Net investment income (loss) | 1.03% | 1.05% | 1.16% | 1.34% | 1.46% |
| Supplemental Data | | | | | |
| Net assets, end of period (000 omitted) | $3,490 | $7,300 | $9,800 | $6,536 | $7,522 |
| Portfolio turnover rateG | -% | 7% | 13% | 5% | 8% |
A Calculated based on average shares outstanding during the period.
B Amount represents less than $.0005 per share.
C Total returns would have been lower if certain expenses had not been reduced during the applicable periods shown.
D Total returns do not include the effect of the sales charges.
E Fees and expenses of any underlying Fidelity Central Funds are not included in the Fund's expense ratio. The Fund indirectly bears its proportionate share of the expenses of any underlying Fidelity Central Funds.
F Expense ratios reflect operating expenses of the class. Expenses before reductions do not reflect amounts reimbursed by the investment adviser or reductions from expense offset arrangements and do not represent the amount paid by the class during periods when reimbursements or reductions occur. Expenses net of fee waivers reflect expenses after reimbursement by the investment adviser but prior to reductions from expense offset arrangements. Expenses net of all reductions represent the net expenses paid by the class.
G Amount does not include the portfolio activity of any underlying Fidelity Central Funds.
See accompanying notes which are an integral part of the financial statements.
Fidelity Municipal Income 2019 Fund
| Years ended June 30, | 2019 | 2018 | 2017 | 2016 | 2015 |
| Selected Per–Share Data | | | | | |
| Net asset value, beginning of period | $10.57 | $10.63 | $10.80 | $10.69 | $10.74 |
| Income from Investment Operations | | | | | |
| Net investment income (loss)A | .136 | .138 | .150 | .171 | .184 |
| Net realized and unrealized gain (loss) | .002 | (.053) | (.157) | .122 | (.052) |
| Total from investment operations | .138 | .085 | (.007) | .293 | .132 |
| Distributions from net investment income | (.138) | (.138) | (.151) | (.171) | (.182) |
| Distributions from net realized gain | – | (.007) | (.012) | (.012) | – |
| Total distributions | (.138) | (.145) | (.163) | (.183) | (.182) |
| Redemption fees added to paid in capitalA | – | – | –B | –B | –B |
| Net asset value, end of period | $10.57 | $10.57 | $10.63 | $10.80 | $10.69 |
| Total ReturnC | 1.31% | .81% | (.06)% | 2.77% | 1.24% |
| Ratios to Average Net AssetsD,E | | | | | |
| Expenses before reductions | .40% | .40% | .40% | .40% | .40% |
| Expenses net of fee waivers, if any | .40% | .40% | .40% | .40% | .40% |
| Expenses net of all reductions | .40% | .40% | .40% | .40% | .40% |
| Net investment income (loss) | 1.28% | 1.30% | 1.41% | 1.59% | 1.71% |
| Supplemental Data | | | | | |
| Net assets, end of period (000 omitted) | $43,456 | $67,100 | $76,098 | $54,610 | $44,331 |
| Portfolio turnover rateF | -% | 7% | 13% | 5% | 8% |
A Calculated based on average shares outstanding during the period.
B Amount represents less than $.0005 per share.
C Total returns would have been lower if certain expenses had not been reduced during the applicable periods shown.
D Fees and expenses of any underlying Fidelity Central Funds are not included in the Fund's expense ratio. The Fund indirectly bears its proportionate share of the expenses of any underlying Fidelity Central Funds.
E Expense ratios reflect operating expenses of the class. Expenses before reductions do not reflect amounts reimbursed by the investment adviser or reductions from expense offset arrangements and do not represent the amount paid by the class during periods when reimbursements or reductions occur. Expenses net of fee waivers reflect expenses after reimbursement by the investment adviser but prior to reductions from expense offset arrangements. Expenses net of all reductions represent the net expenses paid by the class.
F Amount does not include the portfolio activity of any underlying Fidelity Central Funds.
See accompanying notes which are an integral part of the financial statements.
Fidelity Municipal Income 2019 Fund Class I
| Years ended June 30, | 2019 | 2018 | 2017 | 2016 | 2015 |
| Selected Per–Share Data | | | | | |
| Net asset value, beginning of period | $10.57 | $10.63 | $10.80 | $10.69 | $10.74 |
| Income from Investment Operations | | | | | |
| Net investment income (loss)A | .136 | .138 | .150 | .170 | .184 |
| Net realized and unrealized gain (loss) | .002 | (.053) | (.157) | .123 | (.052) |
| Total from investment operations | .138 | .085 | (.007) | .293 | .132 |
| Distributions from net investment income | (.138) | (.138) | (.151) | (.171) | (.182) |
| Distributions from net realized gain | – | (.007) | (.012) | (.012) | – |
| Total distributions | (.138) | (.145) | (.163) | (.183) | (.182) |
| Redemption fees added to paid in capitalA | – | – | –B | –B | –B |
| Net asset value, end of period | $10.57 | $10.57 | $10.63 | $10.80 | $10.69 |
| Total ReturnC | 1.31% | .81% | (.06)% | 2.77% | 1.24% |
| Ratios to Average Net AssetsD,E | | | | | |
| Expenses before reductions | .40% | .40% | .40% | .40% | .40% |
| Expenses net of fee waivers, if any | .40% | .40% | .40% | .40% | .40% |
| Expenses net of all reductions | .40% | .40% | .40% | .40% | .40% |
| Net investment income (loss) | 1.28% | 1.30% | 1.41% | 1.59% | 1.71% |
| Supplemental Data | | | | | |
| Net assets, end of period (000 omitted) | $8,714 | $28,978 | $27,223 | $27,941 | $19,985 |
| Portfolio turnover rateF | -% | 7% | 13% | 5% | 8% |
A Calculated based on average shares outstanding during the period.
B Amount represents less than $.0005 per share.
C Total returns would have been lower if certain expenses had not been reduced during the applicable periods shown.
D Fees and expenses of any underlying Fidelity Central Funds are not included in the Fund's expense ratio. The Fund indirectly bears its proportionate share of the expenses of any underlying Fidelity Central Funds.
E Expense ratios reflect operating expenses of the class. Expenses before reductions do not reflect amounts reimbursed by the investment adviser or reductions from expense offset arrangements and do not represent the amount paid by the class during periods when reimbursements or reductions occur. Expenses net of fee waivers reflect expenses after reimbursement by the investment adviser but prior to reductions from expense offset arrangements. Expenses net of all reductions represent the net expenses paid by the class.
F Amount does not include the portfolio activity of any underlying Fidelity Central Funds.
See accompanying notes which are an integral part of the financial statements.
Fidelity® Municipal Income 2021 Fund
Investment Summary (Unaudited)
Top Five States as of June 30, 2019
| | % of fund's net assets |
| New Jersey | 15.9 |
| Illinois | 9.1 |
| Texas | 9.0 |
| Michigan | 8.7 |
| Florida | 7.6 |
Top Five Sectors as of June 30, 2019
| | % of fund's net assets |
| General Obligations | 23.3 |
| Health Care | 22.1 |
| Transportation | 17.8 |
| Education | 9.3 |
| Water & Sewer | 6.6 |
Quality Diversification (% of fund's net assets)
| As of June 30, 2019 |
| | AAA | 1.4% |
| | AA,A | 71.1% |
| | BBB | 19.1% |
| | BB and Below | 1.4% |
| | Not Rated | 5.8% |
| | Short-Term Investments and Net Other Assets | 1.2% |

We have used ratings from Moody's Investors Service, Inc. Where Moody's® ratings are not available, we have used S&P® ratings. All ratings are as of the date indicated and do not reflect subsequent changes.
Fidelity® Municipal Income 2021 Fund
Schedule of Investments June 30, 2019
Showing Percentage of Net Assets
| Municipal Bonds - 98.8% | | | |
| | | Principal Amount | Value |
| Alabama - 3.0% | | | |
| Infirmary Health Systems Spl. Care Facilities Fing. Auth. Rev. Series 2016 A, 5% 2/1/21 | | 1,000,000 | 1,047,820 |
| Montgomery Med. Clinic Facilities Series 2015, 5% 3/1/21 | | 500,000 | 523,960 |
|
| TOTAL ALABAMA | | | 1,571,780 |
|
| Arizona - 5.9% | | | |
| Glendale Gen. Oblig. Series 2017, 5% 7/1/21 | | 250,000 | 268,128 |
| Phoenix Civic Impt. Board Arpt. Rev. Series 2017 A, 5% 7/1/21 (a) | | 1,000,000 | 1,069,230 |
| Tempe Gen. Oblig. Series A, 4% 7/1/21 | | 605,000 | 637,591 |
| Tucson Street & Hwy. User Rev. Series 2011, 5% 7/1/21 | | 300,000 | 321,444 |
| Univ. Med. Ctr. Corp. Hosp. Rev. Series 2011, 6% 7/1/39 (Pre-Refunded to 7/1/21 @ 100) | | 240,000 | 261,619 |
| Univ. of Arizona Univ. Revs. Series 2011, 5% 8/1/21 | | 500,000 | 538,100 |
|
| TOTAL ARIZONA | | | 3,096,112 |
|
| California - 3.7% | | | |
| California Pub. Works Board Lease Rev. (Various Cap. Projs.) Series 2012 A, 5% 4/1/21 | | 500,000 | 532,745 |
| San Diego County Reg'l. Arpt. Auth. Arpt. Rev. Series 2017 B, 5% 7/1/21 (a) | | 225,000 | 240,577 |
| San Francisco City & County Arpts. Commission Int'l. Arpt. Rev. Series 2011 C, 5% 5/1/21 (a) | | 500,000 | 533,065 |
| Washington Township Health Care District Rev. Series 2017 B, 5% 7/1/21 | | 600,000 | 640,728 |
|
| TOTAL CALIFORNIA | | | 1,947,115 |
|
| Connecticut - 2.4% | | | |
| Connecticut Gen. Oblig. Series 2016 B, 5% 5/15/21 | | 500,000 | 533,185 |
| Connecticut Health & Edl. Facilities Auth. Rev.: | | | |
| Series K1, 5% 7/1/21 | | $500,000 | $531,195 |
| Series K3, 5% 7/1/21 | | 210,000 | 223,058 |
|
| TOTAL CONNECTICUT | | | 1,287,438 |
|
| Florida - 7.6% | | | |
| Broward County School Board Ctfs. of Prtn. Series 2012 A, 5% 7/1/21 | | 500,000 | 535,890 |
| Duval County School Board Ctfs. of Prtn. Series 2015 B, 5% 7/1/21 | | 425,000 | 454,461 |
| Florida Board of Ed. Lottery Rev. Series 2011 A, 5% 7/1/21 | | 750,000 | 804,450 |
| Florida Dept. of Envir. Protection Rev. Series 2011 B, 5% 7/1/21 | | 750,000 | 804,293 |
| Lake County School Board Ctfs. of Prtn. Series 2015 B, 5% 6/1/21 (FSA Insured) | | 1,000,000 | 1,064,020 |
| Volusia County School Board Ctfs. of Prtn. (Master Lease Prog.) Series 2014 B, 5% 8/1/21 | | 325,000 | 348,858 |
|
| TOTAL FLORIDA | | | 4,011,972 |
|
| Georgia - 2.0% | | | |
| Fulton County Wtr. & Swr. Rev. Series 2011, 5% 1/1/21 | | 250,000 | 263,940 |
| Georgia Muni. Elec. Auth. Pwr. Rev.: | | | |
| Series 2011 A, 5% 1/1/21 | | 690,000 | 725,307 |
| Series 2011 B, 5% 1/1/21 | | 85,000 | 89,349 |
|
| TOTAL GEORGIA | | | 1,078,596 |
|
| Illinois - 9.1% | | | |
| Chicago Midway Arpt. Rev. 5% 1/1/21 | | 400,000 | 421,080 |
| Chicago Transit Auth. Cap. Grant Receipts Rev. Series 2017, 5% 6/1/21 | | 200,000 | 211,868 |
| Cook County Gen. Oblig. Series 2011 A, 5% 11/15/21 | | 525,000 | 564,081 |
| Illinois Fin. Auth. Rev.: | | | |
| (OSF Healthcare Sys.) Series 2018 A, 5% 5/15/21 | | 300,000 | 319,224 |
| Series 2016 C, 5% 2/15/21 | | 1,035,000 | 1,094,440 |
| Illinois Gen. Oblig.: | | | |
| Series 2012, 5% 3/1/21 | | 500,000 | 525,170 |
| Series 2013, 5% 7/1/21 | | 510,000 | 540,636 |
| Illinois Muni. Elec. Agcy. Pwr. Supply Series 2015 A, 5% 2/1/21 | | 1,000,000 | 1,053,170 |
| Illinois Reg'l. Trans. Auth. Series 2017 A, 5% 7/1/21 | | 50,000 | 53,476 |
|
| TOTAL ILLINOIS | | | 4,783,145 |
|
| Indiana - 2.7% | | | |
| Indiana Muni. Pwr. Agcy. Pwr. Supply Sys. Rev. Series 2011 A, 5% 1/1/21 | | 200,000 | 210,600 |
| Indianapolis Local Pub. Impt. (Indianapolis Arpt. Auth. Proj.) Series 2016 A1, 5% 1/1/21 (a) | | 500,000 | 525,430 |
| Lake Central Multi-District School Bldg. Corp. Series 2012 B, 5% 7/15/21 | | 250,000 | 267,605 |
| Purdue Univ. Rev. Series A, 5% 7/1/21 | | 300,000 | 322,122 |
| Whiting Envir. Facilities Rev. (BP Products North America, Inc. Proj.) Series 2009, 5.25% 1/1/21 | | 100,000 | 105,547 |
|
| TOTAL INDIANA | | | 1,431,304 |
|
| Maine - 0.2% | | | |
| Maine Health & Higher Edl. Facilities Auth. Rev. Series 2017 B, 4% 7/1/21 | | 100,000 | 104,860 |
| Massachusetts - 1.3% | | | |
| Massachusetts Dev. Fin. Agcy. Rev. Series 2016, 5% 7/1/21 | | 250,000 | 265,800 |
| Massachusetts State College Bldg. Auth. Rev. Series A, 5% 5/1/21 | | 390,000 | 416,231 |
|
| TOTAL MASSACHUSETTS | | | 682,031 |
|
| Michigan - 8.7% | | | |
| Detroit School District School Bldg. and Site Impt. Series 2012 A, 5% 5/1/21 | | 500,000 | 530,815 |
| Kent County Bldg. Auth. Series 2005, 5.5% 6/1/21 | | 200,000 | 215,746 |
| Kent Hosp. Fin. Auth. Hosp. Facilities Rev. (Spectrum Health Sys. Proj.) Series 2011 A, 5% 11/15/21 | | 500,000 | 539,365 |
| Michigan Fin. Auth. Rev.: | | | |
| Series 2012 A, 5% 6/1/21 (Escrowed to Maturity) | | 1,000,000 | 1,066,560 |
| Series 2015 D1, 5% 7/1/21 | | 500,000 | 534,555 |
| Michigan Hosp. Fin. Auth. Rev. 5% 6/1/21 | | 300,000 | 320,205 |
| Milan Area Schools Series 2019, 5% 5/1/21 | | 305,000 | 324,886 |
| Mount Clemens Cmnty. School District Series 2017 A, 5% 5/1/21 | | 220,000 | 234,758 |
| Roseville Cmnty. Schools Series 2014, 5% 5/1/21 | | 750,000 | 798,900 |
|
| TOTAL MICHIGAN | | | 4,565,790 |
|
| Minnesota - 1.4% | | | |
| Maple Grove Health Care Sys. Rev. ( North Memorial Med. Ctr., Proj.) Series 2015, 4% 9/1/21 | | 400,000 | 416,784 |
| Minnesota Higher Ed. Facilities Auth. Rev. Series 7U, 5% 4/1/21 | | 315,000 | 334,499 |
|
| TOTAL MINNESOTA | | | 751,283 |
|
| Nevada - 6.6% | | | |
| Clark County Arpt. Rev. Series 2017 C, 5% 7/1/21 (a) | | 2,725,000 | 2,913,077 |
| Las Vegas Valley Wtr. District Wtr. Impt. Gen. Oblig. Series 2009 A, 5% 6/1/21 | | 250,000 | 267,575 |
| Nevada Lease Rev. Ctfs. Prtn. (Bldg. 1 Proj.) Series 2013, 5% 4/1/21 | | 300,000 | 318,840 |
|
| TOTAL NEVADA | | | 3,499,492 |
|
| New Jersey - 15.9% | | | |
| Bayonne Gen. Oblig. Series 2016, 5% 7/1/21 (Build America Mutual Assurance Insured) | | 695,000 | 744,825 |
| Camden County Impt. Auth. Health Care Redev. Rev. Series 2014 A, 5% 2/15/21 | | 650,000 | 683,859 |
| Garden State Preservation Trust Open Space & Farmland Preservation Series 2003 B, 0% 11/1/21 (FSA Insured) | | 1,000,000 | 964,000 |
| New Jersey Econ. Dev. Auth. Rev.: | | | |
| Series 2011 EE, 5.5% 9/1/21 (Pre-Refunded to 9/1/21 @ 100) | | 325,000 | 344,851 |
| Series 2015 XX: | | | |
| 5% 6/15/21 | | 1,000,000 | 1,062,120 |
| 5.5% 9/1/21 (Pre-Refunded to 3/1/21 @ 100) | | 905,000 | 965,644 |
| New Jersey Edl. Facilities Auth. Rev.: | | | |
| Series 2011 A, 5% 7/1/21 | | 540,000 | 576,277 |
| Series 2013 A, 5% 7/1/21 | | 100,000 | 106,984 |
| New Jersey Edl. Facility (Stevens Institute of Technolgy Proj.) Series 2017 A, 5% 7/1/21 | | 490,000 | 523,418 |
| New Jersey Health Care Facilities Fing. Auth. Rev.: | | | |
| Series 2011, 5% 7/1/21 | | 1,000,000 | 1,070,250 |
| Series 2017 A, 5% 7/1/21 | | 170,000 | 181,664 |
| New Jersey Tobacco Settlement Fing. Corp. Series 2018 A, 5% 6/1/21 | | 250,000 | 265,158 |
| New Jersey Trans. Trust Fund Auth.: | | | |
| Series 2011 A, 4.25% 6/15/21 | | 100,000 | 104,405 |
| Series 2011 B, 5% 6/15/21 | | 750,000 | 797,033 |
|
| TOTAL NEW JERSEY | | | 8,390,488 |
|
| New York - 2.1% | | | |
| Nassau County Local Econ. Assistance Corp. (Univ. Hosp. Proj.) Series 2012, 5% 7/1/21 | | 500,000 | 532,005 |
| New York Dorm. Auth. Revs. Series 2014, 5% 7/1/21 | | 325,000 | 348,631 |
| Saratoga County Cap. Resources Rev. Series A, 5% 7/1/21 | | 200,000 | 215,202 |
|
| TOTAL NEW YORK | | | 1,095,838 |
|
| Ohio - 2.0% | | | |
| Univ. of Toledo Gen. Receipts Series 2017 A, 5% 6/1/21 | | 1,000,000 | 1,066,560 |
| Oregon - 1.8% | | | |
| Clackamas County Hosp. Facility Auth. (Williamette View, Inc.) Series 2017 A, 4% 5/15/21 | | 230,000 | 237,516 |
| Port of Portland Arpt. Rev. Series 22, 5% 7/1/21 (a) | | 650,000 | 695,266 |
|
| TOTAL OREGON | | | 932,782 |
|
| Pennsylvania - 4.1% | | | |
| Central Bradford Prog. Auth. Rev. Series 2011, 4% 12/1/21 | | 380,000 | 402,618 |
| Indiana County Hosp. Auth. Series 2014 A, 5% 6/1/21 | | 680,000 | 711,103 |
| Pennsylvania Econ. Dev. Auth. Governmental Lease (Forum Place Proj.) Series 2012, 5% 3/1/21 | | 500,000 | 527,200 |
| Southeastern Pennsylvania Trans. Auth. Rev. Series 2011, 5% 6/1/21 | | 500,000 | 533,380 |
|
| TOTAL PENNSYLVANIA | | | 2,174,301 |
|
| Pennsylvania, New Jersey - 0.7% | | | |
| Delaware River Joint Toll Bridge Commission Pennsylvania-New Jersey Bridge Rev. Series 2015, 5% 7/1/21 | | 325,000 | 347,662 |
| South Carolina - 1.4% | | | |
| Horry County School District Series 2011, 5% 3/1/21 | | 700,000 | 742,959 |
| South Dakota - 0.5% | | | |
| South Dakota Health & Edl. Facilities Auth. Rev. Series 2017, 5% 7/1/21 | | 255,000 | 273,072 |
| Tennessee - 1.0% | | | |
| Knox County Health Edl. & Hsg. Facilities Board Rev. Series 2017, 4% 4/1/21 | | 500,000 | 516,165 |
| Texas - 9.0% | | | |
| Corpus Christi Util. Sys. Rev.: | | | |
| Series 2013, 5% 7/15/21 | | 250,000 | 268,160 |
| 5% 7/15/21 | | 750,000 | 804,480 |
| Houston Arpt. Sys. Rev.: | | | |
| Series 2011 B, 5% 7/1/21 | | 250,000 | 267,665 |
| Series 2018 C, 5% 7/1/21 (a) | | 1,000,000 | 1,066,570 |
| Lower Colorado River Auth. Rev. Series 2015 B, 4% 5/15/21 | | 400,000 | 419,572 |
| Lubbock Health Facilities Dev. Corp. Rev. (St. Joseph Health Sys. Proj.) Series 2008 B, 5% 7/1/21 | | 500,000 | 535,230 |
| North Texas Tollway Auth. Rev. Series 2014 A, 5% 1/1/21 | | 510,000 | 537,576 |
| Tarrant County Cultural Ed. Facilities Fin. Corp. Hosp. Rev. (Scott & White Healthcare Proj.) Series 2013 A, 5% 8/15/21 | | 70,000 | 75,156 |
| Texas Gen. Oblig. Series 2011 C, 5% 8/1/21 (a) | | 200,000 | 214,554 |
| Tyler Health Facilities Dev. Corp. Hosp. Rev. (Mother Frances Hosp. Reg'l. Health Care Ctr. Proj.) Series 2011, 5% 7/1/21 (Escrowed to Maturity) | | 500,000 | 534,205 |
|
| TOTAL TEXAS | | | 4,723,168 |
|
| Virginia - 0.2% | | | |
| Stafford County Econ. Dev. Auth. Hosp. Facilities Rev. Series 2016, 5% 6/15/21 | | 110,000 | 117,337 |
| Washington - 2.2% | | | |
| Clark County Pub. Util. District #1 Wtr. Series 2017, 5% 1/1/21 | | 240,000 | 253,051 |
| Clark County Pub. Util. District #1 Elec. Rev. Series 2011, 5% 1/1/21 | | 675,000 | 710,876 |
| Washington Gen. Oblig. Series 2003 C, 0% 6/1/21 (Nat'l. Pub. Fin. Guarantee Corp. Insured) | | 200,000 | 194,564 |
|
| TOTAL WASHINGTON | | | 1,158,491 |
|
| Wisconsin - 3.3% | | | |
| Milwaukee Swr. Rev. Series S1, 5% 6/1/21 | | 1,000,000 | 1,069,710 |
| Wisconsin Health & Edl. Facilities: | | | |
| (Agnesian Healthcare Proj.) Series 2017, 5% 7/1/21 | | 100,000 | 106,494 |
| Series 2014, 5% 5/1/21 | | 540,000 | 569,014 |
|
| TOTAL WISCONSIN | | | 1,745,218 |
|
| TOTAL MUNICIPAL BONDS | | | |
| (Cost $51,085,493) | | | 52,094,959 |
| TOTAL INVESTMENT IN SECURITIES - 98.8% | | | |
| (Cost $51,085,493) | | | 52,094,959 |
| NET OTHER ASSETS (LIABILITIES) - 1.2% | | | 646,100 |
| NET ASSETS - 100% | | | $52,741,059 |
Legend
(a) Private activity obligations whose interest is subject to the federal alternative minimum tax for individuals.
Affiliated Central Funds
Information regarding fiscal year to date income earned by the Fund from investments in Fidelity Central Funds is as follows:
| Fund | Income earned |
| Fidelity Municipal Cash Central Fund | $904 |
| Total | $904 |
Amounts in the income column in the above table include any capital gain distributions from underlying funds, which are presented in the corresponding line-item in the Statement of Operations, if applicable.
Investment Valuation
All investments are categorized as Level 2 under the Fair Value Hierarchy. The inputs or methodology used for valuing securities may not be an indication of the risk associated with investing in those securities. For more information on valuation inputs please refer to the Investment Valuation section in the accompanying Notes to Financial Statements.
Other Information
The distribution of municipal securities by revenue source, as a percentage of total Net Assets, is as follows (Unaudited):
| General Obligations | 23.3% |
| Health Care | 22.1% |
| Transportation | 17.8% |
| Education | 9.3% |
| Water & Sewer | 6.6% |
| Electric Utilities | 6.0% |
| Escrowed/Pre-Refunded | 6.0% |
| Special Tax | 6.0% |
| Others* (Individually Less Than 5%) | 2.9% |
| | 100.0% |
* Includes net other assets
See accompanying notes which are an integral part of the financial statements.
Fidelity® Municipal Income 2021 Fund
Financial Statements
Statement of Assets and Liabilities
| | | June 30, 2019 |
| Assets | | |
Investment in securities, at value — See accompanying schedule:
Unaffiliated issuers (cost $51,085,493) | | $52,094,959 |
| Receivable for fund shares sold | | 26 |
| Interest receivable | | 830,431 |
| Distributions receivable from Fidelity Central Funds | | 52 |
| Other receivables | | 73 |
| Total assets | | 52,925,541 |
| Liabilities | | |
| Payable to custodian bank | $111,824 | |
| Payable for fund shares redeemed | 32,411 | |
| Distributions payable | 21,508 | |
| Accrued management fee | 13,206 | |
| Distribution and service plan fees payable | 1,130 | |
| Other affiliated payables | 4,403 | |
| Total liabilities | | 184,482 |
| Net Assets | | $52,741,059 |
| Net Assets consist of: | | |
| Paid in capital | | $51,764,698 |
| Total distributable earnings (loss) | | 976,361 |
| Net Assets | | $52,741,059 |
| Net Asset Value and Maximum Offering Price | | |
| Class A: | | |
| Net Asset Value and redemption price per share ($5,434,649 ÷ 502,015 shares)(a) | | $10.83 |
| Maximum offering price per share (100/97.25 of $10.83) | | $11.14 |
| Municipal Income 2021: | | |
| Net Asset Value, offering price and redemption price per share ($34,246,543 ÷ 3,163,544 shares) | | $10.83 |
| Class I: | | |
| Net Asset Value, offering price and redemption price per share ($13,059,867 ÷ 1,206,420 shares) | | $10.83 |
(a) Redemption price per share is equal to net asset value less any applicable contingent deferred sales charge.
See accompanying notes which are an integral part of the financial statements.
Statement of Operations
| | | Year ended June 30, 2019 |
| Investment Income | | |
| Interest | | $1,449,663 |
| Income from Fidelity Central Funds | | 904 |
| Total income | | 1,450,567 |
| Expenses | | |
| Management fee | $176,003 | |
| Transfer agent fees | 58,668 | |
| Distribution and service plan fees | 16,059 | |
| Independent trustees' fees and expenses | 259 | |
| Commitment fees | 167 | |
| Total expenses before reductions | 251,156 | |
| Expense reductions | (318) | |
| Total expenses after reductions | | 250,838 |
| Net investment income (loss) | | 1,199,729 |
| Realized and Unrealized Gain (Loss) | | |
| Net realized gain (loss) on: | | |
| Investment securities: | | |
| Unaffiliated issuers | | 5,600 |
| Total net realized gain (loss) | | 5,600 |
| Change in net unrealized appreciation (depreciation) on investment securities | | 369,094 |
| Net gain (loss) | | 374,694 |
| Net increase (decrease) in net assets resulting from operations | | $1,574,423 |
See accompanying notes which are an integral part of the financial statements.
Statement of Changes in Net Assets
| | Year ended June 30, 2019 | Year ended June 30, 2018 |
| Increase (Decrease) in Net Assets | | |
| Operations | | |
| Net investment income (loss) | $1,199,729 | $1,299,709 |
| Net realized gain (loss) | 5,600 | 16,070 |
| Change in net unrealized appreciation (depreciation) | 369,094 | (1,230,443) |
| Net increase (decrease) in net assets resulting from operations | 1,574,423 | 85,336 |
| Distributions to shareholders | (1,199,701) | – |
| Distributions to shareholders from net investment income | – | (1,299,707) |
| Total distributions | (1,199,701) | (1,299,707) |
| Share transactions - net increase (decrease) | (11,091,460) | (3,046,970) |
| Total increase (decrease) in net assets | (10,716,738) | (4,261,341) |
| Net Assets | | |
| Beginning of period | 63,457,797 | 67,719,138 |
| End of period | $52,741,059 | $63,457,797 |
See accompanying notes which are an integral part of the financial statements.
Financial Highlights
Fidelity Municipal Income 2021 Fund Class A
| Years ended June 30, | 2019 | 2018 | 2017 | 2016 | 2015 |
| Selected Per–Share Data | | | | | |
| Net asset value, beginning of period | $10.74 | $10.93 | $11.19 | $10.83 | $10.86 |
| Income from Investment Operations | | | | | |
| Net investment income (loss)A | .196 | .186 | .188 | .204 | .221 |
| Net realized and unrealized gain (loss) | .090 | (.191) | (.238) | .376 | (.016) |
| Total from investment operations | .286 | (.005) | (.050) | .580 | .205 |
| Distributions from net investment income | (.196) | (.185) | (.188) | (.205) | (.221) |
| Distributions from net realized gain | – | – | (.022) | (.015) | (.014) |
| Total distributions | (.196) | (.185) | (.210) | (.220) | (.235) |
| Redemption fees added to paid in capitalA | – | – | –B | –B | –B |
| Net asset value, end of period | $10.83 | $10.74 | $10.93 | $11.19 | $10.83 |
| Total ReturnC,D | 2.69% | (.04)% | (.44)% | 5.40% | 1.89% |
| Ratios to Average Net AssetsE,F | | | | | |
| Expenses before reductions | .65% | .65% | .65% | .65% | .65% |
| Expenses net of fee waivers, if any | .65% | .65% | .65% | .65% | .65% |
| Expenses net of all reductions | .65% | .65% | .65% | .65% | .65% |
| Net investment income (loss) | 1.82% | 1.71% | 1.71% | 1.85% | 2.02% |
| Supplemental Data | | | | | |
| Net assets, end of period (000 omitted) | $5,435 | $7,399 | $11,790 | $11,915 | $10,191 |
| Portfolio turnover rateG | 3% | 8% | 14% | 4% | 5% |
A Calculated based on average shares outstanding during the period.
B Amount represents less than $.0005 per share.
C Total returns would have been lower if certain expenses had not been reduced during the applicable periods shown.
D Total returns do not include the effect of the sales charges.
E Fees and expenses of any underlying Fidelity Central Funds are not included in the Fund's expense ratio. The Fund indirectly bears its proportionate share of the expenses of any underlying Fidelity Central Funds.
F Expense ratios reflect operating expenses of the class. Expenses before reductions do not reflect amounts reimbursed by the investment adviser or reductions from expense offset arrangements and do not represent the amount paid by the class during periods when reimbursements or reductions occur. Expenses net of fee waivers reflect expenses after reimbursement by the investment adviser but prior to reductions from expense offset arrangements. Expenses net of all reductions represent the net expenses paid by the class.
G Amount does not include the portfolio activity of any underlying Fidelity Central Funds.
See accompanying notes which are an integral part of the financial statements.
Fidelity Municipal Income 2021 Fund
| Years ended June 30, | 2019 | 2018 | 2017 | 2016 | 2015 |
| Selected Per–Share Data | | | | | |
| Net asset value, beginning of period | $10.74 | $10.93 | $11.19 | $10.83 | $10.86 |
| Income from Investment Operations | | | | | |
| Net investment income (loss)A | .222 | .212 | .215 | .231 | .248 |
| Net realized and unrealized gain (loss) | .091 | (.190) | (.238) | .376 | (.016) |
| Total from investment operations | .313 | .022 | (.023) | .607 | .232 |
| Distributions from net investment income | (.223) | (.212) | (.215) | (.232) | (.248) |
| Distributions from net realized gain | – | – | (.022) | (.015) | (.014) |
| Total distributions | (.223) | (.212) | (.237) | (.247) | (.262) |
| Redemption fees added to paid in capitalA | – | – | –B | –B | –B |
| Net asset value, end of period | $10.83 | $10.74 | $10.93 | $11.19 | $10.83 |
| Total ReturnC | 2.95% | .21% | (.19)% | 5.67% | 2.14% |
| Ratios to Average Net AssetsD,E | | | | | |
| Expenses before reductions | .40% | .40% | .40% | .40% | .40% |
| Expenses net of fee waivers, if any | .40% | .40% | .40% | .40% | .40% |
| Expenses net of all reductions | .40% | .40% | .40% | .40% | .40% |
| Net investment income (loss) | 2.07% | 1.96% | 1.96% | 2.10% | 2.27% |
| Supplemental Data | | | | | |
| Net assets, end of period (000 omitted) | $34,247 | $33,746 | $36,809 | $35,297 | $24,594 |
| Portfolio turnover rateF | 3% | 8% | 14% | 4% | 5% |
A Calculated based on average shares outstanding during the period.
B Amount represents less than $.0005 per share.
C Total returns would have been lower if certain expenses had not been reduced during the applicable periods shown.
D Fees and expenses of any underlying Fidelity Central Funds are not included in the Fund's expense ratio. The Fund indirectly bears its proportionate share of the expenses of any underlying Fidelity Central Funds.
E Expense ratios reflect operating expenses of the class. Expenses before reductions do not reflect amounts reimbursed by the investment adviser or reductions from expense offset arrangements and do not represent the amount paid by the class during periods when reimbursements or reductions occur. Expenses net of fee waivers reflect expenses after reimbursement by the investment adviser but prior to reductions from expense offset arrangements. Expenses net of all reductions represent the net expenses paid by the class.
F Amount does not include the portfolio activity of any underlying Fidelity Central Funds.
See accompanying notes which are an integral part of the financial statements.
Fidelity Municipal Income 2021 Fund Class I
| Years ended June 30, | 2019 | 2018 | 2017 | 2016 | 2015 |
| Selected Per–Share Data | | | | | |
| Net asset value, beginning of period | $10.74 | $10.93 | $11.19 | $10.83 | $10.86 |
| Income from Investment Operations | | | | | |
| Net investment income (loss)A | .222 | .212 | .215 | .231 | .247 |
| Net realized and unrealized gain (loss) | .091 | (.190) | (.238) | .376 | (.015) |
| Total from investment operations | .313 | .022 | (.023) | .607 | .232 |
| Distributions from net investment income | (.223) | (.212) | (.215) | (.232) | (.248) |
| Distributions from net realized gain | – | – | (.022) | (.015) | (.014) |
| Total distributions | (.223) | (.212) | (.237) | (.247) | (.262) |
| Redemption fees added to paid in capitalA | – | – | –B | –B | –B |
| Net asset value, end of period | $10.83 | $10.74 | $10.93 | $11.19 | $10.83 |
| Total ReturnC | 2.95% | .21% | (.19)% | 5.67% | 2.14% |
| Ratios to Average Net AssetsD,E | | | | | |
| Expenses before reductions | .40% | .40% | .40% | .40% | .40% |
| Expenses net of fee waivers, if any | .40% | .40% | .40% | .40% | .40% |
| Expenses net of all reductions | .40% | .40% | .40% | .40% | .40% |
| Net investment income (loss) | 2.07% | 1.96% | 1.96% | 2.10% | 2.27% |
| Supplemental Data | | | | | |
| Net assets, end of period (000 omitted) | $13,060 | $22,313 | $19,120 | $18,771 | $15,758 |
| Portfolio turnover rateF | 3% | 8% | 14% | 4% | 5% |
A Calculated based on average shares outstanding during the period.
B Amount represents less than $.0005 per share.
C Total returns would have been lower if certain expenses had not been reduced during the applicable periods shown.
D Fees and expenses of any underlying Fidelity Central Funds are not included in the Fund's expense ratio. The Fund indirectly bears its proportionate share of the expenses of any underlying Fidelity Central Funds.
E Expense ratios reflect operating expenses of the class. Expenses before reductions do not reflect amounts reimbursed by the investment adviser or reductions from expense offset arrangements and do not represent the amount paid by the class during periods when reimbursements or reductions occur. Expenses net of fee waivers reflect expenses after reimbursement by the investment adviser but prior to reductions from expense offset arrangements. Expenses net of all reductions represent the net expenses paid by the class.
F Amount does not include the portfolio activity of any underlying Fidelity Central Funds.
See accompanying notes which are an integral part of the financial statements.
Fidelity® Municipal Income 2023 Fund
Investment Summary (Unaudited)
Top Five States as of June 30, 2019
| | % of fund's net assets |
| Illinois | 16.7 |
| Florida | 9.2 |
| Ohio | 7.0 |
| New Jersey | 6.5 |
| Pennsylvania | 5.5 |
Top Five Sectors as of June 30, 2019
| | % of fund's net assets |
| General Obligations | 32.5 |
| Health Care | 23.7 |
| Transportation | 19.2 |
| Electric Utilities | 7.2 |
| Education | 6.1 |
Quality Diversification (% of fund's net assets)
| As of June 30, 2019 |
| | AA,A | 79.9% |
| | BBB | 17.3% |
| | BB and Below | 1.6% |
| | Not Rated | 0.9% |
| | Short-Term Investments and Net Other Assets | 0.3% |

We have used ratings from Moody's Investors Service, Inc. Where Moody's® ratings are not available, we have used S&P® ratings. All ratings are as of the date indicated and do not reflect subsequent changes.
Fidelity® Municipal Income 2023 Fund
Schedule of Investments June 30, 2019
Showing Percentage of Net Assets
| Municipal Bonds - 99.7% | | | |
| | | Principal Amount | Value |
| Alabama - 1.9% | | | |
| Mobile County Board of School Commissioners: | | | |
| Series 2016 A, 5% 3/1/23 | | $500,000 | $556,900 |
| Series 2016 B, 5% 3/1/23 | | 100,000 | 111,380 |
|
| TOTAL ALABAMA | | | 668,280 |
|
| Arizona - 3.9% | | | |
| Arizona Ctfs. of Prtn. Series 2019 A, 5% 10/1/23 (a) | | 200,000 | 229,416 |
| Arizona Indl. Dev. Auth. Rev. (Provident Group-Eastern Michigan Univ. Parking Proj.) Series 2018, 4% 5/1/23 | | 330,000 | 349,298 |
| Tucson Ctfs. of Prtn.: | | | |
| Series 2012, 5% 7/1/23 (FSA Insured) | | 450,000 | 510,557 |
| Series 2015, 5% 7/1/23 (FSA Insured) | | 250,000 | 283,643 |
|
| TOTAL ARIZONA | | | 1,372,914 |
|
| California - 1.9% | | | |
| California Health Facilities Fing. Auth. Rev. Series 2013 A, 5% 3/1/23 | | 120,000 | 135,570 |
| Los Angeles Dept. Arpt. Rev. Series 2018 C, 5% 5/15/23 (b) | | 120,000 | 135,906 |
| Riverside County Trans. Commission Toll Rev. Series 2013 A, 0% 6/1/23 | | 200,000 | 182,772 |
| Washington Township Health Care District Rev. Series 2017 B, 5% 7/1/23 | | 200,000 | 225,506 |
|
| TOTAL CALIFORNIA | | | 679,754 |
|
| Colorado - 1.6% | | | |
| Colorado Health Facilities Auth. Bonds (Valley View Hosp. Assoc. Proj.) Series 2018, 2.8%, tender 5/15/23 (c) | | 200,000 | 206,716 |
| Colorado Reg'l. Trans. District Ctfs. of Prtn. Series 2014 A, 5% 6/1/23 | | 200,000 | 226,960 |
| Univ. of Colorado Enterprise Sys. Rev. Series 2014 A, 5% 6/1/23 | | 100,000 | 114,136 |
|
| TOTAL COLORADO | | | 547,812 |
|
| Connecticut - 3.4% | | | |
| Connecticut Gen. Oblig.: | | | |
| Series 2018 C, 5% 6/15/23 | | 200,000 | 226,304 |
| Series 2019 A, 5% 4/15/23 | | 200,000 | 225,264 |
| Connecticut Health & Edl. Facilities Auth. Rev.: | | | |
| Series 2011 A, 4% 7/1/23 | | 65,000 | 67,979 |
| Series K1, 5% 7/1/23 | | 500,000 | 556,790 |
| Connecticut Muni. Elec. Energy Coop. Pwr. Supply Sys. Rev. Series 2013 A, 5% 1/1/23 | | 100,000 | 111,475 |
|
| TOTAL CONNECTICUT | | | 1,187,812 |
|
| Florida - 9.2% | | | |
| Broward County School Board Ctfs. of Prtn.: | | | |
| Series 2015 A, 5% 7/1/23 | | 250,000 | 284,688 |
| Series 2015 B, 5% 7/1/23 | | 45,000 | 51,225 |
| Duval County School Board Ctfs. of Prtn. Series 2015 B, 5% 7/1/23 | | 500,000 | 565,625 |
| Hillsborough County Aviation Auth. Rev. Series 2018 E, 5% 10/1/23 (b) | | 450,000 | 512,492 |
| Lake County School Board Ctfs. of Prtn. Series 2015 B, 5% 6/1/23 (FSA Insured) | | 500,000 | 562,720 |
| Miami-Dade County Expressway Auth.: | | | |
| Series 2014 A, 4% 7/1/23 | | 200,000 | 218,130 |
| Series 2014 B, 5% 7/1/23 | | 90,000 | 101,626 |
| Miami-Dade County School Board Ctfs. of Prtn.: | | | |
| Series 2015 A, 5% 5/1/23 | | 30,000 | 33,831 |
| Series 2015 D, 5% 2/1/23 | | 650,000 | 727,929 |
| Seminole County School Board Ctfs. of Prtn. Series 2012 A, 5% 7/1/23 | | 145,000 | 164,513 |
|
| TOTAL FLORIDA | | | 3,222,779 |
|
| Georgia - 1.5% | | | |
| Bartow County Dev. Auth. Poll. Cont. Rev. Bonds (Georgia Pwr. Co. Plant Bowen Proj.) Series 2009 1st, 2.75%, tender 3/15/23 (c) | | 300,000 | 307,677 |
| Georgia Muni. Elec. Auth. Pwr. Rev. Series GG, 5% 1/1/23 | | 210,000 | 234,020 |
|
| TOTAL GEORGIA | | | 541,697 |
|
| Illinois - 16.7% | | | |
| Chicago Midway Arpt. Rev. 5% 1/1/23 | | 400,000 | 447,200 |
| Chicago O'Hare Int'l. Arpt. Rev. Series 2013 C, 5% 1/1/23 (b) | | 200,000 | 222,084 |
| Chicago Transit Auth. Cap. Grant Receipts Rev. Series 2017, 5% 6/1/23 | | 500,000 | 557,890 |
| Illinois Fin. Auth. Rev.: | | | |
| Series 2016 C, 5% 2/15/23 | | 500,000 | 562,620 |
| Series 2019, 5% 4/1/23 | | 500,000 | 562,360 |
| Illinois Gen. Oblig.: | | | |
| Series 2013, 5% 7/1/23 | | 295,000 | 325,521 |
| Series 2014, 5% 2/1/23 | | 250,000 | 273,385 |
| Illinois Muni. Elec. Agcy. Pwr. Supply Series 2015 A, 5% 2/1/23 | | 510,000 | 568,502 |
| Illinois Reg'l. Trans. Auth. Series 2003 A, 5.5% 7/1/23 (Nat'l. Pub. Fin. Guarantee Corp. Insured) | | 80,000 | 92,077 |
| Illinois Sales Tax Rev. Series 2013, 5% 6/15/23 | | 815,000 | 892,963 |
| Kendall, Kane & Will Counties Cmnty. Unit School District #308 Series 2016, 5% 2/1/23 | | 500,000 | 554,960 |
| Metropolitan Pier & Exposition: | | | |
| (McCormick Place Expansion Proj.) Series 1996 A, 0% 6/15/23 (Nat'l. Pub. Fin. Guarantee Corp. Insured) | | 140,000 | 127,770 |
| Series 2002: | | | |
| 5.7% 6/15/23 | | 45,000 | 50,702 |
| 5.7% 6/15/23 (Escrowed to Maturity) | | 45,000 | 52,453 |
| Railsplitter Tobacco Settlement Auth. Rev. Series 2017, 5% 6/1/23 | | 500,000 | 561,310 |
|
| TOTAL ILLINOIS | | | 5,851,797 |
|
| Indiana - 2.4% | | | |
| Indiana Fin. Auth. Hosp. Rev. Series 2013, 5% 8/15/23 | | 250,000 | 284,065 |
| Indianapolis Local Pub. Impt. (Indianapolis Arpt. Auth. Proj.) Series 2016 A1, 5% 1/1/23 (b) | | 500,000 | 554,670 |
|
| TOTAL INDIANA | | | 838,735 |
|
| Louisiana - 1.7% | | | |
| Tobacco Settlement Fing. Corp. Series 2013 A, 5% 5/15/23 | | 540,000 | 602,370 |
| Maine - 0.6% | | | |
| Maine Health & Higher Edl. Facilities Auth. Rev. Series 2013, 3% 7/1/23 | | 200,000 | 205,724 |
| Massachusetts - 3.2% | | | |
| Massachusetts Bay Trans. Auth. Sales Tax Rev. Series 2005 B, 5.5% 7/1/23 (Nat'l. Pub. Fin. Guarantee Corp. Insured) | | 50,000 | 58,096 |
| Massachusetts Dev. Fin. Agcy. Rev.: | | | |
| Series 2016, 5% 7/1/23 | | 230,000 | 258,005 |
| Series 2019 A, 5% 7/1/23 | | 200,000 | 224,352 |
| Massachusetts Port Auth. Rev. Series 2017 A, 5% 7/1/23 (b) | | 500,000 | 566,455 |
|
| TOTAL MASSACHUSETTS | | | 1,106,908 |
|
| Michigan - 4.9% | | | |
| Detroit Swr. Disp. Rev. Series 2004 A, 5.25% 7/1/23 (FSA Insured) | | 50,000 | 56,837 |
| Grand Traverse County Hosp. Fin. Auth. Series 2014 C, 5% 7/1/23 | | 390,000 | 439,089 |
| Milan Area Schools Series 2019, 5% 5/1/23 | | 590,000 | 665,349 |
| Mount Clemens Cmnty. School District Series 2017 A, 5% 5/1/23 | | 500,000 | 566,650 |
|
| TOTAL MICHIGAN | | | 1,727,925 |
|
| Minnesota - 0.8% | | | |
| Anoka-Hennepin Independent School District 11 Series 2014 A, 5% 2/1/23 | | 250,000 | 279,603 |
| Nevada - 4.8% | | | |
| Clark County McCarran Int'l. Arpt. Passenger Facility Charge Rev. (Clark County Arpt. Rev. Proj.) Series 2017 B, 5% 7/1/23 (b) | | 1,000,000 | 1,131,242 |
| Nevada Gen. Oblig. Series 2013 D1, 5% 3/1/23 | | 110,000 | 124,526 |
| Nevada Lease Rev. Ctfs. Prtn. (Bldg. 1 Proj.) Series 2013, 5% 4/1/23 | | 380,000 | 428,131 |
|
| TOTAL NEVADA | | | 1,683,899 |
|
| New Jersey - 6.5% | | | |
| Camden County Impt. Auth. Health Care Redev. Rev. Series 2014 A, 5% 2/15/23 | | 250,000 | 278,128 |
| New Jersey Econ. Dev. Auth. Rev.: | | | |
| Series 2013, 5% 3/1/23 | | 550,000 | 608,256 |
| Series 2015 XX, 5% 6/15/23 | | 250,000 | 278,405 |
| New Jersey Edl. Facilities Auth. Rev. Series 2013 A, 5% 7/1/23 | | 100,000 | 113,042 |
| New Jersey Health Care Facilities Fing. Auth. Rev.: | | | |
| Series 2013 A, 5% 7/1/23 | | 200,000 | 227,750 |
| Series 2013, 5% 7/1/23 | | 200,000 | 227,248 |
| New Jersey Tobacco Settlement Fing. Corp. Series 2018 A, 5% 6/1/23 | | 240,000 | 267,943 |
| New Jersey Trans. Trust Fund Auth. 5.75% 6/15/23 (Nat'l. Pub. Fin. Guarantee Corp. Insured) | | 250,000 | 286,728 |
|
| TOTAL NEW JERSEY | | | 2,287,500 |
|
| New York - 5.0% | | | |
| Monroe County Indl. Dev. Corp. Univ. of Rochester, Proj.) Series 2017 A, 5% 7/1/23 | | 100,000 | 114,883 |
| Nassau County Local Econ. Assistance Corp.: | | | |
| (Catholic Health Svcs. of Long Island Obligated Group Proj.) Series 2014, 5% 7/1/23 | | 350,000 | 393,768 |
| Series 2014 B, 5% 7/1/23 | | 285,000 | 320,639 |
| New York Dorm. Auth. Rev. Series 2015 A, 5% 5/1/23 | | 530,000 | 599,801 |
| Saratoga County Cap. Resources Rev. Series A, 5% 7/1/23 | | 300,000 | 341,499 |
|
| TOTAL NEW YORK | | | 1,770,590 |
|
| Ohio - 7.0% | | | |
| Cleveland Arpt. Sys. Rev. 5% 1/1/23 (FSA Insured) | | 500,000 | 559,000 |
| Fairfield County Hosp. Facilities Rev. (Fairfield Med. Ctr. Proj.) Series 2013, 5% 6/15/23 | | 400,000 | 441,756 |
| Franklin County Hosp. Facilities Rev. Bonds (U.S. Health Corp. of Columbus Proj.) Series 2011 B, 5%, tender 5/15/23 (c) | | 500,000 | 562,055 |
| Hamilton County Hosp. Facilities Rev. Series 2014, 5% 2/1/23 | | 100,000 | 111,619 |
| Lancaster Port Auth. Gas Rev. Series 2019, 5% 2/1/23 | | 200,000 | 223,904 |
| Univ. of Toledo Gen. Receipts Series 2018 A, 5% 6/1/23 | | 500,000 | 565,360 |
|
| TOTAL OHIO | | | 2,463,694 |
|
| Oregon - 1.6% | | | |
| Clackamas County Hosp. Facility Auth. (Williamette View, Inc.) Series 2017 A, 4% 5/15/23 | | 250,000 | 265,610 |
| Port of Portland Arpt. Rev. Series 22, 5% 7/1/23 (b) | | 250,000 | 283,228 |
|
| TOTAL OREGON | | | 548,838 |
|
| Pennsylvania - 5.5% | | | |
| Commonwealth Fing. Auth. Rev. Series 2020 A, 5% 6/1/23 (a) | | 200,000 | 219,646 |
| Indiana County Hosp. Auth. Series 2014 A, 5% 6/1/23 | | 325,000 | 351,764 |
| Pennsylvania Gen. Oblig.: | | | |
| Series 2013, 5% 4/1/23 | | 250,000 | 283,425 |
| Series 2014, 5% 7/1/23 | | 500,000 | 571,050 |
| Philadelphia Wtr. & Wastewtr. Rev. Series 2014 A, 5% 7/1/23 | | 100,000 | 113,958 |
| State Pub. School Bldg. Auth. Lease Rev. (Philadelphia School District Proj.) Series 2015 A, 5% 6/1/23 | | 340,000 | 382,378 |
|
| TOTAL PENNSYLVANIA | | | 1,922,221 |
|
| Rhode Island - 0.8% | | | |
| Rhode Island Health & Edl. Bldg. Corp. Higher Ed. Facilities Rev. Series 2013 A, 5% 5/15/23 | | 250,000 | 280,428 |
| South Dakota - 0.5% | | | |
| South Dakota Health & Edl. Facilities Auth. Rev. (Avera Health Proj.) Series 2017, 5% 7/1/23 | | 150,000 | 170,124 |
| Tennessee - 1.5% | | | |
| Tennessee Energy Acquisition Corp. Bonds (Gas Rev. Proj.) Series A, 4%, tender 5/1/23 (c) | | 500,000 | 535,980 |
| Texas - 4.2% | | | |
| Lower Colorado River Auth. Rev.: | | | |
| Series 2015 B, 5% 5/15/23 | | 250,000 | 283,338 |
| Series 2015 D, 5% 5/15/23 | | 500,000 | 566,675 |
| North Texas Tollway Auth. Rev.: | | | |
| Series 2014 A, 5% 1/1/23 | | 300,000 | 336,492 |
| Series 2015 B, 5% 1/1/23 | | 250,000 | 280,410 |
|
| TOTAL TEXAS | | | 1,466,915 |
|
| Virginia - 1.2% | | | |
| King George County Indl. Dev. Auth. Solid Waste Disp. Fac. Rev. (King George Landfill, Inc. Proj.) Series 2003 A, 2.5% 6/1/23 (b)(c) | | 200,000 | 204,314 |
| Stafford County Econ. Dev. Auth. Hosp. Facilities Rev. Series 2016, 5% 6/15/23 | | 200,000 | 225,976 |
|
| TOTAL VIRGINIA | | | 430,290 |
|
| Washington - 4.4% | | | |
| Port of Seattle Rev. Series 2013, 5% 7/1/23 (b) | | 250,000 | 282,605 |
| Port of Seattle Spl. Facility Rev. Series 2013, 5% 6/1/23 (b) | | 300,000 | 338,361 |
| Washington Ctfs. of Prtn. Series 2013 B, 4% 7/1/23 | | 300,000 | 330,129 |
| Washington Gen. Oblig. Series 2003 C, 0% 6/1/23 (Nat'l. Pub. Fin. Guarantee Corp. Insured) | | 160,000 | 150,238 |
| Washington Health Care Facilities Auth. Rev. (Overlake Hosp. Med. Ctr., WA. Proj.) Series 2017 B, 5% 7/1/23 | | 380,000 | 429,088 |
|
| TOTAL WASHINGTON | | | 1,530,421 |
|
| Wisconsin - 3.0% | | | |
| Wisconsin Health & Edl. Facilities: | | | |
| (Agnesian Healthcare Proj.) Series 2017, 5% 7/1/23 | | 500,000 | 562,320 |
| Series 2018, 5% 4/1/23 | | 450,000 | 508,406 |
|
| TOTAL WISCONSIN | | | 1,070,726 |
|
| TOTAL MUNICIPAL BONDS | | | |
| (Cost $33,905,500) | | | 34,995,736 |
| | | Shares | Value |
|
| Money Market Funds - 0.4% | | | |
| Fidelity Municipal Cash Central Fund 2.00% (d)(e) | | | |
| (Cost $150,000) | | 149,985 | 150,000 |
| TOTAL INVESTMENT IN SECURITIES - 100.1% | | | |
| (Cost $34,055,500) | | | 35,145,736 |
| NET OTHER ASSETS (LIABILITIES) - (0.1)% | | | (52,186) |
| NET ASSETS - 100% | | | $35,093,550 |
Legend
(a) Security or a portion of the security purchased on a delayed delivery or when-issued basis.
(b) Private activity obligations whose interest is subject to the federal alternative minimum tax for individuals.
(c) Coupon rates for floating and adjustable rate securities reflect the rates in effect at period end.
(d) Information in this report regarding holdings by state and security types does not reflect the holdings of the Fidelity Municipal Cash Central Fund.
(e) Affiliated fund that is available only to investment companies and other accounts managed by Fidelity Investments. The rate quoted is the annualized seven-day yield of the fund at period end. A complete unaudited listing of the fund's holdings as of its most recent quarter end is available upon request. In addition, each Fidelity Central Fund's financial statements, which are not covered by the Fund's Report of Independent Registered Public Accounting Firm, are available on the SEC's website or upon request.
Affiliated Central Funds
Information regarding fiscal year to date income earned by the Fund from investments in Fidelity Central Funds is as follows:
| Fund | Income earned |
| Fidelity Municipal Cash Central Fund | $2,800 |
| Total | $2,800 |
Amounts in the income column in the above table include any capital gain distributions from underlying funds, which are presented in the corresponding line-item in the Statement of Operations, if applicable.
Investment Valuation
The following is a summary of the inputs used, as of June 30, 2019, involving the Fund's assets and liabilities carried at fair value. The inputs or methodology used for valuing securities may not be an indication of the risk associated with investing in those securities. For more information on valuation inputs, and their aggregation into the levels used below, please refer to the Investment Valuation section in the accompanying Notes to Financial Statements.
| | Valuation Inputs at Reporting Date: |
| Description | Total | Level 1 | Level 2 | Level 3 |
| Investments in Securities: | | | | |
| Municipal Securities | $34,995,736 | $-- | $34,995,736 | $-- |
| Money Market Funds | 150,000 | 150,000 | -- | -- |
| Total Investments in Securities: | $35,145,736 | $150,000 | $34,995,736 | $-- |
Other Information
The distribution of municipal securities by revenue source, as a percentage of total Net Assets, is as follows (Unaudited):
| General Obligations | 32.5% |
| Health Care | 23.7% |
| Transportation | 19.2% |
| Electric Utilities | 7.2% |
| Education | 6.1% |
| Others* (Individually Less Than 5%) | 11.3% |
| | 100.0% |
* Includes net other assets
See accompanying notes which are an integral part of the financial statements.
Fidelity® Municipal Income 2023 Fund
Financial Statements
Statement of Assets and Liabilities
| | | June 30, 2019 |
| Assets | | |
Investment in securities, at value — See accompanying schedule:
Unaffiliated issuers (cost $33,905,500) | $34,995,736 | |
| Fidelity Central Funds (cost $150,000) | 150,000 | |
| Total Investment in Securities (cost $34,055,500) | | $35,145,736 |
| Cash | | 17,154 |
| Receivable for fund shares sold | | 5,229 |
| Interest receivable | | 475,597 |
| Distributions receivable from Fidelity Central Funds | | 296 |
| Other receivables | | 85 |
| Total assets | | 35,644,097 |
| Liabilities | | |
| Payable for investments purchased on a delayed delivery basis | $440,686 | |
| Payable for fund shares redeemed | 78,979 | |
| Distributions payable | 18,772 | |
| Accrued management fee | 8,700 | |
| Distribution and service plan fees payable | 510 | |
| Other affiliated payables | 2,900 | |
| Total liabilities | | 550,547 |
| Net Assets | | $35,093,550 |
| Net Assets consist of: | | |
| Paid in capital | | $34,162,231 |
| Total distributable earnings (loss) | | 931,319 |
| Net Assets | | $35,093,550 |
| Net Asset Value and Maximum Offering Price | | |
| Class A: | | |
| Net Asset Value and redemption price per share ($2,486,649 ÷ 240,453 shares)(a) | | $10.34 |
| Maximum offering price per share (100/97.25 of $10.34) | | $10.63 |
| Municipal Income 2023: | | |
| Net Asset Value, offering price and redemption price per share ($23,222,756 ÷ 2,245,694 shares) | | $10.34 |
| Class I: | | |
| Net Asset Value, offering price and redemption price per share ($9,384,145 ÷ 907,440 shares) | | $10.34 |
(a) Redemption price per share is equal to net asset value less any applicable contingent deferred sales charge.
See accompanying notes which are an integral part of the financial statements.
Statement of Operations
| | | Year ended June 30, 2019 |
| Investment Income | | |
| Interest | | $847,296 |
| Income from Fidelity Central Funds | | 2,800 |
| Total income | | 850,096 |
| Expenses | | |
| Management fee | $101,559 | |
| Transfer agent fees | 33,853 | |
| Distribution and service plan fees | 6,000 | |
| Independent trustees' fees and expenses | 146 | |
| Commitment fees | 93 | |
| Total expenses before reductions | 141,651 | |
| Expense reductions | (244) | |
| Total expenses after reductions | | 141,407 |
| Net investment income (loss) | | 708,689 |
| Realized and Unrealized Gain (Loss) | | |
| Net realized gain (loss) on: | | |
| Investment securities: | | |
| Unaffiliated issuers | (99,128) | |
| Total net realized gain (loss) | | (99,128) |
| Change in net unrealized appreciation (depreciation) on investment securities | | 903,086 |
| Net gain (loss) | | 803,958 |
| Net increase (decrease) in net assets resulting from operations | | $1,512,647 |
See accompanying notes which are an integral part of the financial statements.
Statement of Changes in Net Assets
| | Year ended June 30, 2019 | Year ended June 30, 2018 |
| Increase (Decrease) in Net Assets | | |
| Operations | | |
| Net investment income (loss) | $708,689 | $681,215 |
| Net realized gain (loss) | (99,128) | (44,087) |
| Change in net unrealized appreciation (depreciation) | 903,086 | (606,126) |
| Net increase (decrease) in net assets resulting from operations | 1,512,647 | 31,002 |
| Distributions to shareholders | (707,889) | – |
| Distributions to shareholders from net investment income | – | (681,199) |
| Total distributions | (707,889) | (681,199) |
| Share transactions - net increase (decrease) | (928,306) | 6,628,161 |
| Total increase (decrease) in net assets | (123,548) | 5,977,964 |
| Net Assets | | |
| Beginning of period | 35,217,098 | 29,239,134 |
| End of period | $35,093,550 | $35,217,098 |
| Other Information | | |
| Distributions in excess of net investment income end of period | | $(9,629) |
See accompanying notes which are an integral part of the financial statements.
Financial Highlights
Fidelity Municipal Income 2023 Fund Class A
| Years ended June 30, | 2019 | 2018 | 2017 | 2016 | 2015 |
| Selected Per–Share Data | | | | | |
| Net asset value, beginning of period | $10.08 | $10.25 | $10.54 | $9.95 | $9.90 |
| Income from Investment Operations | | | | | |
| Net investment income (loss)A | .189 | .175 | .183 | .177 | .202 |
| Net realized and unrealized gain (loss) | .259 | (.171) | (.272) | .596 | .050 |
| Total from investment operations | .448 | .004 | (.089) | .773 | .252 |
| Distributions from net investment income | (.188) | (.174) | (.184) | (.183) | (.202) |
| Distributions from net realized gain | – | – | (.017) | – | – |
| Total distributions | (.188) | (.174) | (.201) | (.183) | (.202) |
| Redemption fees added to paid in capitalA | – | – | –B | –B | –B |
| Net asset value, end of period | $10.34 | $10.08 | $10.25 | $10.54 | $9.95 |
| Total ReturnC,D | 4.50% | .04% | (.83)% | 7.84% | 2.54% |
| Ratios to Average Net AssetsE,F | | | | | |
| Expenses before reductions | .65% | .65% | .65% | .65% | .65% |
| Expenses net of fee waivers, if any | .65% | .65% | .65% | .65% | .65% |
| Expenses net of all reductions | .65% | .65% | .65% | .65% | .65% |
| Net investment income (loss) | 1.86% | 1.71% | 1.78% | 1.74% | 2.01% |
| Supplemental Data | | | | | |
| Net assets, end of period (000 omitted) | $2,487 | $2,390 | $3,352 | $5,000 | $4,724 |
| Portfolio turnover rateG | 18% | 12% | 8% | 19% | 16% |
A Calculated based on average shares outstanding during the period.
B Amount represents less than $.0005 per share.
C Total returns would have been lower if certain expenses had not been reduced during the applicable periods shown.
D Total returns do not include the effect of the sales charges.
E Fees and expenses of any underlying Fidelity Central Funds are not included in the Fund's expense ratio. The Fund indirectly bears its proportionate share of the expenses of any underlying Fidelity Central Funds.
F Expense ratios reflect operating expenses of the class. Expenses before reductions do not reflect amounts reimbursed by the investment adviser or reductions from expense offset arrangements and do not represent the amount paid by the class during periods when reimbursements or reductions occur. Expenses net of fee waivers reflect expenses after reimbursement by the investment adviser but prior to reductions from expense offset arrangements. Expenses net of all reductions represent the net expenses paid by the class.
G Amount does not include the portfolio activity of any underlying Fidelity Central Funds.
See accompanying notes which are an integral part of the financial statements.
Fidelity Municipal Income 2023 Fund
| Years ended June 30, | 2019 | 2018 | 2017 | 2016 | 2015 |
| Selected Per–Share Data | | | | | |
| Net asset value, beginning of period | $10.08 | $10.24 | $10.54 | $9.95 | $9.90 |
| Income from Investment Operations | | | | | |
| Net investment income (loss)A | .214 | .199 | .209 | .204 | .227 |
| Net realized and unrealized gain (loss) | .260 | (.159) | (.283) | .594 | .050 |
| Total from investment operations | .474 | .040 | (.074) | .798 | .277 |
| Distributions from net investment income | (.214) | (.200) | (.209) | (.208) | (.227) |
| Distributions from net realized gain | – | – | (.017) | – | – |
| Total distributions | (.214) | (.200) | (.226) | (.208) | (.227) |
| Redemption fees added to paid in capitalA | – | – | –B | –B | –B |
| Net asset value, end of period | $10.34 | $10.08 | $10.24 | $10.54 | $9.95 |
| Total ReturnC | 4.76% | .39% | (.68)% | 8.11% | 2.80% |
| Ratios to Average Net AssetsD,E | | | | | |
| Expenses before reductions | .40% | .40% | .40% | .40% | .40% |
| Expenses net of fee waivers, if any | .40% | .40% | .40% | .40% | .40% |
| Expenses net of all reductions | .40% | .40% | .40% | .40% | .40% |
| Net investment income (loss) | 2.11% | 1.96% | 2.03% | 1.99% | 2.26% |
| Supplemental Data | | | | | |
| Net assets, end of period (000 omitted) | $23,223 | $18,883 | $14,238 | $18,465 | $11,424 |
| Portfolio turnover rateF | 18% | 12% | 8% | 19% | 16% |
A Calculated based on average shares outstanding during the period.
B Amount represents less than $.0005 per share.
C Total returns would have been lower if certain expenses had not been reduced during the applicable periods shown.
D Fees and expenses of any underlying Fidelity Central Funds are not included in the Fund's expense ratio. The Fund indirectly bears its proportionate share of the expenses of any underlying Fidelity Central Funds.
E Expense ratios reflect operating expenses of the class. Expenses before reductions do not reflect amounts reimbursed by the investment adviser or reductions from expense offset arrangements and do not represent the amount paid by the class during periods when reimbursements or reductions occur. Expenses net of fee waivers reflect expenses after reimbursement by the investment adviser but prior to reductions from expense offset arrangements. Expenses net of all reductions represent the net expenses paid by the class.
F Amount does not include the portfolio activity of any underlying Fidelity Central Funds.
See accompanying notes which are an integral part of the financial statements.
Fidelity Municipal Income 2023 Fund Class I
| Years ended June 30, | 2019 | 2018 | 2017 | 2016 | 2015 |
| Selected Per–Share Data | | | | | |
| Net asset value, beginning of period | $10.08 | $10.24 | $10.54 | $9.95 | $9.90 |
| Income from Investment Operations | | | | | |
| Net investment income (loss)A | .213 | .199 | .209 | .204 | .227 |
| Net realized and unrealized gain (loss) | .261 | (.159) | (.283) | .594 | .050 |
| Total from investment operations | .474 | .040 | (.074) | .798 | .277 |
| Distributions from net investment income | (.214) | (.200) | (.209) | (.208) | (.227) |
| Distributions from net realized gain | – | – | (.017) | – | – |
| Total distributions | (.214) | (.200) | (.226) | (.208) | (.227) |
| Redemption fees added to paid in capitalA | – | – | –B | –B | –B |
| Net asset value, end of period | $10.34 | $10.08 | $10.24 | $10.54 | $9.95 |
| Total ReturnC | 4.76% | .39% | (.68)% | 8.11% | 2.80% |
| Ratios to Average Net AssetsD,E | | | | | |
| Expenses before reductions | .40% | .40% | .40% | .40% | .40% |
| Expenses net of fee waivers, if any | .40% | .40% | .40% | .40% | .40% |
| Expenses net of all reductions | .40% | .40% | .40% | .40% | .40% |
| Net investment income (loss) | 2.11% | 1.96% | 2.03% | 1.99% | 2.26% |
| Supplemental Data | | | | | |
| Net assets, end of period (000 omitted) | $9,384 | $13,944 | $11,649 | $15,112 | $7,913 |
| Portfolio turnover rateF | 18% | 12% | 8% | 19% | 16% |
A Calculated based on average shares outstanding during the period.
B Amount represents less than $.0005 per share.
C Total returns would have been lower if certain expenses had not been reduced during the applicable periods shown.
D Fees and expenses of any underlying Fidelity Central Funds are not included in the Fund's expense ratio. The Fund indirectly bears its proportionate share of the expenses of any underlying Fidelity Central Funds.
E Expense ratios reflect operating expenses of the class. Expenses before reductions do not reflect amounts reimbursed by the investment adviser or reductions from expense offset arrangements and do not represent the amount paid by the class during periods when reimbursements or reductions occur. Expenses net of fee waivers reflect expenses after reimbursement by the investment adviser but prior to reductions from expense offset arrangements. Expenses net of all reductions represent the net expenses paid by the class.
F Amount does not include the portfolio activity of any underlying Fidelity Central Funds.
See accompanying notes which are an integral part of the financial statements.
Fidelity® Municipal Income 2025 Fund
Investment Summary (Unaudited)
Top Five States as of June 30, 2019
| | % of fund's net assets |
| Illinois | 11.5 |
| Florida | 9.3 |
| Pennsylvania | 8.3 |
| Massachusetts | 7.2 |
| New Jersey | 5.9 |
Top Five Sectors as of June 30, 2019
| | % of fund's net assets |
| Health Care | 26.2 |
| General Obligations | 23.9 |
| Transportation | 22.5 |
| Education | 17.8 |
| Special Tax | 3.8 |
Quality Diversification (% of fund's net assets)
| As of June 30, 2019 |
| | AAA | 1.0% |
| | AA,A | 76.6% |
| | BBB | 17.9% |
| | BB and Below | 2.4% |
| | Not Rated | 2.0% |
| | Short-Term Investments and Net Other Assets | 0.1% |

We have used ratings from Moody's Investors Service, Inc. Where Moody's® ratings are not available, we have used S&P® ratings. All ratings are as of the date indicated and do not reflect subsequent changes.
Fidelity® Municipal Income 2025 Fund
Schedule of Investments June 30, 2019
Showing Percentage of Net Assets
| Municipal Bonds - 99.9% | | | |
| | | Principal Amount | Value |
| Arizona - 5.4% | | | |
| Glendale Gen. Oblig. Series 2017, 5% 7/1/25 | | 250,000 | 299,298 |
| Glendale Trans. Excise Tax Rev. 5% 7/1/25 (FSA Insured) | | 75,000 | 89,885 |
| Phoenix Civic Impt. Board Arpt. Rev.: | | | |
| Series 2017 A, 5% 7/1/25 (a) | | $250,000 | $296,778 |
| Series 2017 B, 5% 7/1/25 | | 250,000 | 300,568 |
| Tucson Wtr. Rev. Series 2017, 5% 7/1/25 | | 250,000 | 300,408 |
|
| TOTAL ARIZONA | | | 1,286,937 |
|
| California - 4.3% | | | |
| California Muni. Fin. Auth. Rev. Series 2017 A, 5% 7/1/25 | | 410,000 | 479,577 |
| Poway Unified School District Series 2009, 0% 8/1/25 | | 90,000 | 80,719 |
| San Diego County Reg'l. Arpt. Auth. Arpt. Rev. (Sub Lien Proj.) Series 2017 B, 5% 7/1/25 (a) | | 150,000 | 179,105 |
| Washington Township Health Care District Rev. Series 2017 B, 5% 7/1/25 | | 250,000 | 293,970 |
|
| TOTAL CALIFORNIA | | | 1,033,371 |
|
| Colorado - 0.7% | | | |
| E-470 Pub. Hwy. Auth. Rev. Series 1997 B, 0% 9/1/25 (Nat'l. Pub. Fin. Guarantee Corp. Insured) | | 200,000 | 175,502 |
| Connecticut - 5.4% | | | |
| Connecticut Gen. Oblig. Series 2015 B, 5% 6/15/25 | | 175,000 | 207,099 |
| Connecticut Health & Edl. Facilities Auth. Rev.: | | | |
| (Quinnipiac Univ., Ct. Proj.) Series M, 5% 7/1/25 | | 40,000 | 47,459 |
| (Sacred Heart Univ., CT. Proj.) Series 2017 I-1, 5% 7/1/25 | | 400,000 | 472,840 |
| Series K1, 5% 7/1/25 | | 280,000 | 323,915 |
| Series K3, 5% 7/1/25 | | 200,000 | 231,246 |
|
| TOTAL CONNECTICUT | | | 1,282,559 |
|
| District Of Columbia - 1.6% | | | |
| District of Columbia Rev. Series 2018, 5% 10/1/25 | | 75,000 | 88,466 |
| Washington D.C. Metropolitan Transit Auth. Rev. Series 2017 B, 5% 7/1/25 | | 250,000 | 301,045 |
|
| TOTAL DISTRICT OF COLUMBIA | | | 389,511 |
|
| Florida - 9.3% | | | |
| Broward County Arpt. Sys. Rev. Series 2017, 5% 10/1/25 (a) | | 500,000 | 593,980 |
| Greater Orlando Aviation Auth. Arpt. Facilities Rev. Series 2017 A, 5% 10/1/25 (a) | | 300,000 | 356,583 |
| Indian River County School Board Ctfs. of Prtn. Series 2014, 5% 7/1/25 | | 250,000 | 298,193 |
| Lakeland Hosp. Sys. Rev. Series 2016, 5% 11/15/25 | | 430,000 | 509,903 |
| Palm Beach County School Board Ctfs. of Prtn. (Palm Beach County School District Proj.) Series 2018 A, 5% 8/1/25 | | 50,000 | 60,172 |
| Seminole County School Board Ctfs. of Prtn. Series 2016 C, 5% 7/1/25 | | 40,000 | 47,736 |
| South Miami Health Facilities Auth. Hosp. Rev. (Baptist Med. Ctr., FL. Proj.) Series 2017, 5% 8/15/25 | | 200,000 | 239,234 |
| Tampa Hosp. Rev. (H. Lee Moffitt Cancer Ctr. Proj.) Series 2016 B, 5% 7/1/25 | | 100,000 | 117,961 |
|
| TOTAL FLORIDA | | | 2,223,762 |
|
| Illinois - 11.5% | | | |
| Chicago O'Hare Int'l. Arpt. Rev. Series 2017 D, 5% 1/1/25 (a) | | 100,000 | 116,339 |
| Chicago Transit Auth. Cap. Grant Receipts Rev. Series 2017, 5% 6/1/25 | | 250,000 | 291,018 |
| Grundy & Will Counties Cmnty. School Gen. Obligan Series 2017, 5% 2/1/25 | | 230,000 | 267,267 |
| Illinois Fin. Auth. Rev.: | | | |
| (Edward-Elmhurst Healthcare) Series 2017 A, 5% 1/1/25 | | 145,000 | 166,972 |
| (Northwestern Memorial Hosp.,IL. Proj.) Series 2017 A, 5% 7/15/25 | | 200,000 | 239,024 |
| Illinois Gen. Oblig.: | | | |
| Series 2013, 5.5% 7/1/25 | | 200,000 | 222,088 |
| Series 2017 D, 5% 11/1/25 | | 25,000 | 28,422 |
| Kendall, Kane & Will Counties Cmnty. Unit School District #308 Series 2008, 0% 2/1/25 (FSA Insured) | | 185,000 | 163,793 |
| Metropolitan Pier & Exposition Series 1994 A, 0% 6/15/25 | | 270,000 | 232,025 |
| Railsplitter Tobacco Settlement Auth. Rev. Series 2017, 5% 6/1/25 | | 365,000 | 429,109 |
| Will County Cmnty. Unit School District #365-U Series 2012, 0% 11/1/25 | | 675,000 | 587,034 |
|
| TOTAL ILLINOIS | | | 2,743,091 |
|
| Indiana - 0.4% | | | |
| Indiana Fin. Auth. Health Sys. Rev. Bonds Series 2019 B, 2.25%, tender 7/1/25 (b)(c) | | 55,000 | 56,524 |
| Indiana Fin. Auth. Rev. (Cmnty. Foundation of Northwest Indiana Obligated Group) Series 2016, 5% 9/1/25 | | 25,000 | 29,726 |
|
| TOTAL INDIANA | | | 86,250 |
|
| Kentucky - 2.0% | | | |
| Kentucky State Property & Buildings Commission Rev.: | | | |
| (Kentucky St) Series 2016, 5% 10/1/25 | | 100,000 | 119,252 |
| (Proj. No. 118) Series 2018, 5% 4/1/25 | | 300,000 | 352,863 |
|
| TOTAL KENTUCKY | | | 472,115 |
|
| Louisiana - 0.5% | | | |
| New Orleans Aviation Board Rev. (North Term. Proj.) Series 2017 B, 5% 1/1/25 (a) | | 100,000 | 115,603 |
| Maine - 3.9% | | | |
| Maine Health & Higher Edl. Facilities Auth. Rev.: | | | |
| Series 2013, 5% 7/1/25 | | 265,000 | 291,701 |
| Series 2017 A, 4% 7/1/25 | | 465,000 | 521,372 |
| Series 2017 B, 4% 7/1/25 | | 100,000 | 112,123 |
|
| TOTAL MAINE | | | 925,196 |
|
| Maryland - 1.8% | | | |
| Maryland Health & Higher Edl. Facilities Auth. Rev. (Lifebridge Health Proj.) Series 2017, 5% 7/1/25 | | 150,000 | 178,254 |
| Rockville Mayor & Council Econ. Dev. (Rfdg.-Ingleside King Farm Proj.) Series 2017, 2.5% 11/1/24 | | 250,000 | 250,058 |
|
| TOTAL MARYLAND | | | 428,312 |
|
| Massachusetts - 7.2% | | | |
| Massachusetts Dev. Fin. Agcy. Rev.: | | | |
| (Fisher College) Series 2017, 5% 4/1/25 | | 250,000 | 288,873 |
| (Lawrence Gen. Hosp. MA. Proj.) Series 2017, 5% 7/1/25 | | 130,000 | 146,801 |
| Bonds Series 2017 A2, 5%, tender 1/30/25 (c) | | 10,000 | 11,794 |
| Caregroup, Inc. Series 2015 H-1, 5% 7/1/25 | | 150,000 | 178,443 |
| Series 2019, 5% 7/1/25 | | 170,000 | 199,689 |
| Massachusetts Edl. Fing. Auth. Rev. Series 2017 A, 5% 7/1/25 (a) | | 250,000 | 292,733 |
| Massachusetts Port Auth. Rev. Series 2017 A, 5% 7/1/25 (a) | | 500,000 | 594,810 |
|
| TOTAL MASSACHUSETTS | | | 1,713,143 |
|
| Michigan - 3.7% | | | |
| Grand Traverse County Hosp. Fin. Auth. Series 2019 A, 5% 7/1/25 | | 150,000 | 176,196 |
| Milan Area Schools Series 2019, 5% 5/1/25 | | 355,000 | 420,054 |
| Warren Consolidated School District Series 2017, 4% 5/1/25 (FSA Insured) | | 250,000 | 279,043 |
|
| TOTAL MICHIGAN | | | 875,293 |
|
| Missouri - 4.6% | | | |
| Saint Louis Arpt. Rev.: | | | |
| Series 2017 A, 5% 7/1/25 (FSA Insured) | | 370,000 | 444,840 |
| Series 2017 B, 5% 7/1/25 (FSA Insured) (a) | | 250,000 | 295,838 |
| Series 2019 C, 5% 7/1/25 | | 290,000 | 346,817 |
|
| TOTAL MISSOURI | | | 1,087,495 |
|
| Nevada - 0.3% | | | |
| Clark County School District Series 2017 A, 5% 6/15/25 | | 60,000 | 71,192 |
| New Hampshire - 1.3% | | | |
| New Hampshire Health & Ed. Facilities Auth.: | | | |
| (Dartmouth-Hitchcock Oblgtd Grp Proj.) Series 2018 A, 5% 8/1/25 | | 50,000 | 59,277 |
| (Partners Healthcare Sys., Inc. Proj.) Series 2017, 5% 7/1/25 | | 200,000 | 239,946 |
|
| TOTAL NEW HAMPSHIRE | | | 299,223 |
|
| New Jersey - 5.9% | | | |
| New Jersey Econ. Dev. Auth. Lease Rev. (Libersty State Park Proj.) Series 2015 A, 5% 6/15/25 | | 200,000 | 230,570 |
| New Jersey Econ. Dev. Auth. Rev. (New Jersey Gen. Oblig. Proj.) Series 2015 XX, 5% 6/15/25 | | 250,000 | 288,213 |
| New Jersey Edl. Facility: | | | |
| (Stevens Institute of Techonolgy Proj.) Series 2017 A, 5% 7/1/25 | | 105,000 | 124,187 |
| (Stockton Univ. Proj.) Series A, 5% 7/1/25 | | 15,000 | 17,583 |
| Series 2016 E, 5% 7/1/25 | | 50,000 | 59,137 |
| New Jersey Health Care Facilities Fing. Auth. Rev.: | | | |
| (St Joseph Hosp. & Med. Ctr., Proj.) Series 2016, 5% 7/1/25 | | 375,000 | 435,416 |
| Series 2016 A, 5% 7/1/25 | | 100,000 | 119,529 |
| New Jersey Tobacco Settlement Fing. Corp. Series 2018 A, 5% 6/1/25 | | 20,000 | 23,289 |
| New Jersey Trans. Trust Fund Auth.: | | | |
| Series 2016 A, 5% 6/15/25 | | 40,000 | 46,917 |
| Series AA, 5% 6/15/25 | | 50,000 | 57,643 |
|
| TOTAL NEW JERSEY | | | 1,402,484 |
|
| New York - 2.0% | | | |
| Dutchess County Local Dev. Corp. Rev. (Health Quest Sys. Proj.) Series 2016 A, 5% 7/1/25 | | 30,000 | 35,557 |
| Niagara Frontier Trans. Auth. Arpt. Rev. Series 2019 A, 5% 4/1/25 (a) | | 255,000 | 296,149 |
| Onondaga Civic Dev. Corp. (Le Moyne College Proj.): | | | |
| Series 2015, 5% 7/1/25 | | 100,000 | 116,847 |
| Series 2018, 5% 1/1/25 | | 15,000 | 17,340 |
|
| TOTAL NEW YORK | | | 465,893 |
|
| Ohio - 4.8% | | | |
| Akron Bath Copley Hosp. District Rev. (Summa Health Sys.) Series 2016, 5% 11/15/25 | | 150,000 | 176,103 |
| Hamilton County Hosp. Facilities Rev. (Trihealth, Inc. Obligated Group Proj.) Series 2017 A, 5% 8/15/25 | | 140,000 | 164,696 |
| Lancaster Port Auth. Gas Rev. Series 2019, 5% 2/1/25 | | 200,000 | 234,140 |
| Ohio Higher Edl. Facility Commission Rev.: | | | |
| (Kenyon College, Oh. Proj.) Series 2017 5% 7/1/25 | | 200,000 | 238,176 |
| (Xavier Univ. 2015 Proj.) Series 2015 C, 5% 5/1/25 | | 190,000 | 220,465 |
| (Xavier Univ. 2016 Proj.) Series 2016, 5% 5/1/25 | | 100,000 | 116,034 |
|
| TOTAL OHIO | | | 1,149,614 |
|
| Oregon - 3.0% | | | |
| Clackamas County Hosp. Facility Auth. (Williamette View, Inc.) Series 2017 A, 4% 5/15/25 | | 200,000 | 216,752 |
| Port of Portland Arpt. Rev. Series 24B, 5% 7/1/25 (a) | | 420,000 | 499,376 |
|
| TOTAL OREGON | | | 716,128 |
|
| Pennsylvania - 8.3% | | | |
| Butler County Hosp. Auth. Hosp. Rev. Series 2015 A, 5% 7/1/25 | | 20,000 | 23,283 |
| Centre County Pennsylvania Hosp. Auth. Rev. (Mount Nittany Med. Ctr. Proj.) Series 2018 A, 5% 11/15/25 | | 100,000 | 118,450 |
| Commonwealth Fing. Auth. Rev. Series 2020 A, 5% 6/1/25 (b) | | 200,000 | 230,366 |
| Delaware County Auth. Rev. Series 2017, 5% 7/1/25 | | 125,000 | 144,074 |
| Doylestown Hosp. Auth. Hosp. Rev. Series 2016 A, 5% 7/1/25 | | 125,000 | 141,525 |
| Dubois Hosp. Auth. Hosp. Rev. (Penn Highlands Healthcare Proj.) Series 2018, 5% 7/15/25 | | 100,000 | 117,810 |
| Monroe County Hosp. Auth. Rev. Series 2016, 5% 7/1/25 | | 50,000 | 58,393 |
| Pennsylvania Ctfs. Prtn. Series 2018 A, 5% 7/1/25 | | 200,000 | 235,922 |
| Pennsylvania Higher Edl. Facilities Auth. Rev.: | | | |
| (Drexel Univ.) Series 2016, 5% 5/1/25 | | 200,000 | 235,314 |
| Series 2015 AQ, 5% 6/15/25 | | 200,000 | 237,430 |
| Philadelphia School District: | | | |
| Series 2015 A, 5% 9/1/25 | | 20,000 | 23,652 |
| Series 2018 A, 5% 9/1/25 | | 50,000 | 59,130 |
| Southcentral Pennsylvania Gen. Auth. Rev. Series 2019 A, 5% 6/1/25 | | 300,000 | 356,763 |
|
| TOTAL PENNSYLVANIA | | | 1,982,112 |
|
| Tennessee - 1.3% | | | |
| Knox County Health Edl. & Hsg. Facilities Board Rev.: | | | |
| Series 2016, 5% 9/1/25 | | 15,000 | 17,304 |
| Series 2017, 5% 4/1/25 | | 265,000 | 303,425 |
|
| TOTAL TENNESSEE | | | 320,729 |
|
| Texas - 2.0% | | | |
| Dallas County Gen. Oblig. Series 2016, 5% 8/15/25 | | 200,000 | 240,786 |
| Houston Arpt. Sys. Rev. Series 2018 C, 5% 7/1/25 (a) | | 200,000 | 235,672 |
|
| TOTAL TEXAS | | | 476,458 |
|
| Utah - 0.1% | | | |
| Salt Lake City Arpt. Rev. Series 2017 A, 5% 7/1/25 (a) | | 30,000 | 35,426 |
| Vermont - 0.5% | | | |
| Vermont Student Assistant Corp. Ed. Ln. Rev. Series 2019 A, 5% 6/15/25 (a) | | 105,000 | 121,875 |
| Washington - 2.3% | | | |
| Port of Seattle Rev. Series 2017 C, 5% 5/1/25 (a) | | 465,000 | 548,798 |
| Wisconsin - 5.8% | | | |
| Wisconsin Gen. Oblig. Series 2016 B, 5% 5/1/25 | | 900,000 | 1,080,418 |
| Wisconsin Health & Edl. Facilities Series 2017 A: | | | |
| 5% 4/1/25 | | 155,000 | 183,057 |
| 5% 9/1/25 | | 100,000 | 114,989 |
|
| TOTAL WISCONSIN | | | 1,378,464 |
|
| TOTAL MUNICIPAL BONDS | | | |
| (Cost $23,095,780) | | | 23,806,536 |
| TOTAL INVESTMENT IN SECURITIES - 99.9% | | | |
| (Cost $23,095,780) | | | 23,806,536 |
| NET OTHER ASSETS (LIABILITIES) - 0.1% | | | 30,024 |
| NET ASSETS - 100% | | | $23,836,560 |
Legend
(a) Private activity obligations whose interest is subject to the federal alternative minimum tax for individuals.
(b) Security or a portion of the security purchased on a delayed delivery or when-issued basis.
(c) Coupon rates for floating and adjustable rate securities reflect the rates in effect at period end.
Affiliated Central Funds
Information regarding fiscal year to date income earned by the Fund from investments in Fidelity Central Funds is as follows:
| Fund | Income earned |
| Fidelity Municipal Cash Central Fund | $1,101 |
| Total | $1,101 |
Amounts in the income column in the above table include any capital gain distributions from underlying funds, which are presented in the corresponding line-item in the Statement of Operations, if applicable.
Investment Valuation
All investments are categorized as Level 2 under the Fair Value Hierarchy. The inputs or methodology used for valuing securities may not be an indication of the risk associated with investing in those securities. For more information on valuation inputs please refer to the Investment Valuation section in the accompanying Notes to Financial Statements.
Other Information
The distribution of municipal securities by revenue source, as a percentage of total Net Assets, is as follows (Unaudited):
| Health Care | 26.2% |
| General Obligations | 23.9% |
| Transportation | 22.5% |
| Education | 17.8% |
| Others* (Individually Less Than 5%) | 9.6% |
| | 100.0% |
* Includes net other assets
See accompanying notes which are an integral part of the financial statements.
Fidelity® Municipal Income 2025 Fund
Financial Statements
Statement of Assets and Liabilities
| | | June 30, 2019 |
| Assets | | |
Investment in securities, at value — See accompanying schedule:
Unaffiliated issuers (cost $23,095,780) | | $23,806,536 |
| Receivable for fund shares sold | | 25,059 |
| Interest receivable | | 318,926 |
| Distributions receivable from Fidelity Central Funds | | 112 |
| Other receivables | | 90 |
| Total assets | | 24,150,723 |
| Liabilities | | |
| Payable to custodian bank | $15,994 | |
| Payable for investments purchased on a delayed delivery basis | 284,302 | |
| Payable for fund shares redeemed | 982 | |
| Distributions payable | 4,397 | |
| Accrued management fee | 5,866 | |
| Distribution and service plan fees payable | 666 | |
| Other affiliated payables | 1,956 | |
| Total liabilities | | 314,163 |
| Net Assets | | $23,836,560 |
| Net Assets consist of: | | |
| Paid in capital | | $23,181,909 |
| Total distributable earnings (loss) | | 654,651 |
| Net Assets | | $23,836,560 |
| Net Asset Value and Maximum Offering Price | | |
| Class A: | | |
| Net Asset Value and redemption price per share ($3,329,094 ÷ 323,587 shares)(a) | | $10.29 |
| Maximum offering price per share (100/97.25 of $10.29) | | $10.58 |
| Municipal Income 2025: | | |
| Net Asset Value, offering price and redemption price per share ($15,780,198 ÷ 1,533,766 shares) | | $10.29 |
| Class I: | | |
| Net Asset Value, offering price and redemption price per share ($4,727,268 ÷ 459,430 shares) | | $10.29 |
(a) Redemption price per share is equal to net asset value less any applicable contingent deferred sales charge.
See accompanying notes which are an integral part of the financial statements.
Statement of Operations
| | | Year ended June 30, 2019 |
| Investment Income | | |
| Interest | | $435,562 |
| Income from Fidelity Central Funds | | 1,101 |
| Total income | | 436,663 |
| Expenses | | |
| Management fee | $53,172 | |
| Transfer agent fees | 17,724 | |
| Distribution and service plan fees | 6,832 | |
| Independent trustees' fees and expenses | 72 | |
| Commitment fees | 43 | |
| Total expenses before reductions | 77,843 | |
| Expense reductions | (153) | |
| Total expenses after reductions | | 77,690 |
| Net investment income (loss) | | 358,973 |
| Realized and Unrealized Gain (Loss) | | |
| Net realized gain (loss) on: | | |
| Investment securities: | | |
| Unaffiliated issuers | | 12,134 |
| Total net realized gain (loss) | | 12,134 |
| Change in net unrealized appreciation (depreciation) on investment securities | | 976,046 |
| Net gain (loss) | | 988,180 |
| Net increase (decrease) in net assets resulting from operations | | $1,347,153 |
See accompanying notes which are an integral part of the financial statements.
Statement of Changes in Net Assets
| | Year ended June 30, 2019 | Year ended June 30, 2018 |
| Increase (Decrease) in Net Assets | | |
| Operations | | |
| Net investment income (loss) | $358,973 | $250,898 |
| Net realized gain (loss) | 12,134 | (68,247) |
| Change in net unrealized appreciation (depreciation) | 976,046 | (218,912) |
| Net increase (decrease) in net assets resulting from operations | 1,347,153 | (36,261) |
| Distributions to shareholders | (358,966) | – |
| Distributions to shareholders from net investment income | – | (250,939) |
| Total distributions | (358,966) | (250,939) |
| Share transactions - net increase (decrease) | 7,625,604 | 5,257,459 |
| Total increase (decrease) in net assets | 8,613,791 | 4,970,259 |
| Net Assets | | |
| Beginning of period | 15,222,769 | 10,252,510 |
| End of period | $23,836,560 | $15,222,769 |
See accompanying notes which are an integral part of the financial statements.
Financial Highlights
Fidelity Municipal Income 2025 Fund Class A
| Years ended June 30, | 2019 | 2018 | 2017 A |
| Selected Per–Share Data | | | |
| Net asset value, beginning of period | $9.77 | $9.96 | $10.00 |
| Income from Investment Operations | | | |
| Net investment income (loss)B | .180 | .163 | .002 |
| Net realized and unrealized gain (loss) | .521 | (.192) | (.040) |
| Total from investment operations | .701 | (.029) | (.038) |
| Distributions from net investment income | (.181) | (.161) | (.002) |
| Total distributions | (.181) | (.161) | (.002) |
| Net asset value, end of period | $10.29 | $9.77 | $9.96 |
| Total ReturnC,D,E | 7.25% | (.29)% | (.38)% |
| Ratios to Average Net AssetsF,G | | | |
| Expenses before reductions | .65% | .65% | .65%H |
| Expenses net of fee waivers, if any | .65% | .65% | .65%H |
| Expenses net of all reductions | .65% | .65% | .62%H |
| Net investment income (loss) | 1.81% | 1.65% | .20%H |
| Supplemental Data | | | |
| Net assets, end of period (000 omitted) | $3,329 | $2,482 | $2,489 |
| Portfolio turnover rateI | 17% | 44% | - %J |
A For the period May 25, 2017 (commencement of operations) to June 30, 2017.
B Calculated based on average shares outstanding during the period.
C Total returns for periods of less than one year are not annualized.
D Total returns would have been lower if certain expenses had not been reduced during the applicable periods shown.
E Total returns do not include the effect of the sales charges.
F Fees and expenses of any underlying Fidelity Central Funds are not included in the Fund's expense ratio. The Fund indirectly bears its proportionate share of the expenses of any underlying Fidelity Central Funds.
G Expense ratios reflect operating expenses of the class. Expenses before reductions do not reflect amounts reimbursed by the investment adviser or reductions from expense offset arrangements and do not represent the amount paid by the class during periods when reimbursements or reductions occur. Expense ratios before reductions for start-up periods may not be representative of longer-term operating periods. Expenses net of fee waivers reflect expenses after reimbursement by the investment adviser but prior to reductions from expense offset arrangements. Expenses net of all reductions represent the net expenses paid by the class.
H Annualized
I Amount does not include the portfolio activity of any underlying Fidelity Central Funds.
J Amount not annualized.
See accompanying notes which are an integral part of the financial statements.
Fidelity Municipal Income 2025 Fund
| Years ended June 30, | 2019 | 2018 | 2017 A |
| Selected Per–Share Data | | | |
| Net asset value, beginning of period | $9.77 | $9.96 | $10.00 |
| Income from Investment Operations | | | |
| Net investment income (loss)B | .205 | .187 | .004 |
| Net realized and unrealized gain (loss) | .521 | (.191) | (.040) |
| Total from investment operations | .726 | (.004) | (.036) |
| Distributions from net investment income | (.206) | (.186) | (.004) |
| Total distributions | (.206) | (.186) | (.004) |
| Net asset value, end of period | $10.29 | $9.77 | $9.96 |
| Total ReturnC,D | 7.52% | (.04)% | (.36)% |
| Ratios to Average Net AssetsE,F | | | |
| Expenses before reductions | .40% | .40% | .40%G |
| Expenses net of fee waivers, if any | .40% | .40% | .40%G |
| Expenses net of all reductions | .40% | .40% | .37%G |
| Net investment income (loss) | 2.06% | 1.90% | .45%G |
| Supplemental Data | | | |
| Net assets, end of period (000 omitted) | $15,780 | $8,947 | $5,273 |
| Portfolio turnover rateH | 17% | 44% | - %I |
A For the period May 25, 2017 (commencement of operations) to June 30, 2017.
B Calculated based on average shares outstanding during the period.
C Total returns for periods of less than one year are not annualized.
D Total returns would have been lower if certain expenses had not been reduced during the applicable periods shown.
E Fees and expenses of any underlying Fidelity Central Funds are not included in the Fund's expense ratio. The Fund indirectly bears its proportionate share of the expenses of any underlying Fidelity Central Funds.
F Expense ratios reflect operating expenses of the class. Expenses before reductions do not reflect amounts reimbursed by the investment adviser or reductions from expense offset arrangements and do not represent the amount paid by the class during periods when reimbursements or reductions occur. Expense ratios before reductions for start-up periods may not be representative of longer-term operating periods. Expenses net of fee waivers reflect expenses after reimbursement by the investment adviser but prior to reductions from expense offset arrangements. Expenses net of all reductions represent the net expenses paid by the class.
G Annualized
H Amount does not include the portfolio activity of any underlying Fidelity Central Funds.
I Amount not annualized.
See accompanying notes which are an integral part of the financial statements.
Fidelity Municipal Income 2025 Fund Class I
| Years ended June 30, | 2019 | 2018 | 2017 A |
| Selected Per–Share Data | | | |
| Net asset value, beginning of period | $9.77 | $9.96 | $10.00 |
| Income from Investment Operations | | | |
| Net investment income (loss)B | .205 | .187 | .004 |
| Net realized and unrealized gain (loss) | .521 | (.191) | (.040) |
| Total from investment operations | .726 | (.004) | (.036) |
| Distributions from net investment income | (.206) | (.186) | (.004) |
| Total distributions | (.206) | (.186) | (.004) |
| Net asset value, end of period | $10.29 | $9.77 | $9.96 |
| Total ReturnC,D | 7.52% | (.04)% | (.36)% |
| Ratios to Average Net AssetsE,F | | | |
| Expenses before reductions | .40% | .40% | .40%G |
| Expenses net of fee waivers, if any | .40% | .40% | .40%G |
| Expenses net of all reductions | .40% | .40% | .37%G |
| Net investment income (loss) | 2.06% | 1.90% | .45%G |
| Supplemental Data | | | |
| Net assets, end of period (000 omitted) | $4,727 | $3,794 | $2,490 |
| Portfolio turnover rateH | 17% | 44% | - %I |
A For the period May 25, 2017 (commencement of operations) to June 30, 2017.
B Calculated based on average shares outstanding during the period.
C Total returns for periods of less than one year are not annualized.
D Total returns would have been lower if certain expenses had not been reduced during the applicable periods shown.
E Fees and expenses of any underlying Fidelity Central Funds are not included in the Fund's expense ratio. The Fund indirectly bears its proportionate share of the expenses of any underlying Fidelity Central Funds.
F Expense ratios reflect operating expenses of the class. Expenses before reductions do not reflect amounts reimbursed by the investment adviser or reductions from expense offset arrangements and do not represent the amount paid by the class during periods when reimbursements or reductions occur. Expense ratios before reductions for start-up periods may not be representative of longer-term operating periods. Expenses net of fee waivers reflect expenses after reimbursement by the investment adviser but prior to reductions from expense offset arrangements. Expenses net of all reductions represent the net expenses paid by the class.
G Annualized
H Amount does not include the portfolio activity of any underlying Fidelity Central Funds.
I Amount not annualized.
See accompanying notes which are an integral part of the financial statements.
Notes to Financial Statements
For the period ended June 30, 2019
1. Organization.
Fidelity Municipal Income 2019 Fund, Fidelity Municipal Income 2021 Fund, Fidelity Municipal Income 2023 Fund and Fidelity Municipal Income 2025 Fund (the Funds) are funds of Fidelity Salem Street Trust (the Trust) and are authorized to issue an unlimited number of shares. The Trust is registered under the Investment Company Act of 1940, as amended (the 1940 Act), as an open-end management investment company organized as a Massachusetts business trust. Fidelity Municipal 2025 Fund is non-diversified fund. The Funds offer Class A, Class I, and Retail Class shares, each of which has equal rights as to assets and voting privileges. Each class has exclusive voting rights with respect to matters that affect that class. Effective after the close of business on June 29, 2018, the Fidelity Municipal Income 2019 Fund was closed to new accounts with certain exceptions.
2. Investments in Fidelity Central Funds.
The Funds may invest in Fidelity Central Funds, which are open-end investment companies generally available only to other investment companies and accounts managed by the investment adviser and its affiliates. The Funds' Schedules of Investments list each of the Fidelity Central Funds held as of period end, if any, as an investment of each Fund, but does not include the underlying holdings of each Fidelity Central Fund. As an Investing Fund, each Fund indirectly bears its proportionate share of the expenses of the underlying Fidelity Central Funds.
The Money Market Central Funds seek preservation of capital and current income and are managed by Fidelity Investments Money Management, Inc. (FIMM), an affiliate of the investment adviser. Annualized expenses of the Money Market Central Funds as of their most recent shareholder report date ranged from less than .005% to .01%.
A complete unaudited list of holdings for each Fidelity Central Fund is available upon request or at the Securities and Exchange Commission (the SEC) website at www.sec.gov. In addition, the financial statements of the Fidelity Central Funds, which are not covered by the Funds' Report of Independent Registered Public Accounting Firm, are available on the SEC website or upon request.
3. Significant Accounting Policies.
Each Fund is an investment company and applies the accounting and reporting guidance of the Financial Accounting Standards Board (FASB) Accounting Standards Codification Topic 946 Financial Services – Investments Companies. The financial statements have been prepared in conformity with accounting principles generally accepted in the United States of America (GAAP), which require management to make certain estimates and assumptions at the date of the financial statements. Actual results could differ from those estimates. Subsequent events, if any, through the date that the financial statements were issued have been evaluated in the preparation of the financial statements. The following summarizes the significant accounting policies of the Funds:
Investment Valuation. Investments are valued as of 4:00 p.m. Eastern time on the last calendar day of the period. The Board of Trustees (the Board) has delegated the day to day responsibility for the valuation of each Fund's investments to the Fair Value Committee (the Committee) established by each Fund's investment adviser. In accordance with valuation policies and procedures approved by the Board, each Fund attempts to obtain prices from one or more third party pricing vendors or brokers to value its investments. When current market prices, quotations or currency exchange rates are not readily available or reliable, investments will be fair valued in good faith by the Committee, in accordance with procedures adopted by the Board. Factors used in determining fair value vary by investment type and may include market or investment specific events, changes in interest rates and credit quality. The frequency with which these procedures are used cannot be predicted and they may be utilized to a significant extent. The Committee oversees each Fund's valuation policies and procedures and reports to the Board on the Committee's activities and fair value determinations. The Board monitors the appropriateness of the procedures used in valuing each Fund's investments and ratifies the fair value determinations of the Committee.
Each Fund categorizes the inputs to valuation techniques used to value its investments into a disclosure hierarchy consisting of three levels as shown below:
- Level 1 – quoted prices in active markets for identical investments
- Level 2 – other significant observable inputs (including quoted prices for similar investments, interest rates, prepayment speeds, etc.)
- Level 3 – unobservable inputs (including the Fund's own assumptions based on the best information available)
Valuation techniques used to value each Fund's investments by major category are as follows:
Debt securities, including restricted securities, are valued based on evaluated prices received from third party pricing vendors or from brokers who make markets in such securities. Municipal securities are valued by pricing vendors who utilize matrix pricing which considers yield or price of bonds of comparable quality, coupon, maturity and type or by broker-supplied prices. When independent prices are unavailable or unreliable, debt securities may be valued utilizing pricing methodologies which consider similar factors that would be used by third party pricing vendors. Debt securities are generally categorized as Level 2 in the hierarchy but may be Level 3 depending on the circumstances.
Investments in open-end mutual funds, including Fidelity Central Funds, are valued at their closing net asset value (NAV) each business day and are categorized as Level 1 in the hierarchy.
Changes in valuation techniques may result in transfers in or out of an assigned level within the disclosure hierarchy. The aggregate value of investments by input level as of June 30, 2019 is included at the end of each applicable Fund's Schedule of Investments.
Investment Transactions and Income. For financial reporting purposes, the Funds' investment holdings and NAV include trades executed through the end of the last business day of the period. The NAV per share for processing shareholder transactions is calculated as of the close of business of the New York Stock Exchange (NYSE), normally 4:00 p.m. Eastern time and includes trades executed through the end of the prior business day. Gains and losses on securities sold are determined on the basis of identified cost. Income and capital gain distributions from Fidelity Central Funds, if any, are recorded on the ex-dividend date. Interest income is accrued as earned and includes coupon interest and amortization of premium and accretion of discount on debt securities as applicable. Debt obligations may be placed on non-accrual status and related interest income may be reduced by ceasing current accruals and writing off interest receivables when the collection of all or a portion of interest has become doubtful based on consistently applied procedures. A debt obligation is removed from non-accrual status when the issuer resumes interest payments or when collectability of interest is reasonably assured.
Class Allocations and Expenses. Investment income, realized and unrealized capital gains and losses, common expenses of each Fund, and certain fund-level expense reductions, if any, are allocated daily on a pro-rata basis to each class based on the relative net assets of each class to the total net assets of each Fund. Each class differs with respect to transfer agent and distribution and service plan fees incurred. Certain expense reductions may also differ by class. For the reporting period, the allocated portion of income and expenses to each class as a percent of its average net assets may vary due to the timing of recording these transactions in relation to fluctuating net assets of the classes. Expenses directly attributable to a fund are charged to that fund. Expenses attributable to more than one fund are allocated among the respective funds on the basis of relative net assets or other appropriate methods. Expense estimates are accrued in the period to which they relate and adjustments are made when actual amounts are known.
Income Tax Information and Distributions to Shareholders. Each year, each Fund intends to qualify as a regulated investment company under Subchapter M of the Internal Revenue Code, including distributing substantially all of its taxable income and realized gains. As a result, no provision for U.S. Federal income taxes is required. As of June 30, 2019, each Fund did not have any unrecognized tax benefits in the financial statements; nor is each Fund aware of any tax positions for which it is reasonably possible that the total amounts of unrecognized tax benefits will significantly change in the next twelve months. Each Fund files a U.S. federal tax return, in addition to state and local tax returns as required. Each Fund's federal income tax returns are subject to examination by the Internal Revenue Service (IRS) for a period of three fiscal years after they are filed. State and local tax returns may be subject to examination for an additional fiscal year depending on the jurisdiction.
Distributions are declared and recorded daily and paid monthly from net investment income. Distributions from realized gains, if any, are declared and recorded on the ex-dividend date. Income and capital gain distributions are declared separately for each class. Income and capital gain distributions are determined in accordance with income tax regulations, which may differ from GAAP.
Capital accounts within the financial statements are adjusted for permanent book-tax differences. These adjustments have no impact on net assets or the results of operations. Capital accounts are not adjusted for temporary book-tax differences which will reverse in a subsequent period.
Book-tax differences are primarily due to market discount and capital loss carryforwards.
The Funds purchase municipal securities whose interest, in the opinion of the issuer, is free from federal income tax. There is no assurance that the IRS will agree with this opinion. In the event the IRS determines that the issuer does not comply with relevant tax requirements, interest payments from a security could become federally taxable, possibly retroactively to the date the security was issued.
As of period end, the cost and unrealized appreciation (depreciation) in securities, and derivatives if applicable, for federal income tax purposes were as follows for each Fund:
| | Tax cost | Gross unrealized appreciation | Gross unrealized depreciation | Net unrealized appreciation (depreciation) |
| Fidelity Municipal Income 2019 Fund | $54,615,000 | $– | $– | $– |
| Fidelity Municipal Income 2021 Fund | 51,085,493 | 1,020,396 | (10,930) | 1,009,466 |
| Fidelity Municipal Income 2023 Fund | 34,050,815 | 1,099,099 | (4,178) | 1,094,921 |
| Fidelity Municipal Income 2025 Fund | 23,095,780 | 712,329 | (1,573) | 710,756 |
The tax-based components of distributable earnings as of period end were as follows for each Fund:
| | Undistributed tax-exempt income | Capital loss carryforward | Net unrealized appreciation (depreciation) on securities and other investments |
| Fidelity Municipal Income 2019 Fund | $– | $(43,288) | $– |
| Fidelity Municipal Income 2021 Fund | 29 | (33,134) | 1,009,466 |
| Fidelity Municipal Income 2023 Fund | – | (150,087) | 1,094,921 |
| Fidelity Municipal Income 2025 Fund | 8 | (56,114) | 710,756 |
Capital loss carryforwards are only available to offset future capital gains of the Funds to the extent provided by regulations and may be limited. Under the Regulated Investment Company Modernization Act of 2010 (the Act), the Funds are permitted to carry forward capital losses incurred in taxable years beginning after December 22, 2010 for an unlimited period and such capital losses are required to be used prior to any losses that expire. The capital loss carryforward information presented below, including any applicable limitation, is estimated as of fiscal period end and is subject to adjustment.
| | No expiration | | | |
| | Short-term | Long-term | Total no expiration | Total capital loss carryfoward |
| Fidelity Municipal Income 2019 Fund | $(22,793) | $(20,495) | $(43,288) | $(43,288) |
| Fidelity Municipal Income 2021 Fund | (33,134) | – | (33,134) | (33,134) |
| Fidelity Municipal Income 2023 Fund | (79,761) | (70,326) | (150,087) | (150,087) |
| Fidelity Municipal Income 2025 Fund | (56,114) | – | (56,114) | (56,114) |
The tax character of distributions paid was as follows:
| June 30, 2019 | |
| | Tax-Exempt Income |
| Fidelity Municipal Income 2019 Fund | $973,657 |
| Fidelity Municipal Income 2021 Fund | 1,199,701 |
| Fidelity Municipal Income 2023 Fund | 707,889 |
| Fidelity Municipal Income 2025 Fund | 358,966 |
| June 30, 2018 | | | |
| | Tax-Exempt Income | Long-term Capital Gains | Total |
| Fidelity Municipal Income 2019 Fund | $1,405,235 | $73,596 | $1,478,831 |
| Fidelity Municipal Income 2021 Fund | 1,299,707 | – | 1,299,707 |
| Fidelity Municipal Income 2023 Fund | 681,199 | – | 681,199 |
| Fidelity Municipal Income 2025 Fund | 250,939 | – | 250,939 |
Delayed Delivery Transactions and When-Issued Securities. During the period, certain Funds transacted in securities on a delayed delivery or when-issued basis. Payment and delivery may take place after the customary settlement period for that security. The price of the underlying securities and the date when the securities will be delivered and paid for are fixed at the time the transaction is negotiated. The securities purchased on a delayed delivery or when-issued basis are identified as such in each applicable Fund's Schedule of Investments. Certain Funds may receive compensation for interest forgone in the purchase of a delayed delivery or when-issued security. With respect to purchase commitments, each applicable Fund identifies securities as segregated in its records with a value at least equal to the amount of the commitment. Losses may arise due to changes in the value of the underlying securities or if the counterparty does not perform under the contract's terms, or if the issuer does not issue the securities due to political, economic, or other factors.
New Rule Issuance. During August 2018, the U.S. Securities and Exchange Commission issued Final Rule Release No. 33-10532, Disclosure Update and Simplification. This Final Rule includes amendments specific to registered investment companies that are intended to eliminate overlap in disclosure requirements between Regulation S-X and GAAP. In accordance with these amendments, certain line-items in the Funds' financial statements have been combined or removed for the current period as outlined in the table below.
| Financial Statement | Current Line-Item Presentation (As Applicable) | Prior Line-Item Presentation (As Applicable) |
| Statement of Assets and Liabilities | Total distributable earnings (loss) | Undistributed/Distributions in excess of/Accumulated net investment income (loss)
Accumulated/Undistributed net realized gain (loss)
Net unrealized appreciation (depreciation) |
| Statement of Changes in Net Assets | N/A - removed | Undistributed/Distributions in excess of/Accumulated net investment income (loss) end of period |
| Statement of Changes in Net Assets | Distributions to shareholders | Distributions to shareholders from net investment income
Distributions to shareholders from net realized gain |
| Distributions to Shareholders Note to Financial Statements | Distributions to shareholders | Distributions to shareholders from net investment income
Distributions to shareholders from net realized gain |
4. Purchases and Sales of Investments.
Purchases and sales of securities, other than short-term securities, are noted in the table below.
| | Purchases ($) | Sales ($) |
| Fidelity Municipal Income 2019 Fund | – | 63,687,611 |
| Fidelity Municipal Income 2021 Fund | 1,947,849 | 11,485,944 |
| Fidelity Municipal Income 2023 Fund | 7,126,106 | 6,066,949 |
| Fidelity Municipal Income 2025 Fund | 11,166,392 | 3,023,730 |
5. Fees and Other Transactions with Affiliates.
Management Fee. Fidelity Management & Research Company (the investment adviser) and its affiliates provide the Funds with investment management related services for which the Funds pay a monthly management fee that is based on an annual rate of .30% of average net assets. Under the management contract, the investment adviser pays all other fund-level expenses, except the compensation of the independent Trustees and certain other expenses such as interest expense, including commitment fees.
Distribution and Service Plan Fees. In accordance with Rule 12b-1 of the 1940 Act, each Fund has adopted separate Distribution and Service Plans for each class of shares. Each Fund's Class A pays Fidelity Distributors Corporation (FDC), an affiliate of the investment adviser, a Service Fee based on an annual percentage of Class A's average net assets. In addition, FDC may pay financial intermediaries for selling shares of the Funds and providing shareholder support services. For the period, the Service Fee rate, total service fees and amounts retained by FDC were as follows:
| | Service Fee | Total Fees | Retained by FDC |
| Fidelity Municipal Income 2019 Fund | | | |
| Class A | .25% | $14,781 | $494 |
| Fidelity Municipal Income 2021 Fund | | | |
| Class A | .25% | $16,059 | $657 |
| Fidelity Municipal Income 2023 Fund | | | |
| Class A | .25% | $6,000 | $195 |
| Fidelity Municipal Income 2025 Fund | | | |
| Class A | .25% | $6,832 | $6,693 |
Sales Load. FDC may receive a front-end sales charge of up to 2.75% for selling each Fund's Class A shares, some of which is paid to financial intermediaries for selling shares of the Fund. Depending on the holding period, FDC may receive contingent deferred sales charges levied on Class A redemptions. The deferred sales charge is .75% or .50% for certain purchases of each Fund's Class A shares.
For the period, sales charge amounts retained by FDC were as follows:
| | Retained by FDC |
| Fidelity Municipal Income 2021 Fund | |
| Class A | $65 |
| Fidelity Municipal Income 2023 Fund | |
| Class A | $6 |
Transfer Agent Fees. Fidelity Investments Institutional Operations Company, Inc. (FIIOC), an affiliate of the investment adviser, is the transfer, dividend disbursing and shareholder servicing agent for the Funds. FIIOC receives asset-based fees of .10% of class-level average net assets for each class of each Fund. FIIOC pays for typesetting, printing and mailing of shareholder reports, except proxy statements. For the period, transfer agent fees for each class of each fund were as follows:
| | Amount |
| Fidelity Municipal Income 2019 Fund | |
| Class A | $5,912 |
| Municipal Income 2019 | 54,666 |
| Class I | 14,731 |
| | $75,309 |
| Fidelity Municipal Income 2021 Fund | |
| Class A | $6,424 |
| Municipal Income 2021 | 34,143 |
| Class I | 18,101 |
| | $58,668 |
| Fidelity Municipal Income 2023 Fund | |
| Class A | $2,400 |
| Municipal Income 2023 | 20,885 |
| Class I | 10,568 |
| | $33,853 |
| Fidelity Municipal Income 2025 Fund | |
| Class A | $2,733 |
| Municipal Income 2025 | 10,858 |
| Class I | 4,133 |
| | $17,724 |
Interfund Trades. The Funds may purchase from or sell securities to other Fidelity Funds under procedures adopted by the Board. The procedures have been designed to ensure these interfund trades are executed in accordance with Rule 17a-7 of the 1940 Act. Interfund trades are included within the respective purchases and sales amounts shown in the Purchases and Sales of Investments note.
6. Committed Line of Credit.
Certain Funds participate with other funds managed by the investment adviser or an affiliate in a $4.25 billion credit facility (the "line of credit") to be utilized for temporary or emergency purposes to fund shareholder redemptions or for other short-term liquidity purposes. The participating funds have agreed to pay commitment fees on their pro-rata portion of the line of credit, which are reflected in Commitment fees on the Statement of Operations, and are as follows:
| Fidelity Municipal Income 2019 Fund | $238 |
| Fidelity Municipal Income 2021 Fund | 167 |
| Fidelity Municipal Income 2023 Fund | 93 |
| Fidelity Municipal Income 2025 Fund | 43 |
During the period, the Funds did not borrow on this line of credit.
7. Expense Reductions.
Through arrangements with each applicable Fund's custodian, credits realized as a result of certain uninvested cash balances were used to reduce the Fund's expenses. All of the applicable expense reductions are noted in the table below.
| | Expense reduction |
| Fidelity Municipal Income 2019 Fund | $498 |
| Fidelity Municipal Income 2021 Fund | 318 |
| Fidelity Municipal Income 2023 Fund | 244 |
| Fidelity Municipal Income 2025 Fund | 153 |
8. Distributions to Shareholders.
Distributions to shareholders of each class were as follows:
| | Year ended
June 30, 2019 | Year ended
June 30, 2018 |
| Fidelity Municipal Income 2019 Fund | | |
| Distributions to shareholders | | |
| Class A | $62,877 | $ - |
| Municipal Income 2019 | 715,541 | – |
| Class I | 195,239 | – |
| Total | $973,657 | $– |
| From net investment income | | |
| Class A | $– | $95,169 |
| Municipal Income 2019 | – | 937,207 |
| Class I | – | 372,859 |
| Total | $– | $1,405,235 |
| From net realized gain | | |
| Class A | $– | $6,266 |
| Municipal Income 2019 | – | 48,674 |
| Class I | – | 18,656 |
| Total | $– | $73,596 |
| Fidelity Municipal Income 2021 Fund | | |
| Distributions to shareholders | | |
| Class A | $117,146 | $– |
| Municipal Income 2021 | 708,884 | – |
| Class I | 373,671 | – |
| Total | $1,199,701 | $– |
| From net investment income | | |
| Class A | $– | $157,443 |
| Municipal Income 2021 | – | 722,655 |
| Class I | – | 419,609 |
| Total | $– | $1,299,707 |
| Fidelity Municipal Income 2023 Fund | | |
| Distributions to shareholders | | |
| Class A | $44,681 | $– |
| Municipal Income 2023 | 441,054 | – |
| Class I | 222,154 | – |
| Total | $707,889 | $– |
| From net investment income | | |
| Class A | $– | $45,090 |
| Municipal Income 2023 | – | 366,187 |
| Class I | – | 269,922 |
| Total | $– | $681,199 |
| Fidelity Municipal Income 2025 Fund | | |
| Distributions to shareholders | | |
| Class A | $49,668 | $– |
| Municipal Income 2025 | 223,806 | – |
| Class I | 85,492 | – |
| Total | $358,966 | $– |
| From net investment income | | |
| Class A | $– | $40,552 |
| Municipal Income 2025 | – | 150,650 |
| Class I | – | 59,737 |
| Total | $– | $250,939 |
9. Share Transactions.
Share transactions for each class were as follows and may contain automatic conversions between classes or exchanges between affiliated funds:
| | Shares | Shares | Dollars | Dollars |
| | Year ended June 30, 2019 | Year ended June 30, 2018 | Year ended June 30, 2019 | Year ended June 30, 2018 |
| Fidelity Municipal Income 2019 Fund | | | | |
| Class A | | | | |
| Shares sold | 2 | 264,063 | $22 | $2,807,378 |
| Reinvestment of distributions | 5,878 | 9,522 | 62,073 | 100,930 |
| Shares redeemed | (366,421) | (504,653) | (3,870,842) | (5,346,205) |
| Net increase (decrease) | (360,541) | (231,068) | $(3,808,747) | $(2,437,897) |
| Municipal Income 2019 | | | | |
| Shares sold | 2,338 | 2,628,223 | $24,709 | $27,854,565 |
| Reinvestment of distributions | 53,461 | 73,536 | 564,501 | 779,182 |
| Shares redeemed | (2,293,162) | (3,510,533) | (24,218,575) | (37,185,558) |
| Net increase (decrease) | (2,237,363) | (808,774) | $(23,629,365) | $(8,551,811) |
| Class I | | | | |
| Shares sold | 3,508 | 1,105,976 | $37,102 | $11,721,290 |
| Reinvestment of distributions | 17,276 | 31,680 | 182,430 | 335,634 |
| Shares redeemed | (1,938,221) | (956,399) | (20,477,714) | (10,119,959) |
| Net increase (decrease) | (1,917,437) | 181,257 | $(20,258,182) | $1,936,965 |
| Fidelity Municipal Income 2021 Fund | | | | |
| Class A | | | | |
| Shares sold | 26,971 | 98,718 | $289,031 | $1,068,296 |
| Reinvestment of distributions | 10,885 | 14,484 | 116,936 | 157,066 |
| Shares redeemed | (224,540) | (503,149) | (2,414,719) | (5,463,013) |
| Net increase (decrease) | (186,684) | (389,947) | $(2,008,752) | $(4,237,651) |
| Municipal Income 2021 | | | | |
| Shares sold | 756,961 | 885,963 | $8,102,271 | $9,631,269 |
| Reinvestment of distributions | 45,356 | 50,631 | 487,379 | 548,743 |
| Shares redeemed | (780,085) | (1,162,839) | (8,371,803) | (12,564,474) |
| Net increase (decrease) | 22,232 | (226,245) | $217,847 | $(2,384,462) |
| Class I | | | | |
| Shares sold | 457,424 | 623,676 | $4,911,161 | $6,787,255 |
| Reinvestment of distributions | 29,592 | 31,502 | 317,748 | 341,131 |
| Shares redeemed | (1,357,731) | (327,302) | (14,529,464) | (3,553,243) |
| Net increase (decrease) | (870,715) | 327,876 | $(9,300,555) | $3,575,143 |
| Fidelity Municipal Income 2023 Fund | | | | |
| Class A | | | | |
| Shares sold | 46,368 | 24,749 | $470,164 | $253,443 |
| Reinvestment of distributions | 3,954 | 4,150 | 40,126 | 42,254 |
| Shares redeemed | (46,890) | (119,103) | (473,664) | (1,223,314) |
| Net increase (decrease) | 3,432 | (90,204) | $36,626 | $(927,617) |
| Municipal Income 2023 | | | | |
| Shares sold | 731,797 | 1,060,815 | $7,360,601 | $10,885,245 |
| Reinvestment of distributions | 29,168 | 27,453 | 295,905 | 279,009 |
| Shares redeemed | (388,160) | (605,152) | (3,919,495) | (6,153,584) |
| Net increase (decrease) | 372,805 | 483,116 | $3,737,011 | $5,010,670 |
| Class I | | | | |
| Shares sold | 323,696 | 526,604 | $3,278,516 | $5,400,900 |
| Reinvestment of distributions | 16,966 | 20,634 | 171,828 | 209,771 |
| Shares redeemed | (816,137) | (301,379) | (8,152,287) | (3,065,563) |
| Net increase (decrease) | (475,475) | 245,859 | $(4,701,943) | $2,545,108 |
| Fidelity Municipal Income 2025 Fund | | | | |
| Class A | | | | |
| Shares sold | 66,981 | – | $674,010 | $– |
| Reinvestment of distributions | 4,985 | 4,115 | 49,668 | 40,552 |
| Shares redeemed | (2,541) | – | (25,535) | – |
| Net increase (decrease) | 69,425 | 4,115 | $698,143 | $40,552 |
| Municipal Income 2025 | | | | |
| Shares sold | 666,016 | 450,315 | $6,696,191 | $4,475,703 |
| Reinvestment of distributions | 19,392 | 13,841 | 193,626 | 136,321 |
| Shares redeemed | (67,588) | (77,898) | (669,904) | (768,287) |
| Net increase (decrease) | 617,820 | 386,258 | $6,219,913 | $3,843,737 |
| Class I | | | | |
| Shares sold | 150,280 | 132,730 | $1,472,253 | $1,318,880 |
| Reinvestment of distributions | 7,823 | 6,073 | 77,828 | 59,737 |
| Shares redeemed | (87,028) | (557) | (842,533) | (5,447) |
| Net increase (decrease) | 71,075 | 138,246 | $707,548 | $1,373,170 |
10. Other.
The Funds' organizational documents provide former and current trustees and officers with a limited indemnification against liabilities arising in connection with the performance of their duties to the Funds. In the normal course of business, the Funds may also enter into contracts that provide general indemnifications. The Funds' maximum exposure under these arrangements is unknown as this would be dependent on future claims that may be made against the Funds. The risk of material loss from such claims is considered remote.
At the end of the period, the investment adviser or its affiliates were owners of record of more than 10% of the outstanding shares of the following funds:
| Fund | Affiliated % |
| Fidelity Municipal Income 2025 Fund | 45% |
In January 2017, Fidelity Municipal Income 2019 Fund's Board of Trustees approved a Plan of Liquidation and Dissolution whereby the Fund distributed all of its net assets to its shareholders on July 5, 2019.
Report of Independent Registered Public Accounting Firm
To the Board of Trustees of Fidelity Salem Street Trust and the Shareholders of Fidelity Municipal Income 2019 Fund, Fidelity Municipal Income 2021 Fund, Fidelity Municipal Income 2023 Fund and Fidelity Municipal Income 2025 Fund:
Opinion on the Financial Statements and Financial Highlights
We have audited the accompanying statements of assets and liabilities of Fidelity Municipal Income 2019 Fund, Fidelity Municipal Income 2021 Fund, Fidelity Municipal Income 2023 Fund and Fidelity Municipal Income 2025 Fund (the "Funds"), each a fund of Fidelity Salem Street Trust, including the schedules of investments, as of June 30, 2019, the related statements of operations for the year then ended, the statements of changes in net assets for each of the two years in the period then ended, and the financial highlights for each of the five years in the period then ended for Fidelity Municipal Income 2019 Fund, Fidelity Municipal Income 2021 Fund and Fidelity Municipal Income 2023 Fund, the related statement of operations for the year then ended, the statement of changes in net assets for each of the two years in the period then ended, and the financial highlights for the two years in the period then ended and for the period from May 25, 2017 (commencement of operations) to June 30, 2017 for Fidelity Municipal Income 2025 Fund; and the related notes. In our opinion, the financial statements and financial highlights present fairly, in all material respects, the financial position of each of the Funds as of June 30, 2019, and the results of their operations for the year then ended, the changes in their net assets for each of the two years in the period then ended, and the financial highlights for each of the five years in the period then ended (or for the period defined above) in conformity with accounting principles generally accepted in the United States of America.
Basis for Opinion
These financial statements and financial highlights are the responsibility of the Funds’ management. Our responsibility is to express an opinion on the Funds’ financial statements and financial highlights based on our audits. We are a public accounting firm registered with the Public Company Accounting Oversight Board (United States) (PCAOB) and are required to be independent with respect to the Funds in accordance with the U.S. federal securities laws and the applicable rules and regulations of the Securities and Exchange Commission and the PCAOB.
We conducted our audits in accordance with the standards of the PCAOB. Those standards require that we plan and perform the audit to obtain reasonable assurance about whether the financial statements and financial highlights are free of material misstatement, whether due to error or fraud. The Funds are not required to have, nor were we engaged to perform, an audit of their internal control over financial reporting. As part of our audits we are required to obtain an understanding of internal control over financial reporting but not for the purpose of expressing an opinion on the effectiveness of the Funds’ internal control over financial reporting. Accordingly, we express no such opinion.
Our audits included performing procedures to assess the risks of material misstatement of the financial statements and financial highlights, whether due to error or fraud, and performing procedures that respond to those risks. Such procedures included examining, on a test basis, evidence regarding the amounts and disclosures in the financial statements and financial highlights. Our audits also included evaluating the accounting principles used and significant estimates made by management, as well as evaluating the overall presentation of the financial statements and financial highlights. Our procedures included confirmation of securities owned as of June 30, 2019, by correspondence with the custodian and brokers; when replies were not received from brokers, we performed other auditing procedures. We believe that our audits provide a reasonable basis for our opinion.
/s/ Deloitte & Touche LLP
Boston, Massachusetts
August 13, 2019
We have served as the auditor of one or more of the Fidelity investment companies since 1999.
Trustees and Officers
The Trustees, Members of the Advisory Board (if any), and officers of the trust and funds, as applicable, are listed below. The Board of Trustees governs each fund and is responsible for protecting the interests of shareholders. The Trustees are experienced executives who meet periodically throughout the year to oversee each fund's activities, review contractual arrangements with companies that provide services to each fund, oversee management of the risks associated with such activities and contractual arrangements, and review each fund's performance. Except for Jonathan Chiel, each of the Trustees oversees 274 funds. Mr. Chiel oversees 170 funds.
The Trustees hold office without limit in time except that (a) any Trustee may resign; (b) any Trustee may be removed by written instrument, signed by at least two-thirds of the number of Trustees prior to such removal; (c) any Trustee who requests to be retired or who has become incapacitated by illness or injury may be retired by written instrument signed by a majority of the other Trustees; and (d) any Trustee may be removed at any special meeting of shareholders by a two-thirds vote of the outstanding voting securities of the trust. Each Trustee who is not an interested person (as defined in the 1940 Act) of the trust and the funds is referred to herein as an Independent Trustee. Each Independent Trustee shall retire not later than the last day of the calendar year in which his or her 75th birthday occurs. The Independent Trustees may waive this mandatory retirement age policy with respect to individual Trustees. Officers and Advisory Board Members hold office without limit in time, except that any officer or Advisory Board Member may resign or may be removed by a vote of a majority of the Trustees at any regular meeting or any special meeting of the Trustees. Except as indicated, each individual has held the office shown or other offices in the same company for the past five years.
Each fund's Statement of Additional Information (SAI) includes more information about the Trustees. To request a free copy, call Fidelity at 1-800-544-8544 if you’re an individual investing directly with Fidelity, call 1-800-835-5092 if you’re a plan sponsor or participant with Fidelity as your recordkeeper or call 1-877-208-0098 on institutional accounts or if you’re an advisor or invest through one.
Experience, Skills, Attributes, and Qualifications of the Trustees. The Governance and Nominating Committee has adopted a statement of policy that describes the experience, qualifications, attributes, and skills that are necessary and desirable for potential Independent Trustee candidates (Statement of Policy). The Board believes that each Trustee satisfied at the time he or she was initially elected or appointed a Trustee, and continues to satisfy, the standards contemplated by the Statement of Policy. The Governance and Nominating Committee also engages professional search firms to help identify potential Independent Trustee candidates who have the experience, qualifications, attributes, and skills consistent with the Statement of Policy. From time to time, additional criteria based on the composition and skills of the current Independent Trustees, as well as experience or skills that may be appropriate in light of future changes to board composition, business conditions, and regulatory or other developments, have also been considered by the professional search firms and the Governance and Nominating Committee. In addition, the Board takes into account the Trustees' commitment and participation in Board and committee meetings, as well as their leadership of standing and ad hoc committees throughout their tenure.
In determining that a particular Trustee was and continues to be qualified to serve as a Trustee, the Board has considered a variety of criteria, none of which, in isolation, was controlling. The Board believes that, collectively, the Trustees have balanced and diverse experience, qualifications, attributes, and skills, which allow the Board to operate effectively in governing each fund and protecting the interests of shareholders. Information about the specific experience, skills, attributes, and qualifications of each Trustee, which in each case led to the Board's conclusion that the Trustee should serve (or continue to serve) as a trustee of the funds, is provided below.
Board Structure and Oversight Function. Abigail P. Johnson is an interested person and currently serves as Chairman. The Trustees have determined that an interested Chairman is appropriate and benefits shareholders because an interested Chairman has a personal and professional stake in the quality and continuity of services provided to the funds. Independent Trustees exercise their informed business judgment to appoint an individual of their choosing to serve as Chairman, regardless of whether the Trustee happens to be independent or a member of management. The Independent Trustees have determined that they can act independently and effectively without having an Independent Trustee serve as Chairman and that a key structural component for assuring that they are in a position to do so is for the Independent Trustees to constitute a substantial majority for the Board. The Independent Trustees also regularly meet in executive session. Arthur E. Johnson serves as Chairman of the Independent Trustees and as such (i) acts as a liaison between the Independent Trustees and management with respect to matters important to the Independent Trustees and (ii) with management prepares agendas for Board meetings.
Fidelity® funds are overseen by different Boards of Trustees. The funds' Board oversees Fidelity's investment-grade bond, money market, asset allocation and certain equity funds, and other Boards oversee Fidelity's high income and other equity funds. The asset allocation funds may invest in Fidelity® funds that are overseen by such other Boards. The use of separate Boards, each with its own committee structure, allows the Trustees of each group of Fidelity® funds to focus on the unique issues of the funds they oversee, including common research, investment, and operational issues. On occasion, the separate Boards establish joint committees to address issues of overlapping consequences for the Fidelity® funds overseen by each Board.
The Trustees operate using a system of committees to facilitate the timely and efficient consideration of all matters of importance to the Trustees, each fund, and fund shareholders and to facilitate compliance with legal and regulatory requirements and oversight of the funds' activities and associated risks. The Board, acting through its committees, has charged FMR and its affiliates with (i) identifying events or circumstances the occurrence of which could have demonstrably adverse effects on the funds' business and/or reputation; (ii) implementing processes and controls to lessen the possibility that such events or circumstances occur or to mitigate the effects of such events or circumstances if they do occur; and (iii) creating and maintaining a system designed to evaluate continuously business and market conditions in order to facilitate the identification and implementation processes described in (i) and (ii) above. Because the day-to-day operations and activities of the funds are carried out by or through FMR, its affiliates, and other service providers, the funds' exposure to risks is mitigated but not eliminated by the processes overseen by the Trustees. While each of the Board's committees has responsibility for overseeing different aspects of the funds' activities, oversight is exercised primarily through the Operations and Audit Committees. In addition, an ad hoc Board committee of Independent Trustees has worked with FMR to enhance the Board's oversight of investment and financial risks, legal and regulatory risks, technology risks, and operational risks, including the development of additional risk reporting to the Board. Appropriate personnel, including but not limited to the funds' Chief Compliance Officer (CCO), FMR's internal auditor, the independent accountants, the funds' Treasurer and portfolio management personnel, make periodic reports to the Board's committees, as appropriate, including an annual review of Fidelity's risk management program for the Fidelity® funds. The responsibilities of each standing committee, including their oversight responsibilities, are described further under "Standing Committees of the Trustees."
Interested Trustees*:
Correspondence intended for a Trustee who is an interested person may be sent to Fidelity Investments, 245 Summer Street, Boston, Massachusetts 02210.
Name, Year of Birth; Principal Occupations and Other Relevant Experience+
Jonathan Chiel (1957)
Year of Election or Appointment: 2016
Trustee
Mr. Chiel also serves as Trustee of other Fidelity® funds. Mr. Chiel is Executive Vice President and General Counsel for FMR LLC (diversified financial services company, 2012-present). Previously, Mr. Chiel served as general counsel (2004-2012) and senior vice president and deputy general counsel (2000-2004) for John Hancock Financial Services; a partner with Choate, Hall & Stewart (1996-2000) (law firm); and an Assistant United States Attorney for the United States Attorney’s Office of the District of Massachusetts (1986-95), including Chief of the Criminal Division (1993-1995). Mr. Chiel is a director on the boards of the Boston Bar Foundation and the Maimonides School.
Abigail P. Johnson (1961)
Year of Election or Appointment: 2009
Trustee
Chairman of the Board of Trustees
Ms. Johnson also serves as Trustee of other Fidelity® funds. Ms. Johnson serves as Chairman (2016-present), Chief Executive Officer (2014-present), and Director (2007-present) of FMR LLC (diversified financial services company), President of Fidelity Financial Services (2012-present) and President of Personal, Workplace and Institutional Services (2005-present). Ms. Johnson is Chairman and Director of FMR Co., Inc. (investment adviser firm, 2011-present) and Chairman and Director of FMR (investment adviser firm, 2011-present). Previously, Ms. Johnson served as Vice Chairman (2007-2016) and President (2013-2016) of FMR LLC, President and a Director of FMR (2001-2005), a Trustee of other investment companies advised by FMR, Fidelity Investments Money Management, Inc. (investment adviser firm), and FMR Co., Inc. (2001-2005), Senior Vice President of the Fidelity® funds (2001-2005), and managed a number of Fidelity® funds. Ms. Abigail P. Johnson and Mr. Arthur E. Johnson are not related.
Jennifer Toolin McAuliffe (1959)
Year of Election or Appointment: 2016
Trustee
Ms. McAuliffe also serves as Trustee of other Fidelity® funds. Ms. McAuliffe previously served as a Member of the Advisory Board of certain Fidelity® funds (2016) and as Co-Head of Fixed Income of Fidelity Investments Limited (now known as FIL Limited (FIL)) (diversified financial services company). Earlier roles at FIL included Director of Research for FIL’s credit and quantitative teams in London, Hong Kong and Tokyo. Ms. McAuliffe also was the Director of Research for taxable and municipal bonds at Fidelity Investments Money Management, Inc. Ms. McAuliffe is also a director or trustee of several not-for-profit entities.
* Determined to be an “Interested Trustee” by virtue of, among other things, his or her affiliation with the trust or various entities under common control with FMR.
+ The information includes the Trustee's principal occupation during the last five years and other information relating to the experience, attributes, and skills relevant to the Trustee's qualifications to serve as a Trustee, which led to the conclusion that the Trustee should serve as a Trustee for each fund.
Independent Trustees:
Correspondence intended for an Independent Trustee may be sent to Fidelity Investments, P.O. Box 55235, Boston, Massachusetts 02205-5235.
Name, Year of Birth; Principal Occupations and Other Relevant Experience+
Elizabeth S. Acton (1951)
Year of Election or Appointment: 2013
Trustee
Ms. Acton also serves as Trustee of other Fidelity® funds. Prior to her retirement in April 2012, Ms. Acton was Executive Vice President, Finance (2011-2012), Executive Vice President, Chief Financial Officer (2002-2011), and Treasurer (2004-2005) of Comerica Incorporated (financial services). Prior to joining Comerica, Ms. Acton held a variety of positions at Ford Motor Company (1983-2002), including Vice President and Treasurer (2000-2002) and Executive Vice President and Chief Financial Officer of Ford Motor Credit Company (1998-2000). Ms. Acton currently serves as a member of the Board of Directors and Audit and Finance Committees of Beazer Homes USA, Inc. (homebuilding, 2012-present). Previously, Ms. Acton served as a Member of the Advisory Board of certain Fidelity® funds (2013-2016).
Ann E. Dunwoody (1953)
Year of Election or Appointment: 2018
Trustee
General Dunwoody also serves as Trustee of other Fidelity® funds. General Dunwoody (United States Army, Retired) was the first woman in U.S. military history to achieve the rank of four-star general and prior to her retirement in 2012 held a variety of positions within the U.S. Army, including Commanding General, U.S. Army Material Command (2008-2012). She is the President of First to Four LLC (leadership and mentoring services, 2012-present). She also serves as a member of the Board of Directors and Nominating and Corporate Governance Committee of L3 Technologies, Inc. (communication, electronic, sensor, and aerospace systems, 2013-present), Board of Directors and Nomination and Corporate Governance Committees of Kforce Inc. (professional staffing services, 2016-present) and Board of Directors of Automattic Inc. (software engineering, 2018-present). Previously, General Dunwoody served as a Member of the Advisory Board of certain Fidelity® funds (2018), a member of the Board of Directors and Audit and Sustainability and Corporate Responsibility Committees of Republic Services, Inc. (waste collection, disposal and recycling, 2013-2016). Ms. Dunwoody also serves on several boards for non-profit organizations, including as a member of the Board of Directors, Chair of the Nomination and Governance Committee and member of the Audit Committee of Logistics Management Institute (consulting non-profit, 2012-present), a member of the Board of Directors of the Army Historical Foundation (2015-present), a member of the Council of Trustees for the Association of the United States Army (advocacy non-profit, 2013-present) and a member of the Board of Trustees of Florida Institute of Technology (2015-present) and ThanksUSA (military family education non-profit, 2014-present).
John Engler (1948)
Year of Election or Appointment: 2014
Trustee
Mr. Engler also serves as Trustee of other Fidelity® funds. He serves on the board of directors for Universal Forest Products (manufacturer and distributor of wood and wood-alternative products, 2003-present) and K12 Inc. (technology-based education company, 2012-present). Previously, Mr. Engler served as interim president of Michigan State University (2018-2019), a Member of the Advisory Board of certain Fidelity® funds (2014-2016), president of the Business Roundtable (2011-2017), a trustee of The Munder Funds (2003-2014), president and CEO of the National Association of Manufacturers (2004-2011), member of the Board of Trustees of the Annie E. Casey Foundation (2004-2015), and as governor of Michigan (1991-2003). He is a past chairman of the National Governors Association.
Robert F. Gartland (1951)
Year of Election or Appointment: 2010
Trustee
Mr. Gartland also serves as Trustee of other Fidelity® funds. Mr. Gartland is Chairman and an investor in Gartland & Mellina Group Corp. (consulting, 2009-present). Previously, Mr. Gartland served as a partner and investor of Vietnam Partners LLC (investments and consulting, 2008-2011). Prior to his retirement, Mr. Gartland held a variety of positions at Morgan Stanley (financial services, 1979-2007), including Managing Director (1987-2007), and Chase Manhattan Bank (1975-1978).
Arthur E. Johnson (1947)
Year of Election or Appointment: 2008
Trustee
Chairman of the Independent Trustees
Mr. Johnson also serves as Trustee of other Fidelity® funds. Mr. Johnson serves as a member of the Board of Directors of Eaton Corporation plc (diversified power management, 2009-present) and Booz Allen Hamilton (management consulting, 2011-present). Prior to his retirement, Mr. Johnson served as Senior Vice President of Corporate Strategic Development of Lockheed Martin Corporation (defense contractor, 1999-2009). Mr. Johnson previously served as Vice Chairman (2015-2018) of the Independent Trustees of certain Fidelity® funds and on the Board of Directors of IKON Office Solutions, Inc. (1999-2008), AGL Resources, Inc. (holding company, 2002-2016), and Delta Airlines (2005-2007). Mr. Arthur E. Johnson is not related to Ms. Abigail P. Johnson.
Michael E. Kenneally (1954)
Year of Election or Appointment: 2009
Trustee
Vice Chairman of the Independent Trustees
Mr. Kenneally also serves as Trustee of other Fidelity® funds. Prior to his retirement, Mr. Kenneally served as Chairman and Global Chief Executive Officer of Credit Suisse Asset Management. Before joining Credit Suisse, he was an Executive Vice President and Chief Investment Officer for Bank of America Corporation. Earlier roles at Bank of America included Director of Research, Senior Portfolio Manager and Research Analyst, and Mr. Kenneally was awarded the Chartered Financial Analyst (CFA) designation in 1991.
Marie L. Knowles (1946)
Year of Election or Appointment: 2001
Trustee
Ms. Knowles also serves as Trustee of other Fidelity® funds. Prior to Ms. Knowles' retirement in June 2000, she served as Executive Vice President and Chief Financial Officer of Atlantic Richfield Company (ARCO) (diversified energy, 1996-2000). From 1993 to 1996, she was a Senior Vice President of ARCO and President of ARCO Transportation Company (pipeline and tanker operations). Ms. Knowles currently serves as a Director and Chairman of the Audit Committee of McKesson Corporation (healthcare service, since 2002). Ms. Knowles is a member of the Board of the Santa Catalina Island Company (real estate, 2009-present). Ms. Knowles is a Member of the Investment Company Institute Board of Governors and a Member of the Governing Council of the Independent Directors Council (2014-present). She also serves as a member of the Advisory Board for the School of Engineering of the University of Southern California. Previously, Ms. Knowles served as a Director of Phelps Dodge Corporation (copper mining and manufacturing, 1994-2007), URS Corporation (engineering and construction, 2000-2003) and America West (airline, 1999-2002). Ms. Knowles previously served as Chairman (2015-2018) and Vice Chairman (2012-2015) of the Independent Trustees of certain Fidelity® funds.
Mark A. Murray (1954)
Year of Election or Appointment: 2016
Trustee
Mr. Murray also serves as Trustee of other Fidelity® funds. Mr. Murray is Vice Chairman (2013-present) of Meijer, Inc. (regional retail chain). Previously, Mr. Murray served as a Member of the Advisory Board of certain Fidelity® funds (2016) and as Co-Chief Executive Officer (2013-2016) and President (2006-2013) of Meijer, Inc. Mr. Murray serves as a member of the Board of Directors and Nuclear Review and Public Policy and Responsibility Committees of DTE Energy Company (diversified energy company, 2009-present). Mr. Murray also serves as a member of the Board of Directors of Spectrum Health (not-for-profit health system, 2015-present). Mr. Murray previously served as President of Grand Valley State University (2001-2006), Treasurer for the State of Michigan (1999-2001), Vice President of Finance and Administration for Michigan State University (1998-1999), and a member of the Board of Directors and Audit Committee and Chairman of the Nominating and Corporate Governance Committee of Universal Forest Products, Inc. (manufacturer and distributor of wood and wood-alternative products, 2004-2016). Mr. Murray is also a director or trustee of many community and professional organizations.
+ The information includes the Trustee's principal occupation during the last five years and other information relating to the experience, attributes, and skills relevant to the Trustee's qualifications to serve as a Trustee, which led to the conclusion that the Trustee should serve as a Trustee for each fund.
Advisory Board Members and Officers:
Correspondence intended for an officer may be sent to Fidelity Investments, 245 Summer Street, Boston, Massachusetts 02210. Officers appear below in alphabetical order.
Name, Year of Birth; Principal Occupation
Elizabeth Paige Baumann (1968)
Year of Election or Appointment: 2017
Anti-Money Laundering (AML) Officer
Ms. Baumann also serves as AML Officer of other funds. She is Chief AML Officer (2012-present) and Senior Vice President (2014-present) of FMR LLC (diversified financial services company) and is an employee of Fidelity Investments. Previously, Ms. Baumann served as AML Officer of the funds (2012-2016), and Vice President (2007-2014) and Deputy Anti-Money Laundering Officer (2007-2012) of FMR LLC.
Craig S. Brown (1977)
Year of Election or Appointment: 2019
Assistant Treasurer
Mr. Brown also serves as Assistant Treasurer of other funds. Mr. Brown is an employee of Fidelity Investments (2013-present).
John J. Burke III (1964)
Year of Election or Appointment: 2018
Chief Financial Officer
Mr. Burke also serves as Chief Financial Officer of other funds. Mr. Burke serves as Head of Investment Operations for Fidelity Fund and Investment Operations (2018-present) and is an employee of Fidelity Investments (1998-present). Previously Mr. Burke served as head of Asset Management Investment Operations (2012-2018).
William C. Coffey (1969)
Year of Election or Appointment: 2018
Secretary and Chief Legal Officer (CLO)
Mr. Coffey also serves as Secretary and CLO of other funds. Mr. Coffey serves as CLO, Secretary, and Senior Vice President of Fidelity Management & Research Company and FMR Co., Inc. (investment adviser firms, 2018-present); Secretary of Fidelity SelectCo, LLC and Fidelity Investments Money Management, Inc. (investment adviser firms, 2018-present); and CLO of Fidelity Management & Research (Hong Kong) Limited, FMR Investment Management (UK) Limited, and Fidelity Management & Research (Japan) Limited (investment adviser firms, 2018-present). He is Senior Vice President and Deputy General Counsel of FMR LLC (diversified financial services company, 2010-present), and is an employee of Fidelity Investments. Previously, Mr. Coffey served as Assistant Secretary of certain funds (2009-2018) and as Vice President and Associate General Counsel of FMR LLC (2005-2009).
Jonathan Davis (1968)
Year of Election or Appointment: 2010
Assistant Treasurer
Mr. Davis also serves as Assistant Treasurer of other funds. Mr. Davis serves as Assistant Treasurer of FMR Capital, Inc. (2017-present) and is an employee of Fidelity Investments. Previously, Mr. Davis served as Vice President and Associate General Counsel of FMR LLC (diversified financial services company, 2003-2010).
Adrien E. Deberghes (1967)
Year of Election or Appointment: 2010
Assistant Treasurer
Mr. Deberghes also serves as an officer of other funds. He serves as Assistant Treasurer of FMR Capital, Inc. (2017-present), Executive Vice President of Fidelity Investments Money Management, Inc. (FIMM) (investment adviser firm, 2016-present), and is an employee of Fidelity Investments (2008-present). Previously, Mr. Deberghes served as President and Treasurer of certain Fidelity® funds (2013-2018). Prior to joining Fidelity Investments, Mr. Deberghes was Senior Vice President of Mutual Fund Administration at State Street Corporation (2007-2008), Senior Director of Mutual Fund Administration at Investors Bank & Trust (2005-2007), and Director of Finance for Dunkin' Brands (2000-2005). Previously, Mr. Deberghes served in other fund officer roles.
Laura M. Del Prato (1964)
Year of Election or Appointment: 2018
President and Treasurer
Ms. Del Prato also serves as an officer of other funds. Ms. Del Prato is an employee of Fidelity Investments (2017-present). Prior to joining Fidelity Investments, Ms. Del Prato served as a Managing Director and Treasurer of the JPMorgan Mutual Funds (2014-2017). Prior to JPMorgan, Ms. Del Prato served as a partner at Cohen Fund Audit Services (accounting firm, 2012-2013) and KPMG LLP (accounting firm, 2004-2012).
Colm A. Hogan (1973)
Year of Election or Appointment: 2016
Assistant Treasurer
Mr. Hogan also serves as an officer of other funds. Mr. Hogan serves as Assistant Treasurer of FMR Capital, Inc. (2017-present) and is an employee of Fidelity Investments (2005-present). Previously, Mr. Hogan served as Assistant Treasurer of certain Fidelity® funds (2016-2018).
Chris Maher (1972)
Year of Election or Appointment: 2013
Assistant Treasurer
Mr. Maher serves as Assistant Treasurer of other funds. Mr. Maher is Vice President of Valuation Oversight, serves as Assistant Treasurer of FMR Capital, Inc. (2017-present), and is an employee of Fidelity Investments. Previously, Mr. Maher served as Vice President of Asset Management Compliance (2013), Vice President of the Program Management Group of FMR (investment adviser firm, 2010-2013), and Vice President of Valuation Oversight (2008-2010).
John B. McGinty, Jr. (1962)
Year of Election or Appointment: 2016
Chief Compliance Officer
Mr. McGinty also serves as Chief Compliance Officer of other funds. Mr. McGinty is Senior Vice President of Asset Management Compliance for Fidelity Investments and is an employee of Fidelity Investments (2016-present). Mr. McGinty previously served as Vice President, Senior Attorney at Eaton Vance Management (investment management firm, 2015-2016), and prior to Eaton Vance as global CCO for all firm operations and registered investment companies at GMO LLC (investment management firm, 2009-2015). Before joining GMO LLC, Mr. McGinty served as Senior Vice President, Deputy General Counsel for Fidelity Investments (2007-2009).
Jason P. Pogorelec (1975)
Year of Election or Appointment: 2015
Assistant Secretary
Mr. Pogorelec also serves as Assistant Secretary of other funds. Mr. Pogorelec serves as Vice President, Associate General Counsel (2010-present) and is an employee of Fidelity Investments (2006-present).
Nancy D. Prior (1967)
Year of Election or Appointment: 2014
Vice President
Ms. Prior also serves as Vice President of other funds. Ms. Prior serves as President Fixed Income, High Income/Emerging Market Debt and Multi Asset Class Strategies of FIAM LLC (2018-present), President (2016-present) and Director (2014-present) of Fidelity Investments Money Management, Inc. (FIMM) (investment adviser firm), President, Fixed Income (2014-present), and is an employee of Fidelity Investments (2002-present). Previously, Ms. Prior served as Vice Chairman of FIAM LLC (investment adviser firm, 2014-2018), a Director of FMR Investment Management (UK) Limited (investment adviser firm, 2015-2018), President Multi-Asset Class Strategies of FMR's Global Asset Allocation Division (2017-2018), Vice President of Fidelity's Money Market Funds (2012-2014), President, Money Market and Short Duration Bond Group of Fidelity Management & Research (FMR) (investment adviser firm, 2013-2014), President, Money Market Group of FMR (2011-2013), Managing Director of Research (2009-2011), Senior Vice President and Deputy General Counsel (2007-2009), and Assistant Secretary of certain Fidelity® funds (2008-2009).
Stacie M. Smith (1974)
Year of Election or Appointment: 2013
Assistant Treasurer
Ms. Smith also serves as an officer of other funds. Ms. Smith serves as Assistant Treasurer of FMR Capital, Inc. (2017-present), is an employee of Fidelity Investments (2009-present), and has served in other fund officer roles. Prior to joining Fidelity Investments, Ms. Smith served as Senior Audit Manager of Ernst & Young LLP (accounting firm, 1996-2009). Previously, Ms. Smith served as Assistant Treasurer (2013-2018) and Deputy Treasurer (2013-2016) of certain Fidelity® funds.
Marc L. Spector (1972)
Year of Election or Appointment: 2016
Deputy Treasurer
Mr. Spector also serves as an officer of other funds. Mr. Spector serves as Assistant Treasurer of FMR Capital, Inc. (2017-present) and is an employee of Fidelity Investments (2016-present). Prior to joining Fidelity Investments, Mr. Spector served as Director at the Siegfried Group (accounting firm, 2013-2016), and prior to Siegfried Group as audit senior manager at Deloitte & Touche (accounting firm, 2005-2013).
Jim Wegmann (1979)
Year of Election or Appointment: 2019
Assistant Treasurer
Mr. Wegmann also serves as Assistant Treasurer of other funds. Mr. Wegmann is an employee of Fidelity Investments (2011-present).
Shareholder Expense Example
As a shareholder of a Fund, you incur two types of costs: (1) transaction costs, including sales charges (loads) on purchase payments or redemption proceeds, and (2) ongoing costs, including management fees, distribution and/or service (12b-1) fees and other Fund expenses. This Example is intended to help you understand your ongoing costs (in dollars) of investing in the Funds and to compare these costs with the ongoing costs of investing in other mutual funds.
The Example is based on an investment of $1,000 invested at the beginning of the period and held for the entire period (January 1, 2019 to June 30, 2019).
Actual Expenses
The first line of the accompanying table for each Class of each fund provides information about actual account values and actual expenses. You may use the information in this line, together with the amount you invested, to estimate the expenses that you paid over the period. Simply divide your account value by $1,000.00 (for example, an $8,600 account value divided by $1,000.00 = 8.6), then multiply the result by the number in the first line for a Class of the fund under the heading entitled "Expenses Paid During Period" to estimate the expenses you paid on your account during this period. In addition, each Fund, as a shareholder in the underlying Fidelity Central Funds, will indirectly bear its pro-rata share of the fees and expenses incurred by the underlying Fidelity Central Funds. These fees and expenses are not included in the Fund's annualized expense ratio used to calculate the expense estimate in the table below.
Hypothetical Example for Comparison Purposes
The second line of the accompanying table for each Class of each fund provides information about hypothetical account values and hypothetical expenses based on a Class' actual expense ratio and an assumed rate of return of 5% per year before expenses, which is not the Class' actual return. The hypothetical account values and expenses may not be used to estimate the actual ending account balance or expenses you paid for the period. You may use this information to compare the ongoing costs of investing in the Fund and other funds. To do so, compare this 5% hypothetical example with the 5% hypothetical examples that appear in the shareholder reports of the other funds. In addition, each Fund, as a shareholder in the underlying Fidelity Central Funds, will indirectly bear its pro-rata share of the fees and expenses incurred by the underlying Fidelity Central Funds. These fees and expenses are not included in the Fund's annualized expense ratio used to calculate the expense estimate in the table below.
Please note that the expenses shown in the table are meant to highlight your ongoing costs only and do not reflect any transaction costs. Therefore, the second line of the table is useful in comparing ongoing costs only, and will not help you determine the relative total costs of owning different funds. In addition, if these transactional costs were included, your costs would have been higher.
| | Annualized Expense Ratio-A | Beginning
Account Value
January 1, 2019 | Ending
Account Value
June 30, 2019 | Expenses Paid
During Period-B
January 1, 2019
to June 30, 2019 |
| Fidelity Municipal Income 2019 Fund | | | | |
| Class A | .66% | | | |
| Actual | | $1,000.00 | $1,006.00 | $3.28 |
| Hypothetical-C | | $1,000.00 | $1,021.52 | $3.31 |
| Municipal Income 2019 | .40% | | | |
| Actual | | $1,000.00 | $1,007.20 | $1.99 |
| Hypothetical-C | | $1,000.00 | $1,022.81 | $2.01 |
| Class I | .40% | | | |
| Actual | | $1,000.00 | $1,007.20 | $2.04 |
| Hypothetical-C | | $1,000.00 | $1,022.76 | $2.06 |
| Fidelity Municipal Income 2021 Fund | | | | |
| Class A | .66% | | | |
| Actual | | $1,000.00 | $1,018.80 | $3.30 |
| Hypothetical-C | | $1,000.00 | $1,021.52 | $3.31 |
| Municipal Income 2021 | .40% | | | |
| Actual | | $1,000.00 | $1,021.00 | $2.00 |
| Hypothetical-C | | $1,000.00 | $1,022.81 | $2.01 |
| Class I | .40% | | | |
| Actual | | $1,000.00 | $1,021.00 | $2.00 |
| Hypothetical-C | | $1,000.00 | $1,022.81 | $2.01 |
| Fidelity Municipal Income 2023 Fund | | | | |
| Class A | .66% | | | |
| Actual | | $1,000.00 | $1,034.50 | $3.33 |
| Hypothetical-C | | $1,000.00 | $1,021.52 | $3.31 |
| Municipal Income 2023 | .40% | | | |
| Actual | | $1,000.00 | $1,035.80 | $2.02 |
| Hypothetical-C | | $1,000.00 | $1,022.81 | $2.01 |
| Class I | .40% | | | |
| Actual | | $1,000.00 | $1,035.80 | $2.02 |
| Hypothetical-C | | $1,000.00 | $1,022.81 | $2.01 |
| Fidelity Municipal Income 2025 Fund | | | | |
| Class A | .66% | | | |
| Actual | | $1,000.00 | $1,051.80 | $3.36 |
| Hypothetical-C | | $1,000.00 | $1,021.52 | $3.31 |
| Municipal Income 2025 | .40% | | | |
| Actual | | $1,000.00 | $1,053.10 | $2.04 |
| Hypothetical-C | | $1,000.00 | $1,022.81 | $2.01 |
| Class I | .40% | | | |
| Actual | | $1,000.00 | $1,052.10 | $2.04 |
| Hypothetical-C | | $1,000.00 | $1,022.81 | $2.01 |
A Annualized expense ratio reflects expenses net of applicable fee waivers.
B Expenses are equal to each Class' annualized expense ratio, multiplied by the average account value over the period, multiplied by 181/ 365 (to reflect the one-half year period).
C 5% return per year before expenses
Distributions (Unaudited)
During fiscal year ended 2019, 100% of each fund's income dividends were free from federal income tax, and 8.11%, 9.51%, 9.60% and 16.49% of Fidelity Municipal Income 2019 Fund, Fidelity Municipal Income 2021 Fund, Fidelity Municipal Income 2023 Fund and Fidelity Municipal Income 2025 Fund income dividends, respectively, were subject to the federal alternative minimum tax.
The funds will notify shareholders in January 2020 of amounts for use in preparing 2019 income tax returns.

DMI-ANN-0819
1.926259.108