Fidelity® Strategic Real Return Fund
Annual Report
September 30, 2019
Includes Fidelity and Fidelity Advisor share classes


Beginning on January 1, 2021, as permitted by regulations adopted by the Securities and Exchange Commission, paper copies of a fund’s shareholder reports will no longer be sent by mail, unless you specifically request paper copies of the reports from the fund or from your financial intermediary, such as a financial advisor, broker-dealer or bank. Instead, the reports will be made available on a website, and you will be notified by mail each time a report is posted and provided with a website link to access the report.
If you already elected to receive shareholder reports electronically, you will not be affected by this change and you need not take any action. You may elect to receive shareholder reports and other communications from a fund electronically, by contacting your financial intermediary. For Fidelity customers, visit Fidelity's web site or call Fidelity using the contact information listed below.
You may elect to receive all future reports in paper free of charge. If you wish to continue receiving paper copies of your shareholder reports, you may contact your financial intermediary or, if you are a Fidelity customer, visit Fidelity’s website, or call Fidelity at the applicable toll-free number listed below. Your election to receive reports in paper will apply to all funds held with the fund complex/your financial intermediary.
| Account Type | Website | Phone Number |
| Brokerage, Mutual Fund, or Annuity Contracts: | fidelity.com/mailpreferences | 1-800-343-3548 |
| Employer Provided Retirement Accounts: | netbenefits.fidelity.com/preferences (choose 'no' under Required Disclosures to continue to print) | 1-800-343-0860 |
| Advisor Sold Accounts Serviced Through Your Financial Intermediary: | Contact Your Financial Intermediary | Your Financial Intermediary's phone number |
| Advisor Sold Accounts Serviced by Fidelity: | institutional.fidelity.com | 1-877-208-0098 |
Contents
To view a fund's proxy voting guidelines and proxy voting record for the 12-month period ended June 30, visit http://www.fidelity.com/proxyvotingresults or visit the Securities and Exchange Commission's (SEC) web site at http://www.sec.gov.
You may also call 1-800-544-8544 if you’re an individual investing directly with Fidelity, call 1-800-835-5092 if you’re a plan sponsor or participant with Fidelity as your recordkeeper or call 1-877-208-0098 on institutional accounts or if you’re an advisor or invest through one to request a free copy of the proxy voting guidelines.
Standard & Poor's, S&P and S&P 500 are registered service marks of The McGraw-Hill Companies, Inc. and have been licensed for use by Fidelity Distributors Corporation.
Other third-party marks appearing herein are the property of their respective owners.
All other marks appearing herein are registered or unregistered trademarks or service marks of FMR LLC or an affiliated company. © 2019 FMR LLC. All rights reserved.
This report and the financial statements contained herein are submitted for the general information of the shareholders of the Fund. This report is not authorized for distribution to prospective investors in the Fund unless preceded or accompanied by an effective prospectus.
A fund files its complete schedule of portfolio holdings with the SEC for the first and third quarters of each fiscal year on Form N-PORT. Forms N-PORT are available on the SEC’s web site at http://www.sec.gov. A fund's Forms N-PORT may be reviewed and copied at the SEC’s Public Reference Room in Washington, DC. Information regarding the operation of the SEC's Public Reference Room may be obtained by calling 1-800-SEC-0330.
For a complete list of a fund's portfolio holdings, view the most recent holdings listing, semiannual report, or annual report on Fidelity's web site at http://www.fidelity.com, http://www.institutional.fidelity.com, or http://www.401k.com, as applicable.
NOT FDIC INSURED •MAY LOSE VALUE •NO BANK GUARANTEE
Neither the Fund nor Fidelity Distributors Corporation is a bank.
Notes to Shareholders:
On March 1, 2019, William Maclay assumed co-management responsibilities for the fund.
At the end of October 2019, the fund's TIPS subportfolio will be converted from an active to passive strategy.
On November 25, 2019, the fund's real estate equity subportfolio will shift to the Fidelity Real Estate Equity Central Fund. As a result, the Dow Jones U.S. Select Real Estate Securities Index will be replaced by the FTSE NAREIT Equity REITs Index in the Fidelity Strategic Real Return Composite Index.
Performance: The Bottom Line
Average annual total return reflects the change in the value of an investment, assuming reinvestment of distributions from dividend income and capital gains (the profits earned upon the sale of securities that have grown in value, if any) and assuming a constant rate of performance each year. The hypothetical investment and the average annual total returns do not reflect the deduction of taxes that a shareholder would pay on fund distributions or the redemption of fund shares. During periods of reimbursement by Fidelity, a fund’s total return will be greater than it would be had the reimbursement not occurred. How a fund did yesterday is no guarantee of how it will do tomorrow.
Average Annual Total Returns
| For the periods ended September 30, 2019 | Past 1 year | Past 5 years | Past 10 years |
| Class A (incl. 4.00% sales charge) | (1.25)% | 0.52% | 2.93% |
| Class M (incl. 4.00% sales charge) | (1.38)% | 0.46% | 2.91% |
| Class C (incl. contingent deferred sales charge) | 1.05% | 0.54% | 2.57% |
| Fidelity® Strategic Real Return Fund | 3.10% | 1.60% | 3.64% |
| Class I | 3.01% | 1.59% | 3.62% |
| Class Z | 3.11%�� | 1.61% | 3.63% |
Class C shares' contingent deferred sales charges included in the past one year, past five years and past ten years total return figures are 1%, 0% and 0%, respectively.
The initial offering of Class Z shares took place on October 2, 2018. Returns prior to October 2, 2018, are those of Class I.
$10,000 Over 10 Years
Let's say hypothetically that $10,000 was invested in Fidelity® Strategic Real Return Fund, a class of the fund, on September 30, 2009.
The chart shows how the value of your investment would have changed, and also shows how the Bloomberg Barclays U.S. Treasury Inflation-Protected Securities (TIPS) Index (Series-L) performed over the same period.
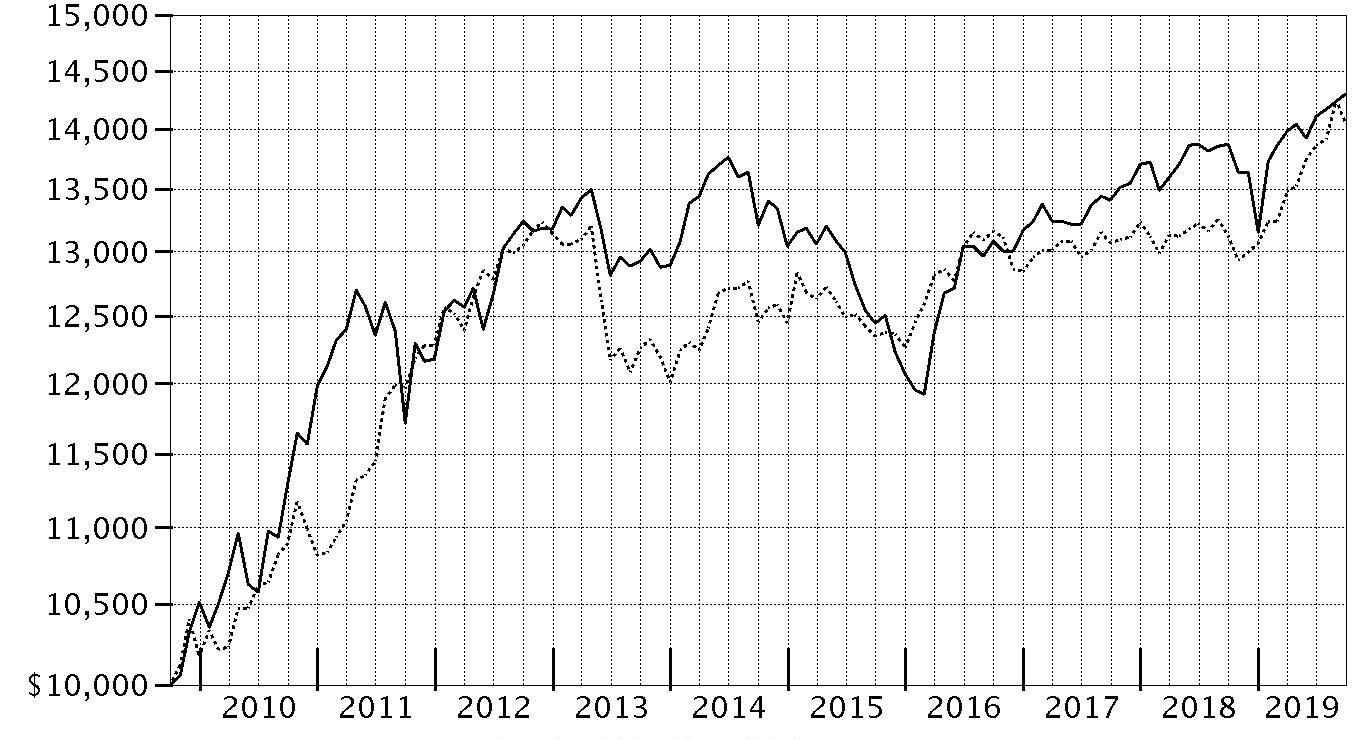
| Period Ending Values |
| $14,302 | Fidelity® Strategic Real Return Fund - Fidelity® Strategic Real Return Fund |
| $14,054 | Bloomberg Barclays U.S. Treasury Inflation-Protected Securities (TIPS) Index (Series-L) |
Management's Discussion of Fund Performance
Market Recap: For investors, the 12-month period ending September 30, 2019, was characterized by slower global economic growth, a maturing U.S. business cycle, global trade uncertainty and, late in the period, the Fed’s dovish shift. Against this backdrop, the Fidelity Strategic Real Return Composite Index℠ gained 4.15%. Looking at the various asset classes represented in this index, real estate equities by far enjoyed the strongest result, with the Dow Jones U.S. Select Real Estate Securities Index℠ gaining 16.41% as interest rates declined and investors appeared to embrace lower-volatility alternatives amid considerable uncertainty in financial markets. In comparison, real estate bonds, as measured by the ICE BofAML
® US Real Estate Index, rose 12.44%. TIPS (Treasury Inflation-Protected Securities) advanced 7.13%, according to the Bloomberg Barclays U.S. Treasury Inflation-Protected Securities Index (Series-L). Yields on both TIPS and nominal U.S. Treasuries alike declined overall during the period, reflecting mounting concerns about U.S. economic data that ultimately led to two interest-rate reductions from the Federal Reserve with expectations for more in the future. Meanwhile, floating-rate loans, as measured by the S&P
®/LSTA Leveraged Performing Loan Index, increased 3.00%, while commodities, according to the Bloomberg Barclays Commodity Index Total Return, returned -6.57%, hampered partly by weaker overall energy prices.
Comments from Co-Lead Portfolio Manager Adam Kramer: For the fiscal year, the fund share classes gained roughly 2% to 3% (excluding sales charges, if applicable), trailing the 4.15% advance of the Fidelity Strategic Real Return Composite Index℠. The fund also underperformed the broader TIPS market, which rose 7.13%, as measured by the Bloomberg Barclays TIPS Index. We see the fund's performance as a mixed result. On one hand, we were disappointed the fund fell short of the Composite index. However, we were also happy that both the Composite index and the fund generated a positive return that significantly outpaced the inflation rate, as we designed this mix of assets to do over time. Relative to the Fidelity Composite index, our primary performance challenge was security selection in the commodities subportfolio, where an overweighting in energy-related futures weighed on the fund's result. An underweighting in the outperforming Treasury Inflation-Protected Securities (TIPS) category also detracted from our relative result this period, as TIPS, along with nominal U.S. Treasuries, performed unusually well in an environment of largely falling interest rates. Conversely, security selection in floating-rate loans was a notable positive, especially within the market's B credit-rating tier. Also adding value versus the Composite index were our picks among real estate securities, particularly in the real estate income subportfolio.
The views expressed above reflect those of the portfolio manager(s) only through the end of the period as stated on the cover of this report and do not necessarily represent the views of Fidelity or any other person in the Fidelity organization. Any such views are subject to change at any time based upon market or other conditions and Fidelity disclaims any responsibility to update such views. These views may not be relied on as investment advice and, because investment decisions for a Fidelity fund are based on numerous factors, may not be relied on as an indication of trading intent on behalf of any Fidelity fund.
Investment Summary (Unaudited)
The information in the Quality Diversification and Asset Allocation tables is based on the combined investments of the Fund and its pro-rata share of investments of each Fidelity Central Fund other than the Commodity Strategy and Money Market Central Funds.
Holdings Distribution (% of fund's net assets)
| As of September 30, 2019 |
| | Commodity-Linked Notes and Related Investments* | 25.0% |
| | Inflation-Protected Investments | 26.1% |
| | Floating Rate High Yield** | 27.6% |
| | Real Estate Investments | 20.0% |
| | Cash and Cash Equivalents | 1.3% |

* Represents investment in Fidelity® Commodity Strategy Central Fund
** Represents investment in Fidelity® Floating Rate Central Fund
Quality Diversification (% of fund's net assets)
| As of September 30, 2019 |
| | U.S. Government and U.S. Government Agency Obligations | 26.1% |
| | AAA | 0.1% |
| | A | 0.2% |
| | BBB | 1.2% |
| | BB and Below | 28.6% |
| | Not Rated | 1.4% |
| | Equities* | 40.0% |
| | Short-Term Investments and Net Other Assets | 2.4% |

* Includes investment in Fidelity® Commodity Strategy Central Fund of 25.0%
We have used ratings from Moody's Investors Service, Inc. Where Moody's® ratings are not available, we have used S&P® ratings. All ratings are as of the date indicated and do not reflect subsequent changes.
Asset Allocation (% of fund's net assets)
| As of September 30, 2019*,** |
| | Stocks | 15.0% |
| | U.S. Government and U.S. Government Agency Obligations | 26.1% |
| | Corporate Bonds | 3.1% |
| | Asset-Backed Securities | 0.9% |
| | Bank Loan Obligations | 25.6% |
| | CMOs and Other Mortgage Related Securities | 1.9% |
| | Other Investments*** | 25.0% |
| | Short-Term Investments and Net Other Assets (Liabilities) | 2.4% |

* Foreign investments - 3.9%
** U.S. Treasury Inflation-Indexed Securities - 26.1%
*** Includes investment in Fidelity® Commodity Strategy Central Fund of 25.0%
An unaudited holdings listing for the Fund, which presents direct holdings as well as the pro-rata share of any securities and other investments held indirectly through its investment in underlying non-money market Fidelity Central Funds, is available at fidelity.com and/or institutional.fidelity.com, as applicable.
Schedule of Investments September 30, 2019
Showing Percentage of Net Assets
| Corporate Bonds - 2.0% | | | |
| | | Principal Amount | Value |
| Convertible Bonds - 0.4% | | | |
| FINANCIALS - 0.4% | | | |
| Diversified Financial Services - 0.1% | | | |
| Granite Point Mortgage Trust, Inc. 5.625% 12/1/22 (a) | | $110,000 | $112,028 |
| RWT Holdings, Inc. 5.75% 10/1/25 (a) | | 130,000 | 130,524 |
| | | | 242,552 |
| Mortgage Real Estate Investment Trusts - 0.3% | | | |
| Colony Financial, Inc. 3.875% 1/15/21 | | 150,000 | 148,125 |
| Exantas Capital Corp. 8% 1/15/20 | | 300,000 | 306,000 |
| MFA Financial, Inc. 6.25% 6/15/24 | | 140,000 | 143,684 |
| Redwood Trust, Inc. 5.625% 7/15/24 | | 140,000 | 142,142 |
| Western Asset Mortgage Capital Corp. 6.75% 10/1/22 | | 330,000 | 331,613 |
| | | | 1,071,564 |
| TOTAL FINANCIALS | | | 1,314,116 |
| Nonconvertible Bonds - 1.6% | | | |
| COMMUNICATION SERVICES - 0.0% | | | |
| Media - 0.0% | | | |
| CBS Outdoor Americas Capital LLC/CBS Outdoor Americas Capital Corp. 5.625% 2/15/24 | | 45,000 | 46,294 |
| CONSUMER DISCRETIONARY - 0.5% | | | |
| Hotels, Restaurants & Leisure - 0.2% | | | |
| Times Square Hotel Trust 8.528% 8/1/26 (a) | | 385,285 | 452,912 |
| Household Durables - 0.3% | | | |
| Ashton Woods U.S.A. LLC/Ashton Woods Finance Co. 6.75% 8/1/25 (a) | | 135,000 | 134,663 |
| Beazer Homes U.S.A., Inc. 5.875% 10/15/27 | | 115,000 | 111,694 |
| Brookfield Residential Properties, Inc./Brookfield Residential U.S. Corp. 6.125% 7/1/22 (a) | | 180,000 | 182,809 |
| KB Home 8% 3/15/20 | | 140,000 | 143,388 |
| M/I Homes, Inc. 5.625% 8/1/25 | | 45,000 | 46,350 |
| Meritage Homes Corp.: | | | |
| 5.125% 6/6/27 | | 80,000 | 84,400 |
| 6% 6/1/25 | | 100,000 | 110,500 |
| New Home Co. LLC 7.25% 4/1/22 | | 150,000 | 141,000 |
| Taylor Morrison Communities, Inc./Monarch Communities, Inc. 5.875% 4/15/23 (a) | | 140,000 | 149,450 |
| TRI Pointe Homes, Inc. 5.25% 6/1/27 | | 80,000 | 80,200 |
| | | | 1,184,454 |
| TOTAL CONSUMER DISCRETIONARY | | | 1,637,366 |
| CONSUMER STAPLES - 0.0% | | | |
| Food & Staples Retailing - 0.0% | | | |
| C&S Group Enterprises LLC 5.375% 7/15/22 (a) | | 15,000 | 15,169 |
| Cumberland Farms, Inc. 6.75% 5/1/25 (a) | | 35,000 | 37,485 |
| | | | 52,654 |
| ENERGY - 0.0% | | | |
| Oil, Gas & Consumable Fuels - 0.0% | | | |
| Global Partners LP/GLP Finance Corp. 7% 8/1/27 (a) | | 100,000 | 103,000 |
| FINANCIALS - 0.1% | | | |
| Banks - 0.0% | | | |
| HAT Holdings I LLC/HAT Holdings II LLC 5.25% 7/15/24 (a) | | 35,000 | 36,794 |
| Capital Markets - 0.0% | | | |
| CyrusOne LP/CyrusOne Finance Corp. 5% 3/15/24 | | 60,000 | 62,100 |
| Diversified Financial Services - 0.1% | | | |
| Five Point Operation Co. LP 7.875% 11/15/25 (a) | | 200,000 | 203,000 |
| Icahn Enterprises LP/Icahn Enterprises Finance Corp. 6.25% 2/1/22 | | 25,000 | 25,650 |
| | | | 228,650 |
| Mortgage Real Estate Investment Trusts - 0.0% | | | |
| Starwood Property Trust, Inc. 4.75% 3/15/25 | | 65,000 | 67,230 |
| TOTAL FINANCIALS | | | 394,774 |
| REAL ESTATE - 1.0% | | | |
| Equity Real Estate Investment Trusts (REITs) - 0.6% | | | |
| Care Capital Properties LP 5.125% 8/15/26 | | 408,000 | 436,202 |
| CBL & Associates LP 5.95% 12/15/26 | | 132,000 | 92,730 |
| CTR Partnership LP/CareTrust Capital Corp. 5.25% 6/1/25 | | 80,000 | 82,600 |
| DDR Corp. 4.625% 7/15/22 | | 11,000 | 11,498 |
| Equinix, Inc. 5.375% 5/15/27 | | 105,000 | 113,203 |
| iStar Financial, Inc.: | | | |
| 4.625% 9/15/20 | | 105,000 | 106,181 |
| 4.75% 10/1/24 | | 70,000 | 71,231 |
| 5.25% 9/15/22 | | 65,000 | 66,381 |
| 6% 4/1/22 | | 135,000 | 138,996 |
| Lexington Corporate Properties Trust 4.4% 6/15/24 | | 35,000 | 36,554 |
| MPT Operating Partnership LP/MPT Finance Corp. 5% 10/15/27 | | 105,000 | 109,988 |
| Omega Healthcare Investors, Inc.: | | | |
| 4.375% 8/1/23 | | 53,000 | 55,861 |
| 4.5% 4/1/27 | | 83,000 | 88,290 |
| 4.75% 1/15/28 | | 67,000 | 72,514 |
| SBA Communications Corp. 4% 10/1/22 | | 40,000 | 40,800 |
| Select Income REIT: | | | |
| 4.15% 2/1/22 | | 63,000 | 64,422 |
| 4.25% 5/15/24 | | 80,000 | 81,785 |
| Senior Housing Properties Trust: | | | |
| 4.75% 5/1/24 | | 271,000 | 280,164 |
| 4.75% 2/15/28 | | 100,000 | 100,529 |
| 6.75% 4/15/20 | | 134,000 | 134,418 |
| | | | 2,184,347 |
| Real Estate Management & Development - 0.4% | | | |
| Greystar Real Estate Partners 5.75% 12/1/25 (a) | | 90,000 | 92,588 |
| Howard Hughes Corp. 5.375% 3/15/25 (a) | | 265,000 | 275,600 |
| Kennedy-Wilson, Inc. 5.875% 4/1/24 | | 560,000 | 574,526 |
| Mattamy Group Corp. 6.5% 10/1/25 (a) | | 160,000 | 168,000 |
| Mid-America Apartments LP 4.3% 10/15/23 | | 67,000 | 71,576 |
| Taylor Morrison Communities, Inc./Monarch Communities, Inc.: | | | |
| 5.625% 3/1/24 (a) | | 5,000 | 5,350 |
| 5.75% 1/15/28 (a) | | 100,000 | 108,500 |
| Washington Prime Group LP 6.45% 8/15/24 | | 330,000 | 322,674 |
| | | | 1,618,814 |
| TOTAL REAL ESTATE | | | 3,803,161 |
|
| TOTAL NONCONVERTIBLE BONDS | | | 6,037,249 |
|
| TOTAL CORPORATE BONDS | | | |
| (Cost $7,158,131) | | | 7,351,365 |
|
| U.S. Treasury Inflation-Protected Obligations - 26.1% | | | |
| U.S. Treasury Inflation-Indexed Bonds: | | | |
| 0.625% 2/15/43 | | $1,841,334 | $1,892,431 |
| 0.75% 2/15/42 | | 660,730 | 700,281 |
| 0.75% 2/15/45 | | 3,034,425 | 3,196,247 |
| 0.875% 2/15/47 | | 2,008,843 | 2,186,794 |
| 1% 2/15/46 | | 1,250,669 | 1,396,907 |
| 1% 2/15/48 | | 260,113 | 292,572 |
| 1% 2/15/49 | | 1,539,611 | 1,744,109 |
| 1.375% 2/15/44 | | 977,581 | 1,173,698 |
| 1.75% 1/15/28 | | 2,481,242 | 2,793,412 |
| 2% 1/15/26 | | 2,944,771 | 3,273,795 |
| 2.125% 2/15/40 | | 1,132,455 | 1,509,782 |
| 2.125% 2/15/41 | | 676,019 | 909,430 |
| 2.375% 1/15/25 | | 7,117,401 | 7,930,509 |
| 2.375% 1/15/27 | | 6,877,892 | 7,954,608 |
| 2.5% 1/15/29 | | 1,622,837 | 1,963,703 |
| 3.375% 4/15/32 | | 245,730 | 340,137 |
| 3.625% 4/15/28 | | 2,890,275 | 3,714,763 |
| 3.875% 4/15/29 | | 2,469,043 | 3,317,104 |
| U.S. Treasury Inflation-Indexed Notes: | | | |
| 0.125% 4/15/20 | | 1,095,610 | 1,086,684 |
| 0.125% 4/15/21 | | 3,951,308 | 3,910,378 |
| 0.125% 1/15/22 | | 5,429,896 | 5,380,773 |
| 0.125% 4/15/22 | | 4,853,000 | 4,806,152 |
| 0.125% 7/15/22 | | 3,904,985 | 3,890,568 |
| 0.125% 1/15/23 | | 3,501,383 | 3,474,538 |
| 0.125% 7/15/24 | | 2,560,880 | 2,561,392 |
| 0.125% 7/15/26 | | 2,301,317 | 2,299,519 |
| 0.25% 1/15/25 | | 2,112,338 | 2,119,952 |
| 0.25% 7/15/29 | | 2,076,293 | 2,099,793 |
| 0.375% 7/15/23 | | 1,345,050 | 1,354,047 |
| 0.375% 7/15/25 | | 2,055,648 | 2,085,571 |
| 0.375% 1/15/27 | | 637,290 | 645,429 |
| 0.375% 7/15/27 | | 461,498 | 469,563 |
| 0.5% 4/15/24 | | 2,268,579 | 2,298,706 |
| 0.5% 1/15/28 | | 499,277 | 511,676 |
| 0.625% 7/15/21 | | 1,162,276 | 1,167,183 |
| 0.625% 4/15/23 | | 3,357,023 | 3,386,728 |
| 0.625% 1/15/24 | | 560,796 | 570,011 |
| 0.625% 1/15/26 | | 377,927 | 388,009 |
| 0.75% 7/15/28 | | 1,809,170 | 1,902,965 |
| 0.875% 1/15/29 | | 1,839,159 | 1,956,001 |
| 1.125% 1/15/21 | | 1,741,727 | 1,747,675 |
| TOTAL U.S. TREASURY INFLATION-PROTECTED OBLIGATIONS | | | |
| (Cost $93,064,169) | | | 96,403,595 |
|
| Asset-Backed Securities - 0.9% | | | |
| American Homes 4 Rent Series 2015-SFR2 Class XS, 0% 10/17/52 (a)(b)(c)(d) | | $141,057 | $1 |
| Conseco Finance Securitizations Corp.: | | | |
| Series 2002-1 Class M2, 9.546% 12/1/33 | | 284,000 | 301,530 |
| Series 2002-2 Class M2, 9.163% 3/1/33 | | 397,650 | 365,367 |
| Deutsche Financial Capital Securitization LLC Series 1997-I Class M, 7.275% 9/15/27 | | 35,392 | 35,929 |
| Home Partners of America Credit Trust Series 2017-1 Class F, 1 month U.S. LIBOR + 3.539% 5.5638% 7/17/34 (a)(b)(e) | | 101,000 | 101,137 |
| Lehman ABS Manufactured Housing Contract Trust Series 2001-B Class M2, 7.17% 4/15/40 | | 518,959 | 382,807 |
| Starwood Waypoint Homes Trust Series 2017-1: | | | |
| Class E, 1 month U.S. LIBOR + 2.600% 4.6275% 1/17/35 (a)(b)(e) | | 100,000 | 100,000 |
| Class F, 1 month U.S. LIBOR + 3.400% 5.4275% 1/17/35 (a)(b)(e) | | 197,000 | 197,120 |
| Taberna Preferred Funding III Ltd. Series 2005-3A Class D, 3 month U.S. LIBOR + 2.650% 4.9368% 2/5/36 (a)(b)(d)(e) | | 387,486 | 29 |
| Tricon American Homes: | | | |
| Series 2017-SFR2 Class F, 5.104% 1/17/36 (a) | | 100,000 | 104,006 |
| Series 2018-SFR1 Class F, 4.96% 5/17/37 (a) | | 105,000 | 109,721 |
| VB-S1 Issuer LLC Series 2018-1A Class F, 5.25% 2/15/48 (a) | | 155,000 | 154,483 |
| Wrightwood Capital Real Estate CDO Ltd. Series 2005-1A Class F, 3 month U.S. LIBOR + 1.950% 4.1015% 11/21/40 (a)(b)(e) | | 1,500,000 | 1,505,045 |
| TOTAL ASSET-BACKED SECURITIES | | | |
| (Cost $3,613,964) | | | 3,357,175 |
|
| Commercial Mortgage Securities - 1.9% | | | |
| Barclays Commercial Mortgage Securities LLC Series 2015-STP Class F, 4.4272% 9/10/28 (a)(b) | | 126,000 | 121,614 |
| CGMS Commercial Mortgage Trust Series 2017-MDRB Class E, 1 month U.S. LIBOR + 3.872% 5.899% 7/15/30 (a)(b)(e) | | 105,000 | 104,318 |
| COMM Mortgage Trust: | | | |
| sequential payer Series 2013-LC6 Class E, 3.5% 1/10/46 (a) | | 250,000 | 216,684 |
| Series 2012-CR1 Class G, 2.462% 5/15/45 (a) | | 100,000 | 81,896 |
| Series 2013-CR12 Class D, 5.2503% 10/10/46 (a)(b) | | 250,000 | 220,106 |
| Series 2017-CD4 Class D, 3.3% 5/10/50 (a) | | 63,000 | 58,392 |
| COMM Mortgage Trust pass-thru certificates Series 2005-LP5 Class F, 4.6592% 5/10/43 (a)(b) | | 102,806 | 101,838 |
| CSAIL Commercial Mortgage Trust: | | | |
| Series 2017-C8 Class D, 4.4701% 6/15/50 (a) | | 156,000 | 153,261 |
| Series 2017-CX10 Class UESD, 4.3778% 10/15/32 (a)(b) | | 84,000 | 85,399 |
| DBCCRE Mortgage Trust Series 2014-ARCP Class E, 5.099% 1/10/34 (a)(b) | | 100,000 | 101,691 |
| Freddie Mac pass-thru certificates: | | | |
| Series K011 Class X3, 2.6604% 12/25/43 (b)(c) | | 1,156,048 | 34,590 |
| Series K012 Class X3, 2.329% 1/25/41 (b)(c) | | 654,162 | 18,089 |
| Series K013 Class X3, 2.91% 1/25/43 (b)(c) | | 1,124,000 | 39,675 |
| GS Mortgage Securities Trust: | | | |
| Series 2011-GC5: | | | |
| Class E, 5.5564% 8/10/44 (a)(b) | | 63,000 | 57,863 |
| Class F, 4.5% 8/10/44 (a) | | 42,000 | 30,027 |
| Series 2012-GC6 Class E, 5% 1/10/45 (a)(b) | | 254,000 | 236,661 |
| Series 2012-GCJ7 Class D, 5.8754% 5/10/45 (a)(b) | | 500,000 | 501,479 |
| Series 2012-GCJ9 Class D, 4.902% 11/10/45 (a)(b) | | 178,000 | 182,883 |
| Series 2013-GC16 Class F, 3.5% 11/10/46 (a) | | 269,000 | 217,251 |
| Series 2016-REMZ Class MZB, 7.727% 2/10/21 (a) | | 651,000 | 661,682 |
| Hilton U.S.A. Trust Series 2016-SFP Class F, 6.1552% 11/5/35 (a) | | 600,000 | 603,175 |
| Independence Plaza Trust Series 2018-INDP Class E, 4.996% 7/10/35 (a) | | 100,000 | 106,408 |
| Invitation Homes Trust floater Series 2018-SFR3 Class F, 1 month U.S. LIBOR + 2.250% 4.2748% 7/17/37 (a)(b)(e) | | 104,000 | 103,727 |
| JPMBB Commercial Mortgage Securities Trust Series 2014-C23 Class UH5, 4.7094% 9/15/47 (a) | | 54,000 | 48,226 |
| JPMorgan Chase Commercial Mortgage Securities Corp. Series 2012-CBX Class G 4% 6/15/45 (a) | | 151,000 | 93,975 |
| JPMorgan Chase Commercial Mortgage Securities Trust Series 2011-C3 Class E, 5.8526% 2/15/46 (a)(b) | | 200,000 | 193,341 |
| Morgan Stanley BAML Trust: | | | |
| Series 2012-C5 Class E, 4.8341% 8/15/45 (a)(b) | | 61,000 | 63,314 |
| Series 2013-C7 Class D, 4.3769% 2/15/46 (a)(b) | | 91,000 | 88,935 |
| Morgan Stanley Capital I Trust: | | | |
| Series 1998-CF1 Class G, 7.2448% 7/15/32 (a)(b) | | 50,324 | 44,498 |
| Series 2011-C2: | | | |
| Class D, 5.6705% 6/15/44 (a)(b) | | 358,000 | 361,738 |
| Class E, 5.6705% 6/15/44 (a)(b) | | 454,000 | 450,765 |
| Class F, 5.6705% 6/15/44 (a)(b) | | 343,000 | 318,052 |
| Class XB, 0.3873% 6/15/44 (a)(b)(c) | | 10,535,018 | 56,435 |
| Series 2011-C3 Class G, 5.2925% 7/15/49 (a)(b) | | 112,000 | 102,278 |
| Motel 6 Trust floater Series 2017-MTL6, Class F, 1 month U.S. LIBOR + 4.250% 6.2775% 8/15/34 (a)(b)(e) | | 176,498 | 177,489 |
| Providence Place Group Ltd. Partnership Series 2000-C1 Class A2, 7.75% 7/20/28 (a) | | 230,232 | 285,737 |
| UBS Commercial Mortgage Trust Series 2012-C1 Class D, 5.7278% 5/10/45 (a)(b) | | 120,000 | 120,146 |
| Wells Fargo Commercial Mortgage Trust: | | | |
| Series 2012-LC5: | | | |
| Class E, 4.9169% 10/15/45 (a)(b) | | 114,000 | 114,543 |
| Class F, 4.9169% 10/15/45 (a)(b) | | 42,000 | 39,401 |
| Series 2017-C38 Class D, 3% 7/15/50 (a)(b) | | 70,000 | 61,947 |
| WF-RBS Commercial Mortgage Trust Series 2013-C11 Class E, 4.4034% 3/15/45 (a)(b) | | 220,000 | 222,168 |
| WP Glimcher Mall Trust Series 2015-WPG Class PR1, 3.6332% 6/5/35 (a)(b) | | 140,000 | 120,562 |
| TOTAL COMMERCIAL MORTGAGE SECURITIES | | | |
| (Cost $6,687,717) | | | 7,002,259 |
| | | Shares | Value |
|
| Common Stocks - 11.0% | | | |
| CONSUMER DISCRETIONARY - 0.2% | | | |
| Hotels, Restaurants & Leisure - 0.2% | | | |
| Hilton Grand Vacations, Inc. (f) | | 7,200 | 230,400 |
| Marriott International, Inc. Class A | | 2,500 | 310,925 |
| Wyndham Destinations, Inc. | | 2,200 | 101,244 |
| | | | 642,569 |
| FINANCIALS - 0.8% | | | |
| Mortgage Real Estate Investment Trusts - 0.8% | | | |
| Chimera Investment Corp. | | 7,000 | 136,920 |
| Dynex Capital, Inc. | | 4,700 | 69,466 |
| Ellington Financial LLC | | 13,400 | 242,138 |
| Ellington Residential Mortgage REIT | | 5,200 | 54,808 |
| Great Ajax Corp. | | 46,000 | 713,000 |
| Hunt Companies Finance Trust, Inc. | | 2,244 | 7,540 |
| MFA Financial, Inc. | | 102,566 | 754,886 |
| New Residential Investment Corp. | | 43,200 | 677,376 |
| Redwood Trust, Inc. | | 10,400 | 170,664 |
| | | | 2,826,798 |
| REAL ESTATE - 10.0% | | | |
| Equity Real Estate Investment Trusts (REITs) - 9.9% | | | |
| Acadia Realty Trust (SBI) | | 42,144 | 1,204,476 |
| Alexandria Real Estate Equities, Inc. | | 4,800 | 739,392 |
| American Tower Corp. | | 5,800 | 1,282,554 |
| Americold Realty Trust | | 15,000 | 556,050 |
| Apartment Investment & Management Co. Class A | | 24,879 | 1,297,191 |
| AvalonBay Communities, Inc. | | 9,109 | 1,961,441 |
| Boston Properties, Inc. | | 7,601 | 985,546 |
| Braemar Hotels & Resorts, Inc. | | 18,376 | 172,551 |
| Cedar Realty Trust, Inc. | | 59,518 | 178,554 |
| Clipper Realty, Inc. | | 16,400 | 167,116 |
| Colony Capital, Inc. | | 52,823 | 317,994 |
| CoreSite Realty Corp. | | 600 | 73,110 |
| Crown Castle International Corp. | | 4,700 | 653,347 |
| CubeSmart | | 24,000 | 837,600 |
| DDR Corp. | | 46,830 | 707,601 |
| Digital Realty Trust, Inc. | | 5,600 | 726,936 |
| Douglas Emmett, Inc. | | 13,900 | 595,337 |
| Duke Realty Corp. | | 19,900 | 676,003 |
| Equinix, Inc. | | 1,945 | 1,121,876 |
| Equity Lifestyle Properties, Inc. | | 17,299 | 2,311,146 |
| Equity Residential (SBI) | | 17,113 | 1,476,167 |
| Essex Property Trust, Inc. | | 3,772 | 1,232,124 |
| Extra Space Storage, Inc. | | 7,450 | 870,309 |
| Healthcare Realty Trust, Inc. | | 20,300 | 680,050 |
| Healthcare Trust of America, Inc. | | 12,690 | 372,832 |
| Highwoods Properties, Inc. (SBI) | | 15,100 | 678,594 |
| Invitation Homes, Inc. | | 26,100 | 772,821 |
| iStar Financial, Inc. (g) | | 15,444 | 201,544 |
| Lexington Corporate Properties Trust | | 31,800 | 325,950 |
| Mack-Cali Realty Corp. | | 8,600 | 186,276 |
| Mid-America Apartment Communities, Inc. | | 5,694 | 740,277 |
| Prologis, Inc. | | 29,008 | 2,472,062 |
| Public Storage | | 2,444 | 599,440 |
| RLJ Lodging Trust | | 29,500 | 501,205 |
| Sabra Health Care REIT, Inc. | | 19,500 | 447,720 |
| Senior Housing Properties Trust (SBI) | | 26,500 | 245,258 |
| Simon Property Group, Inc. | | 6,523 | 1,015,305 |
| Store Capital Corp. | | 4,500 | 168,345 |
| Sunstone Hotel Investors, Inc. | | 27,600 | 379,224 |
| Taubman Centers, Inc. | | 10,795 | 440,760 |
| Terreno Realty Corp. | | 7,700 | 393,393 |
| UDR, Inc. | | 22,800 | 1,105,344 |
| Urban Edge Properties | | 21,673 | 428,909 |
| Ventas, Inc. | | 37,647 | 2,749,360 |
| VEREIT, Inc. | | 5,300 | 51,834 |
| Welltower, Inc. | | 11,425 | 1,035,676 |
| Weyerhaeuser Co. | | 11,600 | 321,320 |
| | | | 36,457,920 |
| Real Estate Management & Development - 0.1% | | | |
| Colony NorthStar Credit Real Estate, Inc. | | 16,400 | 237,144 |
| Jones Lang LaSalle, Inc. | | 1,000 | 139,060 |
| Retail Value, Inc. | | 2,043 | 75,673 |
| | | | 451,877 |
|
| TOTAL REAL ESTATE | | | 36,909,797 |
|
| TOTAL COMMON STOCKS | | | |
| (Cost $36,584,660) | | | 40,379,164 |
|
| Preferred Stocks - 3.9% | | | |
| Convertible Preferred Stocks - 0.6% | | | |
| FINANCIALS - 0.4% | | | |
| Mortgage Real Estate Investment Trusts - 0.4% | | | |
| Great Ajax Corp. 7.25% | | 42,500 | 1,135,600 |
| ZAIS Financial Corp. 7.00% | | 6,400 | 172,800 |
| | | | 1,308,400 |
| REAL ESTATE - 0.2% | | | |
| Equity Real Estate Investment Trusts (REITs) - 0.2% | | | |
| Braemar Hotels & Resorts, Inc. 5.50% | | 2,700 | 56,322 |
| iStar Financial, Inc. Series J, 4.50% | | 3,900 | 208,715 |
| Lexington Corporate Properties Trust Series C, 6.50% | | 2,800 | 161,365 |
| RLJ Lodging Trust Series A, 1.95% | | 400 | 10,772 |
| Wheeler REIT, Inc. 8.75% | | 16,500 | 234,302 |
| | | | 671,476 |
| Real Estate Management & Development - 0.0% | | | |
| Landmark Infrastructure Partners LP 7.012% | | 2,000 | 52,774 |
| TOTAL REAL ESTATE | | | 724,250 |
|
| TOTAL CONVERTIBLE PREFERRED STOCKS | | | 2,032,650 |
|
| Nonconvertible Preferred Stocks - 3.3% | | | |
| CONSUMER DISCRETIONARY - 0.0% | | | |
| Textiles, Apparel & Luxury Goods - 0.0% | | | |
| American Finance Trust, Inc. 7.50% | | 1,900 | 48,773 |
| FINANCIALS - 2.0% | | | |
| Mortgage Real Estate Investment Trusts - 2.0% | | | |
| AG Mortgage Investment Trust, Inc.: | | | |
| 8.00% | | 15,879 | 404,597 |
| 8.25% | | 500 | 12,686 |
| Series C 8.00% (f) | | 1,900 | 48,887 |
| AGNC Investment Corp.: | | | |
| Series B, 7.75% | | 8,000 | 203,520 |
| Series C, 7.00% | | 6,600 | 169,950 |
| Series E 6.50% (f) | | 4,300 | 107,715 |
| Annaly Capital Management, Inc.: | | | |
| Series D, 7.50% | | 8,644 | 221,286 |
| Series F, 6.95% | | 15,500 | 398,815 |
| Series G, 6.50% | | 10,800 | 270,589 |
| Arbor Realty Trust, Inc. Series A, 8.25% | | 5,789 | 150,743 |
| Armour Residential REIT, Inc. Series B, 7.875% | | 5,645 | 141,351 |
| Cherry Hill Mortgage Investment Corp. Series A, 8.20% | | 4,000 | 101,040 |
| Chimera Investment Corp.: | | | |
| Series B, 8.00% | | 27,587 | 720,297 |
| Series C, 7.75% | | 8,600 | 216,419 |
| Dynex Capital, Inc.: | | | |
| Series A, 8.50% | | 16,355 | 417,870 |
| Series B, 7.625% | | 10,545 | 262,992 |
| Exantas Capital Corp. 8.625% | | 300 | 7,878 |
| Invesco Mortgage Capital, Inc.: | | | |
| 7.50% | | 17,200 | 444,104 |
| Series A, 7.75% | | 6,507 | 172,175 |
| Series B, 7.75% | | 13,500 | 372,195 |
| MFA Financial, Inc.: | | | |
| 8.00% | | 11,262 | 297,785 |
| Series B, 7.50% | | 18,486 | 465,847 |
| New Residential Investment Corp.: | | | |
| 7.125% | | 2,600 | 65,832 |
| Series A 7.50% | | 3,200 | 84,009 |
| New York Mortgage Trust, Inc.: | | | |
| Series B, 7.75% | | 8,886 | 222,239 |
| Series C, 7.875% | | 3,200 | 80,880 |
| Series D, 8.00% | | 6,500 | 162,240 |
| PennyMac Mortgage Investment Trust: | | | |
| 8.125% | | 5,700 | 152,532 |
| Series B, 8.00% | | 8,700 | 229,071 |
| Two Harbors Investment Corp.: | | | |
| 7.75% | | 2,162 | 54,720 |
| Series A, 8.125% | | 9,500 | 270,465 |
| Series B, 7.625% | | 7,800 | 206,162 |
| Series C, 7.25% | | 9,800 | 254,408 |
| | | | 7,391,299 |
| REAL ESTATE - 1.3% | | | |
| Equity Real Estate Investment Trusts (REITs) - 1.3% | | | |
| American Homes 4 Rent Series G, 5.875% | | 3,200 | 84,640 |
| Ashford Hospitality Trust, Inc.: | | | |
| Series H, 7.50% | | 2,500 | 53,875 |
| Series I, 7.50% | | 2,500 | 52,800 |
| Cedar Realty Trust, Inc.: | | | |
| Series B, 7.25% | | 2,373 | 59,206 |
| Series C, 6.50% | | 4,900 | 108,290 |
| City Office REIT, Inc. Series A, 6.625% | | 2,079 | 54,823 |
| Colony Capital, Inc.: | | | |
| Series B, 8.25% | | 4,210 | 106,176 |
| Series E, 8.75% | | 13,700 | 346,199 |
| Series G, 7.50% | | 2,800 | 66,245 |
| Series H, 7.125% | | 7,700 | 177,254 |
| Series I, 7.15% | | 18,500 | 426,240 |
| Series J, 7.15% | | 18,200 | 421,512 |
| Farmland Partners, Inc. Series B, 6.00% | | 10,000 | 241,300 |
| Gladstone Commercial Corp. 6.625% (f) | | 2,400 | 61,800 |
| Global Medical REIT, Inc. Series A, 7.50% | | 2,100 | 55,827 |
| Global Net Lease, Inc. Series A, 7.25% | | 7,400 | 189,588 |
| Investors Real Estate Trust Series C, 6.625% | | 5,000 | 130,600 |
| iStar Financial, Inc.: | | | |
| Series D, 8.00% | | 3,000 | 78,750 |
| Series G, 7.65% | | 7,300 | 186,141 |
| Series I, 7.50% | | 2,600 | 66,664 |
| Jernigan Capital, Inc. Series B, 7.00% | | 2,500 | 66,525 |
| Pebblebrook Hotel Trust Series C, 6.50% | | 7,058 | 182,026 |
| Pennsylvania (REIT): | | | |
| Series B, 7.375% | | 4,082 | 84,497 |
| Series D, 6.875% | | 2,500 | 50,900 |
| Plymouth Industrial REIT, Inc. Series A, 7.50% | | 2,500 | 65,500 |
| QTS Realty Trust, Inc. Series A, 7.125% | | 2,700 | 71,739 |
| RAIT Financial Trust 7.625% | | 7,860 | 180,859 |
| Saul Centers, Inc.: | | | |
| Series C, 6.875% | | 2,107 | 52,801 |
| Series D, 6.125% | | 1,300 | 34,255 |
| Sotherly Hotels, Inc. Series C, 7.875% | | 1,700 | 44,200 |
| Spirit Realty Capital, Inc. Series A, 6.00% | | 2,600 | 68,094 |
| Summit Hotel Properties, Inc. Series E, 6.25% | | 3,000 | 80,580 |
| UMH Properties, Inc.: | | | |
| Series C, 6.75% | | 5,340 | 139,748 |
| Series D, 6.375% | | 1,800 | 45,691 |
| Urstadt Biddle Properties, Inc.: | | | |
| Series G, 6.75% | | 3,300 | 83,820 |
| Series H, 6.25% | | 4,500 | 122,490 |
| Series K (f) | | 2,000 | 50,000 |
| VEREIT, Inc. Series F, 6.70% | | 16,408 | 415,943 |
| Washington Prime Group, Inc.: | | | |
| Series H, 7.50% | | 2,898 | 63,785 |
| Series I, 6.875% | | 1,402 | 28,531 |
| | | | 4,899,914 |
|
| TOTAL NONCONVERTIBLE PREFERRED STOCKS | | | 12,339,986 |
|
| TOTAL PREFERRED STOCKS | | | |
| (Cost $14,041,565) | | | 14,372,636 |
| | | Principal Amount | Value |
|
| Bank Loan Obligations - 0.3% | | | |
| CONSUMER DISCRETIONARY - 0.0% | | | |
| Hotels, Restaurants & Leisure - 0.0% | | | |
| Caesars Resort Collection LLC Tranche B 1LN, term loan 3 month U.S. LIBOR + 2.750% 4.7935% 12/22/24 (b)(e) | | 49,125 | 48,781 |
| Playa Resorts Holding BV Tranche B, term loan 3 month U.S. LIBOR + 2.750% 4.79% 4/27/24 (b)(e) | | 63,601 | 61,693 |
| | | | 110,474 |
| Multiline Retail - 0.0% | | | |
| JC Penney Corp., Inc. Tranche B, term loan 3 month U.S. LIBOR + 4.250% 6.3944% 6/23/23 (b)(e) | | 66,755 | 58,014 |
|
| TOTAL CONSUMER DISCRETIONARY | | | 168,488 |
|
| ENERGY - 0.1% | | | |
| Oil, Gas & Consumable Fuels - 0.1% | | | |
| Moxie Patriot LLC Tranche B, term loan 3 month U.S. LIBOR + 5.750% 7.8544% 12/19/20 (b)(e) | | 155,563 | 136,507 |
| TPF II Power LLC Tranche B, term loan 3 month U.S. LIBOR + 3.750% 5.7935% 10/2/23 (b)(e) | | 40,179 | 40,274 |
| | | | 176,781 |
| FINANCIALS - 0.1% | | | |
| Diversified Financial Services - 0.1% | | | |
| Veritas-B Junior Mezz C LLC 10.48% 2/6/21 (b)(d) | | 300,000 | 309,180 |
| Thrifts & Mortgage Finance - 0.0% | | | |
| Ocwen Loan Servicing LLC Tranche B, term loan 3 month U.S. LIBOR + 5.000% 7.0447% 12/5/20 (b)(e) | | 67,213 | 66,037 |
|
| TOTAL FINANCIALS | | | 375,217 |
|
| INFORMATION TECHNOLOGY - 0.0% | | | |
| Electronic Equipment & Components - 0.0% | | | |
| Compass Power Generation LLC Tranche B 1LN, term loan 3 month U.S. LIBOR + 3.500% 5.5435% 12/20/24 (b)(e) | | 47,951 | 47,963 |
| REAL ESTATE - 0.1% | | | |
| Equity Real Estate Investment Trusts (REITs) - 0.1% | | | |
| iStar Financial, Inc. Tranche B 1LN, term loan 3 month U.S. LIBOR + 2.750% 4.8071% 6/28/23 (b)(e) | | 153,063 | 153,254 |
| Real Estate Management & Development - 0.0% | | | |
| Capital Automotive LP Tranche B 1LN, term loan 3 month U.S. LIBOR + 2.500% 4.55% 3/24/24 (b)(e) | | 34,384 | 34,374 |
|
| TOTAL REAL ESTATE | | | 187,628 |
|
| UTILITIES - 0.0% | | | |
| Electric Utilities - 0.0% | | | |
| Southeast Powergen LLC Tranche B, term loan 3 month U.S. LIBOR + 3.500% 5.55% 12/2/21 (b)(e) | | 46,519 | 44,262 |
| TOTAL BANK LOAN OBLIGATIONS | | | |
| (Cost $1,028,863) | | | 1,000,339 |
| | | Shares | Value |
|
| Equity Funds - 25.0% | | | |
| Fidelity Commodity Strategy Central Fund (h) | | | |
| (Cost $218,501,746) | | 19,554,352 | 92,296,539 |
|
| Fixed-Income Funds - 27.6% | | | |
| Fidelity Floating Rate Central Fund (h) | | | |
| (Cost $104,250,939) | | 1,005,757 | 101,963,672 |
| | | Principal Amount | Value |
|
| Preferred Securities - 0.0% | | | |
| FINANCIALS - 0.0% | | | |
| Thrifts & Mortgage Finance - 0.0% | | | |
Crest Clarendon Street 2002-1 Ltd. Series 2002-1A Class PS, 12/28/35
(Cost $594,368)(a)(d) | | 500,000 | 10,474 |
| | | Shares | Value |
|
| Money Market Funds - 1.3% | | | |
| Fidelity Cash Central Fund 1.96% (i) | | 4,900,339 | 4,901,319 |
| Fidelity Securities Lending Cash Central Fund 1.96% (i)(j) | | 2,700 | 2,700 |
| TOTAL MONEY MARKET FUNDS | | | |
| (Cost $4,904,019) | | | 4,904,019 |
| TOTAL INVESTMENT IN SECURITIES - 100.0% | | | |
| (Cost $490,430,141) | | | 369,041,237 |
| NET OTHER ASSETS (LIABILITIES) - 0.0% | | | (108,700) |
| NET ASSETS - 100% | | | $368,932,537 |
Legend
(a) Security exempt from registration under Rule 144A of the Securities Act of 1933. These securities may be resold in transactions exempt from registration, normally to qualified institutional buyers. At the end of the period, the value of these securities amounted to $11,399,793 or 3.1% of net assets.
(b) Coupon rates for floating and adjustable rate securities reflect the rates in effect at period end.
(c) Security represents right to receive monthly interest payments on an underlying pool of mortgages or assets. Principal shown is the outstanding par amount of the pool as of the end of the period.
(d) Level 3 security
(e) Coupon is indexed to a floating interest rate which may be multiplied by a specified factor and/or subject to caps or floors.
(f) Non-income producing
(g) Security or a portion of the security is on loan at period end.
(h) Affiliated fund that is generally available only to investment companies and other accounts managed by Fidelity Investments. A complete unaudited schedule of portfolio holdings for each Fidelity Central Fund is filed with the SEC for the first and third quarters of each fiscal year on Form N-PORT and is available upon request or at the SEC's website at www.sec.gov. An unaudited holdings listing for the Fund, which presents direct holdings as well as the pro-rata share of securities and other investments held indirectly through its investment in underlying non-money market Fidelity Central Funds, other than the Commodity Strategy Central Fund, is available at fidelity.com and/or institutional.fidelity.com, as applicable. In addition, each Fidelity Central Fund's financial statements, which are not covered by the Fund's Report of Independent Registered Public Accounting Firm, are available on the SEC's website or upon request.
(i) Affiliated fund that is generally available only to investment companies and other accounts managed by Fidelity Investments. The rate quoted is the annualized seven-day yield of the fund at period end. A complete unaudited listing of the fund's holdings as of its most recent quarter end is available upon request. In addition, each Fidelity Central Fund's financial statements, which are not covered by the Fund's Report of Independent Registered Public Accounting Firm, are available on the SEC's website or upon request.
(j) Investment made with cash collateral received from securities on loan.
Affiliated Central Funds
Information regarding fiscal year to date income earned by the Fund from investments in Fidelity Central Funds is as follows:
| Fund | Income earned |
| Fidelity Cash Central Fund | $96,117 |
| Fidelity Commodity Strategy Central Fund | 2,116,934 |
| Fidelity Floating Rate Central Fund | 6,685,665 |
| Fidelity Securities Lending Cash Central Fund | 34 |
| Total | $8,898,750 |
Amounts in the income column in the above table include any capital gain distributions from underlying funds, which are presented in the corresponding line-item in the Statement of Operations, if applicable. Amount for Fidelity Securities Lending Cash Central Fund represents the income earned on investing cash collateral, less rebates paid to borrowers and any lending agent fees associated with the loan, plus any premium payments received for lending certain types of securities.
Fiscal year to date information regarding the Fund’s investments in non-Money Market Central Funds, including the ownership percentage, is presented below.
| Fund | Value, beginning of period | Purchases | Sales Proceeds | Realized Gain/Loss | Change in Unrealized appreciation (depreciation) | Value, end of period | % ownership, end of period |
| Fidelity Commodity Strategy Central Fund | $126,472,744 | $11,125,087 | $34,090,852 | $(21,519,934) | $10,309,494 | $92,296,539 | 39.2% |
| Fidelity Floating Rate Central Fund | 124,858,040 | 16,386,116 | 37,051,645 | (901,907) | (1,326,932) | 101,963,672 | 5.2% |
| Total | $251,330,784 | $27,511,203 | $71,142,497 | $(22,421,841) | $8,982,562 | $194,260,211 | |
Investment Valuation
The following is a summary of the inputs used, as of September 30, 2019, involving the Fund's assets and liabilities carried at fair value. The inputs or methodology used for valuing securities may not be an indication of the risk associated with investing in those securities. For more information on valuation inputs, and their aggregation into the levels used below, please refer to the Investment Valuation section in the accompanying Notes to Financial Statements.
| | Valuation Inputs at Reporting Date: |
| Description | Total | Level 1 | Level 2 | Level 3 |
| Investments in Securities: | | | | |
| Equities: | | | | |
| Consumer Discretionary | $691,342 | $691,342 | $-- | $-- |
| Financials | 11,526,497 | 10,218,097 | 1,308,400 | -- |
| Real Estate | 42,533,961 | 41,809,711 | 724,250 | -- |
| Corporate Bonds | 7,351,365 | -- | 7,351,365 | -- |
| U.S. Government and Government Agency Obligations | 96,403,595 | -- | 96,403,595 | -- |
| Asset-Backed Securities | 3,357,175 | -- | 3,357,145 | 30 |
| Commercial Mortgage Securities | 7,002,259 | -- | 7,002,259 | -- |
| Bank Loan Obligations | 1,000,339 | -- | 691,159 | 309,180 |
| Equity Funds | 92,296,539 | 92,296,539 | -- | -- |
| Fixed-Income Funds | 101,963,672 | 101,963,672 | -- | -- |
| Preferred Securities | 10,474 | -- | -- | 10,474 |
| Money Market Funds | 4,904,019 | 4,904,019 | -- | -- |
| Total Investments in Securities: | $369,041,237 | $251,883,380 | $116,838,173 | $319,684 |
See accompanying notes which are an integral part of the financial statements.
Financial Statements
Statement of Assets and Liabilities
| | | September 30, 2019 |
| Assets | | |
Investment in securities, at value (including securities loaned of $2,610) — See accompanying schedule:
Unaffiliated issuers (cost $162,773,437) | $169,877,007 | |
| Fidelity Central Funds (cost $327,656,704) | 199,164,230 | |
| Total Investment in Securities (cost $490,430,141) | | $369,041,237 |
| Cash | | 2,000 |
| Receivable for investments sold | | 1,135,957 |
| Receivable for fund shares sold | | 97,776 |
| Dividends receivable | | 254,735 |
| Interest receivable | | 454,169 |
| Distributions receivable from Fidelity Central Funds | | 7,540 |
| Prepaid expenses | | 732 |
| Other receivables | | 615 |
| Total assets | | 370,994,761 |
| Liabilities | | |
| Payable for investments purchased | $1,269,553 | |
| Payable for fund shares redeemed | 457,396 | |
| Accrued management fee | 170,255 | |
| Distribution and service plan fees payable | 15,209 | |
| Other affiliated payables | 64,365 | |
| Other payables and accrued expenses | 82,746 | |
| Collateral on securities loaned | 2,700 | |
| Total liabilities | | 2,062,224 |
| Net Assets | | $368,932,537 |
| Net Assets consist of: | | |
| Paid in capital | | $597,145,127 |
| Total accumulated earnings (loss) | | (228,212,590) |
| Net Assets | | $368,932,537 |
| Net Asset Value and Maximum Offering Price | | |
| Class A: | | |
| Net Asset Value and redemption price per share ($29,652,350 ÷ 3,535,650 shares)(a) | | $8.39 |
| Maximum offering price per share (100/96.00 of $8.39) | | $8.74 |
| Class M: | | |
| Net Asset Value and redemption price per share ($7,902,502 ÷ 941,384 shares)(a) | | $8.39 |
| Maximum offering price per share (100/96.00 of $8.39) | | $8.74 |
| Class C: | | |
| Net Asset Value and offering price per share ($8,554,580 ÷ 1,035,177 shares)(a) | | $8.26 |
| Strategic Real Return: | | |
| Net Asset Value, offering price and redemption price per share ($197,152,053 ÷ 23,397,908 shares) | | $8.43 |
| Class I: | | |
| Net Asset Value, offering price and redemption price per share ($116,301,876 ÷ 13,837,495 shares) | | $8.40 |
| Class Z: | | |
| Net Asset Value, offering price and redemption price per share ($9,369,176 ÷ 1,115,015 shares) | | $8.40 |
(a) Redemption price per share is equal to net asset value less any applicable contingent deferred sales charge.
See accompanying notes which are an integral part of the financial statements.
Statement of Operations
| | | Year ended September 30, 2019 |
| Investment Income | | |
| Dividends | | $2,731,549 |
| Interest | | 3,651,487 |
| Income from Fidelity Central Funds (including $34 from security lending) | | 8,898,750 |
| Total income | | 15,281,786 |
| Expenses | | |
| Management fee | $2,297,891 | |
| Transfer agent fees | 678,148 | |
| Distribution and service plan fees | 227,758 | |
| Accounting and security lending fees | 203,924 | |
| Custodian fees and expenses | 23,234 | |
| Independent trustees' fees and expenses | 1,842 | |
| Registration fees | 102,650 | |
| Audit | 115,359 | |
| Legal | 756 | |
| Miscellaneous | 3,172 | |
| Total expenses before reductions | 3,654,734 | |
| Expense reductions | (21,388) | |
| Total expenses after reductions | | 3,633,346 |
| Net investment income (loss) | | 11,648,440 |
| Realized and Unrealized Gain (Loss) | | |
| Net realized gain (loss) on: | | |
| Investment securities: | | |
| Unaffiliated issuers | (929,732) | |
| Fidelity Central Funds | (22,421,910) | |
| Foreign currency transactions | (8) | |
| Total net realized gain (loss) | | (23,351,650) |
| Change in net unrealized appreciation (depreciation) on: | | |
| Investment securities: | | |
| Unaffiliated issuers | 13,712,019 | |
| Fidelity Central Funds | 8,982,631 | |
| Total change in net unrealized appreciation (depreciation) | | 22,694,650 |
| Net gain (loss) | | (657,000) |
| Net increase (decrease) in net assets resulting from operations | | $10,991,440 |
See accompanying notes which are an integral part of the financial statements.
Statement of Changes in Net Assets
| | Year ended September 30, 2019 | Year ended September 30, 2018 |
| Increase (Decrease) in Net Assets | | |
| Operations | | |
| Net investment income (loss) | $11,648,440 | $19,624,099 |
| Net realized gain (loss) | (23,351,650) | (24,811,028) |
| Change in net unrealized appreciation (depreciation) | 22,694,650 | 25,442,345 |
| Net increase (decrease) in net assets resulting from operations | 10,991,440 | 20,255,416 |
| Distributions to shareholders | (38,581,735) | – |
| Distributions to shareholders from net investment income | – | (14,684,955) |
| Distributions to shareholders from net realized gain | – | (881,921) |
| Total distributions | (38,581,735) | (15,566,876) |
| Share transactions - net increase (decrease) | (80,956,572) | (262,834,048) |
| Total increase (decrease) in net assets | (108,546,867) | (258,145,508) |
| Net Assets | | |
| Beginning of period | 477,479,404 | 735,624,912 |
| End of period | $368,932,537 | $477,479,404 |
| Other Information | | |
| Undistributed net investment income end of period | | $8,855,377 |
See accompanying notes which are an integral part of the financial statements.
Financial Highlights
Fidelity Strategic Real Return Fund Class A
| Years ended September 30, | 2019 | 2018 | 2017 | 2016 | 2015 |
| Selected Per–Share Data | | | | | |
| Net asset value, beginning of period | $8.88 | $8.80 | $8.81 | $8.55 | $9.25 |
| Income from Investment Operations | | | | | |
| Net investment income (loss)A | .216 | .266 | .170 | .141 | .124 |
| Net realized and unrealized gain (loss) | .012B | .008C | .022 | .266 | (.668) |
| Total from investment operations | .228 | .274 | .192 | .407 | (.544) |
| Distributions from net investment income | (.293) | (.183) | (.190)D | (.137) | (.124) |
| Distributions from net realized gain | (.425) | (.011) | (.012)D | (.010) | (.032) |
| Total distributions | (.718) | (.194) | (.202) | (.147) | (.156) |
| Redemption fees added to paid in capitalA | – | – | –E | –E | –E |
| Net asset value, end of period | $8.39 | $8.88 | $8.80 | $8.81 | $8.55 |
| Total ReturnF,G | 2.86% | 3.15%C | 2.23% | 4.82% | (5.98)% |
| Ratios to Average Net AssetsH,I | | | | | |
| Expenses before reductions | 1.10% | 1.07% | 1.08% | 1.07% | 1.05% |
| Expenses net of fee waivers, if any | 1.09% | 1.07% | 1.08% | 1.07% | 1.05% |
| Expenses net of all reductions | 1.09% | 1.07% | 1.07% | 1.07% | 1.05% |
| Net investment income (loss) | 2.60% | 3.01% | 1.94% | 1.66% | 1.37% |
| Supplemental Data | | | | | |
| Net assets, end of period (000 omitted) | $29,652 | $29,288 | $33,949 | $55,678 | $78,112 |
| Portfolio turnover rateJ | 19% | 23% | 24% | 15% | 23% |
A Calculated based on average shares outstanding during the period.
B The amount shown for a share outstanding does not correspond with the aggregate net gain (loss) on investments for the period due to the timing of sales and repurchases of shares in relation to fluctuating market values of the investments of the Fund.
C Net realized and unrealized gain (loss) per share reflects proceeds received from litigation which amounted to $.01 per share. Excluding these litigation proceeds, the total return would have been 2.99%
D The amounts shown reflect certain reclassifications related to book to tax differences that were made in the year shown.
E Amount represents less than $.0005 per share.
F Total returns would have been lower if certain expenses had not been reduced during the applicable periods shown.
G Total returns do not include the effect of the sales charges.
H Fees and expenses of any underlying Fidelity Central Funds are not included in the Fund's expense ratio. The Fund indirectly bears its proportionate share of the expenses of any underlying Fidelity Central Funds. Based on their most recent shareholder report date, the expenses of any underlying non-money market Fidelity Central Funds ranged from .01% to .02%.
I Expense ratios reflect operating expenses of the class. Expenses before reductions do not reflect amounts reimbursed by the investment adviser or reductions from brokerage service arrangements or reductions from other expense offset arrangements and do not represent the amount paid by the class during periods when reimbursements or reductions occur. Expenses net of fee waivers reflect expenses after reimbursement by the investment adviser but prior to reductions from brokerage service arrangements or other expense offset arrangements. Expenses net of all reductions represent the net expenses paid by the class.
J Amount does not include the portfolio activity of any underlying Fidelity Central Funds.
See accompanying notes which are an integral part of the financial statements.
Fidelity Strategic Real Return Fund Class M
| Years ended September 30, | 2019 | 2018 | 2017 | 2016 | 2015 |
| Selected Per–Share Data | | | | | |
| Net asset value, beginning of period | $8.89 | $8.81 | $8.82 | $8.56 | $9.27 |
| Income from Investment Operations | | | | | |
| Net investment income (loss)A | .215 | .264 | .168 | .138 | .122 |
| Net realized and unrealized gain (loss) | .002B | .008C | .025 | .267 | (.677) |
| Total from investment operations | .217 | .272 | .193 | .405 | (.555) |
| Distributions from net investment income | (.292) | (.181) | (.191)D | (.135) | (.123) |
| Distributions from net realized gain | (.425) | (.011) | (.012)D | (.010) | (.032) |
| Total distributions | (.717) | (.192) | (.203) | (.145) | (.155) |
| Redemption fees added to paid in capitalA | – | – | –E | –E | –E |
| Net asset value, end of period | $8.39 | $8.89 | $8.81 | $8.82 | $8.56 |
| Total ReturnF,G | 2.73% | 3.12%C | 2.23% | 4.79% | (6.08)% |
| Ratios to Average Net AssetsH,I | | | | | |
| Expenses before reductions | 1.12% | 1.11% | 1.11% | 1.10% | 1.07% |
| Expenses net of fee waivers, if any | 1.10% | 1.10% | 1.10% | 1.10% | 1.07% |
| Expenses net of all reductions | 1.10% | 1.10% | 1.10% | 1.10% | 1.07% |
| Net investment income (loss) | 2.59% | 2.98% | 1.91% | 1.63% | 1.35% |
| Supplemental Data | | | | | |
| Net assets, end of period (000 omitted) | $7,903 | $8,391 | $9,723 | $12,032 | $14,805 |
| Portfolio turnover rateJ | 19% | 23% | 24% | 15% | 23% |
A Calculated based on average shares outstanding during the period.
B The amount shown for a share outstanding does not correspond with the aggregate net gain (loss) on investments for the period due to the timing of sales and repurchases of shares in relation to fluctuating market values of the investments of the Fund.
C Net realized and unrealized gain (loss) per share reflects proceeds received from litigation which amounted to $.01 per share. Excluding these litigation proceeds, the total return would have been 2.96%
D The amounts shown reflect certain reclassifications related to book to tax differences that were made in the year shown.
E Amount represents less than $.0005 per share.
F Total returns would have been lower if certain expenses had not been reduced during the applicable periods shown.
G Total returns do not include the effect of the sales charges.
H Fees and expenses of any underlying Fidelity Central Funds are not included in the Fund's expense ratio. The Fund indirectly bears its proportionate share of the expenses of any underlying Fidelity Central Funds. Based on their most recent shareholder report date, the expenses of any underlying non-money market Fidelity Central Funds ranged from .01% to .02%.
I Expense ratios reflect operating expenses of the class. Expenses before reductions do not reflect amounts reimbursed by the investment adviser or reductions from brokerage service arrangements or reductions from other expense offset arrangements and do not represent the amount paid by the class during periods when reimbursements or reductions occur. Expenses net of fee waivers reflect expenses after reimbursement by the investment adviser but prior to reductions from brokerage service arrangements or other expense offset arrangements. Expenses net of all reductions represent the net expenses paid by the class.
J Amount does not include the portfolio activity of any underlying Fidelity Central Funds.
See accompanying notes which are an integral part of the financial statements.
Fidelity Strategic Real Return Fund Class C
| Years ended September 30, | 2019 | 2018 | 2017 | 2016 | 2015 |
| Selected Per–Share Data | | | | | |
| Net asset value, beginning of period | $8.77 | $8.70 | $8.71 | $8.46 | $9.16 |
| Income from Investment Operations | | | | | |
| Net investment income (loss)A | .151 | .197 | .102 | .074 | .054 |
| Net realized and unrealized gain (loss) | .004B | .011C | .023 | .257 | (.665) |
| Total from investment operations | .155 | .208 | .125 | .331 | (.611) |
| Distributions from net investment income | (.240) | (.127) | (.123)D | (.073) | (.057) |
| Distributions from net realized gain | (.425) | (.011) | (.012)D | (.008) | (.032) |
| Total distributions | (.665) | (.138) | (.135) | (.081) | (.089) |
| Redemption fees added to paid in capitalA | – | – | –E | –E | –E |
| Net asset value, end of period | $8.26 | $8.77 | $8.70 | $8.71 | $8.46 |
| Total ReturnF,G | 1.99% | 2.41%C | 1.46% | 3.93% | (6.73)% |
| Ratios to Average Net AssetsH,I | | | | | |
| Expenses before reductions | 1.86% | 1.83% | 1.84% | 1.84% | 1.82% |
| Expenses net of fee waivers, if any | 1.85% | 1.83% | 1.84% | 1.84% | 1.82% |
| Expenses net of all reductions | 1.85% | 1.83% | 1.84% | 1.84% | 1.82% |
| Net investment income (loss) | 1.83% | 2.25% | 1.17% | .89% | .61% |
| Supplemental Data | | | | | |
| Net assets, end of period (000 omitted) | $8,555 | $18,962 | $24,718 | $30,211 | $41,339 |
| Portfolio turnover rateJ | 19% | 23% | 24% | 15% | 23% |
A Calculated based on average shares outstanding during the period.
B The amount shown for a share outstanding does not correspond with the aggregate net gain (loss) on investments for the period due to the timing of sales and repurchases of shares in relation to fluctuating market values of the investments of the Fund.
C Net realized and unrealized gain (loss) per share reflects proceeds received from litigation which amounted to $.01 per share. Excluding these litigation proceeds, the total return would have been 2.25%
D The amounts shown reflect certain reclassifications related to book to tax differences that were made in the year shown.
E Amount represents less than $.0005 per share.
F Total returns would have been lower if certain expenses had not been reduced during the applicable periods shown.
G Total returns do not include the effect of the contingent deferred sales charge.
H Fees and expenses of any underlying Fidelity Central Funds are not included in the Fund's expense ratio. The Fund indirectly bears its proportionate share of the expenses of any underlying Fidelity Central Funds. Based on their most recent shareholder report date, the expenses of any underlying non-money market Fidelity Central Funds ranged from .01% to .02%.
I Expense ratios reflect operating expenses of the class. Expenses before reductions do not reflect amounts reimbursed by the investment adviser or reductions from brokerage service arrangements or reductions from other expense offset arrangements and do not represent the amount paid by the class during periods when reimbursements or reductions occur. Expenses net of fee waivers reflect expenses after reimbursement by the investment adviser but prior to reductions from brokerage service arrangements or other expense offset arrangements. Expenses net of all reductions represent the net expenses paid by the class.
J Amount does not include the portfolio activity of any underlying Fidelity Central Funds.
See accompanying notes which are an integral part of the financial statements.
Fidelity Strategic Real Return Fund
| Years ended September 30, | 2019 | 2018 | 2017 | 2016 | 2015 |
| Selected Per–Share Data | | | | | |
| Net asset value, beginning of period | $8.92 | $8.84 | $8.85 | $8.59 | $9.30 |
| Income from Investment Operations | | | | | |
| Net investment income (loss)A | .239 | .291 | .194 | .164 | .147 |
| Net realized and unrealized gain (loss) | .009B | .008C | .024 | .267 | (.674) |
| Total from investment operations | .248 | .299 | .218 | .431 | (.527) |
| Distributions from net investment income | (.313) | (.208) | (.216)D | (.161) | (.151) |
| Distributions from net realized gain | (.425) | (.011) | (.012)D | (.010) | (.032) |
| Total distributions | (.738) | (.219) | (.228) | (.171) | (.183) |
| Redemption fees added to paid in capitalA | – | – | –E | –E | –E |
| Net asset value, end of period | $8.43 | $8.92 | $8.84 | $8.85 | $8.59 |
| Total ReturnF | 3.10% | 3.43%C | 2.52% | 5.09% | (5.77)% |
| Ratios to Average Net AssetsG,H | | | | | |
| Expenses before reductions | .83% | .81% | .81% | .81% | .79% |
| Expenses net of fee waivers, if any | .83% | .81% | .81% | .81% | .79% |
| Expenses net of all reductions | .83% | .81% | .81% | .80% | .79% |
| Net investment income (loss) | 2.86% | 3.27% | 2.21% | 1.92% | 1.63% |
| Supplemental Data | | | | | |
| Net assets, end of period (000 omitted) | $197,152 | $262,063 | $476,944 | $511,294 | $543,473 |
| Portfolio turnover rateI | 19% | 23% | 24% | 15% | 23% |
A Calculated based on average shares outstanding during the period.
B The amount shown for a share outstanding does not correspond with the aggregate net gain (loss) on investments for the period due to the timing of sales and repurchases of shares in relation to fluctuating market values of the investments of the Fund.
C Net realized and unrealized gain (loss) per share reflects proceeds received from litigation which amounted to $.01 per share. Excluding these litigation proceeds, the total return would have been 3.27%
D The amounts shown reflect certain reclassifications related to book to tax differences that were made in the year shown.
E Amount represents less than $.0005 per share.
F Total returns would have been lower if certain expenses had not been reduced during the applicable periods shown.
G Fees and expenses of any underlying Fidelity Central Funds are not included in the Fund's expense ratio. The Fund indirectly bears its proportionate share of the expenses of any underlying Fidelity Central Funds. Based on their most recent shareholder report date, the expenses of any underlying non-money market Fidelity Central Funds ranged from .01% to .02%.
H Expense ratios reflect operating expenses of the class. Expenses before reductions do not reflect amounts reimbursed by the investment adviser or reductions from brokerage service arrangements or reductions from other expense offset arrangements and do not represent the amount paid by the class during periods when reimbursements or reductions occur. Expenses net of fee waivers reflect expenses after reimbursement by the investment adviser but prior to reductions from brokerage service arrangements or other expense offset arrangements. Expenses net of all reductions represent the net expenses paid by the class.
I Amount does not include the portfolio activity of any underlying Fidelity Central Funds.
See accompanying notes which are an integral part of the financial statements.
Fidelity Strategic Real Return Fund Class I
| Years ended September 30, | 2019 | 2018 | 2017 | 2016 | 2015 |
| Selected Per–Share Data | | | | | |
| Net asset value, beginning of period | $8.90 | $8.82 | $8.83 | $8.57 | $9.28 |
| Income from Investment Operations | | | | | |
| Net investment income (loss)A | .240 | .291 | .194 | .164 | .148 |
| Net realized and unrealized gain (loss) | –B,C | .008D | .027 | .268 | (.676) |
| Total from investment operations | .240 | .299 | .221 | .432 | (.528) |
| Distributions from net investment income | (.315) | (.208) | (.219)E | (.162) | (.150) |
| Distributions from net realized gain | (.425) | (.011) | (.012)E | (.010) | (.032) |
| Total distributions | (.740) | (.219) | (.231) | (.172) | (.182) |
| Redemption fees added to paid in capitalA | – | – | –C | –C | –C |
| Net asset value, end of period | $8.40 | $8.90 | $8.82 | $8.83 | $8.57 |
| Total ReturnF | 3.01% | 3.44%D | 2.56% | 5.12% | (5.80)% |
| Ratios to Average Net AssetsG,H | | | | | |
| Expenses before reductions | .81% | .79% | .80% | .79% | .79% |
| Expenses net of fee waivers, if any | .81% | .79% | .80% | .79% | .79% |
| Expenses net of all reductions | .81% | .79% | .80% | .79% | .79% |
| Net investment income (loss) | 2.88% | 3.29% | 2.22% | 1.93% | 1.64% |
| Supplemental Data | | | | | |
| Net assets, end of period (000 omitted) | $116,302 | $158,776 | $190,292 | $177,867 | $369,782 |
| Portfolio turnover rateI | 19% | 23% | 24% | 15% | 23% |
A Calculated based on average shares outstanding during the period.
B The amount shown for a share outstanding does not correspond with the aggregate net gain (loss) on investments for the period due to the timing of sales and repurchases of shares in relation to fluctuating market values of the investments of the Fund.
C Amount represents less than $.0005 per share.
D Net realized and unrealized gain (loss) per share reflects proceeds received from litigation which amounted to $.01 per share. Excluding these litigation proceeds, the total return would have been 3.28%
E The amounts shown reflect certain reclassifications related to book to tax differences that were made in the year shown.
F Total returns would have been lower if certain expenses had not been reduced during the applicable periods shown.
G Fees and expenses of any underlying Fidelity Central Funds are not included in the Fund's expense ratio. The Fund indirectly bears its proportionate share of the expenses of any underlying Fidelity Central Funds. Based on their most recent shareholder report date, the expenses of any underlying non-money market Fidelity Central Funds ranged from .01% to .02%.
H Expense ratios reflect operating expenses of the class. Expenses before reductions do not reflect amounts reimbursed by the investment adviser or reductions from brokerage service arrangements or reductions from other expense offset arrangements and do not represent the amount paid by the class during periods when reimbursements or reductions occur. Expenses net of fee waivers reflect expenses after reimbursement by the investment adviser but prior to reductions from brokerage service arrangements or other expense offset arrangements. Expenses net of all reductions represent the net expenses paid by the class.
I Amount does not include the portfolio activity of any underlying Fidelity Central Funds.
See accompanying notes which are an integral part of the financial statements.
Fidelity Strategic Real Return Fund Class Z
| Years ended September 30, | 2019 A |
| Selected Per–Share Data | |
| Net asset value, beginning of period | $8.93 |
| Income from Investment Operations | |
| Net investment income (loss)B | .244 |
| Net realized and unrealized gain (loss) | (.026) |
| Total from investment operations | .218 |
| Distributions from net investment income | (.323) |
| Distributions from net realized gain | (.425) |
| Total distributions | (.748) |
| Net asset value, end of period | $8.40 |
| Total ReturnC,D | 2.76% |
| Ratios to Average Net AssetsE,F | |
| Expenses before reductions | .71%G |
| Expenses net of fee waivers, if any | .71%G |
| Expenses net of all reductions | .71%G |
| Net investment income (loss) | 2.97%G |
| Supplemental Data | |
| Net assets, end of period (000 omitted) | $9,369 |
| Portfolio turnover rateH | 19% |
A For the period October 2, 2018 (commencement of sale of shares) to September 30, 2019.
B Calculated based on average shares outstanding during the period.
C Total returns for periods of less than one year are not annualized.
D Total returns would have been lower if certain expenses had not been reduced during the applicable periods shown.
E Fees and expenses of any underlying Fidelity Central Funds are not included in the Fund's expense ratio. The Fund indirectly bears its proportionate share of the expenses of any underlying Fidelity Central Funds. Based on their most recent shareholder report date, the expenses of any underlying non-money market Fidelity Central Funds ranged from .01% to .02%.
F Expense ratios reflect operating expenses of the class. Expenses before reductions do not reflect amounts reimbursed by the investment adviser or reductions from brokerage service arrangements or reductions from other expense offset arrangements and do not represent the amount paid by the class during periods when reimbursements or reductions occur. Expense ratios before reductions for start-up periods may not be representative of longer-term operating periods. Expenses net of fee waivers reflect expenses after reimbursement by the investment adviser but prior to reductions from brokerage service arrangements or other expense offset arrangements. Expenses net of all reductions represent the net expenses paid by the class.
G Annualized
H Amount does not include the portfolio activity of any underlying Fidelity Central Funds.
See accompanying notes which are an integral part of the financial statements.
Notes to Financial Statements
For the period ended September 30, 2019
1. Organization.
Fidelity Strategic Real Return Fund (the Fund) is a fund of Fidelity Salem Street Trust (the Trust) and is authorized to issue an unlimited number of shares. The Trust is registered under the Investment Company Act of 1940, as amended (the 1940 Act), as an open-end management investment company organized as a Massachusetts business trust. The Fund commenced sale of Class Z shares on October 2, 2018. The Fund offers Class A, Class M, Class C, Strategic Real Return, Class I and Class Z shares, each of which has equal rights as to assets and voting privileges. Each class has exclusive voting rights with respect to matters that affect that class. Effective March 1, 2019, Class C shares will automatically convert to Class A shares after a holding period of ten years from the initial date of purchase, with certain exceptions.
2. Investments in Fidelity Central Funds.
The Fund invests in Fidelity Central Funds, which are open-end investment companies generally available only to other investment companies and accounts managed by the investment adviser and its affiliates. The Fund's Schedule of Investments lists each of the Fidelity Central Funds held as of period end, if any, as an investment of the Fund, but does not include the underlying holdings of each Fidelity Central Fund. As an Investing Fund, the Fund indirectly bears its proportionate share of the expenses of the underlying Fidelity Central Funds.
Based on its investment objective, each Fidelity Central Fund may invest or participate in various investment vehicles or strategies that are similar to those of the Fund. These strategies are consistent with the investment objectives of the Fund and may involve certain economic risks which may cause a decline in value of each of the Fidelity Central Funds and thus a decline in the value of the Fund. The Money Market Central Funds seek preservation of capital and current income and are managed by Fidelity Investments Money Management, Inc. (FIMM), an affiliate of the investment adviser. Annualized expenses of the Money Market Central Funds as of their most recent shareholder report date ranged from less than .005% to .01%. The following summarizes the Fund's investment in each non-money market Fidelity Central Fund.
| Fidelity Central Fund | Investment Manager | Investment Objective | Investment Practices | Expense Ratio(a) |
| Fidelity Commodity Strategy Central Fund | Geode Capital Management, LLC (Geode) | Seeks to provide investment returns that correspond to the performance of the commodities market. | Investment in commodity-related investments through a wholly-owned subsidiary organized under the laws of the Cayman Islands
Futures | .02% |
| Fidelity Floating Rate Central Fund | FMR Co., Inc. (FMRC | Seeks a high level of income by normally investing in floating rate loans and other floating rate securities. | Loans & Direct Debt Instruments
Restricted Securities | .01% |
(a) Expenses expressed as a percentage of average net assets and are as of each underlying Central Fund's most recent annual or semi-annual shareholder report.
An unaudited holdings listing for the Fund, which presents direct holdings as well as the pro-rata share of any securities and other investments held indirectly through its investment in underlying non-money market Fidelity Central Funds, is available at fidelity.com and/or institutional.fidelity.com, as applicable. A complete unaudited list of holdings for each Fidelity Central Fund is available upon request or at the Securities and Exchange Commission (the SEC) website at www.sec.gov. In addition, the financial statements of the Fidelity Central Funds which contain the significant accounting policies (including investment valuation policies) of those funds, which are not covered by the Fund's Report of Independent Registered Public Accounting Firm, are available on the SEC website or upon request.
3. Significant Accounting Policies.
The Fund is an investment company and applies the accounting and reporting guidance of the Financial Accounting Standards Board (FASB) Accounting Standards Codification Topic 946 Financial Services – Investments Companies. The financial statements have been prepared in conformity with accounting principles generally accepted in the United States of America (GAAP), which require management to make certain estimates and assumptions at the date of the financial statements. Actual results could differ from those estimates. Subsequent events, if any, through the date that the financial statements were issued have been evaluated in the preparation of the financial statements. The following summarizes the significant accounting policies of the Fund:
Investment Valuation. Investments are valued as of 4:00 p.m. Eastern time on the last calendar day of the period. The Board of Trustees (the Board) has delegated the day to day responsibility for the valuation of the Fund's investments to the Fair Value Committee (the Committee) established by the Fund's investment adviser. In accordance with valuation policies and procedures approved by the Board, the Fund attempts to obtain prices from one or more third party pricing vendors or brokers to value its investments. When current market prices, quotations or currency exchange rates are not readily available or reliable, investments will be fair valued in good faith by the Committee, in accordance with procedures adopted by the Board. Factors used in determining fair value vary by investment type and may include market or investment specific events, changes in interest rates and credit quality. The frequency with which these procedures are used cannot be predicted and they may be utilized to a significant extent. The Committee oversees the Fund's valuation policies and procedures and reports to the Board on the Committee's activities and fair value determinations. The Board monitors the appropriateness of the procedures used in valuing the Fund's investments and ratifies the fair value determinations of the Committee.
The Fund categorizes the inputs to valuation techniques used to value its investments into a disclosure hierarchy consisting of three levels as shown below:
- Level 1 – quoted prices in active markets for identical investments
- Level 2 – other significant observable inputs (including quoted prices for similar investments, interest rates, prepayment speeds, etc.)
- Level 3 – unobservable inputs (including the Fund's own assumptions based on the best information available)
Valuation techniques used to value the Fund's investments by major category are as follows:
Debt securities, including restricted securities, are valued based on evaluated prices received from third party pricing vendors or from brokers who make markets in such securities. Corporate bonds, bank loan obligations, preferred securities, and U.S. government and government agency obligations are valued by pricing vendors who utilize matrix pricing which considers yield or price of bonds of comparable quality, coupon, maturity and type or by broker-supplied prices. Asset backed securities and commercial mortgage securities are valued by pricing vendors who utilize matrix pricing which considers prepayment speed assumptions, attributes of the collateral, yield or price of bonds of comparable quality, coupon, maturity and type or by broker-supplied prices. When independent prices are unavailable or unreliable, debt securities may be valued utilizing pricing methodologies which consider similar factors that would be used by third party pricing vendors. Debt securities are generally categorized as Level 2 in the hierarchy but may be Level 3 depending on the circumstances. The Fund invests a significant portion of its assets in below investment grade securities. The value of these securities can be more volatile due to changes in the credit quality of the issuer and is sensitive to changes in economic, market and regulatory conditions.
Equity securities, including restricted securities, for which market quotations are readily available, are valued at the last reported sale price or official closing price as reported by a third party pricing vendor on the primary market or exchange on which they are traded and are categorized as Level 1 in the hierarchy. In the event there were no sales during the day or closing prices are not available, securities are valued at the last quoted bid price or may be valued using the last available price and are generally categorized as Level 2 in the hierarchy. For equity securities, including restricted securities, where observable inputs are limited, assumptions about market activity and risk are used and these securities may be categorized as Level 3 in the hierarchy.
Investments in open-end mutual funds, including the Fidelity Central Funds, are valued at their closing net asset value (NAV) each business day and are categorized as Level 1 in the hierarchy.
Changes in valuation techniques may result in transfers in or out of an assigned level within the disclosure hierarchy. The aggregate value of investments by input level as of September 30, 2019 is included at the end of the Fund's Schedule of Investments.
Foreign Currency. The Fund may use foreign currency contracts to facilitate transactions in foreign-denominated securities. Gains and losses from these transactions may arise from changes in the value of the foreign currency or if the counterparties do not perform under the contracts' terms.
Foreign-denominated assets, including investment securities, and liabilities are translated into U.S. dollars at the exchange rates at period end. Purchases and sales of investment securities, income and dividends received and expenses denominated in foreign currencies are translated into U.S. dollars at the exchange rate in effect on the transaction date.
The effects of exchange rate fluctuations on investments are included with the net realized and unrealized gain (loss) on investment securities. Other foreign currency transactions resulting in realized and unrealized gain (loss) are disclosed separately.
Investment Transactions and Income. For financial reporting purposes, the Fund's investment holdings and NAV include trades executed through the end of the last business day of the period. The NAV per share for processing shareholder transactions is calculated as of the close of business of the New York Stock Exchange (NYSE), normally 4:00 p.m. Eastern time and includes trades executed through the end of the prior business day. Gains and losses on securities sold are determined on the basis of identified cost and include proceeds received from litigation. Dividend income is recorded on the ex-dividend date, except for certain dividends from foreign securities where the ex-dividend date may have passed, which are recorded as soon as the Fund is informed of the ex-dividend date. Non-cash dividends included in dividend income, if any, are recorded at the fair market value of the securities received. Income and capital gain distributions from Fidelity Central Funds, if any, are recorded on the ex-dividend date. Certain distributions received by the Fund represent a return of capital or capital gain. The Fund determines the components of these distributions subsequent to the ex-dividend date, based upon receipt of tax filings or other correspondence relating to the underlying investment. These distributions are recorded as a reduction of cost of investments and/or as a realized gain. Interest income is accrued as earned and includes coupon interest and amortization of premium and accretion of discount on debt securities as applicable. For Treasury Inflation-Protected Securities (TIPS) the principal amount is adjusted daily to keep pace with inflation. Interest is accrued based on the adjusted principal amount. The adjustments to principal due to inflation are reflected as increases or decreases to Interest in the accompanying Statement of Operations. Such adjustments may have a significant impact on the Fund's distributions. Investment income is recorded net of foreign taxes withheld where recovery of such taxes is uncertain. Debt obligations may be placed on non-accrual status and related interest income may be reduced by ceasing current accruals and writing off interest receivables when the collection of all or a portion of interest has become doubtful based on consistently applied procedures. A debt obligation is removed from non-accrual status when the issuer resumes interest payments or when collectability of interest is reasonably assured.
Class Allocations and Expenses. Investment income, realized and unrealized capital gains and losses, common expenses of the Fund, and certain fund-level expense reductions, if any, are allocated daily on a pro-rata basis to each class based on the relative net assets of each class to the total net assets of the Fund. Each class differs with respect to transfer agent and distribution and service plan fees incurred. Certain expense reductions may also differ by class. For the reporting period, the allocated portion of income and expenses to each class as a percent of its average net assets may vary due to the timing of recording these transactions in relation to fluctuating net assets of the classes. Expenses directly attributable to a fund are charged to that fund. Expenses attributable to more than one fund are allocated among the respective funds on the basis of relative net assets or other appropriate methods. Expense estimates are accrued in the period to which they relate and adjustments are made when actual amounts are known.
Income Tax Information and Distributions to Shareholders. Each year, the Fund intends to qualify as a regulated investment company under Subchapter M of the Internal Revenue Code, including distributing substantially all of its taxable income and realized gains. As a result, no provision for U.S. Federal income taxes is required. As of September 30, 2019, the Fund did not have any unrecognized tax benefits in the financial statements; nor is the Fund aware of any tax positions for which it is reasonably possible that the total amounts of unrecognized tax benefits will significantly change in the next twelve months. The Fund files a U.S. federal tax return, in addition to state and local tax returns as required. The Fund's federal income tax returns are subject to examination by the Internal Revenue Service (IRS) for a period of three fiscal years after they are filed. State and local tax returns may be subject to examination for an additional fiscal year depending on the jurisdiction. Foreign taxes are provided for based on the Fund's understanding of the tax rules and rates that exist in the foreign markets in which it invests.
Distributions are declared and recorded on the ex-dividend date. Income and capital gain distributions are declared separately for each class. Income and capital gain distributions are determined in accordance with income tax regulations, which may differ from GAAP.
Capital accounts within the financial statements are adjusted for permanent book-tax differences. These adjustments have no impact on net assets or the results of operations. Capital accounts are not adjusted for temporary book-tax differences which will reverse in a subsequent period.
Book-tax differences are primarily due to foreign currency transactions, market discount, equity-debt classifications, certain conversion ratio adjustments, partnerships, capital loss carryforwards and losses deferred due to wash sales.
As of period end, the cost and unrealized appreciation (depreciation) in securities, and derivatives if applicable, for federal income tax purposes were as follows:
| Gross unrealized appreciation | $10,976,306 |
| Gross unrealized depreciation | (140,849,453) |
| Net unrealized appreciation (depreciation) | $(129,873,147) |
| Tax Cost | $498,914,384 |
The tax-based components of distributable earnings as of period end were as follows:
| Undistributed ordinary income | $3,813,217 |
| Capital loss carryforward | $(102,145,789) |
| Net unrealized appreciation (depreciation) on securities and other investments | $(129,873,147) |
Capital loss carryforwards are only available to offset future capital gains of the Fund to the extent provided by regulations and may be limited. Under the Regulated Investment Company Modernization Act of 2010 (the Act), the Fund is permitted to carry forward capital losses incurred in taxable years beginning after December 22, 2010 for an unlimited period and such capital losses are required to be used prior to any losses that expire. The capital loss carryforward information presented below, including any applicable limitation, is estimated as of fiscal period end and is subject to adjustment.
| No expiration | |
| Short-term | $(1,411,258) |
| Long-term | (100,734,531) |
| Total capital loss carryforward | $(102,145,789) |
The tax character of distributions paid was as follows:
| | September 30, 2019 | September 30, 2018 |
| Ordinary Income | $38,581,736 | $ 15,566,875 |
Restricted Securities. The Fund may invest in securities that are subject to legal or contractual restrictions on resale. These securities generally may be resold in transactions exempt from registration or to the public if the securities are registered. Disposal of these securities may involve time-consuming negotiations and expense, and prompt sale at an acceptable price may be difficult. Information regarding restricted securities is included at the end of the Fund's Schedule of Investments.
Loans and Other Direct Debt Instruments. The Fund invests in direct debt instruments which are interests in amounts owed to lenders by corporate or other borrowers. These instruments may be in the form of loans, trade claims or other receivables and may include standby financing commitments such as revolving credit facilities that obligate the Fund to supply additional cash to the borrower on demand. Loans may be acquired through assignment or participation. The Fund did not have any unfunded loan commitments, which are contractual obligations for future funding, at period end.
New Rule Issuance. During August 2018, the U.S. Securities and Exchange Commission issued Final Rule Release No. 33-10532, Disclosure Update and Simplification. This Final Rule includes amendments specific to registered investment companies that are intended to eliminate overlap in disclosure requirements between Regulation S-X and GAAP. In accordance with these amendments, certain line-items in the Fund's financial statements have been combined or removed for the current period as outlined in the table below.
| Financial Statement | Current Line-Item Presentation (As Applicable) | Prior Line-Item Presentation (As Applicable) |
| Statement of Assets and Liabilities | Total distributable earnings (loss) | Undistributed/Distributions in excess of/Accumulated net investment income (loss)
Accumulated/Undistributed net realized gain (loss)
Net unrealized appreciation (depreciation) |
| Statement of Changes in Net Assets | N/A - removed | Undistributed/Distributions in excess of/Accumulated net investment income (loss) end of period |
| Statement of Changes in Net Assets | Distributions to shareholders | Distributions to shareholders from net investment income
Distributions to shareholders from net realized gain |
| Distributions to Shareholders Note to Financial Statements | Distributions to shareholders | Distributions to shareholders from net investment income
Distributions to shareholders from net realized gain |
4. Purchases and Sales of Investments.
Purchases and sales of securities (including the Fixed-Income Central Funds), other than short-term securities and U.S. government securities, aggregated $50,385,836 and $132,024,936, respectively.
5. Fees and Other Transactions with Affiliates.
Management Fee. Fidelity Management & Research Company (the investment adviser) and its affiliates provide the Fund with investment management related services for which the Fund pays a monthly management fee. The management fee is the sum of an individual fund fee rate that is based on an annual rate of .45% of the Fund's average net assets and an annualized group fee rate that averaged .10% during the period. The group fee rate is based upon the average net assets of all the mutual funds advised by the investment adviser, including any mutual funds previously advised by the investment adviser that are currently advised by Fidelity SelectCo, LLC, an affiliate of the investment adviser. The group fee rate decreases as assets under management increase and increases as assets under management decrease. For the reporting period, the total annual management fee rate was .55% of the Fund's average net assets.
Distribution and Service Plan Fees. In accordance with Rule 12b-1 of the 1940 Act, the Fund has adopted separate Distribution and Service Plans for each class of shares. Certain classes pay Fidelity Distributors Corporation (FDC), an affiliate of the investment adviser, separate Distribution and Service Fees, each of which is based on an annual percentage of each class' average net assets. In addition, FDC may pay financial intermediaries for selling shares of the Fund and providing shareholder support services. For the period, the Distribution and Service Fee rates, total fees and amounts retained by FDC were as follows:
| | Distribution Fee | Service Fee | Total Fees | Retained by FDC |
| Class A | -% | .25% | $70,858 | $431 |
| Class M | -% | .25% | 20,099 | 54 |
| Class C | .75% | .25% | 136,801 | 4,283 |
| | | | $227,758 | $4,768 |
Sales Load. FDC may receive a front-end sales charge of up to 4.00% for selling Class A shares and Class M shares, some of which is paid to financial intermediaries for selling shares of the Fund. Depending on the holding period, FDC may receive contingent deferred sales charges levied on Class A, Class M and Class C redemptions. The deferred sales charges are 1.00% for Class C shares, 1.00% for certain purchases of Class A shares and .25% for certain purchases of Class M shares.
For the period, sales charge amounts retained by FDC were as follows:
| | Retained by FDC |
| Class A | $2,944 |
| Class M | 386 |
| Class C(a) | 183 |
| | $3,513 |
(a) When Class C shares are initially sold, FDC pays commissions from its own resources to financial intermediaries through which the sales are made.
Transfer Agent Fees. Fidelity Investments Institutional Operations Company, Inc., (FIIOC), an affiliate of the investment adviser, is the transfer, dividend disbursing and shareholder servicing agent for each class of the Fund. FIIOC receives account fees and asset-based fees that vary according to the account size and type of account of the shareholders of the respective classes of the Fund, except for Class Z. FIIOC receives an asset-based fee of Class Z's average net assets. FIIOC pays for typesetting, printing and mailing of shareholder reports, except proxy statements.
For the period, transfer agent fees for each class were as follows:
| | Amount | % of Class-Level Average Net Assets |
| Class A | $51,827 | .18 |
| Class M | 16,743 | .21 |
| Class C | 27,166 | .20 |
| Strategic Real Return | 369,572 | .17 |
| Class I | 211,544 | .15 |
| Class Z | 1,296 | .05(a) |
| | $678,148 | |
(a) Annualized
Accounting and Security Lending Fees. Fidelity Service Company, Inc. (FSC), an affiliate of the investment adviser, maintains the Fund's accounting records. The accounting fee is based on the level of average net assets for each month. Prior to April 1, 2019, FSC had a separate agreement with the Fund for administration of the security lending program, based on the number and duration of lending transactions. For the period, the total fees paid for accounting and administration of securities lending were equivalent to an annual rate of .05%.
Brokerage Commissions. The Fund placed a portion of its portfolio transactions with brokerage firms which are affiliates of the investment adviser. Brokerage commissions are included in net realized gain (loss) and change in net unrealized appreciation (depreciation) in the Statement of Operations. The commissions paid to these affiliated firms were $825 for the period.
Interfund Trades. The Fund may purchase from or sell securities to other Fidelity Funds under procedures adopted by the Board. The procedures have been designed to ensure these interfund trades are executed in accordance with Rule 17a-7 of the 1940 Act. Interfund trades are included within the respective purchases and sales amounts shown in the Purchases and Sales of Investments note.
6. Committed Line of Credit.
The Fund participates with other funds managed by the investment adviser or an affiliate in a $4.25 billion credit facility (the "line of credit") to be utilized for temporary or emergency purposes to fund shareholder redemptions or for other short-term liquidity purposes. The Fund has agreed to pay commitment fees on its pro-rata portion of the line of credit, which amounted to $1,197 and is reflected in Miscellaneous expenses on the Statement of Operations. During the period, the Fund did not borrow on this line of credit.
7. Security Lending.
The Fund lends portfolio securities from time to time in order to earn additional income. For equity securities, lending agents are used, including National Financial Services (NFS), an affiliate of the Fund. Pursuant to a securities lending agreement, NFS will receive a fee, which is capped at 9.9% of daily lending revenue, for its services as lending agent. The Fund may lend securities to certain qualified borrowers, including NFS. On the settlement date of the loan, the Fund receives collateral (in the form of U.S. Treasury obligations, letters of credit and/or cash) against the loaned securities and maintains collateral in an amount not less than 100% of the market value of the loaned securities during the period of the loan. The market value of the loaned securities is determined at the close of business of the Fund and any additional required collateral is delivered to the Fund on the next business day. The Fund or borrower may terminate the loan at any time, and if the borrower defaults on its obligation to return the securities loaned because of insolvency or other reasons, the Fund may apply collateral received from the borrower against the obligation. The Fund may experience delays and costs in recovering the securities loaned. Any cash collateral received is invested in the Fidelity Securities Lending Cash Central Fund. The value of loaned securities and cash collateral at period end are disclosed on the Fund's Statement of Assets and Liabilities. Total fees paid by the Fund to NFS, as lending agent, amounted to $1. Security lending income represents the income earned on investing cash collateral, less rebates paid to borrowers and any lending agent fees associated with the loan, plus any premium payments received for lending certain types of securities. Security lending income is presented in the Statement of Operations as a component of income from Fidelity Central Funds. During the period, there were no securities loaned to NFS.
8. Expense Reductions.
The investment adviser contractually agreed to reimburse each class to the extent annual operating expenses exceeded certain levels of class-level average net assets as noted in the table below. This reimbursement will remain in place through January 31, 2021. Some expenses, for example the compensation of the independent Trustees, and certain miscellaneous expenses such as proxy and shareholder meeting expenses, are excluded from this reimbursement.
The following classes were in reimbursement during the period:
| | Expense Limitations | Reimbursement |
| Class M | 1.10% | 1,405 |
| Class C | 1.85% | 680 |
| | | $2,085 |
Effective October 1, 2019, the expense limitations were changed to 1.00%, 1.00%, 1.75%, .75%, .75% and .66% for Class A, Class M, Class C, Strategic Real Return, Class I and Class Z, respectively.
Commissions paid to certain brokers with whom the investment adviser, or its affiliates, places trades on behalf of the Fund include an amount in addition to trade execution, which may be rebated back to the Fund to offset certain expenses. This amount totaled $1,053 for the period.
In addition, during the period the investment adviser reimbursed and/or waived a portion of fund-level operating expenses in the amount of $2,233 and a portion of class-level operating expenses as follows:
| | Amount |
| Class A | $984 |
| Class M | 298 |
| Class C | 599 |
| Strategic Real Return | 8,103 |
| Class I | 5,962 |
| Class Z | 71 |
| | $16,017 |
9. Distributions to Shareholders.
Distributions to shareholders of each class were as follows:
| | Year ended
September 30, 2019(a) | Year ended
September 30, 2018 |
| Distributions to shareholders | | |
| Class A | $2,327,067 | $– |
| Class M | 674,841 | – |
| Class C | 1,349,467 | – |
| Strategic Real Return | 20,934,786 | – |
| Class I | 13,158,846 | – |
| Class Z | 136,728 | – |
| Total | $38,581,735 | $– |
| From net investment income | | |
| Class A | $– | $655,698 |
| Class M | – | 192,474 |
| Class C | – | 330,292 |
| Strategic Real Return | – | 9,427,755 |
| Class I | – | 4,078,736 |
| Total | $– | $14,684,955 |
| From net realized gain | | |
| Class A | $– | $40,240 |
| Class M | – | 11,882 |
| Class C | – | 30,369 |
| Strategic Real Return | – | 574,106 |
| Class I | – | 225,324 |
| Total | $– | $881,921 |
(a) Distributions for Class Z are for the period October 2, 2018 (commencement of sale of shares) to September 30, 2019.
10. Share Transactions.
Share transactions for each class were as follows and may contain automatic conversions between classes or exchanges between affiliated funds:
| | Shares | Shares | Dollars | Dollars |
| | Year ended September 30, 2019(a) | Year ended September 30, 2018 | Year ended September 30, 2019(a) | Year ended September 30, 2018 |
| Class A | | | | |
| Shares sold | 824,232 | 339,951 | $6,832,095 | $2,994,951 |
| Reinvestment of distributions | 271,726 | 76,550 | 2,243,469 | 672,693 |
| Shares redeemed | (857,173) | (976,689) | (7,126,662) | (8,617,255) |
| Net increase (decrease) | 238,785 | (560,188) | $1,948,902 | $(4,949,611) |
| Class M | | | | |
| Shares sold | 98,596 | 43,346 | $812,331 | $382,863 |
| Reinvestment of distributions | 80,763 | 22,381 | 666,779 | 196,857 |
| Shares redeemed | (181,841) | (225,554) | (1,508,262) | (1,992,642) |
| Net increase (decrease) | (2,482) | (159,827) | $(29,152) | $(1,412,922) |
| Class C | | | | |
| Shares sold | 66,944 | 87,663 | $553,058 | $765,774 |
| Reinvestment of distributions | 160,379 | 40,208 | 1,307,832 | 349,999 |
| Shares redeemed | (1,353,666) | (805,951) | (11,067,958) | (7,030,456) |
| Net increase (decrease) | (1,126,343) | (678,080) | $(9,207,068) | $(5,914,683) |
| Strategic Real Return | | | | |
| Shares sold | 3,815,528 | 5,619,395 | $31,625,307 | $49,819,987 |
| Reinvestment of distributions | 2,420,468 | 1,097,047 | 20,043,148 | 9,660,364 |
| Shares redeemed | (12,223,610) | (31,293,534) | (101,178,915) | (276,435,374) |
| Net increase (decrease) | (5,987,614) | (24,577,092) | $(49,510,460) | $(216,955,023) |
| Class I | | | | |
| Shares sold | 4,729,992 | 4,256,224 | $39,271,888 | $37,643,994 |
| Reinvestment of distributions | 1,586,092 | 484,552 | 13,095,749 | 4,261,402 |
| Shares redeemed | (10,323,129) | (8,477,765) | (85,893,625) | (75,507,205) |
| Net increase (decrease) | (4,007,045) | (3,736,989) | $(33,525,988) | $(33,601,809) |
| Class Z | | | | |
| Shares sold | 1,178,926 | – | $9,898,384 | $– |
| Reinvestment of distributions | 14,262 | – | 116,510 | – |
| Shares redeemed | (78,173) | – | (647,700) | – |
| Net increase (decrease) | 1,115,015 | – | $9,367,194 | $– |
(a) Share transactions for Class Z are for the period October 2, 2018 (commencement of sale of shares) to September 30, 2019.
11. Other.
The Fund's organizational documents provide former and current trustees and officers with a limited indemnification against liabilities arising in connection with the performance of their duties to the Fund. In the normal course of business, the Fund may also enter into contracts that provide general indemnifications. The Fund's maximum exposure under these arrangements is unknown as this would be dependent on future claims that may be made against the Fund. The risk of material loss from such claims is considered remote.
Report of Independent Registered Public Accounting Firm
To the Trustees of Fidelity Salem Street Trust and Shareholders of Fidelity Strategic Real Return Fund:
Opinion on the Financial Statements and Financial Highlights
We have audited the accompanying statement of assets and liabilities of Fidelity Strategic Real Return Fund (the "Fund"), a fund of Fidelity Salem Street Trust, including the schedule of investments, as of September 30, 2019, the related statement of operations for the year then ended, the statement of changes in net assets for each of the two years in the period then ended, the financial highlights for each of the five years in the period then ended, and the related notes. In our opinion, the financial statements and financial highlights present fairly, in all material respects, the financial position of the Fund as of September 30, 2019, and the results of its operations for the year then ended, the changes in its net assets for each of the two years in the period then ended, and the financial highlights for each of the five years in the period then ended in conformity with accounting principles generally accepted in the United States of America.
Basis for Opinion
These financial statements and financial highlights are the responsibility of the Fund's management. Our responsibility is to express an opinion on the Fund's financial statements and financial highlights based on our audits. We are a public accounting firm registered with the Public Company Accounting Oversight Board (United States) (PCAOB) and are required to be independent with respect to the Fund in accordance with the U.S. federal securities laws and the applicable rules and regulations of the Securities and Exchange Commission and the PCAOB.
We conducted our audits in accordance with the standards of the PCAOB. Those standards require that we plan and perform the audit to obtain reasonable assurance about whether the financial statements and financial highlights are free of material misstatement, whether due to error or fraud. The Fund is not required to have, nor were we engaged to perform, an audit of its internal control over financial reporting. As part of our audits we are required to obtain an understanding of internal control over financial reporting but not for the purpose of expressing an opinion on the effectiveness of the Fund’s internal control over financial reporting. Accordingly, we express no such opinion.
Our audits included performing procedures to assess the risks of material misstatement of the financial statements and financial highlights, whether due to error or fraud, and performing procedures that respond to those risks. Such procedures included examining, on a test basis, evidence regarding the amounts and disclosures in the financial statements and financial highlights. Our audits also included evaluating the accounting principles used and significant estimates made by management, as well as evaluating the overall presentation of the financial statements and financial highlights. Our procedures included confirmation of securities owned as of September 30, 2019, by correspondence with the custodians, brokers, and agent banks; when replies were not received from brokers or agent banks, we performed other auditing procedures. We believe that our audits provide a reasonable basis for our opinion.
/s/ Deloitte & Touche LLP
Boston, Massachusetts
November 15, 2019
We have served as the auditor of one or more of the Fidelity investment companies since 1999.
Trustees and Officers
The Trustees, Members of the Advisory Board (if any), and officers of the trust and fund, as applicable, are listed below. The Board of Trustees governs the fund and is responsible for protecting the interests of shareholders. The Trustees are experienced executives who meet periodically throughout the year to oversee the fund's activities, review contractual arrangements with companies that provide services to the fund, oversee management of the risks associated with such activities and contractual arrangements, and review the fund's performance. Except for Jonathan Chiel, each of the Trustees oversees 276 funds. Mr. Chiel oversees 170 funds.
The Trustees hold office without limit in time except that (a) any Trustee may resign; (b) any Trustee may be removed by written instrument, signed by at least two-thirds of the number of Trustees prior to such removal; (c) any Trustee who requests to be retired or who has become incapacitated by illness or injury may be retired by written instrument signed by a majority of the other Trustees; and (d) any Trustee may be removed at any special meeting of shareholders by a two-thirds vote of the outstanding voting securities of the trust. Each Trustee who is not an interested person (as defined in the 1940 Act) of the trust and the fund is referred to herein as an Independent Trustee. Each Independent Trustee shall retire not later than the last day of the calendar year in which his or her 75th birthday occurs. The Independent Trustees may waive this mandatory retirement age policy with respect to individual Trustees. Officers and Advisory Board Members hold office without limit in time, except that any officer or Advisory Board Member may resign or may be removed by a vote of a majority of the Trustees at any regular meeting or any special meeting of the Trustees. Except as indicated, each individual has held the office shown or other offices in the same company for the past five years.
The fund's Statement of Additional Information (SAI) includes more information about the Trustees. To request a free copy, call Fidelity at 1-800-544-8544 if you’re an individual investing directly with Fidelity, call 1-800-835-5092 if you’re a plan sponsor or participant with Fidelity as your recordkeeper or call 1-877-208-0098 on institutional accounts or if you’re an advisor or invest through one.
Experience, Skills, Attributes, and Qualifications of the Trustees. The Governance and Nominating Committee has adopted a statement of policy that describes the experience, qualifications, attributes, and skills that are necessary and desirable for potential Independent Trustee candidates (Statement of Policy). The Board believes that each Trustee satisfied at the time he or she was initially elected or appointed a Trustee, and continues to satisfy, the standards contemplated by the Statement of Policy. The Governance and Nominating Committee also engages professional search firms to help identify potential Independent Trustee candidates who have the experience, qualifications, attributes, and skills consistent with the Statement of Policy. From time to time, additional criteria based on the composition and skills of the current Independent Trustees, as well as experience or skills that may be appropriate in light of future changes to board composition, business conditions, and regulatory or other developments, have also been considered by the professional search firms and the Governance and Nominating Committee. In addition, the Board takes into account the Trustees' commitment and participation in Board and committee meetings, as well as their leadership of standing and ad hoc committees throughout their tenure.
In determining that a particular Trustee was and continues to be qualified to serve as a Trustee, the Board has considered a variety of criteria, none of which, in isolation, was controlling. The Board believes that, collectively, the Trustees have balanced and diverse experience, qualifications, attributes, and skills, which allow the Board to operate effectively in governing the fund and protecting the interests of shareholders. Information about the specific experience, skills, attributes, and qualifications of each Trustee, which in each case led to the Board's conclusion that the Trustee should serve (or continue to serve) as a trustee of the fund, is provided below.
Board Structure and Oversight Function. Abigail P. Johnson is an interested person and currently serves as Chairman. The Trustees have determined that an interested Chairman is appropriate and benefits shareholders because an interested Chairman has a personal and professional stake in the quality and continuity of services provided to the fund. Independent Trustees exercise their informed business judgment to appoint an individual of their choosing to serve as Chairman, regardless of whether the Trustee happens to be independent or a member of management. The Independent Trustees have determined that they can act independently and effectively without having an Independent Trustee serve as Chairman and that a key structural component for assuring that they are in a position to do so is for the Independent Trustees to constitute a substantial majority for the Board. The Independent Trustees also regularly meet in executive session. Arthur E. Johnson serves as Chairman of the Independent Trustees and as such (i) acts as a liaison between the Independent Trustees and management with respect to matters important to the Independent Trustees and (ii) with management prepares agendas for Board meetings.
Fidelity® funds are overseen by different Boards of Trustees. The fund's Board oversees Fidelity's investment-grade bond, money market, asset allocation and certain equity funds, and other Boards oversee Fidelity's high income and other equity funds. The asset allocation funds may invest in Fidelity® funds that are overseen by such other Boards. The use of separate Boards, each with its own committee structure, allows the Trustees of each group of Fidelity® funds to focus on the unique issues of the funds they oversee, including common research, investment, and operational issues. On occasion, the separate Boards establish joint committees to address issues of overlapping consequences for the Fidelity® funds overseen by each Board.
The Trustees operate using a system of committees to facilitate the timely and efficient consideration of all matters of importance to the Trustees, the fund, and fund shareholders and to facilitate compliance with legal and regulatory requirements and oversight of the fund's activities and associated risks. The Board, acting through its committees, has charged FMR and its affiliates with (i) identifying events or circumstances the occurrence of which could have demonstrably adverse effects on the fund's business and/or reputation; (ii) implementing processes and controls to lessen the possibility that such events or circumstances occur or to mitigate the effects of such events or circumstances if they do occur; and (iii) creating and maintaining a system designed to evaluate continuously business and market conditions in order to facilitate the identification and implementation processes described in (i) and (ii) above. Because the day-to-day operations and activities of the fund are carried out by or through FMR, its affiliates, and other service providers, the fund's exposure to risks is mitigated but not eliminated by the processes overseen by the Trustees. While each of the Board's committees has responsibility for overseeing different aspects of the fund's activities, oversight is exercised primarily through the Operations and Audit Committees. In addition, an ad hoc Board committee of Independent Trustees has worked with FMR to enhance the Board's oversight of investment and financial risks, legal and regulatory risks, technology risks, and operational risks, including the development of additional risk reporting to the Board. Appropriate personnel, including but not limited to the fund's Chief Compliance Officer (CCO), FMR's internal auditor, the independent accountants, the fund's Treasurer and portfolio management personnel, make periodic reports to the Board's committees, as appropriate, including an annual review of Fidelity's risk management program for the Fidelity® funds. The responsibilities of each standing committee, including their oversight responsibilities, are described further under "Standing Committees of the Trustees."
Interested Trustees*:
Correspondence intended for a Trustee who is an interested person may be sent to Fidelity Investments, 245 Summer Street, Boston, Massachusetts 02210.
Name, Year of Birth; Principal Occupations and Other Relevant Experience+
Jonathan Chiel (1957)
Year of Election or Appointment: 2016
Trustee
Mr. Chiel also serves as Trustee of other Fidelity® funds. Mr. Chiel is Executive Vice President and General Counsel for FMR LLC (diversified financial services company, 2012-present). Previously, Mr. Chiel served as general counsel (2004-2012) and senior vice president and deputy general counsel (2000-2004) for John Hancock Financial Services; a partner with Choate, Hall & Stewart (1996-2000) (law firm); and an Assistant United States Attorney for the United States Attorney’s Office of the District of Massachusetts (1986-95), including Chief of the Criminal Division (1993-1995). Mr. Chiel is a director on the boards of the Boston Bar Foundation and the Maimonides School.
Abigail P. Johnson (1961)
Year of Election or Appointment: 2009
Trustee
Chairman of the Board of Trustees
Ms. Johnson also serves as Trustee of other Fidelity® funds. Ms. Johnson serves as Chairman (2016-present), Chief Executive Officer (2014-present), and Director (2007-present) of FMR LLC (diversified financial services company), President of Fidelity Financial Services (2012-present) and President of Personal, Workplace and Institutional Services (2005-present). Ms. Johnson is Chairman and Director of FMR Co., Inc. (investment adviser firm, 2011-present) and Chairman and Director of FMR (investment adviser firm, 2011-present). Previously, Ms. Johnson served as Vice Chairman (2007-2016) and President (2013-2016) of FMR LLC, President and a Director of FMR (2001-2005), a Trustee of other investment companies advised by FMR, Fidelity Investments Money Management, Inc. (investment adviser firm), and FMR Co., Inc. (2001-2005), Senior Vice President of the Fidelity® funds (2001-2005), and managed a number of Fidelity® funds. Ms. Abigail P. Johnson and Mr. Arthur E. Johnson are not related.
Jennifer Toolin McAuliffe (1959)
Year of Election or Appointment: 2016
Trustee
Ms. McAuliffe also serves as Trustee of other Fidelity® funds. Ms. McAuliffe previously served as a Member of the Advisory Board of certain Fidelity® funds (2016) and as Co-Head of Fixed Income of Fidelity Investments Limited (now known as FIL Limited (FIL)) (diversified financial services company). Earlier roles at FIL included Director of Research for FIL’s credit and quantitative teams in London, Hong Kong and Tokyo. Ms. McAuliffe also was the Director of Research for taxable and municipal bonds at Fidelity Investments Money Management, Inc. Ms. McAuliffe is also a director or trustee of several not-for-profit entities.
* Determined to be an “Interested Trustee” by virtue of, among other things, his or her affiliation with the trust or various entities under common control with FMR.
+ The information includes the Trustee's principal occupation during the last five years and other information relating to the experience, attributes, and skills relevant to the Trustee's qualifications to serve as a Trustee, which led to the conclusion that the Trustee should serve as a Trustee for the fund.
Independent Trustees:
Correspondence intended for an Independent Trustee may be sent to Fidelity Investments, P.O. Box 55235, Boston, Massachusetts 02205-5235.
Name, Year of Birth; Principal Occupations and Other Relevant Experience+
Elizabeth S. Acton (1951)
Year of Election or Appointment: 2013
Trustee
Ms. Acton also serves as Trustee of other Fidelity® funds. Prior to her retirement in April 2012, Ms. Acton was Executive Vice President, Finance (2011-2012), Executive Vice President, Chief Financial Officer (2002-2011), and Treasurer (2004-2005) of Comerica Incorporated (financial services). Prior to joining Comerica, Ms. Acton held a variety of positions at Ford Motor Company (1983-2002), including Vice President and Treasurer (2000-2002) and Executive Vice President and Chief Financial Officer of Ford Motor Credit Company (1998-2000). Ms. Acton currently serves as a member of the Board of Directors and Audit and Finance Committees of Beazer Homes USA, Inc. (homebuilding, 2012-present). Previously, Ms. Acton served as a Member of the Advisory Board of certain Fidelity® funds (2013-2016).
Ann E. Dunwoody (1953)
Year of Election or Appointment: 2018
Trustee
General Dunwoody also serves as Trustee of other Fidelity® funds. General Dunwoody (United States Army, Retired) was the first woman in U.S. military history to achieve the rank of four-star general and prior to her retirement in 2012 held a variety of positions within the U.S. Army, including Commanding General, U.S. Army Material Command (2008-2012). She is the President of First to Four LLC (leadership and mentoring services, 2012-present). She also serves as a member of the Board of Directors and Nominating and Corporate Governance Committee of L3 Technologies, Inc. (communication, electronic, sensor, and aerospace systems, 2013-present), Board of Directors and Nomination and Corporate Governance Committees of Kforce Inc. (professional staffing services, 2016-present) and Board of Directors of Automattic Inc. (software engineering, 2018-present). Previously, General Dunwoody served as a Member of the Advisory Board of certain Fidelity® funds (2018), a member of the Board of Directors and Audit and Sustainability and Corporate Responsibility Committees of Republic Services, Inc. (waste collection, disposal and recycling, 2013-2016). Ms. Dunwoody also serves on several boards for non-profit organizations, including as a member of the Board of Directors, Chair of the Nomination and Governance Committee and member of the Audit Committee of Logistics Management Institute (consulting non-profit, 2012-present), a member of the Board of Directors of the Army Historical Foundation (2015-present), a member of the Council of Trustees for the Association of the United States Army (advocacy non-profit, 2013-present) and a member of the Board of Trustees of Florida Institute of Technology (2015-present) and ThanksUSA (military family education non-profit, 2014-present).
John Engler (1948)
Year of Election or Appointment: 2014
Trustee
Mr. Engler also serves as Trustee of other Fidelity® funds. He serves on the board of directors for Universal Forest Products (manufacturer and distributor of wood and wood-alternative products, 2003-present) and K12 Inc. (technology-based education company, 2012-present). Previously, Mr. Engler served as interim president of Michigan State University (2018-2019), a Member of the Advisory Board of certain Fidelity® funds (2014-2016), president of the Business Roundtable (2011-2017), a trustee of The Munder Funds (2003-2014), president and CEO of the National Association of Manufacturers (2004-2011), member of the Board of Trustees of the Annie E. Casey Foundation (2004-2015), and as governor of Michigan (1991-2003). He is a past chairman of the National Governors Association.
Robert F. Gartland (1951)
Year of Election or Appointment: 2010
Trustee
Mr. Gartland also serves as Trustee of other Fidelity® funds. Mr. Gartland is Chairman and an investor in Gartland & Mellina Group Corp. (consulting, 2009-present). Previously, Mr. Gartland served as a partner and investor of Vietnam Partners LLC (investments and consulting, 2008-2011). Prior to his retirement, Mr. Gartland held a variety of positions at Morgan Stanley (financial services, 1979-2007), including Managing Director (1987-2007), and Chase Manhattan Bank (1975-1978).
Arthur E. Johnson (1947)
Year of Election or Appointment: 2008
Trustee
Chairman of the Independent Trustees
Mr. Johnson also serves as Trustee of other Fidelity® funds. Mr. Johnson serves as a member of the Board of Directors of Eaton Corporation plc (diversified power management, 2009-present) and Booz Allen Hamilton (management consulting, 2011-present). Prior to his retirement, Mr. Johnson served as Senior Vice President of Corporate Strategic Development of Lockheed Martin Corporation (defense contractor, 1999-2009). Mr. Johnson previously served as Vice Chairman (2015-2018) of the Independent Trustees of certain Fidelity® funds and on the Board of Directors of IKON Office Solutions, Inc. (1999-2008), AGL Resources, Inc. (holding company, 2002-2016), and Delta Airlines (2005-2007). Mr. Arthur E. Johnson is not related to Ms. Abigail P. Johnson.
Michael E. Kenneally (1954)
Year of Election or Appointment: 2009
Trustee
Vice Chairman of the Independent Trustees
Mr. Kenneally also serves as Trustee of other Fidelity® funds. Prior to his retirement, Mr. Kenneally served as Chairman and Global Chief Executive Officer of Credit Suisse Asset Management. Before joining Credit Suisse, he was an Executive Vice President and Chief Investment Officer for Bank of America Corporation. Earlier roles at Bank of America included Director of Research, Senior Portfolio Manager and Research Analyst, and Mr. Kenneally was awarded the Chartered Financial Analyst (CFA) designation in 1991.
Marie L. Knowles (1946)
Year of Election or Appointment: 2001
Trustee
Ms. Knowles also serves as Trustee of other Fidelity® funds. Prior to Ms. Knowles' retirement in June 2000, she served as Executive Vice President and Chief Financial Officer of Atlantic Richfield Company (ARCO) (diversified energy, 1996-2000). From 1993 to 1996, she was a Senior Vice President of ARCO and President of ARCO Transportation Company (pipeline and tanker operations). Ms. Knowles currently serves as a Director and Chairman of the Audit Committee of McKesson Corporation (healthcare service, since 2002). Ms. Knowles is a member of the Board of the Santa Catalina Island Company (real estate, 2009-present). Ms. Knowles is a Member of the Investment Company Institute Board of Governors and a Member of the Governing Council of the Independent Directors Council (2014-present). She also serves as a member of the Advisory Board for the School of Engineering of the University of Southern California. Previously, Ms. Knowles served as a Director of Phelps Dodge Corporation (copper mining and manufacturing, 1994-2007), URS Corporation (engineering and construction, 2000-2003) and America West (airline, 1999-2002). Ms. Knowles previously served as Chairman (2015-2018) and Vice Chairman (2012-2015) of the Independent Trustees of certain Fidelity® funds.
Mark A. Murray (1954)
Year of Election or Appointment: 2016
Trustee
Mr. Murray also serves as Trustee of other Fidelity® funds. Mr. Murray is Vice Chairman (2013-present) of Meijer, Inc. (regional retail chain). Previously, Mr. Murray served as a Member of the Advisory Board of certain Fidelity® funds (2016) and as Co-Chief Executive Officer (2013-2016) and President (2006-2013) of Meijer, Inc. Mr. Murray serves as a member of the Board of Directors and Nuclear Review and Public Policy and Responsibility Committees of DTE Energy Company (diversified energy company, 2009-present). Mr. Murray also serves as a member of the Board of Directors of Spectrum Health (not-for-profit health system, 2015-present). Mr. Murray previously served as President of Grand Valley State University (2001-2006), Treasurer for the State of Michigan (1999-2001), Vice President of Finance and Administration for Michigan State University (1998-1999), and a member of the Board of Directors and Audit Committee and Chairman of the Nominating and Corporate Governance Committee of Universal Forest Products, Inc. (manufacturer and distributor of wood and wood-alternative products, 2004-2016). Mr. Murray is also a director or trustee of many community and professional organizations.
+ The information includes the Trustee's principal occupation during the last five years and other information relating to the experience, attributes, and skills relevant to the Trustee's qualifications to serve as a Trustee, which led to the conclusion that the Trustee should serve as a Trustee for the fund.
Advisory Board Members and Officers:
Correspondence intended for an officer may be sent to Fidelity Investments, 245 Summer Street, Boston, Massachusetts 02210. Officers appear below in alphabetical order.
Name, Year of Birth; Principal Occupation
Elizabeth Paige Baumann (1968)
Year of Election or Appointment: 2017
Anti-Money Laundering (AML) Officer
Ms. Baumann also serves as AML Officer of other funds. She is Chief AML Officer (2012-present) and Senior Vice President (2014-present) of FMR LLC (diversified financial services company) and is an employee of Fidelity Investments. Previously, Ms. Baumann served as AML Officer of the funds (2012-2016), and Vice President (2007-2014) and Deputy Anti-Money Laundering Officer (2007-2012) of FMR LLC.
Craig S. Brown (1977)
Year of Election or Appointment: 2019
Assistant Treasurer
Mr. Brown also serves as Assistant Treasurer of other funds. Mr. Brown is an employee of Fidelity Investments (2013-present).
John J. Burke III (1964)
Year of Election or Appointment: 2018
Chief Financial Officer
Mr. Burke also serves as Chief Financial Officer of other funds. Mr. Burke serves as Head of Investment Operations for Fidelity Fund and Investment Operations (2018-present) and is an employee of Fidelity Investments (1998-present). Previously Mr. Burke served as head of Asset Management Investment Operations (2012-2018).
Jonathan Davis (1968)
Year of Election or Appointment: 2010
Assistant Treasurer
Mr. Davis also serves as Assistant Treasurer of other funds. Mr. Davis serves as Assistant Treasurer of FMR Capital, Inc. (2017-present) and is an employee of Fidelity Investments. Previously, Mr. Davis served as Vice President and Associate General Counsel of FMR LLC (diversified financial services company, 2003-2010).
Adrien E. Deberghes (1967)
Year of Election or Appointment: 2010
Assistant Treasurer
Mr. Deberghes also serves as an officer of other funds. He serves as Assistant Treasurer of FMR Capital, Inc. (2017-present), Executive Vice President of Fidelity Investments Money Management, Inc. (FIMM) (investment adviser firm, 2016-present), and is an employee of Fidelity Investments (2008-present). Previously, Mr. Deberghes served as President and Treasurer of certain Fidelity® funds (2013-2018). Prior to joining Fidelity Investments, Mr. Deberghes was Senior Vice President of Mutual Fund Administration at State Street Corporation (2007-2008), Senior Director of Mutual Fund Administration at Investors Bank & Trust (2005-2007), and Director of Finance for Dunkin' Brands (2000-2005). Previously, Mr. Deberghes served in other fund officer roles.
Laura M. Del Prato (1964)
Year of Election or Appointment: 2018
President and Treasurer
Ms. Del Prato also serves as an officer of other funds. Ms. Del Prato is an employee of Fidelity Investments (2017-present). Prior to joining Fidelity Investments, Ms. Del Prato served as a Managing Director and Treasurer of the JPMorgan Mutual Funds (2014-2017). Prior to JPMorgan, Ms. Del Prato served as a partner at Cohen Fund Audit Services (accounting firm, 2012-2013) and KPMG LLP (accounting firm, 2004-2012).
Colm A. Hogan (1973)
Year of Election or Appointment: 2016
Assistant Treasurer
Mr. Hogan also serves as an officer of other funds. Mr. Hogan serves as Assistant Treasurer of FMR Capital, Inc. (2017-present) and is an employee of Fidelity Investments (2005-present). Previously, Mr. Hogan served as Assistant Treasurer of certain Fidelity® funds (2016-2018).
Cynthia Lo Bessette (1969)
Year of Election or Appointment: 2019
Secretary and Chief Legal Officer (CLO)
Ms. Lo Bessette also serves as Secretary and CLO of other funds. Ms. Lo Bessette serves as CLO, Secretary, and Senior Vice President of Fidelity Management & Research Company and FMR Co., Inc. (investment adviser firms, 2019-present); Secretary of Fidelity SelectCo, LLC and Fidelity Investments Money Management, Inc. (investment adviser firms, 2019-present); and CLO of Fidelity Management & Research (Hong Kong) Limited, FMR Investment Management (UK) Limited, and Fidelity Management & Research (Japan) Limited (investment adviser firms, 2019-present). She is a Senior Vice President and Deputy General Counsel of FMR LLC (diversified financial services company, 2019-present), and is an employee of Fidelity Investments. Previously, Ms. Lo Bessette served as Executive Vice President, General Counsel (2016-2019) and Senior Vice President, Deputy General Counsel (2015-2016) of OppenheimerFunds (investment management company) and Deputy Chief Legal Officer (2013-2015) of Jennison Associates LLC (investment adviser firm).
Chris Maher (1972)
Year of Election or Appointment: 2013
Assistant Treasurer
Mr. Maher serves as Assistant Treasurer of other funds. Mr. Maher is Vice President of Valuation Oversight, serves as Assistant Treasurer of FMR Capital, Inc. (2017-present), and is an employee of Fidelity Investments. Previously, Mr. Maher served as Vice President of Asset Management Compliance (2013), Vice President of the Program Management Group of FMR (investment adviser firm, 2010-2013), and Vice President of Valuation Oversight (2008-2010).
John B. McGinty, Jr. (1962)
Year of Election or Appointment: 2016
Chief Compliance Officer
Mr. McGinty also serves as Chief Compliance Officer of other funds. Mr. McGinty is Senior Vice President of Asset Management Compliance for Fidelity Investments and is an employee of Fidelity Investments (2016-present). Mr. McGinty previously served as Vice President, Senior Attorney at Eaton Vance Management (investment management firm, 2015-2016), and prior to Eaton Vance as global CCO for all firm operations and registered investment companies at GMO LLC (investment management firm, 2009-2015). Before joining GMO LLC, Mr. McGinty served as Senior Vice President, Deputy General Counsel for Fidelity Investments (2007-2009).
Jason P. Pogorelec (1975)
Year of Election or Appointment: 2015
Assistant Secretary
Mr. Pogorelec also serves as Assistant Secretary of other funds. Mr. Pogorelec serves as Vice President, Associate General Counsel (2010-present) and is an employee of Fidelity Investments (2006-present).
Stacie M. Smith (1974)
Year of Election or Appointment: 2013
Assistant Treasurer
Ms. Smith also serves as an officer of other funds. Ms. Smith serves as Assistant Treasurer of FMR Capital, Inc. (2017-present), is an employee of Fidelity Investments (2009-present), and has served in other fund officer roles. Prior to joining Fidelity Investments, Ms. Smith served as Senior Audit Manager of Ernst & Young LLP (accounting firm, 1996-2009). Previously, Ms. Smith served as Assistant Treasurer (2013-2018) and Deputy Treasurer (2013-2016) of certain Fidelity® funds.
Marc L. Spector (1972)
Year of Election or Appointment: 2016
Deputy Treasurer
Mr. Spector also serves as an officer of other funds. Mr. Spector serves as Assistant Treasurer of FMR Capital, Inc. (2017-present) and is an employee of Fidelity Investments (2016-present). Prior to joining Fidelity Investments, Mr. Spector served as Director at the Siegfried Group (accounting firm, 2013-2016), and prior to Siegfried Group as audit senior manager at Deloitte & Touche (accounting firm, 2005-2013).
Jim Wegmann (1979)
Year of Election or Appointment: 2019
Assistant Treasurer
Mr. Wegmann also serves as Assistant Treasurer of other funds. Mr. Wegmann is an employee of Fidelity Investments (2011-present).
Vadim Zlotnikov (1962)
Year of Election or Appointment: 2019
Vice President
Mr. Zlotnikov also serves as Vice President of other funds. Mr. Zlotnikov serves as President and Chief Investment Officer of Global Asset Allocation and is an employee of Fidelity Investments (2018-present). Prior to joining Fidelity Investments, Mr. Zlotnikov served as Co-Head of Multi-Asset Solutions, Chief Market Strategist, and CIO of Systematic Strategies with AllianceBernstein (investment adviser firm, 2013-2018).
Shareholder Expense Example
As a shareholder of the Fund, you incur two types of costs: (1) transaction costs, including sales charges (loads) on purchase payments or redemption proceeds, and (2) ongoing costs, including management fees, distribution and/or service (12b-1) fees and other Fund expenses. This Example is intended to help you understand your ongoing costs (in dollars) of investing in the Fund and to compare these costs with the ongoing costs of investing in other mutual funds.
The Example is based on an investment of $1,000 invested at the beginning of the period and held for the entire period (April 1, 2019 to September 30, 2019).
Actual Expenses
The first line of the accompanying table for each class of the Fund provides information about actual account values and actual expenses. You may use the information in this line, together with the amount you invested, to estimate the expenses that you paid over the period. Simply divide your account value by $1,000.00 (for example, an $8,600 account value divided by $1,000.00 = 8.6), then multiply the result by the number in the first line for a class of the Fund under the heading entitled "Expenses Paid During Period" to estimate the expenses you paid on your account during this period. In addition, the Fund, as a shareholder in the underlying Fidelity Central Funds, will indirectly bear its pro-rata share of the fees and expenses incurred by the underlying Fidelity Central Funds. These fees and expenses are not included in the Fund's annualized expense ratio used to calculate the expense estimate in the table below.
Hypothetical Example for Comparison Purposes
The second line of the accompanying table for each class of the Fund provides information about hypothetical account values and hypothetical expenses based on a Class' actual expense ratio and an assumed rate of return of 5% per year before expenses, which is not the Class' actual return. The hypothetical account values and expenses may not be used to estimate the actual ending account balance or expenses you paid for the period. You may use this information to compare the ongoing costs of investing in the Fund and other funds. To do so, compare this 5% hypothetical example with the 5% hypothetical examples that appear in the shareholder reports of the other funds. In addition, the Fund, as a shareholder in the underlying Fidelity Central Funds, will indirectly bear its pro-rata share of the fees and expenses incurred by the underlying Fidelity Central Funds. These fees and expenses are not included in the Fund's annualized expense ratio used to calculate the expense estimate in the table below.
Please note that the expenses shown in the table are meant to highlight your ongoing costs only and do not reflect any transaction costs. Therefore, the second line of the table is useful in comparing ongoing costs only, and will not help you determine the relative total costs of owning different funds. In addition, if these transactional costs were included, your costs would have been higher.
| | Annualized Expense Ratio-A | Beginning
Account Value
April 1, 2019 | Ending
Account Value
September 30, 2019 | Expenses Paid
During Period-B
April 1, 2019
to September 30, 2019 |
| Class A | 1.11% | | | |
| Actual | | $1,000.00 | $1,022.20 | $5.63** |
| Hypothetical-C | | $1,000.00 | $1,019.50 | $5.62** |
| Class M | 1.10% | | | |
| Actual | | $1,000.00 | $1,020.70 | $5.57** |
| Hypothetical-C | | $1,000.00 | $1,019.55 | $5.57** |
| Class C | 1.85% | | | |
| Actual | | $1,000.00 | $1,017.70 | $9.36** |
| Hypothetical-C | | $1,000.00 | $1,015.79 | $9.35** |
| Strategic Real Return | .83% | | | |
| Actual | | $1,000.00 | $1,023.10 | $4.21** |
| Hypothetical-C | | $1,000.00 | $1,020.91 | $4.20** |
| Class I | .82% | | | |
| Actual | | $1,000.00 | $1,022.20 | $4.16** |
| Hypothetical-C | | $1,000.00 | $1,020.96 | $4.15** |
| Class Z | .72% | | | |
| Actual | | $1,000.00 | $1,022.70 | $3.65** |
| Hypothetical-C | | $1,000.00 | $1,021.46 | $3.65** |
A Annualized expense ratio reflects expenses net of applicable fee waivers.
B Expenses are equal to each Class' annualized expense ratio, multiplied by the average account value over the period, multiplied by 183/365 (to reflect the one-half year period). The fees and expenses of the underlying Fidelity Central Funds in which the Fund invests are not included in each Class' annualized expense ratio. In addition to the expenses noted above, the Fund also indirectly bears its proportional share of the expenses of the underlying Fidelity Central Funds. Annualized expenses of the underlying non-money market Fidelity Central Funds as of their most recent fiscal half year were .01%.
C 5% return per year before expenses
** If fees and changes to the class level expense contract and/ or expense cap, effective October 1, 2019, had been in effect during the current period, the restated annualized expense ratio and the expenses paid in the actual and hypothetical examples above would have been as shown in table below:
| | Annualized Expense Ratio-(a)
| Expenses Paid
|
| Class A | 1.00% | |
| Actual | | $5.07 |
| Hypothetical-(b) | | $5.06 |
| Class M | 1.00% | |
| Actual | | $5.07 |
| Hypothetical-(b) | | $5.06 |
| Class C | 1.75% | |
| Actual | | $8.85 |
| Hypothetical-(b) | | $8.85 |
| Strategic Real Return | .75% | |
| Actual | | $3.80 |
| Hypothetical-(b) | | $3.80 |
| Class I | .75% | |
| Actual | | $3.80 |
| Hypothetical-(b) | | $3.80 |
| Class Z | .66% | |
| Actual | | $3.35 |
| Hypothetical-(b) | | $3.35 |
(a) Annualized expense ratio reflects expenses net of applicable fee waivers.
(b) 5% return per year before expenses
Distributions (Unaudited)
A total of 19.58% of the dividends distributed during the fiscal year was derived from interest on U.S. Government securities which is generally exempt from state income tax.
The fund designates $3,595,306 of distributions paid during the period January 1, 2019 to September 30, 2019 as qualifying to be taxed as interest-related dividends for nonresident alien shareholders.
Class A, Class M, Class C, Strategic Real Return Fund, Class I and Class Z designates 8% of the dividends distributed in October 2018 and December 2018, respectively during the fiscal year as a section 199A dividend.
The fund will notify shareholders in January 2020 of amounts for use in preparing 2019 income tax returns.
Board Approval of Investment Advisory Contracts and Management Fees
Fidelity Strategic Real Return Fund
Each year, the Board of Trustees, including the Independent Trustees (together, the Board), votes on the renewal of the management contract with Fidelity Management & Research Company (FMR) and the sub-advisory agreements (together, the Advisory Contracts) for the fund, including the fund's sub-advisory agreement with Geode Capital Management, LLC (Geode). FMR and the sub-advisers are referred to herein as the Investment Advisers. The Board, assisted by the advice of fund counsel and Independent Trustees' counsel, requests and considers a broad range of information relevant to the renewal of the Advisory Contracts throughout the year.
The Board meets regularly and, at each of its meetings, covers an extensive agenda of topics and materials and considers factors that are relevant to its annual consideration of the renewal of the fund's Advisory Contracts, including the services and support provided to the fund and its shareholders. The Board has established four standing committees (Committees) — Operations, Audit, Fair Valuation, and Governance and Nominating — each composed of and chaired by Independent Trustees with varying backgrounds, to which the Board has assigned specific subject matter responsibilities in order to enhance effective decision-making by the Board. The Operations Committee, of which all of the Independent Trustees are members, meets regularly throughout the year and considers, among other matters, information specifically related to the annual consideration of the renewal of the fund's Advisory Contracts. The Board, acting directly and through its Committees, requests and receives information concerning the annual consideration of the renewal of the fund's Advisory Contracts. The Board also meets as needed to review matters specifically related to the Board's annual consideration of the renewal of the Advisory Contracts. Members of the Board may also meet with trustees of other Fidelity funds through joint ad hoc committees to discuss certain matters relevant to all of the Fidelity funds.
At its September 2019 meeting, the Board unanimously determined to renew the fund's Advisory Contracts. In reaching its determination, the Board considered all factors it believed relevant, including (i) the nature, extent, and quality of the services provided to the fund and its shareholders (including the investment performance of the fund); (ii) the competitiveness of the fund's management fee and total expense ratio relative to peer funds; (iii) the total costs of the services provided by and the profits realized by Fidelity from its relationships with the fund; and (iv) the extent to which, if any, economies of scale exist and are realized as the fund grows, and whether any economies of scale are appropriately shared with fund shareholders.
In considering whether to renew the Advisory Contracts for the fund, the Board reached a determination, with the assistance of fund counsel and Independent Trustees' counsel and through the exercise of its business judgment, that the renewal of the Advisory Contracts was in the best interests of the fund and its shareholders and that the compensation payable under the Advisory Contracts was fair and reasonable. The Board's decision to renew the Advisory Contracts was not based on any single factor, but rather was based on a comprehensive consideration of all the information provided to the Board at its meetings throughout the year. The Board, in reaching its determination to renew the Advisory Contracts, was aware that shareholders of the fund have a broad range of investment choices available to them, including a wide choice among funds offered by Fidelity's competitors, and that the fund's shareholders, who have the opportunity to review and weigh the disclosure provided by the fund in its prospectus and other public disclosures, have chosen to invest in this fund, which is part of the Fidelity family of funds.
Approval of Amended and Restated Advisory Contracts. At its September 2019 meeting, the Board also unanimously determined to approve an amended and restated management contract and sub-advisory agreements with Geode (Amended and Restated Contracts) in connection with an upcoming consolidation of certain of Fidelity's advisory businesses. The Board considered that, on or about January 1, 2020, Fidelity Investments Money Management, Inc. (FIMM) and FMR Co., Inc. (FMRC) expect to merge with and into FMR and, after the merger, FMR expects to redomicile as a Delaware limited liability company. The Board also approved the termination of the sub-advisory agreements with FIMM and FMRC upon the completion of the merger. The Board noted that references to FMR in the Amended and Restated Contracts would be updated to reflect FMR's new form of organization and domicile and considered that the definition of "group assets" for purposes of the fund's group fee would be modified to avoid double-counting assets once the reorganization is complete. The Board also noted Fidelity's assurance that neither the planned consolidation nor the Amended and Restated Contracts will change the investment processes, the level or nature of services provided, the resources and personnel allocated, trading and compliance operations, or any fees paid by the fund.
Nature, Extent, and Quality of Services Provided. The Board considered staffing as it relates to the fund, including the backgrounds of investment personnel of Fidelity and Geode, and also considered the fund's investment objective, strategies, and related investment philosophy. The Independent Trustees also had discussions with senior management of Fidelity's investment operations and investment groups and with representatives of Geode. The Board considered the structure of the investment personnel compensation programs and whether the structures provide appropriate incentives to act in the best interests of the fund. Additionally, the Board considered the portfolio managers' investments, if any, in the funds that they manage.
Resources Dedicated to Investment Management and Support Services. The Board reviewed the general qualifications and capabilities of Fidelity's and Geode's investment staffs, including their size, education, experience, and resources, as well as Fidelity's and Geode's approach to recruiting, managing, and compensating investment personnel. The Board noted that Fidelity has continued to increase the resources devoted to non-U.S. offices, including expansion of Fidelity's global investment organization. The Board also noted that Fidelity's and Geode's analysts have extensive resources, tools and capabilities that allow them to conduct sophisticated quantitative and fundamental analysis, as well as credit analysis of issuers, counterparties and guarantors. Further, the Board considered that Fidelity's and Geode's investment professionals have sufficient access to information and data so as to provide competitive investment results over time, and that those professionals also have access to sophisticated tools that permit them to assess portfolio construction and risk and performance attribution characteristics continuously. Additionally, in its deliberations, the Board considered Fidelity's and Geode's trading, risk management, compliance, and technology and operations capabilities and resources, which are integral parts of the investment management process.
Shareholder and Administrative Services. The Board considered (i) the nature, extent, quality, and cost of advisory, administrative, and shareholder services performed by the Investment Advisers and their affiliates under the Advisory Contracts and under separate agreements covering transfer agency, pricing and bookkeeping, and securities lending services for the fund; (ii) the nature and extent of the supervision of third party service providers, principally custodians, subcustodians, and pricing vendors; and (iii) the resources devoted to, and the record of compliance with, the fund's compliance policies and procedures. The Board also reviewed the allocation of fund brokerage, including allocations to brokers affiliated with the Investment Advisers, the use of brokerage commissions to pay fund expenses, and the use of "soft" commission dollars to pay for research services.
The Board noted that the growth of fund assets over time across the complex allows Fidelity to reinvest in the development of services designed to enhance the value and convenience of the Fidelity funds as investment vehicles. These services include 24-hour access to account information and market information over the Internet and through telephone representatives, investor education materials and asset allocation tools, and the expanded availability of Fidelity Investor Centers.
Investment in a Large Fund Family. The Board considered the benefits to shareholders of investing in a Fidelity fund, including the benefits of investing in a fund that is part of a large family of funds offering a variety of investment disciplines and providing a large variety of mutual fund investor services. The Board noted that Fidelity had taken, or had made recommendations that resulted in the Fidelity funds taking, a number of actions over the previous year that benefited particular funds, including: (i) continuing to dedicate additional resources to Fidelity's investment research process, which includes meetings with management of issuers of securities in which the funds invest, and to the support of the senior management team that oversees asset management; (ii) continuing efforts to enhance Fidelity's global research capabilities; (iii) launching new funds with innovative structures, strategies and pricing and making other enhancements to meet client needs; (iv) launching new share classes of existing funds; (v) eliminating purchase minimums and broadening eligibility requirements for certain funds and share classes; (vi) reducing management fees and total expenses for certain target date funds and index funds; (vii) lowering expense caps for certain existing funds and classes, and converting certain voluntary expense caps to contractual caps, to reduce expenses borne by shareholders; (viii) rationalizing product lines and gaining increased efficiencies from fund mergers, liquidations, and share class consolidations; (ix) continuing to develop, acquire and implement systems and technology to improve services to the funds and shareholders, strengthen information security, and increase efficiency; and (x) continuing to implement enhancements to further strengthen Fidelity's product line to increase investors' probability of success in achieving their investment goals, including retirement income goals.
Investment Performance. The Board considered whether the fund has operated in accordance with its investment objective, as well as its record of compliance with its investment restrictions and its performance history. The Board noted that there was a portfolio management change for the fund in March 2019.
The Board took into account discussions with representatives of the Investment Advisers about fund investment performance. In this regard the Board noted that as part of regularly scheduled fund reviews and other reports to the Board on fund performance, the Board considers annualized return information for the fund for different time periods, measured against one or more appropriate securities market indices, including a customized blended index that reflects the respective weights of the fund's asset classes (each a benchmark index) and a peer group of funds with similar objectives (peer group), if any. In its evaluation of fund investment performance at meetings throughout the year, the Board gave particular attention to information indicating underperformance of certain Fidelity funds for specific time periods and discussed with the Investment Advisers the reasons for such underperformance.
In addition to reviewing absolute and relative fund performance, the Independent Trustees periodically consider the appropriateness of fund performance metrics in evaluating the results achieved. In general, the Independent Trustees believe that fund performance should be evaluated based on gross performance (before fees and expenses but after transaction costs) compared to appropriate benchmark indices, over appropriate time periods that may include full market cycles, and on net performance (after fees and expenses) compared to peer groups, as applicable, over the same periods, taking into account relevant factors including the following: general market conditions; expectations for interest rate levels and credit conditions; issuer-specific information including credit quality; and fund cash flows and other factors. Depending on the circumstances, the Independent Trustees may be satisfied with a fund's performance notwithstanding that it lags its benchmark index or peer group for certain periods.
The Independent Trustees recognize that shareholders evaluate performance on a net basis over their own holding periods, for which one-, three-, and five-year periods are often used as a proxy. For this reason, the performance information reviewed by the Board also included net cumulative calendar year total return information for the fund and an appropriate benchmark index and peer group for the most recent one-, three-, and five-year periods.
Based on its review, the Board concluded that the nature, extent, and quality of services provided to the fund under the Advisory Contracts should continue to benefit the shareholders of the fund.
Competitiveness of Management Fee and Total Expense Ratio. The Board considered the fund's management fee and total expense ratio compared to "mapped groups" of competitive funds and classes created for the purpose of facilitating the Trustees' competitive analysis of management fees and total expenses. Fidelity creates "mapped groups" by combining similar Lipper investment objective categories that have comparable investment mandates. Combining Lipper investment objective categories aids the Board's management fee and total expense ratio comparisons by broadening the competitive group used for comparison.
Management Fee. The Board considered two proprietary management fee comparisons for the 12-month periods shown in basis points (BP) in the chart below. The group of Lipper funds used by the Board for management fee comparisons is referred to below as the "Total Mapped Group." The Total Mapped Group comparison focuses on a fund's standing in terms of gross management fees before expense reimbursements or caps relative to the total universe of funds with comparable investment mandates, regardless of whether their management fee structures also are comparable. Funds with comparable investment mandates offer exposure to similar types of securities. Funds with comparable management fee structures have similar management fee contractual arrangements (
e.g., flat rate charged for advisory services, all-inclusive fee rate,
etc.). "TMG %" represents the percentage of funds in the Total Mapped Group that had management fees that were lower than the fund's. For example, a hypothetical TMG % of 20% would mean that 80% of the funds in the Total Mapped Group had higher, and 20% had lower, management fees than the fund. The fund's actual TMG %s and the number of funds in the Total Mapped Group are in the chart below. The "Asset-Size Peer Group" (ASPG) comparison focuses on a fund's standing relative to a subset of non-Fidelity funds within the Total Mapped Group that are similar in size and management fee structure. For example, if a fund is in the first quartile of the ASPG, the fund's management fee ranks in the least expensive or lowest 25% of funds in the ASPG. The ASPG represents at least 15% of the funds in the Total Mapped Group with comparable asset size and management fee structures, subject to a minimum of 50 funds (or all funds in the Total Mapped Group if fewer than 50). Additional information, such as the ASPG quartile in which the fund's management fee rate ranked, is also included in the chart and was considered by the Board.
Fidelity Strategic Real Return Fund

The Board noted that the fund's management fee rate ranked below the median of its Total Mapped Group and below the median of its ASPG for 2018.
The Board noted that it and the boards of other Fidelity funds formed an ad hoc Committee on Group Fee, which meets periodically, to conduct an in-depth review of the "group fee" component of the management fee of funds with such management fee structures. The Committee's focus included the mechanics of the group fee, the competitive landscape of group fee structures, Fidelity funds with no group fee component and investment products not included in group fee assets. The Board also considered that, for funds subject to the group fee, FMR agreed to voluntarily waive fees over a specified period of time in amounts designed to account for assets converted from certain funds to certain collective investment trusts.
Based on its review, the Board concluded that the fund's management fee is fair and reasonable in light of the services that the fund receives and the other factors considered.
Total Expense Ratio. In its review of each class's total expense ratio, the Board considered the fund's management fee rate as well as other fund or class expenses, as applicable, such as transfer agent fees, pricing and bookkeeping fees, fund-paid 12b-1 fees, and custodial, legal, and audit fees. The Board also noted that Fidelity may agree to waive fees or reimburse expenses from time to time, and the extent to which, if any, it has done so for the fund. As part of its review, the Board also considered the current and historical total expense ratios of each class of the fund compared to competitive fund median expenses. Each class of the fund is compared to those funds and classes in the Total Mapped Group (used by the Board for management fee comparisons) that have a similar sales load structure.
The Board noted that the total expense ratio of the retail class ranked below the competitive median for 2018 and the total expense ratio of each of Class A, Class M, Class C, Class I, and Class Z ranked above the competitive median for 2018. The Board considered that, in general, various factors can affect total expense ratios. The Board noted that the total expense ratio of each of Class A, Class M, Class C, and Class I was above the competitive median primarily because of higher transfer agent fees due to smaller average account sizes, or in the case of Class I, due to omnibus accounts. The Board also considered that Class Z was above the competitive median due to relatively higher expenses as a result of low asset levels. Additionally, the Board considered that this fund has higher expenses because of the nature of its investments, which results in higher pricing and bookkeeping and audit fees. The Board noted that an additional reason for Class M's total expense ratio being above the competitive median is Class M's higher 12b-1 fees. Class M has a higher 12b-1 fee, but a lower front-end sales charge, than traditionally priced front-end sales charge classes. The Board considered that Class M is primarily sold load-waived to retirement plans and intermediary wrap programs where its 0.50% 12b-1 fee is comparable to competing no-load, higher 12b-1 fee classes designed specifically for retirement plans and wrap programs. The Board noted that, when compared with competitor funds that charge a 0.50% 12b-1 fee, the total expense ratio of Class M is below median. The Board noted that the total expense ratio of Class C was also above the competitive median because of its 1.00% 12b-1 fee. The Board noted that the fund offers multiple classes, each of which has a different sales load and 12b-1 fee structure, and that the multiple structures are intended to offer a range of pricing options for the intermediary market. The Board also noted that the total expense ratios of the classes vary primarily by the level of their 12b-1 fees, although differences in transfer agent fees may also cause expenses to vary from class to class.
The Board further considered that FMR has contractually agreed to reimburse Class A, Class M, Class C, Class I, and Class Z of the fund to the extent that total operating expenses (with certain exceptions), as a percentage of their respective average net assets, exceed 1.00%, 1.00%, 1.75%, 0.75%, and 0.66% through January 31, 2021.
Fees Charged to Other Fidelity Clients. The Board also considered Fidelity fee structures and other information with respect to clients of Fidelity, such as other funds advised or subadvised by Fidelity, pension plan clients, and other institutional clients with similar mandates. The Board noted that a joint ad hoc committee created by it and the boards of other Fidelity funds periodically reviews and compares Fidelity's institutional investment advisory business with its business of providing services to the Fidelity funds and also noted the most recent findings of the committee. The Board noted that the committee's review included a consideration of the differences in services provided, fees charged, and costs incurred, as well as competition in the markets serving the different categories of clients.
Based on its review of total expense ratios and fees charged to other Fidelity clients, the Board concluded that the total expense ratio of each class of the fund was reasonable in light of the services that the fund and its shareholders receive and the other factors considered.
Costs of the Services and Profitability. The Board considered the revenues earned and the expenses incurred by Fidelity in conducting the business of developing, marketing, distributing, managing, administering and servicing the fund and servicing the fund's shareholders. The Board also considered the level of Fidelity's profits in respect of all the Fidelity funds.
On an annual basis, Fidelity presents to the Board information about the profitability of its relationships with the fund. Fidelity calculates profitability information for each fund, as well as aggregate profitability information for groups of Fidelity funds and all Fidelity funds, using a series of detailed revenue and cost allocation methodologies which originate with the books and records of Fidelity on which Fidelity's audited financial statements are based. The Audit Committee of the Board reviews any significant changes from the prior year's methodologies and the full Board approves such changes.
PricewaterhouseCoopers LLP (PwC), auditor to Fidelity and certain Fidelity funds, has been engaged annually by the Board as part of the Board's assessment of Fidelity's profitability analysis. PwC's engagement includes the review and assessment of the methodologies used by Fidelity in determining the revenues and expenses attributable to Fidelity's mutual fund business, and completion of agreed-upon procedures in respect of the mathematical accuracy of the fund profitability information and its conformity to established allocation methodologies. After considering PwC's reports issued under the engagement and information provided by Fidelity, the Board concluded that while other allocation methods may also be reasonable, Fidelity's profitability methodologies are reasonable in all material respects.
The Board also reviewed Fidelity's and Geode's non-fund businesses and potential indirect benefits such businesses may have received as a result of their association with Fidelity's mutual fund business (i.e., fall-out benefits) as well as cases where Fidelity's and Geode's affiliates may benefit from the fund's business. The Board noted that changes to fall-out benefits year-over-year reflect business developments at Fidelity's and Geode's various businesses. The Board considered that a joint ad hoc committee created by it and the boards of other Fidelity funds had recently been established, and meets periodically, to evaluate potential fall-out benefits. The Board noted that the committee was expected to, among other things: (i) discuss the legal framework surrounding potential fall-out benefits; (ii) review the Board's responsibilities and approach to potential fall-out benefits; and (iii) review practices employed by competitor funds regarding the review of potential fall-out benefits. The Board noted that it would consider the committee's findings in connection with future consideration of contract renewals.
The Board considered the costs of the services provided by and the profits realized by Fidelity in connection with the operation of the fund and was satisfied that the profitability was not excessive.
Economies of Scale. The Board considered whether there have been economies of scale in respect of the management of the Fidelity funds, whether the Fidelity funds (including the fund) have appropriately benefited from any such economies of scale, and whether there is potential for realization of any further economies of scale. The Board considered the extent to which the fund will benefit from economies of scale as assets grow through increased services to the fund, through waivers or reimbursements, or through fee or expense ratio reductions. The Board also noted that a committee (the Economies of Scale Committee) created by it and the boards of other Fidelity funds periodically analyzes whether Fidelity attains economies of scale in respect of the management and servicing of the Fidelity funds, whether the Fidelity funds have appropriately benefited from such economies of scale, and whether there is potential for realization of any further economies of scale.
The Board recognized that the fund's management contract incorporates a "group fee" structure, which provides for lower group fee rates as total "group assets" increase, and for higher group fee rates as total "group assets" decrease ("group assets" as defined in the management contract). FMR calculates the group fee rates based on a tiered asset "breakpoint" schedule that varies based on asset class. The Board considered that the group fee is designed to deliver the benefits of economies of scale to fund shareholders when total Fidelity fund assets increase, even if assets of any particular fund are unchanged or have declined, because some portion of Fidelity's costs are attributable to services provided to all Fidelity funds, and all funds benefit if those costs can be allocated among more assets. The Board concluded that, given the group fee structure, fund shareholders will benefit from lower management fees as "group assets" increase at the fund complex level, regardless of whether Fidelity achieves any such economies of scale.
The Board concluded, taking into account the analysis of the Economies of Scale Committee, that economies of scale, if any, are being appropriately shared between fund shareholders and Fidelity.
Additional Information Requested by the Board. In order to develop fully the factual basis for consideration of the Fidelity funds' advisory contracts, the Board requested and received additional information on certain topics, including: (i) Fidelity's fund profitability methodology, profitability trends for certain funds, the allocation of various costs to different funds, and the impact of certain factors on fund profitability results; (ii) portfolio manager changes that have occurred during the past year and the amount of the investment that each portfolio manager has made in the Fidelity fund(s) that he or she manages; (iii) Fidelity's compensation structure for portfolio managers, research analysts, and other key personnel, including its effects on fund profitability, the rationale for the compensation structure, and the extent to which current market conditions have affected retention and recruitment; (iv) the arrangements with and compensation paid to certain fund sub-advisers on behalf of the Fidelity funds and the treatment of such compensation within Fidelity's fund profitability methodology; (v) the practices of certain sub-advisers regarding their receipt of research from broker-dealers that execute the funds' portfolio transactions; (vi) the terms of Fidelity's voluntary expense limitation agreements; (vii) the methodology with respect to competitive fund data and peer group classifications; (viii) Fidelity's transfer agent fee, expense, and service structures for different funds and classes relative to competitive trends, and the impact of the increased use of omnibus accounts; (ix) new developments in the retail and institutional marketplaces and the competitive positioning of the funds relative to other investment products and services; (x) the impact on fund profitability of recent changes in total net assets for Fidelity's money market funds, anticipated changes to the competitive landscape for money market funds, and the level of investor comfort with gates, fees, and floating NAVs; (xi) the funds' share class structures and distribution channels; and (xii) explanations regarding the relative total expense ratios of certain funds and classes, total expense competitive trends and methodologies for total expense competitive comparisons, and actions that might be taken by Fidelity to reduce total expense ratios for certain classes. In addition, the Board considered its discussions with Fidelity throughout the year regarding enhanced information security initiatives and the funds' fair valuation policies.
Based on its evaluation of all of the conclusions noted above, and after considering all factors it believed relevant, the Board concluded that the advisory and sub-advisory fee arrangements are fair and reasonable, and that the fund's Advisory Contracts should be renewed and the fund's Amended and Restated Contracts should be approved.

RRS-ANN-1119
1.814960.114