UNITED STATES
SECURITIES AND EXCHANGE COMMISSION
Washington, D.C. 20549
FORM N-CSR
CERTIFIED SHAREHOLDER REPORT OF REGISTERED
MANAGEMENT INVESTMENT COMPANIES
Investment Company Act file number 811-2105
Fidelity Salem Street Trust
(Exact name of registrant as specified in charter)
245 Summer St., Boston, Massachusetts 02210
(Address of principal executive offices) (Zip code)
Cynthia Lo Bessette, Secretary
245 Summer St.
Boston, Massachusetts 02210
(Name and address of agent for service)
Registrant's telephone number, including area code:
617-563-7000
| |
Date of fiscal year end: | August 31 |
| |
Date of reporting period: | August 31, 2019 |
Item 1.
Reports to Stockholders
Fidelity® Conservative Income Bond Fund
Annual Report August 31, 2019 |
 |
Beginning on January 1, 2021, as permitted by regulations adopted by the Securities and Exchange Commission, paper copies of a fund’s shareholder reports will no longer be sent by mail, unless you specifically request paper copies of the reports from the fund or from your financial intermediary, such as a financial advisor, broker-dealer or bank. Instead, the reports will be made available on a website, and you will be notified by mail each time a report is posted and provided with a website link to access the report.
If you already elected to receive shareholder reports electronically, you will not be affected by this change and you need not take any action. You may elect to receive shareholder reports and other communications from a fund electronically, by contacting your financial intermediary. For Fidelity customers, visit Fidelity's web site or call Fidelity using the contact information listed below.
You may elect to receive all future reports in paper free of charge. If you wish to continue receiving paper copies of your shareholder reports, you may contact your financial intermediary or, if you are a Fidelity customer, visit Fidelity’s website, or call Fidelity at the applicable toll-free number listed below. Your election to receive reports in paper will apply to all funds held with the fund complex/your financial intermediary.
| Account Type | Website | Phone Number |
| Brokerage, Mutual Fund, or Annuity Contracts: | fidelity.com/mailpreferences | 1-800-343-3548 |
| Employer Provided Retirement Accounts: | netbenefits.fidelity.com/preferences (choose 'no' under Required Disclosures to continue to print) | 1-800-343-0860 |
| Advisor Sold Accounts Serviced Through Your Financial Intermediary: | Contact Your Financial Intermediary | Your Financial Intermediary's phone number |
| Advisor Sold Accounts Serviced by Fidelity: | institutional.fidelity.com | 1-877-208-0098 |
Contents
To view a fund's proxy voting guidelines and proxy voting record for the 12-month period ended June 30, visit http://www.fidelity.com/proxyvotingresults or visit the Securities and Exchange Commission's (SEC) web site at http://www.sec.gov.
You may also call 1-800-544-8544 to request a free copy of the proxy voting guidelines.
Standard & Poor's, S&P and S&P 500 are registered service marks of The McGraw-Hill Companies, Inc. and have been licensed for use by Fidelity Distributors Corporation.
Other third-party marks appearing herein are the property of their respective owners.
All other marks appearing herein are registered or unregistered trademarks or service marks of FMR LLC or an affiliated company. © 2019 FMR LLC. All rights reserved.
This report and the financial statements contained herein are submitted for the general information of the shareholders of the Fund. This report is not authorized for distribution to prospective investors in the Fund unless preceded or accompanied by an effective prospectus.
A fund files its complete schedule of portfolio holdings with the SEC for the first and third quarters of each fiscal year on Form N-PORT. Forms N-PORT are available on the SEC’s web site at http://www.sec.gov. A fund's Forms N-PORT may be reviewed and copied at the SEC’s Public Reference Room in Washington, DC. Information regarding the operation of the SEC's Public Reference Room may be obtained by calling 1-800-SEC-0330.
For a complete list of a fund's portfolio holdings, view the most recent holdings listing, semiannual report, or annual report on Fidelity's web site at http://www.fidelity.com, http://www.institutional.fidelity.com, or http://www.401k.com, as applicable.
NOT FDIC INSURED •MAY LOSE VALUE •NO BANK GUARANTEE
Neither the Fund nor Fidelity Distributors Corporation is a bank.
Performance: The Bottom Line
Average annual total return reflects the change in the value of an investment, assuming reinvestment of distributions from dividend income and capital gains (the profits earned upon the sale of securities that have grown in value, if any) and assuming a constant rate of performance each year. The hypothetical investment and the average annual total returns do not reflect the deduction of taxes that a shareholder would pay on fund distributions or the redemption of fund shares. During periods of reimbursement by Fidelity, a fund’s total return will be greater than it would be had the reimbursement not occurred. How a fund did yesterday is no guarantee of how it will do tomorrow.
Average Annual Total Returns
| For the periods ended August 31, 2019 | Past 1 year | Past 5 years | Life of fundA |
| Fidelity® Conservative Income Bond Fund | 2.49% | 1.28% | 1.01% |
| Institutional Class | 2.59% | 1.38% | 1.12% |
A From March 3, 2011
$10,000 Over Life of Fund
Let's say hypothetically that $10,000 was invested in Fidelity® Conservative Income Bond Fund, a class of the fund, on March 3, 2011, when the fund started.
The chart shows how the value of your investment would have changed, and also shows how the Bloomberg Barclays U.S. 3-6 Month Treasury Bill Index performed over the same period.
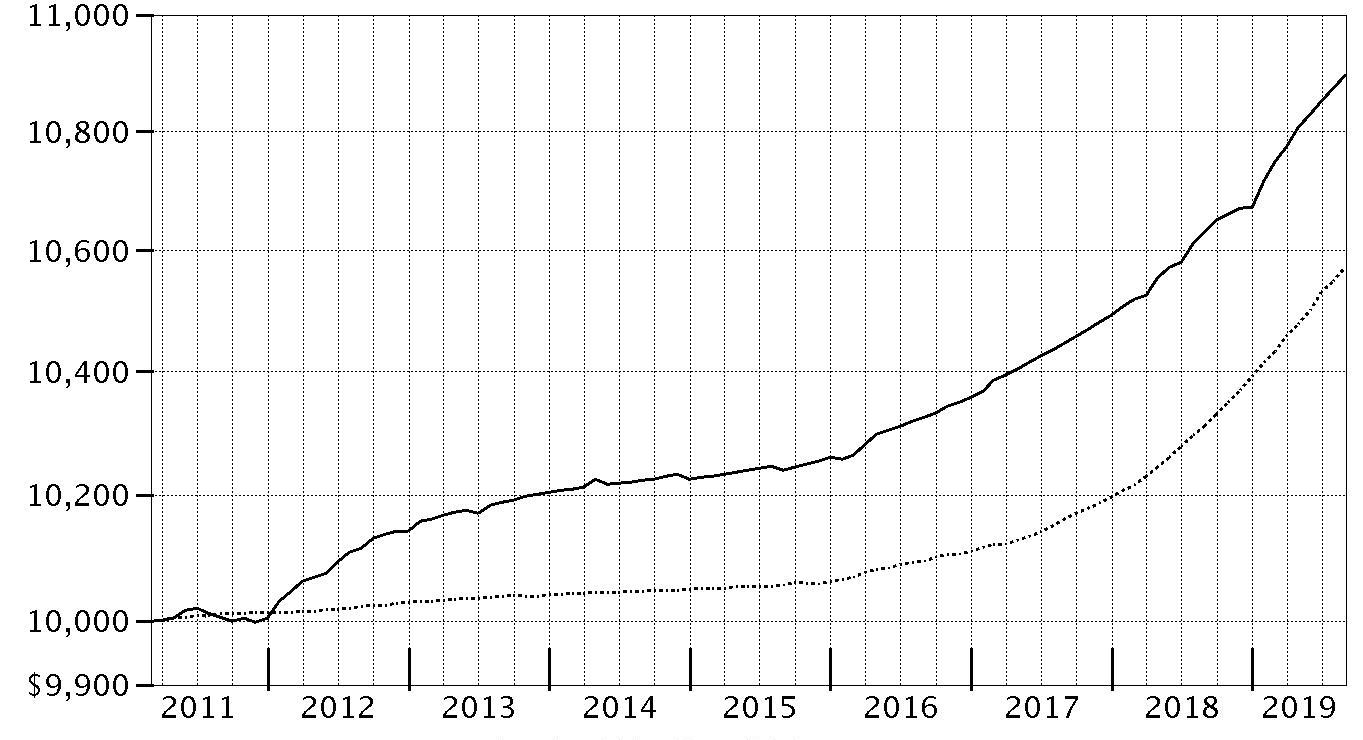
| Period Ending Values |
| $10,896 | Fidelity® Conservative Income Bond Fund |
| $10,572 | Bloomberg Barclays U.S. 3-6 Month Treasury Bill Index |
Management's Discussion of Fund Performance
Market Recap: U.S. taxable investment-grade bonds posted their strongest trailing one-year return since 2009, driven by slower global economic growth, a maturing business cycle, trade uncertainty and, late in the period, the Fed’s dovish shift. The Bloomberg Barclays U.S. Aggregate Bond Index gained 10.17%. Market yields rose in the early fall of 2018, on expectations for higher inflation. Yields then declined and credit spreads widened in November and December, partly because of weaker U.S. manufacturing data. Yield spreads narrowed in January, as the U.S. Federal Reserve said it would be “patient” with policy rate hikes, and that future increases largely would depend on economic data. Yields continued to decline in the spring, amid continued international trade tension and attacks on oil tankers in the Middle East, and then tumbled further in July, when the Fed cut interest rates for the first time since 2008. The yield curve ended the period roughly flat, amid expectations for another rate cut of 25 basis points in September. Within the Bloomberg Barclays index, corporate bonds gained 13.33%, topping the 10.38% advance of U.S. Treasuries. Outside the index, U.S. corporate high-yield bonds lagged nominal U.S. Treasuries, while Treasury Inflation-Protected Securities (TIPS) gained 7.46%.
Comments from Co-Portfolio Managers Julian Potenza and Rob Galusza: For the fiscal year, the fund’s share classes gained about 2.5%, roughly in line, net of fees, with the 2.51% return of the benchmark, the Bloomberg Barclays U.S. 3-6 Month Treasury Bills Index, and slightly behind the Lipper peer group average. Exposure to corporate bonds added meaningful relative value. Within corporates, bonds of banking companies helped the most by far. Positioning among the bonds of industrial companies also contributed, especially the bonds of communications, energy, and certain consumer-related firms. Elsewhere, a small position among natural-gas utility companies helped to a small degree, as did the fund’s positioning along the yield curve. Conversely, the fund’s cash holdings detracted and its fairly small position in Treasury holdings generally broke even versus the benchmark, although each boosted portfolio liquidity. As of August 31, we continue to focus mainly on higher-quality corporate issues. By period end, we added slightly to the fund’s holdings among corporates – both among financials and industrials – while slightly reducing the fund’s cash stake.
The views expressed above reflect those of the portfolio manager(s) only through the end of the period as stated on the cover of this report and do not necessarily represent the views of Fidelity or any other person in the Fidelity organization. Any such views are subject to change at any time based upon market or other conditions and Fidelity disclaims any responsibility to update such views. These views may not be relied on as investment advice and, because investment decisions for a Fidelity fund are based on numerous factors, may not be relied on as an indication of trading intent on behalf of any Fidelity fund.
Note to Shareholders: On September 29, 2018, Maura Walsh joined Robert Galusza and Julian Potenza as a Co-Manager of the fund.
Investment Summary (Unaudited)
Effective Maturity Diversification
| Days | % of Fund's investments 8/31/2019 |
| 0-30 | 30.1% |
| 31-90 | 20.6% |
| 91-180 | 4.8% |
| 181-397 | 5.7% |
| > 397 | 38.8% |
The date shown for securities represents the date when principal payments must be paid, taking into account any call options exercised by the issuer and any permissible maturity shortening features other than interest rate resets.
Asset Allocation (% of fund's net assets)
| As of August 31, 2019* |
| | Corporate Bonds | 63.7% |
| | U.S. Government and U.S. Government Agency Obligations | 3.5% |
| | Bank Notes | 0.9% |
| | Certificates of Deposit | 9.4% |
| | Commercial Paper | 12.6% |
| | Master Notes | 0.9% |
| | Cash and Cash Equivalents | 8.8% |
| | Net Other Assets (Liabilities) | 0.2% |

* Foreign investments - 25.1%
Schedule of Investments August 31, 2019
Showing Percentage of Net Assets
| Nonconvertible Bonds - 63.7% | | | |
| | | Principal Amount | Value |
| COMMUNICATION SERVICES - 2.2% | | | |
| Entertainment - 0.6% | | | |
| NBCUniversal Enterprise, Inc. 3 month U.S. LIBOR + 0.400% 2.7189% 4/1/21 (a)(b)(c) | | $65,899,000 | $66,020,254 |
| Media - 1.6% | | | |
| Comcast Corp.: | | | |
| 3 month U.S. LIBOR + 0.330% 2.6489% 10/1/20 (b)(c) | | 37,864,000 | 37,916,802 |
| 3 month U.S. LIBOR + 0.440% 2.7589% 10/1/21 (b)(c) | | 51,485,000 | 51,605,725 |
| 3.3% 10/1/20 | | 104,600,000 | 106,121,976 |
| | | | 195,644,503 |
|
| TOTAL COMMUNICATION SERVICES | | | 261,664,757 |
|
| CONSUMER DISCRETIONARY - 4.6% | | | |
| Automobiles - 4.6% | | | |
| American Honda Finance Corp.: | | | |
| 3 month U.S. LIBOR + 0.150% 2.3015% 2/21/20 (b)(c) | | 40,100,000 | 40,110,660 |
| 3 month U.S. LIBOR + 0.210% 2.391% 2/12/21 (b)(c) | | 78,600,000 | 78,590,241 |
| 3 month U.S. LIBOR + 0.260% 2.6703% 6/16/20 (b)(c) | | 36,200,000 | 36,242,979 |
| 3 month U.S. LIBOR + 0.280% 2.5825% 10/19/20 (b)(c) | | 45,850,000 | 45,920,106 |
| 2% 11/13/19 | | 30,000,000 | 29,993,400 |
| 3.15% 1/8/21 | | 9,221,000 | 9,358,977 |
| BMW U.S. Capital LLC: | | | |
| 3 month U.S. LIBOR + 0.380% 2.6826% 4/6/20 (a)(b)(c) | | 25,659,000 | 25,696,049 |
| 3 month U.S. LIBOR + 0.410% 2.7495% 4/12/21 (a)(b)(c) | | 40,000,000 | 40,011,520 |
| Daimler Finance North America LLC: | | | |
| 3 month U.S. LIBOR + 0.390% 2.6768% 5/4/20 (a)(b)(c) | | 32,743,000 | 32,770,231 |
| 3 month U.S. LIBOR + 0.530% 2.8168% 5/5/20 (a)(b)(c) | | 25,000,000 | 25,036,937 |
| 3 month U.S. LIBOR + 0.620% 2.8858% 10/30/19 (a)(b)(c) | | 25,348,000 | 25,369,060 |
| 3 month U.S. LIBOR + 0.630% 2.9326% 1/6/20 (a)(b)(c) | | 35,000,000 | 35,058,588 |
| 3 month U.S. LIBOR + 0.900% 3.0581% 2/15/22 (a)(b)(c) | | 59,950,000 | 60,196,275 |
| 2.7% 8/3/20 (a) | | 15,875,000 | 15,943,321 |
| General Motors Financial Co., Inc.: | | | |
| 3 month U.S. LIBOR + 0.850% 3.1614% 4/9/21 (b)(c) | | 18,945,000 | 18,940,082 |
| 3 month U.S. LIBOR + 0.930% 3.2334% 4/13/20 (b)(c) | | 28,000,000 | 28,072,685 |
| Volkswagen Group of America Finance LLC 3 month U.S. LIBOR + 0.770% 2.9456% 11/13/20 (a)(b)(c) | | 15,000,000 | 15,065,079 |
| | | | 562,376,190 |
| CONSUMER STAPLES - 1.4% | | | |
| Beverages - 0.3% | | | |
| Diageo Capital PLC 3 month U.S. LIBOR + 0.240% 2.3638% 5/18/20 (b)(c) | | 33,640,000 | 33,646,301 |
| Food Products - 0.4% | | | |
| Conagra Brands, Inc. 3 month U.S. LIBOR + 0.750% 3.0276% 10/22/20 (b)(c) | | 27,120,000 | 27,132,636 |
| General Mills, Inc. 3 month U.S. LIBOR + 0.540% 2.8623% 4/16/21 (b)(c) | | 25,059,000 | 25,072,782 |
| | | | 52,205,418 |
| Tobacco - 0.7% | | | |
| BAT Capital Corp. 3 month U.S. LIBOR + 0.590% 2.7653% 8/14/20 (b)(c) | | 10,500,000 | 10,520,601 |
| Philip Morris International, Inc.: | | | |
| 3 month U.S. LIBOR + 0.420% 2.5715% 2/21/20 (b)(c) | | 20,428,000 | 20,459,995 |
| 1.875% 2/25/21 | | 52,676,000 | 52,592,278 |
| | | | 83,572,874 |
|
| TOTAL CONSUMER STAPLES | | | 169,424,593 |
|
| ENERGY - 1.9% | | | |
| Oil, Gas & Consumable Fuels - 1.9% | | | |
| BP Capital Markets PLC: | | | |
| 3 month U.S. LIBOR + 0.250% 2.3823% 11/24/20 (b)(c) | | 50,400,000 | 50,449,140 |
| 1.768% 9/19/19 | | 14,940,000 | 14,935,623 |
| Exxon Mobil Corp. 3 month U.S. LIBOR + 0.330% 2.4984% 8/16/22 (b)(c) | | 52,900,000 | 53,036,694 |
| Occidental Petroleum Corp.: | | | |
| 3 month U.S. LIBOR + 0.950% 3.137% 2/8/21 (b)(c) | | 10,636,000 | 10,684,500 |
| 3 month U.S. LIBOR + 1.250% 3.437% 8/13/21 (b)(c) | | 12,300,000 | 12,348,265 |
| Shell International Finance BV: | | | |
| 3 month U.S. LIBOR + 0.350% 2.7858% 9/12/19 (b)(c) | | 20,000,000 | 20,002,625 |
| 2.125% 5/11/20 | | 22,500,000 | 22,514,505 |
| TransCanada PipeLines Ltd. 3 month U.S. LIBOR + 0.275% 2.4331% 11/15/19 (b)(c) | | 50,041,000 | 50,059,112 |
| | | | 234,030,464 |
| FINANCIALS - 47.2% | | | |
| Banks - 31.6% | | | |
| ABN AMRO Bank NV: | | | |
| 3 month U.S. LIBOR + 0.410% 2.7125% 1/19/21 (a)(b)(c) | | 89,130,000 | 89,245,512 |
| 3 month U.S. LIBOR + 0.570% 2.7023% 8/27/21 (a)(b)(c) | | 42,700,000 | 42,852,610 |
| Bank of America Corp.: | | | |
| 3 month U.S. LIBOR + 0.660% 2.9376% 7/21/21 (b)(c) | | 61,446,000 | 61,629,354 |
| 2.151% 11/9/20 | | 28,175,000 | 28,190,106 |
| 2.328% 10/1/21 (b) | | 51,950,000 | 52,031,666 |
| 2.369% 7/21/21 (b) | | 77,420,000 | 77,547,525 |
| Bank of America NA 3 month U.S. LIBOR + 0.320% 2.5866% 7/26/21 (b)(c) | | 50,050,000 | 50,095,838 |
| Bank of Montreal: | | | |
| 3 month U.S. LIBOR + 0.250% 2.7006% 9/11/19 (b)(c) | | 24,080,000 | 24,082,297 |
| 3 month U.S. LIBOR + 0.440% 2.8503% 6/15/20 (b)(c) | | 30,968,000 | 31,055,335 |
| 3 month U.S. LIBOR + 0.460% 2.7634% 4/13/21 (b)(c) | | 11,290,000 | 11,334,764 |
| 3 month U.S. LIBOR + 0.570% 2.9029% 3/26/22 (b)(c) | | 44,400,000 | 44,563,863 |
| 3 month U.S. LIBOR + 0.600% 3.0358% 12/12/19 (b)(c) | | 16,000,000 | 16,024,067 |
| Bank of Nova Scotia: | | | |
| 3 month U.S. LIBOR + 0.290% 2.5926% 1/8/21 (b)(c) | | 20,050,000 | 20,074,231 |
| 3 month U.S. LIBOR + 0.390% 2.6934% 7/14/20 (b)(c) | | 13,902,000 | 13,939,542 |
| 3 month U.S. LIBOR + 0.620% 3.0985% 12/5/19 (b)(c) | | 18,495,000 | 18,521,493 |
| Banque Federative du Credit Mutuel SA 3 month U.S. LIBOR + 0.490% 2.7676% 7/20/20 (a)(b)(c) | | 68,890,000 | 69,099,401 |
| Barclays Bank PLC: | | | |
| 3 month U.S. LIBOR + 0.460% 2.8008% 1/11/21 (b)(c) | | 109,510,000 | 109,333,065 |
| 3 month U.S. LIBOR + 0.650% 2.859% 8/7/20 (b)(c) | | 32,150,000 | 32,230,769 |
| BB&T Corp.: | | | |
| 3 month U.S. LIBOR + 0.450% 2.7534% 1/15/20 (b)(c) | | 30,000,000 | 30,032,759 |
| 2.625% 6/29/20 | | 34,019,000 | 34,166,202 |
| BNP Paribas SA 3 month U.S. LIBOR + 0.390% 2.5676% 8/7/21 (a)(b)(c) | | 47,000,000 | 46,999,882 |
| BPCE SA 3.145% 7/31/20 (a) | | 51,500,000 | 51,966,500 |
| Canadian Imperial Bank of Commerce 3 month U.S. LIBOR + 0.520% 2.9944% 9/6/19 (b)(c) | | 65,258,000 | 65,261,066 |
| Citibank NA: | | | |
| 3 month U.S. LIBOR + 0.320% 2.5731% 5/1/20 (b)(c) | | 35,000,000 | 35,052,130 |
| 3 month U.S. LIBOR + 0.600% 2.7359% 5/20/22 (b)(c) | | 56,100,000 | 56,203,318 |
| 1.85% 9/18/19 | | 35,500,000 | 35,493,822 |
| Citigroup, Inc.: | | | |
| 3 month U.S. LIBOR + 0.790% 3.1278% 1/10/20 (b)(c) | | 30,045,000 | 30,101,769 |
| 2.45% 1/10/20 | | 38,688,000 | 38,716,110 |
| Citizens Bank NA: | | | |
| 3 month U.S. LIBOR + 0.540% 3.0603% 3/2/20 (b)(c) | | 45,000,000 | 45,063,657 |
| 3 month U.S. LIBOR + 0.570% 2.7023% 5/26/20 (b)(c) | | 17,500,000 | 17,552,763 |
| Commonwealth Bank of Australia: | | | |
| 3 month U.S. LIBOR + 0.450% 2.9006% 3/10/20 (a)(b)(c) | | 25,000,000 | 25,050,947 |
| 3 month U.S. LIBOR + 0.640% 2.849% 11/7/19 (a)(b)(c) | | 27,100,000 | 27,132,247 |
| Compass Bank 3 month U.S. LIBOR + 0.730% 3.1806% 6/11/21 (b)(c) | | 50,030,000 | 49,932,073 |
| Credit Agricole CIB 3 month U.S. LIBOR + 0.400% 2.6868% 5/3/21 (a)(b)(c) | | 36,800,000 | 36,799,843 |
| Credit Agricole SA: | | | |
| 3 month U.S. LIBOR + 0.970% 3.423% 6/10/20 (a)(b)(c) | | 600,000 | 603,566 |
| 2.75% 6/10/20 (a) | | 16,300,000 | 16,371,520 |
| Credit Suisse Group Funding Guernsey Ltd.: | | | |
| 3 month U.S. LIBOR + 2.290% 4.5896% 4/16/21 (b)(c) | | 19,300,000 | 19,854,789 |
| 2.75% 3/26/20 | | 44,406,000 | 44,527,074 |
| Fifth Third Bank: | | | |
| 3 month U.S. LIBOR + 0.440% 2.7066% 7/26/21 (b)(c) | | 25,488,000 | 25,534,448 |
| 3 month U.S. LIBOR + 0.590% 2.9013% 9/27/19 (b)(c) | | 37,445,000 | 37,459,241 |
| HSBC Holdings PLC: | | | |
| 3 month U.S. LIBOR + 0.600% 2.7238% 5/18/21 (b)(c) | | 75,000,000 | 75,030,620 |
| 3 month U.S. LIBOR + 0.650% 3.0858% 9/11/21 (b)(c) | | 50,050,000 | 50,095,137 |
| HSBC U.S.A., Inc.: | | | |
| 3 month U.S. LIBOR + 0.610% 2.7856% 11/13/19 (b)(c) | | 33,000,000 | 33,028,500 |
| 2.75% 8/7/20 | | 39,100,000 | 39,349,324 |
| Huntington National Bank: | | | |
| 3 month U.S. LIBOR + 0.510% 2.963% 3/10/20 (b)(c) | | 28,473,000 | 28,531,812 |
| 3 month U.S. LIBOR + 0.550% 2.8368% 2/5/21 (b)(c) | | 55,050,000 | 55,221,366 |
| JP Morgan Chase Bank NA: | | | |
| 3 month U.S. LIBOR + 0.230% 2.7503% 9/1/20 (b)(c) | | 30,000,000 | 29,992,313 |
| 3 month U.S. LIBOR + 0.290% 2.5431% 2/1/21 (b)(c) | | 30,050,000 | 30,063,250 |
| 3 month U.S. LIBOR + 0.340% 2.6066% 4/26/21 (b)(c) | | 20,000,000 | 20,003,405 |
| 3 month U.S. LIBOR + 0.370% 2.4938% 2/19/21 (b)(c) | | 54,500,000 | 54,533,658 |
| U.S. SOFR SEC OVRN FIN RATE INDX + 0.550% 2.67% 10/19/20 (b)(c) | | 30,450,000 | 30,458,743 |
| JPMorgan Chase & Co.: | | | |
| 3 month U.S. LIBOR + 0.680% 3.2003% 6/1/21 (b)(c) | | 32,397,000 | 32,460,575 |
| 3 month U.S. LIBOR + 0.955% 3.2144% 1/23/20 (b)(c) | | 78,069,000 | 78,337,276 |
| 3 month U.S. LIBOR + 1.100% 3.5716% 6/7/21 (b)(c) | | 19,974,000 | 20,208,020 |
| 3 month U.S. LIBOR + 1.205% 3.4608% 10/29/20 (b)(c) | | 22,090,000 | 22,303,140 |
| 2.75% 6/23/20 | | 15,761,000 | 15,835,276 |
| KeyBank NA 3 month U.S. LIBOR + 0.660% 2.9131% 2/1/22 (b)(c) | | 43,444,000 | 43,645,759 |
| KeyCorp. 2.9% 9/15/20 | | 29,995,000 | 30,243,437 |
| Lloyds Bank PLC 3 month U.S. LIBOR + 0.490% 2.699% 5/7/21 (b)(c) | | 80,822,000 | 80,826,122 |
| Manufacturers & Traders Trust Co. 3 month U.S. LIBOR + 0.270% 2.5455% 1/25/21 (b)(c) | | 8,240,000 | 8,239,036 |
| Mitsubishi UFJ Financial Group, Inc.: | | | |
| 3 month U.S. LIBOR + 0.650% 2.9166% 7/26/21 (b)(c) | | 38,063,000 | 38,175,134 |
| 3 month U.S. LIBOR + 0.700% 3.1716% 3/7/22 (b)(c) | | 50,550,000 | 50,545,959 |
| Mizuho Financial Group, Inc. 3 month U.S. LIBOR + 1.480% 3.8195% 4/12/21 (a)(b)(c) | | 9,000,000 | 9,137,985 |
| National Australia Bank Ltd. 3 month U.S. LIBOR + 0.510% 2.6595% 5/22/20 (a)(b)(c) | | 56,650,000 | 56,832,085 |
| Nordea Bank AB: | | | |
| 3 month U.S. LIBOR + 0.470% 2.5874% 5/29/20 (a)(b)(c) | | 42,125,000 | 42,227,686 |
| 2.5% 9/17/20 (a) | | 6,150,000 | 6,176,757 |
| PNC Bank NA: | | | |
| 3 month U.S. LIBOR + 0.350% 2.7858% 3/12/21 (b)(c) | | 15,000,000 | 15,006,629 |
| 3 month U.S. LIBOR + 0.360% 2.4838% 5/19/20 (b)(c) | | 40,430,000 | 40,506,448 |
| Rabobank Nederland New York Branch: | | | |
| 3 month U.S. LIBOR + 0.430% 2.6966% 4/26/21 (b)(c) | | 51,400,000 | 51,545,338 |
| 3 month U.S. LIBOR + 0.830% 3.1678% 1/10/22 (b)(c) | | 29,463,000 | 29,757,930 |
| Regions Bank 3 month U.S. LIBOR + 0.500% 2.6756% 8/13/21 (b)(c) | | 81,774,000 | 81,730,449 |
| Royal Bank of Canada: | | | |
| 3 month U.S. LIBOR + 0.300% 2.5776% 7/22/20 (b)(c) | | 40,200,000 | 40,265,619 |
| 3 month U.S. LIBOR + 0.380% 2.9003% 3/2/20 (b)(c) | | 35,000,000 | 35,067,988 |
| 3 month U.S. LIBOR + 0.400% 2.6755% 1/25/21 (b)(c) | | 55,800,000 | 55,994,519 |
| Skandinaviska Enskilda Banken AB 3 month U.S. LIBOR + 0.430% 2.5538% 5/17/21 (a)(b)(c) | | 38,150,000 | 38,235,855 |
| Sumitomo Mitsui Banking Corp.: | | | |
| 3 month U.S. LIBOR + 0.310% 2.6096% 10/18/19 (b)(c) | | 20,000,000 | 20,010,600 |
| 3 month U.S. LIBOR + 0.350% 2.6533% 1/17/20 (b)(c) | | 69,355,000 | 69,427,129 |
| 3 month U.S. LIBOR + 0.370% 2.6923% 10/16/20 (b)(c) | | 65,650,000 | 65,804,511 |
| SunTrust Bank: | | | |
| 3 month U.S. LIBOR + 0.500% 2.7666% 10/26/21 (b)(c) | | 30,000,000 | 30,039,784 |
| 3 month U.S. LIBOR + 0.530% 2.7855% 1/31/20 (b)(c) | | 6,700,000 | 6,709,697 |
| Svenska Handelsbanken AB: | | | |
| 3 month U.S. LIBOR + 0.470% 2.6023% 5/24/21 (b)(c) | | 70,650,000 | 70,924,485 |
| 3 month U.S. LIBOR + 0.490% 2.9644% 9/6/19 (b)(c) | | 27,635,000 | 27,636,118 |
| The Toronto-Dominion Bank: | | | |
| 3 month U.S. LIBOR + 0.260% 2.6703% 9/17/20 (b)(c) | | 50,400,000 | 50,504,255 |
| 3 month U.S. LIBOR + 0.280% 2.7306% 6/11/20 (b)(c) | | 51,000,000 | 51,087,194 |
| 2.5% 12/14/20 | | 17,700,000 | 17,816,698 |
| U.S. Bancorp 2.35% 1/29/21 | | 39,650,000 | 39,861,407 |
| U.S. Bank NA: | | | |
| 3 month U.S. LIBOR + 0.250% 2.5328% 7/24/20 (b)(c) | | 40,000,000 | 40,057,359 |
| 3% 2/4/21 | | 57,400,000 | 58,181,151 |
| Union Bank NA 3 month U.S. LIBOR + 0.600% 3.0716% 3/7/22 (b)(c) | | 50,450,000 | 50,412,451 |
| Wells Fargo & Co.: | | | |
| 3 month U.S. LIBOR + 0.680% 2.9458% 1/30/20 (b)(c) | | 2,500,000 | 2,506,206 |
| 3 month U.S. LIBOR + 0.880% 3.1576% 7/22/20 (b)(c) | | 11,411,000 | 11,481,146 |
| 3 month U.S. LIBOR + 1.025% 3.2916% 7/26/21 (b)(c) | | 33,952,000 | 34,378,737 |
| Wells Fargo Bank NA: | | | |
| 3 month U.S. LIBOR + 0.230% 2.5334% 1/15/20 (b)(c) | | 30,450,000 | 30,471,196 |
| 3 month U.S. LIBOR + 0.310% 2.6134% 1/15/21 (b)(c) | | 9,500,000 | 9,510,550 |
| 3 month U.S. LIBOR + 0.500% 2.7594% 7/23/21 (b)(c) | | 30,150,000 | 30,219,981 |
| 3 month U.S. LIBOR + 0.620% 2.7523% 5/27/22 (b)(c) | | 85,050,000 | 85,208,419 |
| U.S. SOFR SEC OVRN FIN RATE INDX + 0.480% 2.6% 3/25/20 (b)(c) | | 50,750,000 | 50,811,915 |
| 3.325% 7/23/21 (b) | | 48,156,000 | 48,654,076 |
| | | | 3,833,055,379 |
| Capital Markets - 4.8% | | | |
| Bank New York Mellon Corp.: | | | |
| 3 month U.S. LIBOR + 0.280% 2.7825% 6/4/21 (b)(c) | | 56,250,000 | 56,280,695 |
| 3 month U.S. LIBOR + 0.300% 2.8025% 12/4/20 (b)(c) | | 44,900,000 | 44,918,543 |
| 2.05% 5/3/21 | | 18,750,000 | 18,795,627 |
| Deutsche Bank AG New York Branch 3 month U.S. LIBOR + 0.815% 3.0926% 1/22/21 (b)(c) | | 20,000,000 | 19,768,261 |
| Goldman Sachs Bank U.S.A. U.S. SOFR SEC OVRN FIN RATE INDX + 0.600% 2.7247% 5/24/21 (b)(c) | | 49,900,000 | 49,929,865 |
| Morgan Stanley: | | | |
| 3 month U.S. LIBOR + 0.550% 2.731% 2/10/21 (b)(c) | | 46,650,000 | 46,689,879 |
| 3 month U.S. LIBOR + 0.980% 3.3903% 6/16/20 (b)(c) | | 5,910,000 | 5,944,148 |
| 3 month U.S. LIBOR + 1.140% 3.3958% 1/27/20 (b)(c) | | 31,775,000 | 31,904,741 |
| U.S. SOFR SEC OVRN FIN RATE INDX + 0.830% 3.1339% 6/10/22 (b)(c) | | 61,340,000 | 61,497,644 |
| 2.65% 1/27/20 | | 20,277,000 | 20,310,749 |
| 5.5% 1/26/20 | | 49,746,000 | 50,371,670 |
| 5.5% 7/24/20 | | 16,184,000 | 16,664,313 |
| State Street Corp. 3 month U.S. LIBOR + 0.900% 3.0238% 8/18/20 (b)(c) | | 8,120,000 | 8,182,080 |
| TD Ameritrade Holding Corp. 3 month U.S. LIBOR + 0.430% 2.6831% 11/1/21 (b)(c) | | 64,705,000 | 64,887,080 |
| UBS AG London Branch: | | | |
| 3 month U.S. LIBOR + 0.480% 3.0003% 12/1/20 (a)(b)(c) | | 4,500,000 | 4,510,710 |
| 3 month U.S. LIBOR + 0.580% 3.0306% 6/8/20 (a)(b)(c) | | 80,900,000 | 81,140,748 |
| | | | 581,796,753 |
| Consumer Finance - 5.4% | | | |
| American Express Co.: | | | |
| 3 month U.S. LIBOR + 0.600% 2.8868% 11/5/21 (b)(c) | | 20,000,000 | 20,107,599 |
| 3 month U.S. LIBOR + 0.620% 2.7559% 5/20/22 (b)(c) | | 45,200,000 | 45,344,386 |
| 3% 2/22/21 | | 50,693,000 | 51,388,893 |
| American Express Credit Corp. 3 month U.S. LIBOR + 0.430% 2.9503% 3/3/20 (b)(c) | | 35,000,000 | 35,042,149 |
| Aviation Capital Group LLC: | | | |
| 3 month U.S. LIBOR + 0.670% 2.9358% 7/30/21 (a)(b)(c) | | 19,113,000 | 19,101,493 |
| 3 month U.S. LIBOR + 0.950% 3.4703% 6/1/21 (a)(b)(c) | | 25,973,000 | 26,104,212 |
| Capital One Financial Corp. 3 month U.S. LIBOR + 0.760% 2.941% 5/12/20 (b)(c) | | 26,340,000 | 26,417,721 |
| Caterpillar Financial Services Corp. 3 month U.S. LIBOR + 0.510% 2.8478% 1/10/20 (b)(c) | | 35,000,000 | 35,059,954 |
| Ford Motor Credit Co. LLC: | | | |
| 3 month U.S. LIBOR + 0.430% 2.6956% 11/2/20 (b)(c) | | 21,450,000 | 21,304,482 |
| 3 month U.S. LIBOR + 0.790% 3.2258% 6/12/20 (b)(c) | | 8,372,000 | 8,373,241 |
| 3 month U.S. LIBOR + 1.000% 3.3114% 1/9/20 (b)(c) | | 14,000,000 | 14,023,550 |
| John Deere Capital Corp.: | | | |
| 3 month U.S. LIBOR + 0.160% 2.4626% 1/8/21 (b)(c) | | 32,620,000 | 32,610,275 |
| 3 month U.S. LIBOR + 0.170% 2.4814% 10/9/20 (b)(c) | | 25,000,000 | 25,001,375 |
| 3 month U.S. LIBOR + 0.180% 2.4826% 1/7/20 (b)(c) | | 40,000,000 | 40,029,054 |
| 3 month U.S. LIBOR + 0.240% 2.6758% 3/12/21 (b)(c) | | 40,000,000 | 39,979,814 |
| 3 month U.S. LIBOR + 0.260% 2.713% 9/10/21 (b)(c) | | 20,000,000 | 19,981,722 |
| 3 month U.S. LIBOR + 0.420% 2.7578% 7/10/20 (b)(c) | | 50,650,000 | 50,814,610 |
| 2.875% 3/12/21 | | 16,350,000 | 16,562,174 |
| Toyota Motor Credit Corp.: | | | |
| 3 month U.S. LIBOR + 0.100% 2.4378% 1/10/20 (b)(c) | | 9,880,000 | 9,882,900 |
| 3 month U.S. LIBOR + 0.150% 2.4614% 10/9/20 (b)(c) | | 27,000,000 | 27,024,330 |
| 3 month U.S. LIBOR + 0.170% 2.572% 9/18/20 (b)(c) | | 50,250,000 | 50,314,862 |
| 3 month U.S. LIBOR + 0.280% 2.5834% 4/13/21 (b)(c) | | 35,000,000 | 35,022,256 |
| | | | 649,491,052 |
| Diversified Financial Services - 0.3% | | | |
| AIG Global Funding 3 month U.S. LIBOR + 0.460% 2.8093% 6/25/21 (a)(b)(c) | | 20,759,000 | 20,820,053 |
| Cigna Corp. 3 month U.S. LIBOR + 0.650% 3.0603% 9/17/21 (b)(c) | | 20,488,000 | 20,488,535 |
| | | | 41,308,588 |
| Insurance - 5.1% | | | |
| AIA Group Ltd. 3 month U.S. LIBOR + 0.520% 2.9066% 9/20/21 (a)(b)(c) | | 24,102,000 | 24,101,518 |
| Allstate Corp. 3 month U.S. LIBOR + 0.430% 2.7599% 3/29/21 (b)(c) | | 14,727,000 | 14,743,146 |
| Jackson National Life Global Funding 3 month U.S. LIBOR + 0.300% 2.5558% 4/27/20 (a)(b)(c) | | 40,750,000 | 40,796,795 |
| Marsh & McLennan Companies, Inc.: | | | |
| 3 month U.S. LIBOR + 1.200% 3.5189% 12/29/21 (b)(c) | | 23,954,000 | 23,999,930 |
| 3.5% 12/29/20 | | 12,892,000 | 13,125,257 |
| Metropolitan Life Global Funding I: | | | |
| 3 month U.S. LIBOR + 0.220% 2.6385% 9/19/19 (a)(b)(c) | | 50,250,000 | 50,259,135 |
| 3 month U.S. LIBOR + 0.230% 2.5326% 1/8/21 (a)(b)(c) | | 40,000,000 | 40,002,014 |
| 3 month U.S. LIBOR + 0.400% 2.8358% 6/12/20 (a)(b)(c) | | 15,000,000 | 15,037,201 |
| U.S. SOFR SEC OVRN FIN RATE INDX + 0.500% 2.62% 5/28/21 (a)(b)(c) | | 46,050,000 | 46,084,615 |
| U.S. SOFR SEC OVRN FIN RATE INDX + 0.570% 2.69% 9/7/20 (a)(b)(c) | | 40,750,000 | 40,861,330 |
| U.S. SOFR SEC OVRN FIN RATE INDX + 0.850% 2.97% 1/15/21 (a)(b)(c) | | 44,450,000 | 44,672,638 |
| New York Life Global Funding: | | | |
| 3 month U.S. LIBOR + 0.160% 2.4789% 10/1/20 (a)(b)(c) | | 40,500,000 | 40,526,534 |
| 3 month U.S. LIBOR + 0.270% 2.5814% 4/9/20 (a)(b)(c) | | 25,000,000 | 25,031,750 |
| 3 month U.S. LIBOR + 0.320% 2.5593% 8/6/21 (a)(b)(c) | | 27,621,000 | 27,661,956 |
| 3 month U.S. LIBOR + 0.390% 2.6728% 10/24/19 (a)(b)(c) | | 30,000,000 | 30,014,724 |
| 2% 4/13/21 (a) | | 23,500,000 | 23,524,285 |
| 2.95% 1/28/21 (a) | | 20,129,000 | 20,424,468 |
| Protective Life Global Funding: | | | |
| 3 month U.S. LIBOR + 0.370% 2.6734% 7/13/20 (a)(b)(c) | | 40,050,000 | 40,143,400 |
| 3 month U.S. LIBOR + 0.520% 2.8499% 6/28/21 (a)(b)(c) | | 50,900,000 | 51,132,787 |
| | | | 612,143,483 |
|
| TOTAL FINANCIALS | | | 5,717,795,255 |
|
| HEALTH CARE - 1.3% | | | |
| Health Care Equipment & Supplies - 0.1% | | | |
| Becton, Dickinson & Co. 3 month U.S. LIBOR + 0.875% 3.1939% 12/29/20 (b)(c) | | 16,607,000 | 16,611,815 |
| Health Care Providers & Services - 0.7% | | | |
| CVS Health Corp. 3 month U.S. LIBOR + 0.720% 3.173% 3/9/21 (b)(c) | | 20,353,000 | 20,441,274 |
| Express Scripts Holding Co. 3 month U.S. LIBOR + 0.750% 2.8741% 11/30/20 (b)(c) | | 33,725,000 | 33,730,258 |
| UnitedHealth Group, Inc. 3 month U.S. LIBOR + 0.260% 2.6703% 6/15/21 (b)(c) | | 28,166,000 | 28,148,650 |
| | | | 82,320,182 |
| Pharmaceuticals - 0.5% | | | |
| Bayer U.S. Finance II LLC 3 month U.S. LIBOR + 0.630% 2.9793% 6/25/21 (a)(b)(c) | | 59,850,000 | 59,863,206 |
|
| TOTAL HEALTH CARE | | | 158,795,203 |
|
| INDUSTRIALS - 2.4% | | | |
| Aerospace & Defense - 0.2% | | | |
| General Dynamics Corp. 3 month U.S. LIBOR + 0.290% 2.471% 5/11/20 (b)(c) | | 27,351,000 | 27,385,840 |
| Industrial Conglomerates - 0.4% | | | |
| Honeywell International, Inc. 3 month U.S. LIBOR + 0.370% 2.557% 8/8/22 (b)(c) | | 52,678,000 | 52,812,276 |
| Machinery - 1.8% | | | |
| Caterpillar Financial Services Corp.: | | | |
| 3 month U.S. LIBOR + 0.100% 2.5185% 6/19/20 (b)(c) | | 38,300,000 | 38,307,375 |
| 3 month U.S. LIBOR + 0.130% 2.2474% 11/29/19 (b)(c) | | 16,000,000 | 16,003,707 |
| 3 month U.S. LIBOR + 0.180% 2.3381% 5/15/20 (b)(c) | | 50,600,000 | 50,614,305 |
| 3 month U.S. LIBOR + 0.230% 2.6403% 3/15/21 (b)(c) | | 20,000,000 | 20,005,000 |
| 3 month U.S. LIBOR + 0.250% 2.3823% 8/26/20 (b)(c) | | 57,500,000 | 57,564,007 |
| 2.65% 5/17/21 | | 30,664,000 | 31,116,438 |
| | | | 213,610,832 |
|
| TOTAL INDUSTRIALS | | | 293,808,948 |
|
| INFORMATION TECHNOLOGY - 1.2% | | | |
| Electronic Equipment & Components - 0.2% | | | |
| Tyco Electronics Group SA 3 month U.S. LIBOR + 0.450% 2.9285% 6/5/20 (b)(c) | | 22,200,000 | 22,222,200 |
| IT Services - 1.0% | | | |
| IBM Corp. 2.8% 5/13/21 | | 50,100,000 | 50,750,370 |
| IBM Credit LLC: | | | |
| 3 month U.S. LIBOR + 0.260% 2.5376% 1/20/21 (b)(c) | | 38,350,000 | 38,413,338 |
| 3 month U.S. LIBOR + 0.470% 2.5941% 11/30/20 (b)(c) | | 32,400,000 | 32,529,910 |
| | | | 121,693,618 |
|
| TOTAL INFORMATION TECHNOLOGY | | | 143,915,818 |
|
| UTILITIES - 1.5% | | | |
| Electric Utilities - 0.7% | | | |
| Duke Energy Corp. 2.1% 6/15/20 (a) | | 49,650,000 | 49,630,100 |
| Florida Power & Light Co. 3 month U.S. LIBOR + 0.400% 2.6393% 5/6/22 (b)(c) | | 35,597,000 | 35,606,650 |
| Mississippi Power Co. 3 month U.S. LIBOR + 0.650% 2.9613% 3/27/20 (b)(c) | | 5,047,000 | 5,047,626 |
| | | | 90,284,376 |
| Gas Utilities - 0.5% | | | |
| WGL Holdings, Inc.: | | | |
| 3 month U.S. LIBOR + 0.400% 2.5174% 11/29/19 (b)(c) | | 26,271,000 | 26,258,769 |
| 3 month U.S. LIBOR + 0.550% 2.9858% 3/12/20 (b)(c) | | 34,207,000 | 34,145,129 |
| | | | 60,403,898 |
| Multi-Utilities - 0.3% | | | |
| Consolidated Edison Co. of New York, Inc. 3 month U.S. LIBOR + 0.400% 2.7493% 6/25/21(b)(c) | | 30,250,000 | 30,359,505 |
|
| TOTAL UTILITIES | | | 181,047,779 |
|
| TOTAL NONCONVERTIBLE BONDS | | | |
| (Cost $7,707,581,480) | | | 7,722,859,007 |
|
| U.S. Treasury Obligations - 3.5% | | | |
| U.S. Treasury Notes: | | | |
| U.S. TREASURY 3 MONTH BILL + 0.139% 2.0988% 4/30/21 (b)(c) | | $114,500,000 | $114,349,035 |
| 1.75% 12/31/20 | | 55,000,000 | 55,040,820 |
| 1.75% 7/31/21 | | 72,000,000 | 72,298,125 |
| 1.875% 12/31/19 | | 178,148,000 | 178,071,449 |
| TOTAL U.S. TREASURY OBLIGATIONS | | | |
| (Cost $419,663,032) | | | 419,759,429 |
|
| Bank Notes - 0.9% | | | |
| Citizens Bank NA 2.25% 10/30/20 | | 22,805,000 | 22,838,010 |
| Fifth Third Bank 2.2% 10/30/20 | | 33,100,000 | 33,175,729 |
| Goldman Sachs Bank U.S.A. 3.2% 6/5/20 | | 9,153,000 | 9,233,540 |
| KeyBank NA 2.25% 3/16/20 | | 26,328,000 | 26,353,093 |
| SunTrust Bank 2.59% 1/29/21 (b) | | 13,050,000 | 13,067,772 |
| U.S. Bank NA 3.15% 4/26/21 | | 10,000,000 | 10,179,287 |
| TOTAL BANK NOTES | | | |
| (Cost $114,440,253) | | | 114,847,431 |
|
| Certificates of Deposit - 9.4% | | | |
| Bank of Tokyo-Mitsubishi UFJ Ltd. yankee 2.07% 2/28/20 | | 49,650,000 | 49,662,224 |
| Credit Agricole CIB yankee: | | | |
| 2.3% 10/4/19 | | 30,000,000 | 30,006,186 |
| 2.32% 11/12/19 | | 33,000,000 | 33,016,097 |
| Credit Suisse AG yankee: | | | |
| 1 month U.S. LIBOR + 0.150% 2.3743% 12/2/19 (b)(c) | | 45,000,000 | 45,009,104 |
| 3 month U.S. LIBOR + 0.170% 2.4889% 10/1/19 (b)(c) | | 48,250,000 | 48,254,005 |
| Goldman Sachs Bank U.S.A.: | | | |
| U.S. SOFR SEC OVRN FIN RATE INDX + 0.250% 2.5266% 6/25/20 (b)(c) | | 49,650,000 | 49,656,271 |
| U.S. SOFR SEC OVRN FIN RATE INDX + 0.280% 2.405% 8/21/20 (b)(c) | | 49,650,000 | 49,627,355 |
| U.S. SOFR SEC OVRN FIN RATE INDX + 0.430% 2.5548% 2/26/21 (b)(c) | | 49,650,000 | 49,672,010 |
| Mitsubishi UFJ Trust & Banking Corp. yankee: | | | |
| 2.32% 10/15/19 | | 49,700,000 | 49,711,396 |
| 2.32% 10/24/19 | | 10,000,000 | 10,002,646 |
| Mizuho Corporate Bank Ltd. yankee: | | | |
| 1 month U.S. LIBOR + 0.090% 2.2566% 9/23/19 (b)(c) | | 49,650,000 | 49,653,798 |
| 1 month U.S. LIBOR + 0.120% 2.2653% 11/27/19 (b)(c) | | 39,650,000 | 39,656,507 |
| 1 month U.S. LIBOR + 0.130% 2.3251% 10/15/19 (b)(c) | | 48,000,000 | 48,006,413 |
| Natexis Banques Populaires New York Branch yankee: | | | |
| 2.68% 12/27/19 | | 44,750,000 | 44,828,644 |
| 2.75% 12/20/19 | | 39,700,000 | 39,774,438 |
| State Street Bank & Trust Co.: | | | |
| 1 month U.S. LIBOR + 0.100% 2.2721% 9/20/19 (b)(c) | | 52,000,000 | 52,000,978 |
| U.S. SOFR SEC OVRN FIN RATE INDX + 0.200% 2.32% 11/21/19 (b)(c) | | 24,600,000 | 24,602,750 |
| Sumitomo Mitsui Banking Corp. yankee: | | | |
| 1 month U.S. LIBOR + 0.070% 2.3141% 10/3/19 (b)(c) | | 41,000,000 | 41,001,193 |
| 1 month U.S. LIBOR + 0.100% 2.2395% 10/28/19 (b)(c) | | 30,000,000 | 30,002,976 |
| 1 month U.S. LIBOR + 0.100% 2.3009% 9/12/19 (b)(c) | | 40,000,000 | 40,002,268 |
| 1 month U.S. LIBOR + 0.140% 2.3841% 11/5/19 (b)(c) | | 34,000,000 | 34,005,658 |
| 1 month U.S. LIBOR + 0.170% 2.3813% 9/9/19 (b)(c) | | 47,500,000 | 47,502,997 |
| Sumitomo Mitsui Trust Bank Ltd. yankee: | | | |
| 1 month U.S. LIBOR + 0.080% 2.192% 9/30/19 (b)(c) | | 49,650,000 | 49,652,006 |
| 1 month U.S. LIBOR + 0.100% 2.2453% 9/27/19 (b)(c) | | 25,000,000 | 25,001,938 |
| 1 month U.S. LIBOR + 0.100% 2.3009% 9/10/19 (b)(c) | | 17,000,000 | 17,000,816 |
| 1 month U.S. LIBOR + 0.100% 2.3009% 9/11/19 (b)(c) | | 17,000,000 | 17,000,891 |
| Svenska Handelsbanken, Inc. yankee 2.61% 9/25/19 | | 44,000,000 | 44,015,066 |
| Toronto-Dominion Bank yankee 2.62% 10/18/19 | | 39,600,000 | 39,626,484 |
| Wells Fargo Bank NA 1 month U.S. LIBOR + 0.400% 2.5951% 12/16/19 (b)(c) | | 40,000,000 | 40,041,636 |
| TOTAL CERTIFICATES OF DEPOSIT | | | |
| (Cost $1,137,650,000) | | | 1,137,994,751 |
|
| Commercial Paper - 12.6% | | | |
| American Electric Power Co., Inc.: | | | |
| 2.34% 9/23/19 | | 5,000,000 | 4,992,340 |
| 2.35% 9/16/19 | | 4,000,000 | 3,995,686 |
| 2.36% 9/12/19 | | 7,000,000 | 6,994,250 |
| 2.36% 9/16/19 | | 11,000,000 | 10,988,135 |
| 2.38% 9/17/19 | | 9,000,000 | 8,989,713 |
| Amphenol Corp.: | | | |
| 2.27% 9/3/19 | | 8,000,000 | 7,998,022 |
| 2.27% 9/6/19 | | 7,000,000 | 6,996,910 |
| Atlantic Asset Securitization Corp.: | | | |
| 2.14% 11/19/19 (Liquidity Facility Credit Agricole CIB) | | 2,000,000 | 1,990,523 |
| 2.14% 11/25/19 (Liquidity Facility Credit Agricole CIB) | | 12,000,000 | 11,939,042 |
| 2.14% 11/26/19 (Liquidity Facility Credit Agricole CIB) | | 12,000,000 | 11,938,370 |
| 2.15% 11/12/19 (Liquidity Facility Credit Agricole CIB) | | 10,000,000 | 9,956,607 |
| Bank of Nova Scotia 1 month U.S. LIBOR + 0.130% 2.312% 2/18/20 (b)(c) | | 39,500,000 | 39,490,275 |
| Bell Canada yankee: | | | |
| 2.35% 11/5/19 | | 12,000,000 | 11,946,511 |
| 2.35% 11/5/19 | | 14,100,000 | 14,037,151 |
| 2.35% 11/7/19 | | 29,650,000 | 29,513,951 |
| 2.35% 11/8/19 | | 17,000,000 | 16,920,897 |
| 2.5% 10/15/19 | | 20,000,000 | 19,938,794 |
| 2.52% 9/20/19 | | 12,000,000 | 11,983,228 |
| 2.52% 9/23/19 | | 15,000,000 | 14,976,060 |
| 2.55% 9/3/19 | | 25,370,000 | 25,363,234 |
| 2.55% 9/4/19 | | 14,750,000 | 14,745,084 |
| 2.56% 9/9/19 | | 10,000,000 | 9,993,333 |
| 2.58% 9/12/19 | | 29,689,000 | 29,663,269 |
| BPCE SA yankee: | | | |
| 2.335% 11/12/19 | | 49,650,000 | 49,435,577 |
| 2.48% 10/4/19 | | 49,600,000 | 49,497,432 |
| Canadian Imperial Bank of Commerce yankee 2.58% 10/18/19 | | 43,000,000 | 42,882,008 |
| Commonspirit Health: | | | |
| 2.5% 10/7/19 | | 6,000,000 | 5,986,427 |
| 2.5% 10/16/19 | | 1,833,000 | 1,827,864 |
| 2.75% 10/23/19 | | 21,150,000 | 21,081,855 |
| 2.8% 10/16/19 | | 23,000,000 | 22,935,561 |
| Credit Suisse AG yankee: | | | |
| 2.33% 11/14/19 | | 25,000,000 | 24,888,375 |
| 2.3321% 11/6/19 | | 50,000,000 | 49,800,060 |
| 2.6% 9/26/19 | | 48,600,000 | 48,522,473 |
| DNB Bank ASA: | | | |
| 1 month U.S. LIBOR + 0.100% 2.3441% 10/3/19 (b)(c) | | 60,000,000 | 60,003,444 |
| yankee 1.98% 2/28/20 | | 25,000,000 | 24,746,210 |
| ING U.S. Funding LLC: | | | |
| 1 month U.S. LIBOR + 0.100% 2.3128% 11/8/19 (b)(c) | | 49,500,000 | 49,503,411 |
| 1 month U.S. LIBOR + 0.120% 2.3313% 3/9/20 (b)(c) | | 49,650,000 | 49,649,935 |
| Natexis Banques Populaires New York Branch yankee 2.65% 10/1/19 | | 49,700,000 | 49,606,743 |
| Royal Bank of Canada: | | | |
| 1 month U.S. LIBOR + 0.130% 2.3413% 3/9/20 (b)(c) | | 50,000,000 | 49,980,735 |
| 1 month U.S. LIBOR + 0.180% 2.3751% 4/15/20 (b)(c) | | 49,650,000 | 49,638,506 |
| Sempra Global: | | | |
| 2.3% 9/23/19 | | 9,250,000 | 9,235,829 |
| 2.35% 12/2/19 | | 43,650,000 | 43,383,984 |
| 2.44% 9/17/19 | | 30,750,000 | 30,714,853 |
| 2.48% 10/17/19 | | 50,150,000 | 49,994,736 |
| 2.5% 10/18/19 | | 25,000,000 | 24,920,953 |
| Sumitomo Mitsui Trust Bank Ltd. yankee 2.49% 9/26/19 | | 30,000,000 | 29,952,459 |
| Suncor Energy, Inc. yankee 2.32% 11/12/19 | | 18,150,000 | 18,063,072 |
| The Toronto-Dominion Bank: | | | |
| 3 month U.S. LIBOR + 0.030% 2.2693% 2/6/20 (b)(c) | | 50,000,000 | 49,999,825 |
| yankee 2.57% 10/15/19 | | 45,600,000 | 45,477,172 |
| Toyota Motor Credit Corp.: | | | |
| 1 month U.S. LIBOR + 0.120% 2.3151% 12/11/19 (b)(c) | | 20,000,000 | 20,002,222 |
| 1 month U.S. LIBOR + 0.120% 2.3151% 12/12/19 (b)(c) | | 5,000,000 | 5,000,530 |
| TransCanada PipeLines Ltd.: | | | |
| 2.42% 11/1/19 | | 49,750,000 | 49,547,144 |
| 2.55% 9/23/19 | | 44,700,000 | 44,631,520 |
| Tyson Foods, Inc. 2.25% 9/3/19 | | 15,000,000 | 14,996,246 |
| UBS AG London Branch: | | | |
| 3 month U.S. LIBOR + 0.040% 2.4261% 12/20/19 (b)(c) | | 49,650,000 | 49,649,881 |
| yankee: | | | |
| 2.35% 1/24/20 | | 32,000,000 | 31,736,054 |
| 2.35% 1/29/20 | | 30,000,000 | 29,744,259 |
| Ventas Realty LP 2.3% 9/5/19 | | 4,000,000 | 3,998,495 |
| TOTAL COMMERCIAL PAPER | | | |
| (Cost $1,526,221,640) | | | 1,526,387,235 |
|
| Master Notes - 0.9% | | | |
| Toyota Motor Credit Corp. 1 week U.S. LIBOR + 0.300% 2.4371% 2/28/20 (b)(c)(d) | | | |
| (Cost $111,000,000) | | 111,000,000 | 111,000,000 |
| | | Shares | Value |
|
| Money Market Funds - 7.1% | | | |
| Fidelity Cash Central Fund 2.13% (e) | | | |
| (Cost $863,826,528) | | 863,706,662 | 863,879,403 |
| | | Maturity Amount | Value |
|
| Repurchase Agreements - 1.7% | | | |
| With: | | | |
| Mizuho Securities U.S.A., Inc. at: | | | |
| 2.48%, dated 8/21/19 due 2/18/20 (Collateralized by Mortgage Loan Obligations valued at $76,365,992, 0.00% - 5.58%, 6/15/35 - 6/12/48) | | 68,442,897 | 67,600,000 |
| 2.67%, dated 8/1/19 due 1/28/20 (Collateralized by Mortgage Loan Obligations valued at $36,000,558, 4.40% - 6.69%, 12/16/30 - 3/17/49) | | 34,200,563 | 33,750,000 |
| 3.17%, dated 3/22/19 due 9/18/19 (Collateralized by Mortgage Loan Obligations valued at $43,766,323, 3.25% - 6.73%, 12/16/30 - 12/17/47) | | 40,329,245 | 39,699,698 |
| Morgan Stanley & Co., Inc. at 2.81%, dated: | | | |
| 6/11/19 due 9/10/19 (Collateralized by U.S. Government Obligations valued at $31,373,656, 0.00% - 3.90%, 9/12/19 - 8/20/49)(b)(c)(f) | | 30,464,103 | 30,250,000 |
| 8/5/19 due 11/4/19 (Collateralized by Equity Securities valued at $36,531,153)(b)(c)(f) | | 33,988,875 | 33,750,000 |
| TOTAL REPURCHASE AGREEMENTS | | | |
| (Cost $205,050,000) | | | 205,049,698 |
| TOTAL INVESTMENT IN SECURITIES - 99.8% | | | |
| (Cost $12,085,432,933) | | | 12,101,776,954 |
| NET OTHER ASSETS (LIABILITIES) - 0.2% | | | 27,617,543 |
| NET ASSETS - 100% | | | $12,129,394,497 |
Legend
(a) Security exempt from registration under Rule 144A of the Securities Act of 1933. These securities may be resold in transactions exempt from registration, normally to qualified institutional buyers. At the end of the period, the value of these securities amounted to $1,721,345,382 or 14.2% of net assets.
(b) Coupon rates for floating and adjustable rate securities reflect the rates in effect at period end.
(c) Coupon is indexed to a floating interest rate which may be multiplied by a specified factor and/or subject to caps or floors.
(d) Restricted securities - Investment in securities not registered under the Securities Act of 1933 (excluding 144A issues). At the end of the period, the value of restricted securities (excluding 144A issues) amounted to $111,000,000 or 0.9% of net assets.
(e) Affiliated fund that is generally available only to investment companies and other accounts managed by Fidelity Investments. The rate quoted is the annualized seven-day yield of the fund at period end. A complete unaudited listing of the fund's holdings as of its most recent quarter end is available upon request. In addition, each Fidelity Central Fund's financial statements are available on the SEC's website or upon request.
(f) The maturity amount is based on the rate at period end.
Additional information on each restricted holding is as follows:
| Security | Acquisition Date | Acquisition Cost |
| Toyota Motor Credit Corp. 1 week U.S. LIBOR + 0.300% 2.4371% 2/28/20 | 6/3/19 | $111,000,000 |
Affiliated Central Funds
Information regarding fiscal year to date income earned by the Fund from investments in Fidelity Central Funds is as follows:
| Fund | Income earned |
| Fidelity Cash Central Fund | $19,694,628 |
| Total | $19,694,628 |
Amounts in the income column in the above table include any capital gain distributions from underlying funds, which are presented in the corresponding line-item in the Statement of Operations, if applicable.
Investment Valuation
The following is a summary of the inputs used, as of August 31, 2019, involving the Fund's assets and liabilities carried at fair value. The inputs or methodology used for valuing securities may not be an indication of the risk associated with investing in those securities. For more information on valuation inputs, and their aggregation into the levels used below, please refer to the Investment Valuation section in the accompanying Notes to Financial Statements.
| | Valuation Inputs at Reporting Date: |
| Description | Total | Level 1 | Level 2 | Level 3 |
| Investments in Securities: | | | | |
| Corporate Bonds | $7,722,859,007 | $-- | $7,722,859,007 | $-- |
| U.S. Government and Government Agency Obligations | 419,759,429 | -- | 419,759,429 | -- |
| Bank Notes | 114,847,431 | -- | 114,847,431 | -- |
| Certificates of Deposit | 1,137,994,751 | -- | 1,137,994,751 | -- |
| Commercial Paper | 1,526,387,235 | -- | 1,526,387,235 | -- |
| Master Notes | 111,000,000 | -- | 111,000,000 | -- |
| Money Market Funds | 863,879,403 | 863,879,403 | -- | -- |
| Repurchase Agreements | 205,049,698 | -- | 205,049,698 | -- |
| Total Investments in Securities: | $12,101,776,954 | $863,879,403 | $11,237,897,551 | $-- |
Other Information
Distribution of investments by country or territory of incorporation, as a percentage of Total Net Assets, is as follows (Unaudited):
| United States of America | 74.9% |
| Canada | 9.3% |
| United Kingdom | 5.3% |
| France | 2.6% |
| Japan | 2.1% |
| Sweden | 1.5% |
| Netherlands | 1.4% |
| Others (Individually Less Than 1%) | 2.9% |
| | 100.0% |
See accompanying notes which are an integral part of the financial statements.
Financial Statements
Statement of Assets and Liabilities
| | | August 31, 2019 |
| Assets | | |
Investment in securities, at value (including repurchase agreements of $205,049,698) — See accompanying schedule:
Unaffiliated issuers (cost $11,221,606,405) | $11,237,897,551 | |
| Fidelity Central Funds (cost $863,826,528) | 863,879,403 | |
| Total Investment in Securities (cost $12,085,432,933) | | $12,101,776,954 |
| Receivable for fund shares sold | | 19,058,298 |
| Interest receivable | | 38,316,933 |
| Distributions receivable from Fidelity Central Funds | | 1,565,585 |
| Receivable from investment adviser for expense reductions | | 840,340 |
| Total assets | | 12,161,558,110 |
| Liabilities | | |
| Payable for investments purchased | $5,981,250 | |
| Payable for fund shares redeemed | 13,223,118 | |
| Distributions payable | 9,331,325 | |
| Accrued management fee | 3,012,122 | |
| Other affiliated payables | 615,798 | |
| Total liabilities | | 32,163,613 |
| Net Assets | | $12,129,394,497 |
| Net Assets consist of: | | |
| Paid in capital | | $12,113,438,365 |
| Total distributable earnings (loss) | | 15,956,132 |
| Net Assets | | $12,129,394,497 |
| Net Asset Value and Maximum Offering Price | | |
| Conservative Income Bond: | | |
| Net Asset Value, offering price and redemption price per share ($2,757,403,491 ÷ 274,540,194 shares) | | $10.04 |
| Institutional Class: | | |
| Net Asset Value, offering price and redemption price per share ($9,371,991,006 ÷ 933,120,166 shares) | | $10.04 |
See accompanying notes which are an integral part of the financial statements.
Statement of Operations
| | | Year ended August 31, 2019 |
| Investment Income | | |
| Interest | | $299,337,608 |
| Income from Fidelity Central Funds | | 19,694,628 |
| Total income | | 319,032,236 |
| Expenses | | |
| Management fee | $34,028,654 | |
| Transfer agent fees | 6,964,950 | |
| Independent trustees' fees and expenses | 51,138 | |
| Commitment fees | 29,593 | |
| Total expenses before reductions | 41,074,335 | |
| Expense reductions | (10,059,339) | |
| Total expenses after reductions | | 31,014,996 |
| Net investment income (loss) | | 288,017,240 |
| Realized and Unrealized Gain (Loss) | | |
| Net realized gain (loss) on: | | |
| Investment securities: | | |
| Unaffiliated issuers | 101,274 | |
| Fidelity Central Funds | (26,041) | |
| Total net realized gain (loss) | | 75,233 |
| Change in net unrealized appreciation (depreciation) on: | | |
| Investment securities: | | |
| Unaffiliated issuers | 7,128,143 | |
| Fidelity Central Funds | 26,041 | |
| Total change in net unrealized appreciation (depreciation) | | 7,154,184 |
| Net gain (loss) | | 7,229,417 |
| Net increase (decrease) in net assets resulting from operations | | $295,246,657 |
See accompanying notes which are an integral part of the financial statements.
Statement of Changes in Net Assets
| | Year ended August 31, 2019 | Year ended August 31, 2018 |
| Increase (Decrease) in Net Assets | | |
| Operations | | |
| Net investment income (loss) | $288,017,240 | $159,578,154 |
| Net realized gain (loss) | 75,233 | 313,537 |
| Change in net unrealized appreciation (depreciation) | 7,154,184 | (2,559,662) |
| Net increase (decrease) in net assets resulting from operations | 295,246,657 | 157,332,029 |
| Distributions to shareholders | (287,994,498) | – |
| Distributions to shareholders from net investment income | – | (159,528,195) |
| Total distributions | (287,994,498) | (159,528,195) |
| Share transactions - net increase (decrease) | 1,768,560,662 | 2,909,584,492 |
| Total increase (decrease) in net assets | 1,775,812,821 | 2,907,388,326 |
| Net Assets | | |
| Beginning of period | 10,353,581,676 | 7,446,193,350 |
| End of period | $12,129,394,497 | $10,353,581,676 |
| Other Information | | |
| Distributions in excess of net investment income end of period | | $(487,673) |
See accompanying notes which are an integral part of the financial statements.
Financial Highlights
Fidelity Conservative Income Bond Fund
| Years ended August 31, | 2019 | 2018 | 2017 | 2016 | 2015 |
| Selected Per–Share Data | | | | | |
| Net asset value, beginning of period | $10.04 | $10.04 | $10.03 | $10.02 | $10.04 |
| Income from Investment Operations | | | | | |
| Net investment income (loss)A | .247 | .180 | .106 | .073 | .034 |
| Net realized and unrealized gain (loss) | –B | (.004) | .011 | .010 | (.018) |
| Total from investment operations | .247 | .176 | .117 | .083 | .016 |
| Distributions from net investment income | (.247) | (.176) | (.105) | (.072) | (.034) |
| Distributions from net realized gain | – | – | (.002) | (.001) | (.002) |
| Total distributions | (.247) | (.176) | (.107) | (.073) | (.036) |
| Net asset value, end of period | $10.04 | $10.04 | $10.04 | $10.03 | $10.02 |
| Total ReturnC | 2.49% | 1.77% | 1.17% | .83% | .16% |
| Ratios to Average Net AssetsD,E | | | | | |
| Expenses before reductions | .40% | .40% | .40% | .40% | .40% |
| Expenses net of fee waivers, if any | .35% | .35% | .35% | .36% | .40% |
| Expenses net of all reductions | .35% | .35% | .35% | .36% | .40% |
| Net investment income (loss) | 2.46% | 1.80% | 1.06% | .73% | .34% |
| Supplemental Data | | | | | |
| Net assets, end of period (000 omitted) | $2,757,403 | $2,432,108 | $1,818,466 | $1,416,938 | $1,047,633 |
| Portfolio turnover rateF | 36% | 40% | 45% | 54% | 44% |
A Calculated based on average shares outstanding during the period.
B Amount represents less than $.0005 per share.
C Total returns would have been lower if certain expenses had not been reduced during the applicable periods shown.
D Fees and expenses of any underlying Fidelity Central Funds are not included in the Fund's expense ratio. The Fund indirectly bears its proportionate share of the expenses of any underlying Fidelity Central Funds.
E Expense ratios reflect operating expenses of the class. Expenses before reductions do not reflect amounts reimbursed by the investment adviser or reductions from expense offset arrangements and do not represent the amount paid by the class during periods when reimbursements or reductions occur. Expenses net of fee waivers reflect expenses after reimbursement by the investment adviser but prior to reductions from expense offset arrangements. Expenses net of all reductions represent the net expenses paid by the class.
F Amount does not include the portfolio activity of any underlying Fidelity Central Funds.
See accompanying notes which are an integral part of the financial statements.
Fidelity Conservative Income Bond Fund Institutional Class
| Years ended August 31, | 2019 | 2018 | 2017 | 2016 | 2015 |
| Selected Per–Share Data | | | | | |
| Net asset value, beginning of period | $10.04 | $10.04 | $10.03 | $10.02 | $10.04 |
| Income from Investment Operations | | | | | |
| Net investment income (loss)A | .257 | .190 | .116 | .083 | .044 |
| Net realized and unrealized gain (loss) | –B | (.004) | .011 | .010 | (.018) |
| Total from investment operations | .257 | .186 | .127 | .093 | .026 |
| Distributions from net investment income | (.257) | (.186) | (.115) | (.082) | (.044) |
| Distributions from net realized gain | – | – | (.002) | (.001) | (.002) |
| Total distributions | (.257) | (.186) | (.117) | (.083) | (.046) |
| Net asset value, end of period | $10.04 | $10.04 | $10.04 | $10.03 | $10.02 |
| Total ReturnC | 2.59% | 1.87% | 1.27% | .93% | .26% |
| Ratios to Average Net AssetsD,E | | | | | |
| Expenses before reductions | .35% | .35% | .35% | .35% | .35% |
| Expenses net of fee waivers, if any | .25% | .25% | .25% | .26% | .30% |
| Expenses net of all reductions | .25% | .25% | .25% | .26% | .30% |
| Net investment income (loss) | 2.56% | 1.90% | 1.16% | .83% | .44% |
| Supplemental Data | | | | | |
| Net assets, end of period (000 omitted) | $9,371,991 | $7,921,474 | $5,627,727 | $3,912,804 | $2,687,926 |
| Portfolio turnover rateF | 36% | 40% | 45% | 54% | 44% |
A Calculated based on average shares outstanding during the period.
B Amount represents less than $.0005 per share.
C Total returns would have been lower if certain expenses had not been reduced during the applicable periods shown.
D Fees and expenses of any underlying Fidelity Central Funds are not included in the Fund's expense ratio. The Fund indirectly bears its proportionate share of the expenses of any underlying Fidelity Central Funds.
E Expense ratios reflect operating expenses of the class. Expenses before reductions do not reflect amounts reimbursed by the investment adviser or reductions from expense offset arrangements and do not represent the amount paid by the class during periods when reimbursements or reductions occur. Expenses net of fee waivers reflect expenses after reimbursement by the investment adviser but prior to reductions from expense offset arrangements. Expenses net of all reductions represent the net expenses paid by the class.
F Amount does not include the portfolio activity of any underlying Fidelity Central Funds.
See accompanying notes which are an integral part of the financial statements.
Notes to Financial Statements
For the period ended August 31, 2019
1. Organization.
Fidelity Conservative Income Bond Fund (the Fund) is a fund of Fidelity Salem Street Trust (the Trust) and is authorized to issue an unlimited number of shares. The Trust is registered under the Investment Company Act of 1940, as amended (the 1940 Act), as an open-end management investment company organized as a Massachusetts business trust. The Fund offers Conservative Income Bond and Institutional Class shares, each of which has equal rights as to assets and voting privileges. Each class has exclusive voting rights with respect to matters that affect that class.
2. Investments in Fidelity Central Funds.
The Fund invests in Fidelity Central Funds, which are open-end investment companies generally available only to other investment companies and accounts managed by the investment adviser and its affiliates. The Fund's Schedule of Investments lists each of the Fidelity Central Funds held as of period end, if any, as an investment of the Fund, but does not include the underlying holdings of each Fidelity Central Fund. As an Investing Fund, the Fund indirectly bears its proportionate share of the expenses of the underlying Fidelity Central Funds.
The Money Market Central Funds seek preservation of capital and current income and are managed by Fidelity Investments Money Management, Inc. (FIMM), an affiliate of the investment adviser. Annualized expenses of the Money Market Central Funds as of their most recent shareholder report date ranged from less than .005% to .01%.
A complete unaudited list of holdings for each Fidelity Central Fund is available upon request or at the Securities and Exchange Commission (the SEC) website at www.sec.gov. In addition, the financial statements of the Fidelity Central Funds, which are not covered by the Fund's Report of Independent Registered Public Accounting Firm, are available on the SEC website or upon request.
3. Significant Accounting Policies.
The Fund is an investment company and applies the accounting and reporting guidance of the Financial Accounting Standards Board (FASB) Accounting Standards Codification Topic 946 Financial Services – Investments Companies. The financial statements have been prepared in conformity with accounting principles generally accepted in the United States of America (GAAP), which require management to make certain estimates and assumptions at the date of the financial statements. Actual results could differ from those estimates. Subsequent events, if any, through the date that the financial statements were issued have been evaluated in the preparation of the financial statements. The following summarizes the significant accounting policies of the Fund:
Investment Valuation. Investments are valued as of 4:00 p.m. Eastern time on the last calendar day of the period. The Board of Trustees (the Board) has delegated the day to day responsibility for the valuation of the Fund's investments to the Fair Value Committee (the Committee) established by the Fund's investment adviser. In accordance with valuation policies and procedures approved by the Board, the Fund attempts to obtain prices from one or more third party pricing vendors or brokers to value its investments. When current market prices, quotations or currency exchange rates are not readily available or reliable, investments will be fair valued in good faith by the Committee, in accordance with procedures adopted by the Board. Factors used in determining fair value vary by investment type and may include market or investment specific events, changes in interest rates and credit quality. The frequency with which these procedures are used cannot be predicted and they may be utilized to a significant extent. The Committee oversees the Fund's valuation policies and procedures and reports to the Board on the Committee's activities and fair value determinations. The Board monitors the appropriateness of the procedures used in valuing the Fund's investments and ratifies the fair value determinations of the Committee.
The Fund categorizes the inputs to valuation techniques used to value its investments into a disclosure hierarchy consisting of three levels as shown below:
- Level 1 – quoted prices in active markets for identical investments
- Level 2 – other significant observable inputs (including quoted prices for similar investments, interest rates, prepayment speeds, etc.)
- Level 3 – unobservable inputs (including the Fund's own assumptions based on the best information available)
Valuation techniques used to value the Fund's investments by major category are as follows:
Debt securities, including restricted securities, are valued based on evaluated prices received from third party pricing vendors or from brokers who make markets in such securities. Corporate bonds, bank notes, U.S. government and government agency obligations, commercial paper, certificates of deposit, master notes and other Short-Term securities are valued by pricing vendors who utilize matrix pricing which considers yield or price of bonds of comparable quality, coupon, maturity and type or by broker-supplied prices. When independent prices are unavailable or unreliable, debt securities may be valued utilizing pricing methodologies which consider similar factors that would be used by third party pricing vendors. Debt securities are generally categorized as Level 2 in the hierarchy but may be Level 3 depending on the circumstances.
Investments in open-end mutual funds, including the Fidelity Central Funds, are valued at their closing net asset value (NAV) each business day and are categorized as Level 1 in the hierarchy. Short-term securities with remaining maturities of sixty days or less may be valued at amortized cost, which approximates fair value, and are categorized as Level 2 in the hierarchy.
Changes in valuation techniques may result in transfers in or out of an assigned level within the disclosure hierarchy. The aggregate value of investments by input level as of August 31, 2019 is included at the end of the Fund's Schedule of Investments.
Investment Transactions and Income. For financial reporting purposes, the Fund's investment holdings and NAV include trades executed through the end of the last business day of the period. The NAV per share for processing shareholder transactions is calculated as of the close of business of the New York Stock Exchange (NYSE), normally 4:00 p.m. Eastern time and includes trades executed through the end of the prior business day. Gains and losses on securities sold are determined on the basis of identified cost. Income and capital gain distributions from Fidelity Central Funds, if any, are recorded on the ex-dividend date. Interest income is accrued as earned and includes coupon interest and amortization of premium and accretion of discount on debt securities as applicable. Debt obligations may be placed on non-accrual status and related interest income may be reduced by ceasing current accruals and writing off interest receivables when the collection of all or a portion of interest has become doubtful based on consistently applied procedures. A debt obligation is removed from non-accrual status when the issuer resumes interest payments or when collectability of interest is reasonably assured.
Class Allocations and Expenses. Investment income, realized and unrealized capital gains and losses, common expenses of the Fund, and certain fund-level expense reductions, if any, are allocated daily on a pro-rata basis to each class based on the relative net assets of each class to the total net assets of the Fund. Each class differs with respect to transfer agent fees incurred. Certain expense reductions may also differ by class. For the reporting period, the allocated portion of income and expenses to each class as a percent of its average net assets may vary due to the timing of recording these transactions in relation to fluctuating net assets of the classes. Expenses directly attributable to a fund are charged to that fund. Expenses attributable to more than one fund are allocated among the respective funds on the basis of relative net assets or other appropriate methods. Expense estimates are accrued in the period to which they relate and adjustments are made when actual amounts are known.
Income Tax Information and Distributions to Shareholders. Each year, the Fund intends to qualify as a regulated investment company under Subchapter M of the Internal Revenue Code, including distributing substantially all of its taxable income and realized gains. As a result, no provision for U.S. Federal income taxes is required. As of August 31, 2019, the Fund did not have any unrecognized tax benefits in the financial statements; nor is the Fund aware of any tax positions for which it is reasonably possible that the total amounts of unrecognized tax benefits will significantly change in the next twelve months. The Fund files a U.S. federal tax return, in addition to state and local tax returns as required. The Fund's federal income tax returns are subject to examination by the Internal Revenue Service (IRS) for a period of three fiscal years after they are filed. State and local tax returns may be subject to examination for an additional fiscal year depending on the jurisdiction.
Distributions are declared and recorded daily and paid monthly from net investment income. Distributions from realized gains, if any, are declared and recorded on the ex-dividend date. Income and capital gain distributions are declared separately for each class. Income and capital gain distributions are determined in accordance with income tax regulations, which may differ from GAAP.
Capital accounts within the financial statements are adjusted for permanent book-tax differences. These adjustments have no impact on net assets or the results of operations. Capital accounts are not adjusted for temporary book-tax differences which will reverse in a subsequent period.
Book-tax differences are primarily due to losses deferred due to wash sales.
As of period end, the cost and unrealized appreciation (depreciation) in securities, and derivatives if applicable, for federal income tax purposes were as follows:
| Gross unrealized appreciation | $17,918,074 |
| Gross unrealized depreciation | (1,574,053) |
| Net unrealized appreciation (depreciation) | $16,344,021 |
| Tax Cost | $12,085,432,933 |
The tax-based components of distributable earnings as of period end were as follows:
| Net unrealized appreciation (depreciation) on securities and other investments | $16,344,021 |
The tax character of distributions paid was as follows:
| | August 31, 2019 | August 31, 2018 |
| Ordinary Income | $287,994,498 | $ 159,528,195 |
Repurchase Agreements. Pursuant to an Exemptive Order issued by the SEC, the Fund along with other registered investment companies having management contracts with Fidelity Management & Research Company (FMR), or other affiliated entities of FMR, are permitted to transfer uninvested cash balances into joint trading accounts which are then invested in repurchase agreements. The Fund may also invest directly with institutions in repurchase agreements. Repurchase agreements may be collateralized by government or non-government securities. Upon settlement date, collateral is held in segregated accounts with custodian banks and may be obtained in the event of a default of the counterparty. The Fund monitors, on a daily basis, the value of the collateral to ensure it is at least equal to the principal amount of the repurchase agreement (including accrued interest). In the event of a default by the counterparty, realization of the collateral proceeds could be delayed, during which time the value of the collateral may decline.
Restricted Securities. The Fund may invest in securities that are subject to legal or contractual restrictions on resale. These securities generally may be resold in transactions exempt from registration or to the public if the securities are registered. Disposal of these securities may involve time-consuming negotiations and expense, and prompt sale at an acceptable price may be difficult. Information regarding restricted securities is included at the end of the Fund's Schedule of Investments.
New Rule Issuance. During August 2018, the U.S. Securities and Exchange Commission issued Final Rule Release No. 33-10532, Disclosure Update and Simplification. This Final Rule includes amendments specific to registered investment companies that are intended to eliminate overlap in disclosure requirements between Regulation S-X and GAAP. In accordance with these amendments, certain line-items in the Funds' financial statements have been combined or removed for the current period as outlined in the table below.
| Financial Statement | Current Line-Item Presentation (As Applicable) | Prior Line-Item Presentation (As Applicable) |
| Statement of Assets and Liabilities | Total distributable earnings (loss) | Undistributed/Distributions in excess of/Accumulated net investment income (loss)
Accumulated/Undistributed net realized gain (loss)
Net unrealized appreciation (depreciation) |
| Statement of Changes in Net Assets | N/A - removed | Undistributed/Distributions in excess of/Accumulated net investment income (loss) end of period |
| Statement of Changes in Net Assets | Distributions to shareholders | Distributions to shareholders from net investment income
Distributions to shareholders from net realized gain |
| Distributions to Shareholders Note to Financial Statements | Distributions to shareholders | Distributions to shareholders from net investment income
Distributions to shareholders from net realized gain |
4. Purchases and Sales of Investments.
Purchases and sales of securities, other than short-term securities and U.S. government securities, aggregated $4,192,945,291 and $2,301,293,470, respectively.
5. Fees and Other Transactions with Affiliates.
Management Fee. Fidelity Management & Research Company (the investment adviser) and its affiliates provide the Fund with investment management related services for which the Fund pays a monthly management fee that is based on an annual rate of .30% of the Fund's average net assets. Under the management contract, the investment adviser pays all other fund-level expenses, except the compensation of the independent Trustees and certain other expenses such as interest expense, including commitment fees.
Transfer Agent Fees. Fidelity Investments Institutional Operations Company, Inc., (FIIOC), an affiliate of the investment adviser, is the transfer, dividend disbursing and shareholder servicing agent for each class of the Fund. FIIOC receives asset-based fees of .10% and .05% of average net assets for Conservative Income Bond Class and Institutional Class, respectively. FIIOC pays for typesetting, printing and mailing of shareholder reports, except proxy statements.
For the period, transfer agent fees for each class were as follows:
| | Amount |
| Conservative Income Bond | $2,587,015 |
| Institutional Class | 4,377,935 |
| | $6,964,950 |
Interfund Trades. The Fund may purchase from or sell securities to other Fidelity Funds under procedures adopted by the Board. The procedures have been designed to ensure these interfund trades are executed in accordance with Rule 17a-7 of the 1940 Act. Interfund trades are included within the respective purchases and sales amounts shown in the Purchases and Sales of Investments note.
6. Committed Line of Credit.
The Fund participates with other funds managed by the investment adviser or an affiliate in a $4.25 billion credit facility (the "line of credit") to be utilized for temporary or emergency purposes to fund shareholder redemptions or for other short-term liquidity purposes. The Fund has agreed to pay commitment fees on its pro-rata portion of the line of credit, which amounted to $29,593 and is reflected in Commitment fees on the Statement of Operations. During the period, the Fund did not borrow on this line of credit.
7. Expense Reductions.
The investment adviser contractually agreed to reimburse each class to the extent annual operating expenses exceeded certain levels of average net assets as noted in the table below. This reimbursement will remain in place through December 31, 2020. Some expenses, for example the compensation of the independent Trustees, and certain other expenses such as interest expense, including commitment fees, are excluded from this reimbursement.
The following classes were in reimbursement during the period:
| | Expense Limitations | Reimbursement |
| Conservative Income Bond | .35% | $1,292,981 |
| Institutional Class | .25% | 8,760,769 |
| | | $10,053,750 |
In addition, through arrangements with the Fund's custodian, credits realized as a result of certain uninvested cash balances were used to reduce the Fund's expenses. During the period, these credits reduced the Fund's expenses by $5,589.
8. Distributions to Shareholders.
Distributions to shareholders of each class were as follows:
| | Year ended
August 31, 2019 | Year ended
August 31, 2018 |
| Distributions to shareholders | | |
| Conservative Income Bond | $63,697,167 | $– |
| Institutional Class | 224,297,331 | – |
| Total | $287,994,498 | $– |
| From net investment income | | |
| Conservative Income Bond | $– | $36,396,057 |
| Institutional Class | – | 123,132,138 |
| Total | $– | $159,528,195 |
9. Share Transactions.
Share transactions for each class were as follows and may contain automatic conversions between classes or exchanges between affiliated funds:
| | Shares | Shares | Dollars | Dollars |
| | Year ended August 31, 2019 | Year ended August 31, 2018 | Year ended August 31, 2019 | Year ended August 31, 2018 |
| Conservative Income Bond | | | | |
| Shares sold | 188,876,672 | 189,356,458 | $1,894,249,630 | $1,900,758,129 |
| Reinvestment of distributions | 5,609,600 | 3,198,306 | 56,269,182 | 32,104,577 |
| Shares redeemed | (162,230,779) | (131,364,234) | (1,626,994,534) | (1,318,666,415) |
| Net increase (decrease) | 32,255,493 | 61,190,530 | $323,524,278 | $614,196,291 |
| Institutional Class | | | | |
| Shares sold | 578,195,162 | 609,590,552 | $5,799,806,038 | $6,118,710,290 |
| Reinvestment of distributions | 12,026,749 | 8,449,081 | 120,634,222 | 84,811,839 |
| Shares redeemed | (446,234,116) | (389,350,553) | (4,475,403,876) | (3,908,133,928) |
| Net increase (decrease) | 143,987,795 | 228,689,080 | $1,445,036,384 | $2,295,388,201 |
10. Other.
The Fund's organizational documents provide former and current trustees and officers with a limited indemnification against liabilities arising in connection with the performance of their duties to the Fund. In the normal course of business, the Fund may also enter into contracts that provide general indemnifications. The Fund's maximum exposure under these arrangements is unknown as this would be dependent on future claims that may be made against the Fund. The risk of material loss from such claims is considered remote.
Report of Independent Registered Public Accounting Firm
To the Trustees of Fidelity Salem Street Trust and Shareholders of Fidelity Conservative Income Bond Fund:
Opinion on the Financial Statements and Financial Highlights
We have audited the accompanying statement of assets and liabilities of Fidelity Conservative Income Bond Fund (the "Fund"), a fund of Fidelity Salem Street Trust, including the schedule of investments, as of August 31, 2019, the related statement of operations for the year then ended, the statement of changes in net assets for each of the two years in the period then ended, the financial highlights for each of the five years in the period then ended, and the related notes. In our opinion, the financial statements and financial highlights present fairly, in all material respects, the financial position of the Fund as of August 31, 2019, and the results of its operations for the year then ended, the changes in its net assets for each of the two years in the period then ended, and the financial highlights for each of the five years in the period then ended in conformity with accounting principles generally accepted in the United States of America.
Basis for Opinion
These financial statements and financial highlights are the responsibility of the Fund's management. Our responsibility is to express an opinion on the Fund's financial statements and financial highlights based on our audits. We are a public accounting firm registered with the Public Company Accounting Oversight Board (United States) (PCAOB) and are required to be independent with respect to the Fund in accordance with the U.S. federal securities laws and the applicable rules and regulations of the Securities and Exchange Commission and the PCAOB.
We conducted our audits in accordance with the standards of the PCAOB. Those standards require that we plan and perform the audit to obtain reasonable assurance about whether the financial statements and financial highlights are free of material misstatement, whether due to error or fraud. The Fund is not required to have, nor were we engaged to perform, an audit of its internal control over financial reporting. As part of our audits we are required to obtain an understanding of internal control over financial reporting but not for the purpose of expressing an opinion on the effectiveness of the Fund’s internal control over financial reporting. Accordingly, we express no such opinion.
Our audits included performing procedures to assess the risks of material misstatement of the financial statements and financial highlights, whether due to error or fraud, and performing procedures that respond to those risks. Such procedures included examining, on a test basis, evidence regarding the amounts and disclosures in the financial statements and financial highlights. Our audits also included evaluating the accounting principles used and significant estimates made by management, as well as evaluating the overall presentation of the financial statements and financial highlights. Our procedures included confirmation of securities owned as of August 31, 2019, by correspondence with the custodians and brokers; when replies were not received from brokers, we performed other auditing procedures. We believe that our audits provide a reasonable basis for our opinion.
/s/ Deloitte & Touche LLP
Boston, Massachusetts
October 15, 2019
We have served as the auditor of one or more of the Fidelity investment companies since 1999.
Trustees and Officers
The Trustees, Members of the Advisory Board (if any), and officers of the trust and fund, as applicable, are listed below. The Board of Trustees governs the fund and is responsible for protecting the interests of shareholders. The Trustees are experienced executives who meet periodically throughout the year to oversee the fund's activities, review contractual arrangements with companies that provide services to the fund, oversee management of the risks associated with such activities and contractual arrangements, and review the fund's performance. Except for Jonathan Chiel, each of the Trustees oversees 276 funds. Mr.Chiel oversees 170 funds.
The Trustees hold office without limit in time except that (a) any Trustee may resign; (b) any Trustee may be removed by written instrument, signed by at least two-thirds of the number of Trustees prior to such removal; (c) any Trustee who requests to be retired or who has become incapacitated by illness or injury may be retired by written instrument signed by a majority of the other Trustees; and (d) any Trustee may be removed at any special meeting of shareholders by a two-thirds vote of the outstanding voting securities of the trust. Each Trustee who is not an interested person (as defined in the 1940 Act) of the trust and the fund is referred to herein as an Independent Trustee. Each Independent Trustee shall retire not later than the last day of the calendar year in which his or her 75th birthday occurs. The Independent Trustees may waive this mandatory retirement age policy with respect to individual Trustees. Officers and Advisory Board Members hold office without limit in time, except that any officer or Advisory Board Member may resign or may be removed by a vote of a majority of the Trustees at any regular meeting or any special meeting of the Trustees. Except as indicated, each individual has held the office shown or other offices in the same company for the past five years.
The fund’s Statement of Additional Information (SAI) includes more information about the Trustees. To request a free copy, call Fidelity at 1-800-544-8544
Experience, Skills, Attributes, and Qualifications of the Trustees. The Governance and Nominating Committee has adopted a statement of policy that describes the experience, qualifications, attributes, and skills that are necessary and desirable for potential Independent Trustee candidates (Statement of Policy). The Board believes that each Trustee satisfied at the time he or she was initially elected or appointed a Trustee, and continues to satisfy, the standards contemplated by the Statement of Policy. The Governance and Nominating Committee also engages professional search firms to help identify potential Independent Trustee candidates who have the experience, qualifications, attributes, and skills consistent with the Statement of Policy. From time to time, additional criteria based on the composition and skills of the current Independent Trustees, as well as experience or skills that may be appropriate in light of future changes to board composition, business conditions, and regulatory or other developments, have also been considered by the professional search firms and the Governance and Nominating Committee. In addition, the Board takes into account the Trustees' commitment and participation in Board and committee meetings, as well as their leadership of standing and ad hoc committees throughout their tenure.
In determining that a particular Trustee was and continues to be qualified to serve as a Trustee, the Board has considered a variety of criteria, none of which, in isolation, was controlling. The Board believes that, collectively, the Trustees have balanced and diverse experience, qualifications, attributes, and skills, which allow the Board to operate effectively in governing the fund and protecting the interests of shareholders. Information about the specific experience, skills, attributes, and qualifications of each Trustee, which in each case led to the Board's conclusion that the Trustee should serve (or continue to serve) as a trustee of the fund, is provided below.
Board Structure and Oversight Function. Abigail P. Johnson is an interested person and currently serves as Chairman. The Trustees have determined that an interested Chairman is appropriate and benefits shareholders because an interested Chairman has a personal and professional stake in the quality and continuity of services provided to the fund. Independent Trustees exercise their informed business judgment to appoint an individual of their choosing to serve as Chairman, regardless of whether the Trustee happens to be independent or a member of management. The Independent Trustees have determined that they can act independently and effectively without having an Independent Trustee serve as Chairman and that a key structural component for assuring that they are in a position to do so is for the Independent Trustees to constitute a substantial majority for the Board. The Independent Trustees also regularly meet in executive session. Arthur E. Johnson serves as Chairman of the Independent Trustees and as such (i) acts as a liaison between the Independent Trustees and management with respect to matters important to the Independent Trustees and (ii) with management prepares agendas for Board meetings.
Fidelity® funds are overseen by different Boards of Trustees. The fund's Board oversees Fidelity's investment-grade bond, money market, asset allocation and certain equity funds, and other Boards oversee Fidelity's high income and other equity funds. The asset allocation funds may invest in Fidelity® funds that are overseen by such other Boards. The use of separate Boards, each with its own committee structure, allows the Trustees of each group of Fidelity® funds to focus on the unique issues of the funds they oversee, including common research, investment, and operational issues. On occasion, the separate Boards establish joint committees to address issues of overlapping consequences for the Fidelity® funds overseen by each Board.
The Trustees operate using a system of committees to facilitate the timely and efficient consideration of all matters of importance to the Trustees, the fund, and fund shareholders and to facilitate compliance with legal and regulatory requirements and oversight of the fund's activities and associated risks. The Board, acting through its committees, has charged FMR and its affiliates with (i) identifying events or circumstances the occurrence of which could have demonstrably adverse effects on the fund's business and/or reputation; (ii) implementing processes and controls to lessen the possibility that such events or circumstances occur or to mitigate the effects of such events or circumstances if they do occur; and (iii) creating and maintaining a system designed to evaluate continuously business and market conditions in order to facilitate the identification and implementation processes described in (i) and (ii) above. Because the day-to-day operations and activities of the fund are carried out by or through FMR, its affiliates, and other service providers, the fund's exposure to risks is mitigated but not eliminated by the processes overseen by the Trustees. While each of the Board's committees has responsibility for overseeing different aspects of the fund's activities, oversight is exercised primarily through the Operations and Audit Committees. In addition, an ad hoc Board committee of Independent Trustees has worked with FMR to enhance the Board's oversight of investment and financial risks, legal and regulatory risks, technology risks, and operational risks, including the development of additional risk reporting to the Board. Appropriate personnel, including but not limited to the fund's Chief Compliance Officer (CCO), FMR's internal auditor, the independent accountants, the fund's Treasurer and portfolio management personnel, make periodic reports to the Board's committees, as appropriate, including an annual review of Fidelity's risk management program for the Fidelity® funds. The responsibilities of each standing committee, including their oversight responsibilities, are described further under "Standing Committees of the Trustees."
Interested Trustees*:
Correspondence intended for a Trustee who is an interested person may be sent to Fidelity Investments, 245 Summer Street, Boston, Massachusetts 02210.
Name, Year of Birth; Principal Occupations and Other Relevant Experience+
Jonathan Chiel (1957)
Year of Election or Appointment: 2016
Trustee
Mr. Chiel also serves as Trustee of other Fidelity® funds. Mr. Chiel is Executive Vice President and General Counsel for FMR LLC (diversified financial services company, 2012-present). Previously, Mr. Chiel served as general counsel (2004-2012) and senior vice president and deputy general counsel (2000-2004) for John Hancock Financial Services; a partner with Choate, Hall & Stewart (1996-2000) (law firm); and an Assistant United States Attorney for the United States Attorney’s Office of the District of Massachusetts (1986-95), including Chief of the Criminal Division (1993-1995). Mr. Chiel is a director on the boards of the Boston Bar Foundation and the Maimonides School.
Abigail P. Johnson (1961)
Year of Election or Appointment: 2009
Trustee
Chairman of the Board of Trustees
Ms. Johnson also serves as Trustee of other Fidelity® funds. Ms. Johnson serves as Chairman (2016-present), Chief Executive Officer (2014-present), and Director (2007-present) of FMR LLC (diversified financial services company), President of Fidelity Financial Services (2012-present) and President of Personal, Workplace and Institutional Services (2005-present). Ms. Johnson is Chairman and Director of FMR Co., Inc. (investment adviser firm, 2011-present) and Chairman and Director of FMR (investment adviser firm, 2011-present). Previously, Ms. Johnson served as Vice Chairman (2007-2016) and President (2013-2016) of FMR LLC, President and a Director of FMR (2001-2005), a Trustee of other investment companies advised by FMR, Fidelity Investments Money Management, Inc. (investment adviser firm), and FMR Co., Inc. (2001-2005), Senior Vice President of the Fidelity® funds (2001-2005), and managed a number of Fidelity® funds. Ms. Abigail P. Johnson and Mr. Arthur E. Johnson are not related.
Jennifer Toolin McAuliffe (1959)
Year of Election or Appointment: 2016
Trustee
Ms. McAuliffe also serves as Trustee of other Fidelity® funds. Ms. McAuliffe previously served as a Member of the Advisory Board of certain Fidelity® funds (2016) and as Co-Head of Fixed Income of Fidelity Investments Limited (now known as FIL Limited (FIL)) (diversified financial services company). Earlier roles at FIL included Director of Research for FIL’s credit and quantitative teams in London, Hong Kong and Tokyo. Ms. McAuliffe also was the Director of Research for taxable and municipal bonds at Fidelity Investments Money Management, Inc. Ms. McAuliffe is also a director or trustee of several not-for-profit entities.
* Determined to be an “Interested Trustee” by virtue of, among other things, his or her affiliation with the trust or various entities under common control with FMR.
+ The information includes the Trustee's principal occupation during the last five years and other information relating to the experience, attributes, and skills relevant to the Trustee's qualifications to serve as a Trustee, which led to the conclusion that the Trustee should serve as a Trustee for the fund.
Independent Trustees:
Correspondence intended for an Independent Trustee may be sent to Fidelity Investments, P.O. Box 55235, Boston, Massachusetts 02205-5235.
Name, Year of Birth; Principal Occupations and Other Relevant Experience+
Elizabeth S. Acton (1951)
Year of Election or Appointment: 2013
Trustee
Ms. Acton also serves as Trustee of other Fidelity® funds. Prior to her retirement in April 2012, Ms. Acton was Executive Vice President, Finance (2011-2012), Executive Vice President, Chief Financial Officer (2002-2011), and Treasurer (2004-2005) of Comerica Incorporated (financial services). Prior to joining Comerica, Ms. Acton held a variety of positions at Ford Motor Company (1983-2002), including Vice President and Treasurer (2000-2002) and Executive Vice President and Chief Financial Officer of Ford Motor Credit Company (1998-2000). Ms. Acton currently serves as a member of the Board of Directors and Audit and Finance Committees of Beazer Homes USA, Inc. (homebuilding, 2012-present). Previously, Ms. Acton served as a Member of the Advisory Board of certain Fidelity® funds (2013-2016).
Ann E. Dunwoody (1953)
Year of Election or Appointment: 2018
Trustee
General Dunwoody also serves as Trustee of other Fidelity® funds. General Dunwoody (United States Army, Retired) was the first woman in U.S. military history to achieve the rank of four-star general and prior to her retirement in 2012 held a variety of positions within the U.S. Army, including Commanding General, U.S. Army Material Command (2008-2012). She is the President of First to Four LLC (leadership and mentoring services, 2012-present). She also serves as a member of the Board of Directors and Nominating and Corporate Governance Committee of L3 Technologies, Inc. (communication, electronic, sensor, and aerospace systems, 2013-present), Board of Directors and Nomination and Corporate Governance Committees of Kforce Inc. (professional staffing services, 2016-present) and Board of Directors of Automattic Inc. (software engineering, 2018-present). Previously, General Dunwoody served as a Member of the Advisory Board of certain Fidelity® funds (2018), a member of the Board of Directors and Audit and Sustainability and Corporate Responsibility Committees of Republic Services, Inc. (waste collection, disposal and recycling, 2013-2016). Ms. Dunwoody also serves on several boards for non-profit organizations, including as a member of the Board of Directors, Chair of the Nomination and Governance Committee and member of the Audit Committee of Logistics Management Institute (consulting non-profit, 2012-present), a member of the Board of Directors of the Army Historical Foundation (2015-present), a member of the Council of Trustees for the Association of the United States Army (advocacy non-profit, 2013-present) and a member of the Board of Trustees of Florida Institute of Technology (2015-present) and ThanksUSA (military family education non-profit, 2014-present).
John Engler (1948)
Year of Election or Appointment: 2014
Trustee
Mr. Engler also serves as Trustee of other Fidelity® funds. He serves on the board of directors for Universal Forest Products (manufacturer and distributor of wood and wood-alternative products, 2003-present) and K12 Inc. (technology-based education company, 2012-present). Previously, Mr. Engler served as interim president of Michigan State University (2018-2019), a Member of the Advisory Board of certain Fidelity® funds (2014-2016), president of the Business Roundtable (2011-2017), a trustee of The Munder Funds (2003-2014), president and CEO of the National Association of Manufacturers (2004-2011), member of the Board of Trustees of the Annie E. Casey Foundation (2004-2015), and as governor of Michigan (1991-2003). He is a past chairman of the National Governors Association.
Robert F. Gartland (1951)
Year of Election or Appointment: 2010
Trustee
Mr. Gartland also serves as Trustee of other Fidelity® funds. Mr. Gartland is Chairman and an investor in Gartland & Mellina Group Corp. (consulting, 2009-present). Previously, Mr. Gartland served as a partner and investor of Vietnam Partners LLC (investments and consulting, 2008-2011). Prior to his retirement, Mr. Gartland held a variety of positions at Morgan Stanley (financial services, 1979-2007), including Managing Director (1987-2007), and Chase Manhattan Bank (1975-1978).
Arthur E. Johnson (1947)
Year of Election or Appointment: 2008
Trustee
Chairman of the Independent Trustees
Mr. Johnson also serves as Trustee of other Fidelity® funds. Mr. Johnson serves as a member of the Board of Directors of Eaton Corporation plc (diversified power management, 2009-present) and Booz Allen Hamilton (management consulting, 2011-present). Prior to his retirement, Mr. Johnson served as Senior Vice President of Corporate Strategic Development of Lockheed Martin Corporation (defense contractor, 1999-2009). Mr. Johnson previously served as Vice Chairman (2015-2018) of the Independent Trustees of certain Fidelity® funds and on the Board of Directors of IKON Office Solutions, Inc. (1999-2008), AGL Resources, Inc. (holding company, 2002-2016), and Delta Airlines (2005-2007). Mr. Arthur E. Johnson is not related to Ms. Abigail P. Johnson.
Michael E. Kenneally (1954)
Year of Election or Appointment: 2009
Trustee
Vice Chairman of the Independent Trustees
Mr. Kenneally also serves as Trustee of other Fidelity® funds. Prior to his retirement, Mr. Kenneally served as Chairman and Global Chief Executive Officer of Credit Suisse Asset Management. Before joining Credit Suisse, he was an Executive Vice President and Chief Investment Officer for Bank of America Corporation. Earlier roles at Bank of America included Director of Research, Senior Portfolio Manager and Research Analyst, and Mr. Kenneally was awarded the Chartered Financial Analyst (CFA) designation in 1991.
Marie L. Knowles (1946)
Year of Election or Appointment: 2001
Trustee
Ms. Knowles also serves as Trustee of other Fidelity® funds. Prior to Ms. Knowles' retirement in June 2000, she served as Executive Vice President and Chief Financial Officer of Atlantic Richfield Company (ARCO) (diversified energy, 1996-2000). From 1993 to 1996, she was a Senior Vice President of ARCO and President of ARCO Transportation Company (pipeline and tanker operations). Ms. Knowles currently serves as a Director and Chairman of the Audit Committee of McKesson Corporation (healthcare service, since 2002). Ms. Knowles is a member of the Board of the Santa Catalina Island Company (real estate, 2009-present). Ms. Knowles is a Member of the Investment Company Institute Board of Governors and a Member of the Governing Council of the Independent Directors Council (2014-present). She also serves as a member of the Advisory Board for the School of Engineering of the University of Southern California. Previously, Ms. Knowles served as a Director of Phelps Dodge Corporation (copper mining and manufacturing, 1994-2007), URS Corporation (engineering and construction, 2000-2003) and America West (airline, 1999-2002). Ms. Knowles previously served as Chairman (2015-2018) and Vice Chairman (2012-2015) of the Independent Trustees of certain Fidelity® funds.
Mark A. Murray (1954)
Year of Election or Appointment: 2016
Trustee
Mr. Murray also serves as Trustee of other Fidelity® funds. Mr. Murray is Vice Chairman (2013-present) of Meijer, Inc. (regional retail chain). Previously, Mr. Murray served as a Member of the Advisory Board of certain Fidelity® funds (2016) and as Co-Chief Executive Officer (2013-2016) and President (2006-2013) of Meijer, Inc. Mr. Murray serves as a member of the Board of Directors and Nuclear Review and Public Policy and Responsibility Committees of DTE Energy Company (diversified energy company, 2009-present). Mr. Murray also serves as a member of the Board of Directors of Spectrum Health (not-for-profit health system, 2015-present). Mr. Murray previously served as President of Grand Valley State University (2001-2006), Treasurer for the State of Michigan (1999-2001), Vice President of Finance and Administration for Michigan State University (1998-1999), and a member of the Board of Directors and Audit Committee and Chairman of the Nominating and Corporate Governance Committee of Universal Forest Products, Inc. (manufacturer and distributor of wood and wood-alternative products, 2004-2016). Mr. Murray is also a director or trustee of many community and professional organizations.
+ The information includes the Trustee's principal occupation during the last five years and other information relating to the experience, attributes, and skills relevant to the Trustee's qualifications to serve as a Trustee, which led to the conclusion that the Trustee should serve as a Trustee for the fund.
Advisory Board Members and Officers:
Correspondence intended for an officer may be sent to Fidelity Investments, 245 Summer Street, Boston, Massachusetts 02210. Officers appear below in alphabetical order.
Name, Year of Birth; Principal Occupation
Elizabeth Paige Baumann (1968)
Year of Election or Appointment: 2017
Anti-Money Laundering (AML) Officer
Ms. Baumann also serves as AML Officer of other funds. She is Chief AML Officer (2012-present) and Senior Vice President (2014-present) of FMR LLC (diversified financial services company) and is an employee of Fidelity Investments. Previously, Ms. Baumann served as AML Officer of the funds (2012-2016), and Vice President (2007-2014) and Deputy Anti-Money Laundering Officer (2007-2012) of FMR LLC.
Craig S. Brown (1977)
Year of Election or Appointment: 2019
Assistant Treasurer
Mr. Brown also serves as Assistant Treasurer of other funds. Mr. Brown is an employee of Fidelity Investments (2013-present).
John J. Burke III (1964)
Year of Election or Appointment: 2018
Chief Financial Officer
Mr. Burke also serves as Chief Financial Officer of other funds. Mr. Burke serves as Head of Investment Operations for Fidelity Fund and Investment Operations (2018-present) and is an employee of Fidelity Investments (1998-present). Previously Mr. Burke served as head of Asset Management Investment Operations (2012-2018).
Jonathan Davis (1968)
Year of Election or Appointment: 2010
Assistant Treasurer
Mr. Davis also serves as Assistant Treasurer of other funds. Mr. Davis serves as Assistant Treasurer of FMR Capital, Inc. (2017-present) and is an employee of Fidelity Investments. Previously, Mr. Davis served as Vice President and Associate General Counsel of FMR LLC (diversified financial services company, 2003-2010).
Adrien E. Deberghes (1967)
Year of Election or Appointment: 2010
Assistant Treasurer
Mr. Deberghes also serves as an officer of other funds. He serves as Assistant Treasurer of FMR Capital, Inc. (2017-present), Executive Vice President of Fidelity Investments Money Management, Inc. (FIMM) (investment adviser firm, 2016-present), and is an employee of Fidelity Investments (2008-present). Previously, Mr. Deberghes served as President and Treasurer of certain Fidelity® funds (2013-2018). Prior to joining Fidelity Investments, Mr. Deberghes was Senior Vice President of Mutual Fund Administration at State Street Corporation (2007-2008), Senior Director of Mutual Fund Administration at Investors Bank & Trust (2005-2007), and Director of Finance for Dunkin' Brands (2000-2005). Previously, Mr. Deberghes served in other fund officer roles.
Laura M. Del Prato (1964)
Year of Election or Appointment: 2018
President and Treasurer
Ms. Del Prato also serves as an officer of other funds. Ms. Del Prato is an employee of Fidelity Investments (2017-present). Prior to joining Fidelity Investments, Ms. Del Prato served as a Managing Director and Treasurer of the JPMorgan Mutual Funds (2014-2017). Prior to JPMorgan, Ms. Del Prato served as a partner at Cohen Fund Audit Services (accounting firm, 2012-2013) and KPMG LLP (accounting firm, 2004-2012).
Colm A. Hogan (1973)
Year of Election or Appointment: 2016
Assistant Treasurer
Mr. Hogan also serves as an officer of other funds. Mr. Hogan serves as Assistant Treasurer of FMR Capital, Inc. (2017-present) and is an employee of Fidelity Investments (2005-present). Previously, Mr. Hogan served as Assistant Treasurer of certain Fidelity® funds (2016-2018).
Cynthia Lo Bessette (1969)
Year of Election or Appointment: 2019
Secretary and Chief Legal Officer (CLO)
Ms. Lo Bessette also serves as Secretary and CLO of other funds. She is a Senior Vice President and Deputy General Counsel of FMR LLC (diversified financial services company, 2019-present), and is an employee of Fidelity Investments. Previously, Ms. Lo Bessette served as Executive Vice President, General Counsel (2016-2019) and Senior Vice President, Deputy General Counsel (2015-2016) of OppenheimerFunds (investment management company) and Deputy Chief Legal Officer (2013-2015) of Jennison Associates LLC (investment adviser firm).
Chris Maher (1972)
Year of Election or Appointment: 2013
Assistant Treasurer
Mr. Maher serves as Assistant Treasurer of other funds. Mr. Maher is Vice President of Valuation Oversight, serves as Assistant Treasurer of FMR Capital, Inc. (2017-present), and is an employee of Fidelity Investments. Previously, Mr. Maher served as Vice President of Asset Management Compliance (2013), Vice President of the Program Management Group of FMR (investment adviser firm, 2010-2013), and Vice President of Valuation Oversight (2008-2010).
John B. McGinty, Jr. (1962)
Year of Election or Appointment: 2016
Chief Compliance Officer
Mr. McGinty also serves as Chief Compliance Officer of other funds. Mr. McGinty is Senior Vice President of Asset Management Compliance for Fidelity Investments and is an employee of Fidelity Investments (2016-present). Mr. McGinty previously served as Vice President, Senior Attorney at Eaton Vance Management (investment management firm, 2015-2016), and prior to Eaton Vance as global CCO for all firm operations and registered investment companies at GMO LLC (investment management firm, 2009-2015). Before joining GMO LLC, Mr. McGinty served as Senior Vice President, Deputy General Counsel for Fidelity Investments (2007-2009).
Jason P. Pogorelec (1975)
Year of Election or Appointment: 2015
Assistant Secretary
Mr. Pogorelec also serves as Assistant Secretary of other funds. Mr. Pogorelec serves as Vice President, Associate General Counsel (2010-present) and is an employee of Fidelity Investments (2006-present).
Nancy D. Prior (1967)
Year of Election or Appointment: 2014
Vice President
Ms. Prior also serves as Vice President of other funds. Ms. Prior serves as President of Fixed Income (2014-present), President (2016-present) and Director (2014-present) of Fidelity Investments Money Management, Inc. (FIMM) (investment adviser firm), and is an employee of Fidelity Investments (2002-present). Previously, Ms. Prior served as Vice Chairman of FIAM LLC (investment adviser firm, 2014-2018), a Director of FMR Investment Management (UK) Limited (investment adviser firm, 2015-2018), President Multi-Asset Class Strategies of FMR's Global Asset Allocation Division (2017-2018), Vice President of Fidelity's Money Market Funds (2012-2014), and President, Money Market and Short Duration Bond Group of Fidelity Management & Research Company (FMR) (investment adviser firm, 2013-2014).
Stacie M. Smith (1974)
Year of Election or Appointment: 2013
Assistant Treasurer
Ms. Smith also serves as an officer of other funds. Ms. Smith serves as Assistant Treasurer of FMR Capital, Inc. (2017-present), is an employee of Fidelity Investments (2009-present), and has served in other fund officer roles. Prior to joining Fidelity Investments, Ms. Smith served as Senior Audit Manager of Ernst & Young LLP (accounting firm, 1996-2009). Previously, Ms. Smith served as Assistant Treasurer (2013-2018) and Deputy Treasurer (2013-2016) of certain Fidelity® funds.
Marc L. Spector (1972)
Year of Election or Appointment: 2016
Deputy Treasurer
Mr. Spector also serves as an officer of other funds. Mr. Spector serves as Assistant Treasurer of FMR Capital, Inc. (2017-present) and is an employee of Fidelity Investments (2016-present). Prior to joining Fidelity Investments, Mr. Spector served as Director at the Siegfried Group (accounting firm, 2013-2016), and prior to Siegfried Group as audit senior manager at Deloitte & Touche (accounting firm, 2005-2013).
Jim Wegmann (1979)
Year of Election or Appointment: 2019
Assistant Treasurer
Mr. Wegmann also serves as Assistant Treasurer of other funds. Mr. Wegmann is an employee of Fidelity Investments (2011-present).
Shareholder Expense Example
As a shareholder of the Fund, you incur two types of costs: (1) transaction costs, and (2) ongoing costs, including management fees and other Fund expenses. This Example is intended to help you understand your ongoing costs (in dollars) of investing in the Fund and to compare these costs with the ongoing costs of investing in other mutual funds.
The Example is based on an investment of $1,000 invested at the beginning of the period and held for the entire period (March 1, 2019 to August 31, 2019).
Actual Expenses
The first line of the accompanying table for each class of the Fund provides information about actual account values and actual expenses. You may use the information in this line, together with the amount you invested, to estimate the expenses that you paid over the period. Simply divide your account value by $1,000.00 (for example, an $8,600 account value divided by $1,000.00 = 8.6), then multiply the result by the number in the first line for a class of the Fund under the heading entitled "Expenses Paid During Period" to estimate the expenses you paid on your account during this period. In addition, the Fund, as a shareholder in the underlying Fidelity Central Funds, will indirectly bear its pro-rata share of the fees and expenses incurred by the underlying Fidelity Central Funds. These fees and expenses are not included in the Fund's annualized expense ratio used to calculate the expense estimate in the table below.
Hypothetical Example for Comparison Purposes
The second line of the accompanying table for each class of the Fund provides information about hypothetical account values and hypothetical expenses based on a Class' actual expense ratio and an assumed rate of return of 5% per year before expenses, which is not the Class' actual return. The hypothetical account values and expenses may not be used to estimate the actual ending account balance or expenses you paid for the period. You may use this information to compare the ongoing costs of investing in the Fund and other funds. To do so, compare this 5% hypothetical example with the 5% hypothetical examples that appear in the shareholder reports of the other funds. In addition, the Fund, as a shareholder in the underlying Fidelity Central Funds, will indirectly bear its pro-rata share of the fees and expenses incurred by the underlying Fidelity Central Funds. These fees and expenses are not included in the Fund's annualized expense ratio used to calculate the expense estimate in the table below.
Please note that the expenses shown in the table are meant to highlight your ongoing costs only and do not reflect any transaction costs. Therefore, the second line of the table is useful in comparing ongoing costs only, and will not help you determine the relative total costs of owning different funds.
| | Annualized Expense Ratio-A | Beginning
Account Value
March 1, 2019 | Ending
Account Value
August 31, 2019 | Expenses Paid
During Period-B
March 1, 2019
to August 31, 2019 |
| Conservative Income Bond | .35% | | | |
| Actual | | $1,000.00 | $1,013.60 | $1.78 |
| Hypothetical-C | | $1,000.00 | $1,023.44 | $1.79 |
| Institutional Class | .25% | | | |
| Actual | | $1,000.00 | $1,014.10 | $1.27 |
| Hypothetical-C | | $1,000.00 | $1,023.95 | $1.28 |
A Annualized expense ratio reflects expenses net of applicable fee waivers.
B Expenses are equal to each Class' annualized expense ratio, multiplied by the average account value over the period, multiplied by 184/365 (to reflect the one-half year period).
C 5% return per year before expenses
Distributions (Unaudited)
A total of 3.55% of the dividends distributed during the fiscal year was derived from interest on U.S. Government securities which is generally exempt from state income tax.
The fund designates $149,347,826 of distributions paid during the period January 1, 2019 to August 31, 2019 as qualifying to be taxed as interest-related dividends for nonresident alien shareholders.
The fund will notify shareholders in January 2020 of amounts for use in preparing 2019 income tax returns.

FCV-ANN-1019
1.924089.108
Fidelity® Corporate Bond Fund
Annual Report August 31, 2019 Includes Fidelity and Fidelity Advisor share classes |
|
Beginning on January 1, 2021, as permitted by regulations adopted by the Securities and Exchange Commission, paper copies of a fund’s shareholder reports will no longer be sent by mail, unless you specifically request paper copies of the reports from the fund or from your financial intermediary, such as a financial advisor, broker-dealer or bank. Instead, the reports will be made available on a website, and you will be notified by mail each time a report is posted and provided with a website link to access the report.
If you already elected to receive shareholder reports electronically, you will not be affected by this change and you need not take any action. You may elect to receive shareholder reports and other communications from a fund electronically, by contacting your financial intermediary. For Fidelity customers, visit Fidelity's web site or call Fidelity using the contact information listed below.
You may elect to receive all future reports in paper free of charge. If you wish to continue receiving paper copies of your shareholder reports, you may contact your financial intermediary or, if you are a Fidelity customer, visit Fidelity’s website, or call Fidelity at the applicable toll-free number listed below. Your election to receive reports in paper will apply to all funds held with the fund complex/your financial intermediary.
| Account Type | Website | Phone Number |
| Brokerage, Mutual Fund, or Annuity Contracts: | fidelity.com/mailpreferences | 1-800-343-3548 |
| Employer Provided Retirement Accounts: | netbenefits.fidelity.com/preferences (choose 'no' under Required Disclosures to continue to print) | 1-800-343-0860 |
| Advisor Sold Accounts Serviced Through Your Financial Intermediary: | Contact Your Financial Intermediary | Your Financial Intermediary's phone number |
| Advisor Sold Accounts Serviced by Fidelity: | institutional.fidelity.com | 1-877-208-0098 |
Contents
To view a fund's proxy voting guidelines and proxy voting record for the 12-month period ended June 30, visit http://www.fidelity.com/proxyvotingresults or visit the Securities and Exchange Commission's (SEC) web site at http://www.sec.gov.
You may also call 1-800-544-8544 if you’re an individual investing directly with Fidelity, call 1-800-835-5092 if you’re a plan sponsor or participant with Fidelity as your recordkeeper or call 1-877-208-0098 on institutional accounts or if you’re an advisor or invest through one to request a free copy of the proxy voting guidelines.
Standard & Poor's, S&P and S&P 500 are registered service marks of The McGraw-Hill Companies, Inc. and have been licensed for use by Fidelity Distributors Corporation.
Other third-party marks appearing herein are the property of their respective owners.
All other marks appearing herein are registered or unregistered trademarks or service marks of FMR LLC or an affiliated company. © 2019 FMR LLC. All rights reserved.
This report and the financial statements contained herein are submitted for the general information of the shareholders of the Fund. This report is not authorized for distribution to prospective investors in the Fund unless preceded or accompanied by an effective prospectus.
A fund files its complete schedule of portfolio holdings with the SEC for the first and third quarters of each fiscal year on Form N-PORT. Forms N-PORT are available on the SEC’s web site at http://www.sec.gov. A fund's Forms N-PORT may be reviewed and copied at the SEC’s Public Reference Room in Washington, DC. Information regarding the operation of the SEC's Public Reference Room may be obtained by calling 1-800-SEC-0330.
For a complete list of a fund's portfolio holdings, view the most recent holdings listing, semiannual report, or annual report on Fidelity's web site at http://www.fidelity.com, http://www.institutional.fidelity.com, or http://www.401k.com, as applicable.
NOT FDIC INSURED •MAY LOSE VALUE •NO BANK GUARANTEE
Neither the Fund nor Fidelity Distributors Corporation is a bank.
Performance: The Bottom Line
Average annual total return reflects the change in the value of an investment, assuming reinvestment of distributions from dividend income and capital gains (the profits earned upon the sale of securities that have grown in value, if any) and assuming a constant rate of performance each year. The hypothetical investment and the average annual total returns do not reflect the deduction of taxes that a shareholder would pay on fund distributions or the redemption of fund shares. During periods of reimbursement by Fidelity, a fund’s total return will be greater than it would be had the reimbursement not occurred. How a fund did yesterday is no guarantee of how it will do tomorrow.
Average Annual Total Returns
| For the periods ended August 31, 2019 | Past 1 year | Past 5 years | Life of fundA |
| Class A (incl. 4.00% sales charge) | 8.21% | 3.42% | 5.11% |
| Class M (incl. 4.00% sales charge) | 8.13% | 3.34% | 5.05% |
| Class C (incl. contingent deferred sales charge) | 10.78% | 3.46% | 4.77% |
| Fidelity® Corporate Bond Fund | 13.10% | 4.62% | 5.92% |
| Class I | 13.06% | 4.57% | 5.88% |
| Class Z | 13.08% | 4.57% | 5.88% |
A From May 4, 2010
Class C shares' contingent deferred sales charges included in the past one year, past five years, and life of fund total return figures are 1%, 0%, and 0%, respectively.
The initial offering of Class Z shares took place on October 2, 2018. Returns prior to October 2, 2018, are those of Class I.
$10,000 Over Life of Fund
Let's say hypothetically that $10,000 was invested in Fidelity® Corporate Bond Fund, a class of the fund, on May 4, 2010, when the fund started.
The chart shows how the value of your investment would have changed, and also shows how the Bloomberg Barclays U.S. Credit Bond Index performed over the same period.
| Period Ending Values |
| $17,103 | Fidelity® Corporate Bond Fund |
| $16,053 | Bloomberg Barclays U.S. Credit Bond Index |
Management's Discussion of Fund Performance
Market Recap: For the 12 months ending August 31, 2019, U.S. taxable investment-grade bonds posted their strongest trailing one-year return since 2009, driven by slower global economic growth, a maturing business cycle, trade uncertainty and, late in the period, the Fed’s dovish shift. The Bloomberg Barclays U.S. Aggregate Bond Index gained 10.17%. Market yields rose in the early fall of 2018, on expectations for higher inflation. Yields then declined and credit spreads widened in November and December, partly because of weaker U.S. manufacturing data. Yield spreads narrowed in January, as the U.S. Federal Reserve said it would be “patient” with policy rate hikes, and that future increases largely would depend on economic data. Yields continued to decline in the spring, amid international trade tension and attacks on oil tankers in the Middle East, and then tumbled further in July, when the Fed cut interest rates for the first time since 2008. The yield curve ended the period roughly flat, amid expectations for another rate cut of 25 basis points in September. Within the Bloomberg Barclays index, corporate bonds gained 13.33%, topping the 10.38% advance of U.S. Treasuries. Outside the index, U.S. corporate high-yield bonds lagged nominal U.S. Treasuries, while Treasury Inflation-Protected Securities (TIPS) gained 7.46%.
Comments from Co-Portfolio Managers David Prothro and Matthew Bartlett: For the fiscal year, the fund's share classes (excluding sales charges, if applicable) gained about 13%, roughly in line with the 12.99% return of the benchmark Bloomberg Barclays U.S. Credit Bond Index. Security selection among investment-grade corporate bonds contributed versus the benchmark the past 12 months, whereas sector positioning modestly detracted. Picks among capital goods, energy, communications and technology companies aided the fund’s relative performance. Within financials, selections among insurance companies also contributed. On the downside – and outside of corporate credit – underweighting non-U.S. sovereign bonds and holding a modest out-of-benchmark stake in U.S. Treasuries each detracted, as did the fund’s small cash position. The fund normally holds Treasuries and cash for liquidity and duration-management purposes. Elsewhere, a modest allocation to high-yield credit had a roughly neutral impact versus the benchmark. As of August 31, we think the market’s fundamental backdrop and supply-and-demand dynamics remain generally supportive. We have a more neutral view toward bond valuations, given relatively tight credit spreads. We plan to maintain an overweighted allocation to select BBB-rated issues of companies that are focusing on strengthening their credit quality.
The views expressed above reflect those of the portfolio manager(s) only through the end of the period as stated on the cover of this report and do not necessarily represent the views of Fidelity or any other person in the Fidelity organization. Any such views are subject to change at any time based upon market or other conditions and Fidelity disclaims any responsibility to update such views. These views may not be relied on as investment advice and, because investment decisions for a Fidelity fund are based on numerous factors, may not be relied on as an indication of trading intent on behalf of any Fidelity fund.
Note to shareholders: On October 1, 2019, Ben Tarlow assumed co-management responsibilities for the fund, joining David Prothro and Matthew Bartlett.
Investment Summary (Unaudited)
Quality Diversification (% of fund's net assets)
| As of August 31, 2019 |
| | U.S. Government and U.S. Government Agency Obligations | 6.0% |
| | AAA | 0.5% |
| | AA | 1.8% |
| | A | 19.0% |
| | BBB | 59.3% |
| | BB and Below | 8.8% |
| | Short-Term Investments and Net Other Assets | 4.6% |

We have used ratings from Moody's Investors Service, Inc. Where Moody's® ratings are not available, we have used S&P® ratings. All ratings are as of the date indicated and do not reflect subsequent changes.
Asset Allocation (% of fund's net assets)
| As of August 31, 2019 * |
| | Corporate Bonds | 86.5% |
| | U.S. Government and U.S. Government Agency Obligations | 6.0% |
| | Asset-Backed Securities | 0.2% |
| | Municipal Bonds | 0.5% |
| | Other Investments | 2.2% |
| | Short-Term Investments and Net Other Assets (Liabilities) | 4.6% |

* Foreign investments - 20.2%
Schedule of Investments August 31, 2019
Showing Percentage of Net Assets
| Nonconvertible Bonds - 86.5% | | | |
| | | Principal Amount | Value |
| COMMUNICATION SERVICES - 5.2% | | | |
| Diversified Telecommunication Services - 1.8% | | | |
| AT&T, Inc.: | | | |
| 4.5% 5/15/35 | | $4,270,000 | $4,751,722 |
| 4.5% 3/9/48 | | 4,800,000 | 5,239,324 |
| 4.75% 5/15/46 | | 2,316,000 | 2,589,631 |
| 5.45% 3/1/47 | | 1,000,000 | 1,226,807 |
| 5.55% 8/15/41 | | 2,700,000 | 3,263,903 |
| Verizon Communications, Inc.: | | | |
| 4.329% 9/21/28 | | 2,526,000 | 2,901,551 |
| 4.862% 8/21/46 | | 9,087,000 | 11,315,308 |
| | | | 31,288,246 |
| Entertainment - 0.2% | | | |
| The Walt Disney Co.: | | | |
| 3% 9/15/22 (a) | | 778,000 | 803,565 |
| 4.5% 2/15/21 (a) | | 1,621,000 | 1,680,205 |
| 6.9% 8/15/39 (a) | | 300,000 | 467,182 |
| 7.75% 12/1/45 (a) | | 111,000 | 195,560 |
| | | | 3,146,512 |
| Interactive Media & Services - 0.2% | | | |
| Tencent Holdings Ltd. 3.575% 4/11/26 (a) | | 3,730,000 | 3,926,233 |
| Media - 1.9% | | | |
| Charter Communications Operating LLC/Charter Communications Operating Capital Corp. 5.375% 5/1/47 | | 5,200,000 | 5,775,054 |
| Comcast Corp.: | | | |
| 3.999% 11/1/49 | | 1,587,000 | 1,795,398 |
| 4.65% 7/15/42 | | 2,200,000 | 2,684,552 |
| 4.95% 10/15/58 | | 7,630,000 | 9,907,058 |
| Fox Corp.: | | | |
| 3.666% 1/25/22 (a) | | 177,000 | 183,473 |
| 4.03% 1/25/24 (a) | | 310,000 | 332,007 |
| 4.709% 1/25/29 (a) | | 449,000 | 520,110 |
| 5.476% 1/25/39 (a) | | 443,000 | 553,536 |
| 5.576% 1/25/49 (a) | | 294,000 | 382,527 |
| Time Warner Cable, Inc.: | | | |
| 5.5% 9/1/41 | | 623,000 | 677,541 |
| 5.875% 11/15/40 | | 1,648,000 | 1,876,055 |
| 6.55% 5/1/37 | | 2,149,000 | 2,601,869 |
| 7.3% 7/1/38 | | 3,570,000 | 4,579,550 |
| | | | 31,868,730 |
| Wireless Telecommunication Services - 1.1% | | | |
| Rogers Communications, Inc. 4.1% 10/1/23 | | 4,398,000 | 4,715,460 |
| Vodafone Group PLC: | | | |
| 4.125% 5/30/25 | | 6,550,000 | 7,109,822 |
| 4.375% 5/30/28 | | 6,700,000 | 7,516,180 |
| | | | 19,341,462 |
|
| TOTAL COMMUNICATION SERVICES | | | 89,571,183 |
|
| CONSUMER DISCRETIONARY - 7.0% | | | |
| Automobiles - 1.2% | | | |
| General Motors Co.: | | | |
| 5% 4/1/35 | | 2,537,000 | 2,608,098 |
| 5.4% 4/1/48 | | 1,167,000 | 1,215,504 |
| 5.95% 4/1/49 | | 5,524,000 | 6,129,966 |
| Volkswagen Group of America Finance LLC 4.75% 11/13/28 (a) | | 8,950,000 | 10,044,608 |
| | | | 19,998,176 |
| Diversified Consumer Services - 0.9% | | | |
| Ingersoll-Rand Global Holding Co. Ltd.: | | | |
| 3.75% 8/21/28 | | 5,730,000 | 6,219,314 |
| 5.75% 6/15/43 | | 396,000 | 526,495 |
| Massachusetts Institute of Technology 3.885% 7/1/2116 | | 7,360,000 | 9,216,372 |
| | | | 15,962,181 |
| Hotels, Restaurants & Leisure - 1.6% | | | |
| McDonald's Corp.: | | | |
| 3.625% 9/1/49 | | 8,900,000 | 9,253,315 |
| 4.875% 12/9/45 | | 7,437,000 | 9,168,521 |
| Starbucks Corp. 3.8% 8/15/25 | | 8,686,000 | 9,419,968 |
| | | | 27,841,804 |
| Household Durables - 1.2% | | | |
| D.R. Horton, Inc.: | | | |
| 2.55% 12/1/20 | | 1,583,000 | 1,587,303 |
| 4% 2/15/20 | | 5,000,000 | 5,031,049 |
| Lennar Corp. 4.875% 12/15/23 | | 6,680,000 | 7,164,300 |
| Toll Brothers Finance Corp. 4.375% 4/15/23 | | 5,750,000 | 5,994,375 |
| | | | 19,777,027 |
| Multiline Retail - 0.9% | | | |
| Dollar Tree, Inc.: | | | |
| 4% 5/15/25 | | 7,000,000 | 7,399,806 |
| 4.2% 5/15/28 | | 7,100,000 | 7,566,224 |
| | | | 14,966,030 |
| Specialty Retail - 1.2% | | | |
| Lowe's Companies, Inc. 3.65% 4/5/29 | | 7,100,000 | 7,714,470 |
| O'Reilly Automotive, Inc.: | | | |
| 3.9% 6/1/29 | | 3,250,000 | 3,573,570 |
| 4.35% 6/1/28 | | 7,000,000 | 7,853,924 |
| The Home Depot, Inc. 5.95% 4/1/41 | | 941,000 | 1,352,349 |
| | | | 20,494,313 |
|
| TOTAL CONSUMER DISCRETIONARY | | | 119,039,531 |
|
| CONSUMER STAPLES - 6.3% | | | |
| Beverages - 3.0% | | | |
| Anheuser-Busch InBev Finance, Inc.: | | | |
| 4.7% 2/1/36 | | 2,258,000 | 2,628,392 |
| 4.9% 2/1/46 | | 1,075,000 | 1,278,621 |
| Anheuser-Busch InBev Worldwide, Inc.: | | | |
| 3.5% 1/12/24 | | 8,616,000 | 9,130,116 |
| 4.6% 4/15/48 | | 7,250,000 | 8,427,934 |
| 4.9% 1/23/31 | | 6,380,000 | 7,640,701 |
| Constellation Brands, Inc.: | | | |
| 3.15% 8/1/29 | | 8,250,000 | 8,513,073 |
| 3.75% 5/1/21 | | 2,000,000 | 2,045,933 |
| 4.25% 5/1/23 | | 3,315,000 | 3,556,961 |
| Heineken NV 4% 10/1/42 (a) | | 96,000 | 105,789 |
| PepsiCo, Inc. 4.25% 10/22/44 | | 6,629,000 | 8,176,582 |
| | | | 51,504,102 |
| Food Products - 1.4% | | | |
| Conagra Brands, Inc.: | | | |
| 3.8% 10/22/21 | | 6,632,000 | 6,823,260 |
| 4.6% 11/1/25 | | 8,630,000 | 9,526,773 |
| General Mills, Inc.: | | | |
| 3 month U.S. LIBOR + 0.540% 2.8623% 4/16/21 (b)(c) | | 3,967,000 | 3,969,182 |
| 3.2% 4/16/21 | | 503,000 | 511,846 |
| 3.7% 10/17/23 | | 2,358,000 | 2,494,729 |
| | | | 23,325,790 |
| Tobacco - 1.9% | | | |
| Altria Group, Inc.: | | | |
| 2.85% 8/9/22 | | 5,856,000 | 5,976,765 |
| 4.25% 8/9/42 | | 1,359,000 | 1,400,908 |
| 4.8% 2/14/29 | | 596,000 | 674,883 |
| BAT Capital Corp. 3.222% 8/15/24 | | 6,050,000 | 6,223,376 |
| Imperial Tobacco Finance PLC: | | | |
| 3.5% 7/26/26 (a) | | 8,185,000 | 8,320,937 |
| 3.75% 7/21/22 (a) | | 4,575,000 | 4,732,237 |
| 4.25% 7/21/25 (a) | | 1,134,000 | 1,209,198 |
| Philip Morris International, Inc. 4.375% 11/15/41 | | 2,100,000 | 2,353,242 |
| Reynolds American, Inc.: | | | |
| 3.25% 6/12/20 | | 235,000 | 236,783 |
| 4% 6/12/22 | | 366,000 | 382,520 |
| 4.45% 6/12/25 | | 585,000 | 633,477 |
| 5.7% 8/15/35 | | 304,000 | 353,756 |
| | | | 32,498,082 |
|
| TOTAL CONSUMER STAPLES | | | 107,327,974 |
|
| ENERGY - 11.1% | | | |
| Oil, Gas & Consumable Fuels - 11.1% | | | |
| Alberta Energy Co. Ltd.: | | | |
| 7.375% 11/1/31 | | 1,159,000 | 1,479,758 |
| 8.125% 9/15/30 | | 5,176,000 | 7,027,070 |
| Anadarko Petroleum Corp.: | | | |
| 4.85% 3/15/21 | | 6,032,000 | 6,235,805 |
| 5.55% 3/15/26 | | 744,000 | 842,721 |
| Apache Corp. 4.75% 4/15/43 | | 3,233,000 | 3,125,407 |
| Boardwalk Pipelines LP: | | | |
| 3.375% 2/1/23 | | 3,100,000 | 3,139,913 |
| 4.95% 12/15/24 | | 4,120,000 | 4,429,765 |
| Canadian Natural Resources Ltd.: | | | |
| 3.9% 2/1/25 | | 4,325,000 | 4,558,603 |
| 5.85% 2/1/35 | | 528,000 | 638,087 |
| 6.25% 3/15/38 | | 4,352,000 | 5,580,645 |
| Cenovus Energy, Inc.: | | | |
| 3.8% 9/15/23 | | 5,000,000 | 5,167,815 |
| 4.25% 4/15/27 | | 2,900,000 | 3,028,337 |
| 5.7% 10/15/19 | | 457,308 | 458,826 |
| 6.75% 11/15/39 | | 2,920,000 | 3,610,019 |
| Cheniere Corpus Christi Holdings LLC 5.875% 3/31/25 | | 6,370,000 | 7,102,550 |
| Conoco, Inc. 6.95% 4/15/29 | | 3,050,000 | 4,202,634 |
| ConocoPhillips Co. 6.5% 2/1/39 | | 4,600,000 | 6,744,137 |
| Continental Resources, Inc. 5% 9/15/22 | | 3,359,000 | 3,388,892 |
| DCP Midstream LLC: | | | |
| 4.75% 9/30/21 (a) | | 158,000 | 161,950 |
| 5.35% 3/15/20 (a) | | 10,096,000 | 10,217,152 |
| 5.85% 5/21/43 (a)(b) | | 7,500,000 | 6,656,250 |
| DCP Midstream Operating LP: | | | |
| 3.875% 3/15/23 | | 222,000 | 224,775 |
| 4.95% 4/1/22 | | 1,925,000 | 1,992,375 |
| 5.125% 5/15/29 | | 4,650,000 | 4,766,483 |
| 5.6% 4/1/44 | | 340,000 | 320,450 |
| Empresa Nacional de Petroleo 4.5% 9/14/47 (a) | | 2,750,000 | 2,985,039 |
| Enbridge Energy Partners LP 4.2% 9/15/21 | | 140,000 | 144,589 |
| Enbridge, Inc.: | | | |
| 4.25% 12/1/26 | | 425,000 | 471,074 |
| 5.5% 12/1/46 | | 3,794,000 | 4,892,955 |
| Energy Transfer Partners LP: | | | |
| 4.2% 9/15/23 | | 288,000 | 304,507 |
| 4.95% 6/15/28 | | 981,000 | 1,097,398 |
| 5.8% 6/15/38 | | 547,000 | 637,090 |
| 6% 6/15/48 | | 356,000 | 424,598 |
| Enterprise Products Operating LP: | | | |
| 2.55% 10/15/19 | | 163,000 | 162,988 |
| 3.75% 2/15/25 | | 547,000 | 586,482 |
| 4.85% 3/15/44 | | 2,023,000 | 2,356,680 |
| 4.95% 10/15/54 | | 2,437,000 | 2,918,996 |
| EQT Corp. 2.5% 10/1/20 | | 1,071,000 | 1,065,231 |
| Florida Gas Transmission Co. LLC 4.35% 7/15/25 (a) | | 5,023,000 | 5,445,691 |
| MPLX LP: | | | |
| 3.375% 3/15/23 | | 680,000 | 699,988 |
| 4.875% 12/1/24 | | 423,000 | 463,966 |
| Occidental Petroleum Corp.: | | | |
| 3 month U.S. LIBOR + 0.950% 3.137% 2/8/21 (b)(c) | | 1,446,000 | 1,452,594 |
| 3 month U.S. LIBOR + 1.250% 3.437% 8/13/21 (b)(c) | | 1,672,000 | 1,678,561 |
| 3 month U.S. LIBOR + 1.450% 3.637% 8/15/22 (b)(c) | | 10,821,000 | 10,857,726 |
| 2.6% 8/13/21 | | 443,000 | 445,944 |
| 2.7% 8/15/22 | | 391,000 | 394,849 |
| 2.9% 8/15/24 | | 1,293,000 | 1,305,092 |
| 3.2% 8/15/26 | | 174,000 | 175,800 |
| 4.3% 8/15/39 | | 80,000 | 83,713 |
| 4.4% 8/15/49 | | 80,000 | 83,442 |
| Petroleos Mexicanos: | | | |
| 5.375% 3/13/22 | | 620,000 | 633,950 |
| 5.5% 1/21/21 | | 545,000 | 556,429 |
| 6% 3/5/20 | | 74,000 | 75,064 |
| 6.375% 2/4/21 | | 3,870,000 | 3,978,360 |
| 6.5% 3/13/27 | | 6,598,000 | 6,738,826 |
| 6.875% 8/4/26 | | 2,930,000 | 3,072,105 |
| Phillips 66 Co. 4.3% 4/1/22 | | 300,000 | 317,079 |
| Plains All American Pipeline LP/PAA Finance Corp.: | | | |
| 3.85% 10/15/23 | | 5,550,000 | 5,760,924 |
| 4.65% 10/15/25 | | 6,525,000 | 6,997,244 |
| 5.75% 1/15/20 | | 3,729,000 | 3,769,542 |
| Southeast Supply Header LLC 4.25% 6/15/24 (a) | | 667,000 | 687,111 |
| Spectra Energy Partners LP: | | | |
| 3.375% 10/15/26 | | 4,629,000 | 4,809,551 |
| 4.5% 3/15/45 | | 971,000 | 1,061,739 |
| Sunoco Logistics Partner Operations LP: | | | |
| 4% 10/1/27 | | 4,515,000 | 4,766,404 |
| 5.4% 10/1/47 | | 1,951,000 | 2,176,094 |
| The Williams Companies, Inc. 5.75% 6/24/44 | | 4,911,000 | 5,885,064 |
| Western Gas Partners LP: | | | |
| 4.65% 7/1/26 | | 264,000 | 268,863 |
| 5.375% 6/1/21 | | 1,273,000 | 1,316,289 |
| Williams Partners LP 3.9% 1/15/25 | | 280,000 | 294,414 |
| | | | 189,400,464 |
| FINANCIALS - 30.4% | | | |
| Banks - 14.7% | | | |
| AIB Group PLC: | | | |
| 4.263% 4/10/25 (a)(b) | | 5,462,000 | 5,701,857 |
| 4.75% 10/12/23 (a) | | 6,700,000 | 7,095,550 |
| Bank Ireland Group PLC 4.5% 11/25/23 (a) | | 6,700,000 | 7,034,571 |
| Bank of America Corp.: | | | |
| 3 month U.S. LIBOR + 0.790% 3.2685% 3/5/24 (b)(c) | | 16,000,000 | 16,001,648 |
| 3.194% 7/23/30 (b) | | 7,750,000 | 8,092,651 |
| 3.705% 4/24/28 (b) | | 7,000,000 | 7,552,713 |
| 4% 1/22/25 | | 3,277,000 | 3,501,359 |
| Bank of Nova Scotia 4.5% 12/16/25 | | 7,405,000 | 8,128,316 |
| Barclays PLC: | | | |
| 3.65% 3/16/25 | | 4,116,000 | 4,192,805 |
| 5.088% 6/20/30 (b) | | 1,993,000 | 2,070,254 |
| BNP Paribas SA 3.375% 1/9/25 (a) | | 5,617,000 | 5,826,250 |
| BPCE SA 4% 9/12/23 (a) | | 6,500,000 | 6,878,371 |
| Citigroup, Inc.: | | | |
| 3 month U.S. LIBOR + 1.430% 3.9503% 9/1/23 (b)(c) | | 8,780,000 | 8,945,187 |
| 4.05% 7/30/22 | | 316,000 | 331,403 |
| 4.4% 6/10/25 | | 1,482,000 | 1,608,194 |
| 5.5% 9/13/25 | | 1,317,000 | 1,509,441 |
| 8.125% 7/15/39 | | 1,924,000 | 3,216,289 |
| Citizens Bank NA 3.7% 3/29/23 | | 13,300,000 | 14,003,611 |
| Citizens Financial Group, Inc. 4.15% 9/28/22 (a) | | 7,317,000 | 7,637,687 |
| Credit Suisse Group Funding Guernsey Ltd. 4.55% 4/17/26 | | 5,136,000 | 5,690,963 |
| Discover Bank 7% 4/15/20 | | 2,391,000 | 2,457,818 |
| Fifth Third Bancorp: | | | |
| 4.3% 1/16/24 | | 4,001,000 | 4,314,060 |
| 8.25% 3/1/38 | | 3,848,000 | 5,976,012 |
| HSBC Holdings PLC 4.041% 3/13/28 (b) | | 6,330,000 | 6,752,282 |
| Huntington Bancshares, Inc. 4% 5/15/25 | | 7,050,000 | 7,617,618 |
| Intesa Sanpaolo SpA 5.017% 6/26/24 (a) | | 7,245,000 | 7,426,187 |
| Lloyds Banking Group PLC: | | | |
| 2.907% 11/7/23 (b) | | 5,938,000 | 5,956,218 |
| 3.1% 7/6/21 | | 2,463,000 | 2,499,182 |
| 4.375% 3/22/28 | | 7,313,000 | 7,969,564 |
| Rabobank Nederland: | | | |
| 3.75% 7/21/26 | | 7,120,000 | 7,454,511 |
| 4.625% 12/1/23 | | 4,531,000 | 4,898,712 |
| Regions Bank 6.45% 6/26/37 | | 2,611,000 | 3,495,822 |
| Royal Bank of Canada: | | | |
| 2.55% 7/16/24 | | 10,000,000 | 10,194,262 |
| 4.65% 1/27/26 | | 1,181,000 | 1,317,301 |
| Royal Bank of Scotland Group PLC: | | | |
| 6% 12/19/23 | | 5,228,000 | 5,693,744 |
| 6.1% 6/10/23 | | 1,000,000 | 1,084,531 |
| 6.125% 12/15/22 | | 5,972,000 | 6,460,453 |
| Santander Holdings U.S.A., Inc.: | | | |
| 3.4% 1/18/23 | | 5,900,000 | 6,069,582 |
| 3.5% 6/7/24 | | 7,415,000 | 7,669,683 |
| Standard Chartered PLC 3.785% 5/21/25 (a)(b) | | 7,313,000 | 7,547,819 |
| Synovus Financial Corp. 3.125% 11/1/22 | | 5,717,000 | 5,728,434 |
| UniCredit SpA 3.75% 4/12/22 (a) | | 5,900,000 | 6,027,886 |
| | | | 249,630,801 |
| Capital Markets - 7.0% | | | |
| Ares Capital Corp. 4.25% 3/1/25 | | 5,750,000 | 5,962,639 |
| CME Group, Inc. 5.3% 9/15/43 | | 3,050,000 | 4,239,925 |
| Credit Suisse Group AG 3.574% 1/9/23 (a) | | 8,700,000 | 8,920,066 |
| Deutsche Bank AG 2.7% 7/13/20 | | 5,200,000 | 5,186,661 |
| Goldman Sachs Group, Inc.: | | | |
| 2.876% 10/31/22 (b) | | 6,000,000 | 6,082,663 |
| 3.5% 11/16/26 | | 5,750,000 | 6,018,923 |
| 3.75% 5/22/25 | | 10,750,000 | 11,463,009 |
| 3.75% 2/25/26 | | 5,000,000 | 5,326,949 |
| Merrill Lynch & Co., Inc. 6.11% 1/29/37 | | 2,269,000 | 3,037,504 |
| Moody's Corp. 5.25% 7/15/44 | | 3,386,000 | 4,365,444 |
| Morgan Stanley: | | | |
| 3.737% 4/24/24 (b) | | 6,925,000 | 7,285,654 |
| 3.875% 1/27/26 | | 5,020,000 | 5,427,204 |
| 4.3% 1/27/45 | | 948,000 | 1,122,083 |
| 4.875% 11/1/22 | | 9,466,000 | 10,183,009 |
| 5% 11/24/25 | | 8,200,000 | 9,252,083 |
| 5.5% 7/28/21 | | 1,222,000 | 1,296,572 |
| Peachtree Corners Funding Trust 3.976% 2/15/25 (a) | | 7,500,000 | 7,924,984 |
| UBS Group AG 3 month U.S. LIBOR + 1.468% 3.126% 8/13/30 (a)(b)(c) | | 9,540,000 | 9,769,300 |
| UBS Group Funding AG 3.491% 5/23/23 (a) | | 5,800,000 | 5,976,186 |
| | | | 118,840,858 |
| Consumer Finance - 2.9% | | | |
| AerCap Ireland Capital Ltd./AerCap Global Aviation Trust: | | | |
| 3.3% 1/23/23 | | 5,740,000 | 5,883,253 |
| 3.5% 5/26/22 | | 395,000 | 405,781 |
| 3.95% 2/1/22 | | 7,500,000 | 7,773,372 |
| 4.875% 1/16/24 | | 371,000 | 402,410 |
| 5% 10/1/21 | | 3,970,000 | 4,162,931 |
| Ally Financial, Inc. 4.125% 2/13/22 | | 5,560,000 | 5,768,500 |
| Discover Financial Services: | | | |
| 3.85% 11/21/22 | | 2,538,000 | 2,662,143 |
| 4.5% 1/30/26 | | 1,159,000 | 1,280,027 |
| 5.2% 4/27/22 | | 2,355,000 | 2,532,458 |
| Ford Motor Credit Co. LLC: | | | |
| 2.597% 11/4/19 | | 4,950,000 | 4,948,763 |
| 3.336% 3/18/21 | | 13,000,000 | 13,084,906 |
| Synchrony Financial 4.375% 3/19/24 | | 568,000 | 606,718 |
| | | | 49,511,262 |
| Diversified Financial Services - 1.7% | | | |
| AXA Equitable Holdings, Inc. 4.35% 4/20/28 | | 6,800,000 | 7,301,018 |
| Berkshire Hathaway Finance Corp. 4.4% 5/15/42 | | 107,000 | 130,506 |
| Brixmor Operating Partnership LP 4.125% 5/15/29 | | 1,237,000 | 1,338,219 |
| Cigna Corp.: | | | |
| 4.125% 11/15/25 | | 933,000 | 1,015,073 |
| 4.375% 10/15/28 | | 1,486,000 | 1,661,647 |
| 4.8% 8/15/38 | | 925,000 | 1,069,434 |
| 4.9% 12/15/48 | | 924,000 | 1,093,453 |
| GE Capital International Funding Co. 4.418% 11/15/35 | | 7,005,000 | 7,117,195 |
| General Electric Capital Corp. 5.875% 1/14/38 | | 150,000 | 173,250 |
| ING U.S., Inc. 5.7% 7/15/43 | | 2,607,000 | 3,398,462 |
| Voya Financial, Inc. 4.7% 1/23/48 (b) | | 5,600,000 | 5,224,800 |
| | | | 29,523,057 |
| Insurance - 4.1% | | | |
| ACE INA Holdings, Inc. 4.35% 11/3/45 | | 525,000 | 662,891 |
| AIA Group Ltd.: | | | |
| 3.6% 4/9/29 (a) | | 3,500,000 | 3,795,212 |
| 3.9% 4/6/28 (a) | | 6,785,000 | 7,468,431 |
| American International Group, Inc.: | | | |
| 4.375% 1/15/55 | | 2,685,000 | 2,926,815 |
| 4.5% 7/16/44 | | 5,833,000 | 6,668,183 |
| 5.75% 4/1/48 (b) | | 6,400,000 | 6,768,640 |
| Aon Corp. 6.25% 9/30/40 | | 253,000 | 349,258 |
| Aon PLC 4.75% 5/15/45 | | 6,000,000 | 7,258,721 |
| Five Corners Funding Trust 4.419% 11/15/23 (a) | | 4,111,000 | 4,464,273 |
| Hartford Financial Services Group, Inc. 4.3% 4/15/43 | | 1,211,000 | 1,365,533 |
| Marsh & McLennan Companies, Inc.: | | | |
| 4.375% 3/15/29 | | 977,000 | 1,122,360 |
| 4.8% 7/15/21 | | 1,643,000 | 1,711,880 |
| 4.9% 3/15/49 | | 892,000 | 1,158,076 |
| Massachusetts Mutual Life Insurance Co.: | | | |
| 4.5% 4/15/65(a) | | 2,264,000 | 2,765,243 |
| 5.375% 12/1/41 (a) | | 148,000 | 192,339 |
| Pacific LifeCorp 5.125% 1/30/43 (a) | | 1,285,000 | 1,549,007 |
| Pricoa Global Funding I 5.625% 6/15/43 (b) | | 5,000,000 | 5,358,000 |
| Principal Financial Group, Inc. 3.7% 5/15/29 | | 1,407,000 | 1,529,303 |
| Prudential Financial, Inc. 3.935% 12/7/49 | | 1,508,000 | 1,680,427 |
| Unum Group 5.75% 8/15/42 | | 3,748,000 | 4,653,750 |
| Willis Group North America, Inc. 3.6% 5/15/24 | | 6,692,000 | 6,975,206 |
| | | | 70,423,548 |
|
| TOTAL FINANCIALS | | | 517,929,526 |
|
| HEALTH CARE - 8.2% | | | |
| Biotechnology - 0.5% | | | |
| Celgene Corp. 3.9% 2/20/28 | | 7,300,000 | 8,110,188 |
| Health Care Equipment & Supplies - 1.3% | | | |
| Abbott Laboratories 4.75% 11/30/36 | | 3,700,000 | 4,634,717 |
| Becton, Dickinson & Co.: | | | |
| 3 month U.S. LIBOR + 0.875% 3.1939% 12/29/20 (b)(c) | | 2,114,000 | 2,114,613 |
| 2.894% 6/6/22 | | 1,279,000 | 1,300,099 |
| 3.363% 6/6/24 | | 4,130,000 | 4,306,387 |
| Boston Scientific Corp. 4% 3/1/28 | | 7,000,000 | 7,705,182 |
| Zimmer Biomet Holdings, Inc. 3 month U.S. LIBOR + 0.750% 3.1685% 3/19/21 (b)(c) | | 1,981,000 | 1,978,708 |
| | | | 22,039,706 |
| Health Care Providers & Services - 2.6% | | | |
| CVS Health Corp.: | | | |
| 3 month U.S. LIBOR + 0.720% 3.173% 3/9/21 (b)(c) | | 3,264,000 | 3,278,157 |
| 3.7% 3/9/23 | | 3,302,000 | 3,452,893 |
| 4.1% 3/25/25 | | 2,674,000 | 2,860,732 |
| 4.78% 3/25/38 | | 3,872,000 | 4,341,915 |
| Elanco Animal Health, Inc.: | | | |
| 3.912% 8/27/21 | | 245,000 | 249,724 |
| 4.272% 8/28/23 | | 313,000 | 327,838 |
| 4.9% 8/28/28 | | 8,821,000 | 9,620,385 |
| HCA Holdings, Inc.: | | | |
| 4.125% 6/15/29 | | 3,448,000 | 3,673,913 |
| 5.125% 6/15/39 | | 3,358,000 | 3,707,568 |
| 5.25% 6/15/49 | | 3,700,000 | 4,130,653 |
| UnitedHealth Group, Inc.: | | | |
| 3.95% 10/15/42 | | 132,000 | 147,138 |
| 4.25% 3/15/43 | | 2,500,000 | 2,893,740 |
| 4.625% 7/15/35 | | 745,000 | 915,032 |
| 4.625% 11/15/41 | | 965,000 | 1,173,210 |
| 4.75% 7/15/45 | | 1,829,000 | 2,278,023 |
| WellPoint, Inc. 3.3% 1/15/23 | | 1,300,000 | 1,342,710 |
| | | | 44,393,631 |
| Pharmaceuticals - 3.8% | | | |
| Actavis Funding SCS 4.55% 3/15/35 | | 5,473,000 | 5,887,512 |
| AstraZeneca PLC 6.45% 9/15/37 | | 5,530,000 | 7,944,438 |
| Bayer U.S. Finance II LLC: | | | |
| 4.25% 12/15/25 (a) | | 6,677,000 | 7,196,470 |
| 4.625% 6/25/38 (a) | | 2,970,000 | 3,265,361 |
| Bristol-Myers Squibb Co.: | | | |
| 3.2% 6/15/26 (a) | | 7,050,000 | 7,459,798 |
| 4.125% 6/15/39 (a) | | 2,030,000 | 2,355,939 |
| 4.25% 10/26/49 (a) | | 7,190,000 | 8,648,504 |
| Mylan NV 4.55% 4/15/28 | | 9,004,000 | 9,693,430 |
| Perrigo Co. PLC 3.5% 3/15/21 | | 898,000 | 902,802 |
| Shire Acquisitions Investments Ireland DAC: | | | |
| 2.4% 9/23/21 | | 5,300,000 | 5,316,430 |
| 2.875% 9/23/23 | | 3,000,000 | 3,068,434 |
| Teva Pharmaceutical Finance Netherlands III BV 2.8% 7/21/23 | | 3,500,000 | 2,948,750 |
| | | | 64,687,868 |
|
| TOTAL HEALTH CARE | | | 139,231,393 |
|
| INDUSTRIALS - 4.7% | | | |
| Aerospace & Defense - 1.2% | | | |
| BAE Systems Holdings, Inc. 2.85% 12/15/20 (a) | | 3,251,000 | 3,270,663 |
| Harris Corp. 3.95% 5/28/24 (a) | | 1,026,000 | 1,094,858 |
| Lockheed Martin Corp. 4.09% 9/15/52 | | 2,994,000 | 3,605,622 |
| Northrop Grumman Corp.: | | | |
| 2.93% 1/15/25 | | 6,000,000 | 6,211,050 |
| 4.03% 10/15/47 | | 6,000,000 | 6,946,746 |
| | | | 21,128,939 |
| Airlines - 0.8% | | | |
| American Airlines 2019-1 Class B Pass Through Trust equipment trust certificate 3.85% 8/15/29 | | 3,473,000 | 3,525,790 |
| American Airlines, Inc. 3.75% 10/15/25 | | 5,152,503 | 5,304,561 |
| Delta Air Lines, Inc. 3.4% 4/19/21 | | 2,057,000 | 2,085,319 |
| United Airlines, Inc. equipment trust certificate 4.6% 3/1/26 | | 2,456,867 | 2,570,129 |
| | | | 13,485,799 |
| Commercial Services & Supplies - 0.3% | | | |
| Steelcase, Inc. 5.125% 1/18/29 | | 4,278,000 | 4,877,071 |
| Electrical Equipment - 0.8% | | | |
| Hubbell, Inc. 3.5% 2/15/28 | | 6,000,000 | 6,260,369 |
| Rockwell Automation, Inc. 3.5% 3/1/29 | | 6,550,000 | 7,218,838 |
| | | | 13,479,207 |
| Industrial Conglomerates - 0.8% | | | |
| General Electric Co. 4.125% 10/9/42 | | 434,000 | 416,064 |
| Roper Technologies, Inc.: | | | |
| 2.8% 12/15/21 | | 1,681,000 | 1,704,197 |
| 2.95% 9/15/29 | | 7,800,000 | 7,893,195 |
| 3.65% 9/15/23 | | 1,747,000 | 1,840,348 |
| 3.8% 12/15/26 | | 1,738,000 | 1,883,943 |
| | | | 13,737,747 |
| Machinery - 0.0% | | | |
| Ingersoll-Rand Luxembourg Finance SA 4.65% 11/1/44 | | 559,000 | 649,379 |
| Road & Rail - 0.3% | | | |
| Burlington Northern Santa Fe LLC: | | | |
| 4.15% 4/1/45 | | 1,008,000 | 1,183,172 |
| 4.4% 3/15/42 | | 2,500,000 | 2,980,145 |
| | | | 4,163,317 |
| Trading Companies & Distributors - 0.5% | | | |
| Air Lease Corp.: | | | |
| 2.5% 3/1/21 | | 7,500,000 | 7,531,978 |
| 3.75% 2/1/22 | | 1,086,000 | 1,118,836 |
| | | | 8,650,814 |
|
| TOTAL INDUSTRIALS | | | 80,172,273 |
|
| INFORMATION TECHNOLOGY - 3.1% | | | |
| Electronic Equipment & Components - 0.5% | | | |
| Diamond 1 Finance Corp./Diamond 2 Finance Corp.: | | | |
| 4.42% 6/15/21 (a) | | 3,590,000 | 3,704,144 |
| 6.02% 6/15/26 (a) | | 3,770,000 | 4,254,815 |
| | | | 7,958,959 |
| IT Services - 0.2% | | | |
| Fiserv, Inc. 3.5% 7/1/29 | | 4,201,000 | 4,461,851 |
| Semiconductors & Semiconductor Equipment - 1.8% | | | |
| Applied Materials, Inc. 4.35% 4/1/47 | | 5,000,000 | 6,127,811 |
| Microchip Technology, Inc. 3.922% 6/1/21 | | 7,233,000 | 7,387,583 |
| Micron Technology, Inc.: | | | |
| 4.185% 2/15/27 | | 7,660,000 | 7,902,768 |
| 4.64% 2/6/24 | | 8,167,000 | 8,706,944 |
| | | | 30,125,106 |
| Software - 0.3% | | | |
| Oracle Corp.: | | | |
| 4.375% 5/15/55 | | 4,148,000 | 5,001,670 |
| 5.375% 7/15/40 | | 240,000 | 321,811 |
| | | | 5,323,481 |
| Technology Hardware, Storage & Peripherals - 0.3% | | | |
| Apple, Inc. 3.85% 8/4/46 | | 5,043,000 | 5,799,995 |
|
| TOTAL INFORMATION TECHNOLOGY | | | 53,669,392 |
|
| MATERIALS - 1.7% | | | |
| Chemicals - 0.8% | | | |
| Chevron Phillips Chemical Co. LLC / Chevron Phillips Chemical Co. LP 3.3% 5/1/23 (a) | | 1,345,000 | 1,392,068 |
| Nutrien Ltd. 4% 12/15/26 | | 995,000 | 1,073,858 |
| The Dow Chemical Co.: | | | |
| 3.625% 5/15/26 (a) | | 7,175,000 | 7,546,753 |
| 4.55% 11/30/25 (a) | | 2,306,000 | 2,543,027 |
| | | | 12,555,706 |
| Construction Materials - 0.4% | | | |
| CRH America Finance, Inc. 3.95% 4/4/28 (a) | | 6,800,000 | 7,358,443 |
| Containers & Packaging - 0.4% | | | |
| Avery Dennison Corp. 4.875% 12/6/28 | | 6,460,000 | 7,364,998 |
| Metals & Mining - 0.1% | | | |
| BHP Billiton Financial (U.S.A.) Ltd.: | | | |
| 6.25% 10/19/75 (a)(b) | | 407,000 | 423,060 |
| 6.75% 10/19/75 (a)(b) | | 1,010,000 | 1,182,912 |
| | | | 1,605,972 |
|
| TOTAL MATERIALS | | | 28,885,119 |
|
| REAL ESTATE - 3.0% | | | |
| Equity Real Estate Investment Trusts (REITs) - 2.3% | | | |
| Alexandria Real Estate Equities, Inc. 4.7% 7/1/30 | | 1,536,000 | 1,806,731 |
| Camden Property Trust: | | | |
| 3.15% 7/1/29 | | 7,000,000 | 7,412,754 |
| 4.25% 1/15/24 | | 758,000 | 820,440 |
| Corporate Office Properties LP: | | | |
| 3.6% 5/15/23 | | 3,140,000 | 3,211,404 |
| 3.7% 6/15/21 | | 476,000 | 482,421 |
| DDR Corp. 4.625% 7/15/22 | | 1,879,000 | 1,970,119 |
| Healthcare Trust of America Holdings LP 2.95% 7/1/22 | | 1,521,000 | 1,548,253 |
| Hudson Pacific Properties LP 3.95% 11/1/27 | | 4,600,000 | 4,914,142 |
| Kimco Realty Corp. 3.3% 2/1/25 | | 5,732,000 | 5,949,871 |
| Lexington Corporate Properties Trust 4.4% 6/15/24 | | 250,000 | 261,568 |
| Omega Healthcare Investors, Inc. 4.375% 8/1/23 | | 7,500,000 | 7,904,207 |
| Ventas Realty LP: | | | |
| 2.65% 1/15/25 | | 986,000 | 999,053 |
| 3% 1/15/30 | | 1,267,000 | 1,275,473 |
| 4.125% 1/15/26 | | 345,000 | 373,924 |
| | | | 38,930,360 |
| Real Estate Management & Development - 0.7% | | | |
| Brandywine Operating Partnership LP: | | | |
| 3.95% 2/15/23 | | 2,173,000 | 2,273,087 |
| 4.1% 10/1/24 | | 3,000,000 | 3,178,526 |
| 4.55% 10/1/29 | | 2,014,000 | 2,202,397 |
| Liberty Property LP: | | | |
| 3.375% 6/15/23 | | 1,087,000 | 1,128,215 |
| 4.125% 6/15/22 | | 1,832,000 | 1,919,233 |
| 4.75% 10/1/20 | | 752,000 | 768,110 |
| Mack-Cali Realty LP 4.5% 4/18/22 | | 94,000 | 94,420 |
| | | | 11,563,988 |
|
| TOTAL REAL ESTATE | | | 50,494,348 |
|
| UTILITIES - 5.8% | | | |
| Electric Utilities - 3.2% | | | |
| Cleco Corporate Holdings LLC 3.743% 5/1/26 | | 10,141,000 | 10,579,567 |
| Cleveland Electric Illuminating Co. 3.5% 4/1/28 (a) | | 4,006,000 | 4,245,748 |
| Duke Energy Industries, Inc. 4.9% 7/15/43 | | 3,000,000 | 3,868,734 |
| Duquesne Light Holdings, Inc.: | | | |
| 3.616% 8/1/27 (a) | | 1,831,000 | 1,886,036 |
| 5.9% 12/1/21 (a) | | 500,000 | 533,580 |
| 6.4% 9/15/20 (a) | | 1,310,000 | 1,359,191 |
| Exelon Corp. 3.497% 6/1/22 (b) | | 10,439,000 | 10,748,094 |
| Indiana Michigan Power Co. 4.55% 3/15/46 | | 1,274,000 | 1,571,013 |
| IPALCO Enterprises, Inc.: | | | |
| 3.45% 7/15/20 | | 1,894,000 | 1,905,402 |
| 3.7% 9/1/24 | | 477,000 | 499,048 |
| ITC Holdings Corp. 2.7% 11/15/22 | | 1,493,000 | 1,515,455 |
| Mississippi Power Co. 3 month U.S. LIBOR + 0.650% 2.9613% 3/27/20 (b)(c) | | 807,000 | 807,100 |
| Nevada Power Co. 3.7% 5/1/29 | | 6,300,000 | 6,994,714 |
| Tampa Electric Co. 6.55% 5/15/36 | | 500,000 | 705,251 |
| TECO Finance, Inc. 5.15% 3/15/20 | | 114,000 | 115,639 |
| Virginia Electric & Power Co. 3.8% 4/1/28 | | 6,500,000 | 7,184,597 |
| Xcel Energy, Inc. 4.8% 9/15/41 | | 554,000 | 656,589 |
| | | | 55,175,758 |
| Gas Utilities - 0.5% | | | |
| AGL Capital Corp. 2.45% 10/1/23 | | 5,300,000 | 5,350,580 |
| Boston Gas Co. 4.487% 2/15/42 (a) | | 2,000,000 | 2,391,093 |
| Southern Natural Gas Co./Southern Natural Issuing Corp. 4.4% 6/15/21 | | 18,000 | 18,519 |
| | | | 7,760,192 |
| Multi-Utilities - 2.1% | | | |
| Dominion Energy, Inc.: | | | |
| 3 month U.S. LIBOR + 2.300% 4.6299% 9/30/66 (b)(c) | | 7,158,000 | 6,692,730 |
| 3 month U.S. LIBOR + 2.825% 5.1549% 6/30/66 (b)(c) | | 145,000 | 137,025 |
| 2.715% 8/15/21 | | 2,353,000 | 2,372,793 |
| 3.071% 8/15/24 (b) | | 9,850,000 | 10,127,665 |
| NiSource Finance Corp.: | | | |
| 2.65% 11/17/22 | | 2,115,000 | 2,147,665 |
| 3.49% 5/15/27 | | 4,000,000 | 4,244,346 |
| 5.25% 2/15/43 | | 234,000 | 289,387 |
| 5.95% 6/15/41 | | 1,493,000 | 1,995,015 |
| Puget Energy, Inc.: | | | |
| 3.65% 5/15/25 | | 2,935,000 | 3,032,602 |
| 5.625% 7/15/22 | | 4,240,000 | 4,558,932 |
| 6.5% 12/15/20 | | 613,000 | 644,478 |
| Sempra Energy 2.875% 10/1/22 | | 224,000 | 227,583 |
| Wisconsin Energy Corp. 3 month U.S. LIBOR + 2.113% 4.2706% 5/15/67 (b)(c) | | 117,000 | 98,948 |
| | | | 36,569,169 |
|
| TOTAL UTILITIES | | | 99,505,119 |
|
| TOTAL NONCONVERTIBLE BONDS | | | |
| (Cost $1,372,739,956) | | | 1,475,226,322 |
|
| U.S. Treasury Obligations - 6.0% | | | |
| U.S. Treasury Bonds 2.5% 2/15/46 | | 86,459,000 | 96,047,159 |
| U.S. Treasury Notes 1.5% 8/15/26 | | 6,234,000 | 6,252,994 |
| TOTAL U.S. TREASURY OBLIGATIONS | | | |
| (Cost $88,534,050) | | | 102,300,153 |
|
| Asset-Backed Securities - 0.2% | | | |
| Dominos Pizza Master Issuer LLC Series 2018-1A Class A2I, 4.116% 7/25/48 (a) | | $ | |
| (Cost $2,516,150) | | 2,516,150 | 2,648,449 |
|
| Municipal Securities - 0.5% | | | |
| American Muni. Pwr., Inc. Rev. (Combined Hydroelectric Proj.) Series 2010 B, 8.084% 2/15/50 | | 1,545,000 | 2,876,945 |
| California Gen. Oblig.: | | | |
| Series 2009: | | $ | $ |
| 7.35% 11/1/39 | | 40,000 | 63,931 |
| 7.5% 4/1/34 | | 1,165,000 | 1,835,364 |
| 7.55% 4/1/39 | | 1,815,000 | 3,043,265 |
| Series 2010, 7.625% 3/1/40 | | 345,000 | 575,536 |
| TOTAL MUNICIPAL SECURITIES | | | |
| (Cost $6,564,066) | | | 8,395,041 |
|
| Foreign Government and Government Agency Obligations - 0.4% | | | |
| State of Qatar 3.375% 3/14/24(a) | | $ | |
| (Cost $6,343,616) | | 6,350,000 | 6,725,047 |
|
| Bank Notes - 1.0% | | | |
| Citibank NA 3.65% 1/23/24 | | 6,520,000 | 6,949,667 |
| Compass Bank 2.875% 6/29/22 | | 2,667,000 | 2,712,779 |
| Discover Bank 3.35% 2/6/23 | | 7,500,000 | 7,761,176 |
| TOTAL BANK NOTES | | | |
| (Cost $16,671,805) | | | 17,423,622 |
|
| Preferred Securities - 0.8% | | | |
| FINANCIALS - 0.8% | | | |
| Banks - 0.8% | | | |
Barclays Bank PLC 7.625% 11/21/22
(Cost $14,473,018) | | $12,560,000 | $14,115,452 |
| | | Shares | Value |
|
| Money Market Funds - 4.1% | | | |
| Fidelity Cash Central Fund 2.13% (d) | | | |
| (Cost $69,617,123) | | 69,604,475 | 69,618,396 |
| TOTAL INVESTMENT IN SECURITIES - 99.5% | | | |
| (Cost $1,577,459,784) | | | 1,696,452,482 |
| NET OTHER ASSETS (LIABILITIES) - 0.5% | | | 9,248,858 |
| NET ASSETS - 100% | | | $1,705,701,340 |
Legend
(a) Security exempt from registration under Rule 144A of the Securities Act of 1933. These securities may be resold in transactions exempt from registration, normally to qualified institutional buyers. At the end of the period, the value of these securities amounted to $255,097,538 or 15.0% of net assets.
(b) Coupon rates for floating and adjustable rate securities reflect the rates in effect at period end.
(c) Coupon is indexed to a floating interest rate which may be multiplied by a specified factor and/or subject to caps or floors.
(d) Affiliated fund that is generally available only to investment companies and other accounts managed by Fidelity Investments. The rate quoted is the annualized seven-day yield of the fund at period end. A complete unaudited listing of the fund's holdings as of its most recent quarter end is available upon request. In addition, each Fidelity Central Fund's financial statements are available on the SEC's website or upon request.
Affiliated Central Funds
Information regarding fiscal year to date income earned by the Fund from investments in Fidelity Central Funds is as follows:
| Fund | Income earned |
| Fidelity Cash Central Fund | $960,724 |
| Total | $960,724 |
Amounts in the income column in the above table include any capital gain distributions from underlying funds, which are presented in the corresponding line-item in the Statement of Operations, if applicable.
Investment Valuation
The following is a summary of the inputs used, as of August 31, 2019, involving the Fund's assets and liabilities carried at fair value. The inputs or methodology used for valuing securities may not be an indication of the risk associated with investing in those securities. For more information on valuation inputs, and their aggregation into the levels used below, please refer to the Investment Valuation section in the accompanying Notes to Financial Statements.
| | Valuation Inputs at Reporting Date: |
| Description | Total | Level 1 | Level 2 | Level 3 |
| Investments in Securities: | | | | |
| Corporate Bonds | $1,475,226,322 | $-- | $1,475,226,322 | $-- |
| U.S. Government and Government Agency Obligations | 102,300,153 | -- | 102,300,153 | -- |
| Asset-Backed Securities | 2,648,449 | -- | 2,648,449 | -- |
| Municipal Securities | 8,395,041 | -- | 8,395,041 | -- |
| Foreign Government and Government Agency Obligations | 6,725,047 | -- | 6,725,047 | -- |
| Bank Notes | 17,423,622 | -- | 17,423,622 | -- |
| Preferred Securities | 14,115,452 | -- | 14,115,452 | -- |
| Money Market Funds | 69,618,396 | 69,618,396 | -- | -- |
| Total Investments in Securities: | $1,696,452,482 | $69,618,396 | $1,626,834,086 | $-- |
Other Information
Distribution of investments by country or territory of incorporation, as a percentage of Total Net Assets, is as follows (Unaudited):
| United States of America | 79.8% |
| United Kingdom | 6.4% |
| Canada | 3.7% |
| Ireland | 3.1% |
| Switzerland | 1.4% |
| Others (Individually Less Than 1%) | 5.6% |
| | 100.0% |
See accompanying notes which are an integral part of the financial statements.
Financial Statements
Statement of Assets and Liabilities
| | | August 31, 2019 |
| Assets | | |
Investment in securities, at value — See accompanying schedule:
Unaffiliated issuers (cost $1,507,842,661) | $1,626,834,086 | |
| Fidelity Central Funds (cost $69,617,123) | 69,618,396 | |
| Total Investment in Securities (cost $1,577,459,784) | | $1,696,452,482 |
| Receivable for fund shares sold | | 3,817,815 |
| Interest receivable | | 15,637,044 |
| Distributions receivable from Fidelity Central Funds | | 125,085 |
| Receivable from investment adviser for expense reductions | | 1,529 |
| Total assets | | 1,716,033,955 |
| Liabilities | | |
| Payable for investments purchased | $7,745,117 | |
| Payable for fund shares redeemed | 1,662,161 | |
| Distributions payable | 278,183 | |
| Accrued management fee | 483,554 | |
| Distribution and service plan fees payable | 22,664 | |
| Other affiliated payables | 140,936 | |
| Total liabilities | | 10,332,615 |
| Net Assets | | $1,705,701,340 |
| Net Assets consist of: | | |
| Paid in capital | | $1,589,470,880 |
| Total distributable earnings (loss) | | 116,230,460 |
| Net Assets | | $1,705,701,340 |
| Net Asset Value and Maximum Offering Price | | |
| Class A: | | |
| Net Asset Value and redemption price per share ($48,409,589 ÷ 3,956,470 shares)(a) | | $12.24 |
| Maximum offering price per share (100/96.00 of $12.24) | | $12.75 |
| Class M: | | |
| Net Asset Value and redemption price per share ($9,093,315 ÷ 743,199 shares)(a) | | $12.24 |
| Maximum offering price per share (100/96.00 of $12.24) | | $12.75 |
| Class C: | | |
| Net Asset Value and offering price per share ($14,009,139 ÷ 1,145,111 shares)(a) | | $12.23 |
| Corporate Bond: | | |
| Net Asset Value, offering price and redemption price per share ($1,411,052,497 ÷ 115,327,707 shares) | | $12.24 |
| Class I: | | |
| Net Asset Value, offering price and redemption price per share ($122,653,652 ÷ 10,024,343 shares) | | $12.24 |
| Class Z: | | |
| Net Asset Value, offering price and redemption price per share ($100,483,148 ÷ 8,215,379 shares) | | $12.23 |
(a) Redemption price per share is equal to net asset value less any applicable contingent deferred sales charge.
See accompanying notes which are an integral part of the financial statements.
Statement of Operations
| | | Year ended August 31, 2019 |
| Investment Income | | |
| Dividends | | $957,700 |
| Interest | | 55,099,913 |
| Income from Fidelity Central Funds | | 960,724 |
| Total income | | 57,018,337 |
| Expenses | | |
| Management fee | $4,866,653 | |
| Transfer agent fees | 1,493,468 | |
| Distribution and service plan fees | 245,874 | |
| Independent trustees' fees and expenses | 6,263 | |
| Commitment fees | 3,601 | |
| Total expenses before reductions | 6,615,859 | |
| Expense reductions | (4,474) | |
| Total expenses after reductions | | 6,611,385 |
| Net investment income (loss) | | 50,406,952 |
| Realized and Unrealized Gain (Loss) | | |
| Net realized gain (loss) on: | | |
| Investment securities: | | |
| Unaffiliated issuers | 44,670 | |
| Fidelity Central Funds | (1,241) | |
| Total net realized gain (loss) | | 43,429 |
| Change in net unrealized appreciation (depreciation) on: | | |
| Investment securities: | | |
| Unaffiliated issuers | 128,276,892 | |
| Fidelity Central Funds | 1,242 | |
| Total change in net unrealized appreciation (depreciation) | | 128,278,134 |
| Net gain (loss) | | 128,321,563 |
| Net increase (decrease) in net assets resulting from operations | | $178,728,515 |
See accompanying notes which are an integral part of the financial statements.
Statement of Changes in Net Assets
| | Year ended August 31, 2019 | Year ended August 31, 2018 |
| Increase (Decrease) in Net Assets | | |
| Operations | | |
| Net investment income (loss) | $50,406,952 | $42,680,319 |
| Net realized gain (loss) | 43,429 | 3,692,704 |
| Change in net unrealized appreciation (depreciation) | 128,278,134 | (53,560,486) |
| Net increase (decrease) in net assets resulting from operations | 178,728,515 | (7,187,463) |
| Distributions to shareholders | (49,952,195) | – |
| Distributions to shareholders from net investment income | – | (42,219,535) |
| Total distributions | (49,952,195) | (42,219,535) |
| Share transactions - net increase (decrease) | 244,875,420 | 183,363,326 |
| Total increase (decrease) in net assets | 373,651,740 | 133,956,328 |
| Net Assets | | |
| Beginning of period | 1,332,049,600 | 1,198,093,272 |
| End of period | $1,705,701,340 | $1,332,049,600 |
| Other Information | | |
| Undistributed net investment income end of period | | $1,112,420 |
See accompanying notes which are an integral part of the financial statements.
Financial Highlights
Fidelity Corporate Bond Fund Class A
| Years ended August 31, | 2019 | 2018 | 2017 | 2016 | 2015 |
| Selected Per–Share Data | | | | | |
| Net asset value, beginning of period | $11.22 | $11.68 | $11.73 | $11.11 | $11.53 |
| Income from Investment Operations | | | | | |
| Net investment income (loss)A | .376 | .352 | .329 | .337 | .319 |
| Net realized and unrealized gain (loss) | 1.018 | (.465) | (.054) | .618 | (.420) |
| Total from investment operations | 1.394 | (.113) | .275 | .955 | (.101) |
| Distributions from net investment income | (.374) | (.347) | (.325) | (.335) | (.312) |
| Distributions from net realized gain | – | – | – | – | (.007) |
| Total distributions | (.374) | (.347) | (.325) | (.335) | (.319) |
| Net asset value, end of period | $12.24 | $11.22 | $11.68 | $11.73 | $11.11 |
| Total ReturnB,C | 12.72% | (.97)% | 2.43% | 8.77% | (.92)% |
| Ratios to Average Net AssetsD,E | | | | | |
| Expenses before reductions | .79% | .79% | .79% | .79% | .79% |
| Expenses net of fee waivers, if any | .79% | .79% | .79% | .79% | .79% |
| Expenses net of all reductions | .79% | .79% | .79% | .79% | .79% |
| Net investment income (loss) | 3.31% | 3.09% | 2.87% | 3.00% | 2.79% |
| Supplemental Data | | | | | |
| Net assets, end of period (000 omitted) | $48,410 | $37,046 | $38,496 | $43,691 | $29,835 |
| Portfolio turnover rateF | 28% | 47% | 42% | 40% | 50% |
A Calculated based on average shares outstanding during the period.
B Total returns would have been lower if certain expenses had not been reduced during the applicable periods shown.
C Total returns do not include the effect of the sales charges.
D Fees and expenses of any underlying Fidelity Central Funds are not included in the Fund's expense ratio. The Fund indirectly bears its proportionate share of the expenses of any underlying Fidelity Central Funds. Based on their most recent shareholder report date, the expenses of any underlying non-money market Fidelity Central Funds ranged from less than .005% to .01%.
E Expense ratios reflect operating expenses of the class. Expenses before reductions do not reflect amounts reimbursed by the investment adviser or reductions from expense offset arrangements and do not represent the amount paid by the class during periods when reimbursements or reductions occur. Expenses net of fee waivers reflect expenses after reimbursement by the investment adviser but prior to reductions from expense offset arrangements. Expenses net of all reductions represent the net expenses paid by the class.
F Amount does not include the portfolio activity of any underlying Fidelity Central Funds.
See accompanying notes which are an integral part of the financial statements.
Fidelity Corporate Bond Fund Class M
| Years ended August 31, | 2019 | 2018 | 2017 | 2016 | 2015 |
| Selected Per–Share Data | | | | | |
| Net asset value, beginning of period | $11.22 | $11.68 | $11.73 | $11.11 | $11.53 |
| Income from Investment Operations | | | | | |
| Net investment income (loss)A | .368 | .343 | .319 | .328 | .311 |
| Net realized and unrealized gain (loss) | 1.017 | (.465) | (.054) | .617 | (.420) |
| Total from investment operations | 1.385 | (.122) | .265 | .945 | (.109) |
| Distributions from net investment income | (.365) | (.338) | (.315) | (.325) | (.304) |
| Distributions from net realized gain | – | – | – | – | (.007) |
| Total distributions | (.365) | (.338) | (.315) | (.325) | (.311) |
| Net asset value, end of period | $12.24 | $11.22 | $11.68 | $11.73 | $11.11 |
| Total ReturnB,C | 12.64% | (1.05)% | 2.35% | 8.68% | (.99)% |
| Ratios to Average Net AssetsD,E | | | | | |
| Expenses before reductions | .87% | .87% | .87% | .87% | .86% |
| Expenses net of fee waivers, if any | .87% | .87% | .87% | .87% | .86% |
| Expenses net of all reductions | .87% | .87% | .87% | .87% | .86% |
| Net investment income (loss) | 3.24% | 3.00% | 2.79% | 2.92% | 2.72% |
| Supplemental Data | | | | | |
| Net assets, end of period (000 omitted) | $9,093 | $7,819 | $9,317 | $9,443 | $7,812 |
| Portfolio turnover rateF | 28% | 47% | 42% | 40% | 50% |
A Calculated based on average shares outstanding during the period.
B Total returns would have been lower if certain expenses had not been reduced during the applicable periods shown.
C Total returns do not include the effect of the sales charges.
D Fees and expenses of any underlying Fidelity Central Funds are not included in the Fund's expense ratio. The Fund indirectly bears its proportionate share of the expenses of any underlying Fidelity Central Funds. Based on their most recent shareholder report date, the expenses of any underlying non-money market Fidelity Central Funds ranged from less than .005% to .01%.
E Expense ratios reflect operating expenses of the class. Expenses before reductions do not reflect amounts reimbursed by the investment adviser or reductions from expense offset arrangements and do not represent the amount paid by the class during periods when reimbursements or reductions occur. Expenses net of fee waivers reflect expenses after reimbursement by the investment adviser but prior to reductions from expense offset arrangements. Expenses net of all reductions represent the net expenses paid by the class.
F Amount does not include the portfolio activity of any underlying Fidelity Central Funds.
See accompanying notes which are an integral part of the financial statements.
Fidelity Corporate Bond Fund Class C
| Years ended August 31, | 2019 | 2018 | 2017 | 2016 | 2015 |
| Selected Per–Share Data | | | | | |
| Net asset value, beginning of period | $11.22 | $11.68 | $11.72 | $11.11 | $11.53 |
| Income from Investment Operations | | | | | |
| Net investment income (loss)A | .292 | .266 | .242 | .253 | .231 |
| Net realized and unrealized gain (loss) | 1.005 | (.465) | (.044) | .607 | (.419) |
| Total from investment operations | 1.297 | (.199) | .198 | .860 | (.188) |
| Distributions from net investment income | (.287) | (.261) | (.238) | (.250) | (.225) |
| Distributions from net realized gain | – | – | – | – | (.007) |
| Total distributions | (.287) | (.261) | (.238) | (.250) | (.232) |
| Net asset value, end of period | $12.23 | $11.22 | $11.68 | $11.72 | $11.11 |
| Total ReturnB,C | 11.78% | (1.72)% | 1.75% | 7.86% | (1.67)% |
| Ratios to Average Net AssetsD,E | | | | | |
| Expenses before reductions | 1.55% | 1.55% | 1.54% | 1.54% | 1.55% |
| Expenses net of fee waivers, if any | 1.55% | 1.55% | 1.54% | 1.54% | 1.55% |
| Expenses net of all reductions | 1.55% | 1.55% | 1.54% | 1.54% | 1.55% |
| Net investment income (loss) | 2.56% | 2.33% | 2.11% | 2.25% | 2.03% |
| Supplemental Data | | | | | |
| Net assets, end of period (000 omitted) | $14,009 | $14,836 | $18,432 | $20,816 | $20,372 |
| Portfolio turnover rateF | 28% | 47% | 42% | 40% | 50% |
A Calculated based on average shares outstanding during the period.
B Total returns would have been lower if certain expenses had not been reduced during the applicable periods shown.
C Total returns do not include the effect of the contingent deferred sales charge.
D Fees and expenses of any underlying Fidelity Central Funds are not included in the Fund's expense ratio. The Fund indirectly bears its proportionate share of the expenses of any underlying Fidelity Central Funds. Based on their most recent shareholder report date, the expenses of any underlying non-money market Fidelity Central Funds ranged from less than .005% to .01%.
E Expense ratios reflect operating expenses of the class. Expenses before reductions do not reflect amounts reimbursed by the investment adviser or reductions from expense offset arrangements and do not represent the amount paid by the class during periods when reimbursements or reductions occur. Expenses net of fee waivers reflect expenses after reimbursement by the investment adviser but prior to reductions from expense offset arrangements. Expenses net of all reductions represent the net expenses paid by the class.
F Amount does not include the portfolio activity of any underlying Fidelity Central Funds.
See accompanying notes which are an integral part of the financial statements.
Fidelity Corporate Bond Fund
| Years ended August 31, | 2019 | 2018 | 2017 | 2016 | 2015 |
| Selected Per–Share Data | | | | | |
| Net asset value, beginning of period | $11.22 | $11.68 | $11.73 | $11.11 | $11.53 |
| Income from Investment Operations | | | | | |
| Net investment income (loss)A | .415 | .389 | .367 | .375 | .358 |
| Net realized and unrealized gain (loss) | 1.017 | (.463) | (.054) | .618 | (.420) |
| Total from investment operations | 1.432 | (.074) | .313 | .993 | (.062) |
| Distributions from net investment income | (.412) | (.386) | (.363) | (.373) | (.351) |
| Distributions from net realized gain | – | – | – | – | (.007) |
| Total distributions | (.412) | (.386) | (.363) | (.373) | (.358) |
| Net asset value, end of period | $12.24 | $11.22 | $11.68 | $11.73 | $11.11 |
| Total ReturnB | 13.10% | (.63)% | 2.77% | 9.14% | (.58)% |
| Ratios to Average Net AssetsC,D | | | | | |
| Expenses before reductions | .45% | .45% | .45% | .45% | .45% |
| Expenses net of fee waivers, if any | .45% | .45% | .45% | .45% | .45% |
| Expenses net of all reductions | .45% | .45% | .45% | .45% | .45% |
| Net investment income (loss) | 3.65% | 3.43% | 3.20% | 3.34% | 3.13% |
| Supplemental Data | | | | | |
| Net assets, end of period (000 omitted) | $1,411,052 | $1,142,503 | $991,210 | $1,000,845 | $800,365 |
| Portfolio turnover rateE | 28% | 47% | 42% | 40% | 50% |
A Calculated based on average shares outstanding during the period.
B Total returns would have been lower if certain expenses had not been reduced during the applicable periods shown.
C Fees and expenses of any underlying Fidelity Central Funds are not included in the Fund's expense ratio. The Fund indirectly bears its proportionate share of the expenses of any underlying Fidelity Central Funds. Based on their most recent shareholder report date, the expenses of any underlying non-money market Fidelity Central Funds ranged from less than .005% to .01%.
D Expense ratios reflect operating expenses of the class. Expenses before reductions do not reflect amounts reimbursed by the investment adviser or reductions from expense offset arrangements and do not represent the amount paid by the class during periods when reimbursements or reductions occur. Expenses net of fee waivers reflect expenses after reimbursement by the investment adviser but prior to reductions from expense offset arrangements. Expenses net of all reductions represent the net expenses paid by the class.
E Amount does not include the portfolio activity of any underlying Fidelity Central Funds.
See accompanying notes which are an integral part of the financial statements.
Fidelity Corporate Bond Fund Class I
| Years ended August 31, | 2019 | 2018 | 2017 | 2016 | 2015 |
| Selected Per–Share Data | | | | | |
| Net asset value, beginning of period | $11.22 | $11.68 | $11.73 | $11.11 | $11.53 |
| Income from Investment Operations | | | | | |
| Net investment income (loss)A | .412 | .385 | .362 | .369 | .350 |
| Net realized and unrealized gain (loss) | 1.015 | (.465) | (.054) | .618 | (.418) |
| Total from investment operations | 1.427 | (.080) | .308 | .987 | (.068) |
| Distributions from net investment income | (.407) | (.380) | (.358) | (.367) | (.345) |
| Distributions from net realized gain | – | – | – | – | (.007) |
| Total distributions | (.407) | (.380) | (.358) | (.367) | (.352) |
| Net asset value, end of period | $12.24 | $11.22 | $11.68 | $11.73 | $11.11 |
| Total ReturnB | 13.06% | (.68)% | 2.72% | 9.08% | (.63)% |
| Ratios to Average Net AssetsC,D | | | | | |
| Expenses before reductions | .49% | .50% | .50% | .50% | .50% |
| Expenses net of fee waivers, if any | .49% | .50% | .50% | .50% | .50% |
| Expenses net of all reductions | .49% | .50% | .50% | .50% | .50% |
| Net investment income (loss) | 3.63% | 3.38% | 3.15% | 3.29% | 3.07% |
| Supplemental Data | | | | | |
| Net assets, end of period (000 omitted) | $122,654 | $129,845 | $140,638 | $158,470 | $118,825 |
| Portfolio turnover rateE | 28% | 47% | 42% | 40% | 50% |
A Calculated based on average shares outstanding during the period.
B Total returns would have been lower if certain expenses had not been reduced during the applicable periods shown.
C Fees and expenses of any underlying Fidelity Central Funds are not included in the Fund's expense ratio. The Fund indirectly bears its proportionate share of the expenses of any underlying Fidelity Central Funds. Based on their most recent shareholder report date, the expenses of any underlying non-money market Fidelity Central Funds ranged from less than .005% to .01%.
D Expense ratios reflect operating expenses of the class. Expenses before reductions do not reflect amounts reimbursed by the investment adviser or reductions from expense offset arrangements and do not represent the amount paid by the class during periods when reimbursements or reductions occur. Expenses net of fee waivers reflect expenses after reimbursement by the investment adviser but prior to reductions from expense offset arrangements. Expenses net of all reductions represent the net expenses paid by the class.
E Amount does not include the portfolio activity of any underlying Fidelity Central Funds.
See accompanying notes which are an integral part of the financial statements.
Fidelity Corporate Bond Fund Class Z
| Year ended August 31, | 2019 A |
| Selected Per–Share Data | |
| Net asset value, beginning of period | $11.16 |
| Income from Investment Operations | |
| Net investment income (loss)B | .358 |
| Net realized and unrealized gain (loss) | 1.097 |
| Total from investment operations | 1.455 |
| Distributions from net investment income | (.385) |
| Distributions from net realized gain | – |
| Total distributions | (.385) |
| Net asset value, end of period | $12.23 |
| Total ReturnC,D | 13.34% |
| Ratios to Average Net AssetsE,F | |
| Expenses before reductions | .40%G |
| Expenses net of fee waivers, if any | .36%G |
| Expenses net of all reductions | .36%G |
| Net investment income (loss) | 3.54%G |
| Supplemental Data | |
| Net assets, end of period (000 omitted) | $100,483 |
| Portfolio turnover rateH | 28% |
A For the period October 2, 2018 (commencement of sale of shares) to August 31, 2019.
B Calculated based on average shares outstanding during the period.
C Total returns for periods of less than one year are not annualized.
D Total returns would have been lower if certain expenses had not been reduced during the applicable periods shown.
E Fees and expenses of any underlying Fidelity Central Funds are not included in the Fund's expense ratio. The Fund indirectly bears its proportionate share of the expenses of any underlying Fidelity Central Funds. Based on their most recent shareholder report date, the expenses of any underlying non-money market Fidelity Central Funds ranged from less than .005% to .01%.
F Expense ratios reflect operating expenses of the class. Expenses before reductions do not reflect amounts reimbursed by the investment adviser or reductions from expense offset arrangements and do not represent the amount paid by the class during periods when reimbursements or reductions occur. Expense ratios before reductions for start-up periods may not be representative of longer-term operating periods. Expenses net of fee waivers reflect expenses after reimbursement by the investment adviser but prior to reductions from expense offset arrangements. Expenses net of all reductions represent the net expenses paid by the class.
G Annualized
H Amount does not include the portfolio activity of any underlying Fidelity Central Funds.
See accompanying notes which are an integral part of the financial statements.
Notes to Financial Statements
For the period ended August 31, 2019
1. Organization.
Fidelity Corporate Bond Fund (the Fund) is a fund of Fidelity Salem Street Trust (the Trust) and is authorized to issue an unlimited number of shares. The Trust is registered under the Investment Company Act of 1940, as amended (the 1940 Act), as an open-end management investment company organized as a Massachusetts business trust. The Fund commenced sale of Class Z shares on October 2, 2018. The Fund offers Class A, Class M, Class C, Corporate Bond, Class I and Class Z shares, each of which has equal rights as to assets and voting privileges. Each class has exclusive voting rights with respect to matters that affect that class. Effective March 1, 2019, Class C shares will automatically convert to Class A shares after a holding period of ten years from the initial date of purchase, with certain exceptions.
2. Investments in Fidelity Central Funds.
The Fund invests in Fidelity Central Funds, which are open-end investment companies generally available only to other investment companies and accounts managed by the investment adviser and its affiliates. The Fund's Schedule of Investments lists each of the Fidelity Central Funds held as of period end, if any, as an investment of the Fund, but does not include the underlying holdings of each Fidelity Central Fund. As an Investing Fund, the Fund indirectly bears its proportionate share of the expenses of the underlying Fidelity Central Funds.
The Money Market Central Funds seek preservation of capital and current income and are managed by Fidelity Investments Money Management, Inc. (FIMM), an affiliate of the investment adviser. Annualized expenses of the Money Market Central Funds as of their most recent shareholder report date ranged from less than .005% to .01%.
A complete unaudited list of holdings for each Fidelity Central Fund is available upon request or at the Securities and Exchange Commission (the SEC) website at www.sec.gov. In addition, the financial statements of the Fidelity Central Funds, which are not covered by the Fund's Report of Independent Registered Public Accounting Firm, are available on the SEC website or upon request.
3. Significant Accounting Policies.
The Fund is an investment company and applies the accounting and reporting guidance of the Financial Accounting Standards Board (FASB) Accounting Standards Codification Topic 946 Financial Services – Investments Companies. The financial statements have been prepared in conformity with accounting principles generally accepted in the United States of America (GAAP), which require management to make certain estimates and assumptions at the date of the financial statements. Actual results could differ from those estimates. Subsequent events, if any, through the date that the financial statements were issued have been evaluated in the preparation of the financial statements. The following summarizes the significant accounting policies of the Fund:
Investment Valuation. Investments are valued as of 4:00 p.m. Eastern time on the last calendar day of the period. The Board of Trustees (the Board) has delegated the day to day responsibility for the valuation of the Fund's investments to the Fair Value Committee (the Committee) established by the Fund's investment adviser. In accordance with valuation policies and procedures approved by the Board, the Fund attempts to obtain prices from one or more third party pricing vendors or brokers to value its investments. When current market prices, quotations or currency exchange rates are not readily available or reliable, investments will be fair valued in good faith by the Committee, in accordance with procedures adopted by the Board. Factors used in determining fair value vary by investment type and may include market or investment specific events, changes in interest rates and credit quality. The frequency with which these procedures are used cannot be predicted and they may be utilized to a significant extent. The Committee oversees the Fund's valuation policies and procedures and reports to the Board on the Committee's activities and fair value determinations. The Board monitors the appropriateness of the procedures used in valuing the Fund's investments and ratifies the fair value determinations of the Committee.
The Fund categorizes the inputs to valuation techniques used to value its investments into a disclosure hierarchy consisting of three levels as shown below:
- Level 1 – quoted prices in active markets for identical investments
- Level 2 – other significant observable inputs (including quoted prices for similar investments, interest rates, prepayment speeds, etc.)
- Level 3 – unobservable inputs (including the Fund's own assumptions based on the best information available)
Valuation techniques used to value the Fund's investments by major category are as follows:
Debt securities, including restricted securities, are valued based on evaluated prices received from third party pricing vendors or from brokers who make markets in such securities. Corporate bonds, bank notes, municipal securities, preferred securities and U.S. government and government agency obligations are valued by pricing vendors who utilize matrix pricing which considers yield or price of bonds of comparable quality, coupon, maturity and type or by broker-supplied prices. Asset backed securities are valued by pricing vendors who utilize matrix pricing which considers prepayment speed assumptions, attributes of the collateral, yield or price of bonds of comparable quality, coupon, maturity and type or by broker-supplied prices. When independent prices are unavailable or unreliable, debt securities may be valued utilizing pricing methodologies which consider similar factors that would be used by third party pricing vendors. Debt securities are generally categorized as Level 2 in the hierarchy but may be Level 3 depending on the circumstances.
Investments in open-end mutual funds, including the Fidelity Central Funds, are valued at their closing net asset value (NAV) each business day and are categorized as Level 1 in the hierarchy. Short-term securities with remaining maturities of sixty days or less may be valued at amortized cost, which approximates fair value, and are categorized as Level 2 in the hierarchy.
Changes in valuation techniques may result in transfers in or out of an assigned level within the disclosure hierarchy. The aggregate value of investments by input level as of August 31, 2019 is included at the end of the Fund's Schedule of Investments.
Investment Transactions and Income. For financial reporting purposes, the Fund's investment holdings and NAV include trades executed through the end of the last business day of the period. The NAV per share for processing shareholder transactions is calculated as of the close of business of the New York Stock Exchange (NYSE), normally 4:00 p.m. Eastern time and includes trades executed through the end of the prior business day. Gains and losses on securities sold are determined on the basis of identified cost. Income and capital gain distributions from Fidelity Central Funds, if any, are recorded on the ex-dividend date. Interest income is accrued as earned and includes coupon interest and amortization of premium and accretion of discount on debt securities as applicable. Debt obligations may be placed on non-accrual status and related interest income may be reduced by ceasing current accruals and writing off interest receivables when the collection of all or a portion of interest has become doubtful based on consistently applied procedures. A debt obligation is removed from non-accrual status when the issuer resumes interest payments or when collectability of interest is reasonably assured.
Class Allocations and Expenses. Investment income, realized and unrealized capital gains and losses, common expenses of the Fund, and certain fund-level expense reductions, if any, are allocated daily on a pro-rata basis to each class based on the relative net assets of each class to the total net assets of the Fund. Each class differs with respect to transfer agent and distribution and service plan fees incurred. Certain expense reductions may also differ by class. For the reporting period, the allocated portion of income and expenses to each class as a percent of its average net assets may vary due to the timing of recording these transactions in relation to fluctuating net assets of the classes. Expenses directly attributable to a fund are charged to that fund. Expenses attributable to more than one fund are allocated among the respective funds on the basis of relative net assets or other appropriate methods. Expense estimates are accrued in the period to which they relate and adjustments are made when actual amounts are known.
Income Tax Information and Distributions to Shareholders. Each year, the Fund intends to qualify as a regulated investment company under Subchapter M of the Internal Revenue Code, including distributing substantially all of its taxable income and realized gains. As a result, no provision for U.S. Federal income taxes is required. As of August 31, 2019, the Fund did not have any unrecognized tax benefits in the financial statements; nor is the Fund aware of any tax positions for which it is reasonably possible that the total amounts of unrecognized tax benefits will significantly change in the next twelve months. The Fund files a U.S. federal tax return, in addition to state and local tax returns as required. The Fund's federal income tax returns are subject to examination by the Internal Revenue Service (IRS) for a period of three fiscal years after they are filed. State and local tax returns may be subject to examination for an additional fiscal year depending on the jurisdiction.
Distributions are declared and recorded daily and paid monthly from net investment income. Distributions from realized gains, if any, are declared and recorded on the ex-dividend date. Income and capital gain distributions are declared separately for each class. Income and capital gain distributions are determined in accordance with income tax regulations, which may differ from GAAP.
Capital accounts within the financial statements are adjusted for permanent book-tax differences. These adjustments have no impact on net assets or the results of operations. Capital accounts are not adjusted for temporary book-tax differences which will reverse in a subsequent period.
Book-tax differences are primarily due to market discount, capital loss carryforwards and losses deferred due to wash sales.
As of period end, the cost and unrealized appreciation (depreciation) in securities, and derivatives if applicable, for federal income tax purposes were as follows:
| Gross unrealized appreciation | $122,974,384 |
| Gross unrealized depreciation | (2,552,274) |
| Net unrealized appreciation (depreciation) | $120,422,110 |
| Tax Cost | $1,576,030,372 |
The tax-based components of distributable earnings as of period end were as follows:
| Capital loss carryforward | $(3,970,000) |
| Net unrealized appreciation (depreciation) on securities and other investments | $120,422,110 |
Capital loss carryforwards are only available to offset future capital gains of the Fund to the extent provided by regulations and may be limited. Under the Regulated Investment Company Modernization Act of 2010 (the Act), the Fund is permitted to carry forward capital losses incurred in taxable years beginning after December 22, 2010 for an unlimited period and such capital losses are required to be used prior to any losses that expire. The capital loss carryforward information presented below, including any applicable limitation, is estimated as of fiscal period end and is subject to adjustment.
| No expiration | |
| Short-term | $(2,646,659) |
| Long-term | (1,323,341) |
| Total capital loss carryforward | $(3,970,000) |
The tax character of distributions paid was as follows:
| | August 31, 2019 | August 31, 2018 |
| Ordinary Income | $49,952,195 | $ 42,219,535 |
Restricted Securities. The Fund may invest in securities that are subject to legal or contractual restrictions on resale. These securities generally may be resold in transactions exempt from registration or to the public if the securities are registered. Disposal of these securities may involve time-consuming negotiations and expense, and prompt sale at an acceptable price may be difficult. Information regarding restricted securities is included at the end of the Fund's Schedule of Investments.
New Rule Issuance. During August 2018, the U.S. Securities and Exchange Commission issued Final Rule Release No. 33-10532, Disclosure Update and Simplification. This Final Rule includes amendments specific to registered investment companies that are intended to eliminate overlap in disclosure requirements between Regulation S-X and GAAP. In accordance with these amendments, certain line-items in the Fund's financial statements have been combined or removed for the current period as outlined in the table below.
| Financial Statement | Current Line-Item Presentation (As Applicable) | Prior Line-Item Presentation (As Applicable) |
| Statement of Assets and Liabilities | Total distributable earnings (loss) | Undistributed/Distributions in excess of/Accumulated net investment income (loss)
Accumulated/Undistributed net realized gain (loss)
Net unrealized appreciation (depreciation) |
| Statement of Changes in Net Assets | N/A - removed | Undistributed/Distributions in excess of/Accumulated net investment income (loss) end of period |
| Statement of Changes in Net Assets | Distributions to shareholders | Distributions to shareholders from net investment income
Distributions to shareholders from net realized gain |
| Distributions to Shareholders Note to Financial Statements | Distributions to shareholders | Distributions to shareholders from net investment income
Distributions to shareholders from net realized gain |
4. Purchases and Sales of Investments.
Purchases and sales of securities, other than short-term securities and U.S. government securities, aggregated $419,187,187 and $302,281,200, respectively.
5. Fees and Other Transactions with Affiliates.
Management Fee. Fidelity Management & Research Company (the investment adviser) and its affiliates provide the Fund with investment management related services for which the Fund pays a monthly management fee that is based on an annual rate of .35% of the Fund's average net assets. Under the management contract, the investment adviser pays all other expenses, except the compensation of the independent Trustees and certain other expenses such as transfer agent and distribution and service plan fees, and other expenses such as interest expense, including commitment fees.
Distribution and Service Plan Fees. In accordance with Rule 12b-1 of the 1940 Act, the Fund has adopted separate Distribution and Service Plans for each class of shares. Certain classes pay Fidelity Distributors Corporation (FDC), an affiliate of the investment adviser, separate Distribution and Service Fees, each of which is based on an annual percentage of each class' average net assets. In addition, FDC may pay financial intermediaries for selling shares of the Fund and providing shareholder support services. For the period, the Distribution and Service Fee rates, total fees and amounts retained by FDC were as follows:
| | Distribution Fee | Service Fee | Total Fees | Retained by FDC |
| Class A | -% | .25% | $95,325 | $2,650 |
| Class M | -% | .25% | 19,546 | 27 |
| Class C | .75% | .25% | 131,003 | 11,622 |
| | | | $245,874 | $14,299 |
Sales Load. FDC may receive a front-end sales charge of up to 4.00% for selling Class A shares and Class M shares, some of which is paid to financial intermediaries for selling shares of the Fund. Depending on the holding period, FDC may receive contingent deferred sales charges levied on Class A, Class M and Class C redemptions. The deferred sales charges are 1.00% for Class C shares, .75% for certain purchases of Class A shares and .25% for certain purchases of Class M shares.
For the period, sales charge amounts retained by FDC were as follows:
| | Retained by FDC |
| Class A | $13,962 |
| Class M | 1,109 |
| Class C(a) | 1,240 |
| | $16,311 |
(a) When Class C shares are initially sold, FDC pays commissions from its own resources to financial intermediaries through which the sales are made.
Transfer Agent Fees. Fidelity Investments Institutional Operations Company, Inc., (FIIOC), an affiliate of the investment adviser, is the transfer, dividend disbursing and shareholder servicing agent for each class of the Fund. FIIOC receives account fees and asset-based fees that vary according to the account size and type of account of the shareholders of each respective class of the Fund, with the exception of Corporate Bond and Class Z. FIIOC receives an asset-based fee of Corporate Bond's and Class Z's average net assets. FIIOC pays for typesetting, printing and mailing of shareholder reports, except proxy statements. For the period, transfer agent fees for each class were as follows:
| | Amount | % of Class-Level Average Net Assets |
| Class A | $71,851 | .19 |
| Class M | 20,722 | .26 |
| Class C | 26,729 | .20 |
| Corporate Bond | 1,197,546 | .10 |
| Class I | 171,176 | .14 |
| Class Z | 5,444 | .05(a) |
| | $1,493,468 | |
(a) Annualized
During the period, the investment adviser or its affiliates waived a portion of these fees.
Interfund Trades. The Funds may purchase from or sell securities to other Fidelity Funds under procedures adopted by the Board. The procedures have been designed to ensure these interfund trades are executed in accordance with Rule 17a-7 of the 1940 Act. Interfund trades are included within the respective purchases and sales amounts shown in the Purchases and Sales of Investments note.
6. Committed Line of Credit.
The Fund participates with other funds managed by the investment adviser or an affiliate in a $4.25 billion credit facility (the "line of credit") to be utilized for temporary or emergency purposes to fund shareholder redemptions or for other short-term liquidity purposes. The Fund has agreed to pay commitment fees on its pro-rata portion of the line of credit, which amounted to $3,601 and is reflected in Commitment fees on the Statement of Operations. During the period, the Fund did not borrow on this line of credit.
7. Expense Reductions.
Effective October 2, 2018, the investment adviser contractually agreed to reimburse each class to the extent annual operating expenses exceeded certain levels of class-level average net assets as noted in the table below. This reimbursement will remain in place through December 31, 2020. Some expenses, for example the compensation of the independent Trustees, and certain other expenses such as interest expense, are excluded from this reimbursement.
The following classes were in reimbursement during the period:
| | Expense Limitations | Reimbursement |
| Class Z | .36% | $4,027 |
Through arrangements with the Fund's custodian and each class' transfer agent, credits realized as a result of certain uninvested cash balances were used to reduce the Fund's expenses. During the period, custodian credits reduced the Fund's expenses by $175. During the period, transfer agent credits reduced each class' expenses as noted in the table below.
| | Expense reduction |
| Class I | $272 |
8. Distributions to Shareholders.
Distributions to shareholders of each class were as follows:
| | Year ended
August 31, 2019(a) | Year ended
August 31, 2018 |
| Distributions to shareholders | | |
| Class A | $1,248,823 | $– |
| Class M | 250,897 | – |
| Class C | 332,165 | – |
| Corporate Bond | 43,436,340 | – |
| Class I | 4,302,495 | – |
| Class Z | 381,475 | – |
| Total | $49,952,195 | $– |
| From net investment income | | |
| Class A | $– | $1,167,291 |
| Class M | – | 246,317 |
| Class C | – | 385,348 |
| Corporate Bond | – | 35,907,219 |
| Class I | – | 4,513,360 |
| Total | $– | $42,219,535 |
(a) Distributions for Class Z are for the period October 2, 2018 (commencement of sale of shares) to August 31, 2019.
9. Share Transactions.
Share transactions for each class were as follows and may contain automatic conversions between classes or exchanges between affiliated funds:
| | Shares | Shares | Dollars | Dollars |
| | Year ended August 31, 2019(a) | Year ended August 31, 2018 | Year ended August 31, 2019(a) | Year ended August 31, 2018 |
| Class A | | | | |
| Shares sold | 1,484,140 | 835,988 | $17,125,223 | $9,601,021 |
| Reinvestment of distributions | 107,547 | 100,826 | 1,228,195 | 1,148,607 |
| Shares redeemed | (937,620) | (929,162) | (10,568,541) | (10,606,810) |
| Net increase (decrease) | 654,067 | 7,652 | $7,784,877 | $142,818 |
| Class M | | | | |
| Shares sold | 160,127 | 178,640 | $1,863,645 | $2,044,754 |
| Reinvestment of distributions | 21,807 | 21,371 | 248,556 | 243,643 |
| Shares redeemed | (135,764) | (300,395) | (1,536,097) | (3,452,063) |
| Net increase (decrease) | 46,170 | (100,384) | $576,104 | $(1,163,666) |
| Class C | | | | |
| Shares sold | 377,877 | 224,032 | $4,379,476 | $2,578,882 |
| Reinvestment of distributions | 28,886 | 33,501 | 328,173 | 381,886 |
| Shares redeemed | (584,327) | (512,655) | (6,601,165) | (5,849,142) |
| Net increase (decrease) | (177,564) | (255,122) | $(1,893,516) | $(2,888,374) |
| Corporate Bond | | | | |
| Shares sold | 47,342,827 | 46,084,368 | $546,027,481 | $524,819,506 |
| Reinvestment of distributions | 3,552,770 | 2,956,365 | 40,551,324 | 33,626,733 |
| Shares redeemed | (37,414,288) | (32,031,396) | (429,896,394) | (365,871,641) |
| Net increase (decrease) | 13,481,309 | 17,009,337 | $156,682,411 | $192,574,598 |
| Class I | | | | |
| Shares sold | 3,010,010 | 4,550,393 | $34,699,141 | $52,358,796 |
| Reinvestment of distributions | 373,162 | 385,788 | 4,244,697 | 4,393,276 |
| Shares redeemed | (4,933,203) | (5,398,400) | (55,925,091) | (62,054,122) |
| Net increase (decrease) | (1,550,031) | (462,219) | $(16,981,253) | $(5,302,050) |
| Class Z | | | | |
| Shares sold | 8,540,235 | – | $102,599,871 | $– |
| Reinvestment of distributions | 29,493 | – | 348,244 | – |
| Shares redeemed | (354,349) | – | (4,241,318) | – |
| Net increase (decrease) | 8,215,379 | – | $98,706,797 | $– |
(a) Share transactions for Class Z are for the period October 2, 2018 (commencement of sale of shares) to August 31, 2019.
10. Other.
The Fund's organizational documents provide former and current trustees and officers with a limited indemnification against liabilities arising in connection with the performance of their duties to the Fund. In the normal course of business, the Fund may also enter into contracts that provide general indemnifications. The Fund's maximum exposure under these arrangements is unknown as this would be dependent on future claims that may be made against the Fund. The risk of material loss from such claims is considered remote.
Report of Independent Registered Public Accounting Firm
To the Board of Trustees of Fidelity Salem Street Trust and Shareholders of Fidelity Corporate Bond Fund:
Opinion on the Financial Statements
We have audited the accompanying statement of assets and liabilities, including the schedule of investments, of Fidelity Corporate Bond Fund (one of the funds constituting Fidelity Salem Street Trust, referred to hereafter as the “Fund”) as of August 31, 2019, the related statement of operations for the year ended August 31, 2019, the statement of changes in net assets for each of the two years in the period ended August 31, 2019, including the related notes, and the financial highlights for each of the periods indicated therein (collectively referred to as the “financial statements”). In our opinion, the financial statements present fairly, in all material respects, the financial position of the Fund as of August 31, 2019, the results of its operations for the year then ended, the changes in its net assets for each of the two years in the period ended August 31, 2019 and the financial highlights for each of the periods indicated therein in conformity with accounting principles generally accepted in the United States of America.
Basis for Opinion
These financial statements are the responsibility of the Fund’s management. Our responsibility is to express an opinion on the Fund’s financial statements based on our audits. We are a public accounting firm registered with the Public Company Accounting Oversight Board (United States) (PCAOB) and are required to be independent with respect to the Fund in accordance with the U.S. federal securities laws and the applicable rules and regulations of the Securities and Exchange Commission and the PCAOB.
We conducted our audits of these financial statements in accordance with the standards of the PCAOB. Those standards require that we plan and perform the audit to obtain reasonable assurance about whether the financial statements are free of material misstatement, whether due to error or fraud.
Our audits included performing procedures to assess the risks of material misstatement of the financial statements, whether due to error or fraud, and performing procedures that respond to those risks. Such procedures included examining, on a test basis, evidence regarding the amounts and disclosures in the financial statements. Our audits also included evaluating the accounting principles used and significant estimates made by management, as well as evaluating the overall presentation of the financial statements. Our procedures included confirmation of securities owned as of August 31, 2019 by correspondence with the custodian and brokers; when replies were not received from brokers, we performed other auditing procedures. We believe that our audits provide a reasonable basis for our opinion.
PricewaterhouseCoopers LLP
Boston, Massachusetts
October 15, 2019
We have served as the auditor of one or more investment companies in the Fidelity group of funds since 1932.
Trustees and Officers
The Trustees, Members of the Advisory Board (if any), and officers of the trust and fund, as applicable, are listed below. The Board of Trustees governs the fund and is responsible for protecting the interests of shareholders. The Trustees are experienced executives who meet periodically throughout the year to oversee the fund's activities, review contractual arrangements with companies that provide services to the fund, oversee management of the risks associated with such activities and contractual arrangements, and review the fund's performance. Except for Jonathan Chiel, each of the Trustees oversees 276 funds. Mr. Chiel oversees 170 funds.
The Trustees hold office without limit in time except that (a) any Trustee may resign; (b) any Trustee may be removed by written instrument, signed by at least two-thirds of the number of Trustees prior to such removal; (c) any Trustee who requests to be retired or who has become incapacitated by illness or injury may be retired by written instrument signed by a majority of the other Trustees; and (d) any Trustee may be removed at any special meeting of shareholders by a two-thirds vote of the outstanding voting securities of the trust. Each Trustee who is not an interested person (as defined in the 1940 Act) of the trust and the fund is referred to herein as an Independent Trustee. Each Independent Trustee shall retire not later than the last day of the calendar year in which his or her 75th birthday occurs. The Independent Trustees may waive this mandatory retirement age policy with respect to individual Trustees. Officers and Advisory Board Members hold office without limit in time, except that any officer or Advisory Board Member may resign or may be removed by a vote of a majority of the Trustees at any regular meeting or any special meeting of the Trustees. Except as indicated, each individual has held the office shown or other offices in the same company for the past five years.
The fund's Statement of Additional Information (SAI) includes more information about the Trustees. To request a free copy, call Fidelity at 1-800-544-8544 if you’re an individual investing directly with Fidelity, call 1-800-835-5092 if you’re a plan sponsor or participant with Fidelity as your recordkeeper or call 1-877-208-0098 on institutional accounts or if you’re an advisor or invest through one.
Experience, Skills, Attributes, and Qualifications of the Trustees. The Governance and Nominating Committee has adopted a statement of policy that describes the experience, qualifications, attributes, and skills that are necessary and desirable for potential Independent Trustee candidates (Statement of Policy). The Board believes that each Trustee satisfied at the time he or she was initially elected or appointed a Trustee, and continues to satisfy, the standards contemplated by the Statement of Policy. The Governance and Nominating Committee also engages professional search firms to help identify potential Independent Trustee candidates who have the experience, qualifications, attributes, and skills consistent with the Statement of Policy. From time to time, additional criteria based on the composition and skills of the current Independent Trustees, as well as experience or skills that may be appropriate in light of future changes to board composition, business conditions, and regulatory or other developments, have also been considered by the professional search firms and the Governance and Nominating Committee. In addition, the Board takes into account the Trustees' commitment and participation in Board and committee meetings, as well as their leadership of standing and ad hoc committees throughout their tenure.
In determining that a particular Trustee was and continues to be qualified to serve as a Trustee, the Board has considered a variety of criteria, none of which, in isolation, was controlling. The Board believes that, collectively, the Trustees have balanced and diverse experience, qualifications, attributes, and skills, which allow the Board to operate effectively in governing the fund and protecting the interests of shareholders. Information about the specific experience, skills, attributes, and qualifications of each Trustee, which in each case led to the Board's conclusion that the Trustee should serve (or continue to serve) as a trustee of the fund, is provided below.
Board Structure and Oversight Function. Abigail P. Johnson is an interested person and currently serves as Chairman. The Trustees have determined that an interested Chairman is appropriate and benefits shareholders because an interested Chairman has a personal and professional stake in the quality and continuity of services provided to the fund. Independent Trustees exercise their informed business judgment to appoint an individual of their choosing to serve as Chairman, regardless of whether the Trustee happens to be independent or a member of management. The Independent Trustees have determined that they can act independently and effectively without having an Independent Trustee serve as Chairman and that a key structural component for assuring that they are in a position to do so is for the Independent Trustees to constitute a substantial majority for the Board. The Independent Trustees also regularly meet in executive session. Arthur E. Johnson serves as Chairman of the Independent Trustees and as such (i) acts as a liaison between the Independent Trustees and management with respect to matters important to the Independent Trustees and (ii) with management prepares agendas for Board meetings.
Fidelity® funds are overseen by different Boards of Trustees. The fund's Board oversees Fidelity's investment-grade bond, money market, asset allocation and certain equity funds, and other Boards oversee Fidelity's high income and other equity funds. The asset allocation funds may invest in Fidelity® funds that are overseen by such other Boards. The use of separate Boards, each with its own committee structure, allows the Trustees of each group of Fidelity® funds to focus on the unique issues of the funds they oversee, including common research, investment, and operational issues. On occasion, the separate Boards establish joint committees to address issues of overlapping consequences for the Fidelity® funds overseen by each Board.
The Trustees operate using a system of committees to facilitate the timely and efficient consideration of all matters of importance to the Trustees, the fund, and fund shareholders and to facilitate compliance with legal and regulatory requirements and oversight of the fund's activities and associated risks. The Board, acting through its committees, has charged FMR and its affiliates with (i) identifying events or circumstances the occurrence of which could have demonstrably adverse effects on the fund's business and/or reputation; (ii) implementing processes and controls to lessen the possibility that such events or circumstances occur or to mitigate the effects of such events or circumstances if they do occur; and (iii) creating and maintaining a system designed to evaluate continuously business and market conditions in order to facilitate the identification and implementation processes described in (i) and (ii) above. Because the day-to-day operations and activities of the fund are carried out by or through FMR, its affiliates, and other service providers, the fund's exposure to risks is mitigated but not eliminated by the processes overseen by the Trustees. While each of the Board's committees has responsibility for overseeing different aspects of the fund's activities, oversight is exercised primarily through the Operations and Audit Committees. In addition, an ad hoc Board committee of Independent Trustees has worked with FMR to enhance the Board's oversight of investment and financial risks, legal and regulatory risks, technology risks, and operational risks, including the development of additional risk reporting to the Board. Appropriate personnel, including but not limited to the fund's Chief Compliance Officer (CCO), FMR's internal auditor, the independent accountants, the fund's Treasurer and portfolio management personnel, make periodic reports to the Board's committees, as appropriate, including an annual review of Fidelity's risk management program for the Fidelity® funds. The responsibilities of each standing committee, including their oversight responsibilities, are described further under "Standing Committees of the Trustees."
Interested Trustees*:
Correspondence intended for a Trustee who is an interested person may be sent to Fidelity Investments, 245 Summer Street, Boston, Massachusetts 02210.
Name, Year of Birth; Principal Occupations and Other Relevant Experience+
Jonathan Chiel (1957)
Year of Election or Appointment: 2016
Trustee
Mr. Chiel also serves as Trustee of other Fidelity® funds. Mr. Chiel is Executive Vice President and General Counsel for FMR LLC (diversified financial services company, 2012-present). Previously, Mr. Chiel served as general counsel (2004-2012) and senior vice president and deputy general counsel (2000-2004) for John Hancock Financial Services; a partner with Choate, Hall & Stewart (1996-2000) (law firm); and an Assistant United States Attorney for the United States Attorney’s Office of the District of Massachusetts (1986-95), including Chief of the Criminal Division (1993-1995). Mr. Chiel is a director on the boards of the Boston Bar Foundation and the Maimonides School.
Abigail P. Johnson (1961)
Year of Election or Appointment: 2009
Trustee
Chairman of the Board of Trustees
Ms. Johnson also serves as Trustee of other Fidelity® funds. Ms. Johnson serves as Chairman (2016-present), Chief Executive Officer (2014-present), and Director (2007-present) of FMR LLC (diversified financial services company), President of Fidelity Financial Services (2012-present) and President of Personal, Workplace and Institutional Services (2005-present). Ms. Johnson is Chairman and Director of FMR Co., Inc. (investment adviser firm, 2011-present) and Chairman and Director of FMR (investment adviser firm, 2011-present). Previously, Ms. Johnson served as Vice Chairman (2007-2016) and President (2013-2016) of FMR LLC, President and a Director of FMR (2001-2005), a Trustee of other investment companies advised by FMR, Fidelity Investments Money Management, Inc. (investment adviser firm), and FMR Co., Inc. (2001-2005), Senior Vice President of the Fidelity® funds (2001-2005), and managed a number of Fidelity® funds. Ms. Abigail P. Johnson and Mr. Arthur E. Johnson are not related.
Jennifer Toolin McAuliffe (1959)
Year of Election or Appointment: 2016
Trustee
Ms. McAuliffe also serves as Trustee of other Fidelity® funds. Ms. McAuliffe previously served as a Member of the Advisory Board of certain Fidelity® funds (2016) and as Co-Head of Fixed Income of Fidelity Investments Limited (now known as FIL Limited (FIL)) (diversified financial services company). Earlier roles at FIL included Director of Research for FIL’s credit and quantitative teams in London, Hong Kong and Tokyo. Ms. McAuliffe also was the Director of Research for taxable and municipal bonds at Fidelity Investments Money Management, Inc. Ms. McAuliffe is also a director or trustee of several not-for-profit entities.
* Determined to be an “Interested Trustee” by virtue of, among other things, his or her affiliation with the trust or various entities under common control with FMR.
+ The information includes the Trustee's principal occupation during the last five years and other information relating to the experience, attributes, and skills relevant to the Trustee's qualifications to serve as a Trustee, which led to the conclusion that the Trustee should serve as a Trustee for the fund.
Independent Trustees:
Correspondence intended for an Independent Trustee may be sent to Fidelity Investments, P.O. Box 55235, Boston, Massachusetts 02205-5235.
Name, Year of Birth; Principal Occupations and Other Relevant Experience+
Elizabeth S. Acton (1951)
Year of Election or Appointment: 2013
Trustee
Ms. Acton also serves as Trustee of other Fidelity® funds. Prior to her retirement in April 2012, Ms. Acton was Executive Vice President, Finance (2011-2012), Executive Vice President, Chief Financial Officer (2002-2011), and Treasurer (2004-2005) of Comerica Incorporated (financial services). Prior to joining Comerica, Ms. Acton held a variety of positions at Ford Motor Company (1983-2002), including Vice President and Treasurer (2000-2002) and Executive Vice President and Chief Financial Officer of Ford Motor Credit Company (1998-2000). Ms. Acton currently serves as a member of the Board of Directors and Audit and Finance Committees of Beazer Homes USA, Inc. (homebuilding, 2012-present). Previously, Ms. Acton served as a Member of the Advisory Board of certain Fidelity® funds (2013-2016).
Ann E. Dunwoody (1953)
Year of Election or Appointment: 2018
Trustee
General Dunwoody also serves as Trustee of other Fidelity® funds. General Dunwoody (United States Army, Retired) was the first woman in U.S. military history to achieve the rank of four-star general and prior to her retirement in 2012 held a variety of positions within the U.S. Army, including Commanding General, U.S. Army Material Command (2008-2012). She is the President of First to Four LLC (leadership and mentoring services, 2012-present). She also serves as a member of the Board of Directors and Nominating and Corporate Governance Committee of L3 Technologies, Inc. (communication, electronic, sensor, and aerospace systems, 2013-present), Board of Directors and Nomination and Corporate Governance Committees of Kforce Inc. (professional staffing services, 2016-present) and Board of Directors of Automattic Inc. (software engineering, 2018-present). Previously, General Dunwoody served as a Member of the Advisory Board of certain Fidelity® funds (2018), a member of the Board of Directors and Audit and Sustainability and Corporate Responsibility Committees of Republic Services, Inc. (waste collection, disposal and recycling, 2013-2016). Ms. Dunwoody also serves on several boards for non-profit organizations, including as a member of the Board of Directors, Chair of the Nomination and Governance Committee and member of the Audit Committee of Logistics Management Institute (consulting non-profit, 2012-present), a member of the Board of Directors of the Army Historical Foundation (2015-present), a member of the Council of Trustees for the Association of the United States Army (advocacy non-profit, 2013-present) and a member of the Board of Trustees of Florida Institute of Technology (2015-present) and ThanksUSA (military family education non-profit, 2014-present).
John Engler (1948)
Year of Election or Appointment: 2014
Trustee
Mr. Engler also serves as Trustee of other Fidelity® funds. He serves on the board of directors for Universal Forest Products (manufacturer and distributor of wood and wood-alternative products, 2003-present) and K12 Inc. (technology-based education company, 2012-present). Previously, Mr. Engler served as interim president of Michigan State University (2018-2019), a Member of the Advisory Board of certain Fidelity® funds (2014-2016), president of the Business Roundtable (2011-2017), a trustee of The Munder Funds (2003-2014), president and CEO of the National Association of Manufacturers (2004-2011), member of the Board of Trustees of the Annie E. Casey Foundation (2004-2015), and as governor of Michigan (1991-2003). He is a past chairman of the National Governors Association.
Robert F. Gartland (1951)
Year of Election or Appointment: 2010
Trustee
Mr. Gartland also serves as Trustee of other Fidelity® funds. Mr. Gartland is Chairman and an investor in Gartland & Mellina Group Corp. (consulting, 2009-present). Previously, Mr. Gartland served as a partner and investor of Vietnam Partners LLC (investments and consulting, 2008-2011). Prior to his retirement, Mr. Gartland held a variety of positions at Morgan Stanley (financial services, 1979-2007), including Managing Director (1987-2007), and Chase Manhattan Bank (1975-1978).
Arthur E. Johnson (1947)
Year of Election or Appointment: 2008
Trustee
Chairman of the Independent Trustees
Mr. Johnson also serves as Trustee of other Fidelity® funds. Mr. Johnson serves as a member of the Board of Directors of Eaton Corporation plc (diversified power management, 2009-present) and Booz Allen Hamilton (management consulting, 2011-present). Prior to his retirement, Mr. Johnson served as Senior Vice President of Corporate Strategic Development of Lockheed Martin Corporation (defense contractor, 1999-2009). Mr. Johnson previously served as Vice Chairman (2015-2018) of the Independent Trustees of certain Fidelity® funds and on the Board of Directors of IKON Office Solutions, Inc. (1999-2008), AGL Resources, Inc. (holding company, 2002-2016), and Delta Airlines (2005-2007). Mr. Arthur E. Johnson is not related to Ms. Abigail P. Johnson.
Michael E. Kenneally (1954)
Year of Election or Appointment: 2009
Trustee
Vice Chairman of the Independent Trustees
Mr. Kenneally also serves as Trustee of other Fidelity® funds. Prior to his retirement, Mr. Kenneally served as Chairman and Global Chief Executive Officer of Credit Suisse Asset Management. Before joining Credit Suisse, he was an Executive Vice President and Chief Investment Officer for Bank of America Corporation. Earlier roles at Bank of America included Director of Research, Senior Portfolio Manager and Research Analyst, and Mr. Kenneally was awarded the Chartered Financial Analyst (CFA) designation in 1991.
Marie L. Knowles (1946)
Year of Election or Appointment: 2001
Trustee
Ms. Knowles also serves as Trustee of other Fidelity® funds. Prior to Ms. Knowles' retirement in June 2000, she served as Executive Vice President and Chief Financial Officer of Atlantic Richfield Company (ARCO) (diversified energy, 1996-2000). From 1993 to 1996, she was a Senior Vice President of ARCO and President of ARCO Transportation Company (pipeline and tanker operations). Ms. Knowles currently serves as a Director and Chairman of the Audit Committee of McKesson Corporation (healthcare service, since 2002). Ms. Knowles is a member of the Board of the Santa Catalina Island Company (real estate, 2009-present). Ms. Knowles is a Member of the Investment Company Institute Board of Governors and a Member of the Governing Council of the Independent Directors Council (2014-present). She also serves as a member of the Advisory Board for the School of Engineering of the University of Southern California. Previously, Ms. Knowles served as a Director of Phelps Dodge Corporation (copper mining and manufacturing, 1994-2007), URS Corporation (engineering and construction, 2000-2003) and America West (airline, 1999-2002). Ms. Knowles previously served as Chairman (2015-2018) and Vice Chairman (2012-2015) of the Independent Trustees of certain Fidelity® funds.
Mark A. Murray (1954)
Year of Election or Appointment: 2016
Trustee
Mr. Murray also serves as Trustee of other Fidelity® funds. Mr. Murray is Vice Chairman (2013-present) of Meijer, Inc. (regional retail chain). Previously, Mr. Murray served as a Member of the Advisory Board of certain Fidelity® funds (2016) and as Co-Chief Executive Officer (2013-2016) and President (2006-2013) of Meijer, Inc. Mr. Murray serves as a member of the Board of Directors and Nuclear Review and Public Policy and Responsibility Committees of DTE Energy Company (diversified energy company, 2009-present). Mr. Murray also serves as a member of the Board of Directors of Spectrum Health (not-for-profit health system, 2015-present). Mr. Murray previously served as President of Grand Valley State University (2001-2006), Treasurer for the State of Michigan (1999-2001), Vice President of Finance and Administration for Michigan State University (1998-1999), and a member of the Board of Directors and Audit Committee and Chairman of the Nominating and Corporate Governance Committee of Universal Forest Products, Inc. (manufacturer and distributor of wood and wood-alternative products, 2004-2016). Mr. Murray is also a director or trustee of many community and professional organizations.
+ The information includes the Trustee's principal occupation during the last five years and other information relating to the experience, attributes, and skills relevant to the Trustee's qualifications to serve as a Trustee, which led to the conclusion that the Trustee should serve as a Trustee for the fund.
Advisory Board Members and Officers:
Correspondence intended for an officer may be sent to Fidelity Investments, 245 Summer Street, Boston, Massachusetts 02210. Officers appear below in alphabetical order.
Name, Year of Birth; Principal Occupation
Elizabeth Paige Baumann (1968)
Year of Election or Appointment: 2017
Anti-Money Laundering (AML) Officer
Ms. Baumann also serves as AML Officer of other funds. She is Chief AML Officer (2012-present) and Senior Vice President (2014-present) of FMR LLC (diversified financial services company) and is an employee of Fidelity Investments. Previously, Ms. Baumann served as AML Officer of the funds (2012-2016), and Vice President (2007-2014) and Deputy Anti-Money Laundering Officer (2007-2012) of FMR LLC.
Craig S. Brown (1977)
Year of Election or Appointment: 2019
Assistant Treasurer
Mr. Brown also serves as Assistant Treasurer of other funds. Mr. Brown is an employee of Fidelity Investments (2013-present).
John J. Burke III (1964)
Year of Election or Appointment: 2018
Chief Financial Officer
Mr. Burke also serves as Chief Financial Officer of other funds. Mr. Burke serves as Head of Investment Operations for Fidelity Fund and Investment Operations (2018-present) and is an employee of Fidelity Investments (1998-present). Previously Mr. Burke served as head of Asset Management Investment Operations (2012-2018).
Jonathan Davis (1968)
Year of Election or Appointment: 2010
Assistant Treasurer
Mr. Davis also serves as Assistant Treasurer of other funds. Mr. Davis serves as Assistant Treasurer of FMR Capital, Inc. (2017-present) and is an employee of Fidelity Investments. Previously, Mr. Davis served as Vice President and Associate General Counsel of FMR LLC (diversified financial services company, 2003-2010).
Adrien E. Deberghes (1967)
Year of Election or Appointment: 2010
Assistant Treasurer
Mr. Deberghes also serves as an officer of other funds. He serves as Assistant Treasurer of FMR Capital, Inc. (2017-present), Executive Vice President of Fidelity Investments Money Management, Inc. (FIMM) (investment adviser firm, 2016-present), and is an employee of Fidelity Investments (2008-present). Previously, Mr. Deberghes served as President and Treasurer of certain Fidelity® funds (2013-2018). Prior to joining Fidelity Investments, Mr. Deberghes was Senior Vice President of Mutual Fund Administration at State Street Corporation (2007-2008), Senior Director of Mutual Fund Administration at Investors Bank & Trust (2005-2007), and Director of Finance for Dunkin' Brands (2000-2005). Previously, Mr. Deberghes served in other fund officer roles.
Laura M. Del Prato (1964)
Year of Election or Appointment: 2018
President and Treasurer
Ms. Del Prato also serves as an officer of other funds. Ms. Del Prato is an employee of Fidelity Investments (2017-present). Prior to joining Fidelity Investments, Ms. Del Prato served as a Managing Director and Treasurer of the JPMorgan Mutual Funds (2014-2017). Prior to JPMorgan, Ms. Del Prato served as a partner at Cohen Fund Audit Services (accounting firm, 2012-2013) and KPMG LLP (accounting firm, 2004-2012).
Colm A. Hogan (1973)
Year of Election or Appointment: 2016
Assistant Treasurer
Mr. Hogan also serves as an officer of other funds. Mr. Hogan serves as Assistant Treasurer of FMR Capital, Inc. (2017-present) and is an employee of Fidelity Investments (2005-present). Previously, Mr. Hogan served as Assistant Treasurer of certain Fidelity® funds (2016-2018).
Cynthia Lo Bessette (1969)
Year of Election or Appointment: 2019
Secretary and Chief Legal Officer (CLO)
Ms. Lo Bessette also serves as Secretary and CLO of other funds. She is a Senior Vice President and Deputy General Counsel of FMR LLC (diversified financial services company, 2019-present), and is an employee of Fidelity Investments. Previously, Ms. Lo Bessette served as Executive Vice President, General Counsel (2016-2019) and Senior Vice President, Deputy General Counsel (2015-2016) of OppenheimerFunds (investment management company) and Deputy Chief Legal Officer (2013-2015) of Jennison Associates LLC (investment adviser firm).
Chris Maher (1972)
Year of Election or Appointment: 2013
Assistant Treasurer
Mr. Maher serves as Assistant Treasurer of other funds. Mr. Maher is Vice President of Valuation Oversight, serves as Assistant Treasurer of FMR Capital, Inc. (2017-present), and is an employee of Fidelity Investments. Previously, Mr. Maher served as Vice President of Asset Management Compliance (2013), Vice President of the Program Management Group of FMR (investment adviser firm, 2010-2013), and Vice President of Valuation Oversight (2008-2010).
John B. McGinty, Jr. (1962)
Year of Election or Appointment: 2016
Chief Compliance Officer
Mr. McGinty also serves as Chief Compliance Officer of other funds. Mr. McGinty is Senior Vice President of Asset Management Compliance for Fidelity Investments and is an employee of Fidelity Investments (2016-present). Mr. McGinty previously served as Vice President, Senior Attorney at Eaton Vance Management (investment management firm, 2015-2016), and prior to Eaton Vance as global CCO for all firm operations and registered investment companies at GMO LLC (investment management firm, 2009-2015). Before joining GMO LLC, Mr. McGinty served as Senior Vice President, Deputy General Counsel for Fidelity Investments (2007-2009).
Jason P. Pogorelec (1975)
Year of Election or Appointment: 2015
Assistant Secretary
Mr. Pogorelec also serves as Assistant Secretary of other funds. Mr. Pogorelec serves as Vice President, Associate General Counsel (2010-present) and is an employee of Fidelity Investments (2006-present).
Nancy D. Prior (1967)
Year of Election or Appointment: 2014
Vice President
Ms. Prior also serves as Vice President of other funds. Ms. Prior serves as President of Fixed Income (2014-present), President (2016-present) and Director (2014-present) of Fidelity Investments Money Management, Inc. (FIMM) (investment adviser firm), and is an employee of Fidelity Investments (2002-present). Previously, Ms. Prior served as Vice Chairman of FIAM LLC (investment adviser firm, 2014-2018), a Director of FMR Investment Management (UK) Limited (investment adviser firm, 2015-2018), President Multi-Asset Class Strategies of FMR's Global Asset Allocation Division (2017-2018), Vice President of Fidelity's Money Market Funds (2012-2014), and President, Money Market and Short Duration Bond Group of Fidelity Management & Research Company (FMR) (investment adviser firm, 2013-2014).
Stacie M. Smith (1974)
Year of Election or Appointment: 2013
Assistant Treasurer
Ms. Smith also serves as an officer of other funds. Ms. Smith serves as Assistant Treasurer of FMR Capital, Inc. (2017-present), is an employee of Fidelity Investments (2009-present), and has served in other fund officer roles. Prior to joining Fidelity Investments, Ms. Smith served as Senior Audit Manager of Ernst & Young LLP (accounting firm, 1996-2009). Previously, Ms. Smith served as Assistant Treasurer (2013-2018) and Deputy Treasurer (2013-2016) of certain Fidelity® funds.
Marc L. Spector (1972)
Year of Election or Appointment: 2016
Deputy Treasurer
Mr. Spector also serves as an officer of other funds. Mr. Spector serves as Assistant Treasurer of FMR Capital, Inc. (2017-present) and is an employee of Fidelity Investments (2016-present). Prior to joining Fidelity Investments, Mr. Spector served as Director at the Siegfried Group (accounting firm, 2013-2016), and prior to Siegfried Group as audit senior manager at Deloitte & Touche (accounting firm, 2005-2013).
Jim Wegmann (1979)
Year of Election or Appointment: 2019
Assistant Treasurer
Mr. Wegmann also serves as Assistant Treasurer of other funds. Mr. Wegmann is an employee of Fidelity Investments (2011-present).
Shareholder Expense Example
As a shareholder of the Fund, you incur two types of costs: (1) transaction costs, including sales charges (loads) on purchase payments or redemption proceeds, and (2) ongoing costs, including management fees, distribution and/or service (12b-1) fees and other Fund expenses. This Example is intended to help you understand your ongoing costs (in dollars) of investing in the Fund and to compare these costs with the ongoing costs of investing in other mutual funds.
The Example is based on an investment of $1,000 invested at the beginning of the period and held for the entire period (March 1, 2019 to August 31, 2019).
Actual Expenses
The first line of the accompanying table for each class of the Fund provides information about actual account values and actual expenses. You may use the information in this line, together with the amount you invested, to estimate the expenses that you paid over the period. Simply divide your account value by $1,000.00 (for example, an $8,600 account value divided by $1,000.00 = 8.6), then multiply the result by the number in the first line for a class of the Fund under the heading entitled "Expenses Paid During Period" to estimate the expenses you paid on your account during this period. In addition, the Fund, as a shareholder in the underlying Fidelity Central Funds, will indirectly bear its pro-rata share of the fees and expenses incurred by the underlying Fidelity Central Funds. These fees and expenses are not included in the Fund's annualized expense ratio used to calculate the expense estimate in the table below.
Hypothetical Example for Comparison Purposes
The second line of the accompanying table for each class of the Fund provides information about hypothetical account values and hypothetical expenses based on a Class' actual expense ratio and an assumed rate of return of 5% per year before expenses, which is not the Class' actual return. The hypothetical account values and expenses may not be used to estimate the actual ending account balance or expenses you paid for the period. You may use this information to compare the ongoing costs of investing in the Fund and other funds. To do so, compare this 5% hypothetical example with the 5% hypothetical examples that appear in the shareholder reports of the other funds. In addition, the Fund, as a shareholder in the underlying Fidelity Central Funds, will indirectly bear its pro-rata share of the fees and expenses incurred by the underlying Fidelity Central Funds. These fees and expenses are not included in the Fund's annualized expense ratio used to calculate the expense estimate in the table below.
Please note that the expenses shown in the table are meant to highlight your ongoing costs only and do not reflect any transaction costs. Therefore, the second line of the table is useful in comparing ongoing costs only, and will not help you determine the relative total costs of owning different funds. In addition, if these transactional costs were included, your costs would have been higher.
| | Annualized Expense Ratio-A | Beginning
Account Value
March 1, 2019 | Ending
Account Value
August 31, 2019 | Expenses Paid
During Period-B
March 1, 2019
to August 31, 2019 |
| Class A | .78% | | | |
| Actual | | $1,000.00 | $1,108.10 | $4.14 |
| Hypothetical-C | | $1,000.00 | $1,021.27 | $3.97 |
| Class M | .85% | | | |
| Actual | | $1,000.00 | $1,107.70 | $4.52 |
| Hypothetical-C | | $1,000.00 | $1,020.92 | $4.33 |
| Class C | 1.54% | | | |
| Actual | | $1,000.00 | $1,103.00 | $8.16 |
| Hypothetical-C | | $1,000.00 | $1,017.44 | $7.83 |
| Corporate Bond | .45% | | | |
| Actual | | $1,000.00 | $1,109.90 | $2.39 |
| Hypothetical-C | | $1,000.00 | $1,022.94 | $2.29 |
| Class I | .49% | | | |
| Actual | | $1,000.00 | $1,109.70 | $2.61 |
| Hypothetical-C | | $1,000.00 | $1,022.74 | $2.50 |
| Class Z | .36% | | | |
| Actual | | $1,000.00 | $1,109.50 | $1.91 |
| Hypothetical-C | | $1,000.00 | $1,023.39 | $1.84 |
A Annualized expense ratio reflects expenses net of applicable fee waivers.
B Expenses are equal to each Class' annualized expense ratio, multiplied by the average account value over the period, multiplied by 184/365 (to reflect the one-half year period). In addition to the expenses noted above, the Fund also indirectly bears its proportional share of the expenses of the underlying Fidelity Central Funds. Annualized expenses of the underlying non-money market Fidelity Central Funds as of their most recent fiscal half year ranged from less than .005% to .01%.
C 5% return per year before expenses
Distributions (Unaudited)
A total of 2.43% of the dividends distributed during the fiscal year was derived from interest on U.S. Government securities which is generally exempt from state income tax.
The fund designates $25,559,517 of distributions paid during the period January 1, 2019 to August 31, 2019 as qualifying to be taxed as interest-related dividends for nonresident alien shareholders.
The fund will notify shareholders in January 2020 of amounts for use in preparing 2019 income tax returns.
CBD-ANN-1019
1.907004.109
Fidelity® Intermediate Bond Fund
Annual Report August 31, 2019 |
|
Beginning on January 1, 2021, as permitted by regulations adopted by the Securities and Exchange Commission, paper copies of a fund’s shareholder reports will no longer be sent by mail, unless you specifically request paper copies of the reports from the fund or from your financial intermediary, such as a financial advisor, broker-dealer or bank. Instead, the reports will be made available on a website, and you will be notified by mail each time a report is posted and provided with a website link to access the report.
If you already elected to receive shareholder reports electronically, you will not be affected by this change and you need not take any action. You may elect to receive shareholder reports and other communications from a fund electronically, by contacting your financial intermediary. For Fidelity customers, visit Fidelity's web site or call Fidelity using the contact information listed below.
You may elect to receive all future reports in paper free of charge. If you wish to continue receiving paper copies of your shareholder reports, you may contact your financial intermediary or, if you are a Fidelity customer, visit Fidelity’s website, or call Fidelity at the applicable toll-free number listed below. Your election to receive reports in paper will apply to all funds held with the fund complex/your financial intermediary.
| Account Type | Website | Phone Number |
| Brokerage, Mutual Fund, or Annuity Contracts: | fidelity.com/mailpreferences | 1-800-343-3548 |
| Employer Provided Retirement Accounts: | netbenefits.fidelity.com/preferences (choose 'no' under Required Disclosures to continue to print) | 1-800-343-0860 |
| Advisor Sold Accounts Serviced Through Your Financial Intermediary: | Contact Your Financial Intermediary | Your Financial Intermediary's phone number |
| Advisor Sold Accounts Serviced by Fidelity: | institutional.fidelity.com | 1-877-208-0098 |
Contents
To view a fund's proxy voting guidelines and proxy voting record for the 12-month period ended June 30, visit http://www.fidelity.com/proxyvotingresults or visit the Securities and Exchange Commission's (SEC) web site at http://www.sec.gov.
You may also call 1-800-544-8544 to request a free copy of the proxy voting guidelines.
Standard & Poor's, S&P and S&P 500 are registered service marks of The McGraw-Hill Companies, Inc. and have been licensed for use by Fidelity Distributors Corporation.
Other third-party marks appearing herein are the property of their respective owners.
All other marks appearing herein are registered or unregistered trademarks or service marks of FMR LLC or an affiliated company. © 2019 FMR LLC. All rights reserved.
This report and the financial statements contained herein are submitted for the general information of the shareholders of the Fund. This report is not authorized for distribution to prospective investors in the Fund unless preceded or accompanied by an effective prospectus.
A fund files its complete schedule of portfolio holdings with the SEC for the first and third quarters of each fiscal year on Form N-PORT. Forms N-PORT are available on the SEC’s web site at http://www.sec.gov. A fund's Forms N-PORT may be reviewed and copied at the SEC’s Public Reference Room in Washington, DC. Information regarding the operation of the SEC's Public Reference Room may be obtained by calling 1-800-SEC-0330.
For a complete list of a fund's portfolio holdings, view the most recent holdings listing, semiannual report, or annual report on Fidelity's web site at http://www.fidelity.com, http://www.institutional.fidelity.com, or http://www.401k.com, as applicable.
NOT FDIC INSURED •MAY LOSE VALUE •NO BANK GUARANTEE
Neither the Fund nor Fidelity Distributors Corporation is a bank.
Performance: The Bottom Line
Average annual total return reflects the change in the value of an investment, assuming reinvestment of distributions from dividend income and capital gains (the profits earned upon the sale of securities that have grown in value, if any) and assuming a constant rate of performance each year. The hypothetical investment and the average annual total returns do not reflect the deduction of taxes that a shareholder would pay on fund distributions or the redemption of fund shares. During periods of reimbursement by Fidelity, a fund’s total return will be greater than it would be had the reimbursement not occurred. How a fund did yesterday is no guarantee of how it will do tomorrow.
Average Annual Total Returns
| For the periods ended August 31, 2019 | Past 1 year | Past 5 years | Past 10 years |
| Fidelity® Intermediate Bond Fund | 8.18% | 2.72% | 3.75% |
$10,000 Over 10 Years
Let's say hypothetically that $10,000 was invested in Fidelity® Intermediate Bond Fund on August 31, 2009.
The chart shows how the value of your investment would have changed, and also shows how the Bloomberg Barclays U.S. Intermediate Government/Credit Bond Index performed over the same period.

| Period Ending Values |
| $14,453 | Fidelity® Intermediate Bond Fund |
| $13,666 | Bloomberg Barclays U.S. Intermediate Government/Credit Bond Index |
Management's Discussion of Fund Performance
Market Recap: U.S. taxable investment-grade bonds posted their strongest trailing one-year return since 2009, driven by slower global economic growth, a maturing business cycle, trade uncertainty and, late in the period, the Fed’s dovish shift. The Bloomberg Barclays U.S. Aggregate Bond Index gained 10.17%. Market yields rose in the early fall of 2018, on expectations for higher inflation. Yields then declined and credit spreads widened in November and December, partly because of weaker U.S. manufacturing data. Yield spreads narrowed in January, as the U.S. Federal Reserve said it would be “patient” with policy rate hikes, and that future increases largely would depend on economic data. Yields continued to decline in the spring, amid continued international trade tension and attacks on oil tankers in the Middle East, and then tumbled further in July, when the Fed cut interest rates for the first time since 2008. The yield curve ended the period roughly flat, amid expectations for another rate cut of 25 basis points in September. Within the Bloomberg Barclays index, corporate bonds gained 13.33%, topping the 10.38% advance of U.S. Treasuries. Outside the index, U.S. corporate high-yield bonds lagged nominal U.S. Treasuries, while Treasury Inflation-Protected Securities (TIPS) gained 7.46%.
Comments from Co-Portfolio Managers David DeBiase and Rob Galusza: For the fiscal year, the fund returned 8.18%, about in line, net of fees, with the 8.12% result of its benchmark, the Bloomberg Barclays U.S. Intermediate Government/Credit Bond Index, and notably above the Lipper peer group average. Outsized exposure to corporate bonds contributed meaningfully to the fund’s relative result. Within corporates, overweighting the bonds of financial institutions – including banks, insurance firms, finance companies and real estate investment trusts – added relative value. An overweighting and choices among industrial bonds also contributed, especially picks among energy companies. Lighter-than-index exposure to Treasury securities also benefited the fund’s relative return, as did non-index exposure to asset-backed securities (ABS) and commercial mortgage-backed securities (CMBS). Conversely, non-index positioning among mortgage-backed securities (MBS) detracted from the relative result, as did the fund’s small position, on average, in Treasury Inflation Protected Securities (TIPS). Elsewhere, picks among basic industry and communications firms hurt to a small degree, as did not holding sovereign bonds. As of August 31, we slightly decreased the fund’s holdings among industrial bonds and U.S. Treasuries, and added to CMBS, ABS and TIPS.
The views expressed above reflect those of the portfolio manager(s) only through the end of the period as stated on the cover of this report and do not necessarily represent the views of Fidelity or any other person in the Fidelity organization. Any such views are subject to change at any time based upon market or other conditions and Fidelity disclaims any responsibility to update such views. These views may not be relied on as investment advice and, because investment decisions for a Fidelity fund are based on numerous factors, may not be relied on as an indication of trading intent on behalf of any Fidelity fund.
Note to Shareholders: On October 1, 2019, Julian Potenza assumed co-management responsibilities for the fund, joining David DeBiase and Rob Galusza.
Investment Summary (Unaudited)
The information in the following tables is based on the combined investments of the Fund and its pro-rata share of the investments of Fidelity's Fixed-Income Central Funds.
Quality Diversification (% of fund's net assets)
| As of August 31, 2019 |
| | U.S. Government and U.S. Government Agency Obligations | 37.9% |
| | AAA | 7.0% |
| | AA | 3.4% |
| | A | 10.8% |
| | BBB | 34.2% |
| | BB and Below | 4.8% |
| | Not Rated | 0.9% |
| | Short-Term Investments and Net Other Assets | 1.0% |
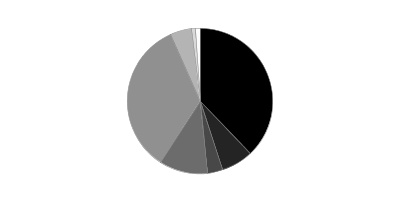
We have used ratings from Moody's Investors Service, Inc. Where Moody's® ratings are not available, we have used S&P® ratings. All ratings are as of the date indicated and do not reflect subsequent changes. Securities rated BB or below were rated investment grade at the time of acquisition.
Asset Allocation (% of fund's net assets)
| As of August 31, 2019* |
| | Corporate Bonds | 49.5% |
| | U.S. Government and U.S. Government Agency Obligations | 37.9% |
| | Asset-Backed Securities | 2.2% |
| | CMOs and Other Mortgage Related Securities | 7.2% |
| | Municipal Bonds | 0.2% |
| | Other Investments | 2.0% |
| | Short-Term Investments and Net Other Assets (Liabilities) | 1.0% |

* Foreign investments - 9.6%
An unaudited holdings listing for the Fund, which presents direct holdings as well as the pro-rata share of any securities and other investments held indirectly through its investment in underlying non-money market Fidelity Central Funds, is available at fidelity.com and/or institutional.fidelity.com, as applicable.
Schedule of Investments August 31, 2019
Showing Percentage of Net Assets
| Nonconvertible Bonds - 48.4% | | | |
| | | Principal Amount (000s) | Value (000s) |
| COMMUNICATION SERVICES - 1.9% | | | |
| Diversified Telecommunication Services - 1.2% | | | |
| AT&T, Inc.: | | | |
| 2.8% 2/17/21 | | $7,750 | $7,827 |
| 3% 6/30/22 | | 2,110 | 2,157 |
| 3.4% 5/15/25 | | 4,920 | 5,168 |
| 3.6% 2/17/23 | | 5,410 | 5,655 |
| SBA Tower Trust 3.156% 10/8/20 (a) | | 4,730 | 4,775 |
| Verizon Communications, Inc.: | | | |
| 2.946% 3/15/22 | | 2,884 | 2,959 |
| 3.125% 3/16/22 | | 5,300 | 5,464 |
| | | | 34,005 |
| Entertainment - 0.1% | | | |
| The Walt Disney Co. 3% 9/15/22 (a) | | 2,241 | 2,315 |
| Media - 0.6% | | | |
| Charter Communications Operating LLC/Charter Communications Operating Capital Corp.: | | | |
| 4.464% 7/23/22 | | 6,000 | 6,340 |
| 4.908% 7/23/25 | | 4,820 | 5,327 |
| Comcast Corp. 3.95% 10/15/25 | | 3,064 | 3,355 |
| | | | 15,022 |
|
| TOTAL COMMUNICATION SERVICES | | | 51,342 |
|
| CONSUMER DISCRETIONARY - 2.2% | | | |
| Automobiles - 1.4% | | | |
| Daimler Finance North America LLC: | | | |
| 2.3% 2/12/21 (a) | | 5,880 | 5,879 |
| 2.85% 1/6/22 (a) | | 3,657 | 3,695 |
| General Motors Financial Co., Inc.: | | | |
| 2.65% 4/13/20 | | 4,423 | 4,430 |
| 3.25% 1/5/23 | | 5,500 | 5,595 |
| 4.15% 6/19/23 | | 6,023 | 6,290 |
| 4.35% 4/9/25 | | 6,000 | 6,286 |
| Volkswagen Group of America Finance LLC 2.45% 11/20/19 (a) | | 6,500 | 6,499 |
| | | | 38,674 |
| Household Durables - 0.4% | | | |
| Lennar Corp. 2.95% 11/29/20 | | 6,000 | 6,000 |
| Toll Brothers Finance Corp. 4.875% 11/15/25 | | 4,400 | 4,719 |
| | | | 10,719 |
| Multiline Retail - 0.3% | | | |
| Dollar Tree, Inc. 4% 5/15/25 | | 7,200 | 7,611 |
| Specialty Retail - 0.1% | | | |
| AutoZone, Inc. 3.7% 4/15/22 | | 3,290 | 3,427 |
|
| TOTAL CONSUMER DISCRETIONARY | | | 60,431 |
|
| CONSUMER STAPLES - 2.2% | | | |
| Beverages - 0.4% | | | |
| Anheuser-Busch InBev Finance, Inc. 3.3% 2/1/23 | | 6,446 | 6,711 |
| Anheuser-Busch InBev Worldwide, Inc. 4.15% 1/23/25 | | 4,876 | 5,339 |
| | | | 12,050 |
| Food Products - 0.7% | | | |
| Cargill, Inc. 3.25% 11/15/21 (a) | | 4,000 | 4,105 |
| Conagra Brands, Inc. 4.3% 5/1/24 | | 6,700 | 7,195 |
| General Mills, Inc.: | | | |
| 3.2% 4/16/21 | | 1,071 | 1,090 |
| 3.7% 10/17/23 | | 5,017 | 5,308 |
| | | | 17,698 |
| Tobacco - 1.1% | | | |
| Altria Group, Inc.: | | | |
| 3.8% 2/14/24 | | 2,534 | 2,684 |
| 4.8% 2/14/29 | | 6,750 | 7,643 |
| BAT International Finance PLC 3.5% 6/15/22 (a) | | 4,810 | 4,947 |
| Imperial Tobacco Finance PLC: | | | |
| 3.125% 7/26/24 (a) | | 5,300 | 5,390 |
| 3.5% 2/11/23 (a) | | 2,700 | 2,773 |
| 3.75% 7/21/22 (a) | | 4,789 | 4,954 |
| Reynolds American, Inc. 4% 6/12/22 | | 2,191 | 2,290 |
| | | | 30,681 |
|
| TOTAL CONSUMER STAPLES | | | 60,429 |
|
| ENERGY - 4.9% | | | |
| Energy Equipment & Services - 0.2% | | | |
| El Paso Pipeline Partners Operating Co. LLC 6.5% 4/1/20 | | 5,067 | 5,188 |
| Oil, Gas & Consumable Fuels - 4.7% | | | |
| Anadarko Petroleum Corp. 4.85% 3/15/21 | | 5,787 | 5,983 |
| Canadian Natural Resources Ltd.: | | | |
| 3.45% 11/15/21 | | 7,072 | 7,222 |
| 3.9% 2/1/25 | | 3,400 | 3,584 |
| Cenovus Energy, Inc. 3.8% 9/15/23 | | 10,231 | 10,574 |
| DCP Midstream LLC 5.35% 3/15/20 (a) | | 4,118 | 4,167 |
| DCP Midstream Operating LP 3.875% 3/15/23 | | 3,530 | 3,574 |
| Enbridge Energy Partners LP 4.2% 9/15/21 | | 4,308 | 4,449 |
| Energy Transfer Partners LP: | | | |
| 3.6% 2/1/23 | | 3,281 | 3,367 |
| 4.2% 9/15/23 | | 1,661 | 1,756 |
| 4.5% 4/15/24 | | 650 | 697 |
| Enterprise Products Operating LP 4.05% 2/15/22 | | 4,350 | 4,550 |
| EQT Corp. 2.5% 10/1/20 | | 2,725 | 2,710 |
| Kinder Morgan Energy Partners LP: | | | |
| 3.5% 9/1/23 | | 3,022 | 3,142 |
| 3.95% 9/1/22 | | 775 | 809 |
| MPLX LP: | | | |
| 3.375% 3/15/23 | | 5,069 | 5,218 |
| 4% 2/15/25 | | 500 | 526 |
| 4.5% 7/15/23 | | 990 | 1,056 |
| Occidental Petroleum Corp.: | | | |
| 2.7% 8/15/22 | | 648 | 654 |
| 2.9% 8/15/24 | | 2,142 | 2,162 |
| 3.2% 8/15/26 | | 288 | 291 |
| 3.5% 8/15/29 | | 907 | 924 |
| Petrobras Global Finance BV 5.299% 1/27/25 | | 7,000 | 7,577 |
| Petroleos Mexicanos: | | | |
| 3.5% 1/30/23 | | 6,905 | 6,708 |
| 5.35% 2/12/28 | | 3,350 | 3,172 |
| Plains All American Pipeline LP/PAA Finance Corp.: | | | |
| 2.6% 12/15/19 | | 3,100 | 3,097 |
| 3.65% 6/1/22 | | 5,156 | 5,299 |
| 3.85% 10/15/23 | | 2,649 | 2,750 |
| Southeast Supply Header LLC 4.25% 6/15/24 (a) | | 3,066 | 3,158 |
| The Williams Companies, Inc.: | | | |
| 3.7% 1/15/23 | | 1,003 | 1,041 |
| 4.55% 6/24/24 | | 4,547 | 4,925 |
| Western Gas Partners LP 5.375% 6/1/21 | | 7,300 | 7,548 |
| Williams Partners LP: | | | |
| 3.6% 3/15/22 | | 9,470 | 9,750 |
| 4.3% 3/4/24 | | 4,990 | 5,326 |
| | | | 127,766 |
|
| TOTAL ENERGY | | | 132,954 |
|
| FINANCIALS - 21.4% | | | |
| Banks - 11.1% | | | |
| Bank of America Corp.: | | | |
| 2.625% 4/19/21 | | 4,740 | 4,786 |
| 3.004% 12/20/23 (b) | | 6,528 | 6,699 |
| 3.864% 7/23/24 (b) | | 5,000 | 5,309 |
| 3.974% 2/7/30 (b) | | 6,800 | 7,538 |
| 4.2% 8/26/24 | | 8,640 | 9,325 |
| 4.25% 10/22/26 | | 3,412 | 3,725 |
| 4.45% 3/3/26 | | 3,485 | 3,838 |
| Bank of Nova Scotia: | | | |
| 2.8% 7/21/21 | | 3,440 | 3,496 |
| 4.5% 12/16/25 | | 6,400 | 7,025 |
| Barclays PLC: | | | |
| 2.875% 6/8/20 | | 4,810 | 4,816 |
| 3.2% 8/10/21 | | 4,798 | 4,841 |
| 3.25% 1/12/21 | | 3,509 | 3,538 |
| 3.932% 5/7/25 (b) | | 4,030 | 4,143 |
| Canadian Imperial Bank of Commerce 2.55% 6/16/22 | | 4,637 | 4,718 |
| CIT Group, Inc. 4.75% 2/16/24 | | 5,000 | 5,375 |
| Citigroup, Inc.: | | | |
| 2.7% 3/30/21 | | 6,300 | 6,364 |
| 2.7% 10/27/22 | | 11,000 | 11,187 |
| 2.75% 4/25/22 | | 4,500 | 4,581 |
| 2.9% 12/8/21 | | 4,703 | 4,785 |
| 4.6% 3/9/26 | | 3,280 | 3,610 |
| Citizens Bank NA: | | | |
| 2.55% 5/13/21 | | 4,261 | 4,291 |
| 2.65% 5/26/22 | | 3,090 | 3,138 |
| Citizens Financial Group, Inc. 4.15% 9/28/22 (a) | | 1,271 | 1,327 |
| Commonwealth Bank of Australia 2.55% 3/15/21 | | 3,120 | 3,147 |
| Danske Bank A/S 3.875% 9/12/23 (a) | | 3,000 | 3,117 |
| First Horizon National Corp. 3.5% 12/15/20 | | 7,958 | 8,056 |
| HSBC Holdings PLC: | | | |
| 3.262% 3/13/23 (b) | | 4,790 | 4,888 |
| 3.803% 3/11/25 (b) | | 6,700 | 6,989 |
| 4% 3/30/22 | | 3,778 | 3,964 |
| Huntington Bancshares, Inc.: | | | |
| 2.3% 1/14/22 | | 4,800 | 4,823 |
| 3.15% 3/14/21 | | 4,700 | 4,768 |
| 7% 12/15/20 | | 1,204 | 1,276 |
| ING Groep NV 3.15% 3/29/22 | | 4,500 | 4,613 |
| Intesa Sanpaolo SpA 3.375% 1/12/23 (a) | | 7,600 | 7,702 |
| Japan Bank International Cooperation 1.5% 7/21/21 | | 5,952 | 5,924 |
| JPMorgan Chase & Co.: | | | |
| 3.514% 6/18/22 (b) | | 9,500 | 9,725 |
| 3.797% 7/23/24 (b) | | 4,840 | 5,141 |
| 3.875% 9/10/24 | | 5,168 | 5,525 |
| 4.125% 12/15/26 | | 5,070 | 5,585 |
| 4.5% 1/24/22 | | 4,210 | 4,456 |
| KeyCorp. 5.1% 3/24/21 | | 4,303 | 4,496 |
| Mitsubishi UFJ Financial Group, Inc.: | | | |
| 2.19% 9/13/21 | | 4,839 | 4,841 |
| 2.95% 3/1/21 | | 4,196 | 4,242 |
| 3.455% 3/2/23 | | 6,000 | 6,251 |
| Regions Financial Corp.: | | | |
| 2.75% 8/14/22 | | 5,593 | 5,691 |
| 3.2% 2/8/21 | | 4,701 | 4,765 |
| 3.8% 8/14/23 | | 2,053 | 2,173 |
| Royal Bank of Scotland Group PLC: | | | |
| 4.519% 6/25/24 (b) | | 6,878 | 7,220 |
| 5.125% 5/28/24 | | 5,130 | 5,429 |
| Santander Holdings U.S.A., Inc.: | | | |
| 3.4% 1/18/23 | | 5,000 | 5,144 |
| 4.45% 12/3/21 | | 5,000 | 5,217 |
| Sumitomo Mitsui Financial Group, Inc. 2.934% 3/9/21 | | 4,046 | 4,095 |
| SunTrust Banks, Inc. 2.9% 3/3/21 | | 4,672 | 4,725 |
| Synovus Financial Corp. 3.125% 11/1/22 | | 6,476 | 6,489 |
| The Toronto-Dominion Bank 2.125% 4/7/21 | | 4,740 | 4,755 |
| Wells Fargo & Co.: | | | |
| 3.75% 1/24/24 | | 5,350 | 5,698 |
| 4.3% 7/22/27 | | 4,780 | 5,294 |
| Westpac Banking Corp.: | | | |
| 2.8% 1/11/22 | | 4,802 | 4,909 |
| 4.11% 7/24/34 (b) | | 1,798 | 1,893 |
| | | | 301,481 |
| Capital Markets - 2.6% | | | |
| Credit Suisse Group AG 4.207% 6/12/24 (a)(b) | | 10,000 | 10,589 |
| Deutsche Bank AG New York Branch 3.15% 1/22/21 | | 3,413 | 3,401 |
| Goldman Sachs Group, Inc.: | | | |
| 2.876% 10/31/22 (b) | | 6,196 | 6,281 |
| 3% 4/26/22 | | 4,000 | 4,052 |
| 3.2% 2/23/23 | | 13,500 | 13,948 |
| IntercontinentalExchange, Inc. 2.75% 12/1/20 | | 1,103 | 1,112 |
| Moody's Corp. 2.75% 12/15/21 | | 1,959 | 1,986 |
| Morgan Stanley: | | | |
| 2.5% 4/21/21 | | 5,000 | 5,028 |
| 3.125% 1/23/23 | | 5,609 | 5,783 |
| 3.737% 4/24/24 (b) | | 5,698 | 5,995 |
| 3.875% 1/27/26 | | 4,600 | 4,973 |
| 4.875% 11/1/22 | | 3,010 | 3,238 |
| 5.75% 1/25/21 | | 4,378 | 4,593 |
| | | | 70,979 |
| Consumer Finance - 3.2% | | | |
| AerCap Ireland Capital Ltd./AerCap Global Aviation Trust: | | | |
| 3.3% 1/23/23 | | 5,800 | 5,945 |
| 3.5% 5/26/22 | | 1,109 | 1,139 |
| 4.125% 7/3/23 | | 2,092 | 2,219 |
| 4.45% 12/16/21 | | 1,512 | 1,571 |
| Ally Financial, Inc. 4.25% 4/15/21 | | 7,800 | 8,015 |
| Capital One Financial Corp.: | | | |
| 3.2% 1/30/23 | | 6,000 | 6,182 |
| 3.9% 1/29/24 | | 4,480 | 4,757 |
| Discover Financial Services: | | | |
| 3.85% 11/21/22 | | 196 | 206 |
| 4.5% 1/30/26 | | 2,428 | 2,682 |
| 5.2% 4/27/22 | | 5,287 | 5,685 |
| Ford Motor Credit Co. LLC: | | | |
| 3.157% 8/4/20 | | 3,320 | 3,332 |
| 3.336% 3/18/21 | | 7,800 | 7,851 |
| 3.339% 3/28/22 | | 2,657 | 2,671 |
| 4.14% 2/15/23 | | 5,500 | 5,641 |
| 4.25% 9/20/22 | | 4,080 | 4,219 |
| Hyundai Capital America 3% 10/30/20 (a) | | 6,329 | 6,362 |
| Synchrony Financial: | | | |
| 2.85% 7/25/22 | | 726 | 736 |
| 3.75% 8/15/21 | | 4,450 | 4,550 |
| 4.25% 8/15/24 | | 5,000 | 5,324 |
| 4.375% 3/19/24 | | 6,708 | 7,165 |
| | | | 86,252 |
| Diversified Financial Services - 1.6% | | | |
| Avolon Holdings Funding Ltd.: | | | |
| 3.625% 5/1/22 (a) | | 787 | 798 |
| 3.95% 7/1/24 (a) | | 1,046 | 1,077 |
| AXA Equitable Holdings, Inc. 4.35% 4/20/28 | | 5,800 | 6,227 |
| Brixmor Operating Partnership LP: | | | |
| 3.85% 2/1/25 | | 2,929 | 3,079 |
| 3.875% 8/15/22 | | 9,128 | 9,525 |
| 4.125% 6/15/26 | | 1,347 | 1,436 |
| Cigna Corp.: | | | |
| 3.75% 7/15/23 | | 2,423 | 2,547 |
| 4.375% 10/15/28 | | 8,024 | 8,972 |
| GE Capital International Funding Co. 2.342% 11/15/20 | | 5,430 | 5,400 |
| USAA Capital Corp. 2% 6/1/21 (a) | | 4,738 | 4,749 |
| | | | 43,810 |
| Insurance - 2.9% | | | |
| AIA Group Ltd. 3.9% 4/6/28 (a) | | 8,500 | 9,356 |
| American International Group, Inc.: | | | |
| 4.2% 4/1/28 | | 7,000 | 7,718 |
| 4.875% 6/1/22 | | 6,517 | 6,980 |
| Aon PLC 3.875% 12/15/25 | | 6,215 | 6,740 |
| Liberty Mutual Group, Inc. 5% 6/1/21 (a) | | 5,410 | 5,636 |
| Marsh & McLennan Companies, Inc.: | | | |
| 3.875% 3/15/24 | | 2,420 | 2,596 |
| 4.8% 7/15/21 | | 4,925 | 5,131 |
| Metropolitan Life Global Funding I 2.65% 4/8/22 (a) | | 7,790 | 7,915 |
| Pricoa Global Funding I 2.45% 9/21/22 (a) | | 4,504 | 4,555 |
| Principal Financial Group, Inc. 3.7% 5/15/29 | | 2,684 | 2,917 |
| Teachers Insurance & Annuity Association of America 4.9% 9/15/44 (a) | | 4,303 | 5,416 |
| Unum Group: | | | |
| 4% 3/15/24 | | 3,330 | 3,536 |
| 5.625% 9/15/20 | | 5,021 | 5,191 |
| Willis Group North America, Inc. 4.5% 9/15/28 | | 5,500 | 6,189 |
| | | | 79,876 |
|
| TOTAL FINANCIALS | | | 582,398 |
|
| HEALTH CARE - 3.1% | | | |
| Biotechnology - 0.1% | | | |
| Celgene Corp. 2.875% 8/15/20 | | 3,000 | 3,018 |
| Health Care Equipment & Supplies - 0.0% | | | |
| Becton, Dickinson & Co. 2.894% 6/6/22 | | 1,094 | 1,112 |
| Health Care Providers & Services - 1.4% | | | |
| Aetna, Inc. 2.75% 11/15/22 | | 597 | 605 |
| Anthem, Inc. 3.35% 12/1/24 | | 4,000 | 4,181 |
| CVS Health Corp.: | | | |
| 2.8% 7/20/20 | | 2,854 | 2,868 |
| 3.7% 3/9/23 | | 2,000 | 2,091 |
| 4.1% 3/25/25 | | 5,945 | 6,360 |
| 4.3% 3/25/28 | | 5,860 | 6,396 |
| Elanco Animal Health, Inc.: | | | |
| 3.912% 8/27/21 | | 501 | 511 |
| 4.272% 8/28/23 | | 641 | 671 |
| Express Scripts Holding Co. 4.75% 11/15/21 | | 2,329 | 2,453 |
| UnitedHealth Group, Inc.: | | | |
| 2.125% 3/15/21 | | 4,680 | 4,691 |
| 2.75% 2/15/23 | | 684 | 700 |
| 3.35% 7/15/22 | | 1,155 | 1,199 |
| 3.875% 10/15/20 | | 5,296 | 5,382 |
| | | | 38,108 |
| Life Sciences Tools & Services - 0.2% | | | |
| Thermo Fisher Scientific, Inc.: | | | |
| 3.3% 2/15/22 | | 3,414 | 3,518 |
| 4.15% 2/1/24 | | 918 | 988 |
| | | | 4,506 |
| Pharmaceuticals - 1.4% | | | |
| Bristol-Myers Squibb Co.: | | | |
| 2.9% 7/26/24 (a) | | 6,730 | 6,978 |
| 3.2% 6/15/26 (a) | | 6,805 | 7,201 |
| Mylan NV 4.55% 4/15/28 | | 9,726 | 10,471 |
| Perrigo Co. PLC 3.5% 3/15/21 | | 2,617 | 2,631 |
| Perrigo Finance PLC 3.5% 12/15/21 | | 351 | 353 |
| Shire Acquisitions Investments Ireland DAC 2.4% 9/23/21 | | 8,037 | 8,062 |
| Zoetis, Inc. 3.25% 2/1/23 | | 1,553 | 1,606 |
| | | | 37,302 |
|
| TOTAL HEALTH CARE | | | 84,046 |
|
| INDUSTRIALS - 2.2% | | | |
| Aerospace & Defense - 0.3% | | | |
| BAE Systems Holdings, Inc.: | | | |
| 2.85% 12/15/20 (a) | | 6,260 | 6,298 |
| 3.8% 10/7/24 (a) | | 2,162 | 2,295 |
| | | | 8,593 |
| Airlines - 0.5% | | | |
| American Airlines 2019-1 Class B Pass Through Trust equipment trust certificate 3.85% 8/15/29 | | 5,785 | 5,873 |
| Delta Air Lines, Inc. 3.8% 4/19/23 | | 2,800 | 2,913 |
| United Airlines, Inc. equipment trust certificate 4.6% 3/1/26 | | 5,146 | 5,383 |
| | | | 14,169 |
| Electrical Equipment - 0.1% | | | |
| Fortive Corp. 2.35% 6/15/21 | | 2,288 | 2,288 |
| Industrial Conglomerates - 0.2% | | | |
| General Electric Co. 2.7% 10/9/22 | | 3,340 | 3,318 |
| Roper Technologies, Inc. 3% 12/15/20 | | 3,140 | 3,172 |
| | | | 6,490 |
| Machinery - 0.3% | | | |
| Westinghouse Air Brake Co. 4.4% 3/15/24 | | 7,000 | 7,497 |
| Trading Companies & Distributors - 0.8% | | | |
| Air Lease Corp.: | | | |
| 2.625% 7/1/22 | | 3,000 | 3,027 |
| 3.375% 6/1/21 | | 4,710 | 4,788 |
| 4.25% 2/1/24 | | 2,956 | 3,155 |
| 4.75% 3/1/20 | | 2,913 | 2,946 |
| International Lease Finance Corp. 5.875% 8/15/22 | | 6,480 | 7,117 |
| | | | 21,033 |
|
| TOTAL INDUSTRIALS | | | 60,070 |
|
| INFORMATION TECHNOLOGY - 1.3% | | | |
| Electronic Equipment & Components - 0.8% | | | |
| Amphenol Corp.: | | | |
| 3.125% 9/15/21 | | 4,522 | 4,597 |
| 3.2% 4/1/24 | | 1,056 | 1,091 |
| Diamond 1 Finance Corp./Diamond 2 Finance Corp.: | | | |
| 4.42% 6/15/21 (a) | | 9,430 | 9,730 |
| 5.45% 6/15/23 (a) | | 6,263 | 6,807 |
| | | | 22,225 |
| IT Services - 0.2% | | | |
| The Western Union Co. 4.25% 6/9/23 | | 5,500 | 5,817 |
| Semiconductors & Semiconductor Equipment - 0.3% | | | |
| Micron Technology, Inc. 4.185% 2/15/27 | | 6,550 | 6,758 |
|
| TOTAL INFORMATION TECHNOLOGY | | | 34,800 |
|
| MATERIALS - 1.0% | | | |
| Chemicals - 0.7% | | | |
| Chevron Phillips Chemical Co. LLC / Chevron Phillips Chemical Co. LP 3.3% 5/1/23 (a) | | 3,392 | 3,511 |
| LYB International Finance II BV 3.5% 3/2/27 | | 3,160 | 3,263 |
| The Dow Chemical Co. 4.125% 11/15/21 | | 4,063 | 4,216 |
| The Mosaic Co.: | | | |
| 3.25% 11/15/22 | | 1,917 | 1,965 |
| 4.25% 11/15/23 | | 5,095 | 5,378 |
| | | | 18,333 |
| Construction Materials - 0.3% | | | |
| CRH America Finance, Inc. 3.95% 4/4/28 (a) | | 8,500 | 9,198 |
|
| TOTAL MATERIALS | | | 27,531 |
|
| REAL ESTATE - 4.2% | | | |
| Equity Real Estate Investment Trusts (REITs) - 3.1% | | | |
| Boston Properties, Inc.: | | | |
| 3.2% 1/15/25 | | 3,000 | 3,122 |
| 3.85% 2/1/23 | | 3,900 | 4,117 |
| Corporate Office Properties LP: | | | |
| 3.7% 6/15/21 | | 2,256 | 2,286 |
| 5% 7/1/25 | | 1,529 | 1,664 |
| DDR Corp.: | | | |
| 3.625% 2/1/25 | | 1,358 | 1,401 |
| 4.25% 2/1/26 | | 2,246 | 2,395 |
| 4.625% 7/15/22 | | 2,122 | 2,225 |
| Duke Realty LP 3.625% 4/15/23 | | 1,976 | 2,069 |
| Equity One, Inc. 3.75% 11/15/22 | | 8,200 | 8,546 |
| HCP, Inc. 4.25% 11/15/23 | | 5,100 | 5,480 |
| Healthcare Trust of America Holdings LP 2.95% 7/1/22 | | 4,747 | 4,832 |
| Hudson Pacific Properties LP 4.65% 4/1/29 | | 3,861 | 4,340 |
| Kimco Realty Corp.: | | | |
| 3.2% 5/1/21 | | 5,040 | 5,118 |
| 3.4% 11/1/22 | | 2,493 | 2,582 |
| Lexington Corporate Properties Trust 4.4% 6/15/24 | | 1,190 | 1,245 |
| Omega Healthcare Investors, Inc.: | | | |
| 4.375% 8/1/23 | | 3,051 | 3,215 |
| 4.5% 1/15/25 | | 1,111 | 1,175 |
| 4.5% 4/1/27 | | 3,298 | 3,531 |
| 4.95% 4/1/24 | | 1,104 | 1,189 |
| 5.25% 1/15/26 | | 3,160 | 3,497 |
| Ventas Realty LP: | | | |
| 2.65% 1/15/25 | | 3,986 | 4,039 |
| 3% 1/15/30 | | 2,083 | 2,097 |
| 3.125% 6/15/23 | | 885 | 913 |
| 3.5% 4/15/24 | | 2,379 | 2,502 |
| 4% 3/1/28 | | 1,168 | 1,269 |
| Welltower, Inc. 3.625% 3/15/24 | | 2,553 | 2,690 |
| WP Carey, Inc.: | | | |
| 3.85% 7/15/29 | | 633 | 672 |
| 4.6% 4/1/24 | | 5,173 | 5,564 |
| | | | 83,775 |
| Real Estate Management & Development - 1.1% | | | |
| Brandywine Operating Partnership LP 3.95% 2/15/23 | | 4,400 | 4,603 |
| Digital Realty Trust LP 3.95% 7/1/22 | | 4,592 | 4,809 |
| Liberty Property LP 4.75% 10/1/20 | | 7,111 | 7,263 |
| Mack-Cali Realty LP 4.5% 4/18/22 | | 1,234 | 1,240 |
| Post Apartment Homes LP 3.375% 12/1/22 | | 2,705 | 2,794 |
| Tanger Properties LP 3.75% 12/1/24 | | 3,076 | 3,164 |
| Washington Prime Group LP 3.85% 4/1/20 | | 4,940 | 4,908 |
| | | | 28,781 |
|
| TOTAL REAL ESTATE | | | 112,556 |
|
| UTILITIES - 4.0% | | | |
| Electric Utilities - 2.2% | | | |
| American Electric Power Co., Inc. 2.15% 11/13/20 | | 3,740 | 3,744 |
| Cleveland Electric Illuminating Co. 3.5% 4/1/28 (a) | | 6,000 | 6,359 |
| Commonwealth Edison Co. 4% 8/1/20 | | 4,400 | 4,456 |
| Duke Energy Corp. 1.8% 9/1/21 | | 1,793 | 1,782 |
| Duquesne Light Holdings, Inc. 6.4% 9/15/20 (a) | | 369 | 383 |
| Edison International 2.95% 3/15/23 | | 1,206 | 1,209 |
| Eversource Energy: | | | |
| 2.5% 3/15/21 | | 2,923 | 2,936 |
| 2.8% 5/1/23 | | 4,679 | 4,766 |
| FirstEnergy Corp. 4.25% 3/15/23 | | 4,000 | 4,251 |
| IPALCO Enterprises, Inc. 3.7% 9/1/24 | | 1,226 | 1,283 |
| ITC Holdings Corp. 2.7% 11/15/22 | | 3,739 | 3,795 |
| LG&E and KU Energy LLC 3.75% 11/15/20 | | 19 | 19 |
| PPL Capital Funding, Inc. 4.2% 6/15/22 | | 4,268 | 4,479 |
| Progress Energy, Inc. 4.4% 1/15/21 | | 4,958 | 5,085 |
| Southern Co. 2.35% 7/1/21 | | 7,954 | 7,977 |
| Tampa Electric Co. 5.4% 5/15/21 | | 1,635 | 1,724 |
| TECO Finance, Inc. 5.15% 3/15/20 | | 1,709 | 1,734 |
| Wisconsin Electric Power Co. 2.95% 9/15/21 | | 768 | 779 |
| Xcel Energy, Inc. 2.4% 3/15/21 | | 1,730 | 1,738 |
| | | | 58,499 |
| Gas Utilities - 0.1% | | | |
| Southern Natural Gas Co./Southern Natural Issuing Corp. 4.4% 6/15/21 | | 1,325 | 1,363 |
| Independent Power and Renewable Electricity Producers - 0.0% | | | |
| Emera U.S. Finance LP 2.7% 6/15/21 | | 806 | 812 |
| Multi-Utilities - 1.7% | | | |
| Berkshire Hathaway Energy Co. 3.25% 4/15/28 | | 6,000 | 6,379 |
| Consolidated Edison Co. of New York, Inc. 4.45% 6/15/20 | | 4,620 | 4,700 |
| Dominion Energy, Inc.: | | | |
| 3 month U.S. LIBOR + 2.300% 4.6299% 9/30/66 (b)(c) | | 4,542 | 4,247 |
| 3 month U.S. LIBOR + 2.825% 5.1549% 6/30/66 (b)(c) | | 4,221 | 3,989 |
| 2% 8/15/21 | | 1,807 | 1,800 |
| 2.715% 8/15/21 | | 4,237 | 4,273 |
| NiSource Finance Corp. 2.65% 11/17/22 | | 5,299 | 5,381 |
| NiSource, Inc.: | | | |
| 2.95% 9/1/29 | | 4,000 | 4,089 |
| 3.65% 6/15/23 | | 6,894 | 7,190 |
| Sempra Energy 2.875% 10/1/22 | | 1,677 | 1,704 |
| Wisconsin Energy Corp. 3 month U.S. LIBOR + 2.113% 4.2706% 5/15/67 (b)(c) | | 3,383 | 2,861 |
| | | | 46,613 |
|
| TOTAL UTILITIES | | | 107,287 |
|
| TOTAL NONCONVERTIBLE BONDS | | | |
| (Cost $1,261,726) | | | 1,313,844 |
|
| U.S. Government and Government Agency Obligations - 29.4% | | | |
| U.S. Treasury Inflation-Protected Obligations - 2.0% | | | |
| U.S. Treasury Inflation-Indexed Notes 0.25% 7/15/29 | | 51,671 | 53,161 |
| U.S. Treasury Obligations - 27.4% | | | |
| U.S. Treasury Notes: | | | |
| 1.375% 3/31/20 | | $114,487 | $114,147 |
| 2.125% 5/15/25 | | 99,375 | 103,125 |
| 2.25% 2/15/27 (d) | | 231,081 | 244,024 |
| 2.375% 8/15/24 | | 145,718 | 152,372 |
| 3.125% 11/15/28 | | 114,994 | 130,972 |
|
| TOTAL U.S. TREASURY OBLIGATIONS | | | 744,640 |
|
| TOTAL U.S. GOVERNMENT AND GOVERNMENT AGENCY OBLIGATIONS | | | |
| (Cost $756,720) | | | 797,801 |
|
| U.S. Government Agency - Mortgage Securities - 2.7% | | | |
| Fannie Mae - 2.2% | | | |
| 2.5% 1/1/33 | | 5,253 | 5,347 |
| 3% 3/1/30 to 12/1/32 | | 48,304 | 49,712 |
| 5.5% 11/1/34 to 6/1/36 | | 2,511 | 2,768 |
| 6.5% 7/1/32 to 8/1/36 | | 1,516 | 1,718 |
| 7% 8/1/25 to 2/1/32 | | 7 | 7 |
| 7.5% 11/1/22 to 8/1/29 | | 53 | 58 |
|
| TOTAL FANNIE MAE | | | 59,610 |
|
| Freddie Mac - 0.2% | | | |
| 5.5% 3/1/34 to 7/1/35 | | 4,239 | 4,675 |
| 7.5% 7/1/27 to 1/1/33 | | 12 | 14 |
|
| TOTAL FREDDIE MAC | | | 4,689 |
|
| Ginnie Mae - 0.3% | | | |
| 7% 1/15/28 to 11/15/32 | | 1,177 | 1,338 |
| 4.5% 6/20/48 | | 6,802 | 7,156 |
|
| TOTAL GINNIE MAE | | | 8,494 |
|
| TOTAL U.S. GOVERNMENT AGENCY - MORTGAGE SECURITIES | | | |
| (Cost $71,573) | | | 72,793 |
|
| Asset-Backed Securities - 2.2% | | | |
| AASET Trust Series 2019-1 Class A, 3.844% 5/15/39 (a) | | $2,083 | $2,096 |
| Bear Stearns Asset Backed Securities I Trust Series 2005-HE2 Class M2, 1 month U.S. LIBOR + 1.125% 3.2703% 2/25/35 (b)(c) | | 972 | 971 |
| Castlelake Aircraft Securitization Trust Series 2019-1A Class A, 3.967% 4/15/39 (a) | | 3,158 | 3,223 |
| Consumer Lending Receivables Trust Series 2019-A Class A, 3.52% 4/15/26 (a) | | 3,801 | 3,822 |
| Dell Equipment Finance Trust Series 2017-2 Class A3, 2.19% 10/24/22 (a) | | 1,632 | 1,632 |
| Dominos Pizza Master Issuer LLC Series 2018-1A Class A2I, 4.116% 7/25/48 (a) | | 5,279 | 5,557 |
| Ford Credit Auto Owner Trust Series 2016-1 Class A, 2.31% 8/15/27 (a) | | 6,130 | 6,154 |
| GM Financial Automobile Leasing Trust Series 2019-2 Class A3, 2.67% 3/21/22 | | 1,933 | 1,954 |
| Horizon Aircraft Finance Ltd. Series 2019-1 Class A, 3.721% 7/15/39 (a) | | 1,430 | 1,445 |
| John Deere Owner Trust Series 2019-B Class A4, 2.32% 5/15/26 | | 3,098 | 3,148 |
| Metlife Securitization Trust Series 2019-1A Class A1A, 3.75% 4/25/58 (a) | | 1,492 | 1,555 |
| Morgan Stanley ABS Capital I Trust Series 2004-HE7 Class B3, 1 month U.S. LIBOR + 5.250% 7.3953% 8/25/34 (b)(c) | | 186 | 189 |
| New Century Home Equity Loan Trust Series 2005-4 Class M2, 1 month U.S. LIBOR + 0.510% 2.6553% 9/25/35 (b)(c) | | 330 | 330 |
| Park Place Securities, Inc. Series 2005-WCH1 Class M4, 1 month U.S. LIBOR + 1.245% 3.3903% 1/25/36 (b)(c) | | 665 | 668 |
| Terwin Mortgage Trust Series 2003-4HE Class A1, 1 month U.S. LIBOR + 0.860% 3.0053% 9/25/34 (b)(c) | | 145 | 141 |
| Thunderbolt Aircraft Lease Ltd. Series 2017-A Class A, 4.212% 5/17/32 (a) | | 2,679 | 2,748 |
| Towd Point Mortgage Trust: | | | |
| Series 2018-3 Class A1, 3.75% 5/25/58 (a) | | 2,867 | 2,992 |
| Series 2018-6 Class A1A, 3.75% 3/25/58 (a) | | 5,962 | 6,153 |
| Trapeza CDO XII Ltd./Trapeza CDO XII, Inc. Series 2007-12A Class B, 3 month U.S. LIBOR + 0.560% 2.8626% 4/6/42 (a)(b)(c)(e) | | 1,745 | 1,302 |
| Verizon Owner Trust Series 2018-A Class B, 3.38% 4/20/23 | | 6,700 | 6,919 |
| Volt Series 2019-NPL4 Class A1A, 3.3515% 8/25/49 (a) | | 5,428 | 5,429 |
| TOTAL ASSET-BACKED SECURITIES | | | |
| (Cost $55,435) | | | 58,428 |
|
| Collateralized Mortgage Obligations - 3.5% | | | |
| Private Sponsor - 0.2% | | | |
| Lanark Master Issuer PLC Series 2019-2A Class 1A, 2.71% 12/22/69 (a) | | 6,036 | 6,079 |
| Merrill Lynch Alternative Note Asset Trust floater Series 2007-OAR1 Class A1, 1 month U.S. LIBOR + 0.170% 2.436% 2/25/37 (b)(c) | | 41 | 41 |
| Sequoia Mortgage Trust floater Series 2004-6 Class A3B, 6 month U.S. LIBOR + 0.880% 3.178% 7/20/34 (b)(c) | | 5 | 5 |
|
| TOTAL PRIVATE SPONSOR | | | 6,125 |
|
| U.S. Government Agency - 3.3% | | | |
| Fannie Mae: | | | |
| planned amortization class: | | | |
| Series 2015-28 Class P, 2.5% 5/25/45 | | 8,706 | 8,889 |
| Series 2019-33 Class N, 3% 3/25/48 | | 17,098 | 17,378 |
| sequential payer Series 2019-14 Class DA, 4% 3/25/48 | | 4,027 | 4,189 |
| Series 2013-16 Class GP, 3% 3/25/33 | | 6,646 | 6,725 |
| Series 2015-28 Class JE, 3% 5/25/45 | | 5,966 | 6,076 |
| Series 2016-19 Class AH, 3% 4/25/46 | | 3,803 | 3,958 |
| Freddie Mac: | | | |
| sequential payer: | | | |
| Series 4872 Class AB, 4% 8/15/47 | | 9,921 | 10,373 |
| Series 4873 Class CA, 4% 7/15/47 | | 10,461 | 10,930 |
| Series 3949 Class MK, 4.5% 10/15/34 | | 715 | 757 |
| Freddie Mac Seasoned Credit Risk Transfer Trust sequential payer: | | | |
| Series 2018-3 Class MA, 3.5% 8/25/57 | | 11,914 | 12,576 |
| Series 2019-2 Class MA, 3.5% 8/25/58 | | 6,200 | 6,498 |
|
| TOTAL U.S. GOVERNMENT AGENCY | | | 88,349 |
|
| TOTAL COLLATERALIZED MORTGAGE OBLIGATIONS | | | |
| (Cost $93,761) | | | 94,474 |
|
| Commercial Mortgage Securities - 9.5% | | | |
| Asset Securitization Corp. Series 1997-D5 Class PS1, 1.8322% 2/14/43 (b)(f) | | 6 | 0 |
| Barclays Commercial Mortgage Securities LLC Series 2015-STP Class A, 3.3228% 9/10/28 (a) | | 3,379 | 3,409 |
| Benchmark Mortgage Trust: | | | |
| Series 2018-B7 Class A2, 4.377% 5/15/53 | | 3,245 | 3,527 |
| Series 2019-B12 Class XA, 1.207% 8/15/52 (b)(f) | | 25,593 | 1,996 |
| BX Trust floater Series 2018-IND Class B, 1 month U.S. LIBOR + 0.900% 3.0951% 11/15/35 (a)(b)(c) | | 4,281 | 4,278 |
| CGBAM Commercial Mortgage Trust Series 2015-SMRT Class D, 3.768% 4/10/28 (a) | | 1,568 | 1,576 |
| CHC Commercial Mortgage Trust floater Series 2019-CHC Class A, 1 month U.S. LIBOR + 1.120% 3.3151% 6/15/34 (a)(b)(c) | | 4,256 | 4,256 |
| Citigroup Commercial Mortgage Trust sequential payer Series 2014-GC23 Class A3, 3.356% 7/10/47 | | 4,430 | 4,708 |
| COMM Mortgage Trust: | | | |
| sequential payer: | | | |
| Series 2012-CR3 Class A3, 2.822% 10/15/45 | | 1,507 | 1,537 |
| Series 2012-LC4 Class A4, 3.288% 12/10/44 | | 4,910 | 5,023 |
| Series 2013-CR7 Class AM, 3.314% 3/10/46 (a) | | 1,527 | 1,583 |
| Series 2013-CR13 Class AM, 4.449% 11/10/46 | | 4,399 | 4,785 |
| Series 2013-CR6 Class A4, 3.101% 3/10/46 | | 3,556 | 3,675 |
| Series 2013-LC6 Class ASB, 2.478% 1/10/46 | | 5,317 | 5,357 |
| Credit Suisse Mortgage Trust Series 2018-SITE Class A, 4.284% 4/15/36 (a) | | 1,869 | 2,004 |
| CSAIL Commercial Mortgage Trust sequential payer Series 19-C15 Class A2, 3.4505% 3/15/52 | | 3,666 | 3,881 |
| Freddie Mac: | | | |
| sequential payer: | | | |
| Series 2017-K066 Class A2, 3.117% 6/25/27 | | 8,333 | 9,005 |
| Series 2017-K067 Class A2, 3.194% 7/25/27 | | 5,780 | 6,282 |
| Series K057 Class A2, 2.57% 7/25/26 | | 5,509 | 5,752 |
| Series K058 Class A2, 2.653% 8/25/26 | | 8,556 | 8,986 |
| Series K061 Class A2, 3.347% 11/25/26 | | 6,618 | 7,245 |
| Series K065 Class A2, 3.243% 4/25/27 | | 6,566 | 7,151 |
| Series K064 Class A2, 3.224% 3/25/27 | | 8,360 | 9,087 |
| Series K068 Class A2, 3.244% 8/25/27 | | 6,357 | 6,932 |
| Series K079 Class A1, 3.729% 2/25/28 | | 1,725 | 1,889 |
| Series K734 Class A2, 3.208% 2/25/26 | | 5,541 | 5,961 |
| GS Mortgage Securities Trust: | | | |
| sequential payer Series 2012-GC6: | | | |
| Class A/S, 4.948% 1/10/45 (a) | | 9,570 | 10,122 |
| Class A3, 3.482% 1/10/45 | | 3,142 | 3,222 |
| Series 2011-GC5 Class A/S, 5.209% 8/10/44 (a) | | 8,245 | 8,662 |
| Series 2012-GCJ9 Class A/S, 3.124% 11/10/45 | | 4,146 | 4,241 |
| Series 2013-GC13 Class A/S, 4.2187% 7/10/46 (a)(b) | | 13,365 | 14,347 |
| Series 2013-GC16 Class A/S, 4.649% 11/10/46 | | 13,383 | 14,700 |
| JPMBB Commercial Mortgage Securities Trust sequential payer Series 2014-C22 Class A4, 3.8012% 9/15/47 | | 2,487 | 2,687 |
| JPMorgan Chase Commercial Mortgage Securities Corp. Series 2012-C6 Class A/S, 4.1166% 5/15/45 | | 8,844 | 9,235 |
| JPMorgan Chase Commercial Mortgage Securities Trust: | | | |
| Series 2013-C10 Class A5, 3.1425% 12/15/47 | | 2,471 | 2,560 |
| Series 2018-AON Class D, 4.767% 7/5/31 (a)(b) | | 5,354 | 5,735 |
| Series 2018-WPT Class AFX, 4.2475% 7/5/33 (a) | | 3,141 | 3,383 |
| Morgan Stanley BAML Trust: | | | |
| sequential payer: | | | |
| Series 2013-C11 Class A4, 4.299% 8/15/46 (b) | | 1,650 | 1,776 |
| Series 2013-C7 Class A4, 2.918% 2/15/46 | | 7,556 | 7,752 |
| Series 2014-C17 Class ASB, 3.477% 8/15/47 | | 4,302 | 4,446 |
| Morgan Stanley Capital I Trust: | | | |
| sequential payer Series 2011-C2 Class A4, 4.661% 6/15/44 (a) | | 2,641 | 2,731 |
| Series 2011-C3 Class AJ, 5.2925% 7/15/49 (a)(b) | | 3,055 | 3,205 |
| MSCG Trust Series 2016-SNR Class A, 3.4596% 11/15/34 (a)(b) | | 2,475 | 2,492 |
| SBA Tower Trust 3.168% 4/9/47 (a) | | 6,190 | 6,276 |
| UBS Commercial Mortgage Trust Series 2017-C7 Class XA, 1.2152% 12/15/50 (b)(f) | | 93,663 | 6,264 |
| UBS-Barclays Commercial Mortgage Trust Series 2012-C2 Class ASEC, 4.179% 5/10/63 (a) | | 3,400 | 3,560 |
| WF-RBS Commercial Mortgage Trust: | | | |
| sequential payer: | | | |
| Series 2012-C9 Class A3, 2.87% 11/15/45 | | 2,942 | 3,017 |
| Series 2013-C11 Class A5, 3.071% 3/15/45 | | 6,010 | 6,209 |
| Series 2013-C11 Class ASB, 2.63% 3/15/45 | | 6,128 | 6,191 |
| Series 2013-C12 Class A4, 3.198% 3/15/48 | | 5,371 | 5,580 |
| TOTAL COMMERCIAL MORTGAGE SECURITIES | | | |
| (Cost $249,247) | | | 258,278 |
|
| Municipal Securities - 0.2% | | | |
| New York City Transitional Fin. Auth. Rev. Series 2017 E, 2.85% 2/1/24 | | 1,515 | 1,579 |
| New York Urban Dev. Corp. Rev. Series 2017 B, 2.67% 3/15/23 | | 3,815 | 3,911 |
| TOTAL MUNICIPAL SECURITIES | | | |
| (Cost $5,328) | | | 5,490 |
|
| Foreign Government and Government Agency Obligations - 0.6% | | | |
| Ontario Province 2.4% 2/8/22 | | $10,820 | $11,013 |
| Province of Quebec 2.375% 1/31/22 | | 6,291 | 6,404 |
| TOTAL FOREIGN GOVERNMENT AND GOVERNMENT AGENCY OBLIGATIONS | | | |
| (Cost $17,095) | | | 17,417 |
|
| Bank Notes - 1.3% | | | |
| Capital One NA 2.95% 7/23/21 | | 3,430 | 3,473 |
| Compass Bank: | | | |
| 2.875% 6/29/22 | | $9,407 | $9,568 |
| 3.5% 6/11/21 | | 2,603 | 2,651 |
| Discover Bank: | | | |
| (Delaware) 3.2% 8/9/21 | | 3,500 | 3,565 |
| 3.1% 6/4/20 | | 2,441 | 2,454 |
| Manufacturers & Traders Trust Co. 2.5% 5/18/22 | | 4,630 | 4,686 |
| SunTrust Bank 2.75% 5/1/23 | | 4,300 | 4,386 |
| Wells Fargo Bank NA 3.55% 8/14/23 | | 5,500 | 5,810 |
| TOTAL BANK NOTES | | | |
| (Cost $35,809) | | | 36,593 |
| | | Shares | Value (000s) |
|
| Fixed-Income Funds - 1.2% | | | |
| Fidelity Specialized High Income Central Fund (g) | | | |
| (Cost $33,832) | | 327,080 | 33,454 |
|
| Money Market Funds - 0.8% | | | |
| Fidelity Cash Central Fund 2.13% (h) | | | |
| (Cost $22,296) | | 22,291,393 | 22,296 |
| TOTAL INVESTMENT IN SECURITIES - 99.8% | | | |
| (Cost $2,602,822) | | | 2,710,868 |
| NET OTHER ASSETS (LIABILITIES) - 0.2% | | | 5,843 |
| NET ASSETS - 100% | | | $2,716,711 |
| Futures Contracts | | | | | |
| | Number of contracts | Expiration Date | Notional Amount (000s) | Value (000s) | Unrealized Appreciation/(Depreciation) (000s) |
| Purchased | | | | | |
| Treasury Contracts | | | | | |
| CBOT 5-Year U.S. Treasury Note Contracts (United States) | 452 | Dec. 2019 | $54,229 | $35 | $35 |
The notional amount of futures purchased as a percentage of Net Assets is 2.0%
Values shown as $0 in the Schedule of Investments may reflect amounts less than $500.
Legend
(a) Security exempt from registration under Rule 144A of the Securities Act of 1933. These securities may be resold in transactions exempt from registration, normally to qualified institutional buyers. At the end of the period, the value of these securities amounted to $307,822,000 or 11.3% of net assets.
(b) Coupon rates for floating and adjustable rate securities reflect the rates in effect at period end.
(c) Coupon is indexed to a floating interest rate which may be multiplied by a specified factor and/or subject to caps or floors.
(d) Security or a portion of the security was pledged to cover margin requirements for futures contracts. At period end, the value of securities pledged amounted to $382,000.
(e) Level 3 security
(f) Security represents right to receive monthly interest payments on an underlying pool of mortgages or assets. Principal shown is the outstanding par amount of the pool as of the end of the period.
(g) Affiliated fund that is generally available only to investment companies and other accounts managed by Fidelity Investments. A complete unaudited schedule of portfolio holdings for each Fidelity Central Fund is filed with the SEC for the first and third quarters of each fiscal year on Form N-PORT and is available upon request or at the SEC's website at www.sec.gov. An unaudited holdings listing for the Fund, which presents direct holdings as well as the pro-rata share of securities and other investments held indirectly through its investment in underlying non-money market Fidelity Central Funds, is available at fidelity.com and/or institutional.fidelity.com, as applicable. In addition, each Fidelity Central Fund's financial statements, which are not covered by the Fund's Report of Independent Registered Public Accounting Firm, are available on the SEC's website or upon request.
(h) Affiliated fund that is generally available only to investment companies and other accounts managed by Fidelity Investments. The rate quoted is the annualized seven-day yield of the fund at period end. A complete unaudited listing of the fund's holdings as of its most recent quarter end is available upon request. In addition, each Fidelity Central Fund's financial statements, which are not covered by the Fund's Report of Independent Registered Public Accounting Firm, are available on the SEC's website or upon request.
Affiliated Central Funds
Information regarding fiscal year to date income earned by the Fund from investments in Fidelity Central Funds is as follows:
| Fund | Income earned |
| | (Amounts in thousands) |
| Fidelity Cash Central Fund | $525 |
| Fidelity Specialized High Income Central Fund | 1,869 |
| Total | $2,394 |
Amounts in the income column in the above table include any capital gain distributions from underlying funds, which are presented in the corresponding line-item in the Statement of Operations, if applicable.
Fiscal year to date information regarding the Fund’s investments in non-Money Market Central Funds, including the ownership percentage, is presented below.
| Fund (Amounts in thousands) | Value, beginning of period | Purchases | Sales Proceeds | Realized Gain/Loss | Change in Unrealized appreciation (depreciation) | Value, end of period | % ownership, end of period |
| Fidelity Specialized High Income Central Fund | $30,768 | $1,869 | $-- | $-- | $817 | $33,454 | 5.6% |
| Total | $30,768 | $1,869 | $-- | $-- | $817 | $33,454 | |
Investment Valuation
The following is a summary of the inputs used, as of August 31, 2019, involving the Fund's assets and liabilities carried at fair value. The inputs or methodology used for valuing securities may not be an indication of the risk associated with investing in those securities. For more information on valuation inputs, and their aggregation into the levels used below, please refer to the Investment Valuation section in the accompanying Notes to Financial Statements.
| | Valuation Inputs at Reporting Date: |
| Description | Total | Level 1 | Level 2 | Level 3 |
| (Amounts in thousands) | | | | |
| Investments in Securities: | | | | |
| Corporate Bonds | $1,313,844 | $-- | $1,313,844 | $-- |
| U.S. Government and Government Agency Obligations | 797,801 | -- | 797,801 | -- |
| U.S. Government Agency - Mortgage Securities | 72,793 | -- | 72,793 | -- |
| Asset-Backed Securities | 58,428 | -- | 57,126 | 1,302 |
| Collateralized Mortgage Obligations | 94,474 | -- | 94,474 | -- |
| Commercial Mortgage Securities | 258,278 | -- | 258,278 | -- |
| Municipal Securities | 5,490 | -- | 5,490 | -- |
| Foreign Government and Government Agency Obligations | 17,417 | -- | 17,417 | -- |
| Bank Notes | 36,593 | -- | 36,593 | -- |
| Fixed-Income Funds | 33,454 | 33,454 | -- | -- |
| Money Market Funds | 22,296 | 22,296 | -- | -- |
| Total Investments in Securities: | $2,710,868 | $55,750 | $2,653,816 | $1,302 |
| Derivative Instruments: | | | | |
| Assets | | | | |
| Futures Contracts | $35 | $35 | $-- | $-- |
| Total Assets | $35 | $35 | $-- | $-- |
| Total Derivative Instruments: | $35 | $35 | $-- | $-- |
Value of Derivative Instruments
The following table is a summary of the Fund's value of derivative instruments by primary risk exposure as of August 31, 2019. For additional information on derivative instruments, please refer to the Derivative Instruments section in the accompanying Notes to Financial Statements.
| Primary Risk Exposure / Derivative Type | Value |
| | Asset | Liability |
| (Amounts in thousands) | | |
| Interest Rate Risk | | |
| Futures Contracts(a) | $35 | $0 |
| Total Interest Rate Risk | 35 | 0 |
| Total Value of Derivatives | $35 | $0 |
(a) Reflects gross cumulative appreciation (depreciation) on futures contracts as presented in the Schedule of Investments. In the Statement of Assets and Liabilities, the period end daily variation margin is included in receivable or payable for daily variation margin on futures contracts, and the net cumulative appreciation (depreciation) is included in distributable earnings.
See accompanying notes which are an integral part of the financial statements.
Financial Statements
Statement of Assets and Liabilities
| Amounts in thousands (except per-share amount) | | August 31, 2019 |
| Assets | | |
Investment in securities, at value — See accompanying schedule:
Unaffiliated issuers (cost $2,546,694) | $2,655,118 | |
| Fidelity Central Funds (cost $56,128) | 55,750 | |
| Total Investment in Securities (cost $2,602,822) | | $2,710,868 |
| Receivable for fund shares sold | | 2,873 |
| Interest receivable | | 16,910 |
| Distributions receivable from Fidelity Central Funds | | 26 |
| Receivable for daily variation margin on futures contracts | | 42 |
| Other receivables | | 126 |
| Total assets | | 2,730,845 |
| Liabilities | | |
| Payable for investments purchased | $10,651 | |
| Payable for fund shares redeemed | 2,010 | |
| Distributions payable | 335 | |
| Accrued management fee | 682 | |
| Other affiliated payables | 331 | |
| Other payables and accrued expenses | 125 | |
| Total liabilities | | 14,134 |
| Net Assets | | $2,716,711 |
| Net Assets consist of: | | |
| Paid in capital | | $2,618,253 |
| Total distributable earnings (loss) | | 98,458 |
| Net Assets, for 243,346 shares outstanding | | $2,716,711 |
| Net Asset Value, offering price and redemption price per share ($2,716,711 ÷ 243,346 shares) | | $11.16 |
See accompanying notes which are an integral part of the financial statements.
Statement of Operations
| Amounts in thousands | | Year ended August 31, 2019 |
| Investment Income | | |
| Interest | | $82,882 |
| Income from Fidelity Central Funds | | 2,219 |
| Total income | | 85,101 |
| Expenses | | |
| Management fee | $8,178 | |
| Transfer agent fees | 2,687 | |
| Fund wide operations fee | 1,212 | |
| Independent trustees' fees and expenses | 12 | |
| Commitment fees | 8 | |
| Total expenses before reductions | 12,097 | |
| Expense reductions | (2) | |
| Total expenses after reductions | | 12,095 |
| Net investment income (loss) | | 73,006 |
| Realized and Unrealized Gain (Loss) | | |
| Net realized gain (loss) on: | | |
| Investment securities: | | |
| Unaffiliated issuers | 2,136 | |
| Futures contracts | (84) | |
| Capital gain distributions from Fidelity Central Funds | 175 | |
| Total net realized gain (loss) | | 2,227 |
| Change in net unrealized appreciation (depreciation) on: | | |
| Investment securities: | | |
| Unaffiliated issuers | 135,554 | |
| Fidelity Central Funds | 817 | |
| Futures contracts | 35 | |
| Total change in net unrealized appreciation (depreciation) | | 136,406 |
| Net gain (loss) | | 138,633 |
| Net increase (decrease) in net assets resulting from operations | | $211,639 |
See accompanying notes which are an integral part of the financial statements.
Statement of Changes in Net Assets
| Amounts in thousands | Year ended August 31, 2019 | Year ended August 31, 2018 |
| Increase (Decrease) in Net Assets | | |
| Operations | | |
| Net investment income (loss) | $73,006 | $71,015 |
| Net realized gain (loss) | 2,227 | (11,420) |
| Change in net unrealized appreciation (depreciation) | 136,406 | (93,539) |
| Net increase (decrease) in net assets resulting from operations | 211,639 | (33,944) |
| Distributions to shareholders | (68,107) | – |
| Distributions to shareholders from net investment income | – | (68,154) |
| Total distributions | (68,107) | (68,154) |
| Share transactions | | |
| Proceeds from sales of shares | 560,368 | 497,023 |
| Reinvestment of distributions | 64,416 | 65,039 |
| Cost of shares redeemed | (770,415) | (806,077) |
| Net increase (decrease) in net assets resulting from share transactions | (145,631) | (244,015) |
| Total increase (decrease) in net assets | (2,099) | (346,113) |
| Net Assets | | |
| Beginning of period | 2,718,810 | 3,064,923 |
| End of period | $2,716,711 | $2,718,810 |
| Other Information | | |
| Undistributed net investment income end of period | | $2,183 |
| Shares | | |
| Sold | 52,227 | 46,433 |
| Issued in reinvestment of distributions | 5,989 | 6,095 |
| Redeemed | (71,763) | (75,443) |
| Net increase (decrease) | (13,547) | (22,915) |
See accompanying notes which are an integral part of the financial statements.
Financial Highlights
Fidelity Intermediate Bond Fund
| | | | | | |
| Years ended August 31, | 2019 | 2018 | 2017 | 2016 | 2015 |
| Selected Per–Share Data | | | | | |
| Net asset value, beginning of period | $10.58 | $10.95 | $11.07 | $10.85 | $10.98 |
| Income from Investment Operations | | | | | |
| Net investment income (loss)A | .292 | .263 | .261 | .297 | .276 |
| Net realized and unrealized gain (loss) | .560 | (.380) | (.142) | .188 | (.158) |
| Total from investment operations | .852 | (.117) | .119 | .485 | .118 |
| Distributions from net investment income | (.272) | (.253) | (.239) | (.265) | (.248) |
| Total distributions | (.272) | (.253) | (.239) | (.265) | (.248) |
| Net asset value, end of period | $11.16 | $10.58 | $10.95 | $11.07 | $10.85 |
| Total ReturnB | 8.18% | (1.07)% | 1.11% | 4.53% | 1.08% |
| Ratios to Average Net AssetsC,D | | | | | |
| Expenses before reductions | .45% | .45% | .45% | .45% | .45% |
| Expenses net of fee waivers, if any | .45% | .45% | .45% | .45% | .45% |
| Expenses net of all reductions | .45% | .45% | .45% | .45% | .45% |
| Net investment income (loss) | 2.72% | 2.46% | 2.40% | 2.73% | 2.52% |
| Supplemental Data | | | | | |
| Net assets, end of period (in millions) | $2,717 | $2,719 | $3,065 | $3,228 | $3,181 |
| Portfolio turnover rateE | 34% | 49% | 59% | 58% | 53% |
A Calculated based on average shares outstanding during the period.
B Total returns would have been lower if certain expenses had not been reduced during the applicable periods shown.
C Fees and expenses of any underlying Fidelity Central Funds are not included in the Fund's expense ratio. The Fund indirectly bears its proportionate share of the expenses of any underlying Fidelity Central Funds. Based on their most recent shareholder report date, the expenses of any underlying non-money market Fidelity Central Funds were less than .005%.
D Expense ratios reflect operating expenses of the Fund. Expenses before reductions do not reflect amounts reimbursed by the investment adviser or reductions from expense offset arrangements and do not represent the amount paid by the Fund during periods when reimbursements or reductions occur. Expenses net of fee waivers reflect expenses after reimbursement by the investment adviser but prior to reductions from expense offset arrangements. Expenses net of all reductions represent the net expenses paid by the Fund.
E Amount does not include the portfolio activity of any underlying Fidelity Central Funds.
See accompanying notes which are an integral part of the financial statements.
Notes to Financial Statements
For the period ended August 31, 2019
(Amounts in thousands except percentages)
1. Organization.
Fidelity Intermediate Bond Fund (the Fund) is a fund of Fidelity Salem Street Trust (the Trust) and is authorized to issue an unlimited number of shares. Share transactions on the Statement of Changes in Net Assets may contain exchanges between affiliated funds. The Trust is registered under the Investment Company Act of 1940, as amended (the 1940 Act), as an open-end management investment company organized as a Massachusetts business trust.
2. Investments in Fidelity Central Funds.
The Fund invests in Fidelity Central Funds, which are open-end investment companies generally available only to other investment companies and accounts managed by the investment adviser and its affiliates. The Fund's Schedule of Investments lists each of the Fidelity Central Funds held as of period end, if any, as an investment of the Fund, but does not include the underlying holdings of each Fidelity Central Fund. As an Investing Fund, the Fund indirectly bears its proportionate share of the expenses of the underlying Fidelity Central Funds.
Based on its investment objective, each Fidelity Central Fund may invest or participate in various investment vehicles or strategies that are similar to those of the Fund. These strategies are consistent with the investment objectives of the Fund and may involve certain economic risks which may cause a decline in value of each of the Fidelity Central Funds and thus a decline in the value of the Fund. The Money Market Central Funds seek preservation of capital and current income and are managed by Fidelity Investments Money Management, Inc. (FIMM), an affiliate of the investment adviser. Annualized expenses of the Money Market Central Funds as of their most recent shareholder report date ranged from less than .005% to .01%. The following summarizes the Fund's investment in each non-money market Fidelity Central Fund.
| Fidelity Central Fund | Investment Manager | Investment Objective | Investment Practices | Expense Ratio(a) |
| Fidelity Specialized High Income Central Fund | FMR Co., Inc. (FMRC) | Seeks a high level of current income by normally investing in income-producing debt securities, with an emphasis on lower-quality debt securities. | Loans & Direct Debt Instruments
Restricted Securities | Less than .005% |
(a) Expenses expressed as a percentage of average net assets and are as of each underlying Central Fund's most recent annual or semi-annual shareholder report.
An unaudited holdings listing for the Fund, which presents direct holdings as well as the pro-rata share of any securities and other investments held indirectly through its investment in underlying non-money market Fidelity Central Funds, is available at fidelity.com. A complete unaudited list of holdings for each Fidelity Central Fund is available upon request or at the Securities and Exchange Commission (the SEC) website at www.sec.gov. In addition, the financial statements of the Fidelity Central Funds which contain the significant accounting policies (including investment valuation policies) of those funds, which are not covered by the Fund's Report of Independent Registered Public Accounting Firm, are available on the SEC website or upon request.
3. Significant Accounting Policies.
The Fund is an investment company and applies the accounting and reporting guidance of the Financial Accounting Standards Board (FASB) Accounting Standards Codification Topic 946 Financial Services – Investments Companies. The financial statements have been prepared in conformity with accounting principles generally accepted in the United States of America (GAAP), which require management to make certain estimates and assumptions at the date of the financial statements. Actual results could differ from those estimates. Subsequent events, if any, through the date that the financial statements were issued have been evaluated in the preparation of the financial statements. The following summarizes the significant accounting policies of the Fund:
Investment Valuation. Investments are valued as of 4:00 p.m. Eastern time on the last calendar day of the period. The Board of Trustees (the Board) has delegated the day to day responsibility for the valuation of the Fund's investments to the Fair Value Committee (the Committee) established by the Fund's investment adviser. In accordance with valuation policies and procedures approved by the Board, the Fund attempts to obtain prices from one or more third party pricing vendors or brokers to value its investments. When current market prices, quotations or currency exchange rates are not readily available or reliable, investments will be fair valued in good faith by the Committee, in accordance with procedures adopted by the Board. Factors used in determining fair value vary by investment type and may include market or investment specific events, changes in interest rates and credit quality. The frequency with which these procedures are used cannot be predicted and they may be utilized to a significant extent. The Committee oversees the Fund's valuation policies and procedures and reports to the Board on the Committee's activities and fair value determinations. The Board monitors the appropriateness of the procedures used in valuing the Fund's investments and ratifies the fair value determinations of the Committee.
The Fund categorizes the inputs to valuation techniques used to value its investments into a disclosure hierarchy consisting of three levels as shown below:
- Level 1 – quoted prices in active markets for identical investments
- Level 2 – other significant observable inputs (including quoted prices for similar investments, interest rates, prepayment speeds, etc.)
- Level 3 – unobservable inputs (including the Fund's own assumptions based on the best information available)
Valuation techniques used to value the Fund's investments by major category are as follows:
Debt securities, including restricted securities, are valued based on evaluated prices received from third party pricing vendors or from brokers who make markets in such securities. Corporate bonds, bank notes, foreign government and government agency obligations, municipal securities, and U.S. government and government agency obligations are valued by pricing vendors who utilize matrix pricing which considers yield or price of bonds of comparable quality, coupon, maturity and type or by broker-supplied prices. Asset backed securities, collateralized mortgage obligations, commercial mortgage securities, and U.S. government agency mortgage securities are valued by pricing vendors who utilize matrix pricing which considers prepayment speed assumptions, attributes of the collateral, yield or price of bonds of comparable quality, coupon, maturity and type or by broker-supplied prices. When independent prices are unavailable or unreliable, debt securities may be valued utilizing pricing methodologies which consider similar factors that would be used by third party pricing vendors. Debt securities are generally categorized as Level 2 in the hierarchy but may be Level 3 depending on the circumstances.
Futures contracts are valued at the settlement price established each day by the board of trade or exchange on which they are traded and are categorized as Level 1 in the hierarchy. Investments in open-end mutual funds, including the Fidelity Central Funds, are valued at their closing net asset value (NAV) each business day and are categorized as Level 1 in the hierarchy.
Changes in valuation techniques may result in transfers in or out of an assigned level within the disclosure hierarchy. The aggregate value of investments by input level as of August 31, 2019 is included at the end of the Fund's Schedule of Investments.
Investment Transactions and Income. For financial reporting purposes, the Fund's investment holdings and NAV include trades executed through the end of the last business day of the period. The NAV per share for processing shareholder transactions is calculated as of the close of business of the New York Stock Exchange (NYSE), normally 4:00 p.m. Eastern time and includes trades executed through the end of the prior business day. Gains and losses on securities sold are determined on the basis of identified cost and include proceeds received from litigation. Income and capital gain distributions from Fidelity Central Funds, if any, are recorded on the ex-dividend date. Interest income is accrued as earned and includes coupon interest and amortization of premium and accretion of discount on debt securities as applicable. The principal amount on inflation-indexed securities is periodically adjusted to the rate of inflation and interest is accrued based on the principal amount. The adjustments to principal due to inflation are reflected as increases or decreases to Interest in the accompanying Statement of Operations. Debt obligations may be placed on non-accrual status and related interest income may be reduced by ceasing current accruals and writing off interest receivables when the collection of all or a portion of interest has become doubtful based on consistently applied procedures. A debt obligation is removed from non-accrual status when the issuer resumes interest payments or when collectability of interest is reasonably assured.
Expenses. Expenses directly attributable to a fund are charged to that fund. Expenses attributable to more than one fund are allocated among the respective funds on the basis of relative net assets or other appropriate methods. Expense estimates are accrued in the period to which they relate and adjustments are made when actual amounts are known.
Deferred Trustee Compensation. Under a Deferred Compensation Plan (the Plan) for the Fund, certain independent Trustees have elected to defer receipt of a portion of their annual compensation. Deferred amounts are invested in a cross-section of Fidelity funds, are marked-to-market and remain in the Fund until distributed in accordance with the Plan. The investment of deferred amounts and the offsetting payable to the Trustees of $125 are included in the accompanying Statement of Assets and Liabilities in other receivables and other payables and accrued expenses, respectively.
Income Tax Information and Distributions to Shareholders. Each year, the Fund intends to qualify as a regulated investment company under Subchapter M of the Internal Revenue Code, including distributing substantially all of its taxable income and realized gains. As a result, no provision for U.S. Federal income taxes is required. As of August 31, 2019, the Fund did not have any unrecognized tax benefits in the financial statements; nor is the Fund aware of any tax positions for which it is reasonably possible that the total amounts of unrecognized tax benefits will significantly change in the next twelve months. The Fund files a U.S. federal tax return, in addition to state and local tax returns as required. The Fund's federal income tax returns are subject to examination by the Internal Revenue Service (IRS) for a period of three fiscal years after they are filed. State and local tax returns may be subject to examination for an additional fiscal year depending on the jurisdiction.
Distributions are declared and recorded daily and paid monthly from net investment income. Distributions from realized gains, if any, are declared and recorded on the ex-dividend date. Income and capital gain distributions are determined in accordance with income tax regulations, which may differ from GAAP.
Capital accounts within the financial statements are adjusted for permanent book-tax differences. These adjustments have no impact on net assets or the results of operations. Capital accounts are not adjusted for temporary book-tax differences which will reverse in a subsequent period.
Book-tax differences are primarily due to futures contracts, prior period premium and discount on debt securities, market discount, deferred trustees compensation, capital loss carryforwards and losses deferred due to wash sales.
As of period end, the cost and unrealized appreciation (depreciation) in securities, and derivatives if applicable, for federal income tax purposes were as follows:
| Gross unrealized appreciation | $111,880 |
| Gross unrealized depreciation | (1,537) |
| Net unrealized appreciation (depreciation) | $110,343 |
| Tax Cost | $2,600,525 |
The tax-based components of distributable earnings as of period end were as follows:
| Capital loss carryforward | $(9,877) |
| Net unrealized appreciation (depreciation) on securities and other investments | $109,733 |
Capital loss carryforwards are only available to offset future capital gains of the Fund to the extent provided by regulations and may be limited. Under the Regulated Investment Company Modernization Act of 2010 (the Act), the Fund is permitted to carry forward capital losses incurred in taxable years beginning after December 22, 2010 for an unlimited period and such capital losses are required to be used prior to any losses that expire. The capital loss carryforward information presented below, including any applicable limitation, is estimated as of fiscal period end and is subject to adjustment.
| No expiration | |
| Short-term | $(5,539) |
| Long-term | (4,338) |
| Total capital loss carryforward | $(9,877) |
The tax character of distributions paid was as follows:
| | August 31, 2019 | August 31, 2018 |
| Ordinary Income | $68,107 | $ 68,154 |
Restricted Securities. The Fund may invest in securities that are subject to legal or contractual restrictions on resale. These securities generally may be resold in transactions exempt from registration or to the public if the securities are registered. Disposal of these securities may involve time-consuming negotiations and expense, and prompt sale at an acceptable price may be difficult. Information regarding restricted securities is included at the end of the Fund's Schedule of Investments.
New Rule Issuance. During August 2018, the U.S. Securities and Exchange Commission issued Final Rule Release No. 33-10532, Disclosure Update and Simplification. This Final Rule includes amendments specific to registered investment companies that are intended to eliminate overlap in disclosure requirements between Regulation S-X and GAAP. In accordance with these amendments, certain line-items in the Fund's financial statements have been combined or removed for the current period as outlined in the table below.
| Financial Statement | Current Line-Item Presentation (As Applicable) | Prior Line-Item Presentation (As Applicable) |
| Statement of Assets and Liabilities | Total distributable earnings (loss) | Undistributed/Distributions in excess of/Accumulated net investment income (loss)
Accumulated/Undistributed net realized gain (loss)
Net unrealized appreciation (depreciation) |
| Statement of Changes in Net Assets | N/A - removed | Undistributed/Distributions in excess of/Accumulated net investment income (loss) end of period |
| Statement of Changes in Net Assets | Distributions to shareholders | Distributions to shareholders from net investment income
Distributions to shareholders from net realized gain |
4. Derivative Instruments.
Risk Exposures and the Use of Derivative Instruments. The Fund's investment objective allows the Fund to enter into various types of derivative contracts, including futures contracts. Derivatives are investments whose value is primarily derived from underlying assets, indices or reference rates and may be transacted on an exchange or over-the-counter (OTC). Derivatives may involve a future commitment to buy or sell a specified asset based on specified terms, to exchange future cash flows at periodic intervals based on a notional principal amount, or for one party to make one or more payments upon the occurrence of specified events in exchange for periodic payments from the other party.
The Fund used derivatives to increase returns and to manage exposure to certain risks as defined below. The success of any strategy involving derivatives depends on analysis of numerous economic factors, and if the strategies for investment do not work as intended, the Fund may not achieve its objectives.
The Fund's use of derivatives increased or decreased its exposure to the following risk:
| Interest Rate Risk | Interest rate risk relates to the fluctuations in the value of interest-bearing securities due to changes in the prevailing levels of market interest rates. |
The Fund is also exposed to additional risks from investing in derivatives, such as liquidity risk and counterparty credit risk. Liquidity risk is the risk that the Fund will be unable to close out the derivative in the open market in a timely manner. Counterparty credit risk is the risk that the counterparty will not be able to fulfill its obligation to the Fund. Counterparty credit risk related to exchange-traded futures contracts may be mitigated by the protection provided by the exchange on which they trade.
Investing in derivatives may involve greater risks than investing in the underlying assets directly and, to varying degrees, may involve risk of loss in excess of any initial investment and collateral received and amounts recognized in the Statement of Assets and Liabilities. In addition, there may be the risk that the change in value of the derivative contract does not correspond to the change in value of the underlying instrument.
Futures Contracts. A futures contract is an agreement between two parties to buy or sell a specified underlying instrument for a fixed price at a specified future date. The Fund used futures contracts to manage its exposure to the bond market and fluctuations in interest rates.
Upon entering into a futures contract, a fund is required to deposit either cash or securities (initial margin) with a clearing broker in an amount equal to a certain percentage of the face value of the contract. Futures contracts are marked-to-market daily and subsequent daily payments (variation margin) are made or received by a fund depending on the daily fluctuations in the value of the futures contracts and are recorded as unrealized appreciation or (depreciation). This receivable and/or payable, if any, is included in daily variation margin on futures contracts in the Statement of Assets and Liabilities. Realized gain or (loss) is recorded upon the expiration or closing of a futures contract. The net realized gain (loss) and change in net unrealized appreciation (depreciation) on futures contracts during the period is presented in the Statement of Operations.
Any open futures contracts at period end are presented in the Schedule of Investments under the caption "Futures Contracts". The notional amount at value reflects each contract's exposure to the underlying instrument or index at period end and is representative of volume of activity during the period. Securities deposited to meet initial margin requirements are identified in the Schedule of Investments.
5. Purchases and Sales of Investments.
Purchases and sales of securities (including the Fixed-Income Central Funds), other than short-term securities and U.S. government securities, aggregated $441,466 and $489,961, respectively.
6. Fees and Other Transactions with Affiliates.
Management Fee. Fidelity Management & Research Company (the investment adviser) and its affiliates provide the Fund with investment management related services for which the Fund pays a monthly management fee. The management fee is the sum of an individual fund fee rate that is based on an annual rate of .20% of the Fund's average net assets and an annualized group fee rate that averaged .10% during the period. The group fee rate is based upon the average net assets of all the mutual funds advised by the investment adviser, including any mutual funds previously advised by the investment adviser that are currently advised by Fidelity SelectCo, LLC, an affiliate of the investment adviser. The group fee rate decreases as assets under management increase and increases as assets under management decrease. For the reporting period, the total annual management fee rate was .30% of the Fund's average net assets.
Transfer Agent Fees. Fidelity Investments Institutional Operations Company, Inc. (FIIOC), an affiliate of the investment adviser, is the Fund's transfer, dividend disbursing and shareholder servicing agent. FIIOC receives an asset-based fee of .10% of the Fund's average net assets. FIIOC pays for typesetting, printing and mailing of shareholder reports, except proxy statements.
Fund Wide Operations Fee. Pursuant to the Fund Wide Operations and Expense Agreement (FWOE), the investment adviser has agreed to provide for fund level expenses (which do not include transfer agent, compensation of the independent Trustees, interest (including commitment fees), taxes or extraordinary expenses, if any) in return for a FWOE fee equal to .35% of the Fund's average net assets less the total amount of the management fee. The FWOE paid by the Fund is reduced by an amount equal to the fees and expenses paid to the independent Trustees. For the period, the FWOE fee was equivalent to an annual rate of .05% of average net assets.
Interfund Trades. The Fund may purchase from or sell securities to other Fidelity Funds under procedures adopted by the Board. The procedures have been designed to ensure these interfund trades are executed in accordance with Rule 17a-7 of the 1940 Act. Interfund trades are included within the respective purchases and sales amounts shown in the Purchases and Sales of Investments note.
7. Committed Line of Credit.
The Fund participates with other funds managed by the investment adviser or an affiliate in a $4.25 billion credit facility (the "line of credit") to be utilized for temporary or emergency purposes to fund shareholder redemptions or for other short-term liquidity purposes. The Fund has agreed to pay commitment fees on its pro-rata portion of the line of credit, which amounted to $8 and is reflected in Commitment fees on the Statement of Operations. During the period, the Fund did not borrow on this line of credit.
8. Expense Reductions.
Through arrangements with the Fund's custodian, credits realized as a result of certain uninvested cash balances were used to reduce the Fund's expenses. During the period, these credits reduced the Fund's expenses by $2.
9. Other.
The Fund's organizational documents provide former and current trustees and officers with a limited indemnification against liabilities arising in connection with the performance of their duties to the Fund. In the normal course of business, the Fund may also enter into contracts that provide general indemnifications. The Fund's maximum exposure under these arrangements is unknown as this would be dependent on future claims that may be made against the Fund. The risk of material loss from such claims is considered remote.
10. Credit Risk.
The Fund invests a portion of its assets in structured securities of issuers backed by commercial and residential mortgage loans, credit card receivables and automotive loans. The value and related income of these securities is sensitive to changes in economic conditions, including delinquencies and/or defaults.
Report of Independent Registered Public Accounting Firm
To the Trustees of Fidelity Salem Street Trust and Shareholders of Fidelity Intermediate Bond Fund:
Opinion on the Financial Statements and Financial Highlights
We have audited the accompanying statement of assets and liabilities of Fidelity Intermediate Bond Fund (the "Fund"), a fund of Fidelity Salem Street Trust, including the schedule of investments, as of August 31, 2019, the related statement of operations for the year then ended, the statement of changes in net assets for each of the two years in the period then ended, the financial highlights for each of the five years in the period then ended, and the related notes. In our opinion, the financial statements and financial highlights present fairly, in all material respects, the financial position of the Fund as of August 31, 2019, and the results of its operations for the year then ended, the changes in its net assets for each of the two years in the period then ended, and the financial highlights for each of the five years in the period then ended in conformity with accounting principles generally accepted in the United States of America.
Basis for Opinion
These financial statements and financial highlights are the responsibility of the Fund's management. Our responsibility is to express an opinion on the Fund's financial statements and financial highlights based on our audits. We are a public accounting firm registered with the Public Company Accounting Oversight Board (United States) (PCAOB) and are required to be independent with respect to the Fund in accordance with the U.S. federal securities laws and the applicable rules and regulations of the Securities and Exchange Commission and the PCAOB.
We conducted our audits in accordance with the standards of the PCAOB. Those standards require that we plan and perform the audit to obtain reasonable assurance about whether the financial statements and financial highlights are free of material misstatement, whether due to error or fraud. The Fund is not required to have, nor were we engaged to perform, an audit of its internal control over financial reporting. As part of our audits we are required to obtain an understanding of internal control over financial reporting but not for the purpose of expressing an opinion on the effectiveness of the Fund’s internal control over financial reporting. Accordingly, we express no such opinion.
Our audits included performing procedures to assess the risks of material misstatement of the financial statements and financial highlights, whether due to error or fraud, and performing procedures that respond to those risks. Such procedures included examining, on a test basis, evidence regarding the amounts and disclosures in the financial statements and financial highlights. Our audits also included evaluating the accounting principles used and significant estimates made by management, as well as evaluating the overall presentation of the financial statements and financial highlights. Our procedures included confirmation of securities owned as of August 31, 2019, by correspondence with the custodians and brokers; when replies were not received from brokers, we performed other auditing procedures. We believe that our audits provide a reasonable basis for our opinion.
/s/ Deloitte & Touche LLP
Boston, Massachusetts
October 17, 2019
We have served as the auditor of one or more of the Fidelity investment companies since 1999.
Trustees and Officers
The Trustees, Members of the Advisory Board (if any), and officers of the trust and fund, as applicable, are listed below. The Board of Trustees governs the fund and is responsible for protecting the interests of shareholders. The Trustees are experienced executives who meet periodically throughout the year to oversee the fund's activities, review contractual arrangements with companies that provide services to the fund, oversee management of the risks associated with such activities and contractual arrangements, and review the fund's performance. Except for Jonathan Chiel, each of the Trustees oversees 276 funds. Mr. Chiel oversees 170 funds.
The Trustees hold office without limit in time except that (a) any Trustee may resign; (b) any Trustee may be removed by written instrument, signed by at least two-thirds of the number of Trustees prior to such removal; (c) any Trustee who requests to be retired or who has become incapacitated by illness or injury may be retired by written instrument signed by a majority of the other Trustees; and (d) any Trustee may be removed at any special meeting of shareholders by a two-thirds vote of the outstanding voting securities of the trust. Each Trustee who is not an interested person (as defined in the 1940 Act) of the trust and the fund is referred to herein as an Independent Trustee. Each Independent Trustee shall retire not later than the last day of the calendar year in which his or her 75th birthday occurs. The Independent Trustees may waive this mandatory retirement age policy with respect to individual Trustees. Officers and Advisory Board Members hold office without limit in time, except that any officer or Advisory Board Member may resign or may be removed by a vote of a majority of the Trustees at any regular meeting or any special meeting of the Trustees. Except as indicated, each individual has held the office shown or other offices in the same company for the past five years.
The fund’s Statement of Additional Information (SAI) includes more information about the Trustees. To request a free copy, call Fidelity at 1-800-544-8544.
Experience, Skills, Attributes, and Qualifications of the Trustees. The Governance and Nominating Committee has adopted a statement of policy that describes the experience, qualifications, attributes, and skills that are necessary and desirable for potential Independent Trustee candidates (Statement of Policy). The Board believes that each Trustee satisfied at the time he or she was initially elected or appointed a Trustee, and continues to satisfy, the standards contemplated by the Statement of Policy. The Governance and Nominating Committee also engages professional search firms to help identify potential Independent Trustee candidates who have the experience, qualifications, attributes, and skills consistent with the Statement of Policy. From time to time, additional criteria based on the composition and skills of the current Independent Trustees, as well as experience or skills that may be appropriate in light of future changes to board composition, business conditions, and regulatory or other developments, have also been considered by the professional search firms and the Governance and Nominating Committee. In addition, the Board takes into account the Trustees' commitment and participation in Board and committee meetings, as well as their leadership of standing and ad hoc committees throughout their tenure.
In determining that a particular Trustee was and continues to be qualified to serve as a Trustee, the Board has considered a variety of criteria, none of which, in isolation, was controlling. The Board believes that, collectively, the Trustees have balanced and diverse experience, qualifications, attributes, and skills, which allow the Board to operate effectively in governing the fund and protecting the interests of shareholders. Information about the specific experience, skills, attributes, and qualifications of each Trustee, which in each case led to the Board's conclusion that the Trustee should serve (or continue to serve) as a trustee of the fund, is provided below.
Board Structure and Oversight Function. Abigail P. Johnson is an interested person and currently serves as Chairman. The Trustees have determined that an interested Chairman is appropriate and benefits shareholders because an interested Chairman has a personal and professional stake in the quality and continuity of services provided to the fund. Independent Trustees exercise their informed business judgment to appoint an individual of their choosing to serve as Chairman, regardless of whether the Trustee happens to be independent or a member of management. The Independent Trustees have determined that they can act independently and effectively without having an Independent Trustee serve as Chairman and that a key structural component for assuring that they are in a position to do so is for the Independent Trustees to constitute a substantial majority for the Board. The Independent Trustees also regularly meet in executive session. Arthur E. Johnson serves as Chairman of the Independent Trustees and as such (i) acts as a liaison between the Independent Trustees and management with respect to matters important to the Independent Trustees and (ii) with management prepares agendas for Board meetings.
Fidelity® funds are overseen by different Boards of Trustees. The fund's Board oversees Fidelity's investment-grade bond, money market, asset allocation and certain equity funds, and other Boards oversee Fidelity's high income and other equity funds. The asset allocation funds may invest in Fidelity® funds that are overseen by such other Boards. The use of separate Boards, each with its own committee structure, allows the Trustees of each group of Fidelity® funds to focus on the unique issues of the funds they oversee, including common research, investment, and operational issues. On occasion, the separate Boards establish joint committees to address issues of overlapping consequences for the Fidelity® funds overseen by each Board.
The Trustees operate using a system of committees to facilitate the timely and efficient consideration of all matters of importance to the Trustees, the fund, and fund shareholders and to facilitate compliance with legal and regulatory requirements and oversight of the fund's activities and associated risks. The Board, acting through its committees, has charged FMR and its affiliates with (i) identifying events or circumstances the occurrence of which could have demonstrably adverse effects on the fund's business and/or reputation; (ii) implementing processes and controls to lessen the possibility that such events or circumstances occur or to mitigate the effects of such events or circumstances if they do occur; and (iii) creating and maintaining a system designed to evaluate continuously business and market conditions in order to facilitate the identification and implementation processes described in (i) and (ii) above. Because the day-to-day operations and activities of the fund are carried out by or through FMR, its affiliates, and other service providers, the fund's exposure to risks is mitigated but not eliminated by the processes overseen by the Trustees. While each of the Board's committees has responsibility for overseeing different aspects of the fund's activities, oversight is exercised primarily through the Operations and Audit Committees. In addition, an ad hoc Board committee of Independent Trustees has worked with FMR to enhance the Board's oversight of investment and financial risks, legal and regulatory risks, technology risks, and operational risks, including the development of additional risk reporting to the Board. Appropriate personnel, including but not limited to the fund's Chief Compliance Officer (CCO), FMR's internal auditor, the independent accountants, the fund's Treasurer and portfolio management personnel, make periodic reports to the Board's committees, as appropriate, including an annual review of Fidelity's risk management program for the Fidelity® funds. The responsibilities of each standing committee, including their oversight responsibilities, are described further under "Standing Committees of the Trustees."
Interested Trustees*:
Correspondence intended for a Trustee who is an interested person may be sent to Fidelity Investments, 245 Summer Street, Boston, Massachusetts 02210.
Name, Year of Birth; Principal Occupations and Other Relevant Experience+
Jonathan Chiel (1957)
Year of Election or Appointment: 2016
Trustee
Mr. Chiel also serves as Trustee of other Fidelity® funds. Mr. Chiel is Executive Vice President and General Counsel for FMR LLC (diversified financial services company, 2012-present). Previously, Mr. Chiel served as general counsel (2004-2012) and senior vice president and deputy general counsel (2000-2004) for John Hancock Financial Services; a partner with Choate, Hall & Stewart (1996-2000) (law firm); and an Assistant United States Attorney for the United States Attorney’s Office of the District of Massachusetts (1986-95), including Chief of the Criminal Division (1993-1995). Mr. Chiel is a director on the boards of the Boston Bar Foundation and the Maimonides School.
Abigail P. Johnson (1961)
Year of Election or Appointment: 2009
Trustee
Chairman of the Board of Trustees
Ms. Johnson also serves as Trustee of other Fidelity® funds. Ms. Johnson serves as Chairman (2016-present), Chief Executive Officer (2014-present), and Director (2007-present) of FMR LLC (diversified financial services company), President of Fidelity Financial Services (2012-present) and President of Personal, Workplace and Institutional Services (2005-present). Ms. Johnson is Chairman and Director of FMR Co., Inc. (investment adviser firm, 2011-present) and Chairman and Director of FMR (investment adviser firm, 2011-present). Previously, Ms. Johnson served as Vice Chairman (2007-2016) and President (2013-2016) of FMR LLC, President and a Director of FMR (2001-2005), a Trustee of other investment companies advised by FMR, Fidelity Investments Money Management, Inc. (investment adviser firm), and FMR Co., Inc. (2001-2005), Senior Vice President of the Fidelity® funds (2001-2005), and managed a number of Fidelity® funds. Ms. Abigail P. Johnson and Mr. Arthur E. Johnson are not related.
Jennifer Toolin McAuliffe (1959)
Year of Election or Appointment: 2016
Trustee
Ms. McAuliffe also serves as Trustee of other Fidelity® funds. Ms. McAuliffe previously served as a Member of the Advisory Board of certain Fidelity® funds (2016) and as Co-Head of Fixed Income of Fidelity Investments Limited (now known as FIL Limited (FIL)) (diversified financial services company). Earlier roles at FIL included Director of Research for FIL’s credit and quantitative teams in London, Hong Kong and Tokyo. Ms. McAuliffe also was the Director of Research for taxable and municipal bonds at Fidelity Investments Money Management, Inc. Ms. McAuliffe is also a director or trustee of several not-for-profit entities.
* Determined to be an “Interested Trustee” by virtue of, among other things, his or her affiliation with the trust or various entities under common control with FMR.
+ The information includes the Trustee's principal occupation during the last five years and other information relating to the experience, attributes, and skills relevant to the Trustee's qualifications to serve as a Trustee, which led to the conclusion that the Trustee should serve as a Trustee for the fund.
Independent Trustees:
Correspondence intended for an Independent Trustee may be sent to Fidelity Investments, P.O. Box 55235, Boston, Massachusetts 02205-5235.
Name, Year of Birth; Principal Occupations and Other Relevant Experience+
Elizabeth S. Acton (1951)
Year of Election or Appointment: 2013
Trustee
Ms. Acton also serves as Trustee of other Fidelity® funds. Prior to her retirement in April 2012, Ms. Acton was Executive Vice President, Finance (2011-2012), Executive Vice President, Chief Financial Officer (2002-2011), and Treasurer (2004-2005) of Comerica Incorporated (financial services). Prior to joining Comerica, Ms. Acton held a variety of positions at Ford Motor Company (1983-2002), including Vice President and Treasurer (2000-2002) and Executive Vice President and Chief Financial Officer of Ford Motor Credit Company (1998-2000). Ms. Acton currently serves as a member of the Board of Directors and Audit and Finance Committees of Beazer Homes USA, Inc. (homebuilding, 2012-present). Previously, Ms. Acton served as a Member of the Advisory Board of certain Fidelity® funds (2013-2016).
Ann E. Dunwoody (1953)
Year of Election or Appointment: 2018
Trustee
General Dunwoody also serves as Trustee of other Fidelity® funds. General Dunwoody (United States Army, Retired) was the first woman in U.S. military history to achieve the rank of four-star general and prior to her retirement in 2012 held a variety of positions within the U.S. Army, including Commanding General, U.S. Army Material Command (2008-2012). She is the President of First to Four LLC (leadership and mentoring services, 2012-present). She also serves as a member of the Board of Directors and Nominating and Corporate Governance Committee of L3 Technologies, Inc. (communication, electronic, sensor, and aerospace systems, 2013-present), Board of Directors and Nomination and Corporate Governance Committees of Kforce Inc. (professional staffing services, 2016-present) and Board of Directors of Automattic Inc. (software engineering, 2018-present). Previously, General Dunwoody served as a Member of the Advisory Board of certain Fidelity® funds (2018), a member of the Board of Directors and Audit and Sustainability and Corporate Responsibility Committees of Republic Services, Inc. (waste collection, disposal and recycling, 2013-2016). Ms. Dunwoody also serves on several boards for non-profit organizations, including as a member of the Board of Directors, Chair of the Nomination and Governance Committee and member of the Audit Committee of Logistics Management Institute (consulting non-profit, 2012-present), a member of the Board of Directors of the Army Historical Foundation (2015-present), a member of the Council of Trustees for the Association of the United States Army (advocacy non-profit, 2013-present) and a member of the Board of Trustees of Florida Institute of Technology (2015-present) and ThanksUSA (military family education non-profit, 2014-present).
John Engler (1948)
Year of Election or Appointment: 2014
Trustee
Mr. Engler also serves as Trustee of other Fidelity® funds. He serves on the board of directors for Universal Forest Products (manufacturer and distributor of wood and wood-alternative products, 2003-present) and K12 Inc. (technology-based education company, 2012-present). Previously, Mr. Engler served as interim president of Michigan State University (2018-2019), a Member of the Advisory Board of certain Fidelity® funds (2014-2016), president of the Business Roundtable (2011-2017), a trustee of The Munder Funds (2003-2014), president and CEO of the National Association of Manufacturers (2004-2011), member of the Board of Trustees of the Annie E. Casey Foundation (2004-2015), and as governor of Michigan (1991-2003). He is a past chairman of the National Governors Association.
Robert F. Gartland (1951)
Year of Election or Appointment: 2010
Trustee
Mr. Gartland also serves as Trustee of other Fidelity® funds. Mr. Gartland is Chairman and an investor in Gartland & Mellina Group Corp. (consulting, 2009-present). Previously, Mr. Gartland served as a partner and investor of Vietnam Partners LLC (investments and consulting, 2008-2011). Prior to his retirement, Mr. Gartland held a variety of positions at Morgan Stanley (financial services, 1979-2007), including Managing Director (1987-2007), and Chase Manhattan Bank (1975-1978).
Arthur E. Johnson (1947)
Year of Election or Appointment: 2008
Trustee
Chairman of the Independent Trustees
Mr. Johnson also serves as Trustee of other Fidelity® funds. Mr. Johnson serves as a member of the Board of Directors of Eaton Corporation plc (diversified power management, 2009-present) and Booz Allen Hamilton (management consulting, 2011-present). Prior to his retirement, Mr. Johnson served as Senior Vice President of Corporate Strategic Development of Lockheed Martin Corporation (defense contractor, 1999-2009). Mr. Johnson previously served as Vice Chairman (2015-2018) of the Independent Trustees of certain Fidelity® funds and on the Board of Directors of IKON Office Solutions, Inc. (1999-2008), AGL Resources, Inc. (holding company, 2002-2016), and Delta Airlines (2005-2007). Mr. Arthur E. Johnson is not related to Ms. Abigail P. Johnson.
Michael E. Kenneally (1954)
Year of Election or Appointment: 2009
Trustee
Vice Chairman of the Independent Trustees
Mr. Kenneally also serves as Trustee of other Fidelity® funds. Prior to his retirement, Mr. Kenneally served as Chairman and Global Chief Executive Officer of Credit Suisse Asset Management. Before joining Credit Suisse, he was an Executive Vice President and Chief Investment Officer for Bank of America Corporation. Earlier roles at Bank of America included Director of Research, Senior Portfolio Manager and Research Analyst, and Mr. Kenneally was awarded the Chartered Financial Analyst (CFA) designation in 1991.
Marie L. Knowles (1946)
Year of Election or Appointment: 2001
Trustee
Ms. Knowles also serves as Trustee of other Fidelity® funds. Prior to Ms. Knowles' retirement in June 2000, she served as Executive Vice President and Chief Financial Officer of Atlantic Richfield Company (ARCO) (diversified energy, 1996-2000). From 1993 to 1996, she was a Senior Vice President of ARCO and President of ARCO Transportation Company (pipeline and tanker operations). Ms. Knowles currently serves as a Director and Chairman of the Audit Committee of McKesson Corporation (healthcare service, since 2002). Ms. Knowles is a member of the Board of the Santa Catalina Island Company (real estate, 2009-present). Ms. Knowles is a Member of the Investment Company Institute Board of Governors and a Member of the Governing Council of the Independent Directors Council (2014-present). She also serves as a member of the Advisory Board for the School of Engineering of the University of Southern California. Previously, Ms. Knowles served as a Director of Phelps Dodge Corporation (copper mining and manufacturing, 1994-2007), URS Corporation (engineering and construction, 2000-2003) and America West (airline, 1999-2002). Ms. Knowles previously served as Chairman (2015-2018) and Vice Chairman (2012-2015) of the Independent Trustees of certain Fidelity® funds.
Mark A. Murray (1954)
Year of Election or Appointment: 2016
Trustee
Mr. Murray also serves as Trustee of other Fidelity® funds. Mr. Murray is Vice Chairman (2013-present) of Meijer, Inc. (regional retail chain). Previously, Mr. Murray served as a Member of the Advisory Board of certain Fidelity® funds (2016) and as Co-Chief Executive Officer (2013-2016) and President (2006-2013) of Meijer, Inc. Mr. Murray serves as a member of the Board of Directors and Nuclear Review and Public Policy and Responsibility Committees of DTE Energy Company (diversified energy company, 2009-present). Mr. Murray also serves as a member of the Board of Directors of Spectrum Health (not-for-profit health system, 2015-present). Mr. Murray previously served as President of Grand Valley State University (2001-2006), Treasurer for the State of Michigan (1999-2001), Vice President of Finance and Administration for Michigan State University (1998-1999), and a member of the Board of Directors and Audit Committee and Chairman of the Nominating and Corporate Governance Committee of Universal Forest Products, Inc. (manufacturer and distributor of wood and wood-alternative products, 2004-2016). Mr. Murray is also a director or trustee of many community and professional organizations.
+ The information includes the Trustee's principal occupation during the last five years and other information relating to the experience, attributes, and skills relevant to the Trustee's qualifications to serve as a Trustee, which led to the conclusion that the Trustee should serve as a Trustee for the fund.
Advisory Board Members and Officers:
Correspondence intended for an officer may be sent to Fidelity Investments, 245 Summer Street, Boston, Massachusetts 02210. Officers appear below in alphabetical order.
Name, Year of Birth; Principal Occupation
Elizabeth Paige Baumann (1968)
Year of Election or Appointment: 2017
Anti-Money Laundering (AML) Officer
Ms. Baumann also serves as AML Officer of other funds. She is Chief AML Officer (2012-present) and Senior Vice President (2014-present) of FMR LLC (diversified financial services company) and is an employee of Fidelity Investments. Previously, Ms. Baumann served as AML Officer of the funds (2012-2016), and Vice President (2007-2014) and Deputy Anti-Money Laundering Officer (2007-2012) of FMR LLC.
Craig S. Brown (1977)
Year of Election or Appointment: 2019
Assistant Treasurer
Mr. Brown also serves as Assistant Treasurer of other funds. Mr. Brown is an employee of Fidelity Investments (2013-present).
John J. Burke III (1964)
Year of Election or Appointment: 2018
Chief Financial Officer
Mr. Burke also serves as Chief Financial Officer of other funds. Mr. Burke serves as Head of Investment Operations for Fidelity Fund and Investment Operations (2018-present) and is an employee of Fidelity Investments (1998-present). Previously Mr. Burke served as head of Asset Management Investment Operations (2012-2018).
Jonathan Davis (1968)
Year of Election or Appointment: 2010
Assistant Treasurer
Mr. Davis also serves as Assistant Treasurer of other funds. Mr. Davis serves as Assistant Treasurer of FMR Capital, Inc. (2017-present) and is an employee of Fidelity Investments. Previously, Mr. Davis served as Vice President and Associate General Counsel of FMR LLC (diversified financial services company, 2003-2010).
Adrien E. Deberghes (1967)
Year of Election or Appointment: 2010
Assistant Treasurer
Mr. Deberghes also serves as an officer of other funds. He serves as Assistant Treasurer of FMR Capital, Inc. (2017-present), Executive Vice President of Fidelity Investments Money Management, Inc. (FIMM) (investment adviser firm, 2016-present), and is an employee of Fidelity Investments (2008-present). Previously, Mr. Deberghes served as President and Treasurer of certain Fidelity® funds (2013-2018). Prior to joining Fidelity Investments, Mr. Deberghes was Senior Vice President of Mutual Fund Administration at State Street Corporation (2007-2008), Senior Director of Mutual Fund Administration at Investors Bank & Trust (2005-2007), and Director of Finance for Dunkin' Brands (2000-2005). Previously, Mr. Deberghes served in other fund officer roles.
Laura M. Del Prato (1964)
Year of Election or Appointment: 2018
President and Treasurer
Ms. Del Prato also serves as an officer of other funds. Ms. Del Prato is an employee of Fidelity Investments (2017-present). Prior to joining Fidelity Investments, Ms. Del Prato served as a Managing Director and Treasurer of the JPMorgan Mutual Funds (2014-2017). Prior to JPMorgan, Ms. Del Prato served as a partner at Cohen Fund Audit Services (accounting firm, 2012-2013) and KPMG LLP (accounting firm, 2004-2012).
Colm A. Hogan (1973)
Year of Election or Appointment: 2016
Assistant Treasurer
Mr. Hogan also serves as an officer of other funds. Mr. Hogan serves as Assistant Treasurer of FMR Capital, Inc. (2017-present) and is an employee of Fidelity Investments (2005-present). Previously, Mr. Hogan served as Assistant Treasurer of certain Fidelity® funds (2016-2018).
Cynthia Lo Bessette (1969)
Year of Election or Appointment: 2019
Secretary and Chief Legal Officer (CLO)
Ms. Lo Bessette also serves as Secretary and CLO of other funds. She is a Senior Vice President and Deputy General Counsel of FMR LLC (diversified financial services company, 2019-present), and is an employee of Fidelity Investments. Previously, Ms. Lo Bessette served as Executive Vice President, General Counsel (2016-2019) and Senior Vice President, Deputy General Counsel (2015-2016) of OppenheimerFunds (investment management company) and Deputy Chief Legal Officer (2013-2015) of Jennison Associates LLC (investment adviser firm).
Chris Maher (1972)
Year of Election or Appointment: 2013
Assistant Treasurer
Mr. Maher serves as Assistant Treasurer of other funds. Mr. Maher is Vice President of Valuation Oversight, serves as Assistant Treasurer of FMR Capital, Inc. (2017-present), and is an employee of Fidelity Investments. Previously, Mr. Maher served as Vice President of Asset Management Compliance (2013), Vice President of the Program Management Group of FMR (investment adviser firm, 2010-2013), and Vice President of Valuation Oversight (2008-2010).
John B. McGinty, Jr. (1962)
Year of Election or Appointment: 2016
Chief Compliance Officer
Mr. McGinty also serves as Chief Compliance Officer of other funds. Mr. McGinty is Senior Vice President of Asset Management Compliance for Fidelity Investments and is an employee of Fidelity Investments (2016-present). Mr. McGinty previously served as Vice President, Senior Attorney at Eaton Vance Management (investment management firm, 2015-2016), and prior to Eaton Vance as global CCO for all firm operations and registered investment companies at GMO LLC (investment management firm, 2009-2015). Before joining GMO LLC, Mr. McGinty served as Senior Vice President, Deputy General Counsel for Fidelity Investments (2007-2009).
Jason P. Pogorelec (1975)
Year of Election or Appointment: 2015
Assistant Secretary
Mr. Pogorelec also serves as Assistant Secretary of other funds. Mr. Pogorelec serves as Vice President, Associate General Counsel (2010-present) and is an employee of Fidelity Investments (2006-present).
Nancy D. Prior (1967)
Year of Election or Appointment: 2014
Vice President
Ms. Prior also serves as Vice President of other funds. Ms. Prior serves as President of Fixed Income (2014-present), President (2016-present) and Director (2014-present) of Fidelity Investments Money Management, Inc. (FIMM) (investment adviser firm), and is an employee of Fidelity Investments (2002-present). Previously, Ms. Prior served as Vice Chairman of FIAM LLC (investment adviser firm, 2014-2018), a Director of FMR Investment Management (UK) Limited (investment adviser firm, 2015-2018), President Multi-Asset Class Strategies of FMR's Global Asset Allocation Division (2017-2018), Vice President of Fidelity's Money Market Funds (2012-2014), and President, Money Market and Short Duration Bond Group of Fidelity Management & Research Company (FMR) (investment adviser firm, 2013-2014).
Stacie M. Smith (1974)
Year of Election or Appointment: 2013
Assistant Treasurer
Ms. Smith also serves as an officer of other funds. Ms. Smith serves as Assistant Treasurer of FMR Capital, Inc. (2017-present), is an employee of Fidelity Investments (2009-present), and has served in other fund officer roles. Prior to joining Fidelity Investments, Ms. Smith served as Senior Audit Manager of Ernst & Young LLP (accounting firm, 1996-2009). Previously, Ms. Smith served as Assistant Treasurer (2013-2018) and Deputy Treasurer (2013-2016) of certain Fidelity® funds.
Marc L. Spector (1972)
Year of Election or Appointment: 2016
Deputy Treasurer
Mr. Spector also serves as an officer of other funds. Mr. Spector serves as Assistant Treasurer of FMR Capital, Inc. (2017-present) and is an employee of Fidelity Investments (2016-present). Prior to joining Fidelity Investments, Mr. Spector served as Director at the Siegfried Group (accounting firm, 2013-2016), and prior to Siegfried Group as audit senior manager at Deloitte & Touche (accounting firm, 2005-2013).
Jim Wegmann (1979)
Year of Election or Appointment: 2019
Assistant Treasurer
Mr. Wegmann also serves as Assistant Treasurer of other funds. Mr. Wegmann is an employee of Fidelity Investments (2011-present).
Shareholder Expense Example
As a shareholder of the Fund, you incur two types of costs: (1) transaction costs and (2) ongoing costs, including management fees and other Fund expenses. This Example is intended to help you understand your ongoing costs (in dollars) of investing in the Fund and to compare these costs with the ongoing costs of investing in other mutual funds.
The Example is based on an investment of $1,000 invested at the beginning of the period and held for the entire period (March 1, 2019 to August 31, 2019).
Actual Expenses
The first line of the accompanying table provides information about actual account values and actual expenses. You may use the information in this line, together with the amount you invested, to estimate the expenses that you paid over the period. Simply divide your account value by $1,000.00 (for example, an $8,600 account value divided by $1,000.00 = 8.6), then multiply the result by the number in the first line under the heading entitled "Expenses Paid During Period" to estimate the expenses you paid on your account during this period. In addition, the Fund, as a shareholder in the underlying Fidelity Central Funds, will indirectly bear its pro-rata share of the fees and expenses incurred by the underlying Fidelity Central Funds. These fees and expenses are not included in the Fund's annualized expense ratio used to calculate the expense estimate in the table below.
Hypothetical Example for Comparison Purposes
The second line of the accompanying table provides information about hypothetical account values and hypothetical expenses based on the Fund's actual expense ratio and an assumed rate of return of 5% per year before expenses, which is not the Fund's actual return. The hypothetical account values and expenses may not be used to estimate the actual ending account balance or expenses you paid for the period. You may use this information to compare the ongoing costs of investing in the Fund and other funds. To do so, compare this 5% hypothetical example with the 5% hypothetical examples that appear in the shareholder reports of the other funds. In addition, the Fund, as a shareholder in the underlying Fidelity Central Funds, will indirectly bear its pro-rata share of the fees and expenses incurred by the underlying Fidelity Central Funds. These fees and expenses are not included in the Fund's annualized expense ratio used to calculate the expense estimate in the table below.
Please note that the expenses shown in the table are meant to highlight your ongoing costs only and do not reflect any transaction costs. Therefore, the second line of the table is useful in comparing ongoing costs only, and will not help you determine the relative total costs of owning different funds.
| | Annualized Expense Ratio-A | Beginning
Account Value
March 1, 2019 | Ending
Account Value
August 31, 2019 | Expenses Paid
During Period-B
March 1, 2019
to August 31, 2019 |
| Actual | .45% | $1,000.00 | $1,059.30 | $2.34 |
| Hypothetical-C | | $1,000.00 | $1,022.94 | $2.29 |
A Annualized expense ratio reflects expenses net of applicable fee waivers.
B Expenses are equal to the Fund's annualized expense ratio, multiplied by the average account value over the period, multiplied by 184/365 (to reflect the one-half year period). The fees and expenses of the underlying Fidelity Central Funds in which the Fund invests are not included in the Fund's annualized expense ratio. In addition to the expenses noted above, the Fund also indirectly bears its proportional share of the expenses of the underlying Fidelity Central Funds. Annualized expenses of the underlying non-money market Fidelity Central Funds as of their most recent fiscal half year were less than .005%.
C 5% return per year before expenses
Distributions (Unaudited)
A total of 25.53% of the dividends distributed during the fiscal year was derived from interest on U.S. Government securities which is generally exempt from state income tax.
The fund designates $42,847,282 of distributions paid during the period January 1, 2019 to August 31, 2019 as qualifying to be taxed as interest-related dividends for nonresident alien shareholders.
The fund will notify shareholders in January 2020 of amounts for use in preparing 2019 income tax returns.
IBF-ANN-1019
1.703559.122
Fidelity® Investment Grade Bond Fund
Annual Report August 31, 2019 Includes Fidelity and Fidelity Advisor share classes |
|
Beginning on January 1, 2021, as permitted by regulations adopted by the Securities and Exchange Commission, paper copies of a fund’s shareholder reports will no longer be sent by mail, unless you specifically request paper copies of the reports from the fund or from your financial intermediary, such as a financial advisor, broker-dealer or bank. Instead, the reports will be made available on a website, and you will be notified by mail each time a report is posted and provided with a website link to access the report.
If you already elected to receive shareholder reports electronically, you will not be affected by this change and you need not take any action. You may elect to receive shareholder reports and other communications from a fund electronically, by contacting your financial intermediary. For Fidelity customers, visit Fidelity's web site or call Fidelity using the contact information listed below.
You may elect to receive all future reports in paper free of charge. If you wish to continue receiving paper copies of your shareholder reports, you may contact your financial intermediary or, if you are a Fidelity customer, visit Fidelity’s website, or call Fidelity at the applicable toll-free number listed below. Your election to receive reports in paper will apply to all funds held with the fund complex/your financial intermediary.
| Account Type | Website | Phone Number |
| Brokerage, Mutual Fund, or Annuity Contracts: | fidelity.com/mailpreferences | 1-800-343-3548 |
| Employer Provided Retirement Accounts: | netbenefits.fidelity.com/preferences (choose 'no' under Required Disclosures to continue to print) | 1-800-343-0860 |
| Advisor Sold Accounts Serviced Through Your Financial Intermediary: | Contact Your Financial Intermediary | Your Financial Intermediary's phone number |
| Advisor Sold Accounts Serviced by Fidelity: | institutional.fidelity.com | 1-877-208-0098 |
Contents
To view a fund's proxy voting guidelines and proxy voting record for the 12-month period ended June 30, visit http://www.fidelity.com/proxyvotingresults or visit the Securities and Exchange Commission's (SEC) web site at http://www.sec.gov.
You may also call 1-800-544-8544 if you’re an individual investing directly with Fidelity, call 1-800-835-5092 if you’re a plan sponsor or participant with Fidelity as your recordkeeper or call 1-877-208-0098 on institutional accounts or if you’re an advisor or invest through one to request a free copy of the proxy voting guidelines.
Standard & Poor's, S&P and S&P 500 are registered service marks of The McGraw-Hill Companies, Inc. and have been licensed for use by Fidelity Distributors Corporation.
Other third-party marks appearing herein are the property of their respective owners.
All other marks appearing herein are registered or unregistered trademarks or service marks of FMR LLC or an affiliated company. © 2019 FMR LLC. All rights reserved.
This report and the financial statements contained herein are submitted for the general information of the shareholders of the Fund. This report is not authorized for distribution to prospective investors in the Fund unless preceded or accompanied by an effective prospectus.
A fund files its complete schedule of portfolio holdings with the SEC for the first and third quarters of each fiscal year on Form N-PORT. Forms N-PORT are available on the SEC’s web site at http://www.sec.gov. A fund's Forms N-PORT may be reviewed and copied at the SEC’s Public Reference Room in Washington, DC. Information regarding the operation of the SEC's Public Reference Room may be obtained by calling 1-800-SEC-0330.
For a complete list of a fund's portfolio holdings, view the most recent holdings listing, semiannual report, or annual report on Fidelity's web site at http://www.fidelity.com, http://www.institutional.fidelity.com, or http://www.401k.com, as applicable.
NOT FDIC INSURED •MAY LOSE VALUE •NO BANK GUARANTEE
Neither the Fund nor Fidelity Distributors Corporation is a bank.
Performance: The Bottom Line
Average annual total return reflects the change in the value of an investment, assuming reinvestment of distributions from dividend income and capital gains (the profits earned upon the sale of securities that have grown in value, if any) and assuming a constant rate of performance each year. The hypothetical investment and the average annual total returns do not reflect the deduction of taxes that a shareholder would pay on fund distributions or the redemption of fund shares. During periods of reimbursement by Fidelity, a fund’s total return will be greater than it would be had the reimbursement not occurred. How a fund did yesterday is no guarantee of how it will do tomorrow.
Average Annual Total Returns
| For the periods ended August 31, 2019 | Past 1 year | Past 5 years | Past 10 years |
| Class A (incl. 4.00% sales charge) | 5.70% | 2.29% | 3.90% |
| Class M (incl. 4.00% sales charge) | 5.68% | 2.27% | 3.87% |
| Class C (incl. contingent deferred sales charge) | 8.26% | 2.35% | 3.53% |
| Fidelity® Investment Grade Bond Fund | 10.45% | 3.46% | 4.65% |
| Class I | 10.38% | 3.41% | 4.61% |
| Class Z | 10.49% | 3.43% | 4.62% |
Class C shares' contingent deferred sales charges included in the past one year, past five years and past ten years total return figures are 1%, 0% and 0%, respectively.
The initial offering of Class Z shares took place on October 2, 2018. Returns prior to October 2, 2018, are those of Class I.
$10,000 Over 10 Years
Let's say hypothetically that $10,000 was invested in Fidelity® Investment Grade Bond Fund, a class of the fund, on August 31, 2009.
The chart shows how the value of your investment would have changed, and also shows how the Bloomberg Barclays U.S. Aggregate Bond Index performed over the same period.

| Period Ending Values |
| $15,758 | Fidelity® Investment Grade Bond Fund |
| $14,678 | Bloomberg Barclays U.S. Aggregate Bond Index |
Management's Discussion of Fund Performance
Market Recap: U.S. taxable investment-grade bonds posted their strongest trailing one-year return since 2009, driven by slower global economic growth, a maturing business cycle, trade uncertainty and, late in the period, the Fed’s dovish shift. The Bloomberg Barclays U.S. Aggregate Bond Index gained 10.17%. Market yields rose in the early fall of 2018, on expectations for higher inflation. Yields then declined and credit spreads widened in November and December, partly because of weaker U.S. manufacturing data. Yield spreads narrowed in January, as the U.S. Federal Reserve said it would be “patient” with policy rate hikes, and that future increases largely would depend on economic data. Yields continued to decline in the spring, amid continued international trade tension and attacks on oil tankers in the Middle East, and then tumbled further in July, when the Fed cut interest rates for the first time since 2008. The yield curve ended the period roughly flat, amid expectations for another rate cut of 25 basis points in September. Within the Bloomberg Barclays index, corporate bonds gained 13.33%, topping the 10.38% advance of U.S. Treasuries. Outside the index, U.S. corporate high-yield bonds lagged nominal U.S. Treasuries, while Treasury Inflation-Protected Securities (TIPS) gained 7.46%.
Comments from Co-Portfolio Managers Jeffrey Moore and Michael Plage: For the fiscal year, the fund's share classes (excluding sales charges, if applicable) gained roughly 9% to 10%, net of fees. The Class C shares trailed on a relative basis, although all other share classes either slightly outperformed or finished roughly in line with the 10.17% advance of the benchmark Bloomberg Barclays U.S. Aggregate Bond Index. Compared with the benchmark, the fund benefited from a modest overweighting, on average, in corporate bonds, as well as security selection in this category. Investments in bonds issued by banks added particular value. The fund also benefited from bonds issued by communication service providers, especially Verizon, which favorably tendered for some of the fund's holdings. A modest non-benchmark allocation to high-yield bonds also helped; we invested in various securities rated BB, the highest credit tier of the below-investment-grade universe. Conversely, the fund's positioning along the yield curve detracted modestly. Coming into the period, we expected the yield curve to steepen, and it mostly flattened for the 12 months. An non-index allocation to Treasury Inflation-Protected Securities (TIPS) also detracted, as inflation expectations remained subdued. We eliminated the fund's TIPS position by early 2019 and reinvested the proceeds in various corporate bonds that ultimately performed well for the remainder of the period.
The views expressed above reflect those of the portfolio manager(s) only through the end of the period as stated on the cover of this report and do not necessarily represent the views of Fidelity or any other person in the Fidelity organization. Any such views are subject to change at any time based upon market or other conditions and Fidelity disclaims any responsibility to update such views. These views may not be relied on as investment advice and, because investment decisions for a Fidelity fund are based on numerous factors, may not be relied on as an indication of trading intent on behalf of any Fidelity fund.
Investment Summary (Unaudited)
The information in the following tables is based on the combined investments of the Fund and its pro-rata share of the investments of Fidelity's Fixed-Income Central Funds.
Quality Diversification (% of fund's net assets)
| As of August 31, 2019 |
| | U.S. Government and U.S. Government Agency Obligations | 61.7% |
| | AAA | 1.8% |
| | AA | 0.7% |
| | A | 5.8% |
| | BBB | 22.5% |
| | BB and Below | 7.3% |
| | Not Rated | 0.9% |
| | Short-Term Investments and Net Other Assets* | (0.7)% |

* Short-Term Investments and Net Other Assets (Liabilities) are not included in the pie chart
We have used ratings from Moody's Investors Service, Inc. Where Moody's® ratings are not available, we have used S&P® ratings. All ratings are as of the date indicated and do not reflect subsequent changes. Securities rated BB or below were rated investment grade at the time of acquisition.
Asset Allocation (% of fund's net assets)
| As of August 31, 2019*,**,*** |
| | Corporate Bonds | 34.7% |
| | U.S. Government and U.S. Government Agency Obligations | 61.7% |
| | Asset-Backed Securities | 2.0% |
| | CMOs and Other Mortgage Related Securities | 1.2% |
| | Municipal Bonds | 0.5% |
| | Other Investments | 0.6% |
| | Short-Term Investments and Net Other Assets (Liabilities)† | (0.7)% |

* Foreign investments - 7.6%
** Futures and Swaps - 1.6%
*** Written options - (1.6)%
† Short-Term Investments and Net Other Assets (Liabilities) are not included in the pie chart
An unaudited holdings listing for the Fund, which presents direct holdings as well as the pro-rata share of any securities and other investments held indirectly through its investment in underlying non-money market Fidelity Central Funds, is available at fidelity.com and/or institutional.fidelity.com, as applicable.
Percentages in the above tables are adjusted for the effect of TBA Sale Commitments.
Schedule of Investments August 31, 2019
Showing Percentage of Net Assets
| Nonconvertible Bonds - 32.4% | | | |
| | | Principal Amount (000s) | Value (000s) |
| COMMUNICATION SERVICES - 3.3% | | | |
| Diversified Telecommunication Services - 1.7% | | | |
| AT&T, Inc.: | | | |
| 3.6% 2/17/23 | | $5,795 | $6,058 |
| 4.3% 2/15/30 | | 4,425 | 4,914 |
| 4.45% 4/1/24 | | 561 | 610 |
| 4.5% 3/9/48 | | 27,086 | 29,565 |
| 4.75% 5/15/46 | | 45,560 | 50,943 |
| 4.9% 6/15/42 | | 8,091 | 9,152 |
| 5.55% 8/15/41 | | 14,683 | 17,750 |
| 6.2% 3/15/40 | | 2,697 | 3,468 |
| BellSouth Capital Funding Corp. 7.875% 2/15/30 | | 120 | 159 |
| CenturyLink, Inc. 6.15% 9/15/19 | | 1,759 | 1,760 |
| Verizon Communications, Inc.: | | | |
| 4.329% 9/21/28 | | 25,000 | 28,717 |
| 4.862% 8/21/46 | | 4,044 | 5,036 |
| 5.012% 4/15/49 | | 1,549 | 1,980 |
| | | | 160,112 |
| Entertainment - 0.1% | | | |
| NBCUniversal, Inc.: | | | |
| 4.45% 1/15/43 | | 2,393 | 2,817 |
| 5.95% 4/1/41 | | 1,674 | 2,329 |
| | | | 5,146 |
| Media - 1.5% | | | |
| Charter Communications Operating LLC/Charter Communications Operating Capital Corp.: | | | |
| 4.464% 7/23/22 | | 7,010 | 7,407 |
| 4.908% 7/23/25 | | 5,437 | 6,009 |
| 5.375% 5/1/47 | | 41,406 | 45,985 |
| 5.75% 4/1/48 | | 20,426 | 23,831 |
| Comcast Corp.: | | | |
| 3.9% 3/1/38 | | 1,283 | 1,439 |
| 4.6% 8/15/45 | | 3,379 | 4,086 |
| 4.65% 7/15/42 | | 3,019 | 3,684 |
| Fox Corp.: | | | |
| 3.666% 1/25/22 (a) | | 1,009 | 1,046 |
| 4.03% 1/25/24 (a) | | 1,775 | 1,901 |
| 4.709% 1/25/29 (a) | | 2,568 | 2,975 |
| 5.476% 1/25/39 (a) | | 2,533 | 3,165 |
| 5.576% 1/25/49 (a) | | 1,680 | 2,186 |
| Time Warner Cable, Inc.: | | | |
| 4% 9/1/21 | | 15,014 | 15,396 |
| 4.5% 9/15/42 | | 1,008 | 1,012 |
| 5.5% 9/1/41 | | 1,791 | 1,948 |
| 5.875% 11/15/40 | | 3,852 | 4,385 |
| 6.55% 5/1/37 | | 6,679 | 8,086 |
| 7.3% 7/1/38 | | 4,433 | 5,687 |
| | | | 140,228 |
|
| TOTAL COMMUNICATION SERVICES | | | 305,486 |
|
| CONSUMER DISCRETIONARY - 0.6% | | | |
| Automobiles - 0.2% | | | |
| General Motors Financial Co., Inc.: | | | |
| 3.7% 5/9/23 | | 10,249 | 10,514 |
| 4.25% 5/15/23 | | 1,591 | 1,666 |
| 4.375% 9/25/21 | | 6,220 | 6,442 |
| | | | 18,622 |
| Household Durables - 0.4% | | | |
| Lennar Corp.: | | | |
| 4.75% 11/29/27 | | 4,753 | 5,169 |
| 5% 6/15/27 | | 6,340 | 6,800 |
| Toll Brothers Finance Corp.: | | | |
| 4.35% 2/15/28 | | 5,394 | 5,637 |
| 4.875% 11/15/25 | | 60 | 64 |
| 4.875% 3/15/27 | | 18,629 | 20,212 |
| 5.625% 1/15/24 | | 1,555 | 1,691 |
| | | | 39,573 |
|
| TOTAL CONSUMER DISCRETIONARY | | | 58,195 |
|
| CONSUMER STAPLES - 1.4% | | | |
| Beverages - 1.1% | | | |
| Anheuser-Busch InBev Finance, Inc.: | | | |
| 3.65% 2/1/26 | | 9,656 | 10,368 |
| 4.7% 2/1/36 | | 7,730 | 8,998 |
| 4.9% 2/1/46 | | 16,856 | 20,049 |
| Anheuser-Busch InBev Worldwide, Inc.: | | | |
| 4.75% 4/15/58 | | 6,606 | 7,734 |
| 5.45% 1/23/39 | | 6,560 | 8,371 |
| 5.55% 1/23/49 | | 14,988 | 19,744 |
| 5.8% 1/23/59 (Reg. S) | | 15,889 | 21,681 |
| Constellation Brands, Inc. 4.75% 11/15/24 | | 4,450 | 4,957 |
| | | | 101,902 |
| Food & Staples Retailing - 0.0% | | | |
| Walgreens Boots Alliance, Inc. 3.3% 11/18/21 | | 2,255 | 2,308 |
| Food Products - 0.3% | | | |
| Conagra Brands, Inc. 3.8% 10/22/21 | | 1,700 | 1,749 |
| H.J. Heinz Co.: | | | |
| 4.375% 6/1/46 | | 7,644 | 7,346 |
| 5.2% 7/15/45 | | 3,616 | 3,815 |
| H.J. Heinz Finance Co. 7.125% 8/1/39 (a) | | 4,933 | 6,186 |
| Kraft Foods Group, Inc. 3.5% 6/6/22 | | 8,465 | 8,665 |
| | | | 27,761 |
|
| TOTAL CONSUMER STAPLES | | | 131,971 |
|
| ENERGY - 4.5% | | | |
| Energy Equipment & Services - 0.0% | | | |
| El Paso Pipeline Partners Operating Co. LLC 5% 10/1/21 | | 1,706 | 1,785 |
| Oil, Gas & Consumable Fuels - 4.5% | | | |
| Alberta Energy Co. Ltd. 8.125% 9/15/30 | | 6,225 | 8,451 |
| Amerada Hess Corp.: | | | |
| 7.125% 3/15/33 | | 1,556 | 1,954 |
| 7.3% 8/15/31 | | 1,898 | 2,365 |
| 7.875% 10/1/29 | | 5,418 | 6,896 |
| Anadarko Finance Co. 7.5% 5/1/31 | | 7,302 | 9,727 |
| Anadarko Petroleum Corp.: | | | |
| 4.85% 3/15/21 | | 1,465 | 1,514 |
| 5.55% 3/15/26 | | 5,634 | 6,382 |
| 6.45% 9/15/36 | | 5,100 | 6,389 |
| 6.6% 3/15/46 | | 5,623 | 7,498 |
| Canadian Natural Resources Ltd.: | | | |
| 3.45% 11/15/21 | | 3,102 | 3,168 |
| 5.85% 2/1/35 | | 2,370 | 2,864 |
| Cenovus Energy, Inc. 4.25% 4/15/27 | | 5,734 | 5,988 |
| Columbia Pipeline Group, Inc.: | | | |
| 3.3% 6/1/20 | | 3,276 | 3,298 |
| 4.5% 6/1/25 | | 997 | 1,082 |
| DCP Midstream LLC: | | | |
| 4.75% 9/30/21 (a) | | 2,616 | 2,681 |
| 5.35% 3/15/20 (a) | | 2,683 | 2,715 |
| 5.85% 5/21/43 (a)(b) | | 5,231 | 4,643 |
| DCP Midstream Operating LP: | | | |
| 3.875% 3/15/23 | | 3,649 | 3,695 |
| 5.6% 4/1/44 | | 3,165 | 2,983 |
| El Paso Corp. 6.5% 9/15/20 | | 8,750 | 9,115 |
| Enable Midstream Partners LP 3.9% 5/15/24 (b) | | 1,018 | 1,047 |
| Enbridge Energy Partners LP 4.2% 9/15/21 | | 3,072 | 3,173 |
| Enbridge, Inc.: | | | |
| 4% 10/1/23 | | 4,259 | 4,508 |
| 4.25% 12/1/26 | | 1,711 | 1,896 |
| Energy Transfer Partners LP: | | | |
| 4.2% 9/15/23 | | 1,408 | 1,489 |
| 4.25% 3/15/23 | | 1,540 | 1,617 |
| 4.5% 4/15/24 | | 1,765 | 1,892 |
| 4.95% 6/15/28 | | 4,806 | 5,376 |
| 5.25% 4/15/29 | | 2,872 | 3,290 |
| 5.8% 6/15/38 | | 2,680 | 3,121 |
| 6% 6/15/48 | | 1,745 | 2,081 |
| 6.25% 4/15/49 | | 1,973 | 2,441 |
| Kinder Morgan Energy Partners LP 3.45% 2/15/23 | | 2,500 | 2,591 |
| Kinder Morgan, Inc. 5.55% 6/1/45 | | 3,410 | 4,092 |
| Marathon Petroleum Corp. 5.125% 3/1/21 | | 1,854 | 1,929 |
| MPLX LP: | | | |
| 4.8% 2/15/29 | | 1,514 | 1,684 |
| 4.875% 12/1/24 | | 2,312 | 2,536 |
| 5.5% 2/15/49 | | 4,543 | 5,207 |
| Nakilat, Inc. 6.067% 12/31/33 (a) | | 1,421 | 1,741 |
| Occidental Petroleum Corp.: | | | |
| 2.6% 8/13/21 | | 2,426 | 2,442 |
| 2.7% 8/15/22 | | 2,144 | 2,165 |
| 2.9% 8/15/24 | | 7,086 | 7,152 |
| 3.125% 2/15/22 | | 4,434 | 4,500 |
| 3.2% 8/15/26 | | 953 | 963 |
| 3.5% 8/15/29 | | 3,006 | 3,063 |
| 4.3% 8/15/39 | | 438 | 458 |
| 4.4% 8/15/49 | | 438 | 457 |
| Petrobras Global Finance BV 7.25% 3/17/44 | | 32,129 | 38,003 |
| Petroleos Mexicanos: | | | |
| 4.625% 9/21/23 | | 6,953 | 6,969 |
| 4.875% 1/18/24 | | 2,361 | 2,370 |
| 5.375% 3/13/22 | | 2,646 | 2,706 |
| 5.625% 1/23/46 | | 15,797 | 13,549 |
| 6.375% 2/4/21 | | 6,290 | 6,466 |
| 6.375% 1/23/45 | | 25,471 | 23,477 |
| 6.5% 3/13/27 | | 19,984 | 20,411 |
| 6.5% 6/2/41 | | 27,475 | 25,560 |
| 6.75% 9/21/47 | | 26,340 | 25,023 |
| Plains All American Pipeline LP/PAA Finance Corp.: | | | |
| 3.65% 6/1/22 | | 4,425 | 4,548 |
| 4.65% 10/15/25 | | 50,000 | 53,619 |
| Regency Energy Partners LP/Regency Energy Finance Corp. 5.875% 3/1/22 | | 2,690 | 2,888 |
| Sunoco Logistics Partner Operations LP 5.4% 10/1/47 | | 1,903 | 2,123 |
| The Williams Companies, Inc.: | | | |
| 3.7% 1/15/23 | | 946 | 981 |
| 4.55% 6/24/24 | | 10,341 | 11,200 |
| Western Gas Partners LP: | | | |
| 4.65% 7/1/26 | | 1,075 | 1,095 |
| 4.75% 8/15/28 | | 1,448 | 1,467 |
| 5.375% 6/1/21 | | 5,631 | 5,822 |
| Williams Partners LP: | | | |
| 4% 11/15/21 | | 1,614 | 1,662 |
| 4.125% 11/15/20 | | 555 | 564 |
| 4.3% 3/4/24 | | 2,334 | 2,491 |
| | | | 419,313 |
|
| TOTAL ENERGY | | | 421,098 |
|
| FINANCIALS - 16.8% | | | |
| Banks - 8.6% | | | |
| Bank of America Corp.: | | | |
| 3.004% 12/20/23 (b) | | 11,780 | 12,089 |
| 3.3% 1/11/23 | | 3,114 | 3,237 |
| 3.419% 12/20/28 (b) | | 6,083 | 6,420 |
| 3.5% 4/19/26 | | 7,118 | 7,627 |
| 3.95% 4/21/25 | | 44,107 | 47,093 |
| 4% 1/22/25 | | 31,454 | 33,607 |
| 4.1% 7/24/23 | | 1,670 | 1,794 |
| 4.183% 11/25/27 | | 8,091 | 8,804 |
| 4.2% 8/26/24 | | 9,735 | 10,506 |
| 4.25% 10/22/26 | | 44,393 | 48,463 |
| 4.45% 3/3/26 | | 7,471 | 8,227 |
| Banque Federative du Credit Mutuel SA 3 month U.S. LIBOR + 0.730% 3.0076% 7/20/22 (a)(b)(c) | | 9,015 | 9,058 |
| Barclays Bank PLC 10.179% 6/12/21 (a) | | 2,050 | 2,299 |
| Barclays PLC: | | | |
| 2.75% 11/8/19 | | 2,761 | 2,762 |
| 4.375% 1/12/26 | | 5,232 | 5,522 |
| 4.836% 5/9/28 | | 6,831 | 7,091 |
| 5.088% 6/20/30 (b) | | 21,186 | 22,007 |
| 5.2% 5/12/26 | | 1,743 | 1,850 |
| BPCE SA 4.875% 4/1/26 (a) | | 8,646 | 9,501 |
| Citigroup, Inc.: | | | |
| 2.7% 10/27/22 | | 38,575 | 39,232 |
| 3.352% 4/24/25 (b) | | 7,513 | 7,850 |
| 4.05% 7/30/22 | | 1,545 | 1,620 |
| 4.075% 4/23/29 (b) | | 30,394 | 33,652 |
| 4.125% 7/25/28 | | 8,091 | 8,825 |
| 4.3% 11/20/26 | | 2,068 | 2,257 |
| 4.4% 6/10/25 | | 22,095 | 23,976 |
| 4.45% 9/29/27 | | 33,679 | 37,064 |
| 4.5% 1/14/22 | | 3,739 | 3,945 |
| 4.6% 3/9/26 | | 7,817 | 8,603 |
| 5.3% 5/6/44 | | 11,127 | 14,208 |
| 5.5% 9/13/25 | | 9,062 | 10,386 |
| Citizens Bank NA 2.55% 5/13/21 | | 1,447 | 1,457 |
| Citizens Financial Group, Inc.: | | | |
| 4.15% 9/28/22 (a) | | 3,666 | 3,827 |
| 4.3% 12/3/25 | | 7,509 | 8,114 |
| Credit Suisse Group Funding Guernsey Ltd.: | | | |
| 3.75% 3/26/25 | | 11,381 | 12,030 |
| 3.8% 9/15/22 | | 5,583 | 5,826 |
| 3.8% 6/9/23 | | 8,071 | 8,473 |
| 4.55% 4/17/26 | | 3,447 | 3,819 |
| Discover Bank 7% 4/15/20 | | 3,616 | 3,717 |
| Fifth Third Bancorp 8.25% 3/1/38 | | 1,287 | 1,999 |
| HSBC Holdings PLC: | | | |
| 4.25% 3/14/24 | | 1,679 | 1,772 |
| 5.25% 3/14/44 | | 1,216 | 1,508 |
| Huntington Bancshares, Inc. 7% 12/15/20 | | 861 | 912 |
| Intesa Sanpaolo SpA: | | | |
| 5.017% 6/26/24 (a) | | 1,550 | 1,589 |
| 5.71% 1/15/26 (a) | | 34,135 | 36,015 |
| JPMorgan Chase & Co.: | | | |
| 2.95% 10/1/26 | | 3,608 | 3,743 |
| 3.797% 7/23/24 (b) | | 11,596 | 12,318 |
| 3.875% 9/10/24 | | 7,368 | 7,877 |
| 4.125% 12/15/26 | | 29,680 | 32,694 |
| 4.35% 8/15/21 | | 9,935 | 10,367 |
| 4.625% 5/10/21 | | 1,466 | 1,528 |
| Rabobank Nederland 4.375% 8/4/25 | | 5,609 | 6,063 |
| Regions Bank 6.45% 6/26/37 | | 4,979 | 6,666 |
| Regions Financial Corp. 3.2% 2/8/21 | | 2,627 | 2,663 |
| Royal Bank of Scotland Group PLC: | | | |
| 5.125% 5/28/24 | | 20,201 | 21,379 |
| 6% 12/19/23 | | 17,302 | 18,843 |
| 6.1% 6/10/23 | | 7,162 | 7,767 |
| 6.125% 12/15/22 | | 25,655 | 27,753 |
| Societe Generale 4.25% 4/14/25 (a) | | 8,328 | 8,695 |
| Synchrony Bank 3% 6/15/22 | | 4,666 | 4,751 |
| UniCredit SpA 6.572% 1/14/22 (a) | | 7,789 | 8,375 |
| Wells Fargo & Co. 3.196% 6/17/27 (b) | | 75,000 | 78,133 |
| Westpac Banking Corp. 4.11% 7/24/34 (b) | | 5,754 | 6,057 |
| | | | 796,305 |
| Capital Markets - 4.3% | | | |
| Affiliated Managers Group, Inc. 4.25% 2/15/24 | | 1,634 | 1,757 |
| Ares Capital Corp. 4.2% 6/10/24 | | 13,503 | 14,017 |
| Deutsche Bank AG 4.5% 4/1/25 | | 6,757 | 6,384 |
| Deutsche Bank AG New York Branch: | | | |
| 3.3% 11/16/22 | | 8,631 | 8,579 |
| 4.1% 1/13/26 | | 9,758 | 9,753 |
| 5% 2/14/22 | | 13,046 | 13,522 |
| Goldman Sachs Group, Inc.: | | | |
| 2.876% 10/31/22 (b) | | 12,461 | 12,633 |
| 3.2% 2/23/23 | | 7,013 | 7,246 |
| 3.272% 9/29/25 (b) | | 112,071 | 116,606 |
| 4.25% 10/21/25 | | 14,224 | 15,343 |
| 6.75% 10/1/37 | | 44,659 | 61,187 |
| IntercontinentalExchange, Inc.: | | | |
| 2.75% 12/1/20 | | 1,335 | 1,346 |
| 3.75% 12/1/25 | | 2,387 | 2,584 |
| Moody's Corp.: | | | |
| 3.25% 1/15/28 | | 2,443 | 2,576 |
| 4.875% 2/15/24 | | 2,293 | 2,540 |
| Morgan Stanley: | | | |
| 3 month U.S. LIBOR + 0.930% 3.2076% 7/22/22 (b)(c) | | 4,139 | 4,168 |
| 3.125% 1/23/23 | | 6,473 | 6,674 |
| 3.125% 7/27/26 | | 17,304 | 17,976 |
| 3.625% 1/20/27 | | 19,436 | 20,794 |
| 3.7% 10/23/24 | | 5,567 | 5,947 |
| 3.75% 2/25/23 | | 4,438 | 4,668 |
| 3.875% 4/29/24 | | 5,127 | 5,504 |
| 4.1% 5/22/23 | | 9,107 | 9,644 |
| 4.431% 1/23/30 (b) | | 6,177 | 7,049 |
| 4.875% 11/1/22 | | 11,659 | 12,542 |
| 5% 11/24/25 | | 24,327 | 27,448 |
| 5.75% 1/25/21 | | 5,469 | 5,738 |
| | | | 404,225 |
| Consumer Finance - 1.3% | | | |
| AerCap Ireland Capital Ltd./AerCap Global Aviation Trust: | | | |
| 2.875% 8/14/24 | | 9,459 | 9,490 |
| 3.5% 5/26/22 | | 1,700 | 1,746 |
| 4.125% 7/3/23 | | 4,978 | 5,281 |
| 4.45% 12/16/21 | | 4,109 | 4,270 |
| 4.45% 4/3/26 | | 4,584 | 4,922 |
| 4.5% 5/15/21 | | 1,562 | 1,611 |
| 4.875% 1/16/24 | | 7,234 | 7,846 |
| 5% 10/1/21 | | 2,341 | 2,455 |
| Capital One Financial Corp. 3.8% 1/31/28 | | 5,072 | 5,407 |
| Discover Financial Services: | | | |
| 3.85% 11/21/22 | | 2,625 | 2,753 |
| 3.95% 11/6/24 | | 2,195 | 2,340 |
| 4.1% 2/9/27 | | 5,363 | 5,774 |
| 4.5% 1/30/26 | | 6,606 | 7,296 |
| 5.2% 4/27/22 | | 2,209 | 2,375 |
| Ford Motor Credit Co. LLC: | | | |
| 5.085% 1/7/21 | | 4,102 | 4,226 |
| 5.584% 3/18/24 | | 9,103 | 9,790 |
| 5.596% 1/7/22 | | 8,487 | 8,975 |
| Synchrony Financial: | | | |
| 2.85% 7/25/22 | | 2,371 | 2,403 |
| 3.75% 8/15/21 | | 1,707 | 1,745 |
| 3.95% 12/1/27 | | 9,671 | 10,026 |
| 4.25% 8/15/24 | | 1,718 | 1,829 |
| 4.375% 3/19/24 | | 3,326 | 3,553 |
| 5.15% 3/19/29 | | 9,572 | 10,780 |
| | | | 116,893 |
| Diversified Financial Services - 1.6% | | | |
| Avolon Holdings Funding Ltd.: | | | |
| 3.625% 5/1/22 (a) | | 2,332 | 2,365 |
| 3.95% 7/1/24 (a) | | 3,098 | 3,188 |
| 4.375% 5/1/26 (a) | | 3,797 | 3,942 |
| 5.25% 5/15/24 (a) | | 5,778 | 6,198 |
| AXA Equitable Holdings, Inc. 3.9% 4/20/23 | | 1,215 | 1,276 |
| Brixmor Operating Partnership LP: | | | |
| 4.125% 6/15/26 | | 6,032 | 6,430 |
| 4.125% 5/15/29 | | 7,908 | 8,555 |
| Cigna Corp.: | | | |
| 3.75% 7/15/23 | | 6,222 | 6,541 |
| 4.125% 11/15/25 | | 54,954 | 59,788 |
| 4.375% 10/15/28 | | 7,766 | 8,684 |
| 4.8% 8/15/38 | | 4,835 | 5,590 |
| 4.9% 12/15/48 | | 4,831 | 5,717 |
| Park Aerospace Holdings Ltd. 5.5% 2/15/24 (a) | | 9,100 | 9,841 |
| Pine Street Trust I: | | | |
| 4.572% 2/15/29 (a) | | 8,376 | 9,042 |
| 5.568% 2/15/49 (a) | | 8,400 | 9,610 |
| Voya Financial, Inc. 3.125% 7/15/24 | | 2,931 | 3,029 |
| | | | 149,796 |
| Insurance - 1.0% | | | |
| American International Group, Inc. 4.875% 6/1/22 | | 3,102 | 3,322 |
| Aon Corp. 5% 9/30/20 | | 1,152 | 1,187 |
| Liberty Mutual Group, Inc. 4.569% 2/1/29 (a) | | 2,844 | 3,237 |
| Marsh & McLennan Companies, Inc.: | | | |
| 4.375% 3/15/29 | | 5,567 | 6,395 |
| 4.75% 3/15/39 | | 2,555 | 3,199 |
| 4.8% 7/15/21 | | 1,586 | 1,652 |
| 4.9% 3/15/49 | | 5,084 | 6,601 |
| Metropolitan Life Global Funding I U.S. SOFR SEC OVRN FIN RATE INDX + 0.500% 2.62% 5/28/21 (a)(b)(c) | | 41,786 | 41,817 |
| Pacific LifeCorp 5.125% 1/30/43 (a) | | 3,073 | 3,704 |
| Pricoa Global Funding I 5.375% 5/15/45 (b) | | 3,686 | 3,933 |
| Prudential Financial, Inc. 4.5% 11/16/21 | | 1,508 | 1,591 |
| Swiss Re Finance Luxembourg SA 5% 4/2/49 (a)(b) | | 3,400 | 3,749 |
| TIAA Asset Management Finance LLC 4.125% 11/1/24 (a) | | 1,358 | 1,477 |
| Unum Group: | | | |
| 4% 6/15/29 | | 6,702 | 7,041 |
| 5.625% 9/15/20 | | 2,241 | 2,317 |
| 5.75% 8/15/42 | | 1,900 | 2,359 |
| | | | 93,581 |
|
| TOTAL FINANCIALS | | | 1,560,800 |
|
| HEALTH CARE - 2.3% | | | |
| Health Care Equipment & Supplies - 0.0% | | | |
| Becton, Dickinson & Co. 2.404% 6/5/20 | | 4,761 | 4,767 |
| Health Care Providers & Services - 1.5% | | | |
| CVS Health Corp.: | | | |
| 2.625% 8/15/24 | | 1,212 | 1,219 |
| 3% 8/15/26 | | 984 | 996 |
| 3.25% 8/15/29 | | 2,260 | 2,291 |
| 4.1% 3/25/25 | | 63,052 | 67,455 |
| 4.3% 3/25/28 | | 15,157 | 16,544 |
| 4.78% 3/25/38 | | 6,747 | 7,566 |
| 5.05% 3/25/48 | | 9,921 | 11,560 |
| Elanco Animal Health, Inc.: | | | |
| 3.912% 8/27/21 | | 1,262 | 1,286 |
| 4.272% 8/28/23 | | 3,984 | 4,173 |
| 4.9% 8/28/28 | | 1,678 | 1,830 |
| HCA Holdings, Inc. 4.75% 5/1/23 | | 162 | 174 |
| Toledo Hospital: | | | |
| 5.325% 11/15/28 | | 2,806 | 3,170 |
| 6.015% 11/15/48 | | 9,291 | 11,719 |
| WellPoint, Inc. 3.3% 1/15/23 | | 5,062 | 5,228 |
| | | | 135,211 |
| Pharmaceuticals - 0.8% | | | |
| Bayer U.S. Finance II LLC 4.25% 12/15/25 (a) | | 56,067 | 60,429 |
| Mylan NV: | | | |
| 3.15% 6/15/21 | | 4,699 | 4,754 |
| 3.95% 6/15/26 | | 2,419 | 2,517 |
| Perrigo Finance PLC 3.5% 12/15/21 | | 342 | 344 |
| Teva Pharmaceutical Finance Netherlands III BV 2.2% 7/21/21 | | 3,381 | 3,165 |
| Zoetis, Inc. 3.25% 2/1/23 | | 1,417 | 1,466 |
| | | | 72,675 |
|
| TOTAL HEALTH CARE | | | 212,653 |
|
| INDUSTRIALS - 0.3% | | | |
| Building Products - 0.0% | | | |
| Masco Corp. 4.45% 4/1/25 | | 1,219 | 1,328 |
| Trading Companies & Distributors - 0.3% | | | |
| Air Lease Corp.: | | | |
| 3% 9/15/23 | | 682 | 694 |
| 3.375% 6/1/21 | | 2,292 | 2,330 |
| 3.75% 2/1/22 | | 3,424 | 3,528 |
| 3.875% 4/1/21 | | 2,473 | 2,530 |
| 4.25% 2/1/24 | | 8,033 | 8,575 |
| 4.25% 9/15/24 | | 2,731 | 2,936 |
| | | | 20,593 |
| Transportation Infrastructure - 0.0% | | | |
| BNSF Funding Trust I 6.613% 12/15/55 (b) | | 1,610 | 1,775 |
|
| TOTAL INDUSTRIALS | | | 23,696 |
|
| INFORMATION TECHNOLOGY - 0.2% | | | |
| Electronic Equipment & Components - 0.1% | | | |
| Diamond 1 Finance Corp./Diamond 2 Finance Corp.: | | | |
| 5.45% 6/15/23 (a) | | 6,300 | 6,847 |
| 6.02% 6/15/26 (a) | | 2,150 | 2,426 |
| | | | 9,273 |
| Technology Hardware, Storage & Peripherals - 0.1% | | | |
| Hewlett Packard Enterprise Co. 4.4% 10/15/22 (b) | | 3,717 | 3,939 |
|
| TOTAL INFORMATION TECHNOLOGY | | | 13,212 |
|
| MATERIALS - 0.1% | | | |
| Chemicals - 0.0% | | | |
| Nutrien Ltd.: | | | |
| 4.2% 4/1/29 | | 893 | 998 |
| 5% 4/1/49 | | 1,556 | 1,857 |
| | | | 2,855 |
| Metals & Mining - 0.1% | | | |
| Anglo American Capital PLC 4.125% 4/15/21 (a) | | 3,409 | 3,486 |
| BHP Billiton Financial (U.S.A.) Ltd. 6.25% 10/19/75 (a)(b) | | 1,547 | 1,608 |
| Corporacion Nacional del Cobre de Chile (Codelco): | | | |
| 3.625% 8/1/27 (a) | | 1,756 | 1,881 |
| 4.5% 8/1/47 (a) | | 1,783 | 2,094 |
| | | | 9,069 |
|
| TOTAL MATERIALS | | | 11,924 |
|
| REAL ESTATE - 2.0% | | | |
| Equity Real Estate Investment Trusts (REITs) - 1.3% | | | |
| American Campus Communities Operating Partnership LP 3.75% 4/15/23 | | 1,003 | 1,051 |
| Boston Properties, Inc. 4.5% 12/1/28 | | 5,238 | 6,052 |
| Camden Property Trust: | | | |
| 2.95% 12/15/22 | | 1,405 | 1,441 |
| 4.25% 1/15/24 | | 2,637 | 2,854 |
| Corporate Office Properties LP 5% 7/1/25 | | 2,662 | 2,897 |
| DDR Corp.: | | | |
| 3.625% 2/1/25 | | 1,794 | 1,851 |
| 4.25% 2/1/26 | | 3,122 | 3,329 |
| 4.625% 7/15/22 | | 1,524 | 1,598 |
| Duke Realty LP: | | | |
| 3.25% 6/30/26 | | 690 | 721 |
| 3.625% 4/15/23 | | 1,808 | 1,893 |
| 3.875% 10/15/22 | | 5,088 | 5,333 |
| 4.375% 6/15/22 | | 1,522 | 1,608 |
| Equity One, Inc. 3.75% 11/15/22 | | 6,473 | 6,746 |
| HCP, Inc.: | | | |
| 3.25% 7/15/26 | | 876 | 906 |
| 3.5% 7/15/29 | | 1,001 | 1,057 |
| Highwoods/Forsyth LP 3.2% 6/15/21 | | 1,903 | 1,928 |
| Hudson Pacific Properties LP 4.65% 4/1/29 | | 11,662 | 13,108 |
| Lexington Corporate Properties Trust 4.4% 6/15/24 | | 1,110 | 1,161 |
| Omega Healthcare Investors, Inc.: | | | |
| 4.375% 8/1/23 | | 5,718 | 6,026 |
| 4.5% 1/15/25 | | 2,358 | 2,493 |
| 4.5% 4/1/27 | | 839 | 898 |
| 4.75% 1/15/28 | | 13,227 | 14,404 |
| 4.95% 4/1/24 | | 1,033 | 1,112 |
| 5.25% 1/15/26 | | 4,397 | 4,866 |
| Retail Opportunity Investments Partnership LP: | | | |
| 4% 12/15/24 | | 751 | 768 |
| 5% 12/15/23 | | 579 | 614 |
| Store Capital Corp. 4.625% 3/15/29 | | 2,589 | 2,876 |
| Ventas Realty LP: | | | |
| 3% 1/15/30 | | 6,922 | 6,968 |
| 3.125% 6/15/23 | | 1,209 | 1,248 |
| 4% 3/1/28 | | 2,519 | 2,737 |
| 4.125% 1/15/26 | | 1,169 | 1,267 |
| Weingarten Realty Investors 3.375% 10/15/22 | | 534 | 547 |
| WP Carey, Inc.: | | | |
| 3.85% 7/15/29 | | 1,938 | 2,058 |
| 4% 2/1/25 | | 4,009 | 4,230 |
| 4.6% 4/1/24 | | 6,239 | 6,711 |
| | | | 115,357 |
| Real Estate Management & Development - 0.7% | | | |
| Brandywine Operating Partnership LP: | | | |
| 3.95% 2/15/23 | | 9,172 | 9,594 |
| 3.95% 11/15/27 | | 5,132 | 5,411 |
| 4.1% 10/1/24 | | 3,258 | 3,452 |
| CBRE Group, Inc. 4.875% 3/1/26 | | 9,186 | 10,214 |
| Digital Realty Trust LP 3.95% 7/1/22 | | 2,503 | 2,621 |
| Essex Portfolio LP 3.875% 5/1/24 | | 2,253 | 2,404 |
| Liberty Property LP: | | | |
| 3.25% 10/1/26 | | 1,857 | 1,921 |
| 3.375% 6/15/23 | | 1,924 | 1,997 |
| 4.125% 6/15/22 | | 1,306 | 1,368 |
| Mack-Cali Realty LP: | | | |
| 3.15% 5/15/23 | | 4,184 | 3,978 |
| 4.5% 4/18/22 | | 795 | 799 |
| Mid-America Apartments LP 4% 11/15/25 | | 969 | 1,047 |
| Post Apartment Homes LP 3.375% 12/1/22 | | 588 | 607 |
| Tanger Properties LP: | | | |
| 3.125% 9/1/26 | | 3,078 | 3,050 |
| 3.75% 12/1/24 | | 3,023 | 3,110 |
| 3.875% 12/1/23 | | 1,388 | 1,438 |
| 3.875% 7/15/27 | | 11,894 | 12,209 |
| | | | 65,220 |
|
| TOTAL REAL ESTATE | | | 180,577 |
|
| UTILITIES - 0.9% | | | |
| Electric Utilities - 0.4% | | | |
| Duquesne Light Holdings, Inc.: | | | |
| 5.9% 12/1/21 (a) | | 4,554 | 4,860 |
| 6.4% 9/15/20 (a) | | 6,058 | 6,285 |
| FirstEnergy Corp.: | | | |
| 4.25% 3/15/23 | | 5,273 | 5,603 |
| 7.375% 11/15/31 | | 7,390 | 10,597 |
| IPALCO Enterprises, Inc.: | | | |
| 3.45% 7/15/20 | | 5,810 | 5,845 |
| 3.7% 9/1/24 | | 2,299 | 2,405 |
| | | | 35,595 |
| Gas Utilities - 0.0% | | | |
| Southern Natural Gas Co./Southern Natural Issuing Corp. 4.4% 6/15/21 | | 821 | 845 |
| Independent Power and Renewable Electricity Producers - 0.1% | | | |
| Dolphin Subsidiary II, Inc. 7.25% 10/15/21 | | 6,911 | 7,412 |
| Emera U.S. Finance LP 2.7% 6/15/21 | | 1,114 | 1,122 |
| | | | 8,534 |
| Multi-Utilities - 0.4% | | | |
| Dominion Energy, Inc.: | | | |
| 3 month U.S. LIBOR + 2.300% 4.6299% 9/30/66 (b)(c) | | 6,865 | 6,419 |
| 3 month U.S. LIBOR + 2.825% 5.1549% 6/30/66 (b)(c) | | 1,971 | 1,863 |
| NiSource Finance Corp. 5.95% 6/15/41 | | 2,662 | 3,557 |
| NiSource, Inc. 2.95% 9/1/29 | | 13,467 | 13,768 |
| Puget Energy, Inc.: | | | |
| 5.625% 7/15/22 | | 3,870 | 4,161 |
| 6% 9/1/21 | | 3,731 | 3,982 |
| 6.5% 12/15/20 | | 1,195 | 1,256 |
| Sempra Energy 6% 10/15/39 | | 3,214 | 4,208 |
| Wisconsin Energy Corp. 3 month U.S. LIBOR + 2.113% 4.2706% 5/15/67 (b)(c) | | 2,158 | 1,825 |
| | | | 41,039 |
|
| TOTAL UTILITIES | | | 86,013 |
|
| TOTAL NONCONVERTIBLE BONDS | | | |
| (Cost $2,817,273) | | | 3,005,625 |
|
| U.S. Treasury Obligations - 38.0% | | | |
| U.S. Treasury Notes: | | | |
| 1.375% 8/31/26 | | $117,969 | $117,347 |
| 1.625% 8/15/29 | | 105,000 | 106,194 |
| 2.125% 7/31/24 | | 52,786 | 54,565 |
| 2.125% 5/15/25 | | 53,492 | 55,511 |
| 2.25% 4/30/24 | | 121,800 | 126,382 |
| 2.25% 12/31/24 | | 79,698 | 83,079 |
| 2.25% 2/15/27 | | 95,634 | 100,991 |
| 2.375% 5/15/27 | | 171,627 | 183,037 |
| 2.625% 3/31/25 | | 100,588 | 107,000 |
| 2.625% 2/15/29 | | 692,500 | 760,695 |
| 2.75% 6/30/25 | | 579,815 | 622,191 |
| 2.875% 11/30/25 | | 819,692 | 889,313 |
| 3.125% 11/15/28 | | 274,917 | 313,115 |
| TOTAL U.S. TREASURY OBLIGATIONS | | | |
| (Cost $3,317,427) | | | 3,519,420 |
|
| Asset-Backed Securities - 2.0% | | | |
| AASET Trust: | | | |
| Series 2018-1A Class A, 3.844% 1/16/38 (a) | | $4,272 | $4,319 |
| Series 2019-1 Class A, 3.844% 5/15/39 (a) | | 6,382 | 6,424 |
| Aimco Series 2019-10A Class A, 3 month U.S. LIBOR + 1.320% 3.6184% 7/22/32 (a)(b)(c) | | 9,489 | 9,489 |
| Ares Xli Clo Ltd. / Ares Xli Cl Series 2016-41A Class AR, 3 month U.S. LIBOR + 1.200% 3.5034% 1/15/29 (a)(b)(c) | | 10,698 | 10,694 |
| Blackbird Capital Aircraft Series 2016-1A: | | | |
| Class A, 4.213% 12/16/41 (a) | | 8,006 | 8,307 |
| Class AA, 2.487% 12/16/41 (a) | | 1,643 | 1,642 |
| Castlelake Aircraft Securitization Trust Series 2019-1A: | | | |
| Class A, 3.967% 4/15/39 (a) | | 9,354 | 9,547 |
| Class B, 5.095% 4/15/39 (a) | | 3,209 | 3,278 |
| Castlelake Aircraft Structured Trust Series 2018-1 Class A, 4.125% 6/15/43 (a) | | 7,622 | 7,813 |
| Cedar Funding Ltd.: | | | |
| Series 2019-10A Class A, 3 month U.S. LIBOR + 1.340% 0% 10/20/32 (a)(b)(c)(d) | | 7,107 | 7,107 |
| Series 2019-11A Class A1A, 3 month U.S. LIBOR + 1.350% 3.8749% 5/29/32 (a)(b)(c) | | 4,744 | 4,741 |
| Countrywide Home Loans, Inc. Series 2003-BC1 Class B1, 1 month U.S. LIBOR + 5.250% 7.3953% 3/25/32 (b)(c) | | 9 | 9 |
| DB Master Finance LLC Series 2017-1A: | | | |
| Class A2I, 3.629% 11/20/47 (a) | | 3,722 | 3,800 |
| Class A2II, 4.03% 11/20/47 (a) | | 6,329 | 6,602 |
| Dryden Senior Loan Fund: | | | |
| Series 2014-36A Class AR2, 3 month U.S. LIBOR + 1.280% 3.5834% 4/15/29 (a)(b)(c) | | 11,028 | 11,056 |
| Series 2019-72A Class A, 3 month U.S. LIBOR + 1.330% 3.7622% 5/15/32 (a)(b)(c) | | 7,758 | 7,745 |
| First Franklin Mortgage Loan Trust Series 2004-FF2 Class M3, 1 month U.S. LIBOR + 0.825% 2.9703% 3/25/34 (b)(c) | | 1 | 1 |
| Grain Spectrum Funding II LLC Series 2014-1 3.29% 10/10/34 (a) | | 2,541 | 2,495 |
| Horizon Aircraft Finance I Ltd. Series 2018-1 Class A, 4.458% 12/15/38 (a) | | 3,849 | 4,023 |
| Horizon Aircraft Finance Ltd. Series 2019-1 Class A, 3.721% 7/15/39 (a) | | 4,422 | 4,471 |
| Madison Park Funding Ltd.: | | | |
| Series 2012-10A Class AR2, 3 month U.S. LIBOR + 1.220% 3.4976% 1/20/29 (a)(b)(c) | | 3,845 | 3,843 |
| Series 2019-37A Class A1, 3 month U.S. LIBOR + 1.300% 3.603% 7/15/32 (a)(b)(c) | | 9,469 | 9,463 |
| Magnetite CLO Ltd. Series 2019-21A Class A, 3 month U.S. LIBOR + 1.280% 3.9086% 4/20/30 (a)(b)(c) | | 8,122 | 8,121 |
| New Century Home Equity Loan Trust Series 2005-4 Class M2, 1 month U.S. LIBOR + 0.510% 2.6553% 9/25/35 (b)(c) | | 250 | 250 |
| Niagara Park CLO, Ltd. Series 2019-1A Class A, 3 month U.S. LIBOR + 1.300% 3.6939% 7/17/32 (a)(b)(c) | | 9,467 | 9,462 |
| Project Silver Series 2019-1 Class A, 3.967% 7/15/44 (a) | | 8,035 | 8,206 |
| Terwin Mortgage Trust Series 2003-4HE Class A1, 1 month U.S. LIBOR + 0.860% 3.0053% 9/25/34 (b)(c) | | 8 | 8 |
| Thunderbolt Aircraft Lease Ltd. Series 2018-A Class A, 4.147% 9/15/38 (a) | | 8,145 | 8,392 |
| Trapeza CDO XII Ltd./Trapeza CDO XII, Inc. Series 2007-12A Class B, 3 month U.S. LIBOR + 0.560% 2.8626% 4/6/42 (a)(b)(c)(e) | | 911 | 680 |
| Verde CLO Ltd. Series 2019-1A Class A, 3 month U.S. LIBOR + 1.350% 3.9137% 4/15/32 (a)(b)(c) | | 9,208 | 9,203 |
| Voya CLO Ltd. Series 2019-2A Class A, 3 month U.S. LIBOR + 1.270% 3.5229% 7/20/32 (a)(b)(c) | | 10,010 | 10,005 |
| TOTAL ASSET-BACKED SECURITIES | | | |
| (Cost $178,799) | | | 181,196 |
|
| Collateralized Mortgage Obligations - 0.0% | | | |
| Private Sponsor - 0.0% | | | |
| CSMC Series 2014-3R: | | | |
| Class 2A1, 1 month U.S. LIBOR + 0.700% 2.966% 5/27/37 (a)(b)(c) | | 1,104 | 1,062 |
| Class AA1, 1 month U.S. LIBOR + 0.280% 2.4664% 5/27/37 (a)(b)(c) | | 1,570 | 1,513 |
| Merrill Lynch Alternative Note Asset Trust floater Series 2007-OAR1 Class A1, 1 month U.S. LIBOR + 0.170% 2.436% 2/25/37 (b)(c) | | 26 | 26 |
| Opteum Mortgage Acceptance Corp. floater Series 2005-3 Class APT, 1 month U.S. LIBOR + 0.290% 2.4353% 7/25/35 (b)(c) | | 27 | 27 |
| Sequoia Mortgage Trust floater Series 2004-6 Class A3B, 6 month U.S. LIBOR + 0.880% 3.178% 7/20/34 (b)(c) | | 4 | 4 |
| TOTAL COLLATERALIZED MORTGAGE OBLIGATIONS | | | |
| (Cost $2,610) | | | 2,632 |
|
| Commercial Mortgage Securities - 1.2% | | | |
| Asset Securitization Corp. Series 1997-D5 Class PS1, 1.8322% 2/14/43 (b)(f) | | 4 | 0 |
| Bayview Commercial Asset Trust floater: | | | |
| Series 2003-2 Class M1, 1 month U.S. LIBOR + 1.275% 3.4203% 12/25/33 (a)(b)(c) | | 10 | 10 |
| Series 2005-3A: | | | |
| Class A2, 1 month U.S. LIBOR + 0.400% 2.5453% 11/25/35 (a)(b)(c) | | 57 | 55 |
| Class M1, 1 month U.S. LIBOR + 0.440% 2.5853% 11/25/35 (a)(b)(c) | | 15 | 14 |
| Class M2, 1 month U.S. LIBOR + 0.490% 2.6353% 11/25/35 (a)(b)(c) | | 21 | 20 |
| Class M3, 1 month U.S. LIBOR + 0.510% 2.6553% 11/25/35 (a)(b)(c) | | 19 | 18 |
| Class M4, 1 month U.S. LIBOR + 0.600% 2.7453% 11/25/35 (a)(b)(c) | | 24 | 22 |
| Series 2005-4A: | | | |
| Class A2, 1 month U.S. LIBOR + 0.390% 2.5353% 1/25/36 (a)(b)(c) | | 139 | 134 |
| Class B1, 1 month U.S. LIBOR + 1.400% 3.5453% 1/25/36 (a)(b)(c) | | 15 | 29 |
| Class M1, 1 month U.S. LIBOR + 0.450% 2.5953% 1/25/36 (a)(b)(c) | | 45 | 43 |
| Class M2, 1 month U.S. LIBOR + 0.470% 2.6153% 1/25/36 (a)(b)(c) | | 17 | 16 |
| Class M3, 1 month U.S. LIBOR + 0.500% 2.6453% 1/25/36 (a)(b)(c) | | 24 | 23 |
| Class M4, 1 month U.S. LIBOR + 0.610% 2.7553% 1/25/36 (a)(b)(c) | | 25 | 23 |
| Class M5, 1 month U.S. LIBOR + 0.650% 2.7953% 1/25/36 (a)(b)(c) | | 25 | 23 |
| Class M6, 1 month U.S. LIBOR + 0.700% 2.8453% 1/25/36 (a)(b)(c) | | 27 | 25 |
| Series 2006-1: | | | |
| Class A2, 1 month U.S. LIBOR + 0.360% 2.5053% 4/25/36 (a)(b)(c) | | 24 | 23 |
| Class M1, 1 month U.S. LIBOR + 0.380% 2.5253% 4/25/36 (a)(b)(c) | | 15 | 14 |
| Class M2, 1 month U.S. LIBOR + 0.400% 2.5453% 4/25/36 (a)(b)(c) | | 15 | 15 |
| Class M3, 1 month U.S. LIBOR + 0.420% 2.5653% 4/25/36 (a)(b)(c) | | 25 | 23 |
| Class M4, 1 month U.S. LIBOR + 0.520% 2.6653% 4/25/36 (a)(b)(c) | | 14 | 13 |
| Class M5, 1 month U.S. LIBOR + 0.560% 2.7053% 4/25/36 (a)(b)(c) | | 14 | 13 |
| Class M6, 1 month U.S. LIBOR + 0.640% 2.7853% 4/25/36 (a)(b)(c) | | 15 | 14 |
| Series 2006-2A: | | | |
| Class M1, 1 month U.S. LIBOR + 0.310% 2.4553% 7/25/36 (a)(b)(c) | | 23 | 22 |
| Class M2, 1 month U.S. LIBOR + 0.330% 2.4753% 7/25/36 (a)(b)(c) | | 16 | 15 |
| Class M3, 1 month U.S. LIBOR + 0.350% 2.4953% 7/25/36 (a)(b)(c) | | 25 | 23 |
| Class M4, 1 month U.S. LIBOR + 0.420% 2.5653% 7/25/36 (a)(b)(c) | | 15 | 14 |
| Class M5, 1 month U.S. LIBOR + 0.470% 2.6153% 7/25/36 (a)(b)(c) | | 20 | 19 |
| Series 2006-3A Class M4, 1 month U.S. LIBOR + 0.430% 2.5753% 10/25/36 (a)(b)(c) | | 15 | 56 |
| Series 2006-4A: | | | |
| Class A2, 1 month U.S. LIBOR + 0.270% 2.4153% 12/25/36 (a)(b)(c) | | 358 | 343 |
| Class M1, 1 month U.S. LIBOR + 0.290% 2.4353% 12/25/36 (a)(b)(c) | | 29 | 27 |
| Class M2, 1 month U.S. LIBOR + 0.310% 2.4553% 12/25/36 (a)(b)(c) | | 36 | 33 |
| Class M3, 1 month U.S. LIBOR + 0.340% 2.4853% 12/25/36 (a)(b)(c) | | 19 | 18 |
| Series 2007-1 Class A2, 1 month U.S. LIBOR + 0.270% 2.4153% 3/25/37 (a)(b)(c) | | 85 | 80 |
| Series 2007-2A: | | | |
| Class A1, 1 month U.S. LIBOR + 0.270% 2.4153% 7/25/37 (a)(b)(c) | | 251 | 239 |
| Class A2, 1 month U.S. LIBOR + 0.320% 2.4653% 7/25/37 (a)(b)(c) | | 235 | 220 |
| Class M1, 1 month U.S. LIBOR + 0.370% 2.5153% 7/25/37 (a)(b)(c) | | 80 | 74 |
| Class M2, 1 month U.S. LIBOR + 0.410% 2.5553% 7/25/37 (a)(b)(c) | | 52 | 48 |
| Class M3, 1 month U.S. LIBOR + 0.490% 2.6353% 7/25/37 (a)(b)(c) | | 45 | 57 |
| Series 2007-3: | | | |
| Class A2, 1 month U.S. LIBOR + 0.290% 2.4353% 7/25/37 (a)(b)(c) | | 87 | 82 |
| Class M1, 1 month U.S. LIBOR + 0.310% 2.4553% 7/25/37 (a)(b)(c) | | 46 | 44 |
| Class M2, 1 month U.S. LIBOR + 0.340% 2.4853% 7/25/37 (a)(b)(c) | | 50 | 47 |
| Class M3, 1 month U.S. LIBOR + 0.370% 2.5153% 7/25/37 (a)(b)(c) | | 80 | 73 |
| Class M4, 1 month U.S. LIBOR + 0.500% 2.6453% 7/25/37 (a)(b)(c) | | 126 | 117 |
| Class M5, 1 month U.S. LIBOR + 0.600% 2.7453% 7/25/37 (a)(b)(c) | | 51 | 62 |
| Benchmark Mortgage Trust Series 2018-B8 Class A5, 4.2317% 1/15/52 | | 7,562 | 8,763 |
| BX Trust: | | | |
| floater: | | | |
| Series 2018-EXCL Class D, 1 month U.S. LIBOR + 2.625% 4.8201% 9/15/37 (a)(b)(c) | | 2,548 | 2,548 |
| Series 2018-IND Class F, 1 month U.S. LIBOR + 1.800% 3.9951% 11/15/35 (a)(b)(c) | | 3,171 | 3,179 |
| Series 2019-IMC: | | | |
| Class B, 1 month U.S. LIBOR + 1.300% 3.4951% 4/15/34 (a)(b)(c) | | 4,904 | 4,904 |
| Class C, 1 month U.S. LIBOR + 1.600% 3.7951% 4/15/34 (a)(b)(c) | | 3,242 | 3,242 |
| Class D, 1 month U.S. LIBOR + 1.900% 4.0951% 4/15/34 (a)(b)(c) | | 3,404 | 3,415 |
| floater, sequential payer Series 2019-IMC Class A, 1 month U.S. LIBOR + 1.000% 3.1951% 4/15/34 (a)(b)(c) | | 8,000 | 8,000 |
| CHC Commercial Mortgage Trust floater Series 2019-CHC: | | | |
| Class A, 1 month U.S. LIBOR + 1.120% 3.3151% 6/15/34 (a)(b)(c) | | 12,190 | 12,190 |
| Class B, 1 month U.S. LIBOR + 1.500% 3.6951% 6/15/34 (a)(b)(c) | | 2,400 | 2,400 |
| Class C, 1 month U.S. LIBOR + 1.750% 3.9451% 6/15/34 (a)(b)(c) | | 2,711 | 2,711 |
| Citigroup Commercial Mortgage Trust Series 2018-C6 Class A4, 4.412% 11/10/51 | | 1,424 | 1,668 |
| Credit Suisse Mortgage Trust Series 2018-SITE: | | | |
| Class A, 4.284% 4/15/36 (a) | | 5,042 | 5,407 |
| Class B, 4.5349% 4/15/36 (a) | | 1,597 | 1,709 |
| Class C, 4.9414% 4/15/36 (a)(b) | | 1,040 | 1,108 |
| Class D, 4.9414% 4/15/36 (a)(b) | | 2,081 | 2,182 |
| CSAIL Commercial Mtg Trust Series 2018-C14 Class A4 4.4216% 11/15/51 | | 3,715 | 4,336 |
| JPMorgan Chase Commercial Mortgage Securities Trust: | | | |
| Series 2007-CB19 Class B, 6.0038% 2/12/49 (b)(e) | | 44 | 12 |
| Series 2018-WPT: | | | |
| Class CFX, 4.9498% 7/5/33 (a) | | 899 | 971 |
| Class DFX, 5.3503% 7/5/33 (a) | | 1,382 | 1,494 |
| Class EFX, 5.5422% 7/5/33 (a) | | 1,891 | 2,026 |
| Morgan Stanley Capital I Trust Series 2018-H4 Class A4, 4.31% 12/15/51 | | 12,665 | 14,751 |
| MSCG Trust Series 2016-SNR: | | | |
| Class A, 3.4596% 11/15/34 (a)(b) | | 3,748 | 3,775 |
| Class B, 4.181% 11/15/34 (a) | | 1,584 | 1,609 |
| Class C, 5.205% 11/15/34 (a) | | 1,110 | 1,137 |
| RETL floater Series 2019-RVP Class C, 1 month U.S. LIBOR + 2.100% 4.2951% 3/15/36 (a)(b)(c) | | 7,296 | 7,326 |
| Wells Fargo Commercial Mortgage Trust Series 2018-C48 Class A5, 4.302% 1/15/52 | | 9,008 | 10,437 |
| TOTAL COMMERCIAL MORTGAGE SECURITIES | | | |
| (Cost $107,676) | | | 113,583 |
|
| Municipal Securities - 0.5% | | | |
| Illinois Gen. Oblig.: | | | |
| Series 2003: | | $ | $ |
| 4.95% 6/1/23 | | 4,817 | 5,071 |
| 5.1% 6/1/33 | | 25,875 | 28,158 |
| Series 2010-1, 6.63% 2/1/35 | | 2,385 | 2,841 |
| Series 2010-3: | | | |
| 6.725% 4/1/35 | | 3,170 | 3,763 |
| 7.35% 7/1/35 | | 1,625 | 1,978 |
| Series 2010-5, 6.2% 7/1/21 | | 692 | 726 |
| Series 2013, 3.6% 12/1/19 | | 2,230 | 2,234 |
| TOTAL MUNICIPAL SECURITIES | | | |
| (Cost $41,700) | | | 44,771 |
|
| Bank Notes - 0.3% | | | |
| Capital One NA 2.95% 7/23/21 | | 4,397 | 4,452 |
| Discover Bank: | | | |
| (Delaware) 3.2% 8/9/21 | | 5,403 | 5,504 |
| 3.1% 6/4/20 | | 4,770 | 4,795 |
| 4.682% 8/9/28 (b) | | 3,459 | 3,629 |
| 8.7% 11/18/19 | | 760 | 769 |
| KeyBank NA 6.95% 2/1/28 | | 725 | 929 |
| PNC Bank NA 2.45% 11/5/20 | | 5,359 | 5,387 |
| Synchrony Bank 3.65% 5/24/21 | | 5,642 | 5,757 |
| TOTAL BANK NOTES | | | |
| (Cost $30,511) | | | 31,222 |
| | | Shares | Value (000s) |
|
| Fixed-Income Funds - 23.7% | | | |
| Fidelity Mortgage Backed Securities Central Fund (g) | | 17,813,937 | $1,957,574 |
| Fidelity Specialized High Income Central Fund (g) | | 2,314,602 | 236,738 |
| TOTAL FIXED-INCOME FUNDS | | | |
| (Cost $2,164,970) | | | 2,194,312 |
| | | Principal Amount (000s) | Value (000s) |
|
| Preferred Securities - 0.2% | | | |
| FINANCIALS - 0.2% | | | |
| Banks - 0.2% | | | |
| Bank of Nova Scotia 4.65% (b)(h) | | 15,108 | 15,148 |
| Barclays Bank PLC 7.625% 11/21/22 | | 5,719 | 6,427 |
| TOTAL PREFERRED SECURITIES | | | |
| (Cost $20,769) | | | 21,575 |
| | | Shares | Value (000s) |
|
| Money Market Funds - 2.5% | | | |
| Fidelity Cash Central Fund 2.13% (i) | | | |
| (Cost $235,726) | | 235,686,412 | 235,734 |
| TOTAL INVESTMENT IN SECURITIES - 100.8% | | | |
| (Cost $8,917,461) | | | 9,350,070 |
| NET OTHER ASSETS (LIABILITIES) - (0.8)% | | | (75,912) |
| NET ASSETS - 100% | | | $9,274,158 |
Values shown as $0 in the Schedule of Investments may reflect amounts less than $500.
Legend
(a) Security exempt from registration under Rule 144A of the Securities Act of 1933. These securities may be resold in transactions exempt from registration, normally to qualified institutional buyers. At the end of the period, the value of these securities amounted to $553,803,000 or 6.0% of net assets.
(b) Coupon rates for floating and adjustable rate securities reflect the rates in effect at period end.
(c) Coupon is indexed to a floating interest rate which may be multiplied by a specified factor and/or subject to caps or floors.
(d) Security or a portion of the security purchased on a delayed delivery or when-issued basis.
(e) Level 3 security
(f) Security represents right to receive monthly interest payments on an underlying pool of mortgages or assets. Principal shown is the outstanding par amount of the pool as of the end of the period.
(g) Affiliated fund that is generally available only to investment companies and other accounts managed by Fidelity Investments. A complete unaudited schedule of portfolio holdings for each Fidelity Central Fund is filed with the SEC for the first and third quarters of each fiscal year on Form N-PORT and is available upon request or at the SEC's website at www.sec.gov. An unaudited holdings listing for the Fund, which presents direct holdings as well as the pro-rata share of securities and other investments held indirectly through its investment in underlying non-money market Fidelity Central Funds, is available at fidelity.com and/or institutional.fidelity.com, as applicable. In addition, each Fidelity Central Fund's financial statements, which are not covered by the Fund's Report of Independent Registered Public Accounting Firm, are available on the SEC's website or upon request.
(h) Security is perpetual in nature with no stated maturity date.
(i) Affiliated fund that is generally available only to investment companies and other accounts managed by Fidelity Investments. The rate quoted is the annualized seven-day yield of the fund at period end. A complete unaudited listing of the fund's holdings as of its most recent quarter end is available upon request. In addition, each Fidelity Central Fund's financial statements, which are not covered by the Fund's Report of Independent Registered Public Accounting Firm, are available on the SEC's website or upon request.
Affiliated Central Funds
Information regarding fiscal year to date income earned by the Fund from investments in Fidelity Central Funds is as follows:
| Fund | Income earned |
| | (Amounts in thousands) |
| Fidelity Cash Central Fund | $5,876 |
| Fidelity Mortgage Backed Securities Central Fund | 59,921 |
| Fidelity Specialized High Income Central Fund | 20,619 |
| Total | $86,416 |
Amounts in the income column in the above table include any capital gain distributions from underlying funds, which are presented in the corresponding line-item in the Statement of Operations, if applicable.
Fiscal year to date information regarding the Fund’s investments in non-Money Market Central Funds, including the ownership percentage, is presented below.
| Fund (Amounts in thousands) | Value, beginning of period | Purchases | Sales Proceeds | Realized Gain/Loss | Change in Unrealized appreciation (depreciation) | Value, end of period | % ownership, end of period |
| Fidelity Mortgage Backed Securities Central Fund | $2,817,552 | $482,619 | $1,406,755 | $(28,108) | $92,266 | $1,957,574 | 33.7% |
| Fidelity Specialized High Income Central Fund | 488,400 | 160,708 | 421,335 | (18,552) | 27,517 | 236,738 | 39.4% |
| Total | $3,305,952 | $643,327 | $1,828,090 | $(46,660) | $119,783 | $2,194,312 | |
Investment Valuation
The following is a summary of the inputs used, as of August 31, 2019, involving the Fund's assets and liabilities carried at fair value. The inputs or methodology used for valuing securities may not be an indication of the risk associated with investing in those securities. For more information on valuation inputs, and their aggregation into the levels used below, please refer to the Investment Valuation section in the accompanying Notes to Financial Statements.
| | Valuation Inputs at Reporting Date: |
| Description | Total | Level 1 | Level 2 | Level 3 |
| (Amounts in thousands) | | | | |
| Investments in Securities: | | | | |
| Corporate Bonds | $3,005,625 | $-- | $3,005,625 | $-- |
| U.S. Government and Government Agency Obligations | 3,519,420 | -- | 3,519,420 | -- |
| Asset-Backed Securities | 181,196 | -- | 180,516 | 680 |
| Collateralized Mortgage Obligations | 2,632 | -- | 2,632 | -- |
| Commercial Mortgage Securities | 113,583 | -- | 113,571 | 12 |
| Municipal Securities | 44,771 | -- | 44,771 | -- |
| Bank Notes | 31,222 | -- | 31,222 | -- |
| Fixed-Income Funds | 2,194,312 | 2,194,312 | -- | -- |
| Preferred Securities | 21,575 | -- | 21,575 | -- |
| Money Market Funds | 235,734 | 235,734 | -- | -- |
| Total Investments in Securities: | $9,350,070 | $2,430,046 | $6,919,332 | $692 |
See accompanying notes which are an integral part of the financial statements.
Financial Statements
Statement of Assets and Liabilities
| Amounts in thousands (except per-share amounts) | | August 31, 2019 |
| Assets | | |
Investment in securities, at value — See accompanying schedule:
Unaffiliated issuers (cost $6,516,765) | $6,920,024 | |
| Fidelity Central Funds (cost $2,400,696) | 2,430,046 | |
| Total Investment in Securities (cost $8,917,461) | | $9,350,070 |
| Receivable for fund shares sold | | 27,675 |
| Interest receivable | | 53,674 |
| Distributions receivable from Fidelity Central Funds | | 414 |
| Receivable from investment adviser for expense reductions | | 1 |
| Other receivables | | 168 |
| Total assets | | 9,432,002 |
| Liabilities | | |
| Payable for investments purchased | | |
| Regular delivery | $130,571 | |
| Delayed delivery | 7,107 | |
| Payable for fund shares redeemed | 14,729 | |
| Distributions payable | 1,804 | |
| Accrued management fee | 2,281 | |
| Distribution and service plan fees payable | 32 | |
| Other affiliated payables | 1,153 | |
| Other payables and accrued expenses | 167 | |
| Total liabilities | | 157,844 |
| Net Assets | | $9,274,158 |
| Net Assets consist of: | | |
| Paid in capital | | $8,932,207 |
| Total distributable earnings (loss) | | 341,951 |
| Net Assets | | $9,274,158 |
| Net Asset Value and Maximum Offering Price | | |
| Class A: | | |
| Net Asset Value and redemption price per share ($72,030 ÷ 8,729 shares)(a) | | $8.25 |
| Maximum offering price per share (100/96.00 of $8.25) | | $8.59 |
| Class M: | | |
| Net Asset Value and redemption price per share ($21,695 ÷ 2,628 shares)(a) | | $8.26 |
| Maximum offering price per share (100/96.00 of $8.26) | | $8.60 |
| Class C: | | |
| Net Asset Value and offering price per share ($16,359 ÷ 1,980 shares)(a) | | $8.26 |
| Investment Grade Bond: | | |
| Net Asset Value, offering price and redemption price per share ($7,638,191 ÷ 924,852 shares) | | $8.26 |
| Class I: | | |
| Net Asset Value, offering price and redemption price per share ($1,452,297 ÷ 175,662 shares) | | $8.27 |
| Class Z: | | |
| Net Asset Value, offering price and redemption price per share ($73,586 ÷ 8,894 shares) | | $8.27 |
(a) Redemption price per share is equal to net asset value less any applicable contingent deferred sales charge.
See accompanying notes which are an integral part of the financial statements.
Statement of Operations
| Amounts in thousands | | Year ended August 31, 2019 |
| Investment Income | | |
| Dividends | | $669 |
| Interest (including $61 from security lending) | | 206,117 |
| Income from Fidelity Central Funds | | 82,653 |
| Total income | | 289,439 |
| Expenses | | |
| Management fee | $26,511 | |
| Transfer agent fees | 9,347 | |
| Distribution and service plan fees | 410 | |
| Fund wide operations fee | 3,930 | |
| Independent trustees' fees and expenses | 43 | |
| Commitment fees | 26 | |
| Total expenses before reductions | 40,267 | |
| Expense reductions | (7) | |
| Total expenses after reductions | | 40,260 |
| Net investment income (loss) | | 249,179 |
| Realized and Unrealized Gain (Loss) | | |
| Net realized gain (loss) on: | | |
| Investment securities: | | |
| Unaffiliated issuers | 35,965 | |
| Redemptions in-kind with affiliated entities | (116,179) | |
| Fidelity Central Funds | (46,655) | |
| Swaps | (241) | |
| Capital gain distributions from Fidelity Central Funds | 3,763 | |
| Total net realized gain (loss) | | (123,347) |
| Change in net unrealized appreciation (depreciation) on: | | |
| Investment securities: | | |
| Unaffiliated issuers | 509,083 | |
| Fidelity Central Funds | 119,778 | |
| Swaps | 199 | |
| Total change in net unrealized appreciation (depreciation) | | 629,060 |
| Net gain (loss) | | 505,713 |
| Net increase (decrease) in net assets resulting from operations | | $754,892 |
See accompanying notes which are an integral part of the financial statements.
Statement of Changes in Net Assets
| Amounts in thousands | Year ended August 31, 2019 | Year ended August 31, 2018 |
| Increase (Decrease) in Net Assets | | |
| Operations | | |
| Net investment income (loss) | $249,179 | $307,125 |
| Net realized gain (loss) | (123,347) | (80,134) |
| Change in net unrealized appreciation (depreciation) | 629,060 | (327,161) |
| Net increase (decrease) in net assets resulting from operations | 754,892 | (100,170) |
| Distributions to shareholders | (269,437) | – |
| Distributions to shareholders from net investment income | – | (280,172) |
| Total distributions | (269,437) | (280,172) |
| Share transactions - net increase (decrease) | (4,130,639) | 2,580,873 |
| Total increase (decrease) in net assets | (3,645,184) | 2,200,531 |
| Net Assets | | |
| Beginning of period | 12,919,342 | 10,718,811 |
| End of period | $9,274,158 | $12,919,342 |
| Other Information | | |
| Undistributed net investment income end of period | | $34,087 |
See accompanying notes which are an integral part of the financial statements.
Financial Highlights
Fidelity Investment Grade Bond Fund Class A
| Years ended August 31, | 2019 | 2018 | 2017 | 2016 | 2015 |
| Selected Per–Share Data | | | | | |
| Net asset value, beginning of period | $7.71 | $7.97 | $8.03 | $7.74 | $7.93 |
| Income from Investment Operations | | | | | |
| Net investment income (loss)A | .199 | .178 | .151 | .197 | .203 |
| Net realized and unrealized gain (loss) | .565 | (.277) | (.071) | .278 | (.204) |
| Total from investment operations | .764 | (.099) | .080 | .475 | (.001) |
| Distributions from net investment income | (.224) | (.161) | (.140) | (.185) | (.189) |
| Total distributions | (.224) | (.161) | (.140) | (.185) | (.189) |
| Net asset value, end of period | $8.25 | $7.71 | $7.97 | $8.03 | $7.74 |
| Total ReturnB,C | 10.11% | (1.25)% | 1.03% | 6.25% | (.04)% |
| Ratios to Average Net AssetsD,E | | | | | |
| Expenses before reductions | .77% | .77% | .77% | .77% | .77% |
| Expenses net of fee waivers, if any | .77% | .77% | .77% | .77% | .77% |
| Expenses net of all reductions | .77% | .77% | .77% | .77% | .77% |
| Net investment income (loss) | 2.55% | 2.29% | 1.91% | 2.54% | 2.57% |
| Supplemental Data | | | | | |
| Net assets, end of period (in millions) | $72 | $88 | $74 | $79 | $78 |
| Portfolio turnover rateF | 59%G | 56%G | 57% | 48% | 182% |
A Calculated based on average shares outstanding during the period.
B Total returns would have been lower if certain expenses had not been reduced during the applicable periods shown.
C Total returns do not include the effect of the sales charges.
D Fees and expenses of any underlying Fidelity Central Funds are not included in the Fund's expense ratio. The Fund indirectly bears its proportionate share of the expenses of any underlying Fidelity Central Funds. Based on their most recent shareholder report date, the expenses of any underlying non-money market Fidelity Central Funds were less than .005%.
E Expense ratios reflect operating expenses of the class. Expenses before reductions do not reflect amounts reimbursed by the investment adviser or reductions from expense offset arrangements and do not represent the amount paid by the class during periods when reimbursements or reductions occur. Expenses net of fee waivers reflect expenses after reimbursement by the investment adviser but prior to reductions from expense offset arrangements. Expenses net of all reductions represent the net expenses paid by the class.
F Amount does not include the portfolio activity of any underlying Fidelity Central Funds.
G Portfolio turnover rate excludes securities received or delivered in-kind.
See accompanying notes which are an integral part of the financial statements.
Fidelity Investment Grade Bond Fund Class M
| Years ended August 31, | 2019 | 2018 | 2017 | 2016 | 2015 |
| Selected Per–Share Data | | | | | |
| Net asset value, beginning of period | $7.72 | $7.98 | $8.04 | $7.75 | $7.94 |
| Income from Investment Operations | | | | | |
| Net investment income (loss)A | .199 | .178 | .148 | .194 | .201 |
| Net realized and unrealized gain (loss) | .564 | (.279) | (.070) | .279 | (.205) |
| Total from investment operations | .763 | (.101) | .078 | .473 | (.004) |
| Distributions from net investment income | (.223) | (.159) | (.138) | (.183) | (.186) |
| Total distributions | (.223) | (.159) | (.138) | (.183) | (.186) |
| Net asset value, end of period | $8.26 | $7.72 | $7.98 | $8.04 | $7.75 |
| Total ReturnB,C | 10.09% | (1.26)% | 1.01% | 6.20% | (.07)% |
| Ratios to Average Net AssetsD,E | | | | | |
| Expenses before reductions | .77% | .79% | .80% | .81% | .80% |
| Expenses net of fee waivers, if any | .77% | .79% | .80% | .81% | .80% |
| Expenses net of all reductions | .77% | .79% | .80% | .81% | .80% |
| Net investment income (loss) | 2.54% | 2.28% | 1.88% | 2.50% | 2.54% |
| Supplemental Data | | | | | |
| Net assets, end of period (in millions) | $22 | $20 | $22 | $24 | $21 |
| Portfolio turnover rateF | 59%G | 56%G | 57% | 48% | 182% |
A Calculated based on average shares outstanding during the period.
B Total returns would have been lower if certain expenses had not been reduced during the applicable periods shown.
C Total returns do not include the effect of the sales charges.
D Fees and expenses of any underlying Fidelity Central Funds are not included in the Fund's expense ratio. The Fund indirectly bears its proportionate share of the expenses of any underlying Fidelity Central Funds. Based on their most recent shareholder report date, the expenses of any underlying non-money market Fidelity Central Funds were less than .005%.
E Expense ratios reflect operating expenses of the class. Expenses before reductions do not reflect amounts reimbursed by the investment adviser or reductions from expense offset arrangements and do not represent the amount paid by the class during periods when reimbursements or reductions occur. Expenses net of fee waivers reflect expenses after reimbursement by the investment adviser but prior to reductions from expense offset arrangements. Expenses net of all reductions represent the net expenses paid by the class.
F Amount does not include the portfolio activity of any underlying Fidelity Central Funds.
G Portfolio turnover rate excludes securities received or delivered in-kind.
See accompanying notes which are an integral part of the financial statements.
Fidelity Investment Grade Bond Fund Class C
| Years ended August 31, | 2019 | 2018 | 2017 | 2016 | 2015 |
| Selected Per–Share Data | | | | | |
| Net asset value, beginning of period | $7.72 | $7.99 | $8.05 | $7.75 | $7.94 |
| Income from Investment Operations | | | | | |
| Net investment income (loss)A | .140 | .119 | .090 | .138 | .143 |
| Net realized and unrealized gain (loss) | .564 | (.288) | (.070) | .288 | (.204) |
| Total from investment operations | .704 | (.169) | .020 | .426 | (.061) |
| Distributions from net investment income | (.164) | (.101) | (.080) | (.126) | (.129) |
| Total distributions | (.164) | (.101) | (.080) | (.126) | (.129) |
| Net asset value, end of period | $8.26 | $7.72 | $7.99 | $8.05 | $7.75 |
| Total ReturnB,C | 9.26% | (2.12)% | .27% | 5.57% | (.79)% |
| Ratios to Average Net AssetsD,E | | | | | |
| Expenses before reductions | 1.54% | 1.54% | 1.54% | 1.54% | 1.52% |
| Expenses net of fee waivers, if any | 1.54% | 1.54% | 1.54% | 1.54% | 1.52% |
| Expenses net of all reductions | 1.54% | 1.54% | 1.54% | 1.54% | 1.52% |
| Net investment income (loss) | 1.78% | 1.53% | 1.14% | 1.78% | 1.81% |
| Supplemental Data | | | | | |
| Net assets, end of period (in millions) | $16 | $22 | $24 | $30 | $28 |
| Portfolio turnover rateF | 59%G | 56%G | 57% | 48% | 182% |
A Calculated based on average shares outstanding during the period.
B Total returns would have been lower if certain expenses had not been reduced during the applicable periods shown.
C Total returns do not include the effect of the contingent deferred sales charge.
D Fees and expenses of any underlying Fidelity Central Funds are not included in the Fund's expense ratio. The Fund indirectly bears its proportionate share of the expenses of any underlying Fidelity Central Funds. Based on their most recent shareholder report date, the expenses of any underlying non-money market Fidelity Central Funds were less than .005%.
E Expense ratios reflect operating expenses of the class. Expenses before reductions do not reflect amounts reimbursed by the investment adviser or reductions from expense offset arrangements and do not represent the amount paid by the class during periods when reimbursements or reductions occur. Expenses net of fee waivers reflect expenses after reimbursement by the investment adviser but prior to reductions from expense offset arrangements. Expenses net of all reductions represent the net expenses paid by the class.
F Amount does not include the portfolio activity of any underlying Fidelity Central Funds.
G Portfolio turnover rate excludes securities received or delivered in-kind.
See accompanying notes which are an integral part of the financial statements.
Fidelity Investment Grade Bond Fund
| Years ended August 31, | 2019 | 2018 | 2017 | 2016 | 2015 |
| Selected Per–Share Data | | | | | |
| Net asset value, beginning of period | $7.72 | $7.98 | $8.04 | $7.75 | $7.94 |
| Income from Investment Operations | | | | | |
| Net investment income (loss)A | .225 | .203 | .176 | .222 | .228 |
| Net realized and unrealized gain (loss) | .564 | (.277) | (.070) | .279 | (.204) |
| Total from investment operations | .789 | (.074) | .106 | .501 | .024 |
| Distributions from net investment income | (.249) | (.186) | (.166) | (.211) | (.214) |
| Total distributions | (.249) | (.186) | (.166) | (.211) | (.214) |
| Net asset value, end of period | $8.26 | $7.72 | $7.98 | $8.04 | $7.75 |
| Total ReturnB | 10.45% | (.93)% | 1.36% | 6.59% | .28% |
| Ratios to Average Net AssetsC,D | | | | | |
| Expenses before reductions | .45% | .45% | .45% | .45% | .45% |
| Expenses net of fee waivers, if any | .45% | .45% | .45% | .45% | .45% |
| Expenses net of all reductions | .45% | .45% | .45% | .45% | .45% |
| Net investment income (loss) | 2.87% | 2.61% | 2.23% | 2.86% | 2.89% |
| Supplemental Data | | | | | |
| Net assets, end of period (in millions) | $7,638 | $11,730 | $9,742 | $7,974 | $6,207 |
| Portfolio turnover rateE | 59%F | 56%F | 57% | 48% | 182% |
A Calculated based on average shares outstanding during the period.
B Total returns would have been lower if certain expenses had not been reduced during the applicable periods shown.
C Fees and expenses of any underlying Fidelity Central Funds are not included in the Fund's expense ratio. The Fund indirectly bears its proportionate share of the expenses of any underlying Fidelity Central Funds. Based on their most recent shareholder report date, the expenses of any underlying non-money market Fidelity Central Funds were less than .005%.
D Expense ratios reflect operating expenses of the class. Expenses before reductions do not reflect amounts reimbursed by the investment adviser or reductions from expense offset arrangements and do not represent the amount paid by the class during periods when reimbursements or reductions occur. Expenses net of fee waivers reflect expenses after reimbursement by the investment adviser but prior to reductions from expense offset arrangements. Expenses net of all reductions represent the net expenses paid by the class.
E Amount does not include the portfolio activity of any underlying Fidelity Central Funds.
F Portfolio turnover rate excludes securities received or delivered in-kind.
See accompanying notes which are an integral part of the financial statements.
Fidelity Investment Grade Bond Fund Class I
| Years ended August 31, | 2019 | 2018 | 2017 | 2016 | 2015 |
| Selected Per–Share Data | | | | | |
| Net asset value, beginning of period | $7.73 | $7.99 | $8.05 | $7.76 | $7.95 |
| Income from Investment Operations | | | | | |
| Net investment income (loss)A | .221 | .199 | .172 | .218 | .224 |
| Net realized and unrealized gain (loss) | .564 | (.277) | (.070) | .279 | (.204) |
| Total from investment operations | .785 | (.078) | .102 | .497 | .020 |
| Distributions from net investment income | (.245) | (.182) | (.162) | (.207) | (.210) |
| Total distributions | (.245) | (.182) | (.162) | (.207) | (.210) |
| Net asset value, end of period | $8.27 | $7.73 | $7.99 | $8.05 | $7.76 |
| Total ReturnB | 10.38% | (.98)% | 1.31% | 6.53% | .23% |
| Ratios to Average Net AssetsC,D | | | | | |
| Expenses before reductions | .50% | .50% | .50% | .50% | .50% |
| Expenses net of fee waivers, if any | .50% | .50% | .50% | .50% | .50% |
| Expenses net of all reductions | .50% | .50% | .50% | .50% | .50% |
| Net investment income (loss) | 2.82% | 2.56% | 2.19% | 2.81% | 2.84% |
| Supplemental Data | | | | | |
| Net assets, end of period (in millions) | $1,452 | $1,059 | $857 | $543 | $490 |
| Portfolio turnover rateE | 59%F | 56%F | 57% | 48% | 182% |
A Calculated based on average shares outstanding during the period.
B Total returns would have been lower if certain expenses had not been reduced during the applicable periods shown.
C Fees and expenses of any underlying Fidelity Central Funds are not included in the Fund's expense ratio. The Fund indirectly bears its proportionate share of the expenses of any underlying Fidelity Central Funds. Based on their most recent shareholder report date, the expenses of any underlying non-money market Fidelity Central Funds were less than .005%.
D Expense ratios reflect operating expenses of the class. Expenses before reductions do not reflect amounts reimbursed by the investment adviser or reductions from expense offset arrangements and do not represent the amount paid by the class during periods when reimbursements or reductions occur. Expenses net of fee waivers reflect expenses after reimbursement by the investment adviser but prior to reductions from expense offset arrangements. Expenses net of all reductions represent the net expenses paid by the class.
E Amount does not include the portfolio activity of any underlying Fidelity Central Funds.
F Portfolio turnover rate excludes securities received or delivered in-kind.
See accompanying notes which are an integral part of the financial statements.
Fidelity Investment Grade Bond Fund Class Z
| Year ended August 31, | 2019 A |
| Selected Per–Share Data | |
| Net asset value, beginning of period | $7.68 |
| Income from Investment Operations | |
| Net investment income (loss)B | .197 |
| Net realized and unrealized gain (loss) | .629 |
| Total from investment operations | .826 |
| Distributions from net investment income | (.236) |
| Total distributions | (.236) |
| Net asset value, end of period | $8.27 |
| Total ReturnC,D | 10.97% |
| Ratios to Average Net AssetsE,F | |
| Expenses before reductions | .40%G |
| Expenses net of fee waivers, if any | .36%G |
| Expenses net of all reductions | .36%G |
| Net investment income (loss) | 2.83%G |
| Supplemental Data | |
| Net assets, end of period (in millions) | $74 |
| Portfolio turnover rateH | 59%I |
A For the period October 2, 2018 (commencement of sale of shares) to August 31, 2019.
B Calculated based on average shares outstanding during the period.
C Total returns for periods of less than one year are not annualized.
D Total returns would have been lower if certain expenses had not been reduced during the applicable periods shown.
E Fees and expenses of any underlying Fidelity Central Funds are not included in the Fund's expense ratio. The Fund indirectly bears its proportionate share of the expenses of any underlying Fidelity Central Funds. Based on their most recent shareholder report date, the expenses of any underlying non-money market Fidelity Central Funds were less than .005%.
F Expense ratios reflect operating expenses of the class. Expenses before reductions do not reflect amounts reimbursed by the investment adviser or reductions from expense offset arrangements and do not represent the amount paid by the class during periods when reimbursements or reductions occur. Expense ratios before reductions for start-up periods may not be representative of longer-term operating periods. Expenses net of fee waivers reflect expenses after reimbursement by the investment adviser but prior to reductions from expense offset arrangements. Expenses net of all reductions represent the net expenses paid by the class.
G Annualized
H Amount does not include the portfolio activity of any underlying Fidelity Central Funds.
I Portfolio turnover rate excludes securities received or delivered in-kind.
See accompanying notes which are an integral part of the financial statements.
Notes to Financial Statements
For the period ended August 31, 2019
(Amounts in thousands except percentages)
1. Organization.
Fidelity Investment Grade Bond Fund (the Fund) is a fund of Fidelity Salem Street Trust (the Trust) and is authorized to issue an unlimited number of shares. The Trust is registered under the Investment Company Act of 1940, as amended (the 1940 Act), as an open-end management investment company organized as a Massachusetts business trust. The Fund commenced sale of Class Z shares on October 2, 2018. The Fund offers Class A, Class M, Class C, Investment Grade Bond, Class I and Class Z shares, each of which has equal rights as to assets and voting privileges. Each class has exclusive voting rights with respect to matters that affect that class. Effective March 1, 2019, Class C shares will automatically convert to Class A shares after a holding period of ten years from the initial date of purchase, with certain exceptions.
2. Investments in Fidelity Central Funds.
The Fund invests in Fidelity Central Funds, which are open-end investment companies generally available only to other investment companies and accounts managed by the investment adviser and its affiliates. The Fund's Schedule of Investments lists each of the Fidelity Central Funds held as of period end, if any, as an investment of the Fund, but does not include the underlying holdings of each Fidelity Central Fund. As an Investing Fund, the Fund indirectly bears its proportionate share of the expenses of the underlying Fidelity Central Funds.
Based on its investment objective, each Fidelity Central Fund may invest or participate in various investment vehicles or strategies that are similar to those of the Fund. These strategies are consistent with the investment objectives of the Fund and may involve certain economic risks which may cause a decline in value of each of the Fidelity Central Funds and thus a decline in the value of the Fund. The Money Market Central Funds seek preservation of capital and current income and are managed by Fidelity Investments Money Management, Inc. (FIMM), an affiliate of the investment adviser. Annualized expenses of the Money Market Central Funds as of their most recent shareholder report date ranged from less than .005% to .01%. The following summarizes the Fund's investment in each non-money market Fidelity Central Fund.
| Fidelity Central Fund | Investment Manager | Investment Objective | Investment Practices | Expense Ratio(a) |
| Fidelity Mortgage Backed Securities Central Fund | Fidelity Investment Money Management, Inc. (FIMM) | Seeks a high level of income by normally investing in investment-grade mortgage-related securities and repurchase agreements for those securities. | Delayed Delivery & When Issued Securities
Futures
Options
Swaps | Less than .005% |
| Fidelity Specialized High Income Central Fund | FMR Co., Inc. (FMRC) | Seeks a high level of current income by normally investing in income-producing debt securities, with an emphasis on lower-quality debt securities. | Loans & Direct Debt Instruments
Restricted Securities
| Less than .005% |
(a) Expenses expressed as a percentage of average net assets and are as of each underlying Central Fund's most recent annual or semi-annual shareholder report.
An unaudited holdings listing for the Fund, which presents direct holdings as well as the pro-rata share of any securities and other investments held indirectly through its investment in underlying non-money market Fidelity Central Funds, is available at fidelity.com and/or institutional.fidelity.com, as applicable. A complete unaudited list of holdings for each Fidelity Central Fund is available upon request or at the Securities and Exchange Commission (the SEC) website at www.sec.gov. In addition, the financial statements of the Fidelity Central Funds which contain the significant accounting policies (including investment valuation policies) of those funds, which are not covered by the Fund's Report of Independent Registered Public Accounting Firm, are available on the SEC website or upon request.
3. Significant Accounting Policies.
The Fund is an investment company and applies the accounting and reporting guidance of the Financial Accounting Standards Board (FASB) Accounting Standards Codification Topic 946 Financial Services – Investments Companies. The financial statements have been prepared in conformity with accounting principles generally accepted in the United States of America (GAAP), which require management to make certain estimates and assumptions at the date of the financial statements. Actual results could differ from those estimates. Subsequent events, if any, through the date that the financial statements were issued have been evaluated in the preparation of the financial statements. The following summarizes the significant accounting policies of the Fund:
Investment Valuation. Investments are valued as of 4:00 p.m. Eastern time on the last calendar day of the period. The Board of Trustees (the Board) has delegated the day to day responsibility for the valuation of the Fund's investments to the Fair Value Committee (the Committee) established by the Fund's investment adviser. In accordance with valuation policies and procedures approved by the Board, the Fund attempts to obtain prices from one or more third party pricing vendors or brokers to value its investments. When current market prices, quotations or currency exchange rates are not readily available or reliable, investments will be fair valued in good faith by the Committee, in accordance with procedures adopted by the Board. Factors used in determining fair value vary by investment type and may include market or investment specific events, changes in interest rates and credit quality. The frequency with which these procedures are used cannot be predicted and they may be utilized to a significant extent. The Committee oversees the Fund's valuation policies and procedures and reports to the Board on the Committee's activities and fair value determinations. The Board monitors the appropriateness of the procedures used in valuing the Fund's investments and ratifies the fair value determinations of the Committee.
The Fund categorizes the inputs to valuation techniques used to value its investments into a disclosure hierarchy consisting of three levels as shown below:
- Level 1 – quoted prices in active markets for identical investments
- Level 2 – other significant observable inputs (including quoted prices for similar investments, interest rates, prepayment speeds, etc.)
- Level 3 – unobservable inputs (including the Fund's own assumptions based on the best information available)
Valuation techniques used to value the Fund's investments by major category are as follows:
Debt securities, including restricted securities, are valued based on evaluated prices received from third party pricing vendors or from brokers who make markets in such securities. Corporate bonds, bank notes, municipal securities, preferred securities and U.S. government and government agency obligations are valued by pricing vendors who utilize matrix pricing which considers yield or price of bonds of comparable quality, coupon, maturity and type or by broker-supplied prices. Asset backed securities, collateralized mortgage obligations and commercial mortgage securities are valued by pricing vendors who utilize matrix pricing which considers prepayment speed assumptions, attributes of the collateral, yield or price of bonds of comparable quality, coupon, maturity and type or by broker-supplied prices. These pricing sources may utilize inputs such as interest rate curves, credit spread curves, default possibilities and recovery rates. When independent prices are unavailable or unreliable, debt securities may be valued utilizing pricing methodologies which consider similar factors that would be used by third party pricing vendors. Debt securities are generally categorized as Level 2 in the hierarchy but may be Level 3 depending on the circumstances.
Investments in open-end mutual funds, including the Fidelity Central Funds, are valued at their closing net asset value (NAV) each business day and are categorized as Level 1 in the hierarchy.
Changes in valuation techniques may result in transfers in or out of an assigned level within the disclosure hierarchy. The aggregate value of investments by input level as of August 31, 2019 is included at the end of the Fund's Schedule of Investments.
Investment Transactions and Income. For financial reporting purposes, the Fund's investment holdings and NAV include trades executed through the end of the last business day of the period. The NAV per share for processing shareholder transactions is calculated as of the close of business of the New York Stock Exchange (NYSE), normally 4:00 p.m. Eastern time and includes trades executed through the end of the prior business day. Gains and losses on securities sold are determined on the basis of identified cost and include proceeds received from litigation. Dividend income is recorded on the ex-dividend date. Income and capital gain distributions from Fidelity Central Funds, if any, are recorded on the ex-dividend date. Interest income is accrued as earned and includes coupon interest and amortization of premium and accretion of discount on debt securities as applicable. The principal amount on inflation-indexed securities is periodically adjusted to the rate of inflation and interest is accrued based on the principal amount. The adjustments to principal due to inflation are reflected as increases or decreases to Interest in the accompanying Statement of Operations. Debt obligations may be placed on non-accrual status and related interest income may be reduced by ceasing current accruals and writing off interest receivables when the collection of all or a portion of interest has become doubtful based on consistently applied procedures. A debt obligation is removed from non-accrual status when the issuer resumes interest payments or when collectability of interest is reasonably assured.
Class Allocations and Expenses. Investment income, realized and unrealized capital gains and losses, common expenses of the Fund, and certain fund-level expense reductions, if any, are allocated daily on a pro-rata basis to each class based on the relative net assets of each class to the total net assets of the Fund. Each class differs with respect to transfer agent and distribution and service plan fees incurred. Certain expense reductions may also differ by class. For the reporting period, the allocated portion of income and expenses to each class as a percent of its average net assets may vary due to the timing of recording these transactions in relation to fluctuating net assets of the classes. Expenses directly attributable to a fund are charged to that fund. Expenses attributable to more than one fund are allocated among the respective funds on the basis of relative net assets or other appropriate methods. Expense estimates are accrued in the period to which they relate and adjustments are made when actual amounts are known.
Deferred Trustee Compensation. Under a Deferred Compensation Plan (the Plan) for the Fund, certain independent Trustees have elected to defer receipt of a portion of their annual compensation. Deferred amounts are invested in a cross-section of Fidelity funds, are marked-to-market and remain in the Fund until distributed in accordance with the Plan. The investment of deferred amounts and the offsetting payable to the Trustees of $168 are included in the accompanying Statement of Assets and Liabilities in other receivables and other payables and accrued expenses, respectively.
Income Tax Information and Distributions to Shareholders. Each year, the Fund intends to qualify as a regulated investment company under Subchapter M of the Internal Revenue Code, including distributing substantially all of its taxable income and realized gains. As a result, no provision for U.S. Federal income taxes is required. As of August 31, 2019, the Fund did not have any unrecognized tax benefits in the financial statements; nor is the Fund aware of any tax positions for which it is reasonably possible that the total amounts of unrecognized tax benefits will significantly change in the next twelve months. The Fund files a U.S. federal tax return, in addition to state and local tax returns as required. The Fund's federal income tax returns are subject to examination by the Internal Revenue Service (IRS) for a period of three fiscal years after they are filed. State and local tax returns may be subject to examination for an additional fiscal year depending on the jurisdiction.
Distributions are declared and recorded daily and paid monthly from net investment income. Distributions from realized gains, if any, are declared and recorded on the ex-dividend date. Income and capital gain distributions are declared separately for each class. Income and capital gain distributions are determined in accordance with income tax regulations, which may differ from GAAP.
Capital accounts within the financial statements are adjusted for permanent book-tax differences. These adjustments have no impact on net assets or the results of operations. Capital accounts are not adjusted for temporary book-tax differences which will reverse in a subsequent period.
Book-tax differences are primarily due to the short-term gain distributions from the Underlying Funds, swaps, market discount, deferred trustees compensation, redemptions in-kind, capital loss carryforwards, and losses deferred due to wash sales and excise tax regulations.
As of period end, the cost and unrealized appreciation (depreciation) in securities, and derivatives if applicable, for federal income tax purposes were as follows:
| Gross unrealized appreciation | $439,655 |
| Gross unrealized depreciation | (12,150) |
| Net unrealized appreciation (depreciation) | $427,505 |
| Tax Cost | $8,922,565 |
The tax-based components of distributable earnings as of period end were as follows:
| Undistributed ordinary income | $2,763 |
| Capital loss carryforward | $(88,149) |
| Net unrealized appreciation (depreciation) on securities and other investments | $427,505 |
Capital loss carryforwards are only available to offset future capital gains of the Fund to the extent provided by regulations and may be limited. Under the Regulated Investment Company Modernization Act of 2010 (the Act), the Fund is permitted to carry forward capital losses incurred in taxable years beginning after December 22, 2010 for an unlimited period and such capital losses are required to be used prior to any losses that expire. The capital loss carryforward information presented below, including any applicable limitation, is estimated as of fiscal period end and is subject to adjustment.
| No expiration | |
| Short-term | $(19,699) |
| Long-term | (68,450) |
| Total no expiration | $(88,149) |
The tax character of distributions paid was as follows:
| | August 31, 2019 | August 31, 2018 |
| Ordinary Income | $269,437 | $ 280,172 |
Delayed Delivery Transactions and When-Issued Securities. During the period, the Fund transacted in securities on a delayed delivery or when-issued basis. Payment and delivery may take place after the customary settlement period for that security. The price of the underlying securities and the date when the securities will be delivered and paid for are fixed at the time the transaction is negotiated. The securities purchased on a delayed delivery or when-issued basis are identified as such in the Fund's Schedule of Investments. The Fund may receive compensation for interest forgone in the purchase of a delayed delivery or when-issued security. With respect to purchase commitments, the Fund identifies securities as segregated in its records with a value at least equal to the amount of the commitment. Losses may arise due to changes in the value of the underlying securities or if the counterparty does not perform under the contract's terms, or if the issuer does not issue the securities due to political, economic, or other factors.
Restricted Securities. The Fund may invest in securities that are subject to legal or contractual restrictions on resale. These securities generally may be resold in transactions exempt from registration or to the public if the securities are registered. Disposal of these securities may involve time-consuming negotiations and expense, and prompt sale at an acceptable price may be difficult. Information regarding restricted securities is included at the end of the Fund's Schedule of Investments.
New Rule Issuance. During August 2018, the U.S. Securities and Exchange Commission issued Final Rule Release No. 33-10532, Disclosure Update and Simplification. This Final Rule includes amendments specific to registered investment companies that are intended to eliminate overlap in disclosure requirements between Regulation S-X and GAAP. In accordance with these amendments, certain line-items in the Fund's financial statements have been combined or removed for the current period as outlined in the table below.
| Financial Statement | Current Line-Item Presentation (As Applicable) | Prior Line-Item Presentation (As Applicable) |
| Statement of Assets and Liabilities | Total distributable earnings (loss) | Undistributed/Distributions in excess of/Accumulated net investment income (loss)
Accumulated/Undistributed net realized gain (loss)
Net unrealized appreciation (depreciation) |
| Statement of Changes in Net Assets | N/A - removed | Undistributed/Distributions in excess of/Accumulated net investment income (loss) end of period |
| Statement of Changes in Net Assets | Distributions to shareholders | Distributions to shareholders from net investment income
Distributions to shareholders from net realized gain |
| Distributions to Shareholders Note to Financial Statements | Distributions to shareholders | Distributions to shareholders from net investment income
Distributions to shareholders from net realized gain |
4. Derivative Instruments.
Risk Exposures and the Use of Derivative Instruments. The Fund's investment objective allows the Fund to enter into various types of derivative contracts, including swaps. Derivatives are investments whose value is primarily derived from underlying assets, indices or reference rates and may be transacted on an exchange or over-the-counter (OTC). Derivatives may involve a future commitment to buy or sell a specified asset based on specified terms, to exchange future cash flows at periodic intervals based on a notional principal amount, or for one party to make one or more payments upon the occurrence of specified events in exchange for periodic payments from the other party.
The Fund used derivatives to increase returns, to gain exposure to certain types of assets and to manage exposure to certain risks as defined below. The success of any strategy involving derivatives depends on analysis of numerous economic factors, and if the strategies for investment do not work as intended, the Fund may not achieve its objectives.
The Fund's use of derivatives increased or decreased its exposure to the following risk:
| Credit Risk | Credit risk relates to the ability of the issuer of a financial instrument to make further principal or interest payments on an obligation or commitment that it has to the Fund.
|
The Fund is also exposed to additional risks from investing in derivatives, such as liquidity risk and counterparty credit risk. Liquidity risk is the risk that the Fund will be unable to close out the derivative in the open market in a timely manner. Counterparty credit risk is the risk that the counterparty will not be able to fulfill its obligation to the Fund. Derivative counterparty credit risk is managed through formal evaluation of the creditworthiness of all potential counterparties. On certain OTC derivatives such as bi-lateral swaps, the Fund attempts to reduce its exposure to counterparty credit risk by entering into an International Swaps and Derivatives Association, Inc. (ISDA) Master Agreement with each of its counterparties. The ISDA Master Agreement gives the Fund the right to terminate all transactions traded under such agreement upon the deterioration in the credit quality of the counterparty beyond specified levels. The ISDA Master Agreement gives each party the right, upon an event of default by the other party or a termination of the agreement, to close out all transactions traded under such agreement and to net amounts owed under each transaction to one net payable by one party to the other. To mitigate counterparty credit risk on bi-lateral OTC derivatives, the Fund receives collateral in the form of cash or securities once the Fund's net unrealized appreciation on outstanding derivative contracts under an ISDA Master Agreement exceeds certain applicable thresholds, subject to certain minimum transfer provisions. The collateral received is held in segregated accounts with the Fund's custodian bank in accordance with the collateral agreements entered into between the Fund, the counterparty and the Fund's custodian bank. The Fund could experience delays and costs in gaining access to the collateral even though it is held by the Fund's custodian bank. The Fund's maximum risk of loss from counterparty credit risk related to bi-lateral OTC derivatives is generally the aggregate unrealized appreciation and unpaid counterparty payments in excess of any collateral pledged by the counterparty to the Fund. The Fund may be required to pledge collateral for the benefit of the counterparties on bi-lateral OTC derivatives in an amount not less than each counterparty's unrealized appreciation on outstanding derivative contracts, subject to certain minimum transfer provisions, and any such pledged collateral is identified in the Schedule of Investments.
Investing in derivatives may involve greater risks than investing in the underlying assets directly and, to varying degrees, may involve risk of loss in excess of any initial investment and collateral received and amounts recognized in the Statement of Assets and Liabilities. In addition, there may be the risk that the change in value of the derivative contract does not correspond to the change in value of the underlying instrument.
Net Realized Gain (Loss) and Change in Net Unrealized Appreciation (Depreciation) on Derivatives. The table below, which reflects the impacts of derivatives on the financial performance of the Fund, summarizes the net realized gain (loss) and change in net unrealized appreciation (depreciation) for derivatives during the period as presented in the Statement of Operations.
| Primary Risk Exposure / Derivative Type | Net Realized Gain (Loss) | Change in Net Unrealized Appreciation (Depreciation) |
| Credit Risk | | |
| Swaps | $(241) | $199 |
A summary of the value of derivatives by primary risk exposure as of period end is included at the end of the Schedule of Investments.
Swaps. A swap is a contract between two parties to exchange future cash flows at periodic intervals based on a notional principal amount. A bi-lateral OTC swap is a transaction between a fund and a dealer counterparty where cash flows are exchanged between the two parties for the life of the swap.
Bi-lateral OTC swaps are marked-to-market daily and changes in value are reflected in the Statement of Assets and Liabilities in the bi-lateral OTC swaps at value line items. Any upfront premiums paid or received upon entering a bi-lateral OTC swap to compensate for differences between stated terms of the swap and prevailing market conditions (e.g. credit spreads, interest rates or other factors) are recorded in net unrealized appreciation (depreciation) in the Statement of Assets and Liabilities and amortized to realized gain or (loss) ratably over the term of the swap. Any unamortized upfront premiums are presented in the Schedule of Investments.
Payments are exchanged at specified intervals, accrued daily commencing with the effective date of the contract and recorded as realized gain or (loss). Some swaps may be terminated prior to the effective date and realize a gain or loss upon termination. The net realized gain (loss) and change in net unrealized appreciation (depreciation) on swaps during the period is presented in the Statement of Operations.
Any open swaps at period end are included in the Schedule of Investments under the caption "Swaps".
Credit Default Swaps. Credit default swaps enable the Fund to buy or sell protection against specified credit events on a single-name issuer or a traded credit index. Under the terms of a credit default swap the buyer of protection (buyer) receives credit protection in exchange for making periodic payments to the seller of protection (seller) based on a fixed percentage applied to a notional principal amount. In return for these payments, the seller will be required to make a payment upon the occurrence of one or more specified credit events. The Fund enters into credit default swaps as a seller to gain credit exposure to an issuer and/or as a buyer to obtain a measure of protection against defaults of an issuer. Periodic payments are made over the life of the contract by the buyer provided that no credit event occurs.
For credit default swaps on most corporate and sovereign issuers, credit events include bankruptcy, failure to pay or repudiation/moratorium. For credit default swaps on corporate or sovereign issuers, the obligation that may be put to the seller is not limited to the specific reference obligation described in the Schedule of Investments. For credit default swaps on asset-backed securities, a credit event may be triggered by events such as failure to pay principal, maturity extension, rating downgrade or write-down. For credit default swaps on asset-backed securities, the reference obligation described represents the security that may be put to the seller. For credit default swaps on a traded credit index, a specified credit event may affect all or individual underlying securities included in the index.
As a seller, if an underlying credit event occurs, the Fund will pay a net settlement amount of cash equal to the notional amount of the swap less the recovery value of the reference obligation or underlying securities comprising an index. Only in the event of the industry's inability to value the underlying asset will the Fund be required to take delivery of the reference obligation or underlying securities comprising an index and pay an amount equal to the notional amount of the swap.
As a buyer, if an underlying credit event occurs, the Fund will receive a net settlement amount of cash equal to the notional amount of the swap less the recovery value of the reference obligation or underlying securities comprising an index. Only in the event of the industry's inability to value the underlying asset will the Fund be required to deliver the reference obligation or underlying securities comprising an index in exchange for payment of an amount equal to the notional amount of the swap.
Typically, the value of each credit default swap and credit rating disclosed for each reference obligation in the Schedule of Investments, where the Fund is the seller, can be used as measures of the current payment/performance risk of the swap. As the value of the swap changes as a positive or negative percentage of the total notional amount, the payment/performance risk may decrease or increase, respectively. In addition to these measures, the investment adviser monitors a variety of factors including cash flow assumptions, market activity and market sentiment as part of its ongoing process of assessing payment/performance risk.
5. Purchases and Sales of Investments.
Purchases and sales of securities (including the Fixed-Income Central Funds), other than short-term securities, U.S. government securities and in-kind transactions, aggregated $2,223,112 and $484,128, respectively.
6. Fees and Other Transactions with Affiliates.
Management Fee and Expense Contract. Fidelity Management & Research Company (the investment adviser) and its affiliates provide the Fund with investment management related services for which the Fund pays a monthly management fee. The management fee is the sum of an individual fund fee rate that is based on an annual rate of .20% of the Fund's average net assets and an annualized group fee rate that averaged .10% during the period. The group fee rate is based upon the average net assets of all the mutual funds advised by the investment adviser, including any mutual funds previously advised by the investment adviser that are currently advised by Fidelity SelectCo, LLC, an affiliate of the investment adviser. The group fee rate decreases as assets under management increase and increases as assets under management decrease. For the reporting period, the total annual management fee rate was .30% of the Fund's average net assets.
In addition, under the expense contract, the investment adviser pays class-level expenses for Investment Grade Bond, so that the total expenses, except the compensation of the independent Trustees and certain other expenses such as interest expense, including commitment fees, do not exceed .45% of the Class' average net assets. This agreement does not apply to any of the other classes and any change or modification that would increase expenses can only be made with shareholder approval.
Distribution and Service Plan Fees. In accordance with Rule 12b-1 of the 1940 Act, the Fund has adopted separate Distribution and Service Plans for each class of shares. Certain classes pay Fidelity Distributors Corporation (FDC), an affiliate of the investment adviser, separate Distribution and Service Fees, each of which is based on an annual percentage of each class' average net assets. In addition, FDC may pay financial intermediaries for selling shares of the Fund and providing shareholder support services. For the period, the Distribution and Service Fee rates, total fees and amounts retained by FDC were as follows:
| | Distribution Fee | Service Fee | Total Fees | Retained by FDC |
| Class A | -% | .25% | $171 | $5 |
| Class M | -% | .25% | 49 | –(a) |
| Class C | .75% | .25% | 190 | 17 |
| | | | $410 | $ 22 |
(a) In the amount of less than five-hundred dollars.
Sales Load. FDC may receive a front-end sales charge of up to 4.00% for selling Class A shares and Class M shares, some of which is paid to financial intermediaries for selling shares of the Fund. Depending on the holding period, FDC may receive contingent deferred sales charges levied on Class A, Class M and Class C redemptions. The deferred sales charges are 1.00% for Class C shares, .75% for certain purchases of Class A shares and .25% for certain purchases of Class M shares.
For the period, sales charge amounts retained by FDC were as follows:
| | Retained by FDC |
| Class A | $16 |
| Class M | 1 |
| Class C(a) | 1 |
| | $18 |
(a) When Class C shares are initially sold, FDC pays commissions from its own resources to financial intermediaries through which the sales are made.
Transfer Agent Fees. Fidelity Investments Institutional Operations Company, Inc., (FIIOC), an affiliate of the investment adviser, is the transfer, dividend disbursing and shareholder servicing agent for each class of the Fund. FIIOC receives account fees and asset-based fees that vary according to the account size and type of account of the shareholders of each respective class of the Fund, with the exception of Investment Grade Bond and Class Z. FIIOC receives an asset-based fee of Investment Grade Bond's and Class Z's average net assets. FIIOC pays for typesetting, printing and mailing of shareholder reports, except proxy statements. For the period, transfer agent fees for each class were as follows:
| | Amount | % of Class-Level Average Net Assets |
| Class A | $115 | .17 |
| Class M | 34 | .18 |
| Class C | 36 | .19 |
| Investment Grade Bond | 7,383 | .10 |
| Class I | 1,775 | .15 |
| Class Z | 4 | .05(a) |
| | $9,347 | |
(a) Annualized
Fund Wide Operations Fee. Pursuant to the Fund Wide Operations and Expense Agreement (FWOE), the investment adviser has agreed to provide for fund level expenses (which do not include transfer agent, Rule 12b-1 fees, compensation of the independent Trustees, interest (including commitment fees), taxes or extraordinary expenses, if any) in return for a FWOE fee equal to .35% of the Fund's average net assets less the total amount of the management fee. The FWOE paid by the Fund is reduced by an amount equal to the fees and expenses paid to the independent Trustees. For the period, the FWOE fee was equivalent to an annual rate of .05% of average net assets.
Interfund Trades. The Fund may purchase from or sell securities to other Fidelity Funds under procedures adopted by the Board. The procedures have been designed to ensure these interfund trades are executed in accordance with Rule 17a-7 of the 1940 Act. Interfund trades are included within the respective purchases and sales amounts shown in the Purchases and Sales of Investments note.
Affiliated Redemptions In-Kind. During the period, 802,914 shares of the Fund were redeemed in-kind for investments, including accrued interest, and cash with a value of $6,118,208. The net realized loss of $(116,179) on investments delivered through in-kind redemptions is included in the accompanying Statement of Operations. The amount of the in-kind redemptions is included in share transactions in the accompanying Statement of Changes in Net Assets as well as the Notes to Financial Statements. The Fund recognized no gain or loss for federal income tax purposes.
Prior Fiscal Year Affiliated Exchanges In-Kind. During the prior period, the Fund completed an exchange in-kind with Fidelity Mortgage Back Securities Central Fund. The Fund delivered investments, including accrued interest valued at $21,226 (which included $49 of unrealized appreciation), in exchange for 197 shares of Fidelity Mortgage Backed Securities Central Fund. The Fund generally did not recognize gain or loss for federal income tax purposes.
7. Committed Line of Credit.
The Fund participates with other funds managed by the investment adviser or an affiliate in a $4.25 billion credit facility (the "line of credit") to be utilized for temporary or emergency purposes to fund shareholder redemptions or for other short-term liquidity purposes. The Fund has agreed to pay commitment fees on its pro-rata portion of the line of credit, which amounted to $25 and is reflected in Commitment fees on the Statement of Operations. During the period, the Fund did not borrow on this line of credit.
8. Security Lending.
The Fund lends portfolio securities from time to time in order to earn additional income. The Fund may lend securities to certain qualified borrowers. On the settlement date of the loan, the Fund receives collateral (in the form of U.S. Treasury obligations, letters of credit and/or cash) against the loaned securities and maintains collateral in an amount not less than 100% of the market value of the loaned securities during the period of the loan. The market value of the loaned securities is determined at the close of business of the Fund and any additional required collateral is delivered to the Fund on the next business day. The Fund or borrower may terminate the loan at any time, and if the borrower defaults on its obligation to return the securities loaned because of insolvency or other reasons, the Fund may apply collateral received from the borrower against the obligation. The Fund may experience delays and costs in recovering the securities loaned. Any cash collateral received is maintained at the Fund's custodian and/or invested in cash equivalents. At period end, there were no security loans outstanding. Security lending income represents the income earned on investing cash collateral, less rebates paid to borrowers, plus any premium payments received for lending certain types of securities. Security lending income is presented in the Statement of Operations as a component of interest income.
9. Expense Reductions.
The investment adviser contractually agreed to reimburse each class to the extent annual operating expenses exceeded certain levels of class-level average net assets as noted in the table below. This reimbursement will remain in place through December 31, 2020. Some expenses, for example the compensation of the independent Trustees, and certain other expenses such as interest expense, are excluded from this reimbursement.
The following classes were in reimbursement during the period:
| | Expense Limitations | Reimbursement |
| Class Z | .36% | $3 |
In addition, through arrangements with the Fund's custodian, credits realized as a result of certain uninvested cash balances were used to reduce the Fund's expenses. During the period, these credits reduced the Fund's expenses by $4.
10. Distributions to Shareholders.
Distributions to shareholders of each class were as follows:
| | Year ended
August 31, 2019(a) | Year ended
August 31, 2018 |
| Distributions to shareholders | | |
| Class A | $1,941 | $– |
| Class M | 551 | – |
| Class C | 401 | – |
| Investment Grade Bond | 228,512 | – |
| Class I | 37,793 | – |
| Class Z | 239 | – |
| Total | $269,437 | $ - |
| From net investment income | | |
| Class A | $– | $1,579 |
| Class M | – | 417 |
| Class C | – | 304 |
| Investment Grade Bond | – | 255,071 |
| Class I | – | 22,801 |
| Total | $– | $280,172 |
(a) Distributions for Class Z are for the period October 2, 2018 (commencement of sale of shares) to August 31, 2019.
11. Share Transactions.
Share transactions for each class were as follows and may contain automatic conversions between classes or exchanges between affiliated funds:
| | Shares | Shares | Dollars | Dollars |
| | Year ended August 31, 2019 (a) | Year ended August 31, 2018 | Year ended August 31, 2019(a) | Year ended August 31, 2018 |
| Class A | | | | |
| Shares sold | 3,790 | 4,998 | $29,898 | $38,720 |
| Reinvestment of distributions | 237 | 195 | 1,851 | 1,515 |
| Shares redeemed | (6,758) | (3,050) | (52,030) | (23,771) |
| Net increase (decrease) | (2,731) | 2,143 | $(20,281) | $16,464 |
| Class M | | | | |
| Shares sold | 681 | 346 | $5,378 | $2,691 |
| Reinvestment of distributions | 68 | 52 | 533 | 403 |
| Shares redeemed | (667) | (548) | (5,225) | (4,266) |
| Net increase (decrease) | 82 | (150) | $686 | $(1,172) |
| Class C | | | | |
| Shares sold | 1,170 | 521 | $9,249 | $4,085 |
| Reinvestment of distributions | 49 | 37 | 379 | 289 |
| Shares redeemed | (2,034) | (812) | (16,078) | (6,319) |
| Net increase (decrease) | (815) | (254) | $(6,450) | $(1,945) |
| Investment Grade Bond | | | | |
| Shares sold | 329,878 | 449,650 | $2,584,445 | $3,509,109 |
| Reinvestment of distributions | 26,752 | 30,820 | 209,071 | 240,155 |
| Shares redeemed | (951,302)(b) | (181,641) | (7,274,147)(b) | (1,415,874) |
| Net increase (decrease) | (594,672) | 298,829 | $(4,480,631) | $2,333,390 |
| Class I | | | | |
| Shares sold | 48,865 | 48,191 | $384,757 | $379,623 |
| Reinvestment of distributions | 4,620 | 2,775 | 36,264 | 21,645 |
| Shares redeemed | (14,910) | (21,160) | (117,601) | (167,132) |
| Net increase (decrease) | 38,575 | 29,806 | $303,420 | $234,136 |
| Class Z | | | | |
| Shares sold | 9,039 | – | $73,791 | $– |
| Reinvestment of distributions | 24 | – | 197 | – |
| Shares redeemed | (169) | – | (1,371) | – |
| Net increase (decrease) | 8,894 | – | $72,617 | $– |
(a) Share transactions for Class Z are for the period October 2, 2018 (commencement of sale of shares) to August 31, 2019.
(b) Amount includes in-kind redemptions (see the Affiliated Redemptions In-Kind note for additional details).
12. Other.
The Fund's organizational documents provide former and current trustees and officers with a limited indemnification against liabilities arising in connection with the performance of their duties to the Fund. In the normal course of business, the Fund may also enter into contracts that provide general indemnifications. The Fund's maximum exposure under these arrangements is unknown as this would be dependent on future claims that may be made against the Fund. The risk of material loss from such claims is considered remote.
Affiliated Redemptions In-Kind. Effective after the close of business on August 31, 2019, 524,304 shares of the Fund were redeemed in-kind for investments, including accrued interest, and cash with a value of $4,300,007. The net realized gain on investments delivered through in-kind redemptions was $181,810. The Fund recognized no gain or loss for federal income tax purposes.
13. Credit Risk.
The Fund invests a portion of its assets in structured securities of issuers backed by commercial and residential mortgage loans, credit card receivables and automotive loans. The value and related income of these securities is sensitive to changes in economic conditions, including delinquencies and/or defaults.
Report of Independent Registered Public Accounting Firm
To the Board of Trustees of Fidelity Salem Street Trust and Shareholders of Fidelity Investment Grade Bond Fund:
Opinion on the Financial Statements
We have audited the accompanying statement of assets and liabilities, including the schedule of investments, of Fidelity Investment Grade Bond Fund (one of the funds constituting Fidelity Salem Street Trust, referred to hereafter as the “Fund”) as of August 31, 2019, the related statement of operations for the year ended August 31, 2019, the statement of changes in net assets for each of the two years in the period ended August 31, 2019, including the related notes, and the financial highlights for each of the periods indicated therein (collectively referred to as the “financial statements”). In our opinion, the financial statements present fairly, in all material respects, the financial position of the Fund as of August 31, 2019, the results of its operations for the year then ended, the changes in its net assets for each of the two years in the period ended August 31, 2019 and the financial highlights for each of the periods indicated therein in conformity with accounting principles generally accepted in the United States of America.
Basis for Opinion
These financial statements are the responsibility of the Fund’s management. Our responsibility is to express an opinion on the Fund’s financial statements based on our audits. We are a public accounting firm registered with the Public Company Accounting Oversight Board (United States) (PCAOB) and are required to be independent with respect to the Fund in accordance with the U.S. federal securities laws and the applicable rules and regulations of the Securities and Exchange Commission and the PCAOB.
We conducted our audits of these financial statements in accordance with the standards of the PCAOB. Those standards require that we plan and perform the audit to obtain reasonable assurance about whether the financial statements are free of material misstatement, whether due to error or fraud.
Our audits included performing procedures to assess the risks of material misstatement of the financial statements, whether due to error or fraud, and performing procedures that respond to those risks. Such procedures included examining, on a test basis, evidence regarding the amounts and disclosures in the financial statements. Our audits also included evaluating the accounting principles used and significant estimates made by management, as well as evaluating the overall presentation of the financial statements. Our procedures included confirmation of securities owned as of August 31, 2019 by correspondence with the custodian and brokers; when replies were not received from brokers, we performed other auditing procedures. We believe that our audits provide a reasonable basis for our opinion.
PricewaterhouseCoopers LLP
Boston, Massachusetts
October 17, 2019
We have served as the auditor of one or more investment companies in the Fidelity group of funds since 1932.
Trustees and Officers
The Trustees, Members of the Advisory Board (if any), and officers of the trust and fund, as applicable, are listed below. The Board of Trustees governs the fund and is responsible for protecting the interests of shareholders. The Trustees are experienced executives who meet periodically throughout the year to oversee the fund's activities, review contractual arrangements with companies that provide services to the fund, oversee management of the risks associated with such activities and contractual arrangements, and review the fund's performance. Except for Jonathan Chiel, each of the Trustees oversees 276 funds. Mr. Chiel oversees 170 funds.
The Trustees hold office without limit in time except that (a) any Trustee may resign; (b) any Trustee may be removed by written instrument, signed by at least two-thirds of the number of Trustees prior to such removal; (c) any Trustee who requests to be retired or who has become incapacitated by illness or injury may be retired by written instrument signed by a majority of the other Trustees; and (d) any Trustee may be removed at any special meeting of shareholders by a two-thirds vote of the outstanding voting securities of the trust. Each Trustee who is not an interested person (as defined in the 1940 Act) of the trust and the fund is referred to herein as an Independent Trustee. Each Independent Trustee shall retire not later than the last day of the calendar year in which his or her 75th birthday occurs. The Independent Trustees may waive this mandatory retirement age policy with respect to individual Trustees. Officers and Advisory Board Members hold office without limit in time, except that any officer or Advisory Board Member may resign or may be removed by a vote of a majority of the Trustees at any regular meeting or any special meeting of the Trustees. Except as indicated, each individual has held the office shown or other offices in the same company for the past five years.
The fund's Statement of Additional Information (SAI) includes more information about the Trustees. To request a free copy, call Fidelity at 1-800-544-8544 if you’re an individual investing directly with Fidelity, call 1-800-835-5092 if you’re a plan sponsor or participant with Fidelity as your recordkeeper or call 1-877-208-0098 on institutional accounts or if you’re an advisor or invest through one.
Experience, Skills, Attributes, and Qualifications of the Trustees. The Governance and Nominating Committee has adopted a statement of policy that describes the experience, qualifications, attributes, and skills that are necessary and desirable for potential Independent Trustee candidates (Statement of Policy). The Board believes that each Trustee satisfied at the time he or she was initially elected or appointed a Trustee, and continues to satisfy, the standards contemplated by the Statement of Policy. The Governance and Nominating Committee also engages professional search firms to help identify potential Independent Trustee candidates who have the experience, qualifications, attributes, and skills consistent with the Statement of Policy. From time to time, additional criteria based on the composition and skills of the current Independent Trustees, as well as experience or skills that may be appropriate in light of future changes to board composition, business conditions, and regulatory or other developments, have also been considered by the professional search firms and the Governance and Nominating Committee. In addition, the Board takes into account the Trustees' commitment and participation in Board and committee meetings, as well as their leadership of standing and ad hoc committees throughout their tenure.
In determining that a particular Trustee was and continues to be qualified to serve as a Trustee, the Board has considered a variety of criteria, none of which, in isolation, was controlling. The Board believes that, collectively, the Trustees have balanced and diverse experience, qualifications, attributes, and skills, which allow the Board to operate effectively in governing the fund and protecting the interests of shareholders. Information about the specific experience, skills, attributes, and qualifications of each Trustee, which in each case led to the Board's conclusion that the Trustee should serve (or continue to serve) as a trustee of the fund, is provided below.
Board Structure and Oversight Function. Abigail P. Johnson is an interested person and currently serves as Chairman. The Trustees have determined that an interested Chairman is appropriate and benefits shareholders because an interested Chairman has a personal and professional stake in the quality and continuity of services provided to the fund. Independent Trustees exercise their informed business judgment to appoint an individual of their choosing to serve as Chairman, regardless of whether the Trustee happens to be independent or a member of management. The Independent Trustees have determined that they can act independently and effectively without having an Independent Trustee serve as Chairman and that a key structural component for assuring that they are in a position to do so is for the Independent Trustees to constitute a substantial majority for the Board. The Independent Trustees also regularly meet in executive session. Arthur E. Johnson serves as Chairman of the Independent Trustees and as such (i) acts as a liaison between the Independent Trustees and management with respect to matters important to the Independent Trustees and (ii) with management prepares agendas for Board meetings.
Fidelity® funds are overseen by different Boards of Trustees. The fund's Board oversees Fidelity's investment-grade bond, money market, asset allocation and certain equity funds, and other Boards oversee Fidelity's high income and other equity funds. The asset allocation funds may invest in Fidelity® funds that are overseen by such other Boards. The use of separate Boards, each with its own committee structure, allows the Trustees of each group of Fidelity® funds to focus on the unique issues of the funds they oversee, including common research, investment, and operational issues. On occasion, the separate Boards establish joint committees to address issues of overlapping consequences for the Fidelity® funds overseen by each Board.
The Trustees operate using a system of committees to facilitate the timely and efficient consideration of all matters of importance to the Trustees, the fund, and fund shareholders and to facilitate compliance with legal and regulatory requirements and oversight of the fund's activities and associated risks. The Board, acting through its committees, has charged FMR and its affiliates with (i) identifying events or circumstances the occurrence of which could have demonstrably adverse effects on the fund's business and/or reputation; (ii) implementing processes and controls to lessen the possibility that such events or circumstances occur or to mitigate the effects of such events or circumstances if they do occur; and (iii) creating and maintaining a system designed to evaluate continuously business and market conditions in order to facilitate the identification and implementation processes described in (i) and (ii) above. Because the day-to-day operations and activities of the fund are carried out by or through FMR, its affiliates, and other service providers, the fund's exposure to risks is mitigated but not eliminated by the processes overseen by the Trustees. While each of the Board's committees has responsibility for overseeing different aspects of the fund's activities, oversight is exercised primarily through the Operations and Audit Committees. In addition, an ad hoc Board committee of Independent Trustees has worked with FMR to enhance the Board's oversight of investment and financial risks, legal and regulatory risks, technology risks, and operational risks, including the development of additional risk reporting to the Board. Appropriate personnel, including but not limited to the fund's Chief Compliance Officer (CCO), FMR's internal auditor, the independent accountants, the fund's Treasurer and portfolio management personnel, make periodic reports to the Board's committees, as appropriate, including an annual review of Fidelity's risk management program for the Fidelity® funds. The responsibilities of each standing committee, including their oversight responsibilities, are described further under "Standing Committees of the Trustees."
Interested Trustees*:
Correspondence intended for a Trustee who is an interested person may be sent to Fidelity Investments, 245 Summer Street, Boston, Massachusetts 02210.
Name, Year of Birth; Principal Occupations and Other Relevant Experience+
Jonathan Chiel (1957)
Year of Election or Appointment: 2016
Trustee
Mr. Chiel also serves as Trustee of other Fidelity® funds. Mr. Chiel is Executive Vice President and General Counsel for FMR LLC (diversified financial services company, 2012-present). Previously, Mr. Chiel served as general counsel (2004-2012) and senior vice president and deputy general counsel (2000-2004) for John Hancock Financial Services; a partner with Choate, Hall & Stewart (1996-2000) (law firm); and an Assistant United States Attorney for the United States Attorney’s Office of the District of Massachusetts (1986-95), including Chief of the Criminal Division (1993-1995). Mr. Chiel is a director on the boards of the Boston Bar Foundation and the Maimonides School.
Abigail P. Johnson (1961)
Year of Election or Appointment: 2009
Trustee
Chairman of the Board of Trustees
Ms. Johnson also serves as Trustee of other Fidelity® funds. Ms. Johnson serves as Chairman (2016-present), Chief Executive Officer (2014-present), and Director (2007-present) of FMR LLC (diversified financial services company), President of Fidelity Financial Services (2012-present) and President of Personal, Workplace and Institutional Services (2005-present). Ms. Johnson is Chairman and Director of FMR Co., Inc. (investment adviser firm, 2011-present) and Chairman and Director of FMR (investment adviser firm, 2011-present). Previously, Ms. Johnson served as Vice Chairman (2007-2016) and President (2013-2016) of FMR LLC, President and a Director of FMR (2001-2005), a Trustee of other investment companies advised by FMR, Fidelity Investments Money Management, Inc. (investment adviser firm), and FMR Co., Inc. (2001-2005), Senior Vice President of the Fidelity® funds (2001-2005), and managed a number of Fidelity® funds. Ms. Abigail P. Johnson and Mr. Arthur E. Johnson are not related.
Jennifer Toolin McAuliffe (1959)
Year of Election or Appointment: 2016
Trustee
Ms. McAuliffe also serves as Trustee of other Fidelity® funds. Ms. McAuliffe previously served as a Member of the Advisory Board of certain Fidelity® funds (2016) and as Co-Head of Fixed Income of Fidelity Investments Limited (now known as FIL Limited (FIL)) (diversified financial services company). Earlier roles at FIL included Director of Research for FIL’s credit and quantitative teams in London, Hong Kong and Tokyo. Ms. McAuliffe also was the Director of Research for taxable and municipal bonds at Fidelity Investments Money Management, Inc. Ms. McAuliffe is also a director or trustee of several not-for-profit entities.
* Determined to be an “Interested Trustee” by virtue of, among other things, his or her affiliation with the trust or various entities under common control with FMR.
+ The information includes the Trustee's principal occupation during the last five years and other information relating to the experience, attributes, and skills relevant to the Trustee's qualifications to serve as a Trustee, which led to the conclusion that the Trustee should serve as a Trustee for the fund.
Independent Trustees:
Correspondence intended for an Independent Trustee may be sent to Fidelity Investments, P.O. Box 55235, Boston, Massachusetts 02205-5235.
Name, Year of Birth; Principal Occupations and Other Relevant Experience+
Elizabeth S. Acton (1951)
Year of Election or Appointment: 2013
Trustee
Ms. Acton also serves as Trustee of other Fidelity® funds. Prior to her retirement in April 2012, Ms. Acton was Executive Vice President, Finance (2011-2012), Executive Vice President, Chief Financial Officer (2002-2011), and Treasurer (2004-2005) of Comerica Incorporated (financial services). Prior to joining Comerica, Ms. Acton held a variety of positions at Ford Motor Company (1983-2002), including Vice President and Treasurer (2000-2002) and Executive Vice President and Chief Financial Officer of Ford Motor Credit Company (1998-2000). Ms. Acton currently serves as a member of the Board of Directors and Audit and Finance Committees of Beazer Homes USA, Inc. (homebuilding, 2012-present). Previously, Ms. Acton served as a Member of the Advisory Board of certain Fidelity® funds (2013-2016).
Ann E. Dunwoody (1953)
Year of Election or Appointment: 2018
Trustee
General Dunwoody also serves as Trustee of other Fidelity® funds. General Dunwoody (United States Army, Retired) was the first woman in U.S. military history to achieve the rank of four-star general and prior to her retirement in 2012 held a variety of positions within the U.S. Army, including Commanding General, U.S. Army Material Command (2008-2012). She is the President of First to Four LLC (leadership and mentoring services, 2012-present). She also serves as a member of the Board of Directors and Nominating and Corporate Governance Committee of L3 Technologies, Inc. (communication, electronic, sensor, and aerospace systems, 2013-present), Board of Directors and Nomination and Corporate Governance Committees of Kforce Inc. (professional staffing services, 2016-present) and Board of Directors of Automattic Inc. (software engineering, 2018-present). Previously, General Dunwoody served as a Member of the Advisory Board of certain Fidelity® funds (2018), a member of the Board of Directors and Audit and Sustainability and Corporate Responsibility Committees of Republic Services, Inc. (waste collection, disposal and recycling, 2013-2016). Ms. Dunwoody also serves on several boards for non-profit organizations, including as a member of the Board of Directors, Chair of the Nomination and Governance Committee and member of the Audit Committee of Logistics Management Institute (consulting non-profit, 2012-present), a member of the Board of Directors of the Army Historical Foundation (2015-present), a member of the Council of Trustees for the Association of the United States Army (advocacy non-profit, 2013-present) and a member of the Board of Trustees of Florida Institute of Technology (2015-present) and ThanksUSA (military family education non-profit, 2014-present).
John Engler (1948)
Year of Election or Appointment: 2014
Trustee
Mr. Engler also serves as Trustee of other Fidelity® funds. He serves on the board of directors for Universal Forest Products (manufacturer and distributor of wood and wood-alternative products, 2003-present) and K12 Inc. (technology-based education company, 2012-present). Previously, Mr. Engler served as interim president of Michigan State University (2018-2019), a Member of the Advisory Board of certain Fidelity® funds (2014-2016), president of the Business Roundtable (2011-2017), a trustee of The Munder Funds (2003-2014), president and CEO of the National Association of Manufacturers (2004-2011), member of the Board of Trustees of the Annie E. Casey Foundation (2004-2015), and as governor of Michigan (1991-2003). He is a past chairman of the National Governors Association.
Robert F. Gartland (1951)
Year of Election or Appointment: 2010
Trustee
Mr. Gartland also serves as Trustee of other Fidelity® funds. Mr. Gartland is Chairman and an investor in Gartland & Mellina Group Corp. (consulting, 2009-present). Previously, Mr. Gartland served as a partner and investor of Vietnam Partners LLC (investments and consulting, 2008-2011). Prior to his retirement, Mr. Gartland held a variety of positions at Morgan Stanley (financial services, 1979-2007), including Managing Director (1987-2007), and Chase Manhattan Bank (1975-1978).
Arthur E. Johnson (1947)
Year of Election or Appointment: 2008
Trustee
Chairman of the Independent Trustees
Mr. Johnson also serves as Trustee of other Fidelity® funds. Mr. Johnson serves as a member of the Board of Directors of Eaton Corporation plc (diversified power management, 2009-present) and Booz Allen Hamilton (management consulting, 2011-present). Prior to his retirement, Mr. Johnson served as Senior Vice President of Corporate Strategic Development of Lockheed Martin Corporation (defense contractor, 1999-2009). Mr. Johnson previously served as Vice Chairman (2015-2018) of the Independent Trustees of certain Fidelity® funds and on the Board of Directors of IKON Office Solutions, Inc. (1999-2008), AGL Resources, Inc. (holding company, 2002-2016), and Delta Airlines (2005-2007). Mr. Arthur E. Johnson is not related to Ms. Abigail P. Johnson.
Michael E. Kenneally (1954)
Year of Election or Appointment: 2009
Trustee
Vice Chairman of the Independent Trustees
Mr. Kenneally also serves as Trustee of other Fidelity® funds. Prior to his retirement, Mr. Kenneally served as Chairman and Global Chief Executive Officer of Credit Suisse Asset Management. Before joining Credit Suisse, he was an Executive Vice President and Chief Investment Officer for Bank of America Corporation. Earlier roles at Bank of America included Director of Research, Senior Portfolio Manager and Research Analyst, and Mr. Kenneally was awarded the Chartered Financial Analyst (CFA) designation in 1991.
Marie L. Knowles (1946)
Year of Election or Appointment: 2001
Trustee
Ms. Knowles also serves as Trustee of other Fidelity® funds. Prior to Ms. Knowles' retirement in June 2000, she served as Executive Vice President and Chief Financial Officer of Atlantic Richfield Company (ARCO) (diversified energy, 1996-2000). From 1993 to 1996, she was a Senior Vice President of ARCO and President of ARCO Transportation Company (pipeline and tanker operations). Ms. Knowles currently serves as a Director and Chairman of the Audit Committee of McKesson Corporation (healthcare service, since 2002). Ms. Knowles is a member of the Board of the Santa Catalina Island Company (real estate, 2009-present). Ms. Knowles is a Member of the Investment Company Institute Board of Governors and a Member of the Governing Council of the Independent Directors Council (2014-present). She also serves as a member of the Advisory Board for the School of Engineering of the University of Southern California. Previously, Ms. Knowles served as a Director of Phelps Dodge Corporation (copper mining and manufacturing, 1994-2007), URS Corporation (engineering and construction, 2000-2003) and America West (airline, 1999-2002). Ms. Knowles previously served as Chairman (2015-2018) and Vice Chairman (2012-2015) of the Independent Trustees of certain Fidelity® funds.
Mark A. Murray (1954)
Year of Election or Appointment: 2016
Trustee
Mr. Murray also serves as Trustee of other Fidelity® funds. Mr. Murray is Vice Chairman (2013-present) of Meijer, Inc. (regional retail chain). Previously, Mr. Murray served as a Member of the Advisory Board of certain Fidelity® funds (2016) and as Co-Chief Executive Officer (2013-2016) and President (2006-2013) of Meijer, Inc. Mr. Murray serves as a member of the Board of Directors and Nuclear Review and Public Policy and Responsibility Committees of DTE Energy Company (diversified energy company, 2009-present). Mr. Murray also serves as a member of the Board of Directors of Spectrum Health (not-for-profit health system, 2015-present). Mr. Murray previously served as President of Grand Valley State University (2001-2006), Treasurer for the State of Michigan (1999-2001), Vice President of Finance and Administration for Michigan State University (1998-1999), and a member of the Board of Directors and Audit Committee and Chairman of the Nominating and Corporate Governance Committee of Universal Forest Products, Inc. (manufacturer and distributor of wood and wood-alternative products, 2004-2016). Mr. Murray is also a director or trustee of many community and professional organizations.
+ The information includes the Trustee's principal occupation during the last five years and other information relating to the experience, attributes, and skills relevant to the Trustee's qualifications to serve as a Trustee, which led to the conclusion that the Trustee should serve as a Trustee for the fund.
Advisory Board Members and Officers:
Correspondence intended for an officer may be sent to Fidelity Investments, 245 Summer Street, Boston, Massachusetts 02210. Officers appear below in alphabetical order.
Name, Year of Birth; Principal Occupation
Elizabeth Paige Baumann (1968)
Year of Election or Appointment: 2017
Anti-Money Laundering (AML) Officer
Ms. Baumann also serves as AML Officer of other funds. She is Chief AML Officer (2012-present) and Senior Vice President (2014-present) of FMR LLC (diversified financial services company) and is an employee of Fidelity Investments. Previously, Ms. Baumann served as AML Officer of the funds (2012-2016), and Vice President (2007-2014) and Deputy Anti-Money Laundering Officer (2007-2012) of FMR LLC.
Craig S. Brown (1977)
Year of Election or Appointment: 2019
Assistant Treasurer
Mr. Brown also serves as Assistant Treasurer of other funds. Mr. Brown is an employee of Fidelity Investments (2013-present).
John J. Burke III (1964)
Year of Election or Appointment: 2018
Chief Financial Officer
Mr. Burke also serves as Chief Financial Officer of other funds. Mr. Burke serves as Head of Investment Operations for Fidelity Fund and Investment Operations (2018-present) and is an employee of Fidelity Investments (1998-present). Previously Mr. Burke served as head of Asset Management Investment Operations (2012-2018).
Jonathan Davis (1968)
Year of Election or Appointment: 2010
Assistant Treasurer
Mr. Davis also serves as Assistant Treasurer of other funds. Mr. Davis serves as Assistant Treasurer of FMR Capital, Inc. (2017-present) and is an employee of Fidelity Investments. Previously, Mr. Davis served as Vice President and Associate General Counsel of FMR LLC (diversified financial services company, 2003-2010).
Adrien E. Deberghes (1967)
Year of Election or Appointment: 2010
Assistant Treasurer
Mr. Deberghes also serves as an officer of other funds. He serves as Assistant Treasurer of FMR Capital, Inc. (2017-present), Executive Vice President of Fidelity Investments Money Management, Inc. (FIMM) (investment adviser firm, 2016-present), and is an employee of Fidelity Investments (2008-present). Previously, Mr. Deberghes served as President and Treasurer of certain Fidelity® funds (2013-2018). Prior to joining Fidelity Investments, Mr. Deberghes was Senior Vice President of Mutual Fund Administration at State Street Corporation (2007-2008), Senior Director of Mutual Fund Administration at Investors Bank & Trust (2005-2007), and Director of Finance for Dunkin' Brands (2000-2005). Previously, Mr. Deberghes served in other fund officer roles.
Laura M. Del Prato (1964)
Year of Election or Appointment: 2018
President and Treasurer
Ms. Del Prato also serves as an officer of other funds. Ms. Del Prato is an employee of Fidelity Investments (2017-present). Prior to joining Fidelity Investments, Ms. Del Prato served as a Managing Director and Treasurer of the JPMorgan Mutual Funds (2014-2017). Prior to JPMorgan, Ms. Del Prato served as a partner at Cohen Fund Audit Services (accounting firm, 2012-2013) and KPMG LLP (accounting firm, 2004-2012).
Colm A. Hogan (1973)
Year of Election or Appointment: 2016
Assistant Treasurer
Mr. Hogan also serves as an officer of other funds. Mr. Hogan serves as Assistant Treasurer of FMR Capital, Inc. (2017-present) and is an employee of Fidelity Investments (2005-present). Previously, Mr. Hogan served as Assistant Treasurer of certain Fidelity® funds (2016-2018).
Cynthia Lo Bessette (1969)
Year of Election or Appointment: 2019
Secretary and Chief Legal Officer (CLO)
Ms. Lo Bessette also serves as Secretary and CLO of other funds. She is a Senior Vice President and Deputy General Counsel of FMR LLC (diversified financial services company, 2019-present), and is an employee of Fidelity Investments. Previously, Ms. Lo Bessette served as Executive Vice President, General Counsel (2016-2019) and Senior Vice President, Deputy General Counsel (2015-2016) of OppenheimerFunds (investment management company) and Deputy Chief Legal Officer (2013-2015) of Jennison Associates LLC (investment adviser firm).
Chris Maher (1972)
Year of Election or Appointment: 2013
Assistant Treasurer
Mr. Maher serves as Assistant Treasurer of other funds. Mr. Maher is Vice President of Valuation Oversight, serves as Assistant Treasurer of FMR Capital, Inc. (2017-present), and is an employee of Fidelity Investments. Previously, Mr. Maher served as Vice President of Asset Management Compliance (2013), Vice President of the Program Management Group of FMR (investment adviser firm, 2010-2013), and Vice President of Valuation Oversight (2008-2010).
John B. McGinty, Jr. (1962)
Year of Election or Appointment: 2016
Chief Compliance Officer
Mr. McGinty also serves as Chief Compliance Officer of other funds. Mr. McGinty is Senior Vice President of Asset Management Compliance for Fidelity Investments and is an employee of Fidelity Investments (2016-present). Mr. McGinty previously served as Vice President, Senior Attorney at Eaton Vance Management (investment management firm, 2015-2016), and prior to Eaton Vance as global CCO for all firm operations and registered investment companies at GMO LLC (investment management firm, 2009-2015). Before joining GMO LLC, Mr. McGinty served as Senior Vice President, Deputy General Counsel for Fidelity Investments (2007-2009).
Jason P. Pogorelec (1975)
Year of Election or Appointment: 2015
Assistant Secretary
Mr. Pogorelec also serves as Assistant Secretary of other funds. Mr. Pogorelec serves as Vice President, Associate General Counsel (2010-present) and is an employee of Fidelity Investments (2006-present).
Nancy D. Prior (1967)
Year of Election or Appointment: 2014
Vice President
Ms. Prior also serves as Vice President of other funds. Ms. Prior serves as President of Fixed Income (2014-present), President (2016-present) and Director (2014-present) of Fidelity Investments Money Management, Inc. (FIMM) (investment adviser firm), and is an employee of Fidelity Investments (2002-present). Previously, Ms. Prior served as Vice Chairman of FIAM LLC (investment adviser firm, 2014-2018), a Director of FMR Investment Management (UK) Limited (investment adviser firm, 2015-2018), President Multi-Asset Class Strategies of FMR's Global Asset Allocation Division (2017-2018), Vice President of Fidelity's Money Market Funds (2012-2014), and President, Money Market and Short Duration Bond Group of Fidelity Management & Research Company (FMR) (investment adviser firm, 2013-2014).
Stacie M. Smith (1974)
Year of Election or Appointment: 2013
Assistant Treasurer
Ms. Smith also serves as an officer of other funds. Ms. Smith serves as Assistant Treasurer of FMR Capital, Inc. (2017-present), is an employee of Fidelity Investments (2009-present), and has served in other fund officer roles. Prior to joining Fidelity Investments, Ms. Smith served as Senior Audit Manager of Ernst & Young LLP (accounting firm, 1996-2009). Previously, Ms. Smith served as Assistant Treasurer (2013-2018) and Deputy Treasurer (2013-2016) of certain Fidelity® funds.
Marc L. Spector (1972)
Year of Election or Appointment: 2016
Deputy Treasurer
Mr. Spector also serves as an officer of other funds. Mr. Spector serves as Assistant Treasurer of FMR Capital, Inc. (2017-present) and is an employee of Fidelity Investments (2016-present). Prior to joining Fidelity Investments, Mr. Spector served as Director at the Siegfried Group (accounting firm, 2013-2016), and prior to Siegfried Group as audit senior manager at Deloitte & Touche (accounting firm, 2005-2013).
Jim Wegmann (1979)
Year of Election or Appointment: 2019
Assistant Treasurer
Mr. Wegmann also serves as Assistant Treasurer of other funds. Mr. Wegmann is an employee of Fidelity Investments (2011-present).
Shareholder Expense Example
As a shareholder of the Fund, you incur two types of costs: (1) transaction costs, including sales charges (loads) on purchase payments or redemption proceeds, and (2) ongoing costs, including management fees, distribution and/or service (12b-1) fees and other Fund expenses. This Example is intended to help you understand your ongoing costs (in dollars) of investing in the Fund and to compare these costs with the ongoing costs of investing in other mutual funds.
The Example is based on an investment of $1,000 invested at the beginning of the period and held for the entire period (March 1, 2019 to August 31, 2019).
Actual Expenses
The first line of the accompanying table for each class of the Fund provides information about actual account values and actual expenses. You may use the information in this line, together with the amount you invested, to estimate the expenses that you paid over the period. Simply divide your account value by $1,000.00 (for example, an $8,600 account value divided by $1,000.00 = 8.6), then multiply the result by the number in the first line for a class of the Fund under the heading entitled "Expenses Paid During Period" to estimate the expenses you paid on your account during this period. In addition, the Fund, as a shareholder in the underlying Fidelity Central Funds, will indirectly bear its pro-rata share of the fees and expenses incurred by the underlying Fidelity Central Funds. These fees and expenses are not included in the Fund's annualized expense ratio used to calculate the expense estimate in the table below.
Hypothetical Example for Comparison Purposes
The second line of the accompanying table for each class of the Fund provides information about hypothetical account values and hypothetical expenses based on a Class' actual expense ratio and an assumed rate of return of 5% per year before expenses, which is not the Class' actual return. The hypothetical account values and expenses may not be used to estimate the actual ending account balance or expenses you paid for the period. You may use this information to compare the ongoing costs of investing in the Fund and other funds. To do so, compare this 5% hypothetical example with the 5% hypothetical examples that appear in the shareholder reports of the other funds. In addition, the Fund, as a shareholder in the underlying Fidelity Central Funds, will indirectly bear its pro-rata share of the fees and expenses incurred by the underlying Fidelity Central Funds. These fees and expenses are not included in the Fund's annualized expense ratio used to calculate the expense estimate in the table below.
Please note that the expenses shown in the table are meant to highlight your ongoing costs only and do not reflect any transaction costs. Therefore, the second line of the table is useful in comparing ongoing costs only, and will not help you determine the relative total costs of owning different funds. In addition, if these transactional costs were included, your costs would have been higher.
| | Annualized Expense Ratio-A | Beginning
Account Value
March 1, 2019 | Ending
Account Value
August 31, 2019 | Expenses Paid
During Period-B
March 1, 2019
to August 31, 2019 |
| Class A | .76% | | | |
| Actual | | $1,000.00 | $1,077.90 | $3.98 |
| Hypothetical-C | | $1,000.00 | $1,021.37 | $3.87 |
| Class M | .76% | | | |
| Actual | | $1,000.00 | $1,079.20 | $3.98 |
| Hypothetical-C | | $1,000.00 | $1,021.37 | $3.87 |
| Class C | 1.53% | | | |
| Actual | | $1,000.00 | $1,073.70 | $8.00 |
| Hypothetical-C | | $1,000.00 | $1,017.49 | $7.78 |
| Investment Grade Bond | .45% | | | |
| Actual | | $1,000.00 | $1,079.60 | $2.36 |
| Hypothetical-C | | $1,000.00 | $1,022.94 | $2.29 |
| Class I | .49% | | | |
| Actual | | $1,000.00 | $1,080.60 | $2.57 |
| Hypothetical-C | | $1,000.00 | $1,022.74 | $2.50 |
| Class Z | .36% | | | |
| Actual | | $1,000.00 | $1,079.90 | $1.89 |
| Hypothetical-C | | $1,000.00 | $1,023.39 | $1.84 |
A Annualized expense ratio reflects expenses net of applicable fee waivers.
B Expenses are equal to each Class' annualized expense ratio, multiplied by the average account value over the period, multiplied by 184/365 (to reflect the one-half year period). The fees and expenses of the underlying Fidelity Central Funds in which the Fund invests are not included in each Class' annualized expense ratio. In addition to the expenses noted above, the Fund also indirectly bears its proportional share of the expenses of the underlying Fidelity Central Funds. Annualized expenses of the underlying non-money market Fidelity Central Funds as of their most recent fiscal half year were less than .005%.
C 5% return per year before expenses
Distributions (Unaudited)
A total of 29.96% of the dividends distributed during the fiscal year was derived from interest on U.S. Government securities which is generally exempt from state income tax.
The fund designates $152,525,074 of distributions paid during the period January 1, 2019 to August 31, 2019 as qualifying to be taxed as interest-related dividends for nonresident alien shareholders.
The fund will notify shareholders in January 2020 of amounts for use in preparing 2019 income tax returns.
IGB-ANN-1019
1.703610.122
Fidelity® Series Investment Grade Bond Fund
Annual Report August 31, 2019 |
|
Beginning on January 1, 2021, as permitted by regulations adopted by the Securities and Exchange Commission, paper copies of a fund’s shareholder reports will no longer be sent by mail, unless you specifically request paper copies of the reports from the fund or from your financial intermediary, such as a financial advisor, broker-dealer or bank. Instead, the reports will be made available on a website, and you will be notified by mail each time a report is posted and provided with a website link to access the report.
If you already elected to receive shareholder reports electronically, you will not be affected by this change and you need not take any action. You may elect to receive shareholder reports and other communications from a fund electronically, by contacting your financial intermediary. For Fidelity customers, visit Fidelity's web site or call Fidelity using the contact information listed below.
You may elect to receive all future reports in paper free of charge. If you wish to continue receiving paper copies of your shareholder reports, you may contact your financial intermediary or, if you are a Fidelity customer, visit Fidelity’s website, or call Fidelity at the applicable toll-free number listed below. Your election to receive reports in paper will apply to all funds held with the fund complex/your financial intermediary.
| Account Type | Website | Phone Number |
| Brokerage, Mutual Fund, or Annuity Contracts: | fidelity.com/mailpreferences | 1-800-343-3548 |
| Employer Provided Retirement Accounts: | netbenefits.fidelity.com/preferences (choose 'no' under Required Disclosures to continue to print) | 1-800-343-0860 |
| Advisor Sold Accounts Serviced Through Your Financial Intermediary: | Contact Your Financial Intermediary | Your Financial Intermediary's phone number |
| Advisor Sold Accounts Serviced by Fidelity: | institutional.fidelity.com | 1-877-208-0098 |
Contents
To view a fund's proxy voting guidelines and proxy voting record for the 12-month period ended June 30, visit http://www.fidelity.com/proxyvotingresults or visit the Securities and Exchange Commission's (SEC) web site at http://www.sec.gov.
You may also call 1-800-544-8544 to request a free copy of the proxy voting guidelines.
Standard & Poor's, S&P and S&P 500 are registered service marks of The McGraw-Hill Companies, Inc. and have been licensed for use by Fidelity Distributors Corporation.
Other third-party marks appearing herein are the property of their respective owners.
All other marks appearing herein are registered or unregistered trademarks or service marks of FMR LLC or an affiliated company. © 2019 FMR LLC. All rights reserved.
This report and the financial statements contained herein are submitted for the general information of the shareholders of the Fund. This report is not authorized for distribution to prospective investors in the Fund unless preceded or accompanied by an effective prospectus.
A fund files its complete schedule of portfolio holdings with the SEC for the first and third quarters of each fiscal year on Form N-PORT. Forms N-PORT are available on the SEC’s web site at http://www.sec.gov. A fund's Forms N-PORT may be reviewed and copied at the SEC’s Public Reference Room in Washington, DC. Information regarding the operation of the SEC's Public Reference Room may be obtained by calling 1-800-SEC-0330.
For a complete list of a fund's portfolio holdings, view the most recent holdings listing, semiannual report, or annual report on Fidelity's web site at http://www.fidelity.com, http://www.institutional.fidelity.com, or http://www.401k.com, as applicable.
NOT FDIC INSURED •MAY LOSE VALUE •NO BANK GUARANTEE
Neither the Fund nor Fidelity Distributors Corporation is a bank.
Performance: The Bottom Line
Average annual total return reflects the change in the value of an investment, assuming reinvestment of distributions from dividend income and capital gains (the profits earned upon the sale of securities that have grown in value, if any) and assuming a constant rate of performance each year. The hypothetical investment and the average annual total returns do not reflect the deduction of taxes that a shareholder would pay on fund distributions or the redemption of fund shares. During periods of reimbursement by Fidelity, a fund’s total return will be greater than it would be had the reimbursement not occurred. How a fund did yesterday is no guarantee of how it will do tomorrow.
Average Annual Total Returns
| For the periods ended August 31, 2019 | Past 1 year | Past 5 years | Past 10 years |
| Fidelity® Series Investment Grade Bond Fund | 10.16% | 3.69% | 4.46% |
$10,000 Over 10 Years
Let's say hypothetically that $10,000 was invested in Fidelity® Series Investment Grade Bond Fund on August 31, 2009.
The chart shows how the value of your investment would have changed, and also shows how the Bloomberg Barclays U.S. Aggregate Bond Index performed over the same period.
| Period Ending Values |
| $15,466 | Fidelity® Series Investment Grade Bond Fund |
| $14,678 | Bloomberg Barclays U.S. Aggregate Bond Index |
Management's Discussion of Fund Performance
Market Recap: For the 12 months ending August 31, 2019, U.S. taxable investment-grade bonds posted their strongest trailing one-year return since 2009, driven by slower global economic growth, a maturing business cycle, trade uncertainty and, late in the period, the Fed’s dovish shift. The Bloomberg Barclays U.S. Aggregate Bond Index gained 10.17%. Market yields rose in the early fall of 2018, on expectations for higher inflation. Yields then declined and credit spreads widened in November and December, partly because of weaker U.S. manufacturing data. Yield spreads narrowed in January, as the U.S. Federal Reserve said it would be “patient” with policy rate hikes, and that future increases largely would depend on economic data. Yields continued to decline in the spring, amid international trade tension and attacks on oil tankers in the Middle East, and then tumbled further in July, when the Fed cut interest rates for the first time since 2008. The yield curve ended the period roughly flat, amid expectations for another rate cut of 25 basis points in September. Within the Bloomberg Barclays index, corporate bonds gained 13.33%, topping the 10.38% advance of U.S. Treasuries. Outside the index, U.S. corporate high-yield bonds lagged nominal U.S. Treasuries, while Treasury Inflation-Protected Securities (TIPS) gained 7.46%.
Comments from Lead Manager Ford O'Neil and Co-Manager Celso Munoz: For the year, the fund gained 10.16%, roughly in line with the 10.17% gain of the benchmark Bloomberg Barclays U.S. Aggregate Bond Index. Both sector allocation and security selection among investment-grade (IG) corporate bonds contributed versus the Aggregate benchmark. In particular, a decision in early 2019 to increase the fund's exposure to IG corporates added value. Within this group, an overweighting and our security choices among the bonds of financial institutions helped, led by helpful picks among banks and real estate investment trusts (REITs). Positioning among the bonds of industrial companies also contributed on a relative basis, most notably, overweightings in the communications and consumer non-cyclical sectors. Conversely, the fund's modestly shorter duration hampered performance versus the Aggregate benchmark, as did positioning along the yield curve – particularly the fund's underweighting in longer-term securities. Owning Treasury Inflation-Protected Securities (TIPS) further detracted from the fund's relative performance.
The views expressed above reflect those of the portfolio manager(s) only through the end of the period as stated on the cover of this report and do not necessarily represent the views of Fidelity or any other person in the Fidelity organization. Any such views are subject to change at any time based upon market or other conditions and Fidelity disclaims any responsibility to update such views. These views may not be relied on as investment advice and, because investment decisions for a Fidelity fund are based on numerous factors, may not be relied on as an indication of trading intent on behalf of any Fidelity fund.
Investment Summary (Unaudited)
Quality Diversification (% of fund's net assets)
| As of August 31, 2019 |
| | U.S. Government and U.S. Government Agency Obligations | 59.2% |
| | AAA | 2.0% |
| | AA | 1.0% |
| | A | 6.9% |
| | BBB | 26.2% |
| | BB and Below | 4.1% |
| | Not Rated | 3.3% |
| | Short-Term Investments and Net Other Assets* | (2.7)% |

* Short-Term Investments and Net Other Assets (Liabilities) are not included in the pie chart
We have used ratings from Moody's Investors Service, Inc. Where Moody's® ratings are not available, we have used S&P® ratings. All ratings are as of the date indicated and do not reflect subsequent changes. Securities rated BB or below were rated investment grade at the time of acquisition.
Asset Allocation (% of fund's net assets)
| As of August 31, 2019 *,**,*** |
| | Corporate Bonds | 35.8% |
| | U.S. Government and U.S. Government Agency Obligations | 59.2% |
| | Asset-Backed Securities | 2.3% |
| | CMOs and Other Mortgage Related Securities | 3.6% |
| | Municipal Bonds | 1.0% |
| | Other Investments | 0.8% |
| | Short-Term Investments and Net Other Assets (Liabilities)† | (2.7)% |

* Foreign investments - 9.2%
** Futures and Swaps - 2.7%
*** Written options - (0.6)%
† Short-Term Investments and Net Other Assets (Liabilities) are not included in the pie chart
Percentages in the above tables are adjusted for the effect of TBA Sale Commitments.
Schedule of Investments August 31, 2019
Showing Percentage of Net Assets
| Nonconvertible Bonds - 35.8% | | | |
| | | Principal Amount | Value |
| COMMUNICATION SERVICES - 2.9% | | | |
| Diversified Telecommunication Services - 1.2% | | | |
| AT&T, Inc.: | | | |
| 2.45% 6/30/20 | | $18,005,000 | $18,037,553 |
| 3% 6/30/22 | | 20,000,000 | 20,447,522 |
| 3.4% 5/15/25 | | 51,500,000 | 54,091,621 |
| 3.6% 2/17/23 | | 56,273,000 | 58,825,351 |
| 3.6% 7/15/25 | | 9,728,000 | 10,251,995 |
| 4.3% 2/15/30 | | 13,625,000 | 15,129,609 |
| 4.45% 4/1/24 | | 2,396,000 | 2,607,285 |
| 4.5% 3/9/48 | | 33,550,000 | 36,620,691 |
| 6.2% 3/15/40 | | 15,555,000 | 19,999,259 |
| 6.3% 1/15/38 | | 40,737,000 | 52,746,086 |
| BellSouth Capital Funding Corp. 7.875% 2/15/30 | | 193,000 | 256,507 |
| Verizon Communications, Inc.: | | | |
| 4.862% 8/21/46 | | 17,028,000 | 21,203,594 |
| 5.012% 4/15/49 | | 6,512,000 | 8,324,533 |
| 5.5% 3/16/47 | | 18,182,000 | 24,405,627 |
| | | | 342,947,233 |
| Entertainment - 0.3% | | | |
| NBCUniversal, Inc.: | | | |
| 4.45% 1/15/43 | | 10,087,000 | 11,873,568 |
| 5.15% 4/30/20 | | 28,753,000 | 29,308,285 |
| 5.95% 4/1/41 | | 7,055,000 | 9,817,194 |
| The Walt Disney Co.: | | | |
| 6.15% 3/1/37 (a) | | 8,831,000 | 12,622,999 |
| 7.75% 12/1/45 (a) | | 8,830,000 | 15,556,703 |
| | | | 79,178,749 |
| Media - 1.4% | | | |
| Charter Communications Operating LLC/Charter Communications Operating Capital Corp.: | | | |
| 4.464% 7/23/22 | | 46,167,000 | 48,780,789 |
| 4.908% 7/23/25 | | 25,893,000 | 28,616,519 |
| 5.375% 5/1/47 | | 37,324,000 | 41,451,560 |
| 6.484% 10/23/45 | | 20,000,000 | 24,730,815 |
| Comcast Corp.: | | | |
| 3.9% 3/1/38 | | 5,337,000 | 5,984,235 |
| 4.6% 8/15/45 | | 14,241,000 | 17,219,927 |
| 4.65% 7/15/42 | | 12,725,000 | 15,527,693 |
| Fox Corp.: | | | |
| 3.666% 1/25/22 (a) | | 3,413,000 | 3,537,811 |
| 4.03% 1/25/24 (a) | | 6,000,000 | 6,425,940 |
| 4.709% 1/25/29 (a) | | 8,684,000 | 10,059,326 |
| 5.476% 1/25/39 (a) | | 8,563,000 | 10,699,619 |
| 5.576% 1/25/49 (a) | | 5,682,000 | 7,392,916 |
| Time Warner Cable, Inc.: | | | |
| 4% 9/1/21 | | 38,151,000 | 39,122,326 |
| 4.5% 9/15/42 | | 21,520,000 | 21,602,206 |
| 5.5% 9/1/41 | | 14,842,000 | 16,141,344 |
| 5.875% 11/15/40 | | 9,556,000 | 10,878,387 |
| 6.55% 5/1/37 | | 47,541,000 | 57,559,552 |
| 7.3% 7/1/38 | | 30,237,000 | 38,787,635 |
| | | | 404,518,600 |
| Wireless Telecommunication Services - 0.0% | | | |
| America Movil S.A.B. de CV 3.125% 7/16/22 | | 16,205,000 | 16,672,514 |
|
| TOTAL COMMUNICATION SERVICES | | | 843,317,096 |
|
| CONSUMER DISCRETIONARY - 0.4% | | | |
| Automobiles - 0.3% | | | |
| General Motors Financial Co., Inc.: | | | |
| 3.2% 7/13/20 | | 26,000,000 | 26,145,933 |
| 4.2% 3/1/21 | | 27,410,000 | 28,057,689 |
| 4.25% 5/15/23 | | 9,285,000 | 9,721,915 |
| 4.375% 9/25/21 | | 41,737,000 | 43,226,016 |
| | | | 107,151,553 |
| Diversified Consumer Services - 0.1% | | | |
| Ingersoll-Rand Global Holding Co. Ltd. 4.25% 6/15/23 | | 18,902,000 | 20,219,320 |
|
| TOTAL CONSUMER DISCRETIONARY | | | 127,370,873 |
|
| CONSUMER STAPLES - 2.7% | | | |
| Beverages - 1.1% | | | |
| Anheuser-Busch InBev Finance, Inc.: | | | |
| 4.7% 2/1/36 | | 48,449,000 | 56,396,350 |
| 4.9% 2/1/46 | | 59,642,000 | 70,939,070 |
| Anheuser-Busch InBev Worldwide, Inc.: | | | |
| 4.75% 4/15/58 | | 29,346,000 | 34,355,373 |
| 5.45% 1/23/39 | | 22,180,000 | 28,303,880 |
| 5.55% 1/23/49 | | 50,684,000 | 66,766,440 |
| 5.8% 1/23/59 (Reg. S) | | 53,730,000 | 73,317,283 |
| | | | 330,078,396 |
| Food & Staples Retailing - 0.1% | | | |
| Walgreens Boots Alliance, Inc. 2.7% 11/18/19 | | 14,218,000 | 14,222,993 |
| Food Products - 0.0% | | | |
| Conagra Brands, Inc. 3.8% 10/22/21 | | 5,378,000 | 5,533,096 |
| Tobacco - 1.5% | | | |
| Altria Group, Inc.: | | | |
| 2.85% 8/9/22 | | 31,563,000 | 32,213,904 |
| 3.875% 9/16/46 | | 21,780,000 | 21,393,141 |
| 4.25% 8/9/42 | | 26,130,000 | 26,935,772 |
| 4.5% 5/2/43 | | 17,568,000 | 18,686,479 |
| 4.8% 2/14/29 | | 26,202,000 | 29,669,939 |
| 5.375% 1/31/44 | | 31,709,000 | 37,511,896 |
| 5.95% 2/14/49 | | 17,400,000 | 22,339,552 |
| Imperial Tobacco Finance PLC: | | | |
| 2.95% 7/21/20 (a) | | 24,400,000 | 24,528,419 |
| 3.75% 7/21/22 (a) | | 56,649,000 | 58,595,954 |
| 4.25% 7/21/25 (a) | | 25,864,000 | 27,579,090 |
| Reynolds American, Inc.: | | | |
| 3.25% 6/12/20 | | 5,106,000 | 5,144,735 |
| 4% 6/12/22 | | 17,554,000 | 18,346,310 |
| 4.45% 6/12/25 | | 12,732,000 | 13,787,064 |
| 5.7% 8/15/35 | | 6,607,000 | 7,688,370 |
| 5.85% 8/15/45 | | 50,684,000 | 57,176,917 |
| 6.15% 9/15/43 | | 11,136,000 | 13,192,751 |
| 7.25% 6/15/37 | | 15,680,000 | 20,436,268 |
| | | | 435,226,561 |
|
| TOTAL CONSUMER STAPLES | | | 785,061,046 |
|
| ENERGY - 5.8% | | | |
| Energy Equipment & Services - 0.3% | | | |
| DCP Midstream LLC 6.75% 9/15/37 (a) | | 2,991,000 | 3,140,550 |
| El Paso Pipeline Partners Operating Co. LLC: | | | |
| 5% 10/1/21 | | 13,430,000 | 14,054,169 |
| 6.5% 4/1/20 | | 2,078,000 | 2,127,637 |
| Halliburton Co.: | | | |
| 3.8% 11/15/25 | | 12,900,000 | 13,665,308 |
| 4.85% 11/15/35 | | 11,266,000 | 12,714,832 |
| Noble Holding International Ltd.: | | | |
| 7.95% 4/1/25 (b) | | 32,232,000 | 20,467,320 |
| 8.95% 4/1/45 (b) | | 11,807,000 | 6,552,885 |
| Valaris PLC: | | | |
| 5.2% 3/15/25 | | 32,677,000 | 19,687,893 |
| 5.75% 10/1/44 | | 12,542,000 | 6,271,000 |
| | | | 98,681,594 |
| Oil, Gas & Consumable Fuels - 5.5% | | | |
| Amerada Hess Corp.: | | | |
| 7.125% 3/15/33 | | 4,838,000 | 6,075,674 |
| 7.3% 8/15/31 | | 6,392,000 | 7,964,441 |
| Anadarko Finance Co. 7.5% 5/1/31 | | 37,261,000 | 49,635,768 |
| Anadarko Petroleum Corp.: | | | |
| 4.85% 3/15/21 | | 8,165,000 | 8,440,874 |
| 5.55% 3/15/26 | | 25,624,000 | 29,024,051 |
| 6.45% 9/15/36 | | 22,220,000 | 27,834,487 |
| 6.6% 3/15/46 | | 51,358,000 | 68,480,104 |
| Canadian Natural Resources Ltd. 5.85% 2/1/35 | | 11,807,000 | 14,268,732 |
| Cenovus Energy, Inc. 4.25% 4/15/27 | | 26,894,000 | 28,084,173 |
| Columbia Pipeline Group, Inc.: | | | |
| 3.3% 6/1/20 | | 23,925,000 | 24,083,152 |
| 4.5% 6/1/25 | | 7,318,000 | 7,940,325 |
| DCP Midstream LLC: | | | |
| 4.75% 9/30/21 (a) | | 21,176,000 | 21,705,400 |
| 5.35% 3/15/20 (a) | | 39,799,000 | 40,276,588 |
| DCP Midstream Operating LP 3.875% 3/15/23 | | 38,871,000 | 39,356,888 |
| Duke Energy Field Services 6.45% 11/3/36 (a) | | 7,882,000 | 8,256,395 |
| El Paso Corp. 6.5% 9/15/20 | | 21,920,000 | 22,833,789 |
| Empresa Nacional de Petroleo 4.375% 10/30/24 (a) | | 16,015,000 | 17,151,064 |
| Enable Midstream Partners LP 3.9% 5/15/24 (b) | | 7,314,000 | 7,520,756 |
| Enbridge Energy Partners LP: | | | |
| 4.2% 9/15/21 | | 24,752,000 | 25,563,292 |
| 4.375% 10/15/20 | | 16,600,000 | 16,949,718 |
| Enbridge, Inc.: | | | |
| 4% 10/1/23 | | 13,539,000 | 14,331,950 |
| 4.25% 12/1/26 | | 8,212,000 | 9,102,250 |
| Energy Transfer Partners LP: | | | |
| 4.2% 9/15/23 | | 5,952,000 | 6,293,148 |
| 4.25% 3/15/23 | | 4,895,000 | 5,141,160 |
| 4.5% 4/15/24 | | 5,975,000 | 6,405,891 |
| 4.95% 6/15/28 | | 20,306,000 | 22,715,350 |
| 5.25% 4/15/29 | | 9,720,000 | 11,134,286 |
| 5.8% 6/15/38 | | 11,323,000 | 13,187,871 |
| 6% 6/15/48 | | 7,374,000 | 8,794,894 |
| 6.25% 4/15/49 | | 6,676,000 | 8,260,789 |
| Enterprise Products Operating LP: | | | |
| 2.55% 10/15/19 | | 4,990,000 | 4,989,619 |
| 3.75% 2/15/25 | | 16,764,000 | 17,974,002 |
| Kinder Morgan Energy Partners LP: | | | |
| 3.45% 2/15/23 | | 7,900,000 | 8,186,953 |
| 6.55% 9/15/40 | | 2,324,000 | 2,954,322 |
| Kinder Morgan, Inc. 5.55% 6/1/45 | | 11,527,000 | 13,832,832 |
| Marathon Petroleum Corp. 5.125% 3/1/21 | | 20,728,000 | 21,567,300 |
| MPLX LP: | | | |
| 4.5% 7/15/23 | | 9,847,000 | 10,507,560 |
| 4.8% 2/15/29 | | 5,209,000 | 5,794,269 |
| 4.875% 12/1/24 | | 13,954,000 | 15,305,399 |
| 5.5% 2/15/49 | | 15,628,000 | 17,913,306 |
| Nakilat, Inc. 6.067% 12/31/33 (a) | | 5,435,000 | 6,657,875 |
| Occidental Petroleum Corp.: | | | |
| 2.6% 8/13/21 | | 7,518,000 | 7,567,967 |
| 2.7% 8/15/22 | | 6,644,000 | 6,709,395 |
| 2.9% 8/15/24 | | 21,957,000 | 22,162,339 |
| 3.2% 8/15/26 | | 2,954,000 | 2,984,559 |
| 3.5% 8/15/29 | | 9,302,000 | 9,477,118 |
| 4.3% 8/15/39 | | 1,356,000 | 1,418,928 |
| 4.4% 8/15/49 | | 1,357,000 | 1,415,385 |
| Petrobras Global Finance BV 5.75% 2/1/29 | | 45,715,000 | 49,516,490 |
| Petroleos Mexicanos: | | | |
| 3.5% 1/30/23 | | 28,927,000 | 28,102,581 |
| 4.5% 1/23/26 | | 25,619,000 | 24,235,574 |
| 4.625% 9/21/23 | | 51,115,000 | 51,234,803 |
| 4.875% 1/24/22 | | 17,019,000 | 17,295,559 |
| 4.875% 1/18/24 | | 25,208,000 | 25,308,832 |
| 5.375% 3/13/22 | | 10,290,000 | 10,521,525 |
| 5.5% 1/21/21 | | 41,149,000 | 42,011,895 |
| 5.5% 6/27/44 | | 29,591,000 | 25,261,837 |
| 5.625% 1/23/46 | | 24,828,000 | 21,294,727 |
| 6% 3/5/20 | | 6,833,000 | 6,931,224 |
| 6.35% 2/12/48 | | 17,400,000 | 15,994,950 |
| 6.375% 1/23/45 | | 22,458,000 | 20,699,961 |
| 6.5% 3/13/27 | | 23,110,000 | 23,603,255 |
| 6.5% 6/2/41 | | 47,555,000 | 44,240,417 |
| 6.75% 9/21/47 | | 83,207,000 | 79,046,650 |
| 6.875% 8/4/26 | | 20,000,000 | 20,970,000 |
| Phillips 66 Partners LP 2.646% 2/15/20 | | 2,101,000 | 2,101,876 |
| Plains All American Pipeline LP/PAA Finance Corp.: | | | |
| 3.6% 11/1/24 | | 6,687,000 | 6,870,226 |
| 3.65% 6/1/22 | | 25,681,000 | 26,394,298 |
| 3.85% 10/15/23 | | 25,000,000 | 25,950,108 |
| Regency Energy Partners LP/Regency Energy Finance Corp. 5.875% 3/1/22 | | 9,720,000 | 10,435,070 |
| Southwestern Energy Co. 6.2% 1/23/25 (b) | | 13,262,000 | 11,604,250 |
| Sunoco Logistics Partner Operations LP 5.4% 10/1/47 | | 6,434,000 | 7,176,313 |
| The Williams Companies, Inc.: | | | |
| 3.7% 1/15/23 | | 18,174,000 | 18,853,942 |
| 4.55% 6/24/24 | | 86,182,000 | 93,341,560 |
| Western Gas Partners LP: | | | |
| 4.65% 7/1/26 | | 5,606,000 | 5,709,262 |
| 4.75% 8/15/28 | | 5,645,000 | 5,717,686 |
| 5.375% 6/1/21 | | 39,434,000 | 40,774,980 |
| Williams Partners LP: | | | |
| 3.6% 3/15/22 | | 17,478,000 | 17,995,139 |
| 3.9% 1/15/25 | | 6,023,000 | 6,333,063 |
| 4% 11/15/21 | | 10,934,000 | 11,260,755 |
| 4.125% 11/15/20 | | 4,302,000 | 4,373,988 |
| 4.3% 3/4/24 | | 17,006,000 | 18,151,775 |
| 4.5% 11/15/23 | | 8,697,000 | 9,363,561 |
| | | | 1,582,910,520 |
|
| TOTAL ENERGY | | | 1,681,592,114 |
|
| FINANCIALS - 15.5% | | | |
| Banks - 6.2% | | | |
| Bank of America Corp.: | | | |
| 3.004% 12/20/23 (b) | | 96,563,000 | 99,097,435 |
| 3.3% 1/11/23 | | 22,906,000 | 23,813,435 |
| 3.419% 12/20/28 (b) | | 29,790,000 | 31,438,162 |
| 3.5% 4/19/26 | | 25,446,000 | 27,264,384 |
| 3.864% 7/23/24 (b) | | 7,284,000 | 7,734,228 |
| 3.95% 4/21/25 | | 22,702,000 | 24,239,048 |
| 4.1% 7/24/23 | | 35,172,000 | 37,790,905 |
| 4.2% 8/26/24 | | 36,930,000 | 39,856,703 |
| 4.25% 10/22/26 | | 24,664,000 | 26,925,292 |
| 4.45% 3/3/26 | | 7,110,000 | 7,829,358 |
| Barclays PLC: | | | |
| 2.75% 11/8/19 | | 20,644,000 | 20,654,180 |
| 3.25% 1/12/21 | | 24,010,000 | 24,205,666 |
| 4.375% 1/12/26 | | 32,341,000 | 34,131,753 |
| 5.088% 6/20/30 (b) | | 35,130,000 | 36,491,740 |
| 5.2% 5/12/26 | | 26,409,000 | 28,037,062 |
| Citigroup, Inc.: | | | |
| 2.4% 2/18/20 | | 57,223,000 | 57,274,962 |
| 2.75% 4/25/22 | | 25,000,000 | 25,447,911 |
| 2.9% 12/8/21 | | 20,972,000 | 21,336,484 |
| 3.142% 1/24/23 (b) | | 22,396,000 | 22,901,226 |
| 3.352% 4/24/25 (b) | | 23,819,000 | 24,885,853 |
| 4.05% 7/30/22 | | 10,740,000 | 11,263,520 |
| 4.3% 11/20/26 | | 8,693,000 | 9,486,976 |
| 4.4% 6/10/25 | | 60,947,000 | 66,136,690 |
| 4.45% 9/29/27 | | 6,943,000 | 7,640,728 |
| 5.5% 9/13/25 | | 14,330,000 | 16,423,907 |
| Citizens Bank NA 2.55% 5/13/21 | | 7,737,000 | 7,791,259 |
| Citizens Financial Group, Inc. 4.15% 9/28/22 (a) | | 27,180,000 | 28,371,237 |
| Credit Suisse Group Funding Guernsey Ltd.: | | | |
| 2.75% 3/26/20 | | 26,632,000 | 26,704,613 |
| 3.75% 3/26/25 | | 26,750,000 | 28,274,979 |
| 3.8% 9/15/22 | | 38,070,000 | 39,730,395 |
| 3.8% 6/9/23 | | 42,579,000 | 44,701,696 |
| Discover Bank: | | | |
| 4.2% 8/8/23 | | 35,498,000 | 38,116,656 |
| 7% 4/15/20 | | 9,043,000 | 9,295,711 |
| Fifth Third Bancorp 8.25% 3/1/38 | | 12,528,000 | 19,456,204 |
| HSBC Holdings PLC 4.25% 3/14/24 | | 12,220,000 | 12,894,972 |
| Huntington Bancshares, Inc. 7% 12/15/20 | | 4,459,000 | 4,725,042 |
| Intesa Sanpaolo SpA: | | | |
| 5.017% 6/26/24 (a) | | 6,553,000 | 6,716,881 |
| 5.71% 1/15/26 (a) | | 50,790,000 | 53,587,820 |
| JPMorgan Chase & Co.: | | | |
| 2.95% 10/1/26 | | 27,458,000 | 28,483,778 |
| 3.25% 9/23/22 | | 53,888,000 | 55,849,875 |
| 3.797% 7/23/24 (b) | | 63,894,000 | 67,871,817 |
| 3.875% 9/10/24 | | 52,753,000 | 56,398,758 |
| 4.125% 12/15/26 | | 48,163,000 | 53,054,641 |
| 4.25% 10/15/20 | | 8,000,000 | 8,195,652 |
| 4.35% 8/15/21 | | 37,606,000 | 39,240,738 |
| 4.625% 5/10/21 | | 10,326,000 | 10,761,175 |
| Rabobank Nederland 4.375% 8/4/25 | | 39,970,000 | 43,206,874 |
| Regions Bank 6.45% 6/26/37 | | 40,184,000 | 53,801,652 |
| Regions Financial Corp. 3.2% 2/8/21 | | 14,047,000 | 14,237,445 |
| Royal Bank of Scotland Group PLC: | | | |
| 4.8% 4/5/26 | | 42,281,000 | 46,164,378 |
| 5.125% 5/28/24 | | 45,938,000 | 48,616,175 |
| 6% 12/19/23 | | 40,227,000 | 43,810,684 |
| 6.1% 6/10/23 | | 44,386,000 | 48,137,980 |
| 6.125% 12/15/22 | | 71,538,000 | 77,389,135 |
| UniCredit SpA 6.572% 1/14/22 (a) | | 26,358,000 | 28,342,412 |
| Westpac Banking Corp. 4.11% 7/24/34 (b) | | 17,896,000 | 18,839,800 |
| | | | 1,795,078,042 |
| Capital Markets - 4.1% | | | |
| Affiliated Managers Group, Inc.: | | | |
| 3.5% 8/1/25 | | 30,803,000 | 32,113,502 |
| 4.25% 2/15/24 | | 23,736,000 | 25,520,375 |
| Ares Capital Corp. 4.2% 6/10/24 | | 42,712,000 | 44,336,653 |
| Credit Suisse Group AG 3.869% 1/12/29 (a)(b) | | 19,608,000 | 20,887,265 |
| Deutsche Bank AG 4.5% 4/1/25 | | 67,755,000 | 64,012,175 |
| Deutsche Bank AG New York Branch: | | | |
| 3.15% 1/22/21 | | 18,975,000 | 18,908,499 |
| 3.3% 11/16/22 | | 46,140,000 | 45,860,504 |
| 5% 2/14/22 | | 43,313,000 | 44,894,248 |
| Goldman Sachs Group, Inc.: | | | |
| 2.876% 10/31/22 (b) | | 158,668,000 | 160,853,991 |
| 3.2% 2/23/23 | | 83,857,000 | 86,639,868 |
| 3.272% 9/29/25 (b) | | 52,832,000 | 54,970,080 |
| 4.25% 10/21/25 | | 26,330,000 | 28,400,962 |
| 6.75% 10/1/37 | | 11,247,000 | 15,409,446 |
| IntercontinentalExchange, Inc. 2.75% 12/1/20 | | 8,512,000 | 8,584,292 |
| Moody's Corp.: | | | |
| 2.75% 12/15/21 | | 5,835,000 | 5,913,962 |
| 3.25% 1/15/28 | | 11,244,000 | 11,856,737 |
| 4.875% 2/15/24 | | 10,558,000 | 11,697,501 |
| Morgan Stanley: | | | |
| 3.125% 1/23/23 | | 52,000,000 | 53,616,674 |
| 3.7% 10/23/24 | | 18,925,000 | 20,215,792 |
| 3.737% 4/24/24 (b) | | 163,561,000 | 172,079,257 |
| 3.75% 2/25/23 | | 53,516,000 | 56,291,795 |
| 4.1% 5/22/23 | | 20,000,000 | 21,178,779 |
| 4.431% 1/23/30 (b) | | 20,903,000 | 23,855,289 |
| 4.875% 11/1/22 | | 39,633,000 | 42,635,031 |
| 5% 11/24/25 | | 39,759,000 | 44,860,190 |
| 5.625% 9/23/19 | | 16,919,000 | 16,948,150 |
| 5.75% 1/25/21 | | 26,624,000 | 27,932,801 |
| UBS Group Funding Ltd. 4.125% 9/24/25 (a) | | 27,816,000 | 30,272,454 |
| | | | 1,190,746,272 |
| Consumer Finance - 1.6% | | | |
| AerCap Ireland Capital Ltd./AerCap Global Aviation Trust: | | | |
| 2.875% 8/14/24 | | 29,196,000 | 29,291,749 |
| 3.5% 5/26/22 | | 8,162,000 | 8,384,766 |
| 4.125% 7/3/23 | | 21,033,000 | 22,312,094 |
| 4.45% 12/16/21 | | 13,913,000 | 14,457,096 |
| 4.45% 4/3/26 | | 14,780,000 | 15,869,746 |
| 4.5% 5/15/21 | | 5,650,000 | 5,828,497 |
| 4.875% 1/16/24 | | 23,718,000 | 25,726,064 |
| 5% 10/1/21 | | 8,475,000 | 8,886,862 |
| Capital One Financial Corp. 3.8% 1/31/28 | | 21,736,000 | 23,173,417 |
| Discover Financial Services: | | | |
| 3.75% 3/4/25 | | 20,000,000 | 21,056,642 |
| 3.85% 11/21/22 | | 38,277,000 | 40,149,275 |
| 3.95% 11/6/24 | | 16,412,000 | 17,495,631 |
| 4.5% 1/30/26 | | 22,355,000 | 24,689,399 |
| 5.2% 4/27/22 | | 16,852,000 | 18,121,863 |
| Ford Motor Credit Co. LLC: | | | |
| 5.085% 1/7/21 | | 13,940,000 | 14,361,644 |
| 5.584% 3/18/24 | | 29,713,000 | 31,954,003 |
| 5.596% 1/7/22 | | 28,839,000 | 30,496,776 |
| Synchrony Financial: | | | |
| 2.85% 7/25/22 | | 7,345,000 | 7,444,111 |
| 3.75% 8/15/21 | | 12,146,000 | 12,419,916 |
| 3.95% 12/1/27 | | 37,578,000 | 38,956,570 |
| 4.25% 8/15/24 | | 12,226,000 | 13,017,290 |
| 4.375% 3/19/24 | | 10,847,000 | 11,586,385 |
| 5.15% 3/19/29 | | 31,181,000 | 35,115,175 |
| | | | 470,794,971 |
| Diversified Financial Services - 1.4% | | | |
| Avolon Holdings Funding Ltd.: | | | |
| 3.625% 5/1/22 (a) | | 7,566,000 | 7,674,194 |
| 3.95% 7/1/24 (a) | | 10,050,000 | 10,343,460 |
| 4.375% 5/1/26 (a) | | 12,230,000 | 12,698,409 |
| 5.25% 5/15/24 (a) | | 18,329,000 | 19,661,518 |
| AXA Equitable Holdings, Inc. 3.9% 4/20/23 | | 5,194,000 | 5,455,209 |
| Brixmor Operating Partnership LP: | | | |
| 3.25% 9/15/23 | | 36,362,000 | 37,434,940 |
| 3.85% 2/1/25 | | 22,346,000 | 23,487,936 |
| 3.875% 8/15/22 | | 17,670,000 | 18,438,606 |
| 4.125% 6/15/26 | | 22,815,000 | 24,319,972 |
| 4.125% 5/15/29 | | 24,605,000 | 26,618,340 |
| Cigna Corp.: | | | |
| 3.75% 7/15/23 | | 23,504,000 | 24,708,773 |
| 4.125% 11/15/25 | | 17,365,000 | 18,892,546 |
| 4.375% 10/15/28 | | 29,335,000 | 32,802,428 |
| 4.8% 8/15/38 | | 18,265,000 | 21,116,976 |
| 4.9% 12/15/48 | | 18,248,000 | 21,594,513 |
| Park Aerospace Holdings Ltd. 5.5% 2/15/24 (a) | | 29,800,000 | 32,225,720 |
| Pine Street Trust I: | | | |
| 4.572% 2/15/29 (a) | | 27,369,000 | 29,544,555 |
| 5.568% 2/15/49 (a) | | 27,400,000 | 31,347,243 |
| Voya Financial, Inc. 3.125% 7/15/24 | | 13,735,000 | 14,192,245 |
| | | | 412,557,583 |
| Insurance - 2.2% | | | |
| American International Group, Inc.: | | | |
| 3.3% 3/1/21 | | 11,928,000 | 12,125,408 |
| 3.875% 1/15/35 | | 29,736,000 | 31,563,312 |
| 4.875% 6/1/22 | | 26,181,000 | 28,041,750 |
| Aon Corp. 5% 9/30/20 | | 5,687,000 | 5,858,262 |
| Liberty Mutual Group, Inc. 4.569% 2/1/29 (a) | | 23,174,000 | 26,375,112 |
| Marsh & McLennan Companies, Inc.: | | | |
| 4.375% 3/15/29 | | 18,840,000 | 21,643,058 |
| 4.75% 3/15/39 | | 8,645,000 | 10,822,960 |
| 4.8% 7/15/21 | | 13,119,000 | 13,668,990 |
| 4.9% 3/15/49 | | 17,204,000 | 22,335,814 |
| Massachusetts Mutual Life Insurance Co. 4.5% 4/15/65 (a) | | 34,265,000 | 41,851,166 |
| MetLife, Inc. 3.048% 12/15/22 (b) | | 21,302,000 | 22,004,298 |
| Metropolitan Life Global Funding I: | | | |
| U.S. SOFR SEC OVRN FIN RATE INDX + 0.500% 2.62% 5/28/21 (a)(b)(c) | | 132,169,000 | 132,268,349 |
| 3% 1/10/23 (a) | | 15,204,000 | 15,680,960 |
| Pacific LifeCorp 5.125% 1/30/43 (a) | | 30,812,000 | 37,142,413 |
| Pricoa Global Funding I 5.375% 5/15/45 (b) | | 27,275,000 | 29,101,334 |
| Swiss Re Finance Luxembourg SA 5% 4/2/49 (a)(b) | | 10,800,000 | 11,907,000 |
| Teachers Insurance & Annuity Association of America 4.9% 9/15/44 (a) | | 29,603,000 | 37,256,971 |
| TIAA Asset Management Finance LLC 4.125% 11/1/24 (a) | | 10,239,000 | 11,137,325 |
| Unum Group: | | | |
| 3.875% 11/5/25 | | 25,368,000 | 26,780,539 |
| 4% 6/15/29 | | 21,140,000 | 22,209,703 |
| 5.625% 9/15/20 | | 18,528,000 | 19,153,495 |
| 5.75% 8/15/42 | | 40,693,000 | 50,526,957 |
| | | | 629,455,176 |
|
| TOTAL FINANCIALS | | | 4,498,632,044 |
|
| HEALTH CARE - 2.3% | | | |
| Health Care Providers & Services - 1.4% | | | |
| CVS Health Corp.: | | | |
| 2.625% 8/15/24 | | 3,747,000 | 3,768,472 |
| 3% 8/15/26 | | 3,041,000 | 3,078,196 |
| 3.25% 8/15/29 | | 6,986,000 | 7,080,516 |
| 3.7% 3/9/23 | | 13,600,000 | 14,221,487 |
| 4% 12/5/23 | | 18,015,000 | 19,149,241 |
| 4.1% 3/25/25 | | 81,952,000 | 87,674,908 |
| 4.3% 3/25/28 | | 68,226,000 | 74,471,484 |
| 4.78% 3/25/38 | | 30,372,000 | 34,058,017 |
| 5.05% 3/25/48 | | 44,655,000 | 52,030,269 |
| Elanco Animal Health, Inc.: | | | |
| 3.912% 8/27/21 | | 4,903,000 | 4,997,545 |
| 4.272% 8/28/23 | | 15,472,000 | 16,205,444 |
| 4.9% 8/28/28 | | 6,518,000 | 7,108,680 |
| Medco Health Solutions, Inc. 4.125% 9/15/20 | | 11,062,000 | 11,250,578 |
| Toledo Hospital: | | | |
| 5.325% 11/15/28 | | 10,187,000 | 11,509,831 |
| 6.015% 11/15/48 | | 34,959,000 | 44,094,846 |
| WellPoint, Inc. 3.3% 1/15/23 | | 21,022,000 | 21,712,652 |
| | | | 412,412,166 |
| Pharmaceuticals - 0.9% | | | |
| Actavis Funding SCS 3.45% 3/15/22 | | 25,461,000 | 26,146,880 |
| Allergan PLC 3.25% 10/1/22 | | 15,000,000 | 15,330,641 |
| Bayer U.S. Finance II LLC 4.25% 12/15/25 (a) | | 20,553,000 | 22,152,022 |
| Mylan NV: | | | |
| 3.15% 6/15/21 | | 24,804,000 | 25,096,919 |
| 3.95% 6/15/26 | | 37,112,000 | 38,617,321 |
| Perrigo Finance PLC 3.5% 12/15/21 | | 2,562,000 | 2,573,556 |
| Shire Acquisitions Investments Ireland DAC 2.875% 9/23/23 | | 50,000,000 | 51,140,569 |
| Teva Pharmaceutical Finance Netherlands III BV: | | | |
| 2.2% 7/21/21 | | 17,346,000 | 16,240,193 |
| 2.8% 7/21/23 | | 15,491,000 | 13,051,168 |
| Zoetis, Inc. 3.25% 2/1/23 | | 33,171,000 | 34,308,161 |
| | | | 244,657,430 |
|
| TOTAL HEALTH CARE | | | 657,069,596 |
|
| INDUSTRIALS - 0.5% | | | |
| Aerospace & Defense - 0.1% | | | |
| BAE Systems Holdings, Inc. 3.8% 10/7/24 (a) | | 15,580,000 | 16,538,965 |
| Professional Services - 0.0% | | | |
| Thomson Reuters Corp. 3.85% 9/29/24 | | 5,745,000 | 6,051,884 |
| Trading Companies & Distributors - 0.4% | | | |
| Air Lease Corp.: | | | |
| 3% 9/15/23 | | 4,809,000 | 4,894,595 |
| 3.375% 6/1/21 | | 12,831,000 | 13,043,041 |
| 3.75% 2/1/22 | | 25,484,000 | 26,254,522 |
| 3.875% 4/1/21 | | 17,429,000 | 17,832,033 |
| 4.25% 2/1/24 | | 27,160,000 | 28,992,324 |
| 4.25% 9/15/24 | | 19,743,000 | 21,224,344 |
| 4.75% 3/1/20 | | 19,421,000 | 19,638,978 |
| | | | 131,879,837 |
| Transportation Infrastructure - 0.0% | | | |
| BNSF Funding Trust I 6.613% 12/15/55 (b) | | 2,599,000 | 2,865,398 |
|
| TOTAL INDUSTRIALS | | | 157,336,084 |
|
| INFORMATION TECHNOLOGY - 0.1% | | | |
| Electronic Equipment & Components - 0.1% | | | |
| Diamond 1 Finance Corp./Diamond 2 Finance Corp.: | | | |
| 5.45% 6/15/23 (a) | | 21,206,000 | 23,048,485 |
| 6.02% 6/15/26 (a) | | 7,331,000 | 8,273,753 |
| | | | 31,322,238 |
| MATERIALS - 0.3% | | | |
| Chemicals - 0.1% | | | |
| Nutrien Ltd.: | | | |
| 4.2% 4/1/29 | | 2,900,000 | 3,241,170 |
| 5% 4/1/49 | | 5,049,000 | 6,027,251 |
| The Dow Chemical Co. 4.125% 11/15/21 | | 19,768,000 | 20,512,050 |
| | | | 29,780,471 |
| Metals & Mining - 0.2% | | | |
| BHP Billiton Financial (U.S.A.) Ltd.: | | | |
| 6.25% 10/19/75 (a)(b) | | 10,050,000 | 10,446,573 |
| 6.75% 10/19/75 (a)(b) | | 24,962,000 | 29,235,494 |
| Corporacion Nacional del Cobre de Chile (Codelco): | | | |
| 3.625% 8/1/27 (a) | | 8,127,000 | 8,703,509 |
| 4.5% 8/1/47 (a) | | 6,415,000 | 7,535,620 |
| | | | 55,921,196 |
|
| TOTAL MATERIALS | | | 85,701,667 |
|
| REAL ESTATE - 3.4% | | | |
| Equity Real Estate Investment Trusts (REITs) - 2.2% | | | |
| American Campus Communities Operating Partnership LP 3.75% 4/15/23 | | 7,324,000 | 7,676,732 |
| AvalonBay Communities, Inc. 3.625% 10/1/20 | | 12,415,000 | 12,575,917 |
| Boston Properties, Inc.: | | | |
| 3.85% 2/1/23 | | 10,817,000 | 11,418,195 |
| 4.5% 12/1/28 | | 17,981,000 | 20,776,083 |
| Camden Property Trust: | | | |
| 2.95% 12/15/22 | | 12,066,000 | 12,372,518 |
| 4.25% 1/15/24 | | 20,255,000 | 21,923,507 |
| Corporate Office Properties LP 5% 7/1/25 | | 16,542,000 | 18,002,453 |
| DDR Corp.: | | | |
| 3.625% 2/1/25 | | 12,380,000 | 12,774,015 |
| 4.25% 2/1/26 | | 14,917,000 | 15,905,309 |
| 4.625% 7/15/22 | | 6,024,000 | 6,316,123 |
| Duke Realty LP: | | | |
| 3.625% 4/15/23 | | 22,930,000 | 24,009,000 |
| 3.75% 12/1/24 | | 9,068,000 | 9,699,984 |
| 3.875% 10/15/22 | | 20,422,000 | 21,406,740 |
| Equity One, Inc. 3.75% 11/15/22 | | 30,646,000 | 31,940,263 |
| ERP Operating LP 4.75% 7/15/20 | | 31,427,000 | 31,929,894 |
| HCP, Inc.: | | | |
| 3.25% 7/15/26 | | 2,740,000 | 2,833,520 |
| 3.5% 7/15/29 | | 3,133,000 | 3,308,443 |
| Hudson Pacific Properties LP 4.65% 4/1/29 | | 36,999,000 | 41,586,289 |
| Lexington Corporate Properties Trust 4.4% 6/15/24 | | 7,941,000 | 8,308,432 |
| Omega Healthcare Investors, Inc.: | | | |
| 4.375% 8/1/23 | | 29,828,000 | 31,435,558 |
| 4.5% 1/15/25 | | 13,762,000 | 14,549,640 |
| 4.5% 4/1/27 | | 73,646,000 | 78,858,855 |
| 4.75% 1/15/28 | | 30,475,000 | 33,187,031 |
| 4.95% 4/1/24 | | 7,519,000 | 8,095,568 |
| 5.25% 1/15/26 | | 29,837,000 | 33,018,149 |
| Retail Opportunity Investments Partnership LP: | | | |
| 4% 12/15/24 | | 5,631,000 | 5,760,999 |
| 5% 12/15/23 | | 4,225,000 | 4,478,346 |
| Store Capital Corp. 4.625% 3/15/29 | | 8,550,000 | 9,498,929 |
| Ventas Realty LP: | | | |
| 3% 1/15/30 | | 21,344,000 | 21,486,739 |
| 3.125% 6/15/23 | | 6,397,000 | 6,602,165 |
| 3.5% 2/1/25 | | 8,762,000 | 9,220,364 |
| 4% 3/1/28 | | 11,430,000 | 12,418,174 |
| 4.125% 1/15/26 | | 8,443,000 | 9,150,835 |
| Weingarten Realty Investors 3.375% 10/15/22 | | 4,634,000 | 4,746,671 |
| WP Carey, Inc.: | | | |
| 3.85% 7/15/29 | | 6,115,000 | 6,492,730 |
| 4% 2/1/25 | | 30,215,000 | 31,878,011 |
| | | | 635,642,181 |
| Real Estate Management & Development - 1.2% | | | |
| Brandywine Operating Partnership LP: | | | |
| 3.95% 2/15/23 | | 30,680,000 | 32,093,097 |
| 3.95% 11/15/27 | | 22,384,000 | 23,599,474 |
| 4.1% 10/1/24 | | 24,424,000 | 25,877,441 |
| 4.55% 10/1/29 | | 23,929,000 | 26,167,404 |
| Digital Realty Trust LP: | | | |
| 3.95% 7/1/22 | | 17,850,000 | 18,694,566 |
| 4.75% 10/1/25 | | 18,728,000 | 20,779,052 |
| Liberty Property LP: | | | |
| 3.375% 6/15/23 | | 12,723,000 | 13,205,404 |
| 3.75% 4/1/25 | | 17,751,000 | 18,738,732 |
| 4.125% 6/15/22 | | 11,558,000 | 12,108,350 |
| 4.4% 2/15/24 | | 32,513,000 | 35,250,233 |
| 4.75% 10/1/20 | | 17,245,000 | 17,614,430 |
| Mack-Cali Realty LP: | | | |
| 3.15% 5/15/23 | | 41,165,000 | 39,141,050 |
| 4.5% 4/18/22 | | 7,126,000 | 7,157,844 |
| Post Apartment Homes LP 3.375% 12/1/22 | | 4,560,000 | 4,710,669 |
| Tanger Properties LP: | | | |
| 3.125% 9/1/26 | | 14,745,000 | 14,610,212 |
| 3.75% 12/1/24 | | 19,449,000 | 20,006,311 |
| 3.875% 12/1/23 | | 10,722,000 | 11,110,138 |
| Washington Prime Group LP 3.85% 4/1/20 | | 20,000,000 | 19,870,600 |
| | | | 360,735,007 |
|
| TOTAL REAL ESTATE | | | 996,377,188 |
|
| UTILITIES - 1.9% | | | |
| Electric Utilities - 1.1% | | | |
| American Electric Power Co., Inc. 2.95% 12/15/22 | | 9,568,000 | 9,772,981 |
| Duquesne Light Holdings, Inc.: | | | |
| 5.9% 12/1/21 (a) | | 15,117,000 | 16,132,268 |
| 6.4% 9/15/20 (a) | | 34,900,000 | 36,210,505 |
| Eversource Energy 2.8% 5/1/23 | | 32,099,000 | 32,693,580 |
| Exelon Corp. 2.85% 6/15/20 | | 7,468,000 | 7,501,258 |
| FirstEnergy Corp.: | | | |
| 4.25% 3/15/23 | | 66,372,000 | 70,532,010 |
| 7.375% 11/15/31 | | 30,718,000 | 44,046,799 |
| IPALCO Enterprises, Inc.: | | | |
| 3.45% 7/15/20 | | 42,035,000 | 42,288,058 |
| 3.7% 9/1/24 | | 10,405,000 | 10,885,949 |
| LG&E and KU Energy LLC 3.75% 11/15/20 | | 2,232,000 | 2,265,574 |
| NV Energy, Inc. 6.25% 11/15/20 | | 7,075,000 | 7,398,152 |
| PPL Capital Funding, Inc. 3.4% 6/1/23 | | 15,470,000 | 15,987,350 |
| TECO Finance, Inc. 5.15% 3/15/20 | | 11,097,000 | 11,256,503 |
| | | | 306,970,987 |
| Gas Utilities - 0.0% | | | |
| Southern Natural Gas Co./Southern Natural Issuing Corp. 4.4% 6/15/21 | | 6,702,000 | 6,895,318 |
| Independent Power and Renewable Electricity Producers - 0.1% | | | |
| Emera U.S. Finance LP: | | | |
| 2.7% 6/15/21 | | 5,862,000 | 5,904,292 |
| 3.55% 6/15/26 | | 9,377,000 | 9,896,499 |
| | | | 15,800,791 |
| Multi-Utilities - 0.7% | | | |
| Dominion Energy, Inc.: | | | |
| 3 month U.S. LIBOR + 2.300% 4.6299% 9/30/66 (b)(c) | | 66,502,000 | 62,179,370 |
| 3 month U.S. LIBOR + 2.825% 5.1549% 6/30/66 (b)(c) | | 7,991,000 | 7,551,495 |
| NiSource Finance Corp.: | | | |
| 5.8% 2/1/42 | | 11,523,000 | 15,121,733 |
| 5.95% 6/15/41 | | 21,763,000 | 29,080,719 |
| NiSource, Inc. 2.95% 9/1/29 | | 41,655,000 | 42,586,292 |
| Puget Energy, Inc.: | | | |
| 6% 9/1/21 | | 26,400,000 | 28,176,072 |
| 6.5% 12/15/20 | | 8,451,000 | 8,884,967 |
| Sempra Energy 2.875% 10/1/22 | | 9,886,000 | 10,044,138 |
| Wisconsin Energy Corp. 3 month U.S. LIBOR + 2.113% 4.2706% 5/15/67 (b)(c) | | 13,102,000 | 11,080,492 |
| | | | 214,705,278 |
|
| TOTAL UTILITIES | | | 544,372,374 |
|
| TOTAL NONCONVERTIBLE BONDS | | | |
| (Cost $9,746,259,793) | | | 10,408,152,320 |
|
| U.S. Government and Government Agency Obligations - 32.0% | | | |
| U.S. Treasury Inflation-Protected Obligations - 4.0% | | | |
| U.S. Treasury Inflation-Indexed Bonds: | | | |
| 0.75% 2/15/45 | | $65,202,399 | $71,212,961 |
| 0.875% 2/15/47 | | 72,230,500 | 81,715,482 |
| 1% 2/15/46 | | 28,322,986 | 32,800,560 |
| 1% 2/15/49 | | 44,106,040 | 52,067,863 |
| U.S. Treasury Inflation-Indexed Notes: | | | |
| 0.125% 7/15/24 | | 90,163,355 | 90,886,857 |
| 0.125% 7/15/26 | | 69,928,636 | 70,760,154 |
| 0.25% 7/15/29 | | 15,020,550 | 15,453,688 |
| 0.375% 7/15/25 | | 280,853,666 | 287,782,067 |
| 0.375% 1/15/27 | | 125,940,145 | 129,315,136 |
| 0.625% 1/15/26 | | 211,445,583 | 219,557,707 |
| 0.875% 1/15/29 | | 112,691,918 | 122,012,333 |
|
| TOTAL U.S. TREASURY INFLATION-PROTECTED OBLIGATIONS | | | 1,173,564,808 |
|
| U.S. Treasury Obligations - 28.0% | | | |
| U.S. Treasury Bonds: | | | |
| 2.875% 5/15/49 (d) | | 50,000,000 | 60,294,200 |
| 3% 2/15/49 | | 940,761,000 | 1,158,973,442 |
| U.S. Treasury Notes: | | | |
| 1.25% 8/31/24 | | 500,000,000 | 496,621,095 |
| 1.375% 8/31/26 | | 945,578,000 | 940,591,551 |
| 1.625% 8/15/29 | | 851,300,000 | 860,976,889 |
| 1.75% 7/31/24 (d) | | 235,000,000 | 238,938,085 |
| 1.875% 3/31/22 | | 711,519,000 | 718,856,540 |
| 1.875% 7/31/22 | | 150,905,000 | 152,750,049 |
| 2% 12/31/21 | | 225,143,000 | 227,728,628 |
| 2.125% 3/31/24 | | 172,231,000 | 177,619,946 |
| 2.125% 11/30/24 | | 379,473,000 | 392,902,785 |
| 2.125% 5/31/26 | | 384,655,000 | 401,183,145 |
| 2.25% 4/30/24 | | 274,340,000 | 284,659,900 |
| 2.25% 12/31/24 | | 247,871,000 | 258,386,154 |
| 2.25% 11/15/27 | | 51,332,000 | 54,389,863 |
| 2.375% 4/30/26 | | 317,775,000 | 336,295,324 |
| 2.5% 1/31/24 | | 316,100,000 | 330,645,537 |
| 2.625% 12/31/23 | | 148,680,000 | 156,172,077 |
| 2.75% 6/30/25 | | 165,101,000 | 177,167,562 |
| 2.75% 2/15/28 | | 132,320,000 | 145,608,857 |
| 2.875% 11/30/25 | | 45,884,000 | 49,780,556 |
| 3.125% 11/15/28 | | 436,958,000 | 497,671,265 |
|
| TOTAL U.S. TREASURY OBLIGATIONS | | | 8,118,213,450 |
|
| TOTAL U.S. GOVERNMENT AND GOVERNMENT AGENCY OBLIGATIONS | | | |
| (Cost $8,817,073,657) | | | 9,291,778,258 |
|
| U.S. Government Agency - Mortgage Securities - 27.2% | | | |
| Fannie Mae - 8.2% | | | |
| 12 month U.S. LIBOR + 1.365% 4.115% 10/1/35 (b)(c) | | 31,016 | 32,080 |
| 12 month U.S. LIBOR + 1.445% 4.497% 4/1/37 (b)(c) | | 117,061 | 121,649 |
| 12 month U.S. LIBOR + 1.480% 4.242% 7/1/34 (b)(c) | | 71,390 | 74,308 |
| 12 month U.S. LIBOR + 1.495% 4.509% 1/1/35 (b)(c) | | 128,643 | 133,267 |
| 12 month U.S. LIBOR + 1.553% 4.337% 6/1/36 (b)(c) | | 81,189 | 84,645 |
| 12 month U.S. LIBOR + 1.565% 4.69% 3/1/37 (b)(c) | | 52,183 | 54,367 |
| 12 month U.S. LIBOR + 1.594% 4.485% 5/1/36 (b)(c) | | 246,743 | 257,252 |
| 12 month U.S. LIBOR + 1.617% 4.583% 3/1/33 (b)(c) | | 93,496 | 97,049 |
| 12 month U.S. LIBOR + 1.641% 4.38% 9/1/36 (b)(c) | | 67,071 | 69,902 |
| 12 month U.S. LIBOR + 1.645% 4.693% 6/1/47 (b)(c) | | 108,207 | 113,469 |
| 12 month U.S. LIBOR + 1.666% 4.538% 11/1/36 (b)(c) | | 204,704 | 213,468 |
| 12 month U.S. LIBOR + 1.711% 4.595% 6/1/42 (b)(c) | | 825,045 | 858,590 |
| 12 month U.S. LIBOR + 1.718% 4.399% 5/1/35 (b)(c) | | 200,961 | 209,389 |
| 12 month U.S. LIBOR + 1.745% 4.755% 7/1/35 (b)(c) | | 138,123 | 143,975 |
| 12 month U.S. LIBOR + 1.750% 4.479% 8/1/41 (b)(c) | | 264,445 | 275,016 |
| 12 month U.S. LIBOR + 1.752% 4.734% 3/1/40 (b)(c) | | 283,546 | 296,271 |
| 12 month U.S. LIBOR + 1.800% 4.492% 7/1/41 (b)(c) | | 1,083,444 | 1,133,677 |
| 12 month U.S. LIBOR + 1.800% 4.786% 1/1/42 (b)(c) | | 384,240 | 398,285 |
| 12 month U.S. LIBOR + 1.810% 4.81% 12/1/39 (b)(c) | | 104,533 | 108,945 |
| 12 month U.S. LIBOR + 1.812% 4.596% 12/1/40 (b)(c) | | 6,122,560 | 6,381,569 |
| 12 month U.S. LIBOR + 1.818% 4.535% 7/1/41 (b)(c) | | 578,631 | 604,073 |
| 12 month U.S. LIBOR + 1.818% 4.568% 9/1/41 (b)(c) | | 331,061 | 344,577 |
| 12 month U.S. LIBOR + 1.818% 4.932% 2/1/42 (b)(c) | | 470,710 | 489,818 |
| 12 month U.S. LIBOR + 1.830% 4.657% 10/1/41 (b)(c) | | 394,527 | 411,691 |
| 12 month U.S. LIBOR + 1.851% 4.58% 5/1/36 (b)(c) | | 85,100 | 89,033 |
| 12 month U.S. LIBOR + 1.900% 4.776% 7/1/37 (b)(c) | | 50,825 | 53,471 |
| 12 month U.S. LIBOR + 1.938% 4.751% 9/1/36 (b)(c) | | 82,414 | 85,468 |
| 6 month U.S. LIBOR + 1.475% 4.178% 10/1/33(b)(c) | | 18,954 | 19,542 |
| 6 month U.S. LIBOR + 1.505% 4.103% 1/1/35 (b)(c) | | 218,796 | 226,124 |
| 6 month U.S. LIBOR + 1.510% 4.144% 2/1/33 (b)(c)(e) | | 18,010 | 18,582 |
| 6 month U.S. LIBOR + 1.535% 4.178% 3/1/35 (b)(c) | | 50,860 | 52,620 |
| 6 month U.S. LIBOR + 1.535% 4.315% 12/1/34 (b)(c) | | 80,698 | 83,275 |
| 6 month U.S. LIBOR + 1.556% 4.278% 10/1/33 (b)(c) | | 27,298 | 28,153 |
| 6 month U.S. LIBOR + 1.565% 4.085% 7/1/35 (b)(c) | | 32,634 | 33,808 |
| 6 month U.S. LIBOR + 1.740% 4.365% 12/1/34 (b)(c) | | 2,940 | 3,057 |
| 6 month U.S. LIBOR + 1.960% 4.725% 9/1/35 (b)(c) | | 36,041 | 37,617 |
| U.S. TREASURY 1 YEAR INDEX + 2.208% 4.833% 3/1/35 (b)(c) | | 39,199 | 41,088 |
| U.S. TREASURY 1 YEAR INDEX + 2.251% 4.765% 12/1/33 (b)(c) | | 700,231 | 733,320 |
| U.S. TREASURY 1 YEAR INDEX + 2.270% 4.676% 6/1/36 (b)(c) | | 237,098 | 247,629 |
| U.S. TREASURY 1 YEAR INDEX + 2.295% 4.678% 10/1/33 (b)(c) | | 139,721 | 145,847 |
| U.S. TREASURY 1 YEAR INDEX + 2.447% 4.946% 7/1/34 (b)(c) | | 263,105 | 275,445 |
| U.S. TREASURY 1 YEAR INDEX + 2.549% 5.085% 5/1/35 (b)(c) | | 47,865 | 50,089 |
| 2.5% 2/1/28 to 4/1/43 | | 107,806,185 | 109,296,735 |
| 3% 3/1/26 to 9/1/49 | | 818,736,320 | 843,688,610 |
| 3.5% 7/1/32 to 6/1/48 (f)(g) | | 539,590,635 | 565,403,964 |
| 4% 11/1/31 to 8/1/48 | | 506,724,170 | 535,997,121 |
| 4.5% 4/1/21 to 12/1/48 | | 203,010,688 | 218,168,450 |
| 5% 12/1/19 to 6/1/39 | | 3,706,135 | 4,012,145 |
| 5.251% 8/1/41 (b) | | 2,623,151 | 2,859,433 |
| 5.5% 9/1/21 to 5/1/44 | | 43,130,160 | 47,656,733 |
| 6% 9/1/19 | | 5 | 5 |
| 6% 11/1/19 to 1/1/42 | | 13,115,656 | 14,905,080 |
| 6.5% 8/1/20 to 4/1/37 | | 10,103,713 | 11,396,487 |
| 6.531% 2/1/39 (b) | | 2,562,474 | 2,769,715 |
| 7% 9/1/21 to 7/1/37 | | 1,800,625 | 2,027,324 |
| 7.5% 11/1/22 to 2/1/32 | | 816,733 | 920,096 |
| 8% 8/1/29 to 3/1/37 | | 24,985 | 29,778 |
| 8.5% 5/1/21 to 9/1/25 | | 741 | 809 |
| 9.5% 9/1/21 to 2/1/25 | | 394 | 401 |
|
| TOTAL FANNIE MAE | | | 2,374,264,386 |
|
| Freddie Mac - 6.7% | | | |
| 12 month U.S. LIBOR + 1.325% 4.237% 1/1/36 (b)(c) | | 64,764 | 66,783 |
| 12 month U.S. LIBOR + 1.375% 4.28% 3/1/36 (b)(c) | | 280,084 | 289,254 |
| 12 month U.S. LIBOR + 1.500% 4.53% 3/1/36 (b)(c) | | 190,680 | 197,835 |
| 12 month U.S. LIBOR + 1.515% 4.39% 11/1/35 (b)(c) | | 56,278 | 58,194 |
| 12 month U.S. LIBOR + 1.750% 4.406% 7/1/41 (b)(c) | | 688,346 | 716,197 |
| 12 month U.S. LIBOR + 1.750% 4.644% 12/1/40 (b)(c) | | 3,518,900 | 3,649,471 |
| 12 month U.S. LIBOR + 1.754% 4.498% 9/1/41 (b)(c) | | 1,300,066 | 1,345,677 |
| 12 month U.S. LIBOR + 1.793% 4.695% 4/1/37 (b)(c) | | 74,309 | 77,555 |
| 12 month U.S. LIBOR + 1.864% 4.739% 4/1/36 (b)(c) | | 73,883 | 77,643 |
| 12 month U.S. LIBOR + 1.877% 4.787% 4/1/41 (b)(c) | | 451,629 | 470,175 |
| 12 month U.S. LIBOR + 1.880% 4.63% 9/1/41 (b)(c) | | 428,839 | 446,834 |
| 12 month U.S. LIBOR + 1.884% 4.628% 10/1/42 (b)(c) | | 552,654 | 575,218 |
| 12 month U.S. LIBOR + 1.910% 4.66% 6/1/41 (b)(c) | | 407,041 | 425,004 |
| 12 month U.S. LIBOR + 1.910% 4.73% 6/1/41 (b)(c) | | 854,778 | 892,883 |
| 12 month U.S. LIBOR + 1.910% 4.785% 5/1/41 (b)(c) | | 726,321 | 763,075 |
| 12 month U.S. LIBOR + 1.910% 4.807% 5/1/41 (b)(c) | | 871,268 | 908,184 |
| 12 month U.S. LIBOR + 1.920% 4.67% 6/1/36 (b)(c) | | 42,219 | 44,393 |
| 12 month U.S. LIBOR + 1.998% 4.913% 4/1/38 (b)(c) | | 213,119 | 223,838 |
| 12 month U.S. LIBOR + 2.045% 4.785% 7/1/36 (b)(c) | | 117,915 | 123,683 |
| 12 month U.S. LIBOR + 2.070% 4.998% 3/1/33 (b)(c) | | 5,364 | 5,598 |
| 12 month U.S. LIBOR + 2.160% 5.035% 11/1/35 (b)(c) | | 47,821 | 49,991 |
| 12 month U.S. LIBOR + 2.200% 5.075% 12/1/36 (b)(c) | | 182,048 | 190,562 |
| 6 month U.S. LIBOR + 1.125% 3.849% 8/1/37 (b)(c) | | 70,131 | 71,537 |
| 6 month U.S. LIBOR + 1.445% 4.195% 3/1/35 (b)(c) | | 76,532 | 78,802 |
| 6 month U.S. LIBOR + 1.608% 4.205% 12/1/35 (b)(c) | | 20,328 | 21,039 |
| 6 month U.S. LIBOR + 1.647% 4.289% 2/1/37 (b)(c) | | 282,446 | 292,463 |
| 6 month U.S. LIBOR + 1.655% 4.375% 4/1/35 (b)(c) | | 139,204 | 144,065 |
| 6 month U.S. LIBOR + 1.720% 4.247% 8/1/37 (b)(c) | | 108,315 | 112,607 |
| 6 month U.S. LIBOR + 1.746% 4.58% 5/1/37 (b)(c) | | 28,050 | 29,185 |
| 6 month U.S. LIBOR + 1.843% 4.534% 10/1/36 (b)(c) | | 313,158 | 325,726 |
| 6 month U.S. LIBOR + 1.912% 4.623% 10/1/35 (b)(c) | | 189,929 | 197,529 |
| 6 month U.S. LIBOR + 2.020% 4.65% 6/1/37 (b)(c) | | 55,080 | 57,424 |
| 6 month U.S. LIBOR + 2.040% 4.665% 6/1/37 (b)(c) | | 82,961 | 86,595 |
| 6 month U.S. LIBOR + 2.276% 4.955% 10/1/35 (b)(c) | | 67,626 | 70,192 |
| U.S. TREASURY 1 YEAR INDEX + 2.035% 4.58% 6/1/33 (b)(c) | | 263,107 | 275,367 |
| U.S. TREASURY 1 YEAR INDEX + 2.248% 4.952% 1/1/35 (b)(c) | | 11,270 | 11,802 |
| U.S. TREASURY 1 YEAR INDEX + 2.286% 4.828% 6/1/33 (b)(c) | | 507,957 | 530,488 |
| U.S. TREASURY 1 YEAR INDEX + 2.412% 4.902% 3/1/35 (b)(c) | | 1,013,423 | 1,057,906 |
| 2.5% 6/1/31 to 6/1/34 | | 130,299,099 | 132,244,411 |
| 3% 6/1/31 to 8/1/49 | | 489,793,750 | 503,812,715 |
| 3.5% 1/1/32 to 5/1/49 (f)(h) | | 561,909,757 | 589,247,780 |
| 3.5% 8/1/47 | | 13,038,619 | 13,663,574 |
| 4% 6/1/33 to 10/1/48 | | 456,284,253 | 484,494,575 |
| 4% 4/1/48 | | 982,290 | 1,026,668 |
| 4.5% 6/1/25 to 12/1/48 | | 148,959,118 | 159,811,196 |
| 5% 6/1/20 to 7/1/41 | | 30,237,844 | 33,395,817 |
| 5.5% 10/1/19 to 3/1/41 | | 6,217,301 | 6,865,899 |
| 6% 10/1/21 to 12/1/37 | | 2,916,792 | 3,261,650 |
| 6.5% 7/1/21 to 9/1/39 | | 4,529,883 | 5,144,103 |
| 7% 6/1/21 to 9/1/36 | | 1,583,739 | 1,802,377 |
| 7.5% 1/1/27 to 1/1/33 | | 43,399 | 49,401 |
| 8% 7/1/24 to 4/1/32 | | 46,228 | 52,760 |
| 8.5% 6/1/22 to 1/1/28 | | 44,313 | 49,354 |
| 9% 10/1/20 | | 4 | 4 |
| 9.5% 5/1/21 | | 3 | 3 |
|
| TOTAL FREDDIE MAC | | | 1,949,883,061 |
|
| Ginnie Mae - 10.8% | | | |
| 3% 4/15/42 to 6/20/48 | | 423,384,346 | 437,875,319 |
| 3.5% 11/15/40 to 6/20/49 | | 611,083,104 | 640,353,896 |
| 4% 2/15/39 to 5/20/49 | | 345,571,604 | 367,760,972 |
| 4.5% 6/20/33 to 6/20/48 | | 191,114,407 | 203,639,594 |
| 5.5% 6/15/33 to 9/15/39 | | 2,742,823 | 3,071,851 |
| 6% 10/15/30 to 5/15/40 | | 5,273,718 | 5,974,591 |
| 7% 10/15/22 to 3/15/33 | | 2,513,092 | 2,850,543 |
| 7.5% 2/15/22 to 9/15/31 | | 685,086 | 754,584 |
| 8% 11/15/21 to 11/15/29 | | 184,260 | 199,986 |
| 8.5% 10/15/21 to 1/15/31 | | 39,731 | 44,681 |
| 9% 10/15/19 to 1/15/23 | | 324 | 347 |
| 9.5% 12/15/20 to 3/15/23 | | 138 | 142 |
| 3% 9/1/49 (i) | | 35,050,000 | 36,143,967 |
| 3% 9/1/49 (i) | | 35,050,000 | 36,143,967 |
| 3% 9/1/49 (i) | | 31,700,000 | 32,689,408 |
| 3% 9/1/49 (i) | | 22,800,000 | 23,511,624 |
| 3% 9/1/49 (i) | | 22,500,000 | 23,202,261 |
| 3% 9/1/49 (i) | | 18,300,000 | 18,871,172 |
| 3% 9/1/49 (i) | | 32,200,000 | 33,205,014 |
| 3% 9/1/49 (i) | | 30,300,000 | 31,245,711 |
| 3% 9/1/49 (i) | | 33,550,000 | 34,597,149 |
| 3% 9/1/49 (i) | | 28,150,000 | 29,028,607 |
| 3% 9/1/49 (i) | | 2,300,000 | 2,371,787 |
| 3% 9/1/49 (i) | | 30,600,000 | 31,555,075 |
| 3% 9/1/49 (i) | | 60,200,000 | 62,078,938 |
| 3% 9/1/49 (i) | | 8,900,000 | 9,177,783 |
| 3% 9/1/49 (i) | | 25,800,000 | 26,605,259 |
| 3% 9/1/49 (i) | | 25,800,000 | 26,605,259 |
| 3% 10/1/49 (i) | | 42,000,000 | 43,255,103 |
| 3.5% 9/1/49 (i) | | 164,600,000 | 171,003,977 |
| 3.5% 9/1/49 (i) | | 134,300,000 | 139,525,116 |
| 3.5% 9/1/49 (i) | | 18,100,000 | 18,804,204 |
| 3.5% 9/1/49 (i) | | 107,200,000 | 111,370,755 |
| 3.5% 9/1/49 (i) | | 88,450,000 | 91,891,262 |
| 3.5% 9/1/49 (i) | | 79,100,000 | 82,177,488 |
| 3.5% 9/1/49 (i) | | 26,600,000 | 27,634,908 |
| 3.5% 9/1/49 (i) | | 58,750,000 | 61,035,745 |
| 3.5% 9/1/49 (i) | | 58,450,000 | 60,724,073 |
| 3.5% 9/1/49 (i) | | 129,000,000 | 134,018,913 |
| 4% 9/1/49 (i) | | 47,000,000 | 48,971,796 |
| 5% 12/15/32 to 9/15/41 | | 31,434,550 | 34,752,587 |
| 6.5% 3/20/31 to 6/15/37 | | 532,508 | 608,763 |
|
| TOTAL GINNIE MAE | | | 3,145,334,177 |
|
| Uniform Mortgage Backed Securities - 1.5% | | | |
| 3% 9/1/34 (i) | | 500,000 | 512,695 |
| 3% 9/1/34 (i) | | 69,050,000 | 70,803,221 |
| 3% 9/1/49 (i) | | 23,800,000 | 24,259,266 |
| 3% 9/1/49 (i) | | 35,300,000 | 35,981,181 |
| 3% 9/1/49 (i) | | 23,000,000 | 23,443,829 |
| 3.5% 9/1/49 (i) | | 35,100,000 | 36,067,991 |
| 3.5% 9/1/49 (i) | | 54,800,000 | 56,311,280 |
| 3.5% 9/1/49 (i) | | 30,750,000 | 31,598,027 |
| 3.5% 9/1/49 (i) | | 26,650,000 | 27,384,956 |
| 3.5% 9/1/49 (i) | | 30,700,000 | 31,546,648 |
| 3.5% 9/1/49 (i) | | 18,800,000 | 19,318,468 |
| 3.5% 9/1/49 (i) | | 23,700,000 | 24,353,601 |
| 3.5% 9/1/49 (i) | | 23,700,000 | 24,353,601 |
| 4% 9/1/49 (i) | | 3,000,000 | 3,114,212 |
| 4.5% 9/1/49 (i) | | 5,300,000 | 5,578,671 |
| 4.5% 9/1/49 (i) | | 13,000,000 | 13,683,534 |
|
| TOTAL UNIFORM MORTGAGE BACKED SECURITIES | | | 428,311,181 |
|
| TOTAL U.S. GOVERNMENT AGENCY - MORTGAGE SECURITIES | | | |
| (Cost $7,779,983,258) | | | 7,897,792,805 |
|
| Asset-Backed Securities - 2.3% | | | |
| AASET Trust: | | | |
| Series 2018-1A Class A, 3.844% 1/16/38 (a) | | $18,331,713 | $18,531,382 |
| Series 2019-1 Class A, 3.844% 5/15/39 (a) | | 20,061,037 | 20,193,891 |
| Aimco Series 2019-10A Class A, 3 month U.S. LIBOR + 1.320% 3.6184% 7/22/32 (a)(b)(c) | | 30,545,000 | 30,545,000 |
| Ares Xli Clo Ltd. / Ares Xli Cl Series 2016-41A Class AR, 3 month U.S. LIBOR + 1.200% 3.5034% 1/15/29 (a)(b)(c) | | 33,040,000 | 33,029,064 |
| Bear Stearns Asset Backed Securities I Trust Series 2005-HE2 Class M2, 1 month U.S. LIBOR + 1.125% 3.2703% 2/25/35 (b)(c) | | 644,570 | 643,969 |
| Blackbird Capital Aircraft Series 2016-1A: | | | |
| Class A, 4.213% 12/16/41 (a) | | 39,022,375 | 40,493,850 |
| Class AA, 2.487% 12/16/41 (a) | | 7,946,250 | 7,938,824 |
| Brazos Higher Education Authority, Inc. Series 2010-1 Class A1, 3 month U.S. LIBOR + 0.900% 3.0323% 5/25/29 (b)(c) | | 17,121,803 | 17,164,768 |
| Castlelake Aircraft Securitization Trust Series 2019-1A: | | | |
| Class A, 3.967% 4/15/39 (a) | | 30,344,765 | 30,971,375 |
| Class B, 5.095% 4/15/39 (a) | | 10,409,518 | 10,633,704 |
| Castlelake Aircraft Structured Trust Series 2018-1 Class A, 4.125% 6/15/43 (a) | | 32,182,110 | 32,986,586 |
| Cedar Funding Ltd.: | | | |
| Series 2019-10A Class A, 3 month U.S. LIBOR + 1.340% 0% 10/20/32 (a)(b)(c)(i) | | 21,882,000 | 21,882,000 |
| Series 2019-11A Class A1A, 3 month U.S. LIBOR + 1.350% 3.8749% 5/29/32 (a)(b)(c) | | 15,297,000 | 15,287,868 |
| Countrywide Home Loans, Inc. Series 2004-7 Class AF5, 4.706% 1/25/35 (b) | | 300,504 | 299,683 |
| DB Master Finance LLC Series 2017-1A: | | | |
| Class A2I, 3.629% 11/20/47 (a) | | 16,690,710 | 17,040,714 |
| Class A2II, 4.03% 11/20/47 (a) | | 28,250,805 | 29,469,545 |
| Dryden Senior Loan Fund: | | | |
| Series 2014-36A Class AR2, 3 month U.S. LIBOR + 1.280% 3.5834% 4/15/29 (a)(b)(c) | | 35,552,000 | 35,643,724 |
| Series 2018-70X Class A1, 3 month U.S. LIBOR + 1.170% 3.4923% 1/16/32 (b)(c) | | 346,000 | 343,496 |
| Series 2019-72A Class A, 3 month U.S. LIBOR + 1.330% 3.7622% 5/15/32 (a)(b)(c) | | 25,028,000 | 24,986,303 |
| First Franklin Mortgage Loan Trust Series 2004-FF2 Class M3, 1 month U.S. LIBOR + 0.825% 2.9703% 3/25/34 (b)(c) | | 1,791 | 1,686 |
| Horizon Aircraft Finance I Ltd. Series 2018-1 Class A, 4.458% 12/15/38 (a) | | 13,216,498 | 13,815,049 |
| Horizon Aircraft Finance Ltd. Series 2019-1 Class A, 3.721% 7/15/39 (a) | | 13,822,820 | 13,973,627 |
| Madison Park Funding Ltd.: | | | |
| Series 2012-10A Class AR2, 3 month U.S. LIBOR + 1.220% 3.4976% 1/20/29 (a)(b)(c) | | 12,417,000 | 12,410,556 |
| Series 2019-37A Class A1, 3 month U.S. LIBOR + 1.300% 3.603% 7/15/32 (a)(b)(c) | | 30,503,000 | 30,485,156 |
| Magnetite CLO Ltd. Series 2019-21A Class A, 3 month U.S. LIBOR + 1.280% 3.9086% 4/20/30 (a)(b)(c) | | 26,927,000 | 26,922,207 |
| New Century Home Equity Loan Trust Series 2005-4 Class M2, 1 month U.S. LIBOR + 0.510% 2.6553% 9/25/35 (b)(c) | | 597,740 | 597,310 |
| Niagara Park CLO, Ltd. Series 2019-1A Class A, 3 month U.S. LIBOR + 1.300% 3.6939% 7/17/32 (a)(b)(c) | | 30,513,000 | 30,496,859 |
| Park Place Securities, Inc. Series 2005-WCH1 Class M4, 1 month U.S. LIBOR + 1.245% 3.3903% 1/25/36 (b)(c) | | 1,245,000 | 1,250,238 |
| Project Silver Series 2019-1 Class A, 3.967% 7/15/44 (a) | | 25,014,615 | 25,546,981 |
| SLM Student Loan Trust Series 2003-10A Class A3, 3 month U.S. LIBOR + 0.470% 2.8803% 12/15/27 (a)(b)(c) | | 41,354,433 | 41,359,111 |
| Terwin Mortgage Trust Series 2003-4HE Class A1, 1 month U.S. LIBOR + 0.860% 3.0053% 9/25/34 (b)(c) | | 99,346 | 96,686 |
| Thunderbolt Aircraft Lease Ltd. Series 2018-A Class A, 4.147% 9/15/38 (a) | | 32,918,601 | 33,915,133 |
| Trapeza CDO XII Ltd./Trapeza CDO XII, Inc. Series 2007-12A Class B, 3 month U.S. LIBOR + 0.560% 2.8626% 4/6/42 (a)(b)(c)(j) | | 2,300,000 | 1,716,490 |
| Verde CLO Ltd. Series 2019-1A Class A, 3 month U.S. LIBOR + 1.350% 3.9137% 4/15/32 (a)(b)(c) | | 30,008,000 | 29,991,226 |
| Voya CLO Ltd. Series 2019-2A Class A, 3 month U.S. LIBOR + 1.270% 3.5229% 7/20/32 (a)(b)(c) | | 31,313,000 | 31,295,934 |
| TOTAL ASSET-BACKED SECURITIES | | | |
| (Cost $672,210,749) | | | 681,959,995 |
|
| Collateralized Mortgage Obligations - 2.3% | | | |
| Private Sponsor - 0.0% | | | |
| Bear Stearns ALT-A Trust floater Series 2005-1 Class A1, 1 month U.S. LIBOR + 0.560% 2.7053% 1/25/35 (b)(c) | | 60,558 | 60,421 |
| Merrill Lynch Alternative Note Asset Trust floater Series 2007-OAR1 Class A1, 1 month U.S. LIBOR + 0.170% 2.436% 2/25/37 (b)(c) | | 68,598 | 68,932 |
| Opteum Mortgage Acceptance Corp. floater Series 2005-3 Class APT, 1 month U.S. LIBOR + 0.290% 2.4353% 7/25/35 (b)(c) | | 67,558 | 67,588 |
| Sequoia Mortgage Trust floater Series 2004-6 Class A3B, 6 month U.S. LIBOR + 0.880% 3.178% 7/20/34 (b)(c) | | 8,729 | 8,493 |
|
| TOTAL PRIVATE SPONSOR | | | 205,434 |
|
| U.S. Government Agency - 2.3% | | | |
| Fannie Mae: | | | |
| floater: | | | |
| Series 2002-18 Class FD, 1 month U.S. LIBOR + 0.800% 2.9453% 2/25/32 (b)(c) | | 33,811 | 34,199 |
| Series 2002-39 Class FD, 1 month U.S. LIBOR + 1.000% 3.182% 3/18/32 (b)(c) | | 62,047 | 63,308 |
| Series 2002-60 Class FV, 1 month U.S. LIBOR + 1.000% 3.1453% 4/25/32 (b)(c) | | 72,102 | 73,277 |
| Series 2002-63 Class FN, 1 month U.S. LIBOR + 1.000% 3.1453% 10/25/32 (b)(c) | | 93,062 | 94,592 |
| Series 2002-7 Class FC, 1 month U.S. LIBOR + 0.750% 2.8953% 1/25/32 (b)(c) | | 35,064 | 35,418 |
| Series 2003-118 Class S, 8.100% - 1 month U.S. LIBOR 5.9548% 12/25/33 (b)(e)(k) | | 1,133,478 | 291,016 |
| Series 2006-104 Class GI, 6.680% - 1 month U.S. LIBOR 4.5348% 11/25/36 (b)(e)(k) | | 827,730 | 161,750 |
| planned amortization class: | | | |
| Series 1992-168 Class KB, 7% 10/25/22 | | 26,867 | 28,301 |
| Series 1993-207 Class H, 6.5% 11/25/23 | | 397,512 | 423,839 |
| Series 1996-28 Class PK, 6.5% 7/25/25 | | 136,998 | 146,563 |
| Series 1999-17 Class PG, 6% 4/25/29 | | 500,187 | 543,801 |
| Series 1999-32 Class PL, 6% 7/25/29 | | 471,942 | 521,446 |
| Series 1999-33 Class PK, 6% 7/25/29 | | 351,794 | 383,711 |
| Series 2001-52 Class YZ, 6.5% 10/25/31 | | 44,390 | 51,203 |
| Series 2003-28 Class KG, 5.5% 4/25/23 | | 228,655 | 237,745 |
| Series 2005-102 Class CO 11/25/35 (l) | | 250,977 | 230,623 |
| Series 2005-73 Class SA, 17.500% - 1 month U.S. LIBOR 11.9724% 8/25/35 (b)(k) | | 75,034 | 96,616 |
| Series 2005-81 Class PC, 5.5% 9/25/35 | | 666,921 | 735,326 |
| Series 2006-12 Class BO 10/25/35 (l) | | 1,138,369 | 1,046,251 |
| Series 2006-37 Class OW 5/25/36 (l) | | 111,669 | 102,022 |
| Series 2006-45 Class OP 6/25/36 (l) | | 378,076 | 344,057 |
| Series 2006-62 Class KP 4/25/36 (l) | | 643,957 | 590,509 |
| Series 2012-149: | | | |
| Class DA, 1.75% 1/25/43 | | 5,782,212 | 5,752,521 |
| Class GA, 1.75% 6/25/42 | | 6,007,619 | 5,931,731 |
| sequential payer: | | | |
| Series 1997-41 Class J, 7.5% 6/18/27 | | 105,652 | 119,834 |
| Series 1999-25 Class Z, 6% 6/25/29 | | 389,882 | 436,489 |
| Series 2001-20 Class Z, 6% 5/25/31 | | 524,304 | 575,409 |
| Series 2001-31 Class ZC, 6.5% 7/25/31 | | 292,821 | 332,783 |
| Series 2002-16 Class ZD, 6.5% 4/25/32 | | 163,306 | 188,820 |
| Series 2002-74 Class SV, 7.550% - 1 month U.S. LIBOR 5.4048% 11/25/32 (b)(e)(k) | | 658,653 | 96,809 |
| Series 2012-67 Class AI, 4.5% 7/25/27 (e) | | 1,455,344 | 120,524 |
| Series 06-116 Class SG, 6.640% - 1 month U.S. LIBOR 4.4948% 12/25/36 (b)(e)(k) | | 575,877 | 137,886 |
| Series 07-40 Class SE, 6.440% - 1 month U.S. LIBOR 4.2948% 5/25/37 (b)(e)(k) | | 325,753 | 67,358 |
| Series 1993-165 Class SH, 19.800% - 1 month U.S. LIBOR 13.7319% 9/25/23 (b)(k) | | 18,701 | 22,253 |
| Series 2003-21 Class SK, 8.100% - 1 month U.S. LIBOR 5.9548% 3/25/33 (b)(e)(k) | | 83,233 | 17,950 |
| Series 2005-72 Class ZC, 5.5% 8/25/35 | | 4,485,173 | 4,884,295 |
| Series 2005-79 Class ZC, 5.9% 9/25/35 | | 1,552,844 | 1,787,919 |
| Series 2007-57 Class SA, 40.600% - 1 month U.S. LIBOR 27.7485% 6/25/37 (b)(k) | | 271,871 | 563,738 |
| Series 2007-66: | | | |
| Class SA, 39.600% - 1 month U.S. LIBOR 26.7285% 7/25/37 (b)(k) | | 415,206 | 856,432 |
| Class SB, 39.600% - 1 month U.S. LIBOR 26.7285% 7/25/37 (b)(k) | | 152,045 | 274,595 |
| Series 2008-12 Class SG, 6.350% - 1 month U.S. LIBOR 4.2048% 3/25/38 (b)(e)(k) | | 2,185,429 | 414,524 |
| Series 2009-85 Class IB, 4.5% 8/25/24 (e) | | 12,643 | 25 |
| Series 2010-112 Class SG, 6.360% - 1 month U.S. LIBOR 4.2148% 6/25/21 (b)(e)(k) | | 4,206 | 47 |
| Series 2010-135: | | | |
| Class LS, 6.050% - 1 month U.S. LIBOR 3.9048% 12/25/40 (b)(e)(k) | | 2,041,845 | 367,257 |
| Class ZA, 4.5% 12/25/40 | | 4,150,409 | 4,625,833 |
| Series 2010-139 Class NI, 4.5% 2/25/40 (e) | | 1,552,208 | 115,561 |
| Series 2010-150 Class ZC, 4.75% 1/25/41 | | 5,870,234 | 6,654,589 |
| Series 2010-17 Class DI, 4.5% 6/25/21 (e) | | 5,198 | 42 |
| Series 2010-95 Class ZC, 5% 9/25/40 | | 12,310,356 | 14,041,964 |
| Series 2010-97 Class CI, 4.5% 8/25/25 (e) | | 180,041 | 3,028 |
| Series 2011-39 Class ZA, 6% 11/25/32 | | 1,451,294 | 1,660,904 |
| Series 2011-4 Class PZ, 5% 2/25/41 | | 2,418,214 | 2,804,045 |
| Series 2011-67 Class AI, 4% 7/25/26 (e) | | 486,118 | 35,300 |
| Series 2011-83 Class DI, 6% 9/25/26 (e) | | 457,530 | 27,056 |
| Series 2012-100 Class WI, 3% 9/25/27 (e) | | 4,875,232 | 382,652 |
| Series 2012-14 Class JS, 6.650% - 1 month U.S. LIBOR 4.5048% 12/25/30 (b)(e)(k) | | 1,693,754 | 157,683 |
| Series 2012-9 Class SH, 6.550% - 1 month U.S. LIBOR 4.4048% 6/25/41 (b)(e)(k) | | 2,163,603 | 247,163 |
| Series 2013-133 Class IB, 3% 4/25/32 (e) | | 3,349,196 | 212,239 |
| Series 2013-134 Class SA, 6.050% - 1 month U.S. LIBOR 3.9048% 1/25/44 (b)(e)(k) | | 1,519,506 | 248,667 |
| Series 2013-51 Class GI, 3% 10/25/32 (e) | | 4,385,740 | 366,888 |
| Series 2013-N1 Class A, 6.720% - 1 month U.S. LIBOR 4.5748% 6/25/35 (b)(e)(k) | | 1,702,682 | 348,718 |
| Series 2015-42 Class IL, 6% 6/25/45 (e) | | 6,254,656 | 1,278,478 |
| Series 2015-70 Class JC, 3% 10/25/45 | | 8,795,590 | 9,139,698 |
| Series 2017-30 Class AI, 5.5% 5/25/47 (e) | | 3,322,622 | 668,733 |
| Fannie Mae Stripped Mortgage-Backed Securities: | | | |
| Series 339 Class 5, 5.5% 7/25/33 (e) | | 322,700 | 65,061 |
| Series 343 Class 16, 5.5% 5/25/34 (e) | | 275,507 | 50,511 |
| Series 348 Class 14, 6.5% 8/25/34 (b)(e) | | 187,699 | 41,371 |
| Series 351: | | | |
| Class 12, 5.5% 4/25/34 (b)(e) | | 124,155 | 22,043 |
| Class 13, 6% 3/25/34 (e) | | 169,355 | 34,174 |
| Series 359 Class 19, 6% 7/25/35 (b)(e) | | 105,012 | 21,960 |
| Series 384 Class 6, 5% 7/25/37 (e) | | 1,336,031 | 227,752 |
| Freddie Mac: | | | |
| floater: | | | |
| Series 2412 Class FK, 1 month U.S. LIBOR + 0.800% 2.9951% 1/15/32 (b)(c) | | 27,715 | 28,033 |
| Series 2423 Class FA, 1 month U.S. LIBOR + 0.900% 3.0951% 3/15/32 (b)(c) | | 39,190 | 39,742 |
| Series 2424 Class FM, 1 month U.S. LIBOR + 1.000% 3.1951% 3/15/32 (b)(c) | | 38,056 | 38,676 |
| Series 2432: | | | |
| Class FE, 1 month U.S. LIBOR + 0.900% 3.0951% 6/15/31 (b)(c) | | 70,305 | 71,261 |
| Class FG, 1 month U.S. LIBOR + 0.900% 3.0951% 3/15/32 (b)(c) | | 21,669 | 21,974 |
| floater target amortization class Series 3366 Class FD, 1 month U.S. LIBOR + 0.250% 2.4451% 5/15/37 (b)(c) | | 1,609,096 | 1,598,638 |
| planned amortization class: | | | |
| Series 2006-15 Class OP 3/25/36 (l) | | 1,136,047 | 1,044,095 |
| Series 2095 Class PE, 6% 11/15/28 | | 579,726 | 632,697 |
| Series 2101 Class PD, 6% 11/15/28 | | 46,165 | 50,270 |
| Series 2121 Class MG, 6% 2/15/29 | | 229,662 | 251,591 |
| Series 2131 Class BG, 6% 3/15/29 | | 1,604,454 | 1,755,286 |
| Series 2137 Class PG, 6% 3/15/29 | | 238,120 | 261,697 |
| Series 2154 Class PT, 6% 5/15/29 | | 404,023 | 448,691 |
| Series 2162 Class PH, 6% 6/15/29 | | 88,057 | 95,736 |
| Series 2520 Class BE, 6% 11/15/32 | | 572,978 | 641,852 |
| Series 2585 Class KS, 7.600% - 1 month U.S. LIBOR 5.4049% 3/15/23 (b)(e)(k) | | 12,480 | 409 |
| Series 2693 Class MD, 5.5% 10/15/33 | | 1,389,874 | 1,565,256 |
| Series 2802 Class OB, 6% 5/15/34 | | 771,197 | 832,823 |
| Series 2962 Class BE, 4.5% 4/15/20 | | 104,667 | 105,055 |
| Series 3002 Class NE, 5% 7/15/35 | | 1,554,674 | 1,671,670 |
| Series 3110 Class OP 9/15/35 (l) | | 660,297 | 625,872 |
| Series 3119 Class PO 2/15/36 (l) | | 1,369,710 | 1,251,556 |
| Series 3121 Class KO 3/15/36 (l) | | 229,037 | 210,433 |
| Series 3123 Class LO 3/15/36 (l) | | 762,492 | 697,609 |
| Series 3145 Class GO 4/15/36 (l) | | 739,923 | 679,326 |
| Series 3189 Class PD, 6% 7/15/36 | | 1,301,883 | 1,517,003 |
| Series 3225 Class EO 10/15/36 (l) | | 407,930 | 372,718 |
| Series 3258 Class PM, 5.5% 12/15/36 | | 662,326 | 718,727 |
| Series 3415 Class PC, 5% 12/15/37 | | 508,787 | 558,977 |
| Series 3786 Class HI, 4% 3/15/38 (e) | | 1,260,933 | 55,740 |
| Series 3806 Class UP, 4.5% 2/15/41 | | 4,239,287 | 4,527,755 |
| Series 3832 Class PE, 5% 3/15/41 | | 5,254,507 | 5,744,310 |
| Series 4135 Class AB, 1.75% 6/15/42 | | 4,510,562 | 4,485,421 |
| Series 4765 Class PE, 3% 12/15/41 | | 15,669,649 | 15,767,682 |
| sequential payer: | | | |
| Series 2135 Class JE, 6% 3/15/29 | | 106,209 | 117,782 |
| Series 2274 Class ZM, 6.5% 1/15/31 | | 138,029 | 156,450 |
| Series 2281 Class ZB, 6% 3/15/30 | | 295,029 | 309,494 |
| Series 2303 Class ZV, 6% 4/15/31 | | 136,303 | 149,663 |
| Series 2357 Class ZB, 6.5% 9/15/31 | | 1,064,020 | 1,226,711 |
| Series 2502 Class ZC, 6% 9/15/32 | | 258,461 | 289,063 |
| Series 2519 Class ZD, 5.5% 11/15/32 | | 410,742 | 450,925 |
| Series 2546 Class MJ, 5.5% 3/15/23 | | 139,045 | 144,681 |
| Series 2601 Class TB, 5.5% 4/15/23 | | 67,218 | 70,347 |
| Series 2998 Class LY, 5.5% 7/15/25 | | 231,111 | 243,428 |
| Series 3871 Class KB, 5.5% 6/15/41 | | 4,789,307 | 5,580,388 |
| Series 4423 Class NJ, 3% 9/15/41 | | 17,925,000 | 18,323,003 |
| Series 06-3115 Class SM, 6.600% - 1 month U.S. LIBOR 4.4049% 2/15/36 (b)(e)(k) | | 435,268 | 97,058 |
| Series 2013-4281 Class AI, 4% 12/15/28 (e) | | 4,553,171 | 303,624 |
| Series 2017-4683 Class LM, 3% 5/15/47 | | 8,061,395 | 8,188,186 |
| Series 2844: | | | |
| Class SC, 46.800% - 1 month U.S. LIBOR 32.5317% 8/15/24 (b)(k) | | 5,820 | 7,339 |
| Class SD, 86.400% - 1 month U.S. LIBOR 57.9133% 8/15/24 (b)(k) | | 8,562 | 12,803 |
| Series 2933 Class ZM, 5.75% 2/15/35 | | 3,346,071 | 3,931,304 |
| Series 2935 Class ZK, 5.5% 2/15/35 | | 5,300,248 | 5,869,300 |
| Series 2947 Class XZ, 6% 3/15/35 | | 2,035,649 | 2,296,944 |
| Series 2996 Class ZD, 5.5% 6/15/35 | | 2,402,905 | 2,797,173 |
| Series 3237 Class C, 5.5% 11/15/36 | | 3,660,624 | 4,177,341 |
| Series 3244 Class SG, 6.660% - 1 month U.S. LIBOR 4.4649% 11/15/36 (b)(e)(k) | | 1,722,613 | 375,095 |
| Series 3287 Class SD, 6.750% - 1 month U.S. LIBOR 4.5549% 3/15/37 (b)(e)(k) | | 2,505,973 | 572,885 |
| Series 3297 Class BI, 6.760% - 1 month U.S. LIBOR 4.5649% 4/15/37 (b)(e)(k) | | 3,603,609 | 845,815 |
| Series 3336 Class LI, 6.580% - 1 month U.S. LIBOR 4.3849% 6/15/37 (b)(e)(k) | | 1,307,774 | 257,323 |
| Series 3949 Class MK, 4.5% 10/15/34 | | 1,112,482 | 1,178,405 |
| Series 4055 Class BI, 3.5% 5/15/31 (e) | | 2,981,164 | 206,603 |
| Series 4149 Class IO, 3% 1/15/33 (e) | | 2,042,018 | 227,165 |
| Series 4314 Class AI, 5% 3/15/34 (e) | | 923,793 | 77,681 |
| Series 4427 Class LI, 3.5% 2/15/34 (e) | | 5,407,372 | 466,539 |
| Series 4471 Class PA 4% 12/15/40 | | 9,669,340 | 9,940,009 |
| target amortization class Series 2156 Class TC, 6.25% 5/15/29 | | 288,411 | 307,075 |
| Freddie Mac Manufactured Housing participation certificates guaranteed: | | | |
| floater Series 1686 Class FA, 1 month U.S. LIBOR + 0.900% 3.225% 2/15/24 (b)(c) | | 97,523 | 98,176 |
| sequential payer: | | | |
| Series 2043 Class ZH, 6% 4/15/28 | | 216,367 | 236,076 |
| Series 2056 Class Z, 6% 5/15/28 | | 414,989 | 453,059 |
| Freddie Mac Multi-family Structured pass-thru certificates Series 4386 Class AZ, 4.5% 11/15/40 | | 11,294,734 | 12,170,322 |
| Freddie Mac Seasoned Credit Risk Transfer Trust Series 2018-3 Class M55D, 4% 8/25/57 | | 13,280,398 | 14,305,339 |
| Ginnie Mae guaranteed REMIC pass-thru certificates: | | | |
| floater: | | | |
| Series 2007-37 Class TS, 6.690% - 1 month U.S. LIBOR 4.4926% 6/16/37 (b)(e)(k) | | 754,510 | 167,347 |
| Series 2010-H03 Class FA, 1 month U.S. LIBOR + 0.550% 2.7911% 3/20/60 (b)(c)(m) | | 9,652,582 | 9,669,053 |
| Series 2010-H17 Class FA, 1 month U.S. LIBOR + 0.330% 2.5711% 7/20/60 (b)(c)(m) | | 1,161,700 | 1,156,882 |
| Series 2010-H18 Class AF, 1 month U.S. LIBOR + 0.300% 2.6795% 9/20/60 (b)(c)(m) | | 1,401,006 | 1,394,731 |
| Series 2010-H19 Class FG, 1 month U.S. LIBOR + 0.300% 2.6795% 8/20/60 (b)(c)(m) | | 1,627,443 | 1,620,302 |
| Series 2010-H27 Series FA, 1 month U.S. LIBOR + 0.380% 2.7595% 12/20/60 (b)(c)(m) | | 2,949,240 | 2,941,657 |
| Series 2011-H05 Class FA, 1 month U.S. LIBOR + 0.500% 2.8795% 12/20/60 (b)(c)(m) | | 4,265,680 | 4,268,511 |
| Series 2011-H07 Class FA, 1 month U.S. LIBOR + 0.500% 2.8795% 2/20/61 (b)(c)(m) | | 8,543,607 | 8,548,689 |
| Series 2011-H12 Class FA, 1 month U.S. LIBOR + 0.490% 2.8695% 2/20/61 (b)(c)(m) | | 11,036,083 | 11,040,883 |
| Series 2011-H13 Class FA, 1 month U.S. LIBOR + 0.500% 2.8795% 4/20/61 (b)(c)(m) | | 3,724,991 | 3,727,481 |
| Series 2011-H14: | | | |
| Class FB, 1 month U.S. LIBOR + 0.500% 2.8795% 5/20/61 (b)(c)(m) | | 5,231,520 | 5,235,305 |
| Class FC, 1 month U.S. LIBOR + 0.500% 2.8795% 5/20/61 (b)(c)(m) | | 4,185,830 | 4,188,696 |
| Series 2011-H17 Class FA, 1 month U.S. LIBOR + 0.530% 2.9095% 6/20/61 (b)(c)(m) | | 5,088,701 | 5,095,502 |
| Series 2011-H21 Class FA, 1 month U.S. LIBOR + 0.600% 2.9795% 10/20/61 (b)(c)(m) | | 5,860,845 | 5,878,371 |
| Series 2012-H01 Class FA, 1 month U.S. LIBOR + 0.700% 3.0795% 11/20/61 (b)(c)(m) | | 5,265,296 | 5,293,383 |
| Series 2012-H03 Class FA, 1 month U.S. LIBOR + 0.700% 3.0795% 1/20/62 (b)(c)(m) | | 3,383,445 | 3,400,990 |
| Series 2012-H06 Class FA, 1 month U.S. LIBOR + 0.630% 3.0095% 1/20/62 (b)(c)(m) | | 4,933,953 | 4,952,453 |
| Series 2012-H07 Class FA, 1 month U.S. LIBOR + 0.630% 3.0095% 3/20/62 (b)(c)(m) | | 3,084,025 | 3,088,000 |
| Series 2012-H21 Class DF, 1 month U.S. LIBOR + 0.650% 3.0295% 5/20/61 (b)(c)(m) | | 171,893 | 172,380 |
| Series 2012-H23 Class WA, 1 month U.S. LIBOR + 0.520% 2.8995% 10/20/62 (b)(c)(m) | | 885,043 | 886,024 |
| Series 2012-H26, Class CA, 1 month U.S. LIBOR + 0.530% 2.9095% 7/20/60 (b)(c)(m) | | 829,465 | 829,730 |
| Series 2013-H07 Class BA, 1 month U.S. LIBOR + 0.360% 2.7395% 3/20/63 (b)(c)(m) | | 1,099,657 | 1,096,634 |
| Series 2014-H03 Class FA, 1 month U.S. LIBOR + 0.600% 2.9795% 1/20/64 (b)(c)(m) | | 4,998,119 | 5,011,651 |
| Series 2014-H05 Class FB, 1 month U.S. LIBOR + 0.600% 2.9795% 12/20/63 (b)(c)(m) | | 15,252,400 | 15,300,894 |
| Series 2014-H11 Class BA, 1 month U.S. LIBOR + 0.500% 2.8795% 6/20/64 (b)(c)(m) | | 4,246,959 | 4,249,919 |
| Series 2015-H07 Class FA, 1 month U.S. LIBOR + 0.300% 2.6795% 3/20/65 (b)(c)(m) | | 166,959 | 166,478 |
| Series 2015-H13 Class FL, 1 month U.S. LIBOR + 0.280% 2.6595% 5/20/63 (b)(c)(m) | | 784,355 | 783,579 |
| Series 2015-H19 Class FA, 1 month U.S. LIBOR + 0.200% 2.5795% 4/20/63 (b)(c)(m) | | 1,055,073 | 1,052,822 |
| Series 2018-65 Class DF, 1 month U.S. LIBOR + 0.300% 2.4721% 5/20/48 (b)(c) | | 9,371,482 | 9,297,219 |
| Series 2018-78 Class AF, 1 month U.S. LIBOR + 0.300% 2.4721% 6/20/48 (b)(c) | | 53,640,791 | 53,191,914 |
| planned amortization class: | | | |
| Series 1997-8 Class PE, 7.5% 5/16/27 | | 269,745 | 308,349 |
| Series 2010-158 Class MS, 10.000% - 1 month U.S. LIBOR 5.6557% 12/20/40 (b)(k) | | 6,361,000 | 7,672,254 |
| Series 2011-136 Class WI, 4.5% 5/20/40 (e) | | 1,058,380 | 83,959 |
| Series 2016-69 Class WA, 3% 2/20/46 | | 13,905,055 | 14,185,381 |
| Series 2017-134 Class BA, 2.5% 11/20/46 | | 6,177,198 | 6,271,206 |
| Series 2017-153 Class GA, 3% 9/20/47 | | 12,212,771 | 12,460,149 |
| Series 2017-182 Class KA, 3% 10/20/47 | | 11,255,613 | 11,437,313 |
| Series 2018-13 Class Q, 3% 4/20/47 | | 14,484,233 | 14,686,851 |
| sequential payer: | | | |
| Series 2004-24 Class ZM, 5% 4/20/34 | | 2,306,762 | 2,548,722 |
| Series 2010-160 Class DY, 4% 12/20/40 | | 14,205,483 | 15,610,964 |
| Series 2010-170 Class B, 4% 12/20/40 | | 3,199,569 | 3,516,287 |
| Series 2013-H06 Class HA, 1.65% 1/20/63 (m) | | 8,050,957 | 8,012,407 |
| Series 2016-H04 Class FE, 1 month U.S. LIBOR + 0.650% 3.0295% 11/20/65 (b)(c)(m) | | 3,827,652 | 3,831,726 |
| Series 2017-139 Class BA, 3% 9/20/47 | | 25,931,090 | 26,314,227 |
| Series 2004-32 Class GS, 6.500% - 1 month U.S. LIBOR 4.3026% 5/16/34 (b)(e)(k) | | 413,947 | 79,279 |
| Series 2004-73 Class AL, 7.200% - 1 month U.S. LIBOR 5.0026% 8/17/34 (b)(e)(k) | | 486,314 | 110,898 |
| Series 2007-35 Class SC, 40.200% - 1 month U.S. LIBOR 27.0157% 6/16/37 (b)(k) | | 27,793 | 51,206 |
| Series 2010-116 Class QB, 4% 9/16/40 | | 3,501,807 | 3,647,667 |
| Series 2010-14 Class SN, 5.950% - 1 month U.S. LIBOR 3.7526% 2/16/40 (b)(e)(k) | | 2,884,879 | 478,155 |
| Series 2010-H10 Class FA, 1 month U.S. LIBOR + 0.330% 2.5711% 5/20/60 (b)(c)(m) | | 3,741,149 | 3,726,298 |
| Series 2011-94 Class SA, 6.100% - 1 month U.S. LIBOR 3.9279% 7/20/41 (b)(e)(k) | | 1,412,938 | 257,290 |
| Series 2012-76 Class GS, 6.700% - 1 month U.S. LIBOR 4.5026% 6/16/42 (b)(e)(k) | | 1,553,500 | 318,766 |
| Series 2013-124: | | | |
| Class ES, 8.667% - 1 month U.S. LIBOR 5.7705% 4/20/39 (b)(k) | | 1,987,621 | 2,046,163 |
| Class ST, 8.800% - 1 month U.S. LIBOR 5.9038% 8/20/39 (b)(k) | | 6,912,423 | 7,159,964 |
| Series 2013-149 Class MA, 2.5% 5/20/40 | | 16,579,345 | 16,925,854 |
| Series 2014-2 Class BA, 3% 1/20/44 | | 19,820,206 | 20,779,965 |
| Series 2014-21 Class HA, 3% 2/20/44 | | 9,074,052 | 9,529,530 |
| Series 2014-25 Class HC, 3% 2/20/44 | | 13,784,517 | 14,546,706 |
| Series 2014-5 Class A, 3% 1/20/44 | | 12,076,811 | 12,660,059 |
| Series 2015-H13 Class HA, 2.5% 8/20/64 (m) | | 15,141,046 | 15,129,174 |
| Series 2015-H17: | | | |
| Class GZ, 4.2933% 5/20/65 (b)(m) | | 1,915,323 | 1,994,573 |
| Class HA, 2.5% 5/20/65 (m) | | 13,566,744 | 13,557,954 |
| Series 2015-H21: | | | |
| Class HA, 2.5% 6/20/63 (m) | | 193,748 | 193,515 |
| Class JA, 2.5% 6/20/65 (m) | | 7,927,168 | 7,921,579 |
| Series 2017-H06 Class FA, U.S. TREASURY 1 YEAR INDEX + 0.350% 2.28% 8/20/66 (b)(c)(m) | | 22,866,733 | 22,807,847 |
|
| TOTAL U.S. GOVERNMENT AGENCY | | | 672,065,757 |
|
| TOTAL COLLATERALIZED MORTGAGE OBLIGATIONS | | | |
| (Cost $662,361,496) | | | 672,271,191 |
|
| Commercial Mortgage Securities - 1.3% | | | |
| Asset Securitization Corp. Series 1997-D5 Class PS1, 1.8322% 2/14/43 (b)(e) | | 8,274 | 23 |
| Bayview Commercial Asset Trust Series 2006-3A, Class IO, 0% 10/25/36 (a)(b)(e)(j) | | 5,571,968 | 1 |
| Benchmark Mortgage Trust Series 2018-B8 Class A5, 4.2317% 1/15/52 | | 25,672,000 | 29,747,643 |
| BX Trust: | | | |
| floater: | | | |
| Series 2018-EXCL Class D, 1 month U.S. LIBOR + 2.625% 4.8201% 9/15/37 (a)(b)(c) | | 9,242,647 | 9,243,482 |
| Series 2018-IND Class F, 1 month U.S. LIBOR + 1.800% 3.9951% 11/15/35 (a)(b)(c) | | 11,444,447 | 11,476,701 |
| Series 2019-IMC: | | | |
| Class B, 1 month U.S. LIBOR + 1.300% 3.4951% 4/15/34 (a)(b)(c) | | 16,075,000 | 16,074,963 |
| Class C, 1 month U.S. LIBOR + 1.600% 3.7951% 4/15/34 (a)(b)(c) | | 10,627,000 | 10,627,018 |
| Class D, 1 month U.S. LIBOR + 1.900% 4.0951% 4/15/34 (a)(b)(c) | | 11,156,000 | 11,190,918 |
| floater, sequential payer Series 2019-IMC Class A, 1 month U.S. LIBOR + 1.000% 3.1951% 4/15/34 (a)(b)(c) | | 25,800,000 | 25,799,951 |
| CHC Commercial Mortgage Trust floater Series 2019-CHC: | | | |
| Class A, 1 month U.S. LIBOR + 1.120% 3.3151% 6/15/34 (a)(b)(c) | | 37,980,000 | 37,979,924 |
| Class B, 1 month U.S. LIBOR + 1.500% 3.6951% 6/15/34 (a)(b)(c) | | 7,477,000 | 7,477,015 |
| Class C, 1 month U.S. LIBOR + 1.750% 3.9451% 6/15/34 (a)(b)(c) | | 8,447,000 | 8,447,014 |
| Citigroup Commercial Mortgage Trust Series 2018-C6 Class A4, 4.412% 11/10/51 | | 4,892,000 | 5,729,611 |
| Credit Suisse Mortgage Trust Series 2018-SITE: | | | |
| Class A, 4.284% 4/15/36 (a) | | 17,109,000 | 18,347,464 |
| Class B, 4.5349% 4/15/36 (a) | | 5,331,000 | 5,705,514 |
| Class C, 4.9414% 4/15/36 (a)(b) | | 3,530,000 | 3,761,869 |
| Class D, 4.9414% 4/15/36 (a)(b) | | 7,059,000 | 7,403,199 |
| CSAIL Commercial Mtg Trust Series 2018-C14 Class A4 4.4216% 11/15/51 | | 12,742,000 | 14,871,472 |
| JPMorgan Chase Commercial Mortgage Securities Trust Series 2018-WPT: | | | |
| Class CFX, 4.9498% 7/5/33 (a) | | 3,633,000 | 3,923,621 |
| Class DFX, 5.3503% 7/5/33 (a) | | 5,586,000 | 6,040,691 |
| Class EFX, 5.5422% 7/5/33 (a) | | 7,644,000 | 8,188,192 |
| Morgan Stanley Capital I Trust Series 2018-H4 Class A4, 4.31% 12/15/51 | | 43,542,000 | 50,712,949 |
| MSCG Trust Series 2016-SNR: | | | |
| Class A, 3.4596% 11/15/34 (a)(b) | | 17,991,644 | 18,119,190 |
| Class B, 4.181% 11/15/34 (a) | | 7,598,150 | 7,722,046 |
| Class C, 5.205% 11/15/34 (a) | | 5,330,350 | 5,461,602 |
| RETL floater Series 2019-RVP Class C, 1 month U.S. LIBOR + 2.100% 4.2951% 3/15/36 (a)(b)(c) | | 23,580,000 | 23,675,820 |
| Wells Fargo Commercial Mortgage Trust Series 2018-C48 Class A5, 4.302% 1/15/52 | | 30,589,000 | 35,443,061 |
| TOTAL COMMERCIAL MORTGAGE SECURITIES | | | |
| (Cost $364,353,495) | | | 383,170,954 |
|
| Municipal Securities - 1.0% | | | |
| California Gen. Oblig.: | | | |
| Series 2009: | | $ | $ |
| 7.35% 11/1/39 | | 4,580,000 | 7,320,077 |
| 7.5% 4/1/34 | | 18,570,000 | 29,255,549 |
| Series 2010, 7.625% 3/1/40 | | 9,470,000 | 15,798,043 |
| Chicago Gen. Oblig. (Taxable Proj.): | | | |
| Series 2008 B, 5.63% 1/1/22 | | 3,455,000 | 3,534,430 |
| Series 2010 C1, 7.781% 1/1/35 | | 12,265,000 | 15,631,988 |
| Series 2012 B, 5.432% 1/1/42 | | 7,305,000 | 7,591,137 |
| Illinois Gen. Oblig.: | | | |
| Series 2003: | | | |
| 4.95% 6/1/23 | | 18,593,455 | 19,573,144 |
| 5.1% 6/1/33 | | 93,565,000 | 101,821,176 |
| Series 2010-1, 6.63% 2/1/35 | | 21,560,000 | 25,680,547 |
| Series 2010-3: | | | |
| 6.725% 4/1/35 | | 31,715,000 | 37,651,414 |
| 7.35% 7/1/35 | | 14,750,000 | 17,956,798 |
| TOTAL MUNICIPAL SECURITIES | | | |
| (Cost $245,050,941) | | | 281,814,303 |
|
| Foreign Government and Government Agency Obligations - 0.2% | | | |
Brazilian Federative Republic:
(Cost $52,864,247) | | $ | $ |
| 4.25% 1/7/25 | | 26,790,000 | 28,556,466 |
| 5.625% 1/7/41 | | 27,107,000 | 31,029,044 |
| TOTAL FOREIGN GOVERNMENT AND GOVERNMENT AGENCY OBLIGATIONS | | | |
| (Cost $52,864,247) | | | 59,585,510 |
|
| Bank Notes - 0.6% | | | |
| Capital One NA 2.95% 7/23/21 | | 31,087,000 | 31,479,075 |
| Discover Bank: | | | |
| (Delaware) 3.2% 8/9/21 | | $37,401,000 | $38,098,980 |
| 3.1% 6/4/20 | | 34,762,000 | 34,945,052 |
| 3.35% 2/6/23 | | 15,572,000 | 16,114,270 |
| 4.682% 8/9/28 (b) | | 13,496,000 | 14,158,654 |
| 8.7% 11/18/19 | | 3,837,000 | 3,883,127 |
| KeyBank NA 6.95% 2/1/28 | | 3,200,000 | 4,099,762 |
| Synchrony Bank 3.65% 5/24/21 | | 23,863,000 | 24,349,695 |
| TOTAL BANK NOTES | | | |
| (Cost $163,154,132) | | | 167,128,615 |
| | | Shares | Value |
|
| Money Market Funds - 5.4% | | | |
| Fidelity Cash Central Fund 2.13% (n) | | | |
| (Cost $1,574,944,809) | | 1,574,651,349 | 1,574,966,279 |
| | | Maturity Amount | Value |
|
| Repurchase Agreements - 1.1% | | | |
| Investments in repurchase agreements in a joint trading account at 2.2%, dated 8/30/19 due 9/3/19 (Collateralized by U.S. Government Obligations) # (o) | | | |
| (Cost $305,411,000) | | 305,485,656 | 305,411,000 |
| Purchased Swaptions - 0.1% | | | | |
| | | Expiration Date | Notional Amount | Value |
| Put Options - 0.0% | | | | |
| Option on an interest rate swap with Bank of America, N.A. to pay semi-annually a fixed rate of 1.476% and receive quarterly a floating rate based on 3-month LIBOR, expiring August 2029 | | 8/27/24 | 25,000,000 | $716,199 |
| Option on an interest rate swap with Bank of America, N.A. to pay semi-annually a fixed rate of 2.605% and receive quarterly a floating rate based on 3-month LIBOR, expiring May 2029 | | 4/29/22 | 19,000,000 | 128,294 |
| Option on an interest rate swap with Goldman Sachs Bank U.S.A. to pay semi-annually a fixed rate of 2.63% and receive quarterly a floating rate based on 3-month LIBOR, expiring April 2029 | | 4/25/22 | 25,200,000 | 163,886 |
| Option on an interest rate swap with Goldman Sachs Bank U.S.A. to pay semi-annually a fixed rate of 2.645% and receive quarterly a floating rate based on 3-month LIBOR, expiring April 2029 | | 4/14/22 | 81,000,000 | 506,249 |
| Option on an interest rate swap with Goldman Sachs Bank U.S.A. to pay semi-annually a fixed rate of 2.99% and receive quarterly a floating rate based on 3 month LIBOR, expiring December 2028. | | 12/6/21 | 5,620,000 | 18,586 |
|
| TOTAL PUT OPTIONS | | | | 1,533,214 |
|
| Call Options - 0.1% | | | | |
| Option on an interest rate swap with Bank of America, N.A. to receive semi-annually a fixed rate of 1.476% and pay quarterly a floating rate based on 3-month LIBOR, expiring August 2029 | | 8/27/24 | 25,000,000 | 745,100 |
| Option on an interest rate swap with Bank of America, N.A. to receive semi-annually a fixed rate of 2.605% and pay quarterly a floating rate based on 3-month LIBOR, expiring May 2029 | | 4/29/22 | 19,000,000 | 1,671,988 |
| Option on an interest rate swap with Goldman Sachs Bank U.S.A. to receive semi-annually a fixed rate of 2.63% and pay quarterly a floating rate based on 3-month LIBOR, expiring April 2029 | | 4/25/22 | 25,200,000 | 2,254,883 |
| Option on an interest rate swap with Goldman Sachs Bank U.S.A. to receive semi-annually a fixed rate of 2.645% and pay quarterly a floating rate based on 3-month LIBOR, expiring April 2029 | | 4/14/22 | 81,000,000 | 7,314,002 |
| Option on an interest rate swap with Goldman Sachs Bank U.S.A. to receive semi-annually a fixed rate of 2.99% and pay quarterly a floating rate based on the 3 month LIBOR, expiring December 2028. | | 12/6/21 | 5,620,000 | 627,663 |
|
| TOTAL CALL OPTIONS | | | | 12,613,636 |
|
| TOTAL PURCHASED SWAPTIONS | | | | |
| (Cost $8,554,514) | | | | 14,146,850 |
| TOTAL INVESTMENT IN SECURITIES - 109.3% | | | | |
| (Cost $30,392,222,091) | | | | 31,738,178,080 |
| NET OTHER ASSETS (LIABILITIES) - (9.3)% | | | | (2,697,842,099) |
| NET ASSETS - 100% | | | | $29,040,335,981 |
| TBA Sale Commitments | | |
| | Principal Amount | Value |
| Ginnie Mae | | |
| 3% 9/1/49 | $(35,050,000) | $(36,143,967) |
| 3% 9/1/49 | (35,050,000) | (36,143,967) |
| 3% 9/1/49 | (42,000,000) | (43,310,887) |
| 3.5% 9/1/49 | (32,500,000) | (33,764,455) |
| 3.5% 9/1/49 | (41,750,000) | (43,374,338) |
| 3.5% 9/1/49 | (44,600,000) | (46,335,221) |
| 3.5% 9/1/49 | (26,450,000) | (27,479,072) |
| 3.5% 9/1/49 | (47,000,000) | (48,828,596) |
| 3.5% 9/1/49 | (16,900,000) | (17,557,516) |
| 3.5% 9/1/49 | (15,100,000) | (15,687,485) |
| 3.5% 9/1/49 | (15,100,000) | (15,687,485) |
| 4% 9/1/49 | (47,000,000) | (48,971,796) |
|
| TOTAL GINNIE MAE | | (413,284,785) |
|
| Uniform Mortgage Backed Securities | | |
| 2.5% 9/1/34 | (7,200,000) | (7,298,438) |
| 3.5% 9/1/49 | (114,500,000) | (117,657,692) |
| 4% 9/1/49 | (3,000,000) | (3,114,212) |
| 4.5% 9/1/49 | (5,300,000) | (5,578,671) |
|
| TOTAL UNIFORM MORTGAGE BACKED SECURITIES | | (133,649,013) |
|
| TOTAL TBA SALE COMMITMENTS | | |
| (Proceeds $545,115,951) | | $(546,933,798) |
| Written Swaptions | | | |
| | Expiration Date | Notional Amount | Value |
| Put Options | | | |
| Option on an interest rate swap with Bank of America, N.A. to pay semi-annually a fixed rate of 1.507% and receive quarterly a floating rate based on 3-month LIBOR, expiring November 2029 | 11/8/19 | 38,000,000 | $(297,763) |
| Option on an interest rate swap with Bank of America, N.A. to pay semi-annually a fixed rate of 1.92% and receive quarterly a floating rate based on 3-month LIBOR, expiring September 2029 | 9/25/19 | 36,790,000 | (3,923) |
| Option on an interest rate swap with Bank of America, N.A. to pay semi-annually a fixed rate of 2.02% and receive quarterly a floating rate based on 3-month LIBOR, expiring September 2029 | 9/16/19 | 14,300,000 | (227) |
|
| TOTAL PUT OPTIONS | | | (301,913) |
|
| Call Options | | | |
| Option on an interest rate swap with Bank of America, N.A. to receive semi-annually a fixed rate of 1.507% and pay quarterly a floating rate based on 3-month LIBOR, expiring November 2029 | 11/8/19 | 38,000,000 | (780,474) |
| Option on an interest rate swap with Bank of America, N.A. to receive semi-annually a fixed rate of 1.92% and pay quarterly a floating rate based on 3-month LIBOR, expiring September 2029 | 9/25/19 | 36,790,000 | (1,877,547) |
| Option on an interest rate swap with Bank of America, N.A. to receive semi-annually a fixed rate of 2.02% and pay quarterly a floating rate based on 3-month LIBOR, expiring September 2029 | 9/16/19 | 14,300,000 | (861,483) |
|
| TOTAL CALL OPTIONS | | | (3,519,504) |
|
| TOTAL WRITTEN SWAPTIONS | | | $(3,821,417) |
| Futures Contracts | | | | | |
| | Number of contracts | Expiration Date | Notional Amount | Value | Unrealized Appreciation/(Depreciation) |
| Sold | | | | | |
| Treasury Contracts | | | | | |
| CBOT 10-Year U.S. Treasury Note Contracts (United States) | 555 | Dec. 2019 | $73,103,906 | $37,884 | $37,884 |
| CBOT 2-Year U.S. Treasury Note Contracts (United States) | 367 | Dec. 2019 | 79,315,008 | (43,727) | (43,727) |
| CBOT 5-Year U.S. Treasury Note Contracts (United States) | 2,114 | Dec. 2019 | 253,630,453 | (242,066) | (242,066) |
| CBOT Long Term U.S. Treasury Bond Contracts (United States) | 251 | Dec. 2019 | 41,477,750 | (235,855) | (235,855) |
| CBOT Ultra 10-Year U.S. Treasury Note Contracts (United States) | 1,086 | Dec. 2019 | 156,859,125 | (434,797) | (434,797) |
| CBOT Ultra Long Term U.S. Treasury Bond Contracts (United States) | 123 | Dec. 2019 | 24,284,813 | 75,228 | 75,228 |
| TOTAL FUTURES CONTRACTS | | | | | $(843,333) |
The notional amount of futures sold as a percentage of Net Assets is 2.2%
Swaps
| Payment Received | Payment Frequency | Payment Paid | Payment Frequency | Clearinghouse / Counterparty(1) | Maturity Date | Notional Amount | Value | Upfront Premium Received/(Paid)(2) | Unrealized Appreciation/(Depreciation) |
| Interest Rate Swaps | | | | | | | | | |
| 1.5% | Semi - annual | 3-month LIBOR(3) | Quarterly | LCH | Dec. 2021 | $129,340,000 | $(71,943) | $0 | $(71,943) |
| 3-month LIBOR(3) | Quarterly | 1.5% | Semi - annual | LCH | Dec. 2029 | 38,115,000 | 74,643 | 0 | 74,643 |
|
| TOTAL INTEREST RATE SWAPS | | | | | | | $2,700 | $0 | $2,700 |
|
(1) Swaps with LCH Clearnet Group (LCH) are centrally cleared over-the-counter (OTC) swaps.
(2) Any premiums for centrally cleared over-the-counter (OTC) swaps are recorded periodically throughout the term of the swap to variation margin and included in unrealized appreciation (depreciation).
(3) Represents floating rate.
Legend
(a) Security exempt from registration under Rule 144A of the Securities Act of 1933. These securities may be resold in transactions exempt from registration, normally to qualified institutional buyers. At the end of the period, the value of these securities amounted to $1,985,984,661 or 6.8% of net assets.
(b) Coupon rates for floating and adjustable rate securities reflect the rates in effect at period end.
(c) Coupon is indexed to a floating interest rate which may be multiplied by a specified factor and/or subject to caps or floors.
(d) Security or a portion of the security is on loan at period end.
(e) Security represents right to receive monthly interest payments on an underlying pool of mortgages or assets. Principal shown is the outstanding par amount of the pool as of the end of the period.
(f) Security or a portion of the security was pledged to cover margin requirements for futures contracts. At period end, the value of securities pledged amounted to $6,283,634.
(g) Security or a portion of the security has been segregated as collateral for open options. At period end, the value of securities pledged amounted to $598,222.
(h) Security or a portion of the security was pledged to cover margin requirements for centrally cleared OTC swaps. At period end, the value of securities pledged amounted to $1,575,824.
(i) Security or a portion of the security purchased on a delayed delivery or when-issued basis.
(j) Level 3 security
(k) Coupon is inversely indexed to a floating interest rate multiplied by a specified factor. The price may be considerably more volatile than the price of a comparable fixed rate security.
(l) Principal Only Strips represent the right to receive the monthly principal payments on an underlying pool of mortgage loans.
(m) Represents an investment in an underlying pool of reverse mortgages which typically do not require regular principal and interest payments as repayment is deferred until a maturity event.
(n) Affiliated fund that is generally available only to investment companies and other accounts managed by Fidelity Investments. The rate quoted is the annualized seven-day yield of the fund at period end. A complete unaudited listing of the fund's holdings as of its most recent quarter end is available upon request. In addition, each Fidelity Central Fund's financial statements, which are not covered by the Fund's Report of Independent Registered Public Accounting Firm, are available on the SEC's website or upon request.
(o) Includes investment made with cash collateral received from securities on loan.
Affiliated Central Funds
Information regarding fiscal year to date income earned by the Fund from investments in Fidelity Central Funds is as follows:
| Fund | Income earned |
| Fidelity Cash Central Fund | $10,303,026 |
| Total | $10,303,026�� |
Amounts in the income column in the above table include any capital gain distributions from underlying funds, which are presented in the corresponding line-item in the Statement of Operations, if applicable.
Investment Valuation
The following is a summary of the inputs used, as of August 31, 2019, involving the Fund's assets and liabilities carried at fair value. The inputs or methodology used for valuing securities may not be an indication of the risk associated with investing in those securities. For more information on valuation inputs, and their aggregation into the levels used below, please refer to the Investment Valuation section in the accompanying Notes to Financial Statements.
| | Valuation Inputs at Reporting Date: |
| Description | Total | Level 1 | Level 2 | Level 3 |
| Investments in Securities: | | | | |
| Corporate Bonds | $10,408,152,320 | $-- | $10,408,152,320 | $-- |
| U.S. Government and Government Agency Obligations | 9,291,778,258 | -- | 9,291,778,258 | -- |
| U.S. Government Agency - Mortgage Securities | 7,897,792,805 | -- | 7,897,792,805 | -- |
| Asset-Backed Securities | 681,959,995 | -- | 680,243,505 | 1,716,490 |
| Collateralized Mortgage Obligations | 672,271,191 | -- | 672,271,191 | -- |
| Commercial Mortgage Securities | 383,170,954 | -- | 383,170,953 | 1 |
| Municipal Securities | 281,814,303 | -- | 281,814,303 | -- |
| Foreign Government and Government Agency Obligations | 59,585,510 | -- | 59,585,510 | -- |
| Bank Notes | 167,128,615 | -- | 167,128,615 | -- |
| Money Market Funds | 1,574,966,279 | 1,574,966,279 | -- | -- |
| Repurchase Agreements | 305,411,000 | -- | 305,411,000 | -- |
| Purchased Swaptions | 14,146,850 | -- | 14,146,850 | -- |
| Total Investments in Securities: | $31,738,178,080 | $1,574,966,279 | $30,161,495,310 | $1,716,491 |
| Derivative Instruments: | | | | |
| Assets | | | | |
| Futures Contracts | $113,112 | $113,112 | $-- | $-- |
| Swaps | 74,643 | -- | 74,643 | -- |
| Total Assets | $187,755 | $113,112 | $74,643 | $-- |
| Liabilities | | | | |
| Futures Contracts | $(956,445) | $(956,445) | $-- | $-- |
| Swaps | (71,943) | -- | (71,943) | -- |
| Written Swaptions | (3,821,417) | -- | (3,821,417) | -- |
| Total Liabilities | $(4,849,805) | $(956,445) | $(3,893,360) | $-- |
| Total Derivative Instruments: | $(4,662,050) | $(843,333) | $(3,818,717) | $-- |
| Other Financial Instruments: | | | | |
| TBA Sale Commitments | $(546,933,798) | $-- | $(546,933,798) | $-- |
| Total Other Financial Instruments: | $(546,933,798) | $-- | $(546,933,798) | $-- |
Value of Derivative Instruments
The following table is a summary of the Fund's value of derivative instruments by primary risk exposure as of August 31, 2019. For additional information on derivative instruments, please refer to the Derivative Instruments section in the accompanying Notes to Financial Statements.
| Primary Risk Exposure / Derivative Type | Value |
| | Asset | Liability |
| Interest Rate Risk | | |
| Futures Contracts(a) | $113,112 | $(956,445) |
| Purchased Swaptions(b) | 14,146,850 | - |
| Swaps(c) | 74,643 | (71,943) |
| Written Swaptions(d) | - | (3,821,417) |
| Total Interest Rate Risk | 14,334,605 | (4,849,805) |
| Total Value of Derivatives | $14,334,605 | $(4,849,805) |
(a) Reflects gross cumulative appreciation (depreciation) on futures contracts as presented in the Schedule of Investments. In the Statement of Assets and Liabilities, the period end daily variation margin is included in receivable or payable for daily variation margin on futures contracts, and the net cumulative appreciation (depreciation) is included in distributable earnings.
(b) Gross value is included in the Statement of Assets and Liabilities in the investments, at value line-item.
(c) For centrally cleared over-the-counter (OTC) swaps, reflects gross cumulative appreciation (depreciation) as presented in the Schedule of Investments. In the Statement of Assets and Liabilities, the period end daily variation margin for centrally cleared OTC swaps is included in receivable or payable for daily variation margin on centrally cleared OTC swaps, and the net cumulative appreciation (depreciation) for centrally cleared OTC swaps is included in distributable earnings.
(d) Gross value is presented in the Statement of Assets and Liabilities in the written options, at value line-item.
Other Information
# Additional information on each counterparty to the repurchase agreement is as follows:
| Repurchase Agreement / Counterparty | Value |
| $305,411,000 due 9/3/19 at 2.2% | |
| J.P. Morgan Securities, Inc. | $305,411,000 |
| | $305,411,000 |
See accompanying notes which are an integral part of the financial statements.
Financial Statements
Statement of Assets and Liabilities
| | | August 31, 2019 |
| Assets | | |
Investment in securities, at value (including securities loaned of $299,422,675 and repurchase agreements of $305,411,000) — See accompanying schedule:
Unaffiliated issuers (cost $28,817,277,282) | $30,163,211,801 | |
| Fidelity Central Funds (cost $1,574,944,809) | 1,574,966,279 | |
| Total Investment in Securities (cost $30,392,222,091) | | $31,738,178,080 |
| Cash | | 665,544 |
| Receivable for investments sold | | 112,681,702 |
| Receivable for premium on written options | | 2,415,255 |
| Receivable for TBA sale commitments | | 545,115,951 |
| Receivable for fund shares sold | | 1,443,124,915 |
| Interest receivable | | 168,176,788 |
| Distributions receivable from Fidelity Central Funds | | 990,610 |
| Receivable for daily variation margin on centrally cleared OTC swaps | | 20,469 |
| Total assets | | 34,011,369,314 |
| Liabilities | | |
| Payable for investments purchased | | |
| Regular delivery | $1,893,752,519 | |
| Delayed delivery | 1,890,816,016 | |
| TBA sale commitments, at value | 546,933,798 | |
| Payable for fund shares redeemed | 329,583,330 | |
| Payable for daily variation margin on futures contracts | 514,843 | |
| Written options, at value (premium receivable $2,415,255) | 3,821,417 | |
| Other payables and accrued expenses | 200,410 | |
| Collateral on securities loaned | 305,411,000 | |
| Total liabilities | | 4,971,033,333 |
| Net Assets | | $29,040,335,981 |
| Net Assets consist of: | | |
| Paid in capital | | $27,780,299,873 |
| Total distributable earnings (loss) | | 1,260,036,108 |
| Net Assets, for 2,485,723,936 shares outstanding | | $29,040,335,981 |
| Net Asset Value, offering price and redemption price per share ($29,040,335,981 ÷ 2,485,723,936 shares) | | $11.68 |
See accompanying notes which are an integral part of the financial statements.
Statement of Operations
| | | Year ended August 31, 2019 |
| Investment Income | | |
| Interest (including $1,060,601 from security lending) | | $831,418,819 |
| Income from Fidelity Central Funds | | 10,303,026 |
| Total income | | 841,721,845 |
| Expenses | | |
| Custodian fees and expenses | $420,897 | |
| Independent trustees' fees and expenses | 118,734 | |
| Commitment fees | 68,976 | |
| Total expenses before reductions | 608,607 | |
| Expense reductions | (28,497) | |
| Total expenses after reductions | | 580,110 |
| Net investment income (loss) | | 841,141,735 |
| Realized and Unrealized Gain (Loss) | | |
| Net realized gain (loss) on: | | |
| Investment securities: | | |
| Unaffiliated issuers | 15,411,978 | |
| Fidelity Central Funds | 6,327 | |
| Futures contracts | (52,017,054) | |
| Swaps | (5,082,521) | |
| Written options | 118,569 | |
| Total net realized gain (loss) | | (41,562,701) |
| Change in net unrealized appreciation (depreciation) on: | | |
| Investment securities: | | |
| Unaffiliated issuers | 1,728,703,103 | |
| Fidelity Central Funds | (6,327) | |
| Futures contracts | (901,394) | |
| Swaps | 2,700 | |
| Written options | (1,474,482) | |
| Delayed delivery commitments | (1,627,039) | |
| Total change in net unrealized appreciation (depreciation) | | 1,724,696,561 |
| Net gain (loss) | | 1,683,133,860 |
| Net increase (decrease) in net assets resulting from operations | | $2,524,275,595 |
See accompanying notes which are an integral part of the financial statements.
Statement of Changes in Net Assets
| | Year ended August 31, 2019 | Year ended August 31, 2018 |
| Increase (Decrease) in Net Assets | | |
| Operations | | |
| Net investment income (loss) | $841,141,735 | $833,244,051 |
| Net realized gain (loss) | (41,562,701) | (78,809,647) |
| Change in net unrealized appreciation (depreciation) | 1,724,696,561 | (888,943,046) |
| Net increase (decrease) in net assets resulting from operations | 2,524,275,595 | (134,508,642) |
| Distributions to shareholders | (877,570,983) | – |
| Distributions to shareholders from net investment income | – | (828,586,240) |
| Distributions to shareholders from net realized gain | – | (25,482,114) |
| Total distributions | (877,570,983) | (854,068,354) |
| Share transactions | | |
| Proceeds from sales of shares | 4,760,731,196 | 5,183,527,349 |
| Reinvestment of distributions | 877,570,983 | 844,980,568 |
| Cost of shares redeemed | (4,622,874,621) | (4,733,237,692) |
| Net increase (decrease) in net assets resulting from share transactions | 1,015,427,558 | 1,295,270,225 |
| Total increase (decrease) in net assets | 2,662,132,170 | 306,693,229 |
| Net Assets | | |
| Beginning of period | 26,378,203,811 | 26,071,510,582 |
| End of period | $29,040,335,981 | $26,378,203,811 |
| Other Information | | |
| Undistributed net investment income end of period | | $79,492,482 |
| Shares | | |
| Sold | 420,431,738 | 463,370,038 |
| Issued in reinvestment of distributions | 78,986,371 | 76,203,846 |
| Redeemed | (418,840,546) | (427,832,104) |
| Net increase (decrease) | 80,577,563 | 111,741,780 |
See accompanying notes which are an integral part of the financial statements.
Financial Highlights
Fidelity Series Investment Grade Bond Fund
| | | | | | |
| Years ended August 31, | 2019 | 2018 | 2017 | 2016 | 2015 |
| Selected Per–Share Data | | | | | |
| Net asset value, beginning of period | $10.97 | $11.37 | $11.62 | $11.27 | $11.47 |
| Income from Investment Operations | | | | | |
| Net investment income (loss)A | .362 | .338 | .293 | .318 | .296 |
| Net realized and unrealized gain (loss) | .727 | (.390) | (.135) | .437 | (.204) |
| Total from investment operations | 1.089 | (.052) | .158 | .755 | .092 |
| Distributions from net investment income | (.379) | (.337) | (.292) | (.325) | (.284) |
| Distributions from net realized gain | – | (.011) | (.116) | (.080) | (.008) |
| Total distributions | (.379) | (.348) | (.408) | (.405) | (.292) |
| Net asset value, end of period | $11.68 | $10.97 | $11.37 | $11.62 | $11.27 |
| Total ReturnB | 10.16% | (.45)% | 1.45% | 6.87% | .79% |
| Ratios to Average Net AssetsC,D | | | | | |
| Expenses before reductions | - %E | - %E | .32% | .45% | .45% |
| Expenses net of fee waivers, if any | - %E | - %E | .32% | .45% | .45% |
| Expenses net of all reductions | - %E | - %E | .32% | .45% | .45% |
| Net investment income (loss) | 3.27% | 3.05% | 2.63% | 2.81% | 2.59% |
| Supplemental Data | | | | | |
| Net assets, end of period (000 omitted) | $29,040,336 | $26,378,204 | $26,071,511 | $11,889,444 | $13,024,398 |
| Portfolio turnover rateF | 175% | 103% | 183% | 121% | 157%G |
A Calculated based on average shares outstanding during the period.
B Total returns would have been lower if certain expenses had not been reduced during the applicable periods shown.
C Fees and expenses of any underlying Fidelity Central Funds are not included in the Fund's expense ratio. The Fund indirectly bears its proportionate share of the expenses of any underlying Fidelity Central Funds.
D Expense ratios reflect operating expenses of the Fund. Expenses before reductions do not reflect amounts reimbursed by the investment adviser or reductions from expense offset arrangements and do not represent the amount paid by the Fund during periods when reimbursements or reductions occur. Expenses net of fee waivers reflect expenses after reimbursement by the investment adviser but prior to reductions from expense offset arrangements. Expenses net of all reductions represent the net expenses paid by the Fund.
E Amount represents less than .005%.
F Amount does not include the portfolio activity of any underlying Fidelity Central Funds.
G Portfolio turnover rate excludes securities received or delivered in-kind.
See accompanying notes which are an integral part of the financial statements.
Notes to Financial Statements
For the period ended August 31, 2019
1. Organization.
Fidelity Series Investment Grade Bond Fund (the Fund) is a fund of Fidelity Salem Street Trust (the Trust) and is authorized to issue an unlimited number of shares. Shares of the Fund are only available for purchase by mutual funds for which Fidelity Management & Research Company (FMR) or an affiliate serves as an investment manager. The Trust is registered under the Investment Company Act of 1940, as amended (the 1940 Act), as an open-end management investment company organized as a Massachusetts business trust.
2. Investments in Fidelity Central Funds.
The Fund invests in Fidelity Central Funds, which are open-end investment companies generally available only to other investment companies and accounts managed by the investment adviser and its affiliates. The Fund's Schedule of Investments lists each of the Fidelity Central Funds held as of period end, if any, as an investment of the Fund, but does not include the underlying holdings of each Fidelity Central Fund. As an Investing Fund, the Fund indirectly bears its proportionate share of the expenses of the underlying Fidelity Central Funds.
The Money Market Central Funds seek preservation of capital and current income and are managed by Fidelity Investments Money Management, Inc. (FIMM), an affiliate of the investment adviser. Annualized expenses of the Money Market Central Funds as of their most recent shareholder report date ranged from less than .005% to .01%.
A complete unaudited list of holdings for each Fidelity Central Fund is available upon request or at the Securities and Exchange Commission (the SEC) website at www.sec.gov. In addition, the financial statements of the Fidelity Central Funds, which are not covered by the Fund's Report of Independent Registered Public Accounting Firm, are available on the SEC website or upon request.
3. Significant Accounting Policies.
The Fund is an investment company and applies the accounting and reporting guidance of the Financial Accounting Standards Board (FASB) Accounting Standards Codification Topic 946 Financial Services – Investments Companies. The financial statements have been prepared in conformity with accounting principles generally accepted in the United States of America (GAAP), which require management to make certain estimates and assumptions at the date of the financial statements. Actual results could differ from those estimates. Subsequent events, if any, through the date that the financial statements were issued have been evaluated in the preparation of the financial statements. The following summarizes the significant accounting policies of the Fund:
Investment Valuation. Investments are valued as of 4:00 p.m. Eastern time on the last calendar day of the period. The Board of Trustees (the Board) has delegated the day to day responsibility for the valuation of the Fund's investments to the Fair Value Committee (the Committee) established by the Fund's investment adviser. In accordance with valuation policies and procedures approved by the Board, the Fund attempts to obtain prices from one or more third party pricing vendors or brokers to value its investments. When current market prices, quotations or currency exchange rates are not readily available or reliable, investments will be fair valued in good faith by the Committee, in accordance with procedures adopted by the Board. Factors used in determining fair value vary by investment type and may include market or investment specific events, changes in interest rates and credit quality. The frequency with which these procedures are used cannot be predicted and they may be utilized to a significant extent. The Committee oversees the Fund's valuation policies and procedures and reports to the Board on the Committee's activities and fair value determinations. The Board monitors the appropriateness of the procedures used in valuing the Fund's investments and ratifies the fair value determinations of the Committee.
The Fund categorizes the inputs to valuation techniques used to value its investments into a disclosure hierarchy consisting of three levels as shown below:
- Level 1 – quoted prices in active markets for identical investments
- Level 2 – other significant observable inputs (including quoted prices for similar investments, interest rates, prepayment speeds, etc.)
- Level 3 – unobservable inputs (including the Fund's own assumptions based on the best information available)
Valuation techniques used to value the Fund's investments by major category are as follows:
Debt securities, including restricted securities, are valued based on evaluated prices received from third party pricing vendors or from brokers who make markets in such securities. Corporate bonds, bank notes, foreign government and government agency obligations, municipal securities and U.S. government and government agency obligations are valued by pricing vendors who utilize matrix pricing which considers yield or price of bonds of comparable quality, coupon, maturity and type or by broker-supplied prices. Asset backed securities, collateralized mortgage obligations, commercial mortgage securities and U.S. government agency mortgage securities are valued by pricing vendors who utilize matrix pricing which considers prepayment speed assumptions, attributes of the collateral, yield or price of bonds of comparable quality, coupon, maturity and type or by broker-supplied prices. Swaps are marked-to-market daily based on valuations from third party pricing vendors, registered derivatives clearing organizations (clearinghouses) or broker-supplied valuations. These pricing sources may utilize inputs such as interest rate curves, credit spread curves, default possibilities and recovery rates. When independent prices are unavailable or unreliable, debt securities and swaps may be valued utilizing pricing methodologies which consider similar factors that would be used by third party pricing vendors. Debt securities and swaps are generally categorized as Level 2 in the hierarchy but may be Level 3 depending on the circumstances.
Futures contracts are valued at the settlement price established each day by the board of trade or exchange on which they are traded and are categorized as Level 1 in the hierarchy. Options traded over-the-counter are valued using vendor or broker-supplied valuations and are categorized as Level 2 in the hierarchy. Investments in open-end mutual funds, including the Fidelity Central Funds, are valued at their closing net asset value (NAV) each business day and are categorized as Level 1 in the hierarchy. Short-term securities with remaining maturities of sixty days or less may be valued at amortized cost, which approximates fair value, and are categorized as Level 2 in the hierarchy.
Changes in valuation techniques may result in transfers in or out of an assigned level within the disclosure hierarchy. The aggregate value of investments by input level as of August 31, 2019 is included at the end of the Fund's Schedule of Investments.
Investment Transactions and Income. For financial reporting purposes, the Fund's investment holdings and NAV include trades executed through the end of the last business day of the period. The NAV per share for processing shareholder transactions is calculated as of the close of business of the New York Stock Exchange (NYSE), normally 4:00 p.m. Eastern time and includes trades executed through the end of the prior business day. Gains and losses on securities sold are determined on the basis of identified cost and include proceeds received from litigation. Income and capital gain distributions from Fidelity Central Funds, if any, are recorded on the ex-dividend date. Interest income is accrued as earned and includes coupon interest and amortization of premium and accretion of discount on debt securities as applicable. The principal amount on inflation-indexed securities is periodically adjusted to the rate of inflation and interest is accrued based on the principal amount. The adjustments to principal due to inflation are reflected as increases or decreases to Interest in the accompanying Statement of Operations. Debt obligations may be placed on non-accrual status and related interest income may be reduced by ceasing current accruals and writing off interest receivables when the collection of all or a portion of interest has become doubtful based on consistently applied procedures. A debt obligation is removed from non-accrual status when the issuer resumes interest payments or when collectability of interest is reasonably assured.
Expenses. Expenses directly attributable to a fund are charged to that fund. Expenses attributable to more than one fund are allocated among the respective funds on the basis of relative net assets or other appropriate methods. Expense estimates are accrued in the period to which they relate and adjustments are made when actual amounts are known.
Income Tax Information and Distributions to Shareholders. Each year, the Fund intends to qualify as a regulated investment company under Subchapter M of the Internal Revenue Code, including distributing substantially all of its taxable income and realized gains. As a result, no provision for U.S. Federal income taxes is required. As of August 31, 2019, the Fund did not have any unrecognized tax benefits in the financial statements; nor is the Fund aware of any tax positions for which it is reasonably possible that the total amounts of unrecognized tax benefits will significantly change in the next twelve months. The Fund files a U.S. federal tax return, in addition to state and local tax returns as required. The Fund's federal income tax returns are subject to examination by the Internal Revenue Service (IRS) for a period of three fiscal years after they are filed. State and local tax returns may be subject to examination for an additional fiscal year depending on the jurisdiction.
Distributions are declared and recorded daily and paid monthly from net investment income. Distributions from realized gains, if any, are declared and recorded on the ex-dividend date. Income and capital gain distributions are determined in accordance with income tax regulations, which may differ from GAAP.
Capital accounts within the financial statements are adjusted for permanent book-tax differences. These adjustments have no impact on net assets or the results of operations. Capital accounts are not adjusted for temporary book-tax differences which will reverse in a subsequent period.
Book-tax differences are primarily due to futures contracts, swaps, market discount, capital loss carryforwards and losses deferred due to wash sales and excise tax regulations.
As of period end, the cost and unrealized appreciation (depreciation) in securities, and derivatives if applicable, for federal income tax purposes were as follows:
| Gross unrealized appreciation | $1,450,931,864 |
| Gross unrealized depreciation | (81,956,167) |
| Net unrealized appreciation (depreciation) | $1,368,975,697 |
| Tax Cost | $30,363,565,819 |
The tax-based components of distributable earnings as of period end were as follows:
| Undistributed ordinary income | $14,212,102 |
| Capital loss carryforward | $(82,424,119) |
| Net unrealized appreciation (depreciation) on securities and other investments | $1,328,248,125 |
Capital loss carryforwards are only available to offset future capital gains of the Fund to the extent provided by regulations and may be limited. Under the Regulated Investment Company Modernization Act of 2010 (the Act), the Fund is permitted to carry forward capital losses incurred in taxable years beginning after December 22, 2010 for an unlimited period and such capital losses are required to be used prior to any losses that expire. The capital loss carryforward information presented below, including any applicable limitation, is estimated as of fiscal period end and is subject to adjustment.
| No expiration | |
| Long-term | $(82,424,119) |
The tax character of distributions paid was as follows:
| | August 31, 2019 | August 31, 2018 |
| Ordinary Income | $877,570,983 | $ 828,586,240 |
| Long-term Capital Gains | – | 25,482,114 |
| Total | $877,570,983 | $ 854,068,354 |
Repurchase Agreements. Pursuant to an Exemptive Order issued by the SEC, the Fund along with other registered investment companies having management contracts with FMR, or other affiliated entities of FMR, are permitted to transfer uninvested cash balances into joint trading accounts which are then invested in repurchase agreements. The Fund may also invest directly with institutions in repurchase agreements. Repurchase agreements may be collateralized by government or non-government securities. Upon settlement date, collateral is held in segregated accounts with custodian banks and may be obtained in the event of a default of the counterparty. The Fund monitors, on a daily basis, the value of the collateral to ensure it is at least equal to the principal amount of the repurchase agreement (including accrued interest). In the event of a default by the counterparty, realization of the collateral proceeds could be delayed, during which time the value of the collateral may decline.
Delayed Delivery Transactions and When-Issued Securities. During the period, the Fund transacted in securities on a delayed delivery or when-issued basis. Payment and delivery may take place after the customary settlement period for that security. The price of the underlying securities and the date when the securities will be delivered and paid for are fixed at the time the transaction is negotiated. The securities purchased on a delayed delivery or when-issued basis are identified as such in the Fund's Schedule of Investments. The Fund may receive compensation for interest forgone in the purchase of a delayed delivery or when-issued security. With respect to purchase commitments, the Fund identifies securities as segregated in its records with a value at least equal to the amount of the commitment. Losses may arise due to changes in the value of the underlying securities or if the counterparty does not perform under the contract's terms, or if the issuer does not issue the securities due to political, economic, or other factors.
To-Be-Announced (TBA) Securities and Mortgage Dollar Rolls. During the period, the Fund transacted in TBA securities that involved buying or selling mortgage-backed securities (MBS) on a forward commitment basis. A TBA transaction typically does not designate the actual security to be delivered and only includes an approximate principal amount; however delivered securities must meet specified terms defined by industry guidelines, including issuer, rate and current principal amount outstanding on underlying mortgage pools. The Fund may enter into a TBA transaction with the intent to take possession of or deliver the underlying MBS, or the Fund may elect to extend the settlement by entering into either a mortgage or reverse mortgage dollar roll. Mortgage dollar rolls are transactions where a fund sells TBA securities and simultaneously agrees to repurchase MBS on a later date at a lower price and with the same counterparty. Reverse mortgage dollar rolls involve the purchase and simultaneous agreement to sell TBA securities on a later date at a lower price. Transactions in mortgage dollar rolls and reverse mortgage dollar rolls are accounted for as purchases and sales and may result in an increase to the Fund's portfolio turnover rate.
Purchases and sales of TBA securities involve risks similar to those discussed above for delayed delivery and when-issued securities. Also, if the counterparty in a mortgage dollar roll or a reverse mortgage dollar roll transaction files for bankruptcy or becomes insolvent, the Fund's right to repurchase or sell securities may be limited. Additionally, when a fund sells TBA securities without already owning or having the right to obtain the deliverable securities (an uncovered forward commitment to sell), it incurs a risk of loss because it could have to purchase the securities at a price that is higher than the price at which it sold them. A fund may be unable to purchase the deliverable securities if the corresponding market is illiquid.
TBA securities subject to a forward commitment to sell at period end are included at the end of the Fund's Schedule of Investments under the caption "TBA Sale Commitments." The proceeds and value of these commitments are reflected in the Fund's Statement of Assets and Liabilities as Receivable for TBA sale commitments and TBA sale commitments, at value, respectively.
Restricted Securities. The Fund may invest in securities that are subject to legal or contractual restrictions on resale. These securities generally may be resold in transactions exempt from registration or to the public if the securities are registered. Disposal of these securities may involve time-consuming negotiations and expense, and prompt sale at an acceptable price may be difficult. Information regarding restricted securities is included at the end of the Fund's Schedule of Investments.
New Rule Issuance. During August 2018, the U.S. Securities and Exchange Commission issued Final Rule Release No. 33-10532, Disclosure Update and Simplification. This Final Rule includes amendments specific to registered investment companies that are intended to eliminate overlap in disclosure requirements between Regulation S-X and GAAP. In accordance with these amendments, certain line-items in the Fund's financial statements have been combined or removed for the current period as outlined in the table below.
| Financial Statement | Current Line-Item Presentation (As Applicable) | Prior Line-Item Presentation (As Applicable) |
| Statement of Assets and Liabilities | Total distributable earnings (loss) | Undistributed/Distributions in excess of/Accumulated net investment income (loss)
Accumulated/Undistributed net realized gain (loss)
Net unrealized appreciation (depreciation) |
| Statement of Changes in Net Assets | N/A - removed | Undistributed/Distributions in excess of/Accumulated net investment income (loss) end of period |
| Statement of Changes in Net Assets | Distributions to shareholders | Distributions to shareholders from net investment income
Distributions to shareholders from net realized gain |
4. Derivative Instruments.
Risk Exposures and the Use of Derivative Instruments. The Fund's investment objective allows the Fund to enter into various types of derivative contracts, including futures contracts, options and swaps. Derivatives are investments whose value is primarily derived from underlying assets, indices or reference rates and may be transacted on an exchange or over-the-counter (OTC). Derivatives may involve a future commitment to buy or sell a specified asset based on specified terms, to exchange future cash flows at periodic intervals based on a notional principal amount, or for one party to make one or more payments upon the occurrence of specified events in exchange for periodic payments from the other party.
The Fund used derivatives to increase returns, to gain exposure to certain types of assets and to manage exposure to certain risks as defined below. The success of any strategy involving derivatives depends on analysis of numerous economic factors, and if the strategies for investment do not work as intended, the Fund may not achieve its objectives.
The Fund's use of derivatives increased or decreased its exposure to the following risk:
| Interest Rate Risk | Interest rate risk relates to the fluctuations in the value of interest-bearing securities due to changes in the prevailing levels of market interest rates. |
The Fund is also exposed to additional risks from investing in derivatives, such as liquidity risk and counterparty credit risk. Liquidity risk is the risk that the Fund will be unable to close out the derivative in the open market in a timely manner. Counterparty credit risk is the risk that the counterparty will not be able to fulfill its obligation to the Fund. Derivative counterparty credit risk is managed through formal evaluation of the creditworthiness of all potential counterparties. On certain OTC derivatives such as options, the Fund attempts to reduce its exposure to counterparty credit risk by entering into an International Swaps and Derivatives Association, Inc. (ISDA) Master Agreement with each of its counterparties. The ISDA Master Agreement gives the Fund the right to terminate all transactions traded under such agreement upon the deterioration in the credit quality of the counterparty beyond specified levels. The ISDA Master Agreement gives each party the right, upon an event of default by the other party or a termination of the agreement, to close out all transactions traded under such agreement and to net amounts owed under each transaction to one net payable by one party to the other. To mitigate counterparty credit risk on bi-lateral OTC derivatives, the Fund receives collateral in the form of cash or securities once the Fund's net unrealized appreciation on outstanding derivative contracts under an ISDA Master Agreement exceeds certain applicable thresholds, subject to certain minimum transfer provisions. The collateral received is held in segregated accounts with the Fund's custodian bank in accordance with the collateral agreements entered into between the Fund, the counterparty and the Fund's custodian bank. The Fund could experience delays and costs in gaining access to the collateral even though it is held by the Fund's custodian bank. The Fund's maximum risk of loss from counterparty credit risk related to bi-lateral OTC derivatives is generally the aggregate unrealized appreciation and unpaid counterparty payments in excess of any collateral pledged by the counterparty to the Fund. For OTC written options with upfront premiums received, the Fund is obligated to perform and therefore does not have counterparty risk. For OTC written options with premiums to be received at a future date, the maximum risk of loss from counterparty credit risk is the amount of the premium in excess of any collateral pledged by the counterparty. The Fund may be required to pledge collateral for the benefit of the counterparties on bi-lateral OTC derivatives in an amount not less than each counterparty's unrealized appreciation on outstanding derivative contracts, subject to certain minimum transfer provisions, and any such pledged collateral is identified in the Schedule of Investments. Exchange-traded futures contracts are not covered by the ISDA Master Agreement; however counterparty credit risk related to exchange-traded futures contracts may be mitigated by the protection provided by the exchange on which they trade. Counterparty credit risk related to centrally cleared OTC swaps may be mitigated by the protection provided by the clearinghouse.
Investing in derivatives may involve greater risks than investing in the underlying assets directly and, to varying degrees, may involve risk of loss in excess of any initial investment and collateral received and amounts recognized in the Statement of Assets and Liabilities. In addition, there may be the risk that the change in value of the derivative contract does not correspond to the change in value of the underlying instrument.
Net Realized Gain (Loss) and Change in Net Unrealized Appreciation (Depreciation) on Derivatives. The table below, which reflects the impacts of derivatives on the financial performance of the Fund, summarizes the net realized gain (loss) and change in net unrealized appreciation (depreciation) for derivatives during the period as presented in the Statement of Operations.
| Primary Risk Exposure / Derivative Type | Net Realized Gain (Loss) | Change in Net Unrealized Appreciation (Depreciation) |
| Interest Rate Risk | | |
| Futures Contracts | $(52,017,054) | $(901,394) |
| Purchased Options | 5,230,041 | 5,592,336 |
| Written Options | 118,569 | (1,474,482) |
| Swaps | (5,082,521) | 2,700 |
| Totals | $(51,750,965) | $3,219,160 |
A summary of the value of derivatives by primary risk exposure as of period end is included at the end of the Schedule of Investments.
Futures Contracts. A futures contract is an agreement between two parties to buy or sell a specified underlying instrument for a fixed price at a specified future date. The Fund used futures contracts to manage its exposure to the bond market and fluctuations in interest rates.
Upon entering into a futures contract, a fund is required to deposit either cash or securities (initial margin) with a clearing broker in an amount equal to a certain percentage of the face value of the contract. Futures contracts are marked-to-market daily and subsequent daily payments (variation margin) are made or received by a fund depending on the daily fluctuations in the value of the futures contracts and are recorded as unrealized appreciation or (depreciation). This receivable and/or payable, if any, is included in daily variation margin on futures contracts in the Statement of Assets and Liabilities. Realized gain or (loss) is recorded upon the expiration or closing of a futures contract. The net realized gain (loss) and change in net unrealized appreciation (depreciation) on futures contracts during the period is presented in the Statement of Operations.
Any open futures contracts at period end are presented in the Schedule of Investments under the caption "Futures Contracts". The notional amount at value reflects each contract's exposure to the underlying instrument or index at period end and is representative of volume of activity during the period. Securities deposited to meet initial margin requirements are identified in the Schedule of Investments.
Options. Options give the purchaser the right, but not the obligation, to buy (call) or sell (put) an underlying security or financial instrument at an agreed exercise or strike price between or on certain dates. Options obligate the seller (writer) to buy (put) or sell (call) an underlying instrument at the exercise or strike price or cash settle an underlying derivative instrument if the holder exercises the option on or before the expiration date. The Fund uses OTC options, such as swaptions, which are options where the underlying instrument is a swap, to manage its exposure to fluctuations in interest rates.
Upon entering into an options contract, a fund will pay or receive a premium. Premiums paid on purchased options are reflected as cost of investments and premiums received on written options are reflected as a liability on the Statement of Assets and Liabilities. Certain options may be purchased or written with premiums to be paid or received on a future date. Options are valued daily and any unrealized appreciation (depreciation) is reflected on the Statement of Assets and Liabilities. When an option is exercised, the cost or proceeds of the underlying instrument purchased or sold is adjusted by the amount of the premium. When an option is closed the Fund will realize a gain or loss depending on whether the proceeds or amount paid for the closing sale transaction is greater or less than the premium received or paid. When an option expires, gains and losses are realized to the extent of premiums received and paid, respectively. The net realized and unrealized gains (losses) on purchased options are included in the Statement of Operations in net realized gain (loss) and change in net unrealized appreciation (depreciation) on investment securities. The net realized gain (loss) and change in net unrealized appreciation (depreciation) on written options are presented in the Statement of Operations.
Any open options at period end are presented in the Schedule of Investments under the captions "Purchased Options," "Purchased Swaptions," "Written Options" and "Written Swaptions," as applicable, and are representative of volume of activity during the period.
Writing puts and buying calls tend to increase exposure to the underlying instrument while buying puts and writing calls tend to decrease exposure to the underlying instrument. For purchased options, risk of loss is limited to the premium paid, and for written options, risk of loss is the change in value in excess of the premium received.
Swaps. A swap is a contract between two parties to exchange future cash flows at periodic intervals based on a notional principal amount. A centrally cleared OTC swap is a transaction executed between a fund and a dealer counterparty, then cleared by a futures commission merchant (FCM) through a clearinghouse. Once cleared, the clearinghouse serves as a central counterparty, with whom a fund exchanges cash flows for the life of the transaction, similar to transactions in futures contracts.
Centrally cleared OTC swaps require a fund to deposit either cash or securities (initial margin) with the FCM, at the instruction of and for the benefit of the clearinghouse. Securities deposited to meet initial margin requirements are identified in the Schedule of Investments. Centrally cleared OTC swaps are marked-to-market daily and subsequent payments (variation margin) are made or received depending on the daily fluctuations in the value of the swaps and are recorded as unrealized appreciation or (depreciation). These daily payments, if any, are included in receivable or payable for daily variation margin on centrally cleared OTC swaps in the Statement of Assets and Liabilities. Any premiums for centrally cleared OTC swaps are recorded periodically throughout the term of the swap to variation margin and included in unrealized appreciation (depreciation) in the Statement of Assets and Liabilities. Any premiums are recognized as realized gain (loss) upon termination or maturity of the swap.
Payments are exchanged at specified intervals, accrued daily commencing with the effective date of the contract and recorded as realized gain or (loss). Some swaps may be terminated prior to the effective date and realize a gain or loss upon termination. The net realized gain (loss) and change in net unrealized appreciation (depreciation) on swaps during the period is presented in the Statement of Operations.
Any open swaps at period end are included in the Schedule of Investments under the caption "Swaps" and are representative of volume of activity during the period.
Interest Rate Swaps. Interest rate swaps are agreements between counterparties to exchange cash flows, one based on a fixed rate, and the other on a floating rate. The Fund entered into interest rate swaps to manage its exposure to interest rate changes. Changes in interest rates can have an effect on both the value of bond holdings as well as the amount of interest income earned. In general, the value of bonds can fall when interest rates rise and can rise when interest rates fall.
5. Purchases and Sales of Investments.
Purchases and sales of securities, other than short-term securities and U.S. government securities, aggregated $3,129,742,289 and $1,958,048,619, respectively.
6. Fees and Other Transactions with Affiliates.
Management Fee. Fidelity Management & Research Company (the investment adviser) and its affiliates provide the Fund with investment management related services for which the Fund does not pay a management fee. Under the management contract, the investment adviser or an affiliate pays all ordinary operating expenses of the Fund, except custody fees, fees and expenses of the independent Trustees, and certain miscellaneous expenses such as proxy and shareholder meeting expenses.
Interfund Trades. The Funds may purchase from or sell securities to other Fidelity Funds under procedures adopted by the Board. The procedures have been designed to ensure these interfund trades are executed in accordance with Rule 17a-7 of the 1940 Act. Interfund trades are included within the respective purchases and sales amounts shown in the Purchases and Sales of Investments note.
Other. During the period, the investment adviser reimbursed the Fund for certain losses in the amount of $3,242.
7. Committed Line of Credit.
The Fund participates with other funds managed by the investment adviser or an affiliate in a $4.25 billion credit facility (the "line of credit") to be utilized for temporary or emergency purposes to fund shareholder redemptions or for other short-term liquidity purposes. The Fund has agreed to pay commitment fees on its pro-rata portion of the line of credit, which amounted to $68,976 and is reflected in Commitment fees on the Statement of Operations. During the period, the Fund did not borrow on this line of credit.
8. Security Lending.
The Fund lends portfolio securities from time to time in order to earn additional income. The Fund may lend securities to certain qualified borrowers. On the settlement date of the loan, the Fund receives collateral (in the form of U.S. Treasury obligations, letters of credit and/or cash) against the loaned securities and maintains collateral in an amount not less than 100% of the market value of the loaned securities during the period of the loan. The market value of the loaned securities is determined at the close of business of the Fund and any additional required collateral is delivered to the Fund on the next business day. The Fund or borrower may terminate the loan at any time, and if the borrower defaults on its obligation to return the securities loaned because of insolvency or other reasons, the Fund may apply collateral received from the borrower against the obligation. The Fund may experience delays and costs in recovering the securities loaned. Any cash collateral received is invested in cash equivalents. The value of loaned securities and cash collateral at period end are disclosed on the Fund's Statement of Assets and Liabilities. Security lending income represents the income earned on investing cash collateral, less rebates paid to borrowers, plus any premium payments received for lending certain types of securities. Security lending income is presented in the Statement of Operations as a component of interest income.
9. Expense Reductions.
Through arrangements with the Fund's custodian, credits realized as a result of certain uninvested cash balances were used to reduce the Fund's expenses. During the period, these credits reduced the Fund's custody expenses by $28,497.
10. Other.
The Fund's organizational documents provide former and current trustees and officers with a limited indemnification against liabilities arising in connection with the performance of their duties to the Fund. In the normal course of business, the Fund may also enter into contracts that provide general indemnifications. The Fund's maximum exposure under these arrangements is unknown as this would be dependent on future claims that may be made against the Fund. The risk of material loss from such claims is considered remote.
At the end of the period, mutual funds managed by the investment adviser or its affiliates were the owners of record of all of the outstanding shares of the Fund.
Report of Independent Registered Public Accounting Firm
To the Board of Trustees of Fidelity Salem Street Trust and Shareholders of Fidelity Series Investment Grade Bond Fund:
Opinion on the Financial Statements
We have audited the accompanying statement of assets and liabilities, including the schedule of investments, of Fidelity Series Investment Grade Bond Fund (one of the funds constituting Fidelity Salem Street Trust, referred to hereafter as the “Fund”) as of August 31, 2019, the related statement of operations for the year ended August 31, 2019, the statement of changes in net assets for each of the two years in the period ended August 31, 2019, including the related notes, and the financial highlights for each of the five years in the period ended August 31, 2019 (collectively referred to as the “financial statements”). In our opinion, the financial statements present fairly, in all material respects, the financial position of the Fund as of August 31, 2019, the results of its operations for the year then ended, the changes in its net assets for each of the two years in the period ended August 31, 2019 and the financial highlights for each of the five years in the period ended August 31, 2019 in conformity with accounting principles generally accepted in the United States of America.
Basis for Opinion
These financial statements are the responsibility of the Fund’s management. Our responsibility is to express an opinion on the Fund’s financial statements based on our audits. We are a public accounting firm registered with the Public Company Accounting Oversight Board (United States) (PCAOB) and are required to be independent with respect to the Fund in accordance with the U.S. federal securities laws and the applicable rules and regulations of the Securities and Exchange Commission and the PCAOB.
We conducted our audits of these financial statements in accordance with the standards of the PCAOB. Those standards require that we plan and perform the audit to obtain reasonable assurance about whether the financial statements are free of material misstatement, whether due to error or fraud.
Our audits included performing procedures to assess the risks of material misstatement of the financial statements, whether due to error or fraud, and performing procedures that respond to those risks. Such procedures included examining, on a test basis, evidence regarding the amounts and disclosures in the financial statements. Our audits also included evaluating the accounting principles used and significant estimates made by management, as well as evaluating the overall presentation of the financial statements. Our procedures included confirmation of securities owned as of August 31, 2019 by correspondence with the custodian and brokers; when replies were not received from brokers, we performed other auditing procedures. We believe that our audits provide a reasonable basis for our opinion.
PricewaterhouseCoopers LLP
Boston, Massachusetts
October 18, 2019
We have served as the auditor of one or more investment companies in the Fidelity group of funds since 1932.
Trustees and Officers
The Trustees, Members of the Advisory Board (if any), and officers of the trust and fund, as applicable, are listed below. The Board of Trustees governs the fund and is responsible for protecting the interests of shareholders. The Trustees are experienced executives who meet periodically throughout the year to oversee the fund's activities, review contractual arrangements with companies that provide services to the fund, oversee management of the risks associated with such activities and contractual arrangements, and review the fund's performance. Except for Jonathan Chiel, each of the Trustees oversees 276 funds. Mr. Chiel oversees 170 funds.
The Trustees hold office without limit in time except that (a) any Trustee may resign; (b) any Trustee may be removed by written instrument, signed by at least two-thirds of the number of Trustees prior to such removal; (c) any Trustee who requests to be retired or who has become incapacitated by illness or injury may be retired by written instrument signed by a majority of the other Trustees; and (d) any Trustee may be removed at any special meeting of shareholders by a two-thirds vote of the outstanding voting securities of the trust. Each Trustee who is not an interested person (as defined in the 1940 Act) of the trust and the fund is referred to herein as an Independent Trustee. Each Independent Trustee shall retire not later than the last day of the calendar year in which his or her 75th birthday occurs. The Independent Trustees may waive this mandatory retirement age policy with respect to individual Trustees. Officers and Advisory Board Members hold office without limit in time, except that any officer or Advisory Board Member may resign or may be removed by a vote of a majority of the Trustees at any regular meeting or any special meeting of the Trustees. Except as indicated, each individual has held the office shown or other offices in the same company for the past five years.
The fund’s Statement of Additional Information (SAI) includes more information about the Trustees. To request a free copy, call Fidelity at 1-800-544-8544.
Experience, Skills, Attributes, and Qualifications of the Trustees. The Governance and Nominating Committee has adopted a statement of policy that describes the experience, qualifications, attributes, and skills that are necessary and desirable for potential Independent Trustee candidates (Statement of Policy). The Board believes that each Trustee satisfied at the time he or she was initially elected or appointed a Trustee, and continues to satisfy, the standards contemplated by the Statement of Policy. The Governance and Nominating Committee also engages professional search firms to help identify potential Independent Trustee candidates who have the experience, qualifications, attributes, and skills consistent with the Statement of Policy. From time to time, additional criteria based on the composition and skills of the current Independent Trustees, as well as experience or skills that may be appropriate in light of future changes to board composition, business conditions, and regulatory or other developments, have also been considered by the professional search firms and the Governance and Nominating Committee. In addition, the Board takes into account the Trustees' commitment and participation in Board and committee meetings, as well as their leadership of standing and ad hoc committees throughout their tenure.
In determining that a particular Trustee was and continues to be qualified to serve as a Trustee, the Board has considered a variety of criteria, none of which, in isolation, was controlling. The Board believes that, collectively, the Trustees have balanced and diverse experience, qualifications, attributes, and skills, which allow the Board to operate effectively in governing the fund and protecting the interests of shareholders. Information about the specific experience, skills, attributes, and qualifications of each Trustee, which in each case led to the Board's conclusion that the Trustee should serve (or continue to serve) as a trustee of the fund, is provided below.
Board Structure and Oversight Function. Abigail P. Johnson is an interested person and currently serves as Chairman. The Trustees have determined that an interested Chairman is appropriate and benefits shareholders because an interested Chairman has a personal and professional stake in the quality and continuity of services provided to the fund. Independent Trustees exercise their informed business judgment to appoint an individual of their choosing to serve as Chairman, regardless of whether the Trustee happens to be independent or a member of management. The Independent Trustees have determined that they can act independently and effectively without having an Independent Trustee serve as Chairman and that a key structural component for assuring that they are in a position to do so is for the Independent Trustees to constitute a substantial majority for the Board. The Independent Trustees also regularly meet in executive session. Arthur E. Johnson serves as Chairman of the Independent Trustees and as such (i) acts as a liaison between the Independent Trustees and management with respect to matters important to the Independent Trustees and (ii) with management prepares agendas for Board meetings.
Fidelity® funds are overseen by different Boards of Trustees. The fund's Board oversees Fidelity's investment-grade bond, money market, asset allocation and certain equity funds, and other Boards oversee Fidelity's high income and other equity funds. The asset allocation funds may invest in Fidelity® funds that are overseen by such other Boards. The use of separate Boards, each with its own committee structure, allows the Trustees of each group of Fidelity® funds to focus on the unique issues of the funds they oversee, including common research, investment, and operational issues. On occasion, the separate Boards establish joint committees to address issues of overlapping consequences for the Fidelity® funds overseen by each Board.
The Trustees operate using a system of committees to facilitate the timely and efficient consideration of all matters of importance to the Trustees, the fund, and fund shareholders and to facilitate compliance with legal and regulatory requirements and oversight of the fund's activities and associated risks. The Board, acting through its committees, has charged FMR and its affiliates with (i) identifying events or circumstances the occurrence of which could have demonstrably adverse effects on the fund's business and/or reputation; (ii) implementing processes and controls to lessen the possibility that such events or circumstances occur or to mitigate the effects of such events or circumstances if they do occur; and (iii) creating and maintaining a system designed to evaluate continuously business and market conditions in order to facilitate the identification and implementation processes described in (i) and (ii) above. Because the day-to-day operations and activities of the fund are carried out by or through FMR, its affiliates, and other service providers, the fund's exposure to risks is mitigated but not eliminated by the processes overseen by the Trustees. While each of the Board's committees has responsibility for overseeing different aspects of the fund's activities, oversight is exercised primarily through the Operations and Audit Committees. In addition, an ad hoc Board committee of Independent Trustees has worked with FMR to enhance the Board's oversight of investment and financial risks, legal and regulatory risks, technology risks, and operational risks, including the development of additional risk reporting to the Board. Appropriate personnel, including but not limited to the fund's Chief Compliance Officer (CCO), FMR's internal auditor, the independent accountants, the fund's Treasurer and portfolio management personnel, make periodic reports to the Board's committees, as appropriate, including an annual review of Fidelity's risk management program for the Fidelity® funds. The responsibilities of each standing committee, including their oversight responsibilities, are described further under "Standing Committees of the Trustees."
Interested Trustees*:
Correspondence intended for a Trustee who is an interested person may be sent to Fidelity Investments, 245 Summer Street, Boston, Massachusetts 02210.
Name, Year of Birth; Principal Occupations and Other Relevant Experience+
Jonathan Chiel (1957)
Year of Election or Appointment: 2016
Trustee
Mr. Chiel also serves as Trustee of other Fidelity® funds. Mr. Chiel is Executive Vice President and General Counsel for FMR LLC (diversified financial services company, 2012-present). Previously, Mr. Chiel served as general counsel (2004-2012) and senior vice president and deputy general counsel (2000-2004) for John Hancock Financial Services; a partner with Choate, Hall & Stewart (1996-2000) (law firm); and an Assistant United States Attorney for the United States Attorney’s Office of the District of Massachusetts (1986-95), including Chief of the Criminal Division (1993-1995). Mr. Chiel is a director on the boards of the Boston Bar Foundation and the Maimonides School.
Abigail P. Johnson (1961)
Year of Election or Appointment: 2009
Trustee
Chairman of the Board of Trustees
Ms. Johnson also serves as Trustee of other Fidelity® funds. Ms. Johnson serves as Chairman (2016-present), Chief Executive Officer (2014-present), and Director (2007-present) of FMR LLC (diversified financial services company), President of Fidelity Financial Services (2012-present) and President of Personal, Workplace and Institutional Services (2005-present). Ms. Johnson is Chairman and Director of FMR Co., Inc. (investment adviser firm, 2011-present) and Chairman and Director of FMR (investment adviser firm, 2011-present). Previously, Ms. Johnson served as Vice Chairman (2007-2016) and President (2013-2016) of FMR LLC, President and a Director of FMR (2001-2005), a Trustee of other investment companies advised by FMR, Fidelity Investments Money Management, Inc. (investment adviser firm), and FMR Co., Inc. (2001-2005), Senior Vice President of the Fidelity® funds (2001-2005), and managed a number of Fidelity® funds. Ms. Abigail P. Johnson and Mr. Arthur E. Johnson are not related.
Jennifer Toolin McAuliffe (1959)
Year of Election or Appointment: 2016
Trustee
Ms. McAuliffe also serves as Trustee of other Fidelity® funds. Ms. McAuliffe previously served as a Member of the Advisory Board of certain Fidelity® funds (2016) and as Co-Head of Fixed Income of Fidelity Investments Limited (now known as FIL Limited (FIL)) (diversified financial services company). Earlier roles at FIL included Director of Research for FIL’s credit and quantitative teams in London, Hong Kong and Tokyo. Ms. McAuliffe also was the Director of Research for taxable and municipal bonds at Fidelity Investments Money Management, Inc. Ms. McAuliffe is also a director or trustee of several not-for-profit entities.
* Determined to be an “Interested Trustee” by virtue of, among other things, his or her affiliation with the trust or various entities under common control with FMR.
+ The information includes the Trustee's principal occupation during the last five years and other information relating to the experience, attributes, and skills relevant to the Trustee's qualifications to serve as a Trustee, which led to the conclusion that the Trustee should serve as a Trustee for the fund.
Independent Trustees:
Correspondence intended for an Independent Trustee may be sent to Fidelity Investments, P.O. Box 55235, Boston, Massachusetts 02205-5235.
Name, Year of Birth; Principal Occupations and Other Relevant Experience+
Elizabeth S. Acton (1951)
Year of Election or Appointment: 2013
Trustee
Ms. Acton also serves as Trustee of other Fidelity® funds. Prior to her retirement in April 2012, Ms. Acton was Executive Vice President, Finance (2011-2012), Executive Vice President, Chief Financial Officer (2002-2011), and Treasurer (2004-2005) of Comerica Incorporated (financial services). Prior to joining Comerica, Ms. Acton held a variety of positions at Ford Motor Company (1983-2002), including Vice President and Treasurer (2000-2002) and Executive Vice President and Chief Financial Officer of Ford Motor Credit Company (1998-2000). Ms. Acton currently serves as a member of the Board of Directors and Audit and Finance Committees of Beazer Homes USA, Inc. (homebuilding, 2012-present). Previously, Ms. Acton served as a Member of the Advisory Board of certain Fidelity® funds (2013-2016).
Ann E. Dunwoody (1953)
Year of Election or Appointment: 2018
Trustee
General Dunwoody also serves as Trustee of other Fidelity® funds. General Dunwoody (United States Army, Retired) was the first woman in U.S. military history to achieve the rank of four-star general and prior to her retirement in 2012 held a variety of positions within the U.S. Army, including Commanding General, U.S. Army Material Command (2008-2012). She is the President of First to Four LLC (leadership and mentoring services, 2012-present). She also serves as a member of the Board of Directors and Nominating and Corporate Governance Committee of L3 Technologies, Inc. (communication, electronic, sensor, and aerospace systems, 2013-present), Board of Directors and Nomination and Corporate Governance Committees of Kforce Inc. (professional staffing services, 2016-present) and Board of Directors of Automattic Inc. (software engineering, 2018-present). Previously, General Dunwoody served as a Member of the Advisory Board of certain Fidelity® funds (2018), a member of the Board of Directors and Audit and Sustainability and Corporate Responsibility Committees of Republic Services, Inc. (waste collection, disposal and recycling, 2013-2016). Ms. Dunwoody also serves on several boards for non-profit organizations, including as a member of the Board of Directors, Chair of the Nomination and Governance Committee and member of the Audit Committee of Logistics Management Institute (consulting non-profit, 2012-present), a member of the Board of Directors of the Army Historical Foundation (2015-present), a member of the Council of Trustees for the Association of the United States Army (advocacy non-profit, 2013-present) and a member of the Board of Trustees of Florida Institute of Technology (2015-present) and ThanksUSA (military family education non-profit, 2014-present).
John Engler (1948)
Year of Election or Appointment: 2014
Trustee
Mr. Engler also serves as Trustee of other Fidelity® funds. He serves on the board of directors for Universal Forest Products (manufacturer and distributor of wood and wood-alternative products, 2003-present) and K12 Inc. (technology-based education company, 2012-present). Previously, Mr. Engler served as interim president of Michigan State University (2018-2019), a Member of the Advisory Board of certain Fidelity® funds (2014-2016), president of the Business Roundtable (2011-2017), a trustee of The Munder Funds (2003-2014), president and CEO of the National Association of Manufacturers (2004-2011), member of the Board of Trustees of the Annie E. Casey Foundation (2004-2015), and as governor of Michigan (1991-2003). He is a past chairman of the National Governors Association.
Robert F. Gartland (1951)
Year of Election or Appointment: 2010
Trustee
Mr. Gartland also serves as Trustee of other Fidelity® funds. Mr. Gartland is Chairman and an investor in Gartland & Mellina Group Corp. (consulting, 2009-present). Previously, Mr. Gartland served as a partner and investor of Vietnam Partners LLC (investments and consulting, 2008-2011). Prior to his retirement, Mr. Gartland held a variety of positions at Morgan Stanley (financial services, 1979-2007), including Managing Director (1987-2007), and Chase Manhattan Bank (1975-1978).
Arthur E. Johnson (1947)
Year of Election or Appointment: 2008
Trustee
Chairman of the Independent Trustees
Mr. Johnson also serves as Trustee of other Fidelity® funds. Mr. Johnson serves as a member of the Board of Directors of Eaton Corporation plc (diversified power management, 2009-present) and Booz Allen Hamilton (management consulting, 2011-present). Prior to his retirement, Mr. Johnson served as Senior Vice President of Corporate Strategic Development of Lockheed Martin Corporation (defense contractor, 1999-2009). Mr. Johnson previously served as Vice Chairman (2015-2018) of the Independent Trustees of certain Fidelity® funds and on the Board of Directors of IKON Office Solutions, Inc. (1999-2008), AGL Resources, Inc. (holding company, 2002-2016), and Delta Airlines (2005-2007). Mr. Arthur E. Johnson is not related to Ms. Abigail P. Johnson.
Michael E. Kenneally (1954)
Year of Election or Appointment: 2009
Trustee
Vice Chairman of the Independent Trustees
Mr. Kenneally also serves as Trustee of other Fidelity® funds. Prior to his retirement, Mr. Kenneally served as Chairman and Global Chief Executive Officer of Credit Suisse Asset Management. Before joining Credit Suisse, he was an Executive Vice President and Chief Investment Officer for Bank of America Corporation. Earlier roles at Bank of America included Director of Research, Senior Portfolio Manager and Research Analyst, and Mr. Kenneally was awarded the Chartered Financial Analyst (CFA) designation in 1991.
Marie L. Knowles (1946)
Year of Election or Appointment: 2001
Trustee
Ms. Knowles also serves as Trustee of other Fidelity® funds. Prior to Ms. Knowles' retirement in June 2000, she served as Executive Vice President and Chief Financial Officer of Atlantic Richfield Company (ARCO) (diversified energy, 1996-2000). From 1993 to 1996, she was a Senior Vice President of ARCO and President of ARCO Transportation Company (pipeline and tanker operations). Ms. Knowles currently serves as a Director and Chairman of the Audit Committee of McKesson Corporation (healthcare service, since 2002). Ms. Knowles is a member of the Board of the Santa Catalina Island Company (real estate, 2009-present). Ms. Knowles is a Member of the Investment Company Institute Board of Governors and a Member of the Governing Council of the Independent Directors Council (2014-present). She also serves as a member of the Advisory Board for the School of Engineering of the University of Southern California. Previously, Ms. Knowles served as a Director of Phelps Dodge Corporation (copper mining and manufacturing, 1994-2007), URS Corporation (engineering and construction, 2000-2003) and America West (airline, 1999-2002). Ms. Knowles previously served as Chairman (2015-2018) and Vice Chairman (2012-2015) of the Independent Trustees of certain Fidelity® funds.
Mark A. Murray (1954)
Year of Election or Appointment: 2016
Trustee
Mr. Murray also serves as Trustee of other Fidelity® funds. Mr. Murray is Vice Chairman (2013-present) of Meijer, Inc. (regional retail chain). Previously, Mr. Murray served as a Member of the Advisory Board of certain Fidelity® funds (2016) and as Co-Chief Executive Officer (2013-2016) and President (2006-2013) of Meijer, Inc. Mr. Murray serves as a member of the Board of Directors and Nuclear Review and Public Policy and Responsibility Committees of DTE Energy Company (diversified energy company, 2009-present). Mr. Murray also serves as a member of the Board of Directors of Spectrum Health (not-for-profit health system, 2015-present). Mr. Murray previously served as President of Grand Valley State University (2001-2006), Treasurer for the State of Michigan (1999-2001), Vice President of Finance and Administration for Michigan State University (1998-1999), and a member of the Board of Directors and Audit Committee and Chairman of the Nominating and Corporate Governance Committee of Universal Forest Products, Inc. (manufacturer and distributor of wood and wood-alternative products, 2004-2016). Mr. Murray is also a director or trustee of many community and professional organizations.
+ The information includes the Trustee's principal occupation during the last five years and other information relating to the experience, attributes, and skills relevant to the Trustee's qualifications to serve as a Trustee, which led to the conclusion that the Trustee should serve as a Trustee for the fund.
Advisory Board Members and Officers:
Correspondence intended for an officer may be sent to Fidelity Investments, 245 Summer Street, Boston, Massachusetts 02210. Officers appear below in alphabetical order.
Name, Year of Birth; Principal Occupation
Elizabeth Paige Baumann (1968)
Year of Election or Appointment: 2017
Anti-Money Laundering (AML) Officer
Ms. Baumann also serves as AML Officer of other funds. She is Chief AML Officer (2012-present) and Senior Vice President (2014-present) of FMR LLC (diversified financial services company) and is an employee of Fidelity Investments. Previously, Ms. Baumann served as AML Officer of the funds (2012-2016), and Vice President (2007-2014) and Deputy Anti-Money Laundering Officer (2007-2012) of FMR LLC.
Craig S. Brown (1977)
Year of Election or Appointment: 2019
Assistant Treasurer
Mr. Brown also serves as Assistant Treasurer of other funds. Mr. Brown is an employee of Fidelity Investments (2013-present).
John J. Burke III (1964)
Year of Election or Appointment: 2018
Chief Financial Officer
Mr. Burke also serves as Chief Financial Officer of other funds. Mr. Burke serves as Head of Investment Operations for Fidelity Fund and Investment Operations (2018-present) and is an employee of Fidelity Investments (1998-present). Previously Mr. Burke served as head of Asset Management Investment Operations (2012-2018).
Jonathan Davis (1968)
Year of Election or Appointment: 2010
Assistant Treasurer
Mr. Davis also serves as Assistant Treasurer of other funds. Mr. Davis serves as Assistant Treasurer of FMR Capital, Inc. (2017-present) and is an employee of Fidelity Investments. Previously, Mr. Davis served as Vice President and Associate General Counsel of FMR LLC (diversified financial services company, 2003-2010).
Adrien E. Deberghes (1967)
Year of Election or Appointment: 2010
Assistant Treasurer
Mr. Deberghes also serves as an officer of other funds. He serves as Assistant Treasurer of FMR Capital, Inc. (2017-present), Executive Vice President of Fidelity Investments Money Management, Inc. (FIMM) (investment adviser firm, 2016-present), and is an employee of Fidelity Investments (2008-present). Previously, Mr. Deberghes served as President and Treasurer of certain Fidelity® funds (2013-2018). Prior to joining Fidelity Investments, Mr. Deberghes was Senior Vice President of Mutual Fund Administration at State Street Corporation (2007-2008), Senior Director of Mutual Fund Administration at Investors Bank & Trust (2005-2007), and Director of Finance for Dunkin' Brands (2000-2005). Previously, Mr. Deberghes served in other fund officer roles.
Laura M. Del Prato (1964)
Year of Election or Appointment: 2018
President and Treasurer
Ms. Del Prato also serves as an officer of other funds. Ms. Del Prato is an employee of Fidelity Investments (2017-present). Prior to joining Fidelity Investments, Ms. Del Prato served as a Managing Director and Treasurer of the JPMorgan Mutual Funds (2014-2017). Prior to JPMorgan, Ms. Del Prato served as a partner at Cohen Fund Audit Services (accounting firm, 2012-2013) and KPMG LLP (accounting firm, 2004-2012).
Colm A. Hogan (1973)
Year of Election or Appointment: 2016
Assistant Treasurer
Mr. Hogan also serves as an officer of other funds. Mr. Hogan serves as Assistant Treasurer of FMR Capital, Inc. (2017-present) and is an employee of Fidelity Investments (2005-present). Previously, Mr. Hogan served as Assistant Treasurer of certain Fidelity® funds (2016-2018).
Cynthia Lo Bessette (1969)
Year of Election or Appointment: 2019
Secretary and Chief Legal Officer (CLO)
Ms. Lo Bessette also serves as Secretary and CLO of other funds. She is a Senior Vice President and Deputy General Counsel of FMR LLC (diversified financial services company, 2019-present), and is an employee of Fidelity Investments. Previously, Ms. Lo Bessette served as Executive Vice President, General Counsel (2016-2019) and Senior Vice President, Deputy General Counsel (2015-2016) of OppenheimerFunds (investment management company) and Deputy Chief Legal Officer (2013-2015) of Jennison Associates LLC (investment adviser firm).
Chris Maher (1972)
Year of Election or Appointment: 2013
Assistant Treasurer
Mr. Maher serves as Assistant Treasurer of other funds. Mr. Maher is Vice President of Valuation Oversight, serves as Assistant Treasurer of FMR Capital, Inc. (2017-present), and is an employee of Fidelity Investments. Previously, Mr. Maher served as Vice President of Asset Management Compliance (2013), Vice President of the Program Management Group of FMR (investment adviser firm, 2010-2013), and Vice President of Valuation Oversight (2008-2010).
John B. McGinty, Jr. (1962)
Year of Election or Appointment: 2016
Chief Compliance Officer
Mr. McGinty also serves as Chief Compliance Officer of other funds. Mr. McGinty is Senior Vice President of Asset Management Compliance for Fidelity Investments and is an employee of Fidelity Investments (2016-present). Mr. McGinty previously served as Vice President, Senior Attorney at Eaton Vance Management (investment management firm, 2015-2016), and prior to Eaton Vance as global CCO for all firm operations and registered investment companies at GMO LLC (investment management firm, 2009-2015). Before joining GMO LLC, Mr. McGinty served as Senior Vice President, Deputy General Counsel for Fidelity Investments (2007-2009).
Jason P. Pogorelec (1975)
Year of Election or Appointment: 2015
Assistant Secretary
Mr. Pogorelec also serves as Assistant Secretary of other funds. Mr. Pogorelec serves as Vice President, Associate General Counsel (2010-present) and is an employee of Fidelity Investments (2006-present).
Nancy D. Prior (1967)
Year of Election or Appointment: 2014
Vice President
Ms. Prior also serves as Vice President of other funds. Ms. Prior serves as President of Fixed Income (2014-present), President (2016-present) and Director (2014-present) of Fidelity Investments Money Management, Inc. (FIMM) (investment adviser firm), and is an employee of Fidelity Investments (2002-present). Previously, Ms. Prior served as Vice Chairman of FIAM LLC (investment adviser firm, 2014-2018), a Director of FMR Investment Management (UK) Limited (investment adviser firm, 2015-2018), President Multi-Asset Class Strategies of FMR's Global Asset Allocation Division (2017-2018), Vice President of Fidelity's Money Market Funds (2012-2014), and President, Money Market and Short Duration Bond Group of Fidelity Management & Research Company (FMR) (investment adviser firm, 2013-2014).
Stacie M. Smith (1974)
Year of Election or Appointment: 2013
Assistant Treasurer
Ms. Smith also serves as an officer of other funds. Ms. Smith serves as Assistant Treasurer of FMR Capital, Inc. (2017-present), is an employee of Fidelity Investments (2009-present), and has served in other fund officer roles. Prior to joining Fidelity Investments, Ms. Smith served as Senior Audit Manager of Ernst & Young LLP (accounting firm, 1996-2009). Previously, Ms. Smith served as Assistant Treasurer (2013-2018) and Deputy Treasurer (2013-2016) of certain Fidelity® funds.
Marc L. Spector (1972)
Year of Election or Appointment: 2016
Deputy Treasurer
Mr. Spector also serves as an officer of other funds. Mr. Spector serves as Assistant Treasurer of FMR Capital, Inc. (2017-present) and is an employee of Fidelity Investments (2016-present). Prior to joining Fidelity Investments, Mr. Spector served as Director at the Siegfried Group (accounting firm, 2013-2016), and prior to Siegfried Group as audit senior manager at Deloitte & Touche (accounting firm, 2005-2013).
Jim Wegmann (1979)
Year of Election or Appointment: 2019
Assistant Treasurer
Mr. Wegmann also serves as Assistant Treasurer of other funds. Mr. Wegmann is an employee of Fidelity Investments (2011-present).
Shareholder Expense Example
As a shareholder of the Fund, you incur two types of costs: (1) transaction costs and (2) ongoing costs, including other Fund expenses. This Example is intended to help you understand your ongoing costs (in dollars) of investing in the Fund and to compare these costs with the ongoing costs of investing in other mutual funds.
The Example is based on an investment of $1,000 invested at the beginning of the period and held for the entire period (March 1, 2019 to August 31, 2019).
Actual Expenses
The first line of the accompanying table provides information about actual account values and actual expenses. You may use the information in this line, together with the amount you invested, to estimate the expenses that you paid over the period. Simply divide your account value by $1,000.00 (for example, an $8,600 account value divided by $1,000.00 = 8.6), then multiply the result by the number in the first line under the heading entitled "Expenses Paid During Period" to estimate the expenses you paid on your account during this period. In addition, the Fund, as a shareholder in the underlying Fidelity Central Funds, will indirectly bear its pro-rata share of the fees and expenses incurred by the underlying Fidelity Central Funds. These fees and expenses are not included in the Fund's annualized expense ratio used to calculate the expense estimate in the table below.
Hypothetical Example for Comparison Purposes
The second line of the accompanying table provides information about hypothetical account values and hypothetical expenses based on the Fund's actual expense ratio and an assumed rate of return of 5% per year before expenses, which is not the Fund's actual return. The hypothetical account values and expenses may not be used to estimate the actual ending account balance or expenses you paid for the period. You may use this information to compare the ongoing costs of investing in the Fund and other funds. To do so, compare this 5% hypothetical example with the 5% hypothetical examples that appear in the shareholder reports of the other funds. In addition, the Fund, as a shareholder in the underlying Fidelity Central Funds, will indirectly bear its pro-rata share of the fees and expenses incurred by the underlying Fidelity Central Funds. These fees and expenses are not included in the Fund's annualized expense ratio used to calculate the expense estimate in the table below.
Please note that the expenses shown in the table are meant to highlight your ongoing costs only and do not reflect any transaction costs. Therefore, the second line of the table is useful in comparing ongoing costs only, and will not help you determine the relative total costs of owning different funds.
| | Annualized Expense Ratio-A | Beginning
Account Value
March 1, 2019 | Ending
Account Value
August 31, 2019 | Expenses Paid
During Period-B
March 1, 2019
to August 31, 2019 |
| Actual | - %-C | $1,000.00 | $1,080.70 | $--D |
| Hypothetical-E | | $1,000.00 | $1,025.21 | $--D |
A Annualized expense ratio reflects expenses net of applicable fee waivers.
B Expenses are equal to the Fund's annualized expense ratio, multiplied by the average account value over the period, multiplied by 184/365 (to reflect the one-half year period).
C Amount represents less than .005%.
D Amount represents less than $.005.
E 5% return per year before expenses
Distributions (Unaudited)
A total of 20.18% of the dividends distributed during the fiscal year was derived from interest on U.S. Government securities which is generally exempt from state income tax.
The fund will notify shareholders in January 2020 of amounts for use in preparing 2019 income tax returns.
LIG-ANN-1019
1.873109.110
Fidelity® Series Short-Term Credit Fund
Annual Report August 31, 2019 |
|
Beginning on January 1, 2021, as permitted by regulations adopted by the Securities and Exchange Commission, paper copies of a fund’s shareholder reports will no longer be sent by mail, unless you specifically request paper copies of the reports from the fund or from your financial intermediary, such as a financial advisor, broker-dealer or bank. Instead, the reports will be made available on a website, and you will be notified by mail each time a report is posted and provided with a website link to access the report.
If you already elected to receive shareholder reports electronically, you will not be affected by this change and you need not take any action. You may elect to receive shareholder reports and other communications from a fund electronically, by contacting your financial intermediary. For Fidelity customers, visit Fidelity's web site or call Fidelity using the contact information listed below.
You may elect to receive all future reports in paper free of charge. If you wish to continue receiving paper copies of your shareholder reports, you may contact your financial intermediary or, if you are a Fidelity customer, visit Fidelity’s website, or call Fidelity at the applicable toll-free number listed below. Your election to receive reports in paper will apply to all funds held with the fund complex/your financial intermediary.
| Account Type | Website | Phone Number |
| Brokerage, Mutual Fund, or Annuity Contracts: | fidelity.com/mailpreferences | 1-800-343-3548 |
| Employer Provided Retirement Accounts: | netbenefits.fidelity.com/preferences (choose 'no' under Required Disclosures to continue to print) | 1-800-343-0860 |
| Advisor Sold Accounts Serviced Through Your Financial Intermediary: | Contact Your Financial Intermediary | Your Financial Intermediary's phone number |
| Advisor Sold Accounts Serviced by Fidelity: | institutional.fidelity.com | 1-877-208-0098 |
Contents
To view a fund's proxy voting guidelines and proxy voting record for the 12-month period ended June 30, visit http://www.fidelity.com/proxyvotingresults or visit the Securities and Exchange Commission's (SEC) web site at http://www.sec.gov.
You may also call 1-800-544-8544 to request a free copy of the proxy voting guidelines.
Standard & Poor's, S&P and S&P 500 are registered service marks of The McGraw-Hill Companies, Inc. and have been licensed for use by Fidelity Distributors Corporation.
Other third-party marks appearing herein are the property of their respective owners.
All other marks appearing herein are registered or unregistered trademarks or service marks of FMR LLC or an affiliated company. © 2019 FMR LLC. All rights reserved.
This report and the financial statements contained herein are submitted for the general information of the shareholders of the Fund. This report is not authorized for distribution to prospective investors in the Fund unless preceded or accompanied by an effective prospectus.
A fund files its complete schedule of portfolio holdings with the SEC for the first and third quarters of each fiscal year on Form N-PORT. Forms N-PORT are available on the SEC’s web site at http://www.sec.gov. A fund's Forms N-PORT may be reviewed and copied at the SEC’s Public Reference Room in Washington, DC. Information regarding the operation of the SEC's Public Reference Room may be obtained by calling 1-800-SEC-0330.
For a complete list of a fund's portfolio holdings, view the most recent holdings listing, semiannual report, or annual report on Fidelity's web site at http://www.fidelity.com, http://www.institutional.fidelity.com, or http://www.401k.com, as applicable.
NOT FDIC INSURED •MAY LOSE VALUE •NO BANK GUARANTEE
Neither the Fund nor Fidelity Distributors Corporation is a bank.
Performance: The Bottom Line
Average annual total return reflects the change in the value of an investment, assuming reinvestment of distributions from dividend income and capital gains (the profits earned upon the sale of securities that have grown in value, if any) and assuming a constant rate of performance each year. The hypothetical investment and the average annual total returns do not reflect the deduction of taxes that a shareholder would pay on fund distributions or the redemption of fund shares. During periods of reimbursement by Fidelity, a fund’s total return will be greater than it would be had the reimbursement not occurred. How a fund did yesterday is no guarantee of how it will do tomorrow.
Average Annual Total Returns
| For the periods ended August 31, 2019 | Past 1 year | Life of fundA |
| Fidelity® Series Short-Term Credit Fund | 5.02% | 2.02% |
A From March 27, 2015
$10,000 Over Life of Fund
Let's say hypothetically that $10,000 was invested in Fidelity® Series Short-Term Credit Fund on March 27, 2015, when the fund started.
The chart shows how the value of your investment would have changed, and also shows how the Bloomberg Barclays U.S. 1-3 Year Credit Bond Index performed over the same period.
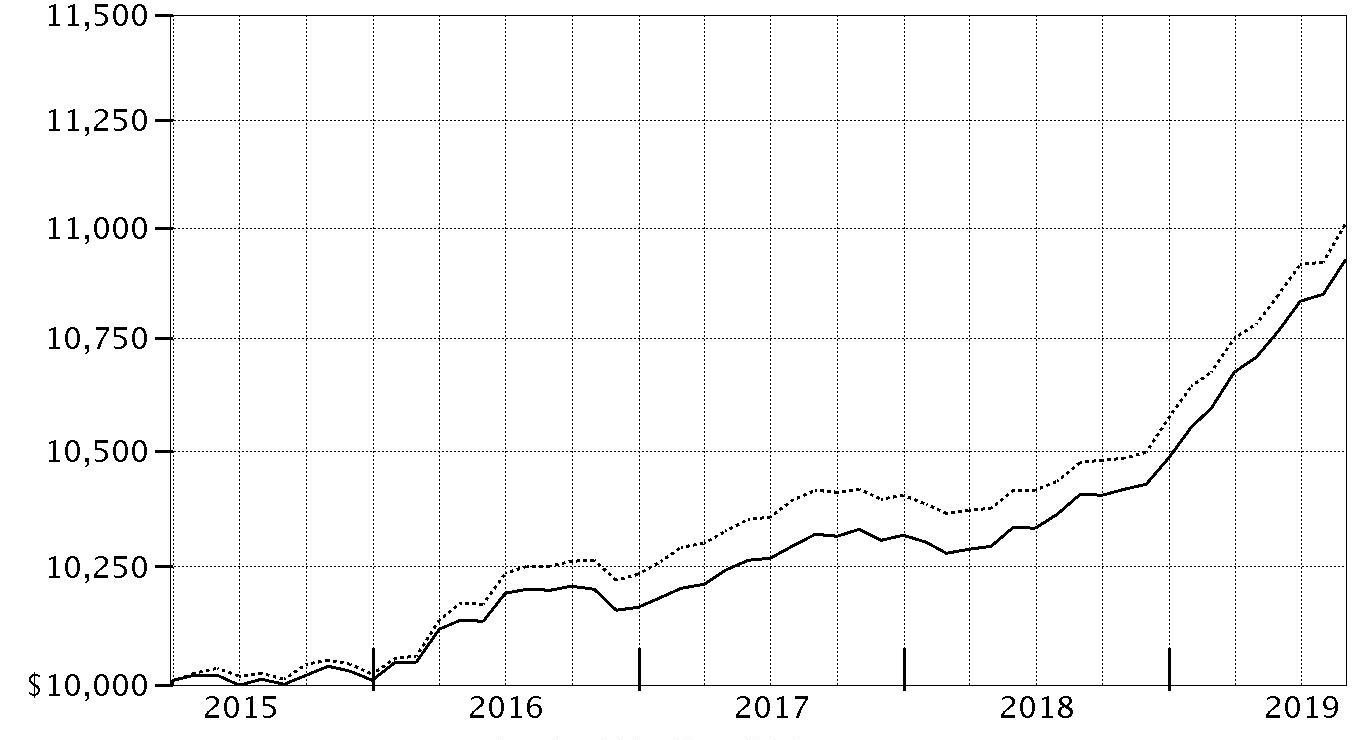
| Period Ending Values |
| $10,927 | Fidelity® Series Short-Term Credit Fund |
| $11,009 | Bloomberg Barclays U.S. 1-3 Year Credit Bond Index |
Management's Discussion of Fund Performance
Market Recap: For the 12 months ending August 31, 2019, U.S. taxable investment-grade bonds posted their strongest trailing one-year return since 2009, driven by slower global economic growth, a maturing business cycle, trade uncertainty and, late in the period, the Fed’s dovish shift. The Bloomberg Barclays U.S. Aggregate Bond Index gained 10.17%. Market yields rose in the early fall of 2018, on expectations for higher inflation. Yields then declined and credit spreads widened in November and December, partly because of weaker U.S. manufacturing data. Yield spreads narrowed in January, as the U.S. Federal Reserve said it would be “patient” with policy rate hikes, and that future increases largely would depend on economic data. Yields continued to decline in the spring, amid international trade tension and attacks on oil tankers in the Middle East, and then tumbled further in July, when the Fed cut interest rates for the first time since 2008. The yield curve ended the period roughly flat, amid expectations for another rate cut of 25 basis points in September. Within the Bloomberg Barclays index, corporate bonds gained 13.33%, topping the 10.38% advance of U.S. Treasuries. Outside the index, U.S. corporate high-yield bonds lagged nominal U.S. Treasuries, while Treasury Inflation-Protected Securities (TIPS) gained 7.46%.
Comments from Co-Portfolio Managers Rob Galusza and Julian Potenza: For the fiscal year, the fund gained 5.02%, about in line, net of fees, with the 5.09% return of its benchmark, the Bloomberg Barclays U.S. 1–3 Year Credit Bond Index. Security selection among corporate bonds, which made up the majority of the fund's holdings, added notably to the fund's relative performance. Within corporates, choices among the bonds of industrial companies helped on a relative basis, particularly selections among consumer-related and energy companies. Also within corporates, picks among the bonds of banking institutions added value. Elsewhere, underweighted exposure to government-agency bonds and not owning sovereign debt further added to the fund's relative return. Conversely, the fund's positioning along the yield curve detracted more than any other factor. A small position in Treasury securities, held mainly for liquidity purposes, also hurt slightly versus the benchmark. By period end, we reduced the fund's stake in Treasuries, and among corporate bonds, added to positions in the industrials segment.
The views expressed above reflect those of the portfolio manager(s) only through the end of the period as stated on the cover of this report and do not necessarily represent the views of Fidelity or any other person in the Fidelity organization. Any such views are subject to change at any time based upon market or other conditions and Fidelity disclaims any responsibility to update such views. These views may not be relied on as investment advice and, because investment decisions for a Fidelity fund are based on numerous factors, may not be relied on as an indication of trading intent on behalf of any Fidelity fund.
Note to Shareholders: On October 1, 2019, David DeBiase assumed co-management responsibilities for the fund, joining Rob Galusza and Julian Potenza.
Investment Summary (Unaudited)
Quality Diversification (% of fund's net assets)
| As of August 31, 2019 |
| | U.S. Government and U.S. Government Agency Obligations | 6.3% |
| | AAA | 22.6% |
| | AA | 5.2% |
| | A | 22.4% |
| | BBB | 37.8% |
| | BB and Below | 3.9% |
| | Not Rated | 0.8% |
| | Short-Term Investments and Net Other Assets | 1.0% |

We have used ratings from Moody's Investors Service, Inc. Where Moody's® ratings are not available, we have used S&P® ratings. All ratings are as of the date indicated and do not reflect subsequent changes.
Asset Allocation (% of fund's net assets)
| As of August 31, 2019* |
| | Corporate Bonds | 64.8% |
| | U.S. Government and U.S. Government Agency Obligations | 6.3% |
| | Asset-Backed Securities | 16.1% |
| | CMOs and Other Mortgage Related Securities | 7.7% |
| | Municipal Bonds | 0.3% |
| | Other Investments | 3.8% |
| | Short-Term Investments and Net Other Assets (Liabilities) | 1.0% |

* Foreign investments - 17.9%
Schedule of Investments August 31, 2019
Showing Percentage of Net Assets
| Nonconvertible Bonds - 64.8% | | | |
| | | Principal Amount | Value |
| COMMUNICATION SERVICES - 3.1% | | | |
| Diversified Telecommunication Services - 1.4% | | | |
| AT&T, Inc.: | | | |
| 2.45% 6/30/20 | | $10,830,000 | $10,849,580 |
| 3.6% 2/17/23 | | 3,089,000 | 3,229,107 |
| Verizon Communications, Inc.: | | | |
| 2.946% 3/15/22 | | 3,294,000 | 3,379,380 |
| 3.125% 3/16/22 | | 8,000,000 | 8,246,943 |
| | | | 25,705,010 |
| Entertainment - 0.3% | | | |
| The Walt Disney Co. 4.5% 2/15/21 (a) | | 5,320,000 | 5,514,306 |
| Media - 1.4% | | | |
| Charter Communications Operating LLC/Charter Communications Operating Capital Corp.: | | | |
| 3.579% 7/23/20 | | 5,900,000 | 5,956,213 |
| 4.464% 7/23/22 | | 7,000,000 | 7,396,312 |
| Comcast Corp.: | | | |
| 3.45% 10/1/21 | | 5,150,000 | 5,304,515 |
| 5.15% 3/1/20 | | 5,000,000 | 5,065,017 |
| Discovery Communications LLC 3 month U.S. LIBOR + 0.710% 3.0966% 9/20/19 (b)(c) | | 3,630,000 | 3,630,707 |
| | | | 27,352,764 |
|
| TOTAL COMMUNICATION SERVICES | | | 58,572,080 |
|
| CONSUMER DISCRETIONARY - 5.0% | | | |
| Automobiles - 4.4% | | | |
| American Honda Finance Corp.: | | | |
| 2.65% 2/12/21 | | 7,000,000 | 7,060,955 |
| 3.15% 1/8/21 | | 1,525,000 | 1,547,819 |
| BMW U.S. Capital LLC 3.45% 4/12/23 (a) | | 8,250,000 | 8,596,982 |
| Daimler Finance North America LLC: | | | |
| 3 month U.S. LIBOR + 0.900% 3.0581% 2/15/22 (a)(b)(c) | | 5,000,000 | 5,020,540 |
| 2.2% 5/5/20 (a) | | 5,350,000 | 5,350,316 |
| 2.25% 3/2/20 (a) | | 3,200,000 | 3,198,836 |
| 2.3% 2/12/21 (a) | | 4,350,000 | 4,348,932 |
| 2.45% 5/18/20 (a) | | 2,200,000 | 2,203,247 |
| 2.85% 1/6/22 (a) | | 5,000,000 | 5,052,142 |
| 3.35% 5/4/21 (a) | | 5,000,000 | 5,082,120 |
| General Motors Financial Co., Inc.: | | | |
| 2.45% 11/6/20 | | 5,400,000 | 5,398,719 |
| 2.65% 4/13/20 | | 3,293,000 | 3,298,042 |
| 4.15% 6/19/23 | | 5,000,000 | 5,221,893 |
| 4.2% 11/6/21 | | 15,000,000 | 15,554,830 |
| Volkswagen Group of America Finance LLC 4% 11/12/21 (a) | | 5,000,000 | 5,176,432 |
| | | | 82,111,805 |
| Diversified Consumer Services - 0.2% | | | |
| Ingersoll-Rand Global Holding Co. Ltd. 2.9% 2/21/21 | | 3,578,000 | 3,614,490 |
| Household Durables - 0.2% | | | |
| D.R. Horton, Inc. 2.55% 12/1/20 | | 3,012,000 | 3,020,187 |
| Specialty Retail - 0.2% | | | |
| AutoZone, Inc. 2.5% 4/15/21 | | 4,570,000 | 4,598,559 |
|
| TOTAL CONSUMER DISCRETIONARY | | | 93,345,041 |
|
| CONSUMER STAPLES - 4.6% | | | |
| Beverages - 0.5% | | | |
| Anheuser-Busch InBev Worldwide, Inc. 4.15% 1/23/25 | | 3,339,000 | 3,656,272 |
| Constellation Brands, Inc. 3 month U.S. LIBOR + 0.700% 2.8581% 11/15/21 (b)(c) | | 5,125,000 | 5,126,116 |
| | | | 8,782,388 |
| Food Products - 1.0% | | | |
| Conagra Brands, Inc. 3.8% 10/22/21 | | 9,115,000 | 9,377,867 |
| General Mills, Inc. 3 month U.S. LIBOR + 0.540% 2.8623% 4/16/21 (b)(c) | | 10,000,000 | 10,005,500 |
| | | | 19,383,367 |
| Tobacco - 3.1% | | | |
| Altria Group, Inc.: | | | |
| 3.49% 2/14/22 | | 1,452,000 | 1,499,992 |
| 3.8% 2/14/24 | | 1,753,000 | 1,856,734 |
| 4.75% 5/5/21 | | 3,838,000 | 4,003,977 |
| BAT Capital Corp.: | | | |
| 2.297% 8/14/20 | | 10,400,000 | 10,401,122 |
| 2.764% 8/15/22 | | 5,000,000 | 5,070,473 |
| BAT International Finance PLC 2.75% 6/15/20 (a) | | 5,000,000 | 5,011,199 |
| Imperial Tobacco Finance PLC: | | | |
| 2.95% 7/21/20 (a) | | 4,900,000 | 4,925,789 |
| 3.125% 7/26/24 (a) | | 4,000,000 | 4,067,720 |
| 3.75% 7/21/22 (a) | | 9,000,000 | 9,309,319 |
| Philip Morris International, Inc. 2.875% 5/1/24 | | 3,530,000 | 3,623,100 |
| Reynolds American, Inc.: | | | |
| 3.25% 6/12/20 | | 2,489,000 | 2,507,882 |
| 4% 6/12/22 | | 5,000,000 | 5,225,678 |
| | | | 57,502,985 |
|
| TOTAL CONSUMER STAPLES | | | 85,668,740 |
|
| ENERGY - 6.9% | | | |
| Oil, Gas & Consumable Fuels - 6.9% | | | |
| Anadarko Petroleum Corp. 4.85% 3/15/21 | | 4,509,000 | 4,661,347 |
| Cenovus Energy, Inc. 3% 8/15/22 | | 3,677,000 | 3,712,500 |
| Encana Corp. 3.9% 11/15/21 | | 5,000,000 | 5,128,499 |
| Energy Transfer Partners LP: | | | |
| 3.6% 2/1/23 | | 7,641,000 | 7,840,644 |
| 4.2% 9/15/23 | | 1,337,000 | 1,413,632 |
| Enterprise Products Operating LP: | | | |
| 2.55% 10/15/19 | | 6,011,000 | 6,010,541 |
| 2.8% 2/15/21 | | 1,688,000 | 1,704,248 |
| EQT Corp. 2.5% 10/1/20 | | 2,054,000 | 2,042,936 |
| Kinder Morgan Energy Partners LP 3.5% 9/1/23 | | 2,093,000 | 2,176,358 |
| Kinder Morgan, Inc. 3.05% 12/1/19 | | 5,497,000 | 5,501,981 |
| Marathon Oil Corp. 2.8% 11/1/22 | | 5,000,000 | 5,045,688 |
| MPLX LP: | | | |
| 3.375% 3/15/23 | | 3,922,000 | 4,037,283 |
| 4.5% 7/15/23 | | 795,000 | 848,331 |
| Occidental Petroleum Corp.: | | | |
| 3 month U.S. LIBOR + 0.950% 3.137% 2/8/21 (b)(c) | | 1,821,000 | 1,829,304 |
| 3 month U.S. LIBOR + 1.250% 3.437% 8/13/21 (b)(c) | | 2,106,000 | 2,114,264 |
| 3 month U.S. LIBOR + 1.450% 3.637% 8/15/22 (b)(c) | | 2,050,000 | 2,056,958 |
| 2.6% 8/13/21 | | 558,000 | 561,709 |
| 2.7% 8/15/22 | | 493,000 | 497,852 |
| 2.9% 8/15/24 | | 1,629,000 | 1,644,234 |
| 3.125% 2/15/22 | | 944,000 | 958,014 |
| Petroleos Mexicanos 4.875% 1/24/22 | | 14,500,000 | 14,735,625 |
| Phillips 66 Co. 3 month U.S. LIBOR + 0.600% 2.7323% 2/26/21 (b)(c) | | 4,543,000 | 4,543,172 |
| Plains All American Pipeline LP/PAA Finance Corp. 3.65% 6/1/22 | | 8,885,000 | 9,131,784 |
| Schlumberger Investment SA 3.3% 9/14/21 (a) | | 5,000,000 | 5,097,710 |
| Sunoco Logistics Partner Operations LP 5.5% 2/15/20 | | 3,476,000 | 3,519,070 |
| TransCanada PipeLines Ltd.: | | | |
| 2.125% 11/15/19 | | 4,510,000 | 4,506,768 |
| 2.5% 8/1/22 | | 5,000,000 | 5,041,911 |
| Western Gas Partners LP 5.375% 6/1/21 | | 7,361,000 | 7,611,316 |
| Williams Partners LP 3.6% 3/15/22 | | 14,400,000 | 14,826,067 |
| | | | 128,799,746 |
| FINANCIALS - 29.1% | | | |
| Banks - 15.3% | | | |
| ABN AMRO Bank NV: | | | |
| 3 month U.S. LIBOR + 0.410% 2.7125% 1/19/21 (a)(b)(c) | | 5,000,000 | 5,006,480 |
| 3.4% 8/27/21 (a) | | 6,991,000 | 7,150,598 |
| Bank of America Corp.: | | | |
| 2.369% 7/21/21 (b) | | 4,000,000 | 4,006,589 |
| 2.625% 10/19/20 | | 13,000,000 | 13,095,721 |
| 3.004% 12/20/23 (b) | | 2,176,000 | 2,233,112 |
| 3.124% 1/20/23 (b) | | 20,000,000 | 20,461,365 |
| Bank of America NA 3 month U.S. LIBOR + 0.320% 2.5866% 7/26/21 (b)(c) | | 3,000,000 | 3,002,748 |
| Banque Federative du Credit Mutuel SA 3 month U.S. LIBOR + 0.490% 2.7676% 7/20/20 (a)(b)(c) | | 5,500,000 | 5,516,718 |
| Barclays Bank PLC 2.65% 1/11/21 | | 7,900,000 | 7,934,412 |
| Barclays PLC: | | | |
| 2.75% 11/8/19 | | 5,000,000 | 5,002,466 |
| 3.2% 8/10/21 | | 5,000,000 | 5,044,702 |
| BPCE SA 3.145% 7/31/20 (a) | | 4,000,000 | 4,036,233 |
| Citibank NA 3 month U.S. LIBOR + 0.600% 2.7359% 5/20/22 (b)(c) | | 5,000,000 | 5,009,208 |
| Citigroup, Inc.: | | | |
| 2.4% 2/18/20 | | 3,174,000 | 3,176,882 |
| 2.75% 4/25/22 | | 7,300,000 | 7,430,790 |
| 3.142% 1/24/23 (b) | | 15,000,000 | 15,338,381 |
| 4.4% 6/10/25 | | 326,000 | 353,759 |
| Citizens Bank NA 2.55% 5/13/21 | | 2,684,000 | 2,702,823 |
| Credit Suisse Group Funding Guernsey Ltd. 3.45% 4/16/21 | | 15,000,000 | 15,266,298 |
| Danske Bank A/S 3.875% 9/12/23 (a) | | 2,500,000 | 2,597,702 |
| Fifth Third Bancorp 2.875% 7/27/20 | | 2,389,000 | 2,404,609 |
| HSBC Holdings PLC 3 month U.S. LIBOR + 0.600% 2.7238% 5/18/21 (b)(c) | | 7,000,000 | 7,002,858 |
| Huntington National Bank: | | | |
| 3 month U.S. LIBOR + 0.550% 2.8368% 2/5/21 (b)(c) | | 4,250,000 | 4,263,230 |
| 3.25% 5/14/21 | | 5,000,000 | 5,085,721 |
| ING Bank NV 2.7% 8/17/20 (a) | | 1,228,000 | 1,236,133 |
| ING Groep NV 3.15% 3/29/22 | | 8,650,000 | 8,867,431 |
| Intesa Sanpaolo SpA 3.375% 1/12/23 (a) | | 5,000,000 | 5,066,778 |
| JPMorgan Chase & Co.: | | | |
| 2.55% 10/29/20 | | 23,000,000 | 23,125,856 |
| 3.514% 6/18/22 (b) | | 10,500,000 | 10,748,816 |
| Lloyds Bank PLC 3 month U.S. LIBOR + 0.490% 2.699% 5/7/21 (b)(c) | | 5,000,000 | 5,000,255 |
| Lloyds Banking Group PLC 2.907% 11/7/23 (b) | | 9,000,000 | 9,027,612 |
| Mitsubishi UFJ Financial Group, Inc.: | | | |
| 2.623% 7/18/22 | | 3,000,000 | 3,035,205 |
| 2.95% 3/1/21 | | 1,748,000 | 1,766,965 |
| 3.218% 3/7/22 | | 4,000,000 | 4,103,746 |
| 3.535% 7/26/21 | | 5,000,000 | 5,124,496 |
| Regions Financial Corp. 2.75% 8/14/22 | | 4,268,000 | 4,343,117 |
| Royal Bank of Canada: | | | |
| 2.15% 10/26/20 | | 5,350,000 | 5,364,357 |
| 3.2% 4/30/21 | | 5,500,000 | 5,620,931 |
| Royal Bank of Scotland Group PLC 3.875% 9/12/23 | | 2,000,000 | 2,060,145 |
| Santander Holdings U.S.A., Inc.: | | | |
| 3.4% 1/18/23 | | 5,000,000 | 5,143,714 |
| 3.5% 6/7/24 | | 3,500,000 | 3,620,215 |
| 4.45% 12/3/21 | | 9,000,000 | 9,390,142 |
| Sumitomo Mitsui Banking Corp. 3 month U.S. LIBOR + 0.370% 2.6923% 10/16/20 (b)(c) | | 3,000,000 | 3,007,061 |
| Wells Fargo Bank NA 3.325% 7/23/21 (b) | | 10,000,000 | 10,103,430 |
| ZB, National Association 3.5% 8/27/21 | | 4,421,000 | 4,523,241 |
| Zions Bancorp NA 3.35% 3/4/22 | | 1,514,000 | 1,550,336 |
| | | | 284,953,387 |
| Capital Markets - 6.2% | | | |
| Deutsche Bank AG 2.7% 7/13/20 | | 12,011,000 | 11,980,190 |
| Deutsche Bank AG New York Branch 3.3% 11/16/22 | | 5,000,000 | 4,969,712 |
| Goldman Sachs Group, Inc.: | | | |
| 2.876% 10/31/22 (b) | | 12,000,000 | 12,165,326 |
| 2.905% 7/24/23 (b) | | 10,000,000 | 10,158,501 |
| 3% 4/26/22 | | 20,000,000 | 20,260,674 |
| Moody's Corp.: | | | |
| 2.75% 12/15/21 | | 4,395,000 | 4,454,475 |
| 3.25% 6/7/21 | | 2,377,000 | 2,422,048 |
| 5.5% 9/1/20 | | 5,734,000 | 5,919,223 |
| Morgan Stanley: | | | |
| 3 month U.S. LIBOR + 0.930% 3.2076% 7/22/22 (b)(c) | | 5,000,000 | 5,034,593 |
| 2.625% 11/17/21 | | 19,750,000 | 19,956,815 |
| 2.65% 1/27/20 | | 10,750,000 | 10,767,893 |
| UBS AG London Branch 2.2% 6/8/20 (a) | | 8,500,000 | 8,503,853 |
| | | | 116,593,303 |
| Consumer Finance - 4.4% | | | |
| AerCap Ireland Capital Ltd./AerCap Global Aviation Trust: | | | |
| 3.5% 5/26/22 | | 5,000,000 | 5,136,465 |
| 4.125% 7/3/23 | | 1,689,000 | 1,791,714 |
| 4.45% 12/16/21 | | 1,037,000 | 1,077,554 |
| 4.875% 1/16/24 | | 1,121,000 | 1,215,908 |
| American Express Co. 2.75% 5/20/22 | | 4,000,000 | 4,077,555 |
| Aviation Capital Group LLC: | | | |
| 3 month U.S. LIBOR + 0.670% 2.9358% 7/30/21 (a)(b)(c) | | 4,005,000 | 4,002,589 |
| 3 month U.S. LIBOR + 0.950% 3.4703% 6/1/21 (a)(b)(c) | | 3,939,000 | 3,958,899 |
| Capital One Financial Corp. 2.5% 5/12/20 | | 9,500,000 | 9,516,977 |
| Ford Motor Credit Co. LLC: | | | |
| 2.343% 11/2/20 | | 7,500,000 | 7,467,135 |
| 2.425% 6/12/20 | | 16,500,000 | 16,486,146 |
| 3.157% 8/4/20 | | 2,000,000 | 2,007,353 |
| 3.336% 3/18/21 | | 8,500,000 | 8,555,515 |
| 4.14% 2/15/23 | | 2,500,000 | 2,563,866 |
| John Deere Capital Corp. 2.6% 3/7/24 | | 1,099,000 | 1,127,559 |
| Synchrony Financial: | | | |
| 2.85% 7/25/22 | | 5,481,000 | 5,554,959 |
| 4.25% 8/15/24 | | 3,745,000 | 3,987,384 |
| 4.375% 3/19/24 | | 3,823,000 | 4,083,594 |
| | | | 82,611,172 |
| Diversified Financial Services - 1.9% | | | |
| AIG Global Funding: | | | |
| 2.3% 7/1/22 (a) | | 1,331,000 | 1,336,081 |
| 3.35% 6/25/21 (a) | | 5,000,000 | 5,101,646 |
| Avolon Holdings Funding Ltd. 3.625% 5/1/22 (a) | | 519,000 | 526,422 |
| AXA Equitable Holdings, Inc. 3.9% 4/20/23 | | 417,000 | 437,971 |
| Brixmor Operating Partnership LP 3.875% 8/15/22 | | 5,111,000 | 5,333,317 |
| Cigna Corp.: | | | |
| 3 month U.S. LIBOR + 0.350% 2.7603% 3/17/20 (b)(c) | | 3,000,000 | 3,000,529 |
| 3 month U.S. LIBOR + 0.650% 3.0603% 9/17/21 (b)(c) | | 2,500,000 | 2,500,065 |
| 3.2% 9/17/20 | | 3,000,000 | 3,027,581 |
| 3.4% 9/17/21 | | 3,693,000 | 3,780,863 |
| GE Capital International Funding Co. 2.342% 11/15/20 | | 10,500,000 | 10,441,139 |
| | | | 35,485,614 |
| Insurance - 1.3% | | | |
| ACE INA Holdings, Inc. 2.3% 11/3/20 | | 1,161,000 | 1,165,635 |
| AIA Group Ltd. 3 month U.S. LIBOR + 0.520% 2.9066% 9/20/21 (a)(b)(c) | | 4,799,000 | 4,798,904 |
| Aon Corp. 5% 9/30/20 | | 2,877,000 | 2,963,640 |
| Marsh & McLennan Companies, Inc.: | | | |
| 2.75% 1/30/22 | | 2,497,000 | 2,537,857 |
| 3.5% 12/29/20 | | 2,141,000 | 2,179,737 |
| Protective Life Global Funding 2.161% 9/25/20 (a) | | 5,500,000 | 5,505,336 |
| Unum Group 5.625% 9/15/20 | | 4,624,000 | 4,780,104 |
| | | | 23,931,213 |
|
| TOTAL FINANCIALS | | | 543,574,689 |
|
| HEALTH CARE - 6.7% | | | |
| Health Care Equipment & Supplies - 1.3% | | | |
| Becton, Dickinson & Co.: | | | |
| 3 month U.S. LIBOR + 0.875% 3.1939% 12/29/20 (b)(c) | | 4,142,000 | 4,143,201 |
| 2.404% 6/5/20 | | 11,000,000 | 11,012,748 |
| 2.894% 6/6/22 | | 5,000,000 | 5,082,483 |
| Boston Scientific Corp. 3.45% 3/1/24 | | 1,437,000 | 1,510,085 |
| Zimmer Biomet Holdings, Inc. 3 month U.S. LIBOR + 0.750% 3.1685% 3/19/21 (b)(c) | | 3,401,000 | 3,397,065 |
| | | | 25,145,582 |
| Health Care Providers & Services - 2.2% | | | |
| CVS Health Corp.: | | | |
| 3 month U.S. LIBOR + 0.720% 3.173% 3/9/21 (b)(c) | | 10,000,000 | 10,043,372 |
| 2.8% 7/20/20 | | 5,200,000 | 5,225,921 |
| 3.35% 3/9/21 | | 3,513,000 | 3,577,081 |
| 3.7% 3/9/23 | | 5,000,000 | 5,228,488 |
| Elanco Animal Health, Inc. 3.912% 8/27/21 | | 2,489,000 | 2,536,996 |
| Express Scripts Holding Co.: | | | |
| 2.6% 11/30/20 | | 991,000 | 995,238 |
| 4.75% 11/15/21 | | 1,759,000 | 1,852,756 |
| Humana, Inc. 2.5% 12/15/20 | | 2,920,000 | 2,925,800 |
| UnitedHealth Group, Inc. 3.35% 7/15/22 | | 4,000,000 | 4,152,950 |
| WellPoint, Inc. 3.125% 5/15/22 | | 4,400,000 | 4,507,125 |
| | | | 41,045,727 |
| Pharmaceuticals - 3.2% | | | |
| Actavis Funding SCS: | | | |
| 3% 3/12/20 | | 10,916,000 | 10,949,372 |
| 3.45% 3/15/22 | | 10,500,000 | 10,782,854 |
| Bayer U.S. Finance II LLC 3.5% 6/25/21 (a) | | 10,500,000 | 10,722,363 |
| Bristol-Myers Squibb Co.: | | | |
| 2.55% 5/14/21 (a) | | 5,000,000 | 5,060,052 |
| 2.6% 5/16/22 (a) | | 3,486,000 | 3,551,499 |
| GlaxoSmithKline Capital PLC 3.125% 5/14/21 | | 5,000,000 | 5,090,067 |
| Mylan NV 3.15% 6/15/21 | | 2,200,000 | 2,225,981 |
| Shire Acquisitions Investments Ireland DAC: | | | |
| 1.9% 9/23/19 | | 6,000,000 | 5,998,680 |
| 2.4% 9/23/21 | | 2,324,000 | 2,331,204 |
| Teva Pharmaceutical Finance Netherlands III BV 2.2% 7/21/21 | | 3,250,000 | 3,042,813 |
| Zoetis, Inc. 3.45% 11/13/20 | | 484,000 | 490,524 |
| | | | 60,245,409 |
|
| TOTAL HEALTH CARE | | | 126,436,718 |
|
| INDUSTRIALS - 2.0% | | | |
| Aerospace & Defense - 0.1% | | | |
| United Technologies Corp. 3.35% 8/16/21 | | 1,256,000 | 1,286,885 |
| Airlines - 0.8% | | | |
| Delta Air Lines, Inc.: | | | |
| 2.875% 3/13/20 | | 5,500,000 | 5,500,968 |
| 3.4% 4/19/21 | | 8,388,000 | 8,503,477 |
| | | | 14,004,445 |
| Commercial Services & Supplies - 0.2% | | | |
| Waste Management, Inc. 2.95% 6/15/24 | | 3,605,000 | 3,749,708 |
| Machinery - 0.2% | | | |
| Westinghouse Air Brake Co. 3 month U.S. LIBOR + 1.050% 3.7103% 9/15/21 (b)(c) | | 4,247,000 | 4,247,346 |
| Trading Companies & Distributors - 0.7% | | | |
| Air Lease Corp.: | | | |
| 2.5% 3/1/21 | | 2,533,000 | 2,543,800 |
| 2.625% 7/1/22 | | 1,180,000 | 1,190,674 |
| 3.5% 1/15/22 | | 5,000,000 | 5,140,085 |
| International Lease Finance Corp. 5.875% 8/15/22 | | 4,500,000 | 4,942,412 |
| | | | 13,816,971 |
|
| TOTAL INDUSTRIALS | | | 37,105,355 |
|
| INFORMATION TECHNOLOGY - 2.1% | | | |
| Electronic Equipment & Components - 1.3% | | | |
| Amphenol Corp. 2.2% 4/1/20 | | 7,313,000 | 7,311,508 |
| Diamond 1 Finance Corp./Diamond 2 Finance Corp.: | | | |
| 4.42% 6/15/21 (a) | | 5,000,000 | 5,158,975 |
| 5.45% 6/15/23 (a) | | 10,020,000 | 10,890,588 |
| | | | 23,361,071 |
| IT Services - 0.8% | | | |
| IBM Corp. 2.8% 5/13/21 | | 10,000,000 | 10,129,814 |
| The Western Union Co. 4.25% 6/9/23 | | 5,000,000 | 5,288,532 |
| | | | 15,418,346 |
|
| TOTAL INFORMATION TECHNOLOGY | | | 38,779,417 |
|
| MATERIALS - 0.5% | | | |
| Chemicals - 0.5% | | | |
| Chevron Phillips Chemical Co. LLC / Chevron Phillips Chemical Co. LP 3.3% 5/1/23 (a) | | 2,636,000 | 2,728,247 |
| The Mosaic Co. 3.25% 11/15/22 | | 6,549,000 | 6,711,469 |
| | | | 9,439,716 |
| REAL ESTATE - 0.4% | | | |
| Equity Real Estate Investment Trusts (REITs) - 0.1% | | | |
| Welltower, Inc. 3.625% 3/15/24 | | 1,939,000 | 2,042,707 |
| Real Estate Management & Development - 0.3% | | | |
| Digital Realty Trust LP 2.75% 2/1/23 | | 1,701,000 | 1,724,523 |
| Washington Prime Group LP 3.85% 4/1/20 | | 3,830,000 | 3,805,220 |
| | | | 5,529,743 |
|
| TOTAL REAL ESTATE | | | 7,572,450 |
|
| UTILITIES - 4.4% | | | |
| Electric Utilities - 2.2% | | | |
| American Electric Power Co., Inc. 2.15% 11/13/20 | | 2,814,000 | 2,816,879 |
| Duke Energy Corp. 1.8% 9/1/21 | | 1,305,000 | 1,297,069 |
| Edison International 2.125% 4/15/20 | | 5,500,000 | 5,476,296 |
| Eversource Energy 2.5% 3/15/21 | | 2,860,000 | 2,872,345 |
| Exelon Corp.: | | | |
| 2.85% 6/15/20 | | 7,475,000 | 7,508,289 |
| 3.497% 6/1/22 (b) | | 9,046,000 | 9,313,848 |
| Florida Power & Light Co. 3 month U.S. LIBOR + 0.400% 2.6393% 5/6/22 (b)(c) | | 8,685,000 | 8,687,354 |
| ITC Holdings Corp. 2.7% 11/15/22 | | 2,814,000 | 2,856,324 |
| Mississippi Power Co. 3 month U.S. LIBOR + 0.650% 2.9613% 3/27/20 (b)(c) | | 1,363,000 | 1,363,169 |
| | | | 42,191,573 |
| Gas Utilities - 0.7% | | | |
| WGL Holdings, Inc.: | | | |
| 3 month U.S. LIBOR + 0.400% 2.5174% 11/29/19 (b)(c) | | 4,400,000 | 4,397,952 |
| 3 month U.S. LIBOR + 0.550% 2.9858% 3/12/20 (b)(c) | | 7,936,000 | 7,921,646 |
| | | | 12,319,598 |
| Independent Power and Renewable Electricity Producers - 0.0% | | | |
| Emera U.S. Finance LP 2.7% 6/15/21 | | 567,000 | 571,091 |
| Multi-Utilities - 1.5% | | | |
| CenterPoint Energy, Inc. 2.5% 9/1/22 | | 1,027,000 | 1,035,284 |
| Consolidated Edison, Inc. 2% 3/15/20 | | 1,214,000 | 1,212,770 |
| Dominion Energy, Inc.: | | | |
| 3 month U.S. LIBOR + 2.300% 4.6299% 9/30/66 (b)(c) | | 2,558,000 | 2,391,730 |
| 2% 8/15/21 | | 1,981,000 | 1,972,978 |
| 2.715% 8/15/21 | | 2,744,000 | 2,767,082 |
| NiSource Finance Corp. 2.65% 11/17/22 | | 3,319,000 | 3,370,260 |
| NiSource, Inc. 3.65% 6/15/23 | | 1,323,000 | 1,379,836 |
| Sempra Energy 2.4% 2/1/20 | | 6,000,000 | 5,991,787 |
| WEC Energy Group, Inc.: | | | |
| 3.1% 3/8/22 | | 2,949,000 | 3,020,577 |
| 3.375% 6/15/21 | | 5,123,000 | 5,235,742 |
| | | | 28,378,046 |
|
| TOTAL UTILITIES | | | 83,460,308 |
|
| TOTAL NONCONVERTIBLE BONDS | | | |
| (Cost $1,198,484,577) | | | 1,212,754,260 |
|
| U.S. Treasury Obligations - 5.9% | | | |
| U.S. Treasury Notes: | | | |
| 1.75% 7/31/21 | | $2,000,000 | $2,008,281 |
| 1.75% 11/30/21 | | 8,000,000 | 8,044,688 |
| 2.125% 12/31/22 (d) | | 5,000,000 | 5,113,477 |
| 2.125% 3/31/24 | | 46,000,000 | 47,439,300 |
| 2.625% 6/30/23 | | 28,000,000 | 29,250,156 |
| 2.875% 11/30/25 | | 18,000,000 | 19,528,594 |
| TOTAL U.S. TREASURY OBLIGATIONS | | | |
| (Cost $108,259,671) | | | 111,384,496 |
|
| U.S. Government Agency - Mortgage Securities - 0.4% | | | |
| Fannie Mae - 0.1% | | | |
| 4.5% 7/1/20 | | 4 | 4 |
| 5.5% 11/1/34 | | 1,779,047 | 1,960,629 |
| 7.5% 11/1/31 | | 356 | 409 |
|
| TOTAL FANNIE MAE | | | 1,961,042 |
|
| Freddie Mac - 0.0% | | | |
| 4% 4/1/26 | | 318,211 | 332,594 |
| 5% 4/1/20 | | 1,317 | 1,320 |
| 8.5% 5/1/26 to 7/1/28 | | 25,855 | 29,225 |
|
| TOTAL FREDDIE MAC | | | 363,139 |
|
| Ginnie Mae - 0.3% | | | |
| 7% 1/15/25 to 8/15/32 | | 190,775 | 214,572 |
| 4.5% 6/20/48 | | 4,512,313 | 4,746,902 |
|
| TOTAL GINNIE MAE | | | 4,961,474 |
|
| TOTAL U.S. GOVERNMENT AGENCY - MORTGAGE SECURITIES | | | |
| (Cost $7,283,241) | | | 7,285,655 |
|
| Asset-Backed Securities - 16.1% | | | |
| Accredited Mortgage Loan Trust Series 2003-3 Class A1, 5.21% 1/25/34 (AMBAC Insured) | | $217,229 | $228,546 |
| Ally Auto Receivables Trust Series 2019-2 Class A2, 2.34% 6/15/22 | | 3,500,000 | 3,508,665 |
| Ally Master Owner Trust: | | | |
| Series 2018-1 Class A1, 2.7% 1/17/23 | | 4,889,000 | 4,937,015 |
| Series 2018-2 Class A, 3.29% 5/15/23 | | 5,580,000 | 5,707,371 |
| American Credit Acceptance Receivables Trust Series 2019-3 Class A, 2.44% 12/12/22 (a) | | 2,871,000 | 2,871,359 |
| American Express Credit Account Master Trust: | | | |
| Series 2018-4 Class A, 2.99% 12/15/23 | | 4,429,000 | 4,520,969 |
| Series 2018-6 Class A, 3.06% 2/15/24 | | 4,378,000 | 4,486,911 |
| Series 2019-1 Class A, 2.87% 10/15/24 | | 1,532,000 | 1,577,726 |
| Bank of America Credit Card Master Trust: | | | |
| Series 2018-A1 Class A1, 2.7% 7/17/23 | | 5,564,000 | 5,632,824 |
| Series 2018-A2 Class A2, 3% 9/15/23 | | 4,470,000 | 4,558,986 |
| Bank of The West Auto Trust: | | | |
| Series 2018-1 Class A3, 3.43% 12/15/22 (a) | | 2,107,000 | 2,133,737 |
| Series 2019-1 Class A2, 2.4% 10/17/22 (a) | | 1,184,000 | 1,185,811 |
| BMW Floorplan Master Owner Trust Series 2018-1 Class A1, 3.15% 5/15/23 (a) | | 4,076,000 | 4,163,663 |
| BMW Vehicle Lease Trust Series 2019-1 Class A3, 2.84% 11/22/21 | | 2,591,000 | 2,623,889 |
| Canadian Pacer Auto Receivables Trust: | | | |
| Series 2017-A1 Class A3, 2.05% 3/19/21 (a) | | 1,419,927 | 1,418,971 |
| Series 2018-1A Class A3, 3% 11/19/21 (a) | | 3,722,000 | 3,741,096 |
| Series 2018-2A Class A3, 3.27% 12/19/22 (a) | | 3,201,000 | 3,262,613 |
| Series 2019-1A Class A2, 2.78% 3/21/22 (a) | | 3,782,000 | 3,798,573 |
| Capital One Multi-Asset Execution Trust: | | | |
| Series 2015-A8 Class A8, 2.05% 8/15/23 | | 3,170,000 | 3,176,421 |
| Series 2018-A1 Class A1, 3.01% 2/15/24 | | 2,949,000 | 3,005,945 |
| Series 2019-A1 Class A1, 2.84% 12/15/24 | | 4,919,000 | 5,055,207 |
| CarMax Auto Owner Trust: | | | |
| Series 2016-4 Class A3, 1.4% 8/15/21 | | 1,557,791 | 1,553,575 |
| Series 2017-4 Class A3, 2.11% 10/17/22 | | 1,871,000 | 1,872,902 |
| Series 2018-2 Class A3, 2.98% 1/17/23 | | 2,409,000 | 2,441,592 |
| Series 2018-4 Class A3, 3.36% 9/15/23 | | 2,578,000 | 2,645,882 |
| Series 2019-1 Class A3, 3.05% 3/15/24 | | 3,034,000 | 3,106,694 |
| Chesapeake Funding II LLC: | | | |
| Series 2017-2A Class A1, 1.99% 5/15/29 (a) | | 1,777,576 | 1,775,201 |
| Series 2018-3A Class A1, 3.39% 1/15/31 (a) | | 2,291,600 | 2,334,598 |
| Series 2019-1A Class A1, 2.94% 4/15/31 (a) | | 3,390,923 | 3,446,631 |
| Citibank Credit Card Issuance Trust Series 2018-A1 Class A1, 2.49% 1/20/23 | | 5,575,000 | 5,629,988 |
| CNH Equipment Trust Series 2018-A Class A3, 3.12% 7/17/23 | | 4,051,000 | 4,109,835 |
| Consumer Lending Receivables Trust Series 2019-A Class A, 3.52% 4/15/26 (a) | | 2,643,197 | 2,657,669 |
| Consumer Loan Underlying Bond Credit Trust: | | | |
| Series 2018-P2 Class A, 3.47% 10/15/25 (a) | | 2,137,389 | 2,149,582 |
| Series 2018-P3 Class A, 3.82% 1/15/26 (a) | | 3,837,758 | 3,873,921 |
| Series 2019-P1 Class A, 2.94% 7/15/26 (a) | | 1,030,250 | 1,033,706 |
| Countrywide Home Loans, Inc.: | | | |
| Series 2003-BC1 Class B1, 1 month U.S. LIBOR + 5.250% 7.3953% 3/25/32 (b)(c) | | 1,524 | 1,612 |
| Series 2004-2 Class 3A4, 1 month U.S. LIBOR + 0.500% 2.6453% 7/25/34 (b)(c) | | 103,055 | 95,149 |
| Dell Equipment Finance Trust: | | | |
| Series 2017-2 Class A3, 2.19% 10/24/22 (a) | | 1,226,060 | 1,225,955 |
| Series 2018-1 Class A3, 3.18% 6/22/23 (a) | | 1,386,000 | 1,403,330 |
| Series 2018-2 Class A3, 3.37% 10/22/23 (a) | | 1,774,000 | 1,805,439 |
| Series 2019-1 Class A2, 2.78% 8/23/21 (a) | | 3,500,000 | 3,524,732 |
| Discover Card Master Trust: | | | |
| Series 2017-A6 Class A6, 1.88% 2/15/23 | | 3,507,000 | 3,505,560 |
| Series 2018-A5 Class A5, 3.32% 3/15/24 | | 5,126,000 | 5,294,858 |
| Series 2019-A1 Class A1, 3.04% 7/15/24 | | 3,589,000 | 3,701,806 |
| Series 2019-A2 Class A, 1 month U.S. LIBOR + 0.270% 2.4651% 12/15/23 (b)(c) | | 5,000,000 | 5,007,999 |
| DLL Securitization Trust: | | | |
| Series 2017-A Class A3, 2.14% 12/15/21 (a) | | 3,445,520 | 3,446,065 |
| Series 2018-ST2 Class A3, 3.46% 1/20/22 (a) | | 3,116,000 | 3,161,805 |
| Series 2019-DA1 Class A2, 2.79% 11/22/21 (a) | | 5,000,000 | 5,018,644 |
| Series 2019-MA2 Class A2, 2.27% 5/20/22 (a) | | 3,385,000 | 3,389,288 |
| DT Auto Owner Trust Series 2019-3A Class A, 2.55% 8/15/22 (a) | | 3,002,539 | 3,005,334 |
| Enterprise Fleet Financing LLC: | | | |
| Series 2016-2 Class A2, 1.74% 2/22/22 (a) | | 24,067 | 24,055 |
| Series 2017-1 Class A2, 2.13% 7/20/22 (a) | | 1,676,223 | 1,675,601 |
| Series 2017-2 Class A2, 1.97% 1/20/23 (a) | | 1,388,525 | 1,386,902 |
| Series 2019-1 Class A2, 2.98% 10/22/24 (a) | | 2,546,000 | 2,581,396 |
| Fifth Third Auto Trust Series 2017-1 Class A3, 1.8% 2/15/22 | | 1,769,903 | 1,767,533 |
| Ford Credit Auto Lease Trust Series 2019-B Class A2A, 2.28% 2/15/22 | | 2,910,000 | 2,913,770 |
| Ford Credit Auto Owner Trust: | | | |
| Series 2015-2 Class A, 2.44% 1/15/27 (a) | | 6,421,000 | 6,434,968 |
| Series 2017-A Class A3, 1.67% 6/15/21 | | 1,770,771 | 1,767,776 |
| Ford Credit Floorplan Master Owner Trust: | | | |
| Series 2015-5 Class A, 2.39% 8/15/22 | | 9,501,000 | 9,527,101 |
| Series 2017-2 Class A1, 2.16% 9/15/22 | | 4,540,000 | 4,547,452 |
| Series 2018-1 Class A1, 2.95% 5/15/23 | | 4,500,000 | 4,578,883 |
| GM Financial Automobile Leasing Trust: | | | |
| Series 2019-1 Class A3, 2.98% 12/20/21 | | 2,198,000 | 2,225,716 |
| Series 2019-2 Class A3, 2.67% 3/21/22 | | 1,270,000 | 1,284,035 |
| GM Financial Securitized Term Auto Receivables Trust Series 2019-1 Class A3, 2.97% 11/16/23 | | 3,388,000 | 3,448,966 |
| GMF Floorplan Owner Revolving Trust: | | | |
| Series 2017-1 Class A1, 2.22% 1/18/22 (a) | | 3,688,000 | 3,686,487 |
| Series 2018-2 Class A2, 3.13% 3/15/23 (a) | | 4,242,000 | 4,309,392 |
| Home Equity Asset Trust Series 2004-1 Class M2, 1 month U.S. LIBOR + 1.700% 3.8453% 6/25/34 (b)(c) | | 8,781 | 8,764 |
| Honda Auto Receivables Owner Trust Series 2017-1 Class A3, 1.72% 7/21/21 | | 1,579,426 | 1,576,795 |
| John Deere Owner Trust: | | | |
| Series 2018-A Class A3, 2.66% 4/18/22 | | 4,248,000 | 4,268,381 |
| Series 2019-B Class A2, 2.28% 5/16/22 | | 3,500,000 | 3,511,822 |
| Kubota Credit Owner Trust Series 2018-1A Class A3, 3.1% 8/15/22 (a) | | 5,585,000 | 5,681,682 |
| Mercedes-Benz Auto Lease Trust Series 2019-A Class A3, 3.1% 11/15/21 | | 2,265,000 | 2,291,675 |
| Mercedes-Benz Master Owner Trust Series 2018-AA Class A, 1 month U.S. LIBOR + 0.260% 2.4551% 5/16/22 (a)(b)(c) | | 5,000,000 | 4,999,902 |
| Nationstar HECM Loan Trust Series 2018-1A Class A, 2.76% 2/25/28 (a) | | 913,487 | 912,612 |
| Navistar Financial Dealer Note Master Trust Series 2018-1 Class A, 1 month U.S. LIBOR + 0.630% 2.896% 9/25/23 (a)(b)(c) | | 4,214,000 | 4,219,516 |
| Nissan Master Owner Trust Receivables Series 2017-B Class A, 1 month U.S. LIBOR + 0.430% 2.6251% 4/18/22 (b)(c) | | 3,000,000 | 3,004,412 |
| Park Place Securities, Inc. Series 2005-WCH1 Class M4, 1 month U.S. LIBOR + 1.245% 3.3903% 1/25/36 (b)(c) | | 336,368 | 337,783 |
| Prosper Marketplace Issuance Trust: | | | |
| Series 2018-1A Class A, 3.11% 6/17/24 (a) | | 83,550 | 83,571 |
| Series 2018-2A Class A, 3.35% 10/15/24 (a) | | 1,331,588 | 1,335,662 |
| Santander Retail Auto Lease Trust: | | | |
| Series 2017-A Class A3, 2.22% 1/20/21 (a) | | 3,498,542 | 3,498,269 |
| Series 2018-A Class A3, 2.93% 5/20/21 (a) | | 3,746,000 | 3,763,865 |
| Series 2019-B Class A2A, 2.29% 4/20/22 (a) | | 3,500,000 | 3,509,851 |
| Securitized Term Auto Receivables Trust: | | | |
| Series 2017-1A Class A3, 1.89% 8/25/20 (a) | | 672,612 | 672,154 |
| Series 2017-2A Class A3, 2.04% 4/26/21 (a) | | 1,715,963 | 1,714,675 |
| Series 2018-2A Class A3 3.325% 8/25/22 (a) | | 5,061,000 | 5,127,434 |
| Series 2019-1A Class A3, 2.986% 2/27/23 (a) | | 2,436,000 | 2,472,939 |
| SLM Student Loan Trust Series 2003-11 Class A6, 3 month U.S. LIBOR + 0.550% 2.9603% 12/15/25 (a)(b)(c) | | 5,220,456 | 5,222,225 |
| Terwin Mortgage Trust Series 2003-4HE Class A1, 1 month U.S. LIBOR + 0.860% 3.0053% 9/25/34 (b)(c) | | 114,910 | 111,833 |
| Tesla Auto Lease Trust Series 2018-A Class A, 2.32% 12/20/19 (a) | | 423,390 | 423,373 |
| Towd Point Mortgage Trust Series 2018-3 Class A1, 3.75% 5/25/58 (a) | | 2,318,010 | 2,419,300 |
| Upgrade Receivables Trust: | | | |
| Series 2018-1A Class A, 3.76% 11/15/24 (a) | | 1,763,976 | 1,770,226 |
| Series 2019-1A Class A, 3.48% 3/15/25 (a) | | 622,164 | 624,346 |
| Series 2019-2A Class A, 2.77% 10/15/25 (a) | | 945,000 | 945,446 |
| Verizon Owner Trust: | | | |
| Series 2016-2A Class A, 1.68% 5/20/21 (a) | | 1,123,760 | 1,122,632 |
| Series 2017-1A Class A, 2.06% 9/20/21 (a) | | 3,230,389 | 3,229,267 |
| Series 2017-3A Class A1A, 2.06% 4/20/22 (a) | | 4,580,000 | 4,578,395 |
| Series 2018-A Class A1A, 3.23% 4/20/23 | | 5,052,000 | 5,162,699 |
| Volkswagen Auto Loan Enhanced Trust Series 2018-1 Class A3, 3.02% 11/21/22 | | 2,654,000 | 2,698,083 |
| Volvo Financial Equipment LLC Series 2019-1A Class A3, 3% 3/15/23 (a) | | 2,004,000 | 2,042,071 |
| Volvo Financial Equipment Master Owner Trust Series 2018-A Class A, 1 month U.S. LIBOR + 0.520% 2.7151% 7/17/23 (a)(b)(c) | | 5,510,000 | 5,518,106 |
| Wheels SPV LLC Series 2018-1A Class A2, 3.06% 4/20/27 (a) | | 3,454,665 | 3,473,666 |
| World Omni Automobile Lease Securitization Trust Series 2019-A Class A3, 2.94% 5/16/22 | | 1,999,000 | 2,031,437 |
| TOTAL ASSET-BACKED SECURITIES | | | |
| (Cost $297,511,723) | | | 300,340,552 |
|
| Collateralized Mortgage Obligations - 1.1% | | | |
| Private Sponsor - 1.1% | | | |
| Credit Suisse Mortgage Trust Series 2012-2R Class 1A1, 4.7374% 5/27/35 (a)(b) | | 402,660 | 407,077 |
| Gosforth Funding PLC floater Series 2018-1A Class A1, 3 month U.S. LIBOR + 0.450% 2.5823% 8/25/60 (a)(b)(c) | | 1,889,168 | 1,885,521 |
| Holmes Master Issuer PLC floater Series 2018-2A Class A2, 3 month U.S. LIBOR + 0.420% 2.7234% 10/15/54 (a)(b)(c) | | 2,483,322 | 2,480,759 |
| Lanark Master Issuer PLC: | | | |
| floater Series 2019-1A Class 1A1, 3 month U.S. LIBOR + 0.770% 2.9023% 12/22/69 (a)(b)(c) | | 1,221,733 | 1,225,164 |
| Series 2019-2A Class 1A, 2.71% 12/22/69 (a) | | 3,883,000 | 3,910,523 |
| Merrill Lynch Alternative Note Asset Trust floater Series 2007-OAR1 Class A1, 1 month U.S. LIBOR + 0.170% 2.436% 2/25/37 (b)(c) | | 16,118 | 16,197 |
| Permanent Master Issuer PLC floater Series 2018-1A Class 1A1, 3 month U.S. LIBOR + 0.380% 2.6834% 7/15/58 (a)(b)(c) | | 7,000,000 | 6,998,572 |
| Sequoia Mortgage Trust floater Series 2004-6 Class A3B, 6 month U.S. LIBOR + 0.880% 3.178% 7/20/34 (b)(c) | | 2,196 | 2,137 |
| Silverstone Master Issuer PLC floater Series 2019-1A Class 1A, 3 month U.S. LIBOR + 0.570% 2.8476% 1/21/70 (a)(b)(c) | | 3,200,000 | 3,200,739 |
|
| TOTAL PRIVATE SPONSOR | | | 20,126,689 |
|
| U.S. Government Agency - 0.0% | | | |
| Fannie Mae sequential payer Series 2001-40 Class Z, 6% 8/25/31 | | 95,175 | 107,153 |
| Freddie Mac Series 3949 Class MK, 4.5% 10/15/34 | | 491,148 | 520,252 |
|
| TOTAL U.S. GOVERNMENT AGENCY | | | 627,405 |
|
| TOTAL COLLATERALIZED MORTGAGE OBLIGATIONS | | | |
| (Cost $20,740,110) | | | 20,754,094 |
|
| Commercial Mortgage Securities - 6.6% | | | |
| Asset Securitization Corp. Series 1997-D5 Class PS1, 1.8322% 2/14/43 (b)(e) | | 8,516 | 24 |
| Bank of America Commercial Mortgage Trust Series 2016-UB10 Class A1, 1.559% 7/15/49 | | 945,437 | 939,913 |
| Bayview Commercial Asset Trust Series 2006-2A Class IO, 0% 7/25/36 (a)(b)(e)(f) | | 3,657,964 | 0 |
| Benchmark Mortgage Trust Series 2018-B7 Class A1, 3.436% 5/15/53 | | 1,810,163 | 1,868,122 |
| BX Trust: | | | |
| floater Series 2018-IND Class B, 1 month U.S. LIBOR + 0.900% 3.0951% 11/15/35 (a)(b)(c) | | 4,188,934 | 4,186,316 |
| floater, sequential payer Series 2019-IMC Class A, 1 month U.S. LIBOR + 1.000% 3.1951% 4/15/34 (a)(b)(c) | | 1,850,000 | 1,849,996 |
| CGDBB Commercial Mortgage Trust floater Series 2017-BIOC Class A, 1 month U.S. LIBOR + 0.790% 2.9851% 7/15/32 (a)(b)(c) | | 4,151,000 | 4,150,993 |
| CHC Commercial Mortgage Trust floater Series 2019-CHC Class A, 1 month U.S. LIBOR + 1.120% 3.3151% 6/15/34 (a)(b)(c) | | 3,254,000 | 3,253,993 |
| Citigroup Commercial Mortgage Trust: | | | |
| floater Series 2017-1500 Class A, 1 month U.S. LIBOR + 0.850% 3.0451% 7/15/32 (a)(b)(c) | | 3,141,000 | 3,141,032 |
| sequential payer: | | | |
| Series 2012-GC8 Class A/S, 3.683% 9/10/45 (a) | | 1,861,000 | 1,940,007 |
| Series 2013-GC17 Class A4, 4.131% 11/10/46 | | 2,062,000 | 2,229,293 |
| Series 2014-GC21 Class AAB, 3.477% 5/10/47 | | 1,281,272 | 1,325,434 |
| Series 2016-GC36 Class AAB, 3.368% 2/10/49 | | 1,999,000 | 2,101,111 |
| COMM Mortgage Trust: | | | |
| sequential payer: | | | |
| Series 2012-LC4 Class A4, 3.288% 12/10/44 | | 3,234,013 | 3,308,455 |
| Series 2013-CR11 Class ASB, 3.66% 8/10/50 | | 2,197,479 | 2,266,943 |
| Series 2013-LC6 Class ASB, 2.478% 1/10/46 | | 1,768,359 | 1,781,893 |
| Credit Suisse Mortgage Trust floater Series 2019-ICE4 Class A, 1 month U.S. LIBOR + 0.980% 3.1751% 5/15/36 (a)(b)(c) | | 4,000,000 | 4,002,510 |
| CSAIL Commercial Mortgage Trust: | | | |
| sequential payer Series 19-C15 Class A2, 3.4505% 3/15/52 | | 2,538,000 | 2,687,043 |
| Series 2016-C7 Class A1, 1.5786% 11/15/49 | | 485,598 | 483,344 |
| CSMC Mortgage Trust Series 2016-NXSR Class A1, 1.9708% 12/15/49 | | 641,850 | 639,666 |
| GS Mortgage Securities Trust: | | | |
| sequential payer: | | | |
| Series 2012-GC6: | | | |
| Class A/S, 4.948% 1/10/45 (a) | | 7,314,000 | 7,735,684 |
| Class A3, 3.482% 1/10/45 | | 2,375,030 | 2,435,429 |
| Series 2012-GCJ7: | | | |
| Class A/S, 4.085% 5/10/45 | | 3,084,000 | 3,227,180 |
| Class A4, 3.377% 5/10/45 | | 6,931,789 | 7,067,405 |
| Series 2014-GC18 Class AAB, 3.648% 1/10/47 | | 49,768 | 51,362 |
| Series 2011-GC5 Class A/S, 5.209% 8/10/44 (a) | | 5,365,000 | 5,636,561 |
| Series 2012-GCJ9 Class A/S, 3.124% 11/10/45 | | 3,148,000 | 3,220,299 |
| Series 2016-GS4 Class A1, 1.731% 11/10/49 | | 319,548 | 318,555 |
| JPMBB Commercial Mortgage Securities sequential payer Series 2014-C25 Class A2, 2.9493% 11/15/47 | | 92,858 | 92,776 |
| JPMBB Commercial Mortgage Securities Trust sequential payer Series 2014-C22 Class ASB, 3.5036% 9/15/47 | | 1,886,362 | 1,949,389 |
| JPMDB Commercial Mortgage Securities Trust Series 2016-C4 Class A1, 1.5366% 12/15/49 | | 6,224,534 | 6,175,376 |
| JPMorgan Chase Commercial Mortgage Securities Corp.: | | | |
| sequential payer Series 2012-C6 Class A3, 3.5074% 5/15/45 | | 1,440,288 | 1,493,236 |
| Series 2012-C6 Class A/S, 4.1166% 5/15/45 | | 6,817,295 | 7,118,934 |
| Series 2012-LC9 Class A/S, 3.3533% 12/15/47 (a) | | 3,933,000 | 4,060,738 |
| JPMorgan Chase Commercial Mortgage Securities Trust sequential payer: | | | |
| Series 2012-C8 Class A3, 2.8291% 10/15/45 | | 2,123,192 | 2,172,988 |
| Series 2014-C20 Class A3A1, 3.4718% 7/15/47 | | 2,609,000 | 2,661,787 |
| Morgan Stanley BAML Trust Series 2016-C32 Class A1, 1.968% 12/15/49 | | 1,041,334 | 1,037,845 |
| Morgan Stanley Capital I Trust: | | | |
| floater Series 2019-AGLN Class A, 1 month U.S. LIBOR + 0.950% 3.1451% 3/15/34 (a)(b)(c) | | 3,257,000 | 3,259,026 |
| Series 2011-C3 Class AJ, 5.2925% 7/15/49 (a)(b) | | 1,961,000 | 2,057,125 |
| Series 2016-BNK2 Class A1, 1.424% 11/15/49 | | 725,872 | 720,187 |
| Series 2019-H7 Class A1, 2.327% 7/15/52 | | 2,122,778 | 2,141,561 |
| RETL floater Series 2019-RVP Class A, 1 month U.S. LIBOR + 1.150% 3.3451% 3/15/36 (a)(b)(c) | | 1,075,708 | 1,077,387 |
| UBS-Barclays Commercial Mortgage Trust: | | | |
| floater Series 2013-C6 Class A3, 1 month U.S. LIBOR + 0.790% 2.9909% 4/10/46 (a)(b)(c) | | 3,234,824 | 3,273,406 |
| sequential payer Series 2013-C6 Class ASB, 2.7877% 4/10/46 | | 2,715,928 | 2,747,567 |
| Series 2012-C2 Class ASEC, 4.179% 5/10/63 (a) | | 2,654,000 | 2,778,976 |
| Wells Fargo Commercial Mortgage Trust: | | | |
| Series 2013-LC12 Class A1, 1.676% 7/15/46 | | 285,406 | 285,128 |
| Series 2016-LC25 Class A1, 1.795% 12/15/59 | | 361,361 | 360,123 |
| WF-RBS Commercial Mortgage Trust: | | | |
| floater Series 2013-C14 Class A3, 1 month U.S. LIBOR + 0.720% 2.9174% 6/15/46 (a)(b)(c) | | 3,429,430 | 3,432,344 |
| sequential payer: | | | |
| Series 2013-C12 Class ASB, 2.838% 3/15/48 | | 360,098 | 363,834 |
| Series 2013-C16 Class ASB, 3.963% 9/15/46 | | 844,027 | 874,725 |
| Series 2014-C20 Class ASB, 3.638% 5/15/47 | | 1,188,275 | 1,228,533 |
| TOTAL COMMERCIAL MORTGAGE SECURITIES | | | |
| (Cost $122,509,183) | | | 123,211,554 |
|
| Municipal Securities - 0.3% | | | |
| New York Urban Dev. Corp. Rev. Series 2017 D, 2.55% 3/15/22 | | | |
| (Cost $5,975,000) | | 5,975,000 | 6,093,903 |
|
| Foreign Government and Government Agency Obligations - 0.4% | | | |
Alberta Province 1.9% 12/6/19
(Cost $7,499,690) | | $7,500,000 | $7,495,650 |
|
| Bank Notes - 3.4% | | | |
| Capital One NA 2.35% 1/31/20 | | 4,300,000 | 4,300,936 |
| Citibank NA: | | | |
| 2.1% 6/12/20 | | $3,500,000 | $3,502,926 |
| 2.844% 5/20/22 (b) | | 5,000,000 | 5,055,944 |
| Citizens Bank NA 2.25% 10/30/20 | | 5,661,000 | 5,669,194 |
| Compass Bank 3.5% 6/11/21 | | 3,301,000 | 3,361,784 |
| KeyBank NA 3.3% 2/1/22 | | 1,076,000 | 1,109,248 |
| PNC Bank NA 2.45% 11/5/20 | | 5,000,000 | 5,025,873 |
| Regions Bank 2.75% 4/1/21 | | 4,346,000 | 4,384,715 |
| SunTrust Bank: | | | |
| 2.8% 5/17/22 | | 4,500,000 | 4,584,484 |
| 3.502% 8/2/22 (b) | | 3,548,000 | 3,632,001 |
| Svenska Handelsbanken AB 3.35% 5/24/21 | | 8,000,000 | 8,178,667 |
| Synchrony Bank 3.65% 5/24/21 | | 1,893,000 | 1,931,608 |
| Wells Fargo Bank NA: | | | |
| 2.6% 1/15/21 | | 5,500,000 | 5,540,712 |
| 2.897% 5/27/22 (b) | | 7,000,000 | 7,095,379 |
| TOTAL BANK NOTES | | | |
| (Cost $62,632,898) | | | 63,373,471 |
|
| Commercial Paper - 0.5% | | | |
| Commonspirit Health 2.8% 10/16/19 | | 3,957,000 | 3,945,914 |
| Sempra Global 2.48% 10/16/19 | | 5,000,000 | 4,984,849 |
| TOTAL COMMERCIAL PAPER | | | |
| (Cost $8,927,651) | | | 8,930,763 |
| | | Shares | Value |
|
| Money Market Funds - 0.7% | | | |
| Fidelity Cash Central Fund 2.13% (g) | | | |
| (Cost $12,981,511) | | 12,978,915 | 12,981,511 |
| TOTAL INVESTMENT IN SECURITIES - 100.2% | | | |
| (Cost $1,852,805,255) | | | 1,874,605,909 |
| NET OTHER ASSETS (LIABILITIES) - (0.2)% | | | (4,544,603) |
| NET ASSETS - 100% | | | $1,870,061,306 |
| Futures Contracts | | | | | |
| | Number of contracts | Expiration Date | Notional Amount | Value | Unrealized Appreciation/(Depreciation) |
| Purchased | | | | | |
| Treasury Contracts | | | | | |
| CBOT 2-Year U.S. Treasury Note Contracts (United States) | 669 | Dec. 2019 | $144,582,398 | $71,861 | $71,861 |
The notional amount of futures purchased as a percentage of Net Assets is 7.7%
Legend
(a) Security exempt from registration under Rule 144A of the Securities Act of 1933. These securities may be resold in transactions exempt from registration, normally to qualified institutional buyers. At the end of the period, the value of these securities amounted to $411,643,844 or 22.0% of net assets.
(b) Coupon rates for floating and adjustable rate securities reflect the rates in effect at period end.
(c) Coupon is indexed to a floating interest rate which may be multiplied by a specified factor and/or subject to caps or floors.
(d) Security or a portion of the security was pledged to cover margin requirements for futures contracts. At period end, the value of securities pledged amounted to $502,159.
(e) Security represents right to receive monthly interest payments on an underlying pool of mortgages or assets. Principal shown is the outstanding par amount of the pool as of the end of the period.
(f) Level 3 security
(g) Affiliated fund that is generally available only to investment companies and other accounts managed by Fidelity Investments. The rate quoted is the annualized seven-day yield of the fund at period end. A complete unaudited listing of the fund's holdings as of its most recent quarter end is available upon request. In addition, each Fidelity Central Fund's financial statements, which are not covered by the Fund's Report of Independent Registered Public Accounting Firm, are available on the SEC's website or upon request.
Affiliated Central Funds
Information regarding fiscal year to date income earned by the Fund from investments in Fidelity Central Funds is as follows:
| Fund | Income earned |
| Fidelity Cash Central Fund | $212,209 |
| Total | $212,209 |
Amounts in the income column in the above table include any capital gain distributions from underlying funds, which are presented in the corresponding line-item in the Statement of Operations, if applicable.
Investment Valuation
The following is a summary of the inputs used, as of August 31, 2019, involving the Fund's assets and liabilities carried at fair value. The inputs or methodology used for valuing securities may not be an indication of the risk associated with investing in those securities. For more information on valuation inputs, and their aggregation into the levels used below, please refer to the Investment Valuation section in the accompanying Notes to Financial Statements.
| | Valuation Inputs at Reporting Date: |
| Description | Total | Level 1 | Level 2 | Level 3 |
| Investments in Securities: | | | | |
| Corporate Bonds | $1,212,754,260 | $-- | $1,212,754,260 | $-- |
| U.S. Government and Government Agency Obligations | 111,384,496 | -- | 111,384,496 | -- |
| U.S. Government Agency - Mortgage Securities | 7,285,655 | -- | 7,285,655 | -- |
| Asset-Backed Securities | 300,340,552 | -- | 300,340,552 | -- |
| Collateralized Mortgage Obligations | 20,754,094 | -- | 20,754,094 | -- |
| Commercial Mortgage Securities | 123,211,554 | -- | 123,211,554 | -- |
| Municipal Securities | 6,093,903 | -- | 6,093,903 | -- |
| Foreign Government and Government Agency Obligations | 7,495,650 | -- | 7,495,650 | -- |
| Bank Notes | 63,373,471 | -- | 63,373,471 | -- |
| Commercial Paper | 8,930,763 | -- | 8,930,763 | -- |
| Money Market Funds | 12,981,511 | 12,981,511 | -- | -- |
| Total Investments in Securities: | $1,874,605,909 | $12,981,511 | $1,861,624,398 | $-- |
| Derivative Instruments: | | | | |
| Assets | | | | |
| Futures Contracts | $71,861 | $71,861 | $-- | $-- |
| Total Assets | $71,861 | $71,861 | $-- | $-- |
| Total Derivative Instruments: | $71,861 | $71,861 | $-- | $-- |
Value of Derivative Instruments
The following table is a summary of the Fund's value of derivative instruments by primary risk exposure as of August 31, 2019. For additional information on derivative instruments, please refer to the Derivative Instruments section in the accompanying Notes to Financial Statements.
| Primary Risk Exposure / Derivative Type | Value |
| | Asset | Liability |
| Interest Rate Risk | | |
| Futures Contracts(a) | $71,861 | $0 |
| Total Interest Rate Risk | 71,861 | 0 |
| Total Value of Derivatives | $71,861 | $0 |
(a) Reflects gross cumulative appreciation (depreciation) on futures contracts as presented in the Schedule of Investments. In the Statement of Assets and Liabilities, the period end daily variation margin is included in receivable or payable for daily variation margin on futures contracts, and the net cumulative appreciation (depreciation) is included in distributable earnings.
Other Information
Distribution of investments by country or territory of incorporation, as a percentage of Total Net Assets, is as follows (Unaudited):
| United States of America | 82.1% |
| United Kingdom | 5.5% |
| Canada | 3.1% |
| Ireland | 1.5% |
| Netherlands | 1.5% |
| Luxembourg | 1.5% |
| Japan | 1.0% |
| Others (Individually Less Than 1%) | 3.8% |
| | 100.0% |
See accompanying notes which are an integral part of the financial statements.
Financial Statements
Statement of Assets and Liabilities
| | | August 31, 2019 |
| Assets | | |
Investment in securities, at value — See accompanying schedule:
Unaffiliated issuers (cost $1,839,823,744) | $1,861,624,398 | |
| Fidelity Central Funds (cost $12,981,511) | 12,981,511 | |
| Total Investment in Securities (cost $1,852,805,255) | | $1,874,605,909 |
| Receivable for investments sold | | 129,998,953 |
| Receivable for fund shares sold | | 9,427,315 |
| Interest receivable | | 12,327,692 |
| Distributions receivable from Fidelity Central Funds | | 49,625 |
| Receivable for daily variation margin on futures contracts | | 62,719 |
| Total assets | | 2,026,472,213 |
| Liabilities | | |
| Payable for fund shares redeemed | $156,399,454 | |
| Other payables and accrued expenses | 11,453 | |
| Total liabilities | | 156,410,907 |
| Net Assets | | $1,870,061,306 |
| Net Assets consist of: | | |
| Paid in capital | | $1,858,576,929 |
| Total distributable earnings (loss) | | 11,484,377 |
| Net Assets, for 185,262,636 shares outstanding | | $1,870,061,306 |
| Net Asset Value, offering price and redemption price per share ($1,870,061,306 ÷ 185,262,636 shares) | | $10.09 |
See accompanying notes which are an integral part of the financial statements.
Statement of Operations
| | | Year ended August 31, 2019 |
| Investment Income | | |
| Interest | | $51,376,273 |
| Income from Fidelity Central Funds | | 212,209 |
| Total income | | 51,588,482 |
| Expenses | | |
| Custodian fees and expenses | $33,466 | |
| Independent trustees' fees and expenses | 8,848 | |
| Commitment fees | 5,178 | |
| Total expenses before reductions | 47,492 | |
| Expense reductions | (340) | |
| Total expenses after reductions | | 47,152 |
| Net investment income (loss) | | 51,541,330 |
| Realized and Unrealized Gain (Loss) | | |
| Net realized gain (loss) on: | | |
| Investment securities: | | |
| Unaffiliated issuers | (2,713,458) | |
| Fidelity Central Funds | 44 | |
| Futures contracts | 169,530 | |
| Total net realized gain (loss) | | (2,543,884) |
| Change in net unrealized appreciation (depreciation) on: | | |
| Investment securities: | | |
| Unaffiliated issuers | 43,598,625 | |
| Fidelity Central Funds | (44) | |
| Futures contracts | 71,861 | |
| Total change in net unrealized appreciation (depreciation) | | 43,670,442 |
| Net gain (loss) | | 41,126,558 |
| Net increase (decrease) in net assets resulting from operations | | $92,667,888 |
See accompanying notes which are an integral part of the financial statements.
Statement of Changes in Net Assets
| | Year ended August 31, 2019 | Year ended August 31, 2018 |
| Increase (Decrease) in Net Assets | | |
| Operations | | |
| Net investment income (loss) | $51,541,330 | $46,642,931 |
| Net realized gain (loss) | (2,543,884) | (4,934,791) |
| Change in net unrealized appreciation (depreciation) | 43,670,442 | (25,476,264) |
| Net increase (decrease) in net assets resulting from operations | 92,667,888 | 16,231,876 |
| Distributions to shareholders | (52,482,070) | – |
| Distributions to shareholders from net investment income | – | (45,920,111) |
| Total distributions | (52,482,070) | (45,920,111) |
| Share transactions | | |
| Proceeds from sales of shares | 477,539,576 | 208,301,422 |
| Net asset value of shares issued in exchange for the net assets of Fidelity Advisor Series Short-Term Credit Fund (note 10) | – | 189,347,036 |
| Reinvestment of distributions | 52,482,070 | 45,709,781 |
| Cost of shares redeemed | (813,538,504) | (413,967,036) |
| Net increase (decrease) in net assets resulting from share transactions | (283,516,858) | 29,391,203 |
| Total increase (decrease) in net assets | (243,331,040) | (297,032) |
| Net Assets | | |
| Beginning of period | 2,113,392,346 | 2,113,689,378 |
| End of period | $1,870,061,306 | $2,113,392,346 |
| Other Information | | |
| Undistributed net investment income end of period | | $2,788,063 |
| Shares | | |
| Sold | 47,809,329 | 20,947,798 |
| Issued in exchange for the shares of Fidelity Advisor Series Short-Term Credit Fund (note 10) | – | 19,106,664 |
| Issued in reinvestment of distributions | 5,278,353 | 4,618,997 |
| Redeemed | (81,838,297) | (41,740,068) |
| Net increase (decrease) | (28,750,615) | 2,933,391 |
See accompanying notes which are an integral part of the financial statements.
Financial Highlights
Fidelity Series Short-Term Credit Fund
| | | | | | |
| Years ended August 31, | 2019 | 2018 | 2017 | 2016 | 2015 A |
| Selected Per–Share Data | | | | | |
| Net asset value, beginning of period | $9.88 | $10.01 | $10.03 | $9.95 | $10.00 |
| Income from Investment Operations | | | | | |
| Net investment income (loss)B | .272 | .214 | .131 | .114 | .052 |
| Net realized and unrealized gain (loss) | .216 | (.133) | (.013) | .081 | (.051) |
| Total from investment operations | .488 | .081 | .118 | .195 | .001 |
| Distributions from net investment income | (.278) | (.211) | (.131) | (.108) | (.051) |
| Distributions from net realized gain | – | – | (.007) | (.007) | – |
| Total distributions | (.278) | (.211) | (.138) | (.115) | (.051) |
| Net asset value, end of period | $10.09 | $9.88 | $10.01 | $10.03 | $9.95 |
| Total ReturnC,D | 5.02% | .82% | 1.19% | 1.98% | .01% |
| Ratios to Average Net AssetsE,F | | | | | |
| Expenses before reductions | - %G | - %G | .34% | .45% | .45%H |
| Expenses net of fee waivers, if any | - %G | - %G | .34% | .45% | .45%H |
| Expenses net of all reductions | - %G | - %G | .34% | .45% | .45%H |
| Net investment income (loss) | 2.74% | 2.16% | 1.32% | 1.15% | 1.21%H |
| Supplemental Data | | | | | |
| Net assets, end of period (000 omitted) | $1,870,061 | $2,113,392 | $2,113,689 | $1,022,609 | $768,418 |
| Portfolio turnover rateI | 67% | 52%J | 70% | 112% | 63%K,L |
A For the period March 27, 2015 (commencement of operations) to August 31, 2015.
B Calculated based on average shares outstanding during the period.
C Total returns for periods of less than one year are not annualized.
D Total returns would have been lower if certain expenses had not been reduced during the applicable periods shown.
E Fees and expenses of any underlying Fidelity Central Funds are not included in the Fund's expense ratio. The Fund indirectly bears its proportionate share of the expenses of any underlying Fidelity Central Funds.
F Expense ratios reflect operating expenses of the Fund. Expenses before reductions do not reflect amounts reimbursed by the investment adviser or reductions from expense offset arrangements and do not represent the amount paid by the Fund during periods when reimbursements or reductions occur. Expense ratios before reductions for start-up periods may not be representative of longer term operating periods. Expenses net of fee waivers reflect expenses after reimbursement by the investment adviser but prior to reductions from expense offset arrangements. Expenses net of all reductions represent the net expenses paid by the Fund.
G Amount represents less than .005%.
H Annualized
I Amount does not include the portfolio activity of any underlying Fidelity Central Funds.
J The portfolio turnover rate does not include the assets acquired in the merger.
K Portfolio turnover rate excludes securities received or delivered in-kind.
L Amount not annualized.
See accompanying notes which are an integral part of the financial statements.
Notes to Financial Statements
For the period ended August 31, 2019
1. Organization.
Fidelity Series Short-Term Credit Fund (the Fund) is a fund of Fidelity Salem Street Trust (the Trust) and is authorized to issue an unlimited number of shares. Shares of the Fund are only available for purchase by mutual funds for which Fidelity Management & Research Company (FMR) or an affiliate serves as an investment manager. The Trust is registered under the Investment Company Act of 1940, as amended (the 1940 Act), as an open-end management investment company organized as a Massachusetts business trust.
2. Investments in Fidelity Central Funds.
The Fund invests in Fidelity Central Funds, which are open-end investment companies generally available only to other investment companies and accounts managed by the investment adviser and its affiliates. The Fund's Schedule of Investments lists each of the Fidelity Central Funds held as of period end, if any, as an investment of the Fund, but does not include the underlying holdings of each Fidelity Central Fund. As an Investing Fund, the Fund indirectly bears its proportionate share of the expenses of the underlying Fidelity Central Funds.
The Money Market Central Funds seek preservation of capital and current income and are managed by Fidelity Investments Money Management, Inc. (FIMM), an affiliate of the investment adviser. Annualized expenses of the Money Market Central Funds as of their most recent shareholder report date ranged from less than .005% to .01%.
A complete unaudited list of holdings for each Fidelity Central Fund is available upon request or at the Securities and Exchange Commission (the SEC) website at www.sec.gov. In addition, the financial statements of the Fidelity Central Funds, which are not covered by the Fund's Report of Independent Registered Public Accounting Firm, are available on the SEC website or upon request.
3. Significant Accounting Policies.
The Fund is an investment company and applies the accounting and reporting guidance of the Financial Accounting Standards Board (FASB) Accounting Standards Codification Topic 946 Financial Services – Investments Companies. The financial statements have been prepared in conformity with accounting principles generally accepted in the United States of America (GAAP), which require management to make certain estimates and assumptions at the date of the financial statements. Actual results could differ from those estimates. Subsequent events, if any, through the date that the financial statements were issued have been evaluated in the preparation of the financial statements. The following summarizes the significant accounting policies of the Fund:
Investment Valuation. Investments are valued as of 4:00 p.m. Eastern time on the last calendar day of the period. The Board of Trustees (the Board) has delegated the day to day responsibility for the valuation of the Fund's investments to the Fair Value Committee (the Committee) established by the Fund's investment adviser. In accordance with valuation policies and procedures approved by the Board, the Fund attempts to obtain prices from one or more third party pricing vendors or brokers to value its investments. When current market prices, quotations or currency exchange rates are not readily available or reliable, investments will be fair valued in good faith by the Committee, in accordance with procedures adopted by the Board. Factors used in determining fair value vary by investment type and may include market or investment specific events, changes in interest rates and credit quality. The frequency with which these procedures are used cannot be predicted and they may be utilized to a significant extent. The Committee oversees the Fund's valuation policies and procedures and reports to the Board on the Committee's activities and fair value determinations. The Board monitors the appropriateness of the procedures used in valuing the Fund's investments and ratifies the fair value determinations of the Committee.
The Fund categorizes the inputs to valuation techniques used to value its investments into a disclosure hierarchy consisting of three levels as shown below:
- Level 1 – quoted prices in active markets for identical investments
- Level 2 – other significant observable inputs (including quoted prices for similar investments, interest rates, prepayment speeds, etc.)
- Level 3 – unobservable inputs (including the Fund's own assumptions based on the best information available)
Valuation techniques used to value the Fund's investments by major category are as follows:
Debt securities, including restricted securities, are valued based on evaluated prices received from third party pricing vendors or from brokers who make markets in such securities. Corporate bonds, bank notes, foreign government and government agency obligations, municipal securities, U.S. government and government agency obligations and commercial paper are valued by pricing vendors who utilize matrix pricing which considers yield or price of bonds of comparable quality, coupon, maturity and type or by broker-supplied prices. Asset backed securities, collateralized mortgage obligations, commercial mortgage securities and U.S. government agency mortgage securities are valued by pricing vendors who utilize matrix pricing which considers prepayment speed assumptions, attributes of the collateral, yield or price of bonds of comparable quality, coupon, maturity and type or by broker-supplied prices. When independent prices are unavailable or unreliable, debt securities may be valued utilizing pricing methodologies which consider similar factors that would be used by third party pricing vendors. Debt securities are generally categorized as Level 2 in the hierarchy but may be Level 3 depending on the circumstances.
Futures contracts are valued at the settlement price established each day by the board of trade or exchange on which they are traded and are categorized as Level 1 in the hierarchy. Investments in open-end mutual funds, including the Fidelity Central Funds, are valued at their closing net asset value (NAV) each business day and are categorized as Level 1 in the hierarchy.
Changes in valuation techniques may result in transfers in or out of an assigned level within the disclosure hierarchy. The aggregate value of investments by input level as of August 31, 2019 is included at the end of the Fund's Schedule of Investments.
Investment Transactions and Income. For financial reporting purposes, the Fund's investment holdings and NAV include trades executed through the end of the last business day of the period. The NAV per share for processing shareholder transactions is calculated as of the close of business of the New York Stock Exchange (NYSE), normally 4:00 p.m. Eastern time and includes trades executed through the end of the prior business day. Gains and losses on securities sold are determined on the basis of identified cost. Income and capital gain distributions from Fidelity Central Funds, if any, are recorded on the ex-dividend date. Interest income is accrued as earned and includes coupon interest and amortization of premium and accretion of discount on debt securities as applicable. Debt obligations may be placed on non-accrual status and related interest income may be reduced by ceasing current accruals and writing off interest receivables when the collection of all or a portion of interest has become doubtful based on consistently applied procedures. A debt obligation is removed from non-accrual status when the issuer resumes interest payments or when collectability of interest is reasonably assured.
Expenses. Expenses directly attributable to a fund are charged to that fund. Expenses attributable to more than one fund are allocated among the respective funds on the basis of relative net assets or other appropriate methods. Expense estimates are accrued in the period to which they relate and adjustments are made when actual amounts are known.
Income Tax Information and Distributions to Shareholders. Each year, the Fund intends to qualify as a regulated investment company under Subchapter M of the Internal Revenue Code, including distributing substantially all of its taxable income and realized gains. As a result, no provision for U.S. Federal income taxes is required. As of August 31, 2019, the Fund did not have any unrecognized tax benefits in the financial statements; nor is the Fund aware of any tax positions for which it is reasonably possible that the total amounts of unrecognized tax benefits will significantly change in the next twelve months. The Fund files a U.S. federal tax return, in addition to state and local tax returns as required. The Fund's federal income tax returns are subject to examination by the Internal Revenue Service (IRS) for a period of three fiscal years after they are filed. State and local tax returns may be subject to examination for an additional fiscal year depending on the jurisdiction.
Distributions are declared and recorded daily and paid monthly from net investment income. Distributions from realized gains, if any, are declared and recorded on the ex-dividend date. Income and capital gain distributions are determined in accordance with income tax regulations, which may differ from GAAP.
Capital accounts within the financial statements are adjusted for permanent book-tax differences. These adjustments have no impact on net assets or the results of operations. Capital accounts are not adjusted for temporary book-tax differences which will reverse in a subsequent period.
Book-tax differences are primarily due to futures contracts, market discount, capital loss carryforwards and losses deferred due to wash sales.
As of period end, the cost and unrealized appreciation (depreciation) in securities, and derivatives if applicable, for federal income tax purposes were as follows:
| Gross unrealized appreciation | $24,091,412 |
| Gross unrealized depreciation | (1,092,541) |
| Net unrealized appreciation (depreciation) | $22,998,871 |
| Tax Cost | $1,851,607,038 |
The tax-based components of distributable earnings as of period end were as follows:
| Undistributed ordinary income | $274,973 |
| Capital loss carryforward | $(11,789,467) |
| Net unrealized appreciation (depreciation) on securities and other investments | $22,998,871 |
Capital loss carryforwards are only available to offset future capital gains of the Fund to the extent provided by regulations and may be limited. Under the Regulated Investment Company Modernization Act of 2010 (the Act), the Fund is permitted to carry forward capital losses incurred in taxable years beginning after December 22, 2010 for an unlimited period and such capital losses are required to be used prior to any losses that expire. The capital loss carryforward information presented below, including any applicable limitation, is estimated as of fiscal period end and is subject to adjustment.
| No expiration | |
| Short-term | $(5,028,527) |
| Long-term | (6,760,940) |
| Total capital loss carryforward | $(11,789,467) |
The tax character of distributions paid was as follows:
| | August 31, 2019 | August 31, 2018 |
| Ordinary Income | $52,482,070 | $ 45,920,111 |
Restricted Securities. The Fund may invest in securities that are subject to legal or contractual restrictions on resale. These securities generally may be resold in transactions exempt from registration or to the public if the securities are registered. Disposal of these securities may involve time-consuming negotiations and expense, and prompt sale at an acceptable price may be difficult. Information regarding restricted securities is included at the end of the Fund's Schedule of Investments.
New Rule Issuance. During August 2018, the U.S. Securities and Exchange Commission issued Final Rule Release No. 33-10532, Disclosure Update and Simplification. This Final Rule includes amendments specific to registered investment companies that are intended to eliminate overlap in disclosure requirements between Regulation S-X and GAAP. In accordance with these amendments, certain line-items in the Fund's financial statements have been combined or removed for the current period as outlined in the table below.
| Financial Statement | Current Line-Item Presentation (As Applicable) | Prior Line-Item Presentation (As Applicable) |
| Statement of Assets and Liabilities | Total distributable earnings (loss) | Undistributed/Distributions in excess of/Accumulated net investment income (loss)
Accumulated/Undistributed net realized gain (loss)
Net unrealized appreciation (depreciation) |
| Statement of Changes in Net Assets | N/A - removed | Undistributed/Distributions in excess of/Accumulated net investment income (loss) end of period |
| Statement of Changes in Net Assets | Distributions to shareholders | Distributions to shareholders from net investment income
Distributions to shareholders from net realized gain |
4. Derivative Instruments.
Risk Exposures and the Use of Derivative Instruments. The Fund's investment objective allows the Fund to enter into various types of derivative contracts, including futures contracts. Derivatives are investments whose value is primarily derived from underlying assets, indices or reference rates and may be transacted on an exchange or over-the-counter (OTC). Derivatives may involve a future commitment to buy or sell a specified asset based on specified terms, to exchange future cash flows at periodic intervals based on a notional principal amount, or for one party to make one or more payments upon the occurrence of specified events in exchange for periodic payments from the other party.
The Fund used derivatives to increase returns and to manage exposure to certain risks as defined below. The success of any strategy involving derivatives depends on analysis of numerous economic factors, and if the strategies for investment do not work as intended, the Fund may not achieve its objectives.
The Fund's use of derivatives increased or decreased its exposure to the following risk:
| Interest Rate Risk | Interest rate risk relates to the fluctuations in the value of interest-bearing securities due to changes in the prevailing levels of market interest rates. |
The Fund is also exposed to additional risks from investing in derivatives, such as liquidity risk and counterparty credit risk. Liquidity risk is the risk that the Fund will be unable to close out the derivative in the open market in a timely manner. Counterparty credit risk is the risk that the counterparty will not be able to fulfill its obligation to the Fund. Counterparty credit risk related to exchange-traded futures contracts may be mitigated by the protection provided by the exchange on which they trade.
Investing in derivatives may involve greater risks than investing in the underlying assets directly and, to varying degrees, may involve risk of loss in excess of any initial investment and collateral received and amounts recognized in the Statement of Assets and Liabilities. In addition, there may be the risk that the change in value of the derivative contract does not correspond to the change in value of the underlying instrument.
Futures Contracts. A futures contract is an agreement between two parties to buy or sell a specified underlying instrument for a fixed price at a specified future date. The Fund used futures contracts to manage its exposure to the bond market and fluctuations in interest rates.
Upon entering into a futures contract, a fund is required to deposit either cash or securities (initial margin) with a clearing broker in an amount equal to a certain percentage of the face value of the contract. Futures contracts are marked-to-market daily and subsequent daily payments (variation margin) are made or received by a fund depending on the daily fluctuations in the value of the futures contracts and are recorded as unrealized appreciation or (depreciation). This receivable and/or payable, if any, is included in daily variation margin on futures contracts in the Statement of Assets and Liabilities. Realized gain or (loss) is recorded upon the expiration or closing of a futures contract. The net realized gain (loss) and change in net unrealized appreciation (depreciation) on futures contracts during the period is presented in the Statement of Operations.
Any open futures contracts at period end are presented in the Schedule of Investments under the caption "Futures Contracts". The notional amount at value reflects each contract's exposure to the underlying instrument or index at period end and is representative of volume of activity during the period. Securities deposited to meet initial margin requirements are identified in the Schedule of Investments.
5. Purchases and Sales of Investments.
Purchases and sales of securities, other than short-term securities and U.S. government securities, aggregated $801,055,337 and $961,431,486, respectively.
6. Fees and Other Transactions with Affiliates.
Management Fee. Fidelity Management & Research Company (the investment adviser) and its affiliates provide the Fund with investment management related services for which the Fund does not pay a management fee. Under the management contract, the investment adviser or an affiliate pays all ordinary operating expenses of the Fund, except custody fees, fees and expenses of the independent Trustees, and certain miscellaneous expenses such as proxy and shareholder meeting expenses.
Interfund Trades. The Fund may purchase from or sell securities to other Fidelity Funds under procedures adopted by the Board. The procedures have been designed to ensure these interfund trades are executed in accordance with Rule 17a-7 of the 1940 Act. Interfund trades are included within the respective purchases and sales amounts shown in the Purchases and Sales of Investments note.
7. Committed Line of Credit.
The Fund participates with other funds managed by the investment adviser or an affiliate in a $4.25 billion credit facility (the "line of credit") to be utilized for temporary or emergency purposes to fund shareholder redemptions or for other short-term liquidity purposes. The Fund has agreed to pay commitment fees on its pro-rata portion of the line of credit, which amounted to $5,178 and is reflected in Commitment fees on the Statement of Operations. During the period, the Fund did not borrow on this line of credit.
8. Expense Reductions.
Through arrangements with the Fund's custodian, credits realized as a result of certain uninvested cash balances were used to reduce the Fund's expenses. During the period, these credits reduced the Fund's custody expenses by $340.
9. Other.
The Fund's organizational documents provide former and current trustees and officers with a limited indemnification against liabilities arising in connection with the performance of their duties to the Fund. In the normal course of business, the Fund may also enter into contracts that provide general indemnifications. The Fund's maximum exposure under these arrangements is unknown as this would be dependent on future claims that may be made against the Fund. The risk of material loss from such claims is considered remote.
10. Prior Year Merger Information.
On January 26, 2018, the Fund acquired all of the assets and assumed all of the liabilities of Fidelity Advisor Series Short-Term Credit Fund ("Target Fund") pursuant to an Agreement and Plan of Reorganization approved by the Board of Trustees ("The Board"). The acquisition was accomplished by an exchange of shares then outstanding of the Target Fund at its respective net asset value on the acquisition date. The reorganization provides shareholders of the Target Fund access to a larger portfolio with a similar investment objective. The reorganization qualified as a tax-free reorganization for federal income tax purposes with no gain or loss recognized to the funds or their shareholders. The Target Fund's net assets of $189,347,036, including securities of $189,174,330 and unrealized depreciation of $1,182,562 was combined with the Fund's net assets of $2,037,411,470 for total net assets after the acquisition of $2,226,758,506.
Pro forma results of operations of the combined entity for the entire period ended August 31, 2018, as though the acquisition had occurred as of the beginning of the year (rather than on the actual acquisition date), are as follows:
| Net investment income (loss) | $48,219,827 |
| Total net realized gain (loss) | (5,112,935) |
| Total change in net unrealized appreciation (depreciation) | (27,069,311) |
| Net increase (decrease) in net assets resulting from operations | $16,037,581 |
Because the combined investment portfolios have been managed as a single portfolio since the acquisition was completed, it is not practicable to separate the amounts of revenue and earnings of the acquired fund that have been included in the Fund's accompanying Statement of Operations since January 26, 2018.
Report of Independent Registered Public Accounting Firm
To the Board of Trustees of Fidelity Salem Street Trust and Shareholders of Fidelity Series Short-Term Credit Fund:
Opinion on the Financial Statements
We have audited the accompanying statement of assets and liabilities, including the schedule of investments, of Fidelity Series Short-Term Credit Fund (one of the funds constituting Fidelity Salem Street Trust, referred to hereafter as the “Fund”) as of August 31, 2019, the related statement of operations for the year ended August 31, 2019, the statement of changes in net assets for each of the two years in the period ended August 31, 2019, including the related notes, and the financial highlights for each of the four years in the period ended August 31, 2019 and for the period March 27, 2015 (commencement of operations) through August 31, 2015 (collectively referred to as the “financial statements”). In our opinion, the financial statements present fairly, in all material respects, the financial position of the Fund as of August 31, 2019, the results of its operations for the year then ended, the changes in its net assets for each of the two years in the period ended August 31, 2019 and the financial highlights for each of the four years in the period ended August 31, 2019 and for the period March 27, 2015 (commencement of operations) through August 31, 2015 in conformity with accounting principles generally accepted in the United States of America.
Basis for Opinion
These financial statements are the responsibility of the Fund’s management. Our responsibility is to express an opinion on the Fund’s financial statements based on our audits. We are a public accounting firm registered with the Public Company Accounting Oversight Board (United States) (PCAOB) and are required to be independent with respect to the Fund in accordance with the U.S. federal securities laws and the applicable rules and regulations of the Securities and Exchange Commission and the PCAOB.
We conducted our audits of these financial statements in accordance with the standards of the PCAOB. Those standards require that we plan and perform the audit to obtain reasonable assurance about whether the financial statements are free of material misstatement, whether due to error or fraud.
Our audits included performing procedures to assess the risks of material misstatement of the financial statements, whether due to error or fraud, and performing procedures that respond to those risks. Such procedures included examining, on a test basis, evidence regarding the amounts and disclosures in the financial statements. Our audits also included evaluating the accounting principles used and significant estimates made by management, as well as evaluating the overall presentation of the financial statements. Our procedures included confirmation of securities owned as of August 31, 2019 by correspondence with the custodian. We believe that our audits provide a reasonable basis for our opinion.
PricewaterhouseCoopers LLP
Boston, Massachusetts
October 18, 2019
We have served as the auditor of one or more investment companies in the Fidelity group of funds since 1932.
Trustees and Officers
The Trustees, Members of the Advisory Board (if any), and officers of the trust and fund, as applicable, are listed below. The Board of Trustees governs the fund and is responsible for protecting the interests of shareholders. The Trustees are experienced executives who meet periodically throughout the year to oversee the fund's activities, review contractual arrangements with companies that provide services to the fund, oversee management of the risks associated with such activities and contractual arrangements, and review the fund's performance. Except for Jonathan Chiel, each of the Trustees oversees 276 funds. Mr. Chiel oversees 170 funds.
The Trustees hold office without limit in time except that (a) any Trustee may resign; (b) any Trustee may be removed by written instrument, signed by at least two-thirds of the number of Trustees prior to such removal; (c) any Trustee who requests to be retired or who has become incapacitated by illness or injury may be retired by written instrument signed by a majority of the other Trustees; and (d) any Trustee may be removed at any special meeting of shareholders by a two-thirds vote of the outstanding voting securities of the trust. Each Trustee who is not an interested person (as defined in the 1940 Act) of the trust and the fund is referred to herein as an Independent Trustee. Each Independent Trustee shall retire not later than the last day of the calendar year in which his or her 75th birthday occurs. The Independent Trustees may waive this mandatory retirement age policy with respect to individual Trustees. Officers and Advisory Board Members hold office without limit in time, except that any officer or Advisory Board Member may resign or may be removed by a vote of a majority of the Trustees at any regular meeting or any special meeting of the Trustees. Except as indicated, each individual has held the office shown or other offices in the same company for the past five years.
The fund’s Statement of Additional Information (SAI) includes more information about the Trustees. To request a free copy, call Fidelity at 1-800-544-8544.
Experience, Skills, Attributes, and Qualifications of the Trustees. The Governance and Nominating Committee has adopted a statement of policy that describes the experience, qualifications, attributes, and skills that are necessary and desirable for potential Independent Trustee candidates (Statement of Policy). The Board believes that each Trustee satisfied at the time he or she was initially elected or appointed a Trustee, and continues to satisfy, the standards contemplated by the Statement of Policy. The Governance and Nominating Committee also engages professional search firms to help identify potential Independent Trustee candidates who have the experience, qualifications, attributes, and skills consistent with the Statement of Policy. From time to time, additional criteria based on the composition and skills of the current Independent Trustees, as well as experience or skills that may be appropriate in light of future changes to board composition, business conditions, and regulatory or other developments, have also been considered by the professional search firms and the Governance and Nominating Committee. In addition, the Board takes into account the Trustees' commitment and participation in Board and committee meetings, as well as their leadership of standing and ad hoc committees throughout their tenure.
In determining that a particular Trustee was and continues to be qualified to serve as a Trustee, the Board has considered a variety of criteria, none of which, in isolation, was controlling. The Board believes that, collectively, the Trustees have balanced and diverse experience, qualifications, attributes, and skills, which allow the Board to operate effectively in governing the fund and protecting the interests of shareholders. Information about the specific experience, skills, attributes, and qualifications of each Trustee, which in each case led to the Board's conclusion that the Trustee should serve (or continue to serve) as a trustee of the fund, is provided below.
Board Structure and Oversight Function. Abigail P. Johnson is an interested person and currently serves as Chairman. The Trustees have determined that an interested Chairman is appropriate and benefits shareholders because an interested Chairman has a personal and professional stake in the quality and continuity of services provided to the fund. Independent Trustees exercise their informed business judgment to appoint an individual of their choosing to serve as Chairman, regardless of whether the Trustee happens to be independent or a member of management. The Independent Trustees have determined that they can act independently and effectively without having an Independent Trustee serve as Chairman and that a key structural component for assuring that they are in a position to do so is for the Independent Trustees to constitute a substantial majority for the Board. The Independent Trustees also regularly meet in executive session. Arthur E. Johnson serves as Chairman of the Independent Trustees and as such (i) acts as a liaison between the Independent Trustees and management with respect to matters important to the Independent Trustees and (ii) with management prepares agendas for Board meetings.
Fidelity® funds are overseen by different Boards of Trustees. The fund's Board oversees Fidelity's investment-grade bond, money market, asset allocation and certain equity funds, and other Boards oversee Fidelity's high income and other equity funds. The asset allocation funds may invest in Fidelity® funds that are overseen by such other Boards. The use of separate Boards, each with its own committee structure, allows the Trustees of each group of Fidelity® funds to focus on the unique issues of the funds they oversee, including common research, investment, and operational issues. On occasion, the separate Boards establish joint committees to address issues of overlapping consequences for the Fidelity® funds overseen by each Board.
The Trustees operate using a system of committees to facilitate the timely and efficient consideration of all matters of importance to the Trustees, the fund, and fund shareholders and to facilitate compliance with legal and regulatory requirements and oversight of the fund's activities and associated risks. The Board, acting through its committees, has charged FMR and its affiliates with (i) identifying events or circumstances the occurrence of which could have demonstrably adverse effects on the fund's business and/or reputation; (ii) implementing processes and controls to lessen the possibility that such events or circumstances occur or to mitigate the effects of such events or circumstances if they do occur; and (iii) creating and maintaining a system designed to evaluate continuously business and market conditions in order to facilitate the identification and implementation processes described in (i) and (ii) above. Because the day-to-day operations and activities of the fund are carried out by or through FMR, its affiliates, and other service providers, the fund's exposure to risks is mitigated but not eliminated by the processes overseen by the Trustees. While each of the Board's committees has responsibility for overseeing different aspects of the fund's activities, oversight is exercised primarily through the Operations and Audit Committees. In addition, an ad hoc Board committee of Independent Trustees has worked with FMR to enhance the Board's oversight of investment and financial risks, legal and regulatory risks, technology risks, and operational risks, including the development of additional risk reporting to the Board. Appropriate personnel, including but not limited to the fund's Chief Compliance Officer (CCO), FMR's internal auditor, the independent accountants, the fund's Treasurer and portfolio management personnel, make periodic reports to the Board's committees, as appropriate, including an annual review of Fidelity's risk management program for the Fidelity® funds. The responsibilities of each standing committee, including their oversight responsibilities, are described further under "Standing Committees of the Trustees."
Interested Trustees*:
Correspondence intended for a Trustee who is an interested person may be sent to Fidelity Investments, 245 Summer Street, Boston, Massachusetts 02210.
Name, Year of Birth; Principal Occupations and Other Relevant Experience+
Jonathan Chiel (1957)
Year of Election or Appointment: 2016
Trustee
Mr. Chiel also serves as Trustee of other Fidelity® funds. Mr. Chiel is Executive Vice President and General Counsel for FMR LLC (diversified financial services company, 2012-present). Previously, Mr. Chiel served as general counsel (2004-2012) and senior vice president and deputy general counsel (2000-2004) for John Hancock Financial Services; a partner with Choate, Hall & Stewart (1996-2000) (law firm); and an Assistant United States Attorney for the United States Attorney’s Office of the District of Massachusetts (1986-95), including Chief of the Criminal Division (1993-1995). Mr. Chiel is a director on the boards of the Boston Bar Foundation and the Maimonides School.
Abigail P. Johnson (1961)
Year of Election or Appointment: 2009
Trustee
Chairman of the Board of Trustees
Ms. Johnson also serves as Trustee of other Fidelity® funds. Ms. Johnson serves as Chairman (2016-present), Chief Executive Officer (2014-present), and Director (2007-present) of FMR LLC (diversified financial services company), President of Fidelity Financial Services (2012-present) and President of Personal, Workplace and Institutional Services (2005-present). Ms. Johnson is Chairman and Director of FMR Co., Inc. (investment adviser firm, 2011-present) and Chairman and Director of FMR (investment adviser firm, 2011-present). Previously, Ms. Johnson served as Vice Chairman (2007-2016) and President (2013-2016) of FMR LLC, President and a Director of FMR (2001-2005), a Trustee of other investment companies advised by FMR, Fidelity Investments Money Management, Inc. (investment adviser firm), and FMR Co., Inc. (2001-2005), Senior Vice President of the Fidelity® funds (2001-2005), and managed a number of Fidelity® funds. Ms. Abigail P. Johnson and Mr. Arthur E. Johnson are not related.
Jennifer Toolin McAuliffe (1959)
Year of Election or Appointment: 2016
Trustee
Ms. McAuliffe also serves as Trustee of other Fidelity® funds. Ms. McAuliffe previously served as a Member of the Advisory Board of certain Fidelity® funds (2016) and as Co-Head of Fixed Income of Fidelity Investments Limited (now known as FIL Limited (FIL)) (diversified financial services company). Earlier roles at FIL included Director of Research for FIL’s credit and quantitative teams in London, Hong Kong and Tokyo. Ms. McAuliffe also was the Director of Research for taxable and municipal bonds at Fidelity Investments Money Management, Inc. Ms. McAuliffe is also a director or trustee of several not-for-profit entities.
* Determined to be an “Interested Trustee” by virtue of, among other things, his or her affiliation with the trust or various entities under common control with FMR.
+ The information includes the Trustee's principal occupation during the last five years and other information relating to the experience, attributes, and skills relevant to the Trustee's qualifications to serve as a Trustee, which led to the conclusion that the Trustee should serve as a Trustee for the fund.
Independent Trustees:
Correspondence intended for an Independent Trustee may be sent to Fidelity Investments, P.O. Box 55235, Boston, Massachusetts 02205-5235.
Name, Year of Birth; Principal Occupations and Other Relevant Experience+
Elizabeth S. Acton (1951)
Year of Election or Appointment: 2013
Trustee
Ms. Acton also serves as Trustee of other Fidelity® funds. Prior to her retirement in April 2012, Ms. Acton was Executive Vice President, Finance (2011-2012), Executive Vice President, Chief Financial Officer (2002-2011), and Treasurer (2004-2005) of Comerica Incorporated (financial services). Prior to joining Comerica, Ms. Acton held a variety of positions at Ford Motor Company (1983-2002), including Vice President and Treasurer (2000-2002) and Executive Vice President and Chief Financial Officer of Ford Motor Credit Company (1998-2000). Ms. Acton currently serves as a member of the Board of Directors and Audit and Finance Committees of Beazer Homes USA, Inc. (homebuilding, 2012-present). Previously, Ms. Acton served as a Member of the Advisory Board of certain Fidelity® funds (2013-2016).
Ann E. Dunwoody (1953)
Year of Election or Appointment: 2018
Trustee
General Dunwoody also serves as Trustee of other Fidelity® funds. General Dunwoody (United States Army, Retired) was the first woman in U.S. military history to achieve the rank of four-star general and prior to her retirement in 2012 held a variety of positions within the U.S. Army, including Commanding General, U.S. Army Material Command (2008-2012). She is the President of First to Four LLC (leadership and mentoring services, 2012-present). She also serves as a member of the Board of Directors and Nominating and Corporate Governance Committee of L3 Technologies, Inc. (communication, electronic, sensor, and aerospace systems, 2013-present), Board of Directors and Nomination and Corporate Governance Committees of Kforce Inc. (professional staffing services, 2016-present) and Board of Directors of Automattic Inc. (software engineering, 2018-present). Previously, General Dunwoody served as a Member of the Advisory Board of certain Fidelity® funds (2018), a member of the Board of Directors and Audit and Sustainability and Corporate Responsibility Committees of Republic Services, Inc. (waste collection, disposal and recycling, 2013-2016). Ms. Dunwoody also serves on several boards for non-profit organizations, including as a member of the Board of Directors, Chair of the Nomination and Governance Committee and member of the Audit Committee of Logistics Management Institute (consulting non-profit, 2012-present), a member of the Board of Directors of the Army Historical Foundation (2015-present), a member of the Council of Trustees for the Association of the United States Army (advocacy non-profit, 2013-present) and a member of the Board of Trustees of Florida Institute of Technology (2015-present) and ThanksUSA (military family education non-profit, 2014-present).
John Engler (1948)
Year of Election or Appointment: 2014
Trustee
Mr. Engler also serves as Trustee of other Fidelity® funds. He serves on the board of directors for Universal Forest Products (manufacturer and distributor of wood and wood-alternative products, 2003-present) and K12 Inc. (technology-based education company, 2012-present). Previously, Mr. Engler served as interim president of Michigan State University (2018-2019), a Member of the Advisory Board of certain Fidelity® funds (2014-2016), president of the Business Roundtable (2011-2017), a trustee of The Munder Funds (2003-2014), president and CEO of the National Association of Manufacturers (2004-2011), member of the Board of Trustees of the Annie E. Casey Foundation (2004-2015), and as governor of Michigan (1991-2003). He is a past chairman of the National Governors Association.
Robert F. Gartland (1951)
Year of Election or Appointment: 2010
Trustee
Mr. Gartland also serves as Trustee of other Fidelity® funds. Mr. Gartland is Chairman and an investor in Gartland & Mellina Group Corp. (consulting, 2009-present). Previously, Mr. Gartland served as a partner and investor of Vietnam Partners LLC (investments and consulting, 2008-2011). Prior to his retirement, Mr. Gartland held a variety of positions at Morgan Stanley (financial services, 1979-2007), including Managing Director (1987-2007), and Chase Manhattan Bank (1975-1978).
Arthur E. Johnson (1947)
Year of Election or Appointment: 2008
Trustee
Chairman of the Independent Trustees
Mr. Johnson also serves as Trustee of other Fidelity® funds. Mr. Johnson serves as a member of the Board of Directors of Eaton Corporation plc (diversified power management, 2009-present) and Booz Allen Hamilton (management consulting, 2011-present). Prior to his retirement, Mr. Johnson served as Senior Vice President of Corporate Strategic Development of Lockheed Martin Corporation (defense contractor, 1999-2009). Mr. Johnson previously served as Vice Chairman (2015-2018) of the Independent Trustees of certain Fidelity® funds and on the Board of Directors of IKON Office Solutions, Inc. (1999-2008), AGL Resources, Inc. (holding company, 2002-2016), and Delta Airlines (2005-2007). Mr. Arthur E. Johnson is not related to Ms. Abigail P. Johnson.
Michael E. Kenneally (1954)
Year of Election or Appointment: 2009
Trustee
Vice Chairman of the Independent Trustees
Mr. Kenneally also serves as Trustee of other Fidelity® funds. Prior to his retirement, Mr. Kenneally served as Chairman and Global Chief Executive Officer of Credit Suisse Asset Management. Before joining Credit Suisse, he was an Executive Vice President and Chief Investment Officer for Bank of America Corporation. Earlier roles at Bank of America included Director of Research, Senior Portfolio Manager and Research Analyst, and Mr. Kenneally was awarded the Chartered Financial Analyst (CFA) designation in 1991.
Marie L. Knowles (1946)
Year of Election or Appointment: 2001
Trustee
Ms. Knowles also serves as Trustee of other Fidelity® funds. Prior to Ms. Knowles' retirement in June 2000, she served as Executive Vice President and Chief Financial Officer of Atlantic Richfield Company (ARCO) (diversified energy, 1996-2000). From 1993 to 1996, she was a Senior Vice President of ARCO and President of ARCO Transportation Company (pipeline and tanker operations). Ms. Knowles currently serves as a Director and Chairman of the Audit Committee of McKesson Corporation (healthcare service, since 2002). Ms. Knowles is a member of the Board of the Santa Catalina Island Company (real estate, 2009-present). Ms. Knowles is a Member of the Investment Company Institute Board of Governors and a Member of the Governing Council of the Independent Directors Council (2014-present). She also serves as a member of the Advisory Board for the School of Engineering of the University of Southern California. Previously, Ms. Knowles served as a Director of Phelps Dodge Corporation (copper mining and manufacturing, 1994-2007), URS Corporation (engineering and construction, 2000-2003) and America West (airline, 1999-2002). Ms. Knowles previously served as Chairman (2015-2018) and Vice Chairman (2012-2015) of the Independent Trustees of certain Fidelity® funds.
Mark A. Murray (1954)
Year of Election or Appointment: 2016
Trustee
Mr. Murray also serves as Trustee of other Fidelity® funds. Mr. Murray is Vice Chairman (2013-present) of Meijer, Inc. (regional retail chain). Previously, Mr. Murray served as a Member of the Advisory Board of certain Fidelity® funds (2016) and as Co-Chief Executive Officer (2013-2016) and President (2006-2013) of Meijer, Inc. Mr. Murray serves as a member of the Board of Directors and Nuclear Review and Public Policy and Responsibility Committees of DTE Energy Company (diversified energy company, 2009-present). Mr. Murray also serves as a member of the Board of Directors of Spectrum Health (not-for-profit health system, 2015-present). Mr. Murray previously served as President of Grand Valley State University (2001-2006), Treasurer for the State of Michigan (1999-2001), Vice President of Finance and Administration for Michigan State University (1998-1999), and a member of the Board of Directors and Audit Committee and Chairman of the Nominating and Corporate Governance Committee of Universal Forest Products, Inc. (manufacturer and distributor of wood and wood-alternative products, 2004-2016). Mr. Murray is also a director or trustee of many community and professional organizations.
+ The information includes the Trustee's principal occupation during the last five years and other information relating to the experience, attributes, and skills relevant to the Trustee's qualifications to serve as a Trustee, which led to the conclusion that the Trustee should serve as a Trustee for the fund.
Advisory Board Members and Officers:
Correspondence intended for an officer may be sent to Fidelity Investments, 245 Summer Street, Boston, Massachusetts 02210. Officers appear below in alphabetical order.
Name, Year of Birth; Principal Occupation
Elizabeth Paige Baumann (1968)
Year of Election or Appointment: 2017
Anti-Money Laundering (AML) Officer
Ms. Baumann also serves as AML Officer of other funds. She is Chief AML Officer (2012-present) and Senior Vice President (2014-present) of FMR LLC (diversified financial services company) and is an employee of Fidelity Investments. Previously, Ms. Baumann served as AML Officer of the funds (2012-2016), and Vice President (2007-2014) and Deputy Anti-Money Laundering Officer (2007-2012) of FMR LLC.
Craig S. Brown (1977)
Year of Election or Appointment: 2019
Assistant Treasurer
Mr. Brown also serves as Assistant Treasurer of other funds. Mr. Brown is an employee of Fidelity Investments (2013-present).
John J. Burke III (1964)
Year of Election or Appointment: 2018
Chief Financial Officer
Mr. Burke also serves as Chief Financial Officer of other funds. Mr. Burke serves as Head of Investment Operations for Fidelity Fund and Investment Operations (2018-present) and is an employee of Fidelity Investments (1998-present). Previously Mr. Burke served as head of Asset Management Investment Operations (2012-2018).
Jonathan Davis (1968)
Year of Election or Appointment: 2010
Assistant Treasurer
Mr. Davis also serves as Assistant Treasurer of other funds. Mr. Davis serves as Assistant Treasurer of FMR Capital, Inc. (2017-present) and is an employee of Fidelity Investments. Previously, Mr. Davis served as Vice President and Associate General Counsel of FMR LLC (diversified financial services company, 2003-2010).
Adrien E. Deberghes (1967)
Year of Election or Appointment: 2010
Assistant Treasurer
Mr. Deberghes also serves as an officer of other funds. He serves as Assistant Treasurer of FMR Capital, Inc. (2017-present), Executive Vice President of Fidelity Investments Money Management, Inc. (FIMM) (investment adviser firm, 2016-present), and is an employee of Fidelity Investments (2008-present). Previously, Mr. Deberghes served as President and Treasurer of certain Fidelity® funds (2013-2018). Prior to joining Fidelity Investments, Mr. Deberghes was Senior Vice President of Mutual Fund Administration at State Street Corporation (2007-2008), Senior Director of Mutual Fund Administration at Investors Bank & Trust (2005-2007), and Director of Finance for Dunkin' Brands (2000-2005). Previously, Mr. Deberghes served in other fund officer roles.
Laura M. Del Prato (1964)
Year of Election or Appointment: 2018
President and Treasurer
Ms. Del Prato also serves as an officer of other funds. Ms. Del Prato is an employee of Fidelity Investments (2017-present). Prior to joining Fidelity Investments, Ms. Del Prato served as a Managing Director and Treasurer of the JPMorgan Mutual Funds (2014-2017). Prior to JPMorgan, Ms. Del Prato served as a partner at Cohen Fund Audit Services (accounting firm, 2012-2013) and KPMG LLP (accounting firm, 2004-2012).
Colm A. Hogan (1973)
Year of Election or Appointment: 2016
Assistant Treasurer
Mr. Hogan also serves as an officer of other funds. Mr. Hogan serves as Assistant Treasurer of FMR Capital, Inc. (2017-present) and is an employee of Fidelity Investments (2005-present). Previously, Mr. Hogan served as Assistant Treasurer of certain Fidelity® funds (2016-2018).
Cynthia Lo Bessette (1969)
Year of Election or Appointment: 2019
Secretary and Chief Legal Officer (CLO)
Ms. Lo Bessette also serves as Secretary and CLO of other funds. She is a Senior Vice President and Deputy General Counsel of FMR LLC (diversified financial services company, 2019-present), and is an employee of Fidelity Investments. Previously, Ms. Lo Bessette served as Executive Vice President, General Counsel (2016-2019) and Senior Vice President, Deputy General Counsel (2015-2016) of OppenheimerFunds (investment management company) and Deputy Chief Legal Officer (2013-2015) of Jennison Associates LLC (investment adviser firm).
Chris Maher (1972)
Year of Election or Appointment: 2013
Assistant Treasurer
Mr. Maher serves as Assistant Treasurer of other funds. Mr. Maher is Vice President of Valuation Oversight, serves as Assistant Treasurer of FMR Capital, Inc. (2017-present), and is an employee of Fidelity Investments. Previously, Mr. Maher served as Vice President of Asset Management Compliance (2013), Vice President of the Program Management Group of FMR (investment adviser firm, 2010-2013), and Vice President of Valuation Oversight (2008-2010).
John B. McGinty, Jr. (1962)
Year of Election or Appointment: 2016
Chief Compliance Officer
Mr. McGinty also serves as Chief Compliance Officer of other funds. Mr. McGinty is Senior Vice President of Asset Management Compliance for Fidelity Investments and is an employee of Fidelity Investments (2016-present). Mr. McGinty previously served as Vice President, Senior Attorney at Eaton Vance Management (investment management firm, 2015-2016), and prior to Eaton Vance as global CCO for all firm operations and registered investment companies at GMO LLC (investment management firm, 2009-2015). Before joining GMO LLC, Mr. McGinty served as Senior Vice President, Deputy General Counsel for Fidelity Investments (2007-2009).
Jason P. Pogorelec (1975)
Year of Election or Appointment: 2015
Assistant Secretary
Mr. Pogorelec also serves as Assistant Secretary of other funds. Mr. Pogorelec serves as Vice President, Associate General Counsel (2010-present) and is an employee of Fidelity Investments (2006-present).
Nancy D. Prior (1967)
Year of Election or Appointment: 2014
Vice President
Ms. Prior also serves as Vice President of other funds. Ms. Prior serves as President of Fixed Income (2014-present), President (2016-present) and Director (2014-present) of Fidelity Investments Money Management, Inc. (FIMM) (investment adviser firm), and is an employee of Fidelity Investments (2002-present). Previously, Ms. Prior served as Vice Chairman of FIAM LLC (investment adviser firm, 2014-2018), a Director of FMR Investment Management (UK) Limited (investment adviser firm, 2015-2018), President Multi-Asset Class Strategies of FMR's Global Asset Allocation Division (2017-2018), Vice President of Fidelity's Money Market Funds (2012-2014), and President, Money Market and Short Duration Bond Group of Fidelity Management & Research Company (FMR) (investment adviser firm, 2013-2014).
Stacie M. Smith (1974)
Year of Election or Appointment: 2013
Assistant Treasurer
Ms. Smith also serves as an officer of other funds. Ms. Smith serves as Assistant Treasurer of FMR Capital, Inc. (2017-present), is an employee of Fidelity Investments (2009-present), and has served in other fund officer roles. Prior to joining Fidelity Investments, Ms. Smith served as Senior Audit Manager of Ernst & Young LLP (accounting firm, 1996-2009). Previously, Ms. Smith served as Assistant Treasurer (2013-2018) and Deputy Treasurer (2013-2016) of certain Fidelity® funds.
Marc L. Spector (1972)
Year of Election or Appointment: 2016
Deputy Treasurer
Mr. Spector also serves as an officer of other funds. Mr. Spector serves as Assistant Treasurer of FMR Capital, Inc. (2017-present) and is an employee of Fidelity Investments (2016-present). Prior to joining Fidelity Investments, Mr. Spector served as Director at the Siegfried Group (accounting firm, 2013-2016), and prior to Siegfried Group as audit senior manager at Deloitte & Touche (accounting firm, 2005-2013).
Jim Wegmann (1979)
Year of Election or Appointment: 2019
Assistant Treasurer
Mr. Wegmann also serves as Assistant Treasurer of other funds. Mr. Wegmann is an employee of Fidelity Investments (2011-present).
Shareholder Expense Example
As a shareholder of the Fund, you incur two types of costs: (1) transaction costs and (2) ongoing costs, including other Fund expenses. This Example is intended to help you understand your ongoing costs (in dollars) of investing in the Fund and to compare these costs with the ongoing costs of investing in other mutual funds.
The Example is based on an investment of $1,000 invested at the beginning of the period and held for the entire period (March 1, 2019 to August 31, 2019).
Actual Expenses
The first line of the accompanying table provides information about actual account values and actual expenses. You may use the information in this line, together with the amount you invested, to estimate the expenses that you paid over the period. Simply divide your account value by $1,000.00 (for example, an $8,600 account value divided by $1,000.00 = 8.6), then multiply the result by the number in the first line under the heading entitled "Expenses Paid During Period" to estimate the expenses you paid on your account during this period. In addition, the Fund, as a shareholder in the underlying Fidelity Central Funds, will indirectly bear its pro-rata share of the fees and expenses incurred by the underlying Fidelity Central Funds. These fees and expenses are not included in the Fund's annualized expense ratio used to calculate the expense estimate in the table below.
Hypothetical Example for Comparison Purposes
The second line of the accompanying table provides information about hypothetical account values and hypothetical expenses based on the Fund's actual expense ratio and an assumed rate of return of 5% per year before expenses, which is not the Fund's actual return. The hypothetical account values and expenses may not be used to estimate the actual ending account balance or expenses you paid for the period. You may use this information to compare the ongoing costs of investing in the Fund and other funds. To do so, compare this 5% hypothetical example with the 5% hypothetical examples that appear in the shareholder reports of the other funds. In addition, the Fund, as a shareholder in the underlying Fidelity Central Funds, will indirectly bear its pro-rata share of the fees and expenses incurred by the underlying Fidelity Central Funds. These fees and expenses are not included in the Fund's annualized expense ratio used to calculate the expense estimate in the table below.
Please note that the expenses shown in the table are meant to highlight your ongoing costs only and do not reflect any transaction costs. Therefore, the second line of the table is useful in comparing ongoing costs only, and will not help you determine the relative total costs of owning different funds.
| | Annualized Expense Ratio-A | Beginning
Account Value
March 1, 2019 | Ending
Account Value
August 31, 2019 | Expenses Paid
During Period-B
March 1, 2019
to August 31, 2019 |
| Actual | - %-C | $1,000.00 | $1,031.30 | $--D |
| Hypothetical-E | | $1,000.00 | $1,025.21 | $--D |
A Annualized expense ratio reflects expenses net of applicable fee waivers.
B Expenses are equal to the Fund's annualized expense ratio, multiplied by the average account value over the period, multiplied by 184/365 (to reflect the one-half year period).
C Amount represents less than .005%.
D Amount represents less than $.005.
E 5% return per year before expenses
Distributions (Unaudited)
A total of 4.92% of the dividends distributed during the fiscal year was derived from interest on U.S. Government securities which is generally exempt from state income tax.
The fund will notify shareholders in January 2020 of amounts for use in preparing 2019 income tax returns.
SS1-ANN-1019
1.9863239.104
Fidelity® Short-Term Bond Fund
Annual Report August 31, 2019 Includes Fidelity and Fidelity Advisor share classes |
|
Beginning on January 1, 2021, as permitted by regulations adopted by the Securities and Exchange Commission, paper copies of a fund’s shareholder reports will no longer be sent by mail, unless you specifically request paper copies of the reports from the fund or from your financial intermediary, such as a financial advisor, broker-dealer or bank. Instead, the reports will be made available on a website, and you will be notified by mail each time a report is posted and provided with a website link to access the report.
If you already elected to receive shareholder reports electronically, you will not be affected by this change and you need not take any action. You may elect to receive shareholder reports and other communications from a fund electronically, by contacting your financial intermediary. For Fidelity customers, visit Fidelity's web site or call Fidelity using the contact information listed below.
You may elect to receive all future reports in paper free of charge. If you wish to continue receiving paper copies of your shareholder reports, you may contact your financial intermediary or, if you are a Fidelity customer, visit Fidelity’s website, or call Fidelity at the applicable toll-free number listed below. Your election to receive reports in paper will apply to all funds held with the fund complex/your financial intermediary.
| Account Type | Website | Phone Number |
| Brokerage, Mutual Fund, or Annuity Contracts: | fidelity.com/mailpreferences | 1-800-343-3548 |
| Employer Provided Retirement Accounts: | netbenefits.fidelity.com/preferences (choose 'no' under Required Disclosures to continue to print) | 1-800-343-0860 |
| Advisor Sold Accounts Serviced Through Your Financial Intermediary: | Contact Your Financial Intermediary | Your Financial Intermediary's phone number |
| Advisor Sold Accounts Serviced by Fidelity: | institutional.fidelity.com | 1-877-208-0098 |
Contents
To view a fund's proxy voting guidelines and proxy voting record for the 12-month period ended June 30, visit http://www.fidelity.com/proxyvotingresults or visit the Securities and Exchange Commission's (SEC) web site at http://www.sec.gov.
You may also call 1-800-544-8544 if you’re an individual investing directly with Fidelity, call 1-800-835-5092 if you’re a plan sponsor or participant with Fidelity as your recordkeeper or call 1-877-208-0098 on institutional accounts or if you’re an advisor or invest through one to request a free copy of the proxy voting guidelines.
Standard & Poor's, S&P and S&P 500 are registered service marks of The McGraw-Hill Companies, Inc. and have been licensed for use by Fidelity Distributors Corporation.
Other third-party marks appearing herein are the property of their respective owners.
All other marks appearing herein are registered or unregistered trademarks or service marks of FMR LLC or an affiliated company. © 2019 FMR LLC. All rights reserved.
This report and the financial statements contained herein are submitted for the general information of the shareholders of the Fund. This report is not authorized for distribution to prospective investors in the Fund unless preceded or accompanied by an effective prospectus.
A fund files its complete schedule of portfolio holdings with the SEC for the first and third quarters of each fiscal year on Form N-PORT. Forms N-PORT are available on the SEC’s web site at http://www.sec.gov. A fund's Forms N-PORT may be reviewed and copied at the SEC’s Public Reference Room in Washington, DC. Information regarding the operation of the SEC's Public Reference Room may be obtained by calling 1-800-SEC-0330.
For a complete list of a fund's portfolio holdings, view the most recent holdings listing, semiannual report, or annual report on Fidelity's web site at http://www.fidelity.com, http://www.institutional.fidelity.com, or http://www.401k.com, as applicable.
NOT FDIC INSURED •MAY LOSE VALUE •NO BANK GUARANTEE
Neither the Fund nor Fidelity Distributors Corporation is a bank.
Performance: The Bottom Line
Average annual total return reflects the change in the value of an investment, assuming reinvestment of distributions from dividend income and capital gains (the profits earned upon the sale of securities that have grown in value, if any) and assuming a constant rate of performance each year. The hypothetical investment and the average annual total returns do not reflect the deduction of taxes that a shareholder would pay on fund distributions or the redemption of fund shares. During periods of reimbursement by Fidelity, a fund’s total return will be greater than it would be had the reimbursement not occurred. How a fund did yesterday is no guarantee of how it will do tomorrow.
Average Annual Total Returns
| For the periods ended August 31, 2019 | Past 1 year | Past 5 years | Past 10 years |
| Class A (incl. 1.50% sales charge) | 2.57% | 1.19% | 1.73% |
| Class M (incl. 1.50% sales charge) | 2.56% | 1.19% | 1.73% |
| Class C (incl. contingent deferred sales charge) | 2.36% | 0.97% | 1.62% |
| Fidelity® Short-Term Bond Fund | 4.47% | 1.63% | 1.95% |
| Class I | 4.29% | 1.59% | 1.93% |
| Class Z | 4.42% | 1.62% | 1.95% |
Class A shares bear a 0.15% 12b-1 fee. The initial offering of Class A shares took place on July 12, 2016. Returns prior to July 12, 2016, are those of Fidelity® Short-Term Bond Fund, the original class of the fund, which has no 12b-1 fee. Had Class A's 12b-1 fee been reflected, returns prior to July 12, 2016, would have been lower.
Class M shares bear a 0.15% 12b-1 fee. The initial offering of Class M shares took place on July 12, 2016. Returns prior to July 12,2016, are those of Fidelity® Short-Term Bond Fund, the original class of the fund, which has no 12b-1 fee. Had Class M's 12b-1 fee been reflected, returns prior to July 12, 2016, would have been lower.
Class C shares bear a 1.00% 12b-1 fee. The initial offering of Class C shares took place on July 12, 2016. Returns prior to July 12, 2016, are those of Fidelity® Short-Term Bond Fund, the original class of the fund, which has no 12b-1 fee. Had Class C's 12b-1 fee been reflected, returns prior to July 12, 2016, would have been lower.
Class C shares' contingent deferred sales charges included in the past one year, past five years and past ten years total return figures are 1%, 0% and 0%, respectively.
The initial offering of Class I shares took place on July 12, 2016. Returns prior to July 12, 2016 are those of Fidelity® Short-Term Bond Fund, the original class of the fund.
The initial offering of Class Z shares took place on October 2, 2018. Returns between July 12, 2016 prior to October 2, 2018, are those of Class I. Returns prior to July 12, 2016 are those of Fidelity Short-Term Bond Fund, the original class of the fund.
$10,000 Over 10 Years
Let's say hypothetically that $10,000 was invested in Fidelity® Short-Term Bond Fund, a class of the fund, on August 31, 2009.
The chart shows how the value of your investment would have changed, and also shows how the Bloomberg Barclays U.S. 1-3 Year Government/Credit Bond Index performed over the same period.
| Period Ending Values |
| $12,134 | Fidelity® Short-Term Bond Fund |
| $11,681 | Bloomberg Barclays U.S. 1-3 Year Government/Credit Bond Index |
Management's Discussion of Fund Performance
Market Recap: For the 12 months ending August 31, 2019, U.S. taxable investment-grade bonds posted their strongest trailing one-year return since 2009, driven by slower global economic growth, a maturing business cycle, trade uncertainty and, late in the period, the Fed’s dovish shift. The Bloomberg Barclays U.S. Aggregate Bond Index gained 10.17%. Market yields rose in the early fall of 2018, on expectations for higher inflation. Yields then declined and credit spreads widened in November and December, partly because of weaker U.S. manufacturing data. Yield spreads narrowed in January, as the U.S. Federal Reserve said it would be “patient” with policy rate hikes, and that future increases largely would depend on economic data. Yields continued to decline in the spring, amid international trade tension and attacks on oil tankers in the Middle East, and then tumbled further in July, when the Fed cut interest rates for the first time since 2008. The yield curve ended the period roughly flat, amid expectations for another rate cut of 25 basis points in September. Within the Bloomberg Barclays index, corporate bonds gained 13.33%, topping the 10.38% advance of U.S. Treasuries. Outside the index, U.S. corporate high-yield bonds lagged nominal U.S. Treasuries, while Treasury Inflation-Protected Securities (TIPS) gained 7.46%.
Comments from Co-Portfolio Manager Rob Galusza: For the fiscal year, the fund’s share classes (excluding sales charges, if applicable) posted returns in the range of roughly 3.4% to 4.5%, net of fees, compared with the 4.62% result of the benchmark, the Bloomberg Barclays U.S. 1-3 Year Government/Credit Bond Index. The fund's modestly shorter duration hampered performance versus this benchmark, as did positioning along the yield curve – particularly the fund's underweighting in longer-term securities. Underweighted exposure to government-agency bonds also hurt the fund’s relative return. Conversely, lighter-than-benchmark exposure to Treasury securities added relative value, as did outsized exposure to the bonds of financial institutions, especially banks. A non-benchmark allocation to asset-backed securities also contributed notably. Security selection contributed overall, especially selections in the industrials sector. As of August 31, we continue to focus mainly on higher-quality corporate issues, which at period end comprised about 51% or fund assets. We maintained exposure to asset-based securities and slightly increased the fund’s exposure to commercial mortgage-backed securities by period end.
The views expressed above reflect those of the portfolio manager(s) only through the end of the period as stated on the cover of this report and do not necessarily represent the views of Fidelity or any other person in the Fidelity organization. Any such views are subject to change at any time based upon market or other conditions and Fidelity disclaims any responsibility to update such views. These views may not be relied on as investment advice and, because investment decisions for a Fidelity fund are based on numerous factors, may not be relied on as an indication of trading intent on behalf of any Fidelity fund.
Note to Shareolders: On October 1, 2019, David DeBiase assumed co-management responsibilities for the fund, joining Rob Galusza and Julian Potenza.
Investment Summary (Unaudited)
Quality Diversification (% of fund's net assets)
| As of August 31, 2019 |
| | U.S. Government and U.S. Government Agency Obligations | 25.5% |
| | AAA | 19.8% |
| | AA | 4.3% |
| | A | 18.2% |
| | BBB | 25.6% |
| | BB and Below | 2.4% |
| | Not Rated | 0.9% |
| | Short-Term Investments and Net Other Assets | 3.3% |
We have used ratings from Moody's Investors Service, Inc. Where Moody's® ratings are not available, we have used S&P® ratings. All ratings are as of the date indicated and do not reflect subsequent changes. Securities rated BB or below were rated investment grade at the time of acquisition.
Asset Allocation (% of fund's net assets)
| As of August 31, 2019* |
| | Corporate Bonds | 46.6% |
| | U.S. Government and U.S. Government Agency Obligations | 25.5% |
| | Asset-Backed Securities | 15.0% |
| | CMOs and Other Mortgage Related Securities | 6.1% |
| | Municipal Bonds | 0.3% |
| | Other Investments | 3.2% |
| | Short-Term Investments and Net Other Assets (Liabilities) | 3.3% |

* Foreign investments - 13.5%
Schedule of Investments August 31, 2019
Showing Percentage of Net Assets
| Nonconvertible Bonds - 46.6% | | | |
| | | Principal Amount (000s) | Value (000s) |
| COMMUNICATION SERVICES - 2.8% | | | |
| Diversified Telecommunication Services - 1.1% | | | |
| AT&T, Inc.: | | | |
| 2.45% 6/30/20 | | $13,309 | $13,333 |
| 3.6% 2/17/23 | | 14,110 | 14,750 |
| Verizon Communications, Inc.: | | | |
| 2.946% 3/15/22 | | 2,835 | 2,908 |
| 3.125% 3/16/22 | | 25,000 | 25,772 |
| 5.15% 9/15/23 | | 4,540 | 5,103 |
| | | | 61,866 |
| Entertainment - 0.3% | | | |
| The Walt Disney Co. 4.5% 2/15/21 (a) | | 20,000 | 20,730 |
| Media - 1.4% | | | |
| Charter Communications Operating LLC/Charter Communications Operating Capital Corp.: | | | |
| 3.579% 7/23/20 | | 11,035 | 11,140 |
| 4.464% 7/23/22 | | 18,225 | 19,257 |
| Comcast Corp.: | | | |
| 3.125% 7/15/22 | | 7,344 | 7,606 |
| 3.3% 10/1/20 | | 15,200 | 15,421 |
| 3.45% 10/1/21 | | 15,185 | 15,641 |
| Discovery Communications LLC 3 month U.S. LIBOR + 0.710% 3.0966% 9/20/19 (b)(c) | | 9,726 | 9,728 |
| | | | 78,793 |
|
| TOTAL COMMUNICATION SERVICES | | | 161,389 |
|
| CONSUMER DISCRETIONARY - 2.8% | | | |
| Automobiles - 2.5% | | | |
| American Honda Finance Corp. 3.15% 1/8/21 | | 4,523 | 4,591 |
| BMW U.S. Capital LLC 3.45% 4/12/23 (a) | | 20,200 | 21,050 |
| Daimler Finance North America LLC: | | | |
| 3 month U.S. LIBOR + 0.900% 3.0581% 2/15/22 (a)(b)(c) | | 15,100 | 15,162 |
| 2.2% 5/5/20 (a) | | 15,650 | 15,651 |
| 2.3% 1/6/20 (a) | | 12,000 | 11,999 |
| 2.3% 2/12/21 (a) | | 15,000 | 14,996 |
| 3.35% 5/4/21 (a) | | 15,000 | 15,246 |
| General Motors Financial Co., Inc.: | | | |
| 2.35% 10/4/19 | | 10,100 | 10,099 |
| 2.65% 4/13/20 | | 8,943 | 8,957 |
| 3.15% 1/15/20 | | 2,000 | 2,004 |
| 3.55% 4/9/21 | | 6,966 | 7,083 |
| 4.2% 3/1/21 | | 6,000 | 6,142 |
| 4.2% 11/6/21 | | 10,250 | 10,629 |
| | | | 143,609 |
| Diversified Consumer Services - 0.2% | | | |
| Ingersoll-Rand Global Holding Co. Ltd. 2.9% 2/21/21 | | 9,085 | 9,178 |
| Household Durables - 0.1% | | | |
| D.R. Horton, Inc. 2.55% 12/1/20 | | 8,106 | 8,128 |
|
| TOTAL CONSUMER DISCRETIONARY | | | 160,915 |
|
| CONSUMER STAPLES - 3.4% | | | |
| Beverages - 0.4% | | | |
| Constellation Brands, Inc. 3 month U.S. LIBOR + 0.700% 2.8581% 11/15/21 (b)(c) | | 13,680 | 13,683 |
| Diageo Capital PLC 3% 5/18/20 | | 12,050 | 12,124 |
| | | | 25,807 |
| Food & Staples Retailing - 0.3% | | | |
| Alimentation Couche-Tard, Inc. 2.35% 12/13/19 (a) | | 15,100 | 15,101 |
| Food Products - 0.5% | | | |
| Conagra Brands, Inc. 3.8% 10/22/21 | | 15,000 | 15,433 |
| General Mills, Inc.: | | | |
| 3 month U.S. LIBOR + 0.540% 2.8623% 4/16/21 (b)(c) | | 10,000 | 10,006 |
| 3.2% 4/16/21 | | 2,089 | 2,126 |
| | | | 27,565 |
| Tobacco - 2.2% | | | |
| Altria Group, Inc.: | | | |
| 3.49% 2/14/22 | | 4,288 | 4,430 |
| 4.75% 5/5/21 | | 11,317 | 11,806 |
| BAT Capital Corp. 2.297% 8/14/20 | | 37,620 | 37,624 |
| BAT International Finance PLC 2.75% 6/15/20 (a) | | 15,080 | 15,114 |
| Imperial Tobacco Finance PLC: | | | |
| 2.95% 7/21/20 (a) | | 11,300 | 11,359 |
| 3.125% 7/26/24 (a) | | 12,250 | 12,457 |
| 3.75% 7/21/22 (a) | | 10,100 | 10,447 |
| Philip Morris International, Inc.: | | | |
| 2.625% 2/18/22 | | 4,058 | 4,112 |
| 2.875% 5/1/24 | | 11,050 | 11,341 |
| Reynolds American, Inc. 3.25% 6/12/20 | | 7,781 | 7,840 |
| | | | 126,530 |
|
| TOTAL CONSUMER STAPLES | | | 195,003 |
|
| ENERGY - 3.4% | | | |
| Oil, Gas & Consumable Fuels - 3.4% | | | |
| Anadarko Petroleum Corp. 4.85% 3/15/21 | | 10,045 | 10,384 |
| Cenovus Energy, Inc. 3% 8/15/22 | | 9,635 | 9,728 |
| Energy Transfer Partners LP: | | | |
| 3.6% 2/1/23 | | 6,333 | 6,498 |
| 4.2% 9/15/23 | | 3,227 | 3,412 |
| Enterprise Products Operating LP: | | | |
| 2.55% 10/15/19 | | 7,751 | 7,750 |
| 2.8% 2/15/21 | | 4,353 | 4,395 |
| EQT Corp. 2.5% 10/1/20 | | 5,508 | 5,478 |
| Kinder Morgan Energy Partners LP 3.5% 9/1/23 | | 6,194 | 6,441 |
| Kinder Morgan, Inc. 3.05% 12/1/19 | | 9,592 | 9,601 |
| MPLX LP 4.5% 7/15/23 | | 1,905 | 2,033 |
| Occidental Petroleum Corp.: | | | |
| 3 month U.S. LIBOR + 0.950% 3.137% 2/8/21 (b)(c) | | 5,111 | 5,134 |
| 3 month U.S. LIBOR + 1.250% 3.437% 8/13/21 (b)(c) | | 5,911 | 5,934 |
| 3 month U.S. LIBOR + 1.450% 3.637% 8/15/22 (b)(c) | | 5,750 | 5,770 |
| 2.6% 8/13/21 | | 1,566 | 1,576 |
| 2.7% 8/15/22 | | 1,384 | 1,398 |
| 2.9% 8/15/24 | | 4,572 | 4,615 |
| 3.125% 2/15/22 | | 2,992 | 3,036 |
| Petroleos Mexicanos: | | | |
| 3.5% 1/30/23 | | 4,460 | 4,333 |
| 4.875% 1/24/22 | | 14,300 | 14,532 |
| Phillips 66 Co. 3 month U.S. LIBOR + 0.600% 2.7323% 2/26/21 (b)(c) | | 11,467 | 11,467 |
| Plains All American Pipeline LP/PAA Finance Corp. 3.65% 6/1/22 | | 10,460 | 10,751 |
| Schlumberger Investment SA 3.3% 9/14/21 (a) | | 10,050 | 10,246 |
| TransCanada PipeLines Ltd. 2.125% 11/15/19 | | 12,200 | 12,191 |
| Western Gas Partners LP 5.375% 6/1/21 | | 19,500 | 20,163 |
| Williams Partners LP 3.6% 3/15/22 | | 17,824 | 18,351 |
| | | | 195,217 |
| FINANCIALS - 22.5% | | | |
| Banks - 11.9% | | | |
| ABN AMRO Bank NV: | | | |
| 3 month U.S. LIBOR + 0.410% 2.7125% 1/19/21 (a)(b)(c) | | 4,000 | 4,005 |
| 3.4% 8/27/21 (a) | | 17,426 | 17,824 |
| Bank of America Corp.: | | | |
| 2.369% 7/21/21 (b) | | 10,000 | 10,016 |
| 2.625% 10/19/20 | | 22,200 | 22,363 |
| 3.004% 12/20/23 (b) | | 30,000 | 30,787 |
| 3.124% 1/20/23 (b) | | 5,000 | 5,115 |
| Bank of America NA 3 month U.S. LIBOR + 0.320% 2.5866% 7/26/21 (b)(c) | | 10,000 | 10,009 |
| Barclays Bank PLC 2.65% 1/11/21 | | 12,000 | 12,052 |
| Barclays PLC: | | | |
| 2.75% 11/8/19 | | 14,000 | 14,007 |
| 3.25% 1/12/21 | | 6,858 | 6,914 |
| BPCE SA: | | | |
| 2.75% 12/2/21 | | 5,000 | 5,068 |
| 3.145% 7/31/20 (a) | | 10,110 | 10,202 |
| Citibank NA 3 month U.S. LIBOR + 0.600% 2.7359% 5/20/22 (b)(c) | | 12,570 | 12,593 |
| Citigroup, Inc.: | | | |
| 2.45% 1/10/20 | | 20,150 | 20,165 |
| 2.75% 4/25/22 | | 10,000 | 10,179 |
| 3.142% 1/24/23 (b) | | 12,100 | 12,373 |
| Citizens Bank NA: | | | |
| 2.25% 3/2/20 | | 12,000 | 12,002 |
| 2.45% 12/4/19 | | 1,240 | 1,240 |
| 2.55% 5/13/21 | | 10,093 | 10,164 |
| Credit Suisse Group Funding Guernsey Ltd. 3.45% 4/16/21 | | 17,045 | 17,348 |
| Danske Bank A/S 3.875% 9/12/23 (a) | | 12,600 | 13,092 |
| Fifth Third Bancorp 2.875% 7/27/20 | | 7,135 | 7,182 |
| HSBC Holdings PLC: | | | |
| 3 month U.S. LIBOR + 0.600% 2.7238% 5/18/21 (b)(c) | | 12,000 | 12,005 |
| 3.262% 3/13/23 (b) | | 12,415 | 12,670 |
| Huntington National Bank: | | | |
| 3 month U.S. LIBOR + 0.550% 2.8368% 2/5/21(b)(c) | | 10,000 | 10,031 |
| 3.25% 5/14/21 | | 12,000 | 12,206 |
| ING Bank NV: | | | |
| 3 month U.S. LIBOR + 0.690% 3.0089% 10/1/19 (a)(b)(c) | | 5,200 | 5,203 |
| 2.7% 8/17/20 (a) | | 3,116 | 3,137 |
| ING Groep NV 3.15% 3/29/22 | | 20,350 | 20,862 |
| JPMorgan Chase & Co.: | | | |
| 2.55% 10/29/20 | | 4,750 | 4,776 |
| 2.75% 6/23/20 | | 11,500 | 11,554 |
| 3.207% 4/1/23 (b) | | 10,000 | 10,281 |
| 3.514% 6/18/22 (b) | | 31,000 | 31,735 |
| Lloyds Bank PLC 3 month U.S. LIBOR + 0.490% 2.699% 5/7/21 (b)(c) | | 12,150 | 12,151 |
| Mitsubishi UFJ Financial Group, Inc.: | | | |
| 2.623% 7/18/22 | | 7,000 | 7,082 |
| 2.95% 3/1/21 | | 7,065 | 7,142 |
| 3.218% 3/7/22 | | 10,800 | 11,080 |
| 3.535% 7/26/21 | | 12,000 | 12,299 |
| Mizuho Financial Group, Inc. 3 month U.S. LIBOR + 1.140% 3.5895% 9/13/21 (b)(c) | | 18,000 | 18,208 |
| Regions Financial Corp.: | | | |
| 2.75% 8/14/22 | | 11,481 | 11,683 |
| 3.2% 2/8/21 | | 6,820 | 6,912 |
| Royal Bank of Canada: | | | |
| 2.125% 3/2/20 | | 15,000 | 15,007 |
| 2.15% 10/26/20 | | 20,000 | 20,054 |
| 2.55% 7/16/24 | | 14,227 | 14,503 |
| Royal Bank of Scotland Group PLC 3.875% 9/12/23 | | 18,000 | 18,541 |
| Santander Holdings U.S.A., Inc.: | | | |
| 3.5% 6/7/24 | | 12,000 | 12,412 |
| 4.45% 12/3/21 | | 10,550 | 11,007 |
| Sumitomo Mitsui Banking Corp. 3 month U.S. LIBOR + 0.370% 2.6923% 10/16/20 (b)(c) | | 16,500 | 16,539 |
| SunTrust Bank 2.25% 1/31/20 | | 25,000 | 24,994 |
| The Toronto-Dominion Bank 2.5% 12/14/20 | | 9,901 | 9,966 |
| Wells Fargo & Co. 2.6% 7/22/20 | | 17,500 | 17,585 |
| Wells Fargo Bank NA 3.325% 7/23/21 (b) | | 10,000 | 10,103 |
| Westpac Banking Corp. 2.15% 3/6/20 | | 12,400 | 12,408 |
| ZB, National Association 3.5% 8/27/21 | | 11,022 | 11,277 |
| Zions Bancorp NA 3.35% 3/4/22 | | 4,455 | 4,562 |
| | | | 684,675 |
| Capital Markets - 3.6% | | | |
| Credit Suisse Group AG 3.574% 1/9/23 (a) | | 10,000 | 10,253 |
| Deutsche Bank AG 2.7% 7/13/20 | | 27,000 | 26,931 |
| Deutsche Bank AG New York Branch 3.15% 1/22/21 | | 6,717 | 6,693 |
| Goldman Sachs Group, Inc.: | | | |
| 3 month U.S. LIBOR + 0.800% 3.2495% 12/13/19 (b)(c) | | 15,000 | 15,030 |
| 2.876% 10/31/22 (b) | | 20,000 | 20,276 |
| 2.905% 7/24/23 (b) | | 5,000 | 5,079 |
| 3% 4/26/22 | | 25,200 | 25,528 |
| IntercontinentalExchange, Inc. 2.75% 12/1/20 | | 7,267 | 7,329 |
| Moody's Corp.: | | | |
| 2.75% 12/15/21 | | 3,971 | 4,025 |
| 3.25% 6/7/21 | | 5,919 | 6,031 |
| Morgan Stanley: | | | |
| 3 month U.S. LIBOR + 0.930% 3.2076% 7/22/22 (b)(c) | | 10,000 | 10,069 |
| 2.625% 11/17/21 | | 14,942 | 15,098 |
| 2.65% 1/27/20 | | 12,000 | 12,020 |
| 3.737% 4/24/24 (b) | | 10,000 | 10,521 |
| TD Ameritrade Holding Corp. 3 month U.S. LIBOR + 0.430% 2.6831% 11/1/21 (b)(c) | | 15,000 | 15,042 |
| UBS AG London Branch 2.2% 6/8/20 (a) | | 15,250 | 15,257 |
| | | | 205,182 |
| Consumer Finance - 3.9% | | | |
| AerCap Ireland Capital Ltd./AerCap Global Aviation Trust: | | | |
| 4.125% 7/3/23 | | 4,127 | 4,378 |
| 4.45% 12/16/21 | | 3,073 | 3,193 |
| 4.875% 1/16/24 | | 3,343 | 3,626 |
| American Express Co. 2.75% 5/20/22 | | 12,000 | 12,233 |
| American Express Credit Corp.: | | | |
| 2.2% 3/3/20 | | 10,275 | 10,280 |
| 2.25% 5/5/21 | | 9,000 | 9,041 |
| 2.6% 9/14/20 | | 16,520 | 16,612 |
| Aviation Capital Group LLC: | | | |
| 3 month U.S. LIBOR + 0.670% 2.9358% 7/30/21 (a)(b)(c) | | 11,435 | 11,428 |
| 3 month U.S. LIBOR + 0.950% 3.4703% 6/1/21 (a)(b)(c) | | 10,963 | 11,018 |
| Capital One Financial Corp. 2.5% 5/12/20 | | 17,000 | 17,030 |
| Ford Motor Credit Co. LLC: | | | |
| 2.425% 6/12/20 | | 10,000 | 9,992 |
| 2.597% 11/4/19 | | 10,000 | 9,998 |
| 2.681% 1/9/20 | | 9,933 | 9,935 |
| 3.157% 8/4/20 | | 10,200 | 10,238 |
| 3.336% 3/18/21 | | 25,885 | 26,054 |
| 4.14% 2/15/23 | | 6,000 | 6,153 |
| John Deere Capital Corp.: | | | |
| 2.35% 1/8/21 | | 10,000 | 10,064 |
| 3.125% 9/10/21 | | 10,000 | 10,245 |
| Synchrony Financial: | | | |
| 2.85% 7/25/22 | | 1,560 | 1,581 |
| 4.25% 8/15/24 | | 15,660 | 16,674 |
| 4.375% 3/19/24 | | 13,403 | 14,317 |
| | | | 224,090 |
| Diversified Financial Services - 1.5% | | | |
| AIG Global Funding: | | | |
| 2.3% 7/1/22 (a) | | 4,229 | 4,245 |
| 3.35% 6/25/21 (a) | | 10,000 | 10,203 |
| Avolon Holdings Funding Ltd. 3.625% 5/1/22 (a) | | 1,614 | 1,637 |
| AXA Equitable Holdings, Inc. 3.9% 4/20/23 | | 1,043 | 1,095 |
| Brixmor Operating Partnership LP 3.875% 8/15/22 | | 13,088 | 13,657 |
| Cigna Corp.: | | | |
| 3 month U.S. LIBOR + 0.350% 2.7603% 3/17/20 (b)(c) | | 10,800 | 10,802 |
| 3 month U.S. LIBOR + 0.650% 3.0603% 9/17/21 (b)(c) | | 5,000 | 5,000 |
| 3.2% 9/17/20 | | 10,300 | 10,395 |
| 3.4% 9/17/21 | | 9,182 | 9,400 |
| GE Capital International Funding Co. 2.342% 11/15/20 | | 19,866 | 19,755 |
| | | | 86,189 |
| Insurance - 1.6% | | | |
| ACE INA Holdings, Inc. 2.3% 11/3/20 | | 4,114 | 4,130 |
| AIA Group Ltd. 3 month U.S. LIBOR + 0.520% 2.9066% 9/20/21 (a)(b)(c) | | 11,959 | 11,959 |
| Aon Corp. 5% 9/30/20 | | 9,135 | 9,410 |
| Marsh & McLennan Companies, Inc.: | | | |
| 2.35% 3/6/20 | | 13,491 | 13,500 |
| 2.75% 1/30/22 | | 6,461 | 6,567 |
| 3.5% 12/29/20 | | 6,346 | 6,461 |
| Metropolitan Life Global Funding I 2.05% 6/12/20 (a) | | 15,230 | 15,249 |
| Protective Life Global Funding 2.161% 9/25/20 (a) | | 15,172 | 15,187 |
| Unum Group 5.625% 9/15/20 | | 7,900 | 8,167 |
| | | | 90,630 |
|
| TOTAL FINANCIALS | | | 1,290,766 |
|
| HEALTH CARE - 4.3% | | | |
| Biotechnology - 0.3% | | | |
| AbbVie, Inc. 2.5% 5/14/20 | | 15,888 | 15,911 |
| Health Care Equipment & Supplies - 0.8% | | | |
| Abbott Laboratories 2.9% 11/30/21 | | 6,090 | 6,209 |
| Becton, Dickinson & Co.: | | | |
| 3 month U.S. LIBOR + 0.875% 3.1939% 12/29/20 (b)(c) | | 10,524 | 10,527 |
| 2.404% 6/5/20 | | 16,230 | 16,249 |
| Boston Scientific Corp. 3.45% 3/1/24 | | 4,235 | 4,450 |
| Zimmer Biomet Holdings, Inc. 3 month U.S. LIBOR + 0.750% 3.1685% 3/19/21 (b)(c) | | 8,625 | 8,615 |
| | | | 46,050 |
| Health Care Providers & Services - 1.1% | | | |
| CVS Health Corp.: | | | |
| 3 month U.S. LIBOR + 0.720% 3.173% 3/9/21 (b)(c) | | 12,000 | 12,052 |
| 3.35% 3/9/21 | | 7,251 | 7,383 |
| Elanco Animal Health, Inc. 3.912% 8/27/21 | | 6,967 | 7,101 |
| Express Scripts Holding Co.: | | | |
| 2.6% 11/30/20 | | 2,683 | 2,694 |
| 4.75% 11/15/21 | | 4,763 | 5,017 |
| Humana, Inc. 2.5% 12/15/20 | | 7,580 | 7,595 |
| UnitedHealth Group, Inc. 3.35% 7/15/22 | | 10,000 | 10,382 |
| WellPoint, Inc. 3.125% 5/15/22 | | 12,140 | 12,436 |
| | | | 64,660 |
| Pharmaceuticals - 2.1% | | | |
| Actavis Funding SCS: | | | |
| 3% 3/12/20 | | 15,452 | 15,499 |
| 3.45% 3/15/22 | | 11,000 | 11,296 |
| Bayer U.S. Finance II LLC 3.5% 6/25/21 (a) | | 15,000 | 15,318 |
| Bristol-Myers Squibb Co.: | | | |
| 2.55% 5/14/21 (a) | | 15,000 | 15,180 |
| 2.6% 5/16/22 (a) | | 11,049 | 11,257 |
| GlaxoSmithKline Capital PLC 3.125% 5/14/21 | | 12,280 | 12,501 |
| Perrigo Co. PLC 3.5% 3/15/21 | | 2,117 | 2,128 |
| Shire Acquisitions Investments Ireland DAC: | | | |
| 1.9% 9/23/19 | | 20,000 | 19,996 |
| 2.4% 9/23/21 | | 5,816 | 5,834 |
| Teva Pharmaceutical Finance Netherlands III BV 2.2% 7/21/21 | | 10,000 | 9,363 |
| Zoetis, Inc. 3.45% 11/13/20 | | 1,708 | 1,731 |
| | | | 120,103 |
|
| TOTAL HEALTH CARE | | | 246,724 |
|
| INDUSTRIALS - 1.9% | | | |
| Aerospace & Defense - 0.3% | | | |
| Northrop Grumman Corp. 2.08% 10/15/20 | | 11,340 | 11,344 |
| United Technologies Corp. 3.35% 8/16/21 | | 3,120 | 3,197 |
| | | | 14,541 |
| Airlines - 0.4% | | | |
| Delta Air Lines, Inc.: | | | |
| 2.875% 3/13/20 | | 15,450 | 15,453 |
| 3.4% 4/19/21 | | 8,454 | 8,570 |
| | | | 24,023 |
| Commercial Services & Supplies - 0.2% | | | |
| Waste Management, Inc. 2.95% 6/15/24 | | 11,453 | 11,913 |
| Machinery - 0.4% | | | |
| Caterpillar Financial Services Corp. 2.65% 5/17/21 | | 11,200 | 11,365 |
| Westinghouse Air Brake Co. 3 month U.S. LIBOR + 1.050% 3.7103% 9/15/21 (b)(c) | | 11,271 | 11,272 |
| | | | 22,637 |
| Trading Companies & Distributors - 0.6% | | | |
| Air Lease Corp.: | | | |
| 2.125% 1/15/20 | | 6,030 | 6,026 |
| 2.5% 3/1/21 | | 6,552 | 6,580 |
| 3.5% 1/15/22 | | 10,200 | 10,486 |
| International Lease Finance Corp. 5.875% 8/15/22 | | 12,000 | 13,180 |
| | | | 36,272 |
|
| TOTAL INDUSTRIALS | | | 109,386 |
|
| INFORMATION TECHNOLOGY - 1.4% | | | |
| Electronic Equipment & Components - 0.8% | | | |
| Amphenol Corp. 2.2% 4/1/20 | | 15,000 | 14,997 |
| Diamond 1 Finance Corp./Diamond 2 Finance Corp. 5.45% 6/15/23 (a) | | 17,439 | 18,954 |
| Tyco Electronics Group SA 3 month U.S. LIBOR + 0.450% 2.9285% 6/5/20 (b)(c) | | 13,393 | 13,406 |
| | | | 47,357 |
| IT Services - 0.5% | | | |
| IBM Corp. 2.8% 5/13/21 | | 15,000 | 15,195 |
| The Western Union Co. 4.25% 6/9/23 | | 10,000 | 10,577 |
| | | | 25,772 |
| Semiconductors & Semiconductor Equipment - 0.1% | | | |
| Analog Devices, Inc. 2.85% 3/12/20 | | 8,263 | 8,287 |
|
| TOTAL INFORMATION TECHNOLOGY | | | 81,416 |
|
| MATERIALS - 0.2% | | | |
| Chemicals - 0.2% | | | |
| Chevron Phillips Chemical Co. LLC / Chevron Phillips Chemical Co. LP 3.3% 5/1/23 (a) | | 6,696 | 6,930 |
| The Mosaic Co. 3.25% 11/15/22 | | 3,784 | 3,878 |
| | | | 10,808 |
| REAL ESTATE - 0.3% | | | |
| Equity Real Estate Investment Trusts (REITs) - 0.1% | | | |
| Welltower, Inc. 3.625% 3/15/24 | | 5,438 | 5,729 |
| Real Estate Management & Development - 0.2% | | | |
| Digital Realty Trust LP 2.75% 2/1/23 | | 4,637 | 4,701 |
| Washington Prime Group LP 3.85% 4/1/20 | | 9,340 | 9,280 |
| | | | 13,981 |
|
| TOTAL REAL ESTATE | | | 19,710 |
|
| UTILITIES - 3.6% | | | |
| Electric Utilities - 1.6% | | | |
| American Electric Power Co., Inc. 2.15% 11/13/20 | | 7,619 | 7,627 |
| Duke Energy Corp. 1.8% 9/1/21 | | 3,796 | 3,773 |
| Edison International 2.125% 4/15/20 | | 15,000 | 14,935 |
| Eversource Energy 2.5% 3/15/21 | | 7,387 | 7,419 |
| Exelon Corp.: | | | |
| 2.85% 6/15/20 | | 6,843 | 6,873 |
| 3.497% 6/1/22 (b) | | 10,555 | 10,868 |
| Florida Power & Light Co. 3 month U.S. LIBOR + 0.400% 2.6393% 5/6/22 (b)(c) | | 11,654 | 11,657 |
| ITC Holdings Corp. 2.7% 11/15/22 | | 7,621 | 7,736 |
| Mississippi Power Co. 3 month U.S. LIBOR + 0.650% 2.9613% 3/27/20 (b)(c) | | 3,420 | 3,420 |
| NextEra Energy Capital Holdings, Inc. 2.9% 4/1/22 | | 11,080 | 11,318 |
| Virginia Electric & Power Co. 2.75% 3/15/23 | | 6,000 | 6,132 |
| | | | 91,758 |
| Gas Utilities - 0.3% | | | |
| WGL Holdings, Inc.: | | | |
| 3 month U.S. LIBOR + 0.400% 2.5174% 11/29/19 (b)(c) | | 12,200 | 12,194 |
| 3 month U.S. LIBOR + 0.550% 2.9858% 3/12/20 (b)(c) | | 3,037 | 3,032 |
| | | | 15,226 |
| Independent Power and Renewable Electricity Producers - 0.0% | | | |
| Emera U.S. Finance LP 2.7% 6/15/21 | | 1,671 | 1,683 |
| Multi-Utilities - 1.7% | | | |
| Berkshire Hathaway Energy Co. 2.375% 1/15/21 | | 11,369 | 11,436 |
| Consolidated Edison, Inc. 2% 3/15/20 | | 3,278 | 3,275 |
| Dominion Energy, Inc.: | | | |
| 3 month U.S. LIBOR + 2.300% 4.6299% 9/30/66 (b)(c) | | 6,389 | 5,974 |
| 2.715% 8/15/21 | | 8,715 | 8,788 |
| NiSource Finance Corp. 2.65% 11/17/22 | | 10,351 | 10,511 |
| NiSource, Inc. 3.65% 6/15/23 | | 3,297 | 3,439 |
| Public Service Enterprise Group, Inc. 1.6% 11/15/19 | | 6,071 | 6,062 |
| Sempra Energy: | | | |
| 1.625% 10/7/19 | | 10,647 | 10,639 |
| 2.4% 2/1/20 | | 15,050 | 15,029 |
| WEC Energy Group, Inc.: | | | |
| 3.1% 3/8/22 | | 8,697 | 8,908 |
| 3.375% 6/15/21 | | 12,513 | 12,788 |
| | | | 96,849 |
|
| TOTAL UTILITIES | | | 205,516 |
|
| TOTAL NONCONVERTIBLE BONDS | | | |
| (Cost $2,641,745) | | | 2,676,850 |
|
| U.S. Treasury Obligations - 23.5% | | | |
| U.S. Treasury Notes: | | | |
| 1.125% 2/28/21 (d) | | $455,476 | $452,065 |
| 1.75% 11/30/21 | | 430,000 | 432,402 |
| 1.875% 7/31/22 | | 30,000 | 30,367 |
| 2.125% 3/31/24 | | 120,000 | 123,755 |
| 2.375% 8/15/24 | | 120,000 | 125,480 |
| 2.5% 12/31/20 | | 98,471 | 99,521 |
| 2.625% 6/30/23 | | 85,000 | 88,795 |
| TOTAL U.S. TREASURY OBLIGATIONS | | | |
| (Cost $1,325,997) | | | 1,352,385 |
|
| U.S. Government Agency - Mortgage Securities - 1.2% | | | |
| Fannie Mae - 0.9% | | | |
| 3% 3/1/30 to 12/1/31 | | 40,485 | 41,608 |
| 3.5% 9/1/29 | | 4,947 | 5,171 |
| 4.5% 7/1/20 | | 0 | 0 |
| 5.5% 11/1/34 | | 4,390 | 4,838 |
| 7.5% 11/1/31 | | 1 | 1 |
|
| TOTAL FANNIE MAE | | | 51,618 |
|
| Freddie Mac - 0.0% | | | |
| 4% 4/1/26 | | 785 | 820 |
| 5% 4/1/20 | | 3 | 3 |
| 8.5% 5/1/26 to 7/1/28 | | 66 | 74 |
|
| TOTAL FREDDIE MAC | | | 897 |
|
| Ginnie Mae - 0.3% | | | |
| 7% 1/15/25 to 8/15/32 | | 480 | 540 |
| 4.5% 6/20/48 | | 14,618 | 15,378 |
|
| TOTAL GINNIE MAE | | | 15,918 |
|
| TOTAL U.S. GOVERNMENT AGENCY - MORTGAGE SECURITIES | | | |
| (Cost $67,682) | | | 68,433 |
|
| Asset-Backed Securities - 15.0% | | | |
| Accredited Mortgage Loan Trust Series 2003-3 Class A1, 5.21% 1/25/34 (AMBAC Insured) | | $553 | $582 |
| Ally Auto Receivables Trust Series 2019-2 Class A2, 2.34% 6/15/22 | | 10,000 | 10,025 |
| Ally Master Owner Trust: | | | |
| Series 2018-1 Class A1, 2.7% 1/17/23 | | 12,380 | 12,502 |
| Series 2018-2 Class A, 3.29% 5/15/23 | | 13,920 | 14,238 |
| American Credit Acceptance Receivables Trust Series 2019-3 Class A, 2.44% 12/12/22 (a) | | 8,017 | 8,018 |
| American Express Credit Account Master Trust: | | | |
| Series 2017-6 Class A, 2.04% 5/15/23 | | 10,120 | 10,139 |
| Series 2018-4 Class A, 2.99% 12/15/23 | | 11,070 | 11,300 |
| Series 2018-6 Class A, 3.06% 2/15/24 | | 10,000 | 10,249 |
| Series 2019-1 Class A, 2.87% 10/15/24 | | 4,526 | 4,661 |
| Bank of America Credit Card Master Trust: | | | |
| Series 2017-A2 Class A2, 1.84% 1/17/23 | | 13,895 | 13,883 |
| Series 2018-A1 Class A1, 2.7% 7/17/23 | | 14,000 | 14,173 |
| Series 2018-A2 Class A2, 3% 9/15/23 | | 11,170 | 11,392 |
| Bank of The West Auto Trust: | | | |
| Series 2018-1 Class A3, 3.43% 12/15/22 (a) | | 5,451 | 5,520 |
| Series 2019-1 Class A2, 2.4% 10/17/22 (a) | | 3,768 | 3,774 |
| BMW Floorplan Master Owner Trust Series 2018-1 Class A1, 3.15% 5/15/23 (a) | | 9,960 | 10,174 |
| BMW Vehicle Lease Trust: | | | |
| Series 2017-2 Class A3, 2.07% 10/20/20 | | 4,694 | 4,692 |
| Series 2019-1 Class A3, 2.84% 11/22/21 | | 7,687 | 7,785 |
| Canadian Pacer Auto Receivables Trust: | | | |
| Series 2017-A1 Class A3, 2.05% 3/19/21 (a) | | 3,816 | 3,813 |
| Series 2018-1A Class A3, 3% 11/19/21 (a) | | 9,302 | 9,350 |
| Series 2018-2A Class A3, 3.27% 12/19/22 (a) | | 8,203 | 8,361 |
| Series 2019-1A Class A2, 2.78% 3/21/22 (a) | | 11,796 | 11,848 |
| Capital One Multi-Asset Execution Trust: | | | |
| Series 2015-A8 Class A8, 2.05% 8/15/23 | | 8,601 | 8,618 |
| Series 2017-A4 Class A4, 1.99% 7/17/23 | | 12,165 | 12,182 |
| Series 2018-A1 Class A1, 3.01% 2/15/24 | | 7,366 | 7,508 |
| Series 2019-A1 Class A1, 2.84% 12/15/24 | | 14,492 | 14,893 |
| CarMax Auto Owner Trust: | | | |
| Series 2016-4 Class A3, 1.4% 8/15/21 | | 4,392 | 4,380 |
| Series 2017-3 Class A3, 1.97% 4/15/22 | | 4,241 | 4,238 |
| Series 2017-4 Class A3, 2.11% 10/17/22 | | 5,039 | 5,044 |
| Series 2018-2 Class A3, 2.98% 1/17/23 | | 6,019 | 6,100 |
| Series 2018-4 Class A3, 3.36% 9/15/23 | | 6,648 | 6,823 |
| Series 2019-1 Class A3, 3.05% 3/15/24 | | 8,974 | 9,189 |
| Chesapeake Funding II LLC: | | | |
| Series 2017-2A Class A1, 1.99% 5/15/29 (a) | | 4,876 | 4,869 |
| Series 2017-4A Class A2, 1 month U.S. LIBOR + 0.340% 2.5351% 11/15/29 (a)(b)(c) | | 5,348 | 5,345 |
| Series 2018-1A Class A1, 3.04% 4/15/30 (a) | | 5,210 | 5,287 |
| Series 2018-3A Class A1, 3.39% 1/15/31 (a) | | 6,621 | 6,745 |
| Series 2019-1A Class A1, 2.94% 4/15/31 (a) | | 10,113 | 10,279 |
| Citibank Credit Card Issuance Trust: | | | |
| Series 2017-A8 Class A8, 1.86% 8/8/22 | | 15,000 | 14,991 |
| Series 2018-A1 Class A1, 2.49% 1/20/23 | | 14,396 | 14,538 |
| CNH Equipment Trust Series 2018-A Class A3, 3.12% 7/17/23 | | 10,123 | 10,270 |
| Consumer Lending Receivables Trust Series 2019-A Class A, 3.52% 4/15/26 (a) | | 7,823 | 7,866 |
| Consumer Loan Underlying Bond Credit Trust: | | | |
| Series 2018-P2 Class A, 3.47% 10/15/25 (a) | | 5,330 | 5,360 |
| Series 2018-P3 Class A, 3.82% 1/15/26 (a) | | 11,162 | 11,268 |
| Series 2019-P1 Class A, 2.94% 7/15/26 (a) | | 3,279 | 3,290 |
| Countrywide Home Loans, Inc.: | | | |
| Series 2003-BC1 Class B1, 1 month U.S. LIBOR + 5.250% 7.3953% 3/25/32 (b)(c) | | 7 | 8 |
| Series 2004-2 Class 3A4, 1 month U.S. LIBOR + 0.500% 2.6453% 7/25/34 (b)(c) | | 261 | 241 |
| Dell Equipment Finance Trust: | | | |
| Series 2017-2 Class A3, 2.19% 10/24/22 (a) | | 3,301 | 3,301 |
| Series 2018-1 Class A3, 3.18% 6/22/23 (a) | | 3,384 | 3,426 |
| Series 2018-2 Class A3, 3.37% 10/22/23 (a) | | 4,565 | 4,646 |
| Series 2019-1 Class A2, 2.78% 8/23/21 (a) | | 10,000 | 10,071 |
| Discover Card Master Trust: | | | |
| Series 2018-A5 Class A5, 3.32% 3/15/24 | | 13,150 | 13,583 |
| Series 2019-A1 Class A1, 3.04% 7/15/24 | | 10,595 | 10,928 |
| Series 2019-A2 Class A, 1 month U.S. LIBOR + 0.270% 2.4651% 12/15/23 (b)(c) | | 20,000 | 20,032 |
| DLL Securitization Trust: | | | |
| Series 2017-A Class A3, 2.14% 12/15/21 (a) | | 9,329 | 9,331 |
| Series 2018-ST2 Class A3, 3.46% 1/20/22 (a) | | 8,545 | 8,671 |
| Series 2019-MA2 Class A2, 2.27% 5/20/22 (a) | | 10,000 | 10,013 |
| DT Auto Owner Trust Series 2019-3A Class A, 2.55% 8/15/22 (a) | | 9,730 | 9,739 |
| Enterprise Fleet Financing LLC: | | | |
| Series 2016-2 Class A2, 1.74% 2/22/22 (a) | | 72 | 72 |
| Series 2017-1 Class A2, 2.13% 7/20/22 (a) | | 1,793 | 1,792 |
| Series 2019-1 Class A2, 2.98% 10/22/24 (a) | | 7,557 | 7,662 |
| Fifth Third Auto Trust Series 2017-1 Class A3, 1.8% 2/15/22 | | 4,740 | 4,733 |
| Ford Credit Auto Lease Trust Series 2019-B Class A2A, 2.28% 2/15/22 | | 9,430 | 9,442 |
| Ford Credit Auto Owner Trust: | | | |
| Series 2015-2 Class A, 2.44% 1/15/27 (a) | | 11,704 | 11,729 |
| Series 2017-A Class A3, 1.67% 6/15/21 | | 4,753 | 4,745 |
| Ford Credit Floorplan Master Owner Trust: | | | |
| Series 2015-5 Class A, 2.39% 8/15/22 | | 25,466 | 25,536 |
| Series 2017-2 Class A1, 2.16% 9/15/22 | | 12,180 | 12,200 |
| Series 2018-1 Class A1, 2.95% 5/15/23 | | 11,000 | 11,193 |
| GM Financial Automobile Leasing Trust: | | | |
| Series 2019-1 Class A3, 2.98% 12/20/21 | | 6,482 | 6,564 |
| Series 2019-2 Class A3, 2.67% 3/21/22 | | 3,973 | 4,017 |
| GM Financial Consumer Automobile Receivables Trust Series 2017-2A Class A3, 1.86% 12/16/21 (a) | | 8,331 | 8,319 |
| GM Financial Securitized Term Automobile Recievables Trust 2.32% 7/18/22 | | 5,240 | 5,256 |
| GMF Floorplan Owner Revolving Trust: | | | |
| Series 2017-1 Class A1, 2.22% 1/18/22 (a) | | 9,903 | 9,899 |
| Series 2018-2 Class A2, 3.13% 3/15/23 (a) | | 10,641 | 10,810 |
| Home Equity Asset Trust Series 2004-1 Class M2, 1 month U.S. LIBOR + 1.700% 3.8453% 6/25/34 (b)(c) | | 22 | 22 |
| Hyundai Auto Receivables Trust Series 2018-A Class A3, 2.79% 7/15/22 | | 7,041 | 7,106 |
| John Deere Owner Trust: | | | |
| Series 2018-A Class A3, 2.66% 4/18/22 | | 10,804 | 10,856 |
| Series 2019-B Class A2, 2.28% 5/16/22 | | 10,580 | 10,616 |
| Kubota Credit Owner Trust Series 2018-1A Class A3, 3.1% 8/15/22 (a) | | 13,952 | 14,194 |
| Mercedes-Benz Auto Lease Trust: | | | |
| Series 2018-A Class A3, 2.41% 2/16/21 | | 9,296 | 9,304 |
| Series 2019-A Class A3, 3.1% 11/15/21 | | 6,680 | 6,759 |
| Mercedes-Benz Master Owner Trust Series 2018-AA Class A, 1 month U.S. LIBOR + 0.260% 2.4551% 5/16/22 (a)(b)(c) | | 10,150 | 10,150 |
| Nationstar HECM Loan Trust Series 2018-1A Class A, 2.76% 2/25/28 (a) | | 2,313 | 2,311 |
| Navistar Financial Dealer Note Master Trust Series 2018-1 Class A, 1 month U.S. LIBOR + 0.630% 2.896% 9/25/23 (a)(b)(c) | | 10,508 | 10,522 |
| Nissan Auto Receivables Owner Trust Series 2016-B Class A3, 1.32% 1/15/21 | | 1,223 | 1,222 |
| Park Place Securities, Inc. Series 2005-WCH1 Class M4, 1 month U.S. LIBOR + 1.245% 3.3903% 1/25/36 (b)(c) | | 845 | 848 |
| Prosper Marketplace Issuance Trust: | | | |
| Series 2018-1A Class A, 3.11% 6/17/24 (a) | | 167 | 167 |
| Series 2018-2A Class A, 3.35% 10/15/24 (a) | | 3,320 | 3,330 |
| Santander Retail Auto Lease Trust: | | | |
| Series 2017-A Class A3, 2.22% 1/20/21 (a) | | 9,479 | 9,478 |
| Series 2018-A Class A3, 2.93% 5/20/21 (a) | | 9,389 | 9,434 |
| Series 2019-B Class A2A, 2.29% 4/20/22 (a) | | 12,525 | 12,560 |
| Securitized Term Auto Receivables Trust: | | | |
| Series 2017-1A Class A3, 1.89% 8/25/20 (a) | | 975 | 974 |
| Series 2017-2A Class A3, 2.04% 4/26/21 (a) | | 4,603 | 4,599 |
| Series 2018-2A Class A3 3.325% 8/25/22 (a) | | 13,026 | 13,197 |
| Series 2019-1A Class A3, 2.986% 2/27/23 (a) | | 7,178 | 7,287 |
| SLM Student Loan Trust Series 2003-11 Class A6, 3 month U.S. LIBOR + 0.550% 2.9603% 12/15/25 (a)(b)(c) | | 13,051 | 13,056 |
| Terwin Mortgage Trust Series 2003-4HE Class A1, 1 month U.S. LIBOR + 0.860% 3.0053% 9/25/34 (b)(c) | | 293 | 285 |
| Tesla Auto Lease Trust Series 2018-A Class A, 2.32% 12/20/19 (a) | | 1,092 | 1,092 |
| Towd Point Mortgage Trust Series 2018-3 Class A1, 3.75% 5/25/58 (a) | | 5,637 | 5,883 |
| Toyota Auto Receivables Owner Trust Series 2018-B Class A3, 2.96% 9/15/22 | | 7,057 | 7,155 |
| Trapeza CDO XII Ltd./Trapeza CDO XII, Inc. Series 2007-12A Class B, 3 month U.S. LIBOR + 0.560% 2.8626% 4/6/42 (a)(b)(c)(e) | | 261 | 195 |
| Upgrade Receivables Trust: | | | |
| Series 2018-1A Class A, 3.76% 11/15/24 (a) | | 5,036 | 5,054 |
| Series 2019-1A Class A, 3.48% 3/15/25 (a) | | 1,835 | 1,841 |
| Series 2019-2A Class A, 2.77% 10/15/25 (a) | | 2,639 | 2,640 |
| USAA Auto Owner Trust Series 2017-1 Class A3, 1.7% 5/17/21 | | 1,737 | 1,735 |
| Verizon Owner Trust: | | | |
| Series 2016-2A Class A, 1.68% 5/20/21 (a) | | 3,360 | 3,356 |
| Series 2017-2A Class A, 1.92% 12/20/21 (a) | | 5,931 | 5,926 |
| Series 2017-3A Class A1A, 2.06% 4/20/22 (a) | | 12,364 | 12,360 |
| Series 2018-A Class A1A, 3.23% 4/20/23 | | 12,945 | 13,229 |
| Volkswagen Auto Loan Enhanced Trust Series 2018-1 Class A3, 3.02% 11/21/22 | | 6,448 | 6,555 |
| Volvo Financial Equipment LLC Series 2019-1A Class A3, 3% 3/15/23 (a) | | 5,916 | 6,028 |
| Volvo Financial Equipment Master Owner Trust Series 2018-A Class A, 1 month U.S. LIBOR + 0.520% 2.7151% 7/17/23 (a)(b)(c) | | 13,210 | 13,229 |
| Wheels SPV LLC Series 2018-1A Class A2, 3.06% 4/20/27 (a) | | 8,281 | 8,327 |
| World Omni Auto Receivables Trust Series 2016-A Class A3, 1.77% 9/15/21 | | 315 | 315 |
| World Omni Automobile Lease Securitization Trust Series 2019-A Class A3, 2.94% 5/16/22 | | 5,914 | 6,010 |
| TOTAL ASSET-BACKED SECURITIES | | | |
| (Cost $854,479) | | | 862,728 |
|
| Collateralized Mortgage Obligations - 1.8% | | | |
| Private Sponsor - 1.0% | | | |
| Credit Suisse Mortgage Trust Series 2012-2R Class 1A1, 4.7374% 5/27/35 (a)(b) | | 989 | 999 |
| FirstKey Mortgage Trust sequential payer Series 2015-1 Class A9, 3% 3/25/45 (a)(b) | | 5,740 | 5,740 |
| Gosforth Funding PLC floater Series 2018-1A Class A1, 3 month U.S. LIBOR + 0.450% 2.5823% 8/25/60 (a)(b)(c) | | 4,712 | 4,702 |
| Holmes Master Issuer PLC floater Series 2018-2A Class A2, 3 month U.S. LIBOR + 0.420% 2.7234% 10/15/54 (a)(b)(c) | | 6,193 | 6,187 |
| Lanark Master Issuer PLC: | | | |
| floater Series 2019-1A Class 1A1, 3 month U.S. LIBOR + 0.770% 2.9023% 12/22/69 (a)(b)(c) | | 3,607 | 3,617 |
| Series 2019-2A Class 1A, 2.71% 12/22/69 (a) | | 12,418 | 12,506 |
| Merrill Lynch Alternative Note Asset Trust floater Series 2007-OAR1 Class A1, 1 month U.S. LIBOR + 0.170% 2.436% 2/25/37 (b)(c) | | 40 | 40 |
| Permanent Master Issuer PLC floater Series 2018-1A Class 1A1, 3 month U.S. LIBOR + 0.380% 2.6834% 7/15/58 (a)(b)(c) | | 15,000 | 14,997 |
| Sequoia Mortgage Trust floater Series 2004-6 Class A3B, 6 month U.S. LIBOR + 0.880% 3.178% 7/20/34 (b)(c) | | 6 | 6 |
| Silverstone Master Issuer PLC floater Series 2019-1A Class 1A, 3 month U.S. LIBOR + 0.570% 2.8476% 1/21/70 (a)(b)(c) | | 9,963 | 9,965 |
|
| TOTAL PRIVATE SPONSOR | | | 58,759 |
|
| U.S. Government Agency - 0.8% | | | |
| Fannie Mae: | | | |
| floater Series 2015-27 Class KF, 1 month U.S. LIBOR + 0.300% 2.4453% 5/25/45 (b)(c) | | 11,137 | 11,112 |
| sequential payer Series 2001-40 Class Z, 6% 8/25/31 | | 247 | 278 |
| Series 2016-27: | | | |
| Class HK, 3% 1/25/41 | | 10,100 | 10,279 |
| Class KG, 3% 1/25/40 | | 4,945 | 5,149 |
| Series 2016-42 Class FL, 1 month U.S. LIBOR + 0.350% 2.4953% 7/25/46 (b)(c) | | 12,574 | 12,590 |
| Freddie Mac Series 3949 Class MK, 4.5% 10/15/34 | | 1,199 | 1,270 |
| Ginnie Mae guaranteed REMIC pass-thru certificates Series 2015-H17 Class HA, 2.5% 5/20/65 (f) | | 2,971 | 2,969 |
|
| TOTAL U.S. GOVERNMENT AGENCY | | | 43,647 |
|
| TOTAL COLLATERALIZED MORTGAGE OBLIGATIONS | | | |
| (Cost $102,519) | | | 102,406 |
|
| Commercial Mortgage Securities - 5.1% | | | |
| Asset Securitization Corp. Series 1997-D5 Class PS1, 1.8322% 2/14/43 (b)(g) | | 21 | 0 |
| Bank of America Commercial Mortgage Trust Series 2016-UB10 Class A1, 1.559% 7/15/49 | | 2,743 | 2,727 |
| Bayview Commercial Asset Trust Series 2006-2A Class IO, 0% 7/25/36 (a)(b)(e)(g) | | 9,327 | 0 |
| Benchmark Mortgage Trust Series 2018-B7 Class A1, 3.436% 5/15/53 | | 4,985 | 5,145 |
| BX Trust: | | | |
| floater Series 2018-IND Class B, 1 month U.S. LIBOR + 0.900% 3.0951% 11/15/35 (a)(b)(c) | | 11,380 | 11,373 |
| floater, sequential payer Series 2019-IMC Class A, 1 month U.S. LIBOR + 1.000% 3.1951% 4/15/34 (a)(b)(c) | | 5,852 | 5,852 |
| CGDBB Commercial Mortgage Trust floater Series 2017-BIOC Class A, 1 month U.S. LIBOR + 0.790% 2.9851% 7/15/32 (a)(b)(c) | | 11,842 | 11,842 |
| CHC Commercial Mortgage Trust floater Series 2019-CHC Class A, 1 month U.S. LIBOR + 1.120% 3.3151% 6/15/34 (a)(b)(c) | | 10,382 | 10,382 |
| Citigroup Commercial Mortgage Trust: | | | |
| floater Series 2017-1500 Class A, 1 month U.S. LIBOR + 0.850% 3.0451% 7/15/32 (a)(b)(c) | | 8,384 | 8,384 |
| sequential payer: | | | |
| Series 2012-GC8 Class A/S, 3.683% 9/10/45 (a) | | 6,035 | 6,291 |
| Series 2014-GC21 Class AAB, 3.477% 5/10/47 | | 3,784 | 3,915 |
| Series 2016-GC36 Class AAB, 3.368% 2/10/49 | | 5,785 | 6,081 |
| COMM Mortgage Trust: | | | |
| sequential payer: | | | |
| Series 2012-LC4 Class A4, 3.288% 12/10/44 | | 8,476 | 8,671 |
| Series 2014-CR18 Class ASB, 3.452% 7/15/47 | | 18,861 | 19,367 |
| Series 2012-CR4 Class ASB, 2.436% 10/15/45 | | 4,752 | 4,759 |
| Series 2013-LC6 Class ASB, 2.478% 1/10/46 | | 5,647 | 5,690 |
| Credit Suisse Mortgage Trust floater Series 2019-ICE4 Class A, 1 month U.S. LIBOR + 0.980% 3.1751% 5/15/36 (a)(b)(c) | | 12,100 | 12,108 |
| CSAIL Commercial Mortgage Trust Series 2016-C7 Class A1, 1.5786% 11/15/49 | | 1,348 | 1,342 |
| CSMC Trust Series 2017-CHOP Class A, 1 month U.S. LIBOR + 0.750% 2.9451% 7/15/32 (a)(b)(c) | | 12,462 | 12,427 |
| GS Mortgage Securities Trust: | | | |
| sequential payer: | | | |
| Series 2012-GC6: | | | |
| Class A/S, 4.948% 1/10/45 (a) | | 5,063 | 5,355 |
| Class A3, 3.482% 1/10/45 | | 6,436 | 6,599 |
| Series 2012-GCJ7 Class A/S, 4.085% 5/10/45 | | 7,670 | 8,026 |
| Series 2011-GC5 Class A/S, 5.209% 8/10/44 (a) | | 14,856 | 15,608 |
| Series 2012-GCJ9 Class A/S, 3.124% 11/10/45 | | 8,201 | 8,389 |
| Series 2017-GS8 Class A1, 2.222% 11/10/50 | | 9,560 | 9,591 |
| JPMBB Commercial Mortgage Securities sequential payer Series 2014-C25 Class A2, 2.9493% 11/15/47 | | 246 | 245 |
| JPMBB Commercial Mortgage Securities Trust sequential payer Series 2014-C22 Class ASB, 3.5036% 9/15/47 | | 5,054 | 5,223 |
| JPMorgan Chase Commercial Mortgage Securities Corp.: | | | |
| sequential payer Series 2012-C6 Class A3, 3.5074% 5/15/45 | | 3,873 | 4,015 |
| Series 2012-C6 Class A/S, 4.1166% 5/15/45 | | 4,886 | 5,102 |
| Series 2012-LC9 Class A/S, 3.3533% 12/15/47 (a) | | 13,767 | 14,214 |
| JPMorgan Chase Commercial Mortgage Securities Trust sequential payer Series 2014-C20 Class A3A1, 3.4718% 7/15/47 | | 8,292 | 8,460 |
| Morgan Stanley BAML Trust Series 2016-C32 Class A1, 1.968% 12/15/49 | | 2,760 | 2,751 |
| Morgan Stanley Capital I Trust: | | | |
| floater Series 2019-AGLN Class A, 1 month U.S. LIBOR + 0.950% 3.1451% 3/15/34 (a)(b)(c) | | 9,713 | 9,719 |
| Series 2011-C3 Class AJ, 5.2925% 7/15/49 (a)(b) | | 6,326 | 6,636 |
| Series 2019-H7 Class A1, 2.327% 7/15/52 | | 6,856 | 6,917 |
| RETL floater Series 2019-RVP Class A, 1 month U.S. LIBOR + 1.150% 3.3451% 3/15/36 (a)(b)(c) | | 3,183 | 3,188 |
| UBS-Barclays Commercial Mortgage Trust: | | | |
| floater Series 2013-C6 Class A3, 1 month U.S. LIBOR + 0.790% 2.9909% 4/10/46 (a)(b)(c) | | 8,034 | 8,129 |
| sequential payer Series 2013-C6 Class ASB, 2.7877% 4/10/46 | | 6,609 | 6,686 |
| Wells Fargo Commercial Mortgage Trust: | | | |
| Series 2013-LC12 Class A1, 1.676% 7/15/46 | | 651 | 650 |
| Series 2016-LC25 Class A1, 1.795% 12/15/59 | | 997 | 993 |
| WF-RBS Commercial Mortgage Trust: | | | |
| floater Series 2013-C14 Class A3, 1 month U.S. LIBOR + 0.720% 2.9174% 6/15/46 (a)(b)(c) | | 8,523 | 8,530 |
| sequential payer: | | | |
| Series 2013-C12 Class ASB, 2.838% 3/15/48 | | 1,010 | 1,020 |
| Series 2013-C14 Class ASB, 2.977% 6/15/46 | | 7,166 | 7,260 |
| Series 2014-C20 Class ASB, 3.638% 5/15/47 | | 3,271 | 3,382 |
| TOTAL COMMERCIAL MORTGAGE SECURITIES | | | |
| (Cost $292,835) | | | 293,044 |
|
| Municipal Securities - 0.3% | | | |
| New York Urban Dev. Corp. Rev. Series 2017 D, 2.55% 3/15/22 | | | |
| (Cost $15,510) | | 15,510 | 15,819 |
|
| Bank Notes - 3.2% | | | |
| Capital One NA 2.35% 1/31/20 | | 15,650 | 15,653 |
| Citibank NA: | | | |
| 2.1% 6/12/20 | | $15,430 | $15,443 |
| 2.844% 5/20/22 (b) | | 12,000 | 12,134 |
| 3.165% 2/19/22 (b) | | 16,000 | 16,237 |
| Compass Bank: | | | |
| 2.875% 6/29/22 | | 13,095 | 13,320 |
| 3.5% 6/11/21 | | 8,067 | 8,216 |
| Discover Bank 3.1% 6/4/20 | | 5,758 | 5,788 |
| Huntington National Bank 2.375% 3/10/20 | | 12,000 | 12,010 |
| KeyBank NA: | | | |
| 2.25% 3/16/20 | | 3,604 | 3,607 |
| 3.3% 2/1/22 | | 3,173 | 3,271 |
| PNC Bank NA 2.45% 11/5/20 | | 10,000 | 10,052 |
| Regions Bank 2.75% 4/1/21 | | 11,226 | 11,326 |
| SunTrust Bank: | | | |
| 2.8% 5/17/22 | | 14,000 | 14,263 |
| 3.502% 8/2/22 (b) | | 8,508 | 8,709 |
| Svenska Handelsbanken AB 3.35% 5/24/21 | | 12,125 | 12,396 |
| Synchrony Bank 3.65% 5/24/21 | | 10,780 | 11,000 |
| Wells Fargo Bank NA 2.6% 1/15/21 | | 10,000 | 10,074 |
| TOTAL BANK NOTES | | | |
| (Cost $181,590) | | | 183,499 |
|
| Certificates of Deposit - 0.2% | | | |
| Natexis Banques Populaires New York Branch yankee 2.68% 12/27/19 | | | |
| (Cost $10,000) | | 10,000 | 10,018 |
|
| Commercial Paper - 0.6% | | | |
| Bell Canada yankee 2.35% 11/6/19 | | 10,000 | 9,955 |
| Commonspirit Health 2.8% 10/16/19 | | 11,000 | 10,969 |
| Sempra Global 2.48% 10/16/19 | | 15,000 | 14,955 |
| TOTAL COMMERCIAL PAPER | | | |
| (Cost $35,873) | | | 35,879 |
| | | Shares | Value (000s) |
|
| Money Market Funds - 1.0% | | | |
| Fidelity Cash Central Fund 2.13% (h) | | | |
| (Cost $59,135) | | 59,123,448 | 59,135 |
| | | Maturity Amount (000s) | Value (000s) |
|
| Repurchase Agreements - 1.7% | | | |
| With: | | | |
| Mizuho Securities U.S.A., Inc. at: | | | |
| 2.48%, dated 8/21/19 due 2/18/20 (Collateralized by Corporate Obligations valued at $34,590,951, 2.97% - 8.80%, 4/17/25 - 7/25/35) | | 32,399 | 32,000 |
| 2.67%, dated 8/1/19 due 1/28/20 (Collateralized by Corporate Obligations valued at $16,841,119, 3.02% - 3.45%, 11/22/27 - 7/26/31) | | 16,214 | 16,000 |
| 3.17%, dated 3/22/19 due 9/18/19 (Collateralized by Corporate Obligations valued at $21,514,481, 2.97% - 7.26%, 4/24/26 - 7/25/35) | | 20,317 | 20,000 |
| Morgan Stanley & Co., Inc. at 2.81%, dated: | | | |
| 6/11/19 due 9/10/19 (Collateralized by U.S. Government Obligations valued at $15,041,977, 0.00% - 3.38%, 9/12/19 - 8/25/58)(b)(c)(i) | | 14,603 | 14,500 |
| 8/5/19 due 11/4/19 (Collateralized by Equity Securities valued at $17,319,005)(b)(c)(i) | | 16,114 | 16,000 |
| TOTAL REPURCHASE AGREEMENTS | | | |
| (Cost $98,500) | | | 98,500 |
| TOTAL INVESTMENT IN SECURITIES - 100.2% | | | |
| (Cost $5,685,865) | | | 5,758,696 |
| NET OTHER ASSETS (LIABILITIES) - (0.2)% | | | (13,782) |
| NET ASSETS - 100% | | | $5,744,914 |
| Futures Contracts | | | | | |
| | Number of contracts | Expiration Date | Notional Amount (000s) | Value (000s) | Unrealized Appreciation/(Depreciation) (000s) |
| Purchased | | | | | |
| Treasury Contracts | | | | | |
| CBOT 2-Year U.S. Treasury Note Contracts (United States) | 2,632 | Dec. 2019 | $568,820 | $283 | $283 |
| CBOT 5-Year U.S. Treasury Note Contracts (United States) | 500 | Dec. 2019 | 59,988 | 50 | 50 |
| TOTAL FUTURES CONTRACTS | | | | | $333 |
The notional amount of futures purchased as a percentage of Net Assets is 10.9%
For the period, the average monthly notional amount at value for futures contracts in the aggregate was $149,041,000.
Values shown as $0 in the Schedule of Investments may reflect amounts less than $500.
Amounts shown as 0 in the Schedule of Investments may represent less than 1 share.
Legend
(a) Security exempt from registration under Rule 144A of the Securities Act of 1933. These securities may be resold in transactions exempt from registration, normally to qualified institutional buyers. At the end of the period, the value of these securities amounted to $1,033,685,000 or 18.0% of net assets.
(b) Coupon rates for floating and adjustable rate securities reflect the rates in effect at period end.
(c) Coupon is indexed to a floating interest rate which may be multiplied by a specified factor and/or subject to caps or floors.
(d) Security or a portion of the security was pledged to cover margin requirements for futures contracts. At period end, the value of securities pledged amounted to $2,213,000.
(e) Level 3 security
(f) Represents an investment in an underlying pool of reverse mortgages which typically do not require regular principal and interest payments as repayment is deferred until a maturity event.
(g) Security represents right to receive monthly interest payments on an underlying pool of mortgages or assets. Principal shown is the outstanding par amount of the pool as of the end of the period.
(h) Affiliated fund that is generally available only to investment companies and other accounts managed by Fidelity Investments. The rate quoted is the annualized seven-day yield of the fund at period end. A complete unaudited listing of the fund's holdings as of its most recent quarter end is available upon request. In addition, each Fidelity Central Fund's financial statements, which are not covered by the Fund's Report of Independent Registered Public Accounting Firm, are available on the SEC's website or upon request.
(i) The maturity amount is based on the rate at period end.
Affiliated Central Funds
Information regarding fiscal year to date income earned by the Fund from investments in Fidelity Central Funds is as follows:
| Fund | Income earned |
| | (Amounts in thousands) |
| Fidelity Cash Central Fund | $646 |
| Total | $646 |
Amounts in the income column in the above table include any capital gain distributions from underlying funds, which are presented in the corresponding line-item in the Statement of Operations, if applicable.
Investment Valuation
The following is a summary of the inputs used, as of August 31, 2019, involving the Fund's assets and liabilities carried at fair value. The inputs or methodology used for valuing securities may not be an indication of the risk associated with investing in those securities. For more information on valuation inputs, and their aggregation into the levels used below, please refer to the Investment Valuation section in the accompanying Notes to Financial Statements.
| | Valuation Inputs at Reporting Date: |
| Description | Total | Level 1 | Level 2 | Level 3 |
| (Amounts in thousands) | | | | |
| Investments in Securities: | | | | |
| Corporate Bonds | $2,676,850 | $-- | $2,676,850 | $-- |
| U.S. Government and Government Agency Obligations | 1,352,385 | -- | 1,352,385 | -- |
| U.S. Government Agency - Mortgage Securities | 68,433 | -- | 68,433 | -- |
| Asset-Backed Securities | 862,728 | -- | 862,533 | 195 |
| Collateralized Mortgage Obligations | 102,406 | -- | 102,406 | -- |
| Commercial Mortgage Securities | 293,044 | -- | 293,044 | -- |
| Municipal Securities | 15,819 | -- | 15,819 | -- |
| Bank Notes | 183,499 | -- | 183,499 | -- |
| Certificates of Deposit | 10,018 | -- | 10,018 | -- |
| Commercial Paper | 35,879 | -- | 35,879 | -- |
| Money Market Funds | 59,135 | 59,135 | -- | -- |
| Repurchase Agreements | 98,500 | -- | 98,500 | -- |
| Total Investments in Securities: | $5,758,696 | $59,135 | $5,699,366 | $195 |
| Derivative Instruments: | | | | |
| Assets | | | | |
| Futures Contracts | $333 | $333 | $-- | $-- |
| Total Assets | $333 | $333 | $-- | $-- |
| Total Derivative Instruments: | $333 | $333 | $-- | $-- |
Value of Derivative Instruments
The following table is a summary of the Fund's value of derivative instruments by primary risk exposure as of August 31, 2019. For additional information on derivative instruments, please refer to the Derivative Instruments section in the accompanying Notes to Financial Statements.
| Primary Risk Exposure / Derivative Type | Value |
| | Asset | Liability |
| (Amounts in thousands) | | |
| Interest Rate Risk | | |
| Futures Contracts(a) | $333 | $0 |
| Total Interest Rate Risk | 333 | 0 |
| Total Value of Derivatives | $333 | $0 |
(a) Reflects gross cumulative appreciation (depreciation) on futures contracts as presented in the Schedule of Investments. In the Statement of Assets and Liabilities, the period end daily variation margin is included in receivable or payable for daily variation margin on futures contracts, and the net cumulative appreciation (depreciation) is included in distributable earnings.
Other Information
Distribution of investments by country or territory of incorporation, as a percentage of Total Net Assets, is as follows (Unaudited):
| United States of America | 86.5% |
| United Kingdom | 3.9% |
| Canada | 2.9% |
| Japan | 1.2% |
| Netherlands | 1.2% |
| Others (Individually Less Than 1%) | 4.3% |
| | 100.0% |
See accompanying notes which are an integral part of the financial statements.
Financial Statements
Statement of Assets and Liabilities
| Amounts in thousands (except per-share amounts) | | August 31, 2019 |
| Assets | | |
Investment in securities, at value (including repurchase agreements of $98,500) — See accompanying schedule:
Unaffiliated issuers (cost $5,626,730) | $5,699,561 | |
| Fidelity Central Funds (cost $59,135) | 59,135 | |
| Total Investment in Securities (cost $5,685,865) | | $5,758,696 |
| Receivable for investments sold | | 99,209 |
| Receivable for fund shares sold | | 7,517 |
| Interest receivable | | 31,250 |
| Distributions receivable from Fidelity Central Funds | | 44 |
| Receivable for daily variation margin on futures contracts | | 294 |
| Receivable from investment adviser for expense reductions | | 3 |
| Other receivables | | 62 |
| Total assets | | 5,897,075 |
| Liabilities | | |
| Payable for investments purchased | $134,026 | |
| Payable for fund shares redeemed | 14,486 | |
| Distributions payable | 1,354 | |
| Accrued management fee | 1,447 | |
| Distribution and service plan fees payable | 59 | |
| Other affiliated payables | 727 | |
| Other payables and accrued expenses | 62 | |
| Total liabilities | | 152,161 |
| Net Assets | | $5,744,914 |
| Net Assets consist of: | | |
| Paid in capital | | $5,695,403 |
| Total distributable earnings (loss) | | 49,511 |
| Net Assets | | $5,744,914 |
| Net Asset Value and Maximum Offering Price | | |
| Class A: | | |
| Net Asset Value and redemption price per share ($174,699 ÷ 20,026 shares)(a) | | $8.72 |
| Maximum offering price per share (100/98.50 of $8.72) | | $8.85 |
| Class M: | | |
| Net Asset Value and redemption price per share ($70,834 ÷ 8,120 shares)(a) | | $8.72 |
| Maximum offering price per share (100/98.50 of $8.72) | | $8.85 |
| Class C: | | |
| Net Asset Value and offering price per share ($33,367 ÷ 3,828 shares)(a) | | $8.72 |
| Short-Term Bond: | | |
| Net Asset Value, offering price and redemption price per share ($5,016,883 ÷ 575,339 shares) | | $8.72 |
| Class I: | | |
| Net Asset Value, offering price and redemption price per share ($333,601 ÷ 38,240 shares) | | $8.72 |
| Class Z: | | |
| Net Asset Value, offering price and redemption price per share ($115,530 ÷ 13,250 shares) | | $8.72 |
(a) Redemption price per share is equal to net asset value less any applicable contingent deferred sales charge.
See accompanying notes which are an integral part of the financial statements.
Statement of Operations
| Amounts in thousands | | Year ended August 31, 2019 |
| Investment Income | | |
| Interest | | $148,988 |
| Income from Fidelity Central Funds | | 646 |
| Total income | | 149,634 |
| Expenses | | |
| Management fee | $16,696 | |
| Transfer agent fees | 5,815 | |
| Distribution and service plan fees | 826 | |
| Fund wide operations fee | 2,476 | |
| Independent trustees' fees and expenses | 25 | |
| Commitment fees | 16 | |
| Total expenses before reductions | 25,854 | |
| Expense reductions | (22) | |
| Total expenses after reductions | | 25,832 |
| Net investment income (loss) | | 123,802 |
| Realized and Unrealized Gain (Loss) | | |
| Net realized gain (loss) on: | | |
| Investment securities: | | |
| Unaffiliated issuers | (5,942) | |
| Fidelity Central Funds | (2) | |
| Futures contracts | 925 | |
| Total net realized gain (loss) | | (5,019) |
| Change in net unrealized appreciation (depreciation) on: | | |
| Investment securities: | | |
| Unaffiliated issuers | 120,634 | |
| Fidelity Central Funds | 2 | |
| Futures contracts | 333 | |
| Total change in net unrealized appreciation (depreciation) | | 120,969 |
| Net gain (loss) | | 115,950 |
| Net increase (decrease) in net assets resulting from operations | | $239,752 |
See accompanying notes which are an integral part of the financial statements.
Statement of Changes in Net Assets
| Amounts in thousands | Year ended August 31, 2019 | Year ended August 31, 2018 |
| Increase (Decrease) in Net Assets | | |
| Operations | | |
| Net investment income (loss) | $123,802 | $92,125 |
| Net realized gain (loss) | (5,019) | (30,140) |
| Change in net unrealized appreciation (depreciation) | 120,969 | (53,974) |
| Net increase (decrease) in net assets resulting from operations | 239,752 | 8,011 |
| Distributions to shareholders | (111,610) | – |
| Distributions to shareholders from net investment income | – | (89,578) |
| Total distributions | (111,610) | (89,578) |
| Share transactions - net increase (decrease) | 367,112 | (837,458) |
| Total increase (decrease) in net assets | 495,254 | (919,025) |
| Net Assets | | |
| Beginning of period | 5,249,660 | 6,168,685 |
| End of period | $5,744,914 | $5,249,660 |
| Other Information | | |
| Undistributed net investment income end of period | | $5,173 |
See accompanying notes which are an integral part of the financial statements.
Financial Highlights
Fidelity Short-Term Bond Fund Class A
| Years ended August 31, | 2019 | 2018 | 2017 | 2016 A |
| Selected Per–Share Data | | | | |
| Net asset value, beginning of period | $8.53 | $8.64 | $8.65 | $8.65 |
| Income from Investment Operations | | | | |
| Net investment income (loss)B | .178 | .123 | .082 | .009 |
| Net realized and unrealized gain (loss) | .171 | (.114) | (.011) | (.001) |
| Total from investment operations | .349 | .009 | .071 | .008 |
| Distributions from net investment income | (.159) | (.119) | (.081) | (.008) |
| Total distributions | (.159) | (.119) | (.081) | (.008) |
| Net asset value, end of period | $8.72 | $8.53 | $8.64 | $8.65 |
| Total ReturnC,D,E | 4.13% | .12% | .83% | .09% |
| Ratios to Average Net AssetsF,G | | | | |
| Expenses before reductions | .65% | .65% | .65% | .67%H |
| Expenses net of fee waivers, if any | .65% | .65% | .65% | .67%H |
| Expenses net of all reductions | .65% | .65% | .65% | .67%H |
| Net investment income (loss) | 2.08% | 1.43% | .94% | .79%H |
| Supplemental Data | | | | |
| Net assets, end of period (in millions) | $175 | $143 | $170 | $208 |
| Portfolio turnover rateI | 46% | 56% | 56% | 138%J |
A For the period July 12, 2016 (commencement of sale of shares) to August 31, 2016.
B Calculated based on average shares outstanding during the period.
C Total returns for periods of less than one year are not annualized.
D Total returns would have been lower if certain expenses had not been reduced during the applicable periods shown.
E Total returns do not include the effect of the sales charges.
F Fees and expenses of any underlying Fidelity Central Funds are not included in the Fund's expense ratio. The Fund indirectly bears its proportionate share of the expenses of any underlying Fidelity Central Funds.
G Expense ratios reflect operating expenses of the class. Expenses before reductions do not reflect amounts reimbursed by the investment adviser or reductions from expense offset arrangements and do not represent the amount paid by the class during periods when reimbursements or reductions occur. Expense ratios before reductions for start-up periods may not be representative of longer-term operating periods. Expenses net of fee waivers reflect expenses after reimbursement by the investment adviser but prior to reductions from expense offset arrangements. Expenses net of all reductions represent the net expenses paid by the class.
H Annualized
I Amount does not include the portfolio activity of any underlying Fidelity Central Funds.
J The portfolio turnover rate does not include the assets acquired in the merger.
See accompanying notes which are an integral part of the financial statements.
Fidelity Short-Term Bond Fund Class M
| Years ended August 31, | 2019 | 2018 | 2017 | 2016 A |
| Selected Per–Share Data | | | | |
| Net asset value, beginning of period | $8.53 | $8.64 | $8.65 | $8.65 |
| Income from Investment Operations | | | | |
| Net investment income (loss)B | .177 | .122 | .081 | .009 |
| Net realized and unrealized gain (loss) | .171 | (.114) | (.011) | (.001) |
| Total from investment operations | .348 | .008 | .070 | .008 |
| Distributions from net investment income | (.158) | (.118) | (.080) | (.008) |
| Total distributions | (.158) | (.118) | (.080) | (.008) |
| Net asset value, end of period | $8.72 | $8.53 | $8.64 | $8.65 |
| Total ReturnC,D,E | 4.12% | .10% | .81% | .09% |
| Ratios to Average Net AssetsF,G | | | | |
| Expenses before reductions | .67% | .67% | .66% | .70%H |
| Expenses net of fee waivers, if any | .67% | .67% | .66% | .70%H |
| Expenses net of all reductions | .67% | .66% | .66% | .70%H |
| Net investment income (loss) | 2.06% | 1.42% | .93% | .76%H |
| Supplemental Data | | | | |
| Net assets, end of period (in millions) | $71 | $70 | $81 | $96 |
| Portfolio turnover rateI | 46% | 56% | 56% | 138%J |
A For the period July 12, 2016 (commencement of sale of shares) to August 31, 2016.
B Calculated based on average shares outstanding during the period.
C Total returns for periods of less than one year are not annualized.
D Total returns would have been lower if certain expenses had not been reduced during the applicable periods shown.
E Total returns do not include the effect of the sales charges.
F Fees and expenses of any underlying Fidelity Central Funds are not included in the Fund's expense ratio. The Fund indirectly bears its proportionate share of the expenses of any underlying Fidelity Central Funds.
G Expense ratios reflect operating expenses of the class. Expenses before reductions do not reflect amounts reimbursed by the investment adviser or reductions from expense offset arrangements and do not represent the amount paid by the class during periods when reimbursements or reductions occur. Expense ratios before reductions for start-up periods may not be representative of longer-term operating periods. Expenses net of fee waivers reflect expenses after reimbursement by the investment adviser but prior to reductions from expense offset arrangements. Expenses net of all reductions represent the net expenses paid by the class.
H Annualized
I Amount does not include the portfolio activity of any underlying Fidelity Central Funds.
J The portfolio turnover rate does not include the assets acquired in the merger.
See accompanying notes which are an integral part of the financial statements.
Fidelity Short-Term Bond Fund Class C
| Years ended August 31, | 2019 | 2018 | 2017 | 2016 A |
| Selected Per–Share Data | | | | |
| Net asset value, beginning of period | $8.52 | $8.64 | $8.65 | $8.65 |
| Income from Investment Operations | | | | |
| Net investment income (loss)B | .104 | .049 | .007 | (.001) |
| Net realized and unrealized gain (loss) | .181 | (.123) | (.006) | .002 |
| Total from investment operations | .285 | (.074) | .001 | .001 |
| Distributions from net investment income | (.085) | (.046) | (.011) | (.001) |
| Total distributions | (.085) | (.046) | (.011) | (.001) |
| Net asset value, end of period | $8.72 | $8.52 | $8.64 | $8.65 |
| Total ReturnC,D,E | 3.36% | (.86)% | .02% | .01% |
| Ratios to Average Net AssetsF,G | | | | |
| Expenses before reductions | 1.51% | 1.51% | 1.52% | 1.53%H |
| Expenses net of fee waivers, if any | 1.51% | 1.51% | 1.52% | 1.53%H |
| Expenses net of all reductions | 1.51% | 1.51% | 1.51% | 1.53%H |
| Net investment income (loss) | 1.20% | .57% | .08% | (.07)%H |
| Supplemental Data | | | | |
| Net assets, end of period (in millions) | $33 | $52 | $69 | $84 |
| Portfolio turnover rateI | 46% | 56% | 56% | 138%J |
A For the period July 12, 2016 (commencement of sale of shares) to August 31, 2016.
B Calculated based on average shares outstanding during the period.
C Total returns for periods of less than one year are not annualized.
D Total returns would have been lower if certain expenses had not been reduced during the applicable periods shown.
E Total returns do not include the effect of the contingent deferred sales charge.
F Fees and expenses of any underlying Fidelity Central Funds are not included in the Fund's expense ratio. The Fund indirectly bears its proportionate share of the expenses of any underlying Fidelity Central Funds.
G Expense ratios reflect operating expenses of the class. Expenses before reductions do not reflect amounts reimbursed by the investment adviser or reductions from expense offset arrangements and do not represent the amount paid by the class during periods when reimbursements or reductions occur. Expense ratios before reductions for start-up periods may not be representative of longer-term operating periods. Expenses net of fee waivers reflect expenses after reimbursement by the investment adviser but prior to reductions from expense offset arrangements. Expenses net of all reductions represent the net expenses paid by the class.
H Annualized
I Amount does not include the portfolio activity of any underlying Fidelity Central Funds.
J The portfolio turnover rate does not include the assets acquired in the merger.
See accompanying notes which are an integral part of the financial statements.
Fidelity Short-Term Bond Fund
| Years ended August 31, | 2019 | 2018 | 2017 | 2016 | 2015 |
| Selected Per–Share Data | | | | | |
| Net asset value, beginning of period | $8.52 | $8.64 | $8.65 | $8.58 | $8.60 |
| Income from Investment Operations | | | | | |
| Net investment income (loss)A | .195 | .140 | .099 | .087 | .091 |
| Net realized and unrealized gain (loss) | .181 | (.123) | (.011) | .065 | (.029) |
| Total from investment operations | .376 | .017 | .088 | .152 | .062 |
| Distributions from net investment income | (.176) | (.137) | (.098) | (.082) | (.082) |
| Total distributions | (.176) | (.137) | (.098) | (.082) | (.082) |
| Net asset value, end of period | $8.72 | $8.52 | $8.64 | $8.65 | $8.58 |
| Total ReturnB | 4.47% | .20% | 1.03% | 1.79% | .72% |
| Ratios to Average Net AssetsC,D | | | | | |
| Expenses before reductions | .45% | .45% | .45% | .45% | .45% |
| Expenses net of fee waivers, if any | .45% | .45% | .45% | .45% | .45% |
| Expenses net of all reductions | .45% | .45% | .45% | .45% | .45% |
| Net investment income (loss) | 2.28% | 1.64% | 1.15% | 1.01% | 1.06% |
| Supplemental Data | | | | | |
| Net assets, end of period (in millions) | $5,017 | $4,617 | $5,423 | $5,894 | $5,278 |
| Portfolio turnover rateE | 46% | 56% | 56% | 138%F | 83%G |
A Calculated based on average shares outstanding during the period.
B Total returns would have been lower if certain expenses had not been reduced during the applicable periods shown.
C Fees and expenses of any underlying Fidelity Central Funds are not included in the Fund's expense ratio. The Fund indirectly bears its proportionate share of the expenses of any underlying Fidelity Central Funds.
D Expense ratios reflect operating expenses of the class. Expenses before reductions do not reflect amounts reimbursed by the investment adviser or reductions from expense offset arrangements and do not represent the amount paid by the class during periods when reimbursements or reductions occur. Expenses net of fee waivers reflect expenses after reimbursement by the investment adviser but prior to reductions from expense offset arrangements. Expenses net of all reductions represent the net expenses paid by the class.
E Amount does not include the portfolio activity of any underlying Fidelity Central Funds.
F The portfolio turnover rate does not include the assets acquired in the merger.
G Portfolio turnover rate excludes securities received or delivered in-kind.
See accompanying notes which are an integral part of the financial statements.
Fidelity Short-Term Bond Fund Class I
| Years ended August 31, | 2019 | 2018 | 2017 | 2016 A |
| Selected Per–Share Data | | | | |
| Net asset value, beginning of period | $8.53 | $8.64 | $8.65 | $8.65 |
| Income from Investment Operations | | | | |
| Net investment income (loss)B | .191 | .135 | .094 | .011 |
| Net realized and unrealized gain (loss) | .171 | (.113) | (.010) | (.001) |
| Total from investment operations | .362 | .022 | .084 | .010 |
| Distributions from net investment income | (.172) | (.132) | (.094) | (.010) |
| Total distributions | (.172) | (.132) | (.094) | (.010) |
| Net asset value, end of period | $8.72 | $8.53 | $8.64 | $8.65 |
| Total ReturnC,D | 4.29% | .26% | .97% | .11% |
| Ratios to Average Net AssetsE,F | | | | |
| Expenses before reductions | .51% | .51% | .51% | .53%G |
| Expenses net of fee waivers, if any | .51% | .51% | .51% | .53%G |
| Expenses net of all reductions | .51% | .51% | .51% | .53%G |
| Net investment income (loss) | 2.22% | 1.58% | 1.09% | .94%G |
| Supplemental Data | | | | |
| Net assets, end of period (in millions) | $334 | $367 | $425 | $525 |
| Portfolio turnover rateH | 46% | 56% | 56% | 138%I |
A For the period July 12, 2016 (commencement of sale of shares) to August 31, 2016.
B Calculated based on average shares outstanding during the period.
C Total returns for periods of less than one year are not annualized.
D Total returns would have been lower if certain expenses had not been reduced during the applicable periods shown.
E Fees and expenses of any underlying Fidelity Central Funds are not included in the Fund's expense ratio. The Fund indirectly bears its proportionate share of the expenses of any underlying Fidelity Central Funds.
F Expense ratios reflect operating expenses of the class. Expenses before reductions do not reflect amounts reimbursed by the investment adviser or reductions from expense offset arrangements and do not represent the amount paid by the class during periods when reimbursements or reductions occur. Expense ratios before reductions for start-up periods may not be representative of longer-term operating periods. Expenses net of fee waivers reflect expenses after reimbursement by the investment adviser but prior to reductions from expense offset arrangements. Expenses net of all reductions represent the net expenses paid by the class.
G Annualized
H Amount does not include the portfolio activity of any underlying Fidelity Central Funds.
I The portfolio turnover rate does not include the assets acquired in the merger.
See accompanying notes which are an integral part of the financial statements.
Fidelity Short-Term Bond Fund Class Z
| Years ended August 31, | 2019 A |
| Selected Per–Share Data | |
| Net asset value, beginning of period | $8.51 |
| Income from Investment Operations | |
| Net investment income (loss)B | .190 |
| Net realized and unrealized gain (loss) | .189 |
| Total from investment operations | .379 |
| Distributions from net investment income | (.169) |
| Total distributions | (.169) |
| Net asset value, end of period | $8.72 |
| Total ReturnC,D | 4.50% |
| Ratios to Average Net AssetsE,F | |
| Expenses before reductions | .40%G |
| Expenses net of fee waivers, if any | .36%G |
| Expenses net of all reductions | .36%G |
| Net investment income (loss) | 2.43 %G |
| Supplemental Data | |
| Net assets, end of period (in millions) | $116 |
| Portfolio turnover rateH | 46% |
A For the period October 2, 2018 (commencement of sale of shares) to August 31, 2019.
B Calculated based on average shares outstanding during the period.
C Total returns for periods of less than one year are not annualized.
D Total returns would have been lower if certain expenses had not been reduced during the applicable periods shown.
E Fees and expenses of any underlying Fidelity Central Funds are not included in the Fund's expense ratio. The Fund indirectly bears its proportionate share of the expenses of any underlying Fidelity Central Funds.
F Expense ratios reflect operating expenses of the class. Expenses before reductions do not reflect amounts reimbursed by the investment adviser or reductions from expense offset arrangements and do not represent the amount paid by the class during periods when reimbursements or reductions occur. Expenses net of fee waivers reflect expenses after reimbursement by the investment adviser but prior to reductions from expense offset arrangements. Expenses net of all reductions represent the net expenses paid by the class.
G Annualized
H Amount does not include the portfolio activity of any underlying Fidelity Central Funds.
See accompanying notes which are an integral part of the financial statements.
Notes to Financial Statements
For the period ended August 31, 2019
(Amounts in thousands except percentages)
1. Organization.
Fidelity Short-Term Bond Fund (the Fund) is a fund of Fidelity Salem Street Trust (the Trust) and is authorized to issue an unlimited number of shares. The Trust is registered under the Investment Company Act of 1940, as amended (the 1940 Act), as an open-end management investment company organized as a Massachusetts business trust. The Fund commenced sale of Class Z shares on October 2, 2018. The Fund offers Class A, Class M, Class C, Short-Term Bond, Class I and Class Z shares, each of which has equal rights as to assets and voting privileges. Each class has exclusive voting rights with respect to matters that affect that class.
Effective March 1, 2019, Class C shares will automatically convert to Class A shares after a holding period of ten years from the initial date of purchase, with certain exceptions.
2. Investments in Fidelity Central Funds.
The Fund invests in Fidelity Central Funds, which are open-end investment companies generally available only to other investment companies and accounts managed by the investment adviser and its affiliates. The Fund's Schedule of Investments lists each of the Fidelity Central Funds held as of period end, if any, as an investment of the Fund, but does not include the underlying holdings of each Fidelity Central Fund. As an Investing Fund, the Fund indirectly bears its proportionate share of the expenses of the underlying Fidelity Central Funds.
The Money Market Central Funds seek preservation of capital and current income and are managed by Fidelity Investments Money Management, Inc. (FIMM), an affiliate of the investment adviser. Annualized expenses of the Money Market Central Funds as of their most recent shareholder report date ranged from less than .005% to .01%.
A complete unaudited list of holdings for each Fidelity Central Fund is available upon request or at the Securities and Exchange Commission (the SEC) website at www.sec.gov. In addition, the financial statements of the Fidelity Central Funds, which are not covered by the Fund's Report of Independent Registered Public Accounting Firm, are available on the SEC website or upon request.
3. Significant Accounting Policies.
The Fund is an investment company and applies the accounting and reporting guidance of the Financial Accounting Standards Board (FASB) Accounting Standards Codification Topic 946 Financial Services – Investments Companies. The financial statements have been prepared in conformity with accounting principles generally accepted in the United States of America (GAAP), which require management to make certain estimates and assumptions at the date of the financial statements. Actual results could differ from those estimates. Subsequent events, if any, through the date that the financial statements were issued have been evaluated in the preparation of the financial statements. The following summarizes the significant accounting policies of the Fund:
Investment Valuation. Investments are valued as of 4:00 p.m. Eastern time on the last calendar day of the period. The Board of Trustees (the Board) has delegated the day to day responsibility for the valuation of the Fund's investments to the Fair Value Committee (the Committee) established by the Fund's investment adviser. In accordance with valuation policies and procedures approved by the Board, the Fund attempts to obtain prices from one or more third party pricing vendors or brokers to value its investments. When current market prices, quotations or currency exchange rates are not readily available or reliable, investments will be fair valued in good faith by the Committee, in accordance with procedures adopted by the Board. Factors used in determining fair value vary by investment type and may include market or investment specific events, changes in interest rates and credit quality. The frequency with which these procedures are used cannot be predicted and they may be utilized to a significant extent. The Committee oversees the Fund's valuation policies and procedures and reports to the Board on the Committee's activities and fair value determinations. The Board monitors the appropriateness of the procedures used in valuing the Fund's investments and ratifies the fair value determinations of the Committee.
The Fund categorizes the inputs to valuation techniques used to value its investments into a disclosure hierarchy consisting of three levels as shown below:
- Level 1 – quoted prices in active markets for identical investments
- Level 2 – other significant observable inputs (including quoted prices for similar investments, interest rates, prepayment speeds, etc.)
- Level 3 – unobservable inputs (including the Fund's own assumptions based on the best information available)
Valuation techniques used to value the Fund's investments by major category are as follows:
Debt securities, including restricted securities, are valued based on evaluated prices received from third party pricing vendors or from brokers who make markets in such securities. Corporate bonds, bank notes, municipal securities, U.S. government and government agency obligations, commercial paper, certificates of deposit and other Short-Term securities are valued by pricing vendors who utilize matrix pricing which considers yield or price of bonds of comparable quality, coupon, maturity and type or by broker-supplied prices. Asset backed securities, collateralized mortgage obligations, commercial mortgage securities and U.S. government agency mortgage securities are valued by pricing vendors who utilize matrix pricing which considers prepayment speed assumptions, attributes of the collateral, yield or price of bonds of comparable quality, coupon, maturity and type or by broker-supplied prices. When independent prices are unavailable or unreliable, debt securities may be valued utilizing pricing methodologies which consider similar factors that would be used by third party pricing vendors. Debt securities are generally categorized as Level 2 in the hierarchy but may be Level 3 depending on the circumstances.
Futures contracts are valued at the settlement price established each day by the board of trade or exchange on which they are traded and are categorized as Level 1 in the hierarchy.
Investments in open-end mutual funds, including the Fidelity Central Funds, are valued at their closing net asset value (NAV) each business day and are categorized as Level 1 in the hierarchy. Short-term securities with remaining maturities of sixty days or less may be valued at amortized cost, which approximates fair value, and are categorized as Level 2 in the hierarchy.
Changes in valuation techniques may result in transfers in or out of an assigned level within the disclosure hierarchy. The aggregate value of investments by input level as of August 31, 2019 is included at the end of the Fund's Schedule of Investments.
Investment Transactions and Income. For financial reporting purposes, the Fund's investment holdings and NAV include trades executed through the end of the last business day of the period. The NAV per share for processing shareholder transactions is calculated as of the close of business of the New York Stock Exchange (NYSE), normally 4:00 p.m. Eastern time and includes trades executed through the end of the prior business day. Gains and losses on securities sold are determined on the basis of identified cost and include proceeds received from litigation. Income and capital gain distributions from Fidelity Central Funds, if any, are recorded on the ex-dividend date. Interest income is accrued as earned and includes coupon interest and amortization of premium and accretion of discount on debt securities as applicable. Debt obligations may be placed on non-accrual status and related interest income may be reduced by ceasing current accruals and writing off interest receivables when the collection of all or a portion of interest has become doubtful based on consistently applied procedures. A debt obligation is removed from non-accrual status when the issuer resumes interest payments or when collectability of interest is reasonably assured.
Class Allocations and Expenses. Investment income, realized and unrealized capital gains and losses, common expenses of the Fund, and certain fund-level expense reductions, if any, are allocated daily on a pro-rata basis to each class based on the relative net assets of each class to the total net assets of the Fund. Each class differs with respect to transfer agent and distribution and service plan fees incurred. Certain expense reductions may also differ by class. For the reporting period, the allocated portion of income and expenses to each class as a percent of its average net assets may vary due to the timing of recording these transactions in relation to fluctuating net assets of the classes. Expenses directly attributable to a fund are charged to that fund. Expenses attributable to more than one fund are allocated among the respective funds on the basis of relative net assets or other appropriate methods. Expense estimates are accrued in the period to which they relate and adjustments are made when actual amounts are known.
Deferred Trustee Compensation. Under a Deferred Compensation Plan (the Plan) for the Fund, certain independent Trustees have elected to defer receipt of a portion of their annual compensation. Deferred amounts are invested in a cross-section of Fidelity funds, are marked-to-market and remain in the Fund until distributed in accordance with the Plan. The investment of deferred amounts and the offsetting payable to the Trustees of $63 are included in the accompanying Statement of Assets and Liabilities in other receivables and other payables and accrued expenses, respectively.
Income Tax Information and Distributions to Shareholders. Each year, the Fund intends to qualify as a regulated investment company under Subchapter M of the Internal Revenue Code, including distributing substantially all of its taxable income and realized gains. As a result, no provision for U.S. Federal income taxes is required. As of August 31, 2019, the Fund did not have any unrecognized tax benefits in the financial statements; nor is the Fund aware of any tax positions for which it is reasonably possible that the total amounts of unrecognized tax benefits will significantly change in the next twelve months. The Fund files a U.S. federal tax return, in addition to state and local tax returns as required. The Fund's federal income tax returns are subject to examination by the Internal Revenue Service (IRS) for a period of three fiscal years after they are filed. State and local tax returns may be subject to examination for an additional fiscal year depending on the jurisdiction.
Distributions are declared and recorded daily and paid monthly from net investment income. Distributions from realized gains, if any, are declared and recorded on the ex-dividend date. Income and capital gain distributions are declared separately for each class. Income and capital gain distributions are determined in accordance with income tax regulations, which may differ from GAAP.
Capital accounts within the financial statements are adjusted for permanent book-tax differences. These adjustments have no impact on net assets or the results of operations. Capital accounts are not adjusted for temporary book-tax differences which will reverse in a subsequent period.
Book-tax differences are primarily due to futures contracts, market discount, deferred trustees compensation and capital loss carryforwards.
As of period end, the cost and unrealized appreciation (depreciation) in securities, and derivatives if applicable, for federal income tax purposes were as follows:
| Gross unrealized appreciation | $91,112 |
| Gross unrealized depreciation | (4,155) |
| Net unrealized appreciation (depreciation) | $86,957 |
| Tax Cost | $5,671,739 |
The tax-based components of distributable earnings as of period end were as follows:
| Undistributed ordinary income | $2,487 |
| Capital loss carryforward | $(39,870) |
| Net unrealized appreciation (depreciation) on securities and other investments | $86,957 |
Capital loss carryforwards are only available to offset future capital gains of the Fund to the extent provided by regulations and may be limited. Under the Regulated Investment Company Modernization Act of 2010 (the Act), the Fund is permitted to carry forward capital losses incurred in taxable years beginning after December 22, 2010 for an unlimited period and such capital losses are required to be used prior to any losses that expire. The capital loss carryforward information presented below, including any applicable limitation, is estimated as of fiscal period end and is subject to adjustment.
| No expiration | |
| Short-term | $(9,829) |
| Long-term | (30,041) |
| Total capital loss carryforward | $(39,870) |
The tax character of distributions paid was as follows:
| | August 31, 2019 | August 31, 2018 |
| Ordinary Income | $111,610 | $ 89,578 |
Repurchase Agreements. Pursuant to an Exemptive Order issued by the SEC, the Fund along with other registered investment companies having management contracts with Fidelity Management & Research Company (FMR), or other affiliated entities of FMR, are permitted to transfer uninvested cash balances into joint trading accounts which are then invested in repurchase agreements. The Fund may also invest directly with institutions in repurchase agreements. Repurchase agreements may be collateralized by government or non-government securities. Upon settlement date, collateral is held in segregated accounts with custodian banks and may be obtained in the event of a default of the counterparty. The Fund monitors, on a daily basis, the value of the collateral to ensure it is at least equal to the principal amount of the repurchase agreement (including accrued interest). In the event of a default by the counterparty, realization of the collateral proceeds could be delayed, during which time the value of the collateral may decline.
Restricted Securities. The Fund may invest in securities that are subject to legal or contractual restrictions on resale. These securities generally may be resold in transactions exempt from registration or to the public if the securities are registered. Disposal of these securities may involve time-consuming negotiations and expense, and prompt sale at an acceptable price may be difficult. Information regarding restricted securities is included at the end of the Fund's Schedule of Investments.
New Rule Issuance. During August 2018, the U.S. Securities and Exchange Commission issued Final Rule Release No. 33-10532, Disclosure Update and Simplification. This Final Rule includes amendments specific to registered investment companies that are intended to eliminate overlap in disclosure requirements between Regulation S-X and GAAP. In accordance with these amendments, certain line-items in the Fund's financial statements have been combined or removed for the current period as outlined in the table below.
| Financial Statement | Current Line-Item Presentation (As Applicable) | Prior Line-Item Presentation (As Applicable) |
| Statement of Assets and Liabilities | Total distributable earnings (loss) | Undistributed/Distributions in excess of/Accumulated net investment income (loss)
Accumulated/Undistributed net realized gain (loss)
Net unrealized appreciation (depreciation) |
| Statement of Changes in Net Assets | N/A - removed | Undistributed/Distributions in excess of/Accumulated net investment income (loss) end of period |
| Statement of Changes in Net Assets | Distributions to shareholders | Distributions to shareholders from net investment income
Distributions to shareholders from net realized gain |
| Distributions to Shareholders Note to Financial Statements | Distributions to shareholders | Distributions to shareholders from net investment income
Distributions to shareholders from net realized gain |
4. Derivative Instruments.
Risk Exposures and the Use of Derivative Instruments. The Fund's investment objective allows the Fund to enter into various types of derivative contracts, including futures contracts. Derivatives are investments whose value is primarily derived from underlying assets, indices or reference rates and may be transacted on an exchange or over-the-counter (OTC). Derivatives may involve a future commitment to buy or sell a specified asset based on specified terms, to exchange future cash flows at periodic intervals based on a notional principal amount, or for one party to make one or more payments upon the occurrence of specified events in exchange for periodic payments from the other party.
The Fund used derivatives to increase returns and to manage exposure to certain risks as defined below. The success of any strategy involving derivatives depends on analysis of numerous economic factors, and if the strategies for investment do not work as intended, the Fund may not achieve its objectives.
The Fund's use of derivatives increased or decreased its exposure to the following risk:
| Equity Risk | Equity risk relates to the fluctuations in the value of financial instruments as a result of changes in market prices (other than those arising from interest rate risk or foreign exchange risk), whether caused by factors specific to an individual investment, its issuer, or all factors affecting all instruments traded in a market or market segment.
|
The Fund is also exposed to additional risks from investing in derivatives, such as liquidity risk and counterparty credit risk. Liquidity risk is the risk that the Fund will be unable to close out the derivative in the open market in a timely manner. Counterparty credit risk is the risk that the counterparty will not be able to fulfill its obligation to the Fund. Counterparty credit risk related to exchange-traded futures contracts may be mitigated by the protection provided by the exchange on which they trade.
Investing in derivatives may involve greater risks than investing in the underlying assets directly and, to varying degrees, may involve risk of loss in excess of any initial investment and collateral received and amounts recognized in the Statement of Assets and Liabilities. In addition, there may be the risk that the change in value of the derivative contract does not correspond to the change in value of the underlying instrument.
Futures Contracts. A futures contract is an agreement between two parties to buy or sell a specified underlying instrument for a fixed price at a specified future date. The Fund used futures contracts to manage its exposure to the stock market.
Upon entering into a futures contract, a fund is required to deposit either cash or securities (initial margin) with a clearing broker in an amount equal to a certain percentage of the face value of the contract. Futures contracts are marked-to-market daily and subsequent daily payments (variation margin) are made or received by a fund depending on the daily fluctuations in the value of the futures contracts and are recorded as unrealized appreciation or (depreciation). This receivable and/or payable, if any, is included in daily variation margin on futures contracts in the Statement of Assets and Liabilities. Realized gain or (loss) is recorded upon the expiration or closing of a futures contract. The net realized gain (loss) and change in net unrealized appreciation (depreciation) on futures contracts during the period is presented in the Statement of Operations.
Any open futures contracts at period end are presented in the Schedule of Investments under the caption "Futures Contracts". The notional amount at value reflects each contract's exposure to the underlying instrument or index at period end and is representative of volume of activity during the period. Securities deposited to meet initial margin requirements are identified in the Schedule of Investments.
5. Purchases and Sales of Investments.
Purchases and sales of securities, other than short-term securities and U.S. government securities, aggregated $1,704,184 and $1,413,080, respectively.
6. Fees and Other Transactions with Affiliates.
Management Fee. Fidelity Management & Research Company (the investment adviser) and its affiliates provide the Fund with investment management related services for which the Fund pays a monthly management fee. The management fee is the sum of an individual fund fee rate that is based on an annual rate of .20% of the Fund's average net assets and an annualized group fee rate that averaged .10% during the period. The group fee rate is based upon the average net assets of all the mutual funds advised by the investment adviser, including any mutual funds previously advised by the investment adviser that are currently advised by Fidelity SelectCo, LLC, an affiliate of the investment adviser. The group fee rate decreases as assets under management increase and increases as assets under management decrease. For the reporting period, the total annual management fee rate was .30% of the Fund's average net assets.
Distribution and Service Plan Fees. In accordance with Rule 12b-1 of the 1940 Act, the Fund has adopted separate Distribution and Service Plans for each class of shares. Certain classes pay Fidelity Distributors Corporation (FDC), an affiliate of the investment adviser, separate Distribution and Service Fees, each of which is based on an annual percentage of each class' average net assets. In addition, FDC may pay financial intermediaries for selling shares of the Fund and providing shareholder support services. For the period, the Distribution and Service Fee rates, total fees and amounts retained by FDC were as follows:
| | Distribution Fee | Service Fee | Total Fees | Retained by FDC |
| Class A | -% | .15% | $238 | $18 |
| Class M | -% | .15% | 105 | 3 |
| Class C | .75% | .25% | 483 | 41 |
| | | | $826 | $62 |
Sales Load. FDC may receive a front-end sales charge of up to 1.50% for selling Class A and Class M shares, some of which is paid to financial intermediaries for selling shares of the Fund. Depending on the holding period, FDC may receive a contingent deferred sales charges levied on Class A, Class M and Class C redemptions. The deferred sales charges are 1.00% for Class C shares, .75% or .50% for certain purchases of Class A shares and .25% for certain purchases of Class M shares.
For the period, sales charge amounts retained by FDC were as follows:
| | Retained by FDC |
| Class A | $19 |
| Class M | 3 |
| Class C(a) | 9 |
| | $31 |
(a) When Class C shares are initially sold, FDC pays commissions from its own resources to financial intermediaries through which the sales are made.
Transfer Agent Fees. Fidelity Investments Institutional Operations Company, Inc., (FIIOC), an affiliate of the investment adviser, is the transfer, dividend disbursing and shareholder servicing agent for each class of the Fund. FIIOC receives account fees and asset-based fees that vary according to the account size and type of account of the shareholders of each respective class of the Fund, with the exception of Short-Term Bond and Class Z. FIIOC receives an asset-based fee of Short-Term Bond's and Class Z's average net assets. FIIOC pays for typesetting, printing and mailing of shareholder reports, except proxy statements. For the period, transfer agent fees for each class were as follows:
| | Amount | % of Class-Level Average Net Assets |
| Class A | $243 | .15 |
| Class M | 116 | .17 |
| Class C | 79 | .16 |
| Short-Term Bond | 4,806 | .10 |
| Class I | 546 | .16 |
| Class Z | 25 | .05(a) |
| | $5,815 | |
(a) Annualized
Fund Wide Operations Fee. Pursuant to the Fund Wide Operations and Expense Agreement (FWOE), the investment adviser has agreed to provide for fund level expenses (which do not include transfer agent, Rule 12b-1 fees, compensation of the independent Trustees, interest (including commitment fees), taxes or extraordinary expenses, if any) in return for a FWOE fee equal to .35% of the Fund's average net assets less the total amount of the management fee. The FWOE paid by the Fund is reduced by an amount equal to the fees and expenses paid to the independent Trustees. For the period, the FWOE fee was equivalent to an annual rate of .05% of average net assets.
Interfund Lending Program. Pursuant to an Exemptive Order issued by the SEC, the Fund, along with other registered investment companies having management contracts with FMR or other affiliated entities of FMR, may participate in an interfund lending program. This program provides an alternative credit facility allowing the funds to borrow from, or lend money to, other participating affiliated funds. At period end, there were no interfund loans outstanding. The Fund's activity in this program during the period for which loans were outstanding was as follows:
| Borrower or Lender | Average Loan Balance | Weighted Average Interest Rate | Interest Expense |
| Borrower | $6,637 | 2.44% | $–(a) |
(a) In the amount of less than five hundred dollars.
Interfund Trades. The Fund may purchase from or sell securities to other Fidelity Funds under procedures adopted by the Board. The procedures have been designed to ensure these interfund trades are executed in accordance with Rule 17a-7 of the 1940 Act. Interfund trades are included within the respective purchases and sales amounts shown in the Purchases and Sales of Investments note.
7. Committed Line of Credit.
The Fund participates with other funds managed by the investment adviser or an affiliate in a $4.25 billion credit facility (the "line of credit") to be utilized for temporary or emergency purposes to fund shareholder redemptions or for other short-term liquidity purposes. The Fund has agreed to pay commitment fees on its pro-rata portion of the line of credit, which amounted to $16 and is reflected in Commitment fees on the Statement of Operations. During the period, the Fund did not borrow on this line of credit.
8. Expense Reductions.
The investment adviser contractually agreed to reimburse each class to the extent annual operating expenses exceeded certain levels of class-level average net assets as noted in the table below. This reimbursement will remain in place through December 31, 2019. Some expenses, for example the compensation of the independent Trustees, and certain other expenses such as interest expense, are excluded from this reimbursement.
The following classes were in reimbursement during the period:
| | Expense Limitations | Reimbursement |
| Class Z | .36% | $18 |
In addition, through arrangements with the Fund's custodian and each class' transfer agent, credits realized as a result of certain uninvested cash balances were used to reduce the Fund's expenses. During the period, these credits reduced the Fund's custody expenses fee by $4.
During the period, credits reduced each class' transfer agent expense as noted in the table below.
(a) In the amount of less than five hundred dollars.
9. Distributions to Shareholders.
Distributions to shareholders of each class were as follows:
| | Year ended
August 31, 2019(a) | Year ended
August 31, 2018 |
| Distributions to shareholders | | |
| Class A | $2,937 | $– |
| Class M | 1,288 | – |
| Class C | 481 | – |
| Short-Term Bond | 98,776 | – |
| Class I | 7,028 | – |
| Class Z | 1,100 | – |
| Total | $111,610 | $– |
| From net investment income | | |
| Class A | $– | $2,173 |
| Class M | – | 1,029 |
| Class C | – | 312 |
| Short-Term Bond | – | 79,866 |
| Class I | – | 6,198 |
| Total | $– | $89,578 |
(a) Distributions for Class Z are for the period October 2, 2018 (commencement of sale of shares) to August 31, 2019.
10. Share Transactions.
Share transactions for each class were as follows and may contain automatic conversions between classes or exchanges between affiliated funds:
| | Shares | Shares | Dollars | Dollars |
| | Year ended August 31, 2019(a) | Year ended August 31, 2018 | Year ended August 31, 2019(a) | Year ended August 31, 2018 |
| Class A | | | | |
| Shares sold | 12,238 | 6,960 | $105,019 | $59,529 |
| Reinvestment of distributions | 322 | 242 | 2,772 | 2,070 |
| Shares redeemed | (9,351) | (10,079) | (80,241) | (86,176) |
| Net increase (decrease) | 3,209 | (2,877) | $27,550 | $(24,577) |
| Class M | | | | |
| Shares sold | 2,557 | 1,504 | $21,913 | $12,850 |
| Reinvestment of distributions | 143 | 114 | 1,226 | 978 |
| Shares redeemed | (2,805) | (2,804) | (24,055) | (23,983) |
| Net increase (decrease) | (105) | (1,186) | $(916) | $(10,155) |
| Class C | | | | |
| Shares sold | 4,339 | 1,293 | $37,058 | $11,057 |
| Reinvestment of distributions | 53 | 34 | 458 | 293 |
| Shares redeemed | (6,694) | (3,197) | (57,458) | (27,333) |
| Net increase (decrease) | (2,302) | (1,870) | $(19,942) | $(15,983) |
| Short-Term Bond | | | | |
| Shares sold | 172,485 | 114,004 | $1,478,932 | $974,360 |
| Reinvestment of distributions | 10,340 | 8,630 | 88,859 | 73,726 |
| Shares redeemed | (149,285) | (208,562) | (1,280,175) | (1,782,560) |
| Net increase (decrease) | 33,540 | (85,928) | $287,616 | $(734,474) |
| Class I | | | | |
| Shares sold | 15,706 | 14,843 | $134,818 | $127,129 |
| Reinvestment of distributions | 761 | 679 | 6,541 | 5,802 |
| Shares redeemed | (21,236) | (21,651) | (182,371) | (185,200) |
| Net increase (decrease) | (4,769) | (6,129) | $(41,012) | $(52,269) |
| Class Z | | | | |
| Shares sold | 14,778 | – | $126,967 | $– |
| Reinvestment of distributions | 88 | – | 759 | – |
| Shares redeemed | (1,616) | – | (13,910) | – |
| Net increase (decrease) | 13,250 | – | $113,816 | $– |
(a) Share transactions for Class Z are for the period October 2, 2018 (commencement of sale of shares) to August 31, 2019
11. Other.
The Fund's organizational documents provide former and current trustees and officers with a limited indemnification against liabilities arising in connection with the performance of their duties to the Fund. In the normal course of business, the Fund may also enter into contracts that provide general indemnifications. The Fund's maximum exposure under these arrangements is unknown as this would be dependent on future claims that may be made against the Fund. The risk of material loss from such claims is considered remote.
At the end of the period, Strategic Advisers Short Duration Fund was the owner of record of approximately 10% of the total outstanding shares of the Fund.
12. Credit Risk.
The Fund invests a portion of its assets in structured securities of issuers backed by commercial and residential mortgage loans, credit card receivables and automotive loans. The value and related income of these securities is sensitive to changes in economic conditions, including delinquencies and/or defaults.
Report of Independent Registered Public Accounting Firm
To the Board of Trustees of Fidelity Salem Street Trust and Shareholders of Fidelity Short-Term Bond Fund:
Opinion on the Financial Statements
We have audited the accompanying statement of assets and liabilities, including the schedule of investments, of Fidelity Short-Term Bond Fund (one of the funds constituting Fidelity Salem Street Trust, referred to hereafter as the “Fund”) as of August 31, 2019, the related statement of operations for the year ended August 31, 2019, the statement of changes in net assets for each of the two years in the period ended August 31, 2019, including the related notes, and the financial highlights for each of the periods indicated therein (collectively referred to as the “financial statements”). In our opinion, the financial statements present fairly, in all material respects, the financial position of the Fund as of August 31, 2019, the results of its operations for the year then ended, the changes in its net assets for each of the two years in the period ended August 31, 2019 and the financial highlights for each of the periods indicated therein in conformity with accounting principles generally accepted in the United States of America.
Basis for Opinion
These financial statements are the responsibility of the Fund’s management. Our responsibility is to express an opinion on the Fund’s financial statements based on our audits. We are a public accounting firm registered with the Public Company Accounting Oversight Board (United States) (PCAOB) and are required to be independent with respect to the Fund in accordance with the U.S. federal securities laws and the applicable rules and regulations of the Securities and Exchange Commission and the PCAOB.
We conducted our audits of these financial statements in accordance with the standards of the PCAOB. Those standards require that we plan and perform the audit to obtain reasonable assurance about whether the financial statements are free of material misstatement, whether due to error or fraud.
Our audits included performing procedures to assess the risks of material misstatement of the financial statements, whether due to error or fraud, and performing procedures that respond to those risks. Such procedures included examining, on a test basis, evidence regarding the amounts and disclosures in the financial statements. Our audits also included evaluating the accounting principles used and significant estimates made by management, as well as evaluating the overall presentation of the financial statements. Our procedures included confirmation of securities owned as of August 31, 2019 by correspondence with the custodians and brokers; when replies were not received from brokers, we performed other auditing procedures. We believe that our audits provide a reasonable basis for our opinion.
PricewaterhouseCoopers LLP
Boston, Massachusetts
October 16, 2019
We have served as the auditor of one or more investment companies in the Fidelity group of funds since 1932.
Trustees and Officers
The Trustees, Members of the Advisory Board (if any), and officers of the trust and fund, as applicable, are listed below. The Board of Trustees governs the fund and is responsible for protecting the interests of shareholders. The Trustees are experienced executives who meet periodically throughout the year to oversee the fund's activities, review contractual arrangements with companies that provide services to the fund, oversee management of the risks associated with such activities and contractual arrangements, and review the fund's performance. Except for Jonathan Chiel, each of the Trustees oversees xxx funds. Mr. Chiel oversees xxx funds.
The Trustees hold office without limit in time except that (a) any Trustee may resign; (b) any Trustee may be removed by written instrument, signed by at least two-thirds of the number of Trustees prior to such removal; (c) any Trustee who requests to be retired or who has become incapacitated by illness or injury may be retired by written instrument signed by a majority of the other Trustees; and (d) any Trustee may be removed at any special meeting of shareholders by a two-thirds vote of the outstanding voting securities of the trust. Each Trustee who is not an interested person (as defined in the 1940 Act) of the trust and the fund is referred to herein as an Independent Trustee. Each Independent Trustee shall retire not later than the last day of the calendar year in which his or her 75th birthday occurs. The Independent Trustees may waive this mandatory retirement age policy with respect to individual Trustees. Officers and Advisory Board Members hold office without limit in time, except that any officer or Advisory Board Member may resign or may be removed by a vote of a majority of the Trustees at any regular meeting or any special meeting of the Trustees. Except as indicated, each individual has held the office shown or other offices in the same company for the past five years.
The fund's Statement of Additional Information (SAI) includes more information about the Trustees. To request a free copy, call Fidelity at 1-800-544-8544 if you’re an individual investing directly with Fidelity, call 1-800-835-5092 if you’re a plan sponsor or participant with Fidelity as your recordkeeper or call 1-877-208-0098 on institutional accounts or if you’re an advisor or invest through one.
Experience, Skills, Attributes, and Qualifications of the Trustees. The Governance and Nominating Committee has adopted a statement of policy that describes the experience, qualifications, attributes, and skills that are necessary and desirable for potential Independent Trustee candidates (Statement of Policy). The Board believes that each Trustee satisfied at the time he or she was initially elected or appointed a Trustee, and continues to satisfy, the standards contemplated by the Statement of Policy. The Governance and Nominating Committee also engages professional search firms to help identify potential Independent Trustee candidates who have the experience, qualifications, attributes, and skills consistent with the Statement of Policy. From time to time, additional criteria based on the composition and skills of the current Independent Trustees, as well as experience or skills that may be appropriate in light of future changes to board composition, business conditions, and regulatory or other developments, have also been considered by the professional search firms and the Governance and Nominating Committee. In addition, the Board takes into account the Trustees' commitment and participation in Board and committee meetings, as well as their leadership of standing and ad hoc committees throughout their tenure.
In determining that a particular Trustee was and continues to be qualified to serve as a Trustee, the Board has considered a variety of criteria, none of which, in isolation, was controlling. The Board believes that, collectively, the Trustees have balanced and diverse experience, qualifications, attributes, and skills, which allow the Board to operate effectively in governing the fund and protecting the interests of shareholders. Information about the specific experience, skills, attributes, and qualifications of each Trustee, which in each case led to the Board's conclusion that the Trustee should serve (or continue to serve) as a trustee of the fund, is provided below.
Board Structure and Oversight Function. Abigail P. Johnson is an interested person and currently serves as Chairman. The Trustees have determined that an interested Chairman is appropriate and benefits shareholders because an interested Chairman has a personal and professional stake in the quality and continuity of services provided to the fund. Independent Trustees exercise their informed business judgment to appoint an individual of their choosing to serve as Chairman, regardless of whether the Trustee happens to be independent or a member of management. The Independent Trustees have determined that they can act independently and effectively without having an Independent Trustee serve as Chairman and that a key structural component for assuring that they are in a position to do so is for the Independent Trustees to constitute a substantial majority for the Board. The Independent Trustees also regularly meet in executive session. Arthur E. Johnson serves as Chairman of the Independent Trustees and as such (i) acts as a liaison between the Independent Trustees and management with respect to matters important to the Independent Trustees and (ii) with management prepares agendas for Board meetings.
Fidelity® funds are overseen by different Boards of Trustees. The fund's Board oversees Fidelity's investment-grade bond, money market, asset allocation and certain equity funds, and other Boards oversee Fidelity's high income and other equity funds. The asset allocation funds may invest in Fidelity® funds that are overseen by such other Boards. The use of separate Boards, each with its own committee structure, allows the Trustees of each group of Fidelity® funds to focus on the unique issues of the funds they oversee, including common research, investment, and operational issues. On occasion, the separate Boards establish joint committees to address issues of overlapping consequences for the Fidelity® funds overseen by each Board.
The Trustees operate using a system of committees to facilitate the timely and efficient consideration of all matters of importance to the Trustees, the fund, and fund shareholders and to facilitate compliance with legal and regulatory requirements and oversight of the fund's activities and associated risks. The Board, acting through its committees, has charged FMR and its affiliates with (i) identifying events or circumstances the occurrence of which could have demonstrably adverse effects on the fund's business and/or reputation; (ii) implementing processes and controls to lessen the possibility that such events or circumstances occur or to mitigate the effects of such events or circumstances if they do occur; and (iii) creating and maintaining a system designed to evaluate continuously business and market conditions in order to facilitate the identification and implementation processes described in (i) and (ii) above. Because the day-to-day operations and activities of the fund are carried out by or through FMR, its affiliates, and other service providers, the fund's exposure to risks is mitigated but not eliminated by the processes overseen by the Trustees. While each of the Board's committees has responsibility for overseeing different aspects of the fund's activities, oversight is exercised primarily through the Operations and Audit Committees. In addition, an ad hoc Board committee of Independent Trustees has worked with FMR to enhance the Board's oversight of investment and financial risks, legal and regulatory risks, technology risks, and operational risks, including the development of additional risk reporting to the Board. Appropriate personnel, including but not limited to the fund's Chief Compliance Officer (CCO), FMR's internal auditor, the independent accountants, the fund's Treasurer and portfolio management personnel, make periodic reports to the Board's committees, as appropriate, including an annual review of Fidelity's risk management program for the Fidelity® funds. The responsibilities of each standing committee, including their oversight responsibilities, are described further under "Standing Committees of the Trustees."
Interested Trustees*:
Correspondence intended for a Trustee who is an interested person may be sent to Fidelity Investments, 245 Summer Street, Boston, Massachusetts 02210.
Name, Year of Birth; Principal Occupations and Other Relevant Experience+
Jonathan Chiel (1957)
Year of Election or Appointment: 2016
Trustee
Mr. Chiel also serves as Trustee of other Fidelity® funds. Mr. Chiel is Executive Vice President and General Counsel for FMR LLC (diversified financial services company, 2012-present). Previously, Mr. Chiel served as general counsel (2004-2012) and senior vice president and deputy general counsel (2000-2004) for John Hancock Financial Services; a partner with Choate, Hall & Stewart (1996-2000) (law firm); and an Assistant United States Attorney for the United States Attorney’s Office of the District of Massachusetts (1986-95), including Chief of the Criminal Division (1993-1995). Mr. Chiel is a director on the boards of the Boston Bar Foundation and the Maimonides School.
Abigail P. Johnson (1961)
Year of Election or Appointment: 2009
Trustee
Chairman of the Board of Trustees
Ms. Johnson also serves as Trustee of other Fidelity® funds. Ms. Johnson serves as Chairman (2016-present), Chief Executive Officer (2014-present), and Director (2007-present) of FMR LLC (diversified financial services company), President of Fidelity Financial Services (2012-present) and President of Personal, Workplace and Institutional Services (2005-present). Ms. Johnson is Chairman and Director of FMR Co., Inc. (investment adviser firm, 2011-present) and Chairman and Director of FMR (investment adviser firm, 2011-present). Previously, Ms. Johnson served as Vice Chairman (2007-2016) and President (2013-2016) of FMR LLC, President and a Director of FMR (2001-2005), a Trustee of other investment companies advised by FMR, Fidelity Investments Money Management, Inc. (investment adviser firm), and FMR Co., Inc. (2001-2005), Senior Vice President of the Fidelity® funds (2001-2005), and managed a number of Fidelity® funds. Ms. Abigail P. Johnson and Mr. Arthur E. Johnson are not related.
Jennifer Toolin McAuliffe (1959)
Year of Election or Appointment: 2016
Trustee
Ms. McAuliffe also serves as Trustee of other Fidelity® funds. Ms. McAuliffe previously served as a Member of the Advisory Board of certain Fidelity® funds (2016) and as Co-Head of Fixed Income of Fidelity Investments Limited (now known as FIL Limited (FIL)) (diversified financial services company). Earlier roles at FIL included Director of Research for FIL’s credit and quantitative teams in London, Hong Kong and Tokyo. Ms. McAuliffe also was the Director of Research for taxable and municipal bonds at Fidelity Investments Money Management, Inc. Ms. McAuliffe is also a director or trustee of several not-for-profit entities.
* Determined to be an “Interested Trustee” by virtue of, among other things, his or her affiliation with the trust or various entities under common control with FMR.
+ The information includes the Trustee's principal occupation during the last five years and other information relating to the experience, attributes, and skills relevant to the Trustee's qualifications to serve as a Trustee, which led to the conclusion that the Trustee should serve as a Trustee for the fund.
Independent Trustees:
Correspondence intended for an Independent Trustee may be sent to Fidelity Investments, P.O. Box 55235, Boston, Massachusetts 02205-5235.
Name, Year of Birth; Principal Occupations and Other Relevant Experience+
Elizabeth S. Acton (1951)
Year of Election or Appointment: 2013
Trustee
Ms. Acton also serves as Trustee of other Fidelity® funds. Prior to her retirement in April 2012, Ms. Acton was Executive Vice President, Finance (2011-2012), Executive Vice President, Chief Financial Officer (2002-2011), and Treasurer (2004-2005) of Comerica Incorporated (financial services). Prior to joining Comerica, Ms. Acton held a variety of positions at Ford Motor Company (1983-2002), including Vice President and Treasurer (2000-2002) and Executive Vice President and Chief Financial Officer of Ford Motor Credit Company (1998-2000). Ms. Acton currently serves as a member of the Board of Directors and Audit and Finance Committees of Beazer Homes USA, Inc. (homebuilding, 2012-present). Previously, Ms. Acton served as a Member of the Advisory Board of certain Fidelity® funds (2013-2016).
Ann E. Dunwoody (1953)
Year of Election or Appointment: 2018
Trustee
General Dunwoody also serves as Trustee of other Fidelity® funds. General Dunwoody (United States Army, Retired) was the first woman in U.S. military history to achieve the rank of four-star general and prior to her retirement in 2012 held a variety of positions within the U.S. Army, including Commanding General, U.S. Army Material Command (2008-2012). She is the President of First to Four LLC (leadership and mentoring services, 2012-present). She also serves as a member of the Board of Directors and Nominating and Corporate Governance Committee of L3 Technologies, Inc. (communication, electronic, sensor, and aerospace systems, 2013-present), Board of Directors and Nomination and Corporate Governance Committees of Kforce Inc. (professional staffing services, 2016-present) and Board of Directors of Automattic Inc. (software engineering, 2018-present). Previously, General Dunwoody served as a Member of the Advisory Board of certain Fidelity® funds (2018), a member of the Board of Directors and Audit and Sustainability and Corporate Responsibility Committees of Republic Services, Inc. (waste collection, disposal and recycling, 2013-2016). Ms. Dunwoody also serves on several boards for non-profit organizations, including as a member of the Board of Directors, Chair of the Nomination and Governance Committee and member of the Audit Committee of Logistics Management Institute (consulting non-profit, 2012-present), a member of the Board of Directors of the Army Historical Foundation (2015-present), a member of the Council of Trustees for the Association of the United States Army (advocacy non-profit, 2013-present) and a member of the Board of Trustees of Florida Institute of Technology (2015-present) and ThanksUSA (military family education non-profit, 2014-present).
John Engler (1948)
Year of Election or Appointment: 2014
Trustee
Mr. Engler also serves as Trustee of other Fidelity® funds. He serves on the board of directors for Universal Forest Products (manufacturer and distributor of wood and wood-alternative products, 2003-present) and K12 Inc. (technology-based education company, 2012-present). Previously, Mr. Engler served as interim president of Michigan State University (2018-2019), a Member of the Advisory Board of certain Fidelity® funds (2014-2016), president of the Business Roundtable (2011-2017), a trustee of The Munder Funds (2003-2014), president and CEO of the National Association of Manufacturers (2004-2011), member of the Board of Trustees of the Annie E. Casey Foundation (2004-2015), and as governor of Michigan (1991-2003). He is a past chairman of the National Governors Association.
Robert F. Gartland (1951)
Year of Election or Appointment: 2010
Trustee
Mr. Gartland also serves as Trustee of other Fidelity® funds. Mr. Gartland is Chairman and an investor in Gartland & Mellina Group Corp. (consulting, 2009-present). Previously, Mr. Gartland served as a partner and investor of Vietnam Partners LLC (investments and consulting, 2008-2011). Prior to his retirement, Mr. Gartland held a variety of positions at Morgan Stanley (financial services, 1979-2007), including Managing Director (1987-2007), and Chase Manhattan Bank (1975-1978).
Arthur E. Johnson (1947)
Year of Election or Appointment: 2008
Trustee
Chairman of the Independent Trustees
Mr. Johnson also serves as Trustee of other Fidelity® funds. Mr. Johnson serves as a member of the Board of Directors of Eaton Corporation plc (diversified power management, 2009-present) and Booz Allen Hamilton (management consulting, 2011-present). Prior to his retirement, Mr. Johnson served as Senior Vice President of Corporate Strategic Development of Lockheed Martin Corporation (defense contractor, 1999-2009). Mr. Johnson previously served as Vice Chairman (2015-2018) of the Independent Trustees of certain Fidelity® funds and on the Board of Directors of IKON Office Solutions, Inc. (1999-2008), AGL Resources, Inc. (holding company, 2002-2016), and Delta Airlines (2005-2007). Mr. Arthur E. Johnson is not related to Ms. Abigail P. Johnson.
Michael E. Kenneally (1954)
Year of Election or Appointment: 2009
Trustee
Vice Chairman of the Independent Trustees
Mr. Kenneally also serves as Trustee of other Fidelity® funds. Prior to his retirement, Mr. Kenneally served as Chairman and Global Chief Executive Officer of Credit Suisse Asset Management. Before joining Credit Suisse, he was an Executive Vice President and Chief Investment Officer for Bank of America Corporation. Earlier roles at Bank of America included Director of Research, Senior Portfolio Manager and Research Analyst, and Mr. Kenneally was awarded the Chartered Financial Analyst (CFA) designation in 1991.
Marie L. Knowles (1946)
Year of Election or Appointment: 2001
Trustee
Ms. Knowles also serves as Trustee of other Fidelity® funds. Prior to Ms. Knowles' retirement in June 2000, she served as Executive Vice President and Chief Financial Officer of Atlantic Richfield Company (ARCO) (diversified energy, 1996-2000). From 1993 to 1996, she was a Senior Vice President of ARCO and President of ARCO Transportation Company (pipeline and tanker operations). Ms. Knowles currently serves as a Director and Chairman of the Audit Committee of McKesson Corporation (healthcare service, since 2002). Ms. Knowles is a member of the Board of the Santa Catalina Island Company (real estate, 2009-present). Ms. Knowles is a Member of the Investment Company Institute Board of Governors and a Member of the Governing Council of the Independent Directors Council (2014-present). She also serves as a member of the Advisory Board for the School of Engineering of the University of Southern California. Previously, Ms. Knowles served as a Director of Phelps Dodge Corporation (copper mining and manufacturing, 1994-2007), URS Corporation (engineering and construction, 2000-2003) and America West (airline, 1999-2002). Ms. Knowles previously served as Chairman (2015-2018) and Vice Chairman (2012-2015) of the Independent Trustees of certain Fidelity® funds.
Mark A. Murray (1954)
Year of Election or Appointment: 2016
Trustee
Mr. Murray also serves as Trustee of other Fidelity® funds. Mr. Murray is Vice Chairman (2013-present) of Meijer, Inc. (regional retail chain). Previously, Mr. Murray served as a Member of the Advisory Board of certain Fidelity® funds (2016) and as Co-Chief Executive Officer (2013-2016) and President (2006-2013) of Meijer, Inc. Mr. Murray serves as a member of the Board of Directors and Nuclear Review and Public Policy and Responsibility Committees of DTE Energy Company (diversified energy company, 2009-present). Mr. Murray also serves as a member of the Board of Directors of Spectrum Health (not-for-profit health system, 2015-present). Mr. Murray previously served as President of Grand Valley State University (2001-2006), Treasurer for the State of Michigan (1999-2001), Vice President of Finance and Administration for Michigan State University (1998-1999), and a member of the Board of Directors and Audit Committee and Chairman of the Nominating and Corporate Governance Committee of Universal Forest Products, Inc. (manufacturer and distributor of wood and wood-alternative products, 2004-2016). Mr. Murray is also a director or trustee of many community and professional organizations.
+ The information includes the Trustee's principal occupation during the last five years and other information relating to the experience, attributes, and skills relevant to the Trustee's qualifications to serve as a Trustee, which led to the conclusion that the Trustee should serve as a Trustee for the fund.
Advisory Board Members and Officers:
Correspondence intended for an officer may be sent to Fidelity Investments, 245 Summer Street, Boston, Massachusetts 02210. Officers appear below in alphabetical order.
Name, Year of Birth; Principal Occupation
Elizabeth Paige Baumann (1968)
Year of Election or Appointment: 2017
Anti-Money Laundering (AML) Officer
Ms. Baumann also serves as AML Officer of other funds. She is Chief AML Officer (2012-present) and Senior Vice President (2014-present) of FMR LLC (diversified financial services company) and is an employee of Fidelity Investments. Previously, Ms. Baumann served as AML Officer of the funds (2012-2016), and Vice President (2007-2014) and Deputy Anti-Money Laundering Officer (2007-2012) of FMR LLC.
Craig S. Brown (1977)
Year of Election or Appointment: 2019
Assistant Treasurer
Mr. Brown also serves as Assistant Treasurer of other funds. Mr. Brown is an employee of Fidelity Investments (2013-present).
John J. Burke III (1964)
Year of Election or Appointment: 2018
Chief Financial Officer
Mr. Burke also serves as Chief Financial Officer of other funds. Mr. Burke serves as Head of Investment Operations for Fidelity Fund and Investment Operations (2018-present) and is an employee of Fidelity Investments (1998-present). Previously Mr. Burke served as head of Asset Management Investment Operations (2012-2018).
William C. Coffey (1969)
Year of Election or Appointment: 2018
Secretary and Chief Legal Officer (CLO)
Mr. Coffey also serves as Assistant Secretary of other funds. He is Senior Vice President and Deputy General Counsel of FMR LLC (diversified financial services company, 2010-present), and is an employee of Fidelity Investments. Previously, Mr. Coffey served as Secretary and CLO of certain funds (2018-2019); CLO, Secretary, and Senior Vice President of Fidelity Management & Research Company and FMR Co., Inc. (investment adviser firms, 2018-2019); Secretary of Fidelity SelectCo, LLC and Fidelity Investments Money Management, Inc. (investment adviser firms, 2018-2019); CLO of Fidelity Management & Research (Hong Kong) Limited, FMR Investment Management (UK) Limited, and Fidelity Management & Research (Japan) Limited (investment adviser firms, 2018-2019); and Assistant Secretary of certain funds (2009-2018).
Jonathan Davis (1968)
Year of Election or Appointment: 2010
Assistant Treasurer
Mr. Davis also serves as Assistant Treasurer of other funds. Mr. Davis serves as Assistant Treasurer of FMR Capital, Inc. (2017-present) and is an employee of Fidelity Investments. Previously, Mr. Davis served as Vice President and Associate General Counsel of FMR LLC (diversified financial services company, 2003-2010).
Adrien E. Deberghes (1967)
Year of Election or Appointment: 2010
Assistant Treasurer
Mr. Deberghes also serves as an officer of other funds. He serves as Assistant Treasurer of FMR Capital, Inc. (2017-present), Executive Vice President of Fidelity Investments Money Management, Inc. (FIMM) (investment adviser firm, 2016-present), and is an employee of Fidelity Investments (2008-present). Previously, Mr. Deberghes served as President and Treasurer of certain Fidelity® funds (2013-2018). Prior to joining Fidelity Investments, Mr. Deberghes was Senior Vice President of Mutual Fund Administration at State Street Corporation (2007-2008), Senior Director of Mutual Fund Administration at Investors Bank & Trust (2005-2007), and Director of Finance for Dunkin' Brands (2000-2005). Previously, Mr. Deberghes served in other fund officer roles.
Laura M. Del Prato (1964)
Year of Election or Appointment: 2018
President and Treasurer
Ms. Del Prato also serves as an officer of other funds. Ms. Del Prato is an employee of Fidelity Investments (2017-present). Prior to joining Fidelity Investments, Ms. Del Prato served as a Managing Director and Treasurer of the JPMorgan Mutual Funds (2014-2017). Prior to JPMorgan, Ms. Del Prato served as a partner at Cohen Fund Audit Services (accounting firm, 2012-2013) and KPMG LLP (accounting firm, 2004-2012).
Colm A. Hogan (1973)
Year of Election or Appointment: 2016
Assistant Treasurer
Mr. Hogan also serves as an officer of other funds. Mr. Hogan serves as Assistant Treasurer of FMR Capital, Inc. (2017-present) and is an employee of Fidelity Investments (2005-present). Previously, Mr. Hogan served as Assistant Treasurer of certain Fidelity® funds (2016-2018).
Chris Maher (1972)
Year of Election or Appointment: 2013
Assistant Treasurer
Mr. Maher serves as Assistant Treasurer of other funds. Mr. Maher is Vice President of Valuation Oversight, serves as Assistant Treasurer of FMR Capital, Inc. (2017-present), and is an employee of Fidelity Investments. Previously, Mr. Maher served as Vice President of Asset Management Compliance (2013), Vice President of the Program Management Group of FMR (investment adviser firm, 2010-2013), and Vice President of Valuation Oversight (2008-2010).
John B. McGinty, Jr. (1962)
Year of Election or Appointment: 2016
Chief Compliance Officer
Mr. McGinty also serves as Chief Compliance Officer of other funds. Mr. McGinty is Senior Vice President of Asset Management Compliance for Fidelity Investments and is an employee of Fidelity Investments (2016-present). Mr. McGinty previously served as Vice President, Senior Attorney at Eaton Vance Management (investment management firm, 2015-2016), and prior to Eaton Vance as global CCO for all firm operations and registered investment companies at GMO LLC (investment management firm, 2009-2015). Before joining GMO LLC, Mr. McGinty served as Senior Vice President, Deputy General Counsel for Fidelity Investments (2007-2009).
Jason P. Pogorelec (1975)
Year of Election or Appointment: 2015
Assistant Secretary
Mr. Pogorelec also serves as Assistant Secretary of other funds. Mr. Pogorelec serves as Vice President, Associate General Counsel (2010-present) and is an employee of Fidelity Investments (2006-present).
Nancy D. Prior (1967)
Year of Election or Appointment: 2014
Vice President
Ms. Prior also serves as Vice President of other funds. Ms. Prior serves as President of Fixed Income (2014-present), President (2016-present) and Director (2014-present) of Fidelity Investments Money Management, Inc. (FIMM) (investment adviser firm), and is an employee of Fidelity Investments (2002-present). Previously, Ms. Prior served as Vice Chairman of FIAM LLC (investment adviser firm, 2014-2018), a Director of FMR Investment Management (UK) Limited (investment adviser firm, 2015-2018), President Multi-Asset Class Strategies of FMR's Global Asset Allocation Division (2017-2018), Vice President of Fidelity's Money Market Funds (2012-2014), and President, Money Market and Short Duration Bond Group of Fidelity Management & Research Company (FMR) (investment adviser firm, 2013-2014).
Stacie M. Smith (1974)
Year of Election or Appointment: 2013
Assistant Treasurer
Ms. Smith also serves as an officer of other funds. Ms. Smith serves as Assistant Treasurer of FMR Capital, Inc. (2017-present), is an employee of Fidelity Investments (2009-present), and has served in other fund officer roles. Prior to joining Fidelity Investments, Ms. Smith served as Senior Audit Manager of Ernst & Young LLP (accounting firm, 1996-2009). Previously, Ms. Smith served as Assistant Treasurer (2013-2018) and Deputy Treasurer (2013-2016) of certain Fidelity® funds.
Marc L. Spector (1972)
Year of Election or Appointment: 2016
Deputy Treasurer
Mr. Spector also serves as an officer of other funds. Mr. Spector serves as Assistant Treasurer of FMR Capital, Inc. (2017-present) and is an employee of Fidelity Investments (2016-present). Prior to joining Fidelity Investments, Mr. Spector served as Director at the Siegfried Group (accounting firm, 2013-2016), and prior to Siegfried Group as audit senior manager at Deloitte & Touche (accounting firm, 2005-2013).
Jim Wegmann (1979)
Year of Election or Appointment: 2019
Assistant Treasurer
Mr. Wegmann also serves as Assistant Treasurer of other funds. Mr. Wegmann is an employee of Fidelity Investments (2011-present).
Shareholder Expense Example
As a shareholder of the Fund, you incur two types of costs: (1) transaction costs, including sales charges (loads) on purchase payments or redemption proceeds, and (2) ongoing costs, including management fees, distribution and/or service (12b-1) fees and other Fund expenses. This Example is intended to help you understand your ongoing costs (in dollars) of investing in the Fund and to compare these costs with the ongoing costs of investing in other mutual funds.
The Example is based on an investment of $1,000 invested at the beginning of the period and held for the entire period (March 1, 2019 to August 31, 2019).
Actual Expenses
The first line of the accompanying table for each class of the Fund provides information about actual account values and actual expenses. You may use the information in this line, together with the amount you invested, to estimate the expenses that you paid over the period. Simply divide your account value by $1,000.00 (for example, an $8,600 account value divided by $1,000.00 = 8.6), then multiply the result by the number in the first line for a class of the Fund under the heading entitled "Expenses Paid During Period" to estimate the expenses you paid on your account during this period. In addition, the Fund, as a shareholder in the underlying Fidelity Central Funds, will indirectly bear its pro-rata share of the fees and expenses incurred by the underlying Fidelity Central Funds. These fees and expenses are not included in the Fund's annualized expense ratio used to calculate the expense estimate in the table below.
Hypothetical Example for Comparison Purposes
The second line of the accompanying table for each class of the Fund provides information about hypothetical account values and hypothetical expenses based on a Class' actual expense ratio and an assumed rate of return of 5% per year before expenses, which is not the Class' actual return. The hypothetical account values and expenses may not be used to estimate the actual ending account balance or expenses you paid for the period. You may use this information to compare the ongoing costs of investing in the Fund and other funds. To do so, compare this 5% hypothetical example with the 5% hypothetical examples that appear in the shareholder reports of the other funds. In addition, the Fund, as a shareholder in the underlying Fidelity Central Funds, will indirectly bear its pro-rata share of the fees and expenses incurred by the underlying Fidelity Central Funds. These fees and expenses are not included in the Fund's annualized expense ratio used to calculate the expense estimate in the table below.
Please note that the expenses shown in the table are meant to highlight your ongoing costs only and do not reflect any transaction costs. Therefore, the second line of the table is useful in comparing ongoing costs only, and will not help you determine the relative total costs of owning different funds. In addition, if these transactional costs were included, your costs would have been higher.
| | Annualized Expense Ratio-A | Beginning
Account Value
March 1, 2019 | Ending
Account Value
August 31, 2019 | Expenses Paid
During Period-B
March 1, 2019
to August 31, 2019 |
| Class A | .65% | | | |
| Actual | | $1,000.00 | $1,027.20 | $3.32 |
| Hypothetical-C | | $1,000.00 | $1,021.93 | $3.31 |
| Class M | .66% | | | |
| Actual | | $1,000.00 | $1,027.10 | $3.37 |
| Hypothetical-C | | $1,000.00 | $1,021.88 | $3.36 |
| Class C | 1.50% | | | |
| Actual | | $1,000.00 | $1,024.00 | $7.65 |
| Hypothetical-C | | $1,000.00 | $1,017.64 | $7.63 |
| Short-Term Bond | .45% | | | |
| Actual | | $1,000.00 | $1,028.20 | $2.30 |
| Hypothetical-C | | $1,000.00 | $1,022.94 | $2.29 |
| Class I | .50% | | | |
| Actual | | $1,000.00 | $1,028.00 | $2.56 |
| Hypothetical-C | | $1,000.00 | $1,022.68 | $2.55 |
| Class Z | .36% | | | |
| Actual | | $1,000.00 | $1,028.70 | $1.84 |
| Hypothetical-C | | $1,000.00 | $1,023.39 | $1.84 |
A Annualized expense ratio reflects expenses net of applicable fee waivers.
B Expenses are equal to each Class' annualized expense ratio, multiplied by the average account value over the period, multiplied by 184/365 (to reflect the one-half year period).
C 5% return per year before expenses
Distributions (Unaudited)
A total of 21.72% of the dividends distributed during the fiscal year was derived from interest on U.S. Government securities which is generally exempt from state income tax.
The fund designates $68,439,271 of distributions paid during the period January 1, 2019 to August 31, 2019 as qualifying to be taxed as interest-related dividends for nonresident alien shareholders.
The fund will notify shareholders in January 2020 of amounts for use in preparing 2019 income tax returns.
STP-ANN-1019
1.703606.122
Fidelity® U.S. Bond Index Fund
Annual Report August 31, 2019 |
|
Beginning on January 1, 2021, as permitted by regulations adopted by the Securities and Exchange Commission, paper copies of a fund’s shareholder reports will no longer be sent by mail, unless you specifically request paper copies of the reports from the fund or from your financial intermediary, such as a financial advisor, broker-dealer or bank. Instead, the reports will be made available on a website, and you will be notified by mail each time a report is posted and provided with a website link to access the report.
If you already elected to receive shareholder reports electronically, you will not be affected by this change and you need not take any action. You may elect to receive shareholder reports and other communications from a fund electronically, by contacting your financial intermediary. For Fidelity customers, visit Fidelity's web site or call Fidelity using the contact information listed below.
You may elect to receive all future reports in paper free of charge. If you wish to continue receiving paper copies of your shareholder reports, you may contact your financial intermediary or, if you are a Fidelity customer, visit Fidelity’s website, or call Fidelity at the applicable toll-free number listed below. Your election to receive reports in paper will apply to all funds held with the fund complex/your financial intermediary.
| Account Type | Website | Phone Number |
| Brokerage, Mutual Fund, or Annuity Contracts: | fidelity.com/mailpreferences | 1-800-343-3548 |
| Employer Provided Retirement Accounts: | netbenefits.fidelity.com/preferences (choose 'no' under Required Disclosures to continue to print) | 1-800-343-0860 |
| Advisor Sold Accounts Serviced Through Your Financial Intermediary: | Contact Your Financial Intermediary | Your Financial Intermediary's phone number |
| Advisor Sold Accounts Serviced by Fidelity: | institutional.fidelity.com | 1-877-208-0098 |
Contents
To view a fund's proxy voting guidelines and proxy voting record for the 12-month period ended June 30, visit http://www.fidelity.com/proxyvotingresults or visit the Securities and Exchange Commission's (SEC) web site at http://www.sec.gov.
You may also call 1-800-544-8544 to request a free copy of the proxy voting guidelines.
Standard & Poor's, S&P and S&P 500 are registered service marks of The McGraw-Hill Companies, Inc. and have been licensed for use by Fidelity Distributors Corporation.
Other third-party marks appearing herein are the property of their respective owners.
All other marks appearing herein are registered or unregistered trademarks or service marks of FMR LLC or an affiliated company. © 2019 FMR LLC. All rights reserved.
This report and the financial statements contained herein are submitted for the general information of the shareholders of the Fund. This report is not authorized for distribution to prospective investors in the Fund unless preceded or accompanied by an effective prospectus.
A fund files its complete schedule of portfolio holdings with the SEC for the first and third quarters of each fiscal year on Form N-PORT. Forms N-PORT are available on the SEC’s web site at http://www.sec.gov. A fund's Forms N-PORT may be reviewed and copied at the SEC’s Public Reference Room in Washington, DC. Information regarding the operation of the SEC's Public Reference Room may be obtained by calling 1-800-SEC-0330.
For a complete list of a fund's portfolio holdings, view the most recent holdings listing, semiannual report, or annual report on Fidelity's web site at http://www.fidelity.com, http://www.institutional.fidelity.com, or http://www.401k.com, as applicable.
NOT FDIC INSURED •MAY LOSE VALUE •NO BANK GUARANTEE
Neither the Fund nor Fidelity Distributors Corporation is a bank.
Performance: The Bottom Line
Average annual total return reflects the change in the value of an investment, assuming reinvestment of distributions from dividend income and capital gains (the profits earned upon the sale of securities that have grown in value, if any) and assuming a constant rate of performance each year. The hypothetical investment and the average annual total returns do not reflect the deduction of taxes that a shareholder would pay on fund distributions or the redemption of fund shares. During periods of reimbursement by Fidelity, a fund’s total return will be greater than it would be had the reimbursement not occurred. How a fund did yesterday is no guarantee of how it will do tomorrow.
Average Annual Total Returns
| For the periods ended August 31, 2019 | Past 1 year | Past 5 years | Past 10 years |
| Fidelity® U.S. Bond Index Fund | 10.33% | 3.32% | 3.86% |
The initial offering of Fidelity U.S. Bond Index Fund (formerly named Institutional Premium Class) took place on May 4, 2011. Returns prior to May 4, 2011 are those of the former Investor Class and have not been restated to reflect current expenses.
$10,000 Over 10 Years
Let's say hypothetically that $10,000 was invested in Fidelity® U.S. Bond Index Fund on August 31, 2009.
The chart shows how the value of your investment would have changed, and also shows how the Bloomberg Barclays U.S. Aggregate Bond Index performed over the same period.
| Period Ending Values |
| $14,607 | Fidelity® U.S. Bond Index Fund |
| $14,678 | Bloomberg Barclays U.S. Aggregate Bond Index |
Management's Discussion of Fund Performance
Market Recap: For the 12 months ending August 31, 2019, U.S. taxable investment-grade bonds posted their strongest trailing one-year return since 2009, driven by slower global economic growth, a maturing business cycle, trade uncertainty and, late in the period, the Fed’s dovish shift. The Bloomberg Barclays U.S. Aggregate Bond Index gained 10.17%. Market yields rose in the early fall of 2018, on expectations for higher inflation. Yields then declined and credit spreads widened in November and December, partly because of weaker U.S. manufacturing data. Yield spreads narrowed in January, as the U.S. Federal Reserve said it would be “patient” with policy rate hikes, and that future increases largely would depend on economic data. Yields continued to decline in the spring, amid international trade tension and attacks on oil tankers in the Middle East, and then tumbled further in July, when the Fed cut interest rates for the first time since 2008. The yield curve ended the period roughly flat, amid expectations for another rate cut of 25 basis points in September. Within the Bloomberg Barclays index, corporate bonds gained 13.33%, topping the 10.38% advance of U.S. Treasuries. Outside the index, U.S. corporate high-yield bonds lagged nominal U.S. Treasuries, while Treasury Inflation-Protected Securities (TIPS) gained 7.46%.
Comments from Co-Portfolio Managers Brandon Bettencourt and Jay Small: For the fiscal year ending August 31, 2019, the fund’s share classes retuned about 10.3% (excluding sales charges, if applicable), slightly topping, net of fees, the 10.17% return of the Bloomberg Barclays U.S. Aggregate Bond Index. These results met our goal of producing monthly returns, before expenses, that closely match the benchmark return. Given the large number of securities in the index (roughly 10,000) and the significant cost and liquidity challenges associated with full replication of the index, we use “stratified sampling techniques” in constructing the portfolio. This approach involves defining and maintaining an “optimal” subset of constituent securities that, in aggregate, mirrors the chief characteristics of the index – including maturity, duration, sector allocation, credit quality and other factors. The fund's performance versus the benchmark was slightly bolstered by "pricing basis." The fund is typically priced at 4:00 p.m. Eastern, while the benchmark is priced at 3:00 p.m. This led to a reported performance differential, particularly due to pricing dispersion on the last day of the period. Bonds were bolstered by expectations of declining interest rates amid muted inflation and a global growth slowdown that was exacerbated by escalating international trade tension.
The views expressed above reflect those of the portfolio manager(s) only through the end of the period as stated on the cover of this report and do not necessarily represent the views of Fidelity or any other person in the Fidelity organization. Any such views are subject to change at any time based upon market or other conditions and Fidelity disclaims any responsibility to update such views. These views may not be relied on as investment advice and, because investment decisions for a Fidelity fund are based on numerous factors, may not be relied on as an indication of trading intent on behalf of any Fidelity fund.
Investment Summary (Unaudited)
Quality Diversification (% of fund's net assets)
| As of August 31, 2019 |
| | U.S. Government and U.S. Government Agency Obligations | 70.9% |
| | AAA | 3.9% |
| | AA | 2.3% |
| | A | 9.3% |
| | BBB | 13.1% |
| | BB and Below | 0.5% |

We have used ratings from Moody's Investors Service, Inc. Where Moody's® ratings are not available, we have used S&P® ratings. All ratings are as of the date indicated and do not reflect subsequent changes.
Asset Allocation (% of fund's net assets)
| As of August 31, 2019* |
| | Corporate Bonds | 24.5% |
| | U.S. Government and U.S. Government Agency Obligations | 70.9% |
| | Asset-Backed Securities | 0.2% |
| | CMOs and Other Mortgage Related Securities | 1.3% |
| | Municipal Bonds | 0.5% |
| | Other Investments | 2.6% |

* Foreign investments - 7.3%
Percentages in the above tables are adjusted for the effect of TBA Sale Commitments.
Schedule of Investments August 31, 2019
Showing Percentage of Net Assets
| Nonconvertible Bonds - 24.5% | | | |
| | | Principal Amount (000s) | Value (000s) |
| COMMUNICATION SERVICES - 2.0% | | | |
| Diversified Telecommunication Services - 0.9% | | | |
| AT&T, Inc.: | | | |
| 2.45% 6/30/20 | | $4,598 | $4,606 |
| 2.8% 2/17/21 | | 7,720 | 7,796 |
| 2.95% 7/15/26 | | 6,863 | 6,996 |
| 3.4% 5/15/25 | | 7,952 | 8,352 |
| 3.55% 6/1/24 | | 2,573 | 2,704 |
| 3.6% 7/15/25 | | 5,439 | 5,732 |
| 3.8% 3/15/22 | | 8,578 | 8,940 |
| 3.8% 2/15/27 | | 7,720 | 8,243 |
| 4% 1/15/22 | | 858 | 896 |
| 4.125% 2/17/26 | | 23,435 | 25,471 |
| 4.35% 6/15/45 | | 21,239 | 22,728 |
| 4.5% 3/9/48 | | 8,209 | 8,960 |
| 4.55% 3/9/49 | | 157 | 172 |
| 4.65% 6/1/44 | | 6,751 | 7,380 |
| 4.75% 5/15/46 | | 8,835 | 9,879 |
| 4.85% 7/15/45 | | 2,573 | 2,946 |
| 4.9% 8/15/37 | | 21,814 | 24,956 |
| 5.15% 11/15/46 | | 723 | 851 |
| 5.15% 2/15/50 | | 20,622 | 24,478 |
| 5.55% 8/15/41 | | 6,262 | 7,570 |
| 6.35% 3/15/40 | | 858 | 1,122 |
| 6.375% 3/1/41 | | 5,876 | 7,681 |
| British Telecommunications PLC 9.625% 12/15/30 (a) | | 3,873 | 5,931 |
| Orange SA 5.5% 2/6/44 | | 2,573 | 3,426 |
| Telefonica Emisiones S.A.U.: | | | |
| 4.103% 3/8/27 | | 11,495 | 12,581 |
| 5.213% 3/8/47 | | 5,619 | 6,545 |
| 5.462% 2/16/21 | | 2,316 | 2,424 |
| 7.045% 6/20/36 | | 2,230 | 3,040 |
| Verizon Communications, Inc.: | | | |
| 2.625% 8/15/26 | | 19,841 | 20,326 |
| 3.5% 11/1/24 | | 2,573 | 2,743 |
| 4.125% 3/16/27 | | 6,005 | 6,701 |
| 4.272% 1/15/36 | | 20,826 | 23,911 |
| 4.4% 11/1/34 | | 3,238 | 3,751 |
| 4.75% 11/1/41 | | 858 | 1,041 |
| 5.012% 4/15/49 | | 10,104 | 12,916 |
| 5.012% 8/21/54 | | 10,772 | 13,933 |
| 5.25% 3/16/37 | | 13,296 | 16,846 |
| 5.5% 3/16/47 | | 23,058 | 30,951 |
| 6.55% 9/15/43 | | 10,736 | 15,816 |
| | | | 381,341 |
| Entertainment - 0.2% | | | |
| NBCUniversal, Inc. 6.4% 4/30/40 | | 2,573 | 3,730 |
| The Walt Disney Co.: | | | |
| 1.85% 7/30/26 | | 4,383 | 4,321 |
| 2.3% 2/12/21 | | 4,066 | 4,086 |
| 2.55% 2/15/22 | | 2,410 | 2,453 |
| 3% 7/30/46 | | 3,860 | 3,982 |
| 3.15% 9/17/25 | | 8,123 | 8,717 |
| 3.7% 10/15/25 (b) | | 6,005 | 6,524 |
| 4.125% 6/1/44 | | 4,890 | 5,944 |
| 5.4% 10/1/43 (b) | | 3,324 | 4,622 |
| 5.65% 8/15/20 (b) | | 858 | 887 |
| 6.15% 3/1/37 (b) | | 3,393 | 4,850 |
| 6.15% 2/15/41 (b) | | 9,007 | 13,252 |
| 6.9% 8/15/39 (b) | | 1,716 | 2,672 |
| 7.75% 12/1/45 (b) | | 2,711 | 4,776 |
| Viacom, Inc.: | | | |
| 4.25% 9/1/23 | | 6,669 | 7,120 |
| 4.375% 3/15/43 | | 2,260 | 2,397 |
| 5.625% 9/15/19 | | 858 | 859 |
| | | | 81,192 |
| Interactive Media & Services - 0.0% | | | |
| Alphabet, Inc.: | | | |
| 1.998% 8/15/26 | | 1,973 | 1,989 |
| 3.625% 5/19/21 | | 3,243 | 3,341 |
| | | | 5,330 |
| Media - 0.7% | | | |
| CBS Corp.: | | | |
| 3.375% 2/15/28 | | 9,050 | 9,307 |
| 4% 1/15/26 | | 5,147 | 5,516 |
| 4.6% 1/15/45 | | 6,262 | 7,039 |
| Charter Communications Operating LLC/Charter Communications Operating Capital Corp.: | | | |
| 4.2% 3/15/28 | | 9,436 | 10,043 |
| 4.908% 7/23/25 | | 6,845 | 7,565 |
| 5.125% 7/1/49 | | 10,600 | 11,579 |
| 5.75% 4/1/48 | | 4,486 | 5,234 |
| 6.384% 10/23/35 | | 11,538 | 14,084 |
| 6.484% 10/23/45 | | 4,023 | 4,975 |
| Comcast Corp.: | | | |
| 1.625% 1/15/22 | | 9,007 | 8,972 |
| 2.35% 1/15/27 | | 20,416 | 20,509 |
| 3.125% 7/15/22 | | 2,573 | 2,665 |
| 3.15% 3/1/26 | | 4,289 | 4,519 |
| 3.3% 2/1/27 | | 10,217 | 10,877 |
| 3.375% 8/15/25 | | 11,752 | 12,510 |
| 3.45% 10/1/21 | | 4,890 | 5,037 |
| 3.7% 4/15/24 | | 8,896 | 9,528 |
| 3.969% 11/1/47 | | 4,461 | 5,013 |
| 4% 3/1/48 | | 10,294 | 11,633 |
| 4.15% 10/15/28 | | 16,170 | 18,346 |
| 4.65% 7/15/42 | | 7,720 | 9,420 |
| 4.7% 10/15/48 | | 16,401 | 20,521 |
| 4.75% 3/1/44 | | 4,632 | 5,718 |
| 4.95% 10/15/58 | | 6,451 | 8,376 |
| 6.4% 3/1/40 | | 858 | 1,215 |
| 6.55% 7/1/39 | | 2,573 | 3,763 |
| 6.95% 8/15/37 | | 5,747 | 8,560 |
| Discovery Communications LLC: | | | |
| 3.25% 4/1/23 | | 2,006 | 2,069 |
| 4.875% 4/1/43 | | 4,203 | 4,472 |
| 5.2% 9/20/47 | | 7,206 | 8,154 |
| Fox Corp.: | | | |
| 4.03% 1/25/24 (b) | | 4,032 | 4,318 |
| 4.709% 1/25/29 (b) | | 8,904 | 10,314 |
| 5.476% 1/25/39 (b) | | 3,268 | 4,083 |
| 5.576% 1/25/49 (b) | | 7,989 | 10,395 |
| Time Warner Cable, Inc.: | | | |
| 4.5% 9/15/42 | | 9,436 | 9,472 |
| 7.3% 7/1/38 | | 3,431 | 4,401 |
| | | | 300,202 |
| Wireless Telecommunication Services - 0.2% | | | |
| America Movil S.A.B. de CV: | | | |
| 3.125% 7/16/22 | | 4,525 | 4,656 |
| 3.625% 4/22/29 | | 7,200 | 7,746 |
| 6.125% 11/15/37 | | 7,176 | 9,786 |
| Rogers Communications, Inc.: | | | |
| 2.9% 11/15/26 | | 2,145 | 2,216 |
| 3.625% 12/15/25 | | 1,716 | 1,843 |
| 4.1% 10/1/23 | | 4,139 | 4,438 |
| 5.45% 10/1/43 | | 4,954 | 6,480 |
| Vodafone Group PLC: | | | |
| 2.5% 9/26/22 | | 2,573 | 2,606 |
| 2.95% 2/19/23 | | 5,919 | 6,076 |
| 3.75% 1/16/24 | | 8,870 | 9,384 |
| 4.375% 5/30/28 | | 21,958 | 24,633 |
| 5.25% 5/30/48 | | 17,425 | 20,858 |
| | | | 100,722 |
|
| TOTAL COMMUNICATION SERVICES | | | 868,787 |
|
| CONSUMER DISCRETIONARY - 1.1% | | | |
| Automobiles - 0.3% | | | |
| American Honda Finance Corp.: | | | |
| 1.65% 7/12/21 | | 6,820 | 6,788 |
| 1.7% 9/9/21 | | 3,860 | 3,844 |
| 2.15% 3/13/20 | | 7,334 | 7,332 |
| 2.3% 9/9/26 | | 4,289 | 4,327 |
| 3.55% 1/12/24 | | 20,932 | 22,353 |
| Ford Motor Co. 4.75% 1/15/43 | | 6,562 | 5,897 |
| General Motors Co.: | | | |
| 5% 10/1/28 | | 5,900 | 6,342 |
| 5.2% 4/1/45 | | 3,663 | 3,735 |
| 6.6% 4/1/36 | | 5,010 | 5,817 |
| 6.75% 4/1/46 | | 6,138 | 7,306 |
| General Motors Financial Co., Inc.: | | | |
| 3.15% 1/15/20 | | 5,687 | 5,697 |
| 3.25% 1/5/23 | | 6,176 | 6,282 |
| 3.85% 1/5/28 | | 6,005 | 6,038 |
| 4% 1/15/25 | | 5,293 | 5,448 |
| 4% 10/6/26 | | 3,157 | 3,239 |
| 4.3% 7/13/25 | | 10,637 | 11,105 |
| 4.35% 1/17/27 | | 6,863 | 7,112 |
| 4.375% 9/25/21 | | 7,883 | 8,164 |
| 5.65% 1/17/29 | | 9,659 | 10,807 |
| | | | 137,633 |
| Diversified Consumer Services - 0.1% | | | |
| George Washington University 4.3% 9/15/44 | | 1,716 | 2,130 |
| Ingersoll-Rand Global Holding Co. Ltd.: | | | |
| 2.9% 2/21/21 | | 4,075 | 4,117 |
| 3.75% 8/21/28 | | 3,989 | 4,330 |
| 4.3% 2/21/48 | | 4,263 | 4,819 |
| Massachusetts Institute of Technology: | | | |
| 3.885% 7/1/2116 | | 2,428 | 3,040 |
| 3.959% 7/1/38 | | 4,053 | 4,785 |
| Northwestern University 4.643% 12/1/44 | | 2,874 | 3,774 |
| President and Fellows of Harvard College: | | | |
| 3.3% 7/15/56 | | 4,160 | 4,690 |
| 3.619% 10/1/37 | | 858 | 975 |
| Rice University 3.774% 5/15/55 | | 1,630 | 1,962 |
| Trustees of Princeton Univ. 5.7% 3/1/39 | | 858 | 1,265 |
| University Notre Dame du Lac 3.438% 2/15/45 | | 2,857 | 3,258 |
| University of Southern California 5.25% 10/1/2111 | | 1,716 | 2,723 |
| | | | 41,868 |
| Hotels, Restaurants & Leisure - 0.2% | | | |
| McDonald's Corp.: | | | |
| 2.75% 12/9/20 | | 1,973 | 1,991 |
| 3.7% 1/30/26 | | 14,471 | 15,685 |
| 4.45% 3/1/47 | | 4,872 | 5,725 |
| 4.875% 12/9/45 | | 4,658 | 5,743 |
| 6.3% 3/1/38 | | 6,043 | 8,484 |
| Metropolitan Museum of Art 3.4% 7/1/45 | | 2,573 | 2,886 |
| Starbucks Corp.: | | | |
| 2.45% 6/15/26 | | 8,578 | 8,703 |
| 3.8% 8/15/25 | | 5,962 | 6,466 |
| 3.85% 10/1/23 | | 1,608 | 1,713 |
| 4% 11/15/28 | | 6,005 | 6,787 |
| 4.5% 11/15/48 | | 4,032 | 4,757 |
| | | | 68,940 |
| Internet & Direct Marketing Retail - 0.1% | | | |
| Amazon.com, Inc.: | | | |
| 2.4% 2/22/23 | | 13,596 | 13,844 |
| 2.8% 8/22/24 | | 5,559 | 5,803 |
| 3.15% 8/22/27 | | 8,973 | 9,649 |
| 3.875% 8/22/37 | | 4,341 | 5,040 |
| 4.05% 8/22/47 | | 11,100 | 13,622 |
| 4.25% 8/22/57 | | 5,696 | 7,256 |
| 4.8% 12/5/34 | | 5,147 | 6,539 |
| | | | 61,753 |
| Multiline Retail - 0.1% | | | |
| Dollar Tree, Inc.: | | | |
| 3.7% 5/15/23 | | 7,463 | 7,773 |
| 4% 5/15/25 | | 6,863 | 7,255 |
| Kohl's Corp. 4.75% 12/15/23 | | 1,825 | 1,955 |
| Macy's Retail Holdings, Inc.: | | | |
| 2.875% 2/15/23 | | 4,075 | 4,005 |
| 4.3% 2/15/43 | | 4,075 | 3,393 |
| Nordstrom, Inc.: | | | |
| 4% 3/15/27 | | 3,869 | 3,948 |
| 5% 1/15/44 | | 1,716 | 1,667 |
| Target Corp.: | | | |
| 3.875% 7/15/20 | | 2,573 | 2,614 |
| 3.9% 11/15/47 | | 7,454 | 8,805 |
| 4% 7/1/42 | | 6,005 | 7,041 |
| | | | 48,456 |
| Specialty Retail - 0.3% | | | |
| Advance Auto Parts, Inc. 4.5% 12/1/23 | | 3,217 | 3,464 |
| AutoZone, Inc.: | | | |
| 3.125% 7/15/23 | | 3,281 | 3,375 |
| 3.25% 4/15/25 | | 3,431 | 3,562 |
| 3.7% 4/15/22 | | 4,718 | 4,915 |
| 3.75% 6/1/27 | | 4,979 | 5,371 |
| Lowe's Companies, Inc.: | | | |
| 3.65% 4/5/29 | | 9,187 | 9,982 |
| 3.7% 4/15/46 | | 3,002 | 3,065 |
| 4.05% 5/3/47 | | 9,865 | 10,724 |
| 4.55% 4/5/49 | | 8,123 | 9,497 |
| 4.625% 4/15/20 | | 1,716 | 1,721 |
| 4.65% 4/15/42 | | 5,576 | 6,392 |
| O'Reilly Automotive, Inc. 3.85% 6/15/23 | | 2,423 | 2,559 |
| The Home Depot, Inc.: | | | |
| 2.8% 9/14/27 | | 4,289 | 4,495 |
| 3% 4/1/26 | | 8,604 | 9,113 |
| 3.75% 2/15/24 | | 5,769 | 6,235 |
| 3.9% 12/6/28 | | 4,941 | 5,633 |
| 3.9% 6/15/47 | | 7,357 | 8,538 |
| 4.2% 4/1/43 | | 1,351 | 1,610 |
| 4.25% 4/1/46 | | 2,814 | 3,424 |
| 4.5% 12/6/48 | | 6,408 | 8,154 |
| 4.875% 2/15/44 | | 2,466 | 3,217 |
| 5.875% 12/16/36 | | 8,921 | 12,592 |
| | | | 127,638 |
| Textiles, Apparel & Luxury Goods - 0.0% | | | |
| NIKE, Inc. 3.375% 11/1/46 | | 3,860 | 4,197 |
|
| TOTAL CONSUMER DISCRETIONARY | | | 490,485 |
|
| CONSUMER STAPLES - 1.9% | | | |
| Beverages - 0.8% | | | |
| Anheuser-Busch InBev Finance, Inc.: | | | |
| 2.625% 1/17/23 | | 2,423 | 2,469 |
| 2.65% 2/1/21 | | 8,102 | 8,177 |
| 3.3% 2/1/23 | | 7,904 | 8,229 |
| 3.65% 2/1/26 | | 51,923 | 55,752 |
| 4.625% 2/1/44 | | 4,932 | 5,670 |
| 4.7% 2/1/36 | | 4,178 | 4,863 |
| 4.9% 2/1/46 | | 15,595 | 18,549 |
| Anheuser-Busch InBev Worldwide, Inc.: | | | |
| 2.5% 7/15/22 | | 7,480 | 7,601 |
| 4.15% 1/23/25 | | 12,052 | 13,197 |
| 4.439% 10/6/48 | | 6,343 | 7,162 |
| 4.6% 4/15/48 | | 16,084 | 18,697 |
| 5.55% 1/23/49 | | 8,192 | 10,791 |
| 5.8% 1/23/59 (Reg. S) | | 11,966 | 16,328 |
| 8.2% 1/15/39 | | 2,402 | 3,860 |
| Constellation Brands, Inc.: | | | |
| 3.5% 5/9/27 | | 8,578 | 9,043 |
| 3.7% 12/6/26 | | 6,476 | 6,950 |
| Dr. Pepper Snapple Group, Inc.: | | | |
| 2% 1/15/20 | | 2,445 | 2,441 |
| 4.057% 5/25/23 | | 12,867 | 13,664 |
| 4.985% 5/25/38 | | 6,176 | 7,287 |
| Molson Coors Brewing Co.: | | | |
| 2.1% 7/15/21 | | 4,203 | 4,202 |
| 3% 7/15/26 | | 14,926 | 15,109 |
| 4.2% 7/15/46 | | 11,349 | 11,552 |
| PepsiCo, Inc.: | | | |
| 2.15% 10/14/20 | | 10,294 | 10,323 |
| 2.25% 5/2/22 | | 10,294 | 10,411 |
| 2.375% 10/6/26 | | 5,790 | 5,933 |
| 3% 10/15/27 | | 15,621 | 16,752 |
| 3.6% 8/13/42 | | 2,573 | 2,891 |
| 4.25% 10/22/44 | | 5,147 | 6,349 |
| 4.45% 4/14/46 | | 4,975 | 6,306 |
| The Coca-Cola Co.: | | | |
| 1.55% 9/1/21 | | 3,423 | 3,420 |
| 2.2% 5/25/22 | | 12,867 | 13,017 |
| 2.875% 10/27/25 | | 8,218 | 8,659 |
| 3.15% 11/15/20 | | 3,174 | 3,224 |
| | | | 338,878 |
| Food & Staples Retailing - 0.2% | | | |
| Costco Wholesale Corp. 2.75% 5/18/24 | | 5,147 | 5,345 |
| Kroger Co.: | | | |
| 2.65% 10/15/26 | | 2,445 | 2,435 |
| 3.5% 2/1/26 | | 3,431 | 3,588 |
| 5.15% 8/1/43 | | 2,338 | 2,608 |
| 5.4% 1/15/49 | | 5,584 | 6,614 |
| Sysco Corp.: | | | |
| 3.3% 7/15/26 | | 2,814 | 2,960 |
| 3.75% 10/1/25 | | 4,890 | 5,252 |
| Walgreen Co. 3.1% 9/15/22 | | 2,445 | 2,511 |
| Walgreens Boots Alliance, Inc.: | | | |
| 3.45% 6/1/26 | | 4,289 | 4,454 |
| 4.65% 6/1/46 | | 4,718 | 5,009 |
| Walmart, Inc.: | | | |
| 3.3% 4/22/24 | | 16,298 | 17,298 |
| 3.4% 6/26/23 | | 8,029 | 8,502 |
| 3.7% 6/26/28 | | 10,551 | 11,852 |
| 4.05% 6/29/48 | | 6,588 | 8,203 |
| 4.3% 4/22/44 | | 5,147 | 6,442 |
| 5.625% 4/1/40 | | 1,716 | 2,470 |
| 5.625% 4/15/41 | | 3,946 | 5,719 |
| 6.5% 8/15/37 | | 7,098 | 10,967 |
| | | | 112,229 |
| Food Products - 0.4% | | | |
| Campbell Soup Co.: | | | |
| 2.5% 8/2/22 | | 4,075 | 4,102 |
| 4.8% 3/15/48 | | 12,009 | 13,520 |
| Conagra Brands, Inc.: | | | |
| 3.2% 1/25/23 | | 7,553 | 7,701 |
| 3.8% 10/22/21 | | 4,032 | 4,148 |
| 4.3% 5/1/24 | | 7,695 | 8,263 |
| 4.85% 11/1/28 | | 11,692 | 13,393 |
| 5.3% 11/1/38 | | 4,251 | 4,978 |
| 5.4% 11/1/48 | | 7,700 | 9,129 |
| General Mills, Inc.: | | | |
| 2.2% 10/21/19 | | 6,005 | 6,003 |
| 3.7% 10/17/23 | | 11,966 | 12,660 |
| 4.2% 4/17/28 | | 14,754 | 16,628 |
| H.J. Heinz Co.: | | | |
| 3% 6/1/26 | | 11,152 | 10,968 |
| 4.375% 6/1/46 | | 5,859 | 5,630 |
| 5% 7/15/35 | | 3,002 | 3,217 |
| 5.2% 7/15/45 | | 4,443 | 4,688 |
| Kellogg Co.: | | | |
| 3.125% 5/17/22 | | 1,608 | 1,652 |
| 3.25% 4/1/26 | | 3,191 | 3,358 |
| 4.3% 5/15/28 | | 5,147 | 5,789 |
| Kraft Foods Group, Inc.: | | | |
| 3.5% 6/6/22 | | 9,994 | 10,230 |
| 5% 6/4/42 | | 2,423 | 2,500 |
| The J.M. Smucker Co. 2.5% 3/15/20 | | 4,890 | 4,897 |
| Tyson Foods, Inc.: | | | |
| 3.95% 8/15/24 | | 6,498 | 6,991 |
| 4% 3/1/26 | | 6,322 | 6,891 |
| 4.35% 3/1/29 | | 7,720 | 8,820 |
| 5.1% 9/28/48 | | 8,000 | 9,957 |
| Unilever Capital Corp.: | | | |
| 2% 7/28/26 | | 1,716 | 1,717 |
| 3.1% 7/30/25 | | 2,488 | 2,633 |
| | | | 190,463 |
| Household Products - 0.1% | | | |
| Colgate-Palmolive Co. 3.25% 3/15/24 | | 8,578 | 9,142 |
| Kimberly-Clark Corp.: | | | |
| 2.4% 3/1/22 | | 4,461 | 4,515 |
| 2.4% 6/1/23 | | 6,863 | 6,975 |
| 3.2% 7/30/46 | | 2,145 | 2,242 |
| Procter & Gamble Co.: | | | |
| 1.9% 11/1/19 | | 3,431 | 3,429 |
| 2.3% 2/6/22 | | 4,032 | 4,089 |
| 2.85% 8/11/27 | | 3,860 | 4,124 |
| 3.1% 8/15/23 | | 8,578 | 9,008 |
| | | | 43,524 |
| Tobacco - 0.4% | | | |
| Altria Group, Inc.: | | | |
| 2.85% 8/9/22 | | 6,005 | 6,129 |
| 3.8% 2/14/24 | | 3,989 | 4,225 |
| 3.875% 9/16/46 | | 8,578 | 8,426 |
| 4.25% 8/9/42 | | 8,389 | 8,648 |
| 4.8% 2/14/29 | | 11,383 | 12,890 |
| 5.8% 2/14/39 | | 8,021 | 9,898 |
| 5.95% 2/14/49 | | 8,921 | 11,454 |
| BAT Capital Corp.: | | | |
| 2.764% 8/15/22 | | 8,149 | 8,264 |
| 3.222% 8/15/24 | | 8,835 | 9,088 |
| 3.557% 8/15/27 | | 18,160 | 18,610 |
| 4.54% 8/15/47 | | 14,360 | 14,403 |
| Philip Morris International, Inc.: | | | |
| 1.875% 2/25/21 | | 12,867 | 12,847 |
| 2.125% 5/10/23 | | 2,659 | 2,655 |
| 2.75% 2/25/26 | | 3,217 | 3,280 |
| 3.6% 11/15/23 | | 3,149 | 3,324 |
| 3.875% 8/21/42 | | 4,139 | 4,251 |
| 4.125% 3/4/43 | | 8,578 | 9,171 |
| 4.5% 3/26/20 | | 1,716 | 1,739 |
| 4.875% 11/15/43 | | 5,147 | 6,077 |
| 6.375% 5/16/38 | | 1,244 | 1,707 |
| Reynolds American, Inc.: | | | |
| 4.45% 6/12/25 | | 6,056 | 6,558 |
| 4.85% 9/15/23 | | 1,544 | 1,687 |
| 5.85% 8/15/45 | | 3,637 | 4,103 |
| 7.25% 6/15/37 | | 6,193 | 8,072 |
| | | | 177,506 |
|
| TOTAL CONSUMER STAPLES | | | 862,600 |
|
| ENERGY - 2.5% | | | |
| Energy Equipment & Services - 0.1% | | | |
| Baker Hughes A GE Co. LLC: | | | |
| 4.08% 12/15/47 | | 10,000 | 9,762 |
| 5.125% 9/15/40 | | 1,716 | 1,935 |
| El Paso Pipeline Partners Operating Co. LLC 4.7% 11/1/42 | | 3,260 | 3,522 |
| Halliburton Co.: | | | |
| 3.8% 11/15/25 | | 8,904 | 9,432 |
| 5% 11/15/45 | | 6,468 | 7,244 |
| 7.45% 9/15/39 | | 1,287 | 1,819 |
| | | | 33,714 |
| Oil, Gas & Consumable Fuels - 2.4% | | | |
| Anadarko Petroleum Corp.: | | | |
| 3.45% 7/15/24 | | 4,289 | 4,391 |
| 4.85% 3/15/21 | | 8,703 | 8,997 |
| 6.2% 3/15/40 | | 1,716 | 2,103 |
| 6.45% 9/15/36 | | 2,295 | 2,875 |
| 6.6% 3/15/46 | | 3,989 | 5,319 |
| Apache Corp.: | | | |
| 4.375% 10/15/28 | | 15,289 | 15,713 |
| 5.1% 9/1/40 | | 2,573 | 2,607 |
| Boardwalk Pipelines LP 4.95% 12/15/24 | | 4,075 | 4,381 |
| BP Capital Markets PLC: | | | |
| 2.315% 2/13/20 | | 1,544 | 1,546 |
| 2.5% 11/6/22 | | 2,573 | 2,610 |
| 2.521% 1/15/20 | | 5,147 | 5,154 |
| 3.062% 3/17/22 | | 3,217 | 3,306 |
| 3.279% 9/19/27 | | 10,929 | 11,584 |
| Canadian Natural Resources Ltd.: | | | |
| 2.95% 1/15/23 | | 10,000 | 10,159 |
| 3.9% 2/1/25 | | 1,608 | 1,695 |
| 4.95% 6/1/47 | | 5,490 | 6,563 |
| 6.25% 3/15/38 | | 5,876 | 7,535 |
| Cenovus Energy, Inc.: | | | |
| 3% 8/15/22 | | 1,458 | 1,472 |
| 3.8% 9/15/23 | | 1,501 | 1,551 |
| 4.25% 4/15/27 | | 8,149 | 8,510 |
| 5.4% 6/15/47 | | 8,063 | 9,167 |
| 6.75% 11/15/39 | | 1,716 | 2,122 |
| Chevron Corp.: | | | |
| 1.961% 3/3/20 | | 7,399 | 7,397 |
| 2.1% 5/16/21 | | 11,795 | 11,848 |
| 2.193% 11/15/19 | | 9,779 | 9,781 |
| 2.895% 3/3/24 | | 20,184 | 21,055 |
| 2.954% 5/16/26 | | 9,436 | 9,980 |
| Columbia Pipeline Group, Inc.: | | | |
| 3.3% 6/1/20 | | 2,610 | 2,627 |
| 4.5% 6/1/25 | | 2,852 | 3,095 |
| ConocoPhillips Co.: | | | |
| 4.95% 3/15/26 | | 21,059 | 24,455 |
| 5.95% 3/15/46 | | 5,147 | 7,453 |
| 6.5% 2/1/39 | | 6,458 | 9,468 |
| DCP Midstream Operating LP 3.875% 3/15/23 | | 3,238 | 3,278 |
| Devon Energy Corp.: | | | |
| 5% 6/15/45 | | 3,002 | 3,530 |
| 5.6% 7/15/41 | | 2,466 | 3,026 |
| Ecopetrol SA: | | | |
| 5.375% 6/26/26 | | 4,066 | 4,553 |
| 5.875% 5/28/45 | | 3,260 | 3,841 |
| 7.375% 9/18/43 | | 4,238 | 5,697 |
| Enbridge Energy Partners LP 4.2% 9/15/21 | | 7,463 | 7,708 |
| Enbridge, Inc.: | | | |
| 3.5% 6/10/24 | | 2,423 | 2,538 |
| 5.5% 12/1/46 | | 12,430 | 16,030 |
| Encana Corp.: | | | |
| 3.9% 11/15/21 | | 4,203 | 4,311 |
| 6.5% 2/1/38 | | 4,289 | 5,225 |
| Energy Transfer Partners LP: | | | |
| 3.6% 2/1/23 | | 7,334 | 7,526 |
| 4.15% 10/1/20 | | 3,860 | 3,921 |
| 4.95% 6/15/28 | | 8,089 | 9,049 |
| 5.15% 3/15/45 | | 6,863 | 7,317 |
| 6% 6/15/48 | | 8,452 | 10,081 |
| 6.25% 4/15/49 | | 2,500 | 3,093 |
| Enterprise Products Operating LP: | | | |
| 3.7% 2/15/26 | | 1,518 | 1,631 |
| 3.95% 2/15/27 | | 22,200 | 24,245 |
| 4.05% 2/15/22 | | 7,999 | 8,367 |
| 4.25% 2/15/48 | | 9,933 | 10,800 |
| 4.8% 2/1/49 | | 6,300 | 7,402 |
| 4.85% 8/15/42 | | 2,145 | 2,469 |
| 4.85% 3/15/44 | | 4,289 | 4,996 |
| 4.9% 5/15/46 | | 3,671 | 4,343 |
| 5.7% 2/15/42 | | 1,716 | 2,172 |
| 7.55% 4/15/38 | | 1,716 | 2,493 |
| EOG Resources, Inc. 4.15% 1/15/26 | | 4,804 | 5,365 |
| Equinor ASA: | | | |
| 2.25% 11/8/19 | | 6,863 | 6,862 |
| 3.625% 9/10/28 | | 10,362 | 11,445 |
| 3.7% 3/1/24 | | 3,131 | 3,363 |
| 5.1% 8/17/40 | | 1,716 | 2,255 |
| Exxon Mobil Corp.: | | | |
| 2.726% 3/1/23 | | 8,578 | 8,837 |
| 3.043% 3/1/26 | | 7,146 | 7,581 |
| 3.567% 3/6/45 | | 5,704 | 6,352 |
| Hess Corp.: | | | |
| 3.5% 7/15/24 | | 3,260 | 3,330 |
| 5.6% 2/15/41 | | 2,917 | 3,251 |
| Kinder Morgan Energy Partners LP: | | | |
| 3.45% 2/15/23 | | 10,465 | 10,845 |
| 3.5% 9/1/23 | | 1,716 | 1,784 |
| 3.95% 9/1/22 | | 6,005 | 6,266 |
| 4.25% 9/1/24 | | 12,867 | 13,867 |
| 5% 3/1/43 | | 858 | 945 |
| 5.5% 3/1/44 | | 6,002 | 7,086 |
| 5.625% 9/1/41 | | 858 | 1,000 |
| 6.55% 9/15/40 | | 2,573 | 3,271 |
| Kinder Morgan, Inc.: | | | |
| 4.3% 3/1/28 | | 8,551 | 9,369 |
| 5.2% 3/1/48 | | 7,531 | 8,864 |
| 5.3% 12/1/34 | | 7,334 | 8,544 |
| Magellan Midstream Partners LP: | | | |
| 4.25% 9/15/46 | | 4,718 | 5,096 |
| 5% 3/1/26 | | 2,573 | 2,920 |
| Marathon Oil Corp.: | | | |
| 3.85% 6/1/25 | | 6,005 | 6,249 |
| 5.2% 6/1/45 | | 4,289 | 4,876 |
| Marathon Petroleum Corp.: | | | |
| 4.5% 4/1/48 | | 5,000 | 5,323 |
| 4.75% 12/15/23 | | 4,903 | 5,343 |
| 5.125% 3/1/21 | | 858 | 893 |
| 6.5% 3/1/41 | | 858 | 1,091 |
| MPLX LP: | | | |
| 4.125% 3/1/27 | | 8,106 | 8,545 |
| 4.7% 4/15/48 | | 16,727 | 17,224 |
| 4.8% 2/15/29 | | 7,883 | 8,769 |
| 5.2% 3/1/47 | | 5,250 | 5,718 |
| Nexen, Inc. 5.875% 3/10/35 | | 3,182 | 4,216 |
| Noble Energy, Inc. 4.95% 8/15/47 | | 11,838 | 13,171 |
| Occidental Petroleum Corp.: | | | |
| 2.7% 8/15/22 | | 3,850 | 3,888 |
| 2.7% 2/15/23 | | 5,147 | 5,157 |
| 2.9% 8/15/24 | | 8,220 | 8,297 |
| 3.125% 2/15/22 | | 1,716 | 1,741 |
| 3.2% 8/15/26 | | 4,647 | 4,695 |
| 3.4% 4/15/26 | | 2,917 | 2,967 |
| 3.5% 8/15/29 | | 11,200 | 11,411 |
| 4.1% 2/15/47 | | 2,419 | 2,393 |
| 4.2% 3/15/48 | | 5,000 | 5,031 |
| 4.3% 8/15/39 | | 2,134 | 2,233 |
| 4.4% 4/15/46 | | 4,375 | 4,504 |
| 4.4% 8/15/49 | | 2,135 | 2,227 |
| ONEOK Partners LP 3.375% 10/1/22 | | 4,289 | 4,397 |
| ONEOK, Inc.: | | | |
| 4.95% 7/13/47 | | 5,018 | 5,421 |
| 5.2% 7/15/48 | | 2,591 | 2,917 |
| Petro-Canada 6.8% 5/15/38 | | 7,244 | 10,349 |
| Petroleos Mexicanos: | | | |
| 3.5% 1/30/23 | | 5,769 | 5,605 |
| 4.625% 9/21/23 | | 8,938 | 8,959 |
| 4.875% 1/24/22 | | 15,449 | 15,700 |
| 5.35% 2/12/28 | | 8,304 | 7,864 |
| 5.5% 6/27/44 | | 2,357 | 2,012 |
| 5.625% 1/23/46 | | 4,872 | 4,179 |
| 6.35% 2/12/48 | | 18,580 | 17,080 |
| 6.375% 1/23/45 | | 17,321 | 15,965 |
| 6.5% 3/13/27 | | 14,600 | 14,912 |
| 6.75% 9/21/47 | | 11,354 | 10,786 |
| Phillips 66 Co.: | | | |
| 4.875% 11/15/44 | | 858 | 1,028 |
| 5.875% 5/1/42 | | 8,149 | 10,795 |
| Plains All American Pipeline LP/PAA Finance Corp.: | | | |
| 3.6% 11/1/24 | | 6,176 | 6,345 |
| 4.65% 10/15/25 | | 10,508 | 11,269 |
| 4.9% 2/15/45 | | 1,630 | 1,674 |
| 5.75% 1/15/20 | | 858 | 867 |
| 6.65% 1/15/37 | | 2,398 | 2,890 |
| Shell International Finance BV: | | | |
| 1.75% 9/12/21 | | 5,576 | 5,567 |
| 2.125% 5/11/20 | | 7,120 | 7,125 |
| 2.375% 8/21/22 | | 2,573 | 2,615 |
| 3.25% 5/11/25 | | 12,147 | 12,914 |
| 3.5% 11/13/23 | | 6,005 | 6,389 |
| 4% 5/10/46 | | 3,431 | 4,032 |
| 4.375% 5/11/45 | | 11,409 | 13,979 |
| 6.375% 12/15/38 | | 3,603 | 5,333 |
| Spectra Energy Partners LP: | | | |
| 3.375% 10/15/26 | | 13,991 | 14,537 |
| 4.75% 3/15/24 | | 4,139 | 4,529 |
| Suncor Energy, Inc.: | | | |
| 3.6% 12/1/24 | | 6,078 | 6,407 |
| 4% 11/15/47 | | 4,289 | 4,725 |
| 6.85% 6/1/39 | | 1,716 | 2,493 |
| Sunoco Logistics Partner Operations LP: | | | |
| 3.9% 7/15/26 | | 6,451 | 6,676 |
| 5.3% 4/1/44 | | 4,975 | 5,326 |
| 5.4% 10/1/47 | | 4,718 | 5,262 |
| The Williams Companies, Inc.: | | | |
| 4.55% 6/24/24 | | 4,868 | 5,272 |
| 5.75% 6/24/44 | | 1,630 | 1,953 |
| Total Capital International SA: | | | |
| 2.7% 1/25/23 | | 1,630 | 1,669 |
| 2.75% 6/19/21 | | 5,147 | 5,216 |
| 2.875% 2/17/22 | | 3,581 | 3,667 |
| 3.455% 2/19/29 | | 18,306 | 20,065 |
| 3.75% 4/10/24 | | 1,716 | 1,847 |
| TransCanada PipeLines Ltd.: | | | |
| 2.5% 8/1/22 | | 4,289 | 4,325 |
| 4.75% 5/15/38 | | 9,000 | 10,320 |
| 4.875% 1/15/26 | | 4,289 | 4,833 |
| 4.875% 5/15/48 | | 4,220 | 5,020 |
| 5.1% 3/15/49 | | 3,000 | 3,665 |
| 6.1% 6/1/40 | | 5,747 | 7,622 |
| Transcontinental Gas Pipe Line Co. LLC: | | | |
| 4.45% 8/1/42 | | 6,648 | 7,366 |
| 4.6% 3/15/48 | | 3,431 | 3,900 |
| Valero Energy Corp.: | | | |
| 4% 4/1/29 | | 8,000 | 8,537 |
| 6.625% 6/15/37 | | 4,649 | 6,144 |
| Western Gas Partners LP: | | | |
| 4% 7/1/22 | | 2,573 | 2,621 |
| 4.5% 3/1/28 | | 6,005 | 5,995 |
| 4.75% 8/15/28 | | 7,549 | 7,646 |
| 5.3% 3/1/48 | | 6,005 | 5,487 |
| Williams Partners LP: | | | |
| 3.35% 8/15/22 | | 2,402 | 2,463 |
| 3.75% 6/15/27 | | 20,039 | 20,915 |
| 3.9% 1/15/25 | | 3,024 | 3,180 |
| 4.85% 3/1/48 | | 4,100 | 4,486 |
| | | | 1,093,758 |
|
| TOTAL ENERGY | | | 1,127,472 |
|
| FINANCIALS - 7.9% | | | |
| Banks - 4.0% | | | |
| Australia & New Zealand Banking Group Ltd. 3.7% 11/16/25 | | 5,696 | 6,222 |
| Bank of America Corp.: | | | |
| 2.503% 10/21/22 | | 7,720 | 7,795 |
| 2.625% 4/19/21 | | 6,005 | 6,063 |
| 3.004% 12/20/23 (a) | | 9,089 | 9,328 |
| 3.194% 7/23/30 (a) | | 12,700 | 13,262 |
| 3.248% 10/21/27 | | 3,217 | 3,395 |
| 3.366% 1/23/26 (a) | | 9,093 | 9,533 |
| 3.419% 12/20/28 (a) | | 15,548 | 16,408 |
| 3.593% 7/21/28 (a) | | 9,522 | 10,180 |
| 3.705% 4/24/28 (a) | | 7,549 | 8,145 |
| 3.864% 7/23/24 (a) | | 20,845 | 22,133 |
| 3.974% 2/7/30 (a) | | 12,129 | 13,445 |
| 4% 4/1/24 | | 4,172 | 4,512 |
| 4% 1/22/25 | | 5,147 | 5,499 |
| 4.1% 7/24/23 | | 6,005 | 6,452 |
| 4.183% 11/25/27 | | 4,418 | 4,808 |
| 4.2% 8/26/24 | | 7,291 | 7,869 |
| 4.25% 10/22/26 | | 3,431 | 3,746 |
| 4.271% 7/23/29 (a) | | 15,449 | 17,437 |
| 4.33% 3/15/50 (a) | | 11,229 | 13,666 |
| 4.443% 1/20/48 (a) | | 13,082 | 16,074 |
| 4.45% 3/3/26 | | 11,152 | 12,280 |
| 5% 1/21/44 | | 4,606 | 6,024 |
| Bank of Nova Scotia: | | | |
| 3.4% 2/11/24 | | 20,459 | 21,521 |
| 4.375% 1/13/21 | | 858 | 886 |
| 4.5% 12/16/25 | | 13,622 | 14,953 |
| Barclays PLC: | | | |
| 2.75% 11/8/19 | | 8,578 | 8,582 |
| 3.25% 1/12/21 | | 6,434 | 6,486 |
| 3.932% 5/7/25 (a) | | 13,600 | 13,982 |
| 4.337% 1/10/28 | | 4,804 | 5,063 |
| 4.375% 1/12/26 | | 4,289 | 4,526 |
| 4.836% 5/9/28 | | 8,235 | 8,548 |
| 4.95% 1/10/47 | | 13,863 | 15,223 |
| 5.25% 8/17/45 | | 4,804 | 5,380 |
| BB&T Corp.: | | | |
| 2.75% 4/1/22 | | 7,609 | 7,744 |
| 3.8% 10/30/26 | | 2,573 | 2,791 |
| BNP Paribas 2.375% 5/21/20 | | 9,951 | 9,970 |
| BPCE SA: | | | |
| 2.25% 1/27/20 | | 3,431 | 3,427 |
| 4% 4/15/24 | | 1,716 | 1,850 |
| Capital One NA 2.25% 9/13/21 | | 7,720 | 7,731 |
| Citigroup, Inc.: | | | |
| 3 month U.S. LIBOR + 1.023% 4.044% 6/1/24 (a)(c) | | 17,156 | 18,259 |
| 3 month U.S. LIBOR + 1.151% 3.52% 10/27/28 (a)(c) | | 9,650 | 10,229 |
| 2.35% 8/2/21 | | 18,100 | 18,217 |
| 2.75% 4/25/22 | | 12,515 | 12,739 |
| 3.142% 1/24/23 (a) | | 19,730 | 20,175 |
| 3.668% 7/24/28 (a) | | 6,502 | 6,971 |
| 3.7% 1/12/26 | | 9,547 | 10,288 |
| 3.887% 1/10/28 (a) | | 3,860 | 4,187 |
| 3.98% 3/20/30 (a) | | 14,000 | 15,474 |
| 4.125% 7/25/28 | | 13,245 | 14,447 |
| 4.4% 6/10/25 | | 3,431 | 3,723 |
| 4.6% 3/9/26 | | 5,147 | 5,665 |
| 4.75% 5/18/46 | | 6,751 | 8,179 |
| 5.3% 5/6/44 | | 1,716 | 2,191 |
| 5.5% 9/13/25 | | 4,289 | 4,916 |
| 5.875% 1/30/42 | | 1,437 | 2,022 |
| 8.125% 7/15/39 | | 6,863 | 11,473 |
| Citizens Bank NA 2.65% 5/26/22 | | 17,482 | 17,751 |
| Citizens Financial Group, Inc.: | | | |
| 2.375% 7/28/21 | | 3,739 | 3,752 |
| 4.3% 12/3/25 | | 1,622 | 1,753 |
| Comerica, Inc. 3.8% 7/22/26 | | 3,131 | 3,354 |
| Commonwealth Bank of Australia 2.3% 3/12/20 | | 6,476 | 6,485 |
| Corporacion Andina de Fomento 4.375% 6/15/22 | | 12,095 | 12,786 |
| Credit Suisse Group Funding Guernsey Ltd.: | | | |
| 3.8% 9/15/22 | | 10,748 | 11,217 |
| 3.8% 6/9/23 | | 17,156 | 18,011 |
| 4.55% 4/17/26 | | 7,291 | 8,079 |
| 4.875% 5/15/45 | | 4,289 | 5,429 |
| Credit Suisse New York Branch: | | | |
| 3% 10/29/21 | | 2,573 | 2,623 |
| 3.625% 9/9/24 | | 8,514 | 9,069 |
| Discover Bank 4.2% 8/8/23 | | 6,005 | 6,448 |
| Export-Import Bank of Korea: | | | |
| 2.875% 1/21/25 | | 6,519 | 6,773 |
| 5% 4/11/22 | | 5,293 | 5,674 |
| Fifth Third Bancorp: | | | |
| 2.6% 6/15/22 | | 6,416 | 6,501 |
| 3.5% 3/15/22 | | 1,415 | 1,462 |
| 8.25% 3/1/38 | | 1,783 | 2,769 |
| HSBC Holdings PLC: | | | |
| 2.65% 1/5/22 | | 18,014 | 18,194 |
| 3.4% 3/8/21 | | 9,093 | 9,238 |
| 3.803% 3/11/25 (a) | | 27,867 | 29,067 |
| 3.9% 5/25/26 | | 9,436 | 10,085 |
| 4.25% 8/18/25 | | 4,804 | 5,093 |
| 4.292% 9/12/26 (a) | | 14,454 | 15,574 |
| 4.375% 11/23/26 | | 24,619 | 26,467 |
| 4.875% 1/14/22 | | 8,664 | 9,188 |
| 5.1% 4/5/21 | | 2,402 | 2,507 |
| 5.25% 3/14/44 | | 3,946 | 4,892 |
| 6.5% 9/15/37 | | 9,007 | 12,217 |
| HSBC U.S.A., Inc. 3.5% 6/23/24 | | 6,005 | 6,290 |
| Huntington Bancshares, Inc.: | | | |
| 2.3% 1/14/22 | | 15,441 | 15,514 |
| 3.15% 3/14/21 | | 8,149 | 8,267 |
| Japan Bank International Cooperation: | | | |
| 1.875% 7/21/26 | | 3,260 | 3,270 |
| 2.125% 2/10/25 | | 1,716 | 1,747 |
| 2.25% 11/4/26 | | 4,486 | 4,609 |
| 2.375% 11/16/22 | | 9,852 | 10,046 |
| 2.375% 4/20/26 | | 11,200 | 11,605 |
| 2.75% 1/21/26 | | 2,720 | 2,877 |
| 2.875% 6/1/27 | | 6,520 | 7,001 |
| 3.125% 7/20/21 | | 3,386 | 3,471 |
| 3.25% 7/20/28 | | 7,720 | 8,620 |
| JPMorgan Chase & Co.: | | | |
| 2.776% 4/25/23 (a) | | 4,289 | 4,356 |
| 2.95% 10/1/26 | | 21,643 | 22,452 |
| 3.22% 3/1/25 (a) | | 14,960 | 15,638 |
| 3.25% 9/23/22 | | 3,431 | 3,556 |
| 3.3% 4/1/26 | | 7,720 | 8,141 |
| 3.375% 5/1/23 | | 1,630 | 1,689 |
| 3.54% 5/1/28 (a) | | 14,583 | 15,634 |
| 3.559% 4/23/24 (a) | | 8,578 | 9,008 |
| 3.797% 7/23/24 (a) | | 11,881 | 12,621 |
| 3.875% 9/10/24 | | 28,072 | 30,012 |
| 3.882% 7/24/38 (a) | | 3,860 | 4,327 |
| 3.9% 7/15/25 | | 18,529 | 20,126 |
| 3.964% 11/15/48 (a) | | 8,063 | 9,281 |
| 4.005% 4/23/29 (a) | | 8,115 | 9,017 |
| 4.125% 12/15/26 | | 5,040 | 5,552 |
| 4.203% 7/23/29 (a) | | 16,075 | 18,145 |
| 4.35% 8/15/21 | | 1,716 | 1,791 |
| 4.5% 1/24/22 | | 11,152 | 11,803 |
| 4.625% 5/10/21 | | 1,287 | 1,341 |
| 4.85% 2/1/44 | | 4,289 | 5,558 |
| 4.95% 6/1/45 | | 8,187 | 10,510 |
| 5.5% 10/15/40 | | 4,890 | 6,704 |
| 5.6% 7/15/41 | | 1,287 | 1,793 |
| 5.625% 8/16/43 | | 4,289 | 5,878 |
| KeyBank NA 3.4% 5/20/26 | | 4,289 | 4,520 |
| KeyCorp. 2.9% 9/15/20 | | 4,975 | 5,016 |
| Lloyds Bank PLC: | | | |
| 3.5% 5/14/25 | | 7,377 | 7,728 |
| 4.344% 1/9/48 | | 12,867 | 12,952 |
| 4.65% 3/24/26 | | 7,377 | 7,786 |
| Lloyds Banking Group PLC: | | | |
| 3.1% 7/6/21 | | 8,578 | 8,704 |
| 4.582% 12/10/25 | | 10,000 | 10,496 |
| Mitsubishi UFJ Financial Group, Inc.: | | | |
| 2.19% 9/13/21 | | 4,289 | 4,291 |
| 2.801% 7/18/24 | | 7,000 | 7,167 |
| 2.998% 2/22/22 | | 7,892 | 8,045 |
| 3.195% 7/18/29 | | 12,200 | 12,786 |
| 3.751% 7/18/39 | | 6,800 | 7,455 |
| 3.85% 3/1/26 | | 5,644 | 6,118 |
| 3.961% 3/2/28 | | 18,872 | 21,014 |
| Mizuho Financial Group, Inc.: | | | |
| 2.953% 2/28/22 | | 7,377 | 7,511 |
| 3.549% 3/5/23 | | 10,294 | 10,753 |
| National Australia Bank Ltd. 2.5% 5/22/22 | | 8,578 | 8,714 |
| Nordic Investment Bank 2.125% 2/1/22 | | 3,260 | 3,305 |
| Oesterreichische Kontrollbank: | | | |
| 2.375% 10/1/21 | | 4,053 | 4,118 |
| 2.875% 9/7/21 | | 3,607 | 3,697 |
| PNC Bank NA: | | | |
| 2.6% 7/21/20 | | 5,730 | 5,755 |
| 2.625% 2/17/22 | | 10,294 | 10,463 |
| PNC Financial Services Group, Inc. 3.9% 4/29/24 | | 4,847 | 5,223 |
| Rabobank Nederland: | | | |
| 3.75% 7/21/26 | | 16,513 | 17,289 |
| 3.95% 11/9/22 | | 4,546 | 4,760 |
| 4.375% 8/4/25 | | 5,147 | 5,564 |
| 4.5% 1/11/21 | | 858 | 887 |
| 5.25% 5/24/41 | | 2,573 | 3,532 |
| Rabobank Nederland New York Branch: | | | |
| 2.75% 1/10/23 | | 14,583 | 14,974 |
| 3.375% 5/21/25 | | 3,217 | 3,468 |
| Regions Financial Corp.: | | | |
| 2.75% 8/14/22 | | 6,502 | 6,616 |
| 3.2% 2/8/21 | | 18,949 | 19,206 |
| Royal Bank of Canada: | | | |
| 2.15% 3/6/20 | | 5,640 | 5,640 |
| 2.75% 2/1/22 | | 11,152 | 11,391 |
| 4.65% 1/27/26 | | 11,143 | 12,429 |
| Royal Bank of Scotland Group PLC: | | | |
| 3.498% 5/15/23 (a) | | 8,780 | 8,886 |
| 3.875% 9/12/23 | | 3,260 | 3,358 |
| 4.8% 4/5/26 | | 5,662 | 6,182 |
| Santander Holdings U.S.A., Inc. 3.4% 1/18/23 | | 9,367 | 9,636 |
| Sumitomo Mitsui Banking Corp.: | | | |
| 2.45% 1/16/20 | | 4,289 | 4,293 |
| 3.4% 7/11/24 | | 4,911 | 5,186 |
| Sumitomo Mitsui Financial Group, Inc.: | | | |
| 2.442% 10/19/21 | | 12,867 | 12,945 |
| 2.778% 10/18/22 | | 6,476 | 6,598 |
| 2.784% 7/12/22 | | 8,998 | 9,158 |
| 2.846% 1/11/22 | | 9,093 | 9,253 |
| 3.102% 1/17/23 | | 7,720 | 7,964 |
| 3.936% 10/16/23 | | 13,451 | 14,387 |
| SunTrust Banks, Inc. 3.3% 5/15/26 | | 6,519 | 6,814 |
| Synchrony Bank 3% 6/15/22 | | 6,005 | 6,114 |
| The Toronto-Dominion Bank: | | | |
| 2.5% 12/14/20 | | 12,027 | 12,106 |
| 3.5% 7/19/23 | | 8,578 | 9,092 |
| U.S. Bancorp: | | | |
| 2.625% 1/24/22 | | 11,902 | 12,099 |
| 3.1% 4/27/26 | | 7,720 | 8,097 |
| 4.125% 5/24/21 | | 2,573 | 2,663 |
| Wells Fargo & Co.: | | | |
| 2.1% 7/26/21 | | 8,578 | 8,585 |
| 2.6% 7/22/20 | | 6,554 | 6,586 |
| 2.625% 7/22/22 | | 12,678 | 12,894 |
| 3% 10/23/26 | | 17,439 | 18,126 |
| 3.3% 9/9/24 | | 3,967 | 4,175 |
| 3.45% 2/13/23 | | 3,152 | 3,275 |
| 3.55% 9/29/25 | | 3,637 | 3,870 |
| 3.75% 1/24/24 | | 24,259 | 25,835 |
| 3.9% 5/1/45 | | 4,083 | 4,779 |
| 4.1% 6/3/26 | | 2,766 | 2,996 |
| 4.4% 6/14/46 | | 6,125 | 7,112 |
| 4.48% 1/16/24 | | 3,273 | 3,548 |
| 4.75% 12/7/46 | | 13,725 | 16,837 |
| 4.9% 11/17/45 | | 8,276 | 10,300 |
| 5.375% 11/2/43 | | 1,587 | 2,096 |
| 5.606% 1/15/44 | | 9,762 | 13,102 |
| Westpac Banking Corp.: | | | |
| 2% 8/19/21 | | 7,360 | 7,368 |
| 2.3% 5/26/20 | | 2,573 | 2,578 |
| 2.5% 6/28/22 | | 21,814 | 22,176 |
| 2.85% 5/13/26 | | 4,075 | 4,248 |
| 3.3% 2/26/24 | | 12,867 | 13,557 |
| 4.421% 7/24/39 | | 5,000 | 5,574 |
| 4.875% 11/19/19 | | 3,174 | 3,192 |
| Zions Bancorp NA 4.5% 6/13/23 | | 178 | 189 |
| | | | 1,770,004 |
| Capital Markets - 1.2% | | | |
| Affiliated Managers Group, Inc. 3.5% 8/1/25 | | 4,075 | 4,248 |
| Bank New York Mellon Corp.: | | | |
| 2.6% 2/7/22 | | 8,578 | 8,719 |
| 2.8% 5/4/26 | | 4,829 | 5,010 |
| 2.95% 1/29/23 | | 12,867 | 13,266 |
| BlackRock, Inc.: | | | |
| 3.5% 3/18/24 | | 2,488 | 2,679 |
| 4.25% 5/24/21 | | 5,576 | 5,804 |
| Brighthouse Financial, Inc. 4.7% 6/22/47 | | 8,149 | 7,340 |
| Deutsche Bank AG 4.5% 4/1/25 | | 2,573 | 2,431 |
| Deutsche Bank AG New York Branch: | | | |
| 2.95% 8/20/20 | | 8,407 | 8,394 |
| 3.3% 11/16/22 | | 7,892 | 7,844 |
| 3.7% 5/30/24 | | 8,407 | 8,377 |
| 3.95% 2/27/23 | | 14,800 | 15,004 |
| 4.1% 1/13/26 | | 18,700 | 18,691 |
| Eaton Vance Corp. 3.625% 6/15/23 | | 2,423 | 2,544 |
| Franklin Resources, Inc. 2.85% 3/30/25 | | 3,260 | 3,375 |
| Goldman Sachs Group, Inc.: | | | |
| 2.35% 11/15/21 | | 23,547 | 23,591 |
| 2.55% 10/23/19 | | 9,436 | 9,440 |
| 3% 4/26/22 | | 14,343 | 14,530 |
| 3.2% 2/23/23 | | 19,876 | 20,536 |
| 3.5% 1/23/25 | | 4,289 | 4,511 |
| 3.625% 1/22/23 | | 7,720 | 8,075 |
| 3.625% 2/20/24 | | 9,007 | 9,499 |
| 3.75% 2/25/26 | | 4,992 | 5,318 |
| 3.85% 7/8/24 | | 3,260 | 3,480 |
| 3.85% 1/26/27 | | 25,940 | 27,700 |
| 4.25% 10/21/25 | | 4,289 | 4,626 |
| 4.75% 10/21/45 | | 13,536 | 16,739 |
| 5.25% 7/27/21 | | 3,860 | 4,079 |
| 5.75% 1/24/22 | | 3,689 | 3,994 |
| 5.95% 1/15/27 | | 12,867 | 15,402 |
| 6% 6/15/20 | | 1,415 | 1,456 |
| 6.75% 10/1/37 | | 17,547 | 24,041 |
| IntercontinentalExchange, Inc.: | | | |
| 3.75% 12/1/25 | | 4,932 | 5,339 |
| 3.75% 9/21/28 | | 8,003 | 8,890 |
| 4% 10/15/23 | | 3,217 | 3,453 |
| Merrill Lynch & Co., Inc. 7.75% 5/14/38 | | 3,581 | 5,591 |
| Morgan Stanley: | | | |
| 3 month U.S. LIBOR + 1.431% 4.457% 4/22/39 (a)(c) | | 6,485 | 7,695 |
| 2.625% 11/17/21 | | 14,909 | 15,065 |
| 2.65% 1/27/20 | | 9,436 | 9,452 |
| 2.75% 5/19/22 | | 10,294 | 10,471 |
| 3.125% 1/23/23 | | 52,498 | 54,130 |
| 3.125% 7/27/26 | | 4,804 | 4,991 |
| 3.591% 7/22/28 (a) | | 7,291 | 7,770 |
| 3.7% 10/23/24 | | 5,147 | 5,498 |
| 3.75% 2/25/23 | | 5,812 | 6,113 |
| 3.875% 4/29/24 | | 12,593 | 13,518 |
| 3.875% 1/27/26 | | 4,504 | 4,869 |
| 3.95% 4/23/27 | | 29,324 | 31,386 |
| 3.971% 7/22/38 (a) | | 5,361 | 5,989 |
| 4.3% 1/27/45 | | 1,716 | 2,031 |
| 4.375% 1/22/47 | | 9,522 | 11,578 |
| 5.5% 7/28/21 | | 2,917 | 3,095 |
| 5.625% 9/23/19 | | 1,716 | 1,719 |
| 5.75% 1/25/21 | | 4,289 | 4,500 |
| 6.375% 7/24/42 | | 2,488 | 3,691 |
| 7.25% 4/1/32 | | 858 | 1,245 |
| State Street Corp. 2.65% 5/19/26 | | 6,476 | 6,698 |
| The Bank of New York Mellon Corp. 2.6% 8/17/20 | | 8,063 | 8,111 |
| | | | 553,631 |
| Consumer Finance - 0.9% | | | |
| AerCap Ireland Capital Ltd./AerCap Global Aviation Trust: | | | |
| 2.875% 8/14/24 | | 12,300 | 12,340 |
| 3.5% 5/26/22 | | 8,106 | 8,327 |
| 3.65% 7/21/27 | | 3,860 | 3,960 |
| 3.875% 1/23/28 | | 13,468 | 13,976 |
| 4.45% 12/16/21 | | 7,206 | 7,488 |
| 4.45% 10/1/25 | | 8,449 | 9,063 |
| 4.5% 5/15/21 | | 12,095 | 12,477 |
| 4.625% 7/1/22 | | 8,106 | 8,572 |
| 4.875% 1/16/24 | | 7,334 | 7,955 |
| American Express Co.: | | | |
| 2.5% 8/1/22 | | 10,774 | 10,925 |
| 4.05% 12/3/42 | | 5,983 | 7,135 |
| Capital One Bank U.S.A. NA 3.375% 2/15/23 | | 2,079 | 2,145 |
| Capital One Financial Corp.: | | | |
| 3.2% 1/30/23 | | 11,941 | 12,304 |
| 3.75% 7/28/26 | | 8,364 | 8,728 |
| 3.75% 3/9/27 | | 19,901 | 21,082 |
| 3.8% 1/31/28 | | 11,152 | 11,889 |
| 4.75% 7/15/21 | | 3,431 | 3,587 |
| Caterpillar Financial Services Corp.: | | | |
| 1.7% 8/9/21 | | 8,055 | 8,017 |
| 2% 3/5/20 | | 3,345 | 3,344 |
| 2.25% 12/1/19 | | 5,662 | 5,663 |
| 2.4% 8/9/26 | | 2,445 | 2,501 |
| 2.85% 6/1/22 | | 3,431 | 3,522 |
| Discover Financial Services: | | | |
| 4.5% 1/30/26 | | 16,142 | 17,828 |
| 5.2% 4/27/22 | | 858 | 923 |
| Ford Motor Credit Co. LLC: | | | |
| 3.2% 1/15/21 | | 3,088 | 3,103 |
| 3.219% 1/9/22 | | 3,002 | 3,011 |
| 3.336% 3/18/21 | | 3,646 | 3,670 |
| 3.815% 11/2/27 | | 9,119 | 8,864 |
| 4.134% 8/4/25 | | 6,005 | 6,049 |
| 4.25% 9/20/22 | | 1,544 | 1,597 |
| 4.375% 8/6/23 | | 3,431 | 3,552 |
| 4.389% 1/8/26 | | 2,822 | 2,870 |
| 5.584% 3/18/24 | | 8,578 | 9,225 |
| 5.875% 8/2/21 | | 9,758 | 10,271 |
| John Deere Capital Corp.: | | | |
| 2.05% 3/10/20 | | 6,584 | 6,583 |
| 2.55% 1/8/21 | | 8,922 | 8,993 |
| 2.65% 6/24/24 | | 8,973 | 9,246 |
| 2.65% 6/10/26 | | 4,289 | 4,454 |
| 2.7% 1/6/23 | | 8,578 | 8,778 |
| 2.8% 1/27/23 | | 4,289 | 4,412 |
| 2.8% 3/6/23 | | 2,788 | 2,869 |
| 2.8% 9/8/27 | | 6,005 | 6,272 |
| 3.45% 3/7/29 | | 17,156 | 18,814 |
| Synchrony Financial: | | | |
| 2.7% 2/3/20 | | 6,863 | 6,872 |
| 3.7% 8/4/26 | | 4,051 | 4,154 |
| 4.375% 3/19/24 | | 9,655 | 10,313 |
| 5.15% 3/19/29 | | 23,364 | 26,312 |
| Toyota Motor Credit Corp.: | | | |
| 1.9% 4/8/21 | | 1,716 | 1,716 |
| 2.15% 3/12/20 | | 5,790 | 5,797 |
| 2.6% 1/11/22 | | 6,863 | 6,974 |
| 2.7% 1/11/23 | | 8,578 | 8,826 |
| 2.75% 5/17/21 | | 2,230 | 2,262 |
| 3.35% 1/8/24 | | 12,000 | 12,709 |
| | | | 412,319 |
| Diversified Financial Services - 1.2% | | | |
| AB Svensk Exportkredit 2.375% 3/9/22 | | 4,804 | 4,899 |
| Berkshire Hathaway Finance Corp.: | | | |
| 4.2% 8/15/48 | | 10,182 | 12,235 |
| 5.75% 1/15/40 | | 4,289 | 6,145 |
| Berkshire Hathaway, Inc.: | | | |
| 3.125% 3/15/26 | | 9,865 | 10,458 |
| 4.5% 2/11/43 | | 1,716 | 2,159 |
| BP Capital Markets America, Inc.: | | | |
| 3.017% 1/16/27 | | 8,149 | 8,499 |
| 3.224% 4/14/24 | | 13,000 | 13,590 |
| 3.245% 5/6/22 | | 6,648 | 6,864 |
| 4.5% 10/1/20 | | 1,716 | 1,762 |
| Brixmor Operating Partnership LP: | | | |
| 3.25% 9/15/23 | | 4,023 | 4,142 |
| 3.9% 3/15/27 | | 4,838 | 5,100 |
| 4.125% 6/15/26 | | 6,476 | 6,903 |
| 4.125% 5/15/29 | | 5,791 | 6,265 |
| Broadcom Corp./Broadcom Cayman LP: | | | |
| 3% 1/15/22 | | 10,508 | 10,593 |
| 3.5% 1/15/28 | | 6,005 | 5,821 |
| 3.875% 1/15/27 | | 6,948 | 6,953 |
| Cigna Corp.: | | | |
| 3.75% 7/15/23 | | 16,037 | 16,859 |
| 4.125% 11/15/25 | | 8,454 | 9,198 |
| 4.375% 10/15/28 | | 22,775 | 25,467 |
| 4.8% 8/15/38 | | 20,219 | 23,376 |
| 4.9% 12/15/48 | | 7,304 | 8,643 |
| Export Development Canada: | | | |
| 2.625% 2/21/24 | | 10,000 | 10,486 |
| 2.75% 3/15/23 | | 39,165 | 40,810 |
| GE Capital International Funding Co.: | | | |
| 2.342% 11/15/20 | | 4,884 | 4,857 |
| 3.373% 11/15/25 | | 24,705 | 25,060 |
| 4.418% 11/15/35 | | 27,361 | 27,799 |
| General Electric Capital Corp.: | | | |
| 4.65% 10/17/21 | | 1,720 | 1,782 |
| 5.875% 1/14/38 | | 3,838 | 4,433 |
| 6.15% 8/7/37 | | 467 | 553 |
| 6.875% 1/10/39 | | 983 | 1,253 |
| ING U.S., Inc. 5.7% 7/15/43 | | 3,217 | 4,194 |
| KfW: | | | |
| 1.5% 4/20/20 | | 2,423 | 2,417 |
| 1.5% 6/15/21 | | 25,614 | 25,569 |
| 1.75% 10/15/19 | | 13,360 | 13,355 |
| 1.875% 6/30/20 | | 4,864 | 4,865 |
| 2% 10/4/22 | | 21,600 | 21,935 |
| 2% 5/2/25 | | 3,281 | 3,371 |
| 2.125% 3/7/22 | | 7,019 | 7,127 |
| 2.125% 1/17/23 | | 10,294 | 10,516 |
| 2.375% 12/29/22 | | 28,417 | 29,248 |
| 2.5% 11/20/24 | | 8,943 | 9,404 |
| 2.625% 2/28/24 | | 17,500 | 18,371 |
| 2.75% 10/1/20 | | 3,581 | 3,619 |
| 2.875% 4/3/28 | | 13,176 | 14,573 |
| 3.125% 12/15/21 | | 16,556 | 17,144 |
| 4% 1/27/20 | | 2,573 | 2,593 |
| Landwirtschaftliche Rentenbank: | | | |
| 1.75% 7/27/26 | | 7,291 | 7,382 |
| 2.5% 11/15/27 | | 7,583 | 8,068 |
| Voya Financial, Inc. 3.65% 6/15/26 | | 13,544 | 14,378 |
| | | | 531,093 |
| Insurance - 0.6% | | | |
| ACE INA Holdings, Inc.: | | | |
| 3.35% 5/3/26 | | 3,620 | 3,884 |
| 4.35% 11/3/45 | | 3,431 | 4,332 |
| AFLAC, Inc. 4% 10/15/46 | | 3,243 | 3,633 |
| Allstate Corp.: | | | |
| 3.28% 12/15/26 | | 4,049 | 4,375 |
| 4.2% 12/15/46 | | 6,485 | 7,875 |
| American International Group, Inc.: | | | |
| 3.375% 8/15/20 | | 4,954 | 5,009 |
| 3.75% 7/10/25 | | 2,445 | 2,604 |
| 3.875% 1/15/35 | | 2,316 | 2,458 |
| 3.9% 4/1/26 | | 3,234 | 3,472 |
| 4.2% 4/1/28 | | 15,912 | 17,545 |
| 4.5% 7/16/44 | | 7,613 | 8,703 |
| 4.7% 7/10/35 | | 4,975 | 5,720 |
| 4.75% 4/1/48 | | 8,431 | 10,054 |
| 4.875% 6/1/22 | | 7,720 | 8,269 |
| 6.4% 12/15/20 | | 2,488 | 2,621 |
| Aon PLC: | | | |
| 3.5% 6/14/24 | | 1,716 | 1,815 |
| 4% 11/27/23 | | 2,573 | 2,751 |
| 4.6% 6/14/44 | | 1,373 | 1,615 |
| 4.75% 5/15/45 | | 5,044 | 6,102 |
| Baylor Scott & White Holdings 3.967% 11/15/46 | | 2,145 | 2,516 |
| Hartford Financial Services Group, Inc.: | | | |
| 2.8% 8/19/29 | | 6,100 | 6,192 |
| 3.6% 8/19/49 | | 7,300 | 7,620 |
| 4.4% 3/15/48 | | 8,329 | 9,723 |
| Lincoln National Corp. 3.625% 12/12/26 | | 5,147 | 5,479 |
| Marsh & McLennan Companies, Inc.: | | | |
| 2.35% 9/10/19 | | 3,303 | 3,303 |
| 2.35% 3/6/20 | | 4,075 | 4,078 |
| 3.5% 6/3/24 | | 1,630 | 1,721 |
| 3.875% 3/15/24 | | 8,149 | 8,742 |
| 4.05% 10/15/23 | | 5,812 | 6,209 |
| 4.2% 3/1/48 | | 4,178 | 4,892 |
| 4.35% 1/30/47 | | 2,402 | 2,878 |
| 4.375% 3/15/29 | | 6,605 | 7,588 |
| 4.9% 3/15/49 | | 7,978 | 10,358 |
| MetLife, Inc.: | | | |
| 4.6% 5/13/46 | | 1,716 | 2,136 |
| 4.721% 12/15/44 (a) | | 4,289 | 5,346 |
| 5.875% 2/6/41 | | 2,059 | 2,868 |
| Principal Financial Group, Inc. 4.3% 11/15/46 | | 6,863 | 7,968 |
| Progressive Corp. 2.45% 1/15/27 | | 4,066 | 4,138 |
| Prudential Financial, Inc.: | | | |
| 3.878% 3/27/28 | | 5,490 | 6,150 |
| 3.905% 12/7/47 | | 472 | 526 |
| 3.935% 12/7/49 | | 9,195 | 10,246 |
| 4.35% 2/25/50 | | 6,657 | 7,950 |
| 4.418% 3/27/48 | | 5,447 | 6,484 |
| 5.7% 12/14/36 | | 326 | 436 |
| The Chubb Corp. 6.5% 5/15/38 | | 3,011 | 4,510 |
| The Travelers Companies, Inc.: | | | |
| 4.3% 8/25/45 | | 1,252 | 1,522 |
| 6.25% 6/15/37 | | 7,163 | 10,385 |
| | | | 254,801 |
|
| TOTAL FINANCIALS | | | 3,521,848 |
|
| HEALTH CARE - 2.7% | | | |
| Biotechnology - 0.4% | | | |
| AbbVie, Inc.: | | | |
| 2.3% 5/14/21 | | 2,342 | 2,348 |
| 2.5% 5/14/20 | | 6,090 | 6,099 |
| 2.9% 11/6/22 | | 4,890 | 4,977 |
| 3.6% 5/14/25 | | 7,720 | 8,050 |
| 4.25% 11/14/28 | | 7,111 | 7,735 |
| 4.3% 5/14/36 | | 5,370 | 5,696 |
| 4.4% 11/6/42 | | 4,096 | 4,299 |
| 4.45% 5/14/46 | | 6,005 | 6,309 |
| 4.7% 5/14/45 | | 11,303 | 12,214 |
| 4.875% 11/14/48 | | 5,000 | 5,570 |
| Amgen, Inc.: | | | |
| 2.6% 8/19/26 | | 9,007 | 9,112 |
| 3.125% 5/1/25 | | 1,716 | 1,793 |
| 3.875% 11/15/21 | | 8,235 | 8,516 |
| 4.4% 5/1/45 | | 8,518 | 9,661 |
| 4.663% 6/15/51 | | 10,700 | 12,751 |
| Celgene Corp.: | | | |
| 2.875% 8/15/20 | | 3,000 | 3,018 |
| 3.875% 8/15/25 | | 9,500 | 10,313 |
| 4.35% 11/15/47 | | 5,500 | 6,641 |
| 4.55% 2/20/48 | | 15,000 | 18,393 |
| 5% 8/15/45 | | 4,300 | 5,473 |
| Gilead Sciences, Inc.: | | | |
| 2.55% 9/1/20 | | 4,066 | 4,088 |
| 3.65% 3/1/26 | | 5,301 | 5,698 |
| 4.15% 3/1/47 | | 10,671 | 12,073 |
| 4.75% 3/1/46 | | 9,436 | 11,479 |
| | | | 182,306 |
| Health Care Equipment & Supplies - 0.4% | | | |
| Abbott Laboratories: | | | |
| 2.9% 11/30/21 | | 9,736 | 9,925 |
| 3.75% 11/30/26 | | 5,981 | 6,581 |
| 4.75% 11/30/36 | | 3,860 | 4,835 |
| 4.9% 11/30/46 | | 8,921 | 11,925 |
| Becton, Dickinson & Co.: | | | |
| 2.675% 12/15/19 | | 5,022 | 5,026 |
| 3.363% 6/6/24 | | 8,578 | 8,944 |
| 3.7% 6/6/27 | | 17,208 | 18,435 |
| 4.685% 12/15/44 | | 9,320 | 11,051 |
| Boston Scientific Corp.: | | | |
| 3.45% 3/1/24 | | 3,989 | 4,192 |
| 4% 3/1/28 | | 17,156 | 18,884 |
| 4% 3/1/29 | | 9,264 | 10,334 |
| 4.7% 3/1/49 | | 7,978 | 9,896 |
| Danaher Corp. 2.4% 9/15/20 | | 6,314 | 6,327 |
| Medtronic Global Holdings SCA 3.35% 4/1/27 | | 12,567 | 13,653 |
| Medtronic, Inc. 4.625% 3/15/45 | | 11,087 | 14,397 |
| Zimmer Biomet Holdings, Inc. 3.55% 4/1/25 | | 9,762 | 10,280 |
| | | | 164,685 |
| Health Care Providers & Services - 0.9% | | | |
| Aetna, Inc.: | | | |
| 2.8% 6/15/23 | | 12,867 | 13,072 |
| 4.125% 11/15/42 | | 9,733 | 10,074 |
| Allina Health System, Inc. 3.887% 4/15/49 | | 5,690 | 6,714 |
| Anthem, Inc.: | | | |
| 3.65% 12/1/27 | | 19,730 | 20,934 |
| 4.375% 12/1/47 | | 3,860 | 4,331 |
| Cardinal Health, Inc. 4.368% 6/15/47 | | 11,915 | 11,521 |
| Childrens Hosp Medical Ctr 4.268% 5/15/44 | | 2,848 | 3,487 |
| Cigna Holding Co. 4% 2/15/22 | | 3,946 | 4,105 |
| Commonspirit Health 4.35% 11/1/42 | | 1,716 | 1,870 |
| CVS Health Corp.: | | | |
| 2.8% 7/20/20 | | 7,206 | 7,242 |
| 2.875% 6/1/26 | | 6,434 | 6,474 |
| 3% 8/15/26 | | 4,809 | 4,868 |
| 3.25% 8/15/29 | | 4,640 | 4,703 |
| 3.7% 3/9/23 | | 18,078 | 18,904 |
| 3.875% 7/20/25 | | 3,997 | 4,235 |
| 4.1% 3/25/25 | | 14,711 | 15,738 |
| 4.3% 3/25/28 | | 20,502 | 22,379 |
| 4.875% 7/20/35 | | 2,659 | 3,036 |
| 5.05% 3/25/48 | | 23,504 | 27,386 |
| 5.125% 7/20/45 | | 7,557 | 8,784 |
| 5.3% 12/5/43 | | 3,767 | 4,448 |
| Express Scripts Holding Co.: | | | |
| 3% 7/15/23 | | 8,578 | 8,774 |
| 4.5% 2/25/26 | | 10,002 | 11,046 |
| 4.8% 7/15/46 | | 6,519 | 7,456 |
| 6.125% 11/15/41 | | 2,573 | 3,322 |
| Humana, Inc. 4.95% 10/1/44 | | 2,145 | 2,555 |
| Kaiser Foundation Hospitals: | | | |
| 4.15% 5/1/47 | | 5,620 | 6,929 |
| 4.875% 4/1/42 | | 1,544 | 2,042 |
| McKesson Corp.: | | | |
| 3.796% 3/15/24 | | 4,289 | 4,506 |
| 4.883% 3/15/44 | | 4,289 | 4,824 |
| Memorial Sloan-Kettring Cancer Center 4.2% 7/1/55 | | 2,573 | 3,278 |
| New York & Presbyterian Hospital: | | | |
| 4.024% 8/1/45 | | 3,002 | 3,617 |
| 4.063% 8/1/56 | | 2,256 | 2,724 |
| NYU Hospitals Center 4.784% 7/1/44 | | 6,519 | 8,413 |
| Partners Healthcare System, Inc. 4.117% 7/1/55 | | 3,002 | 3,649 |
| UnitedHealth Group, Inc.: | | | |
| 2.3% 12/15/19 | | 7,399 | 7,401 |
| 2.375% 8/15/24 | | 8,460 | 8,593 |
| 2.7% 7/15/20 | | 5,147 | 5,181 |
| 2.875% 12/15/21 | | 2,209 | 2,254 |
| 3.375% 4/15/27 | | 4,632 | 4,980 |
| 3.5% 6/15/23 | | 7,635 | 8,057 |
| 3.7% 8/15/49 | | 9,000 | 9,838 |
| 3.75% 7/15/25 | | 3,002 | 3,261 |
| 3.75% 10/15/47 | | 8,201 | 8,962 |
| 3.85% 6/15/28 | | 9,959 | 11,077 |
| 3.875% 12/15/28 | | 12,859 | 14,437 |
| 3.875% 8/15/59 | | 7,100 | 7,845 |
| 4.2% 1/15/47 | | 3,088 | 3,619 |
| 4.375% 3/15/42 | | 10,122 | 11,884 |
| 4.75% 7/15/45 | | 1,433 | 1,785 |
| WellPoint, Inc.: | | | |
| 3.3% 1/15/23 | | 1,716 | 1,772 |
| 4.625% 5/15/42 | | 2,230 | 2,541 |
| 4.65% 1/15/43 | | 1,716 | 1,934 |
| | | | 392,861 |
| Life Sciences Tools & Services - 0.0% | | | |
| Thermo Fisher Scientific, Inc.: | | | |
| 3% 4/15/23 | | 4,006 | 4,121 |
| 4.15% 2/1/24 | | 3,756 | 4,042 |
| 5.3% 2/1/44 | | 4,992 | 6,516 |
| | | | 14,679 |
| Pharmaceuticals - 1.0% | | | |
| Actavis Funding SCS: | | | |
| 3% 3/12/20 | | 23,247 | 23,318 |
| 3.45% 3/15/22 | | 15,462 | 15,879 |
| 3.8% 3/15/25 | | 7,566 | 7,960 |
| 4.55% 3/15/35 | | 5,704 | 6,136 |
| 4.75% 3/15/45 | | 5,430 | 5,956 |
| Allergan PLC 3.25% 10/1/22 | | 2,573 | 2,630 |
| AstraZeneca PLC: | | | |
| 4.375% 11/16/45 | | 6,468 | 7,733 |
| 4.375% 8/17/48 | | 10,610 | 12,937 |
| 6.45% 9/15/37 | | 2,788 | 4,005 |
| Bayer U.S. Finance II LLC: | | | |
| 2.75% 7/15/21 (b) | | 5,453 | 5,463 |
| 2.85% 4/15/25 (b) | | 3,281 | 3,171 |
| 3.95% 4/15/45 (b) | | 1,192 | 1,156 |
| Bristol-Myers Squibb Co.: | | | |
| 2.9% 7/26/24 (b) | | 9,765 | 10,125 |
| 3.2% 6/15/26 (b) | | 3,500 | 3,703 |
| 3.25% 8/1/42 | | 2,402 | 2,432 |
| 3.4% 7/26/29 (b) | | 15,750 | 17,050 |
| 4.125% 6/15/39 (b) | | 2,450 | 2,843 |
| 4.25% 10/26/49 (b) | | 10,400 | 12,510 |
| Eli Lilly & Co. 3.95% 5/15/47 | | 4,718 | 5,498 |
| GlaxoSmithKline Capital PLC 3% 6/1/24 | | 10,000 | 10,408 |
| GlaxoSmithKline Capital, Inc. 6.375% 5/15/38 | | 6,192 | 9,049 |
| Johnson & Johnson: | | | |
| 1.65% 3/1/21 | | 3,234 | 3,230 |
| 2.45% 3/1/26 | | 4,795 | 4,947 |
| 3.4% 1/15/38 | | 8,003 | 8,754 |
| 3.5% 1/15/48 | | 5,147 | 5,785 |
| 3.625% 3/3/37 | | 3,431 | 3,865 |
| 4.5% 12/5/43 | | 5,683 | 7,182 |
| 4.85% 5/15/41 | | 3,654 | 4,821 |
| Merck & Co., Inc.: | | | |
| 1.85% 2/10/20 | | 7,720 | 7,713 |
| 2.4% 9/15/22 | | 1,716 | 1,743 |
| 2.9% 3/7/24 | | 9,850 | 10,306 |
| 3.6% 9/15/42 | | 1,716 | 1,920 |
| 3.7% 2/10/45 | | 5,490 | 6,286 |
| 3.875% 1/15/21 | | 858 | 877 |
| Mylan NV: | | | |
| 3.15% 6/15/21 | | 1,716 | 1,736 |
| 3.95% 6/15/26 | | 2,428 | 2,526 |
| 5.2% 4/15/48 | | 2,573 | 2,806 |
| 5.25% 6/15/46 | | 2,831 | 3,102 |
| Novartis Capital Corp.: | | | |
| 2.4% 5/17/22 | | 9,951 | 10,113 |
| 2.4% 9/21/22 | | 3,217 | 3,274 |
| 3% 11/20/25 | | 8,981 | 9,521 |
| 3.1% 5/17/27 | | 5,053 | 5,434 |
| 3.7% 9/21/42 | | 2,423 | 2,736 |
| 4% 11/20/45 | | 4,495 | 5,348 |
| Perrigo Co. PLC 3.5% 3/15/21 | | 1,446 | 1,454 |
| Perrigo Finance PLC: | | | |
| 4.375% 3/15/26 | | 2,659 | 2,737 |
| 4.9% 12/15/44 | | 1,946 | 1,915 |
| Pfizer, Inc.: | | | |
| 2.95% 3/15/24 | | 4,032 | 4,203 |
| 3% 12/15/26 | | 5,747 | 6,081 |
| 3.2% 9/15/23 | | 10,911 | 11,457 |
| 3.45% 3/15/29 | | 7,146 | 7,824 |
| 3.9% 3/15/39 | | 5,404 | 6,210 |
| 4% 12/15/36 | | 8,149 | 9,470 |
| 4.125% 12/15/46 | | 2,822 | 3,379 |
| 4.2% 9/15/48 | | 6,691 | 8,088 |
| 4.4% 5/15/44 | | 3,594 | 4,378 |
| 7.2% 3/15/39 | | 4,632 | 7,337 |
| Shire Acquisitions Investments Ireland DAC: | | | |
| 2.4% 9/23/21 | | 9,728 | 9,758 |
| 2.875% 9/23/23 | | 8,106 | 8,291 |
| 3.2% 9/23/26 | | 33,609 | 34,957 |
| Zoetis, Inc.: | | | |
| 3.25% 2/1/23 | | 4,289 | 4,436 |
| 3.95% 9/12/47 | | 1,716 | 1,916 |
| 4.7% 2/1/43 | | 1,115 | 1,357 |
| | | | 419,235 |
|
| TOTAL HEALTH CARE | | | 1,173,766 |
|
| INDUSTRIALS - 1.6% | | | |
| Aerospace & Defense - 0.5% | | | |
| General Dynamics Corp.: | | | |
| 3% 5/11/21 | | 4,975 | 5,071 |
| 3.375% 5/15/23 | | 8,149 | 8,574 |
| 3.75% 5/15/28 | | 8,063 | 9,092 |
| Lockheed Martin Corp.: | | | |
| 3.55% 1/15/26 | | 6,519 | 7,072 |
| 4.09% 9/15/52 | | 8,199 | 9,874 |
| Northrop Grumman Corp.: | | | |
| 3.25% 1/15/28 | | 7,206 | 7,655 |
| 3.85% 4/15/45 | | 1,608 | 1,803 |
| 4.03% 10/15/47 | | 16,153 | 18,702 |
| 4.75% 6/1/43 | | 3,431 | 4,241 |
| Raytheon Co.: | | | |
| 3.125% 10/15/20 | | 1,716 | 1,737 |
| 3.15% 12/15/24 | | 7,635 | 8,059 |
| 4.875% 10/15/40 | | 858 | 1,105 |
| Rockwell Collins, Inc.: | | | |
| 2.8% 3/15/22 | | 7,291 | 7,417 |
| 4.35% 4/15/47 | | 5,662 | 6,673 |
| The Boeing Co.: | | | |
| 2.125% 3/1/22 | | 3,225 | 3,240 |
| 2.5% 3/1/25 | | 3,946 | 4,020 |
| 2.7% 2/1/27 | | 6,800 | 6,987 |
| 2.8% 3/1/23 | | 4,238 | 4,345 |
| 2.95% 2/1/30 | | 8,700 | 9,032 |
| 3.625% 3/1/48 | | 3,431 | 3,698 |
| 3.65% 3/1/47 | | 2,368 | 2,574 |
| 3.75% 2/1/50 | | 10,700 | 11,914 |
| 6.875% 3/15/39 | | 2,831 | 4,284 |
| United Technologies Corp.: | | | |
| 2.3% 5/4/22 | | 8,578 | 8,653 |
| 2.65% 11/1/26 | | 4,118 | 4,263 |
| 3.1% 6/1/22 | | 2,466 | 2,545 |
| 3.65% 8/16/23 | | 16,710 | 17,732 |
| 3.75% 11/1/46 | | 3,303 | 3,667 |
| 4.05% 5/4/47 | | 1,999 | 2,313 |
| 4.125% 11/16/28 | | 12,618 | 14,439 |
| 4.5% 4/15/20 | | 3,431 | 3,480 |
| 4.5% 6/1/42 | | 6,331 | 7,637 |
| 4.625% 11/16/48 | | 6,005 | 7,585 |
| 5.7% 4/15/40 | | 1,716 | 2,317 |
| | | | 221,800 |
| Air Freight & Logistics - 0.1% | | | |
| FedEx Corp.: | | | |
| 3.2% 2/1/25 | | 3,277 | 3,433 |
| 3.9% 2/1/35 | | 5,061 | 5,306 |
| 4.4% 1/15/47 | | 6,863 | 7,350 |
| 4.55% 4/1/46 | | 1,287 | 1,403 |
| 4.95% 10/17/48 | | 3,423 | 4,000 |
| United Parcel Service, Inc.: | | | |
| 2.4% 11/15/26 | | 6,434 | 6,522 |
| 3.4% 11/15/46 | | 2,273 | 2,373 |
| 3.75% 11/15/47 | | 5,301 | 5,856 |
| 6.2% 1/15/38 | | 2,145 | 3,003 |
| | | | 39,246 |
| Airlines - 0.0% | | | |
| American Airlines pass-thru trust equipment trust certificate 4.95% 7/15/24 | | 1,598 | 1,682 |
| American Airlines, Inc. equipment trust certificate 3.2% 6/15/28 | | 5,868 | 6,097 |
| Continental Airlines, Inc. 4% 10/29/24 | | 2,917 | 3,091 |
| United Airlines 2015-1 Class AA Pass Through Trust 3.45% 12/1/27 | | 518 | 546 |
| United Airlines Pass-through Trust equipment trust certificate 3.1% 1/7/30 | | 7,251 | 7,601 |
| | | | 19,017 |
| Commercial Services & Supplies - 0.1% | | | |
| FMS Wertmanagement AoeR 1.375% 6/8/21 | | 8,063 | 8,029 |
| Republic Services, Inc.: | | | |
| 2.9% 7/1/26 | | 3,620 | 3,765 |
| 3.2% 3/15/25 | | 9,672 | 10,141 |
| 3.95% 5/15/28 | | 9,007 | 10,100 |
| 5.5% 9/15/19 | | 3,431 | 3,434 |
| Waste Management, Inc.: | | | |
| 2.4% 5/15/23 | | 4,546 | 4,608 |
| 2.9% 9/15/22 | | 5,726 | 5,873 |
| | | | 45,950 |
| Electrical Equipment - 0.0% | | | |
| Eaton Corp.: | | | |
| 2.75% 11/2/22 | | 4,911 | 5,008 |
| 4% 11/2/32 | | 1,630 | 1,877 |
| 4.15% 11/2/42 | | 1,630 | 1,848 |
| Fortive Corp. 2.35% 6/15/21 | | 5,662 | 5,662 |
| | | | 14,395 |
| Industrial Conglomerates - 0.2% | | | |
| 3M Co.: | | | |
| 2% 6/26/22 | | 3,431 | 3,460 |
| 2.375% 8/26/29 | | 9,527 | 9,532 |
| 2.875% 10/15/27 | | 3,431 | 3,614 |
| 3.125% 9/19/46 | | 2,368 | 2,356 |
| 3.25% 8/26/49 | | 7,340 | 7,428 |
| Covidien International Finance SA 3.2% 6/15/22 | | 1,844 | 1,908 |
| Danaher Corp. 4.375% 9/15/45 | | 2,033 | 2,460 |
| General Electric Co.: | | | |
| 3.375% 3/11/24 | | 4,718 | 4,781 |
| 4.5% 3/11/44 | | 26,052 | 26,337 |
| Honeywell International, Inc.: | | | |
| 2.5% 11/1/26 | | 6,142 | 6,319 |
| 3.812% 11/21/47 | | 1,201 | 1,416 |
| Roper Technologies, Inc.: | | | |
| 2.8% 12/15/21 | | 5,670 | 5,748 |
| 3.8% 12/15/26 | | 7,291 | 7,903 |
| | | | 83,262 |
| Machinery - 0.2% | | | |
| Caterpillar Financial Services Corp.: | | | |
| 2.4% 6/6/22 | | 8,578 | 8,701 |
| 3.45% 5/15/23 | | 12,009 | 12,626 |
| Caterpillar, Inc.: | | | |
| 2.6% 6/26/22 | | 5,147 | 5,247 |
| 3.803% 8/15/42 | | 2,145 | 2,479 |
| 5.3% 9/15/35 | | 6,005 | 7,741 |
| Deere & Co. 5.375% 10/16/29 | | 858 | 1,085 |
| Ingersoll-Rand Luxembourg Finance SA: | | | |
| 2.625% 5/1/20 | | 4,369 | 4,380 |
| 3.8% 3/21/29 | | 12,310 | 13,352 |
| 4.65% 11/1/44 | | 5,147 | 5,979 |
| Parker Hannifin Corp.: | | | |
| 3.25% 3/1/27 | | 4,847 | 5,080 |
| 4.1% 3/1/47 | | 4,855 | 5,488 |
| | | | 72,158 |
| Professional Services - 0.0% | | | |
| Thomson Reuters Corp. 3.35% 5/15/26 | | 6,005 | 6,248 |
| Road & Rail - 0.4% | | | |
| Burlington Northern Santa Fe Corp. 4.7% 10/1/19 | | 4,289 | 4,297 |
| Burlington Northern Santa Fe LLC: | | | |
| 3% 3/15/23 | | 2,402 | 2,485 |
| 3.05% 3/15/22 | | 8,578 | 8,810 |
| 3.25% 6/15/27 | | 6,434 | 6,898 |
| 3.9% 8/1/46 | | 3,980 | 4,552 |
| 4.05% 6/15/48 | | 5,147 | 6,049 |
| 4.125% 6/15/47 | | 2,445 | 2,917 |
| 4.15% 4/1/45 | | 1,458 | 1,711 |
| 4.375% 9/1/42 | | 3,860 | 4,602 |
| 4.55% 9/1/44 | | 2,573 | 3,137 |
| 4.9% 4/1/44 | | 3,431 | 4,402 |
| Canadian National Railway Co.: | | | |
| 2.85% 12/15/21 | | 4,289 | 4,357 |
| 3.2% 8/2/46 | | 2,831 | 2,970 |
| CSX Corp.: | | | |
| 3.25% 6/1/27 | | 4,289 | 4,553 |
| 3.4% 8/1/24 | | 3,967 | 4,211 |
| 3.8% 11/1/46 | | 4,907 | 5,267 |
| 3.95% 5/1/50 | | 3,067 | 3,398 |
| 4.1% 3/15/44 | | 5,812 | 6,490 |
| 4.5% 3/15/49 | | 8,321 | 9,994 |
| 4.75% 11/15/48 | | 4,967 | 6,121 |
| Norfolk Southern Corp.: | | | |
| 3% 4/1/22 | | 6,434 | 6,571 |
| 3.25% 12/1/21 | | 4,289 | 4,383 |
| 3.65% 8/1/25 | | 10,294 | 11,069 |
| 3.95% 10/1/42 | | 1,630 | 1,793 |
| 4.65% 1/15/46 | | 2,796 | 3,422 |
| Union Pacific Corp.: | | | |
| 2.75% 3/1/26 | | 5,713 | 5,896 |
| 3% 4/15/27 | | 4,289 | 4,491 |
| 3.35% 8/15/46 | | 4,049 | 4,103 |
| 3.6% 9/15/37 | | 2,831 | 3,027 |
| 3.7% 3/1/29 | | 7,875 | 8,751 |
| 3.799% 10/1/51 | | 2,402 | 2,617 |
| 4.5% 9/10/48 | | 8,063 | 9,823 |
| | | | 163,167 |
| Trading Companies & Distributors - 0.1% | | | |
| Air Lease Corp.: | | | |
| 2.625% 7/1/22 | | 8,081 | 8,154 |
| 2.75% 1/15/23 | | 8,578 | 8,675 |
| 3.375% 6/1/21 | | 12,030 | 12,229 |
| 3.625% 12/1/27 | | 8,200 | 8,545 |
| 3.75% 2/1/22 | | 3,277 | 3,376 |
| 4.25% 2/1/24 | | 11,290 | 12,052 |
| | | | 53,031 |
|
| TOTAL INDUSTRIALS | | | 718,274 |
|
| INFORMATION TECHNOLOGY - 1.8% | | | |
| Communications Equipment - 0.1% | | | |
| Cisco Systems, Inc.: | | | |
| 1.85% 9/20/21 | | 8,664 | 8,658 |
| 2.2% 9/20/23 | | 6,442 | 6,540 |
| 2.5% 9/20/26 | | 4,289 | 4,450 |
| 3.5% 6/15/25 | | 3,663 | 3,979 |
| 4.45% 1/15/20 | | 1,716 | 1,731 |
| 5.9% 2/15/39 | | 10,651 | 15,473 |
| | | | 40,831 |
| Electronic Equipment & Components - 0.2% | | | |
| Corning, Inc. 4.75% 3/15/42 | | 4,289 | 5,010 |
| Diamond 1 Finance Corp./Diamond 2 Finance Corp.: | | | |
| 4% 7/15/24 (b) | | 9,865 | 10,312 |
| 4.42% 6/15/21 (b) | | 14,720 | 15,188 |
| 4.9% 10/1/26 (b) | | 8,106 | 8,666 |
| 5.3% 10/1/29 (b) | | 21,591 | 23,408 |
| 6.02% 6/15/26 (b) | | 13,845 | 15,625 |
| 8.35% 7/15/46 (b) | | 5,053 | 6,639 |
| Tyco Electronics Group SA: | | | |
| 3.45% 8/1/24 | | 3,131 | 3,293 |
| 7.125% 10/1/37 | | 2,123 | 3,034 |
| | | | 91,175 |
| IT Services - 0.3% | | | |
| Fiserv, Inc.: | | | |
| 3.5% 7/1/29 | | 9,500 | 10,090 |
| 4.4% 7/1/49 | | 12,650 | 14,572 |
| IBM Corp.: | | | |
| 2.5% 1/27/22 | | 6,691 | 6,778 |
| 3% 5/15/24 | | 10,300 | 10,711 |
| 3.5% 5/15/29 | | 14,550 | 15,797 |
| 3.625% 2/12/24 | | 8,578 | 9,146 |
| 4.25% 5/15/49 | | 9,300 | 10,849 |
| 4.7% 2/19/46 | | 4,246 | 5,251 |
| IBM Credit LLC 2.2% 9/8/22 | | 7,720 | 7,764 |
| MasterCard, Inc. 3.8% 11/21/46 | | 3,260 | 3,829 |
| Visa, Inc.: | | | |
| 2.2% 12/14/20 | | 4,890 | 4,913 |
| 2.75% 9/15/27 | | 10,225 | 10,818 |
| 3.15% 12/14/25 | | 7,729 | 8,279 |
| 4.3% 12/14/45 | | 5,696 | 7,228 |
| | | | 126,025 |
| Semiconductors & Semiconductor Equipment - 0.2% | | | |
| Applied Materials, Inc. 4.35% 4/1/47 | | 11,083 | 13,583 |
| Broadcom, Inc. 4.75% 4/15/29 (b) | | 14,670 | 15,456 |
| Intel Corp.: | | | |
| 2.35% 5/11/22 | | 14,583 | 14,773 |
| 3.3% 10/1/21 | | 12,867 | 13,265 |
| 3.734% 12/8/47 | | 2,802 | 3,186 |
| 4.1% 5/19/46 | | 6,005 | 7,146 |
| 4.1% 5/11/47 | | 2,059 | 2,460 |
| Qualcomm, Inc.: | | | |
| 2.6% 1/30/23 | | 6,434 | 6,556 |
| 4.3% 5/20/47 | | 8,664 | 9,832 |
| Texas Instruments, Inc.: | | | |
| 1.75% 5/1/20 | | 3,260 | 3,255 |
| 4.15% 5/15/48 | | 3,431 | 4,255 |
| | | | 93,767 |
| Software - 0.6% | | | |
| Microsoft Corp.: | | | |
| 1.55% 8/8/21 | | 17,294 | 17,243 |
| 2.4% 2/6/22 | | 24,019 | 24,432 |
| 2.7% 2/12/25 | | 14,733 | 15,400 |
| 2.875% 2/6/24 | | 10,000 | 10,471 |
| 3.45% 8/8/36 | | 5,233 | 5,880 |
| 3.625% 12/15/23 | | 22,432 | 24,107 |
| 3.7% 8/8/46 | | 14,351 | 16,896 |
| 3.95% 8/8/56 | | 4,289 | 5,250 |
| 4.1% 2/6/37 | | 15,218 | 18,348 |
| 4.25% 2/6/47 | | 5,988 | 7,626 |
| 4.45% 11/3/45 | | 10,783 | 13,959 |
| 5.3% 2/8/41 | | 1,287 | 1,817 |
| Oracle Corp.: | | | |
| 1.9% 9/15/21 | | 7,206 | 7,203 |
| 2.25% 10/8/19 | | 4,053 | 4,053 |
| 2.5% 5/15/22 | | 8,235 | 8,352 |
| 2.625% 2/15/23 | | 8,578 | 8,765 |
| 2.65% 7/15/26 | | 7,720 | 7,909 |
| 2.95% 5/15/25 | | 4,289 | 4,490 |
| 3.25% 11/15/27 | | 14,669 | 15,720 |
| 3.4% 7/8/24 | | 4,053 | 4,296 |
| 3.85% 7/15/36 | | 8,690 | 9,800 |
| 4% 7/15/46 | | 8,407 | 9,592 |
| 4% 11/15/47 | | 4,289 | 4,910 |
| 4.125% 5/15/45 | | 2,573 | 2,973 |
| 4.3% 7/8/34 | | 3,324 | 3,924 |
| 5.375% 7/15/40 | | 10,723 | 14,378 |
| | | | 267,794 |
| Technology Hardware, Storage & Peripherals - 0.4% | | | |
| Apple, Inc.: | | | |
| 2.1% 9/12/22 | | 7,291 | 7,357 |
| 2.15% 2/9/22 | | 4,289 | 4,326 |
| 2.25% 2/23/21 | | 12,867 | 12,939 |
| 2.3% 5/11/22 | | 6,863 | 6,953 |
| 2.4% 1/13/23 | | 25,734 | 26,252 |
| 2.45% 8/4/26 | | 17,671 | 18,074 |
| 2.7% 5/13/22 | | 5,704 | 5,841 |
| 2.9% 9/12/27 | | 12,052 | 12,667 |
| 3% 11/13/27 | | 8,578 | 9,128 |
| 3.2% 5/13/25 | | 8,998 | 9,592 |
| 3.2% 5/11/27 | | 4,778 | 5,115 |
| 3.75% 11/13/47 | | 5,983 | 6,801 |
| 3.85% 5/4/43 | | 11,152 | 12,727 |
| 4.25% 2/9/47 | | 2,145 | 2,605 |
| 4.375% 5/13/45 | | 4,023 | 4,943 |
| 4.5% 2/23/36 | | 7,943 | 9,809 |
| 4.65% 2/23/46 | | 4,847 | 6,199 |
| Hewlett Packard Enterprise Co.: | | | |
| 3.6% 10/15/20 (a) | | 6,116 | 6,204 |
| 4.9% 10/15/25 (a) | | 8,364 | 9,273 |
| 6.2% 10/15/35 (a) | | 3,337 | 3,884 |
| 6.35% 10/15/45 (a) | | 1,613 | 1,871 |
| HP, Inc.: | | | |
| 4.3% 6/1/21 | | 2,385 | 2,472 |
| 6% 9/15/41 | | 1,287 | 1,443 |
| Xerox Corp.: | | | |
| 4.5% 5/15/21 | | 3,431 | 3,517 |
| 5.625% 12/15/19 | | 858 | 864 |
| | | | 190,856 |
|
| TOTAL INFORMATION TECHNOLOGY | | | 810,448 |
|
| MATERIALS - 0.7% | | | |
| Chemicals - 0.5% | | | |
| DowDuPont, Inc.: | | | |
| 4.205% 11/15/23 | | 12,181 | 13,123 |
| 4.725% 11/15/28 | | 14,707 | 17,007 |
| Eastman Chemical Co. 4.65% 10/15/44 | | 2,573 | 2,809 |
| Ecolab, Inc.: | | | |
| 2.25% 1/12/20 | | 3,238 | 3,238 |
| 2.7% 11/1/26 | | 5,662 | 5,872 |
| 3.95% 12/1/47 | | 2,856 | 3,358 |
| 5.5% 12/8/41 | | 350 | 477 |
| LYB International Finance BV: | | | |
| 4% 7/15/23 | | 4,825 | 5,133 |
| 4.875% 3/15/44 | | 5,018 | 5,559 |
| LYB International Finance II BV 3.5% 3/2/27 | | 20,991 | 21,674 |
| LyondellBasell Industries NV 4.625% 2/26/55 | | 3,208 | 3,384 |
| Nutrien Ltd.: | | | |
| 4% 12/15/26 | | 9,779 | 10,554 |
| 4.2% 4/1/29 | | 4,437 | 4,959 |
| 4.875% 3/30/20 | | 1,287 | 1,305 |
| 5% 4/1/49 | | 7,724 | 9,221 |
| 5.25% 1/15/45 | | 3,002 | 3,608 |
| 5.625% 12/1/40 | | 1,544 | 1,899 |
| Praxair, Inc.: | | | |
| 2.2% 8/15/22 | | 1,716 | 1,731 |
| 2.45% 2/15/22 | | 3,989 | 4,041 |
| 3.2% 1/30/26 | | 5,439 | 5,803 |
| 3.55% 11/7/42 | | 1,716 | 1,893 |
| Sherwin-Williams Co.: | | | |
| 2.75% 6/1/22 | | 1,830 | 1,858 |
| 3.45% 6/1/27 | | 9,204 | 9,723 |
| 4.5% 6/1/47 | | 7,317 | 8,329 |
| The Dow Chemical Co.: | | | |
| 3% 11/15/22 | | 4,203 | 4,292 |
| 3.15% 5/15/24 (b) | | 6,190 | 6,393 |
| 3.625% 5/15/26 (b) | | 6,350 | 6,679 |
| 4.125% 11/15/21 | | 6,605 | 6,854 |
| 4.375% 11/15/42 | | 4,182 | 4,432 |
| 4.8% 11/30/28 (b) | | 7,334 | 8,397 |
| 4.8% 5/15/49 (b) | | 6,600 | 7,478 |
| 9.4% 5/15/39 | | 2,573 | 4,233 |
| The Mosaic Co.: | | | |
| 4.05% 11/15/27 | | 4,941 | 5,156 |
| 4.25% 11/15/23 | | 9,340 | 9,860 |
| 5.625% 11/15/43 | | 3,217 | 3,576 |
| Westlake Chemical Corp. 5% 8/15/46 | | 1,716 | 1,860 |
| | | | 215,768 |
| Containers & Packaging - 0.0% | | | |
| International Paper Co.: | | | |
| 3.65% 6/15/24 | | 4,053 | 4,300 |
| 3.8% 1/15/26 | | 2,471 | 2,647 |
| 4.4% 8/15/47 | | 7,460 | 7,955 |
| 4.75% 2/15/22 | | 4,534 | 4,793 |
| 5.15% 5/15/46 | | 1,553 | 1,796 |
| | | | 21,491 |
| Metals & Mining - 0.2% | | | |
| Barrick Gold Corp. 5.25% 4/1/42 | | 3,860 | 4,805 |
| BHP Billiton Financial (U.S.A.) Ltd.: | | | |
| 2.875% 2/24/22 | | 4,940 | 5,052 |
| 5% 9/30/43 | | 2,573 | 3,401 |
| Newmont Goldcorp Corp.: | | | |
| 5.125% 10/1/19 | | 858 | 860 |
| 5.45% 6/9/44 | | 5,500 | 7,078 |
| Nucor Corp.: | | | |
| 4% 8/1/23 | | 2,573 | 2,745 |
| 5.2% 8/1/43 | | 3,431 | 4,381 |
| Rio Tinto Finance (U.S.A.) Ltd.: | | | |
| 3.75% 6/15/25 | | 18,271 | 19,790 |
| 7.125% 7/15/28 | | 1,716 | 2,357 |
| Southern Copper Corp.: | | | |
| 3.875% 4/23/25 | | 3,148 | 3,292 |
| 5.25% 11/8/42 | | 4,954 | 5,650 |
| Vale Overseas Ltd.: | | | |
| 4.375% 1/11/22 | | 3,849 | 3,978 |
| 5.875% 6/10/21 | | 7,051 | 7,439 |
| Vale SA 5.625% 9/11/42 | | 5,662 | 6,338 |
| | | | 77,166 |
|
| TOTAL MATERIALS | | | 314,425 |
|
| REAL ESTATE - 0.6% | | | |
| Equity Real Estate Investment Trusts (REITs) - 0.5% | | | |
| Alexandria Real Estate Equities, Inc. 3.9% 6/15/23 | | 4,847 | 5,153 |
| American Tower Corp. 3.55% 7/15/27 | | 7,334 | 7,798 |
| Boston Properties, Inc.: | | | |
| 2.75% 10/1/26 | | 6,005 | 6,102 |
| 3.125% 9/1/23 | | 1,630 | 1,691 |
| 4.125% 5/15/21 | | 1,801 | 1,856 |
| DDR Corp. 4.625% 7/15/22 | | 511 | 536 |
| Duke Realty LP: | | | |
| 3.625% 4/15/23 | | 2,359 | 2,470 |
| 3.75% 12/1/24 | | 4,932 | 5,276 |
| ERP Operating LP: | | | |
| 3% 4/15/23 | | 1,608 | 1,665 |
| 3.25% 8/1/27 | | 11,138 | 11,898 |
| 4.625% 12/15/21 | | 4,890 | 5,147 |
| Federal Realty Investment Trust 3% 8/1/22 | | 4,075 | 4,174 |
| HCP, Inc.: | | | |
| 3.4% 2/1/25 | | 6,863 | 7,165 |
| 3.875% 8/15/24 | | 6,498 | 6,994 |
| Health Care REIT, Inc. 3.75% 3/15/23 | | 7,429 | 7,820 |
| Kimco Realty Corp.: | | | |
| 3.8% 4/1/27 | | 3,431 | 3,678 |
| 4.125% 12/1/46 | | 8,578 | 9,207 |
| 4.45% 9/1/47 | | 4,443 | 5,014 |
| Omega Healthcare Investors, Inc.: | | | |
| 4.375% 8/1/23 | | 6,863 | 7,233 |
| 4.5% 1/15/25 | | 6,871 | 7,264 |
| 4.5% 4/1/27 | | 8,149 | 8,726 |
| Simon Property Group LP: | | | |
| 2.625% 6/15/22 | | 6,802 | 6,922 |
| 3.375% 12/1/27 | | 17,117 | 18,357 |
| 4.125% 12/1/21 | | 2,745 | 2,858 |
| Ventas Realty LP: | | | |
| 3.125% 6/15/23 | | 5,417 | 5,591 |
| 3.25% 10/15/26 | | 3,002 | 3,104 |
| 3.5% 2/1/25 | | 3,431 | 3,610 |
| 3.85% 4/1/27 | | 8,149 | 8,739 |
| 4% 3/1/28 | | 7,720 | 8,387 |
| 4.125% 1/15/26 | | 1,244 | 1,348 |
| 4.375% 2/1/45 | | 2,573 | 2,894 |
| Weingarten Realty Investors 3.5% 4/15/23 | | 3,260 | 3,365 |
| Welltower, Inc. 4.95% 9/1/48 | | 8,578 | 10,616 |
| | | | 192,658 |
| Real Estate Management & Development - 0.1% | | | |
| Brandywine Operating Partnership LP 3.95% 2/15/23 | | 3,260 | 3,410 |
| CBRE Group, Inc. 4.875% 3/1/26 | | 4,890 | 5,437 |
| Digital Realty Trust LP 3.7% 8/15/27 | | 6,863 | 7,315 |
| Liberty Property LP: | | | |
| 3.25% 10/1/26 | | 3,997 | 4,135 |
| 3.375% 6/15/23 | | 2,380 | 2,470 |
| 3.75% 4/1/25 | | 4,075 | 4,302 |
| 4.4% 2/15/24 | | 6,369 | 6,905 |
| 4.75% 10/1/20 | | 858 | 876 |
| Mack-Cali Realty LP: | | | |
| 3.15% 5/15/23 | | 4,032 | 3,834 |
| 4.5% 4/18/22 | | 3,611 | 3,627 |
| Tanger Properties LP: | | | |
| 3.75% 12/1/24 | | 5,576 | 5,736 |
| 3.875% 7/15/27 | | 5,318 | 5,459 |
| | | | 53,506 |
|
| TOTAL REAL ESTATE | | | 246,164 |
|
| UTILITIES - 1.7% | | | |
| Electric Utilities - 1.1% | | | |
| Alabama Power Co.: | | | |
| 3.7% 12/1/47 | | 5,053 | 5,633 |
| 3.75% 3/1/45 | | 858 | 960 |
| 4.15% 8/15/44 | | 3,989 | 4,666 |
| 4.3% 7/15/48 | | 5,044 | 6,165 |
| 5.2% 6/1/41 | | 3,303 | 4,117 |
| AmerenUE 3.9% 9/15/42 | | 3,174 | 3,621 |
| American Electric Power Co., Inc.: | | | |
| 2.95% 12/15/22 | | 3,431 | 3,505 |
| 4.3% 12/1/28 | | 15,003 | 17,033 |
| Appalachian Power Co. 4.45% 6/1/45 | | 5,147 | 6,193 |
| Baltimore Gas & Electric Co.: | | | |
| 3.35% 7/1/23 | | 2,445 | 2,564 |
| 3.5% 8/15/46 | | 2,145 | 2,287 |
| Carolina Power & Light Co. 2.8% 5/15/22 | | 3,731 | 3,812 |
| CenterPoint Energy Houston Electric LLC 3.55% 8/1/42 | | 1,630 | 1,774 |
| Cleco Corporate Holdings LLC 3.743% 5/1/26 | | 4,855 | 5,065 |
| Commonwealth Edison Co.: | | | |
| 3.1% 11/1/24 | | 8,578 | 8,983 |
| 3.4% 9/1/21 | | 858 | 877 |
| 3.65% 6/15/46 | | 2,453 | 2,728 |
| 3.7% 3/1/45 | | 2,659 | 2,944 |
| 3.75% 8/15/47 | | 5,276 | 5,971 |
| 4% 3/1/48 | | 5,859 | 6,852 |
| 4% 3/1/49 | | 2,010 | 2,367 |
| Detroit Edison Co. 2.65% 6/15/22 | | 6,863 | 6,947 |
| Duke Energy Carolinas LLC: | | | |
| 2.95% 12/1/26 | | 5,147 | 5,393 |
| 3.75% 6/1/45 | | 1,716 | 1,906 |
| 3.875% 3/15/46 | | 3,345 | 3,824 |
| 4% 9/30/42 | | 3,217 | 3,673 |
| Duke Energy Corp.: | | | |
| 1.8% 9/1/21 | | 13,262 | 13,181 |
| 2.65% 9/1/26 | | 11,452 | 11,590 |
| 3.75% 4/15/24 | | 5,147 | 5,470 |
| 3.75% 9/1/46 | | 7,832 | 8,247 |
| 3.95% 10/15/23 | | 2,096 | 2,234 |
| 4.8% 12/15/45 | | 2,393 | 2,918 |
| Duke Energy Ohio, Inc. 4.3% 2/1/49 | | 8,934 | 10,954 |
| Duke Energy Progress, Inc.: | | | |
| 4.15% 12/1/44 | | 1,544 | 1,811 |
| 4.375% 3/30/44 | | 1,716 | 2,068 |
| Edison International 2.95% 3/15/23 | | 7,025 | 7,043 |
| Entergy Corp.: | | | |
| 2.95% 9/1/26 | | 4,032 | 4,115 |
| 4% 7/15/22 | | 5,696 | 5,970 |
| Entergy, Inc. 4% 3/30/29 | | 6,771 | 7,585 |
| Eversource Energy: | | | |
| 2.9% 10/1/24 | | 7,334 | 7,570 |
| 3.35% 3/15/26 | | 5,670 | 5,929 |
| Exelon Corp.: | | | |
| 3.95% 6/15/25 | | 16,859 | 18,157 |
| 5.1% 6/15/45 | | 944 | 1,185 |
| FirstEnergy Corp.: | | | |
| 3.9% 7/15/27 | | 7,291 | 7,832 |
| 4.85% 7/15/47 | | 4,030 | 4,894 |
| Florida Power & Light Co.: | | | |
| 3.125% 12/1/25 | | 4,375 | 4,670 |
| 3.25% 6/1/24 | | 4,053 | 4,279 |
| 4.05% 10/1/44 | | 4,648 | 5,502 |
| 4.125% 6/1/48 | | 10,551 | 12,820 |
| Florida Power Corp. 3.4% 10/1/46 | | 2,145 | 2,281 |
| Indiana Michigan Power Co. 3.2% 3/15/23 | | 2,380 | 2,474 |
| Northern States Power Co.: | | | |
| 3.4% 8/15/42 | | 1,716 | 1,863 |
| 4.125% 5/15/44 | | 3,860 | 4,617 |
| NSTAR Electric Co. 3.2% 5/15/27 | | 6,562 | 6,966 |
| PacifiCorp: | | | |
| 3.6% 4/1/24 | | 3,431 | 3,655 |
| 4.125% 1/15/49 | | 11,546 | 13,782 |
| 6% 1/15/39 | | 5,312 | 7,608 |
| Potomac Electric Power Co. 6.5% 11/15/37 | | 3,265 | 4,776 |
| PPL Capital Funding, Inc.: | | | |
| 3.1% 5/15/26 | | 6,863 | 7,039 |
| 3.4% 6/1/23 | | 2,295 | 2,372 |
| 4.2% 6/15/22 | | 1,716 | 1,801 |
| 4.7% 6/1/43 | | 1,544 | 1,772 |
| PPL Electric Utilities Corp. 4.15% 10/1/45 | | 3,002 | 3,527 |
| Progress Energy, Inc.: | | | |
| 4.875% 12/1/19 | | 1,458 | 1,467 |
| 6% 12/1/39 | | 4,461 | 6,053 |
| Public Service Co. of Colorado: | | | |
| 2.9% 5/15/25 | | 9,436 | 9,784 |
| 3.8% 6/15/47 | | 3,972 | 4,525 |
| Public Service Electric & Gas Co.: | | | |
| 3.65% 9/1/42 | | 2,423 | 2,679 |
| 4% 6/1/44 | | 4,289 | 4,879 |
| Puget Sound Energy, Inc. 4.3% 5/20/45 | | 5,499 | 6,590 |
| Southern California Edison Co. 4% 4/1/47 | | 8,578 | 9,355 |
| Southern Co.: | | | |
| 2.35% 7/1/21 | | 5,662 | 5,678 |
| 3.25% 7/1/26 | | 9,436 | 9,772 |
| 4.4% 7/1/46 | | 6,279 | 7,092 |
| Tampa Electric Co.: | | | |
| 4.45% 6/15/49 | | 10,049 | 12,575 |
| 6.15% 5/15/37 | | 5,370 | 7,350 |
| Virginia Electric & Power Co.: | | | |
| 3.1% 5/15/25 | | 3,431 | 3,595 |
| 3.45% 2/15/24 | | 2,359 | 2,478 |
| 3.8% 4/1/28 | | 12,790 | 14,137 |
| 3.8% 9/15/47 | | 7,043 | 7,869 |
| 4.2% 5/15/45 | | 2,059 | 2,421 |
| 4.45% 2/15/44 | | 2,359 | 2,856 |
| 4.6% 12/1/48 | | 6,073 | 7,680 |
| 6% 5/15/37 | | 1,716 | 2,349 |
| Wisconsin Electric Power Co. 4.25% 6/1/44 | | 4,032 | 4,659 |
| Xcel Energy, Inc.: | | | |
| 2.6% 3/15/22 | | 11,924 | 12,063 |
| 3.35% 12/1/26 | | 2,573 | 2,736 |
| | | | 491,059 |
| Gas Utilities - 0.1% | | | |
| AGL Capital Corp. 3.95% 10/1/46 | | 11,598 | 12,452 |
| Southern California Gas Co. 2.6% 6/15/26 | | 11,349 | 11,494 |
| | | | 23,946 |
| Independent Power and Renewable Electricity Producers - 0.0% | | | |
| Emera U.S. Finance LP: | | | |
| 2.7% 6/15/21 | | 7,429 | 7,483 |
| 4.75% 6/15/46 | | 4,469 | 5,298 |
| | | | 12,781 |
| Multi-Utilities - 0.5% | | | |
| Berkshire Hathaway Energy Co.: | | | |
| 3.25% 4/15/28 | | 8,578 | 9,120 |
| 3.8% 7/15/48 | | 8,578 | 9,533 |
| 4.5% 2/1/45 | | 5,704 | 6,917 |
| 5.15% 11/15/43 | | 1,415 | 1,852 |
| CenterPoint Energy, Inc. 2.5% 9/1/22 | | 12,746 | 12,849 |
| CMS Energy Corp. 4.875% 3/1/44 | | 4,289 | 5,258 |
| Consolidated Edison Co. of New York, Inc.: | | | |
| 3.875% 6/15/47 | | 2,453 | 2,743 |
| 4.45% 6/15/20 | | 1,716 | 1,746 |
| 4.45% 3/15/44 | | 6,863 | 8,231 |
| 4.5% 5/15/58 | | 8,132 | 9,843 |
| 4.65% 12/1/48 | | 8,981 | 11,298 |
| 5.5% 12/1/39 | | 2,145 | 2,882 |
| Consolidated Edison, Inc. 2% 5/15/21 | | 4,735 | 4,733 |
| Consumers Energy Co. 2.85% 5/15/22 | | 5,704 | 5,845 |
| Delmarva Power & Light 4% 6/1/42 | | 3,431 | 3,847 |
| Dominion Energy, Inc.: | | | |
| 3 month U.S. LIBOR + 2.300% 4.6299% 9/30/66 (a)(c) | | 858 | 802 |
| 3 month U.S. LIBOR + 2.825% 5.1549% 6/30/66 (a)(c) | | 858 | 811 |
| 3.9% 10/1/25 | | 11,066 | 11,930 |
| 4.9% 8/1/41 | | 1,716 | 2,058 |
| DTE Energy Co.: | | | |
| 2.85% 10/1/26 | | 5,147 | 5,270 |
| 3.8% 3/15/27 | | 11,589 | 12,556 |
| NiSource Finance Corp.: | | | |
| 3.49% 5/15/27 | | 6,562 | 6,963 |
| 3.95% 3/30/48 | | 8,578 | 9,392 |
| 4.375% 5/15/47 | | 4,100 | 4,725 |
| 4.8% 2/15/44 | | 4,718 | 5,659 |
| 6.25% 12/15/40 | | 2,104 | 2,915 |
| Puget Energy, Inc. 3.65% 5/15/25 | | 6,923 | 7,153 |
| San Diego Gas & Electric Co. 4.5% 8/15/40 | | 858 | 1,019 |
| Sempra Energy: | | | |
| 2.4% 3/15/20 | | 10,642 | 10,630 |
| 2.875% 10/1/22 | | 2,573 | 2,614 |
| 2.9% 2/1/23 | | 2,548 | 2,602 |
| 3.25% 6/15/27 | | 5,233 | 5,421 |
| 4% 2/1/48 | | 15,911 | 17,280 |
| 4.05% 12/1/23 | | 4,289 | 4,558 |
| 6% 10/15/39 | | 858 | 1,123 |
| Wisconsin Energy Corp. 3 month U.S. LIBOR + 2.113% 4.2706% 5/15/67 (a)(c) | | 3,627 | 3,067 |
| | | | 215,245 |
|
| TOTAL UTILITIES | | | 743,031 |
|
| TOTAL NONCONVERTIBLE BONDS | | | |
| (Cost $10,050,962) | | | 10,877,300 |
|
| U.S. Government and Government Agency Obligations - 43.7% | | | |
| U.S. Government Agency Obligations - 1.0% | | | |
| Fannie Mae: | | | |
| 1.25% 8/17/21 | | $26,001 | $25,849 |
| 1.5% 11/30/20 | | 15,532 | 15,501 |
| 1.75% 7/2/24 | | 24,760 | 25,121 |
| 1.875% 4/5/22 | | 27,662 | 27,942 |
| 1.875% 9/24/26 | | 11,452 | 11,737 |
| 2% 10/5/22 | | 31,628 | 32,147 |
| 2.125% 4/24/26 | | 3,431 | 3,562 |
| 2.375% 1/19/23 | | 25,674 | 26,424 |
| 2.625% 9/6/24 | | 3,431 | 3,627 |
| 2.875% 9/12/23 | | 6,605 | 6,973 |
| Federal Home Loan Bank: | | | |
| 1.125% 7/14/21 | | 11,385 | 11,300 |
| 1.375% 2/18/21 | | 17,415 | 17,369 |
| 1.5% 8/15/24 | | 4,250 | 4,259 |
| 1.875% 11/29/21 | | 16,445 | 16,571 |
| 2% 9/9/22 | | 32,595 | 33,053 |
| 2.5% 2/13/24 | | 4,270 | 4,466 |
| 2.625% 10/1/20 | | 14,925 | 15,074 |
| 3% 10/12/21 | | 8,365 | 8,617 |
| 3.25% 11/16/28 | | 20,335 | 23,074 |
| 5.5% 7/15/36 | | 1,285 | 1,916 |
| Freddie Mac: | | | |
| 1.375% 5/1/20 | | 12,009 | 11,970 |
| 2.375% 1/13/22 | | 11,152 | 11,366 |
| 2.75% 6/19/23 | | 20,772 | 21,730 |
| 6.25% 7/15/32 | | 6,605 | 9,944 |
| 6.75% 3/15/31 | | 22,303 | 33,738 |
| Tennessee Valley Authority: | | | |
| 5.25% 9/15/39 | | 17,156 | 24,665 |
| 5.375% 4/1/56 | | 4,628 | 7,654 |
|
| TOTAL U.S. GOVERNMENT AGENCY OBLIGATIONS | | | 435,649 |
|
| U.S. Treasury Obligations - 42.7% | | | |
| U.S. Treasury Bonds: | | | |
| 2.25% 8/15/46 | | 54,892 | 58,136 |
| 2.25% 8/15/49 | | 54,485 | 57,944 |
| 2.5% 2/15/45 | | 135,408 | 150,255 |
| 2.5% 2/15/46 | | 141,220 | 156,881 |
| 2.5% 5/15/46 | | 74,112 | 82,389 |
| 2.75% 11/15/42 | | 48,900 | 56,474 |
| 2.75% 8/15/47 | | 112,262 | 131,202 |
| 2.75% 11/15/47 | | 16,219 | 18,970 |
| 2.875% 5/15/43 | | 37,093 | 43,778 |
| 2.875% 8/15/45 | | 92,656 | 110,032 |
| 2.875% 11/15/46 | | 105,451 | 125,845 |
| 2.875% 5/15/49 (d) | | 45,577 | 54,961 |
| 3% 11/15/44 | | 86,708 | 104,886 |
| 3% 5/15/45 | | 36,963 | 44,821 |
| 3% 11/15/45 | | 74,021 | 89,973 |
| 3% 2/15/47 | | 113,188 | 138,345 |
| 3% 5/15/47 | | 40,384 | 49,370 |
| 3% 2/15/48 | | 106,684 | 130,776 |
| 3% 8/15/48 | | 57,354 | 70,454 |
| 3% 2/15/49 | | 66,284 | 81,658 |
| 3.125% 2/15/42 | | 76,027 | 93,133 |
| 3.125% 2/15/43 | | 43,268 | 53,074 |
| 3.125% 8/15/44 | | 204,405 | 252,168 |
| 3.125% 5/15/48 | | 11,098 | 13,926 |
| 3.375% 5/15/44 | | 143,722 | 184,272 |
| 3.375% 11/15/48 | | 34,078 | 44,826 |
| 3.625% 8/15/43 | | 54,039 | 71,709 |
| 3.625% 2/15/44 | | 23,058 | 30,679 |
| 3.75% 11/15/43 | | 49,802 | 67,406 |
| 3.875% 8/15/40 | | 25,803 | 34,957 |
| 4.25% 5/15/39 | | 6,894 | 9,717 |
| 4.25% 11/15/40 | | 696 | 989 |
| 4.375% 2/15/38 | | 22,629 | 32,071 |
| 4.375% 11/15/39 | | 86 | 123 |
| 4.375% 5/15/40 | | 6,863 | 9,887 |
| 4.375% 5/15/41 | | 25,197 | 36,519 |
| 4.5% 2/15/36 | | 85,405 | 120,091 |
| 4.5% 5/15/38 | | 45,584 | 65,688 |
| 4.5% 8/15/39 | | 25,934 | 37,743 |
| 4.625% 2/15/40 | | 18,443 | 27,337 |
| 4.75% 2/15/37 | | 69,148 | 101,136 |
| 4.75% 2/15/41 | | 47,034 | 71,262 |
| 5% 5/15/37 | | 339,368 | 510,935 |
| 5.375% 2/15/31 | | 45,867 | 64,345 |
| 6.25% 5/15/30 | | 52,460 | 76,946 |
| U.S. Treasury Notes: | | | |
| 1% 10/15/19 | | 4,281 | 4,275 |
| 1.125% 2/28/21 | | 34,235 | 33,979 |
| 1.125% 6/30/21 | | 60,939 | 60,456 |
| 1.125% 7/31/21 | | 232 | 230 |
| 1.125% 8/31/21 | | 58,683 | 58,225 |
| 1.125% 9/30/21 | | 53,469 | 53,037 |
| 1.25% 1/31/20 | | 708 | 706 |
| 1.25% 2/29/20 | | 44,020 | 43,878 |
| 1.25% 3/31/21 | | 180,298 | 179,255 |
| 1.25% 10/31/21 | | 38,319 | 38,106 |
| 1.25% 7/31/23 | | 63,736 | 63,302 |
| 1.375% 12/15/19 | | 9 | 9 |
| 1.375% 1/15/20 | | 16,353 | 16,325 |
| 1.375% 1/31/20 | | 17,946 | 17,903 |
| 1.375% 2/15/20 | | 40 | 39 |
| 1.375% 2/29/20 | | 42,153 | 42,041 |
| 1.375% 3/31/20 | | 5,687 | 5,670 |
| 1.375% 4/30/20 | | 9,719 | 9,687 |
| 1.375% 8/31/20 | | 67,733 | 67,439 |
| 1.375% 9/15/20 | | 76,006 | 75,709 |
| 1.375% 9/30/20 | | 21,960 | 21,865 |
| 1.375% 10/31/20 | | 4,907 | 4,886 |
| 1.375% 1/31/21 | | 17,611 | 17,541 |
| 1.375% 4/30/21 | | 73,755 | 73,484 |
| 1.375% 5/31/21 | | 55,226 | 55,028 |
| 1.375% 6/30/23 | | 55,818 | 55,713 |
| 1.375% 8/31/23 | | 6,806 | 6,795 |
| 1.375% 9/30/23 | | 67,862 | 67,753 |
| 1.5% 10/31/19 | | 11,031 | 11,020 |
| 1.5% 4/15/20 | | 11,513 | 11,487 |
| 1.5% 5/15/20 | | 24,531 | 24,468 |
| 1.5% 5/31/20 | | 33,995 | 33,905 |
| 1.5% 6/15/20 | | 1 | 1 |
| 1.5% 7/15/20 | | 2,879 | 2,870 |
| 1.5% 8/15/20 | | 12,867 | 12,830 |
| 1.5% 1/31/22 | | 3,749 | 3,751 |
| 1.5% 2/28/23 | | 12,910 | 12,943 |
| 1.5% 3/31/23 | | 78,044 | 78,273 |
| 1.5% 8/15/26 | | 227,054 | 227,746 |
| 1.625% 12/31/19 | | 72 | 72 |
| 1.625% 3/15/20 | | 24,528 | 24,494 |
| 1.625% 6/30/20 | | 43,285 | 43,208 |
| 1.625% 7/31/20 | | 40,815 | 40,743 |
| 1.625% 10/15/20 | | 0 | 0 |
| 1.625% 11/30/20 | | 81,304 | 81,227 |
| 1.625% 6/30/21 | | 238,287 | 238,566 |
| 1.625% 8/31/22 | | 80,789 | 81,228 |
| 1.625% 4/30/23 | | 40,652 | 40,941 |
| 1.625% 5/31/23 | | 44,632 | 44,960 |
| 1.625% 10/31/23 | | 80,780 | 81,452 |
| 1.625% 2/15/26 | | 43,131 | 43,591 |
| 1.625% 5/15/26 | | 4,812 | 4,865 |
| 1.625% 8/15/29 | | 73,372 | 74,206 |
| 1.75% 11/30/19 | | 15,653 | 15,640 |
| 1.75% 10/31/20 | | 8,544 | 8,543 |
| 1.75% 11/15/20 | | 21,407 | 21,413 |
| 1.75% 12/31/20 | | 61,016 | 61,062 |
| 1.75% 7/31/21 | | 256,452 | 257,514 |
| 1.75% 11/30/21 | | 72,374 | 72,778 |
| 1.75% 3/31/22 | | 100,364 | 101,125 |
| 1.75% 5/31/22 | | 68,076 | 68,613 |
| 1.75% 6/15/22 | | 46,342 | 46,740 |
| 1.75% 6/30/22 | | 23,418 | 23,623 |
| 1.75% 9/30/22 | | 24,696 | 24,931 |
| 1.75% 1/31/23 | | 21,994 | 22,229 |
| 1.75% 6/30/24 | | 57,783 | 58,713 |
| 1.75% 7/31/24 (d) | | 68,050 | 69,190 |
| 1.875% 6/30/20 | | 20,836 | 20,840 |
| 1.875% 12/15/20 | | 72,936 | 73,101 |
| 1.875% 11/30/21 | | 69,706 | 70,291 |
| 1.875% 1/31/22 | | 47,060 | 47,490 |
| 1.875% 2/28/22 | | 113,043 | 114,142 |
| 1.875% 3/31/22 | | 113,935 | 115,110 |
| 1.875% 4/30/22 | | 104,490 | 105,613 |
| 1.875% 5/31/22 | | 13,755 | 13,916 |
| 1.875% 7/31/22 | | 120,051 | 121,519 |
| 1.875% 8/31/22 | | 59,764 | 60,530 |
| 1.875% 9/30/22 | | 67,767 | 68,683 |
| 1.875% 10/31/22 | | 23,504 | 23,827 |
| 2% 11/30/20 | | 27,373 | 27,469 |
| 2% 1/15/21 | | 176,753 | 177,547 |
| 2% 2/28/21 | | 22,629 | 22,754 |
| 2% 5/31/21 | | 34,561 | 34,811 |
| 2% 8/31/21 | | 92,901 | 93,761 |
| 2% 10/31/21 | | 25,477 | 25,740 |
| 2% 12/31/21 | | 2,929 | 2,963 |
| 2% 7/31/22 | | 41,227 | 41,895 |
| 2% 11/30/22 | | 126,965 | 129,236 |
| 2% 4/30/24 | | 50,174 | 51,491 |
| 2% 5/31/24 | | 84,692 | 87,008 |
| 2% 6/30/24 | | 83,920 | 86,208 |
| 2% 2/15/25 | | 3,118 | 3,212 |
| 2% 8/15/25 | | 31,001 | 31,985 |
| 2% 11/15/26 | | 40,458 | 41,974 |
| 2.125% 8/31/20 | | 42,679 | 42,811 |
| 2.125% 1/31/21 | | 2,625 | 2,642 |
| 2.125% 5/31/21 | | 96,813 | 97,717 |
| 2.125% 6/30/21 | | 6,228 | 6,291 |
| 2.125% 8/15/21 | | 77,847 | 78,707 |
| 2.125% 9/30/21 | | 37,435 | 37,897 |
| 2.125% 12/31/21 | | 13,682 | 13,881 |
| 2.125% 6/30/22 | | 34,973 | 35,647 |
| 2.125% 12/31/22 | | 118,850 | 121,547 |
| 2.125% 11/30/23 | | 99,772 | 102,660 |
| 2.125% 2/29/24 | | 45,138 | 46,517 |
| 2.125% 3/31/24 | | 352,696 | 363,732 |
| 2.125% 7/31/24 | | 10,709 | 11,070 |
| 2.125% 9/30/24 | | 77,075 | 79,730 |
| 2.125% 11/30/24 | | 47,300 | 48,974 |
| 2.125% 5/15/25 | | 50,058 | 51,947 |
| 2.125% 5/31/26 | | 97,823 | 102,026 |
| 2.25% 3/31/20 | | 20,747 | 20,788 |
| 2.25% 3/31/21 | | 103,645 | 104,653 |
| 2.25% 4/30/21 | | 131,118 | 132,506 |
| 2.25% 7/31/21 | | 27,184 | 27,542 |
| 2.25% 4/15/22 | | 30,889 | 31,512 |
| 2.25% 12/31/23 | | 2,513 | 2,601 |
| 2.25% 1/31/24 | | 65,211 | 67,516 |
| 2.25% 4/30/24 | | 314,758 | 326,598 |
| 2.25% 10/31/24 | | 114,887 | 119,626 |
| 2.25% 11/15/24 | | 73,712 | 76,755 |
| 2.25% 12/31/24 | | 67,227 | 70,079 |
| 2.25% 11/15/25 | | 91,143 | 95,476 |
| 2.25% 2/15/27 | | 112,279 | 118,569 |
| 2.25% 8/15/27 | | 672,077 | 711,378 |
| 2.25% 11/15/27 | | 260,200 | 275,700 |
| 2.375% 4/30/20 | | 69,166 | 69,387 |
| 2.375% 3/15/21 | | 213,360 | 215,785 |
| 2.375% 4/15/21 | | 244,466 | 247,416 |
| 2.375% 3/15/22 | | 139,625 | 142,832 |
| 2.375% 1/31/23 | | 36,208 | 37,341 |
| 2.375% 2/29/24 | | 243,727 | 253,952 |
| 2.375% 8/15/24 | | 67,587 | 70,673 |
| 2.375% 5/15/27 | | 76,620 | 81,714 |
| 2.375% 5/15/29 | | 22,039 | 23,761 |
| 2.5% 5/31/20 | | 58,211 | 58,477 |
| 2.5% 1/31/21 | | 67,511 | 68,283 |
| 2.5% 2/28/21 | | 49,384 | 50,011 |
| 2.5% 1/15/22 | | 218,270 | 223,394 |
| 2.5% 2/15/22 | | 400,862 | 410,727 |
| 2.5% 3/31/23 | | 32,459 | 33,677 |
| 2.5% 8/15/23 | | 83,354 | 86,802 |
| 2.5% 1/31/24 | | 218,578 | 228,636 |
| 2.5% 5/15/24 | | 81,921 | 85,950 |
| 2.5% 1/31/25 | | 128,270 | 135,420 |
| 2.5% 2/28/26 | | 78,123 | 83,189 |
| 2.625% 7/31/20 | | 92,575 | 93,233 |
| 2.625% 8/15/20 | | 18,330 | 18,467 |
| 2.625% 11/15/20 | | 80,789 | 81,650 |
| 2.625% 5/15/21 | | 457,816 | 465,738 |
| 2.625% 6/15/21 | | 73,313 | 74,662 |
| 2.625% 7/15/21 | | 186,836 | 190,471 |
| 2.625% 12/15/21 | | 222,216 | 227,919 |
| 2.625% 6/30/23 | | 330,899 | 345,673 |
| 2.625% 12/31/23 | | 97,601 | 102,519 |
| 2.625% 3/31/25 | | 13,759 | 14,636 |
| 2.625% 12/31/25 | | 115,431 | 123,610 |
| 2.625% 2/15/29 | | 206,861 | 227,232 |
| 2.75% 11/30/20 | | 132,078 | 133,765 |
| 2.75% 4/30/23 | | 53,654 | 56,167 |
| 2.75% 5/31/23 | | 266,227 | 278,987 |
| 2.75% 8/31/23 | | 156,809 | 164,846 |
| 2.75% 11/15/23 | | 61,609 | 64,930 |
| 2.75% 2/15/24 | | 116,328 | 122,990 |
| 2.75% 2/28/25 | | 18,066 | 19,324 |
| 2.75% 6/30/25 | | 17,722 | 19,018 |
| 2.75% 2/15/28 | | 110,841 | 121,972 |
| 2.875% 10/31/20 | | 3,370 | 3,413 |
| 2.875% 9/30/23 | | 234,804 | 248,269 |
| 2.875% 10/31/23 | | 162,906 | 172,419 |
| 2.875% 11/30/23 | | 161,440 | 171,082 |
| 2.875% 4/30/25 | | 57,948 | 62,466 |
| 2.875% 5/31/25 | | 103,581 | 111,758 |
| 2.875% 5/15/28 | | 150,780 | 167,796 |
| 2.875% 8/15/28 | | 119,974 | 133,781 |
| 3% 10/31/25 | | 24,684 | 26,935 |
| 3.125% 5/15/21 | | 43,642 | 44,757 |
| 3.125% 11/15/28 | | 79,170 | 90,170 |
| 3.375% 11/15/19 | | 23,796 | 23,854 |
| 3.5% 5/15/20 | | 70,169 | 70,950 |
| 3.625% 2/15/20 | | 7,907 | 7,964 |
| 3.625% 2/15/21 | | 34,141 | 35,109 |
|
| TOTAL U.S. TREASURY OBLIGATIONS | | | 18,956,556 |
|
| TOTAL U.S. GOVERNMENT AND GOVERNMENT AGENCY OBLIGATIONS | | | |
| (Cost $18,355,255) | | | 19,392,205 |
|
| U.S. Government Agency - Mortgage Securities - 26.5% | | | |
| Fannie Mae - 11.4% | | | |
| 12 month U.S. LIBOR + 1.518% 4.241% 11/1/34 (a)(c) | | 3,623 | 3,761 |
| 12 month U.S. LIBOR + 1.645% 4.592% 4/1/41 (a)(c) | | 1,202 | 1,249 |
| 12 month U.S. LIBOR + 1.880% 4.73% 11/1/34 (a)(c) | | 320 | 335 |
| 2.5% 3/1/22 to 2/1/47 | | 325,860 | 330,785 |
| 3% 5/1/24 to 9/1/49 | | 1,270,070 | 1,307,883 |
| 3.5% 5/1/20 to 6/1/49 | | 1,320,931 | 1,373,448 |
| 4% 10/1/19 to 4/1/49 | | 1,209,438 | 1,270,777 |
| 4% 11/1/41 | | 19 | 20 |
| 4.5% 9/1/19 | | 0 | 0 |
| 4.5% 10/1/19 to 4/1/49 | | 439,168 | 466,503 |
| 5% 12/1/20 to 3/1/49 | | 164,806 | 177,854 |
| 5.5% 7/1/23 to 5/1/49 | | 88,945 | 98,337 |
| 6% 2/1/23 to 7/1/41 | | 23,883 | 26,986 |
| 6.5% 3/1/22 to 6/1/40 | | 9,002 | 10,295 |
|
| TOTAL FANNIE MAE | | | 5,068,233 |
|
| Freddie Mac - 6.9% | | | |
| 12 month U.S. LIBOR + 1.951% 4.719% 9/1/37 (a)(c) | | 422 | 442 |
| U.S. TREASURY 1 YEAR INDEX + 1.716% 4.428% 3/1/36 (a)(c) | | 2,405 | 2,505 |
| U.S. TREASURY 1 YEAR INDEX + 2.230% 4.721% 12/1/35 (a)(c) | | 1,590 | 1,666 |
| U.S. TREASURY 1 YEAR INDEX + 2.250% 4.872% 3/1/35 (a)(c) | | 782 | 818 |
| 2.5% 1/1/22 to 7/1/49 | | 177,800 | 180,669 |
| 3% 3/1/27 to 8/1/49 | | 746,829 | 769,096 |
| 3% 8/1/47 | | 675 | 692 |
| 3% 5/1/49 | | 2,392 | 2,450 |
| 3.5% 12/1/20 to 7/1/49 | | 1,042,734 | 1,082,006 |
| 3.5% 8/1/47 | | 1,741 | 1,802 |
| 3.5% 9/1/47 | | 409 | 423 |
| 3.5% 9/1/47 | | 23,044 | 24,199 |
| 3.5% 10/1/48 | | 310 | 319 |
| 3.5% 11/1/48 | | 297 | 306 |
| 4% 4/1/25 to 2/1/49 | | 614,946 | 644,863 |
| 4.5% 6/1/25 to 5/1/49 | | 256,584 | 271,999 |
| 5% 4/1/23 to 2/1/49 | | 41,545 | 45,181 |
| 5.5% 5/1/23 to 6/1/41 | | 23,863 | 26,519 |
| 6% 4/1/32 to 8/1/37 | | 735 | 822 |
| 6.5% 8/1/36 to 12/1/37 | | 180 | 206 |
|
| TOTAL FREDDIE MAC | | | 3,056,983 |
|
| Freddie Mac Multi-family Structured pass-thru certificates - 0.0% | | | |
| 2.5% 12/1/31 | | 76 | 78 |
| 2.5% 12/1/31 | | 5 | 5 |
| 2.5% 1/1/32 | | 79 | 80 |
| 2.5% 2/1/32 | | 157 | 160 |
|
| TOTAL FREDDIE MAC MULTI-FAMILY STRUCTURED PASS-THRU CERTIFICATES | | | 323 |
|
| Ginnie Mae - 7.7% | | | |
| 3.5% 10/15/40 to 12/20/48 | | 1,103,784 | 1,153,412 |
| 4% 1/15/25 to 10/20/48 | | 651,096 | 684,645 |
| 5% 1/20/39 to 1/20/49 | | 140,574 | 150,672 |
| 2.5% 10/20/42 to 8/20/49 | | 21,147 | 21,544 |
| 2.5% 9/1/49 (e) | | 100 | 102 |
| 3% 4/15/42 to 4/20/49 | | 705,596 | 730,428 |
| 3% 9/1/49 (e) | | 16,700 | 17,221 |
| 3.5% 9/1/49 (e) | | 51,200 | 53,192 |
| 3.5% 9/1/49 (e) | | 37,800 | 39,271 |
| 4% 9/1/49 (e) | | 76,250 | 79,449 |
| 4% 9/1/49 (e) | | 22,100 | 23,027 |
| 4.5% 3/20/33 to 12/20/48 | | 370,837 | 391,718 |
| 4.5% 9/1/49 (e) | | 10,200 | 10,671 |
| 5% 9/1/49 (e) | | 3,800 | 3,991 |
| 5.5% 10/20/32 to 1/20/49 | | 22,168 | 24,398 |
| 5.5% 9/1/49 (e) | | 400 | 422 |
| 6% 5/20/34 to 12/15/40 | | 6,714 | 7,611 |
| 6.5% 8/20/36 to 1/15/39 | | 1,285 | 1,485 |
|
| TOTAL GINNIE MAE | | | 3,393,259 |
|
| Uniform Mortgage Backed Securities - 0.5% | | | |
| 2.5% 9/1/34 (e) | | 6,400 | 6,488 |
| 2.5% 9/1/49 (e) | | 100 | 101 |
| 3% 9/1/34 (e) | | 9,400 | 9,639 |
| 3% 9/1/49 (e) | | 50,600 | 51,576 |
| 3.5% 9/1/34 (e) | | 6,600 | 6,839 |
| 3.5% 9/1/49 (e) | | 84,200 | 86,522 |
| 4% 9/1/34 (e) | | 3,000 | 3,125 |
| 4% 9/1/49 (e) | | 33,600 | 34,879 |
| 4.5% 9/1/49 (e) | | 18,100 | 19,052 |
| 5% 9/1/49 (e) | | 5,300 | 5,661 |
|
| TOTAL UNIFORM MORTGAGE BACKED SECURITIES | | | 223,882 |
|
| TOTAL U.S. GOVERNMENT AGENCY - MORTGAGE SECURITIES | | | |
| (Cost $11,548,355) | | | 11,742,680 |
|
| Asset-Backed Securities - 0.2% | | | |
| American Express Credit Account Master Trust Series 2017-3 Class A, 1.77% 11/15/22 | | $3,946 | $3,940 |
| Capital One Multi-Asset Execution Trust Series 2016-A6 Class A, 1.82% 9/15/22 | | 8,106 | 8,100 |
| CarMax Auto Owner Trust Series 2018-3 Class A3, 3.13% 6/15/23 | | 8,192 | 8,354 |
| Chase Issuance Trust: | | | |
| Series 2012-A7 Class A7, 2.16% 9/15/24 | | 7,999 | 8,100 |
| Series 2015-A4 Class A, 1.84% 4/15/22 | | 4,075 | 4,071 |
| Citibank Credit Card Issuance Trust: | | | |
| Series 2013-A9 Class A9, 3.72% 9/8/25 | | 4,010 | 4,304 |
| Series 2018-A6 Class A6, 3.21% 12/7/24 | | 8,149 | 8,550 |
| 2.19% 11/20/23 | | 4,872 | 4,924 |
| Discover Card Master Trust: | | | |
| Series 2015-A2 Class A, 1.9% 10/17/22 | | 9,264 | 9,259 |
| Series 2017-A4 Class A4, 2.53% 10/15/26 | | 1,544 | 1,591 |
| Series 2018-A1 Class A1, 3.03% 8/15/25 | | 16,470 | 17,187 |
| Ford Credit Auto Owner Trust Series 2016-C Class A3, 1.22% 3/15/21 | | 1,870 | 1,866 |
| Ford Credit Floorplan Master Owner Trust: | | | |
| Series 2015-2 Class A1, 1.98% 1/15/22 | | 8,149 | 8,142 |
| Series 2018-2 Class A, 3.17% 3/15/25 | | 16,341 | 17,055 |
| Honda Auto Receivables Owner Trust Series 2016-4 Class A3, 1.21% 12/18/20 | | 1,651 | 1,647 |
| TOTAL ASSET-BACKED SECURITIES | | | |
| (Cost $104,493) | | | 107,090 |
|
| Commercial Mortgage Securities - 2.0% | | | |
| BANK sequential payer Series 2017-BNK4 Class ASB, 3.419% 5/15/50 | | 20,625 | 21,958 |
| Benchmark Mortgage Trust: | | | |
| Series 2019-B12 Class A5, 3.1156% 8/15/52 | | 22,720 | 24,409 |
| Series 2019-B9 Class A5, 4.0156% 3/15/52 | | 20,116 | 23,019 |
| Citigroup Commercial Mortgage Trust sequential payer: | | | |
| Series 2014-GC25 Class A4, 3.635% 10/10/47 | | 25,844 | 27,837 |
| Series 2015-GC29 Class A4, 3.192% 4/10/48 | | 9,760 | 10,354 |
| Series 2015-P1 Class A5, 3.717% 9/15/48 | | 5,031 | 5,475 |
| Series 2016-C1 Class A4, 3.209% 5/10/49 | | 15,921 | 16,950 |
| Series 2016-P4: | | | |
| Class A4, 2.902% 7/10/49 | | 18,443 | 19,317 |
| Class AAB, 2.779% 7/10/49 | | 10,594 | 10,880 |
| COMM Mortgage Trust: | | | |
| sequential payer: | | | |
| Series 2013-CR13 Class A3, 3.928% 11/10/46 | | 27,568 | 29,589 |
| Series 2013-CR7 Class A4, 3.213% 3/10/46 | | 14,252 | 14,778 |
| Series 2014-LC15 Class A4, 4.006% 4/10/47 | | 9,187 | 9,959 |
| Series 2013-CR6 Class A4, 3.101% 3/10/46 | | 16,097 | 16,635 |
| Series 2015-CR22 Class A5, 3.309% 3/10/48 | | 16,663 | 17,711 |
| CSAIL Commercial Mortgage Trust sequential payer Series 2015-C3 Class A4, 3.7182% 8/15/48 | | 10,778 | 11,678 |
| FHLMC Series K047 Class A2, 3.329% 5/25/25 | | 3,311 | 3,572 |
| Freddie Mac: | | | |
| sequential payer: | | | |
| Series K007 Class A2, 4.224% 3/25/20 | | 15,526 | 15,576 |
| Series K034 Class A2, 3.531% 7/25/23 | | 7,720 | 8,179 |
| Series K057 Class A2, 2.57% 7/25/26 | | 13,687 | 14,291 |
| Series K080 Class A2, 3.926% 7/25/28 | | 14,231 | 16,363 |
| Series 2017-K727 Class A2, 2.946% 7/25/24 | | 22,955 | 24,001 |
| Series K-1510 Class A2, 3.718% 1/25/31 | | 12,739 | 14,553 |
| Series K013 Class A2, 3.974% 1/25/21 | | 9,929 | 10,140 |
| Series K020 Class A2, 2.373% 5/25/22 | | 8,921 | 9,033 |
| Series K036 Class A2, 3.527% 10/25/23 | | 7,699 | 8,180 |
| Series K046 Class A2, 3.205% 3/25/25 | | 28,565 | 30,586 |
| Series K053 Class A2, 2.995% 12/25/25 | | 6,100 | 6,499 |
| Series K056 Class A2, 2.525% 5/25/26 | | 17,800 | 18,526 |
| Series K062 Class A1, 3.032% 9/25/26 | | 17,518 | 18,354 |
| Series K064 Class A2, 3.224% 3/25/27 | | 14,797 | 16,084 |
| Series K068 Class A2, 3.244% 8/25/27 | | 20,422 | 22,269 |
| Series K079 Class A2, 3.926% 6/25/28 | | 6,674 | 7,671 |
| Series K094 Class A2, 2.903% 6/25/29 | | 44,120 | 47,569 |
| Series K730 Class A2, 3.59% 1/25/25 | | 33,180 | 35,851 |
| GS Mortgage Securities Trust sequential payer: | | | |
| Series 2013-GC10 Class A4, 2.681% 2/10/46 | | 8,680 | 8,882 |
| Series 2014-GC26 Class A4, 3.364% 11/10/47 | | 21,360 | 22,653 |
| JPMBB Commercial Mortgage Securities Trust: | | | |
| sequential payer: | | | |
| Series 2013-C12 Class A5, 3.6637% 7/15/45 | | 17,165 | 18,175 |
| Series 2014-C21 Class A5, 3.7748% 8/15/47 | | 28,951 | 31,216 |
| Series 2014-C23 Class A5, 3.9342% 9/15/47 | | 8,192 | 8,918 |
| Series 2014-C24 Class A5, 3.6385% 11/15/47 | | 22,359 | 24,045 |
| JPMBB Commercial Mortgage Secutities Trust sequential payer Series 2015-C29 Class A4, 3.6108% 5/15/48 | | 7,720 | 8,344 |
| JPMDB Commercial Mortgage Securities Trust sequential payer Series 2016-C2 Class ASB, 2.9542% 6/15/49 | | 15,158 | 15,715 |
| JPMorgan Chase Commercial Mortgage Securities Corp. sequential payer Series 2012-LC9 Class A5, 2.84% 12/15/47 | | 17,967 | 18,401 |
| JPMorgan Chase Commercial Mortgage Securities Trust Series 2013-C13 Class A4, 3.9936% 1/15/46 (a) | | 7,053 | 7,515 |
| Morgan Stanley BAML Trust: | | | |
| sequential payer: | | | |
| Series 2013-C11 Class A4, 4.299% 8/15/46 (a) | | 16,206 | 17,440 |
| Series 2015-C27 Class ASB, 3.557% 12/15/47 | | 4,049 | 4,265 |
| Series 2016-C28 Class ASB, 3.288% 1/15/49 | | 7,788 | 8,118 |
| Series 2015-C20 Class A4, 3.249% 2/15/48 | | 12,631 | 13,330 |
| Wells Fargo Commercial Mortgage Trust: | | | |
| sequential payer Series 2019-C52 Class A5, 2.892% 8/15/52 | | 27,775 | 29,177 |
| Series 2018-C48 Class A5, 4.302% 1/15/52 | | 16,770 | 19,431 |
| WF-RBS Commercial Mortgage Trust: | | | |
| sequential payer Series 2013-C14 Class A4, 3.073% 6/15/46 | | 8,578 | 8,900 |
| Series 2014-C25 Class A5, 3.631% 11/15/47 | | 12,395 | 13,324 |
| TOTAL COMMERCIAL MORTGAGE SECURITIES | | | |
| (Cost $826,267) | | | 865,695 |
|
| Municipal Securities - 0.5% | | | |
| American Muni. Pwr., Inc. Rev. (Combined Hydroelectric Proj.) Series 2010 B, 8.084% 2/15/50 | | 8,340 | 15,530 |
| Bay Area Toll Auth. San Francisco Bay Toll Bridge Rev. Series 2010 S1, 7.043% 4/1/50 | | 2,035 | 3,525 |
| California Gen. Oblig.: | | | |
| Series 2009, 7.55% 4/1/39 | | $21,230 | $35,597 |
| Series 2018, 3.5% 4/1/28 | | 11,055 | 12,222 |
| Commonwealth Fing. Auth. Rev. Series 2016 A, 4.144% 6/1/38 | | 6,580 | 7,763 |
| Dallas Fort Worth Int'l. Arpt. Rev. Series 2019 A, 3.144% 11/1/45 | | 2,000 | 2,097 |
| Illinois Gen. Oblig. Series 2003, 5.1% 6/1/33 | | 14,085 | 15,328 |
| Kansas St Dev. Fin. Auth. Rev. Series 2015 H, 4.927% 4/15/45 | | 6,520 | 8,696 |
| Los Angeles Cmnty. College District Series 2008 E, 6.75% 8/1/49 | | 8,105 | 13,920 |
| Los Angeles Dept. Arpt. Rev. Series 2009 C, 6.582% 5/15/39 | | 4,275 | 5,962 |
| Massachusetts Gen. Oblig. Series F, 3.277% 6/1/46 | | 4,050 | 4,356 |
| New Jersey Tpk. Auth. Tpk. Rev. Series 2009 E, 7.414% 1/1/40 | | 4,032 | 6,654 |
| New York City Muni. Wtr. Fin. Auth. Wtr. & Swr. Sys. Rev. Series 2010 DD, 5.952% 6/15/42 | | 7,740 | 11,920 |
| New York City Transitional Fin. Auth. Rev. Series 2011 A, 5.508% 8/1/37 | | 9,200 | 12,609 |
| New York Metropolitan Trans. Auth. Rev. Series 2010 A, 6.668% 11/15/39 | | 5,285 | 7,919 |
| Port Auth. of New York & New Jersey: | | | |
| Series 180, 4.96% 8/1/46 | | 4,440 | 6,013 |
| Series 2010 164, 5.647% 11/1/40 | | 4,470 | 6,348 |
| Port of Morrow Transmission Facilities Rev. (Bonneville Coorporation Proj.) Series 2016 1, 2.987% 9/1/36 | | 4,855 | 5,061 |
| San Francisco Pub. Utils. Commission Wtr. Rev. Series 2010 E, 6% 11/1/40 | | 5,420 | 7,588 |
| South Carolina Pub. Svc. Auth. Rev. Series 2013 C, 5.784% 12/1/41 | | 9,704 | 13,406 |
| Univ. of California Revs.: | | | |
| Series 2009 R, 5.77% 5/15/43 | | 860 | 1,225 |
| Series 2015 AP, 3.931% 5/15/45 | | 3,210 | 3,686 |
| Univ. of Virginia Gen. Rev. (Multi-Year Cap. Proj. Fing. Prog.) Series 2017 C, 4.179% 9/1/2117 | | 4,075 | 5,264 |
| TOTAL MUNICIPAL SECURITIES | | | |
| (Cost $170,067) | | | 212,689 |
|
| Foreign Government and Government Agency Obligations - 1.2% | | | |
| Alberta Province: | | | |
| 1.9% 12/6/19 | | $8,149 | $8,144 |
| 3.3% 3/15/28 | | 3,345 | 3,739 |
| Banque Centrale de Tunisie 1.416% 8/5/21 | | 7,291 | 7,243 |
| Canadian Government 2% 11/15/22 | | 4,055 | 4,119 |
| Chilean Republic: | | | |
| 3.125% 1/21/26 | | 1,000 | 1,070 |
| 3.24% 2/6/28 | | 9,951 | 10,856 |
| 3.25% 9/14/21 | | 7,720 | 7,949 |
| 3.86% 6/21/47 | | 5,147 | 6,221 |
| Colombian Republic: | | | |
| 2.625% 3/15/23 | | 6,498 | 6,565 |
| 3.875% 4/25/27 | | 19,387 | 20,992 |
| 4% 2/26/24 | | 4,139 | 4,416 |
| 4.5% 1/28/26 | | 1,000 | 1,107 |
| 4.5% 3/15/29 | | 5,567 | 6,324 |
| 5% 6/15/45 | | 10,328 | 12,487 |
| 5.625% 2/26/44 | | 6,669 | 8,601 |
| 6.125% 1/18/41 | | 4,075 | 5,445 |
| Hungarian Republic 5.75% 11/22/23 | | 16,212 | 18,446 |
| Israeli State: | | | |
| 3.25% 1/17/28 | | 12,344 | 13,598 |
| 4% 6/30/22 | | 6,005 | 6,356 |
| Italian Republic 6.875% 9/27/23 | | 5,147 | 5,935 |
| Jordanian Kingdom 3% 6/30/25 | | 2,059 | 2,201 |
| Manitoba Province: | | | |
| 2.1% 9/6/22 | | 1,630 | 1,651 |
| 2.125% 5/4/22 | | 3,431 | 3,472 |
| 3.05% 5/14/24 | | 1,287 | 1,367 |
| Ontario Province: | | | |
| 2.25% 5/18/22 | | 4,992 | 5,073 |
| 2.3% 6/15/26 | | 12,243 | 12,670 |
| 2.4% 2/8/22 | | 4,469 | 4,549 |
| 2.5% 4/27/26 | | 4,289 | 4,490 |
| 2.55% 2/12/21 | | 8,449 | 8,543 |
| 3.05% 1/29/24 | | 10,000 | 10,598 |
| 4% 10/7/19 | | 12,867 | 12,888 |
| Panamanian Republic: | | | |
| 3.75% 3/16/25 | | 3,260 | 3,496 |
| 3.875% 3/17/28 | | 8,235 | 9,138 |
| 4% 9/22/24 | | 4,118 | 4,450 |
| 4.3% 4/29/53 | | 4,868 | 5,977 |
| 4.5% 4/16/50 | | 5,833 | 7,255 |
| 5.2% 1/30/20 | | 1,544 | 1,564 |
| Peruvian Republic: | | | |
| 2.844% 6/20/30 | | 10,000 | 10,559 |
| 4.125% 8/25/27 | | 12,402 | 14,208 |
| 5.625% 11/18/50 | | 6,133 | 9,376 |
| 6.55% 3/14/37 | | 2,638 | 4,004 |
| Philippine Republic: | | | |
| 3% 2/1/28 | | 16,298 | 17,312 |
| 3.95% 1/20/40 | | 6,948 | 8,344 |
| 4.2% 1/21/24 | | 4,087 | 4,454 |
| 6.375% 10/23/34 | | 8,900 | 13,069 |
| 6.5% 1/20/20 | | 5,270 | 5,357 |
| Polish Government: | | | |
| 3.25% 4/6/26 | | 5,662 | 6,083 |
| 4% 1/22/24 | | 3,903 | 4,243 |
| 5% 3/23/22 | | 12,438 | 13,394 |
| Province of British Columbia 2.25% 6/2/26 | | 3,234 | 3,349 |
| Province of Quebec: | | | |
| 2.375% 1/31/22 | | 3,260 | 3,319 |
| 2.5% 4/20/26 | | 4,855 | 5,091 |
| 2.75% 8/25/21 | | 17,156 | 17,519 |
| 2.75% 4/12/27 | | 4,075 | 4,366 |
| 2.875% 10/16/24 | | 1,780 | 1,889 |
| Ukraine Government 1.471% 9/29/21 | | 8,835 | 8,820 |
| United Mexican States: | | | |
| 3.5% 1/21/21 | | 6,348 | 6,471 |
| 3.625% 3/15/22 | | 2,574 | 2,663 |
| 3.75% 1/11/28 | | 7,720 | 8,060 |
| 4% 10/2/23 | | 16,084 | 17,069 |
| 4.125% 1/21/26 | | 2,745 | 2,919 |
| 4.15% 3/28/27 | | 10,000 | 10,700 |
| 4.35% 1/15/47 | | 12,361 | 12,991 |
| 4.6% 1/23/46 | | 4,975 | 5,399 |
| 4.6% 2/10/48 | | 15,055 | 16,481 |
| 4.75% 3/8/44 | | 8,320 | 9,204 |
| 5.55% 1/21/45 | | 3,359 | 4,135 |
| 6.05% 1/11/40 | | 4,118 | 5,267 |
| Uruguay Republic: | | | |
| 4.125% 11/20/45 | | 4,075 | 4,509 |
| 4.375% 10/27/27 | | 10,508 | 11,671 |
| 4.5% 8/14/24 | | 3,110 | 3,379 |
| 4.975% 4/20/55 | | 5,053 | 6,222 |
| 5.1% 6/18/50 | | 4,937 | 6,142 |
| TOTAL FOREIGN GOVERNMENT AND GOVERNMENT AGENCY OBLIGATIONS | | | |
| (Cost $506,455) | | | 547,033 |
|
| Supranational Obligations - 1.2% | | | |
| African Development Bank: | | | |
| 1.25% 7/26/21 | | 8,055 | 8,003 |
| 2.375% 9/23/21 | | 2,488 | 2,526 |
| Asian Development Bank: | | | |
| 1.5% 1/22/20 | | 4,075 | 4,068 |
| 1.75% 9/13/22 | | 12,243 | 12,332 |
| 1.875% 2/18/22 | | 1,716 | 1,731 |
| 2% 4/24/26 | | 5,404 | 5,565 |
| 2.125% 11/24/21 | | 4,139 | 4,191 |
| 2.25% 1/20/21 | | 2,529 | 2,548 |
| 2.5% 11/2/27 | | 5,747 | 6,153 |
| 2.625% 1/30/24 | | 12,900 | 13,534 |
| 2.625% 1/12/27 | | 5,576 | 5,990 |
| 2.75% 3/17/23 | | 8,218 | 8,572 |
| 2.75% 1/19/28 | | 4,203 | 4,601 |
| Council of Europe Development Bank 1.625% 3/16/21 | | 3,234 | 3,232 |
| European Bank for Reconstruction & Development: | | | |
| 1.125% 8/24/20 | | 4,023 | 3,995 |
| 1.75% 11/26/19 | | 2,466 | 2,464 |
| 2.125% 3/7/22 | | 4,023 | 4,084 |
| European Investment Bank: | | | |
| 1.375% 6/15/20 | | 2,338 | 2,328 |
| 1.375% 9/15/21 | | 15,072 | 15,008 |
| 1.625% 6/15/21 | | 6,005 | 6,008 |
| 1.875% 2/10/25 | | 2,573 | 2,631 |
| 2% 3/15/21 | | 4,092 | 4,115 |
| 2% 12/15/22 | | 12,153 | 12,375 |
| 2.125% 10/15/21 | | 2,436 | 2,464 |
| 2.25% 3/15/22 | | 13,639 | 13,885 |
| 2.25% 8/15/22 | | 1,613 | 1,647 |
| 2.25% 6/24/24 | | 19,400 | 20,097 |
| 2.375% 6/15/22 | | 12,009 | 12,290 |
| 2.375% 5/24/27 | | 3,431 | 3,644 |
| 2.5% 4/15/21 | | 3,989 | 4,046 |
| 2.5% 3/15/23 | | 18,014 | 18,653 |
| 2.5% 10/15/24 | | 4,911 | 5,166 |
| 2.875% 9/15/20 | | 7,720 | 7,808 |
| 2.875% 8/15/23 | | 9,084 | 9,574 |
| 3.125% 12/14/23 | | 11,838 | 12,630 |
| 3.25% 1/29/24 | | 1,716 | 1,846 |
| Inter-American Development Bank: | | | |
| 1.25% 9/14/21 | | 6,305 | 6,262 |
| 1.75% 10/15/19 | | 1,179 | 1,178 |
| 1.75% 4/14/22 | | 1,608 | 1,616 |
| 1.75% 9/14/22 | | 5,276 | 5,315 |
| 1.875% 6/16/20 | | 4,521 | 4,521 |
| 1.875% 3/15/21 | | 3,345 | 3,357 |
| 2% 6/2/26 | | 3,431 | 3,531 |
| 2.125% 1/18/22 | | 5,233 | 5,307 |
| 2.125% 1/15/25 | | 1,570 | 1,621 |
| 2.25% 6/18/29 | | 16,400 | 17,404 |
| 2.375% 7/7/27 | | 5,773 | 6,114 |
| 2.5% 1/18/23 | | 5,970 | 6,164 |
| 2.625% 4/19/21 | | 8,160 | 8,289 |
| 3% 10/4/23 | | 3,067 | 3,248 |
| 3.875% 9/17/19 | | 4,289 | 4,292 |
| 4.375% 1/24/44 | | 3,431 | 4,875 |
| International Bank for Reconstruction & Development: | | | |
| 1.125% 8/10/20 | | 16,985 | 16,878 |
| 1.375% 5/24/21 | | 4,854 | 4,835 |
| 1.375% 9/20/21 | | 4,486 | 4,470 |
| 1.5% 8/28/24 | | 17,000 | 17,025 |
| 1.625% 3/9/21 | | 5,147 | 5,147 |
| 1.625% 2/10/22 | | 3,345 | 3,353 |
| 1.75% 4/19/23 | | 5,747 | 5,795 |
| 1.875% 10/7/19 | | 3,281 | 3,280 |
| 1.875% 10/7/22 | | 14,583 | 14,752 |
| 1.875% 6/19/23 | | 11,700 | 11,856 |
| 1.875% 10/27/26 | | 4,083 | 4,185 |
| 2% 1/26/22 | | 27,816 | 28,136 |
| 2.25% 6/24/21 | | 13,789 | 13,953 |
| 2.5% 3/19/24 | | 3,260 | 3,407 |
| 2.5% 11/25/24 | | 4,890 | 5,142 |
| 2.5% 7/29/25 | | 3,251 | 3,436 |
| 2.75% 7/23/21 | | 8,278 | 8,459 |
| 7.625% 1/19/23 | | 23,500 | 28,161 |
| International Finance Corp.: | | | |
| 1.125% 7/20/21 | | 5,619 | 5,573 |
| 1.625% 7/16/20 | | 2,462 | 2,458 |
| 1.75% 9/16/19 | | 9,736 | 9,735 |
| 2.25% 1/25/21 | | 1,604 | 1,616 |
| 2.875% 7/31/23 | | 3,695 | 3,884 |
| TOTAL SUPRANATIONAL OBLIGATIONS | | | |
| (Cost $525,731) | | | 538,434 |
|
| Bank Notes - 0.2% | | | |
| Bank of America NA 6% 10/15/36 | | 2,075 | 2,902 |
| Citibank NA 3.65% 1/23/24 | | 21,445 | 22,858 |
| Citizens Bank NA 3.75% 2/18/26 | | 11,580 | 12,507 |
| Discover Bank 3.45% 7/27/26 | | 10,937 | 11,428 |
| KeyBank NA 2.5% 12/15/19 | | 3,431 | 3,434 |
| PNC Bank NA 2.4% 10/18/19 | | 4,075 | 4,075 |
| U.S. Bank NA 3.4% 7/24/23 | | 8,578 | 9,035 |
| TOTAL BANK NOTES | | | |
| (Cost $62,347) | | | 66,239 |
| | | Shares | Value (000s) |
|
| Money Market Funds - 0.7% | | | |
| Fidelity Cash Central Fund 2.13% (f) | | | |
| (Cost $320,106) | | 320,044,146 | 320,108 |
| | | Maturity Amount (000s) | Value (000s) |
|
| Repurchase Agreements - 0.3% | | | |
| Investments in repurchase agreements in a joint trading account at 2.2%, dated 8/30/19 due 9/3/19 (Collateralized by U.S. Government Obligations) # (g) | | | |
| (Cost $126,117) | | 126,148 | 126,117 |
| TOTAL INVESTMENT IN SECURITIES - 101.0% | | | |
| (Cost $42,596,155) | | | 44,795,590 |
| NET OTHER ASSETS (LIABILITIES) - (1.0)% | | | (456,989) |
| NET ASSETS - 100% | | | $44,338,601 |
TBA Sale Commitments
| TBA Sale Commitments | | |
| | Principal Amount (000s) | Value (000s) |
| Uniform Mortgage Backed Securities | | |
| 5.5% 9/1/49 | | |
| (Proceeds $432) | $(400) | $(433) |
Values shown as $0 in the Schedule of Investments may reflect amounts less than $500.
Legend
(a) Coupon rates for floating and adjustable rate securities reflect the rates in effect at period end.
(b) Security exempt from registration under Rule 144A of the Securities Act of 1933. These securities may be resold in transactions exempt from registration, normally to qualified institutional buyers. At the end of the period, the value of these securities amounted to $246,955,000 or 0.6% of net assets.
(c) Coupon is indexed to a floating interest rate which may be multiplied by a specified factor and/or subject to caps or floors.
(d) Security or a portion of the security is on loan at period end.
(e) Security or a portion of the security purchased on a delayed delivery or when-issued basis.
(f) Affiliated fund that is generally available only to investment companies and other accounts managed by Fidelity Investments. The rate quoted is the annualized seven-day yield of the fund at period end. A complete unaudited listing of the fund's holdings as of its most recent quarter end is available upon request. In addition, each Fidelity Central Fund's financial statements, which are not covered by the Fund's Report of Independent Registered Public Accounting Firm, are available on the SEC's website or upon request.
(g) Includes investment made with cash collateral received from securities on loan.
Affiliated Central Funds
Information regarding fiscal year to date income earned by the Fund from investments in Fidelity Central Funds is as follows:
| Fund | Income earned |
| | (Amounts in thousands) |
| Fidelity Cash Central Fund | $4,555 |
| Total | $4,555 |
Amounts in the income column in the above table include any capital gain distributions from underlying funds, which are presented in the corresponding line-item in the Statement of Operations, if applicable.
Investment Valuation
The following is a summary of the inputs used, as of August 31, 2019, involving the Fund's assets and liabilities carried at fair value. The inputs or methodology used for valuing securities may not be an indication of the risk associated with investing in those securities. For more information on valuation inputs, and their aggregation into the levels used below, please refer to the Investment Valuation section in the accompanying Notes to Financial Statements.
| | Valuation Inputs at Reporting Date: |
| Description | Total | Level 1 | Level 2 | Level 3 |
| (Amounts in thousands) | | | | |
| Investments in Securities: | | | | |
| Corporate Bonds | $10,877,300 | $-- | $10,877,300 | $-- |
| U.S. Government and Government Agency Obligations | 19,392,205 | -- | 19,392,205 | -- |
| U.S. Government Agency - Mortgage Securities | 11,742,680 | -- | 11,742,680 | -- |
| Asset-Backed Securities | 107,090 | -- | 107,090 | -- |
| Commercial Mortgage Securities | 865,695 | -- | 865,695 | -- |
| Municipal Securities | 212,689 | -- | 212,689 | -- |
| Foreign Government and Government Agency Obligations | 547,033 | -- | 547,033 | -- |
| Supranational Obligations | 538,434 | -- | 538,434 | -- |
| Bank Notes | 66,239 | -- | 66,239 | -- |
| Money Market Funds | 320,108 | 320,108 | -- | -- |
| Repurchase Agreements | 126,117 | -- | 126,117 | -- |
| Total Investments in Securities: | $44,795,590 | $320,108 | $44,475,482 | $-- |
| Other Financial Instruments: | | | | |
| TBA Sale Commitments | $(433) | $-- | $(433) | $-- |
| Total Other Financial Instruments: | $(433) | $-- | $(433) | $-- |
Other Information
# Additional information on each counterparty to the repurchase agreement is as follows:
| Repurchase Agreement/Counterparty | Value |
| $126,117,000 due 9/3/19 at 2.2% | 000's |
| JPMorgan Securities LLC | $126,117 |
See accompanying notes which are an integral part of the financial statements.
Financial Statements
Statement of Assets and Liabilities
| Amounts in thousands (except per-share amounts) | | August 31, 2019 |
| Assets | | |
Investment in securities, at value (including securities loaned of $123,363 and repurchase agreements of $126,117) — See accompanying schedule:
Unaffiliated issuers (cost $42,276,049) | $44,475,482 | |
| Fidelity Central Funds (cost $320,106) | 320,108 | |
| Total Investment in Securities (cost $42,596,155) | | $44,795,590 |
| Cash | | 978 |
| Receivable for investments sold | | 169,086 |
| Receivable for TBA sale commitments | | 433 |
| Receivable for fund shares sold | | 181,677 |
| Interest receivable | | 246,429 |
| Distributions receivable from Fidelity Central Funds | | 379 |
| Other receivables | | 257 |
| Total assets | | 45,394,829 |
| Liabilities | | |
| Payable for investments purchased | | |
| Regular delivery | $365,106 | |
| Delayed delivery | 450,820 | |
| TBA sale commitments, at value | 432 | |
| Payable for fund shares redeemed | 86,796 | |
| Distributions payable | 25,788 | |
| Accrued management fee | 910 | |
| Other payables and accrued expenses | 258 | |
| Collateral on securities loaned | 126,118 | |
| Total liabilities | | 1,056,228 |
| Net Assets | | $44,338,601 |
| Net Assets consist of: | | |
| Paid in capital | | $42,144,443 |
| Total distributable earnings (loss) | | 2,194,158 |
| Net Assets | | $44,338,601 |
| Net Asset Value and Maximum Offering Price | | |
| Net Asset Value, offering price and redemption price per share ($44,338,601 ÷ 3,671,532 shares) | | $12.08 |
See accompanying notes which are an integral part of the financial statements.
Statement of Operations
| Amounts in thousands | | Year ended August 31, 2019 |
| Investment Income | | |
| Interest (including $118 from security lending) | | $1,200,756 |
| Income from Fidelity Central Funds | | 4,555 |
| Total income | | 1,205,311 |
| Expenses | | |
| Management fee | $10,219 | |
| Independent trustees' fees and expenses | 189 | |
| Commitment fees | 109 | |
| Total expenses before reductions | 10,517 | |
| Expense reductions | (6) | |
| Total expenses after reductions | | 10,511 |
| Net investment income (loss) | | 1,194,800 |
| Realized and Unrealized Gain (Loss) | | |
| Net realized gain (loss) on: | | |
| Investment securities: | | |
| Unaffiliated issuers | 75,151 | |
| Fidelity Central Funds | (2) | |
| Total net realized gain (loss) | | 75,149 |
| Change in net unrealized appreciation (depreciation) on: | | |
| Investment securities: | | |
| Unaffiliated issuers | 2,869,657 | |
| Fidelity Central Funds | 2 | |
| Delayed delivery commitments | (160) | |
| Total change in net unrealized appreciation (depreciation) | | 2,869,499 |
| Net gain (loss) | | 2,944,648 |
| Net increase (decrease) in net assets resulting from operations | | $4,139,448 |
See accompanying notes which are an integral part of the financial statements.
Statement of Changes in Net Assets
| Amounts in thousands | Year ended August 31, 2019 | Year ended August 31, 2018 |
| Increase (Decrease) in Net Assets | | |
| Operations | | |
| Net investment income (loss) | $1,194,800 | $957,927 |
| Net realized gain (loss) | 75,149 | (18,473) |
| Change in net unrealized appreciation (depreciation) | 2,869,499 | (1,339,190) |
| Net increase (decrease) in net assets resulting from operations | 4,139,448 | (399,736) |
| Distributions to shareholders | (1,170,528) | – |
| Distributions to shareholders from net investment income | – | (951,073) |
| Distributions to shareholders from net realized gain | – | (20,168) |
| Total distributions | (1,170,528) | (971,241) |
| Share transactions - net increase (decrease) | 1,436,546 | 8,401,950 |
| Total increase (decrease) in net assets | 4,405,466 | 7,030,973 |
| Net Assets | | |
| Beginning of period | 39,933,135 | 32,902,162 |
| End of period | $44,338,601 | $39,933,135 |
| Other Information | | |
| Undistributed net investment income end of period | | $13,936 |
See accompanying notes which are an integral part of the financial statements.
Financial Highlights
Fidelity U.S. Bond Index Fund
| Years ended August 31, | 2019 | 2018 | 2017 | 2016 | 2015 |
| Selected Per–Share Data | | | | | |
| Net asset value, beginning of period | $11.26 | $11.71 | $11.96 | $11.59 | $11.71 |
| Income from Investment Operations | | | | | |
| Net investment income (loss)A | .328 | .302 | .291 | .295 | .307 |
| Net realized and unrealized gain (loss) | .813 | (.445) | (.250) | .388 | (.123) |
| Total from investment operations | 1.141 | (.143) | .041 | .683 | .184 |
| Distributions from net investment income | (.321) | (.300) | (.288) | (.294) | (.296) |
| Distributions from net realized gain | – | (.007) | (.003) | (.019) | (.008) |
| Total distributions | (.321) | (.307) | (.291) | (.313) | (.304) |
| Net asset value, end of period | $12.08 | $11.26 | $11.71 | $11.96 | $11.59 |
| Total ReturnB | 10.33% | (1.22)% | .39% | 5.98% | 1.57% |
| Ratios to Average Net AssetsC,D | | | | | |
| Expenses before reductions | .03% | .03% | .03% | .05% | .05% |
| Expenses net of fee waivers, if any | .03% | .03% | .03% | .05% | .05% |
| Expenses net of all reductions | .03% | .03% | .03% | .05% | .05% |
| Net investment income (loss) | 2.87% | 2.66% | 2.52% | 2.55% | 2.62% |
| Supplemental Data | | | | | |
| Net assets, end of period (in millions) | $44,339 | $20,283 | $15,180 | $9,788 | $1,560 |
| Portfolio turnover rateE | 35%F | 43% | 57% | 63% | 75% |
A Calculated based on average shares outstanding during the period.
B Total returns would have been lower if certain expenses had not been reduced during the applicable periods shown.
C Fees and expenses of any underlying Fidelity Central Funds are not included in the Fund's expense ratio. The Fund indirectly bears its proportionate share of the expenses of any underlying Fidelity Central Funds.
D Expense ratios reflect operating expenses of the Fund. Expenses before reductions do not reflect amounts reimbursed by the investment adviser or reductions from expense offset arrangements and do not represent the amount paid by the Fund during periods when reimbursements or reductions occur. Expenses net of fee waivers reflect expenses after reimbursement by the investment adviser but prior to reductions from expense offset arrangements. Expenses net of all reductions represent the net expenses paid by the Fund.
E Amount does not include the portfolio activity of any underlying Fidelity Central Funds.
F Portfolio turnover rate excludes securities received or delivered in-kind.
See accompanying notes which are an integral part of the financial statements.
Notes to Financial Statements
For the period ended August 31, 2019
(Amounts in thousands except percentages)
1. Organization.
Fidelity U.S. Bond Index Fund (the Fund) is a fund of Fidelity Salem Street Trust (the Trust) and is authorized to issue an unlimited number of shares. The Trust is registered under the Investment Company Act of 1940, as amended (the 1940 Act), as an open-end management investment company organized as a Massachusetts business trust.
Effective after the close of business November 2, 2018, the Fund's publicly offered shares classes, with exception of Class F, were consolidated into a single share class. The surviving class is Fidelity U.S. Bond Index Fund (formerly Institutional Premium Class). Effective after the close of business on April 26, 2019, the Fund no longer offered Class F, and all outstanding shares of Class F were redeemed. Current fiscal period dollar and share amounts for the classes that closed, which are presented in the Notes to Financial Statements, are for the following periods:
| Investor Class, Premium Class and Institutional Class | September 1, 2018 through November 2, 2018 |
| Class F | September 1, 2018 through April 26, 2019 |
2. Investments in Fidelity Central Funds.
The Fund invests in Fidelity Central Funds, which are open-end investment companies generally available only to other investment companies and accounts managed by the investment adviser and its affiliates. The Fund's Schedule of Investments lists each of the Fidelity Central Funds held as of period end, if any, as an investment of the Fund, but does not include the underlying holdings of each Fidelity Central Fund. As an Investing Fund, the Fund indirectly bears its proportionate share of the expenses of the underlying Fidelity Central Funds.
The Money Market Central Funds seek preservation of capital and current income and are managed by Fidelity Investments Money Management, Inc. (FIMM), an affiliate of the investment adviser. Annualized expenses of the Money Market Central Funds as of their most recent shareholder report date ranged from less than .005% to .01%.
A complete unaudited list of holdings for each Fidelity Central Fund is available upon request or at the Securities and Exchange Commission (the SEC) website at www.sec.gov. In addition, the financial statements of the Fidelity Central Funds, which are not covered by the Fund's Report of Independent Registered Public Accounting Firm, are available on the SEC website or upon request.
3. Significant Accounting Policies.
The Fund is an investment company and applies the accounting and reporting guidance of the Financial Accounting Standards Board (FASB) Accounting Standards Codification Topic 946 Financial Services – Investments Companies. The financial statements have been prepared in conformity with accounting principles generally accepted in the United States of America (GAAP), which require management to make certain estimates and assumptions at the date of the financial statements. Actual results could differ from those estimates. Subsequent events, if any, through the date that the financial statements were issued have been evaluated in the preparation of the financial statements. The following summarizes the significant accounting policies of the Fund:
Investment Valuation. Investments are valued as of 4:00 p.m. Eastern time on the last calendar day of the period. The Board of Trustees (the Board) has delegated the day to day responsibility for the valuation of the Fund's investments to the Fair Value Committee (the Committee) established by the Fund's investment adviser. In accordance with valuation policies and procedures approved by the Board, the Fund attempts to obtain prices from one or more third party pricing vendors or brokers to value its investments. When current market prices, quotations or currency exchange rates are not readily available or reliable, investments will be fair valued in good faith by the Committee, in accordance with procedures adopted by the Board. Factors used in determining fair value vary by investment type and may include market or investment specific events, changes in interest rates and credit quality. The frequency with which these procedures are used cannot be predicted and they may be utilized to a significant extent. The Committee oversees the Fund's valuation policies and procedures and reports to the Board on the Committee's activities and fair value determinations. The Board monitors the appropriateness of the procedures used in valuing the Fund's investments and ratifies the fair value determinations of the Committee.
The Fund categorizes the inputs to valuation techniques used to value its investments into a disclosure hierarchy consisting of three levels as shown below:
- Level 1 – quoted prices in active markets for identical investments
- Level 2 – other significant observable inputs (including quoted prices for similar investments, interest rates, prepayment speeds, etc.)
- Level 3 – unobservable inputs (including the Fund's own assumptions based on the best information available)
Valuation techniques used to value the Fund's investments by major category are as follows:
Debt securities, including restricted securities, are valued based on evaluated prices received from third party pricing vendors or from brokers who make markets in such securities. Corporate bonds, bank notes, foreign government and government agency obligations, municipal securities, supranational obligations and U.S. government and government agency obligations are valued by pricing vendors who utilize matrix pricing which considers yield or price of bonds of comparable quality, coupon, maturity and type or by broker-supplied prices. Asset backed securities, commercial mortgage securities and U.S. government agency mortgage securities are valued by pricing vendors who utilize matrix pricing which considers prepayment speed assumptions, attributes of the collateral, yield or price of bonds of comparable quality, coupon, maturity and type or by broker-supplied prices. When independent prices are unavailable or unreliable, debt securities may be valued utilizing pricing methodologies which consider similar factors that would be used by third party pricing vendors. Debt securities are generally categorized as Level 2 in the hierarchy but may be Level 3 depending on the circumstances.
Investments in open-end mutual funds, including the Fidelity Central Funds, are valued at their closing net asset value (NAV) each business day and are categorized as Level 1 in the hierarchy.
Changes in valuation techniques may result in transfers in or out of an assigned level within the disclosure hierarchy. The aggregate value of investments by input level as of August 31, 2019 is included at the end of the Fund's Schedule of Investments.
Investment Transactions and Income. For financial reporting purposes, the Fund's investment holdings and NAV include trades executed through the end of the last business day of the period. The NAV per share for processing shareholder transactions is calculated as of the close of business of the New York Stock Exchange (NYSE), normally 4:00 p.m. Eastern time and includes trades executed through the end of the prior business day. Gains and losses on securities sold are determined on the basis of identified cost and include proceeds received from litigation. Income and capital gain distributions from Fidelity Central Funds, if any, are recorded on the ex-dividend date. Interest income is accrued as earned and includes coupon interest and amortization of premium and accretion of discount on debt securities as applicable. Debt obligations may be placed on non-accrual status and related interest income may be reduced by ceasing current accruals and writing off interest receivables when the collection of all or a portion of interest has become doubtful based on consistently applied procedures. A debt obligation is removed from non-accrual status when the issuer resumes interest payments or when collectability of interest is reasonably assured.
Class Allocations and Expenses. Investment income, realized and unrealized capital gains and losses, common expenses of the Fund, and certain fund-level expense reductions, if any, are allocated daily on a pro-rata basis to each class based on the relative net assets of each class to the total net assets of the Fund. Each class differs with respect to fees incurred. Certain expense reductions may also differ by class. For the reporting period, the allocated portion of income and expenses to each class as a percent of its average net assets may vary due to the timing of recording these transactions in relation to fluctuating net assets of the classes. Expenses directly attributable to a fund are charged to that fund. Expenses attributable to more than one fund are allocated among the respective funds on the basis of relative net assets or other appropriate methods. Expense estimates are accrued in the period to which they relate and adjustments are made when actual amounts are known.
Deferred Trustee Compensation. Under a Deferred Compensation Plan (the Plan) for the Fund, certain independent Trustees have elected to defer receipt of a portion of their annual compensation. Deferred amounts are invested in a cross-section of Fidelity funds, are marked-to-market and remain in the Fund until distributed in accordance with the Plan. The investment of deferred amounts and the offsetting payable to the Trustees of $258 are included in the accompanying Statement of Assets and Liabilities in other receivables and other payables and accrued expenses, respectively.
Income Tax Information and Distributions to Shareholders. Each year, the Fund intends to qualify as a regulated investment company under Subchapter M of the Internal Revenue Code, including distributing substantially all of its taxable income and realized gains. As a result, no provision for U.S. Federal income taxes is required. As of August 31, 2019, the Fund did not have any unrecognized tax benefits in the financial statements; nor is the Fund aware of any tax positions for which it is reasonably possible that the total amounts of unrecognized tax benefits will significantly change in the next twelve months. The Fund files a U.S. federal tax return, in addition to state and local tax returns as required. The Fund's federal income tax returns are subject to examination by the Internal Revenue Service (IRS) for a period of three fiscal years after they are filed. State and local tax returns may be subject to examination for an additional fiscal year depending on the jurisdiction.
Distributions are declared and recorded daily and paid monthly from net investment income. Distributions from realized gains, if any, are declared and recorded on the ex-dividend date. Income and capital gain distributions are declared separately for each class. Income and capital gain distributions are determined in accordance with income tax regulations, which may differ from GAAP.
Capital accounts within the financial statements are adjusted for permanent book-tax differences. These adjustments have no impact on net assets or the results of operations. Capital accounts are not adjusted for temporary book-tax differences which will reverse in a subsequent period.
Book-tax differences are primarily due to market discount, redemptions in-kind, deferred trustees compensation, capital loss carryforwards and losses deferred due to wash sales.
As of period end, the cost and unrealized appreciation (depreciation) in securities, and derivatives if applicable, for federal income tax purposes were as follows:
| Gross unrealized appreciation | $2,258,720 |
| Gross unrealized depreciation | (28,170) |
| Net unrealized appreciation (depreciation) | $2,230,550 |
| Tax Cost | $42,565,040 |
The tax-based components of distributable earnings as of period end were as follows:
| Capital loss carryforward | $(17,749) |
| Net unrealized appreciation (depreciation) on securities and other investments | $2,230,550 |
Capital loss carryforwards are only available to offset future capital gains of the Fund to the extent provided by regulations and may be limited. Under the Regulated Investment Company Modernization Act of 2010 (the Act), the Fund is permitted to carry forward capital losses incurred in taxable years beginning after December 22, 2010 for an unlimited period and such capital losses are required to be used prior to any losses that expire. The capital loss carryforward information presented below, including any applicable limitation, is estimated as of fiscal period end and is subject to adjustment.
| No expiration | |
| Short-term | $(7,458) |
| Long-term | (10,291) |
| Total capital loss carryforward | $(17,749) |
The tax character of distributions paid was as follows:
| | August 31, 2019 | August 31, 2018 |
| Ordinary Income | $1,170,528 | $ 951,073 |
| Long-term Capital Gains | – | 20,168 |
| Total | $1,170,528 | $ 971,241 |
Repurchase Agreements. Pursuant to an Exemptive Order issued by the SEC, the Fund along with other registered investment companies having management contracts with Fidelity Management & Research Company (FMR), or other affiliated entities of FMR, are permitted to transfer uninvested cash balances into joint trading accounts which are then invested in repurchase agreements. The Fund may also invest directly with institutions in repurchase agreements. Repurchase agreements may be collateralized by government or non-government securities. Upon settlement date, collateral is held in segregated accounts with custodian banks and may be obtained in the event of a default of the counterparty. The Fund monitors, on a daily basis, the value of the collateral to ensure it is at least equal to the principal amount of the repurchase agreement (including accrued interest). In the event of a default by the counterparty, realization of the collateral proceeds could be delayed, during which time the value of the collateral may decline.
Delayed Delivery Transactions and When-Issued Securities. During the period, the transacted in securities on a delayed delivery or when-issued basis. Payment and delivery may take place after the customary settlement period for that security. The price of the underlying securities and the date when the securities will be delivered and paid for are fixed at the time the transaction is negotiated. The securities purchased on a delayed delivery or when-issued basis are identified as such in the Fund's Schedule of Investments. The Fund may receive compensation for interest forgone in the purchase of a delayed delivery or when-issued security. With respect to purchase commitments, the Fund identifies securities as segregated in its records with a value at least equal to the amount of the commitment. Losses may arise due to changes in the value of the underlying securities or if the counterparty does not perform under the contract's terms, or if the issuer does not issue the securities due to political, economic, or other factors.
To-Be-Announced (TBA) Securities and Mortgage Dollar Rolls. During the period, the Fund transacted in TBA securities that involved buying or selling mortgage-backed securities (MBS) on a forward commitment basis. A TBA transaction typically does not designate the actual security to be delivered and only includes an approximate principal amount; however delivered securities must meet specified terms defined by industry guidelines, including issuer, rate and current principal amount outstanding on underlying mortgage pools. The Fund may enter into a TBA transaction with the intent to take possession of or deliver the underlying MBS, or the Fund may elect to extend the settlement by entering into either a mortgage or reverse mortgage dollar roll. Mortgage dollar rolls are transactions where a fund sells TBA securities and simultaneously agrees to repurchase MBS on a later date at a lower price and with the same counterparty. Reverse mortgage dollar rolls involve the purchase and simultaneous agreement to sell TBA securities on a later date at a lower price. Transactions in mortgage dollar rolls and reverse mortgage dollar rolls are accounted for as purchases and sales and may result in an increase to the Fund's portfolio turnover rate.
Purchases and sales of TBA securities involve risks similar to those discussed above for delayed delivery and when-issued securities. Also, if the counterparty in a mortgage dollar roll or a reverse mortgage dollar roll transaction files for bankruptcy or becomes insolvent, the Fund's right to repurchase or sell securities may be limited. Additionally, when a fund sells TBA securities without already owning or having the right to obtain the deliverable securities (an uncovered forward commitment to sell), it incurs a risk of loss because it could have to purchase the securities at a price that is higher than the price at which it sold them. A fund may be unable to purchase the deliverable securities if the corresponding market is illiquid.
TBA securities subject to a forward commitment to sell at period end are included at the end of the Fund's Schedule of Investments under the caption "TBA Sale Commitments." The proceeds and value of these commitments are reflected in the Fund's Statement of Assets and Liabilities as Receivable for TBA sale commitments and TBA sale commitments, at value, respectively.
Restricted Securities. The Fund may invest in securities that are subject to legal or contractual restrictions on resale. These securities generally may be resold in transactions exempt from registration or to the public if the securities are registered. Disposal of these securities may involve time-consuming negotiations and expense, and prompt sale at an acceptable price may be difficult. Information regarding restricted securities is included at the end of the Fund's Schedule of Investments.
New Rule Issuance. During August 2018, the U.S. Securities and Exchange Commission issued Final Rule Release No. 33-10532, Disclosure Update and Simplification. This Final Rule includes amendments specific to registered investment companies that are intended to eliminate overlap in disclosure requirements between Regulation S-X and GAAP. In accordance with these amendments, certain line-items in the Fund's financial statements have been combined or removed for the current period as outlined in the table below.
| Financial Statement | Current Line-Item Presentation (As Applicable) | Prior Line-Item Presentation (As Applicable) |
| Statement of Assets and Liabilities | Total distributable earnings (loss) | Undistributed/Distributions in excess of/Accumulated net investment income (loss)
Accumulated/Undistributed net realized gain (loss)
Net unrealized appreciation (depreciation) |
| Statement of Changes in Net Assets | N/A - removed | Undistributed/Distributions in excess of/Accumulated net investment income (loss) end of period |
| Statement of Changes in Net Assets | Distributions to shareholders | Distributions to shareholders from net investment income
Distributions to shareholders from net realized gain |
| Distributions to Shareholders Note to Financial Statements | Distributions to shareholders | Distributions to shareholders from net investment income
Distributions to shareholders from net realized gain |
4. Purchases and Sales of Investments.
Purchases and sales of securities, other than short-term securities, in-kind transactions and U.S. government securities, aggregated $2,833,287 and $882,174, respectively.
Unaffiliated Redemptions In-Kind. During the period, 568,296 shares of the Fund were redeemed in-kind for investments, including accrued interest, cash with a value of $6,538,472. The net realized gain of $78,272 on investments delivered through in-kind redemptions is included in the accompanying Statement of Operations. The amount of the in-kind redemptions is included in share transactions in the accompanying Statement of Changes in Net Assets. The Fund recognized no gain or loss for federal income tax purposes.
5. Fees and Other Transactions with Affiliates.
Management Fee. Fidelity Management & Research Company (the investment adviser) and its affiliates provide the Fund with investment management related services for which the Fund pays a monthly management fee. The management fee is based on an annual rate of .025% of the Fund's average net assets. The management fee is reduced by an amount equal to the fees and expenses paid by the Fund to the independent Trustees. Under the management contract, the investment adviser pays all other fund-level operating expenses, except the compensation of the independent Trustees and certain other expenses such as interest expense, including commitment fees. During July 2019, the Board approved to change the management fee structure from a flat fee to a unitary fee effective August 1, 2019, which eliminated the need for a separate expense contract. There is no change to the total expenses paid by the shareholders.
Prior to August 1, 2019, under the expense contract, the investment adviser paid class-level expenses as necessary so that the total expenses did not exceed .025% of each class' average net assets on an annual basis with certain exceptions.
Interfund Trades. The Fund may purchase from or sell securities to other Fidelity Funds under procedures adopted by the Board. The procedures have been designed to ensure these interfund trades are executed in accordance with Rule 17a-7 of the 1940 Act. Interfund trades are included within the respective purchases and sales amounts shown in the Purchases and Sales of Investments note.
6. Committed Line of Credit.
The Fund participates with other funds managed by the investment adviser or an affiliate in a $4.25 billion credit facility (the "line of credit") to be utilized for temporary or emergency purposes to fund shareholder redemptions or for other short-term liquidity purposes. The Fund has agreed to pay commitment fees on its pro-rata portion of the line of credit, which amounted to $110 and is reflected in Commitment fees on the Statement of Operations. During the period, the Fund did not borrow on this line of credit.
7. Security Lending.
The Fund lends portfolio securities from time to time in order to earn additional income. The Fund may lend securities to certain qualified borrowers. On the settlement date of the loan, the Fund receives collateral (in the form of U.S. Treasury obligations, letters of credit and/or cash) against the loaned securities and maintains collateral in an amount not less than 100% of the market value of the loaned securities during the period of the loan. The market value of the loaned securities is determined at the close of business of the Fund and any additional required collateral is delivered to the Fund on the next business day. The Fund or borrower may terminate the loan at any time, and if the borrower defaults on its obligation to return the securities loaned because of insolvency or other reasons, the Fund may apply collateral received from the borrower against the obligation. The Fund may experience delays and costs in recovering the securities loaned. Any cash collateral received is maintained at the Fund's custodian and/or invested in cash equivalents. The value of loaned securities and cash collateral at period end are disclosed on the Fund's Statement of Assets and Liabilities. Security lending income represents the income earned on investing cash collateral, less rebates paid to borrowers, plus any premium payments received for lending certain types of securities. Security lending income is presented in the Statement of Operations as a component of interest income.
8. Expense Reductions.
Through arrangements with the Fund's custodian credits realized as a result of certain uninvested cash balances were used to reduce the Fund's expenses. During the period, these credits reduced the Fund's expenses by $6.
9. Distributions to Shareholders.
Distributions to shareholders of each class were as follows:
| | Year ended
August 31, 2019 | Year ended
August 31, 2018 |
| Distributions to shareholders | | |
| Investor Class | $1,372 | $– |
| Premium Class | 40,052 | – |
| Institutional Class | 18,667 | – |
| Fidelity U.S. Bond Index Fund | 999,816 | – |
| Class F | 110,621 | – |
| Total | $1,170,528 | $– |
| From net investment income | | |
| Investor Class | $– | $7,944 |
| Premium Class | – | 234,433 |
| Institutional Class | – | 109,741 |
| Fidelity U.S. Bond Index Fund | – | 464,286 |
| Class F | – | 134,669 |
| Total | $– | $951,073 |
| From net realized gain | | |
| Investor Class | $– | $197 |
| Premium Class | – | 5,410 |
| Institutional Class | – | 2,492 |
| Fidelity U.S. Bond Index Fund | – | 9,335 |
| Class F | – | 2,734 |
| Total | $– | $20,168 |
10. Share Transactions.
Share transactions for each class were as follows and may contain automatic conversions between classes or exchanges between affiliated funds:
| | Shares | Shares | Dollars | Dollars |
| | Year ended August 31, 2019 | Year ended August 31, 2018 | Year ended August 31, 2019 | Year ended August 31, 2018 |
| Investor Class | | | | |
| Shares sold | 2,848 | 16,300 | $31,731 | $186,248 |
| Reinvestment of distributions | 109 | 686 | 1,209 | 7,817 |
| Shares redeemed | (31,133) | (17,284) | (344,333) | (197,588) |
| Net increase (decrease) | (28,176) | (298) | $(311,393) | $(3,523) |
| Premium Class | | | | |
| Shares sold | 60,208 | 260,883 | $670,313 | $2,976,599 |
| Reinvestment of distributions | 3,358 | 19,886 | 37,328 | 226,485 |
| Shares redeemed | (865,394) | (245,185) | (9,559,465) | (2,795,040) |
| Net increase (decrease) | (801,828) | 35,584 | $(8,851,824) | $408,044 |
| Institutional Class | | | | |
| Shares sold | 22,965 | 191,483 | $244,669 | $2,181,401 |
| Reinvestment of distributions | 1,574 | 9,639 | 17,504 | 109,759 |
| Shares redeemed | (437,379) | (132,998) | (4,834,754) | (1,519,945) |
| Net increase (decrease) | (412,840) | 68,124 | $(4,572,581) | $771,215 |
| Fidelity U.S. Bond Index Fund | | | | |
| Shares sold | 2,635,092 | 799,021 | $29,715,171 | $9,094,365 |
| Reinvestment of distributions | 60,822 | 24,055 | 700,911 | 273,923 |
| Shares redeemed | (825,667) | (318,163) | (9,457,497) | (3,610,663) |
| Net increase (decrease) | 1,870,247 | 504,913 | $20,958,585 | $5,757,625 |
| Class F | | | | |
| Shares sold | 118,877 | 168,308 | $1,341,579 | $1,919,970 |
| Reinvestment of distributions | 8,547 | 12,078 | 96,300 | 137,403 |
| Shares redeemed | (629,641)(a) | (52,129) | (7,224,120)(a) | (588,784) |
Net increase
(decrease) | (502,217) | 128,257 | $(5,786,241) | $1,468,589 |
(a) Amount includes in-kind redemptions (see the Unaffiliated Redemptions In-Kind note for additional details).
11. Other.
The Fund's organizational documents provide former and current trustees and officers with a limited indemnification against liabilities arising in connection with the performance of their duties to the Fund. In the normal course of business, the Fund may also enter into contracts that provide general indemnifications. The Fund's maximum exposure under these arrangements is unknown as this would be dependent on future claims that may be made against the Fund. The risk of material loss from such claims is considered remote.
Report of Independent Registered Public Accounting Firm
To the Board of Trustees of Fidelity Salem Street Trust and Shareholders of Fidelity U.S. Bond Index Fund:
Opinion on the Financial Statements
We have audited the accompanying statement of assets and liabilities, including the schedule of investments, of Fidelity U.S. Bond Index Fund (one of the funds constituting Fidelity Salem Street Trust, referred to hereafter as the “Fund”) as of August 31, 2019, the related statement of operations for the year ended August 31, 2019, the statement of changes in net assets for each of the two years in the period ended August 31, 2019, including the related notes, and the financial highlights for each of the five years in the period ended August 31, 2019 (collectively referred to as the “financial statements”). In our opinion, the financial statements present fairly, in all material respects, the financial position of the Fund as of August 31, 2019, the results of its operations for the year then ended, the changes in its net assets for each of the two years in the period ended August 31, 2019 and the financial highlights for each of the five years in the period ended August 31, 2019 in conformity with accounting principles generally accepted in the United States of America.
Basis for Opinion
These financial statements are the responsibility of the Fund’s management. Our responsibility is to express an opinion on the Fund’s financial statements based on our audits. We are a public accounting firm registered with the Public Company Accounting Oversight Board (United States) (PCAOB) and are required to be independent with respect to the Fund in accordance with the U.S. federal securities laws and the applicable rules and regulations of the Securities and Exchange Commission and the PCAOB.
We conducted our audits of these financial statements in accordance with the standards of the PCAOB. Those standards require that we plan and perform the audit to obtain reasonable assurance about whether the financial statements are free of material misstatement, whether due to error or fraud.
Our audits included performing procedures to assess the risks of material misstatement of the financial statements, whether due to error or fraud, and performing procedures that respond to those risks. Such procedures included examining, on a test basis, evidence regarding the amounts and disclosures in the financial statements. Our audits also included evaluating the accounting principles used and significant estimates made by management, as well as evaluating the overall presentation of the financial statements. Our procedures included confirmation of securities owned as of August 31, 2019 by correspondence with the custodian and brokers; when replies were not received from brokers, we performed other auditing procedures. We believe that our audits provide a reasonable basis for our opinion.
PricewaterhouseCoopers LLP
Boston, Massachusetts
October 16, 2019
We have served as the auditor of one or more investment companies in the Fidelity group of funds since 1932.
Trustees and Officers
The Trustees, Members of the Advisory Board (if any), and officers of the trust and fund, as applicable, are listed below. The Board of Trustees governs the fund and is responsible for protecting the interests of shareholders. The Trustees are experienced executives who meet periodically throughout the year to oversee the fund's activities, review contractual arrangements with companies that provide services to the fund, oversee management of the risks associated with such activities and contractual arrangements, and review the fund's performance. Except for Jonathan Chiel, each of the Trustees oversees 276 funds. Mr. Chiel oversees 170 funds.
The Trustees hold office without limit in time except that (a) any Trustee may resign; (b) any Trustee may be removed by written instrument, signed by at least two-thirds of the number of Trustees prior to such removal; (c) any Trustee who requests to be retired or who has become incapacitated by illness or injury may be retired by written instrument signed by a majority of the other Trustees; and (d) any Trustee may be removed at any special meeting of shareholders by a two-thirds vote of the outstanding voting securities of the trust. Each Trustee who is not an interested person (as defined in the 1940 Act) of the trust and the fund is referred to herein as an Independent Trustee. Each Independent Trustee shall retire not later than the last day of the calendar year in which his or her 75th birthday occurs. The Independent Trustees may waive this mandatory retirement age policy with respect to individual Trustees. Officers and Advisory Board Members hold office without limit in time, except that any officer or Advisory Board Member may resign or may be removed by a vote of a majority of the Trustees at any regular meeting or any special meeting of the Trustees. Except as indicated, each individual has held the office shown or other offices in the same company for the past five years.
The fund’s Statement of Additional Information (SAI) includes more information about the Trustees. To request a free copy, call Fidelity at 1-800-544-8544.
Experience, Skills, Attributes, and Qualifications of the Trustees. The Governance and Nominating Committee has adopted a statement of policy that describes the experience, qualifications, attributes, and skills that are necessary and desirable for potential Independent Trustee candidates (Statement of Policy). The Board believes that each Trustee satisfied at the time he or she was initially elected or appointed a Trustee, and continues to satisfy, the standards contemplated by the Statement of Policy. The Governance and Nominating Committee also engages professional search firms to help identify potential Independent Trustee candidates who have the experience, qualifications, attributes, and skills consistent with the Statement of Policy. From time to time, additional criteria based on the composition and skills of the current Independent Trustees, as well as experience or skills that may be appropriate in light of future changes to board composition, business conditions, and regulatory or other developments, have also been considered by the professional search firms and the Governance and Nominating Committee. In addition, the Board takes into account the Trustees' commitment and participation in Board and committee meetings, as well as their leadership of standing and ad hoc committees throughout their tenure.
In determining that a particular Trustee was and continues to be qualified to serve as a Trustee, the Board has considered a variety of criteria, none of which, in isolation, was controlling. The Board believes that, collectively, the Trustees have balanced and diverse experience, qualifications, attributes, and skills, which allow the Board to operate effectively in governing the fund and protecting the interests of shareholders. Information about the specific experience, skills, attributes, and qualifications of each Trustee, which in each case led to the Board's conclusion that the Trustee should serve (or continue to serve) as a trustee of the fund, is provided below.
Board Structure and Oversight Function. Abigail P. Johnson is an interested person and currently serves as Chairman. The Trustees have determined that an interested Chairman is appropriate and benefits shareholders because an interested Chairman has a personal and professional stake in the quality and continuity of services provided to the fund. Independent Trustees exercise their informed business judgment to appoint an individual of their choosing to serve as Chairman, regardless of whether the Trustee happens to be independent or a member of management. The Independent Trustees have determined that they can act independently and effectively without having an Independent Trustee serve as Chairman and that a key structural component for assuring that they are in a position to do so is for the Independent Trustees to constitute a substantial majority for the Board. The Independent Trustees also regularly meet in executive session. Arthur E. Johnson serves as Chairman of the Independent Trustees and as such (i) acts as a liaison between the Independent Trustees and management with respect to matters important to the Independent Trustees and (ii) with management prepares agendas for Board meetings.
Fidelity® funds are overseen by different Boards of Trustees. The fund's Board oversees Fidelity's investment-grade bond, money market, asset allocation and certain equity funds, and other Boards oversee Fidelity's high income and other equity funds. The asset allocation funds may invest in Fidelity® funds that are overseen by such other Boards. The use of separate Boards, each with its own committee structure, allows the Trustees of each group of Fidelity® funds to focus on the unique issues of the funds they oversee, including common research, investment, and operational issues. On occasion, the separate Boards establish joint committees to address issues of overlapping consequences for the Fidelity® funds overseen by each Board.
The Trustees operate using a system of committees to facilitate the timely and efficient consideration of all matters of importance to the Trustees, the fund, and fund shareholders and to facilitate compliance with legal and regulatory requirements and oversight of the fund's activities and associated risks. The Board, acting through its committees, has charged FMR and its affiliates with (i) identifying events or circumstances the occurrence of which could have demonstrably adverse effects on the fund's business and/or reputation; (ii) implementing processes and controls to lessen the possibility that such events or circumstances occur or to mitigate the effects of such events or circumstances if they do occur; and (iii) creating and maintaining a system designed to evaluate continuously business and market conditions in order to facilitate the identification and implementation processes described in (i) and (ii) above. Because the day-to-day operations and activities of the fund are carried out by or through FMR, its affiliates, and other service providers, the fund's exposure to risks is mitigated but not eliminated by the processes overseen by the Trustees. While each of the Board's committees has responsibility for overseeing different aspects of the fund's activities, oversight is exercised primarily through the Operations and Audit Committees. In addition, an ad hoc Board committee of Independent Trustees has worked with FMR to enhance the Board's oversight of investment and financial risks, legal and regulatory risks, technology risks, and operational risks, including the development of additional risk reporting to the Board. Appropriate personnel, including but not limited to the fund's Chief Compliance Officer (CCO), FMR's internal auditor, the independent accountants, the fund's Treasurer and portfolio management personnel, make periodic reports to the Board's committees, as appropriate, including an annual review of Fidelity's risk management program for the Fidelity® funds. The responsibilities of each standing committee, including their oversight responsibilities, are described further under "Standing Committees of the Trustees."
Interested Trustees*:
Correspondence intended for a Trustee who is an interested person may be sent to Fidelity Investments, 245 Summer Street, Boston, Massachusetts 02210.
Name, Year of Birth; Principal Occupations and Other Relevant Experience+
Jonathan Chiel (1957)
Year of Election or Appointment: 2016
Trustee
Mr. Chiel also serves as Trustee of other Fidelity® funds. Mr. Chiel is Executive Vice President and General Counsel for FMR LLC (diversified financial services company, 2012-present). Previously, Mr. Chiel served as general counsel (2004-2012) and senior vice president and deputy general counsel (2000-2004) for John Hancock Financial Services; a partner with Choate, Hall & Stewart (1996-2000) (law firm); and an Assistant United States Attorney for the United States Attorney’s Office of the District of Massachusetts (1986-95), including Chief of the Criminal Division (1993-1995). Mr. Chiel is a director on the boards of the Boston Bar Foundation and the Maimonides School.
Abigail P. Johnson (1961)
Year of Election or Appointment: 2009
Trustee
Chairman of the Board of Trustees
Ms. Johnson also serves as Trustee of other Fidelity® funds. Ms. Johnson serves as Chairman (2016-present), Chief Executive Officer (2014-present), and Director (2007-present) of FMR LLC (diversified financial services company), President of Fidelity Financial Services (2012-present) and President of Personal, Workplace and Institutional Services (2005-present). Ms. Johnson is Chairman and Director of FMR Co., Inc. (investment adviser firm, 2011-present) and Chairman and Director of FMR (investment adviser firm, 2011-present). Previously, Ms. Johnson served as Vice Chairman (2007-2016) and President (2013-2016) of FMR LLC, President and a Director of FMR (2001-2005), a Trustee of other investment companies advised by FMR, Fidelity Investments Money Management, Inc. (investment adviser firm), and FMR Co., Inc. (2001-2005), Senior Vice President of the Fidelity® funds (2001-2005), and managed a number of Fidelity® funds. Ms. Abigail P. Johnson and Mr. Arthur E. Johnson are not related.
Jennifer Toolin McAuliffe (1959)
Year of Election or Appointment: 2016
Trustee
Ms. McAuliffe also serves as Trustee of other Fidelity® funds. Ms. McAuliffe previously served as a Member of the Advisory Board of certain Fidelity® funds (2016) and as Co-Head of Fixed Income of Fidelity Investments Limited (now known as FIL Limited (FIL)) (diversified financial services company). Earlier roles at FIL included Director of Research for FIL’s credit and quantitative teams in London, Hong Kong and Tokyo. Ms. McAuliffe also was the Director of Research for taxable and municipal bonds at Fidelity Investments Money Management, Inc. Ms. McAuliffe is also a director or trustee of several not-for-profit entities.
* Determined to be an “Interested Trustee” by virtue of, among other things, his or her affiliation with the trust or various entities under common control with FMR.
+ The information includes the Trustee's principal occupation during the last five years and other information relating to the experience, attributes, and skills relevant to the Trustee's qualifications to serve as a Trustee, which led to the conclusion that the Trustee should serve as a Trustee for the fund.
Independent Trustees:
Correspondence intended for an Independent Trustee may be sent to Fidelity Investments, P.O. Box 55235, Boston, Massachusetts 02205-5235.
Name, Year of Birth; Principal Occupations and Other Relevant Experience+
Elizabeth S. Acton (1951)
Year of Election or Appointment: 2013
Trustee
Ms. Acton also serves as Trustee of other Fidelity® funds. Prior to her retirement in April 2012, Ms. Acton was Executive Vice President, Finance (2011-2012), Executive Vice President, Chief Financial Officer (2002-2011), and Treasurer (2004-2005) of Comerica Incorporated (financial services). Prior to joining Comerica, Ms. Acton held a variety of positions at Ford Motor Company (1983-2002), including Vice President and Treasurer (2000-2002) and Executive Vice President and Chief Financial Officer of Ford Motor Credit Company (1998-2000). Ms. Acton currently serves as a member of the Board of Directors and Audit and Finance Committees of Beazer Homes USA, Inc. (homebuilding, 2012-present). Previously, Ms. Acton served as a Member of the Advisory Board of certain Fidelity® funds (2013-2016).
Ann E. Dunwoody (1953)
Year of Election or Appointment: 2018
Trustee
General Dunwoody also serves as Trustee of other Fidelity® funds. General Dunwoody (United States Army, Retired) was the first woman in U.S. military history to achieve the rank of four-star general and prior to her retirement in 2012 held a variety of positions within the U.S. Army, including Commanding General, U.S. Army Material Command (2008-2012). She is the President of First to Four LLC (leadership and mentoring services, 2012-present). She also serves as a member of the Board of Directors and Nominating and Corporate Governance Committee of L3 Technologies, Inc. (communication, electronic, sensor, and aerospace systems, 2013-present), Board of Directors and Nomination and Corporate Governance Committees of Kforce Inc. (professional staffing services, 2016-present) and Board of Directors of Automattic Inc. (software engineering, 2018-present). Previously, General Dunwoody served as a Member of the Advisory Board of certain Fidelity® funds (2018), a member of the Board of Directors and Audit and Sustainability and Corporate Responsibility Committees of Republic Services, Inc. (waste collection, disposal and recycling, 2013-2016). Ms. Dunwoody also serves on several boards for non-profit organizations, including as a member of the Board of Directors, Chair of the Nomination and Governance Committee and member of the Audit Committee of Logistics Management Institute (consulting non-profit, 2012-present), a member of the Board of Directors of the Army Historical Foundation (2015-present), a member of the Council of Trustees for the Association of the United States Army (advocacy non-profit, 2013-present) and a member of the Board of Trustees of Florida Institute of Technology (2015-present) and ThanksUSA (military family education non-profit, 2014-present).
John Engler (1948)
Year of Election or Appointment: 2014
Trustee
Mr. Engler also serves as Trustee of other Fidelity® funds. He serves on the board of directors for Universal Forest Products (manufacturer and distributor of wood and wood-alternative products, 2003-present) and K12 Inc. (technology-based education company, 2012-present). Previously, Mr. Engler served as interim president of Michigan State University (2018-2019), a Member of the Advisory Board of certain Fidelity® funds (2014-2016), president of the Business Roundtable (2011-2017), a trustee of The Munder Funds (2003-2014), president and CEO of the National Association of Manufacturers (2004-2011), member of the Board of Trustees of the Annie E. Casey Foundation (2004-2015), and as governor of Michigan (1991-2003). He is a past chairman of the National Governors Association.
Robert F. Gartland (1951)
Year of Election or Appointment: 2010
Trustee
Mr. Gartland also serves as Trustee of other Fidelity® funds. Mr. Gartland is Chairman and an investor in Gartland & Mellina Group Corp. (consulting, 2009-present). Previously, Mr. Gartland served as a partner and investor of Vietnam Partners LLC (investments and consulting, 2008-2011). Prior to his retirement, Mr. Gartland held a variety of positions at Morgan Stanley (financial services, 1979-2007), including Managing Director (1987-2007), and Chase Manhattan Bank (1975-1978).
Arthur E. Johnson (1947)
Year of Election or Appointment: 2008
Trustee
Chairman of the Independent Trustees
Mr. Johnson also serves as Trustee of other Fidelity® funds. Mr. Johnson serves as a member of the Board of Directors of Eaton Corporation plc (diversified power management, 2009-present) and Booz Allen Hamilton (management consulting, 2011-present). Prior to his retirement, Mr. Johnson served as Senior Vice President of Corporate Strategic Development of Lockheed Martin Corporation (defense contractor, 1999-2009). Mr. Johnson previously served as Vice Chairman (2015-2018) of the Independent Trustees of certain Fidelity® funds and on the Board of Directors of IKON Office Solutions, Inc. (1999-2008), AGL Resources, Inc. (holding company, 2002-2016), and Delta Airlines (2005-2007). Mr. Arthur E. Johnson is not related to Ms. Abigail P. Johnson.
Michael E. Kenneally (1954)
Year of Election or Appointment: 2009
Trustee
Vice Chairman of the Independent Trustees
Mr. Kenneally also serves as Trustee of other Fidelity® funds. Prior to his retirement, Mr. Kenneally served as Chairman and Global Chief Executive Officer of Credit Suisse Asset Management. Before joining Credit Suisse, he was an Executive Vice President and Chief Investment Officer for Bank of America Corporation. Earlier roles at Bank of America included Director of Research, Senior Portfolio Manager and Research Analyst, and Mr. Kenneally was awarded the Chartered Financial Analyst (CFA) designation in 1991.
Marie L. Knowles (1946)
Year of Election or Appointment: 2001
Trustee
Ms. Knowles also serves as Trustee of other Fidelity® funds. Prior to Ms. Knowles' retirement in June 2000, she served as Executive Vice President and Chief Financial Officer of Atlantic Richfield Company (ARCO) (diversified energy, 1996-2000). From 1993 to 1996, she was a Senior Vice President of ARCO and President of ARCO Transportation Company (pipeline and tanker operations). Ms. Knowles currently serves as a Director and Chairman of the Audit Committee of McKesson Corporation (healthcare service, since 2002). Ms. Knowles is a member of the Board of the Santa Catalina Island Company (real estate, 2009-present). Ms. Knowles is a Member of the Investment Company Institute Board of Governors and a Member of the Governing Council of the Independent Directors Council (2014-present). She also serves as a member of the Advisory Board for the School of Engineering of the University of Southern California. Previously, Ms. Knowles served as a Director of Phelps Dodge Corporation (copper mining and manufacturing, 1994-2007), URS Corporation (engineering and construction, 2000-2003) and America West (airline, 1999-2002). Ms. Knowles previously served as Chairman (2015-2018) and Vice Chairman (2012-2015) of the Independent Trustees of certain Fidelity® funds.
Mark A. Murray (1954)
Year of Election or Appointment: 2016
Trustee
Mr. Murray also serves as Trustee of other Fidelity® funds. Mr. Murray is Vice Chairman (2013-present) of Meijer, Inc. (regional retail chain). Previously, Mr. Murray served as a Member of the Advisory Board of certain Fidelity® funds (2016) and as Co-Chief Executive Officer (2013-2016) and President (2006-2013) of Meijer, Inc. Mr. Murray serves as a member of the Board of Directors and Nuclear Review and Public Policy and Responsibility Committees of DTE Energy Company (diversified energy company, 2009-present). Mr. Murray also serves as a member of the Board of Directors of Spectrum Health (not-for-profit health system, 2015-present). Mr. Murray previously served as President of Grand Valley State University (2001-2006), Treasurer for the State of Michigan (1999-2001), Vice President of Finance and Administration for Michigan State University (1998-1999), and a member of the Board of Directors and Audit Committee and Chairman of the Nominating and Corporate Governance Committee of Universal Forest Products, Inc. (manufacturer and distributor of wood and wood-alternative products, 2004-2016). Mr. Murray is also a director or trustee of many community and professional organizations.
+ The information includes the Trustee's principal occupation during the last five years and other information relating to the experience, attributes, and skills relevant to the Trustee's qualifications to serve as a Trustee, which led to the conclusion that the Trustee should serve as a Trustee for the fund.
Advisory Board Members and Officers:
Correspondence intended for an officer may be sent to Fidelity Investments, 245 Summer Street, Boston, Massachusetts 02210. Officers appear below in alphabetical order.
Name, Year of Birth; Principal Occupation
Elizabeth Paige Baumann (1968)
Year of Election or Appointment: 2017
Anti-Money Laundering (AML) Officer
Ms. Baumann also serves as AML Officer of other funds. She is Chief AML Officer (2012-present) and Senior Vice President (2014-present) of FMR LLC (diversified financial services company) and is an employee of Fidelity Investments. Previously, Ms. Baumann served as AML Officer of the funds (2012-2016), and Vice President (2007-2014) and Deputy Anti-Money Laundering Officer (2007-2012) of FMR LLC.
Craig S. Brown (1977)
Year of Election or Appointment: 2019
Assistant Treasurer
Mr. Brown also serves as Assistant Treasurer of other funds. Mr. Brown is an employee of Fidelity Investments (2013-present).
John J. Burke III (1964)
Year of Election or Appointment: 2018
Chief Financial Officer
Mr. Burke also serves as Chief Financial Officer of other funds. Mr. Burke serves as Head of Investment Operations for Fidelity Fund and Investment Operations (2018-present) and is an employee of Fidelity Investments (1998-present). Previously Mr. Burke served as head of Asset Management Investment Operations (2012-2018).
Jonathan Davis (1968)
Year of Election or Appointment: 2010
Assistant Treasurer
Mr. Davis also serves as Assistant Treasurer of other funds. Mr. Davis serves as Assistant Treasurer of FMR Capital, Inc. (2017-present) and is an employee of Fidelity Investments. Previously, Mr. Davis served as Vice President and Associate General Counsel of FMR LLC (diversified financial services company, 2003-2010).
Adrien E. Deberghes (1967)
Year of Election or Appointment: 2010
Assistant Treasurer
Mr. Deberghes also serves as an officer of other funds. He serves as Assistant Treasurer of FMR Capital, Inc. (2017-present), Executive Vice President of Fidelity Investments Money Management, Inc. (FIMM) (investment adviser firm, 2016-present), and is an employee of Fidelity Investments (2008-present). Previously, Mr. Deberghes served as President and Treasurer of certain Fidelity® funds (2013-2018). Prior to joining Fidelity Investments, Mr. Deberghes was Senior Vice President of Mutual Fund Administration at State Street Corporation (2007-2008), Senior Director of Mutual Fund Administration at Investors Bank & Trust (2005-2007), and Director of Finance for Dunkin' Brands (2000-2005). Previously, Mr. Deberghes served in other fund officer roles.
Laura M. Del Prato (1964)
Year of Election or Appointment: 2018
President and Treasurer
Ms. Del Prato also serves as an officer of other funds. Ms. Del Prato is an employee of Fidelity Investments (2017-present). Prior to joining Fidelity Investments, Ms. Del Prato served as a Managing Director and Treasurer of the JPMorgan Mutual Funds (2014-2017). Prior to JPMorgan, Ms. Del Prato served as a partner at Cohen Fund Audit Services (accounting firm, 2012-2013) and KPMG LLP (accounting firm, 2004-2012).
Colm A. Hogan (1973)
Year of Election or Appointment: 2016
Assistant Treasurer
Mr. Hogan also serves as an officer of other funds. Mr. Hogan serves as Assistant Treasurer of FMR Capital, Inc. (2017-present) and is an employee of Fidelity Investments (2005-present). Previously, Mr. Hogan served as Assistant Treasurer of certain Fidelity® funds (2016-2018).
Cynthia Lo Bessette (1969)
Year of Election or Appointment: 2019
Secretary and Chief Legal Officer (CLO)
Ms. Lo Bessette also serves as Secretary and CLO of other funds. She is a Senior Vice President and Deputy General Counsel of FMR LLC (diversified financial services company, 2019-present), and is an employee of Fidelity Investments. Previously, Ms. Lo Bessette served as Executive Vice President, General Counsel (2016-2019) and Senior Vice President, Deputy General Counsel (2015-2016) of OppenheimerFunds (investment management company) and Deputy Chief Legal Officer (2013-2015) of Jennison Associates LLC (investment adviser firm).
Chris Maher (1972)
Year of Election or Appointment: 2013
Assistant Treasurer
Mr. Maher serves as Assistant Treasurer of other funds. Mr. Maher is Vice President of Valuation Oversight, serves as Assistant Treasurer of FMR Capital, Inc. (2017-present), and is an employee of Fidelity Investments. Previously, Mr. Maher served as Vice President of Asset Management Compliance (2013), Vice President of the Program Management Group of FMR (investment adviser firm, 2010-2013), and Vice President of Valuation Oversight (2008-2010).
John B. McGinty, Jr. (1962)
Year of Election or Appointment: 2016
Chief Compliance Officer
Mr. McGinty also serves as Chief Compliance Officer of other funds. Mr. McGinty is Senior Vice President of Asset Management Compliance for Fidelity Investments and is an employee of Fidelity Investments (2016-present). Mr. McGinty previously served as Vice President, Senior Attorney at Eaton Vance Management (investment management firm, 2015-2016), and prior to Eaton Vance as global CCO for all firm operations and registered investment companies at GMO LLC (investment management firm, 2009-2015). Before joining GMO LLC, Mr. McGinty served as Senior Vice President, Deputy General Counsel for Fidelity Investments (2007-2009).
Jason P. Pogorelec (1975)
Year of Election or Appointment: 2015
Assistant Secretary
Mr. Pogorelec also serves as Assistant Secretary of other funds. Mr. Pogorelec serves as Vice President, Associate General Counsel (2010-present) and is an employee of Fidelity Investments (2006-present).
Nancy D. Prior (1967)
Year of Election or Appointment: 2014
Vice President
Ms. Prior also serves as Vice President of other funds. Ms. Prior serves as President of Fixed Income (2014-present), President (2016-present) and Director (2014-present) of Fidelity Investments Money Management, Inc. (FIMM) (investment adviser firm), and is an employee of Fidelity Investments (2002-present). Previously, Ms. Prior served as Vice Chairman of FIAM LLC (investment adviser firm, 2014-2018), a Director of FMR Investment Management (UK) Limited (investment adviser firm, 2015-2018), President Multi-Asset Class Strategies of FMR's Global Asset Allocation Division (2017-2018), Vice President of Fidelity's Money Market Funds (2012-2014), and President, Money Market and Short Duration Bond Group of Fidelity Management & Research Company (FMR) (investment adviser firm, 2013-2014).
Stacie M. Smith (1974)
Year of Election or Appointment: 2013
Assistant Treasurer
Ms. Smith also serves as an officer of other funds. Ms. Smith serves as Assistant Treasurer of FMR Capital, Inc. (2017-present), is an employee of Fidelity Investments (2009-present), and has served in other fund officer roles. Prior to joining Fidelity Investments, Ms. Smith served as Senior Audit Manager of Ernst & Young LLP (accounting firm, 1996-2009). Previously, Ms. Smith served as Assistant Treasurer (2013-2018) and Deputy Treasurer (2013-2016) of certain Fidelity® funds.
Marc L. Spector (1972)
Year of Election or Appointment: 2016
Deputy Treasurer
Mr. Spector also serves as an officer of other funds. Mr. Spector serves as Assistant Treasurer of FMR Capital, Inc. (2017-present) and is an employee of Fidelity Investments (2016-present). Prior to joining Fidelity Investments, Mr. Spector served as Director at the Siegfried Group (accounting firm, 2013-2016), and prior to Siegfried Group as audit senior manager at Deloitte & Touche (accounting firm, 2005-2013).
Jim Wegmann (1979)
Year of Election or Appointment: 2019
Assistant Treasurer
Mr. Wegmann also serves as Assistant Treasurer of other funds. Mr. Wegmann is an employee of Fidelity Investments (2011-present).
Shareholder Expense Example
As a shareholder of the Fund, you incur two types of costs: (1) transaction costs and (2) ongoing costs, including management fees and other Fund expenses. This Example is intended to help you understand your ongoing costs (in dollars) of investing in the Fund and to compare these costs with the ongoing costs of investing in other mutual funds.
The Example is based on an investment of $1,000 invested at the beginning of the period and held for the entire period (March 1, 2019 to August 31, 2019).
Actual Expenses
The first line of the accompanying table provides information about actual account values and actual expenses. You may use the information in this line, together with the amount you invested, to estimate the expenses that you paid over the period. Simply divide your account value by $1,000.00 (for example, an $8,600 account value divided by $1,000.00 = 8.6), then multiply the result by the number in the first line under the heading entitled "Expenses Paid During Period" to estimate the expenses you paid on your account during this period. In addition, the Fund, as a shareholder in the underlying Fidelity Central Funds, will indirectly bear its pro-rata share of the fees and expenses incurred by the underlying Fidelity Central Funds. These fees and expenses are not included in the Fund's annualized expense ratio used to calculate the expense estimate in the table below.
Hypothetical Example for Comparison Purposes
The second line of the accompanying table provides information about hypothetical account values and hypothetical expenses based on the Fund's actual expense ratio and an assumed rate of return of 5% per year before expenses, which is not the Fund's actual return. The hypothetical account values and expenses may not be used to estimate the actual ending account balance or expenses you paid for the period. You may use this information to compare the ongoing costs of investing in the Fund and other funds. To do so, compare this 5% hypothetical example with the 5% hypothetical examples that appear in the shareholder reports of the other funds. In addition, the Fund, as a shareholder in the underlying Fidelity Central Funds, will indirectly bear its pro-rata share of the fees and expenses incurred by the underlying Fidelity Central Funds. These fees and expenses are not included in the Fund's annualized expense ratio used to calculate the expense estimate in the table below.
Please note that the expenses shown in the table are meant to highlight your ongoing costs only and do not reflect any transaction costs. Therefore, the second line of the table is useful in comparing ongoing costs only, and will not help you determine the relative total costs of owning different funds.
| | Annualized Expense Ratio-A | Beginning
Account Value
March 1, 2019 | Ending
Account Value
August 31, 2019 | Expenses Paid
During Period-B
March 1, 2019
to August 31, 2019 |
| Fidelity U.S. Bond Index Fund | .03% | | | |
| Actual | | $1,000.00 | $1,081.10 | $.16 |
| Hypothetical-C | | $1,000.00 | $1,025.05 | $.15 |
A Annualized expense ratio reflects expenses net of applicable fee waivers.
B Expenses are equal to the Fund's annualized expense ratio, multiplied by the average account value over the period, multiplied by 184/365 (to reflect the one-half year period).
C 5% return per year before expenses
Distributions (Unaudited)
A total of 33.80% of the dividends distributed during the fiscal year was derived from interest on U.S. Government securities which is generally exempt from state income tax.
The fund designates $737,154,975 of distributions paid during the period January 1, 2019 to August 31, 2019 as qualifying to be taxed as interest-related dividends for nonresident alien shareholders.
The fund will notify shareholders in January 2020 of amounts for use in preparing 2019 income tax returns.
UII-UDV-ANN-1019
1.925929.108
Fidelity® Series Government Money Market Fund
Annual Report August 31, 2019 |
|
Beginning on January 1, 2021, as permitted by regulations adopted by the Securities and Exchange Commission, paper copies of a fund’s shareholder reports will no longer be sent by mail, unless you specifically request paper copies of the reports from the fund or from your financial intermediary, such as a financial advisor, broker-dealer or bank. Instead, the reports will be made available on a website, and you will be notified by mail each time a report is posted and provided with a website link to access the report.
If you already elected to receive shareholder reports electronically, you will not be affected by this change and you need not take any action. You may elect to receive shareholder reports and other communications from a fund electronically, by contacting your financial intermediary. For Fidelity customers, visit Fidelity's web site or call Fidelity using the contact information listed below.
You may elect to receive all future reports in paper free of charge. If you wish to continue receiving paper copies of your shareholder reports, you may contact your financial intermediary or, if you are a Fidelity customer, visit Fidelity’s website, or call Fidelity at the applicable toll-free number listed below. Your election to receive reports in paper will apply to all funds held with the fund complex/your financial intermediary.
| Account Type | Website | Phone Number |
| Brokerage, Mutual Fund, or Annuity Contracts: | fidelity.com/mailpreferences | 1-800-343-3548 |
| Employer Provided Retirement Accounts: | netbenefits.fidelity.com/preferences (choose 'no' under Required Disclosures to continue to print) | 1-800-343-0860 |
| Advisor Sold Accounts Serviced Through Your Financial Intermediary: | Contact Your Financial Intermediary | Your Financial Intermediary's phone number |
| Advisor Sold Accounts Serviced by Fidelity: | institutional.fidelity.com | 1-877-208-0098 |
Contents
To view a fund's proxy voting guidelines and proxy voting record for the 12-month period ended June 30, visit http://www.fidelity.com/proxyvotingresults or visit the Securities and Exchange Commission's (SEC) web site at http://www.sec.gov.
You may also call 1-800-544-8544 to request a free copy of the proxy voting guidelines.
Standard & Poor's, S&P and S&P 500 are registered service marks of The McGraw-Hill Companies, Inc. and have been licensed for use by Fidelity Distributors Corporation.
Other third-party marks appearing herein are the property of their respective owners.
All other marks appearing herein are registered or unregistered trademarks or service marks of FMR LLC or an affiliated company. © 2019 FMR LLC. All rights reserved.
This report and the financial statements contained herein are submitted for the general information of the shareholders of the Fund. This report is not authorized for distribution to prospective investors in the Fund unless preceded or accompanied by an effective prospectus.
A fund files its complete schedule of portfolio holdings with the SEC for the first and third quarters of each fiscal year on Form N-PORT. Forms N-PORT are available on the SEC’s web site at http://www.sec.gov. A fund's Forms N-PORT may be reviewed and copied at the SEC’s Public Reference Room in Washington, DC. Information regarding the operation of the SEC's Public Reference Room may be obtained by calling 1-800-SEC-0330.
For a complete list of a fund's portfolio holdings, view the most recent holdings listing, semiannual report, or annual report on Fidelity's web site at http://www.fidelity.com, http://www.institutional.fidelity.com, or http://www.401k.com, as applicable.
NOT FDIC INSURED •MAY LOSE VALUE •NO BANK GUARANTEE
Neither the Fund nor Fidelity Distributors Corporation is a bank.
Investment Summary/Performance (Unaudited)
Effective Maturity Diversification
| Days | % of fund's investments 8/31/19 |
| 1 - 7 | 61.8 |
| 8 - 30 | 18.7 |
| 31 - 60 | 10.7 |
| 61 - 90 | 2.9 |
| 91 - 180 | 4.6 |
| > 180 | 1.3 |
Effective maturity is determined in accordance with the requirements of Rule 2a-7 under the Investment Company Act of 1940.
Asset Allocation (% of fund's net assets)
| As of August 31, 2019 |
| | U.S. Treasury Debt | 8.5% |
| | U.S. Government Agency Debt | 49.4% |
| | Repurchase Agreements | 63.4% |
| | Net Other Assets (Liabilities)* | (21.3)% |

* Net Other Assets (Liabilities) are not included in the pie chart
Current 7-Day Yields
| | 8/30/19 |
| Fidelity® Series Government Money Market Fund | 2.20% |
Yield refers to the income paid by the Fund over a given period. Yield for money market funds is usually for seven-day periods, as it is here, though it is expressed as an annual percentage rate. Past performance is no guarantee of future results. Yield will vary and it's possible to lose money investing in the Fund.
Schedule of Investments August 31, 2019
Showing Percentage of Net Assets
| U.S. Treasury Debt - 8.5% | | | | |
| | | Yield(a) | Principal Amount | Value |
| U.S. Treasury Obligations - 8.5% | | | | |
| U.S. Treasury Bills | | | | |
| 9/5/19 to 8/13/20 | | 1.83 to 2.49 (b)% | $519,898,000 | $516,652,080 |
| U.S. Treasury Notes | | | | |
| 9/30/19 to 4/30/20 | | 1.96 to 2.42 (c) | 39,000,000 | 38,993,504 |
| TOTAL U.S. TREASURY DEBT | | | | |
| (Cost $555,645,584) | | | | 555,645,584 |
|
| U.S. Government Agency Debt - 49.4% | | | | |
| Federal Agencies - 49.4% | | | | |
| Fannie Mae | | | | |
| 10/30/19 to 1/29/21 | | 2.16 to 2.22 (c)(d) | 80,000,000 | 80,000,000 |
| Federal Farm Credit Bank | | | | |
| 9/19/19 to 5/21/20 | | 2.09 to 2.17 (c)(d) | 18,000,000 | 17,999,426 |
| Federal Home Loan Bank | | | | |
| 9/3/19 to 7/23/21 | | 1.98 to 2.47 (c) | 2,922,000,000 | 2,919,623,127 |
| Freddie Mac | | | | |
| 9/3/19 to 12/14/20 | | 2.05 to 2.49 (c) | 231,900,000 | 231,840,174 |
| TOTAL U.S. GOVERNMENT AGENCY DEBT | | | | |
| (Cost $3,249,462,727) | | | | 3,249,462,727 |
| U.S. Government Agency Repurchase Agreement - 20.4% | | | |
| | | Maturity Amount | Value |
| In a joint trading account at 2.17% dated 8/30/19 due 9/3/19 (Collateralized by (U.S. Government Obligations)) # | | $547,995,932 | $547,864,000 |
| With: | | | |
| Barclays Bank PLC at: | | | |
| 2.16%, dated 8/30/19 due 9/3/19 (Collateralized by U.S. Government Obligations valued at $13,263,183, 4.00%, 3/20/49) | | 13,003,120 | 13,000,000 |
| 2.21%, dated 8/28/19 due 9/4/19 (Collateralized by U.S. Government Obligations valued at $14,285,261, 4.00%, 3/20/49) | | 14,006,016 | 14,000,000 |
| BMO Capital Markets Corp. at 2.21%, dated 8/1/19 due 9/6/19 (Collateralized by U.S. Government Obligations valued at $6,132,398, 2.50% - 5.50%, 7/1/28 - 9/1/49) | | 6,014,365 | 6,000,000 |
| BMO Harris Bank NA at: | | | |
| 2.18%, dated 8/13/19 due 9/6/19 (Collateralized by U.S. Government Obligations valued at $19,404,645, 2.50% - 6.00%, 5/1/23 - 11/20/67) | | 19,041,420 | 19,000,000 |
| 2.2%, dated 8/2/19 due 9/6/19 (Collateralized by U.S. Government Obligations valued at $20,439,893, 2.50% - 6.00%, 10/1/21 - 7/20/69) | | 20,046,444 | 20,000,000 |
| BNP Paribas, SA at: | | | |
| 2.04%, dated 8/27/19 due 9/6/19 (Collateralized by U.S. Treasury Obligations valued at $18,473,541, 0.00% - 7.00%, 8/15/25 - 8/1/49) | | 18,063,240 | 18,000,000 |
| 2.17%, dated 8/19/19 due 9/6/19 (Collateralized by U.S. Government Obligations valued at $19,472,942, 0.00% - 8.00%, 9/12/19 - 6/20/49) | | 19,034,358 | 19,000,000 |
| 2.18%, dated 7/23/19 due 9/6/19 (Collateralized by U.S. Treasury Obligations valued at $20,562,323, 0.00% - 6.50%, 5/15/25 - 6/20/49) | | 20,109,000 | 20,000,000 |
| 2.19%, dated: | | | |
| 8/5/19 due 9/6/19 (Collateralized by U.S. Treasury Obligations valued at $13,403,825, 0.00% - 8.00%, 11/15/22 - 6/20/49) | | 13,025,307 | 13,000,000 |
| 8/6/19 due 9/6/19 (Collateralized by U.S. Treasury Obligations valued at $15,406,098, 0.00% - 6.50%, 11/15/22 - 6/20/49) | | 15,031,938 | 15,000,000 |
| 2.22%, dated 8/1/19 due 9/6/19 (Collateralized by U.S. Treasury Obligations valued at $20,565,683, 0.00% - 6.50%, 11/15/20 - 6/20/49) | | 20,077,700 | 20,000,000 |
| 2.23%, dated: | | | |
| 7/19/19 due 9/6/19 (Collateralized by U.S. Government Obligations valued at $12,333,697, 0.00% - 8.00%, 12/15/26 - 8/1/49) | | 12,044,600 | 12,000,000 |
| 7/22/19 due 9/6/19 (Collateralized by U.S. Treasury Obligations valued at $19,538,530, 0.00% - 6.50%, 11/15/27 - 6/20/49) | | 19,070,617 | 19,000,000 |
| BofA Securities, Inc. at: | | | |
| 2.1%, dated 8/29/19 due 9/6/19 (Collateralized by U.S. Government Obligations valued at $18,365,356, 4.00%, 9/1/48) | | 18,033,600 | 18,000,000 |
| 2.17%, dated 8/19/19 due 9/6/19 (Collateralized by U.S. Government Obligations valued at $38,795,046, 4.00%, 3/1/49) | | 38,071,007 | 38,000,000 |
| CIBC Bank U.S.A. at: | | | |
| 2.17%, dated 8/16/19 due 9/6/19 (Collateralized by U.S. Government Obligations valued at $35,738,844, 0.13% - 5.00%, 4/15/22 - 11/15/56) | | 35,071,731 | 35,000,000 |
| 2.19%, dated 8/15/19 due 9/6/19 (Collateralized by U.S. Government Obligations valued at $21,444,880, 0.88% - 4.50%, 1/15/29 - 11/15/56) | | 21,040,880 | 21,000,000 |
| Citibank NA at: | | | |
| 2.22%, dated 8/27/19 due 9/3/19 (Collateralized by U.S. Treasury Obligations valued at $4,102,256, 0.00% - 6.63%, 9/12/19 - 3/15/60) | | 4,001,727 | 4,000,000 |
| 2.23%, dated 8/27/19 due 9/3/19 (Collateralized by U.S. Government Obligations valued at $21,429,541, 0.00% - 8.50%, 9/30/19 - 5/20/49) | | 21,009,106 | 21,000,000 |
| Deutsche Bank AG, New York at 2.2%, dated 8/30/19 due 9/3/19 (Collateralized by Mortgage Loan Obligations valued at $9,272,266, 3.75%, 11/15/46) | | 9,002,200 | 9,000,000 |
| Goldman Sachs & Co. at 2.2%, dated 8/28/19 due 9/4/19 (Collateralized by U.S. Government Obligations valued at $28,570,472, 3.00%, 5/1/48) | | 28,011,978 | 28,000,000 |
| HSBC Securities, Inc. at 2.22%, dated 8/28/19 due 9/4/19 (Collateralized by U.S. Government Obligations valued at $21,427,925, 3.50% - 5.00%, 8/1/40 - 5/1/49) | | 21,009,065 | 21,000,000 |
| ING Financial Markets LLC at: | | | |
| 2%, dated 8/29/19 due 11/27/19 (Collateralized by U.S. Government Obligations valued at $9,182,551, 3.00% - 4.69%, 4/1/20 - 7/1/52) | | 9,045,000 | 9,000,000 |
| 2.08%, dated 8/20/19 due 10/18/19 (Collateralized by U.S. Government Obligations valued at $4,083,301, 3.00% - 4.69%, 4/1/20 - 7/1/52) | | 4,013,636 | 4,000,000 |
| 2.19%, dated 8/8/19 due 9/9/19 (Collateralized by U.S. Government Obligations valued at $5,108,067, 3.00% - 4.50%, 5/1/36 - 7/1/52) | | 5,009,733 | 5,000,000 |
| 2.2%, dated 8/13/19 due 9/17/19 | | | |
| (Collateralized by U.S. Government Obligations valued at $10,213,091, 3.00% - 4.50%, 5/1/36 - 7/1/52) | | 10,021,389 | 10,000,000 |
| (Collateralized by U.S. Government Obligations valued at $6,127,854, 3.00% - 4.69%, 4/1/20 - 7/1/52) | | 6,012,833 | 6,000,000 |
| 2.21%, dated 8/5/19 due 9/4/19 (Collateralized by U.S. Government Obligations valued at $16,349,054, 3.00% - 4.69%, 4/1/20 - 7/1/52) | | 16,029,467 | 16,000,000 |
| 2.3%, dated: | | | |
| 7/9/19 due 10/8/19 (Collateralized by U.S. Government Obligations valued at $6,141,897, 3.00% - 4.69%, 4/1/20 - 7/1/52) | | 6,034,883 | 6,000,000 |
| 7/10/19 due 10/7/19 (Collateralized by U.S. Government Obligations valued at $10,235,842, 3.00% - 4.69%, 4/1/20 - 7/1/52) | | 10,056,861 | 10,000,000 |
| 2.35%, dated: | | | |
| 6/20/19 due 9/18/19 (Collateralized by U.S. Government Obligations valued at $4,099,975, 3.00% - 4.69%, 4/1/20 - 7/1/52) | | 4,023,500 | 4,000,000 |
| 6/26/19 due 9/3/19 (Collateralized by U.S. Government Obligations valued at $5,122,972, 3.00% - 4.69%, 4/1/20 - 7/1/52) | | 5,022,521 | 5,000,000 |
| Mitsubishi UFJ Securities (U.S.A.), Inc. at: | | | |
| 2.21%, dated: | | | |
| 8/15/19 due 10/16/19 (Collateralized by U.S. Government Obligations valued at $16,339,035, 3.00% - 5.00%, 6/1/25 - 7/1/48) | | 16,060,898 | 16,000,000 |
| 8/16/19 due 10/17/19 (Collateralized by U.S. Government Obligations valued at $13,274,653, 3.50%, 12/1/47) | | 13,049,479 | 13,000,000 |
| 8/19/19 due 10/18/19 (Collateralized by U.S. Government Obligations valued at $12,252,010, 0.25% - 5.00%, 12/15/21 - 5/20/69) | | 12,044,200 | 12,000,000 |
| 8/20/19 due 10/21/19 (Collateralized by U.S. Government Obligations valued at $12,250,520, 2.71% - 5.00%, 8/1/32 - 10/1/45) | | 12,045,673 | 12,000,000 |
| 2.23%, dated 8/14/19 due 10/15/19 (Collateralized by U.S. Government Obligations valued at $10,212,637, 2.00% - 4.00%, 10/1/31 - 11/1/48) | | 10,038,406 | 10,000,000 |
| 2.25%, dated 8/13/19 due 10/11/19 (Collateralized by U.S. Government Obligations valued at $10,213,388, 3.00% - 3.91%, 7/1/39 - 11/1/42) | | 10,036,875 | 10,000,000 |
| Morgan Stanley & Co., LLC at 2.17%, dated 8/30/19 due 9/3/19 (Collateralized by Mortgage Loan Obligations valued at $35,708,692, 2.50% - 6.00%, 12/11/20 - 9/1/49) | | 35,008,439 | 35,000,000 |
| MUFG Securities (Canada), Ltd. at: | | | |
| 2.17%, dated 8/30/19 due 9/3/19 (Collateralized by U.S. Government Obligations valued at $14,283,484, 2.63% - 4.00%, 5/15/21 - 2/1/48) | | 14,003,376 | 14,000,000 |
| 2.21%, dated 8/16/19 due 10/17/19 (Collateralized by U.S. Government Obligations valued at $10,211,360, 2.63% - 5.00%, 9/30/23 - 5/1/49) | | 10,038,061 | 10,000,000 |
| 2.25%, dated 8/13/19 due 10/11/19 (Collateralized by U.S. Government Obligations valued at $7,149,436, 1.38% - 5.00%, 1/31/21 - 5/1/49) | | 7,025,813 | 7,000,000 |
| RBC Financial Group at: | | | |
| 2.18%, dated: | | | |
| 8/8/19 due 9/6/19 | | | |
| (Collateralized by U.S. Government Obligations valued at $57,005,612, 3.37% - 5.00%, 6/1/34 - 4/1/49) | | 55,897,991 | 55,800,000 |
| (Collateralized by U.S. Government Obligations valued at $9,213,605, 0.00% - 5.00%, 8/15/21 - 6/1/51) | | 9,015,805 | 9,000,000 |
| 8/9/19 due 9/6/19 (Collateralized by U.S. Government Obligations valued at $80,701,990, 2.90% - 4.00%, 7/1/29 - 10/1/48) | | 79,148,301 | 79,000,000 |
| 2.19%, dated 7/31/19 due 9/3/19 (Collateralized by U.S. Government Obligations valued at $20,449,968, 2.96% - 5.00%, 7/1/27 - 7/20/49) | | 20,041,367 | 20,000,000 |
| TD Securities (U.S.A.) at 2.17%, dated 8/30/19 due 9/3/19 (Collateralized by U.S. Government Obligations valued at $14,283,443, 4.00%, 7/1/48) | | 14,003,376 | 14,000,000 |
| TOTAL U.S. GOVERNMENT AGENCY REPURCHASE AGREEMENT | | | |
| (Cost $1,342,664,000) | | | 1,342,664,000 |
|
| U.S. Treasury Repurchase Agreement - 43.0% | | | |
| With: | | | |
| Barclays Bank PLC at 2.15%, dated 8/30/19 due 9/3/19 | | | |
| (Collateralized by U.S. Treasury Obligations valued at $166,299,748, 2.75%, 11/30/20) | | 163,038,939 | 163,000,000 |
| (Collateralized by U.S. Treasury Obligations valued at $142,174,058, 3.00%, 11/15/45) | | 138,032,967 | 138,000,000 |
| (Collateralized by U.S. Treasury Obligations valued at $24,485,876, 2.50%, 1/31/21) | | 24,005,733 | 24,000,000 |
| BMO Harris Bank NA at: | | | |
| 2.07%, dated 8/23/19 due 9/6/19 (Collateralized by U.S. Treasury Obligations valued at $8,197,738, 2.50%, 8/15/23) | | 8,021,160 | 8,000,000 |
| 2.08%, dated 8/22/19 due 9/6/19 (Collateralized by U.S. Treasury Obligations valued at $9,231,282, 2.13%, 8/15/21) | | 9,022,360 | 9,000,000 |
| 2.1%, dated 8/28/19 due 9/6/19 (Collateralized by U.S. Treasury Obligations valued at $8,183,601, 2.00%, 11/15/21) | | 8,015,867 | 8,000,000 |
| 2.11%, dated 8/28/19 due 9/6/19 (Collateralized by U.S. Treasury Obligations valued at $8,183,601, 2.00%, 11/15/21) | | 8,015,473 | 8,000,000 |
| 2.12%, dated 8/29/19 due 9/6/19 (Collateralized by U.S. Treasury Obligations valued at $8,187,509, 2.63%, 2/15/29) | | 8,012,249 | 8,000,000 |
| 2.17%, dated 8/13/19 due 9/6/19 (Collateralized by U.S. Treasury Obligations valued at $17,384,684, 3.5% - 3.63%, 2/15/20 - 5/15/20) | | 17,036,890 | 17,000,000 |
| 2.19%, dated 8/1/19 due 9/6/19 (Collateralized by U.S. Treasury Obligations valued at $9,177,034, 2.88% - 3.63%, 2/15/20 - 11/15/46) | | 9,021,353 | 9,000,000 |
| BNP Paribas, SA at: | | | |
| 2%, dated 8/20/19 due 9/6/19 (Collateralized by U.S. Treasury Obligations valued at $10,207,985, 2.25% - 6.13%, 11/15/27 - 8/15/49) | | 10,051,111 | 10,000,000 |
| 2.01%, dated 8/29/19 due 9/6/19 (Collateralized by U.S. Treasury Obligations valued at $8,167,618, 0.00% - 4.38%, 10/31/19 - 8/15/49) | | 8,027,247 | 8,000,000 |
| 2.03%, dated: | | | |
| 8/26/19 due 9/6/19 (Collateralized by U.S. Treasury Obligations valued at $25,658,493, 2.25% - 4.75%, 2/15/37 - 8/15/49) | | 24,984,245 | 24,900,000 |
| 8/27/19 due 9/6/19 (Collateralized by U.S. Treasury Obligations valued at $16,485,832, 2.13% - 7.63%, 9/30/24 - 2/15/49) | | 16,055,938 | 16,000,000 |
| 2.14%, dated 8/23/19 due 9/6/19 (Collateralized by U.S. Treasury Obligations valued at $16,330,747, 0.00% - 6.13%, 11/7/19 - 8/15/45) | | 16,029,484 | 16,000,000 |
| 2.17%, dated: | | | |
| 7/17/19 due 9/6/19 (Collateralized by U.S. Treasury Obligations valued at $29,727,921, 1.75% - 4.75%, 11/15/20 - 11/15/48) | | 29,157,325 | 29,000,000 |
| 8/16/19 due 9/6/19 (Collateralized by U.S. Treasury Obligations valued at $26,548,794, 0.00% - 4.75%, 9/12/19 - 2/15/45) | | 26,053,286 | 26,000,000 |
| 2.18%, dated: | | | |
| 8/5/19 due 9/6/19 (Collateralized by U.S. Treasury Obligations valued at $45,980,692, 1.63% - 4.75%, 8/31/20 - 8/15/49) | | 45,087,200 | 45,000,000 |
| 8/9/19 due 9/6/19 (Collateralized by U.S. Treasury Obligations valued at $17,455,357, 0.00% - 4.75%, 9/12/19 - 2/15/45) | | 17,033,972 | 17,000,000 |
| 8/14/19 due 9/6/19 (Collateralized by U.S. Treasury Obligations valued at $64,337,989, 0.00% - 4.75%, 9/12/19 - 8/15/49) | | 63,110,635 | 63,000,000 |
| 2.19%, dated: | | | |
| 7/11/19 due 9/6/19 (Collateralized by U.S. Treasury Obligations valued at $30,700,607, 0.00% - 6.00%, 9/12/19 - 8/15/49) | | 30,167,900 | 30,000,000 |
| 7/12/19 due 9/6/19 (Collateralized by U.S. Treasury Obligations valued at $27,628,963, 0.00% - 4.75%, 1/16/20 - 8/15/49) | | 27,147,825 | 27,000,000 |
| 2.2%, dated 8/2/19 due 9/6/19 (Collateralized by U.S. Treasury Obligations valued at $9,198,026, 0.00% - 6.25%, 9/12/19 - 8/15/46) | | 9,020,900 | 9,000,000 |
| 2.21%, dated: | | | |
| 7/10/19 due 9/6/19 (Collateralized by U.S. Treasury Obligations valued at $18,422,062, 0.00% - 6.00%, 10/10/19 - 8/15/49) | | 18,099,450 | 18,000,000 |
| 8/1/19 due 9/6/19 (Collateralized by U.S. Treasury Obligations valued at $11,342,400, 0.00% - 4.75%, 4/23/20 - 11/15/47) | | 11,042,543 | 11,000,000 |
| 2.22%, dated: | | | |
| 7/18/19 due 9/6/19 (Collateralized by U.S. Treasury Obligations valued at $40,918,361, 1.75% - 4.75%, 5/31/20 - 2/15/45) | | 40,148,000 | 40,000,000 |
| 7/19/19 due 9/6/19 (Collateralized by U.S. Treasury Obligations valued at $59,797,214, 2.50% - 8.75%, 8/15/20 - 2/15/48) | | 58,214,600 | 58,000,000 |
| 7/22/19 due 9/6/19 (Collateralized by U.S. Treasury Obligations valued at $21,642,472, 0.00% - 4.75%, 9/12/19 - 2/15/44) | | 21,077,700 | 21,000,000 |
| 7/24/19 due 9/6/19 (Collateralized by U.S. Treasury Obligations valued at $13,293,665, 2.25% - 5.50%, 3/31/23 - 8/15/49) | | 13,048,902 | 13,000,000 |
| 2.23%, dated 7/16/19 due 9/6/19 (Collateralized by U.S. Treasury Obligations valued at $22,584,756, 2.38% - 4.75%, 11/30/25 - 11/15/47) | | 22,080,404 | 22,000,000 |
| 2.25%, dated 6/21/19 due 9/6/19 (Collateralized by U.S. Treasury Obligations valued at $19,498,986, 0.00% - 4.75%, 10/31/19 - 8/15/45) | | 19,106,875 | 19,000,000 |
| 2.29%, dated 7/8/19 due 9/5/19 (Collateralized by U.S. Treasury Obligations valued at $18,427,017, 0.00% - 6.25%, 9/12/19 - 8/15/49) | | 18,067,555 | 18,000,000 |
| BofA Securities, Inc. at 2.16%, dated 8/19/19 due 9/6/19 (Collateralized by U.S. Treasury Obligations valued at $8,247,528, 2.50%, 5/15/46) | | 8,014,880 | 8,000,000 |
| CIBC Bank U.S.A. at: | | | |
| 2.07%, dated 8/22/19 due 9/6/19 (Collateralized by U.S. Treasury Obligations valued at $4,122,605, 1.63% - 3.00%, 8/31/22 - 5/15/47) | | 4,012,650 | 4,000,000 |
| 2.16%, dated 8/16/19 due 9/6/19 (Collateralized by U.S. Treasury Obligations valued at $9,258,928, 1.63% - 4.25%, 2/28/22 - 5/15/45) | | 9,018,360 | 9,000,000 |
| 2.17%, dated 8/14/19 due 9/6/19 (Collateralized by U.S. Treasury Obligations valued at $6,131,194, 1.63% - 3.00%, 2/28/21 - 5/15/45) | | 6,013,020 | 6,000,000 |
| 2.18%, dated 8/2/19 due 9/3/19 (Collateralized by U.S. Treasury Obligations valued at $20,484,045, 1.63% - 3.63%, 12/31/20 - 5/15/47) | | 20,038,756 | 20,000,000 |
| Commerz Markets LLC at: | | | |
| 2.2%, dated 8/30/19 due 9/3/19 (Collateralized by U.S. Treasury Obligations valued at $109,463,311, 1.50% - 3.13%, 4/15/21 - 11/15/45) | | 107,026,156 | 107,000,000 |
| 2.22%, dated: | | | |
| 8/27/19 due 9/3/19 (Collateralized by U.S. Treasury Obligations valued at $18,405,132, 2.38% - 7.63%, 11/15/22 - 11/15/45) | | 18,007,770 | 18,000,000 |
| 8/28/19 due 9/4/19 (Collateralized by U.S. Treasury Obligations valued at $18,388,504, 1.13% - 8.75%, 8/15/20 - 2/15/44) | | 18,007,770 | 18,000,000 |
| Credit AG at: | | | |
| 2.16%, dated 8/19/19 due 9/6/19 (Collateralized by U.S. Treasury Obligations valued at $17,355,699, 1.13%, 8/31/21) | | 17,031,620 | 17,000,000 |
| 2.17%, dated 8/15/19 due 9/6/19 (Collateralized by U.S. Treasury Obligations valued at $10,211,734, 1.13%, 8/31/21) | | 10,019,289 | 10,000,000 |
| 2.21%, dated 8/28/19 due 9/4/19 (Collateralized by U.S. Treasury Obligations valued at $7,212,725, 4.38%, 11/15/39) | | 7,003,008 | 7,000,000 |
| Deutsche Bank AG, New York at: | | | |
| 2.19%, dated 8/30/19 due 9/3/19 (Collateralized by U.S. Treasury Obligations valued at $26,526,462, 1.88%, 12/15/20) | | 26,006,327 | 26,000,000 |
| 2.22%, dated 8/28/19 due 9/4/19 (Collateralized by U.S. Treasury Obligations valued at $18,366,888, 1.88%, 12/15/20) | | 18,007,770 | 18,000,000 |
| Deutsche Bank Securities, Inc. at 2.19%, dated 8/30/19 due 9/3/19 (Collateralized by U.S. Treasury Obligations valued at $2,040,582, 2.13%, 5/31/26) | | 2,000,487 | 2,000,000 |
| DNB Bank ASA at 2.15%, dated 8/30/19 due 9/3/19 (Collateralized by U.S. Treasury Obligations valued at $39,789,709, 2.13% - 2.63%, 3/31/24 - 3/31/25) | | 39,009,317 | 39,000,000 |
| Fixed Income Clearing Corp. - BNYM at 2.16%, dated 8/30/19 due 9/3/19 (Collateralized by U.S. Treasury Obligations valued at $213,180,006, 1.88%, 2/28/22) | | 209,050,160 | 209,000,000 |
| Goldman Sachs & Co. at 2.18%, dated 8/26/19 due 9/3/19 (Collateralized by U.S. Treasury Obligations valued at $33,676,384, 0.00% - 2.00%, 3/26/20 - 8/15/22) | | 33,015,987 | 33,000,000 |
| HSBC Securities, Inc. at 2.16%, dated 8/30/19 due 9/3/19 (Collateralized by U.S. Treasury Obligations valued at $17,473,767, 2.38%, 4/30/20) | | 17,004,080 | 17,000,000 |
| J.P. Morgan Securities, LLC at: | | | |
| 2.15%, dated 8/15/19 due 11/29/19 (Collateralized by U.S. Treasury Obligations valued at $8,169,331, 0.00% - 2.75%, 10/10/19 - 2/15/28)(c)(d)(e) | | 8,057,333 | 8,000,000 |
| 2.2%, dated 8/30/19 due 9/3/19 (Collateralized by U.S. Treasury Obligations valued at $3,060,808, 0.00% - 2.13%, 10/10/19 - 3/31/24) | | 3,000,733 | 3,000,000 |
| Lloyds Bank Corp. Markets PLC at: | | | |
| 2.03%, dated 9/3/19 due 10/31/19(f) | | 7,022,894 | 7,000,000 |
| 2.23%, dated 7/30/19 due 9/30/19 (Collateralized by U.S. Treasury Obligations valued at $5,136,993, 2.75%, 11/15/23) | | 5,019,203 | 5,000,000 |
| 2.26%, dated 7/18/19 due 9/18/19 (Collateralized by U.S. Treasury Obligations valued at $4,115,542, 2.25%, 11/15/27) | | 4,015,569 | 4,000,000 |
| 2.28%, dated 7/16/19 due 9/16/19 (Collateralized by U.S. Treasury Obligations valued at $9,236,916, 1.75%, 5/15/22) | | 9,035,340 | 9,000,000 |
| Lloyds Bank PLC at: | | | |
| 2.24%, dated 7/24/19 due: | | | |
| 9/24/19 (Collateralized by U.S. Treasury Obligations valued at $9,200,837, 1.00%, 11/30/19) | | 9,034,720 | 9,000,000 |
| 9/27/19 (Collateralized by U.S. Treasury Obligations valued at $9,238,095, 1.88% - 6.00%, 5/31/22 - 2/15/26) | | 9,036,400 | 9,000,000 |
| 2.27%, dated 7/19/19 due 9/19/19 (Collateralized by U.S. Treasury Obligations valued at $4,129,503, 6.13%, 11/15/27) | | 4,015,638 | 4,000,000 |
| 2.29%, dated: | | | |
| 7/8/19 due 9/9/19 (Collateralized by U.S. Treasury Obligations valued at $9,237,560, 1.88% - 6.00%, 12/15/20 - 2/15/26) | | 9,036,068 | 9,000,000 |
| 7/12/19 due 9/12/19 (Collateralized by U.S. Treasury Obligations valued at $8,186,409, 1.00%, 11/30/19) | | 8,031,551 | 8,000,000 |
| 7/15/19 due 9/16/19 (Collateralized by U.S. Treasury Obligations valued at $9,203,569, 6.00% - 6.13%, 2/15/16 - 11/15/27) | | 9,036,068 | 9,000,000 |
| 2.3%, dated 7/3/19 due 9/3/19 (Collateralized by U.S. Treasury Obligations valued at $7,202,778, 1.63% - 6.00%, 11/15/22 - 2/15/26) | | 7,027,728 | 7,000,000 |
| Mizuho Securities U.S.A., Inc. at 2.15%, dated 8/30/19 due 9/3/19 (Collateralized by U.S. Treasury Obligations valued at $110,164,071, 2.63%, 12/31/25) | | 108,025,800 | 108,000,000 |
| MUFG Securities (Canada), Ltd. at 2.15%, dated 8/30/19 due 9/3/19 (Collateralized by U.S. Treasury Obligations valued at $33,668,107, 1.38% - 3.00%, 7/31/20 - 2/15/27) | | 33,007,883 | 33,000,000 |
| MUFG Securities EMEA PLC at: | | | |
| 2.07%, dated 8/23/19 due 9/6/19 (Collateralized by U.S. Treasury Obligations valued at $25,511,572, 2.00% - 2.38%, 4/15/21 - 7/31/22) | | 25,060,375 | 25,000,000 |
| 2.09%, dated 8/19/19 due 9/6/19 (Collateralized by U.S. Treasury Obligations valued at $7,143,061, 2.00% - 2.25%, 1/15/21 - 4/30/24) | | 7,018,694 | 7,000,000 |
| 2.14%, dated 8/20/19 due: | | | |
| 9/3/19 (Collateralized by U.S. Treasury Obligations valued at $13,425,647, 2.00% - 2.75%, 7/31/22 - 4/30/24) | | 13,010,819 | 13,000,000 |
| 9/6/19 (Collateralized by U.S. Treasury Obligations valued at $9,183,971, 2.00% - 2.25%, 3/31/21 - 4/30/24) | | 9,019,260 | 9,000,000 |
| 2.15%, dated 8/23/19 due: | | | |
| 9/3/19 (Collateralized by U.S. Treasury Obligations valued at $8,228,564, 1.88% - 2.75%, 2/28/22 - 8/31/23) | | 8,005,256 | 8,000,000 |
| 9/6/19 (Collateralized by U.S. Treasury Obligations valued at $3,072,042, 1.50% - 2.00%, 7/31/22 - 8/15/26) | | 3,003,404 | 3,000,000 |
| 2.16%, dated: | | | |
| 8/14/19 due 9/6/19 (Collateralized by U.S. Treasury Obligations valued at $8,167,630, 2.00% - 2.25%, 8/15/21 - 4/30/24) | | 8,017,280 | 8,000,000 |
| 8/19/19 due 9/6/19 (Collateralized by U.S. Treasury Obligations valued at $5,102,976, 2.00% - 2.25%, 7/31/22 - 4/30/24) | | 5,008,400 | 5,000,000 |
| 8/26/19 due 9/6/19 (Collateralized by U.S. Treasury Obligations valued at $10,204,988, 1.63%, 5/15/26) | | 10,014,400 | 10,000,000 |
| 8/30/19 due 9/3/19 (Collateralized by U.S. Treasury Obligations valued at $64,249,951, 1.88% - 2.50%, 4/30/22 - 1/31/24) | | 63,015,120 | 63,000,000 |
| 2.21%, dated 7/25/19 due 9/6/19 (Collateralized by U.S. Treasury Obligations valued at $7,158,425, 1.63% - 2.63%, 4/30/23 - 3/31/25) | | 7,023,205 | 7,000,000 |
| 2.23%, dated: | | | |
| 7/26/19 due 9/6/19 (Collateralized by U.S. Treasury Obligations valued at $7,153,487, 1.63% - 2.63%, 8/15/22 - 3/31/25) | | 7,022,981 | 7,000,000 |
| 8/28/19 due 9/4/19 (Collateralized by U.S. Treasury Obligations valued at $35,708,114, 1.50%, 8/15/26) | | 35,015,176 | 35,000,000 |
| Natixis SA at: | | | |
| 2.11%, dated 8/8/19 due 9/6/19 (Collateralized by U.S. Treasury Obligations valued at $17,366,513, 0.00% - 8.13%, 12/5/19 - 2/15/27) | | 17,060,780 | 17,000,000 |
| 2.15%, dated 8/30/19 due 9/3/19 (Collateralized by U.S. Treasury Obligations valued at $32,647,885, 1.50% - 2.88%, 8/15/22 - 11/15/42) | | 32,007,644 | 32,000,000 |
| 2.19%, dated 7/22/19 due 9/6/19 (Collateralized by U.S. Treasury Obligations valued at $9,204,073, 0.00% - 2.88%, 10/17/19 - 5/15/27) | | 9,048,180 | 9,000,000 |
| 2.31%, dated 7/8/19 due 9/6/19 (Collateralized by U.S. Treasury Obligations valued at $51,194,517, 0.00% - 7.25%, 9/19/19 - 11/15/47) | | 50,192,500 | 50,000,000 |
| Norinchukin Bank at: | | | |
| 2.09%, dated 8/20/19 due 11/22/19 (Collateralized by U.S. Government Obligations valued at $9,185,428, 2.63%, 11/15/20) | | 9,049,115 | 9,000,000 |
| 2.1%, dated 8/16/19 due 11/19/19 (Collateralized by U.S. Government Obligations valued at $4,083,405, 1.50%, 8/15/26) | | 4,022,167 | 4,000,000 |
| 2.26%, dated 7/19/19 due 10/18/19 (Collateralized by U.S. Government Obligations valued at $9,204,271, 2.63%, 11/15/20) | | 9,051,415 | 9,000,000 |
| 2.3%, dated 7/17/19 due 10/17/19 (Collateralized by U.S. Government Obligations valued at $4,091,480, 1.50% - 3.63%, 2/15/20 - 8/15/26) | | 4,023,511 | 4,000,000 |
| 2.32%, dated 6/24/19 due 9/24/19 (Collateralized by U.S. Government Obligations valued at $8,195,291, 2.63%, 11/15/20) | | 8,047,431 | 8,000,000 |
| 2.35%, dated: | | | |
| 6/18/19 due 9/18/19 (Collateralized by U.S. Government Obligations valued at $4,099,479, 2.63%, 11/15/20) | | 4,024,022 | 4,000,000 |
| 6/19/19 due 9/18/19 (Collateralized by U.S. Government Obligations valued at $4,099,248, 1.50% - 3.63%, 2/15/20 - 8/15/26) | | 4,023,761 | 4,000,000 |
| 2.42%, dated: | | | |
| 6/4/19 due 9/5/19 (Collateralized by U.S. Government Obligations valued at $13,337,568, 1.50% - 3.63%, 2/15/20 - 8/15/26) | | 13,081,272 | 13,000,000 |
| 6/5/19 due 9/9/19 (Collateralized by U.S. Government Obligations valued at $21,543,857, 2.63%, 11/15/20) | | 21,135,520 | 21,000,000 |
| RBC Dominion Securities at: | | | |
| 2%, dated 8/16/19 due 9/6/19 | | | |
| (Collateralized by U.S. Treasury Obligations valued at $9,189,238, 0.00% - 3.75%, 9/12/19 - 2/15/49) | | 9,045,500 | 9,000,000 |
| (Collateralized by U.S. Treasury Obligations valued at $9,189,267, 1.50% - 3.75%, 5/31/20 - 11/15/46) | | 9,047,000 | 9,000,000 |
| 2.01%, dated 8/15/19 due 9/6/19 | | | |
| (Collateralized by U.S. Treasury Obligations valued at $9,189,827, 1.50% - 4.25%, 5/31/20 - 8/15/44) | | 9,045,225 | 9,000,000 |
| (Collateralized by U.S. Treasury Obligations valued at $9,189,808, 1.13% - 4.25%, 2/28/21 - 11/15/43) | | 9,045,728 | 9,000,000 |
| (Collateralized by U.S. Treasury Obligations valued at $13,274,217, 0.00% - 4.25%, 9/26/19 - 11/15/46) | | 13,066,777 | 13,000,000 |
| 2.14%, dated 8/29/19 due 9/6/19 (Collateralized by U.S. Treasury Obligations valued at $8,162,763, 1.13% - 6.50%, 7/15/21 - 2/15/46) | | 8,010,462 | 8,000,000 |
| 2.17%, dated 8/15/19 due 9/6/19 | | | |
| (Collateralized by U.S. Treasury Obligations valued at $9,190,605, 1.75% - 4.25%, 1/15/22 - 11/15/43) | | 9,017,360 | 9,000,000 |
| (Collateralized by U.S. Treasury Obligations valued at $9,190,567, 1.13% - 4.25%, 5/31/20 - 5/15/46) | | 9,017,903 | 9,000,000 |
| 2.2%, dated: | | | |
| 8/1/19 due 9/3/19 (Collateralized by U.S. Treasury Obligations valued at $11,242,948, 1.13% - 6.50%, 4/30/20 - 11/15/48) | | 11,022,183 | 11,000,000 |
| 8/2/19 due 9/6/19 (Collateralized by U.S. Treasury Obligations valued at $9,236,743, 1.75% - 6.50%, 3/15/21 - 11/15/46) | | 9,026,400 | 9,000,000 |
| RBC Financial Group at: | | | |
| 2.16%, dated 8/19/19 due 9/6/19 (Collateralized by U.S. Treasury Obligations valued at $9,188,311, 0.00% - 7.63%, 6/18/20 - 2/15/47) | | 9,016,740 | 9,000,000 |
| 2.17%, dated 8/8/19 due 9/6/19 (Collateralized by U.S. Treasury Obligations valued at $6,129,684, 1.13% - 7.63%, 1/31/21 - 2/15/47) | | 6,010,488 | 6,000,000 |
| 2.18%, dated 7/31/19 due 9/3/19 (Collateralized by U.S. Treasury Obligations valued at $9,199,000, 1.13% - 7.63%, 2/28/21 - 2/15/47) | | 9,018,530 | 9,000,000 |
| RBS Securities, Inc. at 2.23%, dated 8/27/19 due 9/3/19 (Collateralized by U.S. Treasury Obligations valued at $36,735,968, 2.00%, 10/31/22) | | 36,015,610 | 36,000,000 |
| SMBC Nikko Securities America, Inc. at 2.16%, dated 8/30/19 due 9/3/19 (Collateralized by U.S. Treasury Obligations valued at $484,341,271, 2.13% - 2.88%, 10/31/20 - 4/30/23) | | 475,114,000 | 475,000,000 |
| Societe Generale at: | | | |
| 2.17%, dated 8/23/19 due 9/23/19 (Collateralized by U.S. Treasury Obligations valued at $10,207,204, 0.00% - 6.75%, 11/7/19 - 8/15/47) | | 10,018,686 | 10,000,000 |
| 2.2%, dated: | | | |
| 8/6/19 due 9/6/19 (Collateralized by U.S. Treasury Obligations valued at $34,739,762, 0.00% - 6.75%, 11/7/19 - 8/15/47) | | 34,064,411 | 34,000,000 |
| 8/9/19 due 9/10/19 (Collateralized by U.S. Treasury Obligations valued at $17,366,763, 0.00% - 8.75%, 10/15/19 - 8/15/47) | | 17,033,244 | 17,000,000 |
| 2.34%, dated 7/8/19 due 9/6/19 (Collateralized by U.S. Treasury Obligations valued at $18,432,223, 0.00% - 8.75%, 10/31/19 - 8/15/45) | | 18,070,200 | 18,000,000 |
| TOTAL U.S. TREASURY REPURCHASE AGREEMENT | | | |
| (Cost $2,825,900,000) | | | 2,825,900,000 |
| TOTAL INVESTMENT IN SECURITIES - 121.3% | | | |
| (Cost $7,973,672,311) | | | 7,973,672,311 |
| NET OTHER ASSETS (LIABILITIES) - (21.3)% | | | (1,401,200,303) |
| NET ASSETS - 100% | | | $6,572,472,008 |
The date shown for securities represents the date when principal payments must be paid, taking into account any call options exercised by the issuer and any permissible maturity shortening features other than interest rate resets.
Legend
(a) Yield represents either the annualized yield at the date of purchase, or the stated coupon rate, or, for floating and adjustable rate securities, the rate at period end.
(b) Security or a portion of the security was sold in a reverse repurchase transaction and pledged for the benefit of the counterparty, J.P. Morgan Securities, LLC, as collateral to secure the future obligations of the Fund to repurchase the securities at an agreed-upon date and price within 7 days of period end. At period end, the value of securities pledged by the Fund for reverse repurchase transactions was $2,999,180 and the principal amount of obligations of the Fund with respect to reverse repurchase transactions was $3,000,000.
(c) Coupon rates for floating and adjustable rate securities reflect the rates in effect at period end.
(d) Coupon is indexed to a floating interest rate which may be multiplied by a specified factor and/or subject to caps or floors.
(e) The maturity amount is based on the rate at period end.
(f) Represents a forward settling transaction and therefore no collateral securities had been allocated as of period end. The agreement contemplated the delivery of U.S. Treasury Obligations as collateral on settlement date.
Investment Valuation
All investments are categorized as Level 2 under the Fair Value Hierarchy. The inputs or methodology used for valuing securities may not be an indication of the risk associated with investing in those securities. For more information on valuation inputs please refer to the Investment Valuation section in the accompanying Notes to Financial Statements.
Other Information
# Additional information on each counterparty to the repurchase agreement is as follows:
| Repurchase Agreement / Counterparty | Value |
| $547,864,000 due 9/03/19 at 2.17% | |
| BNY Mellon Capital Markets LLC | $25,171,000 |
| Bank of America NA | 58,137,000 |
| Bank of Nova Scotia | 7,147,000 |
| Citibank NA | 24,901,000 |
| Credit Agricole CIB New York Branch | 14,534,000 |
| HSBC Securities (USA), Inc. | 10,635,000 |
| ING Financial Markets LLC | 5,538,000 |
| J.P. Morgan Securities, Inc. | 91,908,000 |
| Mitsubishi UFJ Securities (USA) | 9,673,000 |
| Mizuho Securities USA, Inc. | 25,655,000 |
| Nomura Securities International Inc. | 21,129,000 |
| Sumitomo Mitsui Banking Corp NY (DI) | 85,360,000 |
| Sumitomo Mitsui Banking Corp (REPO) | 73,781,000 |
| Wells Fargo Securities LLC | 94,295,000 |
| | $547,864,000 |
See accompanying notes which are an integral part of the financial statements.
Financial Statements
Statement of Assets and Liabilities
| | | August 31, 2019 |
| Assets | | |
Investment in securities, at value (including repurchase agreements of $4,168,564,000) — See accompanying schedule:
Unaffiliated issuers (cost $7,973,672,311) | | $7,973,672,311 |
| Cash | | 839 |
| Receivable for fund shares sold | | 31,213,194 |
| Interest receivable | | 7,859,614 |
| Total assets | | 8,012,745,958 |
| Liabilities | | |
| Payable for investments purchased | $44,881,809 | |
| Payable for fund shares redeemed | 1,392,357,450 | |
| Payable for reverse repurchase agreement | 3,000,000 | |
| Other payables and accrued expenses | 34,691 | |
| Total liabilities | | 1,440,273,950 |
| Net Assets | | $6,572,472,008 |
| Net Assets consist of: | | |
| Paid in capital | | $6,572,380,888 |
| Total distributable earnings (loss) | | 91,120 |
| Net Assets, for 6,572,380,888 shares outstanding | | $6,572,472,008 |
| Net Asset Value, offering price and redemption price per share ($6,572,472,008 ÷ 6,572,380,888 shares) | | $1.00 |
See accompanying notes which are an integral part of the financial statements.
Statement of Operations
| | | Year ended August 31, 2019 |
| Investment Income | | |
| Interest | | $176,422,630 |
| Expenses | | |
| Custodian fees and expenses | $87,165 | |
| Independent trustees' fees and expenses | 35,719 | |
| Interest | 187,279 | |
| Total expenses before reductions | 310,163 | |
| Expense reductions | (5,124) | |
| Total expenses after reductions | | 305,039 |
| Net investment income (loss) | | 176,117,591 |
| Realized and Unrealized Gain (Loss) | | |
| Net realized gain (loss) on: | | |
| Investment securities: | | |
| Unaffiliated issuers | | 30,301 |
| Total net realized gain (loss) | | 30,301 |
| Net increase in net assets resulting from operations | | $176,147,892 |
See accompanying notes which are an integral part of the financial statements.
Statement of Changes in Net Assets
| | Year ended August 31, 2019 | Year ended August 31, 2018 |
| Increase (Decrease) in Net Assets | | |
| Operations | | |
| Net investment income (loss) | $176,117,591 | $152,823,506 |
| Net realized gain (loss) | 30,301 | 43,206 |
| Net increase in net assets resulting from operations | 176,147,892 | 152,866,712 |
| Distributions to shareholders | (176,119,431) | – |
| Distributions to shareholders from net investment income | – | (152,824,482) |
| Total distributions | (176,119,431) | (152,824,482) |
| Share transactions | | |
| Proceeds from sales of shares | 3,196,680,621 | 4,249,397,019 |
| Reinvestment of distributions | 176,091,392 | 149,342,233 |
| Cost of shares redeemed | (4,640,078,198) | (5,003,702,808) |
| Net increase (decrease) in net assets and shares resulting from share transactions | (1,267,306,185) | (604,963,556) |
| Total increase (decrease) in net assets | (1,267,277,724) | (604,921,326) |
| Net Assets | | |
| Beginning of period | 7,839,749,732 | 8,444,671,058 |
| End of period | $6,572,472,008 | $7,839,749,732 |
| Other Information | | |
| Shares | | |
| Sold | 3,196,680,621 | 4,249,397,019 |
| Issued in reinvestment of distributions | 176,091,392 | 149,342,233 |
| Redeemed | (4,640,078,198) | (5,003,702,808) |
| Net increase (decrease) | (1,267,306,185) | (604,963,556) |
See accompanying notes which are an integral part of the financial statements.
Financial Highlights
Fidelity Series Government Money Market Fund
| | | | | |
| Years ended August 31, | 2019 | 2018 | 2017 | 2016 A |
| Selected Per–Share Data | | | | |
| Net asset value, beginning of period | $1.00 | $1.00 | $1.00 | $1.00 |
| Income from Investment Operations | | | | |
| Net investment income (loss) | .024 | .015 | .006 | .001 |
| Net realized and unrealized gain (loss)B | – | – | – | – |
| Total from investment operations | .024 | .015 | .006 | .001 |
| Distributions from net investment income | (.024) | (.015) | (.006) | (.001) |
| Total distributions | (.024) | (.015) | (.006) | (.001) |
| Net asset value, end of period | $1.00 | $1.00 | $1.00 | $1.00 |
| Total ReturnC,D | 2.38% | 1.53% | .58% | .08% |
| Ratios to Average Net AssetsE | | | | |
| Expenses before reductions | - %F | - %F | .13% | .20%G |
| Expenses net of fee waivers, if any | - %F | - %F | .10% | .14%G |
| Expenses net of all reductions | - %F | - %F | .10% | .14%G |
| Net investment income (loss) | 2.35% | 1.54% | .62% | .23%G |
| Supplemental Data | | | | |
| Net assets, end of period (000 omitted) | $6,572,472 | $7,839,750 | $8,444,671 | $2,306,850 |
A For the period April 22, 2016 (commencement of operations) to August 31, 2016.
B Amount represents less than $.0005 per share.
C Total returns for periods of less than one year are not annualized.
D Total returns would have been lower if certain expenses had not been reduced during the applicable periods shown.
E Expense ratios reflect operating expenses of the Fund. Expenses before reductions do not reflect amounts reimbursed or waived or reductions from expense offset arrangements and do not represent the amount paid by the Fund during periods when reimbursements, waivers or reductions occur. Expense ratios before reductions for start-up periods may not be representative of longer term operating periods. Expenses net of fee waivers reflect expenses after reimbursement and waivers but prior to reductions from expense offset arrangements. Expenses net of all reductions represent the net expenses paid by the Fund.
F Amount represents less than .005%.
G Annualized
See accompanying notes which are an integral part of the financial statements.
Notes to Financial Statements
For the period ended August 31, 2019
1. Organization.
Fidelity Series Government Money Market Fund (the Fund) is a fund of Fidelity Salem Street Trust (the Trust) and is authorized to issue an unlimited number of shares. The Trust is registered under the Investment Company Act of 1940, as amended (the 1940 Act), as an open-end management investment company organized as a Massachusetts business trust.
2. Significant Accounting Policies.
The Fund is an investment company and applies the accounting and reporting guidance of the Financial Accounting Standards Board (FASB) Accounting Standards Codification Topic 946 Financial Services – Investments Companies. The financial statements have been prepared in conformity with accounting principles generally accepted in the United States of America (GAAP), which require management to make certain estimates and assumptions at the date of the financial statements. Actual results could differ from those estimates. Subsequent events, if any, through the date that the financial statements were issued have been evaluated in the preparation of the financial statements. The following summarizes the significant accounting policies of the Fund:
Investment Valuation. The Fund categorizes the inputs to valuation techniques used to value its investments into a disclosure hierarchy consisting of three levels as shown below:
- Level 1 – quoted prices in active markets for identical investments
- Level 2 – other significant observable inputs (including quoted prices for similar investments, interest rates, prepayment speeds, etc.)
- Level 3 – unobservable inputs (including the Fund's own assumptions based on the best information available)
As permitted by compliance with certain conditions under Rule 2a-7 of the 1940 Act, securities are valued at amortized cost, which approximates fair value. The amortized cost of an instrument is determined by valuing it at its original cost and thereafter amortizing any discount or premium from its face value at a constant rate until maturity. Securities held by a money market fund are generally high quality and liquid; however, they are reflected as Level 2 because the inputs used to determine fair value are not quoted prices in an active market.
Investment Transactions and Income. The net asset value per share for processing shareholder transactions is calculated as of the close of business of the New York Stock Exchange (NYSE), normally 4:00 p.m. Eastern time. Security transactions are accounted for as of trade date. Gains and losses on securities sold are determined on the basis of identified cost. Interest income is accrued as earned and includes coupon interest and amortization of premium and accretion of discount on debt securities as applicable. The principal amount on inflation-indexed securities is periodically adjusted to the rate of inflation and interest is accrued based on the principal amount. The adjustments to principal due to inflation are reflected as increases or decreases to Interest in the accompanying Statement of Operations.
Expenses. Expenses directly attributable to a fund are charged to that fund. Expenses attributable to more than one fund are allocated among the respective funds on the basis of relative net assets or other appropriate methods. Expense estimates are accrued in the period to which they relate and adjustments are made when actual amounts are known.
Income Tax Information and Distributions to Shareholders. Each year, the Fund intends to qualify as a regulated investment company under Subchapter M of the Internal Revenue Code, including distributing substantially all of its taxable income and realized gains. As a result, no provision for U.S. Federal income taxes is required. As of August 31, 2019, the Fund did not have any unrecognized tax benefits in the financial statements; nor is the Fund aware of any tax positions for which it is reasonably possible that the total amounts of unrecognized tax benefits will significantly change in the next twelve months. The Fund files a U.S. federal tax return, in addition to state and local tax returns as required. The Fund's federal income tax returns are subject to examination by the Internal Revenue Service (IRS) for a period of three fiscal years after they are filed. State and local tax returns may be subject to examination for an additional fiscal year depending on the jurisdiction.
Distributions are declared and recorded daily and paid monthly from net investment income. Distributions from realized gains, if any, are declared and recorded on the ex-dividend date. Income and capital gain distributions are determined in accordance with income tax regulations, which may differ from GAAP.
Capital accounts within the financial statements are adjusted for permanent book-tax differences. These adjustments have no impact on net assets or the results of operations. Capital accounts are not adjusted for temporary book-tax differences which will reverse in a subsequent period.
As of period end, the cost and unrealized appreciation (depreciation) in securities for federal income tax purposes were as follows:
| Gross unrealized appreciation | $– |
| Gross unrealized depreciation | – |
| Net unrealized appreciation (depreciation) | $– |
| Tax Cost | $7,973,672,311 |
The tax-based components of distributable earnings as of period end were as follows:
| Undistributed ordinary income | $91,119 |
The tax character of distributions paid was as follows:
| | August 31, 2019 | August 31, 2018 |
| Ordinary Income | $176,119,431 | $ 152,824,482 |
Repurchase Agreements. Pursuant to an Exemptive Order issued by the Securities and Exchange Commission (the SEC), the Fund along with other registered investment companies having management contracts with Fidelity Management & Research Company (FMR), or other affiliated entities of FMR, are permitted to transfer uninvested cash balances into joint trading accounts which are then invested in repurchase agreements. The Fund may also invest directly with institutions in repurchase agreements. Repurchase agreements may be collateralized by cash or government securities. Upon settlement date, collateral is held in segregated accounts with custodian banks and may be obtained in the event of a default of the counterparty. The Fund monitors, on a daily basis, the value of the collateral to ensure it is at least equal to the principal amount of the repurchase agreement (including accrued interest). In the event of a default by the counterparty, realization of the collateral proceeds could be delayed, during which time the value of the collateral may decline.
Reverse Repurchase Agreements. To enhance its yield, the Fund may enter into reverse repurchase transactions under master repurchase agreements whereby the Fund sells securities to a counterparty in return for cash and agrees to repurchase those securities at a future date and agreed upon price. During the period that reverse repurchase transactions are outstanding, the Fund identifies the securities as pledged in its records with an initial value at least equal to its principal obligation under the agreement. The cash proceeds received by the Fund may be invested in other securities. To the extent cash proceeds received from the counterparty exceed the value of the securities sold, the counterparty may request additional collateral from the Fund. If the counterparty defaults on its obligation, because of insolvency or other reasons, the Fund could experience delays and costs in recovering the securities sold. Information regarding securities sold under a reverse repurchase agreement is included at the end of the Fund's Schedule of Investments and the cash proceeds are recorded as a liability in the accompanying Statement of Assets and Liabilities. The Fund continues to receive interest and dividend payments on the securities sold during the term of the reverse repurchase agreement. During the period, the average principal balance of reverse repurchase transactions was $7,722,724 and the weighted average interest rate was 2.24% with payments included in the Statement of Operations as a component of interest expense.
New Rule Issuance. During August 2018, the U.S. Securities and Exchange Commission issued Final Rule Release No. 33-10532, Disclosure Update and Simplification. This Final Rule includes amendments specific to registered investment companies that are intended to eliminate overlap in disclosure requirements between Regulation S-X and GAAP. In accordance with these amendments, certain line-items in the Fund's financial statements have been combined or removed for the current period as outlined in the table below.
| Financial Statement | Current Line-Item Presentation (As Applicable) | Prior Line-Item Presentation (As Applicable) |
| Statement of Assets and Liabilities | Total distributable earnings (loss) | Undistributed/Distributions in excess of/Accumulated net investment income (loss)
Accumulated/Undistributed net realized gain (loss)
Net unrealized appreciation (depreciation) |
| Statement of Changes in Net Assets | N/A - removed | Undistributed/Distributions in excess of/Accumulated net investment income (loss) end of period |
| Statement of Changes in Net Assets | Distributions to shareholders | Distributions to shareholders from net investment income
Distributions to shareholders from net realized gain |
3. Fees and Other Transactions with Affiliates.
Management Fee. Fidelity Management & Research Company (the investment adviser) and its affiliates provide the Fund with investment management related services for which the Fund does not pay a management fee. Under the management contract, the investment adviser or an affiliate pays all ordinary operating expenses of the Fund, except custody fees, fees and expenses of the independent Trustees, and certain miscellaneous expenses such as proxy and shareholder meeting expenses.
Interfund Trades. The Fund may purchase from or sell securities to other Fidelity Funds under procedures adopted by the Board. The procedures have been designed to ensure these interfund trades are executed in accordance with Rule 17a-7 of the 1940 Act.
4. Expense Reductions.
Through arrangements with the Fund's custodian, credits realized as a result of certain uninvested cash balances were used to reduce the Fund's expenses. During the period, these credits reduced the Fund's custody expenses by $5,124.
5. Other.
The Fund's organizational documents provide former and current trustees and officers with a limited indemnification against liabilities arising in connection with the performance of their duties to the Fund. In the normal course of business, the Fund may also enter into contracts that provide general indemnifications. The Fund's maximum exposure under these arrangements is unknown as this would be dependent on future claims that may be made against the Fund. The risk of material loss from such claims is considered remote.
At the end of the period, mutual funds managed by FMR or its affiliates were the owners of record of all of the outstanding shares of the Fund.
Report of Independent Registered Public Accounting Firm
To the Board of Trustees of Fidelity Salem Street Trust and Shareholders of Fidelity Series Government Money Market Fund:
Opinion on the Financial Statements
We have audited the accompanying statement of assets and liabilities, including the schedule of investments, of Fidelity Series Government Money Market Fund (one of the funds constituting Fidelity Salem Street Trust, referred to hereafter as the “Fund”) as of August 31, 2019, the related statement of operations for the year ended August 31, 2019, the statement of changes in net assets for each of the two years in the period ended August 31, 2019, including the related notes, and the financial highlights for each of the three years in the period ended August 31, 2019 and for the period April 22, 2016 (commencement of operations) through August 31, 2016 (collectively referred to as the “financial statements”). In our opinion, the financial statements present fairly, in all material respects, the financial position of the Fund as of August 31, 2019, the results of its operations for the year then ended, the changes in its net assets for each of the two years in the period ended August 31, 2019 and the financial highlights for each of the three years in the period ended August 31, 2019 and for the period April 22, 2016 (commencement of operations) through August 31, 2016 in conformity with accounting principles generally accepted in the United States of America.
Basis for Opinion
These financial statements are the responsibility of the Fund’s management. Our responsibility is to express an opinion on the Fund’s financial statements based on our audits. We are a public accounting firm registered with the Public Company Accounting Oversight Board (United States) (PCAOB) and are required to be independent with respect to the Fund in accordance with the U.S. federal securities laws and the applicable rules and regulations of the Securities and Exchange Commission and the PCAOB.
We conducted our audits of these financial statements in accordance with the standards of the PCAOB. Those standards require that we plan and perform the audit to obtain reasonable assurance about whether the financial statements are free of material misstatement, whether due to error or fraud.
Our audits included performing procedures to assess the risks of material misstatement of the financial statements, whether due to error or fraud, and performing procedures that respond to those risks. Such procedures included examining, on a test basis, evidence regarding the amounts and disclosures in the financial statements. Our audits also included evaluating the accounting principles used and significant estimates made by management, as well as evaluating the overall presentation of the financial statements. Our procedures included confirmation of securities owned as of August 31, 2019 by correspondence with the custodians and brokers; when replies were not received from brokers, we performed other auditing procedures. We believe that our audits provide a reasonable basis for our opinion.
PricewaterhouseCoopers LLP
Boston, Massachusetts
October 15, 2019
We have served as the auditor of one or more investment companies in the Fidelity group of funds since 1932.
Trustees and Officers
The Trustees, Members of the Advisory Board (if any), and officers of the trust and fund, as applicable, are listed below. The Board of Trustees governs the fund and is responsible for protecting the interests of shareholders. The Trustees are experienced executives who meet periodically throughout the year to oversee the fund's activities, review contractual arrangements with companies that provide services to the fund, oversee management of the risks associated with such activities and contractual arrangements, and review the fund's performance. Except for Jonathan Chiel, each of the Trustees oversees 298 funds. Mr. Chiel oversees 170 funds.
The Trustees hold office without limit in time except that (a) any Trustee may resign; (b) any Trustee may be removed by written instrument, signed by at least two-thirds of the number of Trustees prior to such removal; (c) any Trustee who requests to be retired or who has become incapacitated by illness or injury may be retired by written instrument signed by a majority of the other Trustees; and (d) any Trustee may be removed at any special meeting of shareholders by a two-thirds vote of the outstanding voting securities of the trust. Each Trustee who is not an interested person (as defined in the 1940 Act) of the trust and the fund is referred to herein as an Independent Trustee. Each Independent Trustee shall retire not later than the last day of the calendar year in which his or her 75th birthday occurs. The Independent Trustees may waive this mandatory retirement age policy with respect to individual Trustees. Officers and Advisory Board Members hold office without limit in time, except that any officer or Advisory Board Member may resign or may be removed by a vote of a majority of the Trustees at any regular meeting or any special meeting of the Trustees. Except as indicated, each individual has held the office shown or other offices in the same company for the past five years.
The fund’s Statement of Additional Information (SAI) includes more information about the Trustees. To request a free copy, call Fidelity at 1-800-544-8544.
Experience, Skills, Attributes, and Qualifications of the Trustees. The Governance and Nominating Committee has adopted a statement of policy that describes the experience, qualifications, attributes, and skills that are necessary and desirable for potential Independent Trustee candidates (Statement of Policy). The Board believes that each Trustee satisfied at the time he or she was initially elected or appointed a Trustee, and continues to satisfy, the standards contemplated by the Statement of Policy. The Governance and Nominating Committee also engages professional search firms to help identify potential Independent Trustee candidates who have the experience, qualifications, attributes, and skills consistent with the Statement of Policy. From time to time, additional criteria based on the composition and skills of the current Independent Trustees, as well as experience or skills that may be appropriate in light of future changes to board composition, business conditions, and regulatory or other developments, have also been considered by the professional search firms and the Governance and Nominating Committee. In addition, the Board takes into account the Trustees' commitment and participation in Board and committee meetings, as well as their leadership of standing and ad hoc committees throughout their tenure.
In determining that a particular Trustee was and continues to be qualified to serve as a Trustee, the Board has considered a variety of criteria, none of which, in isolation, was controlling. The Board believes that, collectively, the Trustees have balanced and diverse experience, qualifications, attributes, and skills, which allow the Board to operate effectively in governing the fund and protecting the interests of shareholders. Information about the specific experience, skills, attributes, and qualifications of each Trustee, which in each case led to the Board's conclusion that the Trustee should serve (or continue to serve) as a trustee of the fund, is provided below.
Board Structure and Oversight Function. Abigail P. Johnson is an interested person and currently serves as Chairman. The Trustees have determined that an interested Chairman is appropriate and benefits shareholders because an interested Chairman has a personal and professional stake in the quality and continuity of services provided to the fund. Independent Trustees exercise their informed business judgment to appoint an individual of their choosing to serve as Chairman, regardless of whether the Trustee happens to be independent or a member of management. The Independent Trustees have determined that they can act independently and effectively without having an Independent Trustee serve as Chairman and that a key structural component for assuring that they are in a position to do so is for the Independent Trustees to constitute a substantial majority for the Board. The Independent Trustees also regularly meet in executive session. Arthur E. Johnson serves as Chairman of the Independent Trustees and as such (i) acts as a liaison between the Independent Trustees and management with respect to matters important to the Independent Trustees and (ii) with management prepares agendas for Board meetings.
Fidelity® funds are overseen by different Boards of Trustees. The fund's Board oversees Fidelity's investment-grade bond, money market, asset allocation and certain equity funds, and other Boards oversee Fidelity's high income and other equity funds. The asset allocation funds may invest in Fidelity® funds that are overseen by such other Boards. The use of separate Boards, each with its own committee structure, allows the Trustees of each group of Fidelity® funds to focus on the unique issues of the funds they oversee, including common research, investment, and operational issues. On occasion, the separate Boards establish joint committees to address issues of overlapping consequences for the Fidelity® funds overseen by each Board.
The Trustees operate using a system of committees to facilitate the timely and efficient consideration of all matters of importance to the Trustees, the fund, and fund shareholders and to facilitate compliance with legal and regulatory requirements and oversight of the fund's activities and associated risks. The Board, acting through its committees, has charged FMR and its affiliates with (i) identifying events or circumstances the occurrence of which could have demonstrably adverse effects on the fund's business and/or reputation; (ii) implementing processes and controls to lessen the possibility that such events or circumstances occur or to mitigate the effects of such events or circumstances if they do occur; and (iii) creating and maintaining a system designed to evaluate continuously business and market conditions in order to facilitate the identification and implementation processes described in (i) and (ii) above. Because the day-to-day operations and activities of the fund are carried out by or through FMR, its affiliates, and other service providers, the fund's exposure to risks is mitigated but not eliminated by the processes overseen by the Trustees. While each of the Board's committees has responsibility for overseeing different aspects of the fund's activities, oversight is exercised primarily through the Operations and Audit Committees. In addition, an ad hoc Board committee of Independent Trustees has worked with FMR to enhance the Board's oversight of investment and financial risks, legal and regulatory risks, technology risks, and operational risks, including the development of additional risk reporting to the Board. The Operations Committee also worked and continues to work with FMR to enhance the stress tests required under SEC regulations for money market funds. Appropriate personnel, including but not limited to the fund's Chief Compliance Officer (CCO), FMR's internal auditor, the independent accountants, the fund's Treasurer and portfolio management personnel, make periodic reports to the Board's committees, as appropriate, including an annual review of Fidelity's risk management program for the Fidelity® funds. The responsibilities of each standing committee, including their oversight responsibilities, are described further under "Standing Committees of the Trustees."
Interested Trustees*:
Correspondence intended for a Trustee who is an interested person may be sent to Fidelity Investments, 245 Summer Street, Boston, Massachusetts 02210.
Name, Year of Birth; Principal Occupations and Other Relevant Experience+
Jonathan Chiel (1957)
Year of Election or Appointment: 2016
Trustee
Mr. Chiel also serves as Trustee of other Fidelity® funds. Mr. Chiel is Executive Vice President and General Counsel for FMR LLC (diversified financial services company, 2012-present). Previously, Mr. Chiel served as general counsel (2004-2012) and senior vice president and deputy general counsel (2000-2004) for John Hancock Financial Services; a partner with Choate, Hall & Stewart (1996-2000) (law firm); and an Assistant United States Attorney for the United States Attorney’s Office of the District of Massachusetts (1986-95), including Chief of the Criminal Division (1993-1995). Mr. Chiel is a director on the boards of the Boston Bar Foundation and the Maimonides School.
Abigail P. Johnson (1961)
Year of Election or Appointment: 2009
Trustee
Chairman of the Board of Trustees
Ms. Johnson also serves as Trustee of other Fidelity® funds. Ms. Johnson serves as Chairman (2016-present), Chief Executive Officer (2014-present), and Director (2007-present) of FMR LLC (diversified financial services company), President of Fidelity Financial Services (2012-present) and President of Personal, Workplace and Institutional Services (2005-present). Ms. Johnson is Chairman and Director of FMR Co., Inc. (investment adviser firm, 2011-present) and Chairman and Director of FMR (investment adviser firm, 2011-present). Previously, Ms. Johnson served as Vice Chairman (2007-2016) and President (2013-2016) of FMR LLC, President and a Director of FMR (2001-2005), a Trustee of other investment companies advised by FMR, Fidelity Investments Money Management, Inc. (investment adviser firm), and FMR Co., Inc. (2001-2005), Senior Vice President of the Fidelity® funds (2001-2005), and managed a number of Fidelity® funds. Ms. Abigail P. Johnson and Mr. Arthur E. Johnson are not related.
Jennifer Toolin McAuliffe (1959)
Year of Election or Appointment: 2016
Trustee
Ms. McAuliffe also serves as Trustee of other Fidelity® funds. Ms. McAuliffe previously served as a Member of the Advisory Board of certain Fidelity® funds (2016) and as Co-Head of Fixed Income of Fidelity Investments Limited (now known as FIL Limited (FIL)) (diversified financial services company). Earlier roles at FIL included Director of Research for FIL’s credit and quantitative teams in London, Hong Kong and Tokyo. Ms. McAuliffe also was the Director of Research for taxable and municipal bonds at Fidelity Investments Money Management, Inc. Ms. McAuliffe is also a director or trustee of several not-for-profit entities.
* Determined to be an “Interested Trustee” by virtue of, among other things, his or her affiliation with the trust or various entities under common control with FMR.
+ The information includes the Trustee's principal occupation during the last five years and other information relating to the experience, attributes, and skills relevant to the Trustee's qualifications to serve as a Trustee, which led to the conclusion that the Trustee should serve as a Trustee for the fund.
Independent Trustees:
Correspondence intended for an Independent Trustee may be sent to Fidelity Investments, P.O. Box 55235, Boston, Massachusetts 02205-5235.
Name, Year of Birth; Principal Occupations and Other Relevant Experience+
Elizabeth S. Acton (1951)
Year of Election or Appointment: 2013
Trustee
Ms. Acton also serves as Trustee of other Fidelity® funds. Prior to her retirement in April 2012, Ms. Acton was Executive Vice President, Finance (2011-2012), Executive Vice President, Chief Financial Officer (2002-2011), and Treasurer (2004-2005) of Comerica Incorporated (financial services). Prior to joining Comerica, Ms. Acton held a variety of positions at Ford Motor Company (1983-2002), including Vice President and Treasurer (2000-2002) and Executive Vice President and Chief Financial Officer of Ford Motor Credit Company (1998-2000). Ms. Acton currently serves as a member of the Board of Directors and Audit and Finance Committees of Beazer Homes USA, Inc. (homebuilding, 2012-present). Previously, Ms. Acton served as a Member of the Advisory Board of certain Fidelity® funds (2013-2016).
Ann E. Dunwoody (1953)
Year of Election or Appointment: 2018
Trustee
General Dunwoody also serves as Trustee of other Fidelity® funds. General Dunwoody (United States Army, Retired) was the first woman in U.S. military history to achieve the rank of four-star general and prior to her retirement in 2012 held a variety of positions within the U.S. Army, including Commanding General, U.S. Army Material Command (2008-2012). She is the President of First to Four LLC (leadership and mentoring services, 2012-present). She also serves as a member of the Board of Directors and Nominating and Corporate Governance Committee of L3 Technologies, Inc. (communication, electronic, sensor, and aerospace systems, 2013-present), Board of Directors and Nomination and Corporate Governance Committees of Kforce Inc. (professional staffing services, 2016-present) and Board of Directors of Automattic Inc. (software engineering, 2018-present). Previously, General Dunwoody served as a Member of the Advisory Board of certain Fidelity® funds (2018), a member of the Board of Directors and Audit and Sustainability and Corporate Responsibility Committees of Republic Services, Inc. (waste collection, disposal and recycling, 2013-2016). Ms. Dunwoody also serves on several boards for non-profit organizations, including as a member of the Board of Directors, Chair of the Nomination and Governance Committee and member of the Audit Committee of Logistics Management Institute (consulting non-profit, 2012-present), a member of the Board of Directors of the Army Historical Foundation (2015-present), a member of the Council of Trustees for the Association of the United States Army (advocacy non-profit, 2013-present) and a member of the Board of Trustees of Florida Institute of Technology (2015-present) and ThanksUSA (military family education non-profit, 2014-present).
John Engler (1948)
Year of Election or Appointment: 2014
Trustee
Mr. Engler also serves as Trustee of other Fidelity® funds. He serves on the board of directors for Universal Forest Products (manufacturer and distributor of wood and wood-alternative products, 2003-present) and K12 Inc. (technology-based education company, 2012-present). Previously, Mr. Engler served as interim president of Michigan State University (2018-2019), a Member of the Advisory Board of certain Fidelity® funds (2014-2016), president of the Business Roundtable (2011-2017), a trustee of The Munder Funds (2003-2014), president and CEO of the National Association of Manufacturers (2004-2011), member of the Board of Trustees of the Annie E. Casey Foundation (2004-2015), and as governor of Michigan (1991-2003). He is a past chairman of the National Governors Association.
Robert F. Gartland (1951)
Year of Election or Appointment: 2010
Trustee
Mr. Gartland also serves as Trustee of other Fidelity® funds. Mr. Gartland is Chairman and an investor in Gartland & Mellina Group Corp. (consulting, 2009-present). Previously, Mr. Gartland served as a partner and investor of Vietnam Partners LLC (investments and consulting, 2008-2011). Prior to his retirement, Mr. Gartland held a variety of positions at Morgan Stanley (financial services, 1979-2007), including Managing Director (1987-2007), and Chase Manhattan Bank (1975-1978).
Arthur E. Johnson (1947)
Year of Election or Appointment: 2008
Trustee
Chairman of the Independent Trustees
Mr. Johnson also serves as Trustee of other Fidelity® funds. Mr. Johnson serves as a member of the Board of Directors of Eaton Corporation plc (diversified power management, 2009-present) and Booz Allen Hamilton (management consulting, 2011-present). Prior to his retirement, Mr. Johnson served as Senior Vice President of Corporate Strategic Development of Lockheed Martin Corporation (defense contractor, 1999-2009). Mr. Johnson previously served as Vice Chairman (2015-2018) of the Independent Trustees of certain Fidelity® funds and on the Board of Directors of IKON Office Solutions, Inc. (1999-2008), AGL Resources, Inc. (holding company, 2002-2016), and Delta Airlines (2005-2007). Mr. Arthur E. Johnson is not related to Ms. Abigail P. Johnson.
Michael E. Kenneally (1954)
Year of Election or Appointment: 2009
Trustee
Vice Chairman of the Independent Trustees
Mr. Kenneally also serves as Trustee of other Fidelity® funds. Prior to his retirement, Mr. Kenneally served as Chairman and Global Chief Executive Officer of Credit Suisse Asset Management. Before joining Credit Suisse, he was an Executive Vice President and Chief Investment Officer for Bank of America Corporation. Earlier roles at Bank of America included Director of Research, Senior Portfolio Manager and Research Analyst, and Mr. Kenneally was awarded the Chartered Financial Analyst (CFA) designation in 1991.
Marie L. Knowles (1946)
Year of Election or Appointment: 2001
Trustee
Ms. Knowles also serves as Trustee of other Fidelity® funds. Prior to Ms. Knowles' retirement in June 2000, she served as Executive Vice President and Chief Financial Officer of Atlantic Richfield Company (ARCO) (diversified energy, 1996-2000). From 1993 to 1996, she was a Senior Vice President of ARCO and President of ARCO Transportation Company (pipeline and tanker operations). Ms. Knowles currently serves as a Director and Chairman of the Audit Committee of McKesson Corporation (healthcare service, since 2002). Ms. Knowles is a member of the Board of the Santa Catalina Island Company (real estate, 2009-present). Ms. Knowles is a Member of the Investment Company Institute Board of Governors and a Member of the Governing Council of the Independent Directors Council (2014-present). She also serves as a member of the Advisory Board for the School of Engineering of the University of Southern California. Previously, Ms. Knowles served as a Director of Phelps Dodge Corporation (copper mining and manufacturing, 1994-2007), URS Corporation (engineering and construction, 2000-2003) and America West (airline, 1999-2002). Ms. Knowles previously served as Chairman (2015-2018) and Vice Chairman (2012-2015) of the Independent Trustees of certain Fidelity® funds.
Mark A. Murray (1954)
Year of Election or Appointment: 2016
Trustee
Mr. Murray also serves as Trustee of other Fidelity® funds. Mr. Murray is Vice Chairman (2013-present) of Meijer, Inc. (regional retail chain). Previously, Mr. Murray served as a Member of the Advisory Board of certain Fidelity® funds (2016) and as Co-Chief Executive Officer (2013-2016) and President (2006-2013) of Meijer, Inc. Mr. Murray serves as a member of the Board of Directors and Nuclear Review and Public Policy and Responsibility Committees of DTE Energy Company (diversified energy company, 2009-present). Mr. Murray also serves as a member of the Board of Directors of Spectrum Health (not-for-profit health system, 2015-present). Mr. Murray previously served as President of Grand Valley State University (2001-2006), Treasurer for the State of Michigan (1999-2001), Vice President of Finance and Administration for Michigan State University (1998-1999), and a member of the Board of Directors and Audit Committee and Chairman of the Nominating and Corporate Governance Committee of Universal Forest Products, Inc. (manufacturer and distributor of wood and wood-alternative products, 2004-2016). Mr. Murray is also a director or trustee of many community and professional organizations.
+ The information includes the Trustee's principal occupation during the last five years and other information relating to the experience, attributes, and skills relevant to the Trustee's qualifications to serve as a Trustee, which led to the conclusion that the Trustee should serve as a Trustee for the fund.
Advisory Board Members and Officers:
Correspondence intended for an officer may be sent to Fidelity Investments, 245 Summer Street, Boston, Massachusetts 02210. Officers appear below in alphabetical order.
Name, Year of Birth; Principal Occupation
Elizabeth Paige Baumann (1968)
Year of Election or Appointment: 2017
Anti-Money Laundering (AML) Officer
Ms. Baumann also serves as AML Officer of other funds. She is Chief AML Officer (2012-present) and Senior Vice President (2014-present) of FMR LLC (diversified financial services company) and is an employee of Fidelity Investments. Previously, Ms. Baumann served as AML Officer of the funds (2012-2016), and Vice President (2007-2014) and Deputy Anti-Money Laundering Officer (2007-2012) of FMR LLC.
Craig S. Brown (1977)
Year of Election or Appointment: 2019
Assistant Treasurer
Mr. Brown also serves as Assistant Treasurer of other funds. Mr. Brown is an employee of Fidelity Investments (2013-present).
John J. Burke III (1964)
Year of Election or Appointment: 2018
Chief Financial Officer
Mr. Burke also serves as Chief Financial Officer of other funds. Mr. Burke serves as Head of Investment Operations for Fidelity Fund and Investment Operations (2018-present) and is an employee of Fidelity Investments (1998-present). Previously Mr. Burke served as head of Asset Management Investment Operations (2012-2018).
Jonathan Davis (1968)
Year of Election or Appointment: 2010
Assistant Treasurer
Mr. Davis also serves as Assistant Treasurer of other funds. Mr. Davis serves as Assistant Treasurer of FMR Capital, Inc. (2017-present) and is an employee of Fidelity Investments. Previously, Mr. Davis served as Vice President and Associate General Counsel of FMR LLC (diversified financial services company, 2003-2010).
Adrien E. Deberghes (1967)
Year of Election or Appointment: 2010
Assistant Treasurer
Mr. Deberghes also serves as an officer of other funds. He serves as Assistant Treasurer of FMR Capital, Inc. (2017-present), Executive Vice President of Fidelity Investments Money Management, Inc. (FIMM) (investment adviser firm, 2016-present), and is an employee of Fidelity Investments (2008-present). Previously, Mr. Deberghes served as President and Treasurer of certain Fidelity® funds (2013-2018). Prior to joining Fidelity Investments, Mr. Deberghes was Senior Vice President of Mutual Fund Administration at State Street Corporation (2007-2008), Senior Director of Mutual Fund Administration at Investors Bank & Trust (2005-2007), and Director of Finance for Dunkin' Brands (2000-2005). Previously, Mr. Deberghes served in other fund officer roles.
Laura M. Del Prato (1964)
Year of Election or Appointment: 2018
President and Treasurer
Ms. Del Prato also serves as an officer of other funds. Ms. Del Prato is an employee of Fidelity Investments (2017-present). Prior to joining Fidelity Investments, Ms. Del Prato served as a Managing Director and Treasurer of the JPMorgan Mutual Funds (2014-2017). Prior to JPMorgan, Ms. Del Prato served as a partner at Cohen Fund Audit Services (accounting firm, 2012-2013) and KPMG LLP (accounting firm, 2004-2012).
Colm A. Hogan (1973)
Year of Election or Appointment: 2016
Assistant Treasurer
Mr. Hogan also serves as an officer of other funds. Mr. Hogan serves as Assistant Treasurer of FMR Capital, Inc. (2017-present) and is an employee of Fidelity Investments (2005-present). Previously, Mr. Hogan served as Assistant Treasurer of certain Fidelity® funds (2016-2018).
Cynthia Lo Bessette (1969)
Year of Election or Appointment: 2019
Secretary and Chief Legal Officer (CLO)
Ms. Lo Bessette also serves as Secretary and CLO of other funds. She is a Senior Vice President and Deputy General Counsel of FMR LLC (diversified financial services company, 2019-present), and is an employee of Fidelity Investments. Previously, Ms. Lo Bessette served as Executive Vice President, General Counsel (2016-2019) and Senior Vice President, Deputy General Counsel (2015-2016) of OppenheimerFunds (investment management company) and Deputy Chief Legal Officer (2013-2015) of Jennison Associates LLC (investment adviser firm).
Chris Maher (1972)
Year of Election or Appointment: 2013
Assistant Treasurer
Mr. Maher serves as Assistant Treasurer of other funds. Mr. Maher is Vice President of Valuation Oversight, serves as Assistant Treasurer of FMR Capital, Inc. (2017-present), and is an employee of Fidelity Investments. Previously, Mr. Maher served as Vice President of Asset Management Compliance (2013), Vice President of the Program Management Group of FMR (investment adviser firm, 2010-2013), and Vice President of Valuation Oversight (2008-2010).
John B. McGinty, Jr. (1962)
Year of Election or Appointment: 2016
Chief Compliance Officer
Mr. McGinty also serves as Chief Compliance Officer of other funds. Mr. McGinty is Senior Vice President of Asset Management Compliance for Fidelity Investments and is an employee of Fidelity Investments (2016-present). Mr. McGinty previously served as Vice President, Senior Attorney at Eaton Vance Management (investment management firm, 2015-2016), and prior to Eaton Vance as global CCO for all firm operations and registered investment companies at GMO LLC (investment management firm, 2009-2015). Before joining GMO LLC, Mr. McGinty served as Senior Vice President, Deputy General Counsel for Fidelity Investments (2007-2009).
Jason P. Pogorelec (1975)
Year of Election or Appointment: 2015
Assistant Secretary
Mr. Pogorelec also serves as Assistant Secretary of other funds. Mr. Pogorelec serves as Vice President, Associate General Counsel (2010-present) and is an employee of Fidelity Investments (2006-present).
Nancy D. Prior (1967)
Year of Election or Appointment: 2014
Vice President
Ms. Prior also serves as Vice President of other funds. Ms. Prior serves as President of Fixed Income (2014-present), President (2016-present) and Director (2014-present) of Fidelity Investments Money Management, Inc. (FIMM) (investment adviser firm), and is an employee of Fidelity Investments (2002-present). Previously, Ms. Prior served as Vice Chairman of FIAM LLC (investment adviser firm, 2014-2018), a Director of FMR Investment Management (UK) Limited (investment adviser firm, 2015-2018), President Multi-Asset Class Strategies of FMR's Global Asset Allocation Division (2017-2018), Vice President of Fidelity's Money Market Funds (2012-2014), and President, Money Market and Short Duration Bond Group of Fidelity Management & Research Company (FMR) (investment adviser firm, 2013-2014).
Stacie M. Smith (1974)
Year of Election or Appointment: 2013
Assistant Treasurer
Ms. Smith also serves as an officer of other funds. Ms. Smith serves as Assistant Treasurer of FMR Capital, Inc. (2017-present), is an employee of Fidelity Investments (2009-present), and has served in other fund officer roles. Prior to joining Fidelity Investments, Ms. Smith served as Senior Audit Manager of Ernst & Young LLP (accounting firm, 1996-2009). Previously, Ms. Smith served as Assistant Treasurer (2013-2018) and Deputy Treasurer (2013-2016) of certain Fidelity® funds.
Marc L. Spector (1972)
Year of Election or Appointment: 2016
Deputy Treasurer
Mr. Spector also serves as an officer of other funds. Mr. Spector serves as Assistant Treasurer of FMR Capital, Inc. (2017-present) and is an employee of Fidelity Investments (2016-present). Prior to joining Fidelity Investments, Mr. Spector served as Director at the Siegfried Group (accounting firm, 2013-2016), and prior to Siegfried Group as audit senior manager at Deloitte & Touche (accounting firm, 2005-2013).
Jim Wegmann (1979)
Year of Election or Appointment: 2019
Assistant Treasurer
Mr. Wegmann also serves as Assistant Treasurer of other funds. Mr. Wegmann is an employee of Fidelity Investments (2011-present).
Shareholder Expense Example
As a shareholder of the Fund, you incur two types of costs: (1) transaction costs and (2) ongoing costs, including other Fund expenses. This Example is intended to help you understand your ongoing costs (in dollars) of investing in the Fund and to compare these costs with the ongoing costs of investing in other mutual funds.
The Example is based on an investment of $1,000 invested at the beginning of the period and held for the entire period (March 1, 2019 to August 31, 2019).
Actual Expenses
The first line of the accompanying table provides information about actual account values and actual expenses. You may use the information in this line, together with the amount you invested, to estimate the expenses that you paid over the period. Simply divide your account value by $1,000.00 (for example, an $8,600 account value divided by $1,000.00 = 8.6), then multiply the result by the number in the first line under the heading entitled "Expenses Paid During Period" to estimate the expenses you paid on your account during this period.
Hypothetical Example for Comparison Purposes
The second line of the accompanying table provides information about hypothetical account values and hypothetical expenses based on the Fund's actual expense ratio and an assumed rate of return of 5% per year before expenses, which is not the Fund's actual return. The hypothetical account values and expenses may not be used to estimate the actual ending account balance or expenses you paid for the period. You may use this information to compare the ongoing costs of investing in the Fund and other funds. To do so, compare this 5% hypothetical example with the 5% hypothetical examples that appear in the shareholder reports of the other funds.
Please note that the expenses shown in the table are meant to highlight your ongoing costs only and do not reflect any transaction costs. Therefore, the second line of the table is useful in comparing ongoing costs only, and will not help you determine the relative total costs of owning different funds.
| | Annualized Expense Ratio-A | Beginning
Account Value
March 1, 2019 | Ending
Account Value
August 31, 2019 | Expenses Paid
During Period-B
March 1, 2019
to August 31, 2019 |
| Actual | - %-C | $1,000.00 | $1,012.30 | $--D |
| Hypothetical-E | | $1,000.00 | $1,025.21 | $--D |
A Annualized expense ratio reflects expenses net of applicable fee waivers.
B Expenses are equal to the Fund's annualized expense ratio, multiplied by the average account value over the period, multiplied by 184/365 (to reflect the one-half year period).
C Amount represents less than .005%.
D Amount represents less than $.005.
E 5% return per year before expenses
Distributions (Unaudited)
A total of 55.77% of the dividends distributed during the fiscal year was derived from interest on U.S. Government securities which is generally exempt from state income tax.
The fund will notify shareholders in January 2020 of amounts for use in preparing 2019 income tax returns.
GVM-ANN-1019
1.9878695.103
Fidelity Flex℠ Funds Fidelity Flex℠ U.S. Bond Index Fund
Annual Report August 31, 2019 |
|
Beginning on January 1, 2021, as permitted by regulations adopted by the Securities and Exchange Commission, paper copies of a fund’s shareholder reports will no longer be sent by mail, unless you specifically request paper copies of the reports from the fund or from your financial intermediary, such as a financial advisor, broker-dealer or bank. Instead, the reports will be made available on a website, and you will be notified by mail each time a report is posted and provided with a website link to access the report.
If you already elected to receive shareholder reports electronically, you will not be affected by this change and you need not take any action. You may elect to receive shareholder reports and other communications from a fund electronically, by contacting your financial intermediary. For Fidelity customers, visit Fidelity's web site or call Fidelity using the contact information listed below.
You may elect to receive all future reports in paper free of charge. If you wish to continue receiving paper copies of your shareholder reports, you may contact your financial intermediary or, if you are a Fidelity customer, visit Fidelity’s website, or call Fidelity at the applicable toll-free number listed below. Your election to receive reports in paper will apply to all funds held with the fund complex/your financial intermediary.
| Account Type | Website | Phone Number |
| Brokerage, Mutual Fund, or Annuity Contracts: | fidelity.com/mailpreferences | 1-800-343-3548 |
| Employer Provided Retirement Accounts: | netbenefits.fidelity.com/preferences (choose 'no' under Required Disclosures to continue to print) | 1-800-343-0860 |
| Advisor Sold Accounts Serviced Through Your Financial Intermediary: | Contact Your Financial Intermediary | Your Financial Intermediary's phone number |
| Advisor Sold Accounts Serviced by Fidelity: | institutional.fidelity.com | 1-877-208-0098 |
Contents
To view a fund's proxy voting guidelines and proxy voting record for the 12-month period ended June 30, visit http://www.fidelity.com/proxyvotingresults or visit the Securities and Exchange Commission's (SEC) web site at http://www.sec.gov.
You may also call 1-800-544-3455 (for managed account clients) or 1-800-835-5092 (for retirement plan participants) to request a free copy of the proxy voting guidelines.
Standard & Poor's, S&P and S&P 500 are registered service marks of The McGraw-Hill Companies, Inc. and have been licensed for use by Fidelity Distributors Corporation.
Other third-party marks appearing herein are the property of their respective owners.
All other marks appearing herein are registered or unregistered trademarks or service marks of FMR LLC or an affiliated company. © 2019 FMR LLC. All rights reserved.
This report and the financial statements contained herein are submitted for the general information of the shareholders of the Fund. This report is not authorized for distribution to prospective investors in the Fund unless preceded or accompanied by an effective prospectus.
A fund files its complete schedule of portfolio holdings with the SEC for the first and third quarters of each fiscal year on Form N-PORT. Forms N-PORT are available on the SEC’s web site at http://www.sec.gov. A fund's Forms N-PORT may be reviewed and copied at the SEC’s Public Reference Room in Washington, DC. Information regarding the operation of the SEC's Public Reference Room may be obtained by calling 1-800-SEC-0330.
For a complete list of a fund's portfolio holdings, view the most recent holdings listing, semiannual report, or annual report on Fidelity's web site at http://www.fidelity.com, http://www.institutional.fidelity.com, or http://www.401k.com, as applicable.
NOT FDIC INSURED •MAY LOSE VALUE •NO BANK GUARANTEE
Neither the Fund nor Fidelity Distributors Corporation is a bank.
Performance: The Bottom Line
Average annual total return reflects the change in the value of an investment, assuming reinvestment of distributions from dividend income and capital gains (the profits earned upon the sale of securities that have grown in value, if any) and assuming a constant rate of performance each year. The hypothetical investment and the average annual total returns do not reflect the deduction of taxes that a shareholder would pay on fund distributions or the redemption of fund shares. During periods of reimbursement by Fidelity, a fund’s total return will be greater than it would be had the reimbursement not occurred. How a fund did yesterday is no guarantee of how it will do tomorrow.
Average Annual Total Returns
| For the periods ended August 31, 2019 | Past 1 year | Life of fundA |
| Fidelity Flex℠ U.S. Bond Index Fund | 10.28% | 5.20% |
A From March 9, 2017
$10,000 Over Life of Fund
Let's say hypothetically that $10,000 was invested in Fidelity Flex℠ U.S. Bond Index Fund on March 9, 2017, when the fund started.
The chart shows how the value of your investment would have changed, and also shows how the Bloomberg Barclays U.S. Aggregate Bond Index performed over the same period.
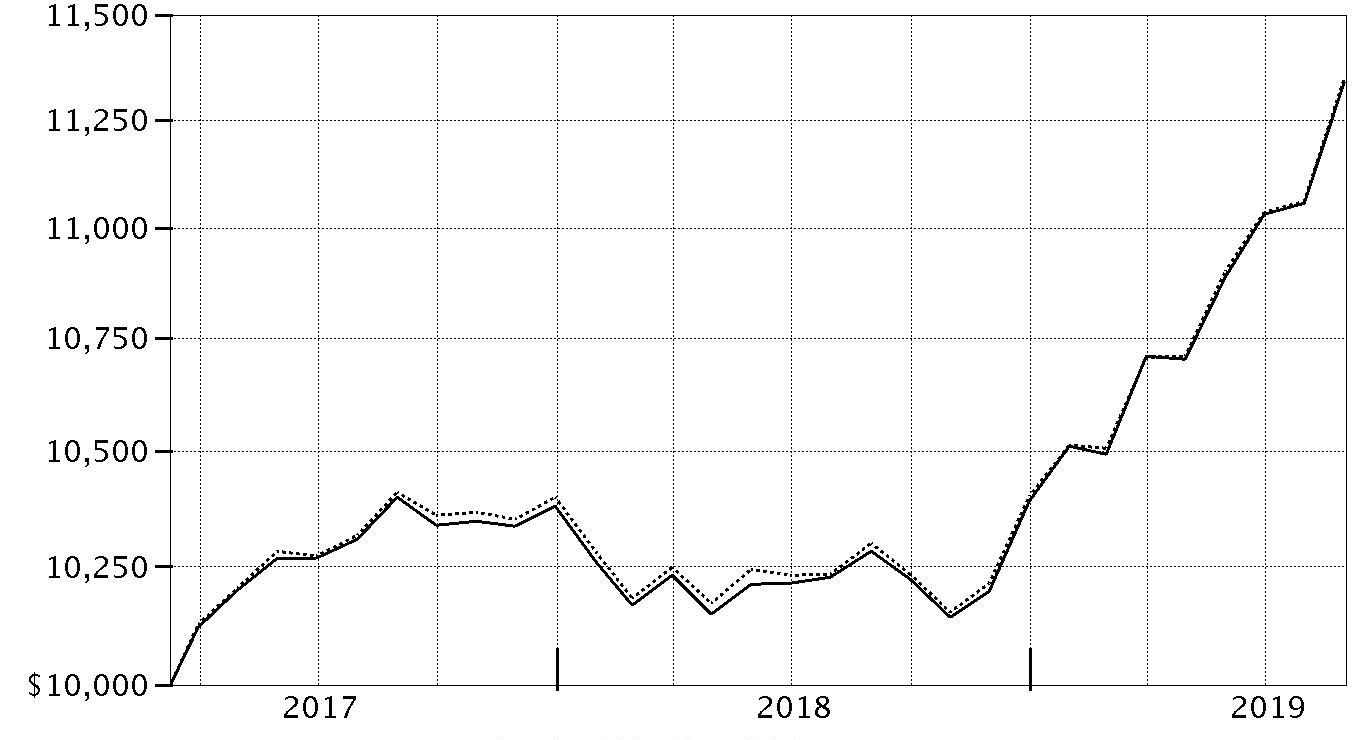
| Period Ending Values |
| $11,340 | Fidelity Flex℠ U.S. Bond Index Fund |
| 11,348 | Bloomberg Barclays U.S. Aggregate Bond Index |
Management's Discussion of Fund Performance
Market Recap: For the 12 months ending August 31, 2019, U.S. taxable investment-grade bonds posted their strongest trailing one-year return since 2009, driven by slower global economic growth, a maturing business cycle, trade uncertainty and, late in the period, the Fed’s dovish shift. The Bloomberg Barclays U.S. Aggregate Bond Index gained 10.17%. Market yields rose in the early fall of 2018, on expectations for higher inflation. Yields then declined and credit spreads widened in November and December, partly because of weaker U.S. manufacturing data. Yield spreads narrowed in January, as the U.S. Federal Reserve said it would be “patient” with policy rate hikes, and that future increases largely would depend on economic data. Yields continued to decline in the spring, amid international trade tension and attacks on oil tankers in the Middle East, and then tumbled further in July, when the Fed cut interest rates for the first time since 2008. The yield curve ended the period roughly flat, amid expectations for another rate cut of 25 basis points in September. Within the Bloomberg Barclays index, corporate bonds gained 13.33%, topping the 10.38% advance of U.S. Treasuries. Outside the index, U.S. corporate high-yield bonds lagged nominal U.S. Treasuries, while Treasury Inflation-Protected Securities (TIPS) gained 7.46%.
Comments from Co-Portfolio Managers Brandon Bettencourt and Jay Small: For the fiscal year ending August 31, 2019, the fund gained 10.28% about in line, net of fees, with the 10.17% return of the Bloomberg Barclays U.S. Aggregate Bond Index. These results met our goal of producing monthly returns, before expenses, that closely match the benchmark return. Given the large number of securities in the index (roughly 10,000) and the significant cost and liquidity challenges associated with full replication of the index, we use “stratified sampling techniques” in constructing the portfolio. This approach involves defining and maintaining an “optimal” subset of constituent securities that, in aggregate, mirrors the chief characteristics of the index – including maturity, duration, sector allocation, credit quality and other factors. The fund's performance versus the benchmark was slightly bolstered by "pricing basis." The fund is typically priced at 4:00 p.m. Eastern Time, while the benchmark is priced at 3:00 p.m. This led to a reported performance differential, particularly due to pricing dispersion on the last day of the period. Bonds were bolstered by expectations of declining interest rates amid muted inflation and a global growth slowdown that was exacerbated by escalating trade tension between the U.S and China.
The views expressed above reflect those of the portfolio manager(s) only through the end of the period as stated on the cover of this report and do not necessarily represent the views of Fidelity or any other person in the Fidelity organization. Any such views are subject to change at any time based upon market or other conditions and Fidelity disclaims any responsibility to update such views. These views may not be relied on as investment advice and, because investment decisions for a Fidelity fund are based on numerous factors, may not be relied on as an indication of trading intent on behalf of any Fidelity fund.
Investment Summary (Unaudited)
Quality Diversification (% of fund's net assets)
| As of August 31, 2019 |
| | U.S. Government and U.S. Government Agency Obligations | 69.2% |
| | AAA | 3.9% |
| | AA | 3.3% |
| | A | 9.9% |
| | BBB | 13.5% |
| | BB and Below | 0.5% |
| | Short-Term Investments and Net Other Assets* | (0.3)% |

* Short-Term Investments and Net Other Assets (Liabilities) are not included in the pie chart
We have used ratings from Moody's Investors Service, Inc. Where Moody's® ratings are not available, we have used S&P® ratings. All ratings are as of the date indicated and do not reflect subsequent changes.
Asset Allocation (% of fund's net assets)
| As of August 31, 2019* |
| | Corporate Bonds | 26.2% |
| | U.S. Government and U.S. Government Agency Obligations | 69.2% |
| | Asset-Backed Securities | 0.2% |
| | CMOs and Other Mortgage Related Securities | 1.1% |
| | Municipal Bonds | 0.5% |
| | Other Investments | 3.1% |
| | Short-Term Investments and Net Other Assets (Liabilities)** | (0.3)% |

* Foreign investments - 8.3%
** Short-Term Investments and Net Other Assets (Liabilities) are not included in the pie chart
Schedule of Investments August 31, 2019
Showing Percentage of Net Assets
| Nonconvertible Bonds - 26.2% | | | |
| | | Principal Amount | Value |
| COMMUNICATION SERVICES - 2.2% | | | |
| Diversified Telecommunication Services - 0.9% | | | |
| AT&T, Inc.: | | | |
| 3.4% 5/15/25 | | $424,000 | $445,337 |
| 3.6% 7/15/25 | | 219,000 | 230,796 |
| 4.65% 6/1/44 | | 110,000 | 120,254 |
| 4.85% 3/1/39 | | 66,000 | 75,896 |
| 4.9% 8/15/37 | | 480,000 | 549,136 |
| 5.15% 2/15/50 | | 60,000 | 71,220 |
| 5.25% 3/1/37 | | 150,000 | 178,308 |
| Telefonica Emisiones S.A.U.: | | | |
| 4.103% 3/8/27 | | 300,000 | 328,335 |
| 5.462% 2/16/21 | | 100,000 | 104,664 |
| Verizon Communications, Inc.: | | | |
| 4.016% 12/3/29 (a) | | 150,000 | 169,424 |
| 4.125% 3/16/27 | | 60,000 | 66,953 |
| 5.012% 8/21/54 | | 214,000 | 276,799 |
| 5.5% 3/16/47 | | 342,000 | 459,065 |
| | | | 3,076,187 |
| Entertainment - 0.2% | | | |
| The Walt Disney Co.: | | | |
| 3.7% 10/15/25 (a) | | 434,000 | 471,519 |
| 4.125% 6/1/44 | | 192,000 | 233,387 |
| | | | 704,906 |
| Media - 0.9% | | | |
| CBS Corp. 4% 1/15/26 | | 176,000 | 188,619 |
| Charter Communications Operating LLC/Charter Communications Operating Capital Corp.: | | | |
| 5.125% 7/1/49 | | 200,000 | 218,464 |
| 5.75% 4/1/48 | | 150,000 | 175,005 |
| Comcast Corp.: | | | |
| 1.625% 1/15/22 | | 1,030,000 | 1,025,995 |
| 3.7% 4/15/24 | | 100,000 | 107,102 |
| 4.15% 10/15/28 | | 150,000 | 170,184 |
| 4.7% 10/15/48 | | 174,000 | 217,705 |
| 4.95% 10/15/58 | | 100,000 | 129,843 |
| 6.95% 8/15/37 | | 207,000 | 308,304 |
| Discovery Communications LLC 3.25% 4/1/23 | | 176,000 | 181,505 |
| Fox Corp.: | | | |
| 4.709% 1/25/29 (a) | | 70,000 | 81,086 |
| 5.476% 1/25/39 (a) | | 164,000 | 204,921 |
| 5.576% 1/25/49 (a) | | 56,000 | 72,862 |
| | | | 3,081,595 |
| Wireless Telecommunication Services - 0.2% | | | |
| America Movil S.A.B. de CV 3.625% 4/22/29 | | 200,000 | 215,158 |
| Rogers Communications, Inc. 2.9% 11/15/26 | | 90,000 | 92,974 |
| Vodafone Group PLC: | | | |
| 3.75% 1/16/24 | | 300,000 | 317,368 |
| 4.375% 5/30/28 | | 250,000 | 280,454 |
| | | | 905,954 |
|
| TOTAL COMMUNICATION SERVICES | | | 7,768,642 |
|
| CONSUMER DISCRETIONARY - 1.6% | | | |
| Automobiles - 0.3% | | | |
| American Honda Finance Corp. 3.55% 1/12/24 | | 428,000 | 457,060 |
| Ford Motor Co. 5.291% 12/8/46 | | 112,000 | 107,906 |
| General Motors Co.: | | | |
| 4.2% 10/1/27 | | 90,000 | 92,808 |
| 6.75% 4/1/46 | | 255,000 | 303,514 |
| General Motors Financial Co., Inc.: | | | |
| 3.25% 1/5/23 | | 70,000 | 71,205 |
| 4.375% 9/25/21 | | 214,000 | 221,635 |
| | | | 1,254,128 |
| Diversified Consumer Services - 0.1% | | | |
| Ingersoll-Rand Global Holding Co. Ltd.: | | | |
| 3.75% 8/21/28 | | 240,000 | 260,495 |
| 4.3% 2/21/48 | | 30,000 | 33,911 |
| Northwestern University 3.868% 12/1/48 | | 120,000 | 145,697 |
| | | | 440,103 |
| Hotels, Restaurants & Leisure - 0.2% | | | |
| McDonald's Corp. 4.45% 3/1/47 | | 153,000 | 179,787 |
| Starbucks Corp. 4% 11/15/28 | | 350,000 | 395,553 |
| | | | 575,340 |
| Internet & Direct Marketing Retail - 0.2% | | | |
| Amazon.com, Inc.: | | | |
| 2.8% 8/22/24 | | 117,000 | 122,141 |
| 3.875% 8/22/37 | | 150,000 | 174,165 |
| 4.05% 8/22/47 | | 228,000 | 279,809 |
| | | | 576,115 |
| Multiline Retail - 0.3% | | | |
| Dollar Tree, Inc.: | | | |
| 3.7% 5/15/23 | | 210,000 | 218,710 |
| 4% 5/15/25 | | 478,000 | 505,301 |
| Nordstrom, Inc. 4% 3/15/27 | | 110,000 | 112,241 |
| Target Corp. 3.9% 11/15/47 | | 160,000 | 188,991 |
| | | | 1,025,243 |
| Specialty Retail - 0.5% | | | |
| Lowe's Companies, Inc.: | | | |
| 3.65% 4/5/29 | | 210,000 | 228,174 |
| 4.05% 5/3/47 | | 132,000 | 143,500 |
| The Home Depot, Inc.: | | | |
| 2% 4/1/21 | | 1,202,000 | 1,204,381 |
| 4.25% 4/1/46 | | 150,000 | 182,519 |
| 4.5% 12/6/48 | | 100,000 | 127,252 |
| | | | 1,885,826 |
|
| TOTAL CONSUMER DISCRETIONARY | | | 5,756,755 |
|
| CONSUMER STAPLES - 1.9% | | | |
| Beverages - 0.7% | | | |
| Anheuser-Busch InBev Finance, Inc. 3.65% 2/1/26 | | 316,000 | 339,302 |
| Anheuser-Busch InBev Worldwide, Inc.: | | | |
| 4.15% 1/23/25 | | 100,000 | 109,502 |
| 4.6% 4/15/48 | | 377,000 | 438,253 |
| 5.8% 1/23/59 (Reg. S) | | 260,000 | 354,783 |
| Constellation Brands, Inc. 3.6% 2/15/28 | | 132,000 | 140,362 |
| Dr. Pepper Snapple Group, Inc. 4.417% 5/25/25 | | 150,000 | 164,002 |
| Molson Coors Brewing Co. 3% 7/15/26 | | 254,000 | 257,112 |
| PepsiCo, Inc.: | | | |
| 2.25% 5/2/22 | | 632,000 | 639,186 |
| 3% 10/15/27 | | 100,000 | 107,239 |
| | | | 2,549,741 |
| Food & Staples Retailing - 0.2% | | | |
| Kroger Co. 5.4% 1/15/49 | | 70,000 | 82,918 |
| Walgreens Boots Alliance, Inc. 3.45% 6/1/26 | | 195,000 | 202,489 |
| Walmart, Inc.: | | | |
| 3.4% 6/26/23 | | 100,000 | 105,887 |
| 3.7% 6/26/28 | | 140,000 | 157,264 |
| 5.625% 4/15/41 | | 169,000 | 244,918 |
| | | | 793,476 |
| Food Products - 0.4% | | | |
| Campbell Soup Co. 4.15% 3/15/28 | | 260,000 | 280,647 |
| Conagra Brands, Inc.: | | | |
| 4.85% 11/1/28 | | 280,000 | 320,747 |
| 5.3% 11/1/38 | | 31,000 | 36,303 |
| General Mills, Inc. 4.2% 4/17/28 | | 200,000 | 225,409 |
| H.J. Heinz Co.: | | | |
| 3% 6/1/26 | | 100,000 | 98,352 |
| 4.375% 6/1/46 | | 110,000 | 105,708 |
| Tyson Foods, Inc. 4% 3/1/26 | | 160,000 | 174,405 |
| | | | 1,241,571 |
| Tobacco - 0.6% | | | |
| Altria Group, Inc.: | | | |
| 3.875% 9/16/46 | | 204,000 | 200,377 |
| 4.8% 2/14/29 | | 30,000 | 33,971 |
| 5.8% 2/14/39 | | 100,000 | 123,397 |
| 5.95% 2/14/49 | | 110,000 | 141,227 |
| BAT Capital Corp.: | | | |
| 3.222% 8/15/24 | | 200,000 | 205,731 |
| 3.557% 8/15/27 | | 450,000 | 461,161 |
| 4.54% 8/15/47 | | 128,000 | 128,386 |
| Philip Morris International, Inc. 2.125% 5/10/23 | | 820,000 | 818,707 |
| Reynolds American, Inc. 4.45% 6/12/25 | | 140,000 | 151,601 |
| | | | 2,264,558 |
|
| TOTAL CONSUMER STAPLES | | | 6,849,346 |
|
| ENERGY - 3.3% | | | |
| Oil, Gas & Consumable Fuels - 3.3% | | | |
| Anadarko Petroleum Corp. 6.6% 3/15/46 | | 50,000 | 66,669 |
| Apache Corp. 4.375% 10/15/28 | | 360,000 | 369,976 |
| Boardwalk Pipelines LP 4.95% 12/15/24 | | 102,000 | 109,669 |
| Canadian Natural Resources Ltd.: | | | |
| 3.85% 6/1/27 | | 152,000 | 161,002 |
| 4.95% 6/1/47 | | 40,000 | 47,821 |
| Cenovus Energy, Inc. 5.4% 6/15/47 | | 286,000 | 325,175 |
| Chevron Corp. 2.954% 5/16/26 | | 231,000 | 244,322 |
| ConocoPhillips Co. 4.95% 3/15/26 | | 366,000 | 425,020 |
| Devon Energy Corp. 5% 6/15/45 | | 65,000 | 76,437 |
| Ecopetrol SA: | | | |
| 5.875% 9/18/23 | | 500,000 | 557,700 |
| 7.375% 9/18/43 | | 60,000 | 80,663 |
| Enbridge, Inc. 3.5% 6/10/24 | | 164,000 | 171,778 |
| Energy Transfer Partners LP: | | | |
| 4.95% 6/15/28 | | 147,000 | 164,442 |
| 5.3% 4/15/47 | | 50,000 | 54,357 |
| Enterprise Products Operating LP: | | | |
| 2.85% 4/15/21 | | 831,000 | 840,332 |
| 3.95% 2/15/27 | | 214,000 | 233,716 |
| 4.25% 2/15/48 | | 150,000 | 163,100 |
| 4.8% 2/1/49 | | 56,000 | 65,797 |
| Equinor ASA: | | | |
| 2.9% 11/8/20 | | 250,000 | 252,730 |
| 3.625% 9/10/28 | | 130,000 | 143,591 |
| Exxon Mobil Corp. 2.222% 3/1/21 | | 794,000 | 798,827 |
| Kinder Morgan, Inc.: | | | |
| 3.15% 1/15/23 | | 110,000 | 113,025 |
| 5.05% 2/15/46 | | 50,000 | 56,399 |
| 5.2% 3/1/48 | | 264,000 | 310,711 |
| Magellan Midstream Partners LP 5% 3/1/26 | | 147,000 | 166,834 |
| Marathon Petroleum Corp.: | | | |
| 4.5% 4/1/48 | | 280,000 | 298,106 |
| 4.75% 12/15/23 | | 35,000 | 38,138 |
| MPLX LP: | | | |
| 4.125% 3/1/27 | | 60,000 | 63,248 |
| 4.5% 4/15/38 | | 150,000 | 155,638 |
| 4.7% 4/15/48 | | 226,000 | 232,708 |
| Noble Energy, Inc.: | | | |
| 4.95% 8/15/47 | | 100,000 | 111,259 |
| 5.05% 11/15/44 | | 70,000 | 77,809 |
| Occidental Petroleum Corp.: | | | |
| 2.9% 8/15/24 | | 240,000 | 242,244 |
| 3.2% 8/15/26 | | 37,000 | 37,383 |
| 3.5% 8/15/29 | | 117,000 | 119,203 |
| 4.2% 3/15/48 | | 50,000 | 50,310 |
| 4.3% 8/15/39 | | 17,000 | 17,789 |
| 4.4% 8/15/49 | | 17,000 | 17,731 |
| ONEOK, Inc.: | | | |
| 4% 7/13/27 | | 80,000 | 84,157 |
| 5.2% 7/15/48 | | 22,000 | 24,772 |
| Petroleos Mexicanos: | | | |
| 5.35% 2/12/28 | | 100,000 | 94,700 |
| 5.5% 6/27/44 | | 70,000 | 59,759 |
| 6.35% 2/12/48 | | 340,000 | 312,545 |
| 6.375% 1/23/45 | | 120,000 | 110,606 |
| 6.5% 1/23/29 | | 160,000 | 161,500 |
| Phillips 66 Co. 3.9% 3/15/28 | | 380,000 | 413,110 |
| Plains All American Pipeline LP/PAA Finance Corp. 5.75% 1/15/20 | | 168,000 | 169,826 |
| Shell International Finance BV: | | | |
| 1.75% 9/12/21 | | 1,227,000 | 1,225,074 |
| 3.75% 9/12/46 | | 106,000 | 120,810 |
| Spectra Energy Partners LP 4.75% 3/15/24 | | 151,000 | 165,213 |
| Suncor Energy, Inc. 4% 11/15/47 | | 114,000 | 125,579 |
| Sunoco Logistics Partner Operations LP 5.4% 10/1/47 | | 80,000 | 89,230 |
| Total Capital International SA 3.75% 4/10/24 | | 165,000 | 177,603 |
| TransCanada PipeLines Ltd. 4.875% 5/15/48 | | 80,000 | 95,163 |
| Valero Energy Corp. 4.35% 6/1/28 | | 70,000 | 76,207 |
| Williams Partners LP: | | | |
| 3.35% 8/15/22 | | 190,000 | 194,787 |
| 3.75% 6/15/27 | | 460,000 | 480,107 |
| | | | 11,642,407 |
| FINANCIALS - 7.5% | | | |
| Banks - 3.6% | | | |
| Bank of America Corp.: | | | |
| 2.625% 4/19/21 | | 1,404,000 | 1,417,567 |
| 3.194% 7/23/30 (b) | | 100,000 | 104,421 |
| 3.419% 12/20/28 (b) | | 445,000 | 469,620 |
| 3.974% 2/7/30 (b) | | 65,000 | 72,051 |
| 4.271% 7/23/29 (b) | | 250,000 | 282,178 |
| 4.33% 3/15/50 (b) | | 200,000 | 243,400 |
| Barclays PLC: | | | |
| 3.932% 5/7/25 (b) | | 200,000 | 205,614 |
| 4.375% 1/12/26 | | 210,000 | 221,628 |
| 4.95% 1/10/47 | | 200,000 | 219,623 |
| BB&T Corp. 2.75% 4/1/22 | | 140,000 | 142,480 |
| Citigroup, Inc.: | | | |
| 3 month U.S. LIBOR + 1.151% 3.52% 10/27/28 (b)(c) | | 200,000 | 211,998 |
| 3.142% 1/24/23 (b) | | 90,000 | 92,030 |
| 3.2% 10/21/26 | | 80,000 | 83,484 |
| 3.98% 3/20/30 (b) | | 150,000 | 165,793 |
| 4.65% 7/23/48 | | 75,000 | 94,166 |
| 4.75% 5/18/46 | | 208,000 | 252,002 |
| Credit Suisse Group Funding Guernsey Ltd. 3.8% 6/9/23 | | 500,000 | 524,927 |
| Fifth Third Bancorp 3.95% 3/14/28 | | 50,000 | 55,428 |
| HSBC Holdings PLC: | | | |
| 2.65% 1/5/22 | | 489,000 | 493,889 |
| 4.292% 9/12/26 (b) | | 200,000 | 215,500 |
| 4.375% 11/23/26 | | 400,000 | 430,026 |
| Japan Bank International Cooperation: | | | |
| 2.375% 11/16/22 | | 400,000 | 407,877 |
| 2.5% 5/23/24 | | 200,000 | 207,120 |
| JPMorgan Chase & Co.: | | | |
| 2.7% 5/18/23 | | 470,000 | 480,892 |
| 2.95% 10/1/26 | | 190,000 | 197,098 |
| 3.22% 3/1/25 (b) | | 340,000 | 355,403 |
| 4.452% 12/5/29 (b) | | 170,000 | 195,486 |
| 5.6% 7/15/41 | | 325,000 | 452,692 |
| Lloyds Bank PLC 3% 1/11/22 | | 800,000 | 810,445 |
| Mitsubishi UFJ Financial Group, Inc.: | | | |
| 2.801% 7/18/24 | | 200,000 | 204,773 |
| 3.195% 7/18/29 | | 400,000 | 419,200 |
| 3.961% 3/2/28 | | 100,000 | 111,349 |
| National Australia Bank Ltd. 2.875% 4/12/23 | | 250,000 | 257,097 |
| Oesterreichische Kontrollbank 1.875% 1/20/21 | | 250,000 | 250,671 |
| Rabobank Nederland 3.75% 7/21/26 | | 250,000 | 261,745 |
| Rabobank Nederland New York Branch 2.75% 1/10/23 | | 250,000 | 256,705 |
| Regions Financial Corp. 2.75% 8/14/22 | | 101,000 | 102,778 |
| Royal Bank of Canada 4.65% 1/27/26 | | 210,000 | 234,236 |
| Santander Holdings U.S.A., Inc. 3.4% 1/18/23 | | 60,000 | 61,725 |
| Sumitomo Mitsui Financial Group, Inc.: | | | |
| 3.102% 1/17/23 | | 288,000 | 297,094 |
| 3.936% 10/16/23 | | 120,000 | 128,350 |
| Wells Fargo & Co.: | | | |
| 3% 10/23/26 | | 100,000 | 103,940 |
| 3.75% 1/24/24 | | 40,000 | 42,599 |
| 4.75% 12/7/46 | | 388,000 | 475,984 |
| Westpac Banking Corp.: | | | |
| 2.75% 1/11/23 | | 306,000 | 314,254 |
| 3.65% 5/15/23 | | 160,000 | 169,430 |
| | | | 12,796,768 |
| Capital Markets - 1.2% | | | |
| Bank New York Mellon Corp. 3.5% 4/28/23 | | 230,000 | 242,477 |
| BlackRock, Inc. 4.25% 5/24/21 | | 152,000 | 158,208 |
| Deutsche Bank AG New York Branch: | | | |
| 3.3% 11/16/22 | | 100,000 | 99,394 |
| 4.1% 1/13/26 | | 154,000 | 153,922 |
| Goldman Sachs Group, Inc.: | | | |
| 3.85% 1/26/27 | | 960,000 | 1,025,126 |
| 5.15% 5/22/45 | | 330,000 | 402,421 |
| 5.25% 7/27/21 | | 393,000 | 415,247 |
| IntercontinentalExchange, Inc. 3.75% 9/21/28 | | 100,000 | 111,082 |
| Morgan Stanley: | | | |
| 3 month U.S. LIBOR + 1.431% 4.457% 4/22/39 (b)(c) | | 120,000 | 142,399 |
| 3.125% 1/23/23 | | 795,000 | 819,716 |
| 3.625% 1/20/27 | | 160,000 | 171,182 |
| 4.375% 1/22/47 | | 224,000 | 272,371 |
| 5.75% 1/25/21 | | 369,000 | 387,140 |
| | | | 4,400,685 |
| Consumer Finance - 1.0% | | | |
| AerCap Ireland Capital Ltd./AerCap Global Aviation Trust: | | | |
| 2.875% 8/14/24 | | 150,000 | 150,492 |
| 3.3% 1/23/23 | | 401,000 | 411,008 |
| 4.45% 10/1/25 | | 150,000 | 160,893 |
| 4.5% 5/15/21 | | 163,000 | 168,150 |
| American Express Co.: | | | |
| 2.5% 8/1/22 | | 150,000 | 152,109 |
| 3.4% 2/27/23 | | 50,000 | 52,234 |
| Capital One Financial Corp.: | | | |
| 3.2% 1/30/23 | | 80,000 | 82,429 |
| 3.8% 1/31/28 | | 438,000 | 466,965 |
| Discover Financial Services 4.5% 1/30/26 | | 208,000 | 229,720 |
| Ford Motor Credit Co. LLC: | | | |
| 4.14% 2/15/23 | | 200,000 | 205,109 |
| 5.875% 8/2/21 | | 221,000 | 232,626 |
| John Deere Capital Corp.: | | | |
| 2.8% 3/6/23 | | 270,000 | 277,855 |
| 2.8% 9/8/27 | | 290,000 | 302,888 |
| Synchrony Financial: | | | |
| 3.95% 12/1/27 | | 380,000 | 393,941 |
| 4.375% 3/19/24 | | 100,000 | 106,816 |
| 5.15% 3/19/29 | | 109,000 | 122,753 |
| Toyota Motor Credit Corp.: | | | |
| 2.15% 9/8/22 | | 100,000 | 100,866 |
| 2.7% 1/11/23 | | 50,000 | 51,443 |
| | | | 3,668,297 |
| Diversified Financial Services - 1.1% | | | |
| Berkshire Hathaway Finance Corp. 4.2% 8/15/48 | | 130,000 | 156,211 |
| Berkshire Hathaway, Inc. 3.125% 3/15/26 | | 92,000 | 97,530 |
| BP Capital Markets America, Inc. 2.52% 9/19/22 | | 620,000 | 629,047 |
| Brixmor Operating Partnership LP 4.125% 5/15/29 | | 44,000 | 47,600 |
| Broadcom Corp./Broadcom Cayman LP: | | | |
| 2.65% 1/15/23 | | 70,000 | 69,907 |
| 3% 1/15/22 | | 167,000 | 168,355 |
| Cigna Corp.: | | | |
| 3.75% 7/15/23 | | 100,000 | 105,126 |
| 4.125% 11/15/25 | | 99,000 | 107,709 |
| 4.375% 10/15/28 | | 100,000 | 111,820 |
| 4.8% 8/15/38 | | 80,000 | 92,492 |
| 4.9% 12/15/48 | | 80,000 | 94,671 |
| Export Development Canada 2.625% 2/21/24 | | 500,000 | 524,280 |
| GE Capital International Funding Co. 4.418% 11/15/35 | | 400,000 | 406,407 |
| KfW: | | | |
| 2.375% 12/29/22 | | 815,000 | 838,822 |
| 2.5% 11/20/24 | | 280,000 | 294,426 |
| Landwirtschaftliche Rentenbank 3.125% 11/14/23 | | 170,000 | 181,146 |
| | | | 3,925,549 |
| Insurance - 0.6% | | | |
| ACE INA Holdings, Inc. 4.35% 11/3/45 | | 74,000 | 93,436 |
| American International Group, Inc.: | | | |
| 3.3% 3/1/21 | | 320,000 | 325,296 |
| 4.5% 7/16/44 | | 115,000 | 131,466 |
| 4.7% 7/10/35 | | 200,000 | 229,953 |
| 4.75% 4/1/48 | | 40,000 | 47,701 |
| Aon PLC 4.75% 5/15/45 | | 140,000 | 169,370 |
| Hartford Financial Services Group, Inc.: | | | |
| 2.8% 8/19/29 | | 250,000 | 253,781 |
| 4.4% 3/15/48 | | 30,000 | 35,020 |
| Marsh & McLennan Companies, Inc.: | | | |
| 4.2% 3/1/48 | | 40,000 | 46,839 |
| 4.9% 3/15/49 | | 120,000 | 155,795 |
| MetLife, Inc. 4.6% 5/13/46 | | 90,000 | 112,011 |
| Prudential Financial, Inc.: | | | |
| 3.878% 3/27/28 | | 70,000 | 78,417 |
| 4.418% 3/27/48 | | 100,000 | 119,046 |
| 5.7% 9/15/48 (b) | | 74,000 | 80,805 |
| The Travelers Companies, Inc. 4.05% 3/7/48 | | 74,000 | 88,294 |
| | | | 1,967,230 |
|
| TOTAL FINANCIALS | | | 26,758,529 |
|
| HEALTH CARE - 2.3% | | | |
| Biotechnology - 0.3% | | | |
| AbbVie, Inc.: | | | |
| 4.25% 11/14/28 | | 92,000 | 100,071 |
| 4.3% 5/14/36 | | 25,000 | 26,515 |
| 4.45% 5/14/46 | | 150,000 | 157,604 |
| Amgen, Inc.: | | | |
| 3.2% 11/2/27 | | 70,000 | 73,738 |
| 4.663% 6/15/51 | | 100,000 | 119,169 |
| Celgene Corp.: | | | |
| 3.875% 8/15/25 | | 80,000 | 86,849 |
| 4.55% 2/20/48 | | 204,000 | 250,144 |
| Gilead Sciences, Inc.: | | | |
| 4.15% 3/1/47 | | 112,000 | 126,715 |
| 4.75% 3/1/46 | | 50,000 | 60,824 |
| | | | 1,001,629 |
| Health Care Equipment & Supplies - 0.2% | | | |
| Becton, Dickinson & Co. 4.669% 6/6/47 | | 290,000 | 350,834 |
| Boston Scientific Corp.: | | | |
| 4% 3/1/29 | | 100,000 | 111,545 |
| 4.7% 3/1/49 | | 100,000 | 124,037 |
| Medtronic Global Holdings SCA 3.35% 4/1/27 | | 100,000 | 108,641 |
| Zimmer Biomet Holdings, Inc. 3.55% 4/1/25 | | 175,000 | 184,279 |
| | | | 879,336 |
| Health Care Providers & Services - 0.7% | | | |
| Aetna, Inc. 3.875% 8/15/47 | | 180,000 | 179,574 |
| Allina Health System, Inc. 3.887% 4/15/49 | | 40,000 | 47,198 |
| Anthem, Inc. 4.101% 3/1/28 | | 130,000 | 141,750 |
| Cardinal Health, Inc.: | | | |
| 3.41% 6/15/27 | | 160,000 | 162,203 |
| 4.368% 6/15/47 | | 30,000 | 29,008 |
| CVS Health Corp.: | | | |
| 2.875% 6/1/26 | | 60,000 | 60,377 |
| 3% 8/15/26 | | 38,000 | 38,465 |
| 3.7% 3/9/23 | | 50,000 | 52,285 |
| 4.78% 3/25/38 | | 412,000 | 462,001 |
| 5.05% 3/25/48 | | 120,000 | 139,819 |
| Express Scripts Holding Co.: | | | |
| 3.05% 11/30/22 | | 110,000 | 112,674 |
| 4.8% 7/15/46 | | 230,000 | 263,062 |
| Kaiser Foundation Hospitals 4.15% 5/1/47 | | 60,000 | 73,977 |
| UnitedHealth Group, Inc.: | | | |
| 2.375% 8/15/24 | | 100,000 | 101,576 |
| 3.7% 8/15/49 | | 90,000 | 98,379 |
| 3.85% 6/15/28 | | 130,000 | 144,589 |
| 4.45% 12/15/48 | | 68,000 | 82,568 |
| 4.75% 7/15/45 | | 182,000 | 226,681 |
| WellPoint, Inc. 3.125% 5/15/22 | | 140,000 | 143,409 |
| | | | 2,559,595 |
| Life Sciences Tools & Services - 0.1% | | | |
| Thermo Fisher Scientific, Inc. 4.15% 2/1/24 | | 173,000 | 186,150 |
| Pharmaceuticals - 1.0% | | | |
| Actavis Funding SCS: | | | |
| 4.55% 3/15/35 | | 50,000 | 53,787 |
| 4.75% 3/15/45 | | 100,000 | 109,683 |
| AstraZeneca PLC 3.125% 6/12/27 | | 140,000 | 147,207 |
| Bayer U.S. Finance II LLC 2.85% 4/15/25 (a) | | 177,000 | 171,077 |
| Bristol-Myers Squibb Co.: | | | |
| 3.2% 6/15/26 (a) | | 100,000 | 105,813 |
| 3.4% 7/26/29 (a) | | 100,000 | 108,252 |
| 4.125% 6/15/39 (a) | | 100,000 | 116,056 |
| 4.25% 10/26/49 (a) | | 100,000 | 120,285 |
| GlaxoSmithKline Capital PLC 3% 6/1/24 | | 200,000 | 208,167 |
| GlaxoSmithKline Capital, Inc. 3.375% 5/15/23 | | 240,000 | 251,589 |
| Johnson & Johnson 3.4% 1/15/38 | | 238,000 | 260,329 |
| Merck & Co., Inc. 3.7% 2/10/45 | | 212,000 | 242,723 |
| Mylan NV 5.2% 4/15/48 | | 74,000 | 80,689 |
| Novartis Capital Corp. 2.4% 5/17/22 | | 670,000 | 680,894 |
| Pfizer, Inc.: | | | |
| 3.2% 9/15/23 | | 80,000 | 84,002 |
| 3.45% 3/15/29 | | 100,000 | 109,488 |
| 3.9% 3/15/39 | | 70,000 | 80,443 |
| 4% 12/15/36 | | 190,000 | 220,791 |
| Shire Acquisitions Investments Ireland DAC 3.2% 9/23/26 | | 444,000 | 461,809 |
| Zoetis, Inc. 3% 9/12/27 | | 50,000 | 51,938 |
| | | | 3,665,022 |
|
| TOTAL HEALTH CARE | | | 8,291,732 |
|
| INDUSTRIALS - 1.8% | | | |
| Aerospace & Defense - 0.6% | | | |
| General Dynamics Corp. 3.75% 5/15/28 | | 100,000 | 112,761 |
| Lockheed Martin Corp. 4.09% 9/15/52 | | 79,000 | 95,138 |
| Northrop Grumman Corp.: | | | |
| 3.25% 1/15/28 | | 100,000 | 106,230 |
| 4.03% 10/15/47 | | 178,000 | 206,087 |
| Rockwell Collins, Inc. 4.35% 4/15/47 | | 100,000 | 117,850 |
| The Boeing Co.: | | | |
| 2.8% 3/1/23 | | 270,000 | 276,807 |
| 3.2% 3/1/29 | | 320,000 | 340,931 |
| 3.75% 2/1/50 | | 70,000 | 77,944 |
| United Technologies Corp.: | | | |
| 3.65% 8/16/23 | | 400,000 | 424,456 |
| 3.75% 11/1/46 | | 100,000 | 111,023 |
| 3.95% 8/16/25 | | 80,000 | 87,820 |
| 4.125% 11/16/28 | | 220,000 | 251,747 |
| | | | 2,208,794 |
| Air Freight & Logistics - 0.1% | | | |
| FedEx Corp.: | | | |
| 4.05% 2/15/48 | | 80,000 | 81,731 |
| 4.95% 10/17/48 | | 40,000 | 46,742 |
| United Parcel Service, Inc. 6.2% 1/15/38 | | 134,000 | 187,624 |
| | | | 316,097 |
| Commercial Services & Supplies - 0.1% | | | |
| Republic Services, Inc. 3.95% 5/15/28 | | 200,000 | 224,269 |
| Waste Management, Inc.: | | | |
| 2.4% 5/15/23 | | 250,000 | 253,432 |
| 3.15% 11/15/27 | | 50,000 | 53,273 |
| | | | 530,974 |
| Industrial Conglomerates - 0.2% | | | |
| 3M Co.: | | | |
| 2.375% 8/26/29 | | 130,000 | 130,065 |
| 3.25% 8/26/49 | | 100,000 | 101,192 |
| General Electric Co. 4.5% 3/11/44 | | 200,000 | 202,191 |
| Honeywell International, Inc. 2.3% 8/15/24 | | 190,000 | 194,125 |
| | | | 627,573 |
| Machinery - 0.2% | | | |
| Caterpillar Financial Services Corp. 2.55% 11/29/22 | | 518,000 | 527,002 |
| Ingersoll-Rand Luxembourg Finance SA 3.8% 3/21/29 | | 180,000 | 195,231 |
| | | | 722,233 |
| Road & Rail - 0.4% | | | |
| Burlington Northern Santa Fe LLC: | | | |
| 4.05% 6/15/48 | | 182,000 | 213,904 |
| 4.15% 12/15/48 | | 100,000 | 119,883 |
| CSX Corp.: | | | |
| 3.8% 3/1/28 | | 50,000 | 55,044 |
| 4.3% 3/1/48 | | 150,000 | 174,452 |
| 4.75% 11/15/48 | | 160,000 | 197,177 |
| Norfolk Southern Corp. 3.95% 10/1/42 | | 185,000 | 203,503 |
| Union Pacific Corp.: | | | |
| 3.7% 3/1/29 | | 170,000 | 188,920 |
| 4% 4/15/47 | | 90,000 | 101,671 |
| | | | 1,254,554 |
| Trading Companies & Distributors - 0.2% | | | |
| Air Lease Corp.: | | | |
| 3.375% 6/1/21 | | 166,000 | 168,743 |
| 3.625% 12/1/27 | | 140,000 | 145,888 |
| 4.625% 10/1/28 | | 350,000 | 391,513 |
| | | | 706,144 |
|
| TOTAL INDUSTRIALS | | | 6,366,369 |
|
| INFORMATION TECHNOLOGY - 2.7% | | | |
| Communications Equipment - 0.2% | | | |
| Cisco Systems, Inc. 1.85% 9/20/21 | | 940,000 | 939,303 |
| Electronic Equipment & Components - 0.3% | | | |
| Diamond 1 Finance Corp./Diamond 2 Finance Corp.: | | | |
| 4.42% 6/15/21 (a) | | 211,000 | 217,709 |
| 4.9% 10/1/26 (a) | | 450,000 | 481,085 |
| 5.45% 6/15/23 (a) | | 230,000 | 249,984 |
| 8.1% 7/15/36 (a) | | 70,000 | 88,763 |
| 8.35% 7/15/46 (a) | | 62,000 | 81,459 |
| | | | 1,119,000 |
| IT Services - 0.4% | | | |
| Fiserv, Inc.: | | | |
| 3.5% 7/1/29 | | 180,000 | 191,177 |
| 4.4% 7/1/49 | | 100,000 | 115,197 |
| IBM Corp.: | | | |
| 3% 5/15/24 | | 100,000 | 103,993 |
| 4.7% 2/19/46 | | 204,000 | 252,286 |
| Visa, Inc.: | | | |
| 2.15% 9/15/22 | | 480,000 | 486,853 |
| 3.15% 12/14/25 | | 160,000 | 171,381 |
| | | | 1,320,887 |
| Semiconductors & Semiconductor Equipment - 0.2% | | | |
| Applied Materials, Inc. 4.35% 4/1/47 | | 90,000 | 110,301 |
| Intel Corp. 3.734% 12/8/47 | | 110,000 | 125,093 |
| Qualcomm, Inc. 2.6% 1/30/23 | | 430,000 | 438,151 |
| | | | 673,545 |
| Software - 0.9% | | | |
| Microsoft Corp.: | | | |
| 2.4% 2/6/22 | | 1,792,000 | 1,822,782 |
| 2.4% 8/8/26 | | 520,000 | 537,548 |
| 4.25% 2/6/47 | | 280,000 | 356,589 |
| Oracle Corp. 4% 11/15/47 | | 388,000 | 444,189 |
| | | | 3,161,108 |
| Technology Hardware, Storage & Peripherals - 0.7% | | | |
| Apple, Inc.: | | | |
| 2.1% 9/12/22 | | 100,000 | 100,906 |
| 2.4% 1/13/23 | | 1,242,000 | 1,266,976 |
| 3% 2/9/24 | | 650,000 | 679,653 |
| 3.75% 11/13/47 | | 90,000 | 102,305 |
| 4.5% 2/23/36 | | 110,000 | 135,845 |
| Xerox Corp. 4.5% 5/15/21 | | 160,000 | 164,000 |
| | | | 2,449,685 |
|
| TOTAL INFORMATION TECHNOLOGY | | | 9,663,528 |
|
| MATERIALS - 0.6% | | | |
| Chemicals - 0.5% | | | |
| DowDuPont, Inc.: | | | |
| 4.205% 11/15/23 | | 100,000 | 107,733 |
| 4.725% 11/15/28 | | 100,000 | 115,641 |
| Eastman Chemical Co. 4.5% 12/1/28 | | 226,000 | 250,631 |
| LYB International Finance BV 4% 7/15/23 | | 153,000 | 162,764 |
| LYB International Finance II BV 3.5% 3/2/27 | | 290,000 | 299,438 |
| Nutrien Ltd.: | | | |
| 4.2% 4/1/29 | | 32,000 | 35,765 |
| 5% 4/1/49 | | 56,000 | 66,850 |
| Sherwin-Williams Co.: | | | |
| 2.75% 6/1/22 | | 32,000 | 32,495 |
| 3.125% 6/1/24 | | 160,000 | 166,174 |
| 4.5% 6/1/47 | | 100,000 | 113,829 |
| The Dow Chemical Co.: | | | |
| 3.15% 5/15/24 (a) | | 100,000 | 103,273 |
| 3.625% 5/15/26 (a) | | 150,000 | 157,772 |
| 5.55% 11/30/48 (a) | | 80,000 | 99,050 |
| The Mosaic Co. 4.05% 11/15/27 | | 40,000 | 41,740 |
| | | | 1,753,155 |
| Metals & Mining - 0.1% | | | |
| BHP Billiton Financial (U.S.A.) Ltd. 5% 9/30/43 | | 151,000 | 199,573 |
| Vale Overseas Ltd. 5.875% 6/10/21 | | 179,000 | 188,845 |
| | | | 388,418 |
|
| TOTAL MATERIALS | | | 2,141,573 |
|
| REAL ESTATE - 0.5% | | | |
| Equity Real Estate Investment Trusts (REITs) - 0.5% | | | |
| American Tower Corp. 3.6% 1/15/28 | | 70,000 | 74,217 |
| Boston Properties, Inc. 4.125% 5/15/21 | | 165,000 | 170,061 |
| Corporate Office Properties LP 3.6% 5/15/23 | | 80,000 | 81,819 |
| ERP Operating LP 3.5% 3/1/28 | | 160,000 | 173,432 |
| Kimco Realty Corp. 2.8% 10/1/26 | | 216,000 | 218,531 |
| Simon Property Group LP: | | | |
| 3.375% 12/1/27 | | 150,000 | 160,863 |
| 4.25% 11/30/46 | | 116,000 | 139,622 |
| Ventas Realty LP: | | | |
| 3.125% 6/15/23 | | 163,000 | 168,228 |
| 4% 3/1/28 | | 184,000 | 199,908 |
| Welltower, Inc. 4.25% 4/15/28 | | 174,000 | 192,735 |
| | | | 1,579,416 |
| UTILITIES - 1.8% | | | |
| Electric Utilities - 1.3% | | | |
| American Electric Power Co., Inc. 4.3% 12/1/28 | | 194,000 | 220,249 |
| Commonwealth Edison Co. 4% 3/1/48 | | 208,000 | 243,242 |
| Duke Energy Carolinas LLC 4% 9/30/42 | | 179,000 | 204,348 |
| Duke Energy Corp. 3.15% 8/15/27 | | 352,000 | 369,662 |
| Duke Energy Ohio, Inc.: | | | |
| 3.65% 2/1/29 | | 210,000 | 232,779 |
| 4.3% 2/1/49 | | 65,000 | 79,699 |
| Exelon Corp.: | | | |
| 3.95% 6/15/25 | | 163,000 | 175,554 |
| 5.1% 6/15/45 | | 160,000 | 200,806 |
| FirstEnergy Corp. 4.85% 7/15/47 | | 150,000 | 182,170 |
| Florida Power & Light Co. 4.05% 10/1/44 | | 170,000 | 201,242 |
| MidAmerican Energy Co.: | | | |
| 3.95% 8/1/47 | | 100,000 | 117,223 |
| 4.25% 7/15/49 | | 100,000 | 123,066 |
| Mississippi Power Co. 3.95% 3/30/28 | | 120,000 | 132,584 |
| PPL Capital Funding, Inc. 4% 9/15/47 | | 90,000 | 95,100 |
| Public Service Co. of Colorado 3.2% 3/1/50 | | 110,000 | 114,257 |
| Public Service Electric & Gas Co. 3% 5/15/25 | | 220,000 | 232,179 |
| Southern Co. 3.25% 7/1/26 | | 765,000 | 792,212 |
| Tampa Electric Co. 4.45% 6/15/49 | | 140,000 | 175,195 |
| Virginia Electric & Power Co.: | | | |
| 3.8% 4/1/28 | | 90,000 | 99,479 |
| 3.8% 9/15/47 | | 60,000 | 67,037 |
| 4.6% 12/1/48 | | 208,000 | 263,043 |
| Xcel Energy, Inc. 3.35% 12/1/26 | | 316,000 | 336,061 |
| | | | 4,657,187 |
| Multi-Utilities - 0.5% | | | |
| Berkshire Hathaway Energy Co. 3.25% 4/15/28 | | 250,000 | 265,797 |
| CenterPoint Energy, Inc. 2.5% 9/1/22 | | 29,000 | 29,234 |
| Consolidated Edison Co. of New York, Inc.: | | | |
| 4.5% 5/15/58 | | 120,000 | 145,242 |
| 4.65% 12/1/48 | | 80,000 | 100,637 |
| DTE Energy Co. 3.8% 3/15/27 | | 90,000 | 97,508 |
| NiSource Finance Corp. 3.49% 5/15/27 | | 442,000 | 469,000 |
| Public Service Enterprise Group, Inc. 2.65% 11/15/22 | | 80,000 | 80,778 |
| Sempra Energy: | | | |
| 3.4% 2/1/28 | | 50,000 | 52,113 |
| 3.8% 2/1/38 | | 240,000 | 251,900 |
| 4% 2/1/48 | | 136,000 | 147,702 |
| | | | 1,639,911 |
|
| TOTAL UTILITIES | | | 6,297,098 |
|
| TOTAL NONCONVERTIBLE BONDS | | | |
| (Cost $86,289,888) | | | 93,115,395 |
|
| U.S. Government and Government Agency Obligations - 42.1% | | | |
| U.S. Government Agency Obligations - 1.5% | | | |
| Fannie Mae: | | | |
| 1.75% 7/2/24 | | $930,000 | $943,560 |
| 2% 10/5/22 | | 190,000 | 193,120 |
| 2.375% 1/19/23 | | 655,000 | 674,132 |
| 2.875% 9/12/23 | | 150,000 | 158,359 |
| Federal Home Loan Bank: | | | |
| 1.5% 8/15/24 | | 125,000 | 125,263 |
| 2% 9/9/22 | | 200,000 | 202,809 |
| 2.5% 2/13/24 | | 230,000 | 240,532 |
| 2.625% 10/1/20 | | 1,100,000 | 1,110,959 |
| 3.25% 11/16/28 | | 30,000 | 34,041 |
| Freddie Mac: | | | |
| 1.375% 5/1/20 | | 1,170,000 | 1,166,201 |
| 2.75% 6/19/23 | | 50,000 | 52,305 |
| Tennessee Valley Authority: | | | |
| 2.875% 2/1/27 | | 145,000 | 155,974 |
| 4.25% 9/15/65 | | 50,000 | 71,687 |
|
| TOTAL U.S. GOVERNMENT AGENCY OBLIGATIONS | | | 5,128,942 |
|
| U.S. Treasury Obligations - 40.6% | | | |
| U.S. Treasury Bonds: | | | |
| 2.25% 8/15/49 | | 422,000 | 448,787 |
| 2.5% 2/15/45 | | 609,000 | 675,776 |
| 2.5% 5/15/46 | | 122,000 | 135,625 |
| 2.75% 11/15/42 | | 189,000 | 218,273 |
| 2.75% 8/15/47 | | 177,000 | 206,862 |
| 2.75% 11/15/47 | | 157,000 | 183,635 |
| 2.875% 5/15/43 | | 938,000 | 1,107,060 |
| 2.875% 8/15/45 | | 269,000 | 319,448 |
| 2.875% 11/15/46 | | 208,000 | 248,227 |
| 2.875% 5/15/49 | | 754,000 | 909,237 |
| 3% 5/15/42 | | 102,000 | 122,551 |
| 3% 11/15/44 | | 108,000 | 130,642 |
| 3% 5/15/45 | | 346,000 | 419,552 |
| 3% 11/15/45 | | 359,000 | 436,367 |
| 3% 2/15/47 | | 314,000 | 383,791 |
| 3% 5/15/47 | | 197,000 | 240,840 |
| 3% 2/15/48 | | 121,000 | 148,324 |
| 3% 8/15/48 | | 188,000 | 230,939 |
| 3% 2/15/49 | | 1,063,000 | 1,309,566 |
| 3.125% 11/15/41 | | 130,000 | 159,057 |
| 3.125% 2/15/42 | | 166,000 | 203,350 |
| 3.125% 2/15/43 | | 601,000 | 737,211 |
| 3.125% 8/15/44 | | 2,192,000 | 2,704,209 |
| 3.125% 5/15/48 | | 411,000 | 515,725 |
| 3.375% 5/15/44 | | 1,386,000 | 1,777,058 |
| 3.375% 11/15/48 | | 356,000 | 468,279 |
| 3.625% 8/15/43 | | 86,000 | 114,121 |
| 3.625% 2/15/44 | | 1,310,000 | 1,742,965 |
| 3.75% 8/15/41 | | 225,000 | 300,727 |
| 3.75% 11/15/43 | | 6,076,000 | 8,223,724 |
| 4.375% 2/15/38 | | 81,000 | 114,799 |
| 4.375% 11/15/39 | | 5,000 | 7,179 |
| 4.375% 5/15/41 | | 2,101,000 | 3,044,973 |
| 4.5% 2/15/36 | | 291,000 | 409,185 |
| 4.5% 5/15/38 | | 69,000 | 99,430 |
| 5% 5/15/37 | | 1,496,000 | 2,252,298 |
| U.S. Treasury Notes: | | | |
| 0.875% 9/15/19 | | 106,000 | 105,959 |
| 1% 10/15/19 | | 20,000 | 19,975 |
| 1.125% 7/31/21 | | 313,000 | 310,481 |
| 1.125% 9/30/21 | | 549,000 | 544,561 |
| 1.375% 2/15/20 | | 671,000 | 669,401 |
| 1.375% 9/15/20 | | 57,000 | 56,777 |
| 1.375% 9/30/20 | | 2,449,000 | 2,438,381 |
| 1.5% 4/15/20 | | 70,000 | 69,841 |
| 1.5% 5/15/20 | | 370,000 | 369,046 |
| 1.5% 6/15/20 | | 204,000 | 203,442 |
| 1.5% 7/15/20 | | 575,000 | 573,338 |
| 1.5% 8/15/20 | | 119,000 | 118,651 |
| 1.5% 8/15/26 | | 283,000 | 283,862 |
| 1.625% 3/15/20 | | 336,000 | 335,541 |
| 1.625% 10/15/20 | | 301,000 | 300,588 |
| 1.625% 6/30/21 | | 2,594,000 | 2,597,040 |
| 1.625% 2/15/26 | | 3,489,000 | 3,526,207 |
| 1.625% 8/15/29 | | 977,000 | 988,106 |
| 1.75% 11/30/19 | | 657,000 | 656,461 |
| 1.75% 11/15/20 | | 220,000 | 220,069 |
| 1.75% 7/31/21 | | 2,224,000 | 2,233,209 |
| 1.75% 5/31/22 | | 130,000 | 131,026 |
| 1.75% 6/30/22 | | 728,000 | 734,370 |
| 1.75% 6/30/24 | | 1,417,000 | 1,439,805 |
| 1.75% 7/31/24 | | 1,129,000 | 1,147,920 |
| 1.875% 12/31/19 | | 67,000 | 66,971 |
| 1.875% 12/15/20 | | 388,000 | 388,879 |
| 1.875% 2/28/22 | | 1,430,000 | 1,443,909 |
| 1.875% 3/31/22 | | 1,271,000 | 1,284,107 |
| 1.875% 7/31/22 | | 151,000 | 152,846 |
| 1.875% 8/31/24 | | 501,000 | 512,096 |
| 1.875% 7/31/26 | | 433,000 | 444,975 |
| 2% 1/31/20 | | 4,000 | 4,000 |
| 2% 1/15/21 | | 761,000 | 764,419 |
| 2% 11/30/22 | | 552,000 | 561,876 |
| 2% 5/31/24 | | 5,025,000 | 5,162,402 |
| 2% 6/30/24 | | 210,000 | 215,726 |
| 2% 11/15/26 | | 425,000 | 440,921 |
| 2.125% 5/31/21 | | 1,654,000 | 1,669,442 |
| 2.125% 5/15/22 | | 1,341,000 | 1,364,520 |
| 2.125% 12/31/22 | | 210,000 | 214,766 |
| 2.125% 2/29/24 | | 551,000 | 567,831 |
| 2.125% 3/31/24 | | 612,000 | 631,149 |
| 2.125% 7/31/24 | | 150,000 | 155,057 |
| 2.125% 11/30/24 | | 320,000 | 331,325 |
| 2.125% 5/31/26 | | 866,000 | 903,211 |
| 2.25% 2/15/21 | | 576,000 | 581,040 |
| 2.25% 3/31/21 | | 1,198,000 | 1,209,652 |
| 2.25% 4/30/21 | | 2,739,000 | 2,767,995 |
| 2.25% 4/15/22 | | 396,000 | 403,982 |
| 2.25% 12/31/23 | | 3,883,000 | 4,018,147 |
| 2.25% 4/30/24 | | 3,658,000 | 3,795,604 |
| 2.25% 12/31/24 | | 30,000 | 31,273 |
| 2.25% 2/15/27 | | 1,473,000 | 1,555,511 |
| 2.25% 8/15/27 | | 2,238,000 | 2,368,871 |
| 2.25% 11/15/27 | | 1,230,000 | 1,303,271 |
| 2.375% 4/30/20 | | 520,000 | 521,666 |
| 2.375% 3/15/21 | | 190,000 | 192,160 |
| 2.375% 4/15/21 | | 1,159,000 | 1,172,989 |
| 2.375% 3/15/22 | | 3,228,000 | 3,302,143 |
| 2.375% 1/31/23 | | 86,000 | 88,691 |
| 2.375% 2/29/24 | | 2,090,000 | 2,177,682 |
| 2.375% 5/15/27 | | 1,576,000 | 1,680,779 |
| 2.375% 5/15/29 | | 176,000 | 189,750 |
| 2.5% 6/30/20 | | 292,000 | 293,551 |
| 2.5% 12/31/20 | | 736,000 | 743,849 |
| 2.5% 1/31/21 | | 3,929,000 | 3,973,969 |
| 2.5% 2/28/21 | | 776,000 | 785,852 |
| 2.5% 1/15/22 | | 406,000 | 415,531 |
| 2.5% 2/15/22 | | 1,815,000 | 1,859,666 |
| 2.5% 3/31/23 | | 1,659,000 | 1,721,213 |
| 2.5% 1/31/24 | | 3,479,000 | 3,639,088 |
| 2.5% 1/31/25 | | 37,000 | 39,062 |
| 2.5% 2/28/26 | | 273,000 | 290,702 |
| 2.625% 5/15/21 | | 2,550,000 | 2,594,127 |
| 2.625% 6/15/21 | | 617,000 | 628,352 |
| 2.625% 7/15/21 | | 1,067,000 | 1,087,756 |
| 2.625% 12/15/21 | | 2,737,000 | 2,807,243 |
| 2.625% 2/28/23 | | 1,495,000 | 1,555,618 |
| 2.625% 6/30/23 | | 2,011,000 | 2,100,788 |
| 2.625% 12/31/23 | | 2,853,000 | 2,996,764 |
| 2.625% 12/31/25 | | 118,000 | 126,361 |
| 2.625% 1/31/26 | | 420,000 | 450,023 |
| 2.625% 2/15/29 | | 2,013,000 | 2,211,233 |
| 2.75% 9/30/20 | | 160,000 | 161,650 |
| 2.75% 11/30/20 | | 1,222,000 | 1,237,609 |
| 2.75% 9/15/21 | | 698,000 | 715,259 |
| 2.75% 4/30/23 | | 1,347,000 | 1,410,088 |
| 2.75% 5/31/23 | | 1,025,000 | 1,074,128 |
| 2.75% 7/31/23 | | 1,141,000 | 1,198,005 |
| 2.75% 8/31/23 | | 1,101,000 | 1,157,426 |
| 2.75% 2/28/25 | | 280,000 | 299,513 |
| 2.75% 6/30/25 | | 237,000 | 254,321 |
| 2.75% 8/31/25 | | 304,000 | 326,753 |
| 2.75% 2/15/28 | | 420,000 | 462,180 |
| 2.875% 10/31/20 | | 614,000 | 621,819 |
| 2.875% 10/15/21 | | 925,000 | 951,052 |
| 2.875% 11/15/21 | | 1,335,000 | 1,374,216 |
| 2.875% 10/31/23 | | 698,000 | 738,762 |
| 2.875% 11/30/23 | | 1,156,000 | 1,225,044 |
| 2.875% 4/30/25 | | 81,000 | 87,315 |
| 2.875% 7/31/25 | | 258,000 | 278,862 |
| 2.875% 11/30/25 | | 288,000 | 312,458 |
| 2.875% 5/15/28 | | 1,116,000 | 1,241,942 |
| 2.875% 8/15/28 | | 1,046,000 | 1,166,372 |
| 3% 10/31/25 | | 535,000 | 583,777 |
| 3.125% 11/15/28 | | 1,270,000 | 1,446,461 |
|
| TOTAL U.S. TREASURY OBLIGATIONS | | | 144,111,243 |
|
| TOTAL U.S. GOVERNMENT AND GOVERNMENT AGENCY OBLIGATIONS | | | |
| (Cost $140,314,264) | | | 149,240,185 |
|
| U.S. Government Agency - Mortgage Securities - 26.5% | | | |
| Fannie Mae - 13.1% | | | |
| 2.5% 10/1/23 to 8/1/49 | | 3,776,005 | 3,831,118 |
| 3% 10/1/30 to 11/1/48 | | 11,940,952 | 12,282,916 |
| 3.5% 12/1/25 to 6/1/49 | | 11,665,734 | 12,108,594 |
| 4% 11/1/33 to 1/1/49 | | 11,076,382 | 11,632,583 |
| 4.5% 2/1/47 to 12/1/48 | | 3,964,288 | 4,191,444 |
| 5% 4/1/25 to 3/1/49 | | 1,189,631 | 1,276,781 |
| 5.5% 9/1/40 to 5/1/49 | | 1,133,671 | 1,236,517 |
|
| TOTAL FANNIE MAE | | | 46,559,953 |
|
| Freddie Mac - 4.9% | | | |
| 2.5% 6/1/31 to 3/1/33 | | 288,666 | 293,202 |
| 3% 11/1/30 to 7/1/47 | | 3,917,636 | 4,040,358 |
| 3.5% 10/1/27 to 4/1/49 | | 7,155,044 | 7,399,775 |
| 4% 9/1/45 to 11/1/48 | | 3,450,760 | 3,615,019 |
| 4% 4/1/48 | | 19,687 | 20,576 |
| 4.5% 1/1/49 to 5/1/49 | | 1,356,256 | 1,427,089 |
| 5% 2/1/49 | | 421,645 | 450,016 |
|
| TOTAL FREDDIE MAC | | | 17,246,035 |
|
| Ginnie Mae - 7.6% | | | |
| 2.5% 3/20/47 to 10/20/47 | | 136,666 | 139,147 |
| 3% 7/20/42 to 1/20/48 | | 5,584,048 | 5,772,522 |
| 3% 9/1/49 (d) | | 200,000 | 206,242 |
| 3.5% 2/20/46 to 11/20/47 | | 8,569,920 | 8,944,789 |
| 3.5% 9/1/49 (d) | | 500,000 | 519,453 |
| 3.5% 9/1/49 (d) | | 500,000 | 519,453 |
| 4% 12/20/45 to 10/20/48 | | 4,658,458 | 4,871,178 |
| 4% 9/1/49 (d) | | 1,075,000 | 1,120,100 |
| 4% 9/1/49 (d) | | 300,000 | 312,586 |
| 4.5% 6/20/45 to 12/20/48 | | 2,889,120 | 3,040,590 |
| 4.5% 9/1/49 (d) | | 200,000 | 209,234 |
| 5% 11/20/45 to 1/20/49 | | 1,103,721 | 1,167,935 |
| 5.5% 12/20/44 to 10/20/48 | | 202,569 | 221,217 |
|
| TOTAL GINNIE MAE | | | 27,044,446 |
|
| Uniform Mortgage Backed Securities - 0.9% | | | |
| 2.5% 9/1/34 (d) | | 100,000 | 101,367 |
| 3% 9/1/34 (d) | | 200,000 | 205,078 |
| 3% 9/1/49 (d) | | 600,000 | 611,578 |
| 3.5% 9/1/34 (d) | | 100,000 | 103,625 |
| 3.5% 9/1/49 (d) | | 1,000,000 | 1,027,578 |
| 4% 9/1/49 (d) | | 500,000 | 519,035 |
| 4.5% 9/1/49 (d) | | 400,000 | 421,032 |
| 5% 9/1/49 (d) | | 100,000 | 106,813 |
|
| TOTAL UNIFORM MORTGAGE BACKED SECURITIES | | | 3,096,106 |
|
| TOTAL U.S. GOVERNMENT AGENCY - MORTGAGE SECURITIES | | | |
| (Cost $91,494,640) | | | 93,946,540 |
|
| Asset-Backed Securities - 0.2% | | | |
| American Express Credit Account Master Trust Series 2017-3 Class A, 1.77% 11/15/22 | | $100,000 | $99,842 |
| CarMax Auto Owner Trust Series 2018-3 Class A3, 3.13% 6/15/23 | | 100,000 | 101,982 |
| Citibank Credit Card Issuance Trust Series 2018-A6 Class A6, 3.21% 12/7/24 | | 200,000 | 209,835 |
| Discover Card Master Trust Series 2018-A1 Class A1, 3.03% 8/15/25 | | 100,000 | 104,355 |
| Ford Credit Floorplan Master Owner Trust: | | | |
| Series 2018-2 Class A, 3.17% 3/15/25 | | 50,000 | 52,185 |
| Series 2018-4 Class A, 4.06% 11/15/30 | | 60,000 | 67,325 |
| TOTAL ASSET-BACKED SECURITIES | | | |
| (Cost $609,905) | | | 635,524 |
|
| Commercial Mortgage Securities - 1.7% | | | |
| BANK sequential payer Series 2017-BNK4 Class ASB, 3.419% 5/15/50 | | 280,000 | 298,097 |
| Benchmark Mortgage Trust: | | | |
| Series 2019-B12 Class A5, 3.1156% 8/15/52 | | 235,000 | 252,471 |
| Series 2019-B9 Class A5, 4.0156% 3/15/52 | | 160,000 | 183,087 |
| Citigroup Commercial Mortgage Trust sequential payer: | | | |
| Series 2015-GC29 Class A4, 3.192% 4/10/48 | | 500,000 | 530,442 |
| Series 2016-C1 Class A4, 3.209% 5/10/49 | | 480,000 | 511,010 |
| COMM Mortgage Trust: | | | |
| sequential payer: | | | |
| Series 2013-CR13 Class A3, 3.928% 11/10/46 | | 44,568 | 47,835 |
| Series 2014-LC15 Class A4, 4.006% 4/10/47 | | 50,000 | 54,201 |
| Series 2013-CR6 Class A4, 3.101% 3/10/46 | | 200,000 | 206,687 |
| Freddie Mac: | | | |
| sequential payer Series K057 Class A2, 2.57% 7/25/26 | | 330,000 | 344,579 |
| Series 2017-K727 Class A2, 2.946% 7/25/24 | | 60,000 | 62,733 |
| Series K-1510 Class A2, 3.718% 1/25/31 | | 165,000 | 188,498 |
| Series K064 Class A2, 3.224% 3/25/27 | | 250,000 | 271,737 |
| Series K068 Class A2, 3.244% 8/25/27 | | 570,000 | 621,542 |
| Series K094 Class A2, 2.903% 6/25/29 | | 430,000 | 463,619 |
| Series K730 Class A2, 3.59% 1/25/25 | | 50,000 | 54,025 |
| GS Mortgage Securities Trust sequential payer Series 2014-GC26 Class A4, 3.364% 11/10/47 | | 340,000 | 360,585 |
| JPMBB Commercial Mortgage Securities Trust: | | | |
| sequential payer Series 2014-C21 Class A5, 3.7748% 8/15/47 | | 50,000 | 53,912 |
| Series 2014-C24 Class A5, 3.6385% 11/15/47 | | 400,000 | 430,162 |
| Morgan Stanley BAML Trust sequential payer Series 2013-C11 Class A4, 4.299% 8/15/46 (b) | | 160,000 | 172,181 |
| Wells Fargo Commercial Mortgage Trust: | | | |
| sequential payer Series 2019-C52 Class A5, 2.892% 8/15/52 | | 200,000 | 210,098 |
| Series 2018-C48 Class A5, 4.302% 1/15/52 | | 240,000 | 278,085 |
| WF-RBS Commercial Mortgage Trust sequential payer Series 2013-C14 Class A4, 3.073% 6/15/46 | | 370,000 | 383,905 |
| TOTAL COMMERCIAL MORTGAGE SECURITIES | | | |
| (Cost $5,599,460) | | | 5,979,491 |
|
| Municipal Securities - 0.5% | | | |
| American Muni. Pwr., Inc. Rev. (Combined Hydroelectric Proj.) Series 2010 B, 7.834% 2/15/41 | | 170,000 | 286,219 |
| California Gen. Oblig.: | | | |
| Series 2009, 7.55% 4/1/39 | | $160,000 | $268,277 |
| Series 2018, 3.5% 4/1/28 | | 175,000 | 193,470 |
| Dallas Fort Worth Int'l. Arpt. Rev. Series 2019 A, 3.144% 11/1/45 | | 20,000 | 20,972 |
| Kansas St Dev. Fin. Auth. Rev. Series 2015 H, 4.927% 4/15/45 | | 140,000 | 186,715 |
| Massachusetts Gen. Oblig. Series 2009 E, 5.456% 12/1/39 | | 145,000 | 196,527 |
| New Jersey Tpk. Auth. Tpk. Rev. Series 2010 A, 7.102% 1/1/41 | | 140,000 | 224,924 |
| New York Metropolitan Trans. Auth. Rev. Series 2010 E, 6.814% 11/15/40 | | 130,000 | 197,874 |
| Port Auth. of New York & New Jersey Series 180, 4.96% 8/1/46 | | 70,000 | 94,807 |
| Texas Gen. Oblig. Series 2015 C, 3.738% 10/1/31 | | 190,000 | 207,693 |
| TOTAL MUNICIPAL SECURITIES | | | |
| (Cost $1,634,473) | | | 1,877,478 |
|
| Foreign Government and Government Agency Obligations - 2.1% | | | |
| Alberta Province: | | | |
| 2.95% 1/23/24 | | $120,000 | $126,647 |
| 3.3% 3/15/28 | | 225,000 | 251,514 |
| Canadian Government 2% 11/15/22 | | 155,000 | 157,449 |
| Chilean Republic 3.24% 2/6/28 | | 200,000 | 218,188 |
| Colombian Republic: | | | |
| 3.875% 4/25/27 | | 200,000 | 216,563 |
| 4.5% 3/15/29 | | 200,000 | 227,188 |
| 8.125% 5/21/24 | | 275,000 | 344,438 |
| 11.75% 2/25/20 | | 220,000 | 230,106 |
| Hungarian Republic: | | | |
| 5.375% 3/25/24 | | 140,000 | 158,725 |
| 7.625% 3/29/41 | | 60,000 | 100,875 |
| Indonesian Republic 4.45% 2/11/24 | | 200,000 | 215,498 |
| Manitoba Province 2.6% 4/16/24 | | 870,000 | 907,106 |
| Ontario Province: | | | |
| 2.3% 6/15/26 | | 70,000 | 72,442 |
| 2.4% 2/8/22 | | 100,000 | 101,788 |
| 2.5% 4/27/26 | | 300,000 | 314,052 |
| 3.05% 1/29/24 | | 100,000 | 105,982 |
| Panamanian Republic: | | | |
| 4.5% 4/16/50 | | 200,000 | 248,750 |
| 6.7% 1/26/36 | | 70,000 | 102,375 |
| Peruvian Republic 6.55% 3/14/37 | | 150,000 | 227,672 |
| Philippine Republic: | | | |
| 3% 2/1/28 | | 200,000 | 212,438 |
| 9.5% 2/2/30 | | 70,000 | 115,806 |
| Polish Government 5% 3/23/22 | | 130,000 | 139,994 |
| Province of Quebec: | | | |
| 2.5% 4/9/24 | | 130,000 | 135,360 |
| 2.75% 4/12/27 | | 320,000 | 342,883 |
| United Mexican States: | | | |
| 3.5% 1/21/21 | | 595,000 | 606,528 |
| 3.625% 3/15/22 | | 150,000 | 155,203 |
| 3.75% 1/11/28 | | 400,000 | 417,600 |
| 4.15% 3/28/27 | | 200,000 | 214,000 |
| 4.5% 4/22/29 | | 400,000 | 441,800 |
| 5.55% 1/21/45 | | 50,000 | 61,550 |
| Uruguay Republic 4.975% 4/20/55 | | 110,000 | 135,472 |
| TOTAL FOREIGN GOVERNMENT AND GOVERNMENT AGENCY OBLIGATIONS | | | |
| (Cost $6,837,587) | | | 7,305,992 |
|
| Supranational Obligations - 0.8% | | | |
| African Development Bank 3% 9/20/23 | | 80,000 | 84,550 |
| Asian Development Bank: | | | |
| 1.75% 9/13/22 | | 83,000 | 83,607 |
| 2.5% 11/2/27 | | 20,000 | 21,415 |
| 2.625% 1/30/24 | | 430,000 | 451,117 |
| European Investment Bank: | | | |
| 2% 12/15/22 | | 118,000 | 120,160 |
| 2.25% 8/15/22 | | 685,000 | 699,456 |
| 2.25% 6/24/24 | | 210,000 | 217,548 |
| 3.125% 12/14/23 | | 110,000 | 117,359 |
| Inter-American Development Bank 4.375% 1/24/44 | | 190,000 | 269,986 |
| International Bank for Reconstruction & Development: | | | |
| 1.5% 8/28/24 | | 90,000 | 90,134 |
| 1.875% 10/27/26 | | 320,000 | 328,023 |
| 2.5% 3/19/24 | | 300,000 | 313,563 |
| 2.75% 7/23/21 | | 120,000 | 122,625 |
| International Finance Corp.: | | | |
| 2.25% 1/25/21 | | 50,000 | 50,373 |
| 2.875% 7/31/23 | | 39,000 | 40,996 |
| TOTAL SUPRANATIONAL OBLIGATIONS | | | |
| (Cost $2,852,964) | | | 3,010,912 |
|
| Bank Notes - 0.2% | | | |
| Bank of Nova Scotia 2.45% 9/19/22 | | 374,000 | 380,510 |
| Citizens Bank NA 3.75% 2/18/26 | | 250,000 | 270,021 |
| Discover Bank 3.35% 2/6/23 | | 250,000 | 258,706 |
| TOTAL BANK NOTES | | | |
| (Cost $863,063) | | | 909,237 |
| | | Shares | Value |
|
| Money Market Funds - 1.1% | | | |
| Fidelity Cash Central Fund 2.13% (e) | | | |
| (Cost $3,848,407) | | 3,847,849 | 3,848,618 |
| TOTAL INVESTMENT IN SECURITIES - 101.4% | | | |
| (Cost $340,344,651) | | | 359,869,372 |
| NET OTHER ASSETS (LIABILITIES) - (1.4)% | | | (5,078,294) |
| NET ASSETS - 100% | | | $354,791,078 |
Legend
(a) Security exempt from registration under Rule 144A of the Securities Act of 1933. These securities may be resold in transactions exempt from registration, normally to qualified institutional buyers. At the end of the period, the value of these securities amounted to $3,100,390 or 0.9% of net assets.
(b) Coupon rates for floating and adjustable rate securities reflect the rates in effect at period end.
(c) Coupon is indexed to a floating interest rate which may be multiplied by a specified factor and/or subject to caps or floors.
(d) Security or a portion of the security purchased on a delayed delivery or when-issued basis.
(e) Affiliated fund that is generally available only to investment companies and other accounts managed by Fidelity Investments. The rate quoted is the annualized seven-day yield of the fund at period end. A complete unaudited listing of the fund's holdings as of its most recent quarter end is available upon request. In addition, each Fidelity Central Fund's financial statements, which are not covered by the Fund's Report of Independent Registered Public Accounting Firm, are available on the SEC's website or upon request.
Affiliated Central Funds
Information regarding fiscal year to date income earned by the Fund from investments in Fidelity Central Funds is as follows:
| Fund | Income earned |
| Fidelity Cash Central Fund | $44,118 |
| Total | $44,118 |
Amounts in the income column in the above table include any capital gain distributions from underlying funds, which are presented in the corresponding line-item in the Statement of Operations, if applicable.
Investment Valuation
The following is a summary of the inputs used, as of August 31, 2019, involving the Fund's assets and liabilities carried at fair value. The inputs or methodology used for valuing securities may not be an indication of the risk associated with investing in those securities. For more information on valuation inputs, and their aggregation into the levels used below, please refer to the Investment Valuation section in the accompanying Notes to Financial Statements.
| | Valuation Inputs at Reporting Date: |
| Description | Total | Level 1 | Level 2 | Level 3 |
| Investments in Securities: | | | | |
| Corporate Bonds | $93,115,395 | $-- | $93,115,395 | $-- |
| U.S. Government and Government Agency Obligations | 149,240,185 | -- | 149,240,185 | -- |
| U.S. Government Agency - Mortgage Securities | 93,946,540 | -- | 93,946,540 | -- |
| Asset-Backed Securities | 635,524 | -- | 635,524 | -- |
| Commercial Mortgage Securities | 5,979,491 | -- | 5,979,491 | -- |
| Municipal Securities | 1,877,478 | -- | 1,877,478 | -- |
| Foreign Government and Government Agency Obligations | 7,305,992 | -- | 7,305,992 | -- |
| Supranational Obligations | 3,010,912 | -- | 3,010,912 | -- |
| Bank Notes | 909,237 | -- | 909,237 | -- |
| Money Market Funds | 3,848,618 | 3,848,618 | -- | -- |
| Total Investments in Securities: | $359,869,372 | $3,848,618 | $356,020,754 | $-- |
See accompanying notes which are an integral part of the financial statements.
Financial Statements
Statement of Assets and Liabilities
| | | August 31, 2019 |
| Assets | | |
Investment in securities, at value — See accompanying schedule:
Unaffiliated issuers (cost $336,496,244) | $356,020,754 | |
| Fidelity Central Funds (cost $3,848,407) | 3,848,618 | |
| Total Investment in Securities (cost $340,344,651) | | $359,869,372 |
| Receivable for investments sold | | 3,126,752 |
| Receivable for fund shares sold | | 802,686 |
| Interest receivable | | 2,040,144 |
| Distributions receivable from Fidelity Central Funds | | 4,580 |
| Total assets | | 365,843,534 |
| Liabilities | | |
| Payable for investments purchased | | |
| Regular delivery | $4,064,124 | |
| Delayed delivery | 5,978,283 | |
| Payable for fund shares redeemed | 261,314 | |
| Distributions payable | 748,735 | |
| Total liabilities | | 11,052,456 |
| Net Assets | | $354,791,078 |
| Net Assets consist of: | | |
| Paid in capital | | $334,094,258 |
| Total distributable earnings (loss) | | 20,696,820 |
| Net Assets, for 33,554,405 shares outstanding | | $354,791,078 |
| Net Asset Value, offering price and redemption price per share ($354,791,078 ÷ 33,554,405 shares) | | $10.57 |
See accompanying notes which are an integral part of the financial statements.
Statement of Operations
| | | Year ended August 31, 2019 |
| Investment Income | | |
| Interest | | $8,472,836 |
| Income from Fidelity Central Funds | | 44,118 |
| Total income | | 8,516,954 |
| Expenses | | |
| Independent trustees' fees and expenses | $1,208 | |
| Commitment fees | 688 | |
| Total expenses before reductions | 1,896 | |
| Expense reductions | (1,056) | |
| Total expenses after reductions | | 840 |
| Net investment income (loss) | | 8,516,114 |
| Realized and Unrealized Gain (Loss) | | |
| Net realized gain (loss) on: | | |
| Investment securities: | | |
| Unaffiliated issuers | 564,045 | |
| Fidelity Central Funds | (211) | |
| Total net realized gain (loss) | | 563,834 |
| Change in net unrealized appreciation (depreciation) on: | | |
| Investment securities: | | |
| Unaffiliated issuers | 20,936,970 | |
| Fidelity Central Funds | 211 | |
| Delayed delivery commitments | (795) | |
| Total change in net unrealized appreciation (depreciation) | | 20,936,386 |
| Net gain (loss) | | 21,500,220 |
| Net increase (decrease) in net assets resulting from operations | | $30,016,334 |
See accompanying notes which are an integral part of the financial statements.
Statement of Changes in Net Assets
| | Year ended August 31, 2019 | Year ended August 31, 2018 |
| Increase (Decrease) in Net Assets | | |
| Operations | | |
| Net investment income (loss) | $8,516,114 | $3,386,373 |
| Net realized gain (loss) | 563,834 | (274,728) |
| Change in net unrealized appreciation (depreciation) | 20,936,386 | (2,790,543) |
| Net increase (decrease) in net assets resulting from operations | 30,016,334 | 321,102 |
| Distributions to shareholders | (7,894,036) | – |
| Distributions to shareholders from net investment income | – | (3,157,745) |
| Distributions to shareholders from net realized gain | – | (371,061) |
| Total distributions | (7,894,036) | (3,528,806) |
| Share transactions | | |
| Proceeds from sales of shares | 189,795,837 | 250,043,402 |
| Reinvestment of distributions | 513,222 | 1,585,049 |
| Cost of shares redeemed | (87,409,397) | (85,080,774) |
| Net increase (decrease) in net assets resulting from share transactions | 102,899,662 | 166,547,677 |
| Total increase (decrease) in net assets | 125,021,960 | 163,339,973 |
| Net Assets | | |
| Beginning of period | 229,769,118 | 66,429,145 |
| End of period | $354,791,078 | $229,769,118 |
| Other Information | | |
| Undistributed net investment income end of period | | $205,258 |
| Shares | | |
| Sold | 18,946,491 | 25,296,839 |
| Issued in reinvestment of distributions | 51,103 | 157,723 |
| Redeemed | (8,755,986) | (8,600,065) |
| Net increase (decrease) | 10,241,608 | 16,854,497 |
See accompanying notes which are an integral part of the financial statements.
Financial Highlights
Fidelity Flex U.S. Bond Index Fund
| | | | |
| Years ended August 31, | 2019 | 2018 | 2017 A |
| Selected Per–Share Data | | | |
| Net asset value, beginning of period | $9.86 | $10.29 | $10.00 |
| Income from Investment Operations | | | |
| Net investment income (loss)B | .306 | .275 | .110 |
| Net realized and unrealized gain (loss) | .688 | (.390) | .288 |
| Total from investment operations | .994 | (.115) | .398 |
| Distributions from net investment income | (.284) | (.258) | (.108) |
| Distributions from net realized gain | – | (.057) | – |
| Total distributions | (.284) | (.315) | (.108) |
| Net asset value, end of period | $10.57 | $9.86 | $10.29 |
| Total ReturnC | 10.28% | (1.12)% | 3.99% |
| Ratios to Average Net AssetsD,E | | | |
| Expenses before reductionsF | -% | -% | - %G |
| Expenses net of fee waivers, if anyF | -% | -% | - %G |
| Expenses net of all reductionsF | -% | -% | - %G |
| Net investment income (loss) | 3.06% | 2.82% | 2.24%G |
| Supplemental Data | | | |
| Net assets, end of period (000 omitted) | $354,791 | $229,769 | $66,429 |
| Portfolio turnover rateH | 85% | 102% | 129%I |
A For the period March 9, 2017 (commencement of operations) to August 31, 2017.
B Calculated based on average shares outstanding during the period.
C Total returns for periods of less than one year are not annualized.
D Fees and expenses of any underlying Fidelity Central Funds are not included in the Fund's expense ratio. The Fund indirectly bears its proportionate share of the expenses of any underlying Fidelity Central Funds.
E Expense ratios reflect operating expenses of the Fund. Expenses before reductions do not reflect amounts reimbursed by the investment adviser or reductions from expense offset arrangements and do not represent the amount paid by the Fund during periods when reimbursements or reductions occur. Expenses net of fee waivers reflect expenses after reimbursement by the investment adviser but prior to reductions from expense offset arrangements. Expenses net of all reductions represent the net expenses paid by the Fund.
F Amount represents less than .005%.
G Annualized
H Amount does not include the portfolio activity of any underlying Fidelity Central Funds.
I Amount not annualized.
See accompanying notes which are an integral part of the financial statements.
Notes to Financial Statements
For the period ended August 31, 2019
1. Organization.
Fidelity Flex U.S. Bond Index Fund (the Fund) is a fund of Fidelity Salem Street Trust (the Trust) and is authorized to issue an unlimited number of shares. Share transactions on the Statement of Changes in Net Assets may contain exchanges between affiliated funds. The Trust is registered under the Investment Company Act of 1940, as amended (the 1940 Act), as an open-end management investment company organized as a Massachusetts business trust. The Fund is available only to certain fee-based accounts offered by Fidelity.
2. Investments in Fidelity Central Funds.
The Fund invests in Fidelity Central Funds, which are open-end investment companies generally available only to other investment companies and accounts managed by the investment adviser and its affiliates. The Fund's Schedule of Investments lists each of the Fidelity Central Funds held as of period end, if any, as an investment of the Fund, but does not include the underlying holdings of each Fidelity Central Fund. As an Investing Fund, the Fund indirectly bears its proportionate share of the expenses of the underlying Fidelity Central Funds.
The Money Market Central Funds seek preservation of capital and current income and are managed by Fidelity Investments Money Management, Inc. (FIMM), an affiliate of the investment adviser. Annualized expenses of the Money Market Central Funds as of their most recent shareholder report date ranged from less than .005% to .01%.
A complete unaudited list of holdings for each Fidelity Central Fund is available upon request or at the Securities and Exchange Commission (the SEC) website at www.sec.gov. In addition, the financial statements of the Fidelity Central Funds, which are not covered by the Fund's Report of Independent Registered Public Accounting Firm, are available on the SEC website or upon request.
3. Significant Accounting Policies.
The Fund is an investment company and applies the accounting and reporting guidance of the Financial Accounting Standards Board (FASB) Accounting Standards Codification Topic 946 Financial Services – Investments Companies. The financial statements have been prepared in conformity with accounting principles generally accepted in the United States of America (GAAP), which require management to make certain estimates and assumptions at the date of the financial statements. Actual results could differ from those estimates. Subsequent events, if any, through the date that the financial statements were issued have been evaluated in the preparation of the financial statements. The following summarizes the significant accounting policies of the Fund:
Investment Valuation. Investments are valued as of 4:00 p.m. Eastern time on the last calendar day of the period. The Board of Trustees (the Board) has delegated the day to day responsibility for the valuation of the Fund's investments to the Fair Value Committee (the Committee) established by the Fund's investment adviser. In accordance with valuation policies and procedures approved by the Board, the Fund attempts to obtain prices from one or more third party pricing vendors or brokers to value its investments. When current market prices, quotations or currency exchange rates are not readily available or reliable, investments will be fair valued in good faith by the Committee, in accordance with procedures adopted by the Board. Factors used in determining fair value vary by investment type and may include market or investment specific events, changes in interest rates and credit quality. The frequency with which these procedures are used cannot be predicted and they may be utilized to a significant extent. The Committee oversees the Fund's valuation policies and procedures and reports to the Board on the Committee's activities and fair value determinations. The Board monitors the appropriateness of the procedures used in valuing the Fund's investments and ratifies the fair value determinations of the Committee.
The Fund categorizes the inputs to valuation techniques used to value its investments into a disclosure hierarchy consisting of three levels as shown below:
- Level 1 – quoted prices in active markets for identical investments
- Level 2 – other significant observable inputs (including quoted prices for similar investments, interest rates, prepayment speeds, etc.)
- Level 3 – unobservable inputs (including the Fund's own assumptions based on the best information available)
Valuation techniques used to value the Fund's investments by major category are as follows:
Debt securities, including restricted securities, are valued based on evaluated prices received from third party pricing vendors or from brokers who make markets in such securities. Corporate bonds, bank notes, foreign government and government agency obligations, municipal securities, supranational obligations and U.S. government and government agency obligations are valued by pricing vendors who utilize matrix pricing which considers yield or price of bonds of comparable quality, coupon, maturity and type or by broker-supplied prices. Asset backed securities, commercial mortgage securities and U.S. government agency mortgage securities are valued by pricing vendors who utilize matrix pricing which considers prepayment speed assumptions, attributes of the collateral, yield or price of bonds of comparable quality, coupon, maturity and type or by broker-supplied prices. When independent prices are unavailable or unreliable, debt securities may be valued utilizing pricing methodologies which consider similar factors that would be used by third party pricing vendors. Debt securities are generally categorized as Level 2 in the hierarchy but may be Level 3 depending on the circumstances.
Investments in open-end mutual funds, including the Fidelity Central Funds, are valued at their closing net asset value (NAV) each business day and are categorized as Level 1 in the hierarchy.
Changes in valuation techniques may result in transfers in or out of an assigned level within the disclosure hierarchy. The aggregate value of investments by input level as of August 31, 2019 is included at the end of the Fund's Schedule of Investments.
Investment Transactions and Income. For financial reporting purposes, the Fund's investment holdings and NAV include trades executed through the end of the last business day of the period. The NAV per share for processing shareholder transactions is calculated as of the close of business of the New York Stock Exchange (NYSE), normally 4:00 p.m. Eastern time and includes trades executed through the end of the prior business day. Gains and losses on securities sold are determined on the basis of identified cost. Income and capital gain distributions from Fidelity Central Funds, if any, are recorded on the ex-dividend date. Interest income is accrued as earned and includes coupon interest and amortization of premium and accretion of discount on debt securities as applicable. Debt obligations may be placed on non-accrual status and related interest income may be reduced by ceasing current accruals and writing off interest receivables when the collection of all or a portion of interest has become doubtful based on consistently applied procedures. A debt obligation is removed from non-accrual status when the issuer resumes interest payments or when collectability of interest is reasonably assured.
Expenses. Expenses directly attributable to a fund are charged to that fund. Expenses attributable to more than one fund are allocated among the respective funds on the basis of relative net assets or other appropriate methods. Expense estimates are accrued in the period to which they relate and adjustments are made when actual amounts are known.
Income Tax Information and Distributions to Shareholders. Each year, the Fund intends to qualify as a regulated investment company under Subchapter M of the Internal Revenue Code, including distributing substantially all of its taxable income and realized gains. As a result, no provision for U.S. Federal income taxes is required. As of August 31, 2019, the Fund did not have any unrecognized tax benefits in the financial statements; nor is the Fund aware of any tax positions for which it is reasonably possible that the total amounts of unrecognized tax benefits will significantly change in the next twelve months. The Fund files a U.S. federal tax return, in addition to state and local tax returns as required. The Fund's federal income tax returns are subject to examination by the Internal Revenue Service (IRS) for a period of three fiscal years after they are filed. State and local tax returns may be subject to examination for an additional fiscal year depending on the jurisdiction.
Distributions are declared and recorded daily and paid monthly from net investment income. Distributions from realized gains, if any, are declared and recorded on the ex-dividend date. Income and capital gain distributions are determined in accordance with income tax regulations, which may differ from GAAP. In addition, the Fund claimed a portion of the payment made to redeeming shareholders as a distribution for income tax purposes.
Capital accounts within the financial statements are adjusted for permanent book-tax differences. These adjustments have no impact on net assets or the results of operations. Capital accounts are not adjusted for temporary book-tax differences which will reverse in a subsequent period.
Book-tax differences are primarily due to market discount, capital loss carryforwards and losses deferred due to wash sales.
As of period end, the cost and unrealized appreciation (depreciation) in securities, and derivatives if applicable, for federal income tax purposes were as follows:
| Gross unrealized appreciation | $20,191,093 |
| Gross unrealized depreciation | (36,963) |
| Net unrealized appreciation (depreciation) | $20,154,130 |
| Tax Cost | $339,715,242 |
The tax-based components of distributable earnings as of period end were as follows:
| Undistributed ordinary income | $506,372 |
| Undistributed long-term capital gain | $36,318 |
| Net unrealized appreciation (depreciation) on securities and other investments | $20,154,130 |
The tax character of distributions paid was as follows:
| | August 31, 2019 | August 31, 2018 |
| Ordinary Income | $7,894,036 | $ 3,528,806 |
Delayed Delivery Transactions and When-Issued Securities. During the period, the Fund transacted in securities on a delayed delivery or when-issued basis. Payment and delivery may take place after the customary settlement period for that security. The price of the underlying securities and the date when the securities will be delivered and paid for are fixed at the time the transaction is negotiated. The securities purchased on a delayed delivery or when-issued basis are identified as such in the Fund's Schedule of Investments. The Fund may receive compensation for interest forgone in the purchase of a delayed delivery or when-issued security. With respect to purchase commitments, the Fund identifies securities as segregated in its records with a value at least equal to the amount of the commitment. Losses may arise due to changes in the value of the underlying securities or if the counterparty does not perform under the contract's terms, or if the issuer does not issue the securities due to political, economic, or other factors.
To-Be-Announced (TBA) Securities and Mortgage Dollar Rolls. During the period, the Fund transacted in TBA securities that involved buying or selling mortgage-backed securities (MBS) on a forward commitment basis. A TBA transaction typically does not designate the actual security to be delivered and only includes an approximate principal amount; however delivered securities must meet specified terms defined by industry guidelines, including issuer, rate and current principal amount outstanding on underlying mortgage pools. The Fund may enter into a TBA transaction with the intent to take possession of or deliver the underlying MBS, or the Fund may elect to extend the settlement by entering into either a mortgage or reverse mortgage dollar roll. Mortgage dollar rolls are transactions where a fund sells TBA securities and simultaneously agrees to repurchase MBS on a later date at a lower price and with the same counterparty. Reverse mortgage dollar rolls involve the purchase and simultaneous agreement to sell TBA securities on a later date at a lower price. Transactions in mortgage dollar rolls and reverse mortgage dollar rolls are accounted for as purchases and sales and may result in an increase to the Fund's portfolio turnover rate.
Purchases and sales of TBA securities involve risks similar to those discussed above for delayed delivery and when-issued securities. Also, if the counterparty in a mortgage dollar roll or a reverse mortgage dollar roll transaction files for bankruptcy or becomes insolvent, the Fund's right to repurchase or sell securities may be limited. Additionally, when a fund sells TBA securities without already owning or having the right to obtain the deliverable securities (an uncovered forward commitment to sell), it incurs a risk of loss because it could have to purchase the securities at a price that is higher than the price at which it sold them. A fund may be unable to purchase the deliverable securities if the corresponding market is illiquid.
Restricted Securities. The Fund may invest in securities that are subject to legal or contractual restrictions on resale. These securities generally may be resold in transactions exempt from registration or to the public if the securities are registered. Disposal of these securities may involve time-consuming negotiations and expense, and prompt sale at an acceptable price may be difficult. Information regarding restricted securities is included at the end of the Fund's Schedule of Investments.
New Rule Issuance. During August 2018, the U.S. Securities and Exchange Commission issued Final Rule Release No. 33-10532, Disclosure Update and Simplification. This Final Rule includes amendments specific to registered investment companies that are intended to eliminate overlap in disclosure requirements between Regulation S-X and GAAP. In accordance with these amendments, certain line-items in the Fund's financial statements have been combined or removed for the current period as outlined in the table below.
| Financial Statement | Current Line-Item Presentation (As Applicable) | Prior Line-Item Presentation (As Applicable) |
| Statement of Assets and Liabilities | Total distributable earnings (loss) | Undistributed/Distributions in excess of/Accumulated net investment income (loss)
Accumulated/Undistributed net realized gain (loss)
Net unrealized appreciation (depreciation) |
| Statement of Changes in Net Assets | N/A - removed | Undistributed/Distributions in excess of/Accumulated net investment income (loss) end of period |
| Statement of Changes in Net Assets | Distributions to shareholders | Distributions to shareholders from net investment income
Distributions to shareholders from net realized gain |
4. Purchases and Sales of Investments.
Purchases and sales of securities, other than short-term securities and U.S. government securities, aggregated $35,364,216 and $2,187,357, respectively.
5. Fees and Other Transactions with Affiliates.
Management Fee. Fidelity Management & Research Company (the investment adviser) and its affiliates provide the Fund with investment management related services and the Fund does not pay any fees for these services. Under the management contract, the investment adviser or an affiliate pays all other expenses of the Fund, excluding fees and expenses of the independent Trustees, and certain miscellaneous expenses such as proxy and shareholder meeting expenses.
Interfund Trades. The Fund may purchase from or sell securities to other Fidelity Funds under procedures adopted by the Board. The procedures have been designed to ensure these interfund trades are executed in accordance with Rule 17a-7 of the 1940 Act. Interfund trades are included within the respective purchases and sales amounts shown in the Purchases and Sales of Investments note.
6. Committed Line of Credit.
The Fund participates with other funds managed by the investment adviser or an affiliate in a $4.25 billion credit facility (the "line of credit") to be utilized for temporary or emergency purposes to fund shareholder redemptions or for other short-term liquidity purposes. The Fund has agreed to pay commitment fees on its pro-rata portion of the line of credit, which amounted to $688 and is reflected in Commitment fees on the Statement of Operations. During the period, the Fund did not borrow on this line of credit.
7. Expense Reductions.
Through arrangements with the Fund's custodian, credits realized as a result of certain uninvested cash balances were used to reduce the Fund's expenses. During the period, these credits reduced the Fund's expenses by $1,056.
8. Other.
The Fund's organizational documents provide former and current trustees and officers with a limited indemnification against liabilities arising in connection with the performance of their duties to the Fund. In the normal course of business, the Fund may also enter into contracts that provide general indemnifications. The Fund's maximum exposure under these arrangements is unknown as this would be dependent on future claims that may be made against the Fund. The risk of material loss from such claims is considered remote.
Report of Independent Registered Public Accounting Firm
To the Board of Trustees of Fidelity Salem Street Trust and Shareholders of Fidelity Flex U.S. Bond Index Fund:
Opinion on the Financial Statements
We have audited the accompanying statement of assets and liabilities, including the schedule of investments, of Fidelity Flex U.S. Bond Index Fund (one of the funds constituting Fidelity Salem Street Trust, referred to hereafter as the “Fund”) as of August 31, 2019, the related statement of operations for the year ended August 31, 2019, the statement of changes in net assets for each of the two years in the period ended August 31, 2019, including the related notes, and the financial highlights for each of the two years in the period ended August 31, 2019 and for the period March 9, 2017 (commencement of operations) through August 31, 2017 (collectively referred to as the “financial statements”). In our opinion, the financial statements present fairly, in all material respects, the financial position of the Fund as of August 31, 2019, the results of its operations for the year then ended, the changes in its net assets for each of the two years in the period ended August 31, 2019 and the financial highlights for each of the two years in the period ended August 31, 2019 and for the period March 9, 2017 (commencement of operations) through August 31, 2017 in conformity with accounting principles generally accepted in the United States of America.
Basis for Opinion
These financial statements are the responsibility of the Fund’s management. Our responsibility is to express an opinion on the Fund’s financial statements based on our audits. We are a public accounting firm registered with the Public Company Accounting Oversight Board (United States) (PCAOB) and are required to be independent with respect to the Fund in accordance with the U.S. federal securities laws and the applicable rules and regulations of the Securities and Exchange Commission and the PCAOB.
We conducted our audits of these financial statements in accordance with the standards of the PCAOB. Those standards require that we plan and perform the audit to obtain reasonable assurance about whether the financial statements are free of material misstatement, whether due to error or fraud.
Our audits included performing procedures to assess the risks of material misstatement of the financial statements, whether due to error or fraud, and performing procedures that respond to those risks. Such procedures included examining, on a test basis, evidence regarding the amounts and disclosures in the financial statements. Our audits also included evaluating the accounting principles used and significant estimates made by management, as well as evaluating the overall presentation of the financial statements. Our procedures included confirmation of securities owned as of August 31, 2019 by correspondence with the custodian and brokers; when replies were not received from brokers, we performed other auditing procedures. We believe that our audits provide a reasonable basis for our opinion.
PricewaterhouseCoopers LLP
Boston, Massachusetts
October 17, 2019
We have served as the auditor of one or more investment companies in the Fidelity group of funds since 1932.
Trustees and Officers
The Trustees, Members of the Advisory Board (if any), and officers of the trust and fund, as applicable, are listed below. The Board of Trustees governs the fund and is responsible for protecting the interests of shareholders. The Trustees are experienced executives who meet periodically throughout the year to oversee the fund's activities, review contractual arrangements with companies that provide services to the fund, oversee management of the risks associated with such activities and contractual arrangements, and review the fund's performance. Except for Jonathan Chiel, each of the Trustees oversees 276 funds. Mr. Chiel oversees 170 funds.
The Trustees hold office without limit in time except that (a) any Trustee may resign; (b) any Trustee may be removed by written instrument, signed by at least two-thirds of the number of Trustees prior to such removal; (c) any Trustee who requests to be retired or who has become incapacitated by illness or injury may be retired by written instrument signed by a majority of the other Trustees; and (d) any Trustee may be removed at any special meeting of shareholders by a two-thirds vote of the outstanding voting securities of the trust. Each Trustee who is not an interested person (as defined in the 1940 Act) of the trust and the fund is referred to herein as an Independent Trustee. Each Independent Trustee shall retire not later than the last day of the calendar year in which his or her 75th birthday occurs. The Independent Trustees may waive this mandatory retirement age policy with respect to individual Trustees. Officers and Advisory Board Members hold office without limit in time, except that any officer or Advisory Board Member may resign or may be removed by a vote of a majority of the Trustees at any regular meeting or any special meeting of the Trustees. Except as indicated, each individual has held the office shown or other offices in the same company for the past five years.
The fund’s Statement of Additional Information (SAI) includes more information about the Trustees. To request a free copy, call Fidelity at 1-800-544-3455 (for managed account clients) or 1-800-835-5092 (for retirement plan participants).
Experience, Skills, Attributes, and Qualifications of the Trustees. The Governance and Nominating Committee has adopted a statement of policy that describes the experience, qualifications, attributes, and skills that are necessary and desirable for potential Independent Trustee candidates (Statement of Policy). The Board believes that each Trustee satisfied at the time he or she was initially elected or appointed a Trustee, and continues to satisfy, the standards contemplated by the Statement of Policy. The Governance and Nominating Committee also engages professional search firms to help identify potential Independent Trustee candidates who have the experience, qualifications, attributes, and skills consistent with the Statement of Policy. From time to time, additional criteria based on the composition and skills of the current Independent Trustees, as well as experience or skills that may be appropriate in light of future changes to board composition, business conditions, and regulatory or other developments, have also been considered by the professional search firms and the Governance and Nominating Committee. In addition, the Board takes into account the Trustees' commitment and participation in Board and committee meetings, as well as their leadership of standing and ad hoc committees throughout their tenure.
In determining that a particular Trustee was and continues to be qualified to serve as a Trustee, the Board has considered a variety of criteria, none of which, in isolation, was controlling. The Board believes that, collectively, the Trustees have balanced and diverse experience, qualifications, attributes, and skills, which allow the Board to operate effectively in governing the fund and protecting the interests of shareholders. Information about the specific experience, skills, attributes, and qualifications of each Trustee, which in each case led to the Board's conclusion that the Trustee should serve (or continue to serve) as a trustee of the fund, is provided below.
Board Structure and Oversight Function. Abigail P. Johnson is an interested person and currently serves as Chairman. The Trustees have determined that an interested Chairman is appropriate and benefits shareholders because an interested Chairman has a personal and professional stake in the quality and continuity of services provided to the fund. Independent Trustees exercise their informed business judgment to appoint an individual of their choosing to serve as Chairman, regardless of whether the Trustee happens to be independent or a member of management. The Independent Trustees have determined that they can act independently and effectively without having an Independent Trustee serve as Chairman and that a key structural component for assuring that they are in a position to do so is for the Independent Trustees to constitute a substantial majority for the Board. The Independent Trustees also regularly meet in executive session. Arthur E. Johnson serves as Chairman of the Independent Trustees and as such (i) acts as a liaison between the Independent Trustees and management with respect to matters important to the Independent Trustees and (ii) with management prepares agendas for Board meetings.
Fidelity® funds are overseen by different Boards of Trustees. The fund's Board oversees Fidelity's investment-grade bond, money market, asset allocation and certain equity funds, and other Boards oversee Fidelity's high income and other equity funds. The asset allocation funds may invest in Fidelity® funds that are overseen by such other Boards. The use of separate Boards, each with its own committee structure, allows the Trustees of each group of Fidelity® funds to focus on the unique issues of the funds they oversee, including common research, investment, and operational issues. On occasion, the separate Boards establish joint committees to address issues of overlapping consequences for the Fidelity® funds overseen by each Board.
The Trustees operate using a system of committees to facilitate the timely and efficient consideration of all matters of importance to the Trustees, the fund, and fund shareholders and to facilitate compliance with legal and regulatory requirements and oversight of the fund's activities and associated risks. The Board, acting through its committees, has charged FMR and its affiliates with (i) identifying events or circumstances the occurrence of which could have demonstrably adverse effects on the fund's business and/or reputation; (ii) implementing processes and controls to lessen the possibility that such events or circumstances occur or to mitigate the effects of such events or circumstances if they do occur; and (iii) creating and maintaining a system designed to evaluate continuously business and market conditions in order to facilitate the identification and implementation processes described in (i) and (ii) above. Because the day-to-day operations and activities of the fund are carried out by or through FMR, its affiliates, and other service providers, the fund's exposure to risks is mitigated but not eliminated by the processes overseen by the Trustees. While each of the Board's committees has responsibility for overseeing different aspects of the fund's activities, oversight is exercised primarily through the Operations and Audit Committees. In addition, an ad hoc Board committee of Independent Trustees has worked with FMR to enhance the Board's oversight of investment and financial risks, legal and regulatory risks, technology risks, and operational risks, including the development of additional risk reporting to the Board. Appropriate personnel, including but not limited to the fund's Chief Compliance Officer (CCO), FMR's internal auditor, the independent accountants, the fund's Treasurer and portfolio management personnel, make periodic reports to the Board's committees, as appropriate, including an annual review of Fidelity's risk management program for the Fidelity® funds. The responsibilities of each standing committee, including their oversight responsibilities, are described further under "Standing Committees of the Trustees."
Interested Trustees*:
Correspondence intended for a Trustee who is an interested person may be sent to Fidelity Investments, 245 Summer Street, Boston, Massachusetts 02210.
Name, Year of Birth; Principal Occupations and Other Relevant Experience+
Jonathan Chiel (1957)
Year of Election or Appointment: 2016
Trustee
Mr. Chiel also serves as Trustee of other Fidelity® funds. Mr. Chiel is Executive Vice President and General Counsel for FMR LLC (diversified financial services company, 2012-present). Previously, Mr. Chiel served as general counsel (2004-2012) and senior vice president and deputy general counsel (2000-2004) for John Hancock Financial Services; a partner with Choate, Hall & Stewart (1996-2000) (law firm); and an Assistant United States Attorney for the United States Attorney’s Office of the District of Massachusetts (1986-95), including Chief of the Criminal Division (1993-1995). Mr. Chiel is a director on the boards of the Boston Bar Foundation and the Maimonides School.
Abigail P. Johnson (1961)
Year of Election or Appointment: 2009
Trustee
Chairman of the Board of Trustees
Ms. Johnson also serves as Trustee of other Fidelity® funds. Ms. Johnson serves as Chairman (2016-present), Chief Executive Officer (2014-present), and Director (2007-present) of FMR LLC (diversified financial services company), President of Fidelity Financial Services (2012-present) and President of Personal, Workplace and Institutional Services (2005-present). Ms. Johnson is Chairman and Director of FMR Co., Inc. (investment adviser firm, 2011-present) and Chairman and Director of FMR (investment adviser firm, 2011-present). Previously, Ms. Johnson served as Vice Chairman (2007-2016) and President (2013-2016) of FMR LLC, President and a Director of FMR (2001-2005), a Trustee of other investment companies advised by FMR, Fidelity Investments Money Management, Inc. (investment adviser firm), and FMR Co., Inc. (2001-2005), Senior Vice President of the Fidelity® funds (2001-2005), and managed a number of Fidelity® funds. Ms. Abigail P. Johnson and Mr. Arthur E. Johnson are not related.
Jennifer Toolin McAuliffe (1959)
Year of Election or Appointment: 2016
Trustee
Ms. McAuliffe also serves as Trustee of other Fidelity® funds. Ms. McAuliffe previously served as a Member of the Advisory Board of certain Fidelity® funds (2016) and as Co-Head of Fixed Income of Fidelity Investments Limited (now known as FIL Limited (FIL)) (diversified financial services company). Earlier roles at FIL included Director of Research for FIL’s credit and quantitative teams in London, Hong Kong and Tokyo. Ms. McAuliffe also was the Director of Research for taxable and municipal bonds at Fidelity Investments Money Management, Inc. Ms. McAuliffe is also a director or trustee of several not-for-profit entities.
* Determined to be an “Interested Trustee” by virtue of, among other things, his or her affiliation with the trust or various entities under common control with FMR.
+ The information includes the Trustee's principal occupation during the last five years and other information relating to the experience, attributes, and skills relevant to the Trustee's qualifications to serve as a Trustee, which led to the conclusion that the Trustee should serve as a Trustee for the fund.
Independent Trustees:
Correspondence intended for an Independent Trustee may be sent to Fidelity Investments, P.O. Box 55235, Boston, Massachusetts 02205-5235.
Name, Year of Birth; Principal Occupations and Other Relevant Experience+
Elizabeth S. Acton (1951)
Year of Election or Appointment: 2013
Trustee
Ms. Acton also serves as Trustee of other Fidelity® funds. Prior to her retirement in April 2012, Ms. Acton was Executive Vice President, Finance (2011-2012), Executive Vice President, Chief Financial Officer (2002-2011), and Treasurer (2004-2005) of Comerica Incorporated (financial services). Prior to joining Comerica, Ms. Acton held a variety of positions at Ford Motor Company (1983-2002), including Vice President and Treasurer (2000-2002) and Executive Vice President and Chief Financial Officer of Ford Motor Credit Company (1998-2000). Ms. Acton currently serves as a member of the Board of Directors and Audit and Finance Committees of Beazer Homes USA, Inc. (homebuilding, 2012-present). Previously, Ms. Acton served as a Member of the Advisory Board of certain Fidelity® funds (2013-2016).
Ann E. Dunwoody (1953)
Year of Election or Appointment: 2018
Trustee
General Dunwoody also serves as Trustee of other Fidelity® funds. General Dunwoody (United States Army, Retired) was the first woman in U.S. military history to achieve the rank of four-star general and prior to her retirement in 2012 held a variety of positions within the U.S. Army, including Commanding General, U.S. Army Material Command (2008-2012). She is the President of First to Four LLC (leadership and mentoring services, 2012-present). She also serves as a member of the Board of Directors and Nominating and Corporate Governance Committee of L3 Technologies, Inc. (communication, electronic, sensor, and aerospace systems, 2013-present), Board of Directors and Nomination and Corporate Governance Committees of Kforce Inc. (professional staffing services, 2016-present) and Board of Directors of Automattic Inc. (software engineering, 2018-present). Previously, General Dunwoody served as a Member of the Advisory Board of certain Fidelity® funds (2018), a member of the Board of Directors and Audit and Sustainability and Corporate Responsibility Committees of Republic Services, Inc. (waste collection, disposal and recycling, 2013-2016). Ms. Dunwoody also serves on several boards for non-profit organizations, including as a member of the Board of Directors, Chair of the Nomination and Governance Committee and member of the Audit Committee of Logistics Management Institute (consulting non-profit, 2012-present), a member of the Board of Directors of the Army Historical Foundation (2015-present), a member of the Council of Trustees for the Association of the United States Army (advocacy non-profit, 2013-present) and a member of the Board of Trustees of Florida Institute of Technology (2015-present) and ThanksUSA (military family education non-profit, 2014-present).
John Engler (1948)
Year of Election or Appointment: 2014
Trustee
Mr. Engler also serves as Trustee of other Fidelity® funds. He serves on the board of directors for Universal Forest Products (manufacturer and distributor of wood and wood-alternative products, 2003-present) and K12 Inc. (technology-based education company, 2012-present). Previously, Mr. Engler served as interim president of Michigan State University (2018-2019), a Member of the Advisory Board of certain Fidelity® funds (2014-2016), president of the Business Roundtable (2011-2017), a trustee of The Munder Funds (2003-2014), president and CEO of the National Association of Manufacturers (2004-2011), member of the Board of Trustees of the Annie E. Casey Foundation (2004-2015), and as governor of Michigan (1991-2003). He is a past chairman of the National Governors Association.
Robert F. Gartland (1951)
Year of Election or Appointment: 2010
Trustee
Mr. Gartland also serves as Trustee of other Fidelity® funds. Mr. Gartland is Chairman and an investor in Gartland & Mellina Group Corp. (consulting, 2009-present). Previously, Mr. Gartland served as a partner and investor of Vietnam Partners LLC (investments and consulting, 2008-2011). Prior to his retirement, Mr. Gartland held a variety of positions at Morgan Stanley (financial services, 1979-2007), including Managing Director (1987-2007), and Chase Manhattan Bank (1975-1978).
Arthur E. Johnson (1947)
Year of Election or Appointment: 2008
Trustee
Chairman of the Independent Trustees
Mr. Johnson also serves as Trustee of other Fidelity® funds. Mr. Johnson serves as a member of the Board of Directors of Eaton Corporation plc (diversified power management, 2009-present) and Booz Allen Hamilton (management consulting, 2011-present). Prior to his retirement, Mr. Johnson served as Senior Vice President of Corporate Strategic Development of Lockheed Martin Corporation (defense contractor, 1999-2009). Mr. Johnson previously served as Vice Chairman (2015-2018) of the Independent Trustees of certain Fidelity® funds and on the Board of Directors of IKON Office Solutions, Inc. (1999-2008), AGL Resources, Inc. (holding company, 2002-2016), and Delta Airlines (2005-2007). Mr. Arthur E. Johnson is not related to Ms. Abigail P. Johnson.
Michael E. Kenneally (1954)
Year of Election or Appointment: 2009
Trustee
Vice Chairman of the Independent Trustees
Mr. Kenneally also serves as Trustee of other Fidelity® funds. Prior to his retirement, Mr. Kenneally served as Chairman and Global Chief Executive Officer of Credit Suisse Asset Management. Before joining Credit Suisse, he was an Executive Vice President and Chief Investment Officer for Bank of America Corporation. Earlier roles at Bank of America included Director of Research, Senior Portfolio Manager and Research Analyst, and Mr. Kenneally was awarded the Chartered Financial Analyst (CFA) designation in 1991.
Marie L. Knowles (1946)
Year of Election or Appointment: 2001
Trustee
Ms. Knowles also serves as Trustee of other Fidelity® funds. Prior to Ms. Knowles' retirement in June 2000, she served as Executive Vice President and Chief Financial Officer of Atlantic Richfield Company (ARCO) (diversified energy, 1996-2000). From 1993 to 1996, she was a Senior Vice President of ARCO and President of ARCO Transportation Company (pipeline and tanker operations). Ms. Knowles currently serves as a Director and Chairman of the Audit Committee of McKesson Corporation (healthcare service, since 2002). Ms. Knowles is a member of the Board of the Santa Catalina Island Company (real estate, 2009-present). Ms. Knowles is a Member of the Investment Company Institute Board of Governors and a Member of the Governing Council of the Independent Directors Council (2014-present). She also serves as a member of the Advisory Board for the School of Engineering of the University of Southern California. Previously, Ms. Knowles served as a Director of Phelps Dodge Corporation (copper mining and manufacturing, 1994-2007), URS Corporation (engineering and construction, 2000-2003) and America West (airline, 1999-2002). Ms. Knowles previously served as Chairman (2015-2018) and Vice Chairman (2012-2015) of the Independent Trustees of certain Fidelity® funds.
Mark A. Murray (1954)
Year of Election or Appointment: 2016
Trustee
Mr. Murray also serves as Trustee of other Fidelity® funds. Mr. Murray is Vice Chairman (2013-present) of Meijer, Inc. (regional retail chain). Previously, Mr. Murray served as a Member of the Advisory Board of certain Fidelity® funds (2016) and as Co-Chief Executive Officer (2013-2016) and President (2006-2013) of Meijer, Inc. Mr. Murray serves as a member of the Board of Directors and Nuclear Review and Public Policy and Responsibility Committees of DTE Energy Company (diversified energy company, 2009-present). Mr. Murray also serves as a member of the Board of Directors of Spectrum Health (not-for-profit health system, 2015-present). Mr. Murray previously served as President of Grand Valley State University (2001-2006), Treasurer for the State of Michigan (1999-2001), Vice President of Finance and Administration for Michigan State University (1998-1999), and a member of the Board of Directors and Audit Committee and Chairman of the Nominating and Corporate Governance Committee of Universal Forest Products, Inc. (manufacturer and distributor of wood and wood-alternative products, 2004-2016). Mr. Murray is also a director or trustee of many community and professional organizations.
+ The information includes the Trustee's principal occupation during the last five years and other information relating to the experience, attributes, and skills relevant to the Trustee's qualifications to serve as a Trustee, which led to the conclusion that the Trustee should serve as a Trustee for the fund.
Advisory Board Members and Officers:
Correspondence intended for an officer may be sent to Fidelity Investments, 245 Summer Street, Boston, Massachusetts 02210. Officers appear below in alphabetical order.
Name, Year of Birth; Principal Occupation
Elizabeth Paige Baumann (1968)
Year of Election or Appointment: 2017
Anti-Money Laundering (AML) Officer
Ms. Baumann also serves as AML Officer of other funds. She is Chief AML Officer (2012-present) and Senior Vice President (2014-present) of FMR LLC (diversified financial services company) and is an employee of Fidelity Investments. Previously, Ms. Baumann served as AML Officer of the funds (2012-2016), and Vice President (2007-2014) and Deputy Anti-Money Laundering Officer (2007-2012) of FMR LLC.
Craig S. Brown (1977)
Year of Election or Appointment: 2019
Assistant Treasurer
Mr. Brown also serves as Assistant Treasurer of other funds. Mr. Brown is an employee of Fidelity Investments (2013-present).
John J. Burke III (1964)
Year of Election or Appointment: 2018
Chief Financial Officer
Mr. Burke also serves as Chief Financial Officer of other funds. Mr. Burke serves as Head of Investment Operations for Fidelity Fund and Investment Operations (2018-present) and is an employee of Fidelity Investments (1998-present). Previously Mr. Burke served as head of Asset Management Investment Operations (2012-2018).
Jonathan Davis (1968)
Year of Election or Appointment: 2010
Assistant Treasurer
Mr. Davis also serves as Assistant Treasurer of other funds. Mr. Davis serves as Assistant Treasurer of FMR Capital, Inc. (2017-present) and is an employee of Fidelity Investments. Previously, Mr. Davis served as Vice President and Associate General Counsel of FMR LLC (diversified financial services company, 2003-2010).
Adrien E. Deberghes (1967)
Year of Election or Appointment: 2010
Assistant Treasurer
Mr. Deberghes also serves as an officer of other funds. He serves as Assistant Treasurer of FMR Capital, Inc. (2017-present), Executive Vice President of Fidelity Investments Money Management, Inc. (FIMM) (investment adviser firm, 2016-present), and is an employee of Fidelity Investments (2008-present). Previously, Mr. Deberghes served as President and Treasurer of certain Fidelity® funds (2013-2018). Prior to joining Fidelity Investments, Mr. Deberghes was Senior Vice President of Mutual Fund Administration at State Street Corporation (2007-2008), Senior Director of Mutual Fund Administration at Investors Bank & Trust (2005-2007), and Director of Finance for Dunkin' Brands (2000-2005). Previously, Mr. Deberghes served in other fund officer roles.
Laura M. Del Prato (1964)
Year of Election or Appointment: 2018
President and Treasurer
Ms. Del Prato also serves as an officer of other funds. Ms. Del Prato is an employee of Fidelity Investments (2017-present). Prior to joining Fidelity Investments, Ms. Del Prato served as a Managing Director and Treasurer of the JPMorgan Mutual Funds (2014-2017). Prior to JPMorgan, Ms. Del Prato served as a partner at Cohen Fund Audit Services (accounting firm, 2012-2013) and KPMG LLP (accounting firm, 2004-2012).
Colm A. Hogan (1973)
Year of Election or Appointment: 2016
Assistant Treasurer
Mr. Hogan also serves as an officer of other funds. Mr. Hogan serves as Assistant Treasurer of FMR Capital, Inc. (2017-present) and is an employee of Fidelity Investments (2005-present). Previously, Mr. Hogan served as Assistant Treasurer of certain Fidelity® funds (2016-2018).
Cynthia Lo Bessette (1969)
Year of Election or Appointment: 2019
Secretary and Chief Legal Officer (CLO)
Ms. Lo Bessette also serves as Secretary and CLO of other funds. She is a Senior Vice President and Deputy General Counsel of FMR LLC (diversified financial services company, 2019-present), and is an employee of Fidelity Investments. Previously, Ms. Lo Bessette served as Executive Vice President, General Counsel (2016-2019) and Senior Vice President, Deputy General Counsel (2015-2016) of OppenheimerFunds (investment management company) and Deputy Chief Legal Officer (2013-2015) of Jennison Associates LLC (investment adviser firm).
Chris Maher (1972)
Year of Election or Appointment: 2013
Assistant Treasurer
Mr. Maher serves as Assistant Treasurer of other funds. Mr. Maher is Vice President of Valuation Oversight, serves as Assistant Treasurer of FMR Capital, Inc. (2017-present), and is an employee of Fidelity Investments. Previously, Mr. Maher served as Vice President of Asset Management Compliance (2013), Vice President of the Program Management Group of FMR (investment adviser firm, 2010-2013), and Vice President of Valuation Oversight (2008-2010).
John B. McGinty, Jr. (1962)
Year of Election or Appointment: 2016
Chief Compliance Officer
Mr. McGinty also serves as Chief Compliance Officer of other funds. Mr. McGinty is Senior Vice President of Asset Management Compliance for Fidelity Investments and is an employee of Fidelity Investments (2016-present). Mr. McGinty previously served as Vice President, Senior Attorney at Eaton Vance Management (investment management firm, 2015-2016), and prior to Eaton Vance as global CCO for all firm operations and registered investment companies at GMO LLC (investment management firm, 2009-2015). Before joining GMO LLC, Mr. McGinty served as Senior Vice President, Deputy General Counsel for Fidelity Investments (2007-2009).
Jason P. Pogorelec (1975)
Year of Election or Appointment: 2015
Assistant Secretary
Mr. Pogorelec also serves as Assistant Secretary of other funds. Mr. Pogorelec serves as Vice President, Associate General Counsel (2010-present) and is an employee of Fidelity Investments (2006-present).
Nancy D. Prior (1967)
Year of Election or Appointment: 2014
Vice President
Ms. Prior also serves as Vice President of other funds. Ms. Prior serves as President of Fixed Income (2014-present), President (2016-present) and Director (2014-present) of Fidelity Investments Money Management, Inc. (FIMM) (investment adviser firm), and is an employee of Fidelity Investments (2002-present). Previously, Ms. Prior served as Vice Chairman of FIAM LLC (investment adviser firm, 2014-2018), a Director of FMR Investment Management (UK) Limited (investment adviser firm, 2015-2018), President Multi-Asset Class Strategies of FMR's Global Asset Allocation Division (2017-2018), Vice President of Fidelity's Money Market Funds (2012-2014), and President, Money Market and Short Duration Bond Group of Fidelity Management & Research Company (FMR) (investment adviser firm, 2013-2014).
Stacie M. Smith (1974)
Year of Election or Appointment: 2013
Assistant Treasurer
Ms. Smith also serves as an officer of other funds. Ms. Smith serves as Assistant Treasurer of FMR Capital, Inc. (2017-present), is an employee of Fidelity Investments (2009-present), and has served in other fund officer roles. Prior to joining Fidelity Investments, Ms. Smith served as Senior Audit Manager of Ernst & Young LLP (accounting firm, 1996-2009). Previously, Ms. Smith served as Assistant Treasurer (2013-2018) and Deputy Treasurer (2013-2016) of certain Fidelity® funds.
Marc L. Spector (1972)
Year of Election or Appointment: 2016
Deputy Treasurer
Mr. Spector also serves as an officer of other funds. Mr. Spector serves as Assistant Treasurer of FMR Capital, Inc. (2017-present) and is an employee of Fidelity Investments (2016-present). Prior to joining Fidelity Investments, Mr. Spector served as Director at the Siegfried Group (accounting firm, 2013-2016), and prior to Siegfried Group as audit senior manager at Deloitte & Touche (accounting firm, 2005-2013).
Jim Wegmann (1979)
Year of Election or Appointment: 2019
Assistant Treasurer
Mr. Wegmann also serves as Assistant Treasurer of other funds. Mr. Wegmann is an employee of Fidelity Investments (2011-present).
Shareholder Expense Example
As a shareholder of the Fund, you incur two types of costs: (1) transaction costs and (2) ongoing costs, including other Fund expenses. This Example is intended to help you understand your ongoing costs (in dollars) of investing in the Fund and to compare these costs with the ongoing costs of investing in other mutual funds.
The Example is based on an investment of $1,000 invested at the beginning of the period and held for the entire period (March 1, 2019 to August 31, 2019).
Actual Expenses
The first line of the accompanying table provides information about actual account values and actual expenses. You may use the information in this line, together with the amount you invested, to estimate the expenses that you paid over the period. Simply divide your account value by $1,000.00 (for example, an $8,600 account value divided by $1,000.00 = 8.6), then multiply the result by the number in the first line under the heading entitled "Expenses Paid During Period" to estimate the expenses you paid on your account during this period. In addition, the Fund, as a shareholder in the underlying Fidelity Central Funds, will indirectly bear its pro-rata share of the fees and expenses incurred by the underlying Fidelity Central Funds. These fees and expenses are not included in the Fund's annualized expense ratio used to calculate the expense estimate in the table below.
Hypothetical Example for Comparison Purposes
The second line of the accompanying table provides information about hypothetical account values and hypothetical expenses based on the Fund's actual expense ratio and an assumed rate of return of 5% per year before expenses, which is not the Fund's actual return. The hypothetical account values and expenses may not be used to estimate the actual ending account balance or expenses you paid for the period. You may use this information to compare the ongoing costs of investing in the Fund and other funds. To do so, compare this 5% hypothetical example with the 5% hypothetical examples that appear in the shareholder reports of the other funds. In addition, the Fund, as a shareholder in the underlying Fidelity Central Funds, will indirectly bear its pro-rata share of the fees and expenses incurred by the underlying Fidelity Central Funds. These fees and expenses are not included in the Fund's annualized expense ratio used to calculate the expense estimate in the table below.
Please note that the expenses shown in the table are meant to highlight your ongoing costs only and do not reflect any transaction costs. Therefore, the second line of the table is useful in comparing ongoing costs only, and will not help you determine the relative total costs of owning different funds.
| | Annualized Expense Ratio-A | Beginning
Account Value
March 1, 2019 | Ending
Account Value
August 31, 2019 | Expenses Paid
During Period-B
March 1, 2019
to August 31, 2019 |
| Actual | - %-C | $1,000.00 | $1,080.70 | $--D |
| Hypothetical-E | | $1,000.00 | $1,025.21 | $--D |
A Annualized expense ratio reflects expenses net of applicable fee waivers.
B Expenses are equal to the Fund's annualized expense ratio, multiplied by the average account value over the period, multiplied by 184/365 (to reflect the one-half year period).
C Amount represents less than .005%.
D Amount represents less than $.005.
E 5% return per year before expenses
Distributions (Unaudited)
The Board of Trustees of Fidelity Flex U.S. Bond Index Fund voted to pay on October 14, 2019, to shareholders of record at the opening of business on October 11, 2019, a distribution of $0.012 per share derived from capital gains realized from sales of portfolio securities.
The fund hereby designates as a capital gain dividend with respect to the taxable year ended August 31, 2019, $36,318, or, if subsequently determined to be different, the net capital gain of such year.
A total of 35.11% of the dividends distributed during the fiscal year was derived from interest on U.S. Government securities which is generally exempt from state income tax.
The fund designates $5,425,772 of distributions paid during the period January 1, 2019 to August 31, 2019 as qualifying to be taxed as interest-related dividends for nonresident alien shareholders.
The fund will notify shareholders in January 2020 of amounts for use in preparing 2019 income tax returns.
ZUB-ANN-1019
1.9881611.102
Fidelity Flex℠ Funds Fidelity Flex℠ Short-Term Bond Fund
Annual Report August 31, 2019 |
|
Beginning on January 1, 2021, as permitted by regulations adopted by the Securities and Exchange Commission, paper copies of a fund’s shareholder reports will no longer be sent by mail, unless you specifically request paper copies of the reports from the fund or from your financial intermediary, such as a financial advisor, broker-dealer or bank. Instead, the reports will be made available on a website, and you will be notified by mail each time a report is posted and provided with a website link to access the report.
If you already elected to receive shareholder reports electronically, you will not be affected by this change and you need not take any action. You may elect to receive shareholder reports and other communications from a fund electronically, by contacting your financial intermediary. For Fidelity customers, visit Fidelity's web site or call Fidelity using the contact information listed below.
You may elect to receive all future reports in paper free of charge. If you wish to continue receiving paper copies of your shareholder reports, you may contact your financial intermediary or, if you are a Fidelity customer, visit Fidelity’s website, or call Fidelity at the applicable toll-free number listed below. Your election to receive reports in paper will apply to all funds held with the fund complex/your financial intermediary.
| Account Type | Website | Phone Number |
| Brokerage, Mutual Fund, or Annuity Contracts: | fidelity.com/mailpreferences | 1-800-343-3548 |
| Employer Provided Retirement Accounts: | netbenefits.fidelity.com/preferences (choose 'no' under Required Disclosures to continue to print) | 1-800-343-0860 |
| Advisor Sold Accounts Serviced Through Your Financial Intermediary: | Contact Your Financial Intermediary | Your Financial Intermediary's phone number |
| Advisor Sold Accounts Serviced by Fidelity: | institutional.fidelity.com | 1-877-208-0098 |
Contents
To view a fund's proxy voting guidelines and proxy voting record for the 12-month period ended June 30, visit http://www.fidelity.com/proxyvotingresults or visit the Securities and Exchange Commission's (SEC) web site at http://www.sec.gov.
You may also call 1-800-544-3455 (for managed account clients) or 1-800-835-5092 (for retirement plan participants) to request a free copy of the proxy voting guidelines.
Standard & Poor's, S&P and S&P 500 are registered service marks of The McGraw-Hill Companies, Inc. and have been licensed for use by Fidelity Distributors Corporation.
Other third-party marks appearing herein are the property of their respective owners.
All other marks appearing herein are registered or unregistered trademarks or service marks of FMR LLC or an affiliated company. © 2019 FMR LLC. All rights reserved.
This report and the financial statements contained herein are submitted for the general information of the shareholders of the Fund. This report is not authorized for distribution to prospective investors in the Fund unless preceded or accompanied by an effective prospectus.
A fund files its complete schedule of portfolio holdings with the SEC for the first and third quarters of each fiscal year on Form N-PORT. Forms N-PORT are available on the SEC’s web site at http://www.sec.gov. A fund's Forms N-PORT may be reviewed and copied at the SEC’s Public Reference Room in Washington, DC. Information regarding the operation of the SEC's Public Reference Room may be obtained by calling 1-800-SEC-0330.
For a complete list of a fund's portfolio holdings, view the most recent holdings listing, semiannual report, or annual report on Fidelity's web site at http://www.fidelity.com, http://www.institutional.fidelity.com, or http://www.401k.com, as applicable.
NOT FDIC INSURED •MAY LOSE VALUE •NO BANK GUARANTEE
Neither the Fund nor Fidelity Distributors Corporation is a bank.
Performance: The Bottom Line
Average annual total return reflects the change in the value of an investment, assuming reinvestment of distributions from dividend income and capital gains (the profits earned upon the sale of securities that have grown in value, if any) and assuming a constant rate of performance each year. The hypothetical investment and the average annual total returns do not reflect the deduction of taxes that a shareholder would pay on fund distributions or the redemption of fund shares. During periods of reimbursement by Fidelity, a fund’s total return will be greater than it would be had the reimbursement not occurred. How a fund did yesterday is no guarantee of how it will do tomorrow.
Average Annual Total Returns
| For the periods ended August 31, 2019 | Past 1 year | Life of fundA |
| Fidelity Flex℠ Short-Term Bond Fund | 4.90% | 2.69% |
A From March 7, 2017
$10,000 Over Life of Fund
Let's say hypothetically that $10,000 was invested in Fidelity Flex℠ Short-Term Bond Fund on March 7, 2017, when the fund started.
The chart shows how the value of your investment would have changed, and also shows how the Bloomberg Barclays U.S. 1-3 Year Government/Credit Bond Index performed over the same period.
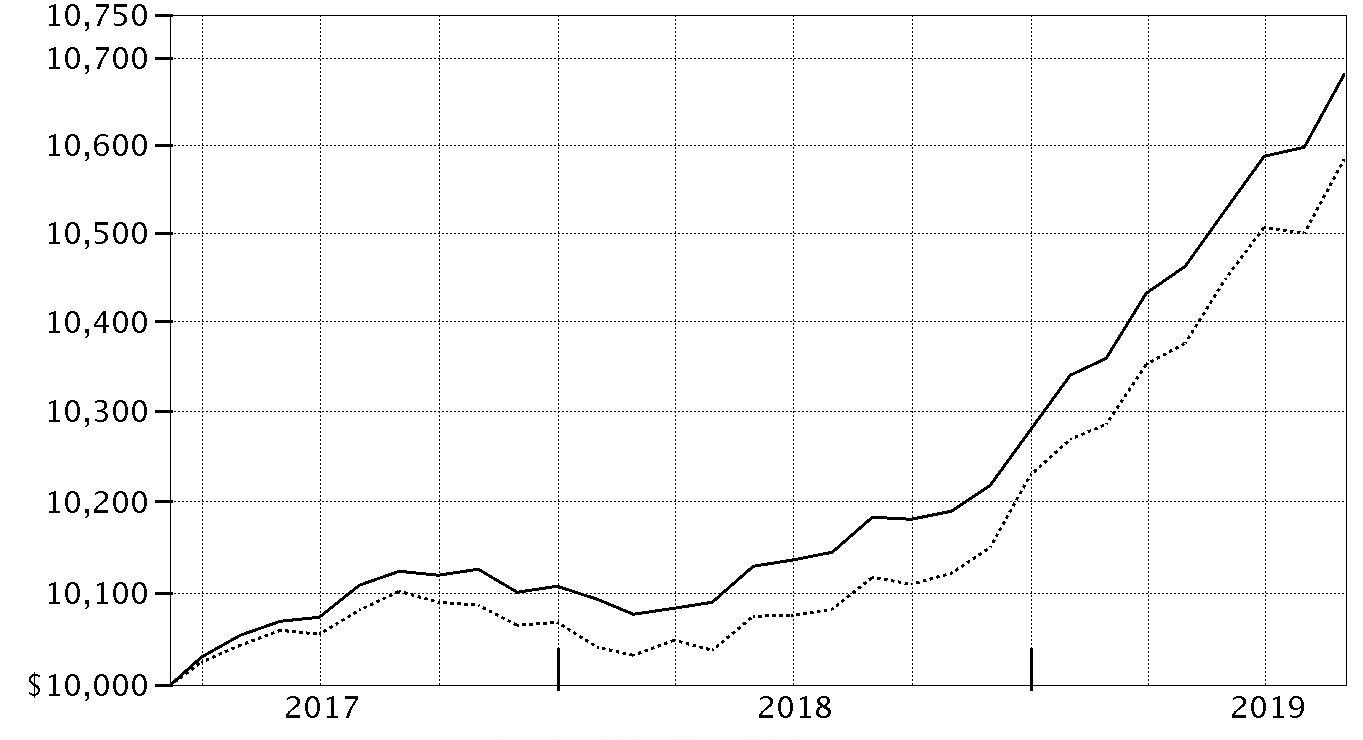
| Period Ending Values |
| $10,682 | Fidelity Flex℠ Short-Term Bond Fund |
| $10,584 | Bloomberg Barclays U.S. 1-3 Year Government/Credit Bond Index |
Management's Discussion of Fund Performance
Market Recap: For the 12 months ending August 31, 2019, U.S. taxable investment-grade bonds posted their strongest trailing one-year return since 2009, driven by slower global economic growth, a maturing business cycle, trade uncertainty and, late in the period, the Fed’s dovish shift. The Bloomberg Barclays U.S. Aggregate Bond Index gained 10.17%. Market yields rose in the early fall of 2018, on expectations for higher inflation. Yields then declined and credit spreads widened in November and December, partly because of weaker U.S. manufacturing data. Yield spreads narrowed in January, as the U.S. Federal Reserve said it would be “patient” with policy rate hikes, and that future increases largely would depend on economic data. Yields continued to decline in the spring, amid international trade tension and attacks on oil tankers in the Middle East, and then tumbled further in July, when the Fed cut interest rates for the first time since 2008. The yield curve ended the period roughly flat, amid expectations for another rate cut of 25 basis points in September. Within the Bloomberg Barclays index, corporate bonds gained 13.33%, topping the 10.38% advance of U.S. Treasuries. Outside the index, U.S. corporate high-yield bonds lagged nominal U.S. Treasuries, while Treasury Inflation-Protected Securities (TIPS) gained 7.46%.
Comments from Co-Portfolio Managers Rob Galusza and Julian Potenza: For the fiscal year ending August 31, 2019, the fund returned 4.90%, roughly in line, net of fees, with the 4.62% return of the benchmark, the Bloomberg Barclays U.S. 1-3 Year Government/Credit Bond Index. Lighter-than-benchmark exposure to Treasury securities added relative value, as did outsized exposure to corporate bonds. Within corporates, an overweighting in bonds of financial institutions contributed notably. Elsewhere within corporates, the bonds of industrial companies helped on a relative basis, particularly overweightings among issuers in the energy, consumer non-cyclical and communications segments. Security selection among corporates also helped, mostly driven by picks among certain industrial and utility firms. Outside of corporates, the fund's lighter-than-benchmark stake in Treasuries added value, as did non-benchmark positions in asset-backed securities and commercial mortgage-backed securities. Conversely, an underweighting in government agency securities detracted to a degree. Also, the fund's positioning along the yield curve hurt slightly. By period end, we added notably to the fund's stake in Treasuries, while reducing exposure to corporate bonds.
The views expressed above reflect those of the portfolio manager(s) only through the end of the period as stated on the cover of this report and do not necessarily represent the views of Fidelity or any other person in the Fidelity organization. Any such views are subject to change at any time based upon market or other conditions and Fidelity disclaims any responsibility to update such views. These views may not be relied on as investment advice and, because investment decisions for a Fidelity fund are based on numerous factors, may not be relied on as an indication of trading intent on behalf of any Fidelity fund.
Note to Shareholders: On October 1, 2019, David DeBiase assumed co-management responsibilities for the fund, joining Rob Galusza and Julian Potenza.
Investment Summary (Unaudited)
Quality Diversification (% of fund's net assets)
| As of August 31, 2019 |
| | U.S. Government and U.S. Government Agency Obligations | 49.3% |
| | AAA | 10.9% |
| | AA | 2.0% |
| | A | 16.4% |
| | BBB | 17.6% |
| | BB and Below | 2.7% |
| | Short-Term Investments and Net Other Assets | 1.1% |

We have used ratings from Moody's Investors Service, Inc. Where Moody's® ratings are not available, we have used S&P® ratings. All ratings are as of the date indicated and do not reflect subsequent changes.
Asset Allocation (% of fund's net assets)
| As of August 31, 2019* |
| | Corporate Bonds | 38.2% |
| | U.S. Government and U.S. Government Agency Obligations | 49.3% |
| | Asset-Backed Securities | 8.2% |
| | CMOs and Other Mortgage Related Securities | 2.7% |
| | Municipal Bonds | 0.2% |
| | Other Investments | 0.3% |
| | Short-Term Investments and Net Other Assets (Liabilities) | 1.1% |

* Foreign investments - 6.1%
Schedule of Investments August 31, 2019
Showing Percentage of Net Assets
| Nonconvertible Bonds - 38.2% | | | |
| | | Principal Amount | Value |
| COMMUNICATION SERVICES - 2.8% | | | |
| Diversified Telecommunication Services - 0.8% | | | |
| AT&T, Inc. 3.6% 2/17/23 | | $18,000 | $18,816 |
| Verizon Communications, Inc.: | | | |
| 2.946% 3/15/22 | | 8,000 | 8,207 |
| 3.125% 3/16/22 | | 20,000 | 20,617 |
| | | | 47,640 |
| Media - 2.0% | | | |
| Charter Communications Operating LLC/Charter Communications Operating Capital Corp.: | | | |
| 3.579% 7/23/20 | | 25,000 | 25,238 |
| 4.464% 7/23/22 | | 25,000 | 26,415 |
| Comcast Corp.: | | | |
| 3.45% 10/1/21 | | 10,000 | 10,300 |
| 5.15% 3/1/20 | | 50,000 | 50,650 |
| Discovery Communications LLC 3 month U.S. LIBOR + 0.710% 3.0966% 9/20/19 (a)(b) | | 8,000 | 8,002 |
| | | | 120,605 |
|
| TOTAL COMMUNICATION SERVICES | | | 168,245 |
|
| CONSUMER DISCRETIONARY - 1.6% | | | |
| Automobiles - 1.4% | | | |
| BMW U.S. Capital LLC 3.45% 4/12/23 (c) | | 25,000 | 26,051 |
| General Motors Financial Co., Inc.: | | | |
| 2.65% 4/13/20 | | 7,000 | 7,011 |
| 3.15% 1/15/20 | | 50,000 | 50,092 |
| | | | 83,154 |
| Diversified Consumer Services - 0.1% | | | |
| Ingersoll-Rand Global Holding Co. Ltd. 2.9% 2/21/21 | | 9,000 | 9,092 |
| Household Durables - 0.1% | | | |
| D.R. Horton, Inc. 2.55% 12/1/20 | | 7,000 | 7,019 |
|
| TOTAL CONSUMER DISCRETIONARY | | | 99,265 |
|
| CONSUMER STAPLES - 2.9% | | | |
| Beverages - 1.1% | | | |
| Constellation Brands, Inc. 3 month U.S. LIBOR + 0.700% 2.8581% 11/15/21 (a)(b) | | 15,000 | 15,003 |
| PepsiCo, Inc. 1.35% 10/4/19 | | 50,000 | 49,966 |
| | | | 64,969 |
| Food & Staples Retailing - 0.1% | | | |
| Alimentation Couche-Tard, Inc. 2.35% 12/13/19 (c) | | 10,000 | 10,000 |
| Food Products - 0.4% | | | |
| Conagra Brands, Inc. 3.8% 10/22/21 | | 10,000 | 10,288 |
| General Mills, Inc.: | | | |
| 3 month U.S. LIBOR + 0.540% 2.8623% 4/16/21 (a)(b) | | 10,000 | 10,006 |
| 3.2% 4/16/21 | | 2,000 | 2,035 |
| | | | 22,329 |
| Tobacco - 1.3% | | | |
| Altria Group, Inc.: | | | |
| 3.49% 2/14/22 | | 5,000 | 5,165 |
| 4.75% 5/5/21 | | 10,000 | 10,432 |
| BAT Capital Corp. 2.297% 8/14/20 | | 50,000 | 50,005 |
| Philip Morris International, Inc.: | | | |
| 2.625% 2/18/22 | | 4,000 | 4,053 |
| 2.875% 5/1/24 | | 10,000 | 10,264 |
| | | | 79,919 |
|
| TOTAL CONSUMER STAPLES | | | 177,217 |
|
| ENERGY - 4.3% | | | |
| Oil, Gas & Consumable Fuels - 4.3% | | | |
| Anadarko Petroleum Corp. 4.85% 3/15/21 | | 10,000 | 10,338 |
| Cenovus Energy, Inc. 3% 8/15/22 | | 10,000 | 10,097 |
| Energy Transfer Partners LP: | | | |
| 3.6% 2/1/23 | | 7,000 | 7,183 |
| 4.2% 9/15/23 | | 4,000 | 4,229 |
| Enterprise Products Operating LP 2.55% 10/15/19 | | 50,000 | 49,996 |
| EOG Resources, Inc. 2.45% 4/1/20 | | 10,000 | 10,014 |
| EQT Corp. 2.5% 10/1/20 | | 5,000 | 4,973 |
| Kinder Morgan Energy Partners LP 3.5% 9/1/23 | | 7,000 | 7,279 |
| MPLX LP 4.5% 7/15/23 | | 2,000 | 2,134 |
| Occidental Petroleum Corp.: | | | |
| 3 month U.S. LIBOR + 0.950% 3.137% 2/8/21 (a)(b) | | 5,000 | 5,023 |
| 3 month U.S. LIBOR + 1.250% 3.437% 8/13/21 (a)(b) | | 6,000 | 6,024 |
| 3 month U.S. LIBOR + 1.450% 3.637% 8/15/22 (a)(b) | | 10,000 | 10,034 |
| 2.6% 8/13/21 | | 2,000 | 2,013 |
| 2.7% 8/15/22 | | 2,000 | 2,020 |
| 2.9% 8/15/24 | | 5,000 | 5,047 |
| 3.125% 2/15/22 | | 3,000 | 3,045 |
| Petroleos Mexicanos 4.875% 1/24/22 | | 20,000 | 20,325 |
| Plains All American Pipeline LP/PAA Finance Corp. 3.65% 6/1/22 | | 9,000 | 9,250 |
| Schlumberger Investment SA 3.3% 9/14/21 (c) | | 25,000 | 25,489 |
| Sunoco Logistics Partner Operations LP 5.5% 2/15/20 | | 7,000 | 7,087 |
| TransCanada PipeLines Ltd. 2.125% 11/15/19 | | 10,000 | 9,993 |
| Western Gas Partners LP 5.375% 6/1/21 | | 19,000 | 19,646 |
| Williams Partners LP 3.6% 3/15/22 | | 28,000 | 28,828 |
| | | | 260,067 |
| FINANCIALS - 16.0% | | | |
| Banks - 8.4% | | | |
| Bank of America Corp. 3.004% 12/20/23 (a) | | 100,000 | 102,625 |
| Bank of Nova Scotia 2.35% 10/21/20 | | 50,000 | 50,239 |
| Citigroup, Inc. 2.4% 2/18/20 | | 75,000 | 75,068 |
| JPMorgan Chase & Co.: | | | |
| 3.207% 4/1/23 (a) | | 100,000 | 102,809 |
| 3.514% 6/18/22 (a) | | 12,000 | 12,284 |
| Mitsubishi UFJ Financial Group, Inc. 3.535% 7/26/21 | | 50,000 | 51,245 |
| Regions Financial Corp. 2.75% 8/14/22 | | 10,000 | 10,176 |
| Royal Bank of Canada: | | | |
| 2.15% 10/26/20 | | 10,000 | 10,027 |
| 2.55% 7/16/24 | | 15,000 | 15,291 |
| Santander Holdings U.S.A., Inc.: | | | |
| 3.5% 6/7/24 | | 10,000 | 10,343 |
| 4.45% 12/3/21 | | 10,000 | 10,433 |
| SunTrust Bank 2.25% 1/31/20 | | 9,000 | 8,998 |
| Westpac Banking Corp. 2.15% 3/6/20 | | 50,000 | 50,033 |
| | | | 509,571 |
| Capital Markets - 3.5% | | | |
| Deutsche Bank AG 2.7% 7/13/20 | | 20,000 | 19,949 |
| Goldman Sachs Group, Inc. 2.876% 10/31/22 (a) | | 75,000 | 76,033 |
| Moody's Corp. 3.25% 6/7/21 | | 6,000 | 6,114 |
| Morgan Stanley 2.65% 1/27/20 | | 100,000 | 100,166 |
| TD Ameritrade Holding Corp. 3 month U.S. LIBOR + 0.430% 2.6831% 11/1/21 (a)(b) | | 10,000 | 10,028 |
| | | | 212,290 |
| Consumer Finance - 3.0% | | | |
| American Express Co. 2.75% 5/20/22 | | 10,000 | 10,194 |
| American Express Credit Corp. 2.2% 3/3/20 | | 50,000 | 50,024 |
| Aviation Capital Group LLC 3 month U.S. LIBOR + 0.950% 3.4703% 6/1/21 (a)(b)(c) | | 10,000 | 10,051 |
| Capital One Financial Corp. 2.5% 5/12/20 | | 20,000 | 20,036 |
| John Deere Capital Corp. 3.125% 9/10/21 | | 50,000 | 51,224 |
| Synchrony Financial: | | | |
| 2.85% 7/25/22 | | 2,000 | 2,027 |
| 4.25% 8/15/24 | | 21,000 | 22,359 |
| 4.375% 3/19/24 | | 14,000 | 14,954 |
| | | | 180,869 |
| Diversified Financial Services - 0.9% | | | |
| AIG Global Funding: | | | |
| 2.3% 7/1/22 (c) | | 5,000 | 5,019 |
| 3.35% 6/25/21 (c) | | 10,000 | 10,203 |
| Avolon Holdings Funding Ltd. 3.625% 5/1/22 (c) | | 2,000 | 2,029 |
| AXA Equitable Holdings, Inc. 3.9% 4/20/23 | | 2,000 | 2,101 |
| Brixmor Operating Partnership LP 3.875% 8/15/22 | | 13,000 | 13,565 |
| Cigna Corp.: | | | |
| 3 month U.S. LIBOR + 0.650% 3.0603% 9/17/21 (a)(b) | | 10,000 | 10,000 |
| 3.4% 9/17/21 | | 10,000 | 10,238 |
| | | | 53,155 |
| Insurance - 0.2% | | | |
| Marsh & McLennan Companies, Inc.: | | | |
| 2.75% 1/30/22 | | 7,000 | 7,115 |
| 3.5% 12/29/20 | | 7,000 | 7,127 |
| | | | 14,242 |
|
| TOTAL FINANCIALS | | | 970,127 |
|
| HEALTH CARE - 4.0% | | | |
| Biotechnology - 0.2% | | | |
| AbbVie, Inc. 2.5% 5/14/20 | | 10,000 | 10,015 |
| Health Care Equipment & Supplies - 0.9% | | | |
| Abbott Laboratories 2.9% 11/30/21 | | 10,000 | 10,195 |
| Becton, Dickinson & Co.: | | | |
| 3 month U.S. LIBOR + 0.875% 3.1939% 12/29/20 (a)(b) | | 9,000 | 9,003 |
| 2.404% 6/5/20 | | 20,000 | 20,023 |
| Boston Scientific Corp. 3.45% 3/1/24 | | 5,000 | 5,254 |
| Zimmer Biomet Holdings, Inc. 3 month U.S. LIBOR + 0.750% 3.1685% 3/19/21 (a)(b) | | 8,000 | 7,991 |
| | | | 52,466 |
| Health Care Providers & Services - 1.5% | | | |
| CVS Health Corp.: | | | |
| 3 month U.S. LIBOR + 0.720% 3.173% 3/9/21 (a)(b) | | 10,000 | 10,043 |
| 2.8% 7/20/20 | | 25,000 | 25,125 |
| 3.35% 3/9/21 | | 31,000 | 31,565 |
| Express Scripts Holding Co.: | | | |
| 2.6% 11/30/20 | | 2,000 | 2,009 |
| 4.75% 11/15/21 | | 4,000 | 4,213 |
| Humana, Inc. 2.5% 12/15/20 | | 10,000 | 10,020 |
| WellPoint, Inc. 3.125% 5/15/22 | | 10,000 | 10,243 |
| | | | 93,218 |
| Pharmaceuticals - 1.4% | | | |
| Actavis Funding SCS 3% 3/12/20 | | 25,000 | 25,076 |
| Bristol-Myers Squibb Co.: | | | |
| 2.55% 5/14/21 (c) | | 20,000 | 20,240 |
| 2.6% 5/16/22 (c) | | 10,000 | 10,188 |
| GlaxoSmithKline Capital PLC 3.125% 5/14/21 | | 20,000 | 20,360 |
| Teva Pharmaceutical Finance Netherlands III BV 2.2% 7/21/21 | | 10,000 | 9,363 |
| | | | 85,227 |
|
| TOTAL HEALTH CARE | | | 240,926 |
|
| INDUSTRIALS - 2.0% | | | |
| Aerospace & Defense - 0.2% | | | |
| Northrop Grumman Corp. 2.08% 10/15/20 | | 10,000 | 10,004 |
| United Technologies Corp. 3.35% 8/16/21 | | 3,000 | 3,074 |
| | | | 13,078 |
| Airlines - 0.3% | | | |
| Delta Air Lines, Inc.: | | | |
| 2.875% 3/13/20 | | 10,000 | 10,002 |
| 3.4% 4/19/21 | | 9,000 | 9,124 |
| | | | 19,126 |
| Commercial Services & Supplies - 0.2% | | | |
| Waste Management, Inc. 2.95% 6/15/24 | | 12,000 | 12,482 |
| Machinery - 0.5% | | | |
| Caterpillar Financial Services Corp. 2.65% 5/17/21 | | 16,000 | 16,236 |
| Westinghouse Air Brake Co. 3 month U.S. LIBOR + 1.050% 3.7103% 9/15/21 (a)(b) | | 13,000 | 13,001 |
| | | | 29,237 |
| Trading Companies & Distributors - 0.8% | | | |
| Air Lease Corp.: | | | |
| 2.125% 1/15/20 | | 5,000 | 4,997 |
| 2.5% 3/1/21 | | 6,000 | 6,026 |
| 3.5% 1/15/22 | | 10,000 | 10,280 |
| International Lease Finance Corp. 5.875% 8/15/22 | | 25,000 | 27,458 |
| | | | 48,761 |
|
| TOTAL INDUSTRIALS | | | 122,684 |
|
| INFORMATION TECHNOLOGY - 0.6% | | | |
| Electronic Equipment & Components - 0.5% | | | |
| Amphenol Corp. 2.2% 4/1/20 | | 16,000 | 15,997 |
| Diamond 1 Finance Corp./Diamond 2 Finance Corp. 5.45% 6/15/23 (c) | | 3,000 | 3,261 |
| Tyco Electronics Group SA 3 month U.S. LIBOR + 0.450% 2.9285% 6/5/20 (a)(b) | | 10,000 | 10,010 |
| | | | 29,268 |
| Semiconductors & Semiconductor Equipment - 0.1% | | | |
| Analog Devices, Inc. 2.85% 3/12/20 | | 8,000 | 8,023 |
|
| TOTAL INFORMATION TECHNOLOGY | | | 37,291 |
|
| MATERIALS - 0.2% | | | |
| Chemicals - 0.2% | | | |
| Chevron Phillips Chemical Co. LLC / Chevron Phillips Chemical Co. LP 3.3% 5/1/23 (c) | | 6,000 | 6,210 |
| The Mosaic Co. 3.25% 11/15/22 | | 5,000 | 5,124 |
| | | | 11,334 |
| REAL ESTATE - 0.1% | | | |
| Equity Real Estate Investment Trusts (REITs) - 0.1% | | | |
| Welltower, Inc. 3.625% 3/15/24 | | 6,000 | 6,321 |
| UTILITIES - 3.7% | | | |
| Electric Utilities - 1.8% | | | |
| American Electric Power Co., Inc. 2.15% 11/13/20 | | 6,000 | 6,006 |
| Edison International 2.125% 4/15/20 | | 30,000 | 29,871 |
| Eversource Energy 2.5% 3/15/21 | | 9,000 | 9,039 |
| Exelon Corp. 3.497% 6/1/22 (a) | | 20,000 | 20,592 |
| Florida Power & Light Co. 3 month U.S. LIBOR + 0.400% 2.6393% 5/6/22 (a)(b) | | 13,000 | 13,004 |
| ITC Holdings Corp. 2.7% 11/15/22 | | 6,000 | 6,090 |
| Mississippi Power Co. 3 month U.S. LIBOR + 0.650% 2.9613% 3/27/20 (a)(b) | | 3,000 | 3,000 |
| NextEra Energy Capital Holdings, Inc. 2.9% 4/1/22 | | 20,000 | 20,429 |
| | | | 108,031 |
| Multi-Utilities - 1.9% | | | |
| Berkshire Hathaway Energy Co. 2.375% 1/15/21 | | 10,000 | 10,059 |
| Dominion Energy, Inc. 2.715% 8/15/21 | | 9,000 | 9,076 |
| NiSource Finance Corp. 2.65% 11/17/22 | | 10,000 | 10,154 |
| NiSource, Inc. 3.65% 6/15/23 | | 4,000 | 4,172 |
| Sempra Energy 2.4% 2/1/20 | | 25,000 | 24,966 |
| WEC Energy Group, Inc. 3.375% 6/15/21 | | 10,000 | 10,220 |
| Wisconsin Energy Corp. 2.45% 6/15/20 | | 50,000 | 50,060 |
| | | | 118,707 |
|
| TOTAL UTILITIES | | | 226,738 |
|
| TOTAL NONCONVERTIBLE BONDS | | | |
| (Cost $2,288,097) | | | 2,320,215 |
|
| U.S. Treasury Obligations - 49.0% | | | |
| U.S. Treasury Notes: | | | |
| 1.5% 1/31/22 | | $537,000 | $537,378 |
| 1.625% 7/31/20 | | 140,000 | 139,754 |
| 1.75% 11/30/21 | | 950,000 | 955,306 |
| 1.875% 9/30/22 | | 100,000 | 101,352 |
| 2.125% 12/31/22 | | 120,000 | 122,723 |
| 2.125% 3/31/24 | | 100,000 | 103,129 |
| 2.375% 8/15/24 | | 100,000 | 104,566 |
| 2.5% 12/31/20 | | 644,000 | 650,868 |
| 2.625% 6/30/23 | | 250,000 | 261,162 |
| TOTAL U.S. TREASURY OBLIGATIONS | | | |
| (Cost $2,925,995) | | | 2,976,238 |
|
| U.S. Government Agency - Mortgage Securities - 0.3% | | | |
| Ginnie Mae - 0.3% | | | |
| 4.5% 6/20/48 | | | |
| (Cost $15,634) | | 14,917 | 15,692 |
|
| Asset-Backed Securities - 8.2% | | | |
| Ally Auto Receivables Trust Series 2019-2 Class A2, 2.34% 6/15/22 | | $10,000 | $10,025 |
| Ally Master Owner Trust: | | | |
| Series 2018-1 Class A1, 2.7% 1/17/23 | | 10,000 | 10,098 |
| Series 2018-2 Class A, 3.29% 5/15/23 | | 10,000 | 10,228 |
| American Credit Acceptance Receivables Trust Series 2019-3 Class A, 2.44% 12/12/22 (c) | | 9,000 | 9,001 |
| Bank of America Credit Card Master Trust: | | | |
| Series 2017-A2 Class A2, 1.84% 1/17/23 | | 10,000 | 9,991 |
| Series 2018-A1 Class A1, 2.7% 7/17/23 | | 10,000 | 10,124 |
| Series 2018-A2 Class A2, 3% 9/15/23 | | 10,000 | 10,199 |
| BMW Vehicle Lease Trust Series 2019-1 Class A3, 2.84% 11/22/21 | | 8,000 | 8,102 |
| Canadian Pacer Auto Receivables Trust: | | | |
| Series 2018-1A Class A3, 3% 11/19/21 (c) | | 10,000 | 10,051 |
| Series 2018-2A Class A3, 3.27% 12/19/22 (c) | | 9,000 | 9,173 |
| Series 2019-1A Class A2, 2.78% 3/21/22 (c) | | 10,000 | 10,044 |
| Capital One Multi-Asset Execution Trust: | | | |
| Series 2015-A8 Class A8, 2.05% 8/15/23 | | 7,000 | 7,014 |
| Series 2017-A4 Class A4, 1.99% 7/17/23 | | 16,000 | 16,023 |
| Series 2018-A1 Class A1, 3.01% 2/15/24 | | 8,000 | 8,154 |
| Series 2019-A1 Class A1, 2.84% 12/15/24 | | 16,000 | 16,443 |
| Capital One Prime Auto Receivables Trust Series 2019-1 Class A2, 2.58% 4/15/22 | | 25,000 | 25,120 |
| CarMax Auto Owner Trust: | | | |
| Series 2017-3 Class A3, 1.97% 4/15/22 | | 4,258 | 4,255 |
| Series 2017-4 Class A3, 2.11% 10/17/22 | | 5,000 | 5,005 |
| Series 2018-2 Class A3, 2.98% 1/17/23 | | 6,000 | 6,081 |
| Series 2018-4 Class A3, 3.36% 9/15/23 | | 7,000 | 7,184 |
| Series 2019-1 Class A3, 3.05% 3/15/24 | | 10,000 | 10,240 |
| CNH Equipment Trust: | | | |
| Series 2018-A Class A3, 3.12% 7/17/23 | | 10,000 | 10,145 |
| Series 2019-B Class A2, 2.55% 9/15/22 | | 25,000 | 25,115 |
| Discover Card Master Trust Series 2019-A2 Class A, 1 month U.S. LIBOR + 0.270% 2.4651% 12/15/23 (a)(b) | | 25,000 | 25,040 |
| Fifth Third Auto Trust Series 2017-1 Class A3, 1.8% 2/15/22 | | 3,787 | 3,782 |
| Ford Credit Auto Lease Trust Series 2019-B Class A2A, 2.28% 2/15/22 | | 10,000 | 10,013 |
| Ford Credit Floorplan Master Owner Trust Series 2017-2 Class A1, 2.16% 9/15/22 | | 10,000 | 10,016 |
| GM Financial Automobile Leasing Trust: | | | |
| Series 2018-2 Class A3, 3.06% 6/21/21 | | 6,000 | 6,032 |
| Series 2019-1 Class A3, 2.98% 12/20/21 | | 7,000 | 7,088 |
| GM Financial Consumer Automobile Receivables Trust Series 2017-2A Class A3, 1.86% 12/16/21 (c) | | 6,424 | 6,414 |
| GM Financial Securitized Term Auto Receivables Trust Series 2019-1 Class A3, 2.97% 11/16/23 | | 11,000 | 11,198 |
| GM Financial Securitized Term Automobile Recievables Trust 2.32% 7/18/22 | | 5,000 | 5,015 |
| Honda Auto Receivables Owner Trust: | | | |
| Series 2017-1 Class A3, 1.72% 7/21/21 | | 3,792 | 3,785 |
| Series 2019-2 Class A2, 2.57% 12/21/21 | | 25,000 | 25,123 |
| Hyundai Auto Receivables Trust Series 2018-A Class A3, 2.79% 7/15/22 | | 7,000 | 7,065 |
| John Deere Owner Trust Series 2019-B Class A2, 2.28% 5/16/22 | | 12,000 | 12,041 |
| Mercedes-Benz Auto Lease Trust: | | | |
| Series 2018-A Class A3, 2.41% 2/16/21 | | 8,615 | 8,623 |
| Series 2019-A Class A3, 3.1% 11/15/21 | | 7,000 | 7,082 |
| Navistar Financial Dealer Note Master Trust Series 2018-1 Class A, 1 month U.S. LIBOR + 0.630% 2.896% 9/25/23 (a)(b)(c) | | 11,000 | 11,014 |
| Nissan Auto Receivables Owner Trust Series 2016-B Class A3, 1.32% 1/15/21 | | 8,264 | 8,253 |
| Santander Retail Auto Lease Trust: | | | |
| Series 2018-A Class A3, 2.93% 5/20/21 (c) | | 9,000 | 9,043 |
| Series 2019-A Class A2, 2.72% 1/20/22 (c) | | 25,000 | 25,188 |
| Securitized Term Auto Receivables Trust: | | | |
| Series 2017-1A Class A3, 1.89% 8/25/20 (c) | | 711 | 711 |
| Series 2017-2A Class A3, 2.04% 4/26/21 (c) | | 3,798 | 3,795 |
| Tesla Auto Lease Trust Series 2018-A Class A, 2.32% 12/20/19 (c) | | 957 | 957 |
| Toyota Auto Receivables Owner Trust Series 2018-B Class A3, 2.96% 9/15/22 | | 7,000 | 7,097 |
| USAA Auto Owner Trust Series 2017-1 Class A3, 1.7% 5/17/21 | | 1,251 | 1,249 |
| Volvo Financial Equipment LLC Series 2019-1A Class A3, 3% 3/15/23 (c) | | 10,000 | 10,190 |
| World Omni Auto Receivables Trust Series 2016-B Class A3, 1.3% 2/15/22 | | 19,250 | 19,183 |
| World Omni Automobile Lease Securitization Trust Series 2019-A Class A3, 2.94% 5/16/22 | | 6,000 | 6,097 |
| TOTAL ASSET-BACKED SECURITIES | | | |
| (Cost $494,883) | | | 498,909 |
|
| Commercial Mortgage Securities - 2.7% | | | |
| Benchmark Mortgage Trust Series 2018-B7 Class A1, 3.436% 5/15/53 | | 8,961 | 9,248 |
| Citigroup Commercial Mortgage Trust: | | | |
| sequential payer Series 2016-GC36 Class AAB, 3.368% 2/10/49 | | 10,000 | 10,511 |
| Series 2017-P7 Class A1, 2.008% 4/14/50 | | 31,336 | 31,298 |
| COMM Mortgage Trust: | | | |
| sequential payer: | | | |
| Series 2012-LC4 Class A4, 3.288% 12/10/44 | | 9,639 | 9,861 |
| Series 2014-CR18 Class ASB, 3.452% 7/15/47 | | 11,292 | 11,595 |
| Series 2013-LC6 Class ASB, 2.478% 1/10/46 | | 6,799 | 6,851 |
| CSMC Trust Series 2017-CHOP Class A, 1 month U.S. LIBOR + 0.750% 2.9451% 7/15/32 (a)(b)(c) | | 10,000 | 9,972 |
| GS Mortgage Securities Trust: | | | |
| sequential payer Series 2012-GC6 Class A3, 3.482% 1/10/45 | | 9,962 | 10,216 |
| Series 2017-GS8 Class A1, 2.222% 11/10/50 | | 8,342 | 8,369 |
| JPMBB Commercial Mortgage Securities sequential payer Series 2014-C25 Class A2, 2.9493% 11/15/47 | | 183 | 183 |
| JPMorgan Chase Commercial Mortgage Securities Trust sequential payer Series 2014-C20 Class A3A1, 3.4718% 7/15/47 | | 10,000 | 10,202 |
| UBS-Barclays Commercial Mortgage Trust sequential payer Series 2013-C6 Class ASB, 2.7877% 4/10/46 | | 36,097 | 36,517 |
| WF-RBS Commercial Mortgage Trust sequential payer Series 2014-C20 Class ASB, 3.638% 5/15/47 | | 9,506 | 9,828 |
| TOTAL COMMERCIAL MORTGAGE SECURITIES | | | |
| (Cost $164,720) | | | 164,651 |
|
| Municipal Securities - 0.2% | | | |
| New York Urban Dev. Corp. Rev. Series 2017 D, 2.55% 3/15/22 | | | |
| (Cost $15,000) | | 15,000 | 15,299 |
|
| Bank Notes - 0.3% | | | |
| SunTrust Bank: | | | |
| 2.8% 5/17/22 | | $10,000 | $10,188 |
| 3.502% 8/2/22 (a) | | 9,000 | 9,213 |
| TOTAL BANK NOTES | | | |
| (Cost $18,995) | | | 19,401 |
| | | Shares | Value |
|
| Money Market Funds - 0.3% | | | |
| Fidelity Cash Central Fund 2.13% (d) | | | |
| (Cost $20,996) | | 20,992 | 20,996 |
| TOTAL INVESTMENT IN SECURITIES - 99.2% | | | |
| (Cost $5,944,320) | | | 6,031,401 |
| NET OTHER ASSETS (LIABILITIES) - 0.8% | | | 48,278 |
| NET ASSETS - 100% | | | $6,079,679 |
Legend
(a) Coupon rates for floating and adjustable rate securities reflect the rates in effect at period end.
(b) Coupon is indexed to a floating interest rate which may be multiplied by a specified factor and/or subject to caps or floors.
(c) Security exempt from registration under Rule 144A of the Securities Act of 1933. These securities may be resold in transactions exempt from registration, normally to qualified institutional buyers. At the end of the period, the value of these securities amounted to $244,294 or 4.0% of net assets.
(d) Affiliated fund that is generally available only to investment companies and other accounts managed by Fidelity Investments. The rate quoted is the annualized seven-day yield of the fund at period end. A complete unaudited listing of the fund's holdings as of its most recent quarter end is available upon request. In addition, each Fidelity Central Fund's financial statements, which are not covered by the Fund's Report of Independent Registered Public Accounting Firm, are available on the SEC's website or upon request.
Affiliated Central Funds
Information regarding fiscal year to date income earned by the Fund from investments in Fidelity Central Funds is as follows:
| Fund | Income earned |
| Fidelity Cash Central Fund | $2,793 |
| Total | $2,793 |
Amounts in the income column in the above table include any capital gain distributions from underlying funds, which are presented in the corresponding line-item in the Statement of Operations, if applicable.
Investment Valuation
The following is a summary of the inputs used, as of August 31, 2019, involving the Fund's assets and liabilities carried at fair value. The inputs or methodology used for valuing securities may not be an indication of the risk associated with investing in those securities. For more information on valuation inputs, and their aggregation into the levels used below, please refer to the Investment Valuation section in the accompanying Notes to Financial Statements.
| | Valuation Inputs at Reporting Date: |
| Description | Total | Level 1 | Level 2 | Level 3 |
| Investments in Securities: | | | | |
| Corporate Bonds | $2,320,215 | $-- | $2,320,215 | $-- |
| U.S. Government and Government Agency Obligations | 2,976,238 | -- | 2,976,238 | -- |
| U.S. Government Agency - Mortgage Securities | 15,692 | -- | 15,692 | -- |
| Asset-Backed Securities | 498,909 | -- | 498,909 | -- |
| Commercial Mortgage Securities | 164,651 | -- | 164,651 | -- |
| Municipal Securities | 15,299 | -- | 15,299 | -- |
| Bank Notes | 19,401 | -- | 19,401 | -- |
| Money Market Funds | 20,996 | 20,996 | -- | -- |
| Total Investments in Securities: | $6,031,401 | $20,996 | $6,010,405 | $-- |
See accompanying notes which are an integral part of the financial statements.
Financial Statements
Statement of Assets and Liabilities
| | | August 31, 2019 |
| Assets | | |
Investment in securities, at value — See accompanying schedule:
Unaffiliated issuers (cost $5,923,324) | $6,010,405 | |
| Fidelity Central Funds (cost $20,996) | 20,996 | |
| Total Investment in Securities (cost $5,944,320) | | $6,031,401 |
| Cash | | 19,630 |
| Receivable for investments sold | | 101,047 |
| Receivable for fund shares sold | | 822 |
| Interest receivable | | 31,141 |
| Distributions receivable from Fidelity Central Funds | | 85 |
| Total assets | | 6,184,126 |
| Liabilities | | |
| Payable for investments purchased | $104,447 | |
| Total liabilities | | 104,447 |
| Net Assets | | $6,079,679 |
| Net Assets consist of: | | |
| Paid in capital | | $5,991,664 |
| Total distributable earnings (loss) | | 88,015 |
| Net Assets, for 599,819 shares outstanding | | $6,079,679 |
| Net Asset Value, offering price and redemption price per share ($6,079,679 ÷ 599,819 shares) | | $10.14 |
See accompanying notes which are an integral part of the financial statements.
Statement of Operations
| | | Year ended August 31, 2019 |
| Investment Income | | |
| Interest | | $144,984 |
| Income from Fidelity Central Funds | | 2,793 |
| Total income | | 147,777 |
| Expenses | | |
| Independent trustees' fees and expenses | $27 | |
| Commitment fees | 16 | |
| Total expenses | | 43 |
| Net investment income (loss) | | 147,734 |
| Realized and Unrealized Gain (Loss) | | |
| Net realized gain (loss) on: | | |
| Investment securities: | | |
| Unaffiliated issuers | (464) | |
| Total net realized gain (loss) | | (464) |
| Change in net unrealized appreciation (depreciation) on investment securities | | 134,271 |
| Net gain (loss) | | 133,807 |
| Net increase (decrease) in net assets resulting from operations | | $281,541 |
See accompanying notes which are an integral part of the financial statements.
Statement of Changes in Net Assets
| | Year ended August 31, 2019 | Year ended August 31, 2018 |
| Increase (Decrease) in Net Assets | | |
| Operations | | |
| Net investment income (loss) | $147,734 | $114,242 |
| Net realized gain (loss) | (464) | (17,204) |
| Change in net unrealized appreciation (depreciation) | 134,271 | (62,633) |
| Net increase (decrease) in net assets resulting from operations | 281,541 | 34,405 |
| Distributions to shareholders | (134,604) | – |
| Distributions to shareholders from net investment income | – | (108,526) |
| Distributions to shareholders from net realized gain | – | (6,112) |
| Total distributions | (134,604) | (114,638) |
| Share transactions | | |
| Proceeds from sales of shares | 468,516 | 1,002,744 |
| Reinvestment of distributions | 134,604 | 114,638 |
| Cost of shares redeemed | (366,097) | (422,030) |
| Net increase (decrease) in net assets resulting from share transactions | 237,023 | 695,352 |
| Total increase (decrease) in net assets | 383,960 | 615,119 |
| Net Assets | | |
| Beginning of period | 5,695,719 | 5,080,600 |
| End of period | $6,079,679 | $5,695,719 |
| Other Information | | |
| Undistributed net investment income end of period | | $3,926 |
| Shares | | |
| Sold | 47,205 | 101,160 |
| Issued in reinvestment of distributions | 13,480 | 11,558 |
| Redeemed | (36,817) | (42,678) |
| Net increase (decrease) | 23,868 | 70,040 |
See accompanying notes which are an integral part of the financial statements.
Financial Highlights
Fidelity Flex Short-Term Bond Fund
| | | | |
| Years ended August 31, | 2019 | 2018 | 2017 A |
| Selected Per–Share Data | | | |
| Net asset value, beginning of period | $9.89 | $10.04 | $10.00 |
| Income from Investment Operations | | | |
| Net investment income (loss)B | .251 | .206 | .085 |
| Net realized and unrealized gain (loss) | .227 | (.148) | .038 |
| Total from investment operations | .478 | .058 | .123 |
| Distributions from net investment income | (.228) | (.196) | (.083) |
| Distributions from net realized gain | – | (.012) | – |
| Total distributions | (.228) | (.208) | (.083) |
| Net asset value, end of period | $10.14 | $9.89 | $10.04 |
| Total ReturnC | 4.90% | .59% | 1.24% |
| Ratios to Average Net AssetsD,E | | | |
| Expenses before reductionsF | -% | -% | - %G |
| Expenses net of fee waivers, if anyF | -% | -% | - %G |
| Expenses net of all reductionsF | -% | -% | - %G |
| Net investment income (loss) | 2.52% | 2.08% | 1.74%G |
| Supplemental Data | | | |
| Net assets, end of period (000 omitted) | $6,080 | $5,696 | $5,081 |
| Portfolio turnover rateH | 62% | 61% | 96%I |
A For the period March 7, 2017 (commencement of operations) to August 31, 2017.
B Calculated based on average shares outstanding during the period.
C Total returns for periods of less than one year are not annualized.
D Fees and expenses of any underlying Fidelity Central Funds are not included in the Fund's expense ratio. The Fund indirectly bears its proportionate share of the expenses of any underlying Fidelity Central Funds.
E Expense ratios reflect operating expenses of the Fund. Expenses before reductions do not reflect amounts reimbursed by the investment adviser or reductions from expense offset arrangements and do not represent the amount paid by the Fund during periods when reimbursements or reductions occur. Expenses net of fee waivers reflect expenses after reimbursement by the investment adviser but prior to reductions from expense offset arrangements. Expenses net of all reductions represent the net expenses paid by the Fund.
F Amount represents less than .005%.
G Annualized
H Amount does not include the portfolio activity of any underlying Fidelity Central Funds.
I Amount not annualized.
See accompanying notes which are an integral part of the financial statements.
Notes to Financial Statements
For the period ended August 31, 2019
1. Organization.
Fidelity Flex Short-Term Bond Fund (the Fund) is a fund of Fidelity Salem Street Trust (the Trust) and is authorized to issue an unlimited number of shares. Share transactions on the Statement of Changes in Net Assets may contain exchanges between affiliated funds. The Trust is registered under the Investment Company Act of 1940, as amended (the 1940 Act), as an open-end management investment company organized as a Massachusetts business trust. The Fund is available only to certain fee-based accounts offered by Fidelity.
2. Investments in Fidelity Central Funds.
The Fund invests in Fidelity Central Funds, which are open-end investment companies generally available only to other investment companies and accounts managed by the investment adviser and its affiliates. The Fund's Schedule of Investments lists each of the Fidelity Central Funds held as of period end, if any, as an investment of the Fund, but does not include the underlying holdings of each Fidelity Central Fund. As an Investing Fund, the Fund indirectly bears its proportionate share of the expenses of the underlying Fidelity Central Funds.
The Money Market Central Funds seek preservation of capital and current income and are managed by Fidelity Investments Money Management, Inc. (FIMM), an affiliate of the investment adviser. Annualized expenses of the Money Market Central Funds as of their most recent shareholder report date ranged from less than .005% to .01%.
A complete unaudited list of holdings for each Fidelity Central Fund is available upon request or at the Securities and Exchange Commission (the SEC) website at www.sec.gov. In addition, the financial statements of the Fidelity Central Funds, which are not covered by the Fund's Report of Independent Registered Public Accounting Firm, are available on the SEC website or upon request.
3. Significant Accounting Policies.
The Fund is an investment company and applies the accounting and reporting guidance of the Financial Accounting Standards Board (FASB) Accounting Standards Codification Topic 946 Financial Services – Investments Companies. The financial statements have been prepared in conformity with accounting principles generally accepted in the United States of America (GAAP), which require management to make certain estimates and assumptions at the date of the financial statements. Actual results could differ from those estimates. Subsequent events, if any, through the date that the financial statements were issued have been evaluated in the preparation of the financial statements. The following summarizes the significant accounting policies of the Fund:
Investment Valuation. Investments are valued as of 4:00 p.m. Eastern time on the last calendar day of the period. The Board of Trustees (the Board) has delegated the day to day responsibility for the valuation of the Fund's investments to the Fair Value Committee (the Committee) established by the Fund's investment adviser. In accordance with valuation policies and procedures approved by the Board, the Fund attempts to obtain prices from one or more third party pricing vendors or brokers to value its investments. When current market prices, quotations or currency exchange rates are not readily available or reliable, investments will be fair valued in good faith by the Committee, in accordance with procedures adopted by the Board. Factors used in determining fair value vary by investment type and may include market or investment specific events, changes in interest rates and credit quality. The frequency with which these procedures are used cannot be predicted and they may be utilized to a significant extent. The Committee oversees the Fund's valuation policies and procedures and reports to the Board on the Committee's activities and fair value determinations. The Board monitors the appropriateness of the procedures used in valuing the Fund's investments and ratifies the fair value determinations of the Committee.
The Fund categorizes the inputs to valuation techniques used to value its investments into a disclosure hierarchy consisting of three levels as shown below:
- Level 1 – quoted prices in active markets for identical investments
- Level 2 – other significant observable inputs (including quoted prices for similar investments, interest rates, prepayment speeds, etc.)
- Level 3 – unobservable inputs (including the Fund's own assumptions based on the best information available)
Valuation techniques used to value the Fund's investments by major category are as follows:
Debt securities, including restricted securities, are valued based on evaluated prices received from third party pricing vendors or from brokers who make markets in such securities. Corporate bonds, bank notes, municipal securities and U.S. government and government agency obligations are valued by pricing vendors who utilize matrix pricing which considers yield or price of bonds of comparable quality, coupon, maturity and type or by broker-supplied prices. Asset backed securities, commercial mortgage securities and U.S. government agency mortgage securities are valued by pricing vendors who utilize matrix pricing which considers prepayment speed assumptions, attributes of the collateral, yield or price of bonds of comparable quality, coupon, maturity and type or by broker-supplied prices. When independent prices are unavailable or unreliable, debt securities may be valued utilizing pricing methodologies which consider similar factors that would be used by third party pricing vendors. Debt securities are generally categorized as Level 2 in the hierarchy but may be Level 3 depending on the circumstances.
Investments in open-end mutual funds, including the Fidelity Central Funds, are valued at their closing net asset value (NAV) each business day and are categorized as Level 1 in the hierarchy.
Changes in valuation techniques may result in transfers in or out of an assigned level within the disclosure hierarchy. The aggregate value of investments by input level as of August 31, 2019 is included at the end of the Fund's Schedule of Investments.
Investment Transactions and Income. For financial reporting purposes, the Fund's investment holdings and NAV include trades executed through the end of the last business day of the period. The NAV per share for processing shareholder transactions is calculated as of the close of business of the New York Stock Exchange (NYSE), normally 4:00 p.m. Eastern time and includes trades executed through the end of the prior business day. Gains and losses on securities sold are determined on the basis of identified cost. Income and capital gain distributions from Fidelity Central Funds, if any, are recorded on the ex-dividend date. Interest income is accrued as earned and includes coupon interest and amortization of premium and accretion of discount on debt securities as applicable. Debt obligations may be placed on non-accrual status and related interest income may be reduced by ceasing current accruals and writing off interest receivables when the collection of all or a portion of interest has become doubtful based on consistently applied procedures. A debt obligation is removed from non-accrual status when the issuer resumes interest payments or when collectability of interest is reasonably assured.
Expenses. Expenses directly attributable to a fund are charged to that fund. Expenses attributable to more than one fund are allocated among the respective funds on the basis of relative net assets or other appropriate methods. Expense estimates are accrued in the period to which they relate and adjustments are made when actual amounts are known.
Income Tax Information and Distributions to Shareholders. Each year, the Fund intends to qualify as a regulated investment company under Subchapter M of the Internal Revenue Code, including distributing substantially all of its taxable income and realized gains. As a result, no provision for U.S. Federal income taxes is required. As of August 31, 2019, the Fund did not have any unrecognized tax benefits in the financial statements; nor is the Fund aware of any tax positions for which it is reasonably possible that the total amounts of unrecognized tax benefits will significantly change in the next twelve months. The Fund files a U.S. federal tax return, in addition to state and local tax returns as required. The Fund's federal income tax returns are subject to examination by the Internal Revenue Service (IRS) for a period of three fiscal years after they are filed. State and local tax returns may be subject to examination for an additional fiscal year depending on the jurisdiction.
Distributions are declared and recorded daily and paid monthly from net investment income. Distributions from realized gains, if any, are declared and recorded on the ex-dividend date. Income and capital gain distributions are determined in accordance with income tax regulations, which may differ from GAAP.
Capital accounts within the financial statements are adjusted for permanent book-tax differences. These adjustments have no impact on net assets or the results of operations. Capital accounts are not adjusted for temporary book-tax differences which will reverse in a subsequent period.
Book-tax differences are primarily due to market discount and capital loss carryforwards.
As of period end, the cost and unrealized appreciation (depreciation) in securities, and derivatives if applicable, for federal income tax purposes were as follows:
| Gross unrealized appreciation | $101,940 |
| Gross unrealized depreciation | (2,394) |
| Net unrealized appreciation (depreciation) | $99,546 |
| Tax Cost | $5,931,855 |
The tax-based components of distributable earnings as of period end were as follows:
| Undistributed ordinary income | $3,494 |
| Capital loss carryforward | $(15,025) |
| Net unrealized appreciation (depreciation) on securities and other investments | $99,546 |
Capital loss carryforwards are only available to offset future capital gains of the Fund to the extent provided by regulations and may be limited. Under the Regulated Investment Company Modernization Act of 2010 (the Act), the Fund is permitted to carry forward capital losses incurred in taxable years beginning after December 22, 2010 for an unlimited period and such capital losses are required to be used prior to any losses that expire. The capital loss carryforward information presented below, including any applicable limitation, is estimated as of fiscal period end and is subject to adjustment.
| No expiration | |
| Short-term | $(4,561) |
| Long-term | (10,464) |
| Total capital loss carryforward | $(15,025) |
The tax character of distributions paid was as follows:
| | August 31, 2019 | August 31, 2018 |
| Ordinary Income | $134,604 | $ 114,638 |
Restricted Securities. The Fund may invest in securities that are subject to legal or contractual restrictions on resale. These securities generally may be resold in transactions exempt from registration or to the public if the securities are registered. Disposal of these securities may involve time-consuming negotiations and expense, and prompt sale at an acceptable price may be difficult. Information regarding restricted securities is included at the end of the Fund's Schedule of Investments.
New Rule Issuance. During August 2018, the U.S. Securities and Exchange Commission issued Final Rule Release No. 33-10532, Disclosure Update and Simplification. This Final Rule includes amendments specific to registered investment companies that are intended to eliminate overlap in disclosure requirements between Regulation S-X and GAAP. In accordance with these amendments, certain line-items in the Fund's financial statements have been combined or removed for the current period as outlined in the table below.
| Financial Statement | Current Line-Item Presentation (As Applicable) | Prior Line-Item Presentation (As Applicable) |
| Statement of Assets and Liabilities | Total distributable earnings (loss) | Undistributed/Distributions in excess of/Accumulated net investment income (loss)
Accumulated/Undistributed net realized gain (loss)
Net unrealized appreciation (depreciation) |
| Statement of Changes in Net Assets | N/A - removed | Undistributed/Distributions in excess of/Accumulated net investment income (loss) end of period |
| Statement of Changes in Net Assets | Distributions to shareholders | Distributions to shareholders from net investment income
Distributions to shareholders from net realized gain |
4. Purchases and Sales of Investments.
Purchases and sales of securities, other than short-term securities and U.S. government securities, aggregated $1,227,666 and $1,623,847, respectively.
5. Fees and Other Transactions with Affiliates.
Management Fee. Fidelity Management & Research Company (the investment adviser) and its affiliates provide the Fund with investment management related services and the Fund does not pay any fees for these services. Under the management contract, the investment adviser or an affiliate pays all other expenses of the Fund, excluding fees and expenses of the independent Trustees, and certain miscellaneous expenses such as proxy and shareholder meeting expenses.
Interfund Trades. The Fund may purchase from or sell securities to other Fidelity Funds under procedures adopted by the Board. The procedures have been designed to ensure these interfund trades are executed in accordance with Rule 17a-7 of the 1940 Act. Interfund trades are included within the respective purchases and sales amounts shown in the Purchases and Sales of Investments note.
6. Committed Line of Credit.
The Fund participates with other funds managed by the investment adviser or an affiliate in a $4.25 billion credit facility (the "line of credit") to be utilized for temporary or emergency purposes to fund shareholder redemptions or for other short-term liquidity purposes. The Fund has agreed to pay commitment fees on its pro-rata portion of the line of credit, which amounted to $16 and is reflected in Commitment fees on the Statement of Operations. During the period, the Fund did not borrow on this line of credit.
7. Other.
The Fund's organizational documents provide former and current trustees and officers with a limited indemnification against liabilities arising in connection with the performance of their duties to the Fund. In the normal course of business, the Fund may also enter into contracts that provide general indemnifications. The Fund's maximum exposure under these arrangements is unknown as this would be dependent on future claims that may be made against the Fund. The risk of material loss from such claims is considered remote.
At the end of the period, the investment adviser or its affiliates were the owners of record of approximately 88% of the total outstanding shares of the Fund.
Report of Independent Registered Public Accounting Firm
To the Board of Trustees of Fidelity Salem Street Trust and Shareholders of Fidelity Flex Short-Term Bond Fund:
Opinion on the Financial Statements
We have audited the accompanying statement of assets and liabilities, including the schedule of investments, of Fidelity Flex Short-Term Bond Fund (one of the funds constituting Fidelity Salem Street Trust, referred to hereafter as the “Fund”) as of August 31, 2019, the related statement of operations for the year ended August 31, 2019, the statement of changes in net assets for each of the two years in the period ended August 31, 2019, including the related notes, and the financial highlights for each of the two years in the period ended August 31, 2019 and for the period March 7, 2017 (commencement of operations) through August 31, 2017 (collectively referred to as the “financial statements”). In our opinion, the financial statements present fairly, in all material respects, the financial position of the Fund as of August 31, 2019, the results of its operations for the year then ended, the changes in its net assets for each of the two years in the period ended August 31, 2019 and the financial highlights for each of the two years in the period ended August 31, 2019 and for the period March 7, 2017 (commencement of operations) through August 31, 2017 in conformity with accounting principles generally accepted in the United States of America.
Basis for Opinion
These financial statements are the responsibility of the Fund’s management. Our responsibility is to express an opinion on the Fund’s financial statements based on our audits. We are a public accounting firm registered with the Public Company Accounting Oversight Board (United States) (PCAOB) and are required to be independent with respect to the Fund in accordance with the U.S. federal securities laws and the applicable rules and regulations of the Securities and Exchange Commission and the PCAOB.
We conducted our audits of these financial statements in accordance with the standards of the PCAOB. Those standards require that we plan and perform the audit to obtain reasonable assurance about whether the financial statements are free of material misstatement, whether due to error or fraud.
Our audits included performing procedures to assess the risks of material misstatement of the financial statements, whether due to error or fraud, and performing procedures that respond to those risks. Such procedures included examining, on a test basis, evidence regarding the amounts and disclosures in the financial statements. Our audits also included evaluating the accounting principles used and significant estimates made by management, as well as evaluating the overall presentation of the financial statements. Our procedures included confirmation of securities owned as of August 31, 2019 by correspondence with the custodian and brokers; when replies were not received from brokers, we performed other auditing procedures. We believe that our audits provide a reasonable basis for our opinion.
PricewaterhouseCoopers LLP
Boston, Massachusetts
October 17, 2019
We have served as the auditor of one or more investment companies in the Fidelity group of funds since 1932.
Trustees and Officers
The Trustees, Members of the Advisory Board (if any), and officers of the trust and fund, as applicable, are listed below. The Board of Trustees governs the fund and is responsible for protecting the interests of shareholders. The Trustees are experienced executives who meet periodically throughout the year to oversee the fund's activities, review contractual arrangements with companies that provide services to the fund, oversee management of the risks associated with such activities and contractual arrangements, and review the fund's performance. Except for Jonathan Chiel, each of the Trustees oversees 276 funds. Mr. Chiel oversees 170 funds.
The Trustees hold office without limit in time except that (a) any Trustee may resign; (b) any Trustee may be removed by written instrument, signed by at least two-thirds of the number of Trustees prior to such removal; (c) any Trustee who requests to be retired or who has become incapacitated by illness or injury may be retired by written instrument signed by a majority of the other Trustees; and (d) any Trustee may be removed at any special meeting of shareholders by a two-thirds vote of the outstanding voting securities of the trust. Each Trustee who is not an interested person (as defined in the 1940 Act) of the trust and the fund is referred to herein as an Independent Trustee. Each Independent Trustee shall retire not later than the last day of the calendar year in which his or her 75th birthday occurs. The Independent Trustees may waive this mandatory retirement age policy with respect to individual Trustees. Officers and Advisory Board Members hold office without limit in time, except that any officer or Advisory Board Member may resign or may be removed by a vote of a majority of the Trustees at any regular meeting or any special meeting of the Trustees. Except as indicated, each individual has held the office shown or other offices in the same company for the past five years.
The fund’s Statement of Additional Information (SAI) includes more information about the Trustees. To request a free copy, call Fidelity at 1-800-544-3455 (for managed account clients) or 1-800-835-5092 (for retirement plan participants).
Experience, Skills, Attributes, and Qualifications of the Trustees. The Governance and Nominating Committee has adopted a statement of policy that describes the experience, qualifications, attributes, and skills that are necessary and desirable for potential Independent Trustee candidates (Statement of Policy). The Board believes that each Trustee satisfied at the time he or she was initially elected or appointed a Trustee, and continues to satisfy, the standards contemplated by the Statement of Policy. The Governance and Nominating Committee also engages professional search firms to help identify potential Independent Trustee candidates who have the experience, qualifications, attributes, and skills consistent with the Statement of Policy. From time to time, additional criteria based on the composition and skills of the current Independent Trustees, as well as experience or skills that may be appropriate in light of future changes to board composition, business conditions, and regulatory or other developments, have also been considered by the professional search firms and the Governance and Nominating Committee. In addition, the Board takes into account the Trustees' commitment and participation in Board and committee meetings, as well as their leadership of standing and ad hoc committees throughout their tenure.
In determining that a particular Trustee was and continues to be qualified to serve as a Trustee, the Board has considered a variety of criteria, none of which, in isolation, was controlling. The Board believes that, collectively, the Trustees have balanced and diverse experience, qualifications, attributes, and skills, which allow the Board to operate effectively in governing the fund and protecting the interests of shareholders. Information about the specific experience, skills, attributes, and qualifications of each Trustee, which in each case led to the Board's conclusion that the Trustee should serve (or continue to serve) as a trustee of the fund, is provided below.
Board Structure and Oversight Function. Abigail P. Johnson is an interested person and currently serves as Chairman. The Trustees have determined that an interested Chairman is appropriate and benefits shareholders because an interested Chairman has a personal and professional stake in the quality and continuity of services provided to the fund. Independent Trustees exercise their informed business judgment to appoint an individual of their choosing to serve as Chairman, regardless of whether the Trustee happens to be independent or a member of management. The Independent Trustees have determined that they can act independently and effectively without having an Independent Trustee serve as Chairman and that a key structural component for assuring that they are in a position to do so is for the Independent Trustees to constitute a substantial majority for the Board. The Independent Trustees also regularly meet in executive session. Arthur E. Johnson serves as Chairman of the Independent Trustees and as such (i) acts as a liaison between the Independent Trustees and management with respect to matters important to the Independent Trustees and (ii) with management prepares agendas for Board meetings.
Fidelity® funds are overseen by different Boards of Trustees. The fund's Board oversees Fidelity's investment-grade bond, money market, asset allocation and certain equity funds, and other Boards oversee Fidelity's high income and other equity funds. The asset allocation funds may invest in Fidelity® funds that are overseen by such other Boards. The use of separate Boards, each with its own committee structure, allows the Trustees of each group of Fidelity® funds to focus on the unique issues of the funds they oversee, including common research, investment, and operational issues. On occasion, the separate Boards establish joint committees to address issues of overlapping consequences for the Fidelity® funds overseen by each Board.
The Trustees operate using a system of committees to facilitate the timely and efficient consideration of all matters of importance to the Trustees, the fund, and fund shareholders and to facilitate compliance with legal and regulatory requirements and oversight of the fund's activities and associated risks. The Board, acting through its committees, has charged FMR and its affiliates with (i) identifying events or circumstances the occurrence of which could have demonstrably adverse effects on the fund's business and/or reputation; (ii) implementing processes and controls to lessen the possibility that such events or circumstances occur or to mitigate the effects of such events or circumstances if they do occur; and (iii) creating and maintaining a system designed to evaluate continuously business and market conditions in order to facilitate the identification and implementation processes described in (i) and (ii) above. Because the day-to-day operations and activities of the fund are carried out by or through FMR, its affiliates, and other service providers, the fund's exposure to risks is mitigated but not eliminated by the processes overseen by the Trustees. While each of the Board's committees has responsibility for overseeing different aspects of the fund's activities, oversight is exercised primarily through the Operations and Audit Committees. In addition, an ad hoc Board committee of Independent Trustees has worked with FMR to enhance the Board's oversight of investment and financial risks, legal and regulatory risks, technology risks, and operational risks, including the development of additional risk reporting to the Board. Appropriate personnel, including but not limited to the fund's Chief Compliance Officer (CCO), FMR's internal auditor, the independent accountants, the fund's Treasurer and portfolio management personnel, make periodic reports to the Board's committees, as appropriate, including an annual review of Fidelity's risk management program for the Fidelity® funds. The responsibilities of each standing committee, including their oversight responsibilities, are described further under "Standing Committees of the Trustees."
Interested Trustees*:
Correspondence intended for a Trustee who is an interested person may be sent to Fidelity Investments, 245 Summer Street, Boston, Massachusetts 02210.
Name, Year of Birth; Principal Occupations and Other Relevant Experience+
Jonathan Chiel (1957)
Year of Election or Appointment: 2016
Trustee
Mr. Chiel also serves as Trustee of other Fidelity® funds. Mr. Chiel is Executive Vice President and General Counsel for FMR LLC (diversified financial services company, 2012-present). Previously, Mr. Chiel served as general counsel (2004-2012) and senior vice president and deputy general counsel (2000-2004) for John Hancock Financial Services; a partner with Choate, Hall & Stewart (1996-2000) (law firm); and an Assistant United States Attorney for the United States Attorney’s Office of the District of Massachusetts (1986-95), including Chief of the Criminal Division (1993-1995). Mr. Chiel is a director on the boards of the Boston Bar Foundation and the Maimonides School.
Abigail P. Johnson (1961)
Year of Election or Appointment: 2009
Trustee
Chairman of the Board of Trustees
Ms. Johnson also serves as Trustee of other Fidelity® funds. Ms. Johnson serves as Chairman (2016-present), Chief Executive Officer (2014-present), and Director (2007-present) of FMR LLC (diversified financial services company), President of Fidelity Financial Services (2012-present) and President of Personal, Workplace and Institutional Services (2005-present). Ms. Johnson is Chairman and Director of FMR Co., Inc. (investment adviser firm, 2011-present) and Chairman and Director of FMR (investment adviser firm, 2011-present). Previously, Ms. Johnson served as Vice Chairman (2007-2016) and President (2013-2016) of FMR LLC, President and a Director of FMR (2001-2005), a Trustee of other investment companies advised by FMR, Fidelity Investments Money Management, Inc. (investment adviser firm), and FMR Co., Inc. (2001-2005), Senior Vice President of the Fidelity® funds (2001-2005), and managed a number of Fidelity® funds. Ms. Abigail P. Johnson and Mr. Arthur E. Johnson are not related.
Jennifer Toolin McAuliffe (1959)
Year of Election or Appointment: 2016
Trustee
Ms. McAuliffe also serves as Trustee of other Fidelity® funds. Ms. McAuliffe previously served as a Member of the Advisory Board of certain Fidelity® funds (2016) and as Co-Head of Fixed Income of Fidelity Investments Limited (now known as FIL Limited (FIL)) (diversified financial services company). Earlier roles at FIL included Director of Research for FIL’s credit and quantitative teams in London, Hong Kong and Tokyo. Ms. McAuliffe also was the Director of Research for taxable and municipal bonds at Fidelity Investments Money Management, Inc. Ms. McAuliffe is also a director or trustee of several not-for-profit entities.
* Determined to be an “Interested Trustee” by virtue of, among other things, his or her affiliation with the trust or various entities under common control with FMR.
+ The information includes the Trustee's principal occupation during the last five years and other information relating to the experience, attributes, and skills relevant to the Trustee's qualifications to serve as a Trustee, which led to the conclusion that the Trustee should serve as a Trustee for the fund.
Independent Trustees:
Correspondence intended for an Independent Trustee may be sent to Fidelity Investments, P.O. Box 55235, Boston, Massachusetts 02205-5235.
Name, Year of Birth; Principal Occupations and Other Relevant Experience+
Elizabeth S. Acton (1951)
Year of Election or Appointment: 2013
Trustee
Ms. Acton also serves as Trustee of other Fidelity® funds. Prior to her retirement in April 2012, Ms. Acton was Executive Vice President, Finance (2011-2012), Executive Vice President, Chief Financial Officer (2002-2011), and Treasurer (2004-2005) of Comerica Incorporated (financial services). Prior to joining Comerica, Ms. Acton held a variety of positions at Ford Motor Company (1983-2002), including Vice President and Treasurer (2000-2002) and Executive Vice President and Chief Financial Officer of Ford Motor Credit Company (1998-2000). Ms. Acton currently serves as a member of the Board of Directors and Audit and Finance Committees of Beazer Homes USA, Inc. (homebuilding, 2012-present). Previously, Ms. Acton served as a Member of the Advisory Board of certain Fidelity® funds (2013-2016).
Ann E. Dunwoody (1953)
Year of Election or Appointment: 2018
Trustee
General Dunwoody also serves as Trustee of other Fidelity® funds. General Dunwoody (United States Army, Retired) was the first woman in U.S. military history to achieve the rank of four-star general and prior to her retirement in 2012 held a variety of positions within the U.S. Army, including Commanding General, U.S. Army Material Command (2008-2012). She is the President of First to Four LLC (leadership and mentoring services, 2012-present). She also serves as a member of the Board of Directors and Nominating and Corporate Governance Committee of L3 Technologies, Inc. (communication, electronic, sensor, and aerospace systems, 2013-present), Board of Directors and Nomination and Corporate Governance Committees of Kforce Inc. (professional staffing services, 2016-present) and Board of Directors of Automattic Inc. (software engineering, 2018-present). Previously, General Dunwoody served as a Member of the Advisory Board of certain Fidelity® funds (2018), a member of the Board of Directors and Audit and Sustainability and Corporate Responsibility Committees of Republic Services, Inc. (waste collection, disposal and recycling, 2013-2016). Ms. Dunwoody also serves on several boards for non-profit organizations, including as a member of the Board of Directors, Chair of the Nomination and Governance Committee and member of the Audit Committee of Logistics Management Institute (consulting non-profit, 2012-present), a member of the Board of Directors of the Army Historical Foundation (2015-present), a member of the Council of Trustees for the Association of the United States Army (advocacy non-profit, 2013-present) and a member of the Board of Trustees of Florida Institute of Technology (2015-present) and ThanksUSA (military family education non-profit, 2014-present).
John Engler (1948)
Year of Election or Appointment: 2014
Trustee
Mr. Engler also serves as Trustee of other Fidelity® funds. He serves on the board of directors for Universal Forest Products (manufacturer and distributor of wood and wood-alternative products, 2003-present) and K12 Inc. (technology-based education company, 2012-present). Previously, Mr. Engler served as interim president of Michigan State University (2018-2019), a Member of the Advisory Board of certain Fidelity® funds (2014-2016), president of the Business Roundtable (2011-2017), a trustee of The Munder Funds (2003-2014), president and CEO of the National Association of Manufacturers (2004-2011), member of the Board of Trustees of the Annie E. Casey Foundation (2004-2015), and as governor of Michigan (1991-2003). He is a past chairman of the National Governors Association.
Robert F. Gartland (1951)
Year of Election or Appointment: 2010
Trustee
Mr. Gartland also serves as Trustee of other Fidelity® funds. Mr. Gartland is Chairman and an investor in Gartland & Mellina Group Corp. (consulting, 2009-present). Previously, Mr. Gartland served as a partner and investor of Vietnam Partners LLC (investments and consulting, 2008-2011). Prior to his retirement, Mr. Gartland held a variety of positions at Morgan Stanley (financial services, 1979-2007), including Managing Director (1987-2007), and Chase Manhattan Bank (1975-1978).
Arthur E. Johnson (1947)
Year of Election or Appointment: 2008
Trustee
Chairman of the Independent Trustees
Mr. Johnson also serves as Trustee of other Fidelity® funds. Mr. Johnson serves as a member of the Board of Directors of Eaton Corporation plc (diversified power management, 2009-present) and Booz Allen Hamilton (management consulting, 2011-present). Prior to his retirement, Mr. Johnson served as Senior Vice President of Corporate Strategic Development of Lockheed Martin Corporation (defense contractor, 1999-2009). Mr. Johnson previously served as Vice Chairman (2015-2018) of the Independent Trustees of certain Fidelity® funds and on the Board of Directors of IKON Office Solutions, Inc. (1999-2008), AGL Resources, Inc. (holding company, 2002-2016), and Delta Airlines (2005-2007). Mr. Arthur E. Johnson is not related to Ms. Abigail P. Johnson.
Michael E. Kenneally (1954)
Year of Election or Appointment: 2009
Trustee
Vice Chairman of the Independent Trustees
Mr. Kenneally also serves as Trustee of other Fidelity® funds. Prior to his retirement, Mr. Kenneally served as Chairman and Global Chief Executive Officer of Credit Suisse Asset Management. Before joining Credit Suisse, he was an Executive Vice President and Chief Investment Officer for Bank of America Corporation. Earlier roles at Bank of America included Director of Research, Senior Portfolio Manager and Research Analyst, and Mr. Kenneally was awarded the Chartered Financial Analyst (CFA) designation in 1991.
Marie L. Knowles (1946)
Year of Election or Appointment: 2001
Trustee
Ms. Knowles also serves as Trustee of other Fidelity® funds. Prior to Ms. Knowles' retirement in June 2000, she served as Executive Vice President and Chief Financial Officer of Atlantic Richfield Company (ARCO) (diversified energy, 1996-2000). From 1993 to 1996, she was a Senior Vice President of ARCO and President of ARCO Transportation Company (pipeline and tanker operations). Ms. Knowles currently serves as a Director and Chairman of the Audit Committee of McKesson Corporation (healthcare service, since 2002). Ms. Knowles is a member of the Board of the Santa Catalina Island Company (real estate, 2009-present). Ms. Knowles is a Member of the Investment Company Institute Board of Governors and a Member of the Governing Council of the Independent Directors Council (2014-present). She also serves as a member of the Advisory Board for the School of Engineering of the University of Southern California. Previously, Ms. Knowles served as a Director of Phelps Dodge Corporation (copper mining and manufacturing, 1994-2007), URS Corporation (engineering and construction, 2000-2003) and America West (airline, 1999-2002). Ms. Knowles previously served as Chairman (2015-2018) and Vice Chairman (2012-2015) of the Independent Trustees of certain Fidelity® funds.
Mark A. Murray (1954)
Year of Election or Appointment: 2016
Trustee
Mr. Murray also serves as Trustee of other Fidelity® funds. Mr. Murray is Vice Chairman (2013-present) of Meijer, Inc. (regional retail chain). Previously, Mr. Murray served as a Member of the Advisory Board of certain Fidelity® funds (2016) and as Co-Chief Executive Officer (2013-2016) and President (2006-2013) of Meijer, Inc. Mr. Murray serves as a member of the Board of Directors and Nuclear Review and Public Policy and Responsibility Committees of DTE Energy Company (diversified energy company, 2009-present). Mr. Murray also serves as a member of the Board of Directors of Spectrum Health (not-for-profit health system, 2015-present). Mr. Murray previously served as President of Grand Valley State University (2001-2006), Treasurer for the State of Michigan (1999-2001), Vice President of Finance and Administration for Michigan State University (1998-1999), and a member of the Board of Directors and Audit Committee and Chairman of the Nominating and Corporate Governance Committee of Universal Forest Products, Inc. (manufacturer and distributor of wood and wood-alternative products, 2004-2016). Mr. Murray is also a director or trustee of many community and professional organizations.
+ The information includes the Trustee's principal occupation during the last five years and other information relating to the experience, attributes, and skills relevant to the Trustee's qualifications to serve as a Trustee, which led to the conclusion that the Trustee should serve as a Trustee for the fund.
Advisory Board Members and Officers:
Correspondence intended for an officer may be sent to Fidelity Investments, 245 Summer Street, Boston, Massachusetts 02210. Officers appear below in alphabetical order.
Name, Year of Birth; Principal Occupation
Elizabeth Paige Baumann (1968)
Year of Election or Appointment: 2017
Anti-Money Laundering (AML) Officer
Ms. Baumann also serves as AML Officer of other funds. She is Chief AML Officer (2012-present) and Senior Vice President (2014-present) of FMR LLC (diversified financial services company) and is an employee of Fidelity Investments. Previously, Ms. Baumann served as AML Officer of the funds (2012-2016), and Vice President (2007-2014) and Deputy Anti-Money Laundering Officer (2007-2012) of FMR LLC.
Craig S. Brown (1977)
Year of Election or Appointment: 2019
Assistant Treasurer
Mr. Brown also serves as Assistant Treasurer of other funds. Mr. Brown is an employee of Fidelity Investments (2013-present).
John J. Burke III (1964)
Year of Election or Appointment: 2018
Chief Financial Officer
Mr. Burke also serves as Chief Financial Officer of other funds. Mr. Burke serves as Head of Investment Operations for Fidelity Fund and Investment Operations (2018-present) and is an employee of Fidelity Investments (1998-present). Previously Mr. Burke served as head of Asset Management Investment Operations (2012-2018).
Jonathan Davis (1968)
Year of Election or Appointment: 2010
Assistant Treasurer
Mr. Davis also serves as Assistant Treasurer of other funds. Mr. Davis serves as Assistant Treasurer of FMR Capital, Inc. (2017-present) and is an employee of Fidelity Investments. Previously, Mr. Davis served as Vice President and Associate General Counsel of FMR LLC (diversified financial services company, 2003-2010).
Adrien E. Deberghes (1967)
Year of Election or Appointment: 2010
Assistant Treasurer
Mr. Deberghes also serves as an officer of other funds. He serves as Assistant Treasurer of FMR Capital, Inc. (2017-present), Executive Vice President of Fidelity Investments Money Management, Inc. (FIMM) (investment adviser firm, 2016-present), and is an employee of Fidelity Investments (2008-present). Previously, Mr. Deberghes served as President and Treasurer of certain Fidelity® funds (2013-2018). Prior to joining Fidelity Investments, Mr. Deberghes was Senior Vice President of Mutual Fund Administration at State Street Corporation (2007-2008), Senior Director of Mutual Fund Administration at Investors Bank & Trust (2005-2007), and Director of Finance for Dunkin' Brands (2000-2005). Previously, Mr. Deberghes served in other fund officer roles.
Laura M. Del Prato (1964)
Year of Election or Appointment: 2018
President and Treasurer
Ms. Del Prato also serves as an officer of other funds. Ms. Del Prato is an employee of Fidelity Investments (2017-present). Prior to joining Fidelity Investments, Ms. Del Prato served as a Managing Director and Treasurer of the JPMorgan Mutual Funds (2014-2017). Prior to JPMorgan, Ms. Del Prato served as a partner at Cohen Fund Audit Services (accounting firm, 2012-2013) and KPMG LLP (accounting firm, 2004-2012).
Colm A. Hogan (1973)
Year of Election or Appointment: 2016
Assistant Treasurer
Mr. Hogan also serves as an officer of other funds. Mr. Hogan serves as Assistant Treasurer of FMR Capital, Inc. (2017-present) and is an employee of Fidelity Investments (2005-present). Previously, Mr. Hogan served as Assistant Treasurer of certain Fidelity® funds (2016-2018).
Cynthia Lo Bessette (1969)
Year of Election or Appointment: 2019
Secretary and Chief Legal Officer (CLO)
Ms. Lo Bessette also serves as Secretary and CLO of other funds. She is a Senior Vice President and Deputy General Counsel of FMR LLC (diversified financial services company, 2019-present), and is an employee of Fidelity Investments. Previously, Ms. Lo Bessette served as Executive Vice President, General Counsel (2016-2019) and Senior Vice President, Deputy General Counsel (2015-2016) of OppenheimerFunds (investment management company) and Deputy Chief Legal Officer (2013-2015) of Jennison Associates LLC (investment adviser firm).
Chris Maher (1972)
Year of Election or Appointment: 2013
Assistant Treasurer
Mr. Maher serves as Assistant Treasurer of other funds. Mr. Maher is Vice President of Valuation Oversight, serves as Assistant Treasurer of FMR Capital, Inc. (2017-present), and is an employee of Fidelity Investments. Previously, Mr. Maher served as Vice President of Asset Management Compliance (2013), Vice President of the Program Management Group of FMR (investment adviser firm, 2010-2013), and Vice President of Valuation Oversight (2008-2010).
John B. McGinty, Jr. (1962)
Year of Election or Appointment: 2016
Chief Compliance Officer
Mr. McGinty also serves as Chief Compliance Officer of other funds. Mr. McGinty is Senior Vice President of Asset Management Compliance for Fidelity Investments and is an employee of Fidelity Investments (2016-present). Mr. McGinty previously served as Vice President, Senior Attorney at Eaton Vance Management (investment management firm, 2015-2016), and prior to Eaton Vance as global CCO for all firm operations and registered investment companies at GMO LLC (investment management firm, 2009-2015). Before joining GMO LLC, Mr. McGinty served as Senior Vice President, Deputy General Counsel for Fidelity Investments (2007-2009).
Jason P. Pogorelec (1975)
Year of Election or Appointment: 2015
Assistant Secretary
Mr. Pogorelec also serves as Assistant Secretary of other funds. Mr. Pogorelec serves as Vice President, Associate General Counsel (2010-present) and is an employee of Fidelity Investments (2006-present).
Nancy D. Prior (1967)
Year of Election or Appointment: 2014
Vice President
Ms. Prior also serves as Vice President of other funds. Ms. Prior serves as President of Fixed Income (2014-present), President (2016-present) and Director (2014-present) of Fidelity Investments Money Management, Inc. (FIMM) (investment adviser firm), and is an employee of Fidelity Investments (2002-present). Previously, Ms. Prior served as Vice Chairman of FIAM LLC (investment adviser firm, 2014-2018), a Director of FMR Investment Management (UK) Limited (investment adviser firm, 2015-2018), President Multi-Asset Class Strategies of FMR's Global Asset Allocation Division (2017-2018), Vice President of Fidelity's Money Market Funds (2012-2014), and President, Money Market and Short Duration Bond Group of Fidelity Management & Research Company (FMR) (investment adviser firm, 2013-2014).
Stacie M. Smith (1974)
Year of Election or Appointment: 2013
Assistant Treasurer
Ms. Smith also serves as an officer of other funds. Ms. Smith serves as Assistant Treasurer of FMR Capital, Inc. (2017-present), is an employee of Fidelity Investments (2009-present), and has served in other fund officer roles. Prior to joining Fidelity Investments, Ms. Smith served as Senior Audit Manager of Ernst & Young LLP (accounting firm, 1996-2009). Previously, Ms. Smith served as Assistant Treasurer (2013-2018) and Deputy Treasurer (2013-2016) of certain Fidelity® funds.
Marc L. Spector (1972)
Year of Election or Appointment: 2016
Deputy Treasurer
Mr. Spector also serves as an officer of other funds. Mr. Spector serves as Assistant Treasurer of FMR Capital, Inc. (2017-present) and is an employee of Fidelity Investments (2016-present). Prior to joining Fidelity Investments, Mr. Spector served as Director at the Siegfried Group (accounting firm, 2013-2016), and prior to Siegfried Group as audit senior manager at Deloitte & Touche (accounting firm, 2005-2013).
Jim Wegmann (1979)
Year of Election or Appointment: 2019
Assistant Treasurer
Mr. Wegmann also serves as Assistant Treasurer of other funds. Mr. Wegmann is an employee of Fidelity Investments (2011-present).
Shareholder Expense Example
As a shareholder of the Fund, you incur two types of costs: (1) transaction costs and (2) ongoing costs, including other Fund expenses. This Example is intended to help you understand your ongoing costs (in dollars) of investing in the Fund and to compare these costs with the ongoing costs of investing in other mutual funds.
The Example is based on an investment of $1,000 invested at the beginning of the period and held for the entire period (March 1, 2019 to August 31, 2019).
Actual Expenses
The first line of the accompanying table provides information about actual account values and actual expenses. You may use the information in this line, together with the amount you invested, to estimate the expenses that you paid over the period. Simply divide your account value by $1,000.00 (for example, an $8,600 account value divided by $1,000.00 = 8.6), then multiply the result by the number in the first line under the heading entitled "Expenses Paid During Period" to estimate the expenses you paid on your account during this period. In addition, the Fund, as a shareholder in the underlying Fidelity Central Funds, will indirectly bear its pro-rata share of the fees and expenses incurred by the underlying Fidelity Central Funds. These fees and expenses are not included in the Fund's annualized expense ratio used to calculate the expense estimate in the table below.
Hypothetical Example for Comparison Purposes
The second line of the accompanying table provides information about hypothetical account values and hypothetical expenses based on the Fund's actual expense ratio and an assumed rate of return of 5% per year before expenses, which is not the Fund's actual return. The hypothetical account values and expenses may not be used to estimate the actual ending account balance or expenses you paid for the period. You may use this information to compare the ongoing costs of investing in the Fund and other funds. To do so, compare this 5% hypothetical example with the 5% hypothetical examples that appear in the shareholder reports of the other funds. In addition, the Fund, as a shareholder in the underlying Fidelity Central Funds, will indirectly bear its pro-rata share of the fees and expenses incurred by the underlying Fidelity Central Funds. These fees and expenses are not included in the Fund's annualized expense ratio used to calculate the expense estimate in the table below.
Please note that the expenses shown in the table are meant to highlight your ongoing costs only and do not reflect any transaction costs. Therefore, the second line of the table is useful in comparing ongoing costs only, and will not help you determine the relative total costs of owning different funds.
| | Annualized Expense Ratio-A | Beginning
Account Value
March 1, 2019 | Ending
Account Value
August 31, 2019 | Expenses Paid
During Period-B
March 1, 2019
to August 31, 2019 |
| Actual | - %-C | $1,000.00 | $1,031.20 | $--D |
| Hypothetical-E | | $1,000.00 | $1,025.21 | $--D |
A Annualized expense ratio reflects expenses net of applicable fee waivers.
B Expenses are equal to the Fund's annualized expense ratio, multiplied by the average account value over the period, multiplied by 184/365 (to reflect the one-half year period).
C Amount represents less than .005%.
D Amount represents less than $.005.
E 5% return per year before expenses
Distributions (Unaudited)
A total of 39.84% of the dividends distributed during the fiscal year was derived from interest on U.S. Government securities which is generally exempt from state income tax.
The fund designates $89,827 of distributions paid during the period January 1, 2019 to August 31, 2019 as qualifying to be taxed as interest-related dividends for nonresident alien shareholders.
The fund will notify shareholders in January 2020 of amounts for use in preparing 2019 income tax returns.
ZSB-ANN-1019
1.9881603.102
Fidelity® Short-Term Bond Index Fund
Annual Report August 31, 2019 |
|
Beginning on January 1, 2021, as permitted by regulations adopted by the Securities and Exchange Commission, paper copies of a fund’s shareholder reports will no longer be sent by mail, unless you specifically request paper copies of the reports from the fund or from your financial intermediary, such as a financial advisor, broker-dealer or bank. Instead, the reports will be made available on a website, and you will be notified by mail each time a report is posted and provided with a website link to access the report.
If you already elected to receive shareholder reports electronically, you will not be affected by this change and you need not take any action. You may elect to receive shareholder reports and other communications from a fund electronically, by contacting your financial intermediary. For Fidelity customers, visit Fidelity's web site or call Fidelity using the contact information listed below.
You may elect to receive all future reports in paper free of charge. If you wish to continue receiving paper copies of your shareholder reports, you may contact your financial intermediary or, if you are a Fidelity customer, visit Fidelity’s website, or call Fidelity at the applicable toll-free number listed below. Your election to receive reports in paper will apply to all funds held with the fund complex/your financial intermediary.
| Account Type | Website | Phone Number |
| Brokerage, Mutual Fund, or Annuity Contracts: | fidelity.com/mailpreferences | 1-800-343-3548 |
| Employer Provided Retirement Accounts: | netbenefits.fidelity.com/preferences (choose 'no' under Required Disclosures to continue to print) | 1-800-343-0860 |
| Advisor Sold Accounts Serviced Through Your Financial Intermediary: | Contact Your Financial Intermediary | Your Financial Intermediary's phone number |
| Advisor Sold Accounts Serviced by Fidelity: | institutional.fidelity.com | 1-877-208-0098 |
Contents
To view a fund's proxy voting guidelines and proxy voting record for the 12-month period ended June 30, visit http://www.fidelity.com/proxyvotingresults or visit the Securities and Exchange Commission's (SEC) web site at http://www.sec.gov.
You may also call 1-800-544-8544 to request a free copy of the proxy voting guidelines.
Standard & Poor's, S&P and S&P 500 are registered service marks of The McGraw-Hill Companies, Inc. and have been licensed for use by Fidelity Distributors Corporation.
Other third-party marks appearing herein are the property of their respective owners.
All other marks appearing herein are registered or unregistered trademarks or service marks of FMR LLC or an affiliated company. © 2019 FMR LLC. All rights reserved.
This report and the financial statements contained herein are submitted for the general information of the shareholders of the Fund. This report is not authorized for distribution to prospective investors in the Fund unless preceded or accompanied by an effective prospectus.
A fund files its complete schedule of portfolio holdings with the SEC for the first and third quarters of each fiscal year on Form N-PORT. Forms N-PORT are available on the SEC’s web site at http://www.sec.gov. A fund's Forms N-PORT may be reviewed and copied at the SEC’s Public Reference Room in Washington, DC. Information regarding the operation of the SEC's Public Reference Room may be obtained by calling 1-800-SEC-0330.
For a complete list of a fund's portfolio holdings, view the most recent holdings listing, semiannual report, or annual report on Fidelity's web site at http://www.fidelity.com, http://www.institutional.fidelity.com, or http://www.401k.com, as applicable.
NOT FDIC INSURED •MAY LOSE VALUE •NO BANK GUARANTEE
Neither the Fund nor Fidelity Distributors Corporation is a bank.
Performance: The Bottom Line
Average annual total return reflects the change in the value of an investment, assuming reinvestment of distributions from dividend income and capital gains (the profits earned upon the sale of securities that have grown in value, if any) and assuming a constant rate of performance each year. The hypothetical investment and the average annual total returns do not reflect the deduction of taxes that a shareholder would pay on fund distributions or the redemption of fund shares. During periods of reimbursement by Fidelity, a fund’s total return will be greater than it would be had the reimbursement not occurred. How a fund did yesterday is no guarantee of how it will do tomorrow.
Average Annual Total Returns
| For the periods ended August 31, 2019 | Past 1 year | Life of fundA |
| Fidelity® Short-Term Bond Index Fund | 5.98% | 2.99% |
A From October 18, 2017
$10,000 Over Life of Fund
Let's say hypothetically that $10,000 was invested in Fidelity® Short-Term Bond Index Fund on October 18, 2017, when the fund started.
The chart shows how the value of your investment would have changed, and also shows how the Bloomberg Barclays U.S. 1-5 Year Government/Credit Bond Index performed over the same period.
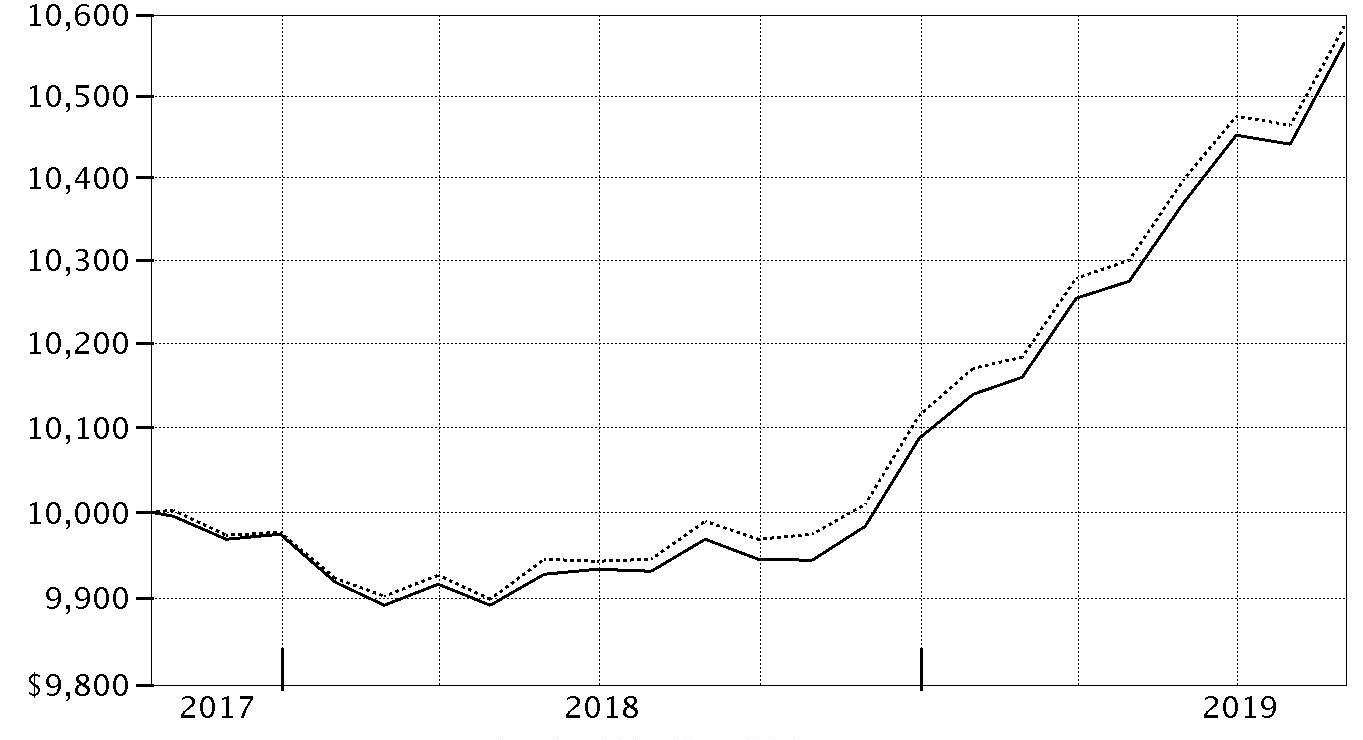
| Period Ending Values |
| $10,565 | Fidelity® Short-Term Bond Index Fund |
| $10,586 | Bloomberg Barclays U.S. 1-5 Year Government/Credit Bond Index |
Management's Discussion of Fund Performance
Market Recap: For the 12 months ending August 31, 2019, U.S. taxable investment-grade bonds posted their strongest trailing one-year return since 2009, driven by slower global economic growth, a maturing business cycle, trade uncertainty and, late in the period, the Fed’s dovish shift. The Bloomberg Barclays U.S. Aggregate Bond Index gained 10.17%. Market yields rose in the early fall of 2018, on expectations for higher inflation. Yields then declined and credit spreads widened in November and December, partly because of weaker U.S. manufacturing data. Yield spreads narrowed in January, as the U.S. Federal Reserve said it would be “patient” with policy rate hikes, and that future increases largely would depend on economic data. Yields continued to decline in the spring, amid international trade tension and attacks on oil tankers in the Middle East, and then tumbled further in July, when the Fed cut interest rates for the first time since 2008. The yield curve ended the period roughly flat, amid expectations for another rate cut of 25 basis points in September. Within the Bloomberg Barclays index, corporate bonds gained 13.33%, topping the 10.38% advance of U.S. Treasuries. Outside the index, U.S. corporate high-yield bonds lagged nominal U.S. Treasuries, while Treasury Inflation-Protected Securities (TIPS) gained 7.46%.
Comments from Co-Portfolio Managers Brandon Bettencourt and Jay Small: For the fiscal year ending August 31, 2019, the fund returned 5.98% about in line, net of fees, with the 5.96% return of the Bloomberg Barclays U.S. 1-5 Year Government/Credit Bond Index. These results met our goal of producing monthly returns, before expenses, that closely match the benchmark return. Given the large number of securities in the index and the significant cost and liquidity challenges associated with full replication of the index, we use “statistical sampling” techniques in constructing the portfolio. This approach involves defining and maintaining an “optimal” subset of constituent securities that, in aggregate, mirrors the chief characteristics of the index – including maturity, duration, sector allocation, credit quality and other factors. The fund's performance versus the benchmark was slightly boosted by "pricing basis." The fund is typically priced at 4:00 p.m. Eastern, while the benchmark is priced at 3:00 p.m. This led to a reported performance differential, particularly due to pricing dispersion on the last day of the period. Short-term bonds were bolstered by expectations of declining interest rates amid muted inflation and a global growth slowdown that was exacerbated by escalating international trade tension.
The views expressed above reflect those of the portfolio manager(s) only through the end of the period as stated on the cover of this report and do not necessarily represent the views of Fidelity or any other person in the Fidelity organization. Any such views are subject to change at any time based upon market or other conditions and Fidelity disclaims any responsibility to update such views. These views may not be relied on as investment advice and, because investment decisions for a Fidelity fund are based on numerous factors, may not be relied on as an indication of trading intent on behalf of any Fidelity fund.
Investment Summary (Unaudited)
Quality Diversification (% of fund's net assets)
| As of August 31, 2019 |
| | U.S. Government and U.S. Government Agency Obligations | 66.6% |
| | AAA | 4.8% |
| | AA | 4.8% |
| | A | 9.0% |
| | BBB | 13.9% |
| | BB and Below | 0.1% |
| | Not Rated | 0.2% |
| | Short-Term Investments and Net Other Assets | 0.6% |

We have used ratings from Moody's Investors Service, Inc. Where Moody's® ratings are not available, we have used S&P® ratings. All ratings are as of the date indicated and do not reflect subsequent changes.
Asset Allocation (% of fund's net assets)
| As of August 31, 2019 * |
| | Corporate Bonds | 26.9% |
| | U.S. Government and U.S. Government Agency Obligations | 66.6% |
| | Other Investments | 5.9% |
| | Short-Term Investments and Net Other Assets (Liabilities) | 0.6% |

* Foreign investments - 11.9%
Schedule of Investments August 31, 2019
Showing Percentage of Net Assets
| Nonconvertible Bonds - 26.9% | | | |
| | | Principal Amount | Value |
| COMMUNICATION SERVICES - 1.4% | | | |
| Diversified Telecommunication Services - 0.5% | | | |
| AT&T, Inc.: | | | |
| 2.8% 2/17/21 | | $70,000 | $70,693 |
| 3.2% 3/1/22 | | 425,000 | 435,957 |
| 3.8% 3/15/22 | | 48,000 | 50,024 |
| 3.8% 3/1/24 | | 480,000 | 510,446 |
| 4.6% 2/15/21 | | 40,000 | 41,190 |
| Telefonica Emisiones S.A.U. 5.462% 2/16/21 | | 100,000 | 104,664 |
| Verizon Communications, Inc.: | | | |
| 2.946% 3/15/22 | | 260,000 | 266,739 |
| 3.125% 3/16/22 | | 790,000 | 814,386 |
| | | | 2,294,099 |
| Entertainment - 0.2% | | | |
| NBCUniversal, Inc. 2.875% 1/15/23 | | 75,000 | 77,191 |
| The Walt Disney Co.: | | | |
| 2.45% 3/4/22 | | 255,000 | 259,679 |
| 3% 9/15/22 (a) | | 860,000 | 888,259 |
| | | | 1,225,129 |
| Media - 0.6% | | | |
| Charter Communications Operating LLC/Charter Communications Operating Capital Corp. 3.579% 7/23/20 | | 46,000 | 46,438 |
| Comcast Corp.: | | | |
| 1.625% 1/15/22 | | 31,000 | 30,879 |
| 3.3% 10/1/20 | | 1,195,000 | 1,212,388 |
| 3.45% 10/1/21 | | 300,000 | 309,001 |
| 3.7% 4/15/24 | | 540,000 | 578,353 |
| Discovery Communications LLC 3.25% 4/1/23 | | 60,000 | 61,877 |
| Fox Corp. 4.03% 1/25/24 (a) | | 650,000 | 696,144 |
| | | | 2,935,080 |
| Wireless Telecommunication Services - 0.1% | | | |
| Vodafone Group PLC 3.75% 1/16/24 | | 530,000 | 560,684 |
|
| TOTAL COMMUNICATION SERVICES | | | 7,014,992 |
|
| CONSUMER DISCRETIONARY - 1.3% | | | |
| Automobiles - 0.5% | | | |
| American Honda Finance Corp.: | | | |
| 1.95% 7/20/20 | | 50,000 | 49,974 |
| 3.375% 12/10/21 | | 290,000 | 299,349 |
| 3.55% 1/12/24 | | 250,000 | 266,974 |
| General Motors Financial Co., Inc.: | | | |
| 2.65% 4/13/20 | | 140,000 | 140,214 |
| 3.15% 6/30/22 | | 30,000 | 30,445 |
| 3.25% 1/5/23 | | 50,000 | 50,861 |
| 3.95% 4/13/24 | | 320,000 | 331,092 |
| 4.15% 6/19/23 | | 250,000 | 261,095 |
| 4.25% 5/15/23 | | 70,000 | 73,294 |
| 5.1% 1/17/24 | | 430,000 | 464,961 |
| Toyota Motor Corp. 2.358% 7/2/24 | | 450,000 | 458,824 |
| | | | 2,427,083 |
| Diversified Consumer Services - 0.1% | | | |
| Ingersoll-Rand Global Holding Co. Ltd. 2.9% 2/21/21 | | 576,000 | 581,874 |
| Hotels, Restaurants & Leisure - 0.2% | | | |
| McDonald's Corp.: | | | |
| 2.625% 1/15/22 | | 53,000 | 53,855 |
| 3.35% 4/1/23 | | 840,000 | 879,187 |
| | | | 933,042 |
| Internet & Direct Marketing Retail - 0.2% | | | |
| Amazon.com, Inc.: | | | |
| 2.4% 2/22/23 | | 1,000,000 | 1,018,208 |
| 3.3% 12/5/21 | | 37,000 | 38,281 |
| | | | 1,056,489 |
| Multiline Retail - 0.3% | | | |
| Dollar Tree, Inc. 3.7% 5/15/23 | | 1,410,000 | 1,468,480 |
| Specialty Retail - 0.0% | | | |
| The Home Depot, Inc. 2.625% 6/1/22 | | 108,000 | 110,589 |
|
| TOTAL CONSUMER DISCRETIONARY | | | 6,577,557 |
|
| CONSUMER STAPLES - 2.0% | | | |
| Beverages - 0.7% | | | |
| Anheuser-Busch InBev Finance, Inc. 3.3% 2/1/23 | | 1,425,000 | 1,483,638 |
| Anheuser-Busch InBev Worldwide, Inc. 2.5% 7/15/22 | | 50,000 | 50,807 |
| Constellation Brands, Inc. 2.7% 5/9/22 | | 25,000 | 25,351 |
| Dr. Pepper Snapple Group, Inc. 4.057% 5/25/23 | | 80,000 | 84,956 |
| Molson Coors Brewing Co.: | | | |
| 2.1% 7/15/21 | | 950,000 | 949,709 |
| 2.25% 3/15/20 | | 48,000 | 47,936 |
| PepsiCo, Inc.: | | | |
| 2% 4/15/21 | | 315,000 | 316,271 |
| 3.125% 11/1/20 | | 50,000 | 50,711 |
| The Coca-Cola Co.: | | | |
| 1.875% 10/27/20 | | 75,000 | 74,981 |
| 2.2% 5/25/22 | | 500,000 | 505,825 |
| | | | 3,590,185 |
| Food & Staples Retailing - 0.2% | | | |
| Walmart, Inc.: | | | |
| 1.75% 10/9/19 | | 240,000 | 239,914 |
| 2.35% 12/15/22 | | 41,000 | 41,756 |
| 2.85% 7/8/24 | | 370,000 | 387,522 |
| 3.4% 6/26/23 | | 140,000 | 148,242 |
| | | | 817,434 |
| Food Products - 0.6% | | | |
| Campbell Soup Co. 3.65% 3/15/23 | | 125,000 | 130,035 |
| Conagra Brands, Inc. 3.8% 10/22/21 | | 1,050,000 | 1,080,281 |
| General Mills, Inc.: | | | |
| 2.6% 10/12/22 | | 50,000 | 50,713 |
| 3.7% 10/17/23 | | 62,000 | 65,595 |
| H.J. Heinz Co. 4% 6/15/23 | | 30,000 | 31,175 |
| Kraft Foods Group, Inc. 3.5% 6/6/22 | | 32,000 | 32,757 |
| McCormick & Co., Inc. 2.7% 8/15/22 | | 23,000 | 23,372 |
| Tyson Foods, Inc. 2.25% 8/23/21 | | 1,380,000 | 1,383,977 |
| | | | 2,797,905 |
| Household Products - 0.0% | | | |
| Procter & Gamble Co. 1.9% 10/23/20 | | 51,000 | 51,038 |
| Tobacco - 0.5% | | | |
| Altria Group, Inc.: | | | |
| 2.625% 1/14/20 | | 58,000 | 58,028 |
| 3.49% 2/14/22 | | 182,000 | 188,016 |
| 3.8% 2/14/24 | | 690,000 | 730,831 |
| BAT Capital Corp.: | | | |
| 2.297% 8/14/20 | | 625,000 | 625,067 |
| 2.764% 8/15/22 | | 52,000 | 52,733 |
| Philip Morris International, Inc.: | | | |
| 2% 2/21/20 | | 57,000 | 56,934 |
| 2.5% 11/2/22 | | 774,000 | 782,722 |
| Reynolds American, Inc. 4% 6/12/22 | | 80,000 | 83,611 |
| | | | 2,577,942 |
|
| TOTAL CONSUMER STAPLES | | | 9,834,504 |
|
| ENERGY - 2.5% | | | |
| Oil, Gas & Consumable Fuels - 2.5% | | | |
| Anadarko Petroleum Corp. 4.85% 3/15/21 | | 15,000 | 15,507 |
| BP Capital Markets PLC 2.5% 11/6/22 | | 60,000 | 60,857 |
| Canadian Natural Resources Ltd. 2.95% 1/15/23 | | 645,000 | 655,266 |
| Chevron Corp.: | | | |
| 2.1% 5/16/21 | | 125,000 | 125,559 |
| 2.355% 12/5/22 | | 63,000 | 64,104 |
| 2.498% 3/3/22 | | 200,000 | 203,472 |
| Ecopetrol SA 5.875% 9/18/23 | | 690,000 | 769,626 |
| Enbridge Energy Partners LP 4.375% 10/15/20 | | 1,340,000 | 1,368,230 |
| Enbridge, Inc. 2.9% 7/15/22 | | 223,000 | 227,311 |
| Energy Transfer Partners LP: | | | |
| 4.15% 10/1/20 | | 100,000 | 101,577 |
| 5.875% 1/15/24 | | 365,000 | 408,398 |
| Enterprise Products Operating LP: | | | |
| 2.85% 4/15/21 | | 580,000 | 586,513 |
| 3.5% 2/1/22 | | 640,000 | 661,755 |
| 4.05% 2/15/22 | | 80,000 | 83,681 |
| 5.2% 9/1/20 | | 43,000 | 44,233 |
| Exxon Mobil Corp. 2.222% 3/1/21 | | 94,000 | 94,572 |
| Kinder Morgan, Inc. 3.15% 1/15/23 | | 611,000 | 627,803 |
| Marathon Petroleum Corp.: | | | |
| 3.4% 12/15/20 | | 360,000 | 364,311 |
| 4.75% 12/15/23 | | 470,000 | 512,142 |
| MPLX LP 3.375% 3/15/23 | | 200,000 | 205,879 |
| Occidental Petroleum Corp.: | | | |
| 2.7% 8/15/22 | | 113,000 | 114,112 |
| 2.9% 8/15/24 | | 374,000 | 377,498 |
| Petroleos Mexicanos: | | | |
| 3.5% 1/30/23 | | 86,000 | 83,549 |
| 4.625% 9/21/23 | | 140,000 | 140,328 |
| 5.375% 3/13/22 | | 790,000 | 807,775 |
| 6.375% 2/4/21 | | 110,000 | 113,080 |
| Plains All American Pipeline LP/PAA Finance Corp. 2.6% 12/15/19 | | 33,000 | 32,972 |
| Shell International Finance BV: | | | |
| 1.75% 9/12/21 | | 260,000 | 259,592 |
| 2.375% 8/21/22 | | 50,000 | 50,823 |
| The Williams Companies, Inc. 3.7% 1/15/23 | | 780,000 | 809,182 |
| Total Capital International SA: | | | |
| 2.218% 7/12/21 | | 2,000,000 | 2,013,255 |
| 2.75% 6/19/21 | | 100,000 | 101,350 |
| Williams Partners LP 3.6% 3/15/22 | | 37,000 | 38,095 |
| | | | 12,122,407 |
| FINANCIALS - 12.1% | | | |
| Banks - 6.2% | | | |
| Australia & New Zealand Banking Group Ltd. 2.3% 6/1/21 | | 250,000 | 251,402 |
| Bank of America Corp.: | | | |
| 2.151% 11/9/20 | | 110,000 | 110,059 |
| 2.328% 10/1/21 (b) | | 100,000 | 100,157 |
| 2.503% 10/21/22 | | 1,730,000 | 1,746,798 |
| 2.881% 4/24/23 (b) | | 190,000 | 193,509 |
| 3.004% 12/20/23 (b) | | 250,000 | 256,562 |
| 3.864% 7/23/24 (b) | | 100,000 | 106,181 |
| 5% 5/13/21 | | 60,000 | 62,856 |
| Bank of Montreal 1.9% 8/27/21 | | 82,000 | 82,037 |
| Bank of Nova Scotia: | | | |
| 2.7% 3/7/22 | | 100,000 | 101,885 |
| 3.4% 2/11/24 | | 360,000 | 378,688 |
| Barclays Bank PLC 2.65% 1/11/21 | | 1,000,000 | 1,004,356 |
| Barclays PLC: | | | |
| 2.75% 11/8/19 | | 200,000 | 200,099 |
| 4.338% 5/16/24 (b) | | 1,000,000 | 1,042,374 |
| BB&T Corp. 2.15% 2/1/21 | | 50,000 | 50,086 |
| Citigroup, Inc.: | | | |
| 2.45% 1/10/20 | | 200,000 | 200,145 |
| 2.65% 10/26/20 | | 100,000 | 100,607 |
| 2.7% 3/30/21 | | 162,000 | 163,636 |
| 2.7% 10/27/22 | | 40,000 | 40,681 |
| 3.142% 1/24/23 (b) | | 100,000 | 102,256 |
| 3.352% 4/24/25 (b) | | 770,000 | 804,488 |
| Comerica, Inc. 3.7% 7/31/23 | | 100,000 | 105,722 |
| Corporacion Andina de Fomento: | | | |
| 2.2% 7/18/20 | | 46,000 | 45,905 |
| 3.75% 11/23/23 | | 190,000 | 201,172 |
| Credit Suisse Group Funding Guernsey Ltd.: | | | |
| 3.45% 4/16/21 | | 1,250,000 | 1,272,192 |
| 3.8% 9/15/22 | | 750,000 | 782,711 |
| Credit Suisse New York Branch 5.4% 1/14/20 | | 300,000 | 303,212 |
| European Investment Bank 1.625% 8/14/20 | | 115,000 | 114,803 |
| Fifth Third Bancorp 2.6% 6/15/22 | | 30,000 | 30,396 |
| HSBC Holdings PLC: | | | |
| 2.65% 1/5/22 | | 1,200,000 | 1,211,998 |
| 3.033% 11/22/23 (b) | | 1,000,000 | 1,016,357 |
| 3.262% 3/13/23 (b) | | 200,000 | 204,105 |
| 3.4% 3/8/21 | | 200,000 | 203,200 |
| 4% 3/30/22 | | 37,000 | 38,820 |
| HSBC U.S.A., Inc. 2.75% 8/7/20 | | 100,000 | 100,638 |
| Huntington Bancshares, Inc. 2.3% 1/14/22 | | 40,000 | 40,188 |
| Huntington National Bank 3.25% 5/14/21 | | 750,000 | 762,858 |
| Japan Bank International Cooperation: | | | |
| 1.75% 5/28/20 | | 200,000 | 199,659 |
| 2.25% 2/24/20 | | 200,000 | 200,115 |
| 2.375% 7/21/22 | | 450,000 | 458,256 |
| 2.375% 11/16/22 | | 200,000 | 203,939 |
| 2.5% 5/23/24 | | 200,000 | 207,120 |
| 3.125% 7/20/21 | | 200,000 | 205,030 |
| JPMorgan Chase & Co.: | | | |
| 2.295% 8/15/21 | | 606,000 | 607,454 |
| 2.972% 1/15/23 | | 1,230,000 | 1,255,152 |
| 3.2% 1/25/23 | | 47,000 | 48,823 |
| 3.559% 4/23/24 (b) | | 100,000 | 105,015 |
| 3.797% 7/23/24 (b) | | 500,000 | 531,128 |
| KeyCorp. 5.1% 3/24/21 | | 78,000 | 81,497 |
| Lloyds Bank PLC: | | | |
| 3.3% 5/7/21 | | 200,000 | 203,346 |
| 3.9% 3/12/24 | | 200,000 | 209,522 |
| Lloyds Banking Group PLC 2.907% 11/7/23 (b) | | 600,000 | 601,841 |
| Mitsubishi UFJ Financial Group, Inc.: | | | |
| 2.801% 7/18/24 | | 800,000 | 819,093 |
| 2.95% 3/1/21 | | 200,000 | 202,170 |
| 3.407% 3/7/24 | | 270,000 | 283,436 |
| National Australia Bank Ltd.: | | | |
| 2.5% 1/12/21 | | 250,000 | 251,678 |
| 2.8% 1/10/22 | | 250,000 | 255,042 |
| Oesterreichische Kontrollbank: | | | |
| 2.875% 9/7/21 | | 75,000 | 76,872 |
| 3.125% 11/7/23 | | 230,000 | 244,727 |
| PNC Funding Corp. 5.125% 2/8/20 | | 150,000 | 151,857 |
| Rabobank Nederland 3.875% 2/8/22 | | 71,000 | 74,151 |
| Regions Financial Corp.: | | | |
| 2.75% 8/14/22 | | 135,000 | 137,376 |
| 3.8% 8/14/23 | | 670,000 | 709,152 |
| Royal Bank of Canada: | | | |
| 2.125% 3/2/20 | | 250,000 | 250,121 |
| 2.55% 7/16/24 | | 600,000 | 611,656 |
| 2.75% 2/1/22 | | 135,000 | 137,888 |
| 2.8% 4/29/22 | | 1,190,000 | 1,215,489 |
| Royal Bank of Scotland Group PLC 3.875% 9/12/23 | | 425,000 | 437,781 |
| Santander Holdings U.S.A., Inc.: | | | |
| 3.4% 1/18/23 | | 20,000 | 20,575 |
| 4.45% 12/3/21 | | 880,000 | 918,147 |
| Sumitomo Mitsui Financial Group, Inc.: | | | |
| 2.784% 7/12/22 | | 67,000 | 68,189 |
| 2.934% 3/9/21 | | 38,000 | 38,460 |
| 3.748% 7/19/23 | | 115,000 | 121,596 |
| SunTrust Bank 2.25% 1/31/20 | | 56,000 | 55,988 |
| Svenska Handelsbanken AB 1.95% 9/8/20 | | 250,000 | 249,955 |
| Synchrony Bank 3% 6/15/22 | | 250,000 | 254,538 |
| The Toronto-Dominion Bank: | | | |
| 1.8% 7/13/21 | | 41,000 | 40,904 |
| 1.85% 9/11/20 | | 100,000 | 99,978 |
| 1.9% 10/24/19 | | 340,000 | 339,926 |
| 2.65% 6/12/24 | | 1,380,000 | 1,416,131 |
| 3.25% 6/11/21 | | 100,000 | 102,298 |
| U.S. Bancorp 2.625% 1/24/22 | | 236,000 | 239,910 |
| Wells Fargo & Co.: | | | |
| 2.5% 3/4/21 | | 85,000 | 85,508 |
| 2.625% 7/22/22 | | 280,000 | 284,763 |
| 3.75% 1/24/24 | | 960,000 | 1,022,370 |
| Westpac Banking Corp.: | | | |
| 2.15% 3/6/20 | | 420,000 | 420,273 |
| 2.5% 6/28/22 | | 37,000 | 37,613 |
| 3.3% 2/26/24 | | 400,000 | 421,444 |
| 3.65% 5/15/23 | | 60,000 | 63,536 |
| | | | 30,811,627 |
| Capital Markets - 1.4% | | | |
| Bank New York Mellon Corp.: | | | |
| 2.05% 5/3/21 | | 92,000 | 92,224 |
| 2.5% 4/15/21 | | 38,000 | 38,323 |
| BlackRock, Inc. 3.375% 6/1/22 | | 35,000 | 36,545 |
| Deutsche Bank AG 2.7% 7/13/20 | | 133,000 | 132,659 |
| Deutsche Bank AG New York Branch: | | | |
| 3.15% 1/22/21 | | 100,000 | 99,650 |
| 3.375% 5/12/21 | | 42,000 | 41,988 |
| 3.95% 2/27/23 | | 200,000 | 202,761 |
| 4.25% 2/4/21 | | 1,050,000 | 1,061,820 |
| 5% 2/14/22 | | 300,000 | 310,952 |
| Goldman Sachs Group, Inc.: | | | |
| 2.3% 12/13/19 | | 100,000 | 100,007 |
| 2.625% 4/25/21 | | 160,000 | 161,237 |
| 2.905% 7/24/23 (b) | | 155,000 | 157,457 |
| 3% 4/26/22 | | 72,000 | 72,938 |
| 3.2% 2/23/23 | | 200,000 | 206,637 |
| 3.625% 2/20/24 | | 440,000 | 464,059 |
| IntercontinentalExchange, Inc. 2.35% 9/15/22 | | 125,000 | 126,320 |
| Moody's Corp. 2.75% 12/15/21 | | 27,000 | 27,365 |
| Morgan Stanley: | | | |
| 2.625% 11/17/21 | | 910,000 | 919,529 |
| 2.75% 5/19/22 | | 49,000 | 49,842 |
| 3.125% 1/23/23 | | 2,110,000 | 2,175,600 |
| 4.875% 11/1/22 | | 130,000 | 139,847 |
| 5.75% 1/25/21 | | 100,000 | 104,916 |
| | | | 6,722,676 |
| Consumer Finance - 1.4% | | | |
| AerCap Ireland Capital Ltd./AerCap Global Aviation Trust: | | | |
| 2.875% 8/14/24 | | 300,000 | 300,984 |
| 3.3% 1/23/23 | | 300,000 | 307,487 |
| 4.45% 12/16/21 | | 600,000 | 623,464 |
| 4.625% 10/30/20 | | 150,000 | 153,648 |
| American Express Co. 2.75% 5/20/22 | | 1,010,000 | 1,029,583 |
| American Express Credit Corp.: | | | |
| 2.2% 3/3/20 | | 137,000 | 137,066 |
| 2.6% 9/14/20 | | 42,000 | 42,233 |
| Capital One Financial Corp.: | | | |
| 2.5% 5/12/20 | | 317,000 | 317,567 |
| 3.2% 1/30/23 | | 255,000 | 262,743 |
| 3.45% 4/30/21 | | 810,000 | 827,069 |
| 3.9% 1/29/24 | | 290,000 | 307,939 |
| Caterpillar Financial Services Corp. 2.1% 1/10/20 | | 210,000 | 210,009 |
| Ford Motor Credit Co. LLC: | | | |
| 2.425% 6/12/20 | | 200,000 | 199,832 |
| 3.47% 4/5/21 | | 200,000 | 201,963 |
| 3.81% 1/9/24 | | 200,000 | 201,701 |
| 5.596% 1/7/22 | | 400,000 | 422,994 |
| John Deere Capital Corp.: | | | |
| 1.95% 6/22/20 | | 57,000 | 56,955 |
| 2.7% 1/6/23 | | 74,000 | 75,729 |
| 3.125% 9/10/21 | | 495,000 | 507,118 |
| 3.65% 10/12/23 | | 450,000 | 480,875 |
| Toyota Motor Credit Corp.: | | | |
| 1.95% 4/17/20 | | 69,000 | 68,940 |
| 2.15% 9/8/22 | | 44,000 | 44,381 |
| 2.6% 1/11/22 | | 110,000 | 111,776 |
| | | | 6,892,056 |
| Diversified Financial Services - 2.5% | | | |
| AB Svensk Exportkredit: | | | |
| 1.75% 3/10/21 | | 600,000 | 600,711 |
| 1.875% 6/23/20 | | 200,000 | 199,971 |
| Berkshire Hathaway, Inc. 2.2% 3/15/21 | | 85,000 | 85,538 |
| BP Capital Markets America, Inc.: | | | |
| 2.52% 9/19/22 | | 215,000 | 218,137 |
| 2.75% 5/10/23 | | 760,000 | 778,664 |
| 3.245% 5/6/22 | | 510,000 | 526,537 |
| 4.5% 10/1/20 | | 130,000 | 133,482 |
| Broadcom Corp./Broadcom Cayman LP: | | | |
| 2.375% 1/15/20 | | 45,000 | 44,980 |
| 2.65% 1/15/23 | | 550,000 | 549,266 |
| 3% 1/15/22 | | 11,000 | 11,089 |
| Cigna Corp.: | | | |
| 3.4% 9/17/21 | | 147,000 | 150,497 |
| 3.75% 7/15/23 | | 1,325,000 | 1,392,917 |
| Export Development Canada: | | | |
| 1.625% 1/17/20 | | 130,000 | 129,818 |
| 1.75% 7/18/22 | | 300,000 | 302,003 |
| 2% 5/17/22 | | 715,000 | 723,723 |
| 2.625% 2/21/24 | | 200,000 | 209,712 |
| 2.75% 3/15/23 | | 150,000 | 156,299 |
| General Electric Capital Corp.: | | | |
| 2.2% 1/9/20 | | 79,000 | 78,810 |
| 3.45% 5/15/24 | | 770,000 | 781,632 |
| KfW: | | | |
| 1.5% 9/9/19 | | 116,000 | 115,989 |
| 1.75% 3/31/20 | | 100,000 | 99,842 |
| 1.75% 9/15/21 | | 330,000 | 331,274 |
| 2.125% 3/7/22 | | 77,000 | 78,187 |
| 2.375% 3/24/21 | | 410,000 | 414,664 |
| 2.375% 12/29/22 | | 1,272,000 | 1,309,180 |
| 2.625% 2/28/24 | | 510,000 | 535,398 |
| 2.75% 7/15/20 | | 1,830,000 | 1,844,373 |
| 3.125% 12/15/21 | | 350,000 | 362,436 |
| 4% 1/27/20 | | 200,000 | 201,558 |
| Landwirtschaftliche Rentenbank 3.125% 11/14/23 | | 140,000 | 149,179 |
| | | | 12,515,866 |
| Insurance - 0.6% | | | |
| ACE INA Holdings, Inc. 2.875% 11/3/22 | | 55,000 | 56,630 |
| American International Group, Inc.: | | | |
| 3.3% 3/1/21 | | 1,718,000 | 1,746,433 |
| 4.875% 6/1/22 | | 65,000 | 69,620 |
| Marsh & McLennan Companies, Inc.: | | | |
| 2.75% 1/30/22 | | 96,000 | 97,571 |
| 3.875% 3/15/24 | | 732,000 | 785,299 |
| | | | 2,755,553 |
|
| TOTAL FINANCIALS | | | 59,697,778 |
|
| HEALTH CARE - 2.1% | | | |
| Biotechnology - 0.5% | | | |
| AbbVie, Inc.: | | | |
| 2.3% 5/14/21 | | 50,000 | 50,125 |
| 3.75% 11/14/23 | | 970,000 | 1,023,566 |
| Amgen, Inc. 2.65% 5/11/22 | | 110,000 | 111,652 |
| Celgene Corp. 3.25% 2/20/23 | | 1,085,000 | 1,128,126 |
| Gilead Sciences, Inc. 1.85% 9/20/19 | | 100,000 | 100,000 |
| | | | 2,413,469 |
| Health Care Equipment & Supplies - 0.4% | | | |
| Abbott Laboratories 2.9% 11/30/21 | | 34,000 | 34,662 |
| Becton, Dickinson & Co.: | | | |
| 2.404% 6/5/20 | | 50,000 | 50,058 |
| 2.894% 6/6/22 | | 530,000 | 538,743 |
| Boston Scientific Corp. 3.45% 3/1/24 | | 1,202,000 | 1,263,133 |
| | | | 1,886,596 |
| Health Care Providers & Services - 0.5% | | | |
| Anthem, Inc. 2.95% 12/1/22 | | 25,000 | 25,576 |
| Cardinal Health, Inc. 2.616% 6/15/22 | | 140,000 | 140,967 |
| CVS Health Corp.: | | | |
| 2.125% 6/1/21 | | 38,000 | 38,041 |
| 2.625% 8/15/24 | | 64,000 | 64,367 |
| 3.35% 3/9/21 | | 515,000 | 524,394 |
| 3.7% 3/9/23 | | 205,000 | 214,368 |
| Express Scripts Holding Co. 3.05% 11/30/22 | | 50,000 | 51,216 |
| UnitedHealth Group, Inc.: | | | |
| 2.125% 3/15/21 | | 40,000 | 40,090 |
| 2.375% 10/15/22 | | 21,000 | 21,278 |
| 2.375% 8/15/24 | | 400,000 | 406,304 |
| 3.15% 6/15/21 | | 770,000 | 785,689 |
| 3.5% 6/15/23 | | 200,000 | 211,051 |
| | | | 2,523,341 |
| Life Sciences Tools & Services - 0.0% | | | |
| Thermo Fisher Scientific, Inc. 3% 4/15/23 | | 60,000 | 61,722 |
| Pharmaceuticals - 0.7% | | | |
| Actavis Funding SCS 3% 3/12/20 | | 255,000 | 255,780 |
| AstraZeneca PLC: | | | |
| 2.375% 6/12/22 | | 27,000 | 27,216 |
| 3.5% 8/17/23 | | 510,000 | 534,206 |
| Bristol-Myers Squibb Co.: | | | |
| 2.6% 5/16/22 (a) | | 250,000 | 254,697 |
| 2.9% 7/26/24 (a) | | 500,000 | 518,409 |
| GlaxoSmithKline Capital PLC 3.125% 5/14/21 | | 100,000 | 101,801 |
| Johnson & Johnson 2.25% 3/3/22 | | 88,000 | 89,136 |
| Merck & Co., Inc. 2.35% 2/10/22 | | 74,000 | 75,104 |
| Novartis Capital Corp.: | | | |
| 2.4% 5/17/22 | | 270,000 | 274,390 |
| 2.4% 9/21/22 | | 33,000 | 33,584 |
| 3.4% 5/6/24 | | 385,000 | 411,690 |
| Pfizer, Inc.: | | | |
| 2.2% 12/15/21 | | 90,000 | 90,793 |
| 2.95% 3/15/24 | | 300,000 | 312,704 |
| Shire Acquisitions Investments Ireland DAC 2.4% 9/23/21 | | 290,000 | 290,899 |
| | | | 3,270,409 |
|
| TOTAL HEALTH CARE | | | 10,155,537 |
|
| INDUSTRIALS - 1.3% | | | |
| Aerospace & Defense - 0.5% | | | |
| General Dynamics Corp. 3% 5/11/21 | | 200,000 | 203,841 |
| Northrop Grumman Corp.: | | | |
| 2.08% 10/15/20 | | 715,000 | 715,281 |
| 2.55% 10/15/22 | | 813,000 | 825,612 |
| Rockwell Collins, Inc. 2.8% 3/15/22 | | 66,000 | 67,143 |
| The Boeing Co. 2.8% 3/1/23 | | 60,000 | 61,513 |
| United Technologies Corp.: | | | |
| 1.9% 5/4/20 | | 100,000 | 99,828 |
| 3.1% 6/1/22 | | 28,000 | 28,902 |
| 3.65% 8/16/23 | | 510,000 | 541,182 |
| | | | 2,543,302 |
| Air Freight & Logistics - 0.0% | | | |
| United Parcel Service, Inc.: | | | |
| 2.05% 4/1/21 | | 64,000 | 64,060 |
| 2.5% 4/1/23 | | 60,000 | 61,023 |
| | | | 125,083 |
| Commercial Services & Supplies - 0.1% | | | |
| FMS Wertmanagement AoeR 2.75% 1/30/24 | | 200,000 | 210,247 |
| Electrical Equipment - 0.0% | | | |
| Eaton Corp. 2.75% 11/2/22 | | 30,000 | 30,591 |
| Industrial Conglomerates - 0.1% | | | |
| General Electric Co. 2.7% 10/9/22 | | 33,000 | 32,785 |
| Honeywell International, Inc. 1.85% 11/1/21 | | 30,000 | 29,965 |
| Roper Technologies, Inc. 3.65% 9/15/23 | | 360,000 | 379,236 |
| | | | 441,986 |
| Machinery - 0.2% | | | |
| Caterpillar Financial Services Corp.: | | | |
| 1.85% 9/4/20 | | 51,000 | 50,999 |
| 2.85% 5/17/24 | | 840,000 | 872,841 |
| 3.45% 5/15/23 | | 130,000 | 136,682 |
| | | | 1,060,522 |
| Road & Rail - 0.0% | | | |
| Burlington Northern Santa Fe LLC 3.05% 9/1/22 | | 34,000 | 34,998 |
| Union Pacific Corp. 2.75% 4/15/23 | | 50,000 | 51,268 |
| | | | 86,266 |
| Trading Companies & Distributors - 0.4% | | | |
| Air Lease Corp.: | | | |
| 2.125% 1/15/20 | | 52,000 | 51,968 |
| 3.5% 1/15/22 | | 750,000 | 771,013 |
| 3.875% 7/3/23 | | 110,000 | 115,235 |
| 4.25% 2/1/24 | | 670,000 | 715,201 |
| International Lease Finance Corp. 5.875% 8/15/22 | | 75,000 | 82,374 |
| | | | 1,735,791 |
|
| TOTAL INDUSTRIALS | | | 6,233,788 |
|
| INFORMATION TECHNOLOGY - 2.4% | | | |
| Communications Equipment - 0.3% | | | |
| Cisco Systems, Inc.: | | | |
| 1.85% 9/20/21 | | 1,340,000 | 1,339,006 |
| 2.45% 6/15/20 | | 50,000 | 50,186 |
| | | | 1,389,192 |
| Electronic Equipment & Components - 0.5% | | | |
| Diamond 1 Finance Corp./Diamond 2 Finance Corp.: | | | |
| 4% 7/15/24 (a) | | 410,000 | 428,567 |
| 4.42% 6/15/21 (a) | | 1,248,000 | 1,287,680 |
| 5.45% 6/15/23 (a) | | 635,000 | 690,172 |
| | | | 2,406,419 |
| IT Services - 0.3% | | | |
| Fiserv, Inc. 2.75% 7/1/24 | | 730,000 | 745,877 |
| IBM Corp.: | | | |
| 2.5% 1/27/22 | | 100,000 | 101,306 |
| 3% 5/15/24 | | 600,000 | 623,959 |
| Visa, Inc. 2.15% 9/15/22 | | 43,000 | 43,614 |
| | | | 1,514,756 |
| Semiconductors & Semiconductor Equipment - 0.0% | | | |
| Analog Devices, Inc. 2.95% 1/12/21 | | 125,000 | 126,215 |
| Intel Corp.: | | | |
| 1.85% 5/11/20 | | 61,000 | 60,981 |
| 2.45% 7/29/20 | | 23,000 | 23,105 |
| Qualcomm, Inc. 3% 5/20/22 | | 38,000 | 39,081 |
| | | | 249,382 |
| Software - 0.7% | | | |
| Microsoft Corp.: | | | |
| 1.55% 8/8/21 | | 133,000 | 132,605 |
| 1.85% 2/6/20 | | 414,000 | 413,701 |
| 2.4% 2/6/22 | | 1,802,000 | 1,832,953 |
| Oracle Corp.: | | | |
| 1.9% 9/15/21 | | 36,000 | 35,984 |
| 2.625% 2/15/23 | | 855,000 | 873,657 |
| 3.875% 7/15/20 | | 58,000 | 58,941 |
| | | | 3,347,841 |
| Technology Hardware, Storage & Peripherals - 0.6% | | | |
| Apple, Inc.: | | | |
| 1.8% 5/11/20 | | 76,000 | 75,918 |
| 1.9% 2/7/20 | | 110,000 | 109,981 |
| 2% 11/13/20 | | 130,000 | 130,361 |
| 2.1% 9/12/22 | | 124,000 | 125,124 |
| 2.25% 2/23/21 | | 45,000 | 45,252 |
| 2.3% 5/11/22 | | 910,000 | 921,985 |
| 2.4% 1/13/23 | | 1,250,000 | 1,275,137 |
| 2.7% 5/13/22 | | 36,000 | 36,864 |
| | | | 2,720,622 |
|
| TOTAL INFORMATION TECHNOLOGY | | | 11,628,212 |
|
| MATERIALS - 0.5% | | | |
| Chemicals - 0.5% | | | |
| DowDuPont, Inc. 4.205% 11/15/23 | | 50,000 | 53,867 |
| Eastman Chemical Co.: | | | |
| 2.7% 1/15/20 | | 15,000 | 15,010 |
| 3.6% 8/15/22 | | 685,000 | 706,883 |
| Ecolab, Inc. 3.25% 1/14/23 | | 76,000 | 78,969 |
| Nutrien Ltd. 3.5% 6/1/23 | | 580,000 | 600,254 |
| Sherwin-Williams Co. 2.75% 6/1/22 | | 467,000 | 474,223 |
| The Dow Chemical Co.: | | | |
| 3% 11/15/22 | | 80,000 | 81,694 |
| 3.15% 5/15/24 (a) | | 450,000 | 464,730 |
| The Mosaic Co. 3.25% 11/15/22 | | 200,000 | 204,962 |
| | | | 2,680,592 |
| Metals & Mining - 0.0% | | | |
| BHP Billiton Financial (U.S.A.) Ltd. 2.875% 2/24/22 | | 55,000 | 56,248 |
|
| TOTAL MATERIALS | | | 2,736,840 |
|
| REAL ESTATE - 0.3% | | | |
| Equity Real Estate Investment Trusts (REITs) - 0.3% | | | |
| American Tower Corp.: | | | |
| 2.25% 1/15/22 | | 96,000 | 96,375 |
| 3.375% 5/15/24 | | 160,000 | 167,223 |
| Boston Properties, Inc. 4.125% 5/15/21 | | 47,000 | 48,442 |
| Duke Realty LP 4.375% 6/15/22 | | 21,000 | 22,182 |
| ERP Operating LP 4.625% 12/15/21 | | 32,000 | 33,680 |
| Health Care REIT, Inc. 3.75% 3/15/23 | | 31,000 | 32,630 |
| Simon Property Group LP 2.625% 6/15/22 | | 170,000 | 172,989 |
| Welltower, Inc.: | | | |
| 3.625% 3/15/24 | | 340,000 | 358,185 |
| 3.95% 9/1/23 | | 360,000 | 383,788 |
| | | | 1,315,494 |
| Real Estate Management & Development - 0.0% | | | |
| Liberty Property LP 4.125% 6/15/22 | | 18,000 | 18,857 |
|
| TOTAL REAL ESTATE | | | 1,334,351 |
|
| UTILITIES - 1.0% | | | |
| Electric Utilities - 0.7% | | | |
| Baltimore Gas & Electric Co. 3.5% 11/15/21 | | 82,000 | 83,975 |
| Duke Energy Carolinas LLC 3.35% 5/15/22 | | 720,000 | 747,727 |
| Duke Energy Corp. 2.4% 8/15/22 | | 102,000 | 103,212 |
| Eversource Energy 2.75% 3/15/22 | | 24,000 | 24,377 |
| Exelon Corp. 3.497% 6/1/22 (b) | | 462,000 | 475,680 |
| FirstEnergy Corp. 2.85% 7/15/22 | | 970,000 | 989,364 |
| NextEra Energy Capital Holdings, Inc. 2.9% 4/1/22 | | 350,000 | 357,503 |
| Southern Co.: | | | |
| 2.35% 7/1/21 | | 85,000 | 85,244 |
| 2.95% 7/1/23 | | 670,000 | 689,705 |
| | | | 3,556,787 |
| Multi-Utilities - 0.3% | | | |
| Berkshire Hathaway Energy Co. 2.375% 1/15/21 | | 70,000 | 70,415 |
| Dominion Energy, Inc.: | | | |
| 2.579% 7/1/20 (b) | | 49,000 | 49,084 |
| 2.75% 1/15/22 | | 455,000 | 460,426 |
| NiSource, Inc. 3.65% 6/15/23 | | 550,000 | 573,628 |
| Public Service Enterprise Group, Inc. 2.65% 11/15/22 | | 96,000 | 96,934 |
| Sempra Energy: | | | |
| 2.4% 3/15/20 | | 46,000 | 45,948 |
| 2.9% 2/1/23 | | 107,000 | 109,264 |
| | | | 1,405,699 |
|
| TOTAL UTILITIES | | | 4,962,486 |
|
| TOTAL NONCONVERTIBLE BONDS | | | |
| (Cost $129,212,842) | | | 132,298,452 |
|
| U.S. Government and Government Agency Obligations - 66.6% | | | |
| U.S. Government Agency Obligations - 2.1% | | | |
| Fannie Mae: | | | |
| 0% 10/9/19 | | $230,000 | $229,513 |
| 1.5% 11/30/20 | | 416,000 | 415,174 |
| 1.75% 7/2/24 | | 860,000 | 872,539 |
| 2.375% 1/19/23 | | 380,000 | 391,099 |
| 2.875% 10/30/20 | | 990,000 | 1,003,836 |
| Federal Home Loan Bank: | | | |
| 1.125% 7/14/21 | | 525,000 | 521,086 |
| 1.375% 9/28/20 | | 200,000 | 199,231 |
| 1.5% 10/21/19 | | 85,000 | 84,933 |
| 1.5% 8/15/24 | | 125,000 | 125,263 |
| 1.875% 7/7/21 | | 1,330,000 | 1,337,929 |
| 1.875% 11/29/21 | | 95,000 | 95,726 |
| 2.625% 10/1/20 | | 3,400,000 | 3,433,873 |
| 3% 10/12/21 | | 450,000 | 463,549 |
| Freddie Mac: | | | |
| 1.375% 5/1/20 | | 195,000 | 194,367 |
| 1.625% 9/29/20 | | 775,000 | 774,769 |
| 2.75% 6/19/23 | | 195,000 | 203,990 |
| Tennessee Valley Authority 3.875% 2/15/21 | | 49,000 | 50,567 |
|
| TOTAL U.S. GOVERNMENT AGENCY OBLIGATIONS | | | 10,397,444 |
|
| U.S. Treasury Obligations - 64.5% | | | |
| U.S. Treasury Notes: | | | |
| 1% 10/15/19 | | 1,000 | 999 |
| 1.125% 2/28/21 | | 1,410,000 | 1,399,425 |
| 1.125% 7/31/21 | | 19,000 | 18,847 |
| 1.125% 8/31/21 | | 161,000 | 159,742 |
| 1.125% 9/30/21 | | 8,000 | 7,935 |
| 1.25% 10/31/19 | | 3,000 | 2,996 |
| 1.25% 3/31/21 | | 34,000 | 33,803 |
| 1.25% 10/31/21 | | 93,000 | 92,484 |
| 1.375% 12/15/19 | | 4,000 | 3,993 |
| 1.375% 1/15/20 | | 41,000 | 40,928 |
| 1.375% 4/30/20 | | 10,000 | 9,967 |
| 1.375% 8/31/20 | | 294,000 | 292,725 |
| 1.375% 9/30/20 | | 1,000 | 996 |
| 1.375% 10/31/20 | | 1,759,000 | 1,751,579 |
| 1.375% 1/31/21 | | 9,592,000 | 9,553,782 |
| 1.375% 4/30/21 | | 332,000 | 330,781 |
| 1.5% 10/31/19 | | 2,000 | 1,998 |
| 1.5% 7/15/20 | | 1,000 | 997 |
| 1.625% 12/31/19 | | 6,000 | 5,993 |
| 1.625% 10/15/20 | | 2,559,000 | 2,555,501 |
| 1.625% 6/30/21 | | 1,756,000 | 1,758,058 |
| 1.625% 8/31/22 | | 747,000 | 751,056 |
| 1.625% 4/30/23 | | 336,000 | 338,389 |
| 1.75% 11/30/19 | | 6,000 | 5,995 |
| 1.75% 11/15/20 | | 2,535,000 | 2,535,792 |
| 1.75% 12/31/20 | | 49,000 | 49,036 |
| 1.75% 7/31/21 | | 3,143,000 | 3,156,014 |
| 1.75% 11/30/21 | | 169,000 | 169,944 |
| 1.75% 2/28/22 | | 543,000 | 546,776 |
| 1.75% 4/30/22 | | 164,000 | 165,281 |
| 1.75% 6/15/22 | | 12,412,000 | 12,518,666 |
| 1.75% 6/30/22 | | 1,134,000 | 1,143,923 |
| 1.75% 7/15/22 | | 5,351,000 | 5,397,194 |
| 1.75% 9/30/22 | | 163,000 | 164,547 |
| 1.75% 6/30/24 | | 134,000 | 136,157 |
| 1.75% 7/31/24 | | 161,000 | 163,698 |
| 1.875% 12/31/19 | | 19,000 | 18,992 |
| 1.875% 12/15/20 | | 907,000 | 909,055 |
| 1.875% 1/31/22 | | 179,000 | 180,636 |
| 1.875% 2/28/22 | | 1,717,000 | 1,733,701 |
| 1.875% 3/31/22 | | 1,316,000 | 1,329,571 |
| 1.875% 4/30/22 | | 230,000 | 232,471 |
| 1.875% 7/31/22 | | 527,000 | 533,443 |
| 1.875% 9/30/22 | | 482,000 | 488,515 |
| 2% 1/31/20 | | 29,000 | 29,003 |
| 2% 7/31/20 | | 156,000 | 156,219 |
| 2% 1/15/21 | | 1,319,000 | 1,324,925 |
| 2% 10/31/21 | | 33,000 | 33,340 |
| 2% 12/31/21 | | 479,000 | 484,501 |
| 2% 10/31/22 | | 1,238,000 | 1,259,568 |
| 2% 11/30/22 | | 2,106,000 | 2,143,678 |
| 2% 5/31/24 | | 558,000 | 573,258 |
| 2.125% 5/31/21 | | 3,791,000 | 3,826,393 |
| 2.125% 5/15/22 | | 7,815,000 | 7,952,068 |
| 2.125% 12/31/22 | | 2,278,000 | 2,329,700 |
| 2.125% 2/29/24 | | 2,848,000 | 2,934,998 |
| 2.125% 3/31/24 | | 8,014,000 | 8,264,751 |
| 2.25% 3/31/20 | | 50,000 | 50,098 |
| 2.25% 2/15/21 | | 242,000 | 244,118 |
| 2.25% 3/31/21 | | 13,037,000 | 13,163,805 |
| 2.25% 4/30/21 | | 3,165,000 | 3,198,505 |
| 2.25% 4/15/22 | | 11,921,000 | 12,161,283 |
| 2.25% 1/31/24 | | 237,000 | 245,378 |
| 2.25% 4/30/24 | | 16,561,000 | 17,183,978 |
| 2.375% 12/31/20 | | 55,000 | 55,492 |
| 2.375% 3/15/21 | | 1,153,000 | 1,166,106 |
| 2.375% 4/15/21 | | 77,000 | 77,929 |
| 2.375% 3/15/22 | | 15,606,000 | 15,964,450 |
| 2.375% 1/31/23 | | 4,672,000 | 4,818,182 |
| 2.375% 2/29/24 | | 8,027,000 | 8,363,758 |
| 2.5% 12/31/20 | | 6,351,000 | 6,418,727 |
| 2.5% 1/31/21 | | 8,484,000 | 8,581,102 |
| 2.5% 2/28/21 | | 7,845,000 | 7,944,595 |
| 2.5% 1/15/22 | | 7,370,000 | 7,543,022 |
| 2.5% 2/15/22 | | 12,017,000 | 12,312,731 |
| 2.5% 3/31/23 | | 1,144,000 | 1,186,900 |
| 2.5% 1/31/24 | | 5,691,000 | 5,952,875 |
| 2.625% 7/31/20 | | 2,000 | 2,014 |
| 2.625% 6/15/21 | | 269,000 | 273,949 |
| 2.625% 7/15/21 | | 1,377,000 | 1,403,787 |
| 2.625% 12/15/21 | | 10,681,000 | 10,955,118 |
| 2.625% 2/28/23 | | 1,492,000 | 1,552,496 |
| 2.625% 6/30/23 | | 5,714,000 | 5,969,121 |
| 2.625% 12/31/23 | | 5,401,000 | 5,673,160 |
| 2.75% 9/30/20 | | 1,300,000 | 1,313,406 |
| 2.75% 11/30/20 | | 7,589,000 | 7,685,938 |
| 2.75% 8/15/21 | | 891,000 | 911,570 |
| 2.75% 9/15/21 | | 1,303,000 | 1,335,219 |
| 2.75% 4/30/23 | | 5,828,000 | 6,100,960 |
| 2.75% 5/31/23 | | 2,401,000 | 2,516,079 |
| 2.75% 8/31/23 | | 5,051,000 | 5,309,864 |
| 2.875% 10/31/20 | | 783,000 | 792,971 |
| 2.875% 10/15/21 | | 6,903,000 | 7,097,417 |
| 2.875% 11/15/21 | | 15,594,000 | 16,052,074 |
| 2.875% 9/30/23 | | 1,467,000 | 1,551,123 |
| 2.875% 10/31/23 | | 25,287,000 | 26,763,708 |
| 2.875% 11/30/23 | | 5,213,000 | 5,524,355 |
|
| TOTAL U.S. TREASURY OBLIGATIONS | | | 317,422,146 |
|
| TOTAL U.S. GOVERNMENT AND GOVERNMENT AGENCY OBLIGATIONS | | | |
| (Cost $321,687,265) | | | 327,819,590 |
|
| Foreign Government and Government Agency Obligations - 1.9% | | | |
| Alberta Province: | | | |
| 2.2% 7/26/22 | | $331,000 | $336,224 |
| 2.95% 1/23/24 | | 640,000 | 675,450 |
| Canadian Government: | | | |
| 2% 11/15/22 | | 200,000 | 203,160 |
| 2.625% 1/25/22 | | 1,140,000 | 1,169,800 |
| Hungarian Republic: | | | |
| 5.375% 2/21/23 | | 1,770,000 | 1,956,956 |
| 5.75% 11/22/23 | | 110,000 | 125,159 |
| Manitoba Province: | | | |
| 2.125% 5/4/22 | | 917,000 | 927,915 |
| 2.6% 4/16/24 | | 720,000 | 750,708 |
| Ontario Province: | | | |
| 2.25% 5/18/22 | | 130,000 | 132,101 |
| 2.55% 2/12/21 | | 420,000 | 424,654 |
| 2.55% 4/25/22 | | 270,000 | 276,318 |
| 3.05% 1/29/24 | | 910,000 | 964,436 |
| 3.4% 10/17/23 | | 90,000 | 96,228 |
| Polish Government: | | | |
| 4% 1/22/24 | | 330,000 | 358,746 |
| 5% 3/23/22 | | 59,000 | 63,536 |
| Province of Quebec: | | | |
| 2.375% 1/31/22 | | 311,000 | 316,610 |
| 2.5% 4/9/24 | | 690,000 | 718,449 |
| United Mexican States 3.625% 3/15/22 | | 62,000 | 64,151 |
| TOTAL FOREIGN GOVERNMENT AND GOVERNMENT AGENCY OBLIGATIONS | | | |
| (Cost $9,386,689) | | | 9,560,601 |
|
| Supranational Obligations - 2.8% | | | |
| African Development Bank: | | | |
| 1.875% 3/16/20 | | 310,000 | 309,830 |
| 3% 9/20/23 | | 240,000 | 253,651 |
| Asian Development Bank: | | | |
| 1.75% 9/13/22 | | 57,000 | 57,417 |
| 2.25% 1/20/21 | | 52,000 | 52,398 |
| 2.625% 1/30/24 | | 650,000 | 681,921 |
| 2.75% 3/17/23 | | 265,000 | 276,413 |
| 2.875% 11/27/20 | | 800,000 | 811,079 |
| European Bank for Reconstruction & Development: | | | |
| 1.625% 5/5/20 | | 140,000 | 139,718 |
| 2% 2/1/21 | | 100,000 | 100,474 |
| 2.75% 4/26/21 | | 580,000 | 590,512 |
| European Investment Bank: | | | |
| 1.75% 5/15/20 | | 110,000 | 109,898 |
| 2% 3/15/21 | | 164,000 | 164,911 |
| 2% 12/15/22 | | 262,000 | 266,795 |
| 2.25% 6/24/24 | | 600,000 | 621,566 |
| 2.375% 5/13/21 | | 410,000 | 415,280 |
| 2.375% 6/15/22 | | 100,000 | 102,343 |
| 2.625% 5/20/22 | | 500,000 | 514,927 |
| 2.875% 12/15/21 | | 120,000 | 123,608 |
| 2.875% 8/15/23 | | 800,000 | 843,183 |
| 3.125% 12/14/23 | | 530,000 | 565,458 |
| Inter-American Development Bank: | | | |
| 1.875% 3/15/21 | | 138,000 | 138,500 |
| 2.5% 1/18/23 | | 240,000 | 247,793 |
| 2.625% 4/19/21 | | 447,000 | 454,074 |
| 2.625% 1/16/24 | | 400,000 | 419,537 |
| 3% 9/26/22 | | 570,000 | 595,608 |
| International Bank for Reconstruction & Development: | | | |
| 1.125% 11/27/19 | | 500,000 | 498,950 |
| 1.125% 8/10/20 | | 150,000 | 149,056 |
| 1.375% 3/30/20 | | 100,000 | 99,670 |
| 1.5% 8/28/24 | | 600,000 | 600,892 |
| 2% 10/30/20 | | 540,000 | 540,182 |
| 2% 1/26/22 | | 64,000 | 64,736 |
| 2.125% 12/13/21�� | | 820,000 | 830,532 |
| 2.5% 3/19/24 | | 250,000 | 261,302 |
| 2.75% 7/23/21 | | 100,000 | 102,188 |
| 7.625% 1/19/23 | | 830,000 | 994,612 |
| International Finance Corp.: | | | |
| 2% 10/24/22 | | 90,000 | 91,356 |
| 2.25% 1/25/21 | | 230,000 | 231,715 |
| 2.875% 7/31/23 | | 300,000 | 315,356 |
| TOTAL SUPRANATIONAL OBLIGATIONS | | | |
| (Cost $13,362,633) | | | 13,637,441 |
|
| Bank Notes - 1.2% | | | |
| Bank of Nova Scotia 2.45% 9/19/22 | | 173,000 | 176,012 |
| BNP Paribas 5% 1/15/21 | | 100,000 | 103,862 |
| Citibank NA 2.85% 2/12/21 | | 250,000 | 252,989 |
| Citizens Bank NA 2.25% 10/30/20 | | 1,250,000 | 1,251,809 |
| Discover Bank 3.35% 2/6/23 | | 500,000 | 517,412 |
| JP Morgan Chase Bank NA 3.086% 4/26/21 (b) | | 1,500,000 | 1,508,965 |
| PNC Bank NA 2% 5/19/20 | | 250,000 | 250,012 |
| Svenska Handelsbanken AB 3.35% 5/24/21 | | 250,000 | 255,583 |
| Synchrony Bank 3.65% 5/24/21 | | 750,000 | 765,297 |
| U.S. Bank NA: | | | |
| 2% 1/24/20 | | $250,000 | $249,914 |
| 2.05% 10/23/20 | | 250,000 | 250,397 |
| Wells Fargo Bank NA: | | | |
| 2.4% 1/15/20 | | 269,000 | 269,244 |
| 3.625% 10/22/21 | | 250,000 | 257,926 |
| TOTAL BANK NOTES | | | |
| (Cost $6,010,877) | | | 6,109,422 |
| | | Shares | Value |
|
| Money Market Funds - 0.2% | | | |
| Fidelity Cash Central Fund 2.13% (c) | | | |
| (Cost $1,064,701) | | 1,064,488 | 1,064,701 |
| TOTAL INVESTMENT IN SECURITIES - 99.6% | | | |
| (Cost $480,725,007) | | | 490,490,207 |
| NET OTHER ASSETS (LIABILITIES) - 0.4% | | | 1,856,308 |
| NET ASSETS - 100% | | | $492,346,515 |
Legend
(a) Security exempt from registration under Rule 144A of the Securities Act of 1933. These securities may be resold in transactions exempt from registration, normally to qualified institutional buyers. At the end of the period, the value of these securities amounted to $5,228,658 or 1.1% of net assets.
(b) Coupon rates for floating and adjustable rate securities reflect the rates in effect at period end.
(c) Affiliated fund that is generally available only to investment companies and other accounts managed by Fidelity Investments. The rate quoted is the annualized seven-day yield of the fund at period end. A complete unaudited listing of the fund's holdings as of its most recent quarter end is available upon request. In addition, each Fidelity Central Fund's financial statements, which are not covered by the Fund's Report of Independent Registered Public Accounting Firm, are available on the SEC's website or upon request.
Affiliated Central Funds
Information regarding fiscal year to date income earned by the Fund from investments in Fidelity Central Funds is as follows:
| Fund | Income earned |
| Fidelity Cash Central Fund | $30,182 |
| Total | $30,182 |
Amounts in the income column in the above table include any capital gain distributions from underlying funds, which are presented in the corresponding line-item in the Statement of Operations, if applicable.
Investment Valuation
The following is a summary of the inputs used, as of August 31, 2019, involving the Fund's assets and liabilities carried at fair value. The inputs or methodology used for valuing securities may not be an indication of the risk associated with investing in those securities. For more information on valuation inputs, and their aggregation into the levels used below, please refer to the Investment Valuation section in the accompanying Notes to Financial Statements.
| | Valuation Inputs at Reporting Date: |
| Description | Total | Level 1 | Level 2 | Level 3 |
| Investments in Securities: | | | | |
| Corporate Bonds | $132,298,452 | $-- | $132,298,452 | $-- |
| U.S. Government and Government Agency Obligations | 327,819,590 | -- | 327,819,590 | -- |
| Foreign Government and Government Agency Obligations | 9,560,601 | -- | 9,560,601 | -- |
| Supranational Obligations | 13,637,441 | -- | 13,637,441 | -- |
| Bank Notes | 6,109,422 | -- | 6,109,422 | -- |
| Money Market Funds | 1,064,701 | 1,064,701 | -- | -- |
| Total Investments in Securities: | $490,490,207 | $1,064,701 | $489,425,506 | $-- |
Other Information
Distribution of investments by country or territory of incorporation, as a percentage of Total Net Assets, is as follows (Unaudited):
| United States of America | 88.1% |
| Canada | 3.0% |
| Multi-National | 2.8% |
| United Kingdom | 1.4% |
| Germany | 1.2% |
| Others (Individually Less Than 1%) | 3.5% |
| | 100.0% |
See accompanying notes which are an integral part of the financial statements.
Financial Statements
Statement of Assets and Liabilities
| | | August 31, 2019 |
| Assets | | |
Investment in securities, at value — See accompanying schedule:
Unaffiliated issuers (cost $479,660,306) | $489,425,506 | |
| Fidelity Central Funds (cost $1,064,701) | 1,064,701 | |
| Total Investment in Securities (cost $480,725,007) | | $490,490,207 |
| Receivable for investments sold | | 13,636,244 |
| Receivable for fund shares sold | | 1,816,084 |
| Interest receivable | | 3,389,164 |
| Distributions receivable from Fidelity Central Funds | | 1,906 |
| Total assets | | 509,333,605 |
| Liabilities | | |
| Payable for investments purchased | $16,459,976 | |
| Payable for fund shares redeemed | 376,406 | |
| Distributions payable | 138,775 | |
| Accrued management fee | 11,933 | |
| Total liabilities | | 16,987,090 |
| Net Assets | | $492,346,515 |
| Net Assets consist of: | | |
| Paid in capital | | $481,138,092 |
| Total distributable earnings (loss) | | 11,208,423 |
| Net Assets | | $492,346,515 |
| Net Asset Value and Maximum Offering Price | | |
| Net Asset Value, offering price and redemption price per share ($492,346,515 ÷ 48,527,541 shares) | | $10.15 |
See accompanying notes which are an integral part of the financial statements.
Statement of Operations
| | | Year ended August 31, 2019 |
| Investment Income | | |
| Interest | | $7,012,971 |
| Income from Fidelity Central Funds | | 30,182 |
| Total income | | 7,043,153 |
| Expenses | | |
| Management fee | $78,369 | |
| Independent trustees' fees and expenses | 964 | |
| Commitment fees | 518 | |
| Total expenses before reductions | 79,851 | |
| Expense reductions | (3,026) | |
| Total expenses after reductions | | 76,825 |
| Net investment income (loss) | | 6,966,328 |
| Realized and Unrealized Gain (Loss) | | |
| Net realized gain (loss) on: | | |
| Investment securities: | | |
| Unaffiliated issuers | 787,730 | |
| Total net realized gain (loss) | | 787,730 |
| Change in net unrealized appreciation (depreciation) on investment securities | | 10,042,031 |
| Net gain (loss) | | 10,829,761 |
| Net increase (decrease) in net assets resulting from operations | | $17,796,089 |
See accompanying notes which are an integral part of the financial statements.
Statement of Changes in Net Assets
| | Year ended August 31, 2019 | For the period
October 18, 2017 (commencement of operations) to August 31, 2018 |
| Increase (Decrease) in Net Assets | | |
| Operations | | |
| Net investment income (loss) | $6,966,328 | $774,289 |
| Net realized gain (loss) | 787,730 | (196,226) |
| Change in net unrealized appreciation (depreciation) | 10,042,031 | (276,831) |
| Net increase (decrease) in net assets resulting from operations | 17,796,089 | 301,232 |
| Distributions to shareholders | (6,205,307) | – |
| Distributions to shareholders from net investment income | – | (627,198) |
| Total distributions | (6,205,307) | (627,198) |
| Share transactions - net increase (decrease) | 397,495,288 | 83,586,411 |
| Total increase (decrease) in net assets | 409,086,070 | 83,260,445 |
| Net Assets | | |
| Beginning of period | 83,260,445 | – |
| End of period | $492,346,515 | $83,260,445 |
| Other Information | | |
| Undistributed net investment income end of period | | $110,752 |
See accompanying notes which are an integral part of the financial statements.
Financial Highlights
Fidelity Short-Term Bond Index Fund
| Years ended August 31, | 2019 | 2018 A |
| Selected Per–Share Data | | |
| Net asset value, beginning of period | $9.81 | $10.00 |
| Income from Investment Operations | | |
| Net investment income (loss)B | .261 | .201 |
| Net realized and unrealized gain (loss) | .318 | (.233) |
| Total from investment operations | .579 | (.032) |
| Distributions from net investment income | (.239) | (.158) |
| Total distributions | (.239) | (.158) |
| Net asset value, end of period | $10.15 | $9.81 |
| Total ReturnC,D | 5.98% | (.31)% |
| Ratios to Average Net AssetsE,F | | |
| Expenses before reductions | .03% | .03%G |
| Expenses net of fee waivers, if any | .03% | .03%G |
| Expenses net of all reductions | .03% | .03%G |
| Net investment income (loss) | 2.66% | 2.36%G |
| Supplemental Data | | |
| Net assets, end of period (000 omitted) | $492,347 | $3,751 |
| Portfolio turnover rateH | 83% | 102%G |
A For the period October 18, 2017 (commencement of operations) to August 31, 2018.
B Calculated based on average shares outstanding during the period.
C Total returns for periods of less than one year are not annualized.
D Total returns would have been lower if certain expenses had not been reduced during the applicable periods shown.
E Fees and expenses of any underlying Fidelity Central Funds are not included in the Fund's expense ratio. The Fund indirectly bears its proportionate share of the expenses of any underlying Fidelity Central Funds.
F Expense ratios reflect operating expenses of the Fund. Expenses before reductions do not reflect amounts reimbursed by the investment adviser or reductions from expense offset arrangements and do not represent the amount paid by the Fund during periods when reimbursements or reductions occur. Expenses net of fee waivers reflect expenses after reimbursement by the investment adviser but prior to reductions from expense offset arrangements. Expenses net of all reductions represent the net expenses paid by the Fund.
G Annualized
H Amount does not include the portfolio activity of any underlying Fidelity Central Funds.
See accompanying notes which are an integral part of the financial statements.
Notes to Financial Statements
For the period ended August 31, 2019
1. Organization.
Fidelity Short-Term Bond Index Fund (the Fund) is a fund of Fidelity Salem Street Trust (the Trust) and is authorized to issue an unlimited number of shares. The Trust is registered under the Investment Company Act of 1940, as amended (the 1940 Act), as an open-end management investment company organized as a Massachusetts business trust.
Effective after the close of business November 2, 2018, the Fund's publicly offered share classes were consolidated into a single share class. The surviving class is Fidelity Short-Term Bond Index Fund (formerly Institutional Premium Class). All current fiscal period dollar and share amounts for the classes that closed, which are presented in the Notes to Financial Statements, are for the period September 1, 2018 through November 2, 2018.
2. Investments in Fidelity Central Funds.
The Fund invests in Fidelity Central Funds, which are open-end investment companies generally available only to other investment companies and accounts managed by the investment adviser and its affiliates. The Fund's Schedule of Investments lists each of the Fidelity Central Funds held as of period end, if any, as an investment of the Fund, but does not include the underlying holdings of each Fidelity Central Fund. As an Investing Fund, the Fund indirectly bears its proportionate share of the expenses of the underlying Fidelity Central Funds.
The Money Market Central Funds seek preservation of capital and current income and are managed by Fidelity Investments Money Management, Inc. (FIMM), an affiliate of the investment adviser. Annualized expenses of the Money Market Central Funds as of their most recent shareholder report date ranged from less than .005% to .01%.
A complete unaudited list of holdings for each Fidelity Central Fund is available upon request or at the Securities and Exchange Commission (the SEC) website at www.sec.gov. In addition, the financial statements of the Fidelity Central Funds, which are not covered by the Fund's Report of Independent Registered Public Accounting Firm, are available on the SEC website or upon request.
3. Significant Accounting Policies.
The Fund is an investment company and applies the accounting and reporting guidance of the Financial Accounting Standards Board (FASB) Accounting Standards Codification Topic 946 Financial Services – Investments Companies. The financial statements have been prepared in conformity with accounting principles generally accepted in the United States of America (GAAP), which require management to make certain estimates and assumptions at the date of the financial statements. Actual results could differ from those estimates. Subsequent events, if any, through the date that the financial statements were issued have been evaluated in the preparation of the financial statements. The following summarizes the significant accounting policies of the Fund:
Investment Valuation. Investments are valued as of 4:00 p.m. Eastern time on the last calendar day of the period. The Board of Trustees (the Board) has delegated the day to day responsibility for the valuation of the Fund's investments to the Fair Value Committee (the Committee) established by the Fund's investment adviser. In accordance with valuation policies and procedures approved by the Board, the Fund attempts to obtain prices from one or more third party pricing vendors or brokers to value its investments. When current market prices, quotations or currency exchange rates are not readily available or reliable, investments will be fair valued in good faith by the Committee, in accordance with procedures adopted by the Board. Factors used in determining fair value vary by investment type and may include market or investment specific events, changes in interest rates and credit quality. The frequency with which these procedures are used cannot be predicted and they may be utilized to a significant extent. The Committee oversees the Fund's valuation policies and procedures and reports to the Board on the Committee's activities and fair value determinations. The Board monitors the appropriateness of the procedures used in valuing the Fund's investments and ratifies the fair value determinations of the Committee.
The Fund categorizes the inputs to valuation techniques used to value its investments into a disclosure hierarchy consisting of three levels as shown below:
- Level 1 – quoted prices in active markets for identical investments
- Level 2 – other significant observable inputs (including quoted prices for similar investments, interest rates, prepayment speeds, etc.)
- Level 3 – unobservable inputs (including the Fund's own assumptions based on the best information available)
Valuation techniques used to value the Fund's investments by major category are as follows:
Debt securities, including restricted securities, are valued based on evaluated prices received from third party pricing vendors or from brokers who make markets in such securities. Corporate bonds, bank notes, foreign government and government agency obligations, supranational obligations and U.S. government and government agency obligations are valued by pricing vendors who utilize matrix pricing which considers yield or price of bonds of comparable quality, coupon, maturity and type or by broker-supplied prices. When independent prices are unavailable or unreliable, debt securities may be valued utilizing pricing methodologies which consider similar factors that would be used by third party pricing vendors. Debt securities are generally categorized as Level 2 in the hierarchy but may be Level 3 depending on the circumstances.
Investments in open-end mutual funds, including the Fidelity Central Funds, are valued at their closing net asset value (NAV) each business day and are categorized as Level 1 in the hierarchy.
Changes in valuation techniques may result in transfers in or out of an assigned level within the disclosure hierarchy. The aggregate value of investments by input level as of August 31, 2019 is included at the end of the Fund's Schedule of Investments.
Investment Transactions and Income. For financial reporting purposes, the Fund's investment holdings and NAV include trades executed through the end of the last business day of the period. The NAV per share for processing shareholder transactions is calculated as of the close of business of the New York Stock Exchange (NYSE), normally 4:00 p.m. Eastern time and includes trades executed through the end of the prior business day. Gains and losses on securities sold are determined on the basis of identified cost. Income and capital gain distributions from Fidelity Central Funds, if any, are recorded on the ex-dividend date. Interest income is accrued as earned and includes coupon interest and amortization of premium and accretion of discount on debt securities as applicable. Debt obligations may be placed on non-accrual status and related interest income may be reduced by ceasing current accruals and writing off interest receivables when the collection of all or a portion of interest has become doubtful based on consistently applied procedures. A debt obligation is removed from non-accrual status when the issuer resumes interest payments or when collectability of interest is reasonably assured.
Class Allocations and Expenses. Investment income, realized and unrealized capital gains and losses, common expenses of the Fund, and certain fund-level expense reductions, if any, are allocated daily on a pro-rata basis to each class based on the relative net assets of each class to the total net assets of the Fund. Each class differs with respect to fees incurred. Certain expense reductions may also differ by class. For the reporting period, the allocated portion of income and expenses to each class as a percent of its average net assets may vary due to the timing of recording these transactions in relation to fluctuating net assets of the classes. Expenses directly attributable to a fund are charged to that fund. Expenses attributable to more than one fund are allocated among the respective funds on the basis of relative net assets or other appropriate methods. Expense estimates are accrued in the period to which they relate and adjustments are made when actual amounts are known.
Income Tax Information and Distributions to Shareholders. Each year, the Fund intends to qualify as a regulated investment company under Subchapter M of the Internal Revenue Code, including distributing substantially all of its taxable income and realized gains. As a result, no provision for U.S. Federal income taxes is required. As of August 31, 2019, the Fund did not have any unrecognized tax benefits in the financial statements; nor is the Fund aware of any tax positions for which it is reasonably possible that the total amounts of unrecognized tax benefits will significantly change in the next twelve months. The Fund files a U.S. federal tax return, in addition to state and local tax returns as required. The Fund's federal income tax returns are subject to examination by the Internal Revenue Service (IRS) for a period of three fiscal years after they are filed. State and local tax returns may be subject to examination for an additional fiscal year depending on the jurisdiction.
Distributions are declared and recorded daily and paid monthly from net investment income. Distributions from realized gains, if any, are declared and recorded on the ex-dividend date. Income and capital gain distributions are declared separately for each class. Income and capital gain distributions are determined in accordance with income tax regulations, which may differ from GAAP. In addition, the Fund claimed a portion of the payment made to redeeming shareholders as a distribution for income tax purposes.
Capital accounts within the financial statements are adjusted for permanent book-tax differences. These adjustments have no impact on net assets or the results of operations. Capital accounts are not adjusted for temporary book-tax differences which will reverse in a subsequent period.
Book-tax differences are primarily due to market discount, capital loss carryforwards and losses deferred due to wash sales.
As of period end, the cost and unrealized appreciation (depreciation) in securities, and derivatives if applicable, for federal income tax purposes were as follows:
| Gross unrealized appreciation | $10,309,780 |
| Gross unrealized depreciation | (7,807) |
| Net unrealized appreciation (depreciation) | $10,301,973 |
| Tax Cost | $480,188,234 |
The tax-based components of distributable earnings as of period end were as follows:
| Undistributed ordinary income | $906,450 |
| Net unrealized appreciation (depreciation) on securities and other investments | $10,301,973 |
The tax character of distributions paid was as follows:
| | August 31, 2019 | August 31, 2018(a) |
| Ordinary Income | $6,205,307 | $ 627,198 |
(a) For the period October 18, 2017 (commencement of operations) to August 31, 2018.
Restricted Securities. The Fund may invest in securities that are subject to legal or contractual restrictions on resale. These securities generally may be resold in transactions exempt from registration or to the public if the securities are registered. Disposal of these securities may involve time-consuming negotiations and expense, and prompt sale at an acceptable price may be difficult. Information regarding restricted securities is included at the end of the Fund's Schedule of Investments.
New Rule Issuance. During August 2018, the U.S. Securities and Exchange Commission issued Final Rule Release No. 33-10532, Disclosure Update and Simplification. This Final Rule includes amendments specific to registered investment companies that are intended to eliminate overlap in disclosure requirements between Regulation S-X and GAAP. In accordance with these amendments, certain line-items in the Fund's financial statements have been combined or removed for the current period as outlined in the table below.
| Financial Statement | Current Line-Item Presentation (As Applicable) | Prior Line-Item Presentation (As Applicable) |
| Statement of Assets and Liabilities | Total distributable earnings (loss) | Undistributed/Distributions in excess of/Accumulated net investment income (loss)
Accumulated/Undistributed net realized gain (loss)
Net unrealized appreciation (depreciation) |
| Statement of Changes in Net Assets | N/A - removed | Undistributed/Distributions in excess of/Accumulated net investment income (loss) end of period |
| Statement of Changes in Net Assets | Distributions to shareholders | Distributions to shareholders from net investment income
Distributions to shareholders from net realized gain |
| Distributions to Shareholders Note to Financial Statements | Distributions to shareholders | Distributions to shareholders from net investment income
Distributions to shareholders from net realized gain |
4. Purchases and Sales of Investments.
Purchases and sales of securities, other than short-term securities and U.S. government securities, aggregated $134,032,090 and $3,432,501, respectively.
5. Fees and Other Transactions with Affiliates.
Management Fee. Fidelity Management & Research Company (the investment adviser) and its affiliates provide the Fund with investment management related services for which the Fund pays a monthly management fee. The management fee is based on an annual rate of .03% of the Fund's average net assets. Under the management contract, the investment adviser pays all other fund-level operating expenses, except the compensation of the independent Trustees and certain miscellaneous expenses such as proxy and shareholder meeting expenses. During July 2019, the Board approved to change the management fee structure from a flat fee to a unitary fee effective August 1, 2019, which eliminated the need for a separate expense contract. There is no change to the total expenses paid by the shareholders.
Prior to August 1, 2019, under the expense contract, the investment adviser paid class-level expenses as necessary so that the total expenses did not exceed .03% of each class' average net assets on an annual basis with certain exceptions.
Interfund Trades. The Fund may purchase from or sell securities to other Fidelity Funds under procedures adopted by the Board. The procedures have been designed to ensure these interfund trades are executed in accordance with Rule 17a-7 of the 1940 Act. Interfund trades are included within the respective purchases and sales amounts shown in the Purchases and Sales of Investments note.
6. Committed Line of Credit.
The Fund participates with other funds managed by the investment adviser or an affiliate in a $4.25 billion credit facility (the "line of credit") to be utilized for temporary or emergency purposes to fund shareholder redemptions or for other short-term liquidity purposes. The Fund has agreed to pay commitment fees on its pro-rata portion of the line of credit, which amounted to $518 and is reflected in Commitment fees on the Statement of Operations. During the period, the Fund did not borrow on this line of credit.
7. Expense Reductions.
Through arrangements with the Fund's custodian and each class' transfer agent, credits realized as a result of certain uninvested cash balances were used to reduce the Fund's expenses. During the period, custodian credits reduced the Fund's expenses by $3,021. During the period, transfer agent credits reduced each class' expenses as noted in the table below.
| | Expense reduction |
| Fidelity Short-Term Bond Index Fund | $5 |
8. Distributions to Shareholders.
Distributions to shareholders of each class were as follows:
| | Year ended
August 31, 2019 | Year ended
August 31, 2018(a) |
| Distributions to shareholders | | |
| Investor Class | $9,376 | $– |
| Premium Class | 286,729 | – |
| Institutional Class | 63,988 | – |
| Fidelity Short-Term Bond Index Fund | 5,845,214 | – |
| Total | $6,205,307 | $– |
| From net investment income | | |
| Investor Class | $– | $19,528 |
| Premium Class | – | 480,658 |
| Institutional Class | – | 84,167 |
| Fidelity Short-Term Bond Index Fund | – | 42,845 |
| Total | $– | $627,198 |
(a) For the period October 18, 2017 (commencement of operations) to August 31, 2018.
9. Share Transactions.
Share transactions for each class were as follows and may contain automatic conversions between classes or exchanges between affiliated funds:
| | Shares | Shares | Dollars | Dollars |
| | Year ended August 31, 2019 | Year ended August 31, 2018(a) | Year ended August 31, 2019 | Year ended August 31, 2018(a) |
| Investor Class | | | | |
| Shares sold | 202,918 | 816,488 | $1,994,324 | $8,080,151 |
| Reinvestment of distributions | 920 | 1,920 | 8,974 | 18,964 |
| Shares redeemed | (345,237) | (677,009) | (3,376,175) | (6,677,252) |
| Net increase (decrease) | (141,399) | 141,399 | $(1,372,877) | $1,421,863 |
| Premium Class | | | | |
| Shares sold | 1,456,637 | 8,152,320 | $14,225,576 | $80,261,133 |
| Reinvestment of distributions | 26,306 | 44,680 | 256,706 | 438,873 |
| Shares redeemed | (8,425,042) | (1,254,901) | (82,109,376) | (12,349,778) |
| Net increase (decrease) | (6,942,099) | 6,942,099 | $(67,627,094) | $68,350,228 |
| Institutional Class | | | | |
| Shares sold | 1,095,048 | 1,043,740 | $10,623,925 | $10,275,467 |
| Reinvestment of distributions | 6,412 | 8,564 | 62,571 | 84,160 |
| Shares redeemed | (2,118,716) | (35,048) | (20,673,222) | (343,684) |
| Net increase (decrease) | (1,017,256) | 1,017,256 | $(9,986,726) | $10,015,943 |
| Fidelity Short-Term Bond Index Fund | | | | |
| Shares sold | 59,408,449 | 380,182 | $588,489,012 | $3,778,545 |
| Reinvestment of distributions | 504,759 | 4,322 | 5,044,408 | 42,550 |
| Shares redeemed | (11,767,850) | (2,321) | (117,051,435) | (22,718) |
| Net increase (decrease) | 48,145,358 | 382,183 | $476,481,985 | $3,798,377 |
(a) For the period October 18, 2017 (commencement of operations) to August 31, 2018.
10. Other.
The Fund's organizational documents provide former and current trustees and officers with a limited indemnification against liabilities arising in connection with the performance of their duties to the Fund. In the normal course of business, the Fund may also enter into contracts that provide general indemnifications. The Fund's maximum exposure under these arrangements is unknown as this would be dependent on future claims that may be made against the Fund. The risk of material loss from such claims is considered remote.
Report of Independent Registered Public Accounting Firm
To the Trustees of Fidelity Salem Street Trust and Shareholders of Fidelity Short-Term Bond Index Fund:
Opinion on the Financial Statements and Financial Highlights
We have audited the accompanying statement of assets and liabilities of Fidelity Short-Term Bond Index Fund (the "Fund"), a fund of Fidelity Salem Street Trust, including the schedule of investments, as of August 31, 2019, the related statement of operations for the year then ended, and the statement of changes in net assets and the financial highlights for the year then ended and for the period from October 18, 2017 (commencement of operations) to August 31, 2018, and the related notes. In our opinion, the financial statements and financial highlights present fairly, in all material respects, the financial position of the Fund as of August 31, 2019, the results of its operations for the year then ended, and the changes in its net assets and the financial highlights for the year then ended and for the period from October 18, 2017 (commencement of operations) to August 31, 2018 in conformity with accounting principles generally accepted in the United States of America.
Basis for Opinion
These financial statements and financial highlights are the responsibility of the Fund's management. Our responsibility is to express an opinion on the Fund's financial statements and financial highlights based on our audits. We are a public accounting firm registered with the Public Company Accounting Oversight Board (United States) (PCAOB) and are required to be independent with respect to the Fund in accordance with the U.S. federal securities laws and the applicable rules and regulations of the Securities and Exchange Commission and the PCAOB.
We conducted our audits in accordance with the standards of the PCAOB. Those standards require that we plan and perform the audit to obtain reasonable assurance about whether the financial statements and financial highlights are free of material misstatement, whether due to error or fraud. The Fund is not required to have, nor were we engaged to perform, an audit of its internal control over financial reporting. As part of our audits we are required to obtain an understanding of internal control over financial reporting but not for the purpose of expressing an opinion on the effectiveness of the Fund’s internal control over financial reporting. Accordingly, we express no such opinion.
Our audits included performing procedures to assess the risks of material misstatement of the financial statements and financial highlights, whether due to error or fraud, and performing procedures that respond to those risks. Such procedures included examining, on a test basis, evidence regarding the amounts and disclosures in the financial statements and financial highlights. Our audits also included evaluating the accounting principles used and significant estimates made by management, as well as evaluating the overall presentation of the financial statements and financial highlights. Our procedures included confirmation of securities owned as of August 31, 2019, by correspondence with the custodians and brokers; when replies were not received from brokers, we performed other auditing procedures. We believe that our audits provide a reasonable basis for our opinion.
/s/ Deloitte & Touche LLP
Boston, Massachusetts
October 17, 2019
We have served as the auditor of one or more of the Fidelity investment companies since 1999.
Trustees and Officers
The Trustees, Members of the Advisory Board (if any), and officers of the trust and fund, as applicable, are listed below. The Board of Trustees governs the fund and is responsible for protecting the interests of shareholders. The Trustees are experienced executives who meet periodically throughout the year to oversee the fund's activities, review contractual arrangements with companies that provide services to the fund, oversee management of the risks associated with such activities and contractual arrangements, and review the fund's performance. Except for Jonathan Chiel, each of the Trustees oversees 276 funds. Mr. Chiel oversees 170 funds.
The Trustees hold office without limit in time except that (a) any Trustee may resign; (b) any Trustee may be removed by written instrument, signed by at least two-thirds of the number of Trustees prior to such removal; (c) any Trustee who requests to be retired or who has become incapacitated by illness or injury may be retired by written instrument signed by a majority of the other Trustees; and (d) any Trustee may be removed at any special meeting of shareholders by a two-thirds vote of the outstanding voting securities of the trust. Each Trustee who is not an interested person (as defined in the 1940 Act) of the trust and the fund is referred to herein as an Independent Trustee. Each Independent Trustee shall retire not later than the last day of the calendar year in which his or her 75th birthday occurs. The Independent Trustees may waive this mandatory retirement age policy with respect to individual Trustees. Officers and Advisory Board Members hold office without limit in time, except that any officer or Advisory Board Member may resign or may be removed by a vote of a majority of the Trustees at any regular meeting or any special meeting of the Trustees. Except as indicated, each individual has held the office shown or other offices in the same company for the past five years.
The fund’s Statement of Additional Information (SAI) includes more information about the Trustees. To request a free copy, call Fidelity at 1-800-544-8544.
Experience, Skills, Attributes, and Qualifications of the Trustees. The Governance and Nominating Committee has adopted a statement of policy that describes the experience, qualifications, attributes, and skills that are necessary and desirable for potential Independent Trustee candidates (Statement of Policy). The Board believes that each Trustee satisfied at the time he or she was initially elected or appointed a Trustee, and continues to satisfy, the standards contemplated by the Statement of Policy. The Governance and Nominating Committee also engages professional search firms to help identify potential Independent Trustee candidates who have the experience, qualifications, attributes, and skills consistent with the Statement of Policy. From time to time, additional criteria based on the composition and skills of the current Independent Trustees, as well as experience or skills that may be appropriate in light of future changes to board composition, business conditions, and regulatory or other developments, have also been considered by the professional search firms and the Governance and Nominating Committee. In addition, the Board takes into account the Trustees' commitment and participation in Board and committee meetings, as well as their leadership of standing and ad hoc committees throughout their tenure.
In determining that a particular Trustee was and continues to be qualified to serve as a Trustee, the Board has considered a variety of criteria, none of which, in isolation, was controlling. The Board believes that, collectively, the Trustees have balanced and diverse experience, qualifications, attributes, and skills, which allow the Board to operate effectively in governing the fund and protecting the interests of shareholders. Information about the specific experience, skills, attributes, and qualifications of each Trustee, which in each case led to the Board's conclusion that the Trustee should serve (or continue to serve) as a trustee of the fund, is provided below.
Board Structure and Oversight Function. Abigail P. Johnson is an interested person and currently serves as Chairman. The Trustees have determined that an interested Chairman is appropriate and benefits shareholders because an interested Chairman has a personal and professional stake in the quality and continuity of services provided to the fund. Independent Trustees exercise their informed business judgment to appoint an individual of their choosing to serve as Chairman, regardless of whether the Trustee happens to be independent or a member of management. The Independent Trustees have determined that they can act independently and effectively without having an Independent Trustee serve as Chairman and that a key structural component for assuring that they are in a position to do so is for the Independent Trustees to constitute a substantial majority for the Board. The Independent Trustees also regularly meet in executive session. Arthur E. Johnson serves as Chairman of the Independent Trustees and as such (i) acts as a liaison between the Independent Trustees and management with respect to matters important to the Independent Trustees and (ii) with management prepares agendas for Board meetings.
Fidelity® funds are overseen by different Boards of Trustees. The fund's Board oversees Fidelity's investment-grade bond, money market, asset allocation and certain equity funds, and other Boards oversee Fidelity's high income and other equity funds. The asset allocation funds may invest in Fidelity® funds that are overseen by such other Boards. The use of separate Boards, each with its own committee structure, allows the Trustees of each group of Fidelity® funds to focus on the unique issues of the funds they oversee, including common research, investment, and operational issues. On occasion, the separate Boards establish joint committees to address issues of overlapping consequences for the Fidelity® funds overseen by each Board.
The Trustees operate using a system of committees to facilitate the timely and efficient consideration of all matters of importance to the Trustees, the fund, and fund shareholders and to facilitate compliance with legal and regulatory requirements and oversight of the fund's activities and associated risks. The Board, acting through its committees, has charged FMR and its affiliates with (i) identifying events or circumstances the occurrence of which could have demonstrably adverse effects on the fund's business and/or reputation; (ii) implementing processes and controls to lessen the possibility that such events or circumstances occur or to mitigate the effects of such events or circumstances if they do occur; and (iii) creating and maintaining a system designed to evaluate continuously business and market conditions in order to facilitate the identification and implementation processes described in (i) and (ii) above. Because the day-to-day operations and activities of the fund are carried out by or through FMR, its affiliates, and other service providers, the fund's exposure to risks is mitigated but not eliminated by the processes overseen by the Trustees. While each of the Board's committees has responsibility for overseeing different aspects of the fund's activities, oversight is exercised primarily through the Operations and Audit Committees. In addition, an ad hoc Board committee of Independent Trustees has worked with FMR to enhance the Board's oversight of investment and financial risks, legal and regulatory risks, technology risks, and operational risks, including the development of additional risk reporting to the Board. Appropriate personnel, including but not limited to the fund's Chief Compliance Officer (CCO), FMR's internal auditor, the independent accountants, the fund's Treasurer and portfolio management personnel, make periodic reports to the Board's committees, as appropriate, including an annual review of Fidelity's risk management program for the Fidelity® funds. The responsibilities of each standing committee, including their oversight responsibilities, are described further under "Standing Committees of the Trustees."
Interested Trustees*:
Correspondence intended for a Trustee who is an interested person may be sent to Fidelity Investments, 245 Summer Street, Boston, Massachusetts 02210.
Name, Year of Birth; Principal Occupations and Other Relevant Experience+
Jonathan Chiel (1957)
Year of Election or Appointment: 2016
Trustee
Mr. Chiel also serves as Trustee of other Fidelity® funds. Mr. Chiel is Executive Vice President and General Counsel for FMR LLC (diversified financial services company, 2012-present). Previously, Mr. Chiel served as general counsel (2004-2012) and senior vice president and deputy general counsel (2000-2004) for John Hancock Financial Services; a partner with Choate, Hall & Stewart (1996-2000) (law firm); and an Assistant United States Attorney for the United States Attorney’s Office of the District of Massachusetts (1986-95), including Chief of the Criminal Division (1993-1995). Mr. Chiel is a director on the boards of the Boston Bar Foundation and the Maimonides School.
Abigail P. Johnson (1961)
Year of Election or Appointment: 2009
Trustee
Chairman of the Board of Trustees
Ms. Johnson also serves as Trustee of other Fidelity® funds. Ms. Johnson serves as Chairman (2016-present), Chief Executive Officer (2014-present), and Director (2007-present) of FMR LLC (diversified financial services company), President of Fidelity Financial Services (2012-present) and President of Personal, Workplace and Institutional Services (2005-present). Ms. Johnson is Chairman and Director of FMR Co., Inc. (investment adviser firm, 2011-present) and Chairman and Director of FMR (investment adviser firm, 2011-present). Previously, Ms. Johnson served as Vice Chairman (2007-2016) and President (2013-2016) of FMR LLC, President and a Director of FMR (2001-2005), a Trustee of other investment companies advised by FMR, Fidelity Investments Money Management, Inc. (investment adviser firm), and FMR Co., Inc. (2001-2005), Senior Vice President of the Fidelity® funds (2001-2005), and managed a number of Fidelity® funds. Ms. Abigail P. Johnson and Mr. Arthur E. Johnson are not related.
Jennifer Toolin McAuliffe (1959)
Year of Election or Appointment: 2016
Trustee
Ms. McAuliffe also serves as Trustee of other Fidelity® funds. Ms. McAuliffe previously served as a Member of the Advisory Board of certain Fidelity® funds (2016) and as Co-Head of Fixed Income of Fidelity Investments Limited (now known as FIL Limited (FIL)) (diversified financial services company). Earlier roles at FIL included Director of Research for FIL’s credit and quantitative teams in London, Hong Kong and Tokyo. Ms. McAuliffe also was the Director of Research for taxable and municipal bonds at Fidelity Investments Money Management, Inc. Ms. McAuliffe is also a director or trustee of several not-for-profit entities.
* Determined to be an “Interested Trustee” by virtue of, among other things, his or her affiliation with the trust or various entities under common control with FMR.
+ The information includes the Trustee's principal occupation during the last five years and other information relating to the experience, attributes, and skills relevant to the Trustee's qualifications to serve as a Trustee, which led to the conclusion that the Trustee should serve as a Trustee for the fund.
Independent Trustees:
Correspondence intended for an Independent Trustee may be sent to Fidelity Investments, P.O. Box 55235, Boston, Massachusetts 02205-5235.
Name, Year of Birth; Principal Occupations and Other Relevant Experience+
Elizabeth S. Acton (1951)
Year of Election or Appointment: 2013
Trustee
Ms. Acton also serves as Trustee of other Fidelity® funds. Prior to her retirement in April 2012, Ms. Acton was Executive Vice President, Finance (2011-2012), Executive Vice President, Chief Financial Officer (2002-2011), and Treasurer (2004-2005) of Comerica Incorporated (financial services). Prior to joining Comerica, Ms. Acton held a variety of positions at Ford Motor Company (1983-2002), including Vice President and Treasurer (2000-2002) and Executive Vice President and Chief Financial Officer of Ford Motor Credit Company (1998-2000). Ms. Acton currently serves as a member of the Board of Directors and Audit and Finance Committees of Beazer Homes USA, Inc. (homebuilding, 2012-present). Previously, Ms. Acton served as a Member of the Advisory Board of certain Fidelity® funds (2013-2016).
Ann E. Dunwoody (1953)
Year of Election or Appointment: 2018
Trustee
General Dunwoody also serves as Trustee of other Fidelity® funds. General Dunwoody (United States Army, Retired) was the first woman in U.S. military history to achieve the rank of four-star general and prior to her retirement in 2012 held a variety of positions within the U.S. Army, including Commanding General, U.S. Army Material Command (2008-2012). She is the President of First to Four LLC (leadership and mentoring services, 2012-present). She also serves as a member of the Board of Directors and Nominating and Corporate Governance Committee of L3 Technologies, Inc. (communication, electronic, sensor, and aerospace systems, 2013-present), Board of Directors and Nomination and Corporate Governance Committees of Kforce Inc. (professional staffing services, 2016-present) and Board of Directors of Automattic Inc. (software engineering, 2018-present). Previously, General Dunwoody served as a Member of the Advisory Board of certain Fidelity® funds (2018), a member of the Board of Directors and Audit and Sustainability and Corporate Responsibility Committees of Republic Services, Inc. (waste collection, disposal and recycling, 2013-2016). Ms. Dunwoody also serves on several boards for non-profit organizations, including as a member of the Board of Directors, Chair of the Nomination and Governance Committee and member of the Audit Committee of Logistics Management Institute (consulting non-profit, 2012-present), a member of the Board of Directors of the Army Historical Foundation (2015-present), a member of the Council of Trustees for the Association of the United States Army (advocacy non-profit, 2013-present) and a member of the Board of Trustees of Florida Institute of Technology (2015-present) and ThanksUSA (military family education non-profit, 2014-present).
John Engler (1948)
Year of Election or Appointment: 2014
Trustee
Mr. Engler also serves as Trustee of other Fidelity® funds. He serves on the board of directors for Universal Forest Products (manufacturer and distributor of wood and wood-alternative products, 2003-present) and K12 Inc. (technology-based education company, 2012-present). Previously, Mr. Engler served as interim president of Michigan State University (2018-2019), a Member of the Advisory Board of certain Fidelity® funds (2014-2016), president of the Business Roundtable (2011-2017), a trustee of The Munder Funds (2003-2014), president and CEO of the National Association of Manufacturers (2004-2011), member of the Board of Trustees of the Annie E. Casey Foundation (2004-2015), and as governor of Michigan (1991-2003). He is a past chairman of the National Governors Association.
Robert F. Gartland (1951)
Year of Election or Appointment: 2010
Trustee
Mr. Gartland also serves as Trustee of other Fidelity® funds. Mr. Gartland is Chairman and an investor in Gartland & Mellina Group Corp. (consulting, 2009-present). Previously, Mr. Gartland served as a partner and investor of Vietnam Partners LLC (investments and consulting, 2008-2011). Prior to his retirement, Mr. Gartland held a variety of positions at Morgan Stanley (financial services, 1979-2007), including Managing Director (1987-2007), and Chase Manhattan Bank (1975-1978).
Arthur E. Johnson (1947)
Year of Election or Appointment: 2008
Trustee
Chairman of the Independent Trustees
Mr. Johnson also serves as Trustee of other Fidelity® funds. Mr. Johnson serves as a member of the Board of Directors of Eaton Corporation plc (diversified power management, 2009-present) and Booz Allen Hamilton (management consulting, 2011-present). Prior to his retirement, Mr. Johnson served as Senior Vice President of Corporate Strategic Development of Lockheed Martin Corporation (defense contractor, 1999-2009). Mr. Johnson previously served as Vice Chairman (2015-2018) of the Independent Trustees of certain Fidelity® funds and on the Board of Directors of IKON Office Solutions, Inc. (1999-2008), AGL Resources, Inc. (holding company, 2002-2016), and Delta Airlines (2005-2007). Mr. Arthur E. Johnson is not related to Ms. Abigail P. Johnson.
Michael E. Kenneally (1954)
Year of Election or Appointment: 2009
Trustee
Vice Chairman of the Independent Trustees
Mr. Kenneally also serves as Trustee of other Fidelity® funds. Prior to his retirement, Mr. Kenneally served as Chairman and Global Chief Executive Officer of Credit Suisse Asset Management. Before joining Credit Suisse, he was an Executive Vice President and Chief Investment Officer for Bank of America Corporation. Earlier roles at Bank of America included Director of Research, Senior Portfolio Manager and Research Analyst, and Mr. Kenneally was awarded the Chartered Financial Analyst (CFA) designation in 1991.
Marie L. Knowles (1946)
Year of Election or Appointment: 2001
Trustee
Ms. Knowles also serves as Trustee of other Fidelity® funds. Prior to Ms. Knowles' retirement in June 2000, she served as Executive Vice President and Chief Financial Officer of Atlantic Richfield Company (ARCO) (diversified energy, 1996-2000). From 1993 to 1996, she was a Senior Vice President of ARCO and President of ARCO Transportation Company (pipeline and tanker operations). Ms. Knowles currently serves as a Director and Chairman of the Audit Committee of McKesson Corporation (healthcare service, since 2002). Ms. Knowles is a member of the Board of the Santa Catalina Island Company (real estate, 2009-present). Ms. Knowles is a Member of the Investment Company Institute Board of Governors and a Member of the Governing Council of the Independent Directors Council (2014-present). She also serves as a member of the Advisory Board for the School of Engineering of the University of Southern California. Previously, Ms. Knowles served as a Director of Phelps Dodge Corporation (copper mining and manufacturing, 1994-2007), URS Corporation (engineering and construction, 2000-2003) and America West (airline, 1999-2002). Ms. Knowles previously served as Chairman (2015-2018) and Vice Chairman (2012-2015) of the Independent Trustees of certain Fidelity® funds.
Mark A. Murray (1954)
Year of Election or Appointment: 2016
Trustee
Mr. Murray also serves as Trustee of other Fidelity® funds. Mr. Murray is Vice Chairman (2013-present) of Meijer, Inc. (regional retail chain). Previously, Mr. Murray served as a Member of the Advisory Board of certain Fidelity® funds (2016) and as Co-Chief Executive Officer (2013-2016) and President (2006-2013) of Meijer, Inc. Mr. Murray serves as a member of the Board of Directors and Nuclear Review and Public Policy and Responsibility Committees of DTE Energy Company (diversified energy company, 2009-present). Mr. Murray also serves as a member of the Board of Directors of Spectrum Health (not-for-profit health system, 2015-present). Mr. Murray previously served as President of Grand Valley State University (2001-2006), Treasurer for the State of Michigan (1999-2001), Vice President of Finance and Administration for Michigan State University (1998-1999), and a member of the Board of Directors and Audit Committee and Chairman of the Nominating and Corporate Governance Committee of Universal Forest Products, Inc. (manufacturer and distributor of wood and wood-alternative products, 2004-2016). Mr. Murray is also a director or trustee of many community and professional organizations.
+ The information includes the Trustee's principal occupation during the last five years and other information relating to the experience, attributes, and skills relevant to the Trustee's qualifications to serve as a Trustee, which led to the conclusion that the Trustee should serve as a Trustee for the fund.
Advisory Board Members and Officers:
Correspondence intended for an officer may be sent to Fidelity Investments, 245 Summer Street, Boston, Massachusetts 02210. Officers appear below in alphabetical order.
Name, Year of Birth; Principal Occupation
Elizabeth Paige Baumann (1968)
Year of Election or Appointment: 2017
Anti-Money Laundering (AML) Officer
Ms. Baumann also serves as AML Officer of other funds. She is Chief AML Officer (2012-present) and Senior Vice President (2014-present) of FMR LLC (diversified financial services company) and is an employee of Fidelity Investments. Previously, Ms. Baumann served as AML Officer of the funds (2012-2016), and Vice President (2007-2014) and Deputy Anti-Money Laundering Officer (2007-2012) of FMR LLC.
Craig S. Brown (1977)
Year of Election or Appointment: 2019
Assistant Treasurer
Mr. Brown also serves as Assistant Treasurer of other funds. Mr. Brown is an employee of Fidelity Investments (2013-present).
John J. Burke III (1964)
Year of Election or Appointment: 2018
Chief Financial Officer
Mr. Burke also serves as Chief Financial Officer of other funds. Mr. Burke serves as Head of Investment Operations for Fidelity Fund and Investment Operations (2018-present) and is an employee of Fidelity Investments (1998-present). Previously Mr. Burke served as head of Asset Management Investment Operations (2012-2018).
Jonathan Davis (1968)
Year of Election or Appointment: 2010
Assistant Treasurer
Mr. Davis also serves as Assistant Treasurer of other funds. Mr. Davis serves as Assistant Treasurer of FMR Capital, Inc. (2017-present) and is an employee of Fidelity Investments. Previously, Mr. Davis served as Vice President and Associate General Counsel of FMR LLC (diversified financial services company, 2003-2010).
Adrien E. Deberghes (1967)
Year of Election or Appointment: 2010
Assistant Treasurer
Mr. Deberghes also serves as an officer of other funds. He serves as Assistant Treasurer of FMR Capital, Inc. (2017-present), Executive Vice President of Fidelity Investments Money Management, Inc. (FIMM) (investment adviser firm, 2016-present), and is an employee of Fidelity Investments (2008-present). Previously, Mr. Deberghes served as President and Treasurer of certain Fidelity® funds (2013-2018). Prior to joining Fidelity Investments, Mr. Deberghes was Senior Vice President of Mutual Fund Administration at State Street Corporation (2007-2008), Senior Director of Mutual Fund Administration at Investors Bank & Trust (2005-2007), and Director of Finance for Dunkin' Brands (2000-2005). Previously, Mr. Deberghes served in other fund officer roles.
Laura M. Del Prato (1964)
Year of Election or Appointment: 2018
President and Treasurer
Ms. Del Prato also serves as an officer of other funds. Ms. Del Prato is an employee of Fidelity Investments (2017-present). Prior to joining Fidelity Investments, Ms. Del Prato served as a Managing Director and Treasurer of the JPMorgan Mutual Funds (2014-2017). Prior to JPMorgan, Ms. Del Prato served as a partner at Cohen Fund Audit Services (accounting firm, 2012-2013) and KPMG LLP (accounting firm, 2004-2012).
Colm A. Hogan (1973)
Year of Election or Appointment: 2016
Assistant Treasurer
Mr. Hogan also serves as an officer of other funds. Mr. Hogan serves as Assistant Treasurer of FMR Capital, Inc. (2017-present) and is an employee of Fidelity Investments (2005-present). Previously, Mr. Hogan served as Assistant Treasurer of certain Fidelity® funds (2016-2018).
Cynthia Lo Bessette (1969)
Year of Election or Appointment: 2019
Secretary and Chief Legal Officer (CLO)
Ms. Lo Bessette also serves as Secretary and CLO of other funds. She is a Senior Vice President and Deputy General Counsel of FMR LLC (diversified financial services company, 2019-present), and is an employee of Fidelity Investments. Previously, Ms. Lo Bessette served as Executive Vice President, General Counsel (2016-2019) and Senior Vice President, Deputy General Counsel (2015-2016) of OppenheimerFunds (investment management company) and Deputy Chief Legal Officer (2013-2015) of Jennison Associates LLC (investment adviser firm).
Chris Maher (1972)
Year of Election or Appointment: 2013
Assistant Treasurer
Mr. Maher serves as Assistant Treasurer of other funds. Mr. Maher is Vice President of Valuation Oversight, serves as Assistant Treasurer of FMR Capital, Inc. (2017-present), and is an employee of Fidelity Investments. Previously, Mr. Maher served as Vice President of Asset Management Compliance (2013), Vice President of the Program Management Group of FMR (investment adviser firm, 2010-2013), and Vice President of Valuation Oversight (2008-2010).
John B. McGinty, Jr. (1962)
Year of Election or Appointment: 2016
Chief Compliance Officer
Mr. McGinty also serves as Chief Compliance Officer of other funds. Mr. McGinty is Senior Vice President of Asset Management Compliance for Fidelity Investments and is an employee of Fidelity Investments (2016-present). Mr. McGinty previously served as Vice President, Senior Attorney at Eaton Vance Management (investment management firm, 2015-2016), and prior to Eaton Vance as global CCO for all firm operations and registered investment companies at GMO LLC (investment management firm, 2009-2015). Before joining GMO LLC, Mr. McGinty served as Senior Vice President, Deputy General Counsel for Fidelity Investments (2007-2009).
Jason P. Pogorelec (1975)
Year of Election or Appointment: 2015
Assistant Secretary
Mr. Pogorelec also serves as Assistant Secretary of other funds. Mr. Pogorelec serves as Vice President, Associate General Counsel (2010-present) and is an employee of Fidelity Investments (2006-present).
Nancy D. Prior (1967)
Year of Election or Appointment: 2014
Vice President
Ms. Prior also serves as Vice President of other funds. Ms. Prior serves as President of Fixed Income (2014-present), President (2016-present) and Director (2014-present) of Fidelity Investments Money Management, Inc. (FIMM) (investment adviser firm), and is an employee of Fidelity Investments (2002-present). Previously, Ms. Prior served as Vice Chairman of FIAM LLC (investment adviser firm, 2014-2018), a Director of FMR Investment Management (UK) Limited (investment adviser firm, 2015-2018), President Multi-Asset Class Strategies of FMR's Global Asset Allocation Division (2017-2018), Vice President of Fidelity's Money Market Funds (2012-2014), and President, Money Market and Short Duration Bond Group of Fidelity Management & Research Company (FMR) (investment adviser firm, 2013-2014).
Stacie M. Smith (1974)
Year of Election or Appointment: 2013
Assistant Treasurer
Ms. Smith also serves as an officer of other funds. Ms. Smith serves as Assistant Treasurer of FMR Capital, Inc. (2017-present), is an employee of Fidelity Investments (2009-present), and has served in other fund officer roles. Prior to joining Fidelity Investments, Ms. Smith served as Senior Audit Manager of Ernst & Young LLP (accounting firm, 1996-2009). Previously, Ms. Smith served as Assistant Treasurer (2013-2018) and Deputy Treasurer (2013-2016) of certain Fidelity® funds.
Marc L. Spector (1972)
Year of Election or Appointment: 2016
Deputy Treasurer
Mr. Spector also serves as an officer of other funds. Mr. Spector serves as Assistant Treasurer of FMR Capital, Inc. (2017-present) and is an employee of Fidelity Investments (2016-present). Prior to joining Fidelity Investments, Mr. Spector served as Director at the Siegfried Group (accounting firm, 2013-2016), and prior to Siegfried Group as audit senior manager at Deloitte & Touche (accounting firm, 2005-2013).
Jim Wegmann (1979)
Year of Election or Appointment: 2019
Assistant Treasurer
Mr. Wegmann also serves as Assistant Treasurer of other funds. Mr. Wegmann is an employee of Fidelity Investments (2011-present).
Shareholder Expense Example
As a shareholder of the Fund, you incur two types of costs: (1) transaction costs and (2) ongoing costs, including management fees and other Fund expenses. This Example is intended to help you understand your ongoing costs (in dollars) of investing in the Fund and to compare these costs with the ongoing costs of investing in other mutual funds.
The Example is based on an investment of $1,000 invested at the beginning of the period and held for the entire period (March 1, 2019 to August 31, 2019).
Actual Expenses
The first line of the accompanying table provides information about actual account values and actual expenses. You may use the information in this line, together with the amount you invested, to estimate the expenses that you paid over the period. Simply divide your account value by $1,000.00 (for example, an $8,600 account value divided by $1,000.00 = 8.6), then multiply the result by the number in the first line under the heading entitled "Expenses Paid During Period" to estimate the expenses you paid on your account during this period. In addition, the Fund, as a shareholder in the underlying Fidelity Central Funds, will indirectly bear its pro-rata share of the fees and expenses incurred by the underlying Fidelity Central Funds. These fees and expenses are not included in the Fund's annualized expense ratio used to calculate the expense estimate in the table below.
Hypothetical Example for Comparison Purposes
The second line of the accompanying table provides information about hypothetical account values and hypothetical expenses based on the Fund's actual expense ratio and an assumed rate of return of 5% per year before expenses, which is not the Fund's actual return. The hypothetical account values and expenses may not be used to estimate the actual ending account balance or expenses you paid for the period. You may use this information to compare the ongoing costs of investing in the Fund and other funds. To do so, compare this 5% hypothetical example with the 5% hypothetical examples that appear in the shareholder reports of the other funds. In addition, the Fund, as a shareholder in the underlying Fidelity Central Funds, will indirectly bear its pro-rata share of the fees and expenses incurred by the underlying Fidelity Central Funds. These fees and expenses are not included in the Fund's annualized expense ratio used to calculate the expense estimate in the table below.
Please note that the expenses shown in the table are meant to highlight your ongoing costs only and do not reflect any transaction costs. Therefore, the second line of the table is useful in comparing ongoing costs only, and will not help you determine the relative total costs of owning different funds.
| | Annualized Expense Ratio-A | Beginning
Account Value
March 1, 2019 | Ending
Account Value
August 31, 2019 | Expenses Paid
During Period-B
March 1, 2019
to August 31, 2019 |
| Fidelity Short-Term Bond Index Fund | .03% | | | |
| Actual | | $1,000.00 | $1,039.90 | $.15 |
| Hypothetical-C | | $1,000.00 | $1,025.05 | $.15 |
A Annualized expense ratio reflects expenses net of applicable fee waivers.
B Expenses are equal to the Fund's annualized expense ratio, multiplied by the average account value over the period, multiplied by 184/365 (to reflect the one-half year period).
C 5% return per year before expenses
Distributions (Unaudited)
The Board of Trustees of Fidelity Short-Term Bond Index Fund voted to pay on October 14, 2019, to shareholders of record at the opening of business on October 11, 2019, a distribution of $0.014 per share derived from capital gains realized from sales of portfolio securities.
A total of 60.79% of the dividends distributed during the fiscal year was derived from interest on U.S. Government securities which is generally exempt from state income tax.
The fund designates $4,907,440 of distributions paid during the period January 1, 2019 to August 31, 2019 as qualifying to be taxed as interest-related dividends for nonresident alien shareholders.
The fund will notify shareholders in January 2020 of amounts for use in preparing 2019 income tax returns.
SDX-I-ANN-1019
1.9884849.101
Fidelity® Sustainability Bond Index Fund
Annual Report August 31, 2019 |
|
Beginning on January 1, 2021, as permitted by regulations adopted by the Securities and Exchange Commission, paper copies of a fund’s shareholder reports will no longer be sent by mail, unless you specifically request paper copies of the reports from the fund or from your financial intermediary, such as a financial advisor, broker-dealer or bank. Instead, the reports will be made available on a website, and you will be notified by mail each time a report is posted and provided with a website link to access the report.
If you already elected to receive shareholder reports electronically, you will not be affected by this change and you need not take any action. You may elect to receive shareholder reports and other communications from a fund electronically, by contacting your financial intermediary. For Fidelity customers, visit Fidelity's web site or call Fidelity using the contact information listed below.
You may elect to receive all future reports in paper free of charge. If you wish to continue receiving paper copies of your shareholder reports, you may contact your financial intermediary or, if you are a Fidelity customer, visit Fidelity’s website, or call Fidelity at the applicable toll-free number listed below. Your election to receive reports in paper will apply to all funds held with the fund complex/your financial intermediary.
| Account Type | Website | Phone Number |
| Brokerage, Mutual Fund, or Annuity Contracts: | fidelity.com/mailpreferences | 1-800-343-3548 |
| Employer Provided Retirement Accounts: | netbenefits.fidelity.com/preferences (choose 'no' under Required Disclosures to continue to print) | 1-800-343-0860 |
| Advisor Sold Accounts Serviced Through Your Financial Intermediary: | Contact Your Financial Intermediary | Your Financial Intermediary's phone number |
| Advisor Sold Accounts Serviced by Fidelity: | institutional.fidelity.com | 1-877-208-0098 |
Contents
To view a fund's proxy voting guidelines and proxy voting record for the 12-month period ended June 30, visit http://www.fidelity.com/proxyvotingresults or visit the Securities and Exchange Commission's (SEC) web site at http://www.sec.gov.
You may also call 1-800-544-8544 to request a free copy of the proxy voting guidelines.
Standard & Poor's, S&P and S&P 500 are registered service marks of The McGraw-Hill Companies, Inc. and have been licensed for use by Fidelity Distributors Corporation.
Other third-party marks appearing herein are the property of their respective owners.
All other marks appearing herein are registered or unregistered trademarks or service marks of FMR LLC or an affiliated company. © 2019 FMR LLC. All rights reserved.
This report and the financial statements contained herein are submitted for the general information of the shareholders of the Fund. This report is not authorized for distribution to prospective investors in the Fund unless preceded or accompanied by an effective prospectus.
A fund files its complete schedule of portfolio holdings with the SEC for the first and third quarters of each fiscal year on Form N-PORT. Forms N-PORT are available on the SEC’s web site at http://www.sec.gov. A fund's Forms N-PORT may be reviewed and copied at the SEC’s Public Reference Room in Washington, DC. Information regarding the operation of the SEC's Public Reference Room may be obtained by calling 1-800-SEC-0330.
For a complete list of a fund's portfolio holdings, view the most recent holdings listing, semiannual report, or annual report on Fidelity's web site at http://www.fidelity.com, http://www.institutional.fidelity.com, or http://www.401k.com, as applicable.
NOT FDIC INSURED •MAY LOSE VALUE •NO BANK GUARANTEE
Neither the Fund nor Fidelity Distributors Corporation is a bank.
Performance: The Bottom Line
Average annual total return reflects the change in the value of an investment, assuming reinvestment of distributions from dividend income and capital gains (the profits earned upon the sale of securities that have grown in value, if any) and assuming a constant rate of performance each year. The hypothetical investment and the average annual total returns do not reflect the deduction of taxes that a shareholder would pay on fund distributions or the redemption of fund shares. During periods of reimbursement by Fidelity, a fund’s total return will be greater than it would be had the reimbursement not occurred. How a fund did yesterday is no guarantee of how it will do tomorrow.
Average Annual Total Returns
| For the periods ended August 31, 2019 | Past 1 year | Life of fundA |
| Fidelity® Sustainability Bond Index Fund | 10.04% | 8.99% |
A From June 19, 2018
$10,000 Over Life of Fund
Let's say hypothetically that $10,000 was invested in Fidelity® Sustainability Bond Index Fund on June 19, 2018, when the fund started.
The chart shows how the value of your investment would have changed, and also shows how the Bloomberg Barclays MSCI U.S. Aggregate ESG Choice Bond Index performed over the same period.
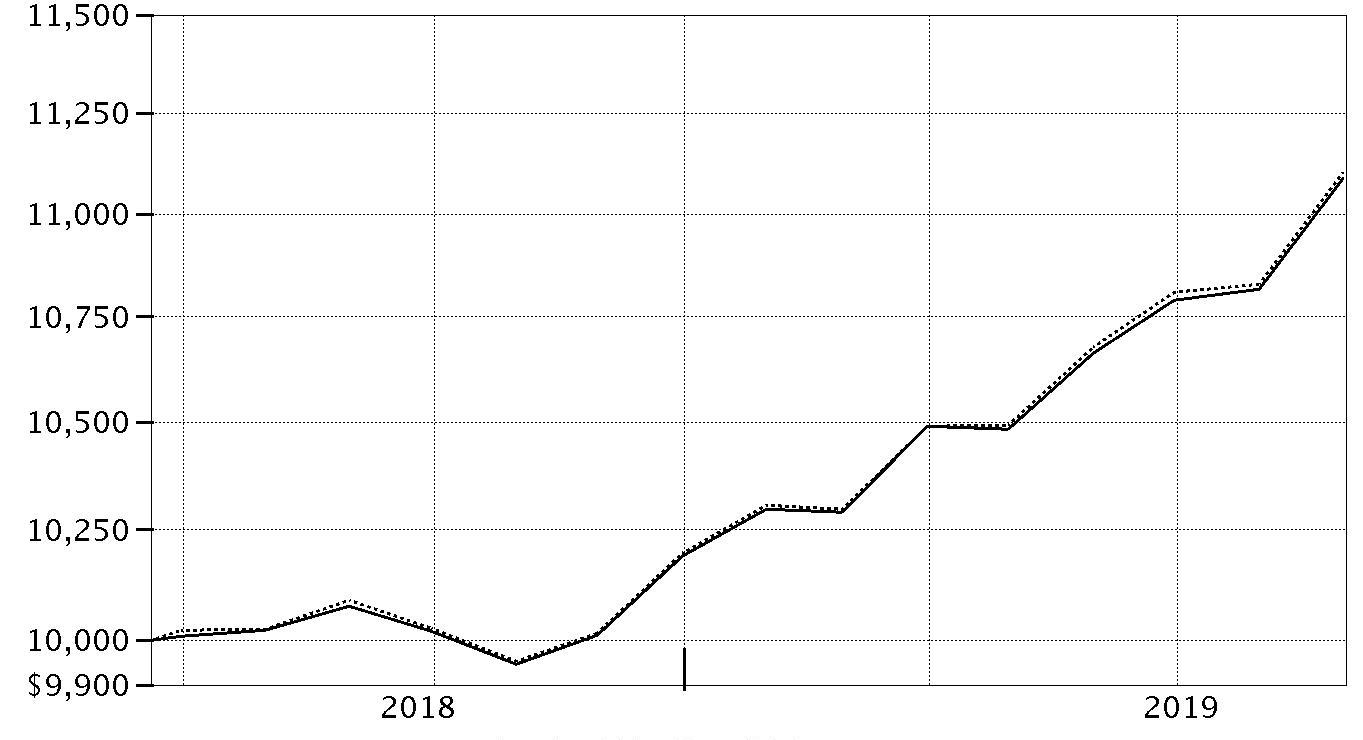
| Period Ending Values |
| $11,088 | Fidelity® Sustainability Bond Index Fund |
| $11,103 | Bloomberg Barclays MSCI U.S. Aggregate ESG Choice Bond Index |
Management's Discussion of Fund Performance
Market Recap: For the 12 months ending August 31, 2019, U.S. taxable investment-grade bonds posted their strongest trailing one-year return since 2009, driven by slower global economic growth, a maturing business cycle, trade uncertainty and, late in the period, the Fed’s dovish shift. The Bloomberg Barclays U.S. Aggregate Bond Index gained 10.17%. Market yields rose in the early fall of 2018, on expectations for higher inflation. Yields then declined and credit spreads widened in November and December, partly because of weaker U.S. manufacturing data. Yield spreads narrowed in January, as the U.S. Federal Reserve said it would be “patient” with policy rate hikes, and that future increases largely would depend on economic data. Yields continued to decline in the spring, amid international trade tension and attacks on oil tankers in the Middle East, and then tumbled further in July, when the Fed cut interest rates for the first time since 2008. The yield curve ended the period roughly flat, amid expectations for another rate cut of 25 basis points in September. Within the Bloomberg Barclays index, corporate bonds gained 13.33%, topping the 10.38% advance of U.S. Treasuries. Outside the index, U.S. corporate high-yield bonds lagged nominal U.S. Treasuries, while Treasury Inflation-Protected Securities (TIPS) gained 7.46%.
Comments from Co-Portfolio Managers Brandon Bettencourt and Jay Small: For the fiscal year ending August 31, 2019, the fund gained 10.04%, matching, net of fees, the 10.04% return of the Bloomberg Barclays MSCI U.S. Aggregate ESG Choice Bond Index. These results met our goal of producing monthly returns, before expenses, that closely match the benchmark return. Given the large number of securities in the index and the significant cost and liquidity challenges associated with full replication of the index, we use “statistical sampling” techniques in constructing the portfolio. This approach involves defining and maintaining an “optimal” subset of constituent securities that, in aggregate, mirrors the chief characteristics of the index – including maturity, duration, sector allocation, credit quality and other factors. Bonds were bolstered this period by expectations of declining interest rates amid muted inflation and a global growth slowdown that was exacerbated by escalating trade tension between the U.S. and China.
The views expressed above reflect those of the portfolio manager(s) only through the end of the period as stated on the cover of this report and do not necessarily represent the views of Fidelity or any other person in the Fidelity organization. Any such views are subject to change at any time based upon market or other conditions and Fidelity disclaims any responsibility to update such views. These views may not be relied on as investment advice and, because investment decisions for a Fidelity fund are based on numerous factors, may not be relied on as an indication of trading intent on behalf of any Fidelity fund.
Investment Summary (Unaudited)
Quality Diversification (% of fund's net assets)
| As of August 31, 2019 |
| | U.S. Government and U.S. Government Agency Obligations | 71.2% |
| | AAA | 2.9% |
| | AA | 1.5% |
| | A | 10.4% |
| | BBB | 14.1% |
| | BB and Below | 0.3% |
| | Not Rated | 0.1% |
| | Short-Term Investments and Net Other Assets* | (0.5)% |

* Short-Term Investments and Net Other Assets (Liabilities) are not included in the pie chart
We have used ratings from Moody's Investors Service, Inc. Where Moody's® ratings are not available, we have used S&P® ratings. All ratings are as of the date indicated and do not reflect subsequent changes.
Asset Allocation (% of fund's net assets)
| As of August 31, 2019 * |
| | Corporate Bonds | 23.9% |
| | U.S. Government and U.S. Government Agency Obligations | 71.2% |
| | CMOs and Other Mortgage Related Securities | 0.8% |
| | Municipal Bonds | 0.3% |
| | Other Investments | 4.3% |
| | Short-Term Investments and Net Other Assets (Liabilities)** | (0.5)% |

* Foreign investments - 8.2%
** Short-Term Investments and Net Other Assets (Liabilities) are not included in the pie chart
Schedule of Investments August 31, 2019
Showing Percentage of Net Assets
| Nonconvertible Bonds - 23.9% | | | |
| | | Principal Amount | Value |
| COMMUNICATION SERVICES - 1.9% | | | |
| Diversified Telecommunication Services - 1.2% | | | |
| AT&T, Inc.: | | | |
| 4.85% 7/15/45 | | $68,000 | $77,870 |
| 5.25% 3/1/37 | | 264,000 | 313,823 |
| 5.7% 3/1/57 | | 34,000 | 43,068 |
| Telefonica Emisiones S.A.U. 4.103% 3/8/27 | | 150,000 | 164,168 |
| Verizon Communications, Inc.: | | | |
| 4.016% 12/3/29 (a) | | 200,000 | 225,899 |
| 5.5% 3/16/47 | | 86,000 | 115,437 |
| | | | 940,265 |
| Entertainment - 0.2% | | | |
| The Walt Disney Co. 6.2% 12/15/34 (a) | | 105,000 | 148,773 |
| Media - 0.2% | | | |
| Discovery Communications LLC 4.375% 6/15/21 | | 149,000 | 154,513 |
| Wireless Telecommunication Services - 0.3% | | | |
| Vodafone Group PLC: | | | |
| 4.125% 5/30/25 | | 120,000 | 130,256 |
| 4.375% 5/30/28 | | 25,000 | 28,045 |
| 5% 5/30/38 | | 43,000 | 49,801 |
| | | | 208,102 |
|
| TOTAL COMMUNICATION SERVICES | | | 1,451,653 |
|
| CONSUMER DISCRETIONARY - 0.8% | | | |
| Automobiles - 0.1% | | | |
| Toyota Motor Corp. 2.358% 7/2/24 | | 60,000 | 61,176 |
| Diversified Consumer Services - 0.1% | | | |
| Ingersoll-Rand Global Holding Co. Ltd. 4.3% 2/21/48 | | 62,000 | 70,084 |
| Hotels, Restaurants & Leisure - 0.3% | | | |
| McDonald's Corp. 3.7% 1/30/26 | | 155,000 | 168,002 |
| Starbucks Corp.: | | | |
| 3.8% 8/15/25 | | 50,000 | 54,225 |
| 4.5% 11/15/48 | | 32,000 | 37,753 |
| | | | 259,980 |
| Multiline Retail - 0.0% | | | |
| Target Corp. 3.9% 11/15/47 | | 25,000 | 29,530 |
| Specialty Retail - 0.3% | | | |
| Lowe's Companies, Inc.: | | | |
| 3.1% 5/3/27 | | 34,000 | 35,563 |
| 4.05% 5/3/47 | | 62,000 | 67,401 |
| The Home Depot, Inc. 4.5% 12/6/48 | | 70,000 | 89,076 |
| | | | 192,040 |
|
| TOTAL CONSUMER DISCRETIONARY | | | 612,810 |
|
| CONSUMER STAPLES - 1.0% | | | |
| Beverages - 0.4% | | | |
| Dr. Pepper Snapple Group, Inc. 5.085% 5/25/48 | | 60,000 | 72,239 |
| PepsiCo, Inc. 2.375% 10/6/26 | | 220,000 | 225,435 |
| | | | 297,674 |
| Food & Staples Retailing - 0.0% | | | |
| Kroger Co. 4.65% 1/15/48 | | 30,000 | 32,198 |
| Food Products - 0.6% | | | |
| Campbell Soup Co. 3.65% 3/15/23 | | 26,000 | 27,047 |
| Conagra Brands, Inc.: | | | |
| 4.3% 5/1/24 | | 30,000 | 32,215 |
| 4.85% 11/1/28 | | 55,000 | 63,004 |
| 5.4% 11/1/48 | | 22,000 | 26,082 |
| General Mills, Inc. 2.6% 10/12/22 | | 50,000 | 50,713 |
| H.J. Heinz Co. 3.95% 7/15/25 | | 169,000 | 175,363 |
| Tyson Foods, Inc.: | | | |
| 4% 3/1/26 | | 40,000 | 43,601 |
| 5.1% 9/28/48 | | 40,000 | 49,787 |
| | | | 467,812 |
|
| TOTAL CONSUMER STAPLES | | | 797,684 |
|
| ENERGY - 2.2% | | | |
| Energy Equipment & Services - 0.1% | | | |
| Halliburton Co. 5% 11/15/45 | | 86,000 | 96,317 |
| Oil, Gas & Consumable Fuels - 2.1% | | | |
| Apache Corp.: | | | |
| 3.25% 4/15/22 | | 72,000 | 73,327 |
| 4.375% 10/15/28 | | 50,000 | 51,386 |
| ConocoPhillips Co. 6.5% 2/1/39 | | 95,000 | 139,281 |
| Equinor ASA 3.625% 9/10/28 | | 70,000 | 77,318 |
| Exxon Mobil Corp. 3.043% 3/1/26 | | 80,000 | 84,867 |
| Kinder Morgan, Inc. 4.3% 3/1/28 | | 183,000 | 200,500 |
| Marathon Petroleum Corp. 4.75% 9/15/44 | | 88,000 | 94,866 |
| MPLX LP: | | | |
| 4.5% 4/15/38 | | 48,000 | 49,804 |
| 4.875% 12/1/24 | | 152,000 | 166,721 |
| 4.9% 4/15/58 | | 50,000 | 50,792 |
| Noble Energy, Inc. 4.95% 8/15/47 | | 74,000 | 82,331 |
| Occidental Petroleum Corp.: | | | |
| 2.9% 8/15/24 | | 20,000 | 20,187 |
| 3.4% 4/15/26 | | 140,000 | 142,404 |
| 4.3% 8/15/39 | | 4,000 | 4,186 |
| 4.4% 8/15/49 | | 4,000 | 4,172 |
| ONEOK, Inc. 7.5% 9/1/23 | | 119,000 | 139,959 |
| Valero Energy Corp. 3.4% 9/15/26 | | 50,000 | 51,762 |
| Williams Partners LP: | | | |
| 3.75% 6/15/27 | | 26,000 | 27,136 |
| 4.3% 3/4/24 | | 149,000 | 159,039 |
| | | | 1,620,038 |
|
| TOTAL ENERGY | | | 1,716,355 |
|
| FINANCIALS - 8.7% | | | |
| Banks - 4.0% | | | |
| Bank of America Corp.: | | | |
| 3.004% 12/20/23 (b) | | 200,000 | 205,249 |
| 3.55% 3/5/24 (b) | | 250,000 | 261,313 |
| 3.974% 2/7/30 (b) | | 35,000 | 38,797 |
| 4.183% 11/25/27 | | 95,000 | 103,376 |
| 4.271% 7/23/29 (b) | | 60,000 | 67,723 |
| 4.33% 3/15/50 (b) | | 50,000 | 60,850 |
| Bank of Nova Scotia 4.5% 12/16/25 | | 85,000 | 93,303 |
| Barclays PLC 3.2% 8/10/21 | | 200,000 | 201,788 |
| Citigroup, Inc.: | | | |
| 3.142% 1/24/23 (b) | | 50,000 | 51,128 |
| 3.2% 10/21/26 | | 191,000 | 199,318 |
| 4.65% 7/23/48 | | 65,000 | 81,610 |
| HSBC Holdings PLC 4.292% 9/12/26 (b) | | 250,000 | 269,376 |
| HSBC U.S.A., Inc. 3.5% 6/23/24 | | 100,000 | 104,749 |
| JPMorgan Chase & Co.: | | | |
| 3.559% 4/23/24 (b) | | 285,000 | 299,292 |
| 4.203% 7/23/29 (b) | | 30,000 | 33,863 |
| 4.452% 12/5/29 (b) | | 75,000 | 86,244 |
| 4.95% 6/1/45 | | 92,000 | 118,105 |
| Mitsubishi UFJ Financial Group, Inc. 2.801% 7/18/24 | | 200,000 | 204,773 |
| Oesterreichische Kontrollbank 2.875% 9/7/21 | | 20,000 | 20,499 |
| Royal Bank of Canada 2.55% 7/16/24 | | 100,000 | 101,943 |
| Royal Bank of Scotland Group PLC 3.875% 9/12/23 | | 200,000 | 206,015 |
| Sumitomo Mitsui Financial Group, Inc. 3.936% 10/16/23 | | 120,000 | 128,350 |
| U.S. Bancorp 3.9% 4/26/28 | | 94,000 | 107,251 |
| | | | 3,044,915 |
| Capital Markets - 1.3% | | | |
| Deutsche Bank AG New York Branch: | | | |
| 3.3% 11/16/22 | | 100,000 | 99,394 |
| 4.25% 10/14/21 | | 148,000 | 150,511 |
| Goldman Sachs Group, Inc. 6.75% 10/1/37 | | 180,000 | 246,617 |
| IntercontinentalExchange, Inc. 3.75% 9/21/28 | | 20,000 | 22,217 |
| Morgan Stanley: | | | |
| 3.625% 1/20/27 | | 268,000 | 286,730 |
| 3.737% 4/24/24 (b) | | 200,000 | 210,416 |
| | | | 1,015,885 |
| Consumer Finance - 1.4% | | | |
| AerCap Ireland Capital Ltd./AerCap Global Aviation Trust 3.5% 1/15/25 | | 150,000 | 153,640 |
| American Express Co. 3.4% 2/22/24 | | 80,000 | 84,381 |
| Capital One Financial Corp. 3.8% 1/31/28 | | 244,000 | 260,136 |
| Caterpillar Financial Services Corp. 2.4% 8/9/26 | | 140,000 | 143,210 |
| Discover Financial Services: | | | |
| 3.85% 11/21/22 | | 141,000 | 147,897 |
| 4.5% 1/30/26 | | 102,000 | 112,651 |
| John Deere Capital Corp.: | | | |
| 3.35% 6/12/24 | | 140,000 | 149,020 |
| 3.45% 3/7/29 | | 60,000 | 65,799 |
| | | | 1,116,734 |
| Diversified Financial Services - 1.1% | | | |
| AXA Equitable Holdings, Inc. 5% 4/20/48 | | 16,000 | 17,375 |
| BP Capital Markets America, Inc.: | | | |
| 3.216% 11/28/23 | | 120,000 | 125,155 |
| 3.796% 9/21/25 | | 50,000 | 54,139 |
| Brixmor Operating Partnership LP 4.125% 5/15/29 | | 9,000 | 9,736 |
| Cigna Corp.: | | | |
| 3.75% 7/15/23 | | 24,000 | 25,230 |
| 4.125% 11/15/25 | | 12,000 | 13,056 |
| 4.375% 10/15/28 | | 20,000 | 22,364 |
| 4.8% 8/15/38 | | 69,000 | 79,774 |
| 4.9% 12/15/48 | | 19,000 | 22,484 |
| Export Development Canada 2.625% 2/21/24 | | 100,000 | 104,856 |
| KfW 2.375% 12/29/22 | | 363,000 | 373,610 |
| | | | 847,779 |
| Insurance - 0.9% | | | |
| ACE INA Holdings, Inc. 3.35% 5/3/26 | | 144,000 | 154,512 |
| American International Group, Inc. 4.5% 7/16/44 | | 127,000 | 145,184 |
| Aon PLC 4.75% 5/15/45 | | 68,000 | 82,266 |
| Hartford Financial Services Group, Inc. 2.8% 8/19/29 | | 70,000 | 71,059 |
| Lincoln National Corp. 3.8% 3/1/28 | | 76,000 | 81,686 |
| Marsh & McLennan Companies, Inc. 4.9% 3/15/49 | | 33,000 | 42,844 |
| Prudential Financial, Inc. 4.35% 2/25/50 | | 70,000 | 83,600 |
| | | | 661,151 |
|
| TOTAL FINANCIALS | | | 6,686,464 |
|
| HEALTH CARE - 2.5% | | | |
| Biotechnology - 1.0% | | | |
| AbbVie, Inc.: | | | |
| 3.6% 5/14/25 | | 180,000 | 187,696 |
| 4.7% 5/14/45 | | 50,000 | 54,031 |
| Amgen, Inc. 4.4% 5/1/45 | | 90,000 | 102,080 |
| Celgene Corp.: | | | |
| 3.25% 2/20/23 | | 130,000 | 135,167 |
| 4.55% 2/20/48 | | 70,000 | 85,834 |
| Gilead Sciences, Inc. 3.65% 3/1/26 | | 175,000 | 188,095 |
| | | | 752,903 |
| Health Care Equipment & Supplies - 0.3% | | | |
| Becton, Dickinson & Co. 3.363% 6/6/24 | | 54,000 | 56,306 |
| Medtronic, Inc. 4.375% 3/15/35 | | 157,000 | 189,946 |
| | | | 246,252 |
| Health Care Providers & Services - 0.7% | | | |
| Aetna, Inc. 4.75% 3/15/44 | | 40,000 | 44,597 |
| CVS Health Corp.: | | | |
| 4.3% 3/25/28 | | 150,000 | 163,731 |
| 4.78% 3/25/38 | | 42,000 | 47,097 |
| 5.05% 3/25/48 | | 60,000 | 69,910 |
| UnitedHealth Group, Inc.: | | | |
| 2.375% 8/15/24 | | 50,000 | 50,788 |
| 3.7% 8/15/49 | | 20,000 | 21,862 |
| 6.875% 2/15/38 | | 94,000 | 141,829 |
| | | | 539,814 |
| Pharmaceuticals - 0.5% | | | |
| AstraZeneca PLC 4.375% 8/17/48 | | 66,000 | 80,475 |
| Bristol-Myers Squibb Co.: | | | |
| 3.4% 7/26/29 (a) | | 50,000 | 54,126 |
| 4.125% 6/15/39 (a) | | 50,000 | 58,028 |
| Merck & Co., Inc. 2.9% 3/7/24 | | 150,000 | 156,946 |
| | | | 349,575 |
|
| TOTAL HEALTH CARE | | | 1,888,544 |
|
| INDUSTRIALS - 1.7% | | | |
| Air Freight & Logistics - 0.3% | | | |
| FedEx Corp.: | | | |
| 3.25% 4/1/26 | | 152,000 | 159,018 |
| 4.95% 10/17/48 | | 28,000 | 32,720 |
| United Parcel Service, Inc. 3.75% 11/15/47 | | 58,000 | 64,069 |
| | | | 255,807 |
| Commercial Services & Supplies - 0.1% | | | |
| Waste Management, Inc. 3.2% 6/15/26 | | 50,000 | 53,204 |
| Electrical Equipment - 0.2% | | | |
| Eaton Corp. 2.75% 11/2/22 | | 137,000 | 139,700 |
| Industrial Conglomerates - 0.1% | | | |
| 3M Co. 2.375% 8/26/29 | | 86,000 | 86,043 |
| Machinery - 0.1% | | | |
| Parker Hannifin Corp. 2.7% 6/14/24 | | 60,000 | 61,378 |
| Road & Rail - 0.7% | | | |
| Canadian National Railway Co. 2.75% 3/1/26 | | 141,000 | 146,679 |
| CSX Corp. 4.5% 3/15/49 | | 70,000 | 84,076 |
| Norfolk Southern Corp. 2.9% 6/15/26 | | 100,000 | 103,531 |
| Union Pacific Corp.: | | | |
| 3.95% 9/10/28 | | 25,000 | 28,118 |
| 4.5% 9/10/48 | | 132,000 | 160,811 |
| | | | 523,215 |
| Trading Companies & Distributors - 0.2% | | | |
| Air Lease Corp.: | | | |
| 3.75% 2/1/22 | | 138,000 | 142,173 |
| 4.625% 10/1/28 | | 52,000 | 58,168 |
| | | | 200,341 |
|
| TOTAL INDUSTRIALS | | | 1,319,688 |
|
| INFORMATION TECHNOLOGY - 2.4% | | | |
| Communications Equipment - 0.3% | | | |
| Cisco Systems, Inc. 5.5% 1/15/40 | | 135,000 | 189,390 |
| Electronic Equipment & Components - 0.5% | | | |
| Diamond 1 Finance Corp./Diamond 2 Finance Corp.: | | | |
| 4% 7/15/24 (a) | | 144,000 | 150,521 |
| 4.42% 6/15/21 (a) | | 156,000 | 160,960 |
| 4.9% 10/1/26 (a) | | 30,000 | 32,072 |
| 8.35% 7/15/46 (a) | | 34,000 | 44,671 |
| | | | 388,224 |
| IT Services - 0.3% | | | |
| Fiserv, Inc.: | | | |
| 3.5% 7/1/29 | | 40,000 | 42,484 |
| 4.4% 7/1/49 | | 30,000 | 34,559 |
| IBM Corp. 3.45% 2/19/26 | | 166,000 | 178,209 |
| | | | 255,252 |
| Semiconductors & Semiconductor Equipment - 0.3% | | | |
| Applied Materials, Inc. 4.35% 4/1/47 | | 26,000 | 31,865 |
| Intel Corp. 3.7% 7/29/25 | | 140,000 | 152,801 |
| | | | 184,666 |
| Software - 0.6% | | | |
| Microsoft Corp. 3.7% 8/8/46 | | 186,000 | 218,987 |
| Oracle Corp. 2.65% 7/15/26 | | 242,000 | 247,923 |
| | | | 466,910 |
| Technology Hardware, Storage & Peripherals - 0.4% | | | |
| Apple, Inc. 3.85% 5/4/43 | | 177,000 | 201,999 |
| Xerox Corp. 4.5% 5/15/21 | | 131,000 | 134,275 |
| | | | 336,274 |
|
| TOTAL INFORMATION TECHNOLOGY | | | 1,820,716 |
|
| MATERIALS - 0.8% | | | |
| Chemicals - 0.7% | | | |
| DowDuPont, Inc.: | | | |
| 4.205% 11/15/23 | | 20,000 | 21,547 |
| 4.725% 11/15/28 | | 20,000 | 23,128 |
| LYB International Finance BV 4% 7/15/23 | | 135,000 | 143,616 |
| LYB International Finance II BV 3.5% 3/2/27 | | 90,000 | 92,929 |
| Nutrien Ltd.: | | | |
| 4.2% 4/1/29 | | 6,000 | 6,706 |
| 5% 4/1/49 | | 11,000 | 13,131 |
| Sherwin-Williams Co. 4.5% 6/1/47 | | 54,000 | 61,468 |
| The Dow Chemical Co.: | | | |
| 3.15% 5/15/24 (a) | | 30,000 | 30,982 |
| 4.8% 5/15/49 (a) | | 40,000 | 45,321 |
| The Mosaic Co. 4.25% 11/15/23 | | 131,000 | 138,286 |
| | | | 577,114 |
| Containers & Packaging - 0.1% | | | |
| International Paper Co. 4.75% 2/15/22 | | 62,000 | 65,536 |
|
| TOTAL MATERIALS | | | 642,650 |
|
| REAL ESTATE - 0.8% | | | |
| Equity Real Estate Investment Trusts (REITs) - 0.7% | | | |
| ERP Operating LP 4.5% 7/1/44 | | 50,000 | 61,785 |
| Kimco Realty Corp. 2.8% 10/1/26 | | 150,000 | 151,758 |
| Simon Property Group LP: | | | |
| 2.75% 6/1/23 | | 75,000 | 76,951 |
| 3.375% 12/1/27 | | 75,000 | 80,432 |
| Welltower, Inc. 3.95% 9/1/23 | | 162,000 | 172,704 |
| | | | 543,630 |
| Real Estate Management & Development - 0.1% | | | |
| Digital Realty Trust LP 3.7% 8/15/27 | | 26,000 | 27,711 |
|
| TOTAL REAL ESTATE | | | 571,341 |
|
| UTILITIES - 1.1% | | | |
| Electric Utilities - 0.6% | | | |
| Eversource Energy 2.9% 10/1/24 | | 70,000 | 72,255 |
| Georgia Power Co. 3.25% 3/30/27 | | 80,000 | 83,421 |
| Indiana Michigan Power Co. 3.85% 5/15/28 | | 60,000 | 66,911 |
| PPL Capital Funding, Inc. 3.1% 5/15/26 | | 80,000 | 82,055 |
| Southern Co. 3.25% 7/1/26 | | 70,000 | 72,490 |
| Southwestern Electric Power Co. 2.75% 10/1/26 | | 50,000 | 50,713 |
| Tampa Electric Co. 4.45% 6/15/49 | | 35,000 | 43,799 |
| | | | 471,644 |
| Gas Utilities - 0.1% | | | |
| AGL Capital Corp.: | | | |
| 2.45% 10/1/23 | | 70,000 | 70,668 |
| 3.25% 6/15/26 | | 50,000 | 51,681 |
| | | | 122,349 |
| Multi-Utilities - 0.4% | | | |
| CenterPoint Energy, Inc. 3.85% 2/1/24 | | 65,000 | 69,157 |
| Consolidated Edison Co. of New York, Inc. 3.875% 6/15/47 | | 44,000 | 49,195 |
| NiSource Finance Corp. 3.95% 3/30/48 | | 52,000 | 56,936 |
| Sempra Energy: | | | |
| 3.4% 2/1/28 | | 26,000 | 27,099 |
| 3.8% 2/1/38 | | 30,000 | 31,488 |
| 4% 2/1/48 | | 46,000 | 49,958 |
| | | | 283,833 |
|
| TOTAL UTILITIES | | | 877,826 |
|
| TOTAL NONCONVERTIBLE BONDS | | | |
| (Cost $16,946,120) | | | 18,385,731 |
|
| U.S. Government and Government Agency Obligations - 44.2% | | | |
| U.S. Government Agency Obligations - 1.4% | | | |
| Fannie Mae: | | | |
| 1.75% 7/2/24 | | $220,000 | $223,208 |
| 2.875% 9/12/23 | | 150,000 | 158,359 |
| Federal Home Loan Bank: | | | |
| 1.5% 8/15/24 | | 50,000 | 50,105 |
| 2.5% 2/13/24 | | 80,000 | 83,663 |
| 2.625% 10/1/20 | | 300,000 | 302,989 |
| 3.25% 11/16/28 | | 10,000 | 11,347 |
| Freddie Mac 2.375% 1/13/22 | | 253,000 | 257,857 |
|
| TOTAL U.S. GOVERNMENT AGENCY OBLIGATIONS | | | 1,087,528 |
|
| U.S. Treasury Obligations - 42.8% | | | |
| U.S. Treasury Bonds: | | | |
| 2.25% 8/15/46 | | 130,000 | 137,683 |
| 2.5% 2/15/45 | | 296,000 | 328,456 |
| 2.5% 2/15/46 | | 74,000 | 82,206 |
| 2.5% 5/15/46 | | 83,000 | 92,269 |
| 2.75% 8/15/42 | | 41,000 | 47,350 |
| 2.75% 11/15/42 | | 43,000 | 49,660 |
| 2.75% 11/15/47 | | 23,000 | 26,902 |
| 2.875% 5/15/43 | | 41,000 | 48,390 |
| 2.875% 5/15/49 | | 284,000 | 342,471 |
| 3% 5/15/42 | | 13,000 | 15,619 |
| 3% 11/15/44 | | 667,000 | 806,836 |
| 3% 5/15/45 | | 100,000 | 121,258 |
| 3% 11/15/45 | | 54,000 | 65,637 |
| 3% 5/15/47 | | 87,000 | 106,361 |
| 3% 2/15/48 | | 400,000 | 490,328 |
| 3% 8/15/48 | | 28,000 | 34,395 |
| 3% 2/15/49 | | 215,000 | 264,870 |
| 3.125% 2/15/43 | | 119,000 | 145,970 |
| 3.125% 8/15/44 | | 818,000 | 1,009,144 |
| 3.125% 5/15/48 | | 57,000 | 71,524 |
| 3.375% 5/15/44 | | 354,000 | 453,881 |
| 3.375% 11/15/48 | | 32,000 | 42,093 |
| 3.625% 8/15/43 | | 277,000 | 367,577 |
| 3.625% 2/15/44 | | 112,000 | 149,017 |
| 3.75% 8/15/41 | | 48,000 | 64,155 |
| 3.75% 11/15/43 | | 472,000 | 638,841 |
| 3.875% 8/15/40 | | 30,000 | 40,643 |
| 4.375% 11/15/39 | | 24,000 | 34,457 |
| 4.375% 5/15/40 | | 45,000 | 64,832 |
| 4.5% 2/15/36 | | 69,000 | 97,023 |
| 4.5% 5/15/38 | | 321,000 | 462,566 |
| 5% 5/15/37 | | 10,000 | 15,055 |
| U.S. Treasury Notes: | | | |
| 1.125% 7/31/21 | | 29,000 | 28,767 |
| 1.125% 9/30/21 | | 209,000 | 207,310 |
| 1.25% 3/31/21 | | 173,000 | 172,000 |
| 1.375% 9/30/19 | | 1,000 | 999 |
| 1.375% 8/31/20 | | 35,000 | 34,848 |
| 1.375% 9/15/20 | | 14,000 | 13,945 |
| 1.375% 9/30/20 | | 11,000 | 10,952 |
| 1.5% 5/31/20 | | 19,000 | 18,950 |
| 1.5% 8/15/26 | | 574,000 | 575,749 |
| 1.625% 10/15/20 | | 134,000 | 133,817 |
| 1.625% 6/30/21 | | 747,000 | 747,875 |
| 1.625% 8/31/22 | | 180,000 | 180,977 |
| 1.625% 8/15/29 | | 244,000 | 246,774 |
| 1.75% 11/30/19 | | 13,000 | 12,989 |
| 1.75% 11/15/20 | | 385,000 | 385,120 |
| 1.75% 7/31/21 | | 889,000 | 892,681 |
| 1.75% 6/15/22 | | 173,000 | 174,487 |
| 1.75% 7/15/22 | | 47,000 | 47,406 |
| 1.75% 6/30/24 | | 22,000 | 22,354 |
| 1.75% 7/31/24 | | 262,000 | 266,391 |
| 1.875% 7/31/22 | | 634,000 | 641,752 |
| 1.875% 7/31/26 | | 210,000 | 215,808 |
| 2% 1/15/21 | | 650,000 | 652,920 |
| 2% 10/31/22 | | 7,000 | 7,122 |
| 2% 5/31/24 | | 108,000 | 110,953 |
| 2% 11/15/26 | | 178,000 | 184,668 |
| 2.125% 5/31/21 | | 281,000 | 283,623 |
| 2.125% 5/15/22 | | 168,000 | 170,947 |
| 2.125% 12/31/22 | | 140,000 | 143,177 |
| 2.125% 3/31/24 | | 561,000 | 578,553 |
| 2.125% 5/31/26 | | 205,000 | 213,809 |
| 2.25% 3/31/20 | | 914,000 | 915,785 |
| 2.25% 3/31/21 | | 467,000 | 471,542 |
| 2.25% 4/30/21 | | 462,000 | 466,891 |
| 2.25% 4/15/22 | | 255,000 | 260,140 |
| 2.25% 4/30/24 | | 265,000 | 274,969 |
| 2.25% 3/31/26 | | 92,000 | 96,593 |
| 2.25% 2/15/27 | | 134,000 | 141,506 |
| 2.25% 8/15/27 | | 303,000 | 320,718 |
| 2.25% 11/15/27 | | 104,000 | 110,195 |
| 2.375% 4/30/20 | | 29,000 | 29,093 |
| 2.375% 4/15/21 | | 10,000 | 10,121 |
| 2.375% 3/15/22 | | 234,000 | 239,375 |
| 2.375% 2/29/24 | | 867,000 | 903,373 |
| 2.375% 5/15/27 | | 22,000 | 23,463 |
| 2.375% 5/15/29 | | 66,000 | 71,156 |
| 2.5% 5/31/20 | | 8,000 | 8,037 |
| 2.5% 6/30/20 | | 1,000 | 1,005 |
| 2.5% 12/31/20 | | 265,000 | 267,826 |
| 2.5% 1/31/21 | | 758,000 | 766,676 |
| 2.5% 2/28/21 | | 498,000 | 504,322 |
| 2.5% 1/15/22 | | 743,000 | 760,443 |
| 2.5% 2/15/22 | | 636,000 | 651,652 |
| 2.5% 3/31/23 | | 163,000 | 169,113 |
| 2.5% 1/31/24 | | 495,000 | 517,778 |
| 2.625% 8/31/20 | | 16,000 | 16,129 |
| 2.625% 5/15/21 | | 138,000 | 140,388 |
| 2.625% 6/15/21 | | 1,423,000 | 1,449,181 |
| 2.625% 7/15/21 | | 35,000 | 35,681 |
| 2.625% 12/15/21 | | 470,000 | 482,062 |
| 2.625% 6/30/23 | | 496,000 | 518,146 |
| 2.625% 12/31/23 | | 800,000 | 840,313 |
| 2.625% 12/31/25 | | 5,000 | 5,354 |
| 2.625% 2/15/29 | | 291,000 | 319,657 |
| 2.75% 9/30/20 | | 254,000 | 256,619 |
| 2.75% 11/30/20 | | 309,000 | 312,947 |
| 2.75% 4/30/23 | | 231,000 | 241,819 |
| 2.75% 5/31/23 | | 708,000 | 741,934 |
| 2.75% 7/31/23 | | 232,000 | 243,591 |
| 2.75% 8/31/23 | | 436,000 | 458,345 |
| 2.75% 6/30/25 | | 82,000 | 87,993 |
| 2.75% 2/15/28 | | 303,000 | 333,430 |
| 2.875% 10/31/20 | | 28,000 | 28,357 |
| 2.875% 10/15/21 | | 222,000 | 228,252 |
| 2.875% 11/15/21 | | 157,000 | 161,612 |
| 2.875% 9/30/23 | | 177,000 | 187,150 |
| 2.875% 10/31/23 | | 712,000 | 753,580 |
| 2.875% 11/30/23 | | 1,073,000 | 1,137,087 |
| 2.875% 5/31/25 | | 10,000 | 10,789 |
| 2.875% 11/30/25 | | 31,000 | 33,633 |
| 2.875% 5/15/28 | | 716,000 | 796,802 |
| 2.875% 8/15/28 | | 472,000 | 526,317 |
| 3% 10/31/25 | | 74,000 | 80,747 |
| 3.125% 11/15/28 | | 345,000 | 392,936 |
|
| TOTAL U.S. TREASURY OBLIGATIONS | | | 32,897,815 |
|
| TOTAL U.S. GOVERNMENT AND GOVERNMENT AGENCY OBLIGATIONS | | | |
| (Cost $32,141,307) | | | 33,985,343 |
|
| U.S. Government Agency - Mortgage Securities - 26.5% | | | |
| Fannie Mae - 12.4% | | | |
| 2.5% 10/1/23 to 4/1/47 | | 794,286 | 805,615 |
| 3% 9/1/32 to 6/1/49 | | 2,594,097 | 2,669,433 |
| 4% 6/1/34 to 3/1/49 | | 2,243,351 | 2,349,164 |
| 4.5% 1/1/48 to 10/1/48 | | 764,368 | 807,103 |
| 5% 4/1/25 to 3/1/49 | | 289,127 | 308,833 |
| 5.5% 1/1/49 | | 211,403 | 229,133 |
| 3.5% 1/1/22 to 3/1/49 | | 2,260,495 | 2,345,568 |
|
| TOTAL FANNIE MAE | | | 9,514,849 |
|
| Freddie Mac - 5.0% | | | |
| 2.5% 3/1/33 | | 95,586 | 97,003 |
| 3% 6/1/34 to 6/1/49 | | 800,884 | 822,738 |
| 3.5% 8/1/46 to 2/1/49 | | 1,634,811 | 1,691,495 |
| 4% 9/1/45 to 11/1/48 | | 770,131 | 815,049 |
| 4.5% 9/1/48 to 5/1/49 | | 362,301 | 381,330 |
| 5% 2/1/49 | | 42,165 | 45,002 |
|
| TOTAL FREDDIE MAC | | | 3,852,617 |
|
| Ginnie Mae - 7.7% | | | |
| 3% 7/20/42 to 4/20/48 | | 1,187,745 | 1,227,124 |
| 3% 9/1/49 (c) | | 100,000 | 103,121 |
| 3.5% 2/20/46 to 10/20/48 | | 1,798,017 | 1,875,881 |
| 3.5% 9/1/49 (c) | | 100,000 | 103,891 |
| 3.5% 9/1/49 | | 200,000 | 207,781 |
| 4% 12/20/47 to 10/20/48 | | 1,024,806 | 1,068,741 |
| 4% 9/1/49 (c) | | 200,000 | 208,391 |
| 4% 9/1/49 (c) | | 100,000 | 104,195 |
| 4.5% 8/20/48 to 11/20/48 | | 574,714 | 603,494 |
| 4.5% 9/1/49 (c) | | 100,000 | 104,617 |
| 5% 12/20/47 to 10/20/48 | | 222,208 | 234,903 |
| 5.5% 12/20/48 | | 99,990 | 105,852 |
|
| TOTAL GINNIE MAE | | | 5,947,991 |
|
| Uniform Mortgage Backed Securities - 1.4% | | | |
| 3% 9/1/49 | | 200,000 | 203,859 |
| 3.5% 9/1/34 | | 100,000 | 103,625 |
| 3.5% 9/1/49 | | 300,000 | 308,273 |
| 4% 9/1/49 | | 200,000 | 207,614 |
| 4.5% 9/1/49 | | 100,000 | 105,258 |
| 5% 9/1/49 | | 100,000 | 106,813 |
|
| TOTAL UNIFORM MORTGAGE BACKED SECURITIES | | | 1,035,442 |
|
| TOTAL U.S. GOVERNMENT AGENCY - MORTGAGE SECURITIES | | | |
| (Cost $19,781,207) | | | 20,350,899 |
|
| Asset-Backed Securities - 0.0% | | | |
| CarMax Auto Owner Trust Series 2018-3 Class A3, 3.13% 6/15/23 | | $20,000 | $20,396 |
| Ford Credit Floorplan Master Owner Trust Series 2018-4 Class A, 4.06% 11/15/30 | | 15,000 | 16,831 |
| TOTAL ASSET-BACKED SECURITIES | | | |
| (Cost $34,989) | | | 37,227 |
|
| Commercial Mortgage Securities - 1.3% | | | |
| BANK sequential payer Series 2017-BNK4 Class ASB, 3.419% 5/15/50 | | 100,000 | 106,463 |
| Benchmark Mortgage Trust: | | | |
| Series 2019-B12 Class A5, 3.1156% 8/15/52 | | 50,000 | 53,717 |
| Series 2019-B9 Class A5, 4.0156% 3/15/52 | | 60,000 | 68,658 |
| COMM Mortgage Trust sequential payer Series 2013-CR13 Class A3, 3.928% 11/10/46 | | 115,876 | 124,370 |
| Freddie Mac: | | | |
| sequential payer: | | | |
| Series K057 Class A2, 2.57% 7/25/26 | | 80,000 | 83,534 |
| Series K080 Class A2, 3.926% 7/25/28 | | 60,000 | 68,987 |
| Series K-1510 Class A2, 3.718% 1/25/31 | | 41,000 | 46,839 |
| Series K068 Class A2, 3.244% 8/25/27 | | 70,000 | 76,330 |
| Series K094 Class A2, 2.903% 6/25/29 | | 110,000 | 118,600 |
| JPMBB Commercial Mortgage Securities Trust Series 2014-C24 Class A5, 3.6385% 11/15/47 | | 100,000 | 107,540 |
| Wells Fargo Commercial Mortgage Trust: | | | |
| sequential payer Series 2019-C52 Class A5, 2.892% 8/15/52 | | 75,000 | 78,787 |
| Series 2018-C48 Class A5, 4.302% 1/15/52 | | 65,000 | 75,315 |
| TOTAL COMMERCIAL MORTGAGE SECURITIES | | | |
| (Cost $940,106) | | | 1,009,140 |
|
| Municipal Securities - 0.3% | | | |
| California Gen. Oblig. Series 2009, 7.55% 4/1/39 | | 60,000 | 100,604 |
| Illinois Gen. Oblig. Series 2003, 5.1% 6/1/33 | | 85,000 | 92,500 |
| TOTAL MUNICIPAL SECURITIES | | | |
| (Cost $169,377) | | | 193,104 |
|
| Foreign Government and Government Agency Obligations - 3.2% | | | |
| Alberta Province 2.95% 1/23/24 | | $110,000 | $116,093 |
| Chilean Republic 3.25% 9/14/21 | | 134,000 | 137,978 |
| Colombian Republic: | | | |
| 4.5% 3/15/29 | | 200,000 | 227,188 |
| 11.75% 2/25/20 | | 136,000 | 142,248 |
| Hungarian Republic: | | | |
| 5.375% 2/21/23 | | 134,000 | 148,154 |
| 5.375% 3/25/24 | | 32,000 | 36,280 |
| Manitoba Province 2.6% 4/16/24 | | 180,000 | 187,677 |
| Ontario Province 2.3% 6/15/26 | | 107,000 | 110,732 |
| Panamanian Republic 4% 9/22/24 | | 120,000 | 129,675 |
| Peruvian Republic 7.35% 7/21/25 | | 113,000 | 146,123 |
| Polish Government: | | | |
| 3.25% 4/6/26 | | 53,000 | 56,942 |
| 5% 3/23/22 | | 136,000 | 146,455 |
| Province of Quebec 2.375% 1/31/22 | | 350,000 | 356,314 |
| United Mexican States: | | | |
| 3.75% 1/11/28 | | 200,000 | 208,800 |
| 4% 10/2/23 | | 128,000 | 135,840 |
| Uruguay Republic 8% 11/18/22 | | 125,000 | 141,836 |
| TOTAL FOREIGN GOVERNMENT AND GOVERNMENT AGENCY OBLIGATIONS | | | |
| (Cost $2,312,472) | | | 2,428,335 |
|
| Supranational Obligations - 1.1% | | | |
| Asian Development Bank 2.5% 11/2/27 | | 156,000 | 167,033 |
| European Investment Bank: | | | |
| 2.25% 6/24/24 | | 50,000 | 51,797 |
| 2.875% 8/15/23 | | 90,000 | 94,858 |
| 3.125% 12/14/23 | | 90,000 | 96,021 |
| Inter-American Development Bank: | | | |
| 2.25% 6/18/29 | | 30,000 | 31,836 |
| 3.125% 9/18/28 | | 60,000 | 67,876 |
| International Bank for Reconstruction & Development: | | | |
| 1.5% 8/28/24 | | 50,000 | 50,074 |
| 1.875% 6/19/23 | | 20,000 | 20,267 |
| 2.5% 3/19/24 | | 120,000 | 125,425 |
| 2.75% 7/23/21 | | 130,000 | 132,844 |
| TOTAL SUPRANATIONAL OBLIGATIONS | | | |
| (Cost $790,764) | | | 838,031 |
| | | Shares | Value |
|
| Money Market Funds - 1.1% | | | |
| Fidelity Cash Central Fund 2.13% (d) | | | |
| (Cost $873,642) | | 873,549 | 873,724 |
| TOTAL INVESTMENT IN SECURITIES - 101.6% | | | |
| (Cost $73,989,984) | | | 78,101,534 |
| NET OTHER ASSETS (LIABILITIES) - (1.6)% | | | (1,204,722) |
| NET ASSETS - 100% | | | $76,896,812 |
Legend
(a) Security exempt from registration under Rule 144A of the Securities Act of 1933. These securities may be resold in transactions exempt from registration, normally to qualified institutional buyers. At the end of the period, the value of these securities amounted to $951,353 or 1.2% of net assets.
(b) Coupon rates for floating and adjustable rate securities reflect the rates in effect at period end.
(c) Security or a portion of the security purchased on a delayed delivery or when-issued basis.
(d) Affiliated fund that is generally available only to investment companies and other accounts managed by Fidelity Investments. The rate quoted is the annualized seven-day yield of the fund at period end. A complete unaudited listing of the fund's holdings as of its most recent quarter end is available upon request. In addition, each Fidelity Central Fund's financial statements, which are not covered by the Fund's Report of Independent Registered Public Accounting Firm, are available on the SEC's website or upon request.
Affiliated Central Funds
Information regarding fiscal year to date income earned by the Fund from investments in Fidelity Central Funds is as follows:
| Fund | Income earned |
| Fidelity Cash Central Fund | $21,737 |
| Total | $21,737 |
Amounts in the income column in the above table include any capital gain distributions from underlying funds, which are presented in the corresponding line-item in the Statement of Operations, if applicable.
Investment Valuation
The following is a summary of the inputs used, as of August 31, 2019, involving the Fund's assets and liabilities carried at fair value. The inputs or methodology used for valuing securities may not be an indication of the risk associated with investing in those securities. For more information on valuation inputs, and their aggregation into the levels used below, please refer to the Investment Valuation section in the accompanying Notes to Financial Statements.
| | Valuation Inputs at Reporting Date: |
| Description | Total | Level 1 | Level 2 | Level 3 |
| Investments in Securities: | | | | |
| Corporate Bonds | $18,385,731 | $-- | $18,385,731 | $-- |
| U.S. Government and Government Agency Obligations | 33,985,343 | -- | 33,985,343 | -- |
| U.S. Government Agency - Mortgage Securities | 20,350,899 | -- | 20,350,899 | -- |
| Asset-Backed Securities | 37,227 | -- | 37,227 | -- |
| Commercial Mortgage Securities | 1,009,140 | -- | 1,009,140 | -- |
| Municipal Securities | 193,104 | -- | 193,104 | -- |
| Foreign Government and Government Agency Obligations | 2,428,335 | -- | 2,428,335 | -- |
| Supranational Obligations | 838,031 | -- | 838,031 | -- |
| Money Market Funds | 873,724 | 873,724 | -- | -- |
| Total Investments in Securities: | $78,101,534 | $873,724 | $77,227,810 | $-- |
See accompanying notes which are an integral part of the financial statements.
Financial Statements
Statement of Assets and Liabilities
| | | August 31, 2019 |
| Assets | | |
Investment in securities, at value — See accompanying schedule:
Unaffiliated issuers (cost $73,116,342) | $77,227,810 | |
| Fidelity Central Funds (cost $873,642) | 873,724 | |
| Total Investment in Securities (cost $73,989,984) | | $78,101,534 |
| Receivable for investments sold | | 655,082 |
| Receivable for fund shares sold | | 96,336 |
| Interest receivable | | 459,409 |
| Distributions receivable from Fidelity Central Funds | | 1,499 |
| Total assets | | 79,313,860 |
| Liabilities | | |
| Payable for investments purchased | | |
| Regular delivery | $514,855 | |
| Delayed delivery | 1,866,273 | |
| Payable for fund shares redeemed | 19,774 | |
| Distributions payable | 9,944 | |
| Accrued management fee | 6,202 | |
| Total liabilities | | 2,417,048 |
| Net Assets | | $76,896,812 |
| Net Assets consist of: | | |
| Paid in capital | | $72,483,938 |
| Total distributable earnings (loss) | | 4,412,874 |
| Net Assets | | $76,896,812 |
| Net Asset Value and Maximum Offering Price | | |
| Net Asset Value, offering price and redemption price per share ($76,896,812 ÷ 7,178,502 shares) | | $10.71 |
See accompanying notes which are an integral part of the financial statements.
Statement of Operations
| | | Year ended August 31, 2019 |
| Investment Income | | |
| Interest | | $1,670,083 |
| Income from Fidelity Central Funds | | 21,737 |
| Total income | | 1,691,820 |
| Expenses | | |
| Management fee | $49,323 | |
| Transfer agent fees | 4,791 | |
| Independent trustees' fees and expenses | 216 | |
| Commitment fees | 50 | |
| Total expenses before reductions | 54,380 | |
| Expense reductions | (814) | |
| Total expenses after reductions | | 53,566 |
| Net investment income (loss) | | 1,638,254 |
| Realized and Unrealized Gain (Loss) | | |
| Net realized gain (loss) on: | | |
| Investment securities: | | |
| Unaffiliated issuers | 221,045 | |
| Fidelity Central Funds | (83) | |
| Total net realized gain (loss) | | 220,962 |
| Change in net unrealized appreciation (depreciation) on: | | |
| Investment securities: | | |
| Unaffiliated issuers | 4,069,305 | |
| Fidelity Central Funds | 82 | |
| Delayed delivery commitments | (204) | |
| Total change in net unrealized appreciation (depreciation) | | 4,069,183 |
| Net gain (loss) | | 4,290,145 |
| Net increase (decrease) in net assets resulting from operations | | $5,928,399 |
See accompanying notes which are an integral part of the financial statements.
Statement of Changes in Net Assets
| | Year ended August 31, 2019 | For the period
June 19, 2018 (commencement of operations) to August 31, 2018 |
| Increase (Decrease) in Net Assets | | |
| Operations | | |
| Net investment income (loss) | $1,638,254 | $152,018 |
| Net realized gain (loss) | 220,962 | 3,370 |
| Change in net unrealized appreciation (depreciation) | 4,069,183 | 42,367 |
| Net increase (decrease) in net assets resulting from operations | 5,928,399 | 197,755 |
| Distributions to shareholders | (1,569,840) | – |
| Distributions to shareholders from net investment income | – | (143,529) |
| Total distributions | (1,569,840) | (143,529) |
| Share transactions - net increase (decrease) | 45,527,609 | 26,956,418 |
| Total increase (decrease) in net assets | 49,886,168 | 27,010,644 |
| Net Assets | | |
| Beginning of period | 27,010,644 | – |
| End of period | $76,896,812 | $27,010,644 |
| Other Information | | |
| Undistributed net investment income end of period | | $8,287 |
See accompanying notes which are an integral part of the financial statements.
Financial Highlights
Fidelity Sustainability Bond Index Fund
| Years ended August 31, | 2019 | 2018 A |
| Selected Per–Share Data | | |
| Net asset value, beginning of period | $10.02 | $10.00 |
| Income from Investment Operations | | |
| Net investment income (loss)B | .307 | .058 |
| Net realized and unrealized gain (loss) | .680 | .018 |
| Total from investment operations | .987 | .076 |
| Distributions from net investment income | (.295) | (.056) |
| Distributions from net realized gain | (.002) | – |
| Total distributions | (.297) | (.056) |
| Net asset value, end of period | $10.71 | $10.02 |
| Total ReturnC,D | 10.04% | .76% |
| Ratios to Average Net AssetsE,F | | |
| Expenses before reductions | .10% | .10%G |
| Expenses net of fee waivers, if any | .10% | .10%G |
| Expenses net of all reductions | .10% | .10%G |
| Net investment income (loss) | 3.03% | 2.92%G |
| Supplemental Data | | |
| Net assets, end of period (000 omitted) | $76,897 | $8,474 |
| Portfolio turnover rateH | 89% | 36%I |
A For the period June 19, 2018 (commencement of operations) to August 31, 2018.
B Calculated based on average shares outstanding during the period.
C Total returns for periods of less than one year are not annualized.
D Total returns would have been lower if certain expenses had not been reduced during the applicable periods shown.
E Fees and expenses of any underlying Fidelity Central Funds are not included in the Fund's expense ratio. The Fund indirectly bears its proportionate share of the expenses of any underlying Fidelity Central Funds.
F Expense ratios reflect operating expenses of the Fund. Expenses before reductions do not reflect amounts reimbursed by the investment adviser or reductions from expense offset arrangements and do not represent the amount paid by the Fund during periods when reimbursements or reductions occur. Expense ratios before reductions for start-up periods may not be representative of longer-term operating periods. Expenses net of fee waivers reflect expenses after reimbursement by the investment adviser but prior to reductions from expense offset arrangements. Expenses net of all reductions represent the net expenses paid by the Fund.
G Annualized
H Amount does not include the portfolio activity of any underlying Fidelity Central Funds.
I Amount not annualized.
See accompanying notes which are an integral part of the financial statements.
Notes to Financial Statements
For the period ended August 31, 2019
1. Organization.
Fidelity Sustainability Bond Index Fund (the Fund) is a fund of Fidelity Salem Street Trust (the Trust) and is authorized to issue an unlimited number of shares. The Trust is registered under the Investment Company Act of 1940, as amended (the 1940 Act), as an open-end management investment company organized as a Massachusetts business trust.
Effective after the close of business November 2, 2018, the Fund's publicly offered shares were consolidated into a single share class. The surviving class is Fidelity Sustainability Bond Index (formerly Institutional Class). All current fiscal period dollar and share amounts for the classes that closed, which are presented in the Notes to Financial Statements, are for the period September 1, 2018 through November 2, 2018.
2. Investments in Fidelity Central Funds.
The Fund invests in Fidelity Central Funds, which are open-end investment companies generally available only to other investment companies and accounts managed by the investment adviser and its affiliates. The Fund's Schedule of Investments lists each of the Fidelity Central Funds held as of period end, if any, as an investment of the Fund, but does not include the underlying holdings of each Fidelity Central Fund. As an Investing Fund, the Fund indirectly bears its proportionate share of the expenses of the underlying Fidelity Central Funds.
The Money Market Central Funds seek preservation of capital and current income and are managed by Fidelity Investments Money Management, Inc. (FIMM), an affiliate of the investment adviser. Annualized expenses of the Money Market Central Funds as of their most recent shareholder report date ranged from less than .005% to .01%.
A complete unaudited list of holdings for each Fidelity Central Fund is available upon request or at the Securities and Exchange Commission (the SEC) website at www.sec.gov. In addition, the financial statements of the Fidelity Central Funds, which are not covered by the Fund's Report of Independent Registered Public Accounting Firm, are available on the SEC website or upon request.
3. Significant Accounting Policies.
The Fund is an investment company and applies the accounting and reporting guidance of the Financial Accounting Standards Board (FASB) Accounting Standards Codification Topic 946 Financial Services – Investments Companies. The financial statements have been prepared in conformity with accounting principles generally accepted in the United States of America (GAAP), which require management to make certain estimates and assumptions at the date of the financial statements. Actual results could differ from those estimates. Subsequent events, if any, through the date that the financial statements were issued have been evaluated in the preparation of the financial statements. The following summarizes the significant accounting policies of the Fund:
Investment Valuation. Investments are valued as of 4:00 p.m. Eastern time on the last calendar day of the period. The Board of Trustees (the Board) has delegated the day to day responsibility for the valuation of the Fund's investments to the Fair Value Committee (the Committee) established by the Fund's investment adviser. In accordance with valuation policies and procedures approved by the Board, the Fund attempts to obtain prices from one or more third party pricing vendors or brokers to value its investments. When current market prices, quotations or currency exchange rates are not readily available or reliable, investments will be fair valued in good faith by the Committee, in accordance with procedures adopted by the Board. Factors used in determining fair value vary by investment type and may include market or investment specific events, changes in interest rates and credit quality. The frequency with which these procedures are used cannot be predicted and they may be utilized to a significant extent. The Committee oversees the Fund's valuation policies and procedures and reports to the Board on the Committee's activities and fair value determinations. The Board monitors the appropriateness of the procedures used in valuing the Fund's investments and ratifies the fair value determinations of the Committee.
The Fund categorizes the inputs to valuation techniques used to value its investments into a disclosure hierarchy consisting of three levels as shown below:
- Level 1 – quoted prices in active markets for identical investments
- Level 2 – other significant observable inputs (including quoted prices for similar investments, interest rates, prepayment speeds, etc.)
- Level 3 – unobservable inputs (including the Fund's own assumptions based on the best information available)
Valuation techniques used to value the Fund's investments by major category are as follows:
Debt securities, including restricted securities, are valued based on evaluated prices received from third party pricing vendors or from brokers who make markets in such securities. Corporate bonds, foreign government and government agency obligations, municipal securities, supranational obligations and U.S. government and government agency obligations are valued by pricing vendors who utilize matrix pricing which considers yield or price of bonds of comparable quality, coupon, maturity and type or by broker-supplied prices. Asset backed securities, commercial mortgage securities and U.S. government agency mortgage securities are valued by pricing vendors who utilize matrix pricing which considers prepayment speed assumptions, attributes of the collateral, yield or price of bonds of comparable quality, coupon, maturity and type or by broker-supplied prices. When independent prices are unavailable or unreliable, debt securities may be valued utilizing pricing methodologies which consider similar factors that would be used by third party pricing vendors. Debt securities are generally categorized as Level 2 in the hierarchy but may be Level 3 depending on the circumstances.
Investments in open-end mutual funds, including the Fidelity Central Funds, are valued at their closing net asset value (NAV) each business day and are categorized as Level 1 in the hierarchy.
Changes in valuation techniques may result in transfers in or out of an assigned level within the disclosure hierarchy. The aggregate value of investments by input level as of August 31, 2019 is included at the end of the Fund's Schedule of Investments.
Investment Transactions and Income. For financial reporting purposes, the Fund's investment holdings and NAV include trades executed through the end of the last business day of the period. The NAV per share for processing shareholder transactions is calculated as of the close of business of the New York Stock Exchange (NYSE), normally 4:00 p.m. Eastern time and includes trades executed through the end of the prior business day. Gains and losses on securities sold are determined on the basis of identified cost. Income and capital gain distributions from Fidelity Central Funds, if any, are recorded on the ex-dividend date. Interest income is accrued as earned and includes coupon interest and amortization of premium and accretion of discount on debt securities as applicable. Debt obligations may be placed on non-accrual status and related interest income may be reduced by ceasing current accruals and writing off interest receivables when the collection of all or a portion of interest has become doubtful based on consistently applied procedures. A debt obligation is removed from non-accrual status when the issuer resumes interest payments or when collectability of interest is reasonably assured.
Class Allocations and Expenses. Investment income, realized and unrealized capital gains and losses, common expenses of the Fund, and certain fund-level expense reductions, if any, are allocated daily on a pro-rata basis to each class based on the relative net assets of each class to the total net assets of the Fund. Each class differs with respect to fees incurred. Certain expense reductions may also differ by class. For the reporting period, the allocated portion of income and expenses to each class as a percent of its average net assets may vary due to the timing of recording these transactions in relation to fluctuating net assets of the classes. Expenses directly attributable to a fund are charged to that fund. Expenses attributable to more than one fund are allocated among the respective funds on the basis of relative net assets or other appropriate methods. Expense estimates are accrued in the period to which they relate and adjustments are made when actual amounts are known.
Income Tax Information and Distributions to Shareholders. Each year, the Fund intends to qualify as a regulated investment company under Subchapter M of the Internal Revenue Code, including distributing substantially all of its taxable income and realized gains. As a result, no provision for U.S. Federal income taxes is required. As of August 31, 2019, the Fund did not have any unrecognized tax benefits in the financial statements; nor is the Fund aware of any tax positions for which it is reasonably possible that the total amounts of unrecognized tax benefits will significantly change in the next twelve months. The Fund files a U.S. federal tax return, in addition to state and local tax returns as required. The Fund's federal income tax returns are subject to examination by the Internal Revenue Service (IRS) for a period of three fiscal years after they are filed. State and local tax returns may be subject to examination for an additional fiscal year depending on the jurisdiction.
Distributions are declared and recorded daily and paid monthly from net investment income. Distributions from realized gains, if any, are declared and recorded on the ex-dividend date. Income and capital gain distributions are declared separately for each class. Income and capital gain distributions are determined in accordance with income tax regulations, which may differ from GAAP.
Capital accounts within the financial statements are adjusted for permanent book-tax differences. These adjustments have no impact on net assets or the results of operations. Capital accounts are not adjusted for temporary book-tax differences which will reverse in a subsequent period.
Book-tax differences are primarily due to market discount and losses deferred due to wash sales.
As of period end, the cost and unrealized appreciation (depreciation) in securities, and derivatives if applicable, for federal income tax purposes were as follows:
| Gross unrealized appreciation | $4,179,560 |
| Gross unrealized depreciation | (983) |
| Net unrealized appreciation (depreciation) | $4,178,577 |
| Tax Cost | $73,922,957 |
The tax-based components of distributable earnings as of period end were as follows:
| Undistributed ordinary income | $192,160 |
| Undistributed long-term capital gain | $42,137 |
| Net unrealized appreciation (depreciation) on securities and other investments | $4,178,577 |
The tax character of distributions paid was as follows:
| | August 31, 2019 | August 31, 2018(a) |
| Ordinary Income | $1,569,840 | $ 143,529 |
(a) For the period June 19, 2018 (commencement of operations) to August 31, 2018.
Delayed Delivery Transactions and When-Issued Securities. During the period, the Fund transacted in securities on a delayed delivery or when-issued basis. Payment and delivery may take place after the customary settlement period for that security. The price of the underlying securities and the date when the securities will be delivered and paid for are fixed at the time the transaction is negotiated. The securities purchased on a delayed delivery or when-issued basis are identified as such in the Fund's Schedule of Investments. The Fund may receive compensation for interest forgone in the purchase of a delayed delivery or when-issued security. With respect to purchase commitments, the Fund identifies securities as segregated in its records with a value at least equal to the amount of the commitment. Losses may arise due to changes in the value of the underlying securities or if the counterparty does not perform under the contract's terms, or if the issuer does not issue the securities due to political, economic, or other factors.
To-Be-Announced (TBA) Securities and Mortgage Dollar Rolls. During the period, the Fund transacted in TBA securities that involved buying or selling mortgage-backed securities (MBS) on a forward commitment basis. A TBA transaction typically does not designate the actual security to be delivered and only includes an approximate principal amount; however delivered securities must meet specified terms defined by industry guidelines, including issuer, rate and current principal amount outstanding on underlying mortgage pools. The Fund may enter into a TBA transaction with the intent to take possession of or deliver the underlying MBS, or the Fund may elect to extend the settlement by entering into either a mortgage or reverse mortgage dollar roll. Mortgage dollar rolls are transactions where a fund sells TBA securities and simultaneously agrees to repurchase MBS on a later date at a lower price and with the same counterparty. Reverse mortgage dollar rolls involve the purchase and simultaneous agreement to sell TBA securities on a later date at a lower price. Transactions in mortgage dollar rolls and reverse mortgage dollar rolls are accounted for as purchases and sales and may result in an increase to the Fund's portfolio turnover rate.
Purchases and sales of TBA securities involve risks similar to those discussed above for delayed delivery and when-issued securities. Also, if the counterparty in a mortgage dollar roll or a reverse mortgage dollar roll transaction files for bankruptcy or becomes insolvent, the Fund's right to repurchase or sell securities may be limited. Additionally, when a fund sells TBA securities without already owning or having the right to obtain the deliverable securities (an uncovered forward commitment to sell), it incurs a risk of loss because it could have to purchase the securities at a price that is higher than the price at which it sold them. A fund may be unable to purchase the deliverable securities if the corresponding market is illiquid.
Restricted Securities. The Fund may invest in securities that are subject to legal or contractual restrictions on resale. These securities generally may be resold in transactions exempt from registration or to the public if the securities are registered. Disposal of these securities may involve time-consuming negotiations and expense, and prompt sale at an acceptable price may be difficult. Information regarding restricted securities is included at the end of the Fund's Schedule of Investments.
New Rule Issuance. During August 2018, the U.S. Securities and Exchange Commission issued Final Rule Release No. 33-10532, Disclosure Update and Simplification. This Final Rule includes amendments specific to registered investment companies that are intended to eliminate overlap in disclosure requirements between Regulation S-X and GAAP. In accordance with these amendments, certain line-items in the Fund's financial statements have been combined or removed for the current period as outlined in the table below.
| Financial Statement | Current Line-Item Presentation (As Applicable) | Prior Line-Item Presentation (As Applicable) |
| Statement of Assets and Liabilities | Total distributable earnings (loss) | Undistributed/Distributions in excess of/Accumulated net investment income (loss)
Accumulated/Undistributed net realized gain (loss)
Net unrealized appreciation (depreciation) |
| Statement of Changes in Net Assets | N/A - removed | Undistributed/Distributions in excess of/Accumulated net investment income (loss) end of period |
| Statement of Changes in Net Assets | Distributions to shareholders | Distributions to shareholders from net investment income
Distributions to shareholders from net realized gain |
| Distributions to Shareholders Note to Financial Statements | Distributions to shareholders | Distributions to shareholders from net investment income
Distributions to shareholders from net realized gain |
4. Purchases and Sales of Investments.
Purchases and sales of securities, other than short-term securities and U.S. government securities, aggregated $13,281,866 and $529,330, respectively.
5. Fees and Other Transactions with Affiliates.
Management Fee. Fidelity Management & Research Company (the investment adviser) and its affiliates provide the Fund with investment management related services for which the Fund pays a monthly management fee. During July 2019, the Board approved to change the management fee to an annual rate of .10% of the Fund's average net assets effective August 1, 2019. Prior to August 1, 2019, the annual management fee rate was .09%. Under the management contract, the investment adviser pays all other fund-level operating expenses, except the compensation of the independent Trustees and certain miscellaneous expenses such as proxy and shareholder meeting expenses. During July 2019, the Board also approved to change the management fee structure from a flat fee to a unitary fee effective August 1, 2019, which eliminated the need for a separate expense contract. There is no change to the total expenses paid by the shareholders.
Prior to August 1, 2019, under the expense contract, the investment adviser paid class-level expenses as necessary so that the total expenses did not exceed .10% of each class' average net assets on an annual basis with certain exceptions.
Transfer Agent Fees. Fidelity Investments Institutional Operations Company, Inc. (FIIOC), an affiliate of the investment adviser, is the transfer, dividend disbursing and shareholder servicing agent for each class. FIIOC receives transfer agent fees at an annual rate of .20%, .13% and .10% of class-level average net assets for Investor Class, Premium Class and Fidelity Sustainability Bond Index Fund, respectively. Effective August 1, 2019, the Fund does not pay transfer agent fees. Prior to August 1, 2019, under the expense contract, Investor Class, Premium Class and Fidelity Sustainability Bond Index Fund paid all or a portion of the transfer agent fees at an annual rate of .01% of class-level average net assets. FIIOC pays for typesetting, printing and mailing of shareholder reports, except proxy statements.
For the period, the total transfer agent fees paid by each applicable class were as follows:
| | Amount |
| Investor Class | $115 |
| Premium Class | 487 |
| Fidelity Sustainability Bond Index Fund | 4,189 |
| | $4,791 |
Interfund Trades. The Fund may purchase from or sell securities to other Fidelity Funds under procedures adopted by the Board. The procedures have been designed to ensure these interfund trades are executed in accordance with Rule 17a-7 of the 1940 Act. Interfund trades are included within the respective purchases and sales amounts shown in the Purchases and Sales of Investments note.
6. Committed Line of Credit.
The Fund participates with other funds managed by the investment adviser or an affiliate in a $4.25 billion credit facility (the "line of credit") to be utilized for temporary or emergency purposes to fund shareholder redemptions or for other short-term liquidity purposes. The Fund has agreed to pay commitment fees on its pro-rata portion of the line of credit, which amounted to $50 and is reflected in Commitment fees on the Statement of Operations. During the period, the Fund did not borrow on this line of credit.
7. Expense Reductions.
Through arrangements with the Fund's custodian, credits realized as a result of certain uninvested cash balances were used to reduce the Fund's expenses. During the period, these credits reduced the Fund's expenses by $814.
8. Distributions to Shareholders.
Distributions to shareholders of each class were as follows:
| | Year ended
August 31, 2019 | Year ended
August 31, 2018(a) |
| Distributions to shareholders | | |
| Investor Class | $35,504 | $– |
| Premium Class | 146,609 | – |
| Fidelity Sustainability Bond Index Fund | 1,387,727 | – |
| Total | $1,569,840 | $– |
| From net investment income | | |
| Investor Class | $– | $48,073 |
| Premium Class | – | 48,652 |
| Fidelity Sustainability Bond Index Fund | – | 46,804 |
| Total | $– | $143,529 |
(a) For the period June 19, 2018 (commencement of operations) to August 31, 2018.
9. Share Transactions.
Share transactions for each class were as follows and may contain automatic conversions between classes or exchanges between affiliated funds:
| | Shares | Shares | Dollars | Dollars |
| | Year ended August 31, 2019 | Year ended August 31, 2018(a) | Year ended August 31, 2019 | Year ended August 31, 2018(a) |
| Investor Class | | | | |
| Shares sold | 84,410 | 922,487 | $836,365 | $9,226,878 |
| Reinvestment of distributions | 3,394 | 4,767 | 33,559 | 47,699 |
| Shares redeemed | (1,014,700) | (358) | (10,019,953) | (3,588) |
| Net increase (decrease) | (926,896) | 926,896 | $(9,150,029) | $9,270,989 |
| Premium Class | | | | |
| Shares sold | 2,427,060 | 918,249 | $24,273,720 | $9,182,764 |
| Reinvestment of distributions | 14,658 | 4,857 | 144,812 | 48,597 |
| Shares redeemed | (3,364,631) | (193) | (33,067,044) | (1,932) |
| Net increase (decrease) | (922,913) | 922,913 | $(8,648,512) | $9,229,429 |
| Fidelity Sustainability Bond Index Fund | | | | |
| Shares sold | 6,828,772 | 840,908 | $68,347,600 | $8,409,196 |
| Reinvestment of distributions | 129,597 | 4,678 | 1,332,131 | 46,804 |
| Shares redeemed | (625,453) | – | (6,353,581) | – |
| Net increase (decrease) | 6,332,916 | 845,586 | $63,326,150 | $8,456,000 |
(a) For the period June 19, 2018 (commencement of operations) to August 31, 2018.
10. Other.
The Fund's organizational documents provide former and current trustees and officers with a limited indemnification against liabilities arising in connection with the performance of their duties to the Fund. In the normal course of business, the Fund may also enter into contracts that provide general indemnifications. The Fund's maximum exposure under these arrangements is unknown as this would be dependent on future claims that may be made against the Fund. The risk of material loss from such claims is considered remote.
At the end of the period, the investment adviser or its affiliates were the owners of record of approximately 22% of the total outstanding shares of the Fund. At the end of the period, Strategic Advisers Core Income Fund was the owner of record of approximately 32% of the total outstanding shares of the Fund.
Report of Independent Registered Public Accounting Firm
To the Trustees of Fidelity Salem Street Trust and Shareholders of Fidelity Sustainability Bond Index Fund:
Opinion on the Financial Statements and Financial Highlights
We have audited the accompanying statement of assets and liabilities of Fidelity Sustainability Bond Index Fund (the "Fund"), a fund of Fidelity Salem Street Trust, including the schedule of investments, as of August 31, 2019, the related statement of operations for the year then ended, and the statement of changes in net assets and the financial highlights for the year then ended and for the period from June 19, 2018 (commencement of operations) to August 31, 2018, and the related notes. In our opinion, the financial statements and financial highlights present fairly, in all material respects, the financial position of the Fund as of August 31, 2019, the results of its operations for the year then ended, and the changes in its net assets and the financial highlights for the year then ended and for the period from June 19, 2018 (commencement of operations) to August 31, 2018 in conformity with accounting principles generally accepted in the United States of America.
Basis for Opinion
These financial statements and financial highlights are the responsibility of the Fund's management. Our responsibility is to express an opinion on the Fund's financial statements and financial highlights based on our audits. We are a public accounting firm registered with the Public Company Accounting Oversight Board (United States) (PCAOB) and are required to be independent with respect to the Fund in accordance with the U.S. federal securities laws and the applicable rules and regulations of the Securities and Exchange Commission and the PCAOB.
We conducted our audits in accordance with the standards of the PCAOB. Those standards require that we plan and perform the audit to obtain reasonable assurance about whether the financial statements and financial highlights are free of material misstatement, whether due to error or fraud. The Fund is not required to have, nor were we engaged to perform, an audit of its internal control over financial reporting. As part of our audits we are required to obtain an understanding of internal control over financial reporting but not for the purpose of expressing an opinion on the effectiveness of the Fund’s internal control over financial reporting. Accordingly, we express no such opinion.
Our audits included performing procedures to assess the risks of material misstatement of the financial statements and financial highlights, whether due to error or fraud, and performing procedures that respond to those risks. Such procedures included examining, on a test basis, evidence regarding the amounts and disclosures in the financial statements and financial highlights. Our audits also included evaluating the accounting principles used and significant estimates made by management, as well as evaluating the overall presentation of the financial statements and financial highlights. Our procedures included confirmation of securities owned as of August 31, 2019, by correspondence with the custodians and brokers; when replies were not received from brokers, we performed other auditing procedures. We believe that our audits provide a reasonable basis for our opinion.
/s/ Deloitte & Touche LLP
Boston, Massachusetts
October 17, 2019
We have served as the auditor of one or more of the Fidelity investment companies since 1999.
Trustees and Officers
The Trustees, Members of the Advisory Board (if any), and officers of the trust and fund, as applicable, are listed below. The Board of Trustees governs the fund and is responsible for protecting the interests of shareholders. The Trustees are experienced executives who meet periodically throughout the year to oversee the fund's activities, review contractual arrangements with companies that provide services to the fund, oversee management of the risks associated with such activities and contractual arrangements, and review the fund's performance. Except for Jonathan Chiel, each of the Trustees oversees 276 funds. Mr. Chiel oversees 170 funds.
The Trustees hold office without limit in time except that (a) any Trustee may resign; (b) any Trustee may be removed by written instrument, signed by at least two-thirds of the number of Trustees prior to such removal; (c) any Trustee who requests to be retired or who has become incapacitated by illness or injury may be retired by written instrument signed by a majority of the other Trustees; and (d) any Trustee may be removed at any special meeting of shareholders by a two-thirds vote of the outstanding voting securities of the trust. Each Trustee who is not an interested person (as defined in the 1940 Act) of the trust and the fund is referred to herein as an Independent Trustee. Each Independent Trustee shall retire not later than the last day of the calendar year in which his or her 75th birthday occurs. The Independent Trustees may waive this mandatory retirement age policy with respect to individual Trustees. Officers and Advisory Board Members hold office without limit in time, except that any officer or Advisory Board Member may resign or may be removed by a vote of a majority of the Trustees at any regular meeting or any special meeting of the Trustees. Except as indicated, each individual has held the office shown or other offices in the same company for the past five years.
The fund’s Statement of Additional Information (SAI) includes more information about the Trustees. To request a free copy, call Fidelity at 1-800-544-8544.
Experience, Skills, Attributes, and Qualifications of the Trustees. The Governance and Nominating Committee has adopted a statement of policy that describes the experience, qualifications, attributes, and skills that are necessary and desirable for potential Independent Trustee candidates (Statement of Policy). The Board believes that each Trustee satisfied at the time he or she was initially elected or appointed a Trustee, and continues to satisfy, the standards contemplated by the Statement of Policy. The Governance and Nominating Committee also engages professional search firms to help identify potential Independent Trustee candidates who have the experience, qualifications, attributes, and skills consistent with the Statement of Policy. From time to time, additional criteria based on the composition and skills of the current Independent Trustees, as well as experience or skills that may be appropriate in light of future changes to board composition, business conditions, and regulatory or other developments, have also been considered by the professional search firms and the Governance and Nominating Committee. In addition, the Board takes into account the Trustees' commitment and participation in Board and committee meetings, as well as their leadership of standing and ad hoc committees throughout their tenure.
In determining that a particular Trustee was and continues to be qualified to serve as a Trustee, the Board has considered a variety of criteria, none of which, in isolation, was controlling. The Board believes that, collectively, the Trustees have balanced and diverse experience, qualifications, attributes, and skills, which allow the Board to operate effectively in governing the fund and protecting the interests of shareholders. Information about the specific experience, skills, attributes, and qualifications of each Trustee, which in each case led to the Board's conclusion that the Trustee should serve (or continue to serve) as a trustee of the fund, is provided below.
Board Structure and Oversight Function. Abigail P. Johnson is an interested person and currently serves as Chairman. The Trustees have determined that an interested Chairman is appropriate and benefits shareholders because an interested Chairman has a personal and professional stake in the quality and continuity of services provided to the fund. Independent Trustees exercise their informed business judgment to appoint an individual of their choosing to serve as Chairman, regardless of whether the Trustee happens to be independent or a member of management. The Independent Trustees have determined that they can act independently and effectively without having an Independent Trustee serve as Chairman and that a key structural component for assuring that they are in a position to do so is for the Independent Trustees to constitute a substantial majority for the Board. The Independent Trustees also regularly meet in executive session. Arthur E. Johnson serves as Chairman of the Independent Trustees and as such (i) acts as a liaison between the Independent Trustees and management with respect to matters important to the Independent Trustees and (ii) with management prepares agendas for Board meetings.
Fidelity® funds are overseen by different Boards of Trustees. The fund's Board oversees Fidelity's investment-grade bond, money market, asset allocation and certain equity funds, and other Boards oversee Fidelity's high income and other equity funds. The asset allocation funds may invest in Fidelity® funds that are overseen by such other Boards. The use of separate Boards, each with its own committee structure, allows the Trustees of each group of Fidelity® funds to focus on the unique issues of the funds they oversee, including common research, investment, and operational issues. On occasion, the separate Boards establish joint committees to address issues of overlapping consequences for the Fidelity® funds overseen by each Board.
The Trustees operate using a system of committees to facilitate the timely and efficient consideration of all matters of importance to the Trustees, the fund, and fund shareholders and to facilitate compliance with legal and regulatory requirements and oversight of the fund's activities and associated risks. The Board, acting through its committees, has charged FMR and its affiliates with (i) identifying events or circumstances the occurrence of which could have demonstrably adverse effects on the fund's business and/or reputation; (ii) implementing processes and controls to lessen the possibility that such events or circumstances occur or to mitigate the effects of such events or circumstances if they do occur; and (iii) creating and maintaining a system designed to evaluate continuously business and market conditions in order to facilitate the identification and implementation processes described in (i) and (ii) above. Because the day-to-day operations and activities of the fund are carried out by or through FMR, its affiliates, and other service providers, the fund's exposure to risks is mitigated but not eliminated by the processes overseen by the Trustees. While each of the Board's committees has responsibility for overseeing different aspects of the fund's activities, oversight is exercised primarily through the Operations and Audit Committees. In addition, an ad hoc Board committee of Independent Trustees has worked with FMR to enhance the Board's oversight of investment and financial risks, legal and regulatory risks, technology risks, and operational risks, including the development of additional risk reporting to the Board. Appropriate personnel, including but not limited to the fund's Chief Compliance Officer (CCO), FMR's internal auditor, the independent accountants, the fund's Treasurer and portfolio management personnel, make periodic reports to the Board's committees, as appropriate, including an annual review of Fidelity's risk management program for the Fidelity® funds. The responsibilities of each standing committee, including their oversight responsibilities, are described further under "Standing Committees of the Trustees."
Interested Trustees*:
Correspondence intended for a Trustee who is an interested person may be sent to Fidelity Investments, 245 Summer Street, Boston, Massachusetts 02210.
Name, Year of Birth; Principal Occupations and Other Relevant Experience+
Jonathan Chiel (1957)
Year of Election or Appointment: 2016
Trustee
Mr. Chiel also serves as Trustee of other Fidelity® funds. Mr. Chiel is Executive Vice President and General Counsel for FMR LLC (diversified financial services company, 2012-present). Previously, Mr. Chiel served as general counsel (2004-2012) and senior vice president and deputy general counsel (2000-2004) for John Hancock Financial Services; a partner with Choate, Hall & Stewart (1996-2000) (law firm); and an Assistant United States Attorney for the United States Attorney’s Office of the District of Massachusetts (1986-95), including Chief of the Criminal Division (1993-1995). Mr. Chiel is a director on the boards of the Boston Bar Foundation and the Maimonides School.
Abigail P. Johnson (1961)
Year of Election or Appointment: 2009
Trustee
Chairman of the Board of Trustees
Ms. Johnson also serves as Trustee of other Fidelity® funds. Ms. Johnson serves as Chairman (2016-present), Chief Executive Officer (2014-present), and Director (2007-present) of FMR LLC (diversified financial services company), President of Fidelity Financial Services (2012-present) and President of Personal, Workplace and Institutional Services (2005-present). Ms. Johnson is Chairman and Director of FMR Co., Inc. (investment adviser firm, 2011-present) and Chairman and Director of FMR (investment adviser firm, 2011-present). Previously, Ms. Johnson served as Vice Chairman (2007-2016) and President (2013-2016) of FMR LLC, President and a Director of FMR (2001-2005), a Trustee of other investment companies advised by FMR, Fidelity Investments Money Management, Inc. (investment adviser firm), and FMR Co., Inc. (2001-2005), Senior Vice President of the Fidelity® funds (2001-2005), and managed a number of Fidelity® funds. Ms. Abigail P. Johnson and Mr. Arthur E. Johnson are not related.
Jennifer Toolin McAuliffe (1959)
Year of Election or Appointment: 2016
Trustee
Ms. McAuliffe also serves as Trustee of other Fidelity® funds. Ms. McAuliffe previously served as a Member of the Advisory Board of certain Fidelity® funds (2016) and as Co-Head of Fixed Income of Fidelity Investments Limited (now known as FIL Limited (FIL)) (diversified financial services company). Earlier roles at FIL included Director of Research for FIL’s credit and quantitative teams in London, Hong Kong and Tokyo. Ms. McAuliffe also was the Director of Research for taxable and municipal bonds at Fidelity Investments Money Management, Inc. Ms. McAuliffe is also a director or trustee of several not-for-profit entities.
* Determined to be an “Interested Trustee” by virtue of, among other things, his or her affiliation with the trust or various entities under common control with FMR.
+ The information includes the Trustee's principal occupation during the last five years and other information relating to the experience, attributes, and skills relevant to the Trustee's qualifications to serve as a Trustee, which led to the conclusion that the Trustee should serve as a Trustee for the fund.
Independent Trustees:
Correspondence intended for an Independent Trustee may be sent to Fidelity Investments, P.O. Box 55235, Boston, Massachusetts 02205-5235.
Name, Year of Birth; Principal Occupations and Other Relevant Experience+
Elizabeth S. Acton (1951)
Year of Election or Appointment: 2013
Trustee
Ms. Acton also serves as Trustee of other Fidelity® funds. Prior to her retirement in April 2012, Ms. Acton was Executive Vice President, Finance (2011-2012), Executive Vice President, Chief Financial Officer (2002-2011), and Treasurer (2004-2005) of Comerica Incorporated (financial services). Prior to joining Comerica, Ms. Acton held a variety of positions at Ford Motor Company (1983-2002), including Vice President and Treasurer (2000-2002) and Executive Vice President and Chief Financial Officer of Ford Motor Credit Company (1998-2000). Ms. Acton currently serves as a member of the Board of Directors and Audit and Finance Committees of Beazer Homes USA, Inc. (homebuilding, 2012-present). Previously, Ms. Acton served as a Member of the Advisory Board of certain Fidelity® funds (2013-2016).
Ann E. Dunwoody (1953)
Year of Election or Appointment: 2018
Trustee
General Dunwoody also serves as Trustee of other Fidelity® funds. General Dunwoody (United States Army, Retired) was the first woman in U.S. military history to achieve the rank of four-star general and prior to her retirement in 2012 held a variety of positions within the U.S. Army, including Commanding General, U.S. Army Material Command (2008-2012). She is the President of First to Four LLC (leadership and mentoring services, 2012-present). She also serves as a member of the Board of Directors and Nominating and Corporate Governance Committee of L3 Technologies, Inc. (communication, electronic, sensor, and aerospace systems, 2013-present), Board of Directors and Nomination and Corporate Governance Committees of Kforce Inc. (professional staffing services, 2016-present) and Board of Directors of Automattic Inc. (software engineering, 2018-present). Previously, General Dunwoody served as a Member of the Advisory Board of certain Fidelity® funds (2018), a member of the Board of Directors and Audit and Sustainability and Corporate Responsibility Committees of Republic Services, Inc. (waste collection, disposal and recycling, 2013-2016). Ms. Dunwoody also serves on several boards for non-profit organizations, including as a member of the Board of Directors, Chair of the Nomination and Governance Committee and member of the Audit Committee of Logistics Management Institute (consulting non-profit, 2012-present), a member of the Board of Directors of the Army Historical Foundation (2015-present), a member of the Council of Trustees for the Association of the United States Army (advocacy non-profit, 2013-present) and a member of the Board of Trustees of Florida Institute of Technology (2015-present) and ThanksUSA (military family education non-profit, 2014-present).
John Engler (1948)
Year of Election or Appointment: 2014
Trustee
Mr. Engler also serves as Trustee of other Fidelity® funds. He serves on the board of directors for Universal Forest Products (manufacturer and distributor of wood and wood-alternative products, 2003-present) and K12 Inc. (technology-based education company, 2012-present). Previously, Mr. Engler served as interim president of Michigan State University (2018-2019), a Member of the Advisory Board of certain Fidelity® funds (2014-2016), president of the Business Roundtable (2011-2017), a trustee of The Munder Funds (2003-2014), president and CEO of the National Association of Manufacturers (2004-2011), member of the Board of Trustees of the Annie E. Casey Foundation (2004-2015), and as governor of Michigan (1991-2003). He is a past chairman of the National Governors Association.
Robert F. Gartland (1951)
Year of Election or Appointment: 2010
Trustee
Mr. Gartland also serves as Trustee of other Fidelity® funds. Mr. Gartland is Chairman and an investor in Gartland & Mellina Group Corp. (consulting, 2009-present). Previously, Mr. Gartland served as a partner and investor of Vietnam Partners LLC (investments and consulting, 2008-2011). Prior to his retirement, Mr. Gartland held a variety of positions at Morgan Stanley (financial services, 1979-2007), including Managing Director (1987-2007), and Chase Manhattan Bank (1975-1978).
Arthur E. Johnson (1947)
Year of Election or Appointment: 2008
Trustee
Chairman of the Independent Trustees
Mr. Johnson also serves as Trustee of other Fidelity® funds. Mr. Johnson serves as a member of the Board of Directors of Eaton Corporation plc (diversified power management, 2009-present) and Booz Allen Hamilton (management consulting, 2011-present). Prior to his retirement, Mr. Johnson served as Senior Vice President of Corporate Strategic Development of Lockheed Martin Corporation (defense contractor, 1999-2009). Mr. Johnson previously served as Vice Chairman (2015-2018) of the Independent Trustees of certain Fidelity® funds and on the Board of Directors of IKON Office Solutions, Inc. (1999-2008), AGL Resources, Inc. (holding company, 2002-2016), and Delta Airlines (2005-2007). Mr. Arthur E. Johnson is not related to Ms. Abigail P. Johnson.
Michael E. Kenneally (1954)
Year of Election or Appointment: 2009
Trustee
Vice Chairman of the Independent Trustees
Mr. Kenneally also serves as Trustee of other Fidelity® funds. Prior to his retirement, Mr. Kenneally served as Chairman and Global Chief Executive Officer of Credit Suisse Asset Management. Before joining Credit Suisse, he was an Executive Vice President and Chief Investment Officer for Bank of America Corporation. Earlier roles at Bank of America included Director of Research, Senior Portfolio Manager and Research Analyst, and Mr. Kenneally was awarded the Chartered Financial Analyst (CFA) designation in 1991.
Marie L. Knowles (1946)
Year of Election or Appointment: 2001
Trustee
Ms. Knowles also serves as Trustee of other Fidelity® funds. Prior to Ms. Knowles' retirement in June 2000, she served as Executive Vice President and Chief Financial Officer of Atlantic Richfield Company (ARCO) (diversified energy, 1996-2000). From 1993 to 1996, she was a Senior Vice President of ARCO and President of ARCO Transportation Company (pipeline and tanker operations). Ms. Knowles currently serves as a Director and Chairman of the Audit Committee of McKesson Corporation (healthcare service, since 2002). Ms. Knowles is a member of the Board of the Santa Catalina Island Company (real estate, 2009-present). Ms. Knowles is a Member of the Investment Company Institute Board of Governors and a Member of the Governing Council of the Independent Directors Council (2014-present). She also serves as a member of the Advisory Board for the School of Engineering of the University of Southern California. Previously, Ms. Knowles served as a Director of Phelps Dodge Corporation (copper mining and manufacturing, 1994-2007), URS Corporation (engineering and construction, 2000-2003) and America West (airline, 1999-2002). Ms. Knowles previously served as Chairman (2015-2018) and Vice Chairman (2012-2015) of the Independent Trustees of certain Fidelity® funds.
Mark A. Murray (1954)
Year of Election or Appointment: 2016
Trustee
Mr. Murray also serves as Trustee of other Fidelity® funds. Mr. Murray is Vice Chairman (2013-present) of Meijer, Inc. (regional retail chain). Previously, Mr. Murray served as a Member of the Advisory Board of certain Fidelity® funds (2016) and as Co-Chief Executive Officer (2013-2016) and President (2006-2013) of Meijer, Inc. Mr. Murray serves as a member of the Board of Directors and Nuclear Review and Public Policy and Responsibility Committees of DTE Energy Company (diversified energy company, 2009-present). Mr. Murray also serves as a member of the Board of Directors of Spectrum Health (not-for-profit health system, 2015-present). Mr. Murray previously served as President of Grand Valley State University (2001-2006), Treasurer for the State of Michigan (1999-2001), Vice President of Finance and Administration for Michigan State University (1998-1999), and a member of the Board of Directors and Audit Committee and Chairman of the Nominating and Corporate Governance Committee of Universal Forest Products, Inc. (manufacturer and distributor of wood and wood-alternative products, 2004-2016). Mr. Murray is also a director or trustee of many community and professional organizations.
+ The information includes the Trustee's principal occupation during the last five years and other information relating to the experience, attributes, and skills relevant to the Trustee's qualifications to serve as a Trustee, which led to the conclusion that the Trustee should serve as a Trustee for the fund.
Advisory Board Members and Officers:
Correspondence intended for an officer may be sent to Fidelity Investments, 245 Summer Street, Boston, Massachusetts 02210. Officers appear below in alphabetical order.
Name, Year of Birth; Principal Occupation
Elizabeth Paige Baumann (1968)
Year of Election or Appointment: 2017
Anti-Money Laundering (AML) Officer
Ms. Baumann also serves as AML Officer of other funds. She is Chief AML Officer (2012-present) and Senior Vice President (2014-present) of FMR LLC (diversified financial services company) and is an employee of Fidelity Investments. Previously, Ms. Baumann served as AML Officer of the funds (2012-2016), and Vice President (2007-2014) and Deputy Anti-Money Laundering Officer (2007-2012) of FMR LLC.
Craig S. Brown (1977)
Year of Election or Appointment: 2019
Assistant Treasurer
Mr. Brown also serves as Assistant Treasurer of other funds. Mr. Brown is an employee of Fidelity Investments (2013-present).
John J. Burke III (1964)
Year of Election or Appointment: 2018
Chief Financial Officer
Mr. Burke also serves as Chief Financial Officer of other funds. Mr. Burke serves as Head of Investment Operations for Fidelity Fund and Investment Operations (2018-present) and is an employee of Fidelity Investments (1998-present). Previously Mr. Burke served as head of Asset Management Investment Operations (2012-2018).
Jonathan Davis (1968)
Year of Election or Appointment: 2010
Assistant Treasurer
Mr. Davis also serves as Assistant Treasurer of other funds. Mr. Davis serves as Assistant Treasurer of FMR Capital, Inc. (2017-present) and is an employee of Fidelity Investments. Previously, Mr. Davis served as Vice President and Associate General Counsel of FMR LLC (diversified financial services company, 2003-2010).
Adrien E. Deberghes (1967)
Year of Election or Appointment: 2010
Assistant Treasurer
Mr. Deberghes also serves as an officer of other funds. He serves as Assistant Treasurer of FMR Capital, Inc. (2017-present), Executive Vice President of Fidelity Investments Money Management, Inc. (FIMM) (investment adviser firm, 2016-present), and is an employee of Fidelity Investments (2008-present). Previously, Mr. Deberghes served as President and Treasurer of certain Fidelity® funds (2013-2018). Prior to joining Fidelity Investments, Mr. Deberghes was Senior Vice President of Mutual Fund Administration at State Street Corporation (2007-2008), Senior Director of Mutual Fund Administration at Investors Bank & Trust (2005-2007), and Director of Finance for Dunkin' Brands (2000-2005). Previously, Mr. Deberghes served in other fund officer roles.
Laura M. Del Prato (1964)
Year of Election or Appointment: 2018
President and Treasurer
Ms. Del Prato also serves as an officer of other funds. Ms. Del Prato is an employee of Fidelity Investments (2017-present). Prior to joining Fidelity Investments, Ms. Del Prato served as a Managing Director and Treasurer of the JPMorgan Mutual Funds (2014-2017). Prior to JPMorgan, Ms. Del Prato served as a partner at Cohen Fund Audit Services (accounting firm, 2012-2013) and KPMG LLP (accounting firm, 2004-2012).
Colm A. Hogan (1973)
Year of Election or Appointment: 2016
Assistant Treasurer
Mr. Hogan also serves as an officer of other funds. Mr. Hogan serves as Assistant Treasurer of FMR Capital, Inc. (2017-present) and is an employee of Fidelity Investments (2005-present). Previously, Mr. Hogan served as Assistant Treasurer of certain Fidelity® funds (2016-2018).
Cynthia Lo Bessette (1969)
Year of Election or Appointment: 2019
Secretary and Chief Legal Officer (CLO)
Ms. Lo Bessette also serves as Secretary and CLO of other funds. She is a Senior Vice President and Deputy General Counsel of FMR LLC (diversified financial services company, 2019-present), and is an employee of Fidelity Investments. Previously, Ms. Lo Bessette served as Executive Vice President, General Counsel (2016-2019) and Senior Vice President, Deputy General Counsel (2015-2016) of OppenheimerFunds (investment management company) and Deputy Chief Legal Officer (2013-2015) of Jennison Associates LLC (investment adviser firm).
Chris Maher (1972)
Year of Election or Appointment: 2013
Assistant Treasurer
Mr. Maher serves as Assistant Treasurer of other funds. Mr. Maher is Vice President of Valuation Oversight, serves as Assistant Treasurer of FMR Capital, Inc. (2017-present), and is an employee of Fidelity Investments. Previously, Mr. Maher served as Vice President of Asset Management Compliance (2013), Vice President of the Program Management Group of FMR (investment adviser firm, 2010-2013), and Vice President of Valuation Oversight (2008-2010).
John B. McGinty, Jr. (1962)
Year of Election or Appointment: 2016
Chief Compliance Officer
Mr. McGinty also serves as Chief Compliance Officer of other funds. Mr. McGinty is Senior Vice President of Asset Management Compliance for Fidelity Investments and is an employee of Fidelity Investments (2016-present). Mr. McGinty previously served as Vice President, Senior Attorney at Eaton Vance Management (investment management firm, 2015-2016), and prior to Eaton Vance as global CCO for all firm operations and registered investment companies at GMO LLC (investment management firm, 2009-2015). Before joining GMO LLC, Mr. McGinty served as Senior Vice President, Deputy General Counsel for Fidelity Investments (2007-2009).
Jason P. Pogorelec (1975)
Year of Election or Appointment: 2015
Assistant Secretary
Mr. Pogorelec also serves as Assistant Secretary of other funds. Mr. Pogorelec serves as Vice President, Associate General Counsel (2010-present) and is an employee of Fidelity Investments (2006-present).
Nancy D. Prior (1967)
Year of Election or Appointment: 2014
Vice President
Ms. Prior also serves as Vice President of other funds. Ms. Prior serves as President of Fixed Income (2014-present), President (2016-present) and Director (2014-present) of Fidelity Investments Money Management, Inc. (FIMM) (investment adviser firm), and is an employee of Fidelity Investments (2002-present). Previously, Ms. Prior served as Vice Chairman of FIAM LLC (investment adviser firm, 2014-2018), a Director of FMR Investment Management (UK) Limited (investment adviser firm, 2015-2018), President Multi-Asset Class Strategies of FMR's Global Asset Allocation Division (2017-2018), Vice President of Fidelity's Money Market Funds (2012-2014), and President, Money Market and Short Duration Bond Group of Fidelity Management & Research Company (FMR) (investment adviser firm, 2013-2014).
Stacie M. Smith (1974)
Year of Election or Appointment: 2013
Assistant Treasurer
Ms. Smith also serves as an officer of other funds. Ms. Smith serves as Assistant Treasurer of FMR Capital, Inc. (2017-present), is an employee of Fidelity Investments (2009-present), and has served in other fund officer roles. Prior to joining Fidelity Investments, Ms. Smith served as Senior Audit Manager of Ernst & Young LLP (accounting firm, 1996-2009). Previously, Ms. Smith served as Assistant Treasurer (2013-2018) and Deputy Treasurer (2013-2016) of certain Fidelity® funds.
Marc L. Spector (1972)
Year of Election or Appointment: 2016
Deputy Treasurer
Mr. Spector also serves as an officer of other funds. Mr. Spector serves as Assistant Treasurer of FMR Capital, Inc. (2017-present) and is an employee of Fidelity Investments (2016-present). Prior to joining Fidelity Investments, Mr. Spector served as Director at the Siegfried Group (accounting firm, 2013-2016), and prior to Siegfried Group as audit senior manager at Deloitte & Touche (accounting firm, 2005-2013).
Jim Wegmann (1979)
Year of Election or Appointment: 2019
Assistant Treasurer
Mr. Wegmann also serves as Assistant Treasurer of other funds. Mr. Wegmann is an employee of Fidelity Investments (2011-present).
Shareholder Expense Example
As a shareholder of the Fund, you incur two types of costs: (1) transaction costs and (2) ongoing costs, including management fees and other Fund expenses. This Example is intended to help you understand your ongoing costs (in dollars) of investing in the Fund and to compare these costs with the ongoing costs of investing in other mutual funds.
The Example is based on an investment of $1,000 invested at the beginning of the period and held for the entire period (March 1, 2019 to August 31, 2019).
Actual Expenses
The first line of the accompanying table provides information about actual account values and actual expenses. You may use the information in this line, together with the amount you invested, to estimate the expenses that you paid over the period. Simply divide your account value by $1,000.00 (for example, an $8,600 account value divided by $1,000.00 = 8.6), then multiply the result by the number in the first line under the heading entitled "Expenses Paid During Period" to estimate the expenses you paid on your account during this period. In addition, the Fund, as a shareholder in the underlying Fidelity Central Funds, will indirectly bear its pro-rata share of the fees and expenses incurred by the underlying Fidelity Central Funds. These fees and expenses are not included in the Fund's annualized expense ratio used to calculate the expense estimate in the table below.
Hypothetical Example for Comparison Purposes
The second line of the accompanying table provides information about hypothetical account values and hypothetical expenses based on the Fund's actual expense ratio and an assumed rate of return of 5% per year before expenses, which is not the Fund's actual return. The hypothetical account values and expenses may not be used to estimate the actual ending account balance or expenses you paid for the period. You may use this information to compare the ongoing costs of investing in the Fund and other funds. To do so, compare this 5% hypothetical example with the 5% hypothetical examples that appear in the shareholder reports of the other funds. In addition, the Fund, as a shareholder in the underlying Fidelity Central Funds, will indirectly bear its pro-rata share of the fees and expenses incurred by the underlying Fidelity Central Funds. These fees and expenses are not included in the Fund's annualized expense ratio used to calculate the expense estimate in the table below.
Please note that the expenses shown in the table are meant to highlight your ongoing costs only and do not reflect any transaction costs. Therefore, the second line of the table is useful in comparing ongoing costs only, and will not help you determine the relative total costs of owning different funds.
| | Annualized Expense Ratio-A | Beginning
Account Value
March 1, 2019 | Ending
Account Value
August 31, 2019 | Expenses Paid
During Period-B
March 1, 2019
to August 31, 2019 |
| Fidelity Sustainability Bond Index Fund | .10% | | | |
| Actual | | $1,000.00 | $1,077.60 | $.52 |
| Hypothetical-C | | $1,000.00 | $1,024.70 | $.51 |
A Annualized expense ratio reflects expenses net of applicable fee waivers.
B Expenses are equal to the Fund's annualized expense ratio, multiplied by the average account value over the period, multiplied by 184/365 (to reflect the one-half year period).
C 5% return per year before expenses
Distributions (Unaudited)
The Board of Trustees of Fidelity Sustainability Bond Index Fund voted to pay on October 14, 2019, to shareholders of record at the opening of business on October 11, 2019, a distribution of $0.03 per share derived from capital gains realized from sales of portfolio securities.
The fund hereby designates as a capital gain dividend with respect to the taxable year ended August 31, 2019, $42,137, or, if subsequently determined to be different, the net capital gain of such year.
A total of 37.23% of the dividends distributed during the fiscal year was derived from interest on U.S. Government securities which is generally exempt from state income tax.
The fund designates $1,074,757 of distributions paid during the period January 1, 2019 to August 31, 2019 as qualifying to be taxed as interest-related dividends for nonresident alien shareholders.
The fund will notify shareholders in January 2020 of amounts for use in preparing 2019 income tax returns.
SBI-I-ANN-1019
1.9887301.101
Fidelity® Series Corporate Bond Fund
Annual Report August 31, 2019 |
|
Beginning on January 1, 2021, as permitted by regulations adopted by the Securities and Exchange Commission, paper copies of a fund’s shareholder reports will no longer be sent by mail, unless you specifically request paper copies of the reports from the fund or from your financial intermediary, such as a financial advisor, broker-dealer or bank. Instead, the reports will be made available on a website, and you will be notified by mail each time a report is posted and provided with a website link to access the report.
If you already elected to receive shareholder reports electronically, you will not be affected by this change and you need not take any action. You may elect to receive shareholder reports and other communications from a fund electronically, by contacting your financial intermediary. For Fidelity customers, visit Fidelity's web site or call Fidelity using the contact information listed below.
You may elect to receive all future reports in paper free of charge. If you wish to continue receiving paper copies of your shareholder reports, you may contact your financial intermediary or, if you are a Fidelity customer, visit Fidelity’s website, or call Fidelity at the applicable toll-free number listed below. Your election to receive reports in paper will apply to all funds held with the fund complex/your financial intermediary.
| Account Type | Website | Phone Number |
| Brokerage, Mutual Fund, or Annuity Contracts: | fidelity.com/mailpreferences | 1-800-343-3548 |
| Employer Provided Retirement Accounts: | netbenefits.fidelity.com/preferences (choose 'no' under Required Disclosures to continue to print) | 1-800-343-0860 |
| Advisor Sold Accounts Serviced Through Your Financial Intermediary: | Contact Your Financial Intermediary | Your Financial Intermediary's phone number |
| Advisor Sold Accounts Serviced by Fidelity: | institutional.fidelity.com | 1-877-208-0098 |
Contents
To view a fund's proxy voting guidelines and proxy voting record for the 12-month period ended June 30, visit http://www.fidelity.com/proxyvotingresults or visit the Securities and Exchange Commission's (SEC) web site at http://www.sec.gov.
You may also call 1-800-544-8544 to request a free copy of the proxy voting guidelines.
Standard & Poor's, S&P and S&P 500 are registered service marks of The McGraw-Hill Companies, Inc. and have been licensed for use by Fidelity Distributors Corporation.
Other third-party marks appearing herein are the property of their respective owners.
All other marks appearing herein are registered or unregistered trademarks or service marks of FMR LLC or an affiliated company. © 2019 FMR LLC. All rights reserved.
This report and the financial statements contained herein are submitted for the general information of the shareholders of the Fund. This report is not authorized for distribution to prospective investors in the Fund unless preceded or accompanied by an effective prospectus.
A fund files its complete schedule of portfolio holdings with the SEC for the first and third quarters of each fiscal year on Form N-PORT. Forms N-PORT are available on the SEC’s web site at http://www.sec.gov. A fund's Forms N-PORT may be reviewed and copied at the SEC’s Public Reference Room in Washington, DC. Information regarding the operation of the SEC's Public Reference Room may be obtained by calling 1-800-SEC-0330.
For a complete list of a fund's portfolio holdings, view the most recent holdings listing, semiannual report, or annual report on Fidelity's web site at http://www.fidelity.com, http://www.institutional.fidelity.com, or http://www.401k.com, as applicable.
NOT FDIC INSURED •MAY LOSE VALUE •NO BANK GUARANTEE
Neither the Fund nor Fidelity Distributors Corporation is a bank.
Performance: The Bottom Line
Average annual total return reflects the change in the value of an investment, assuming reinvestment of distributions from dividend income and capital gains (the profits earned upon the sale of securities that have grown in value, if any) and assuming a constant rate of performance each year. The hypothetical investment and the average annual total returns do not reflect the deduction of taxes that a shareholder would pay on fund distributions or the redemption of fund shares. During periods of reimbursement by Fidelity, a fund’s total return will be greater than it would be had the reimbursement not occurred. How a fund did yesterday is no guarantee of how it will do tomorrow.
Average Annual Total Returns
| For the periods ended August 31, 2019 | Past 1 year | Life of fundA |
| Fidelity® Series Corporate Bond Fund | 13.38% | 12.45% |
A From August 17, 2018
$10,000 Over Life of Fund
Let's say hypothetically that $10,000 was invested in Fidelity® Series Corporate Bond Fund on August 17, 2018, when the fund started.
The chart shows how the value of your investment would have changed, and also shows how the Bloomberg Barclays U.S. Credit Bond Index performed over the same period.
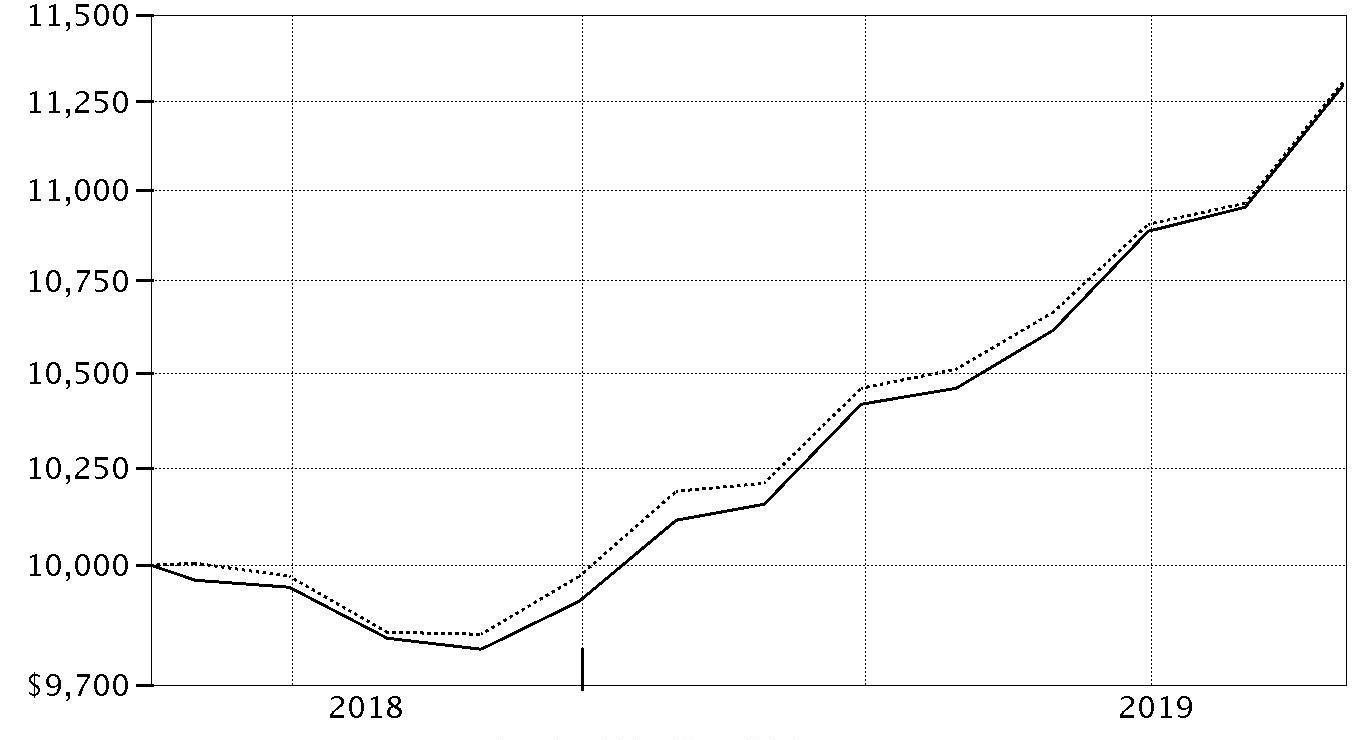
| Period Ending Values |
| $11,296 | Fidelity® Series Corporate Bond Fund |
| $11,305 | Bloomberg Barclays U.S. Credit Bond Index |
Management's Discussion of Fund Performance
Market Recap: For the 12 months ending August 31, 2019, U.S. taxable investment-grade bonds posted their strongest trailing one-year return since 2009, driven by slower global economic growth, a maturing business cycle, trade uncertainty and, late in the period, the Fed’s dovish shift. The Bloomberg Barclays U.S. Aggregate Bond Index gained 10.17%. Market yields rose in the early fall of 2018, on expectations for higher inflation. Yields then declined and credit spreads widened in November and December, partly because of weaker U.S. manufacturing data. Yield spreads narrowed in January, as the U.S. Federal Reserve said it would be “patient” with policy rate hikes, and that future increases largely would depend on economic data. Yields continued to decline in the spring, amid international trade tension and attacks on oil tankers in the Middle East, and then tumbled further in July, when the Fed cut interest rates for the first time since 2008. The yield curve ended the period roughly flat, amid expectations for another rate cut of 25 basis points in September. Within the Bloomberg Barclays index, corporate bonds gained 13.33%, topping the 10.38% advance of U.S. Treasuries. Outside the index, U.S. corporate high-yield bonds lagged nominal U.S. Treasuries, while Treasury Inflation-Protected Securities (TIPS) gained 7.46%.
Comments from Co-Portfolio Managers David Prothro and Matthew Bartlett: For the fiscal year, the fund gained 13.38%, outpacing the 12.99% return of the benchmark Bloomberg Barclays U.S. Credit Bond Index. Security selection among investment-grade corporate bonds contributed versus the benchmark the past 12 months, whereas sector positioning modestly detracted. Picks within industrials helped relative performance most, led by holdings among communications, consumer-related, technology and transportation companies. Within financials, selections among banks also notably contributed. Picks among electric utilities provided a further boost on a relative basis. On the downside – and outside of corporate credit – holding a modest out-of-benchmark stake in U.S. Treasuries and underweighting non-U.S. sovereign bonds each detracted, as did the fund’s small cash position. The fund normally holds Treasuries and cash for liquidity and duration-management purposes. As of August 31, we think the market’s fundamental backdrop and supply-and-demand dynamics remain generally supportive. We have a more neutral view toward bond valuations, given relatively tight credit spreads. We continue to favor select BBB-rated issues of companies that are focusing on strengthening their credit quality.
The views expressed above reflect those of the portfolio manager(s) only through the end of the period as stated on the cover of this report and do not necessarily represent the views of Fidelity or any other person in the Fidelity organization. Any such views are subject to change at any time based upon market or other conditions and Fidelity disclaims any responsibility to update such views. These views may not be relied on as investment advice and, because investment decisions for a Fidelity fund are based on numerous factors, may not be relied on as an indication of trading intent on behalf of any Fidelity fund.
Note to Shareholders: On October 1, 2019, Ben Tarlow assumed co-management responsibilities for the fund, joining David Prothro and Matthew Bartlett.
Investment Summary (Unaudited)
Quality Diversification (% of fund's net assets)
| As of August 31, 2019 |
| | U.S. Government and U.S. Government Agency Obligations | 5.1% |
| | AA | 0.9% |
| | A | 16.8% |
| | BBB | 64.7% |
| | BB and Below | 6.0% |
| | Short-Term Investments and Net Other Assets | 6.5% |
We have used ratings from Moody's Investors Service, Inc. Where Moody's® ratings are not available, we have used S&P® ratings. All ratings are as of the date indicated and do not reflect subsequent changes.
Asset Allocation (% of fund's net assets)
| As of August 31, 2019* |
| | Corporate Bonds | 87.0% |
| | U.S. Government and U.S. Government Agency Obligations | 5.1% |
| | Municipal Bonds | 0.1% |
| | Other Investments | 1.3% |
| | Short-Term Investments and Net Other Assets (Liabilities) | 6.5% |

* Foreign investments - 18.9%
Schedule of Investments August 31, 2019
Showing Percentage of Net Assets
| Nonconvertible Bonds - 87.0% | | | |
| | | Principal Amount | Value |
| COMMUNICATION SERVICES - 8.3% | | | |
| Diversified Telecommunication Services - 3.1% | | | |
| AT&T, Inc.: | | | |
| 4.35% 3/1/29 | | $900,000 | $1,006,335 |
| 4.5% 3/9/48 | | 450,000 | 491,187 |
| 4.9% 6/15/42 | | 250,000 | 282,796 |
| Verizon Communications, Inc.: | | | |
| 3.125% 3/16/22 | | 120,000 | 123,704 |
| 4.016% 12/3/29 (a) | | 800,000 | 903,597 |
| 4.522% 9/15/48 | | 500,000 | 602,130 |
| | | | 3,409,749 |
| Entertainment - 0.4% | | | |
| The Walt Disney Co. 4.75% 9/15/44 (a) | | 320,000 | 419,533 |
| Interactive Media & Services - 0.3% | | | |
| Tencent Holdings Ltd. 3.575% 4/11/26 (a) | | 260,000 | 273,678 |
| Media - 3.5% | | | |
| Charter Communications Operating LLC/Charter Communications Operating Capital Corp.: | | | |
| 5.05% 3/30/29 | | 900,000 | 1,017,440 |
| 5.75% 4/1/48 | | 100,000 | 116,670 |
| Comcast Corp.: | | | |
| 3.125% 7/15/22 | | 417,000 | 431,857 |
| 4.15% 10/15/28 | | 1,075,000 | 1,219,649 |
| 4.95% 10/15/58 | | 60,000 | 77,906 |
| COX Communications, Inc. 3.15% 8/15/24 (a) | | 100,000 | 103,049 |
| Fox Corp.: | | | |
| 3.666% 1/25/22 (a) | | 2,000 | 2,073 |
| 4.03% 1/25/24 (a) | | 3,000 | 3,213 |
| 4.709% 1/25/29 (a) | | 4,000 | 4,634 |
| 5.476% 1/25/39 (a) | | 504,000 | 629,757 |
| 5.576% 1/25/49 (a) | | 3,000 | 3,903 |
| Time Warner Cable, Inc. 5.875% 11/15/40 | | 250,000 | 284,596 |
| | | | 3,894,747 |
| Wireless Telecommunication Services - 1.0% | | | |
| Rogers Communications, Inc. 5% 3/15/44 | | 270,000 | 336,794 |
| Vodafone Group PLC 4.375% 5/30/28 | | 700,000 | 785,273 |
| | | | 1,122,067 |
|
| TOTAL COMMUNICATION SERVICES | | | 9,119,774 |
|
| CONSUMER DISCRETIONARY - 6.8% | | | |
| Automobiles - 2.1% | | | |
| Daimler Finance North America LLC 3.35% 2/22/23 (a) | | 650,000 | 669,949 |
| General Motors Financial Co., Inc.: | | | |
| 3.55% 7/8/22 | | 450,000 | 461,320 |
| 4.15% 6/19/23 | | 400,000 | 417,751 |
| Volkswagen Group of America Finance LLC 4.75% 11/13/28 (a) | | 700,000 | 785,612 |
| | | | 2,334,632 |
| Hotels, Restaurants & Leisure - 2.0% | | | |
| McDonald's Corp.: | | | |
| 3.625% 9/1/49 | | 600,000 | 623,819 |
| 4.875% 12/9/45 | | 470,000 | 579,428 |
| Starbucks Corp.: | | | |
| 3.55% 8/15/29 | | 250,000 | 273,545 |
| 3.8% 8/15/25 | | 580,000 | 629,010 |
| 4% 11/15/28 | | 100,000 | 113,015 |
| | | | 2,218,817 |
| Multiline Retail - 0.9% | | | |
| Dollar Tree, Inc.: | | | |
| 4% 5/15/25 | | 500,000 | 528,558 |
| 4.2% 5/15/28 | | 375,000 | 399,624 |
| | | | 928,182 |
| Specialty Retail - 1.8% | | | |
| AutoZone, Inc. 3.125% 4/18/24 | | 600,000 | 622,124 |
| Lowe's Companies, Inc.: | | | |
| 3.65% 4/5/29 | | 475,000 | 516,109 |
| 4.375% 9/15/45 | | 159,000 | 177,366 |
| O'Reilly Automotive, Inc.: | | | |
| 3.55% 3/15/26 | | 75,000 | 79,469 |
| 3.9% 6/1/29 | | 490,000 | 538,784 |
| 4.35% 6/1/28 | | 75,000 | 84,149 |
| | | | 2,018,001 |
|
| TOTAL CONSUMER DISCRETIONARY | | | 7,499,632 |
|
| CONSUMER STAPLES - 5.7% | | | |
| Beverages - 1.8% | | | |
| Anheuser-Busch InBev Worldwide, Inc.: | | | |
| 4.6% 4/15/48 | | 700,000 | 813,732 |
| 4.9% 1/23/31 | | 525,000 | 628,741 |
| Constellation Brands, Inc. 3.15% 8/1/29 | | 500,000 | 515,944 |
| | | | 1,958,417 |
| Food Products - 0.9% | | | |
| Conagra Brands, Inc.: | | | |
| 3.8% 10/22/21 | | 50,000 | 51,442 |
| 4.6% 11/1/25 | | 70,000 | 77,274 |
| 4.85% 11/1/28 | | 750,000 | 859,144 |
| | | | 987,860 |
| Tobacco - 3.0% | | | |
| Altria Group, Inc.: | | | |
| 4.25% 8/9/42 | | 14,000 | 14,432 |
| 4.8% 2/14/29 | | 607,000 | 687,339 |
| BAT Capital Corp. 3.557% 8/15/27 | | 700,000 | 717,362 |
| Imperial Tobacco Finance PLC: | | | |
| 3.5% 7/26/26 (a) | | 500,000 | 508,304 |
| 3.75% 7/21/22 (a) | | 900,000 | 930,932 |
| Reynolds American, Inc. 4.45% 6/12/25 | | 425,000 | 460,219 |
| | | | 3,318,588 |
|
| TOTAL CONSUMER STAPLES | | | 6,264,865 |
|
| ENERGY - 8.4% | | | |
| Oil, Gas & Consumable Fuels - 8.4% | | | |
| Alberta Energy Co. Ltd. 8.125% 9/15/30 | | 409,000 | 555,269 |
| Boardwalk Pipelines LP 3.375% 2/1/23 | | 100,000 | 101,288 |
| Canadian Natural Resources Ltd. 6.25% 3/15/38 | | 375,000 | 480,869 |
| Cenovus Energy, Inc. 4.25% 4/15/27 | | 1,100,000 | 1,148,680 |
| Cheniere Corpus Christi Holdings LLC 5.875% 3/31/25 | | 485,000 | 540,775 |
| DCP Midstream Operating LP: | | | |
| 3.875% 3/15/23 | | 500,000 | 506,250 |
| 5.125% 5/15/29 | | 450,000 | 461,273 |
| Enbridge, Inc. 4.5% 6/10/44 | | 250,000 | 275,045 |
| Energy Transfer Partners LP: | | | |
| 4.25% 3/15/23 | | 450,000 | 472,630 |
| 4.95% 6/15/28 | | 650,000 | 727,124 |
| Enterprise Products Operating LP 5.1% 2/15/45 | | 375,000 | 449,045 |
| Marathon Petroleum Corp. 4.75% 9/15/44 | | 300,000 | 323,406 |
| Occidental Petroleum Corp.: | | | |
| 3 month U.S. LIBOR + 0.950% 3.137% 2/8/21 (b)(c) | | 92,000 | 92,420 |
| 3 month U.S. LIBOR + 1.250% 3.437% 8/13/21 (b)(c) | | 107,000 | 107,420 |
| 3 month U.S. LIBOR + 1.450% 3.637% 8/15/22 (b)(c) | | 675,000 | 677,291 |
| 2.6% 8/13/21 | | 28,000 | 28,186 |
| 2.7% 8/15/22 | | 25,000 | 25,246 |
| 2.9% 8/15/24 | | 83,000 | 83,776 |
| 3.2% 8/15/26 | | 11,000 | 11,114 |
| 4.3% 8/15/39 | | 5,000 | 5,232 |
| 4.4% 8/15/49 | | 5,000 | 5,215 |
| Petroleos Mexicanos 6.875% 8/4/26 | | 75,000 | 78,638 |
| Phillips 66 Co. 4.875% 11/15/44 | | 300,000 | 359,359 |
| Plains All American Pipeline LP/PAA Finance Corp. 4.65% 10/15/25 | | 619,000 | 663,800 |
| The Williams Companies, Inc. 4.55% 6/24/24 | | 400,000 | 433,230 |
| Western Gas Partners LP 5.375% 6/1/21 | | 700,000 | 723,804 |
| | | | 9,336,385 |
| FINANCIALS - 31.4% | | | |
| Banks - 15.5% | | | |
| AIB Group PLC: | | | |
| 4.263% 4/10/25 (a)(b) | | 250,000 | 260,978 |
| 4.75% 10/12/23 (a) | | 1,000,000 | 1,059,037 |
| Bank Ireland Group PLC 4.5% 11/25/23 (a) | | 200,000 | 209,987 |
| Bank of America Corp.: | | | |
| 3.004% 12/20/23 (b) | | 450,000 | 461,811 |
| 3.95% 4/21/25 | | 1,100,000 | 1,174,476 |
| 4.271% 7/23/29 (b) | | 700,000 | 790,097 |
| Barclays PLC 3.65% 3/16/25 | | 1,000,000 | 1,018,660 |
| BNP Paribas SA 4.705% 1/10/25 (a)(b) | | 700,000 | 758,551 |
| BPCE SA 4.875% 4/1/26 (a) | | 200,000 | 219,767 |
| Citigroup, Inc.: | | | |
| 2.876% 7/24/23 (b) | | 750,000 | 762,888 |
| 4.075% 4/23/29 (b) | | 600,000 | 664,308 |
| 4.4% 6/10/25 | | 400,000 | 434,060 |
| 4.5% 1/14/22 | | 100,000 | 105,509 |
| Citizens Bank NA 3.7% 3/29/23 | | 800,000 | 842,322 |
| Citizens Financial Group, Inc. 4.35% 8/1/25 | | 165,000 | 176,875 |
| Credit Suisse Group Funding Guernsey Ltd. 3.75% 3/26/25 | | 1,150,000 | 1,215,560 |
| Fifth Third Bancorp 8.25% 3/1/38 | | 300,000 | 465,905 |
| HSBC Holdings PLC 3 month U.S. LIBOR + 0.650% 3.0858% 9/11/21 (b)(c) | | 600,000 | 600,541 |
| JPMorgan Chase & Co.: | | | |
| 3.882% 7/24/38 (b) | | 475,000 | 532,505 |
| 4.203% 7/23/29 (b) | | 600,000 | 677,259 |
| Mitsubishi UFJ Financial Group, Inc.: | | | |
| 2.998% 2/22/22 | | 100,000 | 101,942 |
| 3.218% 3/7/22 | | 400,000 | 410,375 |
| Rabobank Nederland: | | | |
| 3.75% 7/21/26 | | 300,000 | 314,095 |
| 4.625% 12/1/23 | | 750,000 | 810,866 |
| Regions Financial Corp. 3.8% 8/14/23 | | 10,000 | 10,584 |
| Royal Bank of Scotland Group PLC 6.1% 6/10/23 | | 450,000 | 488,039 |
| Santander Holdings U.S.A., Inc. 4.45% 12/3/21 | | 650,000 | 678,177 |
| Societe Generale SA 3.875% 3/28/24 (a) | | 700,000 | 737,963 |
| Standard Chartered PLC 3.785% 5/21/25 (a)(b) | | 630,000 | 650,229 |
| Sumitomo Mitsui Financial Group, Inc. 2.442% 10/19/21 | | 100,000 | 100,606 |
| SunTrust Bank 3.2% 4/1/24 | | 100,000 | 104,865 |
| ZB, National Association 3.5% 8/27/21 | | 250,000 | 255,782 |
| | | | 17,094,619 |
| Capital Markets - 3.9% | | | |
| Ares Capital Corp. 4.25% 3/1/25 | | 75,000 | 77,774 |
| Deutsche Bank AG New York Branch 4.25% 10/14/21 | | 500,000 | 508,483 |
| E*TRADE Financial Corp. 4.5% 6/20/28 | | 75,000 | 82,414 |
| Goldman Sachs Group, Inc.: | | | |
| 4.223% 5/1/29 (b) | | 900,000 | 995,496 |
| 5.25% 7/27/21 | | 100,000 | 105,661 |
| Morgan Stanley: | | | |
| 4.35% 9/8/26 | | 1,085,000 | 1,188,059 |
| 4.431% 1/23/30 (b) | | 111,000 | 126,677 |
| 5% 11/24/25 | | 552,000 | 622,823 |
| UBS Group AG 3 month U.S. LIBOR + 1.468% 3.126% 8/13/30 (a)(b)(c) | | 613,000 | 627,734 |
| | | | 4,335,121 |
| Consumer Finance - 4.7% | | | |
| AerCap Ireland Capital Ltd./AerCap Global Aviation Trust 4.125% 7/3/23 | | 850,000 | 901,692 |
| Ally Financial, Inc. 4.125% 2/13/22 | | 700,000 | 726,250 |
| Capital One Financial Corp.: | | | |
| 3.2% 2/5/25 | | 700,000 | 721,932 |
| 3.9% 1/29/24 | | 124,000 | 131,671 |
| Discover Financial Services: | | | |
| 3.75% 3/4/25 | | 600,000 | 631,699 |
| 3.85% 11/21/22 | | 100,000 | 104,891 |
| 4.1% 2/9/27 | | 50,000 | 53,834 |
| Ford Motor Credit Co. LLC: | | | |
| 3.813% 10/12/21 | | 500,000 | 508,378 |
| 5.596% 1/7/22 | | 200,000 | 211,497 |
| John Deere Capital Corp. 2.7% 1/6/23 | | 750,000 | 767,527 |
| Synchrony Financial: | | | |
| 3.95% 12/1/27 | | 75,000 | 77,751 |
| 4.375% 3/19/24 | | 407,000 | 434,743 |
| | | | 5,271,865 |
| Diversified Financial Services - 3.2% | | | |
| AXA Equitable Holdings, Inc. 4.35% 4/20/28 | | 700,000 | 751,575 |
| Brixmor Operating Partnership LP 3.85% 2/1/25 | | 100,000 | 105,110 |
| Cigna Corp.: | | | |
| 3.2% 9/17/20 | | 100,000 | 100,919 |
| 3.4% 9/17/21 | | 18,000 | 18,428 |
| 4.125% 11/15/25 | | 4,000 | 4,352 |
| 4.375% 10/15/28 | | 561,000 | 627,311 |
| 4.8% 8/15/38 | | 307,000 | 354,936 |
| 4.9% 12/15/48 | | 7,000 | 8,284 |
| GE Capital International Funding Co. 2.342% 11/15/20 | | 300,000 | 298,318 |
| General Electric Capital Corp. 5.875% 1/14/38 | | 475,000 | 548,626 |
| Voya Financial, Inc.: | | | |
| 3.125% 7/15/24 | | 75,000 | 77,497 |
| 3.65% 6/15/26 | | 600,000 | 636,938 |
| | | | 3,532,294 |
| Insurance - 4.1% | | | |
| AIA Group Ltd.: | | | |
| 3 month U.S. LIBOR + 0.520% 2.9066% 9/20/21 (a)(b)(c) | | 200,000 | 199,996 |
| 3.6% 4/9/29 (a) | | 700,000 | 759,042 |
| American International Group, Inc. 3.9% 4/1/26 | | 950,000 | 1,019,851 |
| Aon PLC 4.75% 5/15/45 | | 375,000 | 453,670 |
| Hartford Financial Services Group, Inc. 4.3% 4/15/43 | | 275,000 | 310,092 |
| Marsh & McLennan Companies, Inc.: | | | |
| 3.875% 3/15/24 | | 11,000 | 11,801 |
| 4.375% 3/15/29 | | 10,000 | 11,488 |
| 4.9% 3/15/49 | | 434,000 | 563,459 |
| New York Life Insurance Co. 4.45% 5/15/69 (a) | | 54,000 | 65,599 |
| Principal Financial Group, Inc. 3.7% 5/15/29 | | 96,000 | 104,345 |
| Protective Life Global Funding 3.397% 6/28/21 (a) | | 150,000 | 153,289 |
| Swiss Re Finance Luxembourg SA 5% 4/2/49 (a)(b) | | 600,000 | 661,500 |
| Willis Group North America, Inc. 3.6% 5/15/24 | | 186,000 | 193,872 |
| | | | 4,508,004 |
|
| TOTAL FINANCIALS | | | 34,741,903 |
|
| HEALTH CARE - 7.7% | | | |
| Biotechnology - 1.1% | | | |
| AbbVie, Inc. 3.375% 11/14/21 | | 200,000 | 205,022 |
| Celgene Corp.: | | | |
| 3.9% 2/20/28 | | 460,000 | 511,053 |
| 4.55% 2/20/48 | | 425,000 | 521,133 |
| | | | 1,237,208 |
| Health Care Equipment & Supplies - 0.7% | | | |
| Boston Scientific Corp. 4% 3/1/28 | | 700,000 | 770,518 |
| Health Care Providers & Services - 2.5% | | | |
| CVS Health Corp. 4.3% 3/25/28 | | 500,000 | 545,771 |
| Elanco Animal Health, Inc.: | | | |
| 3.912% 8/27/21 | | 100,000 | 101,928 |
| 4.272% 8/28/23 | | 300,000 | 314,221 |
| 4.9% 8/28/28 | | 575,000 | 627,108 |
| HCA Holdings, Inc.: | | | |
| 4.125% 6/15/29 | | 223,000 | 237,611 |
| 5.125% 6/15/39 | | 217,000 | 239,590 |
| 5.25% 6/15/49 | | 240,000 | 267,934 |
| UnitedHealth Group, Inc. 4.75% 7/15/45 | | 350,000 | 435,926 |
| | | | 2,770,089 |
| Life Sciences Tools & Services - 0.3% | | | |
| Thermo Fisher Scientific, Inc. 2.95% 9/19/26 | | 300,000 | 310,229 |
| Pharmaceuticals - 3.1% | | | |
| Actavis Funding SCS 4.55% 3/15/35 | | 75,000 | 80,680 |
| AstraZeneca PLC 6.45% 9/15/37 | | 385,000 | 553,094 |
| Bayer U.S. Finance II LLC 4.25% 12/15/25 (a) | | 700,000 | 754,460 |
| Bristol-Myers Squibb Co.: | | | |
| 3.2% 6/15/26 (a) | | 479,000 | 506,843 |
| 4.125% 6/15/39 (a) | | 138,000 | 160,157 |
| 4.25% 10/26/49 (a) | | 480,000 | 577,369 |
| Mylan NV 4.55% 4/15/28 | | 504,000 | 542,591 |
| Perrigo Finance PLC 3.5% 12/15/21 | | 200,000 | 200,902 |
| | | | 3,376,096 |
|
| TOTAL HEALTH CARE | | | 8,464,140 |
|
| INDUSTRIALS - 5.0% | | | |
| Aerospace & Defense - 0.4% | | | |
| Northrop Grumman Corp. 4.03% 10/15/47 | | 375,000 | 434,172 |
| Airlines - 0.9% | | | |
| American Airlines 2019-1 Class B Pass Through Trust equipment trust certificate 3.85% 8/15/29 | | 220,000 | 223,344 |
| Delta Air Lines, Inc. 3.4% 4/19/21 | | 500,000 | 506,883 |
| United Airlines, Inc. 4.55% 8/25/31 | | 215,000 | 241,666 |
| | | | 971,893 |
| Commercial Services & Supplies - 0.6% | | | |
| Steelcase, Inc. 5.125% 1/18/29 | | 442,000 | 503,896 |
| Waste Management, Inc. 2.95% 6/15/24 | | 197,000 | 204,908 |
| | | | 708,804 |
| Electrical Equipment - 0.1% | | | |
| Rockwell Automation, Inc. 3.5% 3/1/29 | | 70,000 | 77,148 |
| Industrial Conglomerates - 0.8% | | | |
| Roper Technologies, Inc. 3.65% 9/15/23 | | 900,000 | 948,090 |
| Machinery - 0.9% | | | |
| Ingersoll-Rand Luxembourg Finance SA 3.5% 3/21/26 | | 900,000 | 943,796 |
| Westinghouse Air Brake Co. 3 month U.S. LIBOR + 1.050% 3.7103% 9/15/21 (b)(c) | | 14,000 | 14,001 |
| | | | 957,797 |
| Road & Rail - 0.9% | | | |
| CSX Corp. 4.3% 3/1/48 | | 425,000 | 494,282 |
| Norfolk Southern Corp. 5.1% 8/1/18 | | 375,000 | 480,557 |
| | | | 974,839 |
| Trading Companies & Distributors - 0.4% | | | |
| Air Lease Corp.: | | | |
| 3.5% 1/15/22 | | 100,000 | 102,802 |
| 4.25% 2/1/24 | | 364,000 | 388,557 |
| | | | 491,359 |
|
| TOTAL INDUSTRIALS | | | 5,564,102 |
|
| INFORMATION TECHNOLOGY - 3.0% | | | |
| Electronic Equipment & Components - 0.9% | | | |
| Amphenol Corp. 3.125% 9/15/21 | | 117,000 | 118,929 |
| Diamond 1 Finance Corp./Diamond 2 Finance Corp.: | | | |
| 4.42% 6/15/21 (a) | | 100,000 | 103,180 |
| 6.02% 6/15/26 (a) | | 675,000 | 761,804 |
| | | | 983,913 |
| IT Services - 0.3% | | | |
| Fiserv, Inc. 3.5% 7/1/29 | | 271,000 | 287,827 |
| Semiconductors & Semiconductor Equipment - 0.9% | | | |
| Micron Technology, Inc. 4.64% 2/6/24 | | 942,000 | 1,004,278 |
| Software - 0.4% | | | |
| Oracle Corp. 4% 11/15/47 | | 375,000 | 429,306 |
| Technology Hardware, Storage & Peripherals - 0.5% | | | |
| Apple, Inc. 3.85% 8/4/46 | | 500,000 | 575,054 |
|
| TOTAL INFORMATION TECHNOLOGY | | | 3,280,378 |
|
| MATERIALS - 1.6% | | | |
| Chemicals - 1.5% | | | |
| LYB International Finance II BV 3.5% 3/2/27 | | 550,000 | 567,899 |
| Sherwin-Williams Co. 4.5% 6/1/47 | | 375,000 | 426,859 |
| The Dow Chemical Co.: | | | |
| 3.625% 5/15/26 (a) | | 625,000 | 657,383 |
| 4.55% 11/30/25 (a) | | 18,000 | 19,850 |
| | | | 1,671,991 |
| Containers & Packaging - 0.1% | | | |
| Avery Dennison Corp. 4.875% 12/6/28 | | 50,000 | 57,005 |
|
| TOTAL MATERIALS | | | 1,728,996 |
|
| REAL ESTATE - 3.5% | | | |
| Equity Real Estate Investment Trusts (REITs) - 3.4% | | | |
| DDR Corp. 4.625% 7/15/22 | | 32,000 | 33,552 |
| Hudson Pacific Properties LP 3.95% 11/1/27 | | 700,000 | 747,804 |
| Omega Healthcare Investors, Inc. 4.5% 1/15/25 | | 600,000 | 634,340 |
| Ventas Realty LP 4.4% 1/15/29 | | 650,000 | 730,000 |
| Welltower, Inc.: | | | |
| 3.625% 3/15/24 | | 10,000 | 10,535 |
| 4.125% 3/15/29 | | 675,000 | 744,377 |
| WP Carey, Inc.: | | | |
| 4.25% 10/1/26 | | 450,000 | 485,597 |
| 4.6% 4/1/24 | | 375,000 | 403,344 |
| | | | 3,789,549 |
| Real Estate Management & Development - 0.1% | | | |
| Mid-America Apartments LP 3.95% 3/15/29 | | 100,000 | 110,386 |
|
| TOTAL REAL ESTATE | | | 3,899,935 |
|
| UTILITIES - 5.6% | | | |
| Electric Utilities - 2.5% | | | |
| Cleco Corporate Holdings LLC 3.743% 5/1/26 | | 990,000 | 1,032,814 |
| Duquesne Light Holdings, Inc. 3.616% 8/1/27 (a) | | 560,000 | 576,832 |
| Exelon Corp. 5.1% 6/15/45 | | 370,000 | 464,363 |
| Florida Power & Light Co. 3 month U.S. LIBOR + 0.400% 2.6393% 5/6/22 (b)(c) | | 201,000 | 201,054 |
| Nevada Power Co. 3.7% 5/1/29 | | 75,000 | 83,270 |
| NextEra Energy Capital Holdings, Inc. 3.25% 4/1/26 | | 370,000 | 386,730 |
| | | | 2,745,063 |
| Gas Utilities - 0.3% | | | |
| Southern Co. Gas Capital Corp. 4.4% 5/30/47 | | 325,000 | 370,521 |
| Independent Power and Renewable Electricity Producers - 0.8% | | | |
| Emera U.S. Finance LP 3.55% 6/15/26 | | 800,000 | 844,321 |
| Multi-Utilities - 2.0% | | | |
| Dominion Energy, Inc. 4.25% 6/1/28 | | 775,000 | 863,769 |
| NiSource Finance Corp. 3.49% 5/15/27 | | 100,000 | 106,109 |
| NiSource, Inc. 3.65% 6/15/23 | | 650,000 | 677,924 |
| Sempra Energy 3.8% 2/1/38 | | 600,000 | 629,750 |
| | | | 2,277,552 |
|
| TOTAL UTILITIES | | | 6,237,457 |
|
| TOTAL NONCONVERTIBLE BONDS | | | |
| (Cost $89,721,001) | | | 96,137,567 |
|
| U.S. Treasury Obligations - 5.1% | | | |
| U.S. Treasury Bonds: | | | |
| 2.5% 2/15/46 | | $3,881,000 | $4,311,391 |
| 3% 8/15/48 | | 1,085,000 | 1,332,812 |
| TOTAL U.S. TREASURY OBLIGATIONS | | | |
| (Cost $5,131,560) | | | 5,644,203 |
|
| Municipal Securities - 0.1% | | | |
| California Gen. Oblig. Series 2009, 7.55% 4/1/39 | | | |
| (Cost $110,908) | | 75,000 | 125,755 |
|
| Foreign Government and Government Agency Obligations - 0.2% | | | |
State of Qatar 3.375% 3/14/24
(Cost $199,799)(a) | | $200,000 | $211,813 |
|
| Bank Notes - 1.1% | | | |
| Compass Bank: | | | |
| 2.875% 6/29/22 | | $250,000 | $254,291 |
| 3.5% 6/11/21 | | 900,000 | 916,572 |
| TOTAL BANK NOTES | | | |
| (Cost $1,158,622) | | | 1,170,863 |
| | | Shares | Value |
|
| Money Market Funds - 3.5% | | | |
| Fidelity Cash Central Fund 2.13% (d) | | | |
| (Cost $3,816,427) | | 3,815,674 | 3,816,437 |
| TOTAL INVESTMENT IN SECURITIES - 97.0% | | | |
| (Cost $100,138,317) | | | 107,106,638 |
| NET OTHER ASSETS (LIABILITIES) - 3.0% | | | 3,358,775 |
| NET ASSETS - 100% | | | $110,465,413 |
Legend
(a) Security exempt from registration under Rule 144A of the Securities Act of 1933. These securities may be resold in transactions exempt from registration, normally to qualified institutional buyers. At the end of the period, the value of these securities amounted to $15,931,597 or 14.4% of net assets.
(b) Coupon rates for floating and adjustable rate securities reflect the rates in effect at period end.
(c) Coupon is indexed to a floating interest rate which may be multiplied by a specified factor and/or subject to caps or floors.
(d) Affiliated fund that is generally available only to investment companies and other accounts managed by Fidelity Investments. The rate quoted is the annualized seven-day yield of the fund at period end. A complete unaudited listing of the fund's holdings as of its most recent quarter end is available upon request. In addition, each Fidelity Central Fund's financial statements, which are not covered by the Fund's Report of Independent Registered Public Accounting Firm, are available on the SEC's website or upon request.
Affiliated Central Funds
Information regarding fiscal year to date income earned by the Fund from investments in Fidelity Central Funds is as follows:
| Fund | Income earned |
| Fidelity Cash Central Fund | $72,275 |
| Total | $72,275 |
Amounts in the income column in the above table include any capital gain distributions from underlying funds, which are presented in the corresponding line-item in the Statement of Operations, if applicable.
Investment Valuation
The following is a summary of the inputs used, as of August 31, 2019, involving the Fund's assets and liabilities carried at fair value. The inputs or methodology used for valuing securities may not be an indication of the risk associated with investing in those securities. For more information on valuation inputs, and their aggregation into the levels used below, please refer to the Investment Valuation section in the accompanying Notes to Financial Statements.
| | Valuation Inputs at Reporting Date: |
| Description | Total | Level 1 | Level 2 | Level 3 |
| Investments in Securities: | | | | |
| Corporate Bonds | $96,137,567 | $-- | $96,137,567 | $-- |
| U.S. Government and Government Agency Obligations | 5,644,203 | -- | 5,644,203 | -- |
| Municipal Securities | 125,755 | -- | 125,755 | -- |
| Foreign Government and Government Agency Obligations | 211,813 | -- | 211,813 | -- |
| Bank Notes | 1,170,863 | -- | 1,170,863 | -- |
| Money Market Funds | 3,816,437 | 3,816,437 | -- | -- |
| Total Investments in Securities: | $107,106,638 | $3,816,437 | $103,290,201 | $-- |
Other Information
Distribution of investments by country or territory of incorporation, as a percentage of Total Net Assets, is as follows (Unaudited):
| United States of America | 81.1% |
| United Kingdom | 5.3% |
| Ireland | 2.7% |
| Canada | 2.4% |
| France | 1.6% |
| Luxembourg | 1.6% |
| Netherlands | 1.5% |
| Bailiwick of Guernsey | 1.1% |
| Others (Individually Less Than 1%) | 2.7% |
| | 100.0% |
See accompanying notes which are an integral part of the financial statements.
Financial Statements
Statement of Assets and Liabilities
| | | August 31, 2019 |
| Assets | | |
Investment in securities, at value — See accompanying schedule:
Unaffiliated issuers (cost $96,321,890) | $103,290,201 | |
| Fidelity Central Funds (cost $3,816,427) | 3,816,437 | |
| Total Investment in Securities (cost $100,138,317) | | $107,106,638 |
| Receivable for fund shares sold | | 5,568,414 |
| Interest receivable | | 1,055,144 |
| Distributions receivable from Fidelity Central Funds | | 7,663 |
| Total assets | | 113,737,859 |
| Liabilities | | |
| Payable for investments purchased | $1,887,246 | |
| Payable for fund shares redeemed | 1,383,733 | |
| Distributions payable | 10 | |
| Other payables and accrued expenses | 1,457 | |
| Total liabilities | | 3,272,446 |
| Net Assets | | $110,465,413 |
| Net Assets consist of: | | |
| Paid in capital | | $103,252,066 |
| Total distributable earnings (loss) | | 7,213,347 |
| Net Assets, for 10,192,460 shares outstanding | | $110,465,413 |
| Net Asset Value, offering price and redemption price per share ($110,465,413 ÷ 10,192,460 shares) | | $10.84 |
See accompanying notes which are an integral part of the financial statements.
Statement of Operations
| | | Year ended August 31, 2019 |
| Investment Income | | |
| Interest | | $1,720,807 |
| Income from Fidelity Central Funds | | 72,275 |
| Total income | | 1,793,082 |
| Expenses | | |
| Custodian fees and expenses | $2,372 | |
| Independent trustees' fees and expenses | 158 | |
| Commitment fees | 61 | |
| Total expenses before reductions | 2,591 | |
| Expense reductions | (268) | |
| Total expenses after reductions | | 2,323 |
| Net investment income (loss) | | 1,790,759 |
| Realized and Unrealized Gain (Loss) | | |
| Net realized gain (loss) on: | | |
| Investment securities: | | |
| Unaffiliated issuers | 250,067 | |
| Fidelity Central Funds | (10) | |
| Total net realized gain (loss) | | 250,057 |
| Change in net unrealized appreciation (depreciation) on: | | |
| Investment securities: | | |
| Unaffiliated issuers | 7,024,458 | |
| Fidelity Central Funds | 10 | |
| Total change in net unrealized appreciation (depreciation) | | 7,024,468 |
| Net gain (loss) | | 7,274,525 |
| Net increase (decrease) in net assets resulting from operations | | $9,065,284 |
See accompanying notes which are an integral part of the financial statements.
Statement of Changes in Net Assets
| | Year ended August 31, 2019 | For the period
August 17, 2018 (commencement of operations) to August 31, 2018 |
| Increase (Decrease) in Net Assets | | |
| Operations | | |
| Net investment income (loss) | $1,790,759 | $12,759 |
| Net realized gain (loss) | 250,057 | 6,243 |
| Change in net unrealized appreciation (depreciation) | 7,024,468 | (56,147) |
| Net increase (decrease) in net assets resulting from operations | 9,065,284 | (37,145) |
| Distributions to shareholders | (1,802,163) | – |
| Distributions to shareholders from net investment income | – | (12,682) |
| Total distributions | (1,802,163) | (12,682) |
| Share transactions | | |
| Proceeds from sales of shares | 99,694,917 | 10,323,640 |
| Reinvestment of distributions | 1,802,152 | 11,592 |
| Cost of shares redeemed | (8,580,182) | – |
| Net increase (decrease) in net assets resulting from share transactions | 92,916,887 | 10,335,232 |
| Total increase (decrease) in net assets | 100,180,008 | 10,285,405 |
| Net Assets | | |
| Beginning of period | 10,285,405 | – |
| End of period | $110,465,413 | $10,285,405 |
| Other Information�� | | |
| Undistributed net investment income end of period | | $77 |
| Shares | | |
| Sold | 9,811,318 | 1,032,527 |
| Issued in reinvestment of distributions | 173,823 | 1,165 |
| Redeemed | (826,373) | – |
| Net increase (decrease) | 9,158,768 | 1,033,692 |
See accompanying notes which are an integral part of the financial statements.
Financial Highlights
Fidelity Series Corporate Bond Fund
| | | |
| Years ended August 31, | 2019 | 2018 A |
| Selected Per–Share Data | | |
| Net asset value, beginning of period | $9.95 | $10.00 |
| Income from Investment Operations | | |
| Net investment income (loss)B | .377 | .013 |
| Net realized and unrealized gain (loss) | .917 | (.050) |
| Total from investment operations | 1.294 | (.037) |
| Distributions from net investment income | (.397) | (.013) |
| Distributions from net realized gain | (.007) | – |
| Total distributions | (.404) | (.013) |
| Net asset value, end of period | $10.84 | $9.95 |
| Total ReturnC,D | 13.38% | (.37)% |
| Ratios to Average Net AssetsE,F | | |
| Expenses before reductions | .01% | - %G,H |
| Expenses net of fee waivers, if any | .01% | - %G,H |
| Expenses net of all reductions | - %H | - %G,H |
| Net investment income (loss) | 3.73% | 3.11%G |
| Supplemental Data | | |
| Net assets, end of period (000 omitted) | $110,465 | $10,285 |
| Portfolio turnover rateI | 32% | 43%J |
A For the period August 17, 2018 (commencement of operations) to August 31, 2018.
B Calculated based on average shares outstanding during the period.
C Total returns for periods of less than one year are not annualized.
D Total returns would have been lower if certain expenses had not been reduced during the applicable periods shown.
E Fees and expenses of any underlying Fidelity Central Funds are not included in the Fund's expense ratio. The Fund indirectly bears its proportionate share of the expenses of any underlying Fidelity Central Funds.
F Expense ratios reflect operating expenses of the Fund. Expenses before reductions do not reflect amounts reimbursed by the investment adviser or reductions from expense offset arrangements and do not represent the amount paid by the Fund during periods when reimbursements or reductions occur. Expense ratios before reductions for start-up periods may not be representative of longer term operating periods. Expenses net of fee waivers reflect expenses after reimbursement by the investment adviser but prior to reductions from expense offset arrangements. Expenses net of all reductions represent the net expenses paid by the Fund.
G Annualized
H Amount represents less than $.0005 per share.
I Amount does not include the portfolio activity of any underlying Fidelity Central Funds.
J Amount not annualized.
See accompanying notes which are an integral part of the financial statements.
Notes to Financial Statements
For the period ended August 31, 2019
1. Organization.
Fidelity Series Corporate Bond Fund (the Fund) is a fund of Fidelity Salem Street Trust (the Trust) and is authorized to issue an unlimited number of shares. Shares of the Fund are only available for purchase by mutual funds for which Fidelity Management & Research Company (FMR) or an affiliate serves as an investment manager. The Trust is registered under the Investment Company Act of 1940, as amended (the 1940 Act), as an open-end management investment company organized as a Massachusetts business trust.
2. Investments in Fidelity Central Funds.
The Fund invests in Fidelity Central Funds, which are open-end investment companies generally available only to other investment companies and accounts managed by the investment adviser and its affiliates. The Fund's Schedule of Investments lists each of the Fidelity Central Funds held as of period end, if any, as an investment of the Fund, but does not include the underlying holdings of each Fidelity Central Fund. As an Investing Fund, the Fund indirectly bears its proportionate share of the expenses of the underlying Fidelity Central Funds.
The Money Market Central Funds seek preservation of capital and current income and are managed by Fidelity Investments Money Management, Inc. (FIMM), an affiliate of the investment adviser. Annualized expenses of the Money Market Central Funds as of their most recent shareholder report date ranged from less than .005% to .01%.
A complete unaudited list of holdings for each Fidelity Central Fund is available upon request or at the Securities and Exchange Commission (the SEC) website at www.sec.gov. In addition, the financial statements of the Fidelity Central Funds, which are not covered by the Fund's Report of Independent Registered Public Accounting Firm, are available on the SEC website or upon request.
3. Significant Accounting Policies.
The Fund is an investment company and applies the accounting and reporting guidance of the Financial Accounting Standards Board (FASB) Accounting Standards Codification Topic 946 Financial Services – Investments Companies. The financial statements have been prepared in conformity with accounting principles generally accepted in the United States of America (GAAP), which require management to make certain estimates and assumptions at the date of the financial statements. Actual results could differ from those estimates. Subsequent events, if any, through the date that the financial statements were issued have been evaluated in the preparation of the financial statements. The following summarizes the significant accounting policies of the Fund:
Investment Valuation. Investments are valued as of 4:00 p.m. Eastern time on the last calendar day of the period. The Board of Trustees (the Board) has delegated the day to day responsibility for the valuation of the Fund's investments to the Fair Value Committee (the Committee) established by the Fund's investment adviser. In accordance with valuation policies and procedures approved by the Board, the Fund attempts to obtain prices from one or more third party pricing vendors or brokers to value its investments. When current market prices, quotations or currency exchange rates are not readily available or reliable, investments will be fair valued in good faith by the Committee, in accordance with procedures adopted by the Board. Factors used in determining fair value vary by investment type and may include market or investment specific events, changes in interest rates and credit quality. The frequency with which these procedures are used cannot be predicted and they may be utilized to a significant extent. The Committee oversees the Fund's valuation policies and procedures and reports to the Board on the Committee's activities and fair value determinations. The Board monitors the appropriateness of the procedures used in valuing the Fund's investments and ratifies the fair value determinations of the Committee.
The Fund categorizes the inputs to valuation techniques used to value its investments into a disclosure hierarchy consisting of three levels as shown below:
- Level 1 – quoted prices in active markets for identical investments
- Level 2 – other significant observable inputs (including quoted prices for similar investments, interest rates, prepayment speeds, etc.)
- Level 3 – unobservable inputs (including the Fund's own assumptions based on the best information available)
Valuation techniques used to value the Fund's investments by major category are as follows:
Debt securities, including restricted securities, are valued based on evaluated prices received from third party pricing vendors or from brokers who make markets in such securities. Corporate bonds, bank notes, foreign government and government agency obligations, municipal securities and U.S. government and government agency obligations are valued by pricing vendors who utilize matrix pricing which considers yield or price of bonds of comparable quality, coupon, maturity and type or by broker-supplied prices. When independent prices are unavailable or unreliable, debt securities may be valued utilizing pricing methodologies which consider similar factors that would be used by third party pricing vendors. Debt securities are generally categorized as Level 2 in the hierarchy but may be Level 3 depending on the circumstances.
Investments in open-end mutual funds, including the Fidelity Central Funds, are valued at their closing net asset value (NAV) each business day and are categorized as Level 1 in the hierarchy.
Changes in valuation techniques may result in transfers in or out of an assigned level within the disclosure hierarchy. The aggregate value of investments by input level as of August 31, 2019 is included at the end of the Fund's Schedule of Investments.
Investment Transactions and Income. For financial reporting purposes, the Fund's investment holdings and NAV include trades executed through the end of the last business day of the period. The NAV per share for processing shareholder transactions is calculated as of the close of business of the New York Stock Exchange (NYSE), normally 4:00 p.m. Eastern time and includes trades executed through the end of the prior business day. Gains and losses on securities sold are determined on the basis of identified cost. Income and capital gain distributions from Fidelity Central Funds, if any, are recorded on the ex-dividend date. Interest income is accrued as earned and includes coupon interest and amortization of premium and accretion of discount on debt securities as applicable. Debt obligations may be placed on non-accrual status and related interest income may be reduced by ceasing current accruals and writing off interest receivables when the collection of all or a portion of interest has become doubtful based on consistently applied procedures. A debt obligation is removed from non-accrual status when the issuer resumes interest payments or when collectability of interest is reasonably assured.
Expenses. Expenses directly attributable to a fund are charged to that fund. Expenses attributable to more than one fund are allocated among the respective funds on the basis of relative net assets or other appropriate methods. Expense estimates are accrued in the period to which they relate and adjustments are made when actual amounts are known.
Income Tax Information and Distributions to Shareholders. Each year, the Fund intends to qualify as a regulated investment company under Subchapter M of the Internal Revenue Code, including distributing substantially all of its taxable income and realized gains. As a result, no provision for U.S. Federal income taxes is required. As of August 31, 2019, the Fund did not have any unrecognized tax benefits in the financial statements; nor is the Fund aware of any tax positions for which it is reasonably possible that the total amounts of unrecognized tax benefits will significantly change in the next twelve months. The Fund files a U.S. federal tax return, in addition to state and local tax returns as required. The Fund's federal income tax returns are subject to examination by the Internal Revenue Service (IRS) for a period of three fiscal years after they are filed. State and local tax returns may be subject to examination for an additional fiscal year depending on the jurisdiction.
Distributions are declared and recorded daily and paid monthly from net investment income. Distributions from realized gains, if any, are declared and recorded on the ex-dividend date. Income and capital gain distributions are determined in accordance with income tax regulations, which may differ from GAAP.
Capital accounts within the financial statements are adjusted for permanent book-tax differences. These adjustments have no impact on net assets or the results of operations. Capital accounts are not adjusted for temporary book-tax differences which will reverse in a subsequent period.
Book-tax differences are primarily due to wash sales.
As of period end, the cost and unrealized appreciation (depreciation) in securities, and derivatives if applicable, for federal income tax purposes were as follows:
| Gross unrealized appreciation | $6,967,741 |
| Gross unrealized depreciation | (59) |
| Net unrealized appreciation (depreciation) | $6,967,682 |
| Tax Cost | $100,138,956 |
The tax-based components of distributable earnings as of period end were as follows:
| Undistributed ordinary income | $245,664 |
| Net unrealized appreciation (depreciation) on securities and other investments | $6,967,682 |
The tax character of distributions paid was as follows:
| | August 31, 2019 | August 31, 2018(a) |
| Ordinary Income | $1,802,163 | $ 12,682 |
(a) For the period August 17, 2018 (commencement of operations) to August 31, 2018.
Restricted Securities. The Fund may invest in securities that are subject to legal or contractual restrictions on resale. These securities generally may be resold in transactions exempt from registration or to the public if the securities are registered. Disposal of these securities may involve time-consuming negotiations and expense, and prompt sale at an acceptable price may be difficult. Information regarding restricted securities is included at the end of the Fund's Schedule of Investments.
New Rule Issuance. During August 2018, the U.S. Securities and Exchange Commission issued Final Rule Release No. 33-10532, Disclosure Update and Simplification. This Final Rule includes amendments specific to registered investment companies that are intended to eliminate overlap in disclosure requirements between Regulation S-X and GAAP. In accordance with these amendments, certain line-items in the Fund's financial statements have been combined or removed for the current period as outlined in the table below.
| Financial Statement | Current Line-Item Presentation (As Applicable) | Prior Line-Item Presentation (As Applicable) |
| Statement of Assets and Liabilities | Total distributable earnings (loss) | Undistributed/Distributions in excess of/Accumulated net investment income (loss)
Accumulated/Undistributed net realized gain (loss)
Net unrealized appreciation (depreciation) |
| Statement of Changes in Net Assets | N/A - removed | Undistributed/Distributions in excess of/Accumulated net investment income (loss) end of period |
| Statement of Changes in Net Assets | Distributions to shareholders | Distributions to shareholders from net investment income
Distributions to shareholders from net realized gain |
4. Purchases and Sales of Investments.
Purchases and sales of securities, other than short-term securities and U.S. government securities, aggregated $86,911,136 and $4,158,004, respectively.
5. Fees and Other Transactions with Affiliates.
Management Fee. Fidelity Management & Research Company (the investment adviser) and its affiliates provide the Fund with investment management related services for which the Fund does not pay a management fee. Under the management contract, the investment adviser or an affiliate pays all ordinary operating expenses of the Fund, except custody fees, fees and expenses of the independent Trustees, and certain miscellaneous expenses such as proxy and shareholder meeting expenses.
Interfund Trades. The Fund may purchase from or sell securities to other Fidelity Funds under procedures adopted by the Board. The procedures have been designed to ensure these interfund trades are executed in accordance with Rule 17a-7 of the 1940 Act. Interfund trades are included within the respective purchases and sales amounts shown in the Purchases and Sales of Investments note.
6. Committed Line of Credit.
The Fund participates with other funds managed by the investment adviser or an affiliate in a $4.25 billion credit facility (the "line of credit") to be utilized for temporary or emergency purposes to fund shareholder redemptions or for other short-term liquidity purposes. The Fund has agreed to pay commitment fees on its pro-rata portion of the line of credit, which amounted to $61 and is reflected in Commitment fees on the Statement of Operations. During the period, the Fund did not borrow on this line of credit.
7. Expense Reductions.
Through arrangements with the Fund's custodian, credits realized as a result of certain uninvested cash balances were used to reduce the Fund's expenses. During the period, these credits reduced the Fund's custody expenses by $268.
8. Other.
The Fund's organizational documents provide former and current trustees and officers with a limited indemnification against liabilities arising in connection with the performance of their duties to the Fund. In the normal course of business, the Fund may also enter into contracts that provide general indemnifications. The Fund's maximum exposure under these arrangements is unknown as this would be dependent on future claims that may be made against the Fund. The risk of material loss from such claims is considered remote.
At the end of the period, mutual funds managed by the investment adviser or its affiliates were the owners of record of all of the outstanding shares of the Fund.
Report of Independent Registered Public Accounting Firm
To the Trustees of Fidelity Salem Street Trust and Shareholders of Fidelity Series Corporate Bond Fund:
Opinion on the Financial Statements and Financial Highlights
We have audited the accompanying statement of assets and liabilities of Fidelity Series Corporate Bond Fund (the "Fund"), a fund of Fidelity Salem Street Trust, including the schedule of investments, as of August 31, 2019, the related statement of operations for the year then ended, and the statement of changes in net assets and the financial highlights for the year then ended and for the period from August 17, 2018 (commencement of operations) to August 31, 2018, and the related notes. In our opinion, the financial statements and financial highlights present fairly, in all material respects, the financial position of the Fund as of August 31, 2019, the results of its operations for the year then ended, and the changes in its net assets and the financial highlights for the year then ended and for the period from August 17, 2018 (commencement of operations) to August 31, 2018 in conformity with accounting principles generally accepted in the United States of America.
Basis for Opinion
These financial statements and financial highlights are the responsibility of the Fund's management. Our responsibility is to express an opinion on the Fund's financial statements and financial highlights based on our audits. We are a public accounting firm registered with the Public Company Accounting Oversight Board (United States) (PCAOB) and are required to be independent with respect to the Fund in accordance with the U.S. federal securities laws and the applicable rules and regulations of the Securities and Exchange Commission and the PCAOB.
We conducted our audits in accordance with the standards of the PCAOB. Those standards require that we plan and perform the audit to obtain reasonable assurance about whether the financial statements and financial highlights are free of material misstatement, whether due to error or fraud. The Fund is not required to have, nor were we engaged to perform, an audit of its internal control over financial reporting. As part of our audits we are required to obtain an understanding of internal control over financial reporting but not for the purpose of expressing an opinion on the effectiveness of the Fund’s internal control over financial reporting. Accordingly, we express no such opinion.
Our audits included performing procedures to assess the risks of material misstatement of the financial statements and financial highlights, whether due to error or fraud, and performing procedures that respond to those risks. Such procedures included examining, on a test basis, evidence regarding the amounts and disclosures in the financial statements and financial highlights. Our audits also included evaluating the accounting principles used and significant estimates made by management, as well as evaluating the overall presentation of the financial statements and financial highlights. Our procedures included confirmation of securities owned as of August 31, 2019, by correspondence with the custodians and brokers; when replies were not received from brokers, we performed other auditing procedures. We believe that our audits provide a reasonable basis for our opinion.
/s/ Deloitte & Touche LLP
Boston, Massachusetts
October 18, 2019
We have served as the auditor of one or more of the Fidelity investment companies since 1999.
Trustees and Officers
The Trustees, Members of the Advisory Board (if any), and officers of the trust and fund, as applicable, are listed below. The Board of Trustees governs the fund and is responsible for protecting the interests of shareholders. The Trustees are experienced executives who meet periodically throughout the year to oversee the fund's activities, review contractual arrangements with companies that provide services to the fund, oversee management of the risks associated with such activities and contractual arrangements, and review the fund's performance. Except for Jonathan Chiel, each of the Trustees oversees 276 funds. Mr. Chiel oversees 170 funds.
The Trustees hold office without limit in time except that (a) any Trustee may resign; (b) any Trustee may be removed by written instrument, signed by at least two-thirds of the number of Trustees prior to such removal; (c) any Trustee who requests to be retired or who has become incapacitated by illness or injury may be retired by written instrument signed by a majority of the other Trustees; and (d) any Trustee may be removed at any special meeting of shareholders by a two-thirds vote of the outstanding voting securities of the trust. Each Trustee who is not an interested person (as defined in the 1940 Act) of the trust and the fund is referred to herein as an Independent Trustee. Each Independent Trustee shall retire not later than the last day of the calendar year in which his or her 75th birthday occurs. The Independent Trustees may waive this mandatory retirement age policy with respect to individual Trustees. Officers and Advisory Board Members hold office without limit in time, except that any officer or Advisory Board Member may resign or may be removed by a vote of a majority of the Trustees at any regular meeting or any special meeting of the Trustees. Except as indicated, each individual has held the office shown or other offices in the same company for the past five years.
The fund’s Statement of Additional Information (SAI) includes more information about the Trustees. To request a free copy, call Fidelity at 1-800-544-8544.
Experience, Skills, Attributes, and Qualifications of the Trustees. The Governance and Nominating Committee has adopted a statement of policy that describes the experience, qualifications, attributes, and skills that are necessary and desirable for potential Independent Trustee candidates (Statement of Policy). The Board believes that each Trustee satisfied at the time he or she was initially elected or appointed a Trustee, and continues to satisfy, the standards contemplated by the Statement of Policy. The Governance and Nominating Committee also engages professional search firms to help identify potential Independent Trustee candidates who have the experience, qualifications, attributes, and skills consistent with the Statement of Policy. From time to time, additional criteria based on the composition and skills of the current Independent Trustees, as well as experience or skills that may be appropriate in light of future changes to board composition, business conditions, and regulatory or other developments, have also been considered by the professional search firms and the Governance and Nominating Committee. In addition, the Board takes into account the Trustees' commitment and participation in Board and committee meetings, as well as their leadership of standing and ad hoc committees throughout their tenure.
In determining that a particular Trustee was and continues to be qualified to serve as a Trustee, the Board has considered a variety of criteria, none of which, in isolation, was controlling. The Board believes that, collectively, the Trustees have balanced and diverse experience, qualifications, attributes, and skills, which allow the Board to operate effectively in governing the fund and protecting the interests of shareholders. Information about the specific experience, skills, attributes, and qualifications of each Trustee, which in each case led to the Board's conclusion that the Trustee should serve (or continue to serve) as a trustee of the fund, is provided below.
Board Structure and Oversight Function. Abigail P. Johnson is an interested person and currently serves as Chairman. The Trustees have determined that an interested Chairman is appropriate and benefits shareholders because an interested Chairman has a personal and professional stake in the quality and continuity of services provided to the fund. Independent Trustees exercise their informed business judgment to appoint an individual of their choosing to serve as Chairman, regardless of whether the Trustee happens to be independent or a member of management. The Independent Trustees have determined that they can act independently and effectively without having an Independent Trustee serve as Chairman and that a key structural component for assuring that they are in a position to do so is for the Independent Trustees to constitute a substantial majority for the Board. The Independent Trustees also regularly meet in executive session. Arthur E. Johnson serves as Chairman of the Independent Trustees and as such (i) acts as a liaison between the Independent Trustees and management with respect to matters important to the Independent Trustees and (ii) with management prepares agendas for Board meetings.
Fidelity® funds are overseen by different Boards of Trustees. The fund's Board oversees Fidelity's investment-grade bond, money market, asset allocation and certain equity funds, and other Boards oversee Fidelity's high income and other equity funds. The asset allocation funds may invest in Fidelity® funds that are overseen by such other Boards. The use of separate Boards, each with its own committee structure, allows the Trustees of each group of Fidelity® funds to focus on the unique issues of the funds they oversee, including common research, investment, and operational issues. On occasion, the separate Boards establish joint committees to address issues of overlapping consequences for the Fidelity® funds overseen by each Board.
The Trustees operate using a system of committees to facilitate the timely and efficient consideration of all matters of importance to the Trustees, the fund, and fund shareholders and to facilitate compliance with legal and regulatory requirements and oversight of the fund's activities and associated risks. The Board, acting through its committees, has charged FMR and its affiliates with (i) identifying events or circumstances the occurrence of which could have demonstrably adverse effects on the fund's business and/or reputation; (ii) implementing processes and controls to lessen the possibility that such events or circumstances occur or to mitigate the effects of such events or circumstances if they do occur; and (iii) creating and maintaining a system designed to evaluate continuously business and market conditions in order to facilitate the identification and implementation processes described in (i) and (ii) above. Because the day-to-day operations and activities of the fund are carried out by or through FMR, its affiliates, and other service providers, the fund's exposure to risks is mitigated but not eliminated by the processes overseen by the Trustees. While each of the Board's committees has responsibility for overseeing different aspects of the fund's activities, oversight is exercised primarily through the Operations and Audit Committees. In addition, an ad hoc Board committee of Independent Trustees has worked with FMR to enhance the Board's oversight of investment and financial risks, legal and regulatory risks, technology risks, and operational risks, including the development of additional risk reporting to the Board. Appropriate personnel, including but not limited to the fund's Chief Compliance Officer (CCO), FMR's internal auditor, the independent accountants, the fund's Treasurer and portfolio management personnel, make periodic reports to the Board's committees, as appropriate, including an annual review of Fidelity's risk management program for the Fidelity® funds. The responsibilities of each standing committee, including their oversight responsibilities, are described further under "Standing Committees of the Trustees."
Interested Trustees*:
Correspondence intended for a Trustee who is an interested person may be sent to Fidelity Investments, 245 Summer Street, Boston, Massachusetts 02210.
Name, Year of Birth; Principal Occupations and Other Relevant Experience+
Jonathan Chiel (1957)
Year of Election or Appointment: 2016
Trustee
Mr. Chiel also serves as Trustee of other Fidelity® funds. Mr. Chiel is Executive Vice President and General Counsel for FMR LLC (diversified financial services company, 2012-present). Previously, Mr. Chiel served as general counsel (2004-2012) and senior vice president and deputy general counsel (2000-2004) for John Hancock Financial Services; a partner with Choate, Hall & Stewart (1996-2000) (law firm); and an Assistant United States Attorney for the United States Attorney’s Office of the District of Massachusetts (1986-95), including Chief of the Criminal Division (1993-1995). Mr. Chiel is a director on the boards of the Boston Bar Foundation and the Maimonides School.
Abigail P. Johnson (1961)
Year of Election or Appointment: 2009
Trustee
Chairman of the Board of Trustees
Ms. Johnson also serves as Trustee of other Fidelity® funds. Ms. Johnson serves as Chairman (2016-present), Chief Executive Officer (2014-present), and Director (2007-present) of FMR LLC (diversified financial services company), President of Fidelity Financial Services (2012-present) and President of Personal, Workplace and Institutional Services (2005-present). Ms. Johnson is Chairman and Director of FMR Co., Inc. (investment adviser firm, 2011-present) and Chairman and Director of FMR (investment adviser firm, 2011-present). Previously, Ms. Johnson served as Vice Chairman (2007-2016) and President (2013-2016) of FMR LLC, President and a Director of FMR (2001-2005), a Trustee of other investment companies advised by FMR, Fidelity Investments Money Management, Inc. (investment adviser firm), and FMR Co., Inc. (2001-2005), Senior Vice President of the Fidelity® funds (2001-2005), and managed a number of Fidelity® funds. Ms. Abigail P. Johnson and Mr. Arthur E. Johnson are not related.
Jennifer Toolin McAuliffe (1959)
Year of Election or Appointment: 2016
Trustee
Ms. McAuliffe also serves as Trustee of other Fidelity® funds. Ms. McAuliffe previously served as a Member of the Advisory Board of certain Fidelity® funds (2016) and as Co-Head of Fixed Income of Fidelity Investments Limited (now known as FIL Limited (FIL)) (diversified financial services company). Earlier roles at FIL included Director of Research for FIL’s credit and quantitative teams in London, Hong Kong and Tokyo. Ms. McAuliffe also was the Director of Research for taxable and municipal bonds at Fidelity Investments Money Management, Inc. Ms. McAuliffe is also a director or trustee of several not-for-profit entities.
* Determined to be an “Interested Trustee” by virtue of, among other things, his or her affiliation with the trust or various entities under common control with FMR.
+ The information includes the Trustee's principal occupation during the last five years and other information relating to the experience, attributes, and skills relevant to the Trustee's qualifications to serve as a Trustee, which led to the conclusion that the Trustee should serve as a Trustee for the fund.
Independent Trustees:
Correspondence intended for an Independent Trustee may be sent to Fidelity Investments, P.O. Box 55235, Boston, Massachusetts 02205-5235.
Name, Year of Birth; Principal Occupations and Other Relevant Experience+
Elizabeth S. Acton (1951)
Year of Election or Appointment: 2013
Trustee
Ms. Acton also serves as Trustee of other Fidelity® funds. Prior to her retirement in April 2012, Ms. Acton was Executive Vice President, Finance (2011-2012), Executive Vice President, Chief Financial Officer (2002-2011), and Treasurer (2004-2005) of Comerica Incorporated (financial services). Prior to joining Comerica, Ms. Acton held a variety of positions at Ford Motor Company (1983-2002), including Vice President and Treasurer (2000-2002) and Executive Vice President and Chief Financial Officer of Ford Motor Credit Company (1998-2000). Ms. Acton currently serves as a member of the Board of Directors and Audit and Finance Committees of Beazer Homes USA, Inc. (homebuilding, 2012-present). Previously, Ms. Acton served as a Member of the Advisory Board of certain Fidelity® funds (2013-2016).
Ann E. Dunwoody (1953)
Year of Election or Appointment: 2018
Trustee
General Dunwoody also serves as Trustee of other Fidelity® funds. General Dunwoody (United States Army, Retired) was the first woman in U.S. military history to achieve the rank of four-star general and prior to her retirement in 2012 held a variety of positions within the U.S. Army, including Commanding General, U.S. Army Material Command (2008-2012). She is the President of First to Four LLC (leadership and mentoring services, 2012-present). She also serves as a member of the Board of Directors and Nominating and Corporate Governance Committee of L3 Technologies, Inc. (communication, electronic, sensor, and aerospace systems, 2013-present), Board of Directors and Nomination and Corporate Governance Committees of Kforce Inc. (professional staffing services, 2016-present) and Board of Directors of Automattic Inc. (software engineering, 2018-present). Previously, General Dunwoody served as a Member of the Advisory Board of certain Fidelity® funds (2018), a member of the Board of Directors and Audit and Sustainability and Corporate Responsibility Committees of Republic Services, Inc. (waste collection, disposal and recycling, 2013-2016). Ms. Dunwoody also serves on several boards for non-profit organizations, including as a member of the Board of Directors, Chair of the Nomination and Governance Committee and member of the Audit Committee of Logistics Management Institute (consulting non-profit, 2012-present), a member of the Board of Directors of the Army Historical Foundation (2015-present), a member of the Council of Trustees for the Association of the United States Army (advocacy non-profit, 2013-present) and a member of the Board of Trustees of Florida Institute of Technology (2015-present) and ThanksUSA (military family education non-profit, 2014-present).
John Engler (1948)
Year of Election or Appointment: 2014
Trustee
Mr. Engler also serves as Trustee of other Fidelity® funds. He serves on the board of directors for Universal Forest Products (manufacturer and distributor of wood and wood-alternative products, 2003-present) and K12 Inc. (technology-based education company, 2012-present). Previously, Mr. Engler served as interim president of Michigan State University (2018-2019), a Member of the Advisory Board of certain Fidelity® funds (2014-2016), president of the Business Roundtable (2011-2017), a trustee of The Munder Funds (2003-2014), president and CEO of the National Association of Manufacturers (2004-2011), member of the Board of Trustees of the Annie E. Casey Foundation (2004-2015), and as governor of Michigan (1991-2003). He is a past chairman of the National Governors Association.
Robert F. Gartland (1951)
Year of Election or Appointment: 2010
Trustee
Mr. Gartland also serves as Trustee of other Fidelity® funds. Mr. Gartland is Chairman and an investor in Gartland & Mellina Group Corp. (consulting, 2009-present). Previously, Mr. Gartland served as a partner and investor of Vietnam Partners LLC (investments and consulting, 2008-2011). Prior to his retirement, Mr. Gartland held a variety of positions at Morgan Stanley (financial services, 1979-2007), including Managing Director (1987-2007), and Chase Manhattan Bank (1975-1978).
Arthur E. Johnson (1947)
Year of Election or Appointment: 2008
Trustee
Chairman of the Independent Trustees
Mr. Johnson also serves as Trustee of other Fidelity® funds. Mr. Johnson serves as a member of the Board of Directors of Eaton Corporation plc (diversified power management, 2009-present) and Booz Allen Hamilton (management consulting, 2011-present). Prior to his retirement, Mr. Johnson served as Senior Vice President of Corporate Strategic Development of Lockheed Martin Corporation (defense contractor, 1999-2009). Mr. Johnson previously served as Vice Chairman (2015-2018) of the Independent Trustees of certain Fidelity® funds and on the Board of Directors of IKON Office Solutions, Inc. (1999-2008), AGL Resources, Inc. (holding company, 2002-2016), and Delta Airlines (2005-2007). Mr. Arthur E. Johnson is not related to Ms. Abigail P. Johnson.
Michael E. Kenneally (1954)
Year of Election or Appointment: 2009
Trustee
Vice Chairman of the Independent Trustees
Mr. Kenneally also serves as Trustee of other Fidelity® funds. Prior to his retirement, Mr. Kenneally served as Chairman and Global Chief Executive Officer of Credit Suisse Asset Management. Before joining Credit Suisse, he was an Executive Vice President and Chief Investment Officer for Bank of America Corporation. Earlier roles at Bank of America included Director of Research, Senior Portfolio Manager and Research Analyst, and Mr. Kenneally was awarded the Chartered Financial Analyst (CFA) designation in 1991.
Marie L. Knowles (1946)
Year of Election or Appointment: 2001
Trustee
Ms. Knowles also serves as Trustee of other Fidelity® funds. Prior to Ms. Knowles' retirement in June 2000, she served as Executive Vice President and Chief Financial Officer of Atlantic Richfield Company (ARCO) (diversified energy, 1996-2000). From 1993 to 1996, she was a Senior Vice President of ARCO and President of ARCO Transportation Company (pipeline and tanker operations). Ms. Knowles currently serves as a Director and Chairman of the Audit Committee of McKesson Corporation (healthcare service, since 2002). Ms. Knowles is a member of the Board of the Santa Catalina Island Company (real estate, 2009-present). Ms. Knowles is a Member of the Investment Company Institute Board of Governors and a Member of the Governing Council of the Independent Directors Council (2014-present). She also serves as a member of the Advisory Board for the School of Engineering of the University of Southern California. Previously, Ms. Knowles served as a Director of Phelps Dodge Corporation (copper mining and manufacturing, 1994-2007), URS Corporation (engineering and construction, 2000-2003) and America West (airline, 1999-2002). Ms. Knowles previously served as Chairman (2015-2018) and Vice Chairman (2012-2015) of the Independent Trustees of certain Fidelity® funds.
Mark A. Murray (1954)
Year of Election or Appointment: 2016
Trustee
Mr. Murray also serves as Trustee of other Fidelity® funds. Mr. Murray is Vice Chairman (2013-present) of Meijer, Inc. (regional retail chain). Previously, Mr. Murray served as a Member of the Advisory Board of certain Fidelity® funds (2016) and as Co-Chief Executive Officer (2013-2016) and President (2006-2013) of Meijer, Inc. Mr. Murray serves as a member of the Board of Directors and Nuclear Review and Public Policy and Responsibility Committees of DTE Energy Company (diversified energy company, 2009-present). Mr. Murray also serves as a member of the Board of Directors of Spectrum Health (not-for-profit health system, 2015-present). Mr. Murray previously served as President of Grand Valley State University (2001-2006), Treasurer for the State of Michigan (1999-2001), Vice President of Finance and Administration for Michigan State University (1998-1999), and a member of the Board of Directors and Audit Committee and Chairman of the Nominating and Corporate Governance Committee of Universal Forest Products, Inc. (manufacturer and distributor of wood and wood-alternative products, 2004-2016). Mr. Murray is also a director or trustee of many community and professional organizations.
+ The information includes the Trustee's principal occupation during the last five years and other information relating to the experience, attributes, and skills relevant to the Trustee's qualifications to serve as a Trustee, which led to the conclusion that the Trustee should serve as a Trustee for the fund.
Advisory Board Members and Officers:
Correspondence intended for an officer may be sent to Fidelity Investments, 245 Summer Street, Boston, Massachusetts 02210. Officers appear below in alphabetical order.
Name, Year of Birth; Principal Occupation
Elizabeth Paige Baumann (1968)
Year of Election or Appointment: 2017
Anti-Money Laundering (AML) Officer
Ms. Baumann also serves as AML Officer of other funds. She is Chief AML Officer (2012-present) and Senior Vice President (2014-present) of FMR LLC (diversified financial services company) and is an employee of Fidelity Investments. Previously, Ms. Baumann served as AML Officer of the funds (2012-2016), and Vice President (2007-2014) and Deputy Anti-Money Laundering Officer (2007-2012) of FMR LLC.
Craig S. Brown (1977)
Year of Election or Appointment: 2019
Assistant Treasurer
Mr. Brown also serves as Assistant Treasurer of other funds. Mr. Brown is an employee of Fidelity Investments (2013-present).
John J. Burke III (1964)
Year of Election or Appointment: 2018
Chief Financial Officer
Mr. Burke also serves as Chief Financial Officer of other funds. Mr. Burke serves as Head of Investment Operations for Fidelity Fund and Investment Operations (2018-present) and is an employee of Fidelity Investments (1998-present). Previously Mr. Burke served as head of Asset Management Investment Operations (2012-2018).
Jonathan Davis (1968)
Year of Election or Appointment: 2010
Assistant Treasurer
Mr. Davis also serves as Assistant Treasurer of other funds. Mr. Davis serves as Assistant Treasurer of FMR Capital, Inc. (2017-present) and is an employee of Fidelity Investments. Previously, Mr. Davis served as Vice President and Associate General Counsel of FMR LLC (diversified financial services company, 2003-2010).
Adrien E. Deberghes (1967)
Year of Election or Appointment: 2010
Assistant Treasurer
Mr. Deberghes also serves as an officer of other funds. He serves as Assistant Treasurer of FMR Capital, Inc. (2017-present), Executive Vice President of Fidelity Investments Money Management, Inc. (FIMM) (investment adviser firm, 2016-present), and is an employee of Fidelity Investments (2008-present). Previously, Mr. Deberghes served as President and Treasurer of certain Fidelity® funds (2013-2018). Prior to joining Fidelity Investments, Mr. Deberghes was Senior Vice President of Mutual Fund Administration at State Street Corporation (2007-2008), Senior Director of Mutual Fund Administration at Investors Bank & Trust (2005-2007), and Director of Finance for Dunkin' Brands (2000-2005). Previously, Mr. Deberghes served in other fund officer roles.
Laura M. Del Prato (1964)
Year of Election or Appointment: 2018
President and Treasurer
Ms. Del Prato also serves as an officer of other funds. Ms. Del Prato is an employee of Fidelity Investments (2017-present). Prior to joining Fidelity Investments, Ms. Del Prato served as a Managing Director and Treasurer of the JPMorgan Mutual Funds (2014-2017). Prior to JPMorgan, Ms. Del Prato served as a partner at Cohen Fund Audit Services (accounting firm, 2012-2013) and KPMG LLP (accounting firm, 2004-2012).
Colm A. Hogan (1973)
Year of Election or Appointment: 2016
Assistant Treasurer
Mr. Hogan also serves as an officer of other funds. Mr. Hogan serves as Assistant Treasurer of FMR Capital, Inc. (2017-present) and is an employee of Fidelity Investments (2005-present). Previously, Mr. Hogan served as Assistant Treasurer of certain Fidelity® funds (2016-2018).
Cynthia Lo Bessette (1969)
Year of Election or Appointment: 2019
Secretary and Chief Legal Officer (CLO)
Ms. Lo Bessette also serves as Secretary and CLO of other funds. She is a Senior Vice President and Deputy General Counsel of FMR LLC (diversified financial services company, 2019-present), and is an employee of Fidelity Investments. Previously, Ms. Lo Bessette served as Executive Vice President, General Counsel (2016-2019) and Senior Vice President, Deputy General Counsel (2015-2016) of OppenheimerFunds (investment management company) and Deputy Chief Legal Officer (2013-2015) of Jennison Associates LLC (investment adviser firm).
Chris Maher (1972)
Year of Election or Appointment: 2013
Assistant Treasurer
Mr. Maher serves as Assistant Treasurer of other funds. Mr. Maher is Vice President of Valuation Oversight, serves as Assistant Treasurer of FMR Capital, Inc. (2017-present), and is an employee of Fidelity Investments. Previously, Mr. Maher served as Vice President of Asset Management Compliance (2013), Vice President of the Program Management Group of FMR (investment adviser firm, 2010-2013), and Vice President of Valuation Oversight (2008-2010).
John B. McGinty, Jr. (1962)
Year of Election or Appointment: 2016
Chief Compliance Officer
Mr. McGinty also serves as Chief Compliance Officer of other funds. Mr. McGinty is Senior Vice President of Asset Management Compliance for Fidelity Investments and is an employee of Fidelity Investments (2016-present). Mr. McGinty previously served as Vice President, Senior Attorney at Eaton Vance Management (investment management firm, 2015-2016), and prior to Eaton Vance as global CCO for all firm operations and registered investment companies at GMO LLC (investment management firm, 2009-2015). Before joining GMO LLC, Mr. McGinty served as Senior Vice President, Deputy General Counsel for Fidelity Investments (2007-2009).
Jason P. Pogorelec (1975)
Year of Election or Appointment: 2015
Assistant Secretary
Mr. Pogorelec also serves as Assistant Secretary of other funds. Mr. Pogorelec serves as Vice President, Associate General Counsel (2010-present) and is an employee of Fidelity Investments (2006-present).
Nancy D. Prior (1967)
Year of Election or Appointment: 2014
Vice President
Ms. Prior also serves as Vice President of other funds. Ms. Prior serves as President of Fixed Income (2014-present), President (2016-present) and Director (2014-present) of Fidelity Investments Money Management, Inc. (FIMM) (investment adviser firm), and is an employee of Fidelity Investments (2002-present). Previously, Ms. Prior served as Vice Chairman of FIAM LLC (investment adviser firm, 2014-2018), a Director of FMR Investment Management (UK) Limited (investment adviser firm, 2015-2018), President Multi-Asset Class Strategies of FMR's Global Asset Allocation Division (2017-2018), Vice President of Fidelity's Money Market Funds (2012-2014), and President, Money Market and Short Duration Bond Group of Fidelity Management & Research Company (FMR) (investment adviser firm, 2013-2014).
Stacie M. Smith (1974)
Year of Election or Appointment: 2013
Assistant Treasurer
Ms. Smith also serves as an officer of other funds. Ms. Smith serves as Assistant Treasurer of FMR Capital, Inc. (2017-present), is an employee of Fidelity Investments (2009-present), and has served in other fund officer roles. Prior to joining Fidelity Investments, Ms. Smith served as Senior Audit Manager of Ernst & Young LLP (accounting firm, 1996-2009). Previously, Ms. Smith served as Assistant Treasurer (2013-2018) and Deputy Treasurer (2013-2016) of certain Fidelity® funds.
Marc L. Spector (1972)
Year of Election or Appointment: 2016
Deputy Treasurer
Mr. Spector also serves as an officer of other funds. Mr. Spector serves as Assistant Treasurer of FMR Capital, Inc. (2017-present) and is an employee of Fidelity Investments (2016-present). Prior to joining Fidelity Investments, Mr. Spector served as Director at the Siegfried Group (accounting firm, 2013-2016), and prior to Siegfried Group as audit senior manager at Deloitte & Touche (accounting firm, 2005-2013).
Jim Wegmann (1979)
Year of Election or Appointment: 2019
Assistant Treasurer
Mr. Wegmann also serves as Assistant Treasurer of other funds. Mr. Wegmann is an employee of Fidelity Investments (2011-present).
Shareholder Expense Example
As a shareholder of the Fund, you incur two types of costs: (1) transaction costs and (2) ongoing costs, including other Fund expenses. This Example is intended to help you understand your ongoing costs (in dollars) of investing in the Fund and to compare these costs with the ongoing costs of investing in other mutual funds.
The Example is based on an investment of $1,000 invested at the beginning of the period and held for the entire period (March 1, 2019 to August 31, 2019).
Actual Expenses
The first line of the accompanying table provides information about actual account values and actual expenses. You may use the information in this line, together with the amount you invested, to estimate the expenses that you paid over the period. Simply divide your account value by $1,000.00 (for example, an $8,600 account value divided by $1,000.00 = 8.6), then multiply the result by the number in the first line under the heading entitled "Expenses Paid During Period" to estimate the expenses you paid on your account during this period. In addition, the Fund, as a shareholder in the underlying Fidelity Central Funds, will indirectly bear its pro-rata share of the fees and expenses incurred by the underlying Fidelity Central Funds. These fees and expenses are not included in the Fund's annualized expense ratio used to calculate the expense estimate in the table below.
Hypothetical Example for Comparison Purposes
The second line of the accompanying table provides information about hypothetical account values and hypothetical expenses based on the Fund's actual expense ratio and an assumed rate of return of 5% per year before expenses, which is not the Fund's actual return. The hypothetical account values and expenses may not be used to estimate the actual ending account balance or expenses you paid for the period. You may use this information to compare the ongoing costs of investing in the Fund and other funds. To do so, compare this 5% hypothetical example with the 5% hypothetical examples that appear in the shareholder reports of the other funds. In addition, the Fund, as a shareholder in the underlying Fidelity Central Funds, will indirectly bear its pro-rata share of the fees and expenses incurred by the underlying Fidelity Central Funds. These fees and expenses are not included in the Fund's annualized expense ratio used to calculate the expense estimate in the table below.
Please note that the expenses shown in the table are meant to highlight your ongoing costs only and do not reflect any transaction costs. Therefore, the second line of the table is useful in comparing ongoing costs only, and will not help you determine the relative total costs of owning different funds.
| | Annualized Expense Ratio-A | Beginning
Account Value
March 1, 2019 | Ending
Account Value
August 31, 2019 | Expenses Paid
During Period-B
March 1, 2019
to August 31, 2019 |
| Actual | - %-C | $1,000.00 | $1,112.20 | $--D |
| Hypothetical-E | | $1,000.00 | $1,025.21 | $--D |
A Annualized expense ratio reflects expenses net of applicable fee waivers.
B Expenses are equal to the Fund's annualized expense ratio, multiplied by the average account value over the period, multiplied by 184/365 (to reflect the one-half year period).
C Amount represents less than .005%.
D Amount represents less than $.005.
E 5% return per year before expenses
Distributions (Unaudited)
The Board of Trustees of Fidelity Series Corporate Bond Fund voted to pay on October 14, 2019, to shareholders of record at the opening of business on October 11, 2019, a distribution of $0.022 per share derived from capital gains realized from sales of portfolio.
A total of 3.08% of the dividends distributed during the fiscal year was derived from interest on U.S. Government securities which is generally exempt from state income tax
The fund will notify shareholders in January 2020 of amounts for use in preparing 2019 income tax returns.
XBC-ANN-1019
1.9891231.101
Fidelity Flex℠ Conservative Income Bond Fund
Annual Report August 31, 2019 |
|
Beginning on January 1, 2021, as permitted by regulations adopted by the Securities and Exchange Commission, paper copies of a fund’s shareholder reports will no longer be sent by mail, unless you specifically request paper copies of the reports from the fund or from your financial intermediary, such as a financial advisor, broker-dealer or bank. Instead, the reports will be made available on a website, and you will be notified by mail each time a report is posted and provided with a website link to access the report.
If you already elected to receive shareholder reports electronically, you will not be affected by this change and you need not take any action. You may elect to receive shareholder reports and other communications from a fund electronically, by contacting your financial intermediary. For Fidelity customers, visit Fidelity's web site or call Fidelity using the contact information listed below.
You may elect to receive all future reports in paper free of charge. If you wish to continue receiving paper copies of your shareholder reports, you may contact your financial intermediary or, if you are a Fidelity customer, visit Fidelity’s website, or call Fidelity at the applicable toll-free number listed below. Your election to receive reports in paper will apply to all funds held with the fund complex/your financial intermediary.
| Account Type | Website | Phone Number |
| Brokerage, Mutual Fund, or Annuity Contracts: | fidelity.com/mailpreferences | 1-800-343-3548 |
| Employer Provided Retirement Accounts: | netbenefits.fidelity.com/preferences (choose 'no' under Required Disclosures to continue to print) | 1-800-343-0860 |
| Advisor Sold Accounts Serviced Through Your Financial Intermediary: | Contact Your Financial Intermediary | Your Financial Intermediary's phone number |
| Advisor Sold Accounts Serviced by Fidelity: | institutional.fidelity.com | 1-877-208-0098 |
Contents
To view a fund's proxy voting guidelines and proxy voting record for the 12-month period ended June 30, visit http://www.fidelity.com/proxyvotingresults or visit the Securities and Exchange Commission's (SEC) web site at http://www.sec.gov.
You may also call 1-800-544-3455 (for managed account clients) or 1-800-835-5092 (for retirement plan participants) to request a free copy of the proxy voting guidelines.
Standard & Poor's, S&P and S&P 500 are registered service marks of The McGraw-Hill Companies, Inc. and have been licensed for use by Fidelity Distributors Corporation.
Other third-party marks appearing herein are the property of their respective owners.
All other marks appearing herein are registered or unregistered trademarks or service marks of FMR LLC or an affiliated company. © 2019 FMR LLC. All rights reserved.
This report and the financial statements contained herein are submitted for the general information of the shareholders of the Fund. This report is not authorized for distribution to prospective investors in the Fund unless preceded or accompanied by an effective prospectus.
A fund files its complete schedule of portfolio holdings with the SEC for the first and third quarters of each fiscal year on Form N-PORT. Forms N-PORT are available on the SEC’s web site at http://www.sec.gov. A fund's Forms N-PORT may be reviewed and copied at the SEC’s Public Reference Room in Washington, DC. Information regarding the operation of the SEC's Public Reference Room may be obtained by calling 1-800-SEC-0330.
For a complete list of a fund's portfolio holdings, view the most recent holdings listing, semiannual report, or annual report on Fidelity's web site at http://www.fidelity.com, http://www.institutional.fidelity.com, or http://www.401k.com, as applicable.
NOT FDIC INSURED •MAY LOSE VALUE •NO BANK GUARANTEE
Neither the Fund nor Fidelity Distributors Corporation is a bank.
Performance: The Bottom Line
Average annual total return reflects the change in the value of an investment, assuming reinvestment of distributions from dividend income and capital gains (the profits earned upon the sale of securities that have grown in value, if any) and assuming a constant rate of performance each year. The hypothetical investment and the average annual total returns do not reflect the deduction of taxes that a shareholder would pay on fund distributions or the redemption of fund shares. During periods of reimbursement by Fidelity, a fund’s total return will be greater than it would be had the reimbursement not occurred. How a fund did yesterday is no guarantee of how it will do tomorrow.
Average Annual Total Returns
| For the periods ended August 31, 2019 | Past 1 year | Life of fundA |
| Fidelity Flex℠ Conservative Income Bond Fund | 2.80% | 2.77% |
A From May 31, 2018
$10,000 Over Life of Fund
Let's say hypothetically that $10,000 was invested in Fidelity Flex℠ Conservative Income Bond Fund on May 31, 2018, when the fund started.
The chart shows how the value of your investment would have changed, and also shows how the Bloomberg Barclays U.S. 3-6 Month Treasury Bill Index performed over the same period.
| Period Ending Values |
| $10,348 | Fidelity Flex℠ Conservative Income Bond Fund |
| $10,302 | Bloomberg Barclays U.S. 3-6 Month Treasury Bill Index |
Management's Discussion of Fund Performance
Market Recap: For the 12 months ending August 31, 2019, U.S. taxable investment-grade bonds posted their strongest trailing one-year return since 2009, driven by slower global economic growth, a maturing business cycle, trade uncertainty and, late in the period, the Fed’s dovish shift. The Bloomberg Barclays U.S. Aggregate Bond Index gained 10.17%. Market yields rose in the early fall of 2018, on expectations for higher inflation. Yields then declined and credit spreads widened in November and December, partly because of weaker U.S. manufacturing data. Yield spreads narrowed in January, as the U.S. Federal Reserve said it would be “patient” with policy rate hikes, and that future increases largely would depend on economic data. Yields continued to decline in the spring, amid international trade tension and attacks on oil tankers in the Middle East, and then tumbled further in July, when the Fed cut interest rates for the first time since 2008. The yield curve ended the period roughly flat, amid expectations for another rate cut of 25 basis points in September. Within the Bloomberg Barclays index, corporate bonds gained 13.33%, topping the 10.38% advance of U.S. Treasuries. Outside the index, U.S. corporate high-yield bonds lagged nominal U.S. Treasuries, while Treasury Inflation-Protected Securities (TIPS) gained 7.46%.
Comments from Co-Portfolio Managers Julian Potenza and Rob Galusza: For the fiscal year, the fund’s share classes gained 2.80%, moderately topping, net of fees, the 2.51% return of the benchmark, the Bloomberg Barclays U.S. 3-6 Month Treasury Bills Index. Exposure to corporate bonds added meaningful relative value. Within corporates, bonds of banking companies helped the most by far. Positioning among the bonds of industrial companies also contributed, especially the bonds of communications, energy, and certain consumer-related firms. Elsewhere, small positions among natural-gas and electric utility companies helped to a small degree, as did the fund’s positioning along the yield curve. Conversely, the fund’s cash holdings detracted and its fairly small position in Treasury holdings generally broke even versus the benchmark, although each boosted portfolio liquidity. As of August 31, we continue to focus mainly on higher-quality corporate issues. By period end, we added to the fund’s holdings among corporates – both among financials and industrials – while reducing the fund’s cash stake.
The views expressed above reflect those of the portfolio manager(s) only through the end of the period as stated on the cover of this report and do not necessarily represent the views of Fidelity or any other person in the Fidelity organization. Any such views are subject to change at any time based upon market or other conditions and Fidelity disclaims any responsibility to update such views. These views may not be relied on as investment advice and, because investment decisions for a Fidelity fund are based on numerous factors, may not be relied on as an indication of trading intent on behalf of any Fidelity fund.
Note to Shareholders: On September 29, 2018, Maura Walsh joined Robert Galusza and Julian Potenza as a Co-Manager of the fund.
Investment Summary (Unaudited)
Effective Maturity Diversification
| Days | % of Fund's investments |
| 0 - 30 | 30.9% |
| 31 - 90 | 18.9% |
| 91 - 180 | 3.5% |
| 181 - 397 | 6.6% |
| > 397 | 40.1% |
The date shown for securities represents the date when principal payments must be paid, taking into account any call options exercised by the issuer and any permissible maturity shortening features other than interest rate resets.
Asset Allocation (% of fund's net assets)
| As of August 31, 2019* |
| | Corporate Bonds | 56.4% |
| | U.S. Government and U.S. Government Agency Obligations | 3.0% |
| | Bank Notes | 1.8% |
| | Certificates of Deposit | 10.3% |
| | Commercial Paper | 19.6% |
| | Master Notes | 1.3% |
| | Cash and Cash Equivalents | 7.2% |
| | Net Other Assets (Liabilities) | 0.4% |

* Foreign investments - 25.4%
Schedule of Investments August 31, 2019
Showing Percentage of Net Assets
| Nonconvertible Bonds - 56.4% | | | |
| | | Principal Amount | Value |
| COMMUNICATION SERVICES - 2.4% | | | |
| Entertainment - 1.0% | | | |
| NBCUniversal Enterprise, Inc. 3 month U.S. LIBOR + 0.400% 2.7189% 4/1/21 (a)(b)(c) | | $750,000 | $751,380 |
| Media - 1.4% | | | |
| Comcast Corp.: | | | |
| 3 month U.S. LIBOR + 0.330% 2.6489% 10/1/20 (b)(c) | | 179,000 | 179,250 |
| 3 month U.S. LIBOR + 0.440% 2.7589% 10/1/21 (b)(c) | | 220,000 | 220,516 |
| 3.3% 10/1/20 | | 650,000 | 659,458 |
| | | | 1,059,224 |
|
| TOTAL COMMUNICATION SERVICES | | | 1,810,604 |
|
| CONSUMER DISCRETIONARY - 3.4% | | | |
| Automobiles - 3.4% | | | |
| American Honda Finance Corp.: | | | |
| 3 month U.S. LIBOR + 0.150% 2.3015% 2/21/20 (b)(c) | | 250,000 | 250,066 |
| 3 month U.S. LIBOR + 0.210% 2.391% 2/12/21 (b)(c) | | 350,000 | 349,957 |
| 3 month U.S. LIBOR + 0.260% 2.6703% 6/16/20 (b)(c) | | 500,000 | 500,594 |
| 3 month U.S. LIBOR + 0.280% 2.5825% 10/19/20 (b)(c) | | 300,000 | 300,459 |
| 3.15% 1/8/21 | | 46,000 | 46,688 |
| Daimler Finance North America LLC: | | | |
| 3 month U.S. LIBOR + 0.900% 3.0581% 2/15/22 (a)(b)(c) | | 450,000 | 451,849 |
| 2.7% 8/3/20 (a) | | 400,000 | 401,721 |
| General Motors Financial Co., Inc. 3 month U.S. LIBOR + 0.850% 3.1614% 4/9/21 (b)(c) | | 250,000 | 249,935 |
| | | | 2,551,269 |
| CONSUMER STAPLES - 1.6% | | | |
| Beverages - 0.5% | | | |
| Diageo Capital PLC 3 month U.S. LIBOR + 0.240% 2.3638% 5/18/20 (b)(c) | | 350,000 | 350,066 |
| Food Products - 0.5% | | | |
| Conagra Brands, Inc. 3 month U.S. LIBOR + 0.750% 3.0276% 10/22/20 (b)(c) | | 129,000 | 129,060 |
| General Mills, Inc. 3 month U.S. LIBOR + 0.540% 2.8623% 4/16/21 (b)(c) | | 250,000 | 250,138 |
| | | | 379,198 |
| Tobacco - 0.6% | | | |
| Philip Morris International, Inc. 1.875% 2/25/21 | | 500,000 | 499,205 |
|
| TOTAL CONSUMER STAPLES | | | 1,228,469 |
|
| ENERGY - 1.5% | | | |
| Oil, Gas & Consumable Fuels - 1.5% | | | |
| BP Capital Markets PLC 3 month U.S. LIBOR + 0.250% 2.3823% 11/24/20 (b)(c) | | 350,000 | 350,341 |
| Exxon Mobil Corp. 3 month U.S. LIBOR + 0.330% 2.4984% 8/16/22 (b)(c) | | 350,000 | 350,904 |
| Occidental Petroleum Corp.: | | | |
| 3 month U.S. LIBOR + 0.950% 3.137% 2/8/21 (b)(c) | | 65,000 | 65,296 |
| 3 month U.S. LIBOR + 1.250% 3.437% 8/13/21 (b)(c) | | 75,000 | 75,294 |
| Shell International Finance BV 2.125% 5/11/20 | | 250,000 | 250,161 |
| | | | 1,091,996 |
| FINANCIALS - 42.5% | | | |
| Banks - 30.2% | | | |
| ABN AMRO Bank NV 3 month U.S. LIBOR + 0.410% 2.7125% 1/19/21 (a)(b)(c) | | 900,000 | 901,166 |
| Bank of America Corp.: | | | |
| 3 month U.S. LIBOR + 0.660% 2.9376% 7/21/21 (b)(c) | | 500,000 | 501,492 |
| 2.328% 10/1/21 (b) | | 350,000 | 350,550 |
| 2.369% 7/21/21 (b) | | 600,000 | 600,988 |
| Bank of America NA 3 month U.S. LIBOR + 0.320% 2.5866% 7/26/21 (b)(c) | | 350,000 | 350,321 |
| Bank of Montreal 3 month U.S. LIBOR + 0.570% 2.9029% 3/26/22 (b)(c) | | 300,000 | 301,107 |
| Banque Federative du Credit Mutuel SA 3 month U.S. LIBOR + 0.490% 2.7676% 7/20/20 (a)(b)(c) | | 1,000,000 | 1,003,040 |
| Barclays Bank PLC 3 month U.S. LIBOR + 0.460% 2.8008% 1/11/21 (b)(c) | | 500,000 | 499,192 |
| BB&T Corp. 2.625% 6/29/20 | | 250,000 | 251,082 |
| BNP Paribas SA 3 month U.S. LIBOR + 0.390% 2.5676% 8/7/21 (a)(b)(c) | | 300,000 | 299,999 |
| BPCE SA 3.145% 7/31/20 (a) | | 300,000 | 302,717 |
| Citibank NA: | | | |
| 3 month U.S. LIBOR + 0.320% 2.5731% 5/1/20 (b)(c) | | 500,000 | 500,745 |
| 3 month U.S. LIBOR + 0.600% 2.7359% 5/20/22 (b)(c) | | 350,000 | 350,645 |
| Citigroup, Inc. 3 month U.S. LIBOR + 0.790% 3.1278% 1/10/20 (b)(c) | | 750,000 | 751,417 |
| Citizens Bank NA 3 month U.S. LIBOR + 0.570% 2.7023% 5/26/20 (b)(c) | | 500,000 | 501,508 |
| Compass Bank 3 month U.S. LIBOR + 0.730% 3.1806% 6/11/21 (b)(c) | | 500,000 | 499,021 |
| Credit Agricole SA: | | | |
| 3 month U.S. LIBOR + 0.970% 3.423% 6/10/20 (a)(b)(c) | | 400,000 | 402,377 |
| 2.75% 6/10/20 (a) | | 400,000 | 401,755 |
| Credit Suisse Group Funding Guernsey Ltd.: | | | |
| 3 month U.S. LIBOR + 2.290% 4.5896% 4/16/21 (b)(c) | | 1,000,000 | 1,028,746 |
| 2.75% 3/26/20 | | 250,000 | 250,682 |
| HSBC Holdings PLC: | | | |
| 3 month U.S. LIBOR + 0.600% 2.7238% 5/18/21 (b)(c) | | 500,000 | 500,204 |
| 3 month U.S. LIBOR + 0.650% 3.0858% 9/11/21 (b)(c) | | 400,000 | 400,361 |
| HSBC U.S.A., Inc. 2.75% 8/7/20 | | 400,000 | 402,551 |
| JP Morgan Chase Bank NA 3 month U.S. LIBOR + 0.340% 2.6066% 4/26/21 (b)(c) | | 1,250,000 | 1,250,210 |
| JPMorgan Chase & Co.: | | | |
| 3 month U.S. LIBOR + 0.955% 3.2144% 1/23/20 (b)(c) | | 300,000 | 301,031 |
| 3 month U.S. LIBOR + 1.100% 3.5716% 6/7/21 (b)(c) | | 250,000 | 252,929 |
| 3 month U.S. LIBOR + 1.205% 3.4608% 10/29/20 (b)(c) | | 250,000 | 252,412 |
| 2.75% 6/23/20 | | 300,000 | 301,414 |
| KeyCorp. 2.9% 9/15/20 | | 300,000 | 302,485 |
| Lloyds Bank PLC 3 month U.S. LIBOR + 0.490% 2.699% 5/7/21 (b)(c) | | 200,000 | 200,010 |
| Mitsubishi UFJ Financial Group, Inc.: | | | |
| 3 month U.S. LIBOR + 0.650% 2.9166% 7/26/21 (b)(c) | | 453,000 | 454,335 |
| 3 month U.S. LIBOR + 0.700% 3.1716% 3/7/22 (b)(c) | | 250,000 | 249,980 |
| PNC Bank NA 3 month U.S. LIBOR + 0.350% 2.7858% 3/12/21 (b)(c) | | 250,000 | 250,110 |
| Rabobank Nederland New York Branch: | | | |
| 3 month U.S. LIBOR + 0.430% 2.6966% 4/26/21 (b)(c) | | 500,000 | 501,414 |
| 3 month U.S. LIBOR + 0.830% 3.1678% 1/10/22 (b)(c) | | 250,000 | 252,503 |
| Regions Bank 3 month U.S. LIBOR + 0.500% 2.6756% 8/13/21 (b)(c) | | 350,000 | 349,814 |
| Royal Bank of Canada 3 month U.S. LIBOR + 0.400% 2.6755% 1/25/21 (b)(c) | | 300,000 | 301,046 |
| Sumitomo Mitsui Banking Corp.: | | | |
| 3 month U.S. LIBOR + 0.350% 2.6533% 1/17/20 (b)(c) | | 1,000,000 | 1,001,040 |
| 3 month U.S. LIBOR + 0.370% 2.6923% 10/16/20 (b)(c) | | 250,000 | 250,588 |
| SunTrust Bank: | | | |
| 3 month U.S. LIBOR + 0.500% 2.7666% 10/26/21 (b)(c) | | 300,000 | 300,398 |
| 3 month U.S. LIBOR + 0.530% 2.7855% 1/31/20 (b)(c) | | 300,000 | 300,434 |
| Svenska Handelsbanken AB 3 month U.S. LIBOR + 0.470% 2.6023% 5/24/21 (b)(c) | | 700,000 | 702,720 |
| The Toronto-Dominion Bank: | | | |
| 3 month U.S. LIBOR + 0.260% 2.6703% 9/17/20 (b)(c) | | 250,000 | 250,517 |
| 2.5% 12/14/20 | | 400,000 | 402,637 |
| U.S. Bancorp 2.35% 1/29/21 | | 350,000 | 351,866 |
| U.S. Bank NA 3 month U.S. LIBOR + 0.250% 2.5328% 7/24/20 (b)(c) | | 250,000 | 250,358 |
| Union Bank NA 3 month U.S. LIBOR + 0.600% 3.0716% 3/7/22 (b)(c) | | 300,000 | 299,777 |
| Wells Fargo & Co. 3 month U.S. LIBOR + 0.880% 3.1576% 7/22/20 (b)(c) | | 500,000 | 503,074 |
| Wells Fargo Bank NA: | | | |
| 3 month U.S. LIBOR + 0.310% 2.6134% 1/15/21 (b)(c) | | 250,000 | 250,278 |
| 3 month U.S. LIBOR + 0.500% 2.7594% 7/23/21 (b)(c) | | 250,000 | 250,580 |
| 3 month U.S. LIBOR + 0.620% 2.7523% 5/27/22 (b)(c) | | 600,000 | 601,118 |
| 3 month U.S. LIBOR + 0.650% 3.1244% 12/6/19 (b)(c) | | 250,000 | 250,450 |
| 3.325% 7/23/21 (b) | | 300,000 | 303,103 |
| | | | 22,840,297 |
| Capital Markets - 5.2% | | | |
| Bank New York Mellon Corp.: | | | |
| 3 month U.S. LIBOR + 0.280% 2.7825% 6/4/21 (b)(c) | | 400,000 | 400,218 |
| 3 month U.S. LIBOR + 0.300% 2.8025% 12/4/20 (b)(c) | | 250,000 | 250,103 |
| Goldman Sachs Bank U.S.A. U.S. SOFR SEC OVRN FIN RATE INDX + 0.600% 2.7247% 5/24/21 (b)(c) | | 350,000 | 350,209 |
| Goldman Sachs Group, Inc. 3 month U.S. LIBOR + 0.730% 3.0413% 12/27/20 (b)(c) | | 250,000 | 250,320 |
| Morgan Stanley: | | | |
| 3 month U.S. LIBOR + 0.550% 2.731% 2/10/21 (b)(c) | | 300,000 | 300,256 |
| 3 month U.S. LIBOR + 0.980% 3.3903% 6/16/20 (b)(c) | | 400,000 | 402,311 |
| U.S. SOFR SEC OVRN FIN RATE INDX + 0.830% 3.1339% 6/10/22 (b)(c) | | 359,000 | 359,923 |
| 2.65% 1/27/20 | | 250,000 | 250,416 |
| TD Ameritrade Holding Corp. 3 month U.S. LIBOR + 0.430% 2.6831% 11/1/21 (b)(c) | | 400,000 | 401,126 |
| UBS AG London Branch 3 month U.S. LIBOR + 0.580% 3.0306% 6/8/20 (a)(b)(c) | | 1,000,000 | 1,002,976 |
| | | | 3,967,858 |
| Consumer Finance - 4.6% | | | |
| American Express Co.: | | | |
| 3 month U.S. LIBOR + 0.620% 2.7559% 5/20/22 (b)(c) | | 350,000 | 351,118 |
| 3% 2/22/21 | | 259,000 | 262,555 |
| American Express Credit Corp. 3 month U.S. LIBOR + 0.430% 2.9503% 3/3/20 (b)(c) | | 1,100,000 | 1,101,325 |
| Aviation Capital Group LLC 3 month U.S. LIBOR + 0.950% 3.4703% 6/1/21 (a)(b)(c) | | 300,000 | 301,516 |
| Ford Motor Credit Co. LLC 3 month U.S. LIBOR + 0.430% 2.6956% 11/2/20 (b)(c) | | 250,000 | 248,304 |
| John Deere Capital Corp.: | | | |
| 3 month U.S. LIBOR + 0.170% 2.4814% 10/9/20 (b)(c) | | 250,000 | 250,014 |
| 3 month U.S. LIBOR + 0.420% 2.7578% 7/10/20 (b)(c) | | 350,000 | 351,137 |
| 2.875% 3/12/21 | | 350,000 | 354,542 |
| Toyota Motor Credit Corp. 3 month U.S. LIBOR + 0.150% 2.4614% 10/9/20 (b)(c) | | 250,000 | 250,225 |
| | | | 3,470,736 |
| Diversified Financial Services - 0.3% | | | |
| AIG Global Funding 3 month U.S. LIBOR + 0.460% 2.8093% 6/25/21 (a)(b)(c) | | 99,000 | 99,291 |
| Cigna Corp. 3 month U.S. LIBOR + 0.650% 3.0603% 9/17/21 (b)(c) | | 101,000 | 101,003 |
| | | | 200,294 |
| Insurance - 2.2% | | | |
| Marsh & McLennan Companies, Inc.: | | | |
| 3 month U.S. LIBOR + 1.200% 3.5189% 12/29/21 (b)(c) | | 120,000 | 120,230 |
| 3.5% 12/29/20 | | 64,000 | 65,158 |
| Metropolitan Life Global Funding I: | | | |
| U.S. SOFR SEC OVRN FIN RATE INDX + 0.500% 2.62% 5/28/21 (a)(b)(c) | | 350,000 | 350,263 |
| U.S. SOFR SEC OVRN FIN RATE INDX + 0.570% 2.69% 9/7/20 (a)(b)(c) | | 200,000 | 200,546 |
| U.S. SOFR SEC OVRN FIN RATE INDX + 0.850% 2.97% 1/15/21 (a)(b)(c) | | 300,000 | 301,503 |
| New York Life Global Funding 3 month U.S. LIBOR + 0.320% 2.5593% 8/6/21 (a)(b)(c) | | 118,000 | 118,175 |
| Protective Life Global Funding: | | | |
| 3 month U.S. LIBOR + 0.370% 2.6734% 7/13/20 (a)(b)(c) | | 250,000 | 250,583 |
| 3 month U.S. LIBOR + 0.520% 2.8499% 6/28/21 (a)(b)(c) | | 250,000 | 251,143 |
| | | | 1,657,601 |
|
| TOTAL FINANCIALS | | | 32,136,786 |
|
| HEALTH CARE - 1.1% | | | |
| Health Care Equipment & Supplies - 0.3% | | | |
| Becton, Dickinson & Co. 3 month U.S. LIBOR + 0.875% 3.1939% 12/29/20 (b)(c) | | 188,000 | 188,055 |
| Health Care Providers & Services - 0.3% | | | |
| CVS Health Corp. 3 month U.S. LIBOR + 0.720% 3.173% 3/9/21 (b)(c) | | 250,000 | 251,084 |
| Pharmaceuticals - 0.5% | | | |
| Bayer U.S. Finance II LLC 3 month U.S. LIBOR + 0.630% 2.9793% 6/25/21 (a)(b)(c) | | 400,000 | 400,088 |
|
| TOTAL HEALTH CARE | | | 839,227 |
|
| INDUSTRIALS - 1.6% | | | |
| Industrial Conglomerates - 0.4% | | | |
| Honeywell International, Inc. 3 month U.S. LIBOR + 0.370% 2.557% 8/8/22 (b)(c) | | 320,000 | 320,816 |
| Machinery - 1.2% | | | |
| Caterpillar Financial Services Corp.: | | | |
| 3 month U.S. LIBOR + 0.100% 2.5185% 6/19/20 (b)(c) | | 400,000 | 400,077 |
| 3 month U.S. LIBOR + 0.250% 2.3823% 8/26/20 (b)(c) | | 300,000 | 300,334 |
| 2.65% 5/17/21 | | 182,000 | 184,685 |
| | | | 885,096 |
|
| TOTAL INDUSTRIALS | | | 1,205,912 |
|
| INFORMATION TECHNOLOGY - 1.1% | | | |
| IT Services - 1.1% | | | |
| IBM Corp. 2.8% 5/13/21 | | 500,000 | 506,491 |
| IBM Credit LLC 3 month U.S. LIBOR + 0.260% 2.5376% 1/20/21 (b)(c) | | 350,000 | 350,578 |
| | | | 857,069 |
| UTILITIES - 1.2% | | | |
| Electric Utilities - 0.9% | | | |
| Duke Energy Corp. 2.1% 6/15/20 (a) | | 350,000 | 349,860 |
| Florida Power & Light Co. 3 month U.S. LIBOR + 0.400% 2.6393% 5/6/22 (b)(c) | | 338,000 | 338,092 |
| | | | 687,952 |
| Multi-Utilities - 0.3% | | | |
| Consolidated Edison Co. of New York, Inc. 3 month U.S. LIBOR + 0.400% 2.7493% 6/25/21 (b)(c) | | 250,000 | 250,905 |
|
| TOTAL UTILITIES | | | 938,857 |
|
| TOTAL NONCONVERTIBLE BONDS | | | |
| (Cost $42,572,769) | | | 42,660,189 |
|
| U.S. Treasury Obligations - 3.0% | | | |
| U.S. Treasury Notes: | | | |
| U.S. TREASURY 3 MONTH BILL + 0.139% 2.0988% 4/30/21 (b)(c) | | $500,000 | $499,341 |
| 1.75% 12/31/20 | | 700,000 | 700,520 |
| 1.75% 7/31/21 | | 550,000 | 552,277 |
| 1.875% 12/31/19 | | 500,000 | 499,785 |
| TOTAL U.S. TREASURY OBLIGATIONS | | | |
| (Cost $2,250,718) | | | 2,251,923 |
|
| Bank Notes - 1.8% | | | |
| Citizens Bank NA 2.25% 10/30/20 | | 250,000 | 250,362 |
| Fifth Third Bank 2.2% 10/30/20 | | 350,000 | 350,801 |
| KeyBank NA 2.25% 3/16/20 | | 400,000 | 400,381 |
| SunTrust Bank 2.59% 1/29/21 (b) | | 350,000 | 350,477 |
| TOTAL BANK NOTES | | | |
| (Cost $1,348,173) | | | 1,352,021 |
|
| Certificates of Deposit - 10.3% | | | |
| Bank of Tokyo-Mitsubishi UFJ Ltd. yankee 2.07% 2/28/20 | | 350,000 | 350,086 |
| Credit Agricole CIB yankee: | | | |
| 2.3% 10/4/19 | | 250,000 | 250,052 |
| 2.32% 11/12/19 | | 350,000 | 350,171 |
| Credit Suisse AG yankee 3 month U.S. LIBOR + 0.170% 2.4889% 10/1/19 (b)(c) | | 250,000 | 250,021 |
| Goldman Sachs Bank U.S.A.: | | | |
| U.S. SOFR SEC OVRN FIN RATE INDX + 0.250% 2.5266% 6/25/20 (b)(c) | | 350,000 | 350,044 |
| U.S. SOFR SEC OVRN FIN RATE INDX + 0.280% 2.405% 8/21/20 (b)(c) | | 350,000 | 349,840 |
| U.S. SOFR SEC OVRN FIN RATE INDX + 0.430% 2.5548% 2/26/21 (b)(c) | | 350,000 | 350,155 |
| Mitsubishi UFJ Trust & Banking Corp. yankee: | | | |
| 2.32% 10/15/19 | | 300,000 | 300,069 |
| 2.32% 10/24/19 | | 350,000 | 350,093 |
| Mizuho Corporate Bank Ltd. yankee: | | | |
| 1 month U.S. LIBOR + 0.090% 2.2566% 9/23/19 (b)(c) | | 350,000 | 350,027 |
| 1 month U.S. LIBOR + 0.120% 2.2653% 11/27/19 (b)(c) | | 350,000 | 350,057 |
| 1 month U.S. LIBOR + 0.130% 2.3251% 10/15/19 (b)(c) | | 500,000 | 500,067 |
| Natexis Banques Populaires New York Branch yankee: | | | |
| 2.68% 12/27/19 | | 250,000 | 250,439 |
| 2.75% 12/20/19 | | 300,000 | 300,563 |
| State Street Bank & Trust Co.: | | | |
| 1 month U.S. LIBOR + 0.100% 2.2721% 9/20/19 (b)(c) | | 300,000 | 300,006 |
| U.S. SOFR SEC OVRN FIN RATE INDX + 0.200% 2.32% 11/21/19 (b)(c) | | 400,000 | 400,045 |
| Sumitomo Mitsui Banking Corp. yankee: | | | |
| 1 month U.S. LIBOR + 0.100% 2.3009% 9/12/19 (b)(c) | | 300,000 | 300,017 |
| 1 month U.S. LIBOR + 0.140% 2.3841% 11/5/19 (b)(c) | | 500,000 | 500,083 |
| Sumitomo Mitsui Trust Bank Ltd. yankee: | | | |
| 1 month U.S. LIBOR + 0.080% 2.192% 9/30/19 (b)(c) | | 350,000 | 350,014 |
| 1 month U.S. LIBOR + 0.100% 2.2453% 9/27/19 (b)(c) | | 300,000 | 300,023 |
| 1 month U.S. LIBOR + 0.100% 2.3009% 9/11/19 (b)(c) | | 300,000 | 300,016 |
| Svenska Handelsbanken, Inc. yankee 2.61% 9/25/19 | | 300,000 | 300,103 |
| Toronto-Dominion Bank yankee 2.62% 10/18/19 | | 400,000 | 400,268 |
| TOTAL CERTIFICATES OF DEPOSIT | | | |
| (Cost $7,800,000) | | | 7,802,259 |
|
| Commercial Paper - 19.6% | | | |
| American Electric Power Co., Inc.: | | | |
| 2.34% 9/23/19 | | 250,000 | 249,617 |
| 2.35% 9/16/19 | | 250,000 | 249,730 |
| 2.36% 9/12/19 | | 250,000 | 249,795 |
| 2.36% 9/16/19 | | 250,000 | 249,730 |
| 2.38% 9/17/19 | | 250,000 | 249,714 |
| Amphenol Corp.: | | | |
| 2.27% 9/3/19 | | 250,000 | 249,938 |
| 2.27% 9/4/19 | | 250,000 | 249,923 |
| 2.27% 9/5/19 | | 300,000 | 299,888 |
| 2.27% 9/6/19 | | 250,000 | 249,890 |
| Atlantic Asset Securitization Corp.: | | | |
| 2.14% 11/25/19 (Liquidity Facility Credit Agricole CIB) | | 300,000 | 298,476 |
| 2.15% 11/12/19 (Liquidity Facility Credit Agricole CIB) | | 250,000 | 248,915 |
| Bank of Nova Scotia 1 month U.S. LIBOR + 0.130% 2.312% 2/18/20 (b)(c) | | 500,000 | 499,877 |
| Bell Canada yankee: | | | |
| 2.35% 11/5/19 | | 250,000 | 248,886 |
| 2.35% 11/7/19 | | 350,000 | 348,394 |
| 2.55% 9/4/19 | | 250,000 | 249,917 |
| 2.58% 9/12/19 | | 250,000 | 249,783 |
| BPCE SA yankee: | | | |
| 2.335% 11/12/19 | | 350,000 | 348,488 |
| 2.48% 10/4/19 | | 400,000 | 399,173 |
| Canadian Imperial Bank of Commerce yankee 2.58% 10/18/19 | | 300,000 | 299,177 |
| Commonspirit Health: | | | |
| 2.75% 10/23/19 | | 350,000 | 348,872 |
| 2.8% 10/16/19 | | 100,000 | 99,720 |
| Credit Suisse AG yankee 2.6% 9/26/19 | | 400,000 | 399,362 |
| DNB Bank ASA: | | | |
| 1 month U.S. LIBOR + 0.100% 2.3441% 10/3/19 (b)(c) | | 600,000 | 600,034 |
| yankee 1.98% 2/28/20 | | 250,000 | 247,462 |
| Eversource Energy 2.25% 9/3/19 | | 300,000 | 299,925 |
| ING U.S. Funding LLC: | | | |
| 1 month U.S. LIBOR + 0.100% 2.3128% 11/8/19 (b)(c) | | 500,000 | 500,034 |
| 1 month U.S. LIBOR + 0.120% 2.3313% 3/9/20 (b)(c) | | 350,000 | 350,000 |
| Natexis Banques Populaires New York Branch yankee 2.65% 10/1/19 | | 300,000 | 299,437 |
| Royal Bank of Canada: | | | |
| 1 month U.S. LIBOR + 0.130% 2.3413% 3/9/20 (b)(c) | | 500,000 | 499,807 |
| 1 month U.S. LIBOR + 0.180% 2.3751% 4/15/20 (b)(c) | | 350,000 | 349,919 |
| Sempra Global: | | | |
| 2.3% 9/23/19 | | 250,000 | 249,617 |
| 2.31% 9/16/19 | | 250,000 | 249,730 |
| 2.35% 12/2/19 | | 350,000 | 347,867 |
| 2.44% 9/17/19 | | 250,000 | 249,714 |
| 2.48% 10/17/19 | | 350,000 | 348,916 |
| Sumitomo Mitsui Trust Bank Ltd. yankee 2.49% 9/26/19 | | 250,000 | 249,604 |
| Suncor Energy, Inc. yankee: | | | |
| 2.32% 11/12/19 | | 350,000 | 348,324 |
| 2.48% 10/1/19 | | 250,000 | 249,486 |
| The Toronto-Dominion Bank: | | | |
| 3 month U.S. LIBOR + 0.030% 2.2693% 2/6/20 (b)(c) | | 400,000 | 399,999 |
| yankee 2.57% 10/15/19 | | 400,000 | 398,923 |
| Toyota Motor Credit Corp. 1 month U.S. LIBOR + 0.120% 2.3151% 12/11/19 (b)(c) | | 500,000 | 500,056 |
| TransCanada PipeLines Ltd.: | | | |
| 2.42% 11/1/19 | | 250,000 | 248,981 |
| 2.55% 9/23/19 | | 300,000 | 299,540 |
| Tyson Foods, Inc. 2.25% 9/3/19 | | 250,000 | 249,937 |
| UBS AG London Branch: | | | |
| 3 month U.S. LIBOR + 0.040% 2.4261% 12/20/19 (b)(c) | | 350,000 | 349,999 |
| yankee 2.35% 1/24/20 | | 350,000 | 347,113 |
| Ventas Realty LP 2.3% 9/5/19 | | 250,000 | 249,906 |
| TOTAL COMMERCIAL PAPER | | | |
| (Cost $14,821,051) | | | 14,821,595 |
|
| Master Notes - 1.3% | | | |
| Toyota Motor Credit Corp. 1 week U.S. LIBOR + 0.300% 2.4371% 2/28/20 (b)(c)(d) | | | |
| (Cost $1,000,000) | | 1,000,000 | 1,000,000 |
| | | Shares | Value |
|
| Money Market Funds - 5.3% | | | |
| Fidelity Cash Central Fund 2.13% (e) | | | |
| (Cost $3,986,287) | | 3,985,603 | 3,986,400 |
| | | Maturity Amount | Value |
|
| Repurchase Agreements - 1.9% | | | |
| With: | | | |
| Mizuho Securities U.S.A., Inc. at: | | | |
| 2.48%, dated 8/21/19 due 2/18/20 (Collateralized by Corporate Obligations valued at $420,377, 3.43%, 1/22/31) | | 404,988 | 400,000 |
| 2.67%, dated 8/1/19 due 1/28/20 (Collateralized by U.S. Treasury Obligations valued at $255,658, 2.18%, 7/31/21) | | 253,338 | 250,000 |
| 3.17%, dated 3/22/19 due 9/18/19 (Collateralized by Corporate Obligations valued at $319,577, 3.43%, 1/22/31) | | 304,755 | 299,998 |
| Morgan Stanley & Co., Inc. at 2.81%, dated: | | | |
| 6/11/19 due 9/10/19 (Collateralized by U.S. Government Obligations valued at $259,311, 0.00% - 4.00%, 9/12/19 - 8/20/49)(b)(c)(f) | | 251,769 | 250,000 |
| 8/5/19 due 11/4/19 (Collateralized by Equity Securities valued at $270,611)(b)(c)(f) | | 251,769 | 250,000 |
| TOTAL REPURCHASE AGREEMENTS | | | |
| (Cost $1,450,000) | | | 1,449,998 |
| TOTAL INVESTMENT IN SECURITIES - 99.6% | | | |
| (Cost $75,228,998) | | | 75,324,385 |
| NET OTHER ASSETS (LIABILITIES) - 0.4% | | | 268,009 |
| NET ASSETS - 100% | | | $75,592,394 |
Legend
(a) Security exempt from registration under Rule 144A of the Securities Act of 1933. These securities may be resold in transactions exempt from registration, normally to qualified institutional buyers. At the end of the period, the value of these securities amounted to $8,541,948 or 11.3% of net assets.
(b) Coupon rates for floating and adjustable rate securities reflect the rates in effect at period end.
(c) Coupon is indexed to a floating interest rate which may be multiplied by a specified factor and/or subject to caps or floors.
(d) Restricted securities - Investment in securities not registered under the Securities Act of 1933 (excluding 144A issues). At the end of the period, the value of restricted securities (excluding 144A issues) amounted to $1,000,000 or 1.3% of net assets.
(e) Affiliated fund that is generally available only to investment companies and other accounts managed by Fidelity Investments. The rate quoted is the annualized seven-day yield of the fund at period end. A complete unaudited listing of the fund's holdings as of its most recent quarter end is available upon request. In addition, each Fidelity Central Fund's financial statements, which are not covered by the Fund's Report of Independent Registered Public Accounting Firm, are available on the SEC's website or upon request.
(f) The maturity amount is based on the rate at period end.
Additional information on each restricted holding is as follows:
| Security | Acquisition Date | Acquisition Cost |
| Toyota Motor Credit Corp. 1 week U.S. LIBOR + 0.300% 2.4371% 2/28/20 | 6/3/19 | $1,000,000 |
Affiliated Central Funds
Information regarding fiscal year to date income earned by the Fund from investments in Fidelity Central Funds is as follows:
| Fund | Income earned |
| Fidelity Cash Central Fund | $107,452 |
| Total | $107,452 |
Amounts in the income column in the above table include any capital gain distributions from underlying funds, which are presented in the corresponding line-item in the Statement of Operations, if applicable.
Investment Valuation
The following is a summary of the inputs used, as of August 31, 2019, involving the Fund's assets and liabilities carried at fair value. The inputs or methodology used for valuing securities may not be an indication of the risk associated with investing in those securities. For more information on valuation inputs, and their aggregation into the levels used below, please refer to the Investment Valuation section in the accompanying Notes to Financial Statements.
| | Valuation Inputs at Reporting Date: |
| Description | Total | Level 1 | Level 2 | Level 3 |
| Investments in Securities: | | | | |
| Corporate Bonds | $42,660,189 | $-- | $42,660,189 | $-- |
| U.S. Government and Government Agency Obligations | 2,251,923 | -- | 2,251,923 | -- |
| Bank Notes | 1,352,021 | -- | 1,352,021 | -- |
| Certificates of Deposit | 7,802,259 | -- | 7,802,259 | -- |
| Commercial Paper | 14,821,595 | -- | 14,821,595 | -- |
| Master Notes | 1,000,000 | -- | 1,000,000 | -- |
| Money Market Funds | 3,986,400 | 3,986,400 | -- | -- |
| Repurchase Agreements | 1,449,998 | -- | 1,449,998 | -- |
| Total Investments in Securities: | $75,324,385 | $3,986,400 | $71,337,985 | $-- |
Other Information
Distribution of investments by country or territory of incorporation, as a percentage of Total Net Assets, is as follows (Unaudited):
| United States of America | 74.6% |
| Canada | 7.8% |
| United Kingdom | 5.5% |
| France | 4.1% |
| Japan | 2.5% |
| Bailiwick of Guernsey | 1.7% |
| Netherlands | 1.5% |
| Norway | 1.1% |
| Others (Individually Less Than 1%) | 1.2% |
| | 100.0% |
See accompanying notes which are an integral part of the financial statements.
Financial Statements
Statement of Assets and Liabilities
| | | August 31, 2019 |
| Assets | | |
Investment in securities, at value (including repurchase agreements of $1,449,998) — See accompanying schedule:
Unaffiliated issuers (cost $71,242,711) | $71,337,985 | |
| Fidelity Central Funds (cost $3,986,287) | 3,986,400 | |
| Total Investment in Securities (cost $75,228,998) | | $75,324,385 |
| Cash | | 82 |
| Receivable for fund shares sold | | 216,844 |
| Interest receivable | | 238,671 |
| Distributions receivable from Fidelity Central Funds | | 6,954 |
| Total assets | | 75,786,936 |
| Liabilities | | |
| Payable for fund shares redeemed | $54,799 | |
| Distributions payable | 139,743 | |
| Total liabilities | | 194,542 |
| Net Assets | | $75,592,394 |
| Net Assets consist of: | | |
| Paid in capital | | $75,498,507 |
| Total distributable earnings (loss) | | 93,887 |
| Net Assets, for 7,549,276 shares outstanding | | $75,592,394 |
| Net Asset Value, offering price and redemption price per share ($75,592,394 ÷ 7,549,276 shares) | | $10.01 |
See accompanying notes which are an integral part of the financial statements.
Statement of Operations
| | | Year ended August 31, 2019 |
| Investment Income | | |
| Interest | | $1,581,578 |
| Income from Fidelity Central Funds | | 107,452 |
| Total income | | 1,689,030 |
| Expenses | | |
| Independent trustees' fees and expenses | $265 | |
| Commitment fees | 54 | |
| Total expenses | | 319 |
| Net investment income (loss) | | 1,688,711 |
| Realized and Unrealized Gain (Loss) | | |
| Net realized gain (loss) on: | | |
| Investment securities: | | |
| Unaffiliated issuers | 1,408 | |
| Fidelity Central Funds | (114) | |
| Total net realized gain (loss) | | 1,294 |
| Change in net unrealized appreciation (depreciation) on: | | |
| Investment securities: | | |
| Unaffiliated issuers | 76,646 | |
| Fidelity Central Funds | 113 | |
| Total change in net unrealized appreciation (depreciation) | | 76,759 |
| Net gain (loss) | | 78,053 |
| Net increase (decrease) in net assets resulting from operations | | $1,766,764 |
See accompanying notes which are an integral part of the financial statements.
Statement of Changes in Net Assets
| | Year ended August 31, 2019 | For the period
May 31, 2018 (commencement of operations) to August 31, 2018 |
| Increase (Decrease) in Net Assets | | |
| Operations | | |
| Net investment income (loss) | $1,688,711 | $265,483 |
| Net realized gain (loss) | 1,294 | (354) |
| Change in net unrealized appreciation (depreciation) | 76,759 | 18,628 |
| Net increase (decrease) in net assets resulting from operations | 1,766,764 | 283,757 |
| Distributions to shareholders | (1,749,517) | – |
| Distributions to shareholders from net investment income | – | (207,174) |
| Total distributions | (1,749,517) | (207,174) |
| Share transactions | | |
| Proceeds from sales of shares | 43,554,435 | 53,305,758 |
| Reinvestment of distributions | 292,082 | 45,800 |
| Cost of shares redeemed | (19,158,737) | (2,540,774) |
| Net increase (decrease) in net assets resulting from share transactions | 24,687,780 | 50,810,784 |
| Total increase (decrease) in net assets | 24,705,027 | 50,887,367 |
| Net Assets | | |
| Beginning of period | 50,887,367 | – |
| End of period | $75,592,394 | $50,887,367 |
| Other Information | | |
| Undistributed net investment income end of period | | $58,309 |
| Shares | | |
| Sold | 4,355,320 | 5,330,062 |
| Issued in reinvestment of distributions | 29,208 | 4,575 |
| Redeemed | (1,915,969) | (253,920) |
| Net increase (decrease) | 2,468,559 | 5,080,717 |
See accompanying notes which are an integral part of the financial statements.
Financial Highlights
Fidelity Flex Conservative Income Bond Fund
| | | |
| Years ended August 31, | 2019 | 2018 A |
| Selected Per–Share Data | | |
| Net asset value, beginning of period | $10.02 | $10.00 |
| Income from Investment Operations | | |
| Net investment income (loss)B | .275 | .059 |
| Net realized and unrealized gain (loss) | .002 | .007 |
| Total from investment operations | .277 | .066 |
| Distributions from net investment income | (.287) | (.046) |
| Total distributions | (.287) | (.046) |
| Net asset value, end of period | $10.01 | $10.02 |
| Total ReturnC | 2.80% | .66% |
| Ratios to Average Net AssetsD,E | | |
| Expenses before reductionsF | -% | - %G |
| Expenses net of fee waivers, if anyF | -% | - %G |
| Expenses net of all reductionsF | -% | - %G |
| Net investment income (loss) | 2.76% | 2.32%G |
| Supplemental Data | | |
| Net assets, end of period (000 omitted) | $75,592 | $50,887 |
| Portfolio turnover rateH | 12% | 10%I |
A For the period May 31, 2018 (commencement of operations) to August 31, 2018.
B Calculated based on average shares outstanding during the period.
C Total returns for periods of less than one year are not annualized.
D Fees and expenses of any underlying Fidelity Central Funds are not included in the Fund's expense ratio. The Fund indirectly bears its proportionate share of the expenses of any underlying Fidelity Central Funds.
E Expense ratios reflect operating expenses of the Fund. Expenses before reductions do not reflect amounts reimbursed by the investment adviser or reductions from expense offset arrangements and do not represent the amount paid by the Fund during periods when reimbursements or reductions occur. Expenses net of fee waivers reflect expenses after reimbursement by the investment adviser but prior to reductions from expense offset arrangements. Expenses net of all reductions represent the net expenses paid by the Fund.
F Amount represents less than .005%.
G Annualized
H Amount does not include the portfolio activity of any underlying Fidelity Central Funds.
I Amount not annualized.
See accompanying notes which are an integral part of the financial statements.
Notes to Financial Statements
For the period ended August 31, 2019
1. Organization.
Fidelity Flex Conservative Income Bond Fund (the Fund) is a fund of Fidelity Salem Street Trust (the Trust) and is authorized to issue an unlimited number of shares. Share transactions on the Statement of Changes in Net Assets may contain exchanges between affiliated funds. The Trust is registered under the Investment Company Act of 1940, as amended (the 1940 Act), as an open-end management investment company organized as a Massachusetts business trust. The Fund is available only to certain fee-based accounts offered by Fidelity.
2. Investments in Fidelity Central Funds.
The Fund invests in Fidelity Central Funds, which are open-end investment companies generally available only to other investment companies and accounts managed by the investment adviser and its affiliates. The Fund's Schedule of Investments lists each of the Fidelity Central Funds held as of period end, if any, as an investment of the Fund, but does not include the underlying holdings of each Fidelity Central Fund. As an Investing Fund, the Fund indirectly bears its proportionate share of the expenses of the underlying Fidelity Central Funds.
The Money Market Central Funds seek preservation of capital and current income and are managed by Fidelity Investments Money Management, Inc. (FIMM), an affiliate of the investment adviser. Annualized expenses of the Money Market Central Funds as of their most recent shareholder report date ranged from less than .005% to .01%.
A complete unaudited list of holdings for each Fidelity Central Fund is available upon request or at the Securities and Exchange Commission (the SEC) website at www.sec.gov. In addition, the financial statements of the Fidelity Central Funds, which are not covered by the Fund's Report of Independent Registered Public Accounting Firm, are available on the SEC website or upon request.
3. Significant Accounting Policies.
The Fund is an investment company and applies the accounting and reporting guidance of the Financial Accounting Standards Board (FASB) Accounting Standards Codification Topic 946 Financial Services – Investments Companies. The financial statements have been prepared in conformity with accounting principles generally accepted in the United States of America (GAAP), which require management to make certain estimates and assumptions at the date of the financial statements. Actual results could differ from those estimates. Subsequent events, if any, through the date that the financial statements were issued have been evaluated in the preparation of the financial statements. The following summarizes the significant accounting policies of the Fund:
Investment Valuation. Investments are valued as of 4:00 p.m. Eastern time on the last calendar day of the period. The Board of Trustees (the Board) has delegated the day to day responsibility for the valuation of the Fund's investments to the Fair Value Committee (the Committee) established by the Fund's investment adviser. In accordance with valuation policies and procedures approved by the Board, the Fund attempts to obtain prices from one or more third party pricing vendors or brokers to value its investments. When current market prices, quotations or currency exchange rates are not readily available or reliable, investments will be fair valued in good faith by the Committee, in accordance with procedures adopted by the Board. Factors used in determining fair value vary by investment type and may include market or investment specific events, changes in interest rates and credit quality. The frequency with which these procedures are used cannot be predicted and they may be utilized to a significant extent. The Committee oversees the Fund's valuation policies and procedures and reports to the Board on the Committee's activities and fair value determinations. The Board monitors the appropriateness of the procedures used in valuing the Fund's investments and ratifies the fair value determinations of the Committee.
The Fund categorizes the inputs to valuation techniques used to value its investments into a disclosure hierarchy consisting of three levels as shown below:
- Level 1 – quoted prices in active markets for identical investments
- Level 2 – other significant observable inputs (including quoted prices for similar investments, interest rates, prepayment speeds, etc.)
- Level 3 – unobservable inputs (including the Fund's own assumptions based on the best information available)
Valuation techniques used to value the Fund's investments by major category are as follows:
Debt securities, including restricted securities, are valued based on evaluated prices received from third party pricing vendors or from brokers who make markets in such securities. Corporate bonds, bank notes, U.S. government and government agency obligations, commercial paper, certificates of deposit, master notes and other Short-Term securities are valued by pricing vendors who utilize matrix pricing which considers yield or price of bonds of comparable quality, coupon, maturity and type or by broker-supplied prices. When independent prices are unavailable or unreliable, debt securities may be valued utilizing pricing methodologies which consider similar factors that would be used by third party pricing vendors. Debt securities are generally categorized as Level 2 in the hierarchy but may be Level 3 depending on the circumstances.
Investments in open-end mutual funds, including the Fidelity Central Funds, are valued at their closing net asset value (NAV) each business day and are categorized as Level 1 in the hierarchy. Short-term securities with remaining maturities of sixty days or less may be valued at amortized cost, which approximates fair value, and are categorized as Level 2 in the hierarchy.
Changes in valuation techniques may result in transfers in or out of an assigned level within the disclosure hierarchy. The aggregate value of investments by input level as of August 31, 2019 is included at the end of the Fund's Schedule of Investments.
Investment Transactions and Income. For financial reporting purposes, the Fund's investment holdings and NAV include trades executed through the end of the last business day of the period. The NAV per share for processing shareholder transactions is calculated as of the close of business of the New York Stock Exchange (NYSE), normally 4:00 p.m. Eastern time and includes trades executed through the end of the prior business day. Gains and losses on securities sold are determined on the basis of identified cost. Income and capital gain distributions from Fidelity Central Funds, if any, are recorded on the ex-dividend date. Interest income is accrued as earned and includes coupon interest and amortization of premium and accretion of discount on debt securities as applicable. Debt obligations may be placed on non-accrual status and related interest income may be reduced by ceasing current accruals and writing off interest receivables when the collection of all or a portion of interest has become doubtful based on consistently applied procedures. A debt obligation is removed from non-accrual status when the issuer resumes interest payments or when collectability of interest is reasonably assured.
Expenses. Expenses directly attributable to a fund are charged to that fund. Expenses attributable to more than one fund are allocated among the respective funds on the basis of relative net assets or other appropriate methods. Expense estimates are accrued in the period to which they relate and adjustments are made when actual amounts are known.
Income Tax Information and Distributions to Shareholders. Each year, the Fund intends to qualify as a regulated investment company under Subchapter M of the Internal Revenue Code, including distributing substantially all of its taxable income and realized gains. As a result, no provision for U.S. Federal income taxes is required. As of August 31, 2019, the Fund did not have any unrecognized tax benefits in the financial statements; nor is the Fund aware of any tax positions for which it is reasonably possible that the total amounts of unrecognized tax benefits will significantly change in the next twelve months. The Fund files a U.S. federal tax return, in addition to state and local tax returns as required. The Fund's federal income tax returns are subject to examination by the Internal Revenue Service (IRS) for a period of three fiscal years after they are filed. State and local tax returns may be subject to examination for an additional fiscal year depending on the jurisdiction.
Distributions are declared and recorded daily and paid monthly from net investment income. Distributions from realized gains, if any, are declared and recorded on the ex-dividend date. Income and capital gain distributions are determined in accordance with income tax regulations, which may differ from GAAP.
Capital accounts within the financial statements are adjusted for permanent book-tax differences. These adjustments have no impact on net assets or the results of operations. Capital accounts are not adjusted for temporary book-tax differences which will reverse in a subsequent period.
Book-tax differences are primarily due to capital loss carryforwards.
As of period end, the cost and unrealized appreciation (depreciation) in securities, and derivatives if applicable, for federal income tax purposes were as follows:
| Gross unrealized appreciation | $104,041 |
| Gross unrealized depreciation | (8,654) |
| Net unrealized appreciation (depreciation) | $95,387 |
| Tax Cost | $75,228,998 |
The tax-based components of distributable earnings as of period end were as follows:
| Net unrealized appreciation (depreciation) on securities and other investments | $95,387 |
The tax character of distributions paid was as follows:
| | August 31, 2019 | August 31, 2018(a) |
| Ordinary Income | $1,749,517 | $207,174 |
| Total | $1,749,517 | $207,174 |
(a) For the period May 31, 2018 (commencement of operations) to August 31, 2018.
Repurchase Agreements. Pursuant to an Exemptive Order issued by the SEC, the Fund along with other registered investment companies having management contracts with Fidelity Management & Research Company (FMR), or other affiliated entities of FMR, are permitted to transfer uninvested cash balances into joint trading accounts which are then invested in repurchase agreements. The Fund may also invest directly with institutions in repurchase agreements. Repurchase agreements may be collateralized by government or non-government securities. Upon settlement date, collateral is held in segregated accounts with custodian banks and may be obtained in the event of a default of the counterparty. The Fund monitors, on a daily basis, the value of the collateral to ensure it is at least equal to the principal amount of the repurchase agreement (including accrued interest). In the event of a default by the counterparty, realization of the collateral proceeds could be delayed, during which time the value of the collateral may decline.
Restricted Securities. The Fund may invest in securities that are subject to legal or contractual restrictions on resale. These securities generally may be resold in transactions exempt from registration or to the public if the securities are registered. Disposal of these securities may involve time-consuming negotiations and expense, and prompt sale at an acceptable price may be difficult. Information regarding restricted securities is included at the end of the Fund's Schedule of Investments.
New Rule Issuance. During August 2018, the U.S. Securities and Exchange Commission issued Final Rule Release No. 33-10532, Disclosure Update and Simplification. This Final Rule includes amendments specific to registered investment companies that are intended to eliminate overlap in disclosure requirements between Regulation S-X and GAAP. In accordance with these amendments, certain line-items in the Fund's financial statements have been combined or removed for the current period as outlined in the table below.
| Financial Statement | Current Line-Item Presentation (As Applicable) | Prior Line-Item Presentation (As Applicable) |
| Statement of Assets and Liabilities | Total distributable earnings (loss) | Undistributed/Distributions in excess of/Accumulated net investment income (loss)
Accumulated/Undistributed net realized gain (loss)
Net unrealized appreciation (depreciation) |
| Statement of Changes in Net Assets | N/A - removed | Undistributed/Distributions in excess of/Accumulated net investment income (loss) end of period |
| Statement of Changes in Net Assets | Distributions to shareholders | Distributions to shareholders from net investment income
Distributions to shareholders from net realized gain |
4. Purchases and Sales of Investments.
Purchases and sales of securities, other than short-term securities and U.S. government securities, aggregated $26,912,358 and $3,296,873, respectively.
5. Fees and Other Transactions with Affiliates.
Management Fee. Fidelity Management & Research Company (the investment adviser) and its affiliates provide the Fund with investment management related services and the Fund does not pay any fees for these services. Under the management contract, the investment adviser or an affiliate pays all other expenses of the Fund, excluding fees and expenses of the independent Trustees, and certain miscellaneous expenses such as proxy and shareholder meeting expenses.
Interfund Trades. The Fund may purchase from or sell securities to other Fidelity Funds under procedures adopted by the Board. The procedures have been designed to ensure these interfund trades are executed in accordance with Rule 17a-7 of the 1940 Act. Interfund trades are included within the respective purchases and sales amounts shown in the Purchases and Sales of Investments note.
6. Committed Line of Credit.
The Fund participates with other funds managed by the investment adviser or an affiliate in a $4.25 billion credit facility (the "line of credit") to be utilized for temporary or emergency purposes to fund shareholder redemptions or for other short-term liquidity purposes. The Fund has agreed to pay commitment fees on its pro-rata portion of the line of credit, which amounted to $54 and is reflected in Commitment fees on the Statement of Operations. During the period, the Fund did not borrow on this line of credit.
7. Other.
The Fund's organizational documents provide former and current trustees and officers with a limited indemnification against liabilities arising in connection with the performance of their duties to the Fund. In the normal course of business, the Fund may also enter into contracts that provide general indemnifications. The Fund's maximum exposure under these arrangements is unknown as this would be dependent on future claims that may be made against the Fund. The risk of material loss from such claims is considered remote.
At the end of the period, the investment adviser or its affiliates were the owners of record of approximately 14% of the total outstanding shares of the Fund.
Report of Independent Registered Public Accounting Firm
To the Trustees of Fidelity Salem Street Trust and Shareholders of Fidelity Flex Conservative Income Bond Fund :
Opinion on the Financial Statements and Financial Highlights
We have audited the accompanying statement of assets and liabilities of Fidelity Flex Conservative Income Bond Fund (the "Fund"), a fund of Fidelity Salem Street Trust, including the schedule of investments, as of August 31, 2019, the related statement of operations for the year then ended, and the statement of changes in net assets and the financial highlights for the year then ended and for the period from May 31, 2018 (commencement of operations) to August 31, 2018, and the related notes. In our opinion, the financial statements and financial highlights present fairly, in all material respects, the financial position of the Fund as of August 31, 2019, the results of its operations for the year then ended, and the changes in its net assets and the financial highlights for the year then ended and for the period from May 31, 2018 (commencement of operations) to August 31, 2018 in conformity with accounting principles generally accepted in the United States of America.
Basis for Opinion
These financial statements and financial highlights are the responsibility of the Fund's management. Our responsibility is to express an opinion on the Fund's financial statements and financial highlights based on our audits. We are a public accounting firm registered with the Public Company Accounting Oversight Board (United States) (PCAOB) and are required to be independent with respect to the Fund in accordance with the U.S. federal securities laws and the applicable rules and regulations of the Securities and Exchange Commission and the PCAOB.
We conducted our audits in accordance with the standards of the PCAOB. Those standards require that we plan and perform the audit to obtain reasonable assurance about whether the financial statements and financial highlights are free of material misstatement, whether due to error or fraud. The Fund is not required to have, nor were we engaged to perform, an audit of its internal control over financial reporting. As part of our audits we are required to obtain an understanding of internal control over financial reporting but not for the purpose of expressing an opinion on the effectiveness of the Fund’s internal control over financial reporting. Accordingly, we express no such opinion.
Our audits included performing procedures to assess the risks of material misstatement of the financial statements and financial highlights, whether due to error or fraud, and performing procedures that respond to those risks. Such procedures included examining, on a test basis, evidence regarding the amounts and disclosures in the financial statements and financial highlights. Our audits also included evaluating the accounting principles used and significant estimates made by management, as well as evaluating the overall presentation of the financial statements and financial highlights. Our procedures included confirmation of securities owned as of August 31, 2019, by correspondence with the custodians and brokers; when replies were not received from brokers, we performed other auditing procedures. We believe that our audits provide a reasonable basis for our opinion.
/s/ Deloitte & Touche LLP
Boston, Massachusetts
October 15, 2019
We have served as the auditor of one or more of the Fidelity investment companies since 1999.
Trustees and Officers
The Trustees, Members of the Advisory Board (if any), and officers of the trust and fund, as applicable, are listed below. The Board of Trustees governs the fund and is responsible for protecting the interests of shareholders. The Trustees are experienced executives who meet periodically throughout the year to oversee the fund's activities, review contractual arrangements with companies that provide services to the fund, oversee management of the risks associated with such activities and contractual arrangements, and review the fund's performance. Except for Jonathan Chiel, each of the Trustees oversees 276 funds. Mr. Chiel oversees 170 funds.
The Trustees hold office without limit in time except that (a) any Trustee may resign; (b) any Trustee may be removed by written instrument, signed by at least two-thirds of the number of Trustees prior to such removal; (c) any Trustee who requests to be retired or who has become incapacitated by illness or injury may be retired by written instrument signed by a majority of the other Trustees; and (d) any Trustee may be removed at any special meeting of shareholders by a two-thirds vote of the outstanding voting securities of the trust. Each Trustee who is not an interested person (as defined in the 1940 Act) of the trust and the fund is referred to herein as an Independent Trustee. Each Independent Trustee shall retire not later than the last day of the calendar year in which his or her 75th birthday occurs. The Independent Trustees may waive this mandatory retirement age policy with respect to individual Trustees. Officers and Advisory Board Members hold office without limit in time, except that any officer or Advisory Board Member may resign or may be removed by a vote of a majority of the Trustees at any regular meeting or any special meeting of the Trustees. Except as indicated, each individual has held the office shown or other offices in the same company for the past five years.
The fund’s Statement of Additional Information (SAI) includes more information about the Trustees. To request a free copy, call Fidelity at 1-800-544-3455 (for managed account clients) or 1-800-835-5092 (for retirement plan participants).
Experience, Skills, Attributes, and Qualifications of the Trustees. The Governance and Nominating Committee has adopted a statement of policy that describes the experience, qualifications, attributes, and skills that are necessary and desirable for potential Independent Trustee candidates (Statement of Policy). The Board believes that each Trustee satisfied at the time he or she was initially elected or appointed a Trustee, and continues to satisfy, the standards contemplated by the Statement of Policy. The Governance and Nominating Committee also engages professional search firms to help identify potential Independent Trustee candidates who have the experience, qualifications, attributes, and skills consistent with the Statement of Policy. From time to time, additional criteria based on the composition and skills of the current Independent Trustees, as well as experience or skills that may be appropriate in light of future changes to board composition, business conditions, and regulatory or other developments, have also been considered by the professional search firms and the Governance and Nominating Committee. In addition, the Board takes into account the Trustees' commitment and participation in Board and committee meetings, as well as their leadership of standing and ad hoc committees throughout their tenure.
In determining that a particular Trustee was and continues to be qualified to serve as a Trustee, the Board has considered a variety of criteria, none of which, in isolation, was controlling. The Board believes that, collectively, the Trustees have balanced and diverse experience, qualifications, attributes, and skills, which allow the Board to operate effectively in governing the fund and protecting the interests of shareholders. Information about the specific experience, skills, attributes, and qualifications of each Trustee, which in each case led to the Board's conclusion that the Trustee should serve (or continue to serve) as a trustee of the fund, is provided below.
Board Structure and Oversight Function. Abigail P. Johnson is an interested person and currently serves as Chairman. The Trustees have determined that an interested Chairman is appropriate and benefits shareholders because an interested Chairman has a personal and professional stake in the quality and continuity of services provided to the fund. Independent Trustees exercise their informed business judgment to appoint an individual of their choosing to serve as Chairman, regardless of whether the Trustee happens to be independent or a member of management. The Independent Trustees have determined that they can act independently and effectively without having an Independent Trustee serve as Chairman and that a key structural component for assuring that they are in a position to do so is for the Independent Trustees to constitute a substantial majority for the Board. The Independent Trustees also regularly meet in executive session. Arthur E. Johnson serves as Chairman of the Independent Trustees and as such (i) acts as a liaison between the Independent Trustees and management with respect to matters important to the Independent Trustees and (ii) with management prepares agendas for Board meetings.
Fidelity® funds are overseen by different Boards of Trustees. The fund's Board oversees Fidelity's investment-grade bond, money market, asset allocation and certain equity funds, and other Boards oversee Fidelity's high income and other equity funds. The asset allocation funds may invest in Fidelity® funds that are overseen by such other Boards. The use of separate Boards, each with its own committee structure, allows the Trustees of each group of Fidelity® funds to focus on the unique issues of the funds they oversee, including common research, investment, and operational issues. On occasion, the separate Boards establish joint committees to address issues of overlapping consequences for the Fidelity® funds overseen by each Board.
The Trustees operate using a system of committees to facilitate the timely and efficient consideration of all matters of importance to the Trustees, the fund, and fund shareholders and to facilitate compliance with legal and regulatory requirements and oversight of the fund's activities and associated risks. The Board, acting through its committees, has charged FMR and its affiliates with (i) identifying events or circumstances the occurrence of which could have demonstrably adverse effects on the fund's business and/or reputation; (ii) implementing processes and controls to lessen the possibility that such events or circumstances occur or to mitigate the effects of such events or circumstances if they do occur; and (iii) creating and maintaining a system designed to evaluate continuously business and market conditions in order to facilitate the identification and implementation processes described in (i) and (ii) above. Because the day-to-day operations and activities of the fund are carried out by or through FMR, its affiliates, and other service providers, the fund's exposure to risks is mitigated but not eliminated by the processes overseen by the Trustees. While each of the Board's committees has responsibility for overseeing different aspects of the fund's activities, oversight is exercised primarily through the Operations and Audit Committees. In addition, an ad hoc Board committee of Independent Trustees has worked with FMR to enhance the Board's oversight of investment and financial risks, legal and regulatory risks, technology risks, and operational risks, including the development of additional risk reporting to the Board. Appropriate personnel, including but not limited to the fund's Chief Compliance Officer (CCO), FMR's internal auditor, the independent accountants, the fund's Treasurer and portfolio management personnel, make periodic reports to the Board's committees, as appropriate, including an annual review of Fidelity's risk management program for the Fidelity® funds. The responsibilities of each standing committee, including their oversight responsibilities, are described further under "Standing Committees of the Trustees."
Interested Trustees*:
Correspondence intended for a Trustee who is an interested person may be sent to Fidelity Investments, 245 Summer Street, Boston, Massachusetts 02210.
Name, Year of Birth; Principal Occupations and Other Relevant Experience+
Jonathan Chiel (1957)
Year of Election or Appointment: 2016
Trustee
Mr. Chiel also serves as Trustee of other Fidelity® funds. Mr. Chiel is Executive Vice President and General Counsel for FMR LLC (diversified financial services company, 2012-present). Previously, Mr. Chiel served as general counsel (2004-2012) and senior vice president and deputy general counsel (2000-2004) for John Hancock Financial Services; a partner with Choate, Hall & Stewart (1996-2000) (law firm); and an Assistant United States Attorney for the United States Attorney’s Office of the District of Massachusetts (1986-95), including Chief of the Criminal Division (1993-1995). Mr. Chiel is a director on the boards of the Boston Bar Foundation and the Maimonides School.
Abigail P. Johnson (1961)
Year of Election or Appointment: 2009
Trustee
Chairman of the Board of Trustees
Ms. Johnson also serves as Trustee of other Fidelity® funds. Ms. Johnson serves as Chairman (2016-present), Chief Executive Officer (2014-present), and Director (2007-present) of FMR LLC (diversified financial services company), President of Fidelity Financial Services (2012-present) and President of Personal, Workplace and Institutional Services (2005-present). Ms. Johnson is Chairman and Director of FMR Co., Inc. (investment adviser firm, 2011-present) and Chairman and Director of FMR (investment adviser firm, 2011-present). Previously, Ms. Johnson served as Vice Chairman (2007-2016) and President (2013-2016) of FMR LLC, President and a Director of FMR (2001-2005), a Trustee of other investment companies advised by FMR, Fidelity Investments Money Management, Inc. (investment adviser firm), and FMR Co., Inc. (2001-2005), Senior Vice President of the Fidelity® funds (2001-2005), and managed a number of Fidelity® funds. Ms. Abigail P. Johnson and Mr. Arthur E. Johnson are not related.
Jennifer Toolin McAuliffe (1959)
Year of Election or Appointment: 2016
Trustee
Ms. McAuliffe also serves as Trustee of other Fidelity® funds. Ms. McAuliffe previously served as a Member of the Advisory Board of certain Fidelity® funds (2016) and as Co-Head of Fixed Income of Fidelity Investments Limited (now known as FIL Limited (FIL)) (diversified financial services company). Earlier roles at FIL included Director of Research for FIL’s credit and quantitative teams in London, Hong Kong and Tokyo. Ms. McAuliffe also was the Director of Research for taxable and municipal bonds at Fidelity Investments Money Management, Inc. Ms. McAuliffe is also a director or trustee of several not-for-profit entities.
* Determined to be an “Interested Trustee” by virtue of, among other things, his or her affiliation with the trust or various entities under common control with FMR.
+ The information includes the Trustee's principal occupation during the last five years and other information relating to the experience, attributes, and skills relevant to the Trustee's qualifications to serve as a Trustee, which led to the conclusion that the Trustee should serve as a Trustee for the fund.
Independent Trustees:
Correspondence intended for an Independent Trustee may be sent to Fidelity Investments, P.O. Box 55235, Boston, Massachusetts 02205-5235.
Name, Year of Birth; Principal Occupations and Other Relevant Experience+
Elizabeth S. Acton (1951)
Year of Election or Appointment: 2013
Trustee
Ms. Acton also serves as Trustee of other Fidelity® funds. Prior to her retirement in April 2012, Ms. Acton was Executive Vice President, Finance (2011-2012), Executive Vice President, Chief Financial Officer (2002-2011), and Treasurer (2004-2005) of Comerica Incorporated (financial services). Prior to joining Comerica, Ms. Acton held a variety of positions at Ford Motor Company (1983-2002), including Vice President and Treasurer (2000-2002) and Executive Vice President and Chief Financial Officer of Ford Motor Credit Company (1998-2000). Ms. Acton currently serves as a member of the Board of Directors and Audit and Finance Committees of Beazer Homes USA, Inc. (homebuilding, 2012-present). Previously, Ms. Acton served as a Member of the Advisory Board of certain Fidelity® funds (2013-2016).
Ann E. Dunwoody (1953)
Year of Election or Appointment: 2018
Trustee
General Dunwoody also serves as Trustee of other Fidelity® funds. General Dunwoody (United States Army, Retired) was the first woman in U.S. military history to achieve the rank of four-star general and prior to her retirement in 2012 held a variety of positions within the U.S. Army, including Commanding General, U.S. Army Material Command (2008-2012). She is the President of First to Four LLC (leadership and mentoring services, 2012-present). She also serves as a member of the Board of Directors and Nominating and Corporate Governance Committee of L3 Technologies, Inc. (communication, electronic, sensor, and aerospace systems, 2013-present), Board of Directors and Nomination and Corporate Governance Committees of Kforce Inc. (professional staffing services, 2016-present) and Board of Directors of Automattic Inc. (software engineering, 2018-present). Previously, General Dunwoody served as a Member of the Advisory Board of certain Fidelity® funds (2018), a member of the Board of Directors and Audit and Sustainability and Corporate Responsibility Committees of Republic Services, Inc. (waste collection, disposal and recycling, 2013-2016). Ms. Dunwoody also serves on several boards for non-profit organizations, including as a member of the Board of Directors, Chair of the Nomination and Governance Committee and member of the Audit Committee of Logistics Management Institute (consulting non-profit, 2012-present), a member of the Board of Directors of the Army Historical Foundation (2015-present), a member of the Council of Trustees for the Association of the United States Army (advocacy non-profit, 2013-present) and a member of the Board of Trustees of Florida Institute of Technology (2015-present) and ThanksUSA (military family education non-profit, 2014-present).
John Engler (1948)
Year of Election or Appointment: 2014
Trustee
Mr. Engler also serves as Trustee of other Fidelity® funds. He serves on the board of directors for Universal Forest Products (manufacturer and distributor of wood and wood-alternative products, 2003-present) and K12 Inc. (technology-based education company, 2012-present). Previously, Mr. Engler served as interim president of Michigan State University (2018-2019), a Member of the Advisory Board of certain Fidelity® funds (2014-2016), president of the Business Roundtable (2011-2017), a trustee of The Munder Funds (2003-2014), president and CEO of the National Association of Manufacturers (2004-2011), member of the Board of Trustees of the Annie E. Casey Foundation (2004-2015), and as governor of Michigan (1991-2003). He is a past chairman of the National Governors Association.
Robert F. Gartland (1951)
Year of Election or Appointment: 2010
Trustee
Mr. Gartland also serves as Trustee of other Fidelity® funds. Mr. Gartland is Chairman and an investor in Gartland & Mellina Group Corp. (consulting, 2009-present). Previously, Mr. Gartland served as a partner and investor of Vietnam Partners LLC (investments and consulting, 2008-2011). Prior to his retirement, Mr. Gartland held a variety of positions at Morgan Stanley (financial services, 1979-2007), including Managing Director (1987-2007), and Chase Manhattan Bank (1975-1978).
Arthur E. Johnson (1947)
Year of Election or Appointment: 2008
Trustee
Chairman of the Independent Trustees
Mr. Johnson also serves as Trustee of other Fidelity® funds. Mr. Johnson serves as a member of the Board of Directors of Eaton Corporation plc (diversified power management, 2009-present) and Booz Allen Hamilton (management consulting, 2011-present). Prior to his retirement, Mr. Johnson served as Senior Vice President of Corporate Strategic Development of Lockheed Martin Corporation (defense contractor, 1999-2009). Mr. Johnson previously served as Vice Chairman (2015-2018) of the Independent Trustees of certain Fidelity® funds and on the Board of Directors of IKON Office Solutions, Inc. (1999-2008), AGL Resources, Inc. (holding company, 2002-2016), and Delta Airlines (2005-2007). Mr. Arthur E. Johnson is not related to Ms. Abigail P. Johnson.
Michael E. Kenneally (1954)
Year of Election or Appointment: 2009
Trustee
Vice Chairman of the Independent Trustees
Mr. Kenneally also serves as Trustee of other Fidelity® funds. Prior to his retirement, Mr. Kenneally served as Chairman and Global Chief Executive Officer of Credit Suisse Asset Management. Before joining Credit Suisse, he was an Executive Vice President and Chief Investment Officer for Bank of America Corporation. Earlier roles at Bank of America included Director of Research, Senior Portfolio Manager and Research Analyst, and Mr. Kenneally was awarded the Chartered Financial Analyst (CFA) designation in 1991.
Marie L. Knowles (1946)
Year of Election or Appointment: 2001
Trustee
Ms. Knowles also serves as Trustee of other Fidelity® funds. Prior to Ms. Knowles' retirement in June 2000, she served as Executive Vice President and Chief Financial Officer of Atlantic Richfield Company (ARCO) (diversified energy, 1996-2000). From 1993 to 1996, she was a Senior Vice President of ARCO and President of ARCO Transportation Company (pipeline and tanker operations). Ms. Knowles currently serves as a Director and Chairman of the Audit Committee of McKesson Corporation (healthcare service, since 2002). Ms. Knowles is a member of the Board of the Santa Catalina Island Company (real estate, 2009-present). Ms. Knowles is a Member of the Investment Company Institute Board of Governors and a Member of the Governing Council of the Independent Directors Council (2014-present). She also serves as a member of the Advisory Board for the School of Engineering of the University of Southern California. Previously, Ms. Knowles served as a Director of Phelps Dodge Corporation (copper mining and manufacturing, 1994-2007), URS Corporation (engineering and construction, 2000-2003) and America West (airline, 1999-2002). Ms. Knowles previously served as Chairman (2015-2018) and Vice Chairman (2012-2015) of the Independent Trustees of certain Fidelity® funds.
Mark A. Murray (1954)
Year of Election or Appointment: 2016
Trustee
Mr. Murray also serves as Trustee of other Fidelity® funds. Mr. Murray is Vice Chairman (2013-present) of Meijer, Inc. (regional retail chain). Previously, Mr. Murray served as a Member of the Advisory Board of certain Fidelity® funds (2016) and as Co-Chief Executive Officer (2013-2016) and President (2006-2013) of Meijer, Inc. Mr. Murray serves as a member of the Board of Directors and Nuclear Review and Public Policy and Responsibility Committees of DTE Energy Company (diversified energy company, 2009-present). Mr. Murray also serves as a member of the Board of Directors of Spectrum Health (not-for-profit health system, 2015-present). Mr. Murray previously served as President of Grand Valley State University (2001-2006), Treasurer for the State of Michigan (1999-2001), Vice President of Finance and Administration for Michigan State University (1998-1999), and a member of the Board of Directors and Audit Committee and Chairman of the Nominating and Corporate Governance Committee of Universal Forest Products, Inc. (manufacturer and distributor of wood and wood-alternative products, 2004-2016). Mr. Murray is also a director or trustee of many community and professional organizations.
+ The information includes the Trustee's principal occupation during the last five years and other information relating to the experience, attributes, and skills relevant to the Trustee's qualifications to serve as a Trustee, which led to the conclusion that the Trustee should serve as a Trustee for the fund.
Advisory Board Members and Officers:
Correspondence intended for an officer may be sent to Fidelity Investments, 245 Summer Street, Boston, Massachusetts 02210. Officers appear below in alphabetical order.
Name, Year of Birth; Principal Occupation
Elizabeth Paige Baumann (1968)
Year of Election or Appointment: 2017
Anti-Money Laundering (AML) Officer
Ms. Baumann also serves as AML Officer of other funds. She is Chief AML Officer (2012-present) and Senior Vice President (2014-present) of FMR LLC (diversified financial services company) and is an employee of Fidelity Investments. Previously, Ms. Baumann served as AML Officer of the funds (2012-2016), and Vice President (2007-2014) and Deputy Anti-Money Laundering Officer (2007-2012) of FMR LLC.
Craig S. Brown (1977)
Year of Election or Appointment: 2019
Assistant Treasurer
Mr. Brown also serves as Assistant Treasurer of other funds. Mr. Brown is an employee of Fidelity Investments (2013-present).
John J. Burke III (1964)
Year of Election or Appointment: 2018
Chief Financial Officer
Mr. Burke also serves as Chief Financial Officer of other funds. Mr. Burke serves as Head of Investment Operations for Fidelity Fund and Investment Operations (2018-present) and is an employee of Fidelity Investments (1998-present). Previously Mr. Burke served as head of Asset Management Investment Operations (2012-2018).
Jonathan Davis (1968)
Year of Election or Appointment: 2010
Assistant Treasurer
Mr. Davis also serves as Assistant Treasurer of other funds. Mr. Davis serves as Assistant Treasurer of FMR Capital, Inc. (2017-present) and is an employee of Fidelity Investments. Previously, Mr. Davis served as Vice President and Associate General Counsel of FMR LLC (diversified financial services company, 2003-2010).
Adrien E. Deberghes (1967)
Year of Election or Appointment: 2010
Assistant Treasurer
Mr. Deberghes also serves as an officer of other funds. He serves as Assistant Treasurer of FMR Capital, Inc. (2017-present), Executive Vice President of Fidelity Investments Money Management, Inc. (FIMM) (investment adviser firm, 2016-present), and is an employee of Fidelity Investments (2008-present). Previously, Mr. Deberghes served as President and Treasurer of certain Fidelity® funds (2013-2018). Prior to joining Fidelity Investments, Mr. Deberghes was Senior Vice President of Mutual Fund Administration at State Street Corporation (2007-2008), Senior Director of Mutual Fund Administration at Investors Bank & Trust (2005-2007), and Director of Finance for Dunkin' Brands (2000-2005). Previously, Mr. Deberghes served in other fund officer roles.
Laura M. Del Prato (1964)
Year of Election or Appointment: 2018
President and Treasurer
Ms. Del Prato also serves as an officer of other funds. Ms. Del Prato is an employee of Fidelity Investments (2017-present). Prior to joining Fidelity Investments, Ms. Del Prato served as a Managing Director and Treasurer of the JPMorgan Mutual Funds (2014-2017). Prior to JPMorgan, Ms. Del Prato served as a partner at Cohen Fund Audit Services (accounting firm, 2012-2013) and KPMG LLP (accounting firm, 2004-2012).
Colm A. Hogan (1973)
Year of Election or Appointment: 2016
Assistant Treasurer
Mr. Hogan also serves as an officer of other funds. Mr. Hogan serves as Assistant Treasurer of FMR Capital, Inc. (2017-present) and is an employee of Fidelity Investments (2005-present). Previously, Mr. Hogan served as Assistant Treasurer of certain Fidelity® funds (2016-2018).
Cynthia Lo Bessette (1969)
Year of Election or Appointment: 2019
Secretary and Chief Legal Officer (CLO)
Ms. Lo Bessette also serves as Secretary and CLO of other funds. She is a Senior Vice President and Deputy General Counsel of FMR LLC (diversified financial services company, 2019-present), and is an employee of Fidelity Investments. Previously, Ms. Lo Bessette served as Executive Vice President, General Counsel (2016-2019) and Senior Vice President, Deputy General Counsel (2015-2016) of OppenheimerFunds (investment management company) and Deputy Chief Legal Officer (2013-2015) of Jennison Associates LLC (investment adviser firm).
Chris Maher (1972)
Year of Election or Appointment: 2013
Assistant Treasurer
Mr. Maher serves as Assistant Treasurer of other funds. Mr. Maher is Vice President of Valuation Oversight, serves as Assistant Treasurer of FMR Capital, Inc. (2017-present), and is an employee of Fidelity Investments. Previously, Mr. Maher served as Vice President of Asset Management Compliance (2013), Vice President of the Program Management Group of FMR (investment adviser firm, 2010-2013), and Vice President of Valuation Oversight (2008-2010).
John B. McGinty, Jr. (1962)
Year of Election or Appointment: 2016
Chief Compliance Officer
Mr. McGinty also serves as Chief Compliance Officer of other funds. Mr. McGinty is Senior Vice President of Asset Management Compliance for Fidelity Investments and is an employee of Fidelity Investments (2016-present). Mr. McGinty previously served as Vice President, Senior Attorney at Eaton Vance Management (investment management firm, 2015-2016), and prior to Eaton Vance as global CCO for all firm operations and registered investment companies at GMO LLC (investment management firm, 2009-2015). Before joining GMO LLC, Mr. McGinty served as Senior Vice President, Deputy General Counsel for Fidelity Investments (2007-2009).
Jason P. Pogorelec (1975)
Year of Election or Appointment: 2015
Assistant Secretary
Mr. Pogorelec also serves as Assistant Secretary of other funds. Mr. Pogorelec serves as Vice President, Associate General Counsel (2010-present) and is an employee of Fidelity Investments (2006-present).
Nancy D. Prior (1967)
Year of Election or Appointment: 2014
Vice President
Ms. Prior also serves as Vice President of other funds. Ms. Prior serves as President of Fixed Income (2014-present), President (2016-present) and Director (2014-present) of Fidelity Investments Money Management, Inc. (FIMM) (investment adviser firm), and is an employee of Fidelity Investments (2002-present). Previously, Ms. Prior served as Vice Chairman of FIAM LLC (investment adviser firm, 2014-2018), a Director of FMR Investment Management (UK) Limited (investment adviser firm, 2015-2018), President Multi-Asset Class Strategies of FMR's Global Asset Allocation Division (2017-2018), Vice President of Fidelity's Money Market Funds (2012-2014), and President, Money Market and Short Duration Bond Group of Fidelity Management & Research Company (FMR) (investment adviser firm, 2013-2014).
Stacie M. Smith (1974)
Year of Election or Appointment: 2013
Assistant Treasurer
Ms. Smith also serves as an officer of other funds. Ms. Smith serves as Assistant Treasurer of FMR Capital, Inc. (2017-present), is an employee of Fidelity Investments (2009-present), and has served in other fund officer roles. Prior to joining Fidelity Investments, Ms. Smith served as Senior Audit Manager of Ernst & Young LLP (accounting firm, 1996-2009). Previously, Ms. Smith served as Assistant Treasurer (2013-2018) and Deputy Treasurer (2013-2016) of certain Fidelity® funds.
Marc L. Spector (1972)
Year of Election or Appointment: 2016
Deputy Treasurer
Mr. Spector also serves as an officer of other funds. Mr. Spector serves as Assistant Treasurer of FMR Capital, Inc. (2017-present) and is an employee of Fidelity Investments (2016-present). Prior to joining Fidelity Investments, Mr. Spector served as Director at the Siegfried Group (accounting firm, 2013-2016), and prior to Siegfried Group as audit senior manager at Deloitte & Touche (accounting firm, 2005-2013).
Jim Wegmann (1979)
Year of Election or Appointment: 2019
Assistant Treasurer
Mr. Wegmann also serves as Assistant Treasurer of other funds. Mr. Wegmann is an employee of Fidelity Investments (2011-present).
Shareholder Expense Example
As a shareholder of the Fund, you incur two types of costs: (1) transaction costs and (2) ongoing costs, including other Fund expenses. This Example is intended to help you understand your ongoing costs (in dollars) of investing in the Fund and to compare these costs with the ongoing costs of investing in other mutual funds.
The Example is based on an investment of $1,000 invested at the beginning of the period and held for the entire period (March 1, 2019 to August 31, 2019).
Actual Expenses
The first line of the accompanying table provides information about actual account values and actual expenses. You may use the information in this line, together with the amount you invested, to estimate the expenses that you paid over the period. Simply divide your account value by $1,000.00 (for example, an $8,600 account value divided by $1,000.00 = 8.6), then multiply the result by the number in the first line under the heading entitled "Expenses Paid During Period" to estimate the expenses you paid on your account during this period. In addition, the Fund, as a shareholder in the underlying Fidelity Central Funds, will indirectly bear its pro-rata share of the fees and expenses incurred by the underlying Fidelity Central Funds. These fees and expenses are not included in the Fund's annualized expense ratio used to calculate the expense estimate in the table below.
Hypothetical Example for Comparison Purposes
The second line of the accompanying table provides information about hypothetical account values and hypothetical expenses based on the Fund's actual expense ratio and an assumed rate of return of 5% per year before expenses, which is not the Fund's actual return. The hypothetical account values and expenses may not be used to estimate the actual ending account balance or expenses you paid for the period. You may use this information to compare the ongoing costs of investing in the Fund and other funds. To do so, compare this 5% hypothetical example with the 5% hypothetical examples that appear in the shareholder reports of the other funds. In addition, the Fund, as a shareholder in the underlying Fidelity Central Funds, will indirectly bear its pro-rata share of the fees and expenses incurred by the underlying Fidelity Central Funds. These fees and expenses are not included in the Fund's annualized expense ratio used to calculate the expense estimate in the table below.
Please note that the expenses shown in the table are meant to highlight your ongoing costs only and do not reflect any transaction costs. Therefore, the second line of the table is useful in comparing ongoing costs only, and will not help you determine the relative total costs of owning different funds.
| | Annualized Expense Ratio-A | Beginning
Account Value
March 1, 2019 | Ending
Account Value
August 31, 2019 | Expenses Paid
During Period-B
March 1, 2019
to August 31, 2019 |
| Actual | - %-C | $1,000.00 | $1,016.10 | $--D |
| Hypothetical-E | | $1,000.00 | $1,025.21 | $--D |
A Annualized expense ratio reflects expenses net of applicable fee waivers.
B Expenses are equal to the Fund's annualized expense ratio, multiplied by the average account value over the period, multiplied by 184/365 (to reflect the one-half year period).
C Amount represents less than .005%.
D Amount represents less than $.005.
E 5% return per year before expenses
Distributions (Unaudited)
A total of 3.87% of the dividends distributed during the fiscal year was derived from interest on U.S. Government securities which is generally exempt from state income tax.
The fund designates $925,691 of distributions paid during the period January 1, 2019 to August 31, 2019 as qualifying to be taxed as interest-related dividends for nonresident alien shareholders.
The fund will notify shareholders in January 2020 of amounts for use in preparing 2019 income tax returns.
ZCI-ANN-1019
1.9887609.101
Fidelity® Series Bond Index Fund
Annual Report August 31, 2019 |
|
Beginning on January 1, 2021, as permitted by regulations adopted by the Securities and Exchange Commission, paper copies of a fund’s shareholder reports will no longer be sent by mail, unless you specifically request paper copies of the reports from the fund or from your financial intermediary, such as a financial advisor, broker-dealer or bank. Instead, the reports will be made available on a website, and you will be notified by mail each time a report is posted and provided with a website link to access the report.
If you already elected to receive shareholder reports electronically, you will not be affected by this change and you need not take any action. You may elect to receive shareholder reports and other communications from a fund electronically, by contacting your financial intermediary. For Fidelity customers, visit Fidelity's web site or call Fidelity using the contact information listed below.
You may elect to receive all future reports in paper free of charge. If you wish to continue receiving paper copies of your shareholder reports, you may contact your financial intermediary or, if you are a Fidelity customer, visit Fidelity’s website, or call Fidelity at the applicable toll-free number listed below. Your election to receive reports in paper will apply to all funds held with the fund complex/your financial intermediary.
| Account Type | Website | Phone Number |
| Brokerage, Mutual Fund, or Annuity Contracts: | fidelity.com/mailpreferences | 1-800-343-3548 |
| Employer Provided Retirement Accounts: | netbenefits.fidelity.com/preferences (choose 'no' under Required Disclosures to continue to print) | 1-800-343-0860 |
| Advisor Sold Accounts Serviced Through Your Financial Intermediary: | Contact Your Financial Intermediary | Your Financial Intermediary's phone number |
| Advisor Sold Accounts Serviced by Fidelity: | institutional.fidelity.com | 1-877-208-0098 |
Contents
To view a fund's proxy voting guidelines and proxy voting record for the 12-month period ended June 30, visit http://www.fidelity.com/proxyvotingresults or visit the Securities and Exchange Commission's (SEC) web site at http://www.sec.gov.
You may also call 1-800-544-8544 to request a free copy of the proxy voting guidelines.
Standard & Poor's, S&P and S&P 500 are registered service marks of The McGraw-Hill Companies, Inc. and have been licensed for use by Fidelity Distributors Corporation.
Other third-party marks appearing herein are the property of their respective owners.
All other marks appearing herein are registered or unregistered trademarks or service marks of FMR LLC or an affiliated company. © 2019 FMR LLC. All rights reserved.
This report and the financial statements contained herein are submitted for the general information of the shareholders of the Fund. This report is not authorized for distribution to prospective investors in the Fund unless preceded or accompanied by an effective prospectus.
A fund files its complete schedule of portfolio holdings with the SEC for the first and third quarters of each fiscal year on Form N-PORT. Forms N-PORT are available on the SEC’s web site at http://www.sec.gov. A fund's Forms N-PORT may be reviewed and copied at the SEC’s Public Reference Room in Washington, DC. Information regarding the operation of the SEC's Public Reference Room may be obtained by calling 1-800-SEC-0330.
For a complete list of a fund's portfolio holdings, view the most recent holdings listing, semiannual report, or annual report on Fidelity's web site at http://www.fidelity.com, http://www.institutional.fidelity.com, or http://www.401k.com, as applicable.
NOT FDIC INSURED •MAY LOSE VALUE •NO BANK GUARANTEE
Neither the Fund nor Fidelity Distributors Corporation is a bank.
Investment Summary (Unaudited)
Quality Diversification (% of fund's net assets)
| As of August 31, 2019 |
| | U.S. Government and U.S. Government Agency Obligations | 69.9% |
| | AAA | 3.7% |
| | AA | 2.7% |
| | A | 9.5% |
| | BBB | 13.7% |
| | BB and Below | 0.4% |
| | Short-Term Investments and Net Other Assets | 0.1% |

We have used ratings from Moody's Investors Service, Inc. Where Moody's® ratings are not available, we have used S&P® ratings. All ratings are as of the date indicated and do not reflect subsequent changes.
Asset Allocation (% of fund's net assets)
| As of August 31, 2019* |
| | Corporate Bonds | 25.2% |
| | U.S. Government and U.S. Government Agency Obligations | 69.9% |
| | Asset-Backed Securities | 0.2% |
| | CMOs and Other Mortgage Related Securities | 1.2% |
| | Municipal Bonds | 0.5% |
| | Other Investments | 2.9% |
| | Short-Term Investments and Net Other Assets (Liabilities) | 0.1% |

* Foreign investments - 8.2%
Schedule of Investments August 31, 2019
Showing Percentage of Net Assets
| Nonconvertible Bonds - 25.2% | | | |
| | | Principal Amount | Value |
| COMMUNICATION SERVICES - 2.0% | | | |
| Diversified Telecommunication Services - 0.9% | | | |
| AT&T, Inc.: | | | |
| 2.45% 6/30/20 | | $762,000 | $763,378 |
| 2.8% 2/17/21 | | 1,280,000 | 1,292,670 |
| 2.95% 7/15/26 | | 1,137,000 | 1,159,042 |
| 3.4% 5/15/25 | | 1,318,000 | 1,384,325 |
| 3.55% 6/1/24 | | 427,000 | 448,804 |
| 3.6% 7/15/25 | | 901,000 | 949,532 |
| 3.8% 3/15/22 | | 1,422,000 | 1,481,952 |
| 3.8% 2/15/27 | | 1,280,000 | 1,366,651 |
| 4% 1/15/22 | | 142,000 | 148,209 |
| 4.125% 2/17/26 | | 3,885,000 | 4,222,528 |
| 4.35% 6/15/45 | | 3,521,000 | 3,767,889 |
| 4.5% 3/9/48 | | 1,361,000 | 1,485,567 |
| 4.55% 3/9/49 | | 26,000 | 28,409 |
| 4.65% 6/1/44 | | 1,119,000 | 1,223,311 |
| 4.75% 5/15/46 | | 1,465,000 | 1,638,087 |
| 4.85% 7/15/45 | | 427,000 | 488,975 |
| 4.9% 8/15/37 | | 3,616,000 | 4,136,821 |
| 5.15% 11/15/46 | | 120,000 | 141,168 |
| 5.15% 2/15/50 | | 3,418,000 | 4,057,171 |
| 5.55% 8/15/41 | | 1,038,000 | 1,254,789 |
| 6.35% 3/15/40 | | 142,000 | 185,646 |
| 6.375% 3/1/41 | | 974,000 | 1,273,138 |
| British Telecommunications PLC 9.625% 12/15/30 (a) | | 642,000 | 983,120 |
| Orange SA 5.5% 2/6/44 | | 427,000 | 568,490 |
| Telefonica Emisiones S.A.U.: | | | |
| 4.103% 3/8/27 | | 1,905,000 | 2,084,928 |
| 4.665% 3/6/38 | | 1,050,000 | 1,161,169 |
| 5.213% 3/8/47 | | 931,000 | 1,084,420 |
| 5.462% 2/16/21 | | 384,000 | 401,912 |
| 7.045% 6/20/36 | | 370,000 | 504,413 |
| Verizon Communications, Inc.: | | | |
| 2.625% 8/15/26 | | 3,289,000 | 3,369,412 |
| 3.5% 11/1/24 | | 427,000 | 455,179 |
| 4.125% 3/16/27 | | 995,000 | 1,110,309 |
| 4.272% 1/15/36 | | 3,452,000 | 3,963,383 |
| 4.4% 11/1/34 | | 537,000 | 622,059 |
| 4.75% 11/1/41 | | 142,000 | 172,336 |
| 5.012% 4/15/49 | | 1,675,000 | 2,141,215 |
| 5.012% 8/21/54 | | 1,785,000 | 2,308,812 |
| 5.25% 3/16/37 | | 2,204,000 | 2,792,503 |
| 5.5% 3/16/47 | | 3,822,000 | 5,130,256 |
| 6.55% 9/15/43 | | 1,780,000 | 2,622,319 |
| | | | 64,374,297 |
| Entertainment - 0.2% | | | |
| NBCUniversal, Inc. 6.4% 4/30/40 | | 427,000 | 619,048 |
| The Walt Disney Co.: | | | |
| 1.85% 7/30/26 | | 727,000 | 716,768 |
| 2.3% 2/12/21 | | 674,000 | 677,389 |
| 2.55% 2/15/22 | | 400,000 | 407,183 |
| 3% 7/30/46 | | 640,000 | 660,212 |
| 3.15% 9/17/25 | | 1,347,000 | 1,445,572 |
| 3.7% 10/15/25 (b) | | 995,000 | 1,081,017 |
| 4.125% 6/1/44 | | 810,000 | 984,601 |
| 5.4% 10/1/43 (b) | | 551,000 | 766,153 |
| 5.65% 8/15/20 (b) | | 142,000 | 146,872 |
| 6.15% 3/1/37 (b) | | 562,000 | 803,321 |
| 6.15% 2/15/41 (b) | | 1,493,000 | 2,196,631 |
| 6.9% 8/15/39 (b) | | 284,000 | 442,266 |
| 7.75% 12/1/45 (b) | | 449,000 | 791,049 |
| Viacom, Inc.: | | | |
| 4.25% 9/1/23 | | 1,106,000 | 1,180,752 |
| 4.375% 3/15/43 | | 375,000 | 397,708 |
| 5.625% 9/15/19 | | 142,000 | 142,107 |
| | | | 13,458,649 |
| Interactive Media & Services - 0.0% | | | |
| Alphabet, Inc.: | | | |
| 1.998% 8/15/26 | | 327,000 | 329,628 |
| 3.625% 5/19/21 | | 537,000 | 553,224 |
| | | | 882,852 |
| Media - 0.7% | | | |
| CBS Corp.: | | | |
| 3.375% 2/15/28 | | 1,500,000 | 1,542,595 |
| 4% 1/15/26 | | 853,000 | 914,158 |
| 4.6% 1/15/45 | | 1,038,000 | 1,166,745 |
| Charter Communications Operating LLC/Charter Communications Operating Capital Corp.: | | | |
| 4.2% 3/15/28 | | 1,564,000 | 1,664,557 |
| 4.908% 7/23/25 | | 1,135,000 | 1,254,383 |
| 5.125% 7/1/49 | | 2,000,000 | 2,184,639 |
| 5.75% 4/1/48 | | 744,000 | 868,025 |
| 6.384% 10/23/35 | | 1,912,000 | 2,333,901 |
| 6.484% 10/23/45 | | 667,000 | 824,773 |
| Comcast Corp.: | | | |
| 1.625% 1/15/22 | | 1,493,000 | 1,487,195 |
| 2.35% 1/15/27 | | 3,384,000 | 3,399,332 |
| 3.125% 7/15/22 | | 427,000 | 442,213 |
| 3.15% 3/1/26 | | 711,000 | 749,160 |
| 3.3% 2/1/27 | | 1,693,000 | 1,802,319 |
| 3.375% 8/15/25 | | 1,948,000 | 2,073,695 |
| 3.45% 10/1/21 | | 810,000 | 834,302 |
| 3.7% 4/15/24 | | 1,474,000 | 1,578,688 |
| 3.969% 11/1/47 | | 739,000 | 830,403 |
| 4% 3/1/48 | | 1,706,000 | 1,927,859 |
| 4.15% 10/15/28 | | 2,680,000 | 3,040,614 |
| 4.65% 7/15/42 | | 1,280,000 | 1,561,921 |
| 4.7% 10/15/48 | | 2,719,000 | 3,401,954 |
| 4.75% 3/1/44 | | 768,000 | 948,001 |
| 4.95% 10/15/58 | | 1,069,000 | 1,388,027 |
| 6.4% 3/1/40 | | 142,000 | 201,140 |
| 6.55% 7/1/39 | | 427,000 | 624,456 |
| 6.95% 8/15/37 | | 953,000 | 1,419,388 |
| Discovery Communications LLC: | | | |
| 3.25% 4/1/23 | | 332,000 | 342,385 |
| 4.875% 4/1/43 | | 697,000 | 741,564 |
| 5.2% 9/20/47 | | 1,194,000 | 1,351,073 |
| Fox Corp.: | | | |
| 4.03% 1/25/24 (b) | | 668,000 | 715,421 |
| 4.709% 1/25/29 (b) | | 1,476,000 | 1,709,761 |
| 5.476% 1/25/39 (b) | | 542,000 | 677,239 |
| 5.576% 1/25/49 (b) | | 1,324,000 | 1,722,672 |
| Time Warner Cable, Inc.: | | | |
| 4.5% 9/15/42 | | 1,564,000 | 1,569,974 |
| 7.3% 7/1/38 | | 569,000 | 729,906 |
| | | | 50,024,438 |
| Wireless Telecommunication Services - 0.2% | | | |
| America Movil S.A.B. de CV: | | | |
| 3.125% 7/16/22 | | 750,000 | 771,638 |
| 3.625% 4/22/29 | | 2,200,000 | 2,366,741 |
| 6.125% 11/15/37 | | 1,189,000 | 1,621,499 |
| Rogers Communications, Inc.: | | | |
| 2.9% 11/15/26 | | 355,000 | 366,732 |
| 3.625% 12/15/25 | | 284,000 | 304,995 |
| 4.1% 10/1/23 | | 686,000 | 735,517 |
| 5.45% 10/1/43 | | 821,000 | 1,073,882 |
| Vodafone Group PLC: | | | |
| 2.5% 9/26/22 | | 427,000 | 432,526 |
| 2.95% 2/19/23 | | 981,000 | 1,007,070 |
| 3.75% 1/16/24 | | 1,470,000 | 1,555,106 |
| 4.375% 5/30/28 | | 5,282,000 | 5,925,442 |
| 5.25% 5/30/48 | | 2,175,000 | 2,603,475 |
| | | | 18,764,623 |
|
| TOTAL COMMUNICATION SERVICES | | | 147,504,859 |
|
| CONSUMER DISCRETIONARY - 1.1% | | | |
| Automobiles - 0.3% | | | |
| American Honda Finance Corp.: | | | |
| 1.65% 7/12/21 | | 1,130,000 | 1,124,659 |
| 1.7% 9/9/21 | | 640,000 | 637,299 |
| 2.15% 3/13/20 | | 1,216,000 | 1,215,614 |
| 2.3% 9/9/26 | | 711,000 | 717,379 |
| 3.55% 1/12/24 | | 3,470,000 | 3,705,605 |
| Ford Motor Co. 4.75% 1/15/43 | | 1,088,000 | 977,663 |
| General Motors Co.: | | | |
| 5.2% 4/1/45 | | 607,000 | 619,006 |
| 6.6% 4/1/36 | | 830,000 | 963,716 |
| 6.75% 4/1/46 | | 1,017,000 | 1,210,484 |
| General Motors Financial Co., Inc.: | | | |
| 3.15% 1/15/20 | | 943,000 | 944,740 |
| 3.25% 1/5/23 | | 1,024,000 | 1,041,624 |
| 3.85% 1/5/28 | | 995,000 | 1,000,515 |
| 4% 1/15/25 | | 2,407,000 | 2,477,561 |
| 4% 10/6/26 | | 523,000 | 536,512 |
| 4.3% 7/13/25 | | 1,763,000 | 1,840,594 |
| 4.35% 1/17/27 | | 1,137,000 | 1,178,232 |
| 4.375% 9/25/21 | | 1,307,000 | 1,353,629 |
| 5.65% 1/17/29 | | 1,601,000 | 1,791,279 |
| | | | 23,336,111 |
| Diversified Consumer Services - 0.1% | | | |
| George Washington University 4.3% 9/15/44 | | 284,000 | 352,464 |
| Ingersoll-Rand Global Holding Co. Ltd.: | | | |
| 2.9% 2/21/21 | | 675,000 | 681,884 |
| 3.75% 8/21/28 | | 661,000 | 717,446 |
| 4.3% 2/21/48 | | 707,000 | 799,181 |
| Massachusetts Institute of Technology: | | | |
| 3.885% 7/1/2116 | | 402,000 | 503,394 |
| 3.959% 7/1/38 | | 672,000 | 793,327 |
| Northwestern University 4.643% 12/1/44 | | 476,000 | 625,142 |
| President and Fellows of Harvard College: | | | |
| 3.3% 7/15/56 | | 690,000 | 777,967 |
| 3.619% 10/1/37 | | 142,000 | 161,356 |
| Rice University 3.774% 5/15/55 | | 270,000 | 324,971 |
| Trustees of Princeton Univ. 5.7% 3/1/39 | | 142,000 | 209,370 |
| University Notre Dame du Lac 3.438% 2/15/45 | | 473,000 | 539,449 |
| University of Southern California 5.25% 10/1/2111 | | 284,000 | 450,587 |
| | | | 6,936,538 |
| Hotels, Restaurants & Leisure - 0.2% | | | |
| McDonald's Corp.: | | | |
| 2.75% 12/9/20 | | 327,000 | 330,008 |
| 3.7% 1/30/26 | | 2,399,000 | 2,600,232 |
| 4.45% 3/1/47 | | 808,000 | 949,463 |
| 4.875% 12/9/45 | | 772,000 | 951,741 |
| 6.3% 3/1/38 | | 1,002,000 | 1,406,738 |
| Metropolitan Museum of Art 3.4% 7/1/45 | | 427,000 | 478,961 |
| Starbucks Corp.: | | | |
| 2.45% 6/15/26 | | 1,422,000 | 1,442,798 |
| 3.8% 8/15/25 | | 988,000 | 1,071,486 |
| 3.85% 10/1/23 | | 267,000 | 284,423 |
| 4% 11/15/28 | | 995,000 | 1,124,500 |
| 4.5% 11/15/48 | | 668,000 | 788,084 |
| | | | 11,428,434 |
| Internet & Direct Marketing Retail - 0.1% | | | |
| Amazon.com, Inc.: | | | |
| 2.4% 2/22/23 | | 2,254,000 | 2,295,040 |
| 2.8% 8/22/24 | | 921,000 | 961,467 |
| 3.15% 8/22/27 | | 1,487,000 | 1,599,074 |
| 3.875% 8/22/37 | | 719,000 | 834,833 |
| 4.05% 8/22/47 | | 1,840,000 | 2,258,108 |
| 4.25% 8/22/57 | | 944,000 | 1,202,617 |
| 4.8% 12/5/34 | | 853,000 | 1,083,638 |
| | | | 10,234,777 |
| Multiline Retail - 0.1% | | | |
| Dollar Tree, Inc.: | | | |
| 3.7% 5/15/23 | | 1,237,000 | 1,288,305 |
| 4% 5/15/25 | | 1,137,000 | 1,201,940 |
| Kohl's Corp. 4.75% 12/15/23 | | 303,000 | 324,661 |
| Macy's Retail Holdings, Inc.: | | | |
| 2.875% 2/15/23 | | 675,000 | 663,451 |
| 4.3% 2/15/43 | | 675,000 | 562,025 |
| Nordstrom, Inc.: | | | |
| 4% 3/15/27 | | 641,000 | 654,056 |
| 5% 1/15/44 | | 284,000 | 275,842 |
| Target Corp.: | | | |
| 3.875% 7/15/20 | | 427,000 | 433,884 |
| 3.9% 11/15/47 | | 1,236,000 | 1,459,956 |
| 4% 7/1/42 | | 995,000 | 1,166,670 |
| | | | 8,030,790 |
| Specialty Retail - 0.3% | | | |
| Advance Auto Parts, Inc. 4.5% 12/1/23 | | 533,000 | 573,983 |
| AutoZone, Inc.: | | | |
| 3.125% 7/15/23 | | 544,000 | 559,567 |
| 3.25% 4/15/25 | | 569,000 | 590,678 |
| 3.7% 4/15/22 | | 782,000 | 814,636 |
| 3.75% 6/1/27 | | 825,000 | 889,989 |
| Lowe's Companies, Inc.: | | | |
| 3.65% 4/5/29 | | 1,523,000 | 1,654,808 |
| 3.7% 4/15/46 | | 498,000 | 508,396 |
| 4.05% 5/3/47 | | 1,635,000 | 1,777,441 |
| 4.55% 4/5/49 | | 1,347,000 | 1,574,847 |
| 4.625% 4/15/20 | | 284,000 | 284,854 |
| 4.65% 4/15/42 | | 924,000 | 1,059,252 |
| O'Reilly Automotive, Inc. 3.85% 6/15/23 | | 402,000 | 424,538 |
| The Home Depot, Inc.: | | | |
| 2.8% 9/14/27 | | 711,000 | 745,092 |
| 3% 4/1/26 | | 1,426,000 | 1,510,371 |
| 3.75% 2/15/24 | | 956,000 | 1,033,259 |
| 3.9% 12/6/28 | | 819,000 | 933,718 |
| 3.9% 6/15/47 | | 1,220,000 | 1,415,907 |
| 4.2% 4/1/43 | | 224,000 | 266,867 |
| 4.25% 4/1/46 | | 466,000 | 567,025 |
| 4.5% 12/6/48 | | 1,062,000 | 1,351,415 |
| 4.875% 2/15/44 | | 409,000 | 533,549 |
| 5.875% 12/16/36 | | 1,479,000 | 2,087,652 |
| | | | 21,157,844 |
| Textiles, Apparel & Luxury Goods - 0.0% | | | |
| NIKE, Inc. 3.375% 11/1/46 | | 640,000 | 695,897 |
|
| TOTAL CONSUMER DISCRETIONARY | | | 81,820,391 |
|
| CONSUMER STAPLES - 2.1% | | | |
| Beverages - 0.8% | | | |
| Anheuser-Busch InBev Finance, Inc.: | | | |
| 2.625% 1/17/23 | | 402,000 | 409,633 |
| 2.65% 2/1/21 | | 1,343,000 | 1,355,512 |
| 3.3% 2/1/23 | | 1,310,000 | 1,363,906 |
| 3.65% 2/1/26 | | 8,607,000 | 9,241,689 |
| 4.625% 2/1/44 | | 818,000 | 940,397 |
| 4.7% 2/1/36 | | 692,000 | 805,512 |
| 4.9% 2/1/46 | | 2,585,000 | 3,074,637 |
| Anheuser-Busch InBev Worldwide, Inc.: | | | |
| 2.5% 7/15/22 | | 1,240,000 | 1,260,020 |
| 4.15% 1/23/25 | | 1,998,000 | 2,187,850 |
| 4.439% 10/6/48 | | 1,051,000 | 1,186,709 |
| 4.6% 4/15/48 | | 2,666,000 | 3,099,155 |
| 5.55% 1/23/49 | | 1,358,000 | 1,788,904 |
| 5.8% 1/23/59 (Reg. S) | | 1,984,000 | 2,707,268 |
| 8.2% 1/15/39 | | 398,000 | 639,563 |
| Constellation Brands, Inc.: | | | |
| 3.5% 5/9/27 | | 1,422,000 | 1,499,061 |
| 3.7% 12/6/26 | | 1,074,000 | 1,152,594 |
| Dr. Pepper Snapple Group, Inc.: | | | |
| 2% 1/15/20 | | 405,000 | 404,274 |
| 4.057% 5/25/23 | | 2,133,000 | 2,265,142 |
| 4.985% 5/25/38 | | 1,024,000 | 1,208,266 |
| Molson Coors Brewing Co.: | | | |
| 2.1% 7/15/21 | | 697,000 | 696,786 |
| 3% 7/15/26 | | 2,474,000 | 2,504,314 |
| 4.2% 7/15/46 | | 1,881,000 | 1,914,576 |
| PepsiCo, Inc.: | | | |
| 2.15% 10/14/20 | | 1,706,000 | 1,710,879 |
| 2.25% 5/2/22 | | 1,706,000 | 1,725,396 |
| 2.375% 10/6/26 | | 960,000 | 983,716 |
| 3% 10/15/27 | | 2,589,000 | 2,776,422 |
| 3.6% 8/13/42 | | 427,000 | 479,835 |
| 4.25% 10/22/44 | | 853,000 | 1,052,138 |
| 4.45% 4/14/46 | | 825,000 | 1,045,697 |
| The Coca-Cola Co.: | | | |
| 1.55% 9/1/21 | | 567,000 | 566,509 |
| 2.2% 5/25/22 | | 2,133,000 | 2,157,849 |
| 2.875% 10/27/25 | | 1,362,000 | 1,435,150 |
| 3.15% 11/15/20 | | 526,000 | 534,261 |
| | | | 56,173,620 |
| Food & Staples Retailing - 0.3% | | | |
| Costco Wholesale Corp. 2.75% 5/18/24 | | 853,000 | 885,885 |
| Kroger Co.: | | | |
| 2.65% 10/15/26 | | 405,000 | 403,383 |
| 3.5% 2/1/26 | | 569,000 | 595,112 |
| 5.15% 8/1/43 | | 387,000 | 431,737 |
| 5.4% 1/15/49 | | 926,000 | 1,096,889 |
| Sysco Corp.: | | | |
| 3.3% 7/15/26 | | 466,000 | 490,241 |
| 3.75% 10/1/25 | | 810,000 | 870,012 |
| Walgreen Co. 3.1% 9/15/22 | | 405,000 | 415,894 |
| Walgreens Boots Alliance, Inc.: | | | |
| 3.45% 6/1/26 | | 711,000 | 738,305 |
| 4.65% 6/1/46 | | 782,000 | 830,307 |
| Walmart, Inc.: | | | |
| 2.85% 7/8/24 | | 4,600,000 | 4,817,839 |
| 3.3% 4/22/24 | | 2,702,000 | 2,867,781 |
| 3.4% 6/26/23 | | 1,331,000 | 1,409,357 |
| 3.7% 6/26/28 | | 1,749,000 | 1,964,679 |
| 4.05% 6/29/48 | | 1,092,000 | 1,359,720 |
| 4.3% 4/22/44 | | 853,000 | 1,067,549 |
| 5.625% 4/1/40 | | 284,000 | 408,804 |
| 5.625% 4/15/41 | | 654,000 | 947,789 |
| 6.5% 8/15/37 | | 1,177,000 | 1,818,566 |
| | | | 23,419,849 |
| Food Products - 0.5% | | | |
| Campbell Soup Co.: | | | |
| 2.5% 8/2/22 | | 675,000 | 679,407 |
| 4.8% 3/15/48 | | 1,991,000 | 2,241,548 |
| Conagra Brands, Inc.: | | | |
| 3.2% 1/25/23 | | 1,252,000 | 1,276,602 |
| 3.8% 10/22/21 | | 668,000 | 687,264 |
| 4.3% 5/1/24 | | 1,275,000 | 1,369,141 |
| 4.85% 11/1/28 | | 1,938,000 | 2,220,028 |
| 5.3% 11/1/38 | | 2,305,000 | 2,699,294 |
| General Mills, Inc.: | | | |
| 2.2% 10/21/19 | | 995,000 | 994,678 |
| 3.7% 10/17/23 | | 1,984,000 | 2,099,043 |
| 4.2% 4/17/28 | | 2,446,000 | 2,756,755 |
| H.J. Heinz Co.: | | | |
| 3% 6/1/26 | | 1,848,000 | 1,817,551 |
| 4.375% 6/1/46 | | 971,000 | 933,112 |
| 4.625% 1/30/29 | | 1,000,000 | 1,080,373 |
| 5% 7/15/35 | | 498,000 | 533,625 |
| 5.2% 7/15/45 | | 737,000 | 777,597 |
| Kellogg Co.: | | | |
| 3.125% 5/17/22 | | 267,000 | 274,286 |
| 3.25% 4/1/26 | | 529,000 | 556,726 |
| 4.3% 5/15/28 | | 853,000 | 959,455 |
| Kraft Foods Group, Inc.: | | | |
| 3.5% 6/6/22 | | 1,656,000 | 1,695,180 |
| 5% 6/4/42 | | 402,000 | 414,708 |
| The J.M. Smucker Co. 2.5% 3/15/20 | | 810,000 | 811,125 |
| Tyson Foods, Inc.: | | | |
| 3.95% 8/15/24 | | 1,077,000 | 1,158,632 |
| 4% 3/1/26 | | 1,048,000 | 1,142,353 |
| 4.35% 3/1/29 | | 4,280,000 | 4,889,699 |
| Unilever Capital Corp.: | | | |
| 2% 7/28/26 | | 284,000 | 284,244 |
| 3.1% 7/30/25 | | 412,000 | 436,088 |
| | | | 34,788,514 |
| Household Products - 0.1% | | | |
| Colgate-Palmolive Co. 3.25% 3/15/24 | | 1,422,000 | 1,515,464 |
| Kimberly-Clark Corp.: | | | |
| 2.4% 3/1/22 | | 739,000 | 747,938 |
| 2.4% 6/1/23 | | 1,137,000 | 1,155,549 |
| 3.2% 7/30/46 | | 355,000 | 370,999 |
| Procter & Gamble Co.: | | | |
| 1.9% 11/1/19 | | 569,000 | 568,742 |
| 2.3% 2/6/22 | | 668,000 | 677,524 |
| 2.85% 8/11/27 | | 640,000 | 683,733 |
| 3.1% 8/15/23 | | 1,422,000 | 1,493,296 |
| | | | 7,213,245 |
| Tobacco - 0.4% | | | |
| Altria Group, Inc.: | | | |
| 2.85% 8/9/22 | | 995,000 | 1,015,519 |
| 3.8% 2/14/24 | | 661,000 | 700,115 |
| 3.875% 9/16/46 | | 1,422,000 | 1,396,742 |
| 4.25% 8/9/42 | | 1,391,000 | 1,433,894 |
| 4.8% 2/14/29 | | 1,887,000 | 2,136,752 |
| 5.8% 2/14/39 | | 1,329,000 | 1,639,943 |
| 5.95% 2/14/49 | | 1,479,000 | 1,898,862 |
| BAT Capital Corp.: | | | |
| 2.764% 8/15/22 | | 1,351,000 | 1,370,042 |
| 3.222% 8/15/24 | | 1,465,000 | 1,506,983 |
| 3.557% 8/15/27 | | 3,010,000 | 3,084,655 |
| 4.54% 8/15/47 | | 2,380,000 | 2,387,174 |
| Philip Morris International, Inc.: | | | |
| 1.875% 2/25/21 | | 2,133,000 | 2,129,610 |
| 2.125% 5/10/23 | | 441,000 | 440,305 |
| 2.75% 2/25/26 | | 533,000 | 543,517 |
| 3.375% 8/15/29 | | 3,300,000 | 3,462,501 |
| 3.6% 11/15/23 | | 522,000 | 551,009 |
| 3.875% 8/21/42 | | 686,000 | 704,564 |
| 4.125% 3/4/43 | | 1,422,000 | 1,520,382 |
| 4.5% 3/26/20 | | 284,000 | 287,801 |
| 4.875% 11/15/43 | | 853,000 | 1,007,142 |
| 6.375% 5/16/38 | | 206,000 | 282,666 |
| Reynolds American, Inc.: | | | |
| 4.45% 6/12/25 | | 1,004,000 | 1,087,199 |
| 4.85% 9/15/23 | | 256,000 | 279,665 |
| 5.85% 8/15/45 | | 603,000 | 680,248 |
| 7.25% 6/15/37 | | 1,027,000 | 1,338,523 |
| | | | 32,885,813 |
|
| TOTAL CONSUMER STAPLES | | | 154,481,041 |
|
| ENERGY - 2.7% | | | |
| Energy Equipment & Services - 0.0% | | | |
| Baker Hughes A GE Co. LLC 5.125% 9/15/40 | | 284,000 | 320,273 |
| El Paso Pipeline Partners Operating Co. LLC 4.7% 11/1/42 | | 540,000 | 583,467 |
| Halliburton Co.: | | | |
| 3.8% 11/15/25 | | 1,476,000 | 1,563,565 |
| 5% 11/15/45 | | 1,072,000 | 1,200,604 |
| 7.45% 9/15/39 | | 213,000 | 301,102 |
| | | | 3,969,011 |
| Oil, Gas & Consumable Fuels - 2.7% | | | |
| Anadarko Petroleum Corp.: | | | |
| 3.45% 7/15/24 | | 711,000 | 727,978 |
| 4.85% 3/15/21 | | 1,442,000 | 1,490,721 |
| 6.2% 3/15/40 | | 284,000 | 348,017 |
| 6.45% 9/15/36 | | 380,000 | 476,017 |
| 6.6% 3/15/46 | | 661,000 | 881,369 |
| Apache Corp.: | | | |
| 4.375% 10/15/28 | | 4,711,000 | 4,841,550 |
| 5.1% 9/1/40 | | 427,000 | 432,566 |
| Boardwalk Pipelines LP 4.95% 12/15/24 | | 675,000 | 725,750 |
| BP Capital Markets PLC: | | | |
| 2.315% 2/13/20 | | 256,000 | 256,308 |
| 2.5% 11/6/22 | | 427,000 | 433,100 |
| 2.521% 1/15/20 | | 853,000 | 854,175 |
| 3.062% 3/17/22 | | 533,000 | 547,730 |
| 3.279% 9/19/27 | | 1,811,000 | 1,919,579 |
| Canadian Natural Resources Ltd.: | | | |
| 3.9% 2/1/25 | | 267,000 | 281,421 |
| 4.95% 6/1/47 | | 910,000 | 1,087,927 |
| 6.25% 3/15/38 | | 974,000 | 1,248,977 |
| Cenovus Energy, Inc.: | | | |
| 3% 8/15/22 | | 242,000 | 244,336 |
| 3.8% 9/15/23 | | 249,000 | 257,357 |
| 4.25% 4/15/27 | | 1,351,000 | 1,410,787 |
| 5.4% 6/15/47 | | 1,337,000 | 1,520,136 |
| 6.75% 11/15/39 | | 284,000 | 351,111 |
| Chevron Corp.: | | | |
| 1.961% 3/3/20 | | 1,226,000 | 1,225,731 |
| 2.1% 5/16/21 | | 1,955,000 | 1,963,736 |
| 2.193% 11/15/19 | | 1,621,000 | 1,621,317 |
| 2.895% 3/3/24 | | 3,346,000 | 3,490,421 |
| 2.954% 5/16/26 | | 1,564,000 | 1,654,199 |
| Columbia Pipeline Group, Inc.: | | | |
| 3.3% 6/1/20 | | 433,000 | 435,862 |
| 4.5% 6/1/25 | | 473,000 | 513,224 |
| ConocoPhillips Co.: | | | |
| 4.95% 3/15/26 | | 3,491,000 | 4,053,952 |
| 5.95% 3/15/46 | | 853,000 | 1,235,189 |
| 6.5% 2/1/39 | | 1,071,000 | 1,570,211 |
| DCP Midstream Operating LP 3.875% 3/15/23 | | 537,000 | 543,713 |
| Devon Energy Corp.: | | | |
| 5% 6/15/45 | | 498,000 | 585,623 |
| 5.6% 7/15/41 | | 409,000 | 501,945 |
| Ecopetrol SA: | | | |
| 5.375% 6/26/26 | | 674,000 | 754,669 |
| 5.875% 9/18/23 | | 3,000,000 | 3,346,200 |
| 5.875% 5/28/45 | | 540,000 | 636,188 |
| 7.375% 9/18/43 | | 702,000 | 943,751 |
| Enbridge Energy Partners LP 4.2% 9/15/21 | | 1,237,000 | 1,277,545 |
| Enbridge, Inc.: | | | |
| 3.5% 6/10/24 | | 402,000 | 421,065 |
| 5.5% 12/1/46 | | 2,060,000 | 2,656,691 |
| Encana Corp.: | | | |
| 3.9% 11/15/21 | | 697,000 | 714,913 |
| 6.5% 2/1/38 | | 711,000 | 866,216 |
| Energy Transfer Partners LP: | | | |
| 3.6% 2/1/23 | | 1,216,000 | 1,247,772 |
| 4.15% 10/1/20 | | 640,000 | 650,092 |
| 4.95% 6/15/28 | | 1,341,000 | 1,500,112 |
| 5.15% 3/15/45 | | 1,137,000 | 1,212,239 |
| 5.5% 6/1/27 | | 1,400,000 | 1,609,100 |
| 6% 6/15/48 | | 1,401,000 | 1,670,958 |
| Enterprise Products Operating LP: | | | |
| 3.7% 2/15/26 | | 252,000 | 270,811 |
| 3.95% 2/15/27 | | 3,680,000 | 4,019,046 |
| 4.05% 2/15/22 | | 1,326,000 | 1,387,007 |
| 4.25% 2/15/48 | | 1,647,000 | 1,790,834 |
| 4.85% 8/15/42 | | 355,000 | 408,542 |
| 4.85% 3/15/44 | | 711,000 | 828,275 |
| 4.9% 5/15/46 | | 609,000 | 720,500 |
| 5.7% 2/15/42 | | 284,000 | 359,440 |
| 7.55% 4/15/38 | | 284,000 | 412,525 |
| EOG Resources, Inc. 4.15% 1/15/26 | | 796,000 | 888,990 |
| Equinor ASA: | | | |
| 2.25% 11/8/19 | | 1,137,000 | 1,136,824 |
| 3.625% 9/10/28 | | 1,718,000 | 1,897,607 |
| 3.7% 3/1/24 | | 519,000 | 557,521 |
| 5.1% 8/17/40 | | 284,000 | 373,225 |
| Exxon Mobil Corp.: | | | |
| 2.726% 3/1/23 | | 1,422,000 | 1,464,970 |
| 3.043% 3/1/26 | | 1,184,000 | 1,256,025 |
| 3.567% 3/6/45 | | 946,000 | 1,053,527 |
| Hess Corp.: | | | |
| 3.5% 7/15/24 | | 540,000 | 551,662 |
| 5.6% 2/15/41 | | 483,000 | 538,229 |
| Kinder Morgan Energy Partners LP: | | | |
| 3.45% 2/15/23 | | 1,735,000 | 1,798,021 |
| 3.5% 9/1/23 | | 284,000 | 295,311 |
| 3.95% 9/1/22 | | 995,000 | 1,038,278 |
| 4.25% 9/1/24 | | 4,483,000 | 4,831,514 |
| 5% 3/1/43 | | 142,000 | 156,431 |
| 5.5% 3/1/44 | | 995,000 | 1,174,684 |
| 5.625% 9/1/41 | | 142,000 | 165,492 |
| 6.55% 9/15/40 | | 427,000 | 542,812 |
| Kinder Morgan, Inc.: | | | |
| 4.3% 3/1/28 | | 1,417,000 | 1,552,502 |
| 5.2% 3/1/48 | | 569,000 | 669,677 |
| 5.3% 12/1/34 | | 1,216,000 | 1,416,565 |
| Magellan Midstream Partners LP: | | | |
| 4.25% 9/15/46 | | 782,000 | 844,681 |
| 5% 3/1/26 | | 427,000 | 484,614 |
| Marathon Oil Corp.: | | | |
| 3.85% 6/1/25 | | 995,000 | 1,035,478 |
| 5.2% 6/1/45 | | 711,000 | 808,378 |
| Marathon Petroleum Corp.: | | | |
| 4.5% 4/1/48 | | 3,000,000 | 3,193,991 |
| 4.75% 12/15/23 | | 813,000 | 885,896 |
| 5.125% 3/1/21 | | 142,000 | 147,750 |
| 6.5% 3/1/41 | | 142,000 | 180,642 |
| MPLX LP: | | | |
| 4.125% 3/1/27 | | 1,344,000 | 1,416,763 |
| 4.7% 4/15/48 | | 2,773,000 | 2,855,312 |
| 4.8% 2/15/29 | | 2,307,000 | 2,566,208 |
| 5.2% 3/1/47 | | 870,000 | 947,551 |
| Nexen, Inc. 5.875% 3/10/35 | | 528,000 | 699,551 |
| Noble Energy, Inc. 4.95% 8/15/47 | | 1,962,000 | 2,182,896 |
| Occidental Petroleum Corp.: | | | |
| 2.7% 8/15/22 | | 650,000 | 656,398 |
| 2.7% 2/15/23 | | 853,000 | 854,697 |
| 2.9% 8/15/24 | | 1,200,000 | 1,211,222 |
| 3.125% 2/15/22 | | 284,000 | 288,216 |
| 3.2% 8/15/26 | | 791,000 | 799,183 |
| 3.4% 4/15/26 | | 483,000 | 491,295 |
| 3.5% 8/15/29 | | 2,060,000 | 2,098,781 |
| 4.1% 2/15/47 | | 401,000 | 396,759 |
| 4.2% 3/15/48 | | 1,400,000 | 1,408,687 |
| 4.3% 8/15/39 | | 363,000 | 379,846 |
| 4.4% 4/15/46 | | 725,000 | 746,410 |
| 4.4% 8/15/49 | | 363,000 | 378,618 |
| ONEOK Partners LP 3.375% 10/1/22 | | 711,000 | 728,951 |
| ONEOK, Inc.: | | | |
| 4.95% 7/13/47 | | 832,000 | 898,738 |
| 5.2% 7/15/48 | | 429,000 | 483,048 |
| Petro-Canada 6.8% 5/15/38 | | 1,201,000 | 1,715,866 |
| Petroleos Mexicanos: | | | |
| 3.5% 1/30/23 | | 956,000 | 928,754 |
| 4.625% 9/21/23 | | 1,482,000 | 1,485,474 |
| 4.875% 1/24/22 | | 2,561,000 | 2,602,616 |
| 5.35% 2/12/28 | | 1,376,000 | 1,303,072 |
| 5.5% 6/27/44 | | 391,000 | 333,797 |
| 5.625% 1/23/46 | | 808,000 | 693,014 |
| 6.35% 2/12/48 | | 3,080,000 | 2,831,290 |
| 6.375% 1/23/45 | | 3,179,000 | 2,930,144 |
| 6.5% 3/13/27 | | 2,420,000 | 2,471,652 |
| 6.75% 9/21/47 | | 1,882,000 | 1,787,900 |
| Phillips 66 Co.: | | | |
| 4.875% 11/15/44 | | 142,000 | 170,097 |
| 5.875% 5/1/42 | | 1,351,000 | 1,789,715 |
| Plains All American Pipeline LP/PAA Finance Corp.: | | | |
| 3.6% 11/1/24 | | 1,024,000 | 1,052,058 |
| 4.65% 10/15/25 | | 1,742,000 | 1,868,077 |
| 4.9% 2/15/45 | | 270,000 | 277,235 |
| 5.75% 1/15/20 | | 142,000 | 143,544 |
| 6.65% 1/15/37 | | 397,000 | 478,503 |
| Shell International Finance BV: | | | |
| 1.75% 9/12/21 | | 924,000 | 922,549 |
| 2.125% 5/11/20 | | 1,180,000 | 1,180,761 |
| 2.375% 8/21/22 | | 427,000 | 434,029 |
| 3.25% 5/11/25 | | 2,013,000 | 2,140,052 |
| 3.5% 11/13/23 | | 9,495,000 | 10,102,617 |
| 4% 5/10/46 | | 569,000 | 668,653 |
| 4.375% 5/11/45 | | 1,891,000 | 2,316,943 |
| 6.375% 12/15/38 | | 597,000 | 883,708 |
| Spectra Energy Partners LP: | | | |
| 3.375% 10/15/26 | | 2,319,000 | 2,409,451 |
| 4.75% 3/15/24 | | 686,000 | 750,570 |
| Suncor Energy, Inc.: | | | |
| 3.6% 12/1/24 | | 1,008,000 | 1,062,635 |
| 4% 11/15/47 | | 711,000 | 783,214 |
| 6.85% 6/1/39 | | 284,000 | 412,666 |
| Sunoco Logistics Partner Operations LP: | | | |
| 3.9% 7/15/26 | | 1,069,000 | 1,106,270 |
| 5.3% 4/1/44 | | 825,000 | 883,239 |
| 5.4% 10/1/47 | | 782,000 | 872,222 |
| The Williams Companies, Inc.: | | | |
| 4.55% 6/24/24 | | 807,000 | 874,041 |
| 5.75% 6/24/44 | | 270,000 | 323,553 |
| Total Capital International SA: | | | |
| 2.7% 1/25/23 | | 270,000 | 276,523 |
| 2.75% 6/19/21 | | 853,000 | 864,512 |
| 2.875% 2/17/22 | | 594,000 | 608,193 |
| 3.455% 2/19/29 | | 3,034,000 | 3,325,600 |
| 3.75% 4/10/24 | | 284,000 | 305,693 |
| TransCanada PipeLines Ltd.: | | | |
| 2.5% 8/1/22 | | 711,000 | 716,960 |
| 4.875% 1/15/26 | | 711,000 | 801,150 |
| 4.875% 5/15/48 | | 700,000 | 832,680 |
| 5.1% 3/15/49 | | 1,710,000 | 2,088,997 |
| 6.1% 6/1/40 | | 953,000 | 1,263,981 |
| Transcontinental Gas Pipe Line Co. LLC: | | | |
| 4.45% 8/1/42 | | 1,102,000 | 1,221,100 |
| 4.6% 3/15/48 | | 569,000 | 646,750 |
| Valero Energy Corp.: | | | |
| 4% 4/1/29 | | 1,500,000 | 1,600,641 |
| 6.625% 6/15/37 | | 771,000 | 1,018,963 |
| Western Gas Partners LP: | | | |
| 4% 7/1/22 | | 427,000 | 435,042 |
| 4.5% 3/1/28 | | 995,000 | 993,326 |
| 4.75% 8/15/28 | | 1,251,000 | 1,267,108 |
| 5.3% 3/1/48 | | 995,000 | 909,142 |
| Williams Partners LP: | | | |
| 3.35% 8/15/22 | | 398,000 | 408,027 |
| 3.75% 6/15/27 | | 3,321,000 | 3,466,163 |
| 3.9% 1/15/25 | | 501,000 | 526,791 |
| | | | 199,434,276 |
|
| TOTAL ENERGY | | | 203,403,287 |
|
| FINANCIALS - 8.2% | | | |
| Banks - 4.3% | | | |
| Australia & New Zealand Banking Group Ltd. 3.7% 11/16/25 | | 944,000 | 1,031,233 |
| Bank of America Corp.: | | | |
| 2.503% 10/21/22 | | 1,280,000 | 1,292,429 |
| 2.625% 4/19/21 | | 995,000 | 1,004,615 |
| 3.004% 12/20/23 (a) | | 1,506,000 | 1,545,527 |
| 3.194% 7/23/30 (a) | | 2,400,000 | 2,506,111 |
| 3.248% 10/21/27 | | 533,000 | 562,528 |
| 3.366% 1/23/26 (a) | | 1,507,000 | 1,579,996 |
| 3.419% 12/20/28 (a) | | 2,577,000 | 2,719,575 |
| 3.593% 7/21/28 (a) | | 1,578,000 | 1,687,012 |
| 3.705% 4/24/28 (a) | | 1,251,000 | 1,349,778 |
| 3.864% 7/23/24 (a) | | 3,455,000 | 3,668,555 |
| 3.974% 2/7/30 (a) | | 2,011,000 | 2,229,147 |
| 4% 4/1/24 | | 692,000 | 748,449 |
| 4% 1/22/25 | | 853,000 | 911,400 |
| 4.1% 7/24/23 | | 995,000 | 1,069,088 |
| 4.183% 11/25/27 | | 732,000 | 796,536 |
| 4.2% 8/26/24 | | 1,209,000 | 1,304,813 |
| 4.25% 10/22/26 | | 569,000 | 621,168 |
| 4.271% 7/23/29 (a) | | 2,561,000 | 2,890,627 |
| 4.33% 3/15/50 (a) | | 1,861,000 | 2,264,840 |
| 4.443% 1/20/48 (a) | | 2,168,000 | 2,663,767 |
| 4.45% 3/3/26 | | 1,848,000 | 2,034,972 |
| 5% 1/21/44 | | 764,000 | 999,160 |
| Bank of Nova Scotia: | | | |
| 3.4% 2/11/24 | | 3,391,000 | 3,567,027 |
| 4.375% 1/13/21 | | 142,000 | 146,685 |
| 4.5% 12/16/25 | | 2,258,000 | 2,478,560 |
| Barclays PLC: | | | |
| 2.75% 11/8/19 | | 1,422,000 | 1,422,701 |
| 3.25% 1/12/21 | | 1,066,000 | 1,074,687 |
| 4.337% 1/10/28 | | 796,000 | 838,875 |
| 4.375% 1/12/26 | | 711,000 | 750,369 |
| 4.836% 5/9/28 | | 1,365,000 | 1,416,959 |
| 4.95% 1/10/47 | | 2,737,000 | 3,005,534 |
| 5.25% 8/17/45 | | 796,000 | 891,380 |
| BB&T Corp.: | | | |
| 2.75% 4/1/22 | | 1,261,000 | 1,283,342 |
| 3.8% 10/30/26 | | 427,000 | 463,159 |
| BNP Paribas 2.375% 5/21/20 | | 1,649,000 | 1,652,156 |
| BPCE SA: | | | |
| 2.25% 1/27/20 | | 569,000 | 568,381 |
| 4% 4/15/24 | | 284,000 | 306,258 |
| Capital One NA 2.25% 9/13/21 | | 1,280,000 | 1,281,840 |
| Citigroup, Inc.: | | | |
| 3 month U.S. LIBOR + 1.023% 4.044% 6/1/24 (a)(c) | | 2,844,000 | 3,026,837 |
| 3 month U.S. LIBOR + 1.151% 3.52% 10/27/28 (a)(c) | | 1,600,000 | 1,695,980 |
| 2.35% 8/2/21 | | 3,000,000 | 3,019,326 |
| 2.75% 4/25/22 | | 2,075,000 | 2,112,177 |
| 3.142% 1/24/23 (a) | | 3,270,000 | 3,343,767 |
| 3.668% 7/24/28 (a) | | 1,078,000 | 1,155,730 |
| 3.7% 1/12/26 | | 1,583,000 | 1,705,843 |
| 3.887% 1/10/28 (a) | | 640,000 | 694,296 |
| 3.98% 3/20/30 (a) | | 2,990,000 | 3,304,809 |
| 4.125% 7/25/28 | | 2,195,000 | 2,394,171 |
| 4.4% 6/10/25 | | 569,000 | 617,451 |
| 4.6% 3/9/26 | | 853,000 | 938,777 |
| 4.75% 5/18/46 | | 1,119,000 | 1,355,722 |
| 5.3% 5/6/44 | | 284,000 | 362,629 |
| 5.5% 9/13/25 | | 711,000 | 814,892 |
| 5.875% 1/30/42 | | 238,000 | 334,924 |
| 8.125% 7/15/39 | | 1,137,000 | 1,900,686 |
| Citizens Bank NA 2.65% 5/26/22 | | 2,898,000 | 2,942,623 |
| Citizens Financial Group, Inc.: | | | |
| 2.375% 7/28/21 | | 620,000 | 622,107 |
| 4.3% 12/3/25 | | 269,000 | 290,668 |
| Comerica, Inc. 3.8% 7/22/26 | | 519,000 | 555,928 |
| Commonwealth Bank of Australia 2.3% 3/12/20 | | 1,074,000 | 1,075,461 |
| Corporacion Andina de Fomento 4.375% 6/15/22 | | 2,005,000 | 2,119,626 |
| Credit Suisse Group Funding Guernsey Ltd.: | | | |
| 3.8% 9/15/22 | | 1,782,000 | 1,859,721 |
| 3.8% 6/9/23 | | 2,844,000 | 2,985,782 |
| 4.55% 4/17/26 | | 1,209,000 | 1,339,637 |
| 4.875% 5/15/45 | | 711,000 | 899,928 |
| Credit Suisse New York Branch: | | | |
| 3% 10/29/21 | | 427,000 | 435,222 |
| 3.625% 9/9/24 | | 7,161,000 | 7,627,563 |
| Discover Bank 4.2% 8/8/23 | | 995,000 | 1,068,400 |
| Export-Import Bank of Korea: | | | |
| 2.875% 1/21/25 | | 2,681,000 | 2,785,618 |
| 5% 4/11/22 | | 877,000 | 940,208 |
| Fifth Third Bancorp: | | | |
| 2.6% 6/15/22 | | 1,064,000 | 1,078,059 |
| 3.5% 3/15/22 | | 235,000 | 242,791 |
| 8.25% 3/1/38 | | 296,000 | 459,693 |
| HSBC Holdings PLC: | | | |
| 2.65% 1/5/22 | | 2,986,000 | 3,015,855 |
| 3.4% 3/8/21 | | 1,507,000 | 1,531,109 |
| 3.803% 3/11/25 (a) | | 8,333,000 | 8,691,916 |
| 3.9% 5/25/26 | | 1,564,000 | 1,671,522 |
| 4.25% 8/18/25 | | 796,000 | 843,896 |
| 4.292% 9/12/26 (a) | | 2,396,000 | 2,581,695 |
| 4.375% 11/23/26 | | 4,081,000 | 4,387,337 |
| 4.875% 1/14/22 | | 1,436,000 | 1,522,828 |
| 5.1% 4/5/21 | | 398,000 | 415,450 |
| 5.25% 3/14/44 | | 654,000 | 810,856 |
| 6.5% 9/15/37 | | 1,493,000 | 2,025,011 |
| HSBC U.S.A., Inc. 3.5% 6/23/24 | | 995,000 | 1,042,252 |
| Huntington Bancshares, Inc.: | | | |
| 2.3% 1/14/22 | | 2,559,000 | 2,571,056 |
| 3.15% 3/14/21 | | 1,351,000 | 1,370,608 |
| Japan Bank International Cooperation: | | | |
| 1.875% 7/21/26 | | 540,000 | 541,635 |
| 2.125% 2/10/25 | | 284,000 | 289,099 |
| 2.25% 11/4/26 | | 744,000 | 764,371 |
| 2.375% 11/16/22 | | 1,634,000 | 1,666,178 |
| 2.75% 1/21/26 | | 450,000 | 476,046 |
| 2.875% 6/1/27 | | 1,080,000 | 1,159,641 |
| 3.125% 7/20/21 | | 562,000 | 576,134 |
| 3.25% 7/20/28 | | 1,280,000 | 1,429,154 |
| 3.5% 10/31/28 | | 1,000,000 | 1,140,940 |
| JPMorgan Chase & Co.: | | | |
| 2.776% 4/25/23 (a) | | 711,000 | 722,158 |
| 2.95% 10/1/26 | | 3,587,000 | 3,721,003 |
| 3.22% 3/1/25 (a) | | 7,700,000 | 8,048,834 |
| 3.25% 9/23/22 | | 569,000 | 589,715 |
| 3.3% 4/1/26 | | 1,280,000 | 1,349,736 |
| 3.375% 5/1/23 | | 270,000 | 279,784 |
| 3.54% 5/1/28 (a) | | 2,417,000 | 2,591,168 |
| 3.559% 4/23/24 (a) | | 1,422,000 | 1,493,309 |
| 3.797% 7/23/24 (a) | | 1,969,000 | 2,091,583 |
| 3.875% 9/10/24 | | 4,653,000 | 4,974,569 |
| 3.882% 7/24/38 (a) | | 640,000 | 717,481 |
| 3.9% 7/15/25 | | 3,071,000 | 3,335,766 |
| 3.964% 11/15/48 (a) | | 1,337,000 | 1,539,045 |
| 4.005% 4/23/29 (a) | | 1,345,000 | 1,494,529 |
| 4.125% 12/15/26 | | 835,000 | 919,806 |
| 4.203% 7/23/29 (a) | | 2,665,000 | 3,008,157 |
| 4.35% 8/15/21 | | 284,000 | 296,346 |
| 4.5% 1/24/22 | | 1,848,000 | 1,955,795 |
| 4.625% 5/10/21 | | 213,000 | 221,977 |
| 4.85% 2/1/44 | | 711,000 | 921,320 |
| 4.95% 6/1/45 | | 363,000 | 466,003 |
| 5.5% 10/15/40 | | 810,000 | 1,110,420 |
| 5.6% 7/15/41 | | 213,000 | 296,687 |
| 5.625% 8/16/43 | | 711,000 | 974,331 |
| KeyBank NA 3.4% 5/20/26 | | 711,000 | 749,322 |
| KeyCorp. 2.9% 9/15/20 | | 825,000 | 831,833 |
| Lloyds Bank PLC: | | | |
| 3.5% 5/14/25 | | 1,223,000 | 1,281,181 |
| 4.344% 1/9/48 | | 2,133,000 | 2,147,077 |
| 4.65% 3/24/26 | | 1,223,000 | 1,290,820 |
| Lloyds Banking Group PLC: | | | |
| 3.1% 7/6/21 | | 1,422,000 | 1,442,890 |
| 4.375% 3/22/28 | | 2,000,000 | 2,179,561 |
| Mitsubishi UFJ Financial Group, Inc.: | | | |
| 2.19% 9/13/21 | | 711,000 | 711,350 |
| 2.801% 7/18/24 | | 1,000,000 | 1,023,866 |
| 2.998% 2/22/22 | | 1,308,000 | 1,333,399 |
| 3.195% 7/18/29 | | 2,600,000 | 2,724,797 |
| 3.751% 7/18/39 | | 1,000,000 | 1,096,258 |
| 3.85% 3/1/26 | | 936,000 | 1,014,560 |
| 3.961% 3/2/28 | | 3,128,000 | 3,483,006 |
| Mizuho Financial Group, Inc.: | | | |
| 2.953% 2/28/22 | | 1,223,000 | 1,245,293 |
| 3.549% 3/5/23 | | 1,706,000 | 1,782,144 |
| National Australia Bank Ltd. 2.5% 5/22/22 | | 1,422,000 | 1,444,560 |
| Nordic Investment Bank 2.125% 2/1/22 | | 540,000 | 547,481 |
| Oesterreichische Kontrollbank: | | | |
| 2.375% 10/1/21 | | 672,000 | 682,762 |
| 2.875% 9/7/21 | | 598,000 | 612,929 |
| PNC Bank NA: | | | |
| 2.6% 7/21/20 | | 950,000 | 954,209 |
| 2.625% 2/17/22 | | 1,706,000 | 1,734,086 |
| PNC Financial Services Group, Inc. 3.9% 4/29/24 | | 803,000 | 865,349 |
| Rabobank Nederland: | | | |
| 3.75% 7/21/26 | | 2,737,000 | 2,865,589 |
| 3.95% 11/9/22 | | 754,000 | 789,512 |
| 4.375% 8/4/25 | | 853,000 | 922,078 |
| 4.5% 1/11/21 | | 142,000 | 146,727 |
| 5.25% 5/24/41 | | 427,000 | 586,137 |
| Rabobank Nederland New York Branch: | | | |
| 2.75% 1/10/23 | | 2,417,000 | 2,481,820 |
| 3.375% 5/21/25 | | 533,000 | 574,650 |
| Regions Financial Corp.: | | | |
| 2.75% 8/14/22 | | 1,078,000 | 1,096,973 |
| 3.2% 2/8/21 | | 3,141,000 | 3,183,585 |
| Royal Bank of Canada: | | | |
| 2.15% 3/6/20 | | 935,000 | 935,079 |
| 2.75% 2/1/22 | | 1,848,000 | 1,887,531 |
| 4.65% 1/27/26 | | 1,847,000 | 2,060,165 |
| Royal Bank of Scotland Group PLC: | | | |
| 3 month U.S. LIBOR + 1.754% 4.892% 5/18/29 (a)(c) | | 2,600,000 | 2,853,057 |
| 3.498% 5/15/23 (a) | | 1,455,000 | 1,472,504 |
| 3.875% 9/12/23 | | 540,000 | 556,239 |
| 4.8% 4/5/26 | | 938,000 | 1,024,152 |
| Santander Holdings U.S.A., Inc. 3.4% 1/18/23 | | 1,553,000 | 1,597,637 |
| Sumitomo Mitsui Banking Corp.: | | | |
| 2.45% 1/16/20 | | 711,000 | 711,646 |
| 3.4% 7/11/24 | | 814,000 | 859,656 |
| Sumitomo Mitsui Financial Group, Inc.: | | | |
| 2.442% 10/19/21 | | 2,133,000 | 2,145,935 |
| 2.696% 7/16/24 | | 3,600,000 | 3,661,552 |
| 2.778% 10/18/22 | | 1,074,000 | 1,094,303 |
| 2.784% 7/12/22 | | 1,492,000 | 1,518,476 |
| 2.846% 1/11/22 | | 1,507,000 | 1,533,476 |
| 3.102% 1/17/23 | | 1,280,000 | 1,320,419 |
| 3.936% 10/16/23 | | 2,229,000 | 2,384,096 |
| SunTrust Banks, Inc. 3.3% 5/15/26 | | 1,081,000 | 1,129,941 |
| Synchrony Bank 3% 6/15/22 | | 995,000 | 1,013,061 |
| The Toronto-Dominion Bank: | | | |
| 2.5% 12/14/20 | | 1,993,000 | 2,006,140 |
| 3.5% 7/19/23 | | 1,422,000 | 1,507,263 |
| U.S. Bancorp: | | | |
| 2.625% 1/24/22 | | 1,973,000 | 2,005,688 |
| 3.1% 4/27/26 | | 1,280,000 | 1,342,453 |
| 4.125% 5/24/21 | | 427,000 | 441,983 |
| Wells Fargo & Co.: | | | |
| 2.1% 7/26/21 | | 1,422,000 | 1,423,197 |
| 2.6% 7/22/20 | | 1,086,000 | 1,091,284 |
| 2.625% 7/22/22 | | 2,102,000 | 2,137,759 |
| 3% 10/23/26 | | 2,891,000 | 3,004,909 |
| 3.3% 9/9/24 | | 4,818,000 | 5,070,799 |
| 3.45% 2/13/23 | | 523,000 | 543,346 |
| 3.55% 9/29/25 | | 603,000 | 641,609 |
| 3.75% 1/24/24 | | 4,021,000 | 4,282,240 |
| 3.9% 5/1/45 | | 677,000 | 792,393 |
| 4.1% 6/3/26 | | 459,000 | 497,159 |
| 4.4% 6/14/46 | | 1,015,000 | 1,178,589 |
| 4.48% 1/16/24 | | 543,000 | 588,670 |
| 4.75% 12/7/46 | | 2,275,000 | 2,790,888 |
| 4.9% 11/17/45 | | 394,000 | 490,342 |
| 5.375% 11/2/43 | | 263,000 | 347,294 |
| 5.606% 1/15/44 | | 1,618,000 | 2,171,635 |
| Westpac Banking Corp.: | | | |
| 2% 8/19/21 | | 1,220,000 | 1,221,373 |
| 2.3% 5/26/20 | | 427,000 | 427,772 |
| 2.5% 6/28/22 | | 3,616,000 | 3,675,946 |
| 2.85% 5/13/26 | | 675,000 | 703,595 |
| 3.3% 2/26/24 | | 2,133,000 | 2,247,352 |
| 4.421% 7/24/39 | | 1,700,000 | 1,895,290 |
| 4.875% 11/19/19 | | 526,000 | 529,039 |
| Zions Bancorp NA 4.5% 6/13/23 | | 29,000 | 30,772 |
| | | | 319,051,910 |
| Capital Markets - 1.3% | | | |
| Affiliated Managers Group, Inc. 3.5% 8/1/25 | | 675,000 | 703,718 |
| Bank New York Mellon Corp.: | | | |
| 2.6% 2/7/22 | | 1,422,000 | 1,445,309 |
| 2.8% 5/4/26 | | 801,000 | 831,083 |
| 2.95% 1/29/23 | | 2,133,000 | 2,199,107 |
| BlackRock, Inc.: | | | |
| 3.5% 3/18/24 | | 412,000 | 443,561 |
| 4.25% 5/24/21 | | 924,000 | 961,739 |
| Brighthouse Financial, Inc. 4.7% 6/22/47 | | 1,351,000 | 1,216,956 |
| Deutsche Bank AG 4.5% 4/1/25 | | 427,000 | 403,412 |
| Deutsche Bank AG New York Branch: | | | |
| 2.95% 8/20/20 | | 1,393,000 | 1,390,817 |
| 3.3% 11/16/22 | | 1,308,000 | 1,300,077 |
| 3.7% 5/30/24 | | 1,393,000 | 1,388,011 |
| 3.95% 2/27/23 | | 5,000,000 | 5,069,019 |
| 4.1% 1/13/26 | | 3,100,000 | 3,098,436 |
| Eaton Vance Corp. 3.625% 6/15/23 | | 402,000 | 422,082 |
| Franklin Resources, Inc. 2.85% 3/30/25 | | 540,000 | 559,014 |
| Goldman Sachs Group, Inc.: | | | |
| 2.35% 11/15/21 | | 3,903,000 | 3,910,320 |
| 2.55% 10/23/19 | | 1,564,000 | 1,564,678 |
| 3% 4/26/22 | | 2,377,000 | 2,407,981 |
| 3.2% 2/23/23 | | 3,294,000 | 3,403,314 |
| 3.5% 1/23/25 | | 711,000 | 747,795 |
| 3.625% 1/22/23 | | 1,280,000 | 1,338,940 |
| 3.625% 2/20/24 | | 1,493,000 | 1,574,636 |
| 3.75% 2/25/26 | | 828,000 | 882,143 |
| 3.85% 7/8/24 | | 540,000 | 576,412 |
| 3.85% 1/26/27 | | 4,300,000 | 4,591,708 |
| 4.25% 10/21/25 | | 711,000 | 766,923 |
| 4.75% 10/21/45 | | 2,244,000 | 2,774,976 |
| 5.25% 7/27/21 | | 640,000 | 676,230 |
| 5.75% 1/24/22 | | 611,000 | 661,548 |
| 5.95% 1/15/27 | | 2,133,000 | 2,553,279 |
| 6% 6/15/20 | | 235,000 | 241,751 |
| 6.75% 10/1/37 | | 4,433,000 | 6,073,626 |
| IntercontinentalExchange, Inc.: | | | |
| 3.75% 12/1/25 | | 818,000 | 885,436 |
| 3.75% 9/21/28 | | 1,327,000 | 1,474,065 |
| 4% 10/15/23 | | 533,000 | 572,050 |
| Merrill Lynch & Co., Inc. 7.75% 5/14/38 | | 594,000 | 927,462 |
| Morgan Stanley: | | | |
| 3 month U.S. LIBOR + 1.431% 4.457% 4/22/39 (a)(c) | | 2,975,000 | 3,530,313 |
| 2.625% 11/17/21 | | 2,471,000 | 2,496,875 |
| 2.65% 1/27/20 | | 1,564,000 | 1,566,603 |
| 2.75% 5/19/22 | | 1,706,000 | 1,735,315 |
| 3.125% 1/23/23 | | 8,702,000 | 8,972,544 |
| 3.125% 7/27/26 | | 796,000 | 826,910 |
| 3.591% 7/22/28 (a) | | 1,209,000 | 1,288,422 |
| 3.7% 10/23/24 | | 853,000 | 911,179 |
| 3.75% 2/25/23 | | 963,000 | 1,012,949 |
| 3.875% 4/29/24 | | 2,087,000 | 2,240,342 |
| 3.875% 1/27/26 | | 746,000 | 806,513 |
| 3.95% 4/23/27 | | 2,706,000 | 2,896,310 |
| 3.971% 7/22/38 (a) | | 889,000 | 993,174 |
| 4.3% 1/27/45 | | 284,000 | 336,152 |
| 4.375% 1/22/47 | | 1,578,000 | 1,918,760 |
| 5.5% 7/28/21 | | 483,000 | 512,475 |
| 5.625% 9/23/19 | | 284,000 | 284,489 |
| 5.75% 1/25/21 | | 711,000 | 745,952 |
| 6.375% 7/24/42 | | 412,000 | 611,274 |
| 7.25% 4/1/32 | | 142,000 | 205,972 |
| State Street Corp. 2.65% 5/19/26 | | 1,074,000 | 1,110,783 |
| The Bank of New York Mellon Corp. 2.6% 8/17/20 | | 1,337,000 | 1,344,972 |
| | | | 96,385,892 |
| Consumer Finance - 0.9% | | | |
| AerCap Ireland Capital Ltd./AerCap Global Aviation Trust: | | | |
| 2.875% 8/14/24 | | 1,050,000 | 1,053,444 |
| 3.5% 5/26/22 | | 1,344,000 | 1,380,682 |
| 3.65% 7/21/27 | | 640,000 | 656,595 |
| 3.875% 1/23/28 | | 2,232,000 | 2,316,137 |
| 4.45% 12/16/21 | | 1,194,000 | 1,240,694 |
| 4.45% 10/1/25 | | 1,401,000 | 1,502,739 |
| 4.5% 5/15/21 | | 2,005,000 | 2,068,343 |
| 4.625% 7/1/22 | | 1,344,000 | 1,421,186 |
| 4.875% 1/16/24 | | 3,316,000 | 3,596,746 |
| American Express Co.: | | | |
| 2.5% 8/1/22 | | 1,786,000 | 1,811,107 |
| 4.05% 12/3/42 | | 992,000 | 1,183,029 |
| Capital One Bank U.S.A. NA 3.375% 2/15/23 | | 345,000 | 355,999 |
| Capital One Financial Corp.: | | | |
| 3.2% 1/30/23 | | 1,979,000 | 2,039,089 |
| 3.75% 7/28/26 | | 1,386,000 | 1,446,330 |
| 3.75% 3/9/27 | | 3,299,000 | 3,494,820 |
| 3.8% 1/31/28 | | 1,848,000 | 1,970,210 |
| 4.75% 7/15/21 | | 569,000 | 594,859 |
| Caterpillar Financial Services Corp.: | | | |
| 1.7% 8/9/21 | | 1,335,000 | 1,328,677 |
| 2% 3/5/20 | | 555,000 | 554,780 |
| 2.25% 12/1/19 | | 938,000 | 938,171 |
| 2.4% 8/9/26 | | 405,000 | 414,285 |
| 2.85% 6/1/22 | | 569,000 | 584,151 |
| Discover Financial Services: | | | |
| 4.5% 1/30/26 | | 2,676,000 | 2,955,439 |
| 5.2% 4/27/22 | | 142,000 | 152,700 |
| Ford Motor Credit Co. LLC: | | | |
| 3.2% 1/15/21 | | 512,000 | 514,534 |
| 3.219% 1/9/22 | | 498,000 | 499,508 |
| 3.336% 3/18/21 | | 604,000 | 607,945 |
| 3.815% 11/2/27 | | 1,511,000 | 1,468,748 |
| 4.134% 8/4/25 | | 995,000 | 1,002,346 |
| 4.25% 9/20/22 | | 256,000 | 264,749 |
| 4.375% 8/6/23 | | 569,000 | 589,134 |
| 4.389% 1/8/26 | | 468,000 | 475,940 |
| 5.584% 3/18/24 | | 1,422,000 | 1,529,250 |
| 5.875% 8/2/21 | | 1,617,000 | 1,702,067 |
| John Deere Capital Corp.: | | | |
| 2.05% 3/10/20 | | 1,091,000 | 1,090,785 |
| 2.55% 1/8/21 | | 1,479,000 | 1,490,783 |
| 2.65% 6/24/24 | | 1,487,000 | 1,532,310 |
| 2.65% 6/10/26 | | 711,000 | 738,391 |
| 2.7% 1/6/23 | | 1,422,000 | 1,455,231 |
| 2.8% 1/27/23 | | 711,000 | 731,348 |
| 2.8% 3/6/23 | | 462,000 | 475,441 |
| 2.8% 9/8/27 | | 995,000 | 1,039,220 |
| 3.45% 3/7/29 | | 2,844,000 | 3,118,850 |
| Synchrony Financial: | | | |
| 2.7% 2/3/20 | | 1,137,000 | 1,138,458 |
| 3.7% 8/4/26 | | 672,000 | 689,128 |
| 4.375% 3/19/24 | | 1,600,000 | 1,709,064 |
| 5.15% 3/19/29 | | 4,243,000 | 4,778,349 |
| Toyota Motor Credit Corp.: | | | |
| 1.9% 4/8/21 | | 284,000 | 284,076 |
| 2.15% 3/12/20 | | 960,000 | 961,090 |
| 2.6% 1/11/22 | | 1,137,000 | 1,155,360 |
| 2.7% 1/11/23 | | 1,422,000 | 1,463,047 |
| 2.75% 5/17/21 | | 370,000 | 375,318 |
| | | | 67,940,682 |
| Diversified Financial Services - 1.1% | | | |
| AB Svensk Exportkredit 2.375% 3/9/22 | | 796,000 | 811,822 |
| Berkshire Hathaway Finance Corp.: | | | |
| 4.2% 8/15/48 | | 1,688,000 | 2,028,340 |
| 5.75% 1/15/40 | | 711,000 | 1,018,624 |
| Berkshire Hathaway, Inc.: | | | |
| 3.125% 3/15/26 | | 1,635,000 | 1,733,277 |
| 4.5% 2/11/43 | | 284,000 | 357,257 |
| BP Capital Markets America, Inc.: | | | |
| 3.017% 1/16/27 | | 1,351,000 | 1,408,962 |
| 3.245% 5/6/22 | | 1,102,000 | 1,137,734 |
| 4.5% 10/1/20 | | 284,000 | 291,606 |
| Brixmor Operating Partnership LP: | | | |
| 3.25% 9/15/23 | | 667,000 | 686,681 |
| 3.9% 3/15/27 | | 802,000 | 845,351 |
| 4.125% 6/15/26 | | 1,074,000 | 1,144,846 |
| 4.125% 5/15/29 | | 973,000 | 1,052,617 |
| Broadcom Corp./Broadcom Cayman LP: | | | |
| 3% 1/15/22 | | 1,742,000 | 1,756,132 |
| 3.5% 1/15/28 | | 995,000 | 964,564 |
| 3.875% 1/15/27 | | 1,152,000 | 1,152,785 |
| Cigna Corp.: | | | |
| 3.75% 7/15/23 | | 2,658,000 | 2,794,244 |
| 4.125% 11/15/25 | | 1,401,000 | 1,524,242 |
| 4.375% 10/15/28 | | 3,775,000 | 4,221,209 |
| 4.8% 8/15/38 | | 3,351,000 | 3,874,240 |
| 4.9% 12/15/48 | | 1,211,000 | 1,433,086 |
| Export Development Canada: | | | |
| 2.625% 2/21/24 | | 4,600,000 | 4,823,376 |
| 2.75% 3/15/23 | | 2,035,000 | 2,120,450 |
| GE Capital International Funding Co.: | | | |
| 2.342% 11/15/20 | | 810,000 | 805,459 |
| 3.373% 11/15/25 | | 4,095,000 | 4,153,880 |
| 4.418% 11/15/35 | | 4,278,000 | 4,346,518 |
| General Electric Capital Corp.: | | | |
| 4.65% 10/17/21 | | 285,000 | 295,191 |
| 5.875% 1/14/38 | | 636,000 | 734,581 |
| 6.15% 8/7/37 | | 77,000 | 91,102 |
| 6.875% 1/10/39 | | 163,000 | 207,718 |
| ING U.S., Inc. 5.7% 7/15/43 | | 533,000 | 694,814 |
| KfW: | | | |
| 1.5% 4/20/20 | | 402,000 | 400,944 |
| 1.5% 6/15/21 | | 4,246,000 | 4,238,530 |
| 1.75% 10/15/19 | | 2,215,000 | 2,214,158 |
| 1.875% 6/30/20 | | 806,000 | 806,224 |
| 2% 5/2/25 | | 544,000 | 559,004 |
| 2.125% 3/7/22 | | 1,163,000 | 1,180,934 |
| 2.125% 1/17/23 | | 1,706,000 | 1,742,855 |
| 2.375% 12/29/22 | | 2,522,000 | 2,595,718 |
| 2.5% 11/20/24 | | 1,482,000 | 1,558,357 |
| 2.625% 2/28/24 | | 6,000,000 | 6,298,800 |
| 2.75% 10/1/20 | | 594,000 | 600,314 |
| 2.875% 4/3/28 | | 2,184,000 | 2,415,579 |
| 3.125% 12/15/21 | | 2,744,000 | 2,841,501 |
| 4% 1/27/20 | | 427,000 | 430,327 |
| Landwirtschaftliche Rentenbank: | | | |
| 1.75% 7/27/26 | | 1,209,000 | 1,224,130 |
| 2.5% 11/15/27 | | 1,257,000 | 1,337,361 |
| Voya Financial, Inc. 3.65% 6/15/26 | | 2,245,000 | 2,383,209 |
| | | | 81,338,653 |
| Insurance - 0.6% | | | |
| ACE INA Holdings, Inc.: | | | |
| 3.35% 5/3/26 | | 600,000 | 643,801 |
| 4.35% 11/3/45 | | 569,000 | 718,447 |
| AFLAC, Inc. 4% 10/15/46 | | 537,000 | 601,551 |
| Allstate Corp.: | | | |
| 3.28% 12/15/26 | | 671,000 | 725,028 |
| 4.2% 12/15/46 | | 1,075,000 | 1,305,375 |
| American International Group, Inc.: | | | |
| 3.375% 8/15/20 | | 821,000 | 830,037 |
| 3.75% 7/10/25 | | 3,065,000 | 3,264,534 |
| 3.875% 1/15/35 | | 384,000 | 407,597 |
| 3.9% 4/1/26 | | 536,000 | 575,411 |
| 4.2% 4/1/28 | | 2,638,000 | 2,908,736 |
| 4.5% 7/16/44 | | 1,262,000 | 1,442,696 |
| 4.7% 7/10/35 | | 825,000 | 948,555 |
| 4.75% 4/1/48 | | 569,000 | 678,550 |
| 4.875% 6/1/22 | | 1,280,000 | 1,370,973 |
| 6.4% 12/15/20 | | 412,000 | 434,090 |
| Aon PLC: | | | |
| 3.5% 6/14/24 | | 284,000 | 300,437 |
| 4% 11/27/23 | | 427,000 | 456,521 |
| 4.6% 6/14/44 | | 227,000 | 267,046 |
| 4.75% 5/15/45 | | 836,000 | 1,011,382 |
| Baylor Scott & White Holdings 3.967% 11/15/46 | | 355,000 | 416,360 |
| Hartford Financial Services Group, Inc.: | | | |
| 2.8% 8/19/29 | | 1,000,000 | 1,015,124 |
| 3.6% 8/19/49 | | 1,300,000 | 1,356,984 |
| 4.4% 3/15/48 | | 1,381,000 | 1,612,087 |
| Lincoln National Corp. 3.625% 12/12/26 | | 853,000 | 908,053 |
| Marsh & McLennan Companies, Inc.: | | | |
| 2.35% 9/10/19 | | 547,000 | 546,996 |
| 2.35% 3/6/20 | | 675,000 | 675,449 |
| 3.5% 6/3/24 | | 270,000 | 285,111 |
| 3.875% 3/15/24 | | 1,351,000 | 1,449,371 |
| 4.05% 10/15/23 | | 963,000 | 1,028,822 |
| 4.2% 3/1/48 | | 692,000 | 810,313 |
| 4.35% 1/30/47 | | 398,000 | 476,889 |
| 4.375% 3/15/29 | | 1,095,000 | 1,257,917 |
| 4.9% 3/15/49 | | 1,322,000 | 1,716,342 |
| MetLife, Inc.: | | | |
| 4.6% 5/13/46 | | 284,000 | 353,458 |
| 4.721% 12/15/44 (a) | | 711,000 | 886,294 |
| 5.875% 2/6/41 | | 341,000 | 475,004 |
| Principal Financial Group, Inc. 4.3% 11/15/46 | | 1,137,000 | 1,320,147 |
| Progressive Corp. 2.45% 1/15/27 | | 674,000 | 685,909 |
| Prudential Financial, Inc.: | | | |
| 3.878% 3/27/28 | | 910,000 | 1,019,424 |
| 3.905% 12/7/47 | | 78,000 | 86,857 |
| 3.935% 12/7/49 | | 1,524,000 | 1,698,257 |
| 4.35% 2/25/50 | | 1,103,000 | 1,317,303 |
| 4.418% 3/27/48 | | 903,000 | 1,074,988 |
| 5.7% 12/14/36 | | 54,000 | 72,254 |
| The Chubb Corp. 6.5% 5/15/38 | | 499,000 | 747,491 |
| The Travelers Companies, Inc.: | | | |
| 4.3% 8/25/45 | | 208,000 | 252,797 |
| 6.25% 6/15/37 | | 1,187,000 | 1,720,892 |
| | | | 44,157,660 |
|
| TOTAL FINANCIALS | | | 608,874,797 |
|
| HEALTH CARE - 2.7% | | | |
| Biotechnology - 0.4% | | | |
| AbbVie, Inc.: | | | |
| 2.3% 5/14/21 | | 388,000 | 388,969 |
| 2.5% 5/14/20 | | 1,010,000 | 1,011,494 |
| 2.9% 11/6/22 | | 810,000 | 824,444 |
| 3.6% 5/14/25 | | 1,280,000 | 1,334,726 |
| 4.25% 11/14/28 | | 1,179,000 | 1,282,433 |
| 4.3% 5/14/36 | | 890,000 | 943,948 |
| 4.4% 11/6/42 | | 679,000 | 712,664 |
| 4.45% 5/14/46 | | 995,000 | 1,045,438 |
| 4.7% 5/14/45 | | 1,277,000 | 1,379,943 |
| 4.875% 11/14/48 | | 1,500,000 | 1,670,976 |
| Amgen, Inc.: | | | |
| 2.6% 8/19/26 | | 1,493,000 | 1,510,348 |
| 3.125% 5/1/25 | | 284,000 | 296,753 |
| 3.875% 11/15/21 | | 1,365,000 | 1,411,602 |
| 4.4% 5/1/45 | | 1,412,000 | 1,601,518 |
| 4.663% 6/15/51 | | 1,774,000 | 2,114,058 |
| Celgene Corp. 3.9% 2/20/28 | | 5,000,000 | 5,554,924 |
| Gilead Sciences, Inc.: | | | |
| 2.55% 9/1/20 | | 674,000 | 677,612 |
| 3.65% 3/1/26 | | 879,000 | 944,774 |
| 4.15% 3/1/47 | | 1,769,000 | 2,001,419 |
| 4.75% 3/1/46 | | 1,564,000 | 1,902,583 |
| | | | 28,610,626 |
| Health Care Equipment & Supplies - 0.3% | | | |
| Abbott Laboratories: | | | |
| 2.9% 11/30/21 | | 1,614,000 | 1,645,406 |
| 3.75% 11/30/26 | | 991,000 | 1,090,484 |
| 4.75% 11/30/36 | | 640,000 | 801,681 |
| 4.9% 11/30/46 | | 1,479,000 | 1,976,964 |
| Becton, Dickinson & Co.: | | | |
| 2.675% 12/15/19 | | 832,000 | 832,654 |
| 3.363% 6/6/24 | | 1,422,000 | 1,482,732 |
| 3.7% 6/6/27 | | 2,852,000 | 3,055,309 |
| 4.685% 12/15/44 | | 1,545,000 | 1,831,886 |
| Boston Scientific Corp.: | | | |
| 3.45% 3/1/24 | | 661,000 | 694,618 |
| 4% 3/1/28 | | 2,844,000 | 3,130,505 |
| 4% 3/1/29 | | 1,536,000 | 1,713,337 |
| 4.7% 3/1/49 | | 1,322,000 | 1,639,767 |
| Danaher Corp. 2.4% 9/15/20 | | 1,047,000 | 1,049,202 |
| Medtronic Global Holdings SCA 3.35% 4/1/27 | | 2,083,000 | 2,262,990 |
| Medtronic, Inc. 4.625% 3/15/45 | | 1,838,000 | 2,386,685 |
| Zimmer Biomet Holdings, Inc. 3.55% 4/1/25 | | 1,618,000 | 1,703,791 |
| | | | 27,298,011 |
| Health Care Providers & Services - 0.9% | | | |
| Aetna, Inc.: | | | |
| 2.8% 6/15/23 | | 2,133,000 | 2,167,002 |
| 4.125% 11/15/42 | | 1,613,000 | 1,669,446 |
| Allina Health System, Inc. 3.887% 4/15/49 | | 1,000,000 | 1,179,959 |
| Anthem, Inc.: | | | |
| 3.65% 12/1/27 | | 3,270,000 | 3,469,487 |
| 4.375% 12/1/47 | | 640,000 | 718,016 |
| Cardinal Health, Inc. 4.368% 6/15/47 | | 1,975,000 | 1,909,680 |
| Childrens Hosp Medical Ctr 4.268% 5/15/44 | | 472,000 | 577,945 |
| Cigna Holding Co. 4% 2/15/22 | | 654,000 | 680,403 |
| Commonspirit Health 4.35% 11/1/42 | | 284,000 | 309,529 |
| CVS Health Corp.: | | | |
| 2.8% 7/20/20 | | 1,194,000 | 1,199,952 |
| 2.875% 6/1/26 | | 1,066,000 | 1,072,694 |
| 3% 8/15/26 | | 814,000 | 823,956 |
| 3.25% 8/15/29 | | 1,300,000 | 1,317,588 |
| 3.7% 3/9/23 | | 2,997,000 | 3,133,956 |
| 3.875% 7/20/25 | | 663,000 | 702,466 |
| 4.1% 3/25/25 | | 2,439,000 | 2,609,321 |
| 4.3% 3/25/28 | | 3,398,000 | 3,709,057 |
| 4.875% 7/20/35 | | 441,000 | 503,607 |
| 5.05% 3/25/48 | | 3,896,000 | 4,539,468 |
| 5.125% 7/20/45 | | 1,253,000 | 1,456,451 |
| 5.3% 12/5/43 | | 624,000 | 736,838 |
| Express Scripts Holding Co.: | | | |
| 3% 7/15/23 | | 1,422,000 | 1,454,518 |
| 4.5% 2/25/26 | | 1,658,000 | 1,831,083 |
| 4.8% 7/15/46 | | 1,081,000 | 1,236,394 |
| 6.125% 11/15/41 | | 427,000 | 551,377 |
| Humana, Inc. 4.95% 10/1/44 | | 355,000 | 422,826 |
| Kaiser Foundation Hospitals: | | | |
| 4.15% 5/1/47 | | 900,000 | 1,109,657 |
| 4.875% 4/1/42 | | 256,000 | 338,632 |
| McKesson Corp.: | | | |
| 3.796% 3/15/24 | | 711,000 | 747,027 |
| 4.883% 3/15/44 | | 711,000 | 799,732 |
| Memorial Sloan-Kettring Cancer Center 4.2% 7/1/55 | | 427,000 | 543,931 |
| New York & Presbyterian Hospital: | | | |
| 4.024% 8/1/45 | | 498,000 | 600,056 |
| 4.063% 8/1/56 | | 374,000 | 451,571 |
| NYU Hospitals Center 4.784% 7/1/44 | | 1,081,000 | 1,395,096 |
| Partners Healthcare System, Inc. 4.117% 7/1/55 | | 498,000 | 605,412 |
| UnitedHealth Group, Inc.: | | | |
| 2.3% 12/15/19 | | 1,226,000 | 1,226,279 |
| 2.375% 8/15/24 | | 600,000 | 609,456 |
| 2.7% 7/15/20 | | 853,000 | 858,624 |
| 2.875% 12/15/21 | | 366,000 | 373,422 |
| 3.375% 4/15/27 | | 768,000 | 825,650 |
| 3.5% 6/15/23 | | 1,265,000 | 1,334,897 |
| 3.7% 8/15/49 | | 1,350,000 | 1,475,680 |
| 3.75% 7/15/25 | | 498,000 | 540,921 |
| 3.75% 10/15/47 | | 1,359,000 | 1,485,041 |
| 3.85% 6/15/28 | | 1,651,000 | 1,836,287 |
| 3.875% 12/15/28 | | 2,131,000 | 2,392,432 |
| 3.875% 8/15/59 | | 1,500,000 | 1,657,387 |
| 4.2% 1/15/47 | | 512,000 | 600,020 |
| 4.375% 3/15/42 | | 1,678,000 | 1,970,089 |
| 4.75% 7/15/45 | | 237,000 | 295,184 |
| WellPoint, Inc.: | | | |
| 3.3% 1/15/23 | | 284,000 | 293,330 |
| 4.625% 5/15/42 | | 370,000 | 421,547 |
| 4.65% 1/15/43 | | 284,000 | 320,109 |
| | | | 65,090,488 |
| Life Sciences Tools & Services - 0.0% | | | |
| Thermo Fisher Scientific, Inc.: | | | |
| 3% 4/15/23 | | 664,000 | 683,054 |
| 4.15% 2/1/24 | | 623,000 | 670,356 |
| 5.3% 2/1/44 | | 828,000 | 1,080,776 |
| | | | 2,434,186 |
| Pharmaceuticals - 1.1% | | | |
| Actavis Funding SCS: | | | |
| 3% 3/12/20 | | 3,853,000 | 3,864,779 |
| 3.45% 3/15/22 | | 2,563,000 | 2,632,043 |
| 3.8% 3/15/25 | | 1,254,000 | 1,319,297 |
| 4.55% 3/15/35 | | 946,000 | 1,017,648 |
| 4.75% 3/15/45 | | 900,000 | 987,144 |
| Allergan PLC 3.25% 10/1/22 | | 427,000 | 436,412 |
| AstraZeneca PLC: | | | |
| 4.375% 11/16/45 | | 1,072,000 | 1,281,664 |
| 4.375% 8/17/48 | | 1,800,000 | 2,194,784 |
| 6.45% 9/15/37 | | 462,000 | 663,713 |
| Bayer U.S. Finance II LLC: | | | |
| 2.75% 7/15/21 (b) | | 904,000 | 905,588 |
| 2.85% 4/15/25 (b) | | 544,000 | 525,795 |
| 3.95% 4/15/45 (b) | | 198,000 | 192,083 |
| Bristol-Myers Squibb Co.: | | | |
| 2.9% 7/26/24 (b) | | 5,000,000 | 5,184,086 |
| 3.2% 6/15/26 (b) | | 2,000,000 | 2,116,255 |
| 3.25% 8/1/42 | | 398,000 | 402,976 |
| 3.4% 7/26/29 (b) | | 5,000,000 | 5,412,580 |
| 4.125% 6/15/39 (b) | | 2,000,000 | 2,321,122 |
| 4.25% 10/26/49 (b) | | 3,000,000 | 3,608,555 |
| Eli Lilly & Co. 3.95% 5/15/47 | | 782,000 | 911,246 |
| GlaxoSmithKline Capital PLC 3% 6/1/24 | | 4,130,000 | 4,298,649 |
| GlaxoSmithKline Capital, Inc. 6.375% 5/15/38 | | 1,026,000 | 1,499,447 |
| Johnson & Johnson: | | | |
| 1.65% 3/1/21 | | 536,000 | 535,302 |
| 2.45% 3/1/26 | | 795,000 | 820,230 |
| 3.4% 1/15/38 | | 1,327,000 | 1,451,497 |
| 3.5% 1/15/48 | | 853,000 | 958,803 |
| 3.625% 3/3/37 | | 569,000 | 641,057 |
| 4.5% 12/5/43 | | 942,000 | 1,190,544 |
| 4.85% 5/15/41 | | 606,000 | 799,592 |
| Merck & Co., Inc.: | | | |
| 1.85% 2/10/20 | | 1,280,000 | 1,278,780 |
| 2.4% 9/15/22 | | 284,000 | 288,445 |
| 3.6% 9/15/42 | | 284,000 | 317,769 |
| 3.7% 2/10/45 | | 910,000 | 1,041,879 |
| 3.875% 1/15/21 | | 142,000 | 145,221 |
| Mylan NV: | | | |
| 3.15% 6/15/21 | | 284,000 | 287,354 |
| 3.95% 6/15/26 | | 402,000 | 418,306 |
| 5.2% 4/15/48 | | 427,000 | 465,598 |
| 5.25% 6/15/46 | | 469,000 | 513,942 |
| Novartis Capital Corp.: | | | |
| 2.4% 5/17/22 | | 1,649,000 | 1,675,812 |
| 2.4% 9/21/22 | | 533,000 | 542,428 |
| 3% 11/20/25 | | 1,489,000 | 1,578,470 |
| 3.1% 5/17/27 | | 837,000 | 900,179 |
| 3.7% 9/21/42 | | 402,000 | 453,988 |
| 4% 11/20/45 | | 745,000 | 886,449 |
| Perrigo Co. PLC 3.5% 3/15/21 | | 240,000 | 241,283 |
| Perrigo Finance PLC: | | | |
| 4.375% 3/15/26 | | 441,000 | 453,945 |
| 4.9% 12/15/44 | | 322,000 | 316,898 |
| Pfizer, Inc.: | | | |
| 2.95% 3/15/24 | | 668,000 | 696,288 |
| 3% 12/15/26 | | 953,000 | 1,008,325 |
| 3.2% 9/15/23 | | 1,809,000 | 1,899,499 |
| 3.45% 3/15/29 | | 1,184,000 | 1,296,332 |
| 3.9% 3/15/39 | | 896,000 | 1,029,673 |
| 4% 12/15/36 | | 1,351,000 | 1,569,942 |
| 4.125% 12/15/46 | | 468,000 | 560,374 |
| 4.2% 9/15/48 | | 1,109,000 | 1,340,602 |
| 4.4% 5/15/44 | | 596,000 | 726,039 |
| 7.2% 3/15/39 | | 768,000 | 1,216,564 |
| Shire Acquisitions Investments Ireland DAC: | | | |
| 2.4% 9/23/21 | | 1,612,000 | 1,616,997 |
| 2.875% 9/23/23 | | 1,344,000 | 1,374,658 |
| 3.2% 9/23/26 | | 5,571,000 | 5,794,450 |
| Zoetis, Inc.: | | | |
| 3.25% 2/1/23 | | 711,000 | 735,374 |
| 3.95% 9/12/47 | | 284,000 | 317,151 |
| 4.7% 2/1/43 | | 185,000 | 225,163 |
| | | | 81,387,068 |
|
| TOTAL HEALTH CARE | | | 204,820,379 |
|
| INDUSTRIALS - 1.6% | | | |
| Aerospace & Defense - 0.5% | | | |
| General Dynamics Corp.: | | | |
| 3% 5/11/21 | | 825,000 | 840,843 |
| 3.375% 5/15/23 | | 1,351,000 | 1,421,435 |
| 3.75% 5/15/28 | | 1,337,000 | 1,507,610 |
| Lockheed Martin Corp.: | | | |
| 3.55% 1/15/26 | | 1,081,000 | 1,172,619 |
| 4.09% 9/15/52 | | 1,359,000 | 1,636,620 |
| Northrop Grumman Corp.: | | | |
| 3.25% 1/15/28 | | 1,194,000 | 1,268,385 |
| 3.85% 4/15/45 | | 267,000 | 299,358 |
| 4.03% 10/15/47 | | 2,677,000 | 3,099,406 |
| 4.75% 6/1/43 | | 569,000 | 703,283 |
| Raytheon Co.: | | | |
| 3.125% 10/15/20 | | 284,000 | 287,443 |
| 3.15% 12/15/24 | | 1,265,000 | 1,335,186 |
| 4.875% 10/15/40 | | 142,000 | 182,868 |
| Rockwell Collins, Inc.: | | | |
| 2.8% 3/15/22 | | 1,209,000 | 1,229,931 |
| 4.35% 4/15/47 | | 938,000 | 1,105,429 |
| The Boeing Co.: | | | |
| 2.125% 3/1/22 | | 535,000 | 537,555 |
| 2.5% 3/1/25 | | 654,000 | 666,280 |
| 2.7% 2/1/27 | | 2,000,000 | 2,054,901 |
| 2.8% 3/1/23 | | 702,000 | 719,698 |
| 2.95% 2/1/30 | | 1,300,000 | 1,349,636 |
| 3.625% 3/1/48 | | 569,000 | 613,326 |
| 3.65% 3/1/47 | | 392,000 | 426,099 |
| 3.75% 2/1/50 | | 1,500,000 | 1,670,236 |
| 6.875% 3/15/39 | | 469,000 | 709,737 |
| United Technologies Corp.: | | | |
| 2.3% 5/4/22 | | 1,422,000 | 1,434,351 |
| 2.65% 11/1/26 | | 682,000 | 706,073 |
| 3.1% 6/1/22 | | 409,000 | 422,171 |
| 3.65% 8/16/23 | | 2,770,000 | 2,939,358 |
| 3.75% 11/1/46 | | 547,000 | 607,295 |
| 4.05% 5/4/47 | | 331,000 | 383,036 |
| 4.125% 11/16/28 | | 2,092,000 | 2,393,882 |
| 4.5% 4/15/20 | | 569,000 | 577,158 |
| 4.5% 6/1/42 | | 1,049,000 | 1,265,374 |
| 4.625% 11/16/48 | | 995,000 | 1,256,736 |
| 5.7% 4/15/40 | | 284,000 | 383,509 |
| | | | 37,206,827 |
| Air Freight & Logistics - 0.1% | | | |
| FedEx Corp.: | | | |
| 3.2% 2/1/25 | | 543,000 | 568,787 |
| 3.9% 2/1/35 | | 839,000 | 879,659 |
| 4.4% 1/15/47 | | 1,137,000 | 1,217,649 |
| 4.55% 4/1/46 | | 213,000 | 232,192 |
| 4.95% 10/17/48 | | 567,000 | 662,570 |
| United Parcel Service, Inc.: | | | |
| 2.4% 11/15/26 | | 1,066,000 | 1,080,589 |
| 3.4% 11/15/46 | | 377,000 | 393,589 |
| 3.75% 11/15/47 | | 879,000 | 970,973 |
| 6.2% 1/15/38 | | 355,000 | 497,063 |
| | | | 6,503,071 |
| Airlines - 0.0% | | | |
| American Airlines pass-thru trust equipment trust certificate 4.95% 7/15/24 | | 264,693 | 278,695 |
| American Airlines, Inc. equipment trust certificate 3.2% 6/15/28 | | 972,593 | 1,010,524 |
| Continental Airlines, Inc. 4% 10/29/24 | | 483,335 | 512,142 |
| United Airlines 2015-1 Class AA Pass Through Trust 3.45% 12/1/27 | | 85,494 | 90,171 |
| United Airlines Pass-through Trust equipment trust certificate 3.1% 1/7/30 | | 1,202,162 | 1,260,225 |
| | | | 3,151,757 |
| Commercial Services & Supplies - 0.1% | | | |
| FMS Wertmanagement AoeR 1.375% 6/8/21 | | 1,337,000 | 1,331,402 |
| Republic Services, Inc.: | | | |
| 2.9% 7/1/26 | | 600,000 | 623,964 |
| 3.2% 3/15/25 | | 1,603,000 | 1,680,654 |
| 3.95% 5/15/28 | | 1,493,000 | 1,674,168 |
| 5.5% 9/15/19 | | 569,000 | 569,503 |
| Waste Management, Inc.: | | | |
| 2.4% 5/15/23 | | 754,000 | 764,349 |
| 2.9% 9/15/22 | | 949,000 | 973,413 |
| | | | 7,617,453 |
| Electrical Equipment - 0.0% | | | |
| Eaton Corp.: | | | |
| 2.75% 11/2/22 | | 814,000 | 830,043 |
| 4% 11/2/32 | | 270,000 | 310,869 |
| 4.15% 11/2/42 | | 270,000 | 306,066 |
| Fortive Corp. 2.35% 6/15/21 | | 938,000 | 937,973 |
| | | | 2,384,951 |
| Industrial Conglomerates - 0.2% | | | |
| 3M Co.: | | | |
| 2% 6/26/22 | | 569,000 | 573,780 |
| 2.375% 8/26/29 | | 1,600,000 | 1,600,798 |
| 2.875% 10/15/27 | | 569,000 | 599,338 |
| 3.125% 9/19/46 | | 392,000 | 389,942 |
| 3.25% 8/26/49 | | 1,200,000 | 1,214,309 |
| Covidien International Finance SA 3.2% 6/15/22 | | 306,000 | 316,549 |
| Danaher Corp. 4.375% 9/15/45 | | 337,000 | 407,745 |
| General Electric Co.: | | | |
| 3.375% 3/11/24 | | 782,000 | 792,467 |
| 4.5% 3/11/44 | | 4,318,000 | 4,365,314 |
| Honeywell International, Inc.: | | | |
| 2.5% 11/1/26 | | 1,018,000 | 1,047,273 |
| 3.812% 11/21/47 | | 199,000 | 234,603 |
| Roper Technologies, Inc.: | | | |
| 2.8% 12/15/21 | | 940,000 | 952,972 |
| 3.8% 12/15/26 | | 1,209,000 | 1,310,522 |
| | | | 13,805,612 |
| Machinery - 0.2% | | | |
| Caterpillar Financial Services Corp.: | | | |
| 2.4% 6/6/22 | | 1,422,000 | 1,442,332 |
| 3.45% 5/15/23 | | 1,991,000 | 2,093,343 |
| Caterpillar, Inc.: | | | |
| 2.6% 6/26/22 | | 853,000 | 869,505 |
| 3.803% 8/15/42 | | 355,000 | 410,260 |
| 5.3% 9/15/35 | | 995,000 | 1,282,575 |
| Deere & Co. 5.375% 10/16/29 | | 142,000 | 179,537 |
| Ingersoll-Rand Luxembourg Finance SA: | | | |
| 2.625% 5/1/20 | | 724,000 | 725,879 |
| 3.8% 3/21/29 | | 2,040,000 | 2,212,623 |
| 4.65% 11/1/44 | | 853,000 | 990,913 |
| Parker Hannifin Corp.: | | | |
| 3.25% 3/1/27 | | 803,000 | 841,561 |
| 4.1% 3/1/47 | | 805,000 | 909,991 |
| | | | 11,958,519 |
| Professional Services - 0.0% | | | |
| Thomson Reuters Corp. 3.35% 5/15/26 | | 995,000 | 1,035,258 |
| Road & Rail - 0.4% | | | |
| Burlington Northern Santa Fe Corp. 4.7% 10/1/19 | | 711,000 | 712,307 |
| Burlington Northern Santa Fe LLC: | | | |
| 3% 3/15/23 | | 398,000 | 411,734 |
| 3.05% 3/15/22 | | 1,422,000 | 1,460,421 |
| 3.25% 6/15/27 | | 1,066,000 | 1,142,946 |
| 3.9% 8/1/46 | | 660,000 | 754,777 |
| 4.05% 6/15/48 | | 853,000 | 1,002,526 |
| 4.125% 6/15/47 | | 405,000 | 483,194 |
| 4.15% 4/1/45 | | 242,000 | 284,055 |
| 4.375% 9/1/42 | | 640,000 | 763,012 |
| 4.55% 9/1/44 | | 427,000 | 520,665 |
| 4.9% 4/1/44 | | 569,000 | 729,949 |
| Canadian National Railway Co.: | | | |
| 2.85% 12/15/21 | | 711,000 | 722,312 |
| 3.2% 8/2/46 | | 469,000 | 492,065 |
| CSX Corp.: | | | |
| 3.25% 6/1/27 | | 711,000 | 754,842 |
| 3.4% 8/1/24 | | 658,000 | 698,452 |
| 3.8% 11/1/46 | | 813,000 | 872,630 |
| 3.95% 5/1/50 | | 508,000 | 562,790 |
| 4.1% 3/15/44 | | 963,000 | 1,075,383 |
| 4.5% 3/15/49 | | 1,379,000 | 1,656,302 |
| 4.75% 11/15/48 | | 823,000 | 1,014,227 |
| Norfolk Southern Corp.: | | | |
| 3% 4/1/22 | | 1,066,000 | 1,088,627 |
| 3.25% 12/1/21 | | 711,000 | 726,507 |
| 3.65% 8/1/25 | | 1,706,000 | 1,834,416 |
| 3.95% 10/1/42 | | 270,000 | 297,004 |
| 4.65% 1/15/46 | | 464,000 | 567,805 |
| Union Pacific Corp.: | | | |
| 2.75% 3/1/26 | | 947,000 | 977,315 |
| 3% 4/15/27 | | 711,000 | 744,440 |
| 3.35% 8/15/46 | | 671,000 | 679,908 |
| 3.6% 9/15/37 | | 469,000 | 501,432 |
| 3.7% 3/1/29 | | 1,305,000 | 1,450,239 |
| 3.799% 10/1/51 | | 398,000 | 433,553 |
| 4.5% 9/10/48 | | 1,337,000 | 1,628,823 |
| | | | 27,044,658 |
| Trading Companies & Distributors - 0.1% | | | |
| Air Lease Corp.: | | | |
| 2.625% 7/1/22 | | 1,339,000 | 1,351,112 |
| 2.75% 1/15/23 | | 1,422,000 | 1,438,111 |
| 3.375% 6/1/21 | | 1,994,000 | 2,026,952 |
| 3.625% 12/1/27 | | 3,800,000 | 3,959,826 |
| 3.75% 2/1/22 | | 543,000 | 559,418 |
| 4.25% 2/1/24 | | 1,871,000 | 1,997,225 |
| | | | 11,332,644 |
|
| TOTAL INDUSTRIALS | | | 122,040,750 |
|
| INFORMATION TECHNOLOGY - 1.8% | | | |
| Communications Equipment - 0.1% | | | |
| Cisco Systems, Inc.: | | | |
| 1.85% 9/20/21 | | 1,436,000 | 1,434,935 |
| 2.2% 9/20/23 | | 1,068,000 | 1,084,192 |
| 2.5% 9/20/26 | | 711,000 | 737,610 |
| 3.5% 6/15/25 | | 607,000 | 659,383 |
| 4.45% 1/15/20 | | 284,000 | 286,405 |
| 5.9% 2/15/39 | | 1,765,000 | 2,564,090 |
| | | | 6,766,615 |
| Electronic Equipment & Components - 0.2% | | | |
| Corning, Inc. 4.75% 3/15/42 | | 711,000 | 830,582 |
| Diamond 1 Finance Corp./Diamond 2 Finance Corp.: | | | |
| 4% 7/15/24 (b) | | 1,635,000 | 1,709,040 |
| 4.42% 6/15/21 (b) | | 2,440,000 | 2,517,580 |
| 4.9% 10/1/26 (b) | | 1,344,000 | 1,436,841 |
| 5.3% 10/1/29 (b) | | 3,579,000 | 3,880,124 |
| 6.02% 6/15/26 (b) | | 2,295,000 | 2,590,133 |
| 8.35% 7/15/46 (b) | | 837,000 | 1,099,700 |
| Tyco Electronics Group SA: | | | |
| 3.45% 8/1/24 | | 519,000 | 545,932 |
| 7.125% 10/1/37 | | 352,000 | 503,091 |
| | | | 15,113,023 |
| IT Services - 0.3% | | | |
| Fiserv, Inc.: | | | |
| 3.5% 7/1/29 | | 1,700,000 | 1,805,557 |
| 4.4% 7/1/49 | | 2,150,000 | 2,476,734 |
| IBM Corp.: | | | |
| 2.5% 1/27/22 | | 1,109,000 | 1,123,483 |
| 3% 5/15/24 | | 1,900,000 | 1,975,871 |
| 3.5% 5/15/29 | | 2,500,000 | 2,714,273 |
| 3.625% 2/12/24 | | 1,422,000 | 1,516,096 |
| 4.25% 5/15/49 | | 1,500,000 | 1,749,894 |
| 4.7% 2/19/46 | | 704,000 | 870,634 |
| IBM Credit LLC 2.2% 9/8/22 | | 1,280,000 | 1,287,370 |
| MasterCard, Inc. 3.8% 11/21/46 | | 540,000 | 634,221 |
| Visa, Inc.: | | | |
| 2.2% 12/14/20 | | 810,000 | 813,779 |
| 2.75% 9/15/27 | | 1,695,000 | 1,793,339 |
| 3.15% 12/14/25 | | 1,281,000 | 1,372,115 |
| 4.3% 12/14/45 | | 944,000 | 1,197,980 |
| | | | 21,331,346 |
| Semiconductors & Semiconductor Equipment - 0.2% | | | |
| Applied Materials, Inc. 4.35% 4/1/47 | | 1,837,000 | 2,251,358 |
| Broadcom, Inc. 4.75% 4/15/29 (b) | | 2,550,000 | 2,686,556 |
| Intel Corp.: | | | |
| 2.35% 5/11/22 | | 2,417,000 | 2,448,461 |
| 3.3% 10/1/21 | | 2,133,000 | 2,199,044 |
| 3.734% 12/8/47 | | 465,000 | 528,801 |
| 4.1% 5/19/46 | | 995,000 | 1,184,025 |
| 4.1% 5/11/47 | | 341,000 | 407,454 |
| Qualcomm, Inc.: | | | |
| 2.6% 1/30/23 | | 1,066,000 | 1,086,207 |
| 4.3% 5/20/47 | | 1,436,000 | 1,629,555 |
| Texas Instruments, Inc.: | | | |
| 1.75% 5/1/20 | | 540,000 | 539,224 |
| 4.15% 5/15/48 | | 569,000 | 705,598 |
| | | | 15,666,283 |
| Software - 0.6% | | | |
| Microsoft Corp.: | | | |
| 1.55% 8/8/21 | | 2,866,000 | 2,857,485 |
| 2.4% 2/6/22 | | 3,981,000 | 4,049,383 |
| 2.7% 2/12/25 | | 2,442,000 | 2,552,556 |
| 3.45% 8/8/36 | | 867,000 | 974,247 |
| 3.625% 12/15/23 | | 3,718,000 | 3,995,660 |
| 3.7% 8/8/46 | | 2,379,000 | 2,800,910 |
| 3.95% 8/8/56 | | 711,000 | 870,250 |
| 4.1% 2/6/37 | | 2,522,000 | 3,040,801 |
| 4.25% 2/6/47 | | 992,000 | 1,263,342 |
| 4.45% 11/3/45 | | 1,787,000 | 2,313,290 |
| 5.3% 2/8/41 | | 213,000 | 300,731 |
| Oracle Corp.: | | | |
| 1.9% 9/15/21 | | 1,194,000 | 1,193,460 |
| 2.25% 10/8/19 | | 672,000 | 672,007 |
| 2.5% 5/15/22 | | 1,365,000 | 1,384,317 |
| 2.625% 2/15/23 | | 1,422,000 | 1,453,029 |
| 2.65% 7/15/26 | | 1,280,000 | 1,311,329 |
| 2.95% 5/15/25 | | 711,000 | 744,289 |
| 3.25% 11/15/27 | | 2,431,000 | 2,605,238 |
| 3.4% 7/8/24 | | 672,000 | 712,252 |
| 3.85% 7/15/36 | | 1,440,000 | 1,623,910 |
| 4% 7/15/46 | | 1,393,000 | 1,589,387 |
| 4% 11/15/47 | | 711,000 | 813,965 |
| 4.125% 5/15/45 | | 427,000 | 493,376 |
| 4.3% 7/8/34 | | 551,000 | 650,513 |
| 5.375% 7/15/40 | | 1,777,000 | 2,382,746 |
| | | | 42,648,473 |
| Technology Hardware, Storage & Peripherals - 0.4% | | | |
| Apple, Inc.: | | | |
| 2.1% 9/12/22 | | 1,209,000 | 1,219,955 |
| 2.15% 2/9/22 | | 711,000 | 717,170 |
| 2.25% 2/23/21 | | 2,133,000 | 2,144,954 |
| 2.3% 5/11/22 | | 1,137,000 | 1,151,975 |
| 2.4% 1/13/23 | | 4,266,000 | 4,351,788 |
| 2.45% 8/4/26 | | 2,929,000 | 2,995,738 |
| 2.7% 5/13/22 | | 946,000 | 968,694 |
| 2.9% 9/12/27 | | 1,998,000 | 2,099,916 |
| 3% 11/13/27 | | 1,422,000 | 1,513,106 |
| 3.2% 5/13/25 | | 1,492,000 | 1,590,542 |
| 3.2% 5/11/27 | | 792,000 | 847,790 |
| 3.75% 11/13/47 | | 992,000 | 1,127,629 |
| 3.85% 5/4/43 | | 1,848,000 | 2,109,009 |
| 4.25% 2/9/47 | | 355,000 | 431,132 |
| 4.375% 5/13/45 | | 667,000 | 819,523 |
| 4.5% 2/23/36 | | 1,317,000 | 1,626,432 |
| 4.65% 2/23/46 | | 803,000 | 1,026,988 |
| Hewlett Packard Enterprise Co.: | | | |
| 3.6% 10/15/20 (a) | | 1,014,000 | 1,028,523 |
| 4.9% 10/15/25 (a) | | 1,386,000 | 1,536,673 |
| 6.2% 10/15/35 (a) | | 553,000 | 643,691 |
| 6.35% 10/15/45 (a) | | 267,000 | 309,778 |
| HP, Inc.: | | | |
| 4.3% 6/1/21 | | 395,000 | 409,411 |
| 6% 9/15/41 | | 213,000 | 238,750 |
| Xerox Corp.: | | | |
| 4.5% 5/15/21 | | 569,000 | 583,225 |
| 5.625% 12/15/19 | | 142,000 | 142,994 |
| | | | 31,635,386 |
|
| TOTAL INFORMATION TECHNOLOGY | | | 133,161,126 |
|
| MATERIALS - 0.7% | | | |
| Chemicals - 0.5% | | | |
| DowDuPont, Inc.: | | | |
| 4.205% 11/15/23 | | 2,019,000 | 2,175,129 |
| 4.725% 11/15/28 | | 2,438,000 | 2,819,326 |
| Eastman Chemical Co. 4.65% 10/15/44 | | 427,000 | 466,135 |
| Ecolab, Inc.: | | | |
| 2.25% 1/12/20 | | 537,000 | 536,923 |
| 2.7% 11/1/26 | | 938,000 | 972,826 |
| 3.95% 12/1/47 | | 473,000 | 556,159 |
| 5.5% 12/8/41 | | 58,000 | 78,996 |
| LYB International Finance BV: | | | |
| 4% 7/15/23 | | 800,000 | 851,056 |
| 4.875% 3/15/44 | | 832,000 | 921,767 |
| LYB International Finance II BV 3.5% 3/2/27 | | 3,479,000 | 3,592,218 |
| LyondellBasell Industries NV 4.625% 2/26/55 | | 532,000 | 561,187 |
| Nutrien Ltd.: | | | |
| 4% 12/15/26 | | 1,621,000 | 1,749,472 |
| 4.2% 4/1/29 | | 735,000 | 821,469 |
| 4.875% 3/30/20 | | 213,000 | 216,034 |
| 5% 4/1/49 | | 1,280,000 | 1,528,002 |
| 5.25% 1/15/45 | | 498,000 | 598,531 |
| 5.625% 12/1/40 | | 256,000 | 314,787 |
| Praxair, Inc.: | | | |
| 2.2% 8/15/22 | | 284,000 | 286,439 |
| 2.45% 2/15/22 | | 661,000 | 669,635 |
| 3.2% 1/30/26 | | 901,000 | 961,303 |
| 3.55% 11/7/42 | | 284,000 | 313,301 |
| Sherwin-Williams Co.: | | | |
| 2.75% 6/1/22 | | 304,000 | 308,702 |
| 3.45% 6/1/27 | | 1,526,000 | 1,611,998 |
| 4.5% 6/1/47 | | 1,213,000 | 1,380,748 |
| The Dow Chemical Co.: | | | |
| 3% 11/15/22 | | 697,000 | 711,755 |
| 3.15% 5/15/24 (b) | | 1,000,000 | 1,032,733 |
| 3.625% 5/15/26 (b) | | 1,500,000 | 1,577,718 |
| 4.125% 11/15/21 | | 1,095,000 | 1,136,215 |
| 4.375% 11/15/42 | | 693,000 | 734,500 |
| 4.8% 11/30/28 (b) | | 1,216,000 | 1,392,319 |
| 4.8% 5/15/49 (b) | | 1,000,000 | 1,133,020 |
| 9.4% 5/15/39 | | 427,000 | 702,511 |
| The Mosaic Co.: | | | |
| 4.05% 11/15/27 | | 819,000 | 854,622 |
| 4.25% 11/15/23 | | 1,548,000 | 1,634,102 |
| 5.625% 11/15/43 | | 533,000 | 592,402 |
| Westlake Chemical Corp. 5% 8/15/46 | | 284,000 | 307,873 |
| | | | 36,101,913 |
| Containers & Packaging - 0.0% | | | |
| International Paper Co.: | | | |
| 3.65% 6/15/24 | | 672,000 | 713,021 |
| 3.8% 1/15/26 | | 409,000 | 438,139 |
| 4.4% 8/15/47 | | 540,000 | 575,819 |
| 4.75% 2/15/22 | | 752,000 | 794,890 |
| 5.15% 5/15/46 | | 257,000 | 297,296 |
| | | | 2,819,165 |
| Metals & Mining - 0.2% | | | |
| Barrick Gold Corp. 5.25% 4/1/42 | | 640,000 | 796,627 |
| BHP Billiton Financial (U.S.A.) Ltd.: | | | |
| 2.875% 2/24/22 | | 819,000 | 837,581 |
| 5% 9/30/43 | | 427,000 | 564,356 |
| Newmont Goldcorp Corp.: | | | |
| 5.125% 10/1/19 | | 142,000 | 142,264 |
| 5.45% 6/9/44 | | 910,000 | 1,171,143 |
| Nucor Corp.: | | | |
| 4% 8/1/23 | | 427,000 | 455,531 |
| 5.2% 8/1/43 | | 569,000 | 726,577 |
| Rio Tinto Finance (U.S.A.) Ltd.: | | | |
| 3.75% 6/15/25 | | 3,029,000 | 3,280,784 |
| 7.125% 7/15/28 | | 284,000 | 390,004 |
| Southern Copper Corp.: | | | |
| 3.875% 4/23/25 | | 522,000 | 545,960 |
| 5.25% 11/8/42 | | 821,000 | 936,299 |
| Vale Overseas Ltd.: | | | |
| 4.375% 1/11/22 | | 638,000 | 659,333 |
| 5.875% 6/10/21 | | 1,169,000 | 1,233,295 |
| Vale SA 5.625% 9/11/42 | | 938,000 | 1,049,974 |
| | | | 12,789,728 |
|
| TOTAL MATERIALS | | | 51,710,806 |
|
| REAL ESTATE - 0.6% | | | |
| Equity Real Estate Investment Trusts (REITs) - 0.5% | | | |
| Alexandria Real Estate Equities, Inc. 3.9% 6/15/23 | | 803,000 | 853,666 |
| American Tower Corp. 3.55% 7/15/27 | | 1,216,000 | 1,292,938 |
| Boston Properties, Inc.: | | | |
| 2.75% 10/1/26 | | 995,000 | 1,011,056 |
| 3.125% 9/1/23 | | 270,000 | 280,156 |
| 4.125% 5/15/21 | | 299,000 | 308,172 |
| DDR Corp. 4.625% 7/15/22 | | 85,000 | 89,122 |
| Duke Realty LP: | | | |
| 3.625% 4/15/23 | | 391,000 | 409,399 |
| 3.75% 12/1/24 | | 818,000 | 875,010 |
| ERP Operating LP: | | | |
| 3% 4/15/23 | | 267,000 | 276,480 |
| 3.25% 8/1/27 | | 1,846,000 | 1,971,950 |
| 4.625% 12/15/21 | | 810,000 | 852,533 |
| Federal Realty Investment Trust 3% 8/1/22 | | 675,000 | 691,325 |
| HCP, Inc.: | | | |
| 3.4% 2/1/25 | | 1,137,000 | 1,187,062 |
| 3.875% 8/15/24 | | 1,077,000 | 1,159,174 |
| Health Care REIT, Inc. 3.75% 3/15/23 | | 1,231,000 | 1,295,745 |
| Kimco Realty Corp.: | | | |
| 3.8% 4/1/27 | | 569,000 | 609,901 |
| 4.125% 12/1/46 | | 1,422,000 | 1,526,229 |
| 4.45% 9/1/47 | | 737,000 | 831,709 |
| Omega Healthcare Investors, Inc.: | | | |
| 4.375% 8/1/23 | | 1,137,000 | 1,198,278 |
| 4.5% 1/15/25 | | 1,139,000 | 1,204,188 |
| 4.5% 4/1/27 | | 1,351,000 | 1,446,627 |
| Simon Property Group LP: | | | |
| 2.625% 6/15/22 | | 1,128,000 | 1,147,830 |
| 3.375% 12/1/27 | | 3,491,000 | 3,743,822 |
| 4.125% 12/1/21 | | 455,000 | 473,743 |
| Ventas Realty LP: | | | |
| 3.125% 6/15/23 | | 898,000 | 926,801 |
| 3.25% 10/15/26 | | 498,000 | 514,946 |
| 3.5% 2/1/25 | | 569,000 | 598,766 |
| 3.85% 4/1/27 | | 1,351,000 | 1,448,858 |
| 4% 3/1/28 | | 3,420,000 | 3,715,674 |
| 4.125% 1/15/26 | | 206,000 | 223,270 |
| 4.375% 2/1/45 | | 427,000 | 480,274 |
| Weingarten Realty Investors 3.5% 4/15/23 | | 540,000 | 557,403 |
| Welltower, Inc. 4.95% 9/1/48 | | 1,422,000 | 1,759,913 |
| | | | 34,962,020 |
| Real Estate Management & Development - 0.1% | | | |
| Brandywine Operating Partnership LP 3.95% 2/15/23 | | 540,000 | 564,872 |
| CBRE Group, Inc. 4.875% 3/1/26 | | 810,000 | 900,659 |
| Digital Realty Trust LP 3.7% 8/15/27 | | 1,137,000 | 1,211,835 |
| Liberty Property LP: | | | |
| 3.25% 10/1/26 | | 663,000 | 685,951 |
| 3.375% 6/15/23 | | 395,000 | 409,977 |
| 3.75% 4/1/25 | | 675,000 | 712,560 |
| 4.4% 2/15/24 | | 1,056,000 | 1,144,903 |
| 4.75% 10/1/20 | | 142,000 | 145,042 |
| Mack-Cali Realty LP: | | | |
| 3.15% 5/15/23 | | 668,000 | 635,157 |
| 4.5% 4/18/22 | | 599,000 | 601,677 |
| Tanger Properties LP: | | | |
| 3.75% 12/1/24 | | 924,000 | 950,477 |
| 3.875% 7/15/27 | | 882,000 | 905,363 |
| | | | 8,868,473 |
|
| TOTAL REAL ESTATE | | | 43,830,493 |
|
| UTILITIES - 1.7% | | | |
| Electric Utilities - 1.1% | | | |
| Alabama Power Co.: | | | |
| 3.7% 12/1/47 | | 837,000 | 933,102 |
| 3.75% 3/1/45 | | 142,000 | 158,946 |
| 4.15% 8/15/44 | | 661,000 | 773,219 |
| 4.3% 7/15/48 | | 836,000 | 1,021,839 |
| 5.2% 6/1/41 | | 547,000 | 681,848 |
| AmerenUE 3.9% 9/15/42 | | 526,000 | 600,013 |
| American Electric Power Co., Inc.: | | | |
| 2.95% 12/15/22 | | 569,000 | 581,190 |
| 4.3% 12/1/28 | | 2,487,000 | 2,823,505 |
| Appalachian Power Co. 4.45% 6/1/45 | | 853,000 | 1,026,393 |
| Baltimore Gas & Electric Co.: | | | |
| 3.35% 7/1/23 | | 405,000 | 424,723 |
| 3.5% 8/15/46 | | 355,000 | 378,429 |
| Carolina Power & Light Co. 2.8% 5/15/22 | | 619,000 | 632,356 |
| CenterPoint Energy Houston Electric LLC 3.55% 8/1/42 | | 270,000 | 293,892 |
| Cleco Corporate Holdings LLC 3.743% 5/1/26 | | 805,000 | 839,814 |
| Commonwealth Edison Co.: | | | |
| 3.1% 11/1/24 | | 1,422,000 | 1,489,179 |
| 3.4% 9/1/21 | | 142,000 | 145,196 |
| 3.65% 6/15/46 | | 407,000 | 452,696 |
| 3.7% 3/1/45 | | 441,000 | 488,325 |
| 3.75% 8/15/47 | | 874,000 | 989,200 |
| 4% 3/1/48 | | 971,000 | 1,135,521 |
| Detroit Edison Co. 2.65% 6/15/22 | | 1,137,000 | 1,150,966 |
| Duke Energy Carolinas LLC: | | | |
| 2.95% 12/1/26 | | 853,000 | 893,749 |
| 3.75% 6/1/45 | | 284,000 | 315,485 |
| 4% 9/30/42 | | 533,000 | 608,476 |
| Duke Energy Corp.: | | | |
| 1.8% 9/1/21 | | 2,198,000 | 2,184,642 |
| 2.65% 9/1/26 | | 1,898,000 | 1,920,796 |
| 3.75% 4/15/24 | | 853,000 | 906,575 |
| 3.75% 9/1/46 | | 1,298,000 | 1,366,722 |
| 3.95% 10/15/23 | | 347,000 | 369,896 |
| 4.8% 12/15/45 | | 2,897,000 | 3,532,418 |
| Duke Energy Ohio, Inc. 4.3% 2/1/49 | | 1,481,000 | 1,815,900 |
| Duke Energy Progress, Inc.: | | | |
| 4.15% 12/1/44 | | 256,000 | 300,317 |
| 4.375% 3/30/44 | | 284,000 | 342,329 |
| Edison International 2.95% 3/15/23 | | 1,165,000 | 1,167,970 |
| Entergy Corp.: | | | |
| 2.95% 9/1/26 | | 668,000 | 681,715 |
| 4% 7/15/22 | | 944,000 | 989,406 |
| Entergy, Inc. 4% 3/30/29 | | 1,122,000 | 1,256,965 |
| Eversource Energy: | | | |
| 2.9% 10/1/24 | | 1,216,000 | 1,255,176 |
| 3.35% 3/15/26 | | 940,000 | 982,869 |
| Exelon Corp.: | | | |
| 3.95% 6/15/25 | | 2,794,000 | 3,009,188 |
| 5.1% 6/15/45 | | 156,000 | 195,786 |
| FirstEnergy Corp.: | | | |
| 3.9% 7/15/27 | | 1,209,000 | 1,298,771 |
| 4.85% 7/15/47 | | 1,800,000 | 2,186,037 |
| Florida Power & Light Co.: | | | |
| 3.125% 12/1/25 | | 725,000 | 773,829 |
| 3.25% 6/1/24 | | 672,000 | 709,482 |
| 4.05% 10/1/44 | | 771,000 | 912,690 |
| 4.125% 6/1/48 | | 1,749,000 | 2,125,125 |
| Florida Power Corp. 3.4% 10/1/46 | | 355,000 | 377,549 |
| Indiana Michigan Power Co. 3.2% 3/15/23 | | 395,000 | 410,562 |
| Northern States Power Co.: | | | |
| 3.4% 8/15/42 | | 284,000 | 308,301 |
| 4.125% 5/15/44 | | 640,000 | 765,438 |
| NSTAR Electric Co. 3.2% 5/15/27 | | 1,088,000 | 1,155,046 |
| PacifiCorp: | | | |
| 3.6% 4/1/24 | | 569,000 | 606,168 |
| 4.125% 1/15/49 | | 1,914,000 | 2,284,705 |
| 6% 1/15/39 | | 881,000 | 1,261,766 |
| Potomac Electric Power Co. 6.5% 11/15/37 | | 541,000 | 791,381 |
| PPL Capital Funding, Inc.: | | | |
| 3.1% 5/15/26 | | 1,137,000 | 1,166,211 |
| 3.4% 6/1/23 | | 380,000 | 392,708 |
| 4.2% 6/15/22 | | 284,000 | 298,069 |
| 4.7% 6/1/43 | | 256,000 | 293,745 |
| PPL Electric Utilities Corp. 4.15% 10/1/45 | | 498,000 | 585,024 |
| Progress Energy, Inc.: | | | |
| 4.875% 12/1/19 | | 242,000 | 243,477 |
| 6% 12/1/39 | | 739,000 | 1,002,792 |
| Public Service Co. of Colorado: | | | |
| 2.9% 5/15/25 | | 1,564,000 | 1,621,718 |
| 3.8% 6/15/47 | | 658,000 | 749,691 |
| Public Service Electric & Gas Co.: | | | |
| 3.65% 9/1/42 | | 402,000 | 444,439 |
| 4% 6/1/44 | | 711,000 | 808,836 |
| Puget Sound Energy, Inc. 4.3% 5/20/45 | | 911,000 | 1,091,660 |
| Southern California Edison Co. 4% 4/1/47 | | 1,422,000 | 1,550,835 |
| Southern Co.: | | | |
| 2.35% 7/1/21 | | 938,000 | 940,697 |
| 3.25% 7/1/26 | | 1,564,000 | 1,619,633 |
| 4.4% 7/1/46 | | 1,041,000 | 1,175,771 |
| Tampa Electric Co.: | | | |
| 4.45% 6/15/49 | | 1,666,000 | 2,084,822 |
| 6.15% 5/15/37 | | 890,000 | 1,218,213 |
| Virginia Electric & Power Co.: | | | |
| 3.1% 5/15/25 | | 569,000 | 596,185 |
| 3.45% 2/15/24 | | 391,000 | 410,774 |
| 3.8% 4/1/28 | | 2,120,000 | 2,343,284 |
| 3.8% 9/15/47 | | 1,167,000 | 1,303,868 |
| 4.2% 5/15/45 | | 341,000 | 400,954 |
| 4.45% 2/15/44 | | 391,000 | 473,459 |
| 4.6% 12/1/48 | | 1,007,000 | 1,273,483 |
| 6% 5/15/37 | | 284,000 | 388,832 |
| Wisconsin Electric Power Co. 4.25% 6/1/44 | | 668,000 | 771,941 |
| Xcel Energy, Inc.: | | | |
| 2.6% 3/15/22 | | 1,976,000 | 1,999,080 |
| 3.35% 12/1/26 | | 427,000 | 454,107 |
| | | | 84,787,890 |
| Gas Utilities - 0.1% | | | |
| AGL Capital Corp. 3.95% 10/1/46 | | 1,922,000 | 2,063,460 |
| Southern California Gas Co. 2.6% 6/15/26 | | 1,881,000 | 1,905,047 |
| | | | 3,968,507 |
| Independent Power and Renewable Electricity Producers - 0.0% | | | |
| Emera U.S. Finance LP: | | | |
| 2.7% 6/15/21 | | 1,231,000 | 1,239,881 |
| 4.75% 6/15/46 | | 741,000 | 878,400 |
| | | | 2,118,281 |
| Multi-Utilities - 0.5% | | | |
| Berkshire Hathaway Energy Co.: | | | |
| 3.25% 4/15/28 | | 1,422,000 | 1,511,855 |
| 3.8% 7/15/48 | | 1,422,000 | 1,580,267 |
| 4.5% 2/1/45 | | 946,000 | 1,147,149 |
| 5.15% 11/15/43 | | 235,000 | 307,494 |
| CenterPoint Energy, Inc. 2.5% 9/1/22 | | 2,113,000 | 2,130,044 |
| CMS Energy Corp. 4.875% 3/1/44 | | 711,000 | 871,588 |
| Consolidated Edison Co. of New York, Inc.: | | | |
| 3.875% 6/15/47 | | 407,000 | 455,051 |
| 4.45% 6/15/20 | | 284,000 | 288,912 |
| 4.45% 3/15/44 | | 1,137,000 | 1,363,672 |
| 4.5% 5/15/58 | | 1,348,000 | 1,631,553 |
| 4.65% 12/1/48 | | 1,489,000 | 1,873,114 |
| 5.5% 12/1/39 | | 355,000 | 476,953 |
| Consolidated Edison, Inc. 2% 5/15/21 | | 785,000 | 784,702 |
| Consumers Energy Co. 2.85% 5/15/22 | | 946,000 | 969,399 |
| Delmarva Power & Light 4% 6/1/42 | | 569,000 | 638,002 |
| Dominion Energy, Inc.: | | | |
| 3 month U.S. LIBOR + 2.300% 4.6299% 9/30/66 (a)(c) | | 142,000 | 132,770 |
| 3 month U.S. LIBOR + 2.825% 5.1549% 6/30/66 (a)(c) | | 142,000 | 134,190 |
| 3.9% 10/1/25 | | 1,834,000 | 1,977,186 |
| 4.9% 8/1/41 | | 284,000 | 340,660 |
| DTE Energy Co.: | | | |
| 2.85% 10/1/26 | | 853,000 | 873,341 |
| 3.8% 3/15/27 | | 1,921,000 | 2,081,258 |
| Duke Energy Carolinas LLC 3.875% 3/15/46 | | 555,000 | 634,403 |
| NiSource Finance Corp.: | | | |
| 3.49% 5/15/27 | | 1,088,000 | 1,154,462 |
| 3.95% 3/30/48 | | 1,422,000 | 1,556,975 |
| 4.375% 5/15/47 | | 680,000 | 783,600 |
| 4.8% 2/15/44 | | 782,000 | 938,012 |
| 6.25% 12/15/40 | | 349,000 | 483,549 |
| Puget Energy, Inc. 3.65% 5/15/25 | | 1,147,000 | 1,185,143 |
| San Diego Gas & Electric Co. 4.5% 8/15/40 | | 142,000 | 168,702 |
| Sempra Energy: | | | |
| 2.4% 3/15/20 | | 1,764,000 | 1,762,020 |
| 2.875% 10/1/22 | | 427,000 | 433,830 |
| 2.9% 2/1/23 | | 422,000 | 430,930 |
| 3.25% 6/15/27 | | 867,000 | 898,130 |
| 4% 2/1/48 | | 3,069,000 | 3,333,071 |
| 4.05% 12/1/23 | | 711,000 | 755,669 |
| 6% 10/15/39 | | 142,000 | 185,936 |
| Wisconsin Energy Corp. 3 month U.S. LIBOR + 2.113% 4.2706% 5/15/67 (a)(c) | | 601,000 | 508,272 |
| | | | 36,781,864 |
|
| TOTAL UTILITIES | | | 127,656,542 |
|
| TOTAL NONCONVERTIBLE BONDS | | | |
| (Cost $1,763,472,660) | | | 1,879,304,471 |
|
| U.S. Government and Government Agency Obligations - 42.3% | | | |
| U.S. Government Agency Obligations - 1.0% | | | |
| Fannie Mae: | | | |
| 1.25% 8/17/21 | | $4,310,000 | $4,284,779 |
| 1.5% 11/30/20 | | 2,574,000 | 2,568,891 |
| 1.75% 7/2/24 | | 4,600,000 | 4,667,071 |
| 1.875% 4/5/22 | | 4,585,000 | 4,631,435 |
| 1.875% 9/24/26 | | 1,898,000 | 1,945,295 |
| 2% 10/5/22 | | 5,242,000 | 5,328,077 |
| 2.125% 4/24/26 | | 569,000 | 590,800 |
| 2.375% 1/19/23 | | 4,256,000 | 4,380,312 |
| 2.625% 9/6/24 | | 569,000 | 601,446 |
| 2.875% 9/12/23 | | 1,095,000 | 1,156,019 |
| Federal Home Loan Bank: | | | |
| 1.125% 7/14/21 | | 1,885,000 | 1,870,949 |
| 1.375% 2/18/21 | | 2,885,000 | 2,877,429 |
| 1.5% 8/15/24 | | 1,100,000 | 1,102,315 |
| 1.875% 11/29/21 | | 2,725,000 | 2,745,832 |
| 2% 9/9/22 | | 5,405,000 | 5,480,925 |
| 2.5% 2/13/24 | | 710,000 | 742,512 |
| 2.625% 10/1/20 | | 2,475,000 | 2,499,658 |
| 3% 10/12/21 | | 1,385,000 | 1,426,701 |
| 3.25% 11/16/28 | | 3,375,000 | 3,829,652 |
| 5.5% 7/15/36 | | 215,000 | 320,532 |
| Freddie Mac: | | | |
| 1.375% 5/1/20 | | 1,991,000 | 1,984,534 |
| 2.375% 1/13/22 | | 1,848,000 | 1,883,478 |
| 2.75% 6/19/23 | | 3,443,000 | 3,601,730 |
| 6.25% 7/15/32 | | 1,095,000 | 1,648,470 |
| 6.75% 3/15/31 | | 3,697,000 | 5,592,540 |
| Tennessee Valley Authority: | | | |
| 5.25% 9/15/39 | | 2,844,000 | 4,088,810 |
| 5.375% 4/1/56 | | 767,000 | 1,268,440 |
|
| TOTAL U.S. GOVERNMENT AGENCY OBLIGATIONS | | | 73,118,632 |
|
| U.S. Treasury Obligations - 41.3% | | | |
| U.S. Treasury Bonds: | | | |
| 2.25% 8/15/46 | | 9,098,500 | 9,636,236 |
| 2.5% 2/15/45 | | 23,643,900 | 26,236,417 |
| 2.5% 2/15/46 | | 18,583,900 | 20,644,826 |
| 2.5% 5/15/46 | | 21,198,000 | 23,565,386 |
| 2.75% 8/15/47 | | 18,608,000 | 21,747,373 |
| 2.75% 11/15/47 | | 2,688,300 | 3,144,366 |
| 2.875% 5/15/43 | | 14,584,300 | 17,212,892 |
| 2.875% 8/15/45 | | 15,358,200 | 18,238,462 |
| 2.875% 11/15/46 | | 17,479,000 | 20,859,411 |
| 2.875% 5/15/49 | | 2,818,000 | 3,398,181 |
| 3% 11/15/44 | | 38,152,500 | 46,151,112 |
| 3% 5/15/45 | | 4,432,800 | 5,375,116 |
| 3% 11/15/45 | | 12,269,300 | 14,913,430 |
| 3% 2/15/47 | | 18,761,400 | 22,931,414 |
| 3% 5/15/47 | | 13,867,500 | 16,953,560 |
| 3% 2/15/48 | | 12,161,600 | 14,907,936 |
| 3% 8/15/48 | | 11,908,600 | 14,628,506 |
| 3% 2/15/49 | | 11,978,500 | 14,756,950 |
| 3.125% 2/15/42 | | 914,900 | 1,120,753 |
| 3.125% 2/15/43 | | 9,320,900 | 11,433,395 |
| 3.125% 8/15/44 | | 35,437,200 | 43,717,877 |
| 3.375% 5/15/44 | | 28,806,500 | 36,934,209 |
| 3.375% 11/15/48 | | 5,977,600 | 7,862,879 |
| 3.625% 8/15/43 | | 9,564,200 | 12,691,619 |
| 3.625% 2/15/44 | | 8,267,000 | 10,999,308 |
| 3.75% 11/15/43 | | 10,425,900 | 14,111,211 |
| 3.875% 8/15/40 | | 249,000 | 337,337 |
| 4.25% 5/15/39 | | 1,142,800 | 1,610,634 |
| 4.25% 11/15/40 | | 115,300 | 163,947 |
| 4.375% 2/15/38 | | 3,750,900 | 5,316,022 |
| 4.375% 11/15/39 | | 14,200 | 20,387 |
| 4.375% 5/15/40 | | 1,137,500 | 1,638,800 |
| 4.375% 5/15/41 | | 4,176,600 | 6,053,133 |
| 4.5% 2/15/36 | | 14,985,100 | 21,071,041 |
| 4.5% 5/15/38 | | 7,555,800 | 10,888,026 |
| 4.5% 8/15/39 | | 2,887,700 | 4,202,506 |
| 4.625% 2/15/40 | | 3,057,000 | 4,531,167 |
| 4.75% 2/15/37 | | 11,461,500 | 16,763,787 |
| 4.75% 2/15/41 | | 247,100 | 374,385 |
| 5% 5/15/37 | | 56,251,900 | 84,689,873 |
| 5.375% 2/15/31 | | 7,602,700 | 10,665,460 |
| 6.25% 5/15/30 | | 8,695,400 | 12,754,046 |
| U.S. Treasury Notes: | | | |
| 1% 10/15/19 | | 709,500 | 708,616 |
| 1.125% 2/28/21 | | 5,674,700 | 5,632,140 |
| 1.125% 6/30/21 | | 10,100,900 | 10,020,803 |
| 1.125% 7/31/21 | | 38,400 | 38,091 |
| 1.125% 8/31/21 | | 9,727,000 | 9,651,008 |
| 1.125% 9/30/21 | | 8,862,800 | 8,791,136 |
| 1.25% 1/31/20 | | 117,300 | 116,970 |
| 1.25% 2/29/20 | | 600 | 598 |
| 1.25% 3/31/21 | | 29,885,200 | 29,712,426 |
| 1.25% 10/31/21 | | 6,351,500 | 6,316,269 |
| 1.25% 7/31/23 | | 10,564,500 | 10,492,694 |
| 1.375% 12/15/19 | | 1,400 | 1,397 |
| 1.375% 1/15/20 | | 600 | 599 |
| 1.375% 1/31/20 | | 500 | 499 |
| 1.375% 2/15/20 | | 6,500 | 6,485 |
| 1.375% 2/29/20 | | 100 | 100 |
| 1.375% 3/31/20 | | 942,700 | 939,901 |
| 1.375% 4/30/20 | | 1,611,000 | 1,605,651 |
| 1.375% 8/31/20 | | 11,227,100 | 11,178,420 |
| 1.375% 9/15/20 | | 400 | 398 |
| 1.375% 9/30/20 | | 3,640,000 | 3,624,217 |
| 1.375% 10/31/20 | | 813,300 | 809,869 |
| 1.375% 1/31/21 | | 2,919,100 | 2,907,469 |
| 1.375% 4/30/21 | | 12,225,200 | 12,180,311 |
| 1.375% 5/31/21 | | 9,154,000 | 9,121,103 |
| 1.375% 6/30/23 | | 9,252,100 | 9,234,752 |
| 1.375% 8/31/23 | | 1,128,100 | 1,126,337 |
| 1.375% 9/30/23 | | 11,248,400 | 11,230,385 |
| 1.5% 10/31/19 | | 473,400 | 472,950 |
| 1.5% 4/15/20 | | 1,908,300 | 1,903,977 |
| 1.5% 5/31/20 | | 5,634,900 | 5,619,932 |
| 1.5% 6/15/20 | | 447,300 | 446,077 |
| 1.5% 7/15/20 | | 200 | 199 |
| 1.5% 8/15/20 | | 2,132,800 | 2,126,552 |
| 1.5% 1/31/22 | | 621,400 | 621,837 |
| 1.5% 2/28/23 | | 2,139,900 | 2,145,417 |
| 1.5% 3/31/23 | | 12,936,100 | 12,973,999 |
| 1.5% 8/15/26 | | 2,102,200 | 2,108,605 |
| 1.625% 12/31/19 | | 1,278,300 | 1,276,802 |
| 1.625% 3/15/20 | | 500 | 499 |
| 1.625% 6/30/20 | | 2,212,700 | 2,208,724 |
| 1.625% 7/31/20 | | 6,765,200 | 6,753,308 |
| 1.625% 10/15/20 | | 3,183,700 | 3,179,347 |
| 1.625% 11/30/20 | | 32,012,500 | 31,982,488 |
| 1.625% 6/30/21 | | 39,820,000 | 39,866,664 |
| 1.625% 8/31/22 | | 13,391,100 | 13,463,810 |
| 1.625% 4/30/23 | | 6,738,200 | 6,786,104 |
| 1.625% 5/31/23 | | 7,398,000 | 7,452,329 |
| 1.625% 10/31/23 | | 13,389,700 | 13,501,106 |
| 1.625% 2/15/26 | | 7,149,100 | 7,225,338 |
| 1.625% 5/15/26 | | 797,700 | 806,487 |
| 1.75% 11/30/19 | | 500 | 500 |
| 1.75% 10/31/20 | | 1,416,200 | 1,416,089 |
| 1.75% 11/15/20 | | 31,555,500 | 31,565,361 |
| 1.75% 12/31/20 | | 17,860,700 | 17,873,956 |
| 1.75% 7/31/21 | | 31,671,000 | 31,802,138 |
| 1.75% 11/30/21 | | 11,996,300 | 12,063,311 |
| 1.75% 3/31/22 | | 16,635,800 | 16,761,868 |
| 1.75% 5/31/22 | | 900 | 907 |
| 1.75% 6/30/22 | | 3,881,700 | 3,915,665 |
| 1.75% 7/15/22 | | 5,256,000 | 5,301,374 |
| 1.75% 9/30/22 | | 4,093,600 | 4,132,457 |
| 1.75% 1/31/23 | | 3,645,700 | 3,684,578 |
| 1.75% 6/30/24 | | 4,816,000 | 4,893,508 |
| 1.875% 6/30/20 | | 3,453,700 | 3,454,240 |
| 1.875% 12/15/20 | | 12,089,400 | 12,116,790 |
| 1.875% 11/30/21 | | 11,554,100 | 11,651,136 |
| 1.875% 1/31/22 | | 7,800,400 | 7,871,700 |
| 1.875% 2/28/22 | | 18,737,400 | 18,919,650 |
| 1.875% 3/31/22 | | 18,885,200 | 19,079,954 |
| 1.875% 4/30/22 | | 800 | 809 |
| 1.875% 5/31/22 | | 2,280,000 | 2,306,719 |
| 1.875% 7/31/22 | | 883,000 | 893,796 |
| 1.875% 8/31/22 | | 9,906,100 | 10,033,022 |
| 1.875% 9/30/22 | | 11,232,700 | 11,384,517 |
| 1.875% 10/31/22 | | 3,895,900 | 3,949,469 |
| 1.875% 7/31/26 | | 33,197,000 | 34,115,105 |
| 2% 11/30/20 | | 4,537,200 | 4,553,151 |
| 2% 1/15/21 | | 29,297,700 | 29,429,311 |
| 2% 2/28/21 | | 3,750,900 | 3,771,559 |
| 2% 5/31/21 | | 5,728,700 | 5,770,099 |
| 2% 8/31/21 | | 15,398,800 | 15,541,359 |
| 2% 10/31/21 | | 4,222,900 | 4,266,449 |
| 2% 12/31/21 | | 485,600 | 491,177 |
| 2% 7/31/22 | | 6,833,500 | 6,944,277 |
| 2% 11/30/22 | | 21,045,000 | 21,421,508 |
| 2% 4/30/24 | | 8,316,500 | 8,534,808 |
| 2% 5/31/24 | | 32,376,100 | 33,261,384 |
| 2% 6/30/24 | | 933,100 | 958,542 |
| 2% 2/15/25 | | 516,800 | 532,365 |
| 2% 8/15/25 | | 5,138,600 | 5,301,590 |
| 2% 11/15/26 | | 21,778,700 | 22,594,551 |
| 2.125% 8/31/20 | | 7,074,200 | 7,096,031 |
| 2.125% 1/31/21 | | 435,100 | 437,887 |
| 2.125% 5/31/21 | | 28,625,000 | 28,892,241 |
| 2.125% 6/30/21 | | 1,032,300 | 1,042,744 |
| 2.125% 8/15/21 | | 12,903,400 | 13,046,043 |
| 2.125% 9/30/21 | | 6,205,000 | 6,281,593 |
| 2.125% 12/31/21 | | 2,267,900 | 2,300,855 |
| 2.125% 5/15/22 | | 9,016,000 | 9,174,132 |
| 2.125% 6/30/22 | | 5,797,000 | 5,908,638 |
| 2.125% 12/31/22 | | 19,700,000 | 20,147,098 |
| 2.125% 11/30/23 | | 16,537,700 | 17,016,389 |
| 2.125% 2/29/24 | | 7,481,900 | 7,710,449 |
| 2.125% 3/31/24 | | 38,906,900 | 40,124,260 |
| 2.125% 7/31/24 | | 1,775,100 | 1,834,940 |
| 2.125% 9/30/24 | | 12,775,500 | 13,215,656 |
| 2.125% 11/30/24 | | 7,840,200 | 8,117,670 |
| 2.125% 5/15/25 | | 8,297,300 | 8,610,393 |
| 2.125% 5/31/26 | | 12,975,000 | 13,532,520 |
| 2.25% 3/31/20 | | 3,438,900 | 3,445,617 |
| 2.25% 3/31/21 | | 18,051,500 | 18,227,079 |
| 2.25% 4/30/21 | | 11,042,900 | 11,159,799 |
| 2.25% 7/31/21 | | 4,505,900 | 4,565,216 |
| 2.25% 4/15/22 | | 41,263,000 | 42,094,707 |
| 2.25% 12/31/23 | | 416,600 | 431,100 |
| 2.25% 1/31/24 | | 10,809,000 | 11,191,115 |
| 2.25% 4/30/24 | | 53,441,000 | 55,451,300 |
| 2.25% 10/31/24 | | 19,043,100 | 19,828,628 |
| 2.25% 11/15/24 | | 12,218,100 | 12,722,574 |
| 2.25% 12/31/24 | | 11,143,200 | 11,615,915 |
| 2.25% 11/15/25 | | 15,107,300 | 15,825,487 |
| 2.25% 2/15/27 | | 1,848,800 | 1,952,362 |
| 2.25% 8/15/27 | | 80,881,600 | 85,611,278 |
| 2.25% 11/15/27 | | 74,714,300 | 79,165,054 |
| 2.375% 4/30/20 | | 500 | 502 |
| 2.375% 3/15/21 | | 35,365,400 | 35,767,405 |
| 2.375% 4/15/21 | | 40,521,400 | 41,010,506 |
| 2.375% 1/31/23 | | 6,001,700 | 6,189,488 |
| 2.375% 2/29/24 | | 39,930,000 | 41,605,188 |
| 2.375% 8/15/24 | | 2,357,900 | 2,465,571 |
| 2.375% 5/15/27 | | 19,442,100 | 20,734,696 |
| 2.375% 5/15/29 | | 8,399,000 | 9,055,172 |
| 2.5% 5/31/20 | | 1,749,800 | 1,757,797 |
| 2.5% 1/31/21 | | 11,190,200 | 11,318,275 |
| 2.5% 2/28/21 | | 23,380,700 | 23,677,525 |
| 2.5% 1/15/22 | | 36,179,300 | 37,028,666 |
| 2.5% 2/15/22 | | 77,783,900 | 79,698,114 |
| 2.5% 3/31/23 | | 17,934,700 | 18,607,251 |
| 2.5% 8/15/23 | | 13,816,300 | 14,387,842 |
| 2.5% 1/31/24 | | 36,230,300 | 37,897,460 |
| 2.5% 5/15/24 | | 13,578,800 | 14,246,601 |
| 2.5% 1/31/25 | | 15,271,300 | 16,122,556 |
| 2.5% 2/28/26 | | 6,666,000 | 7,098,248 |
| 2.625% 8/15/20 | | 20,048,300 | 20,198,662 |
| 2.625% 11/15/20 | | 13,391,100 | 13,533,903 |
| 2.625% 5/15/21 | | 43,832,200 | 44,590,703 |
| 2.625% 6/15/21 | | 12,152,000 | 12,375,578 |
| 2.625% 7/15/21 | | 30,969,000 | 31,571,444 |
| 2.625% 12/15/21 | | 36,833,300 | 37,778,592 |
| 2.625% 6/30/23 | | 54,848,100 | 57,296,982 |
| 2.625% 12/31/23 | | 26,967,800 | 28,326,724 |
| 2.625% 3/31/25 | | 2,280,700 | 2,426,095 |
| 2.625% 12/31/25 | | 6,029,200 | 6,456,425 |
| 2.625% 2/15/29 | | 4,052,700 | 4,451,796 |
| 2.75% 11/30/20 | | 21,892,600 | 22,172,244 |
| 2.75% 4/30/23 | | 8,893,300 | 9,309,826 |
| 2.75% 5/31/23 | | 61,344,700 | 64,284,932 |
| 2.75% 8/31/23 | | 25,991,900 | 27,323,985 |
| 2.75% 11/15/23 | | 10,212,000 | 10,762,491 |
| 2.75% 2/15/24 | | 19,281,900 | 20,386,090 |
| 2.75% 2/28/25 | | 2,994,500 | 3,203,179 |
| 2.75% 6/30/25 | | 2,937,600 | 3,152,297 |
| 2.75% 2/15/28 | | 73,302,400 | 80,664,137 |
| 2.875% 10/31/20 | | 27,802,200 | 28,156,244 |
| 2.875% 9/30/23 | | 38,919,900 | 41,151,713 |
| 2.875% 10/31/23 | | 27,002,400 | 28,579,298 |
| 2.875% 11/30/23 | | 15,972,400 | 16,926,377 |
| 2.875% 4/30/25 | | 9,605,100 | 10,353,998 |
| 2.875% 5/31/25 | | 17,169,000 | 18,524,412 |
| 2.875% 5/15/28 | | 24,992,600 | 27,813,054 |
| 2.875% 8/15/28 | | 6,723,700 | 7,497,451 |
| 3% 10/31/25 | | 6,729,700 | 7,343,259 |
| 3.125% 5/15/21 | | 7,233,900 | 7,418,704 |
| 3.125% 11/15/28 | | 475,100 | 541,113 |
| 3.375% 11/15/19 | | 300 | 301 |
| 3.5% 5/15/20 | | 900 | 910 |
| 3.625% 2/15/20 | | 300 | 302 |
| 3.625% 2/15/21 | | 5,659,000 | 5,819,486 |
|
| TOTAL U.S. TREASURY OBLIGATIONS | | | 3,073,023,660 |
|
| TOTAL U.S. GOVERNMENT AND GOVERNMENT AGENCY OBLIGATIONS | | | |
| (Cost $2,990,184,464) | | | 3,146,142,292 |
|
| U.S. Government Agency - Mortgage Securities - 26.9% | | | |
| Fannie Mae - 11.8% | | | |
| 12 month U.S. LIBOR + 1.518% 4.241% 11/1/34 (a)(c) | | 600,583 | 623,434 |
| 12 month U.S. LIBOR + 1.645% 4.592% 4/1/41 (a)(c) | | 199,179 | 207,007 |
| 12 month U.S. LIBOR + 1.880% 4.73% 11/1/34 (a)(c) | | 53,066 | 55,537 |
| 2.5% 3/1/22 to 2/1/47 | | 56,555,829 | 57,404,071 |
| 3% 5/1/24 to 5/1/49 | | 211,208,979 | 217,279,005 |
| 3.5% 8/1/21 to 6/1/49 | | 248,028,505 | 257,523,585 |
| 4% 10/1/19 to 2/1/49 | | 207,114,034 | 217,568,466 |
| 4.5% 10/1/19 to 6/1/49 | | 73,891,629 | 78,473,497 |
| 5% 12/1/20 to 3/1/49 | | 27,793,451 | 29,986,688 |
| 5.5% 12/1/22 to 5/1/49 | | 15,216,031 | 16,810,830 |
| 6% 2/1/23 to 7/1/41 | | 3,950,353 | 4,463,418 |
| 6.5% 3/1/22 to 6/1/40 | | 1,487,404 | 1,700,901 |
|
| TOTAL FANNIE MAE | | | 882,096,439 |
|
| Freddie Mac - 6.4% | | | |
| 12 month U.S. LIBOR + 1.951% 4.719% 9/1/37 (a)(c) | | 69,884 | 73,257 |
| U.S. TREASURY 1 YEAR INDEX + 1.716% 4.428% 3/1/36 (a)(c) | | 398,593 | 415,293 |
| U.S. TREASURY 1 YEAR INDEX + 2.230% 4.721% 12/1/35 (a)(c) | | 263,599 | 276,141 |
| U.S. TREASURY 1 YEAR INDEX + 2.250% 4.872% 3/1/35 (a)(c) | | 129,572 | 135,545 |
| 2.5% 11/1/22 to 7/1/49 | | 28,148,188 | 28,601,972 |
| 3% 3/1/27 to 6/1/49 | | 118,072,163 | 121,657,849 |
| 3% 8/1/47 | | 111,729 | 114,485 |
| 3.5% 1/1/21 to 8/1/48 | | 149,876,539 | 155,750,993 |
| 3.5% 8/1/47 | | 288,619 | 298,664 |
| 3.5% 9/1/47 | | 67,716 | 70,052 |
| 3.5% 9/1/47 | | 3,819,657 | 4,011,092 |
| 4% 4/1/25 to 1/1/49 | | 99,695,928 | 104,565,858 |
| 4.5% 6/1/25 to 5/1/49 | | 43,124,502 | 45,711,571 |
| 5% 4/1/23 to 2/1/49 | | 6,881,640 | 7,483,964 |
| 5.5% 5/1/23 to 6/1/41 | | 3,955,223 | 4,395,478 |
| 6% 4/1/32 to 8/1/37 | | 121,885 | 136,225 |
| 6.5% 8/1/36 to 12/1/37 | | 29,768 | 34,159 |
|
| TOTAL FREDDIE MAC | | | 473,732,598 |
|
| Freddie Mac Multi-family Structured pass-thru certificates - 0.0% | | | |
| 2.5% 2/1/32 | | 25,841 | 26,265 |
| Ginnie Mae - 7.8% | | | |
| 3.5% 11/15/40 to 10/20/48 | | 177,579,198 | 185,552,234 |
| 4% 1/15/25 to 10/20/48 | | 104,679,296 | 110,106,397 |
| 5% 1/20/39 to 1/20/49 | | 23,620,566 | 25,307,310 |
| 2.5% 10/20/42 to 6/20/49 | | 3,589,508 | 3,656,835 |
| 3% 4/15/42 to 6/20/49 | | 116,146,884 | 120,186,873 |
| 3% 9/1/49 (d) | | 1,000,000 | 1,031,212 |
| 3% 9/1/49 (d) | | 900,000 | 928,090 |
| 3% 9/1/49 (d) | | 800,000 | 824,969 |
| 3% 9/1/49 (d) | | 4,400,000 | 4,537,331 |
| 3.5% 9/1/49 (d) | | 2,500,000 | 2,597,266 |
| 3.5% 9/1/49 (d) | | 14,400,000 | 14,960,251 |
| 3.5% 9/1/49 (d) | | 9,100,000 | 9,454,047 |
| 4% 9/1/49 (d) | | 17,900,000 | 18,650,960 |
| 4% 9/1/49 (d) | | 5,300,000 | 5,522,351 |
| 4.5% 3/20/33 to 12/20/48 | | 62,422,736 | 65,923,597 |
| 4.5% 9/1/49 (d) | | 2,600,000 | 2,720,047 |
| 5% 9/1/49 (d) | | 1,000,000 | 1,050,234 |
| 5.5% 12/20/32 to 12/20/48 | | 3,754,296 | 4,128,329 |
| 5.5% 9/1/49 (d) | | 100,000 | 105,469 |
| 6% 5/20/34 to 12/15/40 | | 1,112,974 | 1,261,607 |
| 6.5% 8/20/36 to 1/15/39 | | 213,003 | 246,110 |
|
| TOTAL GINNIE MAE | | | 578,751,519 |
|
| Uniform Mortgage Backed Securities - 0.9% | | | |
| 2.5% 9/1/34 (d) | | 2,300,000 | 2,331,445 |
| 2.5% 9/1/49 (d) | | 100,000 | 100,580 |
| 3% 9/1/34 (d) | | 2,800,000 | 2,871,094 |
| 3% 9/1/49 (d) | | 10,600,000 | 10,804,547 |
| 3% 9/1/49 (d) | | 12,300,000 | 12,537,352 |
| 3.5% 9/1/34 (d) | | 1,700,000 | 1,761,625 |
| 3.5% 9/1/49 (d) | | 19,600,000 | 20,140,531 |
| 4% 9/1/34 (d) | | 700,000 | 729,204 |
| 4% 9/1/49 (d) | | 10,100,000 | 10,484,515 |
| 4.5% 9/1/49 (d) | | 4,800,000 | 5,052,382 |
| 5% 9/1/49 (d) | | 1,400,000 | 1,495,375 |
| 5.5% 9/1/49 (d) | | 300,000 | 324,188 |
|
| TOTAL UNIFORM MORTGAGE BACKED SECURITIES | | | 68,632,838 |
|
| TOTAL U.S. GOVERNMENT AGENCY - MORTGAGE SECURITIES | | | |
| (Cost $1,963,844,043) | | | 2,003,239,659 |
|
| Asset-Backed Securities - 0.2% | | | |
| American Express Credit Account Master Trust Series 2017-3 Class A, 1.77% 11/15/22 | | $654,000 | $652,965 |
| Capital One Multi-Asset Execution Trust Series 2016-A6 Class A, 1.82% 9/15/22 | | 1,344,000 | 1,342,993 |
| CarMax Auto Owner Trust Series 2018-3 Class A3, 3.13% 6/15/23 | | 1,358,000 | 1,384,911 |
| Chase Issuance Trust: | | | |
| Series 2012-A7 Class A7, 2.16% 9/15/24 | | 1,326,000 | 1,342,724 |
| Series 2015-A4 Class A, 1.84% 4/15/22 | | 675,000 | 674,395 |
| Citibank Credit Card Issuance Trust: | | | |
| Series 2013-A9 Class A9, 3.72% 9/8/25 | | 665,000 | 713,793 |
| Series 2018-A6 Class A6, 3.21% 12/7/24 | | 1,351,000 | 1,417,434 |
| 2.19% 11/20/23 | | 808,000 | 816,704 |
| Discover Card Master Trust: | | | |
| Series 2015-A2 Class A, 1.9% 10/17/22 | | 1,536,000 | 1,535,186 |
| Series 2017-A4 Class A4, 2.53% 10/15/26 | | 256,000 | 263,821 |
| Series 2018-A1 Class A1, 3.03% 8/15/25 | | 2,730,000 | 2,848,891 |
| Ford Credit Auto Owner Trust Series 2016-C Class A3, 1.22% 3/15/21 | | 310,000 | 309,338 |
| Ford Credit Floorplan Master Owner Trust: | | | |
| Series 2015-2 Class A1, 1.98% 1/15/22 | | 1,351,000 | 1,349,785 |
| Series 2018-2 Class A, 3.17% 3/15/25 | | 2,709,000 | 2,827,408 |
| Honda Auto Receivables Owner Trust Series 2016-4 Class A3, 1.21% 12/18/20 | | 273,758 | 273,017 |
| TOTAL ASSET-BACKED SECURITIES | | | |
| (Cost $17,433,151) | | | 17,753,365 |
|
| Commercial Mortgage Securities - 1.9% | | | |
| BANK sequential payer Series 2017-BNK4 Class ASB, 3.419% 5/15/50 | | 3,419,000 | 3,639,975 |
| Benchmark Mortgage Trust: | | | |
| Series 2019-B12 Class A5, 3.1156% 8/15/52 | | 3,750,000 | 4,028,787 |
| Series 2019-B9 Class A5, 4.0156% 3/15/52 | | 3,334,000 | 3,815,076 |
| Citigroup Commercial Mortgage Trust sequential payer: | | | |
| Series 2014-GC25 Class A4, 3.635% 10/10/47 | | 4,284,000 | 4,614,391 |
| Series 2015-GC29 Class A4, 3.192% 4/10/48 | | 1,618,000 | 1,716,510 |
| Series 2015-P1 Class A5, 3.717% 9/15/48 | | 834,000 | 907,595 |
| Series 2016-C1 Class A4, 3.209% 5/10/49 | | 2,639,000 | 2,809,493 |
| Series 2016-P4: | | | |
| Class A4, 2.902% 7/10/49 | | 3,057,000 | 3,201,827 |
| Class AAB, 2.779% 7/10/49 | | 1,756,000 | 1,803,385 |
| COMM Mortgage Trust: | | | |
| sequential payer: | | | |
| Series 2013-CR13 Class A3, 3.928% 11/10/46 | | 4,569,983 | 4,904,971 |
| Series 2013-CR7 Class A4, 3.213% 3/10/46 | | 2,362,269 | 2,449,541 |
| Series 2014-LC15 Class A4, 4.006% 4/10/47 | | 1,523,000 | 1,650,964 |
| Series 2013-CR6 Class A4, 3.101% 3/10/46 | | 2,668,000 | 2,757,209 |
| Series 2015-CR22 Class A5, 3.309% 3/10/48 | | 2,762,000 | 2,935,760 |
| CSAIL Commercial Mortgage Trust sequential payer Series 2015-C3 Class A4, 3.7182% 8/15/48 | | 1,787,000 | 1,936,227 |
| FHLMC Series K047 Class A2, 3.329% 5/25/25 | | 549,000 | 592,268 |
| Freddie Mac: | | | |
| sequential payer: | | | |
| Series K007 Class A2, 4.224% 3/25/20 | | 2,574,021 | 2,582,230 |
| Series K034 Class A2, 3.531% 7/25/23 | | 1,280,000 | 1,356,041 |
| Series K057 Class A2, 2.57% 7/25/26 | | 2,269,000 | 2,369,243 |
| Series K080 Class A2, 3.926% 7/25/28 | | 2,359,000 | 2,712,331 |
| Series 2017-K727 Class A2, 2.946% 7/25/24 | | 3,805,000 | 3,978,312 |
| Series K-1510 Class A2, 3.718% 1/25/31 | | 2,111,000 | 2,411,637 |
| Series K013 Class A2, 3.974% 1/25/21 | | 1,646,000 | 1,681,023 |
| Series K020 Class A2, 2.373% 5/25/22 | | 1,479,000 | 1,497,635 |
| Series K036 Class A2, 3.527% 10/25/23 | | 1,276,000 | 1,355,772 |
| Series K046 Class A2, 3.205% 3/25/25 | | 4,735,000 | 5,069,952 |
| Series K053 Class A2, 2.995% 12/25/25 | | 1,011,000 | 1,077,168 |
| Series K056 Class A2, 2.525% 5/25/26 | | 2,950,000 | 3,070,248 |
| Series K062 Class A1, 3.032% 9/25/26 | | 2,903,524 | 3,042,141 |
| Series K064 Class A2, 3.224% 3/25/27 | | 2,453,000 | 2,666,282 |
| Series K068 Class A2, 3.244% 8/25/27 | | 3,385,000 | 3,691,088 |
| Series K079 Class A2, 3.926% 6/25/28 | | 1,106,000 | 1,271,291 |
| Series K094 Class A2, 2.903% 6/25/29 | | 7,630,000 | 8,226,547 |
| Series K730 Class A2, 3.59% 1/25/25 | | 5,500,000 | 5,942,694 |
| GS Mortgage Securities Trust sequential payer: | | | |
| Series 2013-GC10 Class A4, 2.681% 2/10/46 | | 1,438,511 | 1,472,066 |
| Series 2014-GC26 Class A4, 3.364% 11/10/47 | | 3,540,000 | 3,754,329 |
| JPMBB Commercial Mortgage Securities Trust: | | | |
| sequential payer: | | | |
| Series 2013-C12 Class A5, 3.6637% 7/15/45 | | 2,845,000 | 3,012,450 |
| Series 2014-C21 Class A5, 3.7748% 8/15/47 | | 4,799,000 | 5,174,459 |
| Series 2014-C23 Class A5, 3.9342% 9/15/47 | | 1,358,000 | 1,478,284 |
| Series 2014-C24 Class A5, 3.6385% 11/15/47 | | 3,706,000 | 3,985,448 |
| JPMBB Commercial Mortgage Secutities Trust sequential payer Series 2015-C29 Class A4, 3.6108% 5/15/48 | | 1,280,000 | 1,383,463 |
| JPMDB Commercial Mortgage Securities Trust sequential payer Series 2016-C2 Class ASB, 2.9542% 6/15/49 | | 2,512,000 | 2,604,238 |
| JPMorgan Chase Commercial Mortgage Securities Corp. sequential payer Series 2012-LC9 Class A5, 2.84% 12/15/47 | | 2,978,000 | 3,049,902 |
| JPMorgan Chase Commercial Mortgage Securities Trust Series 2013-C13 Class A4, 3.9936% 1/15/46 (a) | | 1,168,651 | 1,245,258 |
| Morgan Stanley BAML Trust: | | | |
| sequential payer: | | | |
| Series 2013-C11 Class A4, 4.299% 8/15/46 (a) | | 2,686,000 | 2,890,488 |
| Series 2015-C27 Class ASB, 3.557% 12/15/47 | | 671,000 | 706,723 |
| Series 2016-C28 Class ASB, 3.288% 1/15/49 | | 1,291,000 | 1,345,621 |
| Series 2015-C20 Class A4, 3.249% 2/15/48 | | 2,094,000 | 2,209,953 |
| Wells Fargo Commercial Mortgage Trust: | | | |
| sequential payer Series 2019-C52 Class A5, 2.892% 8/15/52 | | 4,500,000 | 4,727,203 |
| Series 2018-C48 Class A5, 4.302% 1/15/52 | | 2,780,000 | 3,221,148 |
| WF-RBS Commercial Mortgage Trust: | | | |
| sequential payer Series 2013-C14 Class A4, 3.073% 6/15/46 | | 1,422,000 | 1,475,440 |
| Series 2014-C25 Class A5, 3.631% 11/15/47 | | 2,055,000 | 2,209,101 |
| TOTAL COMMERCIAL MORTGAGE SECURITIES | | | |
| (Cost $137,898,654) | | | 143,711,188 |
|
| Municipal Securities - 0.5% | | | |
| American Muni. Pwr., Inc. Rev. (Combined Hydroelectric Proj.) Series 2010 B, 8.084% 2/15/50 | | 1,380,000 | 2,569,698 |
| Bay Area Toll Auth. San Francisco Bay Toll Bridge Rev. Series 2010 S1, 7.043% 4/1/50 | | 340,000 | 588,900 |
| California Gen. Oblig.: | | | |
| Series 2009, 7.55% 4/1/39 | | $3,520,000 | $5,902,090 |
| Series 2018, 3.5% 4/1/28 | | 1,835,000 | 2,028,666 |
| Commonwealth Fing. Auth. Rev. Series 2016 A, 4.144% 6/1/38 | | 1,090,000 | 1,285,971 |
| Dallas Fort Worth Int'l. Arpt. Rev. Series 2019 A, 3.144% 11/1/45 | | 350,000 | 367,017 |
| Illinois Gen. Oblig. Series 2003, 5.1% 6/1/33 | | 2,335,000 | 2,541,040 |
| Kansas St Dev. Fin. Auth. Rev. Series 2015 H, 4.927% 4/15/45 | | 1,080,000 | 1,440,374 |
| Los Angeles Cmnty. College District Series 2008 E, 6.75% 8/1/49 | | 1,345,000 | 2,309,943 |
| Los Angeles Dept. Arpt. Rev. Series 2009 C, 6.582% 5/15/39 | | 710,000 | 990,173 |
| Massachusetts Gen. Oblig. Series F, 3.277% 6/1/46 | | 670,000 | 720,578 |
| New Jersey Tpk. Auth. Tpk. Rev. Series 2009 E, 7.414% 1/1/40 | | 668,000 | 1,102,481 |
| New York City Muni. Wtr. Fin. Auth. Wtr. & Swr. Sys. Rev. Series 2010 DD, 5.952% 6/15/42 | | 1,285,000 | 1,979,041 |
| New York City Transitional Fin. Auth. Rev. Series 2011 A, 5.508% 8/1/37 | | 1,525,000 | 2,090,074 |
| New York Metropolitan Trans. Auth. Rev. Series 2010 A, 6.668% 11/15/39 | | 875,000 | 1,311,091 |
| Port Auth. of New York & New Jersey: | | | |
| Series 180, 4.96% 8/1/46 | | 735,000 | 995,469 |
| Series 2010 164, 5.647% 11/1/40 | | 740,000 | 1,050,911 |
| Port of Morrow Transmission Facilities Rev. (Bonneville Coorporation Proj.) Series 2016 1, 2.987% 9/1/36 | | 805,000 | 839,172 |
| San Francisco Pub. Utils. Commission Wtr. Rev. Series 2010 E, 6% 11/1/40 | | 900,000 | 1,259,991 |
| South Carolina Pub. Svc. Auth. Rev. Series 2013 C, 5.784% 12/1/41 | | 1,608,000 | 2,221,436 |
| Univ. of California Revs.: | | | |
| Series 2009 R, 5.77% 5/15/43 | | 140,000 | 199,450 |
| Series 2015 AP, 3.931% 5/15/45 | | 530,000 | 608,525 |
| Univ. of Virginia Gen. Rev. (Multi-Year Cap. Proj. Fing. Prog.) Series 2017 C, 4.179% 9/1/2117 | | 675,000 | 871,992 |
| TOTAL MUNICIPAL SECURITIES | | | |
| (Cost $31,307,766) | | | 35,274,083 |
|
| Foreign Government and Government Agency Obligations - 1.6% | | | |
| Alberta Province: | | | |
| 1.9% 12/6/19 | | $1,351,000 | $1,350,216 |
| 2.95% 1/23/24 | | 5,000,000 | 5,276,950 |
| 3.3% 3/15/28 | | 555,000 | 620,401 |
| Banque Centrale de Tunisie 1.416% 8/5/21 | | 1,209,000 | 1,201,021 |
| Canadian Government 2% 11/15/22 | | 675,000 | 685,665 |
| Chilean Republic: | | | |
| 3.24% 2/6/28 | | 1,649,000 | 1,798,956 |
| 3.25% 9/14/21 | | 1,280,000 | 1,318,000 |
| 3.86% 6/21/47 | | 853,000 | 1,031,064 |
| Colombian Republic: | | | |
| 2.625% 3/15/23 | | 1,077,000 | 1,088,107 |
| 3.875% 4/25/27 | | 3,213,000 | 3,479,077 |
| 4% 2/26/24 | | 686,000 | 731,876 |
| 4.5% 3/15/29 | | 1,923,000 | 2,184,408 |
| 5% 6/15/45 | | 1,712,000 | 2,069,808 |
| 5.625% 2/26/44 | | 1,106,000 | 1,426,394 |
| 6.125% 1/18/41 | | 675,000 | 901,969 |
| Hungarian Republic: | | | |
| 5.375% 3/25/24 | | 5,000,000 | 5,668,750 |
| 5.75% 11/22/23 | | 8,588,000 | 9,771,534 |
| Indonesian Republic: | | | |
| 3.4% 9/18/29 | | 1,000,000 | 1,054,063 |
| 5.35% 2/11/49 | | 1,000,000 | 1,308,125 |
| Israeli State: | | | |
| 3.25% 1/17/28 | | 2,046,000 | 2,253,767 |
| 4% 6/30/22 | | 995,000 | 1,053,198 |
| Italian Republic 6.875% 9/27/23 | | 853,000 | 983,673 |
| Jordanian Kingdom 3% 6/30/25 | | 341,000 | 364,469 |
| Manitoba Province: | | | |
| 2.1% 9/6/22 | | 270,000 | 273,505 |
| 2.125% 5/4/22 | | 569,000 | 575,773 |
| 3.05% 5/14/24 | | 213,000 | 226,246 |
| Ontario Province: | | | |
| 2.25% 5/18/22 | | 828,000 | 841,380 |
| 2.3% 6/15/26 | | 4,100,000 | 4,243,008 |
| 2.4% 2/8/22 | | 741,000 | 754,249 |
| 2.5% 4/27/26 | | 711,000 | 744,303 |
| 2.55% 2/12/21 | | 1,401,000 | 1,416,523 |
| 3.05% 1/29/24 | | 1,700,000 | 1,801,694 |
| 4% 10/7/19 | | 2,133,000 | 2,136,498 |
| Panamanian Republic: | | | |
| 3.75% 3/16/25 | | 540,000 | 579,150 |
| 3.875% 3/17/28 | | 1,365,000 | 1,514,723 |
| 4% 9/22/24 | | 682,000 | 736,986 |
| 4.3% 4/29/53 | | 807,000 | 990,845 |
| 4.5% 4/16/50 | | 967,000 | 1,202,706 |
| 5.2% 1/30/20 | | 256,000 | 259,360 |
| Peruvian Republic: | | | |
| 2.844% 6/20/30 | | 3,400,000 | 3,590,188 |
| 4.125% 8/25/27 | | 398,000 | 455,959 |
| 5.625% 11/18/50 | | 1,017,000 | 1,554,739 |
| 6.55% 3/14/37 | | 437,000 | 663,284 |
| Philippine Republic: | | | |
| 3% 2/1/28 | | 2,702,000 | 2,870,037 |
| 3.75% 1/14/29 | | 1,000,000 | 1,135,313 |
| 3.95% 1/20/40 | | 1,152,000 | 1,383,480 |
| 4.2% 1/21/24 | | 678,000 | 738,808 |
| 6.375% 10/23/34 | | 1,475,000 | 2,165,945 |
| 6.5% 1/20/20 | | 874,000 | 888,476 |
| Polish Government: | | | |
| 3.25% 4/6/26 | | 938,000 | 1,007,764 |
| 4% 1/22/24 | | 647,000 | 703,360 |
| 5% 3/23/22 | | 2,062,000 | 2,220,516 |
| Province of British Columbia 2.25% 6/2/26 | | 536,000 | 554,996 |
| Province of Quebec: | | | |
| 2.375% 1/31/22 | | 540,000 | 549,742 |
| 2.5% 4/20/26 | | 805,000 | 844,163 |
| 2.75% 8/25/21 | | 2,844,000 | 2,904,151 |
| 2.75% 4/12/27 | | 675,000 | 723,269 |
| 2.875% 10/16/24 | | 295,000 | 313,137 |
| Ukraine Government 1.471% 9/29/21 | | 1,465,000 | 1,462,469 |
| United Mexican States: | | | |
| 3.5% 1/21/21 | | 1,052,000 | 1,072,383 |
| 3.625% 3/15/22 | | 426,000 | 440,777 |
| 3.75% 1/11/28 | | 1,280,000 | 1,336,320 |
| 4% 10/2/23 | | 2,666,000 | 2,829,293 |
| 4.125% 1/21/26 | | 455,000 | 483,893 |
| 4.15% 3/28/27 | | 4,600,000 | 4,922,000 |
| 4.35% 1/15/47 | | 2,049,000 | 2,153,371 |
| 4.5% 4/22/29 | | 1,000,000 | 1,104,500 |
| 4.6% 1/23/46 | | 825,000 | 895,383 |
| 4.6% 2/10/48 | | 2,495,000 | 2,731,245 |
| 4.75% 3/8/44 | | 1,380,000 | 1,526,625 |
| 5.55% 1/21/45 | | 557,000 | 685,667 |
| 6.05% 1/11/40 | | 682,000 | 872,278 |
| Uruguay Republic: | | | |
| 4.125% 11/20/45 | | 675,387 | 747,358 |
| 4.375% 10/27/27 | | 1,741,787 | 1,934,472 |
| 4.5% 8/14/24 | | 515,427 | 560,044 |
| 4.975% 4/20/55 | | 837,480 | 1,031,409 |
| 5.1% 6/18/50 | | 818,284 | 1,017,996 |
| TOTAL FOREIGN GOVERNMENT AND GOVERNMENT AGENCY OBLIGATIONS | | | |
| (Cost $113,015,007) | | | 118,993,250 |
|
| Supranational Obligations - 1.2% | | | |
| African Development Bank: | | | |
| 1.25% 7/26/21 | | 1,335,000 | 1,326,385 |
| 2.375% 9/23/21 | | 412,000 | 418,335 |
| Asian Development Bank: | | | |
| 1.5% 1/22/20 | | 675,000 | 673,797 |
| 1.75% 9/13/22 | | 2,029,000 | 2,043,833 |
| 1.875% 2/18/22 | | 284,000 | 286,459 |
| 2% 4/24/26 | | 896,000 | 922,640 |
| 2.125% 11/24/21 | | 686,000 | 694,644 |
| 2.25% 1/20/21 | | 419,000 | 422,204 |
| 2.5% 11/2/27 | | 953,000 | 1,020,402 |
| 2.625% 1/30/24 | | 2,200,000 | 2,308,039 |
| 2.625% 1/12/27 | | 924,000 | 992,674 |
| 2.75% 3/17/23 | | 1,362,000 | 1,420,657 |
| 2.75% 1/19/28 | | 697,000 | 762,940 |
| Council of Europe Development Bank 1.625% 3/16/21 | | 536,000 | 535,636 |
| European Bank for Reconstruction & Development: | | | |
| 1.125% 8/24/20 | | 667,000 | 662,374 |
| 1.75% 11/26/19 | | 409,000 | 408,648 |
| 2.125% 3/7/22 | | 667,000 | 677,076 |
| European Investment Bank: | | | |
| 1.375% 6/15/20 | | 387,000 | 385,387 |
| 1.375% 9/15/21 | | 2,498,000 | 2,487,312 |
| 1.625% 6/15/21 | | 995,000 | 995,485 |
| 1.875% 2/10/25 | | 427,000 | 436,674 |
| 2% 3/15/21 | | 678,000 | 681,767 |
| 2% 12/15/22 | | 2,014,000 | 2,050,862 |
| 2.125% 10/15/21 | | 404,000 | 408,712 |
| 2.25% 3/15/22 | | 2,261,000 | 2,301,757 |
| 2.25% 8/15/22 | | 267,000 | 272,635 |
| 2.25% 6/24/24 | | 3,300,000 | 3,418,612 |
| 2.375% 6/15/22 | | 1,991,000 | 2,037,658 |
| 2.375% 5/24/27 | | 569,000 | 604,263 |
| 2.5% 4/15/21 | | 661,000 | 670,435 |
| 2.5% 3/15/23 | | 2,986,000 | 3,091,994 |
| 2.5% 10/15/24 | | 814,000 | 856,190 |
| 2.875% 9/15/20 | | 1,280,000 | 1,294,570 |
| 2.875% 8/15/23 | | 1,506,000 | 1,587,292 |
| 3.125% 12/14/23 | | 1,962,000 | 2,093,261 |
| 3.25% 1/29/24 | | 284,000 | 305,487 |
| Inter-American Development Bank: | | | |
| 1.25% 9/14/21 | | 1,045,000 | 1,037,883 |
| 1.75% 10/15/19 | | 196,000 | 195,903 |
| 1.75% 4/14/22 | | 267,000 | 268,391 |
| 1.75% 9/14/22 | | 874,000 | 880,488 |
| 1.875% 6/16/20 | | 749,000 | 748,943 |
| 1.875% 3/15/21 | | 555,000 | 557,009 |
| 2% 6/2/26 | | 569,000 | 585,602 |
| 2.125% 1/18/22 | | 867,000 | 879,243 |
| 2.125% 1/15/25 | | 260,000 | 268,432 |
| 2.25% 6/18/29 | | 2,500,000 | 2,652,989 |
| 2.375% 7/7/27 | | 957,000 | 1,013,603 |
| 2.5% 1/18/23 | | 990,000 | 1,022,145 |
| 2.625% 4/19/21 | | 1,353,000 | 1,374,411 |
| 3% 10/4/23 | | 508,000 | 537,958 |
| 3.875% 9/17/19 | | 711,000 | 711,454 |
| 4.375% 1/24/44 | | 569,000 | 808,536 |
| International Bank for Reconstruction & Development: | | | |
| 1.125% 8/10/20 | | 2,815,000 | 2,797,283 |
| 1.375% 5/24/21 | | 805,000 | 801,824 |
| 1.375% 9/20/21 | | 744,000 | 741,277 |
| 1.5% 8/28/24 | | 6,300,000 | 6,309,371 |
| 1.625% 3/9/21 | | 853,000 | 852,922 |
| 1.625% 2/10/22 | | 555,000 | 556,399 |
| 1.75% 4/19/23 | | 953,000 | 960,950 |
| 1.875% 10/7/19 | | 544,000 | 543,875 |
| 1.875% 10/7/22 | | 2,417,000 | 2,445,073 |
| 1.875% 6/19/23 | | 2,500,000 | 2,533,339 |
| 1.875% 10/27/26 | | 677,000 | 693,974 |
| 2% 1/26/22 | | 4,611,000 | 4,664,010 |
| 2.25% 6/24/21 | | 2,286,000 | 2,313,171 |
| 2.5% 3/19/24 | | 540,000 | 564,413 |
| 2.5% 11/25/24 | | 810,000 | 851,690 |
| 2.5% 7/29/25 | | 539,000 | 569,686 |
| 2.75% 7/23/21 | | 1,372,000 | 1,402,017 |
| International Finance Corp.: | | | |
| 1.125% 7/20/21 | | 931,000 | 923,330 |
| 1.625% 7/16/20 | | 408,000 | 407,267 |
| 1.75% 9/16/19 | | 1,614,000 | 1,613,774 |
| 2.25% 1/25/21 | | 266,000 | 267,983 |
| 2.875% 7/31/23 | | 612,000 | 643,326 |
| TOTAL SUPRANATIONAL OBLIGATIONS | | | |
| (Cost $86,426,199) | | | 88,557,040 |
|
| Bank Notes - 0.1% | | | |
| Bank of America NA 6% 10/15/36 | | 344,000 | 481,066 |
| Citibank NA 3.65% 1/23/24 | | 3,555,000 | 3,789,274 |
| Citizens Bank NA 3.75% 2/18/26 | | 1,920,000 | 2,073,758 |
| Discover Bank 3.45% 7/27/26 | | 1,813,000 | 1,894,472 |
| KeyBank NA 2.5% 12/15/19 | | 569,000 | 569,532 |
| PNC Bank NA 2.4% 10/18/19 | | 675,000 | 675,074 |
| U.S. Bank NA 3.4% 7/24/23 | | 1,422,000 | 1,497,746 |
| TOTAL BANK NOTES | | | |
| (Cost $10,509,545) | | | 10,980,922 |
| | | Shares | Value |
|
| Money Market Funds - 1.6% | | | |
| Fidelity Cash Central Fund 2.13% (e) | | | |
| (Cost $116,088,753) | | 116,065,540 | 116,088,753 |
| TOTAL INVESTMENT IN SECURITIES - 101.5% | | | |
| (Cost $7,230,180,242) | | | 7,560,045,023 |
| NET OTHER ASSETS (LIABILITIES) - (1.5)% | | | (113,952,091) |
| NET ASSETS - 100% | | | $7,446,092,932 |
Legend
(a) Coupon rates for floating and adjustable rate securities reflect the rates in effect at period end.
(b) Security exempt from registration under Rule 144A of the Securities Act of 1933. These securities may be resold in transactions exempt from registration, normally to qualified institutional buyers. At the end of the period, the value of these securities amounted to $52,374,230 or 0.7% of net assets.
(c) Coupon is indexed to a floating interest rate which may be multiplied by a specified factor and/or subject to caps or floors.
(d) Security or a portion of the security purchased on a delayed delivery or when-issued basis.
(e) Affiliated fund that is generally available only to investment companies and other accounts managed by Fidelity Investments. The rate quoted is the annualized seven-day yield of the fund at period end. A complete unaudited listing of the fund's holdings as of its most recent quarter end is available upon request. In addition, each Fidelity Central Fund's financial statements, which are not covered by the Fund's Report of Independent Registered Public Accounting Firm, are available on the SEC's website or upon request.
Affiliated Central Funds
Information regarding fiscal year to date income earned by the Fund from investments in Fidelity Central Funds is as follows:
| Fund | Income earned |
| Fidelity Cash Central Fund | $521,805 |
| Total | $521,805 |
Amounts in the income column in the above table include any capital gain distributions from underlying funds, which are presented in the corresponding line-item in the Statement of Operations, if applicable.
Investment Valuation
The following is a summary of the inputs used, as of August 31, 2019, involving the Fund's assets and liabilities carried at fair value. The inputs or methodology used for valuing securities may not be an indication of the risk associated with investing in those securities. For more information on valuation inputs, and their aggregation into the levels used below, please refer to the Investment Valuation section in the accompanying Notes to Financial Statements.
| | Valuation Inputs at Reporting Date: |
| Description | Total | Level 1 | Level 2 | Level 3 |
| Investments in Securities: | | | | |
| Corporate Bonds | $1,879,304,471 | $-- | $1,879,304,471 | $-- |
| U.S. Government and Government Agency Obligations | 3,146,142,292 | -- | 3,146,142,292 | -- |
| U.S. Government Agency - Mortgage Securities | 2,003,239,659 | -- | 2,003,239,659 | -- |
| Asset-Backed Securities | 17,753,365 | -- | 17,753,365 | -- |
| Commercial Mortgage Securities | 143,711,188 | -- | 143,711,188 | -- |
| Municipal Securities | 35,274,083 | -- | 35,274,083 | -- |
| Foreign Government and Government Agency Obligations | 118,993,250 | -- | 118,993,250 | -- |
| Supranational Obligations | 88,557,040 | -- | 88,557,040 | -- |
| Bank Notes | 10,980,922 | -- | 10,980,922 | -- |
| Money Market Funds | 116,088,753 | 116,088,753 | -- | -- |
| Total Investments in Securities: | $7,560,045,023 | $116,088,753 | $7,443,956,270 | $-- |
See accompanying notes which are an integral part of the financial statements.
Financial Statements
Statement of Assets and Liabilities
| | | August 31, 2019 |
| Assets | | |
Investment in securities, at value — See accompanying schedule:
Unaffiliated issuers (cost $7,114,091,489) | $7,443,956,270 | |
| Fidelity Central Funds (cost $116,088,753) | 116,088,753 | |
| Total Investment in Securities (cost $7,230,180,242) | | $7,560,045,023 |
| Cash | | 17,156 |
| Receivable for investments sold | | 128,078,155 |
| Receivable for fund shares sold | | 15,333 |
| Interest receivable | | 43,084,145 |
| Distributions receivable from Fidelity Central Funds | | 170,665 |
| Total assets | | 7,731,410,477 |
| Liabilities | | |
| Payable for investments purchased on a delayed delivery basis | $130,835,941 | |
| Payable for fund shares redeemed | 154,400,764 | |
| Other payables and accrued expenses | 80,840 | |
| Total liabilities | | 285,317,545 |
| Net Assets | | $7,446,092,932 |
| Net Assets consist of: | | |
| Paid in capital | | $7,105,442,815 |
| Total distributable earnings (loss) | | 340,650,117 |
| Net Assets, for 709,486,947 shares outstanding | | $7,446,092,932 |
| Net Asset Value, offering price and redemption price per share ($7,446,092,932 ÷ 709,486,947 shares) | | $10.50 |
See accompanying notes which are an integral part of the financial statements.
Statement of Operations
| | | For the period
April 26, 2019 (commencement of operations) to
August 31, 2019 |
| Investment Income | | |
| Interest | | $65,862,172 |
| Income from Fidelity Central Funds | | 521,805 |
| Total income | | 66,383,977 |
| Expenses | | |
| Custodian fees and expenses | $80,825 | |
| Independent trustees' fees and expenses | 7,850 | |
| Total expenses | | 88,675 |
| Net investment income (loss) | | 66,295,302 |
| Realized and Unrealized Gain (Loss) | | |
| Net realized gain (loss) on: | | |
| Investment securities: | | |
| Unaffiliated issuers | 11,739,405 | |
| Total net realized gain (loss) | | 11,739,405 |
| Change in net unrealized appreciation (depreciation) on investment securities | | 329,864,781 |
| Net gain (loss) | | 341,604,186 |
| Net increase (decrease) in net assets resulting from operations | | $407,899,488 |
See accompanying notes which are an integral part of the financial statements.
Statement of Changes in Net Assets
| | For the period
April 26, 2019 (commencement of operations) to
August 31, 2019 |
| Increase (Decrease) in Net Assets | |
| Operations | |
| Net investment income (loss) | $66,295,302 |
| Net realized gain (loss) | 11,739,405 |
| Change in net unrealized appreciation (depreciation) | 329,864,781 |
| Net increase (decrease) in net assets resulting from operations | 407,899,488 |
| Distributions to shareholders | (67,250,496) |
| Total distributions | (67,250,496) |
| Share transactions | |
| Proceeds from sales of shares | 7,557,517,097 |
| Reinvestment of distributions | 67,250,474 |
| Cost of shares redeemed | (519,323,631) |
| Net increase (decrease) in net assets resulting from share transactions | 7,105,443,940 |
| Total increase (decrease) in net assets | 7,446,092,932 |
| Net Assets | |
| Beginning of period | – |
| End of period | $7,446,092,932 |
| Other Information | |
| Shares | |
| Sold | 753,547,789 |
| Issued in reinvestment of distributions | 6,541,974 |
| Redeemed | (50,602,816) |
| Net increase (decrease) | 709,486,947 |
See accompanying notes which are an integral part of the financial statements.
Financial Highlights
Fidelity Series Bond Index Fund
| | |
| Year ended August 31, | 2019 A |
| Selected Per–Share Data | |
| Net asset value, beginning of period | $10.00 |
| Income from Investment Operations | |
| Net investment income (loss)B | .098 |
| Net realized and unrealized gain (loss) | .501 |
| Total from investment operations | .599 |
| Distributions from net investment income | (.099) |
| Total distributions | (.099) |
| Net asset value, end of period | $10.50 |
| Total ReturnC | 6.01% |
| Ratios to Average Net AssetsD,E | |
| Expenses before reductions | - %F,G |
| Expenses net of fee waivers, if any | - %F,G |
| Expenses net of all reductions | - %F,G |
| Net investment income (loss) | 2.77%F |
| Supplemental Data | |
| Net assets, end of period (000 omitted) | $7,446,093 |
| Portfolio turnover rateH | 20%I,J |
A For the period April 26, 2019 (commencement of operations) to August 31, 2019.
B Calculated based on average shares outstanding during the period.
C Total returns for periods of less than one year are not annualized.
D Fees and expenses of any underlying Fidelity Central Funds are not included in the Fund's expense ratio. The Fund indirectly bears its proportionate share of the expenses of any underlying Fidelity Central Funds.
E Expense ratios reflect operating expenses of the Fund. Expenses before reductions do not reflect amounts reimbursed by the investment adviser or reductions from expense offset arrangements and do not represent the amount paid by the Fund during periods when reimbursements or reductions occur. Expenses net of fee waivers reflect expenses after reimbursement by the investment adviser but prior to reductions from expense offset arrangements. Expenses net of all reductions represent the net expenses paid by the Fund.
F Annualized
G Amount represents less than .005%.
H Amount does not include the portfolio activity of any underlying Fidelity Central Funds.
I Portfolio turnover rate excludes securities received or delivered in-kind.
J Amount not annualized.
See accompanying notes which are an integral part of the financial statements.
Notes to Financial Statements
For the period ended August 31, 2019
1. Organization.
Fidelity Series Bond Index Fund (the Fund) is a fund of Fidelity Salem Street Trust (the Trust) and is authorized to issue an unlimited number of shares. Shares of the Fund are only available for purchase by mutual funds for which Fidelity Management & Research Company (FMR) or an affiliate serves as an investment manager. The Trust is registered under the Investment Company Act of 1940, as amended (the 1940 Act), as an open-end management investment company organized as a Massachusetts business trust.
2. Investments in Fidelity Central Funds.
The Fund invests in Fidelity Central Funds, which are open-end investment companies generally available only to other investment companies and accounts managed by the investment adviser and its affiliates. The Fund's Schedule of Investments lists each of the Fidelity Central Funds held as of period end, if any, as an investment of the Fund, but does not include the underlying holdings of each Fidelity Central Fund. As an Investing Fund, the Fund indirectly bears its proportionate share of the expenses of the underlying Fidelity Central Funds.
The Money Market Central Funds seek preservation of capital and current income and are managed by Fidelity Investments Money Management, Inc. (FIMM), an affiliate of the investment adviser. Annualized expenses of the Money Market Central Funds as of their most recent shareholder report date ranged from less than .005% to .01%.
A complete unaudited list of holdings for each Fidelity Central Fund is available upon request or at the Securities and Exchange Commission (the SEC) website at www.sec.gov. In addition, the financial statements of the Fidelity Central Funds, which are not covered by the Fund's Report of Independent Registered Public Accounting Firm, are available on the SEC website or upon request.
3. Significant Accounting Policies.
The Fund is an investment company and applies the accounting and reporting guidance of the Financial Accounting Standards Board (FASB) Accounting Standards Codification Topic 946 Financial Services – Investments Companies. The financial statements have been prepared in conformity with accounting principles generally accepted in the United States of America (GAAP), which require management to make certain estimates and assumptions at the date of the financial statements. Actual results could differ from those estimates. Subsequent events, if any, through the date that the financial statements were issued have been evaluated in the preparation of the financial statements. The following summarizes the significant accounting policies of the Fund:
Investment Valuation. Investments are valued as of 4:00 p.m. Eastern time on the last calendar day of the period. The Board of Trustees (the Board) has delegated the day to day responsibility for the valuation of the Fund's investments to the Fair Value Committee (the Committee) established by the Fund's investment adviser. In accordance with valuation policies and procedures approved by the Board, the Fund attempts to obtain prices from one or more third party pricing vendors or brokers to value its investments. When current market prices, quotations or currency exchange rates are not readily available or reliable, investments will be fair valued in good faith by the Committee, in accordance with procedures adopted by the Board. Factors used in determining fair value vary by investment type and may include market or investment specific events, changes in interest rates and credit quality. The frequency with which these procedures are used cannot be predicted and they may be utilized to a significant extent. The Committee oversees the Fund's valuation policies and procedures and reports to the Board on the Committee's activities and fair value determinations. The Board monitors the appropriateness of the procedures used in valuing the Fund's investments and ratifies the fair value determinations of the Committee.
The Fund categorizes the inputs to valuation techniques used to value its investments into a disclosure hierarchy consisting of three levels as shown below:
- Level 1 – quoted prices in active markets for identical investments
- Level 2 – other significant observable inputs (including quoted prices for similar investments, interest rates, prepayment speeds, etc.)
- Level 3 – unobservable inputs (including the Fund's own assumptions based on the best information available)
Valuation techniques used to value the Fund's investments by major category are as follows:
Debt securities, including restricted securities, are valued based on evaluated prices received from third party pricing vendors or from brokers who make markets in such securities. Corporate bonds, bank notes, foreign government and government agency obligations, municipal securities, supranational obligations and U.S. government and government agency obligations are valued by pricing vendors who utilize matrix pricing which considers yield or price of bonds of comparable quality, coupon, maturity and type or by broker-supplied prices. Asset backed securities, commercial mortgage securities and U.S. government agency mortgage securities are valued by pricing vendors who utilize matrix pricing which considers prepayment speed assumptions, attributes of the collateral, yield or price of bonds of comparable quality, coupon, maturity and type or by broker-supplied prices. When independent prices are unavailable or unreliable, debt securities may be valued utilizing pricing methodologies which consider similar factors that would be used by third party pricing vendors. Debt securities are generally categorized as Level 2 in the hierarchy but may be Level 3 depending on the circumstances.
Investments in open-end mutual funds, including the Fidelity Central Funds, are valued at their closing net asset value (NAV) each business day and are categorized as Level 1 in the hierarchy.
Changes in valuation techniques may result in transfers in or out of an assigned level within the disclosure hierarchy. The aggregate value of investments by input level as of August 31, 2019 is included at the end of the Fund's Schedule of Investments.
Investment Transactions and Income. For financial reporting purposes, the Fund's investment holdings and NAV include trades executed through the end of the last business day of the period. The NAV per share for processing shareholder transactions is calculated as of the close of business of the New York Stock Exchange (NYSE), normally 4:00 p.m. Eastern time and includes trades executed through the end of the prior business day. Gains and losses on securities sold are determined on the basis of identified cost. Income and capital gain distributions from Fidelity Central Funds, if any, are recorded on the ex-dividend date. Interest income is accrued as earned and includes coupon interest and amortization of premium and accretion of discount on debt securities as applicable. Debt obligations may be placed on non-accrual status and related interest income may be reduced by ceasing current accruals and writing off interest receivables when the collection of all or a portion of interest has become doubtful based on consistently applied procedures. A debt obligation is removed from non-accrual status when the issuer resumes interest payments or when collectability of interest is reasonably assured.
Expenses. Expenses directly attributable to a fund are charged to that fund. Expenses attributable to more than one fund are allocated among the respective funds on the basis of relative net assets or other appropriate methods. Expense estimates are accrued in the period to which they relate and adjustments are made when actual amounts are known.
Income Tax Information and Distributions to Shareholders. Each year, the Fund intends to qualify as a regulated investment company under Subchapter M of the Internal Revenue Code, including distributing substantially all of its taxable income and realized gains. As a result, no provision for U.S. Federal income taxes is required. As of August 31, 2019, the Fund did not have any unrecognized tax benefits in the financial statements; nor is the Fund aware of any tax positions for which it is reasonably possible that the total amounts of unrecognized tax benefits will significantly change in the next twelve months. The Fund files a U.S. federal tax return, in addition to state and local tax returns as required. The Fund's federal income tax returns are subject to examination by the Internal Revenue Service (IRS) for a period of three fiscal years after they are filed. State and local tax returns may be subject to examination for an additional fiscal year depending on the jurisdiction.
Distributions are declared and recorded daily and paid monthly from net investment income. Distributions from realized gains, if any, are declared and recorded on the ex-dividend date. Income and capital gain distributions are determined in accordance with income tax regulations, which may differ from GAAP.
Capital accounts within the financial statements are adjusted for permanent book-tax differences. These adjustments have no impact on net assets or the results of operations. Capital accounts are not adjusted for temporary book-tax differences which will reverse in a subsequent period.
Book-tax differences are primarily due to market discount and losses deferred due to wash sales.
As of period end, the cost and unrealized appreciation (depreciation) in securities, and derivatives if applicable, for federal income tax purposes were as follows:
| Gross unrealized appreciation | $330,171,270 |
| Gross unrealized depreciation | (310,099) |
| Net unrealized appreciation (depreciation) | $329,861,171 |
| Tax Cost | $7,230,183,852 |
The tax-based components of distributable earnings as of period end were as follows:
| Undistributed ordinary income | $10,788,946 |
| Net unrealized appreciation (depreciation) on securities and other investments | $329,861,171 |
The tax character of distributions paid was as follows:
| | August 31, 2019(a) |
| Ordinary Income | $67,250,496 |
| Total | $67,250,496 |
(a) For the period April 26, 2019 (commencement of operations) to August 31, 2019.
Delayed Delivery Transactions and When-Issued Securities. During the period, the Fund transacted in securities on a delayed delivery or when-issued basis. Payment and delivery may take place after the customary settlement period for that security. The price of the underlying securities and the date when the securities will be delivered and paid for are fixed at the time the transaction is negotiated. The securities purchased on a delayed delivery or when-issued basis are identified as such in the Fund's Schedule of Investments. The Fund may receive compensation for interest forgone in the purchase of a delayed delivery or when-issued security. With respect to purchase commitments, the Fund identifies securities as segregated in its records with a value at least equal to the amount of the commitment. Losses may arise due to changes in the value of the underlying securities or if the counterparty does not perform under the contract's terms, or if the issuer does not issue the securities due to political, economic, or other factors.
Restricted Securities. The Fund may invest in securities that are subject to legal or contractual restrictions on resale. These securities generally may be resold in transactions exempt from registration or to the public if the securities are registered. Disposal of these securities may involve time-consuming negotiations and expense, and prompt sale at an acceptable price may be difficult. Information regarding restricted securities is included at the end of the Fund's Schedule of Investments.
4. Purchases and Sales of Investments.
Purchases and sales of securities, other than short-term securities, U.S. government securities and in-kind transactions, aggregated $301,034,530 and $12,850,352, respectively.
5. Fees and Other Transactions with Affiliates.
Management Fee. Fidelity Management & Research Company (the investment adviser) and its affiliates provide the Fund with investment management related services for which the Fund does not pay a management fee. Under the management contract, the investment adviser or an affiliate pays all ordinary operating expenses of the Fund, except custody fees, fees and expenses of the independent Trustees, and certain miscellaneous expenses such as proxy and shareholder meeting expenses.
Interfund Trades. The Fund may purchase from or sell securities to other Fidelity Funds under procedures adopted by the Board. The procedures have been designed to ensure these interfund trades are executed in accordance with Rule 17a-7 of the 1940 Act. Interfund trades are included within the respective purchases and sales amounts shown in the Purchases and Sales of Investments note.
Affiliated Exchanges In-Kind. During the period, the Fund received investments, including accrued interest and cash, valued at $6,538,471,526 in exchange for 653,847,154 shares of the Fund. The amount of in-kind exchanges is included in share transactions in the accompanying Statement of Changes in Net Assets.
6. Other.
The Fund's organizational documents provide former and current trustees and officers with a limited indemnification against liabilities arising in connection with the performance of their duties to the Fund. In the normal course of business, the Fund may also enter into contracts that provide general indemnifications. The Fund's maximum exposure under these arrangements is unknown as this would be dependent on future claims that may be made against the Fund. The risk of material loss from such claims is considered remote.
At the end of the period, mutual funds managed by the investment adviser or its affiliates were the owners of record of all of the outstanding shares of the Fund.
Affiliated Exchanges In-Kind. Effective after the close of business on August 31, 2019, the Fund received investments, including accrued interest, and cash valued at $1,900,607,034 in exchange for 182,575,123 shares of the Fund.
Report of Independent Registered Public Accounting Firm
To the Board of Trustees of Fidelity Salem Street Trust and Shareholders of Fidelity Series Bond Index Fund:
Opinion on the Financial Statements
We have audited the accompanying statement of assets and liabilities, including the schedule of investments, of Fidelity Series Bond Index Fund (one of the funds constituting Fidelity Salem Street Trust, referred to hereafter as the “Fund”) as of August 31, 2019, and the related statements of operations and changes in net assets, including the related notes, and the financial highlights for the period April 26, 2019 (commencement of operations) through August 31, 2019 (collectively referred to as the “financial statements”). In our opinion, the financial statements present fairly, in all material respects, the financial position of the Fund as of August 31, 2019, and the results of its operations, changes in its net assets, and the financial highlights for the period April 26, 2019 (commencement of operations) through August 31, 2019 in conformity with accounting principles generally accepted in the United States of America.
Basis for Opinion
These financial statements are the responsibility of the Fund’s management. Our responsibility is to express an opinion on the Fund’s financial statements based on our audit. We are a public accounting firm registered with the Public Company Accounting Oversight Board (United States) (PCAOB) and are required to be independent with respect to the Fund in accordance with the U.S. federal securities laws and the applicable rules and regulations of the Securities and Exchange Commission and the PCAOB.
We conducted our audit of these financial statements in accordance with the standards of the PCAOB. Those standards require that we plan and perform the audit to obtain reasonable assurance about whether the financial statements are free of material misstatement, whether due to error or fraud.
Our audit included performing procedures to assess the risks of material misstatement of the financial statements, whether due to error or fraud, and performing procedures that respond to those risks. Such procedures included examining, on a test basis, evidence regarding the amounts and disclosures in the financial statements. Our audit also included evaluating the accounting principles used and significant estimates made by management, as well as evaluating the overall presentation of the financial statements. Our procedures included confirmation of securities owned as of August 31, 2019 by correspondence with the custodian and brokers; when replies were not received from brokers, we performed other auditing procedures. We believe that our audit provides a reasonable basis for our opinion.
PricewaterhouseCoopers LLP
Boston, Massachusetts
October 18, 2019
We have served as the auditor of one or more investment companies in the Fidelity group of funds since 1932.
Trustees and Officers
The Trustees, Members of the Advisory Board (if any), and officers of the trust and fund, as applicable, are listed below. The Board of Trustees governs the fund and is responsible for protecting the interests of shareholders. The Trustees are experienced executives who meet periodically throughout the year to oversee the fund's activities, review contractual arrangements with companies that provide services to the fund, oversee management of the risks associated with such activities and contractual arrangements, and review the fund's performance. Except for Jonathan Chiel, each of the Trustees oversees 276 funds. Mr. Chiel oversees 170 funds.
The Trustees hold office without limit in time except that (a) any Trustee may resign; (b) any Trustee may be removed by written instrument, signed by at least two-thirds of the number of Trustees prior to such removal; (c) any Trustee who requests to be retired or who has become incapacitated by illness or injury may be retired by written instrument signed by a majority of the other Trustees; and (d) any Trustee may be removed at any special meeting of shareholders by a two-thirds vote of the outstanding voting securities of the trust. Each Trustee who is not an interested person (as defined in the 1940 Act) of the trust and the fund is referred to herein as an Independent Trustee. Each Independent Trustee shall retire not later than the last day of the calendar year in which his or her 75th birthday occurs. The Independent Trustees may waive this mandatory retirement age policy with respect to individual Trustees. Officers and Advisory Board Members hold office without limit in time, except that any officer or Advisory Board Member may resign or may be removed by a vote of a majority of the Trustees at any regular meeting or any special meeting of the Trustees. Except as indicated, each individual has held the office shown or other offices in the same company for the past five years.
The fund’s Statement of Additional Information (SAI) includes more information about the Trustees. To request a free copy, call Fidelity at 1-800-544-8544.
Experience, Skills, Attributes, and Qualifications of the Trustees. The Governance and Nominating Committee has adopted a statement of policy that describes the experience, qualifications, attributes, and skills that are necessary and desirable for potential Independent Trustee candidates (Statement of Policy). The Board believes that each Trustee satisfied at the time he or she was initially elected or appointed a Trustee, and continues to satisfy, the standards contemplated by the Statement of Policy. The Governance and Nominating Committee also engages professional search firms to help identify potential Independent Trustee candidates who have the experience, qualifications, attributes, and skills consistent with the Statement of Policy. From time to time, additional criteria based on the composition and skills of the current Independent Trustees, as well as experience or skills that may be appropriate in light of future changes to board composition, business conditions, and regulatory or other developments, have also been considered by the professional search firms and the Governance and Nominating Committee. In addition, the Board takes into account the Trustees' commitment and participation in Board and committee meetings, as well as their leadership of standing and ad hoc committees throughout their tenure.
In determining that a particular Trustee was and continues to be qualified to serve as a Trustee, the Board has considered a variety of criteria, none of which, in isolation, was controlling. The Board believes that, collectively, the Trustees have balanced and diverse experience, qualifications, attributes, and skills, which allow the Board to operate effectively in governing the fund and protecting the interests of shareholders. Information about the specific experience, skills, attributes, and qualifications of each Trustee, which in each case led to the Board's conclusion that the Trustee should serve (or continue to serve) as a trustee of the fund, is provided below.
Board Structure and Oversight Function. Abigail P. Johnson is an interested person and currently serves as Chairman. The Trustees have determined that an interested Chairman is appropriate and benefits shareholders because an interested Chairman has a personal and professional stake in the quality and continuity of services provided to the fund. Independent Trustees exercise their informed business judgment to appoint an individual of their choosing to serve as Chairman, regardless of whether the Trustee happens to be independent or a member of management. The Independent Trustees have determined that they can act independently and effectively without having an Independent Trustee serve as Chairman and that a key structural component for assuring that they are in a position to do so is for the Independent Trustees to constitute a substantial majority for the Board. The Independent Trustees also regularly meet in executive session. Arthur E. Johnson serves as Chairman of the Independent Trustees and as such (i) acts as a liaison between the Independent Trustees and management with respect to matters important to the Independent Trustees and (ii) with management prepares agendas for Board meetings.
Fidelity® funds are overseen by different Boards of Trustees. The fund's Board oversees Fidelity's investment-grade bond, money market, asset allocation and certain equity funds, and other Boards oversee Fidelity's high income and other equity funds. The asset allocation funds may invest in Fidelity® funds that are overseen by such other Boards. The use of separate Boards, each with its own committee structure, allows the Trustees of each group of Fidelity® funds to focus on the unique issues of the funds they oversee, including common research, investment, and operational issues. On occasion, the separate Boards establish joint committees to address issues of overlapping consequences for the Fidelity® funds overseen by each Board.
The Trustees operate using a system of committees to facilitate the timely and efficient consideration of all matters of importance to the Trustees, the fund, and fund shareholders and to facilitate compliance with legal and regulatory requirements and oversight of the fund's activities and associated risks. The Board, acting through its committees, has charged FMR and its affiliates with (i) identifying events or circumstances the occurrence of which could have demonstrably adverse effects on the fund's business and/or reputation; (ii) implementing processes and controls to lessen the possibility that such events or circumstances occur or to mitigate the effects of such events or circumstances if they do occur; and (iii) creating and maintaining a system designed to evaluate continuously business and market conditions in order to facilitate the identification and implementation processes described in (i) and (ii) above. Because the day-to-day operations and activities of the fund are carried out by or through FMR, its affiliates, and other service providers, the fund's exposure to risks is mitigated but not eliminated by the processes overseen by the Trustees. While each of the Board's committees has responsibility for overseeing different aspects of the fund's activities, oversight is exercised primarily through the Operations and Audit Committees. In addition, an ad hoc Board committee of Independent Trustees has worked with FMR to enhance the Board's oversight of investment and financial risks, legal and regulatory risks, technology risks, and operational risks, including the development of additional risk reporting to the Board. Appropriate personnel, including but not limited to the fund's Chief Compliance Officer (CCO), FMR's internal auditor, the independent accountants, the fund's Treasurer and portfolio management personnel, make periodic reports to the Board's committees, as appropriate, including an annual review of Fidelity's risk management program for the Fidelity® funds. The responsibilities of each standing committee, including their oversight responsibilities, are described further under "Standing Committees of the Trustees."
Interested Trustees*:
Correspondence intended for a Trustee who is an interested person may be sent to Fidelity Investments, 245 Summer Street, Boston, Massachusetts 02210.
Name, Year of Birth; Principal Occupations and Other Relevant Experience+
Jonathan Chiel (1957)
Year of Election or Appointment: 2016
Trustee
Mr. Chiel also serves as Trustee of other Fidelity® funds. Mr. Chiel is Executive Vice President and General Counsel for FMR LLC (diversified financial services company, 2012-present). Previously, Mr. Chiel served as general counsel (2004-2012) and senior vice president and deputy general counsel (2000-2004) for John Hancock Financial Services; a partner with Choate, Hall & Stewart (1996-2000) (law firm); and an Assistant United States Attorney for the United States Attorney’s Office of the District of Massachusetts (1986-95), including Chief of the Criminal Division (1993-1995). Mr. Chiel is a director on the boards of the Boston Bar Foundation and the Maimonides School.
Abigail P. Johnson (1961)
Year of Election or Appointment: 2009
Trustee
Chairman of the Board of Trustees
Ms. Johnson also serves as Trustee of other Fidelity® funds. Ms. Johnson serves as Chairman (2016-present), Chief Executive Officer (2014-present), and Director (2007-present) of FMR LLC (diversified financial services company), President of Fidelity Financial Services (2012-present) and President of Personal, Workplace and Institutional Services (2005-present). Ms. Johnson is Chairman and Director of FMR Co., Inc. (investment adviser firm, 2011-present) and Chairman and Director of FMR (investment adviser firm, 2011-present). Previously, Ms. Johnson served as Vice Chairman (2007-2016) and President (2013-2016) of FMR LLC, President and a Director of FMR (2001-2005), a Trustee of other investment companies advised by FMR, Fidelity Investments Money Management, Inc. (investment adviser firm), and FMR Co., Inc. (2001-2005), Senior Vice President of the Fidelity® funds (2001-2005), and managed a number of Fidelity® funds. Ms. Abigail P. Johnson and Mr. Arthur E. Johnson are not related.
Jennifer Toolin McAuliffe (1959)
Year of Election or Appointment: 2016
Trustee
Ms. McAuliffe also serves as Trustee of other Fidelity® funds. Ms. McAuliffe previously served as a Member of the Advisory Board of certain Fidelity® funds (2016) and as Co-Head of Fixed Income of Fidelity Investments Limited (now known as FIL Limited (FIL)) (diversified financial services company). Earlier roles at FIL included Director of Research for FIL’s credit and quantitative teams in London, Hong Kong and Tokyo. Ms. McAuliffe also was the Director of Research for taxable and municipal bonds at Fidelity Investments Money Management, Inc. Ms. McAuliffe is also a director or trustee of several not-for-profit entities.
* Determined to be an “Interested Trustee” by virtue of, among other things, his or her affiliation with the trust or various entities under common control with FMR.
+ The information includes the Trustee's principal occupation during the last five years and other information relating to the experience, attributes, and skills relevant to the Trustee's qualifications to serve as a Trustee, which led to the conclusion that the Trustee should serve as a Trustee for the fund.
Independent Trustees:
Correspondence intended for an Independent Trustee may be sent to Fidelity Investments, P.O. Box 55235, Boston, Massachusetts 02205-5235.
Name, Year of Birth; Principal Occupations and Other Relevant Experience+
Elizabeth S. Acton (1951)
Year of Election or Appointment: 2013
Trustee
Ms. Acton also serves as Trustee of other Fidelity® funds. Prior to her retirement in April 2012, Ms. Acton was Executive Vice President, Finance (2011-2012), Executive Vice President, Chief Financial Officer (2002-2011), and Treasurer (2004-2005) of Comerica Incorporated (financial services). Prior to joining Comerica, Ms. Acton held a variety of positions at Ford Motor Company (1983-2002), including Vice President and Treasurer (2000-2002) and Executive Vice President and Chief Financial Officer of Ford Motor Credit Company (1998-2000). Ms. Acton currently serves as a member of the Board of Directors and Audit and Finance Committees of Beazer Homes USA, Inc. (homebuilding, 2012-present). Previously, Ms. Acton served as a Member of the Advisory Board of certain Fidelity® funds (2013-2016).
Ann E. Dunwoody (1953)
Year of Election or Appointment: 2018
Trustee
General Dunwoody also serves as Trustee of other Fidelity® funds. General Dunwoody (United States Army, Retired) was the first woman in U.S. military history to achieve the rank of four-star general and prior to her retirement in 2012 held a variety of positions within the U.S. Army, including Commanding General, U.S. Army Material Command (2008-2012). She is the President of First to Four LLC (leadership and mentoring services, 2012-present). She also serves as a member of the Board of Directors and Nominating and Corporate Governance Committee of L3 Technologies, Inc. (communication, electronic, sensor, and aerospace systems, 2013-present), Board of Directors and Nomination and Corporate Governance Committees of Kforce Inc. (professional staffing services, 2016-present) and Board of Directors of Automattic Inc. (software engineering, 2018-present). Previously, General Dunwoody served as a Member of the Advisory Board of certain Fidelity® funds (2018), a member of the Board of Directors and Audit and Sustainability and Corporate Responsibility Committees of Republic Services, Inc. (waste collection, disposal and recycling, 2013-2016). Ms. Dunwoody also serves on several boards for non-profit organizations, including as a member of the Board of Directors, Chair of the Nomination and Governance Committee and member of the Audit Committee of Logistics Management Institute (consulting non-profit, 2012-present), a member of the Board of Directors of the Army Historical Foundation (2015-present), a member of the Council of Trustees for the Association of the United States Army (advocacy non-profit, 2013-present) and a member of the Board of Trustees of Florida Institute of Technology (2015-present) and ThanksUSA (military family education non-profit, 2014-present).
John Engler (1948)
Year of Election or Appointment: 2014
Trustee
Mr. Engler also serves as Trustee of other Fidelity® funds. He serves on the board of directors for Universal Forest Products (manufacturer and distributor of wood and wood-alternative products, 2003-present) and K12 Inc. (technology-based education company, 2012-present). Previously, Mr. Engler served as interim president of Michigan State University (2018-2019), a Member of the Advisory Board of certain Fidelity® funds (2014-2016), president of the Business Roundtable (2011-2017), a trustee of The Munder Funds (2003-2014), president and CEO of the National Association of Manufacturers (2004-2011), member of the Board of Trustees of the Annie E. Casey Foundation (2004-2015), and as governor of Michigan (1991-2003). He is a past chairman of the National Governors Association.
Robert F. Gartland (1951)
Year of Election or Appointment: 2010
Trustee
Mr. Gartland also serves as Trustee of other Fidelity® funds. Mr. Gartland is Chairman and an investor in Gartland & Mellina Group Corp. (consulting, 2009-present). Previously, Mr. Gartland served as a partner and investor of Vietnam Partners LLC (investments and consulting, 2008-2011). Prior to his retirement, Mr. Gartland held a variety of positions at Morgan Stanley (financial services, 1979-2007), including Managing Director (1987-2007), and Chase Manhattan Bank (1975-1978).
Arthur E. Johnson (1947)
Year of Election or Appointment: 2008
Trustee
Chairman of the Independent Trustees
Mr. Johnson also serves as Trustee of other Fidelity® funds. Mr. Johnson serves as a member of the Board of Directors of Eaton Corporation plc (diversified power management, 2009-present) and Booz Allen Hamilton (management consulting, 2011-present). Prior to his retirement, Mr. Johnson served as Senior Vice President of Corporate Strategic Development of Lockheed Martin Corporation (defense contractor, 1999-2009). Mr. Johnson previously served as Vice Chairman (2015-2018) of the Independent Trustees of certain Fidelity® funds and on the Board of Directors of IKON Office Solutions, Inc. (1999-2008), AGL Resources, Inc. (holding company, 2002-2016), and Delta Airlines (2005-2007). Mr. Arthur E. Johnson is not related to Ms. Abigail P. Johnson.
Michael E. Kenneally (1954)
Year of Election or Appointment: 2009
Trustee
Vice Chairman of the Independent Trustees
Mr. Kenneally also serves as Trustee of other Fidelity® funds. Prior to his retirement, Mr. Kenneally served as Chairman and Global Chief Executive Officer of Credit Suisse Asset Management. Before joining Credit Suisse, he was an Executive Vice President and Chief Investment Officer for Bank of America Corporation. Earlier roles at Bank of America included Director of Research, Senior Portfolio Manager and Research Analyst, and Mr. Kenneally was awarded the Chartered Financial Analyst (CFA) designation in 1991.
Marie L. Knowles (1946)
Year of Election or Appointment: 2001
Trustee
Ms. Knowles also serves as Trustee of other Fidelity® funds. Prior to Ms. Knowles' retirement in June 2000, she served as Executive Vice President and Chief Financial Officer of Atlantic Richfield Company (ARCO) (diversified energy, 1996-2000). From 1993 to 1996, she was a Senior Vice President of ARCO and President of ARCO Transportation Company (pipeline and tanker operations). Ms. Knowles currently serves as a Director and Chairman of the Audit Committee of McKesson Corporation (healthcare service, since 2002). Ms. Knowles is a member of the Board of the Santa Catalina Island Company (real estate, 2009-present). Ms. Knowles is a Member of the Investment Company Institute Board of Governors and a Member of the Governing Council of the Independent Directors Council (2014-present). She also serves as a member of the Advisory Board for the School of Engineering of the University of Southern California. Previously, Ms. Knowles served as a Director of Phelps Dodge Corporation (copper mining and manufacturing, 1994-2007), URS Corporation (engineering and construction, 2000-2003) and America West (airline, 1999-2002). Ms. Knowles previously served as Chairman (2015-2018) and Vice Chairman (2012-2015) of the Independent Trustees of certain Fidelity® funds.
Mark A. Murray (1954)
Year of Election or Appointment: 2016
Trustee
Mr. Murray also serves as Trustee of other Fidelity® funds. Mr. Murray is Vice Chairman (2013-present) of Meijer, Inc. (regional retail chain). Previously, Mr. Murray served as a Member of the Advisory Board of certain Fidelity® funds (2016) and as Co-Chief Executive Officer (2013-2016) and President (2006-2013) of Meijer, Inc. Mr. Murray serves as a member of the Board of Directors and Nuclear Review and Public Policy and Responsibility Committees of DTE Energy Company (diversified energy company, 2009-present). Mr. Murray also serves as a member of the Board of Directors of Spectrum Health (not-for-profit health system, 2015-present). Mr. Murray previously served as President of Grand Valley State University (2001-2006), Treasurer for the State of Michigan (1999-2001), Vice President of Finance and Administration for Michigan State University (1998-1999), and a member of the Board of Directors and Audit Committee and Chairman of the Nominating and Corporate Governance Committee of Universal Forest Products, Inc. (manufacturer and distributor of wood and wood-alternative products, 2004-2016). Mr. Murray is also a director or trustee of many community and professional organizations.
+ The information includes the Trustee's principal occupation during the last five years and other information relating to the experience, attributes, and skills relevant to the Trustee's qualifications to serve as a Trustee, which led to the conclusion that the Trustee should serve as a Trustee for the fund.
Advisory Board Members and Officers:
Correspondence intended for an officer may be sent to Fidelity Investments, 245 Summer Street, Boston, Massachusetts 02210. Officers appear below in alphabetical order.
Name, Year of Birth; Principal Occupation
Elizabeth Paige Baumann (1968)
Year of Election or Appointment: 2017
Anti-Money Laundering (AML) Officer
Ms. Baumann also serves as AML Officer of other funds. She is Chief AML Officer (2012-present) and Senior Vice President (2014-present) of FMR LLC (diversified financial services company) and is an employee of Fidelity Investments. Previously, Ms. Baumann served as AML Officer of the funds (2012-2016), and Vice President (2007-2014) and Deputy Anti-Money Laundering Officer (2007-2012) of FMR LLC.
Craig S. Brown (1977)
Year of Election or Appointment: 2019
Assistant Treasurer
Mr. Brown also serves as Assistant Treasurer of other funds. Mr. Brown is an employee of Fidelity Investments (2013-present).
John J. Burke III (1964)
Year of Election or Appointment: 2018
Chief Financial Officer
Mr. Burke also serves as Chief Financial Officer of other funds. Mr. Burke serves as Head of Investment Operations for Fidelity Fund and Investment Operations (2018-present) and is an employee of Fidelity Investments (1998-present). Previously Mr. Burke served as head of Asset Management Investment Operations (2012-2018).
Jonathan Davis (1968)
Year of Election or Appointment: 2010
Assistant Treasurer
Mr. Davis also serves as Assistant Treasurer of other funds. Mr. Davis serves as Assistant Treasurer of FMR Capital, Inc. (2017-present) and is an employee of Fidelity Investments. Previously, Mr. Davis served as Vice President and Associate General Counsel of FMR LLC (diversified financial services company, 2003-2010).
Adrien E. Deberghes (1967)
Year of Election or Appointment: 2010
Assistant Treasurer
Mr. Deberghes also serves as an officer of other funds. He serves as Assistant Treasurer of FMR Capital, Inc. (2017-present), Executive Vice President of Fidelity Investments Money Management, Inc. (FIMM) (investment adviser firm, 2016-present), and is an employee of Fidelity Investments (2008-present). Previously, Mr. Deberghes served as President and Treasurer of certain Fidelity® funds (2013-2018). Prior to joining Fidelity Investments, Mr. Deberghes was Senior Vice President of Mutual Fund Administration at State Street Corporation (2007-2008), Senior Director of Mutual Fund Administration at Investors Bank & Trust (2005-2007), and Director of Finance for Dunkin' Brands (2000-2005). Previously, Mr. Deberghes served in other fund officer roles.
Laura M. Del Prato (1964)
Year of Election or Appointment: 2018
President and Treasurer
Ms. Del Prato also serves as an officer of other funds. Ms. Del Prato is an employee of Fidelity Investments (2017-present). Prior to joining Fidelity Investments, Ms. Del Prato served as a Managing Director and Treasurer of the JPMorgan Mutual Funds (2014-2017). Prior to JPMorgan, Ms. Del Prato served as a partner at Cohen Fund Audit Services (accounting firm, 2012-2013) and KPMG LLP (accounting firm, 2004-2012).
Colm A. Hogan (1973)
Year of Election or Appointment: 2016
Assistant Treasurer
Mr. Hogan also serves as an officer of other funds. Mr. Hogan serves as Assistant Treasurer of FMR Capital, Inc. (2017-present) and is an employee of Fidelity Investments (2005-present). Previously, Mr. Hogan served as Assistant Treasurer of certain Fidelity® funds (2016-2018).
Cynthia Lo Bessette (1969)
Year of Election or Appointment: 2019
Secretary and Chief Legal Officer (CLO)
Ms. Lo Bessette also serves as Secretary and CLO of other funds. She is a Senior Vice President and Deputy General Counsel of FMR LLC (diversified financial services company, 2019-present), and is an employee of Fidelity Investments. Previously, Ms. Lo Bessette served as Executive Vice President, General Counsel (2016-2019) and Senior Vice President, Deputy General Counsel (2015-2016) of OppenheimerFunds (investment management company) and Deputy Chief Legal Officer (2013-2015) of Jennison Associates LLC (investment adviser firm).
Chris Maher (1972)
Year of Election or Appointment: 2013
Assistant Treasurer
Mr. Maher serves as Assistant Treasurer of other funds. Mr. Maher is Vice President of Valuation Oversight, serves as Assistant Treasurer of FMR Capital, Inc. (2017-present), and is an employee of Fidelity Investments. Previously, Mr. Maher served as Vice President of Asset Management Compliance (2013), Vice President of the Program Management Group of FMR (investment adviser firm, 2010-2013), and Vice President of Valuation Oversight (2008-2010).
John B. McGinty, Jr. (1962)
Year of Election or Appointment: 2016
Chief Compliance Officer
Mr. McGinty also serves as Chief Compliance Officer of other funds. Mr. McGinty is Senior Vice President of Asset Management Compliance for Fidelity Investments and is an employee of Fidelity Investments (2016-present). Mr. McGinty previously served as Vice President, Senior Attorney at Eaton Vance Management (investment management firm, 2015-2016), and prior to Eaton Vance as global CCO for all firm operations and registered investment companies at GMO LLC (investment management firm, 2009-2015). Before joining GMO LLC, Mr. McGinty served as Senior Vice President, Deputy General Counsel for Fidelity Investments (2007-2009).
Jason P. Pogorelec (1975)
Year of Election or Appointment: 2015
Assistant Secretary
Mr. Pogorelec also serves as Assistant Secretary of other funds. Mr. Pogorelec serves as Vice President, Associate General Counsel (2010-present) and is an employee of Fidelity Investments (2006-present).
Nancy D. Prior (1967)
Year of Election or Appointment: 2014
Vice President
Ms. Prior also serves as Vice President of other funds. Ms. Prior serves as President of Fixed Income (2014-present), President (2016-present) and Director (2014-present) of Fidelity Investments Money Management, Inc. (FIMM) (investment adviser firm), and is an employee of Fidelity Investments (2002-present). Previously, Ms. Prior served as Vice Chairman of FIAM LLC (investment adviser firm, 2014-2018), a Director of FMR Investment Management (UK) Limited (investment adviser firm, 2015-2018), President Multi-Asset Class Strategies of FMR's Global Asset Allocation Division (2017-2018), Vice President of Fidelity's Money Market Funds (2012-2014), and President, Money Market and Short Duration Bond Group of Fidelity Management & Research Company (FMR) (investment adviser firm, 2013-2014).
Stacie M. Smith (1974)
Year of Election or Appointment: 2013
Assistant Treasurer
Ms. Smith also serves as an officer of other funds. Ms. Smith serves as Assistant Treasurer of FMR Capital, Inc. (2017-present), is an employee of Fidelity Investments (2009-present), and has served in other fund officer roles. Prior to joining Fidelity Investments, Ms. Smith served as Senior Audit Manager of Ernst & Young LLP (accounting firm, 1996-2009). Previously, Ms. Smith served as Assistant Treasurer (2013-2018) and Deputy Treasurer (2013-2016) of certain Fidelity® funds.
Marc L. Spector (1972)
Year of Election or Appointment: 2016
Deputy Treasurer
Mr. Spector also serves as an officer of other funds. Mr. Spector serves as Assistant Treasurer of FMR Capital, Inc. (2017-present) and is an employee of Fidelity Investments (2016-present). Prior to joining Fidelity Investments, Mr. Spector served as Director at the Siegfried Group (accounting firm, 2013-2016), and prior to Siegfried Group as audit senior manager at Deloitte & Touche (accounting firm, 2005-2013).
Jim Wegmann (1979)
Year of Election or Appointment: 2019
Assistant Treasurer
Mr. Wegmann also serves as Assistant Treasurer of other funds. Mr. Wegmann is an employee of Fidelity Investments (2011-present).
Shareholder Expense Example
As a shareholder of the Fund, you incur two types of costs: (1) transaction costs and (2) ongoing costs, including other Fund expenses. This Example is intended to help you understand your ongoing costs (in dollars) of investing in the Fund and to compare these costs with the ongoing costs of investing in other mutual funds.
The actual expense Example is based on an investment of $1,000 invested at the beginning of the period and held for the entire period (April 26, 2019 to August 31, 2019). The hypothetical expense Example is based on an investment of $1,000 invested for the one-half year period (March 1, 2019 to August 31, 2019).
Actual Expenses
The first line of the accompanying table provides information about actual account values and actual expenses. You may use the information in this line, together with the amount you invested, to estimate the expenses that you paid over the period. Simply divide your account value by $1,000.00 (for example, an $8,600 account value divided by $1,000.00 = 8.6), then multiply the result by the number in the first line under the heading entitled "Expenses Paid During Period" to estimate the expenses you paid on your account during this period. In addition, the Fund, as a shareholder in the underlying Fidelity Central Funds, will indirectly bear its pro-rata share of the fees and expenses incurred by the underlying Fidelity Central Funds. These fees and expenses are not included in the Fund's annualized expense ratio used to calculate the expense estimate in the table below.
Hypothetical Example for Comparison Purposes
The second line of the accompanying table provides information about hypothetical account values and hypothetical expenses based on the Fund's actual expense ratio and an assumed rate of return of 5% per year before expenses, which is not the Fund's actual return. The hypothetical account values and expenses may not be used to estimate the actual ending account balance or expenses you paid for the period. You may use this information to compare the ongoing costs of investing in the Fund and other funds. To do so, compare this 5% hypothetical example with the 5% hypothetical examples that appear in the shareholder reports of the other funds. In addition, the Fund, as a shareholder in the underlying Fidelity Central Funds, will indirectly bear its pro-rata share of the fees and expenses incurred by the underlying Fidelity Central Funds. These fees and expenses are not included in the Fund's annualized expense ratio used to calculate the expense estimate in the table below.
Please note that the expenses shown in the table are meant to highlight your ongoing costs only and do not reflect any transaction costs. Therefore, the second line of the table is useful in comparing ongoing costs only, and will not help you determine the relative total costs of owning different funds.
| | Annualized Expense Ratio-A | Beginning
Account Value
April 26, 2019 | Ending
Account Value
August 31, 2019 | Expenses Paid
During Period-B
April 26, 2019
to August 31, 2019 |
| Actual | - %-C | $1,000.00 | $1,060.10 | $--B,D |
| Hypothetical-E | | $1,000.00 | $1,025.21 | $--D,F |
A Annualized expense ratio reflects expenses net of applicable fee waivers.
B Actual expenses are equal to the Fund's annualized expense ratio, multiplied by the average account value over the period, multiplied by 128/365 (to reflect the period April 26, 2019 to August 31, 2019).
C Amount represents less than .005%.
D Amount represents less than $.005.
E 5% return per year before expenses
F Hypothetical expenses are equal to the Fund's annualized expense ratio, multiplied by the average account value over the period, multiplied by 184/365 (to reflect the one-half year period).
Distributions (Unaudited)
The Board of Trustees of Fidelity Series Bond Index Fund voted to pay on October 14, 2019, to shareholders of record at the opening of business on October 11, 2019, a distribution of $0.014 per share derived from capital gains realized from sales of portfolio securities.
A total of 33.80% of the dividends distributed during the fiscal year was derived from interest on U.S. Government securities which is generally exempt from state income tax.
The fund will notify shareholders in January 2020 of amounts for use in preparing 2019 income tax returns.
Board Approval of Investment Advisory Contracts and Management Fees
Fidelity Series Bond Index Fund
In January 2019, the Board of Trustees, including the Independent Trustees (together, the Board), voted to approve the management contract with Fidelity Management & Research Company (FMR) and the sub-advisory agreements with affiliates of FMR (together, the Advisory Contracts) for the fund. FMR and the sub-advisers are collectively referred to herein as the Investment Advisers. The Board, assisted by the advice of fund counsel and Independent Trustees' counsel, considered a broad range of information.
Nature, Extent, and Quality of Services Provided. The Board considered staffing as it relates to the fund, including the backgrounds of investment personnel of Fidelity, and also considered the fund's investment objective, strategies, and related investment philosophy, and the purpose of Series funds generally. The Board considered the structure of the investment personnel compensation program, and whether this structure, provides, appropriate incentives to act in the best interests of the fund.
Resources Dedicated to Investment Management and Support Services. The Board reviewed the general qualifications and capabilities of Fidelity's investment staff, including its size, education, experience, and resources, as well as Fidelity's approach to recruiting, managing, and compensating investment personnel. The Board noted that Fidelity has continued to increase the resources devoted to non-U.S. offices, including expansion of Fidelity's global investment organization. The Board also noted that Fidelity's analysts have extensive resources, tools and capabilities that allow them to conduct sophisticated quantitative and fundamental analysis, as well as credit analysis of issuers, counterparties and guarantors. Further, the Board considered that Fidelity's investment professionals have sufficient access to global information and data so as to provide competitive investment results over time, and that those professionals also have access to sophisticated tools that permit them to assess portfolio construction and risk and performance attribution characteristics continuously, as well as to transmit new information and research conclusions rapidly around the world. Additionally, in its deliberations, the Board considered Fidelity's trading, risk management, compliance, and technology and operations capabilities and resources, which are integral parts of the investment management process.
Administrative Services. The Board considered the nature, extent, quality, and cost of advisory and administrative services to be performed by the Investment Advisers and their affiliates under the Advisory Contracts and under separate agreements covering transfer agency, pricing and bookkeeping, and securities lending services for the fund. The Board also considered the nature and extent of the supervision of third party service providers, principally custodians, subcustodians, and pricing vendors.
Investment Performance. The fund is a new fund and therefore had no historical performance for the Board to review at the time it approved the fund's Advisory Contracts. The Board considered the Investment Advisers' strength in fundamental, research-driven security selection, which the Board is familiar with through its supervision of other Fidelity funds.
Based on its review, the Board concluded that the nature, extent, and quality of services to be provided to the fund under the Advisory Contracts should benefit the shareholders of the fund.
Competitiveness of Management Fee and Total Expense Ratio. The Board considered that the fund will not pay FMR a management fee for investment advisory services. In reviewing the Advisory Contracts, the Board also considered the projected total expense ratio of the fund. The Board noted that FMR or an affiliate undertakes to pay all operating expenses of the fund, except transfer agent fees, 12b-1 fees, Independent Trustee fees and expenses, custodian fees and expenses, proxy and shareholder meeting expenses, interest, taxes, and extraordinary expenses (such as litigation expenses).
The Board also noted that FMR has contractually agreed to reimburse the fund to the extent that total operating expenses (excluding interest, certain taxes, fees and expenses of the Independent Trustees, proxy and shareholder meeting expenses, extraordinary expenses, and acquired fund fees and expenses, if any, as well as non-operating expenses such as brokerage commissions and fees and expenses associated with the fund's securities lending program, if applicable), as a percentage of its average net assets exceed 0.014%, through December 31, 2022.
Based on its review, the Board considered that the fund will not pay a management fee and concluded that the fund's projected total expense ratio was reasonable in light of the services that the fund and its shareholders will receive and the other factors considered.
Costs of the Services and Profitability. The fund is a new fund and therefore no revenue, cost, or profitability data was available for the Board to review in respect of the fund at the time it approved the Advisory Contracts. In connection with its future renewal of the fund's Advisory Contracts, the Board will consider the level of Fidelity's profits in respect of all the Fidelity funds.
Economies of Scale. The Board concluded that because the fund will pay no advisory fees and FMR or an affiliate will bear all expenses of the fund, with certain limited exceptions, the realization of economies of scale was not a material factor in the Board's decision to approve the fund's Advisory Contracts.
Additional Information Requested by the Board. In order to develop fully the factual basis for consideration of the Advisory Contracts, the Board received information explaining that the fund is offered exclusively to other Fidelity funds, which use the fund to gain exposure to a specific type of investment. The Board also noted that those Fidelity funds investing in the fund will benefit from investing in one centralized fund as the fund may deliver more uniform asset class performance and offer additional opportunities to generate returns and diversify the investing funds' fixed income allocations.
Based on its evaluation of all of the conclusions noted above, and after considering all factors it believed relevant, the Board concluded that the advisory and sub-advisory fee arrangements are fair and reasonable, and that the fund's Advisory Contracts should be approved.
SBX-ANN-1019
1.9892975.100
Fidelity® SAI Total Bond Fund Offered exclusively to certain clients of the Adviser or its affiliates - not available for sale to the general public. Fidelity SAI is a product name of Fidelity® funds dedicated to certain programs affiliated with Strategic Advisers LLC.
Annual Report August 31, 2019 |
|
Beginning on January 1, 2021, as permitted by regulations adopted by the Securities and Exchange Commission, paper copies of a fund’s shareholder reports will no longer be sent by mail, unless you specifically request paper copies of the reports from the fund or from your financial intermediary, such as a financial advisor, broker-dealer or bank. Instead, the reports will be made available on a website, and you will be notified by mail each time a report is posted and provided with a website link to access the report.
If you already elected to receive shareholder reports electronically, you will not be affected by this change and you need not take any action. You may elect to receive shareholder reports and other communications from a fund electronically, by contacting your financial intermediary. For Fidelity customers, visit Fidelity's web site or call Fidelity using the contact information listed below.
You may elect to receive all future reports in paper free of charge. If you wish to continue receiving paper copies of your shareholder reports, you may contact your financial intermediary or, if you are a Fidelity customer, visit Fidelity’s website, or call Fidelity at the applicable toll-free number listed below. Your election to receive reports in paper will apply to all funds held with the fund complex/your financial intermediary.
| Account Type | Website | Phone Number |
| Brokerage, Mutual Fund, or Annuity Contracts: | fidelity.com/mailpreferences | 1-800-343-3548 |
| Employer Provided Retirement Accounts: | netbenefits.fidelity.com/preferences (choose 'no' under Required Disclosures to continue to print) | 1-800-343-0860 |
| Advisor Sold Accounts Serviced Through Your Financial Intermediary: | Contact Your Financial Intermediary | Your Financial Intermediary's phone number |
| Advisor Sold Accounts Serviced by Fidelity: | institutional.fidelity.com | 1-877-208-0098 |
Contents
To view a fund's proxy voting guidelines and proxy voting record for the 12-month period ended June 30, visit http://www.fidelity.com/proxyvotingresults or visit the Securities and Exchange Commission's (SEC) web site at http://www.sec.gov.
You may also call 1-800-544-3455 to request a free copy of the proxy voting guidelines.
Standard & Poor's, S&P and S&P 500 are registered service marks of The McGraw-Hill Companies, Inc. and have been licensed for use by Fidelity Distributors Corporation.
Other third-party marks appearing herein are the property of their respective owners.
All other marks appearing herein are registered or unregistered trademarks or service marks of FMR LLC or an affiliated company. © 2019 FMR LLC. All rights reserved.
This report and the financial statements contained herein are submitted for the general information of the shareholders of the Fund. This report is not authorized for distribution to prospective investors in the Fund unless preceded or accompanied by an effective prospectus.
A fund files its complete schedule of portfolio holdings with the SEC for the first and third quarters of each fiscal year on Form N-PORT. Forms N-PORT are available on the SEC’s web site at http://www.sec.gov. A fund's Forms N-PORT may be reviewed and copied at the SEC’s Public Reference Room in Washington, DC. Information regarding the operation of the SEC's Public Reference Room may be obtained by calling 1-800-SEC-0330.
For a complete list of a fund's portfolio holdings, view the most recent holdings listing, semiannual report, or annual report on Fidelity's web site at http://www.fidelity.com, http://www.institutional.fidelity.com, or http://www.401k.com, as applicable.
NOT FDIC INSURED •MAY LOSE VALUE •NO BANK GUARANTEE
Neither the Fund nor Fidelity Distributors Corporation is a bank.
Performance: The Bottom Line
Average annual total return reflects the change in the value of an investment, assuming reinvestment of distributions from dividend income and capital gains (the profits earned upon the sale of securities that have grown in value, if any) and assuming a constant rate of performance each year. The hypothetical investment and the average annual total returns do not reflect the deduction of taxes that a shareholder would pay on fund distributions or the redemption of fund shares. During periods of reimbursement by Fidelity, a fund’s total return will be greater than it would be had the reimbursement not occurred. How a fund did yesterday is no guarantee of how it will do tomorrow.
Average annual total returns for Fidelity® SAI Total Bond Fund will be reported once the fund is a year old.
$10,000 Over Life of Fund
Let's say hypothetically that $10,000 was invested in Fidelity® SAI Total Bond Fund on October 25, 2018, when the fund started.
The chart shows how the value of your investment would have changed, and also shows how the undefined performed over the same period.
| Period Ending Values |
| $11,067 | Fidelity® SAI Total Bond Fund |
| $11,154 | Bloomberg Barclays U.S. Aggregate Bond Index |
Management's Discussion of Fund Performance
Market Recap: For the 12 months ending August 31, 2019, U.S. taxable investment-grade bonds posted their strongest trailing one-year return since 2009, driven by slower global economic growth, a maturing business cycle, trade uncertainty and, late in the period, the Fed’s dovish shift. The Bloomberg Barclays U.S. Aggregate Bond Index gained 10.17%. Market yields rose in the early fall of 2018, on expectations for higher inflation. Yields then declined and credit spreads widened in November and December, partly because of weaker U.S. manufacturing data. Yield spreads narrowed in January, as the U.S. Federal Reserve said it would be “patient” with policy rate hikes, and that future increases largely would depend on economic data. Yields continued to decline in the spring, amid continued international trade tension and attacks on oil tankers in the Middle East, and then tumbled further in July, when the Fed cut interest rates for the first time since 2008. The yield curve ended the period roughly flat, amid expectations for another rate cut of 25 basis points in September. Within the Bloomberg Barclays index, corporate bonds gained 13.33%, topping the 10.38% advance of U.S. Treasuries. Outside the index, U.S. corporate high-yield bonds lagged nominal U.S. Treasuries, while Treasury Inflation-Protected Securities (TIPS) gained 7.46%.
Comments from Lead Manager Ford O'Neil and Co-Manager Celso Munoz: The fund gained 10.67% since inception on October 25, 2018, through August 31, 2019, lagging, net of fees, the 11.54% advance of the benchmark Bloomberg Barclays U.S. Aggregate Bond Index over the same time frame. Underweighting the bonds of industrial companies detracted from the fund's relative return, especially the bonds of certain technology, capital goods and consumer-related firms. The fund's positioning along the yield curve also hampered performance versus the benchmark to a degree, as did owning Treasury Inflation-Protected Securities (TIPS). Conversely, security selection among corporate bonds added value overall, especially choices among banking institutions and certain industrial segments, including consumer non-cyclicals. Overweighting financials also contributed. Elsewhere, underweighting U.S. Treasury and mortgage securities was helpful, as was exposure to "plus" sectors, namely emerging-markets debt, high-yield bonds and floating-rate loans.
The views expressed above reflect those of the portfolio manager(s) only through the end of the period as stated on the cover of this report and do not necessarily represent the views of Fidelity or any other person in the Fidelity organization. Any such views are subject to change at any time based upon market or other conditions and Fidelity disclaims any responsibility to update such views. These views may not be relied on as investment advice and, because investment decisions for a Fidelity fund are based on numerous factors, may not be relied on as an indication of trading intent on behalf of any Fidelity fund.
Note to shareholders: On December 1, 2018, Timothy Gill assumed co-management responsibilities for the emerging-markets subportfolio, joining Jonathan Kelly.
Investment Summary (Unaudited)
Quality Diversification (% of fund's net assets)
| As of August 31, 2019 |
| | U.S. Government and U.S. Government Agency Obligations | 53.8% |
| | AAA | 3.9% |
| | AA | 1.0% |
| | A | 5.9% |
| | BBB | 21.8% |
| | BB and Below | 14.9% |
| | Not Rated | 1.8% |
| | Short-Term Investments and Net Other Assets* | (3.1)% |

* Short-Term Investments and Net Other Assets (Liabilities) are not included in the pie chart
We have used ratings from Moody's Investors Service, Inc. Where Moody's® ratings are not available, we have used S&P® ratings. All ratings are as of the date indicated and do not reflect subsequent changes.
Asset Allocation (% of fund's net assets)
| As of August 31, 2019*,**,*** |
| | Corporate Bonds | 35.1% |
| | U.S. Government and U.S. Government Agency Obligations | 53.8% |
| | Asset-Backed Securities | 2.4% |
| | CMOs and Other Mortgage Related Securities | 3.8% |
| | Municipal Bonds | 0.7% |
| | Other Investments | 7.3% |
| | Short-Term Investments and Net Other Assets (Liabilities)† | (3.1)% |
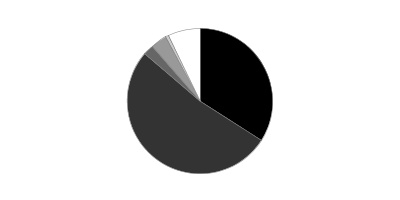
* Foreign investments - 14.1%
** Futures and Swaps - 2.1%
*** Written options - (0.4)%
† Short-Term Investments and Net Other Assets (Liabilities) are not included in the pie chart
Percentages in the above tables are adjusted for the effect of TBA Sale Commitments.
Schedule of Investments August 31, 2019
Showing Percentage of Net Assets
| Corporate Bonds - 35.1% | | | |
| | | Principal Amount(a) | Value |
| Convertible Bonds - 0.0% | | | |
| COMMUNICATION SERVICES - 0.0% | | | |
| Media - 0.0% | | | |
| DISH Network Corp.: | | | |
| 2.375% 3/15/24 | | $2,072,000 | $1,807,389 |
| 3.375% 8/15/26 | | 1,092,000 | 1,004,916 |
| | | | 2,812,305 |
| Nonconvertible Bonds - 35.1% | | | |
| COMMUNICATION SERVICES - 3.3% | | | |
| Diversified Telecommunication Services - 1.1% | | | |
| Altice Finco SA 7.625% 2/15/25 (b) | | 3,236,000 | 3,333,080 |
| AT&T, Inc.: | | | |
| 2.45% 6/30/20 | | 4,099,000 | 4,106,411 |
| 3% 6/30/22 | | 4,553,000 | 4,654,878 |
| 3.4% 5/15/25 | | 14,343,000 | 15,064,779 |
| 3.6% 2/17/23 | | 15,282,000 | 15,975,139 |
| 3.6% 7/15/25 | | 2,325,000 | 2,450,235 |
| 4.3% 2/15/30 | | 5,781,000 | 6,419,396 |
| 4.45% 4/1/24 | | 855,000 | 930,396 |
| 4.5% 3/9/48 | | 7,500,000 | 8,186,444 |
| 6.2% 3/15/40 | | 4,280,000 | 5,502,850 |
| 6.3% 1/15/38 | | 6,048,000 | 7,830,923 |
| Axtel S.A.B. de CV 6.375% 11/14/24 (b) | | 574,000 | 579,919 |
| BellSouth Capital Funding Corp. 7.875% 2/15/30 | | 15,000 | 19,936 |
| C&W Senior Financing Designated Activity Co.: | | | |
| 6.875% 9/15/27 (b) | | 2,840,000 | 3,024,288 |
| 7.5% 10/15/26 (b) | | 3,850,000 | 4,176,480 |
| Colombia Telecomunicaciones SA 5.375% 9/27/22 (b) | | 369,000 | 372,690 |
| Cumulus Media New Holdings, Inc. 6.75% 7/1/26 (b) | | 250,000 | 257,500 |
| Frontier Communications Corp. 8% 4/1/27 (b) | | 3,225,000 | 3,362,063 |
| GTH Finance BV 7.25% 4/26/23 (b) | | 1,265,000 | 1,406,349 |
| Iliad SA 0.625% 11/25/21 (Reg. S) | EUR | 5,800,000 | 6,394,837 |
| Level 3 Communications, Inc. 5.75% 12/1/22 | | 1,748,000 | 1,761,110 |
| Level 3 Financing, Inc.: | | | |
| 5.375% 1/15/24 | | 4,123,000 | 4,195,153 |
| 5.375% 5/1/25 | | 1,002,000 | 1,042,080 |
| Oztel Holdings SPC Ltd. 5.625% 10/24/23 (b) | | 307,000 | 314,675 |
| Qtel International Finance Ltd. 3.25% 2/21/23 (b) | | 1,200,000 | 1,230,000 |
| Qwest Corp. 6.75% 12/1/21 | | 940,000 | 1,014,025 |
| SFR Group SA: | | | |
| 6.25% 5/15/24 (b) | | 1,880,000 | 1,938,130 |
| 7.375% 5/1/26 (b) | | 5,404,000 | 5,768,770 |
| 8.125% 2/1/27 (b) | | 2,109,000 | 2,325,173 |
| Telecom Argentina SA 8% 7/18/26 (b) | | 230,000 | 182,850 |
| Telecom Italia Capital SA: | | | |
| 6% 9/30/34 | | 935,000 | 958,375 |
| 6.375% 11/15/33 | | 530,000 | 560,475 |
| Telecom Italia SpA 5.303% 5/30/24 (b) | | 5,150,000 | 5,510,500 |
| Telefonica Celular del Paraguay SA 5.875% 4/15/27 (b) | | 365,000 | 387,813 |
| Telenet Finance Luxembourg Notes SARL 5.5% 3/1/28 (b) | | 4,200,000 | 4,271,400 |
| Turk Telekomunikasyon A/S 6.875% 2/28/25 (b) | | 355,000 | 359,770 |
| U.S. West Communications 7.25% 9/15/25 | | 1,025,000 | 1,157,497 |
| Verizon Communications, Inc.: | | | |
| 4.862% 8/21/46 | | 6,000,000 | 7,471,316 |
| 5.012% 4/15/49 | | 3,325,000 | 4,250,472 |
| 5.5% 3/16/47 | | 13,101,000 | 17,585,421 |
| | | | 156,333,598 |
| Entertainment - 0.1% | | | |
| NBCUniversal, Inc.: | | | |
| 4.45% 1/15/43 | | 3,554,000 | 4,183,470 |
| 5.15% 4/30/20 | | 4,215,000 | 4,296,401 |
| 5.95% 4/1/41 | | 2,485,000 | 3,457,934 |
| | | | 11,937,805 |
| Media - 1.8% | | | |
| Altice Financing SA: | | | |
| 6.625% 2/15/23 (b) | | 1,009,000 | 1,040,531 |
| 7.5% 5/15/26 (b) | | 8,782,000 | 9,352,830 |
| Altice SA 7.75% 5/15/22 (b) | | 446,000 | 457,384 |
| Cablevision SA 6.5% 6/15/21 (b) | | 368,000 | 322,040 |
| Cablevision Systems Corp. 5.875% 9/15/22 | | 1,132,000 | 1,210,900 |
| CCO Holdings LLC/CCO Holdings Capital Corp.: | | | |
| 4% 3/1/23 (b) | | 2,321,000 | 2,344,210 |
| 5% 2/1/28 (b) | | 6,950,000 | 7,297,500 |
| 5.125% 2/15/23 | | 410,000 | 416,663 |
| 5.125% 5/1/23 (b) | | 4,029,000 | 4,121,667 |
| 5.125% 5/1/27 (b) | | 4,043,000 | 4,275,432 |
| 5.5% 5/1/26 (b) | | 4,426,000 | 4,663,898 |
| 5.75% 1/15/24 | | 1,780,000 | 1,820,050 |
| 5.75% 2/15/26 (b) | | 4,058,000 | 4,296,408 |
| Charter Communications Operating LLC/Charter Communications Operating Capital Corp.: | | | |
| 4.464% 7/23/22 | | 7,411,000 | 7,830,581 |
| 4.908% 7/23/25 | | 7,411,000 | 8,190,516 |
| 5.375% 5/1/47 | | 18,624,000 | 20,683,578 |
| 6.484% 10/23/45 | | 2,976,000 | 3,679,945 |
| Comcast Corp.: | | | |
| 3.9% 3/1/38 | | 1,904,000 | 2,134,904 |
| 4.6% 8/15/45 | | 5,017,000 | 6,066,454 |
| 4.65% 7/15/42 | | 4,483,000 | 5,470,385 |
| 6.45% 3/15/37 | | 797,000 | 1,142,895 |
| CSC Holdings LLC: | | | |
| 5.25% 6/1/24 | | 1,554,000 | 1,662,780 |
| 5.375% 7/15/23 (b) | | 3,470,000 | 3,566,327 |
| 5.5% 5/15/26 (b) | | 2,986,000 | 3,157,695 |
| 5.5% 4/15/27 (b) | | 1,468,000 | 1,570,760 |
| 6.75% 11/15/21 | | 2,985,000 | 3,223,800 |
| 7.5% 4/1/28 (b) | | 1,724,000 | 1,939,500 |
| 7.75% 7/15/25 (b) | | 5,519,000 | 5,926,026 |
| DISH DBS Corp.: | | | |
| 5.875% 7/15/22 | | 1,452,000 | 1,502,820 |
| 5.875% 11/15/24 | | 4,644,000 | 4,417,837 |
| 7.75% 7/1/26 | | 492,000 | 483,390 |
| E.W. Scripps Co. 5.125% 5/15/25 (b) | | 1,132,000 | 1,140,490 |
| Fox Corp.: | | | |
| 3.666% 1/25/22 (b) | | 1,416,000 | 1,467,782 |
| 4.03% 1/25/24 (b) | | 2,489,000 | 2,665,694 |
| 4.709% 1/25/29 (b) | | 3,602,000 | 4,172,466 |
| 5.476% 1/25/39 (b) | | 3,552,000 | 4,438,286 |
| 5.576% 1/25/49 (b) | | 2,357,000 | 3,066,720 |
| Globo Comunicacao e Participacoes SA: | | | |
| 4.843% 6/8/25 (b) | | 686,000 | 711,511 |
| 4.875% 4/11/22 (b) | | 205,000 | 212,816 |
| 5.125% 3/31/27 (b) | | 210,000 | 213,675 |
| iHeartCommunications, Inc.: | | | |
| 6.375% 5/1/26 | | 44,547 | 48,111 |
| 8.375% 5/1/27 | | 80,742 | 87,100 |
| Lagardere S.C.A.: | | | |
| 1.625% 6/21/24 (Reg. S) | EUR | 1,800,000 | 2,035,862 |
| 2.75% 4/13/23 (Reg. S) | EUR | 3,100,000 | 3,616,541 |
| MDC Partners, Inc. 6.5% 5/1/24 (b) | | 2,424,000 | 2,205,840 |
| Nielsen Co. SARL (Luxembourg): | | | |
| 5% 2/1/25 (b) | | 1,426,000 | 1,408,175 |
| 5.5% 10/1/21 (b) | | 319,000 | 319,925 |
| Nielsen Finance LLC/Nielsen Finance Co. 5% 4/15/22 (b) | | 3,231,000 | 3,247,155 |
| Sirius XM Radio, Inc.: | | | |
| 3.875% 8/1/22 (b) | | 2,210,000 | 2,248,675 |
| 4.625% 5/15/23 (b) | | 3,605,000 | 3,668,088 |
| 4.625% 7/15/24 (b) | | 1,350,000 | 1,409,063 |
| 5% 8/1/27 (b) | | 3,009,000 | 3,174,495 |
| 5.375% 4/15/25 (b) | | 2,341,000 | 2,428,788 |
| Time Warner Cable, Inc.: | | | |
| 4% 9/1/21 | | 7,359,000 | 7,546,360 |
| 4.5% 9/15/42 | | 11,810,000 | 11,855,114 |
| 5.5% 9/1/41 | | 4,708,000 | 5,120,162 |
| 5.875% 11/15/40 | | 6,004,000 | 6,834,851 |
| 6.55% 5/1/37 | | 17,014,000 | 20,599,445 |
| 7.3% 7/1/38 | | 14,056,000 | 18,030,856 |
| TV Azteca SA de CV 8.25% 8/9/24 (Reg. S) | | 3,333,000 | 3,250,717 |
| Virgin Media Secured Finance PLC 5.5% 8/15/26 (b) | | 1,573,000 | 1,645,751 |
| VTR Finance BV 6.875% 1/15/24 (b) | | 1,792,000 | 1,851,920 |
| Ziggo Bond Finance BV: | | | |
| 5.875% 1/15/25 (b) | | 2,858,000 | 2,954,458 |
| 6% 1/15/27 (b) | | 2,034,000 | 2,120,445 |
| Ziggo Secured Finance BV 5.5% 1/15/27 (b) | | 4,840,000 | 5,105,958 |
| | | | 255,173,001 |
| Wireless Telecommunication Services - 0.3% | | | |
| America Movil S.A.B. de CV 3.125% 7/16/22 | | 3,345,000 | 3,441,503 |
| Citizens Utilities Co. 7.05% 10/1/46 | | 3,751,000 | 1,791,103 |
| Comcel Trust 6.875% 2/6/24 (b) | | 1,411,000 | 1,457,298 |
| Digicel Group Ltd. 6.75% 3/1/23 (b) | | 459,000 | 195,075 |
| Intelsat Jackson Holdings SA 8.5% 10/15/24 (b) | | 2,590,000 | 2,570,575 |
| Millicom International Cellular SA: | | | |
| 6% 3/15/25 (b) | | 807,000 | 837,767 |
| 6.625% 10/15/26 (b) | | 6,429,000 | 7,033,728 |
| 6.625% 10/15/26 (Reg. S) | | 200,000 | 218,813 |
| MTN (Mauritius) Investments Ltd. 6.5% 10/13/26 (b) | | 241,000 | 264,498 |
| MTS International Funding Ltd. 5% 5/30/23 (b) | | 491,000 | 516,164 |
| Neptune Finco Corp. 6.625% 10/15/25 (b) | | 2,765,000 | 2,960,154 |
| Sprint Communications, Inc. 6% 11/15/22 | | 5,039,000 | 5,363,360 |
| Sprint Corp. 7.875% 9/15/23 | | 11,582,000 | 13,029,750 |
| T-Mobile U.S.A., Inc.: | | | |
| 4.5% 2/1/26 | | 1,472,000 | 1,527,200 |
| 6.375% 3/1/25 | | 1,764,000 | 1,826,622 |
| TBG Global Pte. Ltd. 5.25% 2/10/22 (Reg. S) | | 717,000 | 724,005 |
| | | | 43,757,615 |
| TOTAL COMMUNICATION SERVICES | | | 467,202,019 |
| CONSUMER DISCRETIONARY - 1.1% | | | |
| Auto Components - 0.0% | | | |
| Metalsa SA de CV 4.9% 4/24/23 (b) | | 1,487,000 | 1,503,729 |
| Samvardhana Motherson Automotive Systems Group BV 1.8% 7/6/24 (Reg. S) | EUR | 3,352,000 | 3,389,294 |
| | | | 4,893,023 |
| Automobiles - 0.4% | | | |
| General Motors Financial Co., Inc.: | | | |
| 3.15% 1/15/20 | | 9,891,000 | 9,909,250 |
| 3.2% 7/13/20 | | 7,331,000 | 7,372,147 |
| 4% 1/15/25 | | 6,564,000 | 6,756,424 |
| 4.2% 3/1/21 | | 9,534,000 | 9,759,285 |
| 4.25% 5/15/23 | | 1,967,000 | 2,059,559 |
| 4.375% 9/25/21 | | 17,407,000 | 18,028,015 |
| | | | 53,884,680 |
| Diversified Consumer Services - 0.1% | | | |
| Bonitron Designated Activity Co. 8.75% 10/30/22 (b) | | 1,055,000 | 1,121,267 |
| Frontdoor, Inc. 6.75% 8/15/26 (b) | | 1,301,000 | 1,411,585 |
| Ingersoll-Rand Global Holding Co. Ltd. 4.25% 6/15/23 | | 3,073,000 | 3,287,164 |
| Laureate Education, Inc. 8.25% 5/1/25 (b) | | 3,740,000 | 4,071,925 |
| Service Corp. International 5.125% 6/1/29 | | 1,330,000 | 1,423,100 |
| | | | 11,315,041 |
| Hotels, Restaurants & Leisure - 0.5% | | | |
| 1011778 BC Unlimited Liability Co./New Red Finance, Inc.: | | | |
| 4.25% 5/15/24 (b) | | 1,065,000 | 1,099,357 |
| 5% 10/15/25 (b) | | 1,914,000 | 1,976,205 |
| Aramark Services, Inc.: | | | |
| 4.75% 6/1/26 | | 2,622,000 | 2,687,550 |
| 5.125% 1/15/24 | | 915,000 | 943,420 |
| Eldorado Resorts, Inc.: | | | |
| 6% 4/1/25 | | 2,488,000 | 2,637,280 |
| 6% 9/15/26 | | 350,000 | 382,813 |
| ESH Hospitality, Inc. 5.25% 5/1/25 (b) | | 641,000 | 662,634 |
| GLP Capital LP/GLP Financing II, Inc. 5.25% 6/1/25 | | 1,847,000 | 2,030,740 |
| Golden Entertainment, Inc. 7.625% 4/15/26 (b) | | 4,690,000 | 4,878,069 |
| Golden Nugget, Inc. 6.75% 10/15/24 (b) | | 4,745,000 | 4,851,763 |
| Hilton Escrow Issuer LLC 4.25% 9/1/24 | | 2,642,000 | 2,694,840 |
| Hilton Worldwide Finance LLC/Hilton Worldwide Finance Corp.: | | | |
| 4.625% 4/1/25 | | 936,000 | 966,420 |
| 4.875% 4/1/27 | | 555,000 | 584,138 |
| MCE Finance Ltd. 4.875% 6/6/25 (b) | | 4,542,000 | 4,505,357 |
| MGM Growth Properties Operating Partnership LP: | | | |
| 4.5% 9/1/26 | | 6,112,000 | 6,402,320 |
| 4.5% 1/15/28 | | 2,256,000 | 2,306,760 |
| 5.75% 2/1/27 (b) | | 835,000 | 921,798 |
| Penn National Gaming, Inc. 5.625% 1/15/27 (b) | | 2,400,000 | 2,463,240 |
| RHP Hotel Properties LP/RHP Finance Corp. 5% 4/15/23 | | 328,000 | 336,200 |
| Scientific Games Corp.: | | | |
| 5% 10/15/25 (b) | | 1,851,000 | 1,912,527 |
| 10% 12/1/22 | | 1,527,000 | 1,584,263 |
| Stars Group Holdings BV 7% 7/15/26 (b) | | 7,610,000 | 8,076,113 |
| Station Casinos LLC 5% 10/1/25 (b) | | 1,557,000 | 1,588,296 |
| Studio City Co. Ltd.: | | | |
| 5.875% 11/30/19 (b) | | 377,000 | 377,471 |
| 7.25% 11/30/21 (b) | | 544,000 | 556,410 |
| Sugarhouse HSP Gaming Prop Mezz LP/Sugarhouse HSP Gaming Finance Corp. 5.875% 5/15/25 (b) | | 352,000 | 348,480 |
| Times Square Hotel Trust 8.528% 8/1/26 (b) | | 653,739 | 774,023 |
| Wyndham Hotels & Resorts, Inc. 5.375% 4/15/26 (b) | | 1,871,000 | 1,959,873 |
| Wynn Las Vegas LLC/Wynn Las Vegas Capital Corp. 5.25% 5/15/27 (b) | | 1,717,000 | 1,779,241 |
| Wynn Macau Ltd.: | | | |
| 4.875% 10/1/24 (b) | | 3,620,000 | 3,573,619 |
| 5.5% 10/1/27 (b) | | 4,575,000 | 4,512,094 |
| | | | 70,373,314 |
| Household Durables - 0.0% | | | |
| Reynolds Group Issuer, Inc./Reynolds Group Issuer LLC/Reynolds Group Issuer (Luxembourg) SA: | | | |
| 3 month U.S. LIBOR + 3.500% 5.8034% 7/15/21 (b)(c)(d) | | 512,000 | 511,360 |
| 5.125% 7/15/23 (b) | | 1,656,000 | 1,702,451 |
| 7% 7/15/24 (b) | | 1,760,000 | 1,819,400 |
| | | | 4,033,211 |
| Internet & Direct Marketing Retail - 0.1% | | | |
| Zayo Group LLC/Zayo Capital, Inc.: | | | |
| 5.75% 1/15/27 (b) | | 2,169,000 | 2,212,380 |
| 6.375% 5/15/25 | | 3,445,000 | 3,544,044 |
| | | | 5,756,424 |
| Leisure Products - 0.0% | | | |
| Mattel, Inc. 6.75% 12/31/25 (b) | | 2,123,000 | 2,181,383 |
| Multiline Retail - 0.0% | | | |
| John Lewis PLC 6.125% 1/21/25 | GBP | 1,269,000 | 1,759,987 |
| Marks & Spencer PLC 3.25% 7/10/27 (Reg. S) | GBP | 2,450,000 | 2,974,900 |
| | | | 4,734,887 |
| Specialty Retail - 0.0% | | | |
| Staples, Inc. 10.75% 4/15/27 (b) | | 500,000 | 505,000 |
| Textiles, Apparel & Luxury Goods - 0.0% | | | |
| Delta Merlin Dunia Tekstil PT 8.625% 3/12/24 (b) | | 245,000 | 75,567 |
| The William Carter Co. 5.625% 3/15/27 (b) | | 1,450,000 | 1,544,221 |
| | | | 1,619,788 |
| TOTAL CONSUMER DISCRETIONARY | | | 159,296,751 |
| CONSUMER STAPLES - 2.2% | | | |
| Beverages - 0.8% | | | |
| Anheuser-Busch InBev Finance, Inc.: | | | |
| 4.7% 2/1/36 | | 13,110,000 | 15,260,504 |
| 4.9% 2/1/46 | | 16,343,000 | 19,438,604 |
| Anheuser-Busch InBev Worldwide, Inc.: | | | |
| 4.75% 4/15/58 | | 10,214,000 | 11,957,534 |
| 5.45% 1/23/39 | | 9,200,000 | 11,740,112 |
| 5.55% 1/23/49 | | 21,036,000 | 27,710,892 |
| 5.8% 1/23/59 (Reg. S) | | 22,287,000 | 30,411,731 |
| Central American Bottling Corp. 5.75% 1/31/27 (b) | | 107,000 | 113,052 |
| Constellation Brands, Inc. 4.25% 5/1/23 | | 1,889,000 | 2,026,878 |
| | | | 118,659,307 |
| Food & Staples Retailing - 0.1% | | | |
| C&S Group Enterprises LLC 5.375% 7/15/22 (b) | | 1,715,000 | 1,719,288 |
| Casino Guichard Perrachon SA 5.244% 3/9/20 (c) | EUR | 900,000 | 1,005,080 |
| Walgreens Boots Alliance, Inc.: | | | |
| 2.7% 11/18/19 | | 3,075,000 | 3,076,080 |
| 3.3% 11/18/21 | | 3,647,000 | 3,733,484 |
| | | | 9,533,932 |
| Food Products - 0.2% | | | |
| CF Industries Holdings, Inc. 5.15% 3/15/34 | | 102,000 | 104,550 |
| Conagra Brands, Inc. 3.8% 10/22/21 | | 2,253,000 | 2,317,974 |
| Gruma S.A.B. de CV 4.875% 12/1/24 (Reg. S) | | 803,000 | 862,221 |
| JBS Investments II GmbH: | | | |
| 5.75% 1/15/28 (b) | | 335,000 | 351,750 |
| 7% 1/15/26 (b) | | 683,000 | 738,494 |
| JBS U.S.A. LLC/JBS U.S.A. Finance, Inc.: | | | |
| 5.75% 6/15/25 (b) | | 7,125,000 | 7,410,071 |
| 5.875% 7/15/24 (b) | | 10,055,000 | 10,318,944 |
| 6.75% 2/15/28 (b) | | 880,000 | 981,200 |
| JBS U.S.A. Lux SA / JBS Food Co.: | | | |
| 5.5% 1/15/30 (b) | | 2,645,000 | 2,803,700 |
| 6.5% 4/15/29 (b) | | 2,395,000 | 2,652,463 |
| Lamb Weston Holdings, Inc.: | | | |
| 4.625% 11/1/24 (b) | | 778,000 | 813,329 |
| 4.875% 11/1/26 (b) | | 564,000 | 588,675 |
| Post Holdings, Inc.: | | | |
| 5% 8/15/26 (b) | | 1,176,000 | 1,225,980 |
| 5.75% 3/1/27 (b) | | 976,000 | 1,037,000 |
| | | | 32,206,351 |
| Personal Products - 0.0% | | | |
| Prestige Brands, Inc. 6.375% 3/1/24 (b) | | 697,000 | 730,108 |
| Tobacco - 1.1% | | | |
| Altria Group, Inc.: | | | |
| 2.85% 8/9/22 | | 3,474,000 | 3,545,642 |
| 3.875% 9/16/46 | | 17,640,000 | 17,326,676 |
| 4% 1/31/24 | | 2,326,000 | 2,484,291 |
| 4.25% 8/9/42 | | 10,924,000 | 11,260,864 |
| 4.5% 5/2/43 | | 7,299,000 | 7,763,696 |
| 4.8% 2/14/29 | | 10,842,000 | 12,276,982 |
| 5.375% 1/31/44 | | 13,161,000 | 15,569,525 |
| 5.95% 2/14/49 | | 7,200,000 | 9,243,953 |
| BAT International Finance PLC 3.95% 6/15/25 (b) | | 2,400,000 | 2,543,949 |
| Imperial Tobacco Finance PLC: | | | |
| 2.95% 7/21/20 (b) | | 7,259,000 | 7,297,205 |
| 3.5% 7/26/26 (b) | | 6,321,000 | 6,425,980 |
| 3.75% 7/21/22 (b) | | 7,367,000 | 7,620,194 |
| 4.25% 7/21/25 (b) | | 6,702,000 | 7,146,422 |
| Reynolds American, Inc.: | | | |
| 3.25% 6/12/20 | | 1,188,000 | 1,197,012 |
| 4% 6/12/22 | | 4,132,000 | 4,318,500 |
| 4.45% 6/12/25 | | 11,691,000 | 12,659,800 |
| 5.7% 8/15/35 | | 1,538,000 | 1,789,725 |
| 5.85% 8/15/45 | | 12,953,000 | 14,612,355 |
| 6.15% 9/15/43 | | 1,637,000 | 1,939,344 |
| 7.25% 6/15/37 | | 1,835,000 | 2,391,617 |
| Vector Group Ltd. 6.125% 2/1/25 (b) | | 5,464,000 | 5,354,720 |
| | | | 154,768,452 |
| TOTAL CONSUMER STAPLES | | | 315,898,150 |
| ENERGY - 6.8% | | | |
| Energy Equipment & Services - 0.3% | | | |
| Archrock Partners LP / Archrock Partners Finance Corp. 6.875% 4/1/27 (b) | | 1,300,000 | 1,361,750 |
| Borets Finance DAC 6.5% 4/7/22 (b) | | 704,000 | 717,860 |
| El Paso Pipeline Partners Operating Co. LLC: | | | |
| 5% 10/1/21 | | 6,854,000 | 7,172,544 |
| 6.5% 4/1/20 | | 268,000 | 274,402 |
| Halliburton Co.: | | | |
| 3.8% 11/15/25 | | 3,553,000 | 3,763,786 |
| 4.85% 11/15/35 | | 3,103,000 | 3,502,053 |
| Jonah Energy LLC 7.25% 10/15/25 (b) | | 2,305,000 | 737,600 |
| Nabors Industries, Inc.: | | | |
| 5.5% 1/15/23 | | 1,206,000 | 1,074,848 |
| 5.75% 2/1/25 | | 925,000 | 740,000 |
| Noble Holding International Ltd.: | | | |
| 5.25% 3/15/42 | | 686,000 | 301,840 |
| 7.875% 2/1/26 (b) | | 700,000 | 565,250 |
| 7.95% 4/1/25 (c) | | 2,747,000 | 1,744,345 |
| 8.95% 4/1/45 (c) | | 2,652,000 | 1,471,860 |
| Southern Gas Corridor CJSC 6.875% 3/24/26 (b) | | 454,000 | 536,288 |
| Summit Midstream Holdings LLC: | | | |
| 5.5% 8/15/22 | | 1,030,000 | 968,200 |
| 5.75% 4/15/25 | | 6,683,000 | 5,732,009 |
| The Oil and Gas Holding Co.: | | | |
| 7.5% 10/25/27 (b) | | 688,000 | 770,990 |
| 7.625% 11/7/24 (b) | | 300,000 | 343,219 |
| Valaris PLC: | | | |
| 4.5% 10/1/24 | | 2,296,000 | 1,423,520 |
| 5.2% 3/15/25 | | 4,722,000 | 2,845,005 |
| 5.75% 10/1/44 | | 2,831,000 | 1,415,500 |
| Weatherford International Ltd.: | | | |
| 5.95% 4/15/42 (e) | | 468,000 | 196,560 |
| 6.5% 8/1/36 (e) | | 646,000 | 271,320 |
| 7% 3/15/38 (e) | | 183,000 | 76,860 |
| 9.875% 2/15/24 (e) | | 1,040,000 | 439,400 |
| Weatherford International, Inc. 9.875% 3/1/25 (e) | | 5,580,000 | 2,343,600 |
| | | | 40,790,609 |
| Oil, Gas & Consumable Fuels - 6.5% | | | |
| Amerada Hess Corp.: | | | |
| 7.125% 3/15/33 | | 2,041,000 | 2,563,136 |
| 7.3% 8/15/31 | | 2,651,000 | 3,303,150 |
| Anadarko Finance Co. 7.5% 5/1/31 | | 12,314,000 | 16,403,608 |
| Anadarko Petroleum Corp.: | | | |
| 4.5% 7/15/44 | | 17,494,000 | 18,015,257 |
| 4.85% 3/15/21 | | 2,443,000 | 2,525,543 |
| 5.55% 3/15/26 | | 8,636,000 | 9,781,912 |
| 6.45% 9/15/36 | | 8,786,000 | 11,006,022 |
| 6.6% 3/15/46 | | 10,444,000 | 13,925,897 |
| California Resources Corp. 8% 12/15/22 (b) | | 7,770,000 | 4,467,750 |
| Canadian Natural Resources Ltd.: | | | |
| 3.9% 2/1/25 | | 9,072,000 | 9,561,998 |
| 5.85% 2/1/35 | | 3,955,000 | 4,779,608 |
| Cenovus Energy, Inc. 4.25% 4/15/27 | | 11,280,000 | 11,779,188 |
| Cheniere Corpus Christi Holdings LLC: | | | |
| 5.125% 6/30/27 | | 1,996,000 | 2,203,085 |
| 5.875% 3/31/25 | | 1,922,000 | 2,143,030 |
| 7% 6/30/24 | | 4,275,000 | 4,932,281 |
| Cheniere Energy Partners LP: | | | |
| 5.25% 10/1/25 | | 11,128,000 | 11,503,570 |
| 5.625% 10/1/26 | | 858,000 | 905,190 |
| Chesapeake Energy Corp.: | | | |
| 8% 1/15/25 | | 3,299,000 | 2,498,993 |
| 8% 6/15/27 | | 1,721,000 | 1,243,440 |
| Citgo Holding, Inc. 9.25% 8/1/24 (b) | | 1,580,000 | 1,674,800 |
| Citgo Petroleum Corp. 6.25% 8/15/22 (b) | | 5,170,000 | 5,195,850 |
| Columbia Pipeline Group, Inc.: | | | |
| 3.3% 6/1/20 | | 5,622,000 | 5,659,163 |
| 4.5% 6/1/25 | | 1,708,000 | 1,853,249 |
| Comstock Escrow Corp. 9.75% 8/15/26 | | 3,631,000 | 2,732,328 |
| Consolidated Energy Finance SA: | | | |
| 3 month U.S. LIBOR + 3.750% 6.1603% 6/15/22 (b)(c)(d) | | 6,848,000 | 6,813,619 |
| 6.5% 5/15/26 (b) | | 1,535,000 | 1,531,163 |
| 6.875% 6/15/25 (b) | | 1,706,000 | 1,740,120 |
| Crestwood Midstream Partners LP/Crestwood Midstream Finance Corp.: | | | |
| 5.75% 4/1/25 | | 2,310,000 | 2,361,975 |
| 6.25% 4/1/23 | | 2,490,000 | 2,533,575 |
| CVR Refining LLC/Coffeyville Finance, Inc. 6.5% 11/1/22 | | 3,161,000 | 3,204,464 |
| DCP Midstream LLC: | | | |
| 4.75% 9/30/21 (b) | | 4,113,000 | 4,215,825 |
| 5.85% 5/21/43 (b)(c) | | 9,176,000 | 8,143,700 |
| DCP Midstream Operating LP: | | | |
| 3.875% 3/15/23 | | 2,008,000 | 2,033,100 |
| 5.125% 5/15/29 | | 3,000,000 | 3,075,150 |
| 5.375% 7/15/25 | | 3,234,000 | 3,419,955 |
| Denbury Resources, Inc.: | | | |
| 7.75% 2/15/24 (b) | | 3,046,000 | 2,117,579 |
| 9% 5/15/21 (b) | | 2,279,000 | 2,073,890 |
| 9.25% 3/31/22 (b) | | 4,146,000 | 3,482,640 |
| DTEK Finance PLC 10.75% 12/31/24 pay-in-kind (c) | | 3,412,913 | 3,438,510 |
| Duke Energy Field Services 6.45% 11/3/36 (b) | | 4,987,000 | 5,223,883 |
| El Paso Corp. 6.5% 9/15/20 | | 5,858,000 | 6,102,205 |
| Empresa Nacional de Petroleo 4.375% 10/30/24 (b) | | 3,283,000 | 3,515,888 |
| Enable Midstream Partners LP 3.9% 5/15/24 (c) | | 1,542,000 | 1,585,590 |
| Enbridge Energy Partners LP: | | | |
| 4.2% 9/15/21 | | 4,838,000 | 4,996,574 |
| 4.375% 10/15/20 | | 4,108,000 | 4,194,545 |
| Enbridge, Inc.: | | | |
| 4% 10/1/23 | | 5,655,000 | 5,986,201 |
| 4.25% 12/1/26 | | 2,805,000 | 3,109,086 |
| Endeavor Energy Resources LP/EER Finance, Inc.: | | | |
| 5.5% 1/30/26 (b) | | 312,000 | 324,090 |
| 5.75% 1/30/28 (b) | | 314,000 | 328,915 |
| Energy Transfer Partners LP: | | | |
| 4.2% 9/15/23 | | 2,098,000 | 2,218,250 |
| 4.25% 3/15/23 | | 2,044,000 | 2,146,789 |
| 4.5% 4/15/24 | | 2,483,000 | 2,662,063 |
| 4.95% 6/15/28 | | 7,159,000 | 8,008,430 |
| 5.25% 4/15/29 | | 4,040,000 | 4,627,831 |
| 5.8% 6/15/38 | | 3,992,000 | 4,649,473 |
| 6% 6/15/48 | | 2,599,000 | 3,099,801 |
| 6.25% 4/15/49 | | 2,774,000 | 3,432,509 |
| Enterprise Products Operating LP: | | | |
| 2.55% 10/15/19 | | 1,078,000 | 1,077,918 |
| 3.75% 2/15/25 | | 3,623,000 | 3,884,503 |
| EP Energy LLC/Everest Acquisition Finance, Inc.: | | | |
| 7.75% 5/15/26 (b) | | 1,879,000 | 1,568,965 |
| 8% 11/29/24 (b) | | 3,804,000 | 1,635,720 |
| Frontera Energy Corp. 9.7% 6/25/23 (b) | | 672,000 | 712,740 |
| Georgian Oil & Gas Corp. 6.75% 4/26/21 (b) | | 901,000 | 937,039 |
| Global Partners LP/GLP Finance Corp.: | | | |
| 7% 6/15/23 | | 3,618,000 | 3,654,180 |
| 7% 8/1/27 (b) | | 2,100,000 | 2,126,250 |
| Gran Tierra Energy International Holdings Ltd. 6.25% 2/15/25 (b) | | 236,000 | 217,120 |
| Hess Infrastructure Partners LP 5.625% 2/15/26 (b) | | 4,677,000 | 4,840,695 |
| Hilcorp Energy I LP/Hilcorp Finance Co.: | | | |
| 5% 12/1/24 (b) | | 3,051,000 | 2,814,548 |
| 5.75% 10/1/25 (b) | | 1,400,000 | 1,305,500 |
| Indigo Natural Resources LLC 6.875% 2/15/26 (b) | | 1,746,000 | 1,440,450 |
| Indika Energy Capital II Pte. Ltd. 6.875% 4/10/22 (b) | | 1,724,000 | 1,766,561 |
| KazMunaiGaz Finance Sub BV 4.75% 4/24/25 (b) | | 307,000 | 334,323 |
| Kinder Morgan Energy Partners LP: | | | |
| 3.45% 2/15/23 | | 3,804,000 | 3,942,173 |
| 3.5% 3/1/21 | | 4,115,000 | 4,178,518 |
| 5.5% 3/1/44 | | 15,589,000 | 18,404,176 |
| 6.55% 9/15/40 | | 686,000 | 872,059 |
| Kinder Morgan, Inc.: | | | |
| 5% 2/15/21 (b) | | 3,849,000 | 3,984,835 |
| 5.05% 2/15/46 | | 1,762,000 | 1,987,484 |
| 5.55% 6/1/45 | | 4,783,000 | 5,739,779 |
| Kosmos Energy Ltd. 7.125% 4/4/26 (b) | | 1,705,000 | 1,675,163 |
| Magnolia Oil & Gas Operating LLC 6% 8/1/26 (b) | | 1,722,000 | 1,713,390 |
| Marathon Petroleum Corp. 5.125% 3/1/21 | | 3,694,000 | 3,843,574 |
| Medco Strait Services Pte. Ltd. 8.5% 8/17/22 (b) | | 485,000 | 513,039 |
| MEG Energy Corp.: | | | |
| 6.375% 1/30/23 (b) | | 1,675,000 | 1,582,875 |
| 7% 3/31/24 (b) | | 2,745,000 | 2,611,181 |
| MPLX LP: | | | |
| 4.5% 7/15/23 | | 3,588,000 | 3,828,692 |
| 4.8% 2/15/29 | | 2,198,000 | 2,444,961 |
| 4.875% 12/1/24 | | 4,860,000 | 5,330,675 |
| 5.5% 2/15/49 | | 6,593,000 | 7,557,104 |
| Nakilat, Inc. 6.067% 12/31/33 (b) | | 717,000 | 878,325 |
| Nostrum Oil & Gas Finance BV 8% 7/25/22 (b) | | 3,819,000 | 2,049,132 |
| Occidental Petroleum Corp.: | | | |
| 2.6% 8/13/21 | | 3,189,000 | 3,210,195 |
| 2.7% 8/15/22 | | 2,818,000 | 2,845,737 |
| 2.9% 8/15/24 | | 9,312,000 | 9,399,084 |
| 3.2% 8/15/26 | | 1,253,000 | 1,265,962 |
| 3.5% 8/15/29 | | 3,946,000 | 4,020,287 |
| 4.3% 8/15/39 | | 575,000 | 601,684 |
| 4.4% 8/15/49 | | 575,000 | 599,739 |
| Pan American Energy LLC 7.875% 5/7/21 (b) | | 175,333 | 166,567 |
| Parsley Energy LLC/Parsley: | | | |
| 5.25% 8/15/25 (b) | | 259,000 | 262,885 |
| 5.375% 1/15/25 (b) | | 2,880,000 | 2,937,600 |
| PBF Holding Co. LLC/PBF Finance Corp. 7% 11/15/23 | | 363,000 | 372,983 |
| PBF Logistics LP/PBF Logistics Finance, Inc. 6.875% 5/15/23 | | 2,702,000 | 2,776,305 |
| Pemex Project Funding Master Trust: | | | |
| 6.625% 6/15/35 | | 2,802,000 | 2,731,950 |
| 8.625% 2/1/22 | | 375,000 | 411,094 |
| Petrobras Energia SA 7.375% 7/21/23 (b) | | 457,000 | 310,532 |
| Petrobras Global Finance BV: | | | |
| 5.299% 1/27/25 | | 7,300,000 | 7,901,885 |
| 5.75% 2/1/29 | | 14,579,000 | 15,791,336 |
| 5.999% 1/27/28 | | 21,638,000 | 23,699,020 |
| 6.25% 3/17/24 | | 7,259,000 | 8,073,369 |
| 7.25% 3/17/44 | | 16,350,000 | 19,338,984 |
| 7.375% 1/17/27 | | 14,920,000 | 17,711,681 |
| 8.75% 5/23/26 | | 24,333,000 | 30,404,084 |
| Petrobras International Finance Co. Ltd. 6.875% 1/20/40 | | 1,045,000 | 1,192,933 |
| Petroleos de Venezuela SA: | | | |
| 5.375% 4/12/27 (e) | | 353,900 | 44,238 |
| 6% 5/16/24 (b)(e) | | 1,847,331 | 230,916 |
| 6% 11/15/26 (b)(e) | | 1,619,833 | 202,479 |
| 12.75% 2/17/22 (b)(e) | | 98,000 | 12,250 |
| Petroleos Mexicanos: | | | |
| 2.5% 11/24/22 (Reg. S) | EUR | 302,000 | 331,083 |
| 2.75% 4/21/27 (Reg. S) | EUR | 1,655,000 | 1,648,403 |
| 3.5% 7/23/20 | | 350,000 | 349,672 |
| 3.5% 1/30/23 | | 4,934,000 | 4,793,381 |
| 3.625% 11/24/25 (Reg. S) | EUR | 899,000 | 963,036 |
| 3.75% 2/21/24 (Reg. S) | EUR | 5,084,000 | 5,646,938 |
| 4.5% 1/23/26 | | 16,710,000 | 15,807,660 |
| 4.625% 9/21/23 | | 28,642,000 | 28,709,131 |
| 4.875% 1/24/22 | | 7,305,000 | 7,423,706 |
| 4.875% 1/18/24 | | 6,833,000 | 6,860,332 |
| 5.5% 1/21/21 | | 4,072,000 | 4,157,390 |
| 5.5% 6/27/44 | | 3,922,000 | 3,348,211 |
| 5.625% 1/23/46 | | 12,960,000 | 11,115,662 |
| 6% 3/5/20 | | 1,419,000 | 1,439,398 |
| 6.35% 2/12/48 | | 40,693,000 | 37,407,040 |
| 6.375% 1/23/45 | | 10,032,000 | 9,246,683 |
| 6.5% 3/13/27 | | 33,349,000 | 34,060,794 |
| 6.5% 6/2/41 | | 12,592,000 | 11,714,338 |
| 6.75% 9/21/47 | | 19,923,000 | 18,926,850 |
| 6.875% 8/4/26 | | 14,935,000 | 15,659,348 |
| Phillips 66 Partners LP 2.646% 2/15/20 | | 478,000 | 478,199 |
| Plains All American Pipeline LP/PAA Finance Corp.: | | | |
| 3.6% 11/1/24 | | 2,794,000 | 2,870,557 |
| 3.65% 6/1/22 | | 2,592,000 | 2,663,994 |
| Regency Energy Partners LP/Regency Energy Finance Corp. 5.875% 3/1/22 | | 4,110,000 | 4,412,360 |
| Rose Rock Midstream LP/Rose Rock Finance Corp.: | | | |
| 5.625% 7/15/22 | | 1,232,000 | 1,187,044 |
| 5.625% 11/15/23 | | 4,794,000 | 4,530,330 |
| Sanchez Energy Corp. 7.25% 2/15/23 (b)(e) | | 5,120,000 | 3,584,000 |
| Saudi Arabian Oil Co.: | | | |
| 2.875% 4/16/24 (b) | | 345,000 | 353,625 |
| 3.5% 4/16/29 (b) | | 2,265,000 | 2,416,755 |
| 4.25% 4/16/39 (b) | | 1,905,000 | 2,157,413 |
| 4.375% 4/16/49 (b) | | 860,000 | 979,756 |
| SemGroup Corp.: | | | |
| 6.375% 3/15/25 | | 4,187,000 | 3,956,715 |
| 7.25% 3/15/26 | | 4,415,000 | 4,216,325 |
| Sinopec Group Overseas Development 2012 Ltd. 4.875% 5/17/42 (b) | | 155,000 | 197,039 |
| Sinopec Group Overseas Development Ltd. 3.68% 8/8/49 (b) | | 700,000 | 767,229 |
| Southwestern Energy Co.: | | | |
| 6.2% 1/23/25 (c) | | 12,453,000 | 10,896,375 |
| 7.75% 10/1/27 | | 1,365,000 | 1,187,550 |
| Sunoco Logistics Partner Operations LP 5.4% 10/1/47 | | 18,419,000 | 20,544,064 |
| Targa Resources Partners LP/Targa Resources Partners Finance Corp.: | | | |
| 4.25% 11/15/23 | | 2,945,000 | 2,941,319 |
| 5.125% 2/1/25 | | 3,606,000 | 3,696,150 |
| 5.25% 5/1/23 | | 779,000 | 792,391 |
| 5.875% 4/15/26 | | 2,110,000 | 2,210,225 |
| 6.75% 3/15/24 | | 1,604,000 | 1,666,155 |
| The Williams Companies, Inc.: | | | |
| 4.55% 6/24/24 | | 12,340,000 | 13,365,144 |
| 5.75% 6/24/44 | | 6,964,000 | 8,345,264 |
| Transportadora de Gas del Sur SA 6.75% 5/2/25 (b) | | 792,000 | 590,040 |
| Tullow Oil PLC: | | | |
| 6.25% 4/15/22 (b) | | 570,000 | 568,931 |
| 7% 3/1/25 (b) | | 292,000 | 289,628 |
| Western Gas Partners LP: | | | |
| 4.65% 7/1/26 | | 1,770,000 | 1,802,603 |
| 4.75% 8/15/28 | | 2,108,000 | 2,135,143 |
| 5.375% 6/1/21 | | 15,993,000 | 16,536,853 |
| Williams Partners LP: | | | |
| 3.6% 3/15/22 | | 3,926,000 | 4,042,162 |
| 3.9% 1/15/25 | | 9,678,000 | 10,176,221 |
| 4% 11/15/21 | | 3,676,000 | 3,785,855 |
| 4% 9/15/25 | | 1,089,000 | 1,157,558 |
| 4.125% 11/15/20 | | 871,000 | 885,575 |
| 4.3% 3/4/24 | | 14,855,000 | 15,855,852 |
| 4.5% 11/15/23 | | 2,658,000 | 2,861,716 |
| YPF SA: | | | |
| 8.5% 3/23/21 (b) | | 735,000 | 562,275 |
| 8.5% 3/23/21 (Reg. S) | | 3,095,000 | 2,367,675 |
| 8.5% 6/27/29 (b) | | 375,000 | 236,250 |
| 8.75% 4/4/24 (b) | | 3,011,000 | 2,032,425 |
| | | | 910,936,658 |
| TOTAL ENERGY | | | 951,727,267 |
| FINANCIALS - 13.1% | | | |
| Banks - 4.4% | | | |
| ABN AMRO Bank NV 4.4% 3/27/28 (Reg. S) (c) | | 200,000 | 208,234 |
| Akbank TAS 7.2% 3/16/27 (b)(c) | | 738,000 | 644,828 |
| Allied Irish Banks PLC 4.125% 11/26/25 (Reg. S) (c) | EUR | 3,731,000 | 4,269,703 |
| Banco de Bogota SA 6.25% 5/12/26 (b) | | 250,000 | 281,406 |
| Banco de Reservas de La Republica Dominicana 7% 2/1/23 (b) | | 338,000 | 351,626 |
| Banco Do Brasil SA: | | | |
| 4.625% 1/15/25 (b) | | 287,000 | 299,599 |
| 4.875% 4/19/23 (b) | | 172,000 | 179,364 |
| Banco Hipotecario SA 9.75% 11/30/20 (b) | | 918,000 | 679,320 |
| Banco Macro SA 6.75% 11/4/26 (b)(c) | | 1,760,000 | 1,047,112 |
| Bank Ireland Group PLC 3.125% 9/19/27 (Reg. S) (c) | GBP | 1,700,000 | 2,035,360 |
| Bank of America Corp.: | | | |
| 3.004% 12/20/23 (c) | | 5,145,000 | 5,280,038 |
| 3.3% 1/11/23 | | 327,000 | 339,954 |
| 3.419% 12/20/28 (c) | | 8,456,000 | 8,923,837 |
| 3.5% 4/19/26 | | 7,461,000 | 7,994,167 |
| 3.705% 4/24/28 (c) | | 11,813,000 | 12,745,743 |
| 3.864% 7/23/24 (c) | | 24,740,000 | 26,269,193 |
| 3.95% 4/21/25 | | 6,226,000 | 6,647,534 |
| 4.1% 7/24/23 | | 4,167,000 | 4,477,275 |
| 4.2% 8/26/24 | | 14,710,000 | 15,875,768 |
| 4.25% 10/22/26 | | 5,344,000 | 5,833,959 |
| 4.45% 3/3/26 | | 3,050,000 | 3,358,585 |
| Banque Centrale de Tunisie 5.75% 1/30/25 (b) | | 760,000 | 695,400 |
| Barclays PLC: | | | |
| 2% 2/7/28 (Reg. S) (c) | EUR | 1,600,000 | 1,731,083 |
| 2.625% 11/11/25 (Reg. S) (c) | EUR | 2,900,000 | 3,230,330 |
| 2.75% 11/8/19 | | 4,446,000 | 4,448,192 |
| 3.25% 1/12/21 | | 7,664,000 | 7,726,457 |
| 3.932% 5/7/25 (c) | | 3,410,000 | 3,505,717 |
| 4.375% 1/12/26 | | 9,104,000 | 9,608,097 |
| 5.088% 6/20/30 (c) | | 14,797,000 | 15,370,574 |
| BBVA Bancomer SA 7.25% 4/22/20 (b) | | 345,000 | 354,056 |
| Biz Finance PLC 9.625% 4/27/22 (b) | | 1,036,000 | 1,081,584 |
| BTA Bank JSC 5.5% 12/21/22 (b) | | 385,290 | 387,337 |
| CBOM Finance PLC 5.55% 2/14/23 (b) | | 507,000 | 503,514 |
| Citigroup, Inc.: | | | |
| 2.4% 2/18/20 | | 13,030,000 | 13,041,832 |
| 2.75% 4/25/22 | | 9,073,000 | 9,235,556 |
| 3.142% 1/24/23 (c) | | 8,277,000 | 8,463,719 |
| 3.352% 4/24/25 (c) | | 9,970,000 | 10,416,556 |
| 4.05% 7/30/22 | | 1,925,000 | 2,018,834 |
| 4.3% 11/20/26 | | 4,442,000 | 4,847,711 |
| 4.4% 6/10/25 | | 18,137,000 | 19,681,381 |
| 4.45% 9/29/27 | | 6,486,000 | 7,137,802 |
| 5.5% 9/13/25 | | 8,473,000 | 9,711,079 |
| Citizens Bank NA 2.55% 5/13/21 | | 2,382,000 | 2,398,705 |
| Citizens Financial Group, Inc. 4.15% 9/28/22 (b) | | 5,802,000 | 6,056,288 |
| Credit Suisse Group Funding Guernsey Ltd.: | | | |
| 2.75% 3/26/20 | | 7,061,000 | 7,080,252 |
| 3.75% 3/26/25 | | 7,059,000 | 7,461,423 |
| 3.8% 9/15/22 | | 11,142,000 | 11,627,950 |
| 3.8% 6/9/23 | | 13,301,000 | 13,964,096 |
| CYBG PLC 3.125% 6/22/25 (Reg. S) (c) | GBP | 990,000 | 1,170,897 |
| Danske Bank A/S: | | | |
| 0.5% 8/27/25 (Reg. S) (c) | EUR | 2,850,000 | 3,124,336 |
| 1.375% 5/24/22 (Reg. S) | EUR | 1,400,000 | 1,591,803 |
| 5% 1/12/22 (b) | | 3,390,000 | 3,575,303 |
| 5.375% 1/12/24 (Reg. S) | | 4,000,000 | 4,424,265 |
| Development Bank of Mongolia 7.25% 10/23/23 (b) | | 249,000 | 254,060 |
| Development Bank of the Republic of Belarus 6.75% 5/2/24 (b) | | 175,000 | 183,050 |
| Discover Bank: | | | |
| 4.2% 8/8/23 | | 6,479,000 | 6,956,950 |
| 7% 4/15/20 | | 737,000 | 757,596 |
| Ecobank Transnational, Inc. 9.5% 4/18/24 (b) | | 480,000 | 529,356 |
| Fidelity Bank PLC 10.5% 10/16/22 (b) | | 444,000 | 495,476 |
| Fifth Third Bancorp 8.25% 3/1/38 | | 1,694,000 | 2,630,812 |
| HAT Holdings I LLC/HAT Holdings II LLC 5.25% 7/15/24 (b) | | 375,000 | 395,063 |
| HSBC Holdings PLC 4.25% 3/14/24 | | 2,247,000 | 2,371,113 |
| Huntington Bancshares, Inc. 7% 12/15/20 | | 1,035,000 | 1,096,752 |
| Intesa Sanpaolo SpA: | | | |
| 5.017% 6/26/24 (b) | | 2,332,000 | 2,390,320 |
| 5.71% 1/15/26 (b) | | 15,409,000 | 16,257,821 |
| Itau Unibanco Holding SA: | | | |
| 5.125% 5/13/23 (Reg. S) | | 735,000 | 765,686 |
| 6.2% 12/21/21 (Reg. S) | | 356,000 | 374,134 |
| JPMorgan Chase & Co.: | | | |
| 2.95% 10/1/26 | | 6,707,000 | 6,957,561 |
| 3.25% 9/23/22 | | 6,686,000 | 6,929,414 |
| 3.797% 7/23/24 (c) | | 25,215,000 | 26,784,798 |
| 3.875% 9/10/24 | | 12,990,000 | 13,887,738 |
| 4.125% 12/15/26 | | 11,765,000 | 12,959,904 |
| 4.25% 10/15/20 | | 2,539,000 | 2,601,095 |
| 4.35% 8/15/21 | | 7,356,000 | 7,675,766 |
| 4.452% 12/5/29 (c) | | 20,700,000 | 23,803,313 |
| 4.5% 1/24/22 | | 8,001,000 | 8,467,702 |
| 4.625% 5/10/21 | | 2,497,000 | 2,602,233 |
| JSC BGEO Group 6% 7/26/23 (b) | | 1,157,000 | 1,177,248 |
| Luminor Bank A/S Estonia 1.375% 10/21/22 (Reg. S) | EUR | 830,000 | 924,453 |
| Nykredit Realkredit A/S 4% 6/3/36 (Reg. S) (c) | EUR | 6,158,000 | 7,165,296 |
| Oschadbank Via SSB #1 PLC 9.375% 3/10/23 (b) | | 488,000 | 510,418 |
| Rabobank Nederland 4.375% 8/4/25 | | 9,413,000 | 10,175,289 |
| Regions Bank 6.45% 6/26/37 | | 8,935,000 | 11,962,915 |
| Regions Financial Corp. 3.2% 2/8/21 | | 4,325,000 | 4,383,637 |
| Royal Bank of Scotland Group PLC: | | | |
| 4.8% 4/5/26 | | 18,311,000 | 19,992,808 |
| 5.125% 5/28/24 | | 25,230,000 | 26,700,903 |
| 6% 12/19/23 | | 18,606,000 | 20,263,544 |
| 6.1% 6/10/23 | | 15,243,000 | 16,531,501 |
| 6.125% 12/15/22 | | 15,445,000 | 16,708,256 |
| T.C. Ziraat Bankasi A/S 5.125% 5/3/22 (b) | | 740,000 | 697,635 |
| TBC Bank JSC 5.75% 6/19/24 (b) | | 190,000 | 188,575 |
| Trade and Development Bank of Mongolia LLC 9.375% 5/19/20 (b) | | 864,000 | 889,380 |
| Turkiye Garanti Bankasi A/S: | | | |
| 4.75% 10/17/19 (b) | | 241,000 | 239,795 |
| 6.125% 5/24/27 (b)(c) | | 775,000 | 651,000 |
| 6.25% 4/20/21 (Reg. S) | | 1,700,000 | 1,720,719 |
| Turkiye Is Bankasi A/S: | | | |
| 5% 4/30/20 (b) | | 550,000 | 550,000 |
| 5.5% 4/21/22 (b) | | 514,000 | 495,368 |
| Turkiye Vakiflar Bankasi TAO: | | | |
| 5.75% 1/30/23 (b) | | 2,268,000 | 2,100,962 |
| 6.875% 2/3/25 (b)(c) | | 35,000 | 32,025 |
| 6.875% 2/3/25 (Reg. S) (c) | | 767,000 | 701,805 |
| UniCredit SpA: | | | |
| 4.375% 1/3/27 (Reg. S) (c) | EUR | 1,300,000 | 1,536,002 |
| 6.572% 1/14/22 (b) | | 14,802,000 | 15,916,397 |
| Westpac Banking Corp. 4.11% 7/24/34 (c) | | 7,550,000 | 7,948,172 |
| Zenith Bank PLC 7.375% 5/30/22 (b) | | 1,146,000 | 1,200,435 |
| | | | 622,906,985 |
| Capital Markets - 3.6% | | | |
| Affiliated Managers Group, Inc.: | | | |
| 3.5% 8/1/25 | | 7,624,000 | 7,948,360 |
| 4.25% 2/15/24 | | 5,321,000 | 5,721,011 |
| Ares Capital Corp. 4.2% 6/10/24 | | 17,909,000 | 18,590,212 |
| Banco BTG Pactual SA 7.75% 2/15/29 (b)(c) | | 350,000 | 359,625 |
| Blackstone Property Partners Europe LP: | | | |
| 1.4% 7/6/22 (Reg. S) | EUR | 3,109,000 | 3,526,630 |
| 2% 2/15/24 (Reg. S) | EUR | 1,250,000 | 1,460,442 |
| 2.2% 7/24/25 (Reg. S) | EUR | 3,492,000 | 4,140,446 |
| Credit Suisse Group AG: | | | |
| 3.869% 1/12/29 (b)(c) | | 6,719,000 | 7,157,361 |
| 4.207% 6/12/24 (b)(c) | | 10,289,000 | 10,895,038 |
| 5.75% 9/18/25 (Reg. S) (c) | EUR | 2,615,000 | 3,041,531 |
| 6.5% 8/8/23 (Reg. S) | | 6,815,000 | 7,592,946 |
| Deutsche Bank AG: | | | |
| 1.625% 2/12/21 (Reg. S) | EUR | 9,900,000 | 11,016,798 |
| 4.5% 4/1/25 | | 29,242,000 | 27,626,655 |
| 5% 6/24/20 | EUR | 900,000 | 1,017,601 |
| Deutsche Bank AG New York Branch: | | | |
| 3.15% 1/22/21 | | 10,419,000 | 10,382,485 |
| 3.3% 11/16/22 | | 17,274,000 | 17,169,362 |
| 5% 2/14/22 | | 15,300,000 | 15,858,564 |
| EG Global Finance PLC 6.75% 2/7/25 (b) | | 375,000 | 361,875 |
| Goldman Sachs Group, Inc.: | | | |
| 2.876% 10/31/22 (c) | | 36,646,000 | 37,150,877 |
| 3.2% 2/23/23 | | 6,170,000 | 6,374,757 |
| 3.691% 6/5/28 (c) | | 72,922,000 | 77,547,530 |
| 3.75% 5/22/25 | | 7,259,000 | 7,740,464 |
| 4.25% 10/21/25 | | 2,860,000 | 3,084,951 |
| 6.75% 10/1/37 | | 3,974,000 | 5,444,753 |
| IntercontinentalExchange, Inc. 2.75% 12/1/20 | | 2,355,000 | 2,375,001 |
| Merrill Lynch & Co., Inc. 5.5% 11/22/21 | GBP | 445,000 | 589,472 |
| Moody's Corp.: | | | |
| 3.25% 1/15/28 | | 4,181,000 | 4,408,842 |
| 4.875% 2/15/24 | | 3,926,000 | 4,349,724 |
| Morgan Stanley: | | | |
| 3.125% 1/23/23 | | 4,718,000 | 4,864,682 |
| 3.125% 7/27/26 | | 39,505,000 | 41,039,034 |
| 3.7% 10/23/24 | | 13,602,000 | 14,529,734 |
| 3.737% 4/24/24 (c) | | 45,366,000 | 47,728,661 |
| 3.95% 4/23/27 | | 1,143,000 | 1,223,386 |
| 4.431% 1/23/30 (c) | | 8,668,000 | 9,892,247 |
| 4.875% 11/1/22 | | 9,523,000 | 10,244,327 |
| 5% 11/24/25 | | 15,462,000 | 17,445,817 |
| 5.5% 1/26/20 | | 31,938,000 | 32,339,693 |
| 5.625% 9/23/19 | | 4,614,000 | 4,621,950 |
| 5.75% 1/25/21 | | 7,215,000 | 7,569,680 |
| MSCI, Inc.: | | | |
| 4.75% 8/1/26 (b) | | 1,504,000 | 1,573,560 |
| 5.25% 11/15/24 (b) | | 1,604,000 | 1,665,273 |
| UBS AG 4.75% 2/12/26 (Reg. S) (c) | EUR | 9,037,000 | 10,547,906 |
| UBS Group Funding Ltd. 4.125% 9/24/25 (b) | | 6,852,000 | 7,457,106 |
| | | | 515,676,369 |
| Consumer Finance - 1.8% | | | |
| AerCap Ireland Capital Ltd./AerCap Global Aviation Trust: | | | |
| 2.875% 8/14/24 | | 12,392,000 | 12,432,640 |
| 3.5% 5/26/22 | | 2,714,000 | 2,788,073 |
| 4.125% 7/3/23 | | 7,415,000 | 7,865,934 |
| 4.45% 12/16/21 | | 5,769,000 | 5,994,609 |
| 4.45% 4/3/26 | | 6,213,000 | 6,671,091 |
| 4.875% 1/16/24 | | 9,923,000 | 10,763,122 |
| Ally Financial, Inc.: | | | |
| 3.875% 5/21/24 | | 1,515,000 | 1,596,431 |
| 4.625% 3/30/25 | | 1,212,000 | 1,324,110 |
| 5.75% 11/20/25 | | 18,402,000 | 21,070,290 |
| 8% 11/1/31 | | 2,582,000 | 3,608,345 |
| Capital One Financial Corp. 3.8% 1/31/28 | | 8,091,000 | 8,626,063 |
| Credito Real S.A.B. de CV 9.5% 2/7/26 (b) | | 500,000 | 562,656 |
| Discover Financial Services: | | | |
| 3.85% 11/21/22 | | 12,648,000 | 13,266,662 |
| 3.95% 11/6/24 | | 5,349,000 | 5,702,177 |
| 4.1% 2/9/27 | | 8,791,000 | 9,465,100 |
| 4.5% 1/30/26 | | 9,265,000 | 10,232,488 |
| 5.2% 4/27/22 | | 4,553,000 | 4,896,086 |
| Ford Motor Credit Co. LLC: | | | |
| 1.514% 2/17/23 | EUR | 4,200,000 | 4,694,556 |
| 2.597% 11/4/19 | | 18,948,000 | 18,943,263 |
| 5.085% 1/7/21 | | 5,916,000 | 6,094,942 |
| 5.584% 3/18/24 | | 12,456,000 | 13,395,452 |
| 5.596% 1/7/22 | | 12,239,000 | 12,942,545 |
| Navient Corp.: | | | |
| 5.5% 1/25/23 | | 3,493,000 | 3,668,698 |
| 5.875% 10/25/24 | | 278,000 | 292,453 |
| 6.125% 3/25/24 | | 746,000 | 791,693 |
| 6.5% 6/15/22 | | 4,097,000 | 4,435,003 |
| 6.625% 7/26/21 | | 2,370,000 | 2,535,900 |
| 6.75% 6/15/26 | | 1,970,000 | 2,107,900 |
| 7.25% 1/25/22 | | 1,424,000 | 1,561,060 |
| 7.25% 9/25/23 | | 1,852,000 | 2,055,720 |
| Springleaf Finance Corp.: | | | |
| 6.875% 3/15/25 | | 3,185,000 | 3,610,994 |
| 7.125% 3/15/26 | | 755,000 | 861,078 |
| Synchrony Financial: | | | |
| 2.85% 7/25/22 | | 3,141,000 | 3,183,383 |
| 3.75% 8/15/21 | | 2,689,000 | 2,749,642 |
| 3.95% 12/1/27 | | 14,204,000 | 14,725,082 |
| 4.25% 8/15/24 | | 2,707,000 | 2,882,202 |
| 4.375% 3/19/24 | | 4,546,000 | 4,855,878 |
| 5.15% 3/19/29 | | 17,409,000 | 19,605,532 |
| | | | 252,858,853 |
| Diversified Financial Services - 1.7% | | | |
| 1MDB Global Investments Ltd. 4.4% 3/9/23 | | 3,200,000 | 3,064,000 |
| ADES International Holding Ltd. 8.625% 4/24/24 (b) | | 725,000 | 714,805 |
| Avolon Holdings Funding Ltd.: | | | |
| 3.625% 5/1/22 (b) | | 3,132,000 | 3,176,788 |
| 3.95% 7/1/24 (b) | | 4,160,000 | 4,281,472 |
| 4.375% 5/1/26 (b) | | 5,080,000 | 5,274,564 |
| 5.125% 10/1/23 (b) | | 9,406,000 | 9,986,350 |
| 5.25% 5/15/24 (b) | | 7,670,000 | 8,227,609 |
| 5.5% 1/15/23 (b) | | 2,085,000 | 2,221,359 |
| AXA Equitable Holdings, Inc. 3.9% 4/20/23 | | 1,852,000 | 1,945,138 |
| Brixmor Operating Partnership LP: | | | |
| 3.25% 9/15/23 | | 9,261,000 | 9,534,266 |
| 3.85% 2/1/25 | | 5,199,000 | 5,464,682 |
| 3.875% 8/15/22 | | 7,631,000 | 7,962,932 |
| 4.125% 6/15/26 | | 8,538,000 | 9,101,202 |
| 4.125% 5/15/29 | | 10,374,000 | 11,222,868 |
| Chobani LLC/Finance Corp., Inc. 7.5% 4/15/25 (b) | | 938,000 | 865,305 |
| Cigna Corp.: | | | |
| 3.75% 7/15/23 | | 8,944,000 | 9,402,453 |
| 4.125% 11/15/25 | | 6,870,000 | 7,474,333 |
| 4.375% 10/15/28 | | 11,163,000 | 12,482,479 |
| 4.8% 8/15/38 | | 6,950,000 | 8,035,203 |
| 4.9% 12/15/48 | | 6,944,000 | 8,217,465 |
| Cimpor Financial Operations BV 5.75% 7/17/24 (b) | | 1,343,000 | 1,047,943 |
| Cloverie PLC 4.5% 9/11/44 (Reg. S) (c) | | 2,420,000 | 2,500,741 |
| CRC Escrow Issuer LLC/CRC Finance LLC 5.25% 10/15/25 (b) | | 8,891,000 | 9,046,593 |
| Crown Americas LLC/Crown Americas Capital Corp. IV 4.75% 2/1/26 | | 1,328,000 | 1,394,400 |
| Eagle Intermediate Global Holding BV 7.5% 5/1/25 (b) | | 207,000 | 192,251 |
| GEMS MENASA Cayman Ltd. 7.125% 7/31/26 (b) | | 710,000 | 723,490 |
| HTA Group Ltd. 9.125% 3/8/22 (b) | | 930,000 | 963,277 |
| Icahn Enterprises LP/Icahn Enterprises Finance Corp.: | | | |
| 5.875% 2/1/22 | | 8,988,000 | 9,134,055 |
| 6.25% 2/1/22 | | 2,698,000 | 2,778,940 |
| 6.25% 5/15/26 (b) | | 2,185,000 | 2,280,703 |
| 6.375% 12/15/25 | | 2,559,000 | 2,709,341 |
| 6.75% 2/1/24 | | 726,000 | 759,578 |
| Logicor Financing SARL 1.625% 7/15/27 (Reg. S) | EUR | 4,160,000 | 4,694,438 |
| Park Aerospace Holdings Ltd.: | | | |
| 4.5% 3/15/23 (b) | | 1,290,000 | 1,334,634 |
| 5.25% 8/15/22 (b) | | 1,840,000 | 1,943,500 |
| 5.5% 2/15/24 (b) | | 13,774,000 | 14,895,204 |
| Pine Street Trust I: | | | |
| 4.572% 2/15/29 (b) | | 11,350,000 | 12,252,209 |
| 5.568% 2/15/49 (b) | | 11,300,000 | 12,927,878 |
| PT Bukit Makmur Mandiri Utama 7.75% 2/13/22 (b) | | 1,612,000 | 1,626,105 |
| Radiate Holdco LLC/Radiate Financial Service Ltd.: | | | |
| 6.625% 2/15/25 (b) | | 6,185,000 | 6,138,613 |
| 6.875% 2/15/23 (b) | | 886,000 | 903,720 |
| Solera LLC/Solera Finance, Inc. 10.5% 3/1/24 (b) | | 8,791,000 | 9,318,460 |
| Tempo Acquisition LLC 6.75% 6/1/25 (b) | | 2,772,000 | 2,847,676 |
| Transocean Poseidon Ltd. 6.875% 2/1/27 (b) | | 380,000 | 396,625 |
| Trivium Packaging Finance BV: | | | |
| 5.5% 8/15/26 (b) | | 970,000 | 1,025,775 |
| 8.5% 8/15/27 (b) | | 565,000 | 607,375 |
| Valvoline, Inc. 5.5% 7/15/24 | | 1,050,000 | 1,092,000 |
| Vedanta Resources Finance II PLC 9.25% 4/23/26 (b) | | 625,000 | 606,250 |
| Voya Financial, Inc. 3.125% 7/15/24 | | 5,010,000 | 5,176,785 |
| WPC Eurobond BV 2.25% 4/9/26 | EUR | 790,000 | 951,224 |
| | | | 240,925,056 |
| Insurance - 1.5% | | | |
| American International Group, Inc.: | | | |
| 3.3% 3/1/21 | | 3,489,000 | 3,546,743 |
| 3.875% 1/15/35 | | 6,911,000 | 7,335,689 |
| 4.875% 6/1/22 | | 6,603,000 | 7,072,292 |
| AmWINS Group, Inc. 7.75% 7/1/26 (b) | | 2,225,000 | 2,336,250 |
| Aon Corp. 5% 9/30/20 | | 1,399,000 | 1,441,130 |
| Aquarius + Investments PLC for Swiss Reinsurance Co. Ltd. 6.375% 9/1/24 (c) | | 846,000 | 845,492 |
| Demeter Investments BV 5.75% 8/15/50 (Reg. S) (c) | | 1,546,000 | 1,692,870 |
| Liberty Mutual Group, Inc. 4.569% 2/1/29 (b) | | 4,589,000 | 5,222,896 |
| Marsh & McLennan Companies, Inc.: | | | |
| 4.375% 3/15/29 | | 7,831,000 | 8,996,114 |
| 4.75% 3/15/39 | | 3,593,000 | 4,498,195 |
| 4.8% 7/15/21 | | 2,573,000 | 2,680,868 |
| 4.9% 3/15/49 | | 7,151,000 | 9,284,085 |
| Massachusetts Mutual Life Insurance Co. 4.5% 4/15/65 (b) | | 11,078,000 | 13,530,635 |
| MetLife, Inc. 3.048% 12/15/22 (c) | | 4,512,000 | 4,660,755 |
| Metropolitan Life Global Funding I: | | | |
| U.S. SOFR SEC OVRN FIN RATE INDX + 0.500% 2.62% 5/28/21 (b)(c)(d) | | 55,417,000 | 55,458,656 |
| 3% 1/10/23 (b) | | 2,866,000 | 2,955,908 |
| Pacific LifeCorp 5.125% 1/30/43 (b) | | 12,258,000 | 14,776,441 |
| Pricoa Global Funding I 5.375% 5/15/45 (c) | | 6,348,000 | 6,773,062 |
| Swiss Re Finance Luxembourg SA 5% 4/2/49 (b)(c) | | 4,600,000 | 5,071,500 |
| Teachers Insurance & Annuity Association of America 4.9% 9/15/44 (b) | | 6,563,000 | 8,259,889 |
| TIAA Asset Management Finance LLC 4.125% 11/1/24 (b) | | 2,195,000 | 2,387,580 |
| Unum Group: | | | |
| 3.875% 11/5/25 | | 7,835,000 | 8,271,268 |
| 4% 3/15/24 | | 7,259,000 | 7,707,243 |
| 4% 6/15/29 | | 8,872,000 | 9,320,931 |
| 5.625% 9/15/20 | | 3,044,000 | 3,146,764 |
| 5.75% 8/15/42 | | 9,271,000 | 11,511,450 |
| USIS Merger Sub, Inc. 6.875% 5/1/25 (b) | | 2,350,000 | 2,338,250 |
| | | | 211,122,956 |
| Mortgage Real Estate Investment Trusts - 0.0% | | | |
| Starwood Property Trust, Inc. 4.75% 3/15/25 | | 699,000 | 716,475 |
| Thrifts & Mortgage Finance - 0.1% | | | |
| Nationwide Building Society 3.622% 4/26/23 (b)(c) | | 3,400,000 | 3,474,080 |
| Prime Securities Services Borrower LLC/Prime Finance, Inc. 9.25% 5/15/23 (b) | | 944,000 | 992,710 |
| Quicken Loans, Inc. 5.25% 1/15/28 (b) | | 3,675,000 | 3,812,813 |
| | | | 8,279,603 |
| TOTAL FINANCIALS | | | 1,852,486,297 |
| HEALTH CARE - 2.2% | | | |
| Health Care Equipment & Supplies - 0.1% | | | |
| Becton, Dickinson & Co.: | | | |
| 2.675% 12/15/19 | | 1,435,000 | 1,436,128 |
| 2.894% 6/6/22 | | 5,000,000 | 5,082,483 |
| Hologic, Inc.: | | | |
| 4.375% 10/15/25 (b) | | 1,356,000 | 1,386,510 |
| 4.625% 2/1/28 (b) | | 252,000 | 260,505 |
| Teleflex, Inc. 4.875% 6/1/26 | | 2,531,000 | 2,666,307 |
| | | | 10,831,933 |
| Health Care Providers & Services - 1.4% | | | |
| Aetna, Inc. 2.75% 11/15/22 | | 729,000 | 738,806 |
| Community Health Systems, Inc.: | | | |
| 5.125% 8/1/21 | | 1,835,000 | 1,835,000 |
| 6.25% 3/31/23 | | 8,322,000 | 8,052,367 |
| 8% 3/15/26 (b) | | 1,580,000 | 1,516,800 |
| 8.625% 1/15/24 (b) | | 4,972,000 | 4,972,000 |
| CVS Health Corp.: | | | |
| 2.625% 8/15/24 | | 1,590,000 | 1,599,112 |
| 3% 8/15/26 | | 1,290,000 | 1,305,779 |
| 3.25% 8/15/29 | | 2,964,000 | 3,004,101 |
| 3.7% 3/9/23 | | 3,266,000 | 3,415,248 |
| 4% 12/5/23 | | 3,094,000 | 3,288,801 |
| 4.1% 3/25/25 | | 25,866,000 | 27,672,286 |
| 4.3% 3/25/28 | | 23,650,000 | 25,814,947 |
| 4.78% 3/25/38 | | 10,528,000 | 11,805,703 |
| 5.05% 3/25/48 | | 15,479,000 | 18,035,529 |
| Elanco Animal Health, Inc.: | | | |
| 3.912% 8/27/21 | | 1,833,000 | 1,868,346 |
| 4.272% 8/28/23 | | 5,786,000 | 6,060,283 |
| 4.9% 8/28/28 | | 2,437,000 | 2,657,848 |
| HCA Holdings, Inc.: | | | |
| 4.5% 2/15/27 | | 1,913,000 | 2,074,037 |
| 4.75% 5/1/23 | | 216,000 | 232,199 |
| 5% 3/15/24 | | 2,314,000 | 2,527,590 |
| 5.25% 6/15/26 | | 4,163,000 | 4,699,037 |
| 5.375% 2/1/25 | | 2,255,000 | 2,503,050 |
| 5.875% 2/15/26 | | 1,386,000 | 1,581,080 |
| Medco Health Solutions, Inc. 4.125% 9/15/20 | | 2,717,000 | 2,763,318 |
| MPH Acquisition Holdings LLC 7.125% 6/1/24 (b) | | 1,785,000 | 1,595,451 |
| Sabra Health Care LP/Sabra Capital Corp. 5.375% 6/1/23 | | 2,182,000 | 2,212,003 |
| Tenet Healthcare Corp.: | | | |
| 4.375% 10/1/21 | | 1,388,000 | 1,447,684 |
| 4.625% 7/15/24 | | 2,011,000 | 2,068,816 |
| 5.125% 5/1/25 | | 1,597,000 | 1,600,993 |
| 6.25% 2/1/27 (b) | | 1,465,000 | 1,519,938 |
| 6.75% 6/15/23 | | 3,977,000 | 4,086,368 |
| 8.125% 4/1/22 | | 11,455,000 | 12,341,617 |
| THC Escrow Corp. III 7% 8/1/25 | | 2,537,000 | 2,562,370 |
| Toledo Hospital: | | | |
| 5.325% 11/15/28 | | 3,971,000 | 4,486,653 |
| 6.015% 11/15/48 | | 12,992,000 | 16,387,203 |
| Vizient, Inc. 6.25% 5/15/27 (b) | | 225,000 | 241,875 |
| Wellcare Health Plans, Inc.: | | | |
| 5.25% 4/1/25 | | 2,485,000 | 2,601,919 |
| 5.375% 8/15/26 (b) | | 3,636,000 | 3,876,885 |
| WellPoint, Inc. 3.3% 1/15/23 | | 2,338,000 | 2,414,812 |
| | | | 199,467,854 |
| Health Care Technology - 0.0% | | | |
| IMS Health, Inc. 5% 5/15/27 (b) | | 2,570,000 | 2,714,563 |
| Life Sciences Tools & Services - 0.0% | | | |
| Charles River Laboratories International, Inc. 5.5% 4/1/26 (b) | | 715,000 | 764,979 |
| Pharmaceuticals - 0.7% | | | |
| Actavis Funding SCS 3.45% 3/15/22 | | 17,547,000 | 18,019,689 |
| Bayer AG: | | | |
| 2.375% 4/2/75 (Reg. S) (c) | EUR | 8,060,000 | 8,992,104 |
| 3% 7/1/75 (Reg S.) (c) | EUR | 1,500,000 | 1,673,304 |
| Bayer U.S. Finance II LLC 4.25% 12/15/25 (b) | | 14,438,000 | 15,561,275 |
| Catalent Pharma Solutions 4.875% 1/15/26 (b) | | 1,860,000 | 1,887,900 |
| Mylan NV: | | | |
| 3.15% 6/15/21 | | 7,707,000 | 7,798,015 |
| 3.95% 6/15/26 | | 4,038,000 | 4,201,788 |
| 4.55% 4/15/28 | | 7,694,000 | 8,283,124 |
| Perrigo Finance PLC 3.5% 12/15/21 | | 559,000 | 561,521 |
| Teva Pharmaceutical Finance Co. BV: | | | |
| 2.95% 12/18/22 | | 381,000 | 332,423 |
| 3.65% 11/10/21 | | 244,000 | 232,105 |
| Teva Pharmaceutical Finance IV BV 3.65% 11/10/21 | | 299,000 | 284,424 |
| Teva Pharmaceutical Finance Netherlands III BV: | | | |
| 0.375% 7/25/20 (Reg. S) | EUR | 4,654,000 | 5,012,454 |
| 2.2% 7/21/21 | | 5,444,000 | 5,096,945 |
| 2.8% 7/21/23 | | 7,973,000 | 6,717,253 |
| 4.5% 3/1/25 | EUR | 1,383,000 | 1,348,562 |
| Valeant Pharmaceuticals International, Inc.: | | | |
| 5.5% 11/1/25 (b) | | 1,323,000 | 1,387,470 |
| 5.875% 5/15/23 (b) | | 669,000 | 677,363 |
| 6.5% 3/15/22 (b) | | 907,000 | 939,017 |
| 7% 3/15/24 (b) | | 4,245,000 | 4,483,399 |
| 9% 12/15/25 (b) | | 352,000 | 394,680 |
| Zoetis, Inc.: | | | |
| 3.25% 2/1/23 | | 1,775,000 | 1,835,850 |
| 3.45% 11/13/20 | | 1,880,000 | 1,905,339 |
| | | | 97,626,004 |
| TOTAL HEALTH CARE | | | 311,405,333 |
| INDUSTRIALS - 1.0% | | | |
| Aerospace & Defense - 0.3% | | | |
| BAE Systems Holdings, Inc. 3.8% 10/7/24 (b) | | 3,311,000 | 3,514,795 |
| BBA U.S. Holdings, Inc. 5.375% 5/1/26 (b) | | 3,606,000 | 3,768,270 |
| Bombardier, Inc.: | | | |
| 6.125% 1/15/23 (b) | | 4,765,000 | 4,741,175 |
| 7.5% 12/1/24 (b) | | 3,882,000 | 3,867,831 |
| 7.5% 3/15/25 (b) | | 1,091,000 | 1,062,361 |
| 7.875% 4/15/27 (b) | | 2,690,000 | 2,605,938 |
| BWX Technologies, Inc. 5.375% 7/15/26 (b) | | 3,692,000 | 3,904,290 |
| Rolls-Royce PLC 3.375% 6/18/26 | GBP | 200,000 | 269,587 |
| TransDigm, Inc.: | | | |
| 6% 7/15/22 | | 1,455,000 | 1,478,644 |
| 6.25% 3/15/26 (b) | | 5,550,000 | 5,986,952 |
| 6.375% 6/15/26 | | 350,000 | 367,322 |
| 6.5% 7/15/24 | | 3,970,000 | 4,099,025 |
| 6.5% 5/15/25 | | 3,012,000 | 3,140,010 |
| | | | 38,806,200 |
| Air Freight & Logistics - 0.1% | | | |
| Aercap Global Aviation Trust 6.5% 6/15/45 (b)(c) | | 5,253,000 | 5,601,011 |
| Rumo Luxembourg Sarl 7.375% 2/9/24 (b) | | 1,232,000 | 1,325,940 |
| | | | 6,926,951 |
| Airlines - 0.0% | | | |
| Azul Investments LLP 5.875% 10/26/24 (b) | | 882,000 | 875,936 |
| Building Products - 0.0% | | | |
| Elementia S.A.B. de CV 5.5% 1/15/25 (b) | | 563,000 | 542,239 |
| Commercial Services & Supplies - 0.1% | | | |
| APX Group, Inc.: | | | |
| 7.625% 9/1/23 | | 2,444,000 | 1,820,780 |
| 7.875% 12/1/22 | | 1,900,000 | 1,807,375 |
| 8.75% 12/1/20 | | 1,618,000 | 1,537,100 |
| Brand Energy & Infrastructure Services, Inc. 8.5% 7/15/25 (b) | | 1,758,000 | 1,549,238 |
| LBC Tank Terminals Holding Netherlands BV 6.875% 5/15/23 (b) | | 2,221,000 | 2,243,210 |
| Prime Security One MS, Inc. 4.875% 7/15/32 (b) | | 1,513,000 | 1,318,201 |
| Tervita Escrow Corp. 7.625% 12/1/21 (b) | | 557,000 | 565,355 |
| | | | 10,841,259 |
| Construction & Engineering - 0.1% | | | |
| AECOM: | | | |
| 5.125% 3/15/27 | | 4,458,000 | 4,656,470 |
| 5.875% 10/15/24 | | 2,678,000 | 2,892,240 |
| Cementos Progreso Trust 7.125% 11/6/23 (b) | | 699,000 | 722,810 |
| Odebrecht Finance Ltd.: | | | |
| 4.375% 4/25/25 (b)(e) | | 935,000 | 69,424 |
| 7.125% 6/26/42 (b)(e) | | 1,399,000 | 125,910 |
| | | | 8,466,854 |
| Electrical Equipment - 0.0% | | | |
| Sensata Technologies BV 5% 10/1/25 (b) | | 1,555,000 | 1,648,300 |
| Vestas Wind Systems A/S 2.75% 3/11/22 (Reg. S) | EUR | 1,329,000 | 1,549,035 |
| | | | 3,197,335 |
| Industrial Conglomerates - 0.0% | | | |
| General Electric Co.: | | | |
| 0.375% 5/17/22 | EUR | 200,000 | 216,471 |
| 1.25% 5/26/23 | EUR | 400,000 | 443,177 |
| Turk Sise ve Cam Fabrikalari A/S 6.95% 3/14/26 (b) | | 360,000 | 359,325 |
| | | | 1,018,973 |
| Machinery - 0.0% | | | |
| U.S.A. Compression Partners LP: | | | |
| 6.875% 4/1/26 | | 2,099,000 | 2,151,475 |
| 6.875% 9/1/27 (b) | | 715,000 | 735,435 |
| | | | 2,886,910 |
| Professional Services - 0.0% | | | |
| Thomson Reuters Corp. 3.85% 9/29/24 | | 1,266,000 | 1,333,627 |
| Road & Rail - 0.0% | | | |
| Alpha Trains Finance SA 2.064% 6/30/25 | EUR | 2,765,000 | 3,224,032 |
| JSC Georgian Railway 7.75% 7/11/22 (b) | | 196,000 | 214,816 |
| Lima Metro Line 2 Finance Ltd. 4.35% 4/5/36 (b) | | 455,000 | 479,598 |
| Uber Technologies, Inc. 7.5% 11/1/23 (b) | | 544,000 | 568,480 |
| Ukraine Railways via Shortline PLC 9.875% 9/15/21 (b) | | 948,500 | 963,913 |
| | | | 5,450,839 |
| Trading Companies & Distributors - 0.4% | | | |
| Air Lease Corp.: | | | |
| 3% 9/15/23 | | 1,163,000 | 1,183,700 |
| 3.375% 6/1/21 | | 3,808,000 | 3,870,930 |
| 3.75% 2/1/22 | | 9,580,000 | 9,869,656 |
| 3.875% 4/1/21 | | 4,214,000 | 4,311,446 |
| 4.25% 2/1/24 | | 11,266,000 | 12,026,050 |
| 4.25% 9/15/24 | | 4,366,000 | 4,693,587 |
| 4.75% 3/1/20 | | 4,281,000 | 4,329,049 |
| Avantor, Inc. 6% 10/1/24 (b) | | 1,062,000 | 1,138,995 |
| FLY Leasing Ltd.: | | | |
| 5.25% 10/15/24 | | 5,827,000 | 5,987,243 |
| 6.375% 10/15/21 | | 2,178,000 | 2,218,838 |
| Travis Perkins PLC: | | | |
| 4.375% 9/15/21 (Reg. S) | GBP | 747,000 | 940,763 |
| 4.5% 9/7/23 (Reg. S) | GBP | 1,024,000 | 1,306,210 |
| | | | 51,876,467 |
| Transportation Infrastructure - 0.0% | | | |
| Aeropuertos Argentina 2000 SA 6.875% 2/1/27 (b) | | 2,036,250 | 1,802,081 |
| DP World Ltd. 5.625% 9/25/48 (b) | | 315,000 | 374,850 |
| Heathrow Funding Ltd. 7.125% 2/14/24 | GBP | 2,150,000 | 3,206,390 |
| | | | 5,383,321 |
| TOTAL INDUSTRIALS | | | 137,606,911 |
| INFORMATION TECHNOLOGY - 0.4% | | | |
| Communications Equipment - 0.0% | | | |
| CommScope Finance LLC: | | | |
| 5.5% 3/1/24 (b) | | 350,000 | 354,813 |
| 6% 3/1/26 (b) | | 350,000 | 356,475 |
| | | | 711,288 |
| Electronic Equipment & Components - 0.2% | | | |
| Diamond 1 Finance Corp./Diamond 2 Finance Corp.: | | | |
| 4.42% 6/15/21 (b) | | 871,000 | 898,694 |
| 5.45% 6/15/23 (b) | | 9,000,000 | 9,781,966 |
| 6.02% 6/15/26 (b) | | 3,119,000 | 3,520,098 |
| TTM Technologies, Inc. 5.625% 10/1/25 (b) | | 6,375,000 | 6,215,625 |
| | | | 20,416,383 |
| IT Services - 0.0% | | | |
| Banff Merger Sub, Inc. 9.75% 9/1/26 (b) | | 1,620,000 | 1,474,200 |
| Gartner, Inc. 5.125% 4/1/25 (b) | | 485,000 | 508,639 |
| Indra Sistemas SA 3% 4/19/24 (Reg. S) | EUR | 1,100,000 | 1,269,403 |
| | | | 3,252,242 |
| Semiconductors & Semiconductor Equipment - 0.0% | | | |
| Micron Technology, Inc. 5.5% 2/1/25 | | 2,590,000 | 2,644,168 |
| NXP BV/NXP Funding LLC 4.125% 6/1/21 (b) | | 768,000 | 788,141 |
| Qorvo, Inc. 5.5% 7/15/26 | | 1,546,000 | 1,650,386 |
| Sensata Technologies UK Financing Co. PLC 6.25% 2/15/26 (b) | | 1,098,000 | 1,166,307 |
| | | | 6,249,002 |
| Software - 0.2% | | | |
| Ascend Learning LLC: | | | |
| 6.875% 8/1/25 (b) | | 205,000 | 212,431 |
| 6.875% 8/1/25 (b) | | 1,910,000 | 1,979,238 |
| CDK Global, Inc.: | | | |
| 4.875% 6/1/27 | | 661,000 | 682,972 |
| 5.25% 5/15/29 (b) | | 435,000 | 449,138 |
| 5.875% 6/15/26 | | 1,377,000 | 1,462,512 |
| Ensemble S Merger Sub, Inc. 9% 9/30/23 (b) | | 2,539,000 | 2,608,823 |
| Fair Isaac Corp. 5.25% 5/15/26 (b) | | 3,301,000 | 3,515,565 |
| Nuance Communications, Inc. 5.625% 12/15/26 | | 1,517,000 | 1,598,539 |
| Open Text Corp. 5.875% 6/1/26 (b) | | 4,021,000 | 4,297,243 |
| SS&C Technologies, Inc. 5.5% 9/30/27 (b) | | 1,930,000 | 2,026,500 |
| Symantec Corp. 5% 4/15/25 (b) | | 6,576,000 | 6,619,863 |
| | | | 25,452,824 |
| TOTAL INFORMATION TECHNOLOGY | | | 56,081,739 |
| MATERIALS - 0.7% | | | |
| Chemicals - 0.2% | | | |
| Braskem Finance Ltd. 5.375% 5/2/22 (b) | | 439,000 | 457,658 |
| Element Solutions, Inc. 5.875% 12/1/25 (b) | | 3,141,000 | 3,282,345 |
| International Flavors & Fragrances, Inc. 1.8% 9/25/26 | EUR | 2,852,000 | 3,372,617 |
| Nufarm Australia Ltd. 5.75% 4/30/26 (b) | | 2,724,000 | 2,567,370 |
| Nutrien Ltd.: | | | |
| 4.2% 4/1/29 | | 1,219,000 | 1,362,409 |
| 5% 4/1/49 | | 2,122,000 | 2,533,140 |
| OCI NV 6.625% 4/15/23 (b) | | 3,893,000 | 4,107,115 |
| OCP SA: | | | |
| 5.625% 4/25/24 (b) | | 323,000 | 356,108 |
| 6.875% 4/25/44 (b) | | 150,000 | 186,516 |
| Olin Corp. 5.125% 9/15/27 | | 2,087,000 | 2,144,393 |
| Petkim Petrokimya Holding A/S 5.875% 1/26/23 (b) | | 1,532,000 | 1,474,550 |
| SABIC Capital II BV 4% 10/10/23 (b) | | 842,000 | 898,667 |
| Sasol Financing U.S.A. LLC 5.875% 3/27/24 | | 401,000 | 432,453 |
| The Chemours Co. LLC: | | | |
| 5.375% 5/15/27 | | 1,925,000 | 1,708,438 |
| 7% 5/15/25 | | 1,455,000 | 1,436,813 |
| The Dow Chemical Co. 4.125% 11/15/21 | | 3,952,000 | 4,100,750 |
| TPC Group, Inc. 10.5% 8/1/24 (b) | | 1,040,000 | 1,092,000 |
| Trinseo Materials Operating SCA/Trinseo Materials Finance, Inc. 5.375% 9/1/25 (b) | | 1,688,000 | 1,586,720 |
| Valvoline, Inc. 4.375% 8/15/25 | | 1,395,000 | 1,408,950 |
| | | | 34,509,012 |
| Construction Materials - 0.0% | | | |
| CEMEX Finance LLC: | | | |
| 4.625% 6/15/24 | EUR | 2,059,000 | 2,376,149 |
| 6% 4/1/24 (b) | | 336,000 | 344,047 |
| CEMEX S.A.B. de CV: | | | |
| 3.125% 3/19/26 (Reg. S) | EUR | 1,850,000 | 2,100,543 |
| 7.75% 4/16/26 (b) | | 346,000 | 372,815 |
| | | | 5,193,554 |
| Containers & Packaging - 0.2% | | | |
| Ard Securities Finance SARL 8.75% 1/31/23 pay-in-kind (b)(c) | | 2,493,089 | 2,580,347 |
| Ardagh Packaging Finance PLC/Ardagh MP Holdings U.S.A., Inc. 6% 2/15/25 (b) | | 8,567,000 | 8,947,161 |
| Crown Americas LLC/Crown Americas Capital Corp. V 4.25% 9/30/26 | | 1,942,000 | 2,014,825 |
| Flex Acquisition Co., Inc.: | | | |
| 6.875% 1/15/25 (b) | | 2,270,000 | 2,043,000 |
| 7.875% 7/15/26 (b) | | 505,000 | 457,025 |
| OI European Group BV 4% 3/15/23 (b) | | 1,960,000 | 1,974,700 |
| Owens-Brockway Glass Container, Inc. 5.375% 1/15/25 (b) | | 1,426,000 | 1,475,910 |
| Silgan Holdings, Inc. 4.75% 3/15/25 | | 1,069,000 | 1,097,168 |
| | | | 20,590,136 |
| Metals & Mining - 0.3% | | | |
| BHP Billiton Financial (U.S.A.) Ltd.: | | | |
| 6.25% 10/19/75 (b)(c) | | 2,547,000 | 2,647,505 |
| 6.75% 10/19/75 (b)(c) | | 6,327,000 | 7,410,182 |
| Corporacion Nacional del Cobre de Chile (Codelco): | | | |
| 3.625% 8/1/27 (b) | | 3,004,000 | 3,217,096 |
| 4.5% 8/1/47 (b) | | 2,375,000 | 2,789,883 |
| CSN Resources SA: | | | |
| 6.5% 7/21/20 (b) | | 425,000 | 431,242 |
| 7.625% 2/13/23 (b) | | 2,355,000 | 2,406,516 |
| First Quantum Minerals Ltd.: | | | |
| 6.5% 3/1/24 (b) | | 1,254,000 | 1,123,506 |
| 7.25% 5/15/22 (b) | | 806,000 | 782,324 |
| 7.25% 4/1/23 (b) | | 6,168,000 | 5,736,240 |
| Freeport-McMoRan, Inc.: | | | |
| 3.55% 3/1/22 | | 1,649,000 | 1,653,123 |
| 3.875% 3/15/23 | | 1,118,000 | 1,129,627 |
| Gold Fields Orogen Holding BVI Ltd.: | | | |
| 4.875% 10/7/20 (b) | | 440,000 | 447,563 |
| 5.125% 5/15/24 (b) | | 160,000 | 170,400 |
| Metinvest BV 7.75% 4/23/23 (b) | | 2,296,000 | 2,364,880 |
| Polyus Finance PLC 5.25% 2/7/23 (b) | | 682,000 | 717,805 |
| POSCO 4% 8/1/23 (b) | | 350,000 | 369,866 |
| Stillwater Mining Co. 6.125% 6/27/22 (b) | | 1,978,000 | 1,990,363 |
| Usiminas International SARL 5.875% 7/18/26 (b) | | 400,000 | 402,400 |
| Vale Overseas Ltd. 4.375% 1/11/22 | | 130,000 | 134,347 |
| Vedanta Resources PLC: | | | |
| 6.375% 7/30/22 (b) | | 2,215,000 | 2,125,016 |
| 8.25% 6/7/21 (b) | | 830,000 | 860,347 |
| | | | 38,910,231 |
| Paper & Forest Products - 0.0% | | | |
| Berry Global Escrow Corp. 4.875% 7/15/26 (b) | | 1,995,000 | 2,094,750 |
| TOTAL MATERIALS | | | 101,297,683 |
| REAL ESTATE - 2.6% | | | |
| Equity Real Estate Investment Trusts (REITs) - 1.7% | | | |
| alstria office REIT-AG 1.5% 11/15/27 (Reg. S) | EUR | 1,500,000 | 1,741,166 |
| American Campus Communities Operating Partnership LP 3.75% 4/15/23 | | 1,267,000 | 1,328,020 |
| American Homes 4 Rent 4.25% 2/15/28 | | 498,000 | 541,000 |
| AvalonBay Communities, Inc. 3.625% 10/1/20 | | 1,816,000 | 1,839,538 |
| Boston Properties, Inc.: | | | |
| 3.85% 2/1/23 | | 2,116,000 | 2,233,604 |
| 4.5% 12/1/28 | | 7,625,000 | 8,810,279 |
| Camden Property Trust: | | | |
| 2.95% 12/15/22 | | 2,403,000 | 2,464,045 |
| 4.25% 1/15/24 | | 3,336,000 | 3,610,803 |
| Care Capital Properties LP 5.125% 8/15/26 | | 2,780,000 | 3,001,648 |
| Corporate Office Properties LP 5% 7/1/25 | | 4,492,000 | 4,888,588 |
| Corrections Corp. of America: | | | |
| 4.125% 4/1/20 | | 955,000 | 952,613 |
| 4.625% 5/1/23 | | 2,335,000 | 2,253,275 |
| 5% 10/15/22 | | 1,895,000 | 1,876,050 |
| CTR Partnership LP/CareTrust Capital Corp. 5.25% 6/1/25 | | 1,847,000 | 1,902,742 |
| DDR Corp.: | | | |
| 3.625% 2/1/25 | | 3,106,000 | 3,204,854 |
| 4.25% 2/1/26 | | 10,537,000 | 11,235,117 |
| 4.625% 7/15/22 | | 2,313,000 | 2,425,165 |
| 4.7% 6/1/27 | | 496,000 | 548,368 |
| Duke Realty LP: | | | |
| 3.625% 4/15/23 | | 2,282,000 | 2,389,382 |
| 3.75% 12/1/24 | | 1,963,000 | 2,099,809 |
| 3.875% 10/15/22 | | 6,311,000 | 6,615,314 |
| Equity One, Inc. 3.75% 11/15/22 | | 6,569,000 | 6,846,426 |
| ERP Operating LP 4.75% 7/15/20 | | 2,795,000 | 2,839,726 |
| HCP, Inc.: | | | |
| 3.25% 7/15/26 | | 1,156,000 | 1,195,456 |
| 3.5% 7/15/29 | | 1,322,000 | 1,396,030 |
| Hudson Pacific Properties LP 4.65% 4/1/29 | | 15,534,000 | 17,459,970 |
| iStar Financial, Inc. 6% 4/1/22 | | 456,000 | 467,970 |
| Lexington Corporate Properties Trust 4.4% 6/15/24 | | 1,672,000 | 1,749,364 |
| MPT Operating Partnership LP/MPT Finance Corp.: | | | |
| 5% 10/15/27 | | 2,811,000 | 3,000,743 |
| 5.25% 8/1/26 | | 2,057,000 | 2,173,323 |
| 6.375% 3/1/24 | | 817,000 | 855,808 |
| Omega Healthcare Investors, Inc.: | | | |
| 4.375% 8/1/23 | | 15,275,000 | 16,098,235 |
| 4.5% 1/15/25 | | 3,878,000 | 4,099,949 |
| 4.5% 4/1/27 | | 18,502,000 | 19,811,620 |
| 4.75% 1/15/28 | | 10,700,000 | 11,652,214 |
| 4.95% 4/1/24 | | 9,768,000 | 10,517,024 |
| 5.25% 1/15/26 | | 10,610,000 | 11,741,213 |
| Retail Opportunity Investments Partnership LP: | | | |
| 4% 12/15/24 | | 1,225,000 | 1,253,281 |
| 5% 12/15/23 | | 737,000 | 781,193 |
| Samhallsbyggnadsbolaget I Norden AB: | | | |
| 1.125% 9/4/26 (Reg. S) | EUR | 1,880,000 | 2,052,577 |
| 1.75% 1/14/25 (Reg. S) | EUR | 3,500,000 | 4,002,912 |
| Senior Housing Properties Trust 6.75% 4/15/20 | | 91,000 | 91,398 |
| Store Capital Corp. 4.625% 3/15/29 | | 3,549,000 | 3,942,889 |
| Ventas Realty LP: | | | |
| 3% 1/15/30 | | 9,057,000 | 9,117,569 |
| 3.125% 6/15/23 | | 1,981,000 | 2,044,535 |
| 3.5% 2/1/25 | | 2,163,000 | 2,276,152 |
| 3.75% 5/1/24 | | 9,073,000 | 9,626,340 |
| 4% 3/1/28 | | 3,986,000 | 4,330,607 |
| 4.125% 1/15/26 | | 2,017,000 | 2,186,099 |
| Weingarten Realty Investors 3.375% 10/15/22 | | 990,000 | 1,014,071 |
| WP Carey, Inc.: | | | |
| 3.85% 7/15/29 | | 2,566,000 | 2,724,505 |
| 4% 2/1/25 | | 12,346,000 | 13,025,514 |
| | | | 236,336,093 |
| Real Estate Management & Development - 0.9% | | | |
| Brandywine Operating Partnership LP: | | | |
| 3.95% 2/15/23 | | 10,562,000 | 11,048,478 |
| 3.95% 11/15/27 | | 8,220,000 | 8,666,354 |
| 4.1% 10/1/24 | | 5,764,000 | 6,107,008 |
| 4.55% 10/1/29 | | 6,226,000 | 6,808,402 |
| CPI Property Group SA 1.45% 4/14/22 (Reg. S) | EUR | 5,000,000 | 5,627,479 |
| Deutsche Annington Finance BV 5% 10/2/23 (b) | | 2,105,000 | 2,231,538 |
| Digital Realty Trust LP: | | | |
| 3.625% 10/1/22 | | 3,341,000 | 3,471,865 |
| 3.95% 7/1/22 | | 4,297,000 | 4,500,311 |
| 4.75% 10/1/25 | | 11,110,000 | 12,326,745 |
| Essex Portfolio LP 3.875% 5/1/24 | | 3,195,000 | 3,409,600 |
| Greystar Real Estate Partners 5.75% 12/1/25 (b) | | 261,000 | 267,616 |
| Heimstaden Bostad AB 1.75% 12/7/21 (Reg. S) | EUR | 5,085,000 | 5,785,558 |
| Host Hotels & Resorts LP 4.75% 3/1/23 | | 54,000 | 57,840 |
| Howard Hughes Corp. 5.375% 3/15/25 (b) | | 3,988,000 | 4,107,640 |
| IRSA Propiedades Comerciales SA 8.75% 3/23/23 (b) | | 187,000 | 129,965 |
| Kennedy-Wilson, Inc. 5.875% 4/1/24 | | 294,000 | 300,983 |
| Liberty Property LP: | | | |
| 3.375% 6/15/23 | | 2,967,000 | 3,079,497 |
| 4.125% 6/15/22 | | 5,400,000 | 5,657,128 |
| 4.4% 2/15/24 | | 4,724,000 | 5,121,708 |
| 4.75% 10/1/20 | | 4,095,000 | 4,182,725 |
| Mack-Cali Realty LP: | | | |
| 3.15% 5/15/23 | | 5,348,000 | 5,085,056 |
| 4.5% 4/18/22 | | 6,302,000 | 6,330,162 |
| Post Apartment Homes LP 3.375% 12/1/22 | | 933,000 | 963,828 |
| SELP Finance SARL 1.5% 12/20/26 (Reg. S) | EUR | 1,700,000 | 1,961,270 |
| Shimao Property Holdings Ltd. 4.75% 7/3/22 | | 965,000 | 974,348 |
| Tanger Properties LP: | | | |
| 3.125% 9/1/26 | | 4,970,000 | 4,924,568 |
| 3.75% 12/1/24 | | 8,801,000 | 9,053,193 |
| 3.875% 12/1/23 | | 1,746,000 | 1,809,205 |
| Twin River Worldwide Holdings, Inc. 6.75% 6/1/27 (b) | | 1,987,000 | 2,093,801 |
| | | | 126,083,871 |
| TOTAL REAL ESTATE | | | 362,419,964 |
| UTILITIES - 1.7% | | | |
| Electric Utilities - 0.9% | | | |
| American Electric Power Co., Inc. 2.95% 12/15/22 | | 1,791,000 | 1,829,370 |
| Clearway Energy Operating LLC 5.75% 10/15/25 (b) | | 1,252,000 | 1,305,235 |
| Duquesne Light Holdings, Inc.: | | | |
| 5.9% 12/1/21 (b) | | 10,650,000 | 11,365,261 |
| 6.4% 9/15/20 (b) | | 9,399,000 | 9,751,935 |
| Eskom Holdings SOC Ltd.: | | | |
| 5.75% 1/26/21 (b) | | 2,922,000 | 2,929,305 |
| 5.75% 1/26/21 (Reg. S) | | 1,015,000 | 1,017,538 |
| 7.125% 2/11/25 (b) | | 590,000 | 606,225 |
| Eversource Energy 2.8% 5/1/23 | | 5,482,000 | 5,583,545 |
| Exelon Corp. 2.85% 6/15/20 | | 1,774,000 | 1,781,900 |
| FirstEnergy Corp.: | | | |
| 4.25% 3/15/23 | | 11,339,000 | 12,049,697 |
| 7.375% 11/15/31 | | 23,272,000 | 33,369,917 |
| InterGen NV 7% 6/30/23 (b) | | 4,030,000 | 3,687,450 |
| IPALCO Enterprises, Inc.: | | | |
| 3.45% 7/15/20 | | 9,979,000 | 10,039,075 |
| 3.7% 9/1/24 | | 3,797,000 | 3,972,508 |
| Israel Electric Corp. Ltd. 7.75% 12/15/27 (Reg. S) | | 350,000 | 464,916 |
| LG&E and KU Energy LLC 3.75% 11/15/20 | | 526,000 | 533,912 |
| Monongahela Power Co. 4.1% 4/15/24 (b) | | 1,445,000 | 1,561,630 |
| NRG Yield Operating LLC 5% 9/15/26 | | 1,432,000 | 1,449,900 |
| NSG Holdings II LLC/NSG Holdings, Inc. 7.75% 12/15/25 (b) | | 2,965,411 | 3,180,403 |
| NV Energy, Inc. 6.25% 11/15/20 | | 1,270,000 | 1,328,008 |
| ORSTED A/S 2.125% 5/17/27 (Reg. S) | GBP | 1,700,000 | 2,194,742 |
| Pampa Holding SA 7.5% 1/24/27 (b) | | 321,000 | 192,600 |
| PPL Capital Funding, Inc. 3.4% 6/1/23 | | 2,607,000 | 2,694,184 |
| TECO Finance, Inc. 5.15% 3/15/20 | | 1,365,000 | 1,384,620 |
| Vattenfall AB 0.5% 6/24/26 (Reg. S) | EUR | 1,310,000 | 1,491,659 |
| Vistra Operations Co. LLC: | | | |
| 5% 7/31/27 (b) | | 1,855,000 | 1,915,288 |
| 5.5% 9/1/26 (b) | | 6,599,000 | 6,928,950 |
| | | | 124,609,773 |
| Gas Utilities - 0.0% | | | |
| Southern Natural Gas Co./Southern Natural Issuing Corp. 4.4% 6/15/21 | | 1,323,000 | 1,361,162 |
| Independent Power and Renewable Electricity Producers - 0.3% | | | |
| Dolphin Subsidiary II, Inc. 7.25% 10/15/21 | | 17,828,000 | 19,120,530 |
| Emera U.S. Finance LP: | | | |
| 2.7% 6/15/21 | | 1,835,000 | 1,848,239 |
| 3.55% 6/15/26 | | 2,935,000 | 3,097,603 |
| NextEra Energy Partners LP: | | | |
| 4.25% 9/15/24 (b) | | 1,904,000 | 1,974,448 |
| 4.5% 9/15/27 (b) | | 339,000 | 348,323 |
| NRG Energy, Inc.: | | | |
| 5.25% 6/15/29 (b) | | 1,975,000 | 2,107,463 |
| 6.625% 1/15/27 | | 615,000 | 664,200 |
| Talen Energy Supply LLC: | | | |
| 6.5% 6/1/25 | | 315,000 | 239,400 |
| 10.5% 1/15/26 (b) | | 3,930,000 | 3,572,370 |
| TerraForm Power Operating LLC: | | | |
| 4.25% 1/31/23 (b) | | 747,000 | 765,414 |
| 5% 1/31/28 (b) | | 842,000 | 876,749 |
| 6.625% 6/15/25 (b)(c) | | 2,015,000 | 2,125,825 |
| The AES Corp.: | | | |
| 4.5% 3/15/23 | | 1,054,000 | 1,083,407 |
| 4.875% 5/15/23 | | 3,453,000 | 3,500,479 |
| 5.125% 9/1/27 | | 2,642,000 | 2,832,303 |
| 6% 5/15/26 | | 561,000 | 601,527 |
| | | | 44,758,280 |
| Multi-Utilities - 0.5% | | | |
| Dominion Energy, Inc.: | | | |
| 3 month U.S. LIBOR + 2.300% 4.6299% 9/30/66 (c)(d) | | 12,786,000 | 11,954,910 |
| 3 month U.S. LIBOR + 2.825% 5.1549% 6/30/66 (c)(d) | | 3,755,000 | 3,548,475 |
| NiSource Finance Corp.: | | | |
| 5.25% 2/15/43 | | 4,623,000 | 5,717,242 |
| 5.8% 2/1/42 | | 2,300,000 | 3,018,310 |
| 5.95% 6/15/41 | | 4,294,000 | 5,737,840 |
| NiSource, Inc. 2.95% 9/1/29 | | 17,668,000 | 18,063,008 |
| Puget Energy, Inc.: | | | |
| 6% 9/1/21 | | 5,649,000 | 6,029,039 |
| 6.5% 12/15/20 | | 1,860,000 | 1,955,513 |
| Sempra Energy: | | | |
| 2.875% 10/1/22 | | 2,090,000 | 2,123,432 |
| 6% 10/15/39 | | 5,447,000 | 7,132,345 |
| Wisconsin Energy Corp. 3 month U.S. LIBOR + 2.113% 4.2706% 5/15/67 (c)(d) | | 1,401,000 | 1,184,840 |
| | | | 66,464,954 |
| TOTAL UTILITIES | | | 237,194,169 |
|
| TOTAL NONCONVERTIBLE BONDS | | | 4,952,616,283 |
|
| TOTAL CORPORATE BONDS | | | |
| (Cost $4,628,322,169) | | | 4,955,428,588 |
|
| U.S. Government and Government Agency Obligations - 31.4% | | | |
| U.S. Treasury Inflation-Protected Obligations - 3.8% | | | |
| U.S. Treasury Inflation-Indexed Bonds: | | | |
| 0.75% 2/15/45 | | $56,880,426 | $62,123,843 |
| 1% 2/15/46 | | 21,123,218 | 24,462,583 |
| 1% 2/15/49 | | 19,207,962 | 22,675,296 |
| U.S. Treasury Inflation-Indexed Notes: | | | |
| 0.125% 7/15/24 | | 19,314,732 | 19,469,720 |
| 0.375% 7/15/25 | | 98,650,816 | 101,084,440 |
| 0.375% 1/15/27 | | 41,022,746 | 42,122,089 |
| 0.625% 1/15/26 | | 73,802,429 | 76,633,865 |
| 0.75% 7/15/28 | | 112,313,140 | 120,145,835 |
| 0.875% 1/15/29 | | 58,947,946 | 63,823,357 |
|
| TOTAL U.S. TREASURY INFLATION-PROTECTED OBLIGATIONS | | | 532,541,028 |
|
| U.S. Treasury Obligations - 27.6% | | | |
| U.S. Treasury Bonds: | | | |
| 2.25% 8/15/46 (f)(g) | | 148,800 | 157,594 |
| 2.75% 11/15/47 | | 104,081,100 | 121,738,296 |
| 3% 5/15/45 | | 33,263,500 | 40,334,592 |
| 3% 2/15/48 | | 8,605,900 | 10,549,287 |
| 3% 2/15/49 | | 329,259,000 | 405,631,652 |
| 5% 5/15/37 | | 9,400 | 14,152 |
| U.S. Treasury Notes: | | | |
| 1.25% 10/31/21 (f)(g) | | 1,742,100 | 1,732,437 |
| 1.375% 8/31/26 | | 449,636,000 | 447,264,872 |
| 1.625% 8/15/29 | | 211,900,000 | 214,308,708 |
| 1.75% 6/30/24 | | 480,260,000 | 487,989,122 |
| 1.875% 7/31/22 | | 75,880,400 | 76,808,156 |
| 2% 4/30/24 | | 9,073,300 | 9,311,474 |
| 2% 11/15/26 | | 13,667,000 | 14,178,979 |
| 2.125% 12/31/22 | | 101,770,200 | 104,079,906 |
| 2.125% 3/31/24 | | 74,269,000 | 76,592,807 |
| 2.125% 7/31/24 | | 126,782,000 | 131,055,940 |
| 2.125% 11/30/24 (h) | | 20,001,700 | 20,709,573 |
| 2.125% 5/15/25 (f)(g) | | 834,700 | 866,197 |
| 2.125% 5/31/26 | | 313,445,000 | 326,913,340 |
| 2.25% 4/30/24 | | 219,880,000 | 228,151,268 |
| 2.25% 12/31/24 | | 224,574,900 | 234,101,789 |
| 2.25% 2/15/27 | | 39,711,900 | 41,936,387 |
| 2.25% 11/15/27 | | 113,969,800 | 120,759,016 |
| 2.375% 4/30/26 | | 84,892,000 | 89,839,612 |
| 2.375% 5/15/29 | | 2,775,000 | 2,991,797 |
| 2.5% 3/31/23 | | 232,309,800 | 241,021,418 |
| 2.5% 1/31/24 | | 130,600,000 | 136,609,640 |
| 2.75% 11/30/20 (f)(h) | | 4,304,000 | 4,358,977 |
| 2.75% 2/15/28 | | 54,737,100 | 60,234,330 |
| 2.875% 11/30/25 | | 50,000,000 | 54,246,094 |
| 2.875% 8/15/28 | | 78,639,600 | 87,689,297 |
| 3.125% 11/15/28 | | 92,066,000 | 104,858,139 |
|
| TOTAL U.S. TREASURY OBLIGATIONS | | | 3,897,034,848 |
|
| TOTAL U.S. GOVERNMENT AND GOVERNMENT AGENCY OBLIGATIONS | | | |
| (Cost $4,124,071,056) | | | 4,429,575,876 |
|
| U.S. Government Agency - Mortgage Securities - 23.3% | | | |
| Fannie Mae - 6.2% | | | |
| 12 month U.S. LIBOR + 1.445% 4.497% 4/1/37 (c)(d) | | 19,213 | 19,966 |
| 12 month U.S. LIBOR + 1.480% 4.242% 7/1/34 (c)(d) | | 6,705 | 6,980 |
| 12 month U.S. LIBOR + 1.495% 4.509% 1/1/35 (c)(d) | | 21,122 | 21,882 |
| 12 month U.S. LIBOR + 1.553% 4.337% 6/1/36 (c)(d) | | 16,926 | 17,646 |
| 12 month U.S. LIBOR + 1.565% 4.69% 3/1/37 (c)(d) | | 8,537 | 8,894 |
| 12 month U.S. LIBOR + 1.594% 4.485% 5/1/36 (c)(d) | | 40,474 | 42,198 |
| 12 month U.S. LIBOR + 1.617% 4.583% 3/1/33 (c)(d) | | 15,336 | 15,919 |
| 12 month U.S. LIBOR + 1.641% 4.38% 9/1/36 (c)(d) | | 11,021 | 11,486 |
| 12 month U.S. LIBOR + 1.645% 4.693% 6/1/47 (c)(d) | | 17,760 | 18,623 |
| 12 month U.S. LIBOR + 1.666% 4.538% 11/1/36 (c)(d) | | 10,979 | 11,449 |
| 12 month U.S. LIBOR + 1.711% 4.595% 6/1/42 (c)(d) | | 29,877 | 31,092 |
| 12 month U.S. LIBOR + 1.718% 4.399% 5/1/35 (c)(d) | | 32,956 | 34,338 |
| 12 month U.S. LIBOR + 1.745% 4.755% 7/1/35 (c)(d) | | 14,609 | 15,228 |
| 12 month U.S. LIBOR + 1.750% 4.479% 8/1/41 (c)(d) | | 43,372 | 45,106 |
| 12 month U.S. LIBOR + 1.752% 4.734% 3/1/40 (c)(d) | | 46,512 | 48,599 |
| 12 month U.S. LIBOR + 1.788% 4.913% 2/1/36 (c)(d) | | 39,008 | 40,732 |
| 12 month U.S. LIBOR + 1.800% 4.492% 7/1/41 (c)(d) | | 39,466 | 41,296 |
| 12 month U.S. LIBOR + 1.800% 4.786% 1/1/42 (c)(d) | | 103,568 | 107,354 |
| 12 month U.S. LIBOR + 1.810% 4.81% 12/1/39 (c)(d) | | 17,148 | 17,871 |
| 12 month U.S. LIBOR + 1.812% 4.596% 12/1/40 (c)(d) | | 1,180,881 | 1,230,837 |
| 12 month U.S. LIBOR + 1.818% 4.535% 7/1/41 (c)(d) | | 21,036 | 21,961 |
| 12 month U.S. LIBOR + 1.818% 4.568% 9/1/41 (c)(d) | | 12,020 | 12,511 |
| 12 month U.S. LIBOR + 1.818% 4.932% 2/1/42 (c)(d) | | 95,840 | 99,731 |
| 12 month U.S. LIBOR + 1.820% 4.82% 12/1/35 (c)(d) | | 42,579 | 44,533 |
| 12 month U.S. LIBOR + 1.830% 4.657% 10/1/41 (c)(d) | | 14,372 | 14,998 |
| 12 month U.S. LIBOR + 1.851% 4.58% 5/1/36 (c)(d) | | 13,967 | 14,612 |
| 12 month U.S. LIBOR + 1.900% 4.776% 7/1/37 (c)(d) | | 12,430 | 13,077 |
| 6 month U.S. LIBOR + 1.505% 4.103% 1/1/35 (c)(d) | | 35,914 | 37,116 |
| 6 month U.S. LIBOR + 1.535% 4.178% 3/1/35 (c)(d) | | 5,134 | 5,311 |
| 6 month U.S. LIBOR + 1.535% 4.315% 12/1/34 (c)(d) | | 8,103 | 8,362 |
| 6 month U.S. LIBOR + 1.556% 4.278% 10/1/33 (c)(d) | | 2,711 | 2,796 |
| 6 month U.S. LIBOR + 1.565% 4.085% 7/1/35 (c)(d) | | 3,261 | 3,379 |
| 6 month U.S. LIBOR + 1.740% 4.365% 12/1/34 (c)(d) | | 483 | 502 |
| 6 month U.S. LIBOR + 1.960% 4.725% 9/1/35 (c)(d) | | 5,922 | 6,181 |
| U.S. TREASURY 1 YEAR INDEX + 1.945% 4.27% 10/1/33 (c)(d) | | 61,136 | 63,987 |
| U.S. TREASURY 1 YEAR INDEX + 2.208% 4.833% 3/1/35 (c)(d) | | 5,101 | 5,346 |
| U.S. TREASURY 1 YEAR INDEX + 2.270% 4.676% 6/1/36 (c)(d) | | 38,917 | 40,646 |
| U.S. TREASURY 1 YEAR INDEX + 2.295% 4.678% 10/1/33 (c)(d) | | 18,150 | 18,946 |
| U.S. TREASURY 1 YEAR INDEX + 2.447% 4.946% 7/1/34 (c)(d) | | 43,133 | 45,156 |
| 2.5% 10/1/32 to 8/1/43 | | 59,076,293 | 59,888,818 |
| 3% 7/1/27 to 1/1/47 | | 242,979,742 | 250,566,117 |
| 3.5% 7/1/32 to 1/1/48 (f)(h) | | 169,010,959 | 177,456,460 |
| 4% 5/1/29 to 12/1/48 | | 229,289,517 | 241,884,874 |
| 4.5% 6/1/33 to 12/1/48 | | 85,668,014 | 92,144,587 |
| 5% 12/1/19 to 3/1/45 | | 31,696,840 | 34,549,204 |
| 5.251% 8/1/41 (c) | | 641,423 | 699,199 |
| 5.5% 10/1/21 to 5/1/44 | | 7,726,833 | 8,538,528 |
| 6% 2/1/20 to 1/1/42 | | 3,003,157 | 3,396,028 |
| 6.5% 3/1/22 to 4/1/37 | | 1,299,852 | 1,464,527 |
| 6.531% 2/1/39 (c) | | 714,597 | 772,390 |
| 7% 9/1/21 to 7/1/37 | | 283,706 | 319,292 |
| 7.5% 6/1/25 to 2/1/32 | | 124,076 | 139,922 |
| 8% 8/1/29 to 3/1/37 | | 4,104 | 4,891 |
| 9.5% 9/1/21 | | 64 | 65 |
|
| TOTAL FANNIE MAE | | | 874,071,549 |
|
| Freddie Mac - 4.7% | | | |
| 12 month U.S. LIBOR + 1.325% 4.237% 1/1/36 (c)(d) | | 10,633 | 10,964 |
| 12 month U.S. LIBOR + 1.375% 4.28% 3/1/36 (c)(d) | | 35,491 | 36,653 |
| 12 month U.S. LIBOR + 1.500% 4.53% 3/1/36 (c)(d) | | 31,288 | 32,462 |
| 12 month U.S. LIBOR + 1.515% 4.39% 11/1/35 (c)(d) | | 9,226 | 9,540 |
| 12 month U.S. LIBOR + 1.750% 4.406% 7/1/41 (c)(d) | | 112,964 | 117,535 |
| 12 month U.S. LIBOR + 1.750% 4.644% 12/1/40 (c)(d) | | 615,291 | 638,122 |
| 12 month U.S. LIBOR + 1.754% 4.498% 9/1/41 (c)(d) | | 213,246 | 220,727 |
| 12 month U.S. LIBOR + 1.793% 4.695% 4/1/37 (c)(d) | | 12,191 | 12,723 |
| 12 month U.S. LIBOR + 1.864% 4.739% 4/1/36 (c)(d) | | 12,117 | 12,733 |
| 12 month U.S. LIBOR + 1.877% 4.787% 4/1/41 (c)(d) | | 16,467 | 17,143 |
| 12 month U.S. LIBOR + 1.880% 4.63% 9/1/41 (c)(d) | | 15,639 | 16,296 |
| 12 month U.S. LIBOR + 1.884% 4.628% 10/1/42 (c)(d) | | 178,404 | 185,687 |
| 12 month U.S. LIBOR + 1.910% 4.66% 6/1/41 (c)(d) | | 14,834 | 15,489 |
| 12 month U.S. LIBOR + 1.910% 4.73% 6/1/41 (c)(d) | | 31,156 | 32,545 |
| 12 month U.S. LIBOR + 1.910% 4.785% 5/1/41 (c)(d) | | 26,483 | 27,823 |
| 12 month U.S. LIBOR + 1.910% 4.807% 5/1/41 (c)(d) | | 31,704 | 33,047 |
| 12 month U.S. LIBOR + 1.920% 4.67% 6/1/36 (c)(d) | | 6,929 | 7,286 |
| 12 month U.S. LIBOR + 1.998% 4.913% 4/1/38 (c)(d) | | 34,954 | 36,712 |
| 12 month U.S. LIBOR + 2.045% 4.785% 7/1/36 (c)(d) | | 19,356 | 20,303 |
| 12 month U.S. LIBOR + 2.070% 4.998% 3/1/33 (c)(d) | | 534 | 557 |
| 12 month U.S. LIBOR + 2.200% 5.075% 12/1/36 (c)(d) | | 29,877 | 31,275 |
| 6 month U.S. LIBOR + 1.125% 3.849% 8/1/37 (c)(d) | | 11,539 | 11,770 |
| 6 month U.S. LIBOR + 1.445% 4.195% 3/1/35 (c)(d) | | 12,576 | 12,949 |
| 6 month U.S. LIBOR + 1.608% 4.205% 12/1/35 (c)(d) | | 3,335 | 3,452 |
| 6 month U.S. LIBOR + 1.647% 4.289% 2/1/37 (c)(d) | | 46,318 | 47,961 |
| 6 month U.S. LIBOR + 1.720% 4.247% 8/1/37 (c)(d) | | 17,756 | 18,460 |
| 6 month U.S. LIBOR + 1.746% 4.58% 5/1/37 (c)(d) | | 4,595 | 4,781 |
| 6 month U.S. LIBOR + 1.843% 4.534% 10/1/36 (c)(d) | | 51,360 | 53,422 |
| 6 month U.S. LIBOR + 1.912% 4.623% 10/1/35 (c)(d) | | 31,184 | 32,431 |
| 6 month U.S. LIBOR + 2.020% 4.65% 6/1/37 (c)(d) | | 9,059 | 9,444 |
| 6 month U.S. LIBOR + 2.040% 4.665% 6/1/37 (c)(d) | | 13,604 | 14,200 |
| 6 month U.S. LIBOR + 2.276% 4.955% 10/1/35 (c)(d) | | 14,199 | 14,738 |
| U.S. TREASURY 1 YEAR INDEX + 2.035% 4.58% 6/1/33 (c)(d) | | 43,159 | 45,169 |
| U.S. TREASURY 1 YEAR INDEX + 2.286% 4.828% 6/1/33 (c)(d) | | 83,335 | 87,032 |
| U.S. TREASURY 1 YEAR INDEX + 2.412% 4.902% 3/1/35 (c)(d) | | 166,256 | 173,553 |
| 2.5% 8/1/32 to 5/1/33 | | 13,996,761 | 14,207,368 |
| 3% 4/1/32 to 2/1/47 | | 145,039,655 | 149,521,316 |
| 3.5% 1/1/32 to 5/1/49 (g) | | 244,290,579 | 256,128,386 |
| 3.5% 8/1/47 | | 62,888 | 65,902 |
| 4% 6/1/33 to 10/1/48 | | 174,777,845 | 185,321,270 |
| 4% 4/1/48 | | 483,087 | 504,912 |
| 4.5% 6/1/25 to 12/1/48 | | 39,902,678 | 42,810,680 |
| 5% 6/1/20 to 7/1/41 | | 5,679,137 | 6,276,320 |
| 5.5% 10/1/19 to 5/1/40 | | 1,989,981 | 2,196,061 |
| 6% 10/1/21 to 12/1/37 | | 567,778 | 636,617 |
| 6.5% 9/1/21 to 9/1/39 | | 743,069 | 843,825 |
| 7% 8/1/21 to 9/1/36 | | 259,798 | 295,671 |
| 7.5% 1/1/27 to 4/1/32 | | 5,678 | 6,478 |
| 8% 7/1/24 to 4/1/32 | | 7,588 | 8,661 |
| 8.5% 6/1/22 to 1/1/28 | | 6,259 | 6,964 |
|
| TOTAL FREDDIE MAC | | | 660,875,415 |
|
| Ginnie Mae - 9.1% | | | |
| 3.5% 9/20/40 to 8/20/48 | | 291,874,560 | 305,637,287 |
| 4% 5/20/33 to 5/20/49 | | 136,475,021 | 145,124,062 |
| 4.5% 6/20/33 to 6/20/47 | | 70,824,959 | 75,276,102 |
| 5% 12/15/32 to 9/15/41 | | 6,035,206 | 6,657,442 |
| 5.5% 7/15/33 to 9/15/39 | | 440,025 | 492,898 |
| 6% 10/15/30 to 11/15/39 | | 150,251 | 168,899 |
| 7% 11/15/22 to 3/15/33 | | 272,926 | 309,418 |
| 7.5% 2/15/22 to 9/15/31 | | 97,609 | 107,476 |
| 8% 11/15/21 to 11/15/29 | | 28,174 | 30,588 |
| 8.5% 10/15/21 to 1/15/31 | | 6,034 | 6,830 |
| 9% 10/15/19 to 1/15/23 | | 53 | 57 |
| 9.5% 12/15/20 to 3/15/23 | | 20 | 21 |
| 3% 5/20/42 to 9/20/48 | | 111,311,734 | 115,132,220 |
| 3% 9/1/49 (i) | | 16,750,000 | 17,272,794 |
| 3% 9/1/49 (i) | | 33,650,000 | 34,700,270 |
| 3% 9/1/49 (i) | | 10,600,000 | 10,930,843 |
| 3% 9/1/49 (i) | | 10,500,000 | 10,827,722 |
| 3% 9/1/49 (i) | | 8,600,000 | 8,868,420 |
| 3% 9/1/49 (i) | | 12,500,000 | 12,890,145 |
| 3% 9/1/49 (i) | | 11,800,000 | 12,168,297 |
| 3% 9/1/49 (i) | | 11,950,000 | 12,322,979 |
| 3% 9/1/49 (i) | | 10,050,000 | 10,363,677 |
| 3% 9/1/49 (i) | | 1,400,000 | 1,443,696 |
| 3% 9/1/49 (i) | | 10,100,000 | 10,415,237 |
| 3% 9/1/49 (i) | | 28,200,000 | 29,080,167 |
| 3% 9/1/49 (i) | | 6,000,000 | 6,187,270 |
| 3% 9/1/49 (i) | | 4,600,000 | 4,743,573 |
| 3% 9/1/49 (i) | | 4,000,000 | 4,124,846 |
| 3% 9/1/49 (i) | | 4,000,000 | 4,124,846 |
| 3% 9/1/49 (i) | | 38,050,000 | 39,237,601 |
| 3% 9/1/49 (i) | | 8,550,000 | 8,816,859 |
| 3% 10/1/49 (i) | | 56,000,000 | 57,673,470 |
| 3.5% 9/1/49 (i) | | 44,200,000 | 45,919,658 |
| 3.5% 9/1/49 (i) | | 35,200,000 | 36,569,502 |
| 3.5% 9/1/49 (i) | | 29,100,000 | 30,232,173 |
| 3.5% 9/1/49 (i) | | 23,000,000 | 23,894,845 |
| 3.5% 9/1/49 (i) | | 25,500,000 | 26,492,111 |
| 3.5% 9/1/49 (i) | | 12,200,000 | 12,674,657 |
| 3.5% 9/1/49 (i) | | 22,750,000 | 23,635,118 |
| 3.5% 9/1/49 (i) | | 22,650,000 | 23,531,228 |
| 3.5% 9/1/49 (i) | | 50,100,000 | 52,049,206 |
| 3.5% 9/1/49 (i) | | 54,100,000 | 56,204,831 |
| 4% 9/1/49 (i) | | 8,200,000 | 8,544,015 |
| 6.5% 3/20/31 to 6/15/37 | | 83,502 | 95,477 |
|
| TOTAL GINNIE MAE | | | 1,284,978,833 |
|
| Uniform Mortgage Backed Securities - 3.3% | | | |
| 2.5% 9/1/34 (i) | | 43,450,000 | 44,044,044 |
| 3% 9/1/34 (i) | | 59,825,000 | 61,343,993 |
| 3% 9/1/49 (i) | | 72,150,000 | 73,542,271 |
| 3% 9/1/49 (i) | | 21,000,000 | 21,405,235 |
| 3% 9/1/49 (i) | | 5,900,000 | 6,013,852 |
| 3% 9/1/49 (i) | | 17,900,000 | 18,245,415 |
| 3% 9/1/49 (i) | | 7,000,000 | 7,135,078 |
| 3% 9/1/49 (i) | | 6,500,000 | 6,625,430 |
| 3% 9/1/49 (i) | | 6,500,000 | 6,625,430 |
| 3% 9/1/49 (i) | | 14,900,000 | 15,187,524 |
| 3.5% 9/1/49 (i) | | 27,900,000 | 28,669,429 |
| 3.5% 9/1/49 (i) | | 19,900,000 | 20,448,804 |
| 3.5% 9/1/49 (i) | | 17,200,000 | 17,674,343 |
| 3.5% 9/1/49 (i) | | 5,800,000 | 5,959,953 |
| 3.5% 9/1/49 (i) | | 10,100,000 | 10,378,539 |
| 3.5% 9/1/49 (i) | | 7,500,000 | 7,706,836 |
| 3.5% 9/1/49 (i) | | 16,600,000 | 17,057,796 |
| 3.5% 9/1/49 (i) | | 16,600,000 | 17,057,796 |
| 4% 9/1/49 (i) | | 15,600,000 | 16,193,904 |
| 4% 9/1/49 (i) | | 20,300,000 | 21,072,837 |
| 4% 9/1/49 (i) | | 35,900,000 | 37,266,742 |
| 4% 9/1/49 (i) | | 4,300,000 | 4,463,704 |
| 4.5% 9/1/49 (i) | | 4,200,000 | 4,420,834 |
|
| TOTAL UNIFORM MORTGAGE BACKED SECURITIES | | | 468,539,789 |
|
| TOTAL U.S. GOVERNMENT AGENCY - MORTGAGE SECURITIES | | | |
| (Cost $3,196,314,644) | | | 3,288,465,586 |
|
| Asset-Backed Securities - 2.4% | | | |
| AASET Trust: | | | |
| Series 2018-1A Class A, 3.844% 1/16/38 (b) | | $6,823,042 | $6,897,359 |
| Series 2019-1 Class A, 3.844% 5/15/39 (b) | | 8,443,872 | 8,499,792 |
| Aimco Series 2019-10A Class A, 3 month U.S. LIBOR + 1.320% 3.6184% 7/22/32 (b)(c)(d) | | 12,631,000 | 12,631,000 |
| American Homes 4 Rent: | | | |
| Series 2014-SFR3 Class E, 6.418% 12/17/36 (b) | | 261,000 | 297,092 |
| Series 2015-SFR1 Class E, 5.639% 4/17/52 (b) | | 364,000 | 401,935 |
| Series 2015-SFR2: | | | |
| Class E, 6.07% 10/17/52 (b) | | 611,000 | 694,169 |
| Class XS, 0% 10/17/52 (b)(c)(j)(k) | | 424,498 | 4 |
| Ares Xli Clo Ltd. / Ares Xli Cl Series 2016-41A Class AR, 3 month U.S. LIBOR + 1.200% 3.5034% 1/15/29 (b)(c)(d) | | 14,121,000 | 14,116,326 |
| Argent Securities, Inc. pass-thru certificates Series 2004-W9 Class M7, 1 month U.S. LIBOR + 4.200% 4.2168% 6/26/34 (b)(c)(d) | | 3,518 | 7,540 |
| Blackbird Capital Aircraft Series 2016-1A: | | | |
| Class A, 4.213% 12/16/41 (b) | | 14,039,703 | 14,569,119 |
| Class AA, 2.487% 12/16/41 (b) | | 2,725,938 | 2,723,390 |
| CAM Mortgage Trust Series 2018-1 Class A1, 3.96% 12/1/65 (b) | | 359,234 | 359,047 |
| Castlelake Aircraft Securitization Trust Series 2019-1A: | | | |
| Class A, 3.967% 4/15/39 (b) | | 12,559,331 | 12,818,678 |
| Class B, 5.095% 4/15/39 (b) | | 4,308,357 | 4,401,144 |
| Castlelake Aircraft Structured Trust Series 2018-1 Class A, 4.125% 6/15/43 (b) | | 11,339,415 | 11,622,874 |
| Cedar Funding Ltd.: | | | |
| Series 2019-10A Class A, 3 month U.S. LIBOR + 1.340% 0% 10/20/32 (b)(c)(d)(i) | | 9,285,000 | 9,285,000 |
| Series 2019-11A Class A1A, 3 month U.S. LIBOR + 1.350% 3.8749% 5/29/32 (b)(c)(d) | | 6,355,000 | 6,351,206 |
| Citi Mortgage Loan Trust Series 2007-1 Class 1A, 1 month U.S. LIBOR + 1.350% 3.4953% 10/25/37 (b)(c)(d) | | 4,802,348 | 4,852,998 |
| Consumer Lending Receivables Trust Series 2019-A Class A, 3.52% 4/15/26 (b) | | 3,794,387 | 3,815,162 |
| Consumer Loan Underlying Bond Credit Trust Series 2019-P1 Class A, 2.94% 7/15/26 (b) | | 6,453,058 | 6,474,708 |
| Countrywide Home Loans, Inc.: | | | |
| Series 2003-BC1 Class B1, 1 month U.S. LIBOR + 5.250% 7.3953% 3/25/32 (c)(d) | | 1,167 | 1,234 |
| Series 2004-7 Class AF5, 4.706% 1/25/35 (c) | | 43,871 | 43,751 |
| Crest Ltd. Series 2004-1A Class H1, 3 month U.S. LIBOR + 3.690% 5.9458% 1/28/40 (b)(c)(d)(k) | | 185,379 | 19 |
| DB Master Finance LLC Series 2017-1A: | | | |
| Class A2I, 3.629% 11/20/47 (b) | | 6,192,698 | 6,322,558 |
| Class A2II, 4.03% 11/20/47 (b) | | 10,492,118 | 10,944,747 |
| Deutsche Financial Capital Securitization LLC Series 1997-I Class M, 7.275% 9/15/27 | | 19,880 | 20,142 |
| Dryden Senior Loan Fund: | | | |
| Series 2014-36A Class AR2, 3 month U.S. LIBOR + 1.280% 3.5834% 4/15/29 (b)(c)(d) | | 14,945,000 | 14,983,558 |
| Series 2019-72A Class A, 3 month U.S. LIBOR + 1.330% 3.7622% 5/15/32 (b)(c)(d) | | 10,386,000 | 10,368,697 |
| First Franklin Mortgage Loan Trust Series 2004-FF2 Class M3, 1 month U.S. LIBOR + 0.825% 2.9703% 3/25/34 (c)(d) | | 779 | 733 |
| Ford Credit Floorplan Master Owner Trust Series 2018-4 Class A, 4.06% 11/15/30 | | 1,720,000 | 1,929,997 |
| Home Partners of America Credit Trust Series 2017-1: | | | |
| Class E, 1 month U.S. LIBOR + 2.650% 4.832% 7/17/34 (b)(c)(d) | | 153,000 | 153,276 |
| Class F, 1 month U.S. LIBOR + 3.539% 5.721% 7/17/34 (b)(c)(d) | | 197,000 | 197,272 |
| Home Partners of America Trust Series 2018-1 Class F, 1 month U.S. LIBOR + 2.350% 4.532% 7/17/37 (b)(c)(d) | | 389,000 | 383,860 |
| Horizon Aircraft Finance I Ltd. Series 2018-1 Class A, 4.458% 12/15/38 (b) | | 5,617,973 | 5,872,401 |
| Horizon Aircraft Finance Ltd. Series 2019-1 Class A, 3.721% 7/15/39 (b) | | 5,837,339 | 5,901,025 |
| Invitation Homes Trust: | | | |
| Series 2017-SFR2 Class E, 1 month U.S. LIBOR + 2.250% 4.432% 12/17/36 (b)(c)(d) | | 132,379 | 132,378 |
| Series 2018-SFR2 Class F, 1 month U.S. LIBOR + 2.250% 4.4451% 6/17/37 (b)(c)(d) | | 701,000 | 697,313 |
| Madison Park Funding Ltd.: | | | |
| Series 2012-10A Class AR2, 3 month U.S. LIBOR + 1.220% 3.4976% 1/20/29 (b)(c)(d) | | 5,120,000 | 5,117,343 |
| Series 2019-37A Class A1, 3 month U.S. LIBOR + 1.300% 3.603% 7/15/32 (b)(c)(d) | | 12,607,000 | 12,599,625 |
| Magnetite CLO Ltd. Series 2019-21A Class A, 3 month U.S. LIBOR + 1.280% 3.9086% 4/20/30 (b)(c)(d) | | 11,179,000 | 11,177,010 |
| Metlife Securitization Trust Series 2019-1A Class A1A, 3.75% 4/25/58 (b) | | 5,942,114 | 6,193,399 |
| Nationstar HECM Loan Trust: | | | |
| Series 2018-2A Class A, 3.1877% 7/25/28 (b) | | 3,643,374 | 3,661,621 |
| Series 2018-3A Class A 3.5545% 11/25/28 (b) | | 7,698,380 | 7,680,143 |
| Series 2019-1A Class A, 2.6513% 6/25/29 (b) | | 6,088,024 | 6,103,294 |
| New Century Home Equity Loan Trust Series 2005-4 Class M2, 1 month U.S. LIBOR + 0.510% 2.6553% 9/25/35 (c)(d) | | 266,004 | 265,813 |
| Niagara Park CLO, Ltd. Series 2019-1A Class A, 3 month U.S. LIBOR + 1.300% 3.6939% 7/17/32 (b)(c)(d) | | 12,592,000 | 12,585,339 |
| North Carolina State Ed Assistance Auth. Student Loan Rev. Series 2011-2 Class A2, 3 month U.S. LIBOR + 0.800% 3.0755% 7/25/25 (c)(d) | | 1,674,965 | 1,675,534 |
| Park Place Securities, Inc. Series 2005-WCH1 Class M4, 1 month U.S. LIBOR + 1.245% 3.3903% 1/25/36 (c)(d) | | 536,000 | 538,255 |
| Progress Residential Trust: | | | |
| Series 2017-SFR2 Class F, 1 month U.S. LIBOR + 2.750% 4.836% 12/17/34 (b) | | 100,000 | 102,477 |
| Series 2018-SFR1 Class F, 4.778% 3/17/35 (b) | | 269,000 | 275,784 |
| Series 2018-SFR2 Class F, 4.953% 8/17/35 (b) | | 166,000 | 172,479 |
| Series 2018-SFR3 Class F, 5.368% 10/17/35 (b) | | 392,000 | 412,610 |
| Series 2019-SFR1 Class F, 5.061% 8/17/35 (b) | | 330,000 | 345,515 |
| Series 2019-SFR2 Class F, 4.837% 5/17/36 (b) | | 116,000 | 121,057 |
| Project Silver Series 2019-1 Class A, 3.967% 7/15/44 (b) | | 10,640,353 | 10,866,803 |
| Residential Asset Securities Corp. Series 2003-KS10 Class MI3, 5.5562% 12/25/33 (c) | | 13,316 | 8,726 |
| Starwood Waypoint Homes Trust Series 2017-1: | | | |
| Class E, 1 month U.S. LIBOR + 2.600% 4.7951% 1/17/35 (b)(c)(d) | | 527,000 | 526,998 |
| Class F, 1 month U.S. LIBOR + 3.400% 5.5951% 1/17/35 (b)(c)(d) | | 529,000 | 529,330 |
| Taberna Preferred Funding VI Ltd. Series 2006-6A Class F1, 3 month U.S. LIBOR + 4.500% 6.7868% 12/5/36 (b)(c)(d)(k) | | 335,826 | 25 |
| Terwin Mortgage Trust Series 2003-4HE Class A1, 1 month U.S. LIBOR + 0.860% 3.0053% 9/25/34 (c)(d) | | 9,027 | 8,785 |
| Thunderbolt Aircraft Lease Ltd.: | | | |
| Series 2017-A Class A, 4.212% 5/17/32 (b) | | 7,935,227 | 8,140,980 |
| Series 2018-A Class A, 4.147% 9/15/38 (b) | | 11,989,006 | 12,351,944 |
| Towd Point Mortgage Trust: | | | |
| Series 2018-3 Class A1, 3.75% 5/25/58 (b) | | 10,194,758 | 10,640,238 |
| Series 2018-6 Class A1A, 3.75% 3/25/58 (b) | | 13,460,337 | 13,891,009 |
| Series 2019-1 Class A1, 3.75% 3/25/58 (b) | | 5,099,447 | 5,347,880 |
| Trapeza CDO XII Ltd./Trapeza CDO XII, Inc. Series 2007-12A Class B, 3 month U.S. LIBOR + 0.560% 2.8626% 4/6/42 (b)(c)(d)(k) | | 934,000 | 697,044 |
| Tricon American Homes: | | | |
| Series 2016-SFR1: | | | |
| Class B, 2.989% 11/17/33 (b) | | 188,000 | 188,643 |
| Class F, 5.769% 11/17/33 (b) | | 442,000 | 456,749 |
| Series 2017-SFR1 Class F, 5.151% 9/17/34 (b) | | 927,000 | 963,814 |
| Series 2018-SFR1 Class F, 4.96% 5/17/37 (b) | | 743,000 | 778,959 |
| Upgrade Receivables Trust Series 2019-1A Class A, 3.48% 3/15/25 (b) | | 3,475,451 | 3,487,636 |
| VB-S1 Issuer LLC Series 2018-1A Class F, 5.25% 2/15/48 (b) | | 403,000 | 402,872 |
| Verde CLO Ltd. Series 2019-1A Class A, 3 month U.S. LIBOR + 1.350% 3.9137% 4/15/32 (b)(c)(d) | | 12,578,000 | 12,570,969 |
| Voya CLO Ltd. Series 2019-2A Class A, 3 month U.S. LIBOR + 1.270% 3.5229% 7/20/32 (b)(c)(d) | | 13,214,000 | 13,206,798 |
| TOTAL ASSET-BACKED SECURITIES | | | |
| (Cost $337,411,787) | | | 342,865,004 |
|
| Collateralized Mortgage Obligations - 1.8% | | | |
| Private Sponsor - 0.7% | | | |
| Banc of America Funding Corp. Series 2015-R3 Class 10A1, 1 month U.S. LIBOR + 0.140% 2.406% 6/27/36 (b)(c)(d) | | 1,473,146 | 1,448,818 |
| BCAP LLC Trust sequential payer Series 2012-RR5 Class 8A5, 2.4715% 7/26/36 (b)(c) | | 253,953 | 250,079 |
| Bear Stearns ALT-A Trust floater Series 2005-1 Class A1, 1 month U.S. LIBOR + 0.560% 2.7053% 1/25/35 (c)(d) | | 26,017 | 25,958 |
| Citigroup Mortgage Loan Trust sequential payer Series 2014-8 Class 2A1, 3.45% 6/27/37 (b)(c) | | 1,552,083 | 1,575,104 |
| Citigroup Mortgage Loan Trust, Inc. sequential payer Series 2009-5 Class 5A1, 4.8126% 1/25/37 (b)(c) | | 290,298 | 295,066 |
| Countrywide Home Loans, Inc. Series 2003-R1: | | | |
| Class 2B4, 3.3614% 2/25/43 (b)(c)(k) | | 2,194 | 456 |
| Class 2B5, 3.3614% 2/25/43 (b)(c) | | 1,345 | 62 |
| Credit Suisse Mortgage Trust Series 2010-9R Class 2A5, 4% 2/27/38 (b) | | 1,295,233 | 1,308,846 |
| CSMC: | | | |
| floater Series 2015-1R Class 6A1, 1 month U.S. LIBOR + 0.280% 2.4664% 5/27/37 (b)(c)(d) | | 1,839,758 | 1,778,883 |
| Series 2014-3R Class 2A1, 1 month U.S. LIBOR + 0.700% 2.966% 5/27/37 (b)(c)(d) | | 151,391 | 145,653 |
| FirstKey Mortgage Trust sequential payer Series 2015-1 Class A9, 3% 3/25/45 (b)(c) | | 3,570,556 | 3,570,271 |
| FREMF Mortgage Trust: | | | |
| Series 2010-K6 Class B, 5.5393% 12/25/46 (b)(c) | | 330,000 | 332,479 |
| Series 2010-K7 Class B, 5.6874% 4/25/20 (b)(c) | | 362,930 | 368,137 |
| Gosforth Funding PLC floater Series 2018-1A Class A1, 3 month U.S. LIBOR + 0.450% 2.5823% 8/25/60 (b)(c)(d) | | 8,267,221 | 8,251,265 |
| GSR Mortgage Loan Trust floater Series 2007-AR1 Class 6A1, 4.2778% 3/25/37 (c) | | 40,184 | 39,907 |
| Holmes Master Issuer PLC floater Series 2018-2A Class A2, 3 month U.S. LIBOR + 0.420% 2.7234% 10/15/54 (b)(c)(d) | | 10,843,038 | 10,831,848 |
| JP Morgan Resecuritization Trust floater Series 2012-2 Class 6A1, 1 month U.S. LIBOR + 0.210% 2.4711% 6/21/36 (b)(c)(d) | | 521,036 | 518,624 |
| Lanark Master Issuer PLC: | | | |
| floater Series 2019-1A Class 1A1, 3 month U.S. LIBOR + 0.770% 2.9023% 12/22/69 (b)(c)(d) | | 6,825,467 | 6,844,633 |
| Series 2019-2A Class 1A, 2.71% 12/22/69 (b) | | 24,365,000 | 24,537,699 |
| Merrill Lynch Alternative Note Asset Trust floater Series 2007-OAR1 Class A1, 1 month U.S. LIBOR + 0.170% 2.436% 2/25/37 (c)(d) | | 129,253 | 129,882 |
| Opteum Mortgage Acceptance Corp. floater Series 2005-3 Class APT, 1 month U.S. LIBOR + 0.290% 2.4353% 7/25/35 (c)(d) | | 29,043 | 29,056 |
| Permanent Master Issuer PLC floater Series 2018-1A Class 1A1, 3 month U.S. LIBOR + 0.380% 2.6834% 7/15/58 (b)(c)(d) | | 22,095,000 | 22,090,493 |
| RBSSP Resecuritization Trust sequential payer Series 2010-1 Class 2A1, 4.1275% 7/26/45 (b)(c) | | 1,371,211 | 1,388,089 |
| Sequoia Mortgage Trust floater Series 2004-6 Class A3B, 6 month U.S. LIBOR + 0.880% 3.178% 7/20/34 (c)(d) | | 3,891 | 3,786 |
| Silverstone Master Issuer PLC floater Series 2019-1A Class 1A, 3 month U.S. LIBOR + 0.570% 2.8476% 1/21/70 (b)(c)(d) | | 13,600,000 | 13,603,142 |
| Thornburg Mortgage Securities Trust floater Series 2003-4 Class A1, 1 month U.S. LIBOR + 0.640% 2.7853% 9/25/43 (c)(d) | | 1,801,891 | 1,813,942 |
| Wells Fargo Mortgage Backed Securities Trust: | | | |
| Series 2004-BB Class A2, 4.9504% 1/25/35 (c) | | 301,022 | 307,656 |
| Series 2005-AR10 Class 2A15, 4.9834% 6/25/35 (c) | | 1,779,410 | 1,822,655 |
| Series 2005-AR2 Class 1A2, 5.0775% 3/25/35 (c) | | 234,209 | 237,583 |
| Winwater Mortgage Loan Trust sequential payer Series 2015-1 Class A9, 2.5% 1/20/45 (b) | | 1,331,750 | 1,329,975 |
|
| TOTAL PRIVATE SPONSOR | | | 104,880,047 |
|
| U.S. Government Agency - 1.1% | | | |
| Fannie Mae: | | | |
| floater: | | | |
| Series 2002-18 Class FD, 1 month U.S. LIBOR + 0.800% 2.9453% 2/25/32 (c)(d) | | 5,548 | 5,612 |
| Series 2002-39 Class FD, 1 month U.S. LIBOR + 1.000% 3.182% 3/18/32 (c)(d) | | 10,179 | 10,386 |
| Series 2002-60 Class FV, 1 month U.S. LIBOR + 1.000% 3.1453% 4/25/32 (c)(d) | | 11,831 | 12,024 |
| Series 2002-63 Class FN, 1 month U.S. LIBOR + 1.000% 3.1453% 10/25/32 (c)(d) | | 15,268 | 15,519 |
| Series 2002-7 Class FC, 1 month U.S. LIBOR + 0.750% 2.8953% 1/25/32 (c)(d) | | 5,751 | 5,809 |
| Series 2003-118 Class S, 8.100% - 1 month U.S. LIBOR 5.9548% 12/25/33 (c)(j)(l) | | 185,958 | 47,744 |
| Series 2006-104 Class GI, 6.680% - 1 month U.S. LIBOR 4.5348% 11/25/36 (c)(j)(l) | | 135,816 | 26,540 |
| planned amortization class: | | | |
| Series 1992-168 Class KB, 7% 10/25/22 | | 4,406 | 4,641 |
| Series 1993-207 Class H, 6.5% 11/25/23 | | 65,209 | 69,528 |
| Series 1996-28 Class PK, 6.5% 7/25/25 | | 22,464 | 24,033 |
| Series 1999-17 Class PG, 6% 4/25/29 | | 82,058 | 89,213 |
| Series 1999-32 Class PL, 6% 7/25/29 | | 77,436 | 85,559 |
| Series 1999-33 Class PK, 6% 7/25/29 | | 57,739 | 62,978 |
| Series 2001-52 Class YZ, 6.5% 10/25/31 | | 7,257 | 8,370 |
| Series 2003-28 Class KG, 5.5% 4/25/23 | | 37,533 | 39,025 |
| Series 2005-102 Class CO 11/25/35 (m) | | 41,170 | 37,831 |
| Series 2005-73 Class SA, 17.500% - 1 month U.S. LIBOR 11.9724% 8/25/35 (c)(l) | | 12,317 | 15,860 |
| Series 2005-81 Class PC, 5.5% 9/25/35 | | 109,209 | 120,410 |
| Series 2006-12 Class BO 10/25/35 (m) | | 186,726 | 171,616 |
| Series 2006-37 Class OW 5/25/36 (m) | | 18,319 | 16,737 |
| Series 2006-45 Class OP 6/25/36 (m) | | 62,044 | 56,461 |
| Series 2006-62 Class KP 4/25/36 (m) | | 105,634 | 96,866 |
| Series 2012-149: | | | |
| Class DA, 1.75% 1/25/43 | | 2,132,430 | 2,121,481 |
| Class GA, 1.75% 6/25/42 | | 2,215,988 | 2,187,996 |
| sequential payer: | | | |
| Series 1997-41 Class J, 7.5% 6/18/27 | | 17,338 | 19,666 |
| Series 1999-25 Class Z, 6% 6/25/29 | | 63,983 | 71,631 |
| Series 2001-20 Class Z, 6% 5/25/31 | | 86,022 | 94,406 |
| Series 2001-31 Class ZC, 6.5% 7/25/31 | | 48,042 | 54,598 |
| Series 2002-16 Class ZD, 6.5% 4/25/32 | | 26,772 | 30,955 |
| Series 2002-74 Class SV, 7.550% - 1 month U.S. LIBOR 5.4048% 11/25/32 (c)(j)(l) | | 108,060 | 15,883 |
| Series 2012-67 Class AI, 4.5% 7/25/27 (j) | | 460,213 | 38,112 |
| Series 06-116 Class SG, 6.640% - 1 month U.S. LIBOR 4.4948% 12/25/36 (c)(j)(l) | | 94,483 | 22,623 |
| Series 07-40 Class SE, 6.440% - 1 month U.S. LIBOR 4.2948% 5/25/37 (c)(j)(l) | | 53,425 | 11,047 |
| Series 1993-165 Class SH, 19.800% - 1 month U.S. LIBOR 13.7319% 9/25/23 (c)(l) | | 3,065 | 3,647 |
| Series 2003-21 Class SK, 8.100% - 1 month U.S. LIBOR 5.9548% 3/25/33 (c)(j)(l) | | 13,654 | 2,945 |
| Series 2005-72 Class ZC, 5.5% 8/25/35 | | 735,855 | 801,336 |
| Series 2005-79 Class ZC, 5.9% 9/25/35 | | 499,731 | 575,382 |
| Series 2007-57 Class SA, 40.600% - 1 month U.S. LIBOR 27.7485% 6/25/37 (c)(l) | | 44,602 | 92,485 |
| Series 2007-66: | | | |
| Class SA, 39.600% - 1 month U.S. LIBOR 26.7285% 7/25/37 (c)(l) | | 68,120 | 140,508 |
| Class SB, 39.600% - 1 month U.S. LIBOR 26.7285% 7/25/37 (c)(l) | | 24,920 | 45,006 |
| Series 2007-75 Class JI, 6.545% - 1 month U.S. LIBOR 4.3998% 8/25/37 (c)(j)(l) | | 2,018,748 | 412,777 |
| Series 2008-12 Class SG, 6.350% - 1 month U.S. LIBOR 4.2048% 3/25/38 (c)(j)(l) | | 358,529 | 68,004 |
| Series 2009-85 Class IB, 4.5% 8/25/24 (j) | | 2,074 | 4 |
| Series 2010-112 Class SG, 6.360% - 1 month U.S. LIBOR 4.2148% 6/25/21 (c)(j)(l) | | 690 | 8 |
| Series 2010-135: | | | |
| Class LS, 6.050% - 1 month U.S. LIBOR 3.9048% 12/25/40 (c)(j)(l) | | 334,947 | 60,245 |
| Class ZA, 4.5% 12/25/40 | | 1,474,578 | 1,643,489 |
| Series 2010-139 Class NI, 4.5% 2/25/40 (j) | | 254,586 | 18,954 |
| Series 2010-150 Class ZC, 4.75% 1/25/41 | | 1,745,928 | 1,979,211 |
| Series 2010-17 Class DI, 4.5% 6/25/21 (j) | | 852 | 7 |
| Series 2010-95 Class ZC, 5% 9/25/40 | | 3,661,245 | 4,176,245 |
| Series 2010-97 Class CI, 4.5% 8/25/25 (j) | | 29,535 | 497 |
| Series 2011-39 Class ZA, 6% 11/25/32 | | 238,077 | 272,462 |
| Series 2011-4 Class PZ, 5% 2/25/41 | | 769,956 | 892,804 |
| Series 2011-67 Class AI, 4% 7/25/26 (j) | | 79,771 | 5,793 |
| Series 2011-83 Class DI, 6% 9/25/26 (j) | | 75,047 | 4,438 |
| Series 2012-100 Class WI, 3% 9/25/27 (j) | | 1,476,148 | 115,861 |
| Series 2012-14 Class JS, 6.650% - 1 month U.S. LIBOR 4.5048% 12/25/30 (c)(j)(l) | | 470,418 | 43,794 |
| Series 2012-9 Class SH, 6.550% - 1 month U.S. LIBOR 4.4048% 6/25/41 (c)(j)(l) | | 608,447 | 69,507 |
| Series 2013-133 Class IB, 3% 4/25/32 (j) | | 930,272 | 58,951 |
| Series 2013-134 Class SA, 6.050% - 1 month U.S. LIBOR 3.9048% 1/25/44 (c)(j)(l) | | 498,215 | 81,533 |
| Series 2013-51 Class GI, 3% 10/25/32 (j) | | 1,402,686 | 117,341 |
| Series 2013-N1 Class A, 6.720% - 1 month U.S. LIBOR 4.5748% 6/25/35 (c)(j)(l) | | 279,347 | 57,212 |
| Series 2015-42 Class IL, 6% 6/25/45 (j) | | 2,080,183 | 425,198 |
| Series 2015-70 Class JC, 3% 10/25/45 | | 1,752,637 | 1,821,205 |
| Series 2017-30 Class AI, 5.5% 5/25/47 (j) | | 1,116,577 | 224,730 |
| Fannie Mae Stripped Mortgage-Backed Securities: | | | |
| Series 339 Class 5, 5.5% 7/25/33 (j) | | 52,934 | 10,672 |
| Series 343 Class 16, 5.5% 5/25/34 (j) | | 45,201 | 8,287 |
| Series 348 Class 14, 6.5% 8/25/34 (c)(j) | | 30,804 | 6,790 |
| Series 351: | | | |
| Class 12, 5.5% 4/25/34 (c)(j) | | 20,376 | 3,618 |
| Class 13, 6% 3/25/34 (j) | | 27,794 | 5,608 |
| Series 359 Class 19, 6% 7/25/35 (c)(j) | | 17,221 | 3,601 |
| Series 384 Class 6, 5% 7/25/37 (j) | | 219,172 | 37,362 |
| Freddie Mac: | | | |
| floater: | | | |
| Series 2412 Class FK, 1 month U.S. LIBOR + 0.800% 2.9951% 1/15/32 (c)(d) | | 4,548 | 4,600 |
| Series 2423 Class FA, 1 month U.S. LIBOR + 0.900% 3.0951% 3/15/32 (c)(d) | | 6,431 | 6,522 |
| Series 2424 Class FM, 1 month U.S. LIBOR + 1.000% 3.1951% 3/15/32 (c)(d) | | 6,243 | 6,345 |
| Series 2432: | | | |
| Class FE, 1 month U.S. LIBOR + 0.900% 3.0951% 6/15/31 (c)(d) | | 11,535 | 11,692 |
| Class FG, 1 month U.S. LIBOR + 0.900% 3.0951% 3/15/32 (c)(d) | | 3,555 | 3,605 |
| floater target amortization class Series 3366 Class FD, 1 month U.S. LIBOR + 0.250% 2.4451% 5/15/37 (c)(d) | | 263,988 | 262,272 |
| planned amortization class: | | | |
| Series 2006-15 Class OP 3/25/36 (m) | | 186,346 | 171,263 |
| Series 2095 Class PE, 6% 11/15/28 | | 95,082 | 103,770 |
| Series 2101 Class PD, 6% 11/15/28 | | 7,583 | 8,258 |
| Series 2121 Class MG, 6% 2/15/29 | | 37,667 | 41,264 |
| Series 2131 Class BG, 6% 3/15/29 | | 263,237 | 287,984 |
| Series 2137 Class PG, 6% 3/15/29 | | 39,054 | 42,921 |
| Series 2154 Class PT, 6% 5/15/29 | | 66,267 | 73,594 |
| Series 2162 Class PH, 6% 6/15/29 | | 14,457 | 15,718 |
| Series 2520 Class BE, 6% 11/15/32 | | 93,989 | 105,287 |
| Series 2585 Class KS, 7.600% - 1 month U.S. LIBOR 5.4049% 3/15/23 (c)(j)(l) | | 2,049 | 67 |
| Series 2693 Class MD, 5.5% 10/15/33 | | 970,214 | 1,092,641 |
| Series 2802 Class OB, 6% 5/15/34 | | 126,497 | 136,605 |
| Series 2962 Class BE, 4.5% 4/15/20 | | 17,163 | 17,227 |
| Series 3002 Class NE, 5% 7/15/35 | | 254,986 | 274,175 |
| Series 3110 Class OP 9/15/35 (m) | | 108,307 | 102,661 |
| Series 3119 Class PO 2/15/36 (m) | | 224,727 | 205,342 |
| Series 3121 Class KO 3/15/36 (m) | | 37,547 | 34,497 |
| Series 3123 Class LO 3/15/36 (m) | | 125,102 | 114,457 |
| Series 3145 Class GO 4/15/36 (m) | | 121,365 | 111,426 |
| Series 3189 Class PD, 6% 7/15/36 | | 213,718 | 249,032 |
| Series 3225 Class EO 10/15/36 (m) | | 66,917 | 61,141 |
| Series 3258 Class PM, 5.5% 12/15/36 | | 108,703 | 117,960 |
| Series 3415 Class PC, 5% 12/15/37 | | 83,467 | 91,701 |
| Series 3786 Class HI, 4% 3/15/38 (j) | | 206,924 | 9,147 |
| Series 3806 Class UP, 4.5% 2/15/41 | | 695,556 | 742,886 |
| Series 3832 Class PE, 5% 3/15/41 | | 862,000 | 942,352 |
| Series 4135 Class AB, 1.75% 6/15/42 | | 1,663,732 | 1,654,458 |
| sequential payer: | | | |
| Series 2135 Class JE, 6% 3/15/29 | | 17,428 | 19,327 |
| Series 2274 Class ZM, 6.5% 1/15/31 | | 22,670 | 25,695 |
| Series 2281 Class ZB, 6% 3/15/30 | | 48,424 | 50,798 |
| Series 2303 Class ZV, 6% 4/15/31 | | 22,378 | 24,572 |
| Series 2357 Class ZB, 6.5% 9/15/31 | | 174,592 | 201,288 |
| Series 2502 Class ZC, 6% 9/15/32 | | 42,418 | 47,440 |
| Series 2519 Class ZD, 5.5% 11/15/32 | | 67,345 | 73,933 |
| Series 2546 Class MJ, 5.5% 3/15/23 | | 22,849 | 23,775 |
| Series 2601 Class TB, 5.5% 4/15/23 | | 11,069 | 11,584 |
| Series 2998 Class LY, 5.5% 7/15/25 | | 37,850 | 39,867 |
| Series 3871 Class KB, 5.5% 6/15/41 | | 1,424,191 | 1,659,434 |
| Series 06-3115 Class SM, 6.600% - 1 month U.S. LIBOR 4.4049% 2/15/36 (c)(j)(l) | | 71,385 | 15,918 |
| Series 2013-4281 Class AI, 4% 12/15/28 (j) | | 747,005 | 49,813 |
| Series 2017-4683 Class LM, 3% 5/15/47 | | 2,522,687 | 2,562,364 |
| Series 2844: | | | |
| Class SC, 46.800% - 1 month U.S. LIBOR 32.5317% 8/15/24 (c)(l) | | 955 | 1,205 |
| Class SD, 86.400% - 1 month U.S. LIBOR 57.9133% 8/15/24 (c)(l) | | 1,408 | 2,106 |
| Series 2933 Class ZM, 5.75% 2/15/35 | | 982,647 | 1,154,514 |
| Series 2935 Class ZK, 5.5% 2/15/35 | | 949,226 | 1,051,138 |
| Series 2947 Class XZ, 6% 3/15/35 | | 334,094 | 376,978 |
| Series 2996 Class ZD, 5.5% 6/15/35 | | 714,810 | 832,096 |
| Series 3237 Class C, 5.5% 11/15/36 | | 1,016,673 | 1,160,183 |
| Series 3244 Class SG, 6.660% - 1 month U.S. LIBOR 4.4649% 11/15/36 (c)(j)(l) | | 282,552 | 61,525 |
| Series 3287 Class SD, 6.750% - 1 month U.S. LIBOR 4.5549% 3/15/37 (c)(j)(l) | | 411,133 | 93,988 |
| Series 3297 Class BI, 6.760% - 1 month U.S. LIBOR 4.5649% 4/15/37 (c)(j)(l) | | 591,165 | 138,754 |
| Series 3336 Class LI, 6.580% - 1 month U.S. LIBOR 4.3849% 6/15/37 (c)(j)(l) | | 214,548 | 42,215 |
| Series 3949 Class MK, 4.5% 10/15/34 | | 182,514 | 193,330 |
| Series 3955 Class YI, 3% 11/15/21 (j) | | 200,480 | 4,673 |
| Series 4055 Class BI, 3.5% 5/15/31 (j) | | 827,964 | 57,380 |
| Series 4149 Class IO, 3% 1/15/33 (j) | | 653,393 | 72,687 |
| Series 4314 Class AI, 5% 3/15/34 (j) | | 247,818 | 20,839 |
| Series 4427 Class LI, 3.5% 2/15/34 (j) | | 1,615,564 | 139,388 |
| Series 4471 Class PA 4% 12/15/40 | | 1,702,244 | 1,749,894 |
| target amortization class Series 2156 Class TC, 6.25% 5/15/29 | | 47,314 | 50,376 |
| Freddie Mac Manufactured Housing participation certificates guaranteed: | | | |
| floater Series 1686 Class FA, 1 month U.S. LIBOR + 0.900% 3.225% 2/15/24 (c)(d) | | 15,998 | 16,105 |
| sequential payer: | | | |
| Series 2043 Class ZH, 6% 4/15/28 | | 35,484 | 38,717 |
| Series 2056 Class Z, 6% 5/15/28 | | 68,070 | 74,314 |
| Freddie Mac Multi-family Structured pass-thru certificates Series 4386 Class AZ, 4.5% 11/15/40 | | 2,179,132 | 2,348,062 |
| Freddie Mac Seasoned Credit Risk Transfer Trust Series 2018-3 Class M55D, 4% 8/25/57 | | 4,961,991 | 5,344,943 |
| Ginnie Mae guaranteed REMIC pass-thru certificates: | | | |
| floater: | | | |
| Series 2007-37 Class TS, 6.690% - 1 month U.S. LIBOR 4.4926% 6/16/37 (c)(j)(l) | | 123,774 | 27,452 |
| Series 2010-H03 Class FA, 1 month U.S. LIBOR + 0.550% 2.7911% 3/20/60 (c)(d)(n) | | 1,583,666 | 1,586,368 |
| Series 2010-H17 Class FA, 1 month U.S. LIBOR + 0.330% 2.5711% 7/20/60 (c)(d)(n) | | 190,570 | 189,780 |
| Series 2010-H18 Class AF, 1 month U.S. LIBOR + 0.300% 2.6795% 9/20/60 (c)(d)(n) | | 229,827 | 228,798 |
| Series 2010-H19 Class FG, 1 month U.S. LIBOR + 0.300% 2.6795% 8/20/60 (c)(d)(n) | | 267,080 | 265,908 |
| Series 2010-H27 Series FA, 1 month U.S. LIBOR + 0.380% 2.7595% 12/20/60 (c)(d)(n) | | 483,589 | 482,346 |
| Series 2011-H05 Class FA, 1 month U.S. LIBOR + 0.500% 2.8795% 12/20/60 (c)(d)(n) | | 699,736 | 700,200 |
| Series 2011-H07 Class FA, 1 month U.S. LIBOR + 0.500% 2.8795% 2/20/61 (c)(d)(n) | | 1,401,401 | 1,402,235 |
| Series 2011-H12 Class FA, 1 month U.S. LIBOR + 0.490% 2.8695% 2/20/61 (c)(d)(n) | | 1,810,321 | 1,811,108 |
| Series 2011-H13 Class FA, 1 month U.S. LIBOR + 0.500% 2.8795% 4/20/61 (c)(d)(n) | | 610,984 | 611,393 |
| Series 2011-H14: | | | |
| Class FB, 1 month U.S. LIBOR + 0.500% 2.8795% 5/20/61 (c)(d)(n) | | 745,069 | 745,608 |
| Class FC, 1 month U.S. LIBOR + 0.500% 2.8795% 5/20/61 (c)(d)(n) | | 686,796 | 687,266 |
| Series 2011-H17 Class FA, 1 month U.S. LIBOR + 0.530% 2.9095% 6/20/61 (c)(d)(n) | | 834,773 | 835,888 |
| Series 2011-H21 Class FA, 1 month U.S. LIBOR + 0.600% 2.9795% 10/20/61 (c)(d)(n) | | 1,674,637 | 1,679,645 |
| Series 2012-H01 Class FA, 1 month U.S. LIBOR + 0.700% 3.0795% 11/20/61 (c)(d)(n) | | 863,818 | 868,426 |
| Series 2012-H03 Class FA, 1 month U.S. LIBOR + 0.700% 3.0795% 1/20/62 (c)(d)(n) | | 555,005 | 557,883 |
| Series 2012-H06 Class FA, 1 month U.S. LIBOR + 0.630% 3.0095% 1/20/62 (c)(d)(n) | | 809,387 | 812,422 |
| Series 2012-H07 Class FA, 1 month U.S. LIBOR + 0.630% 3.0095% 3/20/62 (c)(d)(n) | | 505,768 | 506,420 |
| Series 2012-H21 Class DF, 1 month U.S. LIBOR + 0.650% 3.0295% 5/20/61 (c)(d)(n) | | 51,494 | 51,640 |
| Series 2012-H23 Class WA, 1 month U.S. LIBOR + 0.520% 2.8995% 10/20/62 (c)(d)(n) | | 460,348 | 460,859 |
| Series 2012-H26, Class CA, 1 month U.S. LIBOR + 0.530% 2.9095% 7/20/60 (c)(d)(n) | | 136,073 | 136,116 |
| Series 2013-H07 Class BA, 1 month U.S. LIBOR + 0.360% 2.7395% 3/20/63 (c)(d)(n) | | 772,009 | 769,886 |
| Series 2014-H03 Class FA, 1 month U.S. LIBOR + 0.600% 2.9795% 1/20/64 (c)(d)(n) | | 820,229 | 822,449 |
| Series 2014-H05 Class FB, 1 month U.S. LIBOR + 0.600% 2.9795% 12/20/63 (c)(d)(n) | | 2,502,246 | 2,510,201 |
| Series 2014-H11 Class BA, 1 month U.S. LIBOR + 0.500% 2.8795% 6/20/64 (c)(d)(n) | | 3,321,906 | 3,324,221 |
| Series 2014-H20 Class BF, 1 month U.S. LIBOR + 0.500% 2.8795% 9/20/64 (c)(d)(n) | | 10,650,212 | 10,657,705 |
| Series 2016-H20 Class FM, 1 month U.S. LIBOR + 0.400% 2.7795% 12/20/62 (c)(d)(n) | | 386,663 | 386,539 |
| planned amortization class: | | | |
| Series 1997-8 Class PE, 7.5% 5/16/27 | | 44,254 | 50,587 |
| Series 2010-158 Class MS, 10.000% - 1 month U.S. LIBOR 5.6557% 12/20/40 (c)(l) | | 2,061,000 | 2,485,854 |
| Series 2011-136 Class WI, 4.5% 5/20/40 (j) | | 173,685 | 13,778 |
| Series 2016-69 Class WA, 3% 2/20/46 | | 2,189,126 | 2,233,259 |
| Series 2017-134 Class BA, 2.5% 11/20/46 | | 2,177,391 | 2,210,528 |
| sequential payer: | | | |
| Series 2004-24 Class ZM, 5% 4/20/34 | | 378,336 | 418,020 |
| Series 2010-160 Class DY, 4% 12/20/40 | | 4,570,307 | 5,022,490 |
| Series 2010-170 Class B, 4% 12/20/40 | | 1,029,219 | 1,131,099 |
| Series 2017-139 Class BA, 3% 9/20/47 | | 10,029,914 | 10,178,108 |
| Series 2004-32 Class GS, 6.500% - 1 month U.S. LIBOR 4.3026% 5/16/34 (c)(j)(l) | | 67,916 | 13,007 |
| Series 2004-73 Class AL, 7.200% - 1 month U.S. LIBOR 5.0026% 8/17/34 (c)(j)(l) | | 79,805 | 18,198 |
| Series 2010-116 Class QB, 4% 9/16/40 | | 9,754,753 | 10,161,064 |
| Series 2010-H10 Class FA, 1 month U.S. LIBOR + 0.330% 2.5711% 5/20/60 (c)(d)(n) | | 613,765 | 611,328 |
| Series 2011-94 Class SA, 6.100% - 1 month U.S. LIBOR 3.9279% 7/20/41 (c)(j)(l) | | 393,111 | 71,584 |
| Series 2012-76 Class GS, 6.700% - 1 month U.S. LIBOR 4.5026% 6/16/42 (c)(j)(l) | | 254,915 | 52,307 |
| Series 2013-124: | | | |
| Class ES, 8.667% - 1 month U.S. LIBOR 5.7705% 4/20/39 (c)(l) | | 352,831 | 363,223 |
| Class ST, 8.800% - 1 month U.S. LIBOR 5.9038% 8/20/39 (c)(l) | | 1,227,322 | 1,271,274 |
| Series 2013-149 Class MA, 2.5% 5/20/40 | | 5,334,751 | 5,446,248 |
| Series 2014-2 Class BA, 3% 1/20/44 | | 4,480,745 | 4,697,717 |
| Series 2014-21 Class HA, 3% 2/20/44 | | 2,055,324 | 2,158,492 |
| Series 2014-25 Class HC, 3% 2/20/44 | | 3,116,083 | 3,288,381 |
| Series 2014-5 Class A, 3% 1/20/44 | | 2,735,543 | 2,867,655 |
| Series 2015-H13 Class HA, 2.5% 8/20/64 (n) | | 2,661,106 | 2,659,020 |
| Series 2015-H21: | | | |
| Class HA, 2.5% 6/20/63 (n) | | 271,360 | 271,035 |
| Class JA, 2.5% 6/20/65 (n) | | 2,262,707 | 2,261,112 |
| Series 2017-186 Class HK, 3% 11/16/45 | | 4,448,458 | 4,516,756 |
| Series 2017-H06 Class FA, U.S. TREASURY 1 YEAR INDEX + 0.350% 2.28% 8/20/66 (c)(d)(n) | | 6,835,082 | 6,817,481 |
|
| TOTAL U.S. GOVERNMENT AGENCY | | | 151,321,132 |
|
| TOTAL COLLATERALIZED MORTGAGE OBLIGATIONS | | | |
| (Cost $251,299,959) | | | 256,201,179 |
|
| Commercial Mortgage Securities - 3.1% | | | |
| 280 Park Avenue Mortgage Trust floater Series 2017-280P Class F, 1 month U.S. LIBOR + 2.827% 5.0221% 9/15/34 (b)(c)(d) | | 703,000 | 705,855 |
| Americold LLC Trust Series 2010-ARTA Class D, 7.443% 1/14/29 (b) | | 195,000 | 204,383 |
| Asset Securitization Corp. Series 1997-D5 Class PS1, 1.8322% 2/14/43 (c)(j) | | 3,293 | 9 |
| BAMLL Trust Series 2015-200P Class F, 3.7157% 4/14/33 (b)(c) | | 455,000 | 462,959 |
| Banc of America Merrill Lynch Large Loan, Inc. floater: | | | |
| Series 2019-AHT Class E, 1 month U.S. LIBOR + 3.200% 5.3951% 3/15/34 (b)(c)(d) | | 567,000 | 571,273 |
| Series 2019-RLJ Class D, 1 month U.S. LIBOR + 1.950% 4.1451% 4/15/36 (b)(c)(d) | | 756,000 | 755,345 |
| BANK: | | | |
| Series 2017-BNK4 Class D, 3.357% 5/15/50 (b) | | 782,000 | 724,784 |
| Series 2017-BNK6 Class D, 3.1% 7/15/60 (b) | | 455,000 | 423,244 |
| Series 2017-BNK8 Class D, 2.6% 11/15/50 (b) | | 561,000 | 501,578 |
| Series 2018-BN12 Class D, 3% 5/15/61 (b) | | 487,000 | 443,999 |
| Bank Series 2018-BN15: | | | |
| Class D, 3% 11/15/61 (b) | | 430,000 | 407,167 |
| Class E, 3% 11/15/61 (b) | | 430,000 | 376,488 |
| BANK Series 2019-BN18: | | | |
| Class D, 3% 5/15/62 (b) | | 189,000 | 175,154 |
| Class E, 3% 5/15/62 (b) | | 336,000 | 291,901 |
| Bank Series 2019-BN19: | | | |
| Class D, 3% 8/15/61 (b) | | 378,000 | 349,816 |
| Class E, 3% 8/15/61 (b) | | 273,000 | 234,287 |
| Bank of America Commercial Mortgage Securities Trust Series 2017-BNK3: | | | |
| Class C, 4.352% 2/15/50 (c) | | 347,000 | 372,938 |
| Class D, 3.25% 2/15/50 (b) | | 675,000 | 626,606 |
| Bank of America Commercial Mortgage Trust Series 2016-UB10 Class XA, 2.1313% 7/15/49 (c)(j) | | 16,339,601 | 1,372,750 |
| Barclays Commercial Mortgage Securities LLC: | | | |
| Series 2015-STP Class E, 4.4272% 9/10/28 (b)(c) | | 1,098,000 | 1,086,435 |
| Series 2018-C2 Class A5, 4.314% 12/15/51 | | 4,500,000 | 5,223,987 |
| Bayview Commercial Asset Trust Series 2006-3A, Class IO, 0% 10/25/36 (b)(c)(j)(k) | | 996,411 | 0 |
| BBCMS Mortgage Trust Series 2016-ETC: | | | |
| Class D, 3.7292% 8/14/36 (b)(c) | | 483,000 | 495,206 |
| Class E, 3.7292% 8/14/36 (b)(c) | | 363,000 | 346,642 |
| Benchmark Mortgage Trust: | | | |
| Series 2018-B7: | | | |
| Class D, 3% 5/15/53 (b)(c) | | 351,000 | 328,976 |
| Class E, 3% 5/15/53 (b)(c) | | 351,000 | 301,405 |
| Class F, 3.7676% 5/15/53 (b)(c) | | 763,000 | 602,860 |
| Series 2018-B8 Class A5, 4.2317% 1/15/52 | | 8,425,000 | 9,762,539 |
| Series 2019-B12 Class D, 3% 8/15/52 (b) | | 525,000 | 489,302 |
| Braemar Hotels & Resorts Trust floater Series 2018-PRME Class E, 1 month U.S. LIBOR + 2.400% 4.5951% 6/15/35 (b)(c)(d) | | 168,000 | 168,735 |
| BWAY Mortgage Trust Series 2015-1740 Class E, 4.8058% 1/10/35 (b)(c) | | 363,000 | 380,083 |
| BX Commercial Mortgage Trust floater Series 2018-BIOA Class F, 1 month U.S. LIBOR + 2.471% 4.6662% 3/15/37 (b)(c)(d) | | 337,000 | 338,687 |
| BX Trust: | | | |
| floater: | | | |
| Series 2018-EXCL Class D, 1 month U.S. LIBOR + 2.625% 4.8201% 9/15/37 (b)(c)(d) | | 3,605,957 | 3,606,283 |
| Series 2018-IND: | | | |
| Class F, 1 month U.S. LIBOR + 1.800% 3.9951% 11/15/35 (b)(c)(d) | | 4,495,917 | 4,508,588 |
| Class G, 1 month U.S. LIBOR + 2.050% 4.2451% 11/15/35 (b)(c)(d) | | 620,463 | 622,407 |
| Class H, 1 month U.S. LIBOR + 3.000% 5.1951% 11/15/35 (b)(c)(d) | | 229,831 | 230,335 |
| Series 2019-IMC: | | | |
| Class B, 1 month U.S. LIBOR + 1.300% 3.4951% 4/15/34 (b)(c)(d) | | 6,526,000 | 6,525,985 |
| Class C, 1 month U.S. LIBOR + 1.600% 3.7951% 4/15/34 (b)(c)(d) | | 4,315,000 | 4,315,007 |
| Class D, 1 month U.S. LIBOR + 1.900% 4.0951% 4/15/34 (b)(c)(d) | | 4,529,000 | 4,543,176 |
| Class G, 1 month U.S. LIBOR + 3.600% 5.7951% 4/15/34 (b)(c)(d) | | 861,000 | 866,393 |
| floater, sequential payer Series 2019-IMC Class A, 1 month U.S. LIBOR + 1.000% 3.1951% 4/15/34 (b)(c)(d) | | 11,330,000 | 11,329,978 |
| BXMT Ltd. floater Series 2017-FL1 Class D, 1 month U.S. LIBOR + 2.700% 4.8974% 6/15/35 (b)(c)(d) | | 303,000 | 304,042 |
| CALI Mortgage Trust Series 2019-101C Class F, 4.4686% 3/10/39 (b)(c) | | 745,000 | 786,900 |
| CAMB Commercial Mortgage Trust floater Series 2019-LIFE Class G, 1 month U.S. LIBOR + 3.250% 5.4451% 12/15/37 (b)(c)(d) | | 707,000 | 712,746 |
| CCRESG Commercial Mortgage Trust Series 2016-HEAT Class E, 5.6712% 4/10/29 (b)(c) | | 419,000 | 425,461 |
| CD Mortgage Trust Series 2017-CD3: | | | |
| Class C, 4.7128% 2/10/50 (c) | | 813,000 | 896,737 |
| Class D, 3.25% 2/10/50 (b) | | 735,000 | 685,787 |
| CFCRE Commercial Mortgage Trust Series 2011-C2 Class B, 5.9394% 12/15/47 (b)(c) | | 272,000 | 289,284 |
| CGBAM Commercial Mortgage Trust Series 2015-SMRT Class F, 3.9121% 4/10/28 (b)(c) | | 638,000 | 641,309 |
| CHC Commercial Mortgage Trust floater Series 2019-CHC: | | | |
| Class A, 1 month U.S. LIBOR + 1.120% 3.3151% 6/15/34 (b)(c)(d) | | 16,045,000 | 16,044,968 |
| Class B, 1 month U.S. LIBOR + 1.500% 3.6951% 6/15/34 (b)(c)(d) | | 3,159,000 | 3,159,006 |
| Class C, 1 month U.S. LIBOR + 1.750% 3.9451% 6/15/34 (b)(c)(d) | | 3,568,000 | 3,568,006 |
| Class E, 1 month U.S. LIBOR + 2.350% 4.5451% 6/15/34 (b)(c)(d) | | 1,533,000 | 1,533,001 |
| Class F, 1 month U.S. LIBOR + 2.608% 4.8033% 6/15/34 (b)(c)(d) | | 2,142,000 | 2,125,882 |
| Citigroup Commercial Mortgage Trust: | | | |
| sequential payer Series 2018-B2 Class AAB, 3.962% 3/10/51 | | 1,000,000 | 1,097,589 |
| Series 19-SMRT Class E, 4.9031% 1/10/24 (b)(c) | | 443,000 | 464,061 |
| Series 2013-375P Class E, 3.6348% 5/10/35 (b)(c) | | 715,000 | 717,217 |
| Series 2013-GC15 Class D, 5.3888% 9/10/46 (b)(c) | | 1,200,000 | 1,274,280 |
| Series 2015-GC29 Class XA, 1.2411% 4/10/48 (c)(j) | | 23,702,197 | 1,034,684 |
| Series 2015-GC33 Class XA, 1.0759% 9/10/58 (c)(j) | | 32,853,944 | 1,434,574 |
| Series 2015-SHP2 Class E, 1 month U.S. LIBOR + 4.350% 6.5451% 7/15/27 (b)(c)(d) | | 455,000 | 455,810 |
| Series 2016-C3 Class D, 3% 11/15/49 (b) | | 829,000 | 708,346 |
| Series 2016-P6 Class XA, 0.9461% 12/10/49 (c)(j) | | 29,729,828 | 1,089,396 |
| Series 2018-C6 Class A4, 4.412% 11/10/51 | | 2,081,000 | 2,437,310 |
| Series 2019-GC41: | | | |
| Class D, 3% 8/10/56 (b) | | 210,000 | 195,789 |
| Class E, 3% 8/10/56 (b) | | 462,000 | 397,257 |
| COMM Mortgage Trust: | | | |
| floater: | | | |
| Series 2018-HCLV: | | | |
| Class F, 1 month U.S. LIBOR + 3.050% 5.2451% 9/15/33 (b)(c)(d) | | 267,000 | 267,057 |
| Class G, 1 month U.S. LIBOR + 5.056% 7.2514% 9/15/33 (b)(c)(d) | | 300,000 | 288,754 |
| Series 2019-521F Class F, 1 month U.S. LIBOR + 2.394% 4.5891% 6/15/34 (b)(c)(d) | | 700,000 | 695,095 |
| sequential payer: | | | |
| Series 2013-CR7 Class AM, 3.314% 3/10/46 (b) | | 3,375,249 | 3,498,122 |
| Series 2013-LC6 Class E, 3.5% 1/10/46 (b) | | 811,000 | 700,728 |
| Series 2012-CR1: | | | |
| Class C, 5.4976% 5/15/45 (c) | | 426,000 | 448,478 |
| Class D, 5.4976% 5/15/45 (b)(c) | | 1,160,000 | 1,188,242 |
| Class G, 2.462% 5/15/45 (b) | | 425,000 | 346,528 |
| Series 2012-LC4: | | | |
| Class C, 5.7223% 12/10/44 (c) | | 94,000 | 98,588 |
| Class D, 5.7223% 12/10/44 (b)(c) | | 652,530 | 575,978 |
| Series 2013-CR10: | | | |
| Class C, 4.9489% 8/10/46 (b)(c) | | 175,000 | 187,505 |
| Class D, 4.9489% 8/10/46 (b)(c) | | 825,000 | 853,405 |
| Series 2013-CR12 Class D, 5.2308% 10/10/46 (b)(c) | | 655,000 | 575,742 |
| Series 2013-CR9 Class C, 4.3971% 7/10/45 (b)(c) | | 190,538 | 190,272 |
| Series 2013-LC6 Class D, 4.404% 1/10/46 (b)(c) | | 909,000 | 938,068 |
| Series 2014-CR15 Class D, 4.8983% 2/10/47 (b)(c) | | 173,000 | 186,116 |
| Series 2014-CR19 Class XA, 1.2328% 8/10/47 (c)(j) | | 43,164,033 | 1,832,119 |
| Series 2014-CR20 Class XA, 1.2084% 11/10/47 (c)(j) | | 39,882,228 | 1,804,132 |
| Series 2014-LC17 Class XA, 0.9977% 10/10/47 (c)(j) | | 30,012,382 | 910,903 |
| Series 2014-UBS2 Class D, 5.1691% 3/10/47 (b)(c) | | 542,000 | 516,680 |
| Series 2014-UBS4 Class XA, 1.2659% 8/10/47 (c)(j) | | 34,391,948 | 1,546,028 |
| Series 2014-UBS6 Class XA, 1.0841% 12/10/47 (c)(j) | | 51,246,453 | 1,872,704 |
| Series 2015-3BP Class F, 3.3463% 2/10/35 (b)(c) | | 845,000 | 842,618 |
| Series 2015-CR23 Class CME, 3.8073% 5/10/48 (b)(c) | | 175,000 | 174,832 |
| Series 2015-DC1 Class XA, 1.2533% 2/10/48 (c)(j) | | 53,937,951 | 2,122,464 |
| Series 2016-CD1 Class D, 2.9014% 8/10/49 (b)(c) | | 523,000 | 474,931 |
| Series 2017-CD4 Class D, 3.3% 5/10/50 (b) | | 593,000 | 553,934 |
| COMM Mortgage Trust pass-thru certificates Series 2005-LP5 Class F, 4.6619% 5/10/43 (b)(c) | | 243,248 | 241,145 |
| COMM Trust Series 2017-COR2 Class D, 3% 9/10/50 (b) | | 202,000 | 191,074 |
| Commercial Mortgage Trust Series 2016-CD2: | | | |
| Class C, 4.1629% 11/10/49 (c) | | 352,000 | 374,410 |
| Class D, 2.9129% 11/10/49 (c) | | 299,000 | 271,117 |
| Commercial Mortgage Trust pass-thru certificates: | | | |
| Series 2012-CR2: | | | |
| Class D, 4.992% 8/15/45 (b)(c) | | 210,000 | 215,637 |
| Class E, 4.992% 8/15/45 (b)(c) | | 990,000 | 977,721 |
| Class F, 4.25% 8/15/45 (b) | | 1,110,000 | 996,961 |
| Series 2014-CR2 Class G, 4.25% 8/15/45 (b) | | 286,000 | 202,257 |
| Core Industrial Trust: | | | |
| floater Series 2019-CORE Class A, 1 month U.S. LIBOR + 0.880% 3.0751% 12/15/31 (b)(c)(d) | | 6,084,000 | 6,083,990 |
| Series 2015-CALW Class G, 3.9787% 2/10/34 (b)(c) | | 404,000 | 419,793 |
| Series 2015-TEXW Class F, 3.977% 2/10/34 (b)(c) | | 747,000 | 767,253 |
| Series 2015-WEST Class F, 4.3677% 2/10/37 (b)(c) | | 937,000 | 1,013,574 |
| Credit Suisse First Boston Mortgage Securities Corp. Series 1998-C1 Class H, 6% 5/17/40 (b) | | 102,274 | 83,497 |
| Credit Suisse Mortgage Trust: | | | |
| floater: | | | |
| Series 2019-ICE4: | | | |
| Class A, 1 month U.S. LIBOR + 0.980% 3.1751% 5/15/36 (b)(c)(d) | | 15,700,000 | 15,709,852 |
| Class F, 1 month U.S. LIBOR + 2.650% 4.8451% 5/15/36 (b)(c)(d) | | 378,000 | 379,893 |
| Series 2019-SKLZ Class D, 1 month U.S. LIBOR + 3.600% 5.7951% 1/15/34 (b)(c)(d) | | 363,000 | 366,145 |
| Series 2018-SITE: | | | |
| Class A, 4.284% 4/15/36 (b) | | 7,384,000 | 7,918,503 |
| Class B, 4.5349% 4/15/36 (b) | | 2,263,000 | 2,421,981 |
| Class C, 4.9414% 4/15/36 (b)(c) | | 1,523,000 | 1,623,039 |
| Class D, 4.9414% 4/15/36 (b)(c) | | 3,047,000 | 3,195,573 |
| CSAIL Commercial Mortgage Trust: | | | |
| Series 2017-C8 Class D, 4.4701% 6/15/50 (b) | | 701,000 | 689,469 |
| Series 2017-CX10 Class UESD, 4.3778% 10/15/32 (b)(c) | | 588,000 | 598,111 |
| Series 2017-CX9 Class D, 4.2934% 9/15/50 (b)(c) | | 284,000 | 278,383 |
| Series 2018-CX11 Class C, 4.9521% 4/15/51 (c) | | 282,000 | 314,664 |
| CSAIL Commercial Mtg Trust Series 2018-C14 Class A4 4.4216% 11/15/51 | | 5,432,000 | 6,339,808 |
| CSMC Trust Series 2017-MOON Class E, 3.303% 7/10/34 (b)(c) | | 755,000 | 750,009 |
| DBCCRE Mortgage Trust Series 2014-ARCP: | | | |
| Class D, 5.099% 1/10/34 (b)(c) | | 255,000 | 266,495 |
| Class E, 5.099% 1/10/34 (b)(c) | | 818,000 | 835,623 |
| DBGS Mortgage Trust: | | | |
| Series 2018-C1 Class D, 3.0354% 10/15/51 (b)(c) | | 273,000 | 253,324 |
| Series 2019-1735 Class F, 4.3344% 4/10/37 (b)(c) | | 665,000 | 661,765 |
| DBUBS Mortgage Trust: | | | |
| Series 2011-LC1A: | | | |
| Class E, 5.8847% 11/10/46 (b)(c) | | 1,166,000 | 1,209,382 |
| Class F, 5.8847% 11/10/46 (b)(c) | | 1,162,000 | 1,200,463 |
| Class G, 4.652% 11/10/46 (b) | | 1,241,000 | 1,182,157 |
| Class XB, 0.385% 11/10/46 (b)(c)(j) | | 7,592,000 | 34,024 |
| Series 2011-LC3A Class D, 5.5117% 8/10/44 (b)(c) | | 529,000 | 551,586 |
| Deutsche Bank Commercial Mortgage Trust Series 2016-C3 Class C, 3.6332% 8/10/49 (c) | | 218,000 | 224,245 |
| Freddie Mac: | | | |
| pass-thru certificates: | | | |
| Series K011 Class X3, 2.6604% 12/25/43 (c)(j) | | 595,000 | 19,024 |
| Series K012 Class X3, 2.329% 1/25/41 (c)(j) | | 642,215 | 18,912 |
| Series K013 Class X3, 2.91% 1/25/43 (c)(j) | | 604,000 | 22,664 |
| Series KAIV Class X2, 3.6147% 6/25/41 (c)(j) | | 310,000 | 18,518 |
| FREMF Mortgage Trust: | | | |
| Series 2010-K9 Class B, 5.3756% 9/25/45 (b)(c) | | 659,000 | 673,920 |
| Series 2011-K10 Class B, 4.7809% 11/25/49 (b)(c) | | 181,000 | 185,155 |
| Series 2011-K11 Class B, 4.567% 12/25/48 (b)(c) | | 272,000 | 278,441 |
| GMAC Commercial Mortgage Securities, Inc.: | | | |
| Series 1997-C2 Class H, 6.75% 4/15/29 (c) | | 264,397 | 226,003 |
| Series 1999-C2I Class K, 6.481% 9/15/33 (o) | | 548,546 | 560,882 |
| GPMT Ltd. floater Series 2018-FL1 Class D, 1 month U.S. LIBOR + 2.950% 5.1186% 11/21/35 (b)(c)(d) | | 234,000 | 235,170 |
| Grace Mortgage Trust Series 2014-GRCE Class F, 3.7098% 6/10/28 (b)(c) | | 694,000 | 700,610 |
| GS Mortgage Securities Corp. II Series 2010-C1 Class X, 1.4731% 8/10/43 (b)(c)(j) | | 1,657,009 | 13,659 |
| GS Mortgage Securities Corp. Trust floater Series 2019-SOHO Class E, 1 month U.S. LIBOR + 1.875% 4.0698% 6/15/36 (b)(c)(d) | | 503,000 | 501,496 |
| GS Mortgage Securities Trust: | | | |
| floater: | | | |
| Series 2018-3PCK Class A, 1 month U.S. LIBOR + 1.450% 3.6451% 9/15/31 (b)(c)(d) | | 22,596,000 | 22,541,324 |
| Series 2018-HART Class A, 1 month U.S. LIBOR + 1.090% 3.2851% 10/15/31 (b)(c)(d) | | 10,353,000 | 10,345,777 |
| sequential payer Series 2018-GS10 Class A5, 4.155% 7/10/51 | | 1,740,000 | 1,994,431 |
| Series 2010-C2: | | | |
| Class D, 5.3529% 12/10/43 (b)(c) | | 495,000 | 509,926 |
| Class XA, 0.2371% 12/10/43 (b)(c)(j) | | 1,106,380 | 1,355 |
| Series 2011-GC3 Class D, 5.8246% 3/10/44 (b)(c) | | 178,000 | 185,641 |
| Series 2011-GC5: | | | |
| Class C, 5.5565% 8/10/44 (b)(c) | | 505,077 | 525,724 |
| Class D, 5.5565% 8/10/44 (b)(c) | | 1,184,312 | 1,171,748 |
| Class E, 5.5565% 8/10/44 (b)(c) | | 424,043 | 387,742 |
| Class F, 4.5% 8/10/44 (b) | | 733,782 | 517,838 |
| Series 2012-GC6: | | | |
| Class D, 5.8397% 1/10/45 (b)(c) | | 1,025,000 | 1,058,997 |
| Class E, 5% 1/10/45 (b)(c) | | 620,000 | 576,086 |
| Series 2012-GC6I Class F, 5% 1/10/45 (c) | | 244,543 | 195,823 |
| Series 2012-GCJ7: | | | |
| Class C, 5.8754% 5/10/45 (c) | | 562,000 | 595,246 |
| Class D, 5.8754% 5/10/45 (b)(c) | | 1,399,000 | 1,403,148 |
| Class E, 5% 5/10/45 (b) | | 460,844 | 346,963 |
| Class F, 5% 5/10/45 (b) | | 1,235,531 | 485,369 |
| Series 2012-GCJ9: | | | |
| Class D, 4.9021% 11/10/45 (b)(c) | | 1,059,000 | 1,088,946 |
| Class E, 4.9021% 11/10/45 (b)(c) | | 510,000 | 488,212 |
| Series 2013-GC10 Class D, 4.5414% 2/10/46 (b)(c) | | 334,000 | 338,091 |
| Series 2013-GC12: | | | |
| Class D, 4.5878% 6/10/46 (b)(c) | | 138,482 | 138,057 |
| Class XA, 1.5598% 6/10/46 (c)(j) | | 9,381,604 | 407,811 |
| Series 2013-GC13 Class D, 4.2187% 7/10/46 (b)(c) | | 1,048,000 | 1,034,712 |
| Series 2013-GC16: | | | |
| Class C, 5.4877% 11/10/46 (c) | | 241,000 | 266,521 |
| Class D, 5.4877% 11/10/46 (b)(c) | | 634,000 | 689,699 |
| Class F, 3.5% 11/10/46 (b) | | 536,000 | 431,496 |
| Series 2014-GC20 Class XA, 1.2265% 4/10/47 (c)(j) | | 50,571,334 | 1,709,281 |
| Series 2015-GC34 Class XA, 1.4773% 10/10/48 (c)(j) | | 10,391,582 | 647,914 |
| Series 2016-GS2: | | | |
| Class C, 4.6784% 5/10/49 (c) | | 423,000 | 466,735 |
| Class D, 2.753% 5/10/49 (b) | | 386,000 | 350,619 |
| Series 2016-GS3 Class D, 2.62% 10/10/49 (b) | | 1,061,000 | 956,276 |
| Series 2016-GS4 Class C, 3.9215% 11/10/49 (c) | | 264,000 | 274,140 |
| Series 2016-REMZ Class MZB, 7.727% 2/10/21 (b) | | 670,000 | 681,821 |
| Series 2016-RENT: | | | |
| Class E, 4.2022% 2/10/29 (b)(c) | | 1,785,000 | 1,799,295 |
| Class F, 4.2022% 2/10/29 (b)(c) | | 1,881,000 | 1,884,062 |
| Series 2017-GS6 Class D, 3.243% 5/10/50 (b) | | 950,000 | 876,230 |
| Series 2018-GS9 Class D, 3% 3/10/51 (b) | | 476,000 | 411,534 |
| Series 2019-GC38 Class D, 3% 2/10/52 (b) | | 543,000 | 513,570 |
| Series 2019-GC39 Class D, 3% 5/10/52 (b) | | 672,000 | 627,747 |
| Series 2019-GC40: | | | |
| Class D, 3% 7/10/52 (b) | | 525,000 | 490,109 |
| Class DBF, 3.668% 7/10/52 (b)(c) | | 619,000 | 603,451 |
| Class E, 3% 7/10/52 (b) | | 314,000 | 268,153 |
| Hilton U.S.A. Trust: | | | |
| Series 2016-HHV Class F, 4.3333% 11/5/38 (b)(c) | | 998,000 | 1,025,697 |
| Series 2016-SFP Class F, 6.1552% 11/5/35 (b) | | 1,177,000 | 1,188,892 |
| Home Partners of America Trust Series 2019-1: | | | |
| Class E, 3.604% 9/17/39 (b) | | 399,000 | 401,244 |
| Class F, 4.101% 9/17/39 (b) | | 100,000 | 99,406 |
| Hudson Yards Mortgage Trust Series 2019-30HY Class E, 3.5579% 7/10/39 (b)(c) | | 483,000 | 488,179 |
| IMT Trust Series 2017-APTS: | | | |
| Class EFL, 1 month U.S. LIBOR + 2.150% 4.3451% 6/15/34 (b)(c)(d) | | 334,000 | 334,105 |
| Class FFL, 1 month U.S. LIBOR + 2.850% 5.0451% 6/15/34 (b)(c)(d) | | 153,000 | 153,144 |
| Independence Plaza Trust Series 2018-INDP Class E, 4.996% 7/10/35 (b) | | 592,000 | 634,078 |
| Invitation Homes Trust floater: | | | |
| Series 2018-SFR3 Class F, 1 month U.S. LIBOR + 2.250% 4.432% 7/17/37 (b)(c)(d) | | 657,000 | 655,946 |
| Series 2018-SFR4 Class F, 1 month U.S. LIBOR + 2.200% 4.382% 1/17/38 (b)(c)(d) | | 435,000 | 433,250 |
| JP Morgan Chase Commercial Mortgage Securities Trust floater: | | | |
| Series 2018-LAQ Class E, 1 month U.S. LIBOR + 3.000% 5.1951% 6/15/35 (b)(c)(d) | | 37,264 | 37,404 |
| Series 2019-MFP: | | | |
| Class E, 4.3551% 7/15/36 (b) | | 567,000 | 569,131 |
| Class F, 1 month U.S. LIBOR + 3.000% 5.1951% 7/15/36 (b)(c)(d) | | 189,000 | 189,710 |
| JPMBB Commercial Mortgage Securities Trust: | | | |
| Series 2014-C19 Class XA, 0.9299% 4/15/47 (c)(j) | | 4,564,133 | 104,573 |
| Series 2014-C23 Class UH5, 4.7094% 9/15/47 (b) | | 106,000 | 89,182 |
| Series 2014-C26 Class D, 4.0272% 1/15/48 (b)(c) | | 416,000 | 408,080 |
| Series 2015-C30 Class XA, 0.6742% 7/15/48 (c)(j) | | 27,137,396 | 727,469 |
| Series 2015-C32 Class C, 4.816% 11/15/48 (c) | | 1,083,000 | 1,170,354 |
| JPMCC Commercial Mortgage Securities Trust Series 2016-JP4 Class D, 3.5772% 12/15/49 (b)(c) | | 696,000 | 640,446 |
| JPMDB Commercial Mortgage Securities Trust: | | | |
| Series 2016-C4: | | | |
| Class C, 3.2198% 12/15/49 (c) | | 343,000 | 344,408 |
| Class D, 3.2198% 12/15/49 (b)(c) | | 681,000 | 628,565 |
| Series 2017-C7: | | | |
| Class C, 4.3241% 10/15/50 (c) | | 198,000 | 214,829 |
| Class D, 3% 10/15/50 (b) | | 331,000 | 300,247 |
| Series 2018-C8 Class D, 3.403% 6/15/51 (b)(c) | | 223,000 | 207,521 |
| JPMorgan Chase Commercial Mortgage Securities Corp.: | | | |
| Series 2009-IWST: | | | |
| Class C, 7.6935% 12/5/27 (b)(c) | | 138,000 | 138,482 |
| Class D, 7.6935% 12/5/27 (b)(c) | | 684,000 | 686,389 |
| Series 2012-CBX: | | | |
| Class C, 5.3027% 6/15/45 (c) | | 91,000 | 95,256 |
| Class D, 5.3027% 6/15/45 (b)(c) | | 481,000 | 491,745 |
| Class E, 5.3027% 6/15/45 (b)(c) | | 625,000 | 610,805 |
| Class F, 4% 6/15/45 (b) | | 615,000 | 524,666 |
| Class G 4% 6/15/45 (b) | | 674,000 | 414,740 |
| JPMorgan Chase Commercial Mortgage Securities Trust: | | | |
| Series 2004-CBX Class D, 5.097% 1/12/37 (c) | | 38,963 | 38,962 |
| Series 2011-C3: | | | |
| Class E, 5.8526% 2/15/46 (b)(c) | | 637,000 | 602,577 |
| Class G, 4.409% 2/15/46 (b)(c) | | 202,000 | 172,674 |
| Class H, 4.409% 2/15/46 (b)(c) | | 453,000 | 339,084 |
| Series 2011-C4: | | | |
| Class E, 5.7196% 7/15/46 (b)(c) | | 761,000 | 795,644 |
| Class H, 3.873% 7/15/46 (b) | | 428,000 | 409,961 |
| Class NR, 3.873% 7/15/46 (b) | | 231,000 | 184,510 |
| Series 2011-C5: | | | |
| Class B. 5.554% 8/15/46 (b)(c) | | 414,000 | 435,455 |
| Class C, 5.554% 8/15/46 (b)(c) | | 236,000 | 247,066 |
| Series 2013-LC11: | | | |
| Class C, 3.9582% 4/15/46 (c) | | 584,000 | 599,639 |
| Class D, 4.3069% 4/15/46 (c) | | 907,000 | 816,986 |
| Class F, 3.25% 4/15/46 (b)(c) | | 1,014,000 | 431,115 |
| Series 2014-DSTY: | | | |
| Class D, 3.9314% 6/10/27 (b)(c) | | 516,000 | 334,841 |
| Class E, 3.9314% 6/10/27 (b)(c) | | 830,000 | 278,641 |
| Series 2015-UES Class F, 3.7417% 9/5/32 (b)(c) | | 696,000 | 694,366 |
| Series 2018-AON Class F, 4.767% 7/5/31 (b)(c) | | 409,000 | 420,919 |
| Series 2018-WPT: | | | |
| Class CFX, 4.9498% 7/5/33 (b) | | 1,323,000 | 1,428,833 |
| Class DFX, 5.3503% 7/5/33 (b) | | 2,034,000 | 2,199,564 |
| Class EFX, 5.5422% 7/5/33 (b) | | 2,783,000 | 2,981,127 |
| Class XAFX, 1.2948% 7/5/33 (b)(c)(j) | | 19,961,000 | 814,938 |
| Series 2019-OSB Class E, 3.9089% 6/5/39 (b) | | 588,000 | 617,439 |
| KNDL 2019-KNSQ Mortgage Trust floater Series 2019-KNSQ Class F, 1 month U.S. LIBOR + 2.000% 4.1951% 5/15/36 (b)(c)(d) | | 630,000 | 630,022 |
| Ladder Capital Commercial Mortgage Securities Trust Series 2014-909 Class E, 4.0278% 5/15/31 (b)(c) | | 734,000 | 737,363 |
| Liberty Street Trust Series 2016-225L: | | | |
| Class D, 4.8035% 2/10/36 (b)(c) | | 213,000 | 235,374 |
| Class E, 4.8035% 2/10/36 (b)(c) | | 523,000 | 563,094 |
| Merrill Lynch Mortgage Trust Series 2006-C1 Class AJ, 5.7794% 5/12/39 (c) | | 150,480 | 151,516 |
| Morgan Stanley BAML Trust: | | | |
| sequential payer Series 2014-C18 Class 300E, 4.6896% 8/15/31 | | 386,000 | 396,921 |
| Series 2012-C5 Class E, 4.8343% 8/15/45 (b)(c) | | 159,000 | 165,209 |
| Series 2012-C6 Class D, 4.7618% 11/15/45 (b)(c) | | 811,000 | 845,885 |
| Series 2013-C12 Class D, 4.9245% 10/15/46 (b)(c) | | 713,000 | 739,379 |
| Series 2013-C13: | | | |
| Class D, 5.0714% 11/15/46 (b)(c) | | 865,000 | 913,419 |
| Class E, 5.0714% 11/15/46 (b)(c) | | 435,919 | 409,325 |
| Series 2013-C7: | | | |
| Class C, 4.2611% 2/15/46 (c) | | 175,000 | 181,529 |
| Class D, 4.3771% 2/15/46 (b)(c) | | 730,000 | 718,961 |
| Class E, 4.3771% 2/15/46 (b)(c) | | 213,000 | 186,883 |
| Series 2013-C8 Class D, 4.1935% 12/15/48 (b)(c) | | 273,000 | 278,138 |
| Series 2013-C9: | | | |
| Class C, 4.1734% 5/15/46 (c) | | 502,000 | 517,968 |
| Class D, 4.2614% 5/15/46 (b)(c) | | 938,000 | 954,316 |
| Class E, 4.2614% 5/15/46 (b)(c) | | 402,000 | 399,359 |
| Series 2014-C17 Class XA, 1.2738% 8/15/47 (c)(j) | | 47,196,832 | 1,945,043 |
| Series 2015-C25 Class XA, 1.2557% 10/15/48 (c)(j) | | 16,896,788 | 858,125 |
| Series 2016-C30: | | | |
| Class C, 4.2629% 9/15/49 (c) | | 151,000 | 162,011 |
| Class D, 3% 9/15/49 (b) | | 271,000 | 233,912 |
| Series 2016-C31: | | | |
| Class C, 4.4587% 11/15/49 (c) | | 343,000 | 359,091 |
| Class D, 3% 11/15/49 (b)(c) | | 423,000 | 359,812 |
| Series 2016-C32: | | | |
| Class C, 4.4356% 12/15/49 (c) | | 236,000 | 248,067 |
| Class D, 3.396% 12/15/49 (b) | | 546,000 | 458,289 |
| Series 2017-C33 Class D, 3.356% 5/15/50 (b) | | 520,000 | 482,488 |
| Morgan Stanley Capital I Trust: | | | |
| floater Series 2019-AGLN: | | | |
| Class A, 1 month U.S. LIBOR + 0.950% 3.1451% 3/15/34 (b)(c)(d) | | 8,250,000 | 8,255,131 |
| Class F, 1 month U.S. LIBOR + 2.600% 4.7951% 3/15/34 (b)(c)(d) | | 1,050,000 | 1,055,256 |
| Class G, 1 month U.S. LIBOR + 3.150% 5.3451% 3/15/34 (b)(c)(d) | | 231,000 | 232,446 |
| sequential payer Series 2018-L1 Class A4, 4.407% 10/15/51 | | 5,080,000 | 5,935,442 |
| Series 1998-CF1 Class G, 7.2476% 7/15/32 (b)(c) | | 21,148 | 18,758 |
| Series 2011-C1: | | | |
| Class D, 5.5539% 9/15/47 (b)(c) | | 1,124,000 | 1,167,207 |
| Class E, 5.5539% 9/15/47 (b)(c) | | 293,000 | 304,196 |
| Series 2011-C2: | | | |
| Class D, 5.6705% 6/15/44 (b)(c) | | 977,000 | 986,925 |
| Class E, 5.6705% 6/15/44 (b)(c) | | 498,000 | 493,913 |
| Class F, 5.6705% 6/15/44 (b)(c) | | 407,000 | 375,800 |
| Class XB, 0.3873% 6/15/44 (b)(c)(j) | | 2,852,181 | 15,927 |
| Series 2011-C3: | | | |
| Class AJ, 5.2925% 7/15/49 (b)(c) | | 4,800,000 | 5,035,287 |
| Class D, 5.2925% 7/15/49 (b)(c) | | 1,176,000 | 1,193,958 |
| Class E, 5.2925% 7/15/49 (b)(c) | | 666,000 | 661,764 |
| Class F, 5.2925% 7/15/49 (b)(c) | | 182,000 | 175,757 |
| Class G, 5.2925% 7/15/49 (b)(c) | | 616,400 | 560,586 |
| Series 2012-C4 Class D, 5.6002% 3/15/45 (b)(c) | | 231,000 | 229,608 |
| Series 2014-150E: | | | |
| Class C, 4.4382% 9/9/32 (b)(c) | | 238,000 | 257,167 |
| Class F, 4.4382% 9/9/32 (b)(c) | | 401,000 | 417,303 |
| Series 2014-CPT Class F, 3.5604% 7/13/29 (b)(c) | | 521,000 | 525,900 |
| Series 2015-MS1: | | | |
| Class C, 4.1652% 5/15/48 (c) | | 266,000 | 278,467 |
| Class D, 4.1652% 5/15/48 (b)(c) | | 751,000 | 725,594 |
| Series 2015-UBS8 Class D, 3.18% 12/15/48 (b) | | 485,000 | 440,413 |
| Series 2016-BNK2: | | | |
| Class C, 3% 11/15/49 (b) | | 798,000 | 738,109 |
| Class D, 4.0367% 11/15/49 (c) | | 343,000 | 363,593 |
| Series 2017-CLS Class F, 1 month U.S. LIBOR + 2.600% 4.7951% 11/15/34 (b)(c)(d) | | 462,000 | 462,290 |
| Series 2018-H4 Class A4, 4.31% 12/15/51 | | 18,581,000 | 21,641,112 |
| Series 2018-MP Class E, 4.4185% 7/11/40 (b)(c) | | 730,000 | 748,987 |
| Morgan Stanley Dean Witter Capital I Trust Series 2001-TOP3 Class E, 7.8881% 7/15/33 (b)(c) | | 46,679 | 48,905 |
| Motel 6 Trust floater Series 2017-MTL6, Class F, 1 month U.S. LIBOR + 4.250% 6.4451% 8/15/34 (b)(c)(d) | | 1,627,712 | 1,634,327 |
| MSCCG Trust: | | | |
| floater Series 2018-SELF Class E, 1 month U.S. LIBOR + 2.150% 4.3451% 10/15/37 (b)(c)(d) | | 387,000 | 388,693 |
| floater sequential payer Series 2018-SELF Class F, 1 month U.S. LIBOR + 3.050% 5.2451% 10/15/37 (b)(c)(d) | | 58,000 | 58,363 |
| MSCG Trust Series 2016-SNR: | | | |
| Class A, 3.4596% 11/15/34 (b)(c) | | 6,153,017 | 6,196,637 |
| Class B, 4.181% 11/15/34 (b) | | 2,601,850 | 2,644,276 |
| Class C, 5.205% 11/15/34 (b) | | 1,819,850 | 1,864,661 |
| Class D, 6.55% 11/15/34 (b) | | 1,272,450 | 1,309,760 |
| Class E, 6.8087% 11/15/34 (b) | | 307,700 | 304,355 |
| MSJP Commercial Securities Mortgage Trust Series 2015-HAUL Class E, 5.0127% 9/5/47 (b)(c) | | 170,000 | 186,163 |
| MTRO Commercial Mortgage Trust floater Series 2019-TECH Class E, 1 month U.S. LIBOR + 2.050% 4.2451% 12/15/33 (b)(c)(d) | | 415,000 | 415,000 |
| NationsLink Funding Corp. Series 1999-LTL1 Class D, 6.45% 1/22/26 (b) | | 3,336 | 3,339 |
| Natixis Commercial Mortgage Securities Series 2019-10K Class F, 4.2724% 5/15/39 (b)(c) | | 768,000 | 726,939 |
| Natixis Commercial Mortgage Securities Trust: | | | |
| Series 2018-285M Class F, 3.9167% 11/15/32 (b)(c) | | 170,000 | 167,874 |
| Series 2018-TECH Class F, 1 month U.S. LIBOR + 3.000% 5.1951% 11/15/34 (b)(c)(d) | | 138,000 | 135,752 |
| NYT Mortgage Trust floater Series 2019-NYT Class F, 1 month U.S. LIBOR + 3.000% 5.1951% 11/15/35 (b)(c)(d) | | 775,000 | 780,813 |
| Progress Residential Series 2019-SFR3 Class F, 3.867% 9/17/36 (b) | | 315,000 | 316,133 |
| Providence Place Group Ltd. Partnership Series 2000-C1 Class A2, 7.75% 7/20/28 (b) | | 133,430 | 167,166 |
| RETL floater Series 2019-RVP: | | | |
| Class A, 1 month U.S. LIBOR + 1.150% 3.3451% 3/15/36 (b)(c)(d) | | 5,989,851 | 5,999,199 |
| Class B, 1 month U.S. LIBOR + 1.550% 3.7451% 3/15/36 (b)(c)(d) | | 7,700,000 | 7,728,884 |
| Class C, 1 month U.S. LIBOR + 2.100% 4.2951% 3/15/36 (b)(c)(d) | | 12,017,000 | 12,065,832 |
| TIAA Seasoned Commercial Mortgage Trust: | | | |
| sequential payer Series 2007-C4 Class AJ, 5.4832% 8/15/39 (c) | | 8,884 | 8,908 |
| Series 2007-C4 Class F, 5.4832% 8/15/39 (c) | | 603,000 | 590,736 |
| UBS Commercial Mortgage Trust: | | | |
| Series 2012-C1: | | | |
| Class D, 5.7279% 5/10/45 (b)(c) | | 747,000 | 760,087 |
| Class E, 5% 5/10/45 (b)(c) | | 325,000 | 303,232 |
| Class F, 5% 5/10/45 (b)(c) | | 418,000 | 333,183 |
| Series 2017-C7 Class XA, 1.2152% 12/15/50 (c)(j) | | 30,665,176 | 2,050,961 |
| UBS-BAMLL Trust: | | | |
| Series 12-WRM Class D, 4.3793% 6/10/30 (b)(c) | | 201,000 | 197,456 |
| Series 2012-WRM Class E, 4.3793% 6/10/30 (b)(c) | | 478,000 | 462,070 |
| VNO Mortgage Trust Series 2012-6AVE Class D, 3.4484% 11/15/30 (b)(c) | | 471,000 | 479,357 |
| Wells Fargo Commercial Mortgage Trust: | | | |
| Series 2010-C1 Class XB, 0.6613% 11/15/43 (b)(c)(j) | | 8,849,807 | 54,047 |
| Series 2012-LC5: | | | |
| Class C, 4.693% 10/15/45 (c) | | 207,000 | 219,180 |
| Class D, 4.9182% 10/15/45 (b)(c) | | 1,063,000 | 1,106,189 |
| Class E, 4.9182% 10/15/45 (b)(c) | | 486,918 | 489,391 |
| Class F, 4.9182% 10/15/45 (b)(c) | | 147,000 | 137,707 |
| Series 2015-C31 Class XA, 1.1774% 11/15/48 (c)(j) | | 13,332,974 | 693,508 |
| Series 2015-NXS4 Class E, 3.7509% 12/15/48 (b)(c) | | 353,000 | 316,327 |
| Series 2016-BNK1: | | | |
| Class C, 3.071% 8/15/49 | | 254,000 | 252,422 |
| Class D, 3% 8/15/49 (b) | | 266,000 | 228,436 |
| Series 2016-C34 Class XA, 2.3089% 6/15/49 (c)(j) | | 12,165,503 | 1,175,871 |
| Series 2016-C35 Class D, 3.142% 7/15/48 (b) | | 953,000 | 822,065 |
| Series 2016-LC25 Class C, 4.5664% 12/15/59 (c) | | 328,000 | 348,222 |
| Series 2016-NXS6 Class D, 3.059% 11/15/49 (b) | | 733,000 | 660,617 |
| Series 2017-C38 Class D, 3% 7/15/50 (b)(c) | | 810,000 | 716,972 |
| Series 2017-RB1 Class D, 3.401% 3/15/50 (b) | | 326,000 | 305,274 |
| Series 2018-C43 Class C, 4.514% 3/15/51 | | 228,000 | 249,111 |
| Series 2018-C46 Class XA, 1.1126% 8/15/51 (c)(j) | | 26,843,997 | 1,618,234 |
| Series 2018-C48 Class A5, 4.302% 1/15/52 | | 10,027,000 | 11,618,150 |
| WF-RBS Commercial Mortgage Trust: | | | |
| floater Series 2013-C14 Class A3, 1 month U.S. LIBOR + 0.720% 2.9174% 6/15/46 (b)(c)(d) | | 11,121,962 | 11,131,412 |
| sequential payer Series 2011-C4I Class G, 5% 6/15/44 | | 203,000 | 144,025 |
| Series 2011-C3: | | | |
| Class C, 5.335% 3/15/44 (b) | | 131,000 | 135,688 |
| Class D, 5.8555% 3/15/44 (b)(c) | | 517,000 | 445,623 |
| Class E, 5% 3/15/44 (b) | | 409,000 | 211,680 |
| Class F, 5% 3/15/44 (b) | | 418,000 | 90,889 |
| Series 2011-C4: | | | |
| Class D, 5.3966% 6/15/44 (b)(c) | | 258,000 | 263,616 |
| Class E, 5.3966% 6/15/44 (b)(c) | | 183,000 | 183,135 |
| Series 2011-C5: | | | |
| Class C, 5.858% 11/15/44 (b)(c) | | 100,000 | 105,913 |
| Class D, 5.858% 11/15/44 (b)(c) | | 655,000 | 686,338 |
| Class E, 5.858% 11/15/44 (b)(c) | | 927,000 | 954,686 |
| Class F, 5.25% 11/15/44 (b)(c) | | 601,000 | 564,831 |
| Class G, 5.25% 11/15/44 (b)(c) | | 205,000 | 183,698 |
| Class XA, 1.8834% 11/15/44 (b)(c)(j) | | 1,332,781 | 35,957 |
| Series 2012-C6 Class D, 5.7677% 4/15/45 (b)(c) | | 381,000 | 400,991 |
| Series 2012-C7: | | | |
| Class C, 4.9689% 6/15/45 (c) | | 677,000 | 697,283 |
| Class E, 4.9689% 6/15/45 (b)(c) | | 1,156,688 | 963,640 |
| Class F, 4.5% 6/15/45 (b) | | 230,566 | 140,152 |
| Class G, 4.5% 6/15/45 (b) | | 678,513 | 278,457 |
| Series 2012-C8: | | | |
| Class D, 5.0487% 8/15/45 (b)(c) | | 293,000 | 300,240 |
| Class E, 5.0487% 8/15/45 (b)(c) | | 201,000 | 205,967 |
| Series 2013-C11: | | | |
| Class D, 4.4035% 3/15/45 (b)(c) | | 443,749 | 454,635 |
| Class E, 4.4035% 3/15/45 (b)(c) | | 976,128 | 986,236 |
| Series 2013-C13 Class D, 4.2763% 5/15/45 (b)(c) | | 321,000 | 328,300 |
| Series 2013-C16 Class D, 5.1935% 9/15/46 (b)(c) | | 115,000 | 113,998 |
| Series 2013-UBS1 Class D, 4.8976% 3/15/46 (b)(c) | | 455,375 | 466,746 |
| Series 2014-C21 Class XA, 1.1954% 8/15/47 (c)(j) | | 32,240,320 | 1,371,503 |
| Series 2014-C24 Class XA, 1.0046% 11/15/47 (c)(j) | | 11,598,993 | 381,962 |
| Series 2014-LC14 Class XA, 1.397% 3/15/47 (c)(j) | | 20,222,673 | 853,927 |
| Worldwide Plaza Trust Series 2017-WWP: | | | |
| Class E, 3.7154% 11/10/36 (b)(c) | | 198,000 | 197,723 |
| Class F, 3.7154% 11/10/36 (b)(c) | | 1,082,000 | 1,039,238 |
| WP Glimcher Mall Trust Series 2015-WPG: | | | |
| Class PR1, 3.6332% 6/5/35 (b)(c) | | 289,000 | 250,308 |
| Class PR2, 3.6332% 6/5/35 (b)(c) | | 755,000 | 624,901 |
| TOTAL COMMERCIAL MORTGAGE SECURITIES | | | |
| (Cost $433,763,323) | | | 444,643,168 |
|
| Municipal Securities - 0.7% | | | |
| California Gen. Oblig.: | | | |
| Series 2009: | | $ | $ |
| 7.35% 11/1/39 | | 960,000 | 1,534,339 |
| 7.5% 4/1/34 | | 3,305,000 | 5,206,763 |
| 7.55% 4/1/39 | | 6,805,000 | 11,410,148 |
| Series 2010, 7.625% 3/1/40 | | 3,670,000 | 6,122,367 |
| 7.3% 10/1/39 | | 10,015,000 | 15,909,028 |
| Chicago Gen. Oblig. (Taxable Proj.): | | | |
| Series 2008 B, 5.63% 1/1/22 | | 595,000 | 608,679 |
| Series 2010 C1, 7.781% 1/1/35 | | 5,065,000 | 6,455,444 |
| Series 2012 B, 5.432% 1/1/42 | | 1,190,000 | 1,236,612 |
| Illinois Gen. Oblig.: | | | |
| Series 2003: | | | |
| 4.95% 6/1/23 | | 7,675,636 | 8,080,066 |
| 5.1% 6/1/33 | | 22,880,000 | 24,898,931 |
| Series 2010-1, 6.63% 2/1/35 | | 4,335,000 | 5,163,505 |
| Series 2010-3: | | | |
| 6.725% 4/1/35 | | 6,465,000 | 7,675,119 |
| 7.35% 7/1/35 | | 2,965,000 | 3,609,621 |
| Series 2010-5, 6.2% 7/1/21 | | 1,184,000 | 1,241,365 |
| TOTAL MUNICIPAL SECURITIES | | | |
| (Cost $87,071,704) | | | 99,151,987 |
|
| Foreign Government and Government Agency Obligations - 1.3% | | | |
| Angola Republic 9.5% 11/12/25 (b) | | $250,000 | $283,125 |
| Arab Republic of Egypt: | | | |
| 5.577% 2/21/23 (b) | | 343,000 | 353,119 |
| 5.75% 4/29/20 (b) | | 85,000 | 85,850 |
| 6.125% 1/31/22 (b) | | 2,133,000 | 2,218,987 |
| 6.2004% 3/1/24 (b) | | 410,000 | 429,988 |
| 7.5% 1/31/27 (b) | | 4,183,000 | 4,538,555 |
| 7.6003% 3/1/29 (b) | | 1,950,000 | 2,107,219 |
| 7.903% 2/21/48 (b) | | 459,000 | 472,483 |
| 8.5% 1/31/47 (b) | | 904,000 | 978,298 |
| 8.7002% 3/1/49 (b) | | 160,000 | 174,800 |
| Argentine Republic: | | | |
| 5.625% 1/26/22 | | 3,780,000 | 1,493,100 |
| 6.875% 4/22/21 | | 7,304,000 | 3,049,420 |
| 7.5% 4/22/26 | | 7,953,000 | 3,010,211 |
| 8.75% 5/7/24 | | 312,525 | 80,798 |
| Azerbaijan Republic 4.75% 3/18/24 (b) | | 355,000 | 380,738 |
| Bahamian Republic 6% 11/21/28 (b) | | 212,000 | 236,513 |
| Bahrain Kingdom 5.5% 3/31/20 (b) | | 285,000 | 288,206 |
| Belarus Republic: | | | |
| 6.875% 2/28/23 (b) | | 1,509,000 | 1,617,459 |
| 7.625% 6/29/27 (b) | | 167,000 | 189,545 |
| Bermuda Government: | | | |
| 3.717% 1/25/27 (b) | | 435,000 | 465,042 |
| 4.75% 2/15/29 (b) | | 915,000 | 1,047,675 |
| Brazilian Federative Republic: | | | |
| 4.25% 1/7/25 | | 3,631,000 | 3,870,419 |
| 5.625% 1/7/41 | | 4,534,000 | 5,190,013 |
| 5.625% 2/21/47 | | 461,000 | 528,853 |
| 8.25% 1/20/34 | | 2,121,000 | 2,956,807 |
| Buenos Aires Province: | | | |
| 9.95% 6/9/21 (b) | | 650,621 | 234,224 |
| 10.875% 1/26/21 (b) | | 913,333 | 383,600 |
| 10.875% 1/26/21 (Reg. S) | | 3,671,333 | 1,541,960 |
| Cameroon Republic 9.5% 11/19/25 (b) | | 1,868,000 | 2,027,948 |
| City of Buenos Aires: | | | |
| 7.5% 6/1/27 (Reg. S) | | 400,000 | 254,000 |
| 8.95% 2/19/21 (b) | | 704,840 | 581,493 |
| Costa Rican Republic 4.25% 1/26/23 (b) | | 365,000 | 358,613 |
| Democratic Socialist Republic of Sri Lanka: | | | |
| 5.75% 4/18/23 (b) | | 294,000 | 291,428 |
| 6.25% 10/4/20 (b) | | 706,000 | 715,708 |
| 6.85% 3/14/24 (b) | | 400,000 | 407,000 |
| Dominican Republic: | | | |
| 5.95% 1/25/27 (b) | | 324,000 | 355,590 |
| 6% 7/19/28 (b) | | 379,000 | 418,913 |
| 6.4% 6/5/49 (b) | | 385,000 | 422,898 |
| 6.85% 1/27/45 (b) | | 477,000 | 547,358 |
| 6.875% 1/29/26 (b) | | 508,000 | 581,343 |
| 7.45% 4/30/44 (b) | | 796,000 | 964,155 |
| El Salvador Republic: | | | |
| 5.875% 1/30/25 (Reg.S) | | 1,195,000 | 1,217,033 |
| 6.375% 1/18/27 (b) | | 1,055,000 | 1,081,045 |
| 7.1246% 1/20/50 (b) | | 590,000 | 602,169 |
| 7.375% 12/1/19 (b) | | 1,843,000 | 1,853,943 |
| 7.625% 9/21/34 (b) | | 260,000 | 273,894 |
| 7.65% 6/15/35 (Reg. S) | | 175,000 | 187,578 |
| Export Credit Bank of Turkey 5.375% 2/8/21 (b) | | 615,000 | 606,544 |
| German Federal Republic 0.25% 2/15/29 | EUR | 700,000 | 844,068 |
| Ghana Republic: | | | |
| 7.875% 8/7/23 (b) | | 505,000 | 550,450 |
| 7.875% 8/7/23 (Reg.S) | | 200,000 | 218,000 |
| 7.875% 3/26/27 (b) | | 350,000 | 358,750 |
| 8.125% 1/18/26 (b) | | 315,000 | 333,309 |
| Greek Government 1.875% 7/23/26 (b) | EUR | 3,610,000 | 4,098,540 |
| Guatemalan Republic 4.9% 6/1/30 (b) | | 575,000 | 618,664 |
| Indonesian Republic: | | | |
| 2.625% 6/14/23 | EUR | 4,017,000 | 4,823,261 |
| 4.35% 1/11/48 | | 655,000 | 745,063 |
| 5.125% 1/15/45 (b) | | 420,000 | 516,075 |
| 5.25% 1/17/42 (b) | | 540,000 | 668,756 |
| 5.95% 1/8/46 (b) | | 430,000 | 585,069 |
| 6.75% 1/15/44 (b) | | 250,000 | 366,875 |
| 7.75% 1/17/38 (b) | | 1,032,000 | 1,584,138 |
| 8.5% 10/12/35 (b) | | 225,000 | 360,089 |
| 8.5% 10/12/35 (Reg. S) | | 1,070,000 | 1,712,426 |
| Islamic Republic of Pakistan: | | | |
| 6.75% 12/3/19 (b) | | 742,000 | 746,174 |
| 8.25% 4/15/24 (b) | | 164,000 | 178,504 |
| Italian Republic 3.75% 5/1/21 (b) | EUR | 8,650,000 | 10,120,921 |
| Ivory Coast 5.75% 12/31/32 | | 1,885,840 | 1,869,339 |
| Jamaican Government 6.75% 4/28/28 | | 115,000 | 134,550 |
| Kazakhstan Republic 6.5% 7/21/45 (b) | | 100,000 | 145,750 |
| Kingdom of Saudi Arabia: | | | |
| 3.625% 3/4/28 (b) | | 527,000 | 570,346 |
| 4.5% 4/17/30 (b) | | 500,000 | 584,250 |
| 4.5% 10/26/46 (b) | | 920,000 | 1,069,040 |
| 4.625% 10/4/47 (b) | | 655,000 | 773,555 |
| 5.25% 1/16/50 (b) | | 1,760,000 | 2,274,800 |
| Lebanese Republic: | | | |
| 5.8% 4/14/20 | | 1,191,000 | 1,097,209 |
| 6.15% 6/19/20 | | 575,000 | 523,789 |
| 6.375% 3/9/20 | | 2,159,000 | 2,024,737 |
| 8.25% 4/12/21 (Reg.S) | | 175,000 | 147,930 |
| Mendoza Province 8.375% 5/19/24 (b) | | 125,000 | 62,500 |
| Ministry of Finance of the Russian Federation: | | | |
| 5.1% 3/28/35 (b) | | 4,800,000 | 5,424,000 |
| 5.1% 3/28/35(Reg. S) | | 400,000 | 452,000 |
| 5.25% 6/23/47 (b) | | 3,600,000 | 4,289,625 |
| 5.25% 6/23/47(Reg. S) | | 200,000 | 237,902 |
| 5.625% 4/4/42 (b) | | 600,000 | 741,288 |
| 5.875% 9/16/43 (b) | | 400,000 | 511,750 |
| Mongolian People's Republic 8.75% 3/9/24 (b) | | 313,000 | 348,995 |
| Moroccan Kingdom: | | | |
| 4.25% 12/11/22 (b) | | 1,175,000 | 1,232,648 |
| 5.5% 12/11/42 (b) | | 100,000 | 121,719 |
| Papua New Guinea 8.375% 10/4/28 (b) | | 490,000 | 514,500 |
| Peruvian Republic 4% 3/7/27 (k)(p) | | 494,000 | 496,971 |
| Province of Santa Fe 7% 3/23/23 (b) | | 2,171,000 | 1,194,050 |
| Provincia de Cordoba: | | | |
| 7.125% 6/10/21 (b) | | 4,468,000 | 2,099,960 |
| 7.45% 9/1/24 (b) | | 1,097,000 | 493,650 |
| Republic of Iraq 5.8% 1/15/28 (Reg. S) | | 4,099,000 | 4,010,615 |
| Republic of Kenya 6.875% 6/24/24 (b) | | 250,000 | 267,500 |
| Republic of Nigeria: | | | |
| 6.375% 7/12/23 (b) | | 975,000 | 1,024,664 |
| 6.5% 11/28/27 (b) | | 540,000 | 537,638 |
| 7.625% 11/21/25 (b) | | 945,000 | 1,035,366 |
| Republic of Paraguay 5.4% 3/30/50 (b) | | 100,000 | 116,438 |
| Republic of Serbia 7.25% 9/28/21 (b) | | 380,000 | 415,340 |
| Romanian Republic 5.125% 6/15/48 (b) | | 770,000 | 897,050 |
| Rwanda Republic 6.625% 5/2/23 (b) | | 337,000 | 356,377 |
| State of Qatar: | | | |
| 4% 3/14/29 (b) | | 2,190,000 | 2,501,391 |
| 4.5% 4/23/28 (b) | | 746,000 | 874,685 |
| 4.817% 3/14/49 (b) | | 1,850,000 | 2,381,875 |
| 5.103% 4/23/48 (b) | | 1,515,000 | 2,021,105 |
| 9.75% 6/15/30 (b) | | 523,000 | 885,504 |
| Sultanate of Oman: | | | |
| 3.875% 3/8/22 (b) | | 720,000 | 715,320 |
| 4.125% 1/17/23 (b) | | 175,000 | 174,125 |
| 6.75% 1/17/48 (b) | | 401,000 | 377,065 |
| Turkish Republic: | | | |
| 3.25% 3/23/23 | | 405,000 | 369,942 |
| 5.125% 3/25/22 | | 3,925,000 | 3,889,430 |
| 5.625% 3/30/21 | | 2,257,000 | 2,281,686 |
| 5.75% 5/11/47 | | 457,000 | 374,454 |
| 6.25% 9/26/22 | | 6,025,000 | 6,085,250 |
| 6.35% 8/10/24 | | 435,000 | 432,825 |
| 7.25% 12/23/23 | | 1,011,000 | 1,047,017 |
| 7.375% 2/5/25 | | 538,000 | 556,158 |
| Ukraine Government: | | | |
| 7.375% 9/25/32 (b) | | 345,000 | 354,833 |
| 7.75% 9/1/19 (b) | | 2,122,000 | 2,109,268 |
| 7.75% 9/1/20 (b) | | 4,595,000 | 4,722,798 |
| 7.75% 9/1/21 (b) | | 6,909,000 | 7,199,178 |
| 7.75% 9/1/22 (b) | | 2,465,000 | 2,609,203 |
| 7.75% 9/1/23 (b) | | 510,000 | 542,130 |
| 7.75% 9/1/24 (b) | | 1,445,000 | 1,546,150 |
| 7.75% 9/1/26 (b) | | 530,000 | 561,800 |
| 7.75% 9/1/27 (b) | | 345,000 | 365,269 |
| 9.75% 11/1/28 (b) | | 170,000 | 200,388 |
| United Kingdom, Great Britain and Northern Ireland: | | | |
| 1.75% 9/7/37 | GBP | 921,009 | 1,284,304 |
| 4.25% 6/7/32 | GBP | 200,000 | 352,355 |
| 4.25% 3/7/36 | GBP | 397,408 | 743,139 |
| 4.25% 12/7/49 | GBP | 1,765,283 | 3,966,301 |
| United Mexican States: | | | |
| 5.75% 10/12/10 | | 1,175,000 | 1,389,805 |
| 6.05% 1/11/40 | | 2,760,000 | 3,530,040 |
| Venezuelan Republic: | | | |
| 9.25% 9/15/27 (e) | | 4,549,000 | 659,605 |
| 11.95% 8/5/31 (Reg. S) (e) | | 938,300 | 136,054 |
| 12.75% 8/23/22 (e) | | 199,600 | 28,942 |
| Vietnamese Socialist Republic: | | | |
| 6 month U.S. LIBOR + 0.813% 3.5% 3/13/28 (c)(d) | | 71,000 | 70,663 |
| 5.5% 3/12/28 | | 2,317,100 | 2,327,237 |
| TOTAL FOREIGN GOVERNMENT AND GOVERNMENT AGENCY OBLIGATIONS | | | |
| (Cost $186,881,928) | | | 179,149,927 |
| | | Shares | Value |
|
| Common Stocks - 0.0% | | | |
| COMMUNICATION SERVICES - 0.0% | | | |
| Media - 0.0% | | | |
| Clear Channel Outdoor Holdings, Inc. (q) | | 18,523 | 48,160 |
| iHeartMedia, Inc. (q) | | 7,877 | 108,703 |
| | | | 156,863 |
| CONSUMER DISCRETIONARY - 0.0% | | | |
| Specialty Retail - 0.0% | | | |
| David's Bridal, Inc. (k) | | 1,953 | 3,867 |
| ENERGY - 0.0% | | | |
| Energy Equipment & Services - 0.0% | | | |
| Forbes Energy Services Ltd. (q) | | 55,600 | 62,272 |
| MATERIALS - 0.0% | | | |
| Chemicals - 0.0% | | | |
| LyondellBasell Industries NV Class A | | 6,018 | 465,673 |
| TOTAL COMMON STOCKS | | | |
| (Cost $1,041,335) | | | 688,675 |
|
| Preferred Stocks - 0.0% | | | |
| Convertible Preferred Stocks - 0.0% | | | |
| REAL ESTATE - 0.0% | | | |
| Equity Real Estate Investment Trusts (REITs) - 0.0% | | | |
| Alexandria Real Estate Equities, Inc. Series D, 7.00% | | 6,925 | 270,557 |
| RLJ Lodging Trust Series A, 1.95% | | 11,325 | 306,568 |
| | | | 577,125 |
| Nonconvertible Preferred Stocks - 0.0% | | | |
| FINANCIALS - 0.0% | | | |
| Mortgage Real Estate Investment Trusts - 0.0% | | | |
| MFA Financial, Inc. Series B, 7.50% | | 13,700 | 348,847 |
| REAL ESTATE - 0.0% | | | |
| Equity Real Estate Investment Trusts (REITs) - 0.0% | | | |
| American Homes 4 Rent Series D, 6.50% | | 14,800 | 410,996 |
| Boston Properties, Inc. 5.25% | | 6,350 | 161,798 |
| Cedar Realty Trust, Inc.: | | | |
| Series B, 7.25% | | 950 | 23,912 |
| Series C, 6.50% | | 14,300 | 317,317 |
| DDR Corp. Series K, 6.25% | | 11,650 | 299,755 |
| National Storage Affiliates Trust Series A, 6.00% | | 6,925 | 181,781 |
| PS Business Parks, Inc. Series W, 5.20% | | 8,025 | 205,922 |
| Public Storage Series F, 5.15% | | 21,800 | 571,814 |
| Rexford Industrial Realty, Inc. Series B, 5.875% | | 16,525 | 445,845 |
| Spirit Realty Capital, Inc. Series A, 6.00% | | 10,200 | 259,794 |
| Taubman Centers, Inc. Series J, 6.50% | | 7,900 | 202,445 |
| UMH Properties, Inc. Series C, 6.75% | | 8,625 | 224,595 |
| | | | 3,305,974 |
|
| TOTAL NONCONVERTIBLE PREFERRED STOCKS | | | 3,654,821 |
|
| TOTAL PREFERRED STOCKS | | | |
| (Cost $3,760,844) | | | 4,231,946 |
| | | Principal Amount(a) | Value |
|
| Bank Loan Obligations - 4.8% | | | |
| COMMUNICATION SERVICES - 0.7% | | | |
| Diversified Telecommunication Services - 0.2% | | | |
| Frontier Communications Corp. Tranche B 1LN, term loan 3 month U.S. LIBOR + 3.750% 5.87% 6/15/24 (c)(d) | | 12,597,837 | 12,443,891 |
| Level 3 Financing, Inc. Tranche B, term loan 3 month U.S. LIBOR + 2.250% 4.362% 2/22/24 (c)(d) | | 4,284,000 | 4,285,799 |
| Sable International Finance Ltd. Tranche B 4LN, term loan 3 month U.S. LIBOR + 3.250% 5.362% 2/2/26 (c)(d) | | 2,380,843 | 2,386,295 |
| Securus Technologies, Inc. Tranche B, term loan: | | | |
| 3 month U.S. LIBOR + 4.500% 6.8299% 11/1/24 (c)(d) | | 1,430,111 | 1,272,799 |
| 3 month U.S. LIBOR + 8.250% 10.5799% 11/1/25 (c)(d) | | 544,000 | 480,760 |
| SFR Group SA: | | | |
| Tranche B 11LN, term loan 3 month U.S. LIBOR + 2.750% 4.862% 7/31/25 (c)(d) | | 2,869,452 | 2,765,951 |
| Tranche B 12LN, term loan 3 month U.S. LIBOR + 3.688% 5.8849% 1/31/26 (c)(d) | | 620,265 | 608,635 |
| Tranche B 13LN, term loan 3 month U.S. LIBOR + 4.000% 6.1974% 8/14/26 (c)(d) | | 1,939,854 | 1,921,270 |
| Windstream Services LLC 1LN, term loan 3 month U.S. LIBOR + 2.500% 4.62% 2/26/21 (c)(d) | | 1,500,000 | 1,503,750 |
| | | | 27,669,150 |
| Entertainment - 0.0% | | | |
| AMC Entertainment Holdings, Inc. Tranche B 1LN, term loan 3 month U.S. LIBOR + 3.000% 5.23% 4/22/26 (c)(d) | | 1,496,250 | 1,500,305 |
| CDS U.S. Intermediate Holdings, Inc.: | | | |
| Tranche B 1LN, term loan 3 month U.S. LIBOR + 3.750% 6.0799% 7/8/22 (c)(d) | | 1,267,301 | 1,210,273 |
| Tranche B 2LN, term loan 3 month U.S. LIBOR + 8.250% 10.5799% 7/8/23 (c)(d) | | 169,000 | 152,945 |
| | | | 2,863,523 |
| Media - 0.3% | | | |
| Acosta, Inc. Tranche B, term loan 3 month U.S. LIBOR + 3.250% 5.362% 9/26/21 (c)(d) | | 624,478 | 212,323 |
| Altice Financing SA Tranche B, term loan: | | | |
| 3 month U.S. LIBOR + 2.750% 4.9451% 7/15/25 (c)(d) | | 531,919 | 515,073 |
| 3 month U.S. LIBOR + 2.750% 4.9474% 1/31/26 (c)(d) | | 1,457,871 | 1,406,117 |
| Cable One, Inc. Tranche B, term loan 3 month U.S. LIBOR + 1.750% 3.87% 5/1/24 (c)(d) | | 363,220 | 363,674 |
| CBS Radio, Inc. Tranche B 1LN, term loan 3 month U.S. LIBOR + 2.750% 4.8895% 11/18/24 (c)(d) | | 1,182,498 | 1,180,287 |
| Cengage Learning, Inc. Tranche B, term loan 3 month U.S. LIBOR + 4.250% 6.362% 6/7/23 (c)(d) | | 2,187,846 | 2,092,872 |
| Charter Communication Operating LLC Tranche B, term loan 3 month U.S. LIBOR + 2.000% 4.33% 4/30/25 (c)(d) | | 8,758,570 | 8,776,526 |
| CSC Holdings LLC: | | | |
| Tranche B, term loan 3 month U.S. LIBOR + 2.500% 4.6951% 1/25/26 (c)(d) | | 1,599,849 | 1,597,178 |
| Tranche B3 1LN, term loan 3 month U.S. LIBOR + 2.250% 4.4451% 1/15/26 (c)(d) | | 722,370 | 718,159 |
| Tranche B4 1LN, term loan 3 month U.S. LIBOR + 3.000% 5.1951% 4/15/27 (c)(d) | | 997,500 | 1,000,493 |
| Diamond Sports Group LLC Tranche B 1LN, term loan 3 month U.S. LIBOR + 3.250% 8/24/26 (d)(r) | | 4,730,000 | 4,730,000 |
| Getty Images, Inc. Tranche B 1LN, term loan 3 month U.S. LIBOR + 4.500% 6.625% 2/19/26 (c)(d) | | 870,625 | 865,184 |
| ION Media Networks, Inc. Tranche B 1LN, term loan 3 month U.S. LIBOR + 3.000% 5.125% 12/18/24 (c)(d) | | 1,406,538 | 1,403,374 |
| Lamar Media Corp. Tranche B, term loan 3 month U.S. LIBOR + 1.750% 4.125% 3/16/25 (c)(d) | | 763,204 | 763,684 |
| McGraw-Hill Global Education Holdings, LLC term loan 3 month U.S. LIBOR + 4.000% 6.112% 5/4/22 (c)(d) | | 307,715 | 290,676 |
| NEP/NCP Holdco, Inc.: | | | |
| Tranche B 1LN, term loan 3 month U.S. LIBOR + 3.250% 5.362% 10/19/25 (c)(d) | | 323,375 | 314,967 |
| Tranche B 2LN, term loan 3 month U.S. LIBOR + 7.000% 9.112% 10/19/26 (c)(d) | | 272,000 | 266,560 |
| Nexstar Broadcasting, Inc. Tranche B, term loan 3 month U.S. LIBOR + 2.750% 6/19/26 (d)(r) | | 2,725,000 | 2,725,000 |
| Nielsen Finance LLC Tranche B 4LN, term loan 3 month U.S. LIBOR + 2.000% 4.2113% 10/4/23 (c)(d) | | 994,911 | 989,519 |
| Proquest LLC Tranche B, term loan 3 month U.S. LIBOR + 3.250% 5.362% 10/24/21 (c)(d) | | 1,391,857 | 1,390,994 |
| Sinclair Television Group, Inc. Tranche B 1LN, term loan: | | | |
| 3 month U.S. LIBOR + 2.500% 7/18/26 (d)(r) | | 713,462 | 712,570 |
| 3 month U.S. LIBOR + 2.500% 4.7% 7/18/26 (c)(d) | | 611,538 | 610,774 |
| Springer Science+Business Media Deutschland GmbH Tranche B 13LN, term loan 3 month U.S. LIBOR + 3.500% 5.612% 8/24/22 (c)(d) | | 2,748,089 | 2,747,759 |
| WideOpenWest Finance LLC Tranche B, term loan 3 month U.S. LIBOR + 3.250% 5.3953% 8/19/23 (c)(d) | | 5,992,424 | 5,747,753 |
| | | | 41,421,516 |
| Wireless Telecommunication Services - 0.2% | | | |
| iHeartMedia Capital I LLC 1LN, term loan 3 month U.S. LIBOR + 4.000% 6.2298% 5/1/26 (c)(d) | | 1,040,668 | 1,043,009 |
| Intelsat Jackson Holdings SA: | | | |
| Tranche B, term loan 3 month U.S. LIBOR + 3.750% 5.8953% 11/27/23 (c)(d) | | 10,710,000 | 10,698,540 |
| Tranche B-4, term loan 3 month U.S. LIBOR + 4.500% 6.6453% 1/2/24 (c)(d) | | 1,270,000 | 1,275,563 |
| Tranche B-5, term loan 6.625% 1/2/24 | | 1,718,000 | 1,733,754 |
| SBA Senior Finance II, LLC Tranche B, term loan 3 month U.S. LIBOR + 2.000% 4.12% 4/11/25 (c)(d) | | 1,122,496 | 1,115,368 |
| Sprint Communications, Inc.: | | | |
| Tranche B 2LN, term loan 3 month U.S. LIBOR + 3.000% 5.125% 2/2/24 (c)(d) | | 995,000 | 992,204 |
| Tranche B, term loan 3 month U.S. LIBOR + 2.500% 4.625% 2/3/24 (c)(d) | | 502,507 | 498,894 |
| Syniverse Holdings, Inc. Tranche B, term loan 3 month U.S. LIBOR + 5.000% 7.1951% 3/9/23 (c)(d) | | 1,612,751 | 1,503,084 |
| | | | 18,860,416 |
|
| TOTAL COMMUNICATION SERVICES | | | 90,814,605 |
|
| CONSUMER DISCRETIONARY - 1.0% | | | |
| Auto Components - 0.0% | | | |
| North American Lifting Holdings, Inc.: | | | |
| Tranche 1LN, term loan 3 month U.S. LIBOR + 4.500% 6.8299% 11/27/20 (c)(d) | | 1,614,204 | 1,496,173 |
| Tranche 2LN, term loan 3 month U.S. LIBOR + 9.000% 11.3299% 11/27/21 (c)(d) | | 579,000 | 410,366 |
| | | | 1,906,539 |
| Automobiles - 0.0% | | | |
| UOS LLC Tranche B 1LN, term loan 3 month U.S. LIBOR + 5.500% 7.8299% 4/18/23 (c)(d) | | 877,286 | 883,866 |
| Distributors - 0.0% | | | |
| BCPE Empire Holdings, Inc.: | | | |
| 1LN, term loan 3 month U.S. LIBOR + 4.000% 6.112% 6/11/26 (c)(d) | | 626,582 | 615,617 |
| Tranche DD 1LN, term loan 3 month U.S. LIBOR + 4.000% 6/11/26 (d)(r)(s) | | 123,418 | 121,258 |
| Owens & Minor Distribution, Inc. Tranche B, term loan 3 month U.S. LIBOR + 4.500% 6.7297% 4/30/25 (c)(d) | | 1,078,110 | 912,081 |
| | | | 1,648,956 |
| Diversified Consumer Services - 0.1% | | | |
| Alpine Finance Merger Sub LLC Tranche B, term loan 3 month U.S. LIBOR + 3.000% 5.112% 7/12/24 (c)(d) | | 1,425,291 | 1,411,038 |
| Bright Horizons Family Solutions Tranche B, term loan 3 month U.S. LIBOR + 1.750% 3.862% 11/7/23 (c)(d) | | 534,896 | 534,564 |
| CSM Bakery Supplies Tranche B 1LN, term loan 3 month U.S. LIBOR + 4.000% 6.29% 7/3/20 (c)(d) | | 881,000 | 838,606 |
| GEMS MENASA Cayman Ltd. Tranche B 1LN, term loan 3 month U.S. LIBOR + 5.000% 7/30/26 (d)(r) | | 1,375,000 | 1,369,844 |
| KUEHG Corp.: | | | |
| Tranche B 2LN, term loan 3 month U.S. LIBOR + 8.250% 10.5799% 8/22/25 (c)(d) | | 363,000 | 360,278 |
| Tranche B, term loan 3 month U.S. LIBOR + 3.750% 6.0799% 2/21/25 (c)(d) | | 2,689,427 | 2,666,567 |
| Learning Care Group (U.S.) No 2 Tranche B 1LN, term loan 3 month U.S. LIBOR + 3.250% 5.4761% 3/13/25 (c)(d) | | 1,048,932 | 1,034,835 |
| SMG U.S. Midco 2, Inc. Tranche B 1LN, term loan 3 month U.S. LIBOR + 3.000% 5.112% 1/23/25 (c)(d) | | 500,201 | 496,139 |
| Spin Holdco, Inc. Tranche B, term loan 3 month U.S. LIBOR + 3.250% 5.5723% 11/14/22 (c)(d) | | 4,618,731 | 4,512,500 |
| SSH Group Holdings, Inc. Tranche B 1LN, term loan 3 month U.S. LIBOR + 4.250% 6.508% 7/30/25 (c)(d) | | 970,113 | 960,412 |
| WASH Multifamily Acquisition, Inc.: | | | |
| 2LN, term loan 3 month U.S. LIBOR + 7.000% 9.112% 5/15/23 (c)(d) | | 19,525 | 18,939 |
| Tranche B 1LN, term loan: | | | |
| 3 month U.S. LIBOR + 3.250% 5.362% 5/14/22 (c)(d) | | 269,888 | 264,490 |
| 3 month U.S. LIBOR + 3.250% 5.362% 5/14/22 (c)(d) | | 1,553,516 | 1,522,446 |
| Tranche B 2LN, term loan 3 month U.S. LIBOR + 7.000% 9.112% 5/14/23 (c)(d) | | 111,476 | 108,131 |
| Weight Watchers International, Inc. Tranche B, term loan 3 month U.S. LIBOR + 4.750% 7.0455% 11/29/24 (c)(d) | | 2,591,822 | 2,587,778 |
| | | | 18,686,567 |
| Hotels, Restaurants & Leisure - 0.6% | | | |
| Affinity Gaming LLC Tranche B, term loan 3 month U.S. LIBOR + 3.250% 5.362% 7/1/23 (c)(d) | | 677,552 | 653,587 |
| Aimbridge Acquisition Co., Inc. Tranche B 1LN, term loan 3 month U.S. LIBOR + 3.750% 5.9941% 2/1/26 (c)(d) | | 668,325 | 669,996 |
| Alterra Mountain Co. Tranche B 1LN, term loan 3 month U.S. LIBOR + 3.000% 5.112% 7/31/24 (c)(d) | | 1,220,705 | 1,214,602 |
| AP Gaming I LLC Tranche B, term loan 3 month U.S. LIBOR + 3.500% 5.612% 2/15/24 (c)(d) | | 639,170 | 627,384 |
| Aramark Services, Inc. Tranche B 3LN, term loan 3 month U.S. LIBOR + 1.750% 4.0799% 3/11/25 (c)(d) | | 1,946,000 | 1,943,568 |
| Aristocrat Technologies, Inc. Tranche B 3LN, term loan 3 month U.S. LIBOR + 1.750% 4.0276% 10/19/24 (c)(d) | | 1,324,507 | 1,324,507 |
| Boyd Gaming Corp. Tranche B 1LN, term loan 3 month U.S. LIBOR + 2.250% 4.3871% 9/15/23 (c)(d) | | 686,242 | 685,899 |
| Burger King Worldwide, Inc. Tranche B, term loan 3 month U.S. LIBOR + 2.250% 4.362% 2/17/24 (c)(d) | | 4,601,203 | 4,592,185 |
| Caesars Resort Collection LLC Tranche B 1LN, term loan 3 month U.S. LIBOR + 2.750% 4.862% 12/22/24 (c)(d) | | 9,481,332 | 9,333,708 |
| CCM Merger, Inc. Tranche B, term loan 3 month U.S. LIBOR + 2.250% 4.362% 8/8/21 (c)(d) | | 671,642 | 671,642 |
| CEC Entertainment, Inc. Tranche B 1LN, term loan 3 month U.S. LIBOR + 6.500% 8.612% 8/14/26 (c)(d) | | 1,000,000 | 967,500 |
| CityCenter Holdings LLC Tranche B, term loan 3 month U.S. LIBOR + 2.250% 4.362% 4/18/24 (c)(d) | | 1,225,620 | 1,224,664 |
| Delta 2 SARL Tranche B, term loan 3 month U.S. LIBOR + 2.500% 4.612% 2/1/24 (c)(d) | | 5,235,000 | 5,120,511 |
| Eldorado Resorts, Inc. Tranche B, term loan 3 month U.S. LIBOR + 2.000% 4.4185% 4/17/24 (c)(d) | | 1,097,086 | 1,093,312 |
| Equinox Holdings, Inc.: | | | |
| Tranche 2LN, term loan 3 month U.S. LIBOR + 7.000% 9.112% 9/8/24 (c)(d) | | 341,000 | 341,215 |
| Tranche B-1, term loan 3 month U.S. LIBOR + 3.000% 5.112% 3/8/24 (c)(d) | | 2,029,771 | 2,016,578 |
| ESH Hospitality, Inc. Tranche B, term loan 3 month U.S. LIBOR + 2.000% 4.112% 8/30/23 (c)(d) | | 1,063,273 | 1,063,443 |
| Four Seasons Holdings, Inc. Tranche B, term loan 3 month U.S. LIBOR + 2.000% 4.112% 11/30/23 (c)(d) | | 2,794,704 | 2,797,024 |
| Gaming VC Holdings SA Tranche B2 1LN, term loan 3 month U.S. LIBOR + 2.250% 4.4462% 3/15/24 (c)(d) | | 1,080,791 | 1,079,440 |
| Gateway Casinos & Entertainment Ltd. Tranche B 1LN, term loan 3 month U.S. LIBOR + 3.000% 5.3299% 3/13/25 (c)(d) | | 1,049,053 | 1,034,628 |
| Golden Entertainment, Inc. Tranche B, term loan 3 month U.S. LIBOR + 3.000% 5.14% 10/20/24 (c)(d) | | 3,712,212 | 3,706,792 |
| Golden Nugget, Inc. Tranche B 1LN, term loan 3 month U.S. LIBOR + 2.750% 4.8932% 10/4/23 (c)(d) | | 5,767,777 | 5,763,567 |
| Hilton Worldwide Finance LLC Tranche B 1LN, term loan 3 month U.S. LIBOR + 1.750% 3.8952% 6/21/26 (c)(d) | | 1,646,634 | 1,649,795 |
| KFC Holding Co. Tranche B, term loan 3 month U.S. LIBOR + 1.750% 3.932% 4/3/25 (c)(d) | | 1,058,957 | 1,056,088 |
| LTF Merger Sub, Inc. Tranche B, term loan 3 month U.S. LIBOR + 2.750% 4.8741% 6/10/22 (c)(d) | | 1,929,285 | 1,918,829 |
| Marriott Ownership Resorts, Inc. Tranche B, term loan 3 month U.S. LIBOR + 2.250% 4.362% 8/31/25 (c)(d) | | 1,199,970 | 1,202,466 |
| Mohegan Tribal Gaming Authority Tranche B, term loan 3 month U.S. LIBOR + 4.000% 6.112% 10/14/23 (c)(d) | | 491,122 | 454,287 |
| PCI Gaming Authority 1LN, term loan 3 month U.S. LIBOR + 3.000% 5.112% 5/29/26 (c)(d) | | 1,250,000 | 1,255,663 |
| Penn National Gaming, Inc. Tranche B, term loan 3 month U.S. LIBOR + 2.250% 4.362% 10/15/25 (c)(d) | | 878,555 | 880,532 |
| PFC Acquisition Corp. Tranche B 1LN, term loan 3 month U.S. LIBOR + 6.500% 8.7001% 3/1/26 (c)(d) | | 1,371,563 | 1,301,270 |
| Playa Resorts Holding BV Tranche B, term loan 3 month U.S. LIBOR + 2.750% 4.86% 4/27/24 (c)(d) | | 167,719 | 160,171 |
| PlayPower, Inc. Tranche B 1LN, term loan 3 month U.S. LIBOR + 5.500% 7.758% 5/10/26 (c)(d)(k) | | 500,000 | 499,375 |
| Red Lobster Hospitality LLC Tranche B, term loan 3 month U.S. LIBOR + 5.250% 7.362% 7/28/21 (c)(d) | | 851,297 | 843,848 |
| Restaurant Technologies, Inc. 2LN, term loan 3 month U.S. LIBOR + 6.500% 8.612% 10/1/26 (c)(d)(k) | | 181,000 | 180,095 |
| Ryman Hospitality Properties, Inc. Tranche B, term loan 3 month U.S. LIBOR + 2.000% 4.33% 5/11/24 (c)(d) | | 401,916 | 402,169 |
| Scientific Games Corp. Tranche B 5LN, term loan 3 month U.S. LIBOR + 2.750% 4.889% 8/14/24 (c)(d) | | 5,212,425 | 5,145,810 |
| SeaWorld Parks & Entertainment, Inc. Tranche B 5LN, term loan 3 month U.S. LIBOR + 3.000% 5.112% 3/31/24 (c)(d) | | 727,419 | 726,509 |
| Seminole Tribe of Florida Tranche B, term loan 3 month U.S. LIBOR + 1.750% 3.862% 7/6/24 (c)(d) | | 1,391,197 | 1,393,924 |
| Stars Group Holdings BV Tranche B, term loan 3 month U.S. LIBOR + 3.500% 5.8299% 7/10/25 (c)(d) | | 4,061,169 | 4,071,079 |
| Station Casinos LLC Tranche B, term loan 3 month U.S. LIBOR + 2.500% 4.62% 6/8/23 (c)(d) | | 2,141,297 | 2,143,396 |
| Travelport Finance Luxembourg SARL: | | | |
| 1LN, term loan 3 month U.S. LIBOR + 5.000% 7.5412% 5/29/26 (c)(d) | | 2,260,000 | 2,075,810 |
| Tranche B 2LN, term loan 3 month U.S. LIBOR + 9.000% 11.5412% 5/28/27 (c)(d) | | 750,000 | 652,500 |
| United PF Holdings LLC: | | | |
| 1LN, term loan 3 month U.S. LIBOR + 4.500% 6.6877% 6/10/26 (c)(d) | | 716,898 | 709,729 |
| 2LN, term loan 3 month U.S. LIBOR + 8.500% 10.6876% 6/10/27 (c)(d) | | 160,000 | 158,400 |
| Tranche DD 1LN, term loan 3 month U.S. LIBOR + 4.500% 6/10/26 (d)(r)(s) | | 98,102 | 97,121 |
| Wyndham Hotels & Resorts, Inc. Tranche B, term loan 3 month U.S. LIBOR + 1.750% 3.862% 5/30/25 (c)(d) | | 1,423,245 | 1,426,803 |
| Wynn America LLC Tranche A 1LN, term loan 3 month U.S. LIBOR + 1.750% 3.87% 12/31/21 (c)(d) | | 922,000 | 920,848 |
| Wynn Resorts Ltd. Tranche B, term loan 3 month U.S. LIBOR + 2.250% 4.37% 10/30/24 (c)(d) | | 1,265,640 | 1,265,374 |
| | | | 80,517,643 |
| Internet & Direct Marketing Retail - 0.1% | | | |
| Bass Pro Shops LLC. Tranche B, term loan 3 month U.S. LIBOR + 5.000% 7.112% 9/25/24 (c)(d) | | 17,179,454 | 16,309,830 |
| Harbor Freight Tools U.S.A., Inc. Tranche B, term loan 3 month U.S. LIBOR + 2.500% 4.612% 8/19/23 (c)(d) | | 1,384,832 | 1,330,740 |
| NASCAR Holdings, Inc. 1LN, term loan 3 month U.S. LIBOR + 2.750% 7/26/26 (d)(r) | | 1,500,000 | 1,507,185 |
| Red Ventures LLC Tranche B, term loan 3 month U.S. LIBOR + 3.000% 5.112% 11/8/24 (c)(d) | | 1,080,000 | 1,077,980 |
| | | | 20,225,735 |
| Leisure Products - 0.0% | | | |
| Callaway Golf Co. Tranche B, term loan 3 month U.S. LIBOR + 4.500% 6.7128% 1/4/26 (c)(d) | | 752,675 | 761,767 |
| SP PF Buyer LLC Tranche B 1LN, term loan 3 month U.S. LIBOR + 4.500% 6.8299% 12/21/25 (c)(d) | | 997,500 | 902,738 |
| Varsity Brands Holding Co., Inc. Tranche B 1LN, term loan 3 month U.S. LIBOR + 3.500% 5.612% 12/15/24 (c)(d) | | 1,787,404 | 1,737,607 |
| | | | 3,402,112 |
| Media - 0.1% | | | |
| AppLovin Corp. Tranche B, term loan 3 month U.S. LIBOR + 3.500% 5.612% 8/15/25 (c)(d) | | 1,811,725 | 1,807,957 |
| Crown Finance U.S., Inc. Tranche B 1LN, term loan 3 month U.S. LIBOR + 2.250% 4.362% 2/28/25 (c)(d) | | 3,090,778 | 3,065,990 |
| MCC Iowa LLC Tranche M, term loan 3 month U.S. LIBOR + 2.000% 4.14% 1/15/25 (c)(d) | | 295,742 | 296,020 |
| Neptune Finco Corp. Tranche B, term loan 3 month U.S. LIBOR + 2.250% 4.4451% 7/17/25 (c)(d) | | 2,781,657 | 2,766,581 |
| Virgin Media Bristol LLC Tranche B, term loan 3 month U.S. LIBOR + 2.500% 4.6951% 1/15/26 (c)(d) | | 1,815,000 | 1,813,602 |
| | | | 9,750,150 |
| Specialty Retail - 0.1% | | | |
| ABB Optical Group LLC Tranche B, term loan 3 month U.S. LIBOR + 5.000% 7.1678% 6/15/23 (c)(d) | | 474,342 | 438,766 |
| Academy Ltd. Tranche B, term loan 3 month U.S. LIBOR + 4.000% 6.2347% 7/2/22 (c)(d) | | 1,827,799 | 1,216,254 |
| ACProducts, Inc. Tranche B 1LN, term loan 3 month U.S. LIBOR + 5.500% 7.612% 2/15/24 (c)(d)(k) | | 993,750 | 944,063 |
| Burlington Coat Factory Warehouse Corp. Tranche B, term loan 3 month U.S. LIBOR + 2.000% 4.2% 11/17/24 (c)(d) | | 1,333,000 | 1,335,919 |
| David's Bridal, Inc. term loan: | | | |
| 3 month U.S. LIBOR + 7.500% 9.62% 7/18/23 (c)(d) | | 25,427 | 25,427 |
| 3 month U.S. LIBOR + 8.000% 10.12% 1/18/24 (c)(d) | | 101,707 | 72,975 |
| IAA Spinco, Inc. Tranche B 1LN, term loan 3 month U.S. LIBOR + 2.250% 4.625% 6/29/26 (c)(d) | | 1,000,000 | 1,003,750 |
| Party City Holdings, Inc. term loan 3 month U.S. LIBOR + 2.500% 4.62% 8/19/22 (c)(d) | | 1,020,413 | 1,007,178 |
| PETCO Animal Supplies, Inc. Tranche B 1LN, term loan 3 month U.S. LIBOR + 3.250% 5.5055% 1/26/23 (c)(d) | | 1,317,359 | 939,712 |
| Staples, Inc.: | | | |
| Tranche B 1LN, term loan 3 month U.S. LIBOR + 5.000% 7.1974% 4/16/26 (c)(d) | | 1,860,338 | 1,785,924 |
| Tranche B 2LN, term loan 3 month U.S. LIBOR + 4.500% 6.6974% 9/12/24 (c)(d) | | 498,750 | 482,541 |
| | | | 9,252,509 |
|
| TOTAL CONSUMER DISCRETIONARY | | | 146,274,077 |
|
| CONSUMER STAPLES - 0.2% | | | |
| Beverages - 0.0% | | | |
| Arterra Wines Canada, Inc. Tranche B, term loan 3 month U.S. LIBOR + 2.750% 5.1685% 12/16/23 (c)(d) | | 707,557 | 703,581 |
| Food & Staples Retailing - 0.2% | | | |
| 8th Avenue Food & Provisions, Inc.: | | | |
| 2LN, term loan 3 month U.S. LIBOR + 7.750% 9.9628% 10/1/26 (c)(d) | | 98,000 | 96,530 |
| Tranche B 1LN, term loan 3 month U.S. LIBOR + 3.750% 5.9628% 10/1/25 (c)(d) | | 287,555 | 287,736 |
| Agro Merchants Intermediate Ho Tranche B, term loan 3 month U.S. LIBOR + 3.750% 6.0799% 12/6/24 (c)(d) | | 799,087 | 793,094 |
| Albertson's LLC: | | | |
| Tranche B7 1LN, term loan 3 month U.S. LIBOR + 2.750% 4.862% 11/17/25 (c)(d) | | 1,125,000 | 1,128,521 |
| Tranche B8, term loan 3 month U.S. LIBOR + 2.750% 4.862% 8/17/26 (c)(d) | | 1,115,401 | 1,119,584 |
| BI-LO LLC Tranche B, term loan 3 month U.S. LIBOR + 8.000% 10.3308% 5/31/24 (c)(d) | | 3,606,619 | 3,447,928 |
| BJ's Wholesale Club, Inc. Tranche B 1LN, term loan 3 month U.S. LIBOR + 2.750% 4.9443% 2/3/24 (c)(d) | | 3,901,088 | 3,901,907 |
| Eg Finco Ltd. Tranche B, term loan 3 month U.S. LIBOR + 4.000% 6.3299% 2/6/25 (c)(d) | | 991,060 | 975,580 |
| GOBP Holdings, Inc. Tranche B 1LN, term loan 3 month U.S. LIBOR + 3.250% 5.7594% 10/22/25 (c)(d) | | 583,989 | 585,268 |
| JP Intermediate B LLC Tranche B, term loan 3 month U.S. LIBOR + 5.500% 7.7555% 11/20/25 (c)(d) | | 959,613 | 818,070 |
| Saffron Borrowco LLC Tranche B 1LN, term loan 3 month U.S. LIBOR + 6.750% 9.1269% 6/20/25 (c)(d) | | 625,000 | 568,750 |
| Sage Borrowco LLC Tranche B 1LN, term loan 3 month U.S. LIBOR + 4.750% 7.1269% 6/20/26 (c)(d) | | 1,500,000 | 1,501,875 |
| Shearer's Foods, Inc.: | | | |
| Tranche 2LN, term loan 3 month U.S. LIBOR + 6.750% 8.862% 6/30/22 (c)(d) | | 1,038,209 | 1,026,529 |
| Tranche B 1LN, term loan 3 month U.S. LIBOR + 4.250% 6.362% 6/30/21 (c)(d) | | 1,145,355 | 1,141,059 |
| U.S. Foods, Inc.: | | | |
| 1LN, term loan 3 month U.S. LIBOR + 2.000% 8/15/26 (d)(r) | | 1,750,000 | 1,752,923 |
| Tranche B, term loan 3 month U.S. LIBOR + 2.000% 4.112% 6/27/23 (c)(d) | | 1,232,471 | 1,233,247 |
| U.S. Salt LLC Tranche B 1LN, term loan 3 month U.S. LIBOR + 4.750% 6.862% 1/16/26 (c)(d)(k) | | 443,888 | 444,442 |
| Whatabrands LLC Tranche B 1LN, term loan 3 month U.S. LIBOR + 3.250% 5.5156% 7/19/26 (c)(d) | | 1,495,000 | 1,500,143 |
| | | | 22,323,186 |
| Food Products - 0.0% | | | |
| Chobani LLC Tranche B, term loan 3 month U.S. LIBOR + 3.500% 5.612% 10/7/23 (c)(d) | | 3,362,817 | 3,303,968 |
| Hostess Brands LLC Tranche B, term loan 3 month U.S. LIBOR + 2.250% 4.4481% 8/3/22 (c)(d) | | 377,128 | 376,186 |
| JBS U.S.A. Lux SA Tranche B 1LN, term loan 3 month U.S. LIBOR + 2.500% 4.612% 5/1/26 (c)(d) | | 3,097,238 | 3,101,109 |
| Post Holdings, Inc. Tranche B, term loan 3 month U.S. LIBOR + 2.000% 4.15% 5/24/24 (c)(d) | | 1,178,000 | 1,177,835 |
| | | | 7,959,098 |
| Personal Products - 0.0% | | | |
| Coty, Inc. Tranche B 1LN, term loan 3 month U.S. LIBOR + 2.250% 4.4628% 4/5/25 (c)(d) | | 648,090 | 626,217 |
| Prestige Brands, Inc. term loan 3 month U.S. LIBOR + 2.000% 4.112% 1/26/24 (c)(d) | | 450,022 | 449,297 |
| Rodan & Fields LLC Tranche B, term loan 3 month U.S. LIBOR + 4.000% 6.1951% 6/15/25 (c)(d) | | 432,722 | 373,006 |
| | | | 1,448,520 |
|
| TOTAL CONSUMER STAPLES | | | 32,434,385 |
|
| ENERGY - 0.3% | | | |
| Energy Equipment & Services - 0.0% | | | |
| BCP Raptor II LLC Tranche B, term loan 3 month U.S. LIBOR + 4.750% 6.862% 11/3/25 (c)(d) | | 1,270,000 | 1,121,829 |
| Brazos Delaware II LLC Tranche B, term loan 3 month U.S. LIBOR + 4.000% 6.1686% 5/21/25 (c)(d) | | 1,121,504 | 1,004,677 |
| FTS International, Inc. Tranche B, term loan 3 month U.S. LIBOR + 4.750% 6.862% 4/16/21 (c)(d) | | 130,940 | 129,631 |
| | | | 2,256,137 |
| Oil, Gas & Consumable Fuels - 0.3% | | | |
| Arctic LNG Carriers Ltd. Tranche B 1LN, term loan 3 month U.S. LIBOR + 4.500% 6.8299% 5/18/23 (c)(d) | | 2,548,489 | 2,498,589 |
| BCP Raptor LLC Tranche B, term loan 3 month U.S. LIBOR + 4.250% 6.362% 6/22/24 (c)(d) | | 2,587,000 | 2,353,239 |
| California Resources Corp.: | | | |
| Tranche 1LN, term loan 3 month U.S. LIBOR + 10.375% 12.4909% 12/31/21 (c)(d) | | 3,409,000 | 3,016,965 |
| Tranche B, term loan 3 month U.S. LIBOR + 4.750% 6.8659% 12/31/22 (c)(d) | | 5,248,000 | 4,771,324 |
| Citgo Holding, Inc. Tranche B 1LN, term loan 3 month U.S. LIBOR + 7.000% 9.2441% 7/23/23 (c)(d) | | 855,000 | 865,688 |
| Citgo Petroleum Corp.: | | | |
| Tranche B 1LN, term loan 3 month U.S. LIBOR + 5.000% 7.3189% 3/28/24 (c)(d) | | 2,992,500 | 2,998,724 |
| Tranche B, term loan 3 month U.S. LIBOR + 4.500% 6.8189% 7/29/21 (c)(d) | | 2,676,712 | 2,675,882 |
| Consolidated Energy Finance SA Tranche B, term loan 3 month U.S. LIBOR + 2.500% 4.6951% 5/7/25 (c)(d) | | 1,796,391 | 1,715,553 |
| Delek U.S. Holdings, Inc. Tranche B 1LN, term loan 3 month U.S. LIBOR + 2.250% 4.5799% 3/31/25 (c)(d) | | 1,195,815 | 1,188,844 |
| EG America LLC: | | | |
| 2LN, term loan 3 month U.S. LIBOR + 8.000% 10.3299% 3/23/26 (c)(d) | | 256,098 | 251,296 |
| Tranche B 1LN, term loan 3 month U.S. LIBOR + 4.000% 6.3299% 2/6/25 (c)(d) | | 167,727 | 165,107 |
| Epic Crude Services LP Tranche B 1LN, term loan 3 month U.S. LIBOR + 5.000% 7.04% 3/1/26 (c)(d) | | 2,000,000 | 1,922,500 |
| Equitrans Midstream Corp. Tranche B, term loan 3 month U.S. LIBOR + 4.500% 6.612% 1/31/24 (c)(d) | | 711,425 | 708,935 |
| Gavilan Resources LLC Tranche 2LN, term loan 3 month U.S. LIBOR + 6.000% 8.112% 3/1/24 (c)(d) | | 4,122,871 | 1,752,220 |
| GIP III Stetson I LP Tranche B, term loan 3 month U.S. LIBOR + 4.250% 6.432% 7/18/25 (c)(d) | | 3,331,259 | 3,176,156 |
| Houston Fuel Oil Terminal Co. Tranche B 1LN, term loan 3 month U.S. LIBOR + 2.750% 4.87% 6/26/25 (c)(d) | | 1,976,030 | 1,964,925 |
| Limetree Bay Terminals LLC term loan 3 month U.S. LIBOR + 4.000% 6.112% 2/15/24 (c)(d) | | 1,016,204 | 969,967 |
| Lower Cadence Holdings LLC Tranche B 1LN, term loan 3 month U.S. LIBOR + 4.000% 6.1452% 5/22/26 (c)(d) | | 1,625,000 | 1,581,336 |
| Matador Bidco SARL Tranche B 1LN, term loan 3 month U.S. LIBOR + 4.750% 6/13/26 (d)(r) | | 375,000 | 375,469 |
| Medallion Midland Acquisition Tranche B, term loan 3 month U.S. LIBOR + 3.250% 5.362% 10/30/24 (c)(d) | | 1,127,679 | 1,076,934 |
| Moxie Patriot LLC Tranche B, term loan 3 month U.S. LIBOR + 5.750% 8.0799% 12/19/20 (c)(d) | | 1,975,025 | 1,840,486 |
| Natgasoline LLC Tranche B, term loan 3 month U.S. LIBOR + 3.500% 5.8125% 11/14/25 (c)(d) | | 995,000 | 992,513 |
| Sanchez Energy Corp. 1LN, term loan 3 month U.S. LIBOR + 8.000% 2.8571% 5/11/20 (c)(d)(k)(s) | | 2,252,370 | 2,139,751 |
| WaterBridge Operating LLC Tranche B 1LN, term loan 3 month U.S. LIBOR + 5.750% 8.1361% 6/21/26 (c)(d) | | 1,125,000 | 1,074,375 |
| | | | 42,076,778 |
|
| TOTAL ENERGY | | | 44,332,915 |
|
| FINANCIALS - 0.5% | | | |
| Capital Markets - 0.1% | | | |
| AssuredPartners, Inc. Tranche B, term loan 3 month U.S. LIBOR + 3.500% 5.612% 10/22/24 (c)(d) | | 1,829,875 | 1,818,438 |
| Blackstone CQP Holdco LP Tranche B, term loan 3 month U.S. LIBOR + 3.500% 5.8866% 9/30/24 (c)(d) | | 2,445,000 | 2,444,242 |
| Blucora, Inc. Tranche B, term loan 3 month U.S. LIBOR + 3.000% 5.258% 5/22/24 (c)(d) | | 500,000 | 499,585 |
| Citadel Securities LP Tranche B, term loan 3 month U.S. LIBOR + 3.500% 5.612% 2/27/26 (c)(d) | | 1,995,000 | 1,995,000 |
| Cypress Intermediate Holdings, Inc. Tranche B 1LN, term loan 3 month U.S. LIBOR + 2.750% 4.87% 4/27/24 (c)(d) | | 1,082,714 | 1,073,240 |
| HarbourVest Partners LLC Tranche B 1LN, term loan 3 month U.S. LIBOR + 2.250% 4.4451% 3/1/25 (c)(d) | | 2,211,557 | 2,205,342 |
| Recess Holdings, Inc. Tranche B, term loan 3 month U.S. LIBOR + 3.750% 6.0799% 9/29/24 (c)(d) | | 264,977 | 258,851 |
| | | | 10,294,698 |
| Diversified Financial Services - 0.2% | | | |
| Avolon TLB Borrower 1 (U.S.) LLC Tranche B3 1LN, term loan 3 month U.S. LIBOR + 1.750% 3.9221% 1/15/25 (c)(d) | | 3,614,810 | 3,620,088 |
| BCP Renaissance Parent LLC Tranche B, term loan 3 month U.S. LIBOR + 3.500% 5.7555% 10/31/24 (c)(d) | | 1,476,077 | 1,407,808 |
| Deerfield Dakota Holding LLC Tranche B 1LN, term loan 3 month U.S. LIBOR + 4.000% 6.112% 2/13/25 (c)(d) | | 289,275 | 288,312 |
| Delos Finance SARL Tranche B, term loan 3 month U.S. LIBOR + 1.750% 4.0799% 10/6/23 (c)(d) | | 1,245,833 | 1,247,166 |
| Financial & Risk U.S. Holdings, Inc. Tranche B, term loan 3 month U.S. LIBOR + 3.750% 5.862% 10/1/25 (c)(d) | | 4,995,284 | 5,017,463 |
| Finco I LLC Tranche B, term loan 3 month U.S. LIBOR + 2.000% 4.112% 12/27/22 (c)(d) | | 889,650 | 891,038 |
| Flying Fortress Holdings, Inc. Tranche B, term loan 3 month U.S. LIBOR + 1.750% 4.0799% 10/30/22 (c)(d) | | 1,351,000 | 1,351,851 |
| Focus Financial Partners LLC Tranche B 1LN, term loan 3 month U.S. LIBOR + 2.500% 4.612% 7/3/24 (c)(d) | | 502,195 | 503,180 |
| Greensky Holdings LLC Tranche B, term loan 3 month U.S. LIBOR + 3.250% 5.375% 3/29/25 (c)(d) | | 500,201 | 491,447 |
| Kingpin Intermediate Holdings LLC Tranche B 1LN, term loan 3 month U.S. LIBOR + 3.500% 5.61% 7/3/24 (c)(d) | | 356,308 | 355,417 |
| Lions Gate Capital Holdings Ll Tranche B, term loan 3 month U.S. LIBOR + 2.250% 4.362% 3/24/25 (c)(d) | | 641,092 | 638,688 |
| NAB Holdings LLC Tranche B, term loan 3 month U.S. LIBOR + 3.000% 5.3299% 6/30/24 (c)(d) | | 626,244 | 621,159 |
| Onvoy LLC Tranche B 1LN, term loan 3 month U.S. LIBOR + 4.500% 6.8299% 2/10/24 (c)(d) | | 975,515 | 799,923 |
| RegionalCare Hospital Partners Holdings, Inc. Tranche B, term loan 3 month U.S. LIBOR + 4.500% 6.6452% 11/16/25 (c)(d) | | 2,985,000 | 2,973,806 |
| TransUnion LLC: | | | |
| Tranche B 4LN, term loan 3 month U.S. LIBOR + 2.000% 4.112% 6/19/25 (c)(d) | | 1,466,667 | 1,467,459 |
| Tranche B, term loan 3 month U.S. LIBOR + 2.000% 4.112% 4/9/23 (c)(d) | | 1,485,431 | 1,486,233 |
| Veritas-B Junior Mezz C LLC 10.48% 2/6/21 (c)(k) | | 1,105,000 | 1,142,018 |
| Victory Capital Holdings, Inc. Tranche B 1LN, term loan 3 month U.S. LIBOR + 3.250% 5.5689% 7/1/26 (c)(d) | | 1,079,727 | 1,078,043 |
| | | | 25,381,099 |
| Insurance - 0.2% | | | |
| Acrisure LLC Tranche B, term loan 3 month U.S. LIBOR + 4.250% 6.362% 11/22/23 (c)(d) | | 1,556,121 | 1,542,116 |
| Alliant Holdings Intermediate LLC: | | | |
| Tranche B, term loan 3 month U.S. LIBOR + 3.000% 5.1452% 5/10/25 (c)(d) | | 1,941,293 | 1,884,433 |
| Tranche B-2 1LN, term loan 3 month U.S. LIBOR + 3.250% 5.4509% 5/10/25 (c)(d) | | 750,000 | 739,223 |
| AmWINS Group, Inc. Tranche B 1LN, term loan 3 month U.S. LIBOR + 2.750% 4.8844% 1/25/24 (c)(d) | | 1,944,771 | 1,940,959 |
| Asurion LLC: | | | |
| Tranche B 6LN, term loan 3 month U.S. LIBOR + 3.000% 5.112% 11/3/23 (c)(d) | | 2,637,308 | 2,637,783 |
| Tranche B 7LN, term loan 3 month U.S. LIBOR + 3.000% 5.112% 11/3/24 (c)(d) | | 2,171,549 | 2,171,549 |
| Tranche B, term loan: | | | |
| 3 month U.S. LIBOR + 3.000% 5.112% 8/4/22 (c)(d) | | 5,249,800 | 5,250,745 |
| 3 month U.S. LIBOR + 6.500% 8.612% 8/4/25 (c)(d) | | 4,904,000 | 4,971,724 |
| HUB International Ltd. Tranche B, term loan 3 month U.S. LIBOR + 3.000% 5.2663% 4/25/25 (c)(d) | | 5,154,224 | 5,046,656 |
| USI, Inc. Tranche B, term loan 3 month U.S. LIBOR + 3.000% 5.3299% 5/16/24 (c)(d) | | 2,010,652 | 1,961,230 |
| | | | 28,146,418 |
| Mortgage Real Estate Investment Trusts - 0.0% | | | |
| Starwood Property Trust, Inc. Tranche B 1LN, term loan 3 month U.S. LIBOR + 2.500% 4.7805% 7/10/26 (c)(d) | | 750,000 | 751,875 |
| Real Estate Management & Development - 0.0% | | | |
| MGM Growth Properties Operating Partner LP Tranche B, term loan 3 month U.S. LIBOR + 2.000% 4.112% 3/23/25 (c)(d) | | 1,710,738 | 1,710,208 |
| Thrifts & Mortgage Finance - 0.0% | | | |
| Ocwen Loan Servicing LLC Tranche B, term loan 3 month U.S. LIBOR + 5.000% 7.112% 12/5/20 (c)(d) | | 885,800 | 871,405 |
|
| TOTAL FINANCIALS | | | 67,155,703 |
|
| HEALTH CARE - 0.3% | | | |
| Health Care Equipment & Supplies - 0.1% | | | |
| American Renal Holdings, Inc. Tranche B, term loan 3 month U.S. LIBOR + 5.500% 7.612% 6/22/24 (c)(d) | | 2,159,102 | 2,121,318 |
| NVA Holdings, Inc.: | | | |
| 1LN, term loan 3 month U.S. LIBOR + 3.500% 5.612% 2/2/25 (c)(d) | | 625,000 | 623,438 |
| Tranche B 3LN, term loan 3 month U.S. LIBOR + 2.750% 4.862% 2/2/25 (c)(d) | | 761,248 | 760,311 |
| Ortho-Clinical Diagnostics, Inc. Tranche B 1LN, term loan 3 month U.S. LIBOR + 3.250% 5.563% 6/30/25 (c)(d) | | 3,138,712 | 2,954,313 |
| VVC Holding Corp. Tranche B 1LN, term loan 3 month U.S. LIBOR + 4.500% 6.681% 2/11/26 (c)(d) | | 4,738,125 | 4,711,497 |
| | | | 11,170,877 |
| Health Care Providers & Services - 0.1% | | | |
| HCA Holdings, Inc.: | | | |
| Tranche B 10LN, term loan 3 month U.S. LIBOR + 2.000% 4.3299% 3/13/25 (c)(d) | | 1,074,837 | 1,077,696 |
| Tranche B 11LN, term loan 3 month U.S. LIBOR + 1.750% 4.0799% 3/18/23 (c)(d) | | 2,358,090 | 2,360,378 |
| MED ParentCo LP: | | | |
| 1LN, term loan 3 month U.S. LIBOR + 4.250% 7/31/26 (d)(r) | | 624,148 | 616,864 |
| 2LN, term loan 3 month U.S. LIBOR + 8.250% 7/31/27 (d)(r) | | 485,000 | 485,000 |
| Tranche DD 1LN, term loan 3 month U.S. LIBOR + 4.250% 7/31/26 (d)(r) | | 155,852 | 154,033 |
| MPH Acquisition Holdings LLC Tranche B, term loan 3 month U.S. LIBOR + 2.750% 5.0799% 6/7/23 (c)(d) | | 708,843 | 658,338 |
| Surgery Center Holdings, Inc. Tranche B, term loan 3 month U.S. LIBOR + 3.250% 5.37% 8/31/24 (c)(d) | | 1,492,405 | 1,417,785 |
| Tivity Health, Inc. Tranche B 1LN, term loan 3 month U.S. LIBOR + 5.250% 7.362% 3/8/26 (c)(d) | | 884,561 | 875,769 |
| U.S. Anesthesia Partners, Inc. Tranche B, term loan 3 month U.S. LIBOR + 3.000% 5.112% 6/23/24 (c)(d) | | 1,834,053 | 1,755,189 |
| U.S. Renal Care, Inc. Tranche B 1LN, term loan 3 month U.S. LIBOR + 5.000% 7.112% 6/13/26 (c)(d) | | 3,125,000 | 2,980,469 |
| Vizient, Inc. Tranche B 1LN, term loan 3 month U.S. LIBOR + 2.500% 4.612% 5/6/26 (c)(d) | | 748,125 | 750,616 |
| Wink Holdco, Inc. Tranche B, term loan 3 month U.S. LIBOR + 3.000% 5.112% 12/1/24 (c)(d) | | 894,191 | 869,047 |
| | | | 14,001,184 |
| Life Sciences Tools & Services - 0.0% | | | |
| PAREXEL International Corp. Tranche B, term loan 3 month U.S. LIBOR + 2.750% 4.862% 9/27/24 (c)(d) | | 1,302,528 | 1,222,280 |
| Pharmaceuticals - 0.1% | | | |
| Catalent Pharma Solutions Tranche B, term loan 3 month U.S. LIBOR + 2.250% 4.362% 5/9/26 (c)(d) | | 997,500 | 1,000,413 |
| Innoviva, Inc. Tranche B, term loan 3 month U.S. LIBOR + 4.500% 6.6515% 8/18/22 (c)(d)(k) | | 51,000 | 49,980 |
| Lannett Co., Inc.: | | | |
| Tranche B, term loan 3 month U.S. LIBOR + 5.000% 7.112% 11/25/20 (c)(d) | | 72,605 | 70,971 |
| Tranche B, term loan 3 month U.S. LIBOR + 5.375% 7.487% 11/25/22 (c)(d) | | 4,101,585 | 3,910,164 |
| RPI Finance Trust Tranche B 6LN, term loan 3 month U.S. LIBOR + 2.000% 4.112% 3/27/23 (c)(d) | | 2,079,464 | 2,082,355 |
| Valeant Pharmaceuticals International, Inc.: | | | |
| Tranche B 2LN, term loan 3 month U.S. LIBOR + 2.750% 4.9509% 11/27/25 (c)(d) | | 1,387,500 | 1,386,113 |
| Tranche B, term loan 3 month U.S. LIBOR + 3.000% 5.2009% 6/1/25 (c)(d) | | 2,723,486 | 2,726,563 |
| | | | 11,226,559 |
|
| TOTAL HEALTH CARE | | | 37,620,900 |
|
| INDUSTRIALS - 0.4% | | | |
| Aerospace & Defense - 0.1% | | | |
| Jazz Acquisition, Inc. 1LN, term loan 3 month U.S. LIBOR + 4.250% 6.58% 6/19/26 (c)(d) | | 375,000 | 372,345 |
| TransDigm, Inc.: | | | |
| Tranche E, term loan 3 month U.S. LIBOR + 2.500% 4.8299% 5/30/25 (c)(d) | | 1,066,897 | 1,055,310 |
| Tranche F, term loan 3 month U.S. LIBOR + 2.500% 4.8299% 6/9/23 (c)(d) | | 4,285,487 | 4,251,760 |
| Tranche G, term loan 3 month U.S. LIBOR + 2.500% 4.8299% 8/22/24 (c)(d) | | 1,423,164 | 1,408,221 |
| Wesco Aircraft Hardware Corp. Tranche B, term loan 3 month U.S. LIBOR + 2.500% 4.62% 2/28/21 (c)(d) | | 726,000 | 725,318 |
| WP CPP Holdings LLC: | | | |
| Tranche B 1LN, term loan 3 month U.S. LIBOR + 3.750% 6.0096% 4/30/25 (c)(d) | | 1,400,198 | 1,397,579 |
| Tranche B 2LN, term loan 3 month U.S. LIBOR + 7.750% 10.01% 4/30/26 (c)(d) | | 181,000 | 179,643 |
| | | | 9,390,176 |
| Air Freight & Logistics - 0.0% | | | |
| Dynasty Acquisition Co., Inc.: | | | |
| Tranche B 1LN, term loan 3 month U.S. LIBOR + 4.000% 6.3299% 4/4/26 (c)(d) | | 1,323,462 | 1,322,284 |
| Tranche B 2LN, term loan 3 month U.S. LIBOR + 4.000% 6.3299% 4/4/26 (c)(d) | | 711,538 | 710,905 |
| Hanjin International Corp. Tranche B, term loan 3 month U.S. LIBOR + 2.500% 4.6453% 10/18/20 (c)(d) | | 372,000 | 371,070 |
| Transplace Holding, Inc. Tranche B 1LN, term loan 3 month U.S. LIBOR + 3.750% 5.8953% 10/5/24 (c)(d) | | 669,912 | 655,676 |
| XPO Logistics, Inc. Tranche B, term loan 3 month U.S. LIBOR + 2.000% 4.112% 2/23/25 (c)(d) | | 535,000 | 535,369 |
| | | | 3,595,304 |
| Airlines - 0.0% | | | |
| Kestrel Bidco, Inc. 1LN, term loan 3 month U.S. LIBOR + 2.750% 8/7/26 (d)(r) | | 1,715,000 | 1,718,756 |
| Building Products - 0.0% | | | |
| GYP Holdings III Corp. Tranche B 1LN, term loan 3 month U.S. LIBOR + 2.750% 4.862% 6/1/25 (c)(d) | | 1,353,296 | 1,325,391 |
| HD Supply, Inc. Tranche B 5LN, term loan 3 month U.S. LIBOR + 1.750% 3.862% 10/17/23 (c)(d) | | 360,278 | 361,477 |
| The Hillman Group, Inc. Tranche B, term loan 3 month U.S. LIBOR + 4.000% 6.112% 5/31/25 (c)(d) | | 916,060 | 886,746 |
| | | | 2,573,614 |
| Commercial Services & Supplies - 0.2% | | | |
| Brand Energy & Infrastructure Services, Inc. Tranche B, term loan 3 month U.S. LIBOR + 4.250% 6.5149% 6/21/24 (c)(d) | | 4,336,641 | 4,108,968 |
| Ensemble RCM LLC 1LN, term loan 3 month U.S. LIBOR + 3.750% 6.0031% 8/1/26 (c)(d) | | 1,125,000 | 1,122,896 |
| Environmental Resources Management I Tranche B 1LN, term loan 3 month U.S. LIBOR + 3.750% 6.1005% 7/10/26 (c)(d) | | 625,000 | 620,831 |
| Filtration Group Corp. Tranche B, term loan 3 month U.S. LIBOR + 3.000% 5.112% 3/29/25 (c)(d) | | 1,700,278 | 1,699,224 |
| Harland Clarke Holdings Corp. Tranche B 7LN, term loan 3 month U.S. LIBOR + 4.750% 7.0799% 11/3/23 (c)(d) | | 1,612,087 | 1,249,368 |
| Lineage Logistics Holdings, LLC. Tranche B, term loan 3 month U.S. LIBOR + 3.000% 5.112% 2/27/25 (c)(d) | | 6,124,875 | 6,105,765 |
| Merrill Communications LLC Tranche B, term loan 3 month U.S. LIBOR + 5.250% 7.5055% 6/1/22 (c)(d) | | 265,299 | 265,963 |
| SuperMoose Borrower LLC Tranche B 1LN, term loan 3 month U.S. LIBOR + 3.750% 5.862% 8/29/25 (c)(d) | | 866,645 | 808,866 |
| The Brickman Group, Ltd. Tranche B, term loan 3 month U.S. LIBOR + 2.500% 4.6591% 8/15/25 (c)(d) | | 1,464,788 | 1,463,572 |
| Thomson Reuters IP&S Tranche B, term loan 3 month U.S. LIBOR + 3.250% 5.362% 10/3/23 (c)(d) | | 755,974 | 757,864 |
| TMK Hawk Parent Corp. Tranche B, term loan 3 month U.S. LIBOR + 3.500% 5.6307% 9/26/24 (c)(d) | | 463,462 | 389,693 |
| Tunnel Hill Partners LP Tranche B 1LN, term loan 3 month U.S. LIBOR + 3.500% 5.612% 2/8/26 (c)(d) | | 564,585 | 560,351 |
| WTG Holdings III Corp. Tranche B 1LN, term loan 3 month U.S. LIBOR + 3.000% 5.112% 12/20/24 (c)(d) | | 1,535,180 | 1,533,261 |
| | | | 20,686,622 |
| Construction & Engineering - 0.1% | | | |
| AECOM Tranche B, term loan 3 month U.S. LIBOR + 1.750% 3.862% 3/13/25 (c)(d) | | 654,824 | 654,988 |
| Hamilton Holdco LLC Tranche B 1LN, term loan 3 month U.S. LIBOR + 2.000% 4.33% 7/2/25 (c)(d) | | 1,058,242 | 1,058,242 |
| JMC Steel Group, Inc. Tranche B, term loan 3 month U.S. LIBOR + 2.250% 4.4844% 6/14/21 (c)(d) | | 1,009,020 | 1,007,759 |
| Pike Corp. Tranche B 1LN, term loan 3 month U.S. LIBOR + 3.250% 5.4% 7/19/26 (c)(d) | | 1,356,485 | 1,355,916 |
| Traverse Midstream Partners Ll Tranche B, term loan 3 month U.S. LIBOR + 4.000% 6.26% 9/27/24 (c)(d) | | 970,665 | 914,046 |
| Ventia Deco LLC Tranche B, term loan 3 month U.S. LIBOR + 3.500% 5.8422% 5/21/26 (c)(d) | | 2,140,069 | 2,134,719 |
| | | | 7,125,670 |
| Electrical Equipment - 0.0% | | | |
| Vertiv Group Corp. Tranche B, term loan 3 month U.S. LIBOR + 4.000% 6.3299% 11/30/23 (c)(d) | | 2,242,000 | 2,105,619 |
| Machinery - 0.0% | | | |
| Altra Industrial Motion Corp. Tranche B 1LN, term loan 3 month U.S. LIBOR + 2.000% 4.112% 10/1/25 (c)(d) | | 1,151,812 | 1,146,537 |
| CPM Holdings, Inc.: | | | |
| 2LN, term loan 3 month U.S. LIBOR + 8.250% 10.362% 11/15/26 (c)(d) | | 160,000 | 157,733 |
| Tranche B 1LN, term loan 3 month U.S. LIBOR + 3.750% 5.862% 11/15/25 (c)(d) | | 901,410 | 889,016 |
| Sundyne U.S. Purchaser, Inc. Tranche B, term loan 3 month U.S. LIBOR + 4.000% 6.112% 5/15/26 (c)(d) | | 601,389 | 589,361 |
| The Gates Corp. Tranche B 1LN, term loan 3 month U.S. LIBOR + 2.750% 4.862% 3/31/24 (c)(d) | | 1,134,869 | 1,105,487 |
| | | | 3,888,134 |
| Marine - 0.0% | | | |
| International Seaways Operating Corp. Tranche B, term loan 3 month U.S. LIBOR + 5.500% 8.24% 6/22/22 (c)(d) | | 1,656,906 | 1,648,621 |
| Navios Maritime Partners LP Tranche B, term loan 3 month U.S. LIBOR + 5.000% 7.44% 9/14/20 (c)(d) | | 602,453 | 598,687 |
| | | | 2,247,308 |
| Professional Services - 0.0% | | | |
| AlixPartners LLP Tranche B, term loan 3 month U.S. LIBOR + 2.750% 4.862% 4/4/24 (c)(d) | | 1,197,810 | 1,198,456 |
| Cast & Crew Payroll LLC Tranche B 1LN, term loan 3 month U.S. LIBOR + 4.000% 6.12% 2/7/26 (c)(d) | | 708,225 | 710,215 |
| | | | 1,908,671 |
| Road & Rail - 0.0% | | | |
| Hertz Corp. Tranche B 1LN, term loan 3 month U.S. LIBOR + 2.750% 4.87% 6/30/23 (c)(d) | | 1,186,318 | 1,181,134 |
| IBC Capital Ltd.: | | | |
| 2LN, term loan 3 month U.S. LIBOR + 7.000% 9.402% 9/11/24 (c)(d) | | 160,000 | 157,600 |
| Tranche B 1LN, term loan 3 month U.S. LIBOR + 3.750% 6.152% 9/11/23 (c)(d) | | 449,837 | 446,746 |
| Kenan Advantage Group, Inc.: | | | |
| Tranche B 1LN, term loan 3 month U.S. LIBOR + 3.000% 5.112% 7/31/22 (c)(d) | | 635,712 | 611,675 |
| Tranche B 2LN, term loan 3 month U.S. LIBOR + 3.000% 5.112% 7/31/22 (c)(d) | | 162,218 | 156,084 |
| Uber Technologies, Inc. Tranche B, term loan: | | | |
| 3 month U.S. LIBOR + 3.500% 5.6453% 7/13/23 (c)(d) | | 802,809 | 799,654 |
| 3 month U.S. LIBOR + 4.000% 6.1951% 4/4/25 (c)(d) | | 2,609,233 | 2,609,233 |
| | | | 5,962,126 |
| Trading Companies & Distributors - 0.0% | | | |
| Fly Funding II SARL Tranche B, term loan 3 month U.S. LIBOR + 2.000% 4.18% 2/9/23 (c)(d) | | 1,179,415 | 1,177,941 |
|
| TOTAL INDUSTRIALS | | | 62,379,941 |
|
| INFORMATION TECHNOLOGY - 0.9% | | | |
| Communications Equipment - 0.1% | | | |
| Anastasia Parent LLC Tranche B, term loan 3 month U.S. LIBOR + 3.750% 5.862% 8/10/25 (c)(d) | | 1,477,339 | 1,137,551 |
| CommScope, Inc. Tranche B 1LN, term loan 3 month U.S. LIBOR + 3.250% 5.362% 4/4/26 (c)(d) | | 3,570,000 | 3,549,187 |
| Radiate Holdco LLC: | | | |
| 1LN, term loan 3 month U.S. LIBOR + 3.500% 5.612% 2/1/24 (c)(d) | | 1,000,000 | 997,190 |
| Tranche B, term loan 3 month U.S. LIBOR + 3.000% 5.112% 2/1/24 (c)(d) | | 4,621,541 | 4,575,325 |
| Sabre Industries, Inc. Tranche B 1LN, term loan 3 month U.S. LIBOR + 4.500% 6.682% 4/15/26 (c)(d) | | 1,122,188 | 1,122,894 |
| | | | 11,382,147 |
| Electronic Equipment & Components - 0.1% | | | |
| ATS Consolidated, Inc. Tranche B 1LN, term loan 3 month U.S. LIBOR + 3.750% 5.862% 2/28/25 (c)(d) | | 2,236,235 | 2,241,826 |
| DG Investment Intermediate Holdings, Inc.: | | | |
| Tranche B 1LN, term loan 3 month U.S. LIBOR + 3.000% 5.112% 2/1/25 (c)(d) | | 1,406,319 | 1,376,435 |
| Tranche B 2LN, term loan 3 month U.S. LIBOR + 6.750% 8.862% 2/1/26 (c)(d)(k) | | 158,000 | 151,680 |
| Electro Rent Corp. Tranche B 1LN, term loan 3 month U.S. LIBOR + 5.000% 7.2828% 1/31/24 (c)(d) | | 278,855 | 279,379 |
| EPV Merger Sub, Inc.: | | | |
| Tranche 2LN, term loan 3 month U.S. LIBOR + 7.250% 9.362% 3/8/26 (c)(d) | | 129,000 | 124,485 |
| Tranche B 1LN, term loan 3 month U.S. LIBOR + 3.250% 5.362% 3/8/25 (c)(d) | | 441,654 | 423,988 |
| EXC Holdings III Corp. Tranche B, term loan: | | | |
| 3 month U.S. LIBOR + 3.500% 5.8299% 12/2/24 (c)(d) | | 701,657 | 696,977 |
| 3 month U.S. LIBOR + 7.500% 9.8319% 12/1/25 (c)(d) | | 272,000 | 271,320 |
| Go Daddy Operating Co. LLC Tranche B, term loan 3 month U.S. LIBOR + 2.000% 4.112% 2/15/24 (c)(d) | | 2,168,787 | 2,172,040 |
| II-VI, Inc. Tranche B 1LN, term loan 3 month U.S. LIBOR + 3.500% 0% 6/28/26 (c)(d)(r) | | 625,000 | 621,875 |
| Infor U.S., Inc. Tranche B 6LN, term loan 3 month U.S. LIBOR + 2.750% 5.0799% 2/1/22 (c)(d) | | 782,315 | 781,502 |
| LMBE-MC HoldCo II LLC Tranche B, term loan 3 month U.S. LIBOR + 4.000% 6.33% 12/3/25 (c)(d) | | 833,809 | 833,809 |
| TTM Technologies, Inc. Tranche B, term loan 3 month U.S. LIBOR + 2.500% 4.7298% 9/28/24 (c)(d) | | 2,443,227 | 2,436,092 |
| | | | 12,411,408 |
| Internet Software & Services - 0.1% | | | |
| Ancestry.Com Operations, Inc. Tranche B 1LN, term loan 3 month U.S. LIBOR + 3.250% 5.49% 10/19/23 (c)(d) | | 1,764,926 | 1,753,895 |
| McAfee LLC Tranche B, term loan: | | | |
| 3 month U.S. LIBOR + 3.750% 5.8659% 9/29/24 (c)(d) | | 3,492,113 | 3,492,986 |
| 3 month U.S. LIBOR + 8.500% 10.6159% 9/29/25 (c)(d) | | 959,795 | 967,599 |
| Severin Acquisition LLC Tranche B 1LN, term loan 3 month U.S. LIBOR + 3.250% 5.459% 8/1/25 (c)(d) | | 828,835 | 812,946 |
| | | | 7,027,426 |
| IT Services - 0.1% | | | |
| Brave Parent Holdings, Inc. Tranche B 1LN, term loan 3 month U.S. LIBOR + 4.000% 6.2555% 4/19/25 (c)(d) | | 360,271 | 341,807 |
| Datto, Inc. 1LN, term loan 3 month U.S. LIBOR + 4.250% 6.5799% 4/2/26 (c)(d) | | 1,000,000 | 1,002,500 |
| EIG Investors Corp. Tranche B, term loan 3 month U.S. LIBOR + 3.750% 5.8823% 2/9/23 (c)(d) | | 1,703,206 | 1,672,191 |
| Global Payments, Inc. Tranche B 3LN, term loan 3 month U.S. LIBOR + 1.750% 3.862% 4/22/23 (c)(d) | | 441,612 | 440,949 |
| GTT Communications, Inc. Tranche B, term loan 3 month U.S. LIBOR + 2.750% 4.86% 5/31/25 (c)(d) | | 2,585,222 | 2,071,693 |
| Tempo Acquisition LLC Tranche B, term loan 3 month U.S. LIBOR + 3.000% 5.112% 5/1/24 (c)(d) | | 2,035,380 | 2,033,690 |
| Verscend Holding Corp. Tranche B, term loan 3 month U.S. LIBOR + 4.500% 6.612% 8/27/25 (c)(d) | | 1,938,353 | 1,941,376 |
| VFH Parent LLC Tranche B 1LN, term loan 3 month U.S. LIBOR + 3.500% 6.0438% 3/1/26 (c)(d) | | 2,266,833 | 2,270,075 |
| Web.com Group, Inc.: | | | |
| 2LN, term loan 3 month U.S. LIBOR + 7.750% 9.9451% 10/11/26 (c)(d) | | 398,104 | 388,152 |
| Tranche B 1LN, term loan 3 month U.S. LIBOR + 3.750% 5.9451% 10/11/25 (c)(d) | | 1,959,447 | 1,932,093 |
| WEX, Inc. Tranche B, term loan 3 month U.S. LIBOR + 2.250% 4.362% 5/17/26 (c)(d) | | 1,142,250 | 1,144,489 |
| | | | 15,239,015 |
| Semiconductors & Semiconductor Equipment - 0.0% | | | |
| Cabot Microelectronics Corp. Tranche B, term loan 3 month U.S. LIBOR + 2.250% 4.375% 11/15/25 (c)(d) | | 1,027,258 | 1,027,905 |
| Software - 0.5% | | | |
| Almonde, Inc.: | | | |
| Tranche 2LN, term loan 3 month U.S. LIBOR + 7.250% 9.4463% 6/13/25 (c)(d) | | 2,333,000 | 2,275,655 |
| Tranche B 1LN, term loan 3 month U.S. LIBOR + 3.500% 5.6963% 6/13/24 (c)(d) | | 4,433,709 | 4,272,366 |
| Aptean, Inc. 1LN, term loan 3 month U.S. LIBOR + 4.250% 6.5799% 4/23/26 (c)(d) | | 748,125 | 742,514 |
| Boxer Parent Co., Inc. Tranche B, term loan 3 month U.S. LIBOR + 4.250% 6.5799% 10/2/25 (c)(d) | | 2,265,807 | 2,136,792 |
| Bracket Intermediate Holding Corp. 1LN, term loan 3 month U.S. LIBOR + 4.250% 6.473% 9/5/25 (c)(d) | | 969,927 | 965,077 |
| Ceridian HCM Holding, Inc. Tranche B, term loan 3 month U.S. LIBOR + 3.000% 5.112% 4/30/25 (c)(d) | | 1,260,475 | 1,259,946 |
| Compuware Corp. 1LN, term loan 3 month U.S. LIBOR + 4.000% 6.112% 8/23/25 (c)(d) | | 1,418,270 | 1,421,220 |
| Cvent, Inc. Tranche B, term loan 3 month U.S. LIBOR + 3.750% 5.862% 11/29/24 (c)(d) | | 896,193 | 881,353 |
| DCert Buyer, Inc. 1LN, term loan 3 month U.S. LIBOR + 4.250% 8/8/26 (d)(r) | | 2,750,000 | 2,738,533 |
| Digicert Holdings, Inc. Tranche B, term loan 3 month U.S. LIBOR + 4.000% 6.112% 10/31/24 (c)(d) | | 2,588,040 | 2,588,040 |
| Dynatrace LLC Tranche B 1LN, term loan 3 month U.S. LIBOR + 2.750% 4.862% 8/23/25 (c)(d) | | 603,758 | 603,607 |
| EagleView Technology Corp. Tranche B 1LN, term loan 3 month U.S. LIBOR + 3.500% 5.6452% 8/14/25 (c)(d) | | 696,500 | 642,521 |
| Emerald TopCo, Inc. 1LN, term loan 3 month U.S. LIBOR + 3.500% 5.612% 7/22/26 (c)(d) | | 1,125,000 | 1,118,441 |
| Epicor Software Corp. Tranche B, term loan 3 month U.S. LIBOR + 3.250% 5.37% 6/1/22 (c)(d) | | 1,737,138 | 1,734,601 |
| Evo Payments International LLC Tranche B, term loan 3 month U.S. LIBOR + 3.250% 5.37% 12/22/23 (c)(d) | | 1,260,372 | 1,259,187 |
| Flexera Software LLC Tranche B 1LN, term loan 3 month U.S. LIBOR + 3.500% 5.62% 2/26/25 (c)(d) | | 498,737 | 498,583 |
| Hyland Software, Inc.: | | | |
| Tranche 2LN, term loan 3 month U.S. LIBOR + 7.000% 9.112% 7/7/25 (c)(d) | | 144,000 | 144,271 |
| Tranche B 1LN, term loan 3 month U.S. LIBOR + 3.250% 5.362% 7/1/24 (c)(d) | | 1,065,725 | 1,061,068 |
| Ion Trading Finance Ltd. Tranche B 1LN, term loan 3 month U.S. LIBOR + 4.000% 6.6507% 11/21/24 (c)(d) | | 1,605,510 | 1,539,957 |
| Kronos, Inc.: | | | |
| 2LN, term loan 3 month U.S. LIBOR + 8.250% 10.5031% 11/1/24 (c)(d) | | 2,849,000 | 2,911,678 |
| Tranche B 1LN, term loan 3 month U.S. LIBOR + 3.000% 5.2531% 11/1/23 (c)(d) | | 5,697,937 | 5,691,441 |
| Landesk Group, Inc. term loan: | | | |
| 3 month U.S. LIBOR + 4.250% 6.47% 1/20/24 (c)(d) | | 1,859,525 | 1,852,552 |
| 3 month U.S. LIBOR + 9.000% 11.22% 1/20/25 (c)(d) | | 363,000 | 357,555 |
| MA FinanceCo. LLC: | | | |
| Tranche B 2LN, term loan 3 month U.S. LIBOR + 2.250% 4.362% 11/20/21 (c)(d) | | 162,058 | 160,582 |
| Tranche B 3LN, term loan: | | | |
| 3 month U.S. LIBOR + 2.500% 4.612% 6/21/24 (c)(d) | | 5,623,071 | 5,454,379 |
| 3 month U.S. LIBOR + 2.500% 4.612% 6/21/24 (c)(d) | | 837,759 | 812,626 |
| MH Sub I LLC Tranche B, term loan 3 month U.S. LIBOR + 3.750% 5.862% 9/15/24 (c)(d) | | 713,553 | 707,010 |
| NAVEX TopCo, Inc.: | | | |
| 2LN, term loan 3 month U.S. LIBOR + 7.000% 9.13% 9/4/26 (c)(d) | | 100,000 | 99,000 |
| Tranche B 1LN, term loan 3 month U.S. LIBOR + 3.250% 5.38% 9/4/25 (c)(d) | | 743,910 | 727,916 |
| Project Alpha Intermediate Holding, Inc. Tranche B 1LN, term loan 3 month U.S. LIBOR + 4.250% 6.56% 4/26/24 (c)(d) | | 750,000 | 747,660 |
| Project Boost Purchaser LLC 1LN, term loan 3 month U.S. LIBOR + 3.500% 5.612% 5/30/26 (c)(d) | | 375,000 | 371,018 |
| Renaissance Holding Corp.: | | | |
| Tranche B 1LN, term loan 3 month U.S. LIBOR + 3.250% 5.362% 5/31/25 (c)(d) | | 886,871 | 867,138 |
| Tranche B 2LN, term loan 3 month U.S. LIBOR + 7.000% 9.112% 5/31/26 (c)(d) | | 511,000 | 487,152 |
| S2P Acquisition Borrower, Inc. 1LN, term loan 3 month U.S. LIBOR + 4.000% 6.1952% 8/9/26 (c)(d) | | 625,000 | 623,956 |
| Solera LLC Tranche B, term loan 3 month U.S. LIBOR + 2.750% 4.862% 3/3/23 (c)(d) | | 2,744,877 | 2,729,450 |
| Sophia L.P. term loan 3 month U.S. LIBOR + 3.250% 5.5799% 9/30/22 (c)(d) | | 2,651,132 | 2,647,261 |
| SS&C Technologies, Inc.: | | | |
| Tranche B 1LN, term loan 3 month U.S. LIBOR + 2.250% 4.362% 7/8/22 (c)(d) | | 209,967 | 210,130 |
| Tranche B 3LN, term loan 3 month U.S. LIBOR + 2.250% 4.362% 4/16/25 (c)(d) | | 2,183,930 | 2,186,114 |
| Tranche B 4LN, term loan 3 month U.S. LIBOR + 2.250% 4.362% 4/16/25 (c)(d) | | 1,475,683 | 1,477,159 |
| Tranche B 5LN, term loan 3 month U.S. LIBOR + 2.250% 4.362% 4/16/25 (c)(d) | | 3,357,677 | 3,357,207 |
| Sybil Software LLC. Tranche B, term loan 3 month U.S. LIBOR + 2.250% 4.5799% 9/30/23 (c)(d) | | 494,359 | 495,442 |
| TIBCO Software, Inc. Tranche B 1LN, term loan 3 month U.S. LIBOR + 4.000% 6.25% 6/30/26 (c)(d) | | 1,605,387 | 1,603,878 |
| Ultimate Software Group, Inc. 1LN, term loan 3 month U.S. LIBOR + 3.750% 6.0799% 5/4/26 (c)(d) | | 2,315,000 | 2,319,144 |
| Veritas U.S., Inc. Tranche B, term loan 3 month U.S. LIBOR + 4.500% 6.6481% 1/27/23 (c)(d) | | 1,196,997 | 1,134,754 |
| Vertafore, Inc.: | | | |
| Tranche B 1LN, term loan 3 month U.S. LIBOR + 3.250% 5.362% 7/2/25 (c)(d) | | 3,843,446 | 3,707,734 |
| Tranche B 2LN, term loan 3 month U.S. LIBOR + 7.250% 9.362% 7/2/26 (c)(d) | | 817,000 | 802,024 |
| | | | 72,425,692 |
| Technology Hardware, Storage & Peripherals - 0.0% | | | |
| Dell International LLC Tranche B, term loan 3 month U.S. LIBOR + 2.000% 4.12% 9/7/23 (c)(d) | | 573,166 | 574,295 |
|
| TOTAL INFORMATION TECHNOLOGY | | | 120,087,888 |
|
| MATERIALS - 0.3% | | | |
| Chemicals - 0.1% | | | |
| American Rock Salt Co. LLC Tranche B, term loan 3 month U.S. LIBOR + 3.750% 5.862% 3/21/25 (c)(d) | | 1,260,601 | 1,255,874 |
| ASP Chromaflo Dutch I BV Tranche B-2 1LN, term loan: | | | |
| 3 month U.S. LIBOR + 3.500% 5.612% 11/18/23 (c)(d) | | 364,065 | 349,502 |
| 3 month U.S. LIBOR + 4.250% 6.362% 11/18/23 (c)(d) | | 211,449 | 208,277 |
| ASP Chromaflo Intermediate Holdings, Inc.: | | | |
| Tranche B 1LN, term loan 3 month U.S. LIBOR + 3.500% 5.612% 11/18/23 (c)(d) | | 279,981 | 268,782 |
| Tranche B3/B4 1LN, term loan 3 month U.S. LIBOR + 4.250% 6.362% 11/18/23 (c)(d)(k) | | 162,613 | 160,174 |
| Hexion, Inc. Tranche B 1LN, term loan 3 month U.S. LIBOR + 3.500% 5.82% 7/1/26 (c)(d) | | 710,000 | 708,225 |
| Kraton Polymers LLC Tranche B 1LN, term loan 3 month U.S. LIBOR + 2.500% 4.612% 3/8/25 (c)(d) | | 674,000 | 671,473 |
| MacDermid, Inc. Tranche B, term loan 3 month U.S. LIBOR + 2.250% 4.362% 1/31/26 (c)(d) | | 746,250 | 745,317 |
| Messer Industries U.S.A., Inc. Tranche B 1LN, term loan 3 month U.S. LIBOR + 2.500% 4.8299% 3/1/26 (c)(d) | | 1,810,463 | 1,797,536 |
| OCI Partners LP Tranche B, term loan 3 month U.S. LIBOR + 4.000% 6.3299% 3/13/25 (c)(d) | | 896,193 | 892,833 |
| Oxea Corp. Tranche B2, term loan 3 month U.S. LIBOR + 3.500% 5.75% 10/11/24 (c)(d) | | 1,360,815 | 1,350,609 |
| Starfruit U.S. Holdco LLC Tranche B, term loan 3 month U.S. LIBOR + 3.250% 5.4628% 10/1/25 (c)(d) | | 3,997,980 | 3,856,372 |
| The Chemours Co. LLC Tranche B 1LN, term loan 3 month U.S. LIBOR + 1.750% 3.87% 4/3/25 (c)(d) | | 1,217,696 | 1,174,322 |
| Trinseo Materials Operating SCA/Trinseo Materials Finance, Inc. term loan 3 month U.S. LIBOR + 2.000% 4.112% 9/6/24 (c)(d) | | 713,553 | 701,601 |
| Tronox Finance LLC Tranche B, term loan 3 month U.S. LIBOR + 2.750% 4.947% 9/22/24 (c)(d) | | 1,785,289 | 1,770,507 |
| Univar, Inc. Tranche B, term loan 3 month U.S. LIBOR + 2.250% 4.362% 7/1/24 (c)(d) | | 320,050 | 319,877 |
| W. R. Grace & Co.-Conn.: | | | |
| Tranche B 1LN, term loan 3 month U.S. LIBOR + 1.750% 4.0799% 4/3/25 (c)(d) | | 267,975 | 267,372 |
| Tranche B 2LN, term loan 3 month U.S. LIBOR + 1.750% 4.0799% 4/3/25 (c)(d) | | 459,528 | 458,494 |
| | | | 16,957,147 |
| Containers & Packaging - 0.2% | | | |
| Ball Metalpack Finco LLC Tranche B 1LN, term loan 3 month U.S. LIBOR + 4.500% 6.6241% 7/31/25 (c)(d) | | 780,090 | 754,737 |
| Berlin Packaging, LLC Tranche B 1LN, term loan 3 month U.S. LIBOR + 3.000% 5.2151% 11/7/25 (c)(d) | | 3,022,203 | 2,950,425 |
| Berry Global, Inc.: | | | |
| Tranche Q, term loan 3 month U.S. LIBOR + 2.250% 4.4509% 10/1/22 (c)(d) | | 2,965,000 | 2,965,682 |
| Tranche T, term loan 3 month U.S. LIBOR + 2.000% 4.2009% 1/6/21 (c)(d) | | 117,721 | 117,721 |
| Tranche U, term loan 3 month U.S. LIBOR + 2.500% 4.7009% 7/1/26 (c)(d) | | 2,875,000 | 2,873,419 |
| BWAY Holding Co. Tranche B, term loan 3 month U.S. LIBOR + 3.250% 5.5895% 4/3/24 (c)(d) | | 355,281 | 345,010 |
| Charter Nex U.S., Inc.: | | | |
| 1LN, term loan 3 month U.S. LIBOR + 3.500% 5.612% 5/16/24 (c)(d) | | 465,000 | 464,130 |
| Tranche B 1LN, term loan 3 month U.S. LIBOR + 3.000% 5.112% 5/16/24 (c)(d) | | 439,635 | 431,722 |
| Consolidated Container Co. Tranche B 1LN, term loan 3 month U.S. LIBOR + 2.750% 4.862% 5/22/24 (c)(d) | | 816,781 | 803,851 |
| Flex Acquisition Co., Inc.: | | | |
| Tranche B 1LN, term loan 3 month U.S. LIBOR + 3.000% 5.3189% 12/29/23 (c)(d) | | 2,341,322 | 2,226,082 |
| Tranche B 1LN, term loan 3 month U.S. LIBOR + 3.250% 5.5689% 6/29/25 (c)(d) | | 2,235,085 | 2,126,751 |
| Pregis TopCo Corp. 1LN, term loan 3 month U.S. LIBOR + 4.000% 6.2531% 7/31/26 (c)(d) | | 750,000 | 745,935 |
| Reynolds Group Holdings, Inc. Tranche B, term loan 3 month U.S. LIBOR + 2.750% 4.862% 2/5/23 (c)(d) | | 6,190,853 | 6,184,228 |
| | | | 22,989,693 |
| Metals & Mining - 0.0% | | | |
| Gulf Finance LLC Tranche B 1LN, term loan 3 month U.S. LIBOR + 5.250% 7.5173% 8/25/23 (c)(d) | | 1,664,481 | 1,303,838 |
| Murray Energy Corp. Tranche B 2LN, term loan 3 month U.S. LIBOR + 7.250% 9.362% 10/17/22 (c)(d) | | 2,815,885 | 1,357,651 |
| Tank Holding Corp. Tranche B 1LN, term loan 3 month U.S. LIBOR + 4.000% 6.5309% 3/26/26 (c)(d) | | 800,000 | 794,248 |
| | | | 3,455,737 |
| Paper & Forest Products - 0.0% | | | |
| Clearwater Paper Corp. Tranche B 1LN, term loan 3 month U.S. LIBOR + 3.250% 5.4375% 7/26/26 (c)(d) | | 500,000 | 500,000 |
|
| TOTAL MATERIALS | | | 43,902,577 |
|
| REAL ESTATE - 0.1% | | | |
| Equity Real Estate Investment Trusts (REITs) - 0.0% | | | |
| Invitation Homes Operating Par Tranche B, term loan 3 month U.S. LIBOR + 1.700% 3.8666% 2/6/22 (c)(d)(k) | | 870,000 | 848,250 |
| iStar Financial, Inc. Tranche B 1LN, term loan 3 month U.S. LIBOR + 2.750% 4.9483% 6/28/23 (c)(d) | | 616,331 | 616,331 |
| The GEO Group, Inc. Tranche B 1LN, term loan 3 month U.S. LIBOR + 2.000% 4.12% 3/23/24 (c)(d) | | 1,012,943 | 942,544 |
| | | | 2,407,125 |
| Real Estate Management & Development - 0.1% | | | |
| Capital Automotive LP: | | | |
| Tranche 2LN, term loan 3 month U.S. LIBOR + 6.000% 8.12% 3/24/25 (c)(d) | | 395,589 | 395,838 |
| Tranche B 1LN, term loan 3 month U.S. LIBOR + 2.500% 4.62% 3/24/24 (c)(d) | | 514,237 | 512,952 |
| DTZ U.S. Borrower LLC Tranche B, term loan 3 month U.S. LIBOR + 3.250% 5.362% 8/21/25 (c)(d) | | 2,814,730 | 2,811,943 |
| Forest City Enterprises LP Tranche B, term loan 3 month U.S. LIBOR + 4.000% 6.112% 12/7/25 (c)(d) | | 681,575 | 685,835 |
| Realogy Group LLC Tranche B, term loan 3 month U.S. LIBOR + 2.250% 4.42% 2/8/25 (c)(d) | | 1,186,950 | 1,143,424 |
| VICI Properties, LLC Tranche B 1LN, term loan 3 month U.S. LIBOR + 2.000% 4.17% 12/22/24 (c)(d) | | 3,858,000 | 3,863,517 |
| | | | 9,413,509 |
|
| TOTAL REAL ESTATE | | | 11,820,634 |
|
| UTILITIES - 0.1% | | | |
| Electric Utilities - 0.1% | | | |
| Brookfield WEC Holdings, Inc. Tranche B 1LN, term loan 3 month U.S. LIBOR + 3.500% 5.612% 8/1/25 (c)(d) | | 3,413,485 | 3,414,714 |
| ExGen Renewables IV, LLC Tranche B, term loan 3 month U.S. LIBOR + 3.000% 5.13% 11/28/24 (c)(d) | | 1,020,032 | 981,780 |
| Green Energy Partners/Stonewall LLC Tranche B 1LN, term loan 3 month U.S. LIBOR + 5.500% 7.8299% 11/13/21 (c)(d) | | 1,084,720 | 1,041,331 |
| Invenergy Thermal Operating I LLC Tranche B, term loan 3 month U.S. LIBOR + 3.500% 5.612% 8/28/25 (c)(d) | | 870,228 | 873,491 |
| Lightstone Holdco LLC: | | | |
| Tranche B 1LN, term loan 3 month U.S. LIBOR + 3.750% 5.862% 1/30/24 (c)(d) | | 1,901,265 | 1,829,968 |
| Tranche C 1LN, term loan 3 month U.S. LIBOR + 3.750% 5.862% 1/30/24 (c)(d) | | 107,234 | 103,213 |
| Tex Operations Co. LLC Tranche B, term loan 3 month U.S. LIBOR + 2.000% 4.112% 8/4/23 (c)(d) | | 2,027,289 | 2,028,424 |
| Vistra Operations Co. LLC Tranche B 3LN, term loan 3 month U.S. LIBOR + 2.000% 4.1473% 12/31/25 (c)(d) | | 3,732,739 | 3,735,837 |
| | | | 14,008,758 |
| Gas Utilities - 0.0% | | | |
| UGI Energy Services LLC Tranche B 1LN, term loan 3 month U.S. LIBOR + 3.750% 5.862% 8/1/26 (c)(d) | | 625,000 | 625,000 |
| Independent Power and Renewable Electricity Producers - 0.0% | | | |
| Calpine Corp. Tranche B9 1LN, term loan 3 month U.S. LIBOR + 2.750% 5.08% 4/5/26 (c)(d) | | 1,000,000 | 998,330 |
| Oregon Clean Energy LLC Tranche B 1LN, term loan 3 month U.S. LIBOR + 3.750% 5.862% 3/1/26 (c)(d) | | 618,450 | 617,677 |
| Talen Energy Supply LLC Tranche B 1LN, term loan 3 month U.S. LIBOR + 3.750% 5.9628% 6/28/26 (c)(d) | | 125,000 | 122,813 |
| Terra-Gen Finance Co. LLC Tranche B, term loan 3 month U.S. LIBOR + 4.250% 6.37% 12/9/21 (c)(d) | | 873,244 | 785,919 |
| TerraForm Power Operating LLC Tranche B, term loan 3 month U.S. LIBOR + 2.000% 4.112% 11/8/22 (c)(d) | | 289,793 | 289,431 |
| | | | 2,814,170 |
|
| TOTAL UTILITIES | | | 17,447,928 |
|
| TOTAL BANK LOAN OBLIGATIONS | | | |
| (Cost $683,126,671) | | | 674,271,553 |
|
| Bank Notes - 0.3% | | | |
| Capital One NA 2.95% 7/23/21 | | 6,833,000 | 6,919,179 |
| Discover Bank: | | | |
| (Delaware) 3.2% 8/9/21 | | $9,357,000 | $9,531,621 |
| 3.1% 6/4/20 | | 8,196,000 | 8,239,159 |
| 4.682% 8/9/28 (c) | | 5,039,000 | 5,286,415 |
| 8.7% 11/18/19 | | 1,074,000 | 1,086,911 |
| KeyBank NA 6.95% 2/1/28 | | 718,000 | 919,884 |
| Synchrony Bank 3.65% 5/24/21 | | 8,482,000 | 8,654,994 |
| TOTAL BANK NOTES | | | |
| (Cost $39,526,376) | | | 40,638,163 |
|
| Preferred Securities - 0.8% | | | |
| COMMUNICATION SERVICES - 0.0% | | | |
| Diversified Telecommunication Services - 0.0% | | | |
| Colombia Telecomunicaciones SA 8.5% (b)(c)(t) | | $530,000 | $565,041 |
| Telefonica Europe BV 2.625% (Reg. S) (c)(t) | EUR | 1,600,000 | 1,800,305 |
| | | | 2,365,346 |
| CONSUMER DISCRETIONARY - 0.1% | | | |
| Automobiles - 0.1% | | | |
| Volkswagen International Finance NV: | | | |
| 2.5%(Reg. S) (c)(t) | EUR | 4,751,000 | 5,417,461 |
| 2.7%(Reg. S) (c)(t) | EUR | 3,000,000 | 3,462,854 |
| 3.75% (c)(t) | EUR | 3,050,000 | 3,563,423 |
| | | | 12,443,738 |
| CONSUMER STAPLES - 0.0% | | | |
| Food Products - 0.0% | | | |
| Cosan Overseas Ltd. 8.25% (t) | | 2,941,000 | 3,051,633 |
| Danone SA 1.75% (Reg. S) (c)(t) | EUR | 2,100,000 | 2,379,268 |
| | | | 5,430,901 |
| ENERGY - 0.0% | | | |
| Oil, Gas & Consumable Fuels - 0.0% | | | |
| MPLX LP 6.875% (c)(t) | | 2,820,000 | 2,834,596 |
| FINANCIALS - 0.6% | | | |
| Banks - 0.4% | | | |
| Alfa Bond Issuance PLC 8% (Reg. S) (c)(t) | | 1,572,000 | 1,615,807 |
| Allied Irish Banks PLC 7.375% (Reg. S) (c)(t) | EUR | 1,358,000 | 1,614,805 |
| Banco Bilbao Vizcaya Argentaria SA: | | | |
| 5.875% (Reg. S) (c)(t) | EUR | 2,200,000 | 2,543,408 |
| 6.75% (Reg. S) (c)(t) | EUR | 2,800,000 | 3,157,896 |
| Banco Do Brasil SA: | | | |
| 6.25% (b)(c)(t) | | 760,000 | 748,946 |
| 9% (b)(c)(t) | | 475,000 | 529,835 |
| Banco Mercantil del Norte SA 7.625% (b)(c)(t) | | 352,000 | 356,263 |
| Bank of America Corp.: | | | |
| 5.875% (c)(t) | | 1,330,000 | 1,482,072 |
| 6.1% (c)(t) | | 2,955,000 | 3,303,240 |
| 6.25% (c)(t) | | 1,933,000 | 2,166,063 |
| 6.5% (c)(t) | | 1,089,000 | 1,245,016 |
| Bank of Nova Scotia 4.65% (c)(t) | | 2,677,000 | 2,684,123 |
| Barclays Bank PLC 7.625% 11/21/22 | | 9,472,000 | 10,645,065 |
| Barclays PLC: | | | |
| 7.125% (c)(t) | GBP | 1,300,000 | 1,659,069 |
| 7.875% (Reg. S) (c)(t) | | 2,778,000 | 2,935,100 |
| CYBG PLC 9.25% (Reg. S) (c)(t) | GBP | 950,000 | 1,200,505 |
| Danske Bank A/S 5.875% (Reg. S) (c)(t) | EUR | 1,050,000 | 1,252,319 |
| Georgia Bank Joint Stock Co. 11.125% (Reg. S) (c)(t) | | 200,000 | 215,027 |
| HSBC Holdings PLC 5.25% (c)(t) | EUR | 1,695,000 | 2,026,933 |
| Itau Unibanco Holding SA: | | | |
| 5.5% 8/6/22 (b) | | 419,000 | 440,138 |
| 6.125% (b)(c)(t) | | 195,000 | 199,088 |
| Royal Bank of Scotland Group PLC 7.5% (c)(t) | | 4,178,000 | 4,298,074 |
| Stichting AK Rabobank Certificaten 6.5% (Reg. S) (t) | EUR | 2,148,200 | 2,959,182 |
| Tinkoff Credit Systems 9.25% (Reg. S) (c)(t) | | 1,193,000 | 1,276,046 |
| Wells Fargo & Co. 5.9% (c)(t) | | 4,885,000 | 5,276,160 |
| | | | 55,830,180 |
| Capital Markets - 0.0% | | | |
| Deutsche Bank AG 6% (Reg. S) (c)(t) | EUR | 1,300,000 | 1,262,579 |
| Insurance - 0.2% | | | |
| Assicurazioni Generali SpA 6.416% (c)(t) | GBP | 1,750,000 | 2,330,395 |
| Aviva PLC: | | | |
| 5.9021% (c)(t) | GBP | 2,400,000 | 3,010,392 |
| 6.125% (c)(t) | GBP | 5,680,000 | 7,820,668 |
| Credit Agricole Assurances SA 4.25% (Reg. S) (c)(t) | EUR | 1,800,000 | 2,273,817 |
| Generali Finance BV 4.596% (Reg. S) (c)(t) | EUR | 1,450,000 | 1,809,512 |
| QBE Insurance Group Ltd. 5.25% (Reg. S) (c)(t) | | 2,594,000 | 2,653,552 |
| | | | 19,898,336 |
|
| TOTAL FINANCIALS | | | 76,991,095 |
|
| INDUSTRIALS - 0.0% | | | |
| Construction & Engineering - 0.0% | | | |
| Odebrecht Finance Ltd. 7.5% (b)(e)(t) | | 2,413,000 | 241,903 |
| REAL ESTATE - 0.1% | | | |
| Equity Real Estate Investment Trusts (REITs) - 0.0% | | | |
| Samhallsbyggnadsbolaget I Norden AB 4.625% (Reg. S) (c)(t) | EUR | 2,040,000 | 2,387,097 |
| Real Estate Management & Development - 0.1% | | | |
| CPI Property Group SA 4.375% (Reg. S) (c)(t) | EUR | 1,550,000 | 1,762,973 |
| Deutsche Annington Finance BV 4% (Reg. S) (c)(t) | EUR | 1,000,000 | 1,213,927 |
| Grand City Properties SA 3.75% (c)(t) | EUR | 2,900,000 | 3,458,270 |
| | | | 6,435,170 |
|
| TOTAL REAL ESTATE | | | 8,822,267 |
|
| UTILITIES - 0.0% | | | |
| Water Utilities - 0.0% | | | |
| Pennon Group PLC 2.875% (Reg. S) (c)(t) | GBP | 699,000 | 860,571 |
| TOTAL PREFERRED SECURITIES | | | |
| (Cost $107,815,874) | | | 109,990,417 |
| | | Shares | Value |
|
| Money Market Funds - 5.3% | | | |
| Fidelity Cash Central Fund 2.13% (u) | | | |
| (Cost $757,382,265) | | 757,233,015 | 757,384,462 |
| Purchased Swaptions - 0.1% | | | | |
| | | Expiration Date | Notional Amount | Value |
| Put Options - 0.0% | | | | |
| Option on an interest rate swap with Bank of America N.A. to pay semi-annually a fixed rate of 1.476% and receive quarterly a floating rate based on 3-month LIBOR, expiring August 2029 | | 8/27/24 | 28,000,000 | $802,143 |
| Option on an interest rate swap with Citibank, N.A. to pay semi-annually a fixed rate of 2.54% and receive quarterly a floating rate based on 3-month LIBOR, expiring April 2029 | | 4/5/22 | 11,000,000 | 77,493 |
| Option on an interest rate swap with Goldman Sachs Bank U.S.A. to pay semi-annually a fixed rate of 2.5675% and receive quarterly a floating rate based on 3-month LIBOR, expiring April 2029 | | 4/4/22 | 25,000,000 | 170,040 |
| Option on an interest rate swap with Goldman Sachs Bank U.S.A. to pay semi-annually a fixed rate of 2.645% and receive quarterly a floating rate based on 3-month LIBOR, expiring April 2029 | | 4/14/22 | 10,000,000 | 62,500 |
| Option on an interest rate swap with JPMorgan Chase Bank, N.A. to pay semi-annually a fixed rate of 2.313% and receive quarterly a floating rate based on 3-month LIBOR, expiring June 2029 | | 6/6/24 | 59,400,000 | 814,546 |
| Option with an exercise rate of 2.875% on a credit default swap with Citibank N.A. to buy protection on the 5-Year iTraxx Europe Crossover Series 31 Index expiring June 2024, paying 5% quarterly. | | 11/20/19 | 7,127,000 | 53,824 |
| Option with an exercise rate of 2.875% on a credit default swap with JPMorgan Chase Bank N.A. to buy protection on the 5-Year iTraxx Europe Crossover Series 31 Index expiring June 2024, paying 5% quarterly. | | 10/16/19 | 41,717,000 | 170,566 |
|
| TOTAL PUT OPTIONS | | | | 2,151,112 |
|
| Call Options - 0.1% | | | | |
| Option on an interest rate swap with Bank of America N.A. to receive semi-annually a fixed rate of 1.476% and pay quarterly a floating rate based on 3-month LIBOR, expiring August 2029 | | 8/27/24 | 28,000,000 | 834,511 |
| Option on an interest rate swap with Citibank, N.A. to receive semi-annually a fixed rate of 2.54% and pay quarterly a floating rate based on 3-month LIBOR, expiring April 2029 | | 4/5/22 | 11,000,000 | 928,944 |
| Option on an interest rate swap with Goldman Sachs Bank U.S.A. to receive semi-annually a fixed rate of 2.5675% and pay quarterly a floating rate based on 3-month LIBOR, expiring April 2029 | | 4/4/22 | 25,000,000 | 2,149,154 |
| Option on an interest rate swap with Goldman Sachs Bank U.S.A. to receive semi-annually a fixed rate of 2.645% and pay quarterly a floating rate based on 3-month LIBOR, expiring April 2029 | | 4/14/22 | 10,000,000 | 902,963 |
| Option on an interest rate swap with JPMorgan Chase Bank, N.A. to receive semi-annually a fixed rate of 2.313% and pay quarterly a floating rate based on 3-month LIBOR, expiring June 2029 | | 6/6/24 | 59,400,000 | 3,211,643 |
|
| TOTAL CALL OPTIONS | | | | 8,027,215 |
|
| TOTAL PURCHASED SWAPTIONS | | | | |
| (Cost $8,065,610) | | | | 10,178,327 |
| TOTAL INVESTMENT IN SECURITIES - 110.4% | | | | |
| (Cost $14,845,855,545) | | | | 15,592,864,858 |
| NET OTHER ASSETS (LIABILITIES) - (10.4)% | | | | (1,469,629,133) |
| NET ASSETS - 100% | | | | $14,123,235,725 |
| TBA Sale Commitments | | |
| | Principal Amount | Value |
| Ginnie Mae | | |
| 3% 9/1/49 | $(56,000,000) | $(57,747,850) |
| 3.5% 9/1/49 | (20,600,000) | (21,401,470) |
| 3.5% 9/1/49 | (22,000,000) | (22,855,939) |
| 3.5% 9/1/49 | (13,200,000) | (13,713,563) |
| 3.5% 9/1/49 | (8,200,000) | (8,519,032) |
| 3.5% 9/1/49 | (3,000,000) | (3,116,719) |
| 3.5% 9/1/49 | (6,100,000) | (6,337,328) |
| 3.5% 9/1/49 | (6,100,000) | (6,337,328) |
| 4% 9/1/49 | (8,200,000) | (8,544,015) |
|
| TOTAL GINNIE MAE | | (148,573,244) |
|
| Uniform Mortgage Backed Securities | | |
| 3.5% 9/1/49 | (44,500,000) | (45,727,225) |
| 4% 9/1/49 | (40,200,000) | (41,730,446) |
| 4% 9/1/49 | (35,900,000) | (37,266,743) |
|
| TOTAL UNIFORM MORTGAGE BACKED SECURITIES | | (124,724,414) |
|
| TOTAL TBA SALE COMMITMENTS | | |
| (Proceeds $272,807,992) | | $(273,297,658) |
| Written Swaptions | | | |
| | Expiration Date | Notional Amount | Value |
| Put Options | | | |
| Option on an interest rate swap with Bank of America N.A. to pay semi-annually a fixed rate of 1.507% and receive quarterly a floating rate based on 3-month LIBOR, expiring November 2029 | 11/8/19 | 7,000,000 | $(54,851) |
| Option on an interest rate swap with Bank of America N.A. to pay semi-annually a fixed rate of 1.97% and receive quarterly a floating rate based on 3-month LIBOR, expiring August 2029 | 8/1/24 | 10,000,000 | (189,119) |
| Option on an interest rate swap with Bank of America, N.A. to pay semi-annually a fixed rate of 1.92% and receive quarterly a floating rate based on 3-month LIBOR, expiring September 2029 | 9/25/19 | 4,290,000 | (457) |
| Option on an interest rate swap with Bank of America, N.A. to pay semi-annually a fixed rate of 2.26% and receive quarterly a floating rate based on 3-month LIBOR, expiring June 2029 | 5/31/22 | 7,000,000 | (76,385) |
| Option on an interest rate swap with JPMorgan Chase Bank, N.A. to pay semi-annually a fixed rate of 2.46% and receive quarterly a floating rate based on the 3 month LIBOR, expiring March 2029 | 3/28/22 | 175,000 | (1,351) |
|
| TOTAL PUT OPTIONS | | | (322,163) |
|
| Call Options | | | |
| Option on an interest rate swap with Bank of America N.A. to receive semi-annually a fixed rate of 1.507% and pay quarterly a floating rate based on 3-month LIBOR, expiring November 2029 | 11/8/19 | 7,000,000 | (143,771) |
| Option on an interest rate swap with Bank of America N.A. to receive semi-annually a fixed rate of 1.97% and pay quarterly a floating rate based on 3-month LIBOR, expiring August 2029 | 8/1/24 | 10,000,000 | (429,430) |
| Option on an interest rate swap with Bank of America, N.A. to receive semi-annually a fixed rate of 1.92% and pay quarterly a floating rate based on 3-month LIBOR, expiring September 2029 | 9/25/19 | 4,290,000 | (218,936) |
| Option on an interest rate swap with Bank of America, N.A. to receive semi-annually a fixed rate of 2.26% and pay quarterly a floating rate based on 3-month LIBOR, expiring June 2029 | 5/31/22 | 7,000,000 | (485,239) |
| Option on an interest rate swap with JPMorgan Chase Bank, N.A. to receive semi-annually a fixed rate of 2.46% and pay quarterly a floating rate based on the 3 month LIBOR, expiring March 2029 | 3/28/22 | 175,000 | (13,990) |
|
| TOTAL CALL OPTIONS | | | (1,291,366) |
|
| TOTAL WRITTEN SWAPTIONS | | | $(1,613,529) |
| Futures Contracts | | | | | |
| | Number of contracts | Expiration Date | Notional Amount | Value | Unrealized Appreciation/(Depreciation) |
| Purchased | | | | | |
| Bond Index Contracts | | | | | |
| ASX 10 Year Treasury Bond Index Contracts (Australia) | 27 | Sept. 2019 | $2,705,441 | $125,840 | $125,840 |
| Eurex Euro-Bobl Contracts (Germany) | 35 | Sept. 2019 | 5,240,325 | 35,455 | 35,455 |
| ICE Long Gilt Contracts (United Kingdom) | 10 | Dec. 2019 | 1,633,919 | 6,933 | 6,933 |
| TME 10 Year Canadian Note Contracts (Canada) | 115 | Dec. 2019 | 12,531,320 | 14,003 | 14,003 |
| TOTAL BOND INDEX CONTRACTS | | | | | 182,231 |
| Treasury Contracts | | | | | |
| CBOT 2-Year U.S. Treasury Note Contracts (United States) | 24 | Dec. 2019 | 5,186,813 | 2,578 | 2,578 |
| CBOT 5-Year U.S. Treasury Note Contracts (United States) | 46 | Dec. 2019 | 5,518,922 | 3,154 | 3,154 |
| CBOT Long Term U.S. Treasury Bond Contracts (United States) | 5 | Dec. 2019 | 826,250 | 4,661 | 4,661 |
| CBOT Ultra 10-Year U.S. Treasury Note Contracts (United States) | 141 | Dec. 2019 | 20,365,688 | 54,767 | 54,767 |
| CBOT Ultra Long Term U.S. Treasury Bond Contracts (United States) | 74 | Dec. 2019 | 14,610,375 | (32,539) | (32,539) |
| TOTAL TREASURY CONTRACTS | | | | | 32,621 |
|
| TOTAL PURCHASED | | | | | 214,852 |
|
| Sold | | | | | |
| Bond Index Contracts | | | | | |
| Eurex Euro-Bund Contracts (Germany) | 12 | Sept. 2019 | 2,362,078 | (51,980) | (51,980) |
| Treasury Contracts | | | | | |
| CBOT 10-Year U.S. Treasury Note Contracts (United States) | 701 | Dec. 2019 | 92,334,844 | 47,849 | 47,849 |
| CBOT 2-Year U.S. Treasury Note Contracts (United States) | 959 | Dec. 2019 | 207,256,383 | (110,100) | (110,100) |
| CBOT 5-Year U.S. Treasury Note Contracts (United States) | 501 | Dec. 2019 | 60,108,258 | 15,917 | 15,917 |
| CBOT Long Term U.S. Treasury Bond Contracts (United States) | 140 | Dec. 2019 | 23,135,000 | (131,552) | (131,552) |
| CBOT Ultra 10-Year U.S. Treasury Note Contracts (United States) | 309 | Dec. 2019 | 44,631,188 | (123,713) | (123,713) |
| CBOT Ultra Long Term U.S. Treasury Bond Contracts (United States) | 27 | Dec. 2019 | 5,330,813 | 17,460 | 17,460 |
| TOTAL TREASURY CONTRACTS | | | | | (284,139) |
|
| TOTAL SOLD | | | | | (336,119) |
|
| TOTAL FUTURES CONTRACTS | | | | | $(121,267) |
The notional amount of futures purchased as a percentage of Net Assets is 0.5%
The notional amount of futures sold as a percentage of Net Assets is 3.1%
| Forward Foreign Currency Contracts | | | | | | |
| Currency Purchased | Currency Sold | Counterparty | Settlement Date | Unrealized Appreciation/(Depreciation) |
| GBP | 171,000 | USD | 208,004 | Goldman Sachs Bank USA | 9/3/19 | $68 |
| EUR | 199,000 | USD | 222,148 | JPMorgan Chase Bank, N.A. | 11/27/19 | (2,023) |
| USD | 374,739 | EUR | 334,000 | BNP Paribas | 11/27/19 | 5,281 |
| USD | 1,303,696 | EUR | 1,179,000 | BNP Paribas | 11/27/19 | (469) |
| USD | 220,657,833 | EUR | 197,653,000 | Goldman Sachs Bank USA | 11/27/19 | 2,021,990 |
| USD | 355,924 | EUR | 319,000 | Goldman Sachs Bank USA | 11/27/19 | 3,059 |
| USD | 668,795 | GBP | 548,000 | Goldman Sachs Bank USA | 11/27/19 | (250) |
| USD | 40,188,968 | GBP | 32,689,000 | JPMorgan Chase Bank, N.A. | 11/27/19 | 279,491 |
| TOTAL FORWARD FOREIGN CURRENCY CONTRACTS | | | | | | $2,307,147 |
| | | | | | Unrealized Appreciation | 2,309,889 |
| | | | | | Unrealized Depreciation | (2,742) |
Swaps
| Underlying Reference | Maturity Date | Clearinghouse / Counterparty | Fixed Payment Received/(Paid) | Payment Frequency | Notional Amount | Value | Upfront Premium Received/(Paid) | Unrealized Appreciation/(Depreciation) |
| Credit Default Swaps | | | | | | | | |
| Buy Protection | | | | | | | | |
| Akzo Nobel NV | Jun. 2024 | Citibank, N.A. | (1%) | Quarterly | EUR 6,250,000 | $(217,465) | $199,690 | $(17,775) |
| BNP Paribas | Jun. 2024 | JPMorgan Chase Bank, N.A. | (1%) | Quarterly | EUR 3,250,000 | (22,484) | 19,069 | (3,415) |
| CMBX N.A. AAA Index Series 11 | Nov. 2054 | Citigroup Global Markets Ltd. | (0.5%) | Monthly | 13,000,000 | (41,527) | 25,732 | (15,795) |
| CMBX N.A. AAA Index Series 11 | Nov. 2054 | Citigroup Global Markets Ltd. | (0.5%) | Monthly | 11,700,000 | (37,374) | 24,233 | (13,141) |
| CMBX N.A. AAA Index Series 11 | Nov. 2054 | Citigroup Global Markets Ltd. | (0.5%) | Monthly | 7,300,000 | (23,319) | (16,664) | (39,983) |
| CMBX N.A. AAA Index Series 11 | Nov. 2054 | Citigroup Global Markets Ltd. | (0.5%) | Monthly | 3,970,000 | (12,682) | (20,569) | (33,251) |
| CMBX N.A. AAA Index Series 11 | Nov. 2054 | Citigroup Global Markets Ltd. | (0.5%) | Monthly | 12,387,000 | (39,569) | (88,261) | (127,830) |
| CMBX N.A. AAA Index Series 11 | Nov. 2054 | Citigroup Global Markets Ltd. | (0.5%) | Monthly | 14,500,000 | (46,319) | (16,478) | (62,797) |
| CMBX N.A. AAA Index Series 11 | Nov. 2054 | Credit Suisse International | (0.5%) | Monthly | 7,803,000 | (24,926) | (55,599) | (80,525) |
| CMBX N.A. AAA Index Series 11 | Nov. 2054 | Credit Suisse International | (0.5%) | Monthly | 10,000,000 | (31,944) | (35,055) | (66,999) |
| CMBX N.A. AAA Index Series 11 | Nov. 2054 | Credit Suisse International | (0.5%) | Monthly | 14,200,000 | (45,360) | (2,232) | (47,592) |
| CMBX N.A. AAA Index Series 11 | Nov. 2054 | J.P. Morgan Securities LLC | (0.5%) | Monthly | 7,860,000 | (25,108) | (53,201) | (78,309) |
| Commerzbank AG | Jun. 2024 | JPMorgan Chase Bank, N.A. | (1%) | Quarterly | EUR 4,000,000 | (76,118) | 66,084 | (10,034) |
| Leonardo Spa | Jun. 2024 | Citibank, N.A. | (5%) | Quarterly | EUR 1,250,000 | (293,015) | 272,041 | (20,974) |
| Leonardo Spa | Jun. 2024 | Citibank, N.A. | (5%) | Quarterly | EUR 850,000 | (199,250) | 184,161 | (15,089) |
| Leonardo Spa | Jun. 2024 | Citibank, N.A. | (5%) | Quarterly | EUR 550,000 | (128,927) | 119,164 | (9,763) |
| Volvo Treas Ab | Jun. 2024 | Citibank, N.A. | (1%) | Quarterly | EUR 1,050,000 | (33,571) | 25,441 | (8,130) |
|
| TOTAL CREDIT DEFAULT SWAPS | | | | | | $(1,298,958) | $647,556 | $(651,402) |
|
Swaps
| Payment Received | Payment Frequency | Payment Paid | Payment Frequency | Clearinghouse / Counterparty(1) | Maturity Date | Notional Amount | Value | Upfront Premium Received/(Paid)(2) | Unrealized Appreciation/(Depreciation) |
| Interest Rate Swaps | | | | | | | | | |
| 1.5% | Semi - annual | 3-month LIBOR(3) | Quarterly | LCH | Dec. 2021 | $47,800,000 | $(26,586) | $0 | $(26,586) |
| 3-month LIBOR(3) | Quarterly | 1.5% | Semi - annual | LCH | Dec. 2029 | 23,530,000 | 41,962 | 0 | 41,962 |
| 0.75% | Annual | 6-month EURIBOR(3) | Semi - annual | LCH | Dec. 2029 | EUR 8,570,000 | 642,380 | 0 | 642,380 |
| 1.25% | Annual | 6-month EURIBOR(3) | Semi - annual | LCH | Dec. 2034 | EUR 11,230,000 | 1,629,886 | 0 | 1,629,886 |
| 1.25% | Annual | 6-month EURIBOR(3) | Semi - annual | LCH | Dec. 2039 | EUR 3,710,000 | 553,565 | 0 | 553,565 |
| 0.25% | Annual | 6-month EURIBOR(3) | Semi - annual | LCH | Dec. 2039 | EUR 290,000 | (2,646) | 0 | (2,646) |
|
| TOTAL INTEREST RATE SWAPS | | | | | | | $2,838,561 | $0 | $2,838,561 |
|
(1) Swaps with LCH Clearnet Group (LCH) are centrally cleared over-the-counter (OTC) swaps.
(2) Any premiums for centrally cleared over-the-counter (OTC) swaps are recorded periodically throughout the term of the swap to variation margin and included in unrealized appreciation (depreciation).
(3) Represents floating rate.
Currency Abbreviations
EUR – European Monetary Unit
GBP – British pound
USD – U.S. dollar
Legend
(a) Amount is stated in United States dollars unless otherwise noted.
(b) Security exempt from registration under Rule 144A of the Securities Act of 1933. These securities may be resold in transactions exempt from registration, normally to qualified institutional buyers. At the end of the period, the value of these securities amounted to $1,895,103,010 or 13.4% of net assets.
(c) Coupon rates for floating and adjustable rate securities reflect the rates in effect at period end.
(d) Coupon is indexed to a floating interest rate which may be multiplied by a specified factor and/or subject to caps or floors.
(e) Non-income producing - Security is in default.
(f) Security or a portion of the security was pledged to cover margin requirements for futures contracts. At period end, the value of securities pledged amounted to $4,389,357.
(g) Security or a portion of the security was pledged to cover margin requirements for centrally cleared OTC swaps. At period end, the value of securities pledged amounted to $2,637,550.
(h) Security or a portion of the security has been segregated as collateral for open options and bi-lateral over-the-counter (OTC) swaps. At period end, the value of securities pledged amounted to $1,039,611.
(i) Security or a portion of the security purchased on a delayed delivery or when-issued basis.
(j) Security represents right to receive monthly interest payments on an underlying pool of mortgages or assets. Principal shown is the outstanding par amount of the pool as of the end of the period.
(k) Level 3 security
(l) Coupon is inversely indexed to a floating interest rate multiplied by a specified factor. The price may be considerably more volatile than the price of a comparable fixed rate security.
(m) Principal Only Strips represent the right to receive the monthly principal payments on an underlying pool of mortgage loans.
(n) Represents an investment in an underlying pool of reverse mortgages which typically do not require regular principal and interest payments as repayment is deferred until a maturity event.
(o) Restricted securities - Investment in securities not registered under the Securities Act of 1933 (excluding 144A issues). At the end of the period, the value of restricted securities (excluding 144A issues) amounted to $560,882 or 0.0% of net assets.
(p) Security initially issued at one coupon which converts to a higher coupon at a specified date. The rate shown is the rate at period end.
(q) Non-income producing
(r) The coupon rate will be determined upon settlement of the loan after period end.
(s) Position or a portion of the position represents an unfunded loan commitment. At period end, the total principal amount and market value of unfunded commitments totaled $1,830,355 and $1,746,772, respectively.
(t) Security is perpetual in nature with no stated maturity date.
(u) Affiliated fund that is generally available only to investment companies and other accounts managed by Fidelity Investments. The rate quoted is the annualized seven-day yield of the fund at period end. A complete unaudited listing of the fund's holdings as of its most recent quarter end is available upon request. In addition, each Fidelity Central Fund's financial statements, which are not covered by the Fund's Report of Independent Registered Public Accounting Firm, are available on the SEC's website or upon request.
Additional information on each restricted holding is as follows:
| Security | Acquisition Date | Acquisition Cost |
| GMAC Commercial Mortgage Securities, Inc. Series 1999-C2I Class K, 6.481% 9/15/33 | 10/26/18 - 11/28/18 | $544,092 |
Affiliated Central Funds
Information regarding fiscal year to date income earned by the Fund from investments in Fidelity Central Funds is as follows:
| Fund | Income earned |
| Fidelity Cash Central Fund | $8,493,541 |
| Total | $8,493,541 |
Amounts in the income column in the above table include any capital gain distributions from underlying funds, which are presented in the corresponding line-item in the Statement of Operations, if applicable.
Affiliated Underlying Funds
Fiscal year to date information regarding the Fund's investments in affiliated Underlying Funds, excluding any Money Market Central Funds, is presented below. Exchanges between classes of the same affiliated Underlying Funds may occur.
| Fund | Value, beginning of period | Purchases(a) | Sales Proceeds(a) | Dividend Income | Realized Gain/Loss | Change in Unrealized appreciation (depreciation) | Value, end of period |
| Fidelity Real Estate High Income Fund | $-- | $51,000,000 | $51,030,249 | $-- | $30,249 | $-- | $-- |
| Total | $-- | $51,000,000 | $51,030,249 | $-- | $30,249 | $-- | $-- |
(a) Includes the value of shares purchased or redeemed through in-kind transactions.
Amounts in the income column in the above table include any capital gain distributions from underlying funds, which are presented in the corresponding line-item in the Statement of Operations, if applicable.
Investment Valuation
The following is a summary of the inputs used, as of August 31, 2019, involving the Fund's assets and liabilities carried at fair value. The inputs or methodology used for valuing securities may not be an indication of the risk associated with investing in those securities. For more information on valuation inputs, and their aggregation into the levels used below, please refer to the Investment Valuation section in the accompanying Notes to Financial Statements.
| | Valuation Inputs at Reporting Date: |
| Description | Total | Level 1 | Level 2 | Level 3 |
| Investments in Securities: | | | | |
| Equities: | | | | |
| Communication Services | $156,863 | $156,863 | $-- | $-- |
| Consumer Discretionary | 3,867 | -- | -- | 3,867 |
| Energy | 62,272 | 62,272 | -- | -- |
| Financials | 348,847 | 348,847 | -- | -- |
| Materials | 465,673 | 465,673 | -- | -- |
| Real Estate | 3,883,099 | 3,305,974 | 577,125 | -- |
| Corporate Bonds | 4,955,428,588 | -- | 4,955,428,588 | -- |
| U.S. Government and Government Agency Obligations | 4,429,575,876 | -- | 4,429,575,876 | -- |
| U.S. Government Agency - Mortgage Securities | 3,288,465,586 | -- | 3,288,465,586 | -- |
| Asset-Backed Securities | 342,865,004 | -- | 342,167,912 | 697,092 |
| Collateralized Mortgage Obligations | 256,201,179 | -- | 256,200,723 | 456 |
| Commercial Mortgage Securities | 444,643,168 | -- | 444,643,168 | -- |
| Municipal Securities | 99,151,987 | -- | 99,151,987 | -- |
| Foreign Government and Government Agency Obligations | 179,149,927 | -- | 178,652,956 | 496,971 |
| Bank Loan Obligations | 674,271,553 | -- | 667,711,725 | 6,559,828 |
| Bank Notes | 40,638,163 | -- | 40,638,163 | -- |
| Preferred Securities | 109,990,417 | -- | 109,990,417 | -- |
| Money Market Funds | 757,384,462 | 757,384,462 | -- | -- |
| Purchased Swaptions | 10,178,327 | -- | 10,178,327 | -- |
| Total Investments in Securities: | $15,592,864,858 | $761,724,091 | $14,823,382,553 | $7,758,214 |
| Derivative Instruments: | | | | |
| Assets | | | | |
| Forward Foreign Currency Contracts | $2,309,889 | $-- | $2,309,889 | $-- |
| Futures Contracts | 328,617 | 328,617 | | |
| Swaps | 2,867,793 | -- | 2,867,793 | -- |
| Total Assets | $5,506,299 | $328,617 | $5,177,682 | $-- |
| Liabilities | | | | |
| Forward Foreign Currency Contracts | $(2,742) | $-- | $(2,742) | $-- |
| Futures Contracts | (449,884) | (449,884) | -- | -- |
| Swaps | (1,328,190) | -- | (1,328,190) | -- |
| Written Swaptions | (1,613,529) | -- | (1,613,529) | -- |
| Total Liabilities | $(3,394,345) | $(449,884) | $(2,944,461) | $-- |
| Total Derivative Instruments: | $2,111,954 | $(121,267) | $2,233,221 | $-- |
| Other Financial Instruments: | | | | |
| TBA Sale Commitments | $(273,297,658) | $-- | $(273,297,658) | $-- |
| Total Other Financial Instruments: | $(273,297,658) | $-- | $(273,297,658) | $-- |
Value of Derivative Instruments
The following table is a summary of the Fund's value of derivative instruments by primary risk exposure as of August 31, 2019. For additional information on derivative instruments, please refer to the Derivative Instruments section in the accompanying Notes to Financial Statements.
| Primary Risk Exposure / Derivative Type | Value |
| | Asset | Liability |
| Credit Risk | | |
| Purchased Swaptions(a) | $224,390 | $0 |
| Swaps(b) | 0 | (1,298,958) |
| Total Credit Risk | 224,390 | (1,298,958) |
| Foreign Exchange Risk | | |
| Forward Foreign Currency Contracts(c) | 2,309,889 | (2,742) |
| Total Foreign Exchange Risk | 2,309,889 | (2,742) |
| Interest Rate Risk | | |
| Futures Contracts(d) | $328,617 | (449,884) |
| Purchased Swaptions(a) | 9,953,937 | 0 |
| Swaps(b) | 2,867,793 | (29,232) |
| Written Swaptions(e) | 0 | (1,613,529) |
| Total Interest Rate Risk | 13,150,347 | (2,092,645) |
| Total Value of Derivatives | $15,684,626 | $(3,394,345) |
(a) Gross value is included in the Statement of Assets and Liabilities in the investments, at value line-item.
(b) For bi-lateral over-the-counter (OTC) swaps, reflects gross value which is presented in the Statement of Assets and Liabilities in the bi-lateral OTC swaps, at value line-items. For centrally cleared OTC swaps, reflects gross cumulative appreciation (depreciation) as presented in the Schedule of Investments. In the Statement of Assets and Liabilities, the period end daily variation margin for centrally cleared OTC swaps is included in receivable or payable for daily variation margin on centrally cleared OTC swaps, and the net cumulative appreciation (depreciation) for centrally cleared OTC swaps is included in distributable earnings.
(c) Gross value is presented in the Statement of Assets and Liabilities in the unrealized appreciation/depreciation on forward foreign currency contracts line-items.
(d) Reflects gross cumulative appreciation (depreciation) on futures contracts as presented in the Schedule of Investments. In the Statement of Assets and Liabilities, the period end daily variation margin is included in receivable or payable for daily variation margin on futures contracts, and the net cumulative appreciation (depreciation) is included in distributable earnings.
(e) Gross value is presented in the Statement of Assets and Liabilities in the written options, at value line-item.
Other Information
Distribution of investments by country or territory of incorporation, as a percentage of Total Net Assets, is as follows (Unaudited):
| United States of America | 85.9% |
| United Kingdom | 2.4% |
| Netherlands | 2.0% |
| Mexico | 1.9% |
| Cayman Islands | 1.6% |
| Others (Individually Less Than 1%) | 6.2% |
| | 100.0% |
See accompanying notes which are an integral part of the financial statements.
Financial Statements
Statement of Assets and Liabilities
| | | August 31, 2019 |
| Assets | | |
Investment in securities, at value — See accompanying schedule:
Unaffiliated issuers (cost $14,088,473,280) | $14,835,480,396 | |
| Fidelity Central Funds (cost $757,382,265) | 757,384,462 | |
| Total Investment in Securities (cost $14,845,855,545) | | $15,592,864,858 |
| Cash | | 4,629,862 |
| Foreign currency held at value (cost $9,545,146) | | 9,466,312 |
| Receivable for investments sold | | 48,270,755 |
| Receivable for premium on written options | | 1,301,799 |
| Receivable for TBA sale commitments | | 272,807,992 |
| Unrealized appreciation on forward foreign currency contracts | | 2,309,889 |
| Dividends receivable | | 53,235 |
| Interest receivable | | 93,543,415 |
| Distributions receivable from Fidelity Central Funds | | 538,544 |
| Prepaid expenses | | 31,690 |
| Other receivables | | 1 |
| Total assets | | 16,025,818,352 |
| Liabilities | | |
| Payable for investments purchased | | |
| Regular delivery | $506,519,451 | |
| Delayed delivery | 1,110,080,112 | |
| TBA sale commitments, at value | 273,297,658 | |
| Unrealized depreciation on forward foreign currency contracts | 2,742 | |
| Payable for fund shares redeemed | 3,830,403 | |
| Bi-lateral OTC swaps, at value | 1,298,958 | |
| Accrued management fee | 4,110,321 | |
| Payable for daily variation margin on futures contracts | 226,826 | |
| Payable for daily variation margin on centrally cleared OTC swaps | 258,908 | |
| Written options, at value (premium receivable $1,301,799) | 1,613,529 | |
| Other payables and accrued expenses | 1,343,719 | |
| Total liabilities | | 1,902,582,627 |
| Net Assets | | $14,123,235,725 |
| Net Assets consist of: | | |
| Paid in capital | | $13,162,729,870 |
| Total distributable earnings (loss) | | 960,505,855 |
| Net Assets, for 1,312,378,829 shares outstanding | | $14,123,235,725 |
| Net Asset Value, offering price and redemption price per share ($14,123,235,725 ÷ 1,312,378,829 shares) | | $10.76 |
See accompanying notes which are an integral part of the financial statements.
Statement of Operations
| | | For the period
October 25, 2018 (commencement of operations) to
August 31, 2019 |
| Investment Income | | |
| Dividends | | $4,696,343 |
| Interest | | 418,774,295 |
| Income from Fidelity Central Funds | | 8,493,541 |
| Total income | | 431,964,179 |
| Expenses | | |
| Management fee | $33,026,858 | |
| Transfer agent fees | 9,686,983 | |
| Accounting fees and expenses | 1,139,934 | |
| Custodian fees and expenses | 235,558 | |
| Independent trustees' fees and expenses | 41,707 | |
| Registration fees | 1,077,974 | |
| Audit | 116,526 | |
| Legal | 9,447 | |
| Miscellaneous | 98,731 | |
| Total expenses before reductions | 45,433,718 | |
| Expense reductions | (6,503,287) | |
| Total expenses after reductions | | 38,930,431 |
| Net investment income (loss) | | 393,033,748 |
| Realized and Unrealized Gain (Loss) | | |
| Net realized gain (loss) on: | | |
| Investment securities: | | |
| Unaffiliated issuers | 185,549,560 | |
| Fidelity Central Funds | (2,197) | |
| Other affiliated issuers | 30,249 | |
| Forward foreign currency contracts | 13,600,246 | |
| Foreign currency transactions | 30,716 | |
| Futures contracts | (16,629,818) | |
| Swaps | (247,816) | |
| Written options | (855,676) | |
| Total net realized gain (loss) | | 181,475,264 |
| Change in net unrealized appreciation (depreciation) on: | | |
| Investment securities: | | |
| Unaffiliated issuers | 747,007,116 | |
| Fidelity Central Funds | 2,197 | |
| Forward foreign currency contracts | 2,307,147 | |
| Assets and liabilities in foreign currencies | (157,850) | |
| Futures contracts | (121,267) | |
| Swaps | 2,187,159 | |
| Written options | (311,730) | |
| Delayed delivery commitments | (489,666) | |
| Total change in net unrealized appreciation (depreciation) | | 750,423,106 |
| Net gain (loss) | | 931,898,370 |
| Net increase (decrease) in net assets resulting from operations | | $1,324,932,118 |
See accompanying notes which are an integral part of the financial statements.
Statement of Changes in Net Assets
| | For the period
October 25, 2018 (commencement of operations) to
August 31, 2019 |
| Increase (Decrease) in Net Assets | |
| Operations | |
| Net investment income (loss) | $393,033,748 |
| Net realized gain (loss) | 181,475,264 |
| Change in net unrealized appreciation (depreciation) | 750,423,106 |
| Net increase (decrease) in net assets resulting from operations | 1,324,932,118 |
| Distributions to shareholders | (362,982,664) |
| Total distributions | (362,982,664) |
| Share transactions | |
| Proceeds from sales of shares | 13,166,806,652 |
| Reinvestment of distributions | 362,982,544 |
| Cost of shares redeemed | (368,502,925) |
| Net increase (decrease) in net assets resulting from share transactions | 13,161,286,271 |
| Total increase (decrease) in net assets | 14,123,235,725 |
| Net Assets | |
| Beginning of period | – |
| End of period | $14,123,235,725 |
| Other Information | |
| Shares | |
| Sold | 1,313,209,993 |
| Issued in reinvestment of distributions | 35,127,298 |
| Redeemed | (35,958,462) |
| Net increase (decrease) | 1,312,378,829 |
See accompanying notes which are an integral part of the financial statements.
Financial Highlights
Fidelity SAI Total Bond Fund
| | |
| Year ended August 31, | 2019 A |
| Selected Per–Share Data | |
| Net asset value, beginning of period | $10.00 |
| Income from Investment Operations | |
| Net investment income (loss)B | .317 |
| Net realized and unrealized gain (loss) | .734 |
| Total from investment operations | 1.051 |
| Distributions from net investment income | (.289) |
| Distributions from net realized gain | (.002) |
| Total distributions | (.291) |
| Net asset value, end of period | $10.76 |
| Total ReturnC,D | 10.67% |
| Ratios to Average Net AssetsE,F | |
| Expenses before reductions | .42%G |
| Expenses net of fee waivers, if any | .36%G |
| Expenses net of all reductions | .36%G |
| Net investment income (loss) | 3.63%G |
| Supplemental Data | |
| Net assets, end of period (000 omitted) | $14,123,236 |
| Portfolio turnover rateH | 209%G,I |
A For the period October 25, 2018 (commencement of operations) to August 31, 2019.
B Calculated based on average shares outstanding during the period.
C Total returns for periods of less than one year are not annualized.
D Total returns would have been lower if certain expenses had not been reduced during the applicable periods shown.
E Fees and expenses of any underlying Fidelity Central Funds are not included in the Fund's expense ratio. The Fund indirectly bears its proportionate share of the expenses of any underlying Fidelity Central Funds.
F Expense ratios reflect operating expenses of the Fund. Expenses before reductions do not reflect amounts reimbursed by the investment adviser or reductions from brokerage service arrangements or reductions from other expense offset arrangements and do not represent the amount paid by the Fund during periods when reimbursements or reductions occur. Expense ratios before reductions for start-up periods may not be representative of longer term operating periods. Expenses net of fee waivers reflect expenses after reimbursement by the investment adviser but prior to reductions from brokerage service arrangements or other expense offset arrangements. Expenses net of all reductions represent the net expenses paid by the Fund.
G Annualized
H Amount does not include the portfolio activity of any underlying Fidelity Central Funds.
I Portfolio turnover rate excludes securities received or delivered in-kind.
See accompanying notes which are an integral part of the financial statements.
Notes to Financial Statements
For the period ended August 31, 2019
1. Organization.
Fidelity SAI Total Bond Fund (the Fund) is a fund of Fidelity Salem Street Trust (the Trust) and is authorized to issue an unlimited number of shares. Shares are offered exclusively to certain clients of Fidelity Management & Research Company (FMR) or its affiliates. The Trust is registered under the Investment Company Act of 1940, as amended (the 1940 Act), as an open-end management investment company organized as a Massachusetts business trust.
2. Investments in Fidelity Central Funds.
The Fund invests in Fidelity Central Funds, which are open-end investment companies generally available only to other investment companies and accounts managed by the investment adviser and its affiliates. The Fund's Schedule of Investments lists each of the Fidelity Central Funds held as of period end, if any, as an investment of the Fund, but does not include the underlying holdings of each Fidelity Central Fund. As an Investing Fund, the Fund indirectly bears its proportionate share of the expenses of the underlying Fidelity Central Funds.
The Money Market Central Funds seek preservation of capital and current income and are managed by Fidelity Investments Money Management, Inc. (FIMM), an affiliate of the investment adviser. Annualized expenses of the Money Market Central Funds as of their most recent shareholder report date ranged from less than .005% to .01%.
A complete unaudited list of holdings for each Fidelity Central Fund is available upon request or at the Securities and Exchange Commission (the SEC) website at www.sec.gov. In addition, the financial statements of the Fidelity Central Funds, which are not covered by the Fund's Report of Independent Registered Public Accounting Firm, are available on the SEC website or upon request.
3. Significant Accounting Policies.
The Fund is an investment company and applies the accounting and reporting guidance of the Financial Accounting Standards Board (FASB) Accounting Standards Codification Topic 946 Financial Services – Investments Companies. The financial statements have been prepared in conformity with accounting principles generally accepted in the United States of America (GAAP), which require management to make certain estimates and assumptions at the date of the financial statements. Actual results could differ from those estimates. Subsequent events, if any, through the date that the financial statements were issued have been evaluated in the preparation of the financial statements. The following summarizes the significant accounting policies of the Fund:
Investment Valuation. Investments are valued as of 4:00 p.m. Eastern time on the last calendar day of the period. The Board of Trustees (the Board) has delegated the day to day responsibility for the valuation of the Fund's investments to the Fair Value Committee (the Committee) established by the Fund's investment adviser. In accordance with valuation policies and procedures approved by the Board, the Fund attempts to obtain prices from one or more third party pricing vendors or brokers to value its investments. When current market prices, quotations or currency exchange rates are not readily available or reliable, investments will be fair valued in good faith by the Committee, in accordance with procedures adopted by the Board. Factors used in determining fair value vary by investment type and may include market or investment specific events, changes in interest rates and credit quality. The frequency with which these procedures are used cannot be predicted and they may be utilized to a significant extent. The Committee oversees the Fund's valuation policies and procedures and reports to the Board on the Committee's activities and fair value determinations. The Board monitors the appropriateness of the procedures used in valuing the Fund's investments and ratifies the fair value determinations of the Committee.
The Fund categorizes the inputs to valuation techniques used to value its investments into a disclosure hierarchy consisting of three levels as shown below:
- Level 1 – quoted prices in active markets for identical investments
- Level 2 – other significant observable inputs (including quoted prices for similar investments, interest rates, prepayment speeds, etc.)
- Level 3 – unobservable inputs (including the Fund's own assumptions based on the best information available)
Valuation techniques used to value the Fund's investments by major category are as follows:
Debt securities, including restricted securities, are valued based on evaluated prices received from third party pricing vendors or from brokers who make markets in such securities. Corporate bonds, bank notes, bank loan obligations, foreign government and government agency obligations, municipal securities, preferred securities and U.S. government and government agency obligations are valued by pricing vendors who utilize matrix pricing which considers yield or price of bonds of comparable quality, coupon, maturity and type or by broker-supplied prices. Asset backed securities, collateralized mortgage obligations, commercial mortgage securities and U.S. government agency mortgage securities are valued by pricing vendors who utilize matrix pricing which considers prepayment speed assumptions, attributes of the collateral, yield or price of bonds of comparable quality, coupon, maturity and type or by broker-supplied prices. Swaps are marked-to-market daily based on valuations from third party pricing vendors, registered derivatives clearing organizations (clearinghouses) or broker-supplied valuations. These pricing sources may utilize inputs such as interest rate curves, credit spread curves, default possibilities and recovery rates. When independent prices are unavailable or unreliable, debt securities and swaps may be valued utilizing pricing methodologies which consider similar factors that would be used by third party pricing vendors. For foreign debt securities, when significant market or security specific events arise, valuations may be determined in good faith in accordance with procedures adopted by the Board. Debt securities and swaps are generally categorized as Level 2 in the hierarchy but may be Level 3 depending on the circumstances.
Equity securities, including restricted securities, for which market quotations are readily available, are valued at the last reported sale price or official closing price as reported by a third party pricing vendor on the primary market or exchange on which they are traded and are categorized as Level 1 in the hierarchy. In the event there were no sales during the day or closing prices are not available, securities are valued at the last quoted bid price or may be valued using the last available price and are generally categorized as Level 2 in the hierarchy. For foreign equity securities, when market or security specific events arise, comparisons to the valuation of American Depositary Receipts (ADRs), futures contracts, Exchange-Traded Funds (ETFs) and certain indexes as well as quoted prices for similar securities may be used and would be categorized as Level 2 in the hierarchy. For equity securities, including restricted securities, where observable inputs are limited, assumptions about market activity and risk are used and these securities may be categorized as Level 3 in the hierarchy.
The U.S. dollar value of foreign currency contracts is determined using currency exchange rates supplied by a pricing service and are categorized as Level 2 in the hierarchy. Futures contracts are valued at the settlement price established each day by the board of trade or exchange on which they are traded and are categorized as Level 1 in the hierarchy. Options traded over-the-counter are valued using vendor or broker-supplied valuations and are categorized as Level 2 in the hierarchy. Investments in open-end mutual funds, including the Fidelity Central Funds, are valued at their closing net asset value (NAV) each business day and are categorized as Level 1 in the hierarchy.
Changes in valuation techniques may result in transfers in or out of an assigned level within the disclosure hierarchy. The aggregate value of investments by input level as of August 31, 2019 is included at the end of the Fund's Schedule of Investments.
Foreign Currency. Foreign-denominated assets, including investment securities, and liabilities are translated into U.S. dollars at the exchange rates at period end. Purchases and sales of investment securities, income and dividends received and expenses denominated in foreign currencies are translated into U.S. dollars at the exchange rate in effect on the transaction date.
The effects of exchange rate fluctuations on investments are included with the net realized and unrealized gain (loss) on investment securities. Other foreign currency transactions resulting in realized and unrealized gain (loss) are disclosed separately.
Realized gains and losses on foreign currency transactions arise from the disposition of foreign currency, realized changes in the value of foreign currency between the trade and settlement dates on security transactions, and the difference between the amounts of dividends, interest and foreign withholding taxes recorded on transaction date and the U.S. dollar equivalent of the amounts actually received or paid. Unrealized gains and losses on assets and liabilities in foreign currencies arise from changes in the value of foreign currency, and from assets and liabilities denominated in foreign currencies, other than investments, which are held at period end.
Investment Transactions and Income. For financial reporting purposes, the Fund's investment holdings and NAV include trades executed through the end of the last business day of the period. The NAV per share for processing shareholder transactions is calculated as of the close of business of the New York Stock Exchange (NYSE), normally 4:00 p.m. Eastern time and includes trades executed through the end of the prior business day. Gains and losses on securities sold are determined on the basis of identified cost. Dividend income is recorded on the ex-dividend date, except for certain dividends from foreign securities where the ex-dividend date may have passed, which are recorded as soon as the Fund is informed of the ex-dividend date. Non-cash dividends included in dividend income, if any, are recorded at the fair market value of the securities received. Income and capital gain distributions from Fidelity Central Funds, if any, are recorded on the ex-dividend date. Certain distributions received by the Fund represent a return of capital or capital gain. The Fund determines the components of these distributions subsequent to the ex-dividend date, based upon receipt of tax filings or other correspondence relating to the underlying investment. These distributions are recorded as a reduction of cost of investments and/or as a realized gain. Interest income is accrued as earned and includes coupon interest and amortization of premium and accretion of discount on debt securities as applicable. Paid in Kind (PIK) income is recorded at the fair market value of the securities received. The principal amount on inflation-indexed securities is periodically adjusted to the rate of inflation and interest is accrued based on the principal amount. The adjustments to principal due to inflation are reflected as increases or decreases to Interest in the accompanying Statement of Operations. Investment income is recorded net of foreign taxes withheld where recovery of such taxes is uncertain. Debt obligations may be placed on non-accrual status and related interest income may be reduced by ceasing current accruals and writing off interest receivables when the collection of all or a portion of interest has become doubtful based on consistently applied procedures. A debt obligation is removed from non-accrual status when the issuer resumes interest payments or when collectability of interest is reasonably assured.
Expenses. Expenses directly attributable to a fund are charged to that fund. Expenses attributable to more than one fund are allocated among the respective funds on the basis of relative net assets or other appropriate methods. Expense estimates are accrued in the period to which they relate and adjustments are made when actual amounts are known.
Income Tax Information and Distributions to Shareholders. Each year, the Fund intends to qualify as a regulated investment company under Subchapter M of the Internal Revenue Code, including distributing substantially all of its taxable income and realized gains. As a result, no provision for U.S. Federal income taxes is required. As of August 31, 2019, the Fund did not have any unrecognized tax benefits in the financial statements; nor is the Fund aware of any tax positions for which it is reasonably possible that the total amounts of unrecognized tax benefits will significantly change in the next twelve months. The Fund files a U.S. federal tax return, in addition to state and local tax returns as required. The Fund's federal income tax returns are subject to examination by the Internal Revenue Service (IRS) for a period of three fiscal years after they are filed. State and local tax returns may be subject to examination for an additional fiscal year depending on the jurisdiction. Foreign taxes are provided for based on the Fund's understanding of the tax rules and rates that exist in the foreign markets in which it invests.
Distributions are declared and recorded daily and paid monthly from net investment income. Distributions from realized gains, if any, are declared and recorded on the ex-dividend date. Income and capital gain distributions are determined in accordance with income tax regulations, which may differ from GAAP. In addition, the Fund claimed a portion of the payment made to redeeming shareholders as a distribution for income tax purposes.
Capital accounts within the financial statements are adjusted for permanent book-tax differences. These adjustments have no impact on net assets or the results of operations. Capital accounts are not adjusted for temporary book-tax differences which will reverse in a subsequent period.
Book-tax differences are primarily due to swaps, futures and options transactions, foreign currency transactions, market discount, certain conversion ratio adjustments, partnerships and losses deferred due to wash sales.
As of period end, the cost and unrealized appreciation (depreciation) in securities, and derivatives if applicable, for federal income tax purposes were as follows:
| Gross unrealized appreciation | $847,677,575 |
| Gross unrealized depreciation | (77,757,620) |
| Net unrealized appreciation (depreciation) | $769,919,955 |
| Tax Cost | $14,822,581,151 |
The tax-based components of distributable earnings as of period end were as follows:
| Undistributed ordinary income | $202,815,460 |
| Net unrealized appreciation (depreciation) on securities and other investments | $757,690,395 |
The tax character of distributions paid was as follows:
| | August 31, 2019(a) |
| Ordinary Income | $361,754,658 |
| Long-term Capital Gains | 1,228,006 |
| Total | $362,982,664 |
(a) For the period October 25, 2018 (commencement of operations) to August 31, 2019.
Delayed Delivery Transactions and When-Issued Securities. During the period, the Fund transacted in securities on a delayed delivery or when-issued basis. Payment and delivery may take place after the customary settlement period for that security. The price of the underlying securities and the date when the securities will be delivered and paid for are fixed at the time the transaction is negotiated. The securities purchased on a delayed delivery or when-issued basis are identified as such in the Fund's Schedule of Investments. The Fund may receive compensation for interest forgone in the purchase of a delayed delivery or when-issued security. With respect to purchase commitments, the Fund identifies securities as segregated in its records with a value at least equal to the amount of the commitment. Losses may arise due to changes in the value of the underlying securities or if the counterparty does not perform under the contract's terms, or if the issuer does not issue the securities due to political, economic, or other factors.
To-Be-Announced (TBA) Securities and Mortgage Dollar Rolls. During the period, the Fund transacted in TBA securities that involved buying or selling mortgage-backed securities (MBS) on a forward commitment basis. A TBA transaction typically does not designate the actual security to be delivered and only includes an approximate principal amount; however delivered securities must meet specified terms defined by industry guidelines, including issuer, rate and current principal amount outstanding on underlying mortgage pools. The Fund may enter into a TBA transaction with the intent to take possession of or deliver the underlying MBS, or the Fund may elect to extend the settlement by entering into either a mortgage or reverse mortgage dollar roll. Mortgage dollar rolls are transactions where a fund sells TBA securities and simultaneously agrees to repurchase MBS on a later date at a lower price and with the same counterparty. Reverse mortgage dollar rolls involve the purchase and simultaneous agreement to sell TBA securities on a later date at a lower price. Transactions in mortgage dollar rolls and reverse mortgage dollar rolls are accounted for as purchases and sales and may result in an increase to the Fund's portfolio turnover rate.
Purchases and sales of TBA securities involve risks similar to those discussed above for delayed delivery and when-issued securities. Also, if the counterparty in a mortgage dollar roll or a reverse mortgage dollar roll transaction files for bankruptcy or becomes insolvent, the Fund's right to repurchase or sell securities may be limited. Additionally, when a fund sells TBA securities without already owning or having the right to obtain the deliverable securities (an uncovered forward commitment to sell), it incurs a risk of loss because it could have to purchase the securities at a price that is higher than the price at which it sold them. A fund may be unable to purchase the deliverable securities if the corresponding market is illiquid.
TBA securities subject to a forward commitment to sell at period end are included at the end of the Fund's Schedule of Investments under the caption "TBA Sale Commitments." The proceeds and value of these commitments are reflected in the Fund's Statement of Assets and Liabilities as Receivable for TBA sale commitments and TBA sale commitments, at value, respectively.
Restricted Securities. The Fund may invest in securities that are subject to legal or contractual restrictions on resale. These securities generally may be resold in transactions exempt from registration or to the public if the securities are registered. Disposal of these securities may involve time-consuming negotiations and expense, and prompt sale at an acceptable price may be difficult. Information regarding restricted securities is included at the end of the Fund's Schedule of Investments.
Loans and Other Direct Debt Instruments. The Fund invests in direct debt instruments which are interests in amounts owed to lenders by corporate or other borrowers. These instruments may be in the form of loans, trade claims or other receivables and may include standby financing commitments such as revolving credit facilities that obligate the Fund to supply additional cash to the borrower on demand. Loans may be acquired through assignment or participation. The Fund also invests in unfunded loan commitments, which are contractual obligations for future funding. Information regarding unfunded commitments is included at the end of the Fund's Schedule of Investments.
4. Derivative Instruments.
Risk Exposures and the Use of Derivative Instruments. The Fund's investment objective allows the Fund to enter into various types of derivative contracts, including futures contracts, forward foreign currency contracts, options and swaps. Derivatives are investments whose value is primarily derived from underlying assets, indices or reference rates and may be transacted on an exchange or over-the-counter (OTC). Derivatives may involve a future commitment to buy or sell a specified asset based on specified terms, to exchange future cash flows at periodic intervals based on a notional principal amount, or for one party to make one or more payments upon the occurrence of specified events in exchange for periodic payments from the other party.
The Fund used derivatives to increase returns, to gain exposure to certain types of assets, to facilitate transactions in foreign-denominated securities and to manage exposure to certain risks as defined below. The success of any strategy involving derivatives depends on analysis of numerous economic factors, and if the strategies for investment do not work as intended, the Fund may not achieve its objectives.
The Fund's use of derivatives increased or decreased its exposure to the following risks:
| Credit Risk | Credit risk relates to the ability of the issuer of a financial instrument to make further principal or interest payments on an obligation or commitment that it has to the Fund.
|
| Foreign Exchange Risk | Foreign exchange rate risk relates to fluctuations in the value of an asset or liability due to changes in currency exchange rates.
|
| Interest Rate Risk | Interest rate risk relates to the fluctuations in the value of interest-bearing securities due to changes in the prevailing levels of market interest rates. |
The Fund is also exposed to additional risks from investing in derivatives, such as liquidity risk and counterparty credit risk. Liquidity risk is the risk that the Fund will be unable to close out the derivative in the open market in a timely manner. Counterparty credit risk is the risk that the counterparty will not be able to fulfill its obligation to the Fund. Derivative counterparty credit risk is managed through formal evaluation of the creditworthiness of all potential counterparties. On certain OTC derivatives such as forward foreign currency contracts, options and bi-lateral swaps, the Fund attempts to reduce its exposure to counterparty credit risk by entering into an International Swaps and Derivatives Association, Inc. (ISDA) Master Agreement with each of its counterparties. The ISDA Master Agreement gives the Fund the right to terminate all transactions traded under such agreement upon the deterioration in the credit quality of the counterparty beyond specified levels. The ISDA Master Agreement gives each party the right, upon an event of default by the other party or a termination of the agreement, to close out all transactions traded under such agreement and to net amounts owed under each transaction to one net payable by one party to the other. To mitigate counterparty credit risk on bi-lateral OTC derivatives, the Fund receives collateral in the form of cash or securities once the net unrealized appreciation on outstanding derivative contracts under an ISDA Master Agreement exceeds certain applicable thresholds, subject to certain minimum transfer provisions. The collateral received is held in segregated accounts with the Fund's custodian bank in accordance with the collateral agreements entered into between the Fund, the counterparty and the Fund's custodian bank. The Fund could experience delays and costs in gaining access to the collateral even though it is held by the Fund's custodian bank. The Fund's maximum risk of loss from counterparty credit risk related to bi-lateral OTC derivatives is generally the aggregate unrealized appreciation and unpaid counterparty payments in excess of any collateral pledged by the counterparty to the Fund. For OTC written options with upfront premiums received, the Fund is obligated to perform and therefore does not have counterparty risk. For OTC written options with premiums to be received at a future date, the maximum risk of loss from counterparty credit risk is the amount of the premium in excess of any collateral pledged by the counterparty. The Fund may be required to pledge collateral for the benefit of the counterparties on bi-lateral OTC derivatives in an amount not less than each counterparty's unrealized appreciation on outstanding derivative contracts, subject to certain minimum transfer provisions, and any such pledged collateral is identified in the Schedule of Investments. Exchange-traded futures contracts are not covered by the ISDA Master Agreement; however counterparty credit risk related to exchange-traded futures contracts may be mitigated by the protection provided by the exchange on which they trade. Counterparty credit risk related to centrally cleared OTC swaps may be mitigated by the protection provided by the clearinghouse.
Investing in derivatives may involve greater risks than investing in the underlying assets directly and, to varying degrees, may involve risk of loss in excess of any initial investment and collateral received and amounts recognized in the Statement of Assets and Liabilities. In addition, there may be the risk that the change in value of the derivative contract does not correspond to the change in value of the underlying instrument.
Net Realized Gain (Loss) and Change in Net Unrealized Appreciation (Depreciation) on Derivatives. The table below, which reflects the impacts of derivatives on the financial performance of the Fund, summarizes the net realized gain (loss) and change in net unrealized appreciation (depreciation) for derivatives during the period as presented in the Statement of Operations.
| Primary Risk Exposure / Derivative Type | Net Realized Gain (Loss) | Change in Net Unrealized Appreciation (Depreciation) |
| Credit Risk | | |
| Purchased Options | $(645,952) | $2,372,674 |
| Swaps | (184,586) | (651,402) |
| Total Credit Risk | (830,538) | 1,721,272 |
| Foreign Exchange Risk | | |
| Forward Foreign Currency Contracts | 13,600,246 | 2,307,147 |
| Total Foreign Exchange Risk | 13,600,246 | 2,307,147 |
| Interest Rate Risk | | |
| Futures Contracts | (16,629,818) | (121,267) |
| Swaps | (63,230) | 2,838,561 |
| Written Option | (855,676) | (311,730) |
| Purchased Options | 3,170,217 | (259,957) |
| Total Interest Rate Risk | (14,378,507) | 2,145,607 |
| Totals | $(1,608,799) | $6,174,026 |
A summary of the value of derivatives by primary risk exposure as of period end is included at the end of the Schedule of Investments.
Forward Foreign Currency Contracts. Forward foreign currency contracts represent obligations to purchase or sell foreign currency on a specified future date at a price fixed at the time the contracts are entered into. The Fund used forward foreign currency contracts to facilitate transactions in foreign-denominated securities and to manage exposure to certain foreign currencies.
Forward foreign currency contracts are valued daily and fluctuations in exchange rates on open contracts are recorded as unrealized appreciation or (depreciation) and reflected in the Statement of Assets and Liabilities. When the contract is closed, the Fund realizes a gain or loss equal to the difference between the closing value and the value at the time it was opened. Non-deliverable forward foreign currency exchange contracts are settled with the counterparty in cash without the delivery of foreign currency. The net realized gain (loss) and change in net unrealized appreciation (depreciation) on forward foreign currency contracts during the period is presented in the Statement of Operations.
Any open forward foreign currency contracts at period end are presented in the Schedule of Investments under the caption "Forward Foreign Currency Contracts." The contract amount and unrealized appreciation (depreciation) reflects each contract's exposure to the underlying currency at period end and is representative of volume of activity during the period.
Futures Contracts. A futures contract is an agreement between two parties to buy or sell a specified underlying instrument for a fixed price at a specified future date. The Fund used futures contracts to manage its exposure to the bond market and fluctuations in interest rates.
Upon entering into a futures contract, a fund is required to deposit either cash or securities (initial margin) with a clearing broker in an amount equal to a certain percentage of the face value of the contract. Futures contracts are marked-to-market daily and subsequent daily payments (variation margin) are made or received by a fund depending on the daily fluctuations in the value of the futures contracts and are recorded as unrealized appreciation or (depreciation). This receivable and/or payable, if any, is included in daily variation margin on futures contracts in the Statement of Assets and Liabilities. Realized gain or (loss) is recorded upon the expiration or closing of a futures contract. The net realized gain (loss) and change in net unrealized appreciation (depreciation) on futures contracts during the period is presented in the Statement of Operations.
Any open futures contracts at period end are presented in the Schedule of Investments under the caption "Futures Contracts". The notional amount at value reflects each contract's exposure to the underlying instrument or index at period end and is representative of volume of activity during the period. Securities deposited to meet initial margin requirements are identified in the Schedule of Investments.
Options. Options give the purchaser the right, but not the obligation, to buy (call) or sell (put) an underlying security or financial instrument at an agreed exercise or strike price between or on certain dates. Options obligate the seller (writer) to buy (put) or sell (call) an underlying instrument at the exercise or strike price or cash settle an underlying derivative instrument if the holder exercises the option on or before the expiration date. The Fund uses OTC options, such as swaptions, which are options where the underlying instrument is a swap, to manage its exposure to fluctuations in interest rates and potential credit events.
Upon entering into an options contract, a fund will pay or receive a premium. Premiums paid on purchased options are reflected as cost of investments and premiums received on written options are reflected as a liability on the Statement of Assets and Liabilities. Certain options may be purchased or written with premiums to be paid or received on a future date. Options are valued daily and any unrealized appreciation (depreciation) is reflected on the Statement of Assets and Liabilities. When an option is exercised, the cost or proceeds of the underlying instrument purchased or sold is adjusted by the amount of the premium. When an option is closed the Fund will realize a gain or loss depending on whether the proceeds or amount paid for the closing sale transaction is greater or less than the premium received or paid. When an option expires, gains and losses are realized to the extent of premiums received and paid, respectively. The net realized and unrealized gains (losses) on purchased options are included in the Statement of Operations in net realized gain (loss) and change in net unrealized appreciation (depreciation) on investment securities. The net realized gain (loss) and change in net unrealized appreciation (depreciation) on written options are presented in the Statement of Operations.
Any open options at period end are presented in the Schedule of Investments under the captions "Purchased Options," "Purchased Swaptions," "Written Options" and "Written Swaptions," as applicable, and are representative of volume of activity during the period.
Writing puts and buying calls tend to increase exposure to the underlying instrument while buying puts and writing calls tend to decrease exposure to the underlying instrument. For purchased options, risk of loss is limited to the premium paid, and for written options, risk of loss is the change in value in excess of the premium received.
Swaps. A swap is a contract between two parties to exchange future cash flows at periodic intervals based on a notional principal amount. A bi-lateral OTC swap is a transaction between a fund and a dealer counterparty where cash flows are exchanged between the two parties for the life of the swap. A centrally cleared OTC swap is a transaction executed between a fund and a dealer counterparty, then cleared by a futures commission merchant (FCM) through a clearinghouse. Once cleared, the clearinghouse serves as a central counterparty, with whom a fund exchanges cash flows for the life of the transaction, similar to transactions in futures contracts.
Bi-lateral OTC swaps are marked-to-market daily and changes in value are reflected in the Statement of Assets and Liabilities in the bi-lateral OTC swaps at value line items. Any upfront premiums paid or received upon entering a bi-lateral OTC swap to compensate for differences between stated terms of the swap and prevailing market conditions (e.g. credit spreads, interest rates or other factors) are recorded in net unrealized appreciation (depreciation) in the Statement of Assets and Liabilities and amortized to realized gain or (loss) ratably over the term of the swap. Any unamortized upfront premiums are presented in the Schedule of Investments.
Centrally cleared OTC swaps require a fund to deposit either cash or securities (initial margin) with the FCM, at the instruction of and for the benefit of the clearinghouse. Securities deposited to meet initial margin requirements are identified in the Schedule of Investments. Centrally cleared OTC swaps are marked-to-market daily and subsequent payments (variation margin) are made or received depending on the daily fluctuations in the value of the swaps and are recorded as unrealized appreciation or (depreciation). These daily payments, if any, are included in receivable or payable for daily variation margin on centrally cleared OTC swaps in the Statement of Assets and Liabilities. Any premiums for centrally cleared OTC swaps are recorded periodically throughout the term of the swap to variation margin and included in unrealized appreciation (depreciation) in the Statement of Assets and Liabilities. Any premiums are recognized as realized gain (loss) upon termination or maturity of the swap.
For both bi-lateral and centrally cleared OTC swaps, payments are exchanged at specified intervals, accrued daily commencing with the effective date of the contract and recorded as realized gain or (loss). Some swaps may be terminated prior to the effective date and realize a gain or loss upon termination. The net realized gain (loss) and change in net unrealized appreciation (depreciation) on swaps during the period is presented in the Statement of Operations.
Any open swaps at period end are included in the Schedule of Investments under the caption "Swaps" and are representative of volume of activity during the period.
Credit Default Swaps. Credit default swaps enable the Fund to buy or sell protection against specified credit events on a single-name issuer or a traded credit index. Under the terms of a credit default swap the buyer of protection (buyer) receives credit protection in exchange for making periodic payments to the seller of protection (seller) based on a fixed percentage applied to a notional principal amount. In return for these payments, the seller will be required to make a payment upon the occurrence of one or more specified credit events. The Fund enters into credit default swaps as a seller to gain credit exposure to an issuer and/or as a buyer to obtain a measure of protection against defaults of an issuer. Periodic payments are made over the life of the contract by the buyer provided that no credit event occurs.
For credit default swaps on most corporate and sovereign issuers, credit events include bankruptcy, failure to pay or repudiation/moratorium. For credit default swaps on corporate or sovereign issuers, the obligation that may be put to the seller is not limited to the specific reference obligation described in the Schedule of Investments. For credit default swaps on asset-backed securities, a credit event may be triggered by events such as failure to pay principal, maturity extension, rating downgrade or write-down. For credit default swaps on asset-backed securities, the reference obligation described represents the security that may be put to the seller. For credit default swaps on a traded credit index, a specified credit event may affect all or individual underlying securities included in the index.
As a seller, if an underlying credit event occurs, the Fund will pay a net settlement amount of cash equal to the notional amount of the swap less the recovery value of the reference obligation or underlying securities comprising an index. Only in the event of the industry's inability to value the underlying asset will the Fund be required to take delivery of the reference obligation or underlying securities comprising an index and pay an amount equal to the notional amount of the swap.
As a buyer, if an underlying credit event occurs, the Fund will receive a net settlement amount of cash equal to the notional amount of the swap less the recovery value of the reference obligation or underlying securities comprising an index. Only in the event of the industry's inability to value the underlying asset will the Fund be required to deliver the reference obligation or underlying securities comprising an index in exchange for payment of an amount equal to the notional amount of the swap.
Typically, the value of each credit default swap and credit rating disclosed for each reference obligation in the Schedule of Investments, where the Fund is the seller, can be used as measures of the current payment/performance risk of the swap. As the value of the swap changes as a positive or negative percentage of the total notional amount, the payment/performance risk may decrease or increase, respectively. In addition to these measures, the investment adviser monitors a variety of factors including cash flow assumptions, market activity and market sentiment as part of its ongoing process of assessing payment/performance risk.
Interest Rate Swaps. Interest rate swaps are agreements between counterparties to exchange cash flows, one based on a fixed rate, and the other on a floating rate. The Fund entered into interest rate swaps to manage its exposure to interest rate changes. Changes in interest rates can have an effect on both the value of bond holdings as well as the amount of interest income earned. In general, the value of bonds can fall when interest rates rise and can rise when interest rates fall.
5. Purchases and Sales of Investments.
Purchases and sales of securities, other than short-term securities, U.S. government securities and certain in-kind transactions, aggregated $2,844,622,171 and $1,257,113,379, respectively.
6. Fees and Other Transactions with Affiliates.
Management Fee. Fidelity Management & Research Company (the investment adviser) and its affiliates provide the Fund with investment management related services for which the Fund pays a monthly management fee. The management fee is the sum of an individual fund fee rate that is based on an annual rate of .20% of the Fund's average net assets and an annualized group fee rate that averaged .10% during the period. The group fee rate is based upon the average net assets of all the mutual funds advised by the investment adviser, including any mutual funds previously advised by the investment adviser that are currently advised by Fidelity SelectCo, LLC, an affiliate of the investment adviser. The group fee rate decreases as assets under management increase and increases as assets under management decrease. For the reporting period, the total annualized management fee rate was .30% of the Fund's average net assets.
Transfer Agent Fees. Fidelity Investments Institutional Operations Company, Inc. (FIIOC), an affiliate of the investment adviser, is the Fund's transfer, dividend disbursing and shareholder servicing agent. Effective August 1, 2019 transfer agent fees are not paid by the Fund and are instead paid by the investment adviser or an affiliate. Prior to August 1, 2019, FIIOC received an asset-based fee of .10% of the Fund's average net assets. FIIOC paid for typesetting, printing and mailing of shareholder reports, except proxy statements.
Accounting Fees. Fidelity Service Company, Inc. (FSC), an affiliate of the investment adviser, maintains the Fund's accounting records. The fee is based on the level of average net assets for each month. Effective August 1, 2019 accounting fees are not paid by the Fund and are instead paid by the investment adviser or an affiliate. For the period, the fees were equivalent to an annualized rate of .01%.
Brokerage Commissions. The Fund placed a portion of its portfolio transactions with brokerage firms which are affiliates of the investment adviser. Brokerage commissions are included in net realized gain (loss) and change in net unrealized appreciation (depreciation) in the Statement of Operations. The commissions paid to these affiliated firms were $4 for the period.
Interfund Trades. The Fund may purchase from or sell securities to other Fidelity Funds under procedures adopted by the Board. The procedures have been designed to ensure these interfund trades are executed in accordance with Rule 17a-7 of the 1940 Act. Interfund trades are included within the respective purchases and sales amounts shown in the Purchases and Sales of Investments note.
Affiliated Exchanges In-Kind. During the period, the Fund received investments, including accrued interest and cash valued at $11,926,796,615 in exchange for 1,192,679,661 shares of the Fund. The amount of in-kind exchanges is included in share transactions in the accompanying Statement of Changes in Net Assets.
Affiliated Redemptions In-Kind. During the period, the Fund redeemed 6,046,238 shares of Fidelity Real Estate High Income Fund in exchange for investments and cash, including accrued interest, with a value of $51,030,249. The net realized gains of $30,249 on the Fund's redemptions of Fidelity Real Estate High Income Fund shares are included in "Net realized gain (loss) on Investment securities: Other affiliated issuers" in the accompanying Statement of Operations. The Fund recognized gains on the exchanges for federal income tax purposes.
7. Committed Line of Credit.
The Fund participates with other funds managed by the investment adviser or an affiliate in a $4.25 billion credit facility (the "line of credit") to be utilized for temporary or emergency purposes to fund shareholder redemptions or for other short-term liquidity purposes. The Fund has agreed to pay commitment fees on its pro-rata portion of the line of credit, which amounted to $10,599 and is reflected in Miscellaneous expenses on the Statement of Operations. During the period, the Fund did not borrow on this line of credit.
8. Expense Reductions.
The investment adviser contractually agreed to reimburse the Fund to the extent annual operating expenses exceeded .36% of average net assets. This reimbursement will remain in place through December 31, 2020. During the period this reimbursement reduced the Fund's expenses by $6,436,221.
Commissions paid to certain brokers with whom the investment adviser, or its affiliates, places trades on behalf of the Fund include an amount in addition to trade execution, which may be rebated back to the Fund to offset certain expenses. This amount totaled $166 for the period. In addition, through arrangements with the Fund's custodian, credits realized as a result of certain uninvested cash balances were used to reduce the Fund's expenses. During the period, these credits reduced the Fund's expenses by $5,563.
In addition, during the period the investment adviser reimbursed and/or waived a portion of operating expenses in the amount of $61,337.
9. Other.
The Fund's organizational documents provide former and current trustees and officers with a limited indemnification against liabilities arising in connection with the performance of their duties to the Fund. In the normal course of business, the Fund may also enter into contracts that provide general indemnifications. The Fund's maximum exposure under these arrangements is unknown as this would be dependent on future claims that may be made against the Fund. The risk of material loss from such claims is considered remote.
At the end of the period, Strategic Advisers Core Income Fund and Strategic Advisers Fidelity Core Income Fund were the owners of record of approximately 48% and 52%, respectively of the total outstanding shares of the Fund.
Report of Independent Registered Public Accounting Firm
To the Board of Trustees of Fidelity Salem Street Trust and Shareholders of Fidelity SAI Total Bond Fund:
Opinion on the Financial Statements
We have audited the accompanying statement of assets and liabilities, including the schedule of investments, of Fidelity SAI Total Bond Fund (one of the funds constituting Fidelity Salem Street Trust, referred to hereafter as the “Fund”) as of August 31, 2019, and the related statements of operations and changes in net assets, including the related notes, and the financial highlights for the period October 25, 2018 (commencement of operations) through August 31, 2019 (collectively referred to as the “financial statements”). In our opinion, the financial statements present fairly, in all material respects, the financial position of the Fund as of August 31, 2019, and the results of its operations, changes in its net assets, and the financial highlights for the period October 25, 2018 (commencement of operations) through August 31, 2019 in conformity with accounting principles generally accepted in the United States of America.
Basis for Opinion
These financial statements are the responsibility of the Fund’s management. Our responsibility is to express an opinion on the Fund’s financial statements based on our audit. We are a public accounting firm registered with the Public Company Accounting Oversight Board (United States) (PCAOB) and are required to be independent with respect to the Fund in accordance with the U.S. federal securities laws and the applicable rules and regulations of the Securities and Exchange Commission and the PCAOB.
We conducted our audit of these financial statements in accordance with the standards of the PCAOB. Those standards require that we plan and perform the audit to obtain reasonable assurance about whether the financial statements are free of material misstatement, whether due to error or fraud.
Our audit included performing procedures to assess the risks of material misstatement of the financial statements, whether due to error or fraud, and performing procedures that respond to those risks. Such procedures included examining, on a test basis, evidence regarding the amounts and disclosures in the financial statements. Our audit also included evaluating the accounting principles used and significant estimates made by management, as well as evaluating the overall presentation of the financial statements. Our procedures included confirmation of securities owned as of August 31, 2019 by correspondence with the custodian, agent banks, issuers of privately offered securities, and brokers; when replies were not received from brokers, we performed other auditing procedures. We believe that our audit provides a reasonable basis for our opinion.
PricewaterhouseCoopers LLP
Boston, Massachusetts
October 18, 2019
We have served as the auditor of one or more investment companies in the Fidelity group of funds since 1932.
Trustees and Officers
The Trustees, Members of the Advisory Board (if any), and officers of the trust and fund, as applicable, are listed below. The Board of Trustees governs the fund and is responsible for protecting the interests of shareholders. The Trustees are experienced executives who meet periodically throughout the year to oversee the fund's activities, review contractual arrangements with companies that provide services to the fund, oversee management of the risks associated with such activities and contractual arrangements, and review the fund's performance. Except for Jonathan Chiel, each of the Trustees oversees 276 funds. Mr. Chiel oversees 170 funds.
The Trustees hold office without limit in time except that (a) any Trustee may resign; (b) any Trustee may be removed by written instrument, signed by at least two-thirds of the number of Trustees prior to such removal; (c) any Trustee who requests to be retired or who has become incapacitated by illness or injury may be retired by written instrument signed by a majority of the other Trustees; and (d) any Trustee may be removed at any special meeting of shareholders by a two-thirds vote of the outstanding voting securities of the trust. Each Trustee who is not an interested person (as defined in the 1940 Act) of the trust and the fund is referred to herein as an Independent Trustee. Each Independent Trustee shall retire not later than the last day of the calendar year in which his or her 75th birthday occurs. The Independent Trustees may waive this mandatory retirement age policy with respect to individual Trustees. Officers and Advisory Board Members hold office without limit in time, except that any officer or Advisory Board Member may resign or may be removed by a vote of a majority of the Trustees at any regular meeting or any special meeting of the Trustees. Except as indicated, each individual has held the office shown or other offices in the same company for the past five years.
The fund’s Statement of Additional Information (SAI) includes more information about the Trustees. To request a free copy, call Fidelity at 1-800-544-3455.
Experience, Skills, Attributes, and Qualifications of the Trustees. The Governance and Nominating Committee has adopted a statement of policy that describes the experience, qualifications, attributes, and skills that are necessary and desirable for potential Independent Trustee candidates (Statement of Policy). The Board believes that each Trustee satisfied at the time he or she was initially elected or appointed a Trustee, and continues to satisfy, the standards contemplated by the Statement of Policy. The Governance and Nominating Committee also engages professional search firms to help identify potential Independent Trustee candidates who have the experience, qualifications, attributes, and skills consistent with the Statement of Policy. From time to time, additional criteria based on the composition and skills of the current Independent Trustees, as well as experience or skills that may be appropriate in light of future changes to board composition, business conditions, and regulatory or other developments, have also been considered by the professional search firms and the Governance and Nominating Committee. In addition, the Board takes into account the Trustees' commitment and participation in Board and committee meetings, as well as their leadership of standing and ad hoc committees throughout their tenure.
In determining that a particular Trustee was and continues to be qualified to serve as a Trustee, the Board has considered a variety of criteria, none of which, in isolation, was controlling. The Board believes that, collectively, the Trustees have balanced and diverse experience, qualifications, attributes, and skills, which allow the Board to operate effectively in governing the fund and protecting the interests of shareholders. Information about the specific experience, skills, attributes, and qualifications of each Trustee, which in each case led to the Board's conclusion that the Trustee should serve (or continue to serve) as a trustee of the fund, is provided below.
Board Structure and Oversight Function. Abigail P. Johnson is an interested person and currently serves as Chairman. The Trustees have determined that an interested Chairman is appropriate and benefits shareholders because an interested Chairman has a personal and professional stake in the quality and continuity of services provided to the fund. Independent Trustees exercise their informed business judgment to appoint an individual of their choosing to serve as Chairman, regardless of whether the Trustee happens to be independent or a member of management. The Independent Trustees have determined that they can act independently and effectively without having an Independent Trustee serve as Chairman and that a key structural component for assuring that they are in a position to do so is for the Independent Trustees to constitute a substantial majority for the Board. The Independent Trustees also regularly meet in executive session. Arthur E. Johnson serves as Chairman of the Independent Trustees and as such (i) acts as a liaison between the Independent Trustees and management with respect to matters important to the Independent Trustees and (ii) with management prepares agendas for Board meetings.
Fidelity® funds are overseen by different Boards of Trustees. The fund's Board oversees Fidelity's investment-grade bond, money market, asset allocation and certain equity funds, and other Boards oversee Fidelity's high income and other equity funds. The asset allocation funds may invest in Fidelity® funds that are overseen by such other Boards. The use of separate Boards, each with its own committee structure, allows the Trustees of each group of Fidelity® funds to focus on the unique issues of the funds they oversee, including common research, investment, and operational issues. On occasion, the separate Boards establish joint committees to address issues of overlapping consequences for the Fidelity® funds overseen by each Board.
The Trustees operate using a system of committees to facilitate the timely and efficient consideration of all matters of importance to the Trustees, the fund, and fund shareholders and to facilitate compliance with legal and regulatory requirements and oversight of the fund's activities and associated risks. The Board, acting through its committees, has charged FMR and its affiliates with (i) identifying events or circumstances the occurrence of which could have demonstrably adverse effects on the fund's business and/or reputation; (ii) implementing processes and controls to lessen the possibility that such events or circumstances occur or to mitigate the effects of such events or circumstances if they do occur; and (iii) creating and maintaining a system designed to evaluate continuously business and market conditions in order to facilitate the identification and implementation processes described in (i) and (ii) above. Because the day-to-day operations and activities of the fund are carried out by or through FMR, its affiliates, and other service providers, the fund's exposure to risks is mitigated but not eliminated by the processes overseen by the Trustees. While each of the Board's committees has responsibility for overseeing different aspects of the fund's activities, oversight is exercised primarily through the Operations and Audit Committees. In addition, an ad hoc Board committee of Independent Trustees has worked with FMR to enhance the Board's oversight of investment and financial risks, legal and regulatory risks, technology risks, and operational risks, including the development of additional risk reporting to the Board. Appropriate personnel, including but not limited to the fund's Chief Compliance Officer (CCO), FMR's internal auditor, the independent accountants, the fund's Treasurer and portfolio management personnel, make periodic reports to the Board's committees, as appropriate, including an annual review of Fidelity's risk management program for the Fidelity® funds. The responsibilities of each standing committee, including their oversight responsibilities, are described further under "Standing Committees of the Trustees."
Interested Trustees*:
Correspondence intended for a Trustee who is an interested person may be sent to Fidelity Investments, 245 Summer Street, Boston, Massachusetts 02210.
Name, Year of Birth; Principal Occupations and Other Relevant Experience+
Jonathan Chiel (1957)
Year of Election or Appointment: 2016
Trustee
Mr. Chiel also serves as Trustee of other Fidelity® funds. Mr. Chiel is Executive Vice President and General Counsel for FMR LLC (diversified financial services company, 2012-present). Previously, Mr. Chiel served as general counsel (2004-2012) and senior vice president and deputy general counsel (2000-2004) for John Hancock Financial Services; a partner with Choate, Hall & Stewart (1996-2000) (law firm); and an Assistant United States Attorney for the United States Attorney’s Office of the District of Massachusetts (1986-95), including Chief of the Criminal Division (1993-1995). Mr. Chiel is a director on the boards of the Boston Bar Foundation and the Maimonides School.
Abigail P. Johnson (1961)
Year of Election or Appointment: 2009
Trustee
Chairman of the Board of Trustees
Ms. Johnson also serves as Trustee of other Fidelity® funds. Ms. Johnson serves as Chairman (2016-present), Chief Executive Officer (2014-present), and Director (2007-present) of FMR LLC (diversified financial services company), President of Fidelity Financial Services (2012-present) and President of Personal, Workplace and Institutional Services (2005-present). Ms. Johnson is Chairman and Director of FMR Co., Inc. (investment adviser firm, 2011-present) and Chairman and Director of FMR (investment adviser firm, 2011-present). Previously, Ms. Johnson served as Vice Chairman (2007-2016) and President (2013-2016) of FMR LLC, President and a Director of FMR (2001-2005), a Trustee of other investment companies advised by FMR, Fidelity Investments Money Management, Inc. (investment adviser firm), and FMR Co., Inc. (2001-2005), Senior Vice President of the Fidelity® funds (2001-2005), and managed a number of Fidelity® funds. Ms. Abigail P. Johnson and Mr. Arthur E. Johnson are not related.
Jennifer Toolin McAuliffe (1959)
Year of Election or Appointment: 2016
Trustee
Ms. McAuliffe also serves as Trustee of other Fidelity® funds. Ms. McAuliffe previously served as a Member of the Advisory Board of certain Fidelity® funds (2016) and as Co-Head of Fixed Income of Fidelity Investments Limited (now known as FIL Limited (FIL)) (diversified financial services company). Earlier roles at FIL included Director of Research for FIL’s credit and quantitative teams in London, Hong Kong and Tokyo. Ms. McAuliffe also was the Director of Research for taxable and municipal bonds at Fidelity Investments Money Management, Inc. Ms. McAuliffe is also a director or trustee of several not-for-profit entities.
* Determined to be an “Interested Trustee” by virtue of, among other things, his or her affiliation with the trust or various entities under common control with FMR.
+ The information includes the Trustee's principal occupation during the last five years and other information relating to the experience, attributes, and skills relevant to the Trustee's qualifications to serve as a Trustee, which led to the conclusion that the Trustee should serve as a Trustee for the fund.
Independent Trustees:
Correspondence intended for an Independent Trustee may be sent to Fidelity Investments, P.O. Box 55235, Boston, Massachusetts 02205-5235.
Name, Year of Birth; Principal Occupations and Other Relevant Experience+
Elizabeth S. Acton (1951)
Year of Election or Appointment: 2013
Trustee
Ms. Acton also serves as Trustee of other Fidelity® funds. Prior to her retirement in April 2012, Ms. Acton was Executive Vice President, Finance (2011-2012), Executive Vice President, Chief Financial Officer (2002-2011), and Treasurer (2004-2005) of Comerica Incorporated (financial services). Prior to joining Comerica, Ms. Acton held a variety of positions at Ford Motor Company (1983-2002), including Vice President and Treasurer (2000-2002) and Executive Vice President and Chief Financial Officer of Ford Motor Credit Company (1998-2000). Ms. Acton currently serves as a member of the Board of Directors and Audit and Finance Committees of Beazer Homes USA, Inc. (homebuilding, 2012-present). Previously, Ms. Acton served as a Member of the Advisory Board of certain Fidelity® funds (2013-2016).
Ann E. Dunwoody (1953)
Year of Election or Appointment: 2018
Trustee
General Dunwoody also serves as Trustee of other Fidelity® funds. General Dunwoody (United States Army, Retired) was the first woman in U.S. military history to achieve the rank of four-star general and prior to her retirement in 2012 held a variety of positions within the U.S. Army, including Commanding General, U.S. Army Material Command (2008-2012). She is the President of First to Four LLC (leadership and mentoring services, 2012-present). She also serves as a member of the Board of Directors and Nominating and Corporate Governance Committee of L3 Technologies, Inc. (communication, electronic, sensor, and aerospace systems, 2013-present), Board of Directors and Nomination and Corporate Governance Committees of Kforce Inc. (professional staffing services, 2016-present) and Board of Directors of Automattic Inc. (software engineering, 2018-present). Previously, General Dunwoody served as a Member of the Advisory Board of certain Fidelity® funds (2018), a member of the Board of Directors and Audit and Sustainability and Corporate Responsibility Committees of Republic Services, Inc. (waste collection, disposal and recycling, 2013-2016). Ms. Dunwoody also serves on several boards for non-profit organizations, including as a member of the Board of Directors, Chair of the Nomination and Governance Committee and member of the Audit Committee of Logistics Management Institute (consulting non-profit, 2012-present), a member of the Board of Directors of the Army Historical Foundation (2015-present), a member of the Council of Trustees for the Association of the United States Army (advocacy non-profit, 2013-present) and a member of the Board of Trustees of Florida Institute of Technology (2015-present) and ThanksUSA (military family education non-profit, 2014-present).
John Engler (1948)
Year of Election or Appointment: 2014
Trustee
Mr. Engler also serves as Trustee of other Fidelity® funds. He serves on the board of directors for Universal Forest Products (manufacturer and distributor of wood and wood-alternative products, 2003-present) and K12 Inc. (technology-based education company, 2012-present). Previously, Mr. Engler served as interim president of Michigan State University (2018-2019), a Member of the Advisory Board of certain Fidelity® funds (2014-2016), president of the Business Roundtable (2011-2017), a trustee of The Munder Funds (2003-2014), president and CEO of the National Association of Manufacturers (2004-2011), member of the Board of Trustees of the Annie E. Casey Foundation (2004-2015), and as governor of Michigan (1991-2003). He is a past chairman of the National Governors Association.
Robert F. Gartland (1951)
Year of Election or Appointment: 2010
Trustee
Mr. Gartland also serves as Trustee of other Fidelity® funds. Mr. Gartland is Chairman and an investor in Gartland & Mellina Group Corp. (consulting, 2009-present). Previously, Mr. Gartland served as a partner and investor of Vietnam Partners LLC (investments and consulting, 2008-2011). Prior to his retirement, Mr. Gartland held a variety of positions at Morgan Stanley (financial services, 1979-2007), including Managing Director (1987-2007), and Chase Manhattan Bank (1975-1978).
Arthur E. Johnson (1947)
Year of Election or Appointment: 2008
Trustee
Chairman of the Independent Trustees
Mr. Johnson also serves as Trustee of other Fidelity® funds. Mr. Johnson serves as a member of the Board of Directors of Eaton Corporation plc (diversified power management, 2009-present) and Booz Allen Hamilton (management consulting, 2011-present). Prior to his retirement, Mr. Johnson served as Senior Vice President of Corporate Strategic Development of Lockheed Martin Corporation (defense contractor, 1999-2009). Mr. Johnson previously served as Vice Chairman (2015-2018) of the Independent Trustees of certain Fidelity® funds and on the Board of Directors of IKON Office Solutions, Inc. (1999-2008), AGL Resources, Inc. (holding company, 2002-2016), and Delta Airlines (2005-2007). Mr. Arthur E. Johnson is not related to Ms. Abigail P. Johnson.
Michael E. Kenneally (1954)
Year of Election or Appointment: 2009
Trustee
Vice Chairman of the Independent Trustees
Mr. Kenneally also serves as Trustee of other Fidelity® funds. Prior to his retirement, Mr. Kenneally served as Chairman and Global Chief Executive Officer of Credit Suisse Asset Management. Before joining Credit Suisse, he was an Executive Vice President and Chief Investment Officer for Bank of America Corporation. Earlier roles at Bank of America included Director of Research, Senior Portfolio Manager and Research Analyst, and Mr. Kenneally was awarded the Chartered Financial Analyst (CFA) designation in 1991.
Marie L. Knowles (1946)
Year of Election or Appointment: 2001
Trustee
Ms. Knowles also serves as Trustee of other Fidelity® funds. Prior to Ms. Knowles' retirement in June 2000, she served as Executive Vice President and Chief Financial Officer of Atlantic Richfield Company (ARCO) (diversified energy, 1996-2000). From 1993 to 1996, she was a Senior Vice President of ARCO and President of ARCO Transportation Company (pipeline and tanker operations). Ms. Knowles currently serves as a Director and Chairman of the Audit Committee of McKesson Corporation (healthcare service, since 2002). Ms. Knowles is a member of the Board of the Santa Catalina Island Company (real estate, 2009-present). Ms. Knowles is a Member of the Investment Company Institute Board of Governors and a Member of the Governing Council of the Independent Directors Council (2014-present). She also serves as a member of the Advisory Board for the School of Engineering of the University of Southern California. Previously, Ms. Knowles served as a Director of Phelps Dodge Corporation (copper mining and manufacturing, 1994-2007), URS Corporation (engineering and construction, 2000-2003) and America West (airline, 1999-2002). Ms. Knowles previously served as Chairman (2015-2018) and Vice Chairman (2012-2015) of the Independent Trustees of certain Fidelity® funds.
Mark A. Murray (1954)
Year of Election or Appointment: 2016
Trustee
Mr. Murray also serves as Trustee of other Fidelity® funds. Mr. Murray is Vice Chairman (2013-present) of Meijer, Inc. (regional retail chain). Previously, Mr. Murray served as a Member of the Advisory Board of certain Fidelity® funds (2016) and as Co-Chief Executive Officer (2013-2016) and President (2006-2013) of Meijer, Inc. Mr. Murray serves as a member of the Board of Directors and Nuclear Review and Public Policy and Responsibility Committees of DTE Energy Company (diversified energy company, 2009-present). Mr. Murray also serves as a member of the Board of Directors of Spectrum Health (not-for-profit health system, 2015-present). Mr. Murray previously served as President of Grand Valley State University (2001-2006), Treasurer for the State of Michigan (1999-2001), Vice President of Finance and Administration for Michigan State University (1998-1999), and a member of the Board of Directors and Audit Committee and Chairman of the Nominating and Corporate Governance Committee of Universal Forest Products, Inc. (manufacturer and distributor of wood and wood-alternative products, 2004-2016). Mr. Murray is also a director or trustee of many community and professional organizations.
+ The information includes the Trustee's principal occupation during the last five years and other information relating to the experience, attributes, and skills relevant to the Trustee's qualifications to serve as a Trustee, which led to the conclusion that the Trustee should serve as a Trustee for the fund.
Advisory Board Members and Officers:
Correspondence intended for an officer may be sent to Fidelity Investments, 245 Summer Street, Boston, Massachusetts 02210. Officers appear below in alphabetical order.
Name, Year of Birth; Principal Occupation
Elizabeth Paige Baumann (1968)
Year of Election or Appointment: 2017
Anti-Money Laundering (AML) Officer
Ms. Baumann also serves as AML Officer of other funds. She is Chief AML Officer (2012-present) and Senior Vice President (2014-present) of FMR LLC (diversified financial services company) and is an employee of Fidelity Investments. Previously, Ms. Baumann served as AML Officer of the funds (2012-2016), and Vice President (2007-2014) and Deputy Anti-Money Laundering Officer (2007-2012) of FMR LLC.
Craig S. Brown (1977)
Year of Election or Appointment: 2019
Assistant Treasurer
Mr. Brown also serves as Assistant Treasurer of other funds. Mr. Brown is an employee of Fidelity Investments (2013-present).
John J. Burke III (1964)
Year of Election or Appointment: 2018
Chief Financial Officer
Mr. Burke also serves as Chief Financial Officer of other funds. Mr. Burke serves as Head of Investment Operations for Fidelity Fund and Investment Operations (2018-present) and is an employee of Fidelity Investments (1998-present). Previously Mr. Burke served as head of Asset Management Investment Operations (2012-2018).
Jonathan Davis (1968)
Year of Election or Appointment: 2010
Assistant Treasurer
Mr. Davis also serves as Assistant Treasurer of other funds. Mr. Davis serves as Assistant Treasurer of FMR Capital, Inc. (2017-present) and is an employee of Fidelity Investments. Previously, Mr. Davis served as Vice President and Associate General Counsel of FMR LLC (diversified financial services company, 2003-2010).
Adrien E. Deberghes (1967)
Year of Election or Appointment: 2010
Assistant Treasurer
Mr. Deberghes also serves as an officer of other funds. He serves as Assistant Treasurer of FMR Capital, Inc. (2017-present), Executive Vice President of Fidelity Investments Money Management, Inc. (FIMM) (investment adviser firm, 2016-present), and is an employee of Fidelity Investments (2008-present). Previously, Mr. Deberghes served as President and Treasurer of certain Fidelity® funds (2013-2018). Prior to joining Fidelity Investments, Mr. Deberghes was Senior Vice President of Mutual Fund Administration at State Street Corporation (2007-2008), Senior Director of Mutual Fund Administration at Investors Bank & Trust (2005-2007), and Director of Finance for Dunkin' Brands (2000-2005). Previously, Mr. Deberghes served in other fund officer roles.
Laura M. Del Prato (1964)
Year of Election or Appointment: 2018
President and Treasurer
Ms. Del Prato also serves as an officer of other funds. Ms. Del Prato is an employee of Fidelity Investments (2017-present). Prior to joining Fidelity Investments, Ms. Del Prato served as a Managing Director and Treasurer of the JPMorgan Mutual Funds (2014-2017). Prior to JPMorgan, Ms. Del Prato served as a partner at Cohen Fund Audit Services (accounting firm, 2012-2013) and KPMG LLP (accounting firm, 2004-2012).
Colm A. Hogan (1973)
Year of Election or Appointment: 2016
Assistant Treasurer
Mr. Hogan also serves as an officer of other funds. Mr. Hogan serves as Assistant Treasurer of FMR Capital, Inc. (2017-present) and is an employee of Fidelity Investments (2005-present). Previously, Mr. Hogan served as Assistant Treasurer of certain Fidelity® funds (2016-2018).
Cynthia Lo Bessette (1969)
Year of Election or Appointment: 2019
Secretary and Chief Legal Officer (CLO)
Ms. Lo Bessette also serves as Secretary and CLO of other funds. She is a Senior Vice President and Deputy General Counsel of FMR LLC (diversified financial services company, 2019-present), and is an employee of Fidelity Investments. Previously, Ms. Lo Bessette served as Executive Vice President, General Counsel (2016-2019) and Senior Vice President, Deputy General Counsel (2015-2016) of OppenheimerFunds (investment management company) and Deputy Chief Legal Officer (2013-2015) of Jennison Associates LLC (investment adviser firm).
Chris Maher (1972)
Year of Election or Appointment: 2013
Assistant Treasurer
Mr. Maher serves as Assistant Treasurer of other funds. Mr. Maher is Vice President of Valuation Oversight, serves as Assistant Treasurer of FMR Capital, Inc. (2017-present), and is an employee of Fidelity Investments. Previously, Mr. Maher served as Vice President of Asset Management Compliance (2013), Vice President of the Program Management Group of FMR (investment adviser firm, 2010-2013), and Vice President of Valuation Oversight (2008-2010).
John B. McGinty, Jr. (1962)
Year of Election or Appointment: 2016
Chief Compliance Officer
Mr. McGinty also serves as Chief Compliance Officer of other funds. Mr. McGinty is Senior Vice President of Asset Management Compliance for Fidelity Investments and is an employee of Fidelity Investments (2016-present). Mr. McGinty previously served as Vice President, Senior Attorney at Eaton Vance Management (investment management firm, 2015-2016), and prior to Eaton Vance as global CCO for all firm operations and registered investment companies at GMO LLC (investment management firm, 2009-2015). Before joining GMO LLC, Mr. McGinty served as Senior Vice President, Deputy General Counsel for Fidelity Investments (2007-2009).
Jason P. Pogorelec (1975)
Year of Election or Appointment: 2015
Assistant Secretary
Mr. Pogorelec also serves as Assistant Secretary of other funds. Mr. Pogorelec serves as Vice President, Associate General Counsel (2010-present) and is an employee of Fidelity Investments (2006-present).
Nancy D. Prior (1967)
Year of Election or Appointment: 2014
Vice President
Ms. Prior also serves as Vice President of other funds. Ms. Prior serves as President of Fixed Income (2014-present), President (2016-present) and Director (2014-present) of Fidelity Investments Money Management, Inc. (FIMM) (investment adviser firm), and is an employee of Fidelity Investments (2002-present). Previously, Ms. Prior served as Vice Chairman of FIAM LLC (investment adviser firm, 2014-2018), a Director of FMR Investment Management (UK) Limited (investment adviser firm, 2015-2018), President Multi-Asset Class Strategies of FMR's Global Asset Allocation Division (2017-2018), Vice President of Fidelity's Money Market Funds (2012-2014), and President, Money Market and Short Duration Bond Group of Fidelity Management & Research Company (FMR) (investment adviser firm, 2013-2014).
Stacie M. Smith (1974)
Year of Election or Appointment: 2013
Assistant Treasurer
Ms. Smith also serves as an officer of other funds. Ms. Smith serves as Assistant Treasurer of FMR Capital, Inc. (2017-present), is an employee of Fidelity Investments (2009-present), and has served in other fund officer roles. Prior to joining Fidelity Investments, Ms. Smith served as Senior Audit Manager of Ernst & Young LLP (accounting firm, 1996-2009). Previously, Ms. Smith served as Assistant Treasurer (2013-2018) and Deputy Treasurer (2013-2016) of certain Fidelity® funds.
Marc L. Spector (1972)
Year of Election or Appointment: 2016
Deputy Treasurer
Mr. Spector also serves as an officer of other funds. Mr. Spector serves as Assistant Treasurer of FMR Capital, Inc. (2017-present) and is an employee of Fidelity Investments (2016-present). Prior to joining Fidelity Investments, Mr. Spector served as Director at the Siegfried Group (accounting firm, 2013-2016), and prior to Siegfried Group as audit senior manager at Deloitte & Touche (accounting firm, 2005-2013).
Jim Wegmann (1979)
Year of Election or Appointment: 2019
Assistant Treasurer
Mr. Wegmann also serves as Assistant Treasurer of other funds. Mr. Wegmann is an employee of Fidelity Investments (2011-present).
Shareholder Expense Example
As a shareholder of the Fund, you incur two types of costs: (1) transaction costs and (2) ongoing costs, including management fees and other Fund expenses. This Example is intended to help you understand your ongoing costs (in dollars) of investing in the Fund and to compare these costs with the ongoing costs of investing in other mutual funds.
The Example is based on an investment of $1,000 invested at the beginning of the period and held for the entire period (March 1, 2019 to August 31, 2019).
Actual Expenses
The first line of the accompanying table provides information about actual account values and actual expenses. You may use the information in this line, together with the amount you invested, to estimate the expenses that you paid over the period. Simply divide your account value by $1,000.00 (for example, an $8,600 account value divided by $1,000.00 = 8.6), then multiply the result by the number in the first line under the heading entitled "Expenses Paid During Period" to estimate the expenses you paid on your account during this period. In addition, the Fund, as a shareholder in the underlying Fidelity Central Funds, will indirectly bear its pro-rata share of the fees and expenses incurred by the underlying Fidelity Central Funds. These fees and expenses are not included in the Fund's annualized expense ratio used to calculate the expense estimate in the table below.
Hypothetical Example for Comparison Purposes
The second line of the accompanying table provides information about hypothetical account values and hypothetical expenses based on the Fund's actual expense ratio and an assumed rate of return of 5% per year before expenses, which is not the Fund's actual return. The hypothetical account values and expenses may not be used to estimate the actual ending account balance or expenses you paid for the period. You may use this information to compare the ongoing costs of investing in the Fund and other funds. To do so, compare this 5% hypothetical example with the 5% hypothetical examples that appear in the shareholder reports of the other funds. In addition, the Fund, as a shareholder in the underlying Fidelity Central Funds, will indirectly bear its pro-rata share of the fees and expenses incurred by the underlying Fidelity Central Funds. These fees and expenses are not included in the Fund's annualized expense ratio used to calculate the expense estimate in the table below.
Please note that the expenses shown in the table are meant to highlight your ongoing costs only and do not reflect any transaction costs. Therefore, the second line of the table is useful in comparing ongoing costs only, and will not help you determine the relative total costs of owning different funds.
| | Annualized Expense Ratio-A | Beginning
Account Value
March 1, 2019 | Ending
Account Value
August 31, 2019 | Expenses Paid
During Period-B
March 1, 2019
to August 31, 2019 |
| Actual | .36% | $1,000.00 | $1,074.50 | $1.88** |
| Hypothetical-C | | $1,000.00 | $1,023.39 | $1.84** |
A Annualized expense ratio reflects expenses net of applicable fee waivers.
B Expenses are equal to the Fund's annualized expense ratio, multiplied by the average account value over the period, multiplied by 184/365 (to reflect the one-half year period).
C 5% return per year before expenses
** If fees and changes to the Fund level expense contract and/ or expense cap, effective August 1, 2019, had been in effect during the entire current period, the restated annualized expense ratio would have been .31% and the expenses paid in the actual and hypothetical examples above would have been $1.62 and $1.58, respectively.
Distributions (Unaudited)
The Board of Trustees of Fidelity SAI Total Bond Fund voted to pay on October 14, 2019, to shareholders of record at the opening of business on October 11, 2019, a distribution of $0.147 per share derived from capital gains realized from sales of portfolio securities.
A total of 21.89% of the dividends distributed during the fiscal year was derived from interest on U.S. Government securities which is generally exempt from state income tax.
The fund designates $251,696,261 of distributions paid during the period January 1, 2019 to August 31, 2019 as qualifying to be taxed as interest-related dividends for nonresident alien shareholders.
The fund will notify shareholders in January 2020 of amounts for use in preparing 2019 income tax returns.
STB-ANN-1019
1.9887627.100
Item 2.
Code of Ethics
As of the end of the period, August 31, 2019, Fidelity Salem Street Trust (the trust) has adopted a code of ethics, as defined in Item 2 of Form N-CSR, that applies to its President and Treasurer and its Chief Financial Officer. A copy of the code of ethics is filed as an exhibit to this Form N-CSR.
Item 3.
Audit Committee Financial Expert
The Board of Trustees of the trust has determined that Elizabeth S. Acton is an audit committee financial expert, as defined in Item 3 of Form N-CSR. Ms. Acton is independent for purposes of Item 3 of Form N-CSR.
Item 4.
Principal Accountant Fees and Services
Fees and Services
The following table presents fees billed by PricewaterhouseCoopers LLP (“PwC”) in each of the last two fiscal years for services rendered to Fidelity Corporate Bond Fund, Fidelity Flex Short-Term Bond Fund, Fidelity Flex U.S. Bond Index Fund, Fidelity Investment Grade Bond Fund, Fidelity SAI Total Bond Fund, Fidelity Series Bond Index Fund, Fidelity Series Government Money Market Fund, Fidelity Series Investment Grade Bond Fund, Fidelity Series Short-Term Credit Fund, Fidelity Short-Term Bond Fund and Fidelity U.S. Bond Index Fund (the “Funds”):
Services Billed by PwC
August 31, 2019 FeesA,B
| | | | |
| Audit Fees | Audit-Related Fees | Tax Fees | All Other Fees |
Fidelity Corporate Bond Fund | $85,000 | $6,300 | $3,300 | $3,600 |
Fidelity Flex Short-Term Bond Fund | $79,000 | $6,200 | $5,200 | $3,500 |
Fidelity Flex U.S. Bond Index Fund | $80,000 | $6,000 | $3,500 | $3,500 |
Fidelity Investment Grade Bond Fund | $115,000 | $8,300 | $4,600 | $4,800 |
Fidelity SAI Total Bond Fund | $99,000 | $6,600 | $4,600 | $3,800 |
Fidelity Series Bond Index Fund | $60,000 | $2,100 | $4,600 | $1,200 |
Fidelity Series Government Money Market Fund | $36,000 | $2,900 | $2,000 | $1,700 |
Fidelity Series Investment Grade Bond Fund | $113,000 | $9,200 | $4,600 | $5,300 |
Fidelity Series Short-Term Credit Fund | $72,000 | $5,700 | $3,300 | $3,300 |
Fidelity Short-Term Bond Fund | $107,000 | $8,000 | $4,600 | $4,600 |
Fidelity U.S. Bond Index Fund | $97,000 | $8,000 | $4,600 | $4,600 |
| | | | |
| Audit Fees | Audit-Related Fees | Tax Fees | All Other Fees |
Fidelity Corporate Bond Fund | $78,000 | $6,700 | $4,600 | $3,700 |
Fidelity Flex Short-Term Bond Fund | $69,000 | $6,100 | $5,200 | $3,400 |
Fidelity Flex U.S. Bond Index Fund | $69,000 | $5,900 | $3,500 | $3,300 |
Fidelity Investment Grade Bond Fund | $103,000 | $8,800 | $5,900 | $4,900 |
Fidelity SAI Total Bond Fund | $- | $- | $- | $- |
Fidelity Series Bond Index Fund | $- | $- | $- | $- |
Fidelity Series Government Money Market Fund | $38,000 | $3,200 | $2,000 | $1,800 |
Fidelity Series Investment Grade Bond Fund | $116,000 | $9,600 | $4,600 | $5,400 |
Fidelity Series Short-Term Credit Fund | $72,000 | $6,100 | $3,300 | $3,400 |
Fidelity Short-Term Bond Fund | $99,000 | $8,500 | $6,600 | $4,800 |
Fidelity U.S. Bond Index Fund | $103,000 | $8,500 | $5,900 | $4,800 |
AAmounts may reflect rounding.
BFidelity SAI Total Bond Fund commenced operations on October 25, 2018 and Fidelity Series Bond Index Fund commenced operations on April 26, 2019.
The following table presents fees billed by Deloitte & Touche LLP, the member firms of Deloitte Touche Tohmatsu, and their respective affiliates (collectively, “Deloitte Entities”) in each of the last two fiscal years for services rendered to Fidelity Conservative Income Bond Fund, Fidelity Flex Conservative Income Bond Fund, Fidelity Intermediate Bond Fund, Fidelity Series Corporate Bond Fund, Fidelity Short-Term Bond Index Fund and Fidelity Sustainability Bond Index Fund (the “Funds”):
Services Billed by Deloitte Entities
August 31, 2019 FeesA
| | | | |
| Audit Fees | Audit-Related Fees | Tax Fees | All Other Fees |
Fidelity Conservative Income Bond Fund | $52,000 | $100 | $6,300 | $1,500 |
Fidelity Flex Conservative Income Bond Fund | $51,000 | $100 | $6,400 | $1,400 |
Fidelity Intermediate Bond Fund | $79,000 | $100 | $6,300 | $2,200 |
Fidelity Series Corporate Bond Fund | $59,000 | $100 | $6,500 | $1,600 |
Fidelity Short-Term Bond Index Fund | $74,000 | $100 | $6,300 | $1,900 |
Fidelity Sustainability Bond Index Fund | $70,000 | $100 | $6,600 | $1,900 |
| | | | |
| Audit Fees | Audit-Related Fees | Tax Fees | All Other Fees |
Fidelity Conservative Income Bond Fund | $54,000 | $100 | $6,300 | $1,500 |
Fidelity Flex Conservative Income Bond Fund | $32,000 | $- | $6,100 | $300 |
Fidelity Intermediate Bond Fund | $82,000 | $100 | $6,300 | $2,300 |
Fidelity Series Corporate Bond Fund | $37,000 | $- | $6,000 | $- |
Fidelity Short-Term Bond Index Fund | $67,000 | $100 | $6,000 | $1,600 |
Fidelity Sustainability Bond Index Fund | $60,000 | $- | $6,100 | $300 |
AAmounts may reflect rounding.
BFidelity Short-Term Bond Index Fund commenced operations on October 18, 2017, Fidelity Flex Conservative Income Bond Fund commenced operations on May 31, 2018, Fidelity Sustainability Bond Index Fund commenced operations on June 19, 2018 and Fidelity Series Corporate Bond Fund commenced operations on August 17, 2018.
The following table presents fees billed by PwC and Deloitte Entities that were required to be approved by the Audit Committee for services that relate directly to the operations and financial reporting of the Funds and that are rendered on behalf of Fidelity Management & Research Company (“FMR”) and entities controlling, controlled by, or under common control with FMR (not including any sub-adviser whose role is primarily portfolio management and is subcontracted with or overseen by another investment adviser) that provide ongoing services to the Funds (“Fund Service Providers”):
Services Billed by PwC
| | |
| August 31, 2019A,B | August 31, 2018A,B |
Audit-Related Fees | $7,775,000 | $7,745,000 |
Tax Fees | $10,000 | $20,000 |
All Other Fees | $- | $- |
A Amounts may reflect rounding.
BMay include amounts billed prior to the Fidelity SAI Total Bond Fund and Fidelity Series Bond Index Funds’ commencement of operations.
Services Billed by Deloitte Entities
| | |
| August 31, 2019A | August 31, 2018A,B |
Audit-Related Fees | $290,000 | $5,000 |
Tax Fees | $- | $5,000 |
All Other Fees | $- | $- |
A Amounts may reflect rounding.
BMay include amounts billed prior to the Fidelity Short-Term Bond Index Fund, Fidelity Flex Conservative Income Bond Fund, Fidelity Sustainability Bond Index Fund and Fidelity Series Corporate Bond Funds’ commencement of operations.
“Audit-Related Fees” represent fees billed for assurance and related services that are reasonably related to the performance of the fund audit or the review of the fund's financial statements and that are not reported under Audit Fees.
“Tax Fees” represent fees billed for tax compliance, tax advice or tax planning that relate directly to the operations and financial reporting of the fund.
“All Other Fees” represent fees billed for services provided to the fund or Fund Service Provider, a significant portion of which are assurance related, that relate directly to the operations and financial reporting of the fund, excluding those services that are reported under Audit Fees, Audit-Related Fees or Tax Fees.
Assurance services must be performed by an independent public accountant.
* * *
The aggregate non-audit fees billed by PwC and Deloitte Entities for services rendered to the Funds, FMR (not including any sub-adviser whose role is primarily portfolio management and is subcontracted with or overseen by another investment adviser), and any Fund Service Provider for each of the last two fiscal years of the Funds are as follows:
| | |
Billed By | August 31, 2019A,C | August 31, 2018A,B,C |
PwC | $12,610,000 | $11,040,000 |
Deloitte Entities | $750,000 | $395,000 |
A Amounts may reflect rounding.
BMay include amounts billed prior to the Fidelity Short-Term Bond Index Fund, Fidelity Flex Conservative Income Bond Fund, Fidelity Sustainability Bond Index Fund and Fidelity Series Corporate Bond Funds’ commencement of operations.
CMay include amounts billed prior to the Fidelity SAI Total Bond Fund and Fidelity Series Bond Index Funds’ commencement of operations.
The trust's Audit Committee has considered non-audit services that were not pre-approved that were provided by PwC and Deloitte Entities to Fund Service Providers to be compatible with maintaining the independence of PwC and Deloitte Entities in their audits of the Funds, taking into account representations from PwC and Deloitte Entities, in accordance with Public Company Accounting Oversight Board rules, regarding their independence from the Funds and their related entities and FMR’s review of the appropriateness and permissibility under applicable law of such non-audit services prior to their provision to the Fund Service Providers.
Audit Committee Pre-Approval Policies and Procedures
The trust’s Audit Committee must pre-approve all audit and non-audit services provided by a fund’s independent registered public accounting firm relating to the operations or financial reporting of the fund. Prior to the commencement of any audit or non-audit services to a fund, the Audit Committee reviews the services to determine whether they are appropriate and permissible under applicable law.
The Audit Committee has adopted policies and procedures to, among other purposes, provide a framework for the Committee’s consideration of non-audit services by the audit firms that audit the Fidelity funds. The policies and procedures require that any non-audit service provided by a fund audit firm to a Fidelity fund and any non-audit service provided by a fund auditor to a Fund Service Provider that relates directly to the operations and financial reporting of a Fidelity fund (“Covered Service”) are subject to approval by the Audit Committee before such service is provided.
All Covered Services must be approved in advance of provision of the service either: (i) by formal resolution of the Audit Committee, or (ii) by oral or written approval of the service by the Chair of the Audit Committee (or if the Chair is unavailable, such other member of the Audit Committee as may be designated by the Chair to act in the Chair’s absence). The approval contemplated by (ii) above is permitted where the Treasurer determines that action on such an engagement is necessary before the next meeting of the Audit Committee.
Non-audit services provided by a fund audit firm to a Fund Service Provider that do not relate directly to the operations and financial reporting of a Fidelity fund are reported to the Audit Committee periodically.
Non-Audit Services Approved Pursuant to Rule 2-01(c)(7)(i)(C) and (ii) of Regulation S-X (“De Minimis Exception”)
There were no non-audit services approved or required to be approved by the Audit Committee pursuant to the De Minimis Exception during the Funds’ last two fiscal years relating to services provided to (i) the Funds or (ii) any Fund Service Provider that relate directly to the operations and financial reporting of the Funds.
Item 5.
Audit Committee of Listed Registrants
Not applicable.
Item 6.
Investments
(a)
Not applicable.
(b)
Not applicable
Item 7.
Disclosure of Proxy Voting Policies and Procedures for Closed-End Management Investment Companies
Not applicable.
Item 8.
Portfolio Managers of Closed-End Management Investment Companies
Not applicable.
Item 9.
Purchase of Equity Securities by Closed-End Management Investment Company and Affiliated Purchasers
Not applicable.
Item 10.
Submission of Matters to a Vote of Security Holders
There were no material changes to the procedures by which shareholders may recommend nominees to the trust’s Board of Trustees.
Item 11.
Controls and Procedures
(a)(i) The President and Treasurer and the Chief Financial Officer have concluded that the trust’s disclosure controls and procedures (as defined in Rule 30a-3(c) under the Investment Company Act) provide reasonable assurances that material information relating to the trust is made known to them by the appropriate persons, based on their evaluation of these controls and procedures as of a date within 90 days of the filing date of this report.
(a)(ii) There was no change in the trust’s internal control over financial reporting (as defined in Rule 30a-3(d) under the Investment Company Act) that occurred during the period covered by this report that has materially affected, or is reasonably likely to materially affect, the trust’s internal control over financial reporting.
Item 12.
Disclosure of Securities Lending Activities for Closed-End Management
Investment Companies
Not applicable.
Item 13.
Exhibits
| | |
(a) | (1) | Code of Ethics pursuant to Item 2 of Form N-CSR is filed and attached hereto as EX-99.CODE ETH. |
(a) | (2) | Certification pursuant to Rule 30a-2(a) under the Investment Company Act of 1940 (17 CFR 270.30a-2(a)) is filed and attached hereto as Exhibit 99.CERT. |
(a) | (3) | Not applicable. |
(b) | | Certification pursuant to Rule 30a-2(b) under the Investment Company Act of 1940 (17 CFR 270.30a-2(b)) is furnished and attached hereto as Exhibit 99.906CERT. |
SIGNATURES
Pursuant to the requirements of the Securities Exchange Act of 1934 and the Investment Company Act of 1940, the registrant has duly caused this report to be signed on its behalf by the undersigned, thereunto duly authorized.
Fidelity Salem Street Trust
| |
By: | /s/Laura M. Del Prato |
| Laura M. Del Prato |
| President and Treasurer |
| |
Date: | October 25, 2019 |
Pursuant to the requirements of the Securities Exchange Act of 1934 and the Investment Company Act of 1940, this report has been signed below by the following persons on behalf of the registrant and in the capacities and on the dates indicated.
| |
By: | /s/Laura M. Del Prato |
| Laura M. Del Prato |
| President and Treasurer |
| |
Date: | October 25, 2019 |
| |
By: | /s/John J. Burke III |
| John J. Burke III |
| Chief Financial Officer |
| |
Date: | October 25, 2019 |