UNITED STATES
SECURITIES AND EXCHANGE COMMISSION
Washington, D.C. 20549
FORM N-CSR
CERTIFIED SHAREHOLDER REPORT OF REGISTERED
MANAGEMENT INVESTMENT COMPANIES
Investment Company Act file number 811-02105
Fidelity Salem Street Trust
(Exact name of registrant as specified in charter)
245 Summer St., Boston, Massachusetts 02210
(Address of principal executive offices) (Zip code)
Cynthia Lo Bessette, Secretary
245 Summer St.
Boston, Massachusetts 02210
(Name and address of agent for service)
Registrant's telephone number, including area code:
617-563-7000
| |
Date of fiscal year end: | October 31 |
|
|
Date of reporting period: | October 31, 2019 |
Item 1.
Reports to Stockholders
Fidelity® Series Global ex U.S. Index Fund
Annual Report
October 31, 2019

See the inside front cover for important information about access to your fund’s shareholder reports.

Beginning on January 1, 2021, as permitted by regulations adopted by the Securities and Exchange Commission, paper copies of a fund’s shareholder reports will no longer be sent by mail, unless you specifically request paper copies of the reports from the fund or from your financial intermediary, such as a financial advisor, broker-dealer or bank. Instead, the reports will be made available on a website, and you will be notified by mail each time a report is posted and provided with a website link to access the report.
If you already elected to receive shareholder reports electronically, you will not be affected by this change and you need not take any action. You may elect to receive shareholder reports and other communications from a fund electronically, by contacting your financial intermediary. For Fidelity customers, visit Fidelity's web site or call Fidelity using the contact information listed below.
You may elect to receive all future reports in paper free of charge. If you wish to continue receiving paper copies of your shareholder reports, you may contact your financial intermediary or, if you are a Fidelity customer, visit Fidelity’s website, or call Fidelity at the applicable toll-free number listed below. Your election to receive reports in paper will apply to all funds held with the fund complex/your financial intermediary.
| Account Type | Website | Phone Number |
| Brokerage, Mutual Fund, or Annuity Contracts: | fidelity.com/mailpreferences | 1-800-343-3548 |
| Employer Provided Retirement Accounts: | netbenefits.fidelity.com/preferences (choose 'no' under Required Disclosures to continue to print) | 1-800-343-0860 |
| Advisor Sold Accounts Serviced Through Your Financial Intermediary: | Contact Your Financial Intermediary | Your Financial Intermediary's phone number |
| Advisor Sold Accounts Serviced by Fidelity: | institutional.fidelity.com | 1-877-208-0098 |
Contents
To view a fund's proxy voting guidelines and proxy voting record for the 12-month period ended June 30, visit http://www.fidelity.com/proxyvotingresults or visit the Securities and Exchange Commission's (SEC) web site at http://www.sec.gov.
You may also call 1-800-544-8544 to request a free copy of the proxy voting guidelines.
The funds or securities referred to herein are not sponsored, endorsed, or promoted by MSCI, and MSCI bears no liability with respect to any such funds or securities or any index on which such funds or securities are based. The prospectus contains a more detailed description of the limited relationship MSCI has with Fidelity and any related funds.
Standard & Poor's, S&P and S&P 500 are registered service marks of The McGraw-Hill Companies, Inc. and have been licensed for use by Fidelity Distributors Corporation.
Other third-party marks appearing herein are the property of their respective owners.
All other marks appearing herein are registered or unregistered trademarks or service marks of FMR LLC or an affiliated company. © 2019 FMR LLC. All rights reserved.
This report and the financial statements contained herein are submitted for the general information of the shareholders of the Fund. This report is not authorized for distribution to prospective investors in the Fund unless preceded or accompanied by an effective prospectus.
A fund files its complete schedule of portfolio holdings with the SEC for the first and third quarters of each fiscal year on Form N-PORT. Forms N-PORT are available on the SEC’s web site at http://www.sec.gov. A fund's Forms N-PORT may be reviewed and copied at the SEC’s Public Reference Room in Washington, DC. Information regarding the operation of the SEC's Public Reference Room may be obtained by calling 1-800-SEC-0330.
For a complete list of a fund's portfolio holdings, view the most recent holdings listing, semiannual report, or annual report on Fidelity's web site at http://www.fidelity.com, http://www.institutional.fidelity.com, or http://www.401k.com, as applicable.
NOT FDIC INSURED •MAY LOSE VALUE •NO BANK GUARANTEE
Neither the Fund nor Fidelity Distributors Corporation is a bank.
Performance: The Bottom Line
Average annual total return reflects the change in the value of an investment, assuming reinvestment of distributions from dividend income and capital gains (the profits earned upon the sale of securities that have grown in value, if any) and assuming a constant rate of performance each year. The hypothetical investment and the average annual total returns do not reflect the deduction of taxes that a shareholder would pay on fund distributions or the redemption of fund shares. During periods of reimbursement by Fidelity, a fund’s total return will be greater than it would be had the reimbursement not occurred. How a fund did yesterday is no guarantee of how it will do tomorrow.
Average Annual Total Returns
| For the periods ended October 31, 2019 | Past 1 year | Past 5 years | Past 10 years |
| Fidelity® Series Global ex U.S. Index Fund | 11.36% | 3.73% | 4.97% |
$10,000 Over 10 Years
Let's say hypothetically that $10,000 was invested in Fidelity® Series Global ex U.S. Index Fund on October 31, 2009.
The chart shows how the value of your investment would have changed, and also shows how the MSCI ACWI (All Country World Index) ex USA Index performed over the same period.
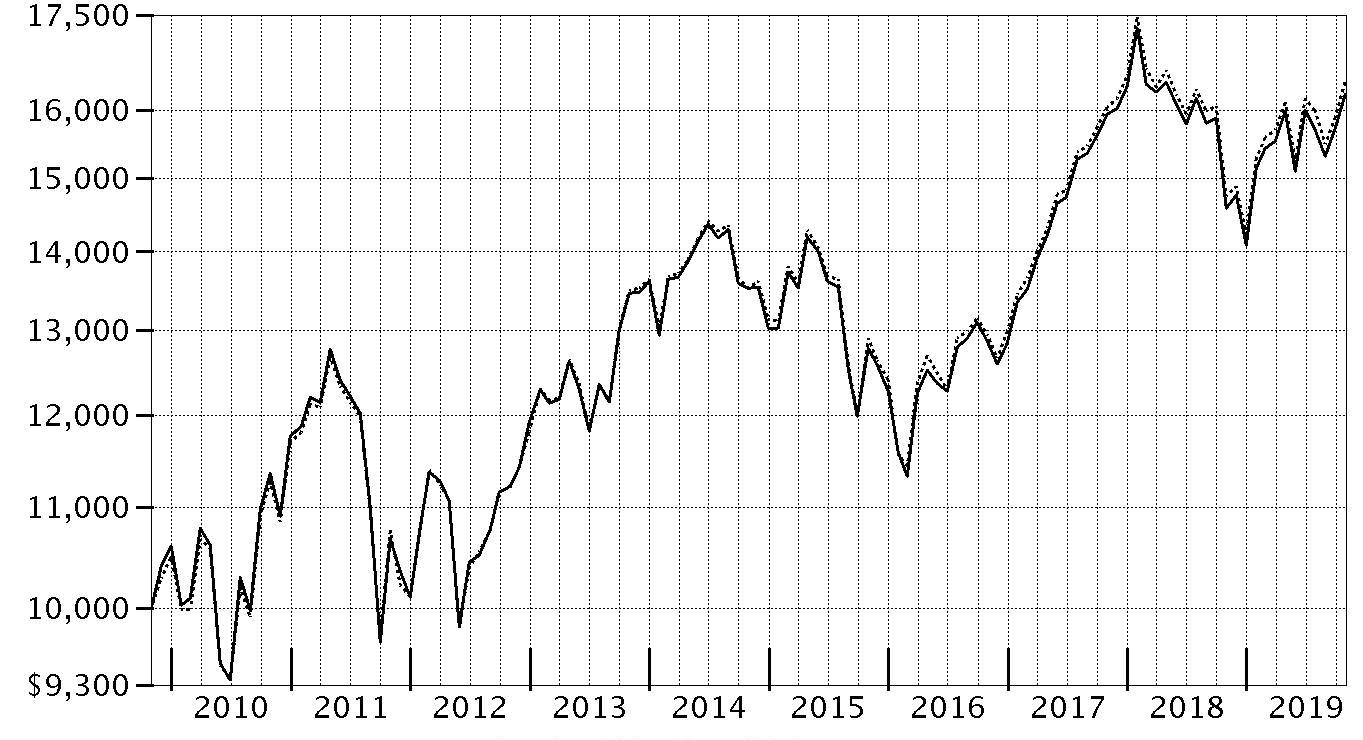
| Period Ending Values |
| $16,240 | Fidelity® Series Global ex U.S. Index Fund |
| $16,440 | MSCI ACWI (All Country World Index) ex USA Index |
Management's Discussion of Fund Performance
Market Recap: The MSCI ACWI (All Country World Index) ex USA Index gained 11.47% for the 12 months ending October 31, 2019, as international stocks reflected a confluence of factors, including escalating trade tension, and moderating but still positive global economic growth. Currency fluctuations were largely modest and varied by region, muting the overall impact on international equity returns. In late December, the U.S. Federal Reserve shifted from raising interest rates to a more dovish policy in 2019, joining many foreign central banks. In June, international stocks rose 6.03%, as policy stimulus in China stabilized that country’s economic growth. The Fed cut its policy rate in July for the first time since 2008. However, the index returned -1.21% for the month, followed by -3.08% in August. In September, the Fed cut its policy rate another quarter point, citing concerns about slowing economic growth and muted inflation, and did the same in October, leading to monthly gains of 2.59% and 3.49%, respectively. For the full 12 months, the growth-oriented information technology sector (+22%) led the way, followed by utilities (+20%) and real estate (+18%), two high-dividend-yielding categories. Conversely, energy was roughly flat, while materials (+6%) and communication services (7%) also lagged. By region, Asia Pacific ex Japan (+16%), Europe ex U.K (+13%), Canada (+12%) and emerging markets (+12%) fared best. Meanwhile, the U.K. (+7%) and Japan (+10%) trailed the broader market.
Comments from the Geode Capital Management, LLC, passive equity index team: For the fiscal year, the fund gained 11.36%, compared with an increase of 11.47% for the benchmark MSCI ACWI (All Country World Index) ex USA Index.
(Note: The fund's performance relative to the index can be affected by Fidelity's methodologies for valuing certain foreign stocks and for incorporating foreign exchange rates, which differ from those used by the index.) Individually, Nestle (+29%) contributed meaningfully to the fund's performance this period, as the Swiss packaged-foods giant reported favorable sales growth. Semiconductor foundry Taiwan Semiconductor Manufacturing (+34%) also performed well, reflecting the firm's better-than-expected quarterly financial results. Chinese e-commerce company Alibaba Group Holding (+24%) announced strong quarterly earnings. Healthy sales lifted LVMH Moet Hennessy Louis Vuitton (+42%), a French luxury goods conglomerate, while Dutch semiconductor equipment supplier ASML Holding (+55%) reported higher third-quarter revenue. French pharmaceutical manufacturer Roche Holdings (+27%) and Chinese internet gaming company Tencent Holdings (+20%) also boosted the fund's performance. In contrast, China-based Baidu (-46%) struggled, as the company anticipated continued challenges for its core online search-advertising business. British American Tobacco (-13%) struggled, partly reflecting investors' concern about weakness in tobacco companies' core cigarette business. Brazilian mining firm Vale (-23%) saw its shares plunge in January, as a dam collapsed at one of its mines, resulting in several casualties and significant financial losses. Israeli drug maker Teva Pharmaceutical Industries (-59%) also detracted.
The views expressed above reflect those of the portfolio manager(s) only through the end of the period as stated on the cover of this report and do not necessarily represent the views of Fidelity or any other person in the Fidelity organization. Any such views are subject to change at any time based upon market or other conditions and Fidelity disclaims any responsibility to update such views. These views may not be relied on as investment advice and, because investment decisions for a Fidelity fund are based on numerous factors, may not be relied on as an indication of trading intent on behalf of any Fidelity fund.
Note to Shareholders: On March 22, 2019, Pat Waddell retired and is no longer a portfolio manager with Geode Capital Management.
Investment Summary (Unaudited)
Geographic Diversification (% of fund's net assets)
| As of October 31, 2019 |
| | Japan | 16.0% |
| | United Kingdom | 10.0% |
| | Canada | 6.8% |
| | France | 6.6% |
| | Switzerland | 6.0% |
| | Germany | 5.6% |
| | Cayman Islands | 4.6% |
| | Australia | 4.4% |
| | United States of America* | 3.7% |
| | Other | 36.3% |

* Includes Short-Term investments and Net Other Assets (Liabilities).
Percentages are based on country or territory of incorporation and are adjusted for the effect of futures contracts, if applicable.
Asset Allocation as of October 31, 2019
| | % of fund's net assets |
| Stocks and Equity Futures | 100.0 |
Top Ten Stocks as of October 31, 2019
| | % of fund's net assets |
| Nestle SA (Reg. S) (Switzerland, Food Products) | 1.5 |
| Alibaba Group Holding Ltd. sponsored ADR (Cayman Islands, Internet & Direct Marketing Retail) | 1.2 |
| Taiwan Semiconductor Manufacturing Co. Ltd. (Taiwan, Semiconductors & Semiconductor Equipment) | 1.1 |
| Tencent Holdings Ltd. (Cayman Islands, Interactive Media & Services) | 1.1 |
| Roche Holding AG (participation certificate) (Switzerland, Pharmaceuticals) | 1.0 |
| Samsung Electronics Co. Ltd. (Korea (South), Technology Hardware, Storage & Peripherals) | 0.9 |
| Novartis AG (Switzerland, Pharmaceuticals) | 0.9 |
| Toyota Motor Corp. (Japan, Automobiles) | 0.7 |
| HSBC Holdings PLC (United Kingdom) (United Kingdom, Banks) | 0.7 |
| Royal Dutch Shell PLC Class A (United Kingdom) (United Kingdom, Oil, Gas & Consumable Fuels) | 0.6 |
| | 9.7 |
Top Market Sectors as of October 31, 2019
| | % of fund's net assets |
| Financials | 21.7 |
| Consumer Discretionary | 11.2 |
| Industrials | 10.6 |
| Consumer Staples | 9.7 |
| Information Technology | 8.9 |
| Health Care | 8.3 |
| Energy | 6.6 |
| Materials | 6.5 |
| Communication Services | 6.5 |
| Utilities | 3.3 |
Schedule of Investments October 31, 2019
Showing Percentage of Net Assets
| Common Stocks - 94.7% | | | |
| | | Shares | Value |
| Argentina - 0.0% | | | |
| Banco Macro SA sponsored ADR | | 32,528 | $744,891 |
| BBVA Banco Frances SA sponsored ADR | | 29,345 | 102,708 |
| Grupo Financiero Galicia SA sponsored ADR | | 54,477 | 629,754 |
| Pampa Holding SA sponsored ADR (a) | | 24,859 | 387,055 |
| Telecom Argentina SA Class B sponsored ADR | | 32,053 | 288,477 |
| Transportadora de Gas del Sur SA Class B sponsored ADR | | 28,556 | 215,883 |
| YPF SA Class D sponsored ADR | | 78,494 | 734,704 |
|
| TOTAL ARGENTINA | | | 3,103,472 |
|
| Australia - 4.4% | | | |
| AGL Energy Ltd. | | 350,459 | 4,783,981 |
| Alumina Ltd. | | 1,278,316 | 1,995,595 |
| AMP Ltd. | | 1,853,343 | 2,341,775 |
| APA Group unit | | 635,397 | 5,103,672 |
| Aristocrat Leisure Ltd. | | 303,358 | 6,614,733 |
| ASX Ltd. | | 106,159 | 6,025,783 |
| Aurizon Holdings Ltd. | | 1,074,263 | 4,370,358 |
| Australia & New Zealand Banking Group Ltd. | | 1,542,128 | 28,339,870 |
| Bank of Queensland Ltd. | | 293,151 | 1,829,573 |
| Bendigo & Adelaide Bank Ltd. | | 248,940 | 1,826,998 |
| BHP Billiton Ltd. | | 1,609,693 | 39,457,533 |
| BlueScope Steel Ltd. | | 296,460 | 2,713,850 |
| Boral Ltd. | | 602,169 | 2,090,681 |
| Brambles Ltd. | | 872,068 | 7,209,430 |
| Caltex Australia Ltd. | | 138,766 | 2,608,609 |
| Challenger Ltd. | | 313,655 | 1,720,308 |
| Cimic Group Ltd. | | 50,788 | 1,157,403 |
| Coca-Cola Amatil Ltd. | | 331,685 | 2,327,649 |
| Cochlear Ltd. | | 31,070 | 4,532,806 |
| Coles Group Ltd. | | 608,880 | 6,301,222 |
| Commonwealth Bank of Australia | | 963,122 | 52,220,583 |
| Computershare Ltd. | | 276,441 | 3,017,483 |
| Crown Ltd. | | 223,452 | 1,919,590 |
| CSL Ltd. | | 249,887 | 44,069,150 |
| DEXUS Property Group unit | | 585,800 | 4,830,782 |
| Flight Centre Travel Group Ltd. | | 28,737 | 844,198 |
| Fortescue Metals Group Ltd. | | 759,823 | 4,650,593 |
| Goodman Group unit | | 900,092 | 8,937,252 |
| Harvey Norman Holdings Ltd. (b) | | 294,644 | 831,344 |
| Incitec Pivot Ltd. | | 856,040 | 2,036,896 |
| Insurance Australia Group Ltd. | | 1,268,221 | 6,948,674 |
| Lendlease Group unit | | 302,153 | 3,905,544 |
| Macquarie Group Ltd. | | 177,316 | 16,372,904 |
| Magellan Financial Group Ltd. | | 69,564 | 2,307,295 |
| Medibank Private Ltd. | | 1,478,858 | 3,446,810 |
| Mirvac Group unit | | 2,090,720 | 4,632,783 |
| National Australia Bank Ltd. | | 1,529,969 | 30,031,993 |
| Newcrest Mining Ltd. | | 422,737 | 9,227,644 |
| Orica Ltd. | | 203,138 | 3,210,333 |
| Origin Energy Ltd. | | 941,712 | 5,105,454 |
| QBE Insurance Group Ltd. | | 727,739 | 6,331,611 |
| Ramsay Health Care Ltd. | | 91,278 | 4,312,945 |
| realestate.com.au Ltd. | | 29,117 | 2,185,213 |
| Rio Tinto Ltd. | | 203,998 | 12,756,613 |
| Santos Ltd. | | 949,019 | 5,308,353 |
| Scentre Group unit | | 2,977,240 | 7,866,303 |
| SEEK Ltd. | | 197,394 | 3,089,222 |
| Sonic Healthcare Ltd. | | 243,615 | 4,797,997 |
| South32 Ltd. | | 2,757,468 | 4,825,380 |
| SP AusNet | | 920,154 | 1,175,376 |
| Stockland Corp. Ltd. unit | | 1,280,023 | 4,321,321 |
| Suncorp Group Ltd. | | 699,819 | 6,497,473 |
| Sydney Airport unit | | 590,535 | 3,576,544 |
| Tabcorp Holdings Ltd. | | 1,142,018 | 3,784,245 |
| Telstra Corp. Ltd. | | 2,236,488 | 5,386,461 |
| The GPT Group unit | | 1,032,333 | 4,237,450 |
| TPG Telecom Ltd. | | 190,507 | 858,648 |
| Transurban Group unit | | 1,454,802 | 14,900,006 |
| Treasury Wine Estates Ltd. | | 386,258 | 4,682,662 |
| Vicinity Centres unit | | 1,872,302 | 3,446,391 |
| Washington H. Soul Pattinson & Co. Ltd. | | 56,006 | 837,191 |
| Wesfarmers Ltd. | | 621,005 | 17,062,061 |
| Westpac Banking Corp. | | 1,876,504 | 36,433,263 |
| Woodside Petroleum Ltd. | | 515,096 | 11,416,313 |
| Woolworths Group Ltd. | | 694,259 | 17,902,265 |
| WorleyParsons Ltd. | | 174,336 | 1,636,358 |
|
| TOTAL AUSTRALIA | | | 531,526,799 |
|
| Austria - 0.2% | | | |
| Andritz AG | | 42,766 | 1,921,232 |
| Erste Group Bank AG | | 163,876 | 5,788,355 |
| OMV AG | | 79,683 | 4,649,702 |
| Raiffeisen International Bank-Holding AG | | 86,658 | 2,131,125 |
| Verbund AG | | 34,136 | 1,846,486 |
| Voestalpine AG | | 76,607 | 1,918,123 |
|
| TOTAL AUSTRIA | | | 18,255,023 |
|
| Bailiwick of Jersey - 0.5% | | | |
| Experian PLC | | 496,905 | 15,628,208 |
| Ferguson PLC | | 126,615 | 10,812,077 |
| Glencore Xstrata PLC | | 6,037,495 | 18,223,458 |
| Polymetal International PLC | | 118,237 | 1,939,808 |
| WPP PLC | | 673,135 | 8,400,427 |
|
| TOTAL BAILIWICK OF JERSEY | | | 55,003,978 |
|
| Belgium - 0.6% | | | |
| Ageas | | 103,116 | 5,938,872 |
| Anheuser-Busch InBev SA NV | | 416,509 | 33,619,545 |
| Colruyt NV | | 28,535 | 1,586,162 |
| Groupe Bruxelles Lambert SA | | 45,744 | 4,590,625 |
| KBC Groep NV | | 138,117 | 9,686,154 |
| Proximus | | 79,714 | 2,447,555 |
| Solvay SA Class A | | 41,206 | 4,480,813 |
| Telenet Group Holding NV | | 23,408 | 1,149,228 |
| Titan Cement International Trading SA (a) | | 14,199 | 296,453 |
| UCB SA | | 70,073 | 5,647,294 |
| Umicore SA (b) | | 105,639 | 4,355,775 |
|
| TOTAL BELGIUM | | | 73,798,476 |
|
| Bermuda - 0.4% | | | |
| Alibaba Health Information Technology Ltd. (a) | | 2,064,000 | 2,077,406 |
| Alibaba Pictures Group Ltd. (a) | | 7,430,000 | 1,218,645 |
| Beijing Enterprises Water Group Ltd. | | 3,116,000 | 1,624,147 |
| Brilliance China Automotive Holdings Ltd. | | 1,572,000 | 1,733,560 |
| Cheung Kong Infrastructure Holdings Ltd. | | 345,500 | 2,486,470 |
| China Gas Holdings Ltd. | | 999,400 | 4,257,384 |
| China Oriental Group Co. Ltd. (H Shares) | | 392,000 | 136,807 |
| China Resource Gas Group Ltd. | | 504,000 | 3,038,771 |
| Cosco Shipping Ports Ltd. | | 973,623 | 765,453 |
| Credicorp Ltd. (United States) | | 37,516 | 8,029,925 |
| Dairy Farm International Holdings Ltd. | | 195,430 | 1,177,918 |
| GOME Electrical Appliances Holdings Ltd. (a) | | 5,462,418 | 493,778 |
| Haier Electronics Group Co. Ltd. | | 657,000 | 1,875,793 |
| HengTen Networks Group Ltd. (a) | | 6,300,000 | 90,652 |
| Hongkong Land Holdings Ltd. | | 658,289 | 3,616,241 |
| Jardine Matheson Holdings Ltd. | | 123,171 | 7,022,104 |
| Jardine Strategic Holdings Ltd. | | 121,801 | 3,933,177 |
| Kerry Properties Ltd. | | 332,500 | 1,075,193 |
| Kunlun Energy Co. Ltd. | | 2,172,000 | 2,021,561 |
| Luye Pharma Group Ltd. (c) | | 680,500 | 502,992 |
| Nine Dragons Paper (Holdings) Ltd. | | 946,000 | 820,621 |
| NWS Holdings Ltd. | | 899,515 | 1,338,730 |
| Shangri-La Asia Ltd. | | 690,000 | 708,225 |
| Shenzhen International Holdings Ltd. | | 531,719 | 1,081,001 |
| Sihuan Pharmaceutical Holdings Group Ltd. | | 1,587,000 | 207,929 |
| Yue Yuen Industrial (Holdings) Ltd. | | 367,000 | 1,034,275 |
|
| TOTAL BERMUDA | | | 52,368,758 |
|
| Brazil - 1.2% | | | |
| Ambev SA | | 1,983,330 | 8,595,007 |
| Atacadao Distribuicao Comercio e Industria Ltda | | 194,200 | 925,361 |
| B2W Companhia Global do Varejo (a) | | 125,374 | 1,588,081 |
| Banco Bradesco SA | | 422,159 | 3,457,904 |
| Banco do Brasil SA | | 470,000 | 5,642,813 |
| Banco Santander SA (Brasil) unit | | 214,700 | 2,519,332 |
| BB Seguridade Participacoes SA | | 389,200 | 3,296,627 |
| BM&F BOVESPA SA | | 1,135,125 | 13,693,392 |
| BR Malls Participacoes SA | | 387,630 | 1,483,636 |
| Brasil Foods SA (a) | | 226,200 | 2,002,833 |
| BTG Pactual Participations Ltd. unit | | 120,900 | 1,958,276 |
| CCR SA | | 700,600 | 2,871,927 |
| Centrais Eletricas Brasileiras SA (Electrobras) (a) | | 158,900 | 1,567,407 |
| Cielo SA | | 709,614 | 1,337,659 |
| Companhia de Saneamento Basico do Estado de Sao Paulo (SABESP) | | 187,700 | 2,556,333 |
| Companhia Siderurgica Nacional SA (CSN) | | 376,000 | 1,106,296 |
| Cosan SA Industria e Comercio | | 83,300 | 1,200,326 |
| Drogasil SA | | 131,900 | 3,617,753 |
| Embraer SA | | 368,200 | 1,609,412 |
| Energisa SA unit | | 93,500 | 1,117,197 |
| ENGIE Brasil Energia SA | | 99,750 | 1,125,716 |
| Equatorial Energia SA | | 92,200 | 2,342,186 |
| Hypermarcas SA | | 198,400 | 1,697,815 |
| IRB Brasil Resseguros SA | | 379,700 | 3,577,824 |
| JBS SA | | 579,700 | 4,089,194 |
| Klabin SA unit | | 347,100 | 1,369,186 |
| Kroton Educacional SA | | 759,592 | 1,831,506 |
| Localiza Rent A Car SA | | 328,554 | 3,537,455 |
| Lojas Renner SA | | 446,223 | 5,646,632 |
| M. Dias Branco SA | | 57,300 | 539,353 |
| Magazine Luiza SA | | 334,100 | 3,718,794 |
| Multiplan Empreendimentos Imobiliarios SA | | 145,956 | 1,063,053 |
| Natura Cosmeticos SA | | 197,500 | 1,534,497 |
| Notre Dame Intermedica Participacoes SA | | 191,800 | 2,869,468 |
| Petrobras Distribuidora SA | | 409,200 | 2,885,470 |
| Petroleo Brasileiro SA - Petrobras (ON) | | 1,067,711 | 8,705,685 |
| Porto Seguro SA | | 49,500 | 708,465 |
| Rumo SA (a) | | 610,900 | 3,473,013 |
| Sul America SA unit | | 120,337 | 1,448,965 |
| Suzano Papel e Celulose SA | | 307,871 | 2,505,650 |
| TIM Participacoes SA | | 413,303 | 1,176,891 |
| Ultrapar Participacoes SA | | 406,800 | 1,914,055 |
| Vale SA (a) | | 1,301,386 | 15,316,150 |
| Vale SA sponsored ADR (a) | | 446,303 | 5,239,597 |
| Weg SA | | 427,366 | 2,717,325 |
|
| TOTAL BRAZIL | | | 143,181,517 |
|
| Canada - 6.5% | | | |
| Agnico Eagle Mines Ltd. (Canada) | | 126,666 | 7,784,992 |
| Air Canada (a) | | 67,285 | 2,395,920 |
| Alimentation Couche-Tard, Inc. Class B (sub. vtg.) | | 482,202 | 14,461,301 |
| AltaGas Ltd. | | 144,390 | 2,100,457 |
| ATCO Ltd. Class I (non-vtg.) | | 41,684 | 1,465,317 |
| Aurora Cannabis, Inc. (a)(b) | | 370,176 | 1,326,574 |
| Bank of Montreal (b) | | 350,200 | 25,924,000 |
| Bank of Nova Scotia | | 664,650 | 38,119,855 |
| Barrick Gold Corp. (Canada) | | 974,180 | 16,922,966 |
| Bausch Health Cos., Inc. (Canada) (a) | | 177,625 | 4,415,339 |
| BCE, Inc. | | 80,534 | 3,820,336 |
| BlackBerry Ltd. (a) | | 266,895 | 1,402,258 |
| Bombardier, Inc. Class B (sub. vtg.) (a) | | 1,066,533 | 1,344,199 |
| Brookfield Asset Management, Inc. Class A | | 485,883 | 26,867,253 |
| CAE, Inc. | | 142,819 | 3,581,590 |
| Cameco Corp. | | 225,030 | 2,009,227 |
| Canadian Imperial Bank of Commerce | | 244,443 | 20,843,818 |
| Canadian National Railway Co. | | 395,652 | 35,386,687 |
| Canadian Natural Resources Ltd. | | 658,433 | 16,602,050 |
| Canadian Pacific Railway Ltd. | | 77,640 | 17,655,422 |
| Canadian Tire Ltd. Class A (non-vtg.) | | 34,649 | 3,735,336 |
| Canadian Utilities Ltd. Class A (non-vtg.) | | 72,830 | 2,123,909 |
| CCL Industries, Inc. Class B | | 81,343 | 3,347,964 |
| Cenovus Energy, Inc. (Canada) | | 575,242 | 4,900,323 |
| CGI Group, Inc. Class A (sub. vtg.) (a) | | 134,468 | 10,452,383 |
| CI Financial Corp. | | 134,556 | 1,958,423 |
| Constellation Software, Inc. | | 11,155 | 11,017,203 |
| Cronos Group, Inc. (a)(b) | | 96,596 | 790,604 |
| Dollarama, Inc. | | 165,080 | 5,553,637 |
| Emera, Inc. (b) | | 136,124 | 5,635,747 |
| Empire Co. Ltd. Class A (non-vtg.) | | 91,872 | 2,439,271 |
| Enbridge, Inc. | | 1,100,976 | 40,098,564 |
| Encana Corp. (Toronto) | | 741,948 | 2,906,728 |
| Fairfax Financial Holdings Ltd. (sub. vtg.) | | 14,999 | 6,354,447 |
| First Capital Realty, Inc. | | 87,933 | 1,455,424 |
| First Quantum Minerals Ltd. | | 383,046 | 3,236,886 |
| Fortis, Inc. | | 236,110 | 9,809,384 |
| Franco-Nevada Corp. | | 103,068 | 10,000,828 |
| George Weston Ltd. | | 44,654 | 3,575,100 |
| Gildan Activewear, Inc. | | 115,258 | 2,944,675 |
| Great-West Lifeco, Inc. | | 148,958 | 3,622,447 |
| H&R (REIT) unit | | 77,113 | 1,304,440 |
| Husky Energy, Inc. | | 176,906 | 1,235,696 |
| Hydro One Ltd. (c) | | 184,020 | 3,421,646 |
| iA Financial Corp, Inc. | | 61,105 | 2,942,746 |
| IGM Financial, Inc. | | 52,355 | 1,477,515 |
| Imperial Oil Ltd. | | 157,853 | 3,931,044 |
| Intact Financial Corp. | | 75,809 | 7,822,066 |
| Inter Pipeline Ltd. | | 224,321 | 3,765,650 |
| Keyera Corp. | | 110,692 | 2,565,809 |
| Kinross Gold Corp. (a) | | 675,270 | 3,281,245 |
| Kirkland Lake Gold Ltd. | | 109,649 | 5,149,032 |
| Loblaw Companies Ltd. | | 100,214 | 5,344,341 |
| Lundin Mining Corp. | | 341,273 | 1,723,078 |
| Magna International, Inc. Class A (sub. vtg.) | | 166,251 | 8,939,257 |
| Manulife Financial Corp. | | 1,080,502 | 20,123,540 |
| Methanex Corp. | | 34,724 | 1,315,826 |
| Metro, Inc. Class A (sub. vtg.) | | 140,829 | 5,955,641 |
| National Bank of Canada | | 185,907 | 9,600,937 |
| Nutrien Ltd. | | 321,067 | 15,359,830 |
| Onex Corp. (sub. vtg.) | | 48,709 | 2,863,517 |
| Open Text Corp. | | 153,081 | 6,185,537 |
| Pembina Pipeline Corp. | | 280,795 | 9,885,707 |
| Power Corp. of Canada (sub. vtg.) | | 169,313 | 3,918,199 |
| Power Financial Corp. | | 143,980 | 3,366,930 |
| PrairieSky Royalty Ltd. | | 121,692 | 1,188,186 |
| Quebecor, Inc. Class B (sub. vtg.) | | 92,524 | 2,151,002 |
| Restaurant Brands International, Inc. | | 118,560 | 7,756,674 |
| Restaurant Brands International, Inc. | | 13,873 | 907,849 |
| RioCan (REIT) | | 83,065 | 1,666,850 |
| Rogers Communications, Inc. Class B (non-vtg.) | | 194,371 | 9,151,124 |
| Royal Bank of Canada | | 778,055 | 62,759,520 |
| Saputo, Inc. | | 125,716 | 3,646,155 |
| Shaw Communications, Inc. Class B | | 264,459 | 5,397,204 |
| Shopify, Inc. Class A (a) | | 54,353 | 17,043,344 |
| Smart (REIT) | | 43,841 | 1,059,826 |
| SNC-Lavalin Group, Inc. (b) | | 100,373 | 1,814,502 |
| Sun Life Financial, Inc. | | 325,294 | 14,593,898 |
| Suncor Energy, Inc. | | 859,714 | 25,561,005 |
| TC Energy Corp. | | 503,104 | 25,359,559 |
| Teck Resources Ltd. Class B (sub. vtg.) | | 275,172 | 4,349,769 |
| TELUS Corp. | | 113,003 | 4,019,581 |
| The Stars Group, Inc. (a) | | 118,658 | 2,581,989 |
| The Toronto-Dominion Bank | | 996,622 | 56,909,833 |
| Thomson Reuters Corp. | | 109,605 | 7,365,529 |
| Tourmaline Oil Corp. | | 132,878 | 1,140,021 |
| Vermilion Energy, Inc. (b) | | 98,252 | 1,297,992 |
| West Fraser Timber Co. Ltd. | | 27,900 | 1,290,039 |
| Wheaton Precious Metals Corp. | | 246,047 | 6,897,013 |
| WSP Global, Inc. | | 60,586 | 3,780,243 |
|
| TOTAL CANADA | | | 781,556,780 |
|
| Cayman Islands - 4.6% | | | |
| 3SBio, Inc. (a)(c) | | 884,000 | 1,646,678 |
| 51job, Inc. sponsored ADR (a) | | 13,082 | 1,030,469 |
| 58.com, Inc. ADR (a) | | 49,623 | 2,620,591 |
| AAC Technology Holdings, Inc. | | 418,500 | 2,708,237 |
| Agile Property Holdings Ltd. | | 586,000 | 789,850 |
| Airtac International Group | | 61,000 | 835,055 |
| Alibaba Group Holding Ltd. sponsored ADR (a) | | 776,939 | 137,261,813 |
| Anta Sports Products Ltd. | | 575,000 | 5,624,720 |
| ASM Pacific Technology Ltd. | | 157,200 | 2,194,957 |
| Autohome, Inc. ADR Class A (a)(b) | | 33,383 | 2,822,866 |
| Baidu.com, Inc. sponsored ADR (a) | | 152,970 | 15,579,995 |
| Baozun, Inc. sponsored ADR (a)(b) | | 19,697 | 857,213 |
| BeiGene Ltd. ADR (a)(b) | | 20,957 | 2,899,191 |
| Bosideng International Holdings Ltd. | | 1,466,000 | 758,083 |
| Budweiser Brewing Co. APAC Ltd. (a)(c) | | 670,100 | 2,432,886 |
| Chailease Holding Co. Ltd. | | 661,475 | 2,982,255 |
| Cheung Kong Property Holdings Ltd. | | 1,418,116 | 9,866,839 |
| China Aoyuan Property Group Ltd. | | 647,000 | 826,821 |
| China Conch Venture Holdings Ltd. | | 956,000 | 3,740,718 |
| China Education Group Holdings Ltd. | | 357,000 | 533,280 |
| China First Capital Group Ltd. (a) | | 1,266,000 | 359,978 |
| China Hongqiao Group Ltd. | | 741,500 | 411,822 |
| China Huishan Dairy Holdings Co. Ltd. (a)(d) | | 958,000 | 25,674 |
| China Investment Fund International Holdings Co. Ltd. (d) | | 320,000 | 471,264 |
| China Literature Ltd. (a)(b)(c) | | 138,600 | 542,973 |
| China Medical System Holdings Ltd. | | 724,000 | 981,834 |
| China Mengniu Dairy Co. Ltd. | | 1,505,000 | 6,000,052 |
| China Resources Cement Holdings Ltd. | | 1,220,000 | 1,336,011 |
| China Resources Land Ltd. | | 1,504,465 | 6,398,306 |
| China State Construction International Holdings Ltd. | | 1,081,750 | 996,241 |
| China Zhongwang Holdings Ltd. | | 548,800 | 227,841 |
| CIFI Holdings Group Co. Ltd. | | 1,497,898 | 999,062 |
| CK Hutchison Holdings Ltd. | | 1,487,116 | 13,730,667 |
| Country Garden Holdings Co. Ltd. | | 4,128,537 | 5,731,356 |
| Country Garden Services Holdings Co. Ltd. | | 613,000 | 2,077,073 |
| Ctrip.com International Ltd. ADR (a) | | 257,098 | 8,481,663 |
| Dali Foods Group Co. Ltd. (c) | | 1,052,000 | 719,232 |
| ENN Energy Holdings Ltd. | | 429,600 | 4,901,112 |
| Evergrande Real Estate Group Ltd. | | 936,000 | 2,278,464 |
| Future Land Development Holding Ltd. | | 832,000 | 876,775 |
| GDS Holdings Ltd. ADR (a)(b) | | 34,744 | 1,448,130 |
| Geely Automobile Holdings Ltd. | | 2,753,000 | 5,209,260 |
| Genscript Biotech Corp. (a) | | 458,000 | 1,097,343 |
| Greentown Service Group Co. Ltd. | | 574,000 | 651,243 |
| Haidilao International Holding Ltd. (c) | | 168,000 | 813,303 |
| Haitian International Holdings Ltd. | | 324,000 | 764,547 |
| Hengan International Group Co. Ltd. | | 417,000 | 2,911,495 |
| Huazhu Group Ltd. ADR | | 74,877 | 2,834,843 |
| Hutchison China Meditech Ltd. sponsored ADR (a) | | 30,122 | 569,306 |
| iQIYI, Inc. ADR (a)(b) | | 61,269 | 1,067,919 |
| JD.com, Inc. sponsored ADR (a) | | 407,284 | 12,686,897 |
| Kaisa Group Holdings Ltd. | | 1,299,000 | 568,066 |
| Kingboard Chemical Holdings Ltd. | | 361,000 | 962,030 |
| Kingboard Laminates Holdings Ltd. | | 637,000 | 583,163 |
| Kingdee International Software Group Co. Ltd. | | 1,319,000 | 1,445,294 |
| Kingsoft Corp. Ltd. (a) | | 423,000 | 973,509 |
| KWG Property Holding Ltd. | | 877,000 | 883,123 |
| Lee & Man Paper Manufacturing Ltd. | | 483,000 | 268,580 |
| Li Ning Co. Ltd. | | 1,056,500 | 3,582,404 |
| Lijun International Pharmaceutical Holding Ltd. | | 768,000 | 640,505 |
| Logan Property Holdings Co. Ltd. | | 716,000 | 1,090,454 |
| Longfor Properties Co. Ltd. (c) | | 1,011,000 | 4,195,804 |
| Meitu, Inc. (a)(c) | | 1,093,500 | 242,006 |
| Meituan Dianping Class B (a) | | 541,490 | 6,458,970 |
| Melco Crown Entertainment Ltd. sponsored ADR | | 117,185 | 2,524,165 |
| MGM China Holdings Ltd. | | 527,200 | 834,812 |
| Momo, Inc. ADR | | 85,204 | 2,856,038 |
| NetEase, Inc. ADR | | 38,710 | 11,065,641 |
| New Oriental Education & Technology Group, Inc. sponsored ADR (a) | | 76,439 | 9,330,144 |
| Nexteer Auto Group Ltd. | | 339,000 | 315,955 |
| NIO, Inc. sponsored ADR (a)(b) | | 308,188 | 446,873 |
| Noah Holdings Ltd. sponsored ADR (a) | | 25,177 | 762,611 |
| Pinduoduo, Inc. ADR (a) | | 104,737 | 4,281,649 |
| Sands China Ltd. | | 1,314,800 | 6,476,205 |
| Semiconductor Manufacturing International Corp. (a) | | 1,770,000 | 2,248,340 |
| Shenzhou International Group Holdings Ltd. | | 412,900 | 5,705,722 |
| Shimao Property Holdings Ltd. | | 669,500 | 2,242,882 |
| Shui On Land Ltd. | | 1,205,500 | 242,598 |
| SINA Corp. (a) | | 38,039 | 1,506,344 |
| Sino Biopharmaceutical Ltd. | | 3,747,000 | 5,578,884 |
| SOHO China Ltd. | | 1,535,000 | 523,806 |
| Sunac China Holdings Ltd. | | 1,321,000 | 5,991,776 |
| Sunny Optical Technology Group Co. Ltd. | | 400,500 | 6,437,591 |
| TAL Education Group ADR (a) | | 212,538 | 9,098,752 |
| Tencent Holdings Ltd. | | 3,117,000 | 126,434,614 |
| Tencent Music Entertainment Group ADR (a) | | 48,329 | 668,873 |
| Tingyi (Cayman Islands) Holding Corp. | | 1,122,000 | 1,492,592 |
| Towngas China Co. Ltd. | | 409,922 | 315,999 |
| Uni-President China Holdings Ltd. | | 776,000 | 801,555 |
| Vipshop Holdings Ltd. ADR (a) | | 248,046 | 2,862,451 |
| Want Want China Holdings Ltd. | | 2,951,000 | 2,485,951 |
| Weibo Corp. sponsored ADR (a)(b) | | 28,517 | 1,402,751 |
| WH Group Ltd. (c) | | 5,109,500 | 5,393,299 |
| Wharf Real Estate Investment Co. Ltd. | | 654,000 | 3,846,648 |
| Wuxi Biologics (Cayman), Inc. (a)(c) | | 312,000 | 3,666,457 |
| Wynn Macau Ltd. | | 914,000 | 1,983,454 |
| Xiaomi Corp. Class B (a)(c) | | 4,337,000 | 4,913,807 |
| Xinyi Solar Holdings Ltd. | | 1,906,488 | 1,077,235 |
| Yihai International Holding Ltd. | | 259,000 | 1,761,392 |
| Yuzhou Properties Co. | | 515,958 | 217,952 |
| YY, Inc. ADR (a) | | 29,696 | 1,687,921 |
| Zhen Ding Technology Holding Ltd. | | 302,230 | 1,436,925 |
| Zhongsheng Group Holdings Ltd. Class H | | 293,000 | 971,359 |
| ZTO Express (Cayman), Inc. sponsored ADR | | 186,839 | 4,110,458 |
|
| TOTAL CAYMAN ISLANDS | | | 553,510,592 |
|
| Chile - 0.2% | | | |
| Aguas Andinas SA | | 1,317,262 | 603,923 |
| Banco de Chile | | 27,055,611 | 3,484,103 |
| Banco de Credito e Inversiones | | 26,766 | 1,490,248 |
| Banco Santander Chile | | 33,573,312 | 2,082,940 |
| Cencosud SA | | 714,322 | 969,960 |
| Colbun SA (a) | | 3,574,461 | 616,710 |
| Compania Cervecerias Unidas SA | | 101,407 | 1,011,868 |
| Compania de Petroleos de Chile SA (COPEC) | | 216,854 | 1,939,024 |
| CorpBanca SA | | 72,283,408 | 438,613 |
| Empresa Nacional de Telecomunicaciones SA (ENTEL) (a) | | 68,353 | 534,676 |
| Empresas CMPC SA | | 659,267 | 1,502,375 |
| Enel Chile SA | | 15,498,586 | 1,274,621 |
| Enersis SA | | 22,148,143 | 4,136,351 |
| LATAM Airlines Group SA | | 176,462 | 1,951,171 |
| S.A.C.I. Falabella | | 391,718 | 1,993,980 |
|
| TOTAL CHILE | | | 24,030,563 |
|
| China - 2.8% | | | |
| Agricultural Bank of China Ltd.: | | | |
| (A Shares) | | 1,137,100 | 587,589 |
| (H Shares) | | 16,906,000 | 6,956,882 |
| Aier Eye Hospital Group Co. Ltd. (A Shares) | | 63,340 | 355,517 |
| Air China Ltd. (H Shares) | | 1,052,000 | 928,814 |
| Aisino Co. Ltd. (A Shares) | | 26,200 | 76,568 |
| Aluminum Corp. of China Ltd.: | | | |
| (A shares) (a) | | 463,800 | 223,033 |
| (H Shares) (a) | | 2,160,000 | 639,936 |
| Angang Steel Co. Ltd. (H Shares) | | 1,449,800 | 484,993 |
| Anhui Conch Cement Co. Ltd.: | | | |
| (A Shares) | | 82,800 | 495,610 |
| (H Shares) | | 701,500 | 4,192,677 |
| Anxin Trust Co. Ltd. (A Shares) (a) | | 43,200 | 25,729 |
| AVIC Aircraft Co. Ltd. (A Shares) | | 84,600 | 180,135 |
| AVIC Aviation Engine Corp. PLC (A Shares) | | 19,952 | 59,866 |
| AVIC Capital Co. Ltd. (A Shares) | | 68,400 | 44,351 |
| AviChina Industry & Technology Co. Ltd. (H Shares) | | 1,358,000 | 641,454 |
| Baic Motor Corp. Ltd. (H Shares) (c) | | 937,000 | 581,228 |
| Bank Communications Co. Ltd.: | | | |
| (H Shares) | | 5,806,200 | 3,965,331 |
| Class A | | 245,000 | 195,136 |
| Bank of Beijing Co. Ltd. (A Shares) | | 179,600 | 141,208 |
| Bank of Chengdu Co. Ltd. Class A | | 202,100 | 241,758 |
| Bank of China Ltd.: | | | |
| (A Shares) | | 150,000 | 78,787 |
| (H Shares) | | 44,426,024 | 18,116,274 |
| Bank of Guiyang Co. Ltd. (A Shares) | | 181,760 | 235,780 |
| Bank of Hangzhou Co. Ltd. (A Shares) | | 181,331 | 231,647 |
| Bank of Jiangsu Co. Ltd. (A Shares) | | 104,400 | 104,811 |
| Bank of Nanjing Co. Ltd. (A Shares) | | 44,100 | 54,018 |
| Bank of Ningbo Co. Ltd. (A Shares) | | 177,700 | 681,163 |
| Bank of Shanghai Co. Ltd. (A Shares) | | 181,900 | 240,853 |
| Baoshan Iron & Steel Co. Ltd. (A Shares) | | 137,800 | 113,419 |
| BBMG Corp. (H Shares) | | 1,247,000 | 356,882 |
| Beijing Capital International Airport Co. Ltd. (H Shares) | | 970,000 | 918,708 |
| Beijing Shiji Information Technology Co. Ltd. (A Shares) | | 27,200 | 140,409 |
| Beijing Tongrentang Co. Ltd. (A Shares) | | 35,900 | 140,117 |
| BOE Technology Group Co. Ltd. (A Shares) | | 989,700 | 500,997 |
| BYD Co. Ltd.: | | | |
| (A Shares) | | 22,300 | 135,565 |
| (H Shares) (b) | | 446,000 | 2,091,971 |
| Caitong Securities Co. Ltd. | | 64,700 | 91,307 |
| CGN Power Co. Ltd. (H Shares) (c) | | 5,799,000 | 1,506,128 |
| Changjiang Securities Co. Ltd. (A Shares) | | 55,200 | 53,314 |
| Chaozhou Three-Circle Group Co. (A Shares) | | 51,500 | 137,129 |
| China Cinda Asset Management Co. Ltd. (H Shares) | | 5,049,000 | 1,047,400 |
| China CITIC Bank Corp. Ltd. (H Shares) | | 5,009,293 | 2,903,691 |
| China Coal Energy Co. Ltd. (H Shares) | | 741,000 | 295,497 |
| China Communications Construction Co. Ltd.: | | | |
| (A Shares) | | 293,200 | 391,647 |
| (H Shares) | | 2,264,000 | 1,723,453 |
| China Communications Services Corp. Ltd. (H Shares) | | 1,312,000 | 810,197 |
| China Construction Bank Corp. (H Shares) | | 52,896,649 | 42,384,525 |
| China Eastern Airlines Corp. Ltd.: | | | |
| (A Shares) (a) | | 209,900 | 154,273 |
| (H Shares) (a) | | 822,000 | 409,967 |
| China Everbright Bank Co. Ltd.: | | | |
| (A Shares) | | 718,700 | 442,723 |
| (H Shares) | | 1,981,000 | 911,592 |
| China Film Co. Ltd. (A Shares) | | 50,000 | 94,467 |
| China Fortune Land Development Co. Ltd. (A Shares) | | 98,100 | 397,731 |
| China Galaxy Securities Co. Ltd. (H Shares) | | 1,844,500 | 940,487 |
| China Gezhouba Group Co. Ltd. (A Shares) | | 76,500 | 62,249 |
| China Grand Automotive Services Co. Ltd. (A Shares) | | 167,800 | 85,966 |
| China Huarong Asset Management Co. Ltd. (c) | | 5,659,000 | 835,465 |
| China International Capital Corp. Ltd. (H Shares) (c) | | 670,800 | 1,223,168 |
| China International Travel Service Corp. Ltd. (A Shares) | | 52,800 | 677,056 |
| China Life Insurance Co. Ltd. (H Shares) | | 4,221,000 | 10,855,110 |
| China Longyuan Power Grid Corp. Ltd. (H Shares) | | 1,687,000 | 911,376 |
| China Merchants Bank Co. Ltd.: | | | |
| (A Shares) | | 287,800 | 1,449,555 |
| (H Shares) | | 2,378,691 | 11,344,527 |
| China Merchants Securities Co. Ltd. (A Shares) | | 189,000 | 440,906 |
| China Merchants Shekou Industrial Zone Holdings Co. Ltd. (A Shares) | | 243,400 | 646,459 |
| China Minsheng Banking Corp. Ltd.: | | | |
| (A Shares) | | 1,507,800 | 1,316,140 |
| (H Shares) | | 3,237,332 | 2,264,419 |
| China Molybdenum Co. Ltd.: | | | |
| (H Shares) (b) | | 2,238,000 | 705,275 |
| Class A | | 384,300 | 185,348 |
| China National Building Materials Co. Ltd. (H Shares) | | 2,044,000 | 1,722,732 |
| China National Chemical Engineering Co. Ltd. (A Shares) | | 121,200 | 102,866 |
| China National Nuclear Power Co. Ltd. (A Shares) | | 207,800 | 149,191 |
| China Northern Rare Earth Group High-Tech Co. Ltd. | | 116,700 | 166,599 |
| China Oilfield Services Ltd. (H Shares) | | 934,000 | 1,300,386 |
| China Pacific Insurance (Group) Co. Ltd. (H Shares) | | 1,691,800 | 6,138,339 |
| China Petroleum & Chemical Corp.: | | | |
| (A Shares) | | 425,000 | 295,596 |
| (H Shares) | | 14,541,800 | 8,271,015 |
| China Railway Construction Corp. Ltd.: | | | |
| (A Shares) | | 389,400 | 518,754 |
| (H Shares) | | 944,000 | 1,032,535 |
| China Railway Group Ltd.: | | | |
| (A Shares) | | 127,200 | 104,041 |
| (H Shares) | | 2,838,000 | 1,710,505 |
| China Railway Signal & Communications Corp. (H Shares) (c) | | 813,000 | 485,348 |
| China Reinsurance Group Corp. (H Shares) | | 3,499,000 | 570,835 |
| China Resources Sanjiu Medical & Pharmaceutical Co. Ltd. (A Shares) | | 35,200 | 147,205 |
| China Shenhua Energy Co. Ltd.: | | | |
| (A Shares) | | 31,000 | 81,118 |
| (H Shares) | | 1,994,500 | 4,050,711 |
| China Shipbuilding Industry Co. (A Shares) | | 334,700 | 251,606 |
| China Shipbuilding Industry Group Power Co. Ltd. (a) | | 13,400 | 39,852 |
| China Shipping Development Co. Ltd. (H Shares) | | 398,000 | 171,212 |
| China Southern Airlines Ltd. (H Shares) | | 1,300,000 | 800,072 |
| China State Construction Engineering Corp. Ltd. (A Shares) | | 1,386,640 | 1,032,008 |
| China Telecom Corp. Ltd. (H Shares) | | 7,600,000 | 3,233,106 |
| China Tower Corp. Ltd. (H Shares) (c) | | 23,360,000 | 5,141,370 |
| China United Network Communications Ltd. (A Shares) | | 760,700 | 662,243 |
| China Vanke Co. Ltd.: | | | |
| (A Shares) | | 184,000 | 692,316 |
| (H Shares) | | 919,100 | 3,351,543 |
| China Yangtze Power Co. Ltd. (A Shares) | | 497,400 | 1,261,259 |
| Chongqing Rural Commercial Bank Co. Ltd. (H Shares) | | 1,249,000 | 666,650 |
| Chongqing Zhifei Biological Products Co. Ltd. (A Shares) | | 31,800 | 219,231 |
| CITIC Securities Co. Ltd.: | | | |
| (A Shares) | | 20,500 | 63,082 |
| (H Shares) | | 1,668,500 | 3,061,224 |
| Contemporary Amperex Technology Co. Ltd. | | 12,100 | 118,026 |
| COSCO Shipping Development Co. Ltd. (H Shares) | | 481,000 | 53,886 |
| COSCO SHIPPING Holdings Co. Ltd.: | | | |
| (A Shares) (a) | | 38,300 | 25,045 |
| (H Shares) (a) | | 1,731,000 | 647,597 |
| CRRC Corp. Ltd.: | | | |
| (A Shares) | | 249,600 | 255,032 |
| (H Shares) | | 3,207,800 | 2,145,489 |
| Daqin Railway Co. Ltd. (A Shares) | | 474,700 | 514,188 |
| Datang International Power Generation Co. Ltd. (H Shares) | | 1,010,000 | 199,219 |
| DHC Software Co. Ltd. (A Shares) | | 157,400 | 159,343 |
| Dong E-E-Jiao Co. Ltd. (A Shares) | | 22,300 | 111,744 |
| Dongfeng Motor Group Co. Ltd. (H Shares) | | 1,650,000 | 1,655,137 |
| Dongxing Securities Co. Ltd. (A Shares) | | 85,900 | 132,565 |
| East Money Information Co. Ltd. (A Shares) | | 115,900 | 245,018 |
| Everbright Securities Co. Ltd. (A Shares) | | 30,600 | 49,742 |
| Fangda Carbon New Material Co. Ltd. (A Shares) | | 52,448 | 79,587 |
| Financial Street Holdings Co. Ltd. (A Shares) | | 177,500 | 197,984 |
| Focus Media Information Technology Co. Ltd. (A Shares) | | 475,840 | 404,792 |
| Foshan Haitian Flavouring & Food Co. Ltd. (A Shares) | | 39,200 | 621,697 |
| Founder Securities Co. Ltd. (A Shares) | | 60,100 | 57,375 |
| Foxconn Industrial Internet Co. Ltd. (A Shares) | | 74,000 | 161,207 |
| Fuyao Glass Industries Group Co. Ltd. (H Shares) (c) | | 358,800 | 1,013,825 |
| GD Power Development Co. Ltd. (A Shares) | | 493,000 | 163,016 |
| Gemdale Corp. (A Shares) | | 43,500 | 73,464 |
| GF Securities Co. Ltd.: | | | |
| (A Shares) (a) | | 70,600 | 137,375 |
| (H Shares) | | 971,000 | 1,011,274 |
| Giant Network Group Co. Ltd. (A Shares) | | 45,400 | 114,756 |
| GoerTek, Inc. (A Shares) | | 90,300 | 237,964 |
| Great Wall Motor Co. Ltd. (H Shares) (b) | | 1,866,500 | 1,512,334 |
| Gree Electric Appliances, Inc. of Zhuhai (A Shares) | | 68,900 | 574,449 |
| Greenland Holdings Corp. Ltd. (A Shares) | | 66,500 | 64,347 |
| Guanghui Energy Co. Ltd. (A Shares) | | 376,500 | 175,820 |
| Guangzhou Automobile Group Co. Ltd. | | 12,200 | 19,898 |
| Guangzhou Automobile Group Co. Ltd. (H Shares) | | 1,821,526 | 1,819,223 |
| Guangzhou Baiyunshan Pharmaceutical Holdings Co. Ltd. (A Shares) | | 24,900 | 119,332 |
| Guangzhou Haige Communications Group (A Shares) | | 113,500 | 154,766 |
| Guangzhou R&F Properties Co. Ltd. (H Shares) | | 554,000 | 858,398 |
| Guosen Securities Co. Ltd. (A Shares) | | 72,000 | 124,916 |
| Guotai Junan Securities Co. Ltd.: | | | |
| (A Shares) | | 173,100 | 418,951 |
| (H Shares) (c) | | 443,600 | 677,865 |
| Guoyuan Securities Co. Ltd. (A Shares) | | 98,900 | 118,542 |
| Haier Smart Home Co. Ltd. (A Shares) | | 90,500 | 205,549 |
| Haitong Securities Co. Ltd.: | | | |
| (A Shares) | | 18,300 | 36,608 |
| (H Shares) | | 1,900,800 | 1,940,543 |
| Hanergy Mobile Energy Holding (d) | | 1,902,000 | 2 |
| Hangzhou Hikvision Digital Technology Co. Ltd. (A Shares) | | 180,200 | 825,411 |
| Hangzhou Robam Appliances Co. Ltd. (A Shares) | | 30,000 | 134,107 |
| Hangzhou Tigermed Consulting Co. Ltd. (A Shares) | | 21,600 | 209,442 |
| Heilan Home Co. Ltd. (A Shares) | | 93,500 | 101,963 |
| Henan Shuanghui Investment & Development Co. Ltd. (A Shares) | | 13,600 | 57,528 |
| Hengli Petrochemical Co. Ltd. (A Shares) | | 48,160 | 110,131 |
| Hengtong Optic-electric Co. Ltd. (A Shares) | | 32,000 | 66,734 |
| Hithink RoyalFlush Information Network Co. Ltd. (A Shares) | | 8,300 | 114,344 |
| Huaan Securities Co. Ltd. (A Shares) | | 14,400 | 12,873 |
| Huadian Power International Corp. Ltd. (H Shares) | | 602,000 | 225,575 |
| Huadong Medicine Co. Ltd. (A Shares) | | 8,560 | 31,685 |
| Huaneng Power International, Inc. (H Shares) | | 2,114,000 | 1,004,098 |
| Huaneng Renewables Corp. Ltd. (H Shares) | | 2,430,000 | 927,715 |
| Huatai Securities Co. Ltd.: | | | |
| (A Shares) | | 217,500 | 538,175 |
| (H Shares) (c) | | 765,000 | 1,137,109 |
| HUAXI Securities Co. Ltd. | | 8,100 | 10,950 |
| Huaxia Bank Co. Ltd. (A Shares) | | 294,600 | 313,201 |
| Huayu Automotive Systems Co. Ltd. (A Shares) | | 14,400 | 51,319 |
| Hubei Biocause Pharmaceutical Co. Ltd. (A Shares) | | 191,400 | 185,108 |
| Hundsun Technologies, Inc. (A Shares) | | 17,600 | 190,265 |
| iFlytek Co. Ltd. (A Shares) | | 13,400 | 62,946 |
| Industrial & Commercial Bank of China Ltd. (H Shares) | | 37,068,008 | 26,555,274 |
| Industrial Bank Co. Ltd. (A Shares) | | 472,900 | 1,256,218 |
| Industrial Securities Co. Ltd. (A Shares) | | 58,300 | 52,766 |
| Inner Mongoli Yili Industries Co. Ltd. (A Shares) | | 162,000 | 666,760 |
| Inner Mongolia Baotou Steel Union Co. Ltd. (A Shares) | | 200,900 | 39,064 |
| Inner Mongolia Yitai Coal Co. Ltd. (B Shares) | | 2,498,988 | 2,179,707 |
| Jiangsu Expressway Co. Ltd. (H Shares) | | 634,000 | 842,300 |
| Jiangsu Hengrui Medicine Co. Ltd. (A Shares) | | 81,360 | 1,049,030 |
| Jiangsu Yanghe Brewery JSC Ltd. (A Shares) | | 40,900 | 584,177 |
| Jiangxi Copper Co. Ltd. (H Shares) | | 779,000 | 911,998 |
| Jinke Properties Group Co. Ltd. (A Shares) | | 152,000 | 149,525 |
| Jointown Pharmaceutical Group (A Shares) | | 62,100 | 113,919 |
| Kangmei Pharmaceutical Co. Ltd. (A Shares) | | 42,400 | 22,418 |
| Kweichow Moutai Co. Ltd. (A Shares) | | 25,100 | 4,200,977 |
| Legend Holdings Corp.: | | | |
| (H Shares) (c) | | 136,700 | 300,494 |
| rights (a)(d) | | 9,446 | 1,567 |
| Lepu Medical Technology Beijing Co. Ltd. (A Shares) | | 31,600 | 135,375 |
| Liaoning Chengda Co. Ltd. (A Shares) (a) | | 64,100 | 127,585 |
| LONGi Green Energy Technology Co. Ltd. | | 81,630 | 264,278 |
| Luxshare Precision Industry Co. Ltd. (A Shares) | | 144,515 | 651,305 |
| Luzhou Laojiao Co. Ltd. (A Shares) | | 35,100 | 434,044 |
| Maanshan Iron & Steel Co. Ltd.: | | | |
| (A Shares) | | 672,600 | 253,828 |
| (H Shares) | | 660,000 | 249,628 |
| Mango Excellent Media Co. Ltd. (A Shares) | | 41,900 | 160,544 |
| Meinian Onehealth Healthcare Holdings Co. Ltd. (A Shares) | | 17,364 | 36,745 |
| Metallurgical Corp. China Ltd.: | | | |
| (A Shares) | | 296,500 | 115,334 |
| (H Shares) | | 1,171,000 | 247,900 |
| Midea Group Co. Ltd. (A Shares) | | 93,100 | 733,239 |
| Muyuan Foodstuff Co. Ltd. (A Shares) | | 35,800 | 500,193 |
| NARI Technology Co. Ltd. (A Shares) | | 78,700 | 245,102 |
| New China Life Insurance Co. Ltd. | | 64,400 | 435,399 |
| New China Life Insurance Co. Ltd. (H Shares) | | 480,900 | 1,866,458 |
| Offshore Oil Enginering Co. Ltd. (A Shares) | | 155,000 | 132,633 |
| Oppein Home Group, Inc. (A Shares) | | 6,900 | 108,110 |
| Orient Securities Co. Ltd. (A Shares) | | 31,300 | 44,401 |
| People's Insurance Co. of China Group (H Shares) | | 4,235,000 | 1,783,669 |
| PetroChina Co. Ltd. (H Shares) | | 12,006,000 | 5,854,865 |
| PICC Property & Casualty Co. Ltd. (H Shares) | | 3,742,001 | 4,735,574 |
| Ping An Bank Co. Ltd. (A Shares) | | 438,300 | 1,011,407 |
| Ping An Insurance Group Co. of China Ltd.: | | | |
| (A Shares) | | 231,900 | 2,895,147 |
| (H Shares) | | 3,093,000 | 35,698,759 |
| Poly Developments & Holdings (A Shares) | | 353,500 | 722,544 |
| Postal Savings Bank of China Co. Ltd. (H Shares) (c) | | 4,495,000 | 2,882,028 |
| Power Construction Corp. of China Ltd. (A Shares) | | 60,646 | 38,402 |
| Qihoo 360 Technology Co. Ltd. (A Shares) | | 35,200 | 112,837 |
| Risesun Real Estate Development Co. Ltd. (A Shares) | | 132,600 | 163,675 |
| Rongsheng Petrochemical Co. Ltd. (A Shares) | | 48,000 | 75,068 |
| SAIC Motor Corp. Ltd. (A Shares) | | 229,100 | 764,088 |
| Sanan Optoelectronics Co. Ltd. (A Shares) | | 15,300 | 32,985 |
| Sany Heavy Industry Co. Ltd. (A Shares) | | 209,900 | 401,112 |
| SDIC Capital Co. Ltd. | | 60,600 | 105,390 |
| SDIC Power Holdings Co. Ltd. (A Shares) | | 52,900 | 62,619 |
| Seazen Holdings Co. Ltd. (A Shares) | | 27,200 | 122,795 |
| Shaanxi Coal Industry Co. Ltd. (A Shares) | | 60,200 | 71,580 |
| Shandong Buchang Pharmaceuticals Co. Ltd. (A Shares) | | 37,470 | 108,899 |
| Shandong Gold Mining Co. Ltd. (A Shares) | | 50,280 | 228,406 |
| Shandong Weigao Medical Polymer Co. Ltd. (H Shares) | | 1,040,000 | 1,193,963 |
| Shanghai 2345 Network Holding Group Co. Ltd. (A Shares) | | 214,240 | 99,047 |
| Shanghai Construction Group Co. Ltd. (A Shares) | | 192,600 | 93,257 |
| Shanghai Electric Group Co. Ltd.: | | | |
| (A Shares) | | 293,800 | 203,456 |
| (H Shares) | | 902,000 | 275,901 |
| Shanghai Fosun Pharmaceutical (Group) Co. Ltd.: | | | |
| (A Shares) | | 37,600 | 135,821 |
| (H Shares) | | 311,500 | 879,166 |
| Shanghai International Airport Co. Ltd. (A Shares) | | 7,072 | 76,547 |
| Shanghai International Port Group Co. Ltd. (A Shares) | | 54,600 | 44,983 |
| Shanghai Lujiazui Finance Trust Ltd. (B Shares) | | 1,609,936 | 1,773,188 |
| Shanghai Pharmaceuticals Holding Co. Ltd. (H Shares) | | 496,300 | 896,774 |
| Shanghai Pudong Development Bank Co. Ltd. (A Shares) | | 702,500 | 1,246,979 |
| Shanghai Tunnel Engineering Co. Ltd. | | 150,800 | 124,605 |
| Shanghaioriental Pearl Media Co. Ltd. | | 189,390 | 241,971 |
| Shanxi Lu'an Environmental Energy Development Co. Ltd. (A Shares) | | 187,000 | 186,018 |
| Shanxi Securities Co. Ltd. (A Shares) | | 99,200 | 109,636 |
| Shanxi Xinghuacun Fen Wine Factory Co. Ltd. (A Shares) | | 14,400 | 181,728 |
| Shanxi Xishan Coal & Electricity Power Co. Ltd. (A Shares) | | 255,000 | 205,147 |
| Shenergy Co. Ltd. (A Shares) | | 85,171 | 70,007 |
| Shenwan Hongyuan Group Co. Ltd. (A Shares) | | 364,100 | 247,486 |
| Shenzhen Inovance Technology Co. Ltd. (A Shares) | | 36,200 | 128,074 |
| Shenzhen Kangtai Biological Products Co. Ltd. | | 14,800 | 181,838 |
| Shenzhen Mindray Bio-Medical Electronics Co. Ltd. (A Shares) | | 7,500 | 189,371 |
| Shenzhen Overseas Chinese Town Co. Ltd. (A Shares) | | 45,700 | 45,659 |
| Shenzhen Salubris Pharmaceuticals Co. Ltd. (A Shares) | | 35,400 | 94,054 |
| Shenzhen Zhongjin Lingnan Nonfemet Co. Ltd. (A Shares) | | 163,000 | 92,959 |
| Shijiazhuang Baosh Electric Co. Ltd. (A Shares) | | 146,100 | 98,794 |
| Sichuan Chuantou Energy Co. Ltd. (A Shares) | | 64,800 | 88,839 |
| Sichuan Kelun Pharmaceutical Co. Ltd. (A Shares) | | 33,300 | 112,870 |
| Sichuan New Hope Agribusiness Co. Ltd. (A Shares) | | 62,400 | 195,353 |
| Sinolink Securities Co. Ltd. (A Shares) | | 103,500 | 124,925 |
| Sinopec Engineering Group Co. Ltd. (H Shares) | | 792,000 | 452,435 |
| Sinopec Shanghai Petrochemical Co. Ltd.: | | | |
| (A Shares) | | 366,600 | 206,073 |
| (H Shares) | | 966,000 | 266,799 |
| Sinopharm Group Co. Ltd. (H Shares) | | 604,800 | 2,165,940 |
| Sinotrans Ltd. (H Shares) | | 836,000 | 245,805 |
| Songcheng Performance Development Co. Ltd. (A Shares) | | 39,200 | 164,695 |
| Soochow Securities Co. Ltd. (A Shares) | | 69,500 | 89,610 |
| Spring Airlines Co. Ltd. (A Shares) | | 27,500 | 168,635 |
| Suning.com Co. Ltd. (A Shares) | | 351,900 | 526,842 |
| Suzhou Gold Mantis Consolidated Co. Ltd. | | 81,600 | 92,600 |
| Tasly Pharmaceutical Group Co. Ltd. (A Shares) | | 40,000 | 83,020 |
| TBEA Co. Ltd. (A Shares) | | 39,900 | 36,357 |
| TCL Corp. (A Shares) | | 339,900 | 158,783 |
| Tong Ren Tang Technologies Co. Ltd. (H Shares) | | 219,000 | 218,037 |
| Tonghua Dongbao Pharmaceutical Co. Ltd. (A Shares) | | 57,100 | 129,508 |
| Tongling Nonferrous Metals Group Co. Ltd. (A Shares) | | 808,900 | 249,161 |
| Tongwei Co. Ltd. (A Shares) | | 67,200 | 121,067 |
| TravelSky Technology Ltd. (H Shares) | | 460,000 | 1,048,550 |
| Tsingtao Brewery Co. Ltd.: | | | |
| (A Shares) | | 22,000 | 146,616 |
| (H Shares) | | 226,000 | 1,309,674 |
| Walvax Biotechnology Co. Ltd. (A Shares) | | 42,800 | 183,210 |
| Wanhua Chemical Group Co. Ltd. (A Shares) | | 91,400 | 591,108 |
| Weichai Power Co. Ltd.: | | | |
| (A Shares) | | 182,100 | 298,570 |
| (H Shares) | | 983,800 | 1,548,521 |
| Weifu High-Technology Group Co. Ltd. (A Shares) | | 6,000 | 14,288 |
| Wens Foodstuffs Group Co. Ltd. (A Shares) | | 106,200 | 606,644 |
| Western Securities Co. Ltd. (A Shares) | | 95,500 | 119,899 |
| Wuliangye Yibin Co. Ltd. (A Shares) | | 79,500 | 1,487,200 |
| WuXi AppTec Co. Ltd. | | 43,300 | 578,002 |
| WuXi AppTec Co. Ltd. (H Shares) (c) | | 63,080 | 760,538 |
| XCMG Construction Machinery Co. Ltd. (A Shares) | | 223,300 | 143,164 |
| Xiamen C&D, Inc. (A Shares) | | 136,200 | 164,092 |
| Xinjiang Goldwind Science & Technology Co. Ltd.: | | | |
| (A Shares) | | 9,500 | 16,939 |
| (H Shares) | | 411,764 | 491,073 |
| Yanzhou Coal Mining Co. Ltd. (H Shares) | | 996,000 | 1,010,515 |
| Yonghui Superstores Co. Ltd. (A Shares) | | 329,600 | 390,191 |
| Yonyou Network Technology Co. Ltd. (A Shares) | | 45,400 | 190,256 |
| Yunnan Baiyao Group Co. Ltd. (A Shares) | | 41,200 | 506,296 |
| Zhangzhou Pientzehuang Pharmaceutical Co. Ltd. (A Shares) | | 9,500 | 146,278 |
| Zhaojin Mining Industry Co. Ltd. (H Shares) | | 540,500 | 604,483 |
| Zhejiang China Commodities City Group Co. Ltd. (A Shares) | | 205,600 | 113,836 |
| Zhejiang Chint Electric Co. Ltd. (A Shares) | | 17,600 | 56,981 |
| Zhejiang Dahua Technology Co. Ltd. (A Shares) | | 25,500 | 58,246 |
| Zhejiang Expressway Co. Ltd. (H Shares) | | 800,000 | 655,095 |
| Zhejiang Longsheng Group Co. Ltd. (A Shares) | | 74,200 | 145,644 |
| Zhejiang Semir Garment Co. Ltd. (A Shares) | | 66,500 | 104,997 |
| Zhengzhou Yutong Bus Co. Ltd. (A Shares) | | 14,600 | 29,623 |
| ZhongAn Online P & C Insurance Co. Ltd. (H Shares) (a)(b)(c) | | 163,100 | 542,937 |
| Zhuzhou CRRC Times Electric Co. Ltd. (H Shares) | | 267,700 | 993,319 |
| Zijin Mining Group Co. Ltd. (H Shares) | | 3,609,000 | 1,250,121 |
| Zoomlion Heavy Industry Science and Technology Co. Ltd. (A Shares) | | 189,900 | 157,639 |
| ZTE Corp.: | | | |
| (A Shares) (a) | | 32,800 | 155,202 |
| (H Shares) (a) | | 531,536 | 1,482,930 |
|
| TOTAL CHINA | | | 342,727,486 |
|
| Colombia - 0.1% | | | |
| Bancolombia SA | | 114,465 | 1,391,867 |
| Cementos Argos SA | | 284,403 | 642,010 |
| Ecopetrol SA | | 2,704,762 | 2,432,685 |
| Grupo de Inversiones Suramerica SA | | 101,638 | 1,028,408 |
| Interconexion Electrica SA ESP | | 226,143 | 1,304,671 |
| Inversiones Argos SA | | 124,907 | 676,272 |
|
| TOTAL COLOMBIA | | | 7,475,913 |
|
| Czech Republic - 0.0% | | | |
| Ceske Energeticke Zavody A/S | | 82,835 | 1,889,603 |
| Komercni Banka A/S | | 40,084 | 1,354,932 |
| MONETA Money Bank A/S (c) | | 292,857 | 973,287 |
|
| TOTAL CZECH REPUBLIC | | | 4,217,822 |
|
| Denmark - 1.1% | | | |
| A.P. Moller - Maersk A/S: | | | |
| Series A | | 1,803 | 2,163,988 |
| Series B | | 3,789 | 4,833,258 |
| Carlsberg A/S Series B | | 58,913 | 8,287,994 |
| Christian Hansen Holding A/S | | 56,447 | 4,333,760 |
| Coloplast A/S Series B | | 64,778 | 7,805,697 |
| Danske Bank A/S | | 348,039 | 4,965,900 |
| DSV A/S | | 120,597 | 11,701,805 |
| Genmab A/S (a) | | 36,532 | 7,982,049 |
| H Lundbeck A/S | | 41,734 | 1,423,571 |
| ISS Holdings A/S | | 89,716 | 2,347,766 |
| Novo Nordisk A/S Series B | | 966,689 | 53,156,982 |
| Novozymes A/S Series B | | 113,894 | 5,362,478 |
| ORSTED A/S (c) | | 103,601 | 9,087,590 |
| Pandora A/S | | 55,690 | 2,738,444 |
| Tryg A/S | | 71,267 | 1,990,514 |
| Vestas Wind Systems A/S | | 103,723 | 8,450,086 |
| William Demant Holding A/S (a) | | 56,425 | 1,489,213 |
|
| TOTAL DENMARK | | | 138,121,095 |
|
| Egypt - 0.0% | | | |
| Commercial International Bank SAE | | 573,150 | 2,876,403 |
| Commercial International Bank SAE sponsored GDR | | 151,516 | 748,489 |
| Eastern Tobacco Co. | | 527,846 | 523,594 |
| Elsewedy Electric Co. | | 287,746 | 239,788 |
|
| TOTAL EGYPT | | | 4,388,274 |
|
| Finland - 0.7% | | | |
| Elisa Corp. (A Shares) | | 76,713 | 4,189,776 |
| Fortum Corp. | | 244,264 | 5,963,441 |
| Kone OYJ (B Shares) | | 185,835 | 11,822,212 |
| Metso Corp. | | 54,431 | 2,056,750 |
| Neste Oyj | | 231,296 | 8,347,729 |
| Nokia Corp. | | 3,131,907 | 11,497,274 |
| Nokian Tyres PLC | | 66,653 | 1,903,055 |
| Nordea Bank ABP (Stockholm Stock Exchange) | | 1,767,995 | 12,940,552 |
| Orion Oyj (B Shares) | | 55,233 | 2,448,038 |
| Sampo Oyj (A Shares) | | 245,362 | 10,054,898 |
| Stora Enso Oyj (R Shares) | | 319,885 | 4,147,425 |
| UPM-Kymmene Corp. | | 294,106 | 9,558,399 |
| Wartsila Corp. | | 250,341 | 2,641,841 |
|
| TOTAL FINLAND | | | 87,571,390 |
|
| France - 6.6% | | | |
| Accor SA | | 103,365 | 4,440,701 |
| Aeroports de Paris | | 15,768 | 2,996,663 |
| Air Liquide SA | | 215,741 | 28,657,358 |
| Alstom SA | | 103,392 | 4,468,383 |
| Amundi SA (c) | | 33,584 | 2,397,199 |
| Arkema SA | | 35,938 | 3,673,083 |
| Atos Origin SA | | 53,633 | 4,162,279 |
| AXA SA | | 1,050,128 | 27,798,182 |
| BIC SA | | 12,363 | 858,331 |
| bioMerieux SA | | 20,246 | 1,656,270 |
| BNP Paribas SA | | 610,543 | 31,906,707 |
| Bollore SA (a) | | 2,237 | 9,531 |
| Bollore SA | | 471,915 | 2,042,148 |
| Bouygues SA | | 119,831 | 5,078,606 |
| Bureau Veritas SA | | 159,706 | 4,077,169 |
| Capgemini SA | | 87,350 | 9,834,696 |
| Carrefour SA | | 324,728 | 5,524,890 |
| Casino Guichard Perrachon SA (b) | | 29,668 | 1,600,501 |
| CNP Assurances | | 86,249 | 1,710,321 |
| Compagnie de St. Gobain | | 269,363 | 10,956,338 |
| Covivio | | 26,704 | 3,022,972 |
| Credit Agricole SA | | 620,174 | 8,092,248 |
| Danone SA | | 336,877 | 27,907,330 |
| Dassault Aviation SA | | 1,272 | 1,766,234 |
| Dassault Systemes SA | | 72,274 | 10,966,609 |
| Edenred SA | | 130,277 | 6,858,063 |
| EDF SA (a) | | 23,260 | 240,014 |
| EDF SA | | 301,129 | 3,107,277 |
| Eiffage SA | | 42,470 | 4,562,369 |
| ENGIE | | 994,141 | 16,625,938 |
| Essilor International SA | | 154,432 | 23,562,160 |
| Eurazeo SA | | 20,696 | 1,442,641 |
| Eutelsat Communications | | 90,472 | 1,715,358 |
| Faurecia SA | | 39,174 | 1,825,400 |
| Gecina SA | | 24,227 | 4,155,733 |
| Groupe Eurotunnel SA | | 242,895 | 4,066,221 |
| Hermes International SCA | | 17,003 | 12,231,423 |
| ICADE | | 15,486 | 1,516,441 |
| Iliad SA | | 12,984 | 1,343,842 |
| Imerys SA | | 18,997 | 733,506 |
| Ingenico SA | | 33,024 | 3,526,264 |
| Ipsen SA | | 21,812 | 2,323,221 |
| JCDecaux SA | | 38,772 | 1,059,439 |
| Kering SA | | 41,294 | 23,497,362 |
| Klepierre SA | | 111,849 | 4,165,242 |
| L'Oreal SA | | 113,518 | 33,145,615 |
| L'Oreal SA (a) | | 23,733 | 6,929,693 |
| Legrand SA | | 144,561 | 11,282,797 |
| LVMH Moet Hennessy Louis Vuitton SE | | 151,222 | 64,580,267 |
| Michelin CGDE Series B | | 93,782 | 11,418,642 |
| Natixis SA | | 487,785 | 2,236,493 |
| Orange SA | | 1,081,847 | 17,411,796 |
| Pernod Ricard SA | | 116,387 | 21,482,963 |
| Peugeot Citroen SA | | 324,028 | 8,203,517 |
| Publicis Groupe SA | | 114,122 | 4,911,647 |
| Remy Cointreau SA (b) | | 13,450 | 1,798,594 |
| Renault SA | | 106,401 | 5,430,295 |
| Safran SA | | 178,453 | 28,232,211 |
| Sanofi SA | | 614,837 | 56,680,074 |
| Sartorius Stedim Biotech | | 14,158 | 2,119,074 |
| Schneider Electric SA | | 298,675 | 27,758,993 |
| SCOR SE | | 93,800 | 3,952,360 |
| SEB SA | | 11,694 | 1,775,060 |
| Societe Generale Series A | | 420,584 | 11,960,957 |
| Sodexo SA (a) | | 8,142 | 895,364 |
| Sodexo SA | | 39,617 | 4,356,625 |
| SR Teleperformance SA | | 32,412 | 7,345,498 |
| Suez Environnement SA | | 198,891 | 3,099,978 |
| Thales SA | | 57,102 | 5,581,429 |
| Total SA | | 1,300,406 | 68,750,184 |
| Ubisoft Entertainment SA (a) | | 45,951 | 2,713,130 |
| Valeo SA | | 129,511 | 4,815,750 |
| Veolia Environnement SA | | 298,852 | 7,856,108 |
| VINCI SA | | 278,039 | 31,195,748 |
| Vivendi SA | | 501,245 | 13,953,602 |
| Wendel SA | | 15,194 | 2,152,125 |
| Worldline SA (a)(c) | | 44,925 | 2,728,209 |
|
| TOTAL FRANCE | | | 800,917,461 |
|
| Germany - 5.2% | | | |
| adidas AG | | 98,339 | 30,364,212 |
| Allianz SE | | 230,218 | 56,224,464 |
| Axel Springer SE (a) | | 27,082 | 1,887,785 |
| BASF AG | | 501,590 | 38,130,490 |
| Bayer AG | | 509,969 | 39,561,456 |
| Bayerische Motoren Werke AG (BMW) | | 178,673 | 13,692,116 |
| Beiersdorf AG | | 54,099 | 6,404,732 |
| Brenntag AG | | 89,500 | 4,491,871 |
| Carl Zeiss Meditec AG | | 21,664 | 2,361,822 |
| Commerzbank AG | | 548,502 | 3,280,785 |
| Continental AG | | 61,180 | 8,194,501 |
| Covestro AG (c) | | 95,612 | 4,590,683 |
| Daimler AG (Germany) | | 497,942 | 29,106,141 |
| Delivery Hero AG (a)(c) | | 63,117 | 2,958,676 |
| Deutsche Bank AG | | 1,093,745 | 7,921,731 |
| Deutsche Borse AG | | 103,863 | 16,084,193 |
| Deutsche Lufthansa AG | | 121,603 | 2,108,272 |
| Deutsche Post AG | | 548,002 | 19,405,176 |
| Deutsche Telekom AG | | 1,804,490 | 31,751,049 |
| Deutsche Wohnen AG (Bearer) | | 195,229 | 7,342,156 |
| Drillisch AG (b) | | 26,900 | 719,438 |
| E.ON AG | | 1,213,990 | 12,242,453 |
| Evonik Industries AG | | 109,382 | 2,885,152 |
| Fraport AG Frankfurt Airport Services Worldwide | | 25,358 | 2,119,436 |
| Fresenius Medical Care AG & Co. KGaA | | 90,437 | 6,527,712 |
| Fresenius Medical Care AG & Co. KGaA sponsored ADR | | 52,053 | 1,877,552 |
| Fresenius SE & Co. KGaA | | 224,804 | 11,815,364 |
| GEA Group AG | | 86,235 | 2,636,236 |
| Hannover Reuck SE | | 32,807 | 5,810,436 |
| HeidelbergCement Finance AG | | 79,677 | 5,920,104 |
| Henkel AG & Co. KGaA | | 54,966 | 5,293,564 |
| Hochtief AG | | 12,856 | 1,603,022 |
| Hugo Boss AG | | 38,464 | 1,618,146 |
| Infineon Technologies AG | | 690,109 | 13,366,566 |
| KION Group AG | | 34,049 | 2,262,542 |
| Knorr-Bremse AG | | 26,165 | 2,640,663 |
| Lanxess AG | | 49,506 | 3,218,979 |
| Merck KGaA | | 69,599 | 8,297,980 |
| Metro Wholesale & Food Specialist AG | | 92,956 | 1,513,638 |
| MTU Aero Engines Holdings AG | | 28,747 | 7,675,530 |
| Muenchener Rueckversicherungs-Gesellschaft AG in Muenchen | | 78,359 | 21,761,054 |
| Puma AG | | 44,590 | 3,354,371 |
| RWE AG | | 300,580 | 9,162,024 |
| SAP SE | | 536,211 | 71,048,753 |
| Siemens AG | | 418,812 | 48,330,935 |
| Siemens Healthineers AG (c) | | 80,040 | 3,400,688 |
| Symrise AG | | 71,748 | 6,904,173 |
| Telefonica Deutschland Holding AG | | 480,741 | 1,525,405 |
| Thyssenkrupp AG (b) | | 222,530 | 3,175,562 |
| TUI AG | | 74,849 | 977,123 |
| TUI AG (GB) | | 174,451 | 2,282,349 |
| Uniper SE | | 108,947 | 3,394,950 |
| United Internet AG | | 65,744 | 1,980,489 |
| Volkswagen AG | | 15,912 | 3,015,156 |
| Vonovia SE | | 276,733 | 14,725,229 |
| Wirecard AG (b) | | 64,800 | 8,206,422 |
| Zalando SE (a)(c) | | 75,925 | 3,289,785 |
|
| TOTAL GERMANY | | | 632,441,292 |
|
| Greece - 0.1% | | | |
| Alpha Bank AE (a) | | 792,301 | 1,688,661 |
| EFG Eurobank Ergasias SA (a) | | 1,471,606 | 1,490,284 |
| Ff Group (a)(d) | | 7,962 | 10,656 |
| Greek Organization of Football Prognostics SA | | 113,644 | 1,235,785 |
| Hellenic Telecommunications Organization SA | | 141,268 | 2,142,764 |
| Jumbo SA | | 54,785 | 1,069,280 |
| Motor Oil (HELLAS) Corinth Refineries SA | | 33,893 | 836,911 |
| National Bank of Greece SA (a) | | 290,345 | 984,418 |
|
| TOTAL GREECE | | | 9,458,759 |
|
| Hong Kong - 2.5% | | | |
| AIA Group Ltd. | | 6,586,000 | 65,584,869 |
| Bank of East Asia Ltd. | | 655,178 | 1,578,259 |
| Beijing Enterprises Holdings Ltd. | | 292,000 | 1,374,852 |
| BOC Hong Kong (Holdings) Ltd. | | 2,024,000 | 6,953,709 |
| BYD Electronic International Co. Ltd. | | 373,500 | 641,365 |
| China Agri-Industries Holdings Ltd. | | 541,000 | 178,236 |
| China Everbright International Ltd. | | 2,068,629 | 1,563,482 |
| China Everbright Ltd. | | 590,000 | 874,147 |
| China Jinmao Holdings Group Ltd. | | 3,058,000 | 2,033,022 |
| China Merchants Holdings International Co. Ltd. | | 793,250 | 1,240,271 |
| China Mobile Ltd. | | 3,370,500 | 27,391,044 |
| China Overseas Land and Investment Ltd. | | 2,108,000 | 6,651,779 |
| China Power International Development Ltd. | | 1,507,000 | 314,714 |
| China Resources Beer Holdings Co. Ltd. | | 810,989 | 4,157,962 |
| China Resources Pharmaceutical Group Ltd. (c) | | 844,000 | 779,441 |
| China Resources Power Holdings Co. Ltd. | | 1,255,780 | 1,578,182 |
| China Taiping Insurance Group Ltd. | | 860,465 | 1,934,413 |
| China Unicom Ltd. | | 3,548,000 | 3,493,003 |
| CITIC Pacific Ltd. | | 3,493,000 | 4,594,988 |
| CLP Holdings Ltd. | | 877,500 | 9,113,209 |
| CNOOC Ltd. | | 9,837,000 | 14,639,922 |
| CSPC Pharmaceutical Group Ltd. | | 2,544,000 | 6,515,492 |
| Far East Horizon Ltd. | | 1,021,000 | 966,625 |
| Fosun International Ltd. | | 1,724,500 | 2,254,918 |
| Galaxy Entertainment Group Ltd. | | 1,194,000 | 8,221,454 |
| Guangdong Investment Ltd. | | 1,616,000 | 3,497,506 |
| Hang Lung Properties Ltd. | | 1,135,000 | 2,494,961 |
| Hang Seng Bank Ltd. | | 414,800 | 8,654,845 |
| Henderson Land Development Co. Ltd. | | 742,296 | 3,707,459 |
| Hong Kong & China Gas Co. Ltd. | | 5,576,794 | 10,824,011 |
| Hong Kong Exchanges and Clearing Ltd. | | 655,673 | 20,426,861 |
| Hua Hong Semiconductor Ltd. (c) | | 272,000 | 546,951 |
| Hysan Development Co. Ltd. | | 314,434 | 1,239,262 |
| Lenovo Group Ltd. | | 4,180,000 | 2,914,058 |
| Link (REIT) | | 1,164,730 | 12,685,543 |
| MMG Ltd. (a) | | 1,436,000 | 298,949 |
| MTR Corp. Ltd. | | 823,413 | 4,721,273 |
| New World Development Co. Ltd. | | 3,280,497 | 4,692,543 |
| PCCW Ltd. | | 2,442,627 | 1,450,713 |
| Power Assets Holdings Ltd. | | 752,500 | 5,369,945 |
| Shanghai Industrial Holdings Ltd. | | 359,000 | 668,269 |
| Shenzhen Investment Ltd. | | 1,118,000 | 440,039 |
| Sino Land Ltd. | | 1,618,225 | 2,419,032 |
| Sino-Ocean Group Holding Ltd. | | 1,091,413 | 401,260 |
| Sinotruk Hong Kong Ltd. | | 383,000 | 578,739 |
| SJM Holdings Ltd. | | 1,016,000 | 1,085,333 |
| Sun Art Retail Group Ltd. | | 1,415,417 | 1,444,281 |
| Sun Hung Kai Properties Ltd. | | 869,083 | 13,169,492 |
| Swire Pacific Ltd. (A Shares) | | 283,500 | 2,702,403 |
| Swire Properties Ltd. | | 582,000 | 1,830,419 |
| Techtronic Industries Co. Ltd. | | 739,000 | 5,775,296 |
| Vitasoy International Holdings Ltd. | | 424,000 | 1,724,115 |
| Wharf Holdings Ltd. | | 594,000 | 1,347,937 |
| Wheelock and Co. Ltd. | | 434,000 | 2,684,118 |
| Winteam Pharmaceutical Group Ltd. | | 1,272,000 | 567,981 |
| Yuexiu Property Co. Ltd. | | 3,716,000 | 818,495 |
|
| TOTAL HONG KONG | | | 295,811,447 |
|
| Hungary - 0.1% | | | |
| MOL Hungarian Oil and Gas PLC Series A (For. Reg.) | | 197,619 | 1,953,337 |
| OTP Bank PLC | | 119,026 | 5,482,503 |
| Richter Gedeon PLC | | 68,735 | 1,273,878 |
|
| TOTAL HUNGARY | | | 8,709,718 |
|
| India - 2.3% | | | |
| Adani Ports & Special Economic Zone Ltd. (a) | | 321,257 | 1,788,887 |
| Ambuja Cements Ltd. | | 338,604 | 964,153 |
| Ashok Leyland Ltd. | | 623,290 | 673,184 |
| Asian Paints Ltd. | | 154,697 | 3,940,471 |
| Aurobindo Pharma Ltd. | | 138,575 | 913,624 |
| Avenue Supermarts Ltd. (a)(c) | | 69,568 | 1,951,994 |
| Axis Bank Ltd. | | 1,133,922 | 11,740,258 |
| Bajaj Auto Ltd. | | 42,883 | 1,960,013 |
| Bajaj Finance Ltd. | | 93,317 | 5,287,991 |
| Bajaj Finserv Ltd. | | 19,770 | 2,264,212 |
| Bandhan Bank Ltd. (c) | | 194,203 | 1,672,219 |
| Bharat Forge Ltd. | | 119,302 | 761,629 |
| Bharat Petroleum Corp. Ltd. | | 360,753 | 2,669,816 |
| Bharti Airtel Ltd. | | 1,131,816 | 5,960,473 |
| Bharti Infratel Ltd. | | 180,435 | 481,883 |
| Bosch Ltd. | | 4,166 | 897,188 |
| Britannia Industries Ltd. | | 34,512 | 1,586,539 |
| Cipla Ltd. (a) | | 185,048 | 1,216,518 |
| Coal India Ltd. | | 710,540 | 2,074,207 |
| Container Corp. of India Ltd. | | 113,134 | 936,777 |
| Dabur India Ltd. | | 310,965 | 2,021,658 |
| Divi's Laboratories Ltd. | | 37,556 | 927,892 |
| Dr. Reddy's Laboratories Ltd. | | 66,452 | 2,607,135 |
| Eicher Motors Ltd. | | 7,749 | 2,455,037 |
| GAIL India Ltd. (a) | | 821,484 | 1,587,653 |
| Glenmark Pharmaceuticals Ltd. | | 75,827 | 336,729 |
| Godrej Consumer Products Ltd. | | 209,623 | 2,186,619 |
| Grasim Industries Ltd. | | 177,668 | 1,923,476 |
| Havells India Ltd. | | 123,073 | 1,198,265 |
| HCL Technologies Ltd. | | 291,055 | 4,769,023 |
| HDFC Standard Life Insurance Co. Ltd. (c) | | 260,082 | 2,291,969 |
| Hero Motocorp Ltd. | | 57,648 | 2,193,779 |
| Hindalco Industries Ltd. | | 615,866 | 1,626,854 |
| Hindustan Petroleum Corp. Ltd. | | 344,801 | 1,575,064 |
| Hindustan Unilever Ltd. | | 354,773 | 10,866,019 |
| Housing Development Finance Corp. Ltd. | | 897,565 | 26,918,333 |
| ICICI Bank Ltd. | | 1,298,730 | 8,466,726 |
| ICICI Lombard General Insurance Co. Ltd. (c) | | 78,816 | 1,485,077 |
| Indiabulls Housing Finance Ltd. | | 130,065 | 377,151 |
| Indian Oil Corp. Ltd. | | 952,958 | 1,966,948 |
| Infosys Ltd. | | 1,725,953 | 16,584,550 |
| Infosys Ltd. sponsored ADR | | 168,080 | 1,611,887 |
| InterGlobe Aviation Ltd. (a)(c) | | 46,939 | 961,253 |
| ITC Ltd. | | 1,882,192 | 6,825,903 |
| JSW Steel Ltd. | | 453,219 | 1,453,192 |
| Larsen & Toubro Ltd. | | 262,439 | 5,441,167 |
| LIC Housing Finance Ltd. | | 163,721 | 950,271 |
| Lupin Ltd. (a) | | 109,562 | 1,149,897 |
| Mahindra & Mahindra Financial Services Ltd. | | 171,208 | 849,645 |
| Mahindra & Mahindra Ltd. | | 391,766 | 3,343,466 |
| Marico Ltd. | | 282,377 | 1,455,277 |
| Maruti Suzuki India Ltd. | | 57,643 | 6,137,358 |
| Motherson Sumi Systems Ltd. (a) | | 515,578 | 892,205 |
| Nestle India Ltd. | | 11,720 | 2,464,787 |
| NTPC Ltd. | | 1,345,424 | 2,318,445 |
| Oil & Natural Gas Corp. Ltd. | | 1,410,596 | 2,813,330 |
| Page Industries Ltd. | | 2,832 | 1,026,010 |
| Petronet LNG Ltd. | | 281,164 | 1,133,731 |
| Pidilite Industries Ltd. (a) | | 73,931 | 1,458,814 |
| Piramal Enterprises Ltd. | | 44,902 | 1,063,493 |
| Power Grid Corp. of India Ltd. | | 1,032,497 | 2,885,198 |
| Rec Ltd. | | 441,253 | 867,426 |
| Reliance Industries Ltd. | | 1,555,885 | 32,045,666 |
| Shree Cement Ltd. | | 4,472 | 1,252,737 |
| Shriram Transport Finance Co. Ltd. | | 99,793 | 1,598,476 |
| State Bank of India (a) | | 1,026,500 | 4,511,168 |
| Sun Pharmaceutical Industries Ltd. | | 491,351 | 2,999,358 |
| Tata Consultancy Services Ltd. | | 492,418 | 15,682,531 |
| Tata Motors Ltd. (a) | | 946,287 | 2,338,218 |
| Tata Power Co. Ltd. | | 437,343 | 365,031 |
| Tata Steel Ltd. | | 195,150 | 1,044,150 |
| Tech Mahindra Ltd. | | 237,736 | 2,473,686 |
| Titan Co. Ltd. | | 172,648 | 3,236,759 |
| Ultratech Cemco Ltd. | | 49,273 | 2,875,366 |
| United Spirits Ltd. (a) | | 143,462 | 1,261,120 |
| UPL Ltd. (a) | | 276,810 | 2,324,365 |
| Vedanta Ltd. | | 971,088 | 2,025,322 |
| Vodafone Idea Ltd. (a) | | 2,754,316 | 150,943 |
| Wipro Ltd. | | 605,222 | 2,214,708 |
| Yes Bank Ltd. | | 880,550 | 871,382 |
| Zee Entertainment Enterprises Ltd. (a) | | 368,944 | 1,349,144 |
|
| TOTAL INDIA | | | 271,830,878 |
|
| Indonesia - 0.5% | | | |
| PT Adaro Energy Tbk | | 7,671,700 | 715,259 |
| PT Astra International Tbk | | 11,290,900 | 5,584,488 |
| PT Bank Central Asia Tbk | | 5,522,600 | 12,361,388 |
| PT Bank Mandiri (Persero) Tbk | | 10,388,800 | 5,193,043 |
| PT Bank Negara Indonesia (Persero) Tbk | | 4,142,189 | 2,261,150 |
| PT Bank Rakyat Indonesia Tbk | | 31,123,700 | 9,325,758 |
| PT Bank Tabungan Negara Tbk | | 1,445,700 | 191,342 |
| PT Barito Pacific Tbk | | 14,965,000 | 1,012,774 |
| PT Bumi Serpong Damai Tbk (a) | | 2,319,700 | 233,591 |
| PT Charoen Pokphand Indonesia Tbk | | 3,766,200 | 1,689,062 |
| PT Gudang Garam Tbk | | 230,800 | 921,751 |
| PT Hanjaya Mandala Sampoerna Tbk | | 4,794,900 | 727,014 |
| PT Indah Kiat Pulp & Paper Tbk | | 1,401,400 | 725,444 |
| PT Indocement Tunggal Prakarsa Tbk | | 948,900 | 1,351,869 |
| PT Indofood CBP Sukses Makmur Tbk | | 1,234,900 | 1,022,408 |
| PT Indofood Sukses Makmur Tbk | | 2,110,300 | 1,156,452 |
| PT Jasa Marga Tbk | | 705,953 | 273,930 |
| PT Kalbe Farma Tbk | | 11,316,400 | 1,285,075 |
| PT Pabrik Kertas Tjiwi Kimia Tbk | | 481,200 | 362,221 |
| PT Pakuwon Jati Tbk | | 5,852,200 | 260,441 |
| PT Perusahaan Gas Negara Tbk Series B | | 5,992,400 | 899,274 |
| PT Semen Gresik (Persero) Tbk | | 1,634,800 | 1,474,403 |
| PT Surya Citra Media Tbk | | 1,664,100 | 144,571 |
| PT Tambang Batubara Bukit Asam Tbk | | 1,003,300 | 160,655 |
| PT Telekomunikasi Indonesia Tbk Series B | | 27,043,100 | 7,891,741 |
| PT Unilever Indonesia Tbk | | 789,000 | 2,456,699 |
| PT United Tractors Tbk | | 842,412 | 1,300,289 |
|
| TOTAL INDONESIA | | | 60,982,092 |
|
| Ireland - 0.4% | | | |
| AIB Group PLC | | 443,931 | 1,421,974 |
| Bank Ireland Group PLC | | 531,688 | 2,556,980 |
| CRH PLC | | 397,508 | 14,473,181 |
| CRH PLC sponsored ADR | | 49,140 | 1,793,610 |
| DCC PLC (United Kingdom) | | 54,337 | 5,093,090 |
| James Hardie Industries PLC CDI | | 235,986 | 4,052,873 |
| Kerry Group PLC Class A | | 84,982 | 10,274,198 |
| Kingspan Group PLC (Ireland) | | 80,816 | 4,187,630 |
| Paddy Power Betfair PLC (Ireland) | | 41,479 | 4,284,743 |
| Smurfit Kappa Group PLC | | 118,847 | 3,963,247 |
|
| TOTAL IRELAND | | | 52,101,526 |
|
| Isle of Man - 0.0% | | | |
| Gaming VC Holdings SA | | 319,610 | 3,684,661 |
| NEPI Rockcastle PLC | | 189,356 | 1,647,882 |
|
| TOTAL ISLE OF MAN | | | 5,332,543 |
|
| Israel - 0.4% | | | |
| Azrieli Group | | 21,660 | 1,668,541 |
| Bank Hapoalim BM (Reg.) | | 599,188 | 4,792,552 |
| Bank Leumi le-Israel BM | | 785,200 | 5,716,702 |
| Check Point Software Technologies Ltd. (a) | | 68,470 | 7,696,713 |
| CyberArk Software Ltd. (a) | | 19,916 | 2,023,067 |
| Elbit Systems Ltd. (Israel) | | 11,923 | 1,953,647 |
| Israel Chemicals Ltd. | | 411,854 | 1,828,800 |
| Israel Discount Bank Ltd. (Class A) | | 596,817 | 2,726,313 |
| Mizrahi Tefahot Bank Ltd. | | 71,714 | 1,778,378 |
| NICE Systems Ltd. (a) | | 30,371 | 4,801,521 |
| NICE Systems Ltd. sponsored ADR (a) | | 3,089 | 487,413 |
| Teva Pharmaceutical Industries Ltd. sponsored ADR (a)(b) | | 586,487 | 4,779,869 |
| Wix.com Ltd. (a) | | 26,111 | 3,187,370 |
|
| TOTAL ISRAEL | | | 43,440,886 |
|
| Italy - 1.2% | | | |
| Assicurazioni Generali SpA | | 584,262 | 11,843,328 |
| Atlantia SpA | | 272,022 | 6,716,969 |
| Davide Campari-Milano SpA | | 321,918 | 2,949,474 |
| Enel SpA | | 4,412,166 | 34,195,894 |
| Eni SpA | | 1,378,274 | 20,909,785 |
| FinecoBank SpA | | 334,338 | 3,766,160 |
| Intesa Sanpaolo SpA | | 8,113,176 | 20,330,210 |
| Leonardo SpA | | 231,025 | 2,682,263 |
| Mediobanca SpA | | 345,483 | 4,103,628 |
| Moncler SpA | | 98,042 | 3,776,819 |
| Pirelli & C. SpA (c) | | 235,244 | 1,359,589 |
| Poste Italiane SpA (c) | | 273,239 | 3,315,609 |
| Prysmian SpA | | 134,254 | 3,100,981 |
| Recordati SpA | | 54,466 | 2,288,299 |
| Snam Rete Gas SpA | | 1,170,619 | 6,005,720 |
| Telecom Italia SpA (a) | | 4,931,043 | 2,886,109 |
| Terna SpA | | 768,548 | 5,077,825 |
| UniCredit SpA | | 1,102,247 | 13,975,093 |
|
| TOTAL ITALY | | | 149,283,755 |
|
| Japan - 16.0% | | | |
| ABC-MART, Inc. | | 19,400 | 1,330,169 |
| ACOM Co. Ltd. | | 225,900 | 907,586 |
| Advantest Corp. | | 108,900 | 4,955,874 |
| AEON Co. Ltd. | | 353,800 | 7,118,585 |
| AEON Financial Service Co. Ltd. | | 54,800 | 835,174 |
| AEON MALL Co. Ltd. | | 54,620 | 873,867 |
| Agc, Inc. | | 101,800 | 3,579,298 |
| Air Water, Inc. | | 83,200 | 1,557,586 |
| Aisin Seiki Co. Ltd. | | 90,500 | 3,611,839 |
| Ajinomoto Co., Inc. | | 233,000 | 4,429,840 |
| Alfresa Holdings Corp. | | 94,000 | 2,098,911 |
| All Nippon Airways Ltd. | | 64,700 | 2,221,699 |
| Alps Electric Co. Ltd. | | 108,000 | 2,315,369 |
| Amada Holdings Co. Ltd. | | 174,700 | 1,989,503 |
| Aozora Bank Ltd. | | 61,100 | 1,567,726 |
| Asahi Group Holdings | | 198,600 | 9,945,384 |
| ASAHI INTECC Co. Ltd. | | 108,700 | 2,990,923 |
| Asahi Kasei Corp. | | 688,900 | 7,647,716 |
| Astellas Pharma, Inc. | | 1,035,700 | 17,775,402 |
| Bandai Namco Holdings, Inc. | | 109,300 | 6,720,768 |
| Bank of Kyoto Ltd. | | 26,600 | 1,052,843 |
| Benesse Holdings, Inc. | | 36,900 | 987,805 |
| Bridgestone Corp. | | 311,400 | 12,938,645 |
| Brother Industries Ltd. | | 128,700 | 2,418,793 |
| Calbee, Inc. | | 48,000 | 1,604,435 |
| Canon, Inc. | | 456,100 | 12,515,257 |
| Canon, Inc. sponsored ADR (b) | | 89,706 | 2,431,033 |
| Casio Computer Co. Ltd. | | 101,700 | 1,650,954 |
| Central Japan Railway Co. | | 78,600 | 16,123,534 |
| Chiba Bank Ltd. | | 286,400 | 1,556,685 |
| Chubu Electric Power Co., Inc. | | 346,500 | 5,198,278 |
| Chugai Pharmaceutical Co. Ltd. | | 122,600 | 10,317,502 |
| Chugoku Electric Power Co., Inc. | | 156,600 | 2,086,189 |
| Coca-Cola West Co. Ltd. | | 70,900 | 1,609,719 |
| Concordia Financial Group Ltd. | | 552,500 | 2,253,058 |
| Credit Saison Co. Ltd. | | 82,600 | 1,196,109 |
| CyberAgent, Inc. | | 57,500 | 1,868,841 |
| Dai Nippon Printing Co. Ltd. | | 130,300 | 3,480,119 |
| Dai-ichi Mutual Life Insurance Co. | | 590,400 | 9,623,174 |
| Daicel Chemical Industries Ltd. | | 127,100 | 1,136,203 |
| Daifuku Co. Ltd. | | 56,300 | 2,987,376 |
| Daiichi Sankyo Kabushiki Kaisha | | 309,800 | 20,370,525 |
| Daikin Industries Ltd. | | 135,700 | 18,992,523 |
| Dainippon Sumitomo Pharma Co. Ltd. | | 84,900 | 1,481,773 |
| Daito Trust Construction Co. Ltd. | | 38,200 | 5,062,282 |
| Daiwa House Industry Co. Ltd. | | 307,600 | 10,589,164 |
| Daiwa House REIT Investment Corp. | | 998 | 2,905,980 |
| Daiwa Securities Group, Inc. | | 895,400 | 4,024,649 |
| DENSO Corp. | | 235,500 | 10,934,246 |
| Dentsu, Inc. | | 118,500 | 4,236,348 |
| Disco Corp. | | 14,700 | 3,208,091 |
| East Japan Railway Co. | | 166,800 | 15,142,276 |
| Eisai Co. Ltd. | | 138,900 | 10,054,833 |
| Electric Power Development Co. Ltd. | | 83,500 | 2,027,416 |
| FamilyMart Co. Ltd. | | 137,600 | 3,413,333 |
| Fanuc Corp. | | 105,900 | 20,888,701 |
| Fast Retailing Co. Ltd. | | 31,800 | 19,610,809 |
| Fuji Electric Co. Ltd. | | 65,300 | 2,075,341 |
| Fujifilm Holdings Corp. | | 196,700 | 8,635,572 |
| Fujitsu Ltd. | | 107,100 | 9,492,170 |
| Fukuoka Financial Group, Inc. | | 87,200 | 1,680,984 |
| GMO Payment Gateway, Inc. | | 21,000 | 1,547,682 |
| Hakuhodo DY Holdings, Inc. | | 123,300 | 1,839,970 |
| Hamamatsu Photonics K.K. | | 81,300 | 3,156,820 |
| Hankyu Hanshin Holdings, Inc. | | 122,600 | 4,906,085 |
| Hikari Tsushin, Inc. | | 11,800 | 2,586,522 |
| Hino Motors Ltd. | | 145,700 | 1,377,494 |
| Hirose Electric Co. Ltd. | | 17,016 | 2,143,506 |
| Hisamitsu Pharmaceutical Co., Inc. | | 28,600 | 1,331,023 |
| Hitachi Chemical Co. Ltd. | | 53,400 | 1,757,917 |
| Hitachi Construction Machinery Co. Ltd. | | 53,800 | 1,388,696 |
| Hitachi High-Technologies Corp. | | 37,900 | 2,357,978 |
| Hitachi Ltd. | | 528,700 | 19,732,386 |
| Hitachi Metals Ltd. | | 130,900 | 1,642,837 |
| Honda Motor Co. Ltd. | | 888,300 | 24,032,062 |
| Hoshizaki Corp. | | 30,400 | 2,584,071 |
| Hoya Corp. | | 207,700 | 18,355,951 |
| Hulic Co. Ltd. | | 148,200 | 1,608,971 |
| Idemitsu Kosan Co. Ltd. | | 110,684 | 3,253,587 |
| IHI Corp. | | 83,800 | 2,065,096 |
| Iida Group Holdings Co. Ltd. | | 70,900 | 1,180,989 |
| INPEX Corp. | | 551,400 | 5,097,410 |
| Isetan Mitsukoshi Holdings Ltd. | | 181,500 | 1,447,493 |
| Isuzu Motors Ltd. | | 300,100 | 3,487,135 |
| Itochu Corp. | | 735,100 | 15,369,385 |
| ITOCHU Techno-Solutions Corp. | | 50,600 | 1,362,699 |
| J. Front Retailing Co. Ltd. | | 116,000 | 1,475,044 |
| Japan Airlines Co. Ltd. | | 54,600 | 1,701,450 |
| Japan Airport Terminal Co. Ltd. | | 24,300 | 1,200,337 |
| Japan Exchange Group, Inc. | | 280,800 | 4,635,589 |
| Japan Post Bank Co. Ltd. | | 203,500 | 2,024,321 |
| Japan Post Holdings Co. Ltd. | | 852,700 | 7,827,132 |
| Japan Prime Realty Investment Corp. | | 450 | 2,162,692 |
| Japan Real Estate Investment Corp. | | 711 | 4,853,150 |
| Japan Retail Fund Investment Corp. | | 1,417 | 3,302,837 |
| Japan Tobacco, Inc. | | 662,900 | 14,983,338 |
| JFE Holdings, Inc. | | 281,900 | 3,525,905 |
| JGC Corp. | | 112,600 | 1,628,583 |
| JSR Corp. | | 100,900 | 1,894,270 |
| JTEKT Corp. | | 124,800 | 1,591,748 |
| JX Holdings, Inc. | | 1,761,610 | 8,234,189 |
| Kajima Corp. | | 250,600 | 3,443,889 |
| Kakaku.com, Inc. | | 67,900 | 1,576,631 |
| Kamigumi Co. Ltd. | | 51,300 | 1,159,952 |
| Kaneka Corp. | | 26,200 | 872,161 |
| Kansai Electric Power Co., Inc. | | 379,800 | 4,430,796 |
| Kansai Paint Co. Ltd. | | 91,700 | 2,208,580 |
| Kao Corp. | | 266,200 | 21,402,131 |
| Kawasaki Heavy Industries Ltd. | | 83,400 | 2,001,461 |
| KDDI Corp. | | 960,700 | 26,583,669 |
| Keihan Electric Railway Co., Ltd. | | 56,700 | 2,677,198 |
| Keihin Electric Express Railway Co. Ltd. | | 125,800 | 2,504,129 |
| Keio Corp. | | 56,300 | 3,482,913 |
| Keisei Electric Railway Co. | | 72,800 | 2,976,462 |
| Keyence Corp. | | 49,740 | 31,450,424 |
| Kikkoman Corp. | | 79,200 | 3,809,732 |
| Kintetsu Group Holdings Co. Ltd. | | 91,600 | 4,992,746 |
| Kirin Holdings Co. Ltd. | | 453,500 | 9,620,715 |
| Kobayashi Pharmaceutical Co. Ltd. | | 25,700 | 2,054,972 |
| Kobe Steel Ltd. | | 162,300 | 872,610 |
| Koito Manufacturing Co. Ltd. | | 58,300 | 3,049,861 |
| Komatsu Ltd. | | 504,400 | 11,810,483 |
| Konami Holdings Corp. | | 53,500 | 2,348,586 |
| Konica Minolta, Inc. | | 250,300 | 1,837,152 |
| Kose Corp. | | 18,600 | 3,297,669 |
| Kubota Corp. | | 573,800 | 9,113,813 |
| Kuraray Co. Ltd. | | 182,200 | 2,167,691 |
| Kurita Water Industries Ltd. | | 59,300 | 1,707,105 |
| Kyocera Corp. | | 176,300 | 11,566,492 |
| Kyowa Hakko Kirin Co., Ltd. | | 144,700 | 2,662,483 |
| Kyushu Electric Power Co., Inc. | | 196,500 | 1,963,717 |
| Kyushu Railway Co. | | 89,500 | 2,956,862 |
| Lawson, Inc. | | 26,100 | 1,439,844 |
| LINE Corp. (a)(b) | | 35,000 | 1,287,542 |
| Lion Corp. | | 125,100 | 2,618,026 |
| LIXIL Group Corp. | | 146,400 | 2,722,734 |
| M3, Inc. (b) | | 237,300 | 5,686,506 |
| Makita Corp. | | 122,500 | 4,119,780 |
| Marubeni Corp. | | 875,900 | 6,164,652 |
| Marui Group Co. Ltd. | | 106,400 | 2,365,311 |
| Maruichi Steel Tube Ltd. | | 30,200 | 824,712 |
| Mazda Motor Corp. | | 295,900 | 2,716,456 |
| McDonald's Holdings Co. (Japan) Ltd. | | 32,000 | 1,606,163 |
| Mebuki Financial Group, Inc. | | 436,110 | 1,107,987 |
| Medipal Holdings Corp. | | 104,600 | 2,389,853 |
| Meiji Holdings Co. Ltd. | | 61,200 | 4,411,167 |
| Mercari, Inc. (a) | | 39,300 | 886,080 |
| Minebea Mitsumi, Inc. | | 199,300 | 3,785,016 |
| Misumi Group, Inc. | | 154,200 | 3,876,397 |
| Mitsubishi Chemical Holdings Corp. | | 688,600 | 5,247,975 |
| Mitsubishi Corp. | | 740,300 | 18,829,098 |
| Mitsubishi Electric Corp. | | 989,400 | 14,136,004 |
| Mitsubishi Estate Co. Ltd. | | 644,000 | 12,503,507 |
| Mitsubishi Gas Chemical Co., Inc. | | 85,300 | 1,203,320 |
| Mitsubishi Heavy Industries Ltd. | | 171,800 | 6,952,638 |
| Mitsubishi Materials Corp. | | 61,100 | 1,756,933 |
| Mitsubishi Motors Corp. of Japan | | 349,800 | 1,597,117 |
| Mitsubishi Tanabe Pharma Corp. | | 121,800 | 1,457,738 |
| Mitsubishi UFJ Financial Group, Inc. | | 6,689,900 | 34,682,370 |
| Mitsubishi UFJ Lease & Finance Co. Ltd. | | 223,800 | 1,373,905 |
| Mitsui & Co. Ltd. | | 910,600 | 15,638,609 |
| Mitsui Chemicals, Inc. | | 102,700 | 2,442,355 |
| Mitsui Fudosan Co. Ltd. | | 486,900 | 12,456,284 |
| Mitsui OSK Lines Ltd. | | 67,600 | 1,841,324 |
| Mizuho Financial Group, Inc. | | 13,130,460 | 20,384,731 |
| MonotaRO Co. Ltd. (b) | | 64,300 | 1,942,543 |
| MS&AD Insurance Group Holdings, Inc. | | 257,590 | 8,317,900 |
| Murata Manufacturing Co. Ltd. | | 313,700 | 17,080,396 |
| Nabtesco Corp. | | 65,300 | 2,078,813 |
| Nagoya Railroad Co. Ltd. | | 103,900 | 3,302,761 |
| NEC Corp. | | 135,900 | 5,385,801 |
| New Hampshire Foods Ltd. | | 41,400 | 1,739,458 |
| Nexon Co. Ltd. (a) | | 265,900 | 3,081,315 |
| NGK Insulators Ltd. | | 154,100 | 2,367,402 |
| NGK Spark Plug Co. Ltd. | | 80,500 | 1,632,041 |
| Nidec Corp. | | 121,700 | 17,917,378 |
| Nikon Corp. | | 166,200 | 2,119,102 |
| Nintendo Co. Ltd. | | 61,600 | 22,594,110 |
| Nippon Building Fund, Inc. | | 722 | 5,477,533 |
| Nippon Electric Glass Co. Ltd. | | 44,700 | 1,006,937 |
| Nippon Express Co. Ltd. | | 43,800 | 2,499,035 |
| Nippon Paint Holdings Co. Ltd. | | 76,900 | 4,188,014 |
| Nippon Prologis REIT, Inc. | | 1,064 | 2,972,055 |
| Nippon Steel & Sumitomo Metal Corp. | | 437,417 | 6,384,336 |
| Nippon Telegraph & Telephone Corp. | | 348,200 | 17,285,662 |
| Nippon Yusen KK | | 83,900 | 1,507,271 |
| Nissan Chemical Corp. | | 72,300 | 2,968,485 |
| Nissan Motor Co. Ltd. | | 1,251,500 | 7,897,692 |
| Nisshin Seifun Group, Inc. | | 102,745 | 2,036,839 |
| Nissin Food Holdings Co. Ltd. | | 32,400 | 2,447,378 |
| Nitori Holdings Co. Ltd. | | 44,000 | 6,697,290 |
| Nitto Denko Corp. | | 87,400 | 4,835,468 |
| NKSJ Holdings, Inc. | | 185,300 | 7,283,417 |
| Nomura Holdings, Inc. | | 1,824,500 | 8,292,323 |
| Nomura Real Estate Holdings, Inc. | | 58,000 | 1,374,565 |
| Nomura Real Estate Master Fund, Inc. | | 2,165 | 4,138,526 |
| Nomura Research Institute Ltd. | | 180,820 | 3,838,938 |
| NSK Ltd. | | 207,900 | 1,933,139 |
| NTT Data Corp. | | 335,900 | 4,410,653 |
| NTT DOCOMO, Inc. | | 598,100 | 16,396,983 |
| NTT DOCOMO, Inc. sponsored ADR | | 122,323 | 3,349,204 |
| Obayashi Corp. | | 361,800 | 3,723,428 |
| OBIC Co. Ltd. | | 34,400 | 4,307,060 |
| Odakyu Electric Railway Co. Ltd. | | 161,300 | 3,926,394 |
| Oji Holdings Corp. | | 520,300 | 2,690,077 |
| Olympus Corp. | | 636,200 | 8,656,386 |
| OMRON Corp. | | 106,100 | 6,207,041 |
| Ono Pharmaceutical Co. Ltd. | | 211,300 | 3,980,227 |
| Oracle Corp. Japan | | 22,000 | 1,933,716 |
| Oriental Land Co. Ltd. | | 108,100 | 15,847,563 |
| ORIX Corp. | | 722,600 | 11,355,583 |
| Osaka Gas Co. Ltd. | | 214,000 | 4,184,702 |
| Otsuka Corp. | | 57,200 | 2,306,187 |
| Otsuka Holdings Co. Ltd. | | 215,600 | 8,988,420 |
| Pan Pacific International Hold | | 244,700 | 3,851,908 |
| Panasonic Corp. | | 1,195,500 | 10,047,436 |
| Park24 Co. Ltd. | | 65,400 | 1,544,517 |
| PeptiDream, Inc. (a) | | 55,400 | 2,780,730 |
| Persol Holdings Co., Ltd. | | 101,300 | 1,945,773 |
| Pigeon Corp. | | 64,700 | 3,158,546 |
| Pola Orbis Holdings, Inc. | | 55,200 | 1,245,632 |
| Rakuten, Inc. | | 467,500 | 4,456,876 |
| Recruit Holdings Co. Ltd. | | 740,900 | 24,623,103 |
| Renesas Electronics Corp. (a) | | 412,500 | 2,792,492 |
| Resona Holdings, Inc. | | 1,138,100 | 4,949,101 |
| Ricoh Co. Ltd. | | 383,600 | 3,416,193 |
| Rinnai Corp. | | 20,600 | 1,514,169 |
| ROHM Co. Ltd. | | 51,400 | 4,072,362 |
| Ryohin Keikaku Co. Ltd. | | 135,600 | 3,018,764 |
| Sankyo Co. Ltd. (Gunma) | | 24,100 | 843,443 |
| Santen Pharmaceutical Co. Ltd. | | 206,300 | 3,654,262 |
| SBI Holdings, Inc. Japan | | 135,880 | 2,955,165 |
| Secom Co. Ltd. | | 113,500 | 10,517,300 |
| Sega Sammy Holdings, Inc. | | 103,600 | 1,457,973 |
| Seibu Holdings, Inc. | | 103,300 | 1,823,245 |
| Seiko Epson Corp. | | 140,900 | 1,992,474 |
| Sekisui Chemical Co. Ltd. | | 191,400 | 3,337,201 |
| Sekisui House Ltd. | | 335,900 | 7,243,475 |
| Seven & i Holdings Co. Ltd. | | 413,800 | 15,633,491 |
| Seven Bank Ltd. | | 386,700 | 1,121,107 |
| SG Holdings Co. Ltd. | | 76,400 | 1,891,959 |
| Sharp Corp. (b) | | 124,100 | 1,423,571 |
| Shimadzu Corp. | | 127,700 | 3,410,370 |
| Shimamura Co. Ltd. | | 11,800 | 999,497 |
| SHIMANO, Inc. | | 42,000 | 6,990,932 |
| SHIMIZU Corp. | | 326,200 | 3,040,839 |
| Shin-Etsu Chemical Co. Ltd. | | 197,600 | 22,032,643 |
| Shinsei Bank Ltd. | | 100,700 | 1,569,888 |
| Shionogi & Co. Ltd. | | 149,800 | 8,991,430 |
| Shiseido Co. Ltd. | | 218,300 | 17,998,388 |
| Shizuoka Bank Ltd. | | 235,400 | 1,788,752 |
| Showa Denko K.K. | | 77,500 | 2,174,413 |
| SMC Corp. | | 31,200 | 13,479,686 |
| SoftBank Corp. | | 904,300 | 12,404,569 |
| SoftBank Corp. | | 901,400 | 34,673,627 |
| Sohgo Security Services Co., Ltd. | | 36,000 | 1,955,442 |
| Sony Corp. | | 694,100 | 42,249,276 |
| Sony Financial Holdings, Inc. | | 78,600 | 1,690,957 |
| Stanley Electric Co. Ltd. | | 67,700 | 1,873,481 |
| Subaru Corp. | | 337,100 | 9,660,448 |
| Sumco Corp. | | 128,300 | 2,131,175 |
| Sumitomo Chemical Co. Ltd. | | 845,500 | 3,867,639 |
| Sumitomo Corp. | | 657,000 | 10,671,257 |
| Sumitomo Electric Industries Ltd. | | 426,600 | 5,850,290 |
| Sumitomo Heavy Industries Ltd. | | 57,200 | 1,776,748 |
| Sumitomo Metal Mining Co. Ltd. | | 127,200 | 4,254,802 |
| Sumitomo Mitsui Financial Group, Inc. | | 720,000 | 25,562,301 |
| Sumitomo Mitsui Trust Holdings, Inc. | | 178,125 | 6,491,837 |
| Sumitomo Realty & Development Co. Ltd. | | 177,300 | 6,435,683 |
| Sumitomo Rubber Industries Ltd. | | 85,800 | 1,137,173 |
| Sundrug Co. Ltd. | | 42,700 | 1,412,974 |
| Suntory Beverage & Food Ltd. | | 76,000 | 3,249,063 |
| Suzuken Co. Ltd. | | 35,810 | 1,912,035 |
| Suzuki Motor Corp. | | 201,000 | 9,490,037 |
| Sysmex Corp. | | 92,100 | 6,009,347 |
| T&D Holdings, Inc. | | 305,100 | 3,398,125 |
| Taiheiyo Cement Corp. | | 68,600 | 1,940,625 |
| Taisei Corp. | | 110,200 | 4,345,563 |
| Taisho Pharmaceutical Holdings Co. Ltd. | | 23,400 | 1,665,483 |
| Taiyo Nippon Sanso Corp. | | 63,900 | 1,495,881 |
| Takeda Pharmaceutical Co. Ltd. | | 812,915 | 29,373,122 |
| TDK Corp. | | 69,800 | 6,887,430 |
| Teijin Ltd. | | 101,200 | 2,027,881 |
| Terumo Corp. | | 351,900 | 11,484,864 |
| THK Co. Ltd. | | 61,400 | 1,765,575 |
| Tobu Railway Co. Ltd. | | 110,100 | 3,674,027 |
| Toho Co. Ltd. | | 57,900 | 2,338,319 |
| Toho Gas Co. Ltd. | | 44,600 | 1,737,106 |
| Tohoku Electric Power Co., Inc. | | 217,500 | 2,235,417 |
| Tokio Marine Holdings, Inc. | | 347,000 | 18,760,770 |
| Tokyo Century Corp. | | 22,400 | 1,034,338 |
| Tokyo Electric Power Co., Inc. (a) | | 822,400 | 3,808,654 |
| Tokyo Electron Ltd. | | 85,300 | 17,281,659 |
| Tokyo Gas Co. Ltd. | | 208,800 | 5,097,024 |
| Tokyu Corp. | | 267,100 | 5,051,826 |
| Tokyu Fudosan Holdings Corp. | | 312,200 | 2,070,793 |
| Toppan Printing Co. Ltd. | | 142,400 | 2,633,735 |
| Toray Industries, Inc. | | 760,700 | 5,375,977 |
| Toshiba Corp. | | 284,100 | 9,715,134 |
| Tosoh Corp. | | 144,200 | 1,974,460 |
| Toto Ltd. | | 73,200 | 2,988,451 |
| Toyo Seikan Group Holdings Ltd. | | 72,900 | 1,152,067 |
| Toyo Suisan Kaisha Ltd. | | 48,800 | 2,054,723 |
| Toyoda Gosei Co. Ltd. | | 35,900 | 839,870 |
| Toyota Industries Corp. | | 77,700 | 4,662,193 |
| Toyota Motor Corp. | | 1,240,372 | 86,058,104 |
| Toyota Tsusho Corp. | | 118,400 | 4,084,628 |
| Trend Micro, Inc. | | 70,500 | 3,558,435 |
| Tsuruha Holdings, Inc. | | 19,100 | 2,148,531 |
| Unicharm Corp. | | 219,700 | 7,445,825 |
| United Urban Investment Corp. | | 1,548 | 3,122,984 |
| USS Co. Ltd. | | 125,700 | 2,434,582 |
| Welcia Holdings Co. Ltd. | | 24,600 | 1,413,523 |
| West Japan Railway Co. | | 89,100 | 7,741,933 |
| Yahoo! Japan Corp. | | 1,433,500 | 4,413,343 |
| Yakult Honsha Co. Ltd. | | 68,300 | 3,914,253 |
| Yamada Denki Co. Ltd. | | 393,100 | 1,900,042 |
| Yamaha Corp. | | 76,300 | 3,553,235 |
| Yamaha Motor Co. Ltd. | | 157,400 | 3,080,780 |
| Yamato Holdings Co. Ltd. | | 176,700 | 2,963,723 |
| Yamazaki Baking Co. Ltd. | | 70,200 | 1,196,818 |
| Yaskawa Electric Corp. | | 129,900 | 4,941,105 |
| Yokogawa Electric Corp. | | 120,900 | 2,215,241 |
| Yokohama Rubber Co. Ltd. | | 73,800 | 1,648,340 |
| Zozo, Inc. (b) | | 114,000 | 2,655,396 |
|
| TOTAL JAPAN | | | 1,924,905,083 |
|
| Korea (South) - 2.9% | | | |
| AMOREPACIFIC Corp. | | 18,679 | 3,064,512 |
| AMOREPACIFIC Group, Inc. | | 15,333 | 1,108,419 |
| BGF Retail Co. Ltd. | | 4,081 | 620,716 |
| BS Financial Group, Inc. | | 152,699 | 906,833 |
| Celltrion Healthcare Co. Ltd. | | 25,600 | 1,205,308 |
| Celltrion Pharm, Inc. (a) | | 5,772 | 197,284 |
| Celltrion, Inc. (a) | | 50,487 | 8,628,118 |
| Cheil Industries, Inc. | | 49,785 | 4,254,074 |
| Cheil Worldwide, Inc. | | 35,913 | 759,510 |
| CJ CheilJedang Corp. | | 4,344 | 848,169 |
| CJ Corp. | | 8,777 | 617,988 |
| CJ O Shopping Co. Ltd. | | 6,218 | 876,680 |
| Daelim Industrial Co. | | 16,794 | 1,305,876 |
| Daewoo Engineering & Construction Co. Ltd. (a) | | 102,616 | 381,865 |
| Daewoo Shipbuilding & Marine Engineering Co. Ltd. (a) | | 19,439 | 467,583 |
| Db Insurance Co. Ltd. | | 24,721 | 1,066,753 |
| Doosan Bobcat, Inc. | | 27,142 | 730,565 |
| E-Mart Co. Ltd. | | 11,155 | 1,062,799 |
| EUSU Holdings Co. Ltd. (a) | | 6 | 36 |
| Fila Korea Ltd. | | 24,881 | 1,224,607 |
| GS Engineering & Construction Corp. | | 32,980 | 870,794 |
| GS Holdings Corp. | | 25,895 | 1,098,605 |
| GS Retail Co. Ltd. | | 15,446 | 504,840 |
| Hana Financial Group, Inc. | | 164,943 | 4,749,745 |
| Hanjin Shipping Co. Ltd. (a)(d) | | 12 | 0 |
| Hankook Tire Co. Ltd. | | 41,578 | 1,103,143 |
| Hanmi Pharm Co. Ltd. | | 3,642 | 1,037,868 |
| Hanmi Science Co. Ltd. | | 12,817 | 477,507 |
| Hanon Systems | | 96,011 | 951,668 |
| Hanwha Chemical Corp. | | 55,219 | 771,459 |
| Hanwha Corp. | | 18,313 | 371,646 |
| Hanwha Life Insurance Co. Ltd. | | 95,766 | 182,483 |
| HDC Hyundai Development Co. | | 11,896 | 314,607 |
| HLB, Inc. (a) | | 15,781 | 2,265,428 |
| Hotel Shilla Co. | | 15,708 | 1,040,229 |
| Hyundai Department Store Co. Ltd. | | 6,947 | 438,680 |
| Hyundai Engineering & Construction Co. Ltd. | | 40,405 | 1,482,876 |
| Hyundai Fire & Marine Insurance Co. Ltd. | | 32,722 | 706,005 |
| Hyundai Glovis Co. Ltd. | | 9,148 | 1,180,347 |
| Hyundai Heavy Industries Co. Ltd. (a) | | 19,965 | 2,081,305 |
| Hyundai Mobis | | 36,941 | 7,512,632 |
| Hyundai Motor Co. | | 80,108 | 8,351,072 |
| Hyundai Robotics Co. Ltd. | | 5,785 | 1,688,109 |
| Hyundai Steel Co. | | 42,272 | 1,148,647 |
| Industrial Bank of Korea | | 124,272 | 1,253,031 |
| ING Life Insurance Korea Ltd. (c) | | 17,112 | 409,416 |
| Kakao Corp. | | 28,254 | 3,416,197 |
| Kangwon Land, Inc. | | 57,624 | 1,543,645 |
| KB Financial Group, Inc. | | 216,014 | 7,730,929 |
| KCC Corp. | | 2,881 | 556,363 |
| Kia Motors Corp. | | 141,611 | 5,148,765 |
| Korea Aerospace Industries Ltd. | | 36,282 | 1,178,098 |
| Korea Electric Power Corp. (a) | | 144,330 | 3,136,705 |
| Korea Express Co. Ltd. (a) | | 4,821 | 648,820 |
| Korea Gas Corp. | | 14,888 | 499,960 |
| Korea Investment Holdings Co. Ltd. | | 21,132 | 1,224,269 |
| Korea Zinc Co. Ltd. | | 5,243 | 1,946,597 |
| Korean Air Lines Co. Ltd. | | 18,747 | 398,876 |
| KT&G Corp. | | 63,346 | 5,412,846 |
| Kumho Petro Chemical Co. Ltd. | | 10,132 | 606,038 |
| LG Chemical Ltd. | | 23,060 | 6,059,139 |
| LG Corp. | | 54,567 | 3,235,907 |
| LG Display Co. Ltd. (a) | | 117,611 | 1,370,583 |
| LG Electronics, Inc. | | 61,578 | 3,520,126 |
| LG Household & Health Care Ltd. | | 5,260 | 5,667,706 |
| LG Innotek Co. Ltd. | | 7,720 | 798,195 |
| LG Telecom Ltd. | | 69,453 | 798,215 |
| Lotte Chemical Corp. | | 8,526 | 1,653,780 |
| Lotte Confectionery Co. Ltd. | | 10,260 | 319,998 |
| Lotte Shopping Co. Ltd. | | 7,779 | 827,560 |
| Medy-Tox, Inc. | | 2,424 | 683,523 |
| Meritz Securities Co. Ltd. | | 130,459 | 502,756 |
| Mirae Asset Daewoo Co. Ltd. | | 216,352 | 1,321,823 |
| NAVER Corp. | | 76,793 | 10,761,480 |
| NCSOFT Corp. | | 8,927 | 3,936,060 |
| Netmarble Corp. (a)(c) | | 15,166 | 1,165,030 |
| Oci Co. Ltd. | | 10,821 | 581,600 |
| Orion Corp./Republic of Korea | | 11,655 | 1,055,661 |
| Ottogi Corp. | | 407 | 196,494 |
| Pearl Abyss Corp. (a) | | 3,353 | 620,581 |
| POSCO | | 42,779 | 7,716,698 |
| POSCO Chemtech Co. Ltd. | | 13,491 | 553,916 |
| Posco International Corp. | | 32,347 | 504,433 |
| S-Oil Corp. | | 23,025 | 1,961,559 |
| S1 Corp. | | 10,021 | 802,338 |
| Samsung Biologics Co. Ltd. (a)(c) | | 9,221 | 3,139,879 |
| Samsung Card Co. Ltd. | | 17,954 | 514,707 |
| Samsung Electro-Mechanics Co. Ltd. | | 29,366 | 2,835,501 |
| Samsung Electronics Co. Ltd. | | 2,584,627 | 111,310,189 |
| Samsung Engineering Co. Ltd.(a) | | 82,485 | 1,254,589 |
| Samsung Fire & Marine Insurance Co. Ltd. | | 17,055 | 3,155,122 |
| Samsung Heavy Industries Co. Ltd. (a) | | 263,000 | 1,629,297 |
| Samsung Life Insurance Co. Ltd. | | 40,979 | 2,472,137 |
| Samsung SDI Co. Ltd. | | 29,759 | 5,785,038 |
| Samsung SDS Co. Ltd. | | 20,043 | 3,450,995 |
| Samsung Securities Co. Ltd. | | 36,281 | 1,041,658 |
| Shinhan Financial Group Co. Ltd. | | 249,543 | 9,038,979 |
| Shinsegae Co. Ltd. | | 3,939 | 794,336 |
| SillaJen, Inc. (a) | | 36,165 | 594,875 |
| SK C&C Co. Ltd. | | 19,792 | 4,371,764 |
| SK Energy Co. Ltd. | | 30,299 | 4,142,426 |
| SK Hynix, Inc. | | 298,971 | 20,948,331 |
| SK Telecom Co. Ltd. | | 10,047 | 2,041,568 |
| STX Pan Ocean Co. Ltd. (Korea) (a) | | 165,665 | 622,152 |
| ViroMed Co. Ltd. | | 10,007 | 827,724 |
| Woongjin Coway Co. Ltd. | | 26,269 | 2,060,595 |
| Woori Financial Group, Inc. (a) | | 281,715 | 2,828,488 |
| Woori Investment & Securities Co. Ltd. | | 80,925 | 836,709 |
| Yuhan Corp. | | 5,210 | 999,449 |
|
| TOTAL KOREA (SOUTH) | | | 348,079,614 |
|
| Luxembourg - 0.2% | | | |
| ArcelorMittal SA (Netherlands) | | 363,395 | 5,362,046 |
| Aroundtown SA | | 473,655 | 3,996,871 |
| Eurofins Scientific SA (b) | | 6,345 | 3,214,182 |
| Globant SA (a)(b) | | 18,885 | 1,761,215 |
| Millicom International Cellular SA (depository receipt) | | 34,137 | 1,555,587 |
| Reinet Investments SCA | | 68,961 | 1,294,151 |
| RTL Group SA | | 21,586 | 1,096,851 |
| SES SA (France) (depositary receipt) | | 196,801 | 3,812,579 |
| Tenaris SA | | 265,932 | 2,697,853 |
|
| TOTAL LUXEMBOURG | | | 24,791,335 |
|
| Malaysia - 0.5% | | | |
| AirAsia Group BHD | | 534,900 | 244,216 |
| Alliance Bank Malaysia Bhd | | 513,600 | 353,458 |
| AMMB Holdings Bhd | | 842,700 | 803,822 |
| Axiata Group Bhd | | 1,392,508 | 1,431,307 |
| British American Tobacco (Malaysia) Bhd | | 78,200 | 352,053 |
| Bumiputra-Commerce Holdings Bhd | | 2,773,270 | 3,480,512 |
| Dialog Group Bhd | | 1,998,722 | 1,663,123 |
| DiGi.com Bhd | | 1,589,000 | 1,784,527 |
| Fraser & Neave Holdings BHD | | 86,200 | 712,859 |
| Gamuda Bhd | | 808,275 | 722,756 |
| Genting Bhd | | 1,093,600 | 1,519,132 |
| Genting Malaysia Bhd | | 1,503,800 | 1,153,396 |
| Genting Plantations Bhd | | 134,600 | 319,024 |
| Hap Seng Consolidated Bhd | | 245,600 | 586,527 |
| Hartalega Holdings Bhd | | 768,900 | 967,277 |
| Hong Leong Bank Bhd | | 352,000 | 1,449,388 |
| Hong Leong Credit Bhd | | 88,200 | 367,577 |
| IHH Healthcare Bhd | | 1,037,600 | 1,414,132 |
| IJM Corp. Bhd | | 1,454,400 | 747,771 |
| IOI Corp. Bhd | | 996,600 | 1,040,166 |
| IOI Properties Group Bhd | | 29,100 | 7,233 |
| Kuala Lumpur Kepong Bhd | | 217,700 | 1,128,744 |
| Malayan Banking Bhd | | 2,171,156 | 4,464,836 |
| Malaysia Airports Holdings Bhd | | 554,798 | 1,050,064 |
| Maxis Bhd | | 1,252,800 | 1,613,151 |
| MISC Bhd | | 785,300 | 1,564,159 |
| Nestle (Malaysia) BHD | | 37,200 | 1,287,416 |
| Petronas Chemicals Group Bhd | | 1,416,000 | 2,529,846 |
| Petronas Dagangan Bhd | | 134,000 | 755,119 |
| Petronas Gas Bhd | | 289,500 | 1,153,158 |
| PPB Group Bhd | | 273,020 | 1,181,109 |
| Press Metal Bhd | | 721,400 | 820,800 |
| Public Bank Bhd | | 1,708,100 | 8,290,021 |
| QL Resources Bhd | | 279,000 | 485,181 |
| RHB Capital Bhd | | 893,757 | 1,229,452 |
| RHB Capital Bhd (a)(d) | | 122,876 | 0 |
| Sime Darby Bhd | | 1,760,607 | 954,620 |
| Sime Darby Plantation Bhd | | 1,073,307 | 1,258,678 |
| Sime Darby Property Bhd | | 1,101,607 | 191,011 |
| SP Setia Bhd | | 583,755 | 168,851 |
| Telekom Malaysia Bhd | | 593,474 | 533,318 |
| Tenaga Nasional Bhd | | 1,686,525 | 5,585,346 |
| Top Glove Corp. Bhd | | 910,300 | 947,045 |
| Westports Holdings Bhd | | 505,900 | 517,534 |
| YTL Corp. Bhd | | 1,160,312 | 241,269 |
|
| TOTAL MALAYSIA | | | 59,070,984 |
|
| Mauritius - 0.0% | | | |
| Golden Agri-Resources Ltd. | | 3,243,200 | 486,809 |
| Mexico - 0.6% | | | |
| Alfa SA de CV Series A | | 1,599,800 | 1,387,189 |
| Alsea S.A.B. de CV (a) | | 323,600 | 863,315 |
| America Movil S.A.B. de CV Series L | | 18,517,346 | 14,670,255 |
| Banco Santander Mexico SA | | 875,550 | 1,175,653 |
| CEMEX S.A.B. de CV unit | | 8,590,840 | 3,228,850 |
| Coca-Cola FEMSA S.A.B. de CV unit | | 282,300 | 1,551,318 |
| El Puerto de Liverpool S.A.B. Dcv Class C | | 67,755 | 345,247 |
| Embotelladoras Arca S.A.B. de CV | | 218,062 | 1,218,263 |
| Fibra Uno Administracion SA de CV | | 1,665,400 | 2,529,722 |
| Fomento Economico Mexicano S.A.B. de CV unit | | 1,099,400 | 9,755,807 |
| Gruma S.A.B. de CV Series B | | 112,555 | 1,181,048 |
| Grupo Aeroportuario del Pacifico S.A.B. de CV Series B | | 189,100 | 1,982,569 |
| Grupo Aeroportuario del Sureste S.A.B. de CV Series B | | 110,400 | 1,810,338 |
| Grupo Bimbo S.A.B. de CV Series A | | 801,800 | 1,489,685 |
| Grupo Carso SA de CV Series A1 | | 249,100 | 833,938 |
| Grupo Financiero Banorte S.A.B. de CV Series O | | 1,387,600 | 7,574,039 |
| Grupo Financiero Inbursa S.A.B. de CV Series O | | 1,183,700 | 1,470,664 |
| Grupo Mexico SA de CV Series B | | 1,897,323 | 4,997,653 |
| Grupo Televisa SA de CV | | 1,348,500 | 2,977,895 |
| Industrias Penoles SA de CV | | 65,500 | 786,007 |
| Infraestructura Energetica Nova S.A.B. de CV | | 263,900 | 1,166,502 |
| Kimberly-Clark de Mexico SA de CV Series A | | 827,800 | 1,669,241 |
| Megacable Holdings S.A.B. de CV unit | | 166,300 | 683,216 |
| Mexichem S.A.B. de CV | | 520,916 | 1,124,073 |
| Promotora y Operadora de Infraestructura S.A.B. de CV | | 113,740 | 1,052,109 |
| Wal-Mart de Mexico SA de CV Series V | | 2,916,800 | 8,753,508 |
|
| TOTAL MEXICO | | | 76,278,104 |
|
| Multi-National - 0.0% | | | |
| HK Electric Investments & HK Electric Investments Ltd. unit | | 1,348,000 | 1,345,540 |
| HKT Trust/HKT Ltd. unit | | 2,140,640 | 3,330,108 |
|
| TOTAL MULTI-NATIONAL | | | 4,675,648 |
|
| Netherlands - 3.3% | | | |
| ABN AMRO Group NV GDR (c) | | 228,014 | 4,244,334 |
| Adyen BV (a)(c) | | 5,498 | 3,859,430 |
| AEGON NV | | 1,008,202 | 4,373,921 |
| AerCap Holdings NV (a) | | 69,320 | 4,012,242 |
| Airbus Group NV | | 318,002 | 45,620,061 |
| Akzo Nobel NV | | 124,850 | 11,494,692 |
| ASML Holding NV (Netherlands) | | 231,946 | 60,796,435 |
| CNH Industrial NV | | 560,524 | 6,093,986 |
| EXOR NV | | 57,047 | 4,372,277 |
| Ferrari NV | | 66,732 | 10,676,438 |
| Fiat Chrysler Automobiles NV (Italy) | | 601,159 | 9,338,343 |
| Heineken Holding NV | | 64,748 | 6,167,028 |
| Heineken NV (Bearer) | | 141,905 | 14,475,068 |
| ING Groep NV (Certificaten Van Aandelen) | | 2,129,198 | 24,109,963 |
| Koninklijke Ahold Delhaize NV | | 651,937 | 16,246,312 |
| Koninklijke DSM NV | | 99,110 | 11,744,597 |
| Koninklijke KPN NV | | 1,983,725 | 6,158,219 |
| Koninklijke Philips Electronics NV | | 505,942 | 22,197,759 |
| NN Group NV | | 161,236 | 6,144,672 |
| NXP Semiconductors NV | | 156,274 | 17,765,228 |
| Prosus NV (a) | | 269,517 | 18,585,623 |
| QIAGEN NV (Germany) (a) | | 122,761 | 3,684,392 |
| Randstad NV | | 68,875 | 3,813,161 |
| STMicroelectronics NV (France) | | 375,558 | 8,523,786 |
| Unibail-Rodamco SE & WFD Unibail-Rodamco NV unit | | 76,529 | 11,834,165 |
| Unilever NV | | 792,718 | 46,814,069 |
| Vopak NV | | 36,039 | 1,977,157 |
| Wolters Kluwer NV | | 156,717 | 11,539,403 |
| X5 Retail Group NV GDR | | 69,153 | 2,315,435 |
|
| TOTAL NETHERLANDS | | | 398,978,196 |
|
| New Zealand - 0.2% | | | |
| Auckland International Airport Ltd. | | 538,174 | 3,207,422 |
| Fisher & Paykel Healthcare Corp. | | 309,279 | 3,793,370 |
| Fletcher Building Ltd. | | 449,943 | 1,321,993 |
| Meridian Energy Ltd. | | 689,697 | 2,033,012 |
| Ryman Healthcare Group Ltd. | | 196,808 | 1,626,609 |
| Spark New Zealand Ltd. | | 1,021,874 | 2,931,415 |
| The a2 Milk Co. Ltd. (a) | | 393,115 | 3,263,782 |
|
| TOTAL NEW ZEALAND | | | 18,177,603 |
|
| Norway - 0.4% | | | |
| Aker Bp ASA | | 63,269 | 1,746,818 |
| DNB ASA | | 525,146 | 9,542,243 |
| Equinor ASA | | 440,684 | 8,151,275 |
| Equinor ASA sponsored ADR | | 107,834 | 1,996,007 |
| Gjensidige Forsikring ASA | | 107,754 | 2,014,203 |
| Marine Harvest ASA | | 232,226 | 5,661,616 |
| Norsk Hydro ASA | | 774,458 | 2,736,595 |
| Orkla ASA | | 399,783 | 3,840,393 |
| Schibsted ASA (B Shares) | | 45,656 | 1,274,931 |
| Telenor ASA | | 398,958 | 7,468,410 |
| Yara International ASA | | 95,460 | 3,715,156 |
|
| TOTAL NORWAY | | | 48,147,647 |
|
| Pakistan - 0.0% | | | |
| Habib Bank Ltd. | | 182,000 | 149,707 |
| Lucky Cement Ltd. | | 15,411 | 34,836 |
| MCB Bank Ltd. | | 131,700 | 146,314 |
| Oil & Gas Development Co. Ltd. | | 204,000 | 168,879 |
|
| TOTAL PAKISTAN | | | 499,736 |
|
| Papua New Guinea - 0.0% | | | |
| Oil Search Ltd. ADR | | 746,963 | 3,686,479 |
| Peru - 0.0% | | | |
| Compania de Minas Buenaventura SA sponsored ADR | | 111,120 | 1,704,581 |
| Philippines - 0.3% | | | |
| Aboitiz Equity Ventures, Inc. | | 1,019,080 | 1,120,968 |
| Aboitiz Power Corp. | | 590,700 | 464,650 |
| Alliance Global Group, Inc. | | 1,967,600 | 444,315 |
| Altus San Nicolas Corp. (d) | | 15,089 | 1,540 |
| Ayala Corp. | | 163,915 | 2,773,373 |
| Ayala Land, Inc. | | 3,826,070 | 3,653,780 |
| Bank of the Philippine Islands (BPI) | | 453,623 | 866,041 |
| BDO Unibank, Inc. | | 1,041,578 | 3,175,153 |
| DMCI Holdings, Inc. | | 1,610,700 | 260,048 |
| Globe Telecom, Inc. | | 17,520 | 626,795 |
| GT Capital Holdings, Inc. | | 51,699 | 909,393 |
| International Container Terminal Services, Inc. | | 548,260 | 1,280,825 |
| JG Summit Holdings, Inc. | | 1,458,290 | 2,187,284 |
| Jollibee Food Corp. | | 242,950 | 1,109,356 |
| Manila Electric Co. | | 120,690 | 804,370 |
| Megaworld Corp. | | 5,875,600 | 558,499 |
| Metro Pacific Investments Corp. | | 6,688,700 | 631,510 |
| Metropolitan Bank & Trust Co. | | 911,181 | 1,212,138 |
| Philippine Long Distance Telephone Co. | | 44,855 | 964,591 |
| Robinsons Land Corp. | | 849,442 | 425,429 |
| Security Bank Corp. | | 99,410 | 389,774 |
| SM Investments Corp. | | 136,525 | 2,765,786 |
| SM Prime Holdings, Inc. | | 5,627,575 | 4,317,930 |
| Universal Robina Corp. | | 473,890 | 1,406,871 |
|
| TOTAL PHILIPPINES | | | 32,350,419 |
|
| Poland - 0.3% | | | |
| Alior Bank SA (a) | | 61,286 | 432,458 |
| Bank Millennium SA (a) | | 238,764 | 384,020 |
| Bank Polska Kasa Opieki SA | | 90,331 | 2,548,698 |
| Bank Zachodni WBK SA | | 18,056 | 1,480,151 |
| BRE Bank SA (a) | | 8,343 | 833,721 |
| CD Projekt RED SA | | 35,032 | 2,311,535 |
| Cyfrowy Polsat SA | | 134,627 | 976,056 |
| Dino Polska SA (a)(c) | | 22,775 | 888,193 |
| Grupa Lotos SA | | 52,925 | 1,321,515 |
| Jastrzebska Spolka Weglowa SA | | 16,313 | 82,661 |
| KGHM Polska Miedz SA (Bearer) (a) | | 70,425 | 1,541,713 |
| LPP SA | | 773 | 1,649,933 |
| NG2 SA | | 16,366 | 478,046 |
| Polish Oil & Gas Co. SA | | 908,456 | 1,118,495 |
| Polska Grupa Energetyczna SA (a) | | 446,225 | 956,534 |
| Polski Koncern Naftowy Orlen SA | | 160,233 | 4,378,398 |
| Powszechna Kasa Oszczednosci Bank SA | | 489,767 | 4,886,582 |
| Powszechny Zaklad Ubezpieczen SA | | 341,865 | 3,306,221 |
| Telekomunikacja Polska SA (a) | | 268,657 | 439,482 |
|
| TOTAL POLAND | | | 30,014,412 |
|
| Portugal - 0.1% | | | |
| Banco Espirito Santo SA (Reg.) (a)(d) | | 319,729 | 4 |
| Energias de Portugal SA | | 1,418,873 | 5,839,311 |
| Galp Energia SGPS SA Class B | | 285,350 | 4,564,113 |
| Jeronimo Martins SGPS SA | | 136,590 | 2,291,938 |
|
| TOTAL PORTUGAL | | | 12,695,366 |
|
| Qatar - 0.2% | | | |
| Barwa Real Estate Co. (a) | | 1,092,929 | 1,026,591 |
| Industries Qatar QSC (a) | | 1,001,052 | 2,889,606 |
| Masraf al Rayan (a) | | 2,058,955 | 2,120,594 |
| Mesaieed Petrochemical Holding Co. (a) | | 2,235,567 | 1,534,995 |
| Qatar Electricity & Water Co. (a) | | 236,792 | 1,027,551 |
| Qatar Fuel Co. (a) | | 244,239 | 1,482,472 |
| Qatar Insurance Co. SAQ (a) | | 727,429 | 613,350 |
| Qatar Islamic Bank (a) | | 584,655 | 2,443,957 |
| Qatar National Bank SAQ (a) | | 2,498,641 | 13,176,025 |
| Qatar Telecom (Qtel) Q.S.C. (a) | | 425,029 | 852,159 |
| The Commercial Bank of Qatar (a) | | 924,469 | 1,091,793 |
|
| TOTAL QATAR | | | 28,259,093 |
|
| Russia - 1.0% | | | |
| Alrosa Co. Ltd. | | 1,586,440 | 1,843,435 |
| Gazprom OAO | | 3,632,824 | 14,737,122 |
| Gazprom OAO sponsored ADR (Reg. S) | | 1,102,910 | 8,827,692 |
| Inter Rao Ues JSC | | 17,913,000 | 1,206,818 |
| Lukoil PJSC | | 159,265 | 14,713,346 |
| Lukoil PJSC sponsored ADR | | 56,975 | 5,239,421 |
| Magnit OJSC GDR (Reg. S) | | 182,468 | 2,072,836 |
| Magnitogorsk Iron & Steel Works PJSC | | 1,318,700 | 751,251 |
| MMC Norilsk Nickel PJSC | | 25,471 | 7,105,544 |
| MMC Norilsk Nickel PJSC sponsored ADR | | 96,628 | 2,676,596 |
| Mobile TeleSystems OJSC sponsored ADR | | 262,271 | 2,347,325 |
| Moscow Exchange MICEX-RTS OAO (a) | | 764,510 | 1,133,009 |
| NOVATEK OAO GDR (Reg. S) | | 49,337 | 10,558,118 |
| Novolipetsk Steel OJSC | | 604,830 | 1,179,429 |
| PhosAgro OJSC GDR (Reg. S) | | 57,321 | 721,098 |
| Polyus PJSC | | 15,036 | 1,751,396 |
| Rosneft Oil Co. OJSC | | 382,006 | 2,537,870 |
| Rosneft Oil Co. OJSC GDR (Reg. S) | | 228,706 | 1,514,491 |
| Sberbank of Russia | | 5,909,833 | 21,659,013 |
| Severstal PAO | | 95,266 | 1,310,674 |
| Severstal PAO GDR (Reg. S) | | 41,939 | 572,887 |
| Surgutneftegas OJSC | | 1,424,700 | 955,392 |
| Surgutneftegas OJSC sponsored ADR | | 214,357 | 1,414,756 |
| Tatneft PAO | | 587,261 | 6,852,332 |
| Tatneft PAO sponsored ADR | | 42,381 | 2,966,670 |
| VTB Bank OJSC | | 1,654,787,984 | 1,112,009 |
|
| TOTAL RUSSIA | | | 117,760,530 |
|
| Saudi Arabia - 0.6% | | | |
| Advanced Polypropylene Co. | | 68,660 | 851,316 |
| Al Rajhi Bank | | 658,108 | 10,599,078 |
| Alinma Bank | | 390,750 | 2,183,857 |
| Almarai Co. Ltd. | | 137,011 | 1,823,014 |
| Bank Al-Jazira | | 176,686 | 614,347 |
| Bank Albilad | | 202,097 | 1,336,428 |
| Banque Saudi Fransi | | 308,236 | 2,769,793 |
| Bupa Arabia for Cooperative Insurance Co. | | 17,248 | 493,943 |
| Dar Al Arkan Real Estate Development Co. (a) | | 238,416 | 765,413 |
| Emaar The Economic City (a) | | 232,487 | 580,861 |
| Etihad Etisalat Co. (a) | | 206,787 | 1,238,417 |
| Jarir Marketing Co. | | 32,007 | 1,351,868 |
| National Commercial Bank | | 643,719 | 7,466,543 |
| National Industrialization Co. (a) | | 151,687 | 494,258 |
| Rabigh Refining & Petrochemical Co. (a) | | 105,657 | 566,276 |
| Riyad Bank | | 647,816 | 3,834,764 |
| SABIC | | 417,698 | 9,767,782 |
| Sahara International Petrochemical Co. | | 230,918 | 1,012,264 |
| Samba Financial Group | | 561,515 | 4,147,392 |
| Saudi Airlines Catering Co. | | 21,115 | 487,014 |
| Saudi Arabian Fertilizers Co. | | 86,718 | 1,805,902 |
| Saudi Arabian Mining Co. (a) | | 236,325 | 2,671,834 |
| Saudi Cement Co. | | 43,295 | 791,947 |
| Saudi Electricity Co. | | 423,332 | 2,345,636 |
| Saudi Industrial Investment Group | | 118,993 | 668,846 |
| Saudi Kayan Petrochemical Co. (a) | | 425,928 | 1,160,703 |
| Saudi Telecom Co. | | 215,249 | 5,498,455 |
| The Co. for Cooperative Insurance (a) | | 28,236 | 530,794 |
| The Saudi British Bank | | 187,874 | 1,633,121 |
| The Savola Group (a) | | 167,002 | 1,375,986 |
| Yanbu National Petrochemical Co. | | 121,249 | 1,610,058 |
|
| TOTAL SAUDI ARABIA | | | 72,477,910 |
|
| Singapore - 0.8% | | | |
| Ascendas Real Estate Investment Trust | | 1,429,900 | 3,330,313 |
| BOC Aviation Ltd. Class A (c) | | 106,500 | 1,000,557 |
| CapitaCommercial Trust (REIT) | | 1,553,550 | 2,339,622 |
| CapitaLand Ltd. | | 1,383,900 | 3,657,957 |
| CapitaMall Trust | | 1,489,500 | 2,779,176 |
| City Developments Ltd. | | 251,200 | 1,989,302 |
| ComfortDelgro Corp. Ltd. | | 1,152,300 | 1,945,869 |
| DBS Group Holdings Ltd. | | 973,741 | 18,560,361 |
| Genting Singapore Ltd. | | 3,131,900 | 2,160,742 |
| Jardine Cycle & Carriage Ltd. | | 55,693 | 1,338,980 |
| Keppel Corp. Ltd. | | 803,800 | 4,047,443 |
| Oversea-Chinese Banking Corp. Ltd. | | 1,766,503 | 14,201,286 |
| Sembcorp Industries Ltd. | | 541,600 | 909,287 |
| Singapore Airlines Ltd. | | 269,600 | 1,863,413 |
| Singapore Airport Terminal Service Ltd. | | 379,900 | 1,408,848 |
| Singapore Exchange Ltd. | | 512,600 | 3,365,496 |
| Singapore Press Holdings Ltd. | | 973,800 | 1,584,757 |
| Singapore Technologies Engineering Ltd. | | 865,700 | 2,535,935 |
| Singapore Telecommunications Ltd. | | 4,426,600 | 10,719,261 |
| Suntec (REIT) | | 1,224,500 | 1,672,800 |
| United Overseas Bank Ltd. | | 690,689 | 13,597,901 |
| UOL Group Ltd. | | 244,821 | 1,401,817 |
| Venture Corp. Ltd. | | 149,800 | 1,737,624 |
| Wilmar International Ltd. | | 1,055,700 | 2,902,627 |
| Yangzijiang Shipbuilding Holdings Ltd. | | 1,227,200 | 859,149 |
|
| TOTAL SINGAPORE | | | 101,910,523 |
|
| South Africa - 1.1% | | | |
| Anglo American Platinum Ltd. | | 29,565 | 2,206,403 |
| AngloGold Ashanti Ltd. | | 227,761 | 5,037,688 |
| Aspen Pharmacare Holdings Ltd. | | 196,031 | 1,368,669 |
| Barclays Africa Group Ltd. | | 397,817 | 4,077,555 |
| Bidcorp Ltd. | | 189,788 | 4,427,528 |
| Bidvest Group Ltd. | | 179,881 | 2,453,015 |
| Capitec Bank Holdings Ltd. | | 22,987 | 2,088,660 |
| Clicks Group Ltd. | | 137,309 | 2,233,401 |
| Discovery Ltd. | | 200,011 | 1,591,828 |
| Exxaro Resources Ltd. | | 123,199 | 1,005,372 |
| FirstRand Ltd. | | 1,836,954 | 7,938,394 |
| Fortress (REIT) Ltd. Class A | | 623,840 | 867,402 |
| Foschini Ltd. | | 121,090 | 1,394,372 |
| Gold Fields Ltd. | | 458,183 | 2,845,492 |
| Growthpoint Properties Ltd. | | 1,556,198 | 2,277,062 |
| Investec Ltd. | | 203,247 | 1,155,685 |
| Kumba Iron Ore Ltd. | | 31,226 | 760,434 |
| Liberty Holdings Ltd. | | 62,003 | 477,502 |
| Life Healthcare Group Holdings Ltd. | | 708,169 | 1,118,223 |
| MMI Holdings Ltd. | | 441,313 | 589,956 |
| Mr Price Group Ltd. | | 149,387 | 1,579,831 |
| MTN Group Ltd. | | 912,253 | 5,650,227 |
| MultiChoice Group Ltd. (a) | | 218,479 | 1,822,237 |
| Naspers Ltd. Class N | | 241,045 | 34,109,945 |
| Nedbank Group Ltd. | | 216,546 | 3,284,340 |
| Netcare Ltd. | | 589,224 | 667,193 |
| Old Mutual Ltd. | | 2,560,135 | 3,329,251 |
| Pick 'n Pay Stores Ltd. | | 205,473 | 898,830 |
| PSG Group Ltd. | | 81,431 | 1,272,620 |
| Rand Merchant Insurance Holdings Ltd. | | 377,588 | 746,155 |
| Redefine Properties Ltd. | | 2,815,796 | 1,405,056 |
| Remgro Ltd. | | 274,761 | 3,150,646 |
| RMB Holdings Ltd. | | 408,593 | 2,148,896 |
| Sanlam Ltd. | | 1,060,866 | 5,586,387 |
| Sappi Ltd. | | 272,901 | 700,742 |
| Sasol Ltd. | | 311,490 | 5,646,904 |
| Shoprite Holdings Ltd. | | 270,785 | 2,426,591 |
| Spar Group Ltd. | | 102,391 | 1,375,762 |
| Standard Bank Group Ltd. | | 723,219 | 8,302,624 |
| Telkom SA Ltd. | | 146,231 | 669,098 |
| Tiger Brands Ltd. | | 83,844 | 1,190,812 |
| Truworths International Ltd. | | 241,530 | 856,276 |
| Vodacom Group Ltd. | | 366,931 | 3,201,737 |
| Woolworths Holdings Ltd. | | 508,281 | 1,933,826 |
|
| TOTAL SOUTH AFRICA | | | 137,870,627 |
|
| Spain - 1.9% | | | |
| ACS Actividades de Construccion y Servicios SA | | 139,874 | 5,675,829 |
| Aena Sme SA (c) | | 35,858 | 6,578,754 |
| Amadeus IT Holding SA Class A | | 239,703 | 17,735,386 |
| Banco Bilbao Vizcaya Argentaria SA | | 3,662,203 | 19,288,209 |
| Banco de Sabadell SA | | 3,125,031 | 3,428,884 |
| Banco Santander SA (Spain) | | 9,138,066 | 36,628,916 |
| Banco Santander SA (Spain) sponsored ADR (b) | | 15,660 | 62,014 |
| Bankia SA | | 622,972 | 1,186,720 |
| Bankinter SA | | 354,660 | 2,452,424 |
| CaixaBank SA | | 1,929,403 | 5,532,757 |
| Cellnex Telecom SA (c) | | 133,198 | 5,743,165 |
| Cellnex Telecom SA (a) | | 25,695 | 1,107,904 |
| Enagas SA | | 128,676 | 3,184,539 |
| Endesa SA | | 167,600 | 4,560,952 |
| Ferrovial SA | | 263,264 | 7,769,141 |
| Gas Natural SDG SA | | 160,358 | 4,365,662 |
| Grifols SA | | 174,698 | 5,626,999 |
| Iberdrola SA | | 3,243,024 | 33,335,037 |
| Inditex SA | | 593,842 | 18,511,620 |
| MAPFRE SA (Reg.) | | 552,929 | 1,541,704 |
| Red Electrica Corporacion SA | | 232,096 | 4,664,558 |
| Repsol SA | | 791,501 | 13,043,714 |
| Siemens Gamesa Renewable Energy SA | | 117,856 | 1,620,057 |
| Telefonica SA | | 2,551,155 | 19,591,044 |
|
| TOTAL SPAIN | | | 223,235,989 |
|
| Sweden - 1.6% | | | |
| Alfa Laval AB | | 169,598 | 3,918,651 |
| ASSA ABLOY AB (B Shares) | | 547,999 | 13,014,088 |
| Atlas Copco AB: | | | |
| (A Shares) | | 382,013 | 13,495,100 |
| (B Shares) | | 193,178 | 5,983,983 |
| Boliden AB | | 149,434 | 4,018,408 |
| Electrolux AB (B Shares) | | 124,690 | 3,273,602 |
| Epiroc AB: | | | |
| Class A | | 379,676 | 4,270,308 |
| Class B | | 191,737 | 2,085,026 |
| Ericsson (B Shares) | | 1,696,746 | 14,827,508 |
| Essity AB Class B | | 329,531 | 10,282,806 |
| H&M Hennes & Mauritz AB (B Shares) | | 438,459 | 9,161,335 |
| Hexagon AB (B Shares) | | 144,137 | 7,357,843 |
| Husqvarna AB (B Shares) | | 215,298 | 1,646,894 |
| ICA Gruppen AB | | 48,616 | 2,149,925 |
| Industrivarden AB (C Shares) | | 83,756 | 1,812,052 |
| Investor AB (B Shares) | | 236,723 | 12,123,360 |
| Kinnevik AB (B Shares) | | 135,494 | 3,703,187 |
| Lundbergfoeretagen AB | | 39,037 | 1,469,189 |
| Lundin Petroleum AB | | 100,530 | 3,319,176 |
| Sandvik AB | | 617,418 | 10,892,753 |
| Securitas AB (B Shares) | | 160,146 | 2,560,823 |
| Skandinaviska Enskilda Banken AB (A Shares) | | 884,030 | 8,470,691 |
| Skanska AB (B Shares) | | 180,751 | 3,846,881 |
| SKF AB (B Shares) | | 206,400 | 3,731,176 |
| Svenska Handelsbanken AB (A Shares) | | 835,992 | 8,389,859 |
| Swedbank AB (A Shares) | | 499,887 | 6,991,698 |
| Swedish Match Co. AB | | 93,123 | 4,370,822 |
| Tele2 AB (B Shares) | | 264,771 | 3,785,498 |
| Telia Co. AB | | 1,516,331 | 6,666,347 |
| Volvo AB (B Shares) | | 811,399 | 12,134,389 |
|
| TOTAL SWEDEN | | | 189,753,378 |
|
| Switzerland - 6.0% | | | |
| ABB Ltd. (Reg.) | | 1,010,489 | 21,220,258 |
| Adecco SA (Reg.) | | 87,623 | 5,194,316 |
| Alcon, Inc. (Switzerland) (a) | | 227,460 | 13,433,167 |
| Baloise Holdings AG | | 26,110 | 4,822,344 |
| Barry Callebaut AG | | 1,123 | 2,367,805 |
| Clariant AG (Reg.) | | 105,541 | 2,162,173 |
| Coca-Cola HBC AG | | 107,311 | 3,266,625 |
| Compagnie Financiere Richemont SA Series A | | 286,127 | 22,484,198 |
| Credit Suisse Group AG | | 1,214,292 | 15,030,354 |
| Credit Suisse Group AG sponsored ADR | | 192,985 | 2,389,154 |
| Dufry AG | | 23,005 | 1,995,710 |
| Ems-Chemie Holding AG | | 4,445 | 2,780,096 |
| Galenica AG | | 25,310 | 3,978,019 |
| Geberit AG (Reg.) | | 20,282 | 10,292,113 |
| Givaudan SA | | 5,059 | 14,856,486 |
| Julius Baer Group Ltd. | | 121,665 | 5,387,768 |
| Kuehne & Nagel International AG | | 28,687 | 4,633,830 |
| Lafargeholcim Ltd. (Reg.) | | 266,628 | 13,751,680 |
| Lindt & Spruengli AG | | 47 | 3,849,569 |
| Lindt & Spruengli AG (participation certificate) | | 701 | 5,208,647 |
| Lonza Group AG | | 40,926 | 14,727,552 |
| Nestle SA (Reg. S) | | 1,668,763 | 178,526,487 |
| Novartis AG | | 1,172,520 | 102,449,259 |
| Pargesa Holding SA | | 20,926 | 1,652,443 |
| Partners Group Holding AG | | 10,461 | 8,156,717 |
| Roche Holding AG (participation certificate) | | 383,159 | 115,313,993 |
| Schindler Holding AG: | | | |
| (participation certificate) | | 24,597 | 6,013,985 |
| (Reg.) | | 8,834 | 2,088,281 |
| SGS SA (Reg.) | | 3,034 | 7,897,934 |
| Sika AG | | 69,996 | 12,026,682 |
| Sonova Holding AG Class B | | 30,583 | 7,006,344 |
| Straumann Holding AG | | 5,517 | 4,920,280 |
| Swatch Group AG (Bearer) | | 12,757 | 3,530,320 |
| Swatch Group AG (Bearer) (Reg.) | | 53,135 | 2,846,614 |
| Swiss Life Holding AG | | 18,806 | 9,402,047 |
| Swiss Prime Site AG | | 39,960 | 4,115,495 |
| Swiss Re Ltd. | | 166,384 | 17,422,673 |
| Swisscom AG | | 14,429 | 7,371,734 |
| Temenos Group AG | | 34,860 | 4,973,690 |
| UBS Group AG | | 1,939,561 | 22,885,444 |
| UBS Group AG (b) | | 181,357 | 2,134,572 |
| Zurich Insurance Group Ltd. | | 81,934 | 32,017,797 |
|
| TOTAL SWITZERLAND | | | 726,584,655 |
|
| Taiwan - 3.0% | | | |
| Acer, Inc. | | 1,646,060 | 960,714 |
| Advantech Co. Ltd. | | 178,465 | 1,764,286 |
| ASE Technology Holding Co. Ltd. | | 1,921,943 | 4,976,951 |
| Asia Cement Corp. | | 1,183,785 | 1,670,993 |
| ASUSTeK Computer, Inc. | | 364,422 | 2,467,478 |
| AU Optronics Corp. | | 5,529,000 | 1,407,018 |
| Catcher Technology Co. Ltd. | | 343,000 | 2,901,633 |
| Cathay Financial Holding Co. Ltd. | | 4,272,227 | 5,645,313 |
| Cathay Financial Holding Co. Ltd. rights 11/25/19 (a) | | 119,105 | 20,698 |
| Chang Hwa Commercial Bank | | 2,761,771 | 2,150,700 |
| Cheng Shin Rubber Industry Co. Ltd. | | 1,173,513 | 1,841,189 |
| Chicony Electronics Co. Ltd. | | 326,870 | 1,014,971 |
| China Airlines Ltd. | | 1,317,835 | 391,487 |
| China Development Finance Holding Corp. | | 6,592,819 | 2,053,636 |
| China Life Insurance Co. Ltd. (a) | | 1,282,431 | 1,055,447 |
| China Steel Corp. | | 6,640,421 | 5,105,839 |
| Chinatrust Financial Holding Co. Ltd. | | 10,430,255 | 7,250,358 |
| Chunghwa Picture Tubes, Ltd. (a)(d) | | 551 | 3 |
| Chunghwa Telecom Co. Ltd. | | 2,078,400 | 7,632,658 |
| Compal Electronics, Inc. | | 2,237,394 | 1,335,188 |
| Delta Electronics, Inc. | | 1,105,383 | 4,856,755 |
| E.SUN Financial Holdings Co. Ltd. | | 5,778,865 | 5,220,268 |
| ECLAT Textile Co. Ltd. | | 115,420 | 1,549,757 |
| EVA Airways Corp. | | 885,284 | 413,643 |
| Evergreen Marine Corp. (Taiwan) (a) | | 861,728 | 353,190 |
| Far Eastern Textile Ltd. | | 1,931,032 | 1,874,174 |
| Far EasTone Telecommunications Co. Ltd. | | 839,000 | 2,008,230 |
| Feng Tay Enterprise Co. Ltd. | | 184,136 | 1,243,754 |
| First Financial Holding Co. Ltd. | | 5,654,187 | 4,143,586 |
| Formosa Chemicals & Fibre Corp. | | 1,988,620 | 5,777,157 |
| Formosa Petrochemical Corp. | | 693,000 | 2,201,839 |
| Formosa Plastics Corp. | | 2,477,640 | 7,945,216 |
| Formosa Taffeta Co. Ltd. | | 247,000 | 280,627 |
| Foxconn Technology Co. Ltd. | | 496,811 | 1,062,105 |
| Fubon Financial Holding Co. Ltd. | | 3,670,487 | 5,361,669 |
| Giant Manufacturing Co. Ltd. | | 142,042 | 1,052,577 |
| GlobalWafers Co. Ltd. | | 123,000 | 1,472,064 |
| Highwealth Construction Corp. | | 708,400 | 1,085,897 |
| HIWIN Technologies Corp. | | 116,305 | 997,238 |
| Hon Hai Precision Industry Co. Ltd. (Foxconn) | | 6,872,593 | 18,162,863 |
| Hotai Motor Co. Ltd. | | 158,000 | 2,787,199 |
| Hua Nan Financial Holdings Co. Ltd. | | 4,043,196 | 2,903,338 |
| Innolux Corp. | | 4,202,819 | 932,949 |
| Inventec Corp. | | 1,376,209 | 997,253 |
| Largan Precision Co. Ltd. | | 54,000 | 7,914,617 |
| Lite-On Technology Corp. | | 1,130,053 | 1,860,078 |
| MediaTek, Inc. | | 826,989 | 11,063,398 |
| Mega Financial Holding Co. Ltd. | | 6,062,833 | 5,943,954 |
| Micro-Star International Co. Ltd. | | 337,000 | 994,491 |
| Nan Ya Plastics Corp. | | 2,833,980 | 6,690,490 |
| Nanya Technology Corp. | | 705,000 | 1,618,139 |
| Nien Made Enterprise Co. Ltd. | | 80,000 | 725,293 |
| Novatek Microelectronics Corp. | | 315,000 | 2,024,395 |
| Pegatron Corp. | | 1,128,652 | 2,194,539 |
| Phison Electronics Corp. | | 69,199 | 629,639 |
| Pou Chen Corp. | | 1,306,240 | 1,745,337 |
| Powertech Technology, Inc. | | 369,700 | 1,163,722 |
| President Chain Store Corp. | | 325,000 | 3,239,557 |
| Quanta Computer, Inc. | | 1,544,000 | 2,961,637 |
| Realtek Semiconductor Corp. | | 260,744 | 1,936,472 |
| Ruentex Development Co. Ltd. | | 198,948 | 303,334 |
| Ruentex Industries Ltd. | | 184,690 | 443,285 |
| Shin Kong Financial Holding Co. Ltd. | | 6,217,780 | 1,961,278 |
| Sinopac Holdings Co. | | 5,792,250 | 2,374,029 |
| Standard Foods Corp. | | 225,981 | 454,956 |
| Synnex Technology International Corp. | | 695,920 | 829,454 |
| TaiMed Biologics, Inc. (a) | | 117,000 | 512,148 |
| Taishin Financial Holdings Co. Ltd. | | 4,986,380 | 2,313,505 |
| Taiwan Business Bank | | 3,365,874 | 1,418,174 |
| Taiwan Cement Corp. | | 2,763,528 | 3,665,313 |
| Taiwan Cooperative Financial Holding Co. Ltd. | | 4,884,812 | 3,355,525 |
| Taiwan High Speed Rail Corp. | | 1,102,000 | 1,302,613 |
| Taiwan Mobile Co. Ltd. | | 905,400 | 3,369,496 |
| Taiwan Semiconductor Manufacturing Co. Ltd. | | 13,096,000 | 128,096,267 |
| Taiwan Semiconductor Manufacturing Co. Ltd. sponsored ADR | | 64,767 | 3,343,920 |
| Tatung Co. Ltd. (a) | | 1,215,000 | 729,048 |
| The Shanghai Commercial & Savings Bank Ltd. | | 1,827,815 | 3,146,445 |
| Unified-President Enterprises Corp. | | 2,552,620 | 6,294,086 |
| United Microelectronics Corp. | | 6,087,000 | 2,797,902 |
| Vanguard International Semiconductor Corp. | | 530,000 | 1,133,058 |
| Walsin Technology Corp. | | 160,000 | 962,686 |
| Win Semiconductors Corp. | | 183,000 | 1,908,125 |
| Winbond Electronics Corp. | | 1,455,000 | 818,193 |
| Wistron Corp. | | 1,398,291 | 1,281,469 |
| WPG Holding Co. Ltd. | | 801,378 | 1,014,269 |
| Yageo Corp. | | 145,292 | 1,495,891 |
| Yuanta Financial Holding Co. Ltd. | | 5,315,085 | 3,319,968 |
|
| TOTAL TAIWAN | | | 357,680,103 |
|
| Thailand - 0.7% | | | |
| Advanced Info Service PCL | | 41,100 | 311,838 |
| Advanced Info Service PCL (For. Reg.) | | 597,100 | 4,530,370 |
| Airports of Thailand PCL | | 254,400 | 659,251 |
| Airports of Thailand PCL (For. Reg.) | | 2,152,200 | 5,577,205 |
| Bangkok Bank PCL (For. Reg.) | | 247,900 | 1,432,457 |
| Bangkok Dusit Medical Services PCL | | 710,300 | 564,752 |
| Bangkok Dusit Medical Services PCL (For. Reg.) | | 4,783,900 | 3,803,628 |
| Bangkok Expressway and Metro PCL | | 3,398,100�� | 1,215,629 |
| Banpu PCL (For. Reg.) | | 2,328,500 | 894,824 |
| Berli Jucker PCL (For. Reg) | | 589,400 | 951,877 |
| BTS Group Holdings PCL (For. Reg.) | | 3,351,100 | 1,481,455 |
| Bumrungrad Hospital PCL (For. Reg.) | | 187,400 | 748,068 |
| C.P. ALL PCL | | 212,500 | 549,349 |
| C.P. ALL PCL (For. Reg.) | | 3,122,400 | 8,071,938 |
| Central Pattana PCL | | 176,000 | 373,165 |
| Central Pattana PCL (For. Reg.) | | 1,216,300 | 2,578,866 |
| Charoen Pokphand Foods PCL (For. Reg.) | | 1,922,140 | 1,608,227 |
| Electricity Generating PCL (For. Reg.) | | 143,200 | 1,646,021 |
| Energy Absolute PCL | | 893,000 | 1,212,764 |
| Gulf Energy Development PCL | | 472,400 | 2,537,870 |
| Home Product Center PCL (For. Reg.) | | 3,017,247 | 1,718,615 |
| Indorama Ventures PCL (For. Reg.) | | 881,000 | 817,574 |
| Intouch Holdings PCL | | 147,900 | 323,332 |
| Intouch Holdings PCL (For. Reg.) | | 1,162,900 | 2,542,280 |
| IRPC PCL (For. Reg.) | | 5,943,100 | 669,329 |
| Kasikornbank PCL | | 426,200 | 1,961,468 |
| Kasikornbank PCL (For. Reg.) | | 666,000 | 3,076,106 |
| Krung Thai Bank PCL (For. Reg.) | | 1,748,975 | 961,676 |
| Land & House PCL | | 948,000 | 304,633 |
| Land & House PCL (For. Reg.) | | 3,696,300 | 1,187,781 |
| Minor International PCL: | | | |
| warrants 9/30/21 (a) | | 45,263 | 4,540 |
| (For. Reg.) | | 1,288,070 | 1,536,089 |
| Muangthai Leasing PCL | | 363,991 | 747,909 |
| PTT Exploration and Production PCL | | 109,900 | 438,519 |
| PTT Exploration and Production PCL (For. Reg.) | | 688,451 | 2,747,031 |
| PTT Global Chemical PCL (For. Reg.) | | 1,183,486 | 1,999,442 |
| PTT PCL | | 468,900 | 702,763 |
| PTT PCL (For. Reg.) | | 5,872,200 | 8,800,954 |
| Ratchaburi Electric Generating Holding PCL (For. Reg.) | | 437,800 | 1,066,624 |
| Robinsons Department Store PCL (For. Reg.) | | 237,000 | 512,266 |
| Siam Cement PCL | | 34,700 | 422,042 |
| Siam Cement PCL (For. Reg.) | | 370,150 | 4,501,987 |
| Siam Commercial Bank PCL (For. Reg.) | | 436,400 | 1,617,702 |
| Thai Oil PCL (For. Reg.) | | 563,600 | 1,278,653 |
| Thai Union Frozen Products PCL (For. Reg.) | | 1,511,200 | 730,881 |
| TMB Bank PCL: | | | |
| (For. Reg.) | | 11,797,700 | 562,458 |
| rights (a) | | 2,400,291 | 3,180 |
| Total Access Communication PCL (For. Reg.) | | 435,700 | 894,469 |
| True Corp. PCL (For. Reg.) | | 7,069,135 | 1,171,121 |
|
| TOTAL THAILAND | | | 84,050,978 |
|
| Turkey - 0.1% | | | |
| Akbank TAS (a) | | 1,606,225 | 1,941,321 |
| Anadolu Efes Biracilik Ve Malt Sanayii A/S | | 87,523 | 294,384 |
| Arcelik A/S (a) | | 70,955 | 219,917 |
| Aselsan A/S | | 135,758 | 435,727 |
| Bim Birlesik Magazalar A/S JSC | | 244,599 | 2,024,474 |
| Eregli Demir ve Celik Fabrikalari T.A.S. | | 1,047,549 | 1,198,298 |
| Ford Otomotiv Sanayi A/S | | 20,705 | 233,587 |
| Haci Omer Sabanci Holding A/S | | 551,482 | 797,719 |
| Koc Holding A/S | | 366,769 | 1,201,554 |
| TAV Havalimanlari Holding A/S | | 65,288 | 297,820 |
| Tupras Turkiye Petrol Rafinerileri A/S | | 66,903 | 1,456,893 |
| Turk Hava Yollari AO (a) | | 232,240 | 472,828 |
| Turk Sise ve Cam Fabrikalari A/S | | 217,307 | 165,339 |
| Turkcell Iletisim Hizmet A/S | | 498,989 | 1,097,082 |
| Turkiye Garanti Bankasi A/S (a) | | 1,238,427 | 1,992,834 |
| Turkiye Is Bankasi A/S Series C (a) | | 683,154 | 693,042 |
|
| TOTAL TURKEY | | | 14,522,819 |
|
| United Arab Emirates - 0.2% | | | |
| Abu Dhabi Commercial Bank PJSC | | 1,577,412 | 3,350,028 |
| Aldar Properties PJSC (a) | | 2,253,351 | 1,441,801 |
| DP World Ltd. | | 77,952 | 1,035,982 |
| Dubai Islamic Bank Pakistan Ltd. (a) | | 1,024,093 | 1,475,040 |
| Emaar Development PJSC (a) | | 402,433 | 443,769 |
| Emaar Malls Group PJSC (a) | | 1,337,682 | 710,225 |
| Emaar Properties PJSC | | 2,039,336 | 2,370,966 |
| Emirates Telecommunications Corp. | | 986,249 | 4,446,881 |
| National Bank of Abu Dhabi PJSC | | 1,473,214 | 6,105,049 |
|
| TOTAL UNITED ARAB EMIRATES | | | 21,379,741 |
|
| United Kingdom - 10.0% | | | |
| 3i Group PLC | | 533,562 | 7,796,167 |
| Admiral Group PLC | | 106,348 | 2,785,464 |
| Anglo American PLC (United Kingdom) | | 576,051 | 14,786,455 |
| Antofagasta PLC | | 222,725 | 2,501,931 |
| Ashtead Group PLC | | 258,686 | 7,867,888 |
| Associated British Foods PLC | | 188,627 | 5,438,964 |
| AstraZeneca PLC (United Kingdom) | | 715,472 | 69,770,875 |
| Auto Trader Group PLC (c) | | 504,109 | 3,673,086 |
| Aviva PLC | | 2,138,511 | 11,526,670 |
| BAE Systems PLC | | 1,744,098 | 13,027,919 |
| Barclays PLC | | 9,389,022 | 20,365,482 |
| Barratt Developments PLC | | 549,703 | 4,494,509 |
| Berkeley Group Holdings PLC | | 69,745 | 3,976,048 |
| BHP Billiton PLC | | 1,153,480 | 24,465,933 |
| BP PLC | | 10,139,734 | 64,299,752 |
| BP PLC sponsored ADR | | 162,311 | 6,153,210 |
| British American Tobacco PLC (United Kingdom) | | 1,253,587 | 43,845,305 |
| British Land Co. PLC | | 508,728 | 4,090,243 |
| BT Group PLC | | 4,603,142 | 12,205,606 |
| Bunzl PLC | | 183,927 | 4,784,057 |
| Burberry Group PLC | | 226,176 | 5,988,452 |
| Carnival PLC | | 88,646 | 3,547,327 |
| Centrica PLC | | 3,226,549 | 3,032,653 |
| Coca-Cola European Partners PLC | | 128,769 | 6,890,429 |
| Compass Group PLC | | 859,641 | 22,887,159 |
| Croda International PLC | | 68,266 | 4,258,710 |
| Diageo PLC | | 1,294,221 | 52,973,732 |
| Direct Line Insurance Group PLC | | 813,548 | 2,867,470 |
| easyJet PLC | | 82,195 | 1,318,115 |
| Evraz PLC | | 257,330 | 1,223,997 |
| Fresnillo PLC | | 109,786 | 1,009,700 |
| G4S PLC (United Kingdom) | | 788,422 | 2,112,012 |
| GlaxoSmithKline PLC | | 2,719,192 | 62,282,933 |
| Halma PLC | | 204,225 | 4,956,210 |
| Hargreaves Lansdown PLC | | 153,132 | 3,514,931 |
| HSBC Holdings PLC (United Kingdom) | | 10,989,789 | 83,029,088 |
| Imperial Brands PLC | | 526,537 | 11,543,009 |
| Informa PLC | | 691,564 | 6,942,585 |
| InterContinental Hotel Group PLC | | 92,466 | 5,595,556 |
| Intertek Group PLC | | 86,640 | 6,006,503 |
| Investec PLC | | 389,055 | 2,205,339 |
| ITV PLC | | 2,037,793 | 3,530,539 |
| J Sainsbury PLC | | 982,982 | 2,591,177 |
| John Wood Group PLC | | 349,090 | 1,529,771 |
| Johnson Matthey PLC | | 105,451 | 4,193,496 |
| Kingfisher PLC | | 1,198,317 | 3,214,614 |
| Land Securities Group PLC | | 383,306 | 4,667,245 |
| Legal & General Group PLC | | 3,260,111 | 11,136,011 |
| Lloyds Banking Group PLC | | 38,686,317 | 28,457,954 |
| London Stock Exchange Group PLC | | 171,404 | 15,446,728 |
| M&G PLC (a) | | 1,355,269 | 3,753,361 |
| Marks & Spencer Group PLC | | 1,112,822 | 2,621,577 |
| Meggitt PLC | | 431,425 | 3,489,437 |
| Melrose Industries PLC | | 2,662,333 | 7,349,080 |
| Merlin Entertainments PLC (c) | | 380,118 | 2,237,894 |
| Micro Focus International PLC | | 183,816 | 2,522,914 |
| Mondi PLC | | 155,625 | 3,220,382 |
| Mondi PLC | | 113,305 | 2,343,259 |
| National Grid PLC | | 1,846,386 | 21,556,537 |
| Next PLC | | 74,228 | 6,328,675 |
| NMC Health PLC | | 46,877 | 1,325,564 |
| Ocado Group PLC (a) | | 246,663 | 4,246,353 |
| Pearson PLC | | 282,334 | 2,493,460 |
| Pearson PLC sponsored ADR (b) | | 138,186 | 1,216,037 |
| Persimmon PLC | | 173,602 | 5,120,412 |
| Prudential PLC | | 1,394,598 | 24,359,217 |
| Reckitt Benckiser Group PLC | | 385,771 | 29,851,584 |
| RELX PLC (London Stock Exchange) | | 1,063,529 | 25,596,594 |
| Rentokil Initial PLC | | 976,615 | 5,749,690 |
| Rio Tinto PLC | | 618,810 | 32,216,375 |
| Rolls-Royce Holdings PLC (a) | | 42,040,780 | 54,458 |
| Rolls-Royce Holdings PLC | | 942,399 | 8,671,718 |
| Royal Bank of Scotland Group PLC | | 2,641,667 | 7,302,201 |
| Royal Dutch Shell PLC: | | | |
| Class A (United Kingdom) | | 2,538,867 | 73,596,925 |
| Class B (United Kingdom) | | 1,865,206 | 53,717,527 |
| RSA Insurance Group PLC | | 558,282 | 3,776,942 |
| Sage Group PLC | | 602,423 | 5,616,949 |
| Schroders PLC | | 70,069 | 2,809,142 |
| Scottish & Southern Energy PLC | | 563,648 | 9,376,879 |
| Segro PLC | | 579,921 | 6,341,636 |
| Severn Trent PLC | | 123,186 | 3,598,281 |
| Smith & Nephew PLC | | 477,145 | 10,242,591 |
| Smiths Group PLC | | 221,844 | 4,636,644 |
| Spirax-Sarco Engineering PLC | | 39,524 | 4,057,395 |
| St. James's Place Capital PLC | | 294,403 | 3,969,905 |
| Standard Chartered PLC (United Kingdom) | | 1,520,258 | 13,804,556 |
| Standard Life PLC | | 1,318,146 | 5,182,142 |
| Taylor Wimpey PLC | | 1,866,239 | 4,000,851 |
| Tesco PLC | | 5,374,016 | 16,404,475 |
| The Weir Group PLC | | 135,443 | 2,362,382 |
| Unilever PLC | | 602,685 | 36,087,303 |
| United Utilities Group PLC | | 363,311 | 4,095,291 |
| Vodafone Group PLC | | 13,339,586 | 27,222,384 |
| Vodafone Group PLC sponsored ADR | | 127,461 | 2,602,754 |
| Whitbread PLC | | 73,662 | 3,874,928 |
| WM Morrison Supermarkets PLC | | 1,421,428 | 3,661,319 |
|
| TOTAL UNITED KINGDOM | | | 1,201,474,989 |
|
| United States of America - 0.1% | | | |
| Southern Copper Corp. | | 44,500 | 1,583,310 |
| Yum China Holdings, Inc. | | 199,407 | 8,474,798 |
|
| TOTAL UNITED STATES OF AMERICA | | | 10,058,108 |
|
| TOTAL COMMON STOCKS | | | |
| (Cost $10,696,932,027) | | | 11,422,709,754 |
|
| Nonconvertible Preferred Stocks - 1.4% | | | |
| Brazil - 0.8% | | | |
| Ambev SA sponsored ADR | | 621,267 | 2,677,661 |
| Banco Bradesco SA: | | | |
| (PN) | | 1,693,647 | 14,852,404 |
| (PN) sponsored ADR | | 747,203 | 6,545,502 |
| Brasil Foods SA sponsored ADR (a) | | 81,052 | 710,016 |
| Braskem SA (PN-A) (a) | | 93,200 | 643,720 |
| Centrais Eletricas Brasileiras SA (Electrobras) (PN-B) (a) | | 97,900 | 1,000,604 |
| Companhia Brasileira de Distribuicao Grupo Pao de Acucar (PN) | | 81,901 | 1,694,792 |
| Companhia Energetica de Minas Gerais (CEMIG) (PN) | | 584,565 | 1,989,605 |
| Gerdau SA | | 600,050 | 2,009,393 |
| Itau Unibanco Holding SA | | 2,006,361 | 18,125,037 |
| Itau Unibanco Holding SA sponsored ADR | | 646,178 | 5,834,987 |
| Itausa-Investimentos Itau SA (PN) | | 2,388,507 | 8,165,174 |
| Lojas Americanas SA (PN) | | 378,937 | 1,888,780 |
| Petroleo Brasileiro SA - Petrobras: | | | |
| (PN) (non-vtg.) | | 1,781,840 | 13,502,086 |
| (PN) sponsored ADR (non-vtg.) | | 516,483 | 7,793,728 |
| sponsored ADR | | 49,157 | 798,310 |
| Telefonica Brasil SA | | 259,940 | 3,440,373 |
|
| TOTAL BRAZIL | | | 91,672,172 |
|
| Chile - 0.0% | | | |
| Embotelladora Andina SA Class B | | 245,535 | 708,529 |
| Sociedad Quimica y Minera de Chile SA (PN-B) (a) | | 58,218 | 1,546,514 |
|
| TOTAL CHILE | | | 2,255,043 |
|
| Colombia - 0.0% | | | |
| Bancolombia SA (PN) | | 248,567 | 3,244,608 |
| Grupo Aval Acciones y Valores SA | | 2,049,020 | 839,613 |
| Grupo de Inversiones Suramerica SA | | 89,423 | 819,623 |
|
| TOTAL COLOMBIA | | | 4,903,844 |
|
| France - 0.0% | | | |
| Air Liquide SA (a) | | 41,428 | 5,502,974 |
| Germany - 0.4% | | | |
| Bayerische Motoren Werke AG (BMW) (non-vtg.) | | 34,301 | 2,113,639 |
| Fuchs Petrolub AG | | 43,782 | 1,869,215 |
| Henkel AG & Co. KGaA | | 99,500 | 10,340,404 |
| Porsche Automobil Holding SE (Germany) | | 81,132 | 5,973,801 |
| Sartorius AG (non-vtg.) | | 19,231 | 3,736,300 |
| Volkswagen AG | | 102,861 | 19,582,853 |
|
| TOTAL GERMANY | | | 43,616,212 |
|
| Italy - 0.0% | | | |
| Telecom Italia SpA (Risparmio Shares) | | 3,108,053 | 1,798,374 |
| Korea (South) - 0.2% | | | |
| AMOREPACIFIC Corp. | | 4,740 | 390,042 |
| Hyundai Motor Co. | | 24,631 | 1,536,425 |
| Hyundai Motor Co. Series 2 | | 13,407 | 908,471 |
| LG Chemical Ltd. | | 7,920 | 1,164,019 |
| LG Household & Health Care Ltd. | | 831 | 524,749 |
| Samsung Electronics Co. Ltd. | | 471,769 | 16,548,135 |
|
| TOTAL KOREA (SOUTH) | | | 21,071,841 |
|
| Russia - 0.0% | | | |
| AK Transneft OAO | | 250 | 649,148 |
| Surgutneftegas OJSC | | 3,983,717 | 2,343,919 |
|
| TOTAL RUSSIA | | | 2,993,067 |
|
| TOTAL NONCONVERTIBLE PREFERRED STOCKS | | | |
| (Cost $159,789,471) | | | 173,813,527 |
| | | Principal Amount(e) | Value |
|
| Nonconvertible Bonds - 0.0% | | | |
| India - 0.0% | | | |
| Britannia Industries Ltd. 8% 8/28/22 | INR | 18,814 | 83 |
| NTPC Ltd. 8.49% 3/25/25 | INR | 233,068 | 44,164 |
| TOTAL NONCONVERTIBLE BONDS | | | |
| (Cost $46,765) | | | 44,247 |
|
| U.S. Government and Government Agency Obligations - 0.1% | | | |
| U.S. Treasury Obligations - 0.1% | | | |
| U.S. Treasury Bills, yield at date of purchase 1.7% to 1.82% 12/19/19 to 3/19/20 (f) | | | |
| (Cost $11,546,447) | | 11,600,000 | 11,555,164 |
| | | Shares | Value |
|
| Money Market Funds - 2.3% | | | |
| Fidelity Cash Central Fund 1.83% (g) | | 196,909,309 | $196,948,690 |
| Fidelity Securities Lending Cash Central Fund 1.84% (g)(h) | | 75,077,650 | 75,085,158 |
| TOTAL MONEY MARKET FUNDS | | | |
| (Cost $272,033,441) | | | 272,033,848 |
| TOTAL INVESTMENT IN SECURITIES - 98.5% | | | |
| (Cost $11,140,348,151) | | | 11,880,156,540 |
| NET OTHER ASSETS (LIABILITIES) - 1.5% | | | 186,428,716 |
| NET ASSETS - 100% | | | $12,066,585,256 |
| Futures Contracts | | | | | |
| | Number of contracts | Expiration Date | Notional Amount | Value | Unrealized Appreciation/(Depreciation) |
| Purchased | | | | | |
| Equity Index Contracts | | | | | |
| ICE E-mini MSCI EAFE Index Contracts (United States) | 3,215 | Dec. 2019 | $314,619,900 | $7,120,777 | $7,120,777 |
| ICE E-mini MSCI Emerging Markets Index Contracts (United States) | 2,365 | Dec. 2019 | 123,145,550 | 2,503,862 | 2,503,862 |
| TME S&P/TSX 60 Index Contracts (Canada) | 211 | Dec. 2019 | 31,556,283 | 144,680 | 144,680 |
| TOTAL FUTURES CONTRACTS | | | | | $9,769,319 |
The notional amount of futures purchased as a percentage of Net Assets is 3.9%
For the period, the average monthly notional amount at value for futures contracts in the aggregate was $395,418,199.
Currency Abbreviations
INR – Indian rupee
Categorizations in the Schedule of Investments are based on country or territory of incorporation.
Legend
(a) Non-income producing
(b) Security or a portion of the security is on loan at period end.
(c) Security exempt from registration under Rule 144A of the Securities Act of 1933. These securities may be resold in transactions exempt from registration, normally to qualified institutional buyers. At the end of the period, the value of these securities amounted to $122,308,543 or 1.0% of net assets.
(d) Level 3 security
(e) Amount is stated in United States dollars unless otherwise noted.
(f) Security or a portion of the security was pledged to cover margin requirements for futures contracts. At period end, the value of securities pledged amounted to $11,339,577.
(g) Affiliated fund that is generally available only to investment companies and other accounts managed by Fidelity Investments. The rate quoted is the annualized seven-day yield of the fund at period end. A complete unaudited listing of the fund's holdings as of its most recent quarter end is available upon request. In addition, each Fidelity Central Fund's financial statements, which are not covered by the Fund's Report of Independent Registered Public Accounting Firm, are available on the SEC's website or upon request.
(h) Investment made with cash collateral received from securities on loan.
Affiliated Central Funds
Information regarding fiscal year to date income earned by the Fund from investments in Fidelity Central Funds is as follows:
| Fund | Income earned |
| Fidelity Cash Central Fund | $7,346,144 |
| Fidelity Securities Lending Cash Central Fund | 749,685 |
| Total | $8,095,829 |
Amounts in the income column in the above table include any capital gain distributions from underlying funds, which are presented in the corresponding line-item in the Statement of Operations, if applicable. Amount for Fidelity Securities Lending Cash Central Fund represents the income earned on investing cash collateral, less rebates paid to borrowers and any lending agent fees associated with the loan, plus any premium payments received for lending certain types of securities.
Investment Valuation
The following is a summary of the inputs used, as of October 31, 2019, involving the Fund's assets and liabilities carried at fair value. The inputs or methodology used for valuing securities may not be an indication of the risk associated with investing in those securities. For more information on valuation inputs, and their aggregation into the levels used below, please refer to the Investment Valuation section in the accompanying Notes to Financial Statements.
| | Valuation Inputs at Reporting Date: |
| Description | Total | Level 1 | Level 2 | Level 3 |
| Investments in Securities: | | | | |
| Equities: | | | | |
| Communication Services | $772,720,295 | $262,964,033 | $509,756,262 | $-- |
| Consumer Discretionary | 1,344,864,133 | 658,284,502 | 686,568,975 | 10,656 |
| Consumer Staples | 1,138,509,111 | 438,524,829 | 699,958,608 | 25,674 |
| Energy | 768,648,964 | 284,763,759 | 483,885,205 | -- |
| Financials | 2,499,987,860 | 1,082,084,280 | 1,417,432,310 | 471,270 |
| Health Care | 1,008,917,893 | 158,686,694 | 850,231,199 | -- |
| Industrials | 1,401,520,216 | 614,510,247 | 787,009,969 | -- |
| Information Technology | 1,043,933,324 | 418,603,429 | 625,328,325 | 1,570 |
| Materials | 844,271,281 | 441,014,276 | 403,257,005 | -- |
| Real Estate | 373,561,200 | 93,040,936 | 280,518,724 | 1,540 |
| Utilities | 399,589,004 | 175,372,020 | 224,216,984 | -- |
| Corporate Bonds | 44,247 | -- | 44,247 | -- |
| U.S. Government and Government Agency Obligations | 11,555,164 | -- | 11,555,164 | -- |
| Money Market Funds | 272,033,848 | 272,033,848 | -- | -- |
| Total Investments in Securities: | $11,880,156,540 | $4,899,882,853 | $6,979,762,977 | $510,710 |
| Derivative Instruments: | | | | |
| Assets | | | | |
| Futures Contracts | $9,769,319 | $9,769,319 | $-- | $-- |
| Total Assets | $9,769,319 | $9,769,319 | $-- | $-- |
| Total Derivative Instruments: | $9,769,319 | $9,769,319 | $-- | $-- |
Value of Derivative Instruments
The following table is a summary of the Fund's value of derivative instruments by primary risk exposure as of October 31, 2019. For additional information on derivative instruments, please refer to the Derivative Instruments section in the accompanying Notes to Financial Statements.
| Primary Risk Exposure / Derivative Type | Value |
| | Asset | Liability |
| Equity Risk | | |
| Futures Contracts(a) | $9,769,319 | $0 |
| Total Equity Risk | 9,769,319 | 0 |
| Total Value of Derivatives | $9,769,319 | $0 |
(a) Reflects gross cumulative appreciation (depreciation) on futures contracts as presented in the Schedule of Investments. In the Statement of Assets and Liabilities, the period end daily variation margin is included in receivable or payable for daily variation margin on futures contracts, and the net cumulative appreciation (depreciation) is included in Total accumulated earnings (loss).
See accompanying notes which are an integral part of the financial statements.
Financial Statements
Statement of Assets and Liabilities
| | | October 31, 2019 |
| Assets | | |
Investment in securities, at value (including securities loaned of $71,376,036) — See accompanying schedule:
Unaffiliated issuers (cost $10,868,314,710) | $11,608,122,692 | |
| Fidelity Central Funds (cost $272,033,441) | 272,033,848 | |
| Total Investment in Securities (cost $11,140,348,151) | | $11,880,156,540 |
| Foreign currency held at value (cost $4,762,544) | | 4,761,721 |
| Receivable for fund shares sold | | 256,942,930 |
| Dividends receivable | | 33,148,884 |
| Interest receivable | | 172 |
| Distributions receivable from Fidelity Central Funds | | 1,158,453 |
| Receivable from investment adviser for expense reductions | | 54,347 |
| Other receivables | | 1,671 |
| Total assets | | 12,176,224,718 |
| Liabilities | | |
| Payable for investments purchased | $3,235,716 | |
| Payable for fund shares redeemed | 28,130,352 | |
| Payable for daily variation margin on futures contracts | 1,003,436 | |
| Other payables and accrued expenses | 2,170,468 | |
| Collateral on securities loaned | 75,099,490 | |
| Total liabilities | | 109,639,462 |
| Net Assets | | $12,066,585,256 |
| Net Assets consist of: | | |
| Paid in capital | | $11,198,584,270 |
| Total accumulated earnings (loss) | | 868,000,986 |
| Net Assets, for 944,344,257 shares outstanding | | $12,066,585,256 |
| Net Asset Value, offering price and redemption price per share ($12,066,585,256 ÷ 944,344,257 shares) | | $12.78 |
See accompanying notes which are an integral part of the financial statements.
Statement of Operations
| | | Year ended October 31, 2019 |
| Investment Income | | |
| Dividends | | $245,649,226 |
| Non-Cash dividends | | 21,288,534 |
| Interest | | 381,937 |
| Income from Fidelity Central Funds (including $749,685 from security lending) | | 8,095,829 |
| Income before foreign taxes withheld | | 275,415,526 |
| Less foreign taxes withheld | | (23,618,028) |
| Total income | | 251,797,498 |
| Expenses | | |
| Management fee | $2,284,741 | |
| Custodian fees and expenses | 706,487 | |
| Independent trustees' fees and expenses | 29,537 | |
| Legal | 2,276 | |
| Commitment fees | 18,734 | |
| Total expenses before reductions | 3,041,775 | |
| Expense reductions | (167,994) | |
| Total expenses after reductions | | 2,873,781 |
| Net investment income (loss) | | 248,923,717 |
| Realized and Unrealized Gain (Loss) | | |
| Net realized gain (loss) on: | | |
| Investment securities: | | |
| Unaffiliated issuers | (63,202,118) | |
| Fidelity Central Funds | (2,414) | |
| Foreign currency transactions | 122,156 | |
| Futures contracts | 56,134,171 | |
| Total net realized gain (loss) | | (6,948,205) |
| Change in net unrealized appreciation (depreciation) on: | | |
| Investment securities: | | |
| Unaffiliated issuers (net of increase in deferred foreign taxes of $882,624) | 642,587,439 | |
| Fidelity Central Funds | 406 | |
| Assets and liabilities in foreign currencies | 294,645 | |
| Futures contracts | 18,537,347 | |
| Total change in net unrealized appreciation (depreciation) | | 661,419,837 |
| Net gain (loss) | | 654,471,632 |
| Net increase (decrease) in net assets resulting from operations | | $903,395,349 |
See accompanying notes which are an integral part of the financial statements.
Statement of Changes in Net Assets
| | Year ended October 31, 2019 | Year ended October 31, 2018 |
| Increase (Decrease) in Net Assets | | |
| Operations | | |
| Net investment income (loss) | $248,923,717 | $159,681,284 |
| Net realized gain (loss) | (6,948,205) | (11,188,546) |
| Change in net unrealized appreciation (depreciation) | 661,419,837 | (687,868,669) |
| Net increase (decrease) in net assets resulting from operations | 903,395,349 | (539,375,931) |
| Distributions to shareholders | (162,270,724) | (128,402,196) |
| Share transactions | | |
| Proceeds from sales of shares | 5,751,733,918 | 1,917,429,917 |
| Reinvestment of distributions | 162,270,722 | 128,402,196 |
| Cost of shares redeemed | (535,268,971) | (428,336,990) |
| Net increase (decrease) in net assets resulting from share transactions | 5,378,735,669 | 1,617,495,123 |
| Total increase (decrease) in net assets | 6,119,860,294 | 949,716,996 |
| Net Assets | | |
| Beginning of period | 5,946,724,962 | 4,997,007,966 |
| End of period | $12,066,585,256 | $5,946,724,962 |
| Other Information | | |
| Shares | | |
| Sold | 470,239,752 | 148,225,327 |
| Issued in reinvestment of distributions | 14,436,897 | 9,922,890 |
| Redeemed | (44,169,493) | (32,286,725) |
| Net increase (decrease) | 440,507,156 | 125,861,492 |
See accompanying notes which are an integral part of the financial statements.
Financial Highlights
Fidelity Series Global ex U.S. Index Fund
| | | | | | |
| Years ended October 31, | 2019 | 2018 | 2017 | 2016 | 2015 |
| Selected Per–Share Data | | | | | |
| Net asset value, beginning of period | $11.80 | $13.22 | $10.95 | $11.15 | $12.16 |
| Income from Investment Operations | | | | | |
| Net investment income (loss)A | .40 | .37 | .33 | .30 | .31 |
| Net realized and unrealized gain (loss) | .90 | (1.46) | 2.21 | (.23) | (.96) |
| Total from investment operations | 1.30 | (1.09) | 2.54 | .07 | (.65) |
| Distributions from net investment income | (.32) | (.31) | (.27) | (.27) | (.35) |
| Distributions from net realized gain | – | (.02) | (.01) | – | (.01) |
| Total distributions | (.32) | (.33) | (.27)B | (.27) | (.36) |
| Net asset value, end of period | $12.78 | $11.80 | $13.22 | $10.95 | $11.15 |
| Total ReturnC | 11.36% | (8.48)% | 23.84% | .71% | (5.53)% |
| Ratios to Average Net AssetsD,E | | | | | |
| Expenses before reductions | .04% | .06% | .06% | .16% | .20% |
| Expenses net of fee waivers, if any | .04% | .06% | .06% | .16% | .20% |
| Expenses net of all reductions | .04% | .06% | .06% | .16% | .20% |
| Net investment income (loss) | 3.27% | 2.82% | 2.74% | 2.84% | 2.68% |
| Supplemental Data | | | | | |
| Net assets, end of period (000 omitted) | $12,066,585 | $5,946,725 | $4,997,008 | $3,638,463 | $2,998,297 |
| Portfolio turnover rateF | 3%G | 2% | 4% | 1% | 2% |
A Calculated based on average shares outstanding during the period.
B Total distributions of $.27 per share is comprised of distributions from net investment income of $.267 and distributions from net realized gain of $.006 per share.
C Total returns would have been lower if certain expenses had not been reduced during the applicable periods shown.
D Fees and expenses of any underlying Fidelity Central Funds are not included in the Fund's expense ratio. The Fund indirectly bears its proportionate share of the expenses of any underlying Fidelity Central Funds.
E Expense ratios reflect operating expenses of the Fund. Expenses before reductions do not reflect amounts reimbursed by the investment adviser or reductions from expense offset arrangements and do not represent the amount paid by the Fund during periods when reimbursements or reductions occur. Expenses net of fee waivers reflect expenses after reimbursement by the investment adviser but prior to reductions from expense offset arrangements. Expenses net of all reductions represent the net expenses paid by the Fund.
F Amount does not include the portfolio activity of any underlying Fidelity Central Funds.
G Portfolio turnover rate excludes securities received or delivered in-kind.
See accompanying notes which are an integral part of the financial statements.
Notes to Financial Statements
For the period ended October 31, 2019
1. Organization.
Fidelity Series Global ex U.S. Index Fund (the Fund) is a fund of Fidelity Salem Street Trust (the Trust) and is authorized to issue an unlimited number of shares. Shares are offered only to certain other Fidelity funds and Fidelity managed 529 plans. The Trust is registered under the Investment Company Act of 1940, as amended (the 1940 Act), as an open-end management investment company organized as a Massachusetts business trust. The Fund's investments in emerging markets can be subject to social, economic, regulatory, and political uncertainties and can be extremely volatile.
2. Investments in Fidelity Central Funds.
The Fund invests in Fidelity Central Funds, which are open-end investment companies generally available only to other investment companies and accounts managed by the investment adviser and its affiliates. The Fund's Schedule of Investments lists each of the Fidelity Central Funds held as of period end, if any, as an investment of the Fund, but does not include the underlying holdings of each Fidelity Central Fund. As an Investing Fund, the Fund indirectly bears its proportionate share of the expenses of the underlying Fidelity Central Funds.
The Money Market Central Funds seek preservation of capital and current income and are managed by Fidelity Investments Money Management, Inc. (FIMM), an affiliate of the investment adviser. Annualized expenses of the Money Market Central Funds as of their most recent shareholder report date ranged from less than .005% to .01%.
A complete unaudited list of holdings for each Fidelity Central Fund is available upon request or at the Securities and Exchange Commission (the SEC) website at www.sec.gov. In addition, the financial statements of the Fidelity Central Funds, which are not covered by the Fund's Report of Independent Registered Public Accounting Firm, are available on the SEC website or upon request.
3. Significant Accounting Policies.
The Fund is an investment company and applies the accounting and reporting guidance of the Financial Accounting Standards Board (FASB) Accounting Standards Codification Topic 946 Financial Services – Investments Companies. The financial statements have been prepared in conformity with accounting principles generally accepted in the United States of America (GAAP), which require management to make certain estimates and assumptions at the date of the financial statements. Actual results could differ from those estimates. Subsequent events, if any, through the date that the financial statements were issued have been evaluated in the preparation of the financial statements. The following summarizes the significant accounting policies of the Fund:
Investment Valuation. Investments are valued as of 4:00 p.m. Eastern time on the last calendar day of the period. The Board of Trustees (the Board) has delegated the day to day responsibility for the valuation of the Fund's investments to the Fair Value Committee (the Committee) established by the Fund's investment adviser. In accordance with valuation policies and procedures approved by the Board, the Fund attempts to obtain prices from one or more third party pricing vendors or brokers to value its investments. When current market prices, quotations or currency exchange rates are not readily available or reliable, investments will be fair valued in good faith by the Committee, in accordance with procedures adopted by the Board. Factors used in determining fair value vary by investment type and may include market or investment specific events, changes in interest rates and credit quality. The frequency with which these procedures are used cannot be predicted and they may be utilized to a significant extent. The Committee oversees the Fund's valuation policies and procedures and reports to the Board on the Committee's activities and fair value determinations. The Board monitors the appropriateness of the procedures used in valuing the Fund's investments and ratifies the fair value determinations of the Committee.
The Fund categorizes the inputs to valuation techniques used to value its investments into a disclosure hierarchy consisting of three levels as shown below:
- Level 1 – quoted prices in active markets for identical investments
- Level 2 – other significant observable inputs (including quoted prices for similar investments, interest rates, prepayment speeds, etc.)
- Level 3 – unobservable inputs (including the Fund's own assumptions based on the best information available)
Valuation techniques used to value the Fund's investments by major category are as follows:
Equity securities, including restricted securities, for which market quotations are readily available, are valued at the last reported sale price or official closing price as reported by a third party pricing vendor on the primary market or exchange on which they are traded and are categorized as Level 1 in the hierarchy. In the event there were no sales during the day or closing prices are not available, securities are valued at the last quoted bid price or may be valued using the last available price and are generally categorized as Level 2 in the hierarchy. For foreign equity securities, when market or security specific events arise, comparisons to the valuation of American Depositary Receipts (ADRs), futures contracts, Exchange-Traded Funds (ETFs) and certain indexes as well as quoted prices for similar securities may be used and would be categorized as Level 2 in the hierarchy. For equity securities, including restricted securities, where observable inputs are limited, assumptions about market activity and risk are used and these securities may be categorized as Level 3 in the hierarchy.
Debt securities, including restricted securities, are valued based on evaluated prices received from third party pricing vendors or from brokers who make markets in such securities. Corporate bonds and U.S. government and government agency obligations are valued by pricing vendors who utilize matrix pricing which considers yield or price of bonds of comparable quality, coupon, maturity and type or by broker-supplied prices. When independent prices are unavailable or unreliable, debt securities may be valued utilizing pricing methodologies which consider similar factors that would be used by third party pricing vendors. Debt securities are generally categorized as Level 2 in the hierarchy but may be Level 3 depending on the circumstances.
Futures contracts are valued at the settlement price established each day by the board of trade or exchange on which they are traded and are categorized as Level 1 in the hierarchy. Investments in open-end mutual funds, including the Fidelity Central Funds, are valued at their closing net asset value (NAV) each business day and are categorized as Level 1 in the hierarchy.
Changes in valuation techniques may result in transfers in or out of an assigned level within the disclosure hierarchy. The aggregate value of investments by input level as of October 31, 2019 is included at the end of the Fund's Schedule of Investments.
Foreign Currency. The Fund may use foreign currency contracts to facilitate transactions in foreign-denominated securities. Gains and losses from these transactions may arise from changes in the value of the foreign currency or if the counterparties do not perform under the contracts' terms.
Foreign-denominated assets, including investment securities, and liabilities are translated into U.S. dollars at the exchange rates at period end. Purchases and sales of investment securities, income and dividends received and expenses denominated in foreign currencies are translated into U.S. dollars at the exchange rate in effect on the transaction date.
The effects of exchange rate fluctuations on investments are included with the net realized and unrealized gain (loss) on investment securities. Other foreign currency transactions resulting in realized and unrealized gain (loss) are disclosed separately.
Investment Transactions and Income. For financial reporting purposes, the Fund's investment holdings and NAV include trades executed through the end of the last business day of the period. The NAV per share for processing shareholder transactions is calculated as of the close of business of the New York Stock Exchange (NYSE), normally 4:00 p.m. Eastern time and includes trades executed through the end of the prior business day. Gains and losses on securities sold are determined on the basis of identified cost and include proceeds received from litigation. Dividend income is recorded on the ex-dividend date, except for certain dividends from foreign securities where the ex-dividend date may have passed, which are recorded as soon as the Fund is informed of the ex-dividend date. Non-cash dividends included in dividend income, if any, are recorded at the fair market value of the securities received. Income and capital gain distributions from Fidelity Central Funds, if any, are recorded on the ex-dividend date. Certain distributions received by the Fund represent a return of capital or capital gain. The Fund determines the components of these distributions subsequent to the ex-dividend date, based upon receipt of tax filings or other correspondence relating to the underlying investment. These distributions are recorded as a reduction of cost of investments and/or as a realized gain. Interest income is accrued as earned and includes coupon interest and amortization of premium and accretion of discount on debt securities as applicable. Investment income is recorded net of foreign taxes withheld where recovery of such taxes is uncertain.
Expenses. Expenses directly attributable to a fund are charged to that fund. Expenses attributable to more than one fund are allocated among the respective funds on the basis of relative net assets or other appropriate methods. Expense estimates are accrued in the period to which they relate and adjustments are made when actual amounts are known.
Income Tax Information and Distributions to Shareholders. Each year, the Fund intends to qualify as a regulated investment company under Subchapter M of the Internal Revenue Code, including distributing substantially all of its taxable income and realized gains. As a result, no provision for U.S. Federal income taxes is required. As of October 31, 2019, the Fund did not have any unrecognized tax benefits in the financial statements; nor is the Fund aware of any tax positions for which it is reasonably possible that the total amounts of unrecognized tax benefits will significantly change in the next twelve months. The Fund files a U.S. federal tax return, in addition to state and local tax returns as required. The Fund's federal income tax returns are subject to examination by the Internal Revenue Service (IRS) for a period of three fiscal years after they are filed. State and local tax returns may be subject to examination for an additional fiscal year depending on the jurisdiction. Foreign taxes are provided for based on the Fund's understanding of the tax rules and rates that exist in the foreign markets in which it invests. The Fund is subject to a tax imposed on capital gains by certain countries in which it invests. An estimated deferred tax liability for net unrealized appreciation on the applicable securities is included in Other payables and accrued expenses on the Statement of Assets & Liabilities.
Distributions are declared and recorded on the ex-dividend date. Income and capital gain distributions are determined in accordance with income tax regulations, which may differ from GAAP.
Capital accounts within the financial statements are adjusted for permanent book-tax differences. These adjustments have no impact on net assets or the results of operations. Capital accounts are not adjusted for temporary book-tax differences which will reverse in a subsequent period.
Book-tax differences are primarily due to futures contracts, foreign currency transactions, passive foreign investment companies (PFIC), partnerships, market discount, capital loss carryforwards, expiring capital loss carryforwards and losses deferred due to wash sales.
As of period end, the cost and unrealized appreciation (depreciation) in securities, and derivatives if applicable, for federal income tax purposes were as follows:
| Gross unrealized appreciation | $1,556,597,595 |
| Gross unrealized depreciation | (899,110,533) |
| Net unrealized appreciation (depreciation) | $657,487,062 |
| Tax Cost | $11,222,814,158 |
The tax-based components of distributable earnings as of period end were as follows:
| Undistributed ordinary income | $239,708,689 |
| Capital loss carryforward | $(27,725,210) |
| Net unrealized appreciation (depreciation) on securities and other investments | $657,481,471 |
Capital loss carryforwards are only available to offset future capital gains of the Fund to the extent provided by regulations and may be limited. Under the Regulated Investment Company Modernization Act of 2010 (the Act), the Fund is permitted to carry forward capital losses incurred in taxable years beginning after December 22, 2010 for an unlimited period and such capital losses are required to be used prior to any losses that expire. The capital loss carryforward information presented below, including any applicable limitation, is estimated as of fiscal period end and is subject to adjustment.
| No expiration | |
| Long-term | $(27,725,210) |
The tax character of distributions paid was as follows:
| | October 31, 2019 | October 31, 2018 |
| Ordinary Income | $162,270,724 | $ 128,402,196 |
Restricted Securities. The Fund may invest in securities that are subject to legal or contractual restrictions on resale. These securities generally may be resold in transactions exempt from registration or to the public if the securities are registered. Disposal of these securities may involve time-consuming negotiations and expense, and prompt sale at an acceptable price may be difficult. Information regarding restricted securities is included at the end of the Fund's Schedule of Investments.
4. Derivative Instruments.
Risk Exposures and the Use of Derivative Instruments. The Fund's investment objective allows the Fund to enter into various types of derivative contracts, including futures contracts. Derivatives are investments whose value is primarily derived from underlying assets, indices or reference rates and may be transacted on an exchange or over-the-counter (OTC). Derivatives may involve a future commitment to buy or sell a specified asset based on specified terms, to exchange future cash flows at periodic intervals based on a notional principal amount, or for one party to make one or more payments upon the occurrence of specified events in exchange for periodic payments from the other party.
The Fund used derivatives to increase returns and to manage exposure to certain risks as defined below. The success of any strategy involving derivatives depends on analysis of numerous economic factors, and if the strategies for investment do not work as intended, the Fund may not achieve its objectives.
The Fund's use of derivatives increased or decreased its exposure to the following risk:
| Equity Risk | Equity risk relates to the fluctuations in the value of financial instruments as a result of changes in market prices (other than those arising from interest rate risk or foreign exchange risk), whether caused by factors specific to an individual investment, its issuer, or all factors affecting all instruments traded in a market or market segment.
|
The Fund is also exposed to additional risks from investing in derivatives, such as liquidity risk and counterparty credit risk. Liquidity risk is the risk that the Fund will be unable to close out the derivative in the open market in a timely manner. Counterparty credit risk is the risk that the counterparty will not be able to fulfill its obligation to the Fund. Counterparty credit risk related to exchange-traded futures contracts may be mitigated by the protection provided by the exchange on which they trade.
Investing in derivatives may involve greater risks than investing in the underlying assets directly and, to varying degrees, may involve risk of loss in excess of any initial investment and collateral received and amounts recognized in the Statement of Assets and Liabilities. In addition, there may be the risk that the change in value of the derivative contract does not correspond to the change in value of the underlying instrument.
Futures Contracts. A futures contract is an agreement between two parties to buy or sell a specified underlying instrument for a fixed price at a specified future date. The Fund used futures contracts to manage its exposure to the stock market.
Upon entering into a futures contract, a fund is required to deposit either cash or securities (initial margin) with a clearing broker in an amount equal to a certain percentage of the face value of the contract. Futures contracts are marked-to-market daily and subsequent daily payments (variation margin) are made or received by a fund depending on the daily fluctuations in the value of the futures contracts and are recorded as unrealized appreciation or (depreciation). This receivable and/or payable, if any, is included in daily variation margin on futures contracts in the Statement of Assets and Liabilities. Realized gain or (loss) is recorded upon the expiration or closing of a futures contract. The net realized gain (loss) and change in net unrealized appreciation (depreciation) on futures contracts during the period is presented in the Statement of Operations.
Any open futures contracts at period end are presented in the Schedule of Investments under the caption "Futures Contracts". The notional amount at value reflects each contract's exposure to the underlying instrument or index at period end. Securities deposited to meet initial margin requirements are identified in the Schedule of Investments.
5. Purchases and Sales of Investments.
Purchases and sales of securities, other than short-term securities and in-kind transactions, aggregated $4,902,740,382 and $193,560,646, respectively.
6. Fees and Other Transactions with Affiliates.
Management Fee. Effective June 1, 2019, under the management contract approved by the Board, Fidelity Management & Research (the investment adviser) and its affiliates provide the Fund with investment management related services for which the Fund does not pay a management fee. In addition, the investment adviser pays all ordinary operating expenses of the Fund, except custody fees, fees and expenses of the independent Trustees, and certain miscellaneous expenses such as proxy and shareholder meeting expenses.
Prior to June 1, 2019, the investment adviser and its affiliates provided the Fund with investment management related services for which the Fund paid a monthly management fee that was based on an annual rate of .06% of the Fund's average net assets. Under the management contract, the investment adviser paid all other expenses, except the compensation of the independent Trustees and certain other expenses such as interest expense, including commitment fees.
Sub-Adviser. Geode Capital Management, LLC (Geode), serves as sub-adviser for the Fund. Geode provides discretionary investment advisory services to the Fund and is paid by the investment adviser for providing these services.
Interfund Trades. The Fund may purchase from or sell securities to other Fidelity Funds under procedures adopted by the Board. The procedures have been designed to ensure these interfund trades are executed in accordance with Rule 17a-7 of the 1940 Act. Interfund trades are included within the respective purchases and sales amounts shown in the Purchases and Sales of Investments note.
Affiliated Exchanges In-Kind. During the period, the Fund received investments and cash valued at $811,648,495 in exchange for 65,088,091 shares of the Fund. The amount of in-kind exchanges is included in share transactions in the accompanying Statement of Changes in Net Assets.
7. Committed Line of Credit.
The Fund participates with other funds managed by the investment adviser or an affiliate in a $4.25 billion credit facility (the "line of credit") to be utilized for temporary or emergency purposes to fund shareholder redemptions or for other short-term liquidity purposes. The Fund has agreed to pay commitment fees on its pro-rata portion of the line of credit, which amounted to $18,734 and is reflected in Commitment fees on the Statement of Operations. During the period, the Fund did not borrow on this line of credit.
8. Security Lending.
The Fund lends portfolio securities from time to time in order to earn additional income. For equity securities, lending agents are used, including National Financial Services (NFS), an affiliate of the Fund. Pursuant to a securities lending agreement, NFS will receive a fee, which is capped at 9.9% of daily lending revenue, for its services as lending agent. The Fund may lend securities to certain qualified borrowers, including NFS. On the settlement date of the loan, the Fund receives collateral (in the form of U.S. Treasury obligations, letters of credit and/or cash) against the loaned securities and maintains collateral in an amount not less than 100% of the market value of the loaned securities during the period of the loan. The market value of the loaned securities is determined at the close of business of the Fund and any additional required collateral is delivered to the Fund on the next business day. The Fund or borrower may terminate the loan at any time, and if the borrower defaults on its obligation to return the securities loaned because of insolvency or other reasons, the Fund may apply collateral received from the borrower against the obligation. The Fund may experience delays and costs in recovering the securities loaned. Any cash collateral received is invested in the Fidelity Securities Lending Cash Central Fund. The value of loaned securities and cash collateral at period end are disclosed on the Fund's Statement of Assets and Liabilities. The value of securities loaned to NFS, as affiliated borrower, at period end was $1,450. Total fees paid by the Fund to NFS, as lending agent, amounted to $7,881. Security lending income represents the income earned on investing cash collateral, less rebates paid to borrowers and any lending agent fees associated with the loan, plus any premium payments received for lending certain types of securities. Security lending income is presented in the Statement of Operations as a component of income from Fidelity Central Funds, and includes $104 from securities loaned to NFS, as affiliated borrower.
9. Expense Reductions.
Effective June 1, 2019, the investment adviser contractually agreed to reimburse the Fund to the extent annual operating expenses exceeded .014% of average net assets. This reimbursement will remain in place through February 28, 2023. Some expenses, for example the compensation of the independent Trustees, and certain miscellaneous expenses such as proxy and shareholder meeting expenses, are excluded from this reimbursement. During the period this reimbursement reduced the Fund's expenses by $166,249.
Through arrangements with the Fund's custodian, credits realized as a result of certain uninvested cash balances were used to reduce the Fund's expenses by $1,745.
10. Other.
The Fund's organizational documents provide former and current trustees and officers with a limited indemnification against liabilities arising in connection with the performance of their duties to the Fund. In the normal course of business, the Fund may also enter into contracts that provide general indemnifications. The Fund's maximum exposure under these arrangements is unknown as this would be dependent on future claims that may be made against the Fund. The risk of material loss from such claims is considered remote.
At the end of the period, mutual funds and accounts managed by the investment adviser or its affiliates were the owners of record of all of the outstanding shares of the Fund.
Report of Independent Registered Public Accounting Firm
To the Trustees of Fidelity Salem Street Trust and Shareholders of Fidelity Series Global ex U.S. Index Fund:
Opinion on the Financial Statements and Financial Highlights
We have audited the accompanying statement of assets and liabilities of Fidelity Series Global ex U.S. Index Fund (the "Fund"), a fund of Fidelity Salem Street Trust, including the schedule of investments, as of October 31, 2019, the related statement of operations for the year then ended, the statement of changes in net assets for each of the two years in the period then ended, the financial highlights for each of the five years in the period then ended, and the related notes. In our opinion, the financial statements and financial highlights present fairly, in all material respects, the financial position of the Fund as of October 31, 2019, and the results of its operations for the year then ended, the changes in its net assets for each of the two years in the period then ended, and the financial highlights for each of the five years in the period then ended in conformity with accounting principles generally accepted in the United States of America.
Basis for Opinion
These financial statements and financial highlights are the responsibility of the Fund's management. Our responsibility is to express an opinion on the Fund's financial statements and financial highlights based on our audits. We are a public accounting firm registered with the Public Company Accounting Oversight Board (United States) (PCAOB) and are required to be independent with respect to the Fund in accordance with the U.S. federal securities laws and the applicable rules and regulations of the Securities and Exchange Commission and the PCAOB.
We conducted our audits in accordance with the standards of the PCAOB. Those standards require that we plan and perform the audit to obtain reasonable assurance about whether the financial statements and financial highlights are free of material misstatement, whether due to error or fraud. The Fund is not required to have, nor were we engaged to perform, an audit of its internal control over financial reporting. As part of our audits we are required to obtain an understanding of internal control over financial reporting but not for the purpose of expressing an opinion on the effectiveness of the Fund’s internal control over financial reporting. Accordingly, we express no such opinion.
Our audits included performing procedures to assess the risks of material misstatement of the financial statements and financial highlights, whether due to error or fraud, and performing procedures that respond to those risks. Such procedures included examining, on a test basis, evidence regarding the amounts and disclosures in the financial statements and financial highlights. Our audits also included evaluating the accounting principles used and significant estimates made by management, as well as evaluating the overall presentation of the financial statements and financial highlights. Our procedures included confirmation of securities owned as of October 31, 2019, by correspondence with the custodians and brokers; when replies were not received from brokers, we performed other auditing procedures. We believe that our audits provide a reasonable basis for our opinion.
/s/ Deloitte & Touche LLP
Boston, Massachusetts
December 16, 2019
We have served as the auditor of one or more of the Fidelity investment companies since 1999.
Trustees and Officers
The Trustees, Members of the Advisory Board (if any), and officers of the trust and fund, as applicable, are listed below. The Board of Trustees governs the fund and is responsible for protecting the interests of shareholders. The Trustees are experienced executives who meet periodically throughout the year to oversee the fund's activities, review contractual arrangements with companies that provide services to the fund, oversee management of the risks associated with such activities and contractual arrangements, and review the fund's performance. Except for Jonathan Chiel, each of the Trustees oversees 277 funds. Mr. Chiel oversees 171 funds.
The Trustees hold office without limit in time except that (a) any Trustee may resign; (b) any Trustee may be removed by written instrument, signed by at least two-thirds of the number of Trustees prior to such removal; (c) any Trustee who requests to be retired or who has become incapacitated by illness or injury may be retired by written instrument signed by a majority of the other Trustees; and (d) any Trustee may be removed at any special meeting of shareholders by a two-thirds vote of the outstanding voting securities of the trust. Each Trustee who is not an interested person (as defined in the 1940 Act) of the trust and the fund is referred to herein as an Independent Trustee. Each Independent Trustee shall retire not later than the last day of the calendar year in which his or her 75th birthday occurs. The Independent Trustees may waive this mandatory retirement age policy with respect to individual Trustees. Officers and Advisory Board Members hold office without limit in time, except that any officer or Advisory Board Member may resign or may be removed by a vote of a majority of the Trustees at any regular meeting or any special meeting of the Trustees. Except as indicated, each individual has held the office shown or other offices in the same company for the past five years.
The fund’s Statement of Additional Information (SAI) includes more information about the Trustees. To request a free copy, call Fidelity at 1-800-544-8544.
Experience, Skills, Attributes, and Qualifications of the Trustees. The Governance and Nominating Committee has adopted a statement of policy that describes the experience, qualifications, attributes, and skills that are necessary and desirable for potential Independent Trustee candidates (Statement of Policy). The Board believes that each Trustee satisfied at the time he or she was initially elected or appointed a Trustee, and continues to satisfy, the standards contemplated by the Statement of Policy. The Governance and Nominating Committee also engages professional search firms to help identify potential Independent Trustee candidates who have the experience, qualifications, attributes, and skills consistent with the Statement of Policy. From time to time, additional criteria based on the composition and skills of the current Independent Trustees, as well as experience or skills that may be appropriate in light of future changes to board composition, business conditions, and regulatory or other developments, have also been considered by the professional search firms and the Governance and Nominating Committee. In addition, the Board takes into account the Trustees' commitment and participation in Board and committee meetings, as well as their leadership of standing and ad hoc committees throughout their tenure.
In determining that a particular Trustee was and continues to be qualified to serve as a Trustee, the Board has considered a variety of criteria, none of which, in isolation, was controlling. The Board believes that, collectively, the Trustees have balanced and diverse experience, qualifications, attributes, and skills, which allow the Board to operate effectively in governing the fund and protecting the interests of shareholders. Information about the specific experience, skills, attributes, and qualifications of each Trustee, which in each case led to the Board's conclusion that the Trustee should serve (or continue to serve) as a trustee of the fund, is provided below.
Board Structure and Oversight Function. Abigail P. Johnson is an interested person and currently serves as Chairman. The Trustees have determined that an interested Chairman is appropriate and benefits shareholders because an interested Chairman has a personal and professional stake in the quality and continuity of services provided to the fund. Independent Trustees exercise their informed business judgment to appoint an individual of their choosing to serve as Chairman, regardless of whether the Trustee happens to be independent or a member of management. The Independent Trustees have determined that they can act independently and effectively without having an Independent Trustee serve as Chairman and that a key structural component for assuring that they are in a position to do so is for the Independent Trustees to constitute a substantial majority for the Board. The Independent Trustees also regularly meet in executive session. Arthur E. Johnson serves as Chairman of the Independent Trustees and as such (i) acts as a liaison between the Independent Trustees and management with respect to matters important to the Independent Trustees and (ii) with management prepares agendas for Board meetings.
Fidelity® funds are overseen by different Boards of Trustees. The fund's Board oversees Fidelity's investment-grade bond, money market, asset allocation and certain equity funds, and other Boards oversee Fidelity's high income and other equity funds. The asset allocation funds may invest in Fidelity® funds that are overseen by such other Boards. The use of separate Boards, each with its own committee structure, allows the Trustees of each group of Fidelity® funds to focus on the unique issues of the funds they oversee, including common research, investment, and operational issues. On occasion, the separate Boards establish joint committees to address issues of overlapping consequences for the Fidelity® funds overseen by each Board.
The Trustees operate using a system of committees to facilitate the timely and efficient consideration of all matters of importance to the Trustees, the fund, and fund shareholders and to facilitate compliance with legal and regulatory requirements and oversight of the fund's activities and associated risks. The Board, acting through its committees, has charged FMR and its affiliates with (i) identifying events or circumstances the occurrence of which could have demonstrably adverse effects on the fund's business and/or reputation; (ii) implementing processes and controls to lessen the possibility that such events or circumstances occur or to mitigate the effects of such events or circumstances if they do occur; and (iii) creating and maintaining a system designed to evaluate continuously business and market conditions in order to facilitate the identification and implementation processes described in (i) and (ii) above. Because the day-to-day operations and activities of the fund are carried out by or through FMR, its affiliates, and other service providers, the fund's exposure to risks is mitigated but not eliminated by the processes overseen by the Trustees. While each of the Board's committees has responsibility for overseeing different aspects of the fund's activities, oversight is exercised primarily through the Operations and Audit Committees. In addition, an ad hoc Board committee of Independent Trustees has worked with FMR to enhance the Board's oversight of investment and financial risks, legal and regulatory risks, technology risks, and operational risks, including the development of additional risk reporting to the Board. Appropriate personnel, including but not limited to the fund's Chief Compliance Officer (CCO), FMR's internal auditor, the independent accountants, the fund's Treasurer and portfolio management personnel, make periodic reports to the Board's committees, as appropriate, including an annual review of Fidelity's risk management program for the Fidelity® funds. The responsibilities of each standing committee, including their oversight responsibilities, are described further under "Standing Committees of the Trustees."
Interested Trustees*:
Correspondence intended for a Trustee who is an interested person may be sent to Fidelity Investments, 245 Summer Street, Boston, Massachusetts 02210.
Name, Year of Birth; Principal Occupations and Other Relevant Experience+
Jonathan Chiel (1957)
Year of Election or Appointment: 2016
Trustee
Mr. Chiel also serves as Trustee of other Fidelity® funds. Mr. Chiel is Executive Vice President and General Counsel for FMR LLC (diversified financial services company, 2012-present). Previously, Mr. Chiel served as general counsel (2004-2012) and senior vice president and deputy general counsel (2000-2004) for John Hancock Financial Services; a partner with Choate, Hall & Stewart (1996-2000) (law firm); and an Assistant United States Attorney for the United States Attorney’s Office of the District of Massachusetts (1986-95), including Chief of the Criminal Division (1993-1995). Mr. Chiel is a director on the boards of the Boston Bar Foundation and the Maimonides School.
Abigail P. Johnson (1961)
Year of Election or Appointment: 2009
Trustee
Chairman of the Board of Trustees
Ms. Johnson also serves as Trustee of other Fidelity® funds. Ms. Johnson serves as Chairman (2016-present), Chief Executive Officer (2014-present), and Director (2007-present) of FMR LLC (diversified financial services company), President of Fidelity Financial Services (2012-present) and President of Personal, Workplace and Institutional Services (2005-present). Ms. Johnson is Chairman and Director of FMR Co., Inc. (investment adviser firm, 2011-present) and Chairman and Director of FMR (investment adviser firm, 2011-present). Previously, Ms. Johnson served as Vice Chairman (2007-2016) and President (2013-2016) of FMR LLC, President and a Director of FMR (2001-2005), a Trustee of other investment companies advised by FMR, Fidelity Investments Money Management, Inc. (investment adviser firm), and FMR Co., Inc. (2001-2005), Senior Vice President of the Fidelity® funds (2001-2005), and managed a number of Fidelity® funds. Ms. Abigail P. Johnson and Mr. Arthur E. Johnson are not related.
Jennifer Toolin McAuliffe (1959)
Year of Election or Appointment: 2016
Trustee
Ms. McAuliffe also serves as Trustee of other Fidelity® funds. Ms. McAuliffe previously served as a Member of the Advisory Board of certain Fidelity® funds (2016) and as Co-Head of Fixed Income of Fidelity Investments Limited (now known as FIL Limited (FIL)) (diversified financial services company). Earlier roles at FIL included Director of Research for FIL’s credit and quantitative teams in London, Hong Kong and Tokyo. Ms. McAuliffe also was the Director of Research for taxable and municipal bonds at Fidelity Investments Money Management, Inc. Ms. McAuliffe is also a director or trustee of several not-for-profit entities.
* Determined to be an “Interested Trustee” by virtue of, among other things, his or her affiliation with the trust or various entities under common control with FMR.
+ The information includes the Trustee's principal occupation during the last five years and other information relating to the experience, attributes, and skills relevant to the Trustee's qualifications to serve as a Trustee, which led to the conclusion that the Trustee should serve as a Trustee for the fund.
Independent Trustees:
Correspondence intended for an Independent Trustee may be sent to Fidelity Investments, P.O. Box 55235, Boston, Massachusetts 02205-5235.
Name, Year of Birth; Principal Occupations and Other Relevant Experience+
Elizabeth S. Acton (1951)
Year of Election or Appointment: 2013
Trustee
Ms. Acton also serves as Trustee of other Fidelity® funds. Prior to her retirement in April 2012, Ms. Acton was Executive Vice President, Finance (2011-2012), Executive Vice President, Chief Financial Officer (2002-2011), and Treasurer (2004-2005) of Comerica Incorporated (financial services). Prior to joining Comerica, Ms. Acton held a variety of positions at Ford Motor Company (1983-2002), including Vice President and Treasurer (2000-2002) and Executive Vice President and Chief Financial Officer of Ford Motor Credit Company (1998-2000). Ms. Acton currently serves as a member of the Board of Directors and Audit and Finance Committees of Beazer Homes USA, Inc. (homebuilding, 2012-present). Previously, Ms. Acton served as a Member of the Advisory Board of certain Fidelity® funds (2013-2016).
Ann E. Dunwoody (1953)
Year of Election or Appointment: 2018
Trustee
General Dunwoody also serves as Trustee of other Fidelity® funds. General Dunwoody (United States Army, Retired) was the first woman in U.S. military history to achieve the rank of four-star general and prior to her retirement in 2012 held a variety of positions within the U.S. Army, including Commanding General, U.S. Army Material Command (2008-2012). She is the President of First to Four LLC (leadership and mentoring services, 2012-present). She also serves as a member of the Board of Directors and Nominating and Corporate Governance Committee of L3 Technologies, Inc. (communication, electronic, sensor, and aerospace systems, 2013-present), Board of Directors and Nomination and Corporate Governance Committees of Kforce Inc. (professional staffing services, 2016-present) and Board of Directors of Automattic Inc. (software engineering, 2018-present). Previously, General Dunwoody served as a Member of the Advisory Board of certain Fidelity® funds (2018), a member of the Board of Directors and Audit and Sustainability and Corporate Responsibility Committees of Republic Services, Inc. (waste collection, disposal and recycling, 2013-2016). Ms. Dunwoody also serves on several boards for non-profit organizations, including as a member of the Board of Directors, Chair of the Nomination and Governance Committee and member of the Audit Committee of Logistics Management Institute (consulting non-profit, 2012-present), a member of the Board of Directors of the Army Historical Foundation (2015-present), a member of the Council of Trustees for the Association of the United States Army (advocacy non-profit, 2013-present) and a member of the Board of Trustees of Florida Institute of Technology (2015-present) and ThanksUSA (military family education non-profit, 2014-present).
John Engler (1948)
Year of Election or Appointment: 2014
Trustee
Mr. Engler also serves as Trustee of other Fidelity® funds. He serves on the board of directors for Universal Forest Products (manufacturer and distributor of wood and wood-alternative products, 2003-present) and K12 Inc. (technology-based education company, 2012-present). Previously, Mr. Engler served as interim president of Michigan State University (2018-2019), a Member of the Advisory Board of certain Fidelity® funds (2014-2016), president of the Business Roundtable (2011-2017), a trustee of The Munder Funds (2003-2014), president and CEO of the National Association of Manufacturers (2004-2011), member of the Board of Trustees of the Annie E. Casey Foundation (2004-2015), and as governor of Michigan (1991-2003). He is a past chairman of the National Governors Association.
Robert F. Gartland (1951)
Year of Election or Appointment: 2010
Trustee
Mr. Gartland also serves as Trustee of other Fidelity® funds. Mr. Gartland is Chairman and an investor in Gartland & Mellina Group Corp. (consulting, 2009-present). Previously, Mr. Gartland served as a partner and investor of Vietnam Partners LLC (investments and consulting, 2008-2011). Prior to his retirement, Mr. Gartland held a variety of positions at Morgan Stanley (financial services, 1979-2007), including Managing Director (1987-2007), and Chase Manhattan Bank (1975-1978).
Arthur E. Johnson (1947)
Year of Election or Appointment: 2008
Trustee
Chairman of the Independent Trustees
Mr. Johnson also serves as Trustee of other Fidelity® funds. Mr. Johnson serves as a member of the Board of Directors of Eaton Corporation plc (diversified power management, 2009-present) and Booz Allen Hamilton (management consulting, 2011-present). Prior to his retirement, Mr. Johnson served as Senior Vice President of Corporate Strategic Development of Lockheed Martin Corporation (defense contractor, 1999-2009). Mr. Johnson previously served as Vice Chairman (2015-2018) of the Independent Trustees of certain Fidelity® funds and on the Board of Directors of IKON Office Solutions, Inc. (1999-2008), AGL Resources, Inc. (holding company, 2002-2016), and Delta Airlines (2005-2007). Mr. Arthur E. Johnson is not related to Ms. Abigail P. Johnson.
Michael E. Kenneally (1954)
Year of Election or Appointment: 2009
Trustee
Vice Chairman of the Independent Trustees
Mr. Kenneally also serves as Trustee of other Fidelity® funds. Prior to his retirement, Mr. Kenneally served as Chairman and Global Chief Executive Officer of Credit Suisse Asset Management. Before joining Credit Suisse, he was an Executive Vice President and Chief Investment Officer for Bank of America Corporation. Earlier roles at Bank of America included Director of Research, Senior Portfolio Manager and Research Analyst, and Mr. Kenneally was awarded the Chartered Financial Analyst (CFA) designation in 1991.
Marie L. Knowles (1946)
Year of Election or Appointment: 2001
Trustee
Ms. Knowles also serves as Trustee of other Fidelity® funds. Prior to Ms. Knowles' retirement in June 2000, she served as Executive Vice President and Chief Financial Officer of Atlantic Richfield Company (ARCO) (diversified energy, 1996-2000). From 1993 to 1996, she was a Senior Vice President of ARCO and President of ARCO Transportation Company (pipeline and tanker operations). Ms. Knowles currently serves as a Director and Chairman of the Audit Committee of McKesson Corporation (healthcare service, since 2002). Ms. Knowles is a member of the Board of the Santa Catalina Island Company (real estate, 2009-present). Ms. Knowles is a Member of the Investment Company Institute Board of Governors and a Member of the Governing Council of the Independent Directors Council (2014-present). She also serves as a member of the Advisory Board for the School of Engineering of the University of Southern California. Previously, Ms. Knowles served as a Director of Phelps Dodge Corporation (copper mining and manufacturing, 1994-2007), URS Corporation (engineering and construction, 2000-2003) and America West (airline, 1999-2002). Ms. Knowles previously served as Chairman (2015-2018) and Vice Chairman (2012-2015) of the Independent Trustees of certain Fidelity® funds.
Mark A. Murray (1954)
Year of Election or Appointment: 2016
Trustee
Mr. Murray also serves as Trustee of other Fidelity® funds. Mr. Murray is Vice Chairman (2013-present) of Meijer, Inc. (regional retail chain). Previously, Mr. Murray served as a Member of the Advisory Board of certain Fidelity® funds (2016) and as Co-Chief Executive Officer (2013-2016) and President (2006-2013) of Meijer, Inc. Mr. Murray serves as a member of the Board of Directors and Nuclear Review and Public Policy and Responsibility Committees of DTE Energy Company (diversified energy company, 2009-present). Mr. Murray also serves as a member of the Board of Directors of Spectrum Health (not-for-profit health system, 2015-present). Mr. Murray previously served as President of Grand Valley State University (2001-2006), Treasurer for the State of Michigan (1999-2001), Vice President of Finance and Administration for Michigan State University (1998-1999), and a member of the Board of Directors and Audit Committee and Chairman of the Nominating and Corporate Governance Committee of Universal Forest Products, Inc. (manufacturer and distributor of wood and wood-alternative products, 2004-2016). Mr. Murray is also a director or trustee of many community and professional organizations.
+ The information includes the Trustee's principal occupation during the last five years and other information relating to the experience, attributes, and skills relevant to the Trustee's qualifications to serve as a Trustee, which led to the conclusion that the Trustee should serve as a Trustee for the fund.
Advisory Board Members and Officers:
Correspondence intended for an officer may be sent to Fidelity Investments, 245 Summer Street, Boston, Massachusetts 02210. Officers appear below in alphabetical order.
Name, Year of Birth; Principal Occupation
Elizabeth Paige Baumann (1968)
Year of Election or Appointment: 2017
Anti-Money Laundering (AML) Officer
Ms. Baumann also serves as AML Officer of other funds. She is Chief AML Officer (2012-present) and Senior Vice President (2014-present) of FMR LLC (diversified financial services company) and is an employee of Fidelity Investments. Previously, Ms. Baumann served as AML Officer of the funds (2012-2016), and Vice President (2007-2014) and Deputy Anti-Money Laundering Officer (2007-2012) of FMR LLC.
Craig S. Brown (1977)
Year of Election or Appointment: 2019
Assistant Treasurer
Mr. Brown also serves as Assistant Treasurer of other funds. Mr. Brown is an employee of Fidelity Investments (2013-present).
John J. Burke III (1964)
Year of Election or Appointment: 2018
Chief Financial Officer
Mr. Burke also serves as Chief Financial Officer of other funds. Mr. Burke serves as Head of Investment Operations for Fidelity Fund and Investment Operations (2018-present) and is an employee of Fidelity Investments (1998-present). Previously Mr. Burke served as head of Asset Management Investment Operations (2012-2018).
Jonathan Davis (1968)
Year of Election or Appointment: 2010
Assistant Treasurer
Mr. Davis also serves as Assistant Treasurer of other funds. Mr. Davis serves as Assistant Treasurer of FMR Capital, Inc. (2017-present) and is an employee of Fidelity Investments. Previously, Mr. Davis served as Vice President and Associate General Counsel of FMR LLC (diversified financial services company, 2003-2010).
Adrien E. Deberghes (1967)
Year of Election or Appointment: 2010
Assistant Treasurer
Mr. Deberghes also serves as an officer of other funds. He serves as Assistant Treasurer of FMR Capital, Inc. (2017-present), Executive Vice President of Fidelity Investments Money Management, Inc. (FIMM) (investment adviser firm, 2016-present), and is an employee of Fidelity Investments (2008-present). Previously, Mr. Deberghes served as President and Treasurer of certain Fidelity® funds (2013-2018). Prior to joining Fidelity Investments, Mr. Deberghes was Senior Vice President of Mutual Fund Administration at State Street Corporation (2007-2008), Senior Director of Mutual Fund Administration at Investors Bank & Trust (2005-2007), and Director of Finance for Dunkin' Brands (2000-2005). Previously, Mr. Deberghes served in other fund officer roles.
Laura M. Del Prato (1964)
Year of Election or Appointment: 2018
President and Treasurer
Ms. Del Prato also serves as an officer of other funds. Ms. Del Prato is an employee of Fidelity Investments (2017-present). Prior to joining Fidelity Investments, Ms. Del Prato served as a Managing Director and Treasurer of the JPMorgan Mutual Funds (2014-2017). Prior to JPMorgan, Ms. Del Prato served as a partner at Cohen Fund Audit Services (accounting firm, 2012-2013) and KPMG LLP (accounting firm, 2004-2012).
Colm A. Hogan (1973)
Year of Election or Appointment: 2016
Assistant Treasurer
Mr. Hogan also serves as an officer of other funds. Mr. Hogan serves as Assistant Treasurer of FMR Capital, Inc. (2017-present) and is an employee of Fidelity Investments (2005-present). Previously, Mr. Hogan served as Assistant Treasurer of certain Fidelity® funds (2016-2018).
Cynthia Lo Bessette (1969)
Year of Election or Appointment: 2019
Secretary and Chief Legal Officer (CLO)
Ms. Lo Bessette also serves as Secretary and CLO of other funds. Ms. Lo Bessette serves as CLO, Secretary, and Senior Vice President of Fidelity Management & Research Company and FMR Co., Inc. (investment adviser firms, 2019-present); Secretary of Fidelity SelectCo, LLC and Fidelity Investments Money Management, Inc. (investment adviser firms, 2019-present); and CLO of Fidelity Management & Research (Hong Kong) Limited, FMR Investment Management (UK) Limited, and Fidelity Management & Research (Japan) Limited (investment adviser firms, 2019-present). She is a Senior Vice President and Deputy General Counsel of FMR LLC (diversified financial services company, 2019-present), and is an employee of Fidelity Investments. Previously, Ms. Lo Bessette served as Executive Vice President, General Counsel (2016-2019) and Senior Vice President, Deputy General Counsel (2015-2016) of OppenheimerFunds (investment management company) and Deputy Chief Legal Officer (2013-2015) of Jennison Associates LLC (investment adviser firm).
Chris Maher (1972)
Year of Election or Appointment: 2013
Assistant Treasurer
Mr. Maher serves as Assistant Treasurer of other funds. Mr. Maher is Vice President of Valuation Oversight, serves as Assistant Treasurer of FMR Capital, Inc. (2017-present), and is an employee of Fidelity Investments. Previously, Mr. Maher served as Vice President of Asset Management Compliance (2013), Vice President of the Program Management Group of FMR (investment adviser firm, 2010-2013), and Vice President of Valuation Oversight (2008-2010).
John B. McGinty, Jr. (1962)
Year of Election or Appointment: 2016
Chief Compliance Officer
Mr. McGinty also serves as Chief Compliance Officer of other funds. Mr. McGinty is Senior Vice President of Asset Management Compliance for Fidelity Investments and is an employee of Fidelity Investments (2016-present). Mr. McGinty previously served as Vice President, Senior Attorney at Eaton Vance Management (investment management firm, 2015-2016), and prior to Eaton Vance as global CCO for all firm operations and registered investment companies at GMO LLC (investment management firm, 2009-2015). Before joining GMO LLC, Mr. McGinty served as Senior Vice President, Deputy General Counsel for Fidelity Investments (2007-2009).
Jason P. Pogorelec (1975)
Year of Election or Appointment: 2015
Assistant Secretary
Mr. Pogorelec also serves as Assistant Secretary of other funds. Mr. Pogorelec serves as Vice President, Associate General Counsel (2010-present) and is an employee of Fidelity Investments (2006-present).
Nancy D. Prior (1967)
Year of Election or Appointment: 2014
Vice President
Ms. Prior also serves as Vice President of other funds. Ms. Prior serves as President of Fixed Income (2014-present), President (2016-present) and Director (2014-present) of Fidelity Investments Money Management, Inc. (FIMM) (investment adviser firm), and is an employee of Fidelity Investments (2002-present). Previously, Ms. Prior served as Vice President of Global Asset Allocation Funds (2017-2019); Vice Chairman of FIAM LLC (investment adviser firm, 2014-2018), a Director of FMR Investment Management (UK) Limited (investment adviser firm, 2015-2018), President Multi-Asset Class Strategies of FMR's Global Asset Allocation Division (2017-2018), Vice President of Fidelity's Money Market Funds (2012-2014), and President, Money Market and Short Duration Bond Group of Fidelity Management & Research Company (FMR) (investment adviser firm, 2013-2014).
Stacie M. Smith (1974)
Year of Election or Appointment: 2013
Assistant Treasurer
Ms. Smith also serves as an officer of other funds. Ms. Smith serves as Assistant Treasurer of FMR Capital, Inc. (2017-present), is an employee of Fidelity Investments (2009-present), and has served in other fund officer roles. Prior to joining Fidelity Investments, Ms. Smith served as Senior Audit Manager of Ernst & Young LLP (accounting firm, 1996-2009). Previously, Ms. Smith served as Assistant Treasurer (2013-2018) and Deputy Treasurer (2013-2016) of certain Fidelity® funds.
Marc L. Spector (1972)
Year of Election or Appointment: 2016
Deputy Treasurer
Mr. Spector also serves as an officer of other funds. Mr. Spector serves as Assistant Treasurer of FMR Capital, Inc. (2017-present) and is an employee of Fidelity Investments (2016-present). Prior to joining Fidelity Investments, Mr. Spector served as Director at the Siegfried Group (accounting firm, 2013-2016), and prior to Siegfried Group as audit senior manager at Deloitte & Touche (accounting firm, 2005-2013).
Jim Wegmann (1979)
Year of Election or Appointment: 2019
Assistant Treasurer
Mr. Wegmann also serves as Assistant Treasurer of other funds. Mr. Wegmann is an employee of Fidelity Investments (2011-present).
Shareholder Expense Example
As a shareholder of the Fund, you incur two types of costs: (1) transaction costs and (2) ongoing costs, including other Fund expenses. This Example is intended to help you understand your ongoing costs (in dollars) of investing in the Fund and to compare these costs with the ongoing costs of investing in other mutual funds.
The Example is based on an investment of $1,000 invested at the beginning of the period and held for the entire period (May 1, 2019 to October 31, 2019).
Actual Expenses
The first line of the accompanying table provides information about actual account values and actual expenses. You may use the information in this line, together with the amount you invested, to estimate the expenses that you paid over the period. Simply divide your account value by $1,000.00 (for example, an $8,600 account value divided by $1,000.00 = 8.6), then multiply the result by the number in the first line under the heading entitled "Expenses Paid During Period" to estimate the expenses you paid on your account during this period. In addition, the Fund, as a shareholder in the underlying Fidelity Central Funds, will indirectly bear its pro-rata share of the fees and expenses incurred by the underlying Fidelity Central Funds. These fees and expenses are not included in the Fund's annualized expense ratio used to calculate the expense estimate in the table below.
Hypothetical Example for Comparison Purposes
The second line of the accompanying table provides information about hypothetical account values and hypothetical expenses based on the Fund's actual expense ratio and an assumed rate of return of 5% per year before expenses, which is not the Fund's actual return. The hypothetical account values and expenses may not be used to estimate the actual ending account balance or expenses you paid for the period. You may use this information to compare the ongoing costs of investing in the Fund and other funds. To do so, compare this 5% hypothetical example with the 5% hypothetical examples that appear in the shareholder reports of the other funds. In addition, the Fund, as a shareholder in the underlying Fidelity Central Funds, will indirectly bear its pro-rata share of the fees and expenses incurred by the underlying Fidelity Central Funds. These fees and expenses are not included in the Fund's annualized expense ratio used to calculate the expense estimate in the table below.
Please note that the expenses shown in the table are meant to highlight your ongoing costs only and do not reflect any transaction costs. Therefore, the second line of the table is useful in comparing ongoing costs only, and will not help you determine the relative total costs of owning different funds.
| | Annualized Expense Ratio-A | Beginning
Account Value
May 1, 2019 | Ending
Account Value
October 31, 2019 | Expenses Paid
During Period-B
May 1, 2019
to October 31, 2019 |
| Actual | .02% | $1,000.00 | $1,016.70 | $.10 |
| Hypothetical-C | | $1,000.00 | $1,025.10 | $.10 |
A Annualized expense ratio reflects expenses net of applicable fee waivers.
B Expenses are equal to the Fund's annualized expense ratio, multiplied by the average account value over the period, multiplied by 184/365 (to reflect the one-half year period).
C 5% return per year before expenses
Distributions (Unaudited)
The Board of Trustees of Fidelity Series Global ex U.S. Index Fund voted to pay on December 16, 2019, to shareholders of record at the opening of business on December 13, 2019, a distribution of $0.012 per share derived from capital gains realized from sales of portfolio securities and a dividend of $0.264 per share from net investment income.
The fund designates 84% of the dividend distributed during the fiscal year as amounts which may be taken into account as a dividend for the purposes of the maximum rate under section 1(h)(11) of the Internal Revenue Code.
The fund will notify shareholders in January 2020 of amounts for use in preparing 2019 income tax returns.
Board Approval of Investment Advisory Contracts and Management Fees
Fidelity Series Global ex U.S. Index Fund
Each year, the Board of Trustees, including the Independent Trustees (together, the Board), votes on the renewal of the management contract with Fidelity Management & Research Company (FMR) and the sub-advisory agreements (together, the Advisory Contracts) for the fund, including the fund's sub-advisory agreement (Sub-Advisory Agreement) with Geode Capital Management, LLC (Geode). FMR and the sub-advisers are referred to herein as the Investment Advisers. The Board, assisted by the advice of fund counsel and Independent Trustees' counsel, requests and considers a broad range of information relevant to the renewal of the Advisory Contracts throughout the year.
The Board meets regularly and, at each of its meetings, covers an extensive agenda of topics and materials and considers factors that are relevant to its annual consideration of the renewal of the fund's Advisory Contracts, including the services and support provided to the fund and its shareholders. The Board has established four standing committees (Committees) — Operations, Audit, Fair Valuation, and Governance and Nominating — each composed of and chaired by Independent Trustees with varying backgrounds, to which the Board has assigned specific subject matter responsibilities in order to enhance effective decision-making by the Board. The Operations Committee, of which all of the Independent Trustees are members, meets regularly throughout the year and considers, among other matters, information specifically related to the annual consideration of the renewal of the fund's Advisory Contracts. The Board, acting directly and through its Committees, requests and receives information concerning the annual consideration of the renewal of the fund's Advisory Contracts. The Board also meets as needed to review matters specifically related to the Board's annual consideration of the renewal of the Advisory Contracts. Members of the Board may also meet with trustees of other Fidelity funds through joint ad hoc committees to discuss certain matters relevant to all of the Fidelity funds.
At its September 2019 meeting, the Board unanimously determined to renew the fund's Advisory Contracts. In reaching its determination, the Board considered that the fund adopted a new fee structure in June 2019 pursuant to which the fund does not pay a management fee to FMR, consistent with the fee structure of the other series funds. In considering whether to renew the Advisory Contracts for the fund, the Board considered all factors it believed relevant and reached a determination, with the assistance of fund counsel and Independent Trustees' counsel and through the exercise of its business judgment, that the renewal of the Advisory Contracts was in the best interests of the fund and its shareholders and the fact that no fee is payable under the management contract was fair and reasonable.
July 2019 Contract Approval. At its July 2019 meeting, the Board voted to approve an amended and restated sub-advisory agreement with FMR Co., Inc. (FMRC) to reduce the sub-advisory fee rate paid by FMR to FMRC (New Contract). In reaching its conclusion to approve the New Contract, the Board considered that it had received and reviewed certain information and made certain findings in connection with the annual renewal of the Advisory Contracts at its September 2018 meeting and considered how, if at all, the approval of the New Contract would change its prior conclusions. The Board noted that FMR, and not the fund, pays the sub-advisory fee. The Board also noted that the New Contract would not change the investment processes, the level or nature of services provided, the resources and personnel allocated, or trading and compliance operations. Based on its evaluation, and after considering all factors it believed relevant, the Board ultimately concluded that the advisory fee structure in the New Contract is fair and reasonable, and that the New Contract should be approved.
Approval of Amended and Restated Advisory Contracts. At its September 2019 meeting, the Board also unanimously determined to approve an amended and restated management contract and sub-advisory agreement with Geode (Amended and Restated Contracts) in connection with an upcoming consolidation of certain of Fidelity's advisory businesses. The Board considered that, on or about January 1, 2020, FMRC expects to merge with and into FMR and, after the merger, FMR expects to redomicile as a Delaware limited liability company. The Board also approved the termination of the sub-advisory agreement with FMRC upon the completion of the merger. The Board noted that references to FMR in the Amended and Restated Contracts would be updated to reflect FMR's new form of organization and domicile. The Board also approved amendments that clarify that the fund pays its non-operating expenses, including brokerage commissions and fees and expenses associated with the fund's securities lending program, if applicable. The Board also noted Fidelity's assurance that neither the planned consolidation nor the Amended and Restated Contracts will change the investment processes, the level or nature of services provided, the resources and personnel allocated, trading and compliance operations, or any fees or expenses paid by the fund.
Nature, Extent, and Quality of Services Provided. The Board considered staffing as it relates to the fund, including the backgrounds of investment personnel of Fidelity and Geode, and also considered the fund's investment objective, strategies, and related investment philosophy. The Independent Trustees also had discussions with senior management of Fidelity's investment operations and investment groups and with representatives of Geode. The Board considered the structure of the investment personnel compensation programs and whether the structures provide appropriate incentives to act in the best interests of the fund.
The Trustees also discussed with representatives of Fidelity, at meetings throughout the year, Fidelity's role in, among other things, overseeing compliance with federal securities laws and other applicable requirements by Geode with respect to the fund and monitoring and overseeing the performance and investment capabilities of Geode. The Trustees considered that the Board had received from Fidelity periodic reports about its oversight and due diligence processes, as well as periodic reports regarding the performance of Geode.
The Board also considered the nature, extent and quality of services provided by Geode. The Trustees noted that under the Sub-Advisory Agreement, subject to oversight by Fidelity, Geode is responsible for, among other things, identifying investments and arranging for execution of portfolio transactions to implement the fund's investment strategy. In addition, the Trustees noted that Geode is responsible for providing such reporting as may be requested by Fidelity to fulfill its oversight responsibilities discussed above.
Resources Dedicated to Investment Management and Support Services. The Board reviewed the general qualifications and capabilities of Fidelity's and Geode's investment staffs, including their size, education, experience, and resources, as well as Fidelity's and Geode's approach to recruiting, managing, and compensating investment personnel. The Board also noted that Fidelity's and Geode's analysts have extensive resources, tools and capabilities that allow them to conduct sophisticated quantitative and fundamental analysis, as well as credit analysis of issuers, counterparties and guarantors. Further, the Board considered that Fidelity's and Geode's investment professionals have sufficient access to information and data so as to provide competitive investment results over time, and that those professionals also have access to sophisticated tools that permit them to assess portfolio construction and risk and performance attribution characteristics continuously. Additionally, in its deliberations, the Board considered Fidelity's and Geode's trading, risk management, compliance, and technology and operations capabilities and resources, which are integral parts of the investment management process.
Administrative Services. The Board considered (i) the nature, extent, quality, and cost of advisory and administrative services performed by the Investment Advisers and their affiliates under the Advisory Contracts and by FMR's affiliates under separate agreements covering transfer agency, pricing and bookkeeping, and securities lending services for the fund; (ii) the nature and extent of the supervision of third party service providers, principally custodians, subcustodians, and pricing vendors; and (iii) the resources devoted to, and the record of compliance with, the fund's compliance policies and procedures. The Board also reviewed the allocation of fund brokerage, including allocations to brokers affiliated with the Investment Advisers.
Investment Performance. The Board considered whether the fund has operated in accordance with its investment objective, as well as its record of compliance with its investment restrictions. The Board reviewed the fund's absolute investment performance, as well as the fund's relative investment performance. In this regard, the Board noted that the fund is designed to offer an investment option for other investment companies and 529 plans managed by Fidelity and ultimately to enhance the performance of those investment companies and 529 plans.
Based on its review, the Board concluded that the nature, extent, and quality of services provided to the fund under the Advisory Contracts should continue to benefit the shareholders of the fund.
Competitiveness of Management Fee and Total Expense Ratio. The Board considered that the fund does not pay FMR a management fee for investment advisory services. The Board also noted that FMR or an affiliate undertakes to pay all operating expenses of the fund, except transfer agent fees, 12b-1 fees, Independent Trustee fees and expenses, custodian fees and expenses, proxy and shareholder meeting expenses, interest, taxes, brokerage expenses, and extraordinary expenses (such as litigation expenses).
The Board further considered that FMR has contractually agreed to reimburse the fund to the extent that total operating expenses (with certain exceptions), as a percentage of its average net assets, exceed 0.014% through February 28, 2022.
Based on its review, the Board considered that the fund does not pay a management fee and concluded that the fund's total expense ratio was reasonable in light of the services that the fund and its shareholders receive and the other factors considered.
Costs of the Services and Profitability. The Board considered the level of Fidelity's profits in respect of all the Fidelity funds.
PricewaterhouseCoopers LLP (PwC), auditor to Fidelity and certain Fidelity funds, has been engaged annually by the Board as part of the Board's assessment of Fidelity's profitability analysis. PwC's engagement includes the review and assessment of the methodologies used by Fidelity in determining the revenues and expenses attributable to Fidelity's mutual fund business, and completion of agreed-upon procedures in respect of the mathematical accuracy of the fund profitability information and its conformity to established allocation methodologies. After considering PwC's reports issued under the engagement and information provided by Fidelity, the Board concluded that while other allocation methods may also be reasonable, Fidelity's profitability methodologies are reasonable in all material respects.
The Board also reviewed Fidelity's and Geode's non-fund businesses and potential indirect benefits such businesses may have received as a result of their association with Fidelity's mutual fund business (i.e., fall-out benefits) as well as cases where Fidelity's and Geode's affiliates may benefit from the fund's business. The Board noted that changes to fall-out benefits year-over-year reflect business developments at Fidelity's and Geode's various businesses. The Board considered that a joint ad hoc committee created by it and the boards of other Fidelity funds had recently been established, and meets periodically, to evaluate potential fall-out benefits. The Board noted that the committee was expected to, among other things: (i) discuss the legal framework surrounding potential fall-out benefits; (ii) review the Board's responsibilities and approach to potential fall-out benefits; and (iii) review practices employed by competitor funds regarding the review of potential fall-out benefits. The Board noted that it would consider the committee's findings in connection with future consideration of contract renewals.
The Board concluded that the costs of the services provided by and the profits realized by Fidelity in connection with the operation of the fund were not relevant to the renewal of the Advisory Contracts because the fund pays no advisory fees and FMR or an affiliate bears all expenses of the fund, with limited exceptions.
The Board also considered information regarding the profitability of Geode's relationship with the fund.
Economies of Scale. The Board concluded that because the fund pays no advisory fees and FMR or an affiliate bears all expenses of the fund with certain limited exceptions, the realization of economies of scale was not a material factor in the Board's decision to renew the fund's Advisory Contracts.
Additional Information Requested by the Board. In order to develop fully the factual basis for consideration of the Fidelity funds' advisory contracts, the Board requested and received additional information on certain topics, including: (i) Fidelity's fund profitability methodology, profitability trends for certain funds, the allocation of various costs to different funds, and the impact of certain factors on fund profitability results; (ii) portfolio manager changes that have occurred during the past year and the amount of the investment that each portfolio manager has made in the Fidelity fund(s) that he or she manages; (iii) Fidelity's compensation structure for portfolio managers, research analysts, and other key personnel, including its effects on fund profitability, the rationale for the compensation structure, and the extent to which current market conditions have affected retention and recruitment; (iv) the arrangements with and compensation paid to certain fund sub-advisers on behalf of the Fidelity funds and the treatment of such compensation within Fidelity's fund profitability methodology; (v) the practices of certain sub-advisers regarding their receipt of research from broker-dealers that execute the funds' portfolio transactions; (vi) the terms of Fidelity's voluntary expense limitation agreements; (vii) the methodology with respect to competitive fund data and peer group classifications; (viii) Fidelity's transfer agent fee, expense, and service structures for different funds and classes relative to competitive trends, and the impact of the increased use of omnibus accounts; (ix) new developments in the retail and institutional marketplaces and the competitive positioning of the funds relative to other investment products and services; (x) the impact on fund profitability of recent changes in total net assets for Fidelity's money market funds, anticipated changes to the competitive landscape for money market funds, and the level of investor comfort with gates, fees, and floating NAVs; (xi) the funds' share class structures and distribution channels; and (xii) explanations regarding the relative total expense ratios of certain funds and classes, total expense competitive trends and methodologies for total expense competitive comparisons, and actions that might be taken by Fidelity to reduce total expense ratios for certain classes. In addition, the Board considered its discussions with Fidelity throughout the year regarding enhanced information security initiatives and the funds' fair valuation policies.
Based on its evaluation of all of the conclusions noted above, and after considering all factors it believed relevant, the Board concluded that the advisory and sub-advisory fee arrangements are fair and reasonable, and that the fund's Advisory Contracts should be renewed and the fund's Amended and Restated Contracts should be approved.

SGX-ANN-1219
1.899279.110
Fidelity® Emerging Markets Index Fund
Fidelity® Global ex U.S. Index Fund
Annual Report
October 31, 2019
See the inside front cover for important information about access to your fund’s shareholder reports.
Beginning on January 1, 2021, as permitted by regulations adopted by the Securities and Exchange Commission, paper copies of a fund’s shareholder reports will no longer be sent by mail, unless you specifically request paper copies of the reports from the fund or from your financial intermediary, such as a financial advisor, broker-dealer or bank. Instead, the reports will be made available on a website, and you will be notified by mail each time a report is posted and provided with a website link to access the report.
If you already elected to receive shareholder reports electronically, you will not be affected by this change and you need not take any action. You may elect to receive shareholder reports and other communications from a fund electronically, by contacting your financial intermediary. For Fidelity customers, visit Fidelity's web site or call Fidelity using the contact information listed below.
You may elect to receive all future reports in paper free of charge. If you wish to continue receiving paper copies of your shareholder reports, you may contact your financial intermediary or, if you are a Fidelity customer, visit Fidelity’s website, or call Fidelity at the applicable toll-free number listed below. Your election to receive reports in paper will apply to all funds held with the fund complex/your financial intermediary.
| Account Type | Website | Phone Number |
| Brokerage, Mutual Fund, or Annuity Contracts: | fidelity.com/mailpreferences | 1-800-343-3548 |
| Employer Provided Retirement Accounts: | netbenefits.fidelity.com/preferences (choose 'no' under Required Disclosures to continue to print) | 1-800-343-0860 |
| Advisor Sold Accounts Serviced Through Your Financial Intermediary: | Contact Your Financial Intermediary | Your Financial Intermediary's phone number |
| Advisor Sold Accounts Serviced by Fidelity: | institutional.fidelity.com | 1-877-208-0098 |
Contents
To view a fund's proxy voting guidelines and proxy voting record for the 12-month period ended June 30, visit http://www.fidelity.com/proxyvotingresults or visit the Securities and Exchange Commission's (SEC) web site at http://www.sec.gov.
You may also call 1-800-544-8544 to request a free copy of the proxy voting guidelines.
The funds or securities referred to herein are not sponsored, endorsed, or promoted by MSCI, and MSCI bears no liability with respect to any such funds or securities or any index on which such funds or securities are based. The prospectus contains a more detailed description of the limited relationship MSCI has with Fidelity and any related funds.
Standard & Poor's, S&P and S&P 500 are registered service marks of The McGraw-Hill Companies, Inc. and have been licensed for use by Fidelity Distributors Corporation.
Other third-party marks appearing herein are the property of their respective owners.
All other marks appearing herein are registered or unregistered trademarks or service marks of FMR LLC or an affiliated company. © 2019 FMR LLC. All rights reserved.
This report and the financial statements contained herein are submitted for the general information of the shareholders of the Funds. This report is not authorized for distribution to prospective investors in the Funds unless preceded or accompanied by an effective prospectus.
A fund files its complete schedule of portfolio holdings with the SEC for the first and third quarters of each fiscal year on Form N-PORT. Forms N-PORT are available on the SEC’s web site at http://www.sec.gov. A fund's Forms N-PORT may be reviewed and copied at the SEC’s Public Reference Room in Washington, DC. Information regarding the operation of the SEC's Public Reference Room may be obtained by calling 1-800-SEC-0330.
For a complete list of a fund's portfolio holdings, view the most recent holdings listing, semiannual report, or annual report on Fidelity's web site at http://www.fidelity.com, http://www.institutional.fidelity.com, or http://www.401k.com, as applicable.
NOT FDIC INSURED •MAY LOSE VALUE •NO BANK GUARANTEE
Neither the Funds nor Fidelity Distributors Corporation is a bank.
Fidelity® Emerging Markets Index Fund
Performance: The Bottom Line
Average annual total return reflects the change in the value of an investment, assuming reinvestment of distributions from dividend income and capital gains (the profits earned upon the sale of securities that have grown in value, if any) and assuming a constant rate of performance each year. The hypothetical investment and the average annual total returns do not reflect the deduction of taxes that a shareholder would pay on fund distributions or the redemption of fund shares. During periods of reimbursement by Fidelity, a fund’s total return will be greater than it would be had the reimbursement not occurred. How a fund did yesterday is no guarantee of how it will do tomorrow.
Average Annual Total Returns
| For the periods ended October 31, 2019 | Past 1 year | Past 5 years | Life of fundA |
| Fidelity® Emerging Markets Index Fund | 11.33% | 2.69% | 2.44% |
A From September 8, 2011
$10,000 Over Life of Fund
Let's say hypothetically that $10,000 was invested in Fidelity® Emerging Markets Index Fund on September 8, 2011, when the fund started.
The chart shows how the value of your investment would have changed, and also shows how the MSCI Emerging Markets Index performed over the same period.
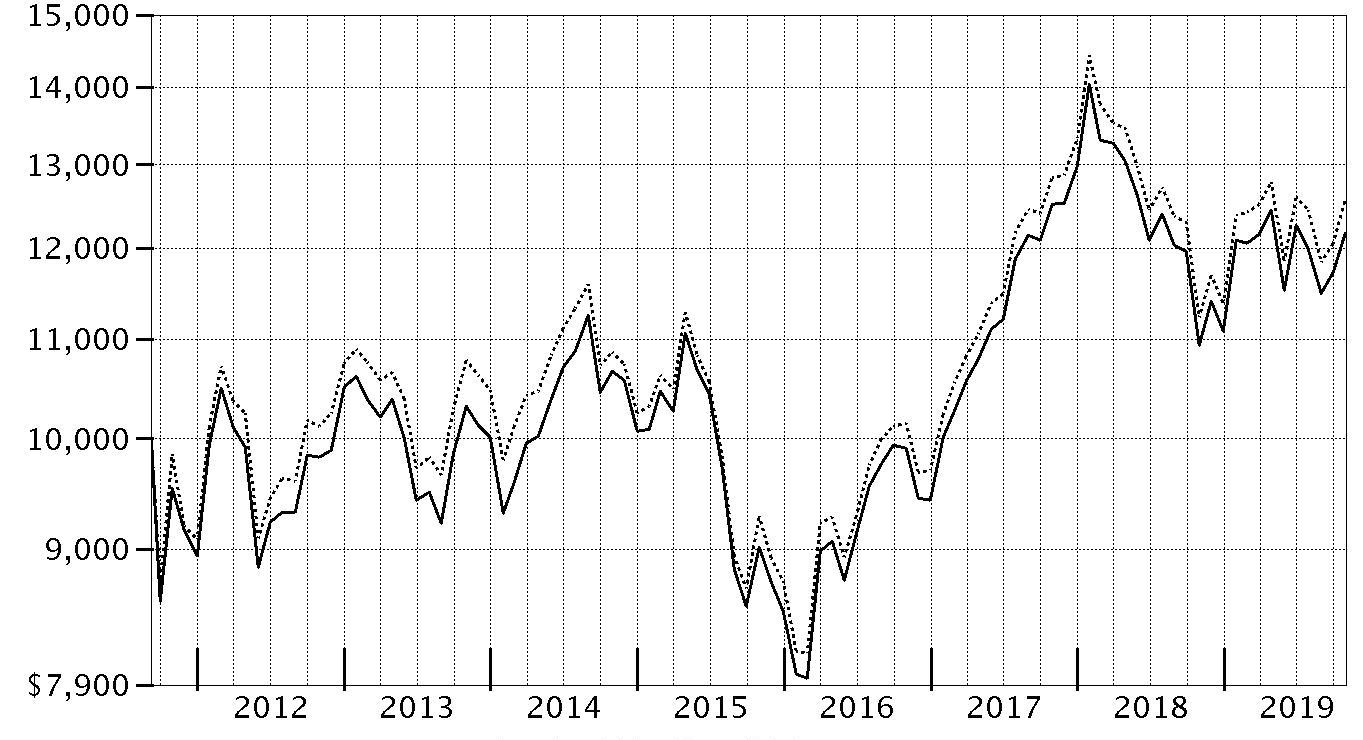
| Period Ending Values |
| $12,175 | Fidelity® Emerging Markets Index Fund |
| $12,570 | MSCI Emerging Markets Index |
Fidelity® Emerging Markets Index Fund
Management's Discussion of Fund Performance
Market Recap: The MSCI ACWI (All Country World Index) ex USA Index gained 11.47% for the 12 months ending October 31, 2019, as international stocks reflected a confluence of factors, including escalating trade tension, moderating but still positive global economic growth and uncertainty about the U.K.’s planned “Brexit” from the European Union. In late December, the U.S. Federal Reserve shifted from raising interest rates to a more dovish policy in 2019, joining many foreign central banks that had cut policy rates. In June, international stocks rose 6.03%, as policy stimulus in China stabilized that country’s economic growth. The Fed cut its policy rate in July for the first time since 2008. However, the index returned -1.21% for the month, followed by -3.08% in August. In September, the Fed cut its policy rate another quarter point, citing concerns about slowing economic growth and muted inflation, and did the same in October, leading to monthly gains of 2.59% and 3.49%, respectively. For the full 12 months, the growth-oriented information technology sector (+22%) led the way, followed by utilities (+20%) and real estate (+18%), two high-dividend-yielding categories. Consumer discretionary gained 16%. Conversely, energy was roughly flat, while materials (+6%) and communication services (7%) also lagged. By region, Asia Pacific ex Japan (+16%), Europe ex U.K (+13%), Canada (+12%) and emerging markets (+12%) fared best. Meanwhile, the U.K. (+7%) and Japan (+10%) trailed the broader market.
Comments from the Geode Capital Management, LLC, passive equity index team: For the fiscal year, the fund's share classes gained 11.33%, compared with an increase of 11.89% for the benchmark MSCI Emerging Markets Index.
(The fund's performance relative to the index can be affected by Fidelity's methodologies for valuing certain foreign stocks and for incorporating foreign exchange rates, which differ from those used by the index.) Of the 11 sectors within the index, nine generated positive performance, led by consumer discretionary and information technology. On an individual basis, China-based Baidu (-46%) struggled considerably, as the company anticipated continued challenges for its core online search-advertising business. Brazilian mining firm Vale (-23%) saw its shares plunge in January, as a dam collapsed at one of its mines, resulting in many casualties and significant financial losses. Shares of South African energy and chemical company Sasol (-44%) fell sharply in May, after the company announced higher-than-expected costs for its Louisiana energy project. In contrast, semiconductor foundry Taiwan Semiconductor Manufacturing (+34%) was the leading contributor, as the company reported better-than-expected quarterly financial results. Similarly, Chinese e-commerce company Alibaba (+24%) announced strong quarterly earnings, while another China-based firm, internet gaming business Tencent Holdings (+21%), also outperformed.
The views expressed above reflect those of the portfolio manager(s) only through the end of the period as stated on the cover of this report and do not necessarily represent the views of Fidelity or any other person in the Fidelity organization. Any such views are subject to change at any time based upon market or other conditions and Fidelity disclaims any responsibility to update such views. These views may not be relied on as investment advice and, because investment decisions for a Fidelity fund are based on numerous factors, may not be relied on as an indication of trading intent on behalf of any Fidelity fund.
Note to Shareholders: On March 22, 2019, Pat Waddell retired and is no longer a portfolio manager with Geode Capital Management.
Fidelity® Emerging Markets Index Fund
Investment Summary (Unaudited)
Top Ten Stocks as of October 31, 2019
| | % of fund's net assets |
| Alibaba Group Holding Ltd. sponsored ADR (Cayman Islands, Internet & Direct Marketing Retail) | 4.4 |
| Taiwan Semiconductor Manufacturing Co. Ltd. (Taiwan, Semiconductors & Semiconductor Equipment) | 4.2 |
| Tencent Holdings Ltd. (Cayman Islands, Interactive Media & Services) | 4.1 |
| Samsung Electronics Co. Ltd. (Korea (South), Technology Hardware, Storage & Peripherals) | 3.6 |
| China Construction Bank Corp. (H Shares) (China, Banks) | 1.4 |
| Ping An Insurance Group Co. of China Ltd. (H Shares) (China, Insurance) | 1.2 |
| Naspers Ltd. Class N (South Africa, Internet & Direct Marketing Retail) | 1.1 |
| Reliance Industries Ltd. (India, Oil, Gas & Consumable Fuels) | 1.0 |
| China Mobile Ltd. (Hong Kong, Wireless Telecommunication Services) | 0.9 |
| Housing Development Finance Corp. Ltd. (India, Thrifts & Mortgage Finance) | 0.9 |
| | 22.8 |
Top Market Sectors as of October 31, 2019
| | % of fund's net assets |
| Financials | 24.7 |
| Information Technology | 15.3 |
| Consumer Discretionary | 13.0 |
| Communication Services | 10.8 |
| Energy | 7.9 |
| Materials | 7.1 |
| Consumer Staples | 6.4 |
| Industrials | 4.6�� |
| Real Estate | 2.4 |
| Health Care | 2.2 |
Geographic Diversification (% of fund's net assets)
| As of October 31, 2019 |
| | Cayman Islands | 16.0% |
| | Korea (South) | 11.8% |
| | Taiwan | 11.4% |
| | China | 11.1% |
| | India | 8.7% |
| | Brazil | 7.5% |
| | South Africa | 4.4% |
| | Russia | 3.9% |
| | United States of America | 3.1% |
| | Other* | 22.1% |
* Includes Short-Term investments and Net Other Assets (Liabilities).
Percentages are based on country or territory of incorporation and are adjusted for the effect of futures contracts, if applicable.
Asset Allocation as of October 31, 2019
| | % of fund's net assets |
| Stocks and Equity Futures | 100.0 |
Fidelity® Emerging Markets Index Fund
Schedule of Investments October 31, 2019
Showing Percentage of Net Assets
| Common Stocks - 93.7% | | | |
| | | Shares | Value |
| Argentina - 0.1% | | | |
| Banco Macro SA sponsored ADR | | 23,838 | $545,890 |
| BBVA Banco Frances SA sponsored ADR | | 32,417 | 113,460 |
| Grupo Financiero Galicia SA sponsored ADR | | 53,225 | 615,281 |
| Pampa Holding SA sponsored ADR (a)(b) | | 30,143 | 469,327 |
| Telecom Argentina SA Class B sponsored ADR | | 46,466 | 418,194 |
| Transportadora de Gas del Sur SA Class B sponsored ADR | | 35,520 | 268,531 |
| YPF SA Class D sponsored ADR | | 93,327 | 873,541 |
|
| TOTAL ARGENTINA | | | 3,304,224 |
|
| Bailiwick of Jersey - 0.1% | | | |
| Polymetal International PLC | | 110,375 | 1,810,823 |
| Belgium - 0.0% | | | |
| Titan Cement International Trading SA (a) | | 17,611 | 367,690 |
| Titan Cement International Trading SA (a) | | 1,757 | 37,232 |
|
| TOTAL BELGIUM | | | 404,922 |
|
| Bermuda - 0.9% | | | |
| Alibaba Health Information Technology Ltd. (a) | | 1,848,000 | 1,860,003 |
| Alibaba Pictures Group Ltd. (a) | | 7,410,000 | 1,215,365 |
| Beijing Enterprises Water Group Ltd. | | 2,736,000 | 1,426,081 |
| Brilliance China Automotive Holdings Ltd. | | 1,578,000 | 1,740,177 |
| China Gas Holdings Ltd. | | 945,400 | 4,027,347 |
| China Oriental Group Co. Ltd. (H Shares) | | 488,000 | 170,311 |
| China Resource Gas Group Ltd. | | 454,000 | 2,737,306 |
| Cosco Shipping Ports Ltd. | | 861,680 | 677,444 |
| Credicorp Ltd. | | 6,502 | 1,392,403 |
| Credicorp Ltd. (United States) | | 28,417 | 6,082,375 |
| GOME Electrical Appliances Holdings Ltd. (a)(b) | | 4,855,802 | 438,943 |
| Haier Electronics Group Co. Ltd. | | 664,000 | 1,895,779 |
| HengTen Networks Group Ltd. (a) | | 12,812,000 | 184,355 |
| Kunlun Energy Co. Ltd. | | 1,636,000 | 1,522,686 |
| Luye Pharma Group Ltd. (c) | | 583,000 | 430,924 |
| Nine Dragons Paper (Holdings) Ltd. | | 904,000 | 784,188 |
| Shenzhen International Holdings Ltd. | | 507,073 | 1,030,895 |
| Sihuan Pharmaceutical Holdings Group Ltd. | | 1,703,000 | 223,127 |
|
| TOTAL BERMUDA | | | 27,839,709 |
|
| Brazil - 4.9% | | | |
| Ambev SA | | 2,423,300 | 10,501,672 |
| Atacadao Distribuicao Comercio e Industria Ltda | | 209,200 | 996,836 |
| B2W Companhia Global do Varejo (a) | | 120,587 | 1,527,445 |
| Banco Bradesco SA | | 655,638 | 5,370,330 |
| Banco do Brasil SA | | 442,300 | 5,310,247 |
| Banco Santander SA (Brasil) unit | | 210,800 | 2,473,569 |
| BB Seguridade Participacoes SA | | 357,700 | 3,029,814 |
| BM&F BOVESPA SA | | 1,057,414 | 12,755,938 |
| BR Malls Participacoes SA | | 401,395 | 1,536,320 |
| Brasil Foods SA (a) | | 288,900 | 2,557,995 |
| BTG Pactual Participations Ltd. unit | | 112,600 | 1,823,836 |
| CCR SA | | 622,500 | 2,551,777 |
| Centrais Eletricas Brasileiras SA (Electrobras) (a) | | 115,600 | 1,140,291 |
| Cielo SA | | 612,314 | 1,154,244 |
| Companhia de Saneamento Basico do Estado de Sao Paulo (SABESP) | | 176,300 | 2,401,074 |
| Companhia Siderurgica Nacional SA (CSN) | | 310,800 | 914,460 |
| Cosan SA Industria e Comercio | | 80,500 | 1,159,979 |
| Drogasil SA | | 119,100 | 3,266,675 |
| Embraer SA | | 367,800 | 1,607,663 |
| Energisa SA unit | | 85,600 | 1,022,803 |
| ENGIE Brasil Energia SA | | 107,750 | 1,215,999 |
| Equatorial Energia SA | | 88,800 | 2,255,814 |
| Hypermarcas SA | | 192,700 | 1,649,037 |
| IRB Brasil Resseguros SA | | 357,000 | 3,363,927 |
| Itausa-Investimentos Itau SA | | 21,512 | 74,022 |
| JBS SA | | 560,500 | 3,953,758 |
| Klabin SA unit | | 347,000 | 1,368,792 |
| Kroton Educacional SA | | 766,074 | 1,847,135 |
| Localiza Rent A Car SA | | 299,452 | 3,224,121 |
| Lojas Renner SA | | 406,859 | 5,148,509 |
| M. Dias Branco SA | | 55,200 | 519,586 |
| Magazine Luiza SA | | 313,200 | 3,486,161 |
| Multiplan Empreendimentos Imobiliarios SA | | 140,058 | 1,020,096 |
| Natura Cosmeticos SA | | 201,300 | 1,564,021 |
| Notre Dame Intermedica Participacoes SA | | 176,200 | 2,636,080 |
| Petrobras Distribuidora SA | | 360,400 | 2,541,357 |
| Petroleo Brasileiro SA - Petrobras (ON) | | 1,492,800 | 12,171,689 |
| Porto Seguro SA | | 47,800 | 684,134 |
| Rumo SA (a) | | 562,600 | 3,198,424 |
| Sul America SA unit | | 117,374 | 1,413,288 |
| Suzano Papel e Celulose SA | | 280,955 | 2,286,591 |
| TIM Participacoes SA | | 420,000 | 1,195,961 |
| Ultrapar Participacoes SA | | 374,900 | 1,763,960 |
| Vale SA (a) | | 1,629,184 | 19,174,039 |
| Weg SA | | 436,832 | 2,777,513 |
|
| TOTAL BRAZIL | | | 143,636,982 |
|
| British Virgin Islands - 0.0% | | | |
| Tianhe Chemicals Group Ltd. (a)(c)(d) | | 376,000 | 28,071 |
| Cayman Islands - 16.0% | | | |
| 3SBio, Inc. (a)(c) | | 712,000 | 1,326,283 |
| 51job, Inc. sponsored ADR (a) | | 12,604 | 992,817 |
| 58.com, Inc. ADR (a) | | 49,378 | 2,607,652 |
| AAC Technology Holdings, Inc. | | 379,000 | 2,452,621 |
| Agile Property Holdings Ltd. | | 660,000 | 889,592 |
| Airtac International Group | | 61,000 | 835,055 |
| Alibaba Group Holding Ltd. sponsored ADR (a) | | 729,681 | 128,912,739 |
| Anta Sports Products Ltd. | | 552,000 | 5,399,731 |
| Autohome, Inc. ADR Class A (a)(b) | | 30,157 | 2,550,076 |
| Baidu.com, Inc. sponsored ADR (a) | | 142,846 | 14,548,865 |
| Baozun, Inc. sponsored ADR (a)(b) | | 21,050 | 916,096 |
| Bosideng International Holdings Ltd. | | 1,606,000 | 830,479 |
| Chailease Holding Co. Ltd. | | 615,850 | 2,776,555 |
| China Aoyuan Property Group Ltd. | | 613,000 | 783,371 |
| China Conch Venture Holdings Ltd. | | 847,000 | 3,314,213 |
| China Education Group Holdings Ltd. | | 274,000 | 409,296 |
| China First Capital Group Ltd. (a) | | 1,520,000 | 432,202 |
| China Hongqiao Group Ltd. | | 861,000 | 478,191 |
| China Huishan Dairy Holdings Co. Ltd. (a)(d) | | 888,000 | 23,798 |
| China Investment Fund International Holdings Co. Ltd. (d) | | 357,000 | 525,754 |
| China Literature Ltd. (a)(b)(c) | | 125,800 | 492,829 |
| China Medical System Holdings Ltd. | | 682,000 | 924,876 |
| China Mengniu Dairy Co. Ltd. | | 1,420,000 | 5,661,178 |
| China Resources Cement Holdings Ltd. | | 1,298,000 | 1,421,428 |
| China Resources Land Ltd. | | 1,432,744 | 6,093,285 |
| China State Construction International Holdings Ltd. | | 1,097,000 | 1,010,286 |
| China Zhongwang Holdings Ltd. | | 847,200 | 351,725 |
| CIFI Holdings Group Co. Ltd. | | 1,371,623 | 914,840 |
| Country Garden Holdings Co. Ltd. | | 3,852,737 | 5,348,482 |
| Country Garden Services Holdings Co. Ltd. | | 620,000 | 2,100,791 |
| Ctrip.com International Ltd. ADR (a) | | 243,205 | 8,023,333 |
| Dali Foods Group Co. Ltd. (c) | | 1,015,500 | 694,278 |
| ENN Energy Holdings Ltd. | | 406,900 | 4,642,138 |
| Evergrande Real Estate Group Ltd. (b) | | 920,000 | 2,239,516 |
| Future Land Development Holding Ltd. | | 918,000 | 967,404 |
| GDS Holdings Ltd. ADR (a)(b) | | 29,700 | 1,237,896 |
| Geely Automobile Holdings Ltd. | | 2,582,000 | 4,885,692 |
| Genscript Biotech Corp. (a) | | 466,000 | 1,116,510 |
| Greentown Service Group Co. Ltd. | | 584,000 | 662,589 |
| Haidilao International Holding Ltd. (c) | | 185,000 | 895,601 |
| Haitian International Holdings Ltd. | | 319,000 | 752,748 |
| Hengan International Group Co. Ltd. | | 372,500 | 2,600,796 |
| Huazhu Group Ltd. ADR (b) | | 68,464 | 2,592,047 |
| Hutchison China Meditech Ltd. sponsored ADR (a) | | 29,936 | 565,790 |
| iQIYI, Inc. ADR (a)(b) | | 63,561 | 1,107,868 |
| JD.com, Inc. sponsored ADR (a) | | 379,502 | 11,821,487 |
| Jiayuan International Group Ltd. | | 296 | 118 |
| Kaisa Group Holdings Ltd. | | 1,228,000 | 537,017 |
| Kingboard Chemical Holdings Ltd. | | 327,000 | 871,424 |
| Kingboard Laminates Holdings Ltd. | | 580,500 | 531,439 |
| Kingdee International Software Group Co. Ltd. | | 1,210,000 | 1,325,858 |
| Kingsoft Corp. Ltd. (a) | | 432,000 | 994,222 |
| KWG Property Holding Ltd. | | 627,000 | 631,378 |
| Lee & Man Paper Manufacturing Ltd. | | 684,000 | 380,349 |
| Li Ning Co. Ltd. | | 998,000 | 3,384,041 |
| Lijun International Pharmaceutical Holding Ltd. | | 750,000 | 625,493 |
| Logan Property Holdings Co. Ltd. | | 736,000 | 1,120,914 |
| Longfor Properties Co. Ltd. (c) | | 910,500 | 3,778,714 |
| Meitu, Inc. (a)(c) | | 952,000 | 210,690 |
| Meituan Dianping Class B (a) | | 516,800 | 6,164,464 |
| Momo, Inc. ADR | | 77,804 | 2,607,990 |
| NetEase, Inc. ADR | | 36,181 | 10,342,701 |
| New Oriental Education & Technology Group, Inc. sponsored ADR (a) | | 73,273 | 8,943,702 |
| Nexteer Auto Group Ltd. | | 447,000 | 416,613 |
| NIO, Inc. sponsored ADR (a)(b) | | 329,437 | 477,684 |
| Noah Holdings Ltd. sponsored ADR (a)(b) | | 17,192 | 520,746 |
| Pinduoduo, Inc. ADR (a)(b) | | 99,698 | 4,075,654 |
| Semiconductor Manufacturing International Corp. (a)(b) | | 1,574,700 | 2,000,260 |
| Shenzhou International Group Holdings Ltd. | | 388,700 | 5,371,311 |
| Shimao Property Holdings Ltd. | | 581,000 | 1,946,400 |
| Shui On Land Ltd. | | 1,537,000 | 309,311 |
| SINA Corp. (a) | | 31,383 | 1,242,767 |
| Sino Biopharmaceutical Ltd. | | 3,570,000 | 5,315,349 |
| SOHO China Ltd. | | 898,000 | 306,435 |
| Sunac China Holdings Ltd. | | 1,260,000 | 5,715,093 |
| Sunny Optical Technology Group Co. Ltd. | | 372,500 | 5,987,522 |
| TAL Education Group ADR (a) | | 198,025 | 8,477,450 |
| Tencent Holdings Ltd. | | 2,930,400 | 118,865,573 |
| Tencent Music Entertainment Group ADR (a) | | 48,649 | 673,302 |
| Tingyi (Cayman Islands) Holding Corp. | | 1,000,000 | 1,330,296 |
| Towngas China Co. Ltd. | | 502,506 | 387,370 |
| Uni-President China Holdings Ltd. | | 691,000 | 713,756 |
| Vipshop Holdings Ltd. ADR (a) | | 226,457 | 2,613,314 |
| Want Want China Holdings Ltd. | | 2,537,000 | 2,137,193 |
| Weibo Corp. sponsored ADR (a)(b) | | 28,858 | 1,419,525 |
| Wuxi Biologics (Cayman), Inc. (a)(c) | | 285,000 | 3,349,168 |
| Xiaomi Corp. Class B (a)(b)(c) | | 3,980,400 | 4,509,781 |
| Xinyi Solar Holdings Ltd. | | 1,700,560 | 960,878 |
| Yihai International Holding Ltd. | | 244,000 | 1,659,381 |
| Yuzhou Properties Co. | | 771,557 | 325,923 |
| YY, Inc. ADR (a) | | 29,459 | 1,674,450 |
| Zhen Ding Technology Holding Ltd. | | 276,000 | 1,312,217 |
| Zhongsheng Group Holdings Ltd. Class H | | 298,000 | 987,935 |
| ZTO Express (Cayman), Inc. sponsored ADR | | 166,389 | 3,660,558 |
|
| TOTAL CAYMAN ISLANDS | | | 471,324,528 |
|
| Chile - 0.8% | | | |
| Aguas Andinas SA | | 1,205,104 | 552,502 |
| Banco de Chile | | 23,728,126 | 3,055,604 |
| Banco de Credito e Inversiones | | 24,980 | 1,390,809 |
| Banco Santander Chile | | 34,439,406 | 2,136,674 |
| Cencosud SA | | 718,318 | 975,386 |
| Colbun SA (a) | | 4,293,276 | 740,729 |
| Compania Cervecerias Unidas SA | | 72,945 | 727,866 |
| Compania de Petroleos de Chile SA (COPEC) | | 199,637 | 1,785,077 |
| CorpBanca SA | | 77,663,419 | 471,259 |
| Empresa Nacional de Telecomunicaciones SA (ENTEL) (a) | | 75,395 | 589,761 |
| Empresas CMPC SA | | 594,404 | 1,354,561 |
| Enel Chile SA | | 13,847,239 | 1,138,812 |
| Enersis SA | | 19,605,055 | 3,661,408 |
| LATAM Airlines Group SA | | 118,592 | 1,311,292 |
| LATAM Airlines Group SA sponsored ADR (b) | | 37,259 | 419,909 |
| S.A.C.I. Falabella | | 389,116 | 1,980,735 |
| Sociedad Quimica y Minera de Chile SA (PN-B) sponsored ADR (b) | | 7,470 | 203,035 |
|
| TOTAL CHILE | | | 22,495,419 |
|
| China - 11.1% | | | |
| Agricultural Bank of China Ltd.: | | | |
| (A Shares) | | 1,146,800 | 592,602 |
| (H Shares) | | 15,569,000 | 6,406,701 |
| Aier Eye Hospital Group Co. Ltd. (A Shares) | | 73,270 | 411,252 |
| Air China Ltd.: | | | |
| (A Shares) | | 76,500 | 90,120 |
| (H Shares) | | 930,000 | 821,100 |
| Aisino Co. Ltd. (A Shares) | | 28,800 | 84,166 |
| Aluminum Corp. of China Ltd.: | | | |
| (A shares) (a) | | 421,600 | 202,740 |
| (H Shares) (a) | | 1,804,000 | 534,465 |
| Angang Steel Co. Ltd.: | | | |
| (A Shares) | | 173,940 | 73,802 |
| (H Shares) | | 590,200 | 197,436 |
| Anhui Conch Cement Co. Ltd.: | | | |
| (A Shares) | | 70,000 | 418,994 |
| (H Shares) | | 663,500 | 3,965,561 |
| Anxin Trust Co. Ltd. (A Shares) (a) | | 76,800 | 45,741 |
| AVIC Aircraft Co. Ltd. (A Shares) | | 45,100 | 96,030 |
| AVIC Aviation Engine Corp. PLC (A Shares) | | 37,000 | 111,019 |
| AVIC Capital Co. Ltd. (A Shares) | | 130,400 | 84,551 |
| AVIC Shenyang Aircraft Co. Ltd. (A Shares) (a) | | 15,700 | 65,513 |
| AviChina Industry & Technology Co. Ltd. (H Shares) | | 1,213,000 | 572,963 |
| Baic Motor Corp. Ltd. (H Shares) (c) | | 886,500 | 549,902 |
| Bank Communications Co. Ltd.: | | | |
| (H Shares) | | 5,068,000 | 3,461,179 |
| Class A | | 439,900 | 350,368 |
| Bank of Beijing Co. Ltd. (A Shares) | | 559,380 | 439,804 |
| Bank of Chengdu Co. Ltd. Class A | | 155,100 | 185,535 |
| Bank of China Ltd.: | | | |
| (A Shares) | | 361,700 | 189,981 |
| (H Shares) | | 41,233,000 | 16,814,206 |
| Bank of Guiyang Co. Ltd. (A Shares) | | 155,920 | 202,260 |
| Bank of Hangzhou Co. Ltd. (A Shares) | | 185,620 | 237,126 |
| Bank of Jiangsu Co. Ltd. (A Shares) | | 185,400 | 186,129 |
| Bank of Nanjing Co. Ltd. (A Shares) | | 252,500 | 309,287 |
| Bank of Ningbo Co. Ltd. (A Shares) | | 128,900 | 494,102 |
| Bank of Shanghai Co. Ltd. (A Shares) | | 349,977 | 463,404 |
| Baoshan Iron & Steel Co. Ltd. (A Shares) | | 484,900 | 399,106 |
| BBMG Corp.: | | | |
| (A Shares) | | 118,700 | 54,933 |
| (H Shares) | | 1,498,000 | 428,716 |
| Beijing Capital International Airport Co. Ltd. (H Shares) | | 954,000 | 903,554 |
| Beijing Dabeinong Technology Group Co. Ltd. (A Shares) | | 59,800 | 41,002 |
| Beijing Shiji Information Technology Co. Ltd. (A Shares) | | 15,000 | 77,431 |
| Beijing Tongrentang Co. Ltd. (A Shares) | | 21,400 | 83,524 |
| BOE Technology Group Co. Ltd. (A Shares) | | 847,800 | 429,165 |
| BYD Co. Ltd.: | | | |
| (A Shares) | | 35,800 | 217,633 |
| (H Shares) (b) | | 337,000 | 1,580,704 |
| Caitong Securities Co. Ltd. | | 50,100 | 70,703 |
| CGN Power Co. Ltd. (H Shares) (c) | | 5,313,000 | 1,379,903 |
| Changjiang Securities Co. Ltd. (A Shares) | | 78,600 | 75,914 |
| Chaozhou Three-Circle Group Co. (A Shares) | | 28,400 | 75,621 |
| China Avionics Systems Co. Ltd. (A Shares) | | 25,300 | 50,448 |
| China Cinda Asset Management Co. Ltd. (H Shares) | | 4,415,000 | 915,879 |
| China CITIC Bank Corp. Ltd.: | | | |
| (A Shares) | | 212,900 | 185,234 |
| (H Shares) | | 4,497,000 | 2,606,734 |
| China Coal Energy Co. Ltd. (H Shares) | | 1,006,000 | 401,174 |
| China Communications Construction Co. Ltd.: | | | |
| (A Shares) | | 34,000 | 45,416 |
| (H Shares) | | 2,333,000 | 1,775,979 |
| China Communications Services Corp. Ltd. (H Shares) | | 1,212,000 | 748,444 |
| China Construction Bank Corp.: | | | |
| (A Shares) | | 498,900 | 516,300 |
| (H Shares) | | 48,939,000 | 39,213,377 |
| China Eastern Airlines Corp. Ltd.: | | | |
| (A Shares) (a) | | 247,600 | 181,982 |
| (H Shares) (a) | | 868,000 | 432,910 |
| China Everbright Bank Co. Ltd.: | | | |
| (A Shares) | | 1,298,100 | 799,636 |
| (H Shares) | | 1,083,000 | 498,362 |
| China Film Co. Ltd. (A Shares) | | 25,100 | 47,422 |
| China Fortune Land Development Co. Ltd. (A Shares) | | 73,500 | 297,994 |
| China Galaxy Securities Co. Ltd. (H Shares) | | 1,867,000 | 951,959 |
| China Gezhouba Group Co. Ltd. (A Shares) | | 88,000 | 71,606 |
| China Grand Automotive Services Co. Ltd. (A Shares) | | 123,300 | 63,168 |
| China Huarong Asset Management Co. Ltd. (c) | | 5,015,000 | 740,388 |
| China International Capital Corp. Ltd. (H Shares) (c) | | 685,200 | 1,249,426 |
| China International Marine Containers Group Co. Ltd. | | 78,300 | 107,770 |
| China International Travel Service Corp. Ltd. (A Shares) | | 45,000 | 577,036 |
| China Life Insurance Co. Ltd. | | 39,900 | 189,310 |
| China Life Insurance Co. Ltd. (H Shares) | | 3,874,000 | 9,962,733 |
| China Longyuan Power Grid Corp. Ltd. (H Shares) | | 1,631,000 | 881,123 |
| China Merchants Bank Co. Ltd.: | | | |
| (A Shares) | | 336,100 | 1,692,826 |
| (H Shares) | | 2,151,846 | 10,262,651 |
| China Merchants Securities Co. Ltd. (A Shares) | | 138,700 | 323,565 |
| China Merchants Shekou Industrial Zone Holdings Co. Ltd. (A Shares) | | 154,800 | 411,141 |
| China Minsheng Banking Corp. Ltd.: | | | |
| (A Shares) | | 1,144,600 | 999,107 |
| (H Shares) | | 3,231,040 | 2,260,018 |
| China Molybdenum Co. Ltd.: | | | |
| (H Shares) (b) | | 1,791,000 | 564,409 |
| Class A | | 465,900 | 224,704 |
| China National Building Materials Co. Ltd. (H Shares) | | 1,956,000 | 1,648,564 |
| China National Chemical Engineering Co. Ltd. (A Shares) | | 96,000 | 81,478 |
| China National Nuclear Power Co. Ltd. (A Shares) | | 222,300 | 159,601 |
| China Northern Rare Earth Group High-Tech Co. Ltd. | | 50,800 | 72,521 |
| China Nuclear Engineering Corp. Ltd. (A Shares) | | 6,601 | 6,494 |
| China Oilfield Services Ltd. (H Shares) | | 846,000 | 1,177,866 |
| China Pacific Insurance (Group) Co. Ltd. | | 96,900 | 474,095 |
| China Pacific Insurance (Group) Co. Ltd. (H Shares) | | 1,428,800 | 5,184,099 |
| China Petroleum & Chemical Corp.: | | | |
| (A Shares) | | 344,500 | 239,607 |
| (H Shares) | | 13,429,000 | 7,638,082 |
| China Railway Construction Corp. Ltd.: | | | |
| (A Shares) | | 248,700 | 331,315 |
| (H Shares) | | 1,036,500 | 1,133,711 |
| China Railway Group Ltd.: | | | |
| (A Shares) | | 550,000 | 449,864 |
| (H Shares) | | 1,795,000 | 1,081,873 |
| China Railway Signal & Communications Corp. (H Shares) (c) | | 720,000 | 429,828 |
| China Reinsurance Group Corp. (H Shares) | | 2,831,000 | 461,856 |
| China Resources Sanjiu Medical & Pharmaceutical Co. Ltd. (A Shares) | | 15,400 | 64,402 |
| China Shenhua Energy Co. Ltd.: | | | |
| (A Shares) | | 82,400 | 215,617 |
| (H Shares) | | 1,753,000 | 3,560,239 |
| China Shipbuilding Industry Co. (A Shares) | | 513,800 | 386,242 |
| China Shipbuilding Industry Group Power Co. Ltd. (a) | | 26,400 | 78,514 |
| China Shipping Development Co. Ltd. (H Shares) | | 722,000 | 310,590 |
| China South Publishing & Media Group Co. Ltd. (A Shares) | | 32,000 | 52,525 |
| China Southern Airlines Ltd.: | | | |
| (A Shares) | | 168,100 | 158,875 |
| (H Shares) | | 902,000 | 555,127 |
| China Spacesat Co. Ltd. (A Shares) | | 17,700 | 52,505 |
| China State Construction Engineering Corp. Ltd. (A Shares) | | 1,025,680 | 763,363 |
| China Telecom Corp. Ltd. (H Shares) | | 7,048,000 | 2,998,280 |
| China Tower Corp. Ltd. (H Shares) (c) | | 21,612,000 | 4,756,647 |
| China United Network Communications Ltd. (A Shares) | | 697,400 | 607,136 |
| China Vanke Co. Ltd.: | | | |
| (A Shares) | | 303,500 | 1,141,945 |
| (H Shares) | | 681,900 | 2,486,582 |
| China Yangtze Power Co. Ltd. (A Shares) | | 481,700 | 1,221,449 |
| Chinese Universe Publishing and Media Group Co. Ltd. (A Shares) | | 5,700 | 9,619 |
| Chongqing Changan Automobile Co. Ltd. (A Shares) | | 58,600 | 59,572 |
| Chongqing Rural Commercial Bank Co. Ltd. (H Shares) | | 1,170,000 | 624,484 |
| Chongqing Zhifei Biological Products Co. Ltd. (A Shares) | | 36,000 | 248,186 |
| CITIC Guoan Information Industry Co. Ltd. (A Shares) (a) | | 23,400 | 11,479 |
| CITIC Securities Co. Ltd.: | | | |
| (A Shares) | | 113,400 | 348,954 |
| (H Shares) | | 1,247,000 | 2,287,891 |
| Contemporary Amperex Technology Co. Ltd. | | 10,900 | 106,321 |
| COSCO Shipping Development Co. Ltd. (A Shares) | | 119,200 | 42,125 |
| COSCO SHIPPING Holdings Co. Ltd.: | | | |
| (A Shares) (a) | | 136,500 | 89,259 |
| (H Shares) (a) | | 1,303,000 | 487,475 |
| CRRC Corp. Ltd.: | | | |
| (A Shares) | | 508,900 | 519,975 |
| (H Shares) | | 2,308,600 | 1,544,073 |
| Daqin Railway Co. Ltd. (A Shares) | | 386,800 | 418,976 |
| Datang International Power Generation Co. Ltd. (H Shares) | | 1,214,000 | 239,457 |
| DHC Software Co. Ltd. (A Shares) | | 128,200 | 129,783 |
| Dong E-E-Jiao Co. Ltd. (A Shares) | | 12,100 | 60,632 |
| Dongfang Electric Corp. Ltd. (A Shares) | | 38,300 | 48,033 |
| Dongfeng Motor Group Co. Ltd. (H Shares) | | 1,426,000 | 1,430,439 |
| Dongxing Securities Co. Ltd. (A Shares) | | 40,900 | 63,119 |
| Dr. Peng Telcom & Media Group Ltd. (A Shares) (a) | | 34,800 | 32,100 |
| East Money Information Co. Ltd. (A Shares) | | 161,400 | 341,207 |
| Everbright Securities Co. Ltd. (A Shares) | | 57,100 | 92,820 |
| Fangda Carbon New Material Co. Ltd. (A Shares) | | 38,144 | 57,882 |
| Financial Street Holdings Co. Ltd. (A Shares) | | 126,400 | 140,987 |
| First Capital Securities Co. Ltd. (A Shares) | | 51,300 | 48,510 |
| Focus Media Information Technology Co. Ltd. (A Shares) | | 389,520 | 331,361 |
| Foshan Haitian Flavouring & Food Co. Ltd. (A Shares) | | 49,300 | 781,879 |
| Founder Securities Co. Ltd. (A Shares) | | 213,500 | 203,820 |
| Foxconn Industrial Internet Co. Ltd. (A Shares) | | 98,100 | 213,709 |
| Fuyao Glass Industries Group Co. Ltd.: | | | |
| (A Shares) | | 129,300 | 390,142 |
| (H Shares) (c) | | 186,000 | 525,562 |
| GD Power Development Co. Ltd. (A Shares) | | 258,900 | 85,608 |
| Gemdale Corp. (A Shares) | | 148,700 | 251,128 |
| GF Securities Co. Ltd.: | | | |
| (A Shares) (a) | | 136,200 | 265,021 |
| (H Shares) | | 725,600 | 755,696 |
| Giant Network Group Co. Ltd. (A Shares) | | 42,700 | 107,931 |
| GoerTek, Inc. (A Shares) | | 46,800 | 123,330 |
| Great Wall Motor Co. Ltd. (H Shares) | | 1,558,000 | 1,262,372 |
| Gree Electric Appliances, Inc. of Zhuhai (A Shares) | | 68,500 | 571,114 |
| Greenland Holdings Corp. Ltd. (A Shares) | | 138,933 | 134,435 |
| Guanghui Energy Co. Ltd. (A Shares) | | 139,800 | 65,285 |
| Guangshen Railway Co. Ltd. (A Shares) | | 15,900 | 6,974 |
| Guangzhou Automobile Group Co. Ltd. | | 64,500 | 105,201 |
| Guangzhou Automobile Group Co. Ltd. (H Shares) | | 1,514,000 | 1,512,086 |
| Guangzhou Baiyunshan Pharmaceutical Holdings Co. Ltd. (A Shares) | | 40,600 | 194,573 |
| Guangzhou Haige Communications Group (A Shares) | | 96,700 | 131,858 |
| Guangzhou R&F Properties Co. Ltd. (H Shares) | | 487,200 | 754,894 |
| Guosen Securities Co. Ltd. (A Shares) | | 95,400 | 165,514 |
| Guotai Junan Securities Co. Ltd.: | | | |
| (A Shares) | | 218,100 | 527,864 |
| (H Shares) (c) | | 361,800 | 552,866 |
| Guoyuan Securities Co. Ltd. (A Shares) | | 50,100 | 60,050 |
| Haier Smart Home Co. Ltd. (A Shares) | | 182,400 | 414,279 |
| Haitong Securities Co. Ltd.: | | | |
| (A Shares) | | 111,300 | 222,648 |
| (H Shares) | | 1,699,600 | 1,735,136 |
| Han's Laser Technology Industry Group Co. Ltd. (A Shares) | | 7,100 | 38,240 |
| Hanergy Mobile Energy Holding (d) | | 1,618,000 | 2 |
| Hangzhou Hikvision Digital Technology Co. Ltd. (A Shares) | | 214,900 | 984,356 |
| Hangzhou Robam Appliances Co. Ltd. (A Shares) | | 14,500 | 64,818 |
| Hangzhou Tigermed Consulting Co. Ltd. (A Shares) | | 20,300 | 196,836 |
| Heilan Home Co. Ltd. (A Shares) | | 55,700 | 60,742 |
| Henan Shuanghui Investment & Development Co. Ltd. (A Shares) | | 72,723 | 307,619 |
| Hengli Petrochemical Co. Ltd. (A Shares) | | 134,840 | 308,348 |
| Hengtong Optic-electric Co. Ltd. (A Shares) | | 30,280 | 63,148 |
| Hengyi Petrochemical Co. Ltd. (A Shares) | | 43,100 | 87,691 |
| Hesteel Co. Ltd. (A Shares) | | 193,000 | 67,939 |
| Hithink RoyalFlush Information Network Co. Ltd. (A Shares) | | 7,400 | 101,946 |
| Huaan Securities Co. Ltd. (A Shares) | | 53,700 | 48,006 |
| Huadian Power International Corp. Ltd.: | | | |
| (A Shares) | | 258,600 | 129,183 |
| (H Shares) | | 756,000 | 283,280 |
| Huadong Medicine Co. Ltd. (A Shares) | | 47,680 | 176,489 |
| Huaneng Power International, Inc.: | | | |
| (A Shares) | | 113,300 | 91,686 |
| (H Shares) | | 1,852,000 | 879,654 |
| Huaneng Renewables Corp. Ltd. (H Shares) | | 2,414,000 | 921,606 |
| Huatai Securities Co. Ltd.: | | | |
| (A Shares) | | 110,200 | 272,675 |
| (H Shares) (c) | | 913,000 | 1,357,099 |
| HUAXI Securities Co. Ltd. | | 38,900 | 52,587 |
| Huaxia Bank Co. Ltd. (A Shares) | | 242,200 | 257,493 |
| Huayu Automotive Systems Co. Ltd. (A Shares) | | 77,800 | 277,265 |
| Hubei Biocause Pharmaceutical Co. Ltd. (A Shares) | | 76,400 | 73,888 |
| Hubei Energy Group Co. Ltd. (A Shares) | | 116,000 | 66,975 |
| Hundsun Technologies, Inc. (A Shares) | | 11,490 | 124,213 |
| iFlytek Co. Ltd. (A Shares) | | 58,300 | 273,862 |
| Industrial & Commercial Bank of China Ltd.: | | | |
| (A Shares) | | 1,298,300 | 1,089,089 |
| (H Shares) | | 33,274,000 | 23,837,272 |
| Industrial Bank Co. Ltd. (A Shares) | | 458,400 | 1,217,700 |
| Industrial Securities Co. Ltd. (A Shares) | | 95,800 | 86,706 |
| Inner Mongoli Yili Industries Co. Ltd. (A Shares) | | 142,000 | 584,444 |
| Inner Mongolia Baotou Steel Union Co. Ltd. (A Shares) | | 1,108,500 | 215,545 |
| Inner Mongolia Junzheng Energy & Chemical Industry Group Co. Ltd. (A Shares) | | 124,000 | 52,048 |
| Inner Mongolia Yitai Coal Co. Ltd. (B Shares) | | 828,722 | 722,841 |
| Jiangsu Expressway Co. Ltd. (H Shares) | | 632,000 | 839,643 |
| Jiangsu Hengrui Medicine Co. Ltd. (A Shares) | | 99,780 | 1,286,532 |
| Jiangsu Yanghe Brewery JSC Ltd. (A Shares) | | 35,500 | 507,048 |
| Jiangxi Copper Co. Ltd.: | | | |
| (A Shares) | | 89,200 | 178,973 |
| (H Shares) | | 542,000 | 634,535 |
| Jiangxi Ganfeng Lithium Co. Ltd. | | 16,300 | 50,354 |
| Jinduicheng Molybdenum Co. Ltd. (A Shares) | | 8,900 | 9,040 |
| Jinke Properties Group Co. Ltd. (A Shares) | | 84,200 | 82,829 |
| Jointown Pharmaceutical Group (A Shares) | | 37,200 | 68,241 |
| Kangmei Pharmaceutical Co. Ltd. (A Shares) | | 40,900 | 21,625 |
| Kweichow Moutai Co. Ltd. (A Shares) | | 28,100 | 4,703,086 |
| Legend Holdings Corp.: | | | |
| (H Shares) (c) | | 188,900 | 415,240 |
| rights (a)(d) | | 12,238 | 2,030 |
| Lens Technology Co. Ltd. (A Shares) | | 48,500 | 90,827 |
| Lepu Medical Technology Beijing Co. Ltd. (A Shares) | | 58,900 | 252,329 |
| Liaoning Chengda Co. Ltd. (A Shares) (a) | | 25,500 | 50,755 |
| LONGi Green Energy Technology Co. Ltd. | | 84,200 | 272,599 |
| Luxshare Precision Industry Co. Ltd. (A Shares) | | 127,095 | 572,796 |
| Luzhou Laojiao Co. Ltd. (A Shares) | | 32,400 | 400,656 |
| Maanshan Iron & Steel Co. Ltd.: | | | |
| (A Shares) | | 1,036,900 | 391,308 |
| (H Shares) | | 146,000 | 55,221 |
| Mango Excellent Media Co. Ltd. (A Shares) | | 17,510 | 67,091 |
| Meinian Onehealth Healthcare Holdings Co. Ltd. (A Shares) | | 58,560 | 123,922 |
| Metallurgical Corp. China Ltd.: | | | |
| (A Shares) | | 823,400 | 320,289 |
| (H Shares) | | 982,000 | 207,888 |
| Midea Group Co. Ltd. (A Shares) | | 82,700 | 651,331 |
| Muyuan Foodstuff Co. Ltd. (A Shares) | | 38,000 | 530,931 |
| NARI Technology Co. Ltd. (A Shares) | | 110,800 | 345,073 |
| New China Life Insurance Co. Ltd. | | 44,300 | 299,506 |
| New China Life Insurance Co. Ltd. (H Shares) | | 443,200 | 1,720,138 |
| Ningbo Zhoushan Port Co. Ltd. Class A | | 233,200 | 121,783 |
| O-film Tech Co. Ltd. (A Shares) (a) | | 48,800 | 77,321 |
| Oceanwide Holdings Co., Ltd. (A Shares) | | 54,500 | 33,859 |
| Offshore Oil Enginering Co. Ltd. (A Shares) | | 77,000 | 65,889 |
| Oppein Home Group, Inc. (A Shares) | | 4,300 | 67,373 |
| Orient Securities Co. Ltd. (A Shares) | | 190,900 | 270,806 |
| People's Insurance Co. of China Group (H Shares) | | 4,278,000 | 1,801,779 |
| Perfect World Co. Ltd. (A Shares) | | 14,100 | 59,055 |
| PetroChina Co. Ltd.: | | | |
| (A Shares) | | 546,400 | 456,049 |
| (H Shares) | | 10,600,000 | 5,169,213 |
| PICC Property & Casualty Co. Ltd. (H Shares) | | 3,569,840 | 4,517,701 |
| Ping An Bank Co. Ltd. (A Shares) | | 390,100 | 900,182 |
| Ping An Insurance Group Co. of China Ltd.: | | | |
| (A Shares) | | 191,600 | 2,392,023 |
| (H Shares) | | 2,927,000 | 33,782,822 |
| Poly Developments & Holdings (A Shares) | | 270,600 | 553,099 |
| Postal Savings Bank of China Co. Ltd. (H Shares) (c) | | 4,088,000 | 2,621,074 |
| Power Construction Corp. of China Ltd. (A Shares) | | 205,400 | 130,061 |
| Qihoo 360 Technology Co. Ltd. (A Shares) | | 21,900 | 70,203 |
| Risesun Real Estate Development Co. Ltd. (A Shares) | | 66,000 | 81,467 |
| Rongsheng Petrochemical Co. Ltd. (A Shares) | | 113,500 | 177,504 |
| SAIC Motor Corp. Ltd. (A Shares) | | 182,600 | 609,002 |
| Sanan Optoelectronics Co. Ltd. (A Shares) | | 57,700 | 124,395 |
| Sany Heavy Industry Co. Ltd. (A Shares) | | 194,200 | 371,110 |
| SDIC Capital Co. Ltd. | | 95,800 | 166,607 |
| SDIC Power Holdings Co. Ltd. (A Shares) | | 201,500 | 238,522 |
| Seazen Holdings Co. Ltd. (A Shares) | | 53,500 | 241,528 |
| SF Holding Co. Ltd. (A Shares) | | 19,200 | 107,975 |
| Shaanxi Coal Industry Co. Ltd. (A Shares) | | 130,700 | 155,408 |
| Shandong Buchang Pharmaceuticals Co. Ltd. (A Shares) | | 47,343 | 137,593 |
| Shandong Gold Mining Co. Ltd. (A Shares) | | 58,560 | 266,019 |
| Shandong Linglong Tyre Co. Ltd. (A Shares) | | 15,500 | 46,123 |
| Shandong Weigao Medical Polymer Co. Ltd. (H Shares) | | 1,072,000 | 1,230,700 |
| Shanghai 2345 Network Holding Group Co. Ltd. (A Shares) | | 12,675 | 5,860 |
| Shanghai Construction Group Co. Ltd. (A Shares) | | 299,000 | 144,776 |
| Shanghai Electric Group Co. Ltd.: | | | |
| (A Shares) | | 291,300 | 201,725 |
| (H Shares) | | 1,184,000 | 362,159 |
| Shanghai Fosun Pharmaceutical (Group) Co. Ltd.: | | | |
| (A Shares) | | 19,400 | 70,078 |
| (H Shares) | | 298,500 | 842,476 |
| Shanghai International Airport Co. Ltd. (A Shares) | | 22,400 | 242,458 |
| Shanghai International Port Group Co. Ltd. (A Shares) | | 229,000 | 188,666 |
| Shanghai Lujiazui Finance Trust Ltd. (B Shares) | | 753,600 | 830,017 |
| Shanghai Pharmaceuticals Holding Co. Ltd.: | | | |
| (A Shares) | | 73,200 | 192,715 |
| (H Shares) | | 376,600 | 680,486 |
| Shanghai Pudong Development Bank Co. Ltd. (A Shares) | | 648,000 | 1,150,238 |
| Shanghai Tunnel Engineering Co. Ltd. | | 71,000 | 58,667 |
| Shanghai Zhangjiang High Ltd. Class A | | 38,700 | 88,721 |
| Shanghaioriental Pearl Media Co. Ltd. | | 54,690 | 69,874 |
| Shanxi Lu'an Environmental Energy Development Co. Ltd. (A Shares) | | 69,000 | 68,638 |
| Shanxi Securities Co. Ltd. (A Shares) | | 49,000 | 54,155 |
| Shanxi Xinghuacun Fen Wine Factory Co. Ltd. (A Shares) | | 21,600 | 272,592 |
| Shanxi Xishan Coal & Electricity Power Co. Ltd. (A Shares) | | 125,600 | 101,045 |
| Shenergy Co. Ltd. (A Shares) | | 85,700 | 70,442 |
| Shenwan Hongyuan Group Co. Ltd. (A Shares) | | 562,300 | 382,206 |
| Shenzhen Energy Group Co. Ltd. (A Shares) | | 64,000 | 55,494 |
| Shenzhen Inovance Technology Co. Ltd. (A Shares) | | 25,300 | 89,510 |
| Shenzhen Kangtai Biological Products Co. Ltd. | | 9,500 | 116,720 |
| Shenzhen Mindray Bio-Medical Electronics Co. Ltd. (A Shares) | | 9,400 | 237,345 |
| Shenzhen Overseas Chinese Town Co. Ltd. (A Shares) | | 127,500 | 127,387 |
| Shenzhen Salubris Pharmaceuticals Co. Ltd. (A Shares) | | 52,300 | 138,956 |
| Shenzhen Zhongjin Lingnan Nonfemet Co. Ltd. (A Shares) | | 10,500 | 5,988 |
| Shijiazhuang Baosh Electric Co. Ltd. (A Shares) | | 80,000 | 54,097 |
| Sichuan Chuantou Energy Co. Ltd. (A Shares) | | 72,000 | 98,710 |
| Sichuan Kelun Pharmaceutical Co. Ltd. (A Shares) | | 21,800 | 73,891 |
| Sichuan New Hope Agribusiness Co. Ltd. (A Shares) | | 93,900 | 293,969 |
| Sinolink Securities Co. Ltd. (A Shares) | | 44,700 | 53,953 |
| Sinopec Engineering Group Co. Ltd. (H Shares) | | 693,000 | 395,881 |
| Sinopec Shanghai Petrochemical Co. Ltd.: | | | |
| (A Shares) | | 392,200 | 220,463 |
| (H Shares) | | 1,081,000 | 298,561 |
| Sinopharm Group Co. Ltd. (H Shares) | | 603,600 | 2,161,643 |
| Sinotrans Ltd. (H Shares) | | 1,194,000 | 351,066 |
| Songcheng Performance Development Co. Ltd. (A Shares) | | 23,900 | 100,414 |
| Soochow Securities Co. Ltd. (A Shares) | | 42,300 | 54,539 |
| Southwest Securities Co. Ltd. (A Shares) | | 174,700 | 110,516 |
| Spring Airlines Co. Ltd. (A Shares) | | 13,987 | 85,771 |
| Suning.com Co. Ltd. (A Shares) | | 246,800 | 369,493 |
| Suzhou Dongshan Precision Manufacturing Co. Ltd. (A Shares) | | 23,200 | 67,793 |
| Suzhou Gold Mantis Consolidated Co. Ltd. | | 47,100 | 53,449 |
| Tasly Pharmaceutical Group Co. Ltd. (A Shares) | | 24,700 | 51,265 |
| TBEA Co. Ltd. (A Shares) | | 57,200 | 52,120 |
| TCL Corp. (A Shares) | | 199,100 | 93,009 |
| Tianma Microelectronics Co. Ltd. (A Shares) | | 28,600 | 55,887 |
| Tianqi Lithium Corp. (A Shares) | | 16,700 | 59,554 |
| Tong Ren Tang Technologies Co. Ltd. (H Shares) | | 321,000 | 319,588 |
| Tonghua Dongbao Pharmaceutical Co. Ltd. (A Shares) | | 30,000 | 68,043 |
| Tongling Nonferrous Metals Group Co. Ltd. (A Shares) | | 166,300 | 51,224 |
| Tongwei Co. Ltd. (A Shares) | | 88,800 | 159,982 |
| Transfar Zhilian Co. Ltd. | | 47,800 | 51,041 |
| TravelSky Technology Ltd. (H Shares) | | 498,000 | 1,135,169 |
| Tsingtao Brewery Co. Ltd.: | | | |
| (A Shares) | | 50,600 | 337,217 |
| (H Shares) | | 164,000 | 950,383 |
| Tus-Sound Environmental Resources Co. Ltd. (A Shares) | | 3,200 | 3,934 |
| Unisplendour Corp. Ltd. (A Shares) | | 10,864 | 45,281 |
| Walvax Biotechnology Co. Ltd. (A Shares) | | 22,700 | 97,170 |
| Wangsu Science & Technology Co. Ltd. (A Shares) | | 34,200 | 46,238 |
| Wanhua Chemical Group Co. Ltd. (A Shares) | | 74,200 | 479,871 |
| Wanxiang Qianchao Co. Ltd. (A Shares) | | 44,000 | 31,606 |
| Weichai Power Co. Ltd.: | | | |
| (A Shares) | | 251,800 | 412,849 |
| (H Shares) | | 916,200 | 1,442,117 |
| Weifu High-Technology Group Co. Ltd. (A Shares) | | 41,200 | 98,108 |
| Wens Foodstuffs Group Co. Ltd. (A Shares) | | 115,400 | 659,197 |
| Western Securities Co. Ltd. (A Shares) | | 50,700 | 63,653 |
| Wuhu Sanqi Interactive Entertainment Network Technology Group Co. Ltd. (A Shares) | | 61,600 | 159,589 |
| Wuliangye Yibin Co. Ltd. (A Shares) | | 84,000 | 1,571,381 |
| WuXi AppTec Co. Ltd. | | 33,500 | 447,184 |
| WuXi AppTec Co. Ltd. (H Shares) (c) | | 80,480 | 970,325 |
| Wuxi Lead Intelligent Equipment Co. Ltd. (A Shares) | | 13,400 | 62,247 |
| XCMG Construction Machinery Co. Ltd. (A Shares) | | 117,700 | 75,461 |
| Xiamen C&D, Inc. (A Shares) | | 45,100 | 54,336 |
| Xinhu Zhongbao Co. Ltd. (A Shares) | | 132,100 | 79,489 |
| Xinjiang Goldwind Science & Technology Co. Ltd.: | | | |
| (A Shares) | | 55,900 | 99,670 |
| (H Shares) | | 432,010 | 515,219 |
| Yanzhou Coal Mining Co. Ltd.: | | | |
| (A Shares) | | 88,100 | 129,869 |
| (H Shares) | | 846,000 | 858,329 |
| Yonghui Superstores Co. Ltd. (A Shares) | | 238,300 | 282,107 |
| Yonyou Network Technology Co. Ltd. (A Shares) | | 58,660 | 245,824 |
| Yunda Holding Co. Ltd. (A Shares) | | 37,900 | 177,000 |
| Yunnan Baiyao Group Co. Ltd. (A Shares) | | 29,300 | 360,060 |
| Zhangzhou Pientzehuang Pharmaceutical Co. Ltd. (A Shares) | | 9,200 | 141,659 |
| Zhaojin Mining Industry Co. Ltd. (H Shares) | | 514,000 | 574,846 |
| Zhejiang Century Huatong Group Co. Ltd. (A Shares) | | 4,096 | 5,202 |
| Zhejiang China Commodities City Group Co. Ltd. (A Shares) | | 204,400 | 113,172 |
| Zhejiang Chint Electric Co. Ltd. (A Shares) | | 85,000 | 275,192 |
| Zhejiang Dahua Technology Co. Ltd. (A Shares) | | 44,500 | 101,645 |
| Zhejiang Expressway Co. Ltd. (H Shares) | | 706,000 | 578,122 |
| Zhejiang Huayou Cobalt Co. Ltd. (A Shares) | | 16,016 | 55,738 |
| Zhejiang Longsheng Group Co. Ltd. (A Shares) | | 44,700 | 87,740 |
| Zhejiang Semir Garment Co. Ltd. (A Shares) | | 78,500 | 123,944 |
| Zhengzhou Yutong Bus Co. Ltd. (A Shares) | | 31,800 | 64,521 |
| ZhongAn Online P & C Insurance Co. Ltd. (H Shares) (a)(b)(c) | | 155,000 | 515,974 |
| Zhongjin Gold Co. Ltd. (A Shares) | | 56,500 | 66,338 |
| Zhuhai Wanlida Electric Co. Ltd. (A Shares) | | 16,400 | 65,013 |
| Zhuzhou CRRC Times Electric Co. Ltd. (H Shares) | | 273,800 | 1,015,953 |
| Zijin Mining Group Co. Ltd.: | | | |
| (A Shares) | | 514,800 | 247,876 |
| (H Shares) | | 2,738,000 | 948,416 |
| Zoomlion Heavy Industry Science and Technology Co. Ltd. (A Shares) | | 94,900 | 78,778 |
| ZTE Corp.: | | | |
| (A Shares) (a) | | 74,000 | 350,150 |
| (H Shares) (a) | | 414,080 | 1,155,240 |
|
| TOTAL CHINA | | | 325,323,855 |
|
| Colombia - 0.3% | | | |
| Bancolombia SA | | 123,050 | 1,496,259 |
| Bancolombia SA sponsored ADR | | 13,961 | 724,297 |
| Cementos Argos SA | | 238,804 | 539,075 |
| Ecopetrol SA | | 2,568,588 | 2,310,209 |
| Grupo de Inversiones Suramerica SA | | 117,307 | 1,186,952 |
| Interconexion Electrica SA ESP | | 233,521 | 1,347,237 |
| Inversiones Argos SA | | 146,148 | 791,275 |
|
| TOTAL COLOMBIA | | | 8,395,304 |
|
| Czech Republic - 0.1% | | | |
| Ceske Energeticke Zavody A/S | | 83,861 | 1,913,007 |
| Komercni Banka A/S | | 37,932 | 1,282,189 |
| MONETA Money Bank A/S (c) | | 264,803 | 880,052 |
|
| TOTAL CZECH REPUBLIC | | | 4,075,248 |
|
| Egypt - 0.1% | | | |
| Commercial International Bank SAE | | 674,886 | 3,386,974 |
| Commercial International Bank SAE sponsored GDR | | 42,342 | 209,169 |
| Eastern Tobacco Co. | | 425,751 | 422,322 |
| Elsewedy Electric Co. | | 334,210 | 278,508 |
|
| TOTAL EGYPT | | | 4,296,973 |
|
| Greece - 0.3% | | | |
| Alpha Bank AE (a) | | 701,425 | 1,494,974 |
| EFG Eurobank Ergasias SA (a) | | 1,307,953 | 1,324,554 |
| Ff Group (a)(d) | | 1,035 | 1,385 |
| Greek Organization of Football Prognostics SA | | 113,418 | 1,233,327 |
| Hellenic Telecommunications Organization SA | | 125,404 | 1,902,138 |
| Jumbo SA | | 58,016 | 1,132,342 |
| Motor Oil (HELLAS) Corinth Refineries SA | | 32,707 | 807,626 |
| National Bank of Greece SA (a) | | 288,206 | 977,166 |
|
| TOTAL GREECE | | | 8,873,512 |
|
| Hong Kong - 3.0% | | | |
| Beijing Enterprises Holdings Ltd. | | 258,500 | 1,217,121 |
| BYD Electronic International Co. Ltd. | | 344,500 | 591,566 |
| China Agri-Industries Holdings Ltd. | | 1,202,000 | 396,007 |
| China Everbright International Ltd. | | 1,838,333 | 1,389,423 |
| China Everbright Ltd. | | 530,000 | 785,250 |
| China Jinmao Holdings Group Ltd. | | 2,614,000 | 1,737,841 |
| China Merchants Holdings International Co. Ltd. | | 666,105 | 1,041,476 |
| China Mobile Ltd. | | 3,154,500 | 25,635,677 |
| China Overseas Land and Investment Ltd. | | 1,946,000 | 6,140,589 |
| China Power International Development Ltd. | | 2,410,000 | 503,291 |
| China Resources Beer Holdings Co. Ltd. | | 756,878 | 3,880,533 |
| China Resources Pharmaceutical Group Ltd. (c) | | 794,500 | 733,727 |
| China Resources Power Holdings Co. Ltd. | | 961,691 | 1,208,590 |
| China Taiping Insurance Group Ltd. | | 811,977 | 1,825,407 |
| China Unicom Ltd. | | 3,122,000 | 3,073,606 |
| CITIC Pacific Ltd. | | 3,031,000 | 3,987,234 |
| CNOOC Ltd. | | 8,607,000 | 12,809,374 |
| CNOOC Ltd. sponsored ADR | | 5,859 | 870,296 |
| CSPC Pharmaceutical Group Ltd. | | 2,412,000 | 6,177,424 |
| Far East Horizon Ltd. | | 1,073,000 | 1,015,856 |
| Fosun International Ltd. | | 1,407,000 | 1,839,762 |
| Guangdong Investment Ltd. | | 1,482,000 | 3,207,490 |
| Hua Hong Semiconductor Ltd. (c) | | 227,000 | 456,463 |
| Lenovo Group Ltd. | | 3,750,000 | 2,614,287 |
| MMG Ltd. (a) | | 1,200,000 | 249,818 |
| Shanghai Industrial Holdings Ltd. | | 304,000 | 565,888 |
| Shenzhen Investment Ltd. | | 1,398,000 | 550,245 |
| Sino-Ocean Group Holding Ltd. | | 1,488,479 | 547,242 |
| Sinotruk Hong Kong Ltd. | | 338,500 | 511,497 |
| Sun Art Retail Group Ltd. | | 1,250,966 | 1,276,477 |
| Winteam Pharmaceutical Group Ltd. | | 1,190,000 | 531,366 |
| Yuexiu Property Co. Ltd. | | 3,394,000 | 747,571 |
|
| TOTAL HONG KONG | | | 88,118,394 |
|
| Hungary - 0.3% | | | |
| MOL Hungarian Oil and Gas PLC Series A (For. Reg.) | | 206,445 | 2,040,577 |
| OTP Bank PLC | | 113,826 | 5,242,983 |
| Richter Gedeon PLC | | 74,077 | 1,372,882 |
|
| TOTAL HUNGARY | | | 8,656,442 |
|
| India - 8.7% | | | |
| Adani Ports & Special Economic Zone Ltd. (a) | | 313,467 | 1,745,509 |
| Ambuja Cements Ltd. | | 308,981 | 879,804 |
| Ashok Leyland Ltd. | | 657,592 | 710,232 |
| Asian Paints Ltd. | | 147,201 | 3,749,531 |
| Aurobindo Pharma Ltd. | | 134,304 | 885,465 |
| Avenue Supermarts Ltd. (a)(c) | | 63,853 | 1,791,638 |
| Axis Bank Ltd. | | 1,072,163 | 11,100,825 |
| Bajaj Auto Ltd. | | 42,853 | 1,958,642 |
| Bajaj Finance Ltd. | | 88,881 | 5,036,616 |
| Bajaj Finserv Ltd. | | 19,555 | 2,239,589 |
| Bandhan Bank Ltd. (c) | | 194,910 | 1,678,306 |
| Bharat Forge Ltd. | | 113,683 | 725,758 |
| Bharat Petroleum Corp. Ltd. | | 334,945 | 2,478,820 |
| Bharti Airtel Ltd. | | 1,053,280 | 5,546,880 |
| Bharti Infratel Ltd. | | 164,403 | 439,066 |
| Bosch Ltd. | | 3,500 | 753,759 |
| Britannia Industries Ltd. | | 29,511 | 1,356,640 |
| Cadila Healthcare Ltd. | | 32,235 | 114,199 |
| Cipla Ltd. (a) | | 182,226 | 1,197,966 |
| Coal India Ltd. | | 616,795 | 1,800,547 |
| Container Corp. of India Ltd. | | 108,226 | 896,137 |
| Dabur India Ltd. | | 265,012 | 1,722,906 |
| Divi's Laboratories Ltd. | | 39,645 | 979,505 |
| Dr. Reddy's Laboratories Ltd. | | 59,185 | 2,322,026 |
| Eicher Motors Ltd. | | 6,804 | 2,155,642 |
| GAIL India Ltd. (a) | | 785,176 | 1,517,482 |
| Glenmark Pharmaceuticals Ltd. | | 63,689 | 282,828 |
| Godrej Consumer Products Ltd. | | 180,522 | 1,883,061 |
| Grasim Industries Ltd. | | 150,114 | 1,625,170 |
| Havells India Ltd. | | 132,578 | 1,290,808 |
| HCL Technologies Ltd. | | 277,513 | 4,547,133 |
| HDFC Standard Life Insurance Co. Ltd. (c) | | 256,999 | 2,264,800 |
| Hero Motocorp Ltd. | | 50,751 | 1,931,315 |
| Hindalco Industries Ltd. | | 618,270 | 1,633,204 |
| Hindustan Petroleum Corp. Ltd. | | 315,676 | 1,442,020 |
| Hindustan Unilever Ltd. | | 331,951 | 10,167,025 |
| Housing Development Finance Corp. Ltd. | | 839,087 | 25,164,554 |
| ICICI Bank Ltd. | | 1,226,479 | 7,995,705 |
| ICICI Lombard General Insurance Co. Ltd. (c) | | 69,967 | 1,318,342 |
| Indiabulls Housing Finance Ltd. | | 139,238 | 403,750 |
| Indian Oil Corp. Ltd. | | 970,406 | 2,002,962 |
| Infosys Ltd. | | 1,771,723 | 17,024,351 |
| InterGlobe Aviation Ltd. (a)(c) | | 45,957 | 941,143 |
| ITC Ltd. | | 1,765,626 | 6,403,168 |
| JSW Steel Ltd. | | 445,450 | 1,428,281 |
| Larsen & Toubro Ltd. | | 244,830 | 5,076,078 |
| LIC Housing Finance Ltd. | | 153,052 | 888,346 |
| Lupin Ltd. (a) | | 112,718 | 1,183,021 |
| Mahindra & Mahindra Financial Services Ltd. | | 159,929 | 793,672 |
| Mahindra & Mahindra Ltd. | | 385,380 | 3,288,966 |
| Marico Ltd. | | 228,404 | 1,177,118 |
| Maruti Suzuki India Ltd. | | 54,315 | 5,783,020 |
| Motherson Sumi Systems Ltd. (a) | | 472,334 | 817,372 |
| Nestle India Ltd. | | 11,782 | 2,477,825 |
| NTPC Ltd. | | 1,230,180 | 2,119,856 |
| Oil & Natural Gas Corp. Ltd. | | 1,295,758 | 2,584,294 |
| Page Industries Ltd. | | 2,705 | 979,999 |
| Petronet LNG Ltd. | | 297,185 | 1,198,332 |
| Pidilite Industries Ltd. (a) | | 61,427 | 1,212,084 |
| Piramal Enterprises Ltd. | | 46,117 | 1,092,270 |
| Power Grid Corp. of India Ltd. | | 923,554 | 2,580,769 |
| Rec Ltd. | | 348,179 | 684,459 |
| Reliance Industries Ltd. | | 1,462,892 | 30,130,343 |
| Shree Cement Ltd. | | 4,145 | 1,161,135 |
| Shriram Transport Finance Co. Ltd. | | 86,006 | 1,377,637 |
| State Bank of India (a) | | 910,498 | 4,001,373 |
| Sun Pharmaceutical Industries Ltd. | | 434,352 | 2,651,418 |
| Tata Consultancy Services Ltd. | | 461,445 | 14,696,103 |
| Tata Motors Ltd. (a) | | 830,909 | 2,053,126 |
| Tata Power Co. Ltd. | | 596,314 | 497,718 |
| Tata Steel Ltd. | | 186,258 | 996,573 |
| Tech Mahindra Ltd. | | 236,184 | 2,457,537 |
| Titan Co. Ltd. | | 159,117 | 2,983,083 |
| Ultratech Cemco Ltd. | | 49,653 | 2,897,542 |
| United Spirits Ltd. (a) | | 147,165 | 1,293,672 |
| UPL Ltd. (a) | | 276,057 | 2,318,042 |
| Vedanta Ltd. | | 972,944 | 2,029,193 |
| Vodafone Idea Ltd. (a) | | 3,808,623 | 208,722 |
| Wipro Ltd. | | 599,852 | 2,195,057 |
| Yes Bank Ltd. | | 937,291 | 927,532 |
| Zee Entertainment Enterprises Ltd. (a) | | 363,656 | 1,329,807 |
|
| TOTAL INDIA | | | 255,676,204 |
|
| Indonesia - 2.0% | | | |
| PT Adaro Energy Tbk | | 7,410,400 | 690,897 |
| PT Astra International Tbk | | 10,490,400 | 5,188,560 |
| PT Bank Central Asia Tbk | | 5,042,000 | 11,285,648 |
| PT Bank Mandiri (Persero) Tbk | | 9,484,600 | 4,741,061 |
| PT Bank Negara Indonesia (Persero) Tbk | | 3,760,600 | 2,052,847 |
| PT Bank Rakyat Indonesia Tbk | | 28,629,700 | 8,578,468 |
| PT Bank Tabungan Negara Tbk | | 1,914,900 | 253,442 |
| PT Barito Pacific Tbk | | 13,251,500 | 896,811 |
| PT Bumi Serpong Damai Tbk (a) | | 3,948,000 | 397,559 |
| PT Charoen Pokphand Indonesia Tbk | | 3,704,200 | 1,661,257 |
| PT Gudang Garam Tbk | | 253,600 | 1,012,807 |
| PT Hanjaya Mandala Sampoerna Tbk | | 4,616,200 | 699,919 |
| PT Indah Kiat Pulp & Paper Tbk | | 1,339,100 | 693,194 |
| PT Indocement Tunggal Prakarsa Tbk | | 951,900 | 1,356,143 |
| PT Indofood CBP Sukses Makmur Tbk | | 1,174,600 | 972,484 |
| PT Indofood Sukses Makmur Tbk | | 2,196,300 | 1,203,580 |
| PT Jasa Marga Tbk | | 1,102,237 | 427,699 |
| PT Kalbe Farma Tbk | | 10,591,500 | 1,202,756 |
| PT Pabrik Kertas Tjiwi Kimia Tbk | | 673,700 | 507,124 |
| PT Pakuwon Jati Tbk | | 8,529,900 | 379,606 |
| PT Perusahaan Gas Negara Tbk Series B | | 5,627,400 | 844,499 |
| PT Semen Gresik (Persero) Tbk | | 1,487,800 | 1,341,826 |
| PT Surya Citra Media Tbk | | 3,058,700 | 265,728 |
| PT Tambang Batubara Bukit Asam Tbk | | 1,259,400 | 201,663 |
| PT Telekomunikasi Indonesia Tbk Series B | | 25,552,500 | 7,456,753 |
| PT Tower Bersama Infrastructure Tbk | | 14,300 | 6,443 |
| PT Unilever Indonesia Tbk | | 794,100 | 2,472,579 |
| PT United Tractors Tbk | | 839,800 | 1,296,257 |
|
| TOTAL INDONESIA | | | 58,087,610 |
|
| Isle of Man - 0.1% | | | |
| NEPI Rockcastle PLC | | 197,810 | 1,721,453 |
| Korea (South) - 11.2% | | | |
| AMOREPACIFIC Corp. | | 15,984 | 2,622,365 |
| AMOREPACIFIC Group, Inc. | | 14,357 | 1,037,864 |
| BGF Retail Co. Ltd. | | 3,923 | 596,685 |
| BS Financial Group, Inc. | | 135,800 | 806,475 |
| Celltrion Healthcare Co. Ltd. | | 25,276 | 1,190,053 |
| Celltrion Pharm, Inc. (a) | | 7,011 | 239,633 |
| Celltrion, Inc. (a) | | 46,386 | 7,927,266 |
| Cheil Industries, Inc. | | 43,975 | 3,757,616 |
| Cheil Worldwide, Inc. | | 35,041 | 741,068 |
| CJ CheilJedang Corp. | | 4,359 | 851,098 |
| CJ Corp. | | 8,506 | 598,907 |
| CJ O Shopping Co. Ltd. | | 5,868 | 827,333 |
| Daelim Industrial Co. | | 14,624 | 1,137,140 |
| Daewoo Engineering & Construction Co. Ltd. (a) | | 104,477 | 388,790 |
| Daewoo Shipbuilding & Marine Engineering Co. Ltd. (a) | | 18,102 | 435,423 |
| Db Insurance Co. Ltd. | | 25,766 | 1,111,847 |
| Doosan Bobcat, Inc. | | 24,462 | 658,429 |
| E-Mart Co. Ltd. | | 11,066 | 1,054,319 |
| Fila Korea Ltd. | | 24,666 | 1,214,025 |
| GS Engineering & Construction Corp. | | 32,335 | 853,764 |
| GS Holdings Corp. | | 26,137 | 1,108,872 |
| GS Retail Co. Ltd. | | 14,602 | 477,255 |
| Hana Financial Group, Inc. | | 154,445 | 4,447,442 |
| Hankook Tire Co. Ltd. | | 37,403 | 992,372 |
| Hanmi Pharm Co. Ltd. | | 3,249 | 925,874 |
| Hanmi Science Co. Ltd. | | 5,976 | 222,640 |
| Hanon Systems | | 91,950 | 911,415 |
| Hanwha Chemical Corp. | | 52,102 | 727,912 |
| Hanwha Corp. | | 21,055 | 427,293 |
| Hanwha Life Insurance Co. Ltd. | | 140,795 | 268,286 |
| HDC Hyundai Development Co. | | 14,481 | 382,971 |
| HLB, Inc. (a) | | 16,726 | 2,401,087 |
| Hotel Shilla Co. | | 16,150 | 1,069,500 |
| Hyundai Department Store Co. Ltd. | | 7,551 | 476,821 |
| Hyundai Engineering & Construction Co. Ltd. | | 41,881 | 1,537,045 |
| Hyundai Fire & Marine Insurance Co. Ltd. | | 31,712 | 684,213 |
| Hyundai Glovis Co. Ltd. | | 9,894 | 1,276,602 |
| Hyundai Heavy Industries Co. Ltd. (a) | | 19,896 | 2,074,112 |
| Hyundai Mobis | | 34,255 | 6,966,384 |
| Hyundai Motor Co. | | 76,703 | 7,996,109 |
| Hyundai Robotics Co. Ltd. | | 5,104 | 1,489,388 |
| Hyundai Steel Co. | | 40,340 | 1,096,149 |
| Industrial Bank of Korea | | 132,581 | 1,336,810 |
| ING Life Insurance Korea Ltd. (c) | | 14,977 | 358,335 |
| Kakao Corp. | | 25,750 | 3,113,438 |
| Kangwon Land, Inc. | | 58,629 | 1,570,567 |
| KB Financial Group, Inc. | | 204,093 | 7,304,288 |
| KCC Corp. | | 2,903 | 560,611 |
| Kia Motors Corp. | | 135,249 | 4,917,452 |
| Korea Aerospace Industries Ltd. | | 36,434 | 1,183,033 |
| Korea Electric Power Corp. (a) | | 132,358 | 2,876,519 |
| Korea Express Co. Ltd. (a) | | 4,583 | 616,789 |
| Korea Gas Corp. | | 15,320 | 514,467 |
| Korea Investment Holdings Co. Ltd. | | 20,989 | 1,215,984 |
| Korea Zinc Co. Ltd. | | 4,445 | 1,650,320 |
| Korean Air Lines Co. Ltd. | | 21,523 | 457,940 |
| KT Corp. | | 216 | 4,891 |
| KT&G Corp. | | 59,898 | 5,118,219 |
| Kumho Petro Chemical Co. Ltd. | | 10,139 | 606,457 |
| LG Chemical Ltd. | | 23,553 | 6,188,678 |
| LG Corp. | | 48,921 | 2,901,091 |
| LG Display Co. Ltd. (a) | | 119,899 | 1,397,246 |
| LG Electronics, Inc. | | 54,702 | 3,127,057 |
| LG Household & Health Care Ltd. | | 4,800 | 5,172,051 |
| LG Innotek Co. Ltd. | | 7,098 | 733,885 |
| LG Telecom Ltd. | | 54,680 | 628,431 |
| Lotte Chemical Corp. | | 8,751 | 1,697,423 |
| Lotte Confectionery Co. Ltd. | | 14,370 | 448,184 |
| Lotte Shopping Co. Ltd. | | 5,671 | 603,303 |
| Medy-Tox, Inc. | | 2,186 | 616,411 |
| Meritz Securities Co. Ltd. | | 154,346 | 594,810 |
| Mirae Asset Daewoo Co. Ltd. | | 204,574 | 1,249,865 |
| NAVER Corp. | | 71,890 | 10,074,392 |
| NCSOFT Corp. | | 8,411 | 3,708,547 |
| Netmarble Corp. (a)(c) | | 12,881 | 989,500 |
| Oci Co. Ltd. | | 9,776 | 525,434 |
| Orion Corp./Republic of Korea | | 11,866 | 1,074,773 |
| Ottogi Corp. | | 585 | 282,430 |
| Pearl Abyss Corp. (a) | | 3,299 | 610,587 |
| POSCO | | 40,403 | 7,288,103 |
| POSCO Chemtech Co. Ltd. | | 13,161 | 540,367 |
| Posco International Corp. | | 26,594 | 414,718 |
| S-Oil Corp. | | 23,234 | 1,979,364 |
| S1 Corp. | | 8,568 | 686,002 |
| Samsung Biologics Co. Ltd. (a)(c) | | 8,476 | 2,886,196 |
| Samsung Card Co. Ltd. | | 15,230 | 436,615 |
| Samsung Electro-Mechanics Co. Ltd. | | 29,005 | 2,800,643 |
| Samsung Electronics Co. Ltd. | | 2,434,050 | 104,825,402 |
| Samsung Engineering Co. Ltd. (a) | | 81,804 | 1,244,231 |
| Samsung Fire & Marine Insurance Co. Ltd. | | 15,688 | 2,902,231 |
| Samsung Heavy Industries Co. Ltd. (a) | | 231,030 | 1,431,241 |
| Samsung Life Insurance Co. Ltd. | | 35,810 | 2,160,307 |
| Samsung SDI Co. Ltd. | | 28,305 | 5,502,386 |
| Samsung SDS Co. Ltd. | | 17,898 | 3,081,670 |
| Samsung Securities Co. Ltd. | | 32,871 | 943,754 |
| Shinhan Financial Group Co. Ltd. | | 230,842 | 8,361,589 |
| Shinsegae Co. Ltd. | | 3,669 | 739,888 |
| SillaJen, Inc. (a) | | 29,445 | 484,338 |
| SK C&C Co. Ltd. | | 18,091 | 3,996,038 |
| SK Energy Co. Ltd. | | 28,334 | 3,873,775 |
| SK Hynix, Inc. | | 280,041 | 19,621,942 |
| SK Telecom Co. Ltd. | | 10,329 | 2,098,871 |
| STX Pan Ocean Co. Ltd. (Korea) (a) | | 132,365 | 497,094 |
| ViroMed Co. Ltd. | | 9,621 | 795,797 |
| Woongjin Coway Co. Ltd. | | 26,626 | 2,088,599 |
| Woori Financial Group, Inc. (a) | | 246,904 | 2,478,977 |
| Woori Investment & Securities Co. Ltd. | | 69,589 | 719,503 |
| Yuhan Corp. | | 4,539 | 870,729 |
|
| TOTAL KOREA (SOUTH) | | | 327,790,430 |
|
| Luxembourg - 0.1% | | | |
| Globant SA (a) | | 17,660 | 1,646,972 |
| Reinet Investments SCA | | 75,377 | 1,414,556 |
|
| TOTAL LUXEMBOURG | | | 3,061,528 |
|
| Malaysia - 1.9% | | | |
| AirAsia Group BHD | | 760,500 | 347,217 |
| Alliance Bank Malaysia Bhd | | 421,800 | 290,282 |
| AMMB Holdings Bhd | | 841,200 | 802,392 |
| Axiata Group Bhd | | 1,392,534 | 1,431,334 |
| British American Tobacco (Malaysia) Bhd | | 73,600 | 331,344 |
| Bumiputra-Commerce Holdings Bhd | | 2,482,964 | 3,116,172 |
| Dialog Group Bhd | | 1,925,000 | 1,601,779 |
| DiGi.com Bhd | | 1,549,500 | 1,740,167 |
| Fraser & Neave Holdings BHD | | 74,200 | 613,621 |
| Gamuda Bhd | | 859,200 | 768,293 |
| Genting Bhd | | 1,130,200 | 1,569,973 |
| Genting Malaysia Bhd | | 1,479,600 | 1,134,835 |
| Genting Plantations Bhd | | 111,700 | 264,747 |
| Hap Seng Consolidated Bhd | | 307,700 | 734,830 |
| Hartalega Holdings Bhd | | 733,100 | 922,241 |
| Hong Leong Bank Bhd | | 317,100 | 1,305,685 |
| Hong Leong Credit Bhd | | 104,500 | 435,508 |
| IHH Healthcare Bhd | | 1,063,900 | 1,449,976 |
| IJM Corp. Bhd | | 1,391,400 | 715,380 |
| IOI Corp. Bhd | | 940,900 | 982,031 |
| IOI Properties Group Bhd | | 17,075 | 4,244 |
| Kuala Lumpur Kepong Bhd | | 211,500 | 1,096,598 |
| Malayan Banking Bhd | | 1,972,287 | 4,055,875 |
| Malaysia Airports Holdings Bhd | | 524,906 | 993,487 |
| Maxis Bhd | | 1,181,400 | 1,521,214 |
| MISC Bhd | | 551,400 | 1,098,278 |
| Nestle (Malaysia) BHD | | 34,000 | 1,176,671 |
| Petronas Chemicals Group Bhd | | 1,242,800 | 2,220,405 |
| Petronas Dagangan Bhd | | 127,000 | 715,672 |
| Petronas Gas Bhd | | 308,900 | 1,230,433 |
| PPB Group Bhd | | 277,420 | 1,200,144 |
| Press Metal Bhd | | 753,700 | 857,551 |
| Public Bank Bhd | | 1,609,600 | 7,811,965 |
| QL Resources Bhd | | 300,100 | 521,874 |
| RHB Capital Bhd | | 852,389 | 1,172,547 |
| RHB Capital Bhd (a)(d) | | 99,132 | 0 |
| Sime Darby Bhd | | 1,398,549 | 758,309 |
| Sime Darby Plantation Bhd | | 1,042,849 | 1,222,960 |
| Sime Darby Property Bhd | | 1,076,349 | 186,632 |
| SP Setia Bhd | | 719,353 | 208,072 |
| Telekom Malaysia Bhd | | 545,480 | 490,189 |
| Tenaga Nasional Bhd | | 1,615,100 | 5,348,805 |
| Top Glove Corp. Bhd | | 808,800 | 841,448 |
| Westports Holdings Bhd | | 469,600 | 480,399 |
| YTL Corp. Bhd | | 1,236,443 | 257,099 |
|
| TOTAL MALAYSIA | | | 56,028,678 |
|
| Mexico - 2.4% | | | |
| Alfa SA de CV Series A | | 1,581,800 | 1,371,581 |
| Alsea S.A.B. de CV (a) | | 271,700 | 724,853 |
| America Movil S.A.B. de CV Series L | | 17,273,300 | 13,684,667 |
| CEMEX S.A.B. de CV unit | | 7,824,218 | 2,940,717 |
| Coca-Cola FEMSA S.A.B. de CV unit | | 276,400 | 1,518,896 |
| El Puerto de Liverpool S.A.B. Dcv Class C | | 97,840 | 498,546 |
| Embotelladoras Arca S.A.B. de CV | | 229,500 | 1,282,165 |
| Fibra Uno Administracion SA de CV | | 1,613,100 | 2,450,278 |
| Fomento Economico Mexicano S.A.B. de CV unit | | 999,300 | 8,867,544 |
| Gruma S.A.B. de CV Series B | | 103,445 | 1,085,456 |
| Grupo Aeroportuario del Pacifico S.A.B. de CV Series B | | 184,400 | 1,933,293 |
| Grupo Aeroportuario del Sureste S.A.B. de CV Series B | | 106,405 | 1,744,828 |
| Grupo Bimbo S.A.B. de CV Series A | | 836,500 | 1,554,155 |
| Grupo Carso SA de CV Series A1 | | 227,900 | 762,964 |
| Grupo Financiero Banorte S.A.B. de CV Series O | | 1,333,400 | 7,278,195 |
| Grupo Financiero Inbursa S.A.B. de CV Series O | | 1,187,800 | 1,475,758 |
| Grupo Mexico SA de CV Series B | | 1,808,807 | 4,764,497 |
| Grupo Televisa SA de CV | | 1,239,600 | 2,737,411 |
| Industrias Penoles SA de CV | | 69,700 | 836,407 |
| Infraestructura Energetica Nova S.A.B. de CV | | 269,900 | 1,193,024 |
| Kimberly-Clark de Mexico SA de CV Series A | | 786,700 | 1,586,364 |
| Megacable Holdings S.A.B. de CV unit | | 152,800 | 627,754 |
| Mexichem S.A.B. de CV | | 527,255 | 1,137,751 |
| Promotora y Operadora de Infraestructura S.A.B. de CV | | 118,445 | 1,095,631 |
| Wal-Mart de Mexico SA de CV Series V | | 2,691,100 | 8,076,168 |
|
| TOTAL MEXICO | | | 71,228,903 |
|
| Netherlands - 0.1% | | | |
| X5 Retail Group NV: | | | |
| GDR | | 58,563 | 1,960,852 |
| GDR (Reg. S) | | 4,732 | 158,333 |
|
| TOTAL NETHERLANDS | | | 2,119,185 |
|
| Pakistan - 0.0% | | | |
| Habib Bank Ltd. | | 266,400 | 219,131 |
| MCB Bank Ltd. | | 190,700 | 211,860 |
| Oil & Gas Development Co. Ltd. | | 296,600 | 245,536 |
|
| TOTAL PAKISTAN | | | 676,527 |
|
| Peru - 0.1% | | | |
| Compania de Minas Buenaventura SA | | 6,329 | 96,694 |
| Compania de Minas Buenaventura SA sponsored ADR | | 102,631 | 1,574,360 |
|
| TOTAL PERU | | | 1,671,054 |
|
| Philippines - 1.1% | | | |
| Aboitiz Equity Ventures, Inc. | | 1,009,170 | 1,110,067 |
| Aboitiz Power Corp. | | 760,600 | 598,295 |
| Alliance Global Group, Inc. | | 2,032,400 | 458,948 |
| Altus San Nicolas Corp. (d) | | 18,209 | 1,858 |
| Ayala Corp. | | 145,455 | 2,461,038 |
| Ayala Land, Inc. | | 3,783,040 | 3,612,688 |
| Bank of the Philippine Islands (BPI) | | 471,577 | 900,318 |
| BDO Unibank, Inc. | | 1,013,756 | 3,090,340 |
| DMCI Holdings, Inc. | | 2,200,250 | 355,232 |
| Globe Telecom, Inc. | | 16,600 | 593,881 |
| GT Capital Holdings, Inc. | | 48,084 | 845,805 |
| International Container Terminal Services, Inc. | | 503,690 | 1,176,702 |
| JG Summit Holdings, Inc. | | 1,483,460 | 2,225,037 |
| Jollibee Food Corp. | | 225,230 | 1,028,443 |
| Manila Electric Co. | | 113,430 | 755,984 |
| Megaworld Corp. | | 5,705,800 | 542,359 |
| Metro Pacific Investments Corp. | | 7,362,500 | 695,127 |
| Metropolitan Bank & Trust Co. | | 927,757 | 1,234,189 |
| Philippine Long Distance Telephone Co. | | 45,380 | 975,881 |
| Robinsons Land Corp. | | 956,651 | 479,123 |
| Security Bank Corp. | | 113,760 | 446,039 |
| SM Investments Corp. | | 126,270 | 2,558,035 |
| SM Prime Holdings, Inc. | | 5,182,400 | 3,976,356 |
| Universal Robina Corp. | | 456,620 | 1,355,600 |
|
| TOTAL PHILIPPINES | | | 31,477,345 |
|
| Poland - 1.0% | | | |
| Alior Bank SA (a) | | 48,061 | 339,137 |
| Bank Millennium SA (a) | | 298,689 | 480,401 |
| Bank Polska Kasa Opieki SA | | 88,450 | 2,495,625 |
| Bank Zachodni WBK SA | | 18,391 | 1,507,613 |
| BRE Bank SA (a) | | 7,788 | 778,260 |
| CD Projekt RED SA | | 34,929 | 2,304,739 |
| Cyfrowy Polsat SA | | 135,057 | 979,173 |
| Dino Polska SA (a)(c) | | 25,430 | 991,734 |
| Grupa Lotos SA | | 47,716 | 1,191,448 |
| Jastrzebska Spolka Weglowa SA | | 23,735 | 120,270 |
| KGHM Polska Miedz SA (Bearer) (a) | | 71,945 | 1,574,989 |
| LPP SA | | 677 | 1,445,025 |
| NG2 SA | | 14,666 | 428,389 |
| Polish Oil & Gas Co. SA | | 883,594 | 1,087,885 |
| Polska Grupa Energetyczna SA (a) | | 445,789 | 955,600 |
| Polski Koncern Naftowy Orlen SA | | 152,612 | 4,170,152 |
| Powszechna Kasa Oszczednosci Bank SA | | 446,641 | 4,456,298 |
| Powszechny Zaklad Ubezpieczen SA | | 309,441 | 2,992,644 |
| Telekomunikacja Polska SA (a) | | 324,404 | 530,675 |
|
| TOTAL POLAND | | | 28,830,057 |
|
| Qatar - 0.9% | | | |
| Barwa Real Estate Co. (a) | | 927,790 | 871,475 |
| Industries Qatar QSC (a) | | 944,407 | 2,726,097 |
| Masraf al Rayan (a) | | 1,876,552 | 1,932,730 |
| Mesaieed Petrochemical Holding Co. (a) | | 2,263,923 | 1,554,465 |
| Qatar Electricity & Water Co. (a) | | 267,513 | 1,160,864 |
| Qatar Fuel Co. (a) | | 250,918 | 1,523,012 |
| Qatar Insurance Co. SAQ (a) | | 791,080 | 667,019 |
| Qatar Islamic Bank (a) | | 595,515 | 2,489,354 |
| Qatar National Bank SAQ (a) | | 2,319,895 | 12,233,448 |
| Qatar Telecom (Qtel) Q.S.C. (a) | | 429,610 | 861,344 |
| The Commercial Bank of Qatar (a) | | 992,278 | 1,171,875 |
|
| TOTAL QATAR | | | 27,191,683 |
|
| Russia - 3.8% | | | |
| Alrosa Co. Ltd. | | 1,322,383 | 1,536,602 |
| Gazprom OAO | | 3,309,366 | 13,424,964 |
| Gazprom OAO sponsored ADR (Reg. S) | | 1,093,992 | 8,756,312 |
| Inter Rao Ues JSC | | 18,415,744 | 1,240,688 |
| Lukoil PJSC | | 158,438 | 14,636,946 |
| Lukoil PJSC sponsored ADR | | 43,675 | 4,016,353 |
| Magnit OJSC GDR (Reg. S) | | 182,540 | 2,073,654 |
| Magnitogorsk Iron & Steel Works PJSC | | 1,120,800 | 638,509 |
| MMC Norilsk Nickel PJSC | | 22,712 | 6,335,877 |
| MMC Norilsk Nickel PJSC sponsored ADR | | 99,181 | 2,747,314 |
| Mobile TeleSystems OJSC sponsored ADR | | 258,629 | 2,314,730 |
| Moscow Exchange MICEX-RTS OAO (a) | | 691,111 | 1,024,231 |
| NOVATEK OAO GDR (Reg. S) | | 46,744 | 10,003,216 |
| Novolipetsk Steel OJSC | | 556,742 | 1,085,657 |
| Novolipetsk Steel OJSC GDR (Reg. S) | | 8,163 | 159,668 |
| PhosAgro OJSC GDR (Reg. S) | | 60,160 | 756,813 |
| Polyus PJSC | | 12,726 | 1,482,327 |
| Polyus PJSC unit | | 2,433 | 143,182 |
| Rosneft Oil Co. OJSC | | 399,914 | 2,656,842 |
| Rosneft Oil Co. OJSC GDR (Reg. S) | | 191,497 | 1,268,093 |
| RusHydro PJSC | | 325,695 | 2,589 |
| Sberbank of Russia | | 5,322,026 | 19,504,752 |
| Sberbank of Russia sponsored ADR | | 53,321 | 783,819 |
| Severstal PAO | | 69,768 | 959,871 |
| Severstal PAO GDR (Reg. S) | | 37,022 | 505,721 |
| Surgutneftegas OJSC | | 2,418,849 | 1,622,059 |
| Surgutneftegas OJSC sponsored ADR | | 92,857 | 612,856 |
| Tatneft PAO | | 518,384 | 6,048,655 |
| Tatneft PAO sponsored ADR | | 44,293 | 3,100,510 |
| VTB Bank OJSC | | 1,422,625,800 | 955,997 |
| VTB Bank OJSC sponsored GDR (Reg. S) | | 100,871 | 134,058 |
|
| TOTAL RUSSIA | | | 110,532,865 |
|
| Saudi Arabia - 2.3% | | | |
| Advanced Polypropylene Co. | | 57,490 | 712,819 |
| Al Rajhi Bank | | 628,034 | 10,114,725 |
| Alinma Bank | | 375,071 | 2,096,229 |
| Almarai Co. Ltd. | | 125,017 | 1,663,426 |
| Bank Al-Jazira | | 214,006 | 744,111 |
| Bank Albilad | | 186,887 | 1,235,847 |
| Banque Saudi Fransi | | 281,082 | 2,525,788 |
| Bupa Arabia for Cooperative Insurance Co. | | 14,092 | 403,563 |
| Dar Al Arkan Real Estate Development Co. (a) | | 277,163 | 889,807 |
| Emaar The Economic City (a) | | 187,696 | 468,952 |
| Etihad Etisalat Co. (a) | | 189,110 | 1,132,552 |
| Jarir Marketing Co. | | 30,435 | 1,285,472 |
| National Commercial Bank | | 615,785 | 7,142,535 |
| National Industrialization Co. (a) | | 163,211 | 531,808 |
| Rabigh Refining & Petrochemical Co. (a) | | 106,454 | 570,548 |
| Riyad Bank | | 611,576 | 3,620,240 |
| SABIC | | 385,210 | 9,008,057 |
| Sahara International Petrochemical Co. | | 189,643 | 831,328 |
| Samba Financial Group | | 505,986 | 3,737,251 |
| Saudi Airlines Catering Co. | | 19,275 | 444,574 |
| Saudi Arabian Fertilizers Co. | | 85,057 | 1,771,312 |
| Saudi Arabian Mining Co. (a) | | 212,041 | 2,397,285 |
| Saudi Cement Co. | | 39,733 | 726,791 |
| Saudi Electricity Co. | | 430,215 | 2,383,774 |
| Saudi Industrial Investment Group | | 106,912 | 600,940 |
| Saudi Kayan Petrochemical Co. (a) | | 362,377 | 987,519 |
| Saudi Telecom Co. | | 205,566 | 5,251,106 |
| The Co. for Cooperative Insurance (a) | | 32,089 | 603,225 |
| The Saudi British Bank | | 186,472 | 1,620,934 |
| The Savola Group (a) | | 139,690 | 1,150,954 |
| Yanbu National Petrochemical Co. | | 113,342 | 1,505,061 |
|
| TOTAL SAUDI ARABIA | | | 68,158,533 |
|
| Singapore - 0.0% | | | |
| BOC Aviation Ltd. Class A (c) | | 93,700 | 880,302 |
| South Africa - 4.4% | | | |
| Anglo American Platinum Ltd. | | 27,732 | 2,069,609 |
| AngloGold Ashanti Ltd. | | 213,009 | 4,711,399 |
| Aspen Pharmacare Holdings Ltd. | | 193,841 | 1,353,378 |
| Barclays Africa Group Ltd. | | 372,926 | 3,822,427 |
| Bidcorp Ltd. | | 172,682 | 4,028,466 |
| Bidvest Group Ltd. | | 150,860 | 2,057,259 |
| Capitec Bank Holdings Ltd. | | 23,566 | 2,141,269 |
| Clicks Group Ltd. | | 135,118 | 2,197,763 |
| Discovery Ltd. | | 198,498 | 1,579,787 |
| Exxaro Resources Ltd. | | 125,574 | 1,024,753 |
| FirstRand Ltd. | | 1,723,792 | 7,449,364 |
| Fortress (REIT) Ltd.: | | | |
| Class A | | 525,171 | 730,210 |
| Class B | | 138,637 | 82,482 |
| Foschini Ltd. | | 124,132 | 1,429,401 |
| Gold Fields Ltd. | | 426,417 | 2,648,213 |
| Growthpoint Properties Ltd. | | 1,554,197 | 2,274,134 |
| Hyprop Investments Ltd. | | 134 | 523 |
| Investec Ltd. | | 141,262 | 803,232 |
| Kumba Iron Ore Ltd. | | 32,505 | 791,581 |
| Liberty Holdings Ltd. | | 67,092 | 516,693 |
| Life Healthcare Group Holdings Ltd. | | 723,133 | 1,141,852 |
| MMI Holdings Ltd. | | 448,236 | 599,210 |
| Mr Price Group Ltd. | | 129,708 | 1,371,718 |
| MTN Group Ltd. | | 863,301 | 5,347,033 |
| MultiChoice Group Ltd. (a) | | 228,637 | 1,906,960 |
| Naspers Ltd. Class N | | 225,188 | 31,866,043 |
| Nedbank Group Ltd. | | 192,499 | 2,919,620 |
| Netcare Ltd. | | 579,330 | 655,990 |
| Old Mutual Ltd. | | 2,477,983 | 3,222,419 |
| Pick 'n Pay Stores Ltd. | | 186,728 | 816,831 |
| PSG Group Ltd. | | 75,252 | 1,176,054 |
| Rand Merchant Insurance Holdings Ltd. | | 381,135 | 753,164 |
| Redefine Properties Ltd. | | 2,736,057 | 1,365,267 |
| Remgro Ltd. | | 278,894 | 3,198,039 |
| Resilient Property Income Fund Ltd. | | 61 | 272 |
| RMB Holdings Ltd. | | 398,480 | 2,095,709 |
| Sanlam Ltd. | | 956,923 | 5,039,037 |
| Sappi Ltd. | | 260,070 | 667,795 |
| Sasol Ltd. | | 289,469 | 5,247,692 |
| Shoprite Holdings Ltd. | | 245,093 | 2,196,356 |
| Spar Group Ltd. | | 102,102 | 1,371,878 |
| Standard Bank Group Ltd. | | 665,855 | 7,644,080 |
| Telkom SA Ltd. | | 149,302 | 683,150 |
| Tiger Brands Ltd. | | 79,882 | 1,134,541 |
| Truworths International Ltd. | | 219,658 | 778,735 |
| Vodacom Group Ltd. | | 330,287 | 2,881,992 |
| Woolworths Holdings Ltd. | | 507,722 | 1,931,699 |
|
| TOTAL SOUTH AFRICA | | | 129,725,079 |
|
| Taiwan - 11.4% | | | |
| Acer, Inc. | | 1,495,994 | 873,129 |
| Advantech Co. Ltd. | | 181,459 | 1,793,884 |
| ASE Technology Holding Co. Ltd. | | 1,762,927 | 4,565,173 |
| Asia Cement Corp. | | 1,107,153 | 1,562,822 |
| ASUSTeK Computer, Inc. | | 366,000 | 2,478,163 |
| AU Optronics Corp. | | 4,559,000 | 1,160,173 |
| Catcher Technology Co. Ltd. | | 338,000 | 2,859,335 |
| Cathay Financial Holding Co. Ltd. | | 3,965,641 | 5,240,191 |
| Cathay Financial Holding Co. Ltd. rights 11/25/19 (a) | | 131,191 | 22,799 |
| Chang Hwa Commercial Bank | | 2,759,913 | 2,149,254 |
| Cheng Shin Rubber Industry Co. Ltd. | | 1,014,937 | 1,592,391 |
| Chicony Electronics Co. Ltd. | | 299,766 | 930,810 |
| China Airlines Ltd. | | 1,202,043 | 357,089 |
| China Development Finance Holding Corp. | | 6,320,800 | 1,968,903 |
| China Life Insurance Co. Ltd. (a) | | 1,314,278 | 1,081,657 |
| China Steel Corp. | | 6,088,204 | 4,681,238 |
| Chinatrust Financial Holding Co. Ltd. | | 9,491,826 | 6,598,030 |
| Chunghwa Telecom Co. Ltd. | | 1,943,000 | 7,135,419 |
| Compal Electronics, Inc. | | 2,082,000 | 1,242,455 |
| Delta Electronics, Inc. | | 995,381 | 4,373,436 |
| E.SUN Financial Holdings Co. Ltd. | | 5,352,278 | 4,834,916 |
| ECLAT Textile Co. Ltd. | | 96,613 | 1,297,233 |
| EVA Airways Corp. | | 1,052,850 | 491,938 |
| Evergreen Marine Corp. (Taiwan) (a) | | 1,224,775 | 501,990 |
| Far Eastern Textile Ltd. | | 1,701,705 | 1,651,599 |
| Far EasTone Telecommunications Co. Ltd. | | 812,000 | 1,943,603 |
| Feng Tay Enterprise Co. Ltd. | | 166,072 | 1,121,740 |
| First Financial Holding Co. Ltd. | | 5,073,617 | 3,718,124 |
| Formosa Chemicals & Fibre Corp. | | 1,789,760 | 5,199,447 |
| Formosa Petrochemical Corp. | | 645,000 | 2,049,331 |
| Formosa Plastics Corp. | | 2,300,520 | 7,377,233 |
| Formosa Taffeta Co. Ltd. | | 411,000 | 466,954 |
| Foxconn Technology Co. Ltd. | | 517,587 | 1,106,521 |
| Fubon Financial Holding Co. Ltd. | | 3,367,334 | 4,918,838 |
| Giant Manufacturing Co. Ltd. | | 157,000 | 1,163,421 |
| GlobalWafers Co. Ltd. | | 110,000 | 1,316,480 |
| Highwealth Construction Corp. | | 375,000 | 574,833 |
| HIWIN Technologies Corp. | | 124,857 | 1,070,565 |
| Hon Hai Precision Industry Co. Ltd. (Foxconn) | | 6,417,869 | 16,961,120 |
| Hotai Motor Co. Ltd. | | 154,000 | 2,716,637 |
| Hua Nan Financial Holdings Co. Ltd. | | 4,019,082 | 2,886,022 |
| Innolux Corp. | | 4,295,347 | 953,489 |
| Inventec Corp. | | 1,326,865 | 961,496 |
| Largan Precision Co. Ltd. | | 52,000 | 7,621,483 |
| Lite-On Technology Corp. | | 1,100,279 | 1,811,070 |
| MediaTek, Inc. | | 774,292 | 10,358,421 |
| Mega Financial Holding Co. Ltd. | | 5,526,413 | 5,418,052 |
| Micro-Star International Co. Ltd. | | 352,000 | 1,038,757 |
| Nan Ya Plastics Corp. | | 2,654,860 | 6,267,621 |
| Nanya Technology Corp. | | 615,000 | 1,411,568 |
| Nien Made Enterprise Co. Ltd. | | 86,000 | 779,690 |
| Novatek Microelectronics Corp. | | 300,000 | 1,927,995 |
| Pegatron Corp. | | 985,000 | 1,915,224 |
| Phison Electronics Corp. | | 79,000 | 718,818 |
| Pou Chen Corp. | | 1,115,000 | 1,489,811 |
| Powertech Technology, Inc. | | 379,000 | 1,192,996 |
| President Chain Store Corp. | | 296,000 | 2,950,489 |
| Quanta Computer, Inc. | | 1,400,000 | 2,685,422 |
| Realtek Semiconductor Corp. | | 249,401 | 1,852,231 |
| Ruentex Development Co. Ltd. | | 297,480 | 453,565 |
| Ruentex Industries Ltd. | | 187,200 | 449,309 |
| Shin Kong Financial Holding Co. Ltd. | | 5,350,513 | 1,687,715 |
| Sinopac Holdings Co. | | 5,539,591 | 2,270,473 |
| Standard Foods Corp. | | 209,812 | 422,403 |
| Synnex Technology International Corp. | | 687,500 | 819,418 |
| TaiMed Biologics, Inc. (a) | | 96,000 | 420,224 |
| Taishin Financial Holdings Co. Ltd. | | 4,912,162 | 2,279,071 |
| Taiwan Business Bank | | 2,695,109 | 1,135,555 |
| Taiwan Cement Corp. | | 2,545,667 | 3,376,360 |
| Taiwan Cooperative Financial Holding Co. Ltd. | | 4,587,362 | 3,151,198 |
| Taiwan High Speed Rail Corp. | | 1,010,000 | 1,193,865 |
| Taiwan Mobile Co. Ltd. | | 820,900 | 3,055,025 |
| Taiwan Semiconductor Manufacturing Co. Ltd. | | 12,635,000 | 123,587,075 |
| Tatung Co. Ltd. (a) | | 954,000 | 572,438 |
| The Shanghai Commercial & Savings Bank Ltd. | | 1,823,246 | 3,138,580 |
| Unified-President Enterprises Corp. | | 2,483,983 | 6,124,845 |
| United Microelectronics Corp. | | 5,940,000 | 2,730,333 |
| Vanguard International Semiconductor Corp. | | 474,000 | 1,013,339 |
| Walsin Technology Corp. | | 165,000 | 992,770 |
| Win Semiconductors Corp. | | 175,000 | 1,824,710 |
| Winbond Electronics Corp. | | 1,532,000 | 861,493 |
| Wistron Corp. | | 1,477,008 | 1,353,609 |
| WPG Holding Co. Ltd. | | 754,200 | 954,558 |
| Yageo Corp. | | 130,085 | 1,339,324 |
| Yuanta Financial Holding Co. Ltd. | | 5,110,952 | 3,192,460 |
|
| TOTAL TAIWAN | | | 335,789,244 |
|
| Thailand - 2.7% | | | |
| Advanced Info Service PCL | | 11,700 | 88,771 |
| Advanced Info Service PCL (For. Reg.) | | 596,600 | 4,526,576 |
| Airports of Thailand PCL | | 20,700 | 53,642 |
| Airports of Thailand PCL (For. Reg.) | | 2,192,300 | 5,681,120 |
| Bangkok Bank PCL (For. Reg.) | | 240,300 | 1,388,541 |
| Bangkok Dusit Medical Services PCL | | 392,800 | 312,311 |
| Bangkok Dusit Medical Services PCL (For. Reg.) | | 4,429,800 | 3,522,087 |
| Bangkok Expressway and Metro PCL | | 3,797,700 | 1,358,581 |
| Banpu PCL (For. Reg.) | | 2,229,500 | 856,779 |
| Berli Jucker PCL (For. Reg) | | 675,900 | 1,091,574 |
| BTS Group Holdings PCL | | 3,295,800 | 1,457,008 |
| Bumrungrad Hospital PCL (For. Reg.) | | 199,900 | 797,965 |
| C.P. ALL PCL | | 72,400 | 187,166 |
| C.P. ALL PCL (For. Reg.) | | 2,956,300 | 7,642,541 |
| Central Pattana PCL | | 100,200 | 212,450 |
| Central Pattana PCL (For. Reg.) | | 1,189,800 | 2,522,679 |
| Charoen Pokphand Foods PCL | | 82,700 | 69,194 |
| Charoen Pokphand Foods PCL (For. Reg.) | | 1,875,320 | 1,569,053 |
| Electricity Generating PCL (For. Reg.) | | 144,100 | 1,656,366 |
| Energy Absolute PCL | | 848,700 | 1,152,601 |
| Gulf Energy Development PCL | | 278,900 | 1,498,332 |
| Home Product Center PCL | | 116,600 | 66,415 |
| Home Product Center PCL (For. Reg.) | | 2,877,906 | 1,639,247 |
| Indorama Ventures PCL (For. Reg.) | | 1,016,200 | 943,041 |
| Intouch Holdings PCL | | 46,400 | 101,438 |
| Intouch Holdings PCL (For. Reg.) | | 1,148,000 | 2,509,706 |
| IRPC PCL (For. Reg.) | | 5,390,100 | 607,048 |
| Kasikornbank PCL | | 313,600 | 1,443,257 |
| Kasikornbank PCL (For. Reg.) | | 716,600 | 3,309,817 |
| Krung Thai Bank PCL | | 145,000 | 79,728 |
| Krung Thai Bank PCL (For. Reg.) | | 1,633,370 | 898,110 |
| Land & House PCL (For. Reg.) | | 3,952,000 | 1,269,948 |
| Minor International PCL: | | | |
| warrants 9/30/21 (a) | | 54,189 | 5,435 |
| (For. Reg.) | | 1,386,380 | 1,653,328 |
| Muangthai Leasing PCL | | 315,700 | 648,683 |
| PTT Exploration and Production PCL | | 56,000 | 223,449 |
| PTT Exploration and Production PCL (For. Reg.) | | 646,339 | 2,578,997 |
| PTT Global Chemical PCL (For. Reg.) | | 1,160,639 | 1,960,843 |
| PTT PCL (For. Reg.) | | 5,933,800 | 8,893,277 |
| Ratchaburi Electric Generating Holding PCL (For. Reg.) | | 405,100 | 986,956 |
| Robinsons Department Store PCL (For. Reg.) | | 240,200 | 519,183 |
| Siam Cement PCL (For. Reg.) | | 384,750 | 4,679,561 |
| Siam Commercial Bank PCL | | 18,800 | 69,690 |
| Siam Commercial Bank PCL (For. Reg.) | | 416,500 | 1,543,934 |
| Thai Oil PCL | | 43,200 | 98,009 |
| Thai Oil PCL (For. Reg.) | | 513,700 | 1,165,444 |
| Thai Union Frozen Products PCL | | 116,700 | 56,441 |
| Thai Union Frozen Products PCL (For. Reg.) | | 1,597,320 | 772,532 |
| TMB Bank PCL | | 3,964,900 | 189,027 |
| TMB Bank PCL: | | | |
| (For. Reg.) | | 5,872,600 | 279,977 |
| rights (a) | | 4,065,396 | 5,386 |
| Total Access Communication PCL (For. Reg.) | | 416,800 | 855,668 |
| True Corp. PCL (For. Reg.) | | 6,138,919 | 1,017,015 |
|
| TOTAL THAILAND | | | 78,715,927 |
|
| Turkey - 0.5% | | | |
| Akbank TAS (a) | | 1,460,368 | 1,765,034 |
| Anadolu Efes Biracilik Ve Malt Sanayii A/S | | 111,985 | 376,662 |
| Arcelik A/S (a) | | 92,672 | 287,227 |
| Aselsan A/S | | 185,873 | 596,575 |
| Bim Birlesik Magazalar A/S JSC | | 217,615 | 1,801,135 |
| Eregli Demir ve Celik Fabrikalari T.A.S. | | 763,635 | 873,527 |
| Ford Otomotiv Sanayi A/S | | 30,812 | 347,610 |
| Haci Omer Sabanci Holding A/S | | 504,056 | 729,117 |
| Koc Holding A/S | | 376,537 | 1,233,554 |
| TAV Havalimanlari Holding A/S | | 79,468 | 362,504 |
| Tupras Turkiye Petrol Rafinerileri A/S | | 67,160 | 1,462,490 |
| Turk Hava Yollari AO (a) | | 249,617 | 508,206 |
| Turk Sise ve Cam Fabrikalari A/S | | 294,577 | 224,130 |
| Turkcell Iletisim Hizmet A/S | | 539,754 | 1,186,708 |
| Turkiye Garanti Bankasi A/S (a) | | 1,186,792 | 1,909,744 |
| Turkiye Is Bankasi A/S Series C (a) | | 801,905 | 813,512 |
|
| TOTAL TURKEY | | | 14,477,735 |
|
| United Arab Emirates - 0.7% | | | |
| Abu Dhabi Commercial Bank PJSC | | 1,424,935 | 3,026,205 |
| Aldar Properties PJSC (a) | | 1,977,019 | 1,264,991 |
| Damac Properties Dubai Co. PJSC (a) | | 50,840 | 11,918 |
| DP World Ltd. | | 86,654 | 1,151,632 |
| Dubai Islamic Bank Pakistan Ltd. (a) | | 866,979 | 1,248,742 |
| Emaar Development PJSC (a) | | 409,358 | 451,406 |
| Emaar Malls Group PJSC (a) | | 1,341,152 | 712,068 |
| Emaar Properties PJSC | | 1,843,146 | 2,142,872 |
| Emirates Telecommunications Corp. | | 902,098 | 4,067,454 |
| National Bank of Abu Dhabi PJSC | | 1,397,446 | 5,791,063 |
|
| TOTAL UNITED ARAB EMIRATES | | | 19,868,351 |
|
| United States of America - 0.3% | | | |
| Southern Copper Corp. | | 45,255 | 1,610,173 |
| Yum China Holdings, Inc. | | 184,852 | 7,856,210 |
|
| TOTAL UNITED STATES OF AMERICA | | | 9,466,383 |
|
| US Virgin Islands - 0.0% | | | |
| Xinyi Energy Holdings Ltd. | | 128,356 | 32,854 |
| TOTAL COMMON STOCKS | | | |
| (Cost $2,581,396,936) | | | 2,751,792,336 |
|
| Nonconvertible Preferred Stocks - 3.5% | | | |
| Brazil - 2.6% | | | |
| Banco Bradesco SA (PN) | | 2,033,575 | 17,833,396 |
| Braskem SA (PN-A) (a) | | 93,000 | 642,339 |
| Centrais Eletricas Brasileiras SA (Electrobras) (PN-B) (a) | | 115,800 | 1,183,554 |
| Companhia Brasileira de Distribuicao Grupo Pao de Acucar (PN) | | 80,200 | 1,659,593 |
| Companhia Energetica de Minas Gerais (CEMIG) (PN) | | 488,033 | 1,661,052 |
| Gerdau SA | | 572,400 | 1,916,801 |
| Itau Unibanco Holding SA | | 2,486,031 | 22,458,273 |
| Itausa-Investimentos Itau SA (PN) | | 2,246,428 | 7,679,473 |
| Lojas Americanas SA (PN) | | 382,484 | 1,906,459 |
| Petroleo Brasileiro SA - Petrobras (PN) (non-vtg.) | | 2,193,000 | 16,617,696 |
| Telefonica Brasil SA | | 228,500 | 3,024,256 |
|
| TOTAL BRAZIL | | | 76,582,892 |
|
| Chile - 0.1% | | | |
| Embotelladora Andina SA Class B | | 202,505 | 584,359 |
| Sociedad Quimica y Minera de Chile SA (PN-B) (a) | | 51,924 | 1,379,319 |
|
| TOTAL CHILE | | | 1,963,678 |
|
| Colombia - 0.1% | | | |
| Bancolombia SA (PN) | | 174,661 | 2,279,894 |
| Grupo Aval Acciones y Valores SA | | 2,017,799 | 826,820 |
| Grupo de Inversiones Suramerica SA | | 58,369 | 534,992 |
|
| TOTAL COLOMBIA | | | 3,641,706 |
|
| Korea (South) - 0.6% | | | |
| AMOREPACIFIC Corp. | | 5,334 | 438,920 |
| Hyundai Motor Co. | | 11,763 | 733,749 |
| Hyundai Motor Co. Series 2 | | 18,848 | 1,277,159 |
| LG Chemical Ltd. | | 4,171 | 613,021 |
| LG Household & Health Care Ltd. | | 1,098 | 693,351 |
| Samsung Electronics Co. Ltd. | | 439,949 | 15,431,992 |
|
| TOTAL KOREA (SOUTH) | | | 19,188,192 |
|
| Russia - 0.1% | | | |
| AK Transneft OAO | | 238 | 617,989 |
| Surgutneftegas OJSC | | 3,939,940 | 2,318,162 |
|
| TOTAL RUSSIA | | | 2,936,151 |
|
| TOTAL NONCONVERTIBLE PREFERRED STOCKS | | | |
| (Cost $92,713,639) | | | 104,312,619 |
| | | Principal Amount(e) | Value |
|
| Nonconvertible Bonds - 0.0% | | | |
| India - 0.0% | | | |
| Britannia Industries Ltd. 8% 8/28/22 | INR | 27,102 | 119 |
| NTPC Ltd. 8.49% 3/25/25 | INR | 264,162 | 50,056 |
| TOTAL NONCONVERTIBLE BONDS | | | |
| (Cost $53,029) | | | 50,175 |
|
| Government Obligations - 0.1% | | | |
| United States of America - 0.1% | | | |
| U.S. Treasury Bills, yield at date of purchase 1.7% to 1.82% 12/19/19 to 3/19/20(f) | | | |
| (Cost $2,787,073) | | 2,800,000 | 2,789,178 |
| | | Shares | Value |
|
| Money Market Funds - 3.2% | | | |
| Fidelity Cash Central Fund 1.83% (g) | | 71,657,364 | 71,671,695 |
| Fidelity Securities Lending Cash Central Fund 1.84% (g)(h) | | 22,141,258 | 22,143,472 |
| TOTAL MONEY MARKET FUNDS | | | |
| (Cost $93,814,755) | | | 93,815,167 |
| TOTAL INVESTMENT IN SECURITIES - 100.5% | | | |
| (Cost $2,770,765,432) | | | 2,952,759,475 |
| NET OTHER ASSETS (LIABILITIES) - (0.5)% | | | (14,738,287) |
| NET ASSETS - 100% | | | $2,938,021,188 |
| Futures Contracts | | | | | |
| | Number of contracts | Expiration Date | Notional Amount | Value | Unrealized Appreciation/(Depreciation) |
| Purchased | | | | | |
| Equity Index Contracts | | | | | |
| ICE E-mini MSCI Emerging Markets Index Contracts (United States) | 1,555 | Dec. 2019 | $80,968,850 | $2,097,586 | $2,097,586 |
The notional amount of futures purchased as a percentage of Net Assets is 2.8%
Currency Abbreviations
INR – Indian rupee
Categorizations in the Schedule of Investments are based on country or territory of incorporation.
Legend
(a) Non-income producing
(b) Security or a portion of the security is on loan at period end.
(c) Security exempt from registration under Rule 144A of the Securities Act of 1933. These securities may be resold in transactions exempt from registration, normally to qualified institutional buyers. At the end of the period, the value of these securities amounted to $47,951,111 or 1.6% of net assets.
(d) Level 3 security
(e) Amount is stated in United States dollars unless otherwise noted.
(f) Security or a portion of the security was pledged to cover margin requirements for futures contracts. At period end, the value of securities pledged amounted to $2,789,178.
(g) Affiliated fund that is generally available only to investment companies and other accounts managed by Fidelity Investments. The rate quoted is the annualized seven-day yield of the fund at period end. A complete unaudited listing of the fund's holdings as of its most recent quarter end is available upon request. In addition, each Fidelity Central Fund's financial statements, which are not covered by the Fund's Report of Independent Registered Public Accounting Firm, are available on the SEC's website or upon request.
(h) Investment made with cash collateral received from securities on loan.
Affiliated Central Funds
Information regarding fiscal year to date income earned by the Fund from investments in Fidelity Central Funds is as follows:
| Fund | Income earned |
| Fidelity Cash Central Fund | $2,320,490 |
| Fidelity Securities Lending Cash Central Fund | 282,604 |
| Total | $2,603,094 |
Amounts in the income column in the above table include any capital gain distributions from underlying funds, which are presented in the corresponding line-item in the Statement of Operations, if applicable. Amount for Fidelity Securities Lending Cash Central Fund represents the income earned on investing cash collateral, less rebates paid to borrowers and any lending agent fees associated with the loan, plus any premium payments received for lending certain types of securities.
Investment Valuation
The following is a summary of the inputs used, as of October 31, 2019, involving the Fund's assets and liabilities carried at fair value. The inputs or methodology used for valuing securities may not be an indication of the risk associated with investing in those securities. For more information on valuation inputs, and their aggregation into the levels used below, please refer to the Investment Valuation section in the accompanying Notes to Financial Statements.
| | Valuation Inputs at Reporting Date: |
| Description | Total | Level 1 | Level 2 | Level 3 |
| Investments in Securities: | | | | |
| Equities: | | | | |
| Communication Services | $316,205,124 | $124,402,964 | $191,802,160 | $-- |
| Consumer Discretionary | 379,703,323 | 266,048,879 | 113,653,059 | 1,385 |
| Consumer Staples | 191,747,425 | 102,540,469 | 89,183,158 | 23,798 |
| Energy | 224,751,008 | 99,659,232 | 125,091,776 | -- |
| Financials | 704,723,388 | 339,733,049 | 364,464,583 | 525,756 |
| Health Care | 79,852,342 | 25,954,170 | 53,898,172 | -- |
| Industrials | 151,735,207 | 71,347,389 | 80,387,818 | -- |
| Information Technology | 440,916,290 | 234,892,773 | 206,021,487 | 2,030 |
| Materials | 204,508,488 | 130,933,810 | 73,546,607 | 28,071 |
| Real Estate | 82,171,064 | 19,022,922 | 63,146,284 | 1,858 |
| Utilities | 79,791,296 | 28,154,615 | 51,636,681 | -- |
| Corporate Bonds | 50,175 | -- | 50,175 | -- |
| Government Obligations | 2,789,178 | -- | 2,789,178 | -- |
| Money Market Funds | 93,815,167 | 93,815,167 | -- | -- |
| Total Investments in Securities: | $2,952,759,475 | $1,536,505,439 | $1,415,671,138 | $582,898 |
| Derivative Instruments: | | | | |
| Assets | | | | |
| Futures Contracts | $2,097,586 | $2,097,586 | $-- | $-- |
| Total Assets | $2,097,586 | $2,097,586 | $-- | $-- |
| Total Derivative Instruments: | $2,097,586 | $2,097,586 | $-- | $-- |
Value of Derivative Instruments
The following table is a summary of the Fund's value of derivative instruments by primary risk exposure as of October 31, 2019. For additional information on derivative instruments, please refer to the Derivative Instruments section in the accompanying Notes to Financial Statements.
| Primary Risk Exposure / Derivative Type | Value |
| | Asset | Liability |
| Equity Risk | | |
| Futures Contracts(a) | $2,097,586 | $0 |
| Total Equity Risk | 2,097,586 | 0 |
| Total Value of Derivatives | $2,097,586 | $0 |
(a) Reflects gross cumulative appreciation (depreciation) on futures contracts as presented in the Schedule of Investments. In the Statement of Assets and Liabilities, the period end daily variation margin is included in receivable or payable for daily variation margin on futures contracts, and the net cumulative appreciation (depreciation) is included in Total accumulated earnings (loss).
See accompanying notes which are an integral part of the financial statements.
Fidelity® Emerging Markets Index Fund
Financial Statements
Statement of Assets and Liabilities
| | | October 31, 2019 |
| Assets | | |
Investment in securities, at value (including securities loaned of $21,299,456) — See accompanying schedule:
Unaffiliated issuers (cost $2,676,950,677) | $2,858,944,308 | |
| Fidelity Central Funds (cost $93,814,755) | 93,815,167 | |
| Total Investment in Securities (cost $2,770,765,432) | | $2,952,759,475 |
| Segregated cash with brokers for derivative instruments | | 1,316,166 |
| Cash | | 68,927 |
| Foreign currency held at value (cost $4,854,399) | | 4,874,861 |
| Receivable for fund shares sold | | 3,635,397 |
| Dividends receivable | | 2,612,464 |
| Interest receivable | | 196 |
| Distributions receivable from Fidelity Central Funds | | 136,731 |
| Other receivables | | 3,641 |
| Total assets | | 2,965,407,858 |
| Liabilities | | |
| Payable for investments purchased | $55,174 | |
| Payable for fund shares redeemed | 3,240,970 | |
| Accrued management fee | 177,920 | |
| Payable for daily variation margin on futures contracts | 619,504 | |
| Other payables and accrued expenses | 1,152,363 | |
| Collateral on securities loaned | 22,140,739 | |
| Total liabilities | | 27,386,670 |
| Net Assets | | $2,938,021,188 |
| Net Assets consist of: | | |
| Paid in capital | | $2,800,336,121 |
| Total accumulated earnings (loss) | | 137,685,067 |
| Net Assets | | $2,938,021,188 |
| Net Asset Value and Maximum Offering Price | | |
| Net Asset Value, offering price and redemption price per share ($2,938,021,188 ÷ 280,271,038 shares) | | $10.48 |
See accompanying notes which are an integral part of the financial statements.
Statement of Operations
| | | Year ended October 31, 2019 |
| Investment Income | | |
| Dividends | | $70,492,437 |
| Non-Cash dividends | | 18,064,088 |
| Interest | | 128,097 |
| Income from Fidelity Central Funds (including $282,604 from security lending) | | 2,603,094 |
| Income before foreign taxes withheld | | 91,287,716 |
| Less foreign taxes withheld | | (8,460,927) |
| Total income | | 82,826,789 |
| Expenses | | |
| Management fee | $1,811,719 | |
| Independent trustees' fees and expenses | 9,323 | |
| Commitment fees | 5,951 | |
| Total expenses before reductions | 1,826,993 | |
| Expense reductions | (23,293) | |
| Total expenses after reductions | | 1,803,700 |
| Net investment income (loss) | | 81,023,089 |
| Realized and Unrealized Gain (Loss) | | |
| Net realized gain (loss) on: | | |
| Investment securities: | | |
| Unaffiliated issuers (net of foreign taxes of $161) | (21,648,806) | |
| Fidelity Central Funds | (732) | |
| Foreign currency transactions | (883,785) | |
| Futures contracts | (7,928,973) | |
| Total net realized gain (loss) | | (30,462,296) |
| Change in net unrealized appreciation (depreciation) on: | | |
| Investment securities: | | |
| Unaffiliated issuers (net of increase in deferred foreign taxes of $503,572) | 157,960,289 | |
| Fidelity Central Funds | 412 | |
| Assets and liabilities in foreign currencies | 105,587 | |
| Futures contracts | 8,331,806 | |
| Total change in net unrealized appreciation (depreciation) | | 166,398,094 |
| Net gain (loss) | | 135,935,798 |
| Net increase (decrease) in net assets resulting from operations | | $216,958,887 |
See accompanying notes which are an integral part of the financial statements.
Statement of Changes in Net Assets
| | Year ended October 31, 2019 | Year ended October 31, 2018 |
| Increase (Decrease) in Net Assets | | |
| Operations | | |
| Net investment income (loss) | $81,023,089 | $38,611,827 |
| Net realized gain (loss) | (30,462,296) | (15,520,773) |
| Change in net unrealized appreciation (depreciation) | 166,398,094 | (249,379,729) |
| Net increase (decrease) in net assets resulting from operations | 216,958,887 | (226,288,675) |
| Distributions to shareholders | (37,459,724) | (26,736,653) |
| Share transactions - net increase (decrease) | 1,148,807,753 | 470,526,076 |
| Redemption fees | – | 26,623 |
| Total increase (decrease) in net assets | 1,328,306,916 | 217,527,371 |
| Net Assets | | |
| Beginning of period | 1,609,714,272 | 1,392,186,901 |
| End of period | $2,938,021,188 | $1,609,714,272 |
See accompanying notes which are an integral part of the financial statements.
Financial Highlights
Fidelity Emerging Markets Index Fund
| Years ended October 31, | 2019 | 2018 | 2017 | 2016 | 2015 |
| Selected Per–Share Data | | | | | |
| Net asset value, beginning of period | $9.62 | $11.23 | $9.04 | $8.43 | $10.18 |
| Income from Investment Operations | | | | | |
| Net investment income (loss)A | .35B | .27 | .24 | .19 | .26 |
| Net realized and unrealized gain (loss) | .72 | (1.66) | 2.09 | .61 | (1.82) |
| Total from investment operations | 1.07 | (1.39) | 2.33 | .80 | (1.56) |
| Distributions from net investment income | (.21) | (.20) | (.14) | (.19) | (.19) |
| Distributions from net realized gain | – | (.01) | – | – | – |
| Total distributions | (.21) | (.22)C | (.14) | (.19) | (.19) |
| Redemption fees added to paid in capitalA | – | –D | –D | –D | –D |
| Net asset value, end of period | $10.48 | $9.62 | $11.23 | $9.04 | $8.43 |
| Total ReturnE | 11.33% | (12.65)% | 26.29% | 9.98% | (15.46)% |
| Ratios to Average Net AssetsF,G | | | | | |
| Expenses before reductions | .08% | .08% | .09% | .19% | .25% |
| Expenses net of fee waivers, if any | .08% | .08% | .09% | .10% | .10% |
| Expenses net of all reductions | .08% | .08% | .09% | .10% | .10% |
| Net investment income (loss) | 3.40%B | 2.46% | 2.36% | 2.26% | 2.76% |
| Supplemental Data | | | | | |
| Net assets, end of period (000 omitted) | $2,938,021 | $593,466 | $192,681 | $269 | $243 |
| Portfolio turnover rateH | 3% | 4% | 4% | 25% | 1% |
A Calculated based on average shares outstanding during the period.
B Net investment income per share reflects a large, non-recurring dividend which amounted to $.08 per share. Excluding this non-recurring dividend, the ratio of net investment income (loss) to average net assets would have been 2.66%.
C Total distributions of $.22 per share is comprised of distributions from net investment income of $.201 and distributions from net realized gain of $.014 per share.
D Amount represents less than $.005 per share.
E Total returns would have been lower if certain expenses had not been reduced during the applicable periods shown.
F Fees and expenses of any underlying Fidelity Central Funds are not included in the Fund's expense ratio. The Fund indirectly bears its proportionate share of the expenses of any underlying Fidelity Central Funds.
G Expense ratios reflect operating expenses of the Fund. Expenses before reductions do not reflect amounts reimbursed by the investment adviser or reductions from expense offset arrangements and do not represent the amount paid by the Fund during periods when reimbursements or reductions occur. Expenses net of fee waivers reflect expenses after reimbursement by the investment adviser but prior to reductions from expense offset arrangements. Expenses net of all reductions represent the net expenses paid by the Fund.
H Amount does not include the portfolio activity of any underlying Fidelity Central Funds.
See accompanying notes which are an integral part of the financial statements.
Fidelity® Global ex U.S. Index Fund
Performance: The Bottom Line
Average annual total return reflects the change in the value of an investment, assuming reinvestment of distributions from dividend income and capital gains (the profits earned upon the sale of securities that have grown in value, if any) and assuming a constant rate of performance each year. The hypothetical investment and the average annual total returns do not reflect the deduction of taxes that a shareholder would pay on fund distributions or the redemption of fund shares. During periods of reimbursement by Fidelity, a fund’s total return will be greater than it would be had the reimbursement not occurred. How a fund did yesterday is no guarantee of how it will do tomorrow.
Average Annual Total Returns
| For the periods ended October 31, 2019 | Past 1 year | Past 5 years | Life of fundA |
| Fidelity® Global ex U.S. Index Fund | 11.28% | 3.73% | 5.40% |
A From September 8, 2011
$10,000 Over Life of Fund
Let's say hypothetically that $10,000 was invested in Fidelity® Global ex U.S. Index Fund on September 8, 2011, when the fund started.
The chart shows how the value of your investment would have changed, and also shows how the MSCI ACWI (All Country World Index) ex USA Index performed over the same period.
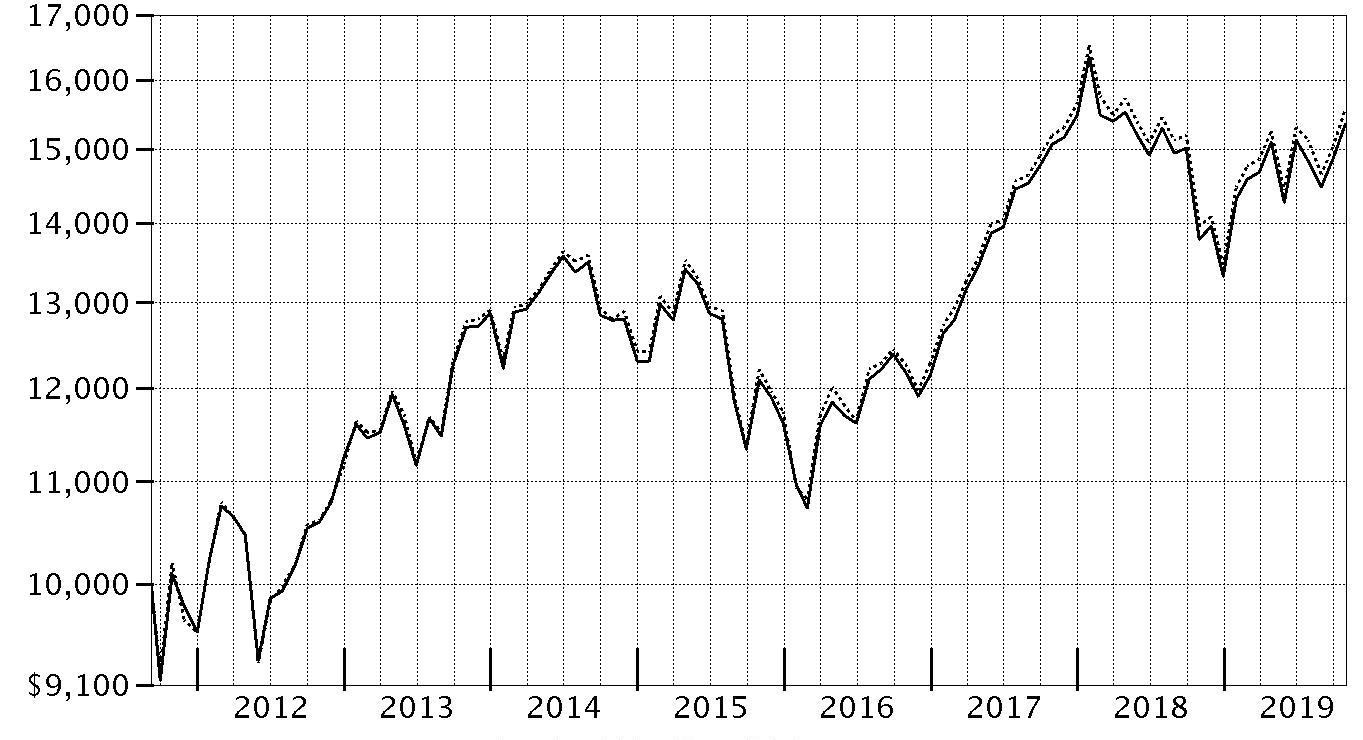
| Period Ending Values |
| $15,353 | Fidelity® Global ex U.S. Index Fund |
| $15,565 | MSCI ACWI (All Country World Index) ex USA Index |
Fidelity® Global ex U.S. Index Fund
Management's Discussion of Fund Performance
Market Recap: The MSCI ACWI (All Country World Index) ex USA Index gained 11.47% for the 12 months ending October 31, 2019, as international stocks reflected a confluence of factors, including escalating trade tension, and moderating but still positive global economic growth. Currency fluctuations were largely modest and varied by region, muting the overall impact on international equity returns. In late December, the U.S. Federal Reserve shifted from raising interest rates to a more dovish policy in 2019, joining many foreign central banks. In June, international stocks rose 6.03%, as policy stimulus in China stabilized that country’s economic growth. The Fed cut its policy rate in July for the first time since 2008. However, the index returned -1.21% for the month, followed by -3.08% in August. In September, the Fed cut its policy rate another quarter point, citing concerns about slowing economic growth and muted inflation, and did the same in October, leading to monthly gains of 2.59% and 3.49%, respectively. For the full 12 months, the growth-oriented information technology sector (+22%) led the way, followed by utilities (+20%) and real estate (+18%), two high-dividend-yielding categories. Conversely, energy was roughly flat, while materials (+6%) and communication services (7%) also lagged. By region, Asia Pacific ex Japan (+16%), Europe ex U.K (+13%), Canada (+12%) and emerging markets (+12%) fared best. Meanwhile, the U.K. (+7%) and Japan (+10%) trailed the broader market.
Comments from the Geode Capital Management, LLC, passive equity index team: For the fiscal year, the fund gained 11.28%, compared with an increase of 11.47% for the benchmark MSCI ACWI (All Country World Index) ex USA Index.
(Note: The fund's performance relative to the index can be affected by Fidelity's methodologies for valuing certain foreign stocks and for incorporating foreign exchange rates, which differ from those used by the index.) Individually, Nestle (+29%) contributed meaningfully to the fund's performance this period, as the Swiss packaged-foods giant reported favorable sales growth. Semiconductor foundry Taiwan Semiconductor Manufacturing (+34%) also performed well, reflecting the firm's better-than-expected quarterly financial results. Chinese e-commerce company Alibaba Group Holding (+24%) announced strong quarterly earnings. Healthy sales lifted LVMH Moet Hennessy Louis Vuitton (+42%), a French luxury goods conglomerate, while Dutch semiconductor equipment supplier ASML Holding (+55%) reported higher third-quarter revenue. French pharmaceutical manufacturer Roche Holdings (+27%) and Chinese internet gaming company Tencent Holdings (+20%) also boosted the fund's performance. In contrast, China-based Baidu (-46%) struggled, as the company anticipated continued challenges for its core online search-advertising business. British American Tobacco (-13%) struggled, partly reflecting investors' concern about weakness in tobacco companies' core cigarette business. Brazilian mining firm Vale (-23%) saw its shares plunge in January, as a dam collapsed at one of its mines, resulting in several casualties and significant financial losses. Israeli drug maker Teva Pharmaceutical Industries (-59%) also detracted.
The views expressed above reflect those of the portfolio manager(s) only through the end of the period as stated on the cover of this report and do not necessarily represent the views of Fidelity or any other person in the Fidelity organization. Any such views are subject to change at any time based upon market or other conditions and Fidelity disclaims any responsibility to update such views. These views may not be relied on as investment advice and, because investment decisions for a Fidelity fund are based on numerous factors, may not be relied on as an indication of trading intent on behalf of any Fidelity fund.
Note to Shareholders: On March 22, 2019, Pat Waddell retired and is no longer a portfolio manager with Geode Capital Management.
Fidelity® Global ex U.S. Index Fund
Investment Summary (Unaudited)
Top Ten Stocks as of October 31, 2019
| | % of fund's net assets |
| Nestle SA (Reg. S) (Switzerland, Food Products) | 1.5 |
| Alibaba Group Holding Ltd. sponsored ADR (Cayman Islands, Internet & Direct Marketing Retail) | 1.2 |
| Tencent Holdings Ltd. (Cayman Islands, Interactive Media & Services) | 1.1 |
| Taiwan Semiconductor Manufacturing Co. Ltd. (Taiwan, Semiconductors & Semiconductor Equipment) | 1.0 |
| Roche Holding AG (participation certificate) (Switzerland, Pharmaceuticals) | 1.0 |
| Samsung Electronics Co. Ltd. (Korea (South), Technology Hardware, Storage & Peripherals) | 1.0 |
| Novartis AG (Switzerland, Pharmaceuticals) | 0.9 |
| Toyota Motor Corp. (Japan, Automobiles) | 0.7 |
| HSBC Holdings PLC (United Kingdom) (United Kingdom, Banks) | 0.7 |
| Royal Dutch Shell PLC Class A (United Kingdom) (United Kingdom, Oil, Gas & Consumable Fuels) | 0.6 |
| | 9.7 |
Top Market Sectors as of October 31, 2019
| | % of fund's net assets |
| Financials | 22.5 |
| Industrials | 10.7 |
| Consumer Discretionary | 11.3 |
| Consumer Staples | 9.4 |
| Information Technology | 9.0 |
| Health Care | 8.3 |
| Materials | 6.8 |
| Communication Services | 6.3 |
| Energy | 6.6 |
| Utilities | 3.2 |
Geographic Diversification (% of fund's net assets)
| As of October 31, 2019 |
| | Japan | 16.1% |
| | United Kingdom | 10.1% |
| | France | 6.8% |
| | Canada | 6.8% |
| | Switzerland | 6.1% |
| | Germany | 5.7% |
| | Cayman Islands | 4.6% |
| | Australia | 4.4% |
| | Netherlands | 3.3% |
| | Other* | 36.1% |

* Includes Short-Term investments and Net Other Assets (Liabilities).
Percentages are based on country or territory of incorporation and are adjusted for the effect of futures contracts, if applicable.
Asset Allocation as of October 31, 2019
| | % of fund's net assets |
| Stocks and Equity Futures | 100.0 |
Fidelity® Global ex U.S. Index Fund
Schedule of Investments October 31, 2019
Showing Percentage of Net Assets
| Common Stocks - 95.8% | | | |
| | | Shares | Value |
| Argentina - 0.0% | | | |
| Banco Macro SA sponsored ADR | | 10,550 | $241,595 |
| BBVA Banco Frances SA sponsored ADR | | 17,602 | 61,607 |
| Grupo Financiero Galicia SA sponsored ADR | | 24,086 | 278,434 |
| Pampa Holding SA sponsored ADR (a)(b) | | 14,811 | 230,607 |
| Telecom Argentina SA Class B sponsored ADR | | 18,972 | 170,748 |
| Transportadora de Gas del Sur SA Class B sponsored ADR | | 16,740 | 126,554 |
| YPF SA Class D sponsored ADR | | 45,420 | 425,131 |
|
| TOTAL ARGENTINA | | | 1,534,676 |
|
| Australia - 4.4% | | | |
| AGL Energy Ltd. | | 156,633 | 2,138,137 |
| Alumina Ltd. | | 653,770 | 1,020,608 |
| AMP Ltd. | | 852,724 | 1,077,452 |
| APA Group unit | | 300,127 | 2,410,697 |
| Aristocrat Leisure Ltd. | | 141,887 | 3,093,852 |
| ASX Ltd. | | 48,832 | 2,771,795 |
| Aurizon Holdings Ltd. | | 459,764 | 1,870,430 |
| Australia & New Zealand Banking Group Ltd. | | 688,904 | 12,660,071 |
| Bank of Queensland Ltd. | | 89,934 | 561,283 |
| Bendigo & Adelaide Bank Ltd. | | 108,779 | 798,341 |
| BHP Billiton Ltd. | | 740,214 | 18,144,465 |
| BlueScope Steel Ltd. | | 127,911 | 1,170,921 |
| Boral Ltd. | | 280,965 | 975,487 |
| Brambles Ltd. | | 394,183 | 3,258,731 |
| Caltex Australia Ltd. | | 57,416 | 1,079,341 |
| Challenger Ltd. | | 122,795 | 673,495 |
| Cimic Group Ltd. | | 20,697 | 471,662 |
| Coca-Cola Amatil Ltd. | | 113,604 | 797,233 |
| Cochlear Ltd. | | 14,469 | 2,110,884 |
| Coles Group Ltd. | | 281,370 | 2,911,862 |
| Commonwealth Bank of Australia | | 430,897 | 23,363,284 |
| Computershare Ltd. | | 115,078 | 1,256,130 |
| Crown Ltd. | | 77,285 | 663,926 |
| CSL Ltd. | | 110,660 | 19,515,590 |
| DEXUS Property Group unit | | 272,371 | 2,246,099 |
| Flight Centre Travel Group Ltd. | | 13,449 | 395,087 |
| Fortescue Metals Group Ltd. | | 332,173 | 2,033,107 |
| Goodman Group unit | | 400,725 | 3,978,905 |
| Harvey Norman Holdings Ltd. | | 132,464 | 373,750 |
| Incitec Pivot Ltd. | | 359,499 | 855,406 |
| Insurance Australia Group Ltd. | | 570,964 | 3,128,353 |
| Lendlease Group unit | | 134,123 | 1,733,636 |
| Macquarie Group Ltd. | | 79,309 | 7,323,190 |
| Magellan Financial Group Ltd. | | 30,987 | 1,027,775 |
| Medibank Private Ltd. | | 657,675 | 1,532,859 |
| Mirvac Group unit | | 1,015,680 | 2,250,624 |
| National Australia Bank Ltd. | | 681,496 | 13,377,188 |
| Newcrest Mining Ltd. | | 184,477 | 4,026,826 |
| Orica Ltd. | | 97,680 | 1,543,706 |
| Origin Energy Ltd. | | 459,939 | 2,493,541 |
| QBE Insurance Group Ltd. | | 327,765 | 2,851,682 |
| Ramsay Health Care Ltd. | | 36,241 | 1,712,411 |
| realestate.com.au Ltd. | | 11,315 | 849,184 |
| Rio Tinto Ltd. | | 91,331 | 5,711,204 |
| Santos Ltd. | | 419,949 | 2,348,992 |
| Scentre Group unit | | 1,329,380 | 3,512,416 |
| SEEK Ltd. | | 85,423 | 1,336,873 |
| Sonic Healthcare Ltd. | | 113,968 | 2,244,600 |
| South32 Ltd. | | 1,242,079 | 2,173,553 |
| SP AusNet | | 417,985 | 533,921 |
| Stockland Corp. Ltd. unit | | 566,189 | 1,911,438 |
| Suncorp Group Ltd. | | 311,316 | 2,890,415 |
| Sydney Airport unit | | 253,794 | 1,537,090 |
| Tabcorp Holdings Ltd. | | 454,420 | 1,505,788 |
| Telstra Corp. Ltd. | | 981,903 | 2,364,861 |
| The GPT Group unit | | 463,780 | 1,903,693 |
| TPG Telecom Ltd. | | 78,175 | 352,348 |
| Transurban Group unit | | 644,182 | 6,597,678 |
| Treasury Wine Estates Ltd. | | 180,628 | 2,189,780 |
| Vicinity Centres unit | | 825,637 | 1,519,770 |
| Washington H. Soul Pattinson & Co. Ltd. | | 24,161 | 361,164 |
| Wesfarmers Ltd. | | 274,786 | 7,549,723 |
| Westpac Banking Corp. | | 846,413 | 16,433,531 |
| Woodside Petroleum Ltd. | | 228,072 | 5,054,866 |
| Woolworths Group Ltd. | | 307,743 | 7,935,506 |
| WorleyParsons Ltd. | | 88,042 | 826,383 |
|
| TOTAL AUSTRALIA | | | 237,324,599 |
|
| Austria - 0.1% | | | |
| Andritz AG | | 16,464 | 739,633 |
| Erste Group Bank AG | | 74,370 | 2,626,864 |
| OMV AG | | 35,041 | 2,044,730 |
| Raiffeisen International Bank-Holding AG | | 35,674 | 877,308 |
| Verbund AG | | 15,240 | 824,363 |
| Voestalpine AG | | 25,461 | 637,505 |
|
| TOTAL AUSTRIA | | | 7,750,403 |
|
| Bailiwick of Jersey - 0.5% | | | |
| Experian PLC | | 224,135 | 7,049,292 |
| Ferguson PLC | | 57,548 | 4,914,216 |
| Glencore Xstrata PLC | | 2,697,419 | 8,141,837 |
| Polymetal International PLC | | 58,356 | 957,394 |
| WPP PLC | | 322,148 | 4,020,264 |
|
| TOTAL BAILIWICK OF JERSEY | | | 25,083,003 |
|
| Belgium - 0.6% | | | |
| Ageas | | 43,425 | 2,501,023 |
| Anheuser-Busch InBev SA NV | | 185,956 | 15,009,895 |
| Colruyt NV | | 13,079 | 727,017 |
| Groupe Bruxelles Lambert SA | | 21,240 | 2,131,534 |
| KBC Groep NV | | 61,191 | 4,291,329 |
| Proximus | | 36,436 | 1,118,739 |
| Solvay SA Class A | | 19,030 | 2,069,356 |
| Telenet Group Holding NV | | 11,813 | 579,965 |
| Titan Cement International Trading SA (a) | | 7,686 | 160,472 |
| UCB SA | | 32,638 | 2,630,348 |
| Umicore SA | | 47,190 | 1,945,768 |
|
| TOTAL BELGIUM | | | 33,165,446 |
|
| Bermuda - 0.4% | | | |
| Alibaba Health Information Technology Ltd. (a) | | 782,000 | 787,079 |
| Alibaba Pictures Group Ltd. (a) | | 3,130,000 | 513,373 |
| Beijing Enterprises Water Group Ltd. | | 1,214,000 | 632,771 |
| Brilliance China Automotive Holdings Ltd. | | 660,000 | 727,831 |
| Cheung Kong Infrastructure Holdings Ltd. | | 167,000 | 1,201,854 |
| China Gas Holdings Ltd. | | 421,800 | 1,796,843 |
| China Oriental Group Co. Ltd. (H Shares) | | 228,000 | 79,571 |
| China Resource Gas Group Ltd. | | 212,000 | 1,278,213 |
| Cosco Shipping Ports Ltd. | | 548,953 | 431,581 |
| Credicorp Ltd. (United States) | | 17,019 | 3,642,747 |
| Dairy Farm International Holdings Ltd. | | 70,200 | 423,117 |
| GOME Electrical Appliances Holdings Ltd. (a) | | 2,681,104 | 242,360 |
| Haier Electronics Group Co. Ltd. | | 350,000 | 999,281 |
| HengTen Networks Group Ltd. (a) | | 3,872,000 | 55,715 |
| Hongkong Land Holdings Ltd. | | 274,336 | 1,507,036 |
| Jardine Matheson Holdings Ltd. | | 52,098 | 2,970,160 |
| Jardine Strategic Holdings Ltd. | | 51,900 | 1,675,946 |
| Kerry Properties Ltd. | | 143,000 | 462,414 |
| Kunlun Energy Co. Ltd. | | 684,000 | 636,624 |
| Luye Pharma Group Ltd. (c) | | 314,500 | 232,463 |
| Nine Dragons Paper (Holdings) Ltd. | | 490,000 | 425,058 |
| NWS Holdings Ltd. | | 355,871 | 529,636 |
| Shangri-La Asia Ltd. | | 288,000 | 295,607 |
| Shenzhen International Holdings Ltd. | | 237,276 | 482,390 |
| Sihuan Pharmaceutical Holdings Group Ltd. | | 1,032,000 | 135,213 |
| Yue Yuen Industrial (Holdings) Ltd. | | 148,000 | 417,092 |
|
| TOTAL BERMUDA | | | 22,581,975 |
|
| Brazil - 1.3% | | | |
| Ambev SA | | 1,136,600 | 4,925,597 |
| Atacadao Distribuicao Comercio e Industria Ltda | | 88,300 | 420,749 |
| B2W Companhia Global do Varejo (a) | | 47,577 | 602,646 |
| Banco Bradesco SA | | 305,458 | 2,502,006 |
| Banco do Brasil SA | | 215,300 | 2,584,888 |
| Banco Santander SA (Brasil) unit | | 91,800 | 1,077,199 |
| BB Seguridade Participacoes SA | | 173,300 | 1,467,897 |
| BM&F BOVESPA SA | | 506,066 | 6,104,843 |
| BR Malls Participacoes SA | | 184,040 | 704,404 |
| Brasil Foods SA (a) | | 136,400 | 1,207,721 |
| BTG Pactual Participations Ltd. unit | | 51,100 | 827,691 |
| CCR SA | | 287,800 | 1,179,761 |
| Centrais Eletricas Brasileiras SA (Electrobras) (a) | | 97,600 | 962,737 |
| Cielo SA | | 261,171 | 492,321 |
| Companhia de Saneamento Basico do Estado de Sao Paulo (SABESP) | | 76,200 | 1,037,787 |
| Companhia Siderurgica Nacional SA (CSN) | | 136,600 | 401,915 |
| Cosan SA Industria e Comercio | | 38,500 | 554,772 |
| Drogasil SA | | 53,500 | 1,467,398 |
| Embraer SA | | 162,400 | 709,855 |
| Energisa SA unit | | 46,200 | 552,027 |
| ENGIE Brasil Energia SA | | 45,350 | 511,792 |
| Equatorial Energia SA | | 47,200 | 1,199,037 |
| Hypermarcas SA | | 93,700 | 801,841 |
| IRB Brasil Resseguros SA | | 171,000 | 1,611,293 |
| JBS SA | | 270,300 | 1,906,692 |
| Klabin SA unit | | 186,900 | 737,254 |
| Kroton Educacional SA | | 350,452 | 845,000 |
| Localiza Rent A Car SA | | 135,467 | 1,458,538 |
| Lojas Renner SA | | 206,718 | 2,615,868 |
| M. Dias Branco SA | | 19,800 | 186,373 |
| Magazine Luiza SA | | 156,600 | 1,743,080 |
| Multiplan Empreendimentos Imobiliarios SA | | 58,766 | 428,015 |
| Natura Cosmeticos SA | | 86,700 | 673,625 |
| Notre Dame Intermedica Participacoes SA | | 89,000 | 1,331,505 |
| Petrobras Distribuidora SA | | 170,300 | 1,200,869 |
| Petroleo Brasileiro SA - Petrobras (ON) | | 719,700 | 5,868,144 |
| Porto Seguro SA | | 18,700 | 267,642 |
| Rumo SA (a) | | 272,500 | 1,549,183 |
| Sul America SA unit | | 59,247 | 713,387 |
| Suzano Papel e Celulose SA | | 129,817 | 1,056,533 |
| TIM Participacoes SA | | 191,600 | 545,586 |
| Ultrapar Participacoes SA | | 158,800 | 747,178 |
| Vale SA (a) | | 773,845 | 9,107,464 |
| Weg SA | | 205,550 | 1,306,951 |
|
| TOTAL BRAZIL | | | 68,197,064 |
|
| Canada - 6.6% | | | |
| Agnico Eagle Mines Ltd. (Canada) | | 58,311 | 3,583,840 |
| Air Canada (a) | | 33,683 | 1,199,402 |
| Alimentation Couche-Tard, Inc. Class B (sub. vtg.) | | 218,098 | 6,540,787 |
| AltaGas Ltd. | | 65,926 | 959,033 |
| ATCO Ltd. Class I (non-vtg.) | | 20,320 | 714,309 |
| Aurora Cannabis, Inc. (a)(b) | | 170,400 | 610,651 |
| Bank of Montreal | | 156,049 | 11,551,725 |
| Bank of Nova Scotia | | 297,558 | 17,065,926 |
| Barrick Gold Corp. (Canada) | | 429,304 | 7,457,654 |
| Bausch Health Cos., Inc. (Canada) (a) | | 82,307 | 2,045,958 |
| BCE, Inc. | | 39,394 | 1,868,755 |
| BlackBerry Ltd. (a) | | 125,464 | 659,184 |
| Bombardier, Inc. Class B (sub. vtg.) (a) | | 476,600 | 600,680 |
| Brookfield Asset Management, Inc. Class A | | 217,510 | 12,027,373 |
| CAE, Inc. | | 63,534 | 1,593,294 |
| Cameco Corp. | | 96,165 | 858,629 |
| Canadian Imperial Bank of Commerce | | 107,852 | 9,196,612 |
| Canadian National Railway Co. | | 176,566 | 15,791,872 |
| Canadian Natural Resources Ltd. | | 290,903 | 7,334,970 |
| Canadian Pacific Railway Ltd. | | 33,980 | 7,727,090 |
| Canadian Tire Ltd. Class A (non-vtg.) | | 14,715 | 1,586,351 |
| Canadian Utilities Ltd. Class A (non-vtg.) | | 30,383 | 886,046 |
| CCL Industries, Inc. Class B | | 39,105 | 1,609,507 |
| Cenovus Energy, Inc. (Canada) | | 266,022 | 2,266,166 |
| CGI Group, Inc. Class A (sub. vtg.) (a) | | 61,732 | 4,798,514 |
| CI Financial Corp. | | 54,667 | 795,662 |
| Constellation Software, Inc. | | 4,870 | 4,809,841 |
| Cronos Group, Inc. (a)(b) | | 44,700 | 365,854 |
| Dollarama, Inc. (b) | | 74,141 | 2,494,258 |
| Emera, Inc. | | 59,787 | 2,475,275 |
| Empire Co. Ltd. Class A (non-vtg.) | | 40,058 | 1,063,570 |
| Enbridge, Inc. | | 494,593 | 18,013,534 |
| Encana Corp. (Toronto) | | 363,198 | 1,422,900 |
| Fairfax Financial Holdings Ltd. (sub. vtg.) | | 6,937 | 2,938,916 |
| First Capital Realty, Inc. | | 43,510 | 720,156 |
| First Quantum Minerals Ltd. | | 165,759 | 1,400,727 |
| Fortis, Inc. | | 103,964 | 4,319,270 |
| Franco-Nevada Corp. | | 45,352 | 4,400,566 |
| George Weston Ltd. | | 19,043 | 1,524,626 |
| Gildan Activewear, Inc. | | 49,078 | 1,253,872 |
| Great-West Lifeco, Inc. | | 69,422 | 1,688,244 |
| H&R (REIT) unit | | 35,468 | 599,975 |
| Husky Energy, Inc. | | 78,191 | 546,167 |
| Hydro One Ltd. (c) | | 82,875 | 1,540,968 |
| iA Financial Corp, Inc. | | 24,132 | 1,162,169 |
| IGM Financial, Inc. | | 19,112 | 539,362 |
| Imperial Oil Ltd. | | 71,760 | 1,787,053 |
| Intact Financial Corp. | | 34,795 | 3,590,191 |
| Inter Pipeline Ltd. | | 96,179 | 1,614,545 |
| Keyera Corp. | | 49,819 | 1,154,790 |
| Kinross Gold Corp. (a) | | 284,602 | 1,382,927 |
| Kirkland Lake Gold Ltd. | | 48,011 | 2,254,560 |
| Loblaw Companies Ltd. | | 45,245 | 2,412,883 |
| Lundin Mining Corp. | | 161,894 | 817,398 |
| Magna International, Inc. Class A (sub. vtg.) | | 76,052 | 4,089,289 |
| Manulife Financial Corp. | | 480,622 | 8,951,224 |
| Methanex Corp. | | 16,214 | 614,411 |
| Metro, Inc. Class A (sub. vtg.) | | 62,221 | 2,631,319 |
| National Bank of Canada | | 85,122 | 4,396,020 |
| Nutrien Ltd. | | 143,461 | 6,863,167 |
| Onex Corp. (sub. vtg.) | | 20,794 | 1,222,443 |
| Open Text Corp. | | 68,194 | 2,755,512 |
| Pembina Pipeline Corp. | | 126,568 | 4,455,970 |
| Power Corp. of Canada (sub. vtg.) | | 79,073 | 1,829,888 |
| Power Financial Corp. | | 68,524 | 1,602,414 |
| PrairieSky Royalty Ltd. | | 49,072 | 479,133 |
| Quebecor, Inc. Class B (sub. vtg.) | | 42,493 | 987,879 |
| Restaurant Brands International, Inc. (b) | | 51,723 | 3,383,928 |
| Restaurant Brands International, Inc. | | 7,408 | 484,780 |
| RioCan (REIT) | | 44,778 | 898,552 |
| Rogers Communications, Inc. Class B (non-vtg.) | | 90,427 | 4,257,367 |
| Royal Bank of Canada | | 347,955 | 28,066,767 |
| Saputo, Inc. | | 55,278 | 1,603,234 |
| Shaw Communications, Inc. Class B | | 119,830 | 2,445,547 |
| Shopify, Inc. Class A (a) | | 24,261 | 7,607,466 |
| Smart (REIT) | | 19,121 | 462,237 |
| SNC-Lavalin Group, Inc. (b) | | 42,937 | 776,198 |
| Sun Life Financial, Inc. | | 146,756 | 6,584,019 |
| Suncor Energy, Inc. | | 385,945 | 11,474,912 |
| TC Energy Corp. | | 227,380 | 11,461,361 |
| Teck Resources Ltd. Class B (sub. vtg.) | | 125,386 | 1,982,034 |
| TELUS Corp. | | 51,979 | 1,848,923 |
| The Stars Group, Inc. (a) | | 57,894 | 1,259,769 |
| The Toronto-Dominion Bank | | 444,587 | 25,387,130 |
| Thomson Reuters Corp. | | 48,492 | 3,258,695 |
| Tourmaline Oil Corp. | | 58,078 | 498,278 |
| Vermilion Energy, Inc. | | 44,549 | 588,530 |
| West Fraser Timber Co. Ltd. | | 12,586 | 581,951 |
| Wheaton Precious Metals Corp. | | 112,087 | 3,141,942 |
| WSP Global, Inc. (b) | | 27,029 | 1,686,465 |
|
| TOTAL CANADA | | | 350,243,341 |
|
| Cayman Islands - 4.6% | | | |
| 3SBio, Inc. (a)(c) | | 288,000 | 536,474 |
| 51job, Inc. sponsored ADR (a) | | 5,621 | 442,766 |
| 58.com, Inc. ADR (a) | | 24,746 | 1,306,836 |
| AAC Technology Holdings, Inc. | | 175,000 | 1,132,477 |
| Agile Property Holdings Ltd. | | 346,000 | 466,362 |
| Airtac International Group | | 27,000 | 369,614 |
| Alibaba Group Holding Ltd. sponsored ADR (a) | | 347,505 | 61,393,708 |
| Anta Sports Products Ltd. | | 258,000 | 2,523,787 |
| ASM Pacific Technology Ltd. | | 81,100 | 1,132,386 |
| Autohome, Inc. ADR Class A (a)(b) | | 14,030 | 1,186,377 |
| Baidu.com, Inc. sponsored ADR (a) | | 66,913 | 6,815,089 |
| Baozun, Inc. sponsored ADR (a)(b) | | 8,784 | 382,280 |
| BeiGene Ltd. ADR (a) | | 9,545 | 1,320,455 |
| Bosideng International Holdings Ltd. | | 836,000 | 432,304 |
| Budweiser Brewing Co. APAC Ltd. (a)(c) | | 291,000 | 1,056,514 |
| Chailease Holding Co. Ltd. | | 322,304 | 1,453,105 |
| Cheung Kong Property Holdings Ltd. | | 634,716 | 4,416,169 |
| China Aoyuan Property Group Ltd. | | 286,000 | 365,488 |
| China Conch Venture Holdings Ltd. | | 378,000 | 1,479,070 |
| China Education Group Holdings Ltd. | | 150,000 | 224,067 |
| China First Capital Group Ltd. (a) | | 626,000 | 177,999 |
| China Hongqiao Group Ltd. | | 417,000 | 231,598 |
| China Huishan Dairy Holdings Co. Ltd. (a)(d) | | 397,000 | 10,639 |
| China Investment Fund International Holdings Co. Ltd. (d) | | 200,000 | 294,540 |
| China Literature Ltd. (a)(b)(c) | | 53,200 | 208,414 |
| China Medical System Holdings Ltd. | | 319,000 | 432,603 |
| China Mengniu Dairy Co. Ltd. | | 702,000 | 2,798,695 |
| China Resources Cement Holdings Ltd. | | 544,000 | 595,729 |
| China Resources Land Ltd. | | 658,634 | 2,801,090 |
| China State Construction International Holdings Ltd. | | 443,250 | 408,213 |
| China Zhongwang Holdings Ltd. | | 280,000 | 116,245 |
| CIFI Holdings Group Co. Ltd. | | 735,441 | 490,522 |
| CK Hutchison Holdings Ltd. | | 647,716 | 5,980,416 |
| Country Garden Holdings Co. Ltd. | | 1,804,644 | 2,505,259 |
| Country Garden Services Holdings Co. Ltd. | | 251,000 | 850,482 |
| Ctrip.com International Ltd. ADR (a) | | 114,883 | 3,789,990 |
| Dali Foods Group Co. Ltd. (c) | | 481,000 | 328,850 |
| ENN Energy Holdings Ltd. | | 188,300 | 2,148,230 |
| Evergrande Real Estate Group Ltd. | | 490,000 | 1,192,786 |
| Future Land Development Holding Ltd. | | 406,000 | 427,850 |
| GDS Holdings Ltd. ADR (a)(b) | | 13,006 | 542,090 |
| Geely Automobile Holdings Ltd. | | 1,244,000 | 2,353,912 |
| Genscript Biotech Corp. (a) | | 222,000 | 531,900 |
| Greentown Service Group Co. Ltd. | | 176,000 | 199,684 |
| Haidilao International Holding Ltd. (c) | | 95,000 | 459,903 |
| Haitian International Holdings Ltd. | | 130,000 | 306,763 |
| Hengan International Group Co. Ltd. | | 162,500 | 1,134,575 |
| Huazhu Group Ltd. ADR (b) | | 31,517 | 1,193,234 |
| Hutchison China Meditech Ltd. sponsored ADR (a) | | 12,208 | 230,731 |
| iQIYI, Inc. ADR (a)(b) | | 26,216 | 456,945 |
| JD.com, Inc. sponsored ADR (a) | | 178,949 | 5,574,261 |
| Kaisa Group Holdings Ltd. | | 505,000 | 220,842 |
| Kingboard Chemical Holdings Ltd. | | 141,500 | 377,084 |
| Kingboard Laminates Holdings Ltd. | | 345,500 | 316,300 |
| Kingdee International Software Group Co. Ltd. | | 497,000 | 544,588 |
| Kingsoft Corp. Ltd. (a) | | 186,000 | 428,068 |
| KWG Property Holding Ltd. | | 307,500 | 309,647 |
| Lee & Man Paper Manufacturing Ltd. | | 261,000 | 145,133 |
| Li Ning Co. Ltd. | | 454,000 | 1,539,433 |
| Lijun International Pharmaceutical Holding Ltd. | | 364,000 | 303,573 |
| Logan Property Holdings Co. Ltd. | | 306,000 | 466,032 |
| Longfor Properties Co. Ltd. (c) | | 457,000 | 1,896,620 |
| Meitu, Inc. (a)(c) | | 422,000 | 93,394 |
| Meituan Dianping Class B (a) | | 248,200 | 2,960,565 |
| Melco Crown Entertainment Ltd. sponsored ADR | | 46,659 | 1,005,035 |
| MGM China Holdings Ltd. | | 210,400 | 333,165 |
| Momo, Inc. ADR | | 36,966 | 1,239,100 |
| NetEase, Inc. ADR | | 17,114 | 4,892,208 |
| New Oriental Education & Technology Group, Inc. sponsored ADR (a) | | 35,463 | 4,328,614 |
| Nexteer Auto Group Ltd. | | 166,000 | 154,715 |
| NIO, Inc. sponsored ADR (a)(b) | | 149,200 | 216,340 |
| Noah Holdings Ltd. sponsored ADR (a)(b) | | 6,500 | 196,885 |
| Pinduoduo, Inc. ADR (a)(b) | | 47,828 | 1,955,209 |
| Sands China Ltd. | | 624,400 | 3,075,557 |
| Semiconductor Manufacturing International Corp. (a) | | 728,100 | 924,868 |
| Shenzhou International Group Holdings Ltd. | | 189,600 | 2,620,017 |
| Shimao Property Holdings Ltd. | | 257,500 | 862,647 |
| Shui On Land Ltd. | | 624,000 | 125,576 |
| SINA Corp. (a) | | 13,573 | 537,491 |
| Sino Biopharmaceutical Ltd. | | 1,683,500 | 2,506,552 |
| SOHO China Ltd. | | 345,000 | 117,728 |
| Sunac China Holdings Ltd. | | 600,000 | 2,721,473 |
| Sunny Optical Technology Group Co. Ltd. | | 171,700 | 2,759,886 |
| TAL Education Group ADR (a) | | 94,880 | 4,061,813 |
| Tencent Holdings Ltd. | | 1,394,200 | 56,552,819 |
| Tencent Music Entertainment Group ADR (a) | | 19,319 | 267,375 |
| Tingyi (Cayman Islands) Holding Corp. | | 432,000 | 574,688 |
| Towngas China Co. Ltd. | | 167,852 | 129,393 |
| Uni-President China Holdings Ltd. | | 260,000 | 268,562 |
| Vipshop Holdings Ltd. ADR (a) | | 104,756 | 1,208,884 |
| Want Want China Holdings Ltd. | | 1,440,000 | 1,213,070 |
| Weibo Corp. sponsored ADR (a) | | 11,549 | 568,095 |
| WH Group Ltd. (c) | | 2,358,500 | 2,489,499 |
| Wharf Real Estate Investment Co. Ltd. | | 313,000 | 1,840,980 |
| Wuxi Biologics (Cayman), Inc. (a)(c) | | 146,000 | 1,715,714 |
| Wynn Macau Ltd. | | 344,800 | 748,244 |
| Xiaomi Corp. Class B (a)(b)(c) | | 1,955,800 | 2,215,915 |
| Xinyi Solar Holdings Ltd. | | 726,432 | 410,460 |
| Yihai International Holding Ltd. | | 108,000 | 734,480 |
| Yuzhou Properties Co. | | 317,229 | 134,004 |
| YY, Inc. ADR (a) | | 14,764 | 839,186 |
| Zhen Ding Technology Holding Ltd. | | 113,302 | 538,684 |
| Zhongsheng Group Holdings Ltd. Class H | | 134,000 | 444,239 |
| ZTO Express (Cayman), Inc. sponsored ADR | | 80,585 | 1,772,870 |
|
| TOTAL CAYMAN ISLANDS | | | 246,112,795 |
|
| Chile - 0.2% | | | |
| Aguas Andinas SA | | 524,141 | 240,302 |
| Banco de Chile | | 11,488,897 | 1,479,490 |
| Banco de Credito e Inversiones | | 13,927 | 775,412 |
| Banco Santander Chile | | 17,119,431 | 1,062,116 |
| Cencosud SA | | 313,595 | 425,823 |
| Colbun SA (a) | | 1,710,041 | 295,037 |
| Compania Cervecerias Unidas SA | | 33,399 | 333,265 |
| Compania de Petroleos de Chile SA (COPEC) | | 106,226 | 949,832 |
| CorpBanca SA | | 34,171,557 | 207,352 |
| Empresa Nacional de Telecomunicaciones SA (ENTEL) (a) | | 31,103 | 243,296 |
| Empresas CMPC SA | | 253,852 | 578,492 |
| Enel Chile SA | | 6,015,047 | 494,684 |
| Enersis SA | | 9,590,988 | 1,791,197 |
| LATAM Airlines Group SA | | 65,025 | 718,993 |
| S.A.C.I. Falabella | | 208,767 | 1,062,696 |
|
| TOTAL CHILE | | | 10,657,987 |
|
| China - 2.9% | | | |
| Agricultural Bank of China Ltd.: | | | |
| (A Shares) | | 584,800 | 302,192 |
| (H Shares) | | 7,220,000 | 2,971,057 |
| Aier Eye Hospital Group Co. Ltd. (A Shares) | | 40,270 | 226,029 |
| Air China Ltd. (H Shares) | | 650,000 | 573,887 |
| Aisino Co. Ltd. (A Shares) | | 37,600 | 109,883 |
| Aluminum Corp. of China Ltd.: | | | |
| (A shares) (a) | | 236,800 | 113,873 |
| (H Shares) (a) | | 844,000 | 250,049 |
| Angang Steel Co. Ltd. (H Shares) | | 248,600 | 83,163 |
| Anhui Conch Cement Co. Ltd.: | | | |
| (A Shares) | | 32,800 | 196,329 |
| (H Shares) | | 318,000 | 1,900,601 |
| Anxin Trust Co. Ltd. (A Shares) (a) | | 32,800 | 19,535 |
| AVIC Aircraft Co. Ltd. (A Shares) | | 66,000 | 140,531 |
| AVIC Aviation Engine Corp. PLC (A Shares) | | 43,500 | 130,523 |
| AVIC Capital Co. Ltd. (A Shares) | | 51,800 | 33,587 |
| AviChina Industry & Technology Co. Ltd. (H Shares) | | 913,000 | 431,258 |
| Baic Motor Corp. Ltd. (H Shares) (c) | | 409,500 | 254,016 |
| Bank Communications Co. Ltd.: | | | |
| (H Shares) | | 2,049,000 | 1,399,360 |
| Class A | | 241,300 | 192,189 |
| Bank of Beijing Co. Ltd. (A Shares) | | 189,016 | 148,611 |
| Bank of Chengdu Co. Ltd. Class A | | 158,600 | 189,722 |
| Bank of China Ltd. (H Shares) | | 19,907,000 | 8,117,779 |
| Bank of Guiyang Co. Ltd. (A Shares) | | 82,420 | 106,916 |
| Bank of Hangzhou Co. Ltd. (A Shares) | | 33,480 | 42,770 |
| Bank of Jiangsu Co. Ltd. (A Shares) | | 181,100 | 181,812 |
| Bank of Nanjing Co. Ltd. (A Shares) | | 33,500 | 41,034 |
| Bank of Ningbo Co. Ltd. (A Shares) | | 118,300 | 453,469 |
| Bank of Shanghai Co. Ltd. (A Shares) | | 121,520 | 160,904 |
| Baoshan Iron & Steel Co. Ltd. (A Shares) | | 33,200 | 27,326 |
| BBMG Corp. (H Shares) | | 585,000 | 167,422 |
| Beijing Capital International Airport Co. Ltd. (H Shares) | | 396,000 | 375,060 |
| Beijing Tongrentang Co. Ltd. (A Shares) | | 6,500 | 25,369 |
| BOE Technology Group Co. Ltd. (A Shares) | | 609,100 | 308,333 |
| BYD Co. Ltd.: | | | |
| (A Shares) | | 17,000 | 103,345 |
| (H Shares) (b) | | 143,500 | 673,089 |
| CGN Power Co. Ltd. (H Shares) (c) | | 2,489,000 | 646,448 |
| Changjiang Securities Co. Ltd. (A Shares) | | 46,300 | 44,718 |
| China Cinda Asset Management Co. Ltd. (H Shares) | | 1,830,000 | 379,628 |
| China CITIC Bank Corp. Ltd. (H Shares) | | 2,503,000 | 1,450,891 |
| China Coal Energy Co. Ltd. (H Shares) | | 334,000 | 133,193 |
| China Communications Construction Co. Ltd.: | | | |
| (A Shares) | | 82,200 | 109,800 |
| (H Shares) | | 942,000 | 717,091 |
| China Communications Services Corp. Ltd. (H Shares) | | 538,000 | 332,230 |
| China Construction Bank Corp. (H Shares) | | 23,684,000 | 18,977,291 |
| China Eastern Airlines Corp. Ltd.: | | | |
| (A Shares) (a) | | 127,400 | 93,637 |
| (H Shares) (a) | | 444,000 | 221,442 |
| China Everbright Bank Co. Ltd.: | | | |
| (A Shares) | | 324,600 | 199,955 |
| (H Shares) | | 891,000 | 410,010 |
| China Fortune Land Development Co. Ltd. (A Shares) | | 9,700 | 39,327 |
| China Galaxy Securities Co. Ltd. (H Shares) | | 805,500 | 410,714 |
| China Huarong Asset Management Co. Ltd. (c) | | 2,132,000 | 314,757 |
| China International Capital Corp. Ltd. (H Shares) (c) | | 317,200 | 578,397 |
| China International Travel Service Corp. Ltd. (A Shares) | | 33,500 | 429,571 |
| China Life Insurance Co. Ltd. (H Shares) | | 1,849,000 | 4,755,058 |
| China Longyuan Power Grid Corp. Ltd. (H Shares) | | 686,000 | 370,601 |
| China Merchants Bank Co. Ltd.: | | | |
| (A Shares) | | 204,500 | 1,030,000 |
| (H Shares) | | 1,017,251 | 4,851,505 |
| China Merchants Securities Co. Ltd. (A Shares) | | 19,100 | 44,557 |
| China Merchants Shekou Industrial Zone Holdings Co. Ltd. (A Shares) | | 163,000 | 432,920 |
| China Minsheng Banking Corp. Ltd.: | | | |
| (A Shares) | | 589,800 | 514,829 |
| (H Shares) | | 1,356,800 | 949,042 |
| China Molybdenum Co. Ltd.: | | | |
| (H Shares) | | 909,000 | 286,459 |
| Class A | | 278,300 | 134,224 |
| China National Building Materials Co. Ltd. (H Shares) | | 835,000 | 703,758 |
| China National Chemical Engineering Co. Ltd. (A Shares) | | 211,300 | 179,337 |
| China National Nuclear Power Co. Ltd. (A Shares) | | 56,000 | 40,205 |
| China Northern Rare Earth Group High-Tech Co. Ltd. | | 51,000 | 72,807 |
| China Oilfield Services Ltd. (H Shares) | | 458,000 | 637,663 |
| China Pacific Insurance (Group) Co. Ltd. (H Shares) | | 733,600 | 2,661,713 |
| China Petroleum & Chemical Corp. (H Shares) | | 6,344,000 | 3,608,310 |
| China Railway Construction Corp. Ltd. (H Shares) | | 544,500 | 595,567 |
| China Railway Group Ltd.: | | | |
| (A Shares) | | 795,600 | 650,749 |
| (H Shares) | | 797,000 | 480,364 |
| China Railway Signal & Communications Corp. (H Shares) (c) | | 323,000 | 192,826 |
| China Reinsurance Group Corp. (H Shares) | | 1,336,000 | 217,958 |
| China Resources Sanjiu Medical & Pharmaceutical Co. Ltd. (A Shares) | | 27,900 | 116,677 |
| China Shenhua Energy Co. Ltd. (H Shares) | | 924,500 | 1,877,604 |
| China Shipbuilding Industry Co. (A Shares) | | 227,100 | 170,719 |
| China Shipping Development Co. Ltd. (H Shares) | | 208,000 | 89,477 |
| China Southern Airlines Ltd. (H Shares) | | 446,000 | 274,486 |
| China State Construction Engineering Corp. Ltd. (A Shares) | | 939,460 | 699,194 |
| China Telecom Corp. Ltd. (H Shares) | | 3,540,000 | 1,505,947 |
| China Tower Corp. Ltd. (H Shares) (c) | | 10,228,000 | 2,251,110 |
| China United Network Communications Ltd. (A Shares) | | 470,300 | 409,429 |
| China Vanke Co. Ltd.: | | | |
| (A Shares) | | 112,000 | 421,410 |
| (H Shares) | | 313,200 | 1,142,099 |
| China Yangtze Power Co. Ltd. (A Shares) | | 301,400 | 764,261 |
| Chongqing Rural Commercial Bank Co. Ltd. (H Shares) | | 655,000 | 349,605 |
| Chongqing Zhifei Biological Products Co. Ltd. (A Shares) | | 22,600 | 155,806 |
| CITIC Securities Co. Ltd.: | | | |
| (A Shares) | | 128,200 | 394,496 |
| (H Shares) | | 549,000 | 1,007,259 |
| COSCO SHIPPING Holdings Co. Ltd.: | | | |
| (A Shares) (a) | | 239,300 | 156,482 |
| (H Shares) (a) | | 748,000 | 279,840 |
| CRRC Corp. Ltd. (H Shares) | | 1,469,950 | 983,154 |
| Daqin Railway Co. Ltd. (A Shares) | | 43,700 | 47,335 |
| Datang International Power Generation Co. Ltd. (H Shares) | | 482,000 | 95,073 |
| DHC Software Co. Ltd. (A Shares) | | 108,600 | 109,941 |
| Dong E-E-Jiao Co. Ltd. (A Shares) | | 21,600 | 108,237 |
| Dongfeng Motor Group Co. Ltd. (H Shares) | | 562,000 | 563,750 |
| Dongxing Securities Co. Ltd. (A Shares) | | 61,600 | 95,064 |
| East Money Information Co. Ltd. (A Shares) | | 77,500 | 163,838 |
| Everbright Securities Co. Ltd. (A Shares) | | 26,600 | 43,240 |
| Financial Street Holdings Co. Ltd. (A Shares) | | 135,000 | 150,579 |
| Focus Media Information Technology Co. Ltd. (A Shares) | | 28,140 | 23,938 |
| Foshan Haitian Flavouring & Food Co. Ltd. (A Shares) | | 32,400 | 513,851 |
| Founder Securities Co. Ltd. (A Shares) | | 45,500 | 43,437 |
| Foxconn Industrial Internet Co. Ltd. (A Shares) | | 41,300 | 89,971 |
| Fuyao Glass Industries Group Co. Ltd. (H Shares) (c) | | 113,200 | 319,858 |
| GD Power Development Co. Ltd. (A Shares) | | 261,000 | 86,302 |
| Gemdale Corp. (A Shares) | | 84,400 | 142,537 |
| GF Securities Co. Ltd. (H Shares) | | 349,000 | 363,475 |
| Great Wall Motor Co. Ltd. (H Shares) | | 658,000 | 533,145 |
| Gree Electric Appliances, Inc. of Zhuhai (A Shares) | | 19,600 | 163,414 |
| Greenland Holdings Corp. Ltd. (A Shares) | | 131,300 | 127,049 |
| Guanghui Energy Co. Ltd. (A Shares) | | 176,300 | 82,329 |
| Guangzhou Automobile Group Co. Ltd. | | 76,100 | 124,120 |
| Guangzhou Automobile Group Co. Ltd. (H Shares) | | 618,000 | 617,219 |
| Guangzhou Baiyunshan Pharmaceutical Holdings Co. Ltd. (A Shares) | | 36,800 | 176,362 |
| Guangzhou Haige Communications Group (A Shares) | | 83,500 | 113,859 |
| Guangzhou R&F Properties Co. Ltd. (H Shares) | | 226,000 | 350,177 |
| Guosen Securities Co. Ltd. (A Shares) | | 48,100 | 83,451 |
| Guotai Junan Securities Co. Ltd.: | | | |
| (A Shares) | | 15,500 | 37,514 |
| (H Shares) (c) | | 347,200 | 530,556 |
| Guoyuan Securities Co. Ltd. (A Shares) | | 71,000 | 85,101 |
| Haier Smart Home Co. Ltd. (A Shares) | | 192,800 | 437,900 |
| Haitong Securities Co. Ltd.: | | | |
| (A Shares) | | 114,700 | 229,449 |
| (H Shares) | | 749,600 | 765,273 |
| Hanergy Mobile Energy Holding (d) | | 576,000 | 1 |
| Hangzhou Hikvision Digital Technology Co. Ltd. (A Shares) | | 131,900 | 604,172 |
| Hangzhou Tigermed Consulting Co. Ltd. (A Shares) | | 15,000 | 145,446 |
| Henan Shuanghui Investment & Development Co. Ltd. (A Shares) | | 10,000 | 42,300 |
| Hengtong Optic-electric Co. Ltd. (A Shares) | | 53,800 | 112,197 |
| Huaan Securities Co. Ltd. (A Shares) | | 89,900 | 80,368 |
| Huadian Power International Corp. Ltd. (H Shares) | | 478,000 | 179,111 |
| Huadong Medicine Co. Ltd. (A Shares) | | 6,560 | 24,282 |
| Huaneng Power International, Inc. (H Shares) | | 956,000 | 454,076 |
| Huaneng Renewables Corp. Ltd. (H Shares) | | 912,000 | 348,179 |
| Huatai Securities Co. Ltd.: | | | |
| (A Shares) | | 47,200 | 116,790 |
| (H Shares) (c) | | 404,200 | 600,810 |
| HUAXI Securities Co. Ltd. | | 51,000 | 68,945 |
| Huaxia Bank Co. Ltd. (A Shares) | | 256,800 | 273,014 |
| Huayu Automotive Systems Co. Ltd. (A Shares) | | 10,931 | 38,956 |
| Hubei Biocause Pharmaceutical Co. Ltd. (A Shares) | | 148,600 | 143,715 |
| Hundsun Technologies, Inc. (A Shares) | | 11,600 | 125,402 |
| iFlytek Co. Ltd. (A Shares) | | 29,300 | 137,635 |
| Industrial & Commercial Bank of China Ltd. (H Shares) | | 16,377,000 | 11,732,373 |
| Industrial Bank Co. Ltd. (A Shares) | | 287,300 | 763,188 |
| Industrial Securities Co. Ltd. (A Shares) | | 43,100 | 39,009 |
| Inner Mongoli Yili Industries Co. Ltd. (A Shares) | | 103,500 | 425,986 |
| Inner Mongolia Baotou Steel Union Co. Ltd. (A Shares) | | 152,300 | 29,614 |
| Inner Mongolia Yitai Coal Co. Ltd. (B Shares) | | 532,064 | 464,085 |
| Jiangsu Expressway Co. Ltd. (H Shares) | | 264,000 | 350,737 |
| Jiangsu Hengrui Medicine Co. Ltd. (A Shares) | | 61,700 | 795,541 |
| Jiangsu Yanghe Brewery JSC Ltd. (A Shares) | | 25,200 | 359,933 |
| Jiangxi Copper Co. Ltd. (H Shares) | | 332,000 | 388,682 |
| Kangmei Pharmaceutical Co. Ltd. (A Shares) | | 10,500 | 5,552 |
| Kweichow Moutai Co. Ltd. (A Shares) | | 14,600 | 2,443,596 |
| Legend Holdings Corp.: | | | |
| (H Shares) (c) | | 86,900 | 191,024 |
| rights (a)(d) | | 7,753 | 1,286 |
| LONGi Green Energy Technology Co. Ltd. | | 34,800 | 112,666 |
| Luxshare Precision Industry Co. Ltd. (A Shares) | | 88,115 | 397,119 |
| Luzhou Laojiao Co. Ltd. (A Shares) | | 21,800 | 269,577 |
| Maanshan Iron & Steel Co. Ltd. (A Shares) | | 415,200 | 156,689 |
| Mango Excellent Media Co. Ltd. (A Shares) | | 27,800 | 106,518 |
| Meinian Onehealth Healthcare Holdings Co. Ltd. (A Shares) | | 13,164 | 27,857 |
| Metallurgical Corp. China Ltd. (H Shares) | | 718,000 | 152,000 |
| Midea Group Co. Ltd. (A Shares) | | 29,100 | 229,187 |
| Muyuan Foodstuff Co. Ltd. (A Shares) | | 12,000 | 167,662 |
| NARI Technology Co. Ltd. (A Shares) | | 52,900 | 164,751 |
| New China Life Insurance Co. Ltd. (H Shares) | | 216,900 | 841,827 |
| Orient Securities Co. Ltd. (A Shares) | | 23,700 | 33,620 |
| People's Insurance Co. of China Group (H Shares) | | 1,801,000 | 758,533 |
| PetroChina Co. Ltd. (H Shares) | | 5,466,000 | 2,665,558 |
| PICC Property & Casualty Co. Ltd. (H Shares) | | 1,772,933 | 2,243,681 |
| Ping An Bank Co. Ltd. (A Shares) | | 267,700 | 617,736 |
| Ping An Insurance Group Co. of China Ltd.: | | | |
| (A Shares) | | 109,400 | 1,365,800 |
| (H Shares) | | 1,372,000 | 15,835,337 |
| Poly Developments & Holdings (A Shares) | | 224,100 | 458,054 |
| Postal Savings Bank of China Co. Ltd. (H Shares) (c) | | 1,857,000 | 1,190,640 |
| Power Construction Corp. of China Ltd. (A Shares) | | 52,000 | 32,927 |
| Risesun Real Estate Development Co. Ltd. (A Shares) | | 93,000 | 114,795 |
| SAIC Motor Corp. Ltd. (A Shares) | | 141,100 | 470,593 |
| Sany Heavy Industry Co. Ltd. (A Shares) | | 33,200 | 63,444 |
| SDIC Capital Co. Ltd. | | 42,900 | 74,608 |
| SDIC Power Holdings Co. Ltd. (A Shares) | | 39,400 | 46,639 |
| Seazen Holdings Co. Ltd. (A Shares) | | 25,600 | 115,572 |
| Shaanxi Coal Industry Co. Ltd. (A Shares) | | 125,800 | 149,581 |
| Shandong Buchang Pharmaceuticals Co. Ltd. (A Shares) | | 32,210 | 93,612 |
| Shandong Gold Mining Co. Ltd. (A Shares) | | 37,080 | 168,443 |
| Shandong Weigao Medical Polymer Co. Ltd. (H Shares) | | 472,000 | 541,875 |
| Shanghai Electric Group Co. Ltd.: | | | |
| (A Shares) | | 219,900 | 152,280 |
| (H Shares) | | 516,000 | 157,833 |
| Shanghai Fosun Pharmaceutical (Group) Co. Ltd. (H Shares) | | 145,000 | 409,243 |
| Shanghai International Airport Co. Ltd. (A Shares) | | 5,300 | 57,367 |
| Shanghai International Port Group Co. Ltd. (A Shares) | | 41,400 | 34,108 |
| Shanghai Lujiazui Finance Trust Ltd. (B Shares) | | 400,136 | 440,711 |
| Shanghai Pharmaceuticals Holding Co. Ltd. (H Shares) | | 197,400 | 356,686 |
| Shanghai Pudong Development Bank Co. Ltd. (A Shares) | | 437,800 | 777,121 |
| Shanghaioriental Pearl Media Co. Ltd. | | 19,390 | 24,773 |
| Shanxi Lu'an Environmental Energy Development Co. Ltd. (A Shares) | | 142,300 | 141,553 |
| Shanxi Xinghuacun Fen Wine Factory Co. Ltd. (A Shares) | | 15,500 | 195,610 |
| Shanxi Xishan Coal & Electricity Power Co. Ltd. (A Shares) | | 191,100 | 153,739 |
| Shenwan Hongyuan Group Co. Ltd. (A Shares) | | 263,100 | 178,834 |
| Shenzhen Mindray Bio-Medical Electronics Co. Ltd. (A Shares) | | 5,200 | 131,297 |
| Shenzhen Overseas Chinese Town Co. Ltd. (A Shares) | | 34,700 | 34,669 |
| Shenzhen Salubris Pharmaceuticals Co. Ltd. (A Shares) | | 32,300 | 85,818 |
| Sichuan Chuantou Energy Co. Ltd. (A Shares) | | 31,436 | 43,098 |
| Sichuan Kelun Pharmaceutical Co. Ltd. (A Shares) | | 29,900 | 101,346 |
| Sichuan New Hope Agribusiness Co. Ltd. (A Shares) | | 39,400 | 123,348 |
| Sinolink Securities Co. Ltd. (A Shares) | | 75,000 | 90,525 |
| Sinopec Engineering Group Co. Ltd. (H Shares) | | 322,000 | 183,945 |
| Sinopec Shanghai Petrochemical Co. Ltd.: | | | |
| (A Shares) | | 287,900 | 161,834 |
| (H Shares) | | 577,000 | 159,361 |
| Sinopharm Group Co. Ltd. (H Shares) | | 277,600 | 994,155 |
| Sinotrans Ltd. (H Shares) | | 514,000 | 151,129 |
| Spring Airlines Co. Ltd. (A Shares) | | 21,200 | 130,002 |
| Suning.com Co. Ltd. (A Shares) | | 218,900 | 327,723 |
| Tasly Pharmaceutical Group Co. Ltd. (A Shares) | | 48,500 | 100,662 |
| Tong Ren Tang Technologies Co. Ltd. (H Shares) | | 164,000 | 163,279 |
| Tongwei Co. Ltd. (A Shares) | | 65,600 | 118,185 |
| TravelSky Technology Ltd. (H Shares) | | 197,000 | 449,053 |
| Tsingtao Brewery Co. Ltd.: | | | |
| (A Shares) | | 14,800 | 98,633 |
| (H Shares) | | 86,000 | 498,371 |
| Walvax Biotechnology Co. Ltd. (A Shares) | | 30,700 | 131,415 |
| Wanhua Chemical Group Co. Ltd. (A Shares) | | 56,600 | 366,047 |
| Weichai Power Co. Ltd. (H Shares) | | 509,600 | 802,121 |
| Weifu High-Technology Group Co. Ltd. (A Shares) | | 37,700 | 89,773 |
| Wens Foodstuffs Group Co. Ltd. (A Shares) | | 41,600 | 237,631 |
| Western Securities Co. Ltd. (A Shares) | | 67,600 | 84,871 |
| Wuliangye Yibin Co. Ltd. (A Shares) | | 46,500 | 869,872 |
| WuXi AppTec Co. Ltd. | | 23,600 | 315,031 |
| WuXi AppTec Co. Ltd. (H Shares) (c) | | 38,000 | 458,156 |
| XCMG Construction Machinery Co. Ltd. (A Shares) | | 267,500 | 171,502 |
| Xiamen C&D, Inc. (A Shares) | | 104,400 | 125,780 |
| Xinjiang Goldwind Science & Technology Co. Ltd.: | | | |
| (A Shares) | | 59,282 | 105,700 |
| (H Shares) | | 134,252 | 160,110 |
| Yanzhou Coal Mining Co. Ltd. (H Shares) | | 424,000 | 430,179 |
| Yonghui Superstores Co. Ltd. (A Shares) | | 225,000 | 266,362 |
| Yonyou Network Technology Co. Ltd. (A Shares) | | 29,100 | 121,948 |
| Yunnan Baiyao Group Co. Ltd. (A Shares) | | 26,500 | 325,652 |
| Zhangzhou Pientzehuang Pharmaceutical Co. Ltd. (A Shares) | | 2,198 | 33,844 |
| Zhaojin Mining Industry Co. Ltd. (H Shares) | | 235,000 | 262,819 |
| Zhejiang Chint Electric Co. Ltd. (A Shares) | | 38,700 | 125,293 |
| Zhejiang Dahua Technology Co. Ltd. (A Shares) | | 76,600 | 174,966 |
| Zhejiang Expressway Co. Ltd. (H Shares) | | 318,000 | 260,400 |
| Zhejiang Longsheng Group Co. Ltd. (A Shares) | | 31,500 | 61,830 |
| ZhongAn Online P & C Insurance Co. Ltd. (H Shares) (a)(b)(c) | | 49,100 | 163,447 |
| Zhuzhou CRRC Times Electric Co. Ltd. (H Shares) | | 114,200 | 423,747 |
| Zijin Mining Group Co. Ltd. (H Shares) | | 1,514,000 | 524,434 |
| Zoomlion Heavy Industry Science and Technology Co. Ltd. (A Shares) | | 145,100 | 120,450 |
| ZTE Corp. (H Shares) (a) | | 224,680 | 626,834 |
|
| TOTAL CHINA | | | 156,036,385 |
|
| Colombia - 0.1% | | | |
| Bancolombia SA | | 69,950 | 850,575 |
| Cementos Argos SA | | 109,103 | 246,289 |
| Ecopetrol SA | | 1,227,960 | 1,104,437 |
| Grupo de Inversiones Suramerica SA | | 57,602 | 582,837 |
| Interconexion Electrica SA ESP | | 104,792 | 604,569 |
| Inversiones Argos SA | | 75,786 | 410,321 |
|
| TOTAL COLOMBIA | | | 3,799,028 |
|
| Czech Republic - 0.0% | | | |
| Ceske Energeticke Zavody A/S | | 35,542 | 810,771 |
| Komercni Banka A/S | | 22,365 | 755,989 |
| MONETA Money Bank A/S (c) | | 97,039 | 322,501 |
|
| TOTAL CZECH REPUBLIC | | | 1,889,261 |
|
| Denmark - 1.2% | | | |
| A.P. Moller - Maersk A/S: | | | |
| Series A | | 1,060 | 1,272,228 |
| Series B | | 1,398 | 1,783,292 |
| Carlsberg A/S Series B | | 26,419 | 3,716,675 |
| Christian Hansen Holding A/S | | 25,809 | 1,981,505 |
| Coloplast A/S Series B | | 29,948 | 3,608,710 |
| Danske Bank A/S | | 164,776 | 2,351,061 |
| DSV A/S | | 53,719 | 5,212,478 |
| Genmab A/S (a) | | 15,784 | 3,448,720 |
| H Lundbeck A/S | | 15,485 | 528,202 |
| ISS Holdings A/S | | 36,907 | 965,814 |
| Novo Nordisk A/S Series B | | 430,788 | 23,688,477 |
| Novozymes A/S Series B | | 51,806 | 2,439,185 |
| ORSTED A/S (c) | | 46,135 | 4,046,833 |
| Pandora A/S | | 24,437 | 1,201,640 |
| Tryg A/S | | 25,520 | 712,783 |
| Vestas Wind Systems A/S | | 47,523 | 3,871,595 |
| William Demant Holding A/S (a) | | 31,231 | 824,273 |
|
| TOTAL DENMARK | | | 61,653,471 |
|
| Egypt - 0.0% | | | |
| Commercial International Bank SAE | | 189,759 | 952,322 |
| Commercial International Bank SAE sponsored GDR | | 131,006 | 647,170 |
| Eastern Tobacco Co. | | 193,921 | 192,359 |
| Elsewedy Electric Co. | | 134,494 | 112,078 |
|
| TOTAL EGYPT | | | 1,903,929 |
|
| Finland - 0.7% | | | |
| Elisa Corp. (A Shares) | | 36,045 | 1,968,642 |
| Fortum Corp. | | 103,853 | 2,535,459 |
| Kone OYJ (B Shares) | | 81,868 | 5,208,173 |
| Metso Corp. | | 27,420 | 1,036,102 |
| Neste Oyj | | 101,370 | 3,658,556 |
| Nokia Corp. | | 1,378,903 | 5,061,972 |
| Nokian Tyres PLC | | 31,625 | 902,947 |
| Nordea Bank ABP (Stockholm Stock Exchange) | | 781,046 | 5,716,739 |
| Orion Oyj (B Shares) | | 26,040 | 1,154,145 |
| Sampo Oyj (A Shares) | | 104,832 | 4,296,000 |
| Stora Enso Oyj (R Shares) | | 151,652 | 1,966,223 |
| UPM-Kymmene Corp. | | 132,462 | 4,304,994 |
| Wartsila Corp. | | 104,566 | 1,103,482 |
|
| TOTAL FINLAND | | | 38,913,434 |
|
| France - 6.8% | | | |
| Accor SA | | 45,604 | 1,959,210 |
| Aeroports de Paris | | 6,861 | 1,303,913 |
| Air Liquide SA | | 114,537 | 15,214,205 |
| Alstom SA | | 46,529 | 2,010,885 |
| Amundi SA (c) | | 16,127 | 1,151,132 |
| Arkema SA | | 18,821 | 1,923,621 |
| Atos Origin SA | | 22,854 | 1,773,623 |
| AXA SA | | 462,539 | 12,243,977 |
| BIC SA | | 5,314 | 368,937 |
| bioMerieux SA | | 9,274 | 758,680 |
| BNP Paribas SA | | 274,588 | 14,349,847 |
| Bollore SA | | 199,265 | 862,292 |
| Bollore SA (a) | | 1,343 | 5,722 |
| Bouygues SA | | 52,029 | 2,205,062 |
| Bureau Veritas SA | | 75,164 | 1,918,878 |
| Capgemini SA | | 38,861 | 4,375,342 |
| Carrefour SA | | 149,890 | 2,550,214 |
| Casino Guichard Perrachon SA (b) | | 12,124 | 654,054 |
| CNP Assurances | | 36,787 | 729,487 |
| Compagnie de St. Gobain | | 120,708 | 4,909,797 |
| Covivio | | 10,102 | 1,143,576 |
| Credit Agricole SA | | 277,348 | 3,618,934 |
| Danone SA | | 149,148 | 12,355,615 |
| Dassault Aviation SA | | 559 | 776,199 |
| Dassault Systemes SA | | 32,124 | 4,874,385 |
| Edenred SA | | 59,355 | 3,124,575 |
| EDF SA | | 138,787 | 1,432,109 |
| EDF SA (a) | | 5,248 | 54,153 |
| Eiffage SA | | 20,553 | 2,207,920 |
| ENGIE | | 443,178 | 7,411,675 |
| Essilor International SA | | 68,537 | 10,456,898 |
| Eurazeo SA | | 8,963 | 624,777 |
| Eutelsat Communications | | 41,523 | 787,280 |
| Faurecia SA | | 20,828 | 970,527 |
| Gecina SA | | 11,595 | 1,988,927 |
| Groupe Eurotunnel SA | | 102,142 | 1,709,924 |
| Hermes International SCA | | 7,518 | 5,408,212 |
| ICADE | | 7,239 | 708,867 |
| Iliad SA | | 5,961 | 616,963 |
| Imerys SA | | 8,094 | 312,523 |
| Ingenico SA | | 14,553 | 1,553,952 |
| Ipsen SA | | 9,172 | 976,920 |
| JCDecaux SA | | 16,653 | 455,041 |
| Kering SA | | 18,548 | 10,554,295 |
| Klepierre SA | | 53,005 | 1,973,899 |
| L'Oreal SA | | 61,568 | 17,976,966 |
| L'Oreal SA (a) | | 4,395 | 1,283,276 |
| Legrand SA | | 65,753 | 5,131,936 |
| LVMH Moet Hennessy Louis Vuitton SE | | 67,551 | 28,848,062 |
| Michelin CGDE Series B | | 42,021 | 5,116,363 |
| Natixis SA | | 246,777 | 1,131,472 |
| Orange SA | | 489,514 | 7,878,487 |
| Pernod Ricard SA | | 52,122 | 9,620,791 |
| Peugeot Citroen SA | | 139,594 | 3,534,145 |
| Publicis Groupe SA | | 52,476 | 2,258,492 |
| Remy Cointreau SA | | 5,039 | 673,838 |
| Renault SA | | 46,938 | 2,395,534 |
| Safran SA | | 79,647 | 12,600,578 |
| Sanofi SA | | 275,551 | 25,402,263 |
| Sartorius Stedim Biotech | | 6,561 | 982,006 |
| Schneider Electric SA | | 134,885 | 12,536,274 |
| SCOR SE | | 38,949 | 1,641,156 |
| SEB SA | | 5,346 | 811,482 |
| Societe Generale Series A | | 189,692 | 5,394,637 |
| Sodexo SA | | 21,862 | 2,404,133 |
| Sodexo SA (a) | | 2,224 | 244,570 |
| SR Teleperformance SA | | 14,335 | 3,248,726 |
| Suez Environnement SA | | 83,457 | 1,300,787 |
| Thales SA | | 25,059 | 2,449,389 |
| Total SA | | 582,528 | 30,797,233 |
| Ubisoft Entertainment SA (a) | | 19,840 | 1,171,433 |
| Valeo SA | | 62,479 | 2,323,226 |
| Veolia Environnement SA | | 133,880 | 3,519,387 |
| VINCI SA | | 123,271 | 13,830,905 |
| Vivendi SA | | 219,278 | 6,104,236 |
| Wendel SA | | 5,908 | 836,827 |
| Worldline SA (a)(c) | | 20,604 | 1,251,241 |
|
| TOTAL FRANCE | | | 362,066,875 |
|
| Germany - 5.3% | | | |
| adidas AG | | 44,064 | 13,605,677 |
| Allianz SE | | 102,690 | 25,079,230 |
| Axel Springer SE (a) | | 11,487 | 800,716 |
| BASF AG | | 224,317 | 17,052,408 |
| Bayer AG | | 228,066 | 17,692,493 |
| Bayerische Motoren Werke AG (BMW) | | 72,693 | 5,570,629 |
| Beiersdorf AG | | 23,729 | 2,809,255 |
| Brenntag AG | | 41,070 | 2,061,242 |
| Carl Zeiss Meditec AG | | 8,988 | 979,877 |
| Commerzbank AG | | 252,075 | 1,507,750 |
| Continental AG | | 27,470 | 3,679,355 |
| Covestro AG (c) | | 45,474 | 2,183,373 |
| Daimler AG (Germany) | | 223,373 | 13,056,794 |
| Delivery Hero AG (a)(c) | | 28,734 | 1,346,937 |
| Deutsche Bank AG | | 483,771 | 3,503,836 |
| Deutsche Borse AG | | 46,162 | 7,148,633 |
| Deutsche Lufthansa AG | | 57,716 | 1,000,642 |
| Deutsche Post AG | | 244,000 | 8,640,229 |
| Deutsche Telekom AG | | 802,742 | 14,124,711 |
| Deutsche Wohnen AG (Bearer) | | 85,715 | 3,223,563 |
| Drillisch AG (b) | | 12,213 | 326,635 |
| E.ON AG | | 541,297 | 5,458,697 |
| Evonik Industries AG | | 51,303 | 1,353,211 |
| Fraport AG Frankfurt Airport Services Worldwide | | 11,355 | 949,058 |
| Fresenius Medical Care AG & Co. KGaA | | 52,890 | 3,817,582 |
| Fresenius SE & Co. KGaA | | 100,725 | 5,293,956 |
| GEA Group AG | | 34,960 | 1,068,740 |
| Hannover Reuck SE | | 13,852 | 2,453,323 |
| HeidelbergCement Finance AG | | 37,825 | 2,810,446 |
| Henkel AG & Co. KGaA | | 24,217 | 2,332,246 |
| Hochtief AG | | 5,400 | 673,329 |
| Hugo Boss AG | | 16,883 | 710,253 |
| Infineon Technologies AG | | 308,148 | 5,968,449 |
| KION Group AG | | 15,455 | 1,026,978 |
| Knorr-Bremse AG | | 12,312 | 1,242,570 |
| Lanxess AG | | 19,777 | 1,285,940 |
| Merck KGaA | | 32,791 | 3,909,526 |
| Metro Wholesale & Food Specialist AG | | 40,156 | 653,875 |
| MTU Aero Engines Holdings AG | | 12,937 | 3,454,216 |
| Muenchener Rueckversicherungs-Gesellschaft AG in Muenchen | | 35,180 | 9,769,827 |
| Puma AG | | 19,505 | 1,467,302 |
| RWE AG | | 134,816 | 4,109,347 |
| SAP SE | | 239,448 | 31,727,215 |
| Siemens AG | | 186,983 | 21,577,852 |
| Siemens Healthineers AG (c) | | 34,678 | 1,473,376 |
| Symrise AG | | 31,434 | 3,024,834 |
| Telefonica Deutschland Holding AG | | 277,669 | 881,052 |
| Thyssenkrupp AG (b) | | 103,478 | 1,476,658 |
| TUI AG | | 6,416 | 83,758 |
| TUI AG (GB) | | 108,837 | 1,423,918 |
| Uniper SE | | 45,964 | 1,432,306 |
| United Internet AG | | 29,093 | 876,405 |
| Volkswagen AG | | 7,459 | 1,413,402 |
| Vonovia SE | | 124,564 | 6,628,170 |
| Wirecard AG (b) | | 28,725 | 3,637,801 |
| Zalando SE (a)(c) | | 33,693 | 1,459,898 |
|
| TOTAL GERMANY | | | 282,319,501 |
|
| Greece - 0.1% | | | |
| Alpha Bank AE (a) | | 318,867 | 679,613 |
| EFG Eurobank Ergasias SA (a) | | 578,513 | 585,856 |
| Ff Group (a)(d) | | 5,453 | 7,298 |
| Greek Organization of Football Prognostics SA | | 72,886 | 792,575 |
| Hellenic Telecommunications Organization SA | | 54,786 | 830,998 |
| Jumbo SA | | 25,368 | 495,126 |
| Motor Oil (HELLAS) Corinth Refineries SA | | 11,554 | 285,300 |
| National Bank of Greece SA (a) | | 124,820 | 423,204 |
|
| TOTAL GREECE | | | 4,099,970 |
|
| Hong Kong - 2.5% | | | |
| AIA Group Ltd. | | 2,949,400 | 29,370,788 |
| Bank of East Asia Ltd. | | 288,312 | 694,515 |
| Beijing Enterprises Holdings Ltd. | | 139,000 | 654,467 |
| BOC Hong Kong (Holdings) Ltd. | | 913,000 | 3,136,727 |
| BYD Electronic International Co. Ltd. | | 134,500 | 230,960 |
| China Agri-Industries Holdings Ltd. | | 344,000 | 113,333 |
| China Everbright International Ltd. | | 1,012,481 | 765,239 |
| China Everbright Ltd. | | 182,000 | 269,652 |
| China Jinmao Holdings Group Ltd. | | 1,188,000 | 789,807 |
| China Merchants Holdings International Co. Ltd. | | 267,123 | 417,655 |
| China Mobile Ltd. | | 1,500,000 | 12,190,051 |
| China Overseas Land and Investment Ltd. | | 960,000 | 3,029,273 |
| China Power International Development Ltd. | | 726,000 | 151,614 |
| China Resources Beer Holdings Co. Ltd. | | 365,162 | 1,872,195 |
| China Resources Pharmaceutical Group Ltd. (c) | | 546,000 | 504,235 |
| China Resources Power Holdings Co. Ltd. | | 404,523 | 508,378 |
| China Taiping Insurance Group Ltd. | | 438,177 | 985,066 |
| China Unicom Ltd. | | 1,636,000 | 1,610,641 |
| CITIC Pacific Ltd. | | 1,455,000 | 1,914,030 |
| CLP Holdings Ltd. | | 402,000 | 4,174,940 |
| CNOOC Ltd. | | 4,295,000 | 6,392,037 |
| CSPC Pharmaceutical Group Ltd. | | 1,164,000 | 2,981,145 |
| Far East Horizon Ltd. | | 454,000 | 429,821 |
| Fosun International Ltd. | | 554,500 | 725,052 |
| Galaxy Entertainment Group Ltd. | | 542,000 | 3,732,017 |
| Guangdong Investment Ltd. | | 766,000 | 1,657,852 |
| Hang Lung Properties Ltd. | | 511,000 | 1,123,282 |
| Hang Seng Bank Ltd. | | 188,000 | 3,922,639 |
| Henderson Land Development Co. Ltd. | | 382,625 | 1,911,052 |
| Hong Kong & China Gas Co. Ltd. | | 2,499,980 | 4,852,216 |
| Hong Kong Exchanges and Clearing Ltd. | | 288,076 | 8,974,730 |
| Hua Hong Semiconductor Ltd. (c) | | 110,000 | 221,193 |
| Hysan Development Co. Ltd. | | 134,020 | 528,206 |
| Lenovo Group Ltd. | | 1,828,000 | 1,274,378 |
| Link (REIT) | | 513,547 | 5,593,247 |
| MMG Ltd. (a) | | 568,000 | 118,247 |
| MTR Corp. Ltd. | | 358,091 | 2,053,217 |
| New World Development Co. Ltd. | | 1,448,354 | 2,071,779 |
| PCCW Ltd. | | 905,913 | 538,035 |
| Power Assets Holdings Ltd. | | 339,500 | 2,422,719 |
| Shanghai Industrial Holdings Ltd. | | 84,000 | 156,364 |
| Shenzhen Investment Ltd. | | 526,000 | 207,031 |
| Sino Land Ltd. | | 835,770 | 1,249,365 |
| Sino-Ocean Group Holding Ltd. | | 872,091 | 320,626 |
| Sinotruk Hong Kong Ltd. | | 164,500 | 248,571 |
| SJM Holdings Ltd. | | 435,000 | 464,685 |
| Sun Art Retail Group Ltd. | | 511,372 | 521,800 |
| Sun Hung Kai Properties Ltd. | | 385,281 | 5,838,286 |
| Swire Pacific Ltd. (A Shares) | | 115,000 | 1,096,213 |
| Swire Properties Ltd. | | 304,800 | 958,611 |
| Techtronic Industries Co. Ltd. | | 348,500 | 2,723,533 |
| Vitasoy International Holdings Ltd. | | 168,000 | 683,140 |
| Wharf Holdings Ltd. | | 301,000 | 683,045 |
| Wheelock and Co. Ltd. | | 216,000 | 1,335,875 |
| Winteam Pharmaceutical Group Ltd. | | 578,000 | 258,092 |
| Yuexiu Property Co. Ltd. | | 1,548,000 | 340,966 |
|
| TOTAL HONG KONG | | | 131,992,633 |
|
| Hungary - 0.1% | | | |
| MOL Hungarian Oil and Gas PLC Series A (For. Reg.) | | 107,789 | 1,065,425 |
| OTP Bank PLC | | 56,781 | 2,615,412 |
| Richter Gedeon PLC | | 31,267 | 579,477 |
|
| TOTAL HUNGARY | | | 4,260,314 |
|
| India - 2.3% | | | |
| Adani Ports & Special Economic Zone Ltd. (a) | | 167,754 | 934,121 |
| Ambuja Cements Ltd. | | 126,037 | 358,882 |
| Ashok Leyland Ltd. | | 285,526 | 308,382 |
| Asian Paints Ltd. | | 71,581 | 1,823,325 |
| Aurobindo Pharma Ltd. | | 60,091 | 396,180 |
| Avenue Supermarts Ltd. (a)(c) | | 27,548 | 772,963 |
| Axis Bank Ltd. | | 508,834 | 5,268,301 |
| Bajaj Auto Ltd. | | 17,847 | 815,716 |
| Bajaj Finance Ltd. | | 44,487 | 2,520,943 |
| Bajaj Finserv Ltd. | | 10,083 | 1,154,783 |
| Bandhan Bank Ltd. (c) | | 94,343 | 812,357 |
| Bharat Forge Ltd. | | 59,479 | 379,717 |
| Bharat Petroleum Corp. Ltd. | | 159,433 | 1,179,912 |
| Bharti Airtel Ltd. | | 498,686 | 2,626,226 |
| Bharti Infratel Ltd. | | 78,312 | 209,146 |
| Bosch Ltd. | | 1,636 | 352,328 |
| Britannia Industries Ltd. | | 12,318 | 566,266 |
| Cipla Ltd. (a) | | 78,426 | 515,578 |
| Coal India Ltd. | | 290,747 | 848,748 |
| Container Corp. of India Ltd. | | 47,207 | 390,885 |
| Dabur India Ltd. | | 115,057 | 748,013 |
| Divi's Laboratories Ltd. | | 18,906 | 467,109 |
| Dr. Reddy's Laboratories Ltd. | | 26,503 | 1,039,802 |
| Eicher Motors Ltd. | | 3,207 | 1,016,041 |
| GAIL India Ltd. (a) | | 384,414 | 742,943 |
| Glenmark Pharmaceuticals Ltd. | | 47,236 | 209,764 |
| Godrej Consumer Products Ltd. | | 79,746 | 831,846 |
| Grasim Industries Ltd. | | 71,738 | 776,653 |
| Havells India Ltd. | | 68,633 | 668,226 |
| HCL Technologies Ltd. | | 128,509 | 2,105,658 |
| HDFC Standard Life Insurance Co. Ltd. (c) | | 122,365 | 1,078,340 |
| Hero Motocorp Ltd. | | 24,995 | 951,178 |
| Hindalco Industries Ltd. | | 261,027 | 689,521 |
| Hindustan Petroleum Corp. Ltd. | | 133,784 | 611,130 |
| Hindustan Unilever Ltd. | | 158,599 | 4,857,584 |
| Housing Development Finance Corp. Ltd. | | 398,455 | 11,949,825 |
| ICICI Bank Ltd. | | 601,812 | 3,923,354 |
| ICICI Lombard General Insurance Co. Ltd. (c) | | 29,522 | 556,263 |
| Indiabulls Housing Finance Ltd. | | 61,920 | 179,550 |
| Indian Oil Corp. Ltd. | | 452,861 | 934,726 |
| Infosys Ltd. | | 740,682 | 7,117,157 |
| Infosys Ltd. sponsored ADR | | 101,024 | 968,820 |
| InterGlobe Aviation Ltd. (a)(c) | | 22,959 | 470,172 |
| ITC Ltd. | | 840,576 | 3,048,409 |
| JSW Steel Ltd. | | 228,570 | 732,882 |
| Larsen & Toubro Ltd. | | 121,857 | 2,526,470 |
| LIC Housing Finance Ltd. | | 67,366 | 391,006 |
| Lupin Ltd. (a) | | 50,688 | 531,991 |
| Mahindra & Mahindra Financial Services Ltd. | | 99,539 | 493,977 |
| Mahindra & Mahindra Ltd. | | 210,589 | 1,797,239 |
| Marico Ltd. | | 97,423 | 502,086 |
| Maruti Suzuki India Ltd. | | 26,754 | 2,848,548 |
| Motherson Sumi Systems Ltd. (a) | | 207,788 | 359,576 |
| Nestle India Ltd. | | 5,448 | 1,145,747 |
| NTPC Ltd. | | 608,459 | 1,048,501 |
| Oil & Natural Gas Corp. Ltd. | | 640,746 | 1,277,921 |
| Page Industries Ltd. | | 1,305 | 472,791 |
| Petronet LNG Ltd. | | 137,881 | 555,974 |
| Pidilite Industries Ltd. (a) | | 26,625 | 525,367 |
| Piramal Enterprises Ltd. | | 22,759 | 539,041 |
| Power Grid Corp. of India Ltd. | | 425,974 | 1,190,337 |
| Rec Ltd. | | 136,013 | 267,378 |
| Reliance Industries Ltd. | | 696,445 | 14,344,276 |
| Shree Cement Ltd. | | 1,756 | 491,907 |
| Shriram Transport Finance Co. Ltd. | | 43,406 | 695,274 |
| State Bank of India (a) | | 471,957 | 2,074,113 |
| Sun Pharmaceutical Industries Ltd. | | 208,483 | 1,272,644 |
| Tata Consultancy Services Ltd. | | 220,323 | 7,016,848 |
| Tata Motors Ltd. (a) | | 366,583 | 905,804 |
| Tata Power Co. Ltd. | | 211,281 | 176,347 |
| Tata Steel Ltd. | | 79,262 | 424,091 |
| Tech Mahindra Ltd. | | 112,135 | 1,166,785 |
| Titan Co. Ltd. | | 73,461 | 1,377,227 |
| Ultratech Cemco Ltd. | | 25,199 | 1,470,508 |
| United Spirits Ltd. (a) | | 66,793 | 587,152 |
| UPL Ltd. (a) | | 135,724 | 1,139,670 |
| Vedanta Ltd. | | 496,535 | 1,035,584 |
| Vodafone Idea Ltd. (a) | | 1,707,982 | 93,602 |
| Wipro Ltd. | | 284,217 | 1,040,044 |
| Yes Bank Ltd. | | 377,959 | 374,024 |
| Zee Entertainment Enterprises Ltd. (a) | | 176,111 | 643,998 |
|
| TOTAL INDIA | | | 121,713,573 |
|
| Indonesia - 0.5% | | | |
| PT Adaro Energy Tbk | | 3,349,900 | 312,323 |
| PT Astra International Tbk | | 5,129,700 | 2,537,154 |
| PT Bank Central Asia Tbk | | 2,354,300 | 5,269,695 |
| PT Bank Mandiri (Persero) Tbk | | 4,550,300 | 2,274,556 |
| PT Bank Negara Indonesia (Persero) Tbk | | 1,734,600 | 946,888 |
| PT Bank Rakyat Indonesia Tbk | | 13,450,300 | 4,030,184 |
| PT Bank Tabungan Negara Tbk | | 699,600 | 92,594 |
| PT Barito Pacific Tbk | | 5,410,700 | 366,176 |
| PT Bumi Serpong Damai Tbk (a) | | 1,279,200 | 128,814 |
| PT Charoen Pokphand Indonesia Tbk | | 1,604,600 | 719,630 |
| PT Gudang Garam Tbk | | 102,900 | 410,954 |
| PT Hanjaya Mandala Sampoerna Tbk | | 2,152,000 | 326,291 |
| PT Indah Kiat Pulp & Paper Tbk | | 625,900 | 324,001 |
| PT Indocement Tunggal Prakarsa Tbk | | 403,300 | 574,569 |
| PT Indofood CBP Sukses Makmur Tbk | | 668,000 | 553,056 |
| PT Indofood Sukses Makmur Tbk | | 968,900 | 530,961 |
| PT Jasa Marga Tbk | | 435,096 | 168,829 |
| PT Kalbe Farma Tbk | | 5,104,700 | 579,683 |
| PT Pabrik Kertas Tjiwi Kimia Tbk | | 262,600 | 197,671 |
| PT Pakuwon Jati Tbk | | 3,007,600 | 133,847 |
| PT Perusahaan Gas Negara Tbk Series B | | 2,587,100 | 388,244 |
| PT Semen Gresik (Persero) Tbk | | 666,000 | 600,656 |
| PT Surya Citra Media Tbk | | 1,007,600 | 87,536 |
| PT Tambang Batubara Bukit Asam Tbk | | 547,200 | 87,621 |
| PT Telekomunikasi Indonesia Tbk Series B | | 12,422,200 | 3,625,057 |
| PT Unilever Indonesia Tbk | | 418,200 | 1,302,144 |
| PT United Tractors Tbk | | 476,400 | 735,338 |
|
| TOTAL INDONESIA | | | 27,304,472 |
|
| Ireland - 0.4% | | | |
| AIB Group PLC | | 183,622 | 588,167 |
| Bank Ireland Group PLC | | 236,569 | 1,137,701 |
| CRH PLC | | 177,238 | 6,453,197 |
| CRH PLC sponsored ADR | | 20,984 | 765,916 |
| DCC PLC (United Kingdom) | | 22,703 | 2,127,987 |
| James Hardie Industries PLC CDI | | 114,074 | 1,959,131 |
| Kerry Group PLC Class A | | 38,873 | 4,699,688 |
| Kingspan Group PLC (Ireland) | | 35,915 | 1,861,002 |
| Paddy Power Betfair PLC (Ireland) | | 18,246 | 1,884,795 |
| Smurfit Kappa Group PLC | | 53,481 | 1,783,456 |
|
| TOTAL IRELAND | | | 23,261,040 |
|
| Isle of Man - 0.0% | | | |
| Gaming VC Holdings SA | | 138,397 | 1,595,526 |
| NEPI Rockcastle PLC | | 83,074 | 722,956 |
|
| TOTAL ISLE OF MAN | | | 2,318,482 |
|
| Israel - 0.4% | | | |
| Azrieli Group | | 9,413 | 725,114 |
| Bank Hapoalim BM (Reg.) | | 284,938 | 2,279,051 |
| Bank Leumi le-Israel BM | | 361,875 | 2,634,656 |
| Check Point Software Technologies Ltd. (a) | | 30,629 | 3,443,006 |
| CyberArk Software Ltd. (a) | | 8,618 | 875,416 |
| Elbit Systems Ltd. (Israel) | | 5,484 | 898,583 |
| Israel Chemicals Ltd. | | 188,795 | 838,327 |
| Israel Discount Bank Ltd. (Class A) | | 280,350 | 1,280,664 |
| Mizrahi Tefahot Bank Ltd. | | 29,981 | 743,475 |
| NICE Systems Ltd. (a) | | 12,711 | 2,009,553 |
| NICE Systems Ltd. sponsored ADR (a) | | 1,661 | 262,089 |
| Teva Pharmaceutical Industries Ltd. sponsored ADR (a)(b) | | 269,692 | 2,197,990 |
| Wix.com Ltd. (a) | | 11,882 | 1,450,436 |
|
| TOTAL ISRAEL | | | 19,638,360 |
|
| Italy - 1.2% | | | |
| Assicurazioni Generali SpA | | 254,159 | 5,151,950 |
| Atlantia SpA | | 120,943 | 2,986,414 |
| Davide Campari-Milano SpA | | 135,826 | 1,244,464 |
| Enel SpA | | 1,971,918 | 15,283,083 |
| Eni SpA | | 620,579 | 9,414,799 |
| FinecoBank SpA | | 145,262 | 1,636,308 |
| Intesa Sanpaolo SpA | | 3,632,008 | 9,101,181 |
| Leonardo SpA | | 95,520 | 1,109,013 |
| Mediobanca SpA | | 157,528 | 1,871,109 |
| Moncler SpA | | 42,185 | 1,625,070 |
| Pirelli & C. SpA (c) | | 85,962 | 496,816 |
| Poste Italiane SpA (c) | | 122,158 | 1,482,322 |
| Prysmian SpA | | 57,854 | 1,336,304 |
| Recordati SpA | | 26,149 | 1,098,607 |
| Snam Rete Gas SpA | | 524,766 | 2,692,249 |
| Telecom Italia SpA (a) | | 1,950,380 | 1,141,545 |
| Terna SpA | | 353,064 | 2,332,707 |
| UniCredit SpA | | 494,163 | 6,265,359 |
|
| TOTAL ITALY | | | 66,269,300 |
|
| Japan - 16.1% | | | |
| ABC-MART, Inc. | | 7,200 | 493,671 |
| ACOM Co. Ltd. | | 85,300 | 342,705 |
| Advantest Corp. | | 45,600 | 2,075,187 |
| AEON Co. Ltd. | | 165,900 | 3,337,969 |
| AEON Financial Service Co. Ltd. | | 24,700 | 376,438 |
| AEON MALL Co. Ltd. | | 24,070 | 385,097 |
| Agc, Inc. | | 43,800 | 1,540,012 |
| Air Water, Inc. | | 32,100 | 600,944 |
| Aisin Seiki Co. Ltd. | | 39,100 | 1,560,474 |
| Ajinomoto Co., Inc. | | 111,800 | 2,125,563 |
| Alfresa Holdings Corp. | | 46,100 | 1,029,360 |
| All Nippon Airways Ltd. | | 25,500 | 875,631 |
| Alps Electric Co. Ltd. | | 48,200 | 1,033,341 |
| Amada Holdings Co. Ltd. | | 74,800 | 851,831 |
| Aozora Bank Ltd. | | 26,400 | 677,381 |
| Asahi Group Holdings | | 89,100 | 4,461,902 |
| ASAHI INTECC Co. Ltd. | | 47,100 | 1,295,975 |
| Asahi Kasei Corp. | | 304,800 | 3,383,690 |
| Astellas Pharma, Inc. | | 461,500 | 7,920,583 |
| Bandai Namco Holdings, Inc. | | 50,200 | 3,086,757 |
| Bank of Kyoto Ltd. | | 11,600 | 459,134 |
| Benesse Holdings, Inc. | | 16,800 | 449,732 |
| Bridgestone Corp. | | 138,800 | 5,767,129 |
| Brother Industries Ltd. | | 62,200 | 1,168,989 |
| Calbee, Inc. | | 18,200 | 608,348 |
| Canon, Inc. | | 240,600 | 6,601,997 |
| Casio Computer Co. Ltd. | | 40,500 | 657,460 |
| Central Japan Railway Co. | | 35,500 | 7,282,258 |
| Chiba Bank Ltd. | | 133,000 | 722,902 |
| Chubu Electric Power Co., Inc. | | 161,300 | 2,419,862 |
| Chugai Pharmaceutical Co. Ltd. | | 54,600 | 4,594,907 |
| Chugoku Electric Power Co., Inc. | | 59,800 | 796,642 |
| Coca-Cola West Co. Ltd. | | 28,600 | 649,337 |
| Concordia Financial Group Ltd. | | 310,900 | 1,267,830 |
| Credit Saison Co. Ltd. | | 35,500 | 514,066 |
| CyberAgent, Inc. | | 23,100 | 750,787 |
| Dai Nippon Printing Co. Ltd. | | 61,800 | 1,650,586 |
| Dai-ichi Mutual Life Insurance Co. | | 263,200 | 4,290,006 |
| Daicel Chemical Industries Ltd. | | 56,600 | 505,972 |
| Daifuku Co. Ltd. | | 24,600 | 1,305,319 |
| Daiichi Sankyo Kabushiki Kaisha | | 139,200 | 9,152,928 |
| Daikin Industries Ltd. | | 61,700 | 8,635,510 |
| Dainippon Sumitomo Pharma Co. Ltd. | | 39,300 | 685,909 |
| Daito Trust Construction Co. Ltd. | | 17,200 | 2,279,352 |
| Daiwa House Industry Co. Ltd. | | 135,100 | 4,650,832 |
| Daiwa House REIT Investment Corp. | | 410 | 1,193,839 |
| Daiwa Securities Group, Inc. | | 402,500 | 1,809,159 |
| DENSO Corp. | | 104,100 | 4,833,355 |
| Dentsu, Inc. | | 51,500 | 1,841,113 |
| Disco Corp. | | 6,100 | 1,331,249 |
| East Japan Railway Co. | | 75,400 | 6,844,890 |
| Eisai Co. Ltd. | | 60,400 | 4,372,296 |
| Electric Power Development Co. Ltd. | | 35,900 | 871,667 |
| FamilyMart Co. Ltd. | | 60,700 | 1,505,736 |
| Fanuc Corp. | | 47,900 | 9,448,242 |
| Fast Retailing Co. Ltd. | | 14,300 | 8,818,697 |
| Fuji Electric Co. Ltd. | | 34,100 | 1,083,754 |
| Fujifilm Holdings Corp. | | 86,200 | 3,784,374 |
| Fujitsu Ltd. | | 46,600 | 4,130,113 |
| Fukuoka Financial Group, Inc. | | 38,000 | 732,539 |
| GMO Payment Gateway, Inc. | | 9,300 | 685,402 |
| Hakuhodo DY Holdings, Inc. | | 66,400 | 990,868 |
| Hamamatsu Photonics K.K. | | 33,100 | 1,285,249 |
| Hankyu Hanshin Holdings, Inc. | | 57,700 | 2,308,981 |
| Hikari Tsushin, Inc. | | 4,900 | 1,074,064 |
| Hino Motors Ltd. | | 57,600 | 544,569 |
| Hirose Electric Co. Ltd. | | 8,983 | 1,131,589 |
| Hisamitsu Pharmaceutical Co., Inc. | | 13,200 | 614,318 |
| Hitachi Chemical Co. Ltd. | | 24,600 | 809,827 |
| Hitachi Construction Machinery Co. Ltd. | | 23,400 | 604,005 |
| Hitachi High-Technologies Corp. | | 15,300 | 951,901 |
| Hitachi Ltd. | | 237,900 | 8,879,014 |
| Hitachi Metals Ltd. | | 47,100 | 591,120 |
| Honda Motor Co. Ltd. | | 399,300 | 10,802,660 |
| Hoshizaki Corp. | | 12,100 | 1,028,528 |
| Hoya Corp. | | 94,400 | 8,342,810 |
| Hulic Co. Ltd. | | 64,100 | 695,918 |
| Idemitsu Kosan Co. Ltd. | | 45,393 | 1,334,340 |
| IHI Corp. | | 32,300 | 795,974 |
| Iida Group Holdings Co. Ltd. | | 42,200 | 702,930 |
| INPEX Corp. | | 253,800 | 2,346,251 |
| Isetan Mitsukoshi Holdings Ltd. | | 95,300 | 760,034 |
| Isuzu Motors Ltd. | | 132,000 | 1,533,828 |
| Itochu Corp. | | 328,000 | 6,857,786 |
| ITOCHU Techno-Solutions Corp. | | 22,600 | 608,636 |
| J. Front Retailing Co. Ltd. | | 53,200 | 676,486 |
| Japan Airlines Co. Ltd. | | 29,800 | 928,630 |
| Japan Airport Terminal Co. Ltd. | | 10,900 | 538,423 |
| Japan Exchange Group, Inc. | | 128,500 | 2,121,343 |
| Japan Post Bank Co. Ltd. | | 89,400 | 889,309 |
| Japan Post Holdings Co. Ltd. | | 370,800 | 3,403,659 |
| Japan Prime Realty Investment Corp. | | 169 | 812,211 |
| Japan Real Estate Investment Corp. | | 305 | 2,081,872 |
| Japan Retail Fund Investment Corp. | | 668 | 1,557,018 |
| Japan Tobacco, Inc. | | 290,600 | 6,568,348 |
| JFE Holdings, Inc. | | 112,600 | 1,408,361 |
| JGC Corp. | | 53,700 | 776,687 |
| JSR Corp. | | 41,400 | 777,233 |
| JTEKT Corp. | | 44,500 | 567,570 |
| JX Holdings, Inc. | | 778,500 | 3,638,896 |
| Kajima Corp. | | 119,500 | 1,642,238 |
| Kakaku.com, Inc. | | 29,900 | 694,275 |
| Kamigumi Co. Ltd. | | 29,400 | 664,768 |
| Kaneka Corp. | | 11,000 | 366,174 |
| Kansai Electric Power Co., Inc. | | 168,700 | 1,968,076 |
| Kansai Paint Co. Ltd. | | 42,600 | 1,026,014 |
| Kao Corp. | | 121,300 | 9,752,361 |
| Kawasaki Heavy Industries Ltd. | | 32,400 | 777,546 |
| KDDI Corp. | | 432,100 | 11,956,702 |
| Keihan Electric Railway Co., Ltd. | | 23,000 | 1,085,989 |
| Keihin Electric Express Railway Co. Ltd. | | 48,600 | 967,414 |
| Keio Corp. | | 24,700 | 1,528,028 |
| Keisei Electric Railway Co. | | 32,900 | 1,345,132 |
| Keyence Corp. | | 22,420 | 14,176,086 |
| Kikkoman Corp. | | 33,600 | 1,616,250 |
| Kintetsu Group Holdings Co. Ltd. | | 39,500 | 2,152,985 |
| Kirin Holdings Co. Ltd. | | 200,000 | 4,242,873 |
| Kobayashi Pharmaceutical Co. Ltd. | | 13,100 | 1,047,476 |
| Kobe Steel Ltd. | | 64,900 | 348,936 |
| Koito Manufacturing Co. Ltd. | | 27,300 | 1,428,151 |
| Komatsu Ltd. | | 222,000 | 5,198,111 |
| Konami Holdings Corp. | | 21,900 | 961,384 |
| Konica Minolta, Inc. | | 100,500 | 737,650 |
| Kose Corp. | | 8,800 | 1,560,188 |
| Kubota Corp. | | 250,400 | 3,977,168 |
| Kuraray Co. Ltd. | | 77,300 | 919,662 |
| Kurita Water Industries Ltd. | | 22,800 | 656,358 |
| Kyocera Corp. | | 78,200 | 5,130,457 |
| Kyowa Hakko Kirin Co., Ltd. | | 59,000 | 1,085,601 |
| Kyushu Electric Power Co., Inc. | | 102,700 | 1,026,330 |
| Kyushu Railway Co. | | 38,200 | 1,262,035 |
| Lawson, Inc. | | 13,100 | 722,680 |
| LINE Corp. (a) | | 15,400 | 566,519 |
| Lion Corp. | | 50,200 | 1,050,559 |
| LIXIL Group Corp. | | 67,900 | 1,262,798 |
| M3, Inc. | | 108,800 | 2,607,214 |
| Makita Corp. | | 57,100 | 1,920,322 |
| Marubeni Corp. | | 398,600 | 2,805,378 |
| Marui Group Co. Ltd. | | 44,600 | 991,474 |
| Maruichi Steel Tube Ltd. | | 12,500 | 341,354 |
| Mazda Motor Corp. | | 149,900 | 1,376,130 |
| McDonald's Holdings Co. (Japan) Ltd. | | 13,900 | 697,677 |
| Mebuki Financial Group, Inc. | | 246,840 | 627,125 |
| Medipal Holdings Corp. | | 45,100 | 1,030,424 |
| Meiji Holdings Co. Ltd. | | 28,200 | 2,032,596 |
| Mercari, Inc. (a) | | 17,800 | 401,329 |
| Minebea Mitsumi, Inc. | | 85,200 | 1,618,080 |
| Misumi Group, Inc. | | 73,200 | 1,840,157 |
| Mitsubishi Chemical Holdings Corp. | | 320,900 | 2,445,651 |
| Mitsubishi Corp. | | 331,700 | 8,436,596 |
| Mitsubishi Electric Corp. | | 437,000 | 6,243,616 |
| Mitsubishi Estate Co. Ltd. | | 283,900 | 5,512,027 |
| Mitsubishi Gas Chemical Co., Inc. | | 36,100 | 509,260 |
| Mitsubishi Heavy Industries Ltd. | | 77,500 | 3,136,376 |
| Mitsubishi Materials Corp. | | 33,700 | 969,045 |
| Mitsubishi Motors Corp. of Japan | | 181,900 | 830,519 |
| Mitsubishi Tanabe Pharma Corp. | | 58,000 | 694,161 |
| Mitsubishi UFJ Financial Group, Inc. | | 2,995,100 | 15,527,462 |
| Mitsubishi UFJ Lease & Finance Co. Ltd. | | 89,100 | 546,984 |
| Mitsui & Co. Ltd. | | 409,900 | 7,039,607 |
| Mitsui Chemicals, Inc. | | 52,200 | 1,241,392 |
| Mitsui Fudosan Co. Ltd. | | 216,100 | 5,528,451 |
| Mitsui OSK Lines Ltd. | | 25,100 | 683,687 |
| Mizuho Financial Group, Inc. | | 5,845,600 | 9,075,157 |
| MonotaRO Co. Ltd. | | 28,000 | 845,897 |
| MS&AD Insurance Group Holdings, Inc. | | 114,500 | 3,697,347 |
| Murata Manufacturing Co. Ltd. | | 141,600 | 7,709,863 |
| Nabtesco Corp. | | 25,000 | 795,870 |
| Nagoya Railroad Co. Ltd. | | 47,200 | 1,500,388 |
| NEC Corp. | | 59,400 | 2,354,059 |
| New Hampshire Foods Ltd. | | 18,900 | 794,100 |
| Nexon Co. Ltd. (a) | | 120,100 | 1,391,748 |
| NGK Insulators Ltd. | | 70,000 | 1,075,394 |
| NGK Spark Plug Co. Ltd. | | 44,400 | 900,157 |
| Nidec Corp. | | 55,400 | 8,156,309 |
| Nikon Corp. | | 77,300 | 985,599 |
| Nintendo Co. Ltd. | | 27,400 | 10,049,978 |
| Nippon Building Fund, Inc. | | 311 | 2,359,436 |
| Nippon Electric Glass Co. Ltd. | | 18,800 | 423,499 |
| Nippon Express Co. Ltd. | | 19,100 | 1,089,762 |
| Nippon Paint Holdings Co. Ltd. | | 34,800 | 1,895,226 |
| Nippon Prologis REIT, Inc. | | 468 | 1,307,257 |
| Nippon Steel & Sumitomo Metal Corp. | | 189,770 | 2,769,795 |
| Nippon Telegraph & Telephone Corp. | | 158,500 | 7,868,402 |
| Nippon Yusen KK | | 48,600 | 873,103 |
| Nissan Chemical Corp. | | 30,000 | 1,231,736 |
| Nissan Motor Co. Ltd. | | 559,900 | 3,533,294 |
| Nisshin Seifun Group, Inc. | | 56,295 | 1,116,004 |
| Nissin Food Holdings Co. Ltd. | | 15,200 | 1,148,153 |
| Nitori Holdings Co. Ltd. | | 20,200 | 3,074,665 |
| Nitto Denko Corp. | | 41,000 | 2,268,354 |
| NKSJ Holdings, Inc. | | 82,750 | 3,252,578 |
| Nomura Holdings, Inc. | | 828,600 | 3,765,974 |
| Nomura Real Estate Holdings, Inc. | | 26,200 | 620,924 |
| Nomura Real Estate Master Fund, Inc. | | 1,011 | 1,932,587 |
| Nomura Research Institute Ltd. | | 86,606 | 1,838,707 |
| NSK Ltd. | | 101,700 | 945,648 |
| NTT Data Corp. | | 149,000 | 1,956,497 |
| NTT DOCOMO, Inc. | | 321,900 | 8,824,927 |
| Obayashi Corp. | | 154,900 | 1,594,138 |
| OBIC Co. Ltd. | | 15,400 | 1,928,160 |
| Odakyu Electric Railway Co. Ltd. | | 74,900 | 1,823,229 |
| Oji Holdings Corp. | | 209,900 | 1,085,234 |
| Olympus Corp. | | 279,300 | 3,800,265 |
| OMRON Corp. | | 46,100 | 2,696,933 |
| Ono Pharmaceutical Co. Ltd. | | 97,600 | 1,838,477 |
| Oracle Corp. Japan | | 8,200 | 720,749 |
| Oriental Land Co. Ltd. | | 49,400 | 7,242,087 |
| ORIX Corp. | | 323,400 | 5,082,197 |
| Osaka Gas Co. Ltd. | | 89,800 | 1,756,010 |
| Otsuka Corp. | | 23,200 | 935,377 |
| Otsuka Holdings Co. Ltd. | | 95,900 | 3,998,096 |
| Pan Pacific International Hold | | 103,500 | 1,629,229 |
| Panasonic Corp. | | 548,200 | 4,607,281 |
| Park24 Co. Ltd. | | 26,100 | 616,390 |
| PeptiDream, Inc. (a) | | 21,600 | 1,084,184 |
| Persol Holdings Co., Ltd. | | 40,200 | 772,162 |
| Pigeon Corp. | | 25,900 | 1,264,395 |
| Pola Orbis Holdings, Inc. | | 20,100 | 453,573 |
| Rakuten, Inc. | | 209,900 | 2,001,066 |
| Recruit Holdings Co. Ltd. | | 331,600 | 11,020,409 |
| Renesas Electronics Corp. (a) | | 174,900 | 1,184,017 |
| Resona Holdings, Inc. | | 516,400 | 2,245,598 |
| Ricoh Co. Ltd. | | 176,800 | 1,574,512 |
| Rinnai Corp. | | 7,200 | 529,224 |
| ROHM Co. Ltd. | | 24,700 | 1,956,952 |
| Ryohin Keikaku Co. Ltd. | | 61,200 | 1,362,451 |
| Sankyo Co. Ltd. (Gunma) | | 9,000 | 314,979 |
| Santen Pharmaceutical Co. Ltd. | | 92,100 | 1,631,399 |
| SBI Holdings, Inc. Japan | | 60,730 | 1,320,777 |
| Secom Co. Ltd. | | 49,700 | 4,605,373 |
| Sega Sammy Holdings, Inc. | | 39,100 | 550,258 |
| Seibu Holdings, Inc. | | 49,300 | 870,145 |
| Seiko Epson Corp. | | 61,300 | 866,846 |
| Sekisui Chemical Co. Ltd. | | 100,400 | 1,750,549 |
| Sekisui House Ltd. | | 155,700 | 3,357,574 |
| Seven & i Holdings Co. Ltd. | | 182,400 | 6,891,128 |
| Seven Bank Ltd. | | 143,000 | 414,580 |
| SG Holdings Co. Ltd. | | 38,100 | 943,503 |
| Sharp Corp. | | 48,100 | 551,763 |
| Shimadzu Corp. | | 53,200 | 1,420,765 |
| Shimamura Co. Ltd. | | 5,000 | 423,515 |
| SHIMANO, Inc. | | 17,700 | 2,946,178 |
| SHIMIZU Corp. | | 154,700 | 1,442,115 |
| Shin-Etsu Chemical Co. Ltd. | | 89,100 | 9,934,760 |
| Shinsei Bank Ltd. | | 40,900 | 637,621 |
| Shionogi & Co. Ltd. | | 68,500 | 4,111,568 |
| Shiseido Co. Ltd. | | 96,300 | 7,939,738 |
| Shizuoka Bank Ltd. | | 131,100 | 996,200 |
| Showa Denko K.K. | | 31,600 | 886,599 |
| SMC Corp. | | 13,700 | 5,918,965 |
| SoftBank Corp. | | 408,900 | 5,609,010 |
| SoftBank Corp. | | 403,000 | 15,501,965 |
| Sohgo Security Services Co., Ltd. | | 18,300 | 994,016 |
| Sony Corp. | | 310,500 | 18,899,871 |
| Sony Financial Holdings, Inc. | | 33,200 | 714,246 |
| Stanley Electric Co. Ltd. | | 28,700 | 794,223 |
| Subaru Corp. | | 150,600 | 4,315,822 |
| Sumco Corp. | | 61,100 | 1,014,924 |
| Sumitomo Chemical Co. Ltd. | | 391,300 | 1,789,955 |
| Sumitomo Corp. | | 285,000 | 4,629,084 |
| Sumitomo Electric Industries Ltd. | | 193,000 | 2,646,755 |
| Sumitomo Heavy Industries Ltd. | | 23,800 | 739,276 |
| Sumitomo Metal Mining Co. Ltd. | | 59,500 | 1,990,257 |
| Sumitomo Mitsui Financial Group, Inc. | | 321,800 | 11,424,929 |
| Sumitomo Mitsui Trust Holdings, Inc. | | 82,900 | 3,021,324 |
| Sumitomo Realty & Development Co. Ltd. | | 82,600 | 2,998,237 |
| Sumitomo Rubber Industries Ltd. | | 36,900 | 489,064 |
| Sundrug Co. Ltd. | | 16,500 | 545,997 |
| Suntory Beverage & Food Ltd. | | 33,300 | 1,423,602 |
| Suzuken Co. Ltd. | | 17,730 | 946,674 |
| Suzuki Motor Corp. | | 88,500 | 4,178,449 |
| Sysmex Corp. | | 40,400 | 2,636,022 |
| T&D Holdings, Inc. | | 150,600 | 1,677,344 |
| Taiheiyo Cement Corp. | | 26,100 | 738,343 |
| Taisei Corp. | | 52,600 | 2,074,198 |
| Taisho Pharmaceutical Holdings Co. Ltd. | | 9,400 | 669,040 |
| Taiyo Nippon Sanso Corp. | | 30,400 | 711,655 |
| Takeda Pharmaceutical Co. Ltd. | | 364,596 | 13,173,976 |
| TDK Corp. | | 33,200 | 3,275,970 |
| Teijin Ltd. | | 37,800 | 757,449 |
| Terumo Corp. | | 156,500 | 5,107,648 |
| THK Co. Ltd. | | 26,400 | 759,140 |
| Tobu Railway Co. Ltd. | | 50,400 | 1,681,843 |
| Toho Co. Ltd. | | 27,000 | 1,090,408 |
| Toho Gas Co. Ltd. | | 18,300 | 712,759 |
| Tohoku Electric Power Co., Inc. | | 103,400 | 1,062,722 |
| Tokio Marine Holdings, Inc. | | 155,400 | 8,401,797 |
| Tokyo Century Corp. | | 9,700 | 447,905 |
| Tokyo Electric Power Co., Inc. (a) | | 369,800 | 1,712,598 |
| Tokyo Electron Ltd. | | 38,600 | 7,820,305 |
| Tokyo Gas Co. Ltd. | | 95,000 | 2,319,048 |
| Tokyu Corp. | | 125,900 | 2,381,224 |
| Tokyu Fudosan Holdings Corp. | | 134,900 | 894,779 |
| Toppan Printing Co. Ltd. | | 72,600 | 1,342,761 |
| Toray Industries, Inc. | | 343,900 | 2,430,391 |
| Toshiba Corp. | | 127,300 | 4,353,174 |
| Tosoh Corp. | | 57,200 | 783,212 |
| Toto Ltd. | | 37,500 | 1,530,969 |
| Toyo Seikan Group Holdings Ltd. | | 33,400 | 527,833 |
| Toyo Suisan Kaisha Ltd. | | 21,600 | 909,468 |
| Toyoda Gosei Co. Ltd. | | 12,600 | 294,773 |
| Toyota Industries Corp. | | 34,600 | 2,076,086 |
| Toyota Motor Corp. | | 554,682 | 38,484,327 |
| Toyota Tsusho Corp. | | 50,000 | 1,724,927 |
| Trend Micro, Inc. | | 32,800 | 1,655,555 |
| Tsuruha Holdings, Inc. | | 8,200 | 922,406 |
| Unicharm Corp. | | 99,200 | 3,361,975 |
| United Urban Investment Corp. | | 639 | 1,289,139 |
| USS Co. Ltd. | | 56,000 | 1,084,619 |
| Welcia Holdings Co. Ltd. | | 10,900 | 626,317 |
| West Japan Railway Co. | | 40,500 | 3,519,061 |
| Yahoo! Japan Corp. | | 671,800 | 2,068,283 |
| Yakult Honsha Co. Ltd. | | 31,600 | 1,810,987 |
| Yamada Denki Co. Ltd. | | 138,500 | 669,437 |
| Yamaha Corp. | | 37,500 | 1,746,347 |
| Yamaha Motor Co. Ltd. | | 74,800 | 1,464,056 |
| Yamato Holdings Co. Ltd. | | 71,500 | 1,199,243 |
| Yamazaki Baking Co. Ltd. | | 25,900 | 441,561 |
| Yaskawa Electric Corp. | | 60,700 | 2,308,892 |
| Yokogawa Electric Corp. | | 61,600 | 1,128,692 |
| Yokohama Rubber Co. Ltd. | | 27,700 | 618,686 |
| Zozo, Inc. (b) | | 48,600 | 1,132,037 |
|
| TOTAL JAPAN | | | 860,725,798 |
|
| Korea (South) - 2.9% | | | |
| AMOREPACIFIC Corp. | | 7,335 | 1,203,394 |
| AMOREPACIFIC Group, Inc. | | 6,549 | 473,426 |
| BGF Retail Co. Ltd. | | 1,772 | 269,520 |
| BS Financial Group, Inc. | | 56,847 | 337,597 |
| Celltrion Healthcare Co. Ltd. | | 10,675 | 502,604 |
| Celltrion Pharm, Inc. (a) | | 3,269 | 111,733 |
| Celltrion, Inc. (a) | | 21,670 | 3,703,356 |
| Cheil Industries, Inc. | | 22,210 | 1,897,820 |
| Cheil Worldwide, Inc. | | 16,169 | 341,952 |
| CJ CheilJedang Corp. | | 1,847 | 360,628 |
| CJ Corp. | | 3,234 | 227,706 |
| CJ O Shopping Co. Ltd. | | 2,363 | 333,161 |
| Daelim Industrial Co. | | 6,053 | 470,672 |
| Daewoo Engineering & Construction Co. Ltd. (a) | | 29,404 | 109,421 |
| Daewoo Shipbuilding & Marine Engineering Co. Ltd. (a) | | 7,280 | 175,112 |
| Db Insurance Co. Ltd. | | 10,806 | 466,297 |
| Doosan Bobcat, Inc. | | 13,707 | 368,943 |
| E-Mart Co. Ltd. | | 4,486 | 427,406 |
| Fila Korea Ltd. | | 11,076 | 545,145 |
| GS Engineering & Construction Corp. | | 13,408 | 354,021 |
| GS Holdings Corp. | | 11,161 | 473,510 |
| GS Retail Co. Ltd. | | 5,082 | 166,101 |
| Hana Financial Group, Inc. | | 76,599 | 2,205,766 |
| Hankook Tire Co. Ltd. | | 16,358 | 434,009 |
| Hanmi Pharm Co. Ltd. | | 1,440 | 410,360 |
| Hanmi Science Co. Ltd. | | 5,265 | 196,151 |
| Hanon Systems | | 42,794 | 424,177 |
| Hanwha Chemical Corp. | | 23,437 | 327,436 |
| Hanwha Corp. | | 21,811 | 442,635 |
| Hanwha Life Insurance Co. Ltd. | | 54,059 | 103,010 |
| HDC Hyundai Development Co. | | 5,741 | 151,829 |
| HLB, Inc. (a) | | 7,797 | 1,119,292 |
| Hotel Shilla Co. | | 7,152 | 473,626 |
| Hyundai Department Store Co. Ltd. | | 2,554 | 161,277 |
| Hyundai Engineering & Construction Co. Ltd. | | 22,774 | 835,813 |
| Hyundai Fire & Marine Insurance Co. Ltd. | | 12,533 | 270,410 |
| Hyundai Glovis Co. Ltd. | | 4,091 | 527,853 |
| Hyundai Heavy Industries Co. Ltd. (a) | | 10,777 | 1,123,477 |
| Hyundai Mobis | | 16,753 | 3,407,031 |
| Hyundai Motor Co. | | 34,174 | 3,562,560 |
| Hyundai Robotics Co. Ltd. | | 2,103 | 613,672 |
| Hyundai Steel Co. | | 17,134 | 465,578 |
| Industrial Bank of Korea | | 60,686 | 611,895 |
| ING Life Insurance Korea Ltd. (c) | | 6,682 | 159,871 |
| Kakao Corp. | | 12,089 | 1,461,683 |
| Kangwon Land, Inc. | | 25,343 | 678,894 |
| KB Financial Group, Inc. | | 99,039 | 3,544,509 |
| KCC Corp. | | 1,405 | 271,326 |
| Kia Motors Corp. | | 63,782 | 2,319,018 |
| Korea Aerospace Industries Ltd. | | 16,574 | 538,167 |
| Korea Electric Power Corp. (a) | | 58,416 | 1,269,547 |
| Korea Express Co. Ltd. (a) | | 1,631 | 219,503 |
| Korea Gas Corp. | | 5,640 | 189,399 |
| Korea Investment Holdings Co. Ltd. | | 9,403 | 544,757 |
| Korea Zinc Co. Ltd. | | 1,818 | 674,979 |
| Korean Air Lines Co. Ltd. | | 13,030 | 277,236 |
| KT&G Corp. | | 30,121 | 2,573,806 |
| Kumho Petro Chemical Co. Ltd. | | 4,158 | 248,708 |
| LG Chemical Ltd. | | 11,347 | 2,981,485 |
| LG Corp. | | 24,166 | 1,433,081 |
| LG Display Co. Ltd. (a) | | 66,252 | 772,069 |
| LG Electronics, Inc. | | 25,130 | 1,436,564 |
| LG Household & Health Care Ltd. | | 2,505 | 2,699,164 |
| LG Innotek Co. Ltd. | | 2,794 | 288,881 |
| LG Telecom Ltd. | | 21,253 | 244,258 |
| Lotte Chemical Corp. | | 4,760 | 923,293 |
| Lotte Confectionery Co. Ltd. | | 5,539 | 172,755 |
| Lotte Shopping Co. Ltd. | | 2,579 | 274,364 |
| Medy-Tox, Inc. | | 1,035 | 291,851 |
| Meritz Securities Co. Ltd. | | 83,365 | 321,268 |
| Mirae Asset Daewoo Co. Ltd. | | 105,580 | 645,051 |
| NAVER Corp. | | 34,933 | 4,895,378 |
| NCSOFT Corp. | | 4,241 | 1,869,926 |
| Netmarble Corp. (a)(c) | | 5,632 | 432,642 |
| Oci Co. Ltd. | | 4,157 | 223,428 |
| Orion Corp./Republic of Korea | | 4,729 | 428,333 |
| Ottogi Corp. | | 294 | 141,939 |
| Pearl Abyss Corp. (a) | | 1,502 | 277,994 |
| POSCO | | 19,631 | 3,541,142 |
| POSCO Chemtech Co. Ltd. | | 5,667 | 232,677 |
| Posco International Corp. | | 9,051 | 141,145 |
| S-Oil Corp. | | 11,612 | 989,256 |
| S1 Corp. | | 4,192 | 335,635 |
| Samsung Biologics Co. Ltd. (a)(c) | | 4,033 | 1,373,293 |
| Samsung Card Co. Ltd. | | 4,849 | 139,012 |
| Samsung Electro-Mechanics Co. Ltd. | | 15,697 | 1,515,659 |
| Samsung Electronics Co. Ltd. | | 1,154,600 | 49,724,291 |
| Samsung Engineering Co. Ltd. (a) | | 35,943 | 546,690 |
| Samsung Fire & Marine Insurance Co. Ltd. | | 7,157 | 1,324,023 |
| Samsung Heavy Industries Co. Ltd. (a) | | 93,992 | 582,285 |
| Samsung Life Insurance Co. Ltd. | | 17,128 | 1,033,280 |
| Samsung SDI Co. Ltd. | | 13,968 | 2,715,327 |
| Samsung SDS Co. Ltd. | | 8,140 | 1,401,542 |
| Samsung Securities Co. Ltd. | | 17,400 | 499,568 |
| Shinhan Financial Group Co. Ltd. | | 111,598 | 4,042,317 |
| Shinsegae Co. Ltd. | | 1,680 | 338,788 |
| SillaJen, Inc. (a) | | 12,751 | 209,740 |
| SK C&C Co. Ltd. | | 9,473 | 2,092,448 |
| SK Energy Co. Ltd. | | 14,699 | 2,009,622 |
| SK Hynix, Inc. | | 134,299 | 9,410,076 |
| SK Telecom Co. Ltd. | | 5,047 | 1,025,559 |
| STX Pan Ocean Co. Ltd. (Korea) (a) | | 45,991 | 172,718 |
| ViroMed Co. Ltd. | | 4,850 | 401,166 |
| Woongjin Coway Co. Ltd. | | 12,731 | 998,646 |
| Woori Financial Group, Inc. (a) | | 117,090 | 1,175,612 |
| Woori Investment & Securities Co. Ltd. | | 40,548 | 419,239 |
| Yuhan Corp. | | 2,126 | 407,837 |
|
| TOTAL KOREA (SOUTH) | | | 155,711,102 |
|
| Luxembourg - 0.2% | | | |
| ArcelorMittal SA (Netherlands) | | 164,110 | 2,421,512 |
| Aroundtown SA | | 221,594 | 1,869,890 |
| Eurofins Scientific SA (b) | | 2,741 | 1,388,506 |
| Globant SA (a) | | 8,474 | 790,285 |
| Millicom International Cellular SA (depository receipt) | | 16,270 | 741,407 |
| Reinet Investments SCA | | 33,218 | 623,383 |
| RTL Group SA | | 10,533 | 535,214 |
| SES SA (France) (depositary receipt) | | 87,119 | 1,687,736 |
| Tenaris SA | | 112,900 | 1,145,359 |
|
| TOTAL LUXEMBOURG | | | 11,203,292 |
|
| Malaysia - 0.5% | | | |
| AirAsia Group BHD | | 476,300 | 217,462 |
| Alliance Bank Malaysia Bhd | | 192,200 | 132,272 |
| AMMB Holdings Bhd | | 353,700 | 337,382 |
| Axiata Group Bhd | | 667,795 | 686,402 |
| British American Tobacco (Malaysia) Bhd | | 36,800 | 165,672 |
| Bumiputra-Commerce Holdings Bhd | | 1,121,513 | 1,407,522 |
| Dialog Group Bhd | | 794,622 | 661,200 |
| DiGi.com Bhd | | 782,800 | 879,124 |
| Fraser & Neave Holdings BHD | | 33,000 | 272,904 |
| Gamuda Bhd | | 467,100 | 417,679 |
| Genting Bhd | | 570,100 | 791,932 |
| Genting Malaysia Bhd | | 678,500 | 520,401 |
| Genting Plantations Bhd | | 41,800 | 99,073 |
| Hap Seng Consolidated Bhd | | 107,800 | 257,441 |
| Hartalega Holdings Bhd | | 365,200 | 459,422 |
| Hong Leong Bank Bhd | | 180,100 | 741,576 |
| Hong Leong Credit Bhd | | 39,300 | 163,784 |
| IHH Healthcare Bhd | | 504,000 | 686,895 |
| IJM Corp. Bhd | | 563,100 | 289,514 |
| IOI Corp. Bhd | | 439,000 | 458,191 |
| IOI Properties Group Bhd | | 182,150 | 45,276 |
| Kuala Lumpur Kepong Bhd | | 87,100 | 451,601 |
| Malayan Banking Bhd | | 915,820 | 1,883,322 |
| Malaysia Airports Holdings Bhd | | 223,102 | 422,264 |
| Maxis Bhd | | 654,600 | 842,887 |
| MISC Bhd | | 337,800 | 672,829 |
| Nestle (Malaysia) BHD | | 18,600 | 643,708 |
| Petronas Chemicals Group Bhd | | 552,500 | 987,105 |
| Petronas Dagangan Bhd | | 48,000 | 270,490 |
| Petronas Gas Bhd | | 151,400 | 603,068 |
| PPB Group Bhd | | 123,280 | 533,320 |
| Press Metal Bhd | | 289,700 | 329,617 |
| Public Bank Bhd | | 747,400 | 3,627,400 |
| QL Resources Bhd | | 139,400 | 242,417 |
| RHB Capital Bhd | | 483,474 | 665,067 |
| RHB Capital Bhd (a)(d) | | 46,292 | 0 |
| Sime Darby Bhd | | 1,052,085 | 570,452 |
| Sime Darby Plantation Bhd | | 530,485 | 622,105 |
| Sime Darby Property Bhd | | 763,685 | 132,418 |
| SP Setia Bhd | | 518,035 | 149,841 |
| Telekom Malaysia Bhd | | 290,626 | 261,168 |
| Tenaga Nasional Bhd | | 751,100 | 2,487,454 |
| Top Glove Corp. Bhd | | 347,600 | 361,631 |
| Westports Holdings Bhd | | 201,800 | 206,441 |
| YTL Corp. Bhd | | 791,122 | 164,502 |
|
| TOTAL MALAYSIA | | | 26,822,231 |
|
| Mauritius - 0.0% | | | |
| Golden Agri-Resources Ltd. | | 1,496,200 | 224,582 |
| Mexico - 0.6% | | | |
| Alfa SA de CV Series A | | 866,500 | 751,344 |
| Alsea S.A.B. de CV (a) | | 114,100 | 304,401 |
| America Movil S.A.B. de CV Series L | | 8,205,400 | 6,500,678 |
| Banco Santander Mexico SA | | 462,360 | 620,838 |
| CEMEX S.A.B. de CV unit | | 3,701,694 | 1,391,274 |
| Coca-Cola FEMSA S.A.B. de CV unit | | 141,100 | 775,384 |
| El Puerto de Liverpool S.A.B. Dcv Class C | | 47,470 | 241,884 |
| Embotelladoras Arca S.A.B. de CV | | 95,000 | 530,744 |
| Fibra Uno Administracion SA de CV | | 750,000 | 1,139,241 |
| Fomento Economico Mexicano S.A.B. de CV unit | | 483,500 | 4,290,461 |
| Gruma S.A.B. de CV Series B | | 43,225 | 453,563 |
| Grupo Aeroportuario del Pacifico S.A.B. de CV Series B | | 96,900 | 1,015,922 |
| Grupo Aeroportuario del Sureste S.A.B. de CV Series B | | 57,485 | 942,639 |
| Grupo Bimbo S.A.B. de CV Series A | | 356,200 | 661,793 |
| Grupo Carso SA de CV Series A1 | | 108,100 | 361,897 |
| Grupo Financiero Banorte S.A.B. de CV Series O | | 635,400 | 3,468,250 |
| Grupo Financiero Inbursa S.A.B. de CV Series O | | 497,300 | 617,860 |
| Grupo Mexico SA de CV Series B | | 870,424 | 2,292,745 |
| Grupo Televisa SA de CV | | 574,400 | 1,268,449 |
| Industrias Penoles SA de CV | | 27,550 | 330,603 |
| Infraestructura Energetica Nova S.A.B. de CV | | 123,100 | 544,132 |
| Kimberly-Clark de Mexico SA de CV Series A | | 390,100 | 786,628 |
| Megacable Holdings S.A.B. de CV unit | | 58,500 | 240,338 |
| Mexichem S.A.B. de CV | | 234,237 | 505,455 |
| Promotora y Operadora de Infraestructura S.A.B. de CV | | 50,620 | 468,241 |
| Wal-Mart de Mexico SA de CV Series V | | 1,292,400 | 3,878,577 |
|
| TOTAL MEXICO | | | 34,383,341 |
|
| Multi-National - 0.0% | | | |
| HK Electric Investments & HK Electric Investments Ltd. unit | | 562,500 | 561,473 |
| HKT Trust/HKT Ltd. unit | | 991,860 | 1,542,997 |
|
| TOTAL MULTI-NATIONAL | | | 2,104,470 |
|
| Netherlands - 3.3% | | | |
| ABN AMRO Group NV GDR (c) | | 99,607 | 1,854,120 |
| Adyen BV (a)(c) | | 2,460 | 1,726,846 |
| AEGON NV | | 473,954 | 2,056,173 |
| AerCap Holdings NV (a) | | 31,425 | 1,818,879 |
| Airbus Group NV | | 141,556 | 20,307,399 |
| Akzo Nobel NV | | 55,006 | 5,064,293 |
| ASML Holding NV (Netherlands) | | 103,933 | 27,242,358 |
| CNH Industrial NV | | 257,231 | 2,796,601 |
| EXOR NV | | 25,646 | 1,965,597 |
| Ferrari NV | | 29,870 | 4,778,895 |
| Fiat Chrysler Automobiles NV (Italy) | | 268,830 | 4,175,978 |
| Heineken Holding NV | | 28,018 | 2,668,620 |
| Heineken NV (Bearer) | | 63,451 | 6,472,341 |
| ING Groep NV (Certificaten Van Aandelen) | | 954,067 | 10,803,373 |
| Koninklijke Ahold Delhaize NV | | 286,413 | 7,137,431 |
| Koninklijke DSM NV | | 44,514 | 5,274,937 |
| Koninklijke KPN NV | | 891,969 | 2,769,003 |
| Koninklijke Philips Electronics NV | | 225,323 | 9,885,848 |
| NN Group NV | | 77,972 | 2,971,497 |
| NXP Semiconductors NV | | 70,144 | 7,973,970 |
| Prosus NV (a) | | 118,999 | 8,206,052 |
| QIAGEN NV (Germany) (a) | | 60,416 | 1,813,249 |
| Randstad NV | | 32,726 | 1,811,826 |
| STMicroelectronics NV (France) | | 170,433 | 3,868,203 |
| Unibail-Rodamco SE & WFD Unibail-Rodamco NV unit | | 34,068 | 5,268,151 |
| Unilever NV | | 354,685 | 20,945,971 |
| Vopak NV | | 18,465 | 1,013,020 |
| Wolters Kluwer NV | | 67,380 | 4,961,331 |
| X5 Retail Group NV GDR | | 29,614 | 991,559 |
|
| TOTAL NETHERLANDS | | | 178,623,521 |
|
| New Zealand - 0.2% | | | |
| Auckland International Airport Ltd. | | 234,279 | 1,396,262 |
| Fisher & Paykel Healthcare Corp. | | 136,122 | 1,669,564 |
| Fletcher Building Ltd. | | 183,035 | 537,782 |
| Meridian Energy Ltd. | | 284,440 | 838,441 |
| Ryman Healthcare Group Ltd. | | 91,787 | 758,615 |
| Spark New Zealand Ltd. | | 441,910 | 1,267,692 |
| The a2 Milk Co. Ltd. (a) | | 176,761 | 1,467,533 |
|
| TOTAL NEW ZEALAND | | | 7,935,889 |
|
| Norway - 0.4% | | | |
| Aker Bp ASA | | 26,524 | 732,311 |
| DNB ASA | | 233,632 | 4,245,245 |
| Equinor ASA | | 248,165 | 4,590,276 |
| Gjensidige Forsikring ASA | | 48,268 | 902,255 |
| Marine Harvest ASA | | 105,393 | 2,569,457 |
| Norsk Hydro ASA | | 346,340 | 1,223,814 |
| Orkla ASA | | 177,849 | 1,708,452 |
| Schibsted ASA (B Shares) | | 22,318 | 623,224 |
| Telenor ASA | | 177,408 | 3,321,041 |
| Yara International ASA | | 43,818 | 1,705,329 |
|
| TOTAL NORWAY | | | 21,621,404 |
|
| Pakistan - 0.0% | | | |
| Habib Bank Ltd. | | 112,000 | 92,127 |
| MCB Bank Ltd. | | 63,800 | 70,879 |
| Oil & Gas Development Co. Ltd. | | 109,100 | 90,317 |
|
| TOTAL PAKISTAN | | | 253,323 |
|
| Papua New Guinea - 0.0% | | | |
| Oil Search Ltd. ADR | | 323,634 | 1,597,227 |
| Peru - 0.0% | | | |
| Compania de Minas Buenaventura SA sponsored ADR | | 58,448 | 896,592 |
| Philippines - 0.3% | | | |
| Aboitiz Equity Ventures, Inc. | | 437,450 | 481,186 |
| Aboitiz Power Corp. | | 309,600 | 243,534 |
| Alliance Global Group, Inc. | | 995,800 | 224,867 |
| Altus San Nicolas Corp. (d) | | 9,184 | 937 |
| Ayala Corp. | | 83,510 | 1,412,954 |
| Ayala Land, Inc. | | 1,764,700 | 1,685,235 |
| Bank of the Philippine Islands (BPI) | | 221,056 | 422,032 |
| BDO Unibank, Inc. | | 466,634 | 1,422,490 |
| DMCI Holdings, Inc. | | 728,050 | 117,544 |
| Globe Telecom, Inc. | | 8,285 | 296,404 |
| GT Capital Holdings, Inc. | | 26,381 | 464,046 |
| International Container Terminal Services, Inc. | | 252,370 | 589,578 |
| JG Summit Holdings, Inc. | | 738,320 | 1,107,404 |
| Jollibee Food Corp. | | 93,480 | 426,848 |
| Manila Electric Co. | | 43,600 | 290,584 |
| Megaworld Corp. | | 2,862,400 | 272,083 |
| Metro Pacific Investments Corp. | | 2,681,200 | 253,144 |
| Metropolitan Bank & Trust Co. | | 418,371 | 556,556 |
| Philippine Long Distance Telephone Co. | | 21,415 | 460,522 |
| Robinsons Land Corp. | | 411,306 | 205,996 |
| Security Bank Corp. | | 37,860 | 148,444 |
| SM Investments Corp. | | 57,103 | 1,156,819 |
| SM Prime Holdings, Inc. | | 2,416,700 | 1,854,287 |
| Universal Robina Corp. | | 192,850 | 572,527 |
|
| TOTAL PHILIPPINES | | | 14,666,021 |
|
| Poland - 0.3% | | | |
| Alior Bank SA (a) | | 21,218 | 149,723 |
| Bank Millennium SA (a) | | 139,019 | 223,593 |
| Bank Polska Kasa Opieki SA | | 45,063 | 1,271,457 |
| Bank Zachodni WBK SA | | 10,131 | 830,495 |
| BRE Bank SA (a) | | 3,270 | 326,773 |
| CD Projekt RED SA | | 14,843 | 979,394 |
| Cyfrowy Polsat SA | | 59,093 | 428,429 |
| Dino Polska SA (a)(c) | | 11,496 | 448,328 |
| Grupa Lotos SA | | 19,668 | 491,102 |
| Jastrzebska Spolka Weglowa SA | | 10,517 | 53,292 |
| KGHM Polska Miedz SA (Bearer) (a) | | 38,387 | 840,351 |
| LPP SA | | 289 | 616,857 |
| NG2 SA | | 6,517 | 190,360 |
| Polish Oil & Gas Co. SA | | 388,105 | 477,836 |
| Polska Grupa Energetyczna SA (a) | | 189,644 | 406,524 |
| Polski Koncern Naftowy Orlen SA | | 74,083 | 2,024,332 |
| Powszechna Kasa Oszczednosci Bank SA | | 216,964 | 2,164,728 |
| Powszechny Zaklad Ubezpieczen SA | | 154,689 | 1,496,017 |
| Telekomunikacja Polska SA (a) | | 162,069 | 265,120 |
|
| TOTAL POLAND | | | 13,684,711 |
|
| Portugal - 0.1% | | | |
| Banco Espirito Santo SA (Reg.) (a)(d) | | 82,039 | 1 |
| Energias de Portugal SA | | 660,924 | 2,720,004 |
| Galp Energia SGPS SA Class B | | 130,031 | 2,079,818 |
| Jeronimo Martins SGPS SA | | 59,076 | 991,277 |
|
| TOTAL PORTUGAL | | | 5,791,100 |
|
| Qatar - 0.2% | | | |
| Barwa Real Estate Co. (a) | | 442,566 | 415,703 |
| Industries Qatar QSC (a) | | 439,479 | 1,268,587 |
| Masraf al Rayan (a) | | 990,594 | 1,020,249 |
| Mesaieed Petrochemical Holding Co. (a) | | 1,004,003 | 689,373 |
| Qatar Electricity & Water Co. (a) | | 112,508 | 488,225 |
| Qatar Fuel Co. (a) | | 117,216 | 711,473 |
| Qatar Insurance Co. SAQ (a) | | 422,529 | 356,266 |
| Qatar Islamic Bank (a) | | 285,092 | 1,191,733 |
| Qatar National Bank SAQ (a) | | 1,101,907 | 5,810,660 |
| Qatar Telecom (Qtel) Q.S.C. (a) | | 152,074 | 304,900 |
| The Commercial Bank of Qatar (a) | | 425,770 | 502,832 |
|
| TOTAL QATAR | | | 12,760,001 |
|
| Russia - 1.0% | | | |
| Alrosa Co. Ltd. | | 646,321 | 751,022 |
| Gazprom OAO | | 2,023,772 | 8,209,749 |
| Gazprom OAO sponsored ADR (Reg. S) | | 284,755 | 2,279,179 |
| Inter Rao Ues JSC | | 9,111,000 | 613,818 |
| Lukoil PJSC | | 90,592 | 8,369,142 |
| Lukoil PJSC sponsored ADR | | 5,519 | 507,527 |
| Magnit OJSC GDR (Reg. S) | | 92,741 | 1,053,538 |
| Magnitogorsk Iron & Steel Works PJSC | | 503,100 | 286,611 |
| MMC Norilsk Nickel PJSC | | 12,142 | 3,387,206 |
| MMC Norilsk Nickel PJSC sponsored ADR | | 33,411 | 925,485 |
| Mobile TeleSystems OJSC sponsored ADR | | 122,886 | 1,099,830 |
| Moscow Exchange MICEX-RTS OAO (a) | | 284,835 | 422,127 |
| NOVATEK OAO GDR (Reg. S) | | 22,463 | 4,807,082 |
| Novolipetsk Steel OJSC | | 337,520 | 658,170 |
| PhosAgro OJSC GDR (Reg. S) | | 21,935 | 275,942 |
| Polyus PJSC | | 5,959 | 694,105 |
| Rosneft Oil Co. OJSC | | 200,723 | 1,333,510 |
| Rosneft Oil Co. OJSC GDR (Reg. S) | | 70,664 | 467,937 |
| Sberbank of Russia | | 2,646,486 | 9,699,136 |
| Severstal PAO | | 43,863 | 603,469 |
| Severstal PAO GDR (Reg. S) | | 12,600 | 172,116 |
| Surgutneftegas OJSC | | 843,000 | 565,309 |
| Surgutneftegas OJSC sponsored ADR | | 79,195 | 522,687 |
| Tatneft PAO | | 300,572 | 3,507,162 |
| Tatneft PAO sponsored ADR | | 11,981 | 838,670 |
| VTB Bank OJSC | | 663,220,334 | 445,681 |
|
| TOTAL RUSSIA | | | 52,496,210 |
|
| Saudi Arabia - 0.6% | | | |
| Advanced Polypropylene Co. | | 28,891 | 358,220 |
| Al Rajhi Bank | | 295,943 | 4,766,274 |
| Alinma Bank | | 181,733 | 1,015,685 |
| Almarai Co. Ltd. | | 63,497 | 844,866 |
| Bank Al-Jazira | | 104,626 | 363,790 |
| Bank Albilad | | 93,270 | 616,776 |
| Banque Saudi Fransi | | 133,237 | 1,197,261 |
| Bupa Arabia for Cooperative Insurance Co. | | 4,697 | 134,511 |
| Dar Al Arkan Real Estate Development Co. (a) | | 102,952 | 330,518 |
| Emaar The Economic City (a) | | 73,027 | 182,456 |
| Etihad Etisalat Co. (a) | | 94,095 | 563,521 |
| Jarir Marketing Co. | | 14,671 | 619,653 |
| National Commercial Bank | | 291,158 | 3,377,163 |
| National Industrialization Co. (a) | | 54,972 | 179,121 |
| Rabigh Refining & Petrochemical Co. (a) | | 60,654 | 325,079 |
| Riyad Bank | | 293,249 | 1,735,895 |
| SABIC | | 181,399 | 4,241,979 |
| Sahara International Petrochemical Co. | | 92,660 | 406,189 |
| Samba Financial Group | | 242,390 | 1,790,311 |
| Saudi Airlines Catering Co. | | 7,462 | 172,110 |
| Saudi Arabian Fertilizers Co. | | 41,950 | 873,609 |
| Saudi Arabian Mining Co. (a) | | 103,297 | 1,167,851 |
| Saudi Cement Co. | | 19,230 | 351,753 |
| Saudi Electricity Co. | | 209,553 | 1,161,110 |
| Saudi Industrial Investment Group | | 59,274 | 333,172 |
| Saudi Kayan Petrochemical Co. (a) | | 195,620 | 533,087 |
| Saudi Telecom Co. | | 97,718 | 2,496,169 |
| The Co. for Cooperative Insurance (a) | | 16,759 | 315,044 |
| The Saudi British Bank | | 91,817 | 798,132 |
| The Savola Group (a) | | 67,055 | 552,489 |
| Yanbu National Petrochemical Co. | | 56,339 | 748,122 |
|
| TOTAL SAUDI ARABIA | | | 32,551,916 |
|
| Singapore - 0.9% | | | |
| Ascendas Real Estate Investment Trust | | 574,700 | 1,338,507 |
| BOC Aviation Ltd. Class A (c) | | 46,400 | 435,923 |
| CapitaCommercial Trust (REIT) | | 594,746 | 895,678 |
| CapitaLand Ltd. | | 667,500 | 1,764,352 |
| CapitaMall Trust | | 602,400 | 1,123,985 |
| City Developments Ltd. | | 128,000 | 1,013,657 |
| ComfortDelgro Corp. Ltd. | | 571,100 | 964,407 |
| DBS Group Holdings Ltd. | | 442,029 | 8,425,462 |
| Genting Singapore Ltd. | | 1,586,500 | 1,094,549 |
| Jardine Cycle & Carriage Ltd. | | 23,300 | 560,182 |
| Keppel Corp. Ltd. | | 389,800 | 1,962,793 |
| Oversea-Chinese Banking Corp. Ltd. | | 794,289 | 6,385,455 |
| Sembcorp Industries Ltd. | | 224,900 | 377,583 |
| Singapore Airlines Ltd. | | 117,900 | 814,898 |
| Singapore Airport Terminal Service Ltd. | | 149,800 | 555,529 |
| Singapore Exchange Ltd. | | 183,300 | 1,203,464 |
| Singapore Press Holdings Ltd. | | 344,900 | 561,288 |
| Singapore Technologies Engineering Ltd. | | 400,100 | 1,172,031 |
| Singapore Telecommunications Ltd. | | 1,966,000 | 4,760,780 |
| Suntec (REIT) | | 467,600 | 638,792 |
| United Overseas Bank Ltd. | | 303,053 | 5,966,339 |
| UOL Group Ltd. | | 111,077 | 636,014 |
| Venture Corp. Ltd. | | 78,500 | 910,571 |
| Wilmar International Ltd. | | 490,200 | 1,347,795 |
| Yangzijiang Shipbuilding Holdings Ltd. | | 536,500 | 375,598 |
|
| TOTAL SINGAPORE | | | 45,285,632 |
|
| South Africa - 1.2% | | | |
| Anglo American Platinum Ltd. | | 11,853 | 884,576 |
| AngloGold Ashanti Ltd. | | 98,986 | 2,189,403 |
| Aspen Pharmacare Holdings Ltd. | | 82,263 | 574,352 |
| Barclays Africa Group Ltd. | | 184,074 | 1,886,727 |
| Bidcorp Ltd. | | 79,594 | 1,856,833 |
| Bidvest Group Ltd. | | 62,270 | 849,168 |
| Capitec Bank Holdings Ltd. | | 11,977 | 1,088,262 |
| Clicks Group Ltd. | | 76,651 | 1,246,768 |
| Discovery Ltd. | | 93,155 | 741,393 |
| Exxaro Resources Ltd. | | 57,939 | 472,814 |
| FirstRand Ltd. | | 845,382 | 3,653,317 |
| Fortress (REIT) Ltd. Class A | | 358,853 | 498,958 |
| Foschini Ltd. | | 64,753 | 745,642 |
| Gold Fields Ltd. | | 199,116 | 1,236,586 |
| Growthpoint Properties Ltd. | | 754,219 | 1,103,589 |
| Investec Ltd. | | 57,258 | 325,575 |
| Kumba Iron Ore Ltd. | | 14,770 | 359,688 |
| Liberty Holdings Ltd. | | 25,827 | 198,901 |
| Life Healthcare Group Holdings Ltd. | | 302,234 | 477,238 |
| MMI Holdings Ltd. | | 199,312 | 266,444 |
| Mr Price Group Ltd. | | 55,269 | 584,493 |
| MTN Group Ltd. | | 405,980 | 2,514,521 |
| MultiChoice Group Ltd. (a) | | 98,876 | 824,681 |
| Naspers Ltd. Class N | | 107,273 | 15,180,054 |
| Nedbank Group Ltd. | | 87,904 | 1,333,234 |
| Netcare Ltd. | | 267,098 | 302,442 |
| Old Mutual Ltd. | | 1,268,684 | 1,649,822 |
| Pick 'n Pay Stores Ltd. | | 84,660 | 370,340 |
| PSG Group Ltd. | | 31,873 | 498,118 |
| Rand Merchant Insurance Holdings Ltd. | | 162,250 | 320,624 |
| Redefine Properties Ltd. | | 1,135,358 | 566,533 |
| Remgro Ltd. | | 140,878 | 1,615,428 |
| RMB Holdings Ltd. | | 222,070 | 1,167,923 |
| Sanlam Ltd. | | 462,106 | 2,433,392 |
| Sappi Ltd. | | 115,021 | 295,345 |
| Sasol Ltd. | | 134,396 | 2,436,423 |
| Shoprite Holdings Ltd. | | 125,105 | 1,121,106 |
| Spar Group Ltd. | | 51,576 | 692,993 |
| Standard Bank Group Ltd. | | 321,810 | 3,694,410 |
| Telkom SA Ltd. | | 55,896 | 255,759 |
| Tiger Brands Ltd. | | 34,818 | 494,510 |
| Truworths International Ltd. | | 99,616 | 353,160 |
| Vodacom Group Ltd. | | 165,614 | 1,445,101 |
| Woolworths Holdings Ltd. | | 260,514 | 991,162 |
|
| TOTAL SOUTH AFRICA | | | 61,797,808 |
|
| Spain - 1.9% | | | |
| ACS Actividades de Construccion y Servicios SA | | 65,489 | 2,657,423 |
| Aena Sme SA (c) | | 16,154 | 2,963,724 |
| Amadeus IT Holding SA Class A | | 108,120 | 7,999,691 |
| Banco Bilbao Vizcaya Argentaria SA | | 1,641,790 | 8,647,033 |
| Banco de Sabadell SA | | 1,352,173 | 1,483,648 |
| Banco Santander SA (Spain) | | 3,946,428 | 15,818,815 |
| Bankia SA | | 269,813 | 513,976 |
| Bankinter SA | | 176,313 | 1,219,180 |
| CaixaBank SA | | 857,372 | 2,458,600 |
| Cellnex Telecom SA (a) | | 15,651 | 674,832 |
| Cellnex Telecom SA (c) | | 46,506 | 2,005,222 |
| Enagas SA | | 53,729 | 1,329,713 |
| Endesa SA | | 79,370 | 2,159,921 |
| Ferrovial SA | | 113,139 | 3,338,827 |
| Gas Natural SDG SA | | 75,934 | 2,067,263 |
| Grifols SA | | 73,901 | 2,380,341 |
| Iberdrola SA | | 1,462,547 | 15,033,518 |
| Inditex SA | | 264,953 | 8,259,283 |
| MAPFRE SA (Reg.) | | 227,107 | 633,231 |
| Red Electrica Corporacion SA | | 110,237 | 2,215,492 |
| Repsol SA | | 357,594 | 5,893,049 |
| Siemens Gamesa Renewable Energy SA | | 56,908 | 782,262 |
| Telefonica SA | | 1,145,446 | 8,796,205 |
|
| TOTAL SPAIN | | | 99,331,249 |
|
| Sweden - 1.6% | | | |
| Alfa Laval AB | | 73,481 | 1,697,817 |
| ASSA ABLOY AB (B Shares) | | 242,094 | 5,749,340 |
| Atlas Copco AB: | | | |
| (A Shares) | | 155,387 | 5,489,245 |
| (B Shares) | | 108,921 | 3,373,994 |
| Boliden AB | | 72,252 | 1,942,918 |
| Electrolux AB (B Shares) | | 52,877 | 1,388,229 |
| Epiroc AB: | | | |
| Class A | | 136,384 | 1,533,944 |
| Class B | | 124,924 | 1,358,474 |
| Ericsson (B Shares) | | 755,553 | 6,602,620 |
| Essity AB Class B | | 144,772 | 4,517,519 |
| H&M Hennes & Mauritz AB (B Shares) | | 196,303 | 4,101,632 |
| Hexagon AB (B Shares) | | 64,855 | 3,310,690 |
| Husqvarna AB (B Shares) | | 112,844 | 863,185 |
| ICA Gruppen AB | | 20,378 | 901,168 |
| Industrivarden AB (C Shares) | | 41,596 | 899,925 |
| Investor AB (B Shares) | | 110,054 | 5,636,226 |
| Kinnevik AB (B Shares) | | 61,591 | 1,683,344 |
| Lundbergfoeretagen AB | | 16,493 | 620,727 |
| Lundin Petroleum AB | | 43,871 | 1,448,479 |
| Sandvik AB | | 277,984 | 4,904,313 |
| Securitas AB (B Shares) | | 78,713 | 1,258,665 |
| Skandinaviska Enskilda Banken AB (A Shares) | | 387,860 | 3,716,438 |
| Skanska AB (B Shares) | | 83,887 | 1,785,347 |
| SKF AB (B Shares) | | 99,289 | 1,794,887 |
| Svenska Handelsbanken AB (A Shares) | | 373,235 | 3,745,716 |
| Swedbank AB (A Shares) | | 215,863 | 3,019,180 |
| Swedish Match Co. AB | | 41,894 | 1,966,337 |
| Tele2 AB (B Shares) | | 118,089 | 1,688,348 |
| Telia Co. AB | | 651,914 | 2,866,053 |
| Volvo AB (B Shares) | | 364,704 | 5,454,111 |
|
| TOTAL SWEDEN | | | 85,318,871 |
|
| Switzerland - 6.1% | | | |
| ABB Ltd. (Reg.) | | 451,966 | 9,491,281 |
| Adecco SA (Reg.) | | 41,226 | 2,443,889 |
| Alcon, Inc. (Switzerland) (a) | | 101,313 | 5,983,270 |
| Baloise Holdings AG | | 11,984 | 2,213,365 |
| Barry Callebaut AG | | 547 | 1,153,330 |
| Clariant AG (Reg.) | | 54,672 | 1,120,042 |
| Coca-Cola HBC AG | | 47,348 | 1,441,307 |
| Compagnie Financiere Richemont SA Series A | | 127,285 | 10,002,206 |
| Credit Suisse Group AG | | 631,211 | 7,813,051 |
| Dufry AG | | 11,750 | 1,019,326 |
| Ems-Chemie Holding AG | | 1,824 | 1,140,809 |
| Galenica AG | | 11,909 | 1,871,759 |
| Geberit AG (Reg.) | | 8,912 | 4,522,400 |
| Givaudan SA | | 2,260 | 6,636,817 |
| Julius Baer Group Ltd. | | 56,176 | 2,487,677 |
| Kuehne & Nagel International AG | | 12,816 | 2,070,177 |
| Lafargeholcim Ltd. (Reg.) | | 121,222 | 6,252,180 |
| Lindt & Spruengli AG | | 22 | 1,801,926 |
| Lindt & Spruengli AG (participation certificate) | | 269 | 1,998,753 |
| Lonza Group AG | | 18,126 | 6,522,788 |
| Nestle SA (Reg. S) | | 745,327 | 79,736,078 |
| Novartis AG | | 523,114 | 45,707,230 |
| Pargesa Holding SA | | 10,421 | 822,905 |
| Partners Group Holding AG | | 4,646 | 3,622,608 |
| Roche Holding AG (participation certificate) | | 171,720 | 51,680,161 |
| Schindler Holding AG: | | | |
| (participation certificate) | | 10,017 | 2,449,164 |
| (Reg.) | | 4,633 | 1,095,201 |
| SGS SA (Reg.) | | 1,336 | 3,477,798 |
| Sika AG | | 30,547 | 5,248,572 |
| Sonova Holding AG Class B | | 13,618 | 3,119,785 |
| Straumann Holding AG | | 2,656 | 2,368,727 |
| Swatch Group AG (Bearer) | | 5,691 | 1,574,904 |
| Swatch Group AG (Bearer) (Reg.) | | 23,681 | 1,268,668 |
| Swiss Life Holding AG | | 8,141 | 4,070,087 |
| Swiss Prime Site AG | | 18,142 | 1,868,451 |
| Swiss Re Ltd. | | 74,790 | 7,831,533 |
| Swisscom AG | | 6,206 | 3,170,627 |
| Temenos Group AG | | 16,064 | 2,291,949 |
| UBS Group AG | | 937,202 | 11,058,319 |
| Zurich Insurance Group Ltd. | | 36,408 | 14,227,353 |
|
| TOTAL SWITZERLAND | | | 324,676,473 |
|
| Taiwan - 3.0% | | | |
| Acer, Inc. | | 685,288 | 399,965 |
| Advantech Co. Ltd. | | 78,591 | 776,942 |
| ASE Technology Holding Co. Ltd. | | 910,840 | 2,358,658 |
| Asia Cement Corp. | | 488,466 | 689,503 |
| ASUSTeK Computer, Inc. | | 188,000 | 1,272,936 |
| AU Optronics Corp. | | 1,880,000 | 478,422 |
| Catcher Technology Co. Ltd. | | 173,000 | 1,463,506 |
| Cathay Financial Holding Co. Ltd. | | 1,907,285 | 2,520,283 |
| Cathay Financial Holding Co. Ltd. rights 11/25/19 (a) | | 65,594 | 11,399 |
| Chang Hwa Commercial Bank | | 1,179,799 | 918,756 |
| Cheng Shin Rubber Industry Co. Ltd. | | 388,899 | 610,165 |
| Chicony Electronics Co. Ltd. | | 134,493 | 417,617 |
| China Airlines Ltd. | | 509,490 | 151,354 |
| China Development Finance Holding Corp. | | 2,843,800 | 885,832 |
| China Life Insurance Co. Ltd. (a) | | 641,256 | 527,757 |
| China Steel Corp. | | 2,832,426 | 2,177,861 |
| Chinatrust Financial Holding Co. Ltd. | | 4,688,579 | 3,259,160 |
| Chunghwa Telecom Co. Ltd. | | 913,000 | 3,352,876 |
| Compal Electronics, Inc. | | 898,000 | 535,891 |
| Delta Electronics, Inc. | | 468,621 | 2,058,994 |
| E.SUN Financial Holdings Co. Ltd. | | 2,685,552 | 2,425,961 |
| ECLAT Textile Co. Ltd. | | 46,941 | 630,282 |
| EVA Airways Corp. | | 447,422 | 209,055 |
| Evergreen Marine Corp. (Taiwan) (a) | | 415,048 | 170,113 |
| Far Eastern Textile Ltd. | | 700,664 | 680,033 |
| Far EasTone Telecommunications Co. Ltd. | | 431,000 | 1,031,641 |
| Feng Tay Enterprise Co. Ltd. | | 84,379 | 569,941 |
| First Financial Holding Co. Ltd. | | 2,619,278 | 1,919,498 |
| Formosa Chemicals & Fibre Corp. | | 848,590 | 2,465,246 |
| Formosa Petrochemical Corp. | | 293,000 | 930,936 |
| Formosa Plastics Corp. | | 1,075,480 | 3,448,814 |
| Formosa Taffeta Co. Ltd. | | 160,000 | 181,782 |
| Foxconn Technology Co. Ltd. | | 198,535 | 424,437 |
| Fubon Financial Holding Co. Ltd. | | 1,527,398 | 2,231,149 |
| Giant Manufacturing Co. Ltd. | | 74,000 | 548,364 |
| GlobalWafers Co. Ltd. | | 49,000 | 586,432 |
| Highwealth Construction Corp. | | 152,480 | 233,735 |
| HIWIN Technologies Corp. | | 54,202 | 464,746 |
| Hon Hai Precision Industry Co. Ltd. (Foxconn) | | 3,021,990 | 7,986,504 |
| Hotai Motor Co. Ltd. | | 76,000 | 1,340,678 |
| Hua Nan Financial Holdings Co. Ltd. | | 2,197,630 | 1,578,074 |
| Innolux Corp. | | 1,954,427 | 433,847 |
| Inventec Corp. | | 531,280 | 384,986 |
| Largan Precision Co. Ltd. | | 25,000 | 3,664,175 |
| Lite-On Technology Corp. | | 488,910 | 804,751 |
| MediaTek, Inc. | | 360,970 | 4,829,030 |
| Mega Financial Holding Co. Ltd. | | 2,730,246 | 2,676,712 |
| Micro-Star International Co. Ltd. | | 159,000 | 469,211 |
| Nan Ya Plastics Corp. | | 1,256,780 | 2,967,019 |
| Nanya Technology Corp. | | 300,000 | 688,570 |
| Nien Made Enterprise Co. Ltd. | | 41,000 | 371,713 |
| Novatek Microelectronics Corp. | | 127,000 | 816,185 |
| Pegatron Corp. | | 441,000 | 857,476 |
| Phison Electronics Corp. | | 33,000 | 300,266 |
| Pou Chen Corp. | | 599,000 | 800,356 |
| Powertech Technology, Inc. | | 164,000 | 516,231 |
| President Chain Store Corp. | | 160,000 | 1,594,859 |
| Quanta Computer, Inc. | | 756,000 | 1,450,128 |
| Realtek Semiconductor Corp. | | 119,090 | 884,448 |
| Ruentex Development Co. Ltd. | | 133,694 | 203,842 |
| Ruentex Industries Ltd. | | 77,809 | 186,754 |
| Shin Kong Financial Holding Co. Ltd. | | 2,307,339 | 727,805 |
| Sinopac Holdings Co. | | 2,986,314 | 1,223,979 |
| Standard Foods Corp. | | 69,986 | 140,899 |
| Synnex Technology International Corp. | | 329,500 | 392,725 |
| TaiMed Biologics, Inc. (a) | | 46,000 | 201,357 |
| Taishin Financial Holdings Co. Ltd. | | 2,113,301 | 980,497 |
| Taiwan Business Bank | | 1,304,943 | 549,824 |
| Taiwan Cement Corp. | | 1,288,942 | 1,709,545 |
| Taiwan Cooperative Financial Holding Co. Ltd. | | 2,460,329 | 1,690,075 |
| Taiwan High Speed Rail Corp. | | 491,000 | 580,384 |
| Taiwan Mobile Co. Ltd. | | 417,600 | 1,554,122 |
| Taiwan Semiconductor Manufacturing Co. Ltd. | | 5,565,000 | 54,433,088 |
| Taiwan Semiconductor Manufacturing Co. Ltd. sponsored ADR | | 86,021 | 4,441,264 |
| Tatung Co. Ltd. (a) | | 527,000 | 316,221 |
| The Shanghai Commercial & Savings Bank Ltd. | | 889,616 | 1,531,407 |
| Unified-President Enterprises Corp. | | 1,211,080 | 2,986,203 |
| United Microelectronics Corp. | | 2,827,000 | 1,299,436 |
| Vanguard International Semiconductor Corp. | | 207,000 | 442,534 |
| Walsin Technology Corp. | | 73,000 | 439,226 |
| Win Semiconductors Corp. | | 71,000 | 740,311 |
| Winbond Electronics Corp. | | 691,000 | 388,571 |
| Wistron Corp. | | 591,666 | 542,234 |
| WPG Holding Co. Ltd. | | 322,320 | 407,946 |
| Yageo Corp. | | 55,519 | 571,610 |
| Yuanta Financial Holding Co. Ltd. | | 2,358,372 | 1,473,113 |
|
| TOTAL TAIWAN | | | 159,590,233 |
|
| Thailand - 0.7% | | | |
| Advanced Info Service PCL (For. Reg.) | | 293,600 | 2,227,628 |
| Airports of Thailand PCL (For. Reg.) | | 1,056,700 | 2,738,329 |
| Bangkok Bank PCL (For. Reg.) | | 113,700 | 657,000 |
| Bangkok Dusit Medical Services PCL (For. Reg.) | | 2,371,300 | 1,885,395 |
| Bangkok Expressway and Metro PCL | | 2,176,300 | 778,545 |
| Banpu PCL (For. Reg.) | | 1,005,100 | 386,252 |
| Berli Jucker PCL (For. Reg) | | 276,400 | 446,384 |
| BTS Group Holdings PCL | | 1,235,800 | 546,323 |
| Bumrungrad Hospital PCL (For. Reg.) | | 80,600 | 321,741 |
| C.P. ALL PCL (For. Reg.) | | 1,403,000 | 3,626,995 |
| Central Pattana PCL (For. Reg.) | | 604,500 | 1,281,694 |
| Charoen Pokphand Foods PCL (For. Reg.) | | 943,900 | 789,748 |
| Electricity Generating PCL (For. Reg.) | | 63,600 | 731,054 |
| Energy Absolute PCL | | 467,700 | 635,173 |
| Gulf Energy Development PCL | | 237,700 | 1,276,993 |
| Home Product Center PCL (For. Reg.) | | 1,612,267 | 918,343 |
| Indorama Ventures PCL (For. Reg.) | | 459,200 | 426,141 |
| Intouch Holdings PCL (For. Reg.) | | 583,300 | 1,275,184 |
| IRPC PCL (For. Reg.) | | 2,299,400 | 258,965 |
| Kasikornbank PCL | | 98,900 | 455,160 |
| Kasikornbank PCL (For. Reg.) | | 392,800 | 1,814,256 |
| Krung Thai Bank PCL (For. Reg.) | | 774,855 | 426,055 |
| Land & House PCL (For. Reg.) | | 2,149,500 | 690,727 |
| Minor International PCL: | | | |
| warrants 9/30/21 (a) | | 36,068 | 3,617 |
| (For. Reg.) | | 793,170 | 945,895 |
| Muangthai Leasing PCL | | 128,209 | 263,437 |
| PTT Exploration and Production PCL (For. Reg.) | | 304,144 | 1,213,584 |
| PTT Global Chemical PCL (For. Reg.) | | 553,439 | 935,008 |
| PTT PCL (For. Reg.) | | 2,829,600 | 4,240,860 |
| Ratchaburi Electric Generating Holding PCL (For. Reg.) | | 175,100 | 426,601 |
| Robinsons Department Store PCL (For. Reg.) | | 96,800 | 209,229 |
| Siam Cement PCL (For. Reg.) | | 185,500 | 2,256,163 |
| Siam Commercial Bank PCL (For. Reg.) | | 186,900 | 692,824 |
| Thai Oil PCL (For. Reg.) | | 311,900 | 707,615 |
| Thai Union Frozen Products PCL (For. Reg.) | | 828,700 | 400,795 |
| TMB Bank PCL: | | | |
| (For. Reg.) | | 1,804,900 | 86,049 |
| rights (a) | | 1,449,188 | 1,920 |
| Total Access Communication PCL (For. Reg.) | | 163,200 | 335,041 |
| True Corp. PCL (For. Reg.) | | 3,710,512 | 614,709 |
|
| TOTAL THAILAND | | | 37,927,432 |
|
| Turkey - 0.1% | | | |
| Akbank TAS (a) | | 745,223 | 900,694 |
| Anadolu Efes Biracilik Ve Malt Sanayii A/S | | 57,165 | 192,275 |
| Arcelik A/S (a) | | 39,999 | 123,973 |
| Aselsan A/S | | 71,791 | 230,419 |
| Bim Birlesik Magazalar A/S JSC | | 111,674 | 924,293 |
| Eregli Demir ve Celik Fabrikalari T.A.S. | | 322,859 | 369,321 |
| Ford Otomotiv Sanayi A/S | | 12,748 | 143,818 |
| Haci Omer Sabanci Holding A/S | | 259,532 | 375,413 |
| Koc Holding A/S | | 156,640 | 513,161 |
| TAV Havalimanlari Holding A/S | | 35,498 | 161,929 |
| Tupras Turkiye Petrol Rafinerileri A/S | | 33,678 | 733,379 |
| Turk Hava Yollari AO (a) | | 153,517 | 312,552 |
| Turk Sise ve Cam Fabrikalari A/S | | 123,204 | 93,740 |
| Turkcell Iletisim Hizmet A/S | | 240,626 | 529,043 |
| Turkiye Garanti Bankasi A/S (a) | | 611,141 | 983,427 |
| Turkiye Is Bankasi A/S Series C (a) | | 370,295 | 375,655 |
|
| TOTAL TURKEY | | | 6,963,092 |
|
| United Arab Emirates - 0.2% | | | |
| Abu Dhabi Commercial Bank PJSC | | 722,610 | 1,534,642 |
| Aldar Properties PJSC (a) | | 869,812 | 556,547 |
| DP World Ltd. | | 36,499 | 485,072 |
| Dubai Islamic Bank Pakistan Ltd. (a) | | 376,105 | 541,718 |
| Emaar Development PJSC (a) | | 198,486 | 218,874 |
| Emaar Malls Group PJSC (a) | | 746,722 | 396,463 |
| Emaar Properties PJSC | | 837,872 | 974,124 |
| Emirates Telecommunications Corp. | | 407,470 | 1,837,235 |
| National Bank of Abu Dhabi PJSC | | 662,928 | 2,747,196 |
|
| TOTAL UNITED ARAB EMIRATES | | | 9,291,871 |
|
| United Kingdom - 10.1% | | | |
| 3i Group PLC | | 238,888 | 3,490,523 |
| Admiral Group PLC | | 44,411 | 1,163,212 |
| Anglo American PLC (United Kingdom) | | 255,669 | 6,562,679 |
| Antofagasta PLC | | 94,403 | 1,060,455 |
| Ashtead Group PLC | | 111,906 | 3,403,601 |
| Associated British Foods PLC | | 89,700 | 2,586,454 |
| AstraZeneca PLC (United Kingdom) | | 319,295 | 31,136,776 |
| Auto Trader Group PLC (c) | | 216,062 | 1,574,291 |
| Aviva PLC | | 980,696 | 5,285,995 |
| BAE Systems PLC | | 781,487 | 5,837,487 |
| Barclays PLC | | 4,159,853 | 9,023,028 |
| Barratt Developments PLC | | 241,528 | 1,974,793 |
| Berkeley Group Holdings PLC | | 32,124 | 1,831,336 |
| BHP Billiton PLC | | 515,864 | 10,941,754 |
| BP PLC | | 4,447,154 | 28,201,026 |
| BP PLC sponsored ADR | | 81,606 | 3,093,683 |
| British American Tobacco PLC (United Kingdom) | | 559,818 | 19,580,126 |
| British Land Co. PLC | | 228,441 | 1,836,697 |
| BT Group PLC | | 2,057,339 | 5,455,202 |
| Bunzl PLC | | 79,392 | 2,065,036 |
| Burberry Group PLC | | 97,559 | 2,583,065 |
| Carnival PLC | | 38,621 | 1,545,488 |
| Centrica PLC | | 1,357,631 | 1,276,045 |
| Coca-Cola European Partners PLC | | 59,288 | 3,172,501 |
| Compass Group PLC | | 383,923 | 10,221,600 |
| Croda International PLC | | 33,443 | 2,086,310 |
| Diageo PLC | | 580,386 | 23,755,767 |
| Direct Line Insurance Group PLC | | 331,706 | 1,169,147 |
| easyJet PLC | | 34,422 | 552,006 |
| Evraz PLC | | 115,056 | 547,267 |
| Fresnillo PLC | | 47,867 | 440,232 |
| G4S PLC (United Kingdom) | | 370,030 | 991,230 |
| GlaxoSmithKline PLC | | 1,216,170 | 27,856,303 |
| Halma PLC | | 91,369 | 2,217,378 |
| Hargreaves Lansdown PLC | | 68,013 | 1,561,143 |
| HSBC Holdings PLC (United Kingdom) | | 4,966,100 | 37,519,442 |
| Imperial Brands PLC | | 234,169 | 5,133,571 |
| Informa PLC | | 313,684 | 3,149,062 |
| InterContinental Hotel Group PLC | | 44,162 | 2,672,452 |
| Intertek Group PLC | | 41,143 | 2,852,326 |
| Investec PLC | | 184,121 | 1,043,681 |
| ITV PLC | | 952,184 | 1,649,688 |
| J Sainsbury PLC | | 416,980 | 1,099,175 |
| John Wood Group PLC | | 166,454 | 729,430 |
| Johnson Matthey PLC | | 45,895 | 1,825,118 |
| Kingfisher PLC | | 542,317 | 1,454,824 |
| Land Securities Group PLC | | 176,670 | 2,151,185 |
| Legal & General Group PLC | | 1,496,400 | 5,111,460 |
| Lloyds Banking Group PLC | | 17,460,468 | 12,844,056 |
| London Stock Exchange Group PLC | | 77,012 | 6,940,231 |
| M&G PLC (a) | | 633,304 | 1,753,909 |
| Marks & Spencer Group PLC | | 461,769 | 1,087,832 |
| Meggitt PLC | | 174,758 | 1,413,472 |
| Melrose Industries PLC | | 1,161,372 | 3,205,841 |
| Merlin Entertainments PLC (c) | | 156,333 | 920,390 |
| Micro Focus International PLC | | 81,324 | 1,116,189 |
| Mondi PLC | | 95,342 | 1,972,933 |
| Mondi PLC | | 25,984 | 537,375 |
| National Grid PLC | | 837,058 | 9,772,643 |
| Next PLC | | 32,219 | 2,746,990 |
| NMC Health PLC | | 23,303 | 658,950 |
| Ocado Group PLC (a) | | 114,995 | 1,979,662 |
| Pearson PLC | | 183,557 | 1,621,101 |
| Persimmon PLC | | 75,147 | 2,216,470 |
| Prudential PLC | | 633,304 | 11,061,818 |
| Reckitt Benckiser Group PLC | | 172,796 | 13,371,234 |
| RELX PLC (London Stock Exchange) | | 478,538 | 11,517,263 |
| Rentokil Initial PLC | | 464,417 | 2,734,193 |
| Rio Tinto PLC | | 278,511 | 14,499,789 |
| Rolls-Royce Holdings PLC | | 422,184 | 3,884,831 |
| Rolls-Royce Holdings PLC (a) | | 19,420,464 | 25,156 |
| Royal Bank of Scotland Group PLC | | 1,141,026 | 3,154,069 |
| Royal Dutch Shell PLC: | | | |
| Class A (United Kingdom) | | 1,097,602 | 31,817,394 |
| Class B (United Kingdom) | | 877,047 | 25,258,763 |
| RSA Insurance Group PLC | | 241,425 | 1,633,311 |
| Sage Group PLC | | 272,625 | 2,541,936 |
| Schroders PLC | | 32,533 | 1,304,283 |
| Scottish & Southern Energy PLC | | 257,695 | 4,287,028 |
| Segro PLC | | 268,901 | 2,940,525 |
| Severn Trent PLC | | 56,089 | 1,638,368 |
| Smith & Nephew PLC | | 216,714 | 4,652,072 |
| Smiths Group PLC | | 95,020 | 1,985,963 |
| Spirax-Sarco Engineering PLC | | 19,208 | 1,971,826 |
| St. James's Place Capital PLC | | 123,078 | 1,659,657 |
| Standard Chartered PLC (United Kingdom) | | 687,833 | 6,245,801 |
| Standard Life PLC | | 586,403 | 2,305,377 |
| Taylor Wimpey PLC | | 778,981 | 1,669,983 |
| Tesco PLC | | 2,408,180 | 7,351,100 |
| The Weir Group PLC | | 67,496 | 1,177,258 |
| Unilever PLC | | 270,348 | 16,187,777 |
| United Utilities Group PLC | | 158,392 | 1,785,416 |
| Vodafone Group PLC | | 5,846,632 | 11,931,349 |
| Vodafone Group PLC sponsored ADR | | 67,954 | 1,387,621 |
| Whitbread PLC | | 32,568 | 1,713,212 |
| WM Morrison Supermarkets PLC | | 544,886 | 1,403,519 |
|
| TOTAL UNITED KINGDOM | | | 538,356,986 |
|
| United States of America - 0.1% | | | |
| Southern Copper Corp. | | 18,576 | 660,934 |
| Yum China Holdings, Inc. | | 89,911 | 3,821,218 |
|
| TOTAL UNITED STATES OF AMERICA | | | 4,482,152 |
|
| TOTAL COMMON STOCKS | | | |
| (Cost $4,999,968,084) | | | 5,119,165,847 |
|
| Nonconvertible Preferred Stocks - 1.4% | | | |
| Brazil - 0.7% | | | |
| Banco Bradesco SA (PN) | | 977,408 | 8,571,360 |
| Braskem SA (PN-A) (a) | | 45,700 | 315,644 |
| Centrais Eletricas Brasileiras SA (Electrobras) (PN-B) (a) | | 5,900 | 60,302 |
| Companhia Brasileira de Distribuicao Grupo Pao de Acucar (PN) | | 41,000 | 848,420 |
| Companhia Energetica de Minas Gerais (CEMIG) (PN) | | 246,407 | 838,662 |
| Gerdau SA | | 317,800 | 1,064,220 |
| Itau Unibanco Holding SA | | 1,181,321 | 10,671,801 |
| Itausa-Investimentos Itau SA (PN) | | 1,077,598 | 3,683,797 |
| Lojas Americanas SA (PN) | | 190,536 | 949,711 |
| Petroleo Brasileiro SA - Petrobras (PN) (non-vtg.) | | 1,032,900 | 7,826,912 |
| Telefonica Brasil SA | | 121,700 | 1,610,731 |
|
| TOTAL BRAZIL | | | 36,441,560 |
|
| Chile - 0.0% | | | |
| Embotelladora Andina SA Class B | | 92,928 | 268,158 |
| Sociedad Quimica y Minera de Chile SA (PN-B) (a) | | 26,785 | 711,522 |
|
| TOTAL CHILE | | | 979,680 |
|
| Colombia - 0.1% | | | |
| Bancolombia SA (PN) | | 107,905 | 1,408,511 |
| Grupo Aval Acciones y Valores SA | | 784,369 | 321,406 |
| Grupo de Inversiones Suramerica SA | | 22,378 | 205,110 |
|
| TOTAL COLOMBIA | | | 1,935,027 |
|
| France - 0.0% | | | |
| Air Liquide SA (a) | | 7,701 | 1,022,941 |
| Germany - 0.4% | | | |
| Bayerische Motoren Werke AG (BMW) (non-vtg.) | | 21,745 | 1,339,934 |
| Fuchs Petrolub AG | | 15,040 | 642,113 |
| Henkel AG & Co. KGaA | | 44,985 | 4,675,006 |
| Porsche Automobil Holding SE (Germany) | | 38,811 | 2,857,679 |
| Sartorius AG (non-vtg.) | | 8,412 | 1,634,328 |
| Volkswagen AG | | 45,575 | 8,676,646 |
|
| TOTAL GERMANY | | | 19,825,706 |
|
| Italy - 0.0% | | | |
| Telecom Italia SpA (Risparmio Shares) | | 1,663,609 | 962,594 |
| Korea (South) - 0.2% | | | |
| AMOREPACIFIC Corp. | | 3,178 | 261,509 |
| Hyundai Motor Co. | | 4,075 | 254,189 |
| Hyundai Motor Co. Series 2 | | 13,638 | 924,124 |
| LG Chemical Ltd. | | 2,468 | 362,727 |
| LG Household & Health Care Ltd. | | 419 | 264,585 |
| Samsung Electronics Co. Ltd. | | 214,656 | 7,529,440 |
|
| TOTAL KOREA (SOUTH) | | | 9,596,574 |
|
| Russia - 0.0% | | | |
| AK Transneft OAO | | 100 | 259,659 |
| Surgutneftegas OJSC | | 1,716,933 | 1,010,200 |
|
| TOTAL RUSSIA | | | 1,269,859 |
|
| TOTAL NONCONVERTIBLE PREFERRED STOCKS | | | |
| (Cost $64,179,911) | | | 72,033,941 |
| | | Principal Amount(e) | Value |
|
| Nonconvertible Bonds - 0.0% | | | |
| India - 0.0% | | | |
| Britannia Industries Ltd. 8% 8/28/22 | INR | 14,287 | 63 |
| NTPC Ltd. 8.49% 3/25/25 | INR | 69,696 | 13,207 |
| TOTAL NONCONVERTIBLE BONDS | | | |
| (Cost $14,023) | | | 13,270 |
|
| Government Obligations - 0.1% | | | |
| United States of America - 0.1% | | | |
| U.S. Treasury Bills, yield at date of purchase 1.7% to 1.82% 12/19/19 to 3/19/20(f) | | | |
| (Cost $7,166,760) | | 7,200,000 | 7,172,171 |
| | | Shares | Value |
|
| Money Market Funds - 2.6% | | | |
| Fidelity Cash Central Fund 1.83% (g) | | 117,754,503 | 117,778,054 |
| Fidelity Securities Lending Cash Central Fund 1.84% (g)(h) | | 22,984,383 | 22,986,682 |
| TOTAL MONEY MARKET FUNDS | | | |
| (Cost $140,764,101) | | | 140,764,736 |
| TOTAL INVESTMENT IN SECURITIES - 99.9% | | | |
| (Cost $5,212,092,879) | | | 5,339,149,965 |
| NET OTHER ASSETS (LIABILITIES) - 0.1% | | | 4,245,103 |
| NET ASSETS - 100% | | | $5,343,395,068 |
| Futures Contracts | | | | | |
| | Number of contracts | Expiration Date | Notional Amount | Value | Unrealized Appreciation/(Depreciation) |
| Purchased | | | | | |
| Equity Index Contracts | | | | | |
| ICE E-mini MSCI EAFE Index Contracts (United States) | 1,045 | Dec. 2019 | $102,263,700 | $2,798,171 | $2,798,171 |
| ICE E-mini MSCI Emerging Markets Index Contracts (United States) | 768 | Dec. 2019 | 39,989,760 | 1,173,238 | 1,173,238 |
| TME S&P/TSX 60 Index Contracts (Canada) | 68 | Dec. 2019 | 10,169,797 | (36,633) | (36,633) |
| TOTAL FUTURES CONTRACTS | | | | | $3,934,776 |
The notional amount of futures purchased as a percentage of Net Assets is 2.9%
Currency Abbreviations
INR – Indian rupee
Categorizations in the Schedule of Investments are based on country or territory of incorporation.
Legend
(a) Non-income producing
(b) Security or a portion of the security is on loan at period end.
(c) Security exempt from registration under Rule 144A of the Securities Act of 1933. These securities may be resold in transactions exempt from registration, normally to qualified institutional buyers. At the end of the period, the value of these securities amounted to $53,991,375 or 1.0% of net assets.
(d) Level 3 security
(e) Amount is stated in United States dollars unless otherwise noted.
(f) Security or a portion of the security was pledged to cover margin requirements for futures contracts. At period end, the value of securities pledged amounted to $7,172,171.
(g) Affiliated fund that is generally available only to investment companies and other accounts managed by Fidelity Investments. The rate quoted is the annualized seven-day yield of the fund at period end. A complete unaudited listing of the fund's holdings as of its most recent quarter end is available upon request. In addition, each Fidelity Central Fund's financial statements, which are not covered by the Fund's Report of Independent Registered Public Accounting Firm, are available on the SEC's website or upon request.
(h) Investment made with cash collateral received from securities on loan.
Affiliated Central Funds
Information regarding fiscal year to date income earned by the Fund from investments in Fidelity Central Funds is as follows:
| Fund | Income earned |
| Fidelity Cash Central Fund | $4,390,202 |
| Fidelity Securities Lending Cash Central Fund | 565,367 |
| Total | $4,955,569 |
Amounts in the income column in the above table include any capital gain distributions from underlying funds, which are presented in the corresponding line-item in the Statement of Operations, if applicable. Amount for Fidelity Securities Lending Cash Central Fund represents the income earned on investing cash collateral, less rebates paid to borrowers and any lending agent fees associated with the loan, plus any premium payments received for lending certain types of securities.
Investment Valuation
The following is a summary of the inputs used, as of October 31, 2019, involving the Fund's assets and liabilities carried at fair value. The inputs or methodology used for valuing securities may not be an indication of the risk associated with investing in those securities. For more information on valuation inputs, and their aggregation into the levels used below, please refer to the Investment Valuation section in the accompanying Notes to Financial Statements.
| | Valuation Inputs at Reporting Date: |
| Description | Total | Level 1 | Level 2 | Level 3 |
| Investments in Securities: | | | | |
| Equities: | | | | |
| Communication Services | $345,645,358 | $115,539,150 | $230,106,208 | $-- |
| Consumer Discretionary | 601,844,720 | 294,315,265 | 307,522,157 | 7,298 |
| Consumer Staples | 510,313,982 | 197,128,239 | 313,175,104 | 10,639 |
| Energy | 343,769,262 | 125,039,486 | 218,729,776 | -- |
| Financials | 1,119,367,771 | 483,704,522 | 635,368,707 | 294,542 |
| Health Care | 452,252,843 | 70,608,271 | 381,644,572 | -- |
| Industrials | 627,108,663 | 274,813,818 | 352,294,845 | -- |
| Information Technology | 466,571,638 | 188,732,563 | 277,837,789 | 1,286 |
| Materials | 378,381,984 | 198,093,654 | 180,288,330 | -- |
| Real Estate | 167,174,009 | 41,847,196 | 125,325,876 | 937 |
| Utilities | 178,769,558 | 78,368,368 | 100,401,190 | -- |
| Corporate Bonds | 13,270 | -- | 13,270 | -- |
| Government Obligations | 7,172,171 | -- | 7,172,171 | -- |
| Money Market Funds | 140,764,736 | 140,764,736 | -- | -- |
| Total Investments in Securities: | $5,339,149,965 | $2,208,955,268 | $3,129,879,995 | $314,702 |
| Derivative Instruments: | | | | |
| Assets | | | | |
| Futures Contracts | $3,971,409 | $3,971,409 | $-- | $--�� |
| Total Assets | $3,971,409 | $3,971,409 | $-- | $-- |
| Liabilities | | | | |
| Futures Contracts | $(36,633) | $(36,633) | $-- | $-- |
| Total Liabilities | $(36,633) | $(36,633) | $-- | $-- |
| Total Derivative Instruments: | $3,934,776 | $3,934,776 | $-- | $-- |
Value of Derivative Instruments
The following table is a summary of the Fund's value of derivative instruments by primary risk exposure as of October 31, 2019. For additional information on derivative instruments, please refer to the Derivative Instruments section in the accompanying Notes to Financial Statements.
| Primary Risk Exposure / Derivative Type | Value |
| | Asset | Liability |
| Equity Risk | | |
| Futures Contracts(a) | $3,971,409 | $(36,633) |
| Total Equity Risk | 3,971,409 | (36,633) |
| Total Value of Derivatives | $3,971,409 | $(36,633) |
(a) Reflects gross cumulative appreciation (depreciation) on futures contracts as presented in the Schedule of Investments. In the Statement of Assets and Liabilities, the period end daily variation margin is included in receivable or payable for daily variation margin on futures contracts, and the net cumulative appreciation (depreciation) is included in Total accumulated earnings (loss).
See accompanying notes which are an integral part of the financial statements.
Fidelity® Global ex U.S. Index Fund
Financial Statements
Statement of Assets and Liabilities
| | | October 31, 2019 |
| Assets | | |
Investment in securities, at value (including securities loaned of $22,057,720) — See accompanying schedule:
Unaffiliated issuers (cost $5,071,328,778) | $5,198,385,229 | |
| Fidelity Central Funds (cost $140,764,101) | 140,764,736 | |
| Total Investment in Securities (cost $5,212,092,879) | | $5,339,149,965 |
| Segregated cash with brokers for derivative instruments | | 212,752 |
| Cash | | 18,636 |
| Foreign currency held at value (cost $6,158,828) | | 6,182,699 |
| Receivable for investments sold | | 57 |
| Receivable for fund shares sold | | 4,878,124 |
| Dividends receivable | | 20,259,423 |
| Interest receivable | | 53 |
| Distributions receivable from Fidelity Central Funds | | 204,041 |
| Other receivables | | 199 |
| Total assets | | 5,370,905,949 |
| Liabilities | | |
| Payable for investments purchased | $503,593 | |
| Payable for fund shares redeemed | 2,525,318 | |
| Accrued management fee | 253,275 | |
| Payable for daily variation margin on futures contracts | 651,973 | |
| Other payables and accrued expenses | 591,617 | |
| Collateral on securities loaned | 22,985,105 | |
| Total liabilities | | 27,510,881 |
| Net Assets | | $5,343,395,068 |
| Net Assets consist of: | | |
| Paid in capital | | $5,188,154,282 |
| Total accumulated earnings (loss) | | 155,240,786 |
| Net Assets | | $5,343,395,068 |
| Net Asset Value and Maximum Offering Price | | |
| Net Asset Value, offering price and redemption price per share ($5,343,395,068 ÷ 408,122,206 shares) | | $13.09 |
See accompanying notes which are an integral part of the financial statements.
Statement of Operations
| | | Year ended October 31, 2019 |
| Investment Income | | |
| Dividends | | $177,561,909 |
| Non-Cash dividends | | 13,694,384 |
| Interest | | 260,907 |
| Income from Fidelity Central Funds (including $565,367 from security lending) | | 4,955,569 |
| Income before foreign taxes withheld | | 196,472,769 |
| Less foreign taxes withheld | | (17,760,874) |
| Total income | | 178,711,895 |
| Expenses | | |
| Management fee | $2,976,495 | |
| Independent trustees' fees and expenses | 21,423 | |
| Legal | 813 | |
| Commitment fees | 13,565 | |
| Total expenses before reductions | 3,012,296 | |
| Expense reductions | (19,893) | |
| Total expenses after reductions | | 2,992,403 |
| Net investment income (loss) | | 175,719,492 |
| Realized and Unrealized Gain (Loss) | | |
| Net realized gain (loss) on: | | |
| Investment securities: | | |
| Unaffiliated issuers (net of foreign taxes of $1,062) | (61,898,732) | |
| Redemption in-kind with affiliated entities | 194,672,044 | |
| Fidelity Central Funds | (893) | |
| Foreign currency transactions | (91,136) | |
| Futures contracts | 7,975,057 | |
| Total net realized gain (loss) | | 140,656,340 |
| Change in net unrealized appreciation (depreciation) on: | | |
| Investment securities: | | |
| Unaffiliated issuers (net of increase in deferred foreign taxes of $245,264) | 220,570,951 | |
| Fidelity Central Funds | 635 | |
| Assets and liabilities in foreign currencies | 216,591 | |
| Futures contracts | 10,303,482 | |
| Total change in net unrealized appreciation (depreciation) | | 231,091,659 |
| Net gain (loss) | | 371,747,999 |
| Net increase (decrease) in net assets resulting from operations | | $547,467,491 |
See accompanying notes which are an integral part of the financial statements.
Statement of Changes in Net Assets
| | Year ended October 31, 2019 | Year ended October 31, 2018 |
| Increase (Decrease) in Net Assets | | |
| Operations | | |
| Net investment income (loss) | $175,719,492 | $118,287,721 |
| Net realized gain (loss) | 140,656,340 | 40,283,064 |
| Change in net unrealized appreciation (depreciation) | 231,091,659 | (583,087,059) |
| Net increase (decrease) in net assets resulting from operations | 547,467,491 | (424,516,274) |
| Distributions to shareholders | (108,403,469) | (72,436,849) |
| Share transactions - net increase (decrease) | 810,629,225 | 1,402,582,678 |
| Total increase (decrease) in net assets | 1,249,693,247 | 905,629,555 |
| Net Assets | | |
| Beginning of period | 4,093,701,821 | 3,188,072,266 |
| End of period | $5,343,395,068 | $4,093,701,821 |
See accompanying notes which are an integral part of the financial statements.
Financial Highlights
Fidelity Global ex U.S. Index Fund
| Years ended October 31, | 2019 | 2018 | 2017 | 2016 | 2015 |
| Selected Per–Share Data | | | | | |
| Net asset value, beginning of period | $12.07 | $13.50 | $11.13 | $11.33 | $12.30 |
| Income from Investment Operations | | | | | |
| Net investment income (loss)A | .41 | .38 | .33 | .32 | .33 |
| Net realized and unrealized gain (loss) | .91 | (1.50) | 2.27 | (.26)B | (1.00) |
| Total from investment operations | 1.32 | (1.12) | 2.60 | .06 | (.67) |
| Distributions from net investment income | (.30) | (.28) | (.22) | (.26) | (.29) |
| Distributions from net realized gain | – | (.03) | (.01) | – | (.01) |
| Total distributions | (.30) | (.31) | (.23) | (.26) | (.30) |
| Redemption fees added to paid in capitalA | – | – | –C | –C | –C |
| Net asset value, end of period | $13.09 | $12.07 | $13.50 | $11.13 | $11.33 |
| Total ReturnD | 11.28% | (8.47)% | 23.83% | .68% | (5.45)% |
| Ratios to Average Net AssetsE,F | | | | | |
| Expenses before reductions | .06% | .06% | .06% | .14% | .20% |
| Expenses net of fee waivers, if any | .06% | .06% | .06% | .08% | .10% |
| Expenses net of all reductions | .06% | .06% | .06% | .08% | .10% |
| Net investment income (loss) | 3.32% | 2.91% | 2.75% | 2.99% | 2.78% |
| Supplemental Data | | | | | |
| Net assets, end of period (000 omitted) | $5,343,395 | $2,879,110 | $952,883 | $644,884 | $87,972 |
| Portfolio turnover rateG | 5%H | 19%H | 9% | 1%H | 1% |
A Calculated based on average shares outstanding during the period.
B The amount shown for a share outstanding does not correspond with the aggregate net gain (loss) on investments for the period due to the timing of sales and repurchases of shares in relation to fluctuating market values of the investments of the Fund.
C Amount represents less than $.005 per share.
D Total returns would have been lower if certain expenses had not been reduced during the applicable periods shown.
E Fees and expenses of any underlying Fidelity Central Funds are not included in the Fund's expense ratio. The Fund indirectly bears its proportionate share of the expenses of any underlying Fidelity Central Funds.
F Expense ratios reflect operating expenses of the Fund. Expenses before reductions do not reflect amounts reimbursed by the investment adviser or reductions from expense offset arrangements and do not represent the amount paid by the Fund during periods when reimbursements or reductions occur. Expenses net of fee waivers reflect expenses after reimbursement by the investment adviser but prior to reductions from expense offset arrangements. Expenses net of all reductions represent the net expenses paid by the Fund.
G Amount does not include the portfolio activity of any underlying Fidelity Central Funds.
H Portfolio turnover rate excludes securities received or delivered in-kind.
See accompanying notes which are an integral part of the financial statements.
Notes to Financial Statements
For the period ended October 31, 2019
1. Organization.
Fidelity Emerging Markets Index Fund and Fidelity Global ex U.S. Index Fund (the Funds) are funds of Fidelity Salem Street Trust (the Trust) and are authorized to issue an unlimited number of shares. The Trust is registered under the Investment Company Act of 1940, as amended (the 1940 Act), as an open-end management investment company organized as a Massachusetts business trust. Investments in emerging markets, if applicable, can be subject to social, economic, regulatory, and political uncertainties and can be extremely volatile.
Effective after the close of business November 9, 2018, each Fund's publicly offered shares classes were consolidated into a single share class. The surviving class is Fidelity Emerging Markets Index Fund and Fidelity Global ex U.S. Index Fund (formerly Institutional Premium Class.). All current fiscal period dollar and share amounts for the classes that closed, which are presented in the Notes to Financial Statements, are for the period November 1, 2018 through November 9, 2018.
2. Investments in Fidelity Central Funds.
The Funds invest in Fidelity Central Funds, which are open-end investment companies generally available only to other investment companies and accounts managed by the investment adviser and its affiliates. The Funds' Schedules of Investments list each of the Fidelity Central Funds held as of period end, if any, as an investment of each Fund, but do not include the underlying holdings of each Fidelity Central Fund. As an Investing Fund, each Fund indirectly bears its proportionate share of the expenses of the underlying Fidelity Central Funds.
The Money Market Central Funds seek preservation of capital and current income and are managed by Fidelity Investments Money Management, Inc. (FIMM), an affiliate of the investment adviser. Annualized expenses of the Money Market Central Funds as of their most recent shareholder report date ranged from less than .005% to .01%.
A complete unaudited list of holdings for each Fidelity Central Fund is available upon request or at the Securities and Exchange Commission (the SEC) website at www.sec.gov. In addition, the financial statements of the Fidelity Central Funds, which are not covered by the Funds' Report of Independent Registered Public Accounting Firm, are available on the SEC website or upon request.
3. Significant Accounting Policies.
Each Fund is an investment company and applies the accounting and reporting guidance of the Financial Accounting Standards Board (FASB) Accounting Standards Codification Topic 946 Financial Services – Investments Companies. The financial statements have been prepared in conformity with accounting principles generally accepted in the United States of America (GAAP), which require management to make certain estimates and assumptions at the date of the financial statements. Actual results could differ from those estimates. Subsequent events, if any, through the date that the financial statements were issued have been evaluated in the preparation of the financial statements. The following summarizes the significant accounting policies of the Funds:
Investment Valuation. Investments are valued as of 4:00 p.m. Eastern time on the last calendar day of the period. The Board of Trustees (the Board) has delegated the day to day responsibility for the valuation of each Fund's investments to the Fair Value Committee (the Committee) established by each Fund's investment adviser. In accordance with valuation policies and procedures approved by the Board, each Fund attempts to obtain prices from one or more third party pricing vendors or brokers to value its investments. When current market prices, quotations or currency exchange rates are not readily available or reliable, investments will be fair valued in good faith by the Committee, in accordance with procedures adopted by the Board. Factors used in determining fair value vary by investment type and may include market or investment specific events, changes in interest rates and credit quality. The frequency with which these procedures are used cannot be predicted and they may be utilized to a significant extent. The Committee oversees each Fund's valuation policies and procedures and reports to the Board on the Committee's activities and fair value determinations. The Board monitors the appropriateness of the procedures used in valuing each Fund's investments and ratifies the fair value determinations of the Committee.
Each Fund categorizes the inputs to valuation techniques used to value its investments into a disclosure hierarchy consisting of three levels as shown below:
- Level 1 – quoted prices in active markets for identical investments
- Level 2 – other significant observable inputs (including quoted prices for similar investments, interest rates, prepayment speeds, etc.)
- Level 3 – unobservable inputs (including the Fund's own assumptions based on the best information available)
Valuation techniques used to value each Fund's investments by major category are as follows:
Equity securities, including restricted securities, for which market quotations are readily available, are valued at the last reported sale price or official closing price as reported by a third party pricing vendor on the primary market or exchange on which they are traded and are categorized as Level 1 in the hierarchy. In the event there were no sales during the day or closing prices are not available, securities are valued at the last quoted bid price or may be valued using the last available price and are generally categorized as Level 2 in the hierarchy. For foreign equity securities, when market or security specific events arise, comparisons to the valuation of American Depositary Receipts (ADRs), futures contracts, Exchange-Traded Funds (ETFs) and certain indexes as well as quoted prices for similar securities may be used and would be categorized as Level 2 in the hierarchy. For equity securities, including restricted securities, where observable inputs are limited, assumptions about market activity and risk are used and these securities may be categorized as Level 3 in the hierarchy.
Debt securities, including restricted securities, are valued based on evaluated prices received from third party pricing vendors or from brokers who make markets in such securities. Corporate bonds and U.S. government and government agency obligations are valued by pricing vendors who utilize matrix pricing which considers yield or price of bonds of comparable quality, coupon, maturity and type or by broker-supplied prices. When independent prices are unavailable or unreliable, debt securities may be valued utilizing pricing methodologies which consider similar factors that would be used by third party pricing vendors. Debt securities are generally categorized as Level 2 in the hierarchy but may be Level 3 depending on the circumstances.
Futures contracts are valued at the settlement price established each day by the board of trade or exchange on which they are traded and are categorized as Level 1 in the hierarchy. Investments in open-end mutual funds, including the Fidelity Central Funds, are valued at their closing net asset value (NAV) each business day and are categorized as Level 1 in the hierarchy.
Changes in valuation techniques may result in transfers in or out of an assigned level within the disclosure hierarchy. The aggregate value of investments by input level as of October 31, 2019 is included at the end of each Fund's Schedule of Investments.
Foreign Currency. The Funds may use foreign currency contracts to facilitate transactions in foreign-denominated securities. Gains and losses from these transactions may arise from changes in the value of the foreign currency or if the counterparties do not perform under the contracts' terms.
Foreign-denominated assets, including investment securities, and liabilities are translated into U.S. dollars at the exchange rates at period end. Purchases and sales of investment securities, income and dividends received and expenses denominated in foreign currencies are translated into U.S. dollars at the exchange rate in effect on the transaction date.
The effects of exchange rate fluctuations on investments are included with the net realized and unrealized gain (loss) on investment securities. Other foreign currency transactions resulting in realized and unrealized gain (loss) are disclosed separately.
Investment Transactions and Income. For financial reporting purposes, the Funds' investment holdings and NAV include trades executed through the end of the last business day of the period. The NAV per share for processing shareholder transactions is calculated as of the close of business of the New York Stock Exchange (NYSE), normally 4:00 p.m. Eastern time and includes trades executed through the end of the prior business day. Gains and losses on securities sold are determined on the basis of identified cost and for certain Funds include proceeds received from litigation. Dividend income is recorded on the ex-dividend date, except for certain dividends from foreign securities where the ex-dividend date may have passed, which are recorded as soon as the Funds are informed of the ex-dividend date. Non-cash dividends included in dividend income, if any, are recorded at the fair market value of the securities received. Income and capital gain distributions from Fidelity Central Funds, if any, are recorded on the ex-dividend date. Certain distributions received by the Funds represent a return of capital or capital gain. The Funds determine the components of these distributions subsequent to the ex-dividend date, based upon receipt of tax filings or other correspondence relating to the underlying investment. These distributions are recorded as a reduction of cost of investments and/or as a realized gain. Large, non-recurring dividends recognized by the Funds are presented separately on the Statement of Operations as "Non-cash dividends" and the impact of these dividends is presented in the Financial Highlights. Interest income is accrued as earned and includes coupon interest and amortization of premium and accretion of discount on debt securities as applicable. Investment income is recorded net of foreign taxes withheld where recovery of such taxes is uncertain.
Class Allocations and Expenses. Investment income, realized and unrealized capital gains and losses, common expenses of each Fund, and certain fund-level expense reductions, if any, are allocated daily on a pro-rata basis to each class based on the relative net assets of each class to the total net assets of each Fund. Each class differs with respect to fees incurred. Certain expense reductions may also differ by class. For the reporting period, the allocated portion of income and expenses to each class as a percent of its average net assets may vary due to the timing of recording these transactions in relation to fluctuating net assets of the classes. Expenses directly attributable to a fund are charged to that fund. Expenses attributable to more than one fund are allocated among the respective funds on the basis of relative net assets or other appropriate methods. Expense estimates are accrued in the period to which they relate and adjustments are made when actual amounts are known.
Income Tax Information and Distributions to Shareholders. Each year, each Fund intends to qualify as a regulated investment company under Subchapter M of the Internal Revenue Code, including distributing substantially all of its taxable income and realized gains. As a result, no provision for U.S. Federal income taxes is required. As of October 31, 2019, each Fund did not have any unrecognized tax benefits in the financial statements; nor is each Fund aware of any tax positions for which it is reasonably possible that the total amounts of unrecognized tax benefits will significantly change in the next twelve months. Each Fund files a U.S. federal tax return, in addition to state and local tax returns as required. Each Fund's federal income tax returns are subject to examination by the Internal Revenue Service (IRS) for a period of three fiscal years after they are filed. State and local tax returns may be subject to examination for an additional fiscal year depending on the jurisdiction. Foreign taxes are provided for based on each Fund's understanding of the tax rules and rates that exist in the foreign markets in which it invests. Fidelity Emerging Markets Index Fund and Fidelity Global ex U.S. Index Fund are subject to a tax imposed on capital gains by certain countries in which they invest. An estimated deferred tax liability for net unrealized appreciation on the applicable securities is included in Other payables and accrued expenses on each applicable Fund's Statement of Assets & Liabilities.
Distributions are declared and recorded on the ex-dividend date. Income and capital gain distributions are declared separately for each class. Income and capital gain distributions are determined in accordance with income tax regulations, which may differ from GAAP. In addition, the Funds claimed a portion of the payment made to redeeming shareholders as a distribution for income tax purposes.
Capital accounts within the financial statements are adjusted for permanent book-tax differences. These adjustments have no impact on net assets or the results of operations. Capital accounts are not adjusted for temporary book-tax differences which will reverse in a subsequent period.
Book-tax differences are primarily due to futures contracts, foreign currency transactions, certain foreign taxes, passive foreign investment companies (PFIC), market discount, redemptions in kind, partnerships, capital loss carryforwards, certain deemed distributions and losses deferred due to wash sales.
As of period end, the cost and unrealized appreciation (depreciation) in securities, and derivatives if applicable, for federal income tax purposes were as follows for each Fund:
| | Tax cost | Gross unrealized appreciation | Gross unrealized depreciation | Net unrealized appreciation (depreciation) |
| Fidelity Emerging Markets Index Fund | $2,784,790,913 | $458,682,727 | $(290,714,165) | $167,968,562 |
| Fidelity Global ex U.S. Index Fund | 5,250,636,337 | 636,692,357 | (548,215,362) | 88,476,995 |
The tax-based components of distributable earnings as of period end were as follows for each Fund:
| | Undistributed ordinary income | Capital loss carryforward | Net unrealized appreciation (depreciation) on securities and other investments |
| Fidelity Emerging Markets Index Fund | $69,666,659 | $(98,831,440) | $168,002,042 |
| Fidelity Global ex U.S. Index Fund | 139,494,963 | (72,118,211) | 88,455,642 |
Capital loss carryforwards are only available to offset future capital gains of the Funds to the extent provided by regulations and may be limited. Under the Regulated Investment Company Modernization Act of 2010 (the Act), the Funds are permitted to carry forward capital losses incurred in taxable years beginning after December 22, 2010 for an unlimited period and such capital losses are required to be used prior to any losses that expire. The capital loss carryforward information presented below, including any applicable limitation, is estimated as of fiscal period end and is subject to adjustment.
| | No expiration | | |
| | Short-term | Long-term | Total capital loss carryforward |
| Fidelity Emerging Markets Index Fund | $(31,981,633) | $(66,849,807) | $(98,831,440) |
| Fidelity Global ex U.S. Index Fund | (10,847,456) | (61,270,755) | (72,118,211) |
The tax character of distributions paid was as follows:
| October 31, 2019 | |
| | Ordinary Income |
| Fidelity Emerging Markets Index Fund | $37,459,724 |
| Fidelity Global ex U.S. Index Fund | 108,403,469 |
| October 31, 2018 | |
| | Ordinary Income |
| Fidelity Emerging Markets Index Fund | $26,736,654 |
| Fidelity Global ex U.S. Index Fund | 72,436,848 |
Restricted Securities. The Funds may invest in securities that are subject to legal or contractual restrictions on resale. These securities generally may be resold in transactions exempt from registration or to the public if the securities are registered. Disposal of these securities may involve time-consuming negotiations and expense, and prompt sale at an acceptable price may be difficult. Information regarding restricted securities is included at the end of each applicable Fund's Schedule of Investments.
4. Derivative Instruments.
Risk Exposures and the Use of Derivative Instruments. The Funds' investment objective allows the Funds to enter into various types of derivative contracts, including futures contracts. Derivatives are investments whose value is primarily derived from underlying assets, indices or reference rates and may be transacted on an exchange or over-the-counter (OTC). Derivatives may involve a future commitment to buy or sell a specified asset based on specified terms, to exchange future cash flows at periodic intervals based on a notional principal amount, or for one party to make one or more payments upon the occurrence of specified events in exchange for periodic payments from the other party.
The Funds used derivatives to increase returns and to manage exposure to certain risks as defined below. The success of any strategy involving derivatives depends on analysis of numerous economic factors, and if the strategies for investment do not work as intended, the Funds may not achieve their objectives.
The Funds' use of derivatives increased or decreased their exposure to the following risk:
| Equity Risk | Equity risk relates to the fluctuations in the value of financial instruments as a result of changes in market prices (other than those arising from interest rate risk or foreign exchange risk), whether caused by factors specific to an individual investment, its issuer, or all factors affecting all instruments traded in a market or market segment.
|
The Funds are also exposed to additional risks from investing in derivatives, such as liquidity risk and counterparty credit risk. Liquidity risk is the risk that the Funds will be unable to close out the derivative in the open market in a timely manner. Counterparty credit risk is the risk that the counterparty will not be able to fulfill its obligation to the Funds. Counterparty credit risk related to exchange-traded futures contracts may be mitigated by the protection provided by the exchange on which they trade.
Investing in derivatives may involve greater risks than investing in the underlying assets directly and, to varying degrees, may involve risk of loss in excess of any initial investment and collateral received and amounts recognized in the Statement of Assets and Liabilities. In addition, there may be the risk that the change in value of the derivative contract does not correspond to the change in value of the underlying instrument.
Futures Contracts. A futures contract is an agreement between two parties to buy or sell a specified underlying instrument for a fixed price at a specified future date. The Funds used futures contracts to manage their exposure to the stock market.
Upon entering into a futures contract, a fund is required to deposit either cash or securities (initial margin) with a clearing broker in an amount equal to a certain percentage of the face value of the contract. Futures contracts are marked-to-market daily and subsequent daily payments (variation margin) are made or received by a fund depending on the daily fluctuations in the value of the futures contracts and are recorded as unrealized appreciation or (depreciation). This receivable and/or payable, if any, is included in daily variation margin on futures contracts in the Statement of Assets and Liabilities. Realized gain or (loss) is recorded upon the expiration or closing of a futures contract. The net realized gain (loss) and change in net unrealized appreciation (depreciation) on futures contracts during the period is presented in the Statement of Operations.
Any open futures contracts at period end are presented in the Schedule of Investments under the caption "Futures Contracts". The notional amount at value reflects each contract's exposure to the underlying instrument or index at period end and is representative of volume of activity during the period. Securities deposited to meet initial margin requirements are identified in the Schedule of Investments. Cash deposited to meet initial margin requirements is presented as segregated cash with brokers for derivative instruments in the Statement of Assets and Liabilities.
5. Purchases and Sales of Investments.
Purchases and sales of securities, other than short-term securities and in-kind transactions, are noted in the table below.
| | Purchases ($) | Sales ($) |
| Fidelity Emerging Markets Index Fund | 1,317,020,649 | 67,415,897 |
| Fidelity Global ex U.S. Index Fund | 1,813,273,011 | 246,820,407 |
Unaffiliated Exchanges In-Kind. During the period, Fidelity Global ex U.S. Index Fund received investments and cash valued at $136,253,459 in exchange for 11,159,169 shares of the Fund. The amount of in-kind exchanges is included in share transactions in the accompanying Statement of Changes in Net Assets as well as the Notes to Financial Statements.
6. Fees and Other Transactions with Affiliates.
Management Fee. Fidelity Management & Research Company (the investment adviser) and its affiliates provide the Funds with investment management related services for which the Funds pay a monthly management fee. During July 2019, the Board approved to change the management fee to an annual rate of .075% and .055% of average net assets for Fidelity Emerging Markets Index Fund and Fidelity Global ex U.S. Index Fund, respectively, effective August 1, 2019. Prior to August 1, 2019, the annual management fee rate was .08% and .06%, respectively. Under the management contract, the investment adviser pays all other fund-level operating expenses, except the compensation of the independent Trustees and certain other expenses such as interest expense, including commitment fees. During July 2019, the Board also approved to change the management fee structure from a flat fee to a unitary fee effective August 1, 2019, which eliminated the need for a separate expense contract. There is no change to the total expenses paid by the shareholders.
From March 1, 2019 through July 31, 2019, under an expense contract, the investment adviser paid expenses as necessary so that the total expenses did not exceed .075% and .055% of average net assets for Fidelity Emerging Markets Index Fund and Fidelity Global ex U.S. Index Fund, respectively, on an annual basis with certain exceptions. From November 1, 2018 through February 28, 2019, the rate was .08% and .06%, respectively.
Sub-Adviser. Geode Capital Management, LLC (Geode), serves as sub-adviser for the Funds. Geode provides discretionary investment advisory services to the Funds and is paid by the investment adviser for providing these services.
Interfund Trades. The Funds may purchase from or sell securities to other Fidelity Funds under procedures adopted by the Board. The procedures have been designed to ensure these interfund trades are executed in accordance with Rule 17a-7 of the 1940 Act. Interfund trades are included within the respective purchases and sales amounts shown in the Purchases and Sales of Investments note.
Affiliated Redemptions In-Kind. During the period, 63,510,266 shares of the Fidelity Global ex U.S. Index Fund were redeemed in-kind for investments and cash with a value of $811,648,495. The net realized gain of $194,672,044 on investments delivered through in-kind redemptions is included in the accompanying Statement of Operations. The amount of the in-kind redemptions is included in share transactions in the accompanying Statement of Changes in Net Assets as well as the Notes to Financial Statements. Fidelity Global ex U.S. Index Fund recognized no gain or loss for federal income tax purposes.
Prior Fiscal Year Affiliated Redemptions In-Kind. During the prior period, 13,347,660 shares of Fidelity Global ex U.S. Index Fund were redeemed in-kind for investments and cash with a value of $181,394,705. Fidelity Global ex U.S Index Fund had a net realized gain of $62,615,780 on investments delivered through in-kind redemptions. The amount of the in-kind redemptions is included in share transactions in the accompanying Statement of Changes in Net Assets as well as the Notes to Financial Statements. The Fidelity Global ex U.S. Index Fund recognized no gain or loss for federal income tax purposes.
Prior Fiscal Year Affiliated Exchanges In-Kind. During the prior period, Fidelity Global ex U.S. Index Fund received investments valued at $621,987,635 in exchange for 14,197,390 shares of Fidelity International Index Fund. Fidelity Global ex U.S. Index Fund had a net realized gain of $1,987,635 on the Fund's redemptions of Fidelity International Index Fund shares. Fidelity Global ex U.S. Index Fund recognized net gains on the exchanges for federal income tax purposes.
7. Committed Line of Credit.
Certain Funds participate with other funds managed by the investment adviser or an affiliate in a $4.25 billion credit facility (the "line of credit") to be utilized for temporary or emergency purposes to fund shareholder redemptions or for other short-term liquidity purposes. The participating funds have agreed to pay commitment fees on their pro-rata portion of the line of credit, which are reflected in Commitment fees on the Statement of Operations, and are as follows:
| Fidelity Emerging Markets Index Fund | $5,951 |
| Fidelity Global ex U.S. Index Fund | 13,565 |
During the period, the Funds did not borrow on this line of credit.
8. Security Lending.
Certain Funds lend portfolio securities from time to time in order to earn additional income. For equity securities, lending agents are used, including National Financial Services (NFS), an affiliate of the Funds. Pursuant to a securities lending agreement, NFS will receive a fee, which is capped at 9.9% of a Fund's daily lending revenue, for its services as lending agent. The Funds may lend securities to certain qualified borrowers, including NFS. On the settlement date of the loan, each applicable Fund receives collateral (in the form of U.S. Treasury obligations, letters of credit and/or cash) against the loaned securities and maintains collateral in an amount not less than 100% of the market value of the loaned securities during the period of the loan. The market value of the loaned securities is determined at the close of business of the Funds and any additional required collateral is delivered to the Funds on the next business day. The Funds or borrower may terminate the loan at any time, and if the borrower defaults on its obligation to return the securities loaned because of insolvency or other reasons, the Funds may apply collateral received from the borrower against the obligation. The Funds may experience delays and costs in recovering the securities loaned. Any cash collateral received is invested in the Fidelity Securities Lending Cash Central Fund. The value of loaned securities and cash collateral at period end are disclosed on each applicable Fund's Statement of Assets and Liabilities. Security lending income represents the income earned on investing cash collateral, less rebates paid to borrowers and any lending agent fees associated with the loan, plus any premium payments received for lending certain types of securities. Security lending income is presented on each applicable Fund's Statement of Operations as a component of income from Fidelity Central Funds. Affiliated security lending activity was as follows:
| | Total Security Lending Income Fees Paid to NFS | Security Lending Income From Securities Loaned to NFS | Value of Securities Loaned to NFS at Period End |
| Fidelity Emerging Markets Index Fund | $10,310 | $1,085 | $– |
| Fidelity Global ex U.S. Index Fund | $5,395 | $329 | $– |
9. Expense Reductions.
Through arrangements with each applicable Fund's custodian, credits realized as a result of certain uninvested cash balances were used to reduce each applicable Fund's or class' expenses. All of the applicable expense reductions are noted in the table below.
| | Custodian credits |
| Fidelity Emerging Markets Index Fund | $23,293 |
| Fidelity Global ex U.S. Index Fund | 19,893 |
10. Distributions to Shareholders.
Distributions to shareholders of each class were as follows:
| | Year ended
October 31, 2019 | Year ended
October 31, 2018 |
| Fidelity Emerging Markets Index Fund | | |
| Distributions to shareholders | | |
| Investor Class | $– | $584,644 |
| Premium Class | – | 17,448,862 |
| Institutional Class | – | 4,938,500 |
| Fidelity Emerging Markets Index Fund | 37,459,724 | 3,764,647 |
| Total | $37,459,724 | $26,736,653 |
| Fidelity Global ex U.S. Index Fund | | |
| Distributions to shareholders | | |
| Investor Class | $– | $1,033,799 |
| Premium Class | – | 36,798,374 |
| Institutional Class | – | 13,853,612 |
| Fidelity Global ex U.S. Index Fund | 108,403,469 | 20,751,064 |
| Total | $108,403,469 | $72,436,849 |
11. Share Transactions.
Share transactions for each class were as follows and may contain automatic conversions between classes or exchanges between affiliated funds:
| | Shares | Shares | Dollars | Dollars |
| | Year ended October 31, 2019 | Year ended October 31, 2018 | Year ended October 31, 2019 | Year ended October 31, 2018 |
| Fidelity Emerging Markets Index Fund | | | | |
| Investor Class | | | | |
| Shares sold | 47,688 | 3,949,532 | $474,950 | $44,525,954 |
| Reinvestment of distributions | – | 50,953 | – | 556,918 |
| Shares redeemed | (3,819,334) | (3,140,244) | (37,362,011) | (35,639,073) |
| Net increase (decrease) | (3,771,646) | 860,241 | $(36,887,061) | $9,443,799 |
| Premium Class | | | | |
| Shares sold | 689,194 | 47,176,175 | $6,903,964 | $526,814,352 |
| Reinvestment of distributions | – | 1,420,087 | – | 15,521,554 |
| Shares redeemed | (77,401,256) | (53,356,103) | (757,631,697) | (567,082,522) |
| Net increase (decrease) | (76,712,062) | (4,759,841) | $(750,727,733) | $(24,746,616) |
| Institutional Class | | | | |
| Shares sold | 582,859 | 30,780,889 | $5,809,747 | $339,663,997 |
| Reinvestment of distributions | – | 419,348 | – | 4,587,665 |
| Shares redeemed | (25,820,349) | (28,524,001) | (253,143,825) | (301,071,387) |
| Net increase (decrease) | (25,237,490) | 2,676,236 | $(247,334,078) | $43,180,275 |
| Fidelity Emerging Markets Index Fund | | | | |
| Shares sold | 276,388,718 | 47,004,672 | $2,766,924,036 | $469,943,013 |
| Reinvestment of distributions | 3,427,984 | 344,433 | 32,805,804 | 3,764,647 |
| Shares redeemed | (61,235,464) | (2,821,883) | (615,973,215) | (31,059,042) |
| Net increase (decrease) | 218,581,238 | 44,527,222 | $2,183,756,625 | $442,648,618 |
| Fidelity Global ex U.S. Index Fund | | | | |
| Investor Class | | | | |
| Shares sold | 83,392 | 2,986,798 | $1,024,236 | $39,620,437 |
| Reinvestment of distributions | – | 77,311 | – | 1,020,503 |
| Shares redeemed | (3,869,137) | (2,649,187) | (47,325,730) | (35,779,157) |
| Net increase (decrease) | (3,785,745) | 414,922 | $(46,301,494) | $4,861,783 |
| Premium Class | | | | |
| Shares sold | 433,950 | 67,776,633 | $5,335,819 | $905,063,963 |
| Reinvestment of distributions | – | 2,335,974 | – | 30,834,860 |
| Shares redeemed | (72,629,330) | (113,973,150)(a) | (888,620,605) | (1,471,681,761)(a) |
| Net increase (decrease) | (72,195,380) | (43,860,543) | $(883,284,786) | $(535,782,938) |
| Institutional Class | | | | |
| Shares sold | 238,558 | 48,173,115 | $2,941,634 | $638,131,655 |
| Reinvestment of distributions | – | 1,037,349 | – | 13,693,009 |
| Shares redeemed | (24,965,817) | (70,782,481) | (305,562,280) | (900,018,289) |
| Net increase (decrease) | (24,727,259) | (21,572,017) | $(302,620,646) | $(248,193,625) |
| Fidelity Global ex U.S. Index Fund | | | | |
| Shares sold | 317,154,787(b) | 206,012,670 | $3,900,989,974(b) | $2,685,932,281 |
| Reinvestment of distributions | 9,016,767 | 1,572,050 | 104,233,831 | 20,751,064 |
| Shares redeemed | (156,601,538)(c) | (39,624,216) | (1,962,387,654)(c) | (524,985,887) |
| Net increase (decrease) | 169,570,016 | 167,960,504 | $2,042,836,151 | $2,181,697,458 |
(a) Amount includes in-kind redemptions (see the Prior Fiscal Year Affiliated Redemptions In-Kind note for additional details).
(b) Amount includes in-kind exchanges (see the Unaffiliated Exchanges In-Kind note for additional details).
(c) Amount includes in-kind redemptions (see the Affiliated Redemptions In-Kind note for additional details).
12. Other.
The Funds' organizational documents provide former and current trustees and officers with a limited indemnification against liabilities arising in connection with the performance of their duties to the Funds. In the normal course of business, the Funds may also enter into contracts that provide general indemnifications. The Funds' maximum exposure under these arrangements is unknown as this would be dependent on future claims that may be made against the Funds. The risk of material loss from such claims is considered remote.
Report of Independent Registered Public Accounting Firm
To the Board of Trustees of Fidelity Salem Street Trust and the Shareholders of Fidelity Emerging Markets Index Fund and Fidelity Global ex U.S. Index Fund:
Opinion on the Financial Statements and Financial Highlights
We have audited the accompanying statements of assets and liabilities of Fidelity Emerging Markets Index Fund and Fidelity Global ex U.S. Index Fund (the "Funds"), each a fund of Fidelity Salem Street Trust, including the schedules of investments, as of October 31, 2019, the related statements of operations for the year then ended, the statements of changes in net assets for each of the two years in the period then ended, the financial highlights for each of the five years in the period then ended, and the related notes. In our opinion, the financial statements and financial highlights present fairly, in all material respects, the financial position of each of the Funds as of October 31, 2019, and the results of their operations for the year then ended, the changes in their net assets for each of the two years in the period then ended, and the financial highlights for each of the five years in the period then ended in conformity with accounting principles generally accepted in the United States of America.
Basis for Opinion
These financial statements and financial highlights are the responsibility of the Funds’ management. Our responsibility is to express an opinion on the Funds’ financial statements and financial highlights based on our audits. We are a public accounting firm registered with the Public Company Accounting Oversight Board (United States) (PCAOB) and are required to be independent with respect to the Funds in accordance with the U.S. federal securities laws and the applicable rules and regulations of the Securities and Exchange Commission and the PCAOB.
We conducted our audits in accordance with the standards of the PCAOB. Those standards require that we plan and perform the audit to obtain reasonable assurance about whether the financial statements and financial highlights are free of material misstatement, whether due to error or fraud. The Funds are not required to have, nor were we engaged to perform, an audit of their internal control over financial reporting. As part of our audits we are required to obtain an understanding of internal control over financial reporting but not for the purpose of expressing an opinion on the effectiveness of the Funds’ internal control over financial reporting. Accordingly, we express no such opinion.
Our audits included performing procedures to assess the risks of material misstatement of the financial statements and financial highlights, whether due to error or fraud, and performing procedures that respond to those risks. Such procedures included examining, on a test basis, evidence regarding the amounts and disclosures in the financial statements and financial highlights. Our audits also included evaluating the accounting principles used and significant estimates made by management, as well as evaluating the overall presentation of the financial statements and financial highlights. Our procedures included confirmation of securities owned as of October 31, 2019, by correspondence with the custodians and brokers; when replies were not received from brokers, we performed other auditing procedures. We believe that our audits provide a reasonable basis for our opinion.
/s/ Deloitte & Touche LLP
Boston, Massachusetts
December 13, 2019
We have served as the auditor of one or more of the Fidelity investment companies since 1999.
Trustees and Officers
The Trustees, Members of the Advisory Board (if any), and officers of the trust and funds, as applicable, are listed below. The Board of Trustees governs each fund and is responsible for protecting the interests of shareholders. The Trustees are experienced executives who meet periodically throughout the year to oversee each fund's activities, review contractual arrangements with companies that provide services to each fund, oversee management of the risks associated with such activities and contractual arrangements, and review each fund's performance. Except for Jonathan Chiel, each of the Trustees oversees 277 funds. Mr. Chiel oversees 171 funds.
The Trustees hold office without limit in time except that (a) any Trustee may resign; (b) any Trustee may be removed by written instrument, signed by at least two-thirds of the number of Trustees prior to such removal; (c) any Trustee who requests to be retired or who has become incapacitated by illness or injury may be retired by written instrument signed by a majority of the other Trustees; and (d) any Trustee may be removed at any special meeting of shareholders by a two-thirds vote of the outstanding voting securities of the trust. Each Trustee who is not an interested person (as defined in the 1940 Act) of the trust and the funds is referred to herein as an Independent Trustee. Each Independent Trustee shall retire not later than the last day of the calendar year in which his or her 75th birthday occurs. The Independent Trustees may waive this mandatory retirement age policy with respect to individual Trustees. Officers and Advisory Board Members hold office without limit in time, except that any officer or Advisory Board Member may resign or may be removed by a vote of a majority of the Trustees at any regular meeting or any special meeting of the Trustees. Except as indicated, each individual has held the office shown or other offices in the same company for the past five years.
Each fund’s Statement of Additional Information (SAI) includes more information about the Trustees. To request a free copy, call Fidelity at 1-800-544-8544.
Experience, Skills, Attributes, and Qualifications of the Trustees. The Governance and Nominating Committee has adopted a statement of policy that describes the experience, qualifications, attributes, and skills that are necessary and desirable for potential Independent Trustee candidates (Statement of Policy). The Board believes that each Trustee satisfied at the time he or she was initially elected or appointed a Trustee, and continues to satisfy, the standards contemplated by the Statement of Policy. The Governance and Nominating Committee also engages professional search firms to help identify potential Independent Trustee candidates who have the experience, qualifications, attributes, and skills consistent with the Statement of Policy. From time to time, additional criteria based on the composition and skills of the current Independent Trustees, as well as experience or skills that may be appropriate in light of future changes to board composition, business conditions, and regulatory or other developments, have also been considered by the professional search firms and the Governance and Nominating Committee. In addition, the Board takes into account the Trustees' commitment and participation in Board and committee meetings, as well as their leadership of standing and ad hoc committees throughout their tenure.
In determining that a particular Trustee was and continues to be qualified to serve as a Trustee, the Board has considered a variety of criteria, none of which, in isolation, was controlling. The Board believes that, collectively, the Trustees have balanced and diverse experience, qualifications, attributes, and skills, which allow the Board to operate effectively in governing each fund and protecting the interests of shareholders. Information about the specific experience, skills, attributes, and qualifications of each Trustee, which in each case led to the Board's conclusion that the Trustee should serve (or continue to serve) as a trustee of the funds, is provided below.
Board Structure and Oversight Function. Abigail P. Johnson is an interested person and currently serves as Chairman. The Trustees have determined that an interested Chairman is appropriate and benefits shareholders because an interested Chairman has a personal and professional stake in the quality and continuity of services provided to the funds. Independent Trustees exercise their informed business judgment to appoint an individual of their choosing to serve as Chairman, regardless of whether the Trustee happens to be independent or a member of management. The Independent Trustees have determined that they can act independently and effectively without having an Independent Trustee serve as Chairman and that a key structural component for assuring that they are in a position to do so is for the Independent Trustees to constitute a substantial majority for the Board. The Independent Trustees also regularly meet in executive session. Arthur E. Johnson serves as Chairman of the Independent Trustees and as such (i) acts as a liaison between the Independent Trustees and management with respect to matters important to the Independent Trustees and (ii) with management prepares agendas for Board meetings.
Fidelity® funds are overseen by different Boards of Trustees. The funds' Board oversees Fidelity's investment-grade bond, money market, asset allocation and certain equity funds, and other Boards oversee Fidelity's high income and other equity funds. The asset allocation funds may invest in Fidelity® funds that are overseen by such other Boards. The use of separate Boards, each with its own committee structure, allows the Trustees of each group of Fidelity® funds to focus on the unique issues of the funds they oversee, including common research, investment, and operational issues. On occasion, the separate Boards establish joint committees to address issues of overlapping consequences for the Fidelity® funds overseen by each Board.
The Trustees operate using a system of committees to facilitate the timely and efficient consideration of all matters of importance to the Trustees, each fund, and fund shareholders and to facilitate compliance with legal and regulatory requirements and oversight of the funds' activities and associated risks. The Board, acting through its committees, has charged FMR and its affiliates with (i) identifying events or circumstances the occurrence of which could have demonstrably adverse effects on the funds' business and/or reputation; (ii) implementing processes and controls to lessen the possibility that such events or circumstances occur or to mitigate the effects of such events or circumstances if they do occur; and (iii) creating and maintaining a system designed to evaluate continuously business and market conditions in order to facilitate the identification and implementation processes described in (i) and (ii) above. Because the day-to-day operations and activities of the funds are carried out by or through FMR, its affiliates, and other service providers, the funds' exposure to risks is mitigated but not eliminated by the processes overseen by the Trustees. While each of the Board's committees has responsibility for overseeing different aspects of the funds' activities, oversight is exercised primarily through the Operations and Audit Committees. In addition, an ad hoc Board committee of Independent Trustees has worked with FMR to enhance the Board's oversight of investment and financial risks, legal and regulatory risks, technology risks, and operational risks, including the development of additional risk reporting to the Board. Appropriate personnel, including but not limited to the funds' Chief Compliance Officer (CCO), FMR's internal auditor, the independent accountants, the funds' Treasurer and portfolio management personnel, make periodic reports to the Board's committees, as appropriate, including an annual review of Fidelity's risk management program for the Fidelity® funds. The responsibilities of each standing committee, including their oversight responsibilities, are described further under "Standing Committees of the Trustees."
Interested Trustees*:
Correspondence intended for a Trustee who is an interested person may be sent to Fidelity Investments, 245 Summer Street, Boston, Massachusetts 02210.
Name, Year of Birth; Principal Occupations and Other Relevant Experience+
Jonathan Chiel (1957)
Year of Election or Appointment: 2016
Trustee
Mr. Chiel also serves as Trustee of other Fidelity® funds. Mr. Chiel is Executive Vice President and General Counsel for FMR LLC (diversified financial services company, 2012-present). Previously, Mr. Chiel served as general counsel (2004-2012) and senior vice president and deputy general counsel (2000-2004) for John Hancock Financial Services; a partner with Choate, Hall & Stewart (1996-2000) (law firm); and an Assistant United States Attorney for the United States Attorney’s Office of the District of Massachusetts (1986-95), including Chief of the Criminal Division (1993-1995). Mr. Chiel is a director on the boards of the Boston Bar Foundation and the Maimonides School.
Abigail P. Johnson (1961)
Year of Election or Appointment: 2009
Trustee
Chairman of the Board of Trustees
Ms. Johnson also serves as Trustee of other Fidelity® funds. Ms. Johnson serves as Chairman (2016-present), Chief Executive Officer (2014-present), and Director (2007-present) of FMR LLC (diversified financial services company), President of Fidelity Financial Services (2012-present) and President of Personal, Workplace and Institutional Services (2005-present). Ms. Johnson is Chairman and Director of FMR Co., Inc. (investment adviser firm, 2011-present) and Chairman and Director of FMR (investment adviser firm, 2011-present). Previously, Ms. Johnson served as Vice Chairman (2007-2016) and President (2013-2016) of FMR LLC, President and a Director of FMR (2001-2005), a Trustee of other investment companies advised by FMR, Fidelity Investments Money Management, Inc. (investment adviser firm), and FMR Co., Inc. (2001-2005), Senior Vice President of the Fidelity® funds (2001-2005), and managed a number of Fidelity® funds. Ms. Abigail P. Johnson and Mr. Arthur E. Johnson are not related.
Jennifer Toolin McAuliffe (1959)
Year of Election or Appointment: 2016
Trustee
Ms. McAuliffe also serves as Trustee of other Fidelity® funds. Ms. McAuliffe previously served as a Member of the Advisory Board of certain Fidelity® funds (2016) and as Co-Head of Fixed Income of Fidelity Investments Limited (now known as FIL Limited (FIL)) (diversified financial services company). Earlier roles at FIL included Director of Research for FIL’s credit and quantitative teams in London, Hong Kong and Tokyo. Ms. McAuliffe also was the Director of Research for taxable and municipal bonds at Fidelity Investments Money Management, Inc. Ms. McAuliffe is also a director or trustee of several not-for-profit entities.
* Determined to be an “Interested Trustee” by virtue of, among other things, his or her affiliation with the trust or various entities under common control with FMR.
+ The information includes the Trustee's principal occupation during the last five years and other information relating to the experience, attributes, and skills relevant to the Trustee's qualifications to serve as a Trustee, which led to the conclusion that the Trustee should serve as a Trustee for each fund.
Independent Trustees:
Correspondence intended for an Independent Trustee may be sent to Fidelity Investments, P.O. Box 55235, Boston, Massachusetts 02205-5235.
Name, Year of Birth; Principal Occupations and Other Relevant Experience+
Elizabeth S. Acton (1951)
Year of Election or Appointment: 2013
Trustee
Ms. Acton also serves as Trustee of other Fidelity® funds. Prior to her retirement in April 2012, Ms. Acton was Executive Vice President, Finance (2011-2012), Executive Vice President, Chief Financial Officer (2002-2011), and Treasurer (2004-2005) of Comerica Incorporated (financial services). Prior to joining Comerica, Ms. Acton held a variety of positions at Ford Motor Company (1983-2002), including Vice President and Treasurer (2000-2002) and Executive Vice President and Chief Financial Officer of Ford Motor Credit Company (1998-2000). Ms. Acton currently serves as a member of the Board of Directors and Audit and Finance Committees of Beazer Homes USA, Inc. (homebuilding, 2012-present). Previously, Ms. Acton served as a Member of the Advisory Board of certain Fidelity® funds (2013-2016).
Ann E. Dunwoody (1953)
Year of Election or Appointment: 2018
Trustee
General Dunwoody also serves as Trustee of other Fidelity® funds. General Dunwoody (United States Army, Retired) was the first woman in U.S. military history to achieve the rank of four-star general and prior to her retirement in 2012 held a variety of positions within the U.S. Army, including Commanding General, U.S. Army Material Command (2008-2012). She is the President of First to Four LLC (leadership and mentoring services, 2012-present). She also serves as a member of the Board of Directors and Nominating and Corporate Governance Committee of L3 Technologies, Inc. (communication, electronic, sensor, and aerospace systems, 2013-present), Board of Directors and Nomination and Corporate Governance Committees of Kforce Inc. (professional staffing services, 2016-present) and Board of Directors of Automattic Inc. (software engineering, 2018-present). Previously, General Dunwoody served as a Member of the Advisory Board of certain Fidelity® funds (2018), a member of the Board of Directors and Audit and Sustainability and Corporate Responsibility Committees of Republic Services, Inc. (waste collection, disposal and recycling, 2013-2016). Ms. Dunwoody also serves on several boards for non-profit organizations, including as a member of the Board of Directors, Chair of the Nomination and Governance Committee and member of the Audit Committee of Logistics Management Institute (consulting non-profit, 2012-present), a member of the Board of Directors of the Army Historical Foundation (2015-present), a member of the Council of Trustees for the Association of the United States Army (advocacy non-profit, 2013-present) and a member of the Board of Trustees of Florida Institute of Technology (2015-present) and ThanksUSA (military family education non-profit, 2014-present).
John Engler (1948)
Year of Election or Appointment: 2014
Trustee
Mr. Engler also serves as Trustee of other Fidelity® funds. He serves on the board of directors for Universal Forest Products (manufacturer and distributor of wood and wood-alternative products, 2003-present) and K12 Inc. (technology-based education company, 2012-present). Previously, Mr. Engler served as interim president of Michigan State University (2018-2019), a Member of the Advisory Board of certain Fidelity® funds (2014-2016), president of the Business Roundtable (2011-2017), a trustee of The Munder Funds (2003-2014), president and CEO of the National Association of Manufacturers (2004-2011), member of the Board of Trustees of the Annie E. Casey Foundation (2004-2015), and as governor of Michigan (1991-2003). He is a past chairman of the National Governors Association.
Robert F. Gartland (1951)
Year of Election or Appointment: 2010
Trustee
Mr. Gartland also serves as Trustee of other Fidelity® funds. Mr. Gartland is Chairman and an investor in Gartland & Mellina Group Corp. (consulting, 2009-present). Previously, Mr. Gartland served as a partner and investor of Vietnam Partners LLC (investments and consulting, 2008-2011). Prior to his retirement, Mr. Gartland held a variety of positions at Morgan Stanley (financial services, 1979-2007), including Managing Director (1987-2007), and Chase Manhattan Bank (1975-1978).
Arthur E. Johnson (1947)
Year of Election or Appointment: 2008
Trustee
Chairman of the Independent Trustees
Mr. Johnson also serves as Trustee of other Fidelity® funds. Mr. Johnson serves as a member of the Board of Directors of Eaton Corporation plc (diversified power management, 2009-present) and Booz Allen Hamilton (management consulting, 2011-present). Prior to his retirement, Mr. Johnson served as Senior Vice President of Corporate Strategic Development of Lockheed Martin Corporation (defense contractor, 1999-2009). Mr. Johnson previously served as Vice Chairman (2015-2018) of the Independent Trustees of certain Fidelity® funds and on the Board of Directors of IKON Office Solutions, Inc. (1999-2008), AGL Resources, Inc. (holding company, 2002-2016), and Delta Airlines (2005-2007). Mr. Arthur E. Johnson is not related to Ms. Abigail P. Johnson.
Michael E. Kenneally (1954)
Year of Election or Appointment: 2009
Trustee
Vice Chairman of the Independent Trustees
Mr. Kenneally also serves as Trustee of other Fidelity® funds. Prior to his retirement, Mr. Kenneally served as Chairman and Global Chief Executive Officer of Credit Suisse Asset Management. Before joining Credit Suisse, he was an Executive Vice President and Chief Investment Officer for Bank of America Corporation. Earlier roles at Bank of America included Director of Research, Senior Portfolio Manager and Research Analyst, and Mr. Kenneally was awarded the Chartered Financial Analyst (CFA) designation in 1991.
Marie L. Knowles (1946)
Year of Election or Appointment: 2001
Trustee
Ms. Knowles also serves as Trustee of other Fidelity® funds. Prior to Ms. Knowles' retirement in June 2000, she served as Executive Vice President and Chief Financial Officer of Atlantic Richfield Company (ARCO) (diversified energy, 1996-2000). From 1993 to 1996, she was a Senior Vice President of ARCO and President of ARCO Transportation Company (pipeline and tanker operations). Ms. Knowles currently serves as a Director and Chairman of the Audit Committee of McKesson Corporation (healthcare service, since 2002). Ms. Knowles is a member of the Board of the Santa Catalina Island Company (real estate, 2009-present). Ms. Knowles is a Member of the Investment Company Institute Board of Governors and a Member of the Governing Council of the Independent Directors Council (2014-present). She also serves as a member of the Advisory Board for the School of Engineering of the University of Southern California. Previously, Ms. Knowles served as a Director of Phelps Dodge Corporation (copper mining and manufacturing, 1994-2007), URS Corporation (engineering and construction, 2000-2003) and America West (airline, 1999-2002). Ms. Knowles previously served as Chairman (2015-2018) and Vice Chairman (2012-2015) of the Independent Trustees of certain Fidelity® funds.
Mark A. Murray (1954)
Year of Election or Appointment: 2016
Trustee
Mr. Murray also serves as Trustee of other Fidelity® funds. Mr. Murray is Vice Chairman (2013-present) of Meijer, Inc. (regional retail chain). Previously, Mr. Murray served as a Member of the Advisory Board of certain Fidelity® funds (2016) and as Co-Chief Executive Officer (2013-2016) and President (2006-2013) of Meijer, Inc. Mr. Murray serves as a member of the Board of Directors and Nuclear Review and Public Policy and Responsibility Committees of DTE Energy Company (diversified energy company, 2009-present). Mr. Murray also serves as a member of the Board of Directors of Spectrum Health (not-for-profit health system, 2015-present). Mr. Murray previously served as President of Grand Valley State University (2001-2006), Treasurer for the State of Michigan (1999-2001), Vice President of Finance and Administration for Michigan State University (1998-1999), and a member of the Board of Directors and Audit Committee and Chairman of the Nominating and Corporate Governance Committee of Universal Forest Products, Inc. (manufacturer and distributor of wood and wood-alternative products, 2004-2016). Mr. Murray is also a director or trustee of many community and professional organizations.
+ The information includes the Trustee's principal occupation during the last five years and other information relating to the experience, attributes, and skills relevant to the Trustee's qualifications to serve as a Trustee, which led to the conclusion that the Trustee should serve as a Trustee for each fund.
Advisory Board Members and Officers:
Correspondence intended for an officer may be sent to Fidelity Investments, 245 Summer Street, Boston, Massachusetts 02210. Officers appear below in alphabetical order.
Name, Year of Birth; Principal Occupation
Elizabeth Paige Baumann (1968)
Year of Election or Appointment: 2017
Anti-Money Laundering (AML) Officer
Ms. Baumann also serves as AML Officer of other funds. She is Chief AML Officer (2012-present) and Senior Vice President (2014-present) of FMR LLC (diversified financial services company) and is an employee of Fidelity Investments. Previously, Ms. Baumann served as AML Officer of the funds (2012-2016), and Vice President (2007-2014) and Deputy Anti-Money Laundering Officer (2007-2012) of FMR LLC.
Craig S. Brown (1977)
Year of Election or Appointment: 2019
Assistant Treasurer
Mr. Brown also serves as Assistant Treasurer of other funds. Mr. Brown is an employee of Fidelity Investments (2013-present).
John J. Burke III (1964)
Year of Election or Appointment: 2018
Chief Financial Officer
Mr. Burke also serves as Chief Financial Officer of other funds. Mr. Burke serves as Head of Investment Operations for Fidelity Fund and Investment Operations (2018-present) and is an employee of Fidelity Investments (1998-present). Previously Mr. Burke served as head of Asset Management Investment Operations (2012-2018).
Jonathan Davis (1968)
Year of Election or Appointment: 2010
Assistant Treasurer
Mr. Davis also serves as Assistant Treasurer of other funds. Mr. Davis serves as Assistant Treasurer of FMR Capital, Inc. (2017-present) and is an employee of Fidelity Investments. Previously, Mr. Davis served as Vice President and Associate General Counsel of FMR LLC (diversified financial services company, 2003-2010).
Adrien E. Deberghes (1967)
Year of Election or Appointment: 2010
Assistant Treasurer
Mr. Deberghes also serves as an officer of other funds. He serves as Assistant Treasurer of FMR Capital, Inc. (2017-present), Executive Vice President of Fidelity Investments Money Management, Inc. (FIMM) (investment adviser firm, 2016-present), and is an employee of Fidelity Investments (2008-present). Previously, Mr. Deberghes served as President and Treasurer of certain Fidelity® funds (2013-2018). Prior to joining Fidelity Investments, Mr. Deberghes was Senior Vice President of Mutual Fund Administration at State Street Corporation (2007-2008), Senior Director of Mutual Fund Administration at Investors Bank & Trust (2005-2007), and Director of Finance for Dunkin' Brands (2000-2005). Previously, Mr. Deberghes served in other fund officer roles.
Laura M. Del Prato (1964)
Year of Election or Appointment: 2018
President and Treasurer
Ms. Del Prato also serves as an officer of other funds. Ms. Del Prato is an employee of Fidelity Investments (2017-present). Prior to joining Fidelity Investments, Ms. Del Prato served as a Managing Director and Treasurer of the JPMorgan Mutual Funds (2014-2017). Prior to JPMorgan, Ms. Del Prato served as a partner at Cohen Fund Audit Services (accounting firm, 2012-2013) and KPMG LLP (accounting firm, 2004-2012).
Colm A. Hogan (1973)
Year of Election or Appointment: 2016
Assistant Treasurer
Mr. Hogan also serves as an officer of other funds. Mr. Hogan serves as Assistant Treasurer of FMR Capital, Inc. (2017-present) and is an employee of Fidelity Investments (2005-present). Previously, Mr. Hogan served as Assistant Treasurer of certain Fidelity® funds (2016-2018).
Cynthia Lo Bessette (1969)
Year of Election or Appointment: 2019
Secretary and Chief Legal Officer (CLO)
Ms. Lo Bessette also serves as Secretary and CLO of other funds. Ms. Lo Bessette serves as CLO, Secretary, and Senior Vice President of Fidelity Management & Research Company and FMR Co., Inc. (investment adviser firms, 2019-present); Secretary of Fidelity SelectCo, LLC and Fidelity Investments Money Management, Inc. (investment adviser firms, 2019-present); and CLO of Fidelity Management & Research (Hong Kong) Limited, FMR Investment Management (UK) Limited, and Fidelity Management & Research (Japan) Limited (investment adviser firms, 2019-present). She is a Senior Vice President and Deputy General Counsel of FMR LLC (diversified financial services company, 2019-present), and is an employee of Fidelity Investments. Previously, Ms. Lo Bessette served as Executive Vice President, General Counsel (2016-2019) and Senior Vice President, Deputy General Counsel (2015-2016) of OppenheimerFunds (investment management company) and Deputy Chief Legal Officer (2013-2015) of Jennison Associates LLC (investment adviser firm).
Chris Maher (1972)
Year of Election or Appointment: 2013
Assistant Treasurer
Mr. Maher serves as Assistant Treasurer of other funds. Mr. Maher is Vice President of Valuation Oversight, serves as Assistant Treasurer of FMR Capital, Inc. (2017-present), and is an employee of Fidelity Investments. Previously, Mr. Maher served as Vice President of Asset Management Compliance (2013), Vice President of the Program Management Group of FMR (investment adviser firm, 2010-2013), and Vice President of Valuation Oversight (2008-2010).
John B. McGinty, Jr. (1962)
Year of Election or Appointment: 2016
Chief Compliance Officer
Mr. McGinty also serves as Chief Compliance Officer of other funds. Mr. McGinty is Senior Vice President of Asset Management Compliance for Fidelity Investments and is an employee of Fidelity Investments (2016-present). Mr. McGinty previously served as Vice President, Senior Attorney at Eaton Vance Management (investment management firm, 2015-2016), and prior to Eaton Vance as global CCO for all firm operations and registered investment companies at GMO LLC (investment management firm, 2009-2015). Before joining GMO LLC, Mr. McGinty served as Senior Vice President, Deputy General Counsel for Fidelity Investments (2007-2009).
Jason P. Pogorelec (1975)
Year of Election or Appointment: 2015
Assistant Secretary
Mr. Pogorelec also serves as Assistant Secretary of other funds. Mr. Pogorelec serves as Vice President, Associate General Counsel (2010-present) and is an employee of Fidelity Investments (2006-present).
Nancy D. Prior (1967)
Year of Election or Appointment: 2014
Vice President
Ms. Prior also serves as Vice President of other funds. Ms. Prior serves as President of Fixed Income (2014-present), President (2016-present) and Director (2014-present) of Fidelity Investments Money Management, Inc. (FIMM) (investment adviser firm), and is an employee of Fidelity Investments (2002-present). Previously, Ms. Prior served as Vice President of Global Asset Allocation Funds (2017-2019); Vice Chairman of FIAM LLC (investment adviser firm, 2014-2018), a Director of FMR Investment Management (UK) Limited (investment adviser firm, 2015-2018), President Multi-Asset Class Strategies of FMR's Global Asset Allocation Division (2017-2018), Vice President of Fidelity's Money Market Funds (2012-2014), and President, Money Market and Short Duration Bond Group of Fidelity Management & Research Company (FMR) (investment adviser firm, 2013-2014).
Stacie M. Smith (1974)
Year of Election or Appointment: 2013
Assistant Treasurer
Ms. Smith also serves as an officer of other funds. Ms. Smith serves as Assistant Treasurer of FMR Capital, Inc. (2017-present), is an employee of Fidelity Investments (2009-present), and has served in other fund officer roles. Prior to joining Fidelity Investments, Ms. Smith served as Senior Audit Manager of Ernst & Young LLP (accounting firm, 1996-2009). Previously, Ms. Smith served as Assistant Treasurer (2013-2018) and Deputy Treasurer (2013-2016) of certain Fidelity® funds.
Marc L. Spector (1972)
Year of Election or Appointment: 2016
Deputy Treasurer
Mr. Spector also serves as an officer of other funds. Mr. Spector serves as Assistant Treasurer of FMR Capital, Inc. (2017-present) and is an employee of Fidelity Investments (2016-present). Prior to joining Fidelity Investments, Mr. Spector served as Director at the Siegfried Group (accounting firm, 2013-2016), and prior to Siegfried Group as audit senior manager at Deloitte & Touche (accounting firm, 2005-2013).
Jim Wegmann (1979)
Year of Election or Appointment: 2019
Assistant Treasurer
Mr. Wegmann also serves as Assistant Treasurer of other funds. Mr. Wegmann is an employee of Fidelity Investments (2011-present).
Shareholder Expense Example
As a shareholder of a Fund, you incur two types of costs: (1) transaction costs and (2) ongoing costs, including management fees and other Fund expenses. This Example is intended to help you understand your ongoing costs (in dollars) of investing in the Funds and to compare these costs with the ongoing costs of investing in other mutual funds.
The Example is based on an investment of $1,000 invested at the beginning of the period and held for the entire period (May 1, 2019 to October 31, 2019).
Actual Expenses
The first line of the accompanying table for each fund provides information about actual account values and actual expenses. You may use the information in this line, together with the amount you invested, to estimate the expenses that you paid over the period. Simply divide your account value by $1,000.00 (for example, an $8,600 account value divided by $1,000.00 = 8.6), then multiply the result by the number in the first line for a fund under the heading entitled "Expenses Paid During Period" to estimate the expenses you paid on your account during this period. In addition, each Fund, as a shareholder in the underlying Fidelity Central Funds, will indirectly bear its pro-rata share of the fees and expenses incurred by the underlying Fidelity Central Funds. These fees and expenses are not included in the Fund's annualized expense ratio used to calculate the expense estimate in the table below.
Hypothetical Example for Comparison Purposes
The second line of the accompanying table for each fund provides information about hypothetical account values and hypothetical expenses based on a fund's actual expense ratio and an assumed rate of return of 5% per year before expenses, which is not the Fund's actual return. The hypothetical account values and expenses may not be used to estimate the actual ending account balance or expenses you paid for the period. You may use this information to compare the ongoing costs of investing in the Fund and other funds. To do so, compare this 5% hypothetical example with the 5% hypothetical examples that appear in the shareholder reports of the other funds. In addition, each Fund, as a shareholder in the underlying Fidelity Central Funds, will indirectly bear its pro-rata share of the fees and expenses incurred by the underlying Fidelity Central Funds. These fees and expenses are not included in the Fund's annualized expense ratio used to calculate the expense estimate in the table below.
Please note that the expenses shown in the table are meant to highlight your ongoing costs only and do not reflect any transaction costs. Therefore, the second line of the table is useful in comparing ongoing costs only, and will not help you determine the relative total costs of owning different funds.
| | Annualized Expense Ratio-A | Beginning
Account Value
May 1, 2019 | Ending
Account Value
October 31, 2019 | Expenses Paid
During Period-B
May 1, 2019
to October 31, 2019 |
| Fidelity Emerging Markets Index Fund | .08% | | | |
| Actual | | $1,000.00 | $978.50 | $.40 |
| Hypothetical-C | | $1,000.00 | $1,024.80 | $.41 |
| Fidelity Global ex U.S. Index Fund | .06% | | | |
| Actual | | $1,000.00 | $1,017.10 | $.31 |
| Hypothetical-C | | $1,000.00 | $1,024.90 | $.31 |
A Annualized expense ratio reflects expenses net of applicable fee waivers.
B Expenses are equal to each Fund's annualized expense ratio, multiplied by the average account value over the period, multiplied by 184/ 365 (to reflect the one-half year period
C 5% return per year before expenses
Distributions (Unaudited)
A percentage of the dividends distributed during the fiscal year for the following funds may be taken into account as a dividend for purposes of the maximum rate under section 1(h)(11) of the Internal Revenue Code.
| Fidelity Emerging Markets Index Fund | |
| December 2018 | 64% |
| Fidelity Global ex U.S. Index Fund | |
| December 2018 | 95% |
The amounts per share which represent income derived from sources within, and taxes paid to, foreign countries or possessions of the United States are as follows:
| | Pay Date | Income | Taxes |
| Fidelity Emerging Markets Index Fund | 12/10/18 | $0.2369 | $0.0269 |
| Fidelity Global ex U.S. Index Fund | 12/10/18 | $0.3347 | $0.0327 |
The funds will notify shareholders in January 2020 of amounts for use in preparing 2019 income tax returns.
Board Approval of Investment Advisory Contracts and Management Fees
Fidelity Emerging Markets Index Fund
Fidelity Global ex U.S. Index Fund
Each year, the Board of Trustees, including the Independent Trustees (together, the Board), votes on the renewal of the management contract with Fidelity Management & Research Company (FMR) and the sub-advisory agreements (together, the Advisory Contracts) for each fund, including the fund's sub-advisory agreement (Sub-Advisory Agreement) with Geode Capital Management, LLC (Geode). FMR and the sub-advisers are referred to herein as the Investment Advisers. The Board, assisted by the advice of fund counsel and Independent Trustees' counsel, requests and considers a broad range of information relevant to the renewal of the Advisory Contracts throughout the year.
The Board meets regularly and, at each of its meetings, covers an extensive agenda of topics and materials and considers factors that are relevant to its annual consideration of the renewal of each fund's Advisory Contracts, including the services and support provided to each fund and its shareholders. The Board has established four standing committees (Committees) — Operations, Audit, Fair Valuation, and Governance and Nominating — each composed of and chaired by Independent Trustees with varying backgrounds, to which the Board has assigned specific subject matter responsibilities in order to enhance effective decision-making by the Board. The Operations Committee, of which all of the Independent Trustees are members, meets regularly throughout the year and considers, among other matters, information specifically related to the annual consideration of the renewal of each fund's Advisory Contracts. The Board, acting directly and through its Committees, requests and receives information concerning the annual consideration of the renewal of each fund's Advisory Contracts. The Board also meets as needed to review matters specifically related to the Board's annual consideration of the renewal of the Advisory Contracts. Members of the Board may also meet with trustees of other Fidelity funds through joint ad hoc committees to discuss certain matters relevant to all of the Fidelity funds.
At its September 2019 meeting, the Board unanimously determined to renew each fund's Advisory Contracts. In reaching its determination, the Board considered all factors it believed relevant, including (i) the nature, extent, and quality of the services provided to each fund and its shareholders (including the investment performance of each fund); (ii) the competitiveness of each fund's management fee and total expense ratio relative to peer funds; (iii) the total costs of the services provided by and the profits realized by Fidelity and Geode from their respective relationships with each fund; and (iv) the extent to which, if any, economies of scale exist and are realized as each fund grows, and whether any economies of scale are appropriately shared with fund shareholders.
In considering whether to renew the Advisory Contracts for each fund, the Board reached a determination, with the assistance of fund counsel and Independent Trustees' counsel and through the exercise of its business judgment, that the renewal of the Advisory Contracts was in the best interests of each fund and its shareholders and that the compensation payable under the Advisory Contracts was fair and reasonable. The Board's decision to renew the Advisory Contracts was not based on any single factor, but rather was based on a comprehensive consideration of all the information provided to the Board at its meetings throughout the year. The Board, in reaching its determination to renew the Advisory Contracts, was aware that shareholders of each fund have a broad range of investment choices available to them, including a wide choice among funds offered by Fidelity's competitors, and that each fund's shareholders, who have the opportunity to review and weigh the disclosure provided by the fund in its prospectus and other public disclosures, have chosen to invest in that fund, which is part of the Fidelity family of funds.
July 2019 Contract Approval. At its July 2019 meeting, the Board voted to approve (i) amended and restated management contracts to reduce each fund's management fee rate and implement a comprehensive unitary fee, and (ii) for Fidelity Emerging Markets Index Fund, an amended and restated sub-advisory agreement with Geode to reduce the sub-advisory fee rate paid by FMR to Geode (New Contracts). In reaching its conclusion to approve the New Contracts, the Board considered that it had received and reviewed certain information and made certain findings in connection with the annual renewal of the Advisory Contracts at its September 2018 meeting and considered how, if at all, the approval of the New Contracts would change its prior conclusions. The Board considered that the amended and restated management contracts would implement a comprehensive unitary fee for each fund set at the fund's current expense contract level (0.005% below the fund's current management fee rate) and payable to FMR for managing the fund and paying all of the fund's operating expenses, subject to certain exceptions. With respect to the amended and restated sub-advisory agreement, the Board noted that FMR, and not the fund, pays the sub-advisory fee out of its management fee. The Board also noted that the New Contracts would not change the investment processes, the level or nature of services provided, the resources and personnel allocated, or trading and compliance operations. Based on its evaluation, and after considering all factors it believed relevant, the Board ultimately concluded that the advisory fee structure in each New Contract is fair and reasonable, and that the New Contracts should be approved.
Approval of Amended and Restated Advisory Contracts. At its September 2019 meeting, the Board also unanimously determined to approve amended and restated management contracts and sub-advisory agreements with Geode (Amended and Restated Contracts) in connection with an upcoming consolidation of certain of Fidelity's advisory businesses. The Board considered that, on or about January 1, 2020, FMR Co., Inc. (FMRC) expects to merge with and into FMR and, after the merger, FMR expects to redomicile as a Delaware limited liability company. The Board also approved the termination of the sub-advisory agreements with FMRC upon the completion of the merger. The Board noted that references to FMR in the Amended and Restated Contracts would be updated to reflect FMR's new form of organization and domicile. The Board also approved amendments that clarify that each fund pays its non-operating expenses, including brokerage commissions and fees and expenses associated with the fund's securities lending program, if applicable. The Board also noted Fidelity's assurance that neither the planned consolidation nor the Amended and Restated Contracts will change the investment processes, the level or nature of services provided, the resources and personnel allocated, trading and compliance operations, or any fees or expenses paid by the funds.
Nature, Extent, and Quality of Services Provided. The Board considered staffing as it relates to the funds, including the backgrounds of investment personnel of Fidelity and Geode, and also considered the funds' investment objectives, strategies, and related investment philosophies. The Independent Trustees also had discussions with senior management of Fidelity's investment operations and investment groups and with representatives of Geode. The Board considered the structure of the investment personnel compensation programs and whether the structures provide appropriate incentives to act in the best interests of each fund. Additionally, the Board considered the portfolio managers' investments, if any, in the funds that they manage.
The Trustees also discussed with representatives of Fidelity, at meetings throughout the year, Fidelity's role in, among other things, overseeing compliance with federal securities laws and other applicable requirements by Geode with respect to the funds and monitoring and overseeing the performance and investment capabilities of Geode. The Trustees considered that the Board had received from Fidelity periodic reports about its oversight and due diligence processes, as well as periodic reports regarding the performance of Geode.
The Board also considered the nature, extent and quality of services provided by Geode. The Trustees noted that under the Sub-Advisory Agreement, subject to oversight by Fidelity, Geode is responsible for, among other things, identifying investments and arranging for execution of portfolio transactions to implement each fund's investment strategy. In addition, the Trustees noted that Geode is responsible for providing such reporting as may be requested by Fidelity to fulfill its oversight responsibilities discussed above.
Resources Dedicated to Investment Management and Support Services. The Board reviewed the general qualifications and capabilities of Fidelity's and Geode's investment staffs, including their size, education, experience, and resources, as well as Fidelity's and Geode's approach to recruiting, managing, and compensating investment personnel. The Board considered that Fidelity's and Geode's investment professionals have extensive resources, tools and capabilities so as to provide competitive investment results over time, and that those professionals also have access to sophisticated tools that permit them to assess portfolio construction and risk and performance attribution characteristics continuously. Additionally, in its deliberations, the Board considered Fidelity's and Geode's trading, risk management, compliance, and technology and operations capabilities and resources, which are integral parts of the investment management process.
Shareholder and Administrative Services. The Board considered (i) the nature, extent, quality, and cost of advisory, administrative, and shareholder services performed by the Investment Advisers and their affiliates under the Advisory Contracts and by FMR's affiliates under separate agreements covering transfer agency, pricing and bookkeeping, and securities lending services for each fund; (ii) the nature and extent of the supervision of third party service providers, principally custodians, subcustodians, and pricing vendors; and (iii) the resources devoted to, and the record of compliance with, each fund's compliance policies and procedures. The Board also reviewed the allocation of fund brokerage, including allocations to brokers affiliated with the Investment Advisers.
The Board noted that the growth of fund assets over time across the complex allows Fidelity to reinvest in the development of services designed to enhance the value and convenience of the Fidelity funds as investment vehicles. These services include 24-hour access to account information and market information over the Internet and through telephone representatives, investor education materials and asset allocation tools, and the expanded availability of Fidelity Investor Centers.
Investment in a Large Fund Family. The Board considered the benefits to shareholders of investing in a Fidelity fund, including the benefits of investing in a fund that is part of a large family of funds offering a variety of investment disciplines and providing a large variety of mutual fund investor services. The Board noted that Fidelity had taken, or had made recommendations that resulted in the Fidelity funds taking, a number of actions over the previous year that benefited particular funds, including: (i) continuing to dedicate additional resources to Fidelity's investment research process, which includes meetings with management of issuers of securities in which the funds invest, and to the support of the senior management team that oversees asset management; (ii) continuing efforts to enhance Fidelity's global research capabilities; (iii) launching new funds with innovative structures, strategies and pricing and making other enhancements to meet client needs; (iv) launching new share classes of existing funds; (v) eliminating purchase minimums and broadening eligibility requirements for certain funds and share classes; (vi) reducing management fees and total expenses for certain target date funds and index funds; (vii) lowering expense caps for certain existing funds and classes, and converting certain voluntary expense caps to contractual caps, to reduce expenses borne by shareholders; (viii) rationalizing product lines and gaining increased efficiencies from fund mergers, liquidations, and share class consolidations; (ix) continuing to develop, acquire and implement systems and technology to improve services to the funds and shareholders, strengthen information security, and increase efficiency; and (x) continuing to implement enhancements to further strengthen Fidelity's product line to increase investors' probability of success in achieving their investment goals, including retirement income goals.
Investment Performance. The Board considered whether each fund has operated in accordance with its investment objective, as well as its record of compliance with its investment restrictions and its performance history.
The Board took into account discussions with representatives of the Investment Advisers about fund investment performance. In this regard the Board noted that as part of regularly scheduled fund reviews and other reports to the Board on fund performance, the Board considers annualized return information for each fund for different time periods, measured against the securities market index the fund seeks to track. The Board also periodically considers each fund's tracking error versus its benchmark index. In its evaluation of fund investment performance, the Board gave particular attention to information indicating underperformance of certain Fidelity funds for specific time periods and discussed with the Investment Advisers the reasons for such underperformance.
In addition to reviewing absolute and relative fund performance, the Independent Trustees periodically consider the appropriateness of fund performance metrics in evaluating the results achieved. In general, the Independent Trustees believe that an index fund's performance should be evaluated based on gross performance (before fees and expenses but after transaction costs) compared to a fund's benchmark index, over appropriate time periods, taking into account relevant factors including the following: general market conditions; the characteristics of the fund's benchmark index; the extent to which statistical sampling is employed; any securities lending revenues; and fund cash flows and other factors. Depending on the circumstances, the Independent Trustees may be satisfied with a fund's performance notwithstanding that it lags its benchmark index for certain periods.
The Independent Trustees recognize that shareholders evaluate performance on a net basis (after fees and expenses) over their own holding periods, for which one-, three-, and five-year periods are often used as a proxy. For this reason, the performance information reviewed by the Board also included net cumulative calendar year total return information for each fund and its benchmark index for the most recent one-, three-, and five-year periods.
Based on its review, the Board concluded that the nature, extent, and quality of services provided to each fund under the Advisory Contracts should continue to benefit the shareholders of each fund.
Competitiveness of Management Fee and Total Expense Ratio. The Board considered each fund's management fee and total expense ratio compared to "mapped groups" of competitive funds and classes created for the purpose of facilitating the Trustees' competitive analysis of management fees and total expenses. Fidelity creates "mapped groups" by combining similar Lipper investment objective categories that have comparable investment mandates. Combining Lipper investment objective categories aids the Board's management fee and total expense ratio comparisons by broadening the competitive group used for comparison.
Management Fee. The Board considered two proprietary management fee comparisons for the 12-month periods shown in basis points (BP) in the charts below. The group of Lipper funds used by the Board for management fee comparisons is referred to below as the "Total Mapped Group." The Total Mapped Group comparison focuses on a fund's standing in terms of gross management fees before expense reimbursements or caps relative to the total universe of funds with comparable investment mandates, regardless of whether their management fee structures also are comparable. Funds with comparable investment mandates offer exposure to similar types of securities. Funds with comparable management fee structures have similar management fee contractual arrangements (e.g., flat rate charged for advisory services, all-inclusive fee rate, etc.). "TMG %" represents the percentage of funds in the Total Mapped Group that had management fees that were lower than a fund's. For example, a hypothetical TMG % of 20% would mean that 80% of the funds in the Total Mapped Group had higher, and 20% had lower, management fees than a fund. The funds' actual TMG %s and the number of funds in the Total Mapped Group are in the charts below. The "Asset-Size Peer Group" (ASPG) comparison focuses on a fund's standing relative to a subset of non-Fidelity funds within the Total Mapped Group that are similar in size and management fee structure. For example, if a fund is in the first quartile of the ASPG, the fund's management fee ranks in the least expensive or lowest 25% of funds in the ASPG. The ASPG represents at least 15% of the funds in the Total Mapped Group with comparable asset size and management fee structures, subject to a minimum of 50 funds (or all funds in the Total Mapped Group if fewer than 50). Additional information, such as the ASPG quartile in which a fund's management fee rate ranked, is also included in the charts and was considered by the Board. Because the vast majority of competitor funds' management fees do not cover non-management expenses, in prior years, each fund was compared on the basis of a hypothetical "net management fee," which was derived by subtracting payments made by FMR for "fund-level" non-management expenses (including pricing and bookkeeping fees and fees paid to non-affiliated custodians), as well as "class-level" expenses paid by FMR under the expense limitation arrangements in effect for the fund, from the fund's management fee. Fidelity no longer calculates hypothetical net management fees for the funds and, as a result, the charts do not include hypothetical net management fees for periods after 2015.
Fidelity Emerging Markets Index Fund
The Board considered that (i) effective July 1, 2016, the fund's management fee rate was reduced from 0.25% to 0.09%, and (ii) effective August 1, 2017, the fund's management fee rate was further reduced from 0.09% to 0.08%. The Board considered that the chart below reflects the fund's lower management fee rates for 2016 and 2017, as if the lower fee rates were in effect for the entire year.
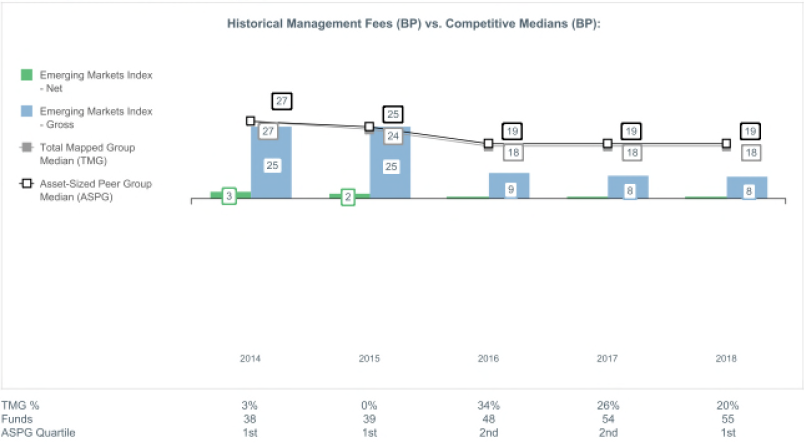
The Board noted that the fund's management fee rate ranked below the median of its Total Mapped Group and below the median of its ASPG for 2018.
The Board considered that, as a result of its approval of the amended and restated management contract for the fund at the July 2019 meeting, the fund's management fee rate was reduced from 0.08% to 0.075% effective August 1, 2019.
Fidelity Global ex U.S. Index Fund
The Board considered that effective July 1, 2016, the fund's management fee rate was reduced from 0.20% to 0.06%. The Board considered that the chart below reflects the fund's lower management fee rate for 2016, as if the lower fee rate were in effect for the entire year.
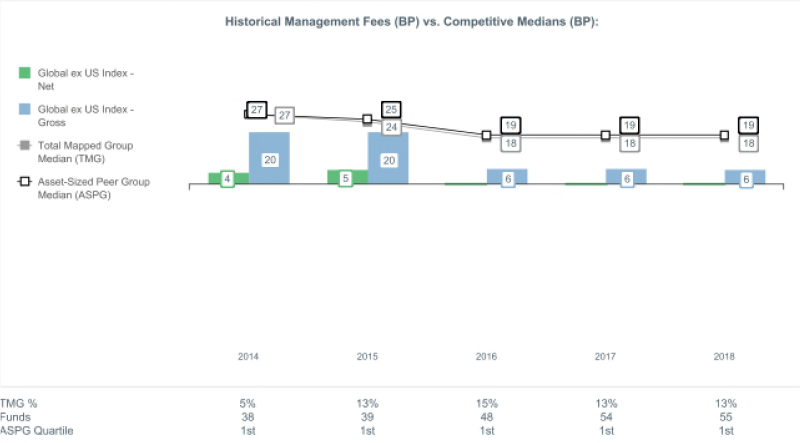
The Board noted that the fund’s management fee rate ranked below the median of its Total Mapped Group and below the median of its ASPG for 2018.
The Board considered that, as a result of its approval of the amended and restated management contract for the fund at the July 2019 meeting, the fund's management fee rate was reduced from 0.06% to 0.055% effective August 1, 2019.
The Board noted that it and the boards of other Fidelity funds formed an ad hoc Committee on Group Fee, which meets periodically, to conduct an in-depth review of the "group fee" component of the management fee of funds with such management fee structures. The Committee's focus included the mechanics of the group fee, the competitive landscape of group fee structures, Fidelity funds with no group fee component (such as the funds) and investment products not included in group fee assets. The Board also considered that, for funds subject to the group fee, FMR agreed to voluntarily waive fees over a specified period of time in amounts designed to account for assets converted from certain funds to certain collective investment trusts.
Based on its review, the Board concluded that each fund's management fee is fair and reasonable in light of the services that the fund receives and the other factors considered.
Total Expense Ratio. In its review of each fund's total expense ratio, the Board considered the fund's unitary fee rate, which covers expenses paid by FMR under the fund's management contract, such as transfer agent fees, pricing and bookkeeping fees and custodial, legal, and audit fees. The Board also noted that Fidelity may agree to waive fees or reimburse expenses from time to time, and the extent to which, if any, it has done so for each fund. As part of its review, the Board also considered the current and historical total expense ratios of each fund compared to competitive fund median expenses. Each fund is compared to those funds and classes in the Total Mapped Group (used by the Board for management fee comparisons) that have a similar sales load structure.
The Board noted that each fund's total expense ratio ranked below the competitive median for 2018.
Fees Charged to Other Clients. The Board also considered fee structures applicable to clients of Fidelity and Geode, such as other funds advised or subadvised by Fidelity or Geode, pension plan clients, and other institutional clients with similar mandates. The Board noted that a joint ad hoc committee created by it and the boards of other Fidelity funds periodically reviews and compares Fidelity's institutional investment advisory business with its business of providing services to the Fidelity funds and also noted the most recent findings of the committee. The Board noted that the committee's review included a consideration of the differences in services provided, fees charged, and costs incurred, as well as competition in the markets serving the different categories of clients.
Based on its review of total expense ratios and fees charged to other Fidelity clients, the Board concluded that each fund's total expense ratio was reasonable in light of the services that the fund and its shareholders receive and the other factors considered.
Costs of the Services and Profitability. The Board considered the revenues earned and the expenses incurred by Fidelity in conducting the business of developing, marketing, distributing, managing, administering and servicing each fund and servicing each fund's shareholders. The Board also considered the level of Fidelity's profits in respect of all the Fidelity funds.
On an annual basis, Fidelity presents to the Board information about the profitability of its relationships with each fund. Fidelity calculates profitability information for each fund, as well as aggregate profitability information for groups of Fidelity funds and all Fidelity funds, using a series of detailed revenue and cost allocation methodologies which originate with the books and records of Fidelity on which Fidelity's audited financial statements are based. The Audit Committee of the Board reviews any significant changes from the prior year's methodologies and the full Board approves such changes.
PricewaterhouseCoopers LLP (PwC), auditor to Fidelity and certain Fidelity funds, has been engaged annually by the Board as part of the Board's assessment of Fidelity's profitability analysis. PwC's engagement includes the review and assessment of the methodologies used by Fidelity in determining the revenues and expenses attributable to Fidelity's mutual fund business, and completion of agreed-upon procedures in respect of the mathematical accuracy of the fund profitability information and its conformity to established allocation methodologies. After considering PwC's reports issued under the engagement and information provided by Fidelity, the Board concluded that while other allocation methods may also be reasonable, Fidelity's profitability methodologies are reasonable in all material respects.
The Board also reviewed Fidelity's and Geode's non-fund businesses and potential indirect benefits such businesses may have received as a result of their association with Fidelity's mutual fund business (i.e., fall-out benefits) as well as cases where Fidelity's and Geode's affiliates may benefit from the funds' business. The Board noted that changes to fall-out benefits year-over-year reflect business developments at Fidelity's and Geode's various businesses. The Board considered that a joint ad hoc committee created by it and the boards of other Fidelity funds had recently been established, and meets periodically, to evaluate potential fall-out benefits. The Board noted that the committee was expected to, among other things: (i) discuss the legal framework surrounding potential fall-out benefits; (ii) review the Board's responsibilities and approach to potential fall-out benefits; and (iii) review practices employed by competitor funds regarding the review of potential fall-out benefits. The Board noted that it would consider the committee's findings in connection with future consideration of contract renewals.
The Board considered the costs of the services provided by and the profits realized by Fidelity in connection with the operation of each fund and was satisfied that the profitability was not excessive.
The Board also considered information regarding the profitability of Geode's relationship with each fund.
Economies of Scale. The Board considered whether there have been economies of scale in respect of the management of the Fidelity funds, whether the Fidelity funds (including each fund) have appropriately benefited from any such economies of scale, and whether there is potential for realization of any further economies of scale. The Board considered the extent to which each fund will benefit from economies of scale as assets grow through increased services to the fund, through waivers or reimbursements, or through fee or expense ratio reductions. The Board recognized that, due to each fund's current contractual arrangements, its expense ratio will not decline if the fund's operating costs decrease as assets grow, or rise as assets decrease. The Board also noted that a committee (the Economies of Scale Committee) created by it and the boards of other Fidelity funds periodically analyzes whether Fidelity attains economies of scale in respect of the management and servicing of the Fidelity funds, whether the Fidelity funds have appropriately benefited from such economies of scale, and whether there is potential for realization of any further economies of scale.
The Board concluded, taking into account the analysis of the Economies of Scale Committee, that economies of scale, if any, are being appropriately shared between fund shareholders and Fidelity.
Additional Information Requested by the Board. In order to develop fully the factual basis for consideration of the Fidelity funds' advisory contracts, the Board requested and received additional information on certain topics, including: (i) Fidelity's fund profitability methodology, profitability trends for certain funds, the allocation of various costs to different funds, and the impact of certain factors on fund profitability results; (ii) portfolio manager changes that have occurred during the past year and the amount of the investment that each portfolio manager has made in the Fidelity fund(s) that he or she manages; (iii) Fidelity's compensation structure for portfolio managers, research analysts, and other key personnel, including its effects on fund profitability, the rationale for the compensation structure, and the extent to which current market conditions have affected retention and recruitment; (iv) the arrangements with and compensation paid to certain fund sub-advisers on behalf of the Fidelity funds and the treatment of such compensation within Fidelity's fund profitability methodology; (v) the practices of certain sub-advisers regarding their receipt of research from broker-dealers that execute the funds' portfolio transactions; (vi) the terms of Fidelity's voluntary expense limitation agreements; (vii) the methodology with respect to competitive fund data and peer group classifications; (viii) Fidelity's transfer agent fee, expense, and service structures for different funds and classes relative to competitive trends, and the impact of the increased use of omnibus accounts; (ix) new developments in the retail and institutional marketplaces and the competitive positioning of the funds relative to other investment products and services; (x) the impact on fund profitability of recent changes in total net assets for Fidelity's money market funds, anticipated changes to the competitive landscape for money market funds, and the level of investor comfort with gates, fees, and floating NAVs; (xi) the funds' share class structures and distribution channels; and (xii) explanations regarding the relative total expense ratios of certain funds and classes, total expense competitive trends and methodologies for total expense competitive comparisons, and actions that might be taken by Fidelity to reduce total expense ratios for certain classes. In addition, the Board considered its discussions with Fidelity throughout the year regarding enhanced information security initiatives and the funds' fair valuation policies.
Based on its evaluation of all of the conclusions noted above, and after considering all factors it believed relevant, the Board concluded that the advisory and sub-advisory fee arrangements are fair and reasonable, and that each fund's Advisory Contracts should be renewed and each fund's Amended and Restated Contracts should be approved.
EMX-I-GUX-I-ANN-1219
1.929368.108
Fidelity® SAI Emerging Markets Low Volatility Index Fund
Fidelity® SAI International Low Volatility Index Fund (formerly Fidelity® SAI International Minimum Volatility Index Fund)
Fidelity® SAI U.S. Low Volatility Index Fund (formerly Fidelity® SAI U.S. Minimum Volatility Index Fund)
Offered exclusively to certain clients of the Adviser or its affiliates - not available for sale to the general public. Fidelity SAI is a product name of Fidelity® funds dedicated to certain programs affiliated with Strategic Advisers LLC.
Annual Report
October 31, 2019
See the inside front cover for important information about access to your fund’s shareholder reports.
Beginning on January 1, 2021, as permitted by regulations adopted by the Securities and Exchange Commission, paper copies of a fund’s shareholder reports will no longer be sent by mail, unless you specifically request paper copies of the reports from the fund or from your financial intermediary, such as a financial advisor, broker-dealer or bank. Instead, the reports will be made available on a website, and you will be notified by mail each time a report is posted and provided with a website link to access the report.
If you already elected to receive shareholder reports electronically, you will not be affected by this change and you need not take any action. You may elect to receive shareholder reports and other communications from a fund electronically, by contacting your financial intermediary. For Fidelity customers, visit Fidelity's web site or call Fidelity using the contact information listed below.
You may elect to receive all future reports in paper free of charge. If you wish to continue receiving paper copies of your shareholder reports, you may contact your financial intermediary or, if you are a Fidelity customer, visit Fidelity’s website, or call Fidelity at the applicable toll-free number listed below. Your election to receive reports in paper will apply to all funds held with the fund complex/your financial intermediary.
| Account Type | Website | Phone Number |
| Brokerage, Mutual Fund, or Annuity Contracts: | fidelity.com/mailpreferences | 1-800-343-3548 |
| Employer Provided Retirement Accounts: | netbenefits.fidelity.com/preferences (choose 'no' under Required Disclosures to continue to print) | 1-800-343-0860 |
| Advisor Sold Accounts Serviced Through Your Financial Intermediary: | Contact Your Financial Intermediary | Your Financial Intermediary's phone number |
| Advisor Sold Accounts Serviced by Fidelity: | institutional.fidelity.com | 1-877-208-0098 |
Contents
To view a fund's proxy voting guidelines and proxy voting record for the 12-month period ended June 30, visit http://www.fidelity.com/proxyvotingresults or visit the Securities and Exchange Commission's (SEC) web site at http://www.sec.gov.
You may also call 1-800-544-3455 to request a free copy of the proxy voting guidelines.
The funds or securities referred to herein are not sponsored, endorsed, or promoted by MSCI, and MSCI bears no liability with respect to any such funds or securities or any index on which such funds or securities are based. The prospectus contains a more detailed description of the limited relationship MSCI has with Fidelity and any related funds.
Standard & Poor's, S&P and S&P 500 are registered service marks of The McGraw-Hill Companies, Inc. and have been licensed for use by Fidelity Distributors Corporation.
Other third-party marks appearing herein are the property of their respective owners.
All other marks appearing herein are registered or unregistered trademarks or service marks of FMR LLC or an affiliated company. © 2019 FMR LLC. All rights reserved.
This report and the financial statements contained herein are submitted for the general information of the shareholders of the Funds. This report is not authorized for distribution to prospective investors in the Funds unless preceded or accompanied by an effective prospectus.
A fund files its complete schedule of portfolio holdings with the SEC for the first and third quarters of each fiscal year on Form N-PORT. Forms N-PORT are available on the SEC’s web site at http://www.sec.gov. A fund's Forms N-PORT may be reviewed and copied at the SEC’s Public Reference Room in Washington, DC. Information regarding the operation of the SEC's Public Reference Room may be obtained by calling 1-800-SEC-0330.
For a complete list of a fund's portfolio holdings, view the most recent holdings listing, semiannual report, or annual report on Fidelity's web site at http://www.fidelity.com, http://www.institutional.fidelity.com, or http://www.401k.com, as applicable.
NOT FDIC INSURED •MAY LOSE VALUE •NO BANK GUARANTEE
Neither the Funds nor Fidelity Distributors Corporation is a bank.
Fidelity® SAI Emerging Markets Low Volatility Index Fund
Performance: The Bottom Line
Average annual total return reflects the change in the value of an investment, assuming reinvestment of distributions from dividend income and capital gains (the profits earned upon the sale of securities that have grown in value, if any) and assuming a constant rate of performance each year. The hypothetical investment and the average annual total returns do not reflect the deduction of taxes that a shareholder would pay on fund distributions or the redemption of fund shares. During periods of reimbursement by Fidelity, a fund’s total return will be greater than it would be had the reimbursement not occurred. How a fund did yesterday is no guarantee of how it will do tomorrow.
Average annual total returns for Fidelity® SAI Emerging Markets Low Volatility Index Fund will be reported once the fund is a year old.
$10,000 Over Life of Fund
Let's say hypothetically that $10,000 was invested in Fidelity® SAI Emerging Markets Low Volatility Index Fund on January 30, 2019, when the fund started.
The chart shows how the value of your investment would have changed, and also shows how the Fidelity Emerging Markets Low Volatility Focus Index℠ performed over the same period.
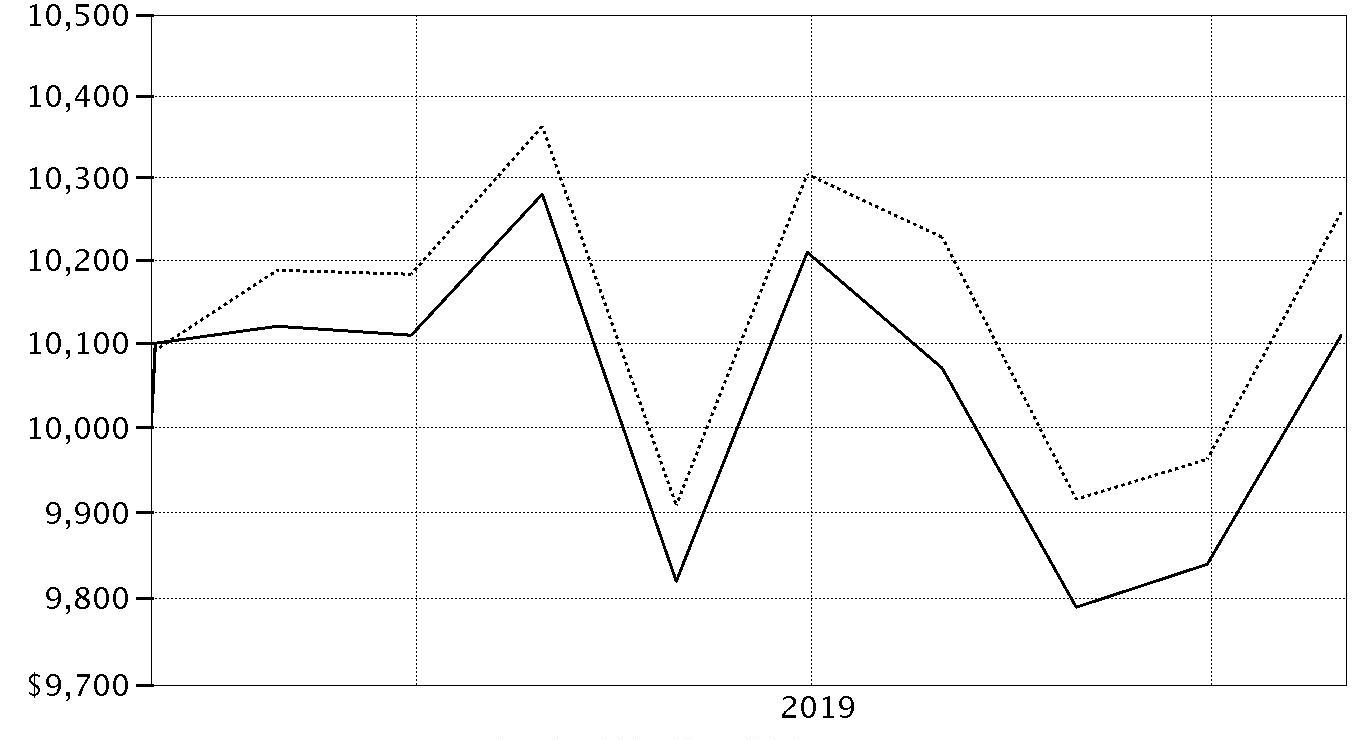
| Period Ending Values |
| $10,110 | Fidelity® SAI Emerging Markets Low Volatility Index Fund |
| $10,258 | Fidelity Emerging Markets Low Volatility Focus Index℠ |
Fidelity® SAI Emerging Markets Low Volatility Index Fund
Management's Discussion of Fund Performance
Market Recap: The MSCI ACWI (All Country World Index) ex USA Index gained 11.47% for the 12 months ending October 31, 2019, as international stocks reflected a confluence of factors, including escalating trade tension, and moderating but still positive global economic growth. Currency fluctuations were largely modest and varied by region, muting the overall impact on international equity returns. In late December, the U.S. Federal Reserve shifted from raising interest rates to a more dovish policy in 2019, joining many foreign central banks. In June, international stocks rose 6.03%, as policy stimulus in China stabilized that country’s economic growth. The Fed cut its policy rate in July for the first time since 2008. However, the index returned -1.21% for the month, followed by -3.08% in August. In September, the Fed cut its policy rate another quarter point, citing concerns about slowing economic growth and muted inflation, and did the same in October, leading to monthly gains of 2.59% and 3.49%, respectively. For the full 12 months, the growth-oriented information technology sector (+22%) led the way, followed by utilities (+20%) and real estate (+18%), two high-dividend-yielding categories. Conversely, energy was roughly flat, while materials (+6%) and communication services (7%) also lagged. By region, Asia Pacific ex Japan (+16%), Europe ex U.K (+13%), Canada (+12%) and emerging markets (+12%) fared best. Meanwhile, the U.K. (+7%) and Japan (+10%) trailed the broader market.
Comments from the passive equity team of Geode Capital Management, LLC: Between the fund's inception date of January 30, 2019 and the end of its fiscal year on October 31, 2019, the fund gained 1.10%, compared with a return of 2.58% for the benchmark Fidelity
® Emerging Markets Low Volatility Focus Index.
(The fund's performance relative to the index can be affected by Fidelity's methodologies for valuing certain foreign stocks and for incorporating foreign exchange rates, which differ from those used by the index.) Among individual fund positions, Sino Biopharmaceutical (+75%) contributed notably; this Hong Kong-listed pharmaceutical company benefited from strong sales growth and a large pipeline of new drugs. Payment processing company PagSeguro Digital (+56%) benefited from the continued shift toward electronic payments in Brazil, while favorable earnings helped lift shares of Hindustan Unilever (+24%), a British-Dutch consumer-goods company based in India. Other contributors included Taiwan's Chang Hwa Commercial Bank (+39%) and natural gas provider China Resources Gas Group (+56%). In contrast, Korean retailer Emart (-46%) struggled in a difficult global business environment for retailers and amid investors' concern about declining profits at the company. Trade tension and weaker-than-expected financial results weighed on shares of wireless communications service provider China Mobile (-20%) Other notable detractors included Korea Electric Power (-30%), Thailand-based KasikornBank (-28%) and Korean insurance provider Samsung Life Insurance (-24%).
The views expressed above reflect those of the portfolio manager(s) only through the end of the period as stated on the cover of this report and do not necessarily represent the views of Fidelity or any other person in the Fidelity organization. Any such views are subject to change at any time based upon market or other conditions and Fidelity disclaims any responsibility to update such views. These views may not be relied on as investment advice and, because investment decisions for a Fidelity fund are based on numerous factors, may not be relied on as an indication of trading intent on behalf of any Fidelity fund.
Fidelity® SAI Emerging Markets Low Volatility Index Fund
Investment Summary (Unaudited)
Geographic Diversification (% of fund's net assets)
| As of October 31, 2019 |
| | Taiwan | 16.5% |
| | India | 12.9% |
| | Cayman Islands | 11.2% |
| | Korea (South) | 10.4% |
| | Thailand | 5.9% |
| | Malaysia | 5.8% |
| | Hong Kong | 5.5% |
| | China | 5.4% |
| | Philippines | 3.5% |
| | Other* | 22.9% |

* Includes Short-Term investments and Net Other Assets (Liabilities).
Percentages are based on country or territory of incorporation and are adjusted for the effect of futures contracts, if applicable.
Asset Allocation as of October 31, 2019
| | % of fund's net assets |
| Stocks and Equity Futures | 100.0 |
Top Ten Stocks as of October 31, 2019
| | % of fund's net assets |
| Hindustan Unilever Ltd. (India, Household Products) | 1.8 |
| Bidcorp Ltd. (South Africa, Food & Staples Retailing) | 1.6 |
| ZTO Express (Cayman), Inc. sponsored ADR (Cayman Islands, Air Freight & Logistics) | 1.6 |
| Chunghwa Telecom Co. Ltd. (Taiwan, Diversified Telecommunication Services) | 1.6 |
| Taiwan Mobile Co. Ltd. (Taiwan, Wireless Telecommunication Services) | 1.6 |
| Guangdong Investment Ltd. (Hong Kong, Water Utilities) | 1.6 |
| HCL Technologies Ltd. (India, IT Services) | 1.5 |
| PT Bank Central Asia Tbk (Indonesia, Banks) | 1.5 |
| Tata Consultancy Services Ltd. (India, IT Services) | 1.5 |
| CITIC Pacific Ltd. (Hong Kong, Industrial Conglomerates) | 1.5 |
| | 15.8 |
Top Market Sectors as of October 31, 2019
| | % of fund's net assets |
| Financials | 20.9 |
| Information Technology | 14.4 |
| Communication Services | 13.1 |
| Consumer Staples | 11.1 |
| Industrials | 9.9 |
| Consumer Discretionary | 8.4 |
| Utilities | 7.7 |
| Health Care | 7.2 |
| Materials | 3.7 |
| Energy | 2.6 |
Fidelity® SAI Emerging Markets Low Volatility Index Fund
Schedule of Investments October 31, 2019
Showing Percentage of Net Assets
| Common Stocks - 99.4% | | | |
| | | Shares | Value |
| Bailiwick of Jersey - 0.9% | | | |
| WNS Holdings Ltd. sponsored ADR (a) | | 90,059 | $5,569,249 |
| Bermuda - 2.0% | | | |
| China Resource Gas Group Ltd. | | 1,492,000 | 8,995,727 |
| Shenzhen International Holdings Ltd. | | 1,801,065 | 3,661,622 |
|
| TOTAL BERMUDA | | | 12,657,349 |
|
| Brazil - 3.0% | | | |
| Atacadao Distribuicao Comercio e Industria Ltda | | 611,200 | 2,912,363 |
| EDP Energias do Brasil SA | | 221,400 | 1,047,240 |
| Embraer SA | | 1,275,300 | 5,574,370 |
| Hapvida Participacoes e Investimentos SA (b) | | 268,600 | 3,770,647 |
| IRB Brasil Resseguros SA | | 508,700 | 4,793,361 |
| Ultrapar Participacoes SA | | 254,100 | 1,195,578 |
|
| TOTAL BRAZIL | | | 19,293,559 |
|
| Cayman Islands - 11.2% | | | |
| AAC Technology Holdings, Inc. | | 943,000 | 6,102,432 |
| China Literature Ltd. (a)(b) | | 590,200 | 2,312,142 |
| Hengan International Group Co. Ltd. | | 1,156,000 | 8,071,194 |
| NetEase, Inc. ADR | | 911 | 260,418 |
| PagSeguro Digital Ltd. (a)(c) | | 100,455 | 3,724,871 |
| Semiconductor Manufacturing International Corp. (a) | | 5,633,000 | 7,155,310 |
| Shenzhou International Group Holdings Ltd. | | 685,800 | 9,476,833 |
| Sino Biopharmaceutical Ltd. | | 4,362,000 | 6,494,553 |
| Tencent Holdings Ltd. | | 199,000 | 8,072,021 |
| Uni-President China Holdings Ltd. | | 1,013,000 | 1,046,360 |
| Want Want China Holdings Ltd. | | 10,860,000 | 9,148,568 |
| ZTO Express (Cayman), Inc. sponsored ADR | | 477,878 | 10,513,316 |
|
| TOTAL CAYMAN ISLANDS | | | 72,378,018 |
|
| Chile - 2.0% | | | |
| Aguas Andinas SA | | 4,932,286 | 2,261,296 |
| Banco de Chile | | 47,831,522 | 6,159,534 |
| Colbun SA | | 12,652,578 | 2,182,979 |
| Compania Cervecerias Unidas SA | | 237,912 | 2,373,955 |
| Empresas CMPC SA | | 9,807 | 22,349 |
|
| TOTAL CHILE | | | 13,000,113 |
|
| China - 5.4% | | | |
| China Construction Bank Corp. (H Shares) | | 10,849,000 | 8,692,984 |
| China Huarong Asset Management Co. Ltd. (b) | | 16,249,000 | 2,398,916 |
| China Telecom Corp. Ltd. (H Shares) | | 19,804,000 | 8,424,793 |
| Huaneng Power International, Inc. (H Shares) | | 6,520,000 | 3,096,838 |
| Jiangsu Expressway Co. Ltd. (H Shares) | | 2,216,000 | 2,944,065 |
| Sinopharm Group Co. Ltd. (H Shares) | | 910,800 | 3,261,803 |
| Tsingtao Brewery Co. Ltd. (H Shares) | | 376,000 | 2,178,926 |
| Zhuzhou CRRC Times Electric Co. Ltd. (H Shares) | | 992,700 | 3,683,480 |
|
| TOTAL CHINA | | | 34,681,805 |
|
| Czech Republic - 0.0% | | | |
| Komercni Banka A/S | | 6,684 | 225,935 |
| Hong Kong - 5.5% | | | |
| China Mobile Ltd. | | 1,126,000 | 9,150,665 |
| China Resources Pharmaceutical Group Ltd. (b) | | 2,970,000 | 2,742,818 |
| CITIC Pacific Ltd. | | 7,312,000 | 9,618,823 |
| Far East Horizon Ltd. | | 4,007,000 | 3,793,600 |
| Guangdong Investment Ltd. | | 4,552,000 | 9,851,885 |
|
| TOTAL HONG KONG | | | 35,157,791 |
|
| India - 12.9% | | | |
| Apollo Hospitals Enterprise Ltd. | | 163,552 | 3,419,670 |
| Cipla Ltd. | | 480,615 | 3,159,596 |
| Dr. Reddy's Laboratories Ltd. | | 146,457 | 5,745,999 |
| HCL Technologies Ltd. | | 593,754 | 9,728,836 |
| Hindustan Unilever Ltd. | | 380,820 | 11,663,789 |
| ICICI Lombard General Insurance Co. Ltd. (b) | | 138,774 | 2,614,826 |
| Infosys Ltd. | | 857,468 | 8,239,344 |
| Lupin Ltd. | | 399,325 | 4,191,077 |
| Petronet LNG Ltd. | | 58,517 | 235,957 |
| Pidilite Industries Ltd. | | 221,608 | 4,372,793 |
| Power Grid Corp. of India Ltd. | | 1,088,010 | 3,040,323 |
| Sun Pharmaceutical Industries Ltd. | | 265,741 | 1,622,165 |
| Tata Consultancy Services Ltd. | | 302,462 | 9,632,811 |
| Tech Mahindra Ltd. | | 675,577 | 7,029,500 |
| Wipro Ltd. | | 2,345,807 | 8,584,085 |
|
| TOTAL INDIA | | | 83,280,771 |
|
| Indonesia - 3.5% | | | |
| PT Bank Central Asia Tbk | | 4,336,400 | 9,706,284 |
| PT Indofood CBP Sukses Makmur Tbk | | 3,995,500 | 3,307,986 |
| PT Telekomunikasi Indonesia Tbk Series B | | 31,499,800 | 9,192,299 |
|
| TOTAL INDONESIA | | | 22,206,569 |
|
| Korea (South) - 10.4% | | | |
| Db Insurance Co. Ltd. | | 81,678 | 3,524,544 |
| E-Mart Co. Ltd. | | 1,425 | 135,768 |
| Hankook Tire Co. Ltd. | | 142,915 | 3,791,804 |
| Hyundai Mobis | | 42,500 | 8,643,157 |
| Kangwon Land, Inc. | | 204,504 | 5,478,301 |
| Korea Electric Power Corp. (a) | | 313,290 | 6,808,690 |
| KT&G Corp. | | 104,008 | 8,887,370 |
| S1 Corp. | | 32,411 | 2,595,007 |
| Samsung Life Insurance Co. Ltd. | | 115,540 | 6,970,173 |
| SK C&C Co. Ltd. | | 20,688 | 4,569,678 |
| SK Telecom Co. Ltd. | | 40,245 | 8,177,854 |
| Woongjin Coway Co. Ltd. | | 97,122 | 7,618,453 |
|
| TOTAL KOREA (SOUTH) | | | 67,200,799 |
|
| Malaysia - 5.8% | | | |
| Dialog Group Bhd | | 2,513,000 | 2,091,050 |
| Hap Seng Consolidated Bhd | | 1,166,500 | 2,785,765 |
| Hong Leong Bank Bhd | | 772,800 | 3,182,066 |
| IHH Healthcare Bhd | | 4,866,200 | 6,632,085 |
| Malayan Banking Bhd | | 3,839,868 | 7,896,430 |
| Petronas Dagangan Bhd | | 541,700 | 3,052,596 |
| Petronas Gas Bhd | | 761,100 | 3,031,670 |
| Public Bank Bhd | | 1,815,600 | 8,811,757 |
|
| TOTAL MALAYSIA | | | 37,483,419 |
|
| Mexico - 2.5% | | | |
| Gruma S.A.B. de CV Series B | | 31,220 | 327,594 |
| Grupo Aeroportuario del Pacifico S.A.B. de CV Series B | | 661,900 | 6,939,516 |
| Grupo Aeroportuario del Sureste S.A.B. de CV Series B | | 341,135 | 5,593,929 |
| Kimberly-Clark de Mexico SA de CV Series A | | 1,460,000 | 2,944,059 |
|
| TOTAL MEXICO | | | 15,805,098 |
|
| Philippines - 3.5% | | | |
| Aboitiz Power Corp. | | 11,500 | 9,046 |
| Bank of the Philippine Islands (BPI) | | 3,082,800 | 5,885,574 |
| BDO Unibank, Inc. | | 3,146,290 | 9,591,170 |
| Jollibee Food Corp. | | 713,710 | 3,258,937 |
| Manila Electric Co. | | 289,710 | 1,930,849 |
| SM Prime Holdings, Inc. | | 2,138,300 | 1,640,676 |
|
| TOTAL PHILIPPINES | | | 22,316,252 |
|
| Qatar - 2.5% | | | |
| Qatar Electricity & Water Co. | | 307,955 | 1,336,361 |
| Qatar Gas Transport Co. Ltd. (Nakilat) | | 4,868,095 | 3,302,443 |
| Qatar National Bank SAQ | | 1,383,889 | 7,297,629 |
| The Commercial Bank of Qatar | | 3,566,053 | 4,211,488 |
|
| TOTAL QATAR | | | 16,147,921 |
|
| Saudi Arabia - 0.8% | | | |
| Jarir Marketing Co. | | 54,194 | 2,288,971 |
| Saudi Arabian Fertilizers Co. | | 150,420 | 3,132,497 |
|
| TOTAL SAUDI ARABIA | | | 5,421,468 |
|
| South Africa - 1.6% | | | |
| Bidcorp Ltd. | | 454,401 | 10,600,635 |
| Taiwan - 16.5% | | | |
| ASUSTeK Computer, Inc. | | 550,000 | 3,724,015 |
| Chang Hwa Commercial Bank | | 11,031,280 | 8,590,494 |
| China Steel Corp. | | 11,718,000 | 9,010,004 |
| Chunghwa Telecom Co. Ltd. | | 2,781,000 | 10,212,866 |
| Far EasTone Telecommunications Co. Ltd. | | 2,893,000 | 6,924,684 |
| Formosa Petrochemical Corp. | | 2,185,000 | 6,942,308 |
| Formosa Plastics Corp. | | 2,201,000 | 7,058,096 |
| Giant Manufacturing Co. Ltd. | | 116,000 | 859,597 |
| Novatek Microelectronics Corp. | | 371,000 | 2,384,287 |
| Pou Chen Corp. | | 3,389,000 | 4,528,223 |
| President Chain Store Corp. | | 277,000 | 2,761,099 |
| Quanta Computer, Inc. | | 5,013,000 | 9,615,729 |
| Taiwan Cooperative Financial Holding Co. Ltd. | | 8,417,990 | 5,782,572 |
| Taiwan Mobile Co. Ltd. | | 2,679,000 | 9,970,047 |
| Unified-President Enterprises Corp. | | 2,554,000 | 6,297,488 |
| United Microelectronics Corp. | | 17,383,000 | 7,990,132 |
| WPG Holding Co. Ltd. | | 2,606,000 | 3,298,302 |
|
| TOTAL TAIWAN | | | 105,949,943 |
|
| Thailand - 5.9% | | | |
| Advanced Info Service PCL | | 16,800 | 127,466 |
| Advanced Info Service PCL (For. Reg.) | | 686,800 | 5,210,949 |
| Bangkok Bank PCL | | 615,300 | 3,545,241 |
| Bangkok Dusit Medical Services PCL | | 80,100 | 63,687 |
| Bangkok Dusit Medical Services PCL (For. Reg.) | | 5,177,000 | 4,116,178 |
| BTS Group Holdings PCL | | 132,100 | 58,650 |
| BTS Group Holdings PCL (For. Reg.) | | 10,110,700 | 4,469,740 |
| Bumrungrad Hospital PCL | | 30,000 | 119,755 |
| Bumrungrad Hospital PCL (For. Reg.) | | 555,000 | 2,215,462 |
| CPN Retail Growth Leasehold REIT | | 59,500 | 69,483 |
| CPN Retail Growth Leasehold REIT | | 709,500 | 828,547 |
| Electricity Generating PCL | | 6,300 | 72,416 |
| Electricity Generating PCL (For. Reg.) | | 426,100 | 4,897,832 |
| Kasikornbank PCL | | 1,504,000 | 6,921,744 |
| Krung Thai Bank PCL | | 195,200 | 107,331 |
| Krung Thai Bank PCL (For. Reg.) | | 6,395,600 | 3,516,628 |
| TMB Bank PCL | | 287,700 | 13,716 |
| TMB Bank PCL: | | | |
| (For. Reg.) | | 38,859,200 | 1,852,620 |
| rights (a) | | 26,787,896 | 35,492 |
|
| TOTAL THAILAND | | | 38,242,937 |
|
| United Arab Emirates - 2.1% | | | |
| Dubai Islamic Bank Pakistan Ltd. (a) | | 141,250 | 203,448 |
| Emirates Telecommunications Corp. | | 1,067,698 | 4,814,125 |
| National Bank of Abu Dhabi PJSC | | 2,087,254 | 8,649,651 |
|
| TOTAL UNITED ARAB EMIRATES | | | 13,667,224 |
|
| United States of America - 1.4% | | | |
| Yum China Holdings, Inc. | | 210,716 | 8,955,430 |
| TOTAL COMMON STOCKS | | | |
| (Cost $635,825,514) | | | 640,242,285 |
| | | Principal Amount | Value |
|
| Government Obligations - 0.1% | | | |
| United States of America - 0.1% | | | |
| U.S. Treasury Bills, yield at date of purchase 1.7% to 1.82% 12/19/19 to 3/19/20(d) | | | |
| (Cost $796,307) | | 800,000 | 796,908 |
| | | Shares | Value |
|
| Money Market Funds - 1.2% | | | |
| Fidelity Cash Central Fund 1.83% (e) | | 3,505,195 | 3,505,896 |
| Fidelity Securities Lending Cash Central Fund 1.84% (e)(f) | | 3,742,877 | 3,743,251 |
| TOTAL MONEY MARKET FUNDS | | | |
| (Cost $7,249,147) | | | 7,249,147 |
| TOTAL INVESTMENT IN SECURITIES - 100.7% | | | |
| (Cost $643,870,968) | | | 648,288,340 |
| NET OTHER ASSETS (LIABILITIES) - (0.7)% | | | (4,203,287) |
| NET ASSETS - 100% | | | $644,085,053 |
| Futures Contracts | | | | | |
| | Number of contracts | Expiration Date | Notional Amount | Value | Unrealized Appreciation/(Depreciation) |
| Purchased | | | | | |
| Equity Index Contracts | | | | | |
| ICE E-mini MSCI Emerging Markets Index Contracts (United States) | 78 | Dec. 2019 | $4,061,460 | $153,393 | $153,393 |
The notional amount of futures purchased as a percentage of Net Assets is 0.6%
For the period, the average monthly notional amount at value for futures contracts in the aggregate was $12,120,795.
Categorizations in the Schedule of Investments are based on country or territory of incorporation.
Legend
(a) Non-income producing
(b) Security exempt from registration under Rule 144A of the Securities Act of 1933. These securities may be resold in transactions exempt from registration, normally to qualified institutional buyers. At the end of the period, the value of these securities amounted to $13,839,349 or 2.1% of net assets.
(c) Security or a portion of the security is on loan at period end.
(d) Security or a portion of the security was pledged to cover margin requirements for futures contracts. At period end, the value of securities pledged amounted to $171,994.
(e) Affiliated fund that is generally available only to investment companies and other accounts managed by Fidelity Investments. The rate quoted is the annualized seven-day yield of the fund at period end. A complete unaudited listing of the fund's holdings as of its most recent quarter end is available upon request. In addition, each Fidelity Central Fund's financial statements, which are not covered by the Fund's Report of Independent Registered Public Accounting Firm, are available on the SEC's website or upon request.
(f) Investment made with cash collateral received from securities on loan.
Affiliated Central Funds
Information regarding fiscal year to date income earned by the Fund from investments in Fidelity Central Funds is as follows:
| Fund | Income earned |
| Fidelity Cash Central Fund | $229,350 |
| Fidelity Securities Lending Cash Central Fund | 934 |
| Total | $230,284 |
Amounts in the income column in the above table include any capital gain distributions from underlying funds, which are presented in the corresponding line-item in the Statement of Operations, if applicable. Amount for Fidelity Securities Lending Cash Central Fund represents the income earned on investing cash collateral, less rebates paid to borrowers and any lending agent fees associated with the loan, plus any premium payments received for lending certain types of securities.
Investment Valuation
The following is a summary of the inputs used, as of October 31, 2019, involving the Fund's assets and liabilities carried at fair value. The inputs or methodology used for valuing securities may not be an indication of the risk associated with investing in those securities. For more information on valuation inputs, and their aggregation into the levels used below, please refer to the Investment Valuation section in the accompanying Notes to Financial Statements.
| | Valuation Inputs at Reporting Date: |
| Description | Total | Level 1 | Level 2 | Level 3 |
| Investments in Securities: | | | | |
| Equities: | | | | |
| Communication Services | $82,850,329 | $32,182,140 | $50,668,189 | $-- |
| Consumer Discretionary | 54,899,706 | 42,163,936 | 12,735,770 | -- |
| Consumer Staples | 72,657,154 | 37,240,331 | 35,416,823 | -- |
| Energy | 16,819,932 | 11,440,329 | 5,379,603 | -- |
| Financials | 134,975,208 | 56,408,829 | 78,566,379 | -- |
| Health Care | 47,555,495 | 3,770,647 | 43,784,848 | -- |
| Industrials | 63,007,961 | 35,785,816 | 27,222,145 | -- |
| Information Technology | 92,778,903 | 28,316,453 | 64,462,450 | -- |
| Materials | 23,595,739 | 19,222,946 | 4,372,793 | -- |
| Real Estate | 2,538,706 | -- | 2,538,706 | -- |
| Utilities | 48,563,152 | 6,827,876 | 41,735,276 | -- |
| Government Obligations | 796,908 | -- | 796,908 | -- |
| Money Market Funds | 7,249,147 | 7,249,147 | -- | -- |
| Total Investments in Securities: | $648,288,340 | $280,608,450 | $367,679,890 | $-- |
| Derivative Instruments: | | | | |
| Assets | | | | |
| Futures Contracts | $153,393 | $153,393 | $-- | $-- |
| Total Assets | $153,393 | $153,393 | $-- | $-- |
| Total Derivative Instruments: | $153,393 | $153,393 | $-- | $-- |
Value of Derivative Instruments
The following table is a summary of the Fund's value of derivative instruments by primary risk exposure as of October 31, 2019. For additional information on derivative instruments, please refer to the Derivative Instruments section in the accompanying Notes to Financial Statements.
| Primary Risk Exposure / Derivative Type | Value |
| | Asset | Liability |
| Equity Risk | | |
| Futures Contracts(a) | $153,393 | $0 |
| Total Equity Risk | 153,393 | 0 |
| Total Value of Derivatives | $153,393 | $0 |
(a) Reflects gross cumulative appreciation (depreciation) on futures contracts as presented in the Schedule of Investments. In the Statement of Assets and Liabilities, the period end daily variation margin is included in receivable or payable for daily variation margin on futures contracts, and the net cumulative appreciation (depreciation) is included in Total accumulated earnings (loss).
See accompanying notes which are an integral part of the financial statements.
Fidelity® SAI Emerging Markets Low Volatility Index Fund
Financial Statements
Statement of Assets and Liabilities
| | | October 31, 2019 |
| Assets | | |
Investment in securities, at value (including securities loaned of $3,581,928) — See accompanying schedule:
Unaffiliated issuers (cost $636,621,821) | $641,039,193 | |
| Fidelity Central Funds (cost $7,249,147) | 7,249,147 | |
| Total Investment in Securities (cost $643,870,968) | | $648,288,340 |
| Foreign currency held at value (cost $10,871,558) | | 10,909,121 |
| Receivable for fund shares sold | | 1,023,927 |
| Dividends receivable | | 149,643 |
| Distributions receivable from Fidelity Central Funds | | 11,251 |
| Prepaid expenses | | 1,299 |
| Other receivables | | 1,337 |
| Total assets | | 660,384,918 |
| Liabilities | | |
| Payable for investments purchased | $11,549,828 | |
| Payable for fund shares redeemed | 96,219 | |
| Accrued management fee | 111,279 | |
| Payable for daily variation margin on futures contracts | 23,911 | |
| Other payables and accrued expenses | 775,377 | |
| Collateral on securities loaned | 3,743,251 | |
| Total liabilities | | 16,299,865 |
| Net Assets | | $644,085,053 |
| Net Assets consist of: | | |
| Paid in capital | | $645,651,111 |
| Total accumulated earnings (loss) | | (1,566,058) |
| Net Assets, for 63,719,247 shares outstanding | | $644,085,053 |
| Net Asset Value, offering price and redemption price per share ($644,085,053 ÷ 63,719,247 shares) | | $10.11 |
See accompanying notes which are an integral part of the financial statements.
Statement of Operations
| | | For the period
January 30, 2019 (commencement of operations) to
October 31, 2019 |
| Investment Income | | |
| Dividends | | $15,482,310 |
| Interest | | 12,701 |
| Income from Fidelity Central Funds (including $934 from security lending) | | 230,284 |
| Income before foreign taxes withheld | | 15,725,295 |
| Less foreign taxes withheld | | (1,809,161) |
| Total income | | 13,916,134 |
| Expenses | | |
| Management fee | $656,066 | |
| Transfer agent fees | 206,548 | |
| Accounting and security lending fees | 97,436 | |
| Custodian fees and expenses | 286,679 | |
| Independent trustees' fees and expenses | 1,478 | |
| Registration fees | 186,297 | |
| Audit | 42,320 | |
| Legal | 191 | |
| Interest | 45,362 | |
| Miscellaneous | 1,549 | |
| Total expenses before reductions | 1,523,926 | |
| Expense reductions | (364,972) | |
| Total expenses after reductions | | 1,158,954 |
| Net investment income (loss) | | 12,757,180 |
| Realized and Unrealized Gain (Loss) | | |
| Net realized gain (loss) on: | | |
| Investment securities: | | |
| Unaffiliated issuers | (14,441,905) | |
| Fidelity Central Funds | (426) | |
| Foreign currency transactions | (19,920) | |
| Futures contracts | (985,954) | |
| Total net realized gain (loss) | | (15,448,205) |
| Change in net unrealized appreciation (depreciation) on: | | |
| Investment securities: | | |
| Unaffiliated issuers (net of increase in deferred foreign taxes of $450,222) | 3,967,150 | |
| Assets and liabilities in foreign currencies | 51,431 | |
| Futures contracts | 153,393 | |
| Total change in net unrealized appreciation (depreciation) | | 4,171,974 |
| Net gain (loss) | | (11,276,231) |
| Net increase (decrease) in net assets resulting from operations | | $1,480,949 |
See accompanying notes which are an integral part of the financial statements.
Statement of Changes in Net Assets
| | For the period
January 30, 2019 (commencement of operations) to
October 31, 2019 |
| Increase (Decrease) in Net Assets | |
| Operations | |
| Net investment income (loss) | $12,757,180 |
| Net realized gain (loss) | (15,448,205) |
| Change in net unrealized appreciation (depreciation) | 4,171,974 |
| Net increase (decrease) in net assets resulting from operations | 1,480,949 |
| Share transactions | |
| Proceeds from sales of shares | 935,474,352 |
| Cost of shares redeemed | (292,870,248) |
| Net increase (decrease) in net assets resulting from share transactions | 642,604,104 |
| Total increase (decrease) in net assets | 644,085,053 |
| Net Assets | |
| Beginning of period | – |
| End of period | $644,085,053 |
| Other Information | |
| Shares | |
| Sold | 92,906,995 |
| Redeemed | (29,187,748) |
| Net increase (decrease) | 63,719,247 |
See accompanying notes which are an integral part of the financial statements.
Financial Highlights
Fidelity SAI Emerging Markets Low Volatility Index Fund
| | |
| Year ended October 31, | 2019 A |
| Selected Per–Share Data | |
| Net asset value, beginning of period | $10.00 |
| Income from Investment Operations | |
| Net investment income (loss)B | .22 |
| Net realized and unrealized gain (loss) | (.11) |
| Total from investment operations | .11 |
| Net asset value, end of period | $10.11 |
| Total ReturnC,D | 1.10% |
| Ratios to Average Net AssetsE,F | |
| Expenses before reductions | .35%G |
| Expenses net of fee waivers, if any | .26%G |
| Expenses net of all reductions | .26%G |
| Net investment income (loss) | 2.90%G |
| Supplemental Data | |
| Net assets, end of period (000 omitted) | $644,085 |
| Portfolio turnover rateH | 75% |
A For the period January 30, 2019 (commencement of operations) to October 31, 2019.
B Calculated based on average shares outstanding during the period.
C Total returns for periods of less than one year are not annualized.
D Total returns would have been lower if certain expenses had not been reduced during the applicable periods shown.
E Fees and expenses of any underlying Fidelity Central Funds are not included in the Fund's expense ratio. The Fund indirectly bears its proportionate share of the expenses of any underlying Fidelity Central Funds.
F Expense ratios reflect operating expenses of the Fund. Expenses before reductions do not reflect amounts reimbursed by the investment adviser or reductions from expense offset arrangements and do not represent the amount paid by the Fund during periods when reimbursements or reductions occur. Expense ratios before reductions for start-up periods may not be representative of longer term operating periods. Expenses net of fee waivers reflect expenses after reimbursement by the investment adviser but prior to reductions from expense offset arrangements. Expenses net of all reductions represent the net expenses paid by the Fund.
G Annualized
H Amount does not include the portfolio activity of any underlying Fidelity Central Funds.
See accompanying notes which are an integral part of the financial statements.
Fidelity® SAI International Low Volatility Index Fund
Performance: The Bottom Line
Average annual total return reflects the change in the value of an investment, assuming reinvestment of distributions from dividend income and capital gains (the profits earned upon the sale of securities that have grown in value, if any) and assuming a constant rate of performance each year. The hypothetical investment and the average annual total returns do not reflect the deduction of taxes that a shareholder would pay on fund distributions or the redemption of fund shares. During periods of reimbursement by Fidelity, a fund’s total return will be greater than it would be had the reimbursement not occurred. How a fund did yesterday is no guarantee of how it will do tomorrow.
Average Annual Total Returns
| For the periods ended October 31, 2019 | Past 1 year | Life of fundA |
| Fidelity® SAI International Low Volatility Index Fund | 12.89% | 5.25% |
A From May 29, 2015
$10,000 Over Life of Fund
Let's say hypothetically that $10,000 was invested in Fidelity® SAI International Low Volatility Index Fund on May 29, 2015, when the fund started.
The chart shows how the value of your investment would have changed, and also shows how the MSCI ACWI (All Country World Index) ex USA Minimum Volatility (USD) Index, Fidelity International Low Volatility Focus Index, and Fidelity SAI International Low Volatility Index Fund Linked Index performed over the same period.
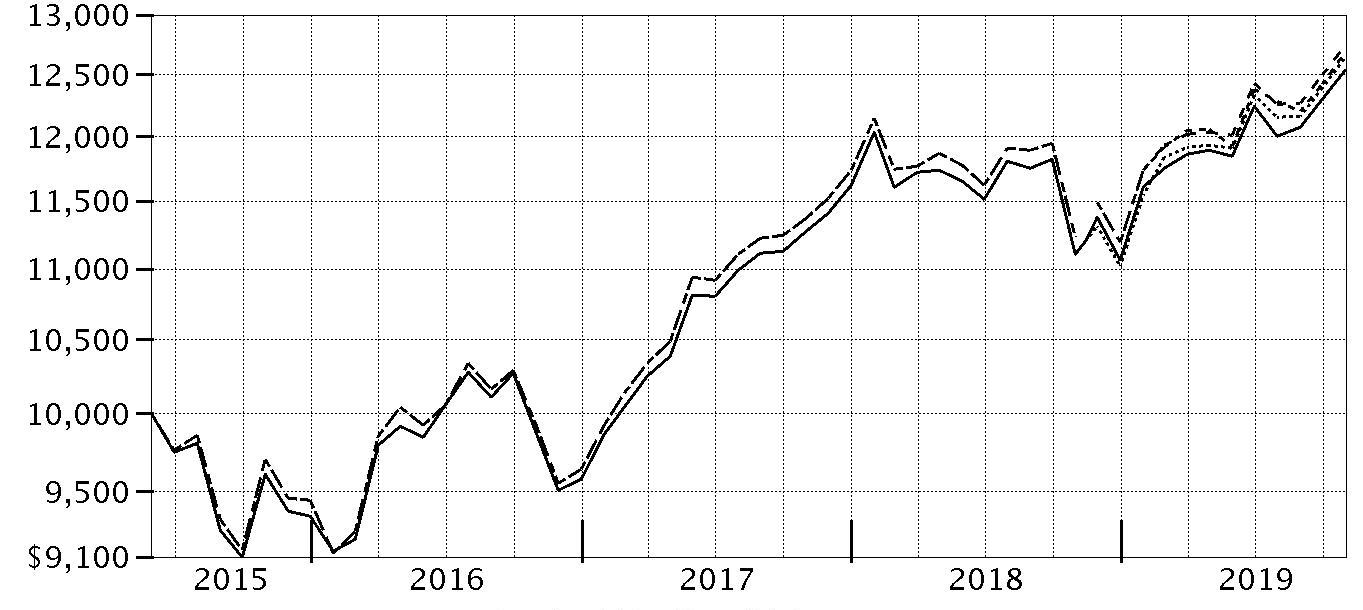
| Period Ending Values |
| $12,538 | Fidelity® SAI International Low Volatility Index Fund |
| $12,639 | Fidelity International Low Volatility Focus Index |
| $12,689 | MSCI ACWI (All Country World Index) ex USA Minimum Volatility (USD) Index |
| $12,745 | Fidelity SAI International Low Volatility Index Fund Linked Index |
Effective February 18, 2019, the Fidelity SAI International Low Volatility Index Fund began comparing its performance to the Fidelity International Low Volatility Focus Index rather than the MSCI ACWI ex USA Minimum Volatility Index as a result of the change to the fund’s investment policies.
Fidelity® SAI International Low Volatility Index Fund
Management's Discussion of Fund Performance
Market Recap: The MSCI ACWI (All Country World Index) ex USA Index gained 11.47% for the 12 months ending October 31, 2019, as international stocks reflected a confluence of factors, including escalating trade tension, and moderating but still positive global economic growth. Currency fluctuations were largely modest and varied by region, muting the overall impact on international equity returns. In late December, the U.S. Federal Reserve shifted from raising interest rates to a more dovish policy in 2019, joining many foreign central banks. In June, international stocks rose 6.03%, as policy stimulus in China stabilized that country’s economic growth. The Fed cut its policy rate in July for the first time since 2008. However, the index returned -1.21% for the month, followed by -3.08% in August. In September, the Fed cut its policy rate another quarter point, citing concerns about slowing economic growth and muted inflation, and did the same in October, leading to monthly gains of 2.59% and 3.49%, respectively. For the full 12 months, the growth-oriented information technology sector (+22%) led the way, followed by utilities (+20%) and real estate (+18%), two high-dividend-yielding categories. Conversely, energy was roughly flat, while materials (+6%) and communication services (7%) also lagged. By region, Asia Pacific ex Japan (+16%), Europe ex U.K (+13%), Canada (+12%) and emerging markets (+12%) fared best. Meanwhile, the U.K. (+7%) and Japan (+10%) trailed the broader market.
Comments from the passive equity index team of Geode Capital Management, LLC: For the fiscal year, the fund gained 12.89%, compared with an increase of 13.45% for the fund's supplemental benchmark, the Fidelity
® SAI International Low Volatility Index Fund Linked Index.
(The fund's performance relative to the index can be affected by Fidelity's methodologies for valuing certain foreign stocks and for incorporating foreign exchange rates, which differ from those used by the index.) Among major fund positions, Nestle (+29%) contributed, as the Swiss packaged-foods giant reported favorable sales growth. U.K.-based contract food-service stock Compass Group gained 38%, while shares of Oriental Land Company, a Japanese tourism company, added 57%. In contrast, Jardine Matheson Holdings (+1%) lagged the index, as the company reported weaker-than-expected earnings as protests engulfed Hong Kong, where the company is headquartered. Shares of French aerospace and defense company Thales (-23%) declined on weak sales, while Japanese convenience store operator Seven & I Holdings returned -11%.
The views expressed above reflect those of the portfolio manager(s) only through the end of the period as stated on the cover of this report and do not necessarily represent the views of Fidelity or any other person in the Fidelity organization. Any such views are subject to change at any time based upon market or other conditions and Fidelity disclaims any responsibility to update such views. These views may not be relied on as investment advice and, because investment decisions for a Fidelity fund are based on numerous factors, may not be relied on as an indication of trading intent on behalf of any Fidelity fund.
Notes to Shareholders: On February 18, 2019, Fidelity SAI International Minimum Volatility Index Fund was renamed Fidelity SAI International Low Volatility Index Fund, and its benchmark changed from the MSCI ACWI ex USA Minimum Volatility Index to the Fidelity International Low Volatility Focus Index. On March 22, 2019, Pat Waddell retired and is no longer a portfolio manager with Geode Capital Management.
Fidelity® SAI International Low Volatility Index Fund
Investment Summary (Unaudited)
Geographic Diversification (% of fund's net assets)
| As of October 31, 2019 |
| | Japan | 31.7% |
| | Switzerland | 14.4% |
| | United Kingdom | 14.3% |
| | France | 8.2% |
| | Hong Kong | 6.7% |
| | Germany | 6.0% |
| | Bermuda | 2.9% |
| | Singapore | 2.6% |
| | Sweden | 2.3% |
| | Other* | 10.9% |

* Includes Short-Term investments and Net Other Assets (Liabilities).
Percentages are based on country or territory of incorporation and are adjusted for the effect of futures contracts, if applicable.
Asset Allocation as of October 31, 2019
| | % of fund's net assets |
| Stocks and Equity Futures | 100.0 |
Top Ten Stocks as of October 31, 2019
| | % of fund's net assets |
| Roche Holding AG (participation certificate) (Switzerland, Pharmaceuticals) | 2.1 |
| Nestle SA (Reg. S) (Switzerland, Food Products) | 1.9 |
| Muenchener Rueckversicherungs-Gesellschaft AG in Muenchen (Germany, Insurance) | 1.9 |
| National Grid PLC (United Kingdom, Multi-Utilities) | 1.8 |
| Diageo PLC (United Kingdom, Beverages) | 1.8 |
| Novartis AG (Switzerland, Pharmaceuticals) | 1.8 |
| Secom Co. Ltd. (Japan, Commercial Services & Supplies) | 1.8 |
| Nippon Telegraph & Telephone Corp. (Japan, Diversified Telecommunication Services) | 1.8 |
| Compass Group PLC (United Kingdom, Hotels, Restaurants & Leisure) | 1.8 |
| RELX PLC (London Stock Exchange) (United Kingdom, Professional Services) | 1.8 |
| | 18.5 |
Top Market Sectors as of October 31, 2019
| | % of fund's net assets |
| Industrials | 17.4 |
| Consumer Staples | 16.3 |
| Financials | 15.0 |
| Communication Services | 10.1 |
| Health Care | 9.1 |
| Real Estate | 8.7 |
| Utilities | 8.4 |
| Consumer Discretionary | 7.1 |
| Materials | 3.7 |
| Information Technology | 2.4 |
Fidelity® SAI International Low Volatility Index Fund
Schedule of Investments October 31, 2019
Showing Percentage of Net Assets
| Common Stocks - 98.4% | | | |
| | | Shares | Value |
| Australia - 1.6% | | | |
| Sonic Healthcare Ltd. | | 1,006,623 | $19,825,438 |
| Telstra Corp. Ltd. | | 8,675,062 | 20,893,422 |
|
| TOTAL AUSTRALIA | | | 40,718,860 |
|
| Belgium - 0.3% | | | |
| Elia System Operator SA/NV | | 86,876 | 7,489,814 |
| Bermuda - 2.9% | | | |
| Cheung Kong Infrastructure Holdings Ltd. | | 1,850,500 | 13,317,548 |
| Hiscox Ltd. | | 741,494 | 14,301,759 |
| Jardine Matheson Holdings Ltd. | | 644,682 | 36,753,975 |
| Jardine Strategic Holdings Ltd. | | 305,324 | 9,859,470 |
|
| TOTAL BERMUDA | | | 74,232,752 |
|
| Cayman Islands - 0.0% | | | |
| China Huishan Dairy Holdings Co. Ltd. (a)(b) | | 5,145,000 | 137,884 |
| Denmark - 1.1% | | | |
| Christian Hansen Holding A/S | | 246,876 | 18,954,089 |
| Tryg A/S | | 305,775 | 8,540,411 |
|
| TOTAL DENMARK | | | 27,494,500 |
|
| Finland - 1.8% | | | |
| Kesko Oyj | | 171,697 | 11,428,342 |
| Sampo Oyj (A Shares) | | 872,567 | 35,757,666 |
|
| TOTAL FINLAND | | | 47,186,008 |
|
| France - 8.2% | | | |
| Essilor International SA | | 294,235 | 44,892,329 |
| Korian SA | | 207,466 | 8,792,700 |
| L'Oreal SA | | 153,148 | 44,717,002 |
| Orange SA | | 2,003,844 | 32,250,885 |
| Orpea | | 129,054 | 15,530,471 |
| SCOR SE | | 396,394 | 16,702,471 |
| Sodexo SA | | 194,626 | 21,402,745 |
| Thales SA | | 264,389 | 25,842,674 |
|
| TOTAL FRANCE | | | 210,131,277 |
|
| Germany - 6.0% | | | |
| Beiersdorf AG | | 248,552 | 29,425,846 |
| Deutsche Borse AG | | 153,726 | 23,805,962 |
| Hannover Reuck SE | | 117,676 | 20,841,554 |
| Muenchener Rueckversicherungs-Gesellschaft AG in Muenchen | | 175,378 | 48,704,172 |
| Symrise AG | | 312,130 | 30,035,672 |
|
| TOTAL GERMANY | | | 152,813,206 |
|
| Hong Kong - 6.7% | | | |
| CLP Holdings Ltd. | | 3,660,500 | 38,015,843 |
| Hang Seng Bank Ltd. | | 1,511,100 | 31,529,257 |
| Hong Kong & China Gas Co. Ltd. | | 9,591,654 | 18,616,461 |
| Link (REIT) | | 3,342,500 | 36,404,513 |
| MTR Corp. Ltd. | | 4,038,447 | 23,155,589 |
| Power Assets Holdings Ltd. | | 3,289,500 | 23,474,331 |
|
| TOTAL HONG KONG | | | 171,195,994 |
|
| Israel - 1.0% | | | |
| Bank Hapoalim BM (Reg.) | | 2,037,578 | 16,297,386 |
| Israel Discount Bank Ltd. (Class A) | | 456,241 | 2,084,149 |
| Mizrahi Tefahot Bank Ltd. | | 253,127 | 6,277,093 |
|
| TOTAL ISRAEL | | | 24,658,628 |
|
| Japan - 31.7% | | | |
| Activia Properties, Inc. | | 1,751 | 9,238,485 |
| Ajinomoto Co., Inc. | | 1,370,800 | 26,061,911 |
| All Nippon Airways Ltd. | | 268,600 | 9,223,312 |
| Aozora Bank Ltd. | | 295,200 | 7,574,351 |
| Asahi Group Holdings | | 860,300 | 43,081,641 |
| Canon, Inc. | | 298,100 | 8,179,781 |
| Central Japan Railway Co. | | 216,300 | 44,370,490 |
| Daito Trust Construction Co. Ltd. | | 171,000 | 22,660,999 |
| Daiwa House REIT Investment Corp. | | 3,812 | 11,099,795 |
| Fujifilm Holdings Corp. | | 825,300 | 36,232,526 |
| Hankyu Hanshin Holdings, Inc. | | 632,400 | 25,306,755 |
| Japan Airlines Co. Ltd. | | 291,400 | 9,080,633 |
| Japan Prime Realty Investment Corp. | | 2,304 | 11,072,982 |
| Japan Real Estate Investment Corp. | | 3,458 | 23,603,645 |
| Japan Retail Fund Investment Corp. | | 6,534 | 15,229,876 |
| Keihan Electric Railway Co., Ltd. | | 272,000 | 12,842,996 |
| Kenedix Office Investment Corp. | | 1,071 | 8,386,013 |
| Kintetsu Group Holdings Co. Ltd. | | 482,400 | 26,293,673 |
| Kyushu Railway Co. | | 38,400 | 1,268,642 |
| Mitsubishi Tanabe Pharma Corp. | | 616,600 | 7,379,649 |
| Nagoya Railroad Co. Ltd. | | 497,300 | 15,808,116 |
| Nippon Building Fund, Inc. | | 3,525 | 26,742,805 |
| Nippon Telegraph & Telephone Corp. | | 906,800 | 45,016,193 |
| NTT Data Corp. | | 1,294,300 | 16,995,261 |
| NTT DOCOMO, Inc. | | 1,497,000 | 41,040,434 |
| Odakyu Electric Railway Co. Ltd. | | 693,000 | 16,869,130 |
| Oriental Land Co. Ltd. | | 232,000 | 34,011,422 |
| ORIX JREIT, Inc. | | 6,888 | 15,574,589 |
| Osaka Gas Co. Ltd. | | 1,040,600 | 20,348,600 |
| Otsuka Holdings Co. Ltd. | | 853,500 | 35,582,637 |
| Secom Co. Ltd. | | 493,800 | 45,757,206 |
| Seven & i Holdings Co. Ltd. | | 957,600 | 36,178,421 |
| SHIMANO, Inc. | | 215,800 | 35,920,074 |
| Suntory Beverage & Food Ltd. | | 302,400 | 12,927,849 |
| Tobu Railway Co. Ltd. | | 494,800 | 16,511,431 |
| Tokyo Gas Co. Ltd. | | 992,000 | 24,215,744 |
| Toyo Suisan Kaisha Ltd. | | 257,700 | 10,850,453 |
|
| TOTAL JAPAN | | | 808,538,520 |
|
| Netherlands - 1.9% | | | |
| Koninklijke Ahold Delhaize NV | | 1,637,833 | 40,814,905 |
| Unilever NV | | 116,368 | 6,872,128 |
|
| TOTAL NETHERLANDS | | | 47,687,033 |
|
| Norway - 1.1% | | | |
| Marine Harvest ASA | | 1,109,504 | 27,049,450 |
| Singapore - 2.6% | | | |
| Ascendas Real Estate Investment Trust | | 920,900 | 2,144,825 |
| CapitaMall Trust | | 6,994,600 | 13,050,841 |
| Singapore Airlines Ltd. | | 1,315,200 | 9,090,358 |
| Singapore Press Holdings Ltd. | | 3,830,900 | 6,234,386 |
| Singapore Telecommunications Ltd. | | 14,401,600 | 34,874,284 |
|
| TOTAL SINGAPORE | | | 65,394,694 |
|
| Spain - 0.5% | | | |
| Enagas SA | | 566,468 | 14,019,237 |
| Sweden - 2.3% | | | |
| ASSA ABLOY AB (B Shares) | | 799,541 | 18,987,803 |
| Svenska Handelsbanken AB (A Shares) | | 3,921,892 | 39,359,371 |
|
| TOTAL SWEDEN | | | 58,347,174 |
|
| Switzerland - 14.4% | | | |
| Baloise Holdings AG | | 121,994 | 22,531,482 |
| Galenica Sante Ltd. (c) | | 126,496 | 7,558,986 |
| Givaudan SA | | 15,025 | 44,123,087 |
| Helvetia Holding AG (Reg.) | | 82,479 | 11,571,306 |
| Lindt & Spruengli AG | | 100 | 8,190,573 |
| Nestle SA (Reg. S) | | 456,701 | 48,858,487 |
| Novartis AG | | 527,895 | 46,124,971 |
| PSP Swiss Property AG | | 21,633 | 2,861,740 |
| Roche Holding AG (participation certificate) | | 181,050 | 54,488,078 |
| SGS SA (Reg.) | | 9,496 | 24,719,440 |
| Swiss Prime Site AG | | 177,974 | 18,329,608 |
| Swiss Re Ltd. | | 426,409 | 44,650,836 |
| Swisscom AG | | 63,358 | 32,369,419 |
|
| TOTAL SWITZERLAND | | | 366,378,013 |
|
| United Kingdom - 14.3% | | | |
| Admiral Group PLC | | 578,966 | 15,164,264 |
| Bunzl PLC | | 849,200 | 22,088,225 |
| Compass Group PLC | | 1,689,224 | 44,974,050 |
| Diageo PLC | | 1,133,285 | 46,386,464 |
| Direct Line Insurance Group PLC | | 3,434,128 | 12,104,090 |
| GlaxoSmithKline PLC | | 132,454 | 3,033,851 |
| Informa PLC | | 3,125,159 | 31,373,354 |
| National Grid PLC | | 3,988,545 | 46,566,221 |
| Pearson PLC | | 1,296,225 | 11,447,736 |
| RELX PLC (London Stock Exchange) | | 1,866,041 | 44,911,134 |
| Royal Dutch Shell PLC Class B (United Kingdom) | | 183,469 | 5,283,867 |
| Smith & Nephew PLC | | 1,707,869 | 36,661,820 |
| Tate & Lyle PLC | | 936,351 | 8,162,832 |
| Tritax Big Box REIT PLC | | 3,778,225 | 7,355,868 |
| Unilever PLC | | 293,724 | 17,587,475 |
| United Utilities Group PLC | | 996,680 | 11,234,712 |
|
| TOTAL UNITED KINGDOM | | | 364,335,963 |
|
| TOTAL COMMON STOCKS | | | |
| (Cost $2,338,071,166) | | | 2,507,809,007 |
| | | Principal Amount | Value |
|
| Government Obligations - 0.1% | | | |
| United States of America - 0.1% | | | |
| U.S. Treasury Bills, yield at date of purchase 1.7% to 1.82% 12/19/19 to 3/19/20 (d) | | | |
| (Cost $3,284,765) | | 3,300,000 | 3,287,245 |
| | | Shares | Value |
|
| Money Market Funds - 2.1% | | | |
| Fidelity Cash Central Fund 1.83% (e) | | | |
| (Cost $52,437,018) | | 52,426,532 | 52,437,018 |
| TOTAL INVESTMENT IN SECURITIES - 100.6% | | | |
| (Cost $2,393,792,949) | | | 2,563,533,270 |
| NET OTHER ASSETS (LIABILITIES) - (0.6)% | | | (15,477,383) |
| NET ASSETS - 100% | | | $2,548,055,887 |
| Futures Contracts | | | | | |
| | Number of contracts | Expiration Date | Notional Amount | Value | Unrealized Appreciation/(Depreciation) |
| Purchased | | | | | |
| Equity Index Contracts | | | | | |
| ICE E-mini MSCI EAFE Index Contracts (United States) | 414 | Dec. 2019 | $40,514,040 | $1,813,263 | $1,813,263 |
The notional amount of futures purchased as a percentage of Net Assets is 1.6%
Categorizations in the Schedule of Investments are based on country or territory of incorporation.
Legend
(a) Non-income producing
(b) Level 3 security
(c) Security exempt from registration under Rule 144A of the Securities Act of 1933. These securities may be resold in transactions exempt from registration, normally to qualified institutional buyers. At the end of the period, the value of these securities amounted to $7,558,986 or 0.3% of net assets.
(d) Security or a portion of the security was pledged to cover margin requirements for futures contracts. At period end, the value of securities pledged amounted to $1,587,143.
(e) Affiliated fund that is generally available only to investment companies and other accounts managed by Fidelity Investments. The rate quoted is the annualized seven-day yield of the fund at period end. A complete unaudited listing of the fund's holdings as of its most recent quarter end is available upon request. In addition, each Fidelity Central Fund's financial statements, which are not covered by the Fund's Report of Independent Registered Public Accounting Firm, are available on the SEC's website or upon request.
Affiliated Central Funds
Information regarding fiscal year to date income earned by the Fund from investments in Fidelity Central Funds is as follows:
| Fund | Income earned |
| Fidelity Cash Central Fund | $1,464,770 |
| Fidelity Securities Lending Cash Central Fund | 142,848 |
| Total | $1,607,618 |
Amounts in the income column in the above table include any capital gain distributions from underlying funds, which are presented in the corresponding line-item in the Statement of Operations, if applicable. Amount for Fidelity Securities Lending Cash Central Fund represents the income earned on investing cash collateral, less rebates paid to borrowers and any lending agent fees associated with the loan, plus any premium payments received for lending certain types of securities.
Investment Valuation
The following is a summary of the inputs used, as of October 31, 2019, involving the Fund's assets and liabilities carried at fair value. The inputs or methodology used for valuing securities may not be an indication of the risk associated with investing in those securities. For more information on valuation inputs, and their aggregation into the levels used below, please refer to the Investment Valuation section in the accompanying Notes to Financial Statements.
| | Valuation Inputs at Reporting Date: |
| Description | Total | Level 1 | Level 2 | Level 3 |
| Investments in Securities: | | | | |
| Equities: | | | | |
| Communication Services | $255,500,113 | $63,742,773 | $191,757,340 | $-- |
| Consumer Discretionary | 181,200,620 | 66,295,074 | 114,905,546 | -- |
| Consumer Staples | 418,731,663 | 153,433,648 | 265,160,131 | 137,884 |
| Energy | 5,283,867 | -- | 5,283,867 | -- |
| Financials | 377,797,580 | 239,770,973 | 138,026,607 | -- |
| Health Care | 234,978,601 | 31,882,157 | 203,096,444 | -- |
| Industrials | 438,741,052 | 117,561,473 | 321,179,579 | -- |
| Information Technology | 61,407,568 | -- | 61,407,568 | -- |
| Materials | 93,112,848 | 74,158,759 | 18,954,089 | -- |
| Real Estate | 223,756,584 | 28,547,216 | 195,209,368 | -- |
| Utilities | 217,298,511 | 79,309,984 | 137,988,527 | -- |
| Government Obligations | 3,287,245 | -- | 3,287,245 | -- |
| Money Market Funds | 52,437,018 | 52,437,018 | -- | -- |
| Total Investments in Securities: | $2,563,533,270 | $907,139,075 | $1,656,256,311 | $137,884 |
| Derivative Instruments: | | | | |
| Assets | | | | |
| Futures Contracts | $1,813,263 | $1,813,263 | $-- | $-- |
| Total Assets | $1,813,263 | $1,813,263 | $-- | $-- |
| Total Derivative Instruments: | $1,813,263 | $1,813,263 | $-- | $-- |
Value of Derivative Instruments
The following table is a summary of the Fund's value of derivative instruments by primary risk exposure as of October 31, 2019. For additional information on derivative instruments, please refer to the Derivative Instruments section in the accompanying Notes to Financial Statements.
| Primary Risk Exposure / Derivative Type | Value |
| | Asset | Liability |
| Equity Risk | | |
| Futures Contracts(a) | $1,813,263 | $0 |
| Total Equity Risk | 1,813,263 | 0 |
| Total Value of Derivatives | $1,813,263 | $0 |
(a) Reflects gross cumulative appreciation (depreciation) on futures contracts as presented in the Schedule of Investments. In the Statement of Assets and Liabilities, the period end daily variation margin is included in receivable or payable for daily variation margin on futures contracts, and the net cumulative appreciation (depreciation) is included in Total accumulated earnings (loss).
See accompanying notes which are an integral part of the financial statements.
Fidelity® SAI International Low Volatility Index Fund
Financial Statements
Statement of Assets and Liabilities
| | | October 31, 2019 |
| Assets | | |
Investment in securities, at value — See accompanying schedule:
Unaffiliated issuers (cost $2,341,355,931) | $2,511,096,252 | |
| Fidelity Central Funds (cost $52,437,018) | 52,437,018 | |
| Total Investment in Securities (cost $2,393,792,949) | | $2,563,533,270 |
| Cash | | 8 |
| Foreign currency held at value (cost $1,397,890) | | 1,402,725 |
| Receivable for investments sold | | 222,309 |
| Receivable for fund shares sold | | 7,033,253 |
| Dividends receivable | | 9,927,868 |
| Distributions receivable from Fidelity Central Funds | | 74,326 |
| Prepaid expenses | | 3,559 |
| Other receivables | | 2 |
| Total assets | | 2,582,197,320 |
| Liabilities | | |
| Payable for investments purchased | $32,817,206 | |
| Payable for fund shares redeemed | 605,562 | |
| Accrued management fee | 411,369 | |
| Payable for daily variation margin on futures contracts | 102,600 | |
| Other payables and accrued expenses | 204,696 | |
| Total liabilities | | 34,141,433 |
| Net Assets | | $2,548,055,887 |
| Net Assets consist of: | | |
| Paid in capital | | $2,257,388,246 |
| Total accumulated earnings (loss) | | 290,667,641 |
| Net Assets, for 220,772,487 shares outstanding | | $2,548,055,887 |
| Net Asset Value, offering price and redemption price per share ($2,548,055,887 ÷ 220,772,487 shares) | | $11.54 |
See accompanying notes which are an integral part of the financial statements.
Statement of Operations
| | | Year ended October 31, 2019 |
| Investment Income | | |
| Dividends | | $56,119,653 |
| Interest | | 110,589 |
| Income from Fidelity Central Funds (including $142,848 from security lending) | | 1,607,618 |
| Income before foreign taxes withheld | | 57,837,860 |
| Less foreign taxes withheld | | (5,031,534) |
| Total income | | 52,806,326 |
| Expenses | | |
| Management fee | $2,822,465 | |
| Transfer agent fees | 985,213 | |
| Accounting and security lending fees | 340,418 | |
| Custodian fees and expenses | 302,646 | |
| Independent trustees' fees and expenses | 7,467 | |
| Registration fees | 212,288 | |
| Audit | 87,660 | |
| Legal | 3,200 | |
| Interest | 36,587 | |
| Miscellaneous | 11,185 | |
| Total expenses before reductions | 4,809,129 | |
| Expense reductions | (991,889) | |
| Total expenses after reductions | | 3,817,240 |
| Net investment income (loss) | | 48,989,086 |
| Realized and Unrealized Gain (Loss) | | |
| Net realized gain (loss) on: | | |
| Investment securities: | | |
| Unaffiliated issuers (net of foreign taxes of $25,798) | 99,511,758 | |
| Fidelity Central Funds | (133) | |
| Foreign currency transactions | (1,193,736) | |
| Futures contracts | (5,468,224) | |
| Total net realized gain (loss) | | 92,849,665 |
| Change in net unrealized appreciation (depreciation) on: | | |
| Investment securities: | | |
| Unaffiliated issuers (net of decrease in deferred foreign taxes of $649) | 84,744,260 | |
| Assets and liabilities in foreign currencies | 74,567 | |
| Futures contracts | 6,246,162 | |
| Total change in net unrealized appreciation (depreciation) | | 91,064,989 |
| Net gain (loss) | | 183,914,654 |
| Net increase (decrease) in net assets resulting from operations | | $232,903,740 |
See accompanying notes which are an integral part of the financial statements.
Statement of Changes in Net Assets
| | Year ended October 31, 2019 | Year ended October 31, 2018 |
| Increase (Decrease) in Net Assets | | |
| Operations | | |
| Net investment income (loss) | $48,989,086 | $41,851,298 |
| Net realized gain (loss) | 92,849,665 | 39,840,593 |
| Change in net unrealized appreciation (depreciation) | 91,064,989 | (87,524,066) |
| Net increase (decrease) in net assets resulting from operations | 232,903,740 | (5,832,175) |
| Distributions to shareholders | (41,490,344) | (32,823,660) |
| Share transactions | | |
| Proceeds from sales of shares | 1,485,208,139 | 1,039,598,042 |
| Reinvestment of distributions | 11,543,460 | 18,818,037 |
| Cost of shares redeemed | (676,579,273) | (1,297,746,811) |
| Net increase (decrease) in net assets resulting from share transactions | 820,172,326 | (239,330,732) |
| Total increase (decrease) in net assets | 1,011,585,722 | (277,986,567) |
| Net Assets | | |
| Beginning of period | 1,536,470,165 | 1,814,456,732 |
| End of period | $2,548,055,887 | $1,536,470,165 |
| Other Information | | |
| Shares | | |
| Sold | 135,788,034 | 94,860,500 |
| Issued in reinvestment of distributions | 1,123,998 | 1,740,799 |
| Redeemed | (62,553,001) | (117,730,775) |
| Net increase (decrease) | 74,359,031 | (21,129,476) |
See accompanying notes which are an integral part of the financial statements.
Financial Highlights
Fidelity SAI International Low Volatility Index Fund
| | | | | | |
| Years ended October 31, | 2019 | 2018 | 2017 | 2016 | 2015 A |
| Selected Per–Share Data | | | | | |
| Net asset value, beginning of period | $10.49 | $10.83 | $9.76 | $9.61 | $10.00 |
| Income from Investment Operations | | | | | |
| Net investment income (loss)B | .28 | .27 | .29 | .28 | .10 |
| Net realized and unrealized gain (loss) | 1.04 | (.42) | 1.04 | (.02) | (.49) |
| Total from investment operations | 1.32 | (.15) | 1.33 | .26 | (.39) |
| Distributions from net investment income | (.24) | (.19) | (.22) | (.10) | – |
| Distributions from net realized gain | (.03) | – | (.05) | –C | – |
| Total distributions | (.27) | (.19) | (.26)D | (.11)E | – |
| Net asset value, end of period | $11.54 | $10.49 | $10.83 | $9.76 | $9.61 |
| Total ReturnF,G | 12.89% | (1.47)% | 14.15% | 2.75% | (3.90)% |
| Ratios to Average Net AssetsH,I | | | | | |
| Expenses before reductions | .25% | .30% | .31% | .32% | .40%J |
| Expenses net of fee waivers, if any | .20% | .20% | .20% | .20% | .20%J |
| Expenses net of all reductions | .20% | .20% | .20% | .20% | .20%J |
| Net investment income (loss) | 2.59% | 2.49% | 2.86% | 2.88% | 2.51%J |
| Supplemental Data | | | | | |
| Net assets, end of period (000 omitted) | $2,548,056 | $1,536,470 | $1,814,457 | $1,179,067 | $737,119 |
| Portfolio turnover rateK | 93% | 43% | 25% | 22% | 6%L |
A For the period May 29, 2015 (commencement of operations) to October 31, 2015.
B Calculated based on average shares outstanding during the period.
C Amount represents less than $.005 per share.
D Total distributions of $.26 per share is comprised of distributions from net investment income of $.217 and distributions from net realized gain of $.045 per share.
E Total distributions of $.11 per share is comprised of distributions from net investment income of $.102 and distributions from net realized gain of $.004 per share.
F Total returns for periods of less than one year are not annualized.
G Total returns would have been lower if certain expenses had not been reduced during the applicable periods shown.
H Fees and expenses of any underlying Fidelity Central Funds are not included in the Fund's expense ratio. The Fund indirectly bears its proportionate share of the expenses of any underlying Fidelity Central Funds.
I Expense ratios reflect operating expenses of the Fund. Expenses before reductions do not reflect amounts reimbursed by the investment adviser or reductions from expense offset arrangements and do not represent the amount paid by the Fund during periods when reimbursements or reductions occur. Expense ratios before reductions for start-up periods may not be representative of longer term operating periods. Expenses net of fee waivers reflect expenses after reimbursement by the investment adviser but prior to reductions from expense offset arrangements. Expenses net of all reductions represent the net expenses paid by the Fund.
J Annualized
K Amount does not include the portfolio activity of any underlying Fidelity Central Funds.
L Amount not annualized.
See accompanying notes which are an integral part of the financial statements.
Fidelity® SAI U.S. Low Volatility Index Fund
Performance: The Bottom Line
Average annual total return reflects the change in the value of an investment, assuming reinvestment of distributions from dividend income and capital gains (the profits earned upon the sale of securities that have grown in value, if any) and assuming a constant rate of performance each year. The hypothetical investment and the average annual total returns do not reflect the deduction of taxes that a shareholder would pay on fund distributions or the redemption of fund shares. During periods of reimbursement by Fidelity, a fund’s total return will be greater than it would be had the reimbursement not occurred. How a fund did yesterday is no guarantee of how it will do tomorrow.
Average Annual Total Returns
| For the periods ended October 31, 2019 | Past 1 year | Life of fundA |
| Fidelity® SAI U.S. Low Volatility Index Fund | 17.62% | 12.29% |
A From May 29, 2015
$10,000 Over Life of Fund
Let's say hypothetically that $10,000 was invested in Fidelity® SAI U.S. Low Volatility Index Fund on May 29, 2015, when the fund started.
The chart shows how the value of your investment would have changed, and also shows how the MSCI USA Minimum Volatility (USD) Index, Fidelity U.S. Low Volatility Focus Index, and Fidelity SAI U.S. Low Volatility Index Fund Linked Index performed over the same period.

| Period Ending Values |
| $16,684 | Fidelity® SAI U.S. Low Volatility Index Fund |
| $16,564 | Fidelity U.S. Low Volatility Focus Index |
| $17,036 | MSCI USA Minimum Volatility (USD) Index |
| $16,795 | Fidelity SAI U.S. Low Volatility Index Fund Linked Index |
Effective February 18, 2019, the Fidelity SAI U.S. Low Volatility Index Fund began comparing its performance to the Fidelity U.S. Low Volatility Focus Index rather than the MSCI USA Minimum Volatility Index as a result of the change to the fund’s investment policies.
Fidelity® SAI U.S. Low Volatility Index Fund
Management's Discussion of Fund Performance
Market Recap: The S&P 500
® index gained 14.33% for the 12 months ending October 31, 2019, ending the period just shy of a record close after seesawing due to trade tension, interest rates, economic data and an inverted yield curve, among other factors. Upbeat company earnings and outlooks, along with signs the Federal Reserve may pause on rates, boosted stocks to an all-time high on April 30. In May, however, volatility spiked and the index sunk as trade negotiations between the U.S. and China broke down. The bull market roared back in June and recorded a series of highs in July, when the Fed, affirming a dovish shift in policy, cut interest rates for the first time since 2008. Volatility intensified in August, however, as the U.S. Treasury yield curve inverted for the first time since 2007, which some investors viewed as a sign the U.S. economy could be heading for recession. The market proved resilient, rising in the final two months and reaching a new high on October 30, when the Fed cut interest rates for the third time this year. For the full 12 months, the defensive real estate (+27%) and utilities (+24%) sectors led the way, followed by information technology (+23%). Communication services and consumer discretionary each gained about 16%, while industrials advanced 15%. In contrast, energy (-11%) was by far the weakest sector – slipping on lower oil prices. Other notable laggards included health care (+9%) and financials (+12%). Lastly, consumer staples and materials finished roughly in line with the index.
Comments from the passive equity index team of Geode Capital Management, LLC: For the fiscal year, the fund gained 17.62%, compared with an increase of 17.74% for the fund's supplemental benchmark, the Fidelity SAI U.S. Low Volatility Index Fund Linked Index. Among major fund positions, consumer-goods company Procter & Gamble (+45%) benefited from better-than-expected sales. Continued growth in cashless payments contributed to a strong gain for payment processor Visa (+31%). Earnings growth and a decision to buy back stock helped drive shares of software company Microsoft (+36%). Other contributors included telecommunication services firm AT&T (+33%) and consumer electronics giant Apple (+15%). Conversely, ample oil supply weighed on energy stocks, especially Exxon Mobil (-11%). Technology company 3M (-18%) suffered due to job cuts and weaker-than-expected quarter results. Tobacco company Altria Group (-24%) also struggled, reflecting competitive pressures and mounting concern about the health impact of e-cigarettes. In late 2018, Altria established a 35% stake in Juul Labs, the leader in this market segment.
The views expressed above reflect those of the portfolio manager(s) only through the end of the period as stated on the cover of this report and do not necessarily represent the views of Fidelity or any other person in the Fidelity organization. Any such views are subject to change at any time based upon market or other conditions and Fidelity disclaims any responsibility to update such views. These views may not be relied on as investment advice and, because investment decisions for a Fidelity fund are based on numerous factors, may not be relied on as an indication of trading intent on behalf of any Fidelity fund.
Notes to Shareholders: On February 18, 2019, Fidelity SAI U.S. Minimum Volatility Index Fund was renamed Fidelity SAI U.S. Low Volatility Index Fund, and its primary benchmark changed from the MSCI USA Minimum Volatility Index to the Fidelity U.S. Low Volatility Focus Index.
On March 22, 2019, Pat Waddell retired and is no longer a portfolio manager with Geode Capital Management.
Fidelity® SAI U.S. Low Volatility Index Fund
Investment Summary (Unaudited)
Top Ten Stocks as of October 31, 2019
| | % of fund's net assets |
| Johnson & Johnson | 3.2 |
| AT&T, Inc. | 3.2 |
| Procter & Gamble Co. | 3.2 |
| Visa, Inc. Class A | 3.0 |
| Verizon Communications, Inc. | 3.0 |
| Intel Corp. | 2.8 |
| UnitedHealth Group, Inc. | 2.8 |
| Exxon Mobil Corp. | 2.6 |
| Walmart, Inc. | 2.4 |
| McDonald's Corp. | 2.3 |
| | 28.5 |
Top Five Market Sectors as of October 31, 2019
| | % of fund's net assets |
| Information Technology | 20.4 |
| Health Care | 13.6 |
| Financials | 12.2 |
| Consumer Discretionary | 10.8 |
| Consumer Staples | 9.0 |
Asset Allocation (% of fund's net assets)
| As of October 31, 2019 * |
| | Stocks and Equity Futures | 99.9% |
| | Short-Term Investments and Net Other Assets (Liabilities) | 0.1% |

* Foreign investments - 6.1%
Fidelity® SAI U.S. Low Volatility Index Fund
Schedule of Investments October 31, 2019
Showing Percentage of Net Assets
| Common Stocks - 99.8% | | | |
| | | Shares | Value |
| COMMUNICATION SERVICES - 8.4% | | | |
| Diversified Telecommunication Services - 6.2% | | | |
| AT&T, Inc. | | 3,402,626 | $130,967,075 |
| Verizon Communications, Inc. | | 2,047,505 | 123,812,627 |
| | | | 254,779,702 |
| Entertainment - 0.1% | | | |
| Cinemark Holdings, Inc. (a) | | 76,855 | 2,812,893 |
| Interactive Media & Services - 1.2% | | | |
| Alphabet, Inc. Class A (b) | | 21,130 | 26,598,444 |
| Facebook, Inc. Class A (b) | | 126,898 | 24,320,002 |
| | | | 50,918,446 |
| Media - 0.4% | | | |
| Cable One, Inc. (a) | | 3,577 | 4,740,848 |
| Omnicom Group, Inc. | | 158,789 | 12,256,923 |
| | | | 16,997,771 |
| Wireless Telecommunication Services - 0.5% | | | |
| T-Mobile U.S., Inc. (b) | | 227,971 | 18,844,083 |
|
| TOTAL COMMUNICATION SERVICES | | | 344,352,895 |
|
| CONSUMER DISCRETIONARY - 10.8% | | | |
| Diversified Consumer Services - 0.3% | | | |
| Bright Horizons Family Solutions, Inc. (b) | | 42,239 | 6,273,336 |
| H&R Block, Inc. (a) | | 146,618 | 3,663,984 |
| | | | 9,937,320 |
| Hotels, Restaurants & Leisure - 5.5% | | | |
| Cracker Barrel Old Country Store, Inc. (a) | | 16,935 | 2,633,393 |
| Darden Restaurants, Inc. | | 88,692 | 9,957,451 |
| Domino's Pizza, Inc. (a) | | 27,540 | 7,480,415 |
| Dunkin' Brands Group, Inc. | | 59,605 | 4,686,145 |
| McDonald's Corp. | | 489,688 | 96,321,630 |
| Starbucks Corp. | | 873,537 | 73,866,289 |
| Texas Roadhouse, Inc. Class A | | 44,003 | 2,486,170 |
| Vail Resorts, Inc. | | 28,423 | 6,604,653 |
| Yum! Brands, Inc. | | 220,674 | 22,444,753 |
| | | | 226,480,899 |
| Household Durables - 0.2% | | | |
| NVR, Inc. (b) | | 2,126 | 7,731,390 |
| Internet & Direct Marketing Retail - 0.7% | | | |
| Amazon.com, Inc. (b) | | 16,437 | 29,202,960 |
| Multiline Retail - 0.7% | | | |
| Target Corp. | | 268,020 | 28,654,018 |
| Specialty Retail - 1.7% | | | |
| AutoZone, Inc. (b) | | 17,691 | 20,245,227 |
| TJX Companies, Inc. | | 874,596 | 50,420,459 |
| | | | 70,665,686 |
| Textiles, Apparel & Luxury Goods - 1.7% | | | |
| Carter's, Inc. (a) | | 32,069 | 3,214,597 |
| NIKE, Inc. Class B | | 751,055 | 67,256,975 |
| | | | 70,471,572 |
|
| TOTAL CONSUMER DISCRETIONARY | | | 443,143,845 |
|
| CONSUMER STAPLES - 9.0% | | | |
| Beverages - 1.5% | | | |
| PepsiCo, Inc. | | 458,362 | 62,873,516 |
| Food & Staples Retailing - 2.9% | | | |
| Sysco Corp. | | 263,116 | 21,015,075 |
| Walmart, Inc. | | 860,634 | 100,917,943 |
| | | | 121,933,018 |
| Food Products - 0.8% | | | |
| Hormel Foods Corp. (a) | | 192,056 | 7,853,170 |
| McCormick & Co., Inc. (non-vtg.) | | 86,364 | 13,877,831 |
| The Hershey Co. | | 67,710 | 9,944,568 |
| | | | 31,675,569 |
| Household Products - 3.8% | | | |
| Church & Dwight Co., Inc. | | 173,218 | 12,114,867 |
| Clorox Co. | | 90,281 | 13,333,601 |
| Procter & Gamble Co. | | 1,048,693 | 130,572,765 |
| | | | 156,021,233 |
|
| TOTAL CONSUMER STAPLES | | | 372,503,336 |
|
| ENERGY - 2.6% | | | |
| Oil, Gas & Consumable Fuels - 2.6% | | | |
| Exxon Mobil Corp. | | 1,595,548 | 107,811,178 |
| FINANCIALS - 12.2% | | | |
| Banks - 2.6% | | | |
| Bank of Hawaii Corp. (a) | | 29,031 | 2,534,697 |
| Commerce Bancshares, Inc. (a) | | 70,933 | 4,565,248 |
| First Republic Bank | | 114,254 | 12,152,055 |
| M&T Bank Corp. | | 27,720 | 4,339,012 |
| U.S. Bancorp | | 1,059,861 | 60,433,274 |
| Wells Fargo & Co. | | 436,850 | 22,554,566 |
| | | | 106,578,852 |
| Capital Markets - 3.0% | | | |
| Cboe Global Markets, Inc. | | 80,567 | 9,277,290 |
| CME Group, Inc. | | 258,175 | 53,119,506 |
| FactSet Research Systems, Inc. | | 23,143 | 5,867,213 |
| Intercontinental Exchange, Inc. | | 406,668 | 38,356,926 |
| MarketAxess Holdings, Inc. | | 27,188 | 10,021,225 |
| The NASDAQ OMX Group, Inc. | | 81,568 | 8,138,039 |
| | | | 124,780,199 |
| Insurance - 6.3% | | | |
| AFLAC, Inc. | | 537,644 | 28,581,155 |
| Allstate Corp. | | 233,842 | 24,885,466 |
| American Financial Group, Inc. | | 49,701 | 5,170,892 |
| Arch Capital Group Ltd. (b) | | 291,229 | 12,161,723 |
| Arthur J. Gallagher & Co. | | 133,607 | 12,187,631 |
| Brown & Brown, Inc. | | 168,833 | 6,361,627 |
| Chubb Ltd. | | 330,224 | 50,332,742 |
| Cincinnati Financial Corp. | | 84,155 | 9,527,188 |
| Erie Indemnity Co. Class A (a) | | 14,324 | 2,639,483 |
| Everest Re Group Ltd. | | 29,378 | 7,552,790 |
| Globe Life, Inc. | | 68,766 | 6,692,995 |
| Hanover Insurance Group, Inc. | | 29,354 | 3,866,215 |
| Loews Corp. | | 191,985 | 9,407,265 |
| Marsh & McLennan Companies, Inc. | | 368,789 | 38,213,916 |
| Progressive Corp. | | 397,009 | 27,671,527 |
| Reinsurance Group of America, Inc. | | 43,226 | 7,022,928 |
| W.R. Berkley Corp. | | 104,334 | 7,292,947 |
| | | | 259,568,490 |
| Mortgage Real Estate Investment Trusts - 0.3% | | | |
| Blackstone Mortgage Trust, Inc. | | 96,851 | 3,515,691 |
| Chimera Investment Corp. | | 131,764 | 2,669,539 |
| MFA Financial, Inc. | | 324,948 | 2,466,355 |
| Starwood Property Trust, Inc. | | 202,154 | 4,972,988 |
| | | | 13,624,573 |
|
| TOTAL FINANCIALS | | | 504,552,114 |
|
| HEALTH CARE - 13.6% | | | |
| Health Care Equipment & Supplies - 1.7% | | | |
| ResMed, Inc. | | 103,417 | 15,297,443 |
| Stryker Corp. | | 213,232 | 46,115,685 |
| Varian Medical Systems, Inc. (b) | | 59,512 | 7,189,645 |
| | | | 68,602,773 |
| Health Care Providers & Services - 5.2% | | | |
| Anthem, Inc. | | 105,104 | 28,281,384 |
| Cigna Corp. | | 181,352 | 32,364,078 |
| Encompass Health Corp. | | 69,557 | 4,453,039 |
| HCA Holdings, Inc. | | 188,119 | 25,121,411 |
| Quest Diagnostics, Inc. | | 85,210 | 8,627,513 |
| UnitedHealth Group, Inc. | | 458,765 | 115,929,916 |
| | | | 214,777,341 |
| Pharmaceuticals - 6.7% | | | |
| Eli Lilly & Co. | | 623,159 | 71,008,968 |
| Johnson & Johnson | | 998,369 | 131,824,643 |
| Pfizer, Inc. | | 1,942,101 | 74,518,415 |
| | | | 277,352,026 |
|
| TOTAL HEALTH CARE | | | 560,732,140 |
|
| INDUSTRIALS - 7.6% | | | |
| Aerospace & Defense - 3.5% | | | |
| Lockheed Martin Corp. | | 165,334 | 62,278,011 |
| Northrop Grumman Corp. | | 117,566 | 41,439,664 |
| Raytheon Co. | | 198,815 | 42,190,531 |
| | | | 145,908,206 |
| Air Freight & Logistics - 0.4% | | | |
| C.H. Robinson Worldwide, Inc. (a) | | 98,491 | 7,449,859 |
| Expeditors International of Washington, Inc. | | 120,928 | 8,820,488 |
| | | | 16,270,347 |
| Commercial Services & Supplies - 1.5% | | | |
| Cintas Corp. | | 41,707 | 11,205,420 |
| Republic Services, Inc. | | 155,395 | 13,598,616 |
| Rollins, Inc. (a) | | 106,299 | 4,051,055 |
| Waste Management, Inc. | | 281,784 | 31,618,983 |
| | | | 60,474,074 |
| Industrial Conglomerates - 1.5% | | | |
| 3M Co. | | 193,453 | 31,917,810 |
| Honeywell International, Inc. | | 166,012 | 28,675,253 |
| | | | 60,593,063 |
| Machinery - 0.1% | | | |
| Toro Co. | | 76,763 | 5,920,730 |
| Professional Services - 0.5% | | | |
| Exponent, Inc. | | 37,432 | 2,378,055 |
| Verisk Analytics, Inc. | | 118,039 | 17,080,243 |
| | | | 19,458,298 |
| Trading Companies & Distributors - 0.1% | | | |
| Watsco, Inc. | | 22,573 | 3,979,620 |
|
| TOTAL INDUSTRIALS | | | 312,604,338 |
|
| INFORMATION TECHNOLOGY - 20.4% | | | |
| Communications Equipment - 0.1% | | | |
| F5 Networks, Inc. (b) | | 41,872 | 6,032,918 |
| Electronic Equipment & Components - 0.6% | | | |
| Amphenol Corp. Class A | | 209,979 | 21,067,193 |
| Dolby Laboratories, Inc. Class A | | 40,540 | 2,607,938 |
| | | | 23,675,131 |
| IT Services - 10.2% | | | |
| Accenture PLC Class A | | 449,033 | 83,259,699 |
| Amdocs Ltd. | | 98,901 | 6,448,345 |
| Automatic Data Processing, Inc. | | 306,867 | 49,783,033 |
| Broadridge Financial Solutions, Inc. | | 83,761 | 10,488,552 |
| CoreLogic, Inc. (b) | | 56,419 | 2,284,405 |
| Fidelity National Information Services, Inc. | | 442,009 | 58,239,106 |
| Fiserv, Inc. (b) | | 410,982 | 43,621,629 |
| Genpact Ltd. | | 109,804 | 4,301,023 |
| Jack Henry & Associates, Inc. | | 54,365 | 7,695,909 |
| MasterCard, Inc. Class A | | 37,640 | 10,419,128 |
| Paychex, Inc. | | 230,688 | 19,294,744 |
| Visa, Inc. Class A (a) | | 698,345 | 124,905,987 |
| | | | 420,741,560 |
| Semiconductors & Semiconductor Equipment - 2.8% | | | |
| Intel Corp. | | 2,070,365 | 117,037,733 |
| Software - 5.2% | | | |
| CDK Global, Inc. | | 87,724 | 4,433,571 |
| Check Point Software Technologies Ltd. (b) | | 88,936 | 9,997,296 |
| Intuit, Inc. | | 110,512 | 28,456,840 |
| j2 Global, Inc. | | 32,628 | 3,098,355 |
| Microsoft Corp. | | 524,548 | 75,204,447 |
| Oracle Corp. | | 1,697,233 | 92,482,226 |
| | | | 213,672,735 |
| Technology Hardware, Storage & Peripherals - 1.5% | | | |
| Apple, Inc. | | 245,805 | 61,146,452 |
|
| TOTAL INFORMATION TECHNOLOGY | | | 842,306,529 |
|
| MATERIALS - 3.8% | | | |
| Chemicals - 3.7% | | | |
| Air Products & Chemicals, Inc. | | 158,763 | 33,857,797 |
| Ecolab, Inc. | | 182,939 | 35,137,094 |
| Linde PLC | | 391,452 | 77,644,504 |
| NewMarket Corp. | | 6,294 | 3,055,674 |
| | | | 149,695,069 |
| Containers & Packaging - 0.1% | | | |
| Aptargroup, Inc. | | 45,575 | 5,384,686 |
|
| TOTAL MATERIALS | | | 155,079,755 |
|
| REAL ESTATE - 5.9% | | | |
| Equity Real Estate Investment Trusts (REITs) - 5.9% | | | |
| American Campus Communities, Inc. | | 87,514 | 4,373,950 |
| American Tower Corp. | | 43,679 | 9,525,516 |
| AvalonBay Communities, Inc. | | 97,569 | 21,236,869 |
| Crown Castle International Corp. | | 299,839 | 41,614,655 |
| CubeSmart | | 131,239 | 4,160,276 |
| EPR Properties | | 42,482 | 3,304,675 |
| Equity Lifestyle Properties, Inc. | | 129,718 | 9,072,477 |
| Essex Property Trust, Inc. | | 31,832 | 10,413,202 |
| Extra Space Storage, Inc. | | 89,672 | 10,067,475 |
| Federal Realty Investment Trust (SBI) | | 52,385 | 7,124,884 |
| Gaming & Leisure Properties | | 124,045 | 5,006,456 |
| Mid-America Apartment Communities, Inc. | | 69,413 | 9,647,713 |
| National Health Investors, Inc. | | 31,156 | 2,672,873 |
| National Retail Properties, Inc. | | 117,327 | 6,911,734 |
| Public Storage | | 108,247 | 24,123,926 |
| Realty Income Corp. | | 227,051 | 18,570,501 |
| Simon Property Group, Inc. | | 217,639 | 32,793,845 |
| Store Capital Corp. | | 145,752 | 5,902,956 |
| Ventas, Inc. | | 243,375 | 15,843,713 |
| | | | 242,367,696 |
| UTILITIES - 5.5% | | | |
| Electric Utilities - 2.9% | | | |
| Duke Energy Corp. | | 525,079 | 49,493,947 |
| Eversource Energy | | 193,959 | 16,242,127 |
| Portland General Electric Co. | | 38,446 | 2,186,808 |
| Southern Co. | | 450,404 | 28,222,315 |
| Xcel Energy, Inc. | | 371,190 | 23,574,277 |
| | | | 119,719,474 |
| Gas Utilities - 0.1% | | | |
| Spire, Inc. | | 35,208 | 2,959,584 |
| Multi-Utilities - 2.2% | | | |
| CMS Energy Corp. | | 193,043 | 12,339,309 |
| Consolidated Edison, Inc. | | 219,624 | 20,253,725 |
| Dominion Energy, Inc. | | 360,311 | 29,743,673 |
| DTE Energy Co. | | 78,497 | 9,994,238 |
| WEC Energy Group, Inc. | | 197,995 | 18,690,728 |
| | | | 91,021,673 |
| Water Utilities - 0.3% | | | |
| American Water Works Co., Inc. | | 113,715 | 14,017,648 |
|
| TOTAL UTILITIES | | | 227,718,379 |
|
| TOTAL COMMON STOCKS | | | |
| (Cost $3,603,096,676) | | | 4,113,172,205 |
| | | Principal Amount | Value |
|
| U.S. Treasury Obligations - 0.0% | | | |
| U.S. Treasury Bills, yield at date of purchase 1.7% to 1.82% 12/19/19 to 3/19/20 (c) | | | |
| (Cost $437,969) | | 440,000 | 438,299 |
| | | Shares | Value |
|
| Money Market Funds - 3.9% | | | |
| Fidelity Cash Central Fund 1.83% (d) | | 22,584,548 | $22,589,065 |
| Fidelity Securities Lending Cash Central Fund 1.84% (d)(e) | | 138,568,613 | 138,582,470 |
| TOTAL MONEY MARKET FUNDS | | | |
| (Cost $161,171,513) | | | 161,171,535 |
| TOTAL INVESTMENT IN SECURITIES - 103.7% | | | |
| (Cost $3,764,706,158) | | | 4,274,782,039 |
| NET OTHER ASSETS (LIABILITIES) - (3.7)% | | | (154,240,541) |
| NET ASSETS - 100% | | | $4,120,541,498 |
| Futures Contracts | | | | | |
| | Number of contracts | Expiration Date | Notional Amount | Value | Unrealized Appreciation/(Depreciation) |
| Purchased | | | | | |
| Equity Index Contracts | | | | | |
| CME E-mini S&P 500 Index Contracts (United States) | 36 | Dec. 2019 | $5,464,440 | $218,206 | $218,206 |
| CME E-mini S&P MidCap 400 Index Contracts (United States) | 10 | Dec. 2019 | 1,955,000 | 71,043 | 71,043 |
| TOTAL FUTURES CONTRACTS | | | | | $289,249 |
The notional amount of futures purchased as a percentage of Net Assets is 0.2%
Legend
(a) Security or a portion of the security is on loan at period end.
(b) Non-income producing
(c) Security or a portion of the security was pledged to cover margin requirements for futures contracts. At period end, the value of securities pledged amounted to $438,299.
(d) Affiliated fund that is generally available only to investment companies and other accounts managed by Fidelity Investments. The rate quoted is the annualized seven-day yield of the fund at period end. A complete unaudited listing of the fund's holdings as of its most recent quarter end is available upon request. In addition, each Fidelity Central Fund's financial statements, which are not covered by the Fund's Report of Independent Registered Public Accounting Firm, are available on the SEC's website or upon request.
(e) Investment made with cash collateral received from securities on loan.
Affiliated Central Funds
Information regarding fiscal year to date income earned by the Fund from investments in Fidelity Central Funds is as follows:
| Fund | Income earned |
| Fidelity Cash Central Fund | $438,239 |
| Fidelity Securities Lending Cash Central Fund | 444,396 |
| Total | $882,635 |
Amounts in the income column in the above table include any capital gain distributions from underlying funds, which are presented in the corresponding line-item in the Statement of Operations, if applicable. Amount for Fidelity Securities Lending Cash Central Fund represents the income earned on investing cash collateral, less rebates paid to borrowers and any lending agent fees associated with the loan, plus any premium payments received for lending certain types of securities.
Investment Valuation
The following is a summary of the inputs used, as of October 31, 2019, involving the Fund's assets and liabilities carried at fair value. The inputs or methodology used for valuing securities may not be an indication of the risk associated with investing in those securities. For more information on valuation inputs, and their aggregation into the levels used below, please refer to the Investment Valuation section in the accompanying Notes to Financial Statements.
| | Valuation Inputs at Reporting Date: |
| Description | Total | Level 1 | Level 2 | Level 3 |
| Investments in Securities: | | | | |
| Equities: | | | | |
| Communication Services | $344,352,895 | $344,352,895 | $-- | $-- |
| Consumer Discretionary | 443,143,845 | 443,143,845 | -- | -- |
| Consumer Staples | 372,503,336 | 372,503,336 | -- | -- |
| Energy | 107,811,178 | 107,811,178 | -- | -- |
| Financials | 504,552,114 | 504,552,114 | -- | -- |
| Health Care | 560,732,140 | 560,732,140 | -- | -- |
| Industrials | 312,604,338 | 312,604,338 | -- | -- |
| Information Technology | 842,306,529 | 842,306,529 | -- | -- |
| Materials | 155,079,755 | 155,079,755 | -- | -- |
| Real Estate | 242,367,696 | 242,367,696 | -- | -- |
| Utilities | 227,718,379 | 227,718,379 | -- | -- |
| U.S. Government and Government Agency Obligations | 438,299 | -- | 438,299 | -- |
| Money Market Funds | 161,171,535 | 161,171,535 | -- | -- |
| Total Investments in Securities: | $4,274,782,039 | $4,274,343,740 | $438,299 | $-- |
| Derivative Instruments: | | | | |
| Assets | | | | |
| Futures Contracts | $289,249 | $289,249 | $-- | $-- |
| Total Assets | $289,249 | $289,249 | $-- | $-- |
| Total Derivative Instruments: | $289,249 | $289,249 | $-- | $-- |
Value of Derivative Instruments
The following table is a summary of the Fund's value of derivative instruments by primary risk exposure as of October 31, 2019. For additional information on derivative instruments, please refer to the Derivative Instruments section in the accompanying Notes to Financial Statements.
| Primary Risk Exposure / Derivative Type | Value |
| | Asset | Liability |
| Equity Risk | | |
| Futures Contracts(a) | $289,249 | $0 |
| Total Equity Risk | 289,249 | 0 |
| Total Value of Derivatives | $289,249 | $0 |
(a) Reflects gross cumulative appreciation (depreciation) on futures contracts as presented in the Schedule of Investments. In the Statement of Assets and Liabilities, the period end daily variation margin is included in receivable or payable for daily variation margin on futures contracts, and the net cumulative appreciation (depreciation) is included in Total accumulated earnings (loss).
See accompanying notes which are an integral part of the financial statements.
Fidelity® SAI U.S. Low Volatility Index Fund
Financial Statements
Statement of Assets and Liabilities
| | | October 31, 2019 |
| Assets | | |
Investment in securities, at value (including securities loaned of $135,226,393) — See accompanying schedule:
Unaffiliated issuers (cost $3,603,534,645) | $4,113,610,504 | |
| Fidelity Central Funds (cost $161,171,513) | 161,171,535 | |
| Total Investment in Securities (cost $3,764,706,158) | | $4,274,782,039 |
| Segregated cash with brokers for derivative instruments | | 369,786 |
| Receivable for fund shares sold | | 11,642,592 |
| Dividends receivable | | 5,144,202 |
| Distributions receivable from Fidelity Central Funds | | 42,951 |
| Prepaid expenses | | 5,790 |
| Other receivables | | 28 |
| Total assets | | 4,291,987,388 |
| Liabilities | | |
| Payable for investments purchased | $30,989,643 | |
| Payable for fund shares redeemed | 1,090,554 | |
| Accrued management fee | 438,028 | |
| Payable for daily variation margin on futures contracts | 96,173 | |
| Other payables and accrued expenses | 253,709 | |
| Collateral on securities loaned | 138,577,783 | |
| Total liabilities | | 171,445,890 |
| Net Assets | | $4,120,541,498 |
| Net Assets consist of: | | |
| Paid in capital | | $3,477,350,579 |
| Total accumulated earnings (loss) | | 643,190,919 |
| Net Assets, for 272,560,666 shares outstanding | | $4,120,541,498 |
| Net Asset Value, offering price and redemption price per share ($4,120,541,498 ÷ 272,560,666 shares) | | $15.12 |
See accompanying notes which are an integral part of the financial statements.
Statement of Operations
| | | Year ended October 31, 2019 |
| Investment Income | | |
| Dividends | | $66,692,390 |
| Interest | | 19,336 |
| Income from Fidelity Central Funds (including $444,396 from security lending) | | 882,635 |
| Total income | | 67,594,361 |
| Expenses | | |
| Management fee | $3,052,128 | |
| Transfer agent fees | 1,569,901 | |
| Accounting and security lending fees | 501,963 | |
| Custodian fees and expenses | 75,607 | |
| Independent trustees' fees and expenses | 11,750 | |
| Registration fees | 408,234 | |
| Audit | 54,347 | |
| Legal | 5,675 | |
| Interest | 1,697 | |
| Miscellaneous | 15,672 | |
| Total expenses before reductions | 5,696,974 | |
| Expense reductions | (1,080,193) | |
| Total expenses after reductions | | 4,616,781 |
| Net investment income (loss) | | 62,977,580 |
| Realized and Unrealized Gain (Loss) | | |
| Net realized gain (loss) on: | | |
| Investment securities: | | |
| Unaffiliated issuers | 112,016,634 | |
| Fidelity Central Funds | 1,471 | |
| Futures contracts | 749,163 | |
| Total net realized gain (loss) | | 112,767,268 |
| Change in net unrealized appreciation (depreciation) on: | | |
| Investment securities: | | |
| Unaffiliated issuers | 332,475,453 | |
| Fidelity Central Funds | 22 | |
| Futures contracts | 217,925 | |
| Total change in net unrealized appreciation (depreciation) | | 332,693,400 |
| Net gain (loss) | | 445,460,668 |
| Net increase (decrease) in net assets resulting from operations | | $508,438,248 |
See accompanying notes which are an integral part of the financial statements.
Statement of Changes in Net Assets
| | Year ended October 31, 2019 | Year ended October 31, 2018 |
| Increase (Decrease) in Net Assets | | |
| Operations | | |
| Net investment income (loss) | $62,977,580 | $29,733,823 |
| Net realized gain (loss) | 112,767,268 | 15,342,381 |
| Change in net unrealized appreciation (depreciation) | 332,693,400 | 88,341,936 |
| Net increase (decrease) in net assets resulting from operations | 508,438,248 | 133,418,140 |
| Distributions to shareholders | (54,799,991) | (36,966,621) |
| Share transactions | | |
| Proceeds from sales of shares | 2,407,697,652 | 1,711,878,423 |
| Reinvestment of distributions | 16,697,276 | 11,753,177 |
| Cost of shares redeemed | (737,165,017) | (688,798,167) |
| Net increase (decrease) in net assets resulting from share transactions | 1,687,229,911 | 1,034,833,433 |
| Total increase (decrease) in net assets | 2,140,868,168 | 1,131,284,952 |
| Net Assets | | |
| Beginning of period | 1,979,673,330 | 848,388,378 |
| End of period | $4,120,541,498 | $1,979,673,330 |
| Other Information | | |
| Shares | | |
| Sold | 173,126,994 | 135,974,905 |
| Issued in reinvestment of distributions | 1,300,351 | 934,275 |
| Redeemed | (52,084,717) | (54,004,780) |
| Net increase (decrease) | 122,342,628 | 82,904,400 |
See accompanying notes which are an integral part of the financial statements.
Financial Highlights
Fidelity SAI U.S. Low Volatility Index Fund
| | | | | | |
| Years ended October 31, | 2019 | 2018 | 2017 | 2016 | 2015 A |
| Selected Per–Share Data | | | | | |
| Net asset value, beginning of period | $13.18 | $12.60 | $10.86 | $10.22 | $10.00 |
| Income from Investment Operations | | | | | |
| Net investment income (loss)B | .29 | .26 | .24 | .23 | .09 |
| Net realized and unrealized gain (loss) | 1.98 | .82 | 1.74 | .53 | .13 |
| Total from investment operations | 2.27 | 1.08 | 1.98 | .76 | .22 |
| Distributions from net investment income | (.20) | (.14) | (.24) | (.12) | – |
| Distributions from net realized gain | (.13) | (.37) | – | –C | – |
| Total distributions | (.33) | (.50)D | (.24) | (.12) | – |
| Net asset value, end of period | $15.12 | $13.18 | $12.60 | $10.86 | $10.22 |
| Total ReturnE,F | 17.62% | 8.79% | 18.60% | 7.56% | 2.20% |
| Ratios to Average Net AssetsG,H | | | | | |
| Expenses before reductions | .19% | .23% | .26% | .23% | .31%I |
| Expenses net of fee waivers, if any | .15% | .15% | .15% | .15% | .15%I |
| Expenses net of all reductions | .15% | .15% | .15% | .15% | .15%I |
| Net investment income (loss) | 2.05% | 2.00% | 2.04% | 2.12% | 2.08%I |
| Supplemental Data | | | | | |
| Net assets, end of period (000 omitted) | $4,120,541 | $1,979,673 | $848,388 | $948,587 | $669,739 |
| Portfolio turnover rateJ | 72% | 39% | 108% | 37% | 3%K |
A For the period May 29, 2015 (commencement of operations) to October 31, 2015.
B Calculated based on average shares outstanding during the period.
C Amount represents less than $.005 per share.
D Total distributions of $.50 per share is comprised of distributions from net investment income of $.136 and distributions from net realized gain of $.368 per share.
E Total returns for periods of less than one year are not annualized.
F Total returns would have been lower if certain expenses had not been reduced during the applicable periods shown.
G Fees and expenses of any underlying Fidelity Central Funds are not included in the Fund's expense ratio. The Fund indirectly bears its proportionate share of the expenses of any underlying Fidelity Central Funds.
H Expense ratios reflect operating expenses of the Fund. Expenses before reductions do not reflect amounts reimbursed by the investment adviser or reductions from expense offset arrangements and do not represent the amount paid by the Fund during periods when reimbursements or reductions occur. Expense ratios before reductions for start-up periods may not be representative of longer term operating periods. Expenses net of fee waivers reflect expenses after reimbursement by the investment adviser but prior to reductions from expense offset arrangements. Expenses net of all reductions represent the net expenses paid by the Fund.
I Annualized
J Amount does not include the portfolio activity of any underlying Fidelity Central Funds.
K Amount not annualized.
See accompanying notes which are an integral part of the financial statements.
Notes to Financial Statements
For the period ended October 31, 2019
1. Organization.
Fidelity SAI Emerging Markets Low Volatility Index Fund, Fidelity SAI International Low Volatility Index Fund (formerly Fidelity SAI International Minimum Volatility Index Fund) and Fidelity SAI U.S. Low Volatility Index Fund (formerly Fidelity SAI U.S. Minimum Volatility Index Fund)(the Funds) are funds of Fidelity Salem Street Trust (the Trust). Each Fund is authorized to issue an unlimited number of shares. Shares are offered only to certain clients of Fidelity Management & Research Company (FMR) or its affiliates. The Trust is registered under the Investment Company Act of 1940, as amended (the 1940 Act), as an open-end management investment company organized as a Massachusetts business trust. Investments in emerging markets, if applicable, can be subject to social, economic, regulatory, and political uncertainties and can be extremely volatile.
2. Investments in Fidelity Central Funds.
The Funds invest in Fidelity Central Funds, which are open-end investment companies generally available only to other investment companies and accounts managed by the investment adviser and its affiliates. The Funds' Schedules of Investments list each of the Fidelity Central Funds held as of period end, if any, as an investment of each Fund, but do not include the underlying holdings of each Fidelity Central Fund. As an Investing Fund, each Fund indirectly bears its proportionate share of the expenses of the underlying Fidelity Central Funds.
The Money Market Central Funds seek preservation of capital and current income and are managed by Fidelity Investments Money Management, Inc. (FIMM), an affiliate of the investment adviser. Annualized expenses of the Money Market Central Funds as of their most recent shareholder report date ranged from less than .005% to .01%.
A complete unaudited list of holdings for each Fidelity Central Fund is available upon request or at the Securities and Exchange Commission (the SEC) website at www.sec.gov. In addition, the financial statements of the Fidelity Central Funds, which are not covered by the Funds' Report of Independent Registered Public Accounting Firm, are available on the SEC website or upon request.
3. Significant Accounting Policies.
Each Fund is an investment company and applies the accounting and reporting guidance of the Financial Accounting Standards Board (FASB) Accounting Standards Codification Topic 946 Financial Services – Investments Companies. The financial statements have been prepared in conformity with accounting principles generally accepted in the United States of America (GAAP), which require management to make certain estimates and assumptions at the date of the financial statements. Actual results could differ from those estimates. Subsequent events, if any, through the date that the financial statements were issued have been evaluated in the preparation of the financial statements. The following summarizes the significant accounting policies of the Funds:
Investment Valuation. Investments are valued as of 4:00 p.m. Eastern time on the last calendar day of the period. The Board of Trustees (the Board) has delegated the day to day responsibility for the valuation of each Fund's investments to the Fair Value Committee (the Committee) established by each Fund's investment adviser. In accordance with valuation policies and procedures approved by the Board, each Fund attempts to obtain prices from one or more third party pricing vendors or brokers to value its investments. When current market prices, quotations or currency exchange rates are not readily available or reliable, investments will be fair valued in good faith by the Committee, in accordance with procedures adopted by the Board. Factors used in determining fair value vary by investment type and may include market or investment specific events, changes in interest rates and credit quality. The frequency with which these procedures are used cannot be predicted and they may be utilized to a significant extent. The Committee oversees each Fund's valuation policies and procedures and reports to the Board on the Committee's activities and fair value determinations. The Board monitors the appropriateness of the procedures used in valuing each Fund's investments and ratifies the fair value determinations of the Committee.
Each Fund categorizes the inputs to valuation techniques used to value its investments into a disclosure hierarchy consisting of three levels as shown below:
- Level 1 – quoted prices in active markets for identical investments
- Level 2 – other significant observable inputs (including quoted prices for similar investments, interest rates, prepayment speeds, etc.)
- Level 3 – unobservable inputs (including the Fund's own assumptions based on the best information available)
Valuation techniques used to value each Fund's investments by major category are as follows:
Equity securities, including restricted securities, for which market quotations are readily available, are valued at the last reported sale price or official closing price as reported by a third party pricing vendor on the primary market or exchange on which they are traded and are categorized as Level 1 in the hierarchy. In the event there were no sales during the day or closing prices are not available, securities are valued at the last quoted bid price or may be valued using the last available price and are generally categorized as Level 2 in the hierarchy. For foreign equity securities, when market or security specific events arise, comparisons to the valuation of American Depositary Receipts (ADRs), futures contracts, Exchange-Traded Funds (ETFs) and certain indexes as well as quoted prices for similar securities may be used and would be categorized as Level 2 in the hierarchy. For equity securities, including restricted securities, where observable inputs are limited, assumptions about market activity and risk are used and these securities may be categorized as Level 3 in the hierarchy.
Debt securities, including restricted securities, are valued based on evaluated prices received from third party pricing vendors or from brokers who make markets in such securities. U.S. government and government agency obligations are valued by pricing vendors who utilize matrix pricing which considers yield or price of bonds of comparable quality, coupon, maturity and type or by broker-supplied prices. When independent prices are unavailable or unreliable, debt securities may be valued utilizing pricing methodologies which consider similar factors that would be used by third party pricing vendors. Debt securities are generally categorized as Level 2 in the hierarchy but may be Level 3 depending on the circumstances.
Futures contracts are valued at the settlement price established each day by the board of trade or exchange on which they are traded and are categorized as Level 1 in the hierarchy. Investments in open-end mutual funds, including the Fidelity Central Funds, are valued at their closing net asset value (NAV) each business day and are categorized as Level 1 in the hierarchy.
Changes in valuation techniques may result in transfers in or out of an assigned level within the disclosure hierarchy. The aggregate value of investments by input level as of October 31, 2019 is included at the end of each Fund's Schedule of Investments.
Foreign Currency. The Funds may use foreign currency contracts to facilitate transactions in foreign-denominated securities. Gains and losses from these transactions may arise from changes in the value of the foreign currency or if the counterparties do not perform under the contracts' terms.
Foreign-denominated assets, including investment securities, and liabilities are translated into U.S. dollars at the exchange rates at period end. Purchases and sales of investment securities, income and dividends received and expenses denominated in foreign currencies are translated into U.S. dollars at the exchange rate in effect on the transaction date.
The effects of exchange rate fluctuations on investments are included with the net realized and unrealized gain (loss) on investment securities. Other foreign currency transactions resulting in realized and unrealized gain (loss) are disclosed separately.
Investment Transactions and Income. For financial reporting purposes, the Funds' investment holdings and NAV include trades executed through the end of the last business day of the period. The NAV per share for processing shareholder transactions is calculated as of the close of business of the New York Stock Exchange (NYSE), normally 4:00 p.m. Eastern time and includes trades executed through the end of the prior business day. Gains and losses on securities sold are determined on the basis of identified cost. Dividend income is recorded on the ex-dividend date, except for certain dividends from foreign securities where the ex-dividend date may have passed, which are recorded as soon as the Funds are informed of the ex-dividend date. Non-cash dividends included in dividend income, if any, are recorded at the fair market value of the securities received. Income and capital gain distributions from Fidelity Central Funds, if any, are recorded on the ex-dividend date. Certain distributions received by the Funds represent a return of capital or capital gain. The Funds determine the components of these distributions subsequent to the ex-dividend date, based upon receipt of tax filings or other correspondence relating to the underlying investment. These distributions are recorded as a reduction of cost of investments and/or as a realized gain. Interest income is accrued as earned and includes coupon interest and amortization of premium and accretion of discount on debt securities as applicable. Investment income is recorded net of foreign taxes withheld where recovery of such taxes is uncertain.
Expenses. Expenses directly attributable to a fund are charged to that fund. Expenses attributable to more than one fund are allocated among the respective funds on the basis of relative net assets or other appropriate methods. Expense estimates are accrued in the period to which they relate and adjustments are made when actual amounts are known.
Income Tax Information and Distributions to Shareholders. Each year, each Fund intends to qualify as a regulated investment company under Subchapter M of the Internal Revenue Code, including distributing substantially all of its taxable income and realized gains. As a result, no provision for U.S. Federal income taxes is required. As of October 31, 2019, each Fund did not have any unrecognized tax benefits in the financial statements; nor is each Fund aware of any tax positions for which it is reasonably possible that the total amounts of unrecognized tax benefits will significantly change in the next twelve months. Each Fund files a U.S. federal tax return, in addition to state and local tax returns as required. Each Fund's federal income tax returns are subject to examination by the Internal Revenue Service (IRS) for a period of three fiscal years after they are filed. State and local tax returns may be subject to examination for an additional fiscal year depending on the jurisdiction. Foreign taxes are provided for based on each Fund's understanding of the tax rules and rates that exist in the foreign markets in which it invests. Fidelity SAI Emerging Markets Low Volatility Index Fund is subject to a tax imposed on capital gains by certain countries in which it invests. An estimated deferred tax liability for net unrealized appreciation on the applicable securities is included in Other payables and accrued expenses on the Fund's Statement of Assets & Liabilities.
Distributions are declared and recorded on the ex-dividend date. Income and capital gain distributions are determined in accordance with income tax regulations, which may differ from GAAP. In addition, the Funds claimed a portion of the payment made to redeeming shareholders as a distribution for income tax purposes.
Capital accounts within the financial statements are adjusted for permanent book-tax differences. These adjustments have no impact on net assets or the results of operations. Capital accounts are not adjusted for temporary book-tax differences which will reverse in a subsequent period.
Book-tax differences are primarily due to futures contracts, foreign currency transactions, certain foreign taxes, passive foreign investment companies (PFIC), market discount, partnerships, capital loss carryforwards, certain deemed distributions and losses deferred due to wash sales.
As of period end, the cost and unrealized appreciation (depreciation) in securities, and derivatives if applicable, for federal income tax purposes were as follows for each Fund:
| | Tax cost | Gross unrealized appreciation | Gross unrealized depreciation | Net unrealized appreciation (depreciation) |
| Fidelity SAI Emerging Markets Low Volatility Index Fund | $649,841,668 | $40,012,693 | $(41,566,021) | $(1,553,328) |
| Fidelity SAI International Low Volatility Index Fund | 2,423,219,494 | 214,993,404 | (74,679,628) | 140,313,776 |
| Fidelity SAI U.S. Low Volatility Index Fund | 3,779,207,643 | 554,048,319 | (58,473,923) | 495,574,396 |
The tax-based components of distributable earnings as of period end were as follows for each Fund:
| | Undistributed ordinary income | Undistributed long-term capital gain | Capital loss carryforward | Net unrealized appreciation (depreciation) on securities and other investments |
| Fidelity SAI Emerging Markets Low Volatility Index Fund | $10,347,589 | $– | $9,964,469 | $1,498,956 |
| Fidelity SAI International Low Volatility Index Fund | 51,631,362 | 98,761,660 | – | 140,273,970 |
| Fidelity SAI U.S. Low Volatility Index Fund | 73,569,973 | 74,046,550 | – | 495,574,396 |
Capital loss carryforwards are only available to offset future capital gains of the Funds to the extent provided by regulations and may be limited. Under the Regulated Investment Company Modernization Act of 2010 (the Act), the Funds are permitted to carry forward capital losses incurred in taxable years beginning after December 22, 2010 for an unlimited period and such capital losses are required to be used prior to any losses that expire. The capital loss carryforward information presented below, including any applicable limitation, is estimated as of fiscal period end and is subject to adjustment.
| | No expiration | | | |
| | Short-term | Long-term | Total no expiration | Total capital loss carryfoward |
| Fidelity SAI Emerging Markets Low Volatility Index Fund | $(9,464,932) | $(499,537) | $(9,964,469) | $(9,964,469) |
The tax character of distributions paid was as follows:
| October 31, 2019 | | | |
| | Ordinary Income | Long-term Capital Gains | Total |
| Fidelity SAI International Low Volatility Index Fund | 39,022,516 | 2,467,828 | 41,490,344 |
| Fidelity SAI U.S. Low Volatility Index Fund | 41,855,336 | 12,944,654 | 54,799,990 |
| October 31, 2018 | | | |
| | Ordinary Income | Long-term Capital Gains | Total |
| Fidelity SAI International Low Volatility Index Fund | $32,823,660 | $– | $32,823,660 |
| Fidelity SAI U.S. Low Volatility Index Fund | 9,975,122 | 26,991,499 | 36,966,621 |
Restricted Securities. The Funds may invest in securities that are subject to legal or contractual restrictions on resale. These securities generally may be resold in transactions exempt from registration or to the public if the securities are registered. Disposal of these securities may involve time-consuming negotiations and expense, and prompt sale at an acceptable price may be difficult. Information regarding restricted securities is included at the end of each applicable Fund's Schedule of Investments.
4. Derivative Instruments.
Risk Exposures and the Use of Derivative Instruments. The Funds' investment objective allows the Funds to enter into various types of derivative contracts, including futures contracts. Derivatives are investments whose value is primarily derived from underlying assets, indices or reference rates and may be transacted on an exchange or over-the-counter (OTC). Derivatives may involve a future commitment to buy or sell a specified asset based on specified terms, to exchange future cash flows at periodic intervals based on a notional principal amount, or for one party to make one or more payments upon the occurrence of specified events in exchange for periodic payments from the other party.
The Funds used derivatives to increase returns and to manage exposure to certain risks as defined below. The success of any strategy involving derivatives depends on analysis of numerous economic factors, and if the strategies for investment do not work as intended, the Funds may not achieve their objectives.
The Funds' use of derivatives increased or decreased their exposure to the following risk:
| Equity Risk | Equity risk relates to the fluctuations in the value of financial instruments as a result of changes in market prices (other than those arising from interest rate risk or foreign exchange risk), whether caused by factors specific to an individual investment, its issuer, or all factors affecting all instruments traded in a market or market segment.
|
The Funds are also exposed to additional risks from investing in derivatives, such as liquidity risk and counterparty credit risk. Liquidity risk is the risk that the Funds will be unable to close out the derivative in the open market in a timely manner. Counterparty credit risk is the risk that the counterparty will not be able to fulfill its obligation to the Funds. Counterparty credit risk related to exchange-traded futures contracts may be mitigated by the protection provided by the exchange on which they trade.
Investing in derivatives may involve greater risks than investing in the underlying assets directly and, to varying degrees, may involve risk of loss in excess of any initial investment and collateral received and amounts recognized in the Statement of Assets and Liabilities. In addition, there may be the risk that the change in value of the derivative contract does not correspond to the change in value of the underlying instrument.
Futures Contracts. A futures contract is an agreement between two parties to buy or sell a specified underlying instrument for a fixed price at a specified future date. The Funds used futures contracts to manage their exposure to the stock market.
Upon entering into a futures contract, a fund is required to deposit either cash or securities (initial margin) with a clearing broker in an amount equal to a certain percentage of the face value of the contract. Futures contracts are marked-to-market daily and subsequent daily payments (variation margin) are made or received by a fund depending on the daily fluctuations in the value of the futures contracts and are recorded as unrealized appreciation or (depreciation). This receivable and/or payable, if any, is included in daily variation margin on futures contracts in the Statement of Assets and Liabilities. Realized gain or (loss) is recorded upon the expiration or closing of a futures contract. The net realized gain (loss) and change in net unrealized appreciation (depreciation) on futures contracts during the period is presented in the Statement of Operations.
Any open futures contracts at period end are presented in the Schedule of Investments under the caption "Futures Contracts". The notional amount at value reflects each contract's exposure to the underlying instrument or index at period end and is representative of volume of activity during the period, except for Fidelity SAI Emerging Markets Low Volatility Index Fund. Securities deposited to meet initial margin requirements are identified in the Schedule of Investments. Cash deposited to meet initial margin requirements is presented as segregated cash with brokers for derivative instruments in the Statement of Assets and Liabilities.
5. Purchases and Sales of Investments.
Purchases and sales of securities, other than short-term securities, are noted in the table below.
| | Purchases ($) | Sales ($) |
| Fidelity SAI Emerging Markets Low Volatility Index Fund | 956,560,686 | 306,293,625 |
| Fidelity SAI International Low Volatility Index Fund | 2,602,857,685 | 1,684,246,469 |
| Fidelity SAI U.S. Low Volatility Index Fund | 3,901,915,876 | 2,182,614,751 |
6. Fees and Other Transactions with Affiliates.
Management Fee. Fidelity Management & Research Company (the investment adviser) and its affiliates provide the Funds with investment management related services for which the Funds pay a monthly management fee. Each Fund's management fee is equal to the following annual rate of average net assets:
| Fidelity SAI Emerging Markets Low Volatility Index Fund | .15% |
| Fidelity SAI International Low Volatility Index Fund | .15% |
| Fidelity SAI U.S. Low Volatility Index Fund | .10% |
Sub-Adviser. Geode Capital Management, LLC (Geode), serves as sub-adviser for the Funds. Geode provides discretionary investment advisory services to the Funds and is paid by the investment adviser for providing these services.
Transfer Agent Fees. Fidelity Investments Institutional Operations Company, Inc. (FIIOC), an affiliate of the investment adviser, is the Funds' transfer, dividend disbursing and shareholder servicing agent. Effective August 1, 2019 transfer agent fees are not paid by the Funds and are instead paid by the investment adviser or an affiliate. Prior to August 1, 2019, FIIOC received an asset-based fee of .075% based on each Fund's average net assets. FIIOC paid for typesetting, printing and mailing of shareholder reports, except proxy statements.
Accounting and Security Lending Fees. Fidelity Service Company, Inc. (FSC), an affiliate of the investment adviser, maintains each Fund's accounting records. The accounting fee is based on the level of average net assets for each month. Prior to April 1, 2019, FSC had a separate agreement with each Fund for administration of the security lending program, based on the number and duration of lending transactions. Effective August 1, 2019 accounting fees are not paid by the Funds and are instead paid by the investment adviser or an affiliate. For the period, the total fees paid for accounting and administration of securities lending were equivalent to the following rates:
| | % of Average Net Assets |
| Fidelity SAI Emerging Markets Low Volatility Index Fund | .02 |
| Fidelity SAI International Low Volatility Index Fund | .02 |
| Fidelity SAI U.S. Low Volatility Index Fund | .02 |
Interfund Lending Program. Pursuant to an Exemptive Order issued by the SEC, the Funds, along with other registered investment companies having management contracts with Fidelity Management & Research Company (FMR) or other affiliated entities of FMR, may participate in an interfund lending program. This program provides an alternative credit facility allowing the funds to borrow from, or lend money to, other participating affiliated funds. At period end, there were no interfund loans outstanding. Each applicable fund's activity in this program during the period for which loans were outstanding was as follows:
| | Borrower or Lender | Average Loan Balance | Weighted Average Interest Rate | Interest Expense |
| Fidelity SAI Emerging Markets Low Volatility Index Fund | Borrower | $14,650,231 | 2.41% | $12,774 |
| Fidelity SAI International Low Volatility Index Fund | Borrower | $35,500,571 | 2.65% | $36,587 |
| Fidelity SAI U.S. Low Volatility Index Fund | Borrower | $5,858,250 | 2.61% | $1,697 |
Interfund Trades. The Funds may purchase from or sell securities to other Fidelity Funds under procedures adopted by the Board. The procedures have been designed to ensure these interfund trades are executed in accordance with Rule 17a-7 of the 1940 Act. Interfund trades are included within the respective purchases and sales amounts shown in the Purchases and Sales of Investments note.
7. Committed Line of Credit.
Certain Funds participate with other funds managed by the investment adviser or an affiliate in a $4.25 billion credit facility (the "line of credit") to be utilized for temporary or emergency purposes to fund shareholder redemptions or for other short-term liquidity purposes. The participating funds have agreed to pay commitment fees on their pro-rata portion of the line of credit, which are reflected in Miscellaneous expenses on the Statement of Operations, and are as follows:
| Fidelity SAI Emerging Markets Low Volatility Index Fund | $897 |
| Fidelity SAI International Low Volatility Index Fund | 4,743 |
| Fidelity SAI U.S. Low Volatility Index Fund | 7,534 |
During the period, the Funds did not borrow on this line of credit.
8. Security Lending.
Certain Funds lend portfolio securities from time to time in order to earn additional income. For equity securities, lending agents are used, including National Financial Services (NFS), an affiliate of the Funds. Pursuant to a securities lending agreement, NFS will receive a fee, which is capped at 9.9% of a Fund's daily lending revenue, for its services as lending agent. The Funds may lend securities to certain qualified borrowers, including NFS. On the settlement date of the loan, each applicable Fund receives collateral (in the form of U.S. Treasury obligations, letters of credit and/or cash) against the loaned securities and maintains collateral in an amount not less than 100% of the market value of the loaned securities during the period of the loan. The market value of the loaned securities is determined at the close of business of the Funds and any additional required collateral is delivered to the Funds on the next business day. The Funds or borrower may terminate the loan at any time, and if the borrower defaults on its obligation to return the securities loaned because of insolvency or other reasons, the Funds may apply collateral received from the borrower against the obligation. The Funds may experience delays and costs in recovering the securities loaned. Any cash collateral received is invested in the Fidelity Securities Lending Cash Central Fund. The value of loaned securities and cash collateral at period end are disclosed on each applicable Fund's Statement of Assets and Liabilities. Security lending income represents the income earned on investing cash collateral, less rebates paid to borrowers and any lending agent fees associated with the loan, plus any premium payments received for lending certain types of securities. Security lending income is presented on each applicable Fund's Statement of Operations as a component of income from Fidelity Central Funds. During the period, there were no securities loaned to NFS. Affiliated security lending activity was as follows:
| | Total Security Lending Income Fees Paid to NFS |
| Fidelity SAI Emerging Markets Low Volatility Index Fund | $99 |
| Fidelity SAI U.S. Low Volatility Index Fund | $2,993 |
9. Bank Borrowings.
Each Fund is permitted to have bank borrowings for temporary or emergency purposes to fund shareholder redemptions or for other short-term liquidity requirements. Each Fund has established borrowing arrangements with certain banks. The interest rate on the borrowings is the bank's base rate, as revised from time to time. At period end, there were no bank borrowings outstanding. Each applicable Fund's activity in this program during the period for which loans were outstanding was as follows:
| | Average Loan Balance | Weighted Average Interest Rate | Interest Expense |
| Fidelity SAI Emerging Markets Low Volatility Index Fund | $69,774,500 | 2.80% | $32,588 |
10. Expense Reductions.
The investment adviser contractually agreed to reimburse each Fund to the extent annual operating expenses exceeded certain levels of average net assets as noted in the table below. This reimbursement will remain in place through February 28, 2021. Some expenses, for example the compensation of the independent Trustees, and certain miscellaneous expenses such as proxy and shareholder meeting expenses, are excluded from this reimbursement.
The following Funds were in reimbursement during the period:
| | Expense Limitations | Reimbursement |
| Fidelity SAI Emerging Markets Low Volatility Index Fund | .25% | $364,972 |
| Fidelity SAI International Low Volatility Index Fund | .20% | $986,949 |
| Fidelity SAI U.S. Low Volatility Index Fund | .15% | $1,077,844 |
In addition, through arrangements with each applicable Fund's custodian, credits realized as a result of certain uninvested cash balances were used to reduce each applicable Fund's expenses. All of the applicable expense reductions are noted in the table below.
| | Custodian credits |
| Fidelity SAI International Low Volatility Index Fund | $4,940 |
| Fidelity SAI U.S. Low Volatility Index Fund | $2,349 |
11. Other.
The Funds' organizational documents provide former and current trustees and officers with a limited indemnification against liabilities arising in connection with the performance of their duties to the Funds. In the normal course of business, the Funds may also enter into contracts that provide general indemnifications. The Funds' maximum exposure under these arrangements is unknown as this would be dependent on future claims that may be made against the Funds. The risk of material loss from such claims is considered remote.
At the end of the period, the following mutual funds managed by the investment adviser or its affiliates were the owners of record of 10% or more of the total outstanding shares of the following Funds.
| | Strategic Advisers Fidelity International Fund | Strategic Advisers Value Fund | Strategic Advisers Fidelity U.S. Total Stock Fund | Strategic Advisers Emerging Market Fund |
| Fidelity SAI Emerging Markets Low Volatility Index Fund | –% | –% | –% | 39% |
| Fidelity SAI International Low Volatility Index Fund | 29% | –% | –% | –% |
| Fidelity SAI U.S. Low Volatility Index Fund | –% | 11% | 15% | –% |
Mutual funds managed by the investment adviser or its affiliates, in aggregate, were the owners of record of more than 20% of the total outstanding shares of the following Funds.
| Fund | % of shares held |
| Fidelity SAI International Low Volatility Index Fund | 36% |
| Fidelity SAI U.S. Low Volatility Index Fund | 26% |
Report of Independent Registered Public Accounting Firm
To the Board of Trustees of Fidelity Salem Street Trust and the Shareholders of Fidelity SAI Emerging Markets Low Volatility Index Fund, Fidelity SAI International Low Volatility Index Fund and Fidelity SAI U.S. Low Volatility Index Fund:
Opinions on the Financial Statements
We have audited the accompanying statements of assets and liabilities, including the schedules of investments, of Fidelity SAI Emerging Markets Low Volatility Index Fund, Fidelity SAI International Low Volatility Index Fund and Fidelity SAI U.S. Low Volatility Index Fund (three of the funds constituting Fidelity Salem Street Trust, hereafter collectively referred to as the “Funds”) as of October 31, 2019, the related statements of operations for each of the periods listed in the table below, the statements of changes in net assets for each of the periods listed in the table below, including the related notes, and the financial highlights for each of the periods indicated therein (collectively referred to as the “financial statements”). In our opinion, the financial statements present fairly, in all material respects, the financial position of each of the Funds as of October 31, 2019, the results of each of their operations for each of the periods listed in the table below, the changes in each of their net assets for each of the periods listed in the table below and each of the financial highlights for each of the periods indicated therein in conformity with accounting principles generally accepted in the United States of America.
| Fund Name | Statement of Operation | Statement of changes in net assets |
| Fidelity SAI Emerging Markets Low Volatility Index Fund | For the period January 30, 2019 (commencement of operations) through October 31, 2019 | For the period January 30, 2019 (commencement of operations) through October 31, 2019 |
| Fidelity SAI International Low Volatility Index Fund | For the year ended October 31, 2019 | For each of the two years in the period ended October 31, 2019 |
| Fidelity SAI U.S. Low Volatility Index Fund | For the year ended October 31, 2019 | For each of the two years in the period ended October 31, 2019 |
Basis for Opinions
These financial statements are the responsibility of the Funds' management. Our responsibility is to express an opinion on the Funds' financial statements based on our audits. We are a public accounting firm registered with the Public Company Accounting Oversight Board (United States) (PCAOB) and are required to be independent with respect to the Funds in accordance with the U.S. federal securities laws and the applicable rules and regulations of the Securities and Exchange Commission and the PCAOB.
We conducted our audits of these financial statements in accordance with the standards of the PCAOB. Those standards require that we plan and perform the audit to obtain reasonable assurance about whether the financial statements are free of material misstatement, whether due to error or fraud.
Our audits included performing procedures to assess the risks of material misstatement of the financial statements, whether due to error or fraud, and performing procedures that respond to those risks. Such procedures included examining, on a test basis, evidence regarding the amounts and disclosures in the financial statements. Our audits also included evaluating the accounting principles used and significant estimates made by management, as well as evaluating the overall presentation of the financial statements. Our procedures included confirmation of securities owned as of October 31, 2019 by correspondence with the custodian and brokers; when replies were not received from brokers, we performed other auditing procedures. We believe that our audits provide a reasonable basis for our opinions.
PricewaterhouseCoopers LLP
Boston, Massachusetts
December 12, 2019
We have served as the auditor of one or more investment companies in the Fidelity group of funds since 1932.
Trustees and Officers
The Trustees, Members of the Advisory Board (if any), and officers of the trust and funds, as applicable, are listed below. The Board of Trustees governs each fund and is responsible for protecting the interests of shareholders. The Trustees are experienced executives who meet periodically throughout the year to oversee each fund's activities, review contractual arrangements with companies that provide services to each fund, oversee management of the risks associated with such activities and contractual arrangements, and review each fund's performance. Except for Jonathan Chiel, each of the Trustees oversees 298 funds. Mr. Chiel oversees 171 funds.
The Trustees hold office without limit in time except that (a) any Trustee may resign; (b) any Trustee may be removed by written instrument, signed by at least two-thirds of the number of Trustees prior to such removal; (c) any Trustee who requests to be retired or who has become incapacitated by illness or injury may be retired by written instrument signed by a majority of the other Trustees; and (d) any Trustee may be removed at any special meeting of shareholders by a two-thirds vote of the outstanding voting securities of the trust. Each Trustee who is not an interested person (as defined in the 1940 Act) of the trust and the funds is referred to herein as an Independent Trustee. Each Independent Trustee shall retire not later than the last day of the calendar year in which his or her 75th birthday occurs. The Independent Trustees may waive this mandatory retirement age policy with respect to individual Trustees. Officers and Advisory Board Members hold office without limit in time, except that any officer or Advisory Board Member may resign or may be removed by a vote of a majority of the Trustees at any regular meeting or any special meeting of the Trustees. Except as indicated, each individual has held the office shown or other offices in the same company for the past five years.
Each fund’s Statement of Additional Information (SAI) includes more information about the Trustees. To request a free copy, call Fidelity at 1-800-544-3455.
Experience, Skills, Attributes, and Qualifications of the Trustees. The Governance and Nominating Committee has adopted a statement of policy that describes the experience, qualifications, attributes, and skills that are necessary and desirable for potential Independent Trustee candidates (Statement of Policy). The Board believes that each Trustee satisfied at the time he or she was initially elected or appointed a Trustee, and continues to satisfy, the standards contemplated by the Statement of Policy. The Governance and Nominating Committee also engages professional search firms to help identify potential Independent Trustee candidates who have the experience, qualifications, attributes, and skills consistent with the Statement of Policy. From time to time, additional criteria based on the composition and skills of the current Independent Trustees, as well as experience or skills that may be appropriate in light of future changes to board composition, business conditions, and regulatory or other developments, have also been considered by the professional search firms and the Governance and Nominating Committee. In addition, the Board takes into account the Trustees' commitment and participation in Board and committee meetings, as well as their leadership of standing and ad hoc committees throughout their tenure.
In determining that a particular Trustee was and continues to be qualified to serve as a Trustee, the Board has considered a variety of criteria, none of which, in isolation, was controlling. The Board believes that, collectively, the Trustees have balanced and diverse experience, qualifications, attributes, and skills, which allow the Board to operate effectively in governing each fund and protecting the interests of shareholders. Information about the specific experience, skills, attributes, and qualifications of each Trustee, which in each case led to the Board's conclusion that the Trustee should serve (or continue to serve) as a trustee of the funds, is provided below.
Board Structure and Oversight Function. Abigail P. Johnson is an interested person and currently serves as Chairman. The Trustees have determined that an interested Chairman is appropriate and benefits shareholders because an interested Chairman has a personal and professional stake in the quality and continuity of services provided to the funds. Independent Trustees exercise their informed business judgment to appoint an individual of their choosing to serve as Chairman, regardless of whether the Trustee happens to be independent or a member of management. The Independent Trustees have determined that they can act independently and effectively without having an Independent Trustee serve as Chairman and that a key structural component for assuring that they are in a position to do so is for the Independent Trustees to constitute a substantial majority for the Board. The Independent Trustees also regularly meet in executive session. Arthur E. Johnson serves as Chairman of the Independent Trustees and as such (i) acts as a liaison between the Independent Trustees and management with respect to matters important to the Independent Trustees and (ii) with management prepares agendas for Board meetings.
Fidelity® funds are overseen by different Boards of Trustees. The funds' Board oversees Fidelity's investment-grade bond, money market, asset allocation and certain equity funds, and other Boards oversee Fidelity's high income and other equity funds. The asset allocation funds may invest in Fidelity® funds that are overseen by such other Boards. The use of separate Boards, each with its own committee structure, allows the Trustees of each group of Fidelity® funds to focus on the unique issues of the funds they oversee, including common research, investment, and operational issues. On occasion, the separate Boards establish joint committees to address issues of overlapping consequences for the Fidelity® funds overseen by each Board.
The Trustees operate using a system of committees to facilitate the timely and efficient consideration of all matters of importance to the Trustees, each fund, and fund shareholders and to facilitate compliance with legal and regulatory requirements and oversight of the funds' activities and associated risks. The Board, acting through its committees, has charged FMR and its affiliates with (i) identifying events or circumstances the occurrence of which could have demonstrably adverse effects on the funds' business and/or reputation; (ii) implementing processes and controls to lessen the possibility that such events or circumstances occur or to mitigate the effects of such events or circumstances if they do occur; and (iii) creating and maintaining a system designed to evaluate continuously business and market conditions in order to facilitate the identification and implementation processes described in (i) and (ii) above. Because the day-to-day operations and activities of the funds are carried out by or through FMR, its affiliates, and other service providers, the funds' exposure to risks is mitigated but not eliminated by the processes overseen by the Trustees. While each of the Board's committees has responsibility for overseeing different aspects of the funds' activities, oversight is exercised primarily through the Operations and Audit Committees. In addition, an ad hoc Board committee of Independent Trustees has worked with FMR to enhance the Board's oversight of investment and financial risks, legal and regulatory risks, technology risks, and operational risks, including the development of additional risk reporting to the Board. Appropriate personnel, including but not limited to the funds' Chief Compliance Officer (CCO), FMR's internal auditor, the independent accountants, the funds' Treasurer and portfolio management personnel, make periodic reports to the Board's committees, as appropriate, including an annual review of Fidelity's risk management program for the Fidelity® funds. The responsibilities of each standing committee, including their oversight responsibilities, are described further under "Standing Committees of the Trustees."
Interested Trustees*:
Correspondence intended for a Trustee who is an interested person may be sent to Fidelity Investments, 245 Summer Street, Boston, Massachusetts 02210.
Name, Year of Birth; Principal Occupations and Other Relevant Experience+
Jonathan Chiel (1957)
Year of Election or Appointment: 2016
Trustee
Mr. Chiel also serves as Trustee of other Fidelity® funds. Mr. Chiel is Executive Vice President and General Counsel for FMR LLC (diversified financial services company, 2012-present). Previously, Mr. Chiel served as general counsel (2004-2012) and senior vice president and deputy general counsel (2000-2004) for John Hancock Financial Services; a partner with Choate, Hall & Stewart (1996-2000) (law firm); and an Assistant United States Attorney for the United States Attorney’s Office of the District of Massachusetts (1986-95), including Chief of the Criminal Division (1993-1995). Mr. Chiel is a director on the boards of the Boston Bar Foundation and the Maimonides School.
Abigail P. Johnson (1961)
Year of Election or Appointment: 2009
Trustee
Chairman of the Board of Trustees
Ms. Johnson also serves as Trustee of other Fidelity® funds. Ms. Johnson serves as Chairman (2016-present), Chief Executive Officer (2014-present), and Director (2007-present) of FMR LLC (diversified financial services company), President of Fidelity Financial Services (2012-present) and President of Personal, Workplace and Institutional Services (2005-present). Ms. Johnson is Chairman and Director of FMR Co., Inc. (investment adviser firm, 2011-present) and Chairman and Director of FMR (investment adviser firm, 2011-present). Previously, Ms. Johnson served as Vice Chairman (2007-2016) and President (2013-2016) of FMR LLC, President and a Director of FMR (2001-2005), a Trustee of other investment companies advised by FMR, Fidelity Investments Money Management, Inc. (investment adviser firm), and FMR Co., Inc. (2001-2005), Senior Vice President of the Fidelity® funds (2001-2005), and managed a number of Fidelity® funds. Ms. Abigail P. Johnson and Mr. Arthur E. Johnson are not related.
Jennifer Toolin McAuliffe (1959)
Year of Election or Appointment: 2016
Trustee
Ms. McAuliffe also serves as Trustee of other Fidelity® funds. Ms. McAuliffe previously served as a Member of the Advisory Board of certain Fidelity® funds (2016) and as Co-Head of Fixed Income of Fidelity Investments Limited (now known as FIL Limited (FIL)) (diversified financial services company). Earlier roles at FIL included Director of Research for FIL’s credit and quantitative teams in London, Hong Kong and Tokyo. Ms. McAuliffe also was the Director of Research for taxable and municipal bonds at Fidelity Investments Money Management, Inc. Ms. McAuliffe is also a director or trustee of several not-for-profit entities.
* Determined to be an “Interested Trustee” by virtue of, among other things, his or her affiliation with the trust or various entities under common control with FMR.
+ The information includes the Trustee's principal occupation during the last five years and other information relating to the experience, attributes, and skills relevant to the Trustee's qualifications to serve as a Trustee, which led to the conclusion that the Trustee should serve as a Trustee for each fund.
Independent Trustees:
Correspondence intended for an Independent Trustee may be sent to Fidelity Investments, P.O. Box 55235, Boston, Massachusetts 02205-5235.
Name, Year of Birth; Principal Occupations and Other Relevant Experience+
Elizabeth S. Acton (1951)
Year of Election or Appointment: 2013
Trustee
Ms. Acton also serves as Trustee of other Fidelity® funds. Prior to her retirement in April 2012, Ms. Acton was Executive Vice President, Finance (2011-2012), Executive Vice President, Chief Financial Officer (2002-2011), and Treasurer (2004-2005) of Comerica Incorporated (financial services). Prior to joining Comerica, Ms. Acton held a variety of positions at Ford Motor Company (1983-2002), including Vice President and Treasurer (2000-2002) and Executive Vice President and Chief Financial Officer of Ford Motor Credit Company (1998-2000). Ms. Acton currently serves as a member of the Board of Directors and Audit and Finance Committees of Beazer Homes USA, Inc. (homebuilding, 2012-present). Previously, Ms. Acton served as a Member of the Advisory Board of certain Fidelity® funds (2013-2016).
Ann E. Dunwoody (1953)
Year of Election or Appointment: 2018
Trustee
General Dunwoody also serves as Trustee of other Fidelity® funds. General Dunwoody (United States Army, Retired) was the first woman in U.S. military history to achieve the rank of four-star general and prior to her retirement in 2012 held a variety of positions within the U.S. Army, including Commanding General, U.S. Army Material Command (2008-2012). She is the President of First to Four LLC (leadership and mentoring services, 2012-present). She also serves as a member of the Board of Directors and Nominating and Corporate Governance Committee of L3 Technologies, Inc. (communication, electronic, sensor, and aerospace systems, 2013-present), Board of Directors and Nomination and Corporate Governance Committees of Kforce Inc. (professional staffing services, 2016-present) and Board of Directors of Automattic Inc. (software engineering, 2018-present). Previously, General Dunwoody served as a Member of the Advisory Board of certain Fidelity® funds (2018), a member of the Board of Directors and Audit and Sustainability and Corporate Responsibility Committees of Republic Services, Inc. (waste collection, disposal and recycling, 2013-2016). Ms. Dunwoody also serves on several boards for non-profit organizations, including as a member of the Board of Directors, Chair of the Nomination and Governance Committee and member of the Audit Committee of Logistics Management Institute (consulting non-profit, 2012-present), a member of the Board of Directors of the Army Historical Foundation (2015-present), a member of the Council of Trustees for the Association of the United States Army (advocacy non-profit, 2013-present) and a member of the Board of Trustees of Florida Institute of Technology (2015-present) and ThanksUSA (military family education non-profit, 2014-present).
John Engler (1948)
Year of Election or Appointment: 2014
Trustee
Mr. Engler also serves as Trustee of other Fidelity® funds. He serves on the board of directors for Universal Forest Products (manufacturer and distributor of wood and wood-alternative products, 2003-present) and K12 Inc. (technology-based education company, 2012-present). Previously, Mr. Engler served as interim president of Michigan State University (2018-2019), a Member of the Advisory Board of certain Fidelity® funds (2014-2016), president of the Business Roundtable (2011-2017), a trustee of The Munder Funds (2003-2014), president and CEO of the National Association of Manufacturers (2004-2011), member of the Board of Trustees of the Annie E. Casey Foundation (2004-2015), and as governor of Michigan (1991-2003). He is a past chairman of the National Governors Association.
Robert F. Gartland (1951)
Year of Election or Appointment: 2010
Trustee
Mr. Gartland also serves as Trustee of other Fidelity® funds. Mr. Gartland is Chairman and an investor in Gartland & Mellina Group Corp. (consulting, 2009-present). Previously, Mr. Gartland served as a partner and investor of Vietnam Partners LLC (investments and consulting, 2008-2011). Prior to his retirement, Mr. Gartland held a variety of positions at Morgan Stanley (financial services, 1979-2007), including Managing Director (1987-2007), and Chase Manhattan Bank (1975-1978).
Arthur E. Johnson (1947)
Year of Election or Appointment: 2008
Trustee
Chairman of the Independent Trustees
Mr. Johnson also serves as Trustee of other Fidelity® funds. Mr. Johnson serves as a member of the Board of Directors of Eaton Corporation plc (diversified power management, 2009-present) and Booz Allen Hamilton (management consulting, 2011-present). Prior to his retirement, Mr. Johnson served as Senior Vice President of Corporate Strategic Development of Lockheed Martin Corporation (defense contractor, 1999-2009). Mr. Johnson previously served as Vice Chairman (2015-2018) of the Independent Trustees of certain Fidelity® funds and on the Board of Directors of IKON Office Solutions, Inc. (1999-2008), AGL Resources, Inc. (holding company, 2002-2016), and Delta Airlines (2005-2007). Mr. Arthur E. Johnson is not related to Ms. Abigail P. Johnson.
Michael E. Kenneally (1954)
Year of Election or Appointment: 2009
Trustee
Vice Chairman of the Independent Trustees
Mr. Kenneally also serves as Trustee of other Fidelity® funds. Prior to his retirement, Mr. Kenneally served as Chairman and Global Chief Executive Officer of Credit Suisse Asset Management. Before joining Credit Suisse, he was an Executive Vice President and Chief Investment Officer for Bank of America Corporation. Earlier roles at Bank of America included Director of Research, Senior Portfolio Manager and Research Analyst, and Mr. Kenneally was awarded the Chartered Financial Analyst (CFA) designation in 1991.
Marie L. Knowles (1946)
Year of Election or Appointment: 2001
Trustee
Ms. Knowles also serves as Trustee of other Fidelity® funds. Prior to Ms. Knowles' retirement in June 2000, she served as Executive Vice President and Chief Financial Officer of Atlantic Richfield Company (ARCO) (diversified energy, 1996-2000). From 1993 to 1996, she was a Senior Vice President of ARCO and President of ARCO Transportation Company (pipeline and tanker operations). Ms. Knowles currently serves as a Director and Chairman of the Audit Committee of McKesson Corporation (healthcare service, since 2002). Ms. Knowles is a member of the Board of the Santa Catalina Island Company (real estate, 2009-present). Ms. Knowles is a Member of the Investment Company Institute Board of Governors and a Member of the Governing Council of the Independent Directors Council (2014-present). She also serves as a member of the Advisory Board for the School of Engineering of the University of Southern California. Previously, Ms. Knowles served as a Director of Phelps Dodge Corporation (copper mining and manufacturing, 1994-2007), URS Corporation (engineering and construction, 2000-2003) and America West (airline, 1999-2002). Ms. Knowles previously served as Chairman (2015-2018) and Vice Chairman (2012-2015) of the Independent Trustees of certain Fidelity® funds.
Mark A. Murray (1954)
Year of Election or Appointment: 2016
Trustee
Mr. Murray also serves as Trustee of other Fidelity® funds. Mr. Murray is Vice Chairman (2013-present) of Meijer, Inc. (regional retail chain). Previously, Mr. Murray served as a Member of the Advisory Board of certain Fidelity® funds (2016) and as Co-Chief Executive Officer (2013-2016) and President (2006-2013) of Meijer, Inc. Mr. Murray serves as a member of the Board of Directors and Nuclear Review and Public Policy and Responsibility Committees of DTE Energy Company (diversified energy company, 2009-present). Mr. Murray also serves as a member of the Board of Directors of Spectrum Health (not-for-profit health system, 2015-present). Mr. Murray previously served as President of Grand Valley State University (2001-2006), Treasurer for the State of Michigan (1999-2001), Vice President of Finance and Administration for Michigan State University (1998-1999), and a member of the Board of Directors and Audit Committee and Chairman of the Nominating and Corporate Governance Committee of Universal Forest Products, Inc. (manufacturer and distributor of wood and wood-alternative products, 2004-2016). Mr. Murray is also a director or trustee of many community and professional organizations.
+ The information includes the Trustee's principal occupation during the last five years and other information relating to the experience, attributes, and skills relevant to the Trustee's qualifications to serve as a Trustee, which led to the conclusion that the Trustee should serve as a Trustee for each fund.
Advisory Board Members and Officers:
Correspondence intended for an officer may be sent to Fidelity Investments, 245 Summer Street, Boston, Massachusetts 02210. Officers appear below in alphabetical order.
Name, Year of Birth; Principal Occupation
Elizabeth Paige Baumann (1968)
Year of Election or Appointment: 2017
Anti-Money Laundering (AML) Officer
Ms. Baumann also serves as AML Officer of other funds. She is Chief AML Officer (2012-present) and Senior Vice President (2014-present) of FMR LLC (diversified financial services company) and is an employee of Fidelity Investments. Previously, Ms. Baumann served as AML Officer of the funds (2012-2016), and Vice President (2007-2014) and Deputy Anti-Money Laundering Officer (2007-2012) of FMR LLC.
Craig S. Brown (1977)
Year of Election or Appointment: 2019
Assistant Treasurer
Mr. Brown also serves as Assistant Treasurer of other funds. Mr. Brown is an employee of Fidelity Investments (2013-present).
John J. Burke III (1964)
Year of Election or Appointment: 2018
Chief Financial Officer
Mr. Burke also serves as Chief Financial Officer of other funds. Mr. Burke serves as Head of Investment Operations for Fidelity Fund and Investment Operations (2018-present) and is an employee of Fidelity Investments (1998-present). Previously Mr. Burke served as head of Asset Management Investment Operations (2012-2018).
Jonathan Davis (1968)
Year of Election or Appointment: 2010
Assistant Treasurer
Mr. Davis also serves as Assistant Treasurer of other funds. Mr. Davis serves as Assistant Treasurer of FMR Capital, Inc. (2017-present) and is an employee of Fidelity Investments. Previously, Mr. Davis served as Vice President and Associate General Counsel of FMR LLC (diversified financial services company, 2003-2010).
Adrien E. Deberghes (1967)
Year of Election or Appointment: 2010
Assistant Treasurer
Mr. Deberghes also serves as an officer of other funds. He serves as Assistant Treasurer of FMR Capital, Inc. (2017-present), Executive Vice President of Fidelity Investments Money Management, Inc. (FIMM) (investment adviser firm, 2016-present), and is an employee of Fidelity Investments (2008-present). Previously, Mr. Deberghes served as President and Treasurer of certain Fidelity® funds (2013-2018). Prior to joining Fidelity Investments, Mr. Deberghes was Senior Vice President of Mutual Fund Administration at State Street Corporation (2007-2008), Senior Director of Mutual Fund Administration at Investors Bank & Trust (2005-2007), and Director of Finance for Dunkin' Brands (2000-2005). Previously, Mr. Deberghes served in other fund officer roles.
Laura M. Del Prato (1964)
Year of Election or Appointment: 2018
President and Treasurer
Ms. Del Prato also serves as an officer of other funds. Ms. Del Prato is an employee of Fidelity Investments (2017-present). Prior to joining Fidelity Investments, Ms. Del Prato served as a Managing Director and Treasurer of the JPMorgan Mutual Funds (2014-2017). Prior to JPMorgan, Ms. Del Prato served as a partner at Cohen Fund Audit Services (accounting firm, 2012-2013) and KPMG LLP (accounting firm, 2004-2012).
Colm A. Hogan (1973)
Year of Election or Appointment: 2016
Assistant Treasurer
Mr. Hogan also serves as an officer of other funds. Mr. Hogan serves as Assistant Treasurer of FMR Capital, Inc. (2017-present) and is an employee of Fidelity Investments (2005-present). Previously, Mr. Hogan served as Assistant Treasurer of certain Fidelity® funds (2016-2018).
Cynthia Lo Bessette (1969)
Year of Election or Appointment: 2019
Secretary and Chief Legal Officer (CLO)
Ms. Lo Bessette also serves as Secretary and CLO of other funds. Ms. Lo Bessette serves as CLO, Secretary, and Senior Vice President of Fidelity Management & Research Company and FMR Co., Inc. (investment adviser firms, 2019-present); Secretary of Fidelity SelectCo, LLC and Fidelity Investments Money Management, Inc. (investment adviser firms, 2019-present); and CLO of Fidelity Management & Research (Hong Kong) Limited, FMR Investment Management (UK) Limited, and Fidelity Management & Research (Japan) Limited (investment adviser firms, 2019-present). She is a Senior Vice President and Deputy General Counsel of FMR LLC (diversified financial services company, 2019-present), and is an employee of Fidelity Investments. Previously, Ms. Lo Bessette served as Executive Vice President, General Counsel (2016-2019) and Senior Vice President, Deputy General Counsel (2015-2016) of OppenheimerFunds (investment management company) and Deputy Chief Legal Officer (2013-2015) of Jennison Associates LLC (investment adviser firm).
Chris Maher (1972)
Year of Election or Appointment: 2013
Assistant Treasurer
Mr. Maher serves as Assistant Treasurer of other funds. Mr. Maher is Vice President of Valuation Oversight, serves as Assistant Treasurer of FMR Capital, Inc. (2017-present), and is an employee of Fidelity Investments. Previously, Mr. Maher served as Vice President of Asset Management Compliance (2013), Vice President of the Program Management Group of FMR (investment adviser firm, 2010-2013), and Vice President of Valuation Oversight (2008-2010).
John B. McGinty, Jr. (1962)
Year of Election or Appointment: 2016
Chief Compliance Officer
Mr. McGinty also serves as Chief Compliance Officer of other funds. Mr. McGinty is Senior Vice President of Asset Management Compliance for Fidelity Investments and is an employee of Fidelity Investments (2016-present). Mr. McGinty previously served as Vice President, Senior Attorney at Eaton Vance Management (investment management firm, 2015-2016), and prior to Eaton Vance as global CCO for all firm operations and registered investment companies at GMO LLC (investment management firm, 2009-2015). Before joining GMO LLC, Mr. McGinty served as Senior Vice President, Deputy General Counsel for Fidelity Investments (2007-2009).
Jason P. Pogorelec (1975)
Year of Election or Appointment: 2015
Assistant Secretary
Mr. Pogorelec also serves as Assistant Secretary of other funds. Mr. Pogorelec serves as Vice President, Associate General Counsel (2010-present) and is an employee of Fidelity Investments (2006-present).
Nancy D. Prior (1967)
Year of Election or Appointment: 2014
Vice President
Ms. Prior also serves as Vice President of other funds. Ms. Prior serves as President of Fixed Income (2014-present), President (2016-present) and Director (2014-present) of Fidelity Investments Money Management, Inc. (FIMM) (investment adviser firm), and is an employee of Fidelity Investments (2002-present). Previously, Ms. Prior served as Vice President of Global Asset Allocation Funds (2017-2019); Vice Chairman of FIAM LLC (investment adviser firm, 2014-2018), a Director of FMR Investment Management (UK) Limited (investment adviser firm, 2015-2018), President Multi-Asset Class Strategies of FMR's Global Asset Allocation Division (2017-2018), Vice President of Fidelity's Money Market Funds (2012-2014), and President, Money Market and Short Duration Bond Group of Fidelity Management & Research Company (FMR) (investment adviser firm, 2013-2014).
Stacie M. Smith (1974)
Year of Election or Appointment: 2013
Assistant Treasurer
Ms. Smith also serves as an officer of other funds. Ms. Smith serves as Assistant Treasurer of FMR Capital, Inc. (2017-present), is an employee of Fidelity Investments (2009-present), and has served in other fund officer roles. Prior to joining Fidelity Investments, Ms. Smith served as Senior Audit Manager of Ernst & Young LLP (accounting firm, 1996-2009). Previously, Ms. Smith served as Assistant Treasurer (2013-2018) and Deputy Treasurer (2013-2016) of certain Fidelity® funds.
Marc L. Spector (1972)
Year of Election or Appointment: 2016
Deputy Treasurer
Mr. Spector also serves as an officer of other funds. Mr. Spector serves as Assistant Treasurer of FMR Capital, Inc. (2017-present) and is an employee of Fidelity Investments (2016-present). Prior to joining Fidelity Investments, Mr. Spector served as Director at the Siegfried Group (accounting firm, 2013-2016), and prior to Siegfried Group as audit senior manager at Deloitte & Touche (accounting firm, 2005-2013).
Jim Wegmann (1979)
Year of Election or Appointment: 2019
Assistant Treasurer
Mr. Wegmann also serves as Assistant Treasurer of other funds. Mr. Wegmann is an employee of Fidelity Investments (2011-present).
Shareholder Expense Example
As a shareholder of a Fund, you incur two types of costs: (1) transaction costs, and (2) ongoing costs, including management fees and other Fund expenses. This Example is intended to help you understand your ongoing costs (in dollars) of investing in the Funds and to compare these costs with the ongoing costs of investing in other mutual funds.
The Example is based on an investment of $1,000 invested at the beginning of the period and held for the entire period (May 1, 2019 to October 31, 2019).
Actual Expenses
The first line of the accompanying table for each fund provides information about actual account values and actual expenses. You may use the information in this line, together with the amount you invested, to estimate the expenses that you paid over the period. Simply divide your account value by $1,000.00 (for example, an $8,600 account value divided by $1,000.00 = 8.6), then multiply the result by the number in the first line for a fund under the heading entitled "Expenses Paid During Period" to estimate the expenses you paid on your account during this period. In addition, each Fund, as a shareholder in the underlying Fidelity Central Funds, will indirectly bear its pro-rata share of the fees and expenses incurred by the underlying Fidelity Central Funds. These fees and expenses are not included in the Fund's annualized expense ratio used to calculate the expense estimate in the table below.
Hypothetical Example for Comparison Purposes
The second line of the accompanying table for each fund provides information about hypothetical account values and hypothetical expenses based on a fund's actual expense ratio and an assumed rate of return of 5% per year before expenses, which is not the Fund's actual return. The hypothetical account values and expenses may not be used to estimate the actual ending account balance or expenses you paid for the period. You may use this information to compare the ongoing costs of investing in the Fund and other funds. To do so, compare this 5% hypothetical example with the 5% hypothetical examples that appear in the shareholder reports of the other funds. In addition, each Fund, as a shareholder in the underlying Fidelity Central Funds, will indirectly bear its pro-rata share of the fees and expenses incurred by the underlying Fidelity Central Funds. These fees and expenses are not included in the Fund's annualized expense ratio used to calculate the expense estimate in the table below.
Please note that the expenses shown in the table are meant to highlight your ongoing costs only and do not reflect any transaction costs. Therefore, the second line of the table is useful in comparing ongoing costs only, and will not help you determine the relative total costs of owning different funds.
| | Annualized Expense Ratio-A | Beginning
Account Value
May 1, 2019 | Ending
Account Value
October 31, 2019 | Expenses Paid
During Period-B
May 1, 2019
to October 31, 2019 |
| Fidelity SAI Emerging Markets Low Volatility Index Fund | .26% | | | |
| Actual | | $1,000.00 | $983.50 | $1.30 |
| Hypothetical-C | | $1,000.00 | $1,023.89 | $1.33 |
| Fidelity SAI International Low Volatility Index Fund | .20% | | | |
| Actual | | $1,000.00 | $1,053.90 | $1.04 |
| Hypothetical-C | | $1,000.00 | $1,024.20 | $1.02 |
| Fidelity SAI U.S. Low Volatility Index Fund | .15% | | | |
| Actual | | $1,000.00 | $1,066.30 | $.78 |
| Hypothetical-C | | $1,000.00 | $1,024.45 | $.77 |
A Annualized expense ratio reflects expenses net of applicable fee waivers.
B Expenses are equal to each Fund's annualized expense ratio, multiplied by the average account value over the period, multiplied by 184/ 365 (to reflect the one-half year period).
C 5% return per year before expenses
Distributions (Unaudited)
The Board of Trustees of each fund voted to pay to shareholders of record at the opening of business on record date, the following distributions per share derived from capital gains realized from sales of portfolio securities, and dividends derived from net investment income:
| | Pay Date | Record Date | Dividends | Capital Gains |
| Fidelity SAI Emerging Markets Low Volatility Index Fund | 12/09/19 | 12/06/19 | $0.193 | $0.000 |
| Fidelity SAI International Low Volatility Index Fund | 12/09/19 | 12/06/19 | $0.216 | $0.459 |
| Fidelity SAI U.S. Low Volatility Index Fund | 12/09/19 | 12/06/19 | $0.243 | $0.335 |
|
The funds hereby designate as capital gain dividend the amounts noted below for the taxable year ended October 31, 2019, or, if subsequently determined to be different, the net capital gain of such year.
| Fidelity SAI International Low Volatility Index Fund | $98,851,286 |
| Fidelity SAI U.S. Low Volatility Index Fund | $74,105,068 |
|
A percentage of the dividends distributed during the fiscal year for the following funds qualify for the dividends–received deduction for corporate shareholders:
| Fidelity SAI U.S. Low Volatility Index Fund | |
| December 14, 2018 | 71% |
| December 28, 2018 | 68% |
|
A percentage of the dividends distributed during the fiscal year for the following funds may be taken into account as a dividend for purposes of the maximum rate under section 1(h)(11) of the Internal Revenue Code.
| Fidelity SAI International Low Volatility Index Fund | |
| December 2018 | 74% |
| Fidelity SAI U.S. Low Volatility Index Fund | |
| December 14, 2018 | 75% |
| December 28, 2018 | 70% |
|
A percentage of the dividends distributed during the fiscal year for the following funds qualify for as a section 199A dividend:
| Fidelity SAI U.S. Low Volatility Index Fund | |
| December 14, 2018 | 17% |
| December 28, 2018 | 17% |
|
The amounts per share which represent income derived from sources within, and taxes paid to, foreign countries or possessions of the United States are as follows:
| | Pay Date | Income | Taxes |
| Fidelity SAI International Low Volatility Index Fund | 12/17/18 | $0.2846 | $0.0316 |
|
The funds will notify shareholders in January 2020 of amounts for use in preparing 2019 income tax returns.
Board Approval of Investment Advisory Contracts and Management Fees
Fidelity SAI Emerging Markets Low Volatility Index Fund
Each year, the Board of Trustees, including the Independent Trustees (together, the Board), votes on the renewal of the management contract with Fidelity Management & Research Company (FMR) and the sub-advisory agreements (together, the Advisory Contracts) for each fund, including the fund's sub-advisory agreement (Sub-Advisory Agreement) with Geode Capital Management, LLC (Geode). FMR and the sub-advisers are referred to herein as the Investment Advisers. The Board, assisted by the advice of fund counsel and Independent Trustees' counsel, requests and considers a broad range of information relevant to the renewal of the Advisory Contracts throughout the year.
The Board meets regularly and, at each of its meetings, covers an extensive agenda of topics and materials and considers factors that are relevant to its annual consideration of the renewal of each fund's Advisory Contracts, including the services and support provided to each fund and its shareholders. The Board has established four standing committees (Committees) — Operations, Audit, Fair Valuation, and Governance and Nominating — each composed of and chaired by Independent Trustees with varying backgrounds, to which the Board has assigned specific subject matter responsibilities in order to enhance effective decision-making by the Board. The Operations Committee, of which all of the Independent Trustees are members, meets regularly throughout the year and considers, among other matters, information specifically related to the annual consideration of the renewal of each fund's Advisory Contracts. The Board, acting directly and through its Committees, requests and receives information concerning the annual consideration of the renewal of each fund's Advisory Contracts. The Board also meets as needed to review matters specifically related to the Board's annual consideration of the renewal of the Advisory Contracts. Members of the Board may also meet with trustees of other Fidelity funds through joint ad hoc committees to discuss certain matters relevant to all of the Fidelity funds.
At its September 2019 meeting, the Board unanimously determined to renew each fund's Advisory Contracts. In reaching its determination, the Board considered all factors it believed relevant, including (i) the nature, extent, and quality of the services provided to each fund and its shareholders (including the investment performance of each fund); (ii) the competitiveness of each fund's management fee and total expense ratio relative to peer funds; (iii) the total costs of the services provided by and the profits realized by Fidelity and Geode from their respective relationships with each fund; and (iv) the extent to which, if any, economies of scale exist and are realized as each fund grows, and whether any economies of scale are appropriately shared with fund shareholders.
In considering whether to renew the Advisory Contracts for each fund, the Board reached a determination, with the assistance of fund counsel and Independent Trustees' counsel and through the exercise of its business judgment, that the renewal of the Advisory Contracts was in the best interests of each fund and its shareholders and that the compensation payable under the Advisory Contracts was fair and reasonable. The Board's decision to renew the Advisory Contracts was not based on any single factor, but rather was based on a comprehensive consideration of all the information provided to the Board at its meetings throughout the year. The Board, in reaching its determination to renew the Advisory Contracts, was aware that shareholders of each fund have a broad range of investment choices available to them, including a wide choice among funds offered by Fidelity's competitors, and that each fund's shareholders, who have the opportunity to review and weigh the disclosure provided by the fund in its prospectus and other public disclosures, have chosen to invest in that fund, which is part of the Fidelity family of funds.
Approval of Amended and Restated Advisory Contracts. At its September 2019 meeting, the Board also unanimously determined to approve amended and restated management contracts and sub-advisory agreements with Geode (Amended and Restated Contracts) in connection with an upcoming consolidation of certain of Fidelity's advisory businesses. The Board considered that, on or about January 1, 2020, FMR Co., Inc. (FMRC) expects to merge with and into FMR and, after the merger, FMR expects to redomicile as a Delaware limited liability company. The Board also approved the termination of the sub-advisory agreements with FMRC upon the completion of the merger. The Board noted that references to FMR in the Amended and Restated Contracts would be updated to reflect FMR's new form of organization and domicile. The Board also approved amendments that clarify that each fund pays its non-operating expenses, including brokerage commissions and fees and expenses associated with the fund's securities lending program, if applicable. The Board also noted Fidelity's assurance that neither the planned consolidation nor the Amended and Restated Contracts will change the investment processes, the level or nature of services provided, the resources and personnel allocated, trading and compliance operations, or any fees or expenses paid by the funds.
Nature, Extent, and Quality of Services Provided. The Board considered staffing as it relates to the funds, including the backgrounds of investment personnel of Fidelity and Geode, and also considered the funds' investment objectives, strategies, and related investment philosophies. The Independent Trustees also had discussions with senior management of Fidelity's investment operations and investment groups and with representatives of Geode. The Board considered the structure of the investment personnel compensation programs and whether the structures provide appropriate incentives to act in the best interests of each fund. Additionally, the Board considered the portfolio managers' investments, if any, in the funds that they manage.
The Trustees also discussed with representatives of Fidelity, at meetings throughout the year, Fidelity's role in, among other things, overseeing compliance with federal securities laws and other applicable requirements by Geode with respect to the fund and monitoring and overseeing the performance and investment capabilities of Geode. The Trustees considered that the Board had received from Fidelity periodic reports about its oversight and due diligence processes, as well as periodic reports regarding the performance of Geode.
The Board also considered the nature, extent and quality of services provided by Geode. The Trustees noted that under the Sub-Advisory Agreement, subject to oversight by Fidelity, Geode is responsible for, among other things, identifying investments and arranging for execution of portfolio transactions to implement each fund's investment strategy. In addition, the Trustees noted that Geode is responsible for providing such reporting as may be requested by Fidelity to fulfill its oversight responsibilities discussed above.
Resources Dedicated to Investment Management and Support Services. The Board reviewed the general qualifications and capabilities of Fidelity's and Geode's investment staffs, including their size, education, experience, and resources, as well as Fidelity's and Geode's approach to recruiting, managing, and compensating investment personnel. The Board considered that Fidelity's and Geode's investment professionals have extensive resources, tools and capabilities so as to provide competitive investment results over time, and that those professionals also have access to sophisticated tools that permit them to assess portfolio construction and risk and performance attribution characteristics continuously. Additionally, in its deliberations, the Board considered Fidelity's and Geode's trading, risk management, compliance, and technology and operations capabilities and resources, which are integral parts of the investment management process.
Shareholder and Administrative Services. The Board considered (i) the nature, extent, quality, and cost of advisory, administrative, and shareholder services performed by the Investment Advisers and their affiliates under the Advisory Contracts and by FMR's affiliates under separate agreements covering transfer agency, pricing and bookkeeping, and securities lending services for each fund; (ii) the nature and extent of the supervision of third party service providers, principally custodians, subcustodians, and pricing vendors; and (iii) the resources devoted to, and the record of compliance with, each fund's compliance policies and procedures. The Board also reviewed the allocation of fund brokerage, including allocations to brokers affiliated with the Investment Advisers.
The Board noted that the growth of fund assets over time across the complex allows Fidelity to reinvest in the development of services designed to enhance the value and convenience of the Fidelity funds as investment vehicles. These services include 24-hour access to account information and market information over the Internet and through telephone representatives, investor education materials and asset allocation tools, and the expanded availability of Fidelity Investor Centers.
Investment in a Large Fund Family. The Board considered the benefits to shareholders of investing in a Fidelity fund, including the benefits of investing in a fund that is part of a large family of funds offering a variety of investment disciplines and providing a large variety of mutual fund investor services. The Board noted that Fidelity had taken, or had made recommendations that resulted in the Fidelity funds taking, a number of actions over the previous year that benefited particular funds, including: (i) continuing to dedicate additional resources to Fidelity's investment research process, which includes meetings with management of issuers of securities in which the funds invest, and to the support of the senior management team that oversees asset management; (ii) continuing efforts to enhance Fidelity's global research capabilities; (iii) launching new funds with innovative structures, strategies and pricing and making other enhancements to meet client needs; (iv) launching new share classes of existing funds; (v) eliminating purchase minimums and broadening eligibility requirements for certain funds and share classes; (vi) reducing management fees and total expenses for certain target date funds and index funds; (vii) lowering expense caps for certain existing funds and classes, and converting certain voluntary expense caps to contractual caps, to reduce expenses borne by shareholders; (viii) rationalizing product lines and gaining increased efficiencies from fund mergers, liquidations, and share class consolidations; (ix) continuing to develop, acquire and implement systems and technology to improve services to the funds and shareholders, strengthen information security, and increase efficiency; and (x) continuing to implement enhancements to further strengthen Fidelity's product line to increase investors' probability of success in achieving their investment goals, including retirement income goals.
Investment Performance (for Fidelity SAI International Low Volatility Index Fund and Fidelity U.S. Low Volatility Index Fund). The Board considered whether each fund has operated in accordance with its investment objective, as well as its record of compliance with its investment restrictions and its performance history.
The Board took into account discussions with representatives of the Investment Advisers about fund investment performance. In this regard the Board noted that as part of regularly scheduled fund reviews and other reports to the Board on fund performance, the Board considers annualized return information for each fund for different time periods, measured against the securities market index the fund seeks to track. The Board also periodically considers each fund's tracking error versus its benchmark index. In its evaluation of fund investment performance, the Board gave particular attention to information indicating underperformance of certain Fidelity funds for specific time periods and discussed with the Investment Advisers the reasons for such underperformance.
In addition to reviewing absolute and relative fund performance, the Independent Trustees periodically consider the appropriateness of fund performance metrics in evaluating the results achieved. In general, the Independent Trustees believe that an index fund's performance should be evaluated based on gross performance (before fees and expenses but after transaction costs) compared to a fund's benchmark index, over appropriate time periods, taking into account relevant factors including the following: general market conditions; the characteristics of the fund's benchmark index; the extent to which statistical sampling is employed; any securities lending revenues; and fund cash flows and other factors. Depending on the circumstances, the Independent Trustees may be satisfied with a fund's performance notwithstanding that it lags its benchmark index for certain periods.
The Independent Trustees recognize that shareholders evaluate performance on a net basis (after fees and expenses) over their own holding periods, for which one-, three-, and five-year periods are often used as a proxy. For this reason, the performance information reviewed by the Board also included net cumulative calendar year total return information for each fund and its benchmark index for the most recent one- and three-year periods.
Investment Performance (for Fidelity SAI Emerging Markets Low Volatility Index Fund). The Board considered whether the fund has operated in accordance with its investment objective, as well as its record of compliance with its investment restrictions. As the fund recently commenced operations, the Board did not believe that it was appropriate to assign significant weight to its limited investment performance.
Based on its review, the Board concluded that the nature, extent, and quality of services provided to each fund under the Advisory Contracts should continue to benefit the shareholders of each fund.
Competitiveness of Management Fee and Total Expense Ratio. The Board considered each fund's management fee and total expense ratio compared to "mapped groups" of competitive funds and classes created for the purpose of facilitating the Trustees' competitive analysis of management fees and total expenses. Fidelity creates "mapped groups" by combining similar Lipper investment objective categories that have comparable investment mandates. Combining Lipper investment objective categories aids the Board's management fee and total expense ratio comparisons by broadening the competitive group used for comparison.
With respect to Fidelity SAI Emerging Markets Low Volatility Index Fund, the Board further considered that it received and reviewed information regarding the fund's management fee rate and total expense ratio compared to "mapped groups" of competitive funds and classes in connection with the approval of the management contract and sub-advisory agreements in September 2018. The Board noted that, because the fund did not commence operations until January 2019, no new competitive management fee and expense information was considered by the Board.
Management Fee. The Board considered two proprietary management fee comparisons for the 12-month (or shorter) periods shown in basis points (BP) in the charts below. The group of Lipper funds used by the Board for management fee comparisons is referred to below as the "Total Mapped Group." The Total Mapped Group comparison focuses on a fund's standing in terms of gross management fees before expense reimbursements or caps relative to the total universe of funds with comparable investment mandates, regardless of whether their management fee structures also are comparable. Funds with comparable investment mandates offer exposure to similar types of securities. Funds with comparable management fee structures have similar management fee contractual arrangements (e.g., flat rate charged for advisory services, all-inclusive fee rate, etc.). "TMG %" represents the percentage of funds in the Total Mapped Group that had management fees that were lower than a fund's. For example, a hypothetical TMG % of 20% would mean that 80% of the funds in the Total Mapped Group had higher, and 20% had lower, management fees than a fund. The funds' actual TMG %s and the number of funds in the Total Mapped Group are in the charts below. The "Asset-Size Peer Group" (ASPG) comparison focuses on a fund's standing relative to a subset of non-Fidelity funds within the Total Mapped Group that are similar in size and management fee structure. For example, if a fund is in the first quartile of the ASPG, the fund's management fee ranks in the least expensive or lowest 25% of funds in the ASPG. The ASPG represents at least 15% of the funds in the Total Mapped Group with comparable asset size and management fee structures, subject to a minimum of 50 funds (or all funds in the Total Mapped Group if fewer than 50). Additional information, such as the ASPG quartile in which a fund's management fee rate ranked, is also included in the charts and was considered by the Board.
Fidelity SAI International Low Volatility Index Fund

The Board noted that the fund's management fee rate ranked below the median of its Total Mapped Group and below the median of its ASPG for 2018.
Fidelity SAI U.S. Low Volatility Index Fund

The Board noted that the fund's management fee rate ranked below the median of its Total Mapped Group and above the median of its ASPG for 2018. The Board considered that the Total Mapped Group is dominated by non-factor based index funds (including Fidelity funds) with lower management fees than the fund. The Board further considered that Fidelity believes the management fee is reasonable and that the total expense ratio for the fund ranks below median.
The Board noted that it and the boards of other Fidelity funds formed an ad hoc Committee on Group Fee, which meets periodically, to conduct an in-depth review of the "group fee" component of the management fee of funds with such management fee structures. The Committee's focus included the mechanics of the group fee, the competitive landscape of group fee structures, Fidelity funds with no group fee component (such as the funds) and investment products not included in group fee assets. The Board also considered that, for funds subject to the group fee, FMR agreed to voluntarily waive fees over a specified period of time in amounts designed to account for assets converted from certain funds to certain collective investment trusts.
Based on its review, the Board concluded that each fund's management fee is fair and reasonable in light of the services that the fund receives and the other factors considered.
Total Expense Ratio. In its review of each fund's total expense ratio, the Board considered the fund's management fee rate as well as other fund expenses, such as custodial, legal, and audit fees. The Board also noted that Fidelity may agree to waive fees or reimburse expenses from time to time, and the extent to which, if any, it has done so for each fund. As part of its review, the Board also considered the current and historical total expense ratios of each fund compared to competitive fund median expenses. Each fund is compared to those funds and classes in the Total Mapped Group (used by the Board for management fee comparisons) that have a similar sales load structure.
The Board noted that each of Fidelity SAI International Low Volatility Index Fund's and Fidelity SAI U.S. Low Volatility Index Fund's total expense ratio ranked below the competitive median for 2018.
The Board further considered that FMR has contractually agreed to reimburse each fund to the extent that total operating expenses (with certain exceptions), as a percentage of its average net assets, exceed 0.25% for Fidelity SAI Emerging Markets Low Volatility Index Fund, 0.20% for Fidelity SAI International Low Volatility Index Fund, and 0.15% for Fidelity SAI U.S. Low Volatility Index Fund through February 29, 2020.
Fees Charged to Other Clients. The Board also considered fee structures applicable to clients of Fidelity and Geode, such as other funds advised or subadvised by Fidelity or Geode, pension plan clients, and other institutional clients with similar mandates. The Board noted that a joint ad hoc committee created by it and the boards of other Fidelity funds periodically reviews and compares Fidelity's institutional investment advisory business with its business of providing services to the Fidelity funds and also noted the most recent findings of the committee. The Board noted that the committee's review included a consideration of the differences in services provided, fees charged, and costs incurred, as well as competition in the markets serving the different categories of clients.
Based on its review of total expense ratios and fees charged to other Fidelity clients, the Board concluded that each fund's total expense ratio was reasonable in light of the services that the fund and its shareholders receive and the other factors considered.
Costs of the Services and Profitability. The Board considered the revenues earned and the expenses incurred by Fidelity in conducting the business of developing, marketing, distributing, managing, administering and servicing each fund and servicing each fund's shareholders. The Board also considered the level of Fidelity's profits in respect of all the Fidelity funds.
On an annual basis, Fidelity presents to the Board information about the profitability of its relationships with each fund. Fidelity calculates profitability information for each fund, as well as aggregate profitability information for groups of Fidelity funds and all Fidelity funds, using a series of detailed revenue and cost allocation methodologies which originate with the books and records of Fidelity on which Fidelity's audited financial statements are based. The Audit Committee of the Board reviews any significant changes from the prior year's methodologies and the full Board approves such changes.
PricewaterhouseCoopers LLP (PwC), auditor to Fidelity and certain Fidelity funds, has been engaged annually by the Board as part of the Board's assessment of Fidelity's profitability analysis. PwC's engagement includes the review and assessment of the methodologies used by Fidelity in determining the revenues and expenses attributable to Fidelity's mutual fund business, and completion of agreed-upon procedures in respect of the mathematical accuracy of the fund profitability information and its conformity to established allocation methodologies. After considering PwC's reports issued under the engagement and information provided by Fidelity, the Board concluded that while other allocation methods may also be reasonable, Fidelity's profitability methodologies are reasonable in all material respects.
The Board also reviewed Fidelity's and Geode's non-fund businesses and potential indirect benefits such businesses may have received as a result of their association with Fidelity's mutual fund business (i.e., fall-out benefits) as well as cases where Fidelity's and Geode's affiliates may benefit from the funds' business. The Board noted that changes to fall-out benefits year-over-year reflect business developments at Fidelity's and Geode's various businesses. The Board considered that a joint ad hoc committee created by it and the boards of other Fidelity funds had recently been established, and meets periodically, to evaluate potential fall-out benefits. The Board noted that the committee was expected to, among other things: (i) discuss the legal framework surrounding potential fall-out benefits; (ii) review the Board's responsibilities and approach to potential fall-out benefits; and (iii) review practices employed by competitor funds regarding the review of potential fall-out benefits. The Board noted that it would consider the committee's findings in connection with future consideration of contract renewals.
The Board considered the costs of the services provided by and the profits realized by Fidelity in connection with the operation of each fund and was satisfied that the profitability was not excessive.
The Board also considered information regarding the profitability of Geode's relationship with each fund.
Economies of Scale. The Board considered whether there have been economies of scale in respect of the management of the Fidelity funds, whether the Fidelity funds (including each fund) have appropriately benefited from any such economies of scale, and whether there is potential for realization of any further economies of scale. The Board considered the extent to which each fund will benefit from economies of scale as assets grow through increased services to the fund, through waivers or reimbursements, or through fee or expense ratio reductions. The Board also noted that a committee (the Economies of Scale Committee) created by it and the boards of other Fidelity funds periodically analyzes whether Fidelity attains economies of scale in respect of the management and servicing of the Fidelity funds, whether the Fidelity funds have appropriately benefited from such economies of scale, and whether there is potential for realization of any further economies of scale.
The Board concluded, taking into account the analysis of the Economies of Scale Committee, that economies of scale, if any, are being appropriately shared between fund shareholders and Fidelity.
Additional Information Requested by the Board. In order to develop fully the factual basis for consideration of the Fidelity funds' advisory contracts, the Board requested and received additional information on certain topics, including: (i) Fidelity's fund profitability methodology, profitability trends for certain funds, the allocation of various costs to different funds, and the impact of certain factors on fund profitability results; (ii) portfolio manager changes that have occurred during the past year and the amount of the investment that each portfolio manager has made in the Fidelity fund(s) that he or she manages; (iii) Fidelity's compensation structure for portfolio managers, research analysts, and other key personnel, including its effects on fund profitability, the rationale for the compensation structure, and the extent to which current market conditions have affected retention and recruitment; (iv) the arrangements with and compensation paid to certain fund sub-advisers on behalf of the Fidelity funds and the treatment of such compensation within Fidelity's fund profitability methodology; (v) the practices of certain sub-advisers regarding their receipt of research from broker-dealers that execute the funds' portfolio transactions; (vi) the terms of Fidelity's voluntary expense limitation agreements; (vii) the methodology with respect to competitive fund data and peer group classifications; (viii) Fidelity's transfer agent fee, expense, and service structures for different funds and classes relative to competitive trends, and the impact of the increased use of omnibus accounts; (ix) new developments in the retail and institutional marketplaces and the competitive positioning of the funds relative to other investment products and services; (x) the impact on fund profitability of recent changes in total net assets for Fidelity's money market funds, anticipated changes to the competitive landscape for money market funds, and the level of investor comfort with gates, fees, and floating NAVs; (xi) the funds' share class structures and distribution channels; and (xii) explanations regarding the relative total expense ratios of certain funds and classes, total expense competitive trends and methodologies for total expense competitive comparisons, and actions that might be taken by Fidelity to reduce total expense ratios for certain classes. In addition, the Board considered its discussions with Fidelity throughout the year regarding enhanced information security initiatives and the funds' fair valuation policies.
Based on its evaluation of all of the conclusions noted above, and after considering all factors it believed relevant, the Board concluded that the advisory and sub-advisory fee arrangements are fair and reasonable, and that each fund's Advisory Contracts should be renewed and each fund's Amended and Restated Contracts should be approved.
SV1-SV2-ANN-1219
1.9867660.104
Fidelity® SAI International Index Fund
Offered exclusively to certain clients of the Adviser or its affiliates - not available for sale to the general public. Fidelity SAI is a product name of Fidelity® funds dedicated to certain programs affiliated with Strategic Advisers LLC.
Annual Report
October 31, 2019
See the inside front cover for important information about access to your fund’s shareholder reports.
Beginning on January 1, 2021, as permitted by regulations adopted by the Securities and Exchange Commission, paper copies of a fund’s shareholder reports will no longer be sent by mail, unless you specifically request paper copies of the reports from the fund or from your financial intermediary, such as a financial advisor, broker-dealer or bank. Instead, the reports will be made available on a website, and you will be notified by mail each time a report is posted and provided with a website link to access the report.
If you already elected to receive shareholder reports electronically, you will not be affected by this change and you need not take any action. You may elect to receive shareholder reports and other communications from a fund electronically, by contacting your financial intermediary. For Fidelity customers, visit Fidelity's web site or call Fidelity using the contact information listed below.
You may elect to receive all future reports in paper free of charge. If you wish to continue receiving paper copies of your shareholder reports, you may contact your financial intermediary or, if you are a Fidelity customer, visit Fidelity’s website, or call Fidelity at the applicable toll-free number listed below. Your election to receive reports in paper will apply to all funds held with the fund complex/your financial intermediary.
| Account Type | Website | Phone Number |
| Brokerage, Mutual Fund, or Annuity Contracts: | fidelity.com/mailpreferences | 1-800-343-3548 |
| Employer Provided Retirement Accounts: | netbenefits.fidelity.com/preferences (choose 'no' under Required Disclosures to continue to print) | 1-800-343-0860 |
| Advisor Sold Accounts Serviced Through Your Financial Intermediary: | Contact Your Financial Intermediary | Your Financial Intermediary's phone number |
| Advisor Sold Accounts Serviced by Fidelity: | institutional.fidelity.com | 1-877-208-0098 |
Contents
To view a fund's proxy voting guidelines and proxy voting record for the 12-month period ended June 30, visit http://www.fidelity.com/proxyvotingresults or visit the Securities and Exchange Commission's (SEC) web site at http://www.sec.gov.
You may also call 1-800-544-3455 to request a free copy of the proxy voting guidelines.
The funds or securities referred to herein are not sponsored, endorsed, or promoted by MSCI, and MSCI bears no liability with respect to any such funds or securities or any index on which such funds or securities are based. The prospectus contains a more detailed description of the limited relationship MSCI has with Fidelity and any related funds.
Standard & Poor's, S&P and S&P 500 are registered service marks of The McGraw-Hill Companies, Inc. and have been licensed for use by Fidelity Distributors Corporation.
Other third-party marks appearing herein are the property of their respective owners.
All other marks appearing herein are registered or unregistered trademarks or service marks of FMR LLC or an affiliated company. © 2019 FMR LLC. All rights reserved.
This report and the financial statements contained herein are submitted for the general information of the shareholders of the Fund. This report is not authorized for distribution to prospective investors in the Fund unless preceded or accompanied by an effective prospectus.
A fund files its complete schedule of portfolio holdings with the SEC for the first and third quarters of each fiscal year on Form N-PORT. Forms N-PORT are available on the SEC’s web site at http://www.sec.gov. A fund's Forms N-PORT may be reviewed and copied at the SEC’s Public Reference Room in Washington, DC. Information regarding the operation of the SEC's Public Reference Room may be obtained by calling 1-800-SEC-0330.
For a complete list of a fund's portfolio holdings, view the most recent holdings listing, semiannual report, or annual report on Fidelity's web site at http://www.fidelity.com, http://www.institutional.fidelity.com, or http://www.401k.com, as applicable.
NOT FDIC INSURED •MAY LOSE VALUE •NO BANK GUARANTEE
Neither the Fund nor Fidelity Distributors Corporation is a bank.
Performance: The Bottom Line
Average annual total return reflects the change in the value of an investment, assuming reinvestment of distributions from dividend income and capital gains (the profits earned upon the sale of securities that have grown in value, if any) and assuming a constant rate of performance each year. The hypothetical investment and the average annual total returns do not reflect the deduction of taxes that a shareholder would pay on fund distributions or the redemption of fund shares. During periods of reimbursement by Fidelity, a fund’s total return will be greater than it would be had the reimbursement not occurred. How a fund did yesterday is no guarantee of how it will do tomorrow.
Average Annual Total Returns
| For the periods ended October 31, 2019 | Past 1 year | Life of fundA |
| Fidelity® SAI International Index Fund | 11.36% | 7.11% |
A From January 5, 2016
$10,000 Over Life of Fund
Let's say hypothetically that $10,000 was invested in Fidelity® SAI International Index Fund on January 5, 2016, when the fund started.
The chart shows how the value of your investment would have changed, and also shows how the MSCI EAFE Index performed over the same period.
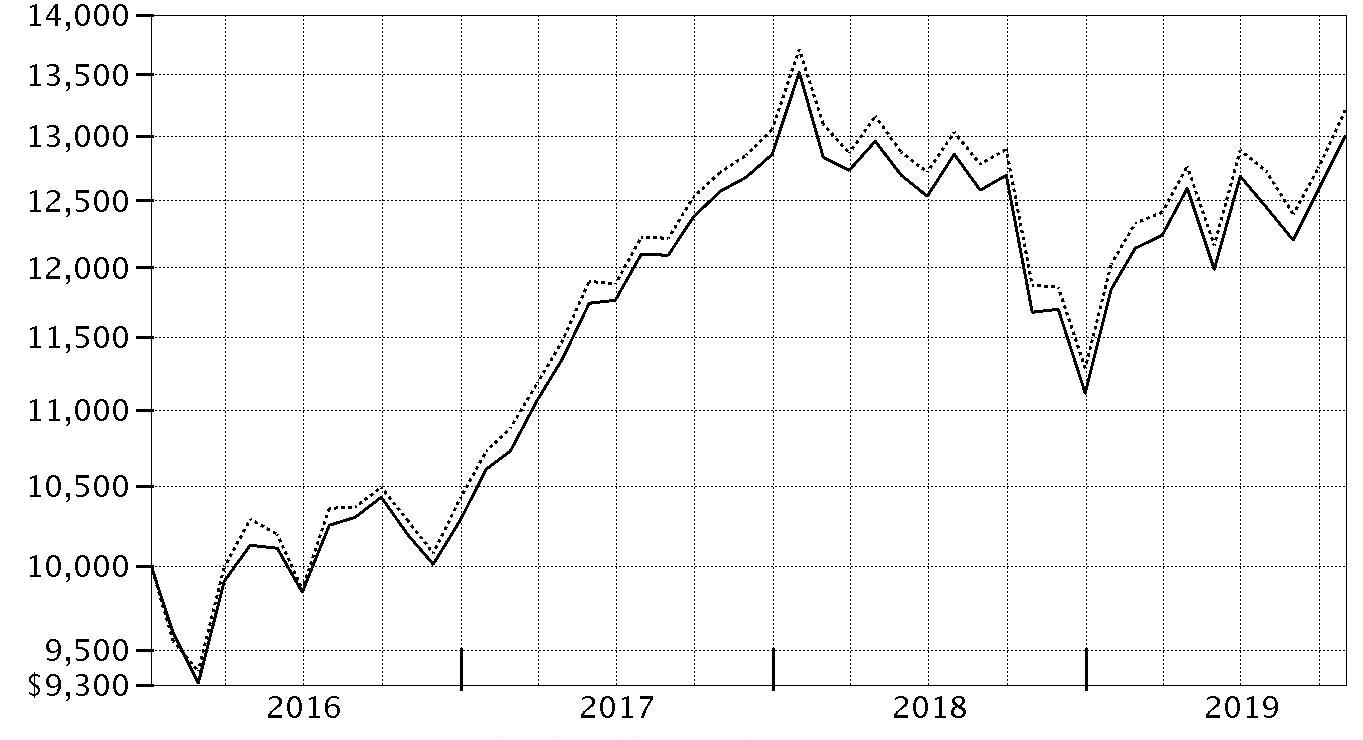
| Period Ending Values |
| $13,004 | Fidelity® SAI International Index Fund |
| $13,211 | MSCI EAFE Index |
Management's Discussion of Fund Performance
Market Recap: The MSCI ACWI (All Country World Index) ex USA Index gained 11.47% for the 12 months ending October 31, 2019, as international stocks reflected a confluence of factors, including escalating trade tension, moderating but still positive global economic growth and uncertainty about the U.K.’s planned “Brexit” from the European Union. In late December, the U.S. Federal Reserve shifted from raising interest rates to a more dovish policy in 2019, joining many foreign central banks that had cut policy rates. In June, international stocks rose 6.03%, as policy stimulus in China stabilized that country’s economic growth. The Fed cut its policy rate in July for the first time since 2008. However, the index returned -1.21% for the month, followed by -3.08% in August. In September, the Fed cut its policy rate another quarter point, citing concerns about slowing economic growth and muted inflation, and did the same in October, leading to monthly gains of 2.59% and 3.49%, respectively. For the full 12 months, the growth-oriented information technology sector (+22%) led the way, followed by utilities (+20%) and real estate (+18%), two high-dividend-yielding categories. Consumer discretionary gained 16%. Conversely, energy was roughly flat, while materials (+6%) and communication services (7%) also lagged. By region, Asia Pacific ex Japan (+16%), Europe ex U.K (+13%), Canada (+12%) and emerging markets (+12%) fared best. Meanwhile, the U.K. (+7%) and Japan (+10%) trailed the broader market.
Comments from the Geode Capital Management, LLC, passive equity index team: For the fiscal year, the fund gained 11.36%, roughly in line with the 11.30% advance of the benchmark MSCI EAFE Index.
(The fund's performance relative to the index can be affected by Fidelity's methodologies for valuing certain foreign stocks and for incorporating foreign exchange rates, which differ from those used by the index.) The past 12 months, the index was primarily driven by four sectors: utilities (+21%), information technology (+19%), health care (+17%) and industrials (+15%). Conversely, energy (-8%) was the only sector to lose ground. Notable individual stocks included Nestle (+29%), as the Swiss packaged-foods giant reported favorable sales growth. Healthy sales also lifted LVMH Moet Hennessy Louis Vuitton (+43%), a French luxury goods conglomerate, while Dutch semiconductor equipment supplier ASML Holding (+55%) reported higher third-quarter revenue. Several health care stocks also stood out, led by Switzerland's Roche Holdings (+27%) and Novartis (+17%), and U.K.-based AstraZeneca (+31%). In contrast, British American Tobacco (-13%) struggled, partly reflecting investors' concern about weakness in tobacco companies' core cigarette business. Teva Pharmaceuticals (-59%), an Israel-based maker of generic drugs, fell sharply due to increasing competition and potential costly legal exposure to the opioid crisis, while shares of Finnish telecom-equipment manufacturer Nokia (-34%) plunged in October after the company issued a disappointing financial outlook.
The views expressed above reflect those of the portfolio manager(s) only through the end of the period as stated on the cover of this report and do not necessarily represent the views of Fidelity or any other person in the Fidelity organization. Any such views are subject to change at any time based upon market or other conditions and Fidelity disclaims any responsibility to update such views. These views may not be relied on as investment advice and, because investment decisions for a Fidelity fund are based on numerous factors, may not be relied on as an indication of trading intent on behalf of any Fidelity fund.
Note to shareholders: On March 22, 2019, Pat Waddell retired and is no longer a portfolio manager with Geode Capital Management.
Investment Summary (Unaudited)
Geographic Diversification (% of fund's net assets)
| As of October 31, 2019 |
| | Japan | 24.4% |
| | United Kingdom | 15.2% |
| | France | 10.3% |
| | Switzerland | 9.2% |
| | Germany | 8.6% |
| | Australia | 6.7% |
| | Netherlands | 5.0% |
| | Spain | 2.8% |
| | Hong Kong | 2.6% |
| | Other* | 15.2% |
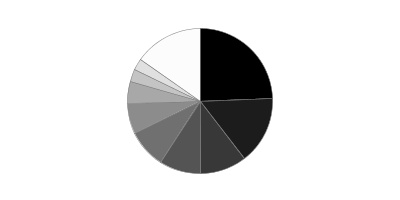
* Includes Short-Term investments and Net Other Assets (Liabilities).
Percentages are based on country or territory of incorporation and are adjusted for the effect of futures contracts, if applicable.
Top Ten Stocks as of October 31, 2019
| | % of fund's net assets |
| Nestle SA (Reg. S) (Switzerland, Food Products) | 2.3 |
| Roche Holding AG (participation certificate) (Switzerland, Pharmaceuticals) | 1.5 |
| Novartis AG (Switzerland, Pharmaceuticals) | 1.3 |
| Toyota Motor Corp. (Japan, Automobiles) | 1.1 |
| HSBC Holdings PLC (United Kingdom) (United Kingdom, Banks) | 1.1 |
| SAP SE (Germany, Software) | 0.9 |
| BP PLC (United Kingdom, Oil, Gas & Consumable Fuels) | 0.9 |
| AstraZeneca PLC (United Kingdom) (United Kingdom, Pharmaceuticals) | 0.9 |
| Royal Dutch Shell PLC Class A (United Kingdom) (United Kingdom, Oil, Gas & Consumable Fuels) | 0.9 |
| Total SA (France, Oil, Gas & Consumable Fuels) | 0.9 |
| | 11.8 |
Top Market Sectors as of October 31, 2019
| | % of fund's net assets |
| Financials | 18.2 |
| Industrials | 15.1 |
| Health Care | 11.7 |
| Consumer Staples | 11.4 |
| Consumer Discretionary | 10.8 |
| Materials | 6.7 |
| Information Technology | 6.7 |
| Communication Services | 5.0 |
| Energy | 4.9 |
| Utilities | 3.9 |
Asset Allocation as of October 31, 2019
| | % of fund's net assets |
| Stocks and Equity Futures | 100.1 |
| Short-Term Investments and Net Other Assets (Liabilities) | (0.1) |
Schedule of Investments October 31, 2019
Showing Percentage of Net Assets
| Common Stocks - 98.1% | | | |
| | | Shares | Value |
| Australia - 6.7% | | | |
| AGL Energy Ltd. | | 297,776 | $4,064,826 |
| Alumina Ltd. | | 1,112,673 | 1,737,007 |
| AMP Ltd. | | 1,508,739 | 1,906,353 |
| APA Group unit | | 536,348 | 4,308,085 |
| Aristocrat Leisure Ltd. | | 257,760 | 5,620,467 |
| ASX Ltd. | | 87,027 | 4,939,815 |
| Aurizon Holdings Ltd. | | 886,093 | 3,604,838 |
| Australia & New Zealand Banking Group Ltd. | | 1,273,500 | 23,403,261 |
| Bank of Queensland Ltd. | | 171,037 | 1,067,452 |
| Bendigo & Adelaide Bank Ltd. | | 216,368 | 1,587,949 |
| BHP Billiton Ltd. | | 1,322,948 | 32,428,708 |
| BlueScope Steel Ltd. | | 233,348 | 2,136,111 |
| Boral Ltd. | | 533,698 | 1,852,956 |
| Brambles Ltd. | | 716,089 | 5,919,944 |
| Caltex Australia Ltd. | | 113,584 | 2,135,222 |
| Challenger Ltd. | | 250,119 | 1,371,831 |
| Cimic Group Ltd. | | 44,293 | 1,009,389 |
| Coca-Cola Amatil Ltd. | | 231,580 | 1,625,147 |
| Cochlear Ltd. | | 26,209 | 3,823,634 |
| Coles Group Ltd. | | 508,944 | 5,266,997 |
| Commonwealth Bank of Australia | | 795,573 | 43,136,057 |
| Computershare Ltd. | | 222,186 | 2,425,264 |
| Crown Ltd. | | 170,005 | 1,460,447 |
| CSL Ltd. | | 203,482 | 35,885,336 |
| DEXUS Property Group unit | | 489,212 | 4,034,272 |
| Flight Centre Travel Group Ltd. | | 25,484 | 748,636 |
| Fortescue Metals Group Ltd. | | 628,283 | 3,845,486 |
| Goodman Group unit | | 733,315 | 7,281,279 |
| Harvey Norman Holdings Ltd. (a) | | 243,652 | 687,469 |
| Incitec Pivot Ltd. | | 732,707 | 1,743,432 |
| Insurance Australia Group Ltd. | | 1,029,952 | 5,643,181 |
| Lendlease Group unit | | 256,350 | 3,313,507 |
| Macquarie Group Ltd. | | 145,375 | 13,423,554 |
| Magellan Financial Group Ltd. | | 56,654 | 1,879,097 |
| Medibank Private Ltd. | | 1,225,401 | 2,856,072 |
| Mirvac Group unit | | 1,775,287 | 3,933,821 |
| National Australia Bank Ltd. | | 1,263,402 | 24,799,509 |
| Newcrest Mining Ltd. | | 344,815 | 7,526,737 |
| Orica Ltd. | | 173,294 | 2,738,688 |
| Origin Energy Ltd. | | 801,135 | 4,343,321 |
| QBE Insurance Group Ltd. | | 588,487 | 5,120,065 |
| Ramsay Health Care Ltd. | | 64,341 | 3,040,154 |
| realestate.com.au Ltd. | | 23,096 | 1,733,341 |
| Rio Tinto Ltd. | | 166,503 | 10,411,937 |
| Santos Ltd. | | 793,809 | 4,440,184 |
| Scentre Group unit | | 2,381,161 | 6,291,375 |
| SEEK Ltd. | | 152,016 | 2,379,055 |
| Sonic Healthcare Ltd. | | 205,133 | 4,040,094 |
| South32 Ltd. | | 2,251,912 | 3,940,691 |
| SP AusNet | | 835,601 | 1,067,370 |
| Stockland Corp. Ltd. unit | | 1,071,252 | 3,616,516 |
| Suncorp Group Ltd. | | 560,347 | 5,202,544 |
| Sydney Airport unit | | 502,215 | 3,041,638 |
| Tabcorp Holdings Ltd. | | 912,219 | 3,022,772 |
| Telstra Corp. Ltd. | | 1,889,667 | 4,551,162 |
| The GPT Group unit | | 871,659 | 3,577,927 |
| TPG Telecom Ltd. | | 169,110 | 762,208 |
| Transurban Group unit | | 1,200,279 | 12,293,195 |
| Treasury Wine Estates Ltd. | | 321,949 | 3,903,035 |
| Vicinity Centres unit | | 1,439,852 | 2,650,370 |
| Washington H. Soul Pattinson & Co. Ltd. | | 54,802 | 819,193 |
| Wesfarmers Ltd. | | 510,094 | 14,014,791 |
| Westpac Banking Corp. | | 1,549,169 | 30,077,890 |
| Woodside Petroleum Ltd. | | 419,826 | 9,304,799 |
| Woolworths Group Ltd. | | 565,666 | 14,586,347 |
| WorleyParsons Ltd. | | 144,002 | 1,351,636 |
|
| TOTAL AUSTRALIA | | | 436,755,446 |
|
| Austria - 0.2% | | | |
| Andritz AG | | 33,186 | 1,490,857 |
| Erste Group Bank AG | | 134,444 | 4,748,771 |
| OMV AG | | 65,619 | 3,829,032 |
| Raiffeisen International Bank-Holding AG | | 67,345 | 1,656,173 |
| Verbund AG | | 30,945 | 1,673,878 |
| Voestalpine AG | | 52,811 | 1,322,307 |
|
| TOTAL AUSTRIA | | | 14,721,018 |
|
| Bailiwick of Jersey - 0.7% | | | |
| Experian PLC | | 407,419 | 12,813,775 |
| Ferguson PLC | | 104,030 | 8,883,469 |
| Glencore Xstrata PLC | | 4,919,245 | 14,848,154 |
| WPP PLC | | 563,906 | 7,037,297 |
|
| TOTAL BAILIWICK OF JERSEY | | | 43,582,695 |
|
| Belgium - 0.9% | | | |
| Ageas | | 77,195 | 4,445,976 |
| Anheuser-Busch InBev SA NV | | 342,164 | 27,618,606 |
| Colruyt NV | | 24,696 | 1,372,765 |
| Groupe Bruxelles Lambert SA | | 36,326 | 3,645,485 |
| KBC Groep NV | | 112,172 | 7,866,630 |
| Proximus | | 69,044 | 2,119,941 |
| Solvay SA Class A | | 33,705 | 3,665,141 |
| Telenet Group Holding NV | | 21,557 | 1,058,352 |
| UCB SA | | 56,535 | 4,556,245 |
| Umicore SA | | 88,320 | 3,641,667 |
|
| TOTAL BELGIUM | | | 59,990,808 |
|
| Bermuda - 0.3% | | | |
| Cheung Kong Infrastructure Holdings Ltd. | | 301,000 | 2,166,216 |
| Dairy Farm International Holdings Ltd. | | 154,213 | 929,490 |
| Hongkong Land Holdings Ltd. | | 529,812 | 2,910,466 |
| Jardine Matheson Holdings Ltd. | | 100,178 | 5,711,249 |
| Jardine Strategic Holdings Ltd. | | 100,548 | 3,246,879 |
| Kerry Properties Ltd. | | 298,500 | 965,249 |
| NWS Holdings Ltd. | | 696,856 | 1,037,117 |
| Shangri-La Asia Ltd. | | 576,000 | 591,214 |
| Yue Yuen Industrial (Holdings) Ltd. | | 332,000 | 935,639 |
|
| TOTAL BERMUDA | | | 18,493,519 |
|
| Cayman Islands - 0.7% | | | |
| ASM Pacific Technology Ltd. | | 133,900 | 1,869,623 |
| BeiGene Ltd. ADR (a)(b) | | 16,230 | 2,245,258 |
| Budweiser Brewing Co. APAC Ltd. (b)(c) | | 540,800 | 1,963,446 |
| Cheung Kong Property Holdings Ltd. | | 1,158,000 | 8,057,027 |
| CK Hutchison Holdings Ltd. | | 1,211,500 | 11,185,881 |
| Melco Crown Entertainment Ltd. sponsored ADR | | 94,039 | 2,025,600 |
| MGM China Holdings Ltd. | | 434,400 | 687,865 |
| Sands China Ltd. | | 1,086,800 | 5,353,164 |
| WH Group Ltd. (c) | | 4,328,500 | 4,568,919 |
| Wharf Real Estate Investment Co. Ltd. | | 551,000 | 3,240,830 |
| Wynn Macau Ltd. | | 709,200 | 1,539,022 |
|
| TOTAL CAYMAN ISLANDS | | | 42,736,635 |
|
| Denmark - 1.7% | | | |
| A.P. Moller - Maersk A/S: | | | |
| Series A | | 1,691 | 2,029,564 |
| Series B | | 2,984 | 3,806,398 |
| Carlsberg A/S Series B | | 47,987 | 6,750,903 |
| Christian Hansen Holding A/S | | 47,840 | 3,672,952 |
| Coloplast A/S Series B | | 53,859 | 6,489,966 |
| Danske Bank A/S | | 287,529 | 4,102,529 |
| DSV A/S | | 97,991 | 9,508,293 |
| Genmab A/S (b) | | 29,074 | 6,352,515 |
| H Lundbeck A/S | | 31,772 | 1,083,762 |
| ISS Holdings A/S | | 71,735 | 1,877,224 |
| Novo Nordisk A/S Series B | | 794,747 | 43,702,113 |
| Novozymes A/S Series B | | 95,692 | 4,505,472 |
| ORSTED A/S (c) | | 85,139 | 7,468,155 |
| Pandora A/S | | 44,765 | 2,201,229 |
| Tryg A/S | | 52,775 | 1,474,026 |
| Vestas Wind Systems A/S | | 84,826 | 6,910,589 |
| William Demant Holding A/S (a)(b) | | 49,137 | 1,296,862 |
|
| TOTAL DENMARK | | | 113,232,552 |
|
| Finland - 1.1% | | | |
| Elisa Corp. (A Shares) | | 63,400 | 3,462,670 |
| Fortum Corp. | | 199,271 | 4,864,986 |
| Kone OYJ (B Shares) | | 152,613 | 9,708,737 |
| Metso Corp. | | 47,807 | 1,806,453 |
| Neste Oyj | | 189,827 | 6,851,067 |
| Nokia Corp. | | 2,528,943 | 9,283,785 |
| Nokian Tyres PLC | | 56,560 | 1,614,883 |
| Nordea Bank ABP (Stockholm Stock Exchange) | | 1,456,249 | 10,658,778 |
| Orion Oyj (B Shares) | | 47,284 | 2,095,723 |
| Sampo Oyj (A Shares) | | 197,618 | 8,098,356 |
| Stora Enso Oyj (R Shares) | | 264,315 | 3,426,940 |
| UPM-Kymmene Corp. | | 239,674 | 7,789,367 |
| Wartsila Corp. | | 201,426 | 2,125,642 |
|
| TOTAL FINLAND | | | 71,787,387 |
|
| France - 10.3% | | | |
| Accor SA | | 82,228 | 3,532,626 |
| Aeroports de Paris | | 13,484 | 2,562,595 |
| Air Liquide SA | | 212,191 | 28,185,804 |
| Alstom SA | | 85,133 | 3,679,267 |
| Amundi SA (c) | | 27,570 | 1,967,925 |
| Arkema SA | | 30,760 | 3,143,859 |
| Atos Origin SA | | 43,468 | 3,373,407 |
| AXA SA | | 868,001 | 22,977,056 |
| BIC SA | | 11,568 | 803,136 |
| bioMerieux SA | | 18,853 | 1,542,312 |
| BNP Paribas SA | | 505,361 | 26,409,942 |
| Bollore SA (b) | | 2,327 | 9,914 |
| Bollore SA | | 400,334 | 1,732,391 |
| Bouygues SA | | 100,081 | 4,241,573 |
| Bureau Veritas SA | | 127,619 | 3,258,013 |
| Capgemini SA | | 71,332 | 8,031,237 |
| Carrefour SA | | 265,011 | 4,508,871 |
| Casino Guichard Perrachon SA | | 25,046 | 1,351,158 |
| CNP Assurances | | 76,636 | 1,519,694 |
| Compagnie de St. Gobain | | 220,817 | 8,981,730 |
| Covivio | | 20,261 | 2,293,605 |
| Credit Agricole SA | | 516,520 | 6,739,734 |
| Danone SA | | 277,144 | 22,958,970 |
| Dassault Aviation SA | | 1,121 | 1,556,563 |
| Dassault Systemes SA | | 59,341 | 9,004,200 |
| Edenred SA | | 108,642 | 5,719,150 |
| EDF SA | | 270,566 | 2,791,904 |
| Eiffage SA | | 35,137 | 3,774,617 |
| ENGIE | | 821,408 | 13,737,165 |
| Essilor International SA | | 127,276 | 19,418,886 |
| Eurazeo SA | | 18,464 | 1,287,056 |
| Eutelsat Communications | | 76,450 | 1,449,500 |
| Faurecia SA | | 33,500 | 1,561,007 |
| Gecina SA | | 20,571 | 3,528,608 |
| Groupe Eurotunnel SA | | 199,822 | 3,345,151 |
| Hermes International SCA | | 14,249 | 10,250,282 |
| ICADE | | 13,658 | 1,337,437 |
| Iliad SA | | 11,711 | 1,212,087 |
| Imerys SA | | 16,318 | 630,065 |
| Ingenico SA | | 26,775 | 2,859,003 |
| Ipsen SA | | 17,134 | 1,824,962 |
| JCDecaux SA | | 34,712 | 948,500 |
| Kering SA | | 34,024 | 19,360,543 |
| Klepierre SA | | 89,795 | 3,343,954 |
| L'Oreal SA | | 113,685 | 33,194,376 |
| Legrand SA | | 119,682 | 9,341,024 |
| LVMH Moet Hennessy Louis Vuitton SE | | 124,808 | 53,300,009 |
| Michelin CGDE Series B | | 76,654 | 9,333,183 |
| Natixis SA | | 430,072 | 1,971,879 |
| Orange SA | | 894,729 | 14,400,224 |
| Pernod Ricard SA | | 95,286 | 17,588,095 |
| Peugeot Citroen SA | | 263,980 | 6,683,264 |
| Publicis Groupe SA | | 94,804 | 4,080,228 |
| Remy Cointreau SA | | 9,586 | 1,281,883 |
| Renault SA | | 86,185 | 4,398,549 |
| Safran SA | | 147,134 | 23,277,379 |
| Sanofi SA | | 505,230 | 46,575,717 |
| Sartorius Stedim Biotech | | 12,553 | 1,878,848 |
| Schneider Electric SA | | 247,134 | 22,968,748 |
| SCOR SE | | 68,819 | 2,899,760 |
| SEB SA | | 10,263 | 1,557,845 |
| Societe Generale Series A | | 345,544 | 9,826,900 |
| Sodexo SA | | 39,647 | 4,359,924 |
| SR Teleperformance SA | | 26,258 | 5,950,823 |
| Suez Environnement SA | | 155,468 | 2,423,174 |
| Thales SA | | 47,875 | 4,679,537 |
| Total SA | | 1,073,846 | 56,772,354 |
| Ubisoft Entertainment SA (b) | | 37,965 | 2,241,605 |
| Valeo SA | | 107,715 | 4,005,286 |
| Veolia Environnement SA | | 241,238 | 6,341,573 |
| VINCI SA | | 229,415 | 25,740,175 |
| Vivendi SA | | 411,070 | 11,443,321 |
| Wendel SA | | 12,079 | 1,710,907 |
| Worldline SA (b)(c) | | 37,325 | 2,266,676 |
|
| TOTAL FRANCE | | | 665,238,725 |
|
| Germany - 8.0% | | | |
| adidas AG | | 80,975 | 25,002,716 |
| Allianz SE | | 190,169 | 46,443,589 |
| Axel Springer SE (b) | | 21,663 | 1,510,047 |
| BASF AG | | 412,319 | 31,344,177 |
| Bayer AG | | 418,690 | 32,480,378 |
| Bayerische Motoren Werke AG (BMW) | | 148,588 | 11,386,635 |
| Beiersdorf AG | | 45,708 | 5,411,329 |
| Brenntag AG | | 70,326 | 3,529,556 |
| Carl Zeiss Meditec AG | | 18,256 | 1,990,280 |
| Commerzbank AG | | 446,920 | 2,673,187 |
| Continental AG | | 49,330 | 6,607,302 |
| Covestro AG (c) | | 77,299 | 3,711,408 |
| Daimler AG (Germany) | | 408,230 | 23,862,216 |
| Delivery Hero AG (b)(c) | | 51,103 | 2,395,507 |
| Deutsche Bank AG | | 879,442 | 6,369,586 |
| Deutsche Borse AG | | 85,176 | 13,190,330 |
| Deutsche Lufthansa AG | | 107,772 | 1,868,480 |
| Deutsche Post AG | | 443,950 | 15,720,614 |
| Deutsche Telekom AG | | 1,496,102 | 26,324,783 |
| Deutsche Wohnen AG (Bearer) | | 160,231 | 6,025,954 |
| Drillisch AG (a) | | 24,796 | 663,166 |
| E.ON AG | | 987,256 | 9,955,960 |
| Evonik Industries AG | | 85,108 | 2,244,881 |
| Fraport AG Frankfurt Airport Services Worldwide | | 18,907 | 1,580,258 |
| Fresenius Medical Care AG & Co. KGaA | | 96,780 | 6,985,548 |
| Fresenius SE & Co. KGaA | | 187,414 | 9,850,201 |
| GEA Group AG | | 69,665 | 2,129,685 |
| Hannover Reuck SE | | 26,725 | 4,733,255 |
| HeidelbergCement Finance AG | | 66,491 | 4,940,367 |
| Henkel AG & Co. KGaA | | 47,676 | 4,591,492 |
| Hochtief AG | | 11,232 | 1,400,524 |
| Hugo Boss AG | | 28,889 | 1,215,335 |
| Infineon Technologies AG | | 560,816 | 10,862,319 |
| KION Group AG | | 29,527 | 1,962,057 |
| Knorr-Bremse AG | | 21,945 | 2,214,766 |
| Lanxess AG | | 39,534 | 2,570,579 |
| Merck KGaA | | 57,764 | 6,886,946 |
| Metro Wholesale & Food Specialist AG | | 79,459 | 1,293,861 |
| MTU Aero Engines Holdings AG | | 23,323 | 6,227,307 |
| Muenchener Rueckversicherungs-Gesellschaft AG in Muenchen | | 64,373 | 17,877,007 |
| Puma AG | | 37,666 | 2,833,500 |
| RWE AG | | 245,032 | 7,468,857 |
| SAP SE | | 441,423 | 58,489,202 |
| Siemens AG | | 343,774 | 39,671,544 |
| Siemens Healthineers AG (c) | | 68,017 | 2,889,862 |
| Symrise AG | | 57,558 | 5,538,696 |
| Telefonica Deutschland Holding AG | | 407,013 | 1,291,464 |
| Thyssenkrupp AG (a) | | 183,654 | 2,620,791 |
| TUI AG (GB) | | 197,175 | 2,579,647 |
| Uniper SE | | 90,033 | 2,805,562 |
| United Internet AG | | 55,284 | 1,665,389 |
| Volkswagen AG | | 13,883 | 2,630,682 |
| Vonovia SE | | 227,945 | 12,129,173 |
| Wirecard AG (a) | | 52,548 | 6,654,800 |
| Zalando SE (b)(c) | | 62,636 | 2,713,981 |
|
| TOTAL GERMANY | | | 520,016,738 |
|
| Hong Kong - 2.6% | | | |
| AIA Group Ltd. | | 5,421,800 | 53,991,503 |
| Bank of East Asia Ltd. | | 585,908 | 1,411,395 |
| BOC Hong Kong (Holdings) Ltd. | | 1,653,000 | 5,679,091 |
| CLP Holdings Ltd. | | 734,500 | 7,628,094 |
| Galaxy Entertainment Group Ltd. | | 970,000 | 6,679,071 |
| Hang Lung Properties Ltd. | | 890,000 | 1,956,401 |
| Hang Seng Bank Ltd. | | 342,200 | 7,140,038 |
| Henderson Land Development Co. Ltd. | | 660,021 | 3,296,530 |
| Hong Kong & China Gas Co. Ltd. | | 4,553,800 | 8,838,480 |
| Hong Kong Exchanges and Clearing Ltd. | | 535,306 | 16,676,943 |
| Hysan Development Co. Ltd. | | 286,000 | 1,127,196 |
| Link (REIT) | | 944,500 | 10,286,930 |
| MTR Corp. Ltd. | | 688,231 | 3,946,169 |
| New World Development Co. Ltd. | | 2,782,380 | 3,980,018 |
| PCCW Ltd. | | 1,803,584 | 1,071,175 |
| Power Assets Holdings Ltd. | | 618,000 | 4,410,134 |
| Sino Land Ltd. | | 1,382,697 | 2,066,948 |
| SJM Holdings Ltd. | | 902,000 | 963,554 |
| Sun Hung Kai Properties Ltd. | | 714,500 | 10,827,046 |
| Swire Pacific Ltd. (A Shares) | | 226,500 | 2,159,063 |
| Swire Properties Ltd. | | 531,000 | 1,670,022 |
| Techtronic Industries Co. Ltd. | | 614,000 | 4,798,419 |
| Vitasoy International Holdings Ltd. | | 338,000 | 1,374,413 |
| Wharf Holdings Ltd. | | 531,000 | 1,204,974 |
| Wheelock and Co. Ltd. | | 374,000 | 2,313,042 |
|
| TOTAL HONG KONG | | | 165,496,649 |
|
| Ireland - 0.7% | | | |
| AIB Group PLC | | 370,551 | 1,186,927 |
| Bank Ireland Group PLC | | 441,302 | 2,122,298 |
| CRH PLC | | 360,201 | 13,114,841 |
| DCC PLC (United Kingdom) | | 43,767 | 4,102,348 |
| James Hardie Industries PLC CDI | | 198,426 | 3,407,810 |
| Kerry Group PLC Class A | | 70,969 | 8,580,047 |
| Kingspan Group PLC (Ireland) | | 68,304 | 3,539,297 |
| Paddy Power Betfair PLC (Ireland) | | 34,751 | 3,589,747 |
| Smurfit Kappa Group PLC | | 102,420 | 3,415,448 |
|
| TOTAL IRELAND | | | 43,058,763 |
|
| Isle of Man - 0.0% | | | |
| Gaming VC Holdings SA | | 259,704 | 2,994,027 |
| Israel - 0.6% | | | |
| Azrieli Group | | 19,500 | 1,502,149 |
| Bank Hapoalim BM (Reg.) | | 510,001 | 4,079,198 |
| Bank Leumi le-Israel BM | | 670,283 | 4,880,041 |
| Check Point Software Technologies Ltd. (b) | | 54,771 | 6,156,808 |
| CyberArk Software Ltd. (b) | | 16,516 | 1,677,695 |
| Elbit Systems Ltd. (Israel) | | 10,441 | 1,710,814 |
| Israel Chemicals Ltd. | | 317,387 | 1,409,328 |
| Israel Discount Bank Ltd. (Class A) | | 520,813 | 2,379,120 |
| Mizrahi Tefahot Bank Ltd. | | 64,647 | 1,603,129 |
| NICE Systems Ltd. (b) | | 28,237 | 4,464,145 |
| Teva Pharmaceutical Industries Ltd. sponsored ADR (a)(b) | | 489,529 | 3,989,661 |
| Wix.com Ltd. (b) | | 20,854 | 2,545,648 |
|
| TOTAL ISRAEL | | | 36,397,736 |
|
| Italy - 1.9% | | | |
| Assicurazioni Generali SpA | | 487,149 | 9,874,792 |
| Atlantia SpA | | 222,473 | 5,493,468 |
| Davide Campari-Milano SpA | | 263,333 | 2,412,707 |
| Enel SpA | | 3,653,750 | 28,317,893 |
| Eni SpA | | 1,139,382 | 17,285,556 |
| FinecoBank SpA | | 276,220 | 3,111,488 |
| Intesa Sanpaolo SpA | | 6,663,467 | 16,697,491 |
| Leonardo SpA | | 183,709 | 2,132,912 |
| Mediobanca SpA | | 274,342 | 3,258,619 |
| Moncler SpA | | 81,278 | 3,131,029 |
| Pirelli & C. SpA (c) | | 182,067 | 1,052,253 |
| Poste Italiane SpA (c) | | 231,699 | 2,811,543 |
| Prysmian SpA | | 109,564 | 2,530,694 |
| Recordati SpA | | 47,471 | 1,994,416 |
| Snam Rete Gas SpA | | 915,529 | 4,697,012 |
| Telecom Italia SpA (b) | | 4,314,165 | 2,525,054 |
| Terna SpA | | 637,353 | 4,211,015 |
| UniCredit SpA | | 900,952 | 11,422,928 |
|
| TOTAL ITALY | | | 122,960,870 |
|
| Japan - 24.4% | | | |
| ABC-MART, Inc. | | 15,100 | 1,035,338 |
| ACOM Co. Ltd. | | 182,100 | 731,613 |
| Advantest Corp. | | 89,300 | 4,063,908 |
| AEON Co. Ltd. | | 293,400 | 5,903,315 |
| AEON Financial Service Co. Ltd. | | 51,400 | 783,357 |
| AEON MALL Co. Ltd. | | 46,900 | 750,355 |
| Agc, Inc. | | 82,900 | 2,914,772 |
| Air Water, Inc. | | 67,900 | 1,271,155 |
| Aisin Seiki Co. Ltd. | | 73,700 | 2,941,354 |
| Ajinomoto Co., Inc. | | 196,600 | 3,737,797 |
| Alfresa Holdings Corp. | | 85,600 | 1,911,349 |
| All Nippon Airways Ltd. | | 52,300 | 1,795,902 |
| Alps Electric Co. Ltd. | | 91,700 | 1,965,920 |
| Amada Holdings Co. Ltd. | | 145,300 | 1,654,692 |
| Aozora Bank Ltd. | | 51,250 | 1,314,991 |
| Asahi Group Holdings | | 162,600 | 8,142,595 |
| ASAHI INTECC Co. Ltd. | | 88,300 | 2,429,609 |
| Asahi Kasei Corp. | | 565,900 | 6,282,251 |
| Astellas Pharma, Inc. | | 847,400 | 14,543,667 |
| Bandai Namco Holdings, Inc. | | 89,400 | 5,497,133 |
| Bank of Kyoto Ltd. | | 24,300 | 961,807 |
| Benesse Holdings, Inc. | | 32,800 | 878,049 |
| Bridgestone Corp. | | 256,400 | 10,653,399 |
| Brother Industries Ltd. | | 101,600 | 1,909,474 |
| Calbee, Inc. | | 36,700 | 1,226,725 |
| Canon, Inc. | | 448,700 | 12,312,203 |
| Casio Computer Co. Ltd. | | 89,000 | 1,444,788 |
| Central Japan Railway Co. | | 64,800 | 13,292,685 |
| Chiba Bank Ltd. | | 242,100 | 1,315,899 |
| Chubu Electric Power Co., Inc. | | 292,600 | 4,389,657 |
| Chugai Pharmaceutical Co. Ltd. | | 100,500 | 8,457,659 |
| Chugoku Electric Power Co., Inc. | | 119,800 | 1,595,948 |
| Coca-Cola West Co. Ltd. | | 56,300 | 1,278,239 |
| Concordia Financial Group Ltd. | | 472,300 | 1,926,008 |
| Credit Saison Co. Ltd. | | 72,000 | 1,042,613 |
| CyberAgent, Inc. | | 45,000 | 1,462,571 |
| Dai Nippon Printing Co. Ltd. | | 110,300 | 2,945,949 |
| Dai-ichi Mutual Life Insurance Co. | | 481,600 | 7,849,798 |
| Daicel Chemical Industries Ltd. | | 109,900 | 982,445 |
| Daifuku Co. Ltd. | | 46,000 | 2,440,840 |
| Daiichi Sankyo Kabushiki Kaisha | | 254,700 | 16,747,491 |
| Daikin Industries Ltd. | | 111,900 | 15,661,484 |
| Dainippon Sumitomo Pharma Co. Ltd. | | 72,300 | 1,261,863 |
| Daito Trust Construction Co. Ltd. | | 32,100 | 4,253,907 |
| Daiwa House Industry Co. Ltd. | | 254,200 | 8,750,863 |
| Daiwa House REIT Investment Corp. | | 845 | 2,460,474 |
| Daiwa Securities Group, Inc. | | 696,100 | 3,128,834 |
| DENSO Corp. | | 194,700 | 9,039,906 |
| Dentsu, Inc. | | 96,700 | 3,457,003 |
| Disco Corp. | | 11,800 | 2,575,203 |
| East Japan Railway Co. | | 137,200 | 12,455,157 |
| Eisai Co. Ltd. | | 112,700 | 8,158,241 |
| Electric Power Development Co. Ltd. | | 63,300 | 1,536,951 |
| FamilyMart Co. Ltd. | | 115,200 | 2,857,674 |
| Fanuc Corp. | | 87,000 | 17,160,689 |
| Fast Retailing Co. Ltd. | | 26,100 | 16,095,664 |
| Fuji Electric Co. Ltd. | | 57,700 | 1,833,801 |
| Fujifilm Holdings Corp. | | 161,500 | 7,090,213 |
| Fujitsu Ltd. | | 88,100 | 7,808,218 |
| Fukuoka Financial Group, Inc. | | 78,300 | 1,509,416 |
| GMO Payment Gateway, Inc. | | 18,600 | 1,370,804 |
| Hakuhodo DY Holdings, Inc. | | 101,200 | 1,510,178 |
| Hamamatsu Photonics K.K. | | 64,000 | 2,485,073 |
| Hankyu Hanshin Holdings, Inc. | | 104,100 | 4,165,770 |
| Hikari Tsushin, Inc. | | 9,500 | 2,082,369 |
| Hino Motors Ltd. | | 131,500 | 1,243,242 |
| Hirose Electric Co. Ltd. | | 14,930 | 1,880,733 |
| Hisamitsu Pharmaceutical Co., Inc. | | 23,900 | 1,112,289 |
| Hitachi Chemical Co. Ltd. | | 47,300 | 1,557,106 |
| Hitachi Construction Machinery Co. Ltd. | | 49,100 | 1,267,379 |
| Hitachi High-Technologies Corp. | | 31,300 | 1,947,354 |
| Hitachi Ltd. | | 433,800 | 16,190,484 |
| Hitachi Metals Ltd. | | 97,400 | 1,222,401 |
| Honda Motor Co. Ltd. | | 732,400 | 19,814,345 |
| Hoshizaki Corp. | | 24,300 | 2,065,557 |
| Hoya Corp. | | 171,200 | 15,130,182 |
| Hulic Co. Ltd. | | 120,900 | 1,312,581 |
| Idemitsu Kosan Co. Ltd. | | 89,123 | 2,619,795 |
| IHI Corp. | | 66,900 | 1,648,626 |
| Iida Group Holdings Co. Ltd. | | 67,600 | 1,126,021 |
| INPEX Corp. | | 458,700 | 4,240,446 |
| Isetan Mitsukoshi Holdings Ltd. | | 154,500 | 1,232,164 |
| Isuzu Motors Ltd. | | 250,200 | 2,907,301 |
| Itochu Corp. | | 605,100 | 12,651,360 |
| ITOCHU Techno-Solutions Corp. | | 43,600 | 1,174,184 |
| J. Front Retailing Co. Ltd. | | 105,700 | 1,344,070 |
| Japan Airlines Co. Ltd. | | 49,800 | 1,551,872 |
| Japan Airport Terminal Co. Ltd. | | 23,000 | 1,136,121 |
| Japan Exchange Group, Inc. | | 227,900 | 3,762,289 |
| Japan Post Bank Co. Ltd. | | 184,300 | 1,833,329 |
| Japan Post Holdings Co. Ltd. | | 704,300 | 6,464,933 |
| Japan Prime Realty Investment Corp. | | 357 | 1,715,736 |
| Japan Real Estate Investment Corp. | | 588 | 4,013,575 |
| Japan Retail Fund Investment Corp. | | 1,164 | 2,713,128 |
| Japan Tobacco, Inc. | | 538,300 | 12,167,040 |
| JFE Holdings, Inc. | | 222,800 | 2,786,704 |
| JGC Corp. | | 100,100 | 1,447,790 |
| JSR Corp. | | 82,100 | 1,541,324 |
| JTEKT Corp. | | 94,400 | 1,204,014 |
| JX Holdings, Inc. | | 1,441,200 | 6,736,515 |
| Kajima Corp. | | 205,100 | 2,818,602 |
| Kakaku.com, Inc. | | 62,100 | 1,441,955 |
| Kamigumi Co. Ltd. | | 48,900 | 1,105,685 |
| Kaneka Corp. | | 22,400 | 745,664 |
| Kansai Electric Power Co., Inc. | | 314,800 | 3,672,498 |
| Kansai Paint Co. Ltd. | | 80,500 | 1,938,830 |
| Kao Corp. | | 219,500 | 17,647,512 |
| Kawasaki Heavy Industries Ltd. | | 65,200 | 1,564,691 |
| KDDI Corp. | | 793,600 | 21,959,820 |
| Keihan Electric Railway Co., Ltd. | | 43,700 | 2,063,378 |
| Keihin Electric Express Railway Co. Ltd. | | 100,300 | 1,996,535 |
| Keio Corp. | | 46,600 | 2,882,838 |
| Keisei Electric Railway Co. | | 57,700 | 2,359,091 |
| Keyence Corp. | | 40,900 | 25,860,923 |
| Kikkoman Corp. | | 66,100 | 3,179,587 |
| Kintetsu Group Holdings Co. Ltd. | | 76,900 | 4,191,508 |
| Kirin Holdings Co. Ltd. | | 368,600 | 7,819,615 |
| Kobayashi Pharmaceutical Co. Ltd. | | 22,400 | 1,791,104 |
| Kobe Steel Ltd. | | 141,900 | 762,929 |
| Koito Manufacturing Co. Ltd. | | 47,300 | 2,474,416 |
| Komatsu Ltd. | | 413,500 | 9,682,067 |
| Konami Holdings Corp. | | 42,400 | 1,861,309 |
| Konica Minolta, Inc. | | 205,800 | 1,510,531 |
| Kose Corp. | | 15,100 | 2,677,140 |
| Kubota Corp. | | 470,100 | 7,466,720 |
| Kuraray Co. Ltd. | | 145,400 | 1,729,869 |
| Kurita Water Industries Ltd. | | 45,200 | 1,301,200 |
| Kyocera Corp. | | 143,800 | 9,434,268 |
| Kyowa Hakko Kirin Co., Ltd. | | 110,700 | 2,036,882 |
| Kyushu Electric Power Co., Inc. | | 172,600 | 1,724,873 |
| Kyushu Railway Co. | | 71,100 | 2,348,970 |
| Lawson, Inc. | | 23,000 | 1,268,828 |
| LINE Corp. (a)(b) | | 27,500 | 1,011,641 |
| Lion Corp. | | 101,900 | 2,132,508 |
| LIXIL Group Corp. | | 115,900 | 2,155,498 |
| M3, Inc. (a) | | 197,100 | 4,723,179 |
| Makita Corp. | | 101,700 | 3,420,258 |
| Marubeni Corp. | | 699,700 | 4,924,543 |
| Marui Group Co. Ltd. | | 83,100 | 1,847,343 |
| Maruichi Steel Tube Ltd. | | 25,700 | 701,824 |
| Mazda Motor Corp. | | 251,600 | 2,309,768 |
| McDonald's Holdings Co. (Japan) Ltd. | | 29,600 | 1,485,701 |
| Mebuki Financial Group, Inc. | | 407,190 | 1,034,512 |
| Medipal Holdings Corp. | | 83,600 | 1,910,055 |
| Meiji Holdings Co. Ltd. | | 52,000 | 3,748,050 |
| Mercari, Inc. (a)(b) | | 33,800 | 762,074 |
| Minebea Mitsumi, Inc. | | 165,000 | 3,133,606 |
| Misumi Group, Inc. | | 128,800 | 3,237,873 |
| Mitsubishi Chemical Holdings Corp. | | 571,700 | 4,357,054 |
| Mitsubishi Corp. | | 606,400 | 15,423,430 |
| Mitsubishi Electric Corp. | | 819,900 | 11,714,281 |
| Mitsubishi Estate Co. Ltd. | | 530,800 | 10,305,685 |
| Mitsubishi Gas Chemical Co., Inc. | | 74,500 | 1,050,966 |
| Mitsubishi Heavy Industries Ltd. | | 143,300 | 5,799,261 |
| Mitsubishi Materials Corp. | | 50,800 | 1,460,756 |
| Mitsubishi Motors Corp. of Japan | | 304,900 | 1,392,113 |
| Mitsubishi Tanabe Pharma Corp. | | 102,700 | 1,229,144 |
| Mitsubishi UFJ Financial Group, Inc. | | 5,523,300 | 28,634,379 |
| Mitsubishi UFJ Lease & Finance Co. Ltd. | | 183,800 | 1,128,346 |
| Mitsui & Co. Ltd. | | 743,700 | 12,772,275 |
| Mitsui Chemicals, Inc. | | 84,000 | 1,997,642 |
| Mitsui Fudosan Co. Ltd. | | 400,300 | 10,240,810 |
| Mitsui OSK Lines Ltd. | | 50,100 | 1,364,650 |
| Mizuho Financial Group, Inc. | | 10,818,800 | 16,795,933 |
| MonotaRO Co. Ltd. | | 56,900 | 1,718,984 |
| MS&AD Insurance Group Holdings, Inc. | | 210,700 | 6,803,764 |
| Murata Manufacturing Co. Ltd. | | 257,700 | 14,031,298 |
| Nabtesco Corp. | | 49,500 | 1,575,823 |
| Nagoya Railroad Co. Ltd. | | 80,800 | 2,568,461 |
| NEC Corp. | | 110,800 | 4,391,072 |
| New Hampshire Foods Ltd. | | 36,300 | 1,525,177 |
| Nexon Co. Ltd. (b) | | 223,400 | 2,588,814 |
| NGK Insulators Ltd. | | 120,300 | 1,848,141 |
| NGK Spark Plug Co. Ltd. | | 68,100 | 1,380,646 |
| Nidec Corp. | | 100,400 | 14,781,469 |
| Nikon Corp. | | 145,700 | 1,857,720 |
| Nintendo Co. Ltd. | | 50,100 | 18,376,054 |
| Nippon Building Fund, Inc. | | 601 | 4,559,553 |
| Nippon Electric Glass Co. Ltd. | | 34,400 | 774,913 |
| Nippon Express Co. Ltd. | | 35,100 | 2,002,651 |
| Nippon Paint Holdings Co. Ltd. | | 66,500 | 3,621,625 |
| Nippon Prologis REIT, Inc. | | 887 | 2,477,644 |
| Nippon Steel & Sumitomo Metal Corp. | | 361,200 | 5,271,908 |
| Nippon Telegraph & Telephone Corp. | | 289,300 | 14,361,694 |
| Nippon Yusen KK | | 66,100 | 1,187,492 |
| Nissan Chemical Corp. | | 56,000 | 2,299,241 |
| Nissan Motor Co. Ltd. | | 1,041,900 | 6,574,994 |
| Nisshin Seifun Group, Inc. | | 90,100 | 1,786,162 |
| Nissin Food Holdings Co. Ltd. | | 28,900 | 2,183,001 |
| Nitori Holdings Co. Ltd. | | 35,900 | 5,464,380 |
| Nitto Denko Corp. | | 71,100 | 3,933,659 |
| NKSJ Holdings, Inc. | | 149,900 | 5,891,982 |
| Nomura Holdings, Inc. | | 1,489,300 | 6,768,845 |
| Nomura Real Estate Holdings, Inc. | | 56,900 | 1,348,495 |
| Nomura Real Estate Master Fund, Inc. | | 1,840 | 3,517,269 |
| Nomura Research Institute Ltd. | | 152,220 | 3,231,739 |
| NSK Ltd. | | 149,200 | 1,387,323 |
| NTT Data Corp. | | 286,400 | 3,760,676 |
| NTT DOCOMO, Inc. | | 600,000 | 16,449,072 |
| Obayashi Corp. | | 293,200 | 3,017,438 |
| OBIC Co. Ltd. | | 29,400 | 3,681,034 |
| Odakyu Electric Railway Co. Ltd. | | 133,800 | 3,256,984 |
| Oji Holdings Corp. | | 392,300 | 2,028,286 |
| Olympus Corp. | | 522,800 | 7,113,421 |
| OMRON Corp. | | 86,000 | 5,031,154 |
| Ono Pharmaceutical Co. Ltd. | | 170,000 | 3,202,265 |
| Oracle Corp. Japan | | 17,500 | 1,538,183 |
| Oriental Land Co. Ltd. | | 89,900 | 13,179,426 |
| ORIX Corp. | | 593,800 | 9,331,504 |
| Osaka Gas Co. Ltd. | | 171,500 | 3,353,628 |
| Otsuka Corp. | | 47,400 | 1,911,071 |
| Otsuka Holdings Co. Ltd. | | 175,200 | 7,304,134 |
| Pan Pacific International Hold | | 201,200 | 3,167,159 |
| Panasonic Corp. | | 988,800 | 8,310,251 |
| Park24 Co. Ltd. | | 53,100 | 1,254,034 |
| PeptiDream, Inc. (b) | | 42,200 | 2,118,174 |
| Persol Holdings Co., Ltd. | | 78,900 | 1,515,513 |
| Pigeon Corp. | | 52,500 | 2,562,962 |
| Pola Orbis Holdings, Inc. | | 41,700 | 940,994 |
| Rakuten, Inc. | | 384,900 | 3,669,415 |
| Recruit Holdings Co. Ltd. | | 609,200 | 20,246,179 |
| Renesas Electronics Corp. (b) | | 341,200 | 2,309,814 |
| Resona Holdings, Inc. | | 948,300 | 4,123,743 |
| Ricoh Co. Ltd. | | 304,400 | 2,710,869 |
| Rinnai Corp. | | 15,300 | 1,124,601 |
| ROHM Co. Ltd. | | 41,800 | 3,311,765 |
| Ryohin Keikaku Co. Ltd. | | 106,000 | 2,359,801 |
| Sankyo Co. Ltd. (Gunma) | | 20,500 | 717,452 |
| Santen Pharmaceutical Co. Ltd. | | 160,700 | 2,846,534 |
| SBI Holdings, Inc. Japan | | 105,000 | 2,283,576 |
| Secom Co. Ltd. | | 94,200 | 8,728,896 |
| Sega Sammy Holdings, Inc. | | 78,900 | 1,110,367 |
| Seibu Holdings, Inc. | | 88,200 | 1,556,730 |
| Seiko Epson Corp. | | 127,600 | 1,804,398 |
| Sekisui Chemical Co. Ltd. | | 161,500 | 2,815,873 |
| Sekisui House Ltd. | | 276,400 | 5,960,394 |
| Seven & i Holdings Co. Ltd. | | 338,300 | 12,781,078 |
| Seven Bank Ltd. | | 272,800 | 790,892 |
| SG Holdings Co. Ltd. | | 65,500 | 1,622,033 |
| Sharp Corp. (a) | | 96,900 | 1,111,556 |
| Shimadzu Corp. | | 101,000 | 2,697,317 |
| Shimamura Co. Ltd. | | 10,200 | 863,972 |
| SHIMANO, Inc. | | 33,600 | 5,592,746 |
| SHIMIZU Corp. | | 268,800 | 2,505,756 |
| Shin-Etsu Chemical Co. Ltd. | | 163,200 | 18,197,001 |
| Shinsei Bank Ltd. | | 85,100 | 1,326,688 |
| Shionogi & Co. Ltd. | | 120,400 | 7,226,757 |
| Shiseido Co. Ltd. | | 179,600 | 14,807,652 |
| Shizuoka Bank Ltd. | | 201,100 | 1,528,114 |
| Showa Denko K.K. | | 57,900 | 1,624,497 |
| SMC Corp. | | 25,700 | 11,103,459 |
| SoftBank Corp. | | 752,600 | 10,323,652 |
| SoftBank Corp. | | 741,200 | 28,511,307 |
| Sohgo Security Services Co., Ltd. | | 32,500 | 1,765,330 |
| Sony Corp. | | 570,700 | 34,738,023 |
| Sony Financial Holdings, Inc. | | 66,500 | 1,430,644 |
| Stanley Electric Co. Ltd. | | 56,900 | 1,574,609 |
| Subaru Corp. | | 276,100 | 7,912,340 |
| Sumco Corp. | | 110,200 | 1,830,518 |
| Sumitomo Chemical Co. Ltd. | | 671,900 | 3,073,527 |
| Sumitomo Corp. | | 533,100 | 8,658,824 |
| Sumitomo Electric Industries Ltd. | | 343,500 | 4,710,676 |
| Sumitomo Heavy Industries Ltd. | | 48,700 | 1,512,721 |
| Sumitomo Metal Mining Co. Ltd. | | 105,600 | 3,532,288 |
| Sumitomo Mitsui Financial Group, Inc. | | 596,600 | 21,181,207 |
| Sumitomo Mitsui Trust Holdings, Inc. | | 148,400 | 5,408,498 |
| Sumitomo Realty & Development Co. Ltd. | | 149,400 | 5,422,961 |
| Sumitomo Rubber Industries Ltd. | | 79,000 | 1,047,047 |
| Sundrug Co. Ltd. | | 32,900 | 1,088,685 |
| Suntory Beverage & Food Ltd. | | 63,200 | 2,701,852 |
| Suzuken Co. Ltd. | | 32,900 | 1,756,659 |
| Suzuki Motor Corp. | | 165,200 | 7,799,772 |
| Sysmex Corp. | | 75,000 | 4,893,605 |
| T&D Holdings, Inc. | | 246,700 | 2,747,681 |
| Taiheiyo Cement Corp. | | 55,100 | 1,558,723 |
| Taisei Corp. | | 91,800 | 3,619,988 |
| Taisho Pharmaceutical Holdings Co. Ltd. | | 15,100 | 1,074,735 |
| Taiyo Nippon Sanso Corp. | | 59,000 | 1,381,173 |
| Takeda Pharmaceutical Co. Ltd. | | 667,503 | 24,118,938 |
| TDK Corp. | | 57,900 | 5,713,212 |
| Teijin Ltd. | | 73,800 | 1,478,830 |
| Terumo Corp. | | 289,700 | 9,454,859 |
| THK Co. Ltd. | | 54,900 | 1,578,666 |
| Tobu Railway Co. Ltd. | | 85,000 | 2,836,442 |
| Toho Co. Ltd. | | 51,600 | 2,083,890 |
| Toho Gas Co. Ltd. | | 32,300 | 1,258,039 |
| Tohoku Electric Power Co., Inc. | | 194,500 | 1,999,028 |
| Tokio Marine Holdings, Inc. | | 286,000 | 15,462,767 |
| Tokyo Century Corp. | | 19,500 | 900,428 |
| Tokyo Electric Power Co., Inc. (b) | | 682,400 | 3,160,294 |
| Tokyo Electron Ltd. | | 70,400 | 14,262,940 |
| Tokyo Gas Co. Ltd. | | 174,300 | 4,254,843 |
| Tokyu Corp. | | 224,000 | 4,236,650 |
| Tokyu Fudosan Holdings Corp. | | 278,500 | 1,847,264 |
| Toppan Printing Co. Ltd. | | 123,700 | 2,287,872 |
| Toray Industries, Inc. | | 621,400 | 4,391,524 |
| Toshiba Corp. | | 231,800 | 7,926,674 |
| Tosoh Corp. | | 118,600 | 1,623,932 |
| Toto Ltd. | | 64,400 | 2,629,184 |
| Toyo Seikan Group Holdings Ltd. | | 64,600 | 1,020,899 |
| Toyo Suisan Kaisha Ltd. | | 38,300 | 1,612,621 |
| Toyoda Gosei Co. Ltd. | | 30,100 | 704,181 |
| Toyota Industries Corp. | | 66,600 | 3,996,165 |
| Toyota Motor Corp. | | 1,026,250 | 71,202,131 |
| Toyota Tsusho Corp. | | 96,700 | 3,336,009 |
| Trend Micro, Inc. | | 56,400 | 2,846,748 |
| Tsuruha Holdings, Inc. | | 16,000 | 1,799,817 |
| Unicharm Corp. | | 181,200 | 6,141,026 |
| United Urban Investment Corp. | | 1,320 | 2,663,009 |
| USS Co. Ltd. | | 100,300 | 1,942,630 |
| Welcia Holdings Co. Ltd. | | 21,100 | 1,212,412 |
| West Japan Railway Co. | | 73,200 | 6,360,376 |
| Yahoo! Japan Corp. | | 1,193,800 | 3,675,374 |
| Yakult Honsha Co. Ltd. | | 54,500 | 3,123,379 |
| Yamada Denki Co. Ltd. | | 267,900 | 1,294,890 |
| Yamaha Corp. | | 65,200 | 3,036,316 |
| Yamaha Motor Co. Ltd. | | 127,300 | 2,491,635 |
| Yamato Holdings Co. Ltd. | | 137,700 | 2,309,590 |
| Yamazaki Baking Co. Ltd. | | 55,300 | 942,793 |
| Yaskawa Electric Corp. | | 106,700 | 4,058,629 |
| Yokogawa Electric Corp. | | 104,100 | 1,907,416 |
| Yokohama Rubber Co. Ltd. | | 52,000 | 1,161,432 |
| Zozo, Inc. (a) | | 92,000 | 2,142,951 |
|
| TOTAL JAPAN | | | 1,585,107,092 |
|
| Luxembourg - 0.3% | | | |
| ArcelorMittal SA (Netherlands) | | 297,300 | 4,386,786 |
| Aroundtown SA | | 406,785 | 3,432,598 |
| Eurofins Scientific SA (a) | | 5,210 | 2,639,226 |
| Millicom International Cellular SA (depository receipt) | | 30,018 | 1,367,888 |
| RTL Group SA | | 17,904 | 909,757 |
| SES SA (France) (depositary receipt) | | 163,127 | 3,160,220 |
| Tenaris SA | | 214,826 | 2,179,388 |
|
| TOTAL LUXEMBOURG | | | 18,075,863 |
|
| Mauritius - 0.0% | | | |
| Golden Agri-Resources Ltd. | | 2,931,600 | 440,037 |
| Multi-National - 0.1% | | | |
| HK Electric Investments & HK Electric Investments Ltd. unit | | 1,146,500 | 1,144,408 |
| HKT Trust/HKT Ltd. unit | | 1,719,000 | 2,674,180 |
|
| TOTAL MULTI-NATIONAL | | | 3,818,588 |
|
| Netherlands - 5.0% | | | |
| ABN AMRO Group NV GDR (c) | | 189,638 | 3,529,989 |
| Adyen BV (b)(c) | | 4,692 | 3,293,642 |
| AEGON NV | | 791,514 | 3,433,855 |
| AerCap Holdings NV (b) | | 56,196 | 3,252,624 |
| Airbus Group NV | | 262,289 | 37,627,563 |
| Akzo Nobel NV | | 102,096 | 9,399,776 |
| ASML Holding NV (Netherlands) | | 191,272 | 50,135,185 |
| CNH Industrial NV | | 460,998 | 5,011,945 |
| EXOR NV | | 49,166 | 3,768,250 |
| Ferrari NV | | 54,824 | 8,771,280 |
| Fiat Chrysler Automobiles NV (Italy) | | 485,388 | 7,539,968 |
| Heineken Holding NV | | 52,332 | 4,984,446 |
| Heineken NV (Bearer) | | 116,502 | 11,883,826 |
| ING Groep NV (Certificaten Van Aandelen) | | 1,750,358 | 19,820,170 |
| Koninklijke Ahold Delhaize NV | | 531,657 | 13,248,927 |
| Koninklijke DSM NV | | 81,394 | 9,645,240 |
| Koninklijke KPN NV | | 1,599,117 | 4,964,253 |
| Koninklijke Philips Electronics NV | | 415,728 | 18,239,699 |
| NN Group NV | | 133,410 | 5,084,229 |
| NXP Semiconductors NV | | 127,918 | 14,541,718 |
| Prosus NV (b) | | 219,009 | 15,102,641 |
| QIAGEN NV (Germany) (b) | | 100,886 | 3,027,864 |
| Randstad NV | | 54,248 | 3,003,359 |
| STMicroelectronics NV (France) | | 306,523 | 6,956,946 |
| Unibail-Rodamco SE & WFD Unibail-Rodamco NV unit | | 62,093 | 9,601,835 |
| Unilever NV | | 654,871 | 38,673,495 |
| Vopak NV | | 30,505 | 1,673,553 |
| Wolters Kluwer NV | | 126,969 | 9,348,995 |
|
| TOTAL NETHERLANDS | | | 325,565,273 |
|
| New Zealand - 0.2% | | | |
| Auckland International Airport Ltd. | | 429,371 | 2,558,976 |
| Fisher & Paykel Healthcare Corp. | | 260,769 | 3,198,385 |
| Fletcher Building Ltd. | | 389,495 | 1,144,389 |
| Meridian Energy Ltd. | | 579,570 | 1,708,392 |
| Ryman Healthcare Group Ltd. | | 172,641 | 1,426,869 |
| Spark New Zealand Ltd. | | 836,264 | 2,398,962 |
| The a2 Milk Co. Ltd. (b) | | 333,097 | 2,765,491 |
|
| TOTAL NEW ZEALAND | | | 15,201,464 |
|
| Norway - 0.6% | | | |
| Aker Bp ASA | | 49,072 | 1,354,848 |
| DNB ASA | | 433,129 | 7,870,234 |
| Equinor ASA | | 449,929 | 8,322,279 |
| Gjensidige Forsikring ASA | | 86,825 | 1,622,985 |
| Marine Harvest ASA | | 196,619 | 4,793,526 |
| Norsk Hydro ASA | | 610,178 | 2,156,101 |
| Orkla ASA | | 341,271 | 3,278,315 |
| Schibsted ASA (B Shares) | | 44,716 | 1,248,682 |
| Telenor ASA | | 330,083 | 6,179,085 |
| Yara International ASA | | 80,547 | 3,134,765 |
|
| TOTAL NORWAY | | | 39,960,820 |
|
| Papua New Guinea - 0.0% | | | |
| Oil Search Ltd. ADR | | 613,818 | 3,029,369 |
| Portugal - 0.2% | | | |
| Energias de Portugal SA | | 1,137,768 | 4,682,435 |
| Galp Energia SGPS SA Class B | | 227,605 | 3,640,494 |
| Jeronimo Martins SGPS SA | | 114,545 | 1,922,029 |
|
| TOTAL PORTUGAL | | | 10,244,958 |
|
| Singapore - 1.3% | | | |
| Ascendas Real Estate Investment Trust | | 1,116,100 | 2,599,456 |
| CapitaCommercial Trust (REIT) | | 1,157,658 | 1,743,415 |
| CapitaLand Ltd. | | 1,142,900 | 3,020,940 |
| CapitaMall Trust | | 1,145,600 | 2,137,512 |
| City Developments Ltd. | | 207,500 | 1,643,233 |
| ComfortDelgro Corp. Ltd. | | 986,800 | 1,666,392 |
| DBS Group Holdings Ltd. | | 804,777 | 15,339,759 |
| Genting Singapore Ltd. | | 2,757,900 | 1,902,714 |
| Jardine Cycle & Carriage Ltd. | | 44,900 | 1,079,493 |
| Keppel Corp. Ltd. | | 648,300 | 3,264,441 |
| Oversea-Chinese Banking Corp. Ltd. | | 1,430,460 | 11,499,766 |
| Sembcorp Industries Ltd. | | 455,600 | 764,903 |
| Singapore Airlines Ltd. | | 236,400 | 1,633,942 |
| Singapore Airport Terminal Service Ltd. | | 307,500 | 1,140,355 |
| Singapore Exchange Ltd. | | 353,300 | 2,319,606 |
| Singapore Press Holdings Ltd. | | 725,000 | 1,179,861 |
| Singapore Technologies Engineering Ltd. | | 696,400 | 2,039,996 |
| Singapore Telecommunications Ltd. | | 3,657,700 | 8,857,326 |
| Suntec (REIT) | | 859,600 | 1,174,307 |
| United Overseas Bank Ltd. | | 564,972 | 11,122,854 |
| UOL Group Ltd. | | 211,891 | 1,213,263 |
| Venture Corp. Ltd. | | 125,100 | 1,451,114 |
| Wilmar International Ltd. | | 875,500 | 2,407,170 |
| Yangzijiang Shipbuilding Holdings Ltd. | | 1,088,300 | 761,907 |
|
| TOTAL SINGAPORE | | | 81,963,725 |
|
| Spain - 2.8% | | | |
| ACS Actividades de Construccion y Servicios SA | | 118,373 | 4,803,358 |
| Aena Sme SA (c) | | 30,302 | 5,559,413 |
| Amadeus IT Holding SA Class A | | 197,043 | 14,579,015 |
| Banco Bilbao Vizcaya Argentaria SA | | 2,982,968 | 15,710,792 |
| Banco de Sabadell SA | | 2,555,883 | 2,804,397 |
| Banco Santander SA (Spain) | | 7,547,271 | 30,252,392 |
| Bankia SA | | 563,168 | 1,072,797 |
| Bankinter SA | | 307,009 | 2,122,924 |
| CaixaBank SA | | 1,612,810 | 4,624,894 |
| Cellnex Telecom SA (b) | | 25,560 | 1,102,083 |
| Cellnex Telecom SA (c) | | 86,844 | 3,744,496 |
| Enagas SA | | 103,039 | 2,550,061 |
| Endesa SA | | 143,909 | 3,916,242 |
| Ferrovial SA | | 217,472 | 6,417,781 |
| Gas Natural SDG SA | | 136,071 | 3,704,461 |
| Grifols SA | | 133,411 | 4,297,150 |
| Iberdrola SA | | 2,696,633 | 27,718,685 |
| Inditex SA | | 489,906 | 15,271,661 |
| MAPFRE SA (Reg.) | | 456,864 | 1,273,851 |
| Red Electrica Corporacion SA | | 193,082 | 3,880,472 |
| Repsol SA | | 651,361 | 10,734,246 |
| Siemens Gamesa Renewable Energy SA | | 107,279 | 1,474,665 |
| Telefonica SA | | 2,096,403 | 16,098,874 |
|
| TOTAL SPAIN | | | 183,714,710 |
|
| Sweden - 2.4% | | | |
| Alfa Laval AB | | 142,864 | 3,300,947 |
| ASSA ABLOY AB (B Shares) | | 450,145 | 10,690,214 |
| Atlas Copco AB: | | | |
| (A Shares) | | 307,674 | 10,868,979 |
| (B Shares) | | 168,308 | 5,213,596 |
| Boliden AB | | 122,002 | 3,280,738 |
| Electrolux AB (B Shares) | | 102,303 | 2,685,855 |
| Epiroc AB: | | | |
| Class A | | 289,575 | 3,256,920 |
| Class B | | 181,797 | 1,976,934 |
| Ericsson (B Shares) | | 1,380,318 | 12,062,310 |
| Essity AB Class B | | 272,371 | 8,499,164 |
| H&M Hennes & Mauritz AB (B Shares) | | 360,567 | 7,533,829 |
| Hexagon AB (B Shares) | | 116,865 | 5,965,674 |
| Husqvarna AB (B Shares) | | 189,503 | 1,449,578 |
| ICA Gruppen AB | | 41,213 | 1,822,545 |
| Industrivarden AB (C Shares) | | 71,562 | 1,548,236 |
| Investor AB (B Shares) | | 205,806 | 10,539,999 |
| Kinnevik AB (B Shares) | | 110,102 | 3,009,198 |
| Lundbergfoeretagen AB | | 33,026 | 1,242,960 |
| Lundin Petroleum AB | | 84,965 | 2,805,270 |
| Sandvik AB | | 506,862 | 8,942,277 |
| Securitas AB (B Shares) | | 142,332 | 2,275,968 |
| Skandinaviska Enskilda Banken AB (A Shares) | | 732,618 | 7,019,876 |
| Skanska AB (B Shares) | | 154,346 | 3,284,910 |
| SKF AB (B Shares) | | 169,375 | 3,061,860 |
| Svenska Handelsbanken AB (A Shares) | | 688,683 | 6,911,493 |
| Swedbank AB (A Shares) | | 406,588 | 5,686,766 |
| Swedish Match Co. AB | | 76,010 | 3,567,606 |
| Tele2 AB (B Shares) | | 223,435 | 3,194,507 |
| Telia Co. AB | | 1,224,769 | 5,384,534 |
| Volvo AB (B Shares) | | 666,534 | 9,967,947 |
|
| TOTAL SWEDEN | | | 157,050,690 |
|
| Switzerland - 9.2% | | | |
| ABB Ltd. (Reg.) | | 827,554 | 17,378,625 |
| Adecco SA (Reg.) | | 70,658 | 4,188,626 |
| Alcon, Inc. (Switzerland) (b) | | 186,382 | 11,007,213 |
| Baloise Holdings AG | | 21,567 | 3,983,282 |
| Barry Callebaut AG | | 999 | 2,106,356 |
| Clariant AG (Reg.) | | 88,244 | 1,807,817 |
| Coca-Cola HBC AG | | 87,976 | 2,678,053 |
| Compagnie Financiere Richemont SA Series A | | 234,233 | 18,406,306 |
| Credit Suisse Group AG | | 1,147,909 | 14,208,674 |
| Dufry AG | | 18,828 | 1,633,350 |
| Ems-Chemie Holding AG | | 3,715 | 2,323,523 |
| Galenica AG | | 20,684 | 3,250,942 |
| Geberit AG (Reg.) | | 16,597 | 8,422,157 |
| Givaudan SA | | 4,143 | 12,166,519 |
| Julius Baer Group Ltd. | | 100,372 | 4,444,837 |
| Kuehne & Nagel International AG | | 24,502 | 3,957,824 |
| Lafargeholcim Ltd. (Reg.) | | 217,764 | 11,231,457 |
| Lindt & Spruengli AG | | 47 | 3,849,569 |
| Lindt & Spruengli AG (participation certificate) | | 472 | 3,507,106 |
| Lonza Group AG | | 33,420 | 12,026,457 |
| Nestle SA (Reg. S) | | 1,375,844 | 147,189,633 |
| Novartis AG | | 964,999 | 84,317,054 |
| Pargesa Holding SA | | 17,737 | 1,400,621 |
| Partners Group Holding AG | | 8,391 | 6,542,683 |
| Roche Holding AG (participation certificate) | | 315,578 | 94,975,087 |
| Schindler Holding AG: | | | |
| (participation certificate) | | 18,100 | 4,425,464 |
| (Reg.) | | 9,199 | 2,174,563 |
| SGS SA (Reg.) | | 2,428 | 6,320,430 |
| Sika AG | | 57,246 | 9,835,983 |
| Sonova Holding AG Class B | | 24,851 | 5,693,184 |
| Straumann Holding AG | | 4,682 | 4,175,594 |
| Swatch Group AG (Bearer) | | 13,784 | 3,814,528 |
| Swatch Group AG (Bearer) (Reg.) | | 20,547 | 1,100,769 |
| Swiss Life Holding AG | | 15,023 | 7,510,739 |
| Swiss Prime Site AG | | 33,935 | 3,494,978 |
| Swiss Re Ltd. | | 136,253 | 14,267,547 |
| Swisscom AG | | 11,604 | 5,928,450 |
| Temenos Group AG | | 29,027 | 4,141,460 |
| UBS Group AG | | 1,733,722 | 20,456,689 |
| Zurich Insurance Group Ltd. | | 67,790 | 26,490,669 |
|
| TOTAL SWITZERLAND | | | 596,834,818 |
|
| United Kingdom - 15.2% | | | |
| 3i Group PLC | | 434,702 | 6,351,669 |
| Admiral Group PLC | | 81,195 | 2,126,658 |
| Anglo American PLC (United Kingdom) | | 471,891 | 12,112,808 |
| Antofagasta PLC | | 177,253 | 1,991,132 |
| Ashtead Group PLC | | 208,713 | 6,347,968 |
| Associated British Foods PLC | | 158,470 | 4,569,402 |
| AstraZeneca PLC (United Kingdom) | | 588,802 | 57,418,363 |
| Auto Trader Group PLC (c) | | 412,754 | 3,007,447 |
| Aviva PLC | | 1,733,916 | 9,345,885 |
| BAE Systems PLC | | 1,434,541 | 10,715,616 |
| Barclays PLC | | 7,729,305 | 16,765,433 |
| Barratt Developments PLC | | 451,883 | 3,694,708 |
| Berkeley Group Holdings PLC | | 54,134 | 3,086,090 |
| BHP Billiton PLC | | 946,178 | 20,068,946 |
| BP PLC | | 9,130,330 | 57,898,753 |
| British American Tobacco PLC (United Kingdom) | | 1,029,502 | 36,007,736 |
| British Land Co. PLC | | 400,337 | 3,218,765 |
| BT Group PLC | | 3,779,251 | 10,020,992 |
| Bunzl PLC | | 149,614 | 3,891,554 |
| Burberry Group PLC | | 183,963 | 4,870,780 |
| Carnival PLC | | 72,924 | 2,918,184 |
| Centrica PLC | | 2,583,815 | 2,428,543 |
| Coca-Cola European Partners PLC | | 105,807 | 5,661,733 |
| Compass Group PLC | | 710,709 | 18,921,980 |
| Croda International PLC | | 56,809 | 3,543,976 |
| Diageo PLC | | 1,065,772 | 43,623,091 |
| Direct Line Insurance Group PLC | | 582,139 | 2,051,835 |
| easyJet PLC | | 72,306 | 1,159,530 |
| Evraz PLC | | 228,819 | 1,088,383 |
| Fresnillo PLC | | 100,171 | 921,271 |
| G4S PLC (United Kingdom) | | 681,463 | 1,825,492 |
| GlaxoSmithKline PLC | | 2,237,557 | 51,251,112 |
| Halma PLC | | 168,197 | 4,081,869 |
| Hargreaves Lansdown PLC | | 127,254 | 2,920,938 |
| HSBC Holdings PLC (United Kingdom) | | 9,084,011 | 68,630,721 |
| Imperial Brands PLC | | 428,865 | 9,401,794 |
| Informa PLC | | 557,520 | 5,596,922 |
| InterContinental Hotel Group PLC | | 76,818 | 4,648,622 |
| Intertek Group PLC | | 71,734 | 4,973,112 |
| Investec PLC | | 301,453 | 1,708,772 |
| ITV PLC | | 1,614,936 | 2,797,926 |
| J Sainsbury PLC | | 780,336 | 2,056,995 |
| John Wood Group PLC | | 310,161 | 1,359,178 |
| Johnson Matthey PLC | | 85,654 | 3,406,224 |
| Kingfisher PLC | | 948,975 | 2,545,728 |
| Land Securities Group PLC | | 314,332 | 3,827,398 |
| Legal & General Group PLC | | 2,661,546 | 9,091,410 |
| Lloyds Banking Group PLC | | 31,841,474 | 23,422,835 |
| London Stock Exchange Group PLC | | 141,191 | 12,723,968 |
| M&G PLC (b) | | 1,160,064 | 3,212,749 |
| Marks & Spencer Group PLC | | 867,662 | 2,044,031 |
| Meggitt PLC | | 343,483 | 2,778,147 |
| Melrose Industries PLC | | 2,175,221 | 6,004,460 |
| Merlin Entertainments PLC (c) | | 317,831 | 1,871,187 |
| Micro Focus International PLC | | 155,404 | 2,132,953 |
| Mondi PLC | | 216,006 | 4,469,859 |
| National Grid PLC | | 1,528,151 | 17,841,147 |
| Next PLC | | 60,602 | 5,166,923 |
| NMC Health PLC | | 42,558 | 1,203,433 |
| Ocado Group PLC (b) | | 203,161 | 3,497,458 |
| Pearson PLC | | 347,735 | 3,071,055 |
| Persimmon PLC | | 141,939 | 4,186,508 |
| Prudential PLC | | 1,147,517 | 20,043,493 |
| Reckitt Benckiser Group PLC | | 317,541 | 24,571,837 |
| RELX PLC (London Stock Exchange) | | 874,798 | 21,054,291 |
| Rentokil Initial PLC | | 824,826 | 4,856,052 |
| Rio Tinto PLC | | 509,194 | 26,509,566 |
| Rolls-Royce Holdings PLC (b) | | 35,338,074 | 45,775 |
| Rolls-Royce Holdings PLC | | 768,219 | 7,068,958 |
| Royal Bank of Scotland Group PLC | | 2,169,695 | 5,997,557 |
| Royal Dutch Shell PLC: | | | |
| Class A (United Kingdom) | | 1,961,204 | 56,851,573 |
| Class B (United Kingdom) | | 1,674,276 | 48,218,785 |
| RSA Insurance Group PLC | | 444,109 | 3,004,528 |
| Sage Group PLC | | 484,722 | 4,519,514 |
| Schroders PLC | | 54,912 | 2,201,482 |
| Scottish & Southern Energy PLC | | 460,932 | 7,668,090 |
| Segro PLC | | 485,942 | 5,313,943 |
| Severn Trent PLC | | 105,369 | 3,077,843 |
| Smith & Nephew PLC | | 391,031 | 8,394,033 |
| Smiths Group PLC | | 175,405 | 3,666,047 |
| Spirax-Sarco Engineering PLC | | 32,684 | 3,355,225 |
| St. James's Place Capital PLC | | 235,598 | 3,176,943 |
| Standard Chartered PLC (United Kingdom) | | 1,250,423 | 11,354,345 |
| Standard Life PLC | | 1,085,558 | 4,267,749 |
| Taylor Wimpey PLC | | 1,455,715 | 3,120,768 |
| Tesco PLC | | 4,385,897 | 13,388,188 |
| The Weir Group PLC | | 114,202 | 1,991,898 |
| Unilever PLC | | 497,987 | 29,818,243 |
| United Utilities Group PLC | | 304,565 | 3,433,098 |
| Vodafone Group PLC | | 11,994,826 | 24,478,103 |
| Whitbread PLC | | 59,192 | 3,113,746 |
| WM Morrison Supermarkets PLC | | 1,047,817 | 2,698,971 |
|
| TOTAL UNITED KINGDOM | | | 986,840,801 |
|
| TOTAL COMMON STOCKS | | | |
| (Cost $5,725,764,078) | | | 6,365,311,776 |
|
| Nonconvertible Preferred Stocks - 0.6% | | | |
| Germany - 0.6% | | | |
| Bayerische Motoren Werke AG (BMW) (non-vtg.) | | 25,396 | 1,564,910 |
| Fuchs Petrolub AG | | 30,041 | 1,282,561 |
| Henkel AG & Co. KGaA | | 79,002 | 8,210,177 |
| Porsche Automobil Holding SE (Germany) | | 68,533 | 5,046,129 |
| Sartorius AG (non-vtg.) | | 16,131 | 3,134,016 |
| Volkswagen AG | | 83,875 | 15,968,266 |
|
| TOTAL GERMANY | | | 35,206,059 |
|
| Italy - 0.0% | | | |
| Telecom Italia SpA (Risparmio Shares) | | 2,467,779 | 1,427,900 |
| TOTAL NONCONVERTIBLE PREFERRED STOCKS | | | |
| (Cost $33,580,113) | | | 36,633,959 |
| | | Principal Amount | Value |
|
| Government Obligations - 0.1% | | | |
| United States of America - 0.1% | | | |
| U.S. Treasury Bills, yield at date of purchase 1.94% 2/27/20(d) | | | |
| (Cost $7,949,666) | | 8,000,000 | 7,960,033 |
| | | Shares | Value |
|
| Money Market Funds - 1.1% | | | |
| Fidelity Cash Central Fund 1.83% (e) | | 46,627,150 | 46,636,476 |
| Fidelity Securities Lending Cash Central Fund 1.84% (e)(f) | | 25,862,729 | 25,865,315 |
| TOTAL MONEY MARKET FUNDS | | | |
| (Cost $72,502,432) | | | 72,501,791 |
| TOTAL INVESTMENT IN SECURITIES - 99.9% | | | |
| (Cost $5,839,796,289) | | | 6,482,407,559 |
| NET OTHER ASSETS (LIABILITIES) - 0.1% | | | 7,625,784 |
| NET ASSETS - 100% | | | $6,490,033,343 |
| Futures Contracts | | | | | |
| | Number of contracts | Expiration Date | Notional Amount | Value | Unrealized Appreciation/(Depreciation) |
| Purchased | | | | | |
| Equity Index Contracts | | | | | |
| ICE E-mini MSCI EAFE Index Contracts (United States) | 908 | Dec. 2019 | $88,856,880 | $1,513,834 | $1,513,834 |
The notional amount of futures purchased as a percentage of Net Assets is 1.4%
Categorizations in the Schedule of Investments are based on country or territory of incorporation.
Legend
(a) Security or a portion of the security is on loan at period end.
(b) Non-income producing
(c) Security exempt from registration under Rule 144A of the Securities Act of 1933. These securities may be resold in transactions exempt from registration, normally to qualified institutional buyers. At the end of the period, the value of these securities amounted to $54,815,849 or 0.8% of net assets.
(d) Security or a portion of the security was pledged to cover margin requirements for futures contracts. At period end, the value of securities pledged amounted to $4,151,157.
(e) Affiliated fund that is generally available only to investment companies and other accounts managed by Fidelity Investments. The rate quoted is the annualized seven-day yield of the fund at period end. A complete unaudited listing of the fund's holdings as of its most recent quarter end is available upon request. In addition, each Fidelity Central Fund's financial statements, which are not covered by the Fund's Report of Independent Registered Public Accounting Firm, are available on the SEC's website or upon request.
(f) Investment made with cash collateral received from securities on loan.
Affiliated Central Funds
Information regarding fiscal year to date income earned by the Fund from investments in Fidelity Central Funds is as follows:
| Fund | Income earned |
| Fidelity Cash Central Fund | $1,069,912 |
| Fidelity Securities Lending Cash Central Fund | 587,528 |
| Total | $1,657,440 |
Amounts in the income column in the above table include any capital gain distributions from underlying funds, which are presented in the corresponding line-item in the Statement of Operations, if applicable. Amount for Fidelity Securities Lending Cash Central Fund represents the income earned on investing cash collateral, less rebates paid to borrowers and any lending agent fees associated with the loan, plus any premium payments received for lending certain types of securities.
Investment Valuation
The following is a summary of the inputs used, as of October 31, 2019, involving the Fund's assets and liabilities carried at fair value. The inputs or methodology used for valuing securities may not be an indication of the risk associated with investing in those securities. For more information on valuation inputs, and their aggregation into the levels used below, please refer to the Investment Valuation section in the accompanying Notes to Financial Statements.
| | Valuation Inputs at Reporting Date: |
| Description | Total | Level 1 | Level 2 | Level 3 |
| Investments in Securities: | | | | |
| Equities: | | | | |
| Communication Services | $339,419,351 | $81,129,484 | $258,289,867 | $-- |
| Consumer Discretionary | 747,838,661 | 281,402,002 | 466,436,659 | -- |
| Consumer Staples | 741,545,658 | 242,320,838 | 499,224,820 | -- |
| Energy | 318,796,856 | 26,195,227 | 292,601,629 | -- |
| Financials | 1,183,171,078 | 335,245,792 | 847,925,286 | -- |
| Health Care | 753,938,165 | 101,070,383 | 652,867,782 | -- |
| Industrials | 961,544,219 | 383,814,098 | 577,730,121 | -- |
| Information Technology | 435,209,471 | 94,783,104 | 340,426,367 | -- |
| Materials | 448,845,660 | 178,790,938 | 270,054,722 | -- |
| Real Estate | 231,696,641 | 55,831,632 | 175,865,009 | -- |
| Utilities | 239,939,975 | 100,117,111 | 139,822,864 | -- |
| Government Obligations | 7,960,033 | -- | 7,960,033 | -- |
| Money Market Funds | 72,501,791 | 72,501,791 | -- | -- |
| Total Investments in Securities: | $6,482,407,559 | $1,953,202,400 | $4,529,205,159 | $-- |
| Derivative Instruments: | | | | |
| Assets | | | | |
| Futures Contracts | $1,513,834 | $1,513,834 | $-- | $-- |
| Total Assets | $1,513,834 | $1,513,834 | $-- | $-- |
| Total Derivative Instruments: | $1,513,834 | $1,513,834 | $-- | $-- |
Value of Derivative Instruments
The following table is a summary of the Fund's value of derivative instruments by primary risk exposure as of October 31, 2019. For additional information on derivative instruments, please refer to the Derivative Instruments section in the accompanying Notes to Financial Statements.
| Primary Risk Exposure / Derivative Type | Value |
| | Asset | Liability |
| Equity Risk | | |
| Futures Contracts(a) | $1,513,834 | $0 |
| Total Equity Risk | 1,513,834 | 0 |
| Total Value of Derivatives | $1,513,834 | $0 |
(a) Reflects gross cumulative appreciation (depreciation) on futures contracts as presented in the Schedule of Investments. In the Statement of Assets and Liabilities, the period end daily variation margin is included in receivable or payable for daily variation margin on futures contracts, and the net cumulative appreciation (depreciation) is included in Total accumulated earnings (loss).
See accompanying notes which are an integral part of the financial statements.
Financial Statements
Statement of Assets and Liabilities
| | | October 31, 2019 |
| Assets | | |
Investment in securities, at value (including securities loaned of $24,639,587) — See accompanying schedule:
Unaffiliated issuers (cost $5,767,293,857) | $6,409,905,768 | |
| Fidelity Central Funds (cost $72,502,432) | 72,501,791 | |
| Total Investment in Securities (cost $5,839,796,289) | | $6,482,407,559 |
| Foreign currency held at value (cost $556,500) | | 558,377 |
| Receivable for investments sold | | 377 |
| Receivable for fund shares sold | | 3,119,974 |
| Dividends receivable | | 34,394,010 |
| Interest receivable | | 3,019 |
| Distributions receivable from Fidelity Central Funds | | 55,549 |
| Prepaid expenses | | 11,394 |
| Receivable from investment adviser for expense reductions | | 49,431 |
| Total assets | | 6,520,599,690 |
| Liabilities | | |
| Payable for investments purchased | $822,429 | |
| Payable for fund shares redeemed | 3,234,142 | |
| Accrued management fee | 185,127 | |
| Payable for daily variation margin on futures contracts | 266,536 | |
| Other payables and accrued expenses | 191,590 | |
| Collateral on securities loaned | 25,866,523 | |
| Total liabilities | | 30,566,347 |
| Net Assets | | $6,490,033,343 |
| Net Assets consist of: | | |
| Paid in capital | | $5,971,454,596 |
| Total accumulated earnings (loss) | | 518,578,747 |
| Net Assets, for 532,431,686 shares outstanding | | $6,490,033,343 |
| Net Asset Value, offering price and redemption price per share ($6,490,033,343 ÷ 532,431,686 shares) | | $12.19 |
See accompanying notes which are an integral part of the financial statements.
Statement of Operations
| | | Year ended October 31, 2019 |
| Investment Income | | |
| Dividends | | $254,818,948 |
| Interest | | 41,250 |
| Income from Fidelity Central Funds (including $587,528 from security lending) | | 1,657,440 |
| Income before foreign taxes withheld | | 256,517,638 |
| Less foreign taxes withheld | | (19,982,738) |
| Total income | | 236,534,900 |
| Expenses | | |
| Management fee | $3,247,249 | |
| Transfer agent fees | 4,041,658 | |
| Custodian fees and expenses | 145,777 | |
| Independent trustees' fees and expenses | 30,664 | |
| Registration fees | 7,874 | |
| Audit | 47,264 | |
| Legal | 1,267 | |
| Interest | 189,733 | |
| Miscellaneous | 25,430 | |
| Total expenses before reductions | 7,736,916 | |
| Expense reductions | (4,499,934) | |
| Total expenses after reductions | | 3,236,982 |
| Net investment income (loss) | | 233,297,918 |
| Realized and Unrealized Gain (Loss) | | |
| Net realized gain (loss) on: | | |
| Investment securities: | | |
| Unaffiliated issuers | (271,286,735) | |
| Fidelity Central Funds | (1,133) | |
| Foreign currency transactions | 38,600 | |
| Futures contracts | 954,448 | |
| Total net realized gain (loss) | | (270,294,820) |
| Change in net unrealized appreciation (depreciation) on: | | |
| Investment securities: | | |
| Unaffiliated issuers | 765,444,898 | |
| Fidelity Central Funds | (641) | |
| Assets and liabilities in foreign currencies | 1,084,275 | |
| Futures contracts | 7,170,355 | |
| Total change in net unrealized appreciation (depreciation) | | 773,698,887 |
| Net gain (loss) | | 503,404,067 |
| Net increase (decrease) in net assets resulting from operations | | $736,701,985 |
See accompanying notes which are an integral part of the financial statements.
Statement of Changes in Net Assets
| | Year ended October 31, 2019 | Year ended October 31, 2018 |
| Increase (Decrease) in Net Assets | | |
| Operations | | |
| Net investment income (loss) | $233,297,918 | $232,870,854 |
| Net realized gain (loss) | (270,294,820) | (11,015,510) |
| Change in net unrealized appreciation (depreciation) | 773,698,887 | (836,442,925) |
| Net increase (decrease) in net assets resulting from operations | 736,701,985 | (614,587,581) |
| Distributions to shareholders | (216,059,751) | (154,716,977) |
| Share transactions | | |
| Proceeds from sales of shares | 1,167,868,158 | 4,661,162,350 |
| Reinvestment of distributions | 90,028,249 | 63,596,711 |
| Cost of shares redeemed | (3,173,000,195) | (2,436,826,674) |
| Net increase (decrease) in net assets resulting from share transactions | (1,915,103,788) | 2,287,932,387 |
| Total increase (decrease) in net assets | (1,394,461,554) | 1,518,627,829 |
| Net Assets | | |
| Beginning of period | 7,884,494,897 | 6,365,867,068 |
| End of period | $6,490,033,343 | $7,884,494,897 |
| Other Information | | |
| Shares | | |
| Sold | 104,064,167 | 377,997,451 |
| Issued in reinvestment of distributions | 8,501,251 | 5,217,121 |
| Redeemed | (279,539,272) | (196,982,550) |
| Net increase (decrease) | (166,973,854) | 186,232,022 |
See accompanying notes which are an integral part of the financial statements.
Financial Highlights
Fidelity SAI International Index Fund
| | | | | |
| Years ended October 31, | 2019 | 2018 | 2017 | 2016 A |
| Selected Per–Share Data | | | | |
| Net asset value, beginning of period | $11.27 | $12.40 | $10.19 | $10.00 |
| Income from Investment Operations | | | | |
| Net investment income (loss)B | .38 | .37 | .33 | .25 |
| Net realized and unrealized gain (loss) | .85 | (1.24) | 2.02 | (.06) |
| Total from investment operations | 1.23 | (.87) | 2.35 | .19 |
| Distributions from net investment income | (.31) | (.20) | (.12) | – |
| Distributions from net realized gain | – | (.06) | (.03) | – |
| Total distributions | (.31) | (.26) | (.14)C | – |
| Net asset value, end of period | $12.19 | $11.27 | $12.40 | $10.19 |
| Total ReturnD,E | 11.36% | (7.14)% | 23.41% | 1.90% |
| Ratios to Average Net AssetsF,G | | | | |
| Expenses before reductions | .11% | .13% | .12% | .21%H |
| Expenses net of fee waivers, if any | .05% | .05% | .05% | .07%H |
| Expenses net of all reductions | .05% | .05% | .05% | .07%H |
| Net investment income (loss) | 3.35% | 2.98% | 2.89% | 3.02%H |
| Supplemental Data | | | | |
| Net assets, end of period (000 omitted) | $6,490,033 | $7,884,495 | $6,365,867 | $1,623,150 |
| Portfolio turnover rateI | 4% | 7% | 2% | 1%H |
A For the period January 5, 2016 (commencement of operations) to October 31, 2016.
B Calculated based on average shares outstanding during the period.
C Total distributions of $.14 per share is comprised of distributions from net investment income of $.117 and distributions from net realized gain of $.026 per share.
D Total returns for periods of less than one year are not annualized.
E Total returns would have been lower if certain expenses had not been reduced during the applicable periods shown.
F Fees and expenses of any underlying Fidelity Central Funds are not included in the Fund's expense ratio. The Fund indirectly bears its proportionate share of the expenses of any underlying Fidelity Central Funds.
G Expense ratios reflect operating expenses of the Fund. Expenses before reductions do not reflect amounts reimbursed by the investment adviser or reductions from expense offset arrangements and do not represent the amount paid by the Fund during periods when reimbursements or reductions occur. Expense ratios before reductions for start-up periods may not be representative of longer term operating periods. Expenses net of fee waivers reflect expenses after reimbursement by the investment adviser but prior to reductions from expense offset arrangements. Expenses net of all reductions represent the net expenses paid by the Fund.
H Annualized
I Amount does not include the portfolio activity of any underlying Fidelity Central Funds.
See accompanying notes which are an integral part of the financial statements.
Notes to Financial Statements
For the period ended October 31, 2019
1. Organization.
Fidelity SAI International Index Fund (the Fund) is a fund of Fidelity Salem Street Trust (the Trust) and is authorized to issue an unlimited number of shares. Shares are offered exclusively to certain clients of Fidelity Management & Research Company (FMR) or its affiliates. The Trust is registered under the Investment Company Act of 1940, as amended (the 1940 Act), as an open-end management investment company organized as a Massachusetts business trust.
2. Investments in Fidelity Central Funds.
The Fund invests in Fidelity Central Funds, which are open-end investment companies generally available only to other investment companies and accounts managed by the investment adviser and its affiliates. The Fund's Schedule of Investments lists each of the Fidelity Central Funds held as of period end, if any, as an investment of the Fund, but does not include the underlying holdings of each Fidelity Central Fund. As an Investing Fund, the Fund indirectly bears its proportionate share of the expenses of the underlying Fidelity Central Funds.
The Money Market Central Funds seek preservation of capital and current income and are managed by Fidelity Investments Money Management, Inc. (FIMM), an affiliate of the investment adviser. Annualized expenses of the Money Market Central Funds as of their most recent shareholder report date ranged from less than .005% to .01%.
A complete unaudited list of holdings for each Fidelity Central Fund is available upon request or at the Securities and Exchange Commission (the SEC) website at www.sec.gov. In addition, the financial statements of the Fidelity Central Funds, which are not covered by the Fund's Report of Independent Registered Public Accounting Firm, are available on the SEC website or upon request.
3. Significant Accounting Policies.
The Fund is an investment company and applies the accounting and reporting guidance of the Financial Accounting Standards Board (FASB) Accounting Standards Codification Topic 946 Financial Services – Investments Companies. The financial statements have been prepared in conformity with accounting principles generally accepted in the United States of America (GAAP), which require management to make certain estimates and assumptions at the date of the financial statements. Actual results could differ from those estimates. Subsequent events, if any, through the date that the financial statements were issued have been evaluated in the preparation of the financial statements. The following summarizes the significant accounting policies of the Fund:
Investment Valuation. Investments are valued as of 4:00 p.m. Eastern time on the last calendar day of the period. The Board of Trustees (the Board) has delegated the day to day responsibility for the valuation of the Fund's investments to the Fair Value Committee (the Committee) established by the Fund's investment adviser. In accordance with valuation policies and procedures approved by the Board, the Fund attempts to obtain prices from one or more third party pricing vendors or brokers to value its investments. When current market prices, quotations or currency exchange rates are not readily available or reliable, investments will be fair valued in good faith by the Committee, in accordance with procedures adopted by the Board. Factors used in determining fair value vary by investment type and may include market or investment specific events, changes in interest rates and credit quality. The frequency with which these procedures are used cannot be predicted and they may be utilized to a significant extent. The Committee oversees the Fund's valuation policies and procedures and reports to the Board on the Committee's activities and fair value determinations. The Board monitors the appropriateness of the procedures used in valuing the Fund's investments and ratifies the fair value determinations of the Committee.
The Fund categorizes the inputs to valuation techniques used to value its investments into a disclosure hierarchy consisting of three levels as shown below:
- Level 1 – quoted prices in active markets for identical investments
- Level 2 – other significant observable inputs (including quoted prices for similar investments, interest rates, prepayment speeds, etc.)
- Level 3 – unobservable inputs (including the Fund's own assumptions based on the best information available)
Valuation techniques used to value the Fund's investments by major category are as follows:
Equity securities, including restricted securities, for which market quotations are readily available, are valued at the last reported sale price or official closing price as reported by a third party pricing vendor on the primary market or exchange on which they are traded and are categorized as Level 1 in the hierarchy. In the event there were no sales during the day or closing prices are not available, securities are valued at the last quoted bid price or may be valued using the last available price and are generally categorized as Level 2 in the hierarchy. For foreign equity securities, when market or security specific events arise, comparisons to the valuation of American Depositary Receipts (ADRs), futures contracts, Exchange-Traded Funds (ETFs) and certain indexes as well as quoted prices for similar securities may be used and would be categorized as Level 2 in the hierarchy. For equity securities, including restricted securities, where observable inputs are limited, assumptions about market activity and risk are used and these securities may be categorized as Level 3 in the hierarchy.
Debt securities, including restricted securities, are valued based on evaluated prices received from third party pricing vendors or from brokers who make markets in such securities. U.S. government and government agency obligations are valued by pricing vendors who utilize matrix pricing which considers yield or price of bonds of comparable quality, coupon, maturity and type or by broker-supplied prices. When independent prices are unavailable or unreliable, debt securities may be valued utilizing pricing methodologies which consider similar factors that would be used by third party pricing vendors. Debt securities are generally categorized as Level 2 in the hierarchy but may be Level 3 depending on the circumstances.
Futures contracts are valued at the settlement price established each day by the board of trade or exchange on which they are traded and are categorized as Level 1 in the hierarchy. Investments in open-end mutual funds, including the Fidelity Central Funds, are valued at their closing net asset value (NAV) each business day and are categorized as Level 1 in the hierarchy.
Changes in valuation techniques may result in transfers in or out of an assigned level within the disclosure hierarchy. The aggregate value of investments by input level as of October 31, 2019 is included at the end of the Fund's Schedule of Investments.
Foreign Currency. The Fund may use foreign currency contracts to facilitate transactions in foreign-denominated securities. Gains and losses from these transactions may arise from changes in the value of the foreign currency or if the counterparties do not perform under the contracts' terms.
Foreign-denominated assets, including investment securities, and liabilities are translated into U.S. dollars at the exchange rates at period end. Purchases and sales of investment securities, income and dividends received and expenses denominated in foreign currencies are translated into U.S. dollars at the exchange rate in effect on the transaction date.
The effects of exchange rate fluctuations on investments are included with the net realized and unrealized gain (loss) on investment securities. Other foreign currency transactions resulting in realized and unrealized gain (loss) are disclosed separately.
Investment Transactions and Income. For financial reporting purposes, the Fund's investment holdings and NAV include trades executed through the end of the last business day of the period. The NAV per share for processing shareholder transactions is calculated as of the close of business of the New York Stock Exchange (NYSE), normally 4:00 p.m. Eastern time and includes trades executed through the end of the prior business day. Gains and losses on securities sold are determined on the basis of identified cost. Dividend income is recorded on the ex-dividend date, except for certain dividends from foreign securities where the ex-dividend date may have passed, which are recorded as soon as the Fund is informed of the ex-dividend date. Non-cash dividends included in dividend income, if any, are recorded at the fair market value of the securities received. Income and capital gain distributions from Fidelity Central Funds, if any, are recorded on the ex-dividend date. Interest income is accrued as earned and includes coupon interest and amortization of premium and accretion of discount on debt securities as applicable. Investment income is recorded net of foreign taxes withheld where recovery of such taxes is uncertain.
Expenses. Expenses directly attributable to a fund are charged to that fund. Expenses attributable to more than one fund are allocated among the respective funds on the basis of relative net assets or other appropriate methods. Expense estimates are accrued in the period to which they relate and adjustments are made when actual amounts are known.
Income Tax Information and Distributions to Shareholders. Each year, the Fund intends to qualify as a regulated investment company under Subchapter M of the Internal Revenue Code, including distributing substantially all of its taxable income and realized gains. As a result, no provision for U.S. Federal income taxes is required. As of October 31, 2019, the Fund did not have any unrecognized tax benefits in the financial statements; nor is the Fund aware of any tax positions for which it is reasonably possible that the total amounts of unrecognized tax benefits will significantly change in the next twelve months. The Fund files a U.S. federal tax return, in addition to state and local tax returns as required. The Fund's federal income tax returns are subject to examination by the Internal Revenue Service (IRS) for a period of three fiscal years after they are filed. State and local tax returns may be subject to examination for an additional fiscal year depending on the jurisdiction. Foreign taxes are provided for based on the Fund's understanding of the tax rules and rates that exist in the foreign markets in which it invests.
Distributions are declared and recorded on the ex-dividend date. Income and capital gain distributions are determined in accordance with income tax regulations, which may differ from GAAP. In addition, the Fund claimed a portion of the payment made to redeeming shareholders as a distribution for income tax purposes.
Capital accounts within the financial statements are adjusted for permanent book-tax differences. These adjustments have no impact on net assets or the results of operations. Capital accounts are not adjusted for temporary book-tax differences which will reverse in a subsequent period.
Book-tax differences are primarily due to futures contracts, foreign currency transactions, passive foreign investment companies (PFIC), market discount, partnerships, capital loss carryforwards and losses deferred due to wash sales.
As of period end, the cost and unrealized appreciation (depreciation) in securities, and derivatives if applicable, for federal income tax purposes were as follows:
| Gross unrealized appreciation | $1,089,115,164 |
| Gross unrealized depreciation | (474,908,394) |
| Net unrealized appreciation (depreciation) | $614,206,770 |
| Tax Cost | $5,868,200,789 |
The tax-based components of distributable earnings as of period end were as follows:
| Undistributed ordinary income | $187,058,871 |
| Capital loss carryforward | $(282,529,720) |
| Net unrealized appreciation (depreciation) on securities and other investments | $614,049,596 |
Capital loss carryforwards are only available to offset future capital gains of the Fund to the extent provided by regulations and may be limited. Under the Regulated Investment Company Modernization Act of 2010 (the Act), the Fund is permitted to carry forward capital losses incurred in taxable years beginning after December 22, 2010 for an unlimited period and such capital losses are required to be used prior to any losses that expire. The capital loss carryforward information presented below, including any applicable limitation, is estimated as of fiscal period end and is subject to adjustment.
| No expiration | |
| Short-term | $(142,829,106) |
| Long-term | (139,700,614) |
| Total no expiration | $(282,529,720) |
The tax character of distributions paid was as follows:
| | October 31, 2019 | October 31, 2018 |
| Ordinary Income | $216,059,751 | $ 138,893,660 |
| Long-term Capital Gains | – | 15,823,317 |
| Total | $216,059,751 | $ 154,716,977 |
Restricted Securities. The Fund may invest in securities that are subject to legal or contractual restrictions on resale. These securities generally may be resold in transactions exempt from registration or to the public if the securities are registered. Disposal of these securities may involve time-consuming negotiations and expense, and prompt sale at an acceptable price may be difficult. Information regarding restricted securities is included at the end of the Fund's Schedule of Investments.
4. Derivative Instruments.
Risk Exposures and the Use of Derivative Instruments. The Fund's investment objective allows the Fund to enter into various types of derivative contracts, including futures contracts. Derivatives are investments whose value is primarily derived from underlying assets, indices or reference rates and may be transacted on an exchange or over-the-counter (OTC). Derivatives may involve a future commitment to buy or sell a specified asset based on specified terms, to exchange future cash flows at periodic intervals based on a notional principal amount, or for one party to make one or more payments upon the occurrence of specified events in exchange for periodic payments from the other party.
The Fund used derivatives to increase returns and to manage exposure to certain risks as defined below. The success of any strategy involving derivatives depends on analysis of numerous economic factors, and if the strategies for investment do not work as intended, the Fund may not achieve its objectives.
The Fund's use of derivatives increased or decreased its exposure to the following risk:
| Equity Risk | Equity risk relates to the fluctuations in the value of financial instruments as a result of changes in market prices (other than those arising from interest rate risk or foreign exchange risk), whether caused by factors specific to an individual investment, its issuer, or all factors affecting all instruments traded in a market or market segment.
|
The Fund is also exposed to additional risks from investing in derivatives, such as liquidity risk and counterparty credit risk. Liquidity risk is the risk that the Fund will be unable to close out the derivative in the open market in a timely manner. Counterparty credit risk is the risk that the counterparty will not be able to fulfill its obligation to the Fund. Counterparty credit risk related to exchange-traded futures contracts may be mitigated by the protection provided by the exchange on which they trade.
Investing in derivatives may involve greater risks than investing in the underlying assets directly and, to varying degrees, may involve risk of loss in excess of any initial investment and collateral received and amounts recognized in the Statement of Assets and Liabilities. In addition, there may be the risk that the change in value of the derivative contract does not correspond to the change in value of the underlying instrument.
Futures Contracts. A futures contract is an agreement between two parties to buy or sell a specified underlying instrument for a fixed price at a specified future date. The Fund used futures contracts to manage its exposure to the stock market.
Upon entering into a futures contract, a fund is required to deposit either cash or securities (initial margin) with a clearing broker in an amount equal to a certain percentage of the face value of the contract. Futures contracts are marked-to-market daily and subsequent daily payments (variation margin) are made or received by a fund depending on the daily fluctuations in the value of the futures contracts and are recorded as unrealized appreciation or (depreciation). This receivable and/or payable, if any, is included in daily variation margin on futures contracts in the Statement of Assets and Liabilities. Realized gain or (loss) is recorded upon the expiration or closing of a futures contract. The net realized gain (loss) and change in net unrealized appreciation (depreciation) on futures contracts during the period is presented in the Statement of Operations.
Any open futures contracts at period end are presented in the Schedule of Investments under the caption "Futures Contracts". The notional amount at value reflects each contract's exposure to the underlying instrument or index at period end and is representative of volume of activity during the period. Securities deposited to meet initial margin requirements are identified in the Schedule of Investments.
5. Purchases and Sales of Investments.
Purchases and sales of securities, other than short-term securities, aggregated $258,718,332 and $2,086,036,124, respectively.
6. Fees and Other Transactions with Affiliates.
Management Fee. Fidelity Management & Research Company (the investment adviser) and its affiliates provide the Fund with investment management related services for which the Fund pays a monthly management fee that is based on an annual rate of .035% of the Fund's average net assets. Prior to August 1, 2019, the annual management fee rate was .05%. During July 2019, the Board approved the elimination of the expense contract effective August 1, 2019. Prior to August 1, 2019, under the expense contract, total expenses of the Fund were limited to an annual rate of .125% of the Fund's average net assets, with certain exceptions.
Sub-Adviser. Geode Capital Management, LLC (Geode), serves as sub-adviser for the Fund. Geode provides discretionary investment advisory services to the Fund and is paid by the investment adviser for providing these services.
Transfer Agent Fees. Fidelity Investments Institutional Operations Company, Inc. (FIIOC), an affiliate of the investment adviser, is the Fund's transfer, dividend disbursing and shareholder servicing agent. Effective August 1, 2019 transfer agent fees are not paid by the Fund and are instead paid by the investment adviser or an affiliate. Prior to August 1, 2019, FIIOC received an asset-based fee of .075% of the Fund's average net assets. FIIOC paid for typesetting, printing and mailing of shareholder reports, except proxy statements.
Interfund Lending Program. Pursuant to an Exemptive Order issued by the SEC, the Fund, along with other registered investment companies having management contracts with Fidelity Management & Research Company (FMR) or other affiliated entities of FMR, may participate in an interfund lending program. This program provides an alternative credit facility allowing the funds to borrow from, or lend money to, other participating affiliated funds. At period end, there were no interfund loans outstanding. The Fund's activity in this program during the period for which loans were outstanding was as follows:
| Borrower or Lender | Average Loan Balance | Weighted Average Interest Rate | Interest Expense |
| Borrower | $60,934,184 | 2.61% | $167,852 |
Interfund Trades. The Fund may purchase from or sell securities to other Fidelity Funds under procedures adopted by the Board. The procedures have been designed to ensure these interfund trades are executed in accordance with Rule 17a-7 of the 1940 Act. Interfund trades are included within the respective purchases and sales amounts shown in the Purchases and Sales of Investments note.
7. Committed Line of Credit.
The Fund participates with other funds managed by the investment adviser or an affiliate in a $4.25 billion credit facility (the "line of credit") to be utilized for temporary or emergency purposes to fund shareholder redemptions or for other short-term liquidity purposes. The Fund has agreed to pay commitment fees on its pro-rata portion of the line of credit, which amounted to $18,961 and is reflected in Miscellaneous expenses on the Statement of Operations. During the period, the Fund did not borrow on this line of credit.
8. Security Lending.
The Fund lends portfolio securities from time to time in order to earn additional income. For equity securities, lending agents are used, including National Financial Services (NFS), an affiliate of the Fund. Pursuant to a securities lending agreement, NFS will receive a fee, which is capped at 9.9% of daily lending revenue, for its services as lending agent. The Fund may lend securities to certain qualified borrowers, including NFS. On the settlement date of the loan, the Fund receives collateral (in the form of U.S. Treasury obligations, letters of credit and/or cash) against the loaned securities and maintains collateral in an amount not less than 100% of the market value of the loaned securities during the period of the loan. The market value of the loaned securities is determined at the close of business of the Fund and any additional required collateral is delivered to the Fund on the next business day. The Fund or borrower may terminate the loan at any time, and if the borrower defaults on its obligation to return the securities loaned because of insolvency or other reasons, the Fund may apply collateral received from the borrower against the obligation. The Fund may experience delays and costs in recovering the securities loaned. Any cash collateral received is invested in the Fidelity Securities Lending Cash Central Fund. The value of loaned securities and cash collateral at period end are disclosed on the Fund's Statement of Assets and Liabilities. Total fees paid by the Fund to NFS, as lending agent, amounted to $146. Security lending income represents the income earned on investing cash collateral, less rebates paid to borrowers and any lending agent fees associated with the loan, plus any premium payments received for lending certain types of securities. Security lending income is presented in the Statement of Operations as a component of income from Fidelity Central Funds. During the period, there were no securities loaned to NFS.
9. Bank Borrowings.
The Fund is permitted to have bank borrowings for temporary or emergency purposes to fund shareholder redemptions or for other short-term liquidity requirements. The Fund has established borrowing arrangements with certain banks. The interest rate on the borrowings is the bank's base rate, as revised from time to time. The average loan balance during the period for which loans were outstanding amounted to $19,297,000. The weighted average interest rate was 2.40%. The interest expense amounted to $21,881 under the bank borrowing program. At period end, there were no bank borrowings outstanding.
10. Expense Reductions.
The investment adviser contractually agreed to reimburse the Fund to the extent annual operating expenses exceeded .035% of average net assets. This reimbursement will remain in place through February 28, 2021. The expense limitation prior to August 1, 2019 was .045%. Some expenses, for example the compensation of the independent Trustees, and certain miscellaneous expenses such as proxy and shareholder meeting expenses, are excluded from this reimbursement. During the period this reimbursement reduced the Fund's expenses by $4,499,892.
In addition, through arrangements with the Fund's custodian, credits realized as a result of certain uninvested cash balances were used to reduce the Fund's expenses by $42.
11. Other.
The Fund's organizational documents provide former and current trustees and officers with a limited indemnification against liabilities arising in connection with the performance of their duties to the Fund. In the normal course of business, the Fund may also enter into contracts that provide general indemnifications. The Fund's maximum exposure under these arrangements is unknown as this would be dependent on future claims that may be made against the Fund. The risk of material loss from such claims is considered remote.
Report of Independent Registered Public Accounting Firm
To the Board of Trustees of Fidelity Salem Street Trust and Shareholders of Fidelity SAI International Index Fund:
Opinion on the Financial Statements
We have audited the accompanying statement of assets and liabilities, including the schedule of investments, of Fidelity SAI International Index Fund (one of the funds constituting Fidelity Salem Street Trust, referred to hereafter as the “Fund”) as of October 31, 2019, the related statement of operations for the year ended October 31, 2019, the statement of changes in net assets for each of the two years in the period ended October 31, 2019, including the related notes, and the financial highlights for each of the three years in the period ended October 31, 2019 and for the period January 5, 2016 (commencement of operations) through October 31, 2016 (collectively referred to as the “financial statements”). In our opinion, the financial statements present fairly, in all material respects, the financial position of the Fund as of October 31, 2019, the results of its operations for the year then ended, the changes in its net assets for each of the two years in the period ended October 31, 2019 and the financial highlights for each of the three years in the period ended October 31, 2019 and for the period January 5, 2016 (commencement of operations) through October 31, 2016 in conformity with accounting principles generally accepted in the United States of America.
Basis for Opinion
These financial statements are the responsibility of the Fund’s management. Our responsibility is to express an opinion on the Fund’s financial statements based on our audits. We are a public accounting firm registered with the Public Company Accounting Oversight Board (United States) (PCAOB) and are required to be independent with respect to the Fund in accordance with the U.S. federal securities laws and the applicable rules and regulations of the Securities and Exchange Commission and the PCAOB.
We conducted our audits of these financial statements in accordance with the standards of the PCAOB. Those standards require that we plan and perform the audit to obtain reasonable assurance about whether the financial statements are free of material misstatement, whether due to error or fraud.
Our audits included performing procedures to assess the risks of material misstatement of the financial statements, whether due to error or fraud, and performing procedures that respond to those risks. Such procedures included examining, on a test basis, evidence regarding the amounts and disclosures in the financial statements. Our audits also included evaluating the accounting principles used and significant estimates made by management, as well as evaluating the overall presentation of the financial statements. Our procedures included confirmation of securities owned as of October 31, 2019 by correspondence with the custodian and broker. We believe that our audits provide a reasonable basis for our opinion.
PricewaterhouseCoopers LLP
Boston, Massachusetts
December 11, 2019
We have served as the auditor of one or more investment companies in the Fidelity group of funds since 1932.
Trustees and Officers
The Trustees, Members of the Advisory Board (if any), and officers of the trust and fund, as applicable, are listed below. The Board of Trustees governs the fund and is responsible for protecting the interests of shareholders. The Trustees are experienced executives who meet periodically throughout the year to oversee the fund's activities, review contractual arrangements with companies that provide services to the fund, oversee management of the risks associated with such activities and contractual arrangements, and review the fund's performance. Except for Jonathan Chiel, each of the Trustees oversees 277 funds. Mr. Chiel oversees 171 funds.
The Trustees hold office without limit in time except that (a) any Trustee may resign; (b) any Trustee may be removed by written instrument, signed by at least two-thirds of the number of Trustees prior to such removal; (c) any Trustee who requests to be retired or who has become incapacitated by illness or injury may be retired by written instrument signed by a majority of the other Trustees; and (d) any Trustee may be removed at any special meeting of shareholders by a two-thirds vote of the outstanding voting securities of the trust. Each Trustee who is not an interested person (as defined in the 1940 Act) of the trust and the fund is referred to herein as an Independent Trustee. Each Independent Trustee shall retire not later than the last day of the calendar year in which his or her 75th birthday occurs. The Independent Trustees may waive this mandatory retirement age policy with respect to individual Trustees. Officers and Advisory Board Members hold office without limit in time, except that any officer or Advisory Board Member may resign or may be removed by a vote of a majority of the Trustees at any regular meeting or any special meeting of the Trustees. Except as indicated, each individual has held the office shown or other offices in the same company for the past five years.
The fund’s Statement of Additional Information (SAI) includes more information about the Trustees. To request a free copy, call Fidelity at 1-800-544-3455.
Experience, Skills, Attributes, and Qualifications of the Trustees. The Governance and Nominating Committee has adopted a statement of policy that describes the experience, qualifications, attributes, and skills that are necessary and desirable for potential Independent Trustee candidates (Statement of Policy). The Board believes that each Trustee satisfied at the time he or she was initially elected or appointed a Trustee, and continues to satisfy, the standards contemplated by the Statement of Policy. The Governance and Nominating Committee also engages professional search firms to help identify potential Independent Trustee candidates who have the experience, qualifications, attributes, and skills consistent with the Statement of Policy. From time to time, additional criteria based on the composition and skills of the current Independent Trustees, as well as experience or skills that may be appropriate in light of future changes to board composition, business conditions, and regulatory or other developments, have also been considered by the professional search firms and the Governance and Nominating Committee. In addition, the Board takes into account the Trustees' commitment and participation in Board and committee meetings, as well as their leadership of standing and ad hoc committees throughout their tenure.
In determining that a particular Trustee was and continues to be qualified to serve as a Trustee, the Board has considered a variety of criteria, none of which, in isolation, was controlling. The Board believes that, collectively, the Trustees have balanced and diverse experience, qualifications, attributes, and skills, which allow the Board to operate effectively in governing the fund and protecting the interests of shareholders. Information about the specific experience, skills, attributes, and qualifications of each Trustee, which in each case led to the Board's conclusion that the Trustee should serve (or continue to serve) as a trustee of the fund, is provided below.
Board Structure and Oversight Function. Abigail P. Johnson is an interested person and currently serves as Chairman. The Trustees have determined that an interested Chairman is appropriate and benefits shareholders because an interested Chairman has a personal and professional stake in the quality and continuity of services provided to the fund. Independent Trustees exercise their informed business judgment to appoint an individual of their choosing to serve as Chairman, regardless of whether the Trustee happens to be independent or a member of management. The Independent Trustees have determined that they can act independently and effectively without having an Independent Trustee serve as Chairman and that a key structural component for assuring that they are in a position to do so is for the Independent Trustees to constitute a substantial majority for the Board. The Independent Trustees also regularly meet in executive session. Arthur E. Johnson serves as Chairman of the Independent Trustees and as such (i) acts as a liaison between the Independent Trustees and management with respect to matters important to the Independent Trustees and (ii) with management prepares agendas for Board meetings.
Fidelity® funds are overseen by different Boards of Trustees. The fund's Board oversees Fidelity's investment-grade bond, money market, asset allocation and certain equity funds, and other Boards oversee Fidelity's high income and other equity funds. The asset allocation funds may invest in Fidelity® funds that are overseen by such other Boards. The use of separate Boards, each with its own committee structure, allows the Trustees of each group of Fidelity® funds to focus on the unique issues of the funds they oversee, including common research, investment, and operational issues. On occasion, the separate Boards establish joint committees to address issues of overlapping consequences for the Fidelity® funds overseen by each Board.
The Trustees operate using a system of committees to facilitate the timely and efficient consideration of all matters of importance to the Trustees, the fund, and fund shareholders and to facilitate compliance with legal and regulatory requirements and oversight of the fund's activities and associated risks. The Board, acting through its committees, has charged FMR and its affiliates with (i) identifying events or circumstances the occurrence of which could have demonstrably adverse effects on the fund's business and/or reputation; (ii) implementing processes and controls to lessen the possibility that such events or circumstances occur or to mitigate the effects of such events or circumstances if they do occur; and (iii) creating and maintaining a system designed to evaluate continuously business and market conditions in order to facilitate the identification and implementation processes described in (i) and (ii) above. Because the day-to-day operations and activities of the fund are carried out by or through FMR, its affiliates, and other service providers, the fund's exposure to risks is mitigated but not eliminated by the processes overseen by the Trustees. While each of the Board's committees has responsibility for overseeing different aspects of the fund's activities, oversight is exercised primarily through the Operations and Audit Committees. In addition, an ad hoc Board committee of Independent Trustees has worked with FMR to enhance the Board's oversight of investment and financial risks, legal and regulatory risks, technology risks, and operational risks, including the development of additional risk reporting to the Board. Appropriate personnel, including but not limited to the fund's Chief Compliance Officer (CCO), FMR's internal auditor, the independent accountants, the fund's Treasurer and portfolio management personnel, make periodic reports to the Board's committees, as appropriate, including an annual review of Fidelity's risk management program for the Fidelity® funds. The responsibilities of each standing committee, including their oversight responsibilities, are described further under "Standing Committees of the Trustees."
Interested Trustees*:
Correspondence intended for a Trustee who is an interested person may be sent to Fidelity Investments, 245 Summer Street, Boston, Massachusetts 02210.
Name, Year of Birth; Principal Occupations and Other Relevant Experience+
Jonathan Chiel (1957)
Year of Election or Appointment: 2016
Trustee
Mr. Chiel also serves as Trustee of other Fidelity® funds. Mr. Chiel is Executive Vice President and General Counsel for FMR LLC (diversified financial services company, 2012-present). Previously, Mr. Chiel served as general counsel (2004-2012) and senior vice president and deputy general counsel (2000-2004) for John Hancock Financial Services; a partner with Choate, Hall & Stewart (1996-2000) (law firm); and an Assistant United States Attorney for the United States Attorney’s Office of the District of Massachusetts (1986-95), including Chief of the Criminal Division (1993-1995). Mr. Chiel is a director on the boards of the Boston Bar Foundation and the Maimonides School.
Abigail P. Johnson (1961)
Year of Election or Appointment: 2009
Trustee
Chairman of the Board of Trustees
Ms. Johnson also serves as Trustee of other Fidelity® funds. Ms. Johnson serves as Chairman (2016-present), Chief Executive Officer (2014-present), and Director (2007-present) of FMR LLC (diversified financial services company), President of Fidelity Financial Services (2012-present) and President of Personal, Workplace and Institutional Services (2005-present). Ms. Johnson is Chairman and Director of FMR Co., Inc. (investment adviser firm, 2011-present) and Chairman and Director of FMR (investment adviser firm, 2011-present). Previously, Ms. Johnson served as Vice Chairman (2007-2016) and President (2013-2016) of FMR LLC, President and a Director of FMR (2001-2005), a Trustee of other investment companies advised by FMR, Fidelity Investments Money Management, Inc. (investment adviser firm), and FMR Co., Inc. (2001-2005), Senior Vice President of the Fidelity® funds (2001-2005), and managed a number of Fidelity® funds. Ms. Abigail P. Johnson and Mr. Arthur E. Johnson are not related.
Jennifer Toolin McAuliffe (1959)
Year of Election or Appointment: 2016
Trustee
Ms. McAuliffe also serves as Trustee of other Fidelity® funds. Ms. McAuliffe previously served as a Member of the Advisory Board of certain Fidelity® funds (2016) and as Co-Head of Fixed Income of Fidelity Investments Limited (now known as FIL Limited (FIL)) (diversified financial services company). Earlier roles at FIL included Director of Research for FIL’s credit and quantitative teams in London, Hong Kong and Tokyo. Ms. McAuliffe also was the Director of Research for taxable and municipal bonds at Fidelity Investments Money Management, Inc. Ms. McAuliffe is also a director or trustee of several not-for-profit entities.
* Determined to be an “Interested Trustee” by virtue of, among other things, his or her affiliation with the trust or various entities under common control with FMR.
+ The information includes the Trustee's principal occupation during the last five years and other information relating to the experience, attributes, and skills relevant to the Trustee's qualifications to serve as a Trustee, which led to the conclusion that the Trustee should serve as a Trustee for the fund.
Independent Trustees:
Correspondence intended for an Independent Trustee may be sent to Fidelity Investments, P.O. Box 55235, Boston, Massachusetts 02205-5235.
Name, Year of Birth; Principal Occupations and Other Relevant Experience+
Elizabeth S. Acton (1951)
Year of Election or Appointment: 2013
Trustee
Ms. Acton also serves as Trustee of other Fidelity® funds. Prior to her retirement in April 2012, Ms. Acton was Executive Vice President, Finance (2011-2012), Executive Vice President, Chief Financial Officer (2002-2011), and Treasurer (2004-2005) of Comerica Incorporated (financial services). Prior to joining Comerica, Ms. Acton held a variety of positions at Ford Motor Company (1983-2002), including Vice President and Treasurer (2000-2002) and Executive Vice President and Chief Financial Officer of Ford Motor Credit Company (1998-2000). Ms. Acton currently serves as a member of the Board of Directors and Audit and Finance Committees of Beazer Homes USA, Inc. (homebuilding, 2012-present). Previously, Ms. Acton served as a Member of the Advisory Board of certain Fidelity® funds (2013-2016).
Ann E. Dunwoody (1953)
Year of Election or Appointment: 2018
Trustee
General Dunwoody also serves as Trustee of other Fidelity® funds. General Dunwoody (United States Army, Retired) was the first woman in U.S. military history to achieve the rank of four-star general and prior to her retirement in 2012 held a variety of positions within the U.S. Army, including Commanding General, U.S. Army Material Command (2008-2012). She is the President of First to Four LLC (leadership and mentoring services, 2012-present). She also serves as a member of the Board of Directors and Nominating and Corporate Governance Committee of L3 Technologies, Inc. (communication, electronic, sensor, and aerospace systems, 2013-present), Board of Directors and Nomination and Corporate Governance Committees of Kforce Inc. (professional staffing services, 2016-present) and Board of Directors of Automattic Inc. (software engineering, 2018-present). Previously, General Dunwoody served as a Member of the Advisory Board of certain Fidelity® funds (2018), a member of the Board of Directors and Audit and Sustainability and Corporate Responsibility Committees of Republic Services, Inc. (waste collection, disposal and recycling, 2013-2016). Ms. Dunwoody also serves on several boards for non-profit organizations, including as a member of the Board of Directors, Chair of the Nomination and Governance Committee and member of the Audit Committee of Logistics Management Institute (consulting non-profit, 2012-present), a member of the Board of Directors of the Army Historical Foundation (2015-present), a member of the Council of Trustees for the Association of the United States Army (advocacy non-profit, 2013-present) and a member of the Board of Trustees of Florida Institute of Technology (2015-present) and ThanksUSA (military family education non-profit, 2014-present).
John Engler (1948)
Year of Election or Appointment: 2014
Trustee
Mr. Engler also serves as Trustee of other Fidelity® funds. He serves on the board of directors for Universal Forest Products (manufacturer and distributor of wood and wood-alternative products, 2003-present) and K12 Inc. (technology-based education company, 2012-present). Previously, Mr. Engler served as interim president of Michigan State University (2018-2019), a Member of the Advisory Board of certain Fidelity® funds (2014-2016), president of the Business Roundtable (2011-2017), a trustee of The Munder Funds (2003-2014), president and CEO of the National Association of Manufacturers (2004-2011), member of the Board of Trustees of the Annie E. Casey Foundation (2004-2015), and as governor of Michigan (1991-2003). He is a past chairman of the National Governors Association.
Robert F. Gartland (1951)
Year of Election or Appointment: 2010
Trustee
Mr. Gartland also serves as Trustee of other Fidelity® funds. Mr. Gartland is Chairman and an investor in Gartland & Mellina Group Corp. (consulting, 2009-present). Previously, Mr. Gartland served as a partner and investor of Vietnam Partners LLC (investments and consulting, 2008-2011). Prior to his retirement, Mr. Gartland held a variety of positions at Morgan Stanley (financial services, 1979-2007), including Managing Director (1987-2007), and Chase Manhattan Bank (1975-1978).
Arthur E. Johnson (1947)
Year of Election or Appointment: 2008
Trustee
Chairman of the Independent Trustees
Mr. Johnson also serves as Trustee of other Fidelity® funds. Mr. Johnson serves as a member of the Board of Directors of Eaton Corporation plc (diversified power management, 2009-present) and Booz Allen Hamilton (management consulting, 2011-present). Prior to his retirement, Mr. Johnson served as Senior Vice President of Corporate Strategic Development of Lockheed Martin Corporation (defense contractor, 1999-2009). Mr. Johnson previously served as Vice Chairman (2015-2018) of the Independent Trustees of certain Fidelity® funds and on the Board of Directors of IKON Office Solutions, Inc. (1999-2008), AGL Resources, Inc. (holding company, 2002-2016), and Delta Airlines (2005-2007). Mr. Arthur E. Johnson is not related to Ms. Abigail P. Johnson.
Michael E. Kenneally (1954)
Year of Election or Appointment: 2009
Trustee
Vice Chairman of the Independent Trustees
Mr. Kenneally also serves as Trustee of other Fidelity® funds. Prior to his retirement, Mr. Kenneally served as Chairman and Global Chief Executive Officer of Credit Suisse Asset Management. Before joining Credit Suisse, he was an Executive Vice President and Chief Investment Officer for Bank of America Corporation. Earlier roles at Bank of America included Director of Research, Senior Portfolio Manager and Research Analyst, and Mr. Kenneally was awarded the Chartered Financial Analyst (CFA) designation in 1991.
Marie L. Knowles (1946)
Year of Election or Appointment: 2001
Trustee
Ms. Knowles also serves as Trustee of other Fidelity® funds. Prior to Ms. Knowles' retirement in June 2000, she served as Executive Vice President and Chief Financial Officer of Atlantic Richfield Company (ARCO) (diversified energy, 1996-2000). From 1993 to 1996, she was a Senior Vice President of ARCO and President of ARCO Transportation Company (pipeline and tanker operations). Ms. Knowles currently serves as a Director and Chairman of the Audit Committee of McKesson Corporation (healthcare service, since 2002). Ms. Knowles is a member of the Board of the Santa Catalina Island Company (real estate, 2009-present). Ms. Knowles is a Member of the Investment Company Institute Board of Governors and a Member of the Governing Council of the Independent Directors Council (2014-present). She also serves as a member of the Advisory Board for the School of Engineering of the University of Southern California. Previously, Ms. Knowles served as a Director of Phelps Dodge Corporation (copper mining and manufacturing, 1994-2007), URS Corporation (engineering and construction, 2000-2003) and America West (airline, 1999-2002). Ms. Knowles previously served as Chairman (2015-2018) and Vice Chairman (2012-2015) of the Independent Trustees of certain Fidelity® funds.
Mark A. Murray (1954)
Year of Election or Appointment: 2016
Trustee
Mr. Murray also serves as Trustee of other Fidelity® funds. Mr. Murray is Vice Chairman (2013-present) of Meijer, Inc. (regional retail chain). Previously, Mr. Murray served as a Member of the Advisory Board of certain Fidelity® funds (2016) and as Co-Chief Executive Officer (2013-2016) and President (2006-2013) of Meijer, Inc. Mr. Murray serves as a member of the Board of Directors and Nuclear Review and Public Policy and Responsibility Committees of DTE Energy Company (diversified energy company, 2009-present). Mr. Murray also serves as a member of the Board of Directors of Spectrum Health (not-for-profit health system, 2015-present). Mr. Murray previously served as President of Grand Valley State University (2001-2006), Treasurer for the State of Michigan (1999-2001), Vice President of Finance and Administration for Michigan State University (1998-1999), and a member of the Board of Directors and Audit Committee and Chairman of the Nominating and Corporate Governance Committee of Universal Forest Products, Inc. (manufacturer and distributor of wood and wood-alternative products, 2004-2016). Mr. Murray is also a director or trustee of many community and professional organizations.
+ The information includes the Trustee's principal occupation during the last five years and other information relating to the experience, attributes, and skills relevant to the Trustee's qualifications to serve as a Trustee, which led to the conclusion that the Trustee should serve as a Trustee for the fund.
Advisory Board Members and Officers:
Correspondence intended for an officer may be sent to Fidelity Investments, 245 Summer Street, Boston, Massachusetts 02210. Officers appear below in alphabetical order.
Name, Year of Birth; Principal Occupation
Elizabeth Paige Baumann (1968)
Year of Election or Appointment: 2017
Anti-Money Laundering (AML) Officer
Ms. Baumann also serves as AML Officer of other funds. She is Chief AML Officer (2012-present) and Senior Vice President (2014-present) of FMR LLC (diversified financial services company) and is an employee of Fidelity Investments. Previously, Ms. Baumann served as AML Officer of the funds (2012-2016), and Vice President (2007-2014) and Deputy Anti-Money Laundering Officer (2007-2012) of FMR LLC.
Craig S. Brown (1977)
Year of Election or Appointment: 2019
Assistant Treasurer
Mr. Brown also serves as Assistant Treasurer of other funds. Mr. Brown is an employee of Fidelity Investments (2013-present).
John J. Burke III (1964)
Year of Election or Appointment: 2018
Chief Financial Officer
Mr. Burke also serves as Chief Financial Officer of other funds. Mr. Burke serves as Head of Investment Operations for Fidelity Fund and Investment Operations (2018-present) and is an employee of Fidelity Investments (1998-present). Previously Mr. Burke served as head of Asset Management Investment Operations (2012-2018).
Jonathan Davis (1968)
Year of Election or Appointment: 2010
Assistant Treasurer
Mr. Davis also serves as Assistant Treasurer of other funds. Mr. Davis serves as Assistant Treasurer of FMR Capital, Inc. (2017-present) and is an employee of Fidelity Investments. Previously, Mr. Davis served as Vice President and Associate General Counsel of FMR LLC (diversified financial services company, 2003-2010).
Adrien E. Deberghes (1967)
Year of Election or Appointment: 2010
Assistant Treasurer
Mr. Deberghes also serves as an officer of other funds. He serves as Assistant Treasurer of FMR Capital, Inc. (2017-present), Executive Vice President of Fidelity Investments Money Management, Inc. (FIMM) (investment adviser firm, 2016-present), and is an employee of Fidelity Investments (2008-present). Previously, Mr. Deberghes served as President and Treasurer of certain Fidelity® funds (2013-2018). Prior to joining Fidelity Investments, Mr. Deberghes was Senior Vice President of Mutual Fund Administration at State Street Corporation (2007-2008), Senior Director of Mutual Fund Administration at Investors Bank & Trust (2005-2007), and Director of Finance for Dunkin' Brands (2000-2005). Previously, Mr. Deberghes served in other fund officer roles.
Laura M. Del Prato (1964)
Year of Election or Appointment: 2018
President and Treasurer
Ms. Del Prato also serves as an officer of other funds. Ms. Del Prato is an employee of Fidelity Investments (2017-present). Prior to joining Fidelity Investments, Ms. Del Prato served as a Managing Director and Treasurer of the JPMorgan Mutual Funds (2014-2017). Prior to JPMorgan, Ms. Del Prato served as a partner at Cohen Fund Audit Services (accounting firm, 2012-2013) and KPMG LLP (accounting firm, 2004-2012).
Colm A. Hogan (1973)
Year of Election or Appointment: 2016
Assistant Treasurer
Mr. Hogan also serves as an officer of other funds. Mr. Hogan serves as Assistant Treasurer of FMR Capital, Inc. (2017-present) and is an employee of Fidelity Investments (2005-present). Previously, Mr. Hogan served as Assistant Treasurer of certain Fidelity® funds (2016-2018).
Cynthia Lo Bessette (1969)
Year of Election or Appointment: 2019
Secretary and Chief Legal Officer (CLO)
Ms. Lo Bessette also serves as Secretary and CLO of other funds. Ms. Lo Bessette serves as CLO, Secretary, and Senior Vice President of Fidelity Management & Research Company and FMR Co., Inc. (investment adviser firms, 2019-present); Secretary of Fidelity SelectCo, LLC and Fidelity Investments Money Management, Inc. (investment adviser firms, 2019-present); and CLO of Fidelity Management & Research (Hong Kong) Limited, FMR Investment Management (UK) Limited, and Fidelity Management & Research (Japan) Limited (investment adviser firms, 2019-present). She is a Senior Vice President and Deputy General Counsel of FMR LLC (diversified financial services company, 2019-present), and is an employee of Fidelity Investments. Previously, Ms. Lo Bessette served as Executive Vice President, General Counsel (2016-2019) and Senior Vice President, Deputy General Counsel (2015-2016) of OppenheimerFunds (investment management company) and Deputy Chief Legal Officer (2013-2015) of Jennison Associates LLC (investment adviser firm).
Chris Maher (1972)
Year of Election or Appointment: 2013
Assistant Treasurer
Mr. Maher serves as Assistant Treasurer of other funds. Mr. Maher is Vice President of Valuation Oversight, serves as Assistant Treasurer of FMR Capital, Inc. (2017-present), and is an employee of Fidelity Investments. Previously, Mr. Maher served as Vice President of Asset Management Compliance (2013), Vice President of the Program Management Group of FMR (investment adviser firm, 2010-2013), and Vice President of Valuation Oversight (2008-2010).
John B. McGinty, Jr. (1962)
Year of Election or Appointment: 2016
Chief Compliance Officer
Mr. McGinty also serves as Chief Compliance Officer of other funds. Mr. McGinty is Senior Vice President of Asset Management Compliance for Fidelity Investments and is an employee of Fidelity Investments (2016-present). Mr. McGinty previously served as Vice President, Senior Attorney at Eaton Vance Management (investment management firm, 2015-2016), and prior to Eaton Vance as global CCO for all firm operations and registered investment companies at GMO LLC (investment management firm, 2009-2015). Before joining GMO LLC, Mr. McGinty served as Senior Vice President, Deputy General Counsel for Fidelity Investments (2007-2009).
Jason P. Pogorelec (1975)
Year of Election or Appointment: 2015
Assistant Secretary
Mr. Pogorelec also serves as Assistant Secretary of other funds. Mr. Pogorelec serves as Vice President, Associate General Counsel (2010-present) and is an employee of Fidelity Investments (2006-present).
Nancy D. Prior (1967)
Year of Election or Appointment: 2014
Vice President
Ms. Prior also serves as Vice President of other funds. Ms. Prior serves as President of Fixed Income (2014-present), President (2016-present) and Director (2014-present) of Fidelity Investments Money Management, Inc. (FIMM) (investment adviser firm), and is an employee of Fidelity Investments (2002-present). Previously, Ms. Prior served as Vice President of Global Asset Allocation Funds (2017-2019); Vice Chairman of FIAM LLC (investment adviser firm, 2014-2018), a Director of FMR Investment Management (UK) Limited (investment adviser firm, 2015-2018), President Multi-Asset Class Strategies of FMR's Global Asset Allocation Division (2017-2018), Vice President of Fidelity's Money Market Funds (2012-2014), and President, Money Market and Short Duration Bond Group of Fidelity Management & Research Company (FMR) (investment adviser firm, 2013-2014).
Stacie M. Smith (1974)
Year of Election or Appointment: 2013
Assistant Treasurer
Ms. Smith also serves as an officer of other funds. Ms. Smith serves as Assistant Treasurer of FMR Capital, Inc. (2017-present), is an employee of Fidelity Investments (2009-present), and has served in other fund officer roles. Prior to joining Fidelity Investments, Ms. Smith served as Senior Audit Manager of Ernst & Young LLP (accounting firm, 1996-2009). Previously, Ms. Smith served as Assistant Treasurer (2013-2018) and Deputy Treasurer (2013-2016) of certain Fidelity® funds.
Marc L. Spector (1972)
Year of Election or Appointment: 2016
Deputy Treasurer
Mr. Spector also serves as an officer of other funds. Mr. Spector serves as Assistant Treasurer of FMR Capital, Inc. (2017-present) and is an employee of Fidelity Investments (2016-present). Prior to joining Fidelity Investments, Mr. Spector served as Director at the Siegfried Group (accounting firm, 2013-2016), and prior to Siegfried Group as audit senior manager at Deloitte & Touche (accounting firm, 2005-2013).
Jim Wegmann (1979)
Year of Election or Appointment: 2019
Assistant Treasurer
Mr. Wegmann also serves as Assistant Treasurer of other funds. Mr. Wegmann is an employee of Fidelity Investments (2011-present).
Shareholder Expense Example
As a shareholder of the Fund, you incur two types of costs: (1) transaction costs and (2) ongoing costs, including management fees and other Fund expenses. This Example is intended to help you understand your ongoing costs (in dollars) of investing in the Fund and to compare these costs with the ongoing costs of investing in other mutual funds.
The Example is based on an investment of $1,000 invested at the beginning of the period and held for the entire period (May 1, 2019 to October 31, 2019).
Actual Expenses
The first line of the accompanying table provides information about actual account values and actual expenses. You may use the information in this line, together with the amount you invested, to estimate the expenses that you paid over the period. Simply divide your account value by $1,000.00 (for example, an $8,600 account value divided by $1,000.00 = 8.6), then multiply the result by the number in the first line under the heading entitled "Expenses Paid During Period" to estimate the expenses you paid on your account during this period. In addition, the Fund, as a shareholder in the underlying Fidelity Central Funds, will indirectly bear its pro-rata share of the fees and expenses incurred by the underlying Fidelity Central Funds. These fees and expenses are not included in the Fund's annualized expense ratio used to calculate the expense estimate in the table below.
Hypothetical Example for Comparison Purposes
The second line of the accompanying table provides information about hypothetical account values and hypothetical expenses based on the Fund's actual expense ratio and an assumed rate of return of 5% per year before expenses, which is not the Fund's actual return. The hypothetical account values and expenses may not be used to estimate the actual ending account balance or expenses you paid for the period. You may use this information to compare the ongoing costs of investing in the Fund and other funds. To do so, compare this 5% hypothetical example with the 5% hypothetical examples that appear in the shareholder reports of the other funds. In addition, the Fund, as a shareholder in the underlying Fidelity Central Funds, will indirectly bear its pro-rata share of the fees and expenses incurred by the underlying Fidelity Central Funds. These fees and expenses are not included in the Fund's annualized expense ratio used to calculate the expense estimate in the table below.
Please note that the expenses shown in the table are meant to highlight your ongoing costs only and do not reflect any transaction costs. Therefore, the second line of the table is useful in comparing ongoing costs only, and will not help you determine the relative total costs of owning different funds.
| | Annualized Expense Ratio-A | Beginning
Account Value
May 1, 2019 | Ending
Account Value
October 31, 2019 | Expenses Paid
During Period-B
May 1, 2019
to October 31, 2019 |
| Actual | .05% | $1,000.00 | $1,032.20 | $.26 |
| Hypothetical-C | | $1,000.00 | $1,024.95 | $.26 |
A Annualized expense ratio reflects expenses net of applicable fee waivers.
B Expenses are equal to the Fund's annualized expense ratio, multiplied by the average account value over the period, multiplied by 184/365 (to reflect the one-half year period).
C 5% return per year before expenses
Distributions (Unaudited)
The fund designates 99% of the dividend distributed during the fiscal year as amounts which may be taken into account as a dividend for the purposes of the maximum rate under section 1(h)(11) of the Internal Revenue Code.
The amounts per share which represent income derived from sources within, and taxes paid to, foreign countries or possessions of the United States are $0.3486 and $0.0356 for the dividend paid December 17, 2018.
The fund will notify shareholders in January 2020 of amounts for use in preparing 2019 income tax returns.
Board Approval of Investment Advisory Contracts and Management Fees
Fidelity SAI International Index Fund
Each year, the Board of Trustees, including the Independent Trustees (together, the Board), votes on the renewal of the management contract with Fidelity Management & Research Company (FMR) and the sub-advisory agreements (together, the Advisory Contracts) for the fund, including the fund's sub-advisory agreement (Sub-Advisory Agreement) with Geode Capital Management, LLC (Geode). FMR and the sub-advisers are referred to herein as the Investment Advisers. The Board, assisted by the advice of fund counsel and Independent Trustees' counsel, requests and considers a broad range of information relevant to the renewal of the Advisory Contracts throughout the year.
The Board meets regularly and, at each of its meetings, covers an extensive agenda of topics and materials and considers factors that are relevant to its annual consideration of the renewal of the fund's Advisory Contracts, including the services and support provided to the fund and its shareholders. The Board has established four standing committees (Committees) — Operations, Audit, Fair Valuation, and Governance and Nominating — each composed of and chaired by Independent Trustees with varying backgrounds, to which the Board has assigned specific subject matter responsibilities in order to enhance effective decision-making by the Board. The Operations Committee, of which all of the Independent Trustees are members, meets regularly throughout the year and considers, among other matters, information specifically related to the annual consideration of the renewal of the fund's Advisory Contracts. The Board, acting directly and through its Committees, requests and receives information concerning the annual consideration of the renewal of the fund's Advisory Contracts. The Board also meets as needed to review matters specifically related to the Board's annual consideration of the renewal of the Advisory Contracts. Members of the Board may also meet with trustees of other Fidelity funds through joint ad hoc committees to discuss certain matters relevant to all of the Fidelity funds.
At its September 2019 meeting, the Board unanimously determined to renew the fund's Advisory Contracts. In reaching its determination, the Board considered all factors it believed relevant, including (i) the nature, extent, and quality of the services provided to the fund and its shareholders (including the investment performance of the fund); (ii) the competitiveness of the fund's management fee and total expense ratio relative to peer funds; (iii) the total costs of the services provided by and the profits realized by Fidelity and Geode from their respective relationships with the fund; and (iv) the extent to which, if any, economies of scale exist and are realized as the fund grows, and whether any economies of scale are appropriately shared with fund shareholders.
In considering whether to renew the Advisory Contracts for the fund, the Board reached a determination, with the assistance of fund counsel and Independent Trustees' counsel and through the exercise of its business judgment, that the renewal of the Advisory Contracts was in the best interests of the fund and its shareholders and that the compensation payable under the Advisory Contracts was fair and reasonable. The Board's decision to renew the Advisory Contracts was not based on any single factor, but rather was based on a comprehensive consideration of all the information provided to the Board at its meetings throughout the year. The Board, in reaching its determination to renew the Advisory Contracts, was aware that shareholders of the fund have a broad range of investment choices available to them, including a wide choice among funds offered by Fidelity's competitors, and that the fund's shareholders, who have the opportunity to review and weigh the disclosure provided by the fund in its prospectus and other public disclosures, have chosen to invest in this fund, which is part of the Fidelity family of funds.
July 2019 Contract Approval. At its July 2019 meeting, the Board voted to approve an amended and restated management contract to reduce the fund's management fee rate (New Contract). In reaching its conclusion to approve the New Contract, the Board considered that it had received and reviewed certain information and made certain findings in connection with the annual renewal of the Advisory Contracts at its September 2018 meeting and considered how, if at all, the approval of the New Contract would change its prior conclusions. The Board considered that the New Contract would reduce the fund's management fee rate from 0.05% to 0.035% effective August 1, 2019. The Board also noted that the New Contract would not change the investment processes, the level or nature of services provided, the resources and personnel allocated, or trading and compliance operations. Based on its evaluation, and after considering all factors it believed relevant, the Board ultimately concluded that the advisory fee structure in the New Contract is fair and reasonable, and that the New Contract should be approved
Approval of Amended and Restated Advisory Contracts. At its September 2019 meeting, the Board also unanimously determined to approve an amended and restated management contract and sub-advisory agreement with Geode (Amended and Restated Contracts) in connection with an upcoming consolidation of certain of Fidelity's advisory businesses. The Board considered that, on or about January 1, 2020, FMR Co., Inc. (FMRC) expects to merge with and into FMR and, after the merger, FMR expects to redomicile as a Delaware limited liability company. The Board also approved the termination of the sub-advisory agreement with FMRC upon the completion of the merger. The Board noted that references to FMR in the Amended and Restated Contracts would be updated to reflect FMR's new form of organization and domicile. The Board also approved amendments that clarify that the fund pays its non-operating expenses, including brokerage commissions and fees and expenses associated with the fund's securities lending program, if applicable. The Board also noted Fidelity's assurance that neither the planned consolidation nor the Amended and Restated Contracts will change the investment processes, the level or nature of services provided, the resources and personnel allocated, trading and compliance operations, or any fees or expenses paid by the fund.
Nature, Extent, and Quality of Services Provided. The Board considered staffing as it relates to the fund, including the backgrounds of investment personnel of Fidelity and Geode, and also considered the fund's investment objective, strategies, and related investment philosophy. The Independent Trustees also had discussions with senior management of Fidelity's investment operations and investment groups and with representatives of Geode. The Board considered the structure of the investment personnel compensation programs and whether the structures provide appropriate incentives to act in the best interests of the fund. Additionally, the Board considered the portfolio managers' investments, if any, in the funds that they manage.
The Trustees also discussed with representatives of Fidelity, at meetings throughout the year, Fidelity's role in, among other things, overseeing compliance with federal securities laws and other applicable requirements by Geode with respect to the fund and monitoring and overseeing the performance and investment capabilities of Geode. The Trustees considered that the Board had received from Fidelity periodic reports about its oversight and due diligence processes, as well as periodic reports regarding the performance of Geode.
The Board also considered the nature, extent and quality of services provided by Geode. The Trustees noted that under the Sub-Advisory Agreement, subject to oversight by Fidelity, Geode is responsible for, among other things, identifying investments and arranging for execution of portfolio transactions to implement the fund's investment strategy. In addition, the Trustees noted that Geode is responsible for providing such reporting as may be requested by Fidelity to fulfill its oversight responsibilities discussed above.
Resources Dedicated to Investment Management and Support Services. The Board reviewed the general qualifications and capabilities of Fidelity's and Geode's investment staffs, including their size, education, experience, and resources, as well as Fidelity's and Geode's approach to recruiting, managing, and compensating investment personnel. The Board considered that Fidelity's and Geode's investment professionals have extensive resources, tools and capabilities so as to provide competitive investment results over time, and that those professionals also have access to sophisticated tools that permit them to assess portfolio construction and risk and performance attribution characteristics continuously. Additionally, in its deliberations, the Board considered Fidelity's and Geode's trading, risk management, compliance, and technology and operations capabilities and resources, which are integral parts of the investment management process.
Shareholder and Administrative Services. The Board considered (i) the nature, extent, quality, and cost of advisory, administrative, and shareholder services performed by the Investment Advisers and their affiliates under the Advisory Contracts and by FMR's affiliates under separate agreements covering transfer agency, pricing and bookkeeping, and securities lending services for the fund; (ii) the nature and extent of the supervision of third party service providers, principally custodians, subcustodians, and pricing vendors; and (iii) the resources devoted to, and the record of compliance with, the fund's compliance policies and procedures. The Board also reviewed the allocation of fund brokerage, including allocations to brokers affiliated with the Investment Advisers.
The Board noted that the growth of fund assets over time across the complex allows Fidelity to reinvest in the development of services designed to enhance the value and convenience of the Fidelity funds as investment vehicles. These services include 24-hour access to account information and market information over the Internet and through telephone representatives, investor education materials and asset allocation tools, and the expanded availability of Fidelity Investor Centers.
Investment in a Large Fund Family. The Board considered the benefits to shareholders of investing in a Fidelity fund, including the benefits of investing in a fund that is part of a large family of funds offering a variety of investment disciplines and providing a large variety of mutual fund investor services. The Board noted that Fidelity had taken, or had made recommendations that resulted in the Fidelity funds taking, a number of actions over the previous year that benefited particular funds, including: (i) continuing to dedicate additional resources to Fidelity's investment research process, which includes meetings with management of issuers of securities in which the funds invest, and to the support of the senior management team that oversees asset management; (ii) continuing efforts to enhance Fidelity's global research capabilities; (iii) launching new funds with innovative structures, strategies and pricing and making other enhancements to meet client needs; (iv) launching new share classes of existing funds; (v) eliminating purchase minimums and broadening eligibility requirements for certain funds and share classes; (vi) reducing management fees and total expenses for certain target date funds and index funds; (vii) lowering expense caps for certain existing funds and classes, and converting certain voluntary expense caps to contractual caps, to reduce expenses borne by shareholders; (viii) rationalizing product lines and gaining increased efficiencies from fund mergers, liquidations, and share class consolidations; (ix) continuing to develop, acquire and implement systems and technology to improve services to the funds and shareholders, strengthen information security, and increase efficiency; and (x) continuing to implement enhancements to further strengthen Fidelity's product line to increase investors' probability of success in achieving their investment goals, including retirement income goals.
Investment Performance. The Board considered whether the fund has operated in accordance with its investment objective, as well as its record of compliance with its investment restrictions and its performance history.
The Board took into account discussions with representatives of the Investment Advisers about fund investment performance. In this regard the Board noted that as part of regularly scheduled fund reviews and other reports to the Board on fund performance, the Board considers annualized return information for the fund for different time periods, measured against the securities market index the fund seeks to track. The Board also periodically considers the fund's tracking error versus its benchmark index. In its evaluation of fund investment performance, the Board gave particular attention to information indicating underperformance of certain Fidelity funds for specific time periods and discussed with the Investment Advisers the reasons for such underperformance.
In addition to reviewing absolute and relative fund performance, the Independent Trustees periodically consider the appropriateness of fund performance metrics in evaluating the results achieved. In general, the Independent Trustees believe that an index fund's performance should be evaluated based on gross performance (before fees and expenses but after transaction costs) compared to a fund's benchmark index, over appropriate time periods, taking into account relevant factors including the following: general market conditions; the characteristics of the fund's benchmark index; the extent to which statistical sampling is employed; any securities lending revenues; and fund cash flows and other factors. Depending on the circumstances, the Independent Trustees may be satisfied with a fund's performance notwithstanding that it lags its benchmark index for certain periods.
The Independent Trustees recognize that shareholders evaluate performance on a net basis (after fees and expenses) over their own holding periods, for which one-, three-, and five-year periods are often used as a proxy. For this reason, the performance information reviewed by the Board also included net calendar year total return information for the fund and its benchmark index for the most recent one-year period.
Based on its review, the Board concluded that the nature, extent, and quality of services provided to the fund under the Advisory Contracts should continue to benefit the shareholders of the fund.
Competitiveness of Management Fee and Total Expense Ratio. The Board considered the fund's management fee and total expense ratio compared to "mapped groups" of competitive funds and classes created for the purpose of facilitating the Trustees' competitive analysis of management fees and total expenses. Fidelity creates "mapped groups" by combining similar Lipper investment objective categories that have comparable investment mandates. Combining Lipper investment objective categories aids the Board's management fee and total expense ratio comparisons by broadening the competitive group used for comparison.
Management Fee. The Board considered two proprietary management fee comparisons for the 12-month (or shorter) periods shown in basis points (BP) in the chart below. The group of Lipper funds used by the Board for management fee comparisons is referred to below as the "Total Mapped Group." The Total Mapped Group comparison focuses on a fund's standing in terms of gross management fees before expense reimbursements or caps relative to the total universe of funds with comparable investment mandates, regardless of whether their management fee structures also are comparable. Funds with comparable investment mandates offer exposure to similar types of securities. Funds with comparable management fee structures have similar management fee contractual arrangements (
e.g., flat rate charged for advisory services, all-inclusive fee rate,
etc.). "TMG %" represents the percentage of funds in the Total Mapped Group that had management fees that were lower than the fund's. For example, a hypothetical TMG % of 20% would mean that 80% of the funds in the Total Mapped Group had higher, and 20% had lower, management fees than the fund. The fund's actual TMG %s and the number of funds in the Total Mapped Group are in the chart below. The "Asset-Size Peer Group" (ASPG) comparison focuses on a fund's standing relative to a subset of non-Fidelity funds within the Total Mapped Group that are similar in size and management fee structure. For example, if a fund is in the first quartile of the ASPG, the fund's management fee ranks in the least expensive or lowest 25% of funds in the ASPG. The ASPG represents at least 15% of the funds in the Total Mapped Group with comparable asset size and management fee structures, subject to a minimum of 50 funds (or all funds in the Total Mapped Group if fewer than 50). Additional information, such as the ASPG quartile in which the fund's management fee rate ranked, is also included in the chart and was considered by the Board.
Fidelity SAI International Index Fund
The Board considered that effective July 1, 2016, the fund's management fee rate was reduced from 0.10% to 0.05%. The Board considered that the chart below reflects the fund's lower management fee rate for 2016, as if the lower fee rate were in effect for the entire period.
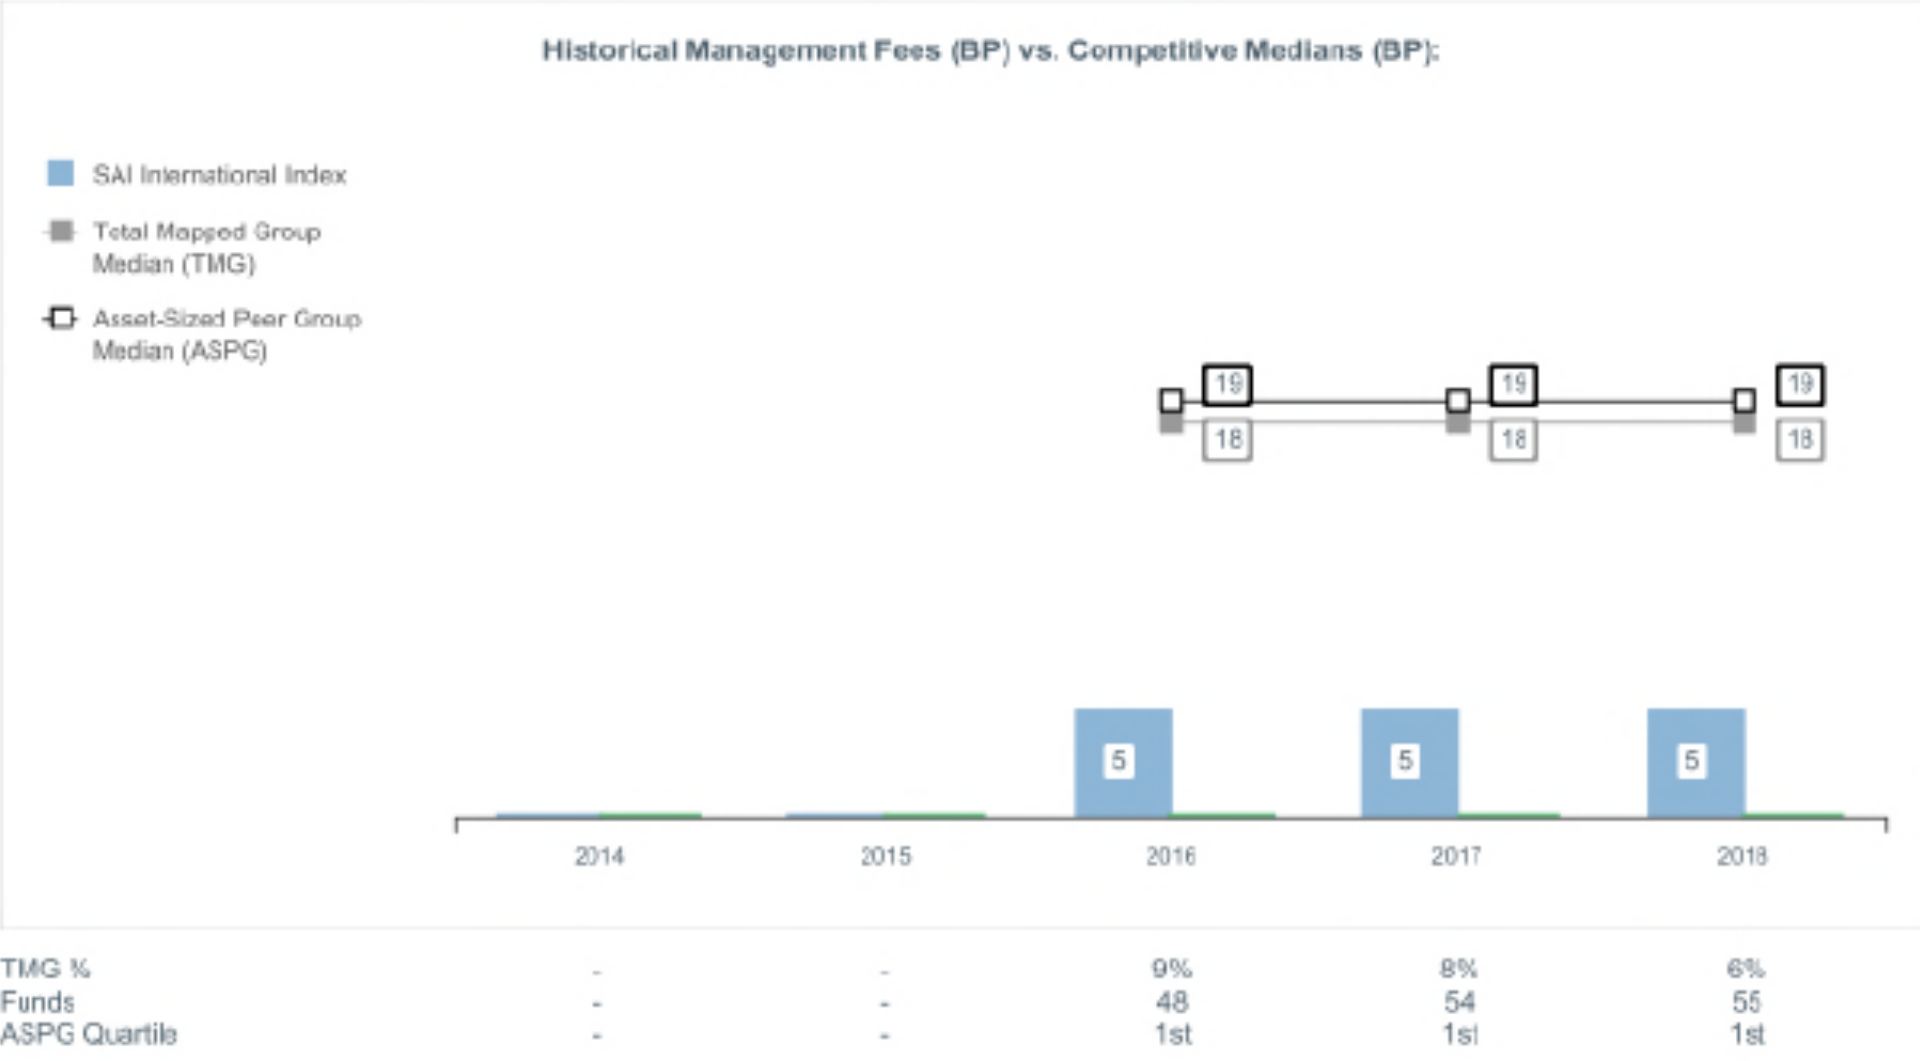
The Board noted that the fund's management fee rate ranked below the median of its Total Mapped Group and below the median of its ASPG for 2018.
The Board considered that, as a result of its approval of the New Contract at the July 2019 meeting, the fund's management fee rate was reduced from 0.05% to 0.035% effective August 1, 2019.
The Board noted that it and the boards of other Fidelity funds formed an ad hoc Committee on Group Fee, which meets periodically, to conduct an in-depth review of the "group fee" component of the management fee of funds with such management fee structures. The Committee's focus included the mechanics of the group fee, the competitive landscape of group fee structures, Fidelity funds with no group fee component (such as the fund) and investment products not included in group fee assets. The Board also considered that, for funds subject to the group fee, FMR agreed to voluntarily waive fees over a specified period of time in amounts designed to account for assets converted from certain funds to certain collective investment trusts.
Based on its review, the Board concluded that the fund's management fee is fair and reasonable in light of the services that the fund receives and the other factors considered.
Total Expense Ratio. In its review of the fund's total expense ratio, the Board considered the fund's management fee rate as well as other fund expenses, such as custodial, legal, and audit fees. The Board also noted that Fidelity may agree to waive fees or reimburse expenses from time to time, and the extent to which, if any, it has done so for the fund. As part of its review, the Board also considered the current and historical total expense ratios of the fund compared to competitive fund median expenses. The fund is compared to those funds and classes in the Total Mapped Group (used by the Board for management fee comparisons) that have a similar sales load structure.
The Board noted that the fund's total expense ratio ranked below the competitive median for 2018.
The Board further considered that FMR has contractually agreed to reimburse the fund to the extent that total operating expenses (with certain exceptions), as a percentage of its average net assets, exceed 0.045% through February 28, 2022.
Fees Charged to Other Clients. The Board also considered fee structures applicable to clients of Fidelity and Geode, such as other funds advised or subadvised by Fidelity or Geode, pension plan clients, and other institutional clients with similar mandates. The Board noted that a joint ad hoc committee created by it and the boards of other Fidelity funds periodically reviews and compares Fidelity's institutional investment advisory business with its business of providing services to the Fidelity funds and also noted the most recent findings of the committee. The Board noted that the committee's review included a consideration of the differences in services provided, fees charged, and costs incurred, as well as competition in the markets serving the different categories of clients.
Based on its review of total expense ratios and fees charged to other Fidelity clients, the Board concluded that the fund's total expense ratio was reasonable in light of the services that the fund and its shareholders receive and the other factors considered.
Costs of the Services and Profitability. The Board considered the revenues earned and the expenses incurred by Fidelity in conducting the business of developing, marketing, distributing, managing, administering and servicing the fund and servicing the fund's shareholders. The Board also considered the level of Fidelity's profits in respect of all the Fidelity funds.
On an annual basis, Fidelity presents to the Board information about the profitability of its relationships with the fund. Fidelity calculates profitability information for each fund, as well as aggregate profitability information for groups of Fidelity funds and all Fidelity funds, using a series of detailed revenue and cost allocation methodologies which originate with the books and records of Fidelity on which Fidelity's audited financial statements are based. The Audit Committee of the Board reviews any significant changes from the prior year's methodologies and the full Board approves such changes.
PricewaterhouseCoopers LLP (PwC), auditor to Fidelity and certain Fidelity funds, has been engaged annually by the Board as part of the Board's assessment of Fidelity's profitability analysis. PwC's engagement includes the review and assessment of the methodologies used by Fidelity in determining the revenues and expenses attributable to Fidelity's mutual fund business, and completion of agreed-upon procedures in respect of the mathematical accuracy of the fund profitability information and its conformity to established allocation methodologies. After considering PwC's reports issued under the engagement and information provided by Fidelity, the Board concluded that while other allocation methods may also be reasonable, Fidelity's profitability methodologies are reasonable in all material respects.
The Board also reviewed Fidelity's and Geode's non-fund businesses and potential indirect benefits such businesses may have received as a result of their association with Fidelity's mutual fund business (i.e., fall-out benefits) as well as cases where Fidelity's and Geode's affiliates may benefit from the fund's business. The Board noted that changes to fall-out benefits year-over-year reflect business developments at Fidelity's and Geode's various businesses. The Board considered that a joint ad hoc committee created by it and the boards of other Fidelity funds had recently been established, and meets periodically, to evaluate potential fall-out benefits. The Board noted that the committee was expected to, among other things: (i) discuss the legal framework surrounding potential fall-out benefits; (ii) review the Board's responsibilities and approach to potential fall-out benefits; and (iii) review practices employed by competitor funds regarding the review of potential fall-out benefits. The Board noted that it would consider the committee's findings in connection with future consideration of contract renewals.
The Board considered the costs of the services provided by and the profits realized by Fidelity in connection with the operation of the fund and was satisfied that the profitability was not excessive.
The Board also considered information regarding the profitability of Geode's relationship with the fund.
Economies of Scale. The Board considered whether there have been economies of scale in respect of the management of the Fidelity funds, whether the Fidelity funds (including the fund) have appropriately benefited from any such economies of scale, and whether there is potential for realization of any further economies of scale. The Board considered the extent to which the fund will benefit from economies of scale as assets grow through increased services to the fund, through waivers or reimbursements, or through fee or expense ratio reductions. The Board also noted that a committee (the Economies of Scale Committee) created by it and the boards of other Fidelity funds periodically analyzes whether Fidelity attains economies of scale in respect of the management and servicing of the Fidelity funds, whether the Fidelity funds have appropriately benefited from such economies of scale, and whether there is potential for realization of any further economies of scale.
The Board concluded, taking into account the analysis of the Economies of Scale Committee, that economies of scale, if any, are being appropriately shared between fund shareholders and Fidelity.
Additional Information Requested by the Board. In order to develop fully the factual basis for consideration of the Fidelity funds' advisory contracts, the Board requested and received additional information on certain topics, including: (i) Fidelity's fund profitability methodology, profitability trends for certain funds, the allocation of various costs to different funds, and the impact of certain factors on fund profitability results; (ii) portfolio manager changes that have occurred during the past year and the amount of the investment that each portfolio manager has made in the Fidelity fund(s) that he or she manages; (iii) Fidelity's compensation structure for portfolio managers, research analysts, and other key personnel, including its effects on fund profitability, the rationale for the compensation structure, and the extent to which current market conditions have affected retention and recruitment; (iv) the arrangements with and compensation paid to certain fund sub-advisers on behalf of the Fidelity funds and the treatment of such compensation within Fidelity's fund profitability methodology; (v) the practices of certain sub-advisers regarding their receipt of research from broker-dealers that execute the funds' portfolio transactions; (vi) the terms of Fidelity's voluntary expense limitation agreements; (vii) the methodology with respect to competitive fund data and peer group classifications; (viii) Fidelity's transfer agent fee, expense, and service structures for different funds and classes relative to competitive trends, and the impact of the increased use of omnibus accounts; (ix) new developments in the retail and institutional marketplaces and the competitive positioning of the funds relative to other investment products and services; (x) the impact on fund profitability of recent changes in total net assets for Fidelity's money market funds, anticipated changes to the competitive landscape for money market funds, and the level of investor comfort with gates, fees, and floating NAVs; (xi) the funds' share class structures and distribution channels; and (xii) explanations regarding the relative total expense ratios of certain funds and classes, total expense competitive trends and methodologies for total expense competitive comparisons, and actions that might be taken by Fidelity to reduce total expense ratios for certain classes. In addition, the Board considered its discussions with Fidelity throughout the year regarding enhanced information security initiatives and the funds' fair valuation policies.
Based on its evaluation of all of the conclusions noted above, and after considering all factors it believed relevant, the Board concluded that the advisory and sub-advisory fee arrangements are fair and reasonable, and that the fund's Advisory Contracts should be renewed and the fund's Amended and Restated Contracts should be approved.
SV7-ANN-1219
1.9879602.103
Fidelity® SAI Emerging Markets Index Fund
Offered exclusively to certain clients of the Adviser or its affiliates - not available for sale to the general public. Fidelity SAI is a product name of Fidelity® funds dedicated to certain programs affiliated with Strategic Advisers LLC.
Annual Report
October 31, 2019
See the inside front cover for important information about access to your fund’s shareholder reports.
Beginning on January 1, 2021, as permitted by regulations adopted by the Securities and Exchange Commission, paper copies of a fund’s shareholder reports will no longer be sent by mail, unless you specifically request paper copies of the reports from the fund or from your financial intermediary, such as a financial advisor, broker-dealer or bank. Instead, the reports will be made available on a website, and you will be notified by mail each time a report is posted and provided with a website link to access the report.
If you already elected to receive shareholder reports electronically, you will not be affected by this change and you need not take any action. You may elect to receive shareholder reports and other communications from a fund electronically, by contacting your financial intermediary. For Fidelity customers, visit Fidelity's web site or call Fidelity using the contact information listed below.
You may elect to receive all future reports in paper free of charge. If you wish to continue receiving paper copies of your shareholder reports, you may contact your financial intermediary or, if you are a Fidelity customer, visit Fidelity’s website, or call Fidelity at the applicable toll-free number listed below. Your election to receive reports in paper will apply to all funds held with the fund complex/your financial intermediary.
| Account Type | Website | Phone Number |
| Brokerage, Mutual Fund, or Annuity Contracts: | fidelity.com/mailpreferences | 1-800-343-3548 |
| Employer Provided Retirement Accounts: | netbenefits.fidelity.com/preferences (choose 'no' under Required Disclosures to continue to print) | 1-800-343-0860 |
| Advisor Sold Accounts Serviced Through Your Financial Intermediary: | Contact Your Financial Intermediary | Your Financial Intermediary's phone number |
| Advisor Sold Accounts Serviced by Fidelity: | institutional.fidelity.com | 1-877-208-0098 |
Contents
To view a fund's proxy voting guidelines and proxy voting record for the 12-month period ended June 30, visit http://www.fidelity.com/proxyvotingresults or visit the Securities and Exchange Commission's (SEC) web site at http://www.sec.gov.
You may also call 1-800-544-3455 to request a free copy of the proxy voting guidelines.
The funds or securities referred to herein are not sponsored, endorsed, or promoted by MSCI, and MSCI bears no liability with respect to any such funds or securities or any index on which such funds or securities are based. The prospectus contains a more detailed description of the limited relationship MSCI has with Fidelity and any related funds.
Standard & Poor's, S&P and S&P 500 are registered service marks of The McGraw-Hill Companies, Inc. and have been licensed for use by Fidelity Distributors Corporation.
Other third-party marks appearing herein are the property of their respective owners.
All other marks appearing herein are registered or unregistered trademarks or service marks of FMR LLC or an affiliated company. © 2019 FMR LLC. All rights reserved.
This report and the financial statements contained herein are submitted for the general information of the shareholders of the Fund. This report is not authorized for distribution to prospective investors in the Fund unless preceded or accompanied by an effective prospectus.
A fund files its complete schedule of portfolio holdings with the SEC for the first and third quarters of each fiscal year on Form N-PORT. Forms N-PORT are available on the SEC’s web site at http://www.sec.gov. A fund's Forms N-PORT may be reviewed and copied at the SEC’s Public Reference Room in Washington, DC. Information regarding the operation of the SEC's Public Reference Room may be obtained by calling 1-800-SEC-0330.
For a complete list of a fund's portfolio holdings, view the most recent holdings listing, semiannual report, or annual report on Fidelity's web site at http://www.fidelity.com, http://www.institutional.fidelity.com, or http://www.401k.com, as applicable.
NOT FDIC INSURED •MAY LOSE VALUE •NO BANK GUARANTEE
Neither the Fund nor Fidelity Distributors Corporation is a bank.
Performance: The Bottom Line
Average annual total return reflects the change in the value of an investment, assuming reinvestment of distributions from dividend income and capital gains (the profits earned upon the sale of securities that have grown in value, if any) and assuming a constant rate of performance each year. The hypothetical investment and the average annual total returns do not reflect the deduction of taxes that a shareholder would pay on fund distributions or the redemption of fund shares. During periods of reimbursement by Fidelity, a fund’s total return will be greater than it would be had the reimbursement not occurred. How a fund did yesterday is no guarantee of how it will do tomorrow.
Average Annual Total Returns
| For the periods ended October 31, 2019 | Past 1 year | Life of fundA |
| Fidelity® SAI Emerging Markets Index Fund | 11.44% | 10.57% |
A From January 5, 2016
$10,000 Over Life of Fund
Let's say hypothetically that $10,000 was invested in Fidelity® SAI Emerging Markets Index Fund on January 5, 2016, when the fund started.
The chart shows how the value of your investment would have changed, and also shows how the MSCI Emerging Markets Index performed over the same period.
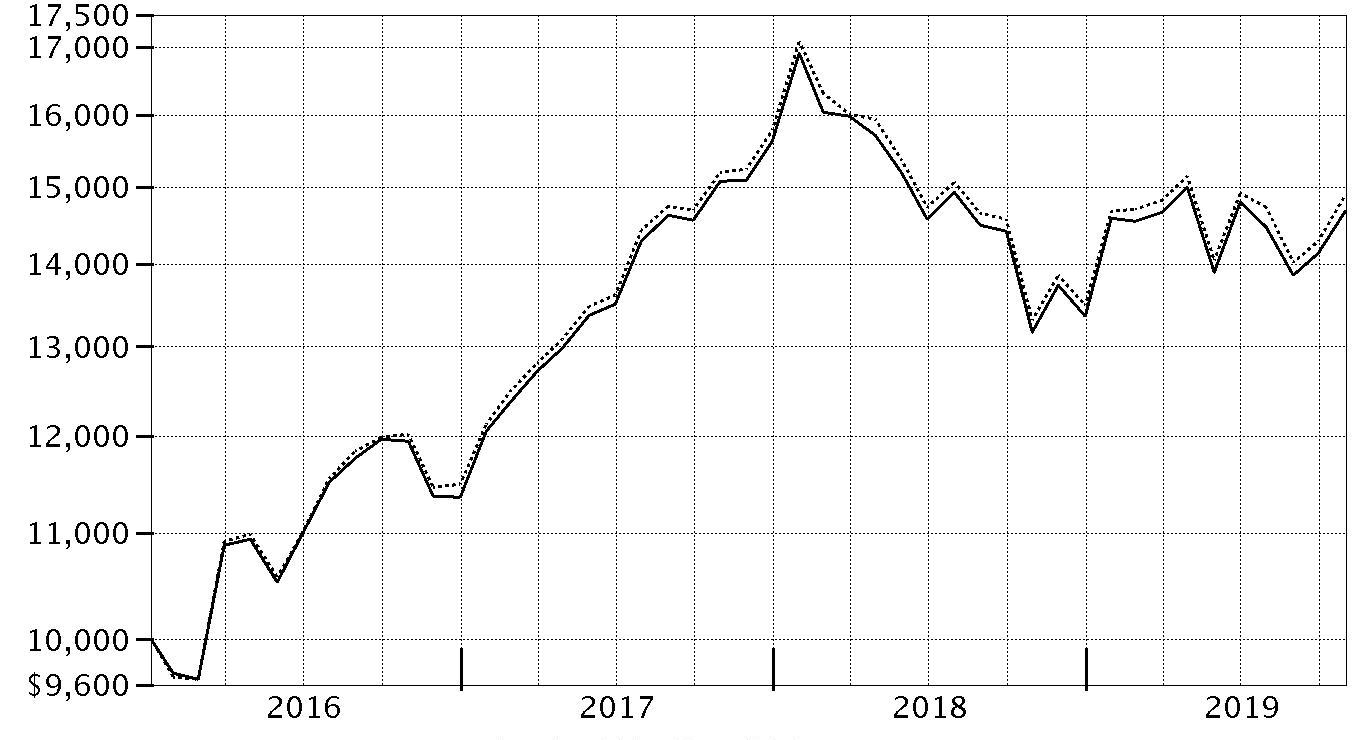
| Period Ending Values |
| $14,680 | Fidelity® SAI Emerging Markets Index Fund |
| $14,888 | MSCI Emerging Markets Index |
Management's Discussion of Fund Performance
Market Recap: The MSCI ACWI (All Country World Index) ex USA Index gained 11.47% for the 12 months ending October 31, 2019, as international stocks reflected a confluence of factors, including escalating trade tension, moderating but still positive global economic growth and uncertainty about the U.K.’s planned “Brexit” from the European Union. In late December, the U.S. Federal Reserve shifted from raising interest rates to a more dovish policy in 2019, joining many foreign central banks that had cut policy rates. In June, international stocks rose 6.03%, as policy stimulus in China stabilized that country’s economic growth. The Fed cut its policy rate in July for the first time since 2008. However, the index returned -1.21% for the month, followed by -3.08% in August. In September, the Fed cut its policy rate another quarter point, citing concerns about slowing economic growth and muted inflation, and did the same in October, leading to monthly gains of 2.59% and 3.49%, respectively. For the full 12 months, the growth-oriented information technology sector (+22%) led the way, followed by utilities (+20%) and real estate (+18%), two high-dividend-yielding categories. Consumer discretionary gained 16%. Conversely, energy was roughly flat, while materials (+6%) and communication services (7%) also lagged. By region, Asia Pacific ex Japan (+16%), Europe ex U.K (+13%), Canada (+12%) and emerging markets (+12%) fared best. Meanwhile, the U.K. (+7%) and Japan (+10%) trailed the broader market.
Comments from the Geode Capital Management, LLC, passive equity index team: For the fiscal year, the fund gained 11.44%, compared with an increase of 11.89% for the benchmark MSCI Emerging Markets Index.
(The fund's performance relative to the index can be affected by Fidelity's methodologies for valuing certain foreign stocks and for incorporating foreign exchange rates, which differ from those used by the index.) Of the 11 sectors within the index, nine generated positive performance, led by information technology and consumer discretionary. On an individual basis, China-based Baidu (-46%) struggled considerably, as the company anticipated continued challenges for its core online search-advertising business. Brazilian mining firm Vale (-23%) saw its shares plunge in January, as a dam collapsed at one of its mines, resulting in many casualties and significant financial losses. The stock of South African energy and chemical company Sasol (-44%) fell sharply in May, after the company announced higher-than-expected costs for its Louisiana energy project. In contrast, semiconductor foundry Taiwan Semiconductor Manufacturing (+33%) was the leading contributor, as the company reported better-than-expected quarterly financial results. Similarly, Chinese e-commerce company Alibaba (+24%) announced strong quarterly earnings, while another China-based firm, internet gaming business Tencent Holdings (+21%), also outperformed.
The views expressed above reflect those of the portfolio manager(s) only through the end of the period as stated on the cover of this report and do not necessarily represent the views of Fidelity or any other person in the Fidelity organization. Any such views are subject to change at any time based upon market or other conditions and Fidelity disclaims any responsibility to update such views. These views may not be relied on as investment advice and, because investment decisions for a Fidelity fund are based on numerous factors, may not be relied on as an indication of trading intent on behalf of any Fidelity fund.
Note to Shareholders: On March 22, 2019, Pat Waddell retired and is no longer a portfolio manager with Geode Capital Management.
Investment Summary (Unaudited)
Geographic Diversification (% of fund's net assets)
| As of October 31, 2019 |
| | Cayman Islands | 16.4% |
| | Korea (South) | 12.1% |
| | Taiwan | 11.7% |
| | China | 11.4% |
| | India | 8.9% |
| | Brazil | 7.6% |
| | South Africa | 4.5% |
| | Russia | 4.0% |
| | Hong Kong | 3.1% |
| | Other* | 20.3% |
* Includes Short-Term investments and Net Other Assets (Liabilities).
Percentages are based on country or territory of incorporation and are adjusted for the effect of futures contracts, if applicable.
Top Ten Stocks as of October 31, 2019
| | % of fund's net assets |
| Alibaba Group Holding Ltd. sponsored ADR (Cayman Islands, Internet & Direct Marketing Retail) | 4.5 |
| Taiwan Semiconductor Manufacturing Co. Ltd. (Taiwan, Semiconductors & Semiconductor Equipment) | 4.3 |
| Tencent Holdings Ltd. (Cayman Islands, Interactive Media & Services) | 4.2 |
| Samsung Electronics Co. Ltd. (Korea (South), Technology Hardware, Storage & Peripherals) | 3.7 |
| China Construction Bank Corp. (H Shares) (China, Banks) | 1.4 |
| Ping An Insurance Group Co. of China Ltd. (H Shares) (China, Insurance) | 1.2 |
| Naspers Ltd. Class N (South Africa, Internet & Direct Marketing Retail) | 1.1 |
| Reliance Industries Ltd. (India, Oil, Gas & Consumable Fuels) | 1.1 |
| China Mobile Ltd. (Hong Kong, Wireless Telecommunication Services) | 0.9 |
| Housing Development Finance Corp. Ltd. (India, Thrifts & Mortgage Finance) | 0.9 |
| | 23.3 |
Top Market Sectors as of October 31, 2019
| | % of fund's net assets |
| Financials | 25.5 |
| Information Technology | 15.6 |
| Consumer Discretionary | 13.5 |
| Communication Services | 11.1 |
| Energy | 8.1 |
| Materials | 7.3 |
| Consumer Staples | 6.4 |
| Industrials | 4.8 |
| Real Estate | 2.9 |
| Utilities | 2.8 |
Asset Allocation as of October 31, 2019
| | % of fund's net assets |
| Stocks and Equity Futures | 100.0 |
Schedule of Investments October 31, 2019
Showing Percentage of Net Assets
| Common Stocks - 96.1% | | | |
| | | Shares | Value |
| Argentina - 0.1% | | | |
| Banco Macro SA sponsored ADR | | 30,517 | $698,839 |
| BBVA Banco Frances SA sponsored ADR | | 46,998 | 164,493 |
| Grupo Financiero Galicia SA sponsored ADR | | 68,228 | 788,716 |
| Pampa Holding SA sponsored ADR (a)(b) | | 42,012 | 654,127 |
| Telecom Argentina SA Class B sponsored ADR | | 59,087 | 531,783 |
| Transportadora de Gas del Sur SA Class B sponsored ADR | | 51,506 | 389,385 |
| YPF SA Class D sponsored ADR | | 119,963 | 1,122,854 |
|
| TOTAL ARGENTINA | | | 4,350,197 |
|
| Bailiwick of Jersey - 0.1% | | | |
| Polymetal International PLC | | 147,762 | 2,424,198 |
| Belgium - 0.0% | | | |
| Titan Cement International Trading SA (a) | | 25,383 | 529,957 |
| Bermuda - 1.0% | | | |
| Alibaba Health Information Technology Ltd. (a) | | 2,435,000 | 2,450,816 |
| Alibaba Pictures Group Ltd. (a) | | 10,020,000 | 1,643,449 |
| Beijing Enterprises Water Group Ltd. | | 3,620,000 | 1,886,847 |
| Brilliance China Automotive Holdings Ltd. | | 2,080,000 | 2,293,769 |
| China Gas Holdings Ltd. | | 1,262,500 | 5,378,174 |
| China Oriental Group Co. Ltd. (H Shares) | | 727,000 | 253,721 |
| China Resource Gas Group Ltd. | | 616,000 | 3,714,054 |
| Cosco Shipping Ports Ltd. | | 1,121,745 | 881,905 |
| Credicorp Ltd. (United States) | | 46,440 | 9,940,018 |
| GOME Electrical Appliances Holdings Ltd. (a)(b) | | 7,062,000 | 638,374 |
| Haier Electronics Group Co. Ltd. | | 878,000 | 2,506,768 |
| HengTen Networks Group Ltd. (a) | | 14,896,000 | 214,342 |
| Kunlun Energy Co. Ltd. | | 2,303,000 | 2,143,487 |
| Luye Pharma Group Ltd. (c) | | 765,500 | 565,819 |
| Nine Dragons Paper (Holdings) Ltd. | | 1,126,000 | 976,765 |
| Shenzhen International Holdings Ltd. | | 644,021 | 1,309,315 |
| Sihuan Pharmaceutical Holdings Group Ltd. | | 2,540,000 | 332,791 |
|
| TOTAL BERMUDA | | | 37,130,414 |
|
| Brazil - 4.9% | | | |
| Ambev SA | | 3,254,498 | 14,103,771 |
| Atacadao Distribuicao Comercio e Industria Ltda | | 267,700 | 1,275,588 |
| B2W Companhia Global do Varejo (a) | | 159,364 | 2,018,624 |
| Banco Bradesco SA | | 775,706 | 6,353,807 |
| Banco do Brasil SA | | 590,505 | 7,089,594 |
| Banco Santander SA (Brasil) unit | | 278,900 | 3,272,668 |
| BB Seguridade Participacoes SA | | 475,658 | 4,028,950 |
| BM&F BOVESPA SA | | 1,423,380 | 17,170,708 |
| BR Malls Participacoes SA | | 514,716 | 1,970,051 |
| Brasil Foods SA (a) | | 391,169 | 3,463,511 |
| BTG Pactual Participations Ltd. unit | | 151,500 | 2,453,918 |
| CCR SA | | 817,812 | 3,352,407 |
| Centrais Eletricas Brasileiras SA (Electrobras) (a) | | 151,900 | 1,498,358 |
| Cielo SA | | 841,231 | 1,585,764 |
| Companhia de Saneamento Basico do Estado de Sao Paulo (SABESP) | | 231,600 | 3,154,218 |
| Companhia Siderurgica Nacional SA (CSN) | | 429,100 | 1,262,531 |
| Cosan SA Industria e Comercio | | 109,100 | 1,572,096 |
| Drogasil SA | | 158,900 | 4,358,309 |
| Embraer SA | | 465,900 | 2,036,461 |
| Energisa SA unit | | 110,600 | 1,321,519 |
| ENGIE Brasil Energia SA | | 127,020 | 1,433,468 |
| Equatorial Energia SA | | 119,700 | 3,040,777 |
| Hypermarcas SA | | 255,500 | 2,186,451 |
| IRB Brasil Resseguros SA | | 482,600 | 4,547,427 |
| JBS SA | | 753,100 | 5,312,355 |
| Klabin SA unit | | 466,700 | 1,840,966 |
| Kroton Educacional SA | | 1,011,782 | 2,439,579 |
| Localiza Rent A Car SA | | 397,520 | 4,279,993 |
| Lojas Renner SA | | 543,394 | 6,876,261 |
| M. Dias Branco SA | | 63,300 | 595,830 |
| Magazine Luiza SA | | 420,100 | 4,676,041 |
| Multiplan Empreendimentos Imobiliarios SA | | 181,419 | 1,321,344 |
| Natura Cosmeticos SA | | 267,200 | 2,076,038 |
| Notre Dame Intermedica Participacoes SA | | 234,100 | 3,502,306 |
| Petrobras Distribuidora SA | | 479,000 | 3,377,664 |
| Petroleo Brasileiro SA - Petrobras (ON) | | 1,820,865 | 14,846,599 |
| Porto Seguro SA | | 63,000 | 901,683 |
| Rumo SA (a) | | 747,500 | 4,249,595 |
| Sul America SA unit | | 159,552 | 1,921,149 |
| Suzano Papel e Celulose SA | | 372,519 | 3,031,797 |
| TIM Participacoes SA | | 562,500 | 1,601,733 |
| Ultrapar Participacoes SA | | 498,638 | 2,346,166 |
| Vale SA (a) | | 2,183,806 | 25,701,445 |
| Weg SA | | 567,040 | 3,605,416 |
|
| TOTAL BRAZIL | | | 189,054,936 |
|
| Cayman Islands - 16.4% | | | |
| 3SBio, Inc. (a)(c) | | 951,000 | 1,771,482 |
| 51job, Inc. sponsored ADR (a) | | 17,652 | 1,390,448 |
| 58.com, Inc. ADR (a) | | 65,128 | 3,439,410 |
| AAC Technology Holdings, Inc. | | 503,133 | 3,255,922 |
| Agile Property Holdings Ltd. | | 900,000 | 1,213,081 |
| Airtac International Group | | 85,000 | 1,163,601 |
| Alibaba Group Holding Ltd. sponsored ADR (a) | | 974,772 | 172,212,954 |
| Anta Sports Products Ltd. | | 739,000 | 7,228,988 |
| Autohome, Inc. ADR Class A (a)(b) | | 40,903 | 3,458,758 |
| Baidu.com, Inc. sponsored ADR (a) | | 190,541 | 19,406,601 |
| Baozun, Inc. sponsored ADR (a)(b) | | 28,178 | 1,226,307 |
| Bosideng International Holdings Ltd. | | 2,194,000 | 1,134,539 |
| Chailease Holding Co. Ltd. | | 829,601 | 3,740,250 |
| China Aoyuan Property Group Ltd. | | 794,000 | 1,014,677 |
| China Conch Venture Holdings Ltd. | | 1,109,100 | 4,339,780 |
| China Education Group Holdings Ltd. | | 382,000 | 570,625 |
| China First Capital Group Ltd. (a) | | 2,092,000 | 594,846 |
| China Hongqiao Group Ltd. | | 1,232,700 | 684,630 |
| China Huishan Dairy Holdings Co. Ltd. (a)(d) | | 2,302,000 | 61,693 |
| China Investment Fund International Holdings Co. Ltd. (d) | | 660,000 | 971,982 |
| China Literature Ltd. (a)(b)(c) | | 165,100 | 646,789 |
| China Medical System Holdings Ltd. | | 942,000 | 1,277,469 |
| China Mengniu Dairy Co. Ltd. | | 1,897,000 | 7,562,856 |
| China Resources Cement Holdings Ltd. | | 1,682,000 | 1,841,943 |
| China Resources Land Ltd. | | 1,902,812 | 8,092,427 |
| China State Construction International Holdings Ltd. | | 1,407,500 | 1,296,242 |
| China Zhongwang Holdings Ltd. | | 1,062,800 | 441,234 |
| CIFI Holdings Group Co. Ltd. | | 1,855,797 | 1,237,772 |
| Country Garden Holdings Co. Ltd. | | 5,187,000 | 7,200,745 |
| Country Garden Services Holdings Co. Ltd. | | 823,000 | 2,788,631 |
| Ctrip.com International Ltd. ADR (a) | | 323,587 | 10,675,135 |
| Dali Foods Group Co. Ltd. (c) | | 1,310,300 | 895,827 |
| ENN Energy Holdings Ltd. | | 544,943 | 6,217,009 |
| Evergrande Real Estate Group Ltd. (b) | | 1,249,000 | 3,040,386 |
| Future Land Development Holding Ltd. | | 1,170,000 | 1,232,966 |
| GDS Holdings Ltd. ADR (a)(b) | | 40,527 | 1,689,165 |
| Geely Automobile Holdings Ltd. | | 3,463,517 | 6,553,709 |
| Genscript Biotech Corp. (a) | | 638,000 | 1,528,613 |
| Greentown Service Group Co. Ltd. | | 778,000 | 882,696 |
| Haidilao International Holding Ltd. (b)(c) | | 252,000 | 1,219,954 |
| Haitian International Holdings Ltd. | | 441,000 | 1,040,633 |
| Hengan International Group Co. Ltd. | | 491,900 | 3,434,447 |
| Huazhu Group Ltd. ADR (b) | | 90,130 | 3,412,322 |
| Hutchison China Meditech Ltd. sponsored ADR (a)(b) | | 39,449 | 745,586 |
| iQIYI, Inc. ADR (a)(b) | | 88,199 | 1,537,309 |
| JD.com, Inc. sponsored ADR (a) | | 506,274 | 15,770,435 |
| Jiayuan International Group Ltd. | | 470 | 188 |
| Kaisa Group Holdings Ltd. | | 1,667,000 | 728,996 |
| Kingboard Chemical Holdings Ltd. | | 449,900 | 1,198,940 |
| Kingboard Laminates Holdings Ltd. | | 728,500 | 666,930 |
| Kingdee International Software Group Co. Ltd. | | 1,620,000 | 1,775,115 |
| Kingsoft Corp. Ltd. (a) | | 578,000 | 1,330,233 |
| KWG Property Holding Ltd. | | 824,000 | 829,753 |
| Lee & Man Paper Manufacturing Ltd. | | 885,000 | 492,118 |
| Li Ning Co. Ltd. | | 1,346,000 | 4,564,047 |
| Lijun International Pharmaceutical Holding Ltd. | | 1,008,000 | 840,663 |
| Logan Property Holdings Co. Ltd. | | 931,000 | 1,417,895 |
| Longfor Properties Co. Ltd. (c) | | 1,217,200 | 5,051,566 |
| Meitu, Inc. (a)(c) | | 1,429,000 | 316,257 |
| Meituan Dianping Class B (a) | | 697,600 | 8,321,072 |
| Momo, Inc. ADR | | 103,952 | 3,484,471 |
| NetEase, Inc. ADR | | 48,226 | 13,785,884 |
| New Oriental Education & Technology Group, Inc. sponsored ADR (a) | | 97,430 | 11,892,306 |
| Nexteer Auto Group Ltd. | | 572,000 | 533,115 |
| NIO, Inc. sponsored ADR (a)(b) | | 451,738 | 655,020 |
| Noah Holdings Ltd. sponsored ADR (a)(b) | | 23,612 | 715,207 |
| Pinduoduo, Inc. ADR (a)(b) | | 132,668 | 5,423,468 |
| Semiconductor Manufacturing International Corp. (a)(b) | | 2,079,100 | 2,640,974 |
| Shenzhou International Group Holdings Ltd. | | 520,400 | 7,191,227 |
| Shimao Property Holdings Ltd. | | 788,700 | 2,642,213 |
| Shui On Land Ltd. | | 2,269,000 | 456,620 |
| SINA Corp. (a) | | 43,595 | 1,726,362 |
| Sino Biopharmaceutical Ltd. | | 4,778,500 | 7,114,677 |
| SOHO China Ltd. | | 1,336,500 | 456,069 |
| Sunac China Holdings Ltd. | | 1,673,000 | 7,588,373 |
| Sunny Optical Technology Group Co. Ltd. | | 492,600 | 7,917,996 |
| TAL Education Group ADR (a) | | 263,938 | 11,299,186 |
| Tencent Holdings Ltd. | | 3,934,500 | 159,594,799 |
| Tencent Music Entertainment Group ADR (a) | | 59,861 | 828,476 |
| Tingyi (Cayman Islands) Holding Corp. | | 1,359,000 | 1,807,872 |
| Towngas China Co. Ltd. | | 689,414 | 531,453 |
| Uni-President China Holdings Ltd. | | 893,000 | 922,408 |
| Vipshop Holdings Ltd. ADR (a) | | 304,734 | 3,516,630 |
| Want Want China Holdings Ltd. | | 3,443,418 | 2,900,768 |
| Weibo Corp. sponsored ADR (a)(b) | | 38,207 | 1,879,402 |
| Wuxi Biologics (Cayman), Inc. (a)(c) | | 378,500 | 4,447,930 |
| Xiaomi Corp. Class B (a)(b)(c) | | 5,393,000 | 6,110,252 |
| Xinyi Solar Holdings Ltd. | | 2,236,751 | 1,263,846 |
| Yihai International Holding Ltd. | | 320,000 | 2,176,237 |
| Yuzhou Properties Co. | | 1,128,223 | 476,586 |
| YY, Inc. ADR (a) | | 38,933 | 2,212,952 |
| Zhen Ding Technology Holding Ltd. | | 372,000 | 1,768,641 |
| Zhongsheng Group Holdings Ltd. Class H | | 396,100 | 1,313,157 |
| ZTO Express (Cayman), Inc. sponsored ADR | | 220,451 | 4,849,922 |
|
| TOTAL CAYMAN ISLANDS | | | 630,801,146 |
|
| Chile - 0.8% | | | |
| Aguas Andinas SA | | 1,599,670 | 733,398 |
| Banco de Chile | | 31,444,767 | 4,049,319 |
| Banco de Credito e Inversiones | | 34,377 | 1,914,005 |
| Banco Santander Chile | | 44,863,290 | 2,783,387 |
| Cencosud SA | | 1,010,933 | 1,372,721 |
| Colbun SA (a) | | 5,103,841 | 880,578 |
| Compania Cervecerias Unidas SA | | 102,840 | 1,026,167 |
| Compania de Petroleos de Chile SA (COPEC) | | 272,396 | 2,435,660 |
| CorpBanca SA | | 109,317,278 | 663,333 |
| Empresa Nacional de Telecomunicaciones SA (ENTEL) (a) | | 104,311 | 815,949 |
| Empresas CMPC SA | | 794,712 | 1,811,035 |
| Enel Chile SA | | 19,432,876 | 1,598,181 |
| Enersis SA | | 26,286,862 | 4,909,291 |
| LATAM Airlines Group SA | | 207,945 | 2,299,284 |
| S.A.C.I. Falabella | | 528,161 | 2,688,522 |
|
| TOTAL CHILE | | | 29,980,830 |
|
| China - 11.4% | | | |
| Agricultural Bank of China Ltd.: | | | |
| (A Shares) | | 592,200 | 306,016 |
| (H Shares) | | 22,155,297 | 9,116,987 |
| Aier Eye Hospital Group Co. Ltd. (A Shares) | | 103,450 | 580,647 |
| Air China Ltd.: | | | |
| (A Shares) | | 117,000 | 137,830 |
| (H Shares) | | 1,156,000 | 1,020,636 |
| Aisino Co. Ltd. (A Shares) | | 45,900 | 134,139 |
| Aluminum Corp. of China Ltd.: | | | |
| (A shares) (a) | | 859,900 | 413,511 |
| (H Shares) (a) | | 2,219,000 | 657,416 |
| Angang Steel Co. Ltd.: | | | |
| (A Shares) | | 414,300 | 175,786 |
| (H Shares) | | 704,600 | 235,706 |
| Anhui Conch Cement Co. Ltd.: | | | |
| (A Shares) | | 40,800 | 244,214 |
| (H Shares) | | 927,400 | 5,542,821 |
| Anxin Trust Co. Ltd. (A Shares) (a) | | 119,500 | 71,172 |
| AVIC Aircraft Co. Ltd. (A Shares) | | 121,800 | 259,344 |
| AVIC Aviation Engine Corp. PLC (A Shares) | | 64,100 | 192,333 |
| AVIC Capital Co. Ltd. (A Shares) | | 211,600 | 137,201 |
| AVIC Shenyang Aircraft Co. Ltd. (A Shares) (a) | | 26,600 | 110,997 |
| AviChina Industry & Technology Co. Ltd. (H Shares) | | 1,696,000 | 801,109 |
| Baic Motor Corp. Ltd. (H Shares) (c) | | 1,166,200 | 723,402 |
| Bank Communications Co. Ltd.: | | | |
| (H Shares) | | 6,178,176 | 4,219,371 |
| Class A | | 1,058,100 | 842,747 |
| Bank of Beijing Co. Ltd. (A Shares) | | 611,025 | 480,409 |
| Bank of Chengdu Co. Ltd. Class A | | 230,600 | 275,850 |
| Bank of China Ltd. (H Shares) | | 56,011,464 | 22,840,645 |
| Bank of Guiyang Co. Ltd. (A Shares) | | 124,880 | 161,995 |
| Bank of Hangzhou Co. Ltd. (A Shares) | | 179,700 | 229,563 |
| Bank of Jiangsu Co. Ltd. (A Shares) | | 320,503 | 321,764 |
| Bank of Nanjing Co. Ltd. (A Shares) | | 223,300 | 273,520 |
| Bank of Ningbo Co. Ltd. (A Shares) | | 181,500 | 695,729 |
| Bank of Shanghai Co. Ltd. (A Shares) | | 604,580 | 800,523 |
| Baoshan Iron & Steel Co. Ltd. (A Shares) | | 777,200 | 639,689 |
| BBMG Corp.: | | | |
| (A Shares) | | 474,800 | 219,734 |
| (H Shares) | | 1,238,000 | 354,306 |
| Beijing Capital International Airport Co. Ltd. (H Shares) | | 1,117,000 | 1,057,935 |
| Beijing Dabeinong Technology Group Co. Ltd. (A Shares) | | 92,200 | 63,217 |
| Beijing Shiji Information Technology Co. Ltd. (A Shares) | | 25,100 | 129,569 |
| Beijing Tongrentang Co. Ltd. (A Shares) | | 43,500 | 169,780 |
| BOE Technology Group Co. Ltd. (A Shares) | | 1,041,200 | 527,067 |
| BYD Co. Ltd.: | | | |
| (A Shares) | | 18,500 | 112,464 |
| (H Shares) (b) | | 498,800 | 2,339,630 |
| Caitong Securities Co. Ltd. | | 77,900 | 109,935 |
| CGN Power Co. Ltd. (H Shares) (c) | | 7,129,447 | 1,851,674 |
| Changjiang Securities Co. Ltd. (A Shares) | | 125,900 | 121,598 |
| Chaozhou Three-Circle Group Co. (A Shares) | | 70,200 | 186,922 |
| China Avionics Systems Co. Ltd. (A Shares) | | 40,800 | 81,355 |
| China Cinda Asset Management Co. Ltd. (H Shares) | | 6,181,000 | 1,282,230 |
| China CITIC Bank Corp. Ltd. (H Shares) | | 6,337,051 | 3,673,340 |
| China Coal Energy Co. Ltd. (H Shares) | | 1,460,000 | 582,221 |
| China Communications Construction Co. Ltd. (H Shares) | | 3,221,000 | 2,451,963 |
| China Communications Services Corp. Ltd. (H Shares) | | 1,748,000 | 1,079,439 |
| China Construction Bank Corp. (H Shares) | | 66,528,000 | 53,306,924 |
| China Eastern Airlines Corp. Ltd.: | | | |
| (A Shares) (a) | | 143,800 | 105,691 |
| (H Shares) (a) | | 1,300,000 | 648,367 |
| China Everbright Bank Co. Ltd.: | | | |
| (A Shares) | | 1,912,800 | 1,178,295 |
| (H Shares) | | 1,237,000 | 569,228 |
| China Film Co. Ltd. (A Shares) | | 66,800 | 126,207 |
| China Fortune Land Development Co. Ltd. (A Shares) | | 105,000 | 425,706 |
| China Galaxy Securities Co. Ltd. (H Shares) | | 2,478,000 | 1,263,500 |
| China Gezhouba Group Co. Ltd. (A Shares) | | 175,400 | 142,725 |
| China Grand Automotive Services Co. Ltd. (A Shares) | | 204,000 | 104,511 |
| China Huarong Asset Management Co. Ltd. (c) | | 7,100,000 | 1,048,206 |
| China International Capital Corp. Ltd. (H Shares) (c) | | 858,600 | 1,565,612 |
| China International Marine Containers Group Co. Ltd. | | 87,400 | 120,295 |
| China International Travel Service Corp. Ltd. (A Shares) | | 61,300 | 786,051 |
| China Life Insurance Co. Ltd. (H Shares) | | 5,262,747 | 13,534,162 |
| China Longyuan Power Grid Corp. Ltd. (H Shares) | | 2,250,000 | 1,215,528 |
| China Merchants Bank Co. Ltd.: | | | |
| (A Shares) | | 327,600 | 1,650,014 |
| (H Shares) | | 3,007,421 | 14,343,086 |
| China Merchants Securities Co. Ltd. (A Shares) | | 207,300 | 483,597 |
| China Merchants Shekou Industrial Zone Holdings Co. Ltd. (A Shares) | | 243,500 | 646,724 |
| China Minsheng Banking Corp. Ltd.: | | | |
| (A Shares) | | 1,027,600 | 896,979 |
| (H Shares) | | 4,844,061 | 3,388,279 |
| China Molybdenum Co. Ltd.: | | | |
| (H Shares) (b) | | 2,629,000 | 828,493 |
| Class A | | 572,200 | 275,973 |
| China National Building Materials Co. Ltd. (H Shares) | | 2,656,000 | 2,238,540 |
| China National Chemical Engineering Co. Ltd. (A Shares) | | 193,708 | 164,406 |
| China National Nuclear Power Co. Ltd. (A Shares) | | 399,700 | 286,967 |
| China Northern Rare Earth Group High-Tech Co. Ltd. | | 74,400 | 106,212 |
| China Oilfield Services Ltd. (H Shares) | | 1,132,000 | 1,576,057 |
| China Pacific Insurance (Group) Co. Ltd. | | 47,300 | 231,421 |
| China Pacific Insurance (Group) Co. Ltd. (H Shares) | | 2,018,228 | 7,322,714 |
| China Petroleum & Chemical Corp.: | | | |
| (A Shares) | | 449,500 | 312,636 |
| (H Shares) | | 18,122,704 | 10,307,745 |
| China Railway Construction Corp. Ltd.: | | | |
| (A Shares) | | 375,100 | 499,704 |
| (H Shares) | | 1,384,000 | 1,513,802 |
| China Railway Group Ltd.: | | | |
| (A Shares) | | 977,000 | 799,122 |
| (H Shares) | | 2,192,000 | 1,321,151 |
| China Railway Signal & Communications Corp. (H Shares) (c) | | 988,000 | 589,820 |
| China Reinsurance Group Corp. (H Shares) | | 3,661,000 | 597,264 |
| China Resources Sanjiu Medical & Pharmaceutical Co. Ltd. (A Shares) | | 22,900 | 95,767 |
| China Shenhua Energy Co. Ltd.: | | | |
| (A Shares) | | 385,485 | 1,008,703 |
| (H Shares) | | 2,043,702 | 4,150,637 |
| China Shipbuilding Industry Co. (A Shares) | | 685,300 | 515,164 |
| China Shipbuilding Industry Group Power Co. Ltd. (a) | | 45,200 | 134,426 |
| China Shipping Development Co. Ltd. (H Shares) | | 798,000 | 343,284 |
| China South Publishing & Media Group Co. Ltd. (A Shares) | | 50,800 | 83,384 |
| China Southern Airlines Ltd.: | | | |
| (A Shares) | | 133,400 | 126,079 |
| (H Shares) | | 1,098,000 | 675,753 |
| China Spacesat Co. Ltd. (A Shares) | | 24,600 | 72,973 |
| China State Construction Engineering Corp. Ltd. (A Shares) | | 1,544,640 | 1,149,600 |
| China Telecom Corp. Ltd. (H Shares) | | 9,648,689 | 4,104,636 |
| China Tower Corp. Ltd. (H Shares) (c) | | 29,017,000 | 6,386,435 |
| China United Network Communications Ltd. (A Shares) | | 978,500 | 851,853 |
| China Vanke Co. Ltd.: | | | |
| (A Shares) | | 408,500 | 1,537,017 |
| (H Shares) | | 913,100 | 3,329,664 |
| China Yangtze Power Co. Ltd. (A Shares) | | 685,800 | 1,738,986 |
| Chinese Universe Publishing and Media Group Co. Ltd. (A Shares) | | 32,200 | 54,336 |
| Chongqing Changan Automobile Co. Ltd. (B Shares) | | 263,500 | 108,502 |
| Chongqing Rural Commercial Bank Co. Ltd. (H Shares) | | 1,546,646 | 825,518 |
| Chongqing Zhifei Biological Products Co. Ltd. (A Shares) | | 45,300 | 312,301 |
| CITIC Guoan Information Industry Co. Ltd. (A Shares) (a) | | 69,100 | 33,898 |
| CITIC Securities Co. Ltd.: | | | |
| (A Shares) | | 99,800 | 307,104 |
| (H Shares) | | 1,772,600 | 3,252,218 |
| Contemporary Amperex Technology Co. Ltd. | | 18,300 | 178,503 |
| COSCO Shipping Development Co. Ltd. (A Shares) | | 311,000 | 109,906 |
| COSCO SHIPPING Holdings Co. Ltd. (H Shares) (a) | | 2,101,000 | 786,020 |
| CRRC Corp. Ltd.: | | | |
| (A Shares) | | 835,700 | 853,886 |
| (H Shares) | | 2,880,000 | 1,926,245 |
| Daqin Railway Co. Ltd. (A Shares) | | 609,900 | 660,634 |
| Datang International Power Generation Co. Ltd. (H Shares) | | 1,696,000 | 334,530 |
| DHC Software Co. Ltd. (A Shares) | | 91,200 | 92,326 |
| Dong E-E-Jiao Co. Ltd. (A Shares) | | 20,100 | 100,720 |
| Dongfang Electric Corp. Ltd. (A Shares) | | 90,400 | 113,374 |
| Dongfeng Motor Group Co. Ltd. (H Shares) | | 1,873,000 | 1,878,831 |
| Dongxing Securities Co. Ltd. (A Shares) | | 68,500 | 105,713 |
| East Money Information Co. Ltd. (A Shares) | | 206,500 | 436,550 |
| Everbright Securities Co. Ltd. (A Shares) | | 85,458 | 138,918 |
| Fangda Carbon New Material Co. Ltd. (A Shares) | | 59,749 | 90,666 |
| Financial Street Holdings Co. Ltd. (A Shares) | | 149,800 | 167,087 |
| First Capital Securities Co. Ltd. (A Shares) | | 86,000 | 81,323 |
| Focus Media Information Technology Co. Ltd. (A Shares) | | 490,340 | 417,127 |
| Foshan Haitian Flavouring & Food Co. Ltd. (A Shares) | | 70,400 | 1,116,517 |
| Founder Securities Co. Ltd. (A Shares) | | 291,300 | 278,092 |
| Foxconn Industrial Internet Co. Ltd. (A Shares) | | 90,400 | 196,934 |
| Fuyao Glass Industries Group Co. Ltd.: | | | |
| (A Shares) | | 134,100 | 404,625 |
| (H Shares) (c) | | 275,900 | 779,583 |
| GD Power Development Co. Ltd. (A Shares) | | 608,600 | 201,240 |
| Gemdale Corp. (A Shares) | | 113,400 | 191,513 |
| GF Securities Co. Ltd.: | | | |
| (A Shares) (a) | | 118,500 | 230,580 |
| (H Shares) | | 1,179,228 | 1,228,139 |
| Giant Network Group Co. Ltd. (A Shares) | | 37,700 | 95,293 |
| GoerTek, Inc. (A Shares) | | 75,900 | 200,016 |
| Great Wall Motor Co. Ltd. (H Shares) | | 2,171,000 | 1,759,056 |
| Gree Electric Appliances, Inc. of Zhuhai (A Shares) | | 93,800 | 782,052 |
| Greenland Holdings Corp. Ltd. (A Shares) | | 248,900 | 240,842 |
| Guanghui Energy Co. Ltd. (A Shares) | | 403,100 | 188,242 |
| Guangshen Railway Co. Ltd. (A Shares) | | 227,624 | 99,842 |
| Guangzhou Automobile Group Co. Ltd. (H Shares) | | 2,172,200 | 2,169,453 |
| Guangzhou Baiyunshan Pharmaceutical Holdings Co. Ltd. (A Shares) | | 46,300 | 221,890 |
| Guangzhou Haige Communications Group (A Shares) | | 64,500 | 87,951 |
| Guangzhou R&F Properties Co. Ltd. (H Shares) | | 702,400 | 1,088,337 |
| Guosen Securities Co. Ltd. (A Shares) | | 132,700 | 230,227 |
| Guotai Junan Securities Co. Ltd.: | | | |
| (A Shares) | | 384,300 | 930,116 |
| (H Shares) (c) | | 325,500 | 497,396 |
| Guoyuan Securities Co. Ltd. (A Shares) | | 84,400 | 101,162 |
| Haier Smart Home Co. Ltd. (A Shares) | | 235,900 | 535,791 |
| Haitong Securities Co. Ltd.: | | | |
| (A Shares) | | 89,500 | 179,038 |
| (H Shares) | | 2,357,600 | 2,406,894 |
| Han's Laser Technology Industry Group Co. Ltd. (A Shares) | | 3,300 | 17,774 |
| Hangzhou Hikvision Digital Technology Co. Ltd. (A Shares) | | 279,900 | 1,282,090 |
| Hangzhou Robam Appliances Co. Ltd. (A Shares) | | 24,300 | 108,627 |
| Hangzhou Tigermed Consulting Co. Ltd. (A Shares) | | 18,000 | 174,535 |
| Heilan Home Co. Ltd. (A Shares) | | 84,100 | 91,712 |
| Henan Shuanghui Investment & Development Co. Ltd. (A Shares) | | 105,200 | 444,998 |
| Hengli Petrochemical Co. Ltd. (A Shares) | | 185,620 | 424,470 |
| Hengtong Optic-electric Co. Ltd. (A Shares) | | 48,108 | 100,327 |
| Hengyi Petrochemical Co. Ltd. (A Shares) | | 73,800 | 150,153 |
| Hesteel Co. Ltd. (A Shares) | | 357,600 | 125,880 |
| Hithink RoyalFlush Information Network Co. Ltd. (A Shares) | | 11,400 | 157,051 |
| Huaan Securities Co. Ltd. (A Shares) | | 76,493 | 68,382 |
| Huadian Power International Corp. Ltd. (H Shares) | | 1,248,000 | 467,636 |
| Huadong Medicine Co. Ltd. (A Shares) | | 57,700 | 213,578 |
| Huaneng Power International, Inc. (H Shares) | | 2,808,186 | 1,333,819 |
| Huaneng Renewables Corp. Ltd. (H Shares) | | 3,170,000 | 1,210,229 |
| Huatai Securities Co. Ltd.: | | | |
| (A Shares) | | 133,200 | 329,586 |
| (H Shares) (c) | | 1,262,800 | 1,877,047 |
| HUAXI Securities Co. Ltd. | | 106,200 | 143,567 |
| Huaxia Bank Co. Ltd. (A Shares) | | 436,558 | 464,122 |
| Huayu Automotive Systems Co. Ltd. (A Shares) | | 96,300 | 343,196 |
| Hubei Biocause Pharmaceutical Co. Ltd. (A Shares) | | 138,000 | 133,463 |
| Hubei Energy Group Co. Ltd. (A Shares) | | 219,700 | 126,848 |
| Hundsun Technologies, Inc. (A Shares) | | 26,660 | 288,208 |
| iFlytek Co. Ltd. (A Shares) | | 73,100 | 343,384 |
| Industrial & Commercial Bank of China Ltd. (H Shares) | | 46,702,000 | 33,457,001 |
| Industrial Bank Co. Ltd. (A Shares) | | 647,700 | 1,720,559 |
| Industrial Securities Co. Ltd. (A Shares) | | 154,700 | 140,015 |
| Inner Mongoli Yili Industries Co. Ltd. (A Shares) | | 194,300 | 799,701 |
| Inner Mongolia Baotou Steel Union Co. Ltd. (A Shares) | | 1,556,000 | 302,560 |
| Inner Mongolia Junzheng Energy & Chemical Industry Group Co. Ltd. (A Shares) | | 301,100 | 126,385 |
| Inner Mongolia Yitai Coal Co. Ltd. (B Shares) | | 578,696 | 504,759 |
| Jiangsu Expressway Co. Ltd. (H Shares) | | 834,000 | 1,108,010 |
| Jiangsu Hengrui Medicine Co. Ltd. (A Shares) | | 135,260 | 1,744,000 |
| Jiangsu Yanghe Brewery JSC Ltd. (A Shares) | | 46,600 | 665,590 |
| Jiangxi Copper Co. Ltd.: | | | |
| (A Shares) | | 158,600 | 318,218 |
| (H Shares) | | 698,000 | 817,169 |
| Jiangxi Ganfeng Lithium Co. Ltd. | | 25,400 | 78,466 |
| Jinduicheng Molybdenum Co. Ltd. (A Shares) | | 120,800 | 122,699 |
| Jinke Properties Group Co. Ltd. (A Shares) | | 189,400 | 186,316 |
| Jointown Pharmaceutical Group (A Shares) | | 61,800 | 113,369 |
| Kangmei Pharmaceutical Co. Ltd. (A Shares) | | 3,500 | 1,851 |
| Kweichow Moutai Co. Ltd. (A Shares) | | 37,100 | 6,209,412 |
| Legend Holdings Corp.: | | | |
| (H Shares) (c) | | 247,700 | 544,494 |
| rights (a)(d) | | 16,330 | 2,709 |
| Lens Technology Co. Ltd. (A Shares) | | 107,200 | 200,756 |
| Lepu Medical Technology Beijing Co. Ltd. (A Shares) | | 41,500 | 177,787 |
| Liaoning Chengda Co. Ltd. (A Shares) (a) | | 51,700 | 102,904 |
| LONGi Green Energy Technology Co. Ltd. | | 113,420 | 367,199 |
| Luxshare Precision Industry Co. Ltd. (A Shares) | | 162,524 | 732,468 |
| Luzhou Laojiao Co. Ltd. (A Shares) | | 44,700 | 552,757 |
| Maanshan Iron & Steel Co. Ltd.: | | | |
| (A Shares) | | 252,800 | 95,402 |
| (H Shares) | | 1,200,000 | 453,868 |
| Mango Excellent Media Co. Ltd. (A Shares) | | 44,370 | 170,008 |
| Meinian Onehealth Healthcare Holdings Co. Ltd. (A Shares) | | 95,688 | 202,491 |
| Metallurgical Corp. China Ltd.: | | | |
| (A Shares) | | 599,100 | 233,040 |
| (H Shares) | | 2,194,000 | 464,468 |
| Midea Group Co. Ltd. (A Shares) | | 117,800 | 927,772 |
| Muyuan Foodstuff Co. Ltd. (A Shares) | | 51,860 | 724,581 |
| NARI Technology Co. Ltd. (A Shares) | | 148,600 | 462,797 |
| New China Life Insurance Co. Ltd. | | 20,000 | 135,217 |
| New China Life Insurance Co. Ltd. (H Shares) | | 644,900 | 2,502,971 |
| Ningbo Zhoushan Port Co. Ltd. Class A | | 305,200 | 159,383 |
| O-film Tech Co. Ltd. (A Shares) (a) | | 61,900 | 98,077 |
| Oceanwide Holdings Co., Ltd. (A Shares) | | 147,400 | 91,574 |
| Offshore Oil Enginering Co. Ltd. (A Shares) | | 128,300 | 109,786 |
| Oppein Home Group, Inc. (A Shares) | | 10,300 | 161,382 |
| Orient Securities Co. Ltd. (A Shares) | | 235,218 | 333,675 |
| People's Insurance Co. of China Group (H Shares) | | 5,638,552 | 2,374,807 |
| Perfect World Co. Ltd. (A Shares) | | 32,400 | 135,700 |
| PetroChina Co. Ltd.: | | | |
| (A Shares) | | 354,100 | 295,547 |
| (H Shares) | | 14,913,790 | 7,272,882 |
| PICC Property & Casualty Co. Ltd. (H Shares) | | 4,759,568 | 6,023,325 |
| Ping An Bank Co. Ltd. (A Shares) | | 536,300 | 1,237,549 |
| Ping An Insurance Group Co. of China Ltd.: | | | |
| (A Shares) | | 320,300 | 3,998,774 |
| (H Shares) | | 3,855,141 | 44,495,231 |
| Poly Developments & Holdings (A Shares) | | 394,500 | 806,347 |
| Postal Savings Bank of China Co. Ltd. (H Shares) (c) | | 5,451,000 | 3,494,979 |
| Power Construction Corp. of China Ltd. (A Shares) | | 367,100 | 232,450 |
| Risesun Real Estate Development Co. Ltd. (A Shares) | | 113,300 | 139,852 |
| Rongsheng Petrochemical Co. Ltd. (A Shares) | | 159,700 | 249,757 |
| SAIC Motor Corp. Ltd. (A Shares) | | 253,500 | 845,466 |
| Sanan Optoelectronics Co. Ltd. (A Shares) | | 89,000 | 191,875 |
| Sany Heavy Industry Co. Ltd. (A Shares) | | 265,800 | 507,935 |
| SDIC Capital Co. Ltd. | | 79,600 | 138,433 |
| SDIC Power Holdings Co. Ltd. (A Shares) | | 195,500 | 231,420 |
| Seazen Holdings Co. Ltd. (A Shares) | | 50,600 | 228,436 |
| SF Holding Co. Ltd. (A Shares) | | 33,700 | 189,519 |
| Shaanxi Coal Industry Co. Ltd. (A Shares) | | 219,900 | 261,470 |
| Shandong Buchang Pharmaceuticals Co. Ltd. (A Shares) | | 42,988 | 124,936 |
| Shandong Gold Mining Co. Ltd. (A Shares) | | 77,660 | 352,784 |
| Shandong Linglong Tyre Co. Ltd. (A Shares) | | 43,300 | 128,848 |
| Shandong Weigao Medical Polymer Co. Ltd. (H Shares) | | 1,402,000 | 1,609,553 |
| Shanghai 2345 Network Holding Group Co. Ltd. (A Shares) | | 143,299 | 66,250 |
| Shanghai Construction Group Co. Ltd. (A Shares) | | 121,300 | 58,734 |
| Shanghai Electric Group Co. Ltd.: | | | |
| (A Shares) | | 210,800 | 145,979 |
| (H Shares) | | 1,744,000 | 533,450 |
| Shanghai Fosun Pharmaceutical (Group) Co. Ltd.: | | | |
| (A Shares) | | 33,100 | 119,566 |
| (H Shares) | | 395,000 | 1,114,834 |
| Shanghai International Airport Co. Ltd. (A Shares) | | 33,000 | 357,192 |
| Shanghai International Port Group Co. Ltd. (A Shares) | | 185,843 | 153,110 |
| Shanghai Lujiazui Finance Trust Ltd. (B Shares) | | 607,878 | 669,519 |
| Shanghai Pharmaceuticals Holding Co. Ltd.: | | | |
| (A Shares) | | 46,500 | 122,422 |
| (H Shares) | | 601,309 | 1,086,517 |
| Shanghai Pudong Development Bank Co. Ltd. (A Shares) | | 955,209 | 1,695,552 |
| Shanghai Tunnel Engineering Co. Ltd. | | 153,000 | 126,423 |
| Shanghai Zhangjiang High Ltd. Class A | | 51,400 | 117,836 |
| Shanghaioriental Pearl Media Co. Ltd. | | 91,370 | 116,737 |
| Shanxi Lu'an Environmental Energy Development Co. Ltd. (A Shares) | | 111,200 | 110,616 |
| Shanxi Securities Co. Ltd. (A Shares) | | 125,200 | 138,371 |
| Shanxi Xinghuacun Fen Wine Factory Co. Ltd. (A Shares) | | 29,100 | 367,242 |
| Shanxi Xishan Coal & Electricity Power Co. Ltd. (A Shares) | | 111,300 | 89,540 |
| Shenergy Co. Ltd. (A Shares) | | 157,200 | 129,212 |
| Shenwan Hongyuan Group Co. Ltd. (A Shares) | | 837,500 | 569,265 |
| Shenzhen Energy Group Co. Ltd. (A Shares) | | 126,800 | 109,947 |
| Shenzhen Inovance Technology Co. Ltd. (A Shares) | | 42,900 | 151,778 |
| Shenzhen Kangtai Biological Products Co. Ltd. | | 21,400 | 262,928 |
| Shenzhen Mindray Bio-Medical Electronics Co. Ltd. (A Shares) | | 14,000 | 353,492 |
| Shenzhen Overseas Chinese Town Co. Ltd. (A Shares) | | 326,300 | 326,010 |
| Shenzhen Salubris Pharmaceuticals Co. Ltd. (A Shares) | | 26,600 | 70,674 |
| Shenzhen Zhongjin Lingnan Nonfemet Co. Ltd. (A Shares) | | 100,700 | 57,429 |
| Shijiazhuang Baosh Electric Co. Ltd. (A Shares) | | 129,900 | 87,840 |
| Sichuan Chuantou Energy Co. Ltd. (A Shares) | | 152,300 | 208,800 |
| Sichuan Kelun Pharmaceutical Co. Ltd. (A Shares) | | 35,100 | 118,971 |
| Sichuan New Hope Agribusiness Co. Ltd. (A Shares) | | 126,000 | 394,463 |
| Sinolink Securities Co. Ltd. (A Shares) | | 74,400 | 89,801 |
| Sinopec Engineering Group Co. Ltd. (H Shares) | | 1,008,500 | 576,113 |
| Sinopec Shanghai Petrochemical Co. Ltd.: | | | |
| (A Shares) | | 696,900 | 391,741 |
| (H Shares) | | 1,057,000 | 291,932 |
| Sinopharm Group Co. Ltd. (H Shares) | | 814,600 | 2,917,287 |
| Sinotrans Ltd. (H Shares) | | 1,374,000 | 403,990 |
| Songcheng Performance Development Co. Ltd. (A Shares) | | 59,100 | 248,303 |
| Soochow Securities Co. Ltd. (A Shares) | | 67,200 | 86,644 |
| Southwest Securities Co. Ltd. (A Shares) | | 19,500 | 12,336 |
| Spring Airlines Co. Ltd. (A Shares) | | 23,700 | 145,333 |
| Suning.com Co. Ltd. (A Shares) | | 318,100 | 476,239 |
| Suzhou Dongshan Precision Manufacturing Co. Ltd. (A Shares) | | 49,800 | 145,520 |
| Suzhou Gold Mantis Consolidated Co. Ltd. | | 88,100 | 99,976 |
| Tasly Pharmaceutical Group Co. Ltd. (A Shares) | | 51,660 | 107,220 |
| TBEA Co. Ltd. (A Shares) | | 120,200 | 109,525 |
| TCL Corp. (A Shares) | | 327,800 | 153,131 |
| Tianma Microelectronics Co. Ltd. (A Shares) | | 36,600 | 71,520 |
| Tianqi Lithium Corp. (A Shares) | | 27,100 | 96,641 |
| Tong Ren Tang Technologies Co. Ltd. (H Shares) | | 355,000 | 353,439 |
| Tonghua Dongbao Pharmaceutical Co. Ltd. (A Shares) | | 46,900 | 106,374 |
| Tongling Nonferrous Metals Group Co. Ltd. (A Shares) | | 297,400 | 91,606 |
| Tongwei Co. Ltd. (A Shares) | | 83,600 | 150,613 |
| Transfar Zhilian Co. Ltd. | | 114,400 | 122,156 |
| TravelSky Technology Ltd. (H Shares) | | 650,000 | 1,481,647 |
| Tsingtao Brewery Co. Ltd.: | | | |
| (A Shares) | | 49,500 | 329,887 |
| (H Shares) | | 243,000 | 1,408,189 |
| Tus-Sound Environmental Resources Co. Ltd. (A Shares) | | 30,100 | 37,002 |
| Unisplendour Corp. Ltd. (A Shares) | | 21,836 | 91,012 |
| Walvax Biotechnology Co. Ltd. (A Shares) | | 37,100 | 158,810 |
| Wangsu Science & Technology Co. Ltd. (A Shares) | | 77,800 | 105,184 |
| Wanhua Chemical Group Co. Ltd. (A Shares) | | 98,100 | 634,439 |
| Wanxiang Qianchao Co. Ltd. (A Shares) | | 78,300 | 56,243 |
| Weichai Power Co. Ltd.: | | | |
| (A Shares) | | 97,400 | 159,696 |
| (H Shares) | | 1,405,000 | 2,211,498 |
| Weifu High-Technology Group Co. Ltd. (A Shares) | | 30,500 | 72,628 |
| Wens Foodstuffs Group Co. Ltd. (A Shares) | | 157,700 | 900,827 |
| Western Securities Co. Ltd. (A Shares) | | 83,000 | 104,205 |
| Wuhu Sanqi Interactive Entertainment Network Technology Group Co. Ltd. (A Shares) | | 49,900 | 129,277 |
| Wuliangye Yibin Co. Ltd. (A Shares) | | 114,500 | 2,141,942 |
| WuXi AppTec Co. Ltd. | | 41,300 | 551,305 |
| WuXi AppTec Co. Ltd. (H Shares) (c) | | 108,260 | 1,305,261 |
| Wuxi Lead Intelligent Equipment Co. Ltd. (A Shares) | | 32,600 | 151,436 |
| XCMG Construction Machinery Co. Ltd. (A Shares) | | 204,000 | 130,791 |
| Xiamen C&D, Inc. (A Shares) | | 82,225 | 99,064 |
| Xinhu Zhongbao Co. Ltd. (A Shares) | | 377,000 | 226,855 |
| Xinjiang Goldwind Science & Technology Co. Ltd.: | | | |
| (A Shares) | | 49,600 | 88,437 |
| (H Shares) | | 591,764 | 705,742 |
| Yanzhou Coal Mining Co. Ltd.: | | | |
| (A Shares) | | 105,000 | 154,782 |
| (H Shares) | | 1,188,000 | 1,205,313 |
| Yonghui Superstores Co. Ltd. (A Shares) | | 325,900 | 385,811 |
| Yonyou Network Technology Co. Ltd. (A Shares) | | 77,300 | 323,937 |
| Yunda Holding Co. Ltd. (A Shares) | | 51,100 | 238,647 |
| Yunnan Baiyao Group Co. Ltd. (A Shares) | | 36,700 | 450,997 |
| Zhangzhou Pientzehuang Pharmaceutical Co. Ltd. (A Shares) | | 20,700 | 318,733 |
| Zhaojin Mining Industry Co. Ltd. (H Shares) | | 738,500 | 825,922 |
| Zhejiang Century Huatong Group Co. Ltd. (A Shares) | | 15,232 | 19,345 |
| Zhejiang China Commodities City Group Co. Ltd. (A Shares) | | 160,100 | 88,644 |
| Zhejiang Chint Electric Co. Ltd. (A Shares) | | 55,800 | 180,655 |
| Zhejiang Dahua Technology Co. Ltd. (A Shares) | | 72,600 | 165,830 |
| Zhejiang Expressway Co. Ltd. (H Shares) | | 942,000 | 771,375 |
| Zhejiang Huayou Cobalt Co. Ltd. (A Shares) | | 25,350 | 88,222 |
| Zhejiang Longsheng Group Co. Ltd. (A Shares) | | 62,200 | 122,090 |
| Zhejiang Semir Garment Co. Ltd. (A Shares) | | 81,900 | 129,313 |
| Zhengzhou Yutong Bus Co. Ltd. (A Shares) | | 43,000 | 87,246 |
| ZhongAn Online P & C Insurance Co. Ltd. (H Shares) (a)(b)(c) | | 204,600 | 681,085 |
| Zhongjin Gold Co. Ltd. (A Shares) | | 109,300 | 128,331 |
| Zhuhai Wanlida Electric Co. Ltd. (A Shares) | | 27,200 | 107,827 |
| Zhuzhou CRRC Times Electric Co. Ltd. (H Shares) | | 380,727 | 1,412,713 |
| Zijin Mining Group Co. Ltd.: | | | |
| (A Shares) | | 219,300 | 105,593 |
| (H Shares) | | 4,440,000 | 1,537,971 |
| Zoomlion Heavy Industry Science and Technology Co. Ltd. (A Shares) | | 163,000 | 135,309 |
| ZTE Corp.: | | | |
| (A Shares) (a) | | 38,900 | 184,065 |
| (H Shares) (a) | | 660,800 | 1,843,563 |
|
| TOTAL CHINA | | | 438,335,621 |
|
| Colombia - 0.3% | | | |
| Bancolombia SA | | 160,033 | 1,945,963 |
| Cementos Argos SA | | 333,934 | 753,821 |
| Ecopetrol SA | | 3,456,668 | 3,108,956 |
| Grupo de Inversiones Suramerica SA | | 167,000 | 1,689,763 |
| Interconexion Electrica SA ESP | | 298,518 | 1,722,219 |
| Inversiones Argos SA | | 203,724 | 1,103,003 |
|
| TOTAL COLOMBIA | | | 10,323,725 |
|
| Czech Republic - 0.1% | | | |
| Ceske Energeticke Zavody A/S | | 111,209 | 2,536,860 |
| Komercni Banka A/S | | 54,035 | 1,826,508 |
| MONETA Money Bank A/S (c) | | 372,547 | 1,238,130 |
|
| TOTAL CZECH REPUBLIC | | | 5,601,498 |
|
| Egypt - 0.1% | | | |
| Commercial International Bank SAE | | 954,066 | 4,788,064 |
| Eastern Tobacco Co. | | 638,682 | 633,538 |
| Elsewedy Electric Co. | | 442,834 | 369,028 |
|
| TOTAL EGYPT | | | 5,790,630 |
|
| Greece - 0.3% | | | |
| Alpha Bank AE (a) | | 964,399 | 2,055,461 |
| EFG Eurobank Ergasias SA (a) | | 1,803,248 | 1,826,136 |
| Ff Group (a)(d) | | 1,944 | 2,602 |
| Greek Organization of Football Prognostics SA | | 151,752 | 1,650,178 |
| Hellenic Telecommunications Organization SA | | 170,420 | 2,584,944 |
| Jumbo SA | | 76,516 | 1,493,420 |
| Motor Oil (HELLAS) Corinth Refineries SA | | 42,904 | 1,059,417 |
| National Bank of Greece SA (a) | | 382,639 | 1,297,342 |
|
| TOTAL GREECE | | | 11,969,500 |
|
| Hong Kong - 3.1% | | | |
| Beijing Enterprises Holdings Ltd. | | 380,427 | 1,791,202 |
| BYD Electronic International Co. Ltd. | | 492,000 | 844,850 |
| China Agri-Industries Holdings Ltd. | | 1,472,000 | 484,961 |
| China Everbright International Ltd. | | 2,647,814 | 2,001,234 |
| China Everbright Ltd. | | 659,000 | 976,377 |
| China Jinmao Holdings Group Ltd. | | 3,542,000 | 2,354,795 |
| China Merchants Holdings International Co. Ltd. | | 900,880 | 1,408,554 |
| China Mobile Ltd. | | 4,233,571 | 34,404,964 |
| China Overseas Land and Investment Ltd. | | 2,620,202 | 8,268,029 |
| China Power International Development Ltd. | | 2,790,000 | 582,648 |
| China Resources Beer Holdings Co. Ltd. | | 1,014,144 | 5,199,543 |
| China Resources Pharmaceutical Group Ltd. (c) | | 1,029,200 | 950,474 |
| China Resources Power Holdings Co. Ltd. | | 1,314,940 | 1,652,531 |
| China Taiping Insurance Group Ltd. | | 1,134,655 | 2,550,820 |
| China Unicom Ltd. | | 4,265,814 | 4,199,690 |
| CITIC Pacific Ltd. | | 4,096,941 | 5,389,463 |
| CNOOC Ltd. | | 12,319,584 | 18,334,630 |
| CSPC Pharmaceutical Group Ltd. | | 3,230,963 | 8,274,887 |
| Far East Horizon Ltd. | | 1,468,000 | 1,389,819 |
| Fosun International Ltd. | | 1,860,954 | 2,433,343 |
| Guangdong Investment Ltd. | | 1,983,126 | 4,292,076 |
| Hua Hong Semiconductor Ltd. (c) | | 303,000 | 609,287 |
| Lenovo Group Ltd. | | 4,931,000 | 3,437,613 |
| MMG Ltd. (a) | | 1,620,000 | 337,255 |
| Shanghai Industrial Holdings Ltd. | | 369,241 | 687,332 |
| Shenzhen Investment Ltd. | | 1,918,000 | 754,915 |
| Sino-Ocean Group Holding Ltd. | | 1,893,500 | 696,148 |
| Sinotruk Hong Kong Ltd. | | 448,500 | 677,714 |
| Sun Art Retail Group Ltd. | | 1,652,571 | 1,686,272 |
| Winteam Pharmaceutical Group Ltd. | | 1,496,000 | 668,003 |
| Yuexiu Property Co. Ltd. | | 4,759,000 | 1,048,229 |
|
| TOTAL HONG KONG | | | 118,387,658 |
|
| Hungary - 0.3% | | | |
| MOL Hungarian Oil and Gas PLC Series A (For. Reg.) | | 282,980 | 2,797,076 |
| OTP Bank PLC | | 152,596 | 7,028,783 |
| Richter Gedeon PLC | | 93,759 | 1,737,652 |
|
| TOTAL HUNGARY | | | 11,563,511 |
|
| India - 8.9% | | | |
| Adani Ports & Special Economic Zone Ltd. (a) | | 426,633 | 2,375,663 |
| Ambuja Cements Ltd. | | 400,484 | 1,140,353 |
| Ashok Leyland Ltd. | | 792,368 | 855,796 |
| Asian Paints Ltd. | | 195,061 | 4,968,630 |
| Aurobindo Pharma Ltd. | | 184,162 | 1,214,179 |
| Avenue Supermarts Ltd. (a)(c) | | 86,684 | 2,432,248 |
| Axis Bank Ltd. | | 1,439,889 | 14,908,140 |
| Bajaj Auto Ltd. | | 57,366 | 2,621,974 |
| Bajaj Finance Ltd. | | 119,164 | 6,752,662 |
| Bajaj Finserv Ltd. | | 26,199 | 3,000,510 |
| Bandhan Bank Ltd. (c) | | 260,715 | 2,244,932 |
| Bharat Forge Ltd. | | 139,517 | 890,683 |
| Bharat Petroleum Corp. Ltd. | | 448,315 | 3,317,834 |
| Bharti Airtel Ltd. | | 1,416,883 | 7,461,719 |
| Bharti Infratel Ltd. | | 233,997 | 624,929 |
| Bosch Ltd. | | 4,999 | 1,076,583 |
| Britannia Industries Ltd. | | 39,418 | 1,812,071 |
| Cipla Ltd. (a) | | 243,359 | 1,599,859 |
| Coal India Ltd. | | 844,496 | 2,465,251 |
| Container Corp. of India Ltd. | | 144,609 | 1,197,397 |
| Dabur India Ltd. | | 362,725 | 2,358,162 |
| Divi's Laboratories Ltd. | | 53,612 | 1,324,586 |
| Dr. Reddy's Laboratories Ltd. | | 78,570 | 3,082,565 |
| Eicher Motors Ltd. | | 9,228 | 2,923,613 |
| GAIL India Ltd. (a) | | 1,088,837 | 2,104,357 |
| Glenmark Pharmaceuticals Ltd. | | 95,142 | 422,503 |
| Godrej Consumer Products Ltd. | | 245,268 | 2,558,440 |
| Grasim Industries Ltd. | | 201,628 | 2,182,872 |
| Havells India Ltd. | | 169,109 | 1,646,482 |
| HCL Technologies Ltd. | | 374,997 | 6,144,438 |
| HDFC Standard Life Insurance Co. Ltd. (c) | | 345,703 | 3,046,503 |
| Hero Motocorp Ltd. | | 67,458 | 2,567,096 |
| Hindalco Industries Ltd. | | 802,654 | 2,120,268 |
| Hindustan Petroleum Corp. Ltd. | | 417,081 | 1,905,242 |
| Hindustan Unilever Ltd. | | 447,443 | 13,704,324 |
| Housing Development Finance Corp. Ltd. | | 1,127,480 | 33,813,576 |
| ICICI Bank Ltd. | | 1,645,101 | 10,724,800 |
| ICICI Lombard General Insurance Co. Ltd. (c) | | 92,165 | 1,736,604 |
| Indiabulls Housing Finance Ltd. | | 190,005 | 550,959 |
| Indian Oil Corp. Ltd. | | 1,308,819 | 2,701,462 |
| Infosys Ltd. | | 2,380,375 | 22,872,841 |
| InterGlobe Aviation Ltd. (a)(c) | | 63,008 | 1,290,326 |
| ITC Ltd. | | 2,385,103 | 8,649,746 |
| JSW Steel Ltd. | | 586,872 | 1,881,734 |
| Larsen & Toubro Ltd. | | 329,022 | 6,821,637 |
| LIC Housing Finance Ltd. | | 197,094 | 1,143,975 |
| Lupin Ltd. (a) | | 156,051 | 1,637,818 |
| Mahindra & Mahindra Financial Services Ltd. | | 212,267 | 1,053,407 |
| Mahindra & Mahindra Ltd. | | 514,544 | 4,391,296 |
| Marico Ltd. | | 306,332 | 1,578,733 |
| Maruti Suzuki India Ltd. | | 72,720 | 7,742,634 |
| Motherson Sumi Systems Ltd. (a) | | 628,328 | 1,087,319 |
| Nestle India Ltd. | | 15,918 | 3,347,651 |
| NTPC Ltd. | | 1,632,603 | 2,813,314 |
| Oil & Natural Gas Corp. Ltd. | | 1,744,808 | 3,479,891 |
| Page Industries Ltd. | | 3,800 | 1,376,708 |
| Petronet LNG Ltd. | | 416,885 | 1,680,996 |
| Pidilite Industries Ltd. (a) | | 81,625 | 1,610,633 |
| Piramal Enterprises Ltd. | | 61,471 | 1,455,926 |
| Power Grid Corp. of India Ltd. | | 1,266,615 | 3,539,415 |
| Rec Ltd. | | 461,586 | 907,397 |
| Reliance Industries Ltd. | | 1,962,528 | 40,421,057 |
| Shree Cement Ltd. | | 5,536 | 1,550,795 |
| Shriram Transport Finance Co. Ltd. | | 116,470 | 1,865,606 |
| State Bank of India (a) | | 1,238,325 | 5,442,077 |
| Sun Pharmaceutical Industries Ltd. | | 575,120 | 3,510,709 |
| Tata Consultancy Services Ltd. | | 620,975 | 19,776,815 |
| Tata Motors Ltd. (a) | | 1,097,244 | 2,711,224 |
| Tata Power Co. Ltd. | | 792,666 | 661,604 |
| Tata Steel Ltd. | | 244,250 | 1,306,859 |
| Tech Mahindra Ltd. | | 319,220 | 3,321,541 |
| Titan Co. Ltd. | | 214,796 | 4,026,939 |
| Ultratech Cemco Ltd. | | 65,277 | 3,809,293 |
| United Spirits Ltd. (a) | | 201,382 | 1,770,273 |
| UPL Ltd. (a) | | 365,984 | 3,073,156 |
| Vedanta Ltd. | | 1,293,335 | 2,697,408 |
| Vodafone Idea Ltd. (a) | | 4,960,592 | 271,852 |
| Wipro Ltd. | | 806,546 | 2,951,419 |
| Yes Bank Ltd. | | 1,305,970 | 1,292,372 |
| Zee Entertainment Enterprises Ltd. (a) | | 371,120 | 1,357,101 |
|
| TOTAL INDIA | | | 342,761,762 |
|
| Indonesia - 2.0% | | | |
| PT Adaro Energy Tbk | | 10,095,900 | 941,276 |
| PT Astra International Tbk | | 14,034,359 | 6,941,405 |
| PT Bank Central Asia Tbk | | 6,768,970 | 15,151,173 |
| PT Bank Mandiri (Persero) Tbk | | 12,884,798 | 6,440,716 |
| PT Bank Negara Indonesia (Persero) Tbk | | 5,202,000 | 2,839,683 |
| PT Bank Rakyat Indonesia Tbk | | 38,373,605 | 11,498,086 |
| PT Bank Tabungan Negara Tbk | | 2,913,600 | 385,623 |
| PT Barito Pacific Tbk | | 18,540,000 | 1,254,717 |
| PT Bumi Serpong Damai Tbk (a) | | 5,084,500 | 512,003 |
| PT Charoen Pokphand Indonesia Tbk | | 5,099,500 | 2,287,020 |
| PT Gudang Garam Tbk | | 334,800 | 1,337,097 |
| PT Hanjaya Mandala Sampoerna Tbk | | 6,497,700 | 985,196 |
| PT Indah Kiat Pulp & Paper Tbk | | 1,908,800 | 988,104 |
| PT Indocement Tunggal Prakarsa Tbk | | 1,283,600 | 1,828,706 |
| PT Indofood CBP Sukses Makmur Tbk | | 1,556,900 | 1,289,001 |
| PT Indofood Sukses Makmur Tbk | | 3,033,400 | 1,662,314 |
| PT Jasa Marga Tbk | | 1,451,897 | 563,377 |
| PT Kalbe Farma Tbk | | 14,133,400 | 1,604,969 |
| PT Pabrik Kertas Tjiwi Kimia Tbk | | 927,000 | 697,795 |
| PT Pakuwon Jati Tbk | | 11,150,900 | 496,249 |
| PT Perusahaan Gas Negara Tbk Series B | | 7,529,700 | 1,129,975 |
| PT Semen Gresik (Persero) Tbk | | 2,039,848 | 1,839,710 |
| PT Surya Citra Media Tbk | | 3,938,600 | 342,170 |
| PT Tambang Batubara Bukit Asam Tbk | | 2,053,300 | 328,788 |
| PT Telekomunikasi Indonesia Tbk Series B | | 34,328,465 | 10,017,762 |
| PT Unilever Indonesia Tbk | | 1,054,039 | 3,281,947 |
| PT United Tractors Tbk | | 1,191,100 | 1,838,499 |
|
| TOTAL INDONESIA | | | 78,483,361 |
|
| Isle of Man - 0.1% | | | |
| NEPI Rockcastle PLC | | 259,863 | 2,261,473 |
| Korea (South) - 11.5% | | | |
| AMOREPACIFIC Corp. | | 23,259 | 3,815,916 |
| AMOREPACIFIC Group, Inc. | | 19,968 | 1,443,482 |
| BGF Retail Co. Ltd. | | 5,129 | 780,116 |
| BS Financial Group, Inc. | | 184,150 | 1,093,611 |
| Celltrion Healthcare Co. Ltd. | | 34,526 | 1,625,565 |
| Celltrion Pharm, Inc. (a) | | 10,518 | 359,501 |
| Celltrion, Inc. (a) | | 62,534 | 10,686,924 |
| Cheil Industries, Inc. | | 59,573 | 5,090,448 |
| Cheil Worldwide, Inc. | | 47,569 | 1,006,018 |
| CJ CheilJedang Corp. | | 5,467 | 1,067,436 |
| CJ Corp. | | 10,708 | 753,949 |
| CJ O Shopping Co. Ltd. | | 7,803 | 1,100,150 |
| Daelim Industrial Co. | | 19,428 | 1,510,692 |
| Daewoo Engineering & Construction Co. Ltd. (a) | | 136,769 | 508,958 |
| Daewoo Shipbuilding & Marine Engineering Co. Ltd. (a) | | 25,288 | 608,274 |
| Db Insurance Co. Ltd. | | 34,635 | 1,494,559 |
| Doosan Bobcat, Inc. | | 34,809 | 936,933 |
| E-Mart Co. Ltd. | | 13,773 | 1,312,230 |
| Fila Korea Ltd. | | 33,594 | 1,653,449 |
| GS Engineering & Construction Corp. | | 41,816 | 1,104,098 |
| GS Holdings Corp. | | 35,679 | 1,513,695 |
| GS Retail Co. Ltd. | | 18,884 | 617,209 |
| Hana Financial Group, Inc. | | 206,553 | 5,947,958 |
| Hankook Tire Co. Ltd. | | 51,295 | 1,360,953 |
| Hanmi Pharm Co. Ltd. | | 4,251 | 1,211,416 |
| Hanmi Science Co. Ltd. | | 8,891 | 331,241 |
| Hanon Systems | | 129,321 | 1,281,839 |
| Hanwha Chemical Corp. | | 69,893 | 976,468 |
| Hanwha Corp. | | 28,651 | 581,447 |
| Hanwha Life Insurance Co. Ltd. | | 210,400 | 400,919 |
| HDC Hyundai Development Co. | | 17,368 | 459,322 |
| HLB, Inc. (a) | | 19,472 | 2,795,287 |
| Hotel Shilla Co. | | 21,984 | 1,455,844 |
| Hyundai Department Store Co. Ltd. | | 9,710 | 613,155 |
| Hyundai Engineering & Construction Co. Ltd. | | 54,511 | 2,000,570 |
| Hyundai Fire & Marine Insurance Co. Ltd. | | 44,535 | 960,880 |
| Hyundai Glovis Co. Ltd. | | 12,964 | 1,672,717 |
| Hyundai Heavy Industries Co. Ltd. (a) | | 26,595 | 2,772,467 |
| Hyundai Mobis | | 45,923 | 9,339,287 |
| Hyundai Motor Co. | | 105,724 | 11,021,480 |
| Hyundai Robotics Co. Ltd. | | 6,659 | 1,943,150 |
| Hyundai Steel Co. | | 57,298 | 1,556,944 |
| Industrial Bank of Korea | | 178,622 | 1,801,040 |
| ING Life Insurance Korea Ltd. (c) | | 22,522 | 538,854 |
| Kakao Corp. | | 34,146 | 4,128,600 |
| Kangwon Land, Inc. | | 79,521 | 2,130,227 |
| KB Financial Group, Inc. | | 274,166 | 9,812,132 |
| KCC Corp. | | 3,991 | 770,720 |
| Kia Motors Corp. | | 181,240 | 6,589,616 |
| Korea Aerospace Industries Ltd. | | 50,204 | 1,630,153 |
| Korea Electric Power Corp. (a) | | 176,791 | 3,842,175 |
| Korea Express Co. Ltd. (a) | | 6,424 | 864,555 |
| Korea Gas Corp. | | 19,217 | 645,334 |
| Korea Investment Holdings Co. Ltd. | | 29,174 | 1,690,177 |
| Korea Zinc Co. Ltd. | | 5,877 | 2,181,986 |
| Korean Air Lines Co. Ltd. | | 32,340 | 688,091 |
| KT&G Corp. | | 80,945 | 6,916,662 |
| Kumho Petro Chemical Co. Ltd. | | 12,399 | 741,637 |
| LG Chemical Ltd. | | 32,229 | 8,468,343 |
| LG Corp. | | 66,115 | 3,920,721 |
| LG Display Co. Ltd. (a) | | 159,970 | 1,864,214 |
| LG Electronics, Inc. | | 73,090 | 4,178,213 |
| LG Household & Health Care Ltd. | | 6,465 | 6,966,107 |
| LG Innotek Co. Ltd. | | 9,748 | 1,007,877 |
| LG Telecom Ltd. | | 77,545 | 891,215 |
| Lotte Chemical Corp. | | 11,711 | 2,271,571 |
| Lotte Confectionery Co. Ltd. | | 18,511 | 577,337 |
| Lotte Shopping Co. Ltd. | | 7,575 | 805,858 |
| Medy-Tox, Inc. | | 3,125 | 881,192 |
| Meritz Securities Co. Ltd. | | 217,585 | 838,517 |
| Mirae Asset Daewoo Co. Ltd. | | 281,168 | 1,717,823 |
| NAVER Corp. | | 96,872 | 13,575,275 |
| NCSOFT Corp. | | 11,452 | 5,049,374 |
| Netmarble Corp. (a)(c) | | 17,955 | 1,379,277 |
| Oci Co. Ltd. | | 13,112 | 704,735 |
| Orion Corp./Republic of Korea | | 16,268 | 1,473,488 |
| Ottogi Corp. | | 665 | 321,053 |
| Pearl Abyss Corp. (a) | | 4,388 | 812,141 |
| POSCO | | 54,198 | 9,776,517 |
| POSCO Chemtech Co. Ltd. | | 16,840 | 691,420 |
| Posco International Corp. | | 40,046 | 624,494 |
| S-Oil Corp. | | 31,060 | 2,646,081 |
| S1 Corp. | | 11,247 | 900,498 |
| Samsung Biologics Co. Ltd. (a)(c) | | 11,323 | 3,855,639 |
| Samsung Card Co. Ltd. | | 20,718 | 593,946 |
| Samsung Electro-Mechanics Co. Ltd. | | 38,468 | 3,714,365 |
| Samsung Electronics Co. Ltd. | | 3,279,914 | 141,253,592 |
| Samsung Engineering Co. Ltd. (a) | | 110,520 | 1,680,999 |
| Samsung Fire & Marine Insurance Co. Ltd. | | 21,251 | 3,931,369 |
| Samsung Heavy Industries Co. Ltd. (a) | | 301,192 | 1,865,898 |
| Samsung Life Insurance Co. Ltd. | | 48,098 | 2,901,605 |
| Samsung SDI Co. Ltd. | | 37,919 | 7,371,312 |
| Samsung SDS Co. Ltd. | | 23,878 | 4,111,303 |
| Samsung Securities Co. Ltd. | | 46,181 | 1,325,895 |
| Shinhan Financial Group Co. Ltd. | | 310,192 | 11,235,815 |
| Shinsegae Co. Ltd. | | 4,900 | 988,131 |
| SillaJen, Inc. (a) | | 42,035 | 691,430 |
| SK C&C Co. Ltd. | | 24,362 | 5,381,211 |
| SK Energy Co. Ltd. | | 38,490 | 5,262,285 |
| SK Hynix, Inc. | | 375,395 | 26,303,215 |
| SK Telecom Co. Ltd. | | 13,752 | 2,794,430 |
| STX Pan Ocean Co. Ltd. (Korea) (a) | | 177,002 | 664,727 |
| ViroMed Co. Ltd. | | 13,377 | 1,106,472 |
| Woongjin Coway Co. Ltd. | | 35,625 | 2,794,500 |
| Woori Financial Group, Inc. (a) | | 325,797 | 3,271,082 |
| Woori Investment & Securities Co. Ltd. | | 98,968 | 1,023,262 |
| Yuhan Corp. | | 6,314 | 1,211,232 |
|
| TOTAL KOREA (SOUTH) | | | 441,415,572 |
|
| Luxembourg - 0.1% | | | |
| Globant SA (a) | | 23,743 | 2,214,272 |
| Reinet Investments SCA | | 104,704 | 1,964,919 |
|
| TOTAL LUXEMBOURG | | | 4,179,191 |
|
| Malaysia - 2.0% | | | |
| AirAsia Group BHD | | 1,018,200 | 464,874 |
| Alliance Bank Malaysia Bhd | | 606,100 | 417,117 |
| AMMB Holdings Bhd | | 1,155,300 | 1,102,001 |
| Axiata Group Bhd | | 1,891,412 | 1,944,112 |
| British American Tobacco (Malaysia) Bhd | | 97,800 | 440,292 |
| Bumiputra-Commerce Holdings Bhd | | 3,453,817 | 4,334,613 |
| Dialog Group Bhd | | 2,643,565 | 2,199,692 |
| DiGi.com Bhd | | 2,218,200 | 2,491,151 |
| Fraser & Neave Holdings BHD | | 87,400 | 722,782 |
| Gamuda Bhd | | 1,222,900 | 1,093,512 |
| Genting Bhd | | 1,426,000 | 1,980,872 |
| Genting Malaysia Bhd | | 2,030,740 | 1,557,553 |
| Genting Plantations Bhd | | 165,100 | 391,314 |
| Hap Seng Consolidated Bhd | | 344,600 | 822,953 |
| Hartalega Holdings Bhd | | 995,500 | 1,252,340 |
| Hong Leong Bank Bhd | | 441,800 | 1,819,147 |
| Hong Leong Credit Bhd | | 148,400 | 618,462 |
| IHH Healthcare Bhd | | 1,433,387 | 1,953,546 |
| IJM Corp. Bhd | | 1,928,500 | 991,527 |
| IOI Corp. Bhd | | 1,242,800 | 1,297,128 |
| IOI Properties Group Bhd | | 25 | 6 |
| Kuala Lumpur Kepong Bhd | | 279,000 | 1,446,575 |
| Malayan Banking Bhd | | 2,737,274 | 5,629,019 |
| Malaysia Airports Holdings Bhd | | 677,800 | 1,282,869 |
| Maxis Bhd | | 1,597,100 | 2,056,484 |
| MISC Bhd | | 771,300 | 1,536,274 |
| Nestle (Malaysia) BHD | | 44,000 | 1,522,750 |
| Petronas Chemicals Group Bhd | | 1,674,100 | 2,990,972 |
| Petronas Dagangan Bhd | | 176,526 | 994,762 |
| Petronas Gas Bhd | | 408,700 | 1,627,964 |
| PPB Group Bhd | | 358,540 | 1,551,077 |
| Press Metal Bhd | | 908,900 | 1,034,136 |
| Public Bank Bhd | | 2,149,557 | 10,432,570 |
| QL Resources Bhd | | 396,500 | 689,514 |
| RHB Capital Bhd | | 1,058,260 | 1,455,743 |
| RHB Capital Bhd (a)(d) | | 141,500 | 0 |
| Sime Darby Bhd | | 1,960,449 | 1,062,977 |
| Sime Darby Plantation Bhd | | 1,361,649 | 1,596,820 |
| Sime Darby Property Bhd | | 1,642,549 | 284,807 |
| SP Setia Bhd | | 1,091,059 | 315,588 |
| Telekom Malaysia Bhd | | 796,300 | 715,585 |
| Tenaga Nasional Bhd | | 2,154,172 | 7,134,075 |
| Top Glove Corp. Bhd | | 1,017,300 | 1,058,364 |
| Westports Holdings Bhd | | 591,900 | 605,511 |
| YTL Corp. Bhd | | 1,883,896 | 391,727 |
|
| TOTAL MALAYSIA | | | 75,311,157 |
|
| Mexico - 2.5% | | | |
| Alfa SA de CV Series A | | 2,132,000 | 1,848,661 |
| Alsea S.A.B. de CV (a) | | 349,300 | 931,878 |
| America Movil S.A.B. de CV Series L | | 23,057,747 | 18,267,360 |
| CEMEX S.A.B. de CV unit | | 10,478,386 | 3,938,280 |
| Coca-Cola FEMSA S.A.B. de CV unit | | 368,669 | 2,025,940 |
| El Puerto de Liverpool S.A.B. Dcv Class C | | 126,299 | 643,559 |
| Embotelladoras Arca S.A.B. de CV | | 309,500 | 1,729,107 |
| Fibra Uno Administracion SA de CV | | 2,144,183 | 3,256,987 |
| Fomento Economico Mexicano S.A.B. de CV unit | | 1,335,091 | 11,847,271 |
| Gruma S.A.B. de CV Series B | | 139,320 | 1,461,895 |
| Grupo Aeroportuario del Pacifico S.A.B. de CV Series B | | 246,027 | 2,579,405 |
| Grupo Aeroportuario del Sureste S.A.B. de CV Series B | | 142,970 | 2,344,421 |
| Grupo Bimbo S.A.B. de CV Series A | | 1,120,370 | 2,081,565 |
| Grupo Carso SA de CV Series A1 | | 321,200 | 1,075,314 |
| Grupo Financiero Banorte S.A.B. de CV Series O | | 1,778,981 | 9,710,343 |
| Grupo Financiero Inbursa S.A.B. de CV Series O | | 1,567,300 | 1,947,260 |
| Grupo Mexico SA de CV Series B | | 2,403,254 | 6,330,303 |
| Grupo Televisa SA de CV | | 1,662,693 | 3,671,728 |
| Industrias Penoles SA de CV | | 97,300 | 1,167,610 |
| Infraestructura Energetica Nova S.A.B. de CV | | 370,500 | 1,637,700 |
| Kimberly-Clark de Mexico SA de CV Series A | | 1,058,527 | 2,134,498 |
| Megacable Holdings S.A.B. de CV unit | | 205,900 | 845,906 |
| Mexichem S.A.B. de CV | | 727,520 | 1,569,899 |
| Promotora y Operadora de Infraestructura S.A.B. de CV | | 159,490 | 1,475,302 |
| Wal-Mart de Mexico SA de CV Series V | | 3,593,956 | 10,785,698 |
|
| TOTAL MEXICO | | | 95,307,890 |
|
| Netherlands - 0.1% | | | |
| X5 Retail Group NV GDR | | 84,587 | 2,832,208 |
| Pakistan - 0.0% | | | |
| Habib Bank Ltd. | | 397,400 | 326,887 |
| MCB Bank Ltd. | | 256,300 | 284,739 |
| Oil & Gas Development Co. Ltd. | | 445,000 | 368,387 |
|
| TOTAL PAKISTAN | | | 980,013 |
|
| Peru - 0.1% | | | |
| Compania de Minas Buenaventura SA sponsored ADR | | 148,660 | 2,280,444 |
| Philippines - 1.1% | | | |
| Aboitiz Equity Ventures, Inc. | | 1,242,030 | 1,366,208 |
| Aboitiz Power Corp. | | 970,955 | 763,762 |
| Alliance Global Group, Inc. | | 2,926,900 | 660,940 |
| Altus San Nicolas Corp. (d) | | 27,638 | 2,820 |
| Ayala Corp. | | 199,916 | 3,382,495 |
| Ayala Land, Inc. | | 5,065,013 | 4,836,933 |
| Bank of the Philippine Islands (BPI) | | 624,828 | 1,192,900 |
| BDO Unibank, Inc. | | 1,365,881 | 4,163,760 |
| DMCI Holdings, Inc. | | 3,043,400 | 491,359 |
| Globe Telecom, Inc. | | 22,600 | 808,537 |
| GT Capital Holdings, Inc. | | 64,747 | 1,138,909 |
| International Container Terminal Services, Inc. | | 700,560 | 1,636,623 |
| JG Summit Holdings, Inc. | | 1,976,740 | 2,964,906 |
| Jollibee Food Corp. | | 299,093 | 1,365,716 |
| Manila Electric Co. | | 152,190 | 1,014,310 |
| Megaworld Corp. | | 7,459,500 | 709,056 |
| Metro Pacific Investments Corp. | | 9,391,200 | 886,666 |
| Metropolitan Bank & Trust Co. | | 1,243,652 | 1,654,422 |
| Philippine Long Distance Telephone Co. | | 57,980 | 1,246,840 |
| Robinsons Land Corp. | | 1,375,797 | 689,045 |
| Security Bank Corp. | | 154,630 | 606,285 |
| SM Investments Corp. | | 174,065 | 3,526,288 |
| SM Prime Holdings, Inc. | | 6,992,500 | 5,365,211 |
| Universal Robina Corp. | | 608,378 | 1,806,135 |
|
| TOTAL PHILIPPINES | | | 42,280,126 |
|
| Poland - 1.0% | | | |
| Alior Bank SA (a) | | 60,649 | 427,963 |
| Bank Millennium SA (a) | | 420,201 | 675,837 |
| Bank Polska Kasa Opieki SA | | 116,281 | 3,280,879 |
| Bank Zachodni WBK SA | | 25,036 | 2,052,341 |
| BRE Bank SA (a) | | 9,852 | 984,517 |
| CD Projekt RED SA | | 46,405 | 3,061,966 |
| Cyfrowy Polsat SA | | 175,454 | 1,272,055 |
| Dino Polska SA (a)(c) | | 33,981 | 1,325,211 |
| Grupa Lotos SA | | 64,130 | 1,601,299 |
| Jastrzebska Spolka Weglowa SA | | 36,128 | 183,068 |
| KGHM Polska Miedz SA (Bearer) (a) | | 98,019 | 2,145,789 |
| LPP SA | | 909 | 1,940,218 |
| NG2 SA | | 18,961 | 553,845 |
| Polish Oil & Gas Co. SA | | 1,209,911 | 1,489,647 |
| Polska Grupa Energetyczna SA (a) | | 578,494 | 1,240,068 |
| Polski Koncern Naftowy Orlen SA | | 204,915 | 5,599,342 |
| Powszechna Kasa Oszczednosci Bank SA | | 596,920 | 5,955,686 |
| Powszechny Zaklad Ubezpieczen SA | | 410,615 | 3,971,111 |
| Telekomunikacja Polska SA (a) | | 441,913 | 722,902 |
|
| TOTAL POLAND | | | 38,483,744 |
|
| Qatar - 1.0% | | | |
| Barwa Real Estate Co. (a) | | 1,183,462 | 1,111,629 |
| Industries Qatar QSC (a) | | 1,265,231 | 3,652,177 |
| Masraf al Rayan (a) | | 2,621,233 | 2,699,704 |
| Mesaieed Petrochemical Holding Co. (a) | | 3,039,324 | 2,086,874 |
| Qatar Electricity & Water Co. (a) | | 344,427 | 1,494,630 |
| Qatar Fuel Co. (a) | | 338,097 | 2,052,168 |
| Qatar Insurance Co. SAQ (a) | | 1,075,090 | 906,489 |
| Qatar Islamic Bank (a) | | 795,003 | 3,323,248 |
| Qatar National Bank SAQ (a) | | 3,125,004 | 16,479,010 |
| Qatar Telecom (Qtel) Q.S.C. (a) | | 564,258 | 1,131,306 |
| The Commercial Bank of Qatar (a) | | 1,369,420 | 1,617,277 |
|
| TOTAL QATAR | | | 36,554,512 |
|
| Russia - 3.9% | | | |
| Alrosa Co. Ltd. | | 1,821,101 | 2,116,110 |
| Gazprom OAO | | 6,473,556 | 26,260,998 |
| Gazprom OAO sponsored ADR (Reg. S) | | 418,279 | 3,347,905 |
| Inter Rao Ues JSC | | 25,262,158 | 1,701,938 |
| Lukoil PJSC | | 269,587 | 24,905,201 |
| Magnit OJSC GDR (Reg. S) | | 246,719 | 2,802,728 |
| Magnitogorsk Iron & Steel Works PJSC | | 1,571,400 | 895,212 |
| MMC Norilsk Nickel PJSC | | 39,036 | 10,889,718 |
| MMC Norilsk Nickel PJSC sponsored ADR | | 43,394 | 1,202,014 |
| Mobile TeleSystems OJSC sponsored ADR | | 343,798 | 3,076,992 |
| Moscow Exchange MICEX-RTS OAO (a) | | 994,487 | 1,473,837 |
| NOVATEK OAO GDR (Reg. S) | | 62,488 | 13,372,432 |
| Novolipetsk Steel OJSC | | 838,136 | 1,634,380 |
| PhosAgro OJSC GDR (Reg. S) | | 75,441 | 949,048 |
| Polyus PJSC | | 18,200 | 2,119,939 |
| Rosneft Oil Co. OJSC | | 710,061 | 4,717,314 |
| Rosneft Oil Co. OJSC GDR (Reg. S) | | 88,545 | 586,345 |
| Sberbank of Russia | | 7,387,375 | 27,074,073 |
| Severstal PAO | | 146,507 | 2,015,649 |
| Severstal PAO GDR (Reg. S) | | 1,679 | 22,935 |
| Surgutneftegas OJSC | | 5,026,062 | 3,370,434 |
| Tatneft PAO | | 993,420 | 11,591,514 |
| Tatneft PAO sponsored ADR | | 8,957 | 626,990 |
| VTB Bank OJSC | | 2,204,029,962 | 1,481,097 |
|
| TOTAL RUSSIA | | | 148,234,803 |
|
| Saudi Arabia - 2.4% | | | |
| Advanced Polypropylene Co. | | 72,564 | 899,722 |
| Al Rajhi Bank | | 844,455 | 13,600,267 |
| Alinma Bank | | 521,120 | 2,912,480 |
| Almarai Co. Ltd. | | 172,718 | 2,298,117 |
| Bank Al-Jazira | | 262,041 | 911,131 |
| Bank Albilad | | 254,036 | 1,679,890 |
| Banque Saudi Fransi | | 370,777 | 3,331,783 |
| Bupa Arabia for Cooperative Insurance Co. | | 18,108 | 518,572 |
| Dar Al Arkan Real Estate Development Co. (a) | | 341,369 | 1,095,934 |
| Emaar The Economic City (a) | | 242,975 | 607,065 |
| Etihad Etisalat Co. (a) | | 264,346 | 1,583,130 |
| Jarir Marketing Co. | | 42,555 | 1,797,379 |
| National Commercial Bank | | 828,082 | 9,604,983 |
| National Industrialization Co. (a) | | 204,730 | 667,093 |
| Rabigh Refining & Petrochemical Co. (a) | | 153,460 | 822,480 |
| Riyad Bank | | 830,072 | 4,913,633 |
| SABIC | | 516,554 | 12,079,510 |
| Sahara International Petrochemical Co. | | 247,398 | 1,084,506 |
| Samba Financial Group | | 670,368 | 4,951,389 |
| Saudi Airlines Catering Co. | | 30,065 | 693,444 |
| Saudi Arabian Fertilizers Co. | | 115,175 | 2,398,519 |
| Saudi Arabian Mining Co. (a) | | 284,365 | 3,214,963 |
| Saudi Cement Co. | | 51,450 | 941,117 |
| Saudi Electricity Co. | | 569,058 | 3,153,088 |
| Saudi Industrial Investment Group | | 151,100 | 849,316 |
| Saudi Kayan Petrochemical Co. (a) | | 495,303 | 1,349,758 |
| Saudi Telecom Co. | | 276,803 | 7,070,828 |
| The Co. for Cooperative Insurance (a) | | 42,707 | 802,827 |
| The Saudi British Bank | | 255,379 | 2,219,917 |
| The Savola Group (a) | | 178,599 | 1,471,538 |
| Yanbu National Petrochemical Co. | | 159,379 | 2,116,384 |
|
| TOTAL SAUDI ARABIA | | | 91,640,763 |
|
| Singapore - 0.0% | | | |
| BOC Aviation Ltd. Class A (c) | | 151,900 | 1,427,086 |
| South Africa - 4.5% | | | |
| Anglo American Platinum Ltd. | | 36,766 | 2,743,806 |
| AngloGold Ashanti Ltd. | | 283,442 | 6,269,257 |
| Aspen Pharmacare Holdings Ltd. | | 265,725 | 1,855,265 |
| Barclays Africa Group Ltd. | | 490,866 | 5,031,291 |
| Bidcorp Ltd. | | 229,031 | 5,343,021 |
| Bidvest Group Ltd. | | 203,476 | 2,774,777 |
| Capitec Bank Holdings Ltd. | | 31,685 | 2,878,983 |
| Clicks Group Ltd. | | 179,092 | 2,913,023 |
| Discovery Ltd. | | 268,601 | 2,137,716 |
| Exxaro Resources Ltd. | | 174,539 | 1,424,334 |
| FirstRand Ltd. | | 2,299,081 | 9,935,475 |
| Fortress (REIT) Ltd. Class A | | 810,508 | 1,126,950 |
| Foschini Ltd. | | 166,538 | 1,917,714 |
| Gold Fields Ltd. | | 574,100 | 3,565,381 |
| Growthpoint Properties Ltd. | | 2,043,764 | 2,990,478 |
| Investec Ltd. | | 195,934 | 1,114,103 |
| Kumba Iron Ore Ltd. | | 45,229 | 1,101,444 |
| Liberty Holdings Ltd. | | 82,787 | 637,565 |
| Life Healthcare Group Holdings Ltd. | | 924,214 | 1,459,366 |
| MMI Holdings Ltd. | | 607,488 | 812,101 |
| Mr Price Group Ltd. | | 176,828 | 1,870,032 |
| MTN Group Ltd. | | 1,156,815 | 7,164,972 |
| MultiChoice Group Ltd. (a) | | 301,693 | 2,516,288 |
| Naspers Ltd. Class N | | 300,926 | 42,583,623 |
| Nedbank Group Ltd. | | 256,448 | 3,889,531 |
| Netcare Ltd. | | 768,039 | 869,670 |
| Oceana Group Ltd. | | 608 | 2,695 |
| Old Mutual Ltd. | | 3,308,184 | 4,302,029 |
| Pick 'n Pay Stores Ltd. | | 255,058 | 1,115,736 |
| PSG Group Ltd. | | 102,643 | 1,604,126 |
| Rand Merchant Insurance Holdings Ltd. | | 522,348 | 1,032,217 |
| Redefine Properties Ltd. | | 3,778,946 | 1,885,659 |
| Remgro Ltd. | | 357,430 | 4,098,600 |
| RMB Holdings Ltd. | | 529,032 | 2,782,315 |
| Sanlam Ltd. | | 1,272,625 | 6,701,484 |
| Sappi Ltd. | | 369,461 | 948,684 |
| Sasol Ltd. | | 384,976 | 6,979,109 |
| Shoprite Holdings Ltd. | | 323,566 | 2,899,578 |
| Spar Group Ltd. | | 131,466 | 1,766,423 |
| Standard Bank Group Ltd. | | 883,580 | 10,143,584 |
| Telkom SA Ltd. | | 196,947 | 901,156 |
| Tiger Brands Ltd. | | 107,779 | 1,530,754 |
| Truworths International Ltd. | | 307,345 | 1,089,605 |
| Vodacom Group Ltd. | | 439,010 | 3,830,679 |
| Woolworths Holdings Ltd. | | 689,850 | 2,624,630 |
|
| TOTAL SOUTH AFRICA | | | 173,165,229 |
|
| Taiwan - 11.7% | | | |
| Acer, Inc. | | 1,918,000 | 1,119,431 |
| Advantech Co. Ltd. | | 239,993 | 2,372,545 |
| ASE Technology Holding Co. Ltd. | | 2,394,592 | 6,200,896 |
| Asia Cement Corp. | | 1,501,000 | 2,118,764 |
| ASUSTeK Computer, Inc. | | 489,502 | 3,314,387 |
| AU Optronics Corp. | | 6,209,000 | 1,580,064 |
| Catcher Technology Co. Ltd. | | 448,095 | 3,790,692 |
| Cathay Financial Holding Co. Ltd. | | 5,162,033 | 6,821,101 |
| Cathay Financial Holding Co. Ltd. rights 11/25/19 (a) | | 175,776 | 30,547 |
| Chang Hwa Commercial Bank | | 3,733,704 | 2,907,583 |
| Cheng Shin Rubber Industry Co. Ltd. | | 1,387,000 | 2,176,141 |
| Chicony Electronics Co. Ltd. | | 409,008 | 1,270,020 |
| China Airlines Ltd. | | 1,769,000 | 525,514 |
| China Development Finance Holding Corp. | | 8,918,000 | 2,777,920 |
| China Life Insurance Co. Ltd. (a) | | 1,770,055 | 1,456,764 |
| China Steel Corp. | | 8,251,289 | 6,344,440 |
| Chinatrust Financial Holding Co. Ltd. | | 12,779,778 | 8,883,576 |
| Chunghwa Telecom Co. Ltd. | | 2,642,129 | 9,702,880 |
| Compal Electronics, Inc. | | 3,053,000 | 1,821,910 |
| Delta Electronics, Inc. | | 1,351,717 | 5,939,081 |
| E.SUN Financial Holdings Co. Ltd. | | 7,225,110 | 6,526,716 |
| ECLAT Textile Co. Ltd. | | 134,129 | 1,800,965 |
| EVA Airways Corp. | | 1,573,659 | 735,282 |
| Evergreen Marine Corp. (Taiwan) (a) | | 1,490,472 | 610,889 |
| Far Eastern Textile Ltd. | | 2,325,000 | 2,256,541 |
| Far EasTone Telecommunications Co. Ltd. | | 1,082,348 | 2,590,708 |
| Feng Tay Enterprise Co. Ltd. | | 230,992 | 1,560,245 |
| First Financial Holding Co. Ltd. | | 6,864,062 | 5,030,224 |
| Formosa Chemicals & Fibre Corp. | | 2,428,149 | 7,054,036 |
| Formosa Petrochemical Corp. | | 869,347 | 2,762,139 |
| Formosa Plastics Corp. | | 3,070,085 | 9,845,049 |
| Formosa Taffeta Co. Ltd. | | 573,000 | 651,008 |
| Foxconn Technology Co. Ltd. | | 671,710 | 1,436,012 |
| Fubon Financial Holding Co. Ltd. | | 4,558,846 | 6,659,341 |
| Giant Manufacturing Co. Ltd. | | 207,000 | 1,533,937 |
| GlobalWafers Co. Ltd. | | 150,000 | 1,795,200 |
| Highwealth Construction Corp. | | 557,000 | 853,818 |
| HIWIN Technologies Corp. | | 162,744 | 1,395,421 |
| Hon Hai Precision Industry Co. Ltd. (Foxconn) | | 8,597,465 | 22,721,348 |
| Hotai Motor Co. Ltd. | | 206,000 | 3,633,943 |
| Hua Nan Financial Holdings Co. Ltd. | | 5,459,203 | 3,920,144 |
| Innolux Corp. | | 5,919,000 | 1,313,910 |
| Inventec Corp. | | 1,725,000 | 1,250,000 |
| Largan Precision Co. Ltd. | | 69,451 | 10,179,224 |
| Lite-On Technology Corp. | | 1,449,044 | 2,385,140 |
| MediaTek, Inc. | | 1,037,615 | 13,881,137 |
| Mega Financial Holding Co. Ltd. | | 7,505,289 | 7,358,126 |
| Micro-Star International Co. Ltd. | | 480,000 | 1,416,486 |
| Nan Ya Plastics Corp. | | 3,551,358 | 8,384,083 |
| Nanya Technology Corp. | | 848,000 | 1,946,357 |
| Nien Made Enterprise Co. Ltd. | | 115,000 | 1,042,609 |
| Novatek Microelectronics Corp. | | 398,000 | 2,557,807 |
| Pegatron Corp. | | 1,352,000 | 2,628,815 |
| Phison Electronics Corp. | | 103,000 | 937,193 |
| Pou Chen Corp. | | 1,536,391 | 2,052,854 |
| Powertech Technology, Inc. | | 511,981 | 1,611,587 |
| President Chain Store Corp. | | 396,000 | 3,947,275 |
| Quanta Computer, Inc. | | 1,851,000 | 3,550,512 |
| Realtek Semiconductor Corp. | | 331,000 | 2,458,243 |
| Ruentex Development Co. Ltd. | | 370,600 | 565,050 |
| Ruentex Industries Ltd. | | 237,000 | 568,837 |
| Shin Kong Financial Holding Co. Ltd. | | 7,668,742 | 2,418,955 |
| Sinopac Holdings Co. | | 7,353,302 | 3,013,846 |
| Standard Foods Corp. | | 265,016 | 533,543 |
| Synnex Technology International Corp. | | 1,009,700 | 1,203,443 |
| TaiMed Biologics, Inc. (a) | | 146,000 | 639,091 |
| Taishin Financial Holdings Co. Ltd. | | 6,599,532 | 3,061,951 |
| Taiwan Business Bank | | 3,605,545 | 1,519,157 |
| Taiwan Cement Corp. | | 3,374,519 | 4,475,680 |
| Taiwan Cooperative Financial Holding Co. Ltd. | | 6,233,202 | 4,281,775 |
| Taiwan High Speed Rail Corp. | | 1,337,000 | 1,580,394 |
| Taiwan Mobile Co. Ltd. | | 1,095,000 | 4,075,103 |
| Taiwan Semiconductor Manufacturing Co. Ltd. | | 16,942,740 | 165,722,491 |
| Tatung Co. Ltd. (a) | | 1,334,000 | 800,452 |
| The Shanghai Commercial & Savings Bank Ltd. | | 2,307,420 | 3,972,049 |
| Unified-President Enterprises Corp. | | 3,317,332 | 8,179,663 |
| United Microelectronics Corp. | | 7,917,000 | 3,639,065 |
| Vanguard International Semiconductor Corp. | | 630,000 | 1,346,842 |
| Walsin Technology Corp. | | 209,000 | 1,257,509 |
| Win Semiconductors Corp. | | 233,000 | 2,429,471 |
| Winbond Electronics Corp. | | 2,084,000 | 1,171,900 |
| Wistron Corp. | | 1,956,251 | 1,792,813 |
| WPG Holding Co. Ltd. | | 1,049,880 | 1,328,788 |
| Yageo Corp. | | 176,321 | 1,815,358 |
| Yuanta Financial Holding Co. Ltd. | | 6,944,284 | 4,337,616 |
|
| TOTAL TAIWAN | | | 451,159,422 |
|
| Thailand - 2.8% | | | |
| Advanced Info Service PCL | | 7,300 | 55,387 |
| Advanced Info Service PCL (For. Reg.) | | 813,600 | 6,173,018 |
| Airports of Thailand PCL | | 76,900 | 199,278 |
| Airports of Thailand PCL (For. Reg.) | | 2,931,700 | 7,597,199 |
| Bangkok Bank PCL (For. Reg.) | | 321,400 | 1,857,167 |
| Bangkok Dusit Medical Services PCL | | 50,600 | 40,232 |
| Bangkok Dusit Medical Services PCL (For. Reg.) | | 6,399,400 | 5,088,095 |
| Bangkok Expressway and Metro PCL | | 5,066,000 | 1,812,299 |
| Banpu PCL (For. Reg.) | | 3,204,700 | 1,231,541 |
| Berli Jucker PCL (For. Reg) | | 856,800 | 1,383,726 |
| BTS Group Holdings PCL (For. Reg.) | | 4,427,100 | 1,957,133 |
| Bumrungrad Hospital PCL (For. Reg.) | | 259,000 | 1,033,882 |
| C.P. ALL PCL | | 85,300 | 220,515 |
| C.P. ALL PCL (For. Reg.) | | 3,980,200 | 10,289,497 |
| Central Pattana PCL | | 57,800 | 122,551 |
| Central Pattana PCL (For. Reg.) | | 1,649,800 | 3,497,997 |
| Charoen Pokphand Foods PCL | | 183,600 | 153,616 |
| Charoen Pokphand Foods PCL (For. Reg.) | | 2,432,000 | 2,034,820 |
| Electricity Generating PCL | | 5,300 | 60,921 |
| Electricity Generating PCL (For. Reg.) | | 190,100 | 2,185,116 |
| Energy Absolute PCL | | 1,160,900 | 1,576,593 |
| Gulf Energy Development PCL | | 16,000 | 85,957 |
| Gulf Energy Development PCL | | 374,500 | 2,011,923 |
| Home Product Center PCL (For. Reg.) | | 4,080,000 | 2,323,956 |
| Indorama Ventures PCL (For. Reg.) | | 1,373,000 | 1,274,154 |
| Intouch Holdings PCL | | 118,700 | 259,497 |
| Intouch Holdings PCL (For. Reg.) | | 1,493,300 | 3,264,585 |
| IRPC PCL | | 983,900 | 110,810 |
| IRPC PCL (For. Reg.) | | 6,498,000 | 731,823 |
| Kasikornbank PCL | | 272,700 | 1,255,026 |
| Kasikornbank PCL (For. Reg.) | | 1,112,300 | 5,137,467 |
| Krung Thai Bank PCL | | 154,700 | 85,062 |
| Krung Thai Bank PCL (For. Reg.) | | 2,253,200 | 1,238,925 |
| Land & House PCL | | 146,400 | 47,045 |
| Land & House PCL (For. Reg.) | | 5,293,100 | 1,700,902 |
| Minor International PCL: | | | |
| warrants 9/30/21 (a) | | 79,000 | 7,923 |
| (For. Reg.) | | 1,797,700 | 2,143,848 |
| Muangthai Leasing PCL | | 442,701 | 909,638 |
| PTT Exploration and Production PCL (For. Reg.) | | 945,700 | 3,773,496 |
| PTT Global Chemical PCL (For. Reg.) | | 1,568,400 | 2,649,735 |
| PTT PCL (For. Reg.) | | 8,035,300 | 12,042,897 |
| Ratchaburi Electric Generating Holding PCL (For. Reg.) | | 491,500 | 1,197,454 |
| Robinsons Department Store PCL (For. Reg.) | | 359,100 | 776,181 |
| Siam Cement PCL | | 14,600 | 177,574 |
| Siam Cement PCL (For. Reg.) | | 502,600 | 6,112,923 |
| Siam Commercial Bank PCL | | 32,100 | 118,992 |
| Siam Commercial Bank PCL (For. Reg.)�� | | 552,700 | 2,048,818 |
| Thai Oil PCL (For. Reg.) | | 742,100 | 1,683,620 |
| Thai Union Frozen Products PCL (For. Reg.) | | 2,377,600 | 1,149,908 |
| TMB Bank PCL | | 5,440,900 | 259,396 |
| TMB Bank PCL: | | | |
| (For. Reg.) | | 7,497,500 | 357,445 |
| rights (a) | | 5,190,258 | 6,877 |
| Total Access Communication PCL | | 80,400 | 165,057 |
| Total Access Communication PCL (For. Reg.) | | 485,900 | 997,527 |
| True Corp. PCL | | 278,500 | 46,138 |
| True Corp. PCL (For. Reg.) | | 7,900,537 | 1,308,857 |
|
| TOTAL THAILAND | | | 106,032,019 |
|
| Turkey - 0.5% | | | |
| Akbank TAS (a) | | 1,981,976 | 2,395,462 |
| Anadolu Efes Biracilik Ve Malt Sanayii A/S | | 139,082 | 467,803 |
| Arcelik A/S (a) | | 136,759 | 423,870 |
| Aselsan A/S | | 211,315 | 678,233 |
| Bim Birlesik Magazalar A/S JSC | | 292,836 | 2,423,718 |
| Eregli Demir ve Celik Fabrikalari T.A.S. | | 944,230 | 1,080,111 |
| Ford Otomotiv Sanayi A/S | | 46,231 | 521,562 |
| Haci Omer Sabanci Holding A/S | | 599,729 | 867,508 |
| Koc Holding A/S | | 543,115 | 1,779,272 |
| TAV Havalimanlari Holding A/S | | 112,982 | 515,382 |
| Tupras Turkiye Petrol Rafinerileri A/S | | 86,098 | 1,874,888 |
| Turk Hava Yollari AO (a) | | 372,460 | 758,308 |
| Turk Sise ve Cam Fabrikalari A/S | | 468,478 | 356,444 |
| Turkcell Iletisim Hizmet A/S | | 746,177 | 1,640,552 |
| Turkiye Garanti Bankasi A/S (a) | | 1,609,940 | 2,590,660 |
| Turkiye Is Bankasi A/S Series C (a) | | 1,036,297 | 1,051,296 |
|
| TOTAL TURKEY | | | 19,425,069 |
|
| United Arab Emirates - 0.7% | | | |
| Abu Dhabi Commercial Bank PJSC | | 1,951,729 | 4,144,983 |
| Aldar Properties PJSC (a) | | 2,726,635 | 1,744,631 |
| DP World Ltd. | | 112,696 | 1,497,730 |
| Dubai Islamic Bank Pakistan Ltd. (a) | | 1,316,363 | 1,896,007 |
| Emaar Development PJSC (a) | | 513,967 | 566,760 |
| Emaar Malls Group PJSC (a) | | 1,722,126 | 914,341 |
| Emaar Properties PJSC | | 2,431,646 | 2,827,072 |
| Emirates Telecommunications Corp. | | 1,214,635 | 5,476,647 |
| National Bank of Abu Dhabi PJSC | | 1,892,790 | 7,843,786 |
|
| TOTAL UNITED ARAB EMIRATES | | | 26,911,957 |
|
| United Kingdom - 0.0% | | | |
| Mediclinic International PLC | | 1 | 5 |
| United States of America - 0.3% | | | |
| Southern Copper Corp. | | 59,822 | 2,128,467 |
| Yum China Holdings, Inc. | | 245,583 | 10,437,278 |
|
| TOTAL UNITED STATES OF AMERICA | | | 12,565,745 |
|
| TOTAL COMMON STOCKS | | | |
| (Cost $3,126,572,304) | | | 3,689,937,372 |
|
| Nonconvertible Preferred Stocks - 3.7% | | | |
| Brazil - 2.7% | | | |
| Banco Bradesco SA: | | | |
| (PN) | | 2,570,360 | 22,540,721 |
| (PN) sponsored ADR | | 256,361 | 2,245,722 |
| Braskem SA (PN-A) (a) | | 128,300 | 886,151 |
| Centrais Eletricas Brasileiras SA (Electrobras) (PN-B) (a) | | 162,200 | 1,657,793 |
| Companhia Brasileira de Distribuicao Grupo Pao de Acucar (PN) | | 110,200 | 2,280,388 |
| Companhia Energetica de Minas Gerais (CEMIG) (PN) | | 617,629 | 2,102,141 |
| Gerdau SA | | 770,400 | 2,579,846 |
| Itau Unibanco Holding SA | | 3,335,271 | 30,130,126 |
| Itausa-Investimentos Itau SA (PN) | | 3,029,912 | 10,357,834 |
| Lojas Americanas SA (PN) | | 509,632 | 2,540,218 |
| Petroleo Brasileiro SA - Petrobras (PN) (non-vtg.) | | 3,133,700 | 23,745,953 |
| Telefonica Brasil SA | | 305,325 | 4,041,055 |
|
| TOTAL BRAZIL | | | 105,107,948 |
|
| Chile - 0.1% | | | |
| Embotelladora Andina SA Class B | | 256,045 | 738,857 |
| Sociedad Quimica y Minera de Chile SA (PN-B) (a) | | 80,049 | 2,126,436 |
|
| TOTAL CHILE | | | 2,865,293 |
|
| Colombia - 0.2% | | | |
| Bancolombia SA (PN) | | 309,980 | 4,046,248 |
| Grupo Aval Acciones y Valores SA | | 2,698,089 | 1,105,578 |
| Grupo de Inversiones Suramerica SA | | 70,902 | 649,865 |
|
| TOTAL COLOMBIA | | | 5,801,691 |
|
| Korea (South) - 0.6% | | | |
| AMOREPACIFIC Corp. | | 2,870 | 236,165 |
| Hyundai Motor Co. | | 7,514 | 468,706 |
| Hyundai Motor Co. Series 2 | | 28,549 | 1,934,508 |
| LG Chemical Ltd. | | 4,092 | 601,410 |
| LG Household & Health Care Ltd. | | 1,444 | 911,839 |
| Samsung Electronics Co. Ltd. | | 571,654 | 20,051,779 |
|
| TOTAL KOREA (SOUTH) | | | 24,204,407 |
|
| Russia - 0.1% | | | |
| AK Transneft OAO | | 309 | 802,347 |
| Surgutneftegas OJSC | | 4,610,122 | 2,712,480 |
|
| TOTAL RUSSIA | | | 3,514,827 |
|
| TOTAL NONCONVERTIBLE PREFERRED STOCKS | | | |
| (Cost $99,009,821) | | | 141,494,166 |
| | | Principal Amount | Value |
|
| Nonconvertible Bonds - 0.0% | | | |
| India - 0.0% | | | |
| Britannia Industries Ltd. 8% 8/28/22 | | | |
| (Cost $169) | | INR 38,067 | 167 |
|
| Government Obligations - 0.1% | | | |
| United States of America - 0.1% | | | |
| U.S. Treasury Bills, yield at date of purchase 1.7% to 1.82% 12/19/19 to 3/19/20(e) | | | |
| (Cost $6,171,377) | | 6,200,000 | 6,176,036 |
| | | Shares | Value |
|
| Money Market Funds - 0.8% | | | |
| Fidelity Cash Central Fund 1.83% (f) | | 400 | 400 |
| Fidelity Securities Lending Cash Central Fund 1.84% (f)(g) | | 30,324,725 | 30,327,757 |
| TOTAL MONEY MARKET FUNDS | | | |
| (Cost $30,328,157) | | | 30,328,157 |
| TOTAL INVESTMENT IN SECURITIES - 100.7% | | | |
| (Cost $3,262,081,828) | | | 3,867,935,898 |
| NET OTHER ASSETS (LIABILITIES) - (0.7)% | | | (27,163,631) |
| NET ASSETS - 100% | | | $3,840,772,267 |
| Futures Contracts | | | | | |
| | Number of contracts | Expiration Date | Notional Amount | Value | Unrealized Appreciation/(Depreciation) |
| Purchased | | | | | |
| Equity Index Contracts | | | | | |
| ICE E-mini MSCI Emerging Markets Index Contracts (United States) | 184 | Dec. 2019 | $9,580,880 | $181,147 | $181,147 |
The notional amount of futures purchased as a percentage of Net Assets is 0.2%
Currency Abbreviations
INR – Indian rupee
Categorizations in the Schedule of Investments are based on country or territory of incorporation.
Legend
(a) Non-income producing
(b) Security or a portion of the security is on loan at period end.
(c) Security exempt from registration under Rule 144A of the Securities Act of 1933. These securities may be resold in transactions exempt from registration, normally to qualified institutional buyers. At the end of the period, the value of these securities amounted to $64,445,441 or 1.7% of net assets.
(d) Level 3 security
(e) Security or a portion of the security was pledged to cover margin requirements for futures contracts. At period end, the value of securities pledged amounted to $560,244.
(f) Affiliated fund that is generally available only to investment companies and other accounts managed by Fidelity Investments. The rate quoted is the annualized seven-day yield of the fund at period end. A complete unaudited listing of the fund's holdings as of its most recent quarter end is available upon request. In addition, each Fidelity Central Fund's financial statements, which are not covered by the Fund's Report of Independent Registered Public Accounting Firm, are available on the SEC's website or upon request.
(g) Investment made with cash collateral received from securities on loan.
Affiliated Central Funds
Information regarding fiscal year to date income earned by the Fund from investments in Fidelity Central Funds is as follows:
| Fund | Income earned |
| Fidelity Cash Central Fund | $1,136,184 |
| Fidelity Securities Lending Cash Central Fund | 490,829 |
| Total | $1,627,013 |
Amounts in the income column in the above table include any capital gain distributions from underlying funds, which are presented in the corresponding line-item in the Statement of Operations, if applicable. Amount for Fidelity Securities Lending Cash Central Fund represents the income earned on investing cash collateral, less rebates paid to borrowers and any lending agent fees associated with the loan, plus any premium payments received for lending certain types of securities.
Investment Valuation
The following is a summary of the inputs used, as of October 31, 2019, involving the Fund's assets and liabilities carried at fair value. The inputs or methodology used for valuing securities may not be an indication of the risk associated with investing in those securities. For more information on valuation inputs, and their aggregation into the levels used below, please refer to the Investment Valuation section in the accompanying Notes to Financial Statements.
| | Valuation Inputs at Reporting Date: |
| Description | Total | Level 1 | Level 2 | Level 3 |
| Investments in Securities: | | | | |
| Equities: | | | | |
| Communication Services | $424,377,467 | $166,780,147 | $257,597,320 | $-- |
| Consumer Discretionary | 508,409,254 | 355,621,478 | 152,785,174 | 2,602 |
| Consumer Staples | 256,557,107 | 137,017,784 | 119,477,630 | 61,693 |
| Energy | 301,792,654 | 119,256,188 | 182,536,466 | -- |
| Financials | 946,948,655 | 455,348,894 | 490,627,779 | 971,982 |
| Health Care | 106,821,236 | 34,956,004 | 71,865,232 | -- |
| Industrials | 203,818,794 | 95,548,051 | 108,270,743 | -- |
| Information Technology | 591,678,407 | 315,114,446 | 276,561,252 | 2,709 |
| Materials | 274,471,166 | 175,618,424 | 98,852,742 | -- |
| Real Estate | 109,664,153 | 25,099,242 | 84,562,091 | 2,820 |
| Utilities | 106,892,645 | 37,115,686 | 69,776,959 | -- |
| Corporate Bonds | 167 | -- | 167 | -- |
| Government Obligations | 6,176,036 | -- | 6,176,036 | -- |
| Money Market Funds | 30,328,157 | 30,328,157 | -- | -- |
| Total Investments in Securities: | $3,867,935,898 | $1,947,804,501 | $1,919,089,591 | $1,041,806 |
| Derivative Instruments: | | | | |
| Assets | | | | |
| Futures Contracts | $181,147 | $181,147 | $-- | $-- |
| Total Assets | $181,147 | $181,147 | $-- | $-- |
| Total Derivative Instruments: | $181,147 | $181,147 | $-- | $-- |
Value of Derivative Instruments
The following table is a summary of the Fund's value of derivative instruments by primary risk exposure as of October 31, 2019. For additional information on derivative instruments, please refer to the Derivative Instruments section in the accompanying Notes to Financial Statements.
| Primary Risk Exposure / Derivative Type | Value |
| | Asset | Liability |
| Equity Risk | | |
| Futures Contracts(a) | $181,147 | $0 |
| Total Equity Risk | 181,147 | 0 |
| Total Value of Derivatives | $181,147 | $0 |
(a) Reflects gross cumulative appreciation (depreciation) on futures contracts as presented in the Schedule of Investments. In the Statement of Assets and Liabilities, the period end daily variation margin is included in receivable or payable for daily variation margin on futures contracts, and the net cumulative appreciation (depreciation) is included in Total accumulated earnings (loss).
See accompanying notes which are an integral part of the financial statements.
Financial Statements
Statement of Assets and Liabilities
| | | October 31, 2019 |
| Assets | | |
Investment in securities, at value (including securities loaned of $29,135,155) — See accompanying schedule:
Unaffiliated issuers (cost $3,231,753,671) | $3,837,607,741 | |
| Fidelity Central Funds (cost $30,328,157) | 30,328,157 | |
| Total Investment in Securities (cost $3,262,081,828) | | $3,867,935,898 |
| Cash | | 239,966 |
| Foreign currency held at value (cost $1,966,056) | | 1,970,190 |
| Receivable for investments sold | | 402 |
| Receivable for fund shares sold | | 1,768,070 |
| Dividends receivable | | 3,431,020 |
| Interest receivable | | 8 |
| Distributions receivable from Fidelity Central Funds | | 117,300 |
| Prepaid expenses | | 6,074 |
| Receivable from investment adviser for expense reductions | | 165,723 |
| Other receivables | | 10,444 |
| Total assets | | 3,875,645,095 |
| Liabilities | | |
| Payable for investments purchased | $199,217 | |
| Payable for fund shares redeemed | 1,491,806 | |
| Accrued management fee | 236,120 | |
| Notes payable | 1,350,000 | |
| Payable for daily variation margin on futures contracts | 69,859 | |
| Other payables and accrued expenses | 1,185,944 | |
| Collateral on securities loaned | 30,339,882 | |
| Total liabilities | | 34,872,828 |
| Net Assets | | $3,840,772,267 |
| Net Assets consist of: | | |
| Paid in capital | | $3,441,761,184 |
| Total accumulated earnings (loss) | | 399,011,083 |
| Net Assets, for 280,086,394 shares outstanding | | $3,840,772,267 |
| Net Asset Value, offering price and redemption price per share ($3,840,772,267 ÷ 280,086,394 shares) | | $13.71 |
See accompanying notes which are an integral part of the financial statements.
Statement of Operations
| | | Year ended October 31, 2019 |
| Investment Income | | |
| Dividends | | $109,377,766 |
| Non-Cash dividends | | 24,177,006 |
| Interest | | 109,985 |
| Income from Fidelity Central Funds (including $490,829 from security lending) | | 1,627,013 |
| Income before foreign taxes withheld | | 135,291,770 |
| Less foreign taxes withheld | | (13,758,201) |
| Total income | | 121,533,569 |
| Expenses | | |
| Management fee | $3,277,052 | |
| Transfer agent fees | 2,164,107 | |
| Custodian fees and expenses | 472,164 | |
| Independent trustees' fees and expenses | 16,426 | |
| Registration fees | 7,088 | |
| Audit | 47,264 | |
| Legal | 699 | |
| Interest | 145,531 | |
| Miscellaneous | 13,607 | |
| Total expenses before reductions | 6,143,938 | |
| Expense reductions | (3,013,500) | |
| Total expenses after reductions | | 3,130,438 |
| Net investment income (loss) | | 118,403,131 |
| Realized and Unrealized Gain (Loss) | | |
| Net realized gain (loss) on: | | |
| Investment securities: | | |
| Unaffiliated issuers (net of foreign taxes of $16,250) | (260,774,693) | |
| Fidelity Central Funds | (459) | |
| Foreign currency transactions | (1,272,740) | |
| Futures contracts | 381,324 | |
| Total net realized gain (loss) | | (261,666,568) |
| Change in net unrealized appreciation (depreciation) on: | | |
| Investment securities: | | |
| Unaffiliated issuers (net of increase in deferred foreign taxes of $30,473) | 538,299,443 | |
| Assets and liabilities in foreign currencies | 189,565 | |
| Futures contracts | 5,775,604 | |
| Total change in net unrealized appreciation (depreciation) | | 544,264,612 |
| Net gain (loss) | | 282,598,044 |
| Net increase (decrease) in net assets resulting from operations | | $401,001,175 |
See accompanying notes which are an integral part of the financial statements.
Statement of Changes in Net Assets
| | Year ended October 31, 2019 | Year ended October 31, 2018 |
| Increase (Decrease) in Net Assets | | |
| Operations | | |
| Net investment income (loss) | $118,403,131 | $95,166,940 |
| Net realized gain (loss) | (261,666,568) | (22,190,337) |
| Change in net unrealized appreciation (depreciation) | 544,264,612 | (645,966,260) |
| Net increase (decrease) in net assets resulting from operations | 401,001,175 | (572,989,657) |
| Distributions to shareholders | (95,358,527) | (82,362,292) |
| Share transactions | | |
| Proceeds from sales of shares | 1,804,261,667 | 2,215,008,539 |
| Reinvestment of distributions | 76,253,303 | 65,006,032 |
| Cost of shares redeemed | (2,603,079,340) | (576,697,558) |
| Net increase (decrease) in net assets resulting from share transactions | (722,564,370) | 1,703,317,013 |
| Total increase (decrease) in net assets | (416,921,722) | 1,047,965,064 |
| Net Assets | | |
| Beginning of period | 4,257,693,989 | 3,209,728,925 |
| End of period | $3,840,772,267 | $4,257,693,989 |
| Other Information | | |
| Shares | | |
| Sold | 136,190,226 | 155,713,369 |
| Issued in reinvestment of distributions | 6,105,149 | 4,495,578 |
| Redeemed | (199,627,613) | (39,711,303) |
| Net increase (decrease) | (57,332,238) | 120,497,644 |
See accompanying notes which are an integral part of the financial statements.
Financial Highlights
Fidelity SAI Emerging Markets Index Fund
| | | | | |
| Years ended October 31, | 2019 | 2018 | 2017 | 2016 A |
| Selected Per–Share Data | | | | |
| Net asset value, beginning of period | $12.62 | $14.80 | $11.94 | $10.00 |
| Income from Investment Operations | | | | |
| Net investment income (loss)B | .42C | .36 | .31 | .25 |
| Net realized and unrealized gain (loss) | .99 | (2.18) | 2.76 | 1.69 |
| Total from investment operations | 1.41 | (1.82) | 3.07 | 1.94 |
| Distributions from net investment income | (.32) | (.27) | (.13) | – |
| Distributions from net realized gain | – | (.09) | (.08) | – |
| Total distributions | (.32) | (.36) | (.21) | – |
| Net asset value, end of period | $13.71 | $12.62 | $14.80 | $11.94 |
| Total ReturnD,E | 11.44% | (12.61)% | 26.24% | 19.40% |
| Ratios to Average Net AssetsF,G | | | | |
| Expenses before reductions | .16% | .17% | .17% | .33%H |
| Expenses net of fee waivers, if any | .08% | .08% | .09% | .11%H |
| Expenses net of all reductions | .08% | .08% | .09% | .11%H |
| Net investment income (loss) | 3.12%C | 2.48% | 2.36% | 2.67%H |
| Supplemental Data | | | | |
| Net assets, end of period (000 omitted) | $3,840,772 | $4,257,694 | $3,209,729 | $1,461,386 |
| Portfolio turnover rateI | 22% | 3% | 2% | 16%H |
A For the period January 5, 2016 (commencement of operations) to October 31, 2016.
B Calculated based on average shares outstanding during the period.
C Net investment income per share reflects a large, non-recurring dividend which amounted to $.08 per share. Excluding this non-recurring dividend, the ratio of net investment income (loss) to average net assets would have been 2.51%.
D Total returns for periods of less than one year are not annualized.
E Total returns would have been lower if certain expenses had not been reduced during the applicable periods shown.
F Fees and expenses of any underlying Fidelity Central Funds are not included in the Fund's expense ratio. The Fund indirectly bears its proportionate share of the expenses of any underlying Fidelity Central Funds.
G Expense ratios reflect operating expenses of the Fund. Expenses before reductions do not reflect amounts reimbursed by the investment adviser or reductions from expense offset arrangements and do not represent the amount paid by the Fund during periods when reimbursements or reductions occur. Expense ratios before reductions for start-up periods may not be representative of longer term operating periods. Expenses net of fee waivers reflect expenses after reimbursement by the investment adviser but prior to reductions from expense offset arrangements. Expenses net of all reductions represent the net expenses paid by the Fund.
H Annualized
I Amount does not include the portfolio activity of any underlying Fidelity Central Funds.
See accompanying notes which are an integral part of the financial statements.
Notes to Financial Statements
For the period ended October 31, 2019
1. Organization.
Fidelity SAI Emerging Markets Index Fund (the Fund) is a fund of Fidelity Salem Street Trust (the Trust) and is authorized to issue an unlimited number of shares. Shares are offered exclusively to certain clients of Fidelity Management & Research Company (FMR) or its affiliates. The Trust is registered under the Investment Company Act of 1940, as amended (the 1940 Act), as an open-end management investment company organized as a Massachusetts business trust. The Fund's investments in emerging markets can be subject to social, economic, regulatory, and political uncertainties and can be extremely volatile.
2. Investments in Fidelity Central Funds.
The Fund invests in Fidelity Central Funds, which are open-end investment companies generally available only to other investment companies and accounts managed by the investment adviser and its affiliates. The Fund's Schedule of Investments lists each of the Fidelity Central Funds held as of period end, if any, as an investment of the Fund, but does not include the underlying holdings of each Fidelity Central Fund. As an Investing Fund, the Fund indirectly bears its proportionate share of the expenses of the underlying Fidelity Central Funds.
The Money Market Central Funds seek preservation of capital and current income and are managed by Fidelity Investments Money Management, Inc. (FIMM), an affiliate of the investment adviser. Annualized expenses of the Money Market Central Funds as of their most recent shareholder report date ranged from less than .005% to .01%.
A complete unaudited list of holdings for each Fidelity Central Fund is available upon request or at the Securities and Exchange Commission (the SEC) website at www.sec.gov. In addition, the financial statements of the Fidelity Central Funds, which are not covered by the Fund's Report of Independent Registered Public Accounting Firm, are available on the SEC website or upon request.
3. Significant Accounting Policies.
The Fund is an investment company and applies the accounting and reporting guidance of the Financial Accounting Standards Board (FASB) Accounting Standards Codification Topic 946 Financial Services – Investments Companies. The financial statements have been prepared in conformity with accounting principles generally accepted in the United States of America (GAAP), which require management to make certain estimates and assumptions at the date of the financial statements. Actual results could differ from those estimates. Subsequent events, if any, through the date that the financial statements were issued have been evaluated in the preparation of the financial statements. The following summarizes the significant accounting policies of the Fund:
Investment Valuation. Investments are valued as of 4:00 p.m. Eastern time on the last calendar day of the period. The Board of Trustees (the Board) has delegated the day to day responsibility for the valuation of the Fund's investments to the Fair Value Committee (the Committee) established by the Fund's investment adviser. In accordance with valuation policies and procedures approved by the Board, the Fund attempts to obtain prices from one or more third party pricing vendors or brokers to value its investments. When current market prices, quotations or currency exchange rates are not readily available or reliable, investments will be fair valued in good faith by the Committee, in accordance with procedures adopted by the Board. Factors used in determining fair value vary by investment type and may include market or investment specific events, changes in interest rates and credit quality. The frequency with which these procedures are used cannot be predicted and they may be utilized to a significant extent. The Committee oversees the Fund's valuation policies and procedures and reports to the Board on the Committee's activities and fair value determinations. The Board monitors the appropriateness of the procedures used in valuing the Fund's investments and ratifies the fair value determinations of the Committee.
The Fund categorizes the inputs to valuation techniques used to value its investments into a disclosure hierarchy consisting of three levels as shown below:
- Level 1 – quoted prices in active markets for identical investments
- Level 2 – other significant observable inputs (including quoted prices for similar investments, interest rates, prepayment speeds, etc.)
- Level 3 – unobservable inputs (including the Fund's own assumptions based on the best information available)
Valuation techniques used to value the Fund's investments by major category are as follows:
Equity securities, including restricted securities, for which market quotations are readily available, are valued at the last reported sale price or official closing price as reported by a third party pricing vendor on the primary market or exchange on which they are traded and are categorized as Level 1 in the hierarchy. In the event there were no sales during the day or closing prices are not available, securities are valued at the last quoted bid price or may be valued using the last available price and are generally categorized as Level 2 in the hierarchy. For foreign equity securities, when market or security specific events arise, comparisons to the valuation of American Depositary Receipts (ADRs), futures contracts, Exchange-Traded Funds (ETFs) and certain indexes as well as quoted prices for similar securities may be used and would be categorized as Level 2 in the hierarchy. For equity securities, including restricted securities, where observable inputs are limited, assumptions about market activity and risk are used and these securities may be categorized as Level 3 in the hierarchy.
Debt securities, including restricted securities, are valued based on evaluated prices received from third party pricing vendors or from brokers who make markets in such securities. Corporate bonds and U.S. government and government agency obligations are valued by pricing vendors who utilize matrix pricing which considers yield or price of bonds of comparable quality, coupon, maturity and type or by broker-supplied prices. When independent prices are unavailable or unreliable, debt securities may be valued utilizing pricing methodologies which consider similar factors that would be used by third party pricing vendors. Debt securities are generally categorized as Level 2 in the hierarchy but may be Level 3 depending on the circumstances.
Futures contracts are valued at the settlement price established each day by the board of trade or exchange on which they are traded and are categorized as Level 1 in the hierarchy. Investments in open-end mutual funds, including the Fidelity Central Funds, are valued at their closing net asset value (NAV) each business day and are categorized as Level 1 in the hierarchy.
Changes in valuation techniques may result in transfers in or out of an assigned level within the disclosure hierarchy. The aggregate value of investments by input level as of October 31, 2019 is included at the end of the Fund's Schedule of Investments.
Foreign Currency. The Fund may use foreign currency contracts to facilitate transactions in foreign-denominated securities. Gains and losses from these transactions may arise from changes in the value of the foreign currency or if the counterparties do not perform under the contracts' terms.
Foreign-denominated assets, including investment securities, and liabilities are translated into U.S. dollars at the exchange rates at period end. Purchases and sales of investment securities, income and dividends received and expenses denominated in foreign currencies are translated into U.S. dollars at the exchange rate in effect on the transaction date.
The effects of exchange rate fluctuations on investments are included with the net realized and unrealized gain (loss) on investment securities. Other foreign currency transactions resulting in realized and unrealized gain (loss) are disclosed separately.
Investment Transactions and Income. For financial reporting purposes, the Fund's investment holdings and NAV include trades executed through the end of the last business day of the period. The NAV per share for processing shareholder transactions is calculated as of the close of business of the New York Stock Exchange (NYSE), normally 4:00 p.m. Eastern time and includes trades executed through the end of the prior business day. Gains and losses on securities sold are determined on the basis of identified cost. Dividend income is recorded on the ex-dividend date, except for certain dividends from foreign securities where the ex-dividend date may have passed, which are recorded as soon as the Fund is informed of the ex-dividend date. Non-cash dividends included in dividend income, if any, are recorded at the fair market value of the securities received. Income and capital gain distributions from Fidelity Central Funds, if any, are recorded on the ex-dividend date. Large, non-recurring dividends recognized by the Fund are presented separately on the Statement of Operations as "Non-Cash dividends" and the impact of these dividends is presented in the Financial Highlights. Interest income is accrued as earned and includes coupon interest and amortization of premium and accretion of discount on debt securities as applicable. Investment income is recorded net of foreign taxes withheld where recovery of such taxes is uncertain.
Expenses. Expenses directly attributable to a fund are charged to that fund. Expenses attributable to more than one fund are allocated among the respective funds on the basis of relative net assets or other appropriate methods. Expense estimates are accrued in the period to which they relate and adjustments are made when actual amounts are known.
Income Tax Information and Distributions to Shareholders. Each year, the Fund intends to qualify as a regulated investment company under Subchapter M of the Internal Revenue Code, including distributing substantially all of its taxable income and realized gains. As a result, no provision for U.S. Federal income taxes is required. As of October 31, 2019, the Fund did not have any unrecognized tax benefits in the financial statements; nor is the Fund aware of any tax positions for which it is reasonably possible that the total amounts of unrecognized tax benefits will significantly change in the next twelve months. The Fund files a U.S. federal tax return, in addition to state and local tax returns as required. The Fund's federal income tax returns are subject to examination by the Internal Revenue Service (IRS) for a period of three fiscal years after they are filed. State and local tax returns may be subject to examination for an additional fiscal year depending on the jurisdiction. Foreign taxes are provided for based on the Fund's understanding of the tax rules and rates that exist in the foreign markets in which it invests. The Fund is subject to a tax imposed on capital gains by certain countries in which it invests. An estimated deferred tax liability for net unrealized appreciation on the applicable securities is included in Other payables and accrued expenses on the Statement of Assets & Liabilities.
Distributions are declared and recorded on the ex-dividend date. Income and capital gain distributions are determined in accordance with income tax regulations, which may differ from GAAP. In addition, the Fund claimed a portion of the payment made to redeeming shareholders as a distribution for income tax purposes.
Capital accounts within the financial statements are adjusted for permanent book-tax differences. These adjustments have no impact on net assets or the results of operations. Capital accounts are not adjusted for temporary book-tax differences which will reverse in a subsequent period.
Book-tax differences are primarily due to futures contracts, foreign currency transactions, certain foreign taxes, passive foreign investment companies (PFIC), market discount, capital loss carryforwards and losses deferred due to wash sales.
As of period end, the cost and unrealized appreciation (depreciation) in securities, and derivatives if applicable, for federal income tax purposes were as follows:
| Gross unrealized appreciation | $851,303,110 |
| Gross unrealized depreciation | (282,518,910) |
| Net unrealized appreciation (depreciation) | $568,784,200 |
| Tax Cost | $3,299,151,698 |
The tax-based components of distributable earnings as of period end were as follows:
| Undistributed ordinary income | $86,964,635 |
| Capital loss carryforward | $(256,086,878) |
| Net unrealized appreciation (depreciation) on securities and other investments | $568,800,004 |
Capital loss carryforwards are only available to offset future capital gains of the Fund to the extent provided by regulations and may be limited. Under the Regulated Investment Company Modernization Act of 2010 (the Act), the Fund is permitted to carry forward capital losses incurred in taxable years beginning after December 22, 2010 for an unlimited period and such capital losses are required to be used prior to any losses that expire. The capital loss carryforward information presented below, including any applicable limitation, is estimated as of fiscal period end and is subject to adjustment.
| No expiration | |
| Short-term | $(175,596,622) |
| Long-term | (80,490,256) |
| Total no expiration | $(256,086,878) |
The tax character of distributions paid was as follows:
| | October 31, 2019 | October 31, 2018 |
| Ordinary Income | $95,358,527 | $ 70,236,741 |
| Long-term Capital Gains | – | 12,125,551 |
| Total | $95,358,527 | $ 82,362,292 |
Restricted Securities. The Fund may invest in securities that are subject to legal or contractual restrictions on resale. These securities generally may be resold in transactions exempt from registration or to the public if the securities are registered. Disposal of these securities may involve time-consuming negotiations and expense, and prompt sale at an acceptable price may be difficult. Information regarding restricted securities is included at the end of the Fund's Schedule of Investments.
4. Derivative Instruments.
Risk Exposures and the Use of Derivative Instruments. The Fund's investment objective allows the Fund to enter into various types of derivative contracts, including futures contracts. Derivatives are investments whose value is primarily derived from underlying assets, indices or reference rates and may be transacted on an exchange or over-the-counter (OTC). Derivatives may involve a future commitment to buy or sell a specified asset based on specified terms, to exchange future cash flows at periodic intervals based on a notional principal amount, or for one party to make one or more payments upon the occurrence of specified events in exchange for periodic payments from the other party.
The Fund used derivatives to increase returns and to manage exposure to certain risks as defined below. The success of any strategy involving derivatives depends on analysis of numerous economic factors, and if the strategies for investment do not work as intended, the Fund may not achieve its objectives.
The Fund's use of derivatives increased or decreased its exposure to the following risk:
| Equity Risk | Equity risk relates to the fluctuations in the value of financial instruments as a result of changes in market prices (other than those arising from interest rate risk or foreign exchange risk), whether caused by factors specific to an individual investment, its issuer, or all factors affecting all instruments traded in a market or market segment.
|
The Fund is also exposed to additional risks from investing in derivatives, such as liquidity risk and counterparty credit risk. Liquidity risk is the risk that the Fund will be unable to close out the derivative in the open market in a timely manner. Counterparty credit risk is the risk that the counterparty will not be able to fulfill its obligation to the Fund. Counterparty credit risk related to exchange-traded futures contracts may be mitigated by the protection provided by the exchange on which they trade.
Investing in derivatives may involve greater risks than investing in the underlying assets directly and, to varying degrees, may involve risk of loss in excess of any initial investment and collateral received and amounts recognized in the Statement of Assets and Liabilities. In addition, there may be the risk that the change in value of the derivative contract does not correspond to the change in value of the underlying instrument.
Futures Contracts. A futures contract is an agreement between two parties to buy or sell a specified underlying instrument for a fixed price at a specified future date. The Fund used futures contracts to manage its exposure to the stock market.
Upon entering into a futures contract, a fund is required to deposit either cash or securities (initial margin) with a clearing broker in an amount equal to a certain percentage of the face value of the contract. Futures contracts are marked-to-market daily and subsequent daily payments (variation margin) are made or received by a fund depending on the daily fluctuations in the value of the futures contracts and are recorded as unrealized appreciation or (depreciation). This receivable and/or payable, if any, is included in daily variation margin on futures contracts in the Statement of Assets and Liabilities. Realized gain or (loss) is recorded upon the expiration or closing of a futures contract. The net realized gain (loss) and change in net unrealized appreciation (depreciation) on futures contracts during the period is presented in the Statement of Operations.
Any open futures contracts at period end are presented in the Schedule of Investments under the caption "Futures Contracts". The notional amount at value reflects each contract's exposure to the underlying instrument or index at period end and is representative of volume of activity during the period. Securities deposited to meet initial margin requirements are identified in the Schedule of Investments.
5. Purchases and Sales of Investments.
Purchases and sales of securities, other than short-term securities, aggregated $821,642,625 and $1,373,999,336, respectively.
6. Fees and Other Transactions with Affiliates.
Management Fee. Fidelity Management & Research Company (the investment adviser) and its affiliates provide the Fund with investment management related services for which the Fund pays a monthly management fee that is based on an annual rate of .075% of the Fund's average net assets. Prior to August 1,2019, the annual management fee rate was .09%. During July 2019, the Board approved the elimination of the expense contract effective August 1, 2019. Prior to August 1, 2019, under the expense contract, total expenses of the Fund were limited to an annual rate of .165% of the Fund's average net assets, with certain exceptions.
Sub-Adviser. Geode Capital Management, LLC (Geode), serves as sub-adviser for the Fund. Geode provides discretionary investment advisory services to the Fund and is paid by the investment adviser for providing these services.
Transfer Agent Fees. Fidelity Investments Institutional Operations Company, Inc. (FIIOC), an affiliate of the investment adviser, is the Fund's transfer, dividend disbursing and shareholder servicing agent. Effective August 1, 2019 transfer agent fees are not paid by the Fund and are instead paid by the investment adviser or an affiliate. Prior to August 1, 2019, FIIOC received an asset-based fee of .075% of the Fund's average net assets. FIIOC paid for typesetting, printing and mailing of shareholder reports, except proxy statements.
Interfund Lending Program. Pursuant to an Exemptive Order issued by the SEC, the Fund, along with other registered investment companies having management contracts with Fidelity Management & Research Company (FMR) or other affiliated entities of FMR, may participate in an interfund lending program. This program provides an alternative credit facility allowing the funds to borrow from, or lend money to, other participating affiliated funds. At period end, there were no interfund loans outstanding. The Fund's activity in this program during the period for which loans were outstanding was as follows:
| Borrower or Lender | Average Loan Balance | Weighted Average Interest Rate | Interest Expense |
| Borrower | $19,725,714 | 2.41% | $74,066 |
Interfund Trades. The Fund may purchase from or sell securities to other Fidelity Funds under procedures adopted by the Board. The procedures have been designed to ensure these interfund trades are executed in accordance with Rule 17a-7 of the 1940 Act. Interfund trades are included within the respective purchases and sales amounts shown in the Purchases and Sales of Investments note.
7. Committed Line of Credit.
The Fund participates with other funds managed by the investment adviser or an affiliate in a $4.25 billion credit facility (the "line of credit") to be utilized for temporary or emergency purposes to fund shareholder redemptions or for other short-term liquidity purposes. The Fund has agreed to pay commitment fees on its pro-rata portion of the line of credit, which amounted to $10,198 and is reflected in Miscellaneous expenses on the Statement of Operations. During the period, the Fund did not borrow on this line of credit.
8. Security Lending.
The Fund lends portfolio securities from time to time in order to earn additional income. For equity securities, lending agents are used, including National Financial Services (NFS), an affiliate of the Fund. Pursuant to a securities lending agreement, NFS will receive a fee, which is capped at 9.9% of daily lending revenue, for its services as lending agent. The Fund may lend securities to certain qualified borrowers, including NFS. On the settlement date of the loan, the Fund receives collateral (in the form of U.S. Treasury obligations, letters of credit and/or cash) against the loaned securities and maintains collateral in an amount not less than 100% of the market value of the loaned securities during the period of the loan. The market value of the loaned securities is determined at the close of business of the Fund and any additional required collateral is delivered to the Fund on the next business day. The Fund or borrower may terminate the loan at any time, and if the borrower defaults on its obligation to return the securities loaned because of insolvency or other reasons, the Fund may apply collateral received from the borrower against the obligation. The Fund may experience delays and costs in recovering the securities loaned. Any cash collateral received is invested in the Fidelity Securities Lending Cash Central Fund. The value of loaned securities and cash collateral at period end are disclosed on the Fund's Statement of Assets and Liabilities. The value of securities loaned to NFS, as affiliated borrower, at period end was $37,700. Total fees paid by the Fund to NFS, as lending agent, amounted to $13,316. Security lending income represents the income earned on investing cash collateral, less rebates paid to borrowers and any lending agent fees associated with the loan, plus any premium payments received for lending certain types of securities. Security lending income is presented in the Statement of Operations as a component of income from Fidelity Central Funds, and includes $1,137 from securities loaned to NFS, as affiliated borrower.
9. Bank Borrowings.
The Fund is permitted to have bank borrowings for temporary or emergency purposes to fund shareholder redemptions or for other short-term liquidity requirements. The Fund has established borrowing arrangements with certain banks. The interest rate on the borrowings is the bank's base rate, as revised from time to time. The average loan balance during the period for which loans were outstanding amounted to $30,133,906. The weighted average interest rate was 2.67%. The interest expense amounted to $71,465 under the bank borrowing program. Any open loans, including accrued interest, at period end are presented under the caption "Notes payable" in the Fund's Statement of Assets and Liabilities.
10. Expense Reductions.
The investment adviser contractually agreed to reimburse the Fund to the extent annual operating expenses exceeded .075% of average net assets. This reimbursement will remain in place through February 28, 2021. The expense limitation prior to August 1, 2019 was .08%. Some expenses, for example the compensation of the independent Trustees, and certain miscellaneous expenses such as proxy and shareholder meeting expenses, are excluded from this reimbursement. During the period this reimbursement reduced the Fund's expenses by $2,957,442.
In addition, through arrangements with the Fund's custodian, credits realized as a result of certain uninvested cash balances were used to reduce the Fund's expenses by $56,058.
11. Other.
The Fund's organizational documents provide former and current trustees and officers with a limited indemnification against liabilities arising in connection with the performance of their duties to the Fund. In the normal course of business, the Fund may also enter into contracts that provide general indemnifications. The Fund's maximum exposure under these arrangements is unknown as this would be dependent on future claims that may be made against the Fund. The risk of material loss from such claims is considered remote.
Report of Independent Registered Public Accounting Firm
To the Board of Trustees of Fidelity Salem Street Trust and Shareholders of Fidelity SAI Emerging Markets Index Fund:
Opinion on the Financial Statements
We have audited the accompanying statement of assets and liabilities, including the schedule of investments, of Fidelity SAI Emerging Markets Index Fund (one of the funds constituting Fidelity Salem Street Trust, referred to hereafter as the “Fund”) as of October 31, 2019, the related statement of operations for the year ended October 31, 2019, the statement of changes in net assets for each of the two years in the period ended October 31, 2019, including the related notes, and the financial highlights for each of the three years in the period ended October 31, 2019 and for the period January 5, 2016 (commencement of operations) through October 31, 2016 (collectively referred to as the “financial statements”). In our opinion, the financial statements present fairly, in all material respects, the financial position of the Fund as of October 31, 2019, the results of its operations for the year then ended, the changes in its net assets for each of the two years in the period ended October 31, 2019 and the financial highlights for each of the three years in the period ended October 31, 2019 and for the period January 5, 2016 (commencement of operations) through October 31, 2016 in conformity with accounting principles generally accepted in the United States of America.
Basis for Opinion
These financial statements are the responsibility of the Fund’s management. Our responsibility is to express an opinion on the Fund’s financial statements based on our audits. We are a public accounting firm registered with the Public Company Accounting Oversight Board (United States) (PCAOB) and are required to be independent with respect to the Fund in accordance with the U.S. federal securities laws and the applicable rules and regulations of the Securities and Exchange Commission and the PCAOB.
We conducted our audits of these financial statements in accordance with the standards of the PCAOB. Those standards require that we plan and perform the audit to obtain reasonable assurance about whether the financial statements are free of material misstatement, whether due to error or fraud.
Our audits included performing procedures to assess the risks of material misstatement of the financial statements, whether due to error or fraud, and performing procedures that respond to those risks. Such procedures included examining, on a test basis, evidence regarding the amounts and disclosures in the financial statements. Our audits also included evaluating the accounting principles used and significant estimates made by management, as well as evaluating the overall presentation of the financial statements. Our procedures included confirmation of securities owned as of October 31, 2019 by correspondence with the custodian and brokers; when replies were not received from brokers, we performed other auditing procedures. We believe that our audits provide a reasonable basis for our opinion.
PricewaterhouseCoopers LLP
Boston, Massachusetts
December 11, 2019
We have served as the auditor of one or more investment companies in the Fidelity group of funds since 1932.
Trustees and Officers
The Trustees, Members of the Advisory Board (if any), and officers of the trust and fund, as applicable, are listed below. The Board of Trustees governs the fund and is responsible for protecting the interests of shareholders. The Trustees are experienced executives who meet periodically throughout the year to oversee the fund's activities, review contractual arrangements with companies that provide services to the fund, oversee management of the risks associated with such activities and contractual arrangements, and review the fund's performance. Except for Jonathan Chiel, each of the Trustees oversees 277 funds. Mr. Chiel oversees 171 funds.
The Trustees hold office without limit in time except that (a) any Trustee may resign; (b) any Trustee may be removed by written instrument, signed by at least two-thirds of the number of Trustees prior to such removal; (c) any Trustee who requests to be retired or who has become incapacitated by illness or injury may be retired by written instrument signed by a majority of the other Trustees; and (d) any Trustee may be removed at any special meeting of shareholders by a two-thirds vote of the outstanding voting securities of the trust. Each Trustee who is not an interested person (as defined in the 1940 Act) of the trust and the fund is referred to herein as an Independent Trustee. Each Independent Trustee shall retire not later than the last day of the calendar year in which his or her 75th birthday occurs. The Independent Trustees may waive this mandatory retirement age policy with respect to individual Trustees. Officers and Advisory Board Members hold office without limit in time, except that any officer or Advisory Board Member may resign or may be removed by a vote of a majority of the Trustees at any regular meeting or any special meeting of the Trustees. Except as indicated, each individual has held the office shown or other offices in the same company for the past five years.
The fund’s Statement of Additional Information (SAI) includes more information about the Trustees. To request a free copy, call Fidelity at 1-800-544-3455.
Experience, Skills, Attributes, and Qualifications of the Trustees. The Governance and Nominating Committee has adopted a statement of policy that describes the experience, qualifications, attributes, and skills that are necessary and desirable for potential Independent Trustee candidates (Statement of Policy). The Board believes that each Trustee satisfied at the time he or she was initially elected or appointed a Trustee, and continues to satisfy, the standards contemplated by the Statement of Policy. The Governance and Nominating Committee also engages professional search firms to help identify potential Independent Trustee candidates who have the experience, qualifications, attributes, and skills consistent with the Statement of Policy. From time to time, additional criteria based on the composition and skills of the current Independent Trustees, as well as experience or skills that may be appropriate in light of future changes to board composition, business conditions, and regulatory or other developments, have also been considered by the professional search firms and the Governance and Nominating Committee. In addition, the Board takes into account the Trustees' commitment and participation in Board and committee meetings, as well as their leadership of standing and ad hoc committees throughout their tenure.
In determining that a particular Trustee was and continues to be qualified to serve as a Trustee, the Board has considered a variety of criteria, none of which, in isolation, was controlling. The Board believes that, collectively, the Trustees have balanced and diverse experience, qualifications, attributes, and skills, which allow the Board to operate effectively in governing the fund and protecting the interests of shareholders. Information about the specific experience, skills, attributes, and qualifications of each Trustee, which in each case led to the Board's conclusion that the Trustee should serve (or continue to serve) as a trustee of the fund, is provided below.
Board Structure and Oversight Function. Abigail P. Johnson is an interested person and currently serves as Chairman. The Trustees have determined that an interested Chairman is appropriate and benefits shareholders because an interested Chairman has a personal and professional stake in the quality and continuity of services provided to the fund. Independent Trustees exercise their informed business judgment to appoint an individual of their choosing to serve as Chairman, regardless of whether the Trustee happens to be independent or a member of management. The Independent Trustees have determined that they can act independently and effectively without having an Independent Trustee serve as Chairman and that a key structural component for assuring that they are in a position to do so is for the Independent Trustees to constitute a substantial majority for the Board. The Independent Trustees also regularly meet in executive session. Arthur E. Johnson serves as Chairman of the Independent Trustees and as such (i) acts as a liaison between the Independent Trustees and management with respect to matters important to the Independent Trustees and (ii) with management prepares agendas for Board meetings.
Fidelity® funds are overseen by different Boards of Trustees. The fund's Board oversees Fidelity's investment-grade bond, money market, asset allocation and certain equity funds, and other Boards oversee Fidelity's high income and other equity funds. The asset allocation funds may invest in Fidelity® funds that are overseen by such other Boards. The use of separate Boards, each with its own committee structure, allows the Trustees of each group of Fidelity® funds to focus on the unique issues of the funds they oversee, including common research, investment, and operational issues. On occasion, the separate Boards establish joint committees to address issues of overlapping consequences for the Fidelity® funds overseen by each Board.
The Trustees operate using a system of committees to facilitate the timely and efficient consideration of all matters of importance to the Trustees, the fund, and fund shareholders and to facilitate compliance with legal and regulatory requirements and oversight of the fund's activities and associated risks. The Board, acting through its committees, has charged FMR and its affiliates with (i) identifying events or circumstances the occurrence of which could have demonstrably adverse effects on the fund's business and/or reputation; (ii) implementing processes and controls to lessen the possibility that such events or circumstances occur or to mitigate the effects of such events or circumstances if they do occur; and (iii) creating and maintaining a system designed to evaluate continuously business and market conditions in order to facilitate the identification and implementation processes described in (i) and (ii) above. Because the day-to-day operations and activities of the fund are carried out by or through FMR, its affiliates, and other service providers, the fund's exposure to risks is mitigated but not eliminated by the processes overseen by the Trustees. While each of the Board's committees has responsibility for overseeing different aspects of the fund's activities, oversight is exercised primarily through the Operations and Audit Committees. In addition, an ad hoc Board committee of Independent Trustees has worked with FMR to enhance the Board's oversight of investment and financial risks, legal and regulatory risks, technology risks, and operational risks, including the development of additional risk reporting to the Board. Appropriate personnel, including but not limited to the fund's Chief Compliance Officer (CCO), FMR's internal auditor, the independent accountants, the fund's Treasurer and portfolio management personnel, make periodic reports to the Board's committees, as appropriate, including an annual review of Fidelity's risk management program for the Fidelity® funds. The responsibilities of each standing committee, including their oversight responsibilities, are described further under "Standing Committees of the Trustees."
Interested Trustees*:
Correspondence intended for a Trustee who is an interested person may be sent to Fidelity Investments, 245 Summer Street, Boston, Massachusetts 02210.
Name, Year of Birth; Principal Occupations and Other Relevant Experience+
Jonathan Chiel (1957)
Year of Election or Appointment: 2016
Trustee
Mr. Chiel also serves as Trustee of other Fidelity® funds. Mr. Chiel is Executive Vice President and General Counsel for FMR LLC (diversified financial services company, 2012-present). Previously, Mr. Chiel served as general counsel (2004-2012) and senior vice president and deputy general counsel (2000-2004) for John Hancock Financial Services; a partner with Choate, Hall & Stewart (1996-2000) (law firm); and an Assistant United States Attorney for the United States Attorney’s Office of the District of Massachusetts (1986-95), including Chief of the Criminal Division (1993-1995). Mr. Chiel is a director on the boards of the Boston Bar Foundation and the Maimonides School.
Abigail P. Johnson (1961)
Year of Election or Appointment: 2009
Trustee
Chairman of the Board of Trustees
Ms. Johnson also serves as Trustee of other Fidelity® funds. Ms. Johnson serves as Chairman (2016-present), Chief Executive Officer (2014-present), and Director (2007-present) of FMR LLC (diversified financial services company), President of Fidelity Financial Services (2012-present) and President of Personal, Workplace and Institutional Services (2005-present). Ms. Johnson is Chairman and Director of FMR Co., Inc. (investment adviser firm, 2011-present) and Chairman and Director of FMR (investment adviser firm, 2011-present). Previously, Ms. Johnson served as Vice Chairman (2007-2016) and President (2013-2016) of FMR LLC, President and a Director of FMR (2001-2005), a Trustee of other investment companies advised by FMR, Fidelity Investments Money Management, Inc. (investment adviser firm), and FMR Co., Inc. (2001-2005), Senior Vice President of the Fidelity® funds (2001-2005), and managed a number of Fidelity® funds. Ms. Abigail P. Johnson and Mr. Arthur E. Johnson are not related.
Jennifer Toolin McAuliffe (1959)
Year of Election or Appointment: 2016
Trustee
Ms. McAuliffe also serves as Trustee of other Fidelity® funds. Ms. McAuliffe previously served as a Member of the Advisory Board of certain Fidelity® funds (2016) and as Co-Head of Fixed Income of Fidelity Investments Limited (now known as FIL Limited (FIL)) (diversified financial services company). Earlier roles at FIL included Director of Research for FIL’s credit and quantitative teams in London, Hong Kong and Tokyo. Ms. McAuliffe also was the Director of Research for taxable and municipal bonds at Fidelity Investments Money Management, Inc. Ms. McAuliffe is also a director or trustee of several not-for-profit entities.
* Determined to be an “Interested Trustee” by virtue of, among other things, his or her affiliation with the trust or various entities under common control with FMR.
+ The information includes the Trustee's principal occupation during the last five years and other information relating to the experience, attributes, and skills relevant to the Trustee's qualifications to serve as a Trustee, which led to the conclusion that the Trustee should serve as a Trustee for the fund.
Independent Trustees:
Correspondence intended for an Independent Trustee may be sent to Fidelity Investments, P.O. Box 55235, Boston, Massachusetts 02205-5235.
Name, Year of Birth; Principal Occupations and Other Relevant Experience+
Elizabeth S. Acton (1951)
Year of Election or Appointment: 2013
Trustee
Ms. Acton also serves as Trustee of other Fidelity® funds. Prior to her retirement in April 2012, Ms. Acton was Executive Vice President, Finance (2011-2012), Executive Vice President, Chief Financial Officer (2002-2011), and Treasurer (2004-2005) of Comerica Incorporated (financial services). Prior to joining Comerica, Ms. Acton held a variety of positions at Ford Motor Company (1983-2002), including Vice President and Treasurer (2000-2002) and Executive Vice President and Chief Financial Officer of Ford Motor Credit Company (1998-2000). Ms. Acton currently serves as a member of the Board of Directors and Audit and Finance Committees of Beazer Homes USA, Inc. (homebuilding, 2012-present). Previously, Ms. Acton served as a Member of the Advisory Board of certain Fidelity® funds (2013-2016).
Ann E. Dunwoody (1953)
Year of Election or Appointment: 2018
Trustee
General Dunwoody also serves as Trustee of other Fidelity® funds. General Dunwoody (United States Army, Retired) was the first woman in U.S. military history to achieve the rank of four-star general and prior to her retirement in 2012 held a variety of positions within the U.S. Army, including Commanding General, U.S. Army Material Command (2008-2012). She is the President of First to Four LLC (leadership and mentoring services, 2012-present). She also serves as a member of the Board of Directors and Nominating and Corporate Governance Committee of L3 Technologies, Inc. (communication, electronic, sensor, and aerospace systems, 2013-present), Board of Directors and Nomination and Corporate Governance Committees of Kforce Inc. (professional staffing services, 2016-present) and Board of Directors of Automattic Inc. (software engineering, 2018-present). Previously, General Dunwoody served as a Member of the Advisory Board of certain Fidelity® funds (2018), a member of the Board of Directors and Audit and Sustainability and Corporate Responsibility Committees of Republic Services, Inc. (waste collection, disposal and recycling, 2013-2016). Ms. Dunwoody also serves on several boards for non-profit organizations, including as a member of the Board of Directors, Chair of the Nomination and Governance Committee and member of the Audit Committee of Logistics Management Institute (consulting non-profit, 2012-present), a member of the Board of Directors of the Army Historical Foundation (2015-present), a member of the Council of Trustees for the Association of the United States Army (advocacy non-profit, 2013-present) and a member of the Board of Trustees of Florida Institute of Technology (2015-present) and ThanksUSA (military family education non-profit, 2014-present).
John Engler (1948)
Year of Election or Appointment: 2014
Trustee
Mr. Engler also serves as Trustee of other Fidelity® funds. He serves on the board of directors for Universal Forest Products (manufacturer and distributor of wood and wood-alternative products, 2003-present) and K12 Inc. (technology-based education company, 2012-present). Previously, Mr. Engler served as interim president of Michigan State University (2018-2019), a Member of the Advisory Board of certain Fidelity® funds (2014-2016), president of the Business Roundtable (2011-2017), a trustee of The Munder Funds (2003-2014), president and CEO of the National Association of Manufacturers (2004-2011), member of the Board of Trustees of the Annie E. Casey Foundation (2004-2015), and as governor of Michigan (1991-2003). He is a past chairman of the National Governors Association.
Robert F. Gartland (1951)
Year of Election or Appointment: 2010
Trustee
Mr. Gartland also serves as Trustee of other Fidelity® funds. Mr. Gartland is Chairman and an investor in Gartland & Mellina Group Corp. (consulting, 2009-present). Previously, Mr. Gartland served as a partner and investor of Vietnam Partners LLC (investments and consulting, 2008-2011). Prior to his retirement, Mr. Gartland held a variety of positions at Morgan Stanley (financial services, 1979-2007), including Managing Director (1987-2007), and Chase Manhattan Bank (1975-1978).
Arthur E. Johnson (1947)
Year of Election or Appointment: 2008
Trustee
Chairman of the Independent Trustees
Mr. Johnson also serves as Trustee of other Fidelity® funds. Mr. Johnson serves as a member of the Board of Directors of Eaton Corporation plc (diversified power management, 2009-present) and Booz Allen Hamilton (management consulting, 2011-present). Prior to his retirement, Mr. Johnson served as Senior Vice President of Corporate Strategic Development of Lockheed Martin Corporation (defense contractor, 1999-2009). Mr. Johnson previously served as Vice Chairman (2015-2018) of the Independent Trustees of certain Fidelity® funds and on the Board of Directors of IKON Office Solutions, Inc. (1999-2008), AGL Resources, Inc. (holding company, 2002-2016), and Delta Airlines (2005-2007). Mr. Arthur E. Johnson is not related to Ms. Abigail P. Johnson.
Michael E. Kenneally (1954)
Year of Election or Appointment: 2009
Trustee
Vice Chairman of the Independent Trustees
Mr. Kenneally also serves as Trustee of other Fidelity® funds. Prior to his retirement, Mr. Kenneally served as Chairman and Global Chief Executive Officer of Credit Suisse Asset Management. Before joining Credit Suisse, he was an Executive Vice President and Chief Investment Officer for Bank of America Corporation. Earlier roles at Bank of America included Director of Research, Senior Portfolio Manager and Research Analyst, and Mr. Kenneally was awarded the Chartered Financial Analyst (CFA) designation in 1991.
Marie L. Knowles (1946)
Year of Election or Appointment: 2001
Trustee
Ms. Knowles also serves as Trustee of other Fidelity® funds. Prior to Ms. Knowles' retirement in June 2000, she served as Executive Vice President and Chief Financial Officer of Atlantic Richfield Company (ARCO) (diversified energy, 1996-2000). From 1993 to 1996, she was a Senior Vice President of ARCO and President of ARCO Transportation Company (pipeline and tanker operations). Ms. Knowles currently serves as a Director and Chairman of the Audit Committee of McKesson Corporation (healthcare service, since 2002). Ms. Knowles is a member of the Board of the Santa Catalina Island Company (real estate, 2009-present). Ms. Knowles is a Member of the Investment Company Institute Board of Governors and a Member of the Governing Council of the Independent Directors Council (2014-present). She also serves as a member of the Advisory Board for the School of Engineering of the University of Southern California. Previously, Ms. Knowles served as a Director of Phelps Dodge Corporation (copper mining and manufacturing, 1994-2007), URS Corporation (engineering and construction, 2000-2003) and America West (airline, 1999-2002). Ms. Knowles previously served as Chairman (2015-2018) and Vice Chairman (2012-2015) of the Independent Trustees of certain Fidelity® funds.
Mark A. Murray (1954)
Year of Election or Appointment: 2016
Trustee
Mr. Murray also serves as Trustee of other Fidelity® funds. Mr. Murray is Vice Chairman (2013-present) of Meijer, Inc. (regional retail chain). Previously, Mr. Murray served as a Member of the Advisory Board of certain Fidelity® funds (2016) and as Co-Chief Executive Officer (2013-2016) and President (2006-2013) of Meijer, Inc. Mr. Murray serves as a member of the Board of Directors and Nuclear Review and Public Policy and Responsibility Committees of DTE Energy Company (diversified energy company, 2009-present). Mr. Murray also serves as a member of the Board of Directors of Spectrum Health (not-for-profit health system, 2015-present). Mr. Murray previously served as President of Grand Valley State University (2001-2006), Treasurer for the State of Michigan (1999-2001), Vice President of Finance and Administration for Michigan State University (1998-1999), and a member of the Board of Directors and Audit Committee and Chairman of the Nominating and Corporate Governance Committee of Universal Forest Products, Inc. (manufacturer and distributor of wood and wood-alternative products, 2004-2016). Mr. Murray is also a director or trustee of many community and professional organizations.
+ The information includes the Trustee's principal occupation during the last five years and other information relating to the experience, attributes, and skills relevant to the Trustee's qualifications to serve as a Trustee, which led to the conclusion that the Trustee should serve as a Trustee for the fund.
Advisory Board Members and Officers:
Correspondence intended for an officer may be sent to Fidelity Investments, 245 Summer Street, Boston, Massachusetts 02210. Officers appear below in alphabetical order.
Name, Year of Birth; Principal Occupation
Elizabeth Paige Baumann (1968)
Year of Election or Appointment: 2017
Anti-Money Laundering (AML) Officer
Ms. Baumann also serves as AML Officer of other funds. She is Chief AML Officer (2012-present) and Senior Vice President (2014-present) of FMR LLC (diversified financial services company) and is an employee of Fidelity Investments. Previously, Ms. Baumann served as AML Officer of the funds (2012-2016), and Vice President (2007-2014) and Deputy Anti-Money Laundering Officer (2007-2012) of FMR LLC.
Craig S. Brown (1977)
Year of Election or Appointment: 2019
Assistant Treasurer
Mr. Brown also serves as Assistant Treasurer of other funds. Mr. Brown is an employee of Fidelity Investments (2013-present).
John J. Burke III (1964)
Year of Election or Appointment: 2018
Chief Financial Officer
Mr. Burke also serves as Chief Financial Officer of other funds. Mr. Burke serves as Head of Investment Operations for Fidelity Fund and Investment Operations (2018-present) and is an employee of Fidelity Investments (1998-present). Previously Mr. Burke served as head of Asset Management Investment Operations (2012-2018).
Jonathan Davis (1968)
Year of Election or Appointment: 2010
Assistant Treasurer
Mr. Davis also serves as Assistant Treasurer of other funds. Mr. Davis serves as Assistant Treasurer of FMR Capital, Inc. (2017-present) and is an employee of Fidelity Investments. Previously, Mr. Davis served as Vice President and Associate General Counsel of FMR LLC (diversified financial services company, 2003-2010).
Adrien E. Deberghes (1967)
Year of Election or Appointment: 2010
Assistant Treasurer
Mr. Deberghes also serves as an officer of other funds. He serves as Assistant Treasurer of FMR Capital, Inc. (2017-present), Executive Vice President of Fidelity Investments Money Management, Inc. (FIMM) (investment adviser firm, 2016-present), and is an employee of Fidelity Investments (2008-present). Previously, Mr. Deberghes served as President and Treasurer of certain Fidelity® funds (2013-2018). Prior to joining Fidelity Investments, Mr. Deberghes was Senior Vice President of Mutual Fund Administration at State Street Corporation (2007-2008), Senior Director of Mutual Fund Administration at Investors Bank & Trust (2005-2007), and Director of Finance for Dunkin' Brands (2000-2005). Previously, Mr. Deberghes served in other fund officer roles.
Laura M. Del Prato (1964)
Year of Election or Appointment: 2018
President and Treasurer
Ms. Del Prato also serves as an officer of other funds. Ms. Del Prato is an employee of Fidelity Investments (2017-present). Prior to joining Fidelity Investments, Ms. Del Prato served as a Managing Director and Treasurer of the JPMorgan Mutual Funds (2014-2017). Prior to JPMorgan, Ms. Del Prato served as a partner at Cohen Fund Audit Services (accounting firm, 2012-2013) and KPMG LLP (accounting firm, 2004-2012).
Colm A. Hogan (1973)
Year of Election or Appointment: 2016
Assistant Treasurer
Mr. Hogan also serves as an officer of other funds. Mr. Hogan serves as Assistant Treasurer of FMR Capital, Inc. (2017-present) and is an employee of Fidelity Investments (2005-present). Previously, Mr. Hogan served as Assistant Treasurer of certain Fidelity® funds (2016-2018).
Cynthia Lo Bessette (1969)
Year of Election or Appointment: 2019
Secretary and Chief Legal Officer (CLO)
Ms. Lo Bessette also serves as Secretary and CLO of other funds. Ms. Lo Bessette serves as CLO, Secretary, and Senior Vice President of Fidelity Management & Research Company and FMR Co., Inc. (investment adviser firms, 2019-present); Secretary of Fidelity SelectCo, LLC and Fidelity Investments Money Management, Inc. (investment adviser firms, 2019-present); and CLO of Fidelity Management & Research (Hong Kong) Limited, FMR Investment Management (UK) Limited, and Fidelity Management & Research (Japan) Limited (investment adviser firms, 2019-present). She is a Senior Vice President and Deputy General Counsel of FMR LLC (diversified financial services company, 2019-present), and is an employee of Fidelity Investments. Previously, Ms. Lo Bessette served as Executive Vice President, General Counsel (2016-2019) and Senior Vice President, Deputy General Counsel (2015-2016) of OppenheimerFunds (investment management company) and Deputy Chief Legal Officer (2013-2015) of Jennison Associates LLC (investment adviser firm).
Chris Maher (1972)
Year of Election or Appointment: 2013
Assistant Treasurer
Mr. Maher serves as Assistant Treasurer of other funds. Mr. Maher is Vice President of Valuation Oversight, serves as Assistant Treasurer of FMR Capital, Inc. (2017-present), and is an employee of Fidelity Investments. Previously, Mr. Maher served as Vice President of Asset Management Compliance (2013), Vice President of the Program Management Group of FMR (investment adviser firm, 2010-2013), and Vice President of Valuation Oversight (2008-2010).
John B. McGinty, Jr. (1962)
Year of Election or Appointment: 2016
Chief Compliance Officer
Mr. McGinty also serves as Chief Compliance Officer of other funds. Mr. McGinty is Senior Vice President of Asset Management Compliance for Fidelity Investments and is an employee of Fidelity Investments (2016-present). Mr. McGinty previously served as Vice President, Senior Attorney at Eaton Vance Management (investment management firm, 2015-2016), and prior to Eaton Vance as global CCO for all firm operations and registered investment companies at GMO LLC (investment management firm, 2009-2015). Before joining GMO LLC, Mr. McGinty served as Senior Vice President, Deputy General Counsel for Fidelity Investments (2007-2009).
Jason P. Pogorelec (1975)
Year of Election or Appointment: 2015
Assistant Secretary
Mr. Pogorelec also serves as Assistant Secretary of other funds. Mr. Pogorelec serves as Vice President, Associate General Counsel (2010-present) and is an employee of Fidelity Investments (2006-present).
Nancy D. Prior (1967)
Year of Election or Appointment: 2014
Vice President
Ms. Prior also serves as Vice President of other funds. Ms. Prior serves as President of Fixed Income (2014-present), President (2016-present) and Director (2014-present) of Fidelity Investments Money Management, Inc. (FIMM) (investment adviser firm), and is an employee of Fidelity Investments (2002-present). Previously, Ms. Prior served as Vice President of Global Asset Allocation Funds (2017-2019); Vice Chairman of FIAM LLC (investment adviser firm, 2014-2018), a Director of FMR Investment Management (UK) Limited (investment adviser firm, 2015-2018), President Multi-Asset Class Strategies of FMR's Global Asset Allocation Division (2017-2018), Vice President of Fidelity's Money Market Funds (2012-2014), and President, Money Market and Short Duration Bond Group of Fidelity Management & Research Company (FMR) (investment adviser firm, 2013-2014).
Stacie M. Smith (1974)
Year of Election or Appointment: 2013
Assistant Treasurer
Ms. Smith also serves as an officer of other funds. Ms. Smith serves as Assistant Treasurer of FMR Capital, Inc. (2017-present), is an employee of Fidelity Investments (2009-present), and has served in other fund officer roles. Prior to joining Fidelity Investments, Ms. Smith served as Senior Audit Manager of Ernst & Young LLP (accounting firm, 1996-2009). Previously, Ms. Smith served as Assistant Treasurer (2013-2018) and Deputy Treasurer (2013-2016) of certain Fidelity® funds.
Marc L. Spector (1972)
Year of Election or Appointment: 2016
Deputy Treasurer
Mr. Spector also serves as an officer of other funds. Mr. Spector serves as Assistant Treasurer of FMR Capital, Inc. (2017-present) and is an employee of Fidelity Investments (2016-present). Prior to joining Fidelity Investments, Mr. Spector served as Director at the Siegfried Group (accounting firm, 2013-2016), and prior to Siegfried Group as audit senior manager at Deloitte & Touche (accounting firm, 2005-2013).
Jim Wegmann (1979)
Year of Election or Appointment: 2019
Assistant Treasurer
Mr. Wegmann also serves as Assistant Treasurer of other funds. Mr. Wegmann is an employee of Fidelity Investments (2011-present).
Shareholder Expense Example
As a shareholder of the Fund, you incur two types of costs: (1) transaction costs and (2) ongoing costs, including management fees and other Fund expenses. This Example is intended to help you understand your ongoing costs (in dollars) of investing in the Fund and to compare these costs with the ongoing costs of investing in other mutual funds.
The Example is based on an investment of $1,000 invested at the beginning of the period and held for the entire period (May 1, 2019 to October 31, 2019).
Actual Expenses
The first line of the accompanying table provides information about actual account values and actual expenses. You may use the information in this line, together with the amount you invested, to estimate the expenses that you paid over the period. Simply divide your account value by $1,000.00 (for example, an $8,600 account value divided by $1,000.00 = 8.6), then multiply the result by the number in the first line under the heading entitled "Expenses Paid During Period" to estimate the expenses you paid on your account during this period. In addition, the Fund, as a shareholder in the underlying Fidelity Central Funds, will indirectly bear its pro-rata share of the fees and expenses incurred by the underlying Fidelity Central Funds. These fees and expenses are not included in the Fund's annualized expense ratio used to calculate the expense estimate in the table below.
Hypothetical Example for Comparison Purposes
The second line of the accompanying table provides information about hypothetical account values and hypothetical expenses based on the Fund's actual expense ratio and an assumed rate of return of 5% per year before expenses, which is not the Fund's actual return. The hypothetical account values and expenses may not be used to estimate the actual ending account balance or expenses you paid for the period. You may use this information to compare the ongoing costs of investing in the Fund and other funds. To do so, compare this 5% hypothetical example with the 5% hypothetical examples that appear in the shareholder reports of the other funds. In addition, the Fund, as a shareholder in the underlying Fidelity Central Funds, will indirectly bear its pro-rata share of the fees and expenses incurred by the underlying Fidelity Central Funds. These fees and expenses are not included in the Fund's annualized expense ratio used to calculate the expense estimate in the table below.
Please note that the expenses shown in the table are meant to highlight your ongoing costs only and do not reflect any transaction costs. Therefore, the second line of the table is useful in comparing ongoing costs only, and will not help you determine the relative total costs of owning different funds.
| | Annualized Expense Ratio-A | Beginning
Account Value
May 1, 2019 | Ending
Account Value
October 31, 2019 | Expenses Paid
During Period-B
May 1, 2019
to October 31, 2019 |
| Actual | .08% | $1,000.00 | $978.60 | $.40 |
| Hypothetical-C | | $1,000.00 | $1,024.80 | $.41 |
A Annualized expense ratio reflects expenses net of applicable fee waivers.
B Expenses are equal to the Fund's annualized expense ratio, multiplied by the average account value over the period, multiplied by 184/365 (to reflect the one-half year period).
C 5% return per year before expenses
Distributions (Unaudited)
The fund designates 61% of the dividend distributed during the fiscal year as amounts which may be taken into account as a dividend for the purposes of the maximum rate under section 1(h)(11) of the Internal Revenue Code.
The amounts per share which represent income derived from sources within, and taxes paid to, foreign countries or possessions of the United States are $0.3560 and $0.0393 for the dividend paid December 17, 2018.
The fund will notify shareholders in January 2020 of amounts for use in preparing 2019 income tax returns.
Board Approval of Investment Advisory Contracts and Management Fees
Fidelity SAI Emerging Markets Index Fund
Each year, the Board of Trustees, including the Independent Trustees (together, the Board), votes on the renewal of the management contract with Fidelity Management & Research Company (FMR) and the sub-advisory agreements (together, the Advisory Contracts) for the fund, including the fund's sub-advisory agreement (Sub-Advisory Agreement) with Geode Capital Management, LLC (Geode). FMR and the sub-advisers are referred to herein as the Investment Advisers. The Board, assisted by the advice of fund counsel and Independent Trustees' counsel, requests and considers a broad range of information relevant to the renewal of the Advisory Contracts throughout the year.
The Board meets regularly and, at each of its meetings, covers an extensive agenda of topics and materials and considers factors that are relevant to its annual consideration of the renewal of the fund's Advisory Contracts, including the services and support provided to the fund and its shareholders. The Board has established four standing committees (Committees) — Operations, Audit, Fair Valuation, and Governance and Nominating — each composed of and chaired by Independent Trustees with varying backgrounds, to which the Board has assigned specific subject matter responsibilities in order to enhance effective decision-making by the Board. The Operations Committee, of which all of the Independent Trustees are members, meets regularly throughout the year and considers, among other matters, information specifically related to the annual consideration of the renewal of the fund's Advisory Contracts. The Board, acting directly and through its Committees, requests and receives information concerning the annual consideration of the renewal of the fund's Advisory Contracts. The Board also meets as needed to review matters specifically related to the Board's annual consideration of the renewal of the Advisory Contracts. Members of the Board may also meet with trustees of other Fidelity funds through joint ad hoc committees to discuss certain matters relevant to all of the Fidelity funds.
At its September 2019 meeting, the Board unanimously determined to renew the fund's Advisory Contracts. In reaching its determination, the Board considered all factors it believed relevant, including (i) the nature, extent, and quality of the services provided to the fund and its shareholders (including the investment performance of the fund); (ii) the competitiveness of the fund's management fee and total expense ratio relative to peer funds; (iii) the total costs of the services provided by and the profits realized by Fidelity and Geode from their respective relationships with the fund; and (iv) the extent to which, if any, economies of scale exist and are realized as the fund grows, and whether any economies of scale are appropriately shared with fund shareholders.
In considering whether to renew the Advisory Contracts for the fund, the Board reached a determination, with the assistance of fund counsel and Independent Trustees' counsel and through the exercise of its business judgment, that the renewal of the Advisory Contracts was in the best interests of the fund and its shareholders and that the compensation payable under the Advisory Contracts was fair and reasonable. The Board's decision to renew the Advisory Contracts was not based on any single factor, but rather was based on a comprehensive consideration of all the information provided to the Board at its meetings throughout the year. The Board, in reaching its determination to renew the Advisory Contracts, was aware that shareholders of the fund have a broad range of investment choices available to them, including a wide choice among funds offered by Fidelity's competitors, and that the fund's shareholders, who have the opportunity to review and weigh the disclosure provided by the fund in its prospectus and other public disclosures, have chosen to invest in this fund, which is part of the Fidelity family of funds.
July 2019 Contract Approval. At its July 2019 meeting, the Board voted to approve (i) an amended and restated management contract to reduce the fund's management fee rate, and (ii) an amended and restated sub-advisory agreement with Geode to reduce the sub-advisory fee rate paid by FMR to Geode (New Contracts). In reaching its conclusion to approve the New Contracts, the Board considered that it had received and reviewed certain information and made certain findings in connection with the annual renewal of the Advisory Contracts at its September 2018 meeting and considered how, if at all, the approval of the New Contracts would change its prior conclusions. The Board considered that the amended and restated management contract would reduce the fund's management fee rate from 0.09% to 0.075% effective August 1, 2019. With respect to the amended and restated sub-advisory agreement, the Board noted that FMR, and not the fund, pays the sub-advisory fee out of its management fee. The Board also noted that the New Contracts would not change the investment processes, the level or nature of services provided, the resources and personnel allocated, or trading and compliance operations. Based on its evaluation, and after considering all factors it believed relevant, the Board ultimately concluded that the advisory fee structure in the New Contract is fair and reasonable, and that the New Contracts should be approved.
Approval of Amended and Restated Advisory Contracts. At its September 2019 meeting, the Board also unanimously determined to approve an amended and restated management contract and sub-advisory agreement with Geode (Amended and Restated Contracts) in connection with an upcoming consolidation of certain of Fidelity's advisory businesses. The Board considered that, on or about January 1, 2020, FMR Co., Inc. (FMRC) expects to merge with and into FMR and, after the merger, FMR expects to redomicile as a Delaware limited liability company. The Board also approved the termination of the sub-advisory agreement with FMRC upon the completion of the merger. The Board noted that references to FMR in the Amended and Restated Contracts would be updated to reflect FMR's new form of organization and domicile. The Board also approved amendments that clarify that the fund pays its non-operating expenses, including brokerage commissions and fees and expenses associated with the fund's securities lending program, if applicable. The Board also noted Fidelity's assurance that neither the planned consolidation nor the Amended and Restated Contracts will change the investment processes, the level or nature of services provided, the resources and personnel allocated, trading and compliance operations, or any fees or expenses paid by the fund.
Nature, Extent, and Quality of Services Provided. The Board considered staffing as it relates to the fund, including the backgrounds of investment personnel of Fidelity and Geode, and also considered the fund's investment objective, strategies, and related investment philosophy. The Independent Trustees also had discussions with senior management of Fidelity's investment operations and investment groups and with representatives of Geode. The Board considered the structure of the investment personnel compensation programs and whether the structures provide appropriate incentives to act in the best interests of the fund. Additionally, the Board considered the portfolio managers' investments, if any, in the funds that they manage.
The Trustees also discussed with representatives of Fidelity, at meetings throughout the year, Fidelity's role in, among other things, overseeing compliance with federal securities laws and other applicable requirements by Geode with respect to the fund and monitoring and overseeing the performance and investment capabilities of Geode. The Trustees considered that the Board had received from Fidelity periodic reports about its oversight and due diligence processes, as well as periodic reports regarding the performance of Geode.
The Board also considered the nature, extent and quality of services provided by Geode. The Trustees noted that under the Sub-Advisory Agreement, subject to oversight by Fidelity, Geode is responsible for, among other things, identifying investments and arranging for execution of portfolio transactions to implement the fund's investment strategy. In addition, the Trustees noted that Geode is responsible for providing such reporting as may be requested by Fidelity to fulfill its oversight responsibilities discussed above.
Resources Dedicated to Investment Management and Support Services. The Board reviewed the general qualifications and capabilities of Fidelity's and Geode's investment staffs, including their size, education, experience, and resources, as well as Fidelity's and Geode's approach to recruiting, managing, and compensating investment personnel. The Board considered that Fidelity's and Geode's investment professionals have extensive resources, tools and capabilities so as to provide competitive investment results over time, and that those professionals also have access to sophisticated tools that permit them to assess portfolio construction and risk and performance attribution characteristics continuously. Additionally, in its deliberations, the Board considered Fidelity's and Geode's trading, risk management, compliance, and technology and operations capabilities and resources, which are integral parts of the investment management process.
Shareholder and Administrative Services. The Board considered (i) the nature, extent, quality, and cost of advisory, administrative, and shareholder services performed by the Investment Advisers and their affiliates under the Advisory Contracts and by FMR's affiliates under separate agreements covering transfer agency, pricing and bookkeeping, and securities lending services for the fund; (ii) the nature and extent of the supervision of third party service providers, principally custodians, subcustodians, and pricing vendors; and (iii) the resources devoted to, and the record of compliance with, the fund's compliance policies and procedures. The Board also reviewed the allocation of fund brokerage, including allocations to brokers affiliated with the Investment Advisers.
The Board noted that the growth of fund assets over time across the complex allows Fidelity to reinvest in the development of services designed to enhance the value and convenience of the Fidelity funds as investment vehicles. These services include 24-hour access to account information and market information over the Internet and through telephone representatives, investor education materials and asset allocation tools, and the expanded availability of Fidelity Investor Centers.
Investment in a Large Fund Family. The Board considered the benefits to shareholders of investing in a Fidelity fund, including the benefits of investing in a fund that is part of a large family of funds offering a variety of investment disciplines and providing a large variety of mutual fund investor services. The Board noted that Fidelity had taken, or had made recommendations that resulted in the Fidelity funds taking, a number of actions over the previous year that benefited particular funds, including: (i) continuing to dedicate additional resources to Fidelity's investment research process, which includes meetings with management of issuers of securities in which the funds invest, and to the support of the senior management team that oversees asset management; (ii) continuing efforts to enhance Fidelity's global research capabilities; (iii) launching new funds with innovative structures, strategies and pricing and making other enhancements to meet client needs; (iv) launching new share classes of existing funds; (v) eliminating purchase minimums and broadening eligibility requirements for certain funds and share classes; (vi) reducing management fees and total expenses for certain target date funds and index funds; (vii) lowering expense caps for certain existing funds and classes, and converting certain voluntary expense caps to contractual caps, to reduce expenses borne by shareholders; (viii) rationalizing product lines and gaining increased efficiencies from fund mergers, liquidations, and share class consolidations; (ix) continuing to develop, acquire and implement systems and technology to improve services to the funds and shareholders, strengthen information security, and increase efficiency; and (x) continuing to implement enhancements to further strengthen Fidelity's product line to increase investors' probability of success in achieving their investment goals, including retirement income goals.
Investment Performance. The Board considered whether the fund has operated in accordance with its investment objective, as well as its record of compliance with its investment restrictions and its performance history.
The Board took into account discussions with representatives of the Investment Advisers about fund investment performance. In this regard the Board noted that as part of regularly scheduled fund reviews and other reports to the Board on fund performance, the Board considers annualized return information for the fund for different time periods, measured against the securities market index the fund seeks to track. The Board also periodically considers the fund's tracking error versus its benchmark index. In its evaluation of fund investment performance, the Board gave particular attention to information indicating underperformance of certain Fidelity funds for specific time periods and discussed with the Investment Advisers the reasons for such underperformance.
In addition to reviewing absolute and relative fund performance, the Independent Trustees periodically consider the appropriateness of fund performance metrics in evaluating the results achieved. In general, the Independent Trustees believe that an index fund's performance should be evaluated based on gross performance (before fees and expenses but after transaction costs) compared to a fund's benchmark index, over appropriate time periods, taking into account relevant factors including the following: general market conditions; the characteristics of the fund's benchmark index; the extent to which statistical sampling is employed; any securities lending revenues; and fund cash flows and other factors. Depending on the circumstances, the Independent Trustees may be satisfied with a fund's performance notwithstanding that it lags its benchmark index for certain periods.
The Independent Trustees recognize that shareholders evaluate performance on a net basis (after fees and expenses) over their own holding periods, for which one-, three-, and five-year periods are often used as a proxy. For this reason, the performance information reviewed by the Board also included net calendar year total return information for the fund and its benchmark index for the most recent one-year period.
Based on its review, the Board concluded that the nature, extent, and quality of services provided to the fund under the Advisory Contracts should continue to benefit the shareholders of the fund.
Competitiveness of Management Fee and Total Expense Ratio. The Board considered the fund's management fee and total expense ratio compared to "mapped groups" of competitive funds and classes created for the purpose of facilitating the Trustees' competitive analysis of management fees and total expenses. Fidelity creates "mapped groups" by combining similar Lipper investment objective categories that have comparable investment mandates. Combining Lipper investment objective categories aids the Board's management fee and total expense ratio comparisons by broadening the competitive group used for comparison.
Management Fee. The Board considered two proprietary management fee comparisons for the 12-month (or shorter) periods shown in basis points (BP) in the chart below. The group of Lipper funds used by the Board for management fee comparisons is referred to below as the "Total Mapped Group." The Total Mapped Group comparison focuses on a fund's standing in terms of gross management fees before expense reimbursements or caps relative to the total universe of funds with comparable investment mandates, regardless of whether their management fee structures also are comparable. Funds with comparable investment mandates offer exposure to similar types of securities. Funds with comparable management fee structures have similar management fee contractual arrangements (
e.g., flat rate charged for advisory services, all-inclusive fee rate,
etc.). "TMG %" represents the percentage of funds in the Total Mapped Group that had management fees that were lower than the fund's. For example, a hypothetical TMG % of 20% would mean that 80% of the funds in the Total Mapped Group had higher, and 20% had lower, management fees than the fund. The fund's actual TMG %s and the number of funds in the Total Mapped Group are in the chart below. The "Asset-Size Peer Group" (ASPG) comparison focuses on a fund's standing relative to a subset of non-Fidelity funds within the Total Mapped Group that are similar in size and management fee structure. For example, if a fund is in the first quartile of the ASPG, the fund's management fee ranks in the least expensive or lowest 25% of funds in the ASPG. The ASPG represents at least 15% of the funds in the Total Mapped Group with comparable asset size and management fee structures, subject to a minimum of 50 funds (or all funds in the Total Mapped Group if fewer than 50). Additional information, such as the ASPG quartile in which the fund's management fee rate ranked, is also included in the chart and was considered by the Board.
Fidelity SAI Emerging Markets Index Fund
The Board considered that effective July 1, 2016, the fund's management fee rate was reduced from 0.20% to 0.09%. The Board considered that the chart below reflects the fund's lower management fee rate for 2016, as if the lower fee rate were in effect for the entire period.
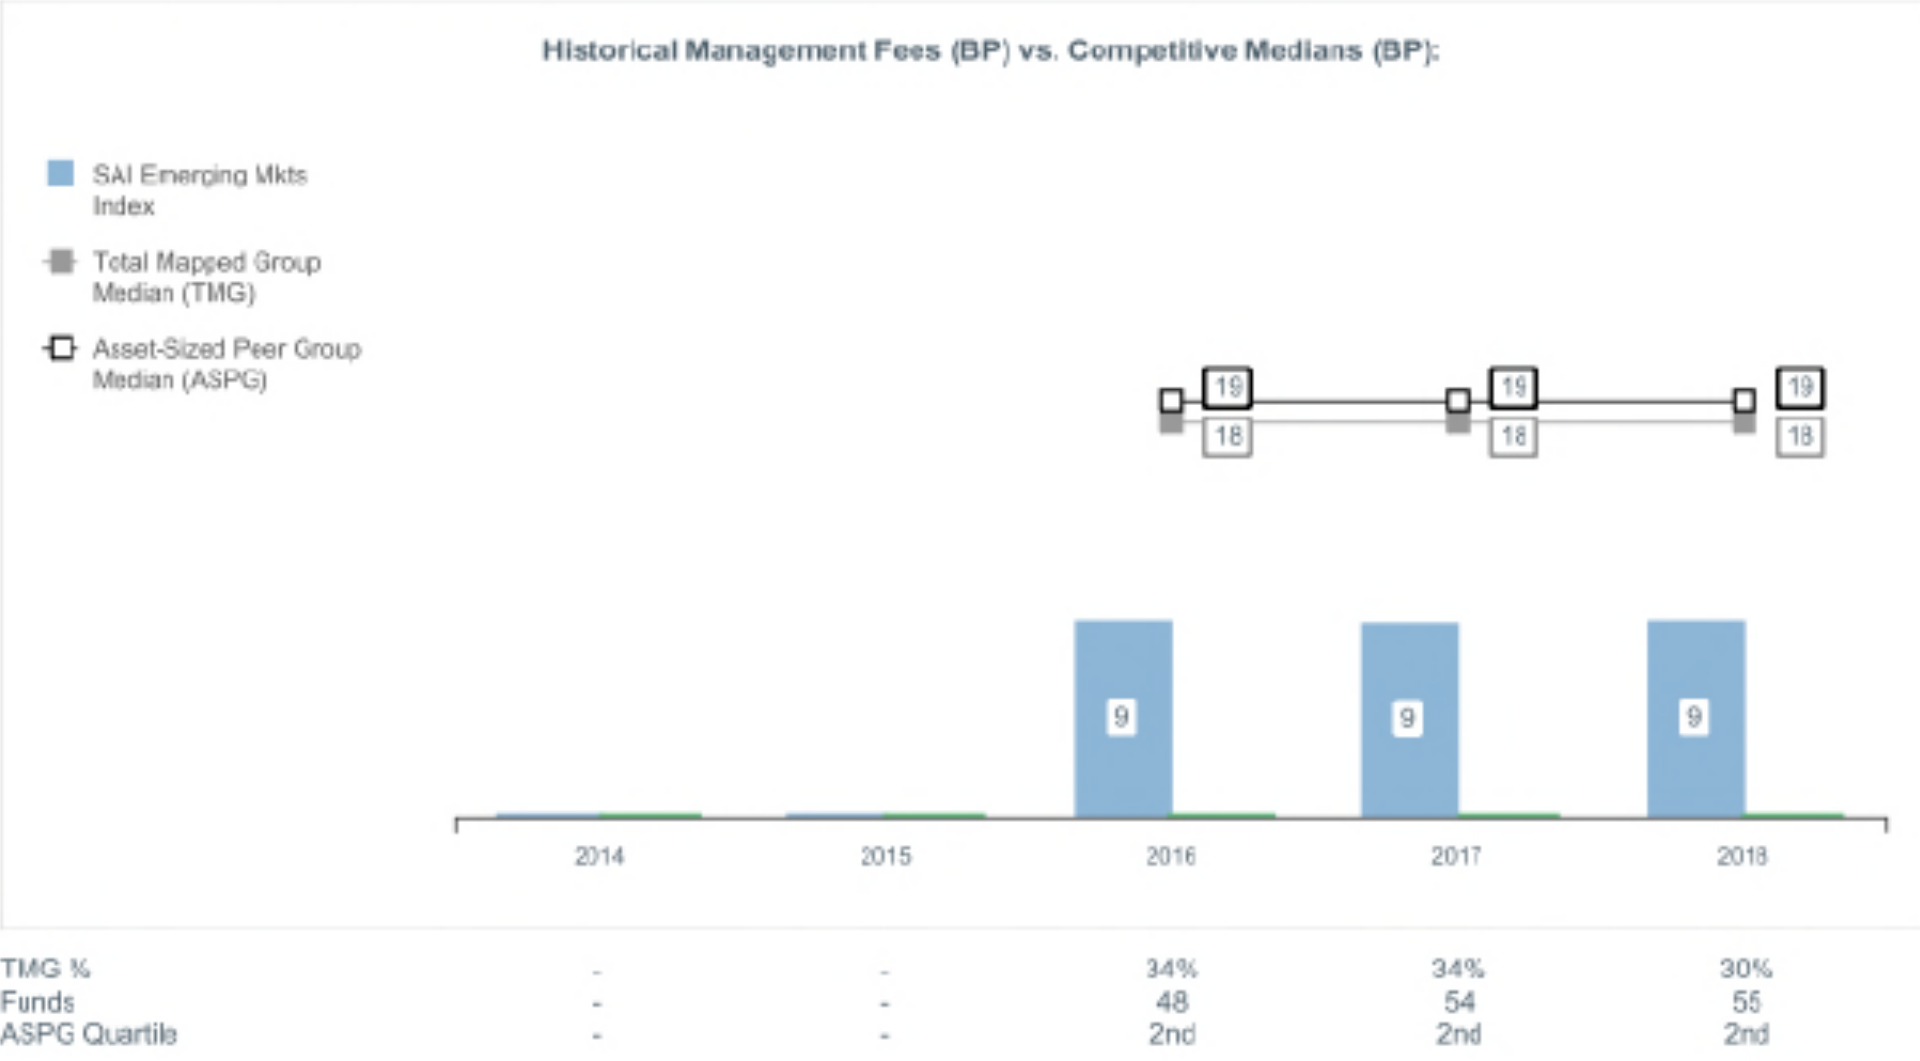
The Board noted that the fund's management fee rate ranked below the median of its Total Mapped Group and below the median of its ASPG for 2018.
The Board considered that, as a result of its approval of the amended and restated management contract at the July 2019 meeting, the fund's management fee rate was reduced from 0.09% to 0.075% effective August 1, 2019.
The Board noted that it and the boards of other Fidelity funds formed an ad hoc Committee on Group Fee, which meets periodically, to conduct an in-depth review of the "group fee" component of the management fee of funds with such management fee structures. The Committee's focus included the mechanics of the group fee, the competitive landscape of group fee structures, Fidelity funds with no group fee component (such as the fund) and investment products not included in group fee assets. The Board also considered that, for funds subject to the group fee, FMR agreed to voluntarily waive fees over a specified period of time in amounts designed to account for assets converted from certain funds to certain collective investment trusts.
Based on its review, the Board concluded that the fund's management fee is fair and reasonable in light of the services that the fund receives and the other factors considered.
Total Expense Ratio. In its review of the fund's total expense ratio, the Board considered the fund's management fee rate as well as other fund expenses, such as custodial, legal, and audit fees. The Board also noted that Fidelity may agree to waive fees or reimburse expenses from time to time, and the extent to which, if any, it has done so for the fund. As part of its review, the Board also considered the current and historical total expense ratios of the fund compared to competitive fund median expenses. The fund is compared to those funds and classes in the Total Mapped Group (used by the Board for management fee comparisons) that have a similar sales load structure.
The Board noted that the fund's total expense ratio ranked below the competitive median for 2018.
The Board further considered that FMR has contractually agreed to reimburse the fund to the extent that total operating expenses (with certain exceptions), as a percentage of its average net assets, exceed 0.08% through February 29, 2020.
Fees Charged to Other Clients. The Board also considered fee structures applicable to clients of Fidelity and Geode, such as other funds advised or subadvised by Fidelity or Geode, pension plan clients, and other institutional clients with similar mandates. The Board noted that a joint ad hoc committee created by it and the boards of other Fidelity funds periodically reviews and compares Fidelity's institutional investment advisory business with its business of providing services to the Fidelity funds and also noted the most recent findings of the committee. The Board noted that the committee's review included a consideration of the differences in services provided, fees charged, and costs incurred, as well as competition in the markets serving the different categories of clients.
Based on its review of total expense ratios and fees charged to other Fidelity clients, the Board concluded that the fund's total expense ratio was reasonable in light of the services that the fund and its shareholders receive and the other factors considered.
Costs of the Services and Profitability. The Board considered the revenues earned and the expenses incurred by Fidelity in conducting the business of developing, marketing, distributing, managing, administering and servicing the fund and servicing the fund's shareholders. The Board also considered the level of Fidelity's profits in respect of all the Fidelity funds.
On an annual basis, Fidelity presents to the Board information about the profitability of its relationships with the fund. Fidelity calculates profitability information for each fund, as well as aggregate profitability information for groups of Fidelity funds and all Fidelity funds, using a series of detailed revenue and cost allocation methodologies which originate with the books and records of Fidelity on which Fidelity's audited financial statements are based. The Audit Committee of the Board reviews any significant changes from the prior year's methodologies and the full Board approves such changes.
PricewaterhouseCoopers LLP (PwC), auditor to Fidelity and certain Fidelity funds, has been engaged annually by the Board as part of the Board's assessment of Fidelity's profitability analysis. PwC's engagement includes the review and assessment of the methodologies used by Fidelity in determining the revenues and expenses attributable to Fidelity's mutual fund business, and completion of agreed-upon procedures in respect of the mathematical accuracy of the fund profitability information and its conformity to established allocation methodologies. After considering PwC's reports issued under the engagement and information provided by Fidelity, the Board concluded that while other allocation methods may also be reasonable, Fidelity's profitability methodologies are reasonable in all material respects.
The Board also reviewed Fidelity's and Geode's non-fund businesses and potential indirect benefits such businesses may have received as a result of their association with Fidelity's mutual fund business (i.e., fall-out benefits) as well as cases where Fidelity's and Geode's affiliates may benefit from the fund's business. The Board noted that changes to fall-out benefits year-over-year reflect business developments at Fidelity's and Geode's various businesses. The Board considered that a joint ad hoc committee created by it and the boards of other Fidelity funds had recently been established, and meets periodically, to evaluate potential fall-out benefits. The Board noted that the committee was expected to, among other things: (i) discuss the legal framework surrounding potential fall-out benefits; (ii) review the Board's responsibilities and approach to potential fall-out benefits; and (iii) review practices employed by competitor funds regarding the review of potential fall-out benefits. The Board noted that it would consider the committee's findings in connection with future consideration of contract renewals.
The Board considered the costs of the services provided by and the profits realized by Fidelity in connection with the operation of the fund and was satisfied that the profitability was not excessive.
The Board also considered information regarding the profitability of Geode's relationship with the fund.
Economies of Scale. The Board considered whether there have been economies of scale in respect of the management of the Fidelity funds, whether the Fidelity funds (including the fund) have appropriately benefited from any such economies of scale, and whether there is potential for realization of any further economies of scale. The Board considered the extent to which the fund will benefit from economies of scale as assets grow through increased services to the fund, through waivers or reimbursements, or through fee or expense ratio reductions. The Board also noted that a committee (the Economies of Scale Committee) created by it and the boards of other Fidelity funds periodically analyzes whether Fidelity attains economies of scale in respect of the management and servicing of the Fidelity funds, whether the Fidelity funds have appropriately benefited from such economies of scale, and whether there is potential for realization of any further economies of scale.
The Board concluded, taking into account the analysis of the Economies of Scale Committee, that economies of scale, if any, are being appropriately shared between fund shareholders and Fidelity.
Additional Information Requested by the Board. In order to develop fully the factual basis for consideration of the Fidelity funds' advisory contracts, the Board requested and received additional information on certain topics, including: (i) Fidelity's fund profitability methodology, profitability trends for certain funds, the allocation of various costs to different funds, and the impact of certain factors on fund profitability results; (ii) portfolio manager changes that have occurred during the past year and the amount of the investment that each portfolio manager has made in the Fidelity fund(s) that he or she manages; (iii) Fidelity's compensation structure for portfolio managers, research analysts, and other key personnel, including its effects on fund profitability, the rationale for the compensation structure, and the extent to which current market conditions have affected retention and recruitment; (iv) the arrangements with and compensation paid to certain fund sub-advisers on behalf of the Fidelity funds and the treatment of such compensation within Fidelity's fund profitability methodology; (v) the practices of certain sub-advisers regarding their receipt of research from broker-dealers that execute the funds' portfolio transactions; (vi) the terms of Fidelity's voluntary expense limitation agreements; (vii) the methodology with respect to competitive fund data and peer group classifications; (viii) Fidelity's transfer agent fee, expense, and service structures for different funds and classes relative to competitive trends, and the impact of the increased use of omnibus accounts; (ix) new developments in the retail and institutional marketplaces and the competitive positioning of the funds relative to other investment products and services; (x) the impact on fund profitability of recent changes in total net assets for Fidelity's money market funds, anticipated changes to the competitive landscape for money market funds, and the level of investor comfort with gates, fees, and floating NAVs; (xi) the funds' share class structures and distribution channels; and (xii) explanations regarding the relative total expense ratios of certain funds and classes, total expense competitive trends and methodologies for total expense competitive comparisons, and actions that might be taken by Fidelity to reduce total expense ratios for certain classes. In addition, the Board considered its discussions with Fidelity throughout the year regarding enhanced information security initiatives and the funds' fair valuation policies.
Based on its evaluation of all of the conclusions noted above, and after considering all factors it believed relevant, the Board concluded that the advisory and sub-advisory fee arrangements are fair and reasonable, and that the fund's Advisory Contracts should be renewed and the fund's Amended and Restated Contracts should be approved.
SV6-ANN-1219
1.9879600.103
Fidelity® Total International Index Fund
Annual Report
October 31, 2019
See the inside front cover for important information about access to your fund’s shareholder reports.
Beginning on January 1, 2021, as permitted by regulations adopted by the Securities and Exchange Commission, paper copies of a fund’s shareholder reports will no longer be sent by mail, unless you specifically request paper copies of the reports from the fund or from your financial intermediary, such as a financial advisor, broker-dealer or bank. Instead, the reports will be made available on a website, and you will be notified by mail each time a report is posted and provided with a website link to access the report.
If you already elected to receive shareholder reports electronically, you will not be affected by this change and you need not take any action. You may elect to receive shareholder reports and other communications from a fund electronically, by contacting your financial intermediary. For Fidelity customers, visit Fidelity's web site or call Fidelity using the contact information listed below.
You may elect to receive all future reports in paper free of charge. If you wish to continue receiving paper copies of your shareholder reports, you may contact your financial intermediary or, if you are a Fidelity customer, visit Fidelity’s website, or call Fidelity at the applicable toll-free number listed below. Your election to receive reports in paper will apply to all funds held with the fund complex/your financial intermediary.
| Account Type | Website | Phone Number |
| Brokerage, Mutual Fund, or Annuity Contracts: | fidelity.com/mailpreferences | 1-800-343-3548 |
| Employer Provided Retirement Accounts: | netbenefits.fidelity.com/preferences (choose 'no' under Required Disclosures to continue to print) | 1-800-343-0860 |
| Advisor Sold Accounts Serviced Through Your Financial Intermediary: | Contact Your Financial Intermediary | Your Financial Intermediary's phone number |
| Advisor Sold Accounts Serviced by Fidelity: | institutional.fidelity.com | 1-877-208-0098 |
Contents
To view a fund's proxy voting guidelines and proxy voting record for the 12-month period ended June 30, visit http://www.fidelity.com/proxyvotingresults or visit the Securities and Exchange Commission's (SEC) web site at http://www.sec.gov.
You may also call 1-800-544-8544 to request a free copy of the proxy voting guidelines.
The funds or securities referred to herein are not sponsored, endorsed, or promoted by MSCI, and MSCI bears no liability with respect to any such funds or securities or any index on which such funds or securities are based. The prospectus contains a more detailed description of the limited relationship MSCI has with Fidelity and any related funds.
Standard & Poor's, S&P and S&P 500 are registered service marks of The McGraw-Hill Companies, Inc. and have been licensed for use by Fidelity Distributors Corporation.
Other third-party marks appearing herein are the property of their respective owners.
All other marks appearing herein are registered or unregistered trademarks or service marks of FMR LLC or an affiliated company. © 2019 FMR LLC. All rights reserved.
This report and the financial statements contained herein are submitted for the general information of the shareholders of the Fund. This report is not authorized for distribution to prospective investors in the Fund unless preceded or accompanied by an effective prospectus.
A fund files its complete schedule of portfolio holdings with the SEC for the first and third quarters of each fiscal year on Form N-PORT. Forms N-PORT are available on the SEC’s web site at http://www.sec.gov. A fund's Forms N-PORT may be reviewed and copied at the SEC’s Public Reference Room in Washington, DC. Information regarding the operation of the SEC's Public Reference Room may be obtained by calling 1-800-SEC-0330.
For a complete list of a fund's portfolio holdings, view the most recent holdings listing, semiannual report, or annual report on Fidelity's web site at http://www.fidelity.com, http://www.institutional.fidelity.com, or http://www.401k.com, as applicable.
NOT FDIC INSURED •MAY LOSE VALUE •NO BANK GUARANTEE
Neither the Fund nor Fidelity Distributors Corporation is a bank.
Performance: The Bottom Line
Average annual total return reflects the change in the value of an investment, assuming reinvestment of distributions from dividend income and capital gains (the profits earned upon the sale of securities that have grown in value, if any) and assuming a constant rate of performance each year. The hypothetical investment and the average annual total returns do not reflect the deduction of taxes that a shareholder would pay on fund distributions or the redemption of fund shares. During periods of reimbursement by Fidelity, a fund’s total return will be greater than it would be had the reimbursement not occurred. How a fund did yesterday is no guarantee of how it will do tomorrow.
Average Annual Total Returns
| For the periods ended October 31, 2019 | Past 1 year | Life of fundA |
| Fidelity® Total International Index Fund | 10.88% | 7.14% |
A From June 7, 2016
$10,000 Over Life of Fund
Let's say hypothetically that $10,000 was invested in Fidelity® Total International Index Fund on June 7, 2016, when the fund started.
The chart shows how the value of your investment would have changed, and also shows how the MSCI ACWI (All Country World Index) ex USA Investable Market Index performed over the same period.

| Period Ending Values |
| $12,641 | Fidelity® Total International Index Fund |
| $12,802 | MSCI ACWI (All Country World Index) ex USA Investable Market Index |
Management's Discussion of Fund Performance
Market Recap: The MSCI ACWI (All Country World Index) ex USA Index gained 11.47% for the 12 months ending October 31, 2019, as international stocks reflected a confluence of factors, including escalating trade tension, moderating but still positive global economic growth and uncertainty about the U.K.’s planned “Brexit” from the European Union. In late December, the U.S. Federal Reserve shifted from raising interest rates to a more dovish policy in 2019, joining many foreign central banks that had cut policy rates. In June, international stocks rose 6.03%, as policy stimulus in China stabilized that country’s economic growth. The Fed cut its policy rate in July for the first time since 2008. However, the index returned -1.21% for the month, followed by -3.08% in August. In September, the Fed cut its policy rate another quarter point, citing concerns about slowing economic growth and muted inflation, and did the same in October, leading to monthly gains of 2.59% and 3.49%, respectively. For the full 12 months, the growth-oriented information technology sector (+22%) led the way, followed by utilities (+20%) and real estate (+18%), two high-dividend-yielding categories. Consumer discretionary gained 16%. Conversely, energy was roughly flat, while materials (+6%) and communication services (7%) also lagged. By region, Asia Pacific ex Japan (+16%), Europe ex U.K (+13%), Canada (+12%) and emerging markets (+12%) fared best. Meanwhile, the U.K. (+7%) and Japan (+10%) trailed the broader market.
Comments from the Geode Capital Management, LLC, passive equity index team: For the fiscal year, the fund gained 10.88%, roughly in line with the 11.12% advance of the benchmark MSCI ACWI (All Country World Index) ex USA Investible Market Index.
(The fund's performance relative to the index can be affected by Fidelity's methodologies for valuing certain foreign stocks and for incorporating foreign exchange rates, which differ from those used by the index.) The past 12 months, the index was primarily driven by three sectors: information technology (+23%), utilities (+20%) and real estate (+20%). Conversely, energy (-2%) was the only sector to lose ground. Notable individual stocks included Nestle (+29%), as the Swiss packaged-foods giant reported favorable sales growth. Semiconductor foundry Taiwan Semiconductor Manufacturing gained about 34%, reflecting the firm's better-than-expected quarterly financial results. Chinese e-commerce company Alibaba Group Holding (+24%) announced strong quarterly earnings. Healthy sales lifted LVMH Moet Hennessy Louis Vuitton (+43%), a French luxury goods conglomerate, while Dutch semiconductor equipment supplier ASML Holding (+55%) reported higher third-quarter revenue. In contrast, China-based Baidu (-46%) struggled, as the company anticipated continued challenges for its core online search-advertising business. British American Tobacco returned about -14%, partly reflecting investors' concern about weakness in tobacco companies' core cigarette business. Brazilian mining firm Vale (-23%) saw its shares plunge in January, as a dam collapsed at one of its mines, resulting in many casualties and significant financial losses.
The views expressed above reflect those of the portfolio manager(s) only through the end of the period as stated on the cover of this report and do not necessarily represent the views of Fidelity or any other person in the Fidelity organization. Any such views are subject to change at any time based upon market or other conditions and Fidelity disclaims any responsibility to update such views. These views may not be relied on as investment advice and, because investment decisions for a Fidelity fund are based on numerous factors, may not be relied on as an indication of trading intent on behalf of any Fidelity fund.
Note to shareholders: On March 22, 2019, Pat Waddell retired and is no longer a portfolio manager with Geode Capital Management.
Investment Summary (Unaudited)
Top Ten Stocks as of October 31, 2019
| | % of fund's net assets |
| Nestle SA (Reg. S) (Switzerland, Food Products) | 1.3 |
| Alibaba Group Holding Ltd. sponsored ADR (Cayman Islands, Internet & Direct Marketing Retail) | 1.0 |
| Taiwan Semiconductor Manufacturing Co. Ltd. (Taiwan, Semiconductors & Semiconductor Equipment) | 1.0 |
| Tencent Holdings Ltd. (Cayman Islands, Interactive Media & Services) | 1.0 |
| Roche Holding AG (participation certificate) (Switzerland, Pharmaceuticals) | 0.9 |
| Samsung Electronics Co. Ltd. (Korea (South), Technology Hardware, Storage & Peripherals) | 0.8 |
| Novartis AG (Switzerland, Pharmaceuticals) | 0.8 |
| Toyota Motor Corp. (Japan, Automobiles) | 0.7 |
| HSBC Holdings PLC (United Kingdom) (United Kingdom, Banks) | 0.6 |
| SAP SE (Germany, Software) | 0.5 |
| | 8.6 |
Top Market Sectors as of October 31, 2019
| | % of fund's net assets |
| Financials | 22.3 |
| Industrials | 11.7 |
| Consumer Discretionary | 11.6 |
| Consumer Staples | 9.6 |
| Information Technology | 8.6 |
| Health Care | 8.2 |
| Materials | 7.5 |
| Communication Services | 6.2 |
| Energy | 6.2 |
| Real Estate | 3.4 |
Geographic Diversification (% of fund's net assets)
| As of October 31, 2019 |
| | Japan | 17.3% |
| | United Kingdom | 10.4% |
| | Canada | 6.8% |
| | France | 6.2% |
| | Switzerland | 5.8% |
| | Germany | 5.5% |
| | Australia | 4.6% |
| | Cayman Islands | 4.3% |
| | Netherlands | 3.3% |
| | Other* | 35.8% |
* Includes Short-Term investments and Net Other Assets (Liabilities).
Percentages are based on country or territory of incorporation and are adjusted for the effect of futures contracts, if applicable.
Asset Allocation as of October 31, 2019
| | % of fund's net assets |
| Stocks and Equity Futures | 99.9 |
| Short-Term Investments and Net Other Assets (Liabilities) | 0.1 |
Schedule of Investments October 31, 2019
Showing Percentage of Net Assets
| Common Stocks - 97.8% | | | |
| | | Shares | Value |
| Argentina - 0.0% | | | |
| Banco Macro SA sponsored ADR | | 6,351 | $145,438 |
| Central Puerto SA sponsored ADR (a) | | 22,701 | 73,097 |
| Grupo Financiero Galicia SA sponsored ADR | | 15,136 | 174,972 |
| Pampa Holding SA sponsored ADR (a)(b) | | 10,214 | 159,032 |
| Telecom Argentina SA Class B sponsored ADR | | 12,929 | 116,361 |
| Transportadora de Gas del Sur SA Class B sponsored ADR | | 19,299 | 145,900 |
| YPF SA Class D sponsored ADR | | 21,637 | 202,522 |
|
| TOTAL ARGENTINA | | | 1,017,322 |
|
| Australia - 4.6% | | | |
| Abacus Property Group unit | | 51,829 | 139,335 |
| Accent Group Ltd. | | 32,302 | 33,610 |
| Adelaide Brighton Ltd. | | 42,842 | 90,994 |
| Afterpay Touch Group Ltd. (a) | | 21,168 | 420,228 |
| AGL Energy Ltd. | | 88,040 | 1,201,800 |
| ALS Ltd. | | 59,345 | 330,053 |
| Altium Ltd. | | 17,251 | 381,889 |
| Alumina Ltd. | | 347,680 | 542,768 |
| AMP Ltd. | | 492,827 | 622,707 |
| Ansell Ltd. | | 17,770 | 337,928 |
| AP Eagers Ltd. | | 15,161 | 128,087 |
| APA Group unit | | 156,886 | 1,260,149 |
| APN News & Media Ltd. | | 14,469 | 16,392 |
| Appen Ltd. | | 12,670 | 190,356 |
| ARB Corp. Ltd. | | 7,746 | 96,668 |
| Ardent Leisure Group Ltd. (a) | | 13,116 | 10,857 |
| Aristocrat Leisure Ltd. | | 71,222 | 1,552,999 |
| ASX Ltd. | | 23,967 | 1,360,412 |
| Atlas Arteria Ltd. unit | | 83,614 | 462,424 |
| Aurizon Holdings Ltd. | | 230,014 | 935,752 |
| Australia & New Zealand Banking Group Ltd. | | 365,343 | 6,713,952 |
| Australian Agricultural Co. Ltd. (a) | | 71,591 | 48,613 |
| Australian Pharmaceutical Industries Ltd. | | 31,076 | 28,394 |
| Babcock & Brown Wind Partners | | 191,114 | 84,054 |
| Bank of Queensland Ltd. | | 53,490 | 333,834 |
| Bapcor Ltd. | | 53,936 | 265,878 |
| Beach Energy Ltd. | | 210,274 | 330,757 |
| Bega Cheese Ltd. | | 25,105 | 61,907 |
| Bellamy's Australia Ltd. (a) | | 14,624 | 128,948 |
| Bendigo & Adelaide Bank Ltd. | | 71,161 | 522,258 |
| BHP Billiton Ltd. | | 384,323 | 9,420,702 |
| Bingo Industries Ltd. | | 33,961 | 56,170 |
| Blackmores Ltd. (b) | | 2,121 | 126,287 |
| BlueScope Steel Ltd. | | 72,373 | 662,516 |
| Boral Ltd. | | 171,088 | 594,003 |
| Brambles Ltd. | | 202,799 | 1,676,550 |
| Bravura Solutions Ltd. | | 47,171 | 132,705 |
| Breville Group Ltd. | | 15,579 | 164,991 |
| Brickworks Ltd. | | 3,884 | 48,481 |
| BT Investment Management Ltd. | | 56,198 | 277,484 |
| BWP Trust | | 57,248 | 163,675 |
| Caltex Australia Ltd. | | 35,357 | 664,663 |
| Carsales.com Ltd. | | 32,878 | 352,337 |
| Centuria Industrial REIT | | 1,042 | 2,454 |
| Challenger Ltd. | | 84,704 | 464,577 |
| Charter Hall Group unit | | 55,554 | 432,871 |
| Charter Hall Long Wale REIT unit | | 71,698 | 283,992 |
| Charter Hall Retail REIT | | 48,962 | 148,760 |
| Charter Hall Social Infrastruc | | 59,686 | 149,335 |
| Cimic Group Ltd. | | 11,956 | 272,464 |
| Clinuvel Pharmaceuticals Ltd. | | 7,719 | 162,677 |
| Coca-Cola Amatil Ltd. | | 74,877 | 525,461 |
| Cochlear Ltd. | | 7,195 | 1,049,679 |
| Coles Group Ltd. | | 146,929 | 1,520,550 |
| Collins Foods Ltd. | | 30,692 | 216,453 |
| Commonwealth Bank of Australia | | 229,606 | 12,449,263 |
| Computershare Ltd. | | 68,630 | 749,129 |
| Cooper Energy Ltd. (a) | | 310,278 | 118,597 |
| Corporate Travel Management Ltd. | | 6,485 | 78,781 |
| Costa Group Holdings Ltd. | | 19,396 | 38,146 |
| Costa Group Holdings Ltd. rights (a) | | 4,849 | 2,231 |
| Credit Corp. Group Ltd. | | 7,519 | 162,416 |
| Cromwell Property Group unit | | 156,494 | 142,996 |
| Crown Ltd. | | 42,649 | 366,381 |
| CSL Ltd. | | 59,410 | 10,477,329 |
| CSR Ltd. | | 113,292 | 323,837 |
| DEXUS Property Group unit | | 148,531 | 1,224,856 |
| Domain Holdings Australia Ltd. | | 43,726 | 95,411 |
| Dominos Pizza Enterprises Ltd. | | 7,917 | 278,534 |
| Downer EDI Ltd. | | 72,536 | 403,449 |
| Elders Ltd. | | 11,287 | 45,945 |
| Estia Health Ltd. | | 5,505 | 10,663 |
| Evolution Mining Ltd. | | 200,780 | 572,702 |
| FKP Property Group unit (a) | | 62,507 | 92,259 |
| Flexigroup Ltd. | | 24,844 | 33,377 |
| Flight Centre Travel Group Ltd. | | 11,974 | 351,757 |
| Fortescue Metals Group Ltd. | | 177,830 | 1,088,431 |
| G8 Education Ltd. | | 37,038 | 65,742 |
| Galaxy Resources Ltd. (a) | | 17,639 | 11,339 |
| GDI Property Group unit | | 5,098 | 5,460 |
| Genworth Mortgage Insurance Ltd. | | 21,812 | 58,650 |
| Gold Road Resources Ltd. (a) | | 122,666 | 96,252 |
| Goodman Group unit | | 211,915 | 2,104,160 |
| GrainCorp Ltd. | | 22,622 | 112,733 |
| Growthpoint Properties Australia Ltd. | | 41,197 | 121,115 |
| GUD Holdings Ltd. | | 13,485 | 100,563 |
| GWA Group Ltd. | | 15,587 | 31,265 |
| Hansen Technologies Ltd. | | 12,222 | 28,600 |
| Harvey Norman Holdings Ltd. | | 79,400 | 224,029 |
| Healius Ltd. | | 83,094 | 176,637 |
| HUB24 Ltd. | | 10,115 | 85,865 |
| IDP Education Ltd. | | 18,128 | 222,196 |
| Iluka Resources Ltd. | | 56,818 | 367,774 |
| Incitec Pivot Ltd. | | 177,677 | 422,772 |
| Independence Group NL | | 85,381 | 373,932 |
| Inghams Group Ltd. | | 88,689 | 189,876 |
| Insurance Australia Group Ltd. | | 310,121 | 1,699,175 |
| Invocare Ltd. | | 19,959 | 180,395 |
| IOOF Holdings Ltd. | | 49,199 | 250,193 |
| IPH Ltd. | | 40,290 | 224,121 |
| Iress Ltd. | | 12,736 | 111,847 |
| JB Hi-Fi Ltd. | | 18,443 | 471,323 |
| Jumbo Interactive Ltd. | | 7,641 | 116,815 |
| Lendlease Group unit | | 76,442 | 988,067 |
| Link Administration Holdings Ltd. | | 65,002 | 250,661 |
| Lynas Corp. Ltd. (a) | | 66,714 | 114,227 |
| Macquarie Group Ltd. | | 41,437 | 3,826,186 |
| Magellan Financial Group Ltd. | | 17,730 | 588,068 |
| Mayne Pharma Group Ltd. (a) | | 231,670 | 82,044 |
| McMillan Shakespeare Ltd. | | 16,052 | 177,567 |
| Medibank Private Ltd. | | 360,410 | 840,016 |
| Megaport Ltd. (a) | | 16,862 | 107,819 |
| Mesoblast Ltd. (a) | | 65,772 | 80,745 |
| Metcash Ltd. | | 155,494 | 302,266 |
| Mineral Resources Ltd. | | 16,681 | 164,073 |
| Mirvac Group unit | | 526,597 | 1,166,875 |
| Monadelphous Group Ltd. | | 7,750 | 82,027 |
| Myer Holdings Ltd. (a) | | 14,173 | 5,311 |
| Nanosonics Ltd. (a) | | 43,970 | 205,722 |
| National Australia Bank Ltd. | | 363,626 | 7,137,670 |
| National Storage (REIT) unit | | 80,926 | 103,842 |
| Nearmap Ltd. (a)(b) | | 59,652 | 109,587 |
| Netwealth Group Ltd. | | 23,696 | 143,731 |
| New Hope Corp. Ltd. | | 32,624 | 47,776 |
| Newcrest Mining Ltd. | | 100,021 | 2,183,292 |
| NEXTDC Ltd. (a) | | 53,261 | 235,375 |
| NIB Holdings Ltd. | | 80,014 | 386,792 |
| Nine Entertainment Co. Holdings Ltd. | | 297,077 | 376,942 |
| Northern Star Resources Ltd. | | 85,199 | 577,506 |
| NRW Holdings Ltd. | | 59,175 | 92,022 |
| Nufarm Ltd. | | 50,267 | 205,130 |
| oOh!media Ltd. | | 32,740 | 62,223 |
| Orica Ltd. | | 50,985 | 805,752 |
| Origin Energy Ltd. | | 237,536 | 1,287,792 |
| Orocobre Ltd. (a) | | 9,603 | 17,295 |
| Orora Ltd. | | 148,623 | 316,784 |
| OZ Minerals Ltd. | | 61,358 | 428,122 |
| Pact Group Holdings Ltd. | | 17,118 | 28,578 |
| Perenti Global Ltd. | | 58,319 | 91,870 |
| Perpetual Trustees Australia Ltd. | | 3,897 | 96,610 |
| Pilbara Minerals Ltd. (a)(b) | | 169,538 | 37,867 |
| Platinum Asset Management Ltd. | | 54,650 | 156,067 |
| Premier Investments Ltd. | | 11,629 | 154,121 |
| Pro Medicus Ltd. | | 7,636 | 140,128 |
| QBE Insurance Group Ltd. | | 167,457 | 1,456,941 |
| Qube Holdings Ltd. | | 167,007 | 374,447 |
| Ramsay Health Care Ltd. | | 21,586 | 1,019,953 |
| realestate.com.au Ltd. | | 6,607 | 495,851 |
| Regis Healthcare Ltd. | | 290 | 645 |
| Regis Resources Ltd. | | 75,711 | 256,589 |
| Reliance Worldwide Corp. Ltd. | | 91,247 | 265,517 |
| Resolute Mng Ltd. | | 141,492 | 118,529 |
| Rio Tinto Ltd. | | 48,043 | 3,004,274 |
| Sandfire Resources NL | | 31,626 | 126,312 |
| Santos Ltd. | | 234,494 | 1,311,646 |
| Saracen Mineral Holdings Ltd. (a) | | 95,568 | 247,274 |
| Scentre Group unit | | 692,649 | 1,830,080 |
| SEEK Ltd. | | 49,954 | 781,782 |
| Select Harvests Ltd. | | 5,638 | 27,999 |
| Service Stream Ltd. | | 80,472 | 143,024 |
| Seven Group Holdings Ltd. | | 17,683 | 228,557 |
| Shopping Centres Australasia Property Group unit | | 87,934 | 163,111 |
| Sigma Healthcare Ltd. | | 31,213 | 12,506 |
| Silver Lake Resources Ltd. (a) | | 159,047 | 127,321 |
| Sims Metal Management Ltd. | | 18,028 | 116,027 |
| Smartgroup Corp. Ltd. | | 18,219 | 143,387 |
| Sonic Healthcare Ltd. | | 59,742 | 1,176,619 |
| South32 Ltd. | | 689,469 | 1,206,523 |
| Southern Cross Media Group Ltd. | | 34,197 | 19,315 |
| SP AusNet | | 255,954 | 326,948 |
| Spark Infrastructure Group unit | | 223,666 | 311,908 |
| SpeedCast International Ltd. | | 9,792 | 6,718 |
| St Barbara Ltd. | | 128,228 | 247,378 |
| Steadfast Group Ltd. | | 128,411 | 318,004 |
| Stockland Corp. Ltd. unit | | 297,093 | 1,002,977 |
| Suncorp Group Ltd. | | 165,951 | 1,540,773 |
| Super Retail Group Ltd. | | 44,388 | 291,608 |
| Sydney Airport unit | | 148,312 | 898,244 |
| Syrah Resources Ltd. (a) | | 14,130 | 3,897 |
| Tabcorp Holdings Ltd. | | 293,384 | 972,171 |
| Tassal Group Ltd. | | 26,831 | 76,610 |
| Technology One Ltd. | | 41,186 | 209,226 |
| Telstra Corp. Ltd. | | 572,750 | 1,379,438 |
| The GPT Group unit | | 257,572 | 1,057,264 |
| The Star Entertainment Group Ltd. | | 113,467 | 367,916 |
| TPG Telecom Ltd. | | 44,979 | 202,728 |
| Transpacific Industries Group Ltd. | | 238,844 | 303,569 |
| Transurban Group unit | | 342,951 | 3,512,486 |
| Treasury Wine Estates Ltd. | | 93,054 | 1,128,107 |
| Vicinity Centres unit | | 423,257 | 779,099 |
| Village Roadshow Ltd. | | 338 | 746 |
| Virtus Health Ltd. | | 1,474 | 4,174 |
| Viva Energy Group Ltd. (c) | | 161,696 | 222,710 |
| Viva Energy REIT unit | | 67,353 | 134,223 |
| Vocus Group Ltd. (a) | | 90,922 | 208,453 |
| Washington H. Soul Pattinson & Co. Ltd. | | 23,609 | 352,913 |
| Webjet Ltd. | | 16,636 | 129,676 |
| Wesfarmers Ltd. | | 147,077 | 4,040,928 |
| West Australian Newspapers Holdings Ltd. (a) | | 77,891 | 21,390 |
| Western Areas NL | | 25,883 | 57,050 |
| Westgold Resources Ltd. (a) | | 33,822 | 54,981 |
| Westpac Banking Corp. | | 447,562 | 8,689,640 |
| Whitehaven Coal Ltd. | | 98,177 | 223,293 |
| WiseTech Global Ltd. | | 14,789 | 265,592 |
| Woodside Petroleum Ltd. | | 123,421 | 2,735,437 |
| Woolworths Group Ltd. | | 162,881 | 4,200,074 |
| WorleyParsons Ltd. | | 42,175 | 395,864 |
| Zip Co. Ltd. (a) | | 27,825 | 71,966 |
|
| TOTAL AUSTRALIA | | | 150,768,115 |
|
| Austria - 0.2% | | | |
| ams AG (a) | | 10,931 | 488,654 |
| Andritz AG | | 8,497 | 381,722 |
| Austria Technologie & Systemtechnik AG | | 1,807 | 33,535 |
| BAWAG Group AG (c) | | 6,574 | 271,283 |
| CA Immobilien Anlagen AG | | 6,878 | 265,418 |
| DO & CO Restaurants & Catering AG | | 329 | 30,602 |
| Erste Group Bank AG | | 38,581 | 1,362,741 |
| EVN AG | | 1,673 | 30,563 |
| IMMOFINANZ Immobilien Anlagen AG | | 11,914 | 342,158 |
| Lenzing AG | | 2,955 | 310,950 |
| Oesterreichische Post AG | | 5,821 | 214,241 |
| OMV AG | | 21,090 | 1,230,654 |
| PORR AG (b) | | 3,992 | 94,388 |
| Raiffeisen International Bank-Holding AG | | 14,796 | 363,869 |
| S IMMO AG | | 14,648 | 370,848 |
| S&T AG (b) | | 6,744 | 143,963 |
| Schoeller-Bleckmann Oilfield Equipment AG | | 1,427 | 81,487 |
| Telekom Austria AG | | 16,425 | 127,132 |
| UNIQA Insurance Group AG | | 7,655 | 73,552 |
| Verbund AG | | 10,100 | 546,330 |
| Vienna Insurance Group AG | | 2,697 | 73,094 |
| Voestalpine AG | | 12,734 | 318,840 |
| Wienerberger AG | | 15,999 | 432,531 |
| Zumtobel AG (a) | | 292 | 2,319 |
|
| TOTAL AUSTRIA | | | 7,590,874 |
|
| Bailiwick of Guernsey - 0.0% | | | |
| Burford Capital Ltd. | | 26,075 | 297,062 |
| Picton Property Income Ltd. | | 162,738 | 195,414 |
| Regional REIT Ltd. (b)(c) | | 102,239 | 139,587 |
| Schroder (REIT) Ltd. | | 2,240 | 1,602 |
| Sirius Real Estate Ltd. | | 170,439 | 162,272 |
| Standard Life Investment Property Income Trust Ltd. | | 929 | 1,063 |
| Stobart Group Ltd. | | 18,958 | 29,223 |
| UK Commercial Property REIT Ltd. | | 139,509 | 158,485 |
|
| TOTAL BAILIWICK OF GUERNSEY | | | 984,708 |
|
| Bailiwick of Jersey - 0.5% | | | |
| Boohoo.Com PLC (a) | | 109,526 | 374,549 |
| Centamin PLC | | 165,807 | 249,250 |
| Experian PLC | | 116,595 | 3,667,041 |
| Ferguson PLC | | 29,615 | 2,528,924 |
| Glencore Xstrata PLC | | 1,432,327 | 4,323,308 |
| IWG PLC | | 78,776 | 391,231 |
| Man Group PLC | | 272,707 | 506,915 |
| Petrofac Ltd. | | 57,231 | 284,898 |
| Polymetal International PLC | | 27,105 | 444,687 |
| Sanne Group PLC | | 11,441 | 78,250 |
| WPP PLC | | 168,924 | 2,108,097 |
|
| TOTAL BAILIWICK OF JERSEY | | | 14,957,150 |
|
| Belgium - 0.8% | | | |
| Ackermans& Van Haaren SA | | 3,597 | 550,811 |
| Aedifica SA | | 2,624 | 315,482 |
| Ageas | | 24,530 | 1,412,783 |
| Agfa-Gevaert NV (a) | | 13,944 | 63,638 |
| Anheuser-Busch InBev SA NV | | 99,491 | 8,030,660 |
| Barco NV | | 1,385 | 301,215 |
| Befimmo SCA Sicafi | | 2,341 | 151,172 |
| Bekaert SA | | 2,466 | 68,703 |
| Bpost SA | | 12,090 | 138,211 |
| Cofinimmo SA | | 2,510 | 371,201 |
| Colruyt NV | | 7,259 | 403,503 |
| Compagnie D'entreprises CFE SA | | 465 | 44,808 |
| D'ieteren SA | | 2,258 | 142,538 |
| Econocom Group SA | | 8,036 | 20,954 |
| Elia System Operator SA/NV | | 3,562 | 307,090 |
| Euronav NV | | 18,114 | 204,248 |
| Fagron NV | | 2,217 | 42,059 |
| Galapagos Genomics NV (a) | | 5,409 | 995,888 |
| Gimv NV | | 7,597 | 455,844 |
| Groupe Bruxelles Lambert SA | | 11,279 | 1,131,901 |
| Intervest Offices & Warehouses NV | | 5,340 | 161,400 |
| Ion Beam Applications SA (a) | | 586 | 9,346 |
| KBC Ancora | | 5,203 | 247,784 |
| KBC Groep NV | | 33,040 | 2,317,097 |
| Kinepolis Group NV | | 846 | 56,235 |
| Melexis NV | | 2,513 | 176,013 |
| Mithra Pharmaceuticals SA (a)(b) | | 2,881 | 86,177 |
| Montea SICAFI SCA | | 1,707 | 154,780 |
| Ontex Group NV | | 8,318 | 150,845 |
| Orange Belgium | | 11,884 | 261,373 |
| Proximus | | 16,815 | 516,291 |
| Retail Estates NV | | 1,852 | 176,810 |
| Sofina SA | | 1,736 | 383,747 |
| Solvay SA Class A | | 11,614 | 1,262,927 |
| Telenet Group Holding NV | | 5,712 | 280,434 |
| Tessenderlo Group (a) | | 1,881 | 62,202 |
| Titan Cement International Trading SA (a) | | 10,981 | 232,695 |
| UCB SA | | 16,860 | 1,358,774 |
| Umicore SA | | 27,209 | 1,121,899 |
| Van de Velde | | 142 | 3,833 |
| Warehouses de Pauw | | 1,809 | 335,321 |
|
| TOTAL BELGIUM | | | 24,508,692 |
|
| Bermuda - 0.5% | | | |
| AGTech Holdings Ltd. (a) | | 40,000 | 1,906 |
| Alibaba Health Information Technology Ltd. (a) | | 400,000 | 402,598 |
| Alibaba Pictures Group Ltd. (a) | | 1,790,000 | 293,590 |
| Beijing Enterprises Water Group Ltd. | | 754,000 | 393,006 |
| Borr Drilling Ltd. (a) | | 10,760 | 72,462 |
| Brightoil Petroleum Holdings Ltd. (a)(d) | | 26,000 | 4,977 |
| Brilliance China Automotive Holdings Ltd. | | 372,000 | 410,232 |
| BW LPG Ltd. (c) | | 25,038 | 175,203 |
| BW Offshore Ltd. (a) | | 18,283 | 139,168 |
| Cafe de Coral Holdings Ltd. | | 104,000 | 283,774 |
| Cheung Kong Infrastructure Holdings Ltd. | | 75,000 | 539,755 |
| China Foods Ltd. | | 188,000 | 77,266 |
| China Gas Holdings Ltd. | | 238,400 | 1,015,570 |
| China Grand Pharmaceutical and Healthcare Holdings Ltd. | | 368,000 | 210,889 |
| China Oil & Gas Group Ltd. | | 360,000 | 15,590 |
| China Oriental Group Co. Ltd. (H Shares) | | 120,000 | 41,880 |
| China Resource Gas Group Ltd. | | 124,000 | 747,634 |
| China Water Affairs Group Ltd. | | 40,000 | 30,570 |
| China Youzan Ltd. (a) | | 1,048,000 | 64,159 |
| Chinese Estates Holdings Ltd. | | 93,000 | 67,573 |
| Chow Sang Sang Holdings International Ltd. | | 61,000 | 71,184 |
| CITIC Resources Holdings Ltd. | | 16,000 | 1,039 |
| CMBC Capital Holdings Ltd. | | 600,000 | 10,854 |
| Cosco Shipping Ports Ltd. | | 144,794 | 113,836 |
| Credicorp Ltd. (United States) | | 9,331 | 1,997,207 |
| Dairy Farm International Holdings Ltd. | | 62,989 | 379,654 |
| Digital China Holdings Ltd. (H Shares) | | 21,261 | 11,080 |
| Digital Domain Holdings Ltd. (a) | | 470,000 | 5,264 |
| Emperor International Holding Ltd. | | 54,000 | 12,038 |
| Esprit Holdings Ltd. (a) | | 52,400 | 10,018 |
| Frontline Ltd. (a) | | 7,218 | 75,742 |
| GCL New Energy Holdings Ltd. (a) | | 476,000 | 15,433 |
| Giordano International Ltd. | | 56,000 | 17,777 |
| Golden Ocean Group Ltd. | | 5,388 | 31,053 |
| GOME Electrical Appliances Holdings Ltd. (a) | | 1,293,000 | 116,881 |
| Gulf Keystone Petroleum Ltd. | | 20,209 | 53,664 |
| GZI Transport Ltd. | | 72,000 | 66,468 |
| Haier Electronics Group Co. Ltd. | | 177,000 | 505,351 |
| HengTen Networks Group Ltd. (a) | | 2,816,000 | 40,520 |
| Hiscox Ltd. | | 34,116 | 658,021 |
| Hoegh LNG Holdings Ltd. | | 550 | 2,123 |
| Hongkong Land Holdings Ltd. | | 164,539 | 903,878 |
| Jardine Matheson Holdings Ltd. | | 29,558 | 1,685,132 |
| Jardine Strategic Holdings Ltd. | | 26,829 | 866,357 |
| Johnson Electric Holdings Ltd. | | 31,000 | 56,609 |
| K Wah International Holdings Ltd. | | 76,902 | 42,025 |
| Kerry Logistics Network Ltd. | | 42,500 | 67,811 |
| Kerry Properties Ltd. | | 90,500 | 292,647 |
| Kunlun Energy Co. Ltd. | | 358,000 | 333,204 |
| Lancashire Holdings Ltd. | | 30,597 | 281,995 |
| Landing International Development Ltd. (a) | | 54,000 | 6,120 |
| Li & Fung Ltd. | | 680,000 | 74,365 |
| Luk Fook Holdings International Ltd. | | 89,000 | 236,394 |
| Luye Pharma Group Ltd. (c) | | 78,500 | 58,023 |
| Man Wah Holdings Ltd. | | 269,600 | 183,624 |
| Mandarin Oriental International Ltd. | | 47,100 | 77,589 |
| Neo-China Group (Holdings) Ltd. | | 135,000 | 16,846 |
| Nine Dragons Paper (Holdings) Ltd. | | 210,000 | 182,168 |
| Northern Drilling Ltd. (a) | | 27,703 | 72,299 |
| NWS Holdings Ltd. | | 179,367 | 266,948 |
| Pacific Basin Shipping Ltd. | | 565,000 | 130,819 |
| Panda Green Energy Group Ltd. (a) | | 56,000 | 1,599 |
| PAX Global Technology Ltd. | | 14,000 | 6,117 |
| Pou Sheng International (Holdings) Ltd. | | 181,000 | 68,332 |
| Road King Infrastructure Ltd. | | 20,000 | 36,588 |
| Shangri-La Asia Ltd. | | 156,000 | 160,120 |
| Shenzhen International Holdings Ltd. | | 176,608 | 359,050 |
| Sihuan Pharmaceutical Holdings Group Ltd. | | 675,000 | 88,439 |
| Silverlake Axis Ltd. Class A | | 81,300 | 27,172 |
| Skyfame Realty Holdings Ltd. | | 150,000 | 21,042 |
| Skyworth Group Ltd. | | 72,098 | 18,631 |
| SmarTone Telecommunications Holdings Ltd. | | 2,643 | 2,294 |
| SMI Corp. Ltd. (a)(d) | | 7,200 | 2,150 |
| Stolt-Nielsen SA | | 172 | 2,121 |
| Tai Fook Securities Group Ltd. | | 666,030 | 193,115 |
| Texwinca Holdings Ltd. | | 200,000 | 45,378 |
| Town Health International Holdings Co. Ltd. (d) | | 114,000 | 10,002 |
| Vtech Holdings Ltd. | | 47,800 | 419,102 |
| Yue Yuen Industrial (Holdings) Ltd. | | 98,000 | 276,183 |
|
| TOTAL BERMUDA | | | 16,755,297 |
|
| Brazil - 1.3% | | | |
| AES Tiete Energia SA unit | | 1,939 | 5,662 |
| Alupar Investimento SA unit | | 23,600 | 142,818 |
| Ambev SA | | 610,963 | 2,647,684 |
| Arezzo Industria e Comercio SA | | 13,300 | 195,993 |
| Atacadao Distribuicao Comercio e Industria Ltda | | 43,700 | 208,230 |
| B2W Companhia Global do Varejo (a) | | 27,304 | 345,853 |
| Banco Bradesco SA | | 205,837 | 1,686,011 |
| Banco do Brasil SA | | 109,800 | 1,318,257 |
| Banco Santander SA (Brasil) unit | | 53,800 | 631,300 |
| BB Seguridade Participacoes SA | | 91,700 | 776,723 |
| BK Brasil Operacao e Assessoria a Restaurantes SA | | 13,300 | 62,015 |
| BM&F BOVESPA SA | | 269,278 | 3,248,390 |
| BR Malls Participacoes SA | | 104,005 | 398,074 |
| Brasil Foods SA (a) | | 70,800 | 626,881 |
| BTG Pactual Participations Ltd. unit | | 28,500 | 461,628 |
| CCR SA | | 160,484 | 657,862 |
| Centrais Eletricas Brasileiras SA (Electrobras) (a) | | 33,100 | 326,502 |
| Cia. Hering SA | | 20,400 | 160,077 |
| Cielo SA | | 147,660 | 278,347 |
| Companhia de Locacao das Americas | | 43,200 | 185,920 |
| Companhia de Saneamento Basico do Estado de Sao Paulo (SABESP) | | 44,800 | 610,142 |
| Companhia de Saneamento de Minas Gerais | | 10,000 | 168,283 |
| Companhia Siderurgica Nacional SA (CSN) | | 78,487 | 230,930 |
| Compania de Saneamento do Parana unit | | 9,700 | 220,581 |
| Cosan Logistica SA (a) | | 25,400 | 128,441 |
| Cosan SA Industria e Comercio | | 22,400 | 322,777 |
| CVC Brasil Operadora e Agencia de Viagens SA | | 20,800 | 265,699 |
| Cyrela Brazil Realty SA | | 46,000 | 308,884 |
| Dommo Energia SA (a) | | 10,230 | 17,090 |
| Drogasil SA | | 32,600 | 894,153 |
| Duratex SA | | 26,100 | 85,514 |
| Ecorodovias Infraestrutura e Logistica SA | | 36,000 | 123,426 |
| EDP Energias do Brasil SA | | 51,300 | 242,653 |
| Embraer SA | | 79,788 | 348,755 |
| Energisa SA unit | | 19,300 | 230,609 |
| ENGIE Brasil Energia SA | | 27,681 | 312,390 |
| Equatorial Energia SA | | 19,200 | 487,744 |
| Estacio Participacoes SA | | 48,900 | 478,575 |
| EZ Tec Empreendimentos e Participacoes SA | | 13,500 | 138,686 |
| Fleury SA | | 61,200 | 388,366 |
| Gol Linhas Aereas Inteligentes SA: | | | |
| warrants 7/15/24 (a) | | 900 | 2,469 |
| warrants 7/30/24 (a) | | 3,278 | 8,991 |
| Grendene SA | | 31,100 | 77,314 |
| Guararapes Confeccoes SA | | 33,500 | 166,560 |
| Hypermarcas SA | | 44,700 | 382,522 |
| Iguatemi Empresa de Shopping Centers SA | | 10,400 | 124,214 |
| Iochpe-Maxion SA | | 3,830 | 16,655 |
| IRB Brasil Resseguros SA | | 93,900 | 884,798 |
| JBS SA | | 141,300 | 996,728 |
| Klabin SA unit | | 87,600 | 345,551 |
| Kroton Educacional SA | | 208,654 | 503,100 |
| Light SA (a) | | 50,300 | 249,587 |
| Linx SA | | 24,500 | 211,920 |
| Localiza Rent A Car SA | | 76,770 | 826,562 |
| LOG Commercial Properties e Participacoes SA | | 591 | 3,728 |
| Lojas Renner SA | | 106,924 | 1,353,047 |
| M. Dias Branco SA | | 17,957 | 169,026 |
| Magazine Luiza SA | | 82,500 | 918,289 |
| Marfrig Global Foods SA (a) | | 37,100 | 99,445 |
| Minerva SA (a) | | 600 | 1,547 |
| MPX Mineracao e Energia SA (a) | | 39,300 | 322,102 |
| MRV Engenharia e Participacoes SA | | 59,000 | 258,773 |
| Multiplan Empreendimentos Imobiliarios SA | | 46,496 | 338,648 |
| Natura Cosmeticos SA | | 55,800 | 433,544 |
| Notre Dame Intermedica Participacoes SA | | 42,700 | 638,823 |
| Odontoprev SA | | 59,900 | 220,900 |
| Petrobras Distribuidora SA | | 92,400 | 651,558 |
| Petroleo Brasileiro SA - Petrobras (ON) | | 402,100 | 3,278,561 |
| Porto Seguro SA | | 14,300 | 204,668 |
| Qualicorp Consultoria E Corret | | 26,300 | 209,193 |
| Rumo SA (a) | | 144,800 | 823,199 |
| Sao Martinho SA | | 21,300 | 93,262 |
| SLC Agricola SA | | 7,000 | 31,610 |
| Smiles Fidelidade SA | | 6,600 | 60,890 |
| Sonae Sierra Brasil SA | | 27,372 | 290,407 |
| Sul America SA unit | | 35,635 | 429,077 |
| Suzano Papel e Celulose SA | | 73,188 | 595,651 |
| Terna Participacoes SA unit | | 20,300 | 146,182 |
| TIM Participacoes SA | | 95,280 | 271,312 |
| Totvs SA | | 26,500 | 411,525 |
| Ultrapar Participacoes SA | | 84,600 | 398,056 |
| Vale SA (a) | | 413,974 | 4,872,104 |
| Valid Solucoes SA | | 660 | 2,185 |
| Via Varejo SA (a) | | 104,400 | 193,155 |
| Weg SA | | 123,940 | 788,049 |
|
| TOTAL BRAZIL | | | 43,673,412 |
|
| British Virgin Islands - 0.0% | | | |
| Arcos Dorados Holdings, Inc. Class A | | 28,497 | 212,873 |
| Despegar.com Corp. (a)(b) | | 8,509 | 95,131 |
| First Pacific Co. Ltd. | | 540,000 | 206,584 |
|
| TOTAL BRITISH VIRGIN ISLANDS | | | 514,588 |
|
| Canada - 6.7% | | | |
| Advantage Oil & Gas Ltd. (a) | | 9,749 | 14,064 |
| Aecon Group, Inc. | | 4,244 | 58,645 |
| AG Growth International, Inc. | | 2,935 | 95,419 |
| AGF Management Ltd. Class B (non-vtg.) | | 1,711 | 7,548 |
| Agnico Eagle Mines Ltd. (Canada) | | 29,652 | 1,822,435 |
| Air Canada (a) | | 18,482 | 658,117 |
| Alacer Gold Corp. (a) | | 30,195 | 149,473 |
| Alamos Gold, Inc. | | 60,342 | 328,488 |
| Alaris Royalty Corp. | | 1,959 | 29,122 |
| Algonquin Power & Utilities Corp. | | 71,980 | 988,625 |
| Alimentation Couche-Tard, Inc. Class B (sub. vtg.) | | 115,040 | 3,450,065 |
| Allied Properties (REIT) | | 3,901 | 158,694 |
| AltaGas Ltd. | | 43,109 | 627,111 |
| Altius Minerals Corp. | | 306 | 2,446 |
| Altus Group Ltd. | | 5,318 | 147,375 |
| Aphria, Inc. (a)(b) | | 39,398 | 197,424 |
| ARC Resources Ltd. | | 47,687 | 202,030 |
| Aritzia LP (a) | | 14,288 | 203,618 |
| Artis (REIT) | | 26,390 | 248,452 |
| ATCO Ltd. Class I (non-vtg.) | | 10,224 | 359,404 |
| Athabasca Oil Corp. (a)(b) | | 19,008 | 5,845 |
| ATS Automation Tooling System, Inc. (a) | | 9,107 | 123,630 |
| Aurora Cannabis, Inc. (a)(b) | | 83,247 | 298,327 |
| B2Gold Corp. | | 119,611 | 420,468 |
| Badger Daylighting Ltd. | | 5,918 | 175,325 |
| Ballard Power Systems, Inc. (a)(b) | | 17,180 | 94,307 |
| Bank of Montreal | | 81,496 | 6,032,845 |
| Bank of Nova Scotia | | 154,224 | 8,845,252 |
| Barrick Gold Corp. (Canada) | | 231,268 | 4,017,472 |
| Bausch Health Cos., Inc. (Canada) (a) | | 42,992 | 1,068,680 |
| Baytex Energy Corp. (a) | | 54,000 | 60,269 |
| BCE, Inc. | | 15,768 | 747,995 |
| Birchcliff Energy Ltd. | | 13,061 | 19,932 |
| BlackBerry Ltd. (a) | | 74,307 | 390,407 |
| Boardwalk (REIT) | | 12,411 | 411,596 |
| Bombardier, Inc. Class B (sub. vtg.) (a) | | 286,624 | 361,245 |
| Boralex, Inc. Class A | | 3,344 | 55,348 |
| Brookfield Asset Management, Inc. Class A | | 115,219 | 6,371,118 |
| BRP, Inc. | | 8,197 | 367,748 |
| CAE, Inc. | | 35,208 | 882,940 |
| Cameco Corp. | | 63,956 | 571,044 |
| Canaccord Capital, Inc. | | 4,468 | 18,183 |
| Canacol Energy Ltd. (a) | | 1,213 | 4,467 |
| Canada Goose Holdings, Inc. (a)(b) | | 9,992 | 418,009 |
| Canadian Apartment Properties (REIT) unit | | 13,514 | 562,681 |
| Canadian Energy Services & Technology Corp. | | 8,231 | 10,999 |
| Canadian Imperial Bank of Commerce | | 55,908 | 4,767,313 |
| Canadian National Railway Co. | | 93,934 | 8,401,355 |
| Canadian Natural Resources Ltd. | | 155,167 | 3,912,456 |
| Canadian Pacific Railway Ltd. | | 18,307 | 4,163,032 |
| Canadian Tire Ltd. Class A (non-vtg.) | | 9,634 | 1,038,594 |
| Canadian Utilities Ltd. Class A (non-vtg.) | | 18,807 | 548,460 |
| Canadian Western Bank, Edmonton | | 8,335 | 211,049 |
| Canfor Corp. | | 6,226 | 75,255 |
| Canfor Pulp Products, Inc. | | 673 | 4,425 |
| Capital Power Corp. | | 16,041 | 384,492 |
| Cardinal Energy Ltd. | | 630 | 918 |
| Cascades, Inc. | | 12,718 | 120,411 |
| CCL Industries, Inc. Class B | | 21,975 | 904,460 |
| Celestica, Inc. (sub. vtg.) (a) | | 20,985 | 151,998 |
| Cenovus Energy, Inc. (Canada) | | 136,994 | 1,167,013 |
| Centerra Gold, Inc. (a) | | 26,850 | 228,931 |
| CGI Group, Inc. Class A (sub. vtg.) (a) | | 31,576 | 2,454,446 |
| China Gold International Resources Corp. Ltd. (a) | | 4,402 | 3,509 |
| Chorus Aviation, Inc. Class B | | 24,896 | 147,626 |
| CI Financial Corp. | | 39,816 | 579,510 |
| Cineplex, Inc. | | 5,228 | 89,111 |
| Cogeco Communications, Inc. | | 956 | 82,637 |
| Cogeco, Inc. (sub. vtg.) | | 155 | 11,995 |
| Colliers International Group, Inc. | | 5,457 | 365,637 |
| Cominar (REIT) | | 7,491 | 76,383 |
| Computer Modelling Group Ltd. | | 610 | 3,247 |
| Constellation Software, Inc. | | 2,619 | 2,586,648 |
| Corby Spirit and Wine Ltd. | | 368 | 4,470 |
| Corus Entertainment, Inc. Class B (non-vtg.) | | 44,591 | 171,309 |
| Cott Corp. | | 25,142 | 322,984 |
| Crescent Point Energy Corp. | | 70,942 | 259,078 |
| Crombie (REIT) | | 448 | 5,381 |
| Cronos Group, Inc. (a)(b) | | 21,273 | 174,112 |
| CT Real Estate Investment Trust | | 401 | 4,509 |
| Descartes Systems Group, Inc. (Canada) (a) | | 13,314 | 518,064 |
| Detour Gold Corp. (a) | | 25,705 | 426,823 |
| Dirtt Environmental Solutions Ltd. (a) | | 12,972 | 58,896 |
| Dollarama, Inc. | | 39,951 | 1,344,035 |
| Dorel Industries, Inc. Class B (sub. vtg.) | | 1,245 | 4,717 |
| Dream Global REIT | | 23,892 | 302,573 |
| Dream Industrial (REIT) | | 1,039 | 10,602 |
| Dream Office (REIT) | | 386 | 8,587 |
| DREAM Unlimited Corp. | | 19,130 | 146,551 |
| ECN Capital Corp. | | 29,196 | 96,426 |
| Eldorado Gold Corp. (a) | | 23,292 | 196,119 |
| Element Financial Corp. (b) | | 60,612 | 515,416 |
| Emera, Inc. | | 30,634 | 1,268,296 |
| Empire Co. Ltd. Class A (non-vtg.) | | 26,152 | 694,355 |
| Enbridge, Inc. | | 264,150 | 9,620,587 |
| Encana Corp. (Toronto) | | 200,242 | 784,488 |
| Endeavour Silver Corp. (a)(b) | | 31,094 | 77,198 |
| Enerflex Ltd. | | 7,164 | 56,133 |
| Enerplus Corp. | | 45,416 | 274,130 |
| Enghouse Systems Ltd. | | 9,192 | 267,783 |
| Ensign Energy Services, Inc. | | 10,557 | 21,481 |
| Entertainment One Ltd. | | 59,993 | 432,467 |
| Equitable Group, Inc. | | 2,732 | 235,054 |
| ERO Copper Corp. (a) | | 11,930 | 149,091 |
| Evertz Technologies Ltd. | | 415 | 5,640 |
| Exco Technologies Ltd. | | 580 | 3,364 |
| Extendicare, Inc. (b) | | 24,719 | 167,221 |
| Fairfax Financial Holdings Ltd. (sub. vtg.) | | 3,444 | 1,459,078 |
| Fiera Capital Corp. | | 751 | 5,987 |
| Finning International, Inc. | | 27,172 | 462,735 |
| First Capital Realty, Inc. | | 37,957 | 628,246 |
| First Majestic Silver Corp. (a)(b) | | 27,984 | 299,153 |
| First National Financial Corp. | | 813 | 26,475 |
| First Quantum Minerals Ltd. | | 90,301 | 763,078 |
| FirstService Corp. | | 4,244 | 370,428 |
| Fortis, Inc. | | 52,761 | 2,191,999 |
| Fortuna Mines, Inc. (a) | | 29,283 | 93,378 |
| Franco-Nevada Corp. | | 24,114 | 2,339,814 |
| Freehold Royalties Ltd. | | 4,398 | 21,604 |
| Frontera Energy Corp. | | 18,532 | 148,582 |
| Genworth MI Canada, Inc. | | 3,705 | 149,652 |
| George Weston Ltd. | | 8,917 | 713,915 |
| Gibson Energy, Inc. | | 17,314 | 301,822 |
| Gildan Activewear, Inc. | | 28,145 | 719,064 |
| Granite Real Estate Investment Trust | | 3,081 | 152,565 |
| Great Canadian Gaming Corp. (a) | | 6,587 | 208,347 |
| Great-West Lifeco, Inc. | | 39,407 | 958,322 |
| H&R (REIT) unit | | 23,980 | 405,645 |
| HEXO Corp. (a)(b) | | 36,646 | 78,740 |
| Home Capital Group, Inc. (a) | | 7,082 | 145,770 |
| HudBay Minerals, Inc. | | 28,641 | 103,944 |
| Hudson's Bay Co. | | 21,687 | 164,328 |
| Husky Energy, Inc. | | 55,294 | 386,231 |
| Hydro One Ltd. (c) | | 36,320 | 675,330 |
| iA Financial Corp, Inc. | | 14,402 | 693,584 |
| IAMGOLD Corp. (a) | | 70,673 | 265,607 |
| IGM Financial, Inc. | | 18,575 | 524,207 |
| Imperial Oil Ltd. | | 40,754 | 1,014,905 |
| Innergex Renewable Energy, Inc. | | 6,435 | 80,321 |
| Intact Financial Corp. | | 17,822 | 1,838,896 |
| Inter Pipeline Ltd. (b) | | 52,380 | 879,297 |
| Interfor Corp. (a) | | 5,374 | 64,059 |
| InterRent REIT | | 1,343 | 15,917 |
| Intertape Polymer Group, Inc. | | 4,330 | 55,756 |
| Ivanhoe Mines Ltd. (a)(b) | | 81,647 | 202,707 |
| Jamieson Wellness, Inc. | | 8,580 | 154,780 |
| Just Energy Group, Inc. | | 14,385 | 33,311 |
| Kelt Exploration Ltd. (a) | | 23,486 | 51,355 |
| Keyera Corp. | | 26,564 | 615,746 |
| Killam Apartment (REIT) (b) | | 18,141 | 268,720 |
| Kinaxis, Inc. (a) | | 2,261 | 144,387 |
| Kinder Morgan Canada Ltd. (c) | | 2,636 | 28,019 |
| Kinross Gold Corp. (a) | | 164,445 | 799,065 |
| Kirkland Lake Gold Ltd. | | 26,072 | 1,224,321 |
| Knight Therapeutics, Inc. (a) | | 30,762 | 195,722 |
| Labrador Iron Ore Royalty Corp. (b) | | 8,396 | 142,218 |
| Largo Resources Ltd. (a) | | 26,828 | 26,887 |
| Lassonde Industries, Inc. Class A (sub. vtg.) | | 1,440 | 191,078 |
| Laurentian Bank of Canada (b) | | 8,165 | 280,825 |
| Linamar Corp. | | 5,243 | 170,972 |
| Loblaw Companies Ltd. | | 21,798 | 1,162,472 |
| Lucara Diamond Corp. | | 4,561 | 3,740 |
| Lundin Mining Corp. | | 91,974 | 464,374 |
| MAG Silver Corp. (a) | | 6,403 | 63,199 |
| Magellan Aerospace Corp. | | 282 | 3,439 |
| Magna International, Inc. Class A (sub. vtg.) | | 40,969 | 2,202,889 |
| Major Drilling Group International, Inc. (a) | | 567 | 2,402 |
| Manulife Financial Corp. | | 257,273 | 4,791,517 |
| Maple Leaf Foods, Inc. | | 14,931 | 260,394 |
| Martinrea International, Inc. | | 20,110 | 163,983 |
| Medical Facilities Corp. | | 378 | 2,244 |
| MEG Energy Corp. (a) | | 50,850 | 195,354 |
| Methanex Corp. | | 7,478 | 283,370 |
| Metro, Inc. Class A (sub. vtg.) | | 32,722 | 1,383,809 |
| Morguard (REIT) | | 354 | 3,061 |
| Morguard North American Resources (REIT) | | 10,443 | 151,836 |
| Morneau Shephell, Inc. | | 19,586 | 471,545 |
| MTY Food Group, Inc. | | 4,627 | 184,855 |
| Mullen Group Ltd. | | 11,037 | 68,714 |
| National Bank of Canada | | 40,761 | 2,105,051 |
| New Gold, Inc. (a) | | 122,409 | 127,325 |
| NexGen Energy Ltd. (a) | | 39,734 | 51,285 |
| Nfi Group, Inc. (b) | | 5,689 | 125,131 |
| Norbord, Inc. | | 7,035 | 203,075 |
| North West Co., Inc. | | 15,714 | 336,209 |
| Northland Power, Inc. | | 23,026 | 459,786 |
| Northview Apartmemt (REIT) | | 252 | 5,522 |
| Northwest Healthcare Properties REIT | | 930 | 8,445 |
| Novagold Resources, Inc. (a) | | 25,999 | 189,105 |
| Nutrien Ltd. | | 77,506 | 3,707,883 |
| NuVista Energy Ltd. (a) | | 14,019 | 20,117 |
| OceanaGold Corp. | | 86,094 | 206,558 |
| Onex Corp. (sub. vtg.) | | 12,466 | 732,854 |
| Open Text Corp. | | 36,593 | 1,478,612 |
| Osisko Gold Royalties Ltd. | | 17,675 | 173,918 |
| Osisko Mining, Inc. (a)(b) | | 32,711 | 69,291 |
| Pan American Silver Corp. | | 27,913 | 475,917 |
| Pan American Silver Corp. rights (a)(d) | | 29,057 | 0 |
| Paramount Resources Ltd. Class A (a) | | 2,068 | 8,070 |
| Parex Resources, Inc. (a) | | 21,679 | 293,805 |
| Parkland Fuel Corp. | | 23,376 | 776,479 |
| Pason Systems, Inc. | | 8,839 | 94,893 |
| Pembina Pipeline Corp. | | 64,672 | 2,276,851 |
| Peyto Exploration & Development Corp. | | 19,657 | 39,251 |
| Power Corp. of Canada (sub. vtg.) | | 42,441 | 982,159 |
| Power Financial Corp. | | 35,060 | 819,868 |
| PrairieSky Royalty Ltd. | | 25,372 | 247,729 |
| Precision Drilling Corp. (a) | | 18,987 | 20,182 |
| Premier Gold Mines Ltd. (a) | | 3,779 | 6,484 |
| Premium Brands Holdings Corp. | | 5,778 | 381,179 |
| Pretium Resources, Inc. (a) | | 27,563 | 277,702 |
| Quebecor, Inc. Class B (sub. vtg.) | | 22,736 | 528,568 |
| Recipe Unlimited Corp. | | 231 | 4,150 |
| Restaurant Brands International, Inc. | | 31,657 | 2,071,129 |
| Richelieu Hardware Ltd. (b) | | 15,048 | 308,935 |
| RioCan (REIT) | | 22,360 | 448,694 |
| Ritchie Bros. Auctioneers, Inc. | | 16,162 | 664,960 |
| Rogers Communications, Inc. Class B (non-vtg.) | | 46,910 | 2,208,556 |
| Rogers Sugar, Inc. | | 24,244 | 99,951 |
| Royal Bank of Canada | | 181,250 | 14,619,998 |
| Russel Metals, Inc. | | 12,893 | 211,637 |
| Sandstorm Gold Ltd. (a) | | 25,998 | 185,545 |
| Saputo, Inc. | | 31,906 | 925,373 |
| Seabridge Gold, Inc. (a) | | 7,539 | 97,135 |
| Secure Energy Services, Inc. | | 12,279 | 39,528 |
| SEMAFO, Inc. (a) | | 36,265 | 117,019 |
| Seven Generations Energy Ltd. (a) | | 45,198 | 253,254 |
| Shaw Communications, Inc. Class B | | 64,671 | 1,319,836 |
| ShawCor Ltd. Class A | | 18,409 | 185,334 |
| Shopify, Inc. Class A (a) | | 12,920 | 4,051,295 |
| Sienna Senior Living, Inc. | | 9,508 | 137,087 |
| Sierra Wireless, Inc. (a) | | 2,657 | 29,312 |
| Silvercorp Metals, Inc. | | 35,099 | 146,301 |
| Sleep Country Canada Holdings, Inc. (c) | | 7,556 | 125,924 |
| Smart (REIT) | | 7,722 | 186,674 |
| SNC-Lavalin Group, Inc. (b) | | 21,801 | 394,110 |
| Spin Master Corp. (a)(c) | | 5,010 | 141,730 |
| Sprott, Inc. | | 62,272 | 143,730 |
| SSR Mining, Inc. (a) | | 17,111 | 253,073 |
| Stantec, Inc. | | 13,423 | 286,376 |
| Stella-Jones, Inc. | | 11,279 | 312,739 |
| Summit Industrial Income REIT (b) | | 18,815 | 182,565 |
| Sun Life Financial, Inc. | | 76,314 | 3,423,730 |
| Suncor Energy, Inc. | | 203,839 | 6,060,538 |
| Superior Plus Corp. | | 15,710 | 141,821 |
| Surge Energy, Inc. | | 1,678 | 1,223 |
| Tamarack Valley Energy Ltd. (a) | | 52,756 | 68,093 |
| TC Energy Corp. | | 117,903 | 5,943,042 |
| Teck Resources Ltd. Class B (sub. vtg.) | | 63,520 | 1,004,090 |
| TELUS Corp. | | 23,015 | 818,657 |
| The Stars Group, Inc. (a) | | 30,321 | 659,783 |
| The Toronto-Dominion Bank | | 235,099 | 13,424,794 |
| Theratechnologies, Inc. (a)(b) | | 9,316 | 37,205 |
| Thomson Reuters Corp. | | 24,745 | 1,662,881 |
| Timbercreek Financial Corp. | | 3,121 | 22,890 |
| TMAC Resources, Inc. (a) | | 1,050 | 3,245 |
| TMX Group Ltd. | | 6,768 | 591,346 |
| TORC Oil & Gas Ltd. | | 5,379 | 13,722 |
| Torex Gold Resources, Inc. (a) | | 14,856 | 217,353 |
| Toromont Industries Ltd. (b) | | 9,104 | 470,096 |
| Total Energy Services, Inc. | | 409 | 1,745 |
| Tourmaline Oil Corp. | | 38,272 | 328,353 |
| TransAlta Corp. | | 38,635 | 228,214 |
| TransAlta Renewables, Inc. | | 33,252 | 357,994 |
| Transcontinental, Inc. Class A | | 7,667 | 87,550 |
| TransForce, Inc. | | 12,631 | 402,493 |
| Trican Well Service Ltd. (a) | | 9,711 | 6,341 |
| Tricon Capital Group, Inc. (b) | | 41,255 | 333,899 |
| Turquoise Hill Resources Ltd. (a) | | 119,799 | 49,117 |
| Uni-Select, Inc. | | 1,404 | 11,353 |
| Uranium Participation Corp. (a) | | 1,297 | 3,781 |
| Vermilion Energy, Inc. | | 19,767 | 261,139 |
| Village Farms International, Inc. (a)(b) | | 7,328 | 58,085 |
| Wajax Corp. | | 186 | 2,161 |
| West Fraser Timber Co. Ltd. | | 8,923 | 412,581 |
| Western Forest Products, Inc. | | 16,341 | 16,129 |
| WestJet Airlines Ltd. | | 6,324 | 147,069 |
| Westshore Terminals Investment Corp. | | 10,081 | 174,816 |
| Wheaton Precious Metals Corp. | | 59,172 | 1,658,667 |
| Whitecap Resources, Inc. | | 117,456 | 327,282 |
| Winpak Ltd. | | 6,822 | 241,575 |
| WPT Industrial (REIT) | | 13,328 | 180,861 |
| WSP Global, Inc. (b) | | 15,868 | 990,078 |
| Yamana Gold, Inc. | | 115,101 | 420,345 |
|
| TOTAL CANADA | | | 217,641,020 |
|
| Cayman Islands - 4.3% | | | |
| 21Vianet Group, Inc. ADR (a) | | 4,992 | 42,332 |
| 3SBio, Inc. (a)(c) | | 156,000 | 290,590 |
| 500.com Ltd. sponsored ADR Class A (a)(b) | | 1,268 | 12,350 |
| 51job, Inc. sponsored ADR (a) | | 2,753 | 216,854 |
| 58.com, Inc. ADR (a) | | 14,118 | 745,572 |
| AAC Technology Holdings, Inc. | | 131,500 | 850,975 |
| Agile Property Holdings Ltd. | | 154,000 | 207,572 |
| Airtac International Group | | 15,134 | 207,176 |
| Alibaba Group Holding Ltd. sponsored ADR (a) | | 186,789 | 33,000,013 |
| Anta Sports Products Ltd. | | 135,000 | 1,320,586 |
| Asia Cement (China) Holdings Corp. | | 67,500 | 81,857 |
| ASM Pacific Technology Ltd. | | 47,800 | 667,423 |
| Ausnutria Dairy Hunan Co. Ltd. (H Shares) | | 80,000 | 119,321 |
| Autohome, Inc. ADR Class A (a)(b) | | 7,671 | 648,660 |
| Baidu.com, Inc. sponsored ADR (a) | | 36,454 | 3,712,840 |
| Baozun, Inc. sponsored ADR (a)(b) | | 6,664 | 290,017 |
| BeiGene Ltd. ADR (a) | | 5,117 | 707,886 |
| Biostime International Holdings Ltd. | | 21,000 | 83,142 |
| Bitauto Holdings Ltd. ADR (a) | | 1,372 | 20,758 |
| BizLink Holding, Inc. | | 11,062 | 75,263 |
| Bosideng International Holdings Ltd. | | 572,000 | 295,787 |
| Budweiser Brewing Co. APAC Ltd. (a)(c) | | 154,300 | 560,207 |
| Camsing International Holding Ltd. (d) | | 74,000 | 10,955 |
| Car, Inc. (a) | | 92,000 | 75,084 |
| Casetek Holdings | | 1,187 | 2,141 |
| Chailease Holding Co. Ltd. | | 158,784 | 715,876 |
| Changyou.com Ltd. (A Shares) ADR | | 517 | 4,943 |
| Cheung Kong Property Holdings Ltd. | | 346,000 | 2,407,367 |
| China Aoyuan Property Group Ltd. | | 210,000 | 268,365 |
| China Conch Venture Holdings Ltd. | | 239,500 | 937,136 |
| China Dongxiang Group Co. Ltd. | | 229,000 | 25,687 |
| China Education Group Holdings Ltd. | | 116,000 | 173,279 |
| China First Capital Group Ltd. (a) | | 464,000 | 131,935 |
| China Harmony New Energy Auto | | 27,000 | 9,291 |
| China High Speed Transmission Equipment Group Co. Ltd. | | 22,000 | 12,971 |
| China Hongqiao Group Ltd. | | 197,500 | 109,690 |
| China Huishan Dairy Holdings Co. Ltd. (a)(d) | | 51,000 | 1,367 |
| China Investment Fund International Holdings Co. Ltd. (d) | | 72,000 | 106,034 |
| China Literature Ltd. (a)(c) | | 47,200 | 184,909 |
| China LNG Group Ltd. (a) | | 60,000 | 4,206 |
| China Logistics Property Holdings Co. Ltd. (a)(c) | | 109,000 | 42,409 |
| China Maple Leaf Educational Systems Ltd. | | 150,000 | 47,121 |
| China Medical System Holdings Ltd. | | 253,000 | 343,099 |
| China Mengniu Dairy Co. Ltd. | | 339,000 | 1,351,507 |
| China Modern Dairy Holdings Ltd. (a) | | 65,000 | 9,266 |
| China Overseas Property Holdings Ltd. | | 420,000 | 256,460 |
| China Resources Cement Holdings Ltd. | | 412,000 | 451,177 |
| China Resources Land Ltd. | | 374,000 | 1,590,576 |
| China Resources Medical Holdin | | 29,500 | 16,925 |
| China SCE Property Holdings Ltd. | | 114,000 | 52,236 |
| China State Construction International Holdings Ltd. | | 267,750 | 246,585 |
| China Wireless Technologies Ltd. (a) | | 8,000 | 231 |
| China Yuhua Education Corp. Ltd. (c) | | 250,000 | 143,419 |
| China ZhengTong Auto Services Holdings Ltd. | | 68,000 | 20,331 |
| China Zhongwang Holdings Ltd. | | 250,000 | 103,791 |
| ChinaSoft International Ltd. | | 240,000 | 103,149 |
| CIFI Holdings Group Co. Ltd. | | 411,532 | 274,482 |
| Cimc Enric Holdings Ltd. | | 332,000 | 179,701 |
| CK Hutchison Holdings Ltd. | | 342,500 | 3,162,331 |
| COFCO Meat Holdings Ltd. (a) | | 92,000 | 32,847 |
| Cogobuy Group (a)(c) | | 5,000 | 828 |
| Country Garden Holdings Co. Ltd. | | 1,017,000 | 1,411,829 |
| Country Garden Services Holdings Co. Ltd. | | 162,000 | 548,916 |
| CT Environmental Group Ltd. (d) | | 26,000 | 1,128 |
| Ctrip.com International Ltd. ADR (a) | | 61,860 | 2,040,761 |
| Dali Foods Group Co. Ltd. (c) | | 430,000 | 293,983 |
| Daqo New Energy Corp. ADR (a) | | 2,367 | 89,851 |
| Dongyue Group Co. Ltd. | | 100,000 | 46,840 |
| Endeavour Mining Corp. (a) | | 13,072 | 236,707 |
| ENN Energy Holdings Ltd. | | 104,400 | 1,191,052 |
| Evergrande Real Estate Group Ltd. | | 285,190 | 694,226 |
| Fang Holdings Ltd. ADR (a) | | 1,685 | 3,387 |
| Fanhua, Inc. ADR | | 8,334 | 210,183 |
| Far East Consortium International Ltd. | | 96,475 | 40,809 |
| FIH Mobile Ltd. (a) | | 298,000 | 42,437 |
| Fu Shou Yuan International Group Ltd. | | 67,000 | 59,134 |
| Fufeng Group Ltd. | | 319,000 | 147,022 |
| Fullshare Holdings Ltd. (a) | | 667,500 | 16,831 |
| Future Land Development Holding Ltd. | | 242,000 | 255,024 |
| GCL-Poly Energy Holdings Ltd. (a) | | 2,014,000 | 80,623 |
| GDS Holdings Ltd. ADR (a)(b) | | 8,363 | 348,570 |
| Geely Automobile Holdings Ltd. | | 632,000 | 1,195,878 |
| General Interface Solution Holding Ltd. | | 27,000 | 101,367 |
| Genscript Biotech Corp. (a) | | 124,000 | 297,097 |
| Ginko International Co. Ltd. | | 1,000 | 5,968 |
| Glorious Property Holdings Ltd. (a) | | 16,000 | 642 |
| Glory Sun Financial Group Ltd. | | 2,408,000 | 86,968 |
| Goodbaby International Holdings Ltd. (a) | | 56,000 | 8,152 |
| Gourmet Master Co. Ltd. | | 5,630 | 25,660 |
| Greatview Aseptic Pack Co. Ltd. | | 75,000 | 37,796 |
| Greentown Service Group Co. Ltd. | | 102,000 | 115,726 |
| Haidilao International Holding Ltd. (c) | | 50,000 | 242,054 |
| Haitian International Holdings Ltd. | | 144,000 | 339,799 |
| HC International, Inc. (a) | | 4,000 | 1,445 |
| Hengan International Group Co. Ltd. | | 98,000 | 684,236 |
| HKBN Ltd. | | 65,000 | 116,005 |
| Huazhu Group Ltd. ADR (b) | | 19,034 | 720,627 |
| Hutchison China Meditech Ltd. sponsored ADR (a) | | 9,512 | 179,777 |
| Hutchison Telecommunications Hong Kong Holdings Ltd. | | 76,000 | 13,748 |
| IGG, Inc. | | 97,000 | 63,388 |
| Imax China Holding, Inc. (c) | | 1,700 | 3,859 |
| iQIYI, Inc. ADR (a)(b) | | 14,150 | 246,635 |
| JD.com, Inc. sponsored ADR (a) | | 97,308 | 3,031,144 |
| Jiayuan International Group Ltd. | | 75,293 | 30,124 |
| JinkoSolar Holdings Co. Ltd. ADR (a) | | 1,902 | 27,465 |
| Kaisa Group Holdings Ltd. | | 299,000 | 130,756 |
| Kasen International Holdings Ltd. (a) | | 131,000 | 81,039 |
| Kingboard Chemical Holdings Ltd. | | 86,500 | 230,514 |
| Kingboard Laminates Holdings Ltd. | | 180,000 | 164,787 |
| Kingdee International Software Group Co. Ltd. | | 383,000 | 419,672 |
| Kingsoft Corp. Ltd. (a) | | 115,000 | 264,666 |
| KWG Property Holding Ltd. | | 129,123 | 130,025 |
| Lee & Man Paper Manufacturing Ltd. | | 97,000 | 53,938 |
| Leyou Technologies Holdings Ltd. (a) | | 95,000 | 31,437 |
| Li Ning Co. Ltd. | | 245,000 | 830,751 |
| Lifestyle International Holdings Ltd. | | 48,500 | 51,052 |
| Lifetech Scientific Corp. (a) | | 140,000 | 23,717 |
| Lijun International Pharmaceutical Holding Ltd. | | 270,000 | 225,178 |
| Logan Property Holdings Co. Ltd. | | 158,000 | 240,631 |
| Longfor Properties Co. Ltd. (c) | | 225,500 | 935,859 |
| Lonking Holdings Ltd. | | 89,000 | 24,669 |
| Macau Legend Development Ltd. (a) | | 9,000 | 987 |
| Meitu, Inc. (a)(c) | | 130,500 | 28,881 |
| Meituan Dianping Class B (a) | | 130,000 | 1,550,659 |
| Melco Crown Entertainment Ltd. sponsored ADR | | 24,322 | 523,896 |
| MGM China Holdings Ltd. | | 93,200 | 147,581 |
| Microport Scientific Corp. | | 289,000 | 296,776 |
| Minth Group Ltd. | | 126,000 | 445,685 |
| Momo, Inc. ADR | | 20,508 | 687,428 |
| NetDragon WebSoft, Inc. | | 92,000 | 210,539 |
| NetEase, Inc. ADR | | 9,299 | 2,658,212 |
| New Oriental Education & Technology Group, Inc. sponsored ADR (a) | | 18,766 | 2,290,578 |
| Nexteer Auto Group Ltd. | | 90,000 | 83,882 |
| NIO, Inc. sponsored ADR (a)(b) | | 77,944 | 113,019 |
| Noah Holdings Ltd. sponsored ADR (a)(b) | | 2,875 | 87,084 |
| OneSmart International Education Group Ltd. ADR (a) | | 26,587 | 190,895 |
| OP Financial Investments Ltd. | | 112,000 | 22,710 |
| Pacific Textile Holdings Ltd. | | 56,000 | 40,734 |
| Parade Technologies Ltd. | | 15,000 | 289,691 |
| Pinduoduo, Inc. ADR (a)(b) | | 25,201 | 1,030,217 |
| Powerlong Real Estate Holding Ltd. | | 212,000 | 140,508 |
| Q Technology (Group) Co. Ltd. (a) | | 59,000 | 78,220 |
| Regina Miracle International Holdings Ltd. (c) | | 2,000 | 1,312 |
| Renhe Commercial Holdings Co. Ltd. (a) | | 302,200 | 92,421 |
| Ronshine China Holdings Ltd. | | 39,000 | 43,537 |
| Sands China Ltd. | | 308,800 | 1,521,031 |
| Sapiens International Corp. NV | | 4,808 | 102,928 |
| Semiconductor Manufacturing International Corp. (a) | | 372,600 | 473,295 |
| Shenzhou International Group Holdings Ltd. | | 102,400 | 1,415,030 |
| Shimao Property Holdings Ltd. | | 187,500 | 628,141 |
| Shui On Land Ltd. | | 152,000 | 30,589 |
| Silergy Corp. | | 11,000 | 309,463 |
| SINA Corp. (a) | | 10,219 | 404,672 |
| Sino Biopharmaceutical Ltd. | | 885,000 | 1,317,671 |
| SITC International Holdings Co. Ltd. | | 157,000 | 172,873 |
| SOHO China Ltd. | | 96,500 | 32,930 |
| Sohu.Com Ltd. ADR (a) | | 1,728 | 17,712 |
| Sunac China Holdings Ltd. | | 328,000 | 1,487,738 |
| Sunevision Holdings Ltd. | | 171,000 | 126,674 |
| Sunny Optical Technology Group Co. Ltd. | | 93,600 | 1,504,516 |
| TAL Education Group ADR (a) | | 49,511 | 2,119,566 |
| Tarena International, Inc. ADR (a) | | 541 | 420 |
| Tencent Holdings Ltd. | | 749,525 | 30,402,921 |
| Tencent Music Entertainment Group ADR (a) | | 12,449 | 172,294 |
| Texhong Textile Group Ltd. | | 1,500 | 1,515 |
| The United Laboratories International Holdings Ltd. | | 40,000 | 22,965 |
| Tianneng Power International Ltd. | | 52,000 | 33,967 |
| Tibet Water Resources Ltd. (a) | | 157,000 | 25,755 |
| Tingyi (Cayman Islands) Holding Corp. | | 228,000 | 303,308 |
| Tongda Group Holdings Ltd. | | 100,000 | 8,139 |
| Towngas China Co. Ltd. | | 83,063 | 64,031 |
| TPK Holding Co. Ltd. (a) | | 9,000 | 19,565 |
| Truly International Holdings Ltd. (a) | | 70,000 | 9,069 |
| Tuniu Corp. Class A sponsored ADR (a) | | 220 | 660 |
| Uni-President China Holdings Ltd. | | 139,000 | 143,577 |
| Value Partners Group Ltd. | | 308,000 | 162,138 |
| Vinda International Holdings Ltd. | | 26,000 | 49,007 |
| Vipshop Holdings Ltd. ADR (a) | | 58,750 | 677,975 |
| Want Want China Holdings Ltd. | | 690,000 | 581,263 |
| Weibo Corp. sponsored ADR (a) | | 7,748 | 381,124 |
| WH Group Ltd. (c) | | 1,286,000 | 1,357,429 |
| Wharf Real Estate Investment Co. Ltd. | | 147,000 | 864,613 |
| Wuxi Biologics (Cayman), Inc. (a)(c) | | 72,000 | 846,106 |
| Wynn Macau Ltd. | | 232,400 | 504,327 |
| Xiaomi Corp. Class B (a)(b)(c) | | 1,051,400 | 1,191,233 |
| Xingda International Holdings Ltd. | | 13,690 | 3,815 |
| Xinyi Glass Holdings Ltd. | | 184,000 | 206,878 |
| Xinyi Solar Holdings Ltd. | | 451,284 | 254,992 |
| XTEP International Holdings Ltd. | | 241,852 | 140,422 |
| Yihai International Holding Ltd. | | 69,000 | 469,251 |
| Yuzhou Properties Co. | | 334,142 | 141,149 |
| YY, Inc. ADR (a) | | 8,853 | 503,205 |
| Zai Lab Ltd. ADR (a) | | 7,242 | 244,707 |
| Zhen Ding Technology Holding Ltd. | | 63,000 | 299,528 |
| Zhongsheng Group Holdings Ltd. Class H | | 93,000 | 308,315 |
| ZTO Express (Cayman), Inc. sponsored ADR | | 44,312 | 974,864 |
|
| TOTAL CAYMAN ISLANDS | | | 141,031,260 |
|
| Chile - 0.2% | | | |
| AES Gener SA | | 171,111 | 36,686 |
| Aguas Andinas SA | | 274,685 | 125,934 |
| Banco de Chile | | 5,813,794 | 748,675 |
| Banco de Credito e Inversiones | | 4,878 | 271,592 |
| Banco Santander Chile | | 8,763,472 | 543,699 |
| CAP SA | | 12,581 | 92,288 |
| Cencosud SA | | 182,792 | 248,209 |
| Colbun SA (a) | | 1,067,569 | 184,190 |
| Compania Cervecerias Unidas SA | | 14,702 | 146,701 |
| Compania de Petroleos de Chile SA (COPEC) | | 59,745 | 534,217 |
| Compania Sud Americana de Vapores SA (a) | | 953,281 | 31,365 |
| CorpBanca SA | | 29,118,503 | 176,690 |
| E-CL SA | | 28,960 | 42,956 |
| Empresa Nacional de Telecomunicaciones SA (ENTEL) (a) | | 25,415 | 198,803 |
| Empresas CMPC SA | | 125,292 | 285,522 |
| Enel Chile SA | | 2,886,623 | 237,399 |
| Enersis SA | | 4,510,092 | 842,297 |
| Forus SA | | 3,734 | 6,797 |
| Grupo Security SA | | 475,730 | 137,985 |
| Inversiones Aguas Metropolitanas SA | | 45,620 | 54,441 |
| Inversiones La Construccion SA | | 1,901 | 23,006 |
| LATAM Airlines Group SA | | 53,285 | 589,182 |
| Parque Arauco SA | | 91,943 | 241,760 |
| Ripley Corp. SA | | 21,855 | 12,613 |
| S.A.C.I. Falabella | | 99,944 | 508,749 |
| Salfacorp SA | | 18,503 | 15,594 |
| SMU SA | | 757,181 | 146,617 |
| Sonda SA | | 38,859 | 41,599 |
| Vina Concha y Toro SA | | 104,755 | 192,814 |
|
| TOTAL CHILE | | | 6,718,380 |
|
| China - 2.6% | | | |
| Agricultural Bank of China Ltd.: | | | |
| (A Shares) | | 954,600 | 493,284 |
| (H Shares) | | 2,796,000 | 1,150,564 |
| Air China Ltd. (H Shares) | | 302,000 | 266,637 |
| Aluminum Corp. of China Ltd. (H Shares) (a) | | 830,000 | 245,901 |
| Angang Steel Co. Ltd. (H Shares) | | 570,400 | 190,813 |
| Anhui Conch Cement Co. Ltd. (H Shares) | | 184,500 | 1,102,707 |
| AVIC Shenyang Aircraft Co. Ltd. (A Shares) (a) | | 15,400 | 64,261 |
| AviChina Industry & Technology Co. Ltd. (H Shares) | | 624,000 | 294,748 |
| Baic Motor Corp. Ltd. (H Shares) (c) | | 229,000 | 142,050 |
| Bank Communications Co. Ltd. (H Shares) | | 1,263,000 | 862,563 |
| Bank of Beijing Co. Ltd. (A Shares) | | 398,800 | 313,551 |
| Bank of Chengdu Co. Ltd. Class A | | 176,000 | 210,536 |
| Bank of China Ltd.: | | | |
| (A Shares) | | 2,247,900 | 1,180,699 |
| (H Shares) | | 7,393,000 | 3,014,756 |
| Bank of Guiyang Co. Ltd. (A Shares) | | 186,200 | 241,539 |
| Bank of Hangzhou Co. Ltd. (A Shares) | | 269,900 | 344,792 |
| Bank of Jiangsu Co. Ltd. (A Shares) | | 178,700 | 179,403 |
| Bank of Nanjing Co. Ltd. (A Shares) | | 128,300 | 157,154 |
| Bank of Ningbo Co. Ltd. (A Shares) | | 42,700 | 163,678 |
| Bank of Shanghai Co. Ltd. (A Shares) | | 201,900 | 267,335 |
| BBMG Corp. (H Shares) | | 1,116,000 | 319,391 |
| Beijing Capital International Airport Co. Ltd. (H Shares) | | 224,000 | 212,155 |
| Beijing Capital Land Ltd. (H Shares) | | 74,000 | 24,866 |
| BYD Co. Ltd. (H Shares) (b) | | 96,000 | 450,290 |
| CGN Power Co. Ltd. (H Shares) (c) | | 1,320,000 | 342,833 |
| China BlueChemical Ltd. (H Shares) | | 156,000 | 37,964 |
| China Cinda Asset Management Co. Ltd. (H Shares) | | 1,363,000 | 282,750 |
| China CITIC Bank Corp. Ltd. (H Shares) | | 1,219,000 | 706,606 |
| China Coal Energy Co. Ltd. (H Shares) | | 183,000 | 72,977 |
| China Communications Construction Co. Ltd. (H Shares) | | 674,000 | 513,078 |
| China Communications Services Corp. Ltd. (H Shares) | | 386,000 | 238,366 |
| China Construction Bank Corp. (H Shares) | | 12,457,000 | 9,981,427 |
| China Eastern Airlines Corp. Ltd. (H Shares) (a) | | 214,000 | 106,731 |
| China Everbright Bank Co. Ltd.: | | | |
| (A Shares) | | 265,800 | 163,734 |
| (H Shares) | | 516,000 | 237,447 |
| China Fangda Group Co. Ltd. Class B | | 243,500 | 91,746 |
| China Galaxy Securities Co. Ltd. (H Shares) | | 420,500 | 214,407 |
| China Huarong Asset Management Co. Ltd. (c) | | 951,000 | 140,401 |
| China International Capital Corp. Ltd. (H Shares) (c) | | 210,800 | 384,383 |
| China Life Insurance Co. Ltd. (H Shares) | | 1,003,000 | 2,579,407 |
| China Longyuan Power Grid Corp. Ltd. (H Shares) | | 519,000 | 280,382 |
| China Merchants Bank Co. Ltd.: | | | |
| (A Shares) | | 41,800 | 210,533 |
| (H Shares) | | 574,500 | 2,739,923 |
| China Minsheng Banking Corp. Ltd.: | | | |
| (A Shares) | | 725,100 | 632,931 |
| (H Shares) | | 642,000 | 449,060 |
| China Molybdenum Co. Ltd. (H Shares) (b) | | 912,000 | 287,404 |
| China National Building Materials Co. Ltd. (H Shares) | | 497,350 | 419,178 |
| China National Nuclear Power Co. Ltd. (A Shares) | | 224,700 | 161,324 |
| China Oilfield Services Ltd. (H Shares) | | 184,000 | 256,179 |
| China Pacific Insurance (Group) Co. Ltd. (H Shares) | | 410,400 | 1,489,050 |
| China Petroleum & Chemical Corp. (H Shares) | | 3,374,000 | 1,919,048 |
| China Railway Construction Corp. Ltd. (H Shares) | | 372,000 | 406,889 |
| China Railway Group Ltd.: | | | |
| (A Shares) | | 193,400 | 158,189 |
| (H Shares) | | 366,000 | 220,594 |
| China Railway Signal & Communications Corp. (H Shares) (c) | | 259,000 | 154,619 |
| China Reinsurance Group Corp. (H Shares) | | 823,000 | 134,266 |
| China Shenhua Energy Co. Ltd.: | | | |
| (A Shares) | | 236,900 | 619,899 |
| (H Shares) | | 166,500 | 338,152 |
| China Shipbuilding Industry Co. (A Shares) | | 245,700 | 184,701 |
| China Shipping Development Co. Ltd. (H Shares) | | 108,000 | 46,459 |
| China Southern Airlines Ltd. (H Shares) | | 378,000 | 232,636 |
| China Telecom Corp. Ltd. (H Shares) | | 1,722,000 | 732,554 |
| China Tower Corp. Ltd. (H Shares) (c) | | 5,420,000 | 1,192,903 |
| China United Network Communications Ltd. (A Shares) | | 178,200 | 155,136 |
| China Vanke Co. Ltd. (H Shares) | | 271,100 | 988,579 |
| China Yangtze Power Co. Ltd. (A Shares) | | 94,000 | 238,356 |
| Chongqing Rural Commercial Bank Co. Ltd. (H Shares) | | 482,000 | 257,266 |
| CITIC Securities Co. Ltd. (H Shares) | | 390,000 | 715,539 |
| COSCO SHIPPING Holdings Co. Ltd. (H Shares) (a) | | 702,500 | 262,817 |
| CRRC Corp. Ltd.: | | | |
| (A Shares) | | 266,300 | 272,095 |
| (H Shares) | | 398,000 | 266,196 |
| Daqin Railway Co. Ltd. (A Shares) | | 182,800 | 198,006 |
| Datang International Power Generation Co. Ltd. (H Shares) | | 1,152,000 | 227,228 |
| Dongfeng Motor Group Co. Ltd. (H Shares) | | 458,000 | 459,426 |
| Foshan Haitian Flavouring & Food Co. Ltd. (A Shares) | | 19,000 | 301,333 |
| Fuyao Glass Industries Group Co. Ltd. (H Shares) (c) | | 124,400 | 351,505 |
| GD Power Development Co. Ltd. (A Shares) | | 909,400 | 300,702 |
| GF Securities Co. Ltd. (H Shares) | | 190,600 | 198,506 |
| Great Wall Motor Co. Ltd. (H Shares) | | 504,500 | 408,772 |
| Gree Electric Appliances, Inc. of Zhuhai (A Shares) | | 25,300 | 210,937 |
| Guangzhou Automobile Group Co. Ltd. (H Shares) | | 365,600 | 365,138 |
| Guangzhou R&F Properties Co. Ltd. (H Shares) | | 102,400 | 158,664 |
| Guotai Junan Securities Co. Ltd. (H Shares) (c) | | 165,000 | 252,136 |
| Haitong Securities Co. Ltd. (H Shares) | | 529,200 | 540,265 |
| Hangzhou Hikvision Digital Technology Co. Ltd. (A Shares) | | 73,100 | 334,837 |
| Hangzhou Steam Turbine Co. Ltd. | | 373,700 | 319,195 |
| Hengli Petrochemical Co. Ltd. (A Shares) | | 72,520 | 165,836 |
| Huadian Power International Corp. Ltd. (H Shares) | | 206,000 | 77,190 |
| Huaneng Power International, Inc. (H Shares) | | 488,000 | 231,788 |
| Huaneng Renewables Corp. Ltd. (H Shares) | | 630,000 | 240,519 |
| Huangshan Tourism Development Co. Ltd. | | 257,933 | 233,374 |
| Huangshi Dongbei Electrical Appliance Co. Ltd. | | 250,300 | 312,885 |
| Huatai Securities Co. Ltd. (H Shares) (c) | | 311,600 | 463,168 |
| Huaxia Bank Co. Ltd. (A Shares) | | 315,000 | 334,889 |
| Industrial & Commercial Bank of China Ltd.: | | | |
| (A Shares) | | 267,100 | 224,059 |
| (H Shares) | | 8,355,000 | 5,985,466 |
| Industrial Bank Co. Ltd. (A Shares) | | 144,400 | 383,586 |
| INESA Intelligent Tech, Inc. (B Shares) | | 250,100 | 157,479 |
| Inner Mongoli Yili Industries Co. Ltd. (A Shares) | | 81,400 | 335,027 |
| Inner Mongolia Eerduosi Resourses Co. Ltd. (B Shares) | | 312,470 | 227,374 |
| Inner Mongolia Yitai Coal Co. Ltd. (B Shares) | | 350,400 | 305,631 |
| Jiangsu Expressway Co. Ltd. (H Shares) | | 176,000 | 233,825 |
| Jiangsu Hengrui Medicine Co. Ltd. (A Shares) | | 34,100 | 439,675 |
| Jiangsu Yanghe Brewery JSC Ltd. (A Shares) | | 16,800 | 239,955 |
| Jiangxi Copper Co. Ltd. (H Shares) | | 320,000 | 374,633 |
| Kama Co. Ltd. (a) | | 490,900 | 237,375 |
| Konka Group Co. Ltd. Series B | | 203,100 | 61,649 |
| Kweichow Moutai Co. Ltd. (A Shares) | | 7,200 | 1,205,061 |
| Legend Holdings Corp.: | | | |
| (H Shares) (c) | | 21,100 | 46,382 |
| rights (a)(d) | | 1,623 | 269 |
| Luthai Textile JSC Ltd. (B Shares) | | 295,300 | 276,137 |
| Maanshan Iron & Steel Co. Ltd. (H Shares) | | 394,000 | 149,020 |
| Metallurgical Corp. China Ltd. (H Shares) | | 435,000 | 92,089 |
| Midea Group Co. Ltd. (A Shares) | | 38,300 | 301,644 |
| Muyuan Foodstuff Co. Ltd. (A Shares) | | 13,600 | 190,017 |
| NARI Technology Co. Ltd. (A Shares) | | 50,600 | 157,588 |
| New China Life Insurance Co. Ltd. (H Shares) | | 115,500 | 448,276 |
| People's Insurance Co. of China Group (H Shares) | | 1,026,000 | 432,124 |
| PetroChina Co. Ltd. (H Shares) | | 2,796,000 | 1,363,502 |
| PICC Property & Casualty Co. Ltd. (H Shares) | | 911,000 | 1,152,888 |
| Ping An Bank Co. Ltd. (A Shares) | | 257,000 | 593,045 |
| Ping An Insurance Group Co. of China Ltd. (H Shares) | | 794,000 | 9,164,182 |
| Postal Savings Bank of China Co. Ltd. (H Shares) (c) | | 977,000 | 626,416 |
| SAIC Motor Corp. Ltd. (A Shares) | | 44,100 | 147,081 |
| SF Holding Co. Ltd. (A Shares) | | 45,500 | 255,879 |
| Shandong Airlines Co. Ltd. | | 141,000 | 169,462 |
| Shandong Linglong Tyre Co. Ltd. (A Shares) | | 153,400 | 456,472 |
| Shandong Weigao Medical Polymer Co. Ltd. (H Shares) | | 372,000 | 427,071 |
| Shang Gong Group Co. Ltd. (B Shares) (a) | | 434,200 | 214,320 |
| Shanghai Chlor Alkali Co. Ltd. (B Shares) | | 262,000 | 154,700 |
| Shanghai Diesel Engine Co. Ltd. (B Shares) | | 357,300 | 174,280 |
| Shanghai Electric Group Co. Ltd. (H Shares) | | 224,000 | 68,516 |
| Shanghai Environment Group Co. Ltd. | | 310 | 488 |
| Shanghai Fosun Pharmaceutical (Group) Co. Ltd. (H Shares) | | 158,500 | 447,345 |
| Shanghai Fudan Microelectronics Group Co. Ltd. (H Shares) (a) | | 38,000 | 28,783 |
| Shanghai Haixin Group Co. Ltd. (B Shares) (a) | | 481,900 | 195,055 |
| Shanghai Highly Group Co. Ltd. (B Shares) | | 219,200 | 157,312 |
| Shanghai Jin Jiang International Industrial Investment Co. Ltd. (B Shares) | | 190,700 | 180,687 |
| Shanghai Lujiazui Finance Trust Ltd. (B Shares) | | 376,096 | 414,233 |
| Shanghai Pharmaceuticals Holding Co. Ltd. (H Shares) | | 146,200 | 264,172 |
| Shanghai Pudong Development Bank Co. Ltd. (A Shares) | | 216,900 | 385,010 |
| Shanghai SMI Holding Co. Ltd. (A Shares) | | 861 | 698 |
| Sinopec Engineering Group Co. Ltd. (H Shares) | | 120,500 | 68,836 |
| Sinopec Shanghai Petrochemical Co. Ltd. (H Shares) | | 1,038,000 | 286,685 |
| Sinopharm Group Co. Ltd. (H Shares) | | 135,200 | 484,185 |
| Sinotrans Ltd. (H Shares) | | 123,000 | 36,165 |
| TCL Corp. (A Shares) | | 260,100 | 121,505 |
| Tong Ren Tang Technologies Co. Ltd. (H Shares) | | 41,000 | 40,820 |
| TravelSky Technology Ltd. (H Shares) | | 134,000 | 305,447 |
| Tsingtao Brewery Co. Ltd. (H Shares) | | 58,000 | 336,111 |
| Weichai Power Co. Ltd. (H Shares) | | 265,000 | 417,115 |
| Wens Foodstuffs Group Co. Ltd. (A Shares) | | 29,200 | 166,799 |
| Wuliangye Yibin Co. Ltd. (A Shares) | | 20,600 | 385,363 |
| WuXi AppTec Co. Ltd. (H Shares) (c) | | 24,220 | 292,014 |
| Xinjiang Goldwind Science & Technology Co. Ltd. (H Shares) | | 115,192 | 137,379 |
| Yanzhou Coal Mining Co. Ltd. (H Shares) | | 376,000 | 381,479 |
| YiChang HEC ChangJiang Pharmaceutical Co. Ltd. (H Shares) (c) | | 7,600 | 46,617 |
| Yonyou Network Technology Co. Ltd. (A Shares) | | 14,430 | 60,471 |
| Zhaojin Mining Industry Co. Ltd. (H Shares) | | 129,000 | 144,271 |
| Zhejiang Expressway Co. Ltd. (H Shares) | | 184,000 | 150,672 |
| ZhongAn Online P & C Insurance Co. Ltd. (H Shares) (a)(b)(c) | | 50,800 | 169,106 |
| Zhuzhou CRRC Times Electric Co. Ltd. (H Shares) | | 85,600 | 317,625 |
| Zijin Mining Group Co. Ltd. (H Shares) | | 872,000 | 302,052 |
| ZTE Corp. (H Shares) (a) | | 127,800 | 356,549 |
|
| TOTAL CHINA | | | 85,650,290 |
|
| Colombia - 0.1% | | | |
| Almacenes Exito SA | | 14,313 | 75,800 |
| Bancolombia SA | | 21,565 | 262,225 |
| Cementos Argos SA | | 110,098 | 248,535 |
| Corporacion Financiera Colombiana SA | | 2,184 | 18,803 |
| Ecopetrol SA | | 644,273 | 579,464 |
| Grupo de Inversiones Suramerica SA | | 23,187 | 234,614 |
| Interconexion Electrica SA ESP | | 59,626 | 343,996 |
| Inversiones Argos SA | | 47,681 | 258,155 |
|
| TOTAL COLOMBIA | | | 2,021,592 |
|
| Cyprus - 0.0% | | | |
| Ros Agro PLC unit | | 9,656 | 102,610 |
| Czech Republic - 0.0% | | | |
| Ceske Energeticke Zavody A/S | | 23,411 | 534,043 |
| Komercni Banka A/S | | 14,246 | 481,548 |
| MONETA Money Bank A/S (c) | | 63,118 | 209,768 |
|
| TOTAL CZECH REPUBLIC | | | 1,225,359 |
|
| Denmark - 1.2% | | | |
| A.P. Moller - Maersk A/S: | | | |
| Series A | | 577 | 692,524 |
| Series B | | 757 | 965,631 |
| ALK-Abello A/S (a) | | 1,192 | 256,059 |
| Alm. Brand A/S | | 2,452 | 19,949 |
| Ambu A/S Series B | | 22,500 | 353,347 |
| Bang & Olufsen A/S Series B (a) | | 1,191 | 6,934 |
| Bavarian Nordic A/S (a) | | 2,538 | 59,692 |
| Carlsberg A/S Series B | | 13,591 | 1,912,008 |
| Christian Hansen Holding A/S | | 13,897 | 1,066,953 |
| Coloplast A/S Series B | | 14,435 | 1,739,406 |
| Dampskibsselskabet NORDEN A/S | | 849 | 12,408 |
| Danske Bank A/S | | 89,076 | 1,270,957 |
| Det Forenede Dampskibs-Selskab (DFDS) A/S | | 6,610 | 260,106 |
| DSV A/S | | 27,590 | 2,677,121 |
| DSV A/S | | 2,693 | 261,785 |
| FLSmidth & Co. A/S | | 6,161 | 220,456 |
| Genmab A/S (a) | | 8,687 | 1,898,064 |
| GN Store Nord A/S | | 18,243 | 801,746 |
| H Lundbeck A/S | | 11,135 | 379,821 |
| ISS Holdings A/S | | 22,265 | 582,650 |
| Jyske Bank A/S (Reg.) | | 7,797 | 259,209 |
| Matas A/S | | 21,059 | 161,272 |
| Netcompany Group A/S (a)(c) | | 3,862 | 164,424 |
| Nilfisk Holding A/S (a) | | 3,634 | 61,409 |
| NKT Holding A/S (a) | | 4,295 | 75,272 |
| NNIT A/S (c) | | 144 | 2,064 |
| Novo Nordisk A/S Series B | | 231,023 | 12,703,657 |
| Novozymes A/S Series B | | 26,198 | 1,233,482 |
| ORSTED A/S (c) | | 24,116 | 2,115,388 |
| Pandora A/S | | 12,786 | 628,726 |
| Per Aarsleff Holding A/S | | 4,622 | 144,205 |
| Ringkjoebing Landbobank A/S | | 5,075 | 350,389 |
| Rockwool International A/S Series B | | 1,319 | 259,122 |
| Royal Unibrew A/S | | 7,239 | 593,488 |
| Scandinavian Tobacco Group A/S (c) | | 21,748 | 256,965 |
| Schouw & Co. | | 759 | 54,409 |
| SimCorp A/S | | 6,274 | 560,547 |
| Spar Nord Bank A/S | | 26,405 | 257,791 |
| Sydbank A/S | | 6,192 | 121,459 |
| The Drilling Co. of 1972 A/S (a) | | 2,108 | 118,950 |
| Topdanmark A/S | | 5,515 | 246,985 |
| Tryg A/S | | 16,567 | 462,723 |
| Vestas Wind Systems A/S | | 24,653 | 2,008,426 |
| William Demant Holding A/S (a) | | 17,320 | 457,123 |
| Zealand Pharma A/S (a) | | 2,658 | 79,199 |
|
| TOTAL DENMARK | | | 38,814,301 |
|
| Egypt - 0.1% | | | |
| Commercial International Bank SAE | | 197,059 | 988,958 |
| Eastern Tobacco Co. | | 163,219 | 161,904 |
| EFG-Hermes Holding SAE | | 48,401 | 56,978 |
| Elsewedy Electric Co. | | 122,375 | 101,979 |
| Global Telecom Holding (a) | | 150,711 | 47,436 |
| Talaat Moustafa Group Holding | | 375,701 | 229,517 |
|
| TOTAL EGYPT | | | 1,586,772 |
|
| Faroe Islands - 0.0% | | | |
| Bakkafrost | | 6,269 | 391,977 |
| Finland - 0.8% | | | |
| Adapteo OYJ (a) | | 7,225 | 79,211 |
| Cargotec Corp. (B Shares) | | 4,319 | 151,253 |
| Caverion Corp. | | 13,709 | 102,441 |
| Citycon Oyj | | 5,700 | 59,694 |
| Cramo Oyj (B Shares) | | 6,223 | 65,935 |
| Elisa Corp. (A Shares) | | 18,543 | 1,012,749 |
| F-Secure Oyj (a) | | 5,468 | 17,442 |
| Finnair Oyj | | 1,883 | 12,286 |
| Fortum Corp. | | 57,318 | 1,399,357 |
| Huhtamaki Oyj | | 13,436 | 621,885 |
| KCI Konecranes Oyj | | 10,102 | 311,526 |
| Kemira Oyj | | 22,421 | 363,839 |
| Kesko Oyj | | 9,885 | 657,957 |
| Kone OYJ (B Shares) | | 43,475 | 2,765,737 |
| M-real OYJ (B Shares) (b) | | 20,192 | 133,657 |
| Metso Corp. | | 12,365 | 467,228 |
| Neste Oyj | | 54,923 | 1,982,232 |
| Nokia Corp. | | 747,451 | 2,743,903 |
| Nokian Tyres PLC | | 14,565 | 415,855 |
| Nordea Bank ABP (Stockholm Stock Exchange) | | 422,755 | 3,094,286 |
| Oriola-KD Oyj | | 973 | 2,235 |
| Orion Oyj (B Shares) | | 11,025 | 488,650 |
| Outokumpu Oyj (A Shares) (b) | | 54,668 | 154,806 |
| Outotec Oyj (a) | | 27,101 | 174,342 |
| Sampo Oyj (A Shares) | | 57,789 | 2,368,185 |
| Sanoma Corp. | | 9,374 | 97,962 |
| Stora Enso Oyj (R Shares) | | 86,086 | 1,116,136 |
| TietoEnator Oyj | | 9,710 | 276,154 |
| Tikkurila Oyj | | 2,101 | 33,508 |
| UPM-Kymmene Corp. | | 67,757 | 2,202,092 |
| Uponor Oyj | | 2,335 | 30,495 |
| Valmet Corp. | | 18,758 | 419,253 |
| Wartsila Corp. | | 66,298 | 699,641 |
| YIT-Yhtyma OY | | 30,403 | 182,428 |
|
| TOTAL FINLAND | | | 24,704,360 |
|
| France - 6.2% | | | |
| Accor SA | | 26,078 | 1,120,346 |
| Aeroports de Paris | | 3,647 | 693,102 |
| Air France KLM (Reg.) (a) | | 23,542 | 280,287 |
| Air Liquide SA | | 61,533 | 8,173,566 |
| Akka Technologies SA | | 1,401 | 90,315 |
| Akwel | | 398 | 7,901 |
| Albioma | | 2,542 | 65,916 |
| ALD SA (c) | | 12,819 | 181,572 |
| Alstom SA | | 26,537 | 1,146,873 |
| ALTEN | | 4,790 | 525,948 |
| Altran Technologies SA | | 29,173 | 462,996 |
| Amundi SA (c) | | 9,318 | 665,111 |
| Arkema SA | | 10,620 | 1,085,429 |
| Atos Origin SA | | 12,173 | 944,706 |
| AXA SA | | 250,518 | 6,631,520 |
| Beneteau SA | | 896 | 8,354 |
| BIC SA | | 3,771 | 261,811 |
| bioMerieux SA | | 5,978 | 489,044 |
| BNP Paribas SA | | 145,733 | 7,615,942 |
| Boiron SA | | 904 | 32,112 |
| Bollore SA (a) | | 570 | 2,428 |
| Bollore SA | | 98,121 | 424,605 |
| Bonduelle SCA | | 2,541 | 66,032 |
| Bouygues SA | | 27,102 | 1,148,621 |
| Bureau Veritas SA | | 41,019 | 1,047,183 |
| Capgemini SA | | 20,893 | 2,352,333 |
| Carbone Lorraine | | 628 | 20,417 |
| Carrefour SA | | 79,651 | 1,355,174 |
| Casino Guichard Perrachon SA (b) | | 7,578 | 408,811 |
| Cellectis SA (a) | | 7,070 | 83,522 |
| CNP Assurances | | 30,391 | 602,655 |
| Coface SA | | 16,049 | 175,415 |
| Compagnie de St. Gobain | | 66,754 | 2,715,218 |
| Compagnie Generale de Geophysique SA (a) | | 66,115 | 153,523 |
| Compagnie Plastic Omnium | | 12,131 | 331,478 |
| Covivio | | 5,396 | 610,843 |
| Credit Agricole SA | | 153,069 | 1,997,298 |
| Danone SA | | 80,077 | 6,633,683 |
| Dassault Aviation SA | | 294 | 408,233 |
| Dassault Systemes SA | | 17,510 | 2,656,907 |
| DBV Technologies SA (a) | | 1,752 | 25,073 |
| Derichebourg | | 8,793 | 31,656 |
| Devoteam SA | | 336 | 28,480 |
| Edenred SA | | 29,484 | 1,552,101 |
| EDF SA | | 77,710 | 801,871 |
| Eiffage SA | | 11,209 | 1,204,135 |
| Elior SA (c) | | 11,494 | 148,575 |
| Elis SA | | 22,196 | 424,057 |
| ENGIE | | 234,633 | 3,923,984 |
| Eramet SA | | 906 | 45,208 |
| Essilor International SA | | 37,017 | 5,647,796 |
| Etablissements Maurel & Prom | | 1,764 | 5,174 |
| Eurazeo SA | | 3,697 | 257,704 |
| Europcar Groupe SA (c) | | 25,987 | 95,355 |
| Eutelsat Communications | | 22,175 | 420,440 |
| Faurecia SA | | 9,318 | 434,193 |
| Fonciere Financiere et Part SA | | 717 | 84,285 |
| Gaztransport et Technigaz SA | | 4,092 | 372,635 |
| Gecina SA | | 5,845 | 1,002,611 |
| Genfit (a) | | 2,027 | 29,276 |
| Groupe Eurotunnel SA | | 57,129 | 956,377 |
| Groupe FNAC SA (a) | | 1,519 | 87,841 |
| Guerbet | | 529 | 29,618 |
| Hermes International SCA | | 3,950 | 2,841,506 |
| ICADE | | 3,036 | 297,295 |
| ID Logistics Group (a) | | 578 | 110,492 |
| Iliad SA | | 3,294 | 340,928 |
| Imerys SA | | 4,743 | 183,135 |
| Industrielle d'Aviation Latecoere SA (a) | | 25,021 | 107,159 |
| Ingenico SA | | 8,406 | 897,583 |
| Innate Pharma SA (a) | | 6,942 | 41,925 |
| Interparfums SA | | 1,144 | 53,524 |
| Ipsen SA | | 5,041 | 536,923 |
| Ipsos SA | | 9,627 | 289,899 |
| JCDecaux SA | | 16,902 | 461,845 |
| Kaufman & Broad SA | | 2,082 | 79,368 |
| Kering SA | | 9,921 | 5,645,308 |
| Klepierre SA | | 27,103 | 1,009,312 |
| Korian SA | | 8,059 | 341,552 |
| L'Oreal SA | | 32,626 | 9,526,320 |
| Lagardere S.C.A. (Reg.) | | 10,690 | 238,690 |
| Legrand SA | | 35,920 | 2,803,509 |
| LVMH Moet Hennessy Louis Vuitton SE | | 36,319 | 15,510,248 |
| M6 Metropole Television SA | | 1,456 | 25,609 |
| Maisons du Monde SA (c) | | 9,337 | 129,024 |
| Mercialys SA | | 6,406 | 89,308 |
| Michelin CGDE Series B | | 22,450 | 2,733,451 |
| Natixis SA | | 133,099 | 610,259 |
| Neopost SA | | 8,120 | 173,699 |
| Nexans SA | | 1,598 | 64,945 |
| Nexity | | 5,303 | 274,312 |
| Orange SA | | 254,179 | 4,090,886 |
| Orpea | | 6,143 | 739,254 |
| Pernod Ricard SA | | 27,465 | 5,069,549 |
| Peugeot Citroen SA | | 79,834 | 2,021,182 |
| Publicis Groupe SA (b) | | 28,563 | 1,229,311 |
| Remy Cointreau SA | | 3,512 | 469,640 |
| Renault SA | | 25,002 | 1,276,005 |
| Rexel SA | | 36,443 | 451,158 |
| Rubis SCA | | 12,033 | 697,190 |
| Safran SA | | 42,673 | 6,751,095 |
| Sanofi SA | | 147,014 | 13,552,803 |
| Sartorius Stedim Biotech | | 4,064 | 608,272 |
| Schneider Electric SA | | 71,129 | 6,610,762 |
| SCOR SE | | 20,964 | 883,340 |
| SEB SA | | 2,660 | 403,768 |
| Societe Generale Series A | | 101,444 | 2,884,958 |
| Sodexo SA | | 10,513 | 1,156,100 |
| Soitec SA (a) | | 2,491 | 274,071 |
| Solocal Group SA (a) | | 52,028 | 40,648 |
| Sopra Steria Group | | 1,972 | 270,303 |
| SPIE SA | | 15,940 | 336,002 |
| SR Teleperformance SA | | 7,476 | 1,694,278 |
| Suez Environnement SA | | 48,585 | 757,261 |
| Tarkett SA | | 5,012 | 81,612 |
| Technicolor SA (a) | | 20,446 | 17,068 |
| Television Francaise 1 SA | | 9,678 | 81,170 |
| Thales SA | | 14,051 | 1,373,413 |
| The Lisi Group | | 3,203 | 112,528 |
| The Vicat Group | | 1,777 | 75,312 |
| Total SA | | 313,041 | 16,549,928 |
| Trigano SA | | 1,456 | 131,128 |
| Ubisoft Entertainment SA (a) | | 11,154 | 658,577 |
| Valeo SA | | 32,470 | 1,207,368 |
| Vallourec SA (a)(b) | | 33,723 | 81,729 |
| Veolia Environnement SA | | 68,535 | 1,801,622 |
| VINCI SA | | 66,356 | 7,445,089 |
| Virbac SA (a) | | 740 | 180,333 |
| Vivendi SA | | 117,588 | 3,273,402 |
| Wendel SA | | 4,044 | 572,805 |
| Worldline SA (a)(c) | | 10,400 | 631,572 |
|
| TOTAL FRANCE | | | 203,245,295 |
|
| Germany - 5.2% | | | |
| Aareal Bank AG | | 21,106 | 709,010 |
| adidas AG | | 23,605 | 7,288,535 |
| ADLER Real Estate AG (a) | | 2,189 | 25,244 |
| ADVA Optical Networking SE (a) | | 851 | 5,998 |
| Aixtron AG (a)(b) | | 11,930 | 108,839 |
| Allianz SE | | 54,710 | 13,361,424 |
| alstria office REIT-AG | | 18,385 | 344,480 |
| Amadeus Fire AG | | 1,925 | 243,035 |
| AURELIUS AG | | 5,292 | 217,790 |
| Aurubis AG (b) | | 4,285 | 210,231 |
| Axel Springer SE (a) | | 6,847 | 477,279 |
| BASF AG | | 119,062 | 9,051,003 |
| Bayer AG | | 122,502 | 9,503,239 |
| Bayerische Motoren Werke AG (BMW) | | 42,556 | 3,261,163 |
| BayWa AG | | 8,643 | 253,038 |
| Bechtle AG | | 3,888 | 421,270 |
| Befesa SA (c) | | 4,068 | 150,630 |
| Beiersdorf AG | | 12,748 | 1,509,224 |
| Bertrandt AG | | 366 | 18,267 |
| Bilfinger Berger AG | | 2,584 | 86,228 |
| Borussia Dortmund GmbH & Co. KGaA | | 5,961 | 56,344 |
| Brenntag AG | | 17,592 | 882,916 |
| CANCOM AG | | 4,538 | 242,129 |
| Capital Stage AG | | 34,177 | 338,866 |
| Carl Zeiss Meditec AG | | 5,551 | 605,173 |
| CeWe Color Holding AG | | 417 | 40,136 |
| Comdirect Bank AG | | 2,144 | 32,329 |
| Commerzbank AG | | 149,034 | 891,425 |
| CompuGroup Medical AG | | 3,498 | 223,936 |
| Continental AG | | 14,923 | 1,998,799 |
| Corestate Capital Holding SA (b) | | 2,573 | 95,847 |
| Covestro AG (c) | | 24,014 | 1,153,000 |
| CTS Eventim AG | | 7,623 | 461,230 |
| Daimler AG (Germany) | | 119,186 | 6,966,764 |
| Delivery Hero AG (a)(c) | | 15,077 | 706,750 |
| Deutsche Bank AG (b) | | 268,280 | 1,943,087 |
| Deutsche Beteiligungs AG | | 642 | 26,099 |
| Deutsche Borse AG | | 24,496 | 3,793,443 |
| Deutsche EuroShop AG (b) | | 10,724 | 320,780 |
| Deutsche Lufthansa AG | | 27,221 | 471,940 |
| Deutsche Pfandbriefbank AG (c) | | 13,252 | 181,054 |
| Deutsche Post AG | | 125,050 | 4,428,117 |
| Deutsche Telekom AG | | 423,434 | 7,450,567 |
| Deutsche Wohnen AG (Bearer) | | 46,714 | 1,756,816 |
| Deutz AG | | 15,525 | 86,575 |
| DIC Asset AG | | 3,887 | 54,190 |
| Draegerwerk AG & Co. KGaA | | 391 | 16,397 |
| Drillisch AG (b) | | 7,053 | 188,632 |
| Duerr AG (b) | | 6,646 | 195,981 |
| E.ON AG | | 285,906 | 2,883,212 |
| Eckert & Ziegler Strahlen-und Medizintechnik AG | | 580 | 101,559 |
| ElringKlinger AG (a) | | 2,008 | 14,870 |
| Evonik Industries AG | | 28,450 | 750,421 |
| Evotec OAI AG (a)(b) | | 18,042 | 412,305 |
| Fraport AG Frankfurt Airport Services Worldwide | | 4,934 | 412,387 |
| Freenet AG | | 17,965 | 398,623 |
| Fresenius Medical Care AG & Co. KGaA | | 28,191 | 2,034,817 |
| Fresenius SE & Co. KGaA | | 54,932 | 2,887,144 |
| GEA Group AG | | 17,989 | 549,930 |
| Gerresheimer AG | | 4,109 | 331,105 |
| Grenkeleasing AG | | 3,340 | 316,075 |
| Hamborner (REIT) AG | | 37,362 | 402,114 |
| Hamburger Hafen und Logistik AG | | 695 | 17,999 |
| Hannover Reuck SE | | 7,347 | 1,301,225 |
| HeidelbergCement Finance AG | | 20,835 | 1,548,067 |
| Heidelberger Druckmaschinen AG (a)(b) | | 58,975 | 76,628 |
| HelloFresh AG (a) | | 28,854 | 502,665 |
| Henkel AG & Co. KGaA | | 18,635 | 1,794,665 |
| Hochtief AG | | 2,838 | 353,872 |
| Hornbach Holding AG & Co. KGaA | | 1,586 | 95,873 |
| Hugo Boss AG | | 8,655 | 364,108 |
| Hypoport AG (a) | | 538 | 167,109 |
| INDUS Holding AG | | 2,082 | 79,414 |
| Infineon Technologies AG | | 165,705 | 3,209,503 |
| Isra Vision AG | | 3,299 | 155,858 |
| Jenoptik AG | | 5,977 | 177,986 |
| JOST Werke AG (c) | | 1,747 | 49,100 |
| K&S AG (b) | | 23,836 | 339,216 |
| KION Group AG | | 7,418 | 492,923 |
| Kloeckner & Co. AG | | 6,272 | 36,235 |
| Knorr-Bremse AG | | 6,507 | 656,709 |
| Koenig & Bauer AG (b) | | 5,449 | 180,009 |
| Krones AG | | 4,962 | 324,576 |
| KWS Saat AG | | 795 | 53,466 |
| Lanxess AG | | 10,873 | 706,984 |
| LEG Immobilien AG | | 8,927 | 1,024,502 |
| LEONI AG (a)(b) | | 3,228 | 38,324 |
| Merck KGaA | | 16,339 | 1,948,027 |
| Metro AG (a) | | 21,837 | 110,206 |
| Metro Wholesale & Food Specialist AG | | 20,745 | 337,799 |
| Morphosys AG (a) | | 5,351 | 582,772 |
| MTU Aero Engines Holdings AG | | 6,639 | 1,772,632 |
| Muenchener Rueckversicherungs-Gesellschaft AG in Muenchen | | 18,372 | 5,102,083 |
| Nemetschek Se | | 7,012 | 356,614 |
| Nordex Se (a)(b) | | 10,421 | 136,449 |
| NORMA Group AG | | 3,332 | 122,485 |
| Open Business Club AG | | 538 | 169,509 |
| OSRAM Licht AG (b) | | 12,774 | 569,874 |
| Patrizia Immobilien AG | | 7,349 | 150,567 |
| Pfeiffer Vacuum Technology AG | | 438 | 68,537 |
| ProSiebenSat.1 Media AG | | 40,318 | 595,359 |
| Puma AG | | 10,582 | 796,052 |
| Rational AG | | 557 | 423,984 |
| Rheinmetall AG | | 5,229 | 628,971 |
| Rhoen-Klinikum AG | | 1,417 | 29,205 |
| RIB Software AG | | 7,638 | 197,803 |
| Rocket Internet AG (a)(c) | | 14,844 | 394,352 |
| RWE AG | | 69,203 | 2,109,387 |
| Salzgitter AG | | 6,642 | 120,229 |
| SAP SE | | 128,986 | 17,090,836 |
| Scout24 AG (c) | | 14,420 | 891,782 |
| SGL Carbon AG (a) | | 4,281 | 19,939 |
| Siemens AG | | 99,359 | 11,466,036 |
| Siemens Healthineers AG (c) | | 19,561 | 831,095 |
| Siltronic AG | | 2,691 | 255,768 |
| Sixt AG | | 1,921 | 187,682 |
| SMA Solar Technology AG (a) | | 508 | 15,875 |
| Software AG (Bearer) | | 12,178 | 387,091 |
| STRATEC Biomedical Systems AG | | 452 | 34,129 |
| Stroer Out-of-Home Media AG (b) | | 4,139 | 333,292 |
| Suedzucker AG (Bearer) | | 7,196 | 103,692 |
| SURTECO SE | | 593 | 13,042 |
| Symrise AG | | 16,522 | 1,589,880 |
| TAG Immobilien AG | | 18,056 | 438,603 |
| Takkt AG | | 3,255 | 38,699 |
| Telefonica Deutschland Holding AG | | 105,880 | 335,960 |
| Thyssenkrupp AG | | 54,773 | 781,625 |
| TLG Immobilien AG | | 8,617 | 252,277 |
| TUI AG (GB) | | 60,869 | 796,351 |
| Uniper SE | | 25,224 | 786,017 |
| United Internet AG | | 19,013 | 572,752 |
| Varta AG (a) | | 2,021 | 228,107 |
| Volkswagen AG | | 6,933 | 1,313,731 |
| Vonovia SE | | 66,230 | 3,524,162 |
| Vossloh AG | | 228 | 9,320 |
| Wacker Construction Equipment AG | | 1,721 | 29,406 |
| WashTec AG | | 1,228 | 61,768 |
| Wirecard AG (b) | | 15,366 | 1,945,986 |
| Wustenrot & Wurttembergische AG | | 3,536 | 72,406 |
| Zalando SE (a)(c) | | 18,732 | 811,646 |
| Zooplus AG (a) | | 1,323 | 144,603 |
|
| TOTAL GERMANY | | | 170,183,281 |
|
| Gibraltar - 0.0% | | | |
| 888 Holdings PLC | | 26,779 | 62,300 |
| Greece - 0.1% | | | |
| Aegean Airlines SA | | 3,180 | 29,083 |
| Alpha Bank AE (a) | | 200,886 | 428,156 |
| Athens Water Supply & Sewage Co. SA | | 7,606 | 67,440 |
| EFG Eurobank Ergasias SA (a) | | 359,742 | 364,308 |
| Ff Group (a)(d) | | 881 | 1,179 |
| GEK Group of Companies SA (a) | | 14,236 | 108,284 |
| Greek Organization of Football Prognostics SA | | 27,020 | 293,820 |
| Hellenic Exchanges Holding SA | | 387 | 1,942 |
| Hellenic Telecommunications Organization SA | | 37,800 | 573,353 |
| Holding Co. ADMIE IPTO SA | | 26,627 | 63,552 |
| Jumbo SA | | 13,307 | 259,723 |
| Motor Oil (HELLAS) Corinth Refineries SA | | 5,716 | 141,144 |
| Mytilineos SA | | 9,797 | 107,190 |
| National Bank of Greece SA (a) | | 67,067 | 227,391 |
| Piraeus Bank SA (a) | | 42,164 | 147,190 |
| Public Power Corp. of Greece (a) | | 8,918 | 31,530 |
| Terna Energy SA | | 24,164 | 197,275 |
|
| TOTAL GREECE | | | 3,042,560 |
|
| Hong Kong - 2.3% | | | |
| AIA Group Ltd. | | 1,590,000 | 15,833,577 |
| Bank of East Asia Ltd. | | 157,207 | 378,696 |
| Beijing Enterprises Holdings Ltd. | | 65,000 | 306,046 |
| Beijing Tong Ren Tang Chinese Medicine Co. Ltd. | | 2,000 | 2,711 |
| BOC Hong Kong (Holdings) Ltd. | | 434,000 | 1,491,062 |
| BYD Electronic International Co. Ltd. | | 80,000 | 137,374 |
| Champion (REIT) | | 208,000 | 137,857 |
| China Agri-Industries Holdings Ltd. | | 225,000 | 74,128 |
| China Everbright International Ltd. | | 657,370 | 496,844 |
| China Everbright Ltd. | | 212,000 | 314,100 |
| China Jinmao Holdings Group Ltd. | | 576,000 | 382,937 |
| China Merchants Holdings International Co. Ltd. | | 287,671 | 449,783 |
| China Mobile Ltd. | | 800,000 | 6,501,360 |
| China Overseas Grand Oceans Group Ltd. | | 106,500 | 55,098 |
| China Overseas Land and Investment Ltd. | | 514,000 | 1,621,923 |
| China Power International Development Ltd. | | 1,101,666 | 230,066 |
| China Resources Beer Holdings Co. Ltd. | | 188,666 | 967,295 |
| China Resources Pharmaceutical Group Ltd. (c) | | 400,500 | 369,865 |
| China Resources Power Holdings Co. Ltd. | | 214,000 | 268,941 |
| China South City Holdings Ltd. | | 2,034,000 | 235,757 |
| China Taiping Insurance Group Ltd. | | 196,400 | 441,527 |
| China Travel International Investment HK Ltd. | | 158,000 | 24,943 |
| China Unicom Ltd. | | 840,000 | 826,979 |
| CITIC 1616 Holdings Ltd. | | 211,000 | 80,092 |
| CITIC Pacific Ltd. | | 703,000 | 924,786 |
| CLP Holdings Ltd. | | 220,000 | 2,284,793 |
| CNOOC Ltd. | | 2,342,000 | 3,485,483 |
| CSPC Pharmaceutical Group Ltd. | | 670,000 | 1,715,951 |
| Dah Sing Banking Group Ltd. | | 140,400 | 181,509 |
| Dah Sing Financial Holdings Ltd. | | 19,200 | 71,445 |
| Far East Horizon Ltd. | | 436,000 | 412,780 |
| Fosun International Ltd. | | 410,000 | 536,107 |
| Fushan International Energy Group Ltd. | | 94,000 | 19,397 |
| Galaxy Entertainment Group Ltd. | | 273,000 | 1,879,780 |
| Guangdong Investment Ltd. | | 360,000 | 779,147 |
| Guotai Junan International Holdings Ltd. | | 205,000 | 34,421 |
| GZI (REIT) | | 194,000 | 128,925 |
| Hang Lung Group Ltd. | | 114,000 | 285,529 |
| Hang Lung Properties Ltd. | | 274,000 | 602,308 |
| Hang Seng Bank Ltd. | | 103,100 | 2,151,192 |
| Henderson Land Development Co. Ltd. | | 198,345 | 990,651 |
| Hong Kong & China Gas Co. Ltd. | | 1,338,842 | 2,598,561 |
| Hong Kong & Shanghai Hotels Ltd. | | 157,500 | 177,350 |
| Hong Kong Exchanges and Clearing Ltd. | | 153,976 | 4,796,974 |
| Hua Hong Semiconductor Ltd. (c) | | 50,000 | 100,542 |
| Hysan Development Co. Ltd. | | 81,000 | 319,241 |
| Lai Sun Development Co. Ltd. | | 7,800 | 9,337 |
| Lenovo Group Ltd. | | 938,000 | 653,920 |
| Link (REIT) | | 271,000 | 2,951,570 |
| Melco International Development Ltd. | | 106,000 | 280,937 |
| MMG Ltd. (a) | | 240,000 | 49,964 |
| MTR Corp. Ltd. | | 194,977 | 1,117,956 |
| New World Development Co. Ltd. | | 817,289 | 1,169,080 |
| PCCW Ltd. | | 538,000 | 319,526 |
| Poly Property Group Co. Ltd. | | 135,000 | 48,763 |
| Power Assets Holdings Ltd. | | 179,500 | 1,280,937 |
| Prosperity (REIT) | | 13,000 | 5,121 |
| Shanghai Industrial Holdings Ltd. | | 127,000 | 236,407 |
| Shenzhen Investment Ltd. | | 717,290 | 282,322 |
| Shun Tak Holdings Ltd. | | 22,000 | 9,020 |
| Sino Land Ltd. | | 329,232 | 492,158 |
| Sino-Ocean Group Holding Ltd. | | 489,500 | 179,965 |
| Sinotruk Hong Kong Ltd. | | 68,000 | 102,753 |
| SJM Holdings Ltd. | | 268,000 | 286,289 |
| Sun Art Retail Group Ltd. | | 352,555 | 359,745 |
| Sun Hung Kai Properties Ltd. | | 208,000 | 3,151,890 |
| Sunlight (REIT) | | 313,000 | 212,339 |
| Swire Pacific Ltd. (A Shares) | | 75,500 | 719,688 |
| Swire Properties Ltd. | | 139,800 | 439,678 |
| Techtronic Industries Co. Ltd. | | 172,000 | 1,344,183 |
| Television Broadcasts Ltd. | | 105,100 | 173,360 |
| Universal Medical Financial & Technical Advisory Services Co. Ltd. (c) | | 290,500 | 198,459 |
| Vitasoy International Holdings Ltd. | | 88,000 | 357,835 |
| Wharf Holdings Ltd. | | 128,000 | 290,465 |
| Wheelock and Co. Ltd. | | 141,000 | 872,029 |
| Winteam Pharmaceutical Group Ltd. | | 292,000 | 130,386 |
| Yuexiu Property Co. Ltd. | | 1,220,000 | 268,720 |
|
| TOTAL HONG KONG | | | 74,100,635 |
|
| Hungary - 0.1% | | | |
| Magyar Telekom PLC | | 312,809 | 466,123 |
| MOL Hungarian Oil and Gas PLC Series A (For. Reg.) | | 41,910 | 414,254 |
| OTP Bank PLC | | 25,795 | 1,188,153 |
| Richter Gedeon PLC | | 16,373 | 303,444 |
|
| TOTAL HUNGARY | | | 2,371,974 |
|
| India - 2.4% | | | |
| Aarti Industries Ltd. | | 12,406 | 153,059 |
| Aarti Surfactants Ltd. (a)(d) | | 620 | 6,643 |
| Adani Ports & Special Economic Zone Ltd. (a) | | 94,229 | 524,705 |
| Adani Power Ltd. (a) | | 61,306 | 56,953 |
| Adani Transmissions Ltd. (a) | | 32,790 | 126,537 |
| Aditya Birla Fashion and Retail Ltd. (a) | | 10,575 | 31,584 |
| AIA Engineering Ltd. | | 6,584 | 160,131 |
| Ajanta Pharma Ltd. | | 281 | 4,156 |
| Alembic Pharmaceuticals Ltd. (a) | | 7,019 | 54,175 |
| Ambuja Cements Ltd. | | 111,782 | 318,292 |
| Apollo Hospitals Enterprise Ltd. | | 8,727 | 182,471 |
| Apollo Tyres Ltd. (a) | | 8,706 | 23,304 |
| Arvind Fashions Ltd. (a) | | 2,663 | 16,988 |
| Arvind Mills Ltd. (a) | | 13,319 | 9,446 |
| Ashok Leyland Ltd. | | 121,377 | 131,093 |
| Asian Paints Ltd. | | 34,771 | 885,693 |
| Astral Poly Technik Ltd. | | 14,965 | 235,063 |
| Atul Ltd. | | 4,782 | 288,218 |
| AU Small Finance Bank Ltd. (a)(c) | | 32,062 | 309,259 |
| Aurobindo Pharma Ltd. | | 55,358 | 364,975 |
| Avenue Supermarts Ltd. (a)(c) | | 17,273 | 484,659 |
| Axis Bank Ltd. | | 305,154 | 3,159,465 |
| Bajaj Auto Ltd. | | 13,922 | 636,320 |
| Bajaj Finance Ltd. | | 20,954 | 1,187,399 |
| Bajaj Finserv Ltd. | | 4,874 | 558,208 |
| Balkrishna Industries Ltd. | | 4,756 | 59,236 |
| Bandhan Bank Ltd. (c) | | 52,505 | 452,103 |
| Bayer CropScience Ltd. | | 495 | 24,963 |
| Bharat Forge Ltd. | | 22,543 | 143,916 |
| Bharat Petroleum Corp. Ltd. | | 88,017 | 651,385 |
| Bharti Airtel Ltd. | | 273,541 | 1,440,547 |
| Bharti Infratel Ltd. | | 50,732 | 135,489 |
| Blue Dart Express Ltd. | | 43 | 1,452 |
| Bosch Ltd. | | 677 | 145,799 |
| Britannia Industries Ltd. | | 5,832 | 268,101 |
| Canara Bank Ltd. (a) | | 4,410 | 12,623 |
| Care Ratings Ltd. (a) | | 132 | 986 |
| CEAT Ltd. (a) | | 225 | 3,196 |
| CESC Ltd. GDR | | 2,216 | 24,900 |
| Cg Power & Industrial Soluti (a) | | 2,315 | 469 |
| Cipla Ltd. (a) | | 32,721 | 215,110 |
| City Union Bank Ltd. | | 54,149 | 161,627 |
| Coal India Ltd. | | 219,489 | 640,732 |
| Container Corp. of India Ltd. | | 22,838 | 189,104 |
| CRISIL Ltd. | | 197 | 4,058 |
| Crompton Greaves Consumer Electricals Ltd. (a) | | 82,929 | 290,551 |
| Dabur India Ltd. | | 96,501 | 627,376 |
| Dalmia Bharat Ltd. (a) | | 6,388 | 72,985 |
| Dcb Bank Ltd. (a) | | 116,523 | 295,311 |
| Dewan Housing Finance Corp. Ltd. (a) | | 17,328 | 4,242 |
| Dish TV India Ltd. (a) | | 40,221 | 7,068 |
| Divi's Laboratories Ltd. | | 8,446 | 208,674 |
| Dr. Reddy's Laboratories Ltd. | | 16,002 | 627,812 |
| eClerx Services Ltd. | | 2,945 | 18,721 |
| Edelweiss Financial Services Ltd. | | 47,278 | 61,350 |
| Eicher Motors Ltd. | | 2,083 | 659,936 |
| Endurance Technologies Ltd. (c) | | 6,526 | 100,136 |
| Engineers India Ltd. | | 1,276 | 2,150 |
| Escorts Ltd. | | 1,831 | 16,975 |
| Exide Industries Ltd. (a) | | 4,874 | 13,251 |
| Federal Bank Ltd. (a) | | 209,596 | 247,096 |
| Finolex Cables Ltd. | | 6,357 | 34,304 |
| Fortis Healthcare Ltd. (a) | | 23,747 | 49,098 |
| GAIL India Ltd. (a) | | 204,875 | 395,955 |
| Ge Power India Ltd. | | 330 | 3,479 |
| Gillette India Ltd. | | 1,261 | 143,855 |
| Glenmark Pharmaceuticals Ltd. | | 45,073 | 200,158 |
| GMR Infrastructure Ltd. (a) | | 75,851 | 22,162 |
| Godrej Consumer Products Ltd. | | 39,294 | 409,884 |
| Godrej Industries Ltd. | | 19,503 | 114,287 |
| Godrej Properties Ltd. (a) | | 9,029 | 126,691 |
| Graphite India Ltd. | | 4,363 | 17,472 |
| Grasim Industries Ltd. | | 40,381 | 437,174 |
| Great Eastern Shipping Co. Ltd. | | 242 | 1,021 |
| Havells India Ltd. | | 27,493 | 267,678 |
| HCL Technologies Ltd. | | 68,563 | 1,123,425 |
| HDFC Standard Life Insurance Co. Ltd. (c) | | 77,656 | 684,342 |
| Hemisphere Properties India Ltd. (a)(d) | | 3,714 | 8,466 |
| Hero Motocorp Ltd. | | 16,571 | 630,605 |
| Hexaware Technologies Ltd. | | 56,087 | 262,869 |
| Hindalco Industries Ltd. | | 168,942 | 446,272 |
| Hindustan Petroleum Corp. Ltd. | | 127,476 | 582,315 |
| Hindustan Unilever Ltd. | | 86,786 | 2,658,089 |
| Housing Development Finance Corp. Ltd. | | 218,756 | 6,560,580 |
| ICICI Bank Ltd. | | 317,149 | 2,067,569 |
| ICICI Lombard General Insurance Co. Ltd. (c) | | 20,243 | 381,425 |
| IDFC Bank Ltd. (a) | | 206,105 | 129,485 |
| Iifl Finance Ltd. (a) | | 6,651 | 10,666 |
| IIFL Securities Ltd. (a) | | 6,651 | 2,772 |
| IIFL Wealth Management Ltd. (a) | | 950 | 17,696 |
| India Cements Ltd. (a) | | 5,046 | 5,962 |
| Indiabulls Housing Finance Ltd. | | 31,150 | 90,326 |
| Indiabulls Real Estate Ltd. (a) | | 6,400 | 4,959 |
| Indiabulls Ventures Ltd. | | 10,489 | 14,836 |
| Indian Oil Corp. Ltd. | | 310,807 | 641,520 |
| Indraprastha Gas Ltd. (a) | | 24,344 | 134,145 |
| Info Edge India Ltd. | | 8,689 | 314,331 |
| Infosys Ltd. | | 452,440 | 4,347,461 |
| InterGlobe Aviation Ltd. (a)(c) | | 13,298 | 272,327 |
| Ipca Laboratories Ltd. | | 13,492 | 186,243 |
| IRB Infrastructure Developers Ltd. | | 3,943 | 4,389 |
| ITC Ltd. | | 532,254 | 1,930,257 |
| Jain Irrigation Systems Ltd. (a) | | 18,440 | 3,894 |
| Jindal Steel & Power Ltd. (a) | | 48,419 | 79,122 |
| JSW Steel Ltd. | | 91,512 | 293,422 |
| Jubilant Foodworks Ltd. | | 15,148 | 341,209 |
| Jubilant Life Sciences Ltd. | | 3,486 | 27,019 |
| Kajaria Ceramics Ltd. | | 1,102 | 8,664 |
| Larsen & Toubro Ltd. | | 67,028 | 1,389,696 |
| LIC Housing Finance Ltd. | | 51,108 | 296,642 |
| Lupin Ltd. (a) | | 30,270 | 317,696 |
| Mahindra & Mahindra Financial Services Ltd. | | 31,751 | 157,569 |
| Mahindra & Mahindra Ltd. | | 90,114 | 769,064 |
| Manappuram General Finance & Leasing Ltd. | | 96,169 | 229,124 |
| Marico Ltd. | | 58,808 | 303,077 |
| Maruti Suzuki India Ltd. | | 14,504 | 1,544,268 |
| Max Financial Services Ltd. (a) | | 21,545 | 123,143 |
| MindTree Consulting Ltd. | | 7,309 | 73,373 |
| Motherson Sumi Systems Ltd. (a) | | 111,817 | 193,499 |
| Motilal Oswal Financial Services Ltd. | | 1,131 | 9,855 |
| Mphasis BFL Ltd. | | 14,654 | 195,397 |
| Multi Commodity Exchange of India Ltd. (a) | | 182 | 2,915 |
| Muthoot Finance Ltd. (a) | | 3,598 | 35,807 |
| Natco Pharma Ltd. | | 35,321 | 293,169 |
| Ncc Ltd. (a) | | 54,238 | 44,089 |
| Nestle India Ltd. | | 2,915 | 613,042 |
| NIIT Technologies Ltd. (a) | | 866 | 18,883 |
| NTPC Ltd. | | 280,087 | 482,648 |
| Oberoi Realty Ltd. (a) | | 3,854 | 27,490 |
| Oil & Natural Gas Corp. Ltd. | | 395,575 | 788,945 |
| Page Industries Ltd. | | 974 | 352,872 |
| PC Jeweller Ltd. (a) | | 6,790 | 3,067 |
| Persistent Systems Ltd. | | 3,130 | 27,213 |
| Petronet LNG Ltd. | | 100,442 | 405,010 |
| Pfizer Ltd. | | 1,331 | 76,087 |
| PI Industries Ltd. | | 10,459 | 209,649 |
| Pidilite Industries Ltd. (a) | | 21,232 | 418,952 |
| Piramal Enterprises Ltd. | | 14,019 | 332,037 |
| PNB Housing Finance Ltd. (a)(c) | | 9,712 | 73,244 |
| Power Finance Corp. Ltd. (a) | | 51,449 | 79,020 |
| Power Grid Corp. of India Ltd. | | 272,442 | 761,309 |
| Prestige Estates Projs. Ltd. | | 4,180 | 17,769 |
| PVR Ltd. | | 11,294 | 282,419 |
| Rajesh Exports Ltd. | | 5,672 | 54,188 |
| RBL Bank Ltd. (c) | | 32,205 | 140,471 |
| Rec Ltd. | | 101,265 | 199,069 |
| Redington India Ltd. | | 14,319 | 23,924 |
| Reliance Capital Ltd. (a) | | 4,711 | 1,279 |
| Reliance Industries Ltd. | | 373,130 | 7,685,143 |
| Reliance Infrastructure Ltd. (a) | | 5,715 | 2,814 |
| Repco Home Finance Ltd. (a) | | 83 | 340 |
| Sadbhav Engineering Ltd. (a) | | 12,879 | 24,870 |
| Sanofi India Ltd. | | 25 | 2,369 |
| Shree Cement Ltd. | | 1,336 | 374,253 |
| Shriram Transport Finance Co. Ltd. | | 33,168 | 531,282 |
| SRF Ltd. | | 3,138 | 127,898 |
| State Bank of India (a) | | 215,246 | 945,943 |
| Strides Shasun Ltd. | | 1,270 | 6,878 |
| Sun Pharmaceutical Industries Ltd. | | 135,447 | 826,810 |
| Sundaram Finance Ltd. | | 2,407 | 54,571 |
| Supreme Industries Ltd. | | 10,061 | 164,351 |
| Suzlon Energy Ltd. (a) | | 45,292 | 1,689 |
| Symphony Ltd. | | 118 | 2,166 |
| Tata Communications Ltd. | | 3,714 | 18,403 |
| Tata Consultancy Services Ltd. | | 118,726 | 3,781,186 |
| Tata Global Beverages Ltd. | | 21,357 | 95,306 |
| Tata Motors Ltd. (a) | | 188,550 | 465,896 |
| Tata Power Co. Ltd. | | 125,220 | 104,516 |
| Tata Steel Ltd. | | 47,035 | 251,661 |
| Tech Mahindra Ltd. | | 67,789 | 705,357 |
| The Indian Hotels Co. Ltd. (a) | | 43,561 | 93,176 |
| The Karur Vysya Bank Ltd. | | 3,746 | 2,891 |
| The Ramco Cements Ltd. (a) | | 1,219 | 13,470 |
| Thermax Ltd. | | 2,019 | 32,083 |
| Titan Co. Ltd. | | 45,077 | 845,092 |
| Tube Investments of India Ltd. | | 4,001 | 22,436 |
| Tube Investments of India Ltd. | | 4,001 | 25,687 |
| Ultratech Cemco Ltd. | | 11,403 | 665,431 |
| United Spirits Ltd. (a) | | 47,983 | 421,800 |
| UPL Ltd. (a) | | 89,859 | 754,543 |
| Varun Beverages Ltd. (a) | | 19,317 | 168,571 |
| Vedanta Ltd. | | 290,902 | 606,712 |
| Vodafone Idea Ltd. (a) | | 660,605 | 36,203 |
| Voltas Ltd. (a) | | 37,783 | 376,554 |
| WABCO India Ltd. | | 355 | 31,013 |
| Welspun India Ltd. (a) | | 12,290 | 9,656 |
| Whirlpool of India Ltd. | | 3,668 | 113,285 |
| Wipro Ltd. | | 169,400 | 619,891 |
| Yes Bank Ltd. | | 276,130 | 273,255 |
| Zee Entertainment Enterprises Ltd. (a) | | 93,360 | 341,396 |
|
| TOTAL INDIA | | | 77,221,923 |
|
| Indonesia - 0.5% | | | |
| PT ACE Hardware Indonesia Tbk | | 1,373,200 | 165,269 |
| PT Adaro Energy Tbk | | 2,037,200 | 189,935 |
| PT AKR Corporindo Tbk | | 192,600 | 54,319 |
| PT Aneka Tambang Tbk | | 1,728,800 | 109,496 |
| PT Astra International Tbk | | 2,569,100 | 1,270,679 |
| PT Bank Central Asia Tbk | | 1,288,100 | 2,883,190 |
| PT Bank Jabar Banten Tbk | | 70,600 | 9,106 |
| PT Bank Mandiri (Persero) Tbk | | 2,336,100 | 1,167,745 |
| PT Bank Negara Indonesia (Persero) Tbk | | 1,236,800 | 675,148 |
| PT Bank Rakyat Indonesia Tbk | | 7,340,800 | 2,199,563 |
| PT Bank Tabungan Negara Tbk | | 1,226,900 | 162,384 |
| PT Bank Tabungan Pensiunan Nasional Syariah Tbk (a) | | 378,400 | 103,487 |
| PT Barito Pacific Tbk | | 3,174,500 | 214,838 |
| PT Bumi Resources Tbk (a) | | 3,868,300 | 23,395 |
| PT Bumi Serpong Damai Tbk (a) | | 696,900 | 70,177 |
| PT Charoen Pokphand Indonesia Tbk | | 975,600 | 437,536 |
| PT Ciputra Development Tbk | | 1,794,300 | 141,759 |
| PT Global Mediacom Tbk (a) | | 14,600 | 389 |
| PT Gudang Garam Tbk | | 57,100 | 228,041 |
| PT Hanjaya Mandala Sampoerna Tbk | | 1,046,900 | 158,733 |
| PT Hanson International Tbk (a) | | 3,268,900 | 20,875 |
| PT Indah Kiat Pulp & Paper Tbk | | 359,200 | 185,942 |
| PT Indocement Tunggal Prakarsa Tbk | | 291,300 | 415,006 |
| PT Indofood CBP Sukses Makmur Tbk | | 356,700 | 295,322 |
| PT Indofood Sukses Makmur Tbk | | 862,800 | 472,817 |
| PT Inti Agriculture Resources Tbk (a) | | 1,180,800 | 4,189 |
| PT Japfa Comfeed Indonesia Tbk | | 445,500 | 54,573 |
| PT Jasa Marga Tbk | | 339,196 | 131,618 |
| PT Kalbe Farma Tbk | | 2,281,500 | 259,084 |
| PT Kresna Graha Investama Tbk (a) | | 910,500 | 32,428 |
| PT Link Net Tbk | | 552,700 | 172,555 |
| PT Lippo Karawaci Tbk (a) | | 8,407,200 | 141,315 |
| PT Matahari Department Store Tbk | | 255,000 | 66,102 |
| PT Medco Energi International Tbk (a) | | 424,200 | 19,930 |
| PT Media Nusantara Citra Tbk | | 1,079,900 | 101,117 |
| PT Mitra Adiperkasa Tbk | | 2,151,200 | 153,230 |
| PT Pabrik Kertas Tjiwi Kimia Tbk | | 205,700 | 154,840 |
| PT Pakuwon Jati Tbk | | 1,383,800 | 61,583 |
| PT Panin Life Tbk (a) | | 3,417,100 | 70,604 |
| PT Pembangunan Perumahan Persero Tbk | | 253,258 | 32,033 |
| PT Perusahaan Gas Negara Tbk Series B | | 1,813,900 | 272,210 |
| PT Perusahaan Perkebunan London Sumatra Indonesia Tbk | | 17,000 | 1,636 |
| PT Pool Advista Indonesia Tbk (a) | | 184,900 | 23,576 |
| PT PP Properti Tbk | | 481,000 | 3,392 |
| PT Semen Gresik (Persero) Tbk | | 361,400 | 325,941 |
| PT Sitara Propertindo Tbk (a) | | 49,100 | 2,526 |
| PT Sugih Energy Tbk (a)(d) | | 40,500 | 144 |
| PT Summarecon Agung Tbk | | 748,400 | 60,230 |
| PT Surya Citra Media Tbk | | 295,600 | 25,681 |
| PT Tambang Batubara Bukit Asam Tbk | | 331,300 | 53,050 |
| PT Telekomunikasi Indonesia Tbk Series B | | 6,701,400 | 1,955,608 |
| PT Tower Bersama Infrastructure Tbk | | 218,400 | 98,395 |
| PT Unilever Indonesia Tbk | | 211,200 | 657,611 |
| PT United Tractors Tbk | | 208,700 | 322,135 |
| PT Waskita Karya Persero Tbk | | 530,900 | 58,789 |
| PT Wijaya Karya Persero Tbk | | 236,426 | 33,344 |
|
| TOTAL INDONESIA | | | 17,004,620 |
|
| Ireland - 0.5% | | | |
| AIB Group PLC | | 105,639 | 338,377 |
| Bank Ireland Group PLC | | 133,229 | 640,721 |
| C&C Group PLC (United Kingdom) | | 35,891 | 176,667 |
| Cairn Homes PLC | | 54,034 | 70,027 |
| CRH PLC | | 101,811 | 3,706,917 |
| Dalata Hotel Group PLC | | 9,355 | 55,298 |
| DCC PLC (United Kingdom) | | 12,309 | 1,153,741 |
| Glanbia PLC | | 27,945 | 311,359 |
| Glenveagh Properties PLC (a)(c) | | 243,350 | 213,870 |
| Grafton Group PLC unit | | 32,648 | 330,289 |
| Green REIT PLC | | 79,320 | 168,615 |
| Greencore Group PLC | | 38,616 | 116,249 |
| Hibernia (REIT) PLC | | 166,522 | 259,268 |
| Irish Residential Properties REIT PLC | | 74,222 | 145,361 |
| James Hardie Industries PLC CDI | | 56,850 | 976,354 |
| Kerry Group PLC Class A | | 20,386 | 2,464,637 |
| Kingspan Group PLC (Ireland) | | 21,369 | 1,107,274 |
| Origin Enterprises PLC | | 17,170 | 90,004 |
| Paddy Power Betfair PLC (Ireland) | | 11,093 | 1,145,897 |
| Permanent Tsb Group Hld PLC (a) | | 637 | 841 |
| Smurfit Kappa Group PLC | | 30,636 | 1,021,633 |
| United Drug PLC (United Kingdom) | | 29,853 | 298,920 |
|
| TOTAL IRELAND | | | 14,792,319 |
|
| Isle of Man - 0.1% | | | |
| Gaming VC Holdings SA | | 76,734 | 884,637 |
| NEPI Rockcastle PLC | | 50,168 | 436,590 |
| Playtech Ltd. | | 30,602 | 155,667 |
| Redefine International PLC | | 85,601 | 143,705 |
|
| TOTAL ISLE OF MAN | | | 1,620,599 |
|
| Israel - 0.5% | | | |
| Airport City Ltd. (a) | | 7,556 | 142,568 |
| Alony Hetz Properties & Investments Ltd. | | 23,143 | 333,902 |
| Amot Investments Ltd. | | 28,138 | 197,995 |
| Azrieli Group | | 5,607 | 431,926 |
| Bank Hapoalim BM (Reg.) | | 138,503 | 1,107,804 |
| Bank Leumi le-Israel BM | | 193,951 | 1,412,074 |
| Bezeq The Israel Telecommunication Corp. Ltd. | | 327,943 | 216,430 |
| Caesarstone Sdot-Yam Ltd. | | 4,697 | 79,332 |
| Cellcom Israel Ltd. (Israel) (a) | | 5,937 | 15,161 |
| Check Point Software Technologies Ltd. (a) | | 15,317 | 1,721,784 |
| Clal Insurance Enterprises Holdings Ltd. (a) | | 9,526 | 147,034 |
| CyberArk Software Ltd. (a) | | 4,707 | 478,137 |
| Delek Group Ltd. | | 317 | 39,575 |
| Elbit Systems Ltd. (Israel) | | 3,129 | 512,703 |
| Electra Israel Ltd. | | 383 | 135,728 |
| Equital Ltd. (a) | | 686 | 19,892 |
| Fattal Holdings 1998 Ltd. | | 820 | 121,844 |
| First International Bank of Israel | | 6,983 | 191,651 |
| Formula Systems (1985) Ltd. | | 1,804 | 120,285 |
| Gazit-Globe Ltd. | | 18,453 | 186,025 |
| Harel Insurance Investments and Financial Services Ltd. | | 9,721 | 77,642 |
| Hilan Ltd. | | 3,519 | 155,659 |
| Israel Chemicals Ltd. | | 90,474 | 401,742 |
| Israel Corp. Ltd. (Class A) (a) | | 429 | 81,797 |
| Israel Discount Bank Ltd. (Class A) | | 171,599 | 783,879 |
| Ituran Location & Control Ltd. | | 1,134 | 27,817 |
| Jerusalem Economy Ltd. (a) | | 34,641 | 147,825 |
| Kornit Digital Ltd. (a)(b) | | 8,123 | 276,101 |
| Matrix IT Ltd. | | 7,364 | 135,289 |
| Melisron Ltd. | | 1,481 | 89,672 |
| Migdal Insurance & Financial Holdings Ltd. | | 78,960 | 81,930 |
| Mizrahi Tefahot Bank Ltd. | | 19,561 | 485,078 |
| NICE Systems Ltd. (a) | | 8,188 | 1,294,487 |
| Nova Measuring Instruments Ltd. (a) | | 3,120 | 104,724 |
| Oil Refineries Ltd. | | 140,105 | 71,872 |
| Partner Communications Co. Ltd. (a) | | 31,298 | 141,018 |
| Paz Oil Co. Ltd. | | 2,284 | 349,879 |
| Plus500 Ltd. | | 16,898 | 175,111 |
| Radware Ltd. (a) | | 17,898 | 403,779 |
| Reit 1 Ltd. | | 23,695 | 149,924 |
| Shapir Engineering and Industry Ltd. | | 23,028 | 114,145 |
| Shikun & Binui Ltd. | | 20,523 | 81,523 |
| Shufersal Ltd. | | 14,878 | 100,511 |
| Strauss Group Ltd. | | 3,837 | 116,162 |
| Teva Pharmaceutical Industries Ltd. sponsored ADR (a) | | 148,503 | 1,210,299 |
| The Phoenix Holdings Ltd. | | 16,773 | 102,177 |
| Tower Semiconductor Ltd. (a) | | 18,431 | 406,330 |
| UroGen Pharma Ltd. (a)(b) | | 5,168 | 116,952 |
| Wix.com Ltd. (a) | | 6,156 | 751,463 |
|
| TOTAL ISRAEL | | | 16,046,637 |
|
| Italy - 1.4% | | | |
| A2A SpA | | 238,301 | 478,133 |
| ACEA SpA | | 9,720 | 193,398 |
| Amplifon SpA | | 16,436 | 412,816 |
| Ascopiave SpA | | 12,371 | 51,464 |
| Assicurazioni Generali SpA | | 129,754 | 2,630,189 |
| Astm SpA (b) | | 3,916 | 123,426 |
| Atlantia SpA | | 63,310 | 1,563,298 |
| Autogrill SpA | | 25,966 | 256,440 |
| Azimut Holding SpA | | 18,353 | 377,041 |
| Banca Farmafactoring SpA (c) | | 51,083 | 309,363 |
| Banca Generali SpA | | 5,954 | 194,168 |
| Banca IFIS SpA | | 642 | 10,884 |
| Banca Mediolanum S.p.A. | | 16,321 | 139,889 |
| Banca Monte dei Paschi di Siena SpA (a)(b) | | 44,273 | 71,252 |
| Banca Popolare dell'Emilia Romagna | | 53,495 | 239,070 |
| Banca Popolare di Sondrio SCARL | | 129,726 | 259,128 |
| Banco BPM SpA (a) | | 201,129 | 456,938 |
| Biesse SpA | | 462 | 5,781 |
| Brembo SpA (b) | | 15,607 | 165,971 |
| Brunello Cucinelli SpA | | 5,050 | 158,154 |
| Buzzi Unicem SpA | | 5,507 | 132,912 |
| Cerved Information Solutions SpA | | 25,608 | 249,048 |
| Compagnie Industriali Riunite SpA (CIR) | | 71,481 | 73,584 |
| Credito Emiliano SpA | | 3,458 | 19,978 |
| Credito Valtellinese SC (a) | | 328,946 | 22,416 |
| Danieli & C. Officine Meccaniche SpA | | 1,400 | 24,171 |
| Datalogic SpA | | 613 | 9,483 |
| Davide Campari-Milano SpA | | 78,579 | 719,956 |
| De Longhi SpA | | 7,954 | 146,373 |
| DiaSorin S.p.A. | | 3,701 | 416,900 |
| Dovalue SpA (c) | | 10,191 | 120,480 |
| Enav SpA (c) | | 62,425 | 363,430 |
| Enel SpA | | 1,048,888 | 8,129,264 |
| Eni SpA | | 321,760 | 4,881,419 |
| ERG SpA | | 15,440 | 326,668 |
| Falck Renewables SpA | | 17,619 | 78,445 |
| Fincantieri SpA | | 23,908 | 25,198 |
| FinecoBank SpA | | 81,556 | 918,690 |
| Hera SpA | | 98,568 | 421,922 |
| Immobiliare Grande Distribuzione SpA | | 903 | 5,801 |
| Industria Macchine Automatiche SpA (IMA) | | 2,444 | 166,273 |
| Infrastrutture Wireless Italiane SpA (c) | | 30,394 | 311,866 |
| Interpump Group SpA | | 9,371 | 256,688 |
| Intesa Sanpaolo SpA | | 1,912,425 | 4,792,205 |
| Iren SpA | | 69,810 | 216,604 |
| Italgas SpA | | 61,082 | 392,944 |
| Italmobiliare SpA | | 66 | 1,763 |
| Juventus Football Club SpA (a)(b) | | 43,244 | 67,763 |
| Leonardo SpA | | 50,453 | 585,773 |
| Maire Tecnimont SpA | | 6,337 | 16,581 |
| MARR SpA | | 7,134 | 149,742 |
| Mediaset SpA (a)(b) | | 72,020 | 215,348 |
| Mediaset SpA rights 11/6/19 (a) | | 72,020 | 1 |
| Mediobanca SpA | | 64,852 | 770,308 |
| Moncler SpA | | 23,525 | 906,241 |
| OVS (a)(c) | | 19,908 | 39,677 |
| Piaggio & C SpA | | 27,378 | 86,108 |
| Pirelli & C. SpA (c) | | 55,511 | 320,825 |
| Poste Italiane SpA (c) | | 69,968 | 849,024 |
| Prysmian SpA | | 33,634 | 776,874 |
| Rai Way SpA(c) | | 3,341 | 20,606 |
| Recordati SpA | | 15,024 | 631,209 |
| Reply SpA | | 2,647 | 172,408 |
| Saipem SpA (a) | | 81,797 | 370,386 |
| Salini Impregilo SpA (a) | | 10,586 | 21,559 |
| Salvatore Ferragamo Italia SpA | | 11,825 | 220,906 |
| Saras Raffinerie Sarde SpA | | 83,647 | 160,461 |
| Snam Rete Gas SpA | | 262,273 | 1,345,560 |
| Societa Cattolica Di Assicurazioni SCRL | | 13,923 | 121,354 |
| Societa Iniziative Autostradali e Servizi SpA (SIAS) | | 6,673 | 115,283 |
| Tamburi Investment Partners SpA | | 69,707 | 498,340 |
| Technogym SpA(c) | | 26,292 | 289,716 |
| Telecom Italia SpA (a) | | 627,057 | 367,013 |
| Terna SpA | | 192,936 | 1,274,735 |
| Tod's SpA | | 1,925 | 91,245 |
| UniCredit SpA | | 263,942 | 3,346,449 |
| Unione di Banche Italiane SCpA (b) | | 131,495 | 399,932 |
| Unipol Gruppo SpA | | 58,598 | 326,706 |
| Zignago Vetro SpA | | 165 | 1,877 |
|
| TOTAL ITALY | | | 45,881,294 |
|
| Japan - 17.3% | | | |
| 77 Bank Ltd. | | 10,100 | 159,117 |
| A/S One Corp. | | 1,900 | 158,875 |
| ABC-MART, Inc. | | 3,307 | 226,746 |
| ACOM Co. Ltd. | | 111,500 | 447,967 |
| Activia Properties, Inc. | | 83 | 437,918 |
| Adastria Co. Ltd. | | 3,300 | 81,163 |
| Adeka Corp. | | 8,300 | 118,782 |
| Advance Residence Investment Corp. | | 175 | 581,538 |
| Advantest Corp. | | 27,459 | 1,249,618 |
| Aeon (REIT) Investment Corp. | | 222 | 319,194 |
| AEON Co. Ltd. | | 85,825 | 1,726,830 |
| Aeon Delight Co. Ltd. | | 1,800 | 62,686 |
| AEON Financial Service Co. Ltd. | | 15,999 | 243,831 |
| AEON MALL Co. Ltd. | | 27,300 | 436,774 |
| Agc, Inc. | | 28,063 | 986,698 |
| Ai Holdings Corp. | | 1,200 | 21,748 |
| Aica Kogyo Co. Ltd. | | 5,100 | 161,964 |
| Aichi Steel Corp. | | 100 | 3,255 |
| Aida Engineering Ltd. | | 3,500 | 29,792 |
| Aiful Corp. (a) | | 52,700 | 122,704 |
| Ain Holdings, Inc. | | 3,800 | 217,433 |
| Air Water, Inc. | | 22,600 | 423,094 |
| Aisin Seiki Co. Ltd. | | 23,300 | 929,899 |
| Ajinomoto Co., Inc. | | 55,725 | 1,059,454 |
| Akita Bank Ltd. | | 11,700 | 238,726 |
| Alfresa Holdings Corp. | | 24,939 | 556,859 |
| All Nippon Airways Ltd. | | 17,441 | 598,897 |
| Alps Electric Co. Ltd. | | 23,198 | 497,333 |
| Amada Holdings Co. Ltd. | | 40,300 | 458,941 |
| Amano Corp. | | 6,300 | 186,270 |
| AnGes MG, Inc. (a)(b) | | 18,200 | 118,861 |
| Anicom Holdings, Inc. | | 4,000 | 147,049 |
| Anritsu Corp. (b) | | 17,300 | 329,916 |
| Aoki International Co. Ltd. | | 200 | 2,035 |
| Aoyama Trading Co. Ltd. | | 5,000 | 87,973 |
| Aozora Bank Ltd. | | 12,500 | 320,730 |
| ARCS Co. Ltd. | | 3,900 | 78,261 |
| Ariake Japan Co. Ltd. | | 2,100 | 163,018 |
| Aruhi Corp. (b) | | 5,600 | 125,899 |
| Asahi Diamond Industrial Co. Ltd. | | 4,700 | 29,240 |
| Asahi Group Holdings | | 47,059 | 2,356,595 |
| Asahi Holdings, Inc. | | 1,700 | 39,577 |
| ASAHI INTECC Co. Ltd. | | 29,060 | 799,597 |
| Asahi Kasei Corp. | | 168,600 | 1,871,687 |
| Asics Corp. | | 19,200 | 329,632 |
| ASKUL Corp. | | 600 | 16,482 |
| Astellas Pharma, Inc. | | 248,503 | 4,264,981 |
| Atom Corp. | | 47,400 | 437,401 |
| Autobacs Seven Co. Ltd. | | 16,300 | 269,083 |
| Avex, Inc. | | 200 | 2,433 |
| Axial Retailing, Inc. | | 1,300 | 50,258 |
| Azbil Corp. | | 25,100 | 698,463 |
| Bandai Namco Holdings, Inc. | | 25,900 | 1,592,570 |
| Bank of Kyoto Ltd. | | 8,300 | 328,519 |
| Bank of Nagoya Ltd. | | 100 | 2,953 |
| Bank of The Ryukyus Ltd. | | 2,700 | 29,370 |
| BayCurrent Consulting, Inc. | | 2,800 | 141,164 |
| Belc Co. Ltd. | | 800 | 38,477 |
| Belluna Co. Ltd. | | 1,500 | 9,806 |
| Benefit One, Inc. | | 14,300 | 289,467 |
| Benesse Holdings, Inc. | | 10,300 | 275,729 |
| Bic Camera, Inc. | | 54,700 | 597,219 |
| BML, Inc. | | 1,600 | 46,934 |
| Bridgestone Corp. | | 73,358 | 3,048,019 |
| Brother Industries Ltd. | | 27,100 | 509,318 |
| Bunka Shutter Co. Ltd. | | 300 | 2,604 |
| Calbee, Inc. | | 11,200 | 374,368 |
| Canon Marketing Japan, Inc. | | 9,800 | 207,346 |
| Canon, Inc. | | 131,743 | 3,614,991 |
| Capcom Co. Ltd. | | 14,300 | 337,532 |
| Casio Computer Co. Ltd. | | 35,700 | 579,539 |
| Cawachi Ltd. | | 200 | 4,080 |
| Central Glass Co. Ltd. | | 2,800 | 67,490 |
| Central Japan Railway Co. | | 18,555 | 3,806,262 |
| Chiba Bank Ltd. | | 86,200 | 468,527 |
| Chiyoda Co. Ltd. | | 100 | 1,482 |
| Chiyoda Corp. (a) | | 17,700 | 45,767 |
| Chofu Seisakusho Co. Ltd. | | 100 | 2,315 |
| Chubu Electric Power Co., Inc. | | 86,216 | 1,293,434 |
| Chudenko Corp. | | 600 | 13,832 |
| Chugai Pharmaceutical Co. Ltd. | | 29,100 | 2,448,934 |
| Chugoku Electric Power Co., Inc. | | 41,600 | 554,186 |
| Chugoku Marine Paints Ltd. | | 5,400 | 52,209 |
| Citizen Watch Co. Ltd. | | 88,800 | 472,110 |
| CKD Corp. | | 2,665 | 37,414 |
| Coca-Cola West Co. Ltd. | | 20,450 | 464,298 |
| cocokara fine HOLDINGS, Inc. | | 3,600 | 198,499 |
| COLOPL, Inc. (b) | | 8,400 | 109,777 |
| Colowide Co. Ltd. | | 4,100 | 79,501 |
| Comforia Residential REIT, Inc. | | 57 | 185,671 |
| COMSYS Holdings Corp. | | 15,700 | 463,168 |
| Concordia Financial Group Ltd. | | 151,500 | 617,807 |
| Cookpad, Inc. (a) | | 500 | 1,505 |
| Cosmo Energy Holdings Co. Ltd. | | 5,600 | 119,753 |
| Cosmos Pharmaceutical Corp. | | 1,700 | 351,069 |
| Create Restaurants Holdings, Inc. | | 9,500 | 163,135 |
| Create SD Holdings Co. Ltd. | | 1,800 | 44,597 |
| Credit Saison Co. Ltd. | | 29,101 | 421,404 |
| CyberAgent, Inc. | | 14,300 | 464,773 |
| CYBERDYNE, Inc. (a) | | 7,900 | 50,862 |
| Dai Nippon Printing Co. Ltd. | | 34,800 | 929,456 |
| Dai-ichi Mutual Life Insurance Co. | | 140,099 | 2,283,532 |
| Daibiru Corp. | | 200 | 2,221 |
| Daicel Chemical Industries Ltd. | | 29,021 | 259,432 |
| Daido Metal Co. Ltd. | | 400 | 2,537 |
| Daido Steel Co. Ltd. | | 7,100 | 309,830 |
| Daifuku Co. Ltd. | | 13,700 | 726,946 |
| Daihen Corp. | | 1,600 | 50,144 |
| Daiho Corp. | | 200 | 5,651 |
| Daiichi Sankyo Kabushiki Kaisha | | 73,700 | 4,846,055 |
| Daiichikosho Co. Ltd. | | 6,900 | 328,008 |
| Daikin Industries Ltd. | | 32,468 | 4,544,210 |
| DaikyoNishikawa Corp. | | 1,600 | 12,292 |
| Dainippon Sumitomo Pharma Co. Ltd. | | 17,300 | 301,940 |
| Daio Paper Corp. | | 6,000 | 79,978 |
| Daiseki Co. Ltd. | | 12,400 | 360,210 |
| Daishi Hokuetsu Financial Group, Inc. | | 8,242 | 208,869 |
| Daito Trust Construction Co. Ltd. | | 9,544 | 1,264,775 |
| Daiwa House Industry Co. Ltd. | | 72,144 | 2,483,565 |
| Daiwa House REIT Investment Corp. | | 220 | 640,597 |
| Daiwa Office Investment Corp. | | 44 | 350,548 |
| Daiwa Securities Group, Inc. | | 215,200 | 967,282 |
| Daiwabo Holdings Co. Ltd. | | 3,500 | 152,936 |
| DCM Japan Holdings Co. Ltd. | | 35,500 | 351,421 |
| DeNA Co. Ltd. | | 17,100 | 291,483 |
| Denki Kagaku Kogyo KK | | 11,300 | 326,103 |
| DENSO Corp. | | 56,222 | 2,610,383 |
| Dentsu, Inc. | | 27,900 | 997,419 |
| Descente Ltd. | | 4,000 | 51,271 |
| Dexerials Corp. | | 1,700 | 15,007 |
| Dic Corp. | | 7,800 | 223,432 |
| Digital Arts, Inc. | | 1,000 | 58,718 |
| Digital Garage, Inc. | | 6,400 | 209,502 |
| Dip Corp. | | 6,600 | 179,152 |
| Disco Corp. | | 3,500 | 763,831 |
| Dmg Mori Co. Ltd. | | 13,500 | 218,567 |
| Doshisha Co. Ltd. | | 100 | 1,585 |
| Doutor Nichires Holdings Co., Ltd. | | 500 | 10,012 |
| Dowa Holdings Co. Ltd. | | 9,800 | 338,337 |
| DTS Corp. | | 3,000 | 63,535 |
| Duskin Co. Ltd. | | 10,500 | 279,004 |
| Dydo Group Holdings, Inc. | | 100 | 4,169 |
| Eagle Industry Co. Ltd. | | 300 | 3,013 |
| Earth Corp. | | 700 | 36,947 |
| East Japan Railway Co. | | 38,610 | 3,505,056 |
| Ebara Corp. | | 13,600 | 402,374 |
| EDION Corp. | | 27,800 | 276,280 |
| Ehime Bank Ltd. | | 2,400 | 25,369 |
| Eiken Chemical Co. Ltd. | | 2,800 | 45,184 |
| Eisai Co. Ltd. | | 32,100 | 2,323,687 |
| Eizo Corp. | | 600 | 22,315 |
| Elecom Co. Ltd. | | 5,800 | 225,221 |
| Electric Power Development Co. Ltd. | | 17,200 | 417,623 |
| en-japan, Inc. | | 7,300 | 308,978 |
| EPS Co. Ltd. | | 2,000 | 24,388 |
| euglena Co. Ltd. (a) | | 21,100 | 178,891 |
| Exedy Corp. | | 1,200 | 28,266 |
| Ezaki Glico Co. Ltd. | | 5,400 | 250,579 |
| FamilyMart Co. Ltd. | | 32,308 | 801,439 |
| Fancl Corp. | | 9,300 | 262,809 |
| Fanuc Corp. | | 25,185 | 4,967,724 |
| Fast Retailing Co. Ltd. | | 7,536 | 4,647,392 |
| FCC Co. Ltd. | | 3,000 | 62,071 |
| Ferrotec Holdings Corp. | | 2,700 | 26,779 |
| Financial Products Group Co. Ltd. | | 4,200 | 42,567 |
| Foster Electric Co. Ltd. | | 1,100 | 19,666 |
| FP Corp. | | 3,800 | 235,934 |
| Frontier Real Estate Investment Corp. | | 58 | 258,935 |
| Fuji Corp. | | 4,800 | 79,705 |
| Fuji Electric Co. Ltd. | | 15,800 | 502,150 |
| Fuji Kyuko Co. Ltd. | | 4,000 | 159,810 |
| Fuji Oil Holdings, Inc. | | 5,600 | 168,423 |
| Fuji Seal International, Inc. | | 5,000 | 124,199 |
| Fuji Soft ABC, Inc. | | 3,200 | 139,395 |
| Fujicco Co. Ltd. | | 100 | 1,821 |
| Fujifilm Holdings Corp. | | 47,800 | 2,098,527 |
| Fujikura Ltd. | | 15,800 | 73,313 |
| Fujimi, Inc. | | 200 | 5,213 |
| Fujimori Kogyo Co. Ltd. | | 400 | 14,142 |
| Fujitec Co. Ltd. | | 4,200 | 61,099 |
| Fujitsu General Ltd. | | 5,500 | 99,279 |
| Fujitsu Ltd. | | 25,442 | 2,254,900 |
| Fukuoka (REIT) Investment Fund | | 104 | 178,421 |
| Fukuoka Financial Group, Inc. | | 25,812 | 497,587 |
| Fukushima Industries Corp. | | 100 | 3,137 |
| Fukuyama Transporting Co. Ltd. | | 5,600 | 200,870 |
| Funai Soken Holdings, Inc. | | 6,900 | 166,248 |
| Furukawa Co. Ltd. | | 600 | 8,595 |
| Furukawa Electric Co. Ltd. | | 13,100 | 366,163 |
| Fuso Chemical Co. Ltd. | | 300 | 7,743 |
| Futaba Corp. | | 3,900 | 50,163 |
| Futaba Industrial Co. Ltd. | | 700 | 4,949 |
| Fuyo General Lease Co. Ltd. | | 4,700 | 306,340 |
| G-Tekt Corp. | | 1,300 | 22,412 |
| Global One Real Estate Investment Corp. | | 131 | 177,649 |
| Glory Ltd. | | 6,200 | 182,544 |
| GLP J-REIT | | 392 | 511,376 |
| GMO Internet, Inc. | | 13,300 | 223,504 |
| GMO Payment Gateway, Inc. | | 5,600 | 412,715 |
| GNI Group Ltd. (a) | | 6,500 | 102,246 |
| Goldcrest Co. Ltd. | | 300 | 6,197 |
| GOLDWIN, Inc. | | 2,000 | 153,140 |
| GREE, Inc. | | 3,400 | 16,143 |
| GS Yuasa Corp. | | 16,300 | 297,154 |
| Gulliver International Co. Ltd. | | 400 | 1,691 |
| GungHo Online Entertainment, Inc. | | 7,900 | 171,101 |
| Gunma Bank Ltd. | | 43,300 | 145,711 |
| Gunze Ltd. | | 700 | 30,458 |
| Gurunavi, Inc. | | 100 | 879 |
| H.I.S. Co. Ltd. | | 2,300 | 59,687 |
| H2O Retailing Corp. | | 8,600 | 97,537 |
| Hakuhodo DY Holdings, Inc. | | 36,400 | 543,187 |
| Hamakyorex Co. Ltd. | | 4,000 | 136,483 |
| Hamamatsu Photonics K.K. | | 25,200 | 978,498 |
| Hankyu Hanshin Holdings, Inc. | | 28,200 | 1,128,480 |
| Hankyu REIT, Inc. | | 82 | 139,522 |
| Hanwa Co. Ltd. | | 11,900 | 346,689 |
| Harmonic Drive Systems, Inc. | | 4,000 | 185,507 |
| Haseko Corp. | | 33,000 | 425,845 |
| Hazama Ando Corp. | | 62,800 | 486,581 |
| Heiwa Corp. | | 9,700 | 199,652 |
| Heiwa Real Estate (REIT), Inc. | | 141 | 186,256 |
| Heiwa Real Estate Co. Ltd. | | 1,700 | 41,002 |
| Heiwado Co. Ltd. | | 1,800 | 33,347 |
| Hiday Hidaka Corp. | | 2,376 | 46,460 |
| Hikari Tsushin, Inc. | | 2,500 | 547,992 |
| Hino Motors Ltd. | | 60,900 | 575,768 |
| Hirata Corp. | | 1,300 | 91,202 |
| Hirose Electric Co. Ltd. | | 4,855 | 611,585 |
| Hiroshima Bank Ltd. | | 14,400 | 73,402 |
| Hisamitsu Pharmaceutical Co., Inc. | | 6,600 | 307,159 |
| Hitachi Capital Corp. | | 13,800 | 309,233 |
| Hitachi Chemical Co. Ltd. | | 12,400 | 408,205 |
| Hitachi Construction Machinery Co. Ltd. | | 14,200 | 366,533 |
| Hitachi High-Technologies Corp. | | 9,300 | 578,607 |
| Hitachi Ltd. | | 127,676 | 4,765,183 |
| Hitachi Metals Ltd. | | 28,100 | 352,664 |
| Hitachi Transport System Ltd. | | 7,500 | 213,471 |
| Hitachi Zosen Corp. | | 32,900 | 111,172 |
| Hogy Medical Co. Ltd. | | 3,300 | 110,121 |
| Hokkaido Electric Power Co., Inc. | | 16,000 | 83,977 |
| Hokuetsu Kishu Paper Co. Ltd. | | 9,200 | 46,854 |
| Hokuhoku Financial Group, Inc. | | 31,100 | 304,215 |
| Hokuriku Electric Power Co., Inc. (a) | | 20,600 | 146,821 |
| Hokuto Corp. | | 100 | 1,799 |
| Honda Motor Co. Ltd. | | 211,472 | 5,721,162 |
| Horiba Ltd. | | 5,500 | 371,145 |
| Hoshino Resorts REIT, Inc. | | 13 | 71,027 |
| Hoshizaki Corp. | | 8,100 | 688,519 |
| Hosiden Corp. | | 1,800 | 18,909 |
| House Foods Group, Inc. | | 7,700 | 291,848 |
| Hoya Corp. | | 49,418 | 4,367,426 |
| Hulic (REIT), Inc. | | 128 | 244,186 |
| Hulic Co. Ltd. | | 37,300 | 404,957 |
| Hyakujushi Bank Ltd. | | 700 | 14,547 |
| Ibiden Co. Ltd. | | 22,000 | 507,997 |
| IBJ Leasing Co. Ltd. | | 1,600 | 45,064 |
| Ichibanya Co. Ltd. | | 100 | 4,675 |
| Ichigo Real Estate Investment Corp. | | 115 | 117,839 |
| Ichigo, Inc. | | 58,800 | 234,194 |
| Idec Corp. | | 3,200 | 65,000 |
| Idemitsu Kosan Co. Ltd. | | 28,700 | 843,644 |
| IHI Corp. | | 22,272 | 548,852 |
| Iida Group Holdings Co. Ltd. | | 31,600 | 526,365 |
| Inaba Denki Sangyo Co. Ltd. | | 4,400 | 202,130 |
| Inabata & Co. Ltd. | | 1,000 | 13,092 |
| Industrial & Infrastructure Fund Investment Corp. | | 207 | 324,081 |
| Ines Corp. | | 3,700 | 41,628 |
| Infocom Corp. | | 4,900 | 102,226 |
| Infomart Corp. | | 10,000 | 150,557 |
| INPEX Corp. | | 138,000 | 1,275,739 |
| Internet Initiative Japan, Inc. | | 1,600 | 37,939 |
| Invesco Office J-REIT, Inc. | | 2,458 | 496,237 |
| Invincible Investment Corp. | | 742 | 468,539 |
| Iriso Electronics Co. Ltd. | | 3,900 | 192,825 |
| Iseki & Co. Ltd. | | 100 | 1,521 |
| Isetan Mitsukoshi Holdings Ltd. | | 32,671 | 260,557 |
| Istyle, Inc. (a) | | 1,300 | 8,926 |
| Isuzu Motors Ltd. | | 74,068 | 860,663 |
| IT Holdings Corp. | | 9,300 | 563,892 |
| ITO EN Ltd. | | 10,660 | 519,589 |
| Itochu Corp. | | 173,450 | 3,626,472 |
| Itochu Enex Co. Ltd. | | 300 | 2,507 |
| ITOCHU Techno-Solutions Corp. | | 12,112 | 326,186 |
| Itoham Yonekyu Holdings, Inc. | | 10,100 | 65,100 |
| Iwatani Corp. | | 9,900 | 343,301 |
| Iyo Bank Ltd. | | 67,700 | 357,710 |
| Izumi Co. Ltd. | | 5,700 | 214,425 |
| J Trust Co. Ltd. | | 7,200 | 25,871 |
| J. Front Retailing Co. Ltd. | | 34,300 | 436,155 |
| JACCS Co. Ltd. | | 200 | 4,514 |
| JAFCO Co. Ltd. | | 5,200 | 195,322 |
| Japan Airlines Co. Ltd. | | 19,200 | 598,312 |
| Japan Airport Terminal Co. Ltd. | | 7,000 | 345,776 |
| Japan Aviation Electronics Industry Ltd. | | 20,000 | 372,576 |
| Japan Display, Inc. (a)(b) | | 24,400 | 14,256 |
| Japan Elevator Service Holdings Co. Ltd. | | 4,200 | 113,599 |
| Japan Excellent, Inc. | | 163 | 279,475 |
| Japan Exchange Group, Inc. | | 69,200 | 1,142,389 |
| Japan Hotel REIT Investment Corp. | | 615 | 510,110 |
| Japan Lifeline Co. Ltd. | | 10,200 | 157,233 |
| Japan Logistics Fund, Inc. | | 99 | 251,697 |
| Japan Material Co. Ltd. | | 9,400 | 131,576 |
| Japan Petroleum Exploration Co. Ltd. | | 8,200 | 209,655 |
| Japan Post Bank Co. Ltd. | | 46,434 | 461,903 |
| Japan Post Holdings Co. Ltd. | | 210,038 | 1,927,988 |
| Japan Prime Realty Investment Corp. | | 88 | 422,926 |
| Japan Real Estate Investment Corp. | | 168 | 1,146,736 |
| Japan Rental Housing Investment, Inc. | | 235 | 225,439 |
| Japan Retail Fund Investment Corp. | | 320 | 745,877 |
| Japan Securities Finance Co. Ltd. | | 500 | 2,406 |
| Japan Steel Works Ltd. | | 7,600 | 160,151 |
| Japan Tobacco, Inc. | | 154,143 | 3,484,050 |
| Japan Wool Textile Co. Ltd. | | 400 | 3,932 |
| JCR Pharmaceuticals Co. Ltd. | | 1,000 | 77,059 |
| JEOL Ltd. | | 2,500 | 66,257 |
| JFE Holdings, Inc. | | 66,800 | 835,511 |
| JGC Corp. | | 34,242 | 495,257 |
| JIN Co. Ltd. | | 1,100 | 68,726 |
| Joshin Denki Co. Ltd. | | 1,800 | 36,092 |
| Joyful Honda Co. Ltd. | | 10,400 | 132,161 |
| JSR Corp. | | 25,800 | 484,362 |
| JTEKT Corp. | | 27,000 | 344,368 |
| Juroku Bank Ltd. | | 1,300 | 29,750 |
| Justsystems Corp. | | 4,400 | 180,912 |
| JVC KENWOOD Holdings, Inc. | | 41,700 | 121,544 |
| JX Holdings, Inc. | | 427,350 | 1,997,537 |
| K's Holdings Corp. | | 33,500 | 382,748 |
| Kadokawa Corp. | | 10,000 | 142,941 |
| Kagome Co. Ltd. | | 13,800 | 347,827 |
| Kajima Corp. | | 61,100 | 839,671 |
| Kakaku.com, Inc. | | 17,200 | 399,382 |
| Kaken Pharmaceutical Co. Ltd. | | 8,456 | 414,587 |
| Kameda Seika Co. Ltd. | | 1,400 | 62,973 |
| Kamigumi Co. Ltd. | | 14,700 | 332,384 |
| Kanamoto Co. Ltd. | | 1,400 | 37,428 |
| Kandenko Co. Ltd. | | 7,800 | 73,752 |
| Kaneka Corp. | | 8,300 | 276,295 |
| Kanematsu Corp. | | 30,900 | 376,450 |
| Kansai Electric Power Co., Inc. | | 96,899 | 1,130,436 |
| Kansai Mirai Financial Group, Inc. | | 6,700 | 43,590 |
| Kansai Paint Co. Ltd. | | 21,239 | 511,538 |
| Kanto Denka Kogyo Co. Ltd. | | 1,000 | 8,842 |
| Kao Corp. | | 63,491 | 5,104,593 |
| Katitas Co. Ltd. | | 3,000 | 129,450 |
| Kato Sangyo | | 1,100 | 34,917 |
| Kawasaki Heavy Industries Ltd. | | 22,200 | 532,763 |
| Kawasaki Kisen Kaisha Ltd. (a) | | 12,700 | 188,975 |
| KDDI Corp. | | 230,937 | 6,390,291 |
| Keihan Electric Railway Co., Ltd. | | 12,700 | 599,655 |
| Keihin Corp. | | 1,600 | 38,036 |
| Keihin Electric Express Railway Co. Ltd. | | 25,739 | 512,351 |
| Keio Corp. | | 13,303 | 822,970 |
| Keisei Electric Railway Co. | | 15,906 | 650,324 |
| Kenedix Office Investment Corp. | | 50 | 391,504 |
| Kenedix Residential Investment Corp. | | 106 | 217,526 |
| Kenedix Retail REIT Corp. | | 68 | 186,646 |
| Kenedix, Inc. | | 26,000 | 141,522 |
| Kewpie Corp. | | 15,000 | 340,458 |
| Key Coffee, Inc. | | 17,100 | 368,542 |
| Keyence Corp. | | 12,075 | 7,634,979 |
| KH Neochem Co. Ltd. | | 5,700 | 138,806 |
| Kikkoman Corp. | | 21,400 | 1,029,397 |
| Kinden Corp. | | 21,192 | 318,788 |
| Kintetsu Group Holdings Co. Ltd. | | 21,953 | 1,196,569 |
| Kintetsu World Express, Inc. | | 2,600 | 42,048 |
| Kirin Holdings Co. Ltd. | | 108,270 | 2,296,879 |
| Kisoji Co. Ltd. | | 300 | 7,791 |
| Kissei Pharmaceutical Co. Ltd. | | 1,400 | 36,067 |
| Kitz Corp. | | 1,400 | 9,541 |
| Koa Corp. | | 1,100 | 13,823 |
| Kobayashi Pharmaceutical Co. Ltd. | | 5,800 | 463,768 |
| Kobe Bussan Co. Ltd. (b) | | 9,000 | 266,317 |
| Kobe Steel Ltd. | | 40,200 | 216,136 |
| Kohnan Shoji Co. Ltd. | | 1,400 | 32,511 |
| Koito Manufacturing Co. Ltd. | | 15,000 | 784,698 |
| Kokuyo Co. Ltd. | | 20,100 | 294,956 |
| Komatsu Ltd. | | 119,411 | 2,795,998 |
| KOMEDA Holdings Co. Ltd. | | 1,900 | 36,929 |
| KOMERI Co. Ltd. | | 4,000 | 85,721 |
| Komori Corp. | | 3,300 | 35,139 |
| Konami Holdings Corp. | | 12,700 | 557,515 |
| Konica Minolta, Inc. | | 66,200 | 485,895 |
| Konoike Transport Co. Ltd. | | 500 | 7,621 |
| Kose Corp. | | 4,900 | 868,741 |
| Koshidaka Holdings Co. Ltd. | | 2,800 | 40,659 |
| Kotobuki Spirits Co. Ltd. | | 2,900 | 199,559 |
| Kubota Corp. | | 138,410 | 2,198,402 |
| Kumagai Gumi Co. Ltd. | | 5,200 | 160,317 |
| Kumiai Chemical Industry Co. Ltd. | | 13,800 | 127,619 |
| Kura Sushi, Inc. | | 700 | 29,449 |
| Kurabo Industries Ltd. | | 300 | 6,869 |
| Kuraray Co. Ltd. | | 39,252 | 466,993 |
| Kureha Chemical Industry Co. Ltd. | | 1,500 | 95,871 |
| Kurita Water Industries Ltd. | | 14,500 | 417,420 |
| Kusuri No Aoki Holdings Co. Ltd. | | 3,300 | 246,105 |
| Kyb Corp. (a) | | 1,400 | 44,710 |
| Kyocera Corp. | | 40,937 | 2,685,749 |
| Kyoei Steel Ltd. | | 100 | 1,821 |
| Kyokuto Kaihatsu Kogyo Co. Ltd. | | 500 | 6,701 |
| Kyorin Holdings, Inc. | | 9,200 | 161,147 |
| Kyoritsu Maintenance Co. Ltd. | | 3,100 | 137,131 |
| Kyowa Exeo Corp. | | 11,600 | 295,127 |
| Kyowa Hakko Kirin Co., Ltd. | | 37,300 | 686,321 |
| Kyudenko Corp. | | 9,300 | 303,893 |
| Kyushu Electric Power Co., Inc. | | 54,778 | 547,422 |
| Kyushu Financial Group, Inc. | | 66,985 | 270,377 |
| Kyushu Railway Co. | | 21,700 | 716,915 |
| LaSalle Logiport REIT | | 142 | 211,385 |
| Lasertec Corp. | | 4,600 | 330,676 |
| Lawson, Inc. | | 8,500 | 468,915 |
| Leopalace21 Corp. (a)(b) | | 28,500 | 77,762 |
| LIFE Corp. | | 100 | 2,295 |
| LIFULL Co. Ltd. | | 2,300 | 13,979 |
| LINE Corp. (a) | | 7,300 | 268,545 |
| Lintec Corp. | | 4,500 | 94,513 |
| Lion Corp. | | 31,536 | 659,968 |
| LIXIL Group Corp. | | 43,895 | 816,355 |
| M3, Inc. (b) | | 62,090 | 1,487,885 |
| Mabuchi Motor Co. Ltd. | | 9,500 | 384,912 |
| Macnica Fuji Electronics Holdings, Inc. | | 3,700 | 62,718 |
| Macromill, Inc. | | 2,100 | 18,704 |
| Maeda Corp. | | 15,000 | 139,212 |
| Maeda Road Construction Co. Ltd. | | 5,700 | 122,626 |
| Makino Milling Machine Co. Ltd. | | 2,000 | 99,438 |
| Makita Corp. | | 30,800 | 1,035,830 |
| Mandom Corp. | | 10,400 | 288,204 |
| Mani, Inc. | | 9,600 | 253,445 |
| Marubeni Corp. | | 218,900 | 1,540,635 |
| Marudai Food Co. Ltd. | | 200 | 4,308 |
| Maruha Nichiro Corp. | | 7,700 | 199,987 |
| Marui Group Co. Ltd. | | 23,302 | 518,012 |
| Maruichi Steel Tube Ltd. | | 22,000 | 600,783 |
| Marusan Securities Co. Ltd. | | 900 | 4,340 |
| Maruwa Ceramic Co. Ltd. | | 500 | 32,582 |
| Matsui Securities Co. Ltd. (b) | | 13,900 | 114,483 |
| Matsumotokiyoshi Holdings Co. Ltd. | | 9,600 | 338,153 |
| Max Co. Ltd. | | 1,000 | 18,346 |
| Maxell Holdings Ltd. | | 1,500 | 20,703 |
| Mazda Motor Corp. | | 65,200 | 598,557 |
| McDonald's Holdings Co. (Japan) Ltd. | | 6,428 | 322,638 |
| MCJ Co. Ltd. | | 5,900 | 38,938 |
| MCUBS MidCity Investment Corp. | | 161 | 186,722 |
| Mebuki Financial Group, Inc. | | 151,768 | 385,584 |
| Medipal Holdings Corp. | | 20,700 | 472,944 |
| Megachips Corp. | | 600 | 11,357 |
| Megmilk Snow Brand Co. Ltd. | | 8,500 | 204,437 |
| Meidensha Corp. | | 3,400 | 65,231 |
| Meiji Holdings Co. Ltd. | | 14,700 | 1,059,545 |
| Meitec Corp. | | 2,700 | 140,752 |
| Menicon Co. Ltd. | | 1,800 | 63,691 |
| Mercari, Inc. (a) | | 10,000 | 225,466 |
| Micronics Japan Co. Ltd. | | 100 | 936 |
| Milbon Co. Ltd. | | 2,300 | 125,974 |
| Minebea Mitsumi, Inc. | | 54,195 | 1,029,247 |
| Miraca Holdings, Inc. | | 9,047 | 213,529 |
| Mirai Corp. | | 344 | 202,071 |
| Mirait Holdings Corp. | | 16,900 | 271,363 |
| Miroku Jyoho Service Co., Ltd. | | 3,600 | 94,888 |
| Misumi Group, Inc. | | 40,905 | 1,028,301 |
| Mitsuba Corp. | | 500 | 3,155 |
| Mitsubishi Chemical Holdings Corp. | | 166,057 | 1,265,558 |
| Mitsubishi Corp. | | 173,251 | 4,406,538 |
| Mitsubishi Electric Corp. | | 239,992 | 3,428,874 |
| Mitsubishi Estate Co. Ltd. | | 152,971 | 2,969,991 |
| Mitsubishi Estate Logistics REIT Investment Corp. | | 55 | 179,987 |
| Mitsubishi Gas Chemical Co., Inc. | | 22,045 | 310,987 |
| Mitsubishi Heavy Industries Ltd. | | 41,866 | 1,694,291 |
| Mitsubishi Logistics Corp. | | 8,500 | 215,770 |
| Mitsubishi Materials Corp. | | 19,600 | 563,599 |
| Mitsubishi Motors Corp. of Japan | | 97,234 | 443,951 |
| Mitsubishi Pencil Co. Ltd. | | 2,600 | 41,054 |
| Mitsubishi Shokuhin Co. Ltd. | | 100 | 2,536 |
| Mitsubishi Tanabe Pharma Corp. | | 27,609 | 330,433 |
| Mitsubishi UFJ Financial Group, Inc. | | 1,600,539 | 8,297,656 |
| Mitsubishi UFJ Lease & Finance Co. Ltd. | | 72,300 | 443,849 |
| Mitsuboshi Belting Ltd. | | 500 | 9,408 |
| Mitsui & Associates Telepark Corp. | | 300 | 7,215 |
| Mitsui & Co. Ltd. | | 212,682 | 3,652,593 |
| Mitsui Chemicals, Inc. | | 22,700 | 539,839 |
| Mitsui Engineering & Shipbuilding Co. (a) | | 7,000 | 70,852 |
| Mitsui Fudosan Co. Ltd. | | 115,740 | 2,960,958 |
| Mitsui Fudosan Logistics Park, Inc. | | 57 | 237,950 |
| Mitsui High-Tec, Inc. | | 500 | 8,598 |
| Mitsui Mining & Smelting Co. Ltd. | | 5,300 | 148,123 |
| Mitsui OSK Lines Ltd. | | 23,100 | 629,210 |
| Mitsui Sugar Co. Ltd. | | 700 | 15,221 |
| Mitsui-Soko Co. Ltd. | | 400 | 6,486 |
| Miura Co. Ltd. | | 10,755 | 324,081 |
| mixi, Inc. | | 11,200 | 216,428 |
| Mizuho Financial Group, Inc. | | 3,108,184 | 4,825,383 |
| Mizuno Corp. | | 200 | 5,231 |
| Mochida Pharmaceutical Co. Ltd. | | 1,800 | 71,834 |
| Modec, Inc. | | 2,600 | 71,319 |
| Monex Group, Inc. | | 14,500 | 35,421 |
| Money Forward, Inc. (a) | | 2,100 | 74,984 |
| MonotaRO Co. Ltd. | | 15,300 | 462,222 |
| Mori Hills REIT Investment Corp. | | 179 | 295,847 |
| Mori Trust Hotel (REIT), Inc. | | 15 | 20,356 |
| MORI TRUST Sogo (REIT), Inc. | | 84 | 152,790 |
| Morinaga & Co. Ltd. | | 6,500 | 321,097 |
| Morinaga Milk Industry Co. Ltd. | | 6,300 | 244,933 |
| Morita Holdings Corp. | | 7,800 | 130,690 |
| MOS Food Services, Inc. | | 400 | 10,117 |
| MS&AD Insurance Group Holdings, Inc. | | 62,797 | 2,027,793 |
| Murata Manufacturing Co. Ltd. | | 75,702 | 4,121,837 |
| Musashi Seimitsu Industry Co. Ltd. | | 9,300 | 129,191 |
| Nabtesco Corp. | | 14,000 | 445,687 |
| Nachi-Fujikoshi Corp. | | 500 | 23,927 |
| Nagaileben Co. Ltd. | | 1,400 | 33,374 |
| Nagase & Co. Ltd. | | 39,600 | 598,793 |
| Nagoya Railroad Co. Ltd. | | 24,716 | 785,669 |
| Nakanishi, Inc. | | 9,300 | 155,052 |
| Nankai Electric Railway Co. Ltd. | | 24,600 | 639,279 |
| NEC Corp. | | 31,200 | 1,236,475 |
| NEC System Integration & Constuction Ltd. | | 100 | 3,156 |
| Net One Systems Co. Ltd. | | 8,800 | 237,253 |
| New Hampshire Foods Ltd. | | 10,613 | 445,915 |
| Nexon Co. Ltd. (a) | | 66,700 | 772,936 |
| NGK Insulators Ltd. | | 34,500 | 530,015 |
| NGK Spark Plug Co. Ltd. | | 25,000 | 506,845 |
| NHK Spring Co. Ltd. | | 29,387 | 240,068 |
| Nichi-iko Pharmaceutical Co. Ltd. | | 500 | 5,859 |
| Nichias Corp. | | 11,100 | 234,167 |
| Nichicon Corp. | | 1,700 | 16,729 |
| Nichiha Corp. | | 4,100 | 117,892 |
| Nichiigakkan Co. Ltd. | | 7,900 | 133,940 |
| Nichirei Corp. | | 12,310 | 282,697 |
| Nidec Corp. | | 29,345 | 4,320,341 |
| Nifco, Inc. | | 8,300 | 219,086 |
| Nihon Kohden Corp. | | 16,100 | 481,675 |
| Nihon M&A Center, Inc. | | 19,700 | 598,980 |
| Nihon Parkerizing Co. Ltd. | | 5,100 | 59,797 |
| Nihon Unisys Ltd. | | 8,000 | 264,076 |
| Nikkiso Co. Ltd. | | 11,700 | 126,404 |
| Nikkon Holdings Co. Ltd. | | 3,200 | 77,785 |
| Nikon Corp. | | 46,600 | 594,164 |
| Nintendo Co. Ltd. | | 14,488 | 5,314,017 |
| Nippo Corp. | | 3,400 | 69,861 |
| Nippon Accommodations Fund, Inc. | | 63 | 396,411 |
| Nippon Building Fund, Inc. | | 166 | 1,259,377 |
| Nippon Carbon Co. Ltd. (b) | | 2,200 | 84,408 |
| Nippon Ceramic Co. Ltd. | | 12,100 | 314,372 |
| Nippon Chemi-con Corp. | | 500 | 8,265 |
| Nippon Densetsu Kogyo Co. Ltd. | | 4,700 | 101,740 |
| Nippon Electric Glass Co. Ltd. | | 10,500 | 236,529 |
| Nippon Express Co. Ltd. | | 11,766 | 671,316 |
| Nippon Flour Mills Co. Ltd. | | 15,000 | 240,891 |
| Nippon Gas Co. Ltd. | | 4,200 | 118,883 |
| Nippon Kayaku Co. Ltd. | | 21,700 | 263,726 |
| Nippon Light Metal Holding Co. Ltd. | | 150,400 | 292,534 |
| Nippon Paint Holdings Co. Ltd. | | 20,297 | 1,105,385 |
| Nippon Paper Industries Co. Ltd. | | 11,945 | 205,903 |
| Nippon Prologis REIT, Inc. | | 259 | 723,461 |
| Nippon REIT Investment Corp. | | 62 | 269,237 |
| Nippon Seiki Co. Ltd. | | 8,900 | 137,607 |
| Nippon Sheet Glass Co. Ltd. | | 9,500 | 59,521 |
| Nippon Shinyaku Co. Ltd. | | 5,300 | 478,148 |
| Nippon Shokubai Co. Ltd. | | 5,100 | 314,481 |
| Nippon Signal Co. Ltd. | | 15,400 | 177,463 |
| Nippon Soda Co. Ltd. | | 2,400 | 63,925 |
| Nippon Steel & Sumikin Bussan Corp. | | 1,200 | 50,241 |
| Nippon Steel & Sumitomo Metal Corp. | | 109,683 | 1,600,882 |
| Nippon Suisan Kaisha Co. Ltd. | | 46,900 | 268,599 |
| Nippon Telegraph & Telephone Corp. | | 83,632 | 4,151,736 |
| Nippon Yusen KK | | 21,800 | 391,639 |
| Nipro Corp. | | 10,138 | 118,874 |
| Nishi-Nippon Financial Holdings, Inc. | | 8,300 | 61,505 |
| Nishi-Nippon Railroad Co. Ltd. | | 21,700 | 503,492 |
| Nishimatsu Construction Co. Ltd. | | 6,100 | 127,007 |
| Nishimatsuya Chain Co. Ltd. | | 1,000 | 8,899 |
| Nishio Rent All Co. Ltd. | | 1,200 | 32,238 |
| Nissan Chemical Corp. | | 18,100 | 743,148 |
| Nissan Motor Co. Ltd. | | 311,548 | 1,966,049 |
| Nissan Shatai Co. Ltd. | | 15,700 | 144,683 |
| Nissha Co. Ltd. | | 1,900 | 19,788 |
| Nisshin Oillio Group Ltd. | | 800 | 28,013 |
| Nisshin Seifun Group, Inc. | | 30,900 | 612,568 |
| Nisshinbo Holdings, Inc. | | 13,200 | 109,900 |
| Nissin Electric Co. Ltd. | | 14,300 | 167,407 |
| Nissin Food Holdings Co. Ltd. | | 7,600 | 574,076 |
| Nissin Kogyo Co. Ltd. | | 2,000 | 40,958 |
| Nitori Holdings Co. Ltd. | | 10,500 | 1,598,217 |
| Nitta Corp. | | 4,800 | 140,000 |
| Nitto Boseki Co. Ltd. | | 1,200 | 36,582 |
| Nitto Denko Corp. | | 23,442 | 1,296,945 |
| Nitto Kogyo Corp. | | 500 | 10,505 |
| NKSJ Holdings, Inc. | | 43,519 | 1,710,561 |
| Noevir Holdings Co. Ltd. | | 5,800 | 313,075 |
| NOF Corp. | | 8,600 | 290,500 |
| Nojima Co. Ltd. | | 1,100 | 19,513 |
| NOK Corp. | | 18,200 | 285,068 |
| NOMURA Co. Ltd. | | 13,900 | 171,551 |
| Nomura Holdings, Inc. | | 439,754 | 1,998,675 |
| Nomura Real Estate Holdings, Inc. | | 20,700 | 490,577 |
| Nomura Real Estate Master Fund, Inc. | | 522 | 997,834 |
| Nomura Research Institute Ltd. | | 44,310 | 940,733 |
| Noritz Corp. | | 1,500 | 18,543 |
| North Pacific Bank Ltd. | | 23,400 | 50,315 |
| NS Solutions Corp. | | 3,200 | 108,794 |
| NSD Co. Ltd. | | 9,800 | 302,081 |
| NSK Ltd. | | 46,400 | 431,446 |
| NTN Corp. (b) | | 45,500 | 141,075 |
| NTT Data Corp. | | 84,100 | 1,104,305 |
| NTT DOCOMO, Inc. | | 171,230 | 4,694,291 |
| Obara Group, Inc. | | 800 | 29,824 |
| Obayashi Corp. | | 88,100 | 906,672 |
| OBIC Business Consultants Ltd. | | 2,500 | 100,159 |
| OBIC Co. Ltd. | | 8,441 | 1,056,857 |
| Odakyu Electric Railway Co. Ltd. | | 38,100 | 927,437 |
| Ogaki Kyoritsu Bank Ltd. | | 14,200 | 342,504 |
| Ohsho Food Service Corp. | | 1,600 | 96,682 |
| Oiles Corp. | | 100 | 1,521 |
| Oji Holdings Corp. | | 147,200 | 761,060 |
| Okamoto Industries, Inc. | | 200 | 7,724 |
| Okamura Corp. | | 3,200 | 32,091 |
| Okasan Securities Group, Inc. | | 13,034 | 46,026 |
| Oki Electric Industry Co. Ltd. | | 9,900 | 132,862 |
| Okuma Corp. | | 5,400 | 322,651 |
| Okumura Corp. | | 7,300 | 206,777 |
| Olympus Corp. | | 151,900 | 2,066,811 |
| OMRON Corp. | | 24,400 | 1,427,444 |
| Ono Pharmaceutical Co. Ltd. | | 53,680 | 1,011,162 |
| Onward Holdings Co. Ltd. | | 6,000 | 34,687 |
| Open House Co. Ltd. | | 6,800 | 173,771 |
| Optex Group Co. Ltd. | | 2,400 | 36,771 |
| Optorun Co. Ltd. | | 4,200 | 126,676 |
| Oracle Corp. Japan | | 5,300 | 465,850 |
| Orient Corp. | | 83,400 | 121,841 |
| Oriental Land Co. Ltd. | | 26,034 | 3,816,609 |
| ORIX Corp. | | 174,420 | 2,740,992 |
| ORIX JREIT, Inc. | | 306 | 691,902 |
| Osaka Gas Co. Ltd. | | 56,700 | 1,108,750 |
| OSG Corp. | | 7,800 | 166,838 |
| Otsuka Corp. | | 14,300 | 576,547 |
| Otsuka Holdings Co. Ltd. | | 55,218 | 2,302,053 |
| Outsourcing, Inc. | | 9,600 | 103,334 |
| Pacific Industrial Co. Ltd. | | 7,600 | 103,704 |
| Pacific Metals Co. Ltd. | | 1,400 | 33,475 |
| PALTAC Corp. | | 7,300 | 352,046 |
| Pan Pacific International Hold | | 61,292 | 964,819 |
| Panasonic Corp. | | 287,689 | 2,417,848 |
| Paramount Bed Holdings Co. Ltd. | | 5,400 | 206,480 |
| Park24 Co. Ltd. | | 17,840 | 421,318 |
| Penta-Ocean Construction Co. Ltd. | | 25,800 | 158,268 |
| Pepper Food Service Co. Ltd. | | 700 | 10,626 |
| PeptiDream, Inc. (a) | | 14,300 | 717,770 |
| Persol Holdings Co., Ltd. | | 21,300 | 409,131 |
| Pigeon Corp. | | 15,800 | 771,330 |
| Pilot Corp. | | 6,800 | 275,792 |
| Piolax, Inc. | | 2,600 | 50,848 |
| PKSHA Technology, Inc. (a) | | 3,300 | 127,677 |
| Plenus Co. Ltd. | | 100 | 1,736 |
| Pola Orbis Holdings, Inc. | | 10,989 | 247,976 |
| Premier Investment Corp. | | 184 | 275,826 |
| Press Kogyo Co. Ltd. | | 8,100 | 34,356 |
| Pressance Corp. | | 200 | 3,268 |
| Prestige International, Inc. | | 16,000 | 132,428 |
| Prima Meat Packers Ltd. | | 1,000 | 24,712 |
| Raito Kogyo Co. Ltd. | | 4,000 | 63,572 |
| Raksul, Inc. (a) | | 2,200 | 72,612 |
| Rakus Co. Ltd. | | 6,200 | 93,027 |
| Rakuten, Inc. | | 114,395 | 1,090,576 |
| Recruit Holdings Co. Ltd. | | 175,754 | 5,841,016 |
| Relia, Inc. | | 10,300 | 134,480 |
| Relo Group, Inc. | | 14,300 | 349,970 |
| Renesas Electronics Corp. (a) | | 103,755 | 702,388 |
| Rengo Co. Ltd. | | 23,400 | 169,674 |
| Resona Holdings, Inc. | | 305,900 | 1,330,226 |
| Resorttrust, Inc. | | 17,200 | 274,480 |
| Ricoh Co. Ltd. | | 94,600 | 842,471 |
| Ricoh Leasing Co. Ltd. | | 300 | 10,110 |
| Ringer Hut Co. Ltd. | | 100 | 2,243 |
| Rinnai Corp. | | 3,961 | 291,147 |
| Riso Kagaku Corp. | | 100 | 1,643 |
| Riso Kyoiku Co. Ltd. | | 19,500 | 74,864 |
| ROHM Co. Ltd. | | 13,200 | 1,045,820 |
| Rohto Pharmaceutical Co. Ltd. | | 12,100 | 363,515 |
| Round One Corp. | | 13,200 | 170,209 |
| Royal Holdings Co. Ltd. | | 12,300 | 310,629 |
| Ryobi Ltd. | | 1,500 | 27,918 |
| Ryohin Keikaku Co. Ltd. | | 27,830 | 619,559 |
| S Foods, Inc. | | 2,000 | 53,885 |
| Saizeriya Co. Ltd. | | 1,600 | 36,327 |
| Sakai Moving Service Co. Ltd. | | 400 | 23,882 |
| Sakata INX Corp. | | 1,600 | 18,085 |
| Sakata Seed Corp. | | 3,900 | 129,197 |
| San-A Co. Ltd. | | 1,000 | 47,352 |
| San-Ai Oil Co. Ltd. | | 2,200 | 23,032 |
| SanBio Co. Ltd. (a) | | 4,200 | 169,255 |
| Sangetsu Corp. | | 15,000 | 283,602 |
| Sanken Electric Co. Ltd. | | 1,800 | 42,253 |
| Sanki Engineering Co. Ltd. | | 2,100 | 25,577 |
| Sankyo Co. Ltd. (Gunma) | | 3,100 | 108,493 |
| Sankyo Tateyama, Inc. | | 400 | 4,358 |
| Sankyu, Inc. | | 6,500 | 330,468 |
| Sanrio Co. Ltd. | | 6,500 | 130,320 |
| Santen Pharmaceutical Co. Ltd. | | 52,160 | 923,928 |
| Sanwa Holdings Corp. | | 26,200 | 306,425 |
| Sanyo Chemical Industries Ltd. | | 1,600 | 76,338 |
| Sanyo Special Steel Co. Ltd. | | 1,200 | 15,198 |
| Sapporo Breweries Ltd. | | 15,800 | 397,340 |
| Sato Holding Corp. | | 1,700 | 50,042 |
| Sawai Pharmaceutical Co. Ltd. | | 8,800 | 496,557 |
| SBI Holdings, Inc. Japan | | 34,000 | 739,444 |
| Screen Holdings Co. Ltd. | | 6,700 | 465,142 |
| SCSK Corp. | | 6,900 | 351,240 |
| Secom Co. Ltd. | | 26,633 | 2,467,905 |
| Sega Sammy Holdings, Inc. | | 17,319 | 243,732 |
| Seibu Holdings, Inc. | | 32,300 | 570,095 |
| Seikagaku Corp. | | 2,200 | 25,050 |
| Seiko Epson Corp. | | 33,073 | 467,687 |
| Seiko Holdings Corp. | | 3,200 | 78,579 |
| Seino Holdings Co. Ltd. | | 20,500 | 263,589 |
| Seiren Co. Ltd. | | 4,100 | 50,546 |
| Sekisui Chemical Co. Ltd. | | 43,700 | 761,942 |
| Sekisui House (REIT), Inc. | | 696 | 642,360 |
| Sekisui House Ltd. | | 77,280 | 1,666,495 |
| Sekisui Jushi Corp. | | 3,100 | 63,479 |
| SENKO Co. Ltd. | | 15,800 | 127,089 |
| Senshu Ikeda Holdings, Inc. | | 17,690 | 31,727 |
| Seria Co. Ltd. | | 5,600 | 140,761 |
| Seven & i Holdings Co. Ltd. | | 98,329 | 3,714,900 |
| Seven Bank Ltd. | | 68,900 | 199,752 |
| SG Holdings Co. Ltd. | | 21,000 | 520,041 |
| Sharp Corp. | | 33,300 | 381,990 |
| Shibuya Corp. | | 200 | 5,456 |
| Shiga Bank Ltd. (b) | | 13,800 | 332,566 |
| Shikoku Electric Power Co., Inc. | | 22,900 | 227,017 |
| Shima Seiki Manufacturing Ltd. | | 2,800 | 66,947 |
| Shimachu Co. Ltd. | | 2,900 | 78,666 |
| Shimadzu Corp. | | 33,700 | 899,996 |
| Shimamura Co. Ltd. | | 2,400 | 203,287 |
| SHIMANO, Inc. | | 9,265 | 1,542,166 |
| SHIMIZU Corp. | | 79,100 | 737,371 |
| Shin-Etsu Chemical Co. Ltd. | | 47,535 | 5,300,211 |
| Shinko Electric Industries Co. Ltd. | | 1,800 | 17,567 |
| Shinmaywa Industries Ltd. | | 9,500 | 117,031 |
| Shinsei Bank Ltd. | | 27,800 | 433,395 |
| Shionogi & Co. Ltd. | | 34,300 | 2,058,785 |
| Ship Healthcare Holdings, Inc. | | 6,000 | 255,731 |
| Shiseido Co. Ltd. | | 51,955 | 4,283,583 |
| Shizuoka Bank Ltd. | | 81,700 | 620,820 |
| Shizuoka Gas Co. Ltd. | | 3,800 | 32,852 |
| SHO-BOND Holdings Co. Ltd. | | 3,200 | 124,193 |
| Shochiku Co. Ltd. | | 800 | 117,384 |
| Showa Corp. | | 3,200 | 66,863 |
| Showa Denko K.K. | | 14,982 | 420,349 |
| Showa Sangyo Co. Ltd. | | 200 | 5,809 |
| Siix Corp. | | 1,400 | 21,226 |
| Sintokogio Ltd. | | 600 | 5,788 |
| SKY Perfect JSAT Holdings, Inc. | | 3,000 | 12,390 |
| Skylark Co. Ltd. | | 35,200 | 638,884 |
| SMC Corp. | | 7,467 | 3,226,052 |
| SMS Co., Ltd. | | 9,400 | 230,457 |
| Sodick Co. Ltd. | | 600 | 5,189 |
| SoftBank Corp. | | 215,100 | 2,950,595 |
| SoftBank Corp. | | 217,302 | 8,358,829 |
| Sohgo Security Services Co., Ltd. | | 9,200 | 499,724 |
| Sojitz Corp. | | 126,900 | 399,423 |
| Solasto Corp. | | 11,200 | 127,475 |
| Sony Corp. | | 166,705 | 10,147,192 |
| Sony Financial Holdings, Inc. | | 22,400 | 481,901 |
| Sosei Group Corp. (a) | | 9,512 | 222,559 |
| Sotetsu Holdings, Inc. | | 5,500 | 146,137 |
| Square Enix Holdings Co. Ltd. | | 10,800 | 513,953 |
| St. Marc Holdings Co. Ltd. | | 100 | 2,231 |
| Stanley Electric Co. Ltd. | | 16,539 | 457,688 |
| Star Micronics Co. Ltd. | | 2,800 | 42,956 |
| Starts Corp., Inc. | | 500 | 12,895 |
| Subaru Corp. | | 81,225 | 2,327,707 |
| Sugi Holdings Co. Ltd. | | 3,400 | 188,725 |
| Sumco Corp. | | 31,600 | 524,904 |
| Sumitomo Bakelite Co. Ltd. | | 7,300 | 302,697 |
| Sumitomo Chemical Co. Ltd. | | 242,400 | 1,108,830 |
| Sumitomo Corp. | | 151,000 | 2,452,602 |
| Sumitomo Electric Industries Ltd. | | 107,600 | 1,475,600 |
| Sumitomo Forestry Co. Ltd. | | 20,323 | 294,979 |
| Sumitomo Heavy Industries Ltd. | | 13,947 | 433,222 |
| Sumitomo Metal Mining Co. Ltd. | | 31,000 | 1,036,941 |
| Sumitomo Mitsui Construction Co. Ltd. | | 19,960 | 113,276 |
| Sumitomo Mitsui Financial Group, Inc. | | 170,833 | 6,065,118 |
| Sumitomo Mitsui Trust Holdings, Inc. | | 41,000 | 1,494,262 |
| Sumitomo Osaka Cement Co. Ltd. | | 5,003 | 218,391 |
| Sumitomo Realty & Development Co. Ltd. | | 44,387 | 1,611,171 |
| Sumitomo Riko Co. Ltd. | | 500 | 4,351 |
| Sumitomo Rubber Industries Ltd. | | 27,900 | 369,780 |
| Sumitomo Seika Chemicals Co. Ltd. | | 100 | 3,183 |
| Sundrug Co. Ltd. | | 11,841 | 391,827 |
| Suntory Beverage & Food Ltd. | | 18,200 | 778,065 |
| Sushiro Global Holdings Ltd. | | 4,700 | 323,139 |
| Suzuken Co. Ltd. | | 8,100 | 432,491 |
| Suzuki Motor Corp. | | 47,140 | 2,225,673 |
| Sysmex Corp. | | 21,700 | 1,415,883 |
| SystemPro Co. Ltd. | | 12,100 | 173,869 |
| T Hasegawa Co. Ltd. (b) | | 6,900 | 128,594 |
| T&D Holdings, Inc. | | 67,900 | 756,253 |
| Tachi-S Co. Ltd. | | 1,100 | 14,610 |
| Tadano Ltd. | | 11,700 | 106,052 |
| Taiheiyo Cement Corp. | | 14,291 | 404,278 |
| Taikisha Ltd. | | 1,100 | 35,583 |
| Taisei Corp. | | 27,500 | 1,084,419 |
| Taisho Pharmaceutical Holdings Co. Ltd. | | 4,500 | 320,285 |
| Taiyo Holdings Co. Ltd. | | 500 | 18,120 |
| Taiyo Nippon Sanso Corp. | | 14,800 | 346,464 |
| Taiyo Yuden Co. Ltd. | | 17,100 | 452,226 |
| Takara Bio, Inc. | | 13,200 | 269,191 |
| Takara Holdings, Inc. | | 19,969 | 198,223 |
| Takara Leben Co. Ltd. | | 300 | 1,277 |
| Takara Standard Co. Ltd. | | 1,200 | 21,046 |
| Takasago International Corp. | | 100 | 2,510 |
| Takasago Thermal Engineering Co. Ltd. | | 500 | 9,046 |
| Takashimaya Co. Ltd. | | 19,200 | 222,874 |
| Takeda Pharmaceutical Co. Ltd. | | 195,370 | 7,059,320 |
| Takeuchi Manufacturing Co. Ltd. | | 1,300 | 20,314 |
| Takuma Co. Ltd. | | 11,600 | 138,039 |
| Tamron Co. Ltd. | | 300 | 6,551 |
| TDK Corp. | | 16,881 | 1,665,712 |
| TechnoPro Holdings, Inc. | | 5,500 | 338,283 |
| TECMO KOEI HOLDINGS CO., LTD. | | 5,160 | 119,064 |
| Teijin Ltd. | | 41,200 | 825,580 |
| Tekken Corp. | | 100 | 2,681 |
| Terumo Corp. | | 85,600 | 2,793,704 |
| The Aichi Bank Ltd. | | 100 | 3,513 |
| The Aomori Bank Ltd. | | 1,000 | 26,746 |
| The Awa Bank Ltd. | | 2,400 | 57,155 |
| The Bank of Iwate Ltd. | | 2,200 | 57,342 |
| The Bank of Okinawa Ltd. | | 500 | 17,074 |
| The Bank of Saga Ltd. | | 16,500 | 245,244 |
| The Chugoku Bank Ltd. | | 10,700 | 104,559 |
| The Chukyo Bank Ltd. | | 1,400 | 28,389 |
| The Hachijuni Bank Ltd. | | 51,300 | 220,675 |
| The Hokkoku Bank Ltd. | | 4,400 | 123,660 |
| The Hyakugo Bank Ltd. | | 7,000 | 22,532 |
| The Keiyo Bank Ltd. | | 3,000 | 18,814 |
| The Kiyo Bank Ltd. | | 19,800 | 305,498 |
| The Miyazaki Bank Ltd. | | 2,500 | 63,978 |
| The Musashino Bank Ltd. | | 900 | 15,691 |
| The Nanto Bank Ltd. | | 500 | 12,679 |
| The Oita Bank Ltd. | | 1,000 | 27,640 |
| The Okinawa Electric Power Co., Inc. | | 18,287 | 303,011 |
| The Pack Corp. | | 300 | 10,571 |
| The San-In Godo Bank Ltd. | | 38,600 | 226,414 |
| The Shikoku Bank Ltd. | | 5,900 | 56,236 |
| The Sumitomo Warehouse Co. Ltd. | | 21,600 | 292,735 |
| The Suruga Bank Ltd. (a) | | 7,900 | 34,335 |
| The Toho Bank Ltd. | | 9,000 | 22,031 |
| The Towa Bank Ltd. | | 1,400 | 11,887 |
| The Yamagata Bank Ltd. | | 200 | 2,822 |
| The Yamanashi Chuo Bank Ltd. | | 3,400 | 33,930 |
| THK Co. Ltd. | | 16,500 | 474,462 |
| TKC Corp. | | 1,400 | 58,976 |
| TKP Corp. (a) | | 2,100 | 92,156 |
| Toagosei Co. Ltd. | | 9,400 | 104,187 |
| Tobu Railway Co. Ltd. | | 20,700 | 690,757 |
| Toc Co. Ltd. | | 2,400 | 17,431 |
| Tocalo Co. Ltd. | | 3,600 | 35,491 |
| Toda Corp. | | 49,100 | 306,705 |
| Toei Co. Ltd. | | 600 | 83,084 |
| Toho Co. Ltd. | | 15,700 | 634,052 |
| Toho Gas Co. Ltd. | | 8,700 | 338,853 |
| Toho Holdings Co. Ltd. | | 11,800 | 299,277 |
| Toho Zinc Co. Ltd. | | 1,000 | 20,293 |
| Tohoku Electric Power Co., Inc. | | 70,700 | 726,639 |
| Tokai Carbon Co. Ltd. (b) | | 22,800 | 230,255 |
| TOKAI Holdings Corp. | | 29,600 | 290,301 |
| Tokai Rika Co. Ltd. | | 2,100 | 40,531 |
| Tokai Tokyo Financial Holdings | | 9,400 | 24,511 |
| Token Corp. | | 200 | 12,826 |
| Tokio Marine Holdings, Inc. | | 83,493 | 4,514,101 |
| Tokushu Tokai Paper Co. Ltd. | | 400 | 15,040 |
| Tokuyama Corp. | | 7,435 | 198,619 |
| Tokyo Broadcasting System Holding | | 700 | 11,162 |
| Tokyo Century Corp. | | 5,700 | 263,202 |
| Tokyo Dome Corp. | | 9,900 | 87,315 |
| Tokyo Electric Power Co., Inc. (a) | | 219,428 | 1,016,203 |
| Tokyo Electron Ltd. | | 20,223 | 4,097,151 |
| Tokyo Gas Co. Ltd. | | 51,835 | 1,265,346 |
| Tokyo Ohka Kogyo Co. Ltd. | | 8,600 | 340,589 |
| Tokyo Seimitsu Co. Ltd. | | 2,800 | 89,933 |
| Tokyo Steel Manufacturing Co. Ltd. | | 18,600 | 149,743 |
| Tokyo Tatemono Co. Ltd. | | 29,600 | 421,134 |
| Tokyo TY Financial Group, Inc. | | 1,500 | 21,126 |
| Tokyotokeiba Co. Ltd. | | 1,200 | 37,741 |
| Tokyu Construction Co. Ltd. | | 2,500 | 19,801 |
| Tokyu Corp. | | 63,000 | 1,191,558 |
| Tokyu Fudosan Holdings Corp. | | 102,900 | 682,526 |
| Tokyu REIT, Inc. | | 95 | 182,964 |
| TOMONY Holdings, Inc. | | 3,900 | 13,579 |
| Tomy Co. Ltd. | | 11,000 | 119,287 |
| Topcon Corp. | | 13,760 | 189,731 |
| Toppan Forms Co. Ltd. | | 300 | 2,999 |
| Toppan Printing Co. Ltd. | | 40,100 | 741,663 |
| Topre Corp. | | 2,700 | 46,852 |
| Topy Industries Ltd. | | 100 | 2,044 |
| Toray Industries, Inc. | | 177,600 | 1,255,125 |
| TORIDOLL Holdings Corp. | | 800 | 18,270 |
| Toshiba Corp. | | 66,652 | 2,279,244 |
| Toshiba Machine Co. Ltd. | | 1,000 | 22,377 |
| Toshiba Plant Systems & Services Corp. | | 4,600 | 89,878 |
| Toshiba Tec Corp. | | 2,800 | 100,984 |
| Tosho Co. Ltd. | | 200 | 4,085 |
| Tosoh Corp. | | 29,300 | 401,191 |
| Totetsu Kogyo Co. Ltd. | | 14,800 | 461,404 |
| Toto Ltd. | | 20,600 | 841,012 |
| Towa Pharmaceutical Co. Ltd. | | 2,400 | 61,543 |
| Toyo Ink South Carolina Holdings Co. Ltd. | | 2,949 | 71,873 |
| Toyo Seikan Group Holdings Ltd. | | 15,200 | 240,211 |
| Toyo Suisan Kaisha Ltd. | | 12,736 | 536,249 |
| Toyo Tire Corp. | | 20,700 | 288,729 |
| Toyobo Co. Ltd. | | 16,800 | 227,086 |
| Toyoda Gosei Co. Ltd. | | 11,400 | 266,700 |
| Toyota Boshoku Corp. | | 25,600 | 376,136 |
| Toyota Industries Corp. | | 18,400 | 1,104,046 |
| Toyota Motor Corp. | | 297,592 | 20,647,196 |
| Toyota Tsusho Corp. | | 29,749 | 1,026,297 |
| TPR Co. Ltd. | | 1,200 | 21,482 |
| Trancom Co. Ltd. | | 1,500 | 98,993 |
| Trans Cosmos, Inc. | | 2,400 | 60,375 |
| Trend Micro, Inc. | | 17,300 | 873,205 |
| Trusco Nakayama Corp. | | 3,200 | 77,373 |
| TS tech Co. Ltd. | | 4,600 | 147,326 |
| TSI Holdings Co. Ltd. | | 5,300 | 27,682 |
| Tsubaki Nakashima Co. Ltd. | | 3,400 | 57,875 |
| Tsubakimoto Chain Co. | | 1,200 | 40,999 |
| Tsugami Corp. | | 4,000 | 36,955 |
| Tsukui Corp. | | 600 | 2,472 |
| Tsumura & Co. | | 9,484 | 261,184 |
| Tsuruha Holdings, Inc. | | 5,600 | 629,936 |
| TV Asahi Corp. | | 100 | 1,562 |
| Uacj Corp. | | 1,600 | 29,309 |
| Ube Industries Ltd. | | 18,900 | 404,671 |
| Ulvac, Inc. | | 5,059 | 221,328 |
| Unicharm Corp. | | 52,500 | 1,779,271 |
| Unipres Corp. | | 9,400 | 153,744 |
| United Arrows Ltd. | | 3,200 | 97,821 |
| United Super Markets Holdings, Inc. | | 2,500 | 22,487 |
| United Technology Holdings Co. Ltd. | | 1,500 | 37,259 |
| United Urban Investment Corp. | | 368 | 742,415 |
| Universal Entertainment Corp. | | 4,500 | 150,165 |
| Unizo Holdings Co. Ltd. | | 3,800 | 175,266 |
| Ushio, Inc. | | 17,200 | 257,051 |
| USS Co. Ltd. | | 32,800 | 635,277 |
| V Technology Co. Ltd. | | 400 | 23,798 |
| Valor Holdings Co. Ltd. | | 3,500 | 59,718 |
| Vector, Inc. (a) | | 900 | 8,462 |
| VT Holdings Co. Ltd. | | 400 | 1,788 |
| W-Scope Corp. | | 800 | 4,904 |
| Wacoal Holdings Corp. | | 16,200 | 425,921 |
| Wacom Co. Ltd. | | 33,400 | 124,316 |
| Welcia Holdings Co. Ltd. | | 7,300 | 419,460 |
| West Japan Railway Co. | | 20,256 | 1,760,052 |
| World Co. Ltd. | | 5,800 | 133,535 |
| Xebio Holdings Co. Ltd. | | 500 | 5,603 |
| YA-MAN Ltd. | | 1,600 | 10,350 |
| Yahoo! Japan Corp. | | 353,065 | 1,086,988 |
| Yakult Honsha Co. Ltd. | | 18,400 | 1,054,499 |
| YAMABIKO Corp. | | 200 | 2,270 |
| Yamada Denki Co. Ltd. | | 74,710 | 361,109 |
| Yamaguchi Financial Group, Inc. | | 40,600 | 284,862 |
| Yamaha Corp. | | 18,800 | 875,502 |
| Yamaha Motor Co. Ltd. | | 41,907 | 820,243 |
| Yamato Holdings Co. Ltd. | | 50,300 | 843,663 |
| Yamato Kogyo Co. Ltd. | | 2,800 | 72,637 |
| Yamazaki Baking Co. Ltd. | | 21,600 | 368,252 |
| Yamazen Co. Ltd. | | 36,200 | 334,228 |
| Yaoko Co. Ltd. | | 5,300 | 247,199 |
| Yaskawa Electric Corp. | | 33,800 | 1,285,676 |
| Yodogawa Steel Works Ltd. | | 900 | 16,994 |
| Yokogawa Bridge Holdings Corp. | | 2,300 | 42,106 |
| Yokogawa Electric Corp. | | 36,112 | 661,677 |
| Yokohama Reito Co. Ltd. | | 800 | 7,936 |
| Yokohama Rubber Co. Ltd. | | 19,500 | 435,537 |
| Yondoshi Holdings, Inc. | | 1,600 | 38,959 |
| YONEX Co. Ltd. | | 4,400 | 23,621 |
| Yoshinoya Holdings Co. Ltd. (b) | | 23,300 | 541,802 |
| Yuasa Trading Co. Ltd. | | 400 | 12,409 |
| Yume No Machi Souzou Iinkai Co. Ltd. | | 2,200 | 20,231 |
| Zenkoku Hosho Co. Ltd. | | 10,400 | 434,189 |
| Zenrin Co. Ltd. | | 6,950 | 125,868 |
| Zensho Holdings Co. Ltd. | | 11,700 | 247,462 |
| Zeon Corp. | | 22,500 | 256,313 |
| ZERIA Pharmaceutical Co. Ltd. | | 2,300 | 43,346 |
| Zojirushi Thermos | | 3,600 | 55,244 |
| Zozo, Inc. (b) | | 27,700 | 645,215 |
|
| TOTAL JAPAN | | | 562,512,950 |
|
| Korea (South) - 3.0% | | | |
| ABL Bio, Inc. | | 4,771 | 78,274 |
| Advanced Process Systems Corp. | | 72 | 1,661 |
| AhnLab, Inc. | | 84 | 4,414 |
| AMOREPACIFIC Corp. | | 4,820 | 790,778 |
| AMOREPACIFIC Group, Inc. | | 4,407 | 318,581 |
| Ananti, Inc. (a) | | 2,696 | 26,262 |
| Asiana Airlines, Inc. (a) | | 10,253 | 46,697 |
| BGF Retail Co. Ltd. | | 1,136 | 172,785 |
| BGFretail Co. Ltd. | | 304 | 1,494 |
| BS Financial Group, Inc. | | 16,547 | 98,268 |
| Bukwang Pharmaceutical Co. Ltd. | | 2,078 | 25,924 |
| Cafe24 Corp. (a) | | 754 | 39,237 |
| Celltrion Healthcare Co. Ltd. | | 5,790 | 272,607 |
| Celltrion Pharm, Inc. (a) | | 791 | 27,036 |
| Celltrion, Inc. (a) | | 12,436 | 2,125,285 |
| CHA Biotech Co. Ltd. (a) | | 13,621 | 177,495 |
| Cheil Industries, Inc. | | 13,343 | 1,140,145 |
| Cheil Worldwide, Inc. | | 15,438 | 326,492 |
| Chong Kun Dang Pharmaceutical Corp. | | 171 | 13,983 |
| CJ CGV Co. Ltd. | | 1,440 | 41,528 |
| CJ CheilJedang Corp. | | 1,113 | 217,314 |
| CJ Corp. | | 2,449 | 172,434 |
| CJ O Shopping Co. Ltd. | | 1,578 | 222,483 |
| Com2uS Corp. | | 659 | 55,354 |
| Cosmax, Inc. | | 2,277 | 155,459 |
| Daelim Industrial Co. | | 5,548 | 431,404 |
| Daesang Corp. | | 710 | 13,013 |
| Daewoo Engineering & Construction Co. Ltd. (a) | | 8,142 | 30,299 |
| Daewoo Shipbuilding & Marine Engineering Co. Ltd. (a) | | 3,699 | 88,975 |
| Daewoong Pharmaceutical Co. Ltd. | | 322 | 41,960 |
| Daou Technology, Inc. | | 10,263 | 158,730 |
| Db Insurance Co. Ltd. | | 7,010 | 302,493 |
| DGB Financial Group Co. Ltd. | | 9,863 | 59,248 |
| DIO Corp. (a) | | 21 | 754 |
| Dong Suh Companies, Inc. | | 448 | 6,699 |
| Dong-A Socio Holdings Co. Ltd. | | 6 | 474 |
| Dong-A St. Co. Ltd. | | 2,127 | 184,476 |
| Dongbu HiTek Co. Ltd. | | 1,070 | 15,543 |
| Dongjin Semichem Co. Ltd. | | 6,614 | 94,382 |
| Dongkuk Steel Mill Co. Ltd. (a) | | 3,645 | 18,314 |
| Dongwon Industries Co. | | 9 | 1,646 |
| Doosan Bobcat, Inc. | | 10,159 | 273,444 |
| Doosan Heavy Industries & Construction Co. Ltd. (a) | | 7,720 | 40,503 |
| Doosan Infracore Co. Ltd. (a) | | 8,372 | 40,419 |
| DOUBLEUGAMES Co. Ltd. | | 331 | 13,576 |
| DuzonBizon Co. Ltd. | | 3,401 | 213,309 |
| E-Mart Co. Ltd. | | 4,898 | 466,660 |
| Ecopro Co. Ltd. (a) | | 1,658 | 29,468 |
| Enzychem Lifesciences Corp. (a) | | 2,340 | 127,968 |
| EO Technics Co. Ltd. | | 2,231 | 183,583 |
| F&F Co. Ltd. | | 1,163 | 99,874 |
| Fila Korea Ltd. | | 5,295 | 260,612 |
| Foosung Co. Ltd. (a) | | 10,749 | 77,521 |
| G-treeBNT Co. Ltd. (a) | | 987 | 19,440 |
| GemVax & Kael Co. Ltd. (a) | | 176 | 3,918 |
| Genexine Co. Ltd. (a) | | 932 | 44,757 |
| Grand Korea Leisure Co. Ltd. | | 2,509 | 45,558 |
| Green Cross Corp. | | 278 | 30,525 |
| Green Cross Holdings Corp. | | 16,302 | 289,742 |
| GS Engineering & Construction Corp. | | 5,979 | 157,868 |
| GS Holdings Corp. | | 9,594 | 407,029 |
| GS Retail Co. Ltd. | | 2,417 | 78,998 |
| Halla Holdings Corp. | | 157 | 5,601 |
| Hana Financial Group, Inc. | | 45,487 | 1,309,856 |
| Hana Tour Service, Inc. | | 861 | 35,719 |
| HanAll BioPharma Co. Ltd. (a) | | 5,195 | 147,599 |
| Handsome Co. Ltd. | | 2,565 | 64,000 |
| Hanjin Kal Corp. | | 5,719 | 148,071 |
| Hankook Technology Group Co. Lt | | 144 | 1,637 |
| Hankook Tire Co. Ltd. | | 8,565 | 227,246 |
| Hanmi Pharm Co. Ltd. | | 799 | 227,693 |
| Hanmi Science Co. Ltd. | | 673 | 25,073 |
| Hanon Systems | | 19,096 | 189,281 |
| Hansae Co. Ltd. | | 90 | 1,392 |
| Hansol Chemical Co. Ltd. | | 1,913 | 153,329 |
| Hanssem Co. Ltd. | | 1,856 | 100,548 |
| Hanwha Aerospace Co. Ltd. (a) | | 4,203 | 135,756 |
| Hanwha Chemical Corp. | | 16,477 | 230,198 |
| Hanwha Corp. | | 11,895 | 241,399 |
| Hanwha Life Insurance Co. Ltd. | | 48,251 | 91,943 |
| HDC Hyundai Development Co. | | 2,195 | 58,050 |
| Hite Jinro Co. Ltd. | | 2,113 | 51,367 |
| HLB Life Science Co. Ltd. (a) | | 9,430 | 265,103 |
| HLB, Inc. (a) | | 4,387 | 629,772 |
| Hotel Shilla Co. | | 3,456 | 228,866 |
| Huchems Fine Chemical Corp. | | 136 | 2,568 |
| HUGEL, Inc. (a) | | 317 | 98,869 |
| Hyosung Advanced Materials Co. (a) | | 92 | 8,608 |
| Hyosung Chemical Co. Ltd. | | 66 | 9,334 |
| Hyosung Corp. | | 1,924 | 135,962 |
| Hyosung Heavy Industries Co. Ltd. (a) | | 193 | 4,667 |
| Hyosung TNC Co. Ltd. | | 89 | 12,206 |
| Hyundai Construction Equipment Co. Ltd. | | 348 | 8,296 |
| Hyundai Department Store Co. Ltd. | | 1,315 | 83,038 |
| Hyundai Electric & Energy System Co. Ltd. | | 108 | 987 |
| Hyundai Elevator Co. Ltd. | | 3,186 | 200,641 |
| Hyundai Engineering & Construction Co. Ltd. | | 14,330 | 525,915 |
| Hyundai Fire & Marine Insurance Co. Ltd. | | 6,284 | 135,583 |
| Hyundai Glovis Co. Ltd. | | 3,184 | 410,825 |
| Hyundai Greenfood Co. Ltd. | | 1,111 | 10,633 |
| Hyundai Heavy Industries Co. Ltd. (a) | | 5,639 | 587,853 |
| Hyundai Home Shopping Network Corp. | | 100 | 7,220 |
| Hyundai Industrial Development & Construction Co. | | 972 | 9,842 |
| Hyundai Merchant Marine Co. Ltd. (a) | | 17,796 | 50,105 |
| Hyundai Mipo Dockyard Co. Ltd. | | 2,611 | 96,940 |
| Hyundai Mobis | | 9,069 | 1,844,348 |
| Hyundai Motor Co. | | 16,567 | 1,727,071 |
| Hyundai Robotics Co. Ltd. | | 1,874 | 546,848 |
| Hyundai Rotem Co. Ltd. (a) | | 12,871 | 177,070 |
| Hyundai Steel Co. | | 8,835 | 240,071 |
| Hyundai Wia Corp. | | 1,099 | 48,081 |
| Iljin Materials Co. Ltd. (a) | | 2,130 | 71,528 |
| Illinois-Yang Pharmaceutical Co. Ltd. (a) | | 16,313 | 303,876 |
| Industrial Bank of Korea | | 28,276 | 285,106 |
| ING Life Insurance Korea Ltd. (c) | | 2,082 | 49,813 |
| INNOCEAN Worldwide, Inc. | | 2,226 | 122,114 |
| iNtRON Biotechnology, Inc. | | 1,996 | 22,087 |
| IS Dongseo Co. Ltd. | | 24 | 655 |
| JB Financial Group Co. Ltd. | | 11,115 | 50,717 |
| Jeil Pharmaceutical Co. Ltd. | | 60 | 1,782 |
| Jenax, Inc. (a) | | 1,126 | 3,820 |
| JW Holdings Corp. | | 120 | 640 |
| JW Pharmaceutical Corp. | | 104 | 2,573 |
| JYP Entertainment Corp. | | 3,048 | 58,340 |
| Kakao Corp. | | 7,214 | 872,246 |
| Kangwon Land, Inc. | | 16,003 | 428,692 |
| KB Financial Group, Inc. | | 52,505 | 1,879,102 |
| KCC Corp. | | 1,383 | 267,077 |
| KEPCO Plant Service & Engineering Co. Ltd. | | 1,160 | 32,313 |
| Kia Motors Corp. | | 34,678 | 1,260,840 |
| Kiwoom Securities Co. Ltd. | | 1,279 | 75,628 |
| KMW Co. Ltd. (a) | | 4,850 | 222,133 |
| Koh Young Technology, Inc. | | 946 | 76,065 |
| Kolmar Korea Co. Ltd. | | 3,686 | 151,655 |
| Kolon Industries, Inc. | | 569 | 22,973 |
| Komipharm International Co. Ltd. (a) | | 2,855 | 34,154 |
| Korea Aerospace Industries Ltd. | | 12,702 | 412,441 |
| Korea Electric Power Corp. (a) | | 36,916 | 802,291 |
| Korea Electric Terminal Co. Ltd. | | 40 | 1,576 |
| Korea Express Co. Ltd. (a) | | 2,975 | 400,382 |
| Korea Gas Corp. | | 4,969 | 166,866 |
| Korea Investment Holdings Co. Ltd. | | 9,126 | 528,709 |
| Korea Petro Chemical Industries Co. Ltd. | | 202 | 20,540 |
| Korea Real Estate Investment Trust Co. | | 960 | 1,813 |
| Korea Zinc Co. Ltd. | | 1,476 | 548,003 |
| Korean Air Lines Co. Ltd. | | 8,893 | 189,214 |
| Korean Reinsurance Co. | | 3,067 | 20,809 |
| KT Skylife Co. Ltd. | | 136 | 1,011 |
| KT&G Corp. | | 15,633 | 1,335,823 |
| Kumho Petro Chemical Co. Ltd. | | 1,976 | 118,193 |
| Kumho Tire Co., Inc. (a) | | 6,369 | 23,021 |
| Kwang Dong Pharmaceutical Co. Ltd. | | 82,821 | 486,895 |
| LG Chemical Ltd. | | 6,319 | 1,660,351 |
| LG Corp. | | 15,057 | 892,903 |
| LG Display Co. Ltd. (a) | | 25,577 | 298,062 |
| LG Electronics, Inc. | | 15,950 | 911,787 |
| LG Fashion Corp. | | 1,267 | 21,274 |
| LG Hausys Ltd. | | 145 | 7,372 |
| LG Home Shopping, Inc. | | 38 | 4,832 |
| LG Household & Health Care Ltd. | | 1,316 | 1,418,004 |
| LG Innotek Co. Ltd. | | 2,186 | 226,017 |
| LG International Corp. | | 1,950 | 25,910 |
| LG Telecom Ltd. | | 13,039 | 149,856 |
| Lotte Chemical Corp. | | 2,075 | 402,486 |
| Lotte Confectionery Co. Ltd. | | 2,279 | 71,079 |
| Lotte Fine Chemical Co. Ltd. | | 1,033 | 39,015 |
| LOTTE Hi-Mart Co. Ltd. | | 97 | 2,507 |
| Lotte Samkang Co. Ltd. | | 1 | 369 |
| Lotte Shopping Co. Ltd. | | 1,993 | 212,023 |
| LS Cable Ltd. | | 839 | 34,770 |
| LS Industrial Systems Ltd. | | 1,241 | 52,756 |
| Mando Corp. | | 8,247 | 252,282 |
| Medipost Co. Ltd. (a) | | 640 | 17,719 |
| Medy-Tox, Inc. | | 639 | 180,186 |
| Meritz Financial Holdings Co. | | 10,185 | 108,352 |
| Meritz Fire & Marine Insurance Co. Ltd. | | 9,111 | 144,027 |
| Meritz Securities Co. Ltd. | | 66,773 | 257,326 |
| Mezzion Pharma Co. Ltd. (a) | | 1,409 | 231,765 |
| Mirae Asset Daewoo Co. Ltd. | | 52,212 | 318,994 |
| Mirae Asset Life Insurance Co. Ltd. | | 883 | 3,022 |
| Naturecell Co. Ltd. (a) | | 3,819 | 34,754 |
| NAVER Corp. | | 18,637 | 2,611,718 |
| NCSOFT Corp. | | 2,289 | 1,009,258 |
| Netmarble Corp. (a)(c) | | 4,346 | 333,853 |
| Nexen Tire Corp. | | 309 | 2,471 |
| NHN Entertainment Corp. (a) | | 450 | 22,187 |
| Nong Shim Co. Ltd. | | 835 | 172,667 |
| Oci Co. Ltd. | | 1,695 | 91,102 |
| Orion Corp./Republic of Korea | | 4,949 | 448,260 |
| Orion Holdings Corp. | | 184 | 2,484 |
| Oscotec, Inc. (a) | | 5,662 | 102,568 |
| Osstem Implant Co. Ltd. (a) | | 3,309 | 113,242 |
| Ottogi Corp. | | 370 | 178,631 |
| Paradise Co. Ltd. | | 2,531 | 40,335 |
| Partron Co. Ltd. | | 892 | 9,032 |
| Pearl Abyss Corp. (a) | | 493 | 91,246 |
| Pharmicell Co. Ltd. (a) | | 3,798 | 27,975 |
| Poongsan Corp. | | 1,184 | 20,386 |
| POSCO | | 10,305 | 1,858,869 |
| POSCO Chemtech Co. Ltd. | | 2,467 | 101,291 |
| Posco International Corp. | | 1,030 | 16,062 |
| S&T Motiv Co. Ltd. | | 1,844 | 71,851 |
| S-Oil Corp. | | 4,998 | 425,792 |
| S.M. Entertainment Co. Ltd. (a) | | 1,057 | 33,509 |
| S1 Corp. | | 2,397 | 191,917 |
| Sam Chun Dang Pharm Co. Ltd. | | 4,978 | 142,923 |
| Samlip General Food Co. Ltd. | | 19 | 1,492 |
| Samsung Biologics Co. Ltd. (a)(c) | | 2,316 | 788,630 |
| Samsung Card Co. Ltd. | | 10,496 | 300,900 |
| Samsung Electro-Mechanics Co. Ltd. | | 6,826 | 659,100 |
| Samsung Electronics Co. Ltd. | | 619,829 | 26,693,710 |
| Samsung Engineering Co. Ltd. (a) | | 30,934 | 470,503 |
| Samsung Fire & Marine Insurance Co. Ltd. | | 4,469 | 826,751 |
| Samsung Heavy Industries Co. Ltd. (a) | | 55,009 | 340,783 |
| Samsung Life Insurance Co. Ltd. | | 12,708 | 766,635 |
| Samsung SDI Co. Ltd. | | 7,565 | 1,470,608 |
| Samsung SDS Co. Ltd. | | 5,300 | 912,552 |
| Samsung Securities Co. Ltd. | | 13,136 | 377,145 |
| Samyang Holdings Corp. | | 20 | 1,083 |
| Sebang Global Battery Co. Ltd. | | 44 | 1,432 |
| Seegene, Inc. (a) | | 124 | 2,252 |
| Seoul Semiconductor Co. Ltd. | | 3,465 | 39,675 |
| SFA Engineering Corp. | | 764 | 27,288 |
| Shinhan Financial Group Co. Ltd. | | 56,931 | 2,062,162 |
| Shinsegae Co. Ltd. | | 732 | 147,615 |
| Shinsegae International Co. Ltd. | | 512 | 86,843 |
| SillaJen, Inc. (a) | | 5,766 | 94,844 |
| SK C&C Co. Ltd. | | 5,208 | 1,150,371 |
| SK Chemicals Co. Ltd. | | 563 | 10,800 |
| SK Chemicals Co. Ltd./New | | 604 | 24,360 |
| SK Energy Co. Ltd. | | 7,846 | 1,072,691 |
| SK Gas Co. Ltd. | | 28 | 2,010 |
| SK Hynix, Inc. | | 72,024 | 5,046,585 |
| SK Materials Co., Ltd. | | 1,092 | 170,944 |
| SK Networks Co. Ltd. | | 40,170 | 199,427 |
| SK Telecom Co. Ltd. | | 3,079 | 625,658 |
| SKC Co. Ltd. | | 1,350 | 51,160 |
| Soulbrain Co. Ltd. | | 1,557 | 100,315 |
| STX Pan Ocean Co. Ltd. (Korea)(a) | | 27,089 | 101,732 |
| Taekwang Industrial Co. Ltd. | | 71 | 66,554 |
| Telcon Rf Pharmaceutical, Inc. (a) | | 2,567 | 14,521 |
| Texcell-NetCom Co. Ltd. | | 2,112 | 21,837 |
| Tong Yang Life Insurance Co. Ltd. | | 381 | 1,193 |
| Tongyang, Inc. | | 451 | 553 |
| Toptec Co. Ltd. | | 877 | 6,115 |
| Vieworks Co. Ltd. | | 36 | 744 |
| ViroMed Co. Ltd. | | 2,301 | 190,326 |
| WONIK IPS Co. Ltd. | | 5,958 | 168,768 |
| Woongjin Coway Co. Ltd. | | 8,384 | 657,659 |
| Woori Financial Group, Inc. (a) | | 83,664 | 840,007 |
| Woori Investment & Securities Co. Ltd. | | 12,772 | 132,054 |
| Youngone Corp. | | 1,963 | 58,288 |
| Yuhan Corp. | | 917 | 175,911 |
| YUNGJIN Pharmaceutical Co. Ltd. (a) | | 5,131 | 23,413 |
|
| TOTAL KOREA (SOUTH) | | | 96,897,196 |
|
| Liechtenstein - 0.0% | | | |
| Liechtensteinische Landesbank AG | | 3,376 | 222,785 |
| Luxembourg - 0.3% | | | |
| Adecoagro SA (a) | | 16,257 | 96,404 |
| ADO Properties SA (c) | | 4,442 | 180,827 |
| Aperam | | 9,365 | 238,768 |
| ArcelorMittal SA (Netherlands) | | 92,843 | 1,369,937 |
| Aroundtown SA | | 120,016 | 1,012,738 |
| B&M European Value Retail SA | | 107,679 | 516,502 |
| Eurofins Scientific SA | | 1,632 | 826,721 |
| Globant SA (a) | | 3,922 | 365,766 |
| Grand City Properties SA | | 17,880 | 417,975 |
| Millicom International Cellular SA (depository receipt) | | 9,355 | 426,297 |
| PLAY Communications SA (c) | | 20,585 | 163,036 |
| Reinet Investments SCA | | 16,415 | 308,051 |
| RTL Group SA | | 4,050 | 205,793 |
| SAF-Holland SA | | 3,387 | 23,912 |
| SES SA (France) (depositary receipt) | | 52,709 | 1,021,119 |
| Solutions 30 SE (a)(b) | | 11,156 | 118,513 |
| Stabilus SA | | 5,998 | 337,489 |
| Subsea 7 SA | | 28,669 | 268,105 |
| Tenaris SA | | 69,505 | 705,121 |
|
| TOTAL LUXEMBOURG | | | 8,603,074 |
|
| Malaysia - 0.5% | | | |
| AEON Credit Service Bhd | | 450 | 1,647 |
| AirAsia Group BHD | | 165,300 | 75,470 |
| Alliance Bank Malaysia Bhd | | 160,900 | 110,731 |
| AMMB Holdings Bhd | | 323,800 | 308,862 |
| Axiata Group Bhd | | 346,330 | 355,980 |
| Berjaya Sports Toto Bhd | | 6,300 | 3,993 |
| British American Tobacco (Malaysia) Bhd | | 17,000 | 76,533 |
| Bumi Armada Bhd (a) | | 81,700 | 8,777 |
| Bumiputra-Commerce Holdings Bhd | | 556,712 | 698,685 |
| Bursa Malaysia Bhd | | 59,700 | 86,374 |
| Cahya Mata Sarawak Bhd | | 36,300 | 20,997 |
| Carlsberg Brewery BHD | | 22,200 | 147,355 |
| Dialog Group Bhd | | 406,500 | 338,246 |
| DiGi.com Bhd | | 427,800 | 480,441 |
| Felda Global Ventures Holdings Bhd (a)(c) | | 123,800 | 32,528 |
| Fraser & Neave Holdings BHD | | 13,500 | 111,643 |
| Gamuda Bhd | | 183,800 | 164,353 |
| Genting Bhd | | 252,500 | 350,751 |
| Genting Malaysia Bhd | | 372,300 | 285,550 |
| Genting Plantations Bhd | | 5,700 | 13,510 |
| Hap Seng Consolidated Bhd | | 132,800 | 317,145 |
| Hartalega Holdings Bhd | | 168,700 | 212,225 |
| Hong Leong Bank Bhd | | 83,400 | 343,406 |
| Hong Leong Credit Bhd | | 34,000 | 141,696 |
| IGB (REIT) | | 392,600 | 179,404 |
| IHH Healthcare Bhd | | 329,000 | 448,390 |
| IJM Corp. Bhd | | 322,200 | 165,657 |
| Inari Amertron Bhd | | 536,950 | 252,407 |
| IOI Corp. Bhd | | 263,800 | 275,332 |
| Kossan Rubber Industries Bhd | | 29,800 | 29,576 |
| KPJ Healthcare Bhd | | 198,000 | 43,568 |
| Kuala Lumpur Kepong Bhd | | 47,100 | 244,207 |
| Mah Sing Group Bhd | | 78,600 | 14,288 |
| Malayan Banking Bhd | | 511,884 | 1,052,655 |
| Malaysia Airports Holdings Bhd | | 191,300 | 362,073 |
| Malaysia Building Society Bhd | | 109,516 | 22,915 |
| Maxis Bhd | | 294,200 | 378,823 |
| MISC Bhd | | 150,800 | 300,363 |
| My E.G.Services Bhd | | 142,050 | 38,674 |
| Nestle (Malaysia) BHD | | 16,300 | 564,110 |
| Petronas Chemicals Group Bhd | | 378,400 | 676,055 |
| Petronas Dagangan Bhd | | 45,700 | 257,529 |
| Petronas Gas Bhd | | 106,000 | 422,227 |
| PPB Group Bhd | | 68,840 | 297,808 |
| Press Metal Bhd | | 193,400 | 220,048 |
| Public Bank Bhd | | 418,800 | 2,032,586 |
| QL Resources Bhd | | 82,550 | 143,554 |
| RHB Capital Bhd | | 285,400 | 392,596 |
| SapuraKencana Petroleum Bhd | | 716,100 | 45,341 |
| Serba Dinamik Holdings BHD | | 121,800 | 121,449 |
| Sime Darby Bhd | | 617,289 | 334,701 |
| Sime Darby Plantation Bhd | | 239,889 | 281,320 |
| Sime Darby Property Bhd | | 222,889 | 38,647 |
| SP Setia Bhd | | 185,461 | 53,644 |
| Sunway (REIT) | | 92,800 | 40,193 |
| Sunway Bhd | | 67,652 | 27,500 |
| Telekom Malaysia Bhd | | 226,700 | 203,721 |
| Tenaga Nasional Bhd | | 401,400 | 1,329,336 |
| TIME dotCom Bhd | | 29,600 | 64,586 |
| Top Glove Corp. Bhd | | 208,600 | 217,020 |
| UEM Land Holdings Bhd (a) | | 9,900 | 1,620 |
| UMW Holdings Bhd | | 33,700 | 35,707 |
| UMW Oil & Gas Corp. Bhd (a) | | 26,254 | 2,227 |
| UOA Development Bhd | | 4,200 | 2,008 |
| Westports Holdings Bhd | | 100,200 | 102,504 |
| Yinson Holdings Bhd | | 93,900 | 155,088 |
| YTL Corp. Bhd | | 207,534 | 43,153 |
|
| TOTAL MALAYSIA | | | 16,601,508 |
|
| Malta - 0.0% | | | |
| Brait SA (a) | | 18,088 | 20,493 |
| Kindred Group PLC (depositary receipt) | | 33,993 | 246,295 |
|
| TOTAL MALTA | | | 266,788 |
|
| Marshall Islands - 0.0% | | | |
| Seaspan Corp. (b) | | 13,817 | 149,776 |
| Mauritius - 0.0% | | | |
| Golden Agri-Resources Ltd. | | 818,400 | 122,843 |
| Mexico - 0.6% | | | |
| Alfa SA de CV Series A | | 495,700 | 429,822 |
| Alsea S.A.B. de CV (a) | | 93,711 | 250,006 |
| America Movil S.A.B. de CV Series L | | 4,362,196 | 3,455,923 |
| Banco del Bajio SA (c) | | 126,600 | 203,953 |
| Bolsa Mexicana de Valores S.A.B. de CV | | 23,900 | 52,406 |
| CEMEX S.A.B. de CV unit | | 2,103,732 | 790,683 |
| Coca-Cola FEMSA S.A.B. de CV unit | | 58,600 | 322,024 |
| Compartamos S.A.B. de CV | | 74,100 | 73,420 |
| Concentradora Fibra Danhos SA de CV | | 52,445 | 79,118 |
| Concentradora Fibra Hotelera Mexicana SA de CV (c) | | 47,600 | 21,627 |
| Controladora Comercial Mexicana S.A.B de C.V. (a) | | 23,100 | 31,510 |
| Controladora Vuela Compania de Aviacion S.A.B. de CV (a) | | 96,200 | 104,419 |
| Corporacion Inmobiliaria Vesta S.A.B. de CV | | 32,100 | 53,549 |
| Credito Real S.A.B. de CV | | 13,100 | 16,072 |
| El Puerto de Liverpool S.A.B. Dcv Class C | | 14,100 | 71,847 |
| Embotelladoras Arca S.A.B. de CV | | 60,400 | 337,441 |
| Fibra Uno Administracion SA de CV | | 377,635 | 573,623 |
| Fomento Economico Mexicano S.A.B. de CV unit | | 256,191 | 2,273,376 |
| Genomma Lab Internacional SA de CV (a) | | 58,600 | 61,870 |
| Gruma S.A.B. de CV Series B | | 20,815 | 218,413 |
| Grupo Aeroportuario del Pacifico S.A.B. de CV Series B | | 43,796 | 459,168 |
| Grupo Aeroportuario del Sureste S.A.B. de CV Series B | | 29,265 | 479,887 |
| Grupo Aeroportuario Norte S.A.B. de CV | | 46,800 | 324,473 |
| Grupo Bimbo S.A.B. de CV Series A | | 247,777 | 460,351 |
| Grupo Carso SA de CV Series A1 | | 95,627 | 320,140 |
| Grupo Cementos de Chihuahua S.A.B. de CV | | 14,100 | 78,818 |
| Grupo Comercial Chedraui S.A.B. de CV | | 31,400 | 43,534 |
| Grupo Financiero Banorte S.A.B. de CV Series O | | 342,119 | 1,867,413 |
| Grupo Financiero Inbursa S.A.B. de CV Series O | | 366,700 | 455,599 |
| Grupo Herdez S.A.B. de CV | | 18,800 | 38,320 |
| Grupo Mexico SA de CV Series B | | 460,917 | 1,214,081 |
| Grupo Televisa SA de CV | | 332,770 | 734,857 |
| Hoteles City Express S.A.B. de CV (a) | | 29,900 | 25,926 |
| Industrias Bachoco SA de CV Series B | | 17,700 | 79,480 |
| Industrias Penoles SA de CV | | 18,945 | 227,342 |
| Infraestructura Energetica Nova S.A.B. de CV | | 61,733 | 272,875 |
| Kimberly-Clark de Mexico SA de CV Series A | | 252,167 | 508,489 |
| Macquarie Mexican (REIT) (c) | | 87,950 | 123,994 |
| Megacable Holdings S.A.B. de CV unit | | 33,500 | 137,629 |
| Mexichem S.A.B. de CV | | 179,028 | 386,320 |
| Prologis Property Mexico SA | | 22,300 | 47,599 |
| Promotora y Operadora de Infraestructura S.A.B. de CV | | 26,780 | 247,718 |
| Qualitas Controladora S.A.B. de CV | | 60,000 | 258,758 |
| Regional S.A.B. de CV | | 24,500 | 130,139 |
| Telesites S.A.B. de C.V. (a) | | 296,363 | 193,811 |
| Terrafina | | 88,971 | 147,032 |
| Unifin Financiera SAPI de CV | | 2,000 | 3,364 |
| Wal-Mart de Mexico SA de CV Series V | | 684,030 | 2,052,819 |
|
| TOTAL MEXICO | | | 20,741,038 |
|
| Multi-National - 0.0% | | | |
| HK Electric Investments & HK Electric Investments Ltd. unit | | 343,000 | 342,374 |
| HKT Trust/HKT Ltd. unit | | 523,000 | 813,610 |
| Langham Hospitality Investment unit | | 24,000 | 6,794 |
|
| TOTAL MULTI-NATIONAL | | | 1,162,778 |
|
| Netherlands - 3.3% | | | |
| Aalberts Industries NV | | 14,628 | 588,305 |
| ABN AMRO Group NV GDR (c) | | 56,867 | 1,058,543 |
| Accell Group NV | | 2,287 | 56,753 |
| Adyen BV (a)(c) | | 1,365 | 958,189 |
| AEGON NV | | 266,387 | 1,155,677 |
| AerCap Holdings NV (a) | | 17,373 | 1,005,549 |
| Airbus Group NV | | 76,253 | 10,939,134 |
| Akzo Nobel NV | | 29,270 | 2,694,831 |
| Altice Europe NV Class A (a) | | 68,915 | 393,528 |
| AMG Advanced Metallurgical Group NV (b) | | 9,841 | 241,574 |
| Arcadis NV | | 10,167 | 200,705 |
| Argenx SE (a) | | 4,982 | 606,654 |
| ASM International NV (Netherlands) | | 7,674 | 770,807 |
| ASML Holding NV (Netherlands) | | 55,758 | 14,614,986 |
| ASR Nederland NV | | 22,427 | 820,671 |
| Basic-Fit NV (a)(c) | | 5,919 | 180,880 |
| BE Semiconductor Industries NV | | 9,450 | 349,176 |
| Brack Capital Properties NV (a) | | 281 | 32,019 |
| Brunel International NV | | 60 | 554 |
| CNH Industrial NV | | 135,312 | 1,471,105 |
| Constellium NV (a) | | 20,238 | 269,773 |
| COSMO Pharmaceuticals NV (a) | | 427 | 31,641 |
| CSM NV (exchangeable) | | 9,520 | 274,997 |
| Eurocommercial Properties NV (Certificaten Van Aandelen) unit | | 17,720 | 565,225 |
| Euronext NV (c) | | 6,127 | 493,716 |
| EXOR NV | | 13,795 | 1,057,296 |
| Ferrari NV | | 15,746 | 2,519,199 |
| Fiat Chrysler Automobiles NV (Italy) | | 138,416 | 2,150,140 |
| Flow Traders BV (c) | | 5,516 | 129,930 |
| Fugro NV (Certificaten Van Aandelen) (a) | | 3,080 | 27,790 |
| Heineken Holding NV | | 13,871 | 1,321,166 |
| Heineken NV (Bearer) | | 32,816 | 3,347,407 |
| IMCD Group BV | | 7,397 | 576,666 |
| ING Groep NV (Certificaten Van Aandelen) | | 501,871 | 5,682,934 |
| Intertrust NV (c) | | 21,727 | 412,915 |
| InterXion Holding NV (a)(b) | | 9,387 | 828,121 |
| Kendrion NV | | 921 | 19,537 |
| Koninklijke Ahold Delhaize NV | | 152,799 | 3,807,761 |
| Koninklijke BAM Groep NV | | 52,204 | 132,283 |
| Koninklijke Boskalis Westminster NV (b) | | 11,009 | 241,638 |
| Koninklijke DSM NV | | 23,529 | 2,788,201 |
| Koninklijke KPN NV | | 485,867 | 1,508,312 |
| Koninklijke Philips Electronics NV | | 122,057 | 5,355,143 |
| Koninklijke Volkerwessels NV | | 3,756 | 87,133 |
| NN Group NV | | 37,037 | 1,411,473 |
| NSI NV | | 3,499 | 159,805 |
| NXP Semiconductors NV | | 37,194 | 4,228,214 |
| OCI NV (a) | | 11,437 | 256,517 |
| Pharming Group NV (a) | | 50,698 | 72,319 |
| Philips Lighting NV (c) | | 19,053 | 557,595 |
| PostNL NV | | 82,444 | 189,233 |
| Prosus NV (a) | | 63,095 | 4,350,968 |
| QIAGEN NV (Germany) (a) | | 31,605 | 948,552 |
| Randstad NV | | 16,355 | 905,470 |
| RHI Magnesita NV | | 3,536 | 159,305 |
| SBM Offshore NV | | 16,198 | 278,482 |
| Steinhoff International Holdings NV (South Africa) (a) | | 197,801 | 12,829 |
| STMicroelectronics NV (France) | | 89,380 | 2,028,598 |
| Takeaway.com Holding BV (a)(c) | | 4,162 | 338,857 |
| TKH Group NV (depositary receipt) | | 8,288 | 423,912 |
| TomTom Group BV | | 6,809 | 76,928 |
| Unibail-Rodamco SE & WFD Unibail-Rodamco NV unit | | 18,169 | 2,809,588 |
| Unilever NV | | 188,793 | 11,149,196 |
| VastNed Retail NV | | 905 | 27,151 |
| Vopak NV | | 7,371 | 404,385 |
| Wereldhave NV | | 6,566 | 155,249 |
| Wolters Kluwer NV | | 35,239 | 2,594,722 |
| X5 Retail Group NV GDR | | 16,205 | 542,589 |
|
| TOTAL NETHERLANDS | | | 105,850,501 |
|
| New Zealand - 0.2% | | | |
| Air New Zealand Ltd. | | 48,086 | 87,053 |
| Argosy Property Ltd. | | 102,887 | 92,975 |
| Auckland International Airport Ltd. | | 119,649 | 713,087 |
| Chorus Ltd. | | 62,945 | 214,022 |
| Contact Energy Ltd. | | 86,921 | 411,102 |
| Fisher & Paykel Healthcare Corp. | | 76,123 | 933,664 |
| Fletcher Building Ltd. | | 150,049 | 440,864 |
| Genesis Energy Ltd. | | 73,498 | 154,402 |
| Goodman Property Trust | | 98,744 | 134,805 |
| Infratil Ltd. | | 93,057 | 294,034 |
| Kiwi Property Group Ltd. | | 148,761 | 151,579 |
| Mercury Nz Ltd. | | 97,781 | 310,942 |
| Meridian Energy Ltd. | | 180,329 | 531,554 |
| Metlifecare Ltd. | | 10,948 | 33,822 |
| New Zealand Refining Co. Ltd. | | 2,258 | 2,965 |
| Precinct Properties New Zealand Ltd. | | 124,126 | 144,747 |
| Restaurant Brands NZ Ltd. (a) | | 2,022 | 15,445 |
| Ryman Healthcare Group Ltd. | | 50,885 | 420,562 |
| Sky Network Television Ltd. | | 43,709 | 25,260 |
| SKYCITY Entertainment Group Ltd. | | 56,805 | 142,316 |
| Spark New Zealand Ltd. | | 253,743 | 727,904 |
| Summerset Group Holdings Ltd. | | 56,341 | 237,443 |
| Synlait Milk Ltd. (a) | | 12,620 | 76,018 |
| The a2 Milk Co. Ltd. (a) | | 96,948 | 804,897 |
| Z Energy Ltd. | | 41,646 | 143,011 |
|
| TOTAL NEW ZEALAND | | | 7,244,473 |
|
| Norway - 0.5% | | | |
| Adevinta ASA Class B | | 10,734 | 122,559 |
| Akastor ASA (a) | | 1,713 | 1,937 |
| Aker ASA (A Shares) | | 3,330 | 176,926 |
| Aker Bp ASA | | 12,753 | 352,102 |
| Aker Solutions ASA (a) | | 14,785 | 34,004 |
| Austevoll Seafood ASA | | 17,512 | 176,622 |
| B2Holding ASA | | 10,356 | 9,161 |
| Borregaard ASA | | 15,405 | 148,168 |
| Det Norske Oljeselskap ASA (DNO) (A Shares) | | 82,029 | 99,056 |
| DNB ASA | | 131,139 | 2,382,881 |
| Elkem ASA (c) | | 44,366 | 105,172 |
| Entra ASA (c) | | 22,409 | 335,301 |
| Equinor ASA | | 131,776 | 2,437,444 |
| Europris ASA (c) | | 6,082 | 16,494 |
| Evry A/S (c) | | 53,325 | 208,171 |
| Gjensidige Forsikring ASA | | 24,768 | 462,978 |
| Grieg Seafood ASA | | 4,522 | 55,369 |
| Kongsberg Automotive ASA (a) | | 27,567 | 14,359 |
| Kongsberg Gruppen ASA | | 12,021 | 177,515 |
| Leroy Seafood Group ASA | | 37,685 | 252,595 |
| Marine Harvest ASA | | 59,646 | 1,454,156 |
| Merkantildata ASA | | 12,111 | 153,031 |
| NEL ASA (a) | | 190,206 | 164,225 |
| Nordic Nanovector ASA (a) | | 1,041 | 2,339 |
| Nordic VLSI ASA (a) | | 8,476 | 48,250 |
| Norsk Hydro ASA | | 225,058 | 795,256 |
| Norway Royal Salmon ASA | | 138 | 3,259 |
| Norwegian Air Shuttle A/S (a) | | 11,304 | 54,909 |
| Norwegian Finans Holding ASA (a) | | 19,614 | 189,397 |
| Ocean Yield ASA | | 4,258 | 23,799 |
| Orkla ASA | | 97,263 | 934,327 |
| Petroleum Geo-Services ASA (a) | | 14,562 | 24,544 |
| Protector Forsikring ASA (a) | | 1,752 | 8,840 |
| Salmar ASA | | 6,443 | 300,215 |
| Scatec Solar AS (c) | | 7,878 | 87,465 |
| Schibsted ASA (B Shares) | | 10,734 | 299,744 |
| Skandiabanken ASA (c) | | 7,051 | 50,068 |
| SpareBank 1 SR-Bank ASA (primary capital certificate) | | 21,153 | 225,420 |
| Sparebanken Midt-Norge | | 13,816 | 148,734 |
| Sparebanken Nord-Norge | | 9,302 | 72,121 |
| Storebrand ASA (A Shares) | | 57,110 | 403,663 |
| Telenor ASA | | 93,936 | 1,758,462 |
| TGS Nopec Geophysical Co. ASA | | 22,176 | 574,406 |
| Tomra Systems ASA | | 16,119 | 433,993 |
| Veidekke ASA | | 19,046 | 206,591 |
| Wallenius Wilhelmsen ASA | | 3,283 | 7,140 |
| XXL ASA (a)(c) | | 8,237 | 16,929 |
| Yara International ASA | | 23,413 | 911,198 |
|
| TOTAL NORWAY | | | 16,921,295 |
|
| Pakistan - 0.0% | | | |
| Engro Corp. Ltd. | | 19,910 | 37,899 |
| Habib Bank Ltd. | | 43,900 | 36,111 |
| Hub Power Co. Ltd. | | 19,280 | 8,971 |
| MCB Bank Ltd. | | 28,400 | 31,551 |
| National Bank of Pakistan (a) | | 186,000 | 42,653 |
| Oil & Gas Development Co. Ltd. | | 34,300 | 28,395 |
| Pakistan Oilfields Ltd. | | 58,850 | 148,326 |
| Pakistan State Oil Co. Ltd. | | 66,475 | 65,821 |
| United Bank Ltd. | | 39,600 | 35,020 |
|
| TOTAL PAKISTAN | | | 434,747 |
|
| Papua New Guinea - 0.0% | | | |
| Oil Search Ltd. ADR | | 209,835 | 1,035,596 |
| Peru - 0.0% | | | |
| Compania de Minas Buenaventura SA sponsored ADR | | 38,820 | 595,499 |
| Philippines - 0.3% | | | |
| Aboitiz Equity Ventures, Inc. | | 339,360 | 373,289 |
| Aboitiz Power Corp. | | 140,300 | 110,361 |
| Alliance Global Group, Inc. | | 780,700 | 176,294 |
| Altus San Nicolas Corp. (d) | | 2,638 | 269 |
| Ayala Corp. | | 41,545 | 702,924 |
| Ayala Land, Inc. | | 975,400 | 931,477 |
| Bank of the Philippine Islands (BPI) | | 91,244 | 174,200 |
| BDO Unibank, Inc. | | 236,643 | 721,384 |
| Bloomberry Resorts Corp. | | 351,100 | 69,035 |
| Cebu Air, Inc. | | 5,790 | 10,526 |
| Cosco Capital, Inc. | | 9,000 | 1,223 |
| D&L Industries, Inc. | | 313,200 | 52,401 |
| DMCI Holdings, Inc. | | 485,800 | 78,433 |
| DoubleDragon Properties Corp. (a) | | 7,760 | 3,093 |
| Filinvest Land, Inc. | | 24,000 | 756 |
| First Gen Corp. | | 236,200 | 115,303 |
| Globe Telecom, Inc. | | 6,205 | 221,990 |
| GT Capital Holdings, Inc. | | 9,520 | 167,458 |
| International Container Terminal Services, Inc. | | 145,430 | 339,748 |
| JG Summit Holdings, Inc. | | 398,030 | 597,004 |
| Jollibee Food Corp. | | 69,740 | 318,446 |
| Manila Electric Co. | | 22,440 | 149,557 |
| Manila Water Co., Inc. | | 257,300 | 100,126 |
| Megaworld Corp. | | 1,235,000 | 117,392 |
| Metro Pacific Investments Corp. | | 1,211,600 | 114,393 |
| Metropolitan Bank & Trust Co. | | 194,677 | 258,978 |
| Philippine Long Distance Telephone Co. | | 12,335 | 265,260 |
| Robinsons Land Corp. | | 457,956 | 229,360 |
| Security Bank Corp. | | 13,030 | 51,089 |
| SM Investments Corp. | | 31,470 | 637,534 |
| SM Prime Holdings, Inc. | | 1,384,200 | 1,062,070 |
| Universal Robina Corp. | | 135,840 | 403,278 |
| Vista Land & Lifescapes, Inc. | | 754,300 | 113,772 |
|
| TOTAL PHILIPPINES | | | 8,668,423 |
|
| Poland - 0.2% | | | |
| Alior Bank SA (a) | | 9,906 | 69,901 |
| Asseco Poland SA | | 7,520 | 100,971 |
| Bank Millennium SA (a) | | 81,895 | 131,717 |
| Bank Polska Kasa Opieki SA | | 24,266 | 684,667 |
| Bank Zachodni WBK SA | | 5,350 | 438,569 |
| BRE Bank SA (a) | | 1,819 | 181,774 |
| Budimex SA | | 886 | 30,611 |
| CD Projekt RED SA | | 9,001 | 593,918 |
| Ciech SA (a) | | 399 | 3,384 |
| Cyfrowy Polsat SA | | 43,422 | 314,813 |
| Dino Polska SA (a)(c) | | 6,357 | 247,914 |
| ENEA SA (a) | | 14,840 | 32,802 |
| Energa SA (a) | | 14,234 | 22,912 |
| Eurocash SA | | 19,858 | 113,930 |
| Grupa Lotos SA | | 9,926 | 247,848 |
| Jastrzebska Spolka Weglowa SA | | 5,055 | 25,615 |
| KGHM Polska Miedz SA (Bearer) (a) | | 14,855 | 325,199 |
| Kruk SA | | 919 | 34,950 |
| LPP SA | | 227 | 484,521 |
| NG2 SA | | 2,770 | 80,911 |
| PKP Cargo SA | | 2,161 | 13,575 |
| Polish Oil & Gas Co. SA | | 183,762 | 226,249 |
| Polska Grupa Energetyczna SA (a) | | 102,536 | 219,798 |
| Polski Koncern Naftowy Orlen SA | | 39,133 | 1,069,317 |
| Powszechna Kasa Oszczednosci Bank SA | | 111,426 | 1,111,737 |
| Powszechny Zaklad Ubezpieczen SA | | 85,412 | 826,030 |
| Tauron Polska Energia SA (a) | | 68,381 | 29,585 |
| Telekomunikacja Polska SA (a) | | 98,519 | 161,162 |
| Warsaw Stock Exchange | | 1,335 | 13,488 |
| Zaklady Azotowe w Tarnowie-Moscicach SA (a) | | 3,442 | 31,585 |
|
| TOTAL POLAND | | | 7,869,453 |
|
| Portugal - 0.1% | | | |
| Altri SGPS SA | | 5,601 | 34,139 |
| Banco Comercial Portugues SA (Reg.) (b) | | 1,223,822 | 277,081 |
| Corticeira Amorim SGPS SA | | 7,280 | 78,352 |
| CTT Correios de Portugal SA | | 8,784 | 28,058 |
| Energias de Portugal SA | | 322,568 | 1,327,515 |
| Galp Energia SGPS SA Class B | | 68,409 | 1,094,187 |
| Jeronimo Martins SGPS SA | | 30,992 | 520,036 |
| NOS SGPS SA | | 53,834 | 319,719 |
| Portucel Industrial Empresa Produtora de Celulosa SA | | 21,540 | 77,644 |
| REN - Redes Energeticas Nacionais SGPS SA | | 48,268 | 143,197 |
| Semapa | | 19,258 | 264,614 |
| Sonae SGPS SA | | 163,298 | 164,551 |
|
| TOTAL PORTUGAL | | | 4,329,093 |
|
| Qatar - 0.3% | | | |
| Barwa Real Estate Co. (a) | | 282,459 | 265,314 |
| Doha Bank (a) | | 336,482 | 234,733 |
| Gulf International Services QSC (a) | | 222,842 | 103,434 |
| Gulf Warehousing Co. (a) | | 43,390 | 60,777 |
| Industries Qatar QSC (a) | | 208,267 | 601,177 |
| Masraf al Rayan (a) | | 456,005 | 469,656 |
| Medicare Group | | 28,830 | 71,263 |
| Mesaieed Petrochemical Holding Co. (a) | | 571,627 | 392,493 |
| Qatar Aluminum Manufacturing Co. | | 469,550 | 105,749 |
| Qatar Electricity & Water Co. (a) | | 59,250 | 257,113 |
| Qatar Fuel Co. (a) | | 59,080 | 358,601 |
| Qatar Gas Transport Co. Ltd. (Nakilat) (a) | | 349,621 | 237,178 |
| Qatar Insurance Co. SAQ (a) | | 226,220 | 190,743 |
| Qatar Islamic Bank (a) | | 143,625 | 600,377 |
| Qatar National Bank SAQ (a) | | 580,244 | 3,059,787 |
| Qatar National Cement Co. QSC (a) | | 61,766 | 98,391 |
| Qatar Navigation QPSC | | 120,548 | 215,205 |
| Qatar Telecom (Qtel) Q.S.C. (a) | | 114,107 | 228,778 |
| The Commercial Bank of Qatar (a) | | 278,938 | 329,424 |
| United Development Co. (a) | | 335,140 | 128,865 |
| Vodafone Qatar QSC (a) | | 384,242 | 129,804 |
|
| TOTAL QATAR | | | 8,138,862 |
|
| Russia - 0.9% | | | |
| Aeroflot - Russian Airlines | | 63,269 | 105,477 |
| Alrosa Co. Ltd. | | 297,243 | 345,395 |
| Credit Bank of Moscow | | 1,200,400 | 108,054 |
| Detsky Mir PJSC (c) | | 144,430 | 216,006 |
| Gazprom OAO | | 1,395,041 | 5,659,203 |
| Inter Rao Ues JSC | | 6,568,773 | 442,545 |
| Lukoil PJSC | | 50,980 | 4,709,675 |
| M.video PJSC (a) | | 67,830 | 449,996 |
| Magnit OJSC GDR (Reg. S) | | 42,612 | 484,072 |
| Magnitogorsk Iron & Steel Works PJSC | | 183,600 | 104,595 |
| Mechel Steel Group OAO sponsored ADR (a)(b) | | 13,492 | 25,095 |
| MMC Norilsk Nickel PJSC | | 7,826 | 2,183,188 |
| Mobile TeleSystems OJSC sponsored ADR | | 59,415 | 531,764 |
| Moscow Exchange MICEX-RTS OAO (a) | | 209,074 | 309,849 |
| Mosenergo PJSC | | 337,078 | 11,925 |
| NOVATEK OAO GDR (Reg. S) | | 11,775 | 2,519,850 |
| Novolipetsk Steel OJSC | | 154,741 | 301,748 |
| PhosAgro OJSC GDR (Reg. S) | | 17,450 | 219,521 |
| Polyus PJSC | | 3,012 | 350,838 |
| Rosneft Oil Co. OJSC | | 138,416 | 919,571 |
| Rostelecom PJSC | | 132,760 | 162,527 |
| SAFMAR Financial Investments PJSC (a) | | 6,590 | 48,303 |
| Sberbank of Russia | | 1,387,633 | 5,085,552 |
| Severstal PAO | | 27,473 | 377,975 |
| Sistema JSFC sponsored GDR | | 40,315 | 181,982 |
| Surgutneftegas OJSC | | 914,086 | 612,978 |
| Tatneft PAO | | 199,528 | 2,328,151 |
| TMK OAO GDR (Reg. S) | | 2,884 | 9,315 |
| Unipro PJSC | | 2,233,000 | 91,935 |
| VTB Bank OJSC | | 445,337,980 | 299,265 |
|
| TOTAL RUSSIA | | | 29,196,350 |
|
| Saudi Arabia - 0.6% | | | |
| Abdullah Al Othaim Markets Co. | | 9,940 | 183,411 |
| Advanced Polypropylene Co. | | 18,751 | 232,494 |
| Al Rajhi Bank | | 146,280 | 2,355,895 |
| Alinma Bank | | 100,449 | 561,398 |
| Almarai Co. Ltd. | | 30,594 | 407,072 |
| Bank Al-Jazira | | 126,249 | 438,975 |
| Bank Albilad | | 53,084 | 351,034 |
| Banque Saudi Fransi | | 73,123 | 657,079 |
| Bupa Arabia for Cooperative Insurance Co. | | 3,033 | 86,858 |
| Dar Al Arkan Real Estate Development Co. (a) | | 69,549 | 223,281 |
| Emaar The Economic City (a) | | 94,198 | 235,351 |
| Etihad Etisalat Co. (a) | | 40,877 | 244,806 |
| Halwani Bros Co. | | 8,664 | 72,310 |
| Jarir Marketing Co. | | 8,625 | 364,291 |
| Mobile Telecommunications Co. Saudi Arabia (a) | | 51,332 | 165,071 |
| Mouwasat Medical Services Co. | | 8,293 | 181,326 |
| National Commercial Bank | | 147,554 | 1,711,489 |
| National Industrialization Co. (a) | | 61,723 | 201,119 |
| Rabigh Refining & Petrochemical Co. (a) | | 35,972 | 192,795 |
| Riyad Bank | | 152,285 | 901,455 |
| SABIC | | 90,666 | 2,120,206 |
| Sahara International Petrochemical Co. | | 42,037 | 184,275 |
| Samba Financial Group | | 130,675 | 965,175 |
| Saudi Airlines Catering Co. | | 16,080 | 370,882 |
| Saudi Arabian Fertilizers Co. | | 21,124 | 439,907 |
| Saudi Arabian Mining Co. (a) | | 51,422 | 581,365 |
| Saudi Cement Co. | | 9,717 | 177,742 |
| Saudi Dairy & Foodstuffs Co. | | 4,840 | 163,902 |
| Saudi Electricity Co. | | 93,324 | 517,098 |
| Saudi Industrial Investment Group | | 35,384 | 198,889 |
| Saudi Kayan Petrochemical Co. (a) | | 112,061 | 305,379 |
| Saudi Pharmaceutical Industries & Medical Appliances Corp. | | 13,221 | 91,658 |
| Saudi Research & Marketing Group (a) | | 5,604 | 99,220 |
| Saudi Telecom Co. | | 49,505 | 1,264,587 |
| Seera Group Holding | | 39,529 | 192,043 |
| Southern Province Cement Co. | | 9,381 | 135,326 |
| The Co. for Cooperative Insurance (a) | | 11,393 | 214,171 |
| The National Agriculture Development Co. (a) | | 11,238 | 76,262 |
| The Saudi British Bank | | 48,092 | 418,046 |
| The Savola Group (a) | | 38,085 | 313,795 |
| United Electronics Co. | | 7,174 | 136,773 |
| Yamama Cement Co. (a) | | 26,689 | 151,297 |
| Yanbu Cement Co. | | 17,070 | 145,652 |
| Yanbu National Petrochemical Co. | | 29,233 | 388,183 |
|
| TOTAL SAUDI ARABIA | | | 19,419,343 |
|
| Singapore - 0.9% | | | |
| Accordia Golf Trust | | 13,000 | 5,491 |
| Ascendas Hospitality Trust unit | | 11,400 | 9,640 |
| Ascendas Real Estate Investment Trust | | 273,100 | 636,064 |
| Ascott Residence Trust | | 83,171 | 84,294 |
| Best World International Ltd. (d) | | 50,000 | 49,542 |
| BOC Aviation Ltd. Class A (c) | | 19,200 | 180,382 |
| Cache Logistics Trust | | 48,292 | 25,744 |
| CapitaCommercial Trust (REIT) | | 323,389 | 487,019 |
| CapitaLand Ltd. | | 313,200 | 827,858 |
| CapitaMall Trust | | 325,500 | 607,333 |
| CapitaRetail China Trust | | 60,241 | 67,267 |
| CDL Hospitality Trusts unit | | 305,000 | 367,531 |
| City Developments Ltd. | | 69,400 | 549,592 |
| ComfortDelgro Corp. Ltd. | | 278,800 | 470,805 |
| DBS Group Holdings Ltd. | | 231,766 | 4,417,664 |
| ESR (REIT) | | 353,717 | 139,130 |
| Ezion Holdings Ltd. warrants 4/16/23 (a)(d) | | 30,780 | 36 |
| Far East Hospitality Trust unit | | 13,122 | 7,037 |
| First (REIT) | | 8,466 | 6,343 |
| First Resources Ltd. | | 134,300 | 150,806 |
| Frasers Centrepoint Trust | | 118,565 | 239,607 |
| Frasers Commercial Trust | | 103,524 | 124,782 |
| Frasers Logistics & Industrial Trust | | 138,820 | 128,475 |
| Genting Singapore Ltd. | | 730,900 | 504,258 |
| Hutchison Port Holdings Trust | | 671,800 | 104,063 |
| Jardine Cycle & Carriage Ltd. | | 14,200 | 341,399 |
| K-REIT Asia | | 269,294 | 239,380 |
| Keppel Corp. Ltd. | | 168,900 | 850,477 |
| Keppel DC (REIT) | | 197,574 | 290,194 |
| Keppel Infrastructure Trust | | 1,049,843 | 413,141 |
| Lippo Malls Indonesia Retail Trust | | 147,100 | 25,846 |
| Macquarie MEAG Prime (REIT) | | 158,200 | 85,965 |
| Manulife U.S. REIT | | 233,649 | 212,934 |
| Mapletree Commercial Trust | | 222,423 | 380,718 |
| Mapletree Commercial Trust rights 11/7/19 (a) | | 15,792 | 1,045 |
| Mapletree Greater China Commercial Trust | | 234,200 | 220,163 |
| Mapletree Industrial (REIT) | | 179,891 | 336,966 |
| Mapletree Logistics Trust (REIT) | | 330,388 | 407,800 |
| NetLink NBN Trust | | 555,869 | 379,760 |
| OUE Commercial (REIT) | | 603,085 | 239,280 |
| Oue Ltd. | | 6,100 | 6,497 |
| Oversea-Chinese Banking Corp. Ltd. | | 401,485 | 3,227,622 |
| Parkway Life REIT | | 73,500 | 176,623 |
| Raffles Medical Group Ltd. | | 67,772 | 50,316 |
| Sembcorp Industries Ltd. | | 100,700 | 169,064 |
| Sembcorp Marine Ltd. (a) | | 419,800 | 421,841 |
| Sheng Siong Group Ltd. | | 313,400 | 269,385 |
| SIA Engineering Co. Ltd. | | 118,400 | 232,145 |
| SIIC Environment Holdings Ltd. | | 4,900 | 812 |
| Singapore Airlines Ltd. | | 99,700 | 689,103 |
| Singapore Airport Terminal Service Ltd. | | 86,900 | 322,266 |
| Singapore Exchange Ltd. | | 89,200 | 585,646 |
| Singapore Post Ltd. | | 520,100 | 366,701 |
| Singapore Press Holdings Ltd. | | 177,700 | 289,188 |
| Singapore Technologies Engineering Ltd. | | 181,900 | 532,848 |
| Singapore Telecommunications Ltd. | | 1,080,600 | 2,616,734 |
| SPH REIT | | 219,300 | 183,029 |
| StarHub Ltd. | | 59,300 | 56,664 |
| Suntec (REIT) | | 257,300 | 351,500 |
| United Engineers Ltd. | | 15,800 | 30,787 |
| United Overseas Bank Ltd. | | 157,814 | 3,106,954 |
| UOL Group Ltd. | | 87,531 | 501,192 |
| Venture Corp. Ltd. | | 31,200 | 361,908 |
| Wilmar International Ltd. | | 274,200 | 753,908 |
| Wing Tai Holdings Ltd. | | 6,800 | 10,141 |
| Yangzijiang Shipbuilding Holdings Ltd. | | 294,800 | 206,386 |
| Yanlord Land Group Ltd. | | 140,900 | 125,058 |
| Yoma Strategic Holdings Ltd. (a) | | 99,600 | 22,993 |
|
| TOTAL SINGAPORE | | | 30,283,142 |
|
| South Africa - 1.2% | | | |
| Advtech Ltd. | | 4,172 | 3,106 |
| Aeci Ltd. | | 3,629 | 23,452 |
| African Rainbow Minerals Ltd. | | 10,346 | 103,525 |
| Alexander Forbes Group Holdings Ltd. | | 5,905 | 2,020 |
| Anglo American Platinum Ltd. | | 6,622 | 494,193 |
| AngloGold Ashanti Ltd. | | 54,527 | 1,206,045 |
| Aspen Pharmacare Holdings Ltd. | | 52,102 | 363,771 |
| Astral Foods Ltd. | | 2,806 | 29,951 |
| Attacq Ltd. | | 33,527 | 29,088 |
| AVI Ltd. | | 45,897 | 263,102 |
| Barclays Africa Group Ltd. | | 97,159 | 995,863 |
| Barloworld Ltd. | | 42,624 | 340,247 |
| Bidcorp Ltd. | | 43,170 | 1,007,105 |
| Bidvest Group Ltd. | | 32,822 | 447,590 |
| Blue Label Telecoms Ltd. (a) | | 2,242 | 411 |
| Capitec Bank Holdings Ltd. | | 6,170 | 560,623 |
| Cashbuild Ltd. | | 1,224 | 17,821 |
| City Lodge Hotels Ltd. | | 140 | 740 |
| Clicks Group Ltd. | | 40,260 | 654,849 |
| Coronation Fund Managers Ltd. | | 6,216 | 17,512 |
| Curro Holdings Ltd. | | 7,456 | 8,995 |
| DataTec Ltd. | | 7,047 | 16,747 |
| Dis-Chem Pharmacies Pty Ltd. (c) | | 10,513 | 16,614 |
| Discovery Ltd. | | 59,357 | 472,405 |
| Emira Property Fund Ltd. | | 40,873 | 34,326 |
| EOH Holdings Ltd. (a) | | 4,397 | 4,522 |
| Equites Property Fund Ltd. | | 84,729 | 117,977 |
| Exxaro Resources Ltd. | | 33,546 | 273,754 |
| Famous Brands Ltd. | | 6,133 | 31,983 |
| FirstRand Ltd. | | 426,656 | 1,843,793 |
| Fortress (REIT) Ltd. Class A | | 262,030 | 364,333 |
| Foschini Ltd. | | 43,080 | 496,074 |
| Gold Fields Ltd. | | 106,562 | 661,791 |
| Grindrod Ltd. | | 13,572 | 4,347 |
| Growthpoint Properties Ltd. | | 424,134 | 620,602 |
| Harmony Gold Mining Co. Ltd. (a) | | 67,411 | 233,276 |
| Hosken Consolidated Investment Ltd. | | 537 | 3,198 |
| Hyprop Investments Ltd. | | 54,426 | 212,510 |
| Impala Platinum Holdings Ltd. (a) | | 87,745 | 603,045 |
| Imperial Holdings Ltd. | | 12,136 | 45,539 |
| Investec Ltd. | | 47,143 | 268,060 |
| JSE Ltd. | | 2,784 | 23,952 |
| KAP Industrial Holdings Ltd. | | 368,967 | 113,543 |
| Kumba Iron Ore Ltd. | | 8,457 | 205,950 |
| Liberty Holdings Ltd. | | 7,641 | 58,845 |
| Life Healthcare Group Holdings Ltd. | | 236,993 | 374,220 |
| Massmart Holdings Ltd. | | 5,344 | 15,172 |
| MMI Holdings Ltd. | | 177,689 | 237,538 |
| Motus Holdings Ltd. | | 12,136 | 57,570 |
| Mr Price Group Ltd. | | 31,427 | 332,354 |
| MTN Group Ltd. | | 231,359 | 1,432,970 |
| MultiChoice Group Ltd. (a) | | 62,139 | 518,274 |
| Murray & Roberts Holdings Ltd. | | 6,685 | 4,959 |
| Nampak Ltd. (a) | | 133,153 | 70,760 |
| Naspers Ltd. Class N | | 57,512 | 8,138,444 |
| Nedbank Group Ltd. | | 43,300 | 656,728 |
| Netcare Ltd. | | 129,762 | 146,933 |
| Northam Platinum Ltd. (a) | | 45,859 | 309,561 |
| Oceana Group Ltd. | | 6,380 | 28,285 |
| Old Mutual Ltd. | | 633,556 | 823,889 |
| Omnia Holdings Ltd. | | 32,703 | 56,054 |
| Peregrine Holdings Ltd. | | 1,032 | 1,270 |
| Pick 'n Pay Stores Ltd. | | 86,335 | 377,667 |
| Pioneer Foods Ltd. | | 15,497 | 110,465 |
| Pretoria Portland Cement Co. Ltd. (a) | | 181,818 | 46,325 |
| PSG Group Ltd. | | 19,801 | 309,454 |
| Rand Merchant Insurance Holdings Ltd. | | 111,637 | 220,607 |
| Redefine Properties Ltd. | | 643,220 | 320,961 |
| Remgro Ltd. | | 96,209 | 1,103,215 |
| Resilient Property Income Fund Ltd. | | 58,565 | 260,918 |
| Reunert Ltd. | | 33,657 | 159,125 |
| RMB Holdings Ltd. | | 96,643 | 508,270 |
| SA Corporate Real Estate Fund | | 131,416 | 26,874 |
| Sanlam Ltd. | | 236,518 | 1,245,474 |
| Sappi Ltd. | | 105,360 | 270,538 |
| Sasol Ltd. | | 76,919 | 1,394,440 |
| Shoprite Holdings Ltd. | | 61,583 | 551,865 |
| Sibanye-Stillwater (a) | | 299,612 | 578,460 |
| Spar Group Ltd. | | 22,842 | 306,913 |
| Standard Bank Group Ltd. | | 165,320 | 1,897,890 |
| Sun International Ltd. (a) | | 7,633 | 20,625 |
| Super Group Ltd. (a) | | 46,976 | 87,793 |
| Telkom SA Ltd. | | 31,256 | 143,016 |
| Tiger Brands Ltd. | | 19,225 | 273,047 |
| Tongaat Hulett Ltd. (a)(d) | | 13,023 | 11,385 |
| Truworths International Ltd. | | 66,549 | 235,931 |
| Tsogo Sun Gaming Ltd. | | 16,839 | 13,852 |
| Tsogo Sun Hotels Ltd. (a) | | 16,839 | 4,079 |
| Vodacom Group Ltd. | | 85,258 | 743,937 |
| Vukile Property Fund Ltd. | | 82,348 | 105,398 |
| Wilson Bayly Holmes-Ovcon Ltd. | | 9,618 | 89,863 |
| Woolworths Holdings Ltd. | | 127,352 | 484,528 |
| Zeder Investments Ltd. | | 90,708 | 29,415 |
|
| TOTAL SOUTH AFRICA | | | 38,434,506 |
|
| Spain - 1.9% | | | |
| Acerinox SA | | 21,073 | 196,906 |
| ACS Actividades de Construccion y Servicios SA | | 37,669 | 1,528,539 |
| Aedas Homes SAU (a)(c) | | 6,214 | 143,461 |
| Aena Sme SA (c) | | 7,833 | 1,437,096 |
| Almirall SA | | 4,515 | 84,698 |
| Amadeus IT Holding SA Class A | | 57,113 | 4,225,734 |
| Applus Services SA | | 20,854 | 251,424 |
| Atresmedia Corporacion de Medios de Comunicacion SA | | 7,971 | 33,320 |
| Azucarera Ebro Agricolas SA | | 7,600 | 166,813 |
| Banco Bilbao Vizcaya Argentaria SA | | 871,867 | 4,591,977 |
| Banco de Sabadell SA | | 742,510 | 814,706 |
| Banco Santander SA (Spain) | | 2,192,562 | 8,788,640 |
| Bankia SA | | 289,565 | 551,602 |
| Bankinter SA | | 111,510 | 771,076 |
| Bolsas Y Mercados Espanoles | | 10,015 | 277,679 |
| CaixaBank SA | | 476,123 | 1,365,330 |
| Catalana Occidente SA | | 9,751 | 341,484 |
| Cellnex Telecom SA (c) | | 25,369 | 1,093,848 |
| Cellnex Telecom SA (a) | | 7,362 | 317,431 |
| Cemex Latam Holdings SA (a) | | 16,652 | 22,416 |
| Cie Automotive SA | | 8,793 | 218,889 |
| Compania de Distribucion Integral Logista Holdings SA | | 4,137 | 86,697 |
| Construcciones y Auxiliar de Ferrocarriles | | 2,258 | 101,363 |
| Corporacion Financiera Alba SA | | 954 | 47,614 |
| Enagas SA | | 34,671 | 858,055 |
| Ence Energia y Celulosa SA (b) | | 27,851 | 109,650 |
| Endesa SA | | 38,809 | 1,056,122 |
| Euskaltel, S.A. (c) | | 11,343 | 105,508 |
| Faes Farma SA | | 21,909 | 125,841 |
| Ferrovial SA | | 61,707 | 1,821,025 |
| Fluidra SA (a) | | 5,840 | 72,950 |
| Fomento Construcciones y Contratas SA (FOCSA) | | 12,411 | 150,324 |
| Gas Natural SDG SA | | 37,037 | 1,008,313 |
| Gestamp Automocion SA (c) | | 60,821 | 260,753 |
| Global Dominion Access SA (a)(c) | | 14,952 | 62,702 |
| Grifols SA | | 41,530 | 1,337,676 |
| Grupo Acciona SA | | 3,159 | 329,246 |
| Iberdrola SA | | 773,225 | 7,947,978 |
| Inditex SA | | 140,286 | 4,373,084 |
| Indra Sistemas SA (a) | | 19,780 | 191,045 |
| Inmobiliaria Colonial SA | | 28,770 | 371,570 |
| Lar Espana Real Estate Socimi SA | | 11,103 | 100,551 |
| Liberbank SA | | 155,645 | 49,751 |
| MAPFRE SA (Reg.) | | 118,858 | 331,406 |
| Masmovil Ibercom SA (a) | | 12,080 | 279,157 |
| Mediaset Espana Comunicacion SA | | 29,134 | 178,062 |
| Melia Hotels International SA | | 24,939 | 203,185 |
| Merlin Properties Socimi SA | | 40,742 | 599,802 |
| Metrovacesa SA (c) | | 6,030 | 56,896 |
| Miquel y Costas & Miquel SA | | 842 | 14,143 |
| Neinor Homes SLU (a)(c) | | 15,573 | 204,949 |
| Obrascon Huarte Lain SA (a) | | 18,317 | 21,042 |
| Prosegur Cash SA (c) | | 60,922 | 95,125 |
| Prosegur Compania de Seguridad SA (Reg.) | | 42,228 | 163,897 |
| Red Electrica Corporacion SA | | 58,558 | 1,176,872 |
| Repsol SA | | 185,342 | 3,054,384 |
| Sacyr SA | | 56,445 | 160,530 |
| Siemens Gamesa Renewable Energy SA | | 32,848 | 451,531 |
| Talgo SA (a)(c) | | 5,549 | 34,657 |
| Tecnicas Reunidas SA (a) | | 6,816 | 171,346 |
| Telefonica SA | | 610,300 | 4,686,667 |
| Tubacex SA | | 2,062 | 6,117 |
| Unicaja Banco SA (c) | | 58,447 | 52,898 |
| Viscofan Envolturas Celulosicas SA | | 3,887 | 210,603 |
| Zardoya Otis SA | | 18,427 | 139,546 |
|
| TOTAL SPAIN | | | 60,083,702 |
|
| Sweden - 1.9% | | | |
| AarhusKarlshamn AB | | 20,931 | 370,899 |
| AcadeMedia AB (c) | | 27,075 | 136,978 |
| AF Poyry AB (B Shares) | | 18,348 | 389,926 |
| Alfa Laval AB | | 41,345 | 955,298 |
| Alimak Group AB (c) | | 5,181 | 68,252 |
| Arjo AB | | 49,871 | 205,358 |
| ASSA ABLOY AB (B Shares) | | 130,071 | 3,088,975 |
| Atlas Copco AB: | | | |
| (A Shares) | | 92,687 | 3,274,287 |
| (B Shares) | | 43,115 | 1,335,553 |
| Attendo AB (c) | | 7,307 | 37,278 |
| Avanza Bank Holding AB | | 13,885 | 118,348 |
| Axfood AB | | 15,862 | 341,366 |
| Betsson AB (B Shares) | | 11,155 | 54,933 |
| Bilia AB (A Shares) | | 6,304 | 63,199 |
| Billerud AB (b) | | 26,452 | 317,511 |
| BioGaia AB | | 893 | 33,988 |
| Biotage AB Class A | | 4,743 | 48,925 |
| Boliden AB | | 38,814 | 1,043,742 |
| Bonava AB | | 7,577 | 72,979 |
| Bravida AB (c) | | 27,164 | 249,958 |
| Bure Equity AB | | 10,427 | 160,902 |
| Castellum AB | | 41,041 | 838,400 |
| Cellavision AB | | 3,789 | 108,109 |
| Clas Ohlson AB (B Shares) | | 2,193 | 21,088 |
| Cloetta AB | | 13,927 | 47,252 |
| D. Carnegie & Co. AB (a) | | 5,533 | 123,201 |
| Dios Fastigheter AB | | 5,457 | 45,439 |
| Dometic Group AB (c) | | 47,501 | 440,096 |
| Dustin Group AB (c) | | 1,921 | 15,299 |
| Electrolux AB (B Shares) | | 25,573 | 671,392 |
| Elekta AB (B Shares) | | 46,800 | 651,905 |
| Eltel AB (a)(c) | | 3,974 | 8,561 |
| Epiroc AB: | | | |
| Class A | | 67,945 | 764,194 |
| Class B | | 69,283 | 753,411 |
| Ericsson (B Shares) | | 402,004 | 3,513,029 |
| Essity AB Class B | | 76,959 | 2,401,457 |
| Evolution Gaming Group AB (c) | | 14,126 | 337,215 |
| Fabege AB | | 35,764 | 533,365 |
| Fastighets AB Balder (a) | | 14,045 | 544,013 |
| Fingerprint Cards AB (a)(b) | | 58,221 | 108,143 |
| Fortnox AB | | 10,313 | 184,777 |
| Getinge AB (B Shares) | | 33,875 | 577,815 |
| Granges AB | | 3,812 | 37,032 |
| H&M Hennes & Mauritz AB (B Shares) | | 104,137 | 2,175,880 |
| Haldex AB | | 927 | 4,666 |
| Hansa Medical AB (a) | | 1,570 | 20,894 |
| Hemfosa Fastigheter AB | | 28,852 | 297,165 |
| Hexagon AB (B Shares) | | 35,140 | 1,793,812 |
| HEXPOL AB (B Shares) | | 29,846 | 265,828 |
| Hoist Finance AB (a)(c) | | 6,041 | 33,065 |
| Holmen AB (B Shares) | | 13,450 | 396,436 |
| Hufvudstaden AB Series A | | 16,525 | 276,395 |
| Husqvarna AB (B Shares) | | 62,957 | 481,581 |
| ICA Gruppen AB | | 10,988 | 485,918 |
| Industrivarden AB (C Shares) | | 14,791 | 320,002 |
| Indutrade AB | | 11,324 | 348,550 |
| Intrum Justitia AB | | 10,271 | 276,568 |
| Investment AB Oresund | | 5,819 | 76,657 |
| Investor AB (B Shares) | | 52,368 | 2,681,937 |
| Inwido AB | | 1,240 | 8,251 |
| JM AB (B Shares) (b) | | 10,617 | 271,591 |
| Karo Bio AB (a) | | 16,144 | 68,952 |
| Kinnevik AB (B Shares) | | 35,010 | 956,859 |
| Klovern AB (B Shares) | | 27,231 | 47,549 |
| Kungsleden AB | | 31,054 | 282,055 |
| LeoVegas AB (c) | | 1,894 | 6,650 |
| Lifco AB | | 6,287 | 313,318 |
| Lindab International AB | | 12,535 | 139,946 |
| Loomis AB (B Shares) | | 8,494 | 328,123 |
| Lundbergfoeretagen AB | | 12,056 | 453,737 |
| Lundin Petroleum AB | | 27,947 | 922,720 |
| Mekonomen AB (a) | | 3,273 | 27,863 |
| Modern Times Group MTG AB (B Shares) (a) | | 8,438 | 78,230 |
| Mycronic AB (b) | | 12,357 | 205,402 |
| NCC AB Series B | | 7,552 | 121,308 |
| NetEnt AB | | 13,480 | 38,113 |
| New Wave Group AB (B Shares) | | 582 | 3,381 |
| Nibe Industrier AB (B Shares) | | 36,906 | 504,530 |
| Nobia AB | | 5,154 | 32,881 |
| Nobina AB (c) | | 11,963 | 75,762 |
| Nolato AB Series B | | 4,032 | 225,492 |
| Nordic Entertainment Group AB Class B | | 8,438 | 239,445 |
| Nordnet AB Class B (a)(d) | | 492 | 0 |
| Nyfosa AB (a) | | 32,013 | 213,847 |
| Pandox AB | | 9,325 | 186,390 |
| Paradox Interactive AB | | 3,211 | 43,697 |
| Peab AB | | 27,341 | 230,208 |
| Probi AB (a) | | 251 | 6,889 |
| Ratos AB (B Shares) | | 20,802 | 53,601 |
| RaySearch Laboratories AB (a) | | 4,705 | 75,382 |
| Recipharm AB | | 2,999 | 42,645 |
| Resurs Holding AB (c) | | 24,498 | 144,110 |
| Saab AB (B Shares) | | 15,083 | 465,032 |
| Sandvik AB | | 147,327 | 2,599,206 |
| SAS AB (a) | | 22,547 | 35,213 |
| Scandic Hotels Group AB (c) | | 5,491 | 52,745 |
| Securitas AB (B Shares) | | 41,464 | 663,032 |
| Skandinaviska Enskilda Banken AB (A Shares) | | 204,678 | 1,961,205 |
| Skanska AB (B Shares) | | 44,195 | 940,592 |
| SKF AB (B Shares) | | 58,786 | 1,062,698 |
| SkiStar AB | | 1,558 | 18,685 |
| SSAB Svenskt Stal AB: | | | |
| (A Shares) | | 69,911 | 195,128 |
| (B Shares) | | 42,341 | 106,382 |
| Stillfront Group AB (a) | | 4,043 | 103,632 |
| Svenska Cellulosa AB (SCA) (B Shares) | | 87,665 | 893,020 |
| Svenska Handelsbanken AB (A Shares) | | 194,312 | 1,950,079 |
| Sweco AB (B Shares) | | 9,232 | 324,698 |
| Swedbank AB (A Shares) | | 119,333 | 1,669,058 |
| Swedish Match Co. AB | | 21,463 | 1,007,388 |
| Swedish Orphan Biovitrum AB (a) | | 28,924 | 458,018 |
| Tele2 AB (B Shares) | | 62,409 | 892,277 |
| Telia Co. AB | | 340,111 | 1,495,253 |
| THQ Nordic AB (a) | | 24,321 | 164,983 |
| Thule Group AB (c) | | 20,874 | 424,368 |
| Tobii AB (a) | | 2,177 | 8,238 |
| Trelleborg AB (B Shares) | | 43,426 | 701,377 |
| Vitrolife AB | | 6,709 | 104,640 |
| Volvo AB (B Shares) | | 190,841 | 2,854,008 |
| Wallenstam AB (B Shares) | | 23,831 | 260,876 |
| Wihlborgs Fastigheter AB | | 17,067 | 257,887 |
|
| TOTAL SWEDEN | | | 63,047,847 |
|
| Switzerland - 5.8% | | | |
| ABB Ltd. (Reg.) | | 241,362 | 5,068,599 |
| Adecco SA (Reg.) | | 21,132 | 1,252,711 |
| AFG Arbonia-Forster-Holding AG | | 7,452 | 93,216 |
| Alcon, Inc. (Switzerland) (a) | | 53,791 | 3,176,750 |
| Allreal Holding AG | | 1,268 | 247,045 |
| ALSO Holding AG | | 1,515 | 225,446 |
| APG SGA SA | | 197 | 58,112 |
| Aryzta AG (a) | | 94,558 | 74,515 |
| Ascom Holding AG (Reg.) | | 12,241 | 121,231 |
| Autoneum Holding AG | | 113 | 12,657 |
| Bachem Holding AG (B Shares) | | 167 | 25,461 |
| Baloise Holdings AG | | 6,798 | 1,255,545 |
| Banque Cantonale Vaudoise | | 351 | 275,036 |
| Barry Callebaut AG | | 237 | 499,706 |
| Basilea Pharmaceutica AG (a)(b) | | 3,631 | 149,068 |
| Bell AG | | 352 | 96,697 |
| BKW AG | | 3,722 | 274,670 |
| Bobst Group SA | | 1,729 | 90,700 |
| Bossard Holding AG | | 776 | 123,106 |
| Bucher Industries AG | | 2,017 | 622,786 |
| Burckhardt Compression Holding AG | | 468 | 111,485 |
| Burkhalter Holding AG | | 381 | 30,125 |
| Cembra Money Bank AG | | 7,210 | 763,025 |
| Clariant AG (Reg.) | | 23,985 | 491,370 |
| Coca-Cola HBC AG | | 24,320 | 740,318 |
| Comet Holding AG | | 480 | 47,976 |
| Compagnie Financiere Richemont SA Series A | | 68,377 | 5,373,145 |
| Credit Suisse Group AG | | 328,950 | 4,071,702 |
| Daetwyler Holdings AG | | 793 | 136,494 |
| DKSH Holding AG | | 4,485 | 212,861 |
| Dufry AG | | 6,218 | 539,419 |
| EFG International | | 3,288 | 20,731 |
| Emmi AG | | 246 | 208,221 |
| Ems-Chemie Holding AG | | 1,104 | 690,490 |
| Flughafen Zuerich AG | | 2,743 | 494,101 |
| Forbo Holding AG (Reg.) | | 221 | 351,718 |
| Galenica AG | | 5,841 | 918,041 |
| Galenica Sante Ltd. (c) | | 6,916 | 413,277 |
| GAM Holding Ltd. (a) | | 10,183 | 33,940 |
| Geberit AG (Reg.) | | 4,679 | 2,374,361 |
| Georg Fischer AG (Reg.) | | 521 | 496,442 |
| Givaudan SA | | 1,197 | 3,515,164 |
| Helvetia Holding AG (Reg.) | | 3,840 | 538,729 |
| Huber+Suhner AG | | 2,524 | 167,840 |
| Idorsia Ltd. (a)(b) | | 21,065 | 478,740 |
| Implenia AG | | 604 | 22,935 |
| INFICON Holding AG | | 332 | 237,936 |
| Interroll Holding AG | | 106 | 219,199 |
| Intershop Holding AG | | 12 | 6,593 |
| Julius Baer Group Ltd. | | 31,138 | 1,378,904 |
| Kaba Holding AG (B Shares) (Reg.) | | 396 | 253,496 |
| Kardex AG | | 862 | 125,128 |
| Komax Holding AG (Reg.) (b) | | 349 | 74,151 |
| Kudelski SA (Bearer) | | 453 | 2,631 |
| Kuehne & Nagel International AG | | 6,601 | 1,066,264 |
| Lafargeholcim Ltd. (Reg.) | | 64,686 | 3,336,263 |
| Landis+Gyr Group AG | | 3,472 | 321,860 |
| LEM Holding SA | | 112 | 132,379 |
| Leonteq AG (a) | | 538 | 17,179 |
| Lindt & Spruengli AG | | 9 | 737,152 |
| Lindt & Spruengli AG (participation certificate) | | 196 | 1,456,341 |
| Logitech International SA (Reg.) | | 20,314 | 831,093 |
| Lonza Group AG | | 9,724 | 3,499,260 |
| Meyer Burger Technology AG (a) | | 17,793 | 7,492 |
| Mobimo Holding AG | | 983 | 277,014 |
| Nestle SA (Reg. S) | | 400,741 | 42,871,778 |
| Novartis AG | | 280,885 | 24,542,404 |
| OC Oerlikon Corp. AG (Reg.) | | 29,540 | 302,437 |
| Orior AG | | 98 | 8,613 |
| Pargesa Holding SA | | 5,844 | 461,478 |
| Partners Group Holding AG | | 2,352 | 1,833,916 |
| PSP Swiss Property AG | | 4,714 | 623,596 |
| Rieter Holding AG (Reg.) | | 147 | 20,012 |
| Roche Holding AG (participation certificate) | | 91,453 | 27,523,327 |
| Schindler Holding AG: | | | |
| (participation certificate) | | 3,887 | 950,374 |
| (Reg.) | | 3,814 | 901,596 |
| Schmolz & Bickenbach AG (a) | | 6,294 | 1,668 |
| Schweiter Technologies AG | | 130 | 133,624 |
| SFS Group AG | | 2,795 | 247,201 |
| SGS SA (Reg.) | | 736 | 1,915,913 |
| Siegfried Holding AG | | 769 | 312,979 |
| Sig Combibloc Group AG | | 21,140 | 292,296 |
| Sika AG | | 16,971 | 2,915,950 |
| Sonova Holding AG Class B | | 7,153 | 1,638,700 |
| St.Galler Kantonalbank AG | | 589 | 257,632 |
| Straumann Holding AG | | 1,339 | 1,194,174 |
| Sulzer AG (Reg.) | | 2,888 | 291,581 |
| Sunrise Communications Group AG (b)(c) | | 4,439 | 344,906 |
| Swatch Group AG (Bearer) | | 3,705 | 1,025,307 |
| Swatch Group AG (Bearer) (Reg.) | | 10,217 | 547,358 |
| Swiss Life Holding AG | | 4,337 | 2,168,280 |
| Swiss Prime Site AG | | 8,804 | 906,727 |
| Swiss Re Ltd. | | 39,535 | 4,139,854 |
| Swisscom AG | | 3,179 | 1,624,142 |
| Tecan Group AG | | 2,684 | 634,474 |
| Temenos Group AG | | 8,812 | 1,257,262 |
| u-blox Holding AG | | 486 | 39,314 |
| UBS Group AG | | 500,180 | 5,901,769 |
| Valiant Holding AG | | 1,501 | 152,154 |
| Valora Holding AG | | 825 | 235,834 |
| VAT Group AG (c) | | 3,425 | 502,206 |
| Vetropack Holding AG | | 57 | 154,562 |
| Vontobel Holdings AG | | 8,714 | 507,028 |
| VZ Holding AG | | 1,004 | 279,878 |
| Ypsomed Holding AG | | 367 | 54,315 |
| Zehnder Group AG | | 53 | 2,310 |
| Zur Rose Group AG (a) | | 867 | 85,777 |
| Zurich Insurance Group Ltd. | | 19,502 | 7,620,903 |
| ZZ Holding AG | | 120 | 104,491 |
|
| TOTAL SWITZERLAND | | | 188,496,142 |
|
| Taiwan - 3.2% | | | |
| A-DATA Technology Co. Ltd. | | 1,000 | 1,659 |
| Accton Technology Corp. | | 86,000 | 511,804 |
| Acer, Inc. | | 449,000 | 262,057 |
| Advanced Ceramic X Corp. | | 1,000 | 8,263 |
| Advantech Co. Ltd. | | 47,499 | 469,570 |
| AmTRAN Technology Co. Ltd. (a) | | 4,000 | 1,443 |
| ASE Technology Holding Co. Ltd. | | 518,718 | 1,343,242 |
| Asia Cement Corp. | | 279,000 | 393,827 |
| Asia Optical Co., Inc. | | 6,000 | 16,526 |
| Asia Pacific Telecom Co. Ltd. (a) | | 262,000 | 51,544 |
| ASMedia Technology, Inc. | | 6,000 | 96,400 |
| ASPEED Tech, Inc. | | 4,000 | 104,663 |
| ASUSTeK Computer, Inc. | | 122,000 | 826,054 |
| AU Optronics Corp. | | 1,138,000 | 289,598 |
| Bank of Kaohsiung Co. Ltd. | | 831,867 | 261,578 |
| Brighton-Best International Taiwan, Inc. | | 165,000 | 173,126 |
| Capital Securities Corp. | | 7,490 | 2,259 |
| Catcher Technology Co. Ltd. | | 92,000 | 778,281 |
| Cathay Financial Holding Co. Ltd. | | 1,024,000 | 1,353,112 |
| Cathay Financial Holding Co. Ltd. rights 11/25/19 (a) | | 35,216 | 6,120 |
| Center Laboratories, Inc. | | 96,594 | 211,254 |
| Chang Hwa Commercial Bank | | 917,181 | 714,245 |
| Cheng Loong Corp. | | 28,000 | 16,663 |
| Cheng Shin Rubber Industry Co. Ltd. | | 267,000 | 418,911 |
| Cheng Uei Precision Industries Co. Ltd. | | 3,000 | 4,495 |
| Chicony Electronics Co. Ltd. | | 130,125 | 404,054 |
| Chilisin Electronics Corp. | | 9,958 | 28,080 |
| Chin-Poon Industrial Co. Ltd. | | 6,000 | 6,069 |
| China Airlines Ltd. | | 177,000 | 52,581 |
| China Bills Finance Corp. | | 4,000 | 1,954 |
| China Development Finance Holding Corp. | | 1,655,000 | 515,526 |
| China Life Insurance Co. Ltd. (a) | | 397,269 | 326,954 |
| China Motor Co. Ltd. | | 50,800 | 68,959 |
| China Petrochemical Development Corp. | | 217,350 | 72,336 |
| China Steel Chemical Corp. | | 37,000 | 153,469 |
| China Steel Corp. | | 1,467,000 | 1,127,981 |
| China Synthetic Rubber Corp. | | 227,579 | 244,384 |
| Chinatrust Financial Holding Co. Ltd. | | 2,502,960 | 1,739,876 |
| Chipbond Technology Corp. | | 99,000 | 196,065 |
| Chroma ATE, Inc. | | 40,000 | 200,013 |
| Chunghwa Precision Test Tech Co. Ltd. | | 4,000 | 128,271 |
| Chunghwa Telecom Co. Ltd. | | 492,000 | 1,806,807 |
| Clevo Co. Ltd. | | 2,000 | 2,417 |
| Compal Electronics, Inc. | | 597,000 | 356,266 |
| Compeq Manufacturing Co. Ltd. | | 198,000 | 277,543 |
| Coretronic Corp. | | 14,000 | 18,086 |
| CTCI Corp. | | 58,000 | 77,782 |
| Cub Elecparts, Inc. | | 2,606 | 21,789 |
| Delta Electronics, Inc. | | 251,000 | 1,102,826 |
| E Ink Holdings, Inc. | | 57,000 | 55,976 |
| E.SUN Financial Holdings Co. Ltd. | | 1,444,189 | 1,304,591 |
| ECLAT Textile Co. Ltd. | | 32,060 | 430,473 |
| Elan Microelectronics Corp. | | 31,500 | 97,398 |
| Elite Material Co. Ltd. | | 34,000 | 142,140 |
| eMemory Technology, Inc. | | 6,000 | 66,398 |
| Ennoconn Corp. | | 1,062 | 7,957 |
| EPISTAR Corp. | | 118,000 | 114,526 |
| Eternal Materials Co. Ltd. | | 311,291 | 264,360 |
| EVA Airways Corp. | | 389,040 | 181,777 |
| Evergreen Marine Corp. (Taiwan) (a) | | 564,840 | 231,507 |
| Everlight Electronics Co. Ltd. | | 11,000 | 10,081 |
| Far Eastern Department Stores Co. Ltd. | | 172,000 | 147,479 |
| Far Eastern International Bank | | 55,092 | 21,587 |
| Far Eastern Textile Ltd. | | 586,000 | 568,745 |
| Far EasTone Telecommunications Co. Ltd. | | 271,000 | 648,665 |
| Farglory Land Development Co. Ltd. | | 10,000 | 12,689 |
| Feng Hsin Iron & Steel Co. | | 114,000 | 196,990 |
| Feng Tay Enterprise Co. Ltd. | | 48,132 | 325,110 |
| Firich Enterprise Co. Ltd. | | 1,060 | 1,312 |
| First Financial Holding Co. Ltd. | | 1,533,664 | 1,123,923 |
| FLEXium Interconnect, Inc. | | 20,940 | 75,526 |
| Formosa Chemicals & Fibre Corp. | | 490,000 | 1,423,503 |
| Formosa Petrochemical Corp. | | 175,000 | 556,020 |
| Formosa Plastics Corp. | | 612,000 | 1,962,542 |
| Formosa Taffeta Co. Ltd. | | 92,000 | 104,525 |
| Foxconn Technology Co. Ltd. | | 192,010 | 410,488 |
| Fubon Financial Holding Co. Ltd. | | 900,000 | 1,314,676 |
| Fusheng Precision Co. Ltd. | | 48,000 | 280,150 |
| Genius Electronic Optical Co. Ltd. | | 10,000 | 144,272 |
| Getac Technology Corp. | | 85,000 | 139,353 |
| Giant Manufacturing Co. Ltd. | | 43,000 | 318,644 |
| Giga-Byte Technology Co. Ltd. | | 36,000 | 60,083 |
| Global Unichip Corp. | | 18,000 | 157,879 |
| GlobalWafers Co. Ltd. | | 36,000 | 430,848 |
| Grand Pacific Petrochemical Corp. (a) | | 41,000 | 24,736 |
| Grape King Bio Ltd. | | 7,000 | 43,265 |
| Great Wall Enterprise Co. Ltd. | | 133,497 | 165,022 |
| Greatek Electronics, Inc. | | 9,000 | 12,645 |
| HannStar Display Corp. | | 76,000 | 16,148 |
| Highwealth Construction Corp. | | 209,000 | 320,373 |
| HIWIN Technologies Corp. | | 23,474 | 201,274 |
| Holystone Enterprise Co. Ltd. | | 9,000 | 29,805 |
| Hon Hai Precision Industry Co. Ltd. (Foxconn) | | 1,679,600 | 4,438,841 |
| Hota Industrial Manufacturing Co. Ltd. | | 31,063 | 115,093 |
| Hotai Motor Co. Ltd. | | 40,000 | 705,620 |
| HTC Corp. | | 49,000 | 59,125 |
| Hua Nan Financial Holdings Co. Ltd. | | 892,606 | 640,962 |
| Huaku Development Co. Ltd. | | 1,000 | 2,744 |
| Innolux Corp. | | 1,005,000 | 223,092 |
| International Games Systems Co. Ltd. | | 14,000 | 179,946 |
| Inventec Corp. | | 347,000 | 251,449 |
| ITEQ Corp. | | 37,000 | 188,045 |
| Kenda Rubber Industrial Co. Ltd. | | 12,060 | 12,832 |
| King Slide Works Co. Ltd. | | 35,000 | 418,306 |
| King Yuan Electronics Co. Ltd. | | 200,000 | 250,836 |
| King's Town Bank | | 111,000 | 115,193 |
| Kinpo Electronics, Inc. | | 6,000 | 2,213 |
| Kinsus Interconnect Technology Corp. | | 2,000 | 3,164 |
| LandMark Optoelectronics Corp. | | 4,000 | 33,773 |
| Largan Precision Co. Ltd. | | 13,000 | 1,905,371 |
| Lien Hwa Industrial Corp. | | 63,700 | 72,372 |
| Lite-On Technology Corp. | | 286,009 | 470,774 |
| Longchen Paper & Packaging Co. | | 49,292 | 21,900 |
| Macronix International Co. Ltd. | | 246,380 | 251,243 |
| Makalot Industrial Co. Ltd. | | 21,000 | 117,057 |
| MediaTek, Inc. | | 197,000 | 2,635,452 |
| Mega Financial Holding Co. Ltd. | | 1,414,000 | 1,386,275 |
| Mercuries Life Insurance Co. Ltd. (a) | | 146,526 | 51,888 |
| Merida Industry Co. Ltd. | | 36,000 | 207,751 |
| Merry Electronics Co. Ltd. | | 13,209 | 64,533 |
| Micro-Star International Co. Ltd. | | 102,000 | 301,003 |
| MiTAC Holdings Corp. | | 6,610 | 5,809 |
| Namchow Chemical Industrial Co. Ltd. | | 1,000 | 1,626 |
| Nan Ya Plastics Corp. | | 686,000 | 1,619,516 |
| Nankang Rubber Tire Co. Ltd. | | 78,000 | 142,199 |
| Nanya Technology Corp. | | 152,000 | 348,875 |
| Nien Made Enterprise Co. Ltd. | | 24,000 | 217,588 |
| Novatek Microelectronics Corp. | | 86,000 | 552,692 |
| OBI Pharma, Inc. (a) | | 6,389 | 27,967 |
| Oriental Union Chemical Corp. | | 4,000 | 2,885 |
| PChome Online, Inc. (a) | | 6,062 | 26,237 |
| Pegatron Corp. | | 253,000 | 491,931 |
| PharmaEngine, Inc. | | 1,199 | 2,866 |
| PharmaEssentia Corp. (a) | | 43,000 | 161,437 |
| Phison Electronics Corp. | | 28,000 | 254,771 |
| PixArt Imaging, Inc. | | 52,000 | 200,341 |
| Pou Chen Corp. | | 339,000 | 452,956 |
| Powertech Technology, Inc. | | 136,000 | 428,094 |
| Poya International Co. Ltd. | | 11,010 | 151,082 |
| President Chain Store Corp. | | 88,000 | 877,172 |
| Primax Electronics Ltd. | | 84,000 | 179,028 |
| Prince Housing & Development Corp. | | 6,000 | 2,213 |
| Qisda Corp. | | 388,000 | 290,701 |
| Quanta Computer, Inc. | | 325,000 | 623,402 |
| Radiant Opto-Electronics Corp. | | 88,000 | 349,138 |
| Realtek Semiconductor Corp. | | 86,000 | 638,698 |
| Ritek Corp. (a) | | 78,497 | 20,822 |
| Ruentex Development Co. Ltd. | | 249,000 | 379,648 |
| Ruentex Industries Ltd. | | 46,000 | 110,407 |
| SerComm Corp. | | 28,000 | 73,723 |
| Shin Kong Financial Holding Co. Ltd. | | 1,451,640 | 457,892 |
| Shin Zu Shing Co. Ltd. | | 31,000 | 122,992 |
| Shinkong Insurance Co. Ltd. | | 2,000 | 2,505 |
| Simplo Technology Co. Ltd. | | 30,000 | 276,412 |
| SINBON Electronics Co. Ltd. | | 97,000 | 391,206 |
| Sino-American Silicon Products, Inc. | | 87,000 | 261,873 |
| Sinopac Holdings Co. | | 1,500,495 | 614,997 |
| Sitronix Technology Corp. | | 22,000 | 131,287 |
| St.Shine Optical Co. Ltd. | | 3,000 | 46,872 |
| Standard Foods Corp. | | 41,714 | 83,981 |
| Synnex Technology International Corp. | | 248,100 | 295,706 |
| Systex Corp. | | 1,000 | 2,426 |
| Ta Chen Stainless Pipe Co. Ltd. | | 70,932 | 76,519 |
| Taichung Commercial Bank Co. Ltd. | | 137,191 | 52,856 |
| TaiMed Biologics, Inc. (a) | | 17,000 | 74,415 |
| Tainan Spinning Co. Ltd. | | 115,000 | 42,232 |
| Taishin Financial Holdings Co. Ltd. | | 1,026,629 | 476,320 |
| Taiwan Business Bank | | 804,669 | 339,039 |
| Taiwan Cement Corp. | | 636,423 | 844,098 |
| Taiwan Cooperative Financial Holding Co. Ltd. | | 1,123,361 | 771,671 |
| Taiwan Fertilizer Co. Ltd. | | 190,000 | 302,151 |
| Taiwan Glass Industry Corp. | | 24,000 | 9,128 |
| Taiwan High Speed Rail Corp. | | 265,000 | 313,242 |
| Taiwan Hon Chuan Enterprise Co. Ltd. | | 2,000 | 3,607 |
| Taiwan Mobile Co. Ltd. | | 197,000 | 733,146 |
| Taiwan Paiho Ltd. | | 17,000 | 44,370 |
| Taiwan Secom Co. | | 33,000 | 94,246 |
| Taiwan Semiconductor Manufacturing Co. Ltd. | | 3,238,000 | 31,671,939 |
| Taiwan Shin Kong Security Co. Ltd. | | 2,000 | 2,462 |
| Taiwan Surface Mounting Technology Co. Ltd. | | 55,000 | 179,438 |
| Taiwan Union Technology Corp. | | 24,000 | 105,450 |
| Tatung Co. Ltd. (a) | | 170,000 | 102,007 |
| TCI Co. Ltd. | | 8,557 | 94,414 |
| TECO Electric & Machinery Co. Ltd. | | 388,000 | 344,134 |
| The Shanghai Commercial & Savings Bank Ltd. | | 487,842 | 839,783 |
| Ton Yi Industrial Corp. | | 5,000 | 1,992 |
| Tong Hsing Electronics Industries Ltd. | | 6,000 | 26,657 |
| Tong Yang Industry Co. Ltd. | | 55,000 | 85,661 |
| Topco Scientific Co. Ltd. | | 4,304 | 13,689 |
| Transcend Information, Inc. | | 1,000 | 2,167 |
| Tripod Technology Corp. | | 91,000 | 352,089 |
| TSRC Corp. | | 6,000 | 4,771 |
| TTY Biopharm Co. Ltd. | | 137,000 | 360,266 |
| Tung Ho Steel Enterprise Corp. | | 55,000 | 38,953 |
| TXC Corp. | | 2,000 | 2,453 |
| Unified-President Enterprises Corp. | | 660,000 | 1,627,385 |
| Unimicron Technology Corp. | | 161,000 | 248,906 |
| Unitech Printed Circuit Board Corp. | | 111,000 | 121,016 |
| United Integrated Services Co. | | 33,000 | 171,503 |
| United Microelectronics Corp. | | 1,412,000 | 649,029 |
| United Renewable Energy Co. Ltd. (a) | | 201,000 | 54,372 |
| USI Corp. | | 5,202 | 2,286 |
| Vanguard International Semiconductor Corp. | | 164,000 | 350,607 |
| Visual Photonics Epitaxy Co. Ltd. | | 14,000 | 54,856 |
| Voltronic Power Technology Corp. | | 10,500 | 232,392 |
| Wafer Works Corp. | | 43,000 | 49,418 |
| Walsin Lihwa Corp. | | 224,000 | 109,437 |
| Walsin Technology Corp. | | 53,875 | 324,154 |
| Waterland Financial Holdings Co. Ltd. | | 371,288 | 132,699 |
| Wei-Chuan Food Corp. | | 2,000 | 1,731 |
| Win Semiconductors Corp. | | 48,389 | 504,548 |
| Winbond Electronics Corp. | | 609,363 | 342,664 |
| Wistron Corp. | | 266,829 | 244,536 |
| Wistron NeWeb Corp. | | 20,460 | 50,986 |
| WPG Holding Co. Ltd. | | 293,760 | 371,799 |
| WT Microelectronics Co. Ltd. | | 188,235 | 214,787 |
| Yageo Corp. | | 32,129 | 330,792 |
| Yieh Phui Enterprise Co. | | 5,568 | 1,663 |
| Yuanta Financial Holding Co. Ltd. | | 1,390,000 | 868,237 |
| Yuen Foong Yu Paper Manufacturing Co. | | 105,000 | 41,142 |
| Yulon Motor Co. Ltd. | | 135,000 | 86,760 |
|
| TOTAL TAIWAN | | | 103,434,139 |
|
| Thailand - 0.7% | | | |
| Advanced Info Service PCL (For. Reg.) | | 155,600 | 1,180,582 |
| Airports of Thailand PCL (For. Reg.) | | 573,500 | 1,486,166 |
| Bangchak Corp. PCL (For. Reg.) | | 266,300 | 217,833 |
| Bangkok Airways PCL | | 65,400 | 16,579 |
| Bangkok Bank PCL | | 17,700 | 101,984 |
| Bangkok Bank PCL (For. Reg.) | | 31,700 | 183,174 |
| Bangkok Chain Hospital PCL | | 97,300 | 54,153 |
| Bangkok Dusit Medical Services PCL (For. Reg.) | | 1,214,900 | 965,954 |
| Bangkok Expressway and Metro PCL | | 975,400 | 348,937 |
| Bangkok Land PCL | | 1,205,600 | 54,490 |
| Banpu PCL (For. Reg.) | | 702,800 | 270,080 |
| Beauty Community PCL | | 134,100 | 9,502 |
| BEC World PCL (For. Reg.) (a) | | 29,200 | 6,433 |
| Berli Jucker PCL (For. Reg) | | 185,000 | 298,774 |
| BTS Group Holdings PCL (For. Reg.) | | 838,800 | 370,817 |
| Bumrungrad Hospital PCL (For. Reg.) | | 46,900 | 187,216 |
| C.P. ALL PCL (For. Reg.) | | 731,500 | 1,891,052 |
| Carabao Group PCL | | 50,200 | 140,155 |
| Central Pattana PCL (For. Reg.) | | 273,400 | 579,678 |
| CH. Karnchang PCL | | 388,600 | 262,538 |
| Charoen Pokphand Foods PCL (For. Reg.) | | 550,560 | 460,646 |
| Chularat Hospital PCL | | 25,300 | 2,146 |
| Dynasty Ceramic PCL (For. Reg.) | | 25,060 | 1,611 |
| Electricity Generating PCL (For. Reg.) | | 32,500 | 373,573 |
| Energy Absolute PCL | | 202,400 | 274,875 |
| Energy Earth PCL (a)(d) | | 7,600 | 93 |
| Gulf Energy Development PCL | | 82,100 | 441,065 |
| Gunkul Engineering PCL | | 26,739 | 2,584 |
| Hana Microelectronics PCL (For. Reg.) | | 58,900 | 49,762 |
| Home Product Center PCL (For. Reg.) | | 1,012,000 | 576,432 |
| Indorama Ventures PCL (For. Reg.) | | 307,300 | 285,177 |
| Intouch Holdings PCL (For. Reg.) | | 254,800 | 557,032 |
| IRPC PCL (For. Reg.) | | 2,406,200 | 270,993 |
| Jasmine International Public Co. Ltd. | | 1,007,800 | 207,802 |
| Kasikornbank PCL | | 135,800 | 624,982 |
| Kasikornbank PCL (For. Reg.) | | 137,400 | 634,620 |
| KCE Electronics PCL | | 110,600 | 53,855 |
| Kiatnakin Bank PCL (For. Reg.) | | 34,900 | 75,697 |
| Krung Thai Bank PCL (For. Reg.) | | 373,200 | 205,204 |
| Land & House PCL (For. Reg.) | | 1,043,900 | 335,450 |
| Major Cineplex Group PCL (For. Reg.) | | 78,400 | 63,885 |
| MBK PCL | | 287,400 | 215,233 |
| Minor International PCL: | | | |
| warrants 9/30/21 (a) | | 17,870 | 1,792 |
| (For. Reg.) | | 357,400 | 426,218 |
| Muangthai Leasing PCL | | 119,900 | 246,364 |
| PTG Energy PCL | | 123,600 | 73,678 |
| PTT Exploration and Production PCL (For. Reg.) | | 189,600 | 756,535 |
| PTT Global Chemical PCL (For. Reg.) | | 249,500 | 421,518 |
| PTT PCL (For. Reg.) | | 1,792,900 | 2,687,107 |
| Quality Houses PCL | | 2,204,300 | 189,827 |
| Ratchaburi Electric Generating Holding PCL (For. Reg.) | | 130,200 | 317,210 |
| Robinsons Department Store PCL (For. Reg.) | | 121,000 | 261,537 |
| Sansiri PCL (For. Reg.) | | 3,222,500 | 121,694 |
| Siam Cement PCL (For. Reg.) | | 96,100 | 1,168,826 |
| Siam Commercial Bank PCL (For. Reg.) | | 92,900 | 344,373 |
| Siam Global House PCL | | 205,167 | 103,323 |
| Sino-Thai Engineering & Construction PCL (For. Reg.) | | 521,300 | 290,381 |
| Sri Trang Agro-Industry PCL | | 17,760 | 6,124 |
| Srisawad Corp. PCL | | 187,130 | 398,198 |
| Supalai PCL (For. Reg.) | | 85,475 | 45,875 |
| Thai Airways International PCL (For. Reg.) (a) | | 60,900 | 14,929 |
| Thai Oil PCL (For. Reg.) | | 110,900 | 251,602 |
| Thai Union Frozen Products PCL (For. Reg.) | | 470,600 | 227,602 |
| Thai Vegetable Oil PCL | | 29,800 | 25,412 |
| Thanachart Capital PCL (For. Reg.) | | 117,000 | 204,578 |
| TISCO Financial Group PCL | | 10,800 | 34,871 |
| TMB Bank PCL: | | | |
| (For. Reg.) | | 3,749,200 | 178,744 |
| rights (a) | | 308,888 | 409 |
| Total Access Communication PCL (For. Reg.) | | 120,000 | 246,354 |
| True Corp. PCL (For. Reg.) | | 2,301,300 | 381,249 |
| TTW PCL | | 130,400 | 58,742 |
| Vibhavadi Medical Center PCL | | 84 | 5 |
| WHA Corp. PCL | | 2,137,700 | 331,455 |
|
| TOTAL THAILAND | | | 24,155,346 |
|
| Turkey - 0.2% | | | |
| Akbank TAS (a) | | 352,249 | 425,736 |
| Anadolu Efes Biracilik Ve Malt Sanayii A/S | | 75,037 | 252,387 |
| Arcelik A/S (a) | | 31,498 | 97,625 |
| Aselsan A/S | | 28,147 | 90,340 |
| Aygaz A/S | | 428 | 816 |
| Bim Birlesik Magazalar A/S JSC | | 55,256 | 457,338 |
| Coca-Cola Icecek Sanayi A/S | | 17,663 | 96,514 |
| Emlak Konut Gayrimenkul Yatirim Ortakligi A/S | | 124,151 | 26,275 |
| Eregli Demir ve Celik Fabrikalari T.A.S. | | 253,310 | 289,763 |
| Ford Otomotiv Sanayi A/S | | 25,274 | 285,132 |
| Haci Omer Sabanci Holding A/S | | 98,554 | 142,558 |
| Koc Holding A/S | | 137,286 | 449,756 |
| Petkim Petrokimya Holding A/S | | 64,760 | 38,965 |
| Soda Sanayii AS | | 51,836 | 49,685 |
| TAV Havalimanlari Holding A/S | | 17,302 | 78,925 |
| Tekfen Holding A/S | | 34,514 | 102,324 |
| Tupras Turkiye Petrol Rafinerileri A/S | | 19,737 | 429,797 |
| Turk Hava Yollari AO (a) | | 57,354 | 116,770 |
| Turk Sise ve Cam Fabrikalari A/S | | 66,361 | 50,491 |
| Turkcell Iletisim Hizmet A/S | | 179,352 | 394,325 |
| Turkiye Garanti Bankasi A/S (a) | | 347,480 | 559,153 |
| Turkiye Halk Bankasi A/S (a) | | 29,067 | 26,641 |
| Turkiye Is Bankasi A/S Series C (a) | | 161,614 | 163,953 |
| Turkiye Sinai Kalkinma Bankasi A/S (a) | | 136,631 | 21,508 |
| Ulker Biskuvi Sanayi A/S | | 38,897 | 125,115 |
|
| TOTAL TURKEY | | | 4,771,892 |
|
| United Arab Emirates - 0.2% | | | |
| Abu Dhabi Commercial Bank PJSC | | 389,853 | 827,950 |
| Air Arabia PJSC (a) | | 150,733 | 55,816 |
| Aldar Properties PJSC (a) | | 522,278 | 334,178 |
| Arabtec Holding Co. (a) | | 17,581 | 8,856 |
| Dana Gas PJSC (a) | | 723,243 | 180,380 |
| DP World Ltd. | | 26,365 | 350,391 |
| Dubai Investments Ltd. (a) | | 140,493 | 49,346 |
| Dubai Islamic Bank Pakistan Ltd. (a) | | 246,262 | 354,700 |
| Dubai Parks and Resorts PJSC (a) | | 83,207 | 4,644 |
| Emaar Development PJSC (a) | | 62,036 | 68,408 |
| Emaar Malls Group PJSC (a) | | 401,203 | 213,014 |
| Emaar Properties PJSC | | 497,397 | 578,282 |
| Emirates Telecommunications Corp. | | 236,862 | 1,067,983 |
| Eshraq Properties Co. PJSC (a) | | 6,866 | 688 |
| National Bank of Abu Dhabi PJSC | | 352,925 | 1,462,533 |
|
| TOTAL UNITED ARAB EMIRATES | | | 5,557,169 |
|
| United Kingdom - 10.4% | | | |
| 3i Group PLC | | 121,672 | 1,777,816 |
| A.G. Barr PLC | | 32,074 | 230,586 |
| AA PLC | | 74,373 | 42,486 |
| AB Dynamics PLC | | 2,947 | 80,165 |
| Abcam PLC | | 21,452 | 323,451 |
| Accesso Technology Group PLC (a) | | 1,923 | 14,448 |
| Admiral Group PLC | | 23,662 | 619,755 |
| Advanced Medical Solutions Group PLC | | 61,667 | 194,908 |
| Aggreko PLC | | 24,800 | 254,042 |
| Anglo American PLC (United Kingdom) | | 136,875 | 3,513,397 |
| Antofagasta PLC | | 56,712 | 637,061 |
| AO World PLC (a) | | 14,204 | 11,591 |
| Arrow Global Group PLC | | 38,913 | 119,865 |
| Ascential PLC (c) | | 83,318 | 376,877 |
| Ashmore Group PLC | | 65,698 | 396,234 |
| Ashtead Group PLC | | 62,014 | 1,886,145 |
| ASOS PLC (a) | | 7,983 | 365,030 |
| Associated British Foods PLC | | 49,142 | 1,416,985 |
| Assura PLC | | 385,389 | 373,412 |
| Aston Martin Lagonda Global Holdings PLC (a)(c) | | 11,339 | 58,649 |
| AstraZeneca PLC (United Kingdom) | | 171,552 | 16,729,282 |
| Auto Trader Group PLC (c) | | 126,609 | 922,510 |
| Avast PLC (c) | | 83,730 | 449,891 |
| Aveva Group PLC | | 8,035 | 435,268 |
| Aviva PLC | | 503,097 | 2,711,715 |
| Babcock International Group PLC | | 35,011 | 251,247 |
| BAE Systems PLC | | 412,446 | 3,080,855 |
| Balfour Beatty PLC | | 101,169 | 295,385 |
| Bank of Georgia Group PLC | | 9,026 | 151,877 |
| Barclays PLC | | 2,238,983 | 4,856,519 |
| Barratt Developments PLC | | 135,460 | 1,107,555 |
| BBA Aviation PLC | | 119,251 | 468,976 |
| BCA Marketplace PLC | | 101,094 | 309,047 |
| Beazley PLC | | 69,816 | 530,408 |
| Bellway PLC | | 13,876 | 567,987 |
| Berkeley Group Holdings PLC | | 16,247 | 926,215 |
| BHP Billiton PLC | | 273,864 | 5,808,803 |
| Biffa PLC (c) | | 16,227 | 53,600 |
| Big Yellow Group PLC | | 13,146 | 194,467 |
| Blue Prism Group PLC (a) | | 5,155 | 54,923 |
| Bodycote PLC | | 14,511 | 134,585 |
| Bovis Homes Group PLC | | 28,565 | 432,920 |
| BP PLC | | 2,656,509 | 16,845,893 |
| Brewin Dolphin Holding PLC | | 17,451 | 75,140 |
| British American Tobacco PLC (United Kingdom) | | 299,771 | 10,484,754 |
| British Land Co. PLC | | 120,563 | 969,343 |
| Britvic PLC | | 51,166 | 654,163 |
| BT Group PLC | | 1,101,686 | 2,921,210 |
| Bunzl PLC | | 41,117 | 1,069,479 |
| Burberry Group PLC | | 54,117 | 1,432,853 |
| Cairn Energy PLC (a) | | 108,283 | 249,390 |
| Capita Group PLC (a) | | 254,974 | 515,568 |
| Capital & Counties Properties PLC | | 98,432 | 325,135 |
| Card Factory PLC | | 20,062 | 44,023 |
| Carnival PLC | | 23,215 | 928,990 |
| Carphone Warehouse Group PLC | | 103,837 | 176,538 |
| Centrica PLC | | 700,797 | 658,683 |
| Chemring Group PLC | | 30,409 | 79,175 |
| Cineworld Group PLC | | 111,842 | 322,636 |
| Civitas Social Housing PLC | | 12,154 | 13,382 |
| Clinigen Group PLC | | 15,846 | 170,572 |
| Close Brothers Group PLC | | 18,338 | 328,520 |
| Coats Group PLC (a) | | 263,829 | 243,668 |
| Cobham PLC | | 305,633 | 624,733 |
| Coca-Cola European Partners PLC | | 29,134 | 1,558,960 |
| Compass Group PLC | | 204,446 | 5,443,189 |
| Computacenter PLC | | 7,919 | 140,430 |
| ConvaTec Group PLC (c) | | 207,869 | 530,852 |
| Costain Group PLC | | 19,829 | 42,895 |
| Countryside Properties PLC (c) | | 62,944 | 287,980 |
| Cranswick PLC | | 6,827 | 274,498 |
| Crest Nicholson PLC | | 16,859 | 84,820 |
| Croda International PLC | | 17,704 | 1,104,447 |
| Custodian (REIT) PLC (b) | | 115,107 | 171,469 |
| CVS Group PLC | | 11,815 | 148,072 |
| CYBG PLC | | 182,284 | 324,549 |
| Daily Mail & General Trust PLC Class A | | 18,896 | 214,663 |
| Dart Group PLC | | 9,875 | 161,814 |
| De La Rue PLC | | 46,790 | 95,157 |
| Dechra Pharmaceuticals PLC | | 14,132 | 481,445 |
| Derwent London PLC | | 15,083 | 693,591 |
| DFS Furniture PLC | | 13,771 | 41,742 |
| Diageo PLC | | 309,920 | 12,685,329 |
| Dialog Semiconductor PLC (a) | | 10,769 | 482,949 |
| Dignity PLC | | 1,628 | 11,693 |
| Diploma PLC | | 17,967 | 372,144 |
| Direct Line Insurance Group PLC | | 188,462 | 664,262 |
| Diversified Gas & Oil PLC | | 132,072 | 183,055 |
| Domino's Pizza UK & IRL PLC | | 85,117 | 315,223 |
| Drax Group PLC | | 55,026 | 211,553 |
| DS Smith PLC | | 192,833 | 893,236 |
| Dunelm Group PLC | | 14,492 | 148,207 |
| easyJet PLC | | 24,051 | 385,692 |
| Electrocomponents PLC | | 54,433 | 479,608 |
| Elementis PLC | | 130,428 | 251,229 |
| EMIS Group PLC | | 1,676 | 23,360 |
| Empiric Student Property PLC | | 23,726 | 28,889 |
| EnQuest PLC (a) | | 83,348 | 19,218 |
| Enterprise Inns PLC (a) | | 61,435 | 224,097 |
| Equiniti Group PLC (c) | | 53,086 | 147,982 |
| Essentra PLC | | 19,084 | 94,284 |
| Euromoney Publications PLC | | 20,926 | 382,744 |
| Evraz PLC | | 70,213 | 333,970 |
| Ferrexpo PLC | | 47,083 | 76,816 |
| Fever-Tree Drinks PLC | | 14,053 | 338,586 |
| First Derivatives PLC | | 1,836 | 54,105 |
| Firstgroup PLC (a) | | 176,390 | 294,976 |
| Forterra PLC (c) | | 9,489 | 32,880 |
| Fresnillo PLC | | 32,734 | 301,054 |
| Funding Circle Holdings PLC (a)(c) | | 35,742 | 54,354 |
| Future PLC | | 13,376 | 262,325 |
| G4S PLC (United Kingdom) | | 208,799 | 559,327 |
| Galliford Try PLC | | 16,672 | 158,299 |
| Games Workshop Group PLC | | 2,944 | 170,464 |
| GB Group PLC | | 27,578 | 215,768 |
| GCP Student Living PLC | | 84,803 | 192,237 |
| Genus PLC | | 11,314 | 424,133 |
| GlaxoSmithKline PLC | | 646,249 | 14,802,295 |
| Grainger Trust PLC | | 117,585 | 391,142 |
| Great Portland Estates PLC | | 38,197 | 389,693 |
| Greggs PLC | | 12,994 | 298,932 |
| Halfords Group PLC | | 14,706 | 30,174 |
| Halma PLC | | 46,939 | 1,139,134 |
| Hammerson PLC | | 119,672 | 449,550 |
| Hansteen Holdings PLC | | 4,785 | 6,372 |
| Hargreaves Lansdown PLC | | 37,481 | 860,324 |
| Hastings Group Holdings PLC (c) | | 28,228 | 66,549 |
| Hays PLC | | 144,929 | 294,930 |
| Helical Bar PLC | | 50,560 | 256,405 |
| Hikma Pharmaceuticals PLC | | 15,547 | 404,790 |
| Hill & Smith Holdings PLC | | 7,635 | 129,559 |
| Hochschild Mining PLC | | 41,759 | 108,293 |
| HomeServe PLC | | 41,049 | 616,273 |
| Howden Joinery Group PLC | | 74,097 | 554,197 |
| HSBC Holdings PLC (United Kingdom) | | 2,620,960 | 19,801,647 |
| Hunting PLC | | 9,314 | 47,415 |
| Hurricane Energy PLC (a)(b) | | 247,335 | 136,292 |
| Ibstock PLC (c) | | 31,649 | 99,130 |
| IG Group Holdings PLC | | 51,986 | 427,879 |
| IMI PLC | | 35,853 | 465,815 |
| Imperial Brands PLC | | 126,284 | 2,768,461 |
| Inchcape PLC | | 54,571 | 455,941 |
| Indivior PLC (a) | | 66,482 | 33,672 |
| Informa PLC | | 164,092 | 1,647,313 |
| Inmarsat PLC | | 50,019 | 356,486 |
| IntegraFin Holdings PLC | | 22,663 | 108,326 |
| InterContinental Hotel Group PLC | | 25,067 | 1,516,923 |
| Intermediate Capital Group PLC | | 40,765 | 784,681 |
| International Personal Finance PLC | | 7,621 | 13,130 |
| International Quantum Epitaxy PLC (a) | | 151,981 | 147,651 |
| Intertek Group PLC | | 22,426 | 1,554,730 |
| Intu Properties PLC | | 209,893 | 122,348 |
| Investec PLC | | 91,697 | 519,780 |
| iomart Group PLC | | 1,226 | 5,852 |
| ITE Group PLC | | 27,302 | 27,479 |
| ITV PLC | | 532,041 | 921,777 |
| J Sainsbury PLC | | 236,810 | 624,240 |
| J.D. Weatherspoon PLC | | 14,989 | 284,056 |
| Jackpotjoy PLC (a) | | 1,132 | 11,833 |
| John David Group PLC | | 55,308 | 550,506 |
| John Laing Group PLC (c) | | 48,706 | 230,283 |
| John Menzies PLC | | 927 | 4,881 |
| John Wood Group PLC | | 111,814 | 489,988 |
| Johnson Matthey PLC | | 27,772 | 1,104,416 |
| JRP Group PLC (a) | | 156,636 | 123,261 |
| Jupiter Fund Management PLC | | 103,425 | 458,987 |
| Just Eat Holding Ltd. (a) | | 88,258 | 840,289 |
| KAZ Minerals PLC | | 50,268 | 305,648 |
| Keller Group PLC | | 9,943 | 67,103 |
| Keywords Studios PLC | | 5,855 | 84,185 |
| Kier Group PLC (b) | | 22,416 | 32,957 |
| Kingfisher PLC | | 243,939 | 654,393 |
| Land Securities Group PLC | | 83,532 | 1,017,110 |
| Learning Technologies Group PLC | | 35,683 | 49,458 |
| Legal & General Group PLC | | 785,730 | 2,683,926 |
| Lloyds Banking Group PLC | | 9,262,961 | 6,813,906 |
| London Stock Exchange Group PLC | | 41,116 | 3,705,326 |
| Londonmetric Properity PLC | | 91,288 | 274,103 |
| Lookers PLC | | 2,630 | 1,690 |
| LXI REIT PLC | | 106,246 | 172,583 |
| M&G PLC (a) | | 333,908 | 924,744 |
| Marks & Spencer Group PLC | | 269,080 | 633,897 |
| Marshalls PLC | | 30,185 | 278,198 |
| McCarthy & Stone PLC (c) | | 17,225 | 32,688 |
| Mediclinic International PLC | | 69,531 | 329,645 |
| Meggitt PLC | | 102,341 | 827,751 |
| Melrose Industries PLC | | 663,489 | 1,831,489 |
| Merlin Entertainments PLC (c) | | 93,272 | 549,126 |
| Metro Bank PLC (a)(b) | | 18,426 | 48,405 |
| Micro Focus International PLC | | 46,825 | 642,683 |
| Mitchells & Butlers PLC (a) | | 34,235 | 188,915 |
| Mitie Group PLC | | 26,411 | 54,191 |
| Mondi PLC | | 68,218 | 1,411,650 |
| Moneysupermarket.com Group PLC | | 126,907 | 564,019 |
| Morgan Advanced Materials PLC | | 79,329 | 242,100 |
| Morgan Sindall PLC | | 6,480 | 107,442 |
| N Brown Group PLC | | 3,824 | 6,202 |
| National Express Group PLC Class L | | 47,289 | 273,446 |
| National Grid PLC | | 429,035 | 5,008,979 |
| NCC Group Ltd. | | 41,972 | 101,886 |
| NewRiver REIT PLC | | 48,702 | 126,803 |
| Next PLC | | 18,287 | 1,559,148 |
| NMC Health PLC | | 13,294 | 375,921 |
| Northgate PLC | | 8,573 | 38,257 |
| Ocado Group PLC (a) | | 63,933 | 1,100,619 |
| On The Beach Group PLC (c) | | 17,698 | 102,750 |
| OneSavings Bank PLC | | 77,261 | 360,288 |
| P2P Global Investments PLC | | 5,361 | 58,194 |
| Pagegroup PLC | | 55,059 | 317,520 |
| Paragon Banking Group PLC | | 21,947 | 143,140 |
| Pearson PLC | | 98,392 | 868,958 |
| Pendragon PLC | | 85,397 | 15,841 |
| Pennon Group PLC | | 61,438 | 714,821 |
| Persimmon PLC | | 40,812 | 1,203,755 |
| Pets At Home Group PLC | | 67,772 | 181,020 |
| Phoenix Group Holdings PLC | | 67,061 | 611,721 |
| Photo-Me International PLC | | 11,079 | 13,160 |
| Polypipe Group PLC | | 17,721 | 103,986 |
| Premier Foods PLC (a) | | 23,207 | 9,710 |
| Premier Oil PLC (a) | | 58,507 | 62,676 |
| Primary Health Properties PLC | | 241,549 | 442,427 |
| Provident Financial PLC | | 26,051 | 148,512 |
| Prudential PLC | | 333,908 | 5,832,317 |
| Purplebricks Group PLC (a) | | 10,054 | 14,664 |
| PZ Cussons PLC Class L | | 16,813 | 43,884 |
| QinetiQ Group PLC | | 90,575 | 369,813 |
| Quilter PLC (c) | | 294,673 | 522,554 |
| Rathbone Brothers PLC | | 8,022 | 215,619 |
| Reckitt Benckiser Group PLC | | 92,007 | 7,119,651 |
| Redde PLC | | 25,770 | 37,387 |
| Redrow PLC | | 45,635 | 355,862 |
| RELX PLC (London Stock Exchange) | | 252,732 | 6,082,653 |
| Renishaw PLC | | 4,949 | 242,837 |
| Rentokil Initial PLC | | 239,578 | 1,410,483 |
| Restore PLC | | 21,461 | 115,368 |
| Rightmove PLC | | 97,830 | 758,570 |
| Rio Tinto PLC | | 147,506 | 7,679,431 |
| Rolls-Royce Holdings PLC | | 219,214 | 2,017,152 |
| Rolls-Royce Holdings PLC (a) | | 10,083,844 | 13,062 |
| Rotork PLC | | 100,002 | 390,426 |
| Royal Bank of Scotland Group PLC | | 647,784 | 1,790,630 |
| Royal Dutch Shell PLC: | | | |
| Class A (United Kingdom) | | 588,880 | 17,070,511 |
| Class B (United Kingdom) | | 469,069 | 13,509,085 |
| Royal Mail PLC | | 135,614 | 371,713 |
| RPS Group PLC | | 24,886 | 45,646 |
| RSA Insurance Group PLC | | 122,786 | 830,684 |
| RWS Holdings PLC | | 29,665 | 230,559 |
| Sabre Insurance Group PLC (c) | | 61,807 | 236,182 |
| Safestore Holdings PLC | | 21,871 | 198,456 |
| Saga PLC | | 187,997 | 114,260 |
| Sage Group PLC | | 145,432 | 1,355,998 |
| Savills PLC | | 20,105 | 238,945 |
| Scapa Group PLC | | 26,697 | 77,118 |
| Schroders PLC | | 14,655 | 587,535 |
| Scottish & Southern Energy PLC | | 135,407 | 2,252,638 |
| Segro PLC | | 130,104 | 1,422,732 |
| Senior Engineering Group PLC | | 40,300 | 96,418 |
| Serco Group PLC (a) | | 189,482 | 382,895 |
| Severn Trent PLC | | 30,463 | 889,829 |
| Shaftesbury PLC | | 17,376 | 212,701 |
| Shanks Group PLC | | 22,634 | 8,649 |
| SIG PLC | | 105,657 | 154,108 |
| Sirius Minerals PLC (a)(b) | | 1,116,808 | 41,577 |
| Smart Metering Systems PLC (b) | | 16,109 | 99,117 |
| Smith & Nephew PLC | | 110,142 | 2,364,354 |
| Smiths Group PLC | | 52,833 | 1,104,235 |
| SOCO International PLC | | 500 | 378 |
| Softcat PLC | | 9,564 | 116,516 |
| Sophos Group PLC (c) | | 44,632 | 328,268 |
| Spectris PLC | | 17,930 | 555,557 |
| Spirax-Sarco Engineering PLC | | 9,986 | 1,025,128 |
| Spire Healthcare Group PLC (c) | | 16,378 | 24,779 |
| Sports Direct International PLC (a) | | 49,843 | 199,503 |
| SSP Group PLC | | 72,715 | 599,999 |
| St. James's Place Capital PLC | | 75,607 | 1,019,530 |
| St. Modwen Properties PLC | | 29,677 | 173,374 |
| Stagecoach Group PLC | | 47,395 | 84,293 |
| Standard Chartered PLC (United Kingdom) | | 364,464 | 3,309,480 |
| Standard Life PLC | | 336,890 | 1,324,445 |
| Stock Spirits Group PLC | | 10,658 | 28,302 |
| SuperGroup PLC | | 2,109 | 11,173 |
| Synthomer PLC | | 56,730 | 205,024 |
| TalkTalk Telecom Group PLC | | 65,899 | 95,264 |
| Tate & Lyle PLC | | 54,037 | 471,079 |
| Taylor Wimpey PLC | | 449,698 | 964,064 |
| Ted Baker PLC | | 2,860 | 15,063 |
| Telecom Plus PLC | | 15,990 | 248,966 |
| Tesco PLC | | 1,260,767 | 3,848,560 |
| The Go-Ahead Group PLC | | 6,359 | 168,367 |
| The Restaurant Group PLC | | 61,366 | 107,789 |
| The Weir Group PLC | | 38,514 | 671,757 |
| Thomas Cook Group PLC (a)(d) | | 82,838 | 3,703 |
| TORM PLC (a) | | 167 | 1,593 |
| Travis Perkins PLC | | 33,762 | 626,703 |
| Tritax Big Box REIT PLC | | 173,778 | 338,330 |
| Tullett Prebon PLC | | 98,962 | 439,565 |
| Tullow Oil PLC | | 188,064 | 501,590 |
| Ultra Electronics Holdings PLC | | 9,100 | 229,860 |
| Unilever PLC | | 143,930 | 8,618,176 |
| Unite Group PLC | | 36,588 | 533,185 |
| United Utilities Group PLC | | 81,011 | 913,167 |
| Urban & Civic PLC | | 64,715 | 276,634 |
| Vectura Group PLC | | 166,711 | 190,467 |
| Vesuvius PLC | | 22,365 | 115,708 |
| Victoria PLC (a) | | 19,305 | 110,780 |
| Victrex PLC | | 16,137 | 459,031 |
| Vodafone Group PLC | | 3,496,828 | 7,136,053 |
| WH Smith PLC | | 13,951 | 395,403 |
| Whitbread PLC | | 15,789 | 830,567 |
| William Hill PLC | | 127,517 | 326,394 |
| WM Morrison Supermarkets PLC | | 334,830 | 862,456 |
| Wolverhampton & Dudley Breweries PLC | | 147,334 | 235,317 |
| Workspace Group PLC | | 25,915 | 340,725 |
|
| TOTAL UNITED KINGDOM | | | 339,528,931 |
|
| United States of America - 0.1% | | | |
| Southern Copper Corp. | | 15,154 | 539,179 |
| Yum China Holdings, Inc. | | 47,192 | 2,005,660 |
|
| TOTAL UNITED STATES OF AMERICA | | | 2,544,839 |
|
| TOTAL COMMON STOCKS | | | |
| (Cost $3,086,170,316) | | | 3,183,553,542 |
|
| Nonconvertible Preferred Stocks - 1.2% | | | |
| Brazil - 0.7% | | | |
| Alpargatas SA (PN) (a) | | 19,125 | 129,900 |
| Azul SA (a) | | 35,100 | 459,656 |
| Banco ABC Brasil SA | | 3,575 | 16,081 |
| Banco Bradesco SA (PN) | | 474,306 | 4,159,417 |
| Banco do Estado Rio Grande do Sul SA | | 16,700 | 93,109 |
| Banco Inter SA (c) | | 26,800 | 114,537 |
| Bradespar SA (PN) | | 27,279 | 217,729 |
| Braskem SA (PN-A) (a) | | 21,200 | 146,426 |
| Centrais Eletricas Brasileiras SA (Electrobras) (PN-B) (a) | | 29,062 | 297,033 |
| Cia de Saneamento do Parana | | 15,500 | 70,186 |
| Companhia Brasileira de Distribuicao Grupo Pao de Acucar (PN) | | 23,061 | 477,205 |
| Companhia Energetica de Minas Gerais (CEMIG) (PN) | | 146,135 | 497,380 |
| Companhia Energetica de Sao Paulo Series B | | 27,100 | 200,691 |
| Companhia Paranaense de Energia-Copel (PN-B) | | 15,300 | 212,380 |
| Gerdau SA | | 178,403 | 597,420 |
| Gol Linhas Aereas Inteligentes SA (PN) (a) | | 11,000 | 100,386 |
| Itau Unibanco Holding SA | | 633,860 | 5,726,156 |
| Itausa-Investimentos Itau SA (PN) | | 569,632 | 1,947,302 |
| Lojas Americanas SA (PN) | | 92,500 | 461,058 |
| Marcopolo SA (PN) | | 10,356 | 9,373 |
| Metalurgica Gerdau SA (PN) | | 60,300 | 94,573 |
| Petroleo Brasileiro SA - Petrobras (PN) (non-vtg.) | | 538,186 | 4,078,163 |
| Telefonica Brasil SA | | 56,300 | 745,145 |
|
| TOTAL BRAZIL | | | 20,851,306 |
|
| Chile - 0.0% | | | |
| Embotelladora Andina SA Class B | | 34,522 | 99,619 |
| Sociedad Quimica y Minera de Chile SA (PN-B) (a) | | 17,532 | 465,723 |
|
| TOTAL CHILE | | | 565,342 |
|
| Colombia - 0.0% | | | |
| Bancolombia SA (PN) | | 71,459 | 932,773 |
| Grupo Aval Acciones y Valores SA | | 712,437 | 291,931 |
| Grupo de Inversiones Suramerica SA | | 9,299 | 85,232 |
|
| TOTAL COLOMBIA | | | 1,309,936 |
|
| Germany - 0.3% | | | |
| Bayerische Motoren Werke AG (BMW) (non-vtg.) | | 6,507 | 400,963 |
| Draegerwerk AG & Co. KGaA (non-vtg.) | | 125 | 7,326 |
| Fuchs Petrolub AG | | 8,877 | 378,992 |
| Henkel AG & Co. KGaA | | 18,527 | 1,925,394 |
| Jungheinrich AG | | 6,788 | 172,157 |
| Porsche Automobil Holding SE (Germany) | | 20,279 | 1,493,156 |
| Sartorius AG (non-vtg.) | | 4,474 | 869,232 |
| Sixt AG Preference Shares | | 2,910 | 197,328 |
| Sto SE & Co. KGaA | | 572 | 62,519 |
| Volkswagen AG | | 21,110 | 4,018,958 |
|
| TOTAL GERMANY | | | 9,526,025 |
|
| Italy - 0.0% | | | |
| Buzzi Unicem SpA (Risparmio Shares) | | 12,897 | 197,349 |
| Danieli & C. Officine Meccaniche SpA | | 1,027 | 11,282 |
| Telecom Italia SpA (Risparmio Shares) | | 1,286,405 | 744,337 |
|
| TOTAL ITALY | | | 952,968 |
|
| Korea (South) - 0.2% | | | |
| AMOREPACIFIC Corp. | | 1,738 | 143,015 |
| Daishin Securities Co. Ltd. | | 4,429 | 35,385 |
| Hyundai Motor Co. | | 5,997 | 374,079 |
| Hyundai Motor Co. Series 2 | | 6,279 | 425,471 |
| LG Chemical Ltd. | | 665 | 97,736 |
| LG Household & Health Care Ltd. | | 351 | 221,645 |
| Samsung Electronics Co. Ltd. | | 118,158 | 4,144,602 |
|
| TOTAL KOREA (SOUTH) | | | 5,441,933 |
|
| Panama - 0.0% | | | |
| Avianca Holdings SA | | 19,286 | 10,670 |
| Russia - 0.0% | | | |
| AK Transneft OAO | | 65 | 168,779 |
| Surgutneftegas OJSC | | 942,955 | 554,811 |
|
| TOTAL RUSSIA | | | 723,590 |
|
| TOTAL NONCONVERTIBLE PREFERRED STOCKS | | | |
| (Cost $37,435,169) | | | 39,381,770 |
| | | Principal Amount | Value |
|
| Nonconvertible Bonds - 0.0% | | | |
| India - 0.0% | | | |
Britannia Industries Ltd. 8% 8/28/22
(Cost $26) | INR | 5,832 | 26 |
|
| Government Obligations - 0.1% | | | |
| United States of America - 0.1% | | | |
| U.S. Treasury Bills, yield at date of purchase 1.7% to 1.82% 12/19/19 to 3/19/20 (e) | | | |
| (Cost $3,981,534) | | 4,000,000 | 3,984,539 |
| | | Shares | Value |
|
| Money Market Funds - 1.2% | | | |
| Fidelity Cash Central Fund 1.83% (f) | | 11,413,870 | 11,416,152 |
| Fidelity Securities Lending Cash Central Fund 1.84% (f)(g) | | 25,393,239 | 25,395,778 |
| TOTAL MONEY MARKET FUNDS | | | |
| (Cost $36,811,930) | | | 36,811,930 |
| TOTAL INVESTMENT IN SECURITIES - 100.3% | | | |
| (Cost $3,164,398,975) | | | 3,263,731,807 |
| NET OTHER ASSETS (LIABILITIES) - (0.3)% | | | (9,025,218) |
| NET ASSETS - 100% | | | $3,254,706,589 |
| Futures Contracts | | | | | |
| | Number of contracts | Expiration Date | Notional Amount | Value | Unrealized Appreciation/(Depreciation) |
| Purchased | | | | | |
| Equity Index Contracts | | | | | |
| ICE E-mini MSCI EAFE Index Contracts (United States) | 211 | Dec. 2019 | $20,648,460 | $349,328 | $349,328 |
| ICE E-mini MSCI Emerging Markets Index Contracts (United States) | 154 | Dec. 2019 | 8,018,780 | 108,893 | 108,893 |
| TME S&P/TSX 60 Index Contracts (Canada) | 13 | Dec. 2019 | 1,944,226 | 7,680 | 7,680 |
| TOTAL FUTURES CONTRACTS | | | | | $465,901 |
The notional amount of futures purchased as a percentage of Net Assets is 0.9%
Currency Abbreviations
INR – Indian rupee
Categorizations in the Schedule of Investments are based on country or territory of incorporation.
Legend
(a) Non-income producing
(b) Security or a portion of the security is on loan at period end.
(c) Security exempt from registration under Rule 144A of the Securities Act of 1933. These securities may be resold in transactions exempt from registration, normally to qualified institutional buyers. At the end of the period, the value of these securities amounted to $48,310,778 or 1.5% of net assets.
(d) Level 3 security
(e) Security or a portion of the security was pledged to cover margin requirements for futures contracts. At period end, the value of securities pledged amounted to $1,272,555.
(f) Affiliated fund that is generally available only to investment companies and other accounts managed by Fidelity Investments. The rate quoted is the annualized seven-day yield of the fund at period end. A complete unaudited listing of the fund's holdings as of its most recent quarter end is available upon request. In addition, each Fidelity Central Fund's financial statements, which are not covered by the Fund's Report of Independent Registered Public Accounting Firm, are available on the SEC's website or upon request.
(g) Investment made with cash collateral received from securities on loan.
Affiliated Central Funds
Information regarding fiscal year to date income earned by the Fund from investments in Fidelity Central Funds is as follows:
| Fund | Income earned |
| Fidelity Cash Central Fund | $2,505,119 |
| Fidelity Securities Lending Cash Central Fund | 331,047 |
| Total | $2,836,166 |
Amounts in the income column in the above table include any capital gain distributions from underlying funds, which are presented in the corresponding line-item in the Statement of Operations, if applicable. Amount for Fidelity Securities Lending Cash Central Fund represents the income earned on investing cash collateral, less rebates paid to borrowers and any lending agent fees associated with the loan, plus any premium payments received for lending certain types of securities.
Investment Valuation
The following is a summary of the inputs used, as of October 31, 2019, involving the Fund's assets and liabilities carried at fair value. The inputs or methodology used for valuing securities may not be an indication of the risk associated with investing in those securities. For more information on valuation inputs, and their aggregation into the levels used below, please refer to the Investment Valuation section in the accompanying Notes to Financial Statements.
| | Valuation Inputs at Reporting Date: |
| Description | Total | Level 1 | Level 2 | Level 3 |
| Investments in Securities: | | | | |
| Equities: | | | | |
| Communication Services | $205,947,962 | $75,291,601 | $130,654,211 | $2,150 |
| Consumer Discretionary | 377,511,328 | 188,315,326 | 189,191,120 | 4,882 |
| Consumer Staples | 300,904,660 | 118,845,048 | 181,997,318 | 62,294 |
| Energy | 198,654,864 | 74,075,552 | 124,574,062 | 5,250 |
| Financials | 646,374,760 | 291,418,442 | 354,850,284 | 106,034 |
| Health Care | 273,984,862 | 58,281,836 | 215,693,024 | 10,002 |
| Industrials | 421,205,956 | 199,644,660 | 221,560,168 | 1,128 |
| Information Technology | 296,910,054 | 128,780,811 | 168,118,019 | 11,224 |
| Materials | 246,021,094 | 131,321,738 | 114,692,713 | 6,643 |
| Real Estate | 144,575,230 | 53,366,448 | 91,200,047 | 8,735 |
| Utilities | 110,844,542 | 52,403,842 | 58,440,700 | -- |
| Corporate Bonds | 26 | -- | 26 | -- |
| Government Obligations | 3,984,539 | -- | 3,984,539 | -- |
| Money Market Funds | 36,811,930 | 36,811,930 | -- | -- |
| Total Investments in Securities: | $3,263,731,807 | $1,408,557,234 | $1,854,956,231 | $218,342 |
| Derivative Instruments: | | | | |
| Assets | | | | |
| Futures Contracts | $465,901 | $465,901 | $-- | $-- |
| Total Assets | $465,901 | $465,901 | $-- | $-- |
| Total Derivative Instruments: | $465,901 | $465,901 | $-- | $-- |
Value of Derivative Instruments
The following table is a summary of the Fund's value of derivative instruments by primary risk exposure as of October 31, 2019. For additional information on derivative instruments, please refer to the Derivative Instruments section in the accompanying Notes to Financial Statements.
| Primary Risk Exposure / Derivative Type | Value |
| | Asset | Liability |
| Equity Risk | | |
| Futures Contracts(a) | $465,901 | $0 |
| Total Equity Risk | 465,901 | 0 |
| Total Value of Derivatives | $465,901 | $0 |
(a) Reflects gross cumulative appreciation (depreciation) on futures contracts as presented in the Schedule of Investments. In the Statement of Assets and Liabilities, the period end daily variation margin is included in receivable or payable for daily variation margin on futures contracts, and the net cumulative appreciation (depreciation) is included in Total accumulated earnings (loss).
See accompanying notes which are an integral part of the financial statements.
Financial Statements
Statement of Assets and Liabilities
| | | October 31, 2019 |
| Assets | | |
Investment in securities, at value (including securities loaned of $24,158,616) — See accompanying schedule:
Unaffiliated issuers (cost $3,127,587,045) | $3,226,919,877 | |
| Fidelity Central Funds (cost $36,811,930) | 36,811,930 | |
| Total Investment in Securities (cost $3,164,398,975) | | $3,263,731,807 |
| Cash | | 5,877 |
| Foreign currency held at value (cost $3,172,200) | | 3,170,545 |
| Receivable for investments sold | | 611,544 |
| Receivable for fund shares sold | | 7,606,423 |
| Dividends receivable | | 8,920,242 |
| Distributions receivable from Fidelity Central Funds | | 113,395 |
| Other receivables | | 882 |
| Total assets | | 3,284,160,715 |
| Liabilities | | |
| Payable for investments purchased | $264,527 | |
| Payable for fund shares redeemed | 3,196,774 | |
| Accrued management fee | 158,124 | |
| Payable for daily variation margin on futures contracts | 112,714 | |
| Other payables and accrued expenses | 324,553 | |
| Collateral on securities loaned | 25,397,434 | |
| Total liabilities | | 29,454,126 |
| Net Assets | | $3,254,706,589 |
| Net Assets consist of: | | |
| Paid in capital | | $3,091,343,352 |
| Total accumulated earnings (loss) | | 163,363,237 |
| Net Assets | | $3,254,706,589 |
| Net Asset Value and Maximum Offering Price | | |
| Net Asset Value, offering price and redemption price per share ($3,254,706,589 ÷ 269,151,204 shares) | | $12.09 |
See accompanying notes which are an integral part of the financial statements.
Statement of Operations
| | | Year ended October 31, 2019 |
| Investment Income | | |
| Dividends | | $78,791,415 |
| Non-Cash dividends | | 5,719,764 |
| Interest | | 130,222 |
| Income from Fidelity Central Funds (including $331,047 from security lending) | | 2,836,166 |
| Income before foreign taxes withheld | | 87,477,567 |
| Less foreign taxes withheld | | (7,644,494) |
| Total income | | 79,833,073 |
| Expenses | | |
| Management fee | $1,434,604 | |
| Independent trustees' fees and expenses | 8,982 | |
| Interest | 1,226 | |
| Commitment fees | 5,813 | |
| Total expenses before reductions | 1,450,625 | |
| Expense reductions | (3,118) | |
| Total expenses after reductions | | 1,447,507 |
| Net investment income (loss) | | 78,385,566 |
| Realized and Unrealized Gain (Loss) | | |
| Net realized gain (loss) on: | | |
| Investment securities: | | |
| Unaffiliated issuers (net of foreign taxes of $1,883) | (8,781,850) | |
| Fidelity Central Funds | (735) | |
| Foreign currency transactions | (1,106,299) | |
| Futures contracts | 6,935,911 | |
| Total net realized gain (loss) | | (2,952,973) |
| Change in net unrealized appreciation (depreciation) on: | | |
| Investment securities: | | |
| Unaffiliated issuers (net of increase in deferred foreign taxes of $324,562) | 193,291,782 | |
| Assets and liabilities in foreign currencies | 119,664 | |
| Futures contracts | 1,785,975 | |
| Total change in net unrealized appreciation (depreciation) | | 195,197,421 |
| Net gain (loss) | | 192,244,448 |
| Net increase (decrease) in net assets resulting from operations | | $270,630,014 |
See accompanying notes which are an integral part of the financial statements.
Statement of Changes in Net Assets
| | Year ended October 31, 2019 | Year ended October 31, 2018 |
| Increase (Decrease) in Net Assets | | |
| Operations | | |
| Net investment income (loss) | $78,385,566 | $28,597,524 |
| Net realized gain (loss) | (2,952,973) | 1,624,140 |
| Change in net unrealized appreciation (depreciation) | 195,197,421 | (154,449,643) |
| Net increase (decrease) in net assets resulting from operations | 270,630,014 | (124,227,979) |
| Distributions to shareholders | (29,366,688) | (12,739,319) |
| Share transactions - net increase (decrease) | 1,751,970,675 | 753,570,682 |
| Redemption fees | – | 11,499 |
| Total increase (decrease) in net assets | 1,993,234,001 | 616,614,883 |
| Net Assets | | |
| Beginning of period | 1,261,472,588 | 644,857,705 |
| End of period | $3,254,706,589 | $1,261,472,588 |
See accompanying notes which are an integral part of the financial statements.
Financial Highlights
Fidelity Total International Index Fund
| Years ended October 31, | 2019 | 2018 | 2017 | 2016 A |
| Selected Per–Share Data | | | | |
| Net asset value, beginning of period | $11.14 | $12.39 | $10.09 | $10.00 |
| Income from Investment Operations | | | | |
| Net investment income (loss)B | .37 | .34 | .31 | .08 |
| Net realized and unrealized gain (loss) | .81 | (1.36) | 2.04 | .01 |
| Total from investment operations | 1.18 | (1.02) | 2.35 | .09 |
| Distributions from net investment income | (.23) | (.17) | (.04) | – |
| Distributions from net realized gain | – | (.06) | (.01) | – |
| Total distributions | (.23) | (.23) | (.05) | – |
| Redemption fees added to paid in capitalB | – | –C | –C | –C |
| Net asset value, end of period | $12.09 | $11.14 | $12.39 | $10.09 |
| Total ReturnD,E | 10.88% | (8.42)% | 23.37% | .90% |
| Ratios to Average Net AssetsF,G | | | | |
| Expenses before reductions | .06% | .06% | .06% | .10%H |
| Expenses net of fee waivers, if any | .06% | .06% | .06% | .06%H |
| Expenses net of all reductions | .06% | .06% | .06% | .06%H |
| Net investment income (loss) | 3.25% | 2.81% | 2.65% | 2.09%H |
| Supplemental Data | | | | |
| Net assets, end of period (000 omitted) | $3,254,707 | $589,295 | $135,488 | $1,289 |
| Portfolio turnover rateI | 4% | 3% | 2% | 1%J |
A For the period June 7, 2016 (commencement of operations) to October 31, 2016.
B Calculated based on average shares outstanding during the period.
C Amount represents less than $.005 per share.
D Total returns for periods of less than one year are not annualized.
E Total returns would have been lower if certain expenses had not been reduced during the applicable periods shown.
F Fees and expenses of any underlying Fidelity Central Funds are not included in the Fund's expense ratio. The Fund indirectly bears its proportionate share of the expenses of any underlying Fidelity Central Funds.
G Expense ratios reflect operating expenses of the Fund. Expenses before reductions do not reflect amounts reimbursed by the investment adviser or reductions from expense offset arrangements and do not represent the amount paid by the Fund during periods when reimbursements or reductions occur. Expense ratios before reductions for start-up periods may not be representative of longer-term operating periods. Expenses net of fee waivers reflect expenses after reimbursement by the investment adviser but prior to reductions from expense offset arrangements. Expenses net of all reductions represent the net expenses paid by the Fund.
H Annualized
I Amount does not include the portfolio activity of any underlying Fidelity Central Funds.
J Amount not annualized.
See accompanying notes which are an integral part of the financial statements.
Notes to Financial Statements
For the period ended October 31, 2019
1. Organization.
Fidelity Total International Index Fund (the Fund) is a fund of Fidelity Salem Street Trust (the Trust) and is authorized to issue an unlimited number of shares. The Trust is registered under the Investment Company Act of 1940, as amended (the 1940 Act), as an open-end management investment company organized as a Massachusetts business trust. The Fund's investments in emerging markets can be subject to social, economic, regulatory, and political uncertainties and can be extremely volatile.
Effective after the close of business November 9, 2018, the Fund's publicly offered shares classes were consolidated into a single share class. The surviving class is Fidelity Total International Index Fund (formerly Institutional Premium Class). All current fiscal period dollar and share amounts for the classes that closed, which are presented in the Notes to Financial Statements, are for the period November 1, 2018 through November 9, 2018.
2. Investments in Fidelity Central Funds.
The Fund invests in Fidelity Central Funds, which are open-end investment companies generally available only to other investment companies and accounts managed by the investment adviser and its affiliates. The Fund's Schedule of Investments lists each of the Fidelity Central Funds held as of period end, if any, as an investment of the Fund, but does not include the underlying holdings of each Fidelity Central Fund. As an Investing Fund, the Fund indirectly bears its proportionate share of the expenses of the underlying Fidelity Central Funds.
The Money Market Central Funds seek preservation of capital and current income and are managed by Fidelity Investments Money Management, Inc. (FIMM), an affiliate of the investment adviser. Annualized expenses of the Money Market Central Funds as of their most recent shareholder report date ranged from less than .005% to .01%.
A complete unaudited list of holdings for each Fidelity Central Fund is available upon request or at the Securities and Exchange Commission (the SEC) website at www.sec.gov. In addition, the financial statements of the Fidelity Central Funds, which are not covered by the Fund's Report of Independent Registered Public Accounting Firm, are available on the SEC website or upon request.
3. Significant Accounting Policies.
The Fund is an investment company and applies the accounting and reporting guidance of the Financial Accounting Standards Board (FASB) Accounting Standards Codification Topic 946 Financial Services – Investments Companies. The financial statements have been prepared in conformity with accounting principles generally accepted in the United States of America (GAAP), which require management to make certain estimates and assumptions at the date of the financial statements. Actual results could differ from those estimates. Subsequent events, if any, through the date that the financial statements were issued have been evaluated in the preparation of the financial statements. The following summarizes the significant accounting policies of the Fund:
Investment Valuation. Investments are valued as of 4:00 p.m. Eastern time on the last calendar day of the period. The Board of Trustees (the Board) has delegated the day to day responsibility for the valuation of the Fund's investments to the Fair Value Committee (the Committee) established by the Fund's investment adviser. In accordance with valuation policies and procedures approved by the Board, the Fund attempts to obtain prices from one or more third party pricing vendors or brokers to value its investments. When current market prices, quotations or currency exchange rates are not readily available or reliable, investments will be fair valued in good faith by the Committee, in accordance with procedures adopted by the Board. Factors used in determining fair value vary by investment type and may include market or investment specific events. The frequency with which these procedures are used cannot be predicted and they may be utilized to a significant extent. The Committee oversees the Fund's valuation policies and procedures and reports to the Board on the Committee's activities and fair value determinations. The Board monitors the appropriateness of the procedures used in valuing the Fund's investments and ratifies the fair value determinations of the Committee.
The Fund categorizes the inputs to valuation techniques used to value its investments into a disclosure hierarchy consisting of three levels as shown below:
- Level 1 – quoted prices in active markets for identical investments
- Level 2 – other significant observable inputs (including quoted prices for similar investments, interest rates, prepayment speeds, etc.)
- Level 3 – unobservable inputs (including the Fund's own assumptions based on the best information available)
Valuation techniques used to value the Fund's investments by major category are as follows:
Equity securities, including restricted securities, for which market quotations are readily available, are valued at the last reported sale price or official closing price as reported by a third party pricing vendor on the primary market or exchange on which they are traded and are categorized as Level 1 in the hierarchy. In the event there were no sales during the day or closing prices are not available, securities are valued at the last quoted bid price or may be valued using the last available price and are generally categorized as Level 2 in the hierarchy. For foreign equity securities, when market or security specific events arise, comparisons to the valuation of American Depositary Receipts (ADRs), futures contracts, Exchange-Traded Funds (ETFs) and certain indexes as well as quoted prices for similar securities may be used and would be categorized as Level 2 in the hierarchy. For equity securities, including restricted securities, where observable inputs are limited, assumptions about market activity and risk are used and these securities may be categorized as Level 3 in the hierarchy.
Debt securities, including restricted securities, are valued based on evaluated prices received from third party pricing vendors or from brokers who make markets in such securities. Corporate bonds and U.S. government and government agency obligations are valued by pricing vendors who utilize matrix pricing which considers yield or price of bonds of comparable quality, coupon, maturity and type or by broker-supplied prices. When independent prices are unavailable or unreliable, debt securities may be valued utilizing pricing methodologies which consider similar factors that would be used by third party pricing vendors. Debt securities are generally categorized as Level 2 in the hierarchy but may be Level 3 depending on the circumstances.
Futures contracts are valued at the settlement price established each day by the board of trade or exchange on which they are traded and are categorized as Level 1 in the hierarchy. Investments in open-end mutual funds, including the Fidelity Central Funds, are valued at their closing net asset value (NAV) each business day and are categorized as Level 1 in the hierarchy.
Changes in valuation techniques may result in transfers in or out of an assigned level within the disclosure hierarchy. The aggregate value of investments by input level as of October 31, 2019 is included at the end of the Fund's Schedule of Investments.
Foreign Currency. The Fund may use foreign currency contracts to facilitate transactions in foreign-denominated securities. Gains and losses from these transactions may arise from changes in the value of the foreign currency or if the counterparties do not perform under the contracts' terms.
Foreign-denominated assets, including investment securities, and liabilities are translated into U.S. dollars at the exchange rates at period end. Purchases and sales of investment securities, income and dividends received and expenses denominated in foreign currencies are translated into U.S. dollars at the exchange rate in effect on the transaction date.
The effects of exchange rate fluctuations on investments are included with the net realized and unrealized gain (loss) on investment securities. Other foreign currency transactions resulting in realized and unrealized gain (loss) are disclosed separately.
Investment Transactions and Income. For financial reporting purposes, the Fund's investment holdings and NAV include trades executed through the end of the last business day of the period. The NAV per share for processing shareholder transactions is calculated as of the close of business of the New York Stock Exchange (NYSE), normally 4:00 p.m. Eastern time and includes trades executed through the end of the prior business day. Gains and losses on securities sold are determined on the basis of identified cost. Dividend income is recorded on the ex-dividend date, except for certain dividends from foreign securities where the ex-dividend date may have passed, which are recorded as soon as the Fund is informed of the ex-dividend date. Non-cash dividends included in dividend income, if any, are recorded at the fair market value of the securities received. Income and capital gain distributions from Fidelity Central Funds, if any, are recorded on the ex-dividend date. Certain distributions received by the Fund represent a return of capital or capital gain. The Fund determines the components of these distributions subsequent to the ex-dividend date, based upon receipt of tax filings or other correspondence relating to the underlying investment. These distributions are recorded as a reduction of cost of investments and/or as a realized gain. Interest income is accrued as earned and includes coupon interest and amortization of premium and accretion of discount on debt securities as applicable. Investment income is recorded net of foreign taxes withheld where recovery of such taxes is uncertain.
Class Allocations and Expenses. Investment income, realized and unrealized capital gains and losses, common expenses of the Fund, and certain fund-level expense reductions, if any, are allocated daily on a pro-rata basis to each class based on the relative net assets of each class to the total net assets of the Fund. Each class differs with respect to fees incurred. Certain expense reductions may also differ by class. For the reporting period, the allocated portion of income and expenses to each class as a percent of its average net assets may vary due to the timing of recording these transactions in relation to fluctuating net assets of the classes. Expenses directly attributable to a fund are charged to that fund. Expenses attributable to more than one fund are allocated among the respective funds on the basis of relative net assets or other appropriate methods. Expense estimates are accrued in the period to which they relate and adjustments are made when actual amounts are known.
Income Tax Information and Distributions to Shareholders. Each year, the Fund intends to qualify as a regulated investment company under Subchapter M of the Internal Revenue Code, including distributing substantially all of its taxable income and realized gains. As a result, no provision for U.S. Federal income taxes is required. As of October 31, 2019, the Fund did not have any unrecognized tax benefits in the financial statements; nor is the Fund aware of any tax positions for which it is reasonably possible that the total amounts of unrecognized tax benefits will significantly change in the next twelve months. The Fund files a U.S. federal tax return, in addition to state and local tax returns as required. The Fund's federal income tax returns are subject to examination by the Internal Revenue Service (IRS) for a period of three fiscal years after they are filed. State and local tax returns may be subject to examination for an additional fiscal year depending on the jurisdiction. Foreign taxes are provided for based on the Fund's understanding of the tax rules and rates that exist in the foreign markets in which it invests. The Fund is subject to a tax imposed on capital gains by certain countries in which it invests. An estimated deferred tax liability for net unrealized appreciation on the applicable securities is included in Other payables and accrued expenses on the Statement of Assets & Liabilities.
Distributions are declared and recorded on the ex-dividend date. Income and capital gain distributions are declared separately for each class. Income and capital gain distributions are determined in accordance with income tax regulations, which may differ from GAAP. In addition, the Fund claimed a portion of the payment made to redeeming shareholders as a distribution for income tax purposes.
Capital accounts within the financial statements are adjusted for permanent book-tax differences. These adjustments have no impact on net assets or the results of operations. Capital accounts are not adjusted for temporary book-tax differences which will reverse in a subsequent period.
Book-tax differences are primarily due to futures contracts, foreign currency transactions, certain foreign taxes, passive foreign investment companies (PFIC), partnerships, market discount, certain deemed distributions, and losses deferred due to wash sales.
As of period end, the cost and unrealized appreciation (depreciation) in securities, and derivatives if applicable, for federal income tax purposes were as follows:
| Gross unrealized appreciation | $323,617,108 |
| Gross unrealized depreciation | (239,164,413) |
| Net unrealized appreciation (depreciation) | $84,452,695 |
| Tax Cost | $3,179,286,793 |
The tax-based components of distributable earnings as of period end were as follows:
| Undistributed ordinary income | $79,223,304 |
| Net unrealized appreciation (depreciation) on securities and other investments | $84,464,496 |
The tax character of distributions paid was as follows:
| | October 31, 2019 | October 31, 2018 |
| Ordinary Income | $29,366,688 | $ 11,596,216 |
| Long-term Capital Gains | – | 1,143,103 |
| Total | $29,366,688 | $ 12,739,319 |
Restricted Securities. The Fund may invest in securities that are subject to legal or contractual restrictions on resale. These securities generally may be resold in transactions exempt from registration or to the public if the securities are registered. Disposal of these securities may involve time-consuming negotiations and expense, and prompt sale at an acceptable price may be difficult. Information regarding restricted securities is included at the end of the Fund's Schedule of Investments.
4. Derivative Instruments.
Risk Exposures and the Use of Derivative Instruments. The Fund's investment objective allows the Fund to enter into various types of derivative contracts, including futures contracts. Derivatives are investments whose value is primarily derived from underlying assets, indices or reference rates and may be transacted on an exchange or over-the-counter (OTC). Derivatives may involve a future commitment to buy or sell a specified asset based on specified terms, to exchange future cash flows at periodic intervals based on a notional principal amount, or for one party to make one or more payments upon the occurrence of specified events in exchange for periodic payments from the other party.
The Fund used derivatives to increase returns and to manage exposure to certain risks as defined below. The success of any strategy involving derivatives depends on analysis of numerous economic factors, and if the strategies for investment do not work as intended, the Fund may not achieve its objectives.
The Fund's use of derivatives increased or decreased its exposure to the following risk:
| Equity Risk | Equity risk relates to the fluctuations in the value of financial instruments as a result of changes in market prices (other than those arising from interest rate risk or foreign exchange risk), whether caused by factors specific to an individual investment, its issuer, or all factors affecting all instruments traded in a market or market segment.
|
The Fund is also exposed to additional risks from investing in derivatives, such as liquidity risk and counterparty credit risk. Liquidity risk is the risk that the Fund will be unable to close out the derivative in the open market in a timely manner. Counterparty credit risk is the risk that the counterparty will not be able to fulfill its obligation to the Fund. Counterparty credit risk related to exchange-traded futures contracts may be mitigated by the protection provided by the exchange on which they trade.
Investing in derivatives may involve greater risks than investing in the underlying assets directly and, to varying degrees, may involve risk of loss in excess of any initial investment and collateral received and amounts recognized in the Statement of Assets and Liabilities. In addition, there may be the risk that the change in value of the derivative contract does not correspond to the change in value of the underlying instrument.
Futures Contracts. A futures contract is an agreement between two parties to buy or sell a specified underlying instrument for a fixed price at a specified future date. The Fund used futures contracts to manage its exposure to the stock market.
Upon entering into a futures contract, a fund is required to deposit either cash or securities (initial margin) with a clearing broker in an amount equal to a certain percentage of the face value of the contract. Futures contracts are marked-to-market daily and subsequent daily payments (variation margin) are made or received by a fund depending on the daily fluctuations in the value of the futures contracts and are recorded as unrealized appreciation or (depreciation). This receivable and/or payable, if any, is included in daily variation margin on futures contracts in the Statement of Assets and Liabilities. Realized gain or (loss) is recorded upon the expiration or closing of a futures contract. The net realized gain (loss) and change in net unrealized appreciation (depreciation) on futures contracts during the period is presented in the Statement of Operations.
Any open futures contracts at period end are presented in the Schedule of Investments under the caption "Futures Contracts". The notional amount at value reflects each contract's exposure to the underlying instrument or index at period end and is representative of volume of activity during the period. Securities deposited to meet initial margin requirements are identified in the Schedule of Investments.
5. Purchases and Sales of Investments.
Purchases and sales of securities, other than short-term securities, aggregated $1,964,659,564 and $82,061,228, respectively.
6. Fees and Other Transactions with Affiliates.
Management Fee. Fidelity Management & Research Company (the investment adviser) and its affiliates provide the Fund with investment management related services for which the Fund pays a monthly management fee. The management fee is based on an annual rate of .06% of the Fund's average net assets. Under the management contract, the investment adviser pays all other fund-level operating expenses, except the compensation of the independent Trustees and certain other expenses such as interest expense, including commitment fees. During July 2019, the Board approved to change the management fee structure from a flat fee to a unitary fee effective August 1, 2019, which eliminated the need for a separate expense contract. There is no change to the total expenses paid by the shareholders.
Prior to August 1, 2019, under the expense contract, the investment adviser paid class-level expenses as necessary so that the total expenses did not exceed .06% of each class' average net assets on an annual basis with certain exceptions.
Sub-Adviser. Geode Capital Management, LLC (Geode), serves as sub-adviser for the Fund. Geode provides discretionary investment advisory services to the Fund and is paid by the investment adviser for providing these services.
Interfund Lending Program. Pursuant to an Exemptive Order issued by the SEC, the Fund, along with other registered investment companies having management contracts with Fidelity Management & Research Company (FMR) or other affiliated entities of FMR, may participate in an interfund lending program. This program provides an alternative credit facility allowing the funds to borrow from, or lend money to, other participating affiliated funds. At period end, there were no interfund loans outstanding. The Fund's activity in this program during the period for which loans were outstanding was as follows:
| Borrower or Lender | Average Loan Balance | Weighted Average Interest Rate | Interest Expense |
| Borrower | $7,011,000 | 2.10% | $1,226 |
Interfund Trades. The Fund may purchase from or sell securities to other Fidelity Funds under procedures adopted by the Board. The procedures have been designed to ensure these interfund trades are executed in accordance with Rule 17a-7 of the 1940 Act. Interfund trades are included within the respective purchases and sales amounts shown in the Purchases and Sales of Investments note.
7. Committed Line of Credit.
The Fund participates with other funds managed by the investment adviser or an affiliate in a $4.25 billion credit facility (the "line of credit") to be utilized for temporary or emergency purposes to fund shareholder redemptions or for other short-term liquidity purposes. The Fund has agreed to pay commitment fees on its pro-rata portion of the line of credit, which amounted to $5,813 and is reflected in Commitment fees on the Statement of Operations. During the period, the Fund did not borrow on this line of credit.
8. Security Lending.
The Fund lends portfolio securities from time to time in order to earn additional income. For equity securities, lending agents are used, including National Financial Services (NFS), an affiliate of the Fund. Pursuant to a securities lending agreement, NFS will receive a fee, which is capped at 9.9% of daily lending revenue, for its services as lending agent. The Fund may lend securities to certain qualified borrowers, including NFS. On the settlement date of the loan, the Fund receives collateral (in the form of U.S. Treasury obligations, letters of credit and/or cash) against the loaned securities and maintains collateral in an amount not less than 100% of the market value of the loaned securities during the period of the loan. The market value of the loaned securities is determined at the close of business of the Fund and any additional required collateral is delivered to the Fund on the next business day. The Fund or borrower may terminate the loan at any time, and if the borrower defaults on its obligation to return the securities loaned because of insolvency or other reasons, the Fund may apply collateral received from the borrower against the obligation. The Fund may experience delays and costs in recovering the securities loaned. Any cash collateral received is invested in the Fidelity Securities Lending Cash Central Fund. The value of loaned securities and cash collateral at period end are disclosed on the Fund's Statement of Assets and Liabilities. At period end, there were no security loans outstanding with NFS, as affiliated borrower. Total fees paid by the Fund to NFS, as lending agent, amounted to $2,904. Security lending income represents the income earned on investing cash collateral, less rebates paid to borrowers and any lending agent fees associated with the loan, plus any premium payments received for lending certain types of securities. Security lending income is presented in the Statement of Operations as a component of income from Fidelity Central Funds, and includes $350 from securities loaned to NFS, as affiliated borrower.
9. Expense Reductions.
Through arrangements with the Fund's custodian, credits realized as a result of certain uninvested cash balances were used to reduce the Fund's expenses. During the period, custodian credits reduced the Fund's expenses by $3,118.
10. Distributions to Shareholders.
Distributions to shareholders of each class were as follows:
| | Year ended
October 31, 2019 | Year ended
October 31, 2018 |
| Distributions to shareholders | | |
| Investor Class | $– | $240,444 |
| Premium Class | – | 7,540,473 |
| Institutional Class | – | 2,474,976 |
| Fidelity Total International Index Fund | 29,366,688 | 2,483,426 |
| Total | $29,366,688 | $12,739,319 |
11. Share Transactions.
Share transactions for each class were as follows and may contain automatic conversions between classes or exchanges between affiliated funds:
| | Shares | Shares | Dollars | Dollars |
| | Year ended October 31, 2019 | Year ended October 31, 2018 | Year ended October 31, 2019 | Year ended October 31, 2018 |
| Investor Class | | | | |
| Shares sold | 18,656 | 2,271,802 | $212,470 | $28,292,302 |
| Reinvestment of distributions | – | 19,410 | – | 236,609 |
| Shares redeemed | (1,838,722) | (1,525,971) | (20,778,358) | (19,099,753) |
| Net increase (decrease) | (1,820,066) | 765,241 | $(20,565,888) | $9,429,158 |
| Premium Class | | | | |
| Shares sold | 749,820 | 38,944,563 | $8,552,900 | $481,016,695 |
| Reinvestment of distributions | – | 578,359 | – | 7,050,193 |
| Shares redeemed | (50,634,660) | (21,258,693) | (572,404,366) | (253,769,567) |
| Net increase (decrease) | (49,884,840) | 18,264,229 | $(563,851,466) | $234,297,321 |
| Institutional Class | | | | |
| Shares sold | 11,248 | 26,080,594 | $127,638 | $322,527,531 |
| Reinvestment of distributions | – | 202,632 | – | 2,470,085 |
| Shares redeemed | (8,685,711) | (26,048,101) | (98,214,683) | (301,741,078) |
| Net increase (decrease) | (8,674,463) | 235,125 | $(98,087,045) | $23,256,538 |
| Fidelity Total International Index Fund | | | | |
| Shares sold | 262,446,248 | 44,428,194 | $2,966,946,794 | $514,699,906 |
| Reinvestment of distributions | 2,613,038 | 203,727 | 27,959,510 | 2,483,426 |
| Shares redeemed | (48,824,886) | (2,647,162) | (560,431,230) | (30,595,667) |
| Net increase (decrease) | 216,234,400 | 41,984,759 | $2,434,475,074 | $486,587,665 |
12. Other.
The Fund's organizational documents provide former and current trustees and officers with a limited indemnification against liabilities arising in connection with the performance of their duties to the Fund. In the normal course of business, the Fund may also enter into contracts that provide general indemnifications. The Fund's maximum exposure under these arrangements is unknown as this would be dependent on future claims that may be made against the Fund. The risk of material loss from such claims is considered remote.
Report of Independent Registered Public Accounting Firm
To the Board of Trustees of Fidelity Salem Street Trust and Shareholders of Fidelity Total International Index Fund:
Opinion on the Financial Statements
We have audited the accompanying statement of assets and liabilities, including the schedule of investments, of Fidelity Total International Index Fund (one of the funds constituting Fidelity Salem Street Trust, referred to hereafter as the “Fund”) as of October 31, 2019, the related statement of operations for the year ended October 31, 2019, the statement of changes in net assets for each of the two years in the period ended October 31, 2019, including the related notes, and the financial highlights for each of the three years in the period ended October 31, 2019 and for the period June 07, 2016 (commencement of operations) through October 31, 2016 (collectively referred to as the “financial statements”). In our opinion, the financial statements present fairly, in all material respects, the financial position of the Fund as of October 31, 2019, the results of its operations for the year then ended, the changes in its net assets for each of the two years in the period ended October 31, 2019 and the financial highlights for each of the three years in the period ended October 31, 2019 and for the period June 07, 2016 (commencement of operations) through October 31, 2016 in conformity with accounting principles generally accepted in the United States of America.
Basis for Opinion
These financial statements are the responsibility of the Fund’s management. Our responsibility is to express an opinion on the Fund’s financial statements based on our audits. We are a public accounting firm registered with the Public Company Accounting Oversight Board (United States) (PCAOB) and are required to be independent with respect to the Fund in accordance with the U.S. federal securities laws and the applicable rules and regulations of the Securities and Exchange Commission and the PCAOB.
We conducted our audits of these financial statements in accordance with the standards of the PCAOB. Those standards require that we plan and perform the audit to obtain reasonable assurance about whether the financial statements are free of material misstatement, whether due to error or fraud.
Our audits included performing procedures to assess the risks of material misstatement of the financial statements, whether due to error or fraud, and performing procedures that respond to those risks. Such procedures included examining, on a test basis, evidence regarding the amounts and disclosures in the financial statements. Our audits also included evaluating the accounting principles used and significant estimates made by management, as well as evaluating the overall presentation of the financial statements. Our procedures included confirmation of securities owned as of October 31, 2019 by correspondence with the custodian and brokers; when replies were not received from brokers, we performed other auditing procedures. We believe that our audits provide a reasonable basis for our opinion.
PricewaterhouseCoopers LLP
Boston, Massachusetts
December 13, 2019
We have served as the auditor of one or more investment companies in the Fidelity group of funds since 1932.
Trustees and Officers
The Trustees, Members of the Advisory Board (if any), and officers of the trust and fund, as applicable, are listed below. The Board of Trustees governs the fund and is responsible for protecting the interests of shareholders. The Trustees are experienced executives who meet periodically throughout the year to oversee the fund's activities, review contractual arrangements with companies that provide services to the fund, oversee management of the risks associated with such activities and contractual arrangements, and review the fund's performance. Except for Jonathan Chiel, each of the Trustees oversees 298 funds. Mr. Chiel oversees 171 funds.
The Trustees hold office without limit in time except that (a) any Trustee may resign; (b) any Trustee may be removed by written instrument, signed by at least two-thirds of the number of Trustees prior to such removal; (c) any Trustee who requests to be retired or who has become incapacitated by illness or injury may be retired by written instrument signed by a majority of the other Trustees; and (d) any Trustee may be removed at any special meeting of shareholders by a two-thirds vote of the outstanding voting securities of the trust. Each Trustee who is not an interested person (as defined in the 1940 Act) of the trust and the fund is referred to herein as an Independent Trustee. Each Independent Trustee shall retire not later than the last day of the calendar year in which his or her 75th birthday occurs. The Independent Trustees may waive this mandatory retirement age policy with respect to individual Trustees. Officers and Advisory Board Members hold office without limit in time, except that any officer or Advisory Board Member may resign or may be removed by a vote of a majority of the Trustees at any regular meeting or any special meeting of the Trustees. Except as indicated, each individual has held the office shown or other offices in the same company for the past five years.
The fund’s Statement of Additional Information (SAI) includes more information about the Trustees. To request a free copy, call Fidelity at 1-800-544-8544.
Experience, Skills, Attributes, and Qualifications of the Trustees. The Governance and Nominating Committee has adopted a statement of policy that describes the experience, qualifications, attributes, and skills that are necessary and desirable for potential Independent Trustee candidates (Statement of Policy). The Board believes that each Trustee satisfied at the time he or she was initially elected or appointed a Trustee, and continues to satisfy, the standards contemplated by the Statement of Policy. The Governance and Nominating Committee also engages professional search firms to help identify potential Independent Trustee candidates who have the experience, qualifications, attributes, and skills consistent with the Statement of Policy. From time to time, additional criteria based on the composition and skills of the current Independent Trustees, as well as experience or skills that may be appropriate in light of future changes to board composition, business conditions, and regulatory or other developments, have also been considered by the professional search firms and the Governance and Nominating Committee. In addition, the Board takes into account the Trustees' commitment and participation in Board and committee meetings, as well as their leadership of standing and ad hoc committees throughout their tenure.
In determining that a particular Trustee was and continues to be qualified to serve as a Trustee, the Board has considered a variety of criteria, none of which, in isolation, was controlling. The Board believes that, collectively, the Trustees have balanced and diverse experience, qualifications, attributes, and skills, which allow the Board to operate effectively in governing the fund and protecting the interests of shareholders. Information about the specific experience, skills, attributes, and qualifications of each Trustee, which in each case led to the Board's conclusion that the Trustee should serve (or continue to serve) as a trustee of the fund, is provided below.
Board Structure and Oversight Function. Abigail P. Johnson is an interested person and currently serves as Chairman. The Trustees have determined that an interested Chairman is appropriate and benefits shareholders because an interested Chairman has a personal and professional stake in the quality and continuity of services provided to the fund. Independent Trustees exercise their informed business judgment to appoint an individual of their choosing to serve as Chairman, regardless of whether the Trustee happens to be independent or a member of management. The Independent Trustees have determined that they can act independently and effectively without having an Independent Trustee serve as Chairman and that a key structural component for assuring that they are in a position to do so is for the Independent Trustees to constitute a substantial majority for the Board. The Independent Trustees also regularly meet in executive session. Arthur E. Johnson serves as Chairman of the Independent Trustees and as such (i) acts as a liaison between the Independent Trustees and management with respect to matters important to the Independent Trustees and (ii) with management prepares agendas for Board meetings.
Fidelity® funds are overseen by different Boards of Trustees. The fund's Board oversees Fidelity's investment-grade bond, money market, asset allocation and certain equity funds, and other Boards oversee Fidelity's high income and other equity funds. The asset allocation funds may invest in Fidelity® funds that are overseen by such other Boards. The use of separate Boards, each with its own committee structure, allows the Trustees of each group of Fidelity® funds to focus on the unique issues of the funds they oversee, including common research, investment, and operational issues. On occasion, the separate Boards establish joint committees to address issues of overlapping consequences for the Fidelity® funds overseen by each Board.
The Trustees operate using a system of committees to facilitate the timely and efficient consideration of all matters of importance to the Trustees, the fund, and fund shareholders and to facilitate compliance with legal and regulatory requirements and oversight of the fund's activities and associated risks. The Board, acting through its committees, has charged FMR and its affiliates with (i) identifying events or circumstances the occurrence of which could have demonstrably adverse effects on the fund's business and/or reputation; (ii) implementing processes and controls to lessen the possibility that such events or circumstances occur or to mitigate the effects of such events or circumstances if they do occur; and (iii) creating and maintaining a system designed to evaluate continuously business and market conditions in order to facilitate the identification and implementation processes described in (i) and (ii) above. Because the day-to-day operations and activities of the fund are carried out by or through FMR, its affiliates, and other service providers, the fund's exposure to risks is mitigated but not eliminated by the processes overseen by the Trustees. While each of the Board's committees has responsibility for overseeing different aspects of the fund's activities, oversight is exercised primarily through the Operations and Audit Committees. In addition, an ad hoc Board committee of Independent Trustees has worked with FMR to enhance the Board's oversight of investment and financial risks, legal and regulatory risks, technology risks, and operational risks, including the development of additional risk reporting to the Board. Appropriate personnel, including but not limited to the fund's Chief Compliance Officer (CCO), FMR's internal auditor, the independent accountants, the fund's Treasurer and portfolio management personnel, make periodic reports to the Board's committees, as appropriate, including an annual review of Fidelity's risk management program for the Fidelity® funds. The responsibilities of each standing committee, including their oversight responsibilities, are described further under "Standing Committees of the Trustees."
Interested Trustees*:
Correspondence intended for a Trustee who is an interested person may be sent to Fidelity Investments, 245 Summer Street, Boston, Massachusetts 02210.
Name, Year of Birth; Principal Occupations and Other Relevant Experience+
Jonathan Chiel (1957)
Year of Election or Appointment: 2016
Trustee
Mr. Chiel also serves as Trustee of other Fidelity® funds. Mr. Chiel is Executive Vice President and General Counsel for FMR LLC (diversified financial services company, 2012-present). Previously, Mr. Chiel served as general counsel (2004-2012) and senior vice president and deputy general counsel (2000-2004) for John Hancock Financial Services; a partner with Choate, Hall & Stewart (1996-2000) (law firm); and an Assistant United States Attorney for the United States Attorney’s Office of the District of Massachusetts (1986-95), including Chief of the Criminal Division (1993-1995). Mr. Chiel is a director on the boards of the Boston Bar Foundation and the Maimonides School.
Abigail P. Johnson (1961)
Year of Election or Appointment: 2009
Trustee
Chairman of the Board of Trustees
Ms. Johnson also serves as Trustee of other Fidelity® funds. Ms. Johnson serves as Chairman (2016-present), Chief Executive Officer (2014-present), and Director (2007-present) of FMR LLC (diversified financial services company), President of Fidelity Financial Services (2012-present) and President of Personal, Workplace and Institutional Services (2005-present). Ms. Johnson is Chairman and Director of FMR Co., Inc. (investment adviser firm, 2011-present) and Chairman and Director of FMR (investment adviser firm, 2011-present). Previously, Ms. Johnson served as Vice Chairman (2007-2016) and President (2013-2016) of FMR LLC, President and a Director of FMR (2001-2005), a Trustee of other investment companies advised by FMR, Fidelity Investments Money Management, Inc. (investment adviser firm), and FMR Co., Inc. (2001-2005), Senior Vice President of the Fidelity® funds (2001-2005), and managed a number of Fidelity® funds. Ms. Abigail P. Johnson and Mr. Arthur E. Johnson are not related.
Jennifer Toolin McAuliffe (1959)
Year of Election or Appointment: 2016
Trustee
Ms. McAuliffe also serves as Trustee of other Fidelity® funds. Ms. McAuliffe previously served as a Member of the Advisory Board of certain Fidelity® funds (2016) and as Co-Head of Fixed Income of Fidelity Investments Limited (now known as FIL Limited (FIL)) (diversified financial services company). Earlier roles at FIL included Director of Research for FIL’s credit and quantitative teams in London, Hong Kong and Tokyo. Ms. McAuliffe also was the Director of Research for taxable and municipal bonds at Fidelity Investments Money Management, Inc. Ms. McAuliffe is also a director or trustee of several not-for-profit entities.
* Determined to be an “Interested Trustee” by virtue of, among other things, his or her affiliation with the trust or various entities under common control with FMR.
+ The information includes the Trustee's principal occupation during the last five years and other information relating to the experience, attributes, and skills relevant to the Trustee's qualifications to serve as a Trustee, which led to the conclusion that the Trustee should serve as a Trustee for the fund.
Independent Trustees:
Correspondence intended for an Independent Trustee may be sent to Fidelity Investments, P.O. Box 55235, Boston, Massachusetts 02205-5235.
Name, Year of Birth; Principal Occupations and Other Relevant Experience+
Elizabeth S. Acton (1951)
Year of Election or Appointment: 2013
Trustee
Ms. Acton also serves as Trustee of other Fidelity® funds. Prior to her retirement in April 2012, Ms. Acton was Executive Vice President, Finance (2011-2012), Executive Vice President, Chief Financial Officer (2002-2011), and Treasurer (2004-2005) of Comerica Incorporated (financial services). Prior to joining Comerica, Ms. Acton held a variety of positions at Ford Motor Company (1983-2002), including Vice President and Treasurer (2000-2002) and Executive Vice President and Chief Financial Officer of Ford Motor Credit Company (1998-2000). Ms. Acton currently serves as a member of the Board of Directors and Audit and Finance Committees of Beazer Homes USA, Inc. (homebuilding, 2012-present). Previously, Ms. Acton served as a Member of the Advisory Board of certain Fidelity® funds (2013-2016).
Ann E. Dunwoody (1953)
Year of Election or Appointment: 2018
Trustee
General Dunwoody also serves as Trustee of other Fidelity® funds. General Dunwoody (United States Army, Retired) was the first woman in U.S. military history to achieve the rank of four-star general and prior to her retirement in 2012 held a variety of positions within the U.S. Army, including Commanding General, U.S. Army Material Command (2008-2012). She is the President of First to Four LLC (leadership and mentoring services, 2012-present). She also serves as a member of the Board of Directors and Nominating and Corporate Governance Committee of L3 Technologies, Inc. (communication, electronic, sensor, and aerospace systems, 2013-present), Board of Directors and Nomination and Corporate Governance Committees of Kforce Inc. (professional staffing services, 2016-present) and Board of Directors of Automattic Inc. (software engineering, 2018-present). Previously, General Dunwoody served as a Member of the Advisory Board of certain Fidelity® funds (2018), a member of the Board of Directors and Audit and Sustainability and Corporate Responsibility Committees of Republic Services, Inc. (waste collection, disposal and recycling, 2013-2016). Ms. Dunwoody also serves on several boards for non-profit organizations, including as a member of the Board of Directors, Chair of the Nomination and Governance Committee and member of the Audit Committee of Logistics Management Institute (consulting non-profit, 2012-present), a member of the Board of Directors of the Army Historical Foundation (2015-present), a member of the Council of Trustees for the Association of the United States Army (advocacy non-profit, 2013-present) and a member of the Board of Trustees of Florida Institute of Technology (2015-present) and ThanksUSA (military family education non-profit, 2014-present).
John Engler (1948)
Year of Election or Appointment: 2014
Trustee
Mr. Engler also serves as Trustee of other Fidelity® funds. He serves on the board of directors for Universal Forest Products (manufacturer and distributor of wood and wood-alternative products, 2003-present) and K12 Inc. (technology-based education company, 2012-present). Previously, Mr. Engler served as interim president of Michigan State University (2018-2019), a Member of the Advisory Board of certain Fidelity® funds (2014-2016), president of the Business Roundtable (2011-2017), a trustee of The Munder Funds (2003-2014), president and CEO of the National Association of Manufacturers (2004-2011), member of the Board of Trustees of the Annie E. Casey Foundation (2004-2015), and as governor of Michigan (1991-2003). He is a past chairman of the National Governors Association.
Robert F. Gartland (1951)
Year of Election or Appointment: 2010
Trustee
Mr. Gartland also serves as Trustee of other Fidelity® funds. Mr. Gartland is Chairman and an investor in Gartland & Mellina Group Corp. (consulting, 2009-present). Previously, Mr. Gartland served as a partner and investor of Vietnam Partners LLC (investments and consulting, 2008-2011). Prior to his retirement, Mr. Gartland held a variety of positions at Morgan Stanley (financial services, 1979-2007), including Managing Director (1987-2007), and Chase Manhattan Bank (1975-1978).
Arthur E. Johnson (1947)
Year of Election or Appointment: 2008
Trustee
Chairman of the Independent Trustees
Mr. Johnson also serves as Trustee of other Fidelity® funds. Mr. Johnson serves as a member of the Board of Directors of Eaton Corporation plc (diversified power management, 2009-present) and Booz Allen Hamilton (management consulting, 2011-present). Prior to his retirement, Mr. Johnson served as Senior Vice President of Corporate Strategic Development of Lockheed Martin Corporation (defense contractor, 1999-2009). Mr. Johnson previously served as Vice Chairman (2015-2018) of the Independent Trustees of certain Fidelity® funds and on the Board of Directors of IKON Office Solutions, Inc. (1999-2008), AGL Resources, Inc. (holding company, 2002-2016), and Delta Airlines (2005-2007). Mr. Arthur E. Johnson is not related to Ms. Abigail P. Johnson.
Michael E. Kenneally (1954)
Year of Election or Appointment: 2009
Trustee
Vice Chairman of the Independent Trustees
Mr. Kenneally also serves as Trustee of other Fidelity® funds. Prior to his retirement, Mr. Kenneally served as Chairman and Global Chief Executive Officer of Credit Suisse Asset Management. Before joining Credit Suisse, he was an Executive Vice President and Chief Investment Officer for Bank of America Corporation. Earlier roles at Bank of America included Director of Research, Senior Portfolio Manager and Research Analyst, and Mr. Kenneally was awarded the Chartered Financial Analyst (CFA) designation in 1991.
Marie L. Knowles (1946)
Year of Election or Appointment: 2001
Trustee
Ms. Knowles also serves as Trustee of other Fidelity® funds. Prior to Ms. Knowles' retirement in June 2000, she served as Executive Vice President and Chief Financial Officer of Atlantic Richfield Company (ARCO) (diversified energy, 1996-2000). From 1993 to 1996, she was a Senior Vice President of ARCO and President of ARCO Transportation Company (pipeline and tanker operations). Ms. Knowles currently serves as a Director and Chairman of the Audit Committee of McKesson Corporation (healthcare service, since 2002). Ms. Knowles is a member of the Board of the Santa Catalina Island Company (real estate, 2009-present). Ms. Knowles is a Member of the Investment Company Institute Board of Governors and a Member of the Governing Council of the Independent Directors Council (2014-present). She also serves as a member of the Advisory Board for the School of Engineering of the University of Southern California. Previously, Ms. Knowles served as a Director of Phelps Dodge Corporation (copper mining and manufacturing, 1994-2007), URS Corporation (engineering and construction, 2000-2003) and America West (airline, 1999-2002). Ms. Knowles previously served as Chairman (2015-2018) and Vice Chairman (2012-2015) of the Independent Trustees of certain Fidelity® funds.
Mark A. Murray (1954)
Year of Election or Appointment: 2016
Trustee
Mr. Murray also serves as Trustee of other Fidelity® funds. Mr. Murray is Vice Chairman (2013-present) of Meijer, Inc. (regional retail chain). Previously, Mr. Murray served as a Member of the Advisory Board of certain Fidelity® funds (2016) and as Co-Chief Executive Officer (2013-2016) and President (2006-2013) of Meijer, Inc. Mr. Murray serves as a member of the Board of Directors and Nuclear Review and Public Policy and Responsibility Committees of DTE Energy Company (diversified energy company, 2009-present). Mr. Murray also serves as a member of the Board of Directors of Spectrum Health (not-for-profit health system, 2015-present). Mr. Murray previously served as President of Grand Valley State University (2001-2006), Treasurer for the State of Michigan (1999-2001), Vice President of Finance and Administration for Michigan State University (1998-1999), and a member of the Board of Directors and Audit Committee and Chairman of the Nominating and Corporate Governance Committee of Universal Forest Products, Inc. (manufacturer and distributor of wood and wood-alternative products, 2004-2016). Mr. Murray is also a director or trustee of many community and professional organizations.
+ The information includes the Trustee's principal occupation during the last five years and other information relating to the experience, attributes, and skills relevant to the Trustee's qualifications to serve as a Trustee, which led to the conclusion that the Trustee should serve as a Trustee for the fund.
Advisory Board Members and Officers:
Correspondence intended for an officer may be sent to Fidelity Investments, 245 Summer Street, Boston, Massachusetts 02210. Officers appear below in alphabetical order.
Name, Year of Birth; Principal Occupation
Elizabeth Paige Baumann (1968)
Year of Election or Appointment: 2017
Anti-Money Laundering (AML) Officer
Ms. Baumann also serves as AML Officer of other funds. She is Chief AML Officer (2012-present) and Senior Vice President (2014-present) of FMR LLC (diversified financial services company) and is an employee of Fidelity Investments. Previously, Ms. Baumann served as AML Officer of the funds (2012-2016), and Vice President (2007-2014) and Deputy Anti-Money Laundering Officer (2007-2012) of FMR LLC.
Craig S. Brown (1977)
Year of Election or Appointment: 2019
Assistant Treasurer
Mr. Brown also serves as Assistant Treasurer of other funds. Mr. Brown is an employee of Fidelity Investments (2013-present).
John J. Burke III (1964)
Year of Election or Appointment: 2018
Chief Financial Officer
Mr. Burke also serves as Chief Financial Officer of other funds. Mr. Burke serves as Head of Investment Operations for Fidelity Fund and Investment Operations (2018-present) and is an employee of Fidelity Investments (1998-present). Previously Mr. Burke served as head of Asset Management Investment Operations (2012-2018).
Jonathan Davis (1968)
Year of Election or Appointment: 2010
Assistant Treasurer
Mr. Davis also serves as Assistant Treasurer of other funds. Mr. Davis serves as Assistant Treasurer of FMR Capital, Inc. (2017-present) and is an employee of Fidelity Investments. Previously, Mr. Davis served as Vice President and Associate General Counsel of FMR LLC (diversified financial services company, 2003-2010).
Adrien E. Deberghes (1967)
Year of Election or Appointment: 2010
Assistant Treasurer
Mr. Deberghes also serves as an officer of other funds. He serves as Assistant Treasurer of FMR Capital, Inc. (2017-present), Executive Vice President of Fidelity Investments Money Management, Inc. (FIMM) (investment adviser firm, 2016-present), and is an employee of Fidelity Investments (2008-present). Previously, Mr. Deberghes served as President and Treasurer of certain Fidelity® funds (2013-2018). Prior to joining Fidelity Investments, Mr. Deberghes was Senior Vice President of Mutual Fund Administration at State Street Corporation (2007-2008), Senior Director of Mutual Fund Administration at Investors Bank & Trust (2005-2007), and Director of Finance for Dunkin' Brands (2000-2005). Previously, Mr. Deberghes served in other fund officer roles.
Laura M. Del Prato (1964)
Year of Election or Appointment: 2018
President and Treasurer
Ms. Del Prato also serves as an officer of other funds. Ms. Del Prato is an employee of Fidelity Investments (2017-present). Prior to joining Fidelity Investments, Ms. Del Prato served as a Managing Director and Treasurer of the JPMorgan Mutual Funds (2014-2017). Prior to JPMorgan, Ms. Del Prato served as a partner at Cohen Fund Audit Services (accounting firm, 2012-2013) and KPMG LLP (accounting firm, 2004-2012).
Colm A. Hogan (1973)
Year of Election or Appointment: 2016
Assistant Treasurer
Mr. Hogan also serves as an officer of other funds. Mr. Hogan serves as Assistant Treasurer of FMR Capital, Inc. (2017-present) and is an employee of Fidelity Investments (2005-present). Previously, Mr. Hogan served as Assistant Treasurer of certain Fidelity® funds (2016-2018).
Cynthia Lo Bessette (1969)
Year of Election or Appointment: 2019
Secretary and Chief Legal Officer (CLO)
Ms. Lo Bessette also serves as Secretary and CLO of other funds. Ms. Lo Bessette serves as CLO, Secretary, and Senior Vice President of Fidelity Management & Research Company and FMR Co., Inc. (investment adviser firms, 2019-present); Secretary of Fidelity SelectCo, LLC and Fidelity Investments Money Management, Inc. (investment adviser firms, 2019-present); and CLO of Fidelity Management & Research (Hong Kong) Limited, FMR Investment Management (UK) Limited, and Fidelity Management & Research (Japan) Limited (investment adviser firms, 2019-present). She is a Senior Vice President and Deputy General Counsel of FMR LLC (diversified financial services company, 2019-present), and is an employee of Fidelity Investments. Previously, Ms. Lo Bessette served as Executive Vice President, General Counsel (2016-2019) and Senior Vice President, Deputy General Counsel (2015-2016) of OppenheimerFunds (investment management company) and Deputy Chief Legal Officer (2013-2015) of Jennison Associates LLC (investment adviser firm).
Chris Maher (1972)
Year of Election or Appointment: 2013
Assistant Treasurer
Mr. Maher serves as Assistant Treasurer of other funds. Mr. Maher is Vice President of Valuation Oversight, serves as Assistant Treasurer of FMR Capital, Inc. (2017-present), and is an employee of Fidelity Investments. Previously, Mr. Maher served as Vice President of Asset Management Compliance (2013), Vice President of the Program Management Group of FMR (investment adviser firm, 2010-2013), and Vice President of Valuation Oversight (2008-2010).
John B. McGinty, Jr. (1962)
Year of Election or Appointment: 2016
Chief Compliance Officer
Mr. McGinty also serves as Chief Compliance Officer of other funds. Mr. McGinty is Senior Vice President of Asset Management Compliance for Fidelity Investments and is an employee of Fidelity Investments (2016-present). Mr. McGinty previously served as Vice President, Senior Attorney at Eaton Vance Management (investment management firm, 2015-2016), and prior to Eaton Vance as global CCO for all firm operations and registered investment companies at GMO LLC (investment management firm, 2009-2015). Before joining GMO LLC, Mr. McGinty served as Senior Vice President, Deputy General Counsel for Fidelity Investments (2007-2009).
Jason P. Pogorelec (1975)
Year of Election or Appointment: 2015
Assistant Secretary
Mr. Pogorelec also serves as Assistant Secretary of other funds. Mr. Pogorelec serves as Vice President, Associate General Counsel (2010-present) and is an employee of Fidelity Investments (2006-present).
Nancy D. Prior (1967)
Year of Election or Appointment: 2014
Vice President
Ms. Prior also serves as Vice President of other funds. Ms. Prior serves as President of Fixed Income (2014-present), President (2016-present) and Director (2014-present) of Fidelity Investments Money Management, Inc. (FIMM) (investment adviser firm), and is an employee of Fidelity Investments (2002-present). Previously, Ms. Prior served as Vice President of Global Asset Allocation Funds (2017-2019); Vice Chairman of FIAM LLC (investment adviser firm, 2014-2018), a Director of FMR Investment Management (UK) Limited (investment adviser firm, 2015-2018), President Multi-Asset Class Strategies of FMR's Global Asset Allocation Division (2017-2018), Vice President of Fidelity's Money Market Funds (2012-2014), and President, Money Market and Short Duration Bond Group of Fidelity Management & Research Company (FMR) (investment adviser firm, 2013-2014).
Stacie M. Smith (1974)
Year of Election or Appointment: 2013
Assistant Treasurer
Ms. Smith also serves as an officer of other funds. Ms. Smith serves as Assistant Treasurer of FMR Capital, Inc. (2017-present), is an employee of Fidelity Investments (2009-present), and has served in other fund officer roles. Prior to joining Fidelity Investments, Ms. Smith served as Senior Audit Manager of Ernst & Young LLP (accounting firm, 1996-2009). Previously, Ms. Smith served as Assistant Treasurer (2013-2018) and Deputy Treasurer (2013-2016) of certain Fidelity® funds.
Marc L. Spector (1972)
Year of Election or Appointment: 2016
Deputy Treasurer
Mr. Spector also serves as an officer of other funds. Mr. Spector serves as Assistant Treasurer of FMR Capital, Inc. (2017-present) and is an employee of Fidelity Investments (2016-present). Prior to joining Fidelity Investments, Mr. Spector served as Director at the Siegfried Group (accounting firm, 2013-2016), and prior to Siegfried Group as audit senior manager at Deloitte & Touche (accounting firm, 2005-2013).
Jim Wegmann (1979)
Year of Election or Appointment: 2019
Assistant Treasurer
Mr. Wegmann also serves as Assistant Treasurer of other funds. Mr. Wegmann is an employee of Fidelity Investments (2011-present).
Shareholder Expense Example
As a shareholder of the Fund, you incur two types of costs: (1) transaction costs, and (2) ongoing costs, including management fees and other Fund expenses. This Example is intended to help you understand your ongoing costs (in dollars) of investing in the Fund and to compare these costs with the ongoing costs of investing in other mutual funds.
The Example is based on an investment of $1,000 invested at the beginning of the period and held for the entire period (May 1, 2019 to October 31, 2019).
Actual Expenses
The first line of the accompanying table provides information about actual account values and actual expenses. You may use the information in this line, together with the amount you invested, to estimate the expenses that you paid over the period. Simply divide your account value by $1,000.00 (for example, an $8,600 account value divided by $1,000.00 = 8.6), then multiply the result by the number in the first line under the heading entitled "Expenses Paid During Period" to estimate the expenses you paid on your account during this period. In addition, the Fund, as a shareholder in the underlying Fidelity Central Funds, will indirectly bear its pro-rata share of the fees and expenses incurred by the underlying Fidelity Central Funds. These fees and expenses are not included in the Fund's annualized expense ratio used to calculate the expense estimate in the table below.
Hypothetical Example for Comparison Purposes
The second line of the accompanying table provides information about hypothetical account values and hypothetical expenses based on the Fund's actual expense ratio and an assumed rate of return of 5% per year before expenses, which is not the Fund's actual return. The hypothetical account values and expenses may not be used to estimate the actual ending account balance or expenses you paid for the period. You may use this information to compare the ongoing costs of investing in the Fund and other funds. To do so, compare this 5% hypothetical example with the 5% hypothetical examples that appear in the shareholder reports of the other funds. In addition, the Fund, as a shareholder in the underlying Fidelity Central Funds, will indirectly bear its pro-rata share of the fees and expenses incurred by the underlying Fidelity Central Funds. These fees and expenses are not included in the Fund's annualized expense ratio used to calculate the expense estimate in the table below.
Please note that the expenses shown in the table are meant to highlight your ongoing costs only and do not reflect any transaction costs. Therefore, the second line of the table is useful in comparing ongoing costs only, and will not help you determine the relative total costs of owning different funds.
| | Annualized Expense Ratio-A | Beginning
Account Value
May 1, 2019 | Ending
Account Value
October 31, 2019 | Expenses Paid
During Period-B
May 1, 2019
to October 31, 2019 |
| Fidelity Total International Index Fund | .06% | | | |
| Actual | | $1,000.00 | $1,016.80 | $.31 |
| Hypothetical-C | | $1,000.00 | $1,024.90 | $.31 |
A Annualized expense ratio reflects expenses net of applicable fee waivers.
B Expenses are equal to the Fund's annualized expense ratio, multiplied by the average account value over the period, multiplied by 184/365 (to reflect the one-half year period).
C 5% return per year before expenses
Distributions (Unaudited)
The fund hereby designates as a capital gain dividend with respect to the taxable year ended October 31, 2019, $1,753,552 or, if subsequently determined to be different, the net capital gain of such year.
The fund designates 87% of the dividend distributed during the fiscal year as amounts which may be taken into account as a dividend for the purposes of the maximum rate under section 1(h)(11) of the Internal Revenue Code.
The amounts per share which represent income derived from sources within, and taxes paid to, foreign countries or possessions of the United States are $0.2445 and $0.0227 for the dividend paid December 10, 2018.
The fund will notify shareholders in January 2020 of amounts for use in preparing 2019 income tax returns.
Board Approval of Investment Advisory Contracts and Management Fees
Fidelity Total International Index Fund
Each year, the Board of Trustees, including the Independent Trustees (together, the Board), votes on the renewal of the management contract with Fidelity Management & Research Company (FMR) and the sub-advisory agreements (together, the Advisory Contracts) for the fund, including the fund's sub-advisory agreement (Sub-Advisory Agreement) with Geode Capital Management, LLC (Geode). FMR and the sub-advisers are referred to herein as the Investment Advisers. The Board, assisted by the advice of fund counsel and Independent Trustees' counsel, requests and considers a broad range of information relevant to the renewal of the Advisory Contracts throughout the year.
The Board meets regularly and, at each of its meetings, covers an extensive agenda of topics and materials and considers factors that are relevant to its annual consideration of the renewal of the fund's Advisory Contracts, including the services and support provided to the fund and its shareholders. The Board has established four standing committees (Committees) — Operations, Audit, Fair Valuation, and Governance and Nominating — each composed of and chaired by Independent Trustees with varying backgrounds, to which the Board has assigned specific subject matter responsibilities in order to enhance effective decision-making by the Board. The Operations Committee, of which all of the Independent Trustees are members, meets regularly throughout the year and considers, among other matters, information specifically related to the annual consideration of the renewal of the fund's Advisory Contracts. The Board, acting directly and through its Committees, requests and receives information concerning the annual consideration of the renewal of the fund's Advisory Contracts. The Board also meets as needed to review matters specifically related to the Board's annual consideration of the renewal of the Advisory Contracts. Members of the Board may also meet with trustees of other Fidelity funds through joint ad hoc committees to discuss certain matters relevant to all of the Fidelity funds.
At its September 2019 meeting, the Board unanimously determined to renew the fund's Advisory Contracts. In reaching its determination, the Board considered all factors it believed relevant, including (i) the nature, extent, and quality of the services provided to the fund and its shareholders (including the investment performance of the fund); (ii) the competitiveness of the fund's management fee and total expense ratio relative to peer funds; (iii) the total costs of the services provided by and the profits realized by Fidelity and Geode from their respective relationships with the fund; and (iv) the extent to which, if any, economies of scale exist and are realized as the fund grows, and whether any economies of scale are appropriately shared with fund shareholders.
In considering whether to renew the Advisory Contracts for the fund, the Board reached a determination, with the assistance of fund counsel and Independent Trustees' counsel and through the exercise of its business judgment, that the renewal of the Advisory Contracts was in the best interests of the fund and its shareholders and that the compensation payable under the Advisory Contracts was fair and reasonable. The Board's decision to renew the Advisory Contracts was not based on any single factor, but rather was based on a comprehensive consideration of all the information provided to the Board at its meetings throughout the year. The Board, in reaching its determination to renew the Advisory Contracts, was aware that shareholders of the fund have a broad range of investment choices available to them, including a wide choice among funds offered by Fidelity's competitors, and that the fund's shareholders, who have the opportunity to review and weigh the disclosure provided by the fund in its prospectus and other public disclosures, have chosen to invest in this fund, which is part of the Fidelity family of funds.
July 2019 Contract Approval. At its July 2019 meeting, the Board voted to approve an amended and restated management contract to implement a comprehensive unitary fee for the fund (New Contract). In reaching its conclusion to approve the New Contract, the Board considered that it had received and reviewed certain information and made certain findings in connection with the annual renewal of the Advisory Contracts at its September 2018 meeting and considered how, if at all, the approval of the New Contract would change its prior conclusions. The Board considered that the New Contract would implement a comprehensive unitary fee set at the fund's current management fee and expense contract levels and payable to FMR for managing the fund and paying all of the fund's operating expenses, subject to certain exceptions. The Board also noted that the New Contract would not change the investment processes, the level or nature of services provided, the resources and personnel allocated, or trading and compliance operations. Based on its evaluation, and after considering all factors it believed relevant, the Board ultimately concluded that the advisory fee structure in the New Contract is fair and reasonable, and that the New Contract should be approved.
Approval of Amended and Restated Advisory Contracts. At its September 2019 meeting, the Board also unanimously determined to approve an amended and restated management contract and sub-advisory agreement with Geode (Amended and Restated Contracts) in connection with an upcoming consolidation of certain of Fidelity's advisory businesses. The Board considered that, on or about January 1, 2020, FMR Co., Inc. (FMRC) expects to merge with and into FMR and, after the merger, FMR expects to redomicile as a Delaware limited liability company. The Board also approved the termination of the sub-advisory agreement with FMRC upon the completion of the merger. The Board noted that references to FMR in the Amended and Restated Contracts would be updated to reflect FMR's new form of organization and domicile. The Board also approved amendments that clarify that the fund pays its non-operating expenses, including brokerage commissions and fees and expenses associated with the fund's securities lending program, if applicable. The Board also noted Fidelity's assurance that neither the planned consolidation nor the Amended and Restated Contracts will change the investment processes, the level or nature of services provided, the resources and personnel allocated, trading and compliance operations, or any fees or expenses paid by the fund.
Nature, Extent, and Quality of Services Provided. The Board considered staffing as it relates to the fund, including the backgrounds of investment personnel of Fidelity and Geode, and also considered the fund's investment objective, strategies, and related investment philosophy. The Independent Trustees also had discussions with senior management of Fidelity's investment operations and investment groups and with representatives of Geode. The Board considered the structure of the investment personnel compensation programs and whether the structures provide appropriate incentives to act in the best interests of the fund. Additionally, the Board considered the portfolio managers' investments, if any, in the funds that they manage.
The Trustees also discussed with representatives of Fidelity, at meetings throughout the year, Fidelity's role in, among other things, overseeing compliance with federal securities laws and other applicable requirements by Geode with respect to the fund and monitoring and overseeing the performance and investment capabilities of Geode. The Trustees considered that the Board had received from Fidelity periodic reports about its oversight and due diligence processes, as well as periodic reports regarding the performance of Geode.
The Board also considered the nature, extent and quality of services provided by Geode. The Trustees noted that under the Sub-Advisory Agreement, subject to oversight by Fidelity, Geode is responsible for, among other things, identifying investments and arranging for execution of portfolio transactions to implement the fund's investment strategy. In addition, the Trustees noted that Geode is responsible for providing such reporting as may be requested by Fidelity to fulfill its oversight responsibilities discussed above.
Resources Dedicated to Investment Management and Support Services. The Board reviewed the general qualifications and capabilities of Fidelity's and Geode's investment staffs, including their size, education, experience, and resources, as well as Fidelity's and Geode's approach to recruiting, managing, and compensating investment personnel. The Board considered that Fidelity's and Geode's investment professionals have extensive resources, tools and capabilities so as to provide competitive investment results over time, and that those professionals also have access to sophisticated tools that permit them to assess portfolio construction and risk and performance attribution characteristics continuously. Additionally, in its deliberations, the Board considered Fidelity's and Geode's trading, risk management, compliance, and technology and operations capabilities and resources, which are integral parts of the investment management process.
Shareholder and Administrative Services. The Board considered (i) the nature, extent, quality, and cost of advisory, administrative, and shareholder services performed by the Investment Advisers and their affiliates under the Advisory Contracts and by FMR's affiliates under separate agreements covering transfer agency, pricing and bookkeeping, and securities lending services for the fund; (ii) the nature and extent of the supervision of third party service providers, principally custodians, subcustodians, and pricing vendors; and (iii) the resources devoted to, and the record of compliance with, the fund's compliance policies and procedures. The Board also reviewed the allocation of fund brokerage, including allocations to brokers affiliated with the Investment Advisers.
The Board noted that the growth of fund assets over time across the complex allows Fidelity to reinvest in the development of services designed to enhance the value and convenience of the Fidelity funds as investment vehicles. These services include 24-hour access to account information and market information over the Internet and through telephone representatives, investor education materials and asset allocation tools, and the expanded availability of Fidelity Investor Centers.
Investment in a Large Fund Family. The Board considered the benefits to shareholders of investing in a Fidelity fund, including the benefits of investing in a fund that is part of a large family of funds offering a variety of investment disciplines and providing a large variety of mutual fund investor services. The Board noted that Fidelity had taken, or had made recommendations that resulted in the Fidelity funds taking, a number of actions over the previous year that benefited particular funds, including: (i) continuing to dedicate additional resources to Fidelity's investment research process, which includes meetings with management of issuers of securities in which the funds invest, and to the support of the senior management team that oversees asset management; (ii) continuing efforts to enhance Fidelity's global research capabilities; (iii) launching new funds with innovative structures, strategies and pricing and making other enhancements to meet client needs; (iv) launching new share classes of existing funds; (v) eliminating purchase minimums and broadening eligibility requirements for certain funds and share classes; (vi) reducing management fees and total expenses for certain target date funds and index funds; (vii) lowering expense caps for certain existing funds and classes, and converting certain voluntary expense caps to contractual caps, to reduce expenses borne by shareholders; (viii) rationalizing product lines and gaining increased efficiencies from fund mergers, liquidations, and share class consolidations; (ix) continuing to develop, acquire and implement systems and technology to improve services to the funds and shareholders, strengthen information security, and increase efficiency; and (x) continuing to implement enhancements to further strengthen Fidelity's product line to increase investors' probability of success in achieving their investment goals, including retirement income goals.
Investment Performance. The Board considered whether the fund has operated in accordance with its investment objective, as well as its record of compliance with its investment restrictions and its performance history.
The Board took into account discussions with representatives of the Investment Advisers about fund investment performance. In this regard the Board noted that as part of regularly scheduled fund reviews and other reports to the Board on fund performance, the Board considers annualized return information for the fund for different time periods, measured against the securities market index the fund seeks to track. The Board also periodically considers the fund's tracking error versus its benchmark index. In its evaluation of fund investment performance, the Board gave particular attention to information indicating underperformance of certain Fidelity funds for specific time periods and discussed with the Investment Advisers the reasons for such underperformance.
In addition to reviewing absolute and relative fund performance, the Independent Trustees periodically consider the appropriateness of fund performance metrics in evaluating the results achieved. In general, the Independent Trustees believe that an index fund's performance should be evaluated based on gross performance (before fees and expenses but after transaction costs) compared to a fund's benchmark index, over appropriate time periods, taking into account relevant factors including the following: general market conditions; the characteristics of the fund's benchmark index; the extent to which statistical sampling is employed; any securities lending revenues; and fund cash flows and other factors. Depending on the circumstances, the Independent Trustees may be satisfied with a fund's performance notwithstanding that it lags its benchmark index for certain periods.
The Independent Trustees recognize that shareholders evaluate performance on a net basis (after fees and expenses) over their own holding periods, for which one-, three-, and five-year periods are often used as a proxy. For this reason, the performance information reviewed by the Board also included net calendar year total return information for the fund and its benchmark index for the most recent one-year period.
Based on its review, the Board concluded that the nature, extent, and quality of services provided to the fund under the Advisory Contracts should continue to benefit the shareholders of the fund.
Competitiveness of Management Fee and Total Expense Ratio. The Board considered the fund's management fee and total expense ratio compared to "mapped groups" of competitive funds and classes created for the purpose of facilitating the Trustees' competitive analysis of management fees and total expenses. Fidelity creates "mapped groups" by combining similar Lipper investment objective categories that have comparable investment mandates. Combining Lipper investment objective categories aids the Board's management fee and total expense ratio comparisons by broadening the competitive group used for comparison.
Management Fee. The Board considered two proprietary management fee comparisons for the 12-month (or shorter) periods shown in basis points (BP) in the chart below. The group of Lipper funds used by the Board for management fee comparisons is referred to below as the "Total Mapped Group." The Total Mapped Group comparison focuses on a fund's standing in terms of gross management fees before expense reimbursements or caps relative to the total universe of funds with comparable investment mandates, regardless of whether their management fee structures also are comparable. Funds with comparable investment mandates offer exposure to similar types of securities. Funds with comparable management fee structures have similar management fee contractual arrangements (
e.g., flat rate charged for advisory services, all-inclusive fee rate,
etc.). "TMG %" represents the percentage of funds in the Total Mapped Group that had management fees that were lower than the fund's. For example, a hypothetical TMG % of 20% would mean that 80% of the funds in the Total Mapped Group had higher, and 20% had lower, management fees than the fund. The fund's actual TMG %s and the number of funds in the Total Mapped Group are in the chart below. The "Asset-Size Peer Group" (ASPG) comparison focuses on a fund's standing relative to a subset of non-Fidelity funds within the Total Mapped Group that are similar in size and management fee structure. For example, if a fund is in the first quartile of the ASPG, the fund's management fee ranks in the least expensive or lowest 25% of funds in the ASPG. The ASPG represents at least 15% of the funds in the Total Mapped Group with comparable asset size and management fee structures, subject to a minimum of 50 funds (or all funds in the Total Mapped Group if fewer than 50). Additional information, such as the ASPG quartile in which the fund's management fee rate ranked, is also included in the chart and was considered by the Board.
Fidelity Total International Index Fund
The Board considered that effective July 1, 2016, the fund's management fee rate was reduced from 0.20% to 0.06%. The Board considered that the chart below reflects the fund's lower management fee rate for 2016, as if the lower fee rate were in effect for the entire period.

The Board noted that the fund's management fee rate ranked below the median of its Total Mapped Group and below the median of its ASPG for 2018.
The Board noted that it and the boards of other Fidelity funds formed an ad hoc Committee on Group Fee, which meets periodically, to conduct an in-depth review of the "group fee" component of the management fee of funds with such management fee structures. The Committee's focus included the mechanics of the group fee, the competitive landscape of group fee structures, Fidelity funds with no group fee component (such as the fund) and investment products not included in group fee assets. The Board also considered that, for funds subject to the group fee, FMR agreed to voluntarily waive fees over a specified period of time in amounts designed to account for assets converted from certain funds to certain collective investment trusts.
Based on its review, the Board concluded that the fund's management fee is fair and reasonable in light of the services that the fund receives and the other factors considered.
Total Expense Ratio. In its review of the fund's total expense ratio, the Board considered the fund's unitary fee rate, which covers expenses paid by FMR under the fund's management contract, such as transfer agent fees, pricing and bookkeeping fees and custodial, legal, and audit fees. The Board also noted that Fidelity may agree to waive fees or reimburse expenses from time to time, and the extent to which, if any, it has done so for the fund. As part of its review, the Board also considered the current and historical total expense ratios of the fund compared to competitive fund median expenses. The fund is compared to those funds and classes in the Total Mapped Group (used by the Board for management fee comparisons) that have a similar sales load structure.
The Board noted that the fund's total expense ratio ranked below the competitive median for 2018.
Fees Charged to Other Clients. The Board also considered fee structures applicable to clients of Fidelity and Geode, such as other funds advised or subadvised by Fidelity or Geode, pension plan clients, and other institutional clients with similar mandates. The Board noted that a joint ad hoc committee created by it and the boards of other Fidelity funds periodically reviews and compares Fidelity's institutional investment advisory business with its business of providing services to the Fidelity funds and also noted the most recent findings of the committee. The Board noted that the committee's review included a consideration of the differences in services provided, fees charged, and costs incurred, as well as competition in the markets serving the different categories of clients.
Based on its review of total expense ratios and fees charged to other Fidelity clients, the Board concluded that the fund's total expense ratio was reasonable in light of the services that the fund and its shareholders receive and the other factors considered.
Costs of the Services and Profitability. The Board considered the revenues earned and the expenses incurred by Fidelity in conducting the business of developing, marketing, distributing, managing, administering and servicing the fund and servicing the fund's shareholders. The Board also considered the level of Fidelity's profits in respect of all the Fidelity funds.
On an annual basis, Fidelity presents to the Board information about the profitability of its relationships with the fund. Fidelity calculates profitability information for each fund, as well as aggregate profitability information for groups of Fidelity funds and all Fidelity funds, using a series of detailed revenue and cost allocation methodologies which originate with the books and records of Fidelity on which Fidelity's audited financial statements are based. The Audit Committee of the Board reviews any significant changes from the prior year's methodologies and the full Board approves such changes.
PricewaterhouseCoopers LLP (PwC), auditor to Fidelity and certain Fidelity funds, has been engaged annually by the Board as part of the Board's assessment of Fidelity's profitability analysis. PwC's engagement includes the review and assessment of the methodologies used by Fidelity in determining the revenues and expenses attributable to Fidelity's mutual fund business, and completion of agreed-upon procedures in respect of the mathematical accuracy of the fund profitability information and its conformity to established allocation methodologies. After considering PwC's reports issued under the engagement and information provided by Fidelity, the Board concluded that while other allocation methods may also be reasonable, Fidelity's profitability methodologies are reasonable in all material respects.
The Board also reviewed Fidelity's and Geode's non-fund businesses and potential indirect benefits such businesses may have received as a result of their association with Fidelity's mutual fund business (i.e., fall-out benefits) as well as cases where Fidelity's and Geode's affiliates may benefit from the fund's business. The Board noted that changes to fall-out benefits year-over-year reflect business developments at Fidelity's and Geode's various businesses. The Board considered that a joint ad hoc committee created by it and the boards of other Fidelity funds had recently been established, and meets periodically, to evaluate potential fall-out benefits. The Board noted that the committee was expected to, among other things: (i) discuss the legal framework surrounding potential fall-out benefits; (ii) review the Board's responsibilities and approach to potential fall-out benefits; and (iii) review practices employed by competitor funds regarding the review of potential fall-out benefits. The Board noted that it would consider the committee's findings in connection with future consideration of contract renewals.
The Board considered the costs of the services provided by and the profits realized by Fidelity in connection with the operation of the fund and was satisfied that the profitability was not excessive.
The Board also considered information regarding the profitability of Geode's relationship with the fund.
Economies of Scale. The Board considered whether there have been economies of scale in respect of the management of the Fidelity funds, whether the Fidelity funds (including the fund) have appropriately benefited from any such economies of scale, and whether there is potential for realization of any further economies of scale. The Board considered the extent to which the fund will benefit from economies of scale as assets grow through increased services to the fund, through waivers or reimbursements, or through fee or expense ratio reductions. The Board recognized that, due to the fund's current contractual arrangements, its expense ratio will not decline if the fund's operating costs decrease as assets grow, or rise as assets decrease. The Board also noted that a committee (the Economies of Scale Committee) created by it and the boards of other Fidelity funds periodically analyzes whether Fidelity attains economies of scale in respect of the management and servicing of the Fidelity funds, whether the Fidelity funds have appropriately benefited from such economies of scale, and whether there is potential for realization of any further economies of scale.
The Board concluded, taking into account the analysis of the Economies of Scale Committee, that economies of scale, if any, are being appropriately shared between fund shareholders and Fidelity.
Additional Information Requested by the Board. In order to develop fully the factual basis for consideration of the Fidelity funds' advisory contracts, the Board requested and received additional information on certain topics, including: (i) Fidelity's fund profitability methodology, profitability trends for certain funds, the allocation of various costs to different funds, and the impact of certain factors on fund profitability results; (ii) portfolio manager changes that have occurred during the past year and the amount of the investment that each portfolio manager has made in the Fidelity fund(s) that he or she manages; (iii) Fidelity's compensation structure for portfolio managers, research analysts, and other key personnel, including its effects on fund profitability, the rationale for the compensation structure, and the extent to which current market conditions have affected retention and recruitment; (iv) the arrangements with and compensation paid to certain fund sub-advisers on behalf of the Fidelity funds and the treatment of such compensation within Fidelity's fund profitability methodology; (v) the practices of certain sub-advisers regarding their receipt of research from broker-dealers that execute the funds' portfolio transactions; (vi) the terms of Fidelity's voluntary expense limitation agreements; (vii) the methodology with respect to competitive fund data and peer group classifications; (viii) Fidelity's transfer agent fee, expense, and service structures for different funds and classes relative to competitive trends, and the impact of the increased use of omnibus accounts; (ix) new developments in the retail and institutional marketplaces and the competitive positioning of the funds relative to other investment products and services; (x) the impact on fund profitability of recent changes in total net assets for Fidelity's money market funds, anticipated changes to the competitive landscape for money market funds, and the level of investor comfort with gates, fees, and floating NAVs; (xi) the funds' share class structures and distribution channels; and (xii) explanations regarding the relative total expense ratios of certain funds and classes, total expense competitive trends and methodologies for total expense competitive comparisons, and actions that might be taken by Fidelity to reduce total expense ratios for certain classes. In addition, the Board considered its discussions with Fidelity throughout the year regarding enhanced information security initiatives and the funds' fair valuation policies.
Based on its evaluation of all of the conclusions noted above, and after considering all factors it believed relevant, the Board concluded that the advisory and sub-advisory fee arrangements are fair and reasonable, and that the fund's Advisory Contracts should be renewed and the fund's Amended and Restated Contracts should be approved.
TI1-I-ANN-1219
1.9879613.103
Fidelity Flex℠ Funds
Fidelity Flex℠ International Index Fund
Annual Report
October 31, 2019
See the inside front cover for important information about access to your fund’s shareholder reports.
Beginning on January 1, 2021, as permitted by regulations adopted by the Securities and Exchange Commission, paper copies of a fund’s shareholder reports will no longer be sent by mail, unless you specifically request paper copies of the reports from the fund or from your financial intermediary, such as a financial advisor, broker-dealer or bank. Instead, the reports will be made available on a website, and you will be notified by mail each time a report is posted and provided with a website link to access the report.
If you already elected to receive shareholder reports electronically, you will not be affected by this change and you need not take any action. You may elect to receive shareholder reports and other communications from a fund electronically, by contacting your financial intermediary. For Fidelity customers, visit Fidelity's web site or call Fidelity using the contact information listed below.
You may elect to receive all future reports in paper free of charge. If you wish to continue receiving paper copies of your shareholder reports, you may contact your financial intermediary or, if you are a Fidelity customer, visit Fidelity’s website, or call Fidelity at the applicable toll-free number listed below. Your election to receive reports in paper will apply to all funds held with the fund complex/your financial intermediary.
| Account Type | Website | Phone Number |
| Brokerage, Mutual Fund, or Annuity Contracts: | fidelity.com/mailpreferences | 1-800-343-3548 |
| Employer Provided Retirement Accounts: | netbenefits.fidelity.com/preferences (choose 'no' under Required Disclosures to continue to print) | 1-800-343-0860 |
| Advisor Sold Accounts Serviced Through Your Financial Intermediary: | Contact Your Financial Intermediary | Your Financial Intermediary's phone number |
| Advisor Sold Accounts Serviced by Fidelity: | institutional.fidelity.com | 1-877-208-0098 |
Contents
To view a fund's proxy voting guidelines and proxy voting record for the 12-month period ended June 30, visit http://www.fidelity.com/proxyvotingresults or visit the Securities and Exchange Commission's (SEC) web site at http://www.sec.gov.
You may also call 1-800-544-3455 (for managed account clients) or 1-800-835-5092 (for retirement plan participants) to request a free copy of the proxy voting guidelines.
The funds or securities referred to herein are not sponsored, endorsed, or promoted by MSCI, and MSCI bears no liability with respect to any such funds or securities or any index on which such funds or securities are based. The prospectus contains a more detailed description of the limited relationship MSCI has with Fidelity and any related funds.
Standard & Poor's, S&P and S&P 500 are registered service marks of The McGraw-Hill Companies, Inc. and have been licensed for use by Fidelity Distributors Corporation.
Other third-party marks appearing herein are the property of their respective owners.
All other marks appearing herein are registered or unregistered trademarks or service marks of FMR LLC or an affiliated company. © 2019 FMR LLC. All rights reserved.
This report and the financial statements contained herein are submitted for the general information of the shareholders of the Fund. This report is not authorized for distribution to prospective investors in the Fund unless preceded or accompanied by an effective prospectus.
A fund files its complete schedule of portfolio holdings with the SEC for the first and third quarters of each fiscal year on Form N-PORT. Forms N-PORT are available on the SEC’s web site at http://www.sec.gov. A fund's Forms N-PORT may be reviewed and copied at the SEC’s Public Reference Room in Washington, DC. Information regarding the operation of the SEC's Public Reference Room may be obtained by calling 1-800-SEC-0330.
For a complete list of a fund's portfolio holdings, view the most recent holdings listing, semiannual report, or annual report on Fidelity's web site at http://www.fidelity.com, http://www.institutional.fidelity.com, or http://www.401k.com, as applicable.
NOT FDIC INSURED •MAY LOSE VALUE •NO BANK GUARANTEE
Neither the Fund nor Fidelity Distributors Corporation is a bank.
Performance: The Bottom Line
Average annual total return reflects the change in the value of an investment, assuming reinvestment of distributions from dividend income and capital gains (the profits earned upon the sale of securities that have grown in value, if any) and assuming a constant rate of performance each year. The hypothetical investment and the average annual total returns do not reflect the deduction of taxes that a shareholder would pay on fund distributions or the redemption of fund shares. During periods of reimbursement by Fidelity, a fund’s total return will be greater than it would be had the reimbursement not occurred. How a fund did yesterday is no guarantee of how it will do tomorrow.
Average Annual Total Returns
| For the periods ended October 31, 2019 | Past 1 year | Life of fundA |
| Fidelity Flex℠ International Index Fund | 11.40% | 7.18% |
A From March 9, 2017
$10,000 Over Life of Fund
Let's say hypothetically that $10,000 was invested in Fidelity Flex℠ International Index Fund on March 9, 2017, when the fund started.
The chart shows how the value of your investment would have changed, and also shows how the MSCI ACWI (All Country World Index) ex USA Index performed over the same period.
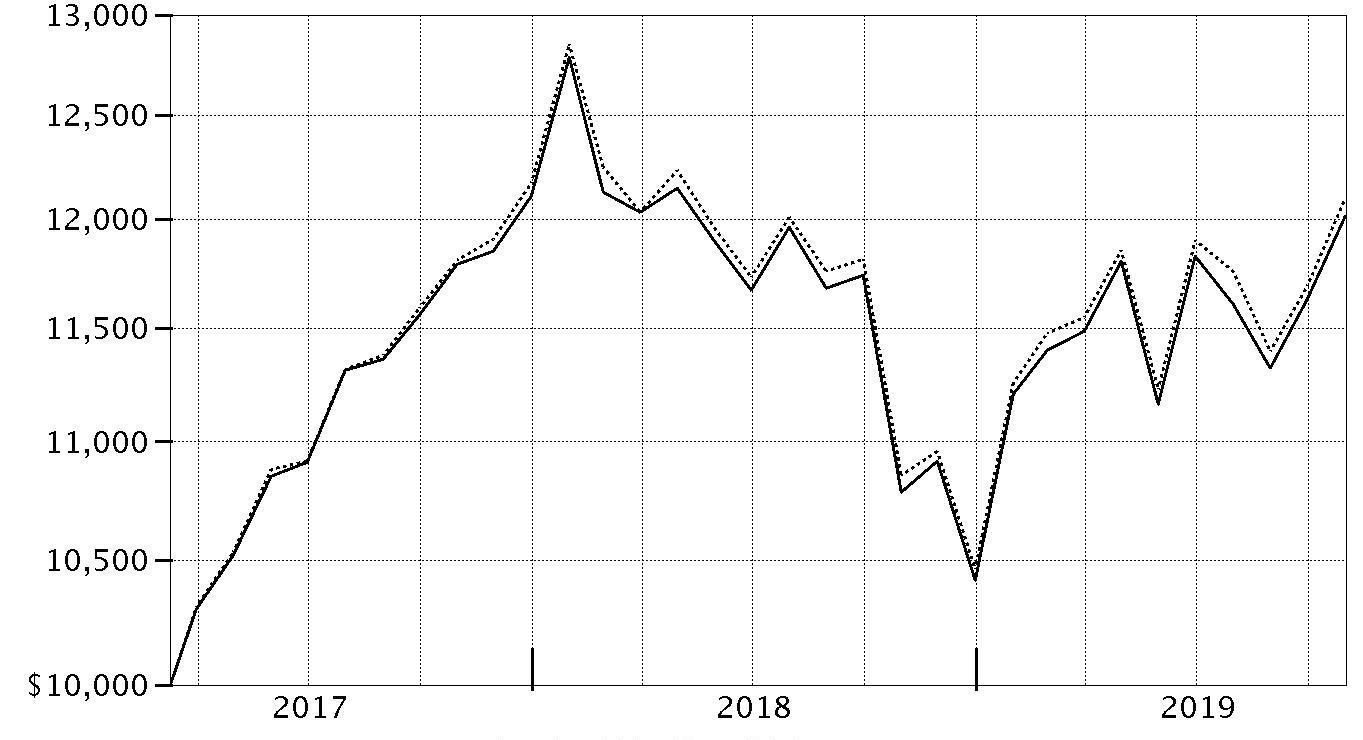
| Period Ending Values |
| $12,014 | Fidelity Flex℠ International Index Fund |
| $12,101 | MSCI ACWI (All Country World Index) ex USA Index |
Management's Discussion of Fund Performance
Market Recap: The MSCI ACWI (All Country World Index) ex USA Index gained 11.47% for the 12 months ending October 31, 2019, as international stocks reflected a confluence of factors, including escalating trade tension, and moderating but still positive global economic growth. Currency fluctuations were largely modest and varied by region, muting the overall impact on international equity returns. In late December, the U.S. Federal Reserve shifted from raising interest rates to a more dovish policy in 2019, joining many foreign central banks. In June, international stocks rose 6.03%, as policy stimulus in China stabilized that country’s economic growth. The Fed cut its policy rate in July for the first time since 2008. However, the index returned -1.21% for the month, followed by -3.08% in August. In September, the Fed cut its policy rate another quarter point, citing concerns about slowing economic growth and muted inflation, and did the same in October, leading to monthly gains of 2.59% and 3.49%, respectively. For the full 12 months, the growth-oriented information technology sector (+22%) led the way, followed by utilities (+20%) and real estate (+18%), two high-dividend-yielding categories. Conversely, energy was roughly flat, while materials (+6%) and communication services (7%) also lagged. By region, Asia Pacific ex Japan (+16%), Europe ex U.K (+13%), Canada (+12%) and emerging markets (+12%) fared best. Meanwhile, the U.K. (+7%) and Japan (+10%) trailed the broader market.
Comments from the Geode Capital Management, LLC, passive equity index team: For the fiscal year, the fund gained 11.40%, roughly in line with the benchmark MSCI ACWI (All Country World Index) ex USA Index.
(The fund's performance relative to the index can be affected by Fidelity's methodologies for valuing certain foreign stocks and for incorporating foreign exchange rates, which differ from those used by the index.) Nestle gained 29%, as the Swiss packaged-foods giant reported favorable sales growth. Semiconductor foundry Taiwan Semiconductor Manufacturing (+34%) also stood out, reflecting the firm's better-than-expected quarterly financial results. Chinese e-commerce company Alibaba Group Holding (+24%) benefited from strong quarterly earnings, while healthy sales lifted LVMH Moet Hennessy Louis (+42%), a French luxury goods conglomerate. Dutch semiconductor equipment supplier ASML Holding (+55%) rose on higher revenue and French pharmaceutical manufacturer Roche Holdings gained 27%. In contrast, China-based Baidu returned about -46%, as the company anticipated continued challenges for its core online search-advertising business. British American Tobacco (-13%) struggled, partly reflecting investors' concern about weakness in tobacco companies' core cigarette business. Israeli generic drug maker Teva Pharmaceuticals (-59%) fell sharply, due to increasing competition and potential costly legal exposure to the opioid crisis.
The views expressed above reflect those of the portfolio manager(s) only through the end of the period as stated on the cover of this report and do not necessarily represent the views of Fidelity or any other person in the Fidelity organization. Any such views are subject to change at any time based upon market or other conditions and Fidelity disclaims any responsibility to update such views. These views may not be relied on as investment advice and, because investment decisions for a Fidelity fund are based on numerous factors, may not be relied on as an indication of trading intent on behalf of any Fidelity fund.
Note to shareholders: On March 22, 2019, Pat Waddell retired and is no longer a portfolio manager with Geode Capital Management.
Investment Summary (Unaudited)
Top Ten Stocks as of October 31, 2019
| | % of fund's net assets |
| Nestle SA (Reg. S) (Switzerland, Food Products) | 1.5 |
| Alibaba Group Holding Ltd. sponsored ADR (Cayman Islands, Internet & Direct Marketing Retail) | 1.2 |
| Royal Dutch Shell PLC Class A (United Kingdom) (United Kingdom, Oil, Gas & Consumable Fuels) | 1.1 |
| Samsung Electronics Co. Ltd. (Korea (South), Technology Hardware, Storage & Peripherals) | 1.1 |
| Taiwan Semiconductor Manufacturing Co. Ltd. (Taiwan, Semiconductors & Semiconductor Equipment) | 1.1 |
| Tencent Holdings Ltd. (Cayman Islands, Interactive Media & Services) | 1.1 |
| Roche Holding AG (participation certificate) (Switzerland, Pharmaceuticals) | 1.0 |
| Novartis AG (Switzerland, Pharmaceuticals) | 0.9 |
| Toyota Motor Corp. (Japan, Automobiles) | 0.7 |
| HSBC Holdings PLC (United Kingdom) (United Kingdom, Banks) | 0.7 |
| | 10.4 |
Top Market Sectors as of October 31, 2019
| | % of fund's net assets |
| Financials | 22.2 |
| Industrials | 10.5 |
| Consumer Discretionary | 11.7 |
| Consumer Staples | 9.6 |
| Information Technology | 8.8 |
| Health Care | 8.3 |
| Materials | 6.5 |
| Communication Services | 6.5 |
| Energy | 6.5 |
| Utilities | 3.4 |
Geographic Diversification (% of fund's net assets)
| As of October 31, 2019 |
| | Japan | 16.1% |
| | United Kingdom | 10.1% |
| | France | 6.8% |
| | Canada | 6.8% |
| | Switzerland | 6.1% |
| | Germany | 5.7% |
| | Cayman Islands | 4.6% |
| | Australia | 4.4% |
| | Netherlands | 3.3% |
| | Other* | 36.1% |

* Includes Short-Term investments and Net Other Assets (Liabilities).
Percentages are based on country or territory of incorporation and are adjusted for the effect of futures contracts, if applicable.
Asset Allocation as of October 31, 2019
| | % of fund's net assets |
| Stocks and Equity Futures | 100.0 |
Schedule of Investments October 31, 2019
Showing Percentage of Net Assets
| Common Stocks - 95.7% | | | |
| | | Shares | Value |
| Argentina - 0.0% | | | |
| Banco Macro SA sponsored ADR | | 713 | $16,328 |
| BBVA Banco Frances SA sponsored ADR | | 1,062 | 3,717 |
| Grupo Financiero Galicia SA sponsored ADR | | 1,610 | 18,612 |
| Pampa Holding SA sponsored ADR (a) | | 1,053 | 16,395 |
| Telecom Argentina SA Class B sponsored ADR | | 2,179 | 19,611 |
| Transportadora de Gas del Sur SA Class B sponsored ADR | | 1,196 | 9,042 |
| YPF SA Class D sponsored ADR | | 2,561 | 23,971 |
|
| TOTAL ARGENTINA | | | 107,676 |
|
| Australia - 4.4% | | | |
| AGL Energy Ltd. | | 10,976 | 149,829 |
| Alumina Ltd. | | 40,135 | 62,655 |
| AMP Ltd. | | 55,386 | 69,982 |
| APA Group unit | | 21,975 | 176,509 |
| Aristocrat Leisure Ltd. | | 9,803 | 213,755 |
| ASX Ltd. | | 3,223 | 182,943 |
| Aurizon Holdings Ltd. | | 33,147 | 134,850 |
| Australia & New Zealand Banking Group Ltd. | | 48,671 | 894,433 |
| Bank of Queensland Ltd. | | 6,640 | 41,441 |
| Bendigo & Adelaide Bank Ltd. | | 8,073 | 59,249 |
| BHP Billiton Ltd. | | 50,947 | 1,248,836 |
| BlueScope Steel Ltd. | | 8,390 | 76,804 |
| Boral Ltd. | | 19,828 | 68,841 |
| Brambles Ltd. | | 26,808 | 221,623 |
| Caltex Australia Ltd. | | 3,993 | 75,063 |
| Challenger Ltd. | | 9,265 | 50,816 |
| Cimic Group Ltd. | | 1,615 | 36,804 |
| Coca-Cola Amatil Ltd. | | 8,379 | 58,801 |
| Cochlear Ltd. | | 957 | 139,617 |
| Coles Group Ltd. | | 20,312 | 210,206 |
| Commonwealth Bank of Australia | | 30,399 | 1,648,237 |
| Computershare Ltd. | | 8,727 | 95,259 |
| Crown Ltd. | | 6,307 | 54,181 |
| CSL Ltd. | | 7,896 | 1,392,509 |
| DEXUS Property Group unit | | 18,337 | 151,216 |
| Dominos Pizza Enterprises Ltd. | | 104 | 3,659 |
| Flight Centre Travel Group Ltd. | | 949 | 27,879 |
| Fortescue Metals Group Ltd. | | 24,174 | 147,960 |
| Goodman Group unit | | 28,994 | 287,889 |
| Harvey Norman Holdings Ltd. | | 8,770 | 24,745 |
| Incitec Pivot Ltd. | | 30,332 | 72,173 |
| Insurance Australia Group Ltd. | | 40,910 | 224,149 |
| Lendlease Group unit | | 9,472 | 122,432 |
| Macquarie Group Ltd. | | 5,585 | 515,705 |
| Magellan Financial Group Ltd. | | 2,074 | 68,790 |
| Medibank Private Ltd. | | 47,585 | 110,908 |
| Mirvac Group unit | | 64,405 | 142,714 |
| National Australia Bank Ltd. | | 48,386 | 949,776 |
| Newcrest Mining Ltd. | | 13,478 | 294,202 |
| Orica Ltd. | | 6,911 | 109,219 |
| Origin Energy Ltd. | | 30,220 | 163,837 |
| QBE Insurance Group Ltd. | | 23,655 | 205,808 |
| Ramsay Health Care Ltd. | | 3,093 | 146,146 |
| realestate.com.au Ltd. | | 865 | 64,918 |
| Rio Tinto Ltd. | | 6,431 | 402,150 |
| Santos Ltd. | | 29,782 | 166,586 |
| Scentre Group unit | | 94,847 | 250,600 |
| SEEK Ltd. | | 5,867 | 91,819 |
| Sonic Healthcare Ltd. | | 7,567 | 149,032 |
| South32 Ltd. | | 83,966 | 146,935 |
| SP AusNet | | 30,477 | 38,930 |
| Stockland Corp. Ltd. unit | | 40,160 | 135,579 |
| Suncorp Group Ltd. | | 22,623 | 210,043 |
| Sydney Airport unit | | 18,487 | 111,966 |
| Tabcorp Holdings Ltd. | | 34,797 | 115,305 |
| Telstra Corp. Ltd. | | 69,779 | 168,059 |
| The GPT Group unit | | 33,114 | 135,924 |
| TPG Telecom Ltd. | | 6,228 | 28,071 |
| Transurban Group unit | | 46,248 | 473,670 |
| Treasury Wine Estates Ltd. | | 12,395 | 150,266 |
| Vicinity Centres unit | | 51,563 | 94,913 |
| Washington H. Soul Pattinson & Co. Ltd. | | 2,509 | 37,505 |
| Wesfarmers Ltd. | | 20,087 | 551,889 |
| Westpac Banking Corp. | | 59,299 | 1,151,320 |
| Woodside Petroleum Ltd. | | 16,750 | 371,238 |
| Woolworths Group Ltd. | | 21,811 | 562,422 |
| WorleyParsons Ltd. | | 5,652 | 53,051 |
|
| TOTAL AUSTRALIA | | | 16,794,641 |
|
| Austria - 0.1% | | | |
| Andritz AG | | 1,258 | 56,515 |
| Erste Group Bank AG | | 5,136 | 181,411 |
| OMV AG | | 2,625 | 153,175 |
| Raiffeisen International Bank-Holding AG | | 2,646 | 65,071 |
| Verbund AG | | 1,126 | 60,908 |
| Voestalpine AG | | 1,769 | 44,293 |
|
| TOTAL AUSTRIA | | | 561,373 |
|
| Bailiwick of Jersey - 0.5% | | | |
| Experian PLC | | 15,769 | 495,952 |
| Ferguson PLC | | 4,039 | 344,904 |
| Glencore Xstrata PLC | | 192,954 | 582,409 |
| Polymetal International PLC | | 4,058 | 66,576 |
| WPP PLC | | 22,593 | 281,951 |
|
| TOTAL BAILIWICK OF JERSEY | | | 1,771,792 |
|
| Belgium - 0.6% | | | |
| Ageas | | 3,232 | 186,144 |
| Anheuser-Busch InBev SA NV | | 13,158 | 1,062,080 |
| Colruyt NV | | 923 | 51,306 |
| Groupe Bruxelles Lambert SA | | 1,394 | 139,894 |
| KBC Groep NV | | 4,505 | 315,936 |
| Proximus | | 2,518 | 77,313 |
| Solvay SA Class A | | 1,310 | 142,452 |
| Telenet Group Holding NV | | 690 | 33,876 |
| Titan Cement International Trading SA (a) | | 726 | 15,158 |
| UCB SA | | 2,136 | 172,144 |
| Umicore SA | | 3,301 | 136,109 |
|
| TOTAL BELGIUM | | | 2,332,412 |
|
| Bermuda - 0.4% | | | |
| Alibaba Health Information Technology Ltd. (a) | | 60,000 | 60,390 |
| Alibaba Pictures Group Ltd. (a) | | 240,000 | 39,364 |
| Beijing Enterprises Water Group Ltd. | | 80,000 | 41,698 |
| Brilliance China Automotive Holdings Ltd. | | 50,000 | 55,139 |
| Cheung Kong Infrastructure Holdings Ltd. | | 10,500 | 75,566 |
| China Gas Holdings Ltd. | | 30,400 | 129,502 |
| China Oriental Group Co. Ltd. (H Shares) | | 16,000 | 5,584 |
| China Resource Gas Group Ltd. | | 16,000 | 96,469 |
| Cosco Shipping Ports Ltd. | | 29,015 | 22,811 |
| Credicorp Ltd. (United States) | | 1,160 | 248,286 |
| Dairy Farm International Holdings Ltd. | | 5,600 | 33,753 |
| GOME Electrical Appliances Holdings Ltd. (a) | | 148,000 | 13,379 |
| Haier Electronics Group Co. Ltd. | | 24,000 | 68,522 |
| HengTen Networks Group Ltd. (a) | | 216,000 | 3,108 |
| Hongkong Land Holdings Ltd. | | 19,900 | 109,319 |
| Jardine Matheson Holdings Ltd. | | 3,706 | 211,283 |
| Jardine Strategic Holdings Ltd. | | 3,662 | 118,253 |
| Kerry Properties Ltd. | | 11,000 | 35,570 |
| Kunlun Energy Co. Ltd. | | 48,000 | 44,675 |
| Luye Pharma Group Ltd. (b) | | 23,500 | 17,370 |
| Nine Dragons Paper (Holdings) Ltd. | | 21,000 | 18,217 |
| NWS Holdings Ltd. | | 26,000 | 38,695 |
| Shangri-La Asia Ltd. | | 18,000 | 18,475 |
| Shenzhen International Holdings Ltd. | | 15,113 | 30,725 |
| Sihuan Pharmaceutical Holdings Group Ltd. | | 76,000 | 9,958 |
| Yue Yuen Industrial (Holdings) Ltd. | | 12,000 | 33,818 |
|
| TOTAL BERMUDA | | | 1,579,929 |
|
| Brazil - 1.3% | | | |
| Ambev SA | | 83,000 | 359,691 |
| Atacadao Distribuicao Comercio e Industria Ltda | | 5,500 | 26,207 |
| B2W Companhia Global do Varejo (a) | | 3,827 | 48,476 |
| Banco Bradesco SA | | 23,737 | 194,430 |
| Banco do Brasil SA | | 14,400 | 172,886 |
| Banco Santander SA (Brasil) unit | | 7,100 | 83,313 |
| BB Seguridade Participacoes SA | | 12,200 | 103,337 |
| BM&F BOVESPA SA | | 36,200 | 436,693 |
| BR Malls Participacoes SA | | 11,900 | 45,547 |
| Brasil Foods SA (a) | | 9,800 | 86,772 |
| BTG Pactual Participations Ltd. unit | | 3,800 | 61,550 |
| CCR SA | | 21,400 | 87,724 |
| Centrais Eletricas Brasileiras SA (Electrobras) (a) | | 4,400 | 43,402 |
| Cielo SA | | 19,140 | 36,080 |
| Companhia de Saneamento Basico do Estado de Sao Paulo (SABESP) | | 5,700 | 77,630 |
| Companhia Siderurgica Nacional SA (CSN) | | 10,100 | 29,717 |
| Cosan SA Industria e Comercio | | 2,400 | 34,583 |
| Drogasil SA | | 3,800 | 104,226 |
| Embraer SA | | 13,100 | 57,260 |
| Energisa SA unit | | 3,100 | 37,041 |
| ENGIE Brasil Energia SA | | 3,250 | 36,677 |
| Equatorial Energia SA | | 3,800 | 96,533 |
| Hypermarcas SA | | 7,300 | 62,470 |
| IRB Brasil Resseguros SA | | 11,400 | 107,420 |
| JBS SA | | 18,300 | 129,088 |
| Klabin SA unit | | 13,600 | 53,647 |
| Kroton Educacional SA | | 25,000 | 60,279 |
| Localiza Rent A Car SA | | 9,500 | 102,284 |
| Lojas Renner SA | | 13,630 | 172,478 |
| M. Dias Branco SA | | 1,700 | 16,002 |
| Magazine Luiza SA | | 10,200 | 113,534 |
| Multiplan Empreendimentos Imobiliarios SA | | 3,900 | 28,405 |
| Natura Cosmeticos SA | | 6,400 | 49,725 |
| Notre Dame Intermedica Participacoes SA | | 5,900 | 88,268 |
| Petrobras Distribuidora SA | | 11,500 | 81,092 |
| Petroleo Brasileiro SA - Petrobras (ON) | | 51,100 | 416,649 |
| Porto Seguro SA | | 1,300 | 18,606 |
| Rumo SA (a) | | 18,000 | 102,331 |
| Sul America SA unit | | 4,200 | 50,572 |
| Suzano Papel e Celulose SA | | 9,130 | 74,306 |
| TIM Participacoes SA | | 16,900 | 48,123 |
| Ultrapar Participacoes SA | | 11,800 | 55,521 |
| Vale SA (a) | | 55,573 | 654,045 |
| Weg SA | | 15,780 | 100,334 |
|
| TOTAL BRAZIL | | | 4,844,954 |
|
| Canada - 6.6% | | | |
| Agnico Eagle Mines Ltd. (Canada) | | 3,961 | 243,446 |
| Air Canada (a) | | 2,149 | 76,523 |
| Alimentation Couche-Tard, Inc. Class B (sub. vtg.) | | 15,308 | 459,089 |
| AltaGas Ltd. | | 4,762 | 69,273 |
| ATCO Ltd. Class I (non-vtg.) | | 1,273 | 44,750 |
| Aurora Cannabis, Inc. (a)(c) | | 11,955 | 42,842 |
| Bank of Montreal | | 11,161 | 826,207 |
| Bank of Nova Scotia | | 21,001 | 1,204,476 |
| Barrick Gold Corp. (Canada) | | 31,084 | 539,976 |
| Bausch Health Cos., Inc. (Canada) (a) | | 5,369 | 133,461 |
| BCE, Inc. | | 2,551 | 121,013 |
| BlackBerry Ltd. (a) | | 8,565 | 45,000 |
| Bombardier, Inc. Class B (sub. vtg.) (a) | | 37,324 | 47,041 |
| Brookfield Asset Management, Inc. Class A | | 15,393 | 851,167 |
| CAE, Inc. | | 4,490 | 112,599 |
| Cameco Corp. | | 6,742 | 60,197 |
| Canadian Imperial Bank of Commerce | | 7,834 | 668,010 |
| Canadian National Railway Co. | | 12,514 | 1,119,239 |
| Canadian Natural Resources Ltd. | | 21,115 | 532,404 |
| Canadian Pacific Railway Ltd. | | 2,467 | 560,999 |
| Canadian Tire Ltd. Class A (non-vtg.) | | 956 | 103,062 |
| Canadian Utilities Ltd. Class A (non-vtg.) | | 2,274 | 66,316 |
| CCL Industries, Inc. Class B | | 2,650 | 109,070 |
| Cenovus Energy, Inc. (Canada) | | 17,874 | 152,264 |
| CGI Group, Inc. Class A (sub. vtg.) (a) | | 4,338 | 337,199 |
| CI Financial Corp. | | 3,784 | 55,075 |
| Constellation Software, Inc. | | 358 | 353,578 |
| Cronos Group, Inc. (a)(c) | | 3,075 | 25,168 |
| Dollarama, Inc. | | 5,028 | 169,152 |
| Emera, Inc. | | 4,001 | 165,648 |
| Empire Co. Ltd. Class A (non-vtg.) | | 3,522 | 93,512 |
| Enbridge, Inc. | | 35,022 | 1,275,534 |
| Encana Corp. (Toronto) | | 23,937 | 93,778 |
| Fairfax Financial Holdings Ltd. (sub. vtg.) | | 468 | 198,272 |
| First Capital Realty, Inc. | | 2,872 | 47,536 |
| First Quantum Minerals Ltd. | | 12,098 | 102,233 |
| Fortis, Inc. | | 7,712 | 320,401 |
| Franco-Nevada Corp. | | 3,329 | 323,017 |
| George Weston Ltd. | | 1,561 | 124,977 |
| Gildan Activewear, Inc. | | 3,670 | 93,763 |
| Great-West Lifeco, Inc. | | 4,705 | 114,419 |
| H&R (REIT) unit | | 2,756 | 46,620 |
| Husky Energy, Inc. | | 5,980 | 41,771 |
| Hydro One Ltd. (b) | | 5,516 | 102,564 |
| iA Financial Corp, Inc. | | 1,783 | 85,867 |
| IGM Financial, Inc. | | 1,276 | 36,010 |
| Imperial Oil Ltd. | | 5,612 | 139,757 |
| Intact Financial Corp. | | 2,455 | 253,310 |
| Inter Pipeline Ltd. | | 6,949 | 116,652 |
| Keyera Corp. | | 3,506 | 81,268 |
| Kinross Gold Corp. (a) | | 21,482 | 104,384 |
| Kirkland Lake Gold Ltd. | | 3,437 | 161,399 |
| Loblaw Companies Ltd. | | 3,077 | 164,094 |
| Lundin Mining Corp. | | 12,501 | 63,117 |
| Magna International, Inc. Class A (sub. vtg.) | | 5,439 | 292,453 |
| Manulife Financial Corp. | | 34,427 | 641,177 |
| Methanex Corp. | | 1,037 | 39,296 |
| Metro, Inc. Class A (sub. vtg.) | | 4,449 | 188,148 |
| National Bank of Canada | | 5,721 | 295,454 |
| Nutrien Ltd. | | 10,239 | 489,833 |
| Onex Corp. (sub. vtg.) | | 1,443 | 84,831 |
| Open Text Corp. | | 4,979 | 201,186 |
| Pembina Pipeline Corp. | | 9,240 | 325,305 |
| Power Corp. of Canada (sub. vtg.) | | 4,915 | 113,742 |
| Power Financial Corp. | | 4,732 | 110,656 |
| PrairieSky Royalty Ltd. | | 3,191 | 31,157 |
| Quebecor, Inc. Class B (sub. vtg.) | | 3,026 | 70,349 |
| Restaurant Brands International, Inc. | | 4,097 | 268,042 |
| Restaurant Brands International, Inc. | | 241 | 15,771 |
| RioCan (REIT) | | 2,856 | 57,311 |
| Rogers Communications, Inc. Class B (non-vtg.) | | 6,534 | 307,625 |
| Royal Bank of Canada | | 24,485 | 1,975,011 |
| Saputo, Inc. | | 3,943 | 114,359 |
| Shaw Communications, Inc. Class B | | 8,413 | 171,696 |
| Shopify, Inc. Class A (a) | | 1,725 | 540,904 |
| Smart (REIT) | | 1,386 | 33,506 |
| SNC-Lavalin Group, Inc. | | 2,996 | 54,160 |
| Sun Life Financial, Inc. | | 10,377 | 465,551 |
| Suncor Energy, Inc. | | 27,536 | 818,700 |
| TC Energy Corp. | | 16,089 | 810,985 |
| Teck Resources Ltd. Class B (sub. vtg.) | | 8,820 | 139,422 |
| TELUS Corp. | | 3,560 | 126,631 |
| The Stars Group, Inc. (a) | | 3,813 | 82,971 |
| The Toronto-Dominion Bank | | 31,479 | 1,797,537 |
| Thomson Reuters Corp. | | 3,524 | 236,815 |
| Tourmaline Oil Corp. | | 3,999 | 34,309 |
| Vermilion Energy, Inc. | | 2,827 | 37,347 |
| West Fraser Timber Co. Ltd. | | 938 | 43,371 |
| Wheaton Precious Metals Corp. | | 7,959 | 223,101 |
| WSP Global, Inc. | | 1,730 | 107,943 |
|
| TOTAL CANADA | | | 24,825,154 |
|
| Cayman Islands - 4.6% | | | |
| 3SBio, Inc. (a)(b) | | 19,500 | 36,324 |
| 51job, Inc. sponsored ADR (a) | | 354 | 27,885 |
| 58.com, Inc. ADR (a) | | 1,605 | 84,760 |
| AAC Technology Holdings, Inc. | | 11,500 | 74,420 |
| Agile Property Holdings Ltd. | | 26,000 | 35,045 |
| Airtac International Group | | 2,000 | 27,379 |
| Alibaba Group Holding Ltd. sponsored ADR (a) | | 24,623 | 4,350,145 |
| Anta Sports Products Ltd. | | 18,000 | 176,078 |
| ASM Pacific Technology Ltd. | | 5,100 | 71,210 |
| Autohome, Inc. ADR Class A (a)(c) | | 991 | 83,799 |
| Baidu.com, Inc. sponsored ADR (a) | | 4,895 | 498,556 |
| Baozun, Inc. sponsored ADR (a)(c) | | 658 | 28,636 |
| BeiGene Ltd. ADR (a) | | 631 | 87,293 |
| Bosideng International Holdings Ltd. | | 52,000 | 26,890 |
| Budweiser Brewing Co. APAC Ltd. (a)(b) | | 20,000 | 72,613 |
| Chailease Holding Co. Ltd. | | 20,867 | 94,079 |
| Cheung Kong Property Holdings Ltd. | | 47,000 | 327,012 |
| China Aoyuan Property Group Ltd. | | 20,000 | 25,559 |
| China Conch Venture Holdings Ltd. | | 25,500 | 99,779 |
| China Education Group Holdings Ltd. | | 11,000 | 16,432 |
| China First Capital Group Ltd. (a) | | 44,000 | 12,511 |
| China Hongqiao Group Ltd. | | 29,500 | 16,384 |
| China Investment Fund International Holdings Co. Ltd. (d) | | 16,000 | 23,563 |
| China Literature Ltd. (a)(b) | | 3,800 | 14,887 |
| China Medical System Holdings Ltd. | | 22,000 | 29,835 |
| China Mengniu Dairy Co. Ltd. | | 47,000 | 187,377 |
| China Resources Cement Holdings Ltd. | | 38,000 | 41,613 |
| China Resources Land Ltd. | | 46,000 | 195,632 |
| China State Construction International Holdings Ltd. | | 32,000 | 29,471 |
| China Zhongwang Holdings Ltd. | | 27,600 | 11,458 |
| CIFI Holdings Group Co. Ltd. | | 54,590 | 36,410 |
| CK Hutchison Holdings Ltd. | | 48,000 | 443,188 |
| Country Garden Holdings Co. Ltd. | | 130,000 | 180,470 |
| Country Garden Services Holdings Co. Ltd. | | 20,000 | 67,767 |
| Ctrip.com International Ltd. ADR (a) | | 8,567 | 282,625 |
| Dali Foods Group Co. Ltd. (b) | | 33,000 | 22,561 |
| ENN Energy Holdings Ltd. | | 13,400 | 152,875 |
| Evergrande Real Estate Group Ltd. | | 32,000 | 77,896 |
| Future Land Development Holding Ltd. | | 26,000 | 27,399 |
| GDS Holdings Ltd. ADR (a) | | 983 | 40,971 |
| Geely Automobile Holdings Ltd. | | 88,000 | 166,515 |
| Genscript Biotech Corp. (a) | | 14,000 | 33,543 |
| Greentown Service Group Co. Ltd. | | 18,000 | 20,422 |
| Haidilao International Holding Ltd. (b) | | 6,000 | 29,047 |
| Haitian International Holdings Ltd. | | 10,000 | 23,597 |
| Hengan International Group Co. Ltd. | | 12,000 | 83,784 |
| Huazhu Group Ltd. ADR | | 2,214 | 83,822 |
| Hutchison China Meditech Ltd. sponsored ADR (a) | | 1,005 | 18,995 |
| iQIYI, Inc. ADR (a)(c) | | 2,212 | 38,555 |
| JD.com, Inc. sponsored ADR (a) | | 13,009 | 405,230 |
| Jiayuan International Group Ltd. | | 11 | 4 |
| Kaisa Group Holdings Ltd. | | 49,000 | 21,428 |
| Kingboard Chemical Holdings Ltd. | | 11,500 | 30,646 |
| Kingboard Laminates Holdings Ltd. | | 18,500 | 16,936 |
| Kingdee International Software Group Co. Ltd. | | 39,000 | 42,734 |
| Kingsoft Corp. Ltd. (a) | | 14,000 | 32,220 |
| KWG Property Holding Ltd. | | 18,500 | 18,629 |
| Lee & Man Paper Manufacturing Ltd. | | 23,000 | 12,790 |
| Li Ning Co. Ltd. | | 32,500 | 110,202 |
| Lijun International Pharmaceutical Holding Ltd. | | 24,000 | 20,016 |
| Logan Property Holdings Co. Ltd. | | 28,000 | 42,643 |
| Longfor Properties Co. Ltd. (b) | | 31,000 | 128,655 |
| Meitu, Inc. (a)(b) | | 36,500 | 8,078 |
| Meituan Dianping Class B (a) | | 17,900 | 213,514 |
| Melco Crown Entertainment Ltd. sponsored ADR | | 3,523 | 75,885 |
| MGM China Holdings Ltd. | | 16,000 | 25,336 |
| Momo, Inc. ADR | | 2,528 | 84,739 |
| NetEase, Inc. ADR | | 1,244 | 355,610 |
| New Oriental Education & Technology Group, Inc. sponsored ADR (a) | | 2,533 | 309,178 |
| Nexteer Auto Group Ltd. | | 11,000 | 10,252 |
| NIO, Inc. sponsored ADR (a)(c) | | 10,287 | 14,916 |
| Noah Holdings Ltd. sponsored ADR (a) | | 559 | 16,932 |
| Pinduoduo, Inc. ADR (a)(c) | | 3,232 | 132,124 |
| Sands China Ltd. | | 40,400 | 198,995 |
| Semiconductor Manufacturing International Corp. (a) | | 56,500 | 71,769 |
| Shenzhou International Group Holdings Ltd. | | 13,900 | 192,079 |
| Shimao Property Holdings Ltd. | | 18,000 | 60,302 |
| Shui On Land Ltd. | | 34,500 | 6,943 |
| SINA Corp. (a) | | 995 | 39,402 |
| Sino Biopharmaceutical Ltd. | | 115,500 | 171,967 |
| SOHO China Ltd. | | 31,000 | 10,578 |
| Sunac China Holdings Ltd. | | 41,000 | 185,967 |
| Sunny Optical Technology Group Co. Ltd. | | 12,200 | 196,101 |
| TAL Education Group ADR (a) | | 6,795 | 290,894 |
| Tencent Holdings Ltd. | | 98,900 | 4,011,673 |
| Tencent Music Entertainment Group ADR (a) | | 1,222 | 16,912 |
| Tingyi (Cayman Islands) Holding Corp. | | 32,000 | 42,569 |
| Towngas China Co. Ltd. | | 15,181 | 11,703 |
| Uni-President China Holdings Ltd. | | 26,000 | 26,856 |
| Vipshop Holdings Ltd. ADR (a) | | 6,982 | 80,572 |
| Want Want China Holdings Ltd. | | 81,000 | 68,235 |
| Weibo Corp. sponsored ADR (a) | | 860 | 42,303 |
| WH Group Ltd. (b) | | 159,500 | 168,359 |
| Wharf Real Estate Investment Co. Ltd. | | 21,000 | 123,516 |
| Wuxi Biologics (Cayman), Inc. (a)(b) | | 9,500 | 111,639 |
| Wynn Macau Ltd. | | 28,800 | 62,498 |
| Xiaomi Corp. Class B (a)(b) | | 129,800 | 147,063 |
| Xinyi Solar Holdings Ltd. | | 52,143 | 29,463 |
| Yihai International Holding Ltd. | | 8,000 | 54,406 |
| Yuzhou Properties Co. | | 17,586 | 7,429 |
| YY, Inc. ADR (a) | | 955 | 54,282 |
| Zhen Ding Technology Holding Ltd. | | 9,000 | 42,790 |
| Zhongsheng Group Holdings Ltd. Class H | | 8,500 | 28,179 |
| ZTO Express (Cayman), Inc. sponsored ADR | | 5,296 | 116,512 |
|
| TOTAL CAYMAN ISLANDS | | | 17,437,720 |
|
| Chile - 0.2% | | | |
| Aguas Andinas SA | | 45,960 | 21,071 |
| Banco de Chile | | 730,838 | 94,114 |
| Banco de Credito e Inversiones | | 732 | 40,756 |
| Banco Santander Chile | | 1,266,887 | 78,600 |
| Cencosud SA | | 24,276 | 32,964 |
| Colbun SA (a) | | 131,544 | 22,696 |
| Compania Cervecerias Unidas SA | | 2,280 | 22,751 |
| Compania de Petroleos de Chile SA (COPEC) | | 7,698 | 68,833 |
| CorpBanca SA | | 2,383,336 | 14,462 |
| Empresa Nacional de Telecomunicaciones SA (ENTEL) (a) | | 2,550 | 19,947 |
| Empresas CMPC SA | | 17,857 | 40,694 |
| Enel Chile SA | | 408,328 | 33,581 |
| Enersis SA | | 662,639 | 123,753 |
| LATAM Airlines Group SA | | 5,151 | 56,956 |
| S.A.C.I. Falabella | | 12,178 | 61,990 |
|
| TOTAL CHILE | | | 733,168 |
|
| China - 2.9% | | | |
| Agricultural Bank of China Ltd.: | | | |
| (A Shares) | | 80,200 | 41,443 |
| (H Shares) | | 445,000 | 183,119 |
| Aier Eye Hospital Group Co. Ltd. (A Shares) | | 4,420 | 24,809 |
| Air China Ltd. (H Shares) | | 28,000 | 24,721 |
| Aluminum Corp. of China Ltd. (H Shares) (a) | | 68,000 | 20,146 |
| Angang Steel Co. Ltd. (H Shares) | | 28,600 | 9,567 |
| Anhui Conch Cement Co. Ltd. (H Shares) | | 23,500 | 140,453 |
| AviChina Industry & Technology Co. Ltd. (H Shares) | | 38,000 | 17,949 |
| Baic Motor Corp. Ltd. (H Shares) (b) | | 28,000 | 17,369 |
| Bank Communications Co. Ltd.: | | | |
| (H Shares) | | 135,000 | 92,198 |
| Class A | | 34,800 | 27,717 |
| Bank of Beijing Co. Ltd. (A Shares) | | 36,300 | 28,540 |
| Bank of China Ltd.: | | | |
| (A Shares) | | 6,000 | 3,151 |
| (H Shares) | | 1,397,000 | 569,676 |
| Bank of Jiangsu Co. Ltd. (A Shares) | | 22,300 | 22,388 |
| Bank of Nanjing Co. Ltd. (A Shares) | | 6,000 | 7,349 |
| Bank of Ningbo Co. Ltd. (A Shares) | | 8,000 | 30,666 |
| Bank of Shanghai Co. Ltd. (A Shares) | | 8,918 | 11,808 |
| Baoshan Iron & Steel Co. Ltd. (A Shares) | | 7,300 | 6,008 |
| BBMG Corp. (H Shares) | | 60,000 | 17,172 |
| Beijing Capital International Airport Co. Ltd. (H Shares) | | 26,000 | 24,625 |
| Beijing Tongrentang Co. Ltd. (A Shares) | | 5,400 | 21,076 |
| BOE Technology Group Co. Ltd. (A Shares) | | 18,600 | 9,416 |
| BYD Co. Ltd. (H Shares) | | 12,500 | 58,631 |
| CGN Power Co. Ltd. (H Shares) (b) | | 214,000 | 55,581 |
| China Cinda Asset Management Co. Ltd. (H Shares) | | 114,000 | 23,649 |
| China CITIC Bank Corp. Ltd. (H Shares) | | 164,000 | 95,064 |
| China Coal Energy Co. Ltd. (H Shares) | | 18,000 | 7,178 |
| China Communications Construction Co. Ltd. (H Shares) | | 84,000 | 63,944 |
| China Communications Services Corp. Ltd. (H Shares) | | 32,000 | 19,761 |
| China Construction Bank Corp. (H Shares) | | 1,679,000 | 1,345,333 |
| China Eastern Airlines Corp. Ltd. (H Shares) (a) | | 30,000 | 14,962 |
| China Everbright Bank Co. Ltd. (A Shares) | | 66,500 | 40,964 |
| China Fortune Land Development Co. Ltd. (A Shares) | | 2,300 | 9,325 |
| China Galaxy Securities Co. Ltd. (H Shares) | | 59,000 | 30,083 |
| China Huarong Asset Management Co. Ltd. (b) | | 141,000 | 20,816 |
| China International Capital Corp. Ltd. (H Shares) (b) | | 20,000 | 36,469 |
| China International Travel Service Corp. Ltd. (A Shares) | | 1,600 | 20,517 |
| China Life Insurance Co. Ltd. (H Shares) | | 137,000 | 352,322 |
| China Longyuan Power Grid Corp. Ltd. (H Shares) | | 52,000 | 28,092 |
| China Merchants Bank Co. Ltd.: | | | |
| (A Shares) | | 7,800 | 39,286 |
| (H Shares) | | 77,000 | 367,231 |
| China Merchants Securities Co. Ltd. (A Shares) | | 3,800 | 8,865 |
| China Merchants Shekou Industrial Zone Holdings Co. Ltd. (A Shares) | | 3,500 | 9,296 |
| China Minsheng Banking Corp. Ltd.: | | | |
| (A Shares) | | 58,500 | 51,064 |
| (H Shares) | | 105,400 | 73,724 |
| China Molybdenum Co. Ltd.: | | | |
| (H Shares) | | 48,000 | 15,127 |
| Class A | | 19,000 | 9,164 |
| China National Building Materials Co. Ltd. (H Shares) | | 63,000 | 53,098 |
| China National Nuclear Power Co. Ltd. (A Shares) | | 11,400 | 8,185 |
| China Northern Rare Earth Group High-Tech Co. Ltd. | | 3,200 | 4,568 |
| China Oilfield Services Ltd. (H Shares) | | 30,000 | 41,768 |
| China Pacific Insurance (Group) Co. Ltd. (H Shares) | | 55,600 | 201,733 |
| China Petroleum & Chemical Corp.: | | | |
| (A Shares) | | 18,500 | 12,867 |
| (H Shares) | | 460,000 | 261,637 |
| China Railway Construction Corp. Ltd. (H Shares) | | 38,500 | 42,111 |
| China Railway Group Ltd.: | | | |
| (A Shares) | | 83,400 | 68,216 |
| (H Shares) | | 51,000 | 30,738 |
| China Railway Signal & Communications Corp. (H Shares) (b) | | 22,000 | 13,134 |
| China Reinsurance Group Corp. (H Shares) | | 82,000 | 13,378 |
| China Shenhua Energy Co. Ltd.: | | | |
| (A Shares) | | 5,800 | 15,177 |
| (H Shares) | | 51,000 | 103,578 |
| China Shipbuilding Industry Co. (A Shares) | | 25,200 | 18,944 |
| China Shipping Development Co. Ltd. (H Shares) | | 12,000 | 5,162 |
| China Southern Airlines Ltd. (H Shares) | | 32,000 | 19,694 |
| China State Construction Engineering Corp. Ltd. (A Shares) | | 82,800 | 61,624 |
| China Telecom Corp. Ltd. (H Shares) | | 230,000 | 97,844 |
| China Tower Corp. Ltd. (H Shares) (b) | | 750,000 | 165,070 |
| China United Network Communications Ltd. (A Shares) | | 38,500 | 33,517 |
| China Vanke Co. Ltd. (H Shares) | | 32,400 | 118,148 |
| China Yangtze Power Co. Ltd. (A Shares) | | 22,900 | 58,068 |
| Chongqing Rural Commercial Bank Co. Ltd. (H Shares) | | 26,000 | 13,877 |
| Chongqing Zhifei Biological Products Co. Ltd. (A Shares) | | 1,200 | 8,273 |
| CITIC Securities Co. Ltd.: | | | |
| (A Shares) | | 5,100 | 15,694 |
| (H Shares) | | 39,500 | 72,471 |
| Contemporary Amperex Technology Co. Ltd. | | 600 | 5,853 |
| COSCO Shipping Development Co. Ltd. (H Shares) | | 37,000 | 4,145 |
| COSCO SHIPPING Holdings Co. Ltd. (H Shares) (a) | | 40,500 | 15,152 |
| CRRC Corp. Ltd.: | | | |
| (A Shares) | | 30,000 | 30,653 |
| (H Shares) | | 62,000 | 41,468 |
| Daqin Railway Co. Ltd. (A Shares) | | 6,400 | 6,932 |
| Datang International Power Generation Co. Ltd. (H Shares) | | 26,000 | 5,128 |
| Dong E-E-Jiao Co. Ltd. (A Shares) | | 3,000 | 15,033 |
| Dongfeng Motor Group Co. Ltd. (H Shares) | | 40,000 | 40,125 |
| East Money Information Co. Ltd. (A Shares) | | 8,300 | 17,547 |
| Focus Media Information Technology Co. Ltd. (A Shares) | | 7,100 | 6,040 |
| Foshan Haitian Flavouring & Food Co. Ltd. (A Shares) | | 2,500 | 39,649 |
| Foxconn Industrial Internet Co. Ltd. (A Shares) | | 3,100 | 6,753 |
| Fuyao Glass Industries Group Co. Ltd. (H Shares) (b) | | 7,600 | 21,475 |
| GF Securities Co. Ltd. (H Shares) | | 40,600 | 42,284 |
| GoerTek, Inc. (A Shares) | | 2,600 | 6,852 |
| Great Wall Motor Co. Ltd. (H Shares) | | 51,000 | 41,323 |
| Gree Electric Appliances, Inc. of Zhuhai (A Shares) | | 1,800 | 15,007 |
| Guangzhou Automobile Group Co. Ltd. (H Shares) | | 46,000 | 45,942 |
| Guangzhou Baiyunshan Pharmaceutical Holdings Co. Ltd. (A Shares) | | 2,800 | 13,419 |
| Guangzhou R&F Properties Co. Ltd. (H Shares) | | 16,400 | 25,411 |
| Guotai Junan Securities Co. Ltd.: | | | |
| (A Shares) | | 9,600 | 23,235 |
| (H Shares) (b) | | 11,200 | 17,115 |
| Haier Smart Home Co. Ltd. (A Shares) | | 4,200 | 9,539 |
| Haitong Securities Co. Ltd.: | | | |
| (A Shares) | | 7,300 | 14,603 |
| (H Shares) | | 55,200 | 56,354 |
| Hangzhou Hikvision Digital Technology Co. Ltd. (A Shares) | | 10,300 | 47,179 |
| Henan Shuanghui Investment & Development Co. Ltd. (A Shares) | | 4,900 | 20,727 |
| Hengli Petrochemical Co. Ltd. (A Shares) | | 4,500 | 10,290 |
| Hithink RoyalFlush Information Network Co. Ltd. (A Shares) | | 400 | 5,511 |
| Huadian Power International Corp. Ltd.: | | | |
| (A Shares) | | 35,600 | 17,784 |
| (H Shares) | | 16,000 | 5,995 |
| Huadong Medicine Co. Ltd. (A Shares) | | 1,600 | 5,922 |
| Huaneng Power International, Inc. (H Shares) | | 68,000 | 32,298 |
| Huaneng Renewables Corp. Ltd. (H Shares) | | 72,000 | 27,488 |
| Huatai Securities Co. Ltd. (H Shares) (b) | | 38,000 | 56,484 |
| Huaxia Bank Co. Ltd. (A Shares) | | 41,300 | 43,908 |
| Huayu Automotive Systems Co. Ltd. (A Shares) | | 2,600 | 9,266 |
| Hundsun Technologies, Inc. (A Shares) | | 700 | 7,567 |
| iFlytek Co. Ltd. (A Shares) | | 4,400 | 20,669 |
| Industrial & Commercial Bank of China Ltd. (H Shares) | | 1,168,000 | 836,747 |
| Industrial Bank Co. Ltd. (A Shares) | | 22,800 | 60,566 |
| Inner Mongoli Yili Industries Co. Ltd. (A Shares) | | 8,000 | 32,926 |
| Inner Mongolia Baotou Steel Union Co. Ltd. (A Shares) | | 62,400 | 12,134 |
| Inner Mongolia Yitai Coal Co. Ltd. (B Shares) | | 47,800 | 41,693 |
| Jiangsu Expressway Co. Ltd. (H Shares) | | 18,000 | 23,914 |
| Jiangsu Hengrui Medicine Co. Ltd. (A Shares) | | 5,300 | 68,337 |
| Jiangsu Yanghe Brewery JSC Ltd. (A Shares) | | 1,900 | 27,138 |
| Jiangxi Copper Co. Ltd. (H Shares) | | 23,000 | 26,927 |
| Kangmei Pharmaceutical Co. Ltd. (A Shares) | | 3,200 | 1,692 |
| Kweichow Moutai Co. Ltd. (A Shares) | | 1,000 | 167,370 |
| Legend Holdings Corp.: | | | |
| (H Shares) (b) | | 5,700 | 12,530 |
| rights (a)(d) | | 438 | 73 |
| Lepu Medical Technology Beijing Co. Ltd. (A Shares) | | 6,400 | 27,418 |
| LONGi Green Energy Technology Co. Ltd. | | 3,100 | 10,036 |
| Luxshare Precision Industry Co. Ltd. (A Shares) | | 5,880 | 26,500 |
| Luzhou Laojiao Co. Ltd. (A Shares) | | 1,600 | 19,786 |
| Maanshan Iron & Steel Co. Ltd. (A Shares) | | 26,900 | 10,152 |
| Metallurgical Corp. China Ltd. (H Shares) | | 62,000 | 13,125 |
| Midea Group Co. Ltd. (A Shares) | | 5,500 | 43,317 |
| Muyuan Foodstuff Co. Ltd. (A Shares) | | 1,600 | 22,355 |
| NARI Technology Co. Ltd. (A Shares) | | 4,600 | 14,326 |
| New China Life Insurance Co. Ltd. (H Shares) | | 16,300 | 63,263 |
| Orient Securities Co. Ltd. (A Shares) | | 4,800 | 6,809 |
| People's Insurance Co. of China Group (H Shares) | | 136,000 | 57,280 |
| PetroChina Co. Ltd.: | | | |
| (A Shares) | | 10,000 | 8,346 |
| (H Shares) | | 386,000 | 188,237 |
| PICC Property & Casualty Co. Ltd. (H Shares) | | 118,000 | 149,331 |
| Ping An Bank Co. Ltd. (A Shares) | | 9,800 | 22,614 |
| Ping An Insurance Group Co. of China Ltd.: | | | |
| (A Shares) | | 5,800 | 72,410 |
| (H Shares) | | 99,500 | 1,148,408 |
| Poly Developments & Holdings (A Shares) | | 17,700 | 36,178 |
| Postal Savings Bank of China Co. Ltd. (H Shares) (b) | | 128,000 | 82,069 |
| Power Construction Corp. of China Ltd. (A Shares) | | 10,500 | 6,649 |
| SAIC Motor Corp. Ltd. (A Shares) | | 12,700 | 42,357 |
| Sanan Optoelectronics Co. Ltd. (A Shares) | | 3,300 | 7,114 |
| Sany Heavy Industry Co. Ltd. (A Shares) | | 9,500 | 18,154 |
| Seazen Holdings Co. Ltd. (A Shares) | | 2,700 | 12,189 |
| Shaanxi Coal Industry Co. Ltd. (A Shares) | | 15,100 | 17,955 |
| Shandong Gold Mining Co. Ltd. (A Shares) | | 3,000 | 13,628 |
| Shandong Weigao Medical Polymer Co. Ltd. (H Shares) | | 36,000 | 41,329 |
| Shanghai Electric Group Co. Ltd. (H Shares) | | 42,000 | 12,847 |
| Shanghai Fosun Pharmaceutical (Group) Co. Ltd. (H Shares) | | 9,000 | 25,401 |
| Shanghai International Airport Co. Ltd. (A Shares) | | 1,400 | 15,154 |
| Shanghai International Port Group Co. Ltd. (A Shares) | | 7,000 | 5,767 |
| Shanghai Lujiazui Finance Trust Ltd. (B Shares) | | 29,625 | 32,629 |
| Shanghai Pharmaceuticals Holding Co. Ltd. (H Shares) | | 17,400 | 31,440 |
| Shanghai Pudong Development Bank Co. Ltd. (A Shares) | | 37,900 | 67,275 |
| Shanxi Xinghuacun Fen Wine Factory Co. Ltd. (A Shares) | | 700 | 8,834 |
| Shenwan Hongyuan Group Co. Ltd. (A Shares) | | 14,000 | 9,516 |
| Shenzhen Kangtai Biological Products Co. Ltd. | | 600 | 7,372 |
| Shenzhen Mindray Bio-Medical Electronics Co. Ltd. (A Shares) | | 300 | 7,575 |
| Sichuan Kelun Pharmaceutical Co. Ltd. (A Shares) | | 1,400 | 4,745 |
| Sichuan New Hope Agribusiness Co. Ltd. (A Shares) | | 3,300 | 10,331 |
| Sinopec Engineering Group Co. Ltd. (H Shares) | | 23,500 | 13,425 |
| Sinopec Shanghai Petrochemical Co. Ltd. (H Shares) | | 48,000 | 13,257 |
| Sinopharm Group Co. Ltd. (H Shares) | | 19,200 | 68,760 |
| Sinotrans Ltd. (H Shares) | | 41,000 | 12,055 |
| Suning.com Co. Ltd. (A Shares) | | 4,400 | 6,587 |
| Tong Ren Tang Technologies Co. Ltd. (H Shares) | | 15,000 | 14,934 |
| Tongwei Co. Ltd. (A Shares) | | 3,000 | 5,405 |
| TravelSky Technology Ltd. (H Shares) | | 14,000 | 31,912 |
| Tsingtao Brewery Co. Ltd. (H Shares) | | 8,000 | 46,360 |
| Walvax Biotechnology Co. Ltd. (A Shares) | | 1,400 | 5,993 |
| Wanhua Chemical Group Co. Ltd. (A Shares) | | 4,900 | 31,690 |
| Weichai Power Co. Ltd. (H Shares) | | 36,000 | 56,665 |
| Wens Foodstuffs Group Co. Ltd. (A Shares) | | 3,500 | 19,993 |
| Wuliangye Yibin Co. Ltd. (A Shares) | | 3,200 | 59,862 |
| WuXi AppTec Co. Ltd. | | 2,200 | 29,367 |
| WuXi AppTec Co. Ltd. (H Shares) (b) | | 2,660 | 32,071 |
| XCMG Construction Machinery Co. Ltd. (A Shares) | | 30,200 | 19,362 |
| Xinjiang Goldwind Science & Technology Co. Ltd.: | | | |
| (A Shares) | | 5,236 | 9,336 |
| (H Shares) | | 7,616 | 9,083 |
| Yanzhou Coal Mining Co. Ltd. (H Shares) | | 32,000 | 32,466 |
| Yonghui Superstores Co. Ltd. (A Shares) | | 13,100 | 15,508 |
| Yonyou Network Technology Co. Ltd. (A Shares) | | 3,400 | 14,248 |
| Yunnan Baiyao Group Co. Ltd. (A Shares) | | 2,900 | 35,637 |
| Zhangzhou Pientzehuang Pharmaceutical Co. Ltd. (A Shares) | | 1,100 | 16,937 |
| Zhaojin Mining Industry Co. Ltd. (H Shares) | | 16,000 | 17,894 |
| Zhejiang Expressway Co. Ltd. (H Shares) | | 30,000 | 24,566 |
| Zhejiang Longsheng Group Co. Ltd. (A Shares) | | 2,600 | 5,103 |
| ZhongAn Online P & C Insurance Co. Ltd. (H Shares) (a)(b) | | 4,000 | 13,315 |
| Zhuzhou CRRC Times Electric Co. Ltd. (H Shares) | | 8,900 | 33,024 |
| Zijin Mining Group Co. Ltd. (H Shares) | | 112,000 | 38,796 |
| ZTE Corp. (H Shares) (a) | | 17,200 | 47,986 |
|
| TOTAL CHINA | | | 11,098,378 |
|
| Colombia - 0.1% | | | |
| Bancolombia SA | | 4,718 | 57,370 |
| Cementos Argos SA | | 8,641 | 19,506 |
| Ecopetrol SA | | 76,348 | 68,668 |
| Grupo de Inversiones Suramerica SA | | 5,171 | 52,322 |
| Interconexion Electrica SA ESP | | 7,981 | 46,044 |
| Inversiones Argos SA | | 3,671 | 19,876 |
|
| TOTAL COLOMBIA | | | 263,786 |
|
| Czech Republic - 0.0% | | | |
| Ceske Energeticke Zavody A/S | | 3,257 | 74,298 |
| Komercni Banka A/S | | 1,308 | 44,213 |
| MONETA Money Bank A/S (b) | | 6,836 | 22,719 |
|
| TOTAL CZECH REPUBLIC | | | 141,230 |
|
| Denmark - 1.2% | | | |
| A.P. Moller - Maersk A/S: | | | |
| Series A | | 85 | 102,018 |
| Series B | | 92 | 117,355 |
| Carlsberg A/S Series B | | 1,879 | 264,341 |
| Christian Hansen Holding A/S | | 1,880 | 144,338 |
| Coloplast A/S Series B | | 2,122 | 255,699 |
| Danske Bank A/S | | 11,061 | 157,821 |
| DSV A/S | | 3,832 | 371,828 |
| Genmab A/S (a) | | 1,095 | 239,252 |
| H Lundbeck A/S | | 1,209 | 41,240 |
| ISS Holdings A/S | | 2,528 | 66,155 |
| Novo Nordisk A/S Series B | | 30,650 | 1,685,404 |
| Novozymes A/S Series B | | 3,578 | 168,463 |
| ORSTED A/S (b) | | 3,309 | 290,256 |
| Pandora A/S | | 1,655 | 81,381 |
| Tryg A/S | | 2,024 | 56,531 |
| Vestas Wind Systems A/S | | 3,331 | 271,369 |
| William Demant Holding A/S (a) | | 1,821 | 48,061 |
|
| TOTAL DENMARK | | | 4,361,512 |
|
| Egypt - 0.0% | | | |
| Commercial International Bank SAE | | 20,113 | 100,939 |
| Commercial International Bank SAE sponsored GDR | | 4,202 | 20,758 |
| Eastern Tobacco Co. | | 12,960 | 12,856 |
| Elsewedy Electric Co. | | 7,370 | 6,142 |
|
| TOTAL EGYPT | | | 140,695 |
|
| Finland - 0.7% | | | |
| Elisa Corp. (A Shares) | | 2,459 | 134,301 |
| Fortum Corp. | | 7,462 | 182,177 |
| Kone OYJ (B Shares) | | 5,870 | 373,430 |
| Metso Corp. | | 1,652 | 62,423 |
| Neste Oyj | | 7,070 | 255,164 |
| Nokia Corp. | | 98,978 | 363,350 |
| Nokian Tyres PLC | | 2,112 | 60,301 |
| Nordea Bank ABP (Stockholm Stock Exchange) | | 56,308 | 412,137 |
| Orion Oyj (B Shares) | | 1,635 | 72,467 |
| Sampo Oyj (A Shares) | | 7,805 | 319,848 |
| Stora Enso Oyj (R Shares) | | 10,144 | 131,521 |
| UPM-Kymmene Corp. | | 9,556 | 310,568 |
| Wartsila Corp. | | 7,722 | 81,490 |
|
| TOTAL FINLAND | | | 2,759,177 |
|
| France - 6.8% | | | |
| Accor SA | | 3,120 | 134,039 |
| Aeroports de Paris | | 512 | 97,304 |
| Air Liquide SA | | 8,129 | 1,079,793 |
| Alstom SA | | 3,200 | 138,297 |
| Amundi SA (b) | | 1,157 | 82,586 |
| Arkema SA | | 1,234 | 126,122 |
| Atos Origin SA | | 1,658 | 128,672 |
| AXA SA | | 33,245 | 880,036 |
| BIC SA | | 374 | 25,966 |
| bioMerieux SA | | 686 | 56,120 |
| BNP Paribas SA | | 19,489 | 1,018,487 |
| Bollore SA | | 13,672 | 59,164 |
| Bollore SA (a) | | 79 | 337 |
| Bouygues SA | | 3,753 | 159,057 |
| Bureau Veritas SA | | 5,163 | 131,807 |
| Capgemini SA | | 2,796 | 314,800 |
| Carrefour SA | | 9,941 | 169,135 |
| Casino Guichard Perrachon SA | | 923 | 49,793 |
| CNP Assurances | | 2,700 | 53,541 |
| Compagnie de St. Gobain | | 8,785 | 357,330 |
| Covivio | | 715 | 80,940 |
| Credit Agricole SA | | 20,348 | 265,508 |
| Danone SA | | 10,598 | 877,952 |
| Dassault Aviation SA | | 42 | 58,319 |
| Dassault Systemes SA | | 2,318 | 351,725 |
| Edenred SA | | 3,984 | 209,726 |
| EDF SA | | 10,146 | 104,694 |
| Eiffage SA | | 1,353 | 145,347 |
| ENGIE | | 31,410 | 525,298 |
| Essilor International SA | | 4,881 | 744,709 |
| Eurazeo SA | | 658 | 45,867 |
| Eutelsat Communications | | 2,763 | 52,387 |
| Faurecia SA | | 1,278 | 59,551 |
| Gecina SA | | 769 | 131,909 |
| Groupe Eurotunnel SA | | 7,290 | 122,039 |
| Hermes International SCA | | 530 | 381,265 |
| ICADE | | 493 | 48,276 |
| Iliad SA | | 452 | 46,782 |
| Imerys SA | | 608 | 23,476 |
| Ingenico SA | | 1,039 | 110,943 |
| Ipsen SA | | 612 | 65,185 |
| JCDecaux SA | | 1,301 | 35,550 |
| Kering SA | | 1,309 | 744,855 |
| Klepierre SA | | 3,581 | 133,356 |
| L'Oreal SA | | 4,358 | 1,272,473 |
| Legrand SA | | 4,758 | 371,356 |
| LVMH Moet Hennessy Louis Vuitton SE | | 4,779 | 2,040,901 |
| Michelin CGDE Series B | | 2,980 | 362,837 |
| Natixis SA | | 16,032 | 73,507 |
| Orange SA | | 34,694 | 558,383 |
| Pernod Ricard SA | | 3,690 | 681,108 |
| Peugeot Citroen SA | | 10,413 | 263,629 |
| Publicis Groupe SA | | 3,724 | 160,276 |
| Remy Cointreau SA | | 365 | 48,809 |
| Renault SA | | 3,378 | 172,400 |
| Safran SA | | 5,654 | 894,493 |
| Sanofi SA | | 19,478 | 1,795,621 |
| Sartorius Stedim Biotech | | 475 | 71,095 |
| Schneider Electric SA | | 9,575 | 889,905 |
| SCOR SE | | 2,751 | 115,916 |
| SEB SA | | 356 | 54,038 |
| Societe Generale Series A | | 13,595 | 386,627 |
| Sodexo SA | | 1,688 | 185,627 |
| SR Teleperformance SA | | 1,000 | 226,629 |
| Suez Environnement SA | | 5,958 | 92,863 |
| Thales SA | | 1,902 | 185,911 |
| Total SA | | 41,306 | 2,183,776 |
| Ubisoft Entertainment SA (a) | | 1,398 | 82,543 |
| Valeo SA | | 4,187 | 155,690 |
| Veolia Environnement SA | | 9,068 | 238,376 |
| VINCI SA | | 8,780 | 985,109 |
| Vivendi SA | | 16,137 | 449,220 |
| Wendel SA | | 469 | 66,431 |
| Worldline SA (a)(b) | | 1,388 | 84,291 |
|
| TOTAL FRANCE | | | 25,577,885 |
|
| Germany - 5.3% | | | |
| adidas AG | | 3,117 | 962,439 |
| Allianz SE | | 7,239 | 1,767,928 |
| Axel Springer SE (a) | | 814 | 56,741 |
| BASF AG | | 15,997 | 1,216,080 |
| Bayer AG | | 16,208 | 1,257,355 |
| Bayerische Motoren Werke AG (BMW) | | 5,891 | 451,441 |
| Beiersdorf AG | | 1,677 | 198,539 |
| Brenntag AG | | 3,157 | 158,445 |
| Carl Zeiss Meditec AG | | 668 | 72,826 |
| Commerzbank AG | | 16,499 | 98,686 |
| Continental AG | | 1,964 | 263,060 |
| Covestro AG (b) | | 3,117 | 149,659 |
| Daimler AG (Germany) | | 15,857 | 926,887 |
| Delivery Hero AG (a)(b) | | 1,882 | 88,221 |
| Deutsche Bank AG | | 33,615 | 243,465 |
| Deutsche Borse AG | | 3,296 | 510,418 |
| Deutsche Lufthansa AG | | 4,439 | 76,960 |
| Deutsche Post AG | | 17,486 | 619,193 |
| Deutsche Telekom AG | | 57,165 | 1,005,851 |
| Deutsche Wohnen AG (Bearer) | | 6,010 | 226,024 |
| Drillisch AG | | 878 | 23,482 |
| E.ON AG | | 38,490 | 388,151 |
| Evonik Industries AG | | 3,495 | 92,187 |
| Fraport AG Frankfurt Airport Services Worldwide | | 740 | 61,850 |
| Fresenius Medical Care AG & Co. KGaA | | 3,842 | 277,314 |
| Fresenius SE & Co. KGaA | | 7,511 | 394,767 |
| GEA Group AG | | 2,513 | 76,823 |
| Hannover Reuck SE | | 989 | 175,161 |
| HeidelbergCement Finance AG | | 2,573 | 191,177 |
| Henkel AG & Co. KGaA | | 1,905 | 183,463 |
| Hochtief AG | | 401 | 50,001 |
| Hugo Boss AG | | 1,049 | 44,131 |
| Infineon Technologies AG | | 21,977 | 425,668 |
| KION Group AG | | 1,082 | 71,898 |
| Knorr-Bremse AG | | 852 | 85,987 |
| Lanxess AG | | 1,454 | 94,542 |
| Merck KGaA | | 2,181 | 260,031 |
| Metro Wholesale & Food Specialist AG | | 3,213 | 52,319 |
| MTU Aero Engines Holdings AG | | 935 | 249,648 |
| Muenchener Rueckversicherungs-Gesellschaft AG in Muenchen | | 2,474 | 687,054 |
| Puma AG | | 1,458 | 109,681 |
| RWE AG | | 9,644 | 293,960 |
| SAP SE | | 16,991 | 2,251,333 |
| Siemens AG | | 13,263 | 1,530,551 |
| Siemens Healthineers AG (b) | | 2,471 | 104,986 |
| Symrise AG | | 2,228 | 214,396 |
| Telefonica Deutschland Holding AG | | 18,066 | 57,324 |
| Thyssenkrupp AG | | 6,539 | 93,313 |
| TUI AG | | 302 | 3,942 |
| TUI AG (GB) | | 7,227 | 94,551 |
| Uniper SE | | 3,307 | 103,051 |
| United Internet AG | | 2,061 | 62,086 |
| Volkswagen AG | | 508 | 96,261 |
| Vonovia SE | | 8,840 | 470,385 |
| Wirecard AG | | 2,065 | 261,516 |
| Zalando SE (a)(b) | | 2,318 | 100,438 |
|
| TOTAL GERMANY | | | 20,083,646 |
|
| Greece - 0.1% | | | |
| Alpha Bank AE (a) | | 22,659 | 48,294 |
| EFG Eurobank Ergasias SA (a) | | 39,127 | 39,624 |
| Ff Group (a)(d) | | 256 | 343 |
| Greek Organization of Football Prognostics SA | | 4,283 | 46,574 |
| Hellenic Telecommunications Organization SA | | 4,081 | 61,901 |
| Jumbo SA | | 1,734 | 33,844 |
| Motor Oil (HELLAS) Corinth Refineries SA | | 1,107 | 27,335 |
| National Bank of Greece SA (a) | | 8,731 | 29,603 |
|
| TOTAL GREECE | | | 287,518 |
|
| Hong Kong - 2.5% | | | |
| AIA Group Ltd. | | 209,200 | 2,083,261 |
| Bank of East Asia Ltd. | | 20,253 | 48,787 |
| Beijing Enterprises Holdings Ltd. | | 6,500 | 30,605 |
| BOC Hong Kong (Holdings) Ltd. | | 61,000 | 209,573 |
| BYD Electronic International Co. Ltd. | | 11,500 | 19,748 |
| China Agri-Industries Holdings Ltd. | | 21,000 | 6,919 |
| China Everbright International Ltd. | | 69,888 | 52,822 |
| China Everbright Ltd. | | 12,000 | 17,779 |
| China Jinmao Holdings Group Ltd. | | 98,000 | 65,152 |
| China Merchants Holdings International Co. Ltd. | | 18,131 | 28,348 |
| China Mobile Ltd. | | 107,500 | 873,620 |
| China Overseas Land and Investment Ltd. | | 64,000 | 201,952 |
| China Power International Development Ltd. | | 84,000 | 17,542 |
| China Resources Beer Holdings Co. Ltd. | | 24,000 | 123,049 |
| China Resources Pharmaceutical Group Ltd. (b) | | 27,000 | 24,935 |
| China Resources Power Holdings Co. Ltd. | | 32,000 | 40,216 |
| China Taiping Insurance Group Ltd. | | 26,400 | 59,350 |
| China Unicom Ltd. | | 102,000 | 100,419 |
| CITIC Pacific Ltd. | | 99,000 | 130,233 |
| CLP Holdings Ltd. | | 29,500 | 306,370 |
| CNOOC Ltd. | | 315,000 | 468,799 |
| CSPC Pharmaceutical Group Ltd. | | 80,000 | 204,890 |
| Far East Horizon Ltd. | | 30,000 | 28,402 |
| Fosun International Ltd. | | 50,500 | 66,033 |
| Galaxy Entertainment Group Ltd. | | 39,000 | 268,540 |
| Guangdong Investment Ltd. | | 50,000 | 108,215 |
| Hang Lung Properties Ltd. | | 33,000 | 72,541 |
| Hang Seng Bank Ltd. | | 13,200 | 275,419 |
| Henderson Land Development Co. Ltd. | | 25,010 | 124,915 |
| Hong Kong & China Gas Co. Ltd. | | 181,121 | 351,538 |
| Hong Kong Exchanges and Clearing Ltd. | | 21,018 | 654,796 |
| Hua Hong Semiconductor Ltd. (b) | | 5,000 | 10,054 |
| Hysan Development Co. Ltd. | | 11,000 | 43,354 |
| i-CABLE Communications Ltd. (a) | | 531 | 5 |
| Lenovo Group Ltd. | | 130,000 | 90,629 |
| Link (REIT) | | 37,500 | 408,428 |
| MMG Ltd. (a) | | 40,000 | 8,327 |
| MTR Corp. Ltd. | | 28,544 | 163,665 |
| New World Development Co. Ltd. | | 105,070 | 150,296 |
| PCCW Ltd. | | 61,000 | 36,229 |
| Power Assets Holdings Ltd. | | 26,000 | 185,540 |
| Shanghai Industrial Holdings Ltd. | | 5,000 | 9,307 |
| Shenzhen Investment Ltd. | | 30,000 | 11,808 |
| Sino Land Ltd. | | 55,666 | 83,213 |
| Sino-Ocean Group Holding Ltd. | | 53,500 | 19,669 |
| Sinotruk Hong Kong Ltd. | | 10,000 | 15,111 |
| SJM Holdings Ltd. | | 33,000 | 35,252 |
| Sun Art Retail Group Ltd. | | 40,000 | 40,816 |
| Sun Hung Kai Properties Ltd. | | 28,500 | 431,870 |
| Swire Pacific Ltd. (A Shares) | | 8,500 | 81,024 |
| Swire Properties Ltd. | | 18,600 | 58,498 |
| Techtronic Industries Co. Ltd. | | 23,000 | 179,745 |
| Vitasoy International Holdings Ltd. | | 12,000 | 48,796 |
| Wharf Holdings Ltd. | | 19,000 | 43,116 |
| Wheelock and Co. Ltd. | | 13,000 | 80,400 |
| Winteam Pharmaceutical Group Ltd. | | 36,000 | 16,075 |
| Yuexiu Property Co. Ltd. | | 110,000 | 24,229 |
|
| TOTAL HONG KONG | | | 9,340,224 |
|
| Hungary - 0.1% | | | |
| MOL Hungarian Oil and Gas PLC Series A (For. Reg.) | | 7,645 | 75,566 |
| OTP Bank PLC | | 3,674 | 169,230 |
| Richter Gedeon PLC | | 2,410 | 44,665 |
|
| TOTAL HUNGARY | | | 289,461 |
|
| India - 2.3% | | | |
| Adani Ports & Special Economic Zone Ltd. (a) | | 11,039 | 61,470 |
| Ambuja Cements Ltd. | | 13,243 | 37,709 |
| Ashok Leyland Ltd. | | 19,792 | 21,376 |
| Asian Paints Ltd. | | 4,703 | 119,796 |
| Aurobindo Pharma Ltd. | | 4,598 | 30,315 |
| Avenue Supermarts Ltd. (a)(b) | | 1,982 | 55,613 |
| Axis Bank Ltd. | | 39,275 | 406,641 |
| Bajaj Auto Ltd. | | 1,489 | 68,056 |
| Bajaj Finance Ltd. | | 2,864 | 162,294 |
| Bajaj Finserv Ltd. | | 689 | 78,910 |
| Bandhan Bank Ltd. (b) | | 6,491 | 55,892 |
| Bharat Forge Ltd. | | 3,016 | 19,254 |
| Bharat Petroleum Corp. Ltd. | | 10,508 | 77,766 |
| Bharti Airtel Ltd. | | 34,321 | 180,744 |
| Bharti Infratel Ltd. | | 4,557 | 12,170 |
| Bosch Ltd. | | 89 | 19,167 |
| Britannia Industries Ltd. | | 912 | 41,925 |
| Cipla Ltd. (a) | | 5,668 | 37,262 |
| Coal India Ltd. | | 21,423 | 62,538 |
| Container Corp. of India Ltd. | | 2,700 | 22,357 |
| Dabur India Ltd. | | 11,122 | 72,307 |
| Divi's Laboratories Ltd. | | 1,132 | 27,968 |
| Dr. Reddy's Laboratories Ltd. | | 1,847 | 72,464 |
| Eicher Motors Ltd. | | 237 | 75,086 |
| GAIL India Ltd. (a) | | 24,872 | 48,069 |
| Glenmark Pharmaceuticals Ltd. | | 3,243 | 14,401 |
| Godrej Consumer Products Ltd. | | 5,472 | 57,080 |
| Grasim Industries Ltd. | | 4,648 | 50,320 |
| Havells India Ltd. | | 4,014 | 39,081 |
| HCL Technologies Ltd. | | 8,995 | 147,386 |
| HDFC Standard Life Insurance Co. Ltd. (b) | | 8,282 | 72,985 |
| Hero Motocorp Ltd. | | 1,617 | 61,534 |
| Hindalco Industries Ltd. | | 24,088 | 63,630 |
| Hindustan Petroleum Corp. Ltd. | | 10,019 | 45,767 |
| Hindustan Unilever Ltd. | | 11,595 | 355,133 |
| Housing Development Finance Corp. Ltd. | | 29,034 | 870,741 |
| ICICI Bank Ltd. | | 40,635 | 264,909 |
| ICICI Lombard General Insurance Co. Ltd. (b) | | 2,238 | 42,169 |
| Indiabulls Housing Finance Ltd. | | 4,678 | 13,565 |
| Indian Oil Corp. Ltd. | | 31,011 | 64,008 |
| Infosys Ltd. | | 55,693 | 535,150 |
| Infosys Ltd. sponsored ADR | | 4,735 | 45,409 |
| InterGlobe Aviation Ltd. (a)(b) | | 1,526 | 31,251 |
| ITC Ltd. | | 58,686 | 212,829 |
| JSW Steel Ltd. | | 16,173 | 51,857 |
| Larsen & Toubro Ltd. | | 8,094 | 167,813 |
| LIC Housing Finance Ltd. | | 4,908 | 28,487 |
| Lupin Ltd. (a) | | 4,076 | 42,779 |
| Mahindra & Mahindra Financial Services Ltd. | | 7,101 | 35,240 |
| Mahindra & Mahindra Ltd. | | 13,592 | 115,999 |
| Marico Ltd. | | 6,091 | 31,391 |
| Maruti Suzuki India Ltd. | | 1,797 | 191,330 |
| Motherson Sumi Systems Ltd. (a) | | 15,831 | 27,395 |
| Nestle India Ltd. | | 357 | 75,079 |
| NTPC Ltd. | | 36,688 | 63,221 |
| Oil & Natural Gas Corp. Ltd. | | 40,979 | 81,730 |
| Page Industries Ltd. | | 79 | 28,621 |
| Petronet LNG Ltd. | | 8,132 | 32,790 |
| Pidilite Industries Ltd. (a) | | 1,685 | 33,249 |
| Piramal Enterprises Ltd. | | 1,451 | 34,367 |
| Power Grid Corp. of India Ltd. | | 30,212 | 84,424 |
| Rec Ltd. | | 11,242 | 22,100 |
| Reliance Industries Ltd. | | 49,648 | 1,022,571 |
| Shree Cement Ltd. | | 142 | 39,778 |
| Shriram Transport Finance Co. Ltd. | | 3,097 | 49,607 |
| State Bank of India (a) | | 31,178 | 137,018 |
| Sun Pharmaceutical Industries Ltd. | | 15,666 | 95,630 |
| Tata Consultancy Services Ltd. | | 15,775 | 502,402 |
| Tata Motors Ltd. (a) | | 25,706 | 63,518 |
| Tata Power Co. Ltd. | | 18,370 | 15,333 |
| Tata Steel Ltd. | | 6,621 | 35,426 |
| Tech Mahindra Ltd. | | 7,443 | 77,446 |
| Titan Co. Ltd. | | 5,387 | 100,994 |
| Ultratech Cemco Ltd. | | 1,989 | 116,070 |
| United Spirits Ltd. (a) | | 4,679 | 41,131 |
| UPL Ltd. (a) | | 10,118 | 84,961 |
| Vedanta Ltd. | | 33,209 | 69,261 |
| Vodafone Idea Ltd. (a) | | 88,782 | 4,865 |
| Wipro Ltd. | | 18,959 | 69,377 |
| Yes Bank Ltd. | | 31,913 | 31,581 |
| Zee Entertainment Enterprises Ltd. (a) | | 12,116 | 44,305 |
|
| TOTAL INDIA | | | 8,603,643 |
|
| Indonesia - 0.5% | | | |
| PT Adaro Energy Tbk | | 208,200 | 19,411 |
| PT Astra International Tbk | | 398,800 | 197,247 |
| PT Bank Central Asia Tbk | | 166,900 | 373,577 |
| PT Bank Mandiri (Persero) Tbk | | 306,900 | 153,410 |
| PT Bank Negara Indonesia (Persero) Tbk | | 141,000 | 76,969 |
| PT Bank Rakyat Indonesia Tbk | | 939,300 | 281,447 |
| PT Bank Tabungan Negara Tbk | | 60,700 | 8,034 |
| PT Barito Pacific Tbk | | 437,000 | 29,575 |
| PT Bumi Serpong Damai Tbk (a) | | 121,200 | 12,205 |
| PT Charoen Pokphand Indonesia Tbk | | 122,600 | 54,984 |
| PT Gudang Garam Tbk | | 7,900 | 31,550 |
| PT Hanjaya Mandala Sampoerna Tbk | | 154,100 | 23,365 |
| PT Indah Kiat Pulp & Paper Tbk | | 46,100 | 23,864 |
| PT Indocement Tunggal Prakarsa Tbk | | 30,000 | 42,740 |
| PT Indofood CBP Sukses Makmur Tbk | | 40,100 | 33,200 |
| PT Indofood Sukses Makmur Tbk | | 70,000 | 38,360 |
| PT Jasa Marga Tbk | | 32,800 | 12,727 |
| PT Kalbe Farma Tbk | | 362,600 | 41,176 |
| PT Pabrik Kertas Tjiwi Kimia Tbk | | 23,500 | 17,690 |
| PT Pakuwon Jati Tbk | | 192,000 | 8,545 |
| PT Perusahaan Gas Negara Tbk Series B | | 177,600 | 26,652 |
| PT Semen Gresik (Persero) Tbk | | 47,900 | 43,200 |
| PT Surya Citra Media Tbk | | 93,600 | 8,132 |
| PT Tambang Batubara Bukit Asam Tbk | | 41,200 | 6,597 |
| PT Telekomunikasi Indonesia Tbk Series B | | 845,500 | 246,735 |
| PT Unilever Indonesia Tbk | | 28,000 | 87,183 |
| PT United Tractors Tbk | | 31,800 | 49,084 |
|
| TOTAL INDONESIA | | | 1,947,659 |
|
| Ireland - 0.4% | | | |
| AIB Group PLC | | 13,899 | 44,520 |
| Bank Ireland Group PLC | | 16,325 | 78,510 |
| CRH PLC | | 12,821 | 466,810 |
| CRH PLC sponsored ADR | | 1,081 | 39,457 |
| DCC PLC (United Kingdom) | | 1,632 | 152,970 |
| James Hardie Industries PLC CDI | | 7,771 | 133,461 |
| Kerry Group PLC Class A | | 2,791 | 337,428 |
| Kingspan Group PLC (Ireland) | | 2,578 | 133,584 |
| Paddy Power Betfair PLC (Ireland) | | 1,315 | 135,838 |
| Smurfit Kappa Group PLC | | 3,915 | 130,555 |
|
| TOTAL IRELAND | | | 1,653,133 |
|
| Isle of Man - 0.0% | | | |
| Gaming VC Holdings SA | | 9,763 | 112,554 |
| NEPI Rockcastle PLC | | 6,401 | 55,705 |
|
| TOTAL ISLE OF MAN | | | 168,259 |
|
| Israel - 0.4% | | | |
| Azrieli Group | | 708 | 54,540 |
| Bank Hapoalim BM (Reg.) | | 19,141 | 153,098 |
| Bank Leumi le-Israel BM | | 25,073 | 182,546 |
| Check Point Software Technologies Ltd. (a) | | 2,050 | 230,441 |
| CyberArk Software Ltd. (a) | | 604 | 61,354 |
| Elbit Systems Ltd. (Israel) | | 416 | 68,164 |
| Israel Chemicals Ltd. | | 12,468 | 55,363 |
| Israel Discount Bank Ltd. (Class A) | | 19,325 | 88,278 |
| Mizrahi Tefahot Bank Ltd. | | 2,321 | 57,557 |
| NICE Systems Ltd. (a) | | 928 | 146,713 |
| NICE Systems Ltd. sponsored ADR (a) | | 117 | 18,461 |
| Teva Pharmaceutical Industries Ltd. sponsored ADR (a) | | 18,097 | 147,491 |
| Wix.com Ltd. (a) | | 811 | 98,999 |
|
| TOTAL ISRAEL | | | 1,363,005 |
|
| Italy - 1.2% | | | |
| Assicurazioni Generali SpA | | 18,247 | 369,877 |
| Atlantia SpA | | 8,306 | 205,098 |
| Davide Campari-Milano SpA | | 9,629 | 88,223 |
| Enel SpA | | 139,669 | 1,082,486 |
| Eni SpA | | 44,080 | 668,737 |
| FinecoBank SpA | | 10,005 | 112,702 |
| Intesa Sanpaolo SpA | | 259,193 | 649,493 |
| Leonardo SpA | | 6,854 | 79,577 |
| Mediobanca SpA | | 10,302 | 122,367 |
| Moncler SpA | | 3,154 | 121,500 |
| Pirelli & C. SpA (b) | | 6,856 | 39,624 |
| Poste Italiane SpA (b) | | 8,885 | 107,815 |
| Prysmian SpA | | 4,071 | 94,031 |
| Recordati SpA | | 1,770 | 74,364 |
| Snam Rete Gas SpA | | 33,964 | 174,248 |
| Telecom Italia SpA (a) | | 128,554 | 75,242 |
| Terna SpA | | 23,376 | 154,446 |
| UniCredit SpA | | 35,379 | 448,561 |
|
| TOTAL ITALY | | | 4,668,391 |
|
| Japan - 16.1% | | | |
| ABC-MART, Inc. | | 700 | 47,996 |
| ACOM Co. Ltd. | | 9,500 | 38,168 |
| Advantest Corp. | | 3,300 | 150,178 |
| AEON Co. Ltd. | | 11,200 | 225,348 |
| AEON Financial Service Co. Ltd. | | 1,600 | 24,385 |
| AEON MALL Co. Ltd. | | 1,500 | 23,999 |
| Agc, Inc. | | 3,100 | 108,996 |
| Air Water, Inc. | | 2,300 | 43,058 |
| Aisin Seiki Co. Ltd. | | 2,600 | 103,766 |
| Ajinomoto Co., Inc. | | 7,300 | 138,789 |
| Alfresa Holdings Corp. | | 3,000 | 66,987 |
| All Nippon Airways Ltd. | | 2,000 | 68,677 |
| Alps Electric Co. Ltd. | | 3,600 | 77,179 |
| Amada Holdings Co. Ltd. | | 5,200 | 59,218 |
| Aozora Bank Ltd. | | 1,800 | 46,185 |
| Asahi Group Holdings | | 6,400 | 320,496 |
| ASAHI INTECC Co. Ltd. | | 3,300 | 90,801 |
| Asahi Kasei Corp. | | 22,400 | 248,670 |
| Astellas Pharma, Inc. | | 33,600 | 576,667 |
| Bandai Namco Holdings, Inc. | | 3,500 | 215,212 |
| Bank of Kyoto Ltd. | | 900 | 35,622 |
| Benesse Holdings, Inc. | | 1,200 | 32,124 |
| Bridgestone Corp. | | 9,900 | 411,344 |
| Brother Industries Ltd. | | 3,500 | 65,779 |
| Calbee, Inc. | | 1,300 | 43,453 |
| Canon, Inc. | | 17,500 | 480,195 |
| Casio Computer Co. Ltd. | | 3,200 | 51,947 |
| Central Japan Railway Co. | | 2,500 | 512,835 |
| Chiba Bank Ltd. | | 8,400 | 45,657 |
| Chubu Electric Power Co., Inc. | | 10,900 | 163,524 |
| Chugai Pharmaceutical Co. Ltd. | | 4,000 | 336,623 |
| Chugoku Electric Power Co., Inc. | | 4,600 | 61,280 |
| Coca-Cola West Co. Ltd. | | 2,100 | 47,679 |
| Concordia Financial Group Ltd. | | 21,800 | 88,899 |
| Credit Saison Co. Ltd. | | 2,600 | 37,650 |
| CyberAgent, Inc. | | 1,700 | 55,253 |
| Dai Nippon Printing Co. Ltd. | | 4,400 | 117,517 |
| Dai-ichi Mutual Life Insurance Co. | | 19,200 | 312,949 |
| Daicel Chemical Industries Ltd. | | 3,700 | 33,076 |
| Daifuku Co. Ltd. | | 1,800 | 95,511 |
| Daiichi Sankyo Kabushiki Kaisha | | 9,900 | 650,963 |
| Daikin Industries Ltd. | | 4,300 | 601,826 |
| Dainippon Sumitomo Pharma Co. Ltd. | | 2,900 | 50,614 |
| Daito Trust Construction Co. Ltd. | | 1,200 | 159,025 |
| Daiwa House Industry Co. Ltd. | | 10,000 | 344,251 |
| Daiwa House REIT Investment Corp. | | 30 | 87,354 |
| Daiwa Securities Group, Inc. | | 25,600 | 115,067 |
| DENSO Corp. | | 7,500 | 348,224 |
| Dentsu, Inc. | | 3,700 | 132,274 |
| Disco Corp. | | 500 | 109,119 |
| East Japan Railway Co. | | 5,200 | 472,061 |
| Eisai Co. Ltd. | | 4,800 | 347,467 |
| Electric Power Development Co. Ltd. | | 2,800 | 67,985 |
| FamilyMart Co. Ltd. | | 4,500 | 111,628 |
| Fanuc Corp. | | 3,400 | 670,648 |
| Fast Retailing Co. Ltd. | | 1,000 | 616,692 |
| Fuji Electric Co. Ltd. | | 2,200 | 69,920 |
| Fujifilm Holdings Corp. | | 6,100 | 267,804 |
| Fujitsu Ltd. | | 3,400 | 301,339 |
| Fukuoka Financial Group, Inc. | | 2,900 | 55,904 |
| GMO Payment Gateway, Inc. | | 700 | 51,589 |
| Hakuhodo DY Holdings, Inc. | | 3,700 | 55,214 |
| Hamamatsu Photonics K.K. | | 2,300 | 89,307 |
| Hankyu Hanshin Holdings, Inc. | | 4,000 | 160,068 |
| Hikari Tsushin, Inc. | | 400 | 87,679 |
| Hino Motors Ltd. | | 5,800 | 54,835 |
| Hirose Electric Co. Ltd. | | 700 | 88,179 |
| Hisamitsu Pharmaceutical Co., Inc. | | 800 | 37,231 |
| Hitachi Chemical Co. Ltd. | | 1,700 | 55,964 |
| Hitachi Construction Machinery Co. Ltd. | | 1,600 | 41,300 |
| Hitachi High-Technologies Corp. | | 1,200 | 74,659 |
| Hitachi Ltd. | | 16,900 | 630,750 |
| Hitachi Metals Ltd. | | 3,600 | 45,181 |
| Honda Motor Co. Ltd. | | 28,300 | 765,628 |
| Hoshizaki Corp. | | 900 | 76,502 |
| Hoya Corp. | | 6,600 | 583,290 |
| Hulic Co. Ltd. | | 5,000 | 54,284 |
| Idemitsu Kosan Co. Ltd. | | 3,266 | 96,005 |
| IHI Corp. | | 2,700 | 66,536 |
| Iida Group Holdings Co. Ltd. | | 2,100 | 34,980 |
| INPEX Corp. | | 17,200 | 159,005 |
| Isetan Mitsukoshi Holdings Ltd. | | 5,300 | 42,268 |
| Isuzu Motors Ltd. | | 9,100 | 105,741 |
| Itochu Corp. | | 23,200 | 485,063 |
| ITOCHU Techno-Solutions Corp. | | 1,600 | 43,089 |
| J. Front Retailing Co. Ltd. | | 3,700 | 47,049 |
| Japan Airlines Co. Ltd. | | 1,900 | 59,208 |
| Japan Airport Terminal Co. Ltd. | | 800 | 39,517 |
| Japan Exchange Group, Inc. | | 8,800 | 145,275 |
| Japan Post Bank Co. Ltd. | | 6,500 | 64,659 |
| Japan Post Holdings Co. Ltd. | | 26,400 | 242,332 |
| Japan Prime Realty Investment Corp. | | 12 | 57,672 |
| Japan Real Estate Investment Corp. | | 23 | 156,994 |
| Japan Retail Fund Investment Corp. | | 53 | 123,536 |
| Japan Tobacco, Inc. | | 21,000 | 474,657 |
| JFE Holdings, Inc. | | 8,500 | 106,315 |
| JGC Corp. | | 4,000 | 57,854 |
| JSR Corp. | | 3,100 | 58,199 |
| JTEKT Corp. | | 3,200 | 40,814 |
| JX Holdings, Inc. | | 54,000 | 252,409 |
| Kajima Corp. | | 8,300 | 114,063 |
| Kakaku.com, Inc. | | 2,200 | 51,084 |
| Kamigumi Co. Ltd. | | 2,200 | 49,745 |
| Kaneka Corp. | | 800 | 26,631 |
| Kansai Electric Power Co., Inc. | | 11,800 | 137,660 |
| Kansai Paint Co. Ltd. | | 2,900 | 69,846 |
| Kao Corp. | | 8,500 | 683,389 |
| Kawasaki Heavy Industries Ltd. | | 2,200 | 52,796 |
| KDDI Corp. | | 30,600 | 846,737 |
| Keihan Electric Railway Co., Ltd. | | 1,700 | 80,269 |
| Keihin Electric Express Railway Co. Ltd. | | 3,900 | 77,632 |
| Keio Corp. | | 1,700 | 105,168 |
| Keisei Electric Railway Co. | | 2,300 | 94,037 |
| Keyence Corp. | | 1,600 | 1,011,674 |
| Kikkoman Corp. | | 2,500 | 120,257 |
| Kintetsu Group Holdings Co. Ltd. | | 2,900 | 158,067 |
| Kirin Holdings Co. Ltd. | | 14,500 | 307,608 |
| Kobayashi Pharmaceutical Co. Ltd. | | 900 | 71,964 |
| Kobe Steel Ltd. | | 5,400 | 29,033 |
| Koito Manufacturing Co. Ltd. | | 1,800 | 94,164 |
| Komatsu Ltd. | | 16,200 | 379,322 |
| Konami Holdings Corp. | | 1,600 | 70,238 |
| Konica Minolta, Inc. | | 7,700 | 56,516 |
| Kose Corp. | | 600 | 106,376 |
| Kubota Corp. | | 18,600 | 295,429 |
| Kuraray Co. Ltd. | | 6,800 | 80,902 |
| Kurita Water Industries Ltd. | | 1,600 | 46,060 |
| Kyocera Corp. | | 5,700 | 373,959 |
| Kyowa Hakko Kirin Co., Ltd. | | 4,100 | 75,440 |
| Kyushu Electric Power Co., Inc. | | 6,900 | 68,955 |
| Kyushu Railway Co. | | 2,900 | 95,809 |
| Lawson, Inc. | | 800 | 44,133 |
| LINE Corp. (a) | | 1,000 | 36,787 |
| Lion Corp. | | 3,800 | 79,524 |
| LIXIL Group Corp. | | 4,300 | 79,971 |
| M3, Inc. (c) | | 7,400 | 177,329 |
| Makita Corp. | | 3,900 | 131,160 |
| Marubeni Corp. | | 27,100 | 190,732 |
| Marui Group Co. Ltd. | | 3,200 | 71,137 |
| Maruichi Steel Tube Ltd. | | 1,000 | 27,308 |
| Mazda Motor Corp. | | 10,500 | 96,393 |
| McDonald's Holdings Co. (Japan) Ltd. | | 1,100 | 55,212 |
| Mebuki Financial Group, Inc. | | 19,000 | 48,272 |
| Medipal Holdings Corp. | | 3,400 | 77,682 |
| Meiji Holdings Co. Ltd. | | 2,000 | 144,156 |
| Mercari, Inc. (a) | | 1,300 | 29,311 |
| Minebea Mitsumi, Inc. | | 6,100 | 115,848 |
| Misumi Group, Inc. | | 4,700 | 118,152 |
| Mitsubishi Chemical Holdings Corp. | | 21,600 | 164,618 |
| Mitsubishi Corp. | | 23,300 | 592,622 |
| Mitsubishi Electric Corp. | | 32,000 | 457,198 |
| Mitsubishi Estate Co. Ltd. | | 20,800 | 403,840 |
| Mitsubishi Gas Chemical Co., Inc. | | 2,400 | 33,857 |
| Mitsubishi Heavy Industries Ltd. | | 5,800 | 234,722 |
| Mitsubishi Materials Corp. | | 1,700 | 48,884 |
| Mitsubishi Motors Corp. of Japan | | 11,200 | 51,137 |
| Mitsubishi Tanabe Pharma Corp. | | 4,200 | 50,267 |
| Mitsubishi UFJ Financial Group, Inc. | | 212,800 | 1,103,217 |
| Mitsubishi UFJ Lease & Finance Co. Ltd. | | 6,700 | 41,131 |
| Mitsui & Co. Ltd. | | 29,100 | 499,762 |
| Mitsui Chemicals, Inc. | | 3,800 | 90,370 |
| Mitsui Fudosan Co. Ltd. | | 15,700 | 401,651 |
| Mitsui OSK Lines Ltd. | | 1,900 | 51,753 |
| Mizuho Financial Group, Inc. | | 420,000 | 652,040 |
| MonotaRO Co. Ltd. | | 2,000 | 60,421 |
| MS&AD Insurance Group Holdings, Inc. | | 8,400 | 271,246 |
| Murata Manufacturing Co. Ltd. | | 10,000 | 544,482 |
| Nabtesco Corp. | | 1,800 | 57,303 |
| Nagoya Railroad Co. Ltd. | | 3,000 | 95,364 |
| NEC Corp. | | 4,400 | 174,375 |
| New Hampshire Foods Ltd. | | 1,600 | 67,225 |
| Nexon Co. Ltd. (a) | | 8,200 | 95,024 |
| NGK Insulators Ltd. | | 4,100 | 62,987 |
| NGK Spark Plug Co. Ltd. | | 3,000 | 60,821 |
| Nidec Corp. | | 3,900 | 574,181 |
| Nikon Corp. | | 5,300 | 67,577 |
| Nintendo Co. Ltd. | | 2,000 | 733,575 |
| Nippon Building Fund, Inc. | | 24 | 182,079 |
| Nippon Electric Glass Co. Ltd. | | 1,200 | 27,032 |
| Nippon Express Co. Ltd. | | 1,300 | 74,172 |
| Nippon Paint Holdings Co. Ltd. | | 2,400 | 130,705 |
| Nippon Prologis REIT, Inc. | | 36 | 100,558 |
| Nippon Steel & Sumitomo Metal Corp. | | 14,900 | 217,474 |
| Nippon Telegraph & Telephone Corp. | | 11,100 | 551,036 |
| Nippon Yusen KK | | 2,700 | 48,506 |
| Nissan Chemical Corp. | | 2,000 | 82,116 |
| Nissan Motor Co. Ltd. | | 39,000 | 246,113 |
| Nisshin Seifun Group, Inc. | | 3,300 | 65,420 |
| Nissin Food Holdings Co. Ltd. | | 1,200 | 90,644 |
| Nitori Holdings Co. Ltd. | | 1,400 | 213,096 |
| Nitto Denko Corp. | | 2,600 | 143,847 |
| NKSJ Holdings, Inc. | | 6,000 | 235,836 |
| Nomura Holdings, Inc. | | 58,700 | 266,791 |
| Nomura Real Estate Holdings, Inc. | | 2,000 | 47,399 |
| Nomura Real Estate Master Fund, Inc. | | 67 | 128,074 |
| Nomura Research Institute Ltd. | | 5,600 | 118,892 |
| NSK Ltd. | | 6,000 | 55,790 |
| NTT Data Corp. | | 10,600 | 139,187 |
| NTT DOCOMO, Inc. | | 22,800 | 625,065 |
| Obayashi Corp. | | 10,400 | 107,031 |
| OBIC Co. Ltd. | | 1,100 | 137,726 |
| Odakyu Electric Railway Co. Ltd. | | 5,000 | 121,711 |
| Oji Holdings Corp. | | 13,500 | 69,798 |
| Olympus Corp. | | 20,500 | 278,931 |
| OMRON Corp. | | 3,300 | 193,056 |
| Ono Pharmaceutical Co. Ltd. | | 6,200 | 116,789 |
| Oracle Corp. Japan | | 700 | 61,527 |
| Oriental Land Co. Ltd. | | 3,500 | 513,103 |
| ORIX Corp. | | 23,400 | 367,729 |
| Osaka Gas Co. Ltd. | | 6,800 | 132,972 |
| Otsuka Corp. | | 1,800 | 72,572 |
| Otsuka Holdings Co. Ltd. | | 6,600 | 275,156 |
| Pan Pacific International Hold | | 8,500 | 133,801 |
| Panasonic Corp. | | 37,400 | 314,324 |
| Park24 Co. Ltd. | | 2,000 | 47,233 |
| PeptiDream, Inc. (a) | | 1,500 | 75,291 |
| Persol Holdings Co., Ltd. | | 3,000 | 57,624 |
| Pigeon Corp. | | 1,900 | 92,755 |
| Pola Orbis Holdings, Inc. | | 1,500 | 33,849 |
| Rakuten, Inc. | | 14,800 | 141,095 |
| Recruit Holdings Co. Ltd. | | 23,500 | 781,000 |
| Renesas Electronics Corp. (a) | | 12,700 | 85,975 |
| Resona Holdings, Inc. | | 35,100 | 152,635 |
| Ricoh Co. Ltd. | | 11,500 | 102,415 |
| Rinnai Corp. | | 600 | 44,102 |
| ROHM Co. Ltd. | | 1,600 | 126,766 |
| Ryohin Keikaku Co. Ltd. | | 4,000 | 89,049 |
| Sankyo Co. Ltd. (Gunma) | | 800 | 27,998 |
| Santen Pharmaceutical Co. Ltd. | | 5,800 | 102,737 |
| SBI Holdings, Inc. Japan | | 4,200 | 91,343 |
| Secom Co. Ltd. | | 3,600 | 333,588 |
| Sega Sammy Holdings, Inc. | | 3,200 | 45,034 |
| Seibu Holdings, Inc. | | 3,300 | 58,245 |
| Seiko Epson Corp. | | 4,400 | 62,221 |
| Sekisui Chemical Co. Ltd. | | 7,800 | 135,999 |
| Sekisui House Ltd. | | 10,600 | 228,582 |
| Seven & i Holdings Co. Ltd. | | 13,200 | 498,700 |
| Seven Bank Ltd. | | 9,200 | 26,672 |
| SG Holdings Co. Ltd. | | 2,500 | 61,910 |
| Sharp Corp. | | 3,400 | 39,002 |
| Shimadzu Corp. | | 3,700 | 98,813 |
| Shimamura Co. Ltd. | | 400 | 33,881 |
| SHIMANO, Inc. | | 1,300 | 216,386 |
| SHIMIZU Corp. | | 10,200 | 95,084 |
| Shin-Etsu Chemical Co. Ltd. | | 6,300 | 702,458 |
| Shinsei Bank Ltd. | | 3,300 | 51,446 |
| Shionogi & Co. Ltd. | | 4,900 | 294,112 |
| Shiseido Co. Ltd. | | 7,000 | 577,136 |
| Shizuoka Bank Ltd. | | 8,300 | 63,070 |
| Showa Denko K.K. | | 2,200 | 61,725 |
| SMC Corp. | | 1,000 | 432,041 |
| SoftBank Corp. | | 28,700 | 393,687 |
| SoftBank Corp. | | 28,600 | 1,100,139 |
| Sohgo Security Services Co., Ltd. | | 1,100 | 59,750 |
| Sony Corp. | | 22,000 | 1,339,121 |
| Sony Financial Holdings, Inc. | | 2,500 | 53,784 |
| Stanley Electric Co. Ltd. | | 2,500 | 69,183 |
| Subaru Corp. | | 10,800 | 309,501 |
| Sumco Corp. | | 4,600 | 76,410 |
| Sumitomo Chemical Co. Ltd. | | 26,300 | 120,306 |
| Sumitomo Corp. | | 21,000 | 341,090 |
| Sumitomo Electric Industries Ltd. | | 13,300 | 182,393 |
| Sumitomo Heavy Industries Ltd. | | 1,700 | 52,805 |
| Sumitomo Metal Mining Co. Ltd. | | 3,900 | 130,454 |
| Sumitomo Mitsui Financial Group, Inc. | | 22,900 | 813,023 |
| Sumitomo Mitsui Trust Holdings, Inc. | | 5,600 | 204,094 |
| Sumitomo Realty & Development Co. Ltd. | | 5,600 | 203,270 |
| Sumitomo Rubber Industries Ltd. | | 2,700 | 35,785 |
| Sundrug Co. Ltd. | | 1,200 | 39,709 |
| Suntory Beverage & Food Ltd. | | 2,300 | 98,327 |
| Suzuken Co. Ltd. | | 1,300 | 69,412 |
| Suzuki Motor Corp. | | 6,200 | 292,728 |
| Sysmex Corp. | | 2,800 | 182,695 |
| T&D Holdings, Inc. | | 10,000 | 111,377 |
| Taiheiyo Cement Corp. | | 2,300 | 65,065 |
| Taisei Corp. | | 3,600 | 141,960 |
| Taisho Pharmaceutical Holdings Co. Ltd. | | 600 | 42,705 |
| Taiyo Nippon Sanso Corp. | | 2,100 | 49,160 |
| Takeda Pharmaceutical Co. Ltd. | | 25,877 | 935,016 |
| TDK Corp. | | 2,200 | 217,082 |
| Teijin Ltd. | | 2,700 | 54,104 |
| Terumo Corp. | | 11,300 | 368,795 |
| THK Co. Ltd. | | 2,000 | 57,511 |
| Tobu Railway Co. Ltd. | | 3,100 | 103,447 |
| Toho Co. Ltd. | | 1,900 | 76,732 |
| Toho Gas Co. Ltd. | | 1,200 | 46,738 |
| Tohoku Electric Power Co., Inc. | | 7,200 | 74,000 |
| Tokio Marine Holdings, Inc. | | 11,000 | 594,722 |
| Tokyo Century Corp. | | 700 | 32,323 |
| Tokyo Electric Power Co., Inc. (a) | | 25,300 | 117,168 |
| Tokyo Electron Ltd. | | 2,700 | 547,016 |
| Tokyo Gas Co. Ltd. | | 6,400 | 156,231 |
| Tokyu Corp. | | 8,400 | 158,874 |
| Tokyu Fudosan Holdings Corp. | | 10,400 | 68,982 |
| Toppan Printing Co. Ltd. | | 4,700 | 86,928 |
| Toray Industries, Inc. | | 23,400 | 165,371 |
| Toshiba Corp. | | 9,200 | 314,605 |
| Tosoh Corp. | | 4,100 | 56,139 |
| Toto Ltd. | | 2,400 | 97,982 |
| Toyo Seikan Group Holdings Ltd. | | 2,400 | 37,928 |
| Toyo Suisan Kaisha Ltd. | | 1,400 | 58,947 |
| Toyoda Gosei Co. Ltd. | | 1,000 | 23,395 |
| Toyota Industries Corp. | | 2,400 | 144,006 |
| Toyota Motor Corp. | | 39,100 | 2,712,793 |
| Toyota Tsusho Corp. | | 3,700 | 127,645 |
| Trend Micro, Inc. | | 2,100 | 105,996 |
| Tsuruha Holdings, Inc. | | 600 | 67,493 |
| Unicharm Corp. | | 7,200 | 244,014 |
| United Urban Investment Corp. | | 48 | 96,837 |
| USS Co. Ltd. | | 4,100 | 79,410 |
| Welcia Holdings Co. Ltd. | | 800 | 45,968 |
| West Japan Railway Co. | | 2,800 | 243,293 |
| Yahoo! Japan Corp. | | 43,900 | 135,156 |
| Yakult Honsha Co. Ltd. | | 2,100 | 120,350 |
| Yamada Denki Co. Ltd. | | 10,200 | 49,302 |
| Yamaha Corp. | | 2,500 | 116,423 |
| Yamaha Motor Co. Ltd. | | 4,700 | 91,993 |
| Yamato Holdings Co. Ltd. | | 5,600 | 93,927 |
| Yamazaki Baking Co. Ltd. | | 2,000 | 34,097 |
| Yaskawa Electric Corp. | | 4,200 | 159,759 |
| Yokogawa Electric Corp. | | 3,700 | 67,795 |
| Yokohama Rubber Co. Ltd. | | 2,000 | 44,670 |
| Zozo, Inc. (c) | | 3,600 | 83,855 |
|
| TOTAL JAPAN | | | 61,037,062 |
|
| Korea (South) - 2.9% | | | |
| AMOREPACIFIC Corp. | | 557 | 91,382 |
| AMOREPACIFIC Group, Inc. | | 472 | 34,121 |
| BGF Retail Co. Ltd. | | 113 | 17,187 |
| BS Financial Group, Inc. | | 4,458 | 26,475 |
| Celltrion Healthcare Co. Ltd. | | 837 | 39,408 |
| Celltrion Pharm, Inc. (a) | | 261 | 8,921 |
| Celltrion, Inc. (a) | | 1,510 | 258,056 |
| Cheil Industries, Inc. | | 1,417 | 121,081 |
| Cheil Worldwide, Inc. | | 1,027 | 21,720 |
| CJ CheilJedang Corp. | | 137 | 26,749 |
| CJ Corp. | | 198 | 13,941 |
| CJ O Shopping Co. Ltd. | | 213 | 30,031 |
| Daelim Industrial Co. | | 589 | 45,800 |
| Daewoo Engineering & Construction Co. Ltd. (a) | | 2,565 | 9,545 |
| Daewoo Shipbuilding & Marine Engineering Co. Ltd. (a) | | 518 | 12,460 |
| Db Insurance Co. Ltd. | | 1,087 | 46,906 |
| Doosan Bobcat, Inc. | | 919 | 24,736 |
| E-Mart Co. Ltd. | | 363 | 34,585 |
| Fila Korea Ltd. | | 906 | 44,592 |
| GS Engineering & Construction Corp. | | 814 | 21,493 |
| GS Holdings Corp. | | 812 | 34,449 |
| GS Retail Co. Ltd. | | 369 | 12,060 |
| Hana Financial Group, Inc. | | 4,984 | 143,521 |
| Hankook Tire Co. Ltd. | | 1,203 | 31,918 |
| Hanmi Pharm Co. Ltd. | | 107 | 30,492 |
| Hanmi Science Co. Ltd. | | 204 | 7,600 |
| Hanon Systems | | 3,089 | 30,618 |
| Hanwha Chemical Corp. | | 1,727 | 24,128 |
| Hanwha Corp. | | 731 | 14,835 |
| Hanwha Life Insurance Co. Ltd. | | 2,972 | 5,663 |
| HDC Hyundai Development Co. | | 456 | 12,060 |
| HLB, Inc. (a) | | 474 | 68,045 |
| Hotel Shilla Co. | | 466 | 30,860 |
| Hyundai Department Store Co. Ltd. | | 150 | 9,472 |
| Hyundai Engineering & Construction Co. Ltd. | | 1,574 | 57,766 |
| Hyundai Fire & Marine Insurance Co. Ltd. | | 900 | 19,418 |
| Hyundai Glovis Co. Ltd. | | 317 | 40,902 |
| Hyundai Heavy Industries Co. Ltd. (a) | | 646 | 67,344 |
| Hyundai Mobis | | 1,120 | 227,773 |
| Hyundai Motor Co. | | 1,393 | 145,217 |
| Hyundai Robotics Co. Ltd. | | 160 | 46,689 |
| Hyundai Steel Co. | | 1,245 | 33,830 |
| Industrial Bank of Korea | | 9,265 | 93,419 |
| ING Life Insurance Korea Ltd. (b) | | 466 | 11,149 |
| Kakao Corp. | | 839 | 101,444 |
| Kangwon Land, Inc. | | 1,995 | 53,443 |
| KB Financial Group, Inc. | | 6,811 | 243,759 |
| KCC Corp. | | 82 | 15,835 |
| Kia Motors Corp. | | 4,535 | 164,886 |
| Korea Aerospace Industries Ltd. | | 1,194 | 38,770 |
| Korea Electric Power Corp. (a) | | 4,299 | 93,430 |
| Korea Express Co. Ltd. (a) | | 151 | 20,322 |
| Korea Gas Corp. | | 377 | 12,660 |
| Korea Investment Holdings Co. Ltd. | | 744 | 43,103 |
| Korea Zinc Co. Ltd. | | 142 | 52,721 |
| Korean Air Lines Co. Ltd. | | 866 | 18,426 |
| KT&G Corp. | | 1,945 | 166,198 |
| Kumho Petro Chemical Co. Ltd. | | 268 | 16,030 |
| LG Chemical Ltd. | | 720 | 189,184 |
| LG Corp. | | 1,526 | 90,494 |
| LG Display Co. Ltd. (a) | | 3,866 | 45,053 |
| LG Electronics, Inc. | | 1,944 | 111,129 |
| LG Household & Health Care Ltd. | | 161 | 173,479 |
| LG Innotek Co. Ltd. | | 250 | 25,848 |
| LG Telecom Ltd. | | 1,777 | 20,423 |
| Lotte Chemical Corp. | | 279 | 54,117 |
| Lotte Confectionery Co. Ltd. | | 319 | 9,949 |
| Lotte Shopping Co. Ltd. | | 145 | 15,426 |
| Medy-Tox, Inc. | | 62 | 17,483 |
| Meritz Securities Co. Ltd. | | 5,373 | 20,706 |
| Mirae Asset Daewoo Co. Ltd. | | 6,523 | 39,853 |
| NAVER Corp. | | 2,378 | 333,244 |
| NCSOFT Corp. | | 275 | 121,252 |
| Netmarble Corp. (a)(b) | | 486 | 37,334 |
| Oci Co. Ltd. | | 238 | 12,792 |
| Orion Corp./Republic of Korea | | 386 | 34,962 |
| Ottogi Corp. | | 18 | 8,690 |
| Pearl Abyss Corp. (a) | | 89 | 16,472 |
| POSCO | | 1,549 | 279,417 |
| POSCO Chemtech Co. Ltd. | | 330 | 13,549 |
| Posco International Corp. | | 544 | 8,483 |
| S-Oil Corp. | | 899 | 76,588 |
| S1 Corp. | | 306 | 24,500 |
| Samsung Biologics Co. Ltd. (a)(b) | | 275 | 93,641 |
| Samsung Card Co. Ltd. | | 466 | 13,359 |
| Samsung Electro-Mechanics Co. Ltd. | | 932 | 89,991 |
| Samsung Electronics Co. Ltd. | | 82,784 | 3,565,196 |
| Samsung Engineering Co. Ltd. (a) | | 2,512 | 38,207 |
| Samsung Fire & Marine Insurance Co. Ltd. | | 566 | 104,708 |
| Samsung Heavy Industries Co. Ltd. (a) | | 7,638 | 47,318 |
| Samsung Life Insurance Co. Ltd. | | 1,324 | 79,873 |
| Samsung SDI Co. Ltd. | | 928 | 180,400 |
| Samsung SDS Co. Ltd. | | 607 | 104,513 |
| Samsung Securities Co. Ltd. | | 877 | 25,179 |
| Shinhan Financial Group Co. Ltd. | | 7,685 | 278,367 |
| Shinsegae Co. Ltd. | | 125 | 25,207 |
| SillaJen, Inc. (a) | | 1,021 | 16,794 |
| SK C&C Co. Ltd. | | 594 | 131,206 |
| SK Energy Co. Ltd. | | 923 | 126,191 |
| SK Hynix, Inc. | | 9,673 | 677,769 |
| SK Telecom Co. Ltd. | | 330 | 67,057 |
| STX Pan Ocean Co. Ltd. (Korea) (a) | | 4,268 | 16,028 |
| ViroMed Co. Ltd. | | 331 | 27,379 |
| Woongjin Coway Co. Ltd. | | 831 | 65,185 |
| Woori Financial Group, Inc. (a) | | 8,931 | 89,669 |
| Woori Investment & Securities Co. Ltd. | | 2,248 | 23,243 |
| Yuhan Corp. | | 142 | 27,240 |
|
| TOTAL KOREA (SOUTH) | | | 10,863,591 |
|
| Luxembourg - 0.2% | | | |
| ArcelorMittal SA (Netherlands) | | 11,230 | 165,703 |
| Aroundtown SA | | 14,986 | 126,457 |
| Eurofins Scientific SA | | 189 | 95,742 |
| Globant SA (a) | | 580 | 54,091 |
| Millicom International Cellular SA (depository receipt) | | 1,018 | 46,389 |
| Reinet Investments SCA | | 2,394 | 44,927 |
| RTL Group SA | | 665 | 33,791 |
| SES SA (France) (depositary receipt) | | 6,455 | 125,051 |
| Tenaris SA | | 8,516 | 86,394 |
|
| TOTAL LUXEMBOURG | | | 778,545 |
|
| Malaysia - 0.5% | | | |
| AirAsia Group BHD | | 23,400 | 10,684 |
| Alliance Bank Malaysia Bhd | | 16,600 | 11,424 |
| AMMB Holdings Bhd | | 27,600 | 26,327 |
| Axiata Group Bhd | | 50,218 | 51,617 |
| British American Tobacco (Malaysia) Bhd | | 2,200 | 9,904 |
| Bumiputra-Commerce Holdings Bhd | | 76,140 | 95,557 |
| Dialog Group Bhd | | 59,000 | 49,094 |
| DiGi.com Bhd | | 50,700 | 56,939 |
| Fraser & Neave Holdings BHD | | 2,500 | 20,675 |
| Gamuda Bhd | | 31,100 | 27,809 |
| Genting Bhd | | 35,400 | 49,175 |
| Genting Malaysia Bhd | | 50,000 | 38,349 |
| Genting Plantations Bhd | | 1,900 | 4,503 |
| Hap Seng Consolidated Bhd | | 8,000 | 19,105 |
| Hartalega Holdings Bhd | | 25,700 | 32,331 |
| Hong Leong Bank Bhd | | 10,900 | 44,882 |
| Hong Leong Credit Bhd | | 3,600 | 15,003 |
| IHH Healthcare Bhd | | 34,400 | 46,883 |
| IJM Corp. Bhd | | 42,700 | 21,954 |
| IOI Corp. Bhd | | 30,200 | 31,520 |
| Kuala Lumpur Kepong Bhd | | 6,500 | 33,702 |
| Malayan Banking Bhd | | 62,099 | 127,702 |
| Malaysia Airports Holdings Bhd | | 16,000 | 30,283 |
| Maxis Bhd | | 49,600 | 63,867 |
| MISC Bhd | | 18,900 | 37,645 |
| Nestle (Malaysia) BHD | | 1,100 | 38,069 |
| Petronas Chemicals Group Bhd | | 39,800 | 71,107 |
| Petronas Dagangan Bhd | | 4,000 | 22,541 |
| Petronas Gas Bhd | | 9,500 | 37,841 |
| PPB Group Bhd | | 8,640 | 37,377 |
| Press Metal Bhd | | 19,800 | 22,528 |
| Public Bank Bhd | | 53,400 | 259,169 |
| QL Resources Bhd | | 9,800 | 17,042 |
| RHB Capital Bhd | | 36,200 | 49,797 |
| Sime Darby Bhd | | 72,400 | 39,256 |
| Sime Darby Plantation Bhd | | 32,200 | 37,761 |
| Sime Darby Property Bhd | | 35,100 | 6,086 |
| SP Setia Bhd | | 21,277 | 6,154 |
| Telekom Malaysia Bhd | | 19,300 | 17,344 |
| Tenaga Nasional Bhd | | 52,400 | 173,536 |
| Top Glove Corp. Bhd | | 24,700 | 25,697 |
| Westports Holdings Bhd | | 15,300 | 15,652 |
| YTL Corp. Bhd | | 34,500 | 7,174 |
|
| TOTAL MALAYSIA | | | 1,841,065 |
|
| Mauritius - 0.0% | | | |
| Golden Agri-Resources Ltd. | | 99,100 | 14,875 |
| Mexico - 0.6% | | | |
| Alfa SA de CV Series A | | 43,200 | 37,459 |
| Alsea S.A.B. de CV (a) | | 6,900 | 18,408 |
| America Movil S.A.B. de CV Series L | | 602,900 | 477,644 |
| Banco Santander Mexico SA | | 28,285 | 37,980 |
| CEMEX S.A.B. de CV unit | | 270,780 | 101,772 |
| Coca-Cola FEMSA S.A.B. de CV unit | | 8,400 | 46,160 |
| El Puerto de Liverpool S.A.B. Dcv Class C | | 2,500 | 12,739 |
| Embotelladoras Arca S.A.B. de CV | | 6,100 | 34,079 |
| Fibra Uno Administracion SA de CV | | 49,800 | 75,646 |
| Fomento Economico Mexicano S.A.B. de CV unit | | 33,500 | 297,271 |
| Gruma S.A.B. de CV Series B | | 2,975 | 31,217 |
| Grupo Aeroportuario del Pacifico S.A.B. de CV Series B | | 5,600 | 58,712 |
| Grupo Aeroportuario del Sureste S.A.B. de CV Series B | | 3,545 | 58,131 |
| Grupo Bimbo S.A.B. de CV Series A | | 25,400 | 47,191 |
| Grupo Carso SA de CV Series A1 | | 6,600 | 22,096 |
| Grupo Financiero Banorte S.A.B. de CV Series O | | 47,200 | 257,635 |
| Grupo Financiero Inbursa S.A.B. de CV Series O | | 43,900 | 54,543 |
| Grupo Mexico SA de CV Series B | | 60,600 | 159,624 |
| Grupo Televisa SA de CV | | 39,700 | 87,670 |
| Industrias Penoles SA de CV | | 2,220 | 26,640 |
| Infraestructura Energetica Nova S.A.B. de CV | | 10,800 | 47,739 |
| Kimberly-Clark de Mexico SA de CV Series A | | 23,300 | 46,984 |
| Megacable Holdings S.A.B. de CV unit | | 4,100 | 16,844 |
| Mexichem S.A.B. de CV | | 17,800 | 38,410 |
| Promotora y Operadora de Infraestructura S.A.B. de CV | | 3,475 | 32,144 |
| Wal-Mart de Mexico SA de CV Series V | | 88,800 | 266,495 |
|
| TOTAL MEXICO | | | 2,391,233 |
|
| Multi-National - 0.0% | | | |
| HK Electric Investments & HK Electric Investments Ltd. unit | | 42,500 | 42,422 |
| HKT Trust/HKT Ltd. unit | | 62,000 | 96,451 |
|
| TOTAL MULTI-NATIONAL | | | 138,873 |
|
| Netherlands - 3.3% | | | |
| ABN AMRO Group NV GDR (b) | | 7,101 | 132,181 |
| Adyen BV (a)(b) | | 174 | 122,143 |
| AEGON NV | | 31,190 | 135,313 |
| AerCap Holdings NV (a) | | 2,127 | 123,111 |
| Airbus Group NV | | 10,074 | 1,445,200 |
| Akzo Nobel NV | | 3,939 | 362,656 |
| ASML Holding NV (Netherlands) | | 7,305 | 1,914,747 |
| CNH Industrial NV | | 17,140 | 186,345 |
| EXOR NV | | 1,822 | 139,644 |
| Ferrari NV | | 2,113 | 338,058 |
| Fiat Chrysler Automobiles NV (Italy) | | 19,096 | 296,635 |
| Heineken Holding NV | | 2,076 | 197,732 |
| Heineken NV (Bearer) | | 4,477 | 456,678 |
| ING Groep NV (Certificaten Van Aandelen) | | 68,120 | 771,357 |
| Koninklijke Ahold Delhaize NV | | 20,480 | 510,363 |
| Koninklijke DSM NV | | 3,143 | 372,447 |
| Koninklijke KPN NV | | 65,821 | 204,333 |
| Koninklijke Philips Electronics NV | | 16,118 | 707,163 |
| NN Group NV | | 5,083 | 193,712 |
| NXP Semiconductors NV | | 4,944 | 562,034 |
| Prosus NV (a) | | 8,527 | 588,013 |
| QIAGEN NV (Germany) (a) | | 3,813 | 114,439 |
| Randstad NV | | 2,186 | 121,025 |
| STMicroelectronics NV (France) | | 11,521 | 261,484 |
| Unibail-Rodamco SE & WFD Unibail-Rodamco NV unit | | 2,462 | 380,715 |
| Unilever NV | | 25,105 | 1,482,579 |
| Vopak NV | | 1,174 | 64,408 |
| Wolters Kluwer NV | | 4,974 | 366,246 |
| X5 Retail Group NV GDR | | 2,182 | 73,059 |
|
| TOTAL NETHERLANDS | | | 12,623,820 |
|
| New Zealand - 0.2% | | | |
| Auckland International Airport Ltd. | | 16,073 | 95,792 |
| Fisher & Paykel Healthcare Corp. | | 9,526 | 116,838 |
| Fletcher Building Ltd. | | 15,697 | 46,120 |
| Meridian Energy Ltd. | | 21,224 | 62,562 |
| Ryman Healthcare Group Ltd. | | 6,424 | 53,094 |
| Spark New Zealand Ltd. | | 30,690 | 88,039 |
| The a2 Milk Co. Ltd. (a) | | 12,590 | 104,527 |
|
| TOTAL NEW ZEALAND | | | 566,972 |
|
| Norway - 0.4% | | | |
| Aker Bp ASA | | 1,791 | 49,448 |
| DNB ASA | | 17,065 | 310,082 |
| Equinor ASA | | 17,629 | 326,081 |
| Gjensidige Forsikring ASA | | 3,407 | 63,686 |
| Marine Harvest ASA | | 7,453 | 181,702 |
| Norsk Hydro ASA | | 22,769 | 80,456 |
| Orkla ASA | | 12,648 | 121,499 |
| Schibsted ASA (B Shares) | | 1,580 | 44,121 |
| Telenor ASA | | 12,774 | 239,127 |
| Yara International ASA | | 2,989 | 116,327 |
|
| TOTAL NORWAY | | | 1,532,529 |
|
| Pakistan - 0.0% | | | |
| Habib Bank Ltd. | | 11,500 | 9,460 |
| MCB Bank Ltd. | | 8,200 | 9,110 |
| Oil & Gas Development Co. Ltd. | | 7,600 | 6,292 |
|
| TOTAL PAKISTAN | | | 24,862 |
|
| Papua New Guinea - 0.0% | | | |
| Oil Search Ltd. ADR | | 23,941 | 118,156 |
| Peru - 0.0% | | | |
| Compania de Minas Buenaventura SA sponsored ADR | | 3,964 | 60,808 |
| Philippines - 0.3% | | | |
| Aboitiz Equity Ventures, Inc. | | 31,840 | 35,023 |
| Aboitiz Power Corp. | | 23,800 | 18,721 |
| Alliance Global Group, Inc. | | 65,700 | 14,836 |
| Altus San Nicolas Corp. (d) | | 770 | 79 |
| Ayala Corp. | | 5,300 | 89,674 |
| Ayala Land, Inc. | | 130,300 | 124,433 |
| Bank of the Philippine Islands (BPI) | | 13,010 | 24,838 |
| BDO Unibank, Inc. | | 31,790 | 96,909 |
| DMCI Holdings, Inc. | | 56,200 | 9,074 |
| Globe Telecom, Inc. | | 475 | 16,994 |
| GT Capital Holdings, Inc. | | 1,547 | 27,212 |
| International Container Terminal Services, Inc. | | 15,330 | 35,813 |
| JG Summit Holdings, Inc. | | 47,720 | 71,575 |
| Jollibee Food Corp. | | 7,220 | 32,968 |
| Manila Electric Co. | | 3,250 | 21,660 |
| Megaworld Corp. | | 204,000 | 19,391 |
| Metro Pacific Investments Corp. | | 220,200 | 20,790 |
| Metropolitan Bank & Trust Co. | | 27,583 | 36,693 |
| Philippine Long Distance Telephone Co. | | 1,400 | 30,107 |
| Robinsons Land Corp. | | 40,000 | 20,033 |
| Security Bank Corp. | | 3,710 | 14,546 |
| SM Investments Corp. | | 4,700 | 95,215 |
| SM Prime Holdings, Inc. | | 178,100 | 136,653 |
| Universal Robina Corp. | | 15,300 | 45,422 |
|
| TOTAL PHILIPPINES | | | 1,038,659 |
|
| Poland - 0.2% | | | |
| Alior Bank SA (a) | | 1,294 | 9,131 |
| Bank Millennium SA (a) | | 10,148 | 16,322 |
| Bank Polska Kasa Opieki SA | | 2,743 | 77,394 |
| Bank Zachodni WBK SA | | 696 | 57,055 |
| BRE Bank SA (a) | | 212 | 21,185 |
| CD Projekt RED SA | | 1,124 | 74,166 |
| Cyfrowy Polsat SA | | 4,286 | 31,074 |
| Dino Polska SA (a)(b) | | 906 | 35,333 |
| Grupa Lotos SA | | 1,532 | 38,253 |
| Jastrzebska Spolka Weglowa SA | | 644 | 3,263 |
| KGHM Polska Miedz SA (Bearer) (a) | | 2,278 | 49,869 |
| LPP SA | | 21 | 44,824 |
| NG2 SA | | 383 | 11,187 |
| Polish Oil & Gas Co. SA | | 34,272 | 42,196 |
| Polska Grupa Energetyczna SA (a) | | 13,686 | 29,338 |
| Polski Koncern Naftowy Orlen SA | | 5,144 | 140,561 |
| Powszechna Kasa Oszczednosci Bank SA | | 14,778 | 147,445 |
| Powszechny Zaklad Ubezpieczen SA | | 9,524 | 92,108 |
| Telekomunikacja Polska SA (a) | | 9,824 | 16,071 |
|
| TOTAL POLAND | | | 936,775 |
|
| Portugal - 0.1% | | | |
| Energias de Portugal SA | | 42,094 | 173,236 |
| Galp Energia SGPS SA Class B | | 8,496 | 135,892 |
| Jeronimo Martins SGPS SA | | 4,080 | 68,461 |
|
| TOTAL PORTUGAL | | | 377,589 |
|
| Qatar - 0.2% | | | |
| Barwa Real Estate Co. (a) | | 32,203 | 30,248 |
| Industries Qatar QSC (a) | | 31,938 | 92,191 |
| Masraf al Rayan (a) | | 62,060 | 63,918 |
| Mesaieed Petrochemical Holding Co. (a) | | 72,916 | 50,066 |
| Qatar Electricity & Water Co. (a) | | 10,332 | 44,835 |
| Qatar Fuel Co. (a) | | 7,520 | 45,645 |
| Qatar Insurance Co. SAQ (a) | | 27,424 | 23,123 |
| Qatar Islamic Bank (a) | | 19,102 | 79,850 |
| Qatar National Bank SAQ (a) | | 81,328 | 428,865 |
| Qatar Telecom (Qtel) Q.S.C. (a) | | 11,600 | 23,257 |
| The Commercial Bank of Qatar (a) | | 33,178 | 39,183 |
|
| TOTAL QATAR | | | 921,181 |
|
| Russia - 1.0% | | | |
| Alrosa Co. Ltd. | | 39,460 | 45,852 |
| Gazprom OAO | | 159,840 | 648,416 |
| Gazprom OAO sponsored ADR (Reg. S) | | 12,184 | 97,521 |
| Inter Rao Ues JSC | | 725,000 | 48,844 |
| Lukoil PJSC | | 6,832 | 631,159 |
| Lukoil PJSC sponsored ADR | | 44 | 4,046 |
| Magnit OJSC GDR (Reg. S) | | 5,950 | 67,592 |
| Magnitogorsk Iron & Steel Works PJSC | | 32,900 | 18,743 |
| MMC Norilsk Nickel PJSC | | 923 | 257,486 |
| MMC Norilsk Nickel PJSC sponsored ADR | | 1,346 | 37,284 |
| Mobile TeleSystems OJSC sponsored ADR | | 9,095 | 81,400 |
| Moscow Exchange MICEX-RTS OAO (a) | | 24,180 | 35,835 |
| NOVATEK OAO GDR (Reg. S) | | 1,601 | 342,614 |
| Novolipetsk Steel OJSC | | 21,210 | 41,360 |
| PhosAgro OJSC GDR (Reg. S) | | 1,882 | 23,676 |
| Polyus PJSC | | 437 | 50,902 |
| Rosneft Oil Co. OJSC | | 16,530 | 109,818 |
| Rosneft Oil Co. OJSC GDR (Reg. S) | | 2,345 | 15,529 |
| Sberbank of Russia | | 187,365 | 686,676 |
| Severstal PAO | | 2,980 | 40,999 |
| Severstal PAO GDR (Reg. S) | | 592 | 8,087 |
| Surgutneftegas OJSC | | 66,200 | 44,393 |
| Tatneft PAO | | 24,738 | 288,650 |
| Tatneft PAO sponsored ADR | | 414 | 28,980 |
| VTB Bank OJSC | | 50,370,000 | 33,848 |
|
| TOTAL RUSSIA | | | 3,689,710 |
|
| Saudi Arabia - 0.6% | | | |
| Advanced Polypropylene Co. | | 2,016 | 24,996 |
| Al Rajhi Bank | | 22,166 | 356,992 |
| Alinma Bank | | 12,218 | 68,285 |
| Almarai Co. Ltd. | | 4,158 | 55,325 |
| Bank Al-Jazira | | 7,763 | 26,992 |
| Bank Albilad | | 6,146 | 40,642 |
| Banque Saudi Fransi | | 8,886 | 79,849 |
| Bupa Arabia for Cooperative Insurance Co. | | 365 | 10,453 |
| Dar Al Arkan Real Estate Development Co. (a) | | 8,879 | 28,505 |
| Emaar The Economic City (a) | | 6,657 | 16,632 |
| Etihad Etisalat Co. (a) | | 6,209 | 37,185 |
| Jarir Marketing Co. | | 1,096 | 46,291 |
| National Commercial Bank | | 21,581 | 250,320 |
| National Industrialization Co. (a) | | 5,643 | 18,387 |
| Rabigh Refining & Petrochemical Co. (a) | | 3,644 | 19,530 |
| Riyad Bank | | 20,008 | 118,438 |
| SABIC | | 13,335 | 311,836 |
| Sahara International Petrochemical Co. | | 6,230 | 27,310 |
| Samba Financial Group | | 16,090 | 118,842 |
| Saudi Airlines Catering Co. | | 687 | 15,846 |
| Saudi Arabian Fertilizers Co. | | 2,775 | 57,789 |
| Saudi Arabian Mining Co. (a) | | 6,745 | 76,257 |
| Saudi Cement Co. | | 1,088 | 19,902 |
| Saudi Electricity Co. | | 13,491 | 74,752 |
| Saudi Industrial Investment Group | | 4,278 | 24,046 |
| Saudi Kayan Petrochemical Co. (a) | | 13,202 | 35,977 |
| Saudi Telecom Co. | | 6,690 | 170,894 |
| The Co. for Cooperative Insurance (a) | | 1,043 | 19,607 |
| The Saudi British Bank | | 6,056 | 52,643 |
| The Savola Group (a) | | 4,482 | 36,929 |
| Yanbu National Petrochemical Co. | | 3,958 | 52,558 |
|
| TOTAL SAUDI ARABIA | | | 2,294,010 |
|
| Singapore - 0.9% | | | |
| Ascendas Real Estate Investment Trust | | 46,400 | 108,068 |
| BOC Aviation Ltd. Class A (b) | | 3,000 | 28,185 |
| CapitaCommercial Trust (REIT) | | 41,200 | 62,047 |
| CapitaLand Ltd. | | 53,400 | 141,148 |
| CapitaMall Trust | | 48,100 | 89,747 |
| City Developments Ltd. | | 7,500 | 59,394 |
| ComfortDelgro Corp. Ltd. | | 40,800 | 68,898 |
| DBS Group Holdings Ltd. | | 31,502 | 600,456 |
| Genting Singapore Ltd. | | 113,600 | 78,374 |
| Jardine Cycle & Carriage Ltd. | | 1,600 | 38,467 |
| Keppel Corp. Ltd. | | 24,200 | 121,856 |
| Oversea-Chinese Banking Corp. Ltd. | | 54,287 | 436,425 |
| Sembcorp Industries Ltd. | | 17,100 | 28,709 |
| Singapore Airlines Ltd. | | 9,400 | 64,971 |
| Singapore Airport Terminal Service Ltd. | | 11,100 | 41,164 |
| Singapore Exchange Ltd. | | 17,200 | 112,927 |
| Singapore Press Holdings Ltd. | | 25,900 | 42,150 |
| Singapore Technologies Engineering Ltd. | | 26,400 | 77,335 |
| Singapore Telecommunications Ltd. | | 147,400 | 356,937 |
| Suntec (REIT) | | 31,300 | 42,759 |
| United Overseas Bank Ltd. | | 22,403 | 441,058 |
| UOL Group Ltd. | | 7,900 | 45,234 |
| Venture Corp. Ltd. | | 4,500 | 52,198 |
| Wilmar International Ltd. | | 31,900 | 87,708 |
| Yangzijiang Shipbuilding Holdings Ltd. | | 40,400 | 28,284 |
|
| TOTAL SINGAPORE | | | 3,254,499 |
|
| South Africa - 1.2% | | | |
| Anglo American Platinum Ltd. | | 894 | 66,718 |
| AngloGold Ashanti Ltd. | | 7,030 | 155,492 |
| Aspen Pharmacare Holdings Ltd. | | 6,560 | 45,801 |
| Barclays Africa Group Ltd. | | 12,506 | 128,184 |
| Bidcorp Ltd. | | 5,690 | 132,741 |
| Bidvest Group Ltd. | | 4,499 | 61,352 |
| Capitec Bank Holdings Ltd. | | 741 | 67,329 |
| Clicks Group Ltd. | | 4,909 | 79,847 |
| Discovery Ltd. | | 7,661 | 60,972 |
| Exxaro Resources Ltd. | | 4,104 | 33,491 |
| FirstRand Ltd. | | 59,049 | 255,180 |
| Fortress (REIT) Ltd. Class A | | 20,291 | 28,213 |
| Foschini Ltd. | | 3,923 | 45,174 |
| Gold Fields Ltd. | | 14,406 | 89,467 |
| Growthpoint Properties Ltd. | | 48,495 | 70,959 |
| Investec Ltd. | | 4,433 | 25,207 |
| Kumba Iron Ore Ltd. | | 1,106 | 26,934 |
| Liberty Holdings Ltd. | | 1,966 | 15,141 |
| Life Healthcare Group Holdings Ltd. | | 22,627 | 35,729 |
| MMI Holdings Ltd. | | 14,314 | 19,135 |
| Mr Price Group Ltd. | | 4,153 | 43,920 |
| MTN Group Ltd. | | 28,636 | 177,363 |
| MultiChoice Group Ltd. (a) | | 6,852 | 57,150 |
| Naspers Ltd. Class N | | 7,652 | 1,082,824 |
| Nedbank Group Ltd. | | 7,566 | 114,753 |
| Netcare Ltd. | | 22,090 | 25,013 |
| Old Mutual Ltd. | | 85,402 | 111,058 |
| Pick 'n Pay Stores Ltd. | | 5,574 | 24,383 |
| PSG Group Ltd. | | 3,322 | 51,917 |
| Rand Merchant Insurance Holdings Ltd. | | 12,528 | 24,757 |
| Redefine Properties Ltd. | | 81,192 | 40,514 |
| Remgro Ltd. | | 12,894 | 147,854 |
| RMB Holdings Ltd. | | 11,778 | 61,944 |
| Sanlam Ltd. | | 30,797 | 162,173 |
| Sappi Ltd. | | 8,587 | 22,049 |
| Sasol Ltd. | | 10,088 | 182,882 |
| Shoprite Holdings Ltd. | | 8,647 | 77,489 |
| Spar Group Ltd. | | 3,129 | 42,042 |
| Standard Bank Group Ltd. | | 22,329 | 256,339 |
| Telkom SA Ltd. | | 4,772 | 21,835 |
| Tiger Brands Ltd. | | 2,603 | 36,970 |
| Truworths International Ltd. | | 7,343 | 26,033 |
| Vodacom Group Ltd. | | 10,088 | 88,025 |
| Woolworths Holdings Ltd. | | 18,618 | 70,835 |
|
| TOTAL SOUTH AFRICA | | | 4,393,188 |
|
| Spain - 1.9% | | | |
| ACS Actividades de Construccion y Servicios SA | | 4,337 | 175,987 |
| Aena Sme SA (b) | | 1,113 | 204,199 |
| Amadeus IT Holding SA Class A | | 7,627 | 564,314 |
| Banco Bilbao Vizcaya Argentaria SA | | 117,376 | 618,200 |
| Banco de Sabadell SA | | 94,810 | 104,029 |
| Banco Santander SA (Spain) | | 291,094 | 1,166,818 |
| Bankia SA | | 25,115 | 47,842 |
| Bankinter SA | | 11,278 | 77,986 |
| CaixaBank SA | | 61,788 | 177,183 |
| Cellnex Telecom SA (a) | | 963 | 41,522 |
| Cellnex Telecom SA (b) | | 4,406 | 189,976 |
| Enagas SA | | 4,060 | 100,479 |
| Endesa SA | | 5,259 | 143,115 |
| Ferrovial SA | | 8,290 | 244,645 |
| Gas Natural SDG SA | | 5,036 | 137,102 |
| Grifols SA | | 5,536 | 178,314 |
| Iberdrola SA | | 102,026 | 1,048,725 |
| Inditex SA | | 18,709 | 583,209 |
| MAPFRE SA (Reg.) | | 17,673 | 49,277 |
| Red Electrica Corporacion SA | | 7,393 | 148,581 |
| Repsol SA | | 25,482 | 419,936 |
| Siemens Gamesa Renewable Energy SA | | 3,986 | 54,792 |
| Telefonica SA | | 81,476 | 625,677 |
|
| TOTAL SPAIN | | | 7,101,908 |
|
| Sweden - 1.6% | | | |
| Alfa Laval AB | | 5,289 | 122,205 |
| ASSA ABLOY AB (B Shares) | | 17,425 | 413,816 |
| Atlas Copco AB: | | | |
| (A Shares) | | 10,774 | 380,605 |
| (B Shares) | | 7,484 | 231,828 |
| Boliden AB | | 4,843 | 130,232 |
| Electrolux AB (B Shares) | | 3,754 | 98,557 |
| Epiroc AB: | | | |
| Class A | | 12,169 | 136,868 |
| Class B | | 5,744 | 62,463 |
| Ericsson (B Shares) | | 53,693 | 469,212 |
| Essity AB Class B | | 10,478 | 326,959 |
| H&M Hennes & Mauritz AB (B Shares) | | 13,923 | 290,913 |
| Hexagon AB (B Shares) | | 4,601 | 234,870 |
| Husqvarna AB (B Shares) | | 7,774 | 59,466 |
| ICA Gruppen AB | | 1,510 | 66,776 |
| Industrivarden AB (C Shares) | | 2,950 | 63,823 |
| Investor AB (B Shares) | | 7,519 | 385,073 |
| Kinnevik AB (B Shares) | | 4,054 | 110,800 |
| Lundbergfoeretagen AB | | 1,220 | 45,916 |
| Lundin Petroleum AB | | 3,324 | 109,748 |
| Sandvik AB | | 19,808 | 349,461 |
| Securitas AB (B Shares) | | 5,222 | 83,503 |
| Skandinaviska Enskilda Banken AB (A Shares) | | 28,238 | 270,574 |
| Skanska AB (B Shares) | | 5,759 | 122,567 |
| SKF AB (B Shares) | | 6,333 | 114,484 |
| Svenska Handelsbanken AB (A Shares) | | 27,026 | 271,228 |
| Swedbank AB (A Shares) | | 15,198 | 212,568 |
| Swedish Match Co. AB | | 3,005 | 141,043 |
| Tele2 AB (B Shares) | | 8,276 | 118,324 |
| Telia Co. AB | | 48,274 | 212,230 |
| Volvo AB (B Shares) | | 25,687 | 384,146 |
|
| TOTAL SWEDEN | | | 6,020,258 |
|
| Switzerland - 6.1% | | | |
| ABB Ltd. (Reg.) | | 32,549 | 683,529 |
| Adecco SA (Reg.) | | 2,634 | 156,144 |
| Alcon, Inc. (Switzerland) (a) | | 7,234 | 427,220 |
| Baloise Holdings AG | | 818 | 151,079 |
| Barry Callebaut AG | | 39 | 82,230 |
| Clariant AG (Reg.) | | 3,456 | 70,802 |
| Coca-Cola HBC AG | | 3,576 | 108,856 |
| Compagnie Financiere Richemont SA Series A | | 9,091 | 714,382 |
| Credit Suisse Group AG | | 45,161 | 558,997 |
| Dufry AG | | 824 | 71,483 |
| Ems-Chemie Holding AG | | 138 | 86,311 |
| Galenica AG | | 771 | 121,179 |
| Geberit AG (Reg.) | | 656 | 332,888 |
| Givaudan SA | | 160 | 469,863 |
| Julius Baer Group Ltd. | | 3,828 | 169,518 |
| Kuehne & Nagel International AG | | 897 | 144,893 |
| Lafargeholcim Ltd. (Reg.) | | 8,448 | 435,716 |
| Lindt & Spruengli AG | | 2 | 163,811 |
| Lindt & Spruengli AG (participation certificate) | | 16 | 118,885 |
| Lonza Group AG | | 1,323 | 476,092 |
| Nestle SA (Reg. S) | | 52,723 | 5,640,364 |
| Novartis AG | | 37,096 | 3,241,273 |
| Pargesa Holding SA | | 811 | 64,041 |
| Partners Group Holding AG | | 325 | 253,411 |
| Roche Holding AG (participation certificate) | | 12,101 | 3,641,868 |
| Schindler Holding AG: | | | |
| (participation certificate) | | 663 | 162,104 |
| (Reg.) | | 357 | 84,392 |
| SGS SA (Reg.) | | 96 | 249,902 |
| Sika AG | | 2,262 | 388,656 |
| Sonova Holding AG Class B | | 925 | 211,911 |
| Straumann Holding AG | | 172 | 153,396 |
| Swatch Group AG (Bearer) | | 392 | 108,480 |
| Swatch Group AG (Bearer) (Reg.) | | 1,879 | 100,664 |
| Swiss Life Holding AG | | 594 | 296,970 |
| Swiss Prime Site AG | | 1,267 | 130,489 |
| Swiss Re Ltd. | | 5,270 | 551,841 |
| Swisscom AG | | 477 | 243,698 |
| Temenos Group AG | | 1,095 | 156,230 |
| UBS Group AG | | 67,614 | 797,797 |
| Zurich Insurance Group Ltd. | | 2,575 | 1,006,247 |
|
| TOTAL SWITZERLAND | | | 23,027,612 |
|
| Taiwan - 3.0% | | | |
| Acer, Inc. | | 39,000 | 22,762 |
| Advantech Co. Ltd. | | 6,000 | 59,315 |
| ASE Technology Holding Co. Ltd. | | 60,500 | 156,667 |
| Asia Cement Corp. | | 41,000 | 57,874 |
| ASUSTeK Computer, Inc. | | 12,000 | 81,251 |
| AU Optronics Corp. | | 145,000 | 36,900 |
| Catcher Technology Co. Ltd. | | 11,000 | 93,055 |
| Cathay Financial Holding Co. Ltd. | | 129,000 | 170,460 |
| Cathay Financial Holding Co. Ltd. rights 11/25/19 (a) | | 4,436 | 771 |
| Chang Hwa Commercial Bank | | 98,001 | 76,317 |
| Cheng Shin Rubber Industry Co. Ltd. | | 43,000 | 67,465 |
| Chicony Electronics Co. Ltd. | | 10,030 | 31,144 |
| China Airlines Ltd. | | 40,000 | 11,883 |
| China Development Finance Holding Corp. | | 206,000 | 64,168 |
| China Life Insurance Co. Ltd. (a) | | 47,648 | 39,215 |
| China Steel Corp. | | 194,000 | 149,167 |
| Chinatrust Financial Holding Co. Ltd. | | 311,000 | 216,185 |
| Chunghwa Telecom Co. Ltd. | | 71,000 | 260,738 |
| Compal Electronics, Inc. | | 64,000 | 38,193 |
| Delta Electronics, Inc. | | 37,000 | 162,568 |
| E.SUN Financial Holdings Co. Ltd. | | 183,028 | 165,336 |
| ECLAT Textile Co. Ltd. | | 3,000 | 40,281 |
| EVA Airways Corp. | | 31,935 | 14,921 |
| Evergreen Marine Corp. (Taiwan) (a) | | 46,866 | 19,209 |
| Far Eastern Textile Ltd. | | 48,000 | 46,587 |
| Far EasTone Telecommunications Co. Ltd. | | 25,000 | 59,840 |
| Feng Tay Enterprise Co. Ltd. | | 5,500 | 37,150 |
| First Financial Holding Co. Ltd. | | 171,872 | 125,954 |
| Formosa Chemicals & Fibre Corp. | | 58,000 | 168,496 |
| Formosa Petrochemical Corp. | | 20,000 | 63,545 |
| Formosa Plastics Corp. | | 84,000 | 269,368 |
| Formosa Taffeta Co. Ltd. | | 13,000 | 14,770 |
| Foxconn Technology Co. Ltd. | | 21,000 | 44,895 |
| Fubon Financial Holding Co. Ltd. | | 118,000 | 172,369 |
| Giant Manufacturing Co. Ltd. | | 5,000 | 37,052 |
| GlobalWafers Co. Ltd. | | 4,000 | 47,872 |
| Highwealth Construction Corp. | | 12,000 | 18,395 |
| HIWIN Technologies Corp. | | 3,221 | 27,618 |
| Hon Hai Precision Industry Co. Ltd. (Foxconn) | | 221,800 | 586,172 |
| Hotai Motor Co. Ltd. | | 5,000 | 88,203 |
| Hua Nan Financial Holdings Co. Ltd. | | 121,634 | 87,343 |
| Innolux Corp. | | 126,000 | 27,970 |
| Inventec Corp. | | 42,000 | 30,435 |
| Largan Precision Co. Ltd. | | 2,000 | 293,134 |
| Lite-On Technology Corp. | | 35,000 | 57,610 |
| MediaTek, Inc. | | 26,000 | 347,826 |
| Mega Financial Holding Co. Ltd. | | 180,000 | 176,471 |
| Micro-Star International Co. Ltd. | | 11,000 | 32,461 |
| Nan Ya Plastics Corp. | | 86,000 | 203,030 |
| Nanya Technology Corp. | | 25,000 | 57,381 |
| Nien Made Enterprise Co. Ltd. | | 3,000 | 27,199 |
| Novatek Microelectronics Corp. | | 11,000 | 70,693 |
| Pegatron Corp. | | 33,000 | 64,165 |
| Phison Electronics Corp. | | 2,000 | 18,198 |
| Pou Chen Corp. | | 37,000 | 49,438 |
| Powertech Technology, Inc. | | 11,000 | 34,625 |
| President Chain Store Corp. | | 9,000 | 89,711 |
| Quanta Computer, Inc. | | 46,000 | 88,235 |
| Realtek Semiconductor Corp. | | 8,000 | 59,414 |
| Ruentex Development Co. Ltd. | | 9,000 | 13,722 |
| Ruentex Industries Ltd. | | 4,800 | 11,521 |
| Shin Kong Financial Holding Co. Ltd. | | 173,508 | 54,730 |
| Sinopac Holdings Co. | | 197,100 | 80,784 |
| Standard Foods Corp. | | 7,000 | 14,093 |
| Synnex Technology International Corp. | | 19,000 | 22,646 |
| TaiMed Biologics, Inc. (a) | | 3,000 | 13,132 |
| Taishin Financial Holdings Co. Ltd. | | 219,808 | 101,983 |
| Taiwan Business Bank | | 89,692 | 37,791 |
| Taiwan Cement Corp. | | 79,937 | 106,022 |
| Taiwan Cooperative Financial Holding Co. Ltd. | | 141,874 | 97,458 |
| Taiwan High Speed Rail Corp. | | 32,000 | 37,825 |
| Taiwan Mobile Co. Ltd. | | 26,000 | 96,760 |
| Taiwan Semiconductor Manufacturing Co. Ltd. | | 424,000 | 4,147,283 |
| Taiwan Semiconductor Manufacturing Co. Ltd. sponsored ADR | | 261 | 13,475 |
| Tatung Co. Ltd. (a) | | 25,000 | 15,001 |
| The Shanghai Commercial & Savings Bank Ltd. | | 58,899 | 101,390 |
| Unified-President Enterprises Corp. | | 81,000 | 199,725 |
| United Microelectronics Corp. | | 206,000 | 94,688 |
| Vanguard International Semiconductor Corp. | | 13,000 | 27,792 |
| Walsin Technology Corp. | | 5,000 | 30,084 |
| Win Semiconductors Corp. | | 6,000 | 62,561 |
| Winbond Electronics Corp. | | 48,000 | 26,992 |
| Wistron Corp. | | 45,763 | 41,940 |
| WPG Holding Co. Ltd. | | 33,400 | 42,273 |
| Yageo Corp. | | 4,396 | 45,260 |
| Yuanta Financial Holding Co. Ltd. | | 160,000 | 99,941 |
|
| TOTAL TAIWAN | | | 11,296,342 |
|
| Thailand - 0.7% | | | |
| Advanced Info Service PCL (For. Reg.) | | 19,900 | 150,987 |
| Airports of Thailand PCL (For. Reg.) | | 77,400 | 200,574 |
| Bangkok Bank PCL (For. Reg.) | | 10,900 | 62,984 |
| Bangkok Dusit Medical Services PCL (For. Reg.) | | 156,500 | 124,431 |
| Bangkok Expressway and Metro PCL | | 135,800 | 48,581 |
| Banpu PCL (For. Reg.) | | 78,200 | 30,052 |
| Berli Jucker PCL (For. Reg) | | 21,000 | 33,915 |
| BTS Group Holdings PCL | | 125,400 | 55,437 |
| Bumrungrad Hospital PCL (For. Reg.) | | 8,100 | 32,334 |
| C.P. ALL PCL (For. Reg.) | | 106,900 | 276,355 |
| Central Pattana PCL (For. Reg.) | | 43,600 | 92,443 |
| Charoen Pokphand Foods PCL (For. Reg.) | | 63,800 | 53,381 |
| Electricity Generating PCL (For. Reg.) | | 4,500 | 51,726 |
| Energy Absolute PCL | | 27,400 | 37,211 |
| Gulf Energy Development PCL | | 14,100 | 75,749 |
| Home Product Center PCL (For. Reg.) | | 91,500 | 52,118 |
| Indorama Ventures PCL (For. Reg.) | | 32,300 | 29,975 |
| Intouch Holdings PCL (For. Reg.) | | 36,800 | 80,451 |
| IRPC PCL (For. Reg.) | | 159,300 | 17,941 |
| Kasikornbank PCL | | 6,300 | 28,994 |
| Kasikornbank PCL (For. Reg.) | | 27,100 | 125,169 |
| Krung Thai Bank PCL (For. Reg.) | | 46,300 | 25,458 |
| Land & House PCL (For. Reg.) | | 123,000 | 39,525 |
| Minor International PCL: | | | |
| warrants 9/30/21 (a) | | 1,750 | 176 |
| (For. Reg.) | | 45,800 | 54,619 |
| Muangthai Leasing PCL | | 9,000 | 18,493 |
| PTT Exploration and Production PCL (For. Reg.) | | 21,400 | 85,389 |
| PTT Global Chemical PCL (For. Reg.) | | 41,000 | 69,268 |
| PTT PCL (For. Reg.) | | 198,700 | 297,801 |
| Ratchaburi Electric Generating Holding PCL (For. Reg.) | | 12,800 | 31,185 |
| Robinsons Department Store PCL (For. Reg.) | | 7,400 | 15,995 |
| Siam Cement PCL (For. Reg.) | | 12,700 | 154,465 |
| Siam Commercial Bank PCL (For. Reg.) | | 13,100 | 48,561 |
| Thai Oil PCL (For. Reg.) | | 17,100 | 38,795 |
| Thai Union Frozen Products PCL (For. Reg.) | | 59,700 | 28,873 |
| TMB Bank PCL: | | | |
| (For. Reg.) | | 231,100 | 11,018 |
| rights (a) | | 159,982 | 212 |
| Total Access Communication PCL (For. Reg.) | | 12,000 | 24,635 |
| True Corp. PCL (For. Reg.) | | 236,700 | 39,213 |
|
| TOTAL THAILAND | | | 2,644,489 |
|
| Turkey - 0.1% | | | |
| Akbank TAS (a) | | 48,202 | 58,258 |
| Anadolu Efes Biracilik Ve Malt Sanayii A/S | | 3,349 | 11,264 |
| Arcelik A/S (a) | | 2,523 | 7,820 |
| Aselsan A/S | | 6,163 | 19,781 |
| Bim Birlesik Magazalar A/S JSC | | 7,418 | 61,397 |
| Eregli Demir ve Celik Fabrikalari T.A.S. | | 22,334 | 25,548 |
| Ford Otomotiv Sanayi A/S | | 1,552 | 17,509 |
| Haci Omer Sabanci Holding A/S | | 12,020 | 17,387 |
| Koc Holding A/S | | 11,610 | 38,035 |
| TAV Havalimanlari Holding A/S | | 2,449 | 11,171 |
| Tupras Turkiye Petrol Rafinerileri A/S | | 2,221 | 48,365 |
| Turk Hava Yollari AO (a) | | 10,802 | 21,992 |
| Turk Sise ve Cam Fabrikalari A/S | | 5,790 | 4,405 |
| Turkcell Iletisim Hizmet A/S | | 18,609 | 40,914 |
| Turkiye Garanti Bankasi A/S (a) | | 38,856 | 62,526 |
| Turkiye Is Bankasi A/S Series C (a) | | 29,351 | 29,776 |
|
| TOTAL TURKEY | | | 476,148 |
|
| United Arab Emirates - 0.2% | | | |
| Abu Dhabi Commercial Bank PJSC | | 48,492 | 102,985 |
| Aldar Properties PJSC (a) | | 61,630 | 39,434 |
| DP World Ltd. | | 2,719 | 36,136 |
| Dubai Islamic Bank Pakistan Ltd. (a) | | 29,752 | 42,853 |
| Emaar Development PJSC (a) | | 12,943 | 14,272 |
| Emaar Malls Group PJSC (a) | | 49,794 | 26,437 |
| Emaar Properties PJSC | | 55,776 | 64,846 |
| Emirates Telecommunications Corp. | | 28,790 | 129,811 |
| National Bank of Abu Dhabi PJSC | | 45,694 | 189,357 |
|
| TOTAL UNITED ARAB EMIRATES | | | 646,131 |
|
| United Kingdom - 10.1% | | | |
| 3i Group PLC | | 17,142 | 250,471 |
| Admiral Group PLC | | 3,126 | 81,876 |
| Anglo American PLC (United Kingdom) | | 18,478 | 474,305 |
| Antofagasta PLC | | 6,263 | 70,354 |
| Ashtead Group PLC | | 7,970 | 242,406 |
| Associated British Foods PLC | | 5,969 | 172,113 |
| AstraZeneca PLC (United Kingdom) | | 22,718 | 2,215,397 |
| Auto Trader Group PLC (b) | | 15,768 | 114,890 |
| Aviva PLC | | 69,675 | 375,551 |
| BAE Systems PLC | | 56,141 | 419,357 |
| Barclays PLC | | 300,890 | 652,653 |
| Barratt Developments PLC | | 17,962 | 146,862 |
| Berkeley Group Holdings PLC | | 2,329 | 132,772 |
| BHP Billiton PLC | | 36,615 | 776,624 |
| BP PLC | | 341,293 | 2,164,263 |
| BP PLC sponsored ADR | | 1,630 | 61,793 |
| British American Tobacco PLC (United Kingdom) | | 39,726 | 1,389,452 |
| British Land Co. PLC | | 15,226 | 122,419 |
| BT Group PLC | | 148,637 | 394,123 |
| Bunzl PLC | | 5,848 | 152,110 |
| Burberry Group PLC | | 6,917 | 183,141 |
| Carnival PLC | | 2,733 | 109,366 |
| Centrica PLC | | 97,973 | 92,085 |
| Coca-Cola European Partners PLC | | 4,016 | 214,896 |
| Compass Group PLC | | 27,578 | 734,239 |
| Croda International PLC | | 2,360 | 147,226 |
| Diageo PLC | | 41,084 | 1,681,608 |
| Direct Line Insurance Group PLC | | 22,982 | 81,003 |
| easyJet PLC | | 2,731 | 43,796 |
| Evraz PLC | | 8,552 | 40,678 |
| Fresnillo PLC | | 3,725 | 34,259 |
| G4S PLC (United Kingdom) | | 26,449 | 70,851 |
| GlaxoSmithKline PLC | | 86,491 | 1,981,071 |
| Halma PLC | | 6,232 | 151,241 |
| Hargreaves Lansdown PLC | | 4,711 | 108,134 |
| HSBC Holdings PLC (United Kingdom) | | 347,768 | 2,627,426 |
| Imperial Tobacco Group PLC | | 16,773 | 367,706 |
| Informa PLC | | 21,458 | 215,416 |
| InterContinental Hotel Group PLC | | 2,885 | 174,585 |
| Intertek Group PLC | | 2,734 | 189,540 |
| Investec PLC | | 11,114 | 62,999 |
| ITV PLC | | 67,363 | 116,708 |
| J Sainsbury PLC | | 29,588 | 77,995 |
| John Wood Group PLC | | 11,458 | 50,211 |
| Johnson Matthey PLC | | 3,360 | 133,618 |
| Kingfisher PLC | | 37,912 | 101,703 |
| Land Securities Group PLC | | 11,936 | 145,336 |
| Legal & General Group PLC | | 105,108 | 359,032 |
| Lloyds Banking Group PLC | | 1,229,280 | 904,268 |
| London Stock Exchange Group PLC | | 5,444 | 490,607 |
| M&G PLC (a) | | 44,484 | 123,197 |
| Marks & Spencer Group PLC | | 32,185 | 75,821 |
| Meggitt PLC | | 13,071 | 105,720 |
| Melrose Industries PLC | | 83,891 | 231,572 |
| Merlin Entertainments PLC (b) | | 12,009 | 70,701 |
| Micro Focus International PLC | | 5,570 | 76,449 |
| Mondi PLC | | 6,159 | 127,450 |
| Mondi PLC | | 1,964 | 40,617 |
| National Grid PLC | | 58,867 | 687,272 |
| Next PLC | | 2,438 | 207,864 |
| NMC Health PLC | | 1,601 | 45,272 |
| Ocado Group PLC (a) | | 7,639 | 131,507 |
| Pearson PLC | | 12,949 | 114,360 |
| Persimmon PLC | | 5,588 | 164,819 |
| Prudential PLC | | 44,484 | 776,995 |
| Reckitt Benckiser Group PLC | | 12,257 | 948,467 |
| RELX PLC (London Stock Exchange) | | 33,730 | 811,800 |
| Rentokil Initial PLC | | 32,792 | 193,059 |
| Rio Tinto PLC | | 19,607 | 1,020,776 |
| Rolls-Royce Holdings PLC (a) | | 1,400,102 | 1,814 |
| Rolls-Royce Holdings PLC | | 30,437 | 280,074 |
| Royal Bank of Scotland Group PLC | | 85,535 | 236,439 |
| Royal Dutch Shell PLC: | | | |
| Class A (United Kingdom) | | 77,890 | 2,257,883 |
| Class B (United Kingdom) | | 61,576 | 1,773,375 |
| RSA Insurance Group PLC | | 17,641 | 119,347 |
| Sage Group PLC | | 18,226 | 169,938 |
| Schroders PLC | | 2,152 | 86,276 |
| Scottish & Southern Energy PLC | | 18,319 | 304,756 |
| Segro PLC | | 18,274 | 199,832 |
| Severn Trent PLC | | 3,952 | 115,438 |
| Smith & Nephew PLC | | 15,303 | 328,501 |
| Smiths Group PLC | | 6,554 | 136,982 |
| Spirax-Sarco Engineering PLC | | 1,298 | 133,248 |
| St. James's Place Capital PLC | | 9,518 | 128,346 |
| Standard Chartered PLC (United Kingdom) | | 48,995 | 444,894 |
| Standard Life PLC | | 42,226 | 166,007 |
| Taylor Wimpey PLC | | 58,486 | 125,383 |
| Tesco PLC | | 170,291 | 519,823 |
| The Weir Group PLC | | 4,600 | 80,233 |
| Unilever PLC | | 19,162 | 1,147,374 |
| United Utilities Group PLC | | 11,505 | 129,686 |
| Vodafone Group PLC | | 461,477 | 941,746 |
| Vodafone Group PLC sponsored ADR | | 110 | 2,246 |
| Whitbread PLC | | 2,202 | 115,834 |
| WM Morrison Supermarkets PLC | | 42,905 | 110,515 |
|
| TOTAL UNITED KINGDOM | | | 38,110,243 |
|
| United States of America - 0.1% | | | |
| Southern Copper Corp. | | 1,347 | 47,926 |
| Yum China Holdings, Inc. | | 6,449 | 274,083 |
|
| TOTAL UNITED STATES OF AMERICA | | | 322,009 |
|
| TOTAL COMMON STOCKS | | | |
| (Cost $369,520,434) | | | 362,279,563 |
|
| Nonconvertible Preferred Stocks - 1.3% | | | |
| Brazil - 0.7% | | | |
| Banco Bradesco SA (PN) | | 67,890 | 595,360 |
| Braskem SA (PN-A) (a) | | 3,200 | 22,102 |
| Centrais Eletricas Brasileiras SA (Electrobras) (PN-B) (a) | | 3,200 | 32,706 |
| Companhia Brasileira de Distribuicao Grupo Pao de Acucar (PN) | | 2,700 | 55,872 |
| Companhia Energetica de Minas Gerais (CEMIG) (PN) | | 14,800 | 50,373 |
| Gerdau SA | | 21,200 | 70,993 |
| Itau Unibanco Holding SA | | 84,850 | 766,517 |
| Itausa-Investimentos Itau SA (PN) | | 79,447 | 271,592 |
| Lojas Americanas SA (PN) | | 12,400 | 61,807 |
| Petroleo Brasileiro SA - Petrobras (PN) (non-vtg.) | | 74,300 | 563,016 |
| Telefonica Brasil SA | | 7,300 | 96,617 |
|
| TOTAL BRAZIL | | | 2,586,955 |
|
| Chile - 0.0% | | | |
| Embotelladora Andina SA Class B | | 4,764 | 13,747 |
| Sociedad Quimica y Minera de Chile SA (PN-B) (a) | | 1,954 | 51,906 |
|
| TOTAL CHILE | | | 65,653 |
|
| Colombia - 0.0% | | | |
| Bancolombia SA (PN) | | 7,142 | 93,226 |
| Grupo Aval Acciones y Valores SA | | 57,647 | 23,622 |
| Grupo de Inversiones Suramerica SA | | 1,893 | 17,351 |
|
| TOTAL COLOMBIA | | | 134,199 |
|
| Germany - 0.4% | | | |
| Bayerische Motoren Werke AG (BMW) (non-vtg.) | | 800 | 49,296 |
| Fuchs Petrolub AG | | 1,409 | 60,155 |
| Henkel AG & Co. KGaA | | 3,035 | 315,408 |
| Porsche Automobil Holding SE (Germany) | | 2,651 | 195,195 |
| Sartorius AG (non-vtg.) | | 618 | 120,068 |
| Volkswagen AG | | 3,227 | 614,362 |
|
| TOTAL GERMANY | | | 1,354,484 |
|
| Italy - 0.0% | | | |
| Telecom Italia SpA (Risparmio Shares) | | 130,897 | 75,739 |
| Korea (South) - 0.2% | | | |
| AMOREPACIFIC Corp. | | 110 | 9,052 |
| Hyundai Motor Co. | | 2,624 | 163,679 |
| Hyundai Motor Co. Series 2 | | 341 | 23,106 |
| LG Chemical Ltd. | | 299 | 43,945 |
| LG Household & Health Care Ltd. | | 30 | 18,944 |
| Samsung Electronics Co. Ltd. | | 14,497 | 508,508 |
|
| TOTAL KOREA (SOUTH) | | | 767,234 |
|
| Russia - 0.0% | | | |
| AK Transneft OAO | | 7 | 18,176 |
| Surgutneftegas OJSC | | 171,200 | 100,730 |
|
| TOTAL RUSSIA | | | 118,906 |
|
| TOTAL NONCONVERTIBLE PREFERRED STOCKS | | | |
| (Cost $5,126,438) | | | 5,103,170 |
| | | Principal Amount | Value |
|
| Nonconvertible Bonds - 0.0% | | | |
| India - 0.0% | | | |
Britannia Industries Ltd. 8% 8/28/22
(Cost $3) | INR | 756 | 3 |
|
| Government Obligations - 0.2% | | | |
| United States of America - 0.2% | | | |
| U.S. Treasury Bills, yield at date of purchase 1.7% to 1.82% 12/19/19 to 3/19/20(e) | | | |
| (Cost $637,045) | | $640,000 | 637,526 |
| | | Shares | Value |
|
| Money Market Funds - 2.3% | | | |
| Fidelity Cash Central Fund 1.83% (f) | | 8,330,787 | 8,332,453 |
| Fidelity Securities Lending Cash Central Fund 1.84% (f)(g) | | 422,644 | 422,686 |
| TOTAL MONEY MARKET FUNDS | | | |
| (Cost $8,755,139) | | | 8,755,139 |
| TOTAL INVESTMENT IN SECURITIES - 99.5% | | | |
| (Cost $384,039,059) | | | 376,775,401 |
| NET OTHER ASSETS (LIABILITIES) - 0.5% | | | 1,811,970 |
| NET ASSETS - 100% | | | $378,587,371 |
| Futures Contracts | | | | | |
| | Number of contracts | Expiration Date | Notional Amount | Value | Unrealized Appreciation/(Depreciation) |
| Purchased | | | | | |
| Equity Index Contracts | | | | | |
| ICE E-mini MSCI EAFE Index Contracts (United States) | 77 | Dec. 2019 | $7,535,220 | $190,961 | $190,961 |
| ICE E-mini MSCI Emerging Markets Index Contracts (United States) | 57 | Dec. 2019 | 2,967,990 | 64,549 | 64,549 |
| TME S&P/TSX 60 Index Contracts (Canada) | 5 | Dec. 2019 | 747,779 | 5,561 | 5,561 |
| TOTAL FUTURES CONTRACTS | | | | | $261,071 |
The notional amount of futures purchased as a percentage of Net Assets is 3.0%
Currency Abbreviations
INR – Indian rupee
Categorizations in the Schedule of Investments are based on country or territory of incorporation.
Legend
(a) Non-income producing
(b) Security exempt from registration under Rule 144A of the Securities Act of 1933. These securities may be resold in transactions exempt from registration, normally to qualified institutional buyers. At the end of the period, the value of these securities amounted to $3,805,884 or 1.0% of net assets.
(c) Security or a portion of the security is on loan at period end.
(d) Level 3 security
(e) Security or a portion of the security was pledged to cover margin requirements for futures contracts. At period end, the value of securities pledged amounted to $511,199.
(f) Affiliated fund that is generally available only to investment companies and other accounts managed by Fidelity Investments. The rate quoted is the annualized seven-day yield of the fund at period end. A complete unaudited listing of the fund's holdings as of its most recent quarter end is available upon request. In addition, each Fidelity Central Fund's financial statements, which are not covered by the Fund's Report of Independent Registered Public Accounting Firm, are available on the SEC's website or upon request.
(g) Investment made with cash collateral received from securities on loan.
Affiliated Central Funds
Information regarding fiscal year to date income earned by the Fund from investments in Fidelity Central Funds is as follows:
| Fund | Income earned |
| Fidelity Cash Central Fund | $235,409 |
| Fidelity Securities Lending Cash Central Fund | 9,395 |
| Total | $244,804 |
Amounts in the income column in the above table include any capital gain distributions from underlying funds, which are presented in the corresponding line-item in the Statement of Operations, if applicable. Amount for Fidelity Securities Lending Cash Central Fund represents the income earned on investing cash collateral, less rebates paid to borrowers and any lending agent fees associated with the loan, plus any premium payments received for lending certain types of securities.
Investment Valuation
The following is a summary of the inputs used, as of October 31, 2019, involving the Fund's assets and liabilities carried at fair value. The inputs or methodology used for valuing securities may not be an indication of the risk associated with investing in those securities. For more information on valuation inputs, and their aggregation into the levels used below, please refer to the Investment Valuation section in the accompanying Notes to Financial Statements.
| | Valuation Inputs at Reporting Date: |
| Description | Total | Level 1 | Level 2 | Level 3 |
| Investments in Securities: | | | | |
| Equities: | | | | |
| Communication Services | $24,513,192 | $8,153,027 | $16,360,165 | $-- |
| Consumer Discretionary | 42,569,515 | 20,825,663 | 21,743,509 | 343 |
| Consumer Staples | 36,037,912 | 13,808,941 | 22,228,971 | -- |
| Energy | 24,361,627 | 8,589,473 | 15,772,154 | -- |
| Financials | 79,334,754 | 34,223,894 | 45,087,297 | 23,563 |
| Health Care | 32,062,935 | 4,929,960 | 27,132,975 | -- |
| Industrials | 44,247,022 | 19,374,142 | 24,872,880 | -- |
| Information Technology | 33,096,019 | 13,151,843 | 19,944,103 | 73 |
| Materials | 26,727,024 | 13,898,339 | 12,828,685 | -- |
| Real Estate | 11,808,194 | 2,910,712 | 8,897,403 | 79 |
| Utilities | 12,624,539 | 5,538,010 | 7,086,529 | -- |
| Corporate Bonds | 3 | -- | 3 | -- |
| Government Obligations | 637,526 | -- | 637,526 | -- |
| Money Market Funds | 8,755,139 | 8,755,139 | -- | -- |
| Total Investments in Securities: | $376,775,401 | $154,159,143 | $222,592,200 | $24,058 |
| Derivative Instruments: | | | | |
| Assets | | | | |
| Futures Contracts | $261,071 | $261,071 | $-- | $-- |
| Total Assets | $261,071 | $261,071 | $-- | $-- |
| Total Derivative Instruments: | $261,071 | $261,071 | $-- | $-- |
Value of Derivative Instruments
The following table is a summary of the Fund's value of derivative instruments by primary risk exposure as of October 31, 2019. For additional information on derivative instruments, please refer to the Derivative Instruments section in the accompanying Notes to Financial Statements.
| Primary Risk Exposure / Derivative Type | Value |
| | Asset | Liability |
| Equity Risk | | |
| Futures Contracts(a) | $261,071 | $0 |
| Total Equity Risk | 261,071 | 0 |
| Total Value of Derivatives | $261,071 | $0 |
(a) Reflects gross cumulative appreciation (depreciation) on futures contracts as presented in the Schedule of Investments. In the Statement of Assets and Liabilities, the period end daily variation margin is included in receivable or payable for daily variation margin on futures contracts, and the net cumulative appreciation (depreciation) is included in Total accumulated earnings (loss).
See accompanying notes which are an integral part of the financial statements.
Financial Statements
Statement of Assets and Liabilities
| | | October 31, 2019 |
| Assets | | |
Investment in securities, at value (including securities loaned of $407,947) — See accompanying schedule:
Unaffiliated issuers (cost $375,283,920) | $368,020,262 | |
| Fidelity Central Funds (cost $8,755,139) | 8,755,139 | |
| Total Investment in Securities (cost $384,039,059) | | $376,775,401 |
| Cash | | 1,091 |
| Foreign currency held at value (cost $779,600) | | 782,973 |
| Receivable for fund shares sold | | 777,746 |
| Dividends receivable | | 1,056,477 |
| Distributions receivable from Fidelity Central Funds | | 17,283 |
| Total assets | | 379,410,971 |
| Liabilities | | |
| Payable for investments purchased | $31,245 | |
| Payable for fund shares redeemed | 265,846 | |
| Payable for daily variation margin on futures contracts | 45,031 | |
| Other payables and accrued expenses | 59,002 | |
| Collateral on securities loaned | 422,476 | |
| Total liabilities | | 823,600 |
| Net Assets | | $378,587,371 |
| Net Assets consist of: | | |
| Paid in capital | | $378,762,593 |
| Total accumulated earnings (loss) | | (175,222) |
| Net Assets, for 32,670,187 shares outstanding | | $378,587,371 |
| Net Asset Value, offering price and redemption price per share ($378,587,371 ÷ 32,670,187 shares) | | $11.59 |
See accompanying notes which are an integral part of the financial statements.
Statement of Operations
| | | Year ended October 31, 2019 |
| Investment Income | | |
| Dividends | | $10,389,839 |
| Non-Cash dividends | | 788,422 |
| Interest | | 15,531 |
| Income from Fidelity Central Funds (including $9,395 from security lending) | | 244,804 |
| Income before foreign taxes withheld | | 11,438,596 |
| Less foreign taxes withheld | | (995,088) |
| Total income | | 10,443,508 |
| Expenses | | |
| Independent trustees' fees and expenses | $1,245 | |
| Commitment fees | 789 | |
| Total expenses before reductions | 2,034 | |
| Expense reductions | (188) | |
| Total expenses after reductions | | 1,846 |
| Net investment income (loss) | | 10,441,662 |
| Realized and Unrealized Gain (Loss) | | |
| Net realized gain (loss) on: | | |
| Investment securities: | | |
| Unaffiliated issuers | (2,170,960) | |
| Fidelity Central Funds | (16) | |
| Foreign currency transactions | (55,063) | |
| Futures contracts | 491,553 | |
| Total net realized gain (loss) | | (1,734,486) |
| Change in net unrealized appreciation (depreciation) on: | | |
| Investment securities: | | |
| Unaffiliated issuers (net of increase in deferred foreign taxes of $58,949) | 23,581,316 | |
| Assets and liabilities in foreign currencies | 16,365 | |
| Futures contracts | 1,097,308 | |
| Total change in net unrealized appreciation (depreciation) | | 24,694,989 |
| Net gain (loss) | | 22,960,503 |
| Net increase (decrease) in net assets resulting from operations | | $33,402,165 |
See accompanying notes which are an integral part of the financial statements.
Statement of Changes in Net Assets
| | Year ended October 31, 2019 | Year ended October 31, 2018 |
| Increase (Decrease) in Net Assets | | |
| Operations | | |
| Net investment income (loss) | $10,441,662 | $4,069,385 |
| Net realized gain (loss) | (1,734,486) | 230,182 |
| Change in net unrealized appreciation (depreciation) | 24,694,989 | (32,247,806) |
| Net increase (decrease) in net assets resulting from operations | 33,402,165 | (27,948,239) |
| Distributions to shareholders | (4,638,877) | (129,938) |
| Share transactions | | |
| Proceeds from sales of shares | 204,836,737 | 304,258,299 |
| Reinvestment of distributions | 493,244 | 129,938 |
| Cost of shares redeemed | (100,377,123) | (39,431,399) |
| Net increase (decrease) in net assets resulting from share transactions | 104,952,858 | 264,956,838 |
| Total increase (decrease) in net assets | 133,716,146 | 236,878,661 |
| Net Assets | | |
| Beginning of period | 244,871,225 | 7,992,564 |
| End of period | $378,587,371 | $244,871,225 |
| Other Information | | |
| Shares | | |
| Sold | 18,674,141 | 25,836,592 |
| Issued in reinvestment of distributions | 48,215 | 11,202 |
| Redeemed | (9,148,091) | (3,429,802) |
| Net increase (decrease) | 9,574,265 | 22,417,992 |
See accompanying notes which are an integral part of the financial statements.
Financial Highlights
Fidelity Flex International Index Fund
| | | | |
| Years ended October 31, | 2019 | 2018 | 2017 A |
| Selected Per–Share Data | | | |
| Net asset value, beginning of period | $10.60 | $11.79 | $10.00 |
| Income from Investment Operations | | | |
| Net investment income (loss)B | .37 | .36 | .19 |
| Net realized and unrealized gain (loss) | .81 | (1.35) | 1.60 |
| Total from investment operations | 1.18 | (.99) | 1.79 |
| Distributions from net investment income | (.19) | (.15) | – |
| Distributions from net realized gain | – | (.05) | – |
| Total distributions | (.19) | (.20) | – |
| Net asset value, end of period | $11.59 | $10.60 | $11.79 |
| Total ReturnC,D | 11.40% | (8.53)% | 17.90% |
| Ratios to Average Net AssetsE,F | | | |
| Expenses before reductionsG | -% | -% | - %H |
| Expenses net of fee waivers, if anyG | -% | -% | - %H |
| Expenses net of all reductionsG | -% | -% | - %H |
| Net investment income (loss) | 3.35% | 3.13% | 2.64%H |
| Supplemental Data | | | |
| Net assets, end of period (000 omitted) | $378,587 | $244,871 | $7,993 |
| Portfolio turnover rateI | 4% | 4%J | 18%H |
A For the period March 9, 2017 (commencement of operations) to October 31, 2017.
B Calculated based on average shares outstanding during the period.
C Total returns for periods of less than one year are not annualized.
D Total returns would have been lower if certain expenses had not been reduced during the applicable periods shown.
E Fees and expenses of any underlying Fidelity Central Funds are not included in the Fund's expense ratio. The Fund indirectly bears its proportionate share of the expenses of any underlying Fidelity Central Funds.
F Expense ratios reflect operating expenses of the Fund. Expenses before reductions do not reflect amounts reimbursed by the investment adviser or reductions from expense offset arrangements and do not represent the amount paid by the Fund during periods when reimbursements or reductions occur. Expenses net of fee waivers reflect expenses after reimbursement by the investment adviser but prior to reductions from expense offset arrangements. Expenses net of all reductions represent the net expenses paid by the Fund.
G Amount represents less than .005%.
H Annualized
I Amount does not include the portfolio activity of any underlying Fidelity Central Funds.
J Portfolio turnover rate excludes securities received or delivered in-kind.
See accompanying notes which are an integral part of the financial statements.
Notes to Financial Statements
For the period ended October 31, 2019
1. Organization.
Fidelity Flex International Index Fund (the Fund) is a fund of Fidelity Salem Street Trust (the Trust) and is authorized to issue an unlimited number of shares. Share transactions on the Statement of Changes in Net Assets may contain exchanges between affiliated funds. The Trust is registered under the Investment Company Act of 1940, as amended (the 1940 Act), as an open-end management investment company organized as a Massachusetts business trust. The Fund is available only to certain fee-based accounts offered by Fidelity. The Fund's investments in emerging markets can be subject to social, economic, regulatory, and political uncertainties and can be extremely volatile.
2. Investments in Fidelity Central Funds.
The Fund invests in Fidelity Central Funds, which are open-end investment companies generally available only to other investment companies and accounts managed by the investment adviser and its affiliates. The Fund's Schedule of Investments lists each of the Fidelity Central Funds held as of period end, if any, as an investment of the Fund, but does not include the underlying holdings of each Fidelity Central Fund. As an Investing Fund, the Fund indirectly bears its proportionate share of the expenses of the underlying Fidelity Central Funds.
The Money Market Central Funds seek preservation of capital and current income and are managed by Fidelity Investments Money Management, Inc. (FIMM), an affiliate of the investment adviser. Annualized expenses of the Money Market Central Funds as of their most recent shareholder report date ranged from less than .005% to .01%.
A complete unaudited list of holdings for each Fidelity Central Fund is available upon request or at the Securities and Exchange Commission (the SEC) website at www.sec.gov. In addition, the financial statements of the Fidelity Central Funds, which are not covered by the Fund's Report of Independent Registered Public Accounting Firm, are available on the SEC website or upon request.
3. Significant Accounting Policies.
The Fund is an investment company and applies the accounting and reporting guidance of the Financial Accounting Standards Board (FASB) Accounting Standards Codification Topic 946 Financial Services – Investments Companies. The financial statements have been prepared in conformity with accounting principles generally accepted in the United States of America (GAAP), which require management to make certain estimates and assumptions at the date of the financial statements. Actual results could differ from those estimates. Subsequent events, if any, through the date that the financial statements were issued have been evaluated in the preparation of the financial statements. The following summarizes the significant accounting policies of the Fund:
Investment Valuation. Investments are valued as of 4:00 p.m. Eastern time on the last calendar day of the period. The Board of Trustees (the Board) has delegated the day to day responsibility for the valuation of the Fund's investments to the Fair Value Committee (the Committee) established by the Fund's investment adviser. In accordance with valuation policies and procedures approved by the Board, the Fund attempts to obtain prices from one or more third party pricing vendors or brokers to value its investments. When current market prices, quotations or currency exchange rates are not readily available or reliable, investments will be fair valued in good faith by the Committee, in accordance with procedures adopted by the Board. Factors used in determining fair value vary by investment type and may include market or investment specific events, changes in interest rates and credit quality. The frequency with which these procedures are used cannot be predicted and they may be utilized to a significant extent. The Committee oversees the Fund's valuation policies and procedures and reports to the Board on the Committee's activities and fair value determinations. The Board monitors the appropriateness of the procedures used in valuing the Fund's investments and ratifies the fair value determinations of the Committee.
The Fund categorizes the inputs to valuation techniques used to value its investments into a disclosure hierarchy consisting of three levels as shown below:
- Level 1 – quoted prices in active markets for identical investments
- Level 2 – other significant observable inputs (including quoted prices for similar investments, interest rates, prepayment speeds, etc.)
- Level 3 – unobservable inputs (including the Fund's own assumptions based on the best information available)
Valuation techniques used to value the Fund's investments by major category are as follows:
Equity securities, including restricted securities, for which market quotations are readily available, are valued at the last reported sale price or official closing price as reported by a third party pricing vendor on the primary market or exchange on which they are traded and are categorized as Level 1 in the hierarchy. In the event there were no sales during the day or closing prices are not available, securities are valued at the last quoted bid price or may be valued using the last available price and are generally categorized as Level 2 in the hierarchy. For foreign equity securities, when market or security specific events arise, comparisons to the valuation of American Depositary Receipts (ADRs), futures contracts, Exchange-Traded Funds (ETFs) and certain indexes as well as quoted prices for similar securities may be used and would be categorized as Level 2 in the hierarchy. For equity securities, including restricted securities, where observable inputs are limited, assumptions about market activity and risk are used and these securities may be categorized as Level 3 in the hierarchy.
Debt securities, including restricted securities, are valued based on evaluated prices received from third party pricing vendors or from brokers who make markets in such securities. Corporate bonds and U.S. government and government agency obligations are valued by pricing vendors who utilize matrix pricing which considers yield or price of bonds of comparable quality, coupon, maturity and type or by broker-supplied prices. When independent prices are unavailable or unreliable, debt securities may be valued utilizing pricing methodologies which consider similar factors that would be used by third party pricing vendors. Debt securities are generally categorized as Level 2 in the hierarchy but may be Level 3 depending on the circumstances.
Futures contracts are valued at the settlement price established each day by the board of trade or exchange on which they are traded and are categorized as Level 1 in the hierarchy. Investments in open-end mutual funds, including the Fidelity Central Funds, are valued at their closing net asset value (NAV) each business day and are categorized as Level 1 in the hierarchy.
Changes in valuation techniques may result in transfers in or out of an assigned level within the disclosure hierarchy. The aggregate value of investments by input level as of October 31, 2019 is included at the end of the Fund's Schedule of Investments.
Foreign Currency. The Fund may use foreign currency contracts to facilitate transactions in foreign-denominated securities. Gains and losses from these transactions may arise from changes in the value of the foreign currency or if the counterparties do not perform under the contracts' terms.
Foreign-denominated assets, including investment securities, and liabilities are translated into U.S. dollars at the exchange rates at period end. Purchases and sales of investment securities, income and dividends received and expenses denominated in foreign currencies are translated into U.S. dollars at the exchange rate in effect on the transaction date.
The effects of exchange rate fluctuations on investments are included with the net realized and unrealized gain (loss) on investment securities. Other foreign currency transactions resulting in realized and unrealized gain (loss) are disclosed separately.
Investment Transactions and Income. For financial reporting purposes, the Fund's investment holdings and NAV include trades executed through the end of the last business day of the period. The NAV per share for processing shareholder transactions is calculated as of the close of business of the New York Stock Exchange (NYSE), normally 4:00 p.m. Eastern time and includes trades executed through the end of the prior business day. Gains and losses on securities sold are determined on the basis of identified cost. Dividend income is recorded on the ex-dividend date, except for certain dividends from foreign securities where the ex-dividend date may have passed, which are recorded as soon as the Fund is informed of the ex-dividend date. Non-cash dividends included in dividend income, if any, are recorded at the fair market value of the securities received. Income and capital gain distributions from Fidelity Central Funds, if any, are recorded on the ex-dividend date. Certain distributions received by the Fund represent a return of capital or capital gain. The Fund determines the components of these distributions subsequent to the ex-dividend date, based upon receipt of tax filings or other correspondence relating to the underlying investment. These distributions are recorded as a reduction of cost of investments and/or as a realized gain. Interest income is accrued as earned and includes coupon interest and amortization of premium and accretion of discount on debt securities as applicable. Investment income is recorded net of foreign taxes withheld where recovery of such taxes is uncertain.
Expenses. Expenses directly attributable to a fund are charged to that fund. Expenses attributable to more than one fund are allocated among the respective funds on the basis of relative net assets or other appropriate methods. Expense estimates are accrued in the period to which they relate and adjustments are made when actual amounts are known.
Income Tax Information and Distributions to Shareholders. Each year, the Fund intends to qualify as a regulated investment company under Subchapter M of the Internal Revenue Code, including distributing substantially all of its taxable income and realized gains. As a result, no provision for U.S. Federal income taxes is required. As of October 31, 2019, the Fund did not have any unrecognized tax benefits in the financial statements; nor is the Fund aware of any tax positions for which it is reasonably possible that the total amounts of unrecognized tax benefits will significantly change in the next twelve months. The Fund files a U.S. federal tax return, in addition to state and local tax returns as required. The Fund's federal income tax returns are subject to examination by the Internal Revenue Service (IRS) for a period of three fiscal years after they are filed. State and local tax returns may be subject to examination for an additional fiscal year depending on the jurisdiction. Foreign taxes are provided for based on the Fund's understanding of the tax rules and rates that exist in the foreign markets in which it invests. The Fund is subject to a tax imposed on capital gains by certain countries in which it invests. An estimated deferred tax liability for net unrealized appreciation on the applicable securities is included in Other payables and accrued expenses on the Statement of Assets & Liabilities.
Distributions are declared and recorded on the ex-dividend date. Income and capital gain distributions are determined in accordance with income tax regulations, which may differ from GAAP. In addition, the Fund claimed a portion of the payment made to redeeming shareholders as a distribution for income tax purposes.
Capital accounts within the financial statements are adjusted for permanent book-tax differences. These adjustments have no impact on net assets or the results of operations. Capital accounts are not adjusted for temporary book-tax differences which will reverse in a subsequent period.
Book-tax differences are primarily due to futures contracts, foreign currency transactions, passive foreign investment companies (PFIC), market discount, capital loss carryforwards, partnerships and losses deferred due to wash sales.
As of period end, the cost and unrealized appreciation (depreciation) in securities, and derivatives if applicable, for federal income tax purposes were as follows:
| Gross unrealized appreciation | $28,659,278 |
| Gross unrealized depreciation | (37,144,718) |
| Net unrealized appreciation (depreciation) | $(8,485,440) |
| Tax Cost | $385,266,402 |
The tax-based components of distributable earnings as of period end were as follows:
| Undistributed ordinary income | $8,752,428 |
| Capital loss carryforward | $(388,488) |
| Net unrealized appreciation (depreciation) on securities and other investments | $(8,480,214) |
Capital loss carryforwards are only available to offset future capital gains of the Fund to the extent provided by regulations and may be limited. Under the Regulated Investment Company Modernization Act of 2010 (the Act), the Fund is permitted to carry forward capital losses incurred in taxable years beginning after December 22, 2010 for an unlimited period and such capital losses are required to be used prior to any losses that expire. The capital loss carryforward information presented below, including any applicable limitation, is estimated as of fiscal period end and is subject to adjustment.
| No expiration | |
| Short-term | $(279,735) |
| Long-term | (108,753) |
| Total capital loss carryforward | $(388,488) |
The tax character of distributions paid was as follows:
| | October 31, 2019 | October 31, 2018 |
| Ordinary Income | $4,638,877 | $ 118,359 |
| Long-term Capital Gains | – | 11,579 |
| Total | $4,638,877 | $ 129,938 |
Restricted Securities. The Fund may invest in securities that are subject to legal or contractual restrictions on resale. These securities generally may be resold in transactions exempt from registration or to the public if the securities are registered. Disposal of these securities may involve time-consuming negotiations and expense, and prompt sale at an acceptable price may be difficult. Information regarding restricted securities is included at the end of the Fund's Schedule of Investments.
4. Derivative Instruments.
Risk Exposures and the Use of Derivative Instruments. The Fund's investment objective allows the Fund to enter into various types of derivative contracts, including futures contracts. Derivatives are investments whose value is primarily derived from underlying assets, indices or reference rates and may be transacted on an exchange or over-the-counter (OTC). Derivatives may involve a future commitment to buy or sell a specified asset based on specified terms, to exchange future cash flows at periodic intervals based on a notional principal amount, or for one party to make one or more payments upon the occurrence of specified events in exchange for periodic payments from the other party.
The Fund used derivatives to increase returns and to manage exposure to certain risks as defined below. The success of any strategy involving derivatives depends on analysis of numerous economic factors, and if the strategies for investment do not work as intended, the Fund may not achieve its objectives.
The Fund's use of derivatives increased or decreased its exposure to the following risk:
| Equity Risk | Equity risk relates to the fluctuations in the value of financial instruments as a result of changes in market prices (other than those arising from interest rate risk or foreign exchange risk), whether caused by factors specific to an individual investment, its issuer, or all factors affecting all instruments traded in a market or market segment.
|
The Fund is also exposed to additional risks from investing in derivatives, such as liquidity risk and counterparty credit risk. Liquidity risk is the risk that the Fund will be unable to close out the derivative in the open market in a timely manner. Counterparty credit risk is the risk that the counterparty will not be able to fulfill its obligation to the Fund. Counterparty credit risk related to exchange-traded futures contracts may be mitigated by the protection provided by the exchange on which they trade.
Investing in derivatives may involve greater risks than investing in the underlying assets directly and, to varying degrees, may involve risk of loss in excess of any initial investment and collateral received and amounts recognized in the Statement of Assets and Liabilities. In addition, there may be the risk that the change in value of the derivative contract does not correspond to the change in value of the underlying instrument.
Futures Contracts. A futures contract is an agreement between two parties to buy or sell a specified underlying instrument for a fixed price at a specified future date. The Fund used futures contracts to manage its exposure to the stock market.
Upon entering into a futures contract, a fund is required to deposit either cash or securities (initial margin) with a clearing broker in an amount equal to a certain percentage of the face value of the contract. Futures contracts are marked-to-market daily and subsequent daily payments (variation margin) are made or received by a fund depending on the daily fluctuations in the value of the futures contracts and are recorded as unrealized appreciation or (depreciation). This receivable and/or payable, if any, is included in daily variation margin on futures contracts in the Statement of Assets and Liabilities. Realized gain or (loss) is recorded upon the expiration or closing of a futures contract. The net realized gain (loss) and change in net unrealized appreciation (depreciation) on futures contracts during the period is presented in the Statement of Operations.
Any open futures contracts at period end are presented in the Schedule of Investments under the caption "Futures Contracts". The notional amount at value reflects each contract's exposure to the underlying instrument or index at period end and is representative of volume of activity during the period. Securities deposited to meet initial margin requirements are identified in the Schedule of Investments.
5. Purchases and Sales of Investments.
Purchases and sales of securities, other than short-term securities, aggregated $127,844,877 and $11,397,623, respectively.
6. Fees and Other Transactions with Affiliates.
Management Fee. Fidelity Management & Research Company (the investment adviser) and its affiliates provide the Fund with investment management related services and the Fund does not pay any fees for these services. Under the management contract, the investment adviser or an affiliate pays all other expenses of the Fund, excluding fees and expenses of the independent Trustees, and certain miscellaneous expenses such as proxy and shareholder meeting expenses.
Sub-Adviser. Geode Capital Management, LLC (Geode), serves as sub-adviser for the Fund. Geode provides discretionary investment advisory services to the Fund and is paid by the investment adviser for providing these services.
Interfund Trades. The Fund may purchase from or sell securities to other Fidelity Funds under procedures adopted by the Board. The procedures have been designed to ensure these interfund trades are executed in accordance with Rule 17a-7 of the 1940 Act. Interfund trades are included within the respective purchases and sales amounts shown in the Purchases and Sales of Investments note.
Prior Fiscal Year Affiliated Exchanges In-Kind. During the prior period, the Fund received investments and cash valued at $181,394,706 in exchange for 15,179,473 shares of the Fund. The amount of in-kind exchanges is included in share transactions in the accompanying Statement of Changes in Net Assets as well as Notes to Financial Statements.
7. Committed Line of Credit.
The Fund participates with other funds managed by the investment adviser or an affiliate in a $4.25 billion credit facility (the "line of credit") to be utilized for temporary or emergency purposes to fund shareholder redemptions or for other short-term liquidity purposes. The Fund has agreed to pay commitment fees on its pro-rata portion of the line of credit, which amounted to $789 and is reflected in Commitment fees on the Statement of Operations. During the period, the Fund did not borrow on this line of credit.
8. Security Lending.
The Fund lends portfolio securities from time to time in order to earn additional income. For equity securities, lending agents are used, including National Financial Services (NFS), an affiliate of the Fund. Pursuant to a securities lending agreement, NFS will receive a fee, which is capped at 9.9% of daily lending revenue, for its services as lending agent. The Fund may lend securities to certain qualified borrowers, including NFS. On the settlement date of the loan, the Fund receives collateral (in the form of U.S. Treasury obligations, letters of credit and/or cash) against the loaned securities and maintains collateral in an amount not less than 100% of the market value of the loaned securities during the period of the loan. The market value of the loaned securities is determined at the close of business of the Fund and any additional required collateral is delivered to the Fund on the next business day. The Fund or borrower may terminate the loan at any time, and if the borrower defaults on its obligation to return the securities loaned because of insolvency or other reasons, the Fund may apply collateral received from the borrower against the obligation. The Fund may experience delays and costs in recovering the securities loaned. Any cash collateral received is invested in the Fidelity Securities Lending Cash Central Fund. The value of loaned securities and cash collateral at period end are disclosed on the Fund's Statement of Assets and Liabilities. The value of securities loaned to NFS, as affiliated borrower, at period end was $24,605. Security lending income represents the income earned on investing cash collateral, less rebates paid to borrowers and any lending agent fees associated with the loan, plus any premium payments received for lending certain types of securities. Security lending income is presented in the Statement of Operations as a component of income from Fidelity Central Funds, and includes $138 from securities loaned to NFS, as affiliated borrower.
9. Expense Reductions.
Through arrangements with the Fund's custodian, credits realized as a result of certain uninvested cash balances were used to reduce the Fund's expenses by $188.
10. Other.
The Fund's organizational documents provide former and current trustees and officers with a limited indemnification against liabilities arising in connection with the performance of their duties to the Fund. In the normal course of business, the Fund may also enter into contracts that provide general indemnifications. The Fund's maximum exposure under these arrangements is unknown as this would be dependent on future claims that may be made against the Fund. The risk of material loss from such claims is considered remote.
Report of Independent Registered Public Accounting Firm
To the Trustees of Fidelity Salem Street Trust and Shareholders of Fidelity Flex International Index Fund:
Opinion on the Financial Statements and Financial Highlights
We have audited the accompanying statement of assets and liabilities of Fidelity Flex International Index Fund (the “Fund”), a fund of Fidelity Salem Street Trust, including the schedule of investments, as of October 31, 2019, the related statement of operations for the year then ended, the statement of changes in net assets for each of the two years in the period then ended, the financial highlights for each of the two years in the period then ended and for the period from March 9, 2017 (commencement of operations) to October 31, 2017, and the related notes. In our opinion, the financial statements and financial highlights present fairly, in all material respects, the financial position of the Fund as of October 31, 2019 and the results of its operations for the year then ended, the changes in its net assets for each of the two years in the period then ended, and the financial highlights for each of the two years in the period then ended and for the period from March 9, 2017 (commencement of operations) to October 31, 2017 in conformity with accounting principles generally accepted in the United States of America.
Basis for Opinion
These financial statements and financial highlights are the responsibility of the Fund's management. Our responsibility is to express an opinion on the Fund's financial statements and financial highlights based on our audits. We are a public accounting firm registered with the Public Company Accounting Oversight Board (United States) (PCAOB) and are required to be independent with respect to the Fund in accordance with the U.S. federal securities laws and the applicable rules and regulations of the Securities and Exchange Commission and the PCAOB.
We conducted our audits in accordance with the standards of the PCAOB. Those standards require that we plan and perform the audit to obtain reasonable assurance about whether the financial statements and financial highlights are free of material misstatement, whether due to error or fraud. The Fund is not required to have, nor were we engaged to perform, an audit of its internal control over financial reporting. As part of our audits we are required to obtain an understanding of internal control over financial reporting but not for the purpose of expressing an opinion on the effectiveness of the Fund’s internal control over financial reporting. Accordingly, we express no such opinion.
Our audits included performing procedures to assess the risks of material misstatement of the financial statements and financial highlights, whether due to error or fraud, and performing procedures that respond to those risks. Such procedures included examining, on a test basis, evidence regarding the amounts and disclosures in the financial statements and financial highlights. Our audits also included evaluating the accounting principles used and significant estimates made by management, as well as evaluating the overall presentation of the financial statements and financial highlights. Our procedures included confirmation of securities owned as of October 31, 2019, by correspondence with the custodians and brokers; when replies were not received from brokers, we performed other auditing procedures. We believe that our audits provide a reasonable basis for our opinion.
/s/ Deloitte & Touche LLP
Boston, Massachusetts
December 13, 2019
We have served as the auditor of one or more of the Fidelity investment companies since 1999.
Trustees and Officers
The Trustees, Members of the Advisory Board (if any), and officers of the trust and fund, as applicable, are listed below. The Board of Trustees governs the fund and is responsible for protecting the interests of shareholders. The Trustees are experienced executives who meet periodically throughout the year to oversee the fund's activities, review contractual arrangements with companies that provide services to the fund, oversee management of the risks associated with such activities and contractual arrangements, and review the fund's performance. Except for Jonathan Chiel, each of the Trustees oversees 298 funds. Mr. Chiel oversees 171 funds.
The Trustees hold office without limit in time except that (a) any Trustee may resign; (b) any Trustee may be removed by written instrument, signed by at least two-thirds of the number of Trustees prior to such removal; (c) any Trustee who requests to be retired or who has become incapacitated by illness or injury may be retired by written instrument signed by a majority of the other Trustees; and (d) any Trustee may be removed at any special meeting of shareholders by a two-thirds vote of the outstanding voting securities of the trust. Each Trustee who is not an interested person (as defined in the 1940 Act) of the trust and the fund is referred to herein as an Independent Trustee. Each Independent Trustee shall retire not later than the last day of the calendar year in which his or her 75th birthday occurs. The Independent Trustees may waive this mandatory retirement age policy with respect to individual Trustees. Officers and Advisory Board Members hold office without limit in time, except that any officer or Advisory Board Member may resign or may be removed by a vote of a majority of the Trustees at any regular meeting or any special meeting of the Trustees. Except as indicated, each individual has held the office shown or other offices in the same company for the past five years.
The fund’s Statement of Additional Information (SAI) includes more information about the Trustees. To request a free copy, call Fidelity at 1-800-544-3455 (for managed account clients) or 1-800-835-5092 (for retirement plan participants).
Experience, Skills, Attributes, and Qualifications of the Trustees. The Governance and Nominating Committee has adopted a statement of policy that describes the experience, qualifications, attributes, and skills that are necessary and desirable for potential Independent Trustee candidates (Statement of Policy). The Board believes that each Trustee satisfied at the time he or she was initially elected or appointed a Trustee, and continues to satisfy, the standards contemplated by the Statement of Policy. The Governance and Nominating Committee also engages professional search firms to help identify potential Independent Trustee candidates who have the experience, qualifications, attributes, and skills consistent with the Statement of Policy. From time to time, additional criteria based on the composition and skills of the current Independent Trustees, as well as experience or skills that may be appropriate in light of future changes to board composition, business conditions, and regulatory or other developments, have also been considered by the professional search firms and the Governance and Nominating Committee. In addition, the Board takes into account the Trustees' commitment and participation in Board and committee meetings, as well as their leadership of standing and ad hoc committees throughout their tenure.
In determining that a particular Trustee was and continues to be qualified to serve as a Trustee, the Board has considered a variety of criteria, none of which, in isolation, was controlling. The Board believes that, collectively, the Trustees have balanced and diverse experience, qualifications, attributes, and skills, which allow the Board to operate effectively in governing the fund and protecting the interests of shareholders. Information about the specific experience, skills, attributes, and qualifications of each Trustee, which in each case led to the Board's conclusion that the Trustee should serve (or continue to serve) as a trustee of the fund, is provided below.
Board Structure and Oversight Function. Abigail P. Johnson is an interested person and currently serves as Chairman. The Trustees have determined that an interested Chairman is appropriate and benefits shareholders because an interested Chairman has a personal and professional stake in the quality and continuity of services provided to the fund. Independent Trustees exercise their informed business judgment to appoint an individual of their choosing to serve as Chairman, regardless of whether the Trustee happens to be independent or a member of management. The Independent Trustees have determined that they can act independently and effectively without having an Independent Trustee serve as Chairman and that a key structural component for assuring that they are in a position to do so is for the Independent Trustees to constitute a substantial majority for the Board. The Independent Trustees also regularly meet in executive session. Arthur E. Johnson serves as Chairman of the Independent Trustees and as such (i) acts as a liaison between the Independent Trustees and management with respect to matters important to the Independent Trustees and (ii) with management prepares agendas for Board meetings.
Fidelity® funds are overseen by different Boards of Trustees. The fund's Board oversees Fidelity's investment-grade bond, money market, asset allocation and certain equity funds, and other Boards oversee Fidelity's high income and other equity funds. The asset allocation funds may invest in Fidelity® funds that are overseen by such other Boards. The use of separate Boards, each with its own committee structure, allows the Trustees of each group of Fidelity® funds to focus on the unique issues of the funds they oversee, including common research, investment, and operational issues. On occasion, the separate Boards establish joint committees to address issues of overlapping consequences for the Fidelity® funds overseen by each Board.
The Trustees operate using a system of committees to facilitate the timely and efficient consideration of all matters of importance to the Trustees, the fund, and fund shareholders and to facilitate compliance with legal and regulatory requirements and oversight of the fund's activities and associated risks. The Board, acting through its committees, has charged FMR and its affiliates with (i) identifying events or circumstances the occurrence of which could have demonstrably adverse effects on the fund's business and/or reputation; (ii) implementing processes and controls to lessen the possibility that such events or circumstances occur or to mitigate the effects of such events or circumstances if they do occur; and (iii) creating and maintaining a system designed to evaluate continuously business and market conditions in order to facilitate the identification and implementation processes described in (i) and (ii) above. Because the day-to-day operations and activities of the fund are carried out by or through FMR, its affiliates, and other service providers, the fund's exposure to risks is mitigated but not eliminated by the processes overseen by the Trustees. While each of the Board's committees has responsibility for overseeing different aspects of the fund's activities, oversight is exercised primarily through the Operations and Audit Committees. In addition, an ad hoc Board committee of Independent Trustees has worked with FMR to enhance the Board's oversight of investment and financial risks, legal and regulatory risks, technology risks, and operational risks, including the development of additional risk reporting to the Board. Appropriate personnel, including but not limited to the fund's Chief Compliance Officer (CCO), FMR's internal auditor, the independent accountants, the fund's Treasurer and portfolio management personnel, make periodic reports to the Board's committees, as appropriate, including an annual review of Fidelity's risk management program for the Fidelity® funds. The responsibilities of each standing committee, including their oversight responsibilities, are described further under "Standing Committees of the Trustees."
Interested Trustees*:
Correspondence intended for a Trustee who is an interested person may be sent to Fidelity Investments, 245 Summer Street, Boston, Massachusetts 02210.
Name, Year of Birth; Principal Occupations and Other Relevant Experience+
Jonathan Chiel (1957)
Year of Election or Appointment: 2016
Trustee
Mr. Chiel also serves as Trustee of other Fidelity® funds. Mr. Chiel is Executive Vice President and General Counsel for FMR LLC (diversified financial services company, 2012-present). Previously, Mr. Chiel served as general counsel (2004-2012) and senior vice president and deputy general counsel (2000-2004) for John Hancock Financial Services; a partner with Choate, Hall & Stewart (1996-2000) (law firm); and an Assistant United States Attorney for the United States Attorney’s Office of the District of Massachusetts (1986-95), including Chief of the Criminal Division (1993-1995). Mr. Chiel is a director on the boards of the Boston Bar Foundation and the Maimonides School.
Abigail P. Johnson (1961)
Year of Election or Appointment: 2009
Trustee
Chairman of the Board of Trustees
Ms. Johnson also serves as Trustee of other Fidelity® funds. Ms. Johnson serves as Chairman (2016-present), Chief Executive Officer (2014-present), and Director (2007-present) of FMR LLC (diversified financial services company), President of Fidelity Financial Services (2012-present) and President of Personal, Workplace and Institutional Services (2005-present). Ms. Johnson is Chairman and Director of FMR Co., Inc. (investment adviser firm, 2011-present) and Chairman and Director of FMR (investment adviser firm, 2011-present). Previously, Ms. Johnson served as Vice Chairman (2007-2016) and President (2013-2016) of FMR LLC, President and a Director of FMR (2001-2005), a Trustee of other investment companies advised by FMR, Fidelity Investments Money Management, Inc. (investment adviser firm), and FMR Co., Inc. (2001-2005), Senior Vice President of the Fidelity® funds (2001-2005), and managed a number of Fidelity® funds. Ms. Abigail P. Johnson and Mr. Arthur E. Johnson are not related.
Jennifer Toolin McAuliffe (1959)
Year of Election or Appointment: 2016
Trustee
Ms. McAuliffe also serves as Trustee of other Fidelity® funds. Ms. McAuliffe previously served as a Member of the Advisory Board of certain Fidelity® funds (2016) and as Co-Head of Fixed Income of Fidelity Investments Limited (now known as FIL Limited (FIL)) (diversified financial services company). Earlier roles at FIL included Director of Research for FIL’s credit and quantitative teams in London, Hong Kong and Tokyo. Ms. McAuliffe also was the Director of Research for taxable and municipal bonds at Fidelity Investments Money Management, Inc. Ms. McAuliffe is also a director or trustee of several not-for-profit entities.
* Determined to be an “Interested Trustee” by virtue of, among other things, his or her affiliation with the trust or various entities under common control with FMR.
+ The information includes the Trustee's principal occupation during the last five years and other information relating to the experience, attributes, and skills relevant to the Trustee's qualifications to serve as a Trustee, which led to the conclusion that the Trustee should serve as a Trustee for the fund.
Independent Trustees:
Correspondence intended for an Independent Trustee may be sent to Fidelity Investments, P.O. Box 55235, Boston, Massachusetts 02205-5235.
Name, Year of Birth; Principal Occupations and Other Relevant Experience+
Elizabeth S. Acton (1951)
Year of Election or Appointment: 2013
Trustee
Ms. Acton also serves as Trustee of other Fidelity® funds. Prior to her retirement in April 2012, Ms. Acton was Executive Vice President, Finance (2011-2012), Executive Vice President, Chief Financial Officer (2002-2011), and Treasurer (2004-2005) of Comerica Incorporated (financial services). Prior to joining Comerica, Ms. Acton held a variety of positions at Ford Motor Company (1983-2002), including Vice President and Treasurer (2000-2002) and Executive Vice President and Chief Financial Officer of Ford Motor Credit Company (1998-2000). Ms. Acton currently serves as a member of the Board of Directors and Audit and Finance Committees of Beazer Homes USA, Inc. (homebuilding, 2012-present). Previously, Ms. Acton served as a Member of the Advisory Board of certain Fidelity® funds (2013-2016).
Ann E. Dunwoody (1953)
Year of Election or Appointment: 2018
Trustee
General Dunwoody also serves as Trustee of other Fidelity® funds. General Dunwoody (United States Army, Retired) was the first woman in U.S. military history to achieve the rank of four-star general and prior to her retirement in 2012 held a variety of positions within the U.S. Army, including Commanding General, U.S. Army Material Command (2008-2012). She is the President of First to Four LLC (leadership and mentoring services, 2012-present). She also serves as a member of the Board of Directors and Nominating and Corporate Governance Committee of L3 Technologies, Inc. (communication, electronic, sensor, and aerospace systems, 2013-present), Board of Directors and Nomination and Corporate Governance Committees of Kforce Inc. (professional staffing services, 2016-present) and Board of Directors of Automattic Inc. (software engineering, 2018-present). Previously, General Dunwoody served as a Member of the Advisory Board of certain Fidelity® funds (2018), a member of the Board of Directors and Audit and Sustainability and Corporate Responsibility Committees of Republic Services, Inc. (waste collection, disposal and recycling, 2013-2016). Ms. Dunwoody also serves on several boards for non-profit organizations, including as a member of the Board of Directors, Chair of the Nomination and Governance Committee and member of the Audit Committee of Logistics Management Institute (consulting non-profit, 2012-present), a member of the Board of Directors of the Army Historical Foundation (2015-present), a member of the Council of Trustees for the Association of the United States Army (advocacy non-profit, 2013-present) and a member of the Board of Trustees of Florida Institute of Technology (2015-present) and ThanksUSA (military family education non-profit, 2014-present).
John Engler (1948)
Year of Election or Appointment: 2014
Trustee
Mr. Engler also serves as Trustee of other Fidelity® funds. He serves on the board of directors for Universal Forest Products (manufacturer and distributor of wood and wood-alternative products, 2003-present) and K12 Inc. (technology-based education company, 2012-present). Previously, Mr. Engler served as interim president of Michigan State University (2018-2019), a Member of the Advisory Board of certain Fidelity® funds (2014-2016), president of the Business Roundtable (2011-2017), a trustee of The Munder Funds (2003-2014), president and CEO of the National Association of Manufacturers (2004-2011), member of the Board of Trustees of the Annie E. Casey Foundation (2004-2015), and as governor of Michigan (1991-2003). He is a past chairman of the National Governors Association.
Robert F. Gartland (1951)
Year of Election or Appointment: 2010
Trustee
Mr. Gartland also serves as Trustee of other Fidelity® funds. Mr. Gartland is Chairman and an investor in Gartland & Mellina Group Corp. (consulting, 2009-present). Previously, Mr. Gartland served as a partner and investor of Vietnam Partners LLC (investments and consulting, 2008-2011). Prior to his retirement, Mr. Gartland held a variety of positions at Morgan Stanley (financial services, 1979-2007), including Managing Director (1987-2007), and Chase Manhattan Bank (1975-1978).
Arthur E. Johnson (1947)
Year of Election or Appointment: 2008
Trustee
Chairman of the Independent Trustees
Mr. Johnson also serves as Trustee of other Fidelity® funds. Mr. Johnson serves as a member of the Board of Directors of Eaton Corporation plc (diversified power management, 2009-present) and Booz Allen Hamilton (management consulting, 2011-present). Prior to his retirement, Mr. Johnson served as Senior Vice President of Corporate Strategic Development of Lockheed Martin Corporation (defense contractor, 1999-2009). Mr. Johnson previously served as Vice Chairman (2015-2018) of the Independent Trustees of certain Fidelity® funds and on the Board of Directors of IKON Office Solutions, Inc. (1999-2008), AGL Resources, Inc. (holding company, 2002-2016), and Delta Airlines (2005-2007). Mr. Arthur E. Johnson is not related to Ms. Abigail P. Johnson.
Michael E. Kenneally (1954)
Year of Election or Appointment: 2009
Trustee
Vice Chairman of the Independent Trustees
Mr. Kenneally also serves as Trustee of other Fidelity® funds. Prior to his retirement, Mr. Kenneally served as Chairman and Global Chief Executive Officer of Credit Suisse Asset Management. Before joining Credit Suisse, he was an Executive Vice President and Chief Investment Officer for Bank of America Corporation. Earlier roles at Bank of America included Director of Research, Senior Portfolio Manager and Research Analyst, and Mr. Kenneally was awarded the Chartered Financial Analyst (CFA) designation in 1991.
Marie L. Knowles (1946)
Year of Election or Appointment: 2001
Trustee
Ms. Knowles also serves as Trustee of other Fidelity® funds. Prior to Ms. Knowles' retirement in June 2000, she served as Executive Vice President and Chief Financial Officer of Atlantic Richfield Company (ARCO) (diversified energy, 1996-2000). From 1993 to 1996, she was a Senior Vice President of ARCO and President of ARCO Transportation Company (pipeline and tanker operations). Ms. Knowles currently serves as a Director and Chairman of the Audit Committee of McKesson Corporation (healthcare service, since 2002). Ms. Knowles is a member of the Board of the Santa Catalina Island Company (real estate, 2009-present). Ms. Knowles is a Member of the Investment Company Institute Board of Governors and a Member of the Governing Council of the Independent Directors Council (2014-present). She also serves as a member of the Advisory Board for the School of Engineering of the University of Southern California. Previously, Ms. Knowles served as a Director of Phelps Dodge Corporation (copper mining and manufacturing, 1994-2007), URS Corporation (engineering and construction, 2000-2003) and America West (airline, 1999-2002). Ms. Knowles previously served as Chairman (2015-2018) and Vice Chairman (2012-2015) of the Independent Trustees of certain Fidelity® funds.
Mark A. Murray (1954)
Year of Election or Appointment: 2016
Trustee
Mr. Murray also serves as Trustee of other Fidelity® funds. Mr. Murray is Vice Chairman (2013-present) of Meijer, Inc. (regional retail chain). Previously, Mr. Murray served as a Member of the Advisory Board of certain Fidelity® funds (2016) and as Co-Chief Executive Officer (2013-2016) and President (2006-2013) of Meijer, Inc. Mr. Murray serves as a member of the Board of Directors and Nuclear Review and Public Policy and Responsibility Committees of DTE Energy Company (diversified energy company, 2009-present). Mr. Murray also serves as a member of the Board of Directors of Spectrum Health (not-for-profit health system, 2015-present). Mr. Murray previously served as President of Grand Valley State University (2001-2006), Treasurer for the State of Michigan (1999-2001), Vice President of Finance and Administration for Michigan State University (1998-1999), and a member of the Board of Directors and Audit Committee and Chairman of the Nominating and Corporate Governance Committee of Universal Forest Products, Inc. (manufacturer and distributor of wood and wood-alternative products, 2004-2016). Mr. Murray is also a director or trustee of many community and professional organizations.
+ The information includes the Trustee's principal occupation during the last five years and other information relating to the experience, attributes, and skills relevant to the Trustee's qualifications to serve as a Trustee, which led to the conclusion that the Trustee should serve as a Trustee for the fund.
Advisory Board Members and Officers:
Correspondence intended for an officer may be sent to Fidelity Investments, 245 Summer Street, Boston, Massachusetts 02210. Officers appear below in alphabetical order.
Name, Year of Birth; Principal Occupation
Elizabeth Paige Baumann (1968)
Year of Election or Appointment: 2017
Anti-Money Laundering (AML) Officer
Ms. Baumann also serves as AML Officer of other funds. She is Chief AML Officer (2012-present) and Senior Vice President (2014-present) of FMR LLC (diversified financial services company) and is an employee of Fidelity Investments. Previously, Ms. Baumann served as AML Officer of the funds (2012-2016), and Vice President (2007-2014) and Deputy Anti-Money Laundering Officer (2007-2012) of FMR LLC.
Craig S. Brown (1977)
Year of Election or Appointment: 2019
Assistant Treasurer
Mr. Brown also serves as Assistant Treasurer of other funds. Mr. Brown is an employee of Fidelity Investments (2013-present).
John J. Burke III (1964)
Year of Election or Appointment: 2018
Chief Financial Officer
Mr. Burke also serves as Chief Financial Officer of other funds. Mr. Burke serves as Head of Investment Operations for Fidelity Fund and Investment Operations (2018-present) and is an employee of Fidelity Investments (1998-present). Previously Mr. Burke served as head of Asset Management Investment Operations (2012-2018).
Jonathan Davis (1968)
Year of Election or Appointment: 2010
Assistant Treasurer
Mr. Davis also serves as Assistant Treasurer of other funds. Mr. Davis serves as Assistant Treasurer of FMR Capital, Inc. (2017-present) and is an employee of Fidelity Investments. Previously, Mr. Davis served as Vice President and Associate General Counsel of FMR LLC (diversified financial services company, 2003-2010).
Adrien E. Deberghes (1967)
Year of Election or Appointment: 2010
Assistant Treasurer
Mr. Deberghes also serves as an officer of other funds. He serves as Assistant Treasurer of FMR Capital, Inc. (2017-present), Executive Vice President of Fidelity Investments Money Management, Inc. (FIMM) (investment adviser firm, 2016-present), and is an employee of Fidelity Investments (2008-present). Previously, Mr. Deberghes served as President and Treasurer of certain Fidelity® funds (2013-2018). Prior to joining Fidelity Investments, Mr. Deberghes was Senior Vice President of Mutual Fund Administration at State Street Corporation (2007-2008), Senior Director of Mutual Fund Administration at Investors Bank & Trust (2005-2007), and Director of Finance for Dunkin' Brands (2000-2005). Previously, Mr. Deberghes served in other fund officer roles.
Laura M. Del Prato (1964)
Year of Election or Appointment: 2018
President and Treasurer
Ms. Del Prato also serves as an officer of other funds. Ms. Del Prato is an employee of Fidelity Investments (2017-present). Prior to joining Fidelity Investments, Ms. Del Prato served as a Managing Director and Treasurer of the JPMorgan Mutual Funds (2014-2017). Prior to JPMorgan, Ms. Del Prato served as a partner at Cohen Fund Audit Services (accounting firm, 2012-2013) and KPMG LLP (accounting firm, 2004-2012).
Colm A. Hogan (1973)
Year of Election or Appointment: 2016
Assistant Treasurer
Mr. Hogan also serves as an officer of other funds. Mr. Hogan serves as Assistant Treasurer of FMR Capital, Inc. (2017-present) and is an employee of Fidelity Investments (2005-present). Previously, Mr. Hogan served as Assistant Treasurer of certain Fidelity® funds (2016-2018).
Cynthia Lo Bessette (1969)
Year of Election or Appointment: 2019
Secretary and Chief Legal Officer (CLO)
Ms. Lo Bessette also serves as Secretary and CLO of other funds. Ms. Lo Bessette serves as CLO, Secretary, and Senior Vice President of Fidelity Management & Research Company and FMR Co., Inc. (investment adviser firms, 2019-present); Secretary of Fidelity SelectCo, LLC and Fidelity Investments Money Management, Inc. (investment adviser firms, 2019-present); and CLO of Fidelity Management & Research (Hong Kong) Limited, FMR Investment Management (UK) Limited, and Fidelity Management & Research (Japan) Limited (investment adviser firms, 2019-present). She is a Senior Vice President and Deputy General Counsel of FMR LLC (diversified financial services company, 2019-present), and is an employee of Fidelity Investments. Previously, Ms. Lo Bessette served as Executive Vice President, General Counsel (2016-2019) and Senior Vice President, Deputy General Counsel (2015-2016) of OppenheimerFunds (investment management company) and Deputy Chief Legal Officer (2013-2015) of Jennison Associates LLC (investment adviser firm).
Chris Maher (1972)
Year of Election or Appointment: 2013
Assistant Treasurer
Mr. Maher serves as Assistant Treasurer of other funds. Mr. Maher is Vice President of Valuation Oversight, serves as Assistant Treasurer of FMR Capital, Inc. (2017-present), and is an employee of Fidelity Investments. Previously, Mr. Maher served as Vice President of Asset Management Compliance (2013), Vice President of the Program Management Group of FMR (investment adviser firm, 2010-2013), and Vice President of Valuation Oversight (2008-2010).
John B. McGinty, Jr. (1962)
Year of Election or Appointment: 2016
Chief Compliance Officer
Mr. McGinty also serves as Chief Compliance Officer of other funds. Mr. McGinty is Senior Vice President of Asset Management Compliance for Fidelity Investments and is an employee of Fidelity Investments (2016-present). Mr. McGinty previously served as Vice President, Senior Attorney at Eaton Vance Management (investment management firm, 2015-2016), and prior to Eaton Vance as global CCO for all firm operations and registered investment companies at GMO LLC (investment management firm, 2009-2015). Before joining GMO LLC, Mr. McGinty served as Senior Vice President, Deputy General Counsel for Fidelity Investments (2007-2009).
Jason P. Pogorelec (1975)
Year of Election or Appointment: 2015
Assistant Secretary
Mr. Pogorelec also serves as Assistant Secretary of other funds. Mr. Pogorelec serves as Vice President, Associate General Counsel (2010-present) and is an employee of Fidelity Investments (2006-present).
Nancy D. Prior (1967)
Year of Election or Appointment: 2014
Vice President
Ms. Prior also serves as Vice President of other funds. Ms. Prior serves as President of Fixed Income (2014-present), President (2016-present) and Director (2014-present) of Fidelity Investments Money Management, Inc. (FIMM) (investment adviser firm), and is an employee of Fidelity Investments (2002-present). Previously, Ms. Prior served as Vice President of Global Asset Allocation Funds (2017-2019); Vice Chairman of FIAM LLC (investment adviser firm, 2014-2018), a Director of FMR Investment Management (UK) Limited (investment adviser firm, 2015-2018), President Multi-Asset Class Strategies of FMR's Global Asset Allocation Division (2017-2018), Vice President of Fidelity's Money Market Funds (2012-2014), and President, Money Market and Short Duration Bond Group of Fidelity Management & Research Company (FMR) (investment adviser firm, 2013-2014).
Stacie M. Smith (1974)
Year of Election or Appointment: 2013
Assistant Treasurer
Ms. Smith also serves as an officer of other funds. Ms. Smith serves as Assistant Treasurer of FMR Capital, Inc. (2017-present), is an employee of Fidelity Investments (2009-present), and has served in other fund officer roles. Prior to joining Fidelity Investments, Ms. Smith served as Senior Audit Manager of Ernst & Young LLP (accounting firm, 1996-2009). Previously, Ms. Smith served as Assistant Treasurer (2013-2018) and Deputy Treasurer (2013-2016) of certain Fidelity® funds.
Marc L. Spector (1972)
Year of Election or Appointment: 2016
Deputy Treasurer
Mr. Spector also serves as an officer of other funds. Mr. Spector serves as Assistant Treasurer of FMR Capital, Inc. (2017-present) and is an employee of Fidelity Investments (2016-present). Prior to joining Fidelity Investments, Mr. Spector served as Director at the Siegfried Group (accounting firm, 2013-2016), and prior to Siegfried Group as audit senior manager at Deloitte & Touche (accounting firm, 2005-2013).
Jim Wegmann (1979)
Year of Election or Appointment: 2019
Assistant Treasurer
Mr. Wegmann also serves as Assistant Treasurer of other funds. Mr. Wegmann is an employee of Fidelity Investments (2011-present).
Shareholder Expense Example
As a shareholder of the Fund, you incur two types of costs: (1) transaction costs and (2) ongoing costs, including other Fund expenses. This Example is intended to help you understand your ongoing costs (in dollars) of investing in the Fund and to compare these costs with the ongoing costs of investing in other mutual funds.
The Example is based on an investment of $1,000 invested at the beginning of the period and held for the entire period (May 1, 2019 to October 31, 2019).
Actual Expenses
The first line of the accompanying table provides information about actual account values and actual expenses. You may use the information in this line, together with the amount you invested, to estimate the expenses that you paid over the period. Simply divide your account value by $1,000.00 (for example, an $8,600 account value divided by $1,000.00 = 8.6), then multiply the result by the number in the first line under the heading entitled "Expenses Paid During Period" to estimate the expenses you paid on your account during this period. In addition, the Fund, as a shareholder in the underlying Fidelity Central Funds, will indirectly bear its pro-rata share of the fees and expenses incurred by the underlying Fidelity Central Funds. These fees and expenses are not included in the Fund's annualized expense ratio used to calculate the expense estimate in the table below.
Hypothetical Example for Comparison Purposes
The second line of the accompanying table provides information about hypothetical account values and hypothetical expenses based on the Fund's actual expense ratio and an assumed rate of return of 5% per year before expenses, which is not the Fund's actual return. The hypothetical account values and expenses may not be used to estimate the actual ending account balance or expenses you paid for the period. You may use this information to compare the ongoing costs of investing in the Fund and other funds. To do so, compare this 5% hypothetical example with the 5% hypothetical examples that appear in the shareholder reports of the other funds. In addition, the Fund, as a shareholder in the underlying Fidelity Central Funds, will indirectly bear its pro-rata share of the fees and expenses incurred by the underlying Fidelity Central Funds. These fees and expenses are not included in the Fund's annualized expense ratio used to calculate the expense estimate in the table below.
Please note that the expenses shown in the table are meant to highlight your ongoing costs only and do not reflect any transaction costs. Therefore, the second line of the table is useful in comparing ongoing costs only, and will not help you determine the relative total costs of owning different funds.
| | Annualized Expense Ratio-A | Beginning
Account Value
May 1, 2019 | Ending
Account Value
October 31, 2019 | Expenses Paid
During Period-B
May 1, 2019
to October 31, 2019 |
| Actual | - %-C | $1,000.00 | $1,017.60 | $--D |
| Hypothetical-E | | $1,000.00 | $1,025.21 | $--D |
A Annualized expense ratio reflects expenses net of applicable fee waivers.
B Expenses are equal to the Fund's annualized expense ratio, multiplied by the average account value over the period, multiplied by 184/365 (to reflect the one-half year period).
C Amount represents less than .005%.
D Amount represents less than $.005.
E 5% return per year before expenses
Distributions (Unaudited)
The fund designates 84% of the dividends distributed in December, during the fiscal year as amounts which may be taken into account as a dividend for the purposes of the maximum rate under section 1(h)(11) of the Internal Revenue Code.
The amounts per share which represent income derived from sources within, and taxes paid to, foreign countries or possessions of the United States are $0.1807 and $0.0171 for the dividend paid December 10, 2018.
The fund will notify shareholders in January 2020 of amounts for use in preparing 2019 income tax returns.
Board Approval of Investment Advisory Contracts and Management Fees
Fidelity Flex International Index Fund
Each year, the Board of Trustees, including the Independent Trustees (together, the Board), votes on the renewal of the management contract with Fidelity Management & Research Company (FMR) and the sub-advisory agreements (together, the Advisory Contracts) for the fund, including the fund's sub-advisory agreement (Sub-Advisory Agreement) with Geode Capital Management, LLC (Geode). FMR and the sub-advisers are referred to herein as the Investment Advisers. The Board, assisted by the advice of fund counsel and Independent Trustees' counsel, requests and considers a broad range of information relevant to the renewal of the Advisory Contracts throughout the year.
The Board meets regularly and, at each of its meetings, covers an extensive agenda of topics and materials and considers factors that are relevant to its annual consideration of the renewal of the fund's Advisory Contracts, including the services and support provided to the fund and its shareholders. The Board has established four standing committees (Committees) — Operations, Audit, Fair Valuation, and Governance and Nominating — each composed of and chaired by Independent Trustees with varying backgrounds, to which the Board has assigned specific subject matter responsibilities in order to enhance effective decision-making by the Board. The Operations Committee, of which all of the Independent Trustees are members, meets regularly throughout the year and considers, among other matters, information specifically related to the annual consideration of the renewal of the fund's Advisory Contracts. The Board, acting directly and through its Committees, requests and receives information concerning the annual consideration of the renewal of the fund's Advisory Contracts. The Board also meets as needed to review matters specifically related to the Board's annual consideration of the renewal of the Advisory Contracts. Members of the Board may also meet with trustees of other Fidelity funds through joint ad hoc committees to discuss certain matters relevant to all of the Fidelity funds.
At its September 2019 meeting, the Board unanimously determined to renew the fund's Advisory Contracts. In considering whether to renew the Advisory Contracts for the fund, the Board considered all factors it believed relevant and reached a determination, with the assistance of fund counsel and Independent Trustees' counsel and through the exercise of its business judgment, that the renewal of the Advisory Contracts was in the best interests of the fund and its shareholders and the fact that no fee is payable under the management contract was fair and reasonable.
July 2019 Contract Approval. At its July 2019 meeting, the Board voted to approve an amended and restated sub-advisory agreement with FMR Co., Inc. (FMRC) to reduce the sub-advisory fee rate paid by FMR to FMRC (New Contract). In reaching its conclusion to approve the New Contract, the Board considered that it had received and reviewed certain information and made certain findings in connection with the annual renewal of the Advisory Contracts at its September 2018 meeting and considered how, if at all, the approval of the New Contract would change its prior conclusions. The Board noted that FMR, and not the fund, pays the sub-advisory fee. The Board also noted that the New Contract would not change the investment processes, the level or nature of services provided, the resources and personnel allocated, or trading and compliance operations. Based on its evaluation, and after considering all factors it believed relevant, the Board ultimately concluded that the advisory fee structure in the New Contract is fair and reasonable, and that the New Contract should be approved.
Approval of Amended and Restated Advisory Contracts. At its September 2019 meeting, the Board also unanimously determined to approve an amended and restated management contract and sub-advisory agreement with Geode (Amended and Restated Contracts) in connection with an upcoming consolidation of certain of Fidelity's advisory businesses. The Board considered that, on or about January 1, 2020, FMRC expects to merge with and into FMR and, after the merger, FMR expects to redomicile as a Delaware limited liability company. The Board also approved the termination of the sub-advisory agreement with FMRC upon the completion of the merger. The Board noted that references to FMR in the Amended and Restated Contracts would be updated to reflect FMR's new form of organization and domicile. The Board also approved amendments that clarify that the fund pays its non-operating expenses, including brokerage commissions and fees and expenses associated with the fund's securities lending program, if applicable. The Board also noted Fidelity's assurance that neither the planned consolidation nor the Amended and Restated Contracts will change the investment processes, the level or nature of services provided, the resources and personnel allocated, trading and compliance operations, or any fees or expenses paid by the fund.
Nature, Extent, and Quality of Services Provided. The Board considered staffing as it relates to the fund, including the backgrounds of investment personnel of Fidelity and Geode, and also considered the fund's investment objective, strategies, and related investment philosophy. The Independent Trustees also had discussions with senior management of Fidelity's investment operations and investment groups and with representatives of Geode. The Board considered the structure of the investment personnel compensation programs and whether the structures provide appropriate incentives to act in the best interests of the fund. Additionally, the Board considered the portfolio managers' investments, if any, in the funds that they manage.
The Trustees also discussed with representatives of Fidelity, at meetings throughout the year, Fidelity's role in, among other things, overseeing compliance with federal securities laws and other applicable requirements by Geode with respect to the fund and monitoring and overseeing the performance and investment capabilities of Geode. The Trustees considered that the Board had received from Fidelity periodic reports about its oversight and due diligence processes, as well as periodic reports regarding the performance of Geode.
The Board also considered the nature, extent and quality of services provided by Geode. The Trustees noted that under the Sub-Advisory Agreement, subject to oversight by Fidelity, Geode is responsible for, among other things, identifying investments and arranging for execution of portfolio transactions to implement the fund's investment strategy. In addition, the Trustees noted that Geode is responsible for providing such reporting as may be requested by Fidelity to fulfill its oversight responsibilities discussed above.
Resources Dedicated to Investment Management and Support Services. The Board reviewed the general qualifications and capabilities of Fidelity's and Geode's investment staffs, including their size, education, experience, and resources, as well as Fidelity's and Geode's approach to recruiting, managing, and compensating investment personnel. The Board also noted that Fidelity's and Geode's analysts have extensive resources, tools and capabilities that allow them to conduct sophisticated quantitative and fundamental analysis, as well as credit analysis of issuers, counterparties and guarantors. Further, the Board considered that Fidelity's and Geode's investment professionals have sufficient access to information and data so as to provide competitive investment results over time, and that those professionals also have access to sophisticated tools that permit them to assess portfolio construction and risk and performance attribution characteristics continuously. Additionally, in its deliberations, the Board considered Fidelity's and Geode's trading, risk management, compliance, and technology and operations capabilities and resources, which are integral parts of the investment management process.
Shareholder and Administrative Services. The Board considered (i) the nature, extent, quality, and cost of advisory, administrative, and shareholder services performed by the Investment Advisers and their affiliates under the Advisory Contracts and by FMR's affiliates under separate agreements covering transfer agency, pricing and bookkeeping, and securities lending services for the fund; (ii) the nature and extent of the supervision of third party service providers, principally custodians, subcustodians, and pricing vendors; and (iii) the resources devoted to, and the record of compliance with, the fund's compliance policies and procedures.
The Board noted that the growth of fund assets over time across the complex allows Fidelity to reinvest in the development of services designed to enhance the value and convenience of the Fidelity funds as investment vehicles. These services include 24-hour access to account information and market information over the Internet and through telephone representatives, investor education materials and asset allocation tools, and the expanded availability of Fidelity Investor Centers.
Investment in a Large Fund Family. The Board considered the benefits to shareholders of investing in a Fidelity fund, including the benefits of investing in a fund that is part of a large family of funds offering a variety of investment disciplines and providing a large variety of mutual fund investor services. The Board noted that Fidelity had taken, or had made recommendations that resulted in the Fidelity funds taking, a number of actions over the previous year that benefited particular funds, including: (i) continuing to dedicate additional resources to Fidelity's investment research process, which includes meetings with management of issuers of securities in which the funds invest, and to the support of the senior management team that oversees asset management; (ii) continuing efforts to enhance Fidelity's global research capabilities; (iii) launching new funds with innovative structures, strategies and pricing and making other enhancements to meet client needs; (iv) launching new share classes of existing funds; (v) eliminating purchase minimums and broadening eligibility requirements for certain funds and share classes; (vi) reducing management fees and total expenses for certain target date funds and index funds; (vii) lowering expense caps for certain existing funds and classes, and converting certain voluntary expense caps to contractual caps, to reduce expenses borne by shareholders; (viii) rationalizing product lines and gaining increased efficiencies from fund mergers, liquidations, and share class consolidations; (ix) continuing to develop, acquire and implement systems and technology to improve services to the funds and shareholders, strengthen information security, and increase efficiency; and (x) continuing to implement enhancements to further strengthen Fidelity's product line to increase investors' probability of success in achieving their investment goals, including retirement income goals.
Investment Performance. The Board considered whether the fund has operated in accordance with its investment objective, as well as its record of compliance with its investment restrictions. The Board reviewed the fund's absolute investment performance, as well as the fund's relative investment performance. The Board considered the Investment Advisers' strength in fundamental, research-driven security selection, with which the Board is familiar through its supervision of other Fidelity funds.
Based on its review, the Board concluded that the nature, extent, and quality of services provided to the fund under the Advisory Contracts should continue to benefit the shareholders of the fund.
Competitiveness of Management Fee and Total Expense Ratio. The Board noted that the fund is available exclusively to certain Fidelity fee-based programs. The Board considered that the fund does not pay FMR a management fee for investment advisory services, but that FMR is indirectly compensated for its services out of the program fees. The Board also noted that FMR or an affiliate undertakes to pay all operating expenses of the fund, except Independent Trustee fees and expenses, proxy and shareholder meeting expenses, interest, taxes, brokerage expenses, and extraordinary expenses (such as litigation expenses).
Based on its review, the Board considered that the fund does not pay a management fee and concluded that the total expense ratio of the fund was reasonable in light of the services that the fund and its shareholders receive and the other factors considered.
Costs of the Services and Profitability. The Board considered the level of Fidelity's profits in respect of all the Fidelity funds.
PricewaterhouseCoopers LLP (PwC), auditor to Fidelity and certain Fidelity funds, has been engaged annually by the Board as part of the Board's assessment of Fidelity's profitability analysis. PwC's engagement includes the review and assessment of the methodologies used by Fidelity in determining the revenues and expenses attributable to Fidelity's mutual fund business, and completion of agreed-upon procedures in respect of the mathematical accuracy of the fund profitability information and its conformity to established allocation methodologies. After considering PwC's reports issued under the engagement and information provided by Fidelity, the Board concluded that while other allocation methods may also be reasonable, Fidelity's profitability methodologies are reasonable in all material respects.
The Board also reviewed Fidelity's and Geode's non-fund businesses and potential indirect benefits such businesses may have received as a result of their association with Fidelity's mutual fund business (i.e., fall-out benefits) as well as cases where Fidelity's and Geode's affiliates may benefit from the fund's business. The Board noted that changes to fall-out benefits year-over-year reflect business developments at Fidelity's and Geode's various businesses. The Board considered that a joint ad hoc committee created by it and the boards of other Fidelity funds had recently been established, and meets periodically, to evaluate potential fall-out benefits. The Board noted that the committee was expected to, among other things: (i) discuss the legal framework surrounding potential fall-out benefits; (ii) review the Board's responsibilities and approach to potential fall-out benefits; and (iii) review practices employed by competitor funds regarding the review of potential fall-out benefits. The Board noted that it would consider the committee's findings in connection with future consideration of contract renewals.
The Board concluded that the costs of the services provided by and the profits realized by Fidelity in connection with the operation of the fund were not relevant to the renewal of the Advisory Contracts because the fund pays no advisory fees and FMR or an affiliate bears all expenses of the fund, with limited exceptions.
The Board also considered information regarding the profitability of Geode's relationship with the fund.
Economies of Scale. The Board concluded that because the fund pays no advisory fees and FMR bears all expenses of the fund with certain limited exceptions, the realization of economies of scale was not a material factor in the Board's decision to renew the fund's Advisory Contract.
Additional Information Requested by the Board. In order to develop fully the factual basis for consideration of the Fidelity funds' advisory contracts, the Board requested and received additional information on certain topics, including: (i) Fidelity's fund profitability methodology, profitability trends for certain funds, the allocation of various costs to different funds, and the impact of certain factors on fund profitability results; (ii) portfolio manager changes that have occurred during the past year and the amount of the investment that each portfolio manager has made in the Fidelity fund(s) that he or she manages; (iii) Fidelity's compensation structure for portfolio managers, research analysts, and other key personnel, including its effects on fund profitability, the rationale for the compensation structure, and the extent to which current market conditions have affected retention and recruitment; (iv) the arrangements with and compensation paid to certain fund sub-advisers on behalf of the Fidelity funds and the treatment of such compensation within Fidelity's fund profitability methodology; (v) the practices of certain sub-advisers regarding their receipt of research from broker-dealers that execute the funds' portfolio transactions; (vi) the terms of Fidelity's voluntary expense limitation agreements; (vii) the methodology with respect to competitive fund data and peer group classifications; (viii) Fidelity's transfer agent fee, expense, and service structures for different funds and classes relative to competitive trends, and the impact of the increased use of omnibus accounts; (ix) new developments in the retail and institutional marketplaces and the competitive positioning of the funds relative to other investment products and services; (x) the impact on fund profitability of recent changes in total net assets for Fidelity's money market funds, anticipated changes to the competitive landscape for money market funds, and the level of investor comfort with gates, fees, and floating NAVs; (xi) the funds' share class structures and distribution channels; and (xii) explanations regarding the relative total expense ratios of certain funds and classes, total expense competitive trends and methodologies for total expense competitive comparisons, and actions that might be taken by Fidelity to reduce total expense ratios for certain classes. In addition, the Board considered its discussions with Fidelity throughout the year regarding enhanced information security initiatives and the funds' fair valuation policies.
Based on its evaluation of all of the conclusions noted above, and after considering all factors it believed relevant, the Board concluded that the advisory and sub-advisory fee arrangements are fair and reasonable, and that the fund's Advisory Contracts should be renewed and the fund's Amended and Restated Contracts should be approved.
ZEI-ANN-1219
1.9881635.102
Fidelity® U.S. Sustainability Index Fund
Annual Report
October 31, 2019
See the inside front cover for important information about access to your fund’s shareholder reports.
Beginning on January 1, 2021, as permitted by regulations adopted by the Securities and Exchange Commission, paper copies of a fund’s shareholder reports will no longer be sent by mail, unless you specifically request paper copies of the reports from the fund or from your financial intermediary, such as a financial advisor, broker-dealer or bank. Instead, the reports will be made available on a website, and you will be notified by mail each time a report is posted and provided with a website link to access the report.
If you already elected to receive shareholder reports electronically, you will not be affected by this change and you need not take any action. You may elect to receive shareholder reports and other communications from a fund electronically, by contacting your financial intermediary. For Fidelity customers, visit Fidelity's web site or call Fidelity using the contact information listed below.
You may elect to receive all future reports in paper free of charge. If you wish to continue receiving paper copies of your shareholder reports, you may contact your financial intermediary or, if you are a Fidelity customer, visit Fidelity’s website, or call Fidelity at the applicable toll-free number listed below. Your election to receive reports in paper will apply to all funds held with the fund complex/your financial intermediary.
| Account Type | Website | Phone Number |
| Brokerage, Mutual Fund, or Annuity Contracts: | fidelity.com/mailpreferences | 1-800-343-3548 |
| Employer Provided Retirement Accounts: | netbenefits.fidelity.com/preferences (choose 'no' under Required Disclosures to continue to print) | 1-800-343-0860 |
| Advisor Sold Accounts Serviced Through Your Financial Intermediary: | Contact Your Financial Intermediary | Your Financial Intermediary's phone number |
| Advisor Sold Accounts Serviced by Fidelity: | institutional.fidelity.com | 1-877-208-0098 |
Contents
To view a fund's proxy voting guidelines and proxy voting record for the 12-month period ended June 30, visit http://www.fidelity.com/proxyvotingresults or visit the Securities and Exchange Commission's (SEC) web site at http://www.sec.gov.
You may also call 1-800-544-8544 to request a free copy of the proxy voting guidelines.
The funds or securities referred to herein are not sponsored, endorsed, or promoted by MSCI, and MSCI bears no liability with respect to any such funds or securities or any index on which such funds or securities are based. The prospectus contains a more detailed description of the limited relationship MSCI has with Fidelity and any related funds.
Standard & Poor's, S&P and S&P 500 are registered service marks of The McGraw-Hill Companies, Inc. and have been licensed for use by Fidelity Distributors Corporation.
Other third-party marks appearing herein are the property of their respective owners.
All other marks appearing herein are registered or unregistered trademarks or service marks of FMR LLC or an affiliated company. © 2019 FMR LLC. All rights reserved.
This report and the financial statements contained herein are submitted for the general information of the shareholders of the Fund. This report is not authorized for distribution to prospective investors in the Fund unless preceded or accompanied by an effective prospectus.
A fund files its complete schedule of portfolio holdings with the SEC for the first and third quarters of each fiscal year on Form N-PORT. Forms N-PORT are available on the SEC’s web site at http://www.sec.gov. A fund's Forms N-PORT may be reviewed and copied at the SEC’s Public Reference Room in Washington, DC. Information regarding the operation of the SEC's Public Reference Room may be obtained by calling 1-800-SEC-0330.
For a complete list of a fund's portfolio holdings, view the most recent holdings listing, semiannual report, or annual report on Fidelity's web site at http://www.fidelity.com, http://www.institutional.fidelity.com, or http://www.401k.com, as applicable.
NOT FDIC INSURED •MAY LOSE VALUE •NO BANK GUARANTEE
Neither the Fund nor Fidelity Distributors Corporation is a bank.
Performance: The Bottom Line
Average annual total return reflects the change in the value of an investment, assuming reinvestment of distributions from dividend income and capital gains (the profits earned upon the sale of securities that have grown in value, if any) and assuming a constant rate of performance each year. The hypothetical investment and the average annual total returns do not reflect the deduction of taxes that a shareholder would pay on fund distributions or the redemption of fund shares. During periods of reimbursement by Fidelity, a fund’s total return will be greater than it would be had the reimbursement not occurred. How a fund did yesterday is no guarantee of how it will do tomorrow.
Average Annual Total Returns
| For the periods ended October 31, 2019 | Past 1 year | Life of fundA |
| Fidelity® U.S. Sustainability Index Fund | 17.06% | 12.81% |
A From May 9, 2017
$10,000 Over Life of Fund
Let's say hypothetically that $10,000 was invested in Fidelity® U.S. Sustainability Index Fund on May 9, 2017, when the fund started.
The chart shows how the value of your investment would have changed, and also shows how the MSCI USA ESG Leaders Index performed over the same period.

| Period Ending Values |
| $13,483 | Fidelity® U.S. Sustainability Index Fund |
| $13,531 | MSCI USA ESG Leaders Index |
Management's Discussion of Fund Performance
Market Recap: The S&P 500
® index gained 14.33% for the 12 months ending October 31, 2019, ending the period just shy of a record close after seesawing due to trade tension, interest rates, economic data and an inverted yield curve, among other factors. Upbeat company earnings and outlooks, along with signs the Federal Reserve may pause on rates, boosted stocks to an all-time high on April 30. In May, however, volatility spiked and the index sunk as trade negotiations between the U.S. and China broke down. The bull market roared back in June and recorded a series of highs in July, when the Fed, affirming a dovish shift in policy, cut interest rates for the first time since 2008. Volatility intensified in August, however, as the U.S. Treasury yield curve inverted for the first time since 2007, which some investors viewed as a sign the U.S. economy could be heading for recession. The market proved resilient, rising in the final two months and reaching a new high on October 30, when the Fed cut interest rates for the third time this year. For the full 12 months, the defensive real estate (+27%) and utilities (+24%) sectors led the way, followed by information technology (+23%). Communication services and consumer discretionary each gained about 16%, while industrials advanced 15%. In contrast, energy (-11%) was by far the weakest sector – slipping on lower oil prices. Other notable laggards included health care (+9%) and financials (+12%). Lastly, consumer staples and materials finished roughly in line with the index.
Comments from the Geode Capital Management, LLC, passive equity index team: For the fiscal year, the fund's share classes gained 17.06%, compared with the 17.24% advance of the benchmark MSCI USA ESG Leaders Index. Within this strong market environment, nine of 11 sectors produced double-digit gains, while only one, energy (-13%), lost value. More specifically, a backdrop of sluggish oil pricing weighed on several energy stocks, especially oil-field services company Schlumberger (-33%), exploration and production firm Occidental Petroleum (-36%) and multinational energy company ConocoPhillips (-19%). Outside of energy, Kraft Heinz (-46%) also detracted with more than half of that decline taking place in February, after the packaged-foods company reported an exceptionally large charge to its quarterly earnings and simultaneously announced a government inquiry into the firm's accounting practices. In contrast, the leading absolute contributor was software company Microsoft (+36%), whose strong earnings growth, coupled with management's decision to buy back stock and increase its quarterly dividend, helped drive its stock price higher. Better-than-expected sales growth was partly behind the favorable stock performance of consumer-goods company Procter & Gamble (+44%), while continued growth in electronic payments contributed to the strong gains of payment processors Visa (+31%) and Mastercard (+41%). Lastly, shares of Alphabet, the parent company of internet search leader Google, also added value.
The views expressed above reflect those of the portfolio manager(s) only through the end of the period as stated on the cover of this report and do not necessarily represent the views of Fidelity or any other person in the Fidelity organization. Any such views are subject to change at any time based upon market or other conditions and Fidelity disclaims any responsibility to update such views. These views may not be relied on as investment advice and, because investment decisions for a Fidelity fund are based on numerous factors, may not be relied on as an indication of trading intent on behalf of any Fidelity fund.
Note to Shareholders: On March 22, 2019, Pat Waddell retired and is no longer a portfolio manager with Geode Capital Management.
Investment Summary (Unaudited)
Top Ten Stocks as of October 31, 2019
| | % of fund's net assets |
| Microsoft Corp. | 7.7 |
| Alphabet, Inc. Class C | 2.9 |
| Alphabet, Inc. Class A | 2.8 |
| Johnson & Johnson | 2.6 |
| Procter & Gamble Co. | 2.3 |
| Visa, Inc. Class A | 2.3 |
| The Home Depot, Inc. | 1.9 |
| Intel Corp. | 1.9 |
| MasterCard, Inc. Class A | 1.8 |
| Verizon Communications, Inc. | 1.8 |
| | 28.0 |
Top Five Market Sectors as of October 31, 2019
| | % of fund's net assets |
| Information Technology | 22.5 |
| Health Care | 13.7 |
| Financials | 12.3 |
| Communication Services | 11.0 |
| Consumer Discretionary | 10.5 |
Asset Allocation (% of fund's net assets)
| As of October 31, 2019* |
| | Stocks and Equity Futures | 99.8% |
| | Short-Term Investments and Net Other Assets (Liabilities) | 0.2% |

* Foreign investments - 5.3%
Schedule of Investments October 31, 2019
Showing Percentage of Net Assets
| Common Stocks - 99.6% | | | |
| | | Shares | Value |
| COMMUNICATION SERVICES - 11.0% | | | |
| Diversified Telecommunication Services - 1.9% | | | |
| CenturyLink, Inc. (a) | | 14,933 | $193,233 |
| Verizon Communications, Inc. | | 63,150 | 3,818,681 |
| | | | 4,011,914 |
| Entertainment - 2.9% | | | |
| Electronic Arts, Inc. (b) | | 4,530 | 436,692 |
| Netflix, Inc. (b) | | 6,676 | 1,918,749 |
| The Walt Disney Co. | | 27,479 | 3,570,072 |
| | | | 5,925,513 |
| Interactive Media & Services - 5.8% | | | |
| Alphabet, Inc.: | | | |
| Class A (b) | | 4,570 | 5,752,716 |
| Class C (b) | | 4,788 | 6,033,407 |
| TripAdvisor, Inc. (b) | | 1,665 | 67,266 |
| | | | 11,853,389 |
| Media - 0.4% | | | |
| Discovery Communications, Inc.: | | | |
| Class A (a)(b) | | 2,380 | 64,153 |
| Class C (non-vtg.) (b) | | 5,506 | 138,971 |
| Liberty Broadband Corp. Class C (b) | | 1,626 | 191,982 |
| Liberty Global PLC: | | | |
| Class A (b) | | 2,489 | 62,598 |
| Class C (b) | | 6,395 | 152,649 |
| Omnicom Group, Inc. | | 3,376 | 260,593 |
| | | | 870,946 |
|
| TOTAL COMMUNICATION SERVICES | | | 22,661,762 |
|
| CONSUMER DISCRETIONARY - 10.5% | | | |
| Auto Components - 0.2% | | | |
| Aptiv PLC | | 3,928 | 351,752 |
| BorgWarner, Inc. | | 3,196 | 133,209 |
| | | | 484,961 |
| Automobiles - 0.4% | | | |
| Harley-Davidson, Inc. | | 2,428 | 94,473 |
| Tesla, Inc. (a)(b) | | 2,001 | 630,155 |
| | | | 724,628 |
| Distributors - 0.2% | | | |
| Genuine Parts Co. | | 2,224 | 228,138 |
| LKQ Corp. (b) | | 4,797 | 163,050 |
| | | | 391,188 |
| Diversified Consumer Services - 0.0% | | | |
| H&R Block, Inc. | | 3,098 | 77,419 |
| Hotels, Restaurants & Leisure - 2.6% | | | |
| ARAMARK Holdings Corp. | | 3,755 | 164,319 |
| Darden Restaurants, Inc. | | 1,871 | 210,057 |
| Domino's Pizza, Inc. | | 595 | 161,614 |
| Hilton Worldwide Holdings, Inc. | | 4,214 | 408,589 |
| McDonald's Corp. | | 11,661 | 2,293,719 |
| Norwegian Cruise Line Holdings Ltd. (b) | | 3,283 | 166,645 |
| Royal Caribbean Cruises Ltd. | | 2,716 | 295,582 |
| Starbucks Corp. | | 18,500 | 1,564,360 |
| Vail Resorts, Inc. | | 613 | 142,443 |
| | | | 5,407,328 |
| Household Durables - 0.4% | | | |
| Garmin Ltd. | | 2,029 | 190,219 |
| Mohawk Industries, Inc. (b) | | 940 | 134,777 |
| Newell Brands, Inc. | | 6,151 | 116,684 |
| NVR, Inc. (b) | | 52 | 189,103 |
| Whirlpool Corp. | | 964 | 146,644 |
| | | | 777,427 |
| Internet & Direct Marketing Retail - 1.0% | | | |
| Expedia, Inc. | | 2,148 | 293,546 |
| MercadoLibre, Inc. (b) | | 676 | 352,548 |
| The Booking Holdings, Inc. (b) | | 661 | 1,354,237 |
| | | | 2,000,331 |
| Leisure Products - 0.1% | | | |
| Hasbro, Inc. | | 1,821 | 177,202 |
| Multiline Retail - 0.1% | | | |
| Kohl's Corp. | | 2,498 | 128,047 |
| Macy's, Inc. (a) | | 4,699 | 71,237 |
| Nordstrom, Inc. (a) | | 1,652 | 59,307 |
| | | | 258,591 |
| Specialty Retail - 4.1% | | | |
| Advance Auto Parts, Inc. | | 1,093 | 177,591 |
| Best Buy Co., Inc. | | 3,676 | 264,047 |
| CarMax, Inc. (a)(b) | | 2,534 | 236,093 |
| Gap, Inc. | | 3,535 | 57,479 |
| L Brands, Inc. | | 3,642 | 62,060 |
| Lowe's Companies, Inc. | | 12,137 | 1,354,611 |
| Ross Stores, Inc. | | 5,610 | 615,249 |
| The Home Depot, Inc. | | 16,799 | 3,940,709 |
| Tiffany & Co., Inc. (a) | | 1,666 | 207,434 |
| TJX Companies, Inc. | | 18,516 | 1,067,447 |
| Tractor Supply Co. | | 1,839 | 174,742 |
| Ulta Beauty, Inc. (b) | | 852 | 198,644 |
| | | | 8,356,106 |
| Textiles, Apparel & Luxury Goods - 1.4% | | | |
| Capri Holdings Ltd. (b) | | 2,302 | 71,523 |
| Hanesbrands, Inc. | | 5,515 | 83,883 |
| lululemon athletica, Inc. (b) | | 1,697 | 346,646 |
| NIKE, Inc. Class B | | 19,186 | 1,718,106 |
| PVH Corp. | | 1,137 | 99,101 |
| Tapestry, Inc. | | 4,431 | 114,586 |
| Under Armour, Inc.: | | | |
| Class A (sub. vtg.) (a)(b) | | 2,868 | 59,224 |
| Class C (non-vtg.) (b) | | 2,959 | 54,742 |
| VF Corp. | | 5,146 | 423,464 |
| | | | 2,971,275 |
|
| TOTAL CONSUMER DISCRETIONARY | | | 21,626,456 |
|
| CONSUMER STAPLES - 7.3% | | | |
| Beverages - 3.1% | | | |
| PepsiCo, Inc. | | 21,405 | 2,936,124 |
| The Coca-Cola Co. | | 61,884 | 3,368,346 |
| | | | 6,304,470 |
| Food Products - 0.7% | | | |
| Bunge Ltd. | | 2,145 | 115,830 |
| Campbell Soup Co. (a) | | 2,539 | 117,581 |
| General Mills, Inc. | | 9,163 | 466,030 |
| Hormel Foods Corp. (a) | | 4,485 | 183,392 |
| Kellogg Co. | | 3,892 | 247,259 |
| McCormick & Co., Inc. (non-vtg.) | | 1,866 | 299,848 |
| | | | 1,429,940 |
| Household Products - 3.2% | | | |
| Clorox Co. | | 1,941 | 286,666 |
| Colgate-Palmolive Co. | | 12,456 | 854,482 |
| Kimberly-Clark Corp. | | 5,253 | 698,019 |
| Procter & Gamble Co. | | 38,299 | 4,768,608 |
| | | | 6,607,775 |
| Personal Products - 0.3% | | | |
| Estee Lauder Companies, Inc. Class A | | 3,350 | 624,005 |
|
| TOTAL CONSUMER STAPLES | | | 14,966,190 |
|
| ENERGY - 3.9% | | | |
| Energy Equipment & Services - 0.6% | | | |
| Baker Hughes, A GE Co. Class A | | 9,585 | 205,119 |
| National Oilwell Varco, Inc. | | 5,880 | 133,006 |
| Schlumberger Ltd. | | 21,166 | 691,917 |
| TechnipFMC PLC (a) | | 6,498 | 128,206 |
| | | | 1,158,248 |
| Oil, Gas & Consumable Fuels - 3.3% | | | |
| Apache Corp. | | 5,791 | 125,433 |
| Cheniere Energy, Inc. (b) | | 3,528 | 217,148 |
| Cimarex Energy Co. | | 1,557 | 65,737 |
| ConocoPhillips Co. | | 17,261 | 952,807 |
| Devon Energy Corp. | | 6,323 | 128,230 |
| Hess Corp. | | 4,160 | 273,520 |
| HollyFrontier Corp. | | 2,477 | 136,086 |
| Kinder Morgan, Inc. | | 31,130 | 621,977 |
| Marathon Oil Corp. | | 12,511 | 144,252 |
| Marathon Petroleum Corp. | | 10,125 | 647,494 |
| Noble Energy, Inc. | | 7,302 | 140,637 |
| Occidental Petroleum Corp. | | 13,677 | 553,919 |
| ONEOK, Inc. | | 6,287 | 439,021 |
| Parsley Energy, Inc. Class A | | 4,297 | 67,936 |
| Phillips 66 Co. | | 6,934 | 810,030 |
| Pioneer Natural Resources Co. | | 2,565 | 315,546 |
| Targa Resources Corp. (a) | | 3,554 | 138,180 |
| The Williams Companies, Inc. | | 18,459 | 411,820 |
| Valero Energy Corp. | | 6,376 | 618,344 |
| | | | 6,808,117 |
|
| TOTAL ENERGY | | | 7,966,365 |
|
| FINANCIALS - 12.3% | | | |
| Banks - 3.0% | | | |
| BB&T Corp. | | 11,680 | 619,624 |
| CIT Group, Inc. | | 1,497 | 64,206 |
| Citizens Financial Group, Inc. | | 7,019 | 246,788 |
| Comerica, Inc. | | 2,355 | 154,064 |
| East West Bancorp, Inc. | | 2,224 | 95,454 |
| Fifth Third Bancorp | | 11,249 | 327,121 |
| First Republic Bank | | 2,555 | 271,750 |
| Huntington Bancshares, Inc. | | 16,052 | 226,815 |
| KeyCorp | | 15,375 | 276,289 |
| M&T Bank Corp. | | 1,977 | 309,460 |
| Peoples United Financial, Inc. | | 6,750 | 109,148 |
| PNC Financial Services Group, Inc. | | 6,896 | 1,011,643 |
| Regions Financial Corp. | | 15,519 | 249,856 |
| Signature Bank | | 843 | 99,744 |
| SunTrust Banks, Inc. | | 6,769 | 462,593 |
| SVB Financial Group (b) | | 790 | 174,969 |
| U.S. Bancorp | | 23,086 | 1,316,364 |
| Zions Bancorp NA | | 2,809 | 136,152 |
| | | | 6,152,040 |
| Capital Markets - 4.2% | | | |
| Affiliated Managers Group, Inc. | | 783 | 62,546 |
| Ameriprise Financial, Inc. | | 2,041 | 307,966 |
| Bank of New York Mellon Corp. | | 13,172 | 615,791 |
| BlackRock, Inc. Class A | | 1,769 | 816,747 |
| Cboe Global Markets, Inc. | | 1,700 | 195,755 |
| Charles Schwab Corp. | | 18,354 | 747,191 |
| CME Group, Inc. | | 5,467 | 1,124,835 |
| E*TRADE Financial Corp. | | 3,735 | 156,086 |
| FactSet Research Systems, Inc. (a) | | 585 | 148,309 |
| Franklin Resources, Inc. | | 4,657 | 128,300 |
| Intercontinental Exchange, Inc. | | 8,614 | 812,472 |
| Invesco Ltd. | | 6,087 | 102,383 |
| KKR & Co. LP (a) | | 7,460 | 215,072 |
| Moody's Corp. | | 2,608 | 575,560 |
| Northern Trust Corp. | | 3,151 | 314,092 |
| Raymond James Financial, Inc. | | 1,930 | 161,136 |
| S&P Global, Inc. | | 3,760 | 970,042 |
| State Street Corp. | | 5,686 | 375,674 |
| T. Rowe Price Group, Inc. | | 3,603 | 417,227 |
| TD Ameritrade Holding Corp. | | 4,220 | 161,964 |
| The NASDAQ OMX Group, Inc. | | 1,768 | 176,393 |
| | | | 8,585,541 |
| Consumer Finance - 1.2% | | | |
| Ally Financial, Inc. | | 6,047 | 185,220 |
| American Express Co. | | 10,839 | 1,271,198 |
| Capital One Financial Corp. | | 7,179 | 669,442 |
| Discover Financial Services | | 4,936 | 396,163 |
| | | | 2,522,023 |
| Diversified Financial Services - 0.1% | | | |
| AXA Equitable Holdings, Inc. (a) | | 4,495 | 97,092 |
| Voya Financial, Inc. | | 2,208 | 119,144 |
| | | | 216,236 |
| Insurance - 3.8% | | | |
| Allstate Corp. | | 5,095 | 542,210 |
| American Financial Group, Inc. | | 1,155 | 120,166 |
| American International Group, Inc. | | 13,291 | 703,891 |
| Aon PLC | | 3,675 | 709,863 |
| Arch Capital Group Ltd. (b) | | 6,144 | 256,573 |
| Arthur J. Gallagher & Co. | | 2,838 | 258,882 |
| Assurant, Inc. | | 939 | 118,380 |
| Chubb Ltd. | | 6,990 | 1,065,416 |
| Erie Indemnity Co. Class A (a) | | 383 | 70,575 |
| Hartford Financial Services Group, Inc. | | 5,511 | 314,568 |
| Lincoln National Corp. | | 3,087 | 174,354 |
| Loews Corp. | | 4,183 | 204,967 |
| Marsh & McLennan Companies, Inc. | | 7,810 | 809,272 |
| Principal Financial Group, Inc. | | 4,268 | 227,826 |
| Progressive Corp. | | 8,928 | 622,282 |
| Prudential Financial, Inc. | | 6,211 | 566,071 |
| Reinsurance Group of America, Inc. | | 954 | 154,996 |
| The Travelers Companies, Inc. | | 4,006 | 525,026 |
| Willis Group Holdings PLC | | 1,969 | 368,006 |
| | | | 7,813,324 |
|
| TOTAL FINANCIALS | | | 25,289,164 |
|
| HEALTH CARE - 13.7% | | | |
| Biotechnology - 3.9% | | | |
| AbbVie, Inc. | | 22,573 | 1,795,682 |
| Amgen, Inc. | | 9,314 | 1,986,211 |
| Biogen, Inc. (b) | | 2,961 | 884,480 |
| BioMarin Pharmaceutical, Inc. (b) | | 2,727 | 199,644 |
| Celgene Corp. (b) | | 10,771 | 1,163,591 |
| Gilead Sciences, Inc. | | 19,417 | 1,237,057 |
| Vertex Pharmaceuticals, Inc. (b) | | 3,912 | 764,718 |
| | | | 8,031,383 |
| Health Care Equipment & Supplies - 1.8% | | | |
| Align Technology, Inc. (b) | | 1,159 | 292,404 |
| Becton, Dickinson & Co. | | 4,120 | 1,054,720 |
| Dentsply Sirona, Inc. | | 3,565 | 195,291 |
| DexCom, Inc. (b) | | 1,387 | 213,931 |
| Edwards Lifesciences Corp. (b) | | 3,186 | 759,479 |
| Hologic, Inc. (b) | | 4,076 | 196,912 |
| IDEXX Laboratories, Inc. (b) | | 1,311 | 373,648 |
| ResMed, Inc. | | 2,197 | 324,980 |
| STERIS PLC | | 1,289 | 182,484 |
| Varian Medical Systems, Inc. (b) | | 1,387 | 167,563 |
| | | | 3,761,412 |
| Health Care Providers & Services - 1.7% | | | |
| AmerisourceBergen Corp. | | 2,402 | 205,083 |
| Cardinal Health, Inc. | | 4,542 | 224,602 |
| Centene Corp. (b) | | 6,298 | 334,298 |
| Cigna Corp. | | 5,795 | 1,034,176 |
| HCA Holdings, Inc. | | 4,187 | 559,132 |
| Henry Schein, Inc. (b) | | 2,282 | 142,819 |
| Humana, Inc. | | 2,064 | 607,229 |
| Laboratory Corp. of America Holdings (b) | | 1,500 | 247,155 |
| Quest Diagnostics, Inc. | | 2,047 | 207,259 |
| | | | 3,561,753 |
| Health Care Technology - 0.2% | | | |
| Cerner Corp. | | 4,980 | 334,258 |
| Life Sciences Tools & Services - 0.6% | | | |
| Agilent Technologies, Inc. | | 4,816 | 364,812 |
| IQVIA Holdings, Inc. (b) | | 2,568 | 370,871 |
| Mettler-Toledo International, Inc. (b) | | 378 | 266,467 |
| Waters Corp. (b) | | 1,059 | 224,106 |
| | | | 1,226,256 |
| Pharmaceuticals - 5.5% | | | |
| Bristol-Myers Squibb Co. | | 24,977 | 1,432,930 |
| Jazz Pharmaceuticals PLC (b) | | 862 | 108,293 |
| Johnson & Johnson | | 40,540 | 5,352,902 |
| Merck & Co., Inc. | | 39,314 | 3,406,951 |
| Perrigo Co. PLC | | 1,966 | 104,237 |
| Zoetis, Inc. Class A | | 7,312 | 935,351 |
| | | | 11,340,664 |
|
| TOTAL HEALTH CARE | | | 28,255,726 |
|
| INDUSTRIALS - 9.0% | | | |
| Aerospace & Defense - 0.3% | | | |
| Arconic, Inc. | | 6,050 | 166,194 |
| TransDigm Group, Inc. | | 733 | 385,763 |
| | | | 551,957 |
| Air Freight & Logistics - 0.8% | | | |
| C.H. Robinson Worldwide, Inc. (a) | | 2,077 | 157,104 |
| Expeditors International of Washington, Inc. | | 2,625 | 191,468 |
| United Parcel Service, Inc. Class B | | 10,651 | 1,226,676 |
| | | | 1,575,248 |
| Airlines - 0.1% | | | |
| Delta Air Lines, Inc. | | 2,500 | 137,700 |
| Southwest Airlines Co. | | 2,068 | 116,077 |
| | | | 253,777 |
| Building Products - 0.6% | | | |
| Allegion PLC | | 1,430 | 165,937 |
| Fortune Brands Home & Security, Inc. | | 2,123 | 127,486 |
| Johnson Controls International PLC | | 12,168 | 527,239 |
| Lennox International, Inc. | | 539 | 133,327 |
| Masco Corp. | | 4,484 | 207,385 |
| Owens Corning | | 1,666 | 102,092 |
| | | | 1,263,466 |
| Commercial Services & Supplies - 0.5% | | | |
| Copart, Inc. (b) | | 3,142 | 259,655 |
| Waste Management, Inc. | | 6,490 | 728,243 |
| | | | 987,898 |
| Electrical Equipment - 0.5% | | | |
| Acuity Brands, Inc. | | 608 | 75,872 |
| Eaton Corp. PLC | | 6,464 | 563,079 |
| Rockwell Automation, Inc. | | 1,804 | 310,270 |
| Sensata Technologies, Inc. PLC (b) | | 2,475 | 126,695 |
| | | | 1,075,916 |
| Industrial Conglomerates - 1.0% | | | |
| 3M Co. | | 8,800 | 1,451,912 |
| Roper Technologies, Inc. | | 1,587 | 534,756 |
| | | | 1,986,668 |
| Machinery - 2.8% | | | |
| Caterpillar, Inc. | | 8,729 | 1,202,856 |
| Cummins, Inc. | | 2,281 | 393,427 |
| Deere & Co. | | 4,600 | 801,044 |
| Dover Corp. | | 2,216 | 230,220 |
| Flowserve Corp. | | 1,982 | 96,801 |
| IDEX Corp. | | 1,154 | 179,482 |
| Illinois Tool Works, Inc. | | 4,977 | 839,023 |
| Ingersoll-Rand PLC | | 3,675 | 466,321 |
| PACCAR, Inc. | | 5,281 | 401,673 |
| Parker Hannifin Corp. | | 1,961 | 359,824 |
| Pentair PLC | | 2,518 | 104,421 |
| Snap-On, Inc. | | 847 | 137,781 |
| Stanley Black & Decker, Inc. | | 2,310 | 349,572 |
| WABCO Holdings, Inc. (b) | | 784 | 105,542 |
| Xylem, Inc. | | 2,757 | 211,434 |
| | | | 5,879,421 |
| Professional Services - 0.3% | | | |
| IHS Markit Ltd. (b) | | 5,812 | 406,956 |
| Manpower, Inc. | | 912 | 82,919 |
| Nielsen Holdings PLC | | 5,423 | 109,328 |
| Robert Half International, Inc. | | 1,820 | 104,231 |
| | | | 703,434 |
| Road & Rail - 1.8% | | | |
| AMERCO | | 133 | 53,870 |
| CSX Corp. | | 11,741 | 825,040 |
| Kansas City Southern | | 1,533 | 215,816 |
| Norfolk Southern Corp. | | 4,064 | 739,648 |
| Union Pacific Corp. | | 10,809 | 1,788,457 |
| | | | 3,622,831 |
| Trading Companies & Distributors - 0.3% | | | |
| Fastenal Co. | | 8,722 | 313,469 |
| United Rentals, Inc. (b) | | 1,202 | 160,551 |
| W.W. Grainger, Inc. | | 722 | 222,982 |
| | | | 697,002 |
|
| TOTAL INDUSTRIALS | | | 18,597,618 |
|
| INFORMATION TECHNOLOGY - 22.5% | | | |
| Communications Equipment - 0.2% | | | |
| Motorola Solutions, Inc. | | 2,512 | 417,796 |
| Electronic Equipment & Components - 0.4% | | | |
| Keysight Technologies, Inc. (b) | | 2,881 | 290,722 |
| TE Connectivity Ltd. | | 5,149 | 460,836 |
| Trimble, Inc. (b) | | 3,843 | 153,105 |
| | | | 904,663 |
| IT Services - 6.3% | | | |
| Accenture PLC Class A | | 9,739 | 1,805,805 |
| Cognizant Technology Solutions Corp. Class A | | 8,700 | 530,178 |
| IBM Corp. | | 13,536 | 1,810,169 |
| Jack Henry & Associates, Inc. | | 1,178 | 166,758 |
| MasterCard, Inc. Class A | | 13,877 | 3,841,292 |
| The Western Union Co. | | 6,572 | 164,694 |
| Visa, Inc. Class A (a) | | 26,552 | 4,749,091 |
| | | | 13,067,987 |
| Semiconductors & Semiconductor Equipment - 4.4% | | | |
| Applied Materials, Inc. | | 14,300 | 775,918 |
| Intel Corp. | | 68,353 | 3,863,995 |
| Lam Research Corp. | | 2,291 | 620,953 |
| Marvell Technology Group Ltd. (a) | | 9,544 | 232,778 |
| NVIDIA Corp. | | 8,833 | 1,775,610 |
| Texas Instruments, Inc. | | 14,322 | 1,689,853 |
| | | | 8,959,107 |
| Software - 10.8% | | | |
| Adobe, Inc. (b) | | 7,449 | 2,070,301 |
| Autodesk, Inc. (b) | | 3,365 | 495,866 |
| Cadence Design Systems, Inc. (b) | | 4,294 | 280,613 |
| Citrix Systems, Inc. | | 2,019 | 219,788 |
| Intuit, Inc. | | 3,959 | 1,019,443 |
| Microsoft Corp. | | 111,149 | 15,935,428 |
| Salesforce.com, Inc. (b) | | 12,695 | 1,986,641 |
| VMware, Inc. Class A | | 1,268 | 200,686 |
| | | | 22,208,766 |
| Technology Hardware, Storage & Peripherals - 0.4% | | | |
| Dell Technologies, Inc. (b) | | 2,384 | 126,090 |
| Hewlett Packard Enterprise Co. | | 20,490 | 336,241 |
| HP, Inc. | | 22,953 | 398,694 |
| | | | 861,025 |
|
| TOTAL INFORMATION TECHNOLOGY | | | 46,419,344 |
|
| MATERIALS - 2.8% | | | |
| Chemicals - 2.0% | | | |
| Axalta Coating Systems Ltd. (b) | | 3,215 | 94,810 |
| Celanese Corp. Class A | | 1,929 | 233,698 |
| Ecolab, Inc. | | 3,962 | 760,981 |
| International Flavors & Fragrances, Inc. (a) | | 1,545 | 188,505 |
| Linde PLC | | 8,287 | 1,643,726 |
| PPG Industries, Inc. | | 3,613 | 452,059 |
| Sherwin-Williams Co. | | 1,269 | 726,274 |
| The Mosaic Co. | | 5,596 | 111,248 |
| | | | 4,211,301 |
| Containers & Packaging - 0.4% | | | |
| Avery Dennison Corp. | | 1,289 | 164,812 |
| Ball Corp. | | 4,844 | 338,935 |
| International Paper Co. | | 5,787 | 252,776 |
| | | | 756,523 |
| Metals & Mining - 0.4% | | | |
| Newmont Goldcorp Corp. | | 12,537 | 498,095 |
| Nucor Corp. | | 4,645 | 250,133 |
| | | | 748,228 |
|
| TOTAL MATERIALS | | | 5,716,052 |
|
| REAL ESTATE - 3.3% | | | |
| Equity Real Estate Investment Trusts (REITs) - 3.1% | | | |
| Alexandria Real Estate Equities, Inc. | | 1,719 | 272,891 |
| American Tower Corp. | | 6,751 | 1,472,258 |
| Boston Properties, Inc. | | 2,367 | 324,752 |
| Camden Property Trust (SBI) | | 1,472 | 168,353 |
| Duke Realty Corp. | | 5,468 | 192,146 |
| Equinix, Inc. | | 1,284 | 727,746 |
| Federal Realty Investment Trust (SBI) | | 1,140 | 155,051 |
| HCP, Inc. | | 7,291 | 274,287 |
| Host Hotels & Resorts, Inc. | | 11,305 | 185,289 |
| Iron Mountain, Inc. | | 4,378 | 143,598 |
| Liberty Property Trust (SBI) | | 2,383 | 140,764 |
| Prologis, Inc. | | 9,637 | 845,743 |
| SBA Communications Corp. Class A | | 1,733 | 417,046 |
| The Macerich Co. | | 1,712 | 47,080 |
| UDR, Inc. | | 4,290 | 215,573 |
| Welltower, Inc. | | 6,191 | 561,462 |
| Weyerhaeuser Co. | | 11,356 | 331,709 |
| | | | 6,475,748 |
| Real Estate Management & Development - 0.2% | | | |
| CBRE Group, Inc. (b) | | 4,892 | 261,967 |
| Jones Lang LaSalle, Inc. | | 785 | 115,018 |
| | | | 376,985 |
|
| TOTAL REAL ESTATE | | | 6,852,733 |
|
| UTILITIES - 3.3% | | | |
| Electric Utilities - 1.2% | | | |
| Alliant Energy Corp. | | 3,604 | 192,237 |
| Edison International | | 5,391 | 339,094 |
| Eversource Energy | | 4,836 | 404,967 |
| Pinnacle West Capital Corp. | | 1,709 | 160,851 |
| Southern Co. | | 15,892 | 995,793 |
| Xcel Energy, Inc. | | 7,887 | 500,903 |
| | | | 2,593,845 |
| Independent Power and Renewable Electricity Producers - 0.1% | | | |
| The AES Corp. | | 10,122 | 172,580 |
| Multi-Utilities - 1.8% | | | |
| CMS Energy Corp. | | 4,317 | 275,943 |
| Consolidated Edison, Inc. | | 4,985 | 459,717 |
| Dominion Energy, Inc. | | 12,256 | 1,011,733 |
| DTE Energy Co. | | 2,793 | 355,605 |
| NiSource, Inc. | | 5,703 | 159,912 |
| Public Service Enterprise Group, Inc. | | 7,703 | 487,677 |
| Sempra Energy | | 4,194 | 606,075 |
| WEC Energy Group, Inc. | | 4,835 | 456,424 |
| | | | 3,813,086 |
| Water Utilities - 0.2% | | | |
| American Water Works Co., Inc. | | 2,766 | 340,965 |
|
| TOTAL UTILITIES | | | 6,920,476 |
|
| TOTAL COMMON STOCKS | | | |
| (Cost $185,714,657) | | | 205,271,886 |
|
| Money Market Funds - 3.8% | | | |
| Fidelity Cash Central Fund 1.83% (c) | | 922,679 | 922,864 |
| Fidelity Securities Lending Cash Central Fund 1.84% (c)(d) | | 6,876,514 | 6,877,201 |
| TOTAL MONEY MARKET FUNDS | | | |
| (Cost $7,800,065) | | | 7,800,065 |
| TOTAL INVESTMENT IN SECURITIES - 103.4% | | | |
| (Cost $193,514,722) | | | 213,071,951 |
| NET OTHER ASSETS (LIABILITIES) - (3.4)% | | | (6,978,093) |
| NET ASSETS - 100% | | | $206,093,858 |
| Futures Contracts | | | | | |
| | Number of contracts | Expiration Date | Notional Amount | Value | Unrealized Appreciation/(Depreciation) |
| Purchased | | | | | |
| Equity Index Contracts | | | | | |
| CME E-mini S&P 500 Index Contracts (United States) | 3 | Dec. 2019 | $455,370 | $18,290 | $18,290 |
The notional amount of futures purchased as a percentage of Net Assets is 0.2%
Legend
(a) Security or a portion of the security is on loan at period end.
(b) Non-income producing
(c) Affiliated fund that is generally available only to investment companies and other accounts managed by Fidelity Investments. The rate quoted is the annualized seven-day yield of the fund at period end. A complete unaudited listing of the fund's holdings as of its most recent quarter end is available upon request. In addition, each Fidelity Central Fund's financial statements, which are not covered by the Fund's Report of Independent Registered Public Accounting Firm, are available on the SEC's website or upon request.
(d) Investment made with cash collateral received from securities on loan.
Affiliated Central Funds
Information regarding fiscal year to date income earned by the Fund from investments in Fidelity Central Funds is as follows:
| Fund | Income earned |
| Fidelity Cash Central Fund | $19,429 |
| Fidelity Securities Lending Cash Central Fund | 4,594 |
| Total | $24,023 |
Amounts in the income column in the above table include any capital gain distributions from underlying funds, which are presented in the corresponding line-item in the Statement of Operations, if applicable. Amount for Fidelity Securities Lending Cash Central Fund represents the income earned on investing cash collateral, less rebates paid to borrowers and any lending agent fees associated with the loan, plus any premium payments received for lending certain types of securities.
Investment Valuation
The following is a summary of the inputs used, as of October 31, 2019, involving the Fund's assets and liabilities carried at fair value. The inputs or methodology used for valuing securities may not be an indication of the risk associated with investing in those securities. For more information on valuation inputs, and their aggregation into the levels used below, please refer to the Investment Valuation section in the accompanying Notes to Financial Statements.
| | Valuation Inputs at Reporting Date: |
| Description | Total | Level 1 | Level 2 | Level 3 |
| Investments in Securities: | | | | |
| Equities: | | | | |
| Communication Services | $22,661,762 | $22,661,762 | $-- | $-- |
| Consumer Discretionary | 21,626,456 | 21,626,456 | -- | -- |
| Consumer Staples | 14,966,190 | 14,966,190 | -- | -- |
| Energy | 7,966,365 | 7,966,365 | -- | -- |
| Financials | 25,289,164 | 25,289,164 | -- | -- |
| Health Care | 28,255,726 | 28,255,726 | -- | -- |
| Industrials | 18,597,618 | 18,597,618 | -- | -- |
| Information Technology | 46,419,344 | 46,419,344 | -- | -- |
| Materials | 5,716,052 | 5,716,052 | -- | -- |
| Real Estate | 6,852,733 | 6,852,733 | -- | -- |
| Utilities | 6,920,476 | 6,920,476 | -- | -- |
| Money Market Funds | 7,800,065 | 7,800,065 | -- | -- |
| Total Investments in Securities: | $213,071,951 | $213,071,951 | $-- | $-- |
| Derivative Instruments: | | | | |
| Assets | | | | |
| Futures Contracts | $18,290 | $18,290 | $-- | $-- |
| Total Assets | $18,290 | $18,290 | $-- | $-- |
| Total Derivative Instruments: | $18,290 | $18,290 | $-- | $-- |
Value of Derivative Instruments
The following table is a summary of the Fund's value of derivative instruments by primary risk exposure as of October 31, 2019. For additional information on derivative instruments, please refer to the Derivative Instruments section in the accompanying Notes to Financial Statements.
| Primary Risk Exposure / Derivative Type | Value |
| | Asset | Liability |
| Equity Risk | | |
| Futures Contracts(a) | $18,290 | $0 |
| Total Equity Risk | 18,290 | 0 |
| Total Value of Derivatives | $18,290 | $0 |
(a) Reflects gross cumulative appreciation (depreciation) on futures contracts as presented in the Schedule of Investments. In the Statement of Assets and Liabilities, the period end daily variation margin is included in receivable or payable for daily variation margin on futures contracts, and the net cumulative appreciation (depreciation) is included in Total accumulated earnings (loss).
See accompanying notes which are an integral part of the financial statements.
Financial Statements
Statement of Assets and Liabilities
| | | October 31, 2019 |
| Assets | | |
Investment in securities, at value (including securities loaned of $6,715,302) — See accompanying schedule:
Unaffiliated issuers (cost $185,714,657) | $205,271,886 | |
| Fidelity Central Funds (cost $7,800,065) | 7,800,065 | |
| Total Investment in Securities (cost $193,514,722) | | $213,071,951 |
| Segregated cash with brokers for derivative instruments | | 25,200 |
| Cash | | 4,303 |
| Receivable for fund shares sold | | 654,451 |
| Dividends receivable | | 226,823 |
| Distributions receivable from Fidelity Central Funds | | 2,580 |
| Total assets | | 213,985,308 |
| Liabilities | | |
| Payable for investments purchased | $916,052 | |
| Payable for fund shares redeemed | 77,922 | |
| Accrued management fee | 17,932 | |
| Payable for daily variation margin on futures contracts | 2,413 | |
| Collateral on securities loaned | 6,877,131 | |
| Total liabilities | | 7,891,450 |
| Net Assets | | $206,093,858 |
| Net Assets consist of: | | |
| Paid in capital | | $184,751,090 |
| Total accumulated earnings (loss) | | 21,342,768 |
| Net Assets | | $206,093,858 |
| Net Asset Value and Maximum Offering Price | | |
| Net Asset Value, offering price and redemption price per share ($206,093,858 ÷ 15,633,433 shares) | | $13.18 |
See accompanying notes which are an integral part of the financial statements.
Statement of Operations
| | | Year ended October 31, 2019 |
| Investment Income | | |
| Dividends | | $2,579,811 |
| Interest | | 511 |
| Income from Fidelity Central Funds (including $4,594 from security lending) | | 24,023 |
| Total income | | 2,604,345 |
| Expenses | | |
| Management fee | $119,848 | |
| Transfer agent fees | 25,967 | |
| Independent trustees' fees and expenses | 486 | |
| Commitment fees | 316 | |
| Total expenses before reductions | 146,617 | |
| Expense reductions | (74) | |
| Total expenses after reductions | | 146,543 |
| Net investment income (loss) | | 2,457,802 |
| Realized and Unrealized Gain (Loss) | | |
| Net realized gain (loss) on: | | |
| Investment securities: | | |
| Unaffiliated issuers | (16,393) | |
| Fidelity Central Funds | 91 | |
| Futures contracts | 41,448 | |
| Total net realized gain (loss) | | 25,146 |
| Change in net unrealized appreciation (depreciation) on: | | |
| Investment securities: | | |
| Unaffiliated issuers | 19,177,412 | |
| Futures contracts | 6,109 | |
| Total change in net unrealized appreciation (depreciation) | | 19,183,521 |
| Net gain (loss) | | 19,208,667 |
| Net increase (decrease) in net assets resulting from operations | | $21,666,469 |
See accompanying notes which are an integral part of the financial statements.
Statement of Changes in Net Assets
| | Year ended October 31, 2019 | Year ended October 31, 2018 |
| Increase (Decrease) in Net Assets | | |
| Operations | | |
| Net investment income (loss) | $2,457,802 | $786,814 |
| Net realized gain (loss) | 25,146 | (64,431) |
| Change in net unrealized appreciation (depreciation) | 19,183,521 | (394,740) |
| Net increase (decrease) in net assets resulting from operations | 21,666,469 | 327,643 |
| Distributions to shareholders | (1,116,687) | (166,474) |
| Share transactions - net increase (decrease) | 117,209,271 | 50,677,146 |
| Total increase (decrease) in net assets | 137,759,053 | 50,838,315 |
| Net Assets | | |
| Beginning of period | 68,334,805 | 17,496,490 |
| End of period | $206,093,858 | $68,334,805 |
See accompanying notes which are an integral part of the financial statements.
Financial Highlights
Fidelity U.S. Sustainability Index Fund
| Years ended October 31, | 2019 | 2018 | 2017 A |
| Selected Per–Share Data | | | |
| Net asset value, beginning of period | $11.43 | $10.90 | $10.00 |
| Income from Investment Operations | | | |
| Net investment income (loss)B | .23 | .21 | .09 |
| Net realized and unrealized gain (loss) | 1.69 | .41C | .81 |
| Total from investment operations | 1.92 | .62 | .90 |
| Distributions from net investment income | (.15) | (.08) | – |
| Distributions from net realized gain | (.02) | (.01) | – |
| Total distributions | (.17) | (.09) | – |
| Net asset value, end of period | $13.18 | $11.43 | $10.90 |
| Total ReturnD,E | 17.06% | 5.67% | 9.00% |
| Ratios to Average Net AssetsF,G | | | |
| Expenses before reductions | .11% | .11% | .11%H |
| Expenses net of fee waivers, if any | .11% | .11% | .11%H |
| Expenses net of all reductions | .11% | .11% | .11%H |
| Net investment income (loss) | 1.84% | 1.82% | 1.86%H |
| Supplemental Data | | | |
| Net assets, end of period (000 omitted) | $206,094 | $6,125 | $558 |
| Portfolio turnover rateI | 12% | 15% | 3%J |
A For the period May 9, 2017 (commencement of operations) to October 31, 2017.
B Calculated based on average shares outstanding during the period.
C The amount shown for a share outstanding does not correspond with the aggregate net gain (loss) on investments for the period due to the timing of sales and repurchases of shares in relation to fluctuating market values of the investments of the Fund.
D Total returns for periods of less than one year are not annualized.
E Total returns would have been lower if certain expenses had not been reduced during the applicable periods shown.
F Fees and expenses of any underlying Fidelity Central Funds are not included in the Fund's expense ratio. The Fund indirectly bears its proportionate share of the expenses of any underlying Fidelity Central Funds.
G Expense ratios reflect operating expenses of the Fund. Expenses before reductions do not reflect amounts reimbursed by the investment adviser or reductions from expense offset arrangements and do not represent the amount paid by the Fund during periods when reimbursements or reductions occur. Expense ratios before reductions for start-up periods may not be representative of longer-term operating periods. Expenses net of fee waivers reflect expenses after reimbursement by the investment adviser but prior to reductions from expense offset arrangements. Expenses net of all reductions represent the net expenses paid by the Fund.
H Annualized
I Amount does not include the portfolio activity of any underlying Fidelity Central Funds.
J Amount not annualized.
See accompanying notes which are an integral part of the financial statements.
Notes to Financial Statements
For the period ended October 31, 2019
1. Organization.
Fidelity U.S. Sustainability Index Fund (the Fund) is a fund of Fidelity Salem Street Trust (the Trust) and is authorized to issue an unlimited number of shares. The Trust is registered under the Investment Company Act of 1940, as amended (the 1940 Act), as an open-end management investment company organized as a Massachusetts business trust.
Effective after the close of business November 9, 2018, the Fund's publicly offered shares classes were consolidated into a single share class. The surviving class is Fidelity U.S. Sustainability Index Fund (formerly Institutional Class). All current fiscal period dollar and share amounts for the classes that closed, which are presented in the Notes to Financial Statements, are for the period November 1, 2018 through November 9, 2018.
2. Investments in Fidelity Central Funds.
The Fund invests in Fidelity Central Funds, which are open-end investment companies generally available only to other investment companies and accounts managed by the investment adviser and its affiliates. The Fund's Schedule of Investments lists each of the Fidelity Central Funds held as of period end, if any, as an investment of the Fund, but does not include the underlying holdings of each Fidelity Central Fund. As an Investing Fund, the Fund indirectly bears its proportionate share of the expenses of the underlying Fidelity Central Funds.
The Money Market Central Funds seek preservation of capital and current income and are managed by Fidelity Investments Money Management, Inc. (FIMM), an affiliate of the investment adviser. Annualized expenses of the Money Market Central Funds as of their most recent shareholder report date ranged from less than .005% to .01%.
A complete unaudited list of holdings for each Fidelity Central Fund is available upon request or at the Securities and Exchange Commission (the SEC) website at www.sec.gov. In addition, the financial statements of the Fidelity Central Funds, which are not covered by the Fund's Report of Independent Registered Public Accounting Firm, are available on the SEC website or upon request.
3. Significant Accounting Policies.
The Fund is an investment company and applies the accounting and reporting guidance of the Financial Accounting Standards Board (FASB) Accounting Standards Codification Topic 946 Financial Services – Investments Companies. The financial statements have been prepared in conformity with accounting principles generally accepted in the United States of America (GAAP), which require management to make certain estimates and assumptions at the date of the financial statements. Actual results could differ from those estimates. Subsequent events, if any, through the date that the financial statements were issued have been evaluated in the preparation of the financial statements. The following summarizes the significant accounting policies of the Fund:
Investment Valuation. Investments are valued as of 4:00 p.m. Eastern time on the last calendar day of the period. The Board of Trustees (the Board) has delegated the day to day responsibility for the valuation of the Fund's investments to the Fair Value Committee (the Committee) established by the Fund's investment adviser. In accordance with valuation policies and procedures approved by the Board, the Fund attempts to obtain prices from one or more third party pricing vendors or brokers to value its investments. When current market prices, quotations or currency exchange rates are not readily available or reliable, investments will be fair valued in good faith by the Committee, in accordance with procedures adopted by the Board. Factors used in determining fair value vary by investment type and may include market or investment specific events. The frequency with which these procedures are used cannot be predicted and they may be utilized to a significant extent. The Committee oversees the Fund's valuation policies and procedures and reports to the Board on the Committee's activities and fair value determinations. The Board monitors the appropriateness of the procedures used in valuing the Fund's investments and ratifies the fair value determinations of the Committee.
The Fund categorizes the inputs to valuation techniques used to value its investments into a disclosure hierarchy consisting of three levels as shown below:
- Level 1 – quoted prices in active markets for identical investments
- Level 2 – other significant observable inputs (including quoted prices for similar investments, interest rates, prepayment speeds, etc.)
- Level 3 – unobservable inputs (including the Fund's own assumptions based on the best information available)
Valuation techniques used to value the Fund's investments by major category are as follows:
Equity securities, including restricted securities, for which market quotations are readily available, are valued at the last reported sale price or official closing price as reported by a third party pricing vendor on the primary market or exchange on which they are traded and are categorized as Level 1 in the hierarchy. In the event there were no sales during the day or closing prices are not available, securities are valued at the last quoted bid price or may be valued using the last available price and are generally categorized as Level 2 in the hierarchy. For foreign equity securities, when market or security specific events arise, comparisons to the valuation of American Depositary Receipts (ADRs), futures contracts, Exchange-Traded Funds (ETFs) and certain indexes as well as quoted prices for similar securities may be used and would be categorized as Level 2 in the hierarchy. For equity securities, including restricted securities, where observable inputs are limited, assumptions about market activity and risk are used and these securities may be categorized as Level 3 in the hierarchy.
Futures contracts are valued at the settlement price established each day by the board of trade or exchange on which they are traded and are categorized as Level 1 in the hierarchy. Investments in open-end mutual funds, including the Fidelity Central Funds, are valued at their closing net asset value (NAV) each business day and are categorized as Level 1 in the hierarchy.
Changes in valuation techniques may result in transfers in or out of an assigned level within the disclosure hierarchy. The aggregate value of investments by input level as of October 31, 2019, is included at the end of the Fund's Schedule of Investments.
Investment Transactions and Income. For financial reporting purposes, the Fund's investment holdings and NAV include trades executed through the end of the last business day of the period. The NAV per share for processing shareholder transactions is calculated as of the close of business of the New York Stock Exchange (NYSE), normally 4:00 p.m. Eastern time and includes trades executed through the end of the prior business day. Gains and losses on securities sold are determined on the basis of identified cost. Dividend income is recorded on the ex-dividend date, except for certain dividends from foreign securities where the ex-dividend date may have passed, which are recorded as soon as the Fund is informed of the ex-dividend date. Non-cash dividends included in dividend income, if any, are recorded at the fair market value of the securities received. Income and capital gain distributions from Fidelity Central Funds, if any, are recorded on the ex-dividend date. Certain distributions received by the Fund represent a return of capital or capital gain. The Fund determines the components of these distributions subsequent to the ex-dividend date, based upon receipt of tax filings or other correspondence relating to the underlying investment. These distributions are recorded as a reduction of cost of investments and/or as a realized gain. Interest income is accrued as earned and includes coupon interest and amortization of premium and accretion of discount on debt securities as applicable.
Class Allocations and Expenses. Investment income, realized and unrealized capital gains and losses, common expenses of the Fund, and certain fund-level expense reductions, if any, are allocated daily on a pro-rata basis to each class based on the relative net assets of each class to the total net assets of the Fund. Each class differs with respect to transfer agent fees incurred. Certain expense reductions may also differ by class. For the reporting period, the allocated portion of income and expenses to each class as a percent of its average net assets may vary due to the timing of recording these transactions in relation to fluctuating net assets of the classes. Expenses directly attributable to a fund are charged to that fund. Expenses attributable to more than one fund are allocated among the respective funds on the basis of relative net assets or other appropriate methods. Expense estimates are accrued in the period to which they relate and adjustments are made when actual amounts are known.
Income Tax Information and Distributions to Shareholders. Each year, the Fund intends to qualify as a regulated investment company under Subchapter M of the Internal Revenue Code, including distributing substantially all of its taxable income and realized gains. As a result, no provision for U.S. Federal income taxes is required. As of October 31, 2019, the Fund did not have any unrecognized tax benefits in the financial statements; nor is the Fund aware of any tax positions for which it is reasonably possible that the total amounts of unrecognized tax benefits will significantly change in the next twelve months. The Fund files a U.S. federal tax return, in addition to state and local tax returns as required. The Fund's federal income tax returns are subject to examination by the Internal Revenue Service (IRS) for a period of three fiscal years after they are filed. State and local tax returns may be subject to examination for an additional fiscal year depending on the jurisdiction.
Distributions are declared and recorded on the ex-dividend date. Income and capital gain distributions are declared separately for each class. Income and capital gain distributions are determined in accordance with income tax regulations, which may differ from GAAP. In addition, the Fund claimed a portion of the payment made to redeeming shareholders as a distribution for income tax purposes.
Capital accounts within the financial statements are adjusted for permanent book-tax differences. These adjustments have no impact on net assets or the results of operations. Capital accounts are not adjusted for temporary book-tax differences which will reverse in a subsequent period.
Book-tax differences are primarily due to futures contracts, market discount and losses deferred due to wash sales.
As of period end, the cost and unrealized appreciation (depreciation) in securities, and derivatives if applicable, for federal income tax purposes were as follows:
| Gross unrealized appreciation | $24,485,729 |
| Gross unrealized depreciation | (5,607,489) |
| Net unrealized appreciation (depreciation) | $18,878,240 |
| Tax Cost | $194,193,711 |
The tax-based components of distributable earnings as of period end were as follows:
| Undistributed ordinary income | $2,168,050 |
| Undistributed long-term capital gain | $296,477 |
| Net unrealized appreciation (depreciation) on securities and other investments | $18,878,240 |
The tax character of distributions paid was as follows:
| | October 31, 2019 | October 31, 2018 |
| Ordinary Income | $1,044,003 | $ 160,394 |
| Long-term Capital Gains | 72,684 | 6,080 |
| Total | $1,116,687 | $ 166,474 |
4. Derivative Instruments.
Risk Exposures and the Use of Derivative Instruments. The Fund's investment objective allows the Fund to enter into various types of derivative contracts, including futures contracts. Derivatives are investments whose value is primarily derived from underlying assets, indices or reference rates and may be transacted on an exchange or over-the-counter (OTC). Derivatives may involve a future commitment to buy or sell a specified asset based on specified terms, to exchange future cash flows at periodic intervals based on a notional principal amount, or for one party to make one or more payments upon the occurrence of specified events in exchange for periodic payments from the other party.
The Fund used derivatives to increase returns and to manage exposure to certain risks as defined below. The success of any strategy involving derivatives depends on analysis of numerous economic factors, and if the strategies for investment do not work as intended, the Fund may not achieve its objectives.
The Fund's use of derivatives increased or decreased its exposure to the following risk:
| Equity Risk | Equity risk relates to the fluctuations in the value of financial instruments as a result of changes in market prices (other than those arising from interest rate risk or foreign exchange risk), whether caused by factors specific to an individual investment, its issuer, or all factors affecting all instruments traded in a market or market segment.
|
The Fund is also exposed to additional risks from investing in derivatives, such as liquidity risk and counterparty credit risk. Liquidity risk is the risk that the Fund will be unable to close out the derivative in the open market in a timely manner. Counterparty credit risk is the risk that the counterparty will not be able to fulfill its obligation to the Fund. Counterparty credit risk related to exchange-traded futures contracts may be mitigated by the protection provided by the exchange on which they trade.
Investing in derivatives may involve greater risks than investing in the underlying assets directly and, to varying degrees, may involve risk of loss in excess of any initial investment and collateral received and amounts recognized in the Statement of Assets and Liabilities. In addition, there may be the risk that the change in value of the derivative contract does not correspond to the change in value of the underlying instrument.
Futures Contracts. A futures contract is an agreement between two parties to buy or sell a specified underlying instrument for a fixed price at a specified future date. The Fund used futures contracts to manage its exposure to the stock market.
Upon entering into a futures contract, a fund is required to deposit either cash or securities (initial margin) with a clearing broker in an amount equal to a certain percentage of the face value of the contract. Futures contracts are marked-to-market daily and subsequent daily payments (variation margin) are made or received by a fund depending on the daily fluctuations in the value of the futures contracts and are recorded as unrealized appreciation or (depreciation). This receivable and/or payable, if any, is included in daily variation margin on futures contracts in the Statement of Assets and Liabilities. Realized gain or (loss) is recorded upon the expiration or closing of a futures contract. The net realized gain (loss) and change in net unrealized appreciation (depreciation) on futures contracts during the period is presented in the Statement of Operations.
Any open futures contracts at period end are presented in the Schedule of Investments under the caption "Futures Contracts". The notional amount at value reflects each contract's exposure to the underlying instrument or index at period end and is representative of volume of activity during the period. Cash deposited to meet initial margin requirements is presented as segregated cash with brokers for derivative instruments in the Statement of Assets and Liabilities.
5. Purchases and Sales of Investments.
Purchases and sales of securities, other than short-term securities, aggregated $134,994,559 and $16,263,569, respectively.
6. Fees and Other Transactions with Affiliates.
Management Fee. Fidelity Management & Research Company (the investment adviser) and its affiliates provide the Fund with investment management related services for which the Fund pays a monthly management fee. During July 2019, the Board approved to change the management fee to an annual rate of .11% of the Fund's average net assets effective August 1, 2019. Prior to August 1, 2019, the annual management fee rate was .08%. Under the management contract, the investment adviser pays all other fund-level operating expenses, except the compensation of the independent Trustees and certain miscellaneous expenses such as proxy and shareholder meeting expenses. During July 2019, the Board also approved to change the management fee structure from a flat fee to a unitary fee effective August 1, 2019, which eliminated the need for a separate expense contract. There is no change to the total expenses paid by the shareholders.
Prior to August 1, 2019, under the expense contract, the investment adviser paid class-level expenses as necessary so that the total expenses did not exceed .11% of each class' average net assets on an annual basis with certain exceptions.
Sub-Adviser. Geode Capital Management, LLC (Geode), serves as sub-adviser for the Fund. Geode provides discretionary investment advisory services to the Fund and is paid by the investment adviser for providing these services.
Transfer Agent Fees. Fidelity Investments Institutional Operations Company, Inc. (FIIOC), an affiliate of the investment adviser, is the transfer, dividend disbursing and shareholder servicing agent for each class. FIIOC receives transfer agent fees at an annual rate of .21%, .11% and .035% of class-level average net assets for Investor Class, Premium Class and Fidelity U.S. Sustainability Index Fund, respectively. FIIOC pays for typesetting, printing and mailing of shareholder reports, except proxy statements. Effective August 1, 2019, the Fund does not pay transfer agent fees. Prior to August 1, 2019, under the expense contract, each Class paid a portion of the transfer agent fees at an annual rate of .03% of class-level average net assets.
For the period, the total transfer agent fees paid by each applicable class were as follows:
| | Amount |
| Investor Class | $114 |
| Premium Class | 428 |
| Fidelity U.S. Sustainability Index Fund | 25,425 |
| | $ 25,967 |
Interfund Trades. The Fund may purchase from or sell securities to other Fidelity Funds under procedures adopted by the Board. The procedures have been designed to ensure these interfund trades are executed in accordance with Rule 17a-7 of the 1940 Act. Interfund trades are included within the respective purchases and sales amounts shown in the Purchases and Sales of Investments note.
7. Committed Line of Credit.
The Fund participates with other funds managed by the investment adviser or an affiliate in a $4.25 billion credit facility (the "line of credit") to be utilized for temporary or emergency purposes to fund shareholder redemptions or for other short-term liquidity purposes. The Fund has agreed to pay commitment fees on its pro-rata portion of the line of credit, which amounted to $316 and is reflected in Commitment fees on the Statement of Operations. During the period, the Fund did not borrow on this line of credit.
8. Security Lending.
The Fund lends portfolio securities from time to time in order to earn additional income. For equity securities, lending agents are used, including National Financial Services (NFS), an affiliate of the Fund. Pursuant to a securities lending agreement, NFS will receive a fee, which is capped at 9.9% of daily lending revenue, for its services as lending agent. The Fund may lend securities to certain qualified borrowers, including NFS. On the settlement date of the loan, the Fund receives collateral (in the form of U.S. Treasury obligations, letters of credit and/or cash) against the loaned securities and maintains collateral in an amount not less than 100% of the market value of the loaned securities during the period of the loan. The market value of the loaned securities is determined at the close of business of the Fund and any additional required collateral is delivered to the Fund on the next business day. The Fund or borrower may terminate the loan at any time, and if the borrower defaults on its obligation to return the securities loaned because of insolvency or other reasons, the Fund may apply collateral received from the borrower against the obligation. The Fund may experience delays and costs in recovering the securities loaned. Any cash collateral received is invested in the Fidelity Securities Lending Cash Central Fund. The value of loaned securities and cash collateral at period end are disclosed on the Fund's Statement of Assets and Liabilities. Total fees paid by the Fund to NFS, as lending agent, amounted to $317. Security lending income represents the income earned on investing cash collateral, less rebates paid to borrowers and any lending agent fees associated with the loan, plus any premium payments received for lending certain types of securities. Security lending income is presented in the Statement of Operations as a component of income from Fidelity Central Funds. During the period, there were no securities loaned to NFS.
9. Expense Reductions.
Through arrangements with the Fund's custodian, credits realized as a result of certain uninvested cash balances were used to reduce the Fund's expenses. During the period, custodian credits reduced the Fund's expenses by $74.
10. Distributions to Shareholders.
Distributions to shareholders of each class were as follows:
| | Year ended
October 31, 2019 | Year ended
October 31, 2018 |
| Distributions to shareholders | | |
| Investor Class | $– | $30,652 |
| Premium Class | – | 131,284 |
| Fidelity U.S. Sustainability Index Fund | 1,116,687 | 4,538 |
| Total | $1,116,687 | $166,474 |
11. Share Transactions.
Share transactions for each class were as follows and may contain automatic conversions between classes or exchanges between affiliated funds:
| | Shares | Shares | Dollars | Dollars |
| | Year ended October 31, 2019 | Year ended October 31, 2018 | Year ended October 31, 2019 | Year ended October 31, 2018 |
| Investor Class | | | | |
| Shares sold | 52,131 | 2,070,468 | $605,676 | $24,029,375 |
| Reinvestment of distributions | – | 2,706 | – | 30,067 |
| Shares redeemed | (1,190,190) | (1,230,207) | (14,026,768) | (14,115,014) |
| Net increase (decrease) | (1,138,059) | 842,967 | $(13,421,092) | $9,944,428 |
| Premium Class | | | | |
| Shares sold | 163,334 | 3,858,697 | $1,886,350 | $44,544,353 |
| Reinvestment of distributions | – | 11,366 | – | 126,165 |
| Shares redeemed | (4,469,837) | (823,359) | (52,703,290) | (9,524,016) |
| Net increase (decrease) | (4,306,503) | 3,046,704 | $(50,816,940) | $35,146,502 |
| Fidelity U.S. Sustainability Index Fund | | | | |
| Shares sold | 17,250,022 | 524,953 | $207,779,031 | $6,053,807 |
| Reinvestment of distributions | 91,681 | 311 | 1,022,239 | 3,452 |
| Shares redeemed | (2,244,159) | (40,613) | (27,353,967) | (471,043) |
| Net increase (decrease) | 15,097,544 | 484,651 | $181,447,303 | $5,586,216 |
12. Other.
The Fund's organizational documents provide former and current trustees and officers with a limited indemnification against liabilities arising in connection with the performance of their duties to the Fund. In the normal course of business, the Fund may also enter into contracts that provide general indemnifications. The Fund's maximum exposure under these arrangements is unknown as this would be dependent on future claims that may be made against the Fund. The risk of material loss from such claims is considered remote.
Report of Independent Registered Public Accounting Firm
To the Board of Trustees of Fidelity Salem Street Trust and Shareholders of Fidelity U.S. Sustainability Index Fund:
Opinion on the Financial Statements
We have audited the accompanying statement of assets and liabilities, including the schedule of investments, of Fidelity U.S. Sustainability Index Fund (one of the funds constituting Fidelity Salem Street Trust, referred to hereafter as the “Fund”) as of October 31, 2019, the related statement of operations for the year ended October 31, 2019, the statement of changes in net assets for each of the two years in the period ended October 31, 2019, including the related notes, and the financial highlights for each of the two years in the period ended October 31, 2019 and for the period May 9, 2017 (commencement of operations) through October 31, 2017 (collectively referred to as the “financial statements”). In our opinion, the financial statements present fairly, in all material respects, the financial position of the Fund as of October 31, 2019, the results of its operations for the year then ended, the changes in its net assets for each of the two years in the period ended October 31, 2019 and the financial highlights for each of the two years in the period ended October 31, 2019 and for the period May 9, 2017 (commencement of operations) through October 31, 2017 in conformity with accounting principles generally accepted in the United States of America.
Basis for Opinion
These financial statements are the responsibility of the Fund’s management. Our responsibility is to express an opinion on the Fund’s financial statements based on our audits. We are a public accounting firm registered with the Public Company Accounting Oversight Board (United States) (PCAOB) and are required to be independent with respect to the Fund in accordance with the U.S. federal securities laws and the applicable rules and regulations of the Securities and Exchange Commission and the PCAOB.
We conducted our audits of these financial statements in accordance with the standards of the PCAOB. Those standards require that we plan and perform the audit to obtain reasonable assurance about whether the financial statements are free of material misstatement, whether due to error or fraud.
Our audits included performing procedures to assess the risks of material misstatement of the financial statements, whether due to error or fraud, and performing procedures that respond to those risks. Such procedures included examining, on a test basis, evidence regarding the amounts and disclosures in the financial statements. Our audits also included evaluating the accounting principles used and significant estimates made by management, as well as evaluating the overall presentation of the financial statements. Our procedures included confirmation of securities owned as of October 31, 2019 by correspondence with the custodian and brokers; when replies were not received from brokers, we performed other auditing procedures. We believe that our audits provide a reasonable basis for our opinion.
PricewaterhouseCoopers LLP
Boston, Massachusetts
December 13, 2019
We have served as the auditor of one or more investment companies in the Fidelity group of funds since 1932.
Trustees and Officers
The Trustees, Members of the Advisory Board (if any), and officers of the trust and fund, as applicable, are listed below. The Board of Trustees governs the fund and is responsible for protecting the interests of shareholders. The Trustees are experienced executives who meet periodically throughout the year to oversee the fund's activities, review contractual arrangements with companies that provide services to the fund, oversee management of the risks associated with such activities and contractual arrangements, and review the fund's performance. Except for Jonathan Chiel, each of the Trustees oversees 277 funds. Mr. Chiel oversees 171 funds.
The Trustees hold office without limit in time except that (a) any Trustee may resign; (b) any Trustee may be removed by written instrument, signed by at least two-thirds of the number of Trustees prior to such removal; (c) any Trustee who requests to be retired or who has become incapacitated by illness or injury may be retired by written instrument signed by a majority of the other Trustees; and (d) any Trustee may be removed at any special meeting of shareholders by a two-thirds vote of the outstanding voting securities of the trust. Each Trustee who is not an interested person (as defined in the 1940 Act) of the trust and the fund is referred to herein as an Independent Trustee. Each Independent Trustee shall retire not later than the last day of the calendar year in which his or her 75th birthday occurs. The Independent Trustees may waive this mandatory retirement age policy with respect to individual Trustees. Officers and Advisory Board Members hold office without limit in time, except that any officer or Advisory Board Member may resign or may be removed by a vote of a majority of the Trustees at any regular meeting or any special meeting of the Trustees. Except as indicated, each individual has held the office shown or other offices in the same company for the past five years.
The fund’s Statement of Additional Information (SAI) includes more information about the Trustees. To request a free copy, call Fidelity at 1-800-544-8544.
Experience, Skills, Attributes, and Qualifications of the Trustees. The Governance and Nominating Committee has adopted a statement of policy that describes the experience, qualifications, attributes, and skills that are necessary and desirable for potential Independent Trustee candidates (Statement of Policy). The Board believes that each Trustee satisfied at the time he or she was initially elected or appointed a Trustee, and continues to satisfy, the standards contemplated by the Statement of Policy. The Governance and Nominating Committee also engages professional search firms to help identify potential Independent Trustee candidates who have the experience, qualifications, attributes, and skills consistent with the Statement of Policy. From time to time, additional criteria based on the composition and skills of the current Independent Trustees, as well as experience or skills that may be appropriate in light of future changes to board composition, business conditions, and regulatory or other developments, have also been considered by the professional search firms and the Governance and Nominating Committee. In addition, the Board takes into account the Trustees' commitment and participation in Board and committee meetings, as well as their leadership of standing and ad hoc committees throughout their tenure.
In determining that a particular Trustee was and continues to be qualified to serve as a Trustee, the Board has considered a variety of criteria, none of which, in isolation, was controlling. The Board believes that, collectively, the Trustees have balanced and diverse experience, qualifications, attributes, and skills, which allow the Board to operate effectively in governing the fund and protecting the interests of shareholders. Information about the specific experience, skills, attributes, and qualifications of each Trustee, which in each case led to the Board's conclusion that the Trustee should serve (or continue to serve) as a trustee of the fund, is provided below.
Board Structure and Oversight Function. Abigail P. Johnson is an interested person and currently serves as Chairman. The Trustees have determined that an interested Chairman is appropriate and benefits shareholders because an interested Chairman has a personal and professional stake in the quality and continuity of services provided to the fund. Independent Trustees exercise their informed business judgment to appoint an individual of their choosing to serve as Chairman, regardless of whether the Trustee happens to be independent or a member of management. The Independent Trustees have determined that they can act independently and effectively without having an Independent Trustee serve as Chairman and that a key structural component for assuring that they are in a position to do so is for the Independent Trustees to constitute a substantial majority for the Board. The Independent Trustees also regularly meet in executive session. Arthur E. Johnson serves as Chairman of the Independent Trustees and as such (i) acts as a liaison between the Independent Trustees and management with respect to matters important to the Independent Trustees and (ii) with management prepares agendas for Board meetings.
Fidelity® funds are overseen by different Boards of Trustees. The fund's Board oversees Fidelity's investment-grade bond, money market, asset allocation and certain equity funds, and other Boards oversee Fidelity's high income and other equity funds. The asset allocation funds may invest in Fidelity® funds that are overseen by such other Boards. The use of separate Boards, each with its own committee structure, allows the Trustees of each group of Fidelity® funds to focus on the unique issues of the funds they oversee, including common research, investment, and operational issues. On occasion, the separate Boards establish joint committees to address issues of overlapping consequences for the Fidelity® funds overseen by each Board.
The Trustees operate using a system of committees to facilitate the timely and efficient consideration of all matters of importance to the Trustees, the fund, and fund shareholders and to facilitate compliance with legal and regulatory requirements and oversight of the fund's activities and associated risks. The Board, acting through its committees, has charged FMR and its affiliates with (i) identifying events or circumstances the occurrence of which could have demonstrably adverse effects on the fund's business and/or reputation; (ii) implementing processes and controls to lessen the possibility that such events or circumstances occur or to mitigate the effects of such events or circumstances if they do occur; and (iii) creating and maintaining a system designed to evaluate continuously business and market conditions in order to facilitate the identification and implementation processes described in (i) and (ii) above. Because the day-to-day operations and activities of the fund are carried out by or through FMR, its affiliates, and other service providers, the fund's exposure to risks is mitigated but not eliminated by the processes overseen by the Trustees. While each of the Board's committees has responsibility for overseeing different aspects of the fund's activities, oversight is exercised primarily through the Operations and Audit Committees. In addition, an ad hoc Board committee of Independent Trustees has worked with FMR to enhance the Board's oversight of investment and financial risks, legal and regulatory risks, technology risks, and operational risks, including the development of additional risk reporting to the Board. Appropriate personnel, including but not limited to the fund's Chief Compliance Officer (CCO), FMR's internal auditor, the independent accountants, the fund's Treasurer and portfolio management personnel, make periodic reports to the Board's committees, as appropriate, including an annual review of Fidelity's risk management program for the Fidelity® funds. The responsibilities of each standing committee, including their oversight responsibilities, are described further under "Standing Committees of the Trustees."
Interested Trustees*:
Correspondence intended for a Trustee who is an interested person may be sent to Fidelity Investments, 245 Summer Street, Boston, Massachusetts 02210.
Name, Year of Birth; Principal Occupations and Other Relevant Experience+
Jonathan Chiel (1957)
Year of Election or Appointment: 2016
Trustee
Mr. Chiel also serves as Trustee of other Fidelity® funds. Mr. Chiel is Executive Vice President and General Counsel for FMR LLC (diversified financial services company, 2012-present). Previously, Mr. Chiel served as general counsel (2004-2012) and senior vice president and deputy general counsel (2000-2004) for John Hancock Financial Services; a partner with Choate, Hall & Stewart (1996-2000) (law firm); and an Assistant United States Attorney for the United States Attorney’s Office of the District of Massachusetts (1986-95), including Chief of the Criminal Division (1993-1995). Mr. Chiel is a director on the boards of the Boston Bar Foundation and the Maimonides School.
Abigail P. Johnson (1961)
Year of Election or Appointment: 2009
Trustee
Chairman of the Board of Trustees
Ms. Johnson also serves as Trustee of other Fidelity® funds. Ms. Johnson serves as Chairman (2016-present), Chief Executive Officer (2014-present), and Director (2007-present) of FMR LLC (diversified financial services company), President of Fidelity Financial Services (2012-present) and President of Personal, Workplace and Institutional Services (2005-present). Ms. Johnson is Chairman and Director of FMR Co., Inc. (investment adviser firm, 2011-present) and Chairman and Director of FMR (investment adviser firm, 2011-present). Previously, Ms. Johnson served as Vice Chairman (2007-2016) and President (2013-2016) of FMR LLC, President and a Director of FMR (2001-2005), a Trustee of other investment companies advised by FMR, Fidelity Investments Money Management, Inc. (investment adviser firm), and FMR Co., Inc. (2001-2005), Senior Vice President of the Fidelity® funds (2001-2005), and managed a number of Fidelity® funds. Ms. Abigail P. Johnson and Mr. Arthur E. Johnson are not related.
Jennifer Toolin McAuliffe (1959)
Year of Election or Appointment: 2016
Trustee
Ms. McAuliffe also serves as Trustee of other Fidelity® funds. Ms. McAuliffe previously served as a Member of the Advisory Board of certain Fidelity® funds (2016) and as Co-Head of Fixed Income of Fidelity Investments Limited (now known as FIL Limited (FIL)) (diversified financial services company). Earlier roles at FIL included Director of Research for FIL’s credit and quantitative teams in London, Hong Kong and Tokyo. Ms. McAuliffe also was the Director of Research for taxable and municipal bonds at Fidelity Investments Money Management, Inc. Ms. McAuliffe is also a director or trustee of several not-for-profit entities.
* Determined to be an “Interested Trustee” by virtue of, among other things, his or her affiliation with the trust or various entities under common control with FMR.
+ The information includes the Trustee's principal occupation during the last five years and other information relating to the experience, attributes, and skills relevant to the Trustee's qualifications to serve as a Trustee, which led to the conclusion that the Trustee should serve as a Trustee for the fund.
Independent Trustees:
Correspondence intended for an Independent Trustee may be sent to Fidelity Investments, P.O. Box 55235, Boston, Massachusetts 02205-5235.
Name, Year of Birth; Principal Occupations and Other Relevant Experience+
Elizabeth S. Acton (1951)
Year of Election or Appointment: 2013
Trustee
Ms. Acton also serves as Trustee of other Fidelity® funds. Prior to her retirement in April 2012, Ms. Acton was Executive Vice President, Finance (2011-2012), Executive Vice President, Chief Financial Officer (2002-2011), and Treasurer (2004-2005) of Comerica Incorporated (financial services). Prior to joining Comerica, Ms. Acton held a variety of positions at Ford Motor Company (1983-2002), including Vice President and Treasurer (2000-2002) and Executive Vice President and Chief Financial Officer of Ford Motor Credit Company (1998-2000). Ms. Acton currently serves as a member of the Board of Directors and Audit and Finance Committees of Beazer Homes USA, Inc. (homebuilding, 2012-present). Previously, Ms. Acton served as a Member of the Advisory Board of certain Fidelity® funds (2013-2016).
Ann E. Dunwoody (1953)
Year of Election or Appointment: 2018
Trustee
General Dunwoody also serves as Trustee of other Fidelity® funds. General Dunwoody (United States Army, Retired) was the first woman in U.S. military history to achieve the rank of four-star general and prior to her retirement in 2012 held a variety of positions within the U.S. Army, including Commanding General, U.S. Army Material Command (2008-2012). She is the President of First to Four LLC (leadership and mentoring services, 2012-present). She also serves as a member of the Board of Directors and Nominating and Corporate Governance Committee of L3 Technologies, Inc. (communication, electronic, sensor, and aerospace systems, 2013-present), Board of Directors and Nomination and Corporate Governance Committees of Kforce Inc. (professional staffing services, 2016-present) and Board of Directors of Automattic Inc. (software engineering, 2018-present). Previously, General Dunwoody served as a Member of the Advisory Board of certain Fidelity® funds (2018), a member of the Board of Directors and Audit and Sustainability and Corporate Responsibility Committees of Republic Services, Inc. (waste collection, disposal and recycling, 2013-2016). Ms. Dunwoody also serves on several boards for non-profit organizations, including as a member of the Board of Directors, Chair of the Nomination and Governance Committee and member of the Audit Committee of Logistics Management Institute (consulting non-profit, 2012-present), a member of the Board of Directors of the Army Historical Foundation (2015-present), a member of the Council of Trustees for the Association of the United States Army (advocacy non-profit, 2013-present) and a member of the Board of Trustees of Florida Institute of Technology (2015-present) and ThanksUSA (military family education non-profit, 2014-present).
John Engler (1948)
Year of Election or Appointment: 2014
Trustee
Mr. Engler also serves as Trustee of other Fidelity® funds. He serves on the board of directors for Universal Forest Products (manufacturer and distributor of wood and wood-alternative products, 2003-present) and K12 Inc. (technology-based education company, 2012-present). Previously, Mr. Engler served as interim president of Michigan State University (2018-2019), a Member of the Advisory Board of certain Fidelity® funds (2014-2016), president of the Business Roundtable (2011-2017), a trustee of The Munder Funds (2003-2014), president and CEO of the National Association of Manufacturers (2004-2011), member of the Board of Trustees of the Annie E. Casey Foundation (2004-2015), and as governor of Michigan (1991-2003). He is a past chairman of the National Governors Association.
Robert F. Gartland (1951)
Year of Election or Appointment: 2010
Trustee
Mr. Gartland also serves as Trustee of other Fidelity® funds. Mr. Gartland is Chairman and an investor in Gartland & Mellina Group Corp. (consulting, 2009-present). Previously, Mr. Gartland served as a partner and investor of Vietnam Partners LLC (investments and consulting, 2008-2011). Prior to his retirement, Mr. Gartland held a variety of positions at Morgan Stanley (financial services, 1979-2007), including Managing Director (1987-2007), and Chase Manhattan Bank (1975-1978).
Arthur E. Johnson (1947)
Year of Election or Appointment: 2008
Trustee
Chairman of the Independent Trustees
Mr. Johnson also serves as Trustee of other Fidelity® funds. Mr. Johnson serves as a member of the Board of Directors of Eaton Corporation plc (diversified power management, 2009-present) and Booz Allen Hamilton (management consulting, 2011-present). Prior to his retirement, Mr. Johnson served as Senior Vice President of Corporate Strategic Development of Lockheed Martin Corporation (defense contractor, 1999-2009). Mr. Johnson previously served as Vice Chairman (2015-2018) of the Independent Trustees of certain Fidelity® funds and on the Board of Directors of IKON Office Solutions, Inc. (1999-2008), AGL Resources, Inc. (holding company, 2002-2016), and Delta Airlines (2005-2007). Mr. Arthur E. Johnson is not related to Ms. Abigail P. Johnson.
Michael E. Kenneally (1954)
Year of Election or Appointment: 2009
Trustee
Vice Chairman of the Independent Trustees
Mr. Kenneally also serves as Trustee of other Fidelity® funds. Prior to his retirement, Mr. Kenneally served as Chairman and Global Chief Executive Officer of Credit Suisse Asset Management. Before joining Credit Suisse, he was an Executive Vice President and Chief Investment Officer for Bank of America Corporation. Earlier roles at Bank of America included Director of Research, Senior Portfolio Manager and Research Analyst, and Mr. Kenneally was awarded the Chartered Financial Analyst (CFA) designation in 1991.
Marie L. Knowles (1946)
Year of Election or Appointment: 2001
Trustee
Ms. Knowles also serves as Trustee of other Fidelity® funds. Prior to Ms. Knowles' retirement in June 2000, she served as Executive Vice President and Chief Financial Officer of Atlantic Richfield Company (ARCO) (diversified energy, 1996-2000). From 1993 to 1996, she was a Senior Vice President of ARCO and President of ARCO Transportation Company (pipeline and tanker operations). Ms. Knowles currently serves as a Director and Chairman of the Audit Committee of McKesson Corporation (healthcare service, since 2002). Ms. Knowles is a member of the Board of the Santa Catalina Island Company (real estate, 2009-present). Ms. Knowles is a Member of the Investment Company Institute Board of Governors and a Member of the Governing Council of the Independent Directors Council (2014-present). She also serves as a member of the Advisory Board for the School of Engineering of the University of Southern California. Previously, Ms. Knowles served as a Director of Phelps Dodge Corporation (copper mining and manufacturing, 1994-2007), URS Corporation (engineering and construction, 2000-2003) and America West (airline, 1999-2002). Ms. Knowles previously served as Chairman (2015-2018) and Vice Chairman (2012-2015) of the Independent Trustees of certain Fidelity® funds.
Mark A. Murray (1954)
Year of Election or Appointment: 2016
Trustee
Mr. Murray also serves as Trustee of other Fidelity® funds. Mr. Murray is Vice Chairman (2013-present) of Meijer, Inc. (regional retail chain). Previously, Mr. Murray served as a Member of the Advisory Board of certain Fidelity® funds (2016) and as Co-Chief Executive Officer (2013-2016) and President (2006-2013) of Meijer, Inc. Mr. Murray serves as a member of the Board of Directors and Nuclear Review and Public Policy and Responsibility Committees of DTE Energy Company (diversified energy company, 2009-present). Mr. Murray also serves as a member of the Board of Directors of Spectrum Health (not-for-profit health system, 2015-present). Mr. Murray previously served as President of Grand Valley State University (2001-2006), Treasurer for the State of Michigan (1999-2001), Vice President of Finance and Administration for Michigan State University (1998-1999), and a member of the Board of Directors and Audit Committee and Chairman of the Nominating and Corporate Governance Committee of Universal Forest Products, Inc. (manufacturer and distributor of wood and wood-alternative products, 2004-2016). Mr. Murray is also a director or trustee of many community and professional organizations.
+ The information includes the Trustee's principal occupation during the last five years and other information relating to the experience, attributes, and skills relevant to the Trustee's qualifications to serve as a Trustee, which led to the conclusion that the Trustee should serve as a Trustee for the fund.
Advisory Board Members and Officers:
Correspondence intended for an officer may be sent to Fidelity Investments, 245 Summer Street, Boston, Massachusetts 02210. Officers appear below in alphabetical order.
Name, Year of Birth; Principal Occupation
Elizabeth Paige Baumann (1968)
Year of Election or Appointment: 2017
Anti-Money Laundering (AML) Officer
Ms. Baumann also serves as AML Officer of other funds. She is Chief AML Officer (2012-present) and Senior Vice President (2014-present) of FMR LLC (diversified financial services company) and is an employee of Fidelity Investments. Previously, Ms. Baumann served as AML Officer of the funds (2012-2016), and Vice President (2007-2014) and Deputy Anti-Money Laundering Officer (2007-2012) of FMR LLC.
Craig S. Brown (1977)
Year of Election or Appointment: 2019
Assistant Treasurer
Mr. Brown also serves as Assistant Treasurer of other funds. Mr. Brown is an employee of Fidelity Investments (2013-present).
John J. Burke III (1964)
Year of Election or Appointment: 2018
Chief Financial Officer
Mr. Burke also serves as Chief Financial Officer of other funds. Mr. Burke serves as Head of Investment Operations for Fidelity Fund and Investment Operations (2018-present) and is an employee of Fidelity Investments (1998-present). Previously Mr. Burke served as head of Asset Management Investment Operations (2012-2018).
Jonathan Davis (1968)
Year of Election or Appointment: 2010
Assistant Treasurer
Mr. Davis also serves as Assistant Treasurer of other funds. Mr. Davis serves as Assistant Treasurer of FMR Capital, Inc. (2017-present) and is an employee of Fidelity Investments. Previously, Mr. Davis served as Vice President and Associate General Counsel of FMR LLC (diversified financial services company, 2003-2010).
Adrien E. Deberghes (1967)
Year of Election or Appointment: 2010
Assistant Treasurer
Mr. Deberghes also serves as an officer of other funds. He serves as Assistant Treasurer of FMR Capital, Inc. (2017-present), Executive Vice President of Fidelity Investments Money Management, Inc. (FIMM) (investment adviser firm, 2016-present), and is an employee of Fidelity Investments (2008-present). Previously, Mr. Deberghes served as President and Treasurer of certain Fidelity® funds (2013-2018). Prior to joining Fidelity Investments, Mr. Deberghes was Senior Vice President of Mutual Fund Administration at State Street Corporation (2007-2008), Senior Director of Mutual Fund Administration at Investors Bank & Trust (2005-2007), and Director of Finance for Dunkin' Brands (2000-2005). Previously, Mr. Deberghes served in other fund officer roles.
Laura M. Del Prato (1964)
Year of Election or Appointment: 2018
President and Treasurer
Ms. Del Prato also serves as an officer of other funds. Ms. Del Prato is an employee of Fidelity Investments (2017-present). Prior to joining Fidelity Investments, Ms. Del Prato served as a Managing Director and Treasurer of the JPMorgan Mutual Funds (2014-2017). Prior to JPMorgan, Ms. Del Prato served as a partner at Cohen Fund Audit Services (accounting firm, 2012-2013) and KPMG LLP (accounting firm, 2004-2012).
Colm A. Hogan (1973)
Year of Election or Appointment: 2016
Assistant Treasurer
Mr. Hogan also serves as an officer of other funds. Mr. Hogan serves as Assistant Treasurer of FMR Capital, Inc. (2017-present) and is an employee of Fidelity Investments (2005-present). Previously, Mr. Hogan served as Assistant Treasurer of certain Fidelity® funds (2016-2018).
Cynthia Lo Bessette (1969)
Year of Election or Appointment: 2019
Secretary and Chief Legal Officer (CLO)
Ms. Lo Bessette also serves as Secretary and CLO of other funds. Ms. Lo Bessette serves as CLO, Secretary, and Senior Vice President of Fidelity Management & Research Company and FMR Co., Inc. (investment adviser firms, 2019-present); Secretary of Fidelity SelectCo, LLC and Fidelity Investments Money Management, Inc. (investment adviser firms, 2019-present); and CLO of Fidelity Management & Research (Hong Kong) Limited, FMR Investment Management (UK) Limited, and Fidelity Management & Research (Japan) Limited (investment adviser firms, 2019-present). She is a Senior Vice President and Deputy General Counsel of FMR LLC (diversified financial services company, 2019-present), and is an employee of Fidelity Investments. Previously, Ms. Lo Bessette served as Executive Vice President, General Counsel (2016-2019) and Senior Vice President, Deputy General Counsel (2015-2016) of OppenheimerFunds (investment management company) and Deputy Chief Legal Officer (2013-2015) of Jennison Associates LLC (investment adviser firm).
Chris Maher (1972)
Year of Election or Appointment: 2013
Assistant Treasurer
Mr. Maher serves as Assistant Treasurer of other funds. Mr. Maher is Vice President of Valuation Oversight, serves as Assistant Treasurer of FMR Capital, Inc. (2017-present), and is an employee of Fidelity Investments. Previously, Mr. Maher served as Vice President of Asset Management Compliance (2013), Vice President of the Program Management Group of FMR (investment adviser firm, 2010-2013), and Vice President of Valuation Oversight (2008-2010).
John B. McGinty, Jr. (1962)
Year of Election or Appointment: 2016
Chief Compliance Officer
Mr. McGinty also serves as Chief Compliance Officer of other funds. Mr. McGinty is Senior Vice President of Asset Management Compliance for Fidelity Investments and is an employee of Fidelity Investments (2016-present). Mr. McGinty previously served as Vice President, Senior Attorney at Eaton Vance Management (investment management firm, 2015-2016), and prior to Eaton Vance as global CCO for all firm operations and registered investment companies at GMO LLC (investment management firm, 2009-2015). Before joining GMO LLC, Mr. McGinty served as Senior Vice President, Deputy General Counsel for Fidelity Investments (2007-2009).
Jason P. Pogorelec (1975)
Year of Election or Appointment: 2015
Assistant Secretary
Mr. Pogorelec also serves as Assistant Secretary of other funds. Mr. Pogorelec serves as Vice President, Associate General Counsel (2010-present) and is an employee of Fidelity Investments (2006-present).
Nancy D. Prior (1967)
Year of Election or Appointment: 2014
Vice President
Ms. Prior also serves as Vice President of other funds. Ms. Prior serves as President of Fixed Income (2014-present), President (2016-present) and Director (2014-present) of Fidelity Investments Money Management, Inc. (FIMM) (investment adviser firm), and is an employee of Fidelity Investments (2002-present). Previously, Ms. Prior served as Vice President of Global Asset Allocation Funds (2017-2019); Vice Chairman of FIAM LLC (investment adviser firm, 2014-2018), a Director of FMR Investment Management (UK) Limited (investment adviser firm, 2015-2018), President Multi-Asset Class Strategies of FMR's Global Asset Allocation Division (2017-2018), Vice President of Fidelity's Money Market Funds (2012-2014), and President, Money Market and Short Duration Bond Group of Fidelity Management & Research Company (FMR) (investment adviser firm, 2013-2014).
Stacie M. Smith (1974)
Year of Election or Appointment: 2013
Assistant Treasurer
Ms. Smith also serves as an officer of other funds. Ms. Smith serves as Assistant Treasurer of FMR Capital, Inc. (2017-present), is an employee of Fidelity Investments (2009-present), and has served in other fund officer roles. Prior to joining Fidelity Investments, Ms. Smith served as Senior Audit Manager of Ernst & Young LLP (accounting firm, 1996-2009). Previously, Ms. Smith served as Assistant Treasurer (2013-2018) and Deputy Treasurer (2013-2016) of certain Fidelity® funds.
Marc L. Spector (1972)
Year of Election or Appointment: 2016
Deputy Treasurer
Mr. Spector also serves as an officer of other funds. Mr. Spector serves as Assistant Treasurer of FMR Capital, Inc. (2017-present) and is an employee of Fidelity Investments (2016-present). Prior to joining Fidelity Investments, Mr. Spector served as Director at the Siegfried Group (accounting firm, 2013-2016), and prior to Siegfried Group as audit senior manager at Deloitte & Touche (accounting firm, 2005-2013).
Jim Wegmann (1979)
Year of Election or Appointment: 2019
Assistant Treasurer
Mr. Wegmann also serves as Assistant Treasurer of other funds. Mr. Wegmann is an employee of Fidelity Investments (2011-present).
Shareholder Expense Example
As a shareholder of the Fund, you incur two types of costs: (1) transaction costs and (2) ongoing costs, including management fees and other Fund expenses. This Example is intended to help you understand your ongoing costs (in dollars) of investing in the Fund and to compare these costs with the ongoing costs of investing in other mutual funds.
The Example is based on an investment of $1,000 invested at the beginning of the period and held for the entire period (May 1, 2019 to October 31, 2019).
Actual Expenses
The first line of the accompanying table provides information about actual account values and actual expenses. You may use the information in this line, together with the amount you invested, to estimate the expenses that you paid over the period. Simply divide your account value by $1,000.00 (for example, an $8,600 account value divided by $1,000.00 = 8.6), then multiply the result by the number in the first line under the heading entitled "Expenses Paid During Period" to estimate the expenses you paid on your account during this period. In addition, the Fund, as a shareholder in the underlying Fidelity Central Funds, will indirectly bear its pro-rata share of the fees and expenses incurred by the underlying Fidelity Central Funds. These fees and expenses are not included in the Fund's annualized expense ratio used to calculate the expense estimate in the table below.
Hypothetical Example for Comparison Purposes
The second line of the accompanying table provides information about hypothetical account values and hypothetical expenses based on the Fund's actual expense ratio and an assumed rate of return of 5% per year before expenses, which is not the Fund's actual return. The hypothetical account values and expenses may not be used to estimate the actual ending account balance or expenses you paid for the period. You may use this information to compare the ongoing costs of investing in the Fund and other funds. To do so, compare this 5% hypothetical example with the 5% hypothetical examples that appear in the shareholder reports of the other funds. In addition, the Fund, as a shareholder in the underlying Fidelity Central Funds, will indirectly bear its pro-rata share of the fees and expenses incurred by the underlying Fidelity Central Funds. These fees and expenses are not included in the Fund's annualized expense ratio used to calculate the expense estimate in the table below.
Please note that the expenses shown in the table are meant to highlight your ongoing costs only and do not reflect any transaction costs. Therefore, the second line of the table is useful in comparing ongoing costs only, and will not help you determine the relative total costs of owning different funds.
| | Annualized Expense Ratio-A | Beginning
Account Value
May 1, 2019 | Ending
Account Value
October 31, 2019 | Expenses Paid
During Period-B
May 1, 2019
to October 31, 2019 |
| Fidelity U.S. Sustainability Index Fund | .11% | | | |
| Actual | | $1,000.00 | $1,046.90 | $.57 |
| Hypothetical-C | | $1,000.00 | $1,024.65 | $.56 |
A Annualized expense ratio reflects expenses net of applicable fee waivers.
B Expenses are equal to the Fund's annualized expense ratio, multiplied by the average account value over the period, multiplied by 184/365 (to reflect the one-half year period).
C 5% return per year before expenses
Distributions (Unaudited)
The Board of Trustees of Fidelity U.S. Sustainability Index Fund voted to pay on December 9, 2019, to shareholders of record at the opening of business on December 6, 2019, a distribution of $0.019 per share derived from capital gains realized from sales of portfolio securities and a dividend of $0.176 per share from net investment income.
The fund hereby designates as a capital gain dividend with respect to the taxable year ended October 31, 2019, $297,237, or, if subsequently determined to be different, the net capital gain of such year.
The fund designates 92% of the dividend distributed during the fiscal year as qualifying for the dividends–received deduction for corporate shareholders.
The fund designates 97% of the dividend distributed during the fiscal year as amounts which may be taken into account as a dividend for the purposes of the maximum rate under section 1(h)(11) of the Internal Revenue Code.
The fund will notify shareholders in January 2020 of amounts for use in preparing 2019 income tax returns.
Board Approval of Investment Advisory Contracts and Management Fees
Fidelity U.S. Sustainability Index Fund
Each year, the Board of Trustees, including the Independent Trustees (together, the Board), votes on the renewal of the management contract with Fidelity Management & Research Company (FMR) and the sub-advisory agreements (together, the Advisory Contracts) for the fund, including the fund's sub-advisory agreement (Sub-Advisory Agreement) with Geode Capital Management, LLC (Geode). FMR and the sub-advisers are referred to herein as the Investment Advisers. The Board, assisted by the advice of fund counsel and Independent Trustees' counsel, requests and considers a broad range of information relevant to the renewal of the Advisory Contracts throughout the year.
The Board meets regularly and, at each of its meetings, covers an extensive agenda of topics and materials and considers factors that are relevant to its annual consideration of the renewal of the fund's Advisory Contracts, including the services and support provided to the fund and its shareholders. The Board has established four standing committees (Committees) — Operations, Audit, Fair Valuation, and Governance and Nominating — each composed of and chaired by Independent Trustees with varying backgrounds, to which the Board has assigned specific subject matter responsibilities in order to enhance effective decision-making by the Board. The Operations Committee, of which all of the Independent Trustees are members, meets regularly throughout the year and considers, among other matters, information specifically related to the annual consideration of the renewal of the fund's Advisory Contracts. The Board, acting directly and through its Committees, requests and receives information concerning the annual consideration of the renewal of the fund's Advisory Contracts. The Board also meets as needed to review matters specifically related to the Board's annual consideration of the renewal of the Advisory Contracts. Members of the Board may also meet with trustees of other Fidelity funds through joint ad hoc committees to discuss certain matters relevant to all of the Fidelity funds.
At its September 2019 meeting, the Board unanimously determined to renew the fund's Advisory Contracts. In reaching its determination, the Board considered all factors it believed relevant, including (i) the nature, extent, and quality of the services provided to the fund and its shareholders (including the investment performance of the fund); (ii) the competitiveness of the fund's management fee and total expense ratio relative to peer funds; (iii) the total costs of the services provided by and the profits realized by Fidelity and Geode from their respective relationships with the fund; and (iv) the extent to which, if any, economies of scale exist and are realized as the fund grows, and whether any economies of scale are appropriately shared with fund shareholders.
In considering whether to renew the Advisory Contracts for the fund, the Board reached a determination, with the assistance of fund counsel and Independent Trustees' counsel and through the exercise of its business judgment, that the renewal of the Advisory Contracts was in the best interests of the fund and its shareholders and that the compensation payable under the Advisory Contracts was fair and reasonable. The Board's decision to renew the Advisory Contracts was not based on any single factor, but rather was based on a comprehensive consideration of all the information provided to the Board at its meetings throughout the year. The Board, in reaching its determination to renew the Advisory Contracts, was aware that shareholders of the fund have a broad range of investment choices available to them, including a wide choice among funds offered by Fidelity's competitors, and that the fund's shareholders, who have the opportunity to review and weigh the disclosure provided by the fund in its prospectus and other public disclosures, have chosen to invest in this fund, which is part of the Fidelity family of funds.
At its July 2019 meeting, the Board voted to approve an amended and restated management contract to implement a comprehensive unitary fee for the fund (New Contract). In reaching its conclusion to approve the New Contract, the Board considered that it had received and reviewed certain information and made certain findings in connection with the annual renewal of the Advisory Contracts at its September 2018 meeting and considered how, if at all, the approval of the New Contract would change its prior conclusions. The Board considered that the New Contract would implement a comprehensive unitary fee set at the fund's current expense contract level and payable to FMR for managing the fund and paying all of the fund's operating expenses, subject to certain exceptions. The Board considered that, although the proposed unitary fee rate was higher than the fund's current management fee rate, the fund would no longer pay operating expenses under separate agreements and there would be no change to the fund's current total expense ratio. The Board also noted that the New Contract would not change the investment processes, the level or nature of services provided, the resources and personnel allocated, or trading and compliance operations. Based on its evaluation, and after considering all factors it believed relevant, the Board ultimately concluded that the advisory fee structure in the New Contract is fair and reasonable, and that the New Contract should be approved.
Approval of Amended and Restated Advisory Contracts. At its September 2019 meeting, the Board also unanimously determined to approve an amended and restated management contract and sub-advisory agreement with Geode (Amended and Restated Contracts) in connection with an upcoming consolidation of certain of Fidelity's advisory businesses. The Board considered that, on or about January 1, 2020, FMR Co., Inc. (FMRC) expects to merge with and into FMR and, after the merger, FMR expects to redomicile as a Delaware limited liability company. The Board also approved the termination of the sub-advisory agreement with FMRC upon the completion of the merger. The Board noted that references to FMR in the Amended and Restated Contracts would be updated to reflect FMR's new form of organization and domicile. The Board also approved amendments that clarify that the fund pays its non-operating expenses, including brokerage commissions and fees and expenses associated with the fund's securities lending program, if applicable. The Board also noted Fidelity's assurance that neither the planned consolidation nor the Amended and Restated Contracts will change the investment processes, the level or nature of services provided, the resources and personnel allocated, trading and compliance operations, or any fees or expenses paid by the fund.
Nature, Extent, and Quality of Services Provided. The Board considered staffing as it relates to the fund, including the backgrounds of investment personnel of Fidelity and Geode, and also considered the fund's investment objective, strategies, and related investment philosophy. The Independent Trustees also had discussions with senior management of Fidelity's investment operations and investment groups and with representatives of Geode. The Board considered the structure of the investment personnel compensation programs and whether the structures provide appropriate incentives to act in the best interests of the fund. Additionally, the Board considered the portfolio managers' investments, if any, in the funds that they manage.
The Trustees also discussed with representatives of Fidelity, at meetings throughout the year, Fidelity's role in, among other things, overseeing compliance with federal securities laws and other applicable requirements by Geode with respect to the fund and monitoring and overseeing the performance and investment capabilities of Geode. The Trustees considered that the Board had received from Fidelity periodic reports about its oversight and due diligence processes, as well as periodic reports regarding the performance of Geode.
The Board also considered the nature, extent and quality of services provided by Geode. The Trustees noted that under the Sub-Advisory Agreement, subject to oversight by Fidelity, Geode is responsible for, among other things, identifying investments and arranging for execution of portfolio transactions to implement the fund's investment strategy. In addition, the Trustees noted that Geode is responsible for providing such reporting as may be requested by Fidelity to fulfill its oversight responsibilities discussed above.
Resources Dedicated to Investment Management and Support Services. The Board reviewed the general qualifications and capabilities of Fidelity's and Geode's investment staffs, including their size, education, experience, and resources, as well as Fidelity's and Geode's approach to recruiting, managing, and compensating investment personnel. The Board considered that Fidelity's and Geode's investment professionals have extensive resources, tools and capabilities so as to provide competitive investment results over time, and that those professionals also have access to sophisticated tools that permit them to assess portfolio construction and risk and performance attribution characteristics continuously. Additionally, in its deliberations, the Board considered Fidelity's and Geode's trading, risk management, compliance, and technology and operations capabilities and resources, which are integral parts of the investment management process.
Shareholder and Administrative Services. The Board considered (i) the nature, extent, quality, and cost of advisory, administrative, and shareholder services performed by the Investment Advisers and their affiliates under the Advisory Contracts and by FMR's affiliates under separate agreements covering transfer agency, pricing and bookkeeping, and securities lending services for the fund; (ii) the nature and extent of the supervision of third party service providers, principally custodians, subcustodians, and pricing vendors; and (iii) the resources devoted to, and the record of compliance with, the fund's compliance policies and procedures. The Board also reviewed the allocation of fund brokerage, including allocations to brokers affiliated with the Investment Advisers.
The Board noted that the growth of fund assets over time across the complex allows Fidelity to reinvest in the development of services designed to enhance the value and convenience of the Fidelity funds as investment vehicles. These services include 24-hour access to account information and market information over the Internet and through telephone representatives, investor education materials and asset allocation tools, and the expanded availability of Fidelity Investor Centers.
Investment in a Large Fund Family. The Board considered the benefits to shareholders of investing in a Fidelity fund, including the benefits of investing in a fund that is part of a large family of funds offering a variety of investment disciplines and providing a large variety of mutual fund investor services. The Board noted that Fidelity had taken, or had made recommendations that resulted in the Fidelity funds taking, a number of actions over the previous year that benefited particular funds, including: (i) continuing to dedicate additional resources to Fidelity's investment research process, which includes meetings with management of issuers of securities in which the funds invest, and to the support of the senior management team that oversees asset management; (ii) continuing efforts to enhance Fidelity's global research capabilities; (iii) launching new funds with innovative structures, strategies and pricing and making other enhancements to meet client needs; (iv) launching new share classes of existing funds; (v) eliminating purchase minimums and broadening eligibility requirements for certain funds and share classes; (vi) reducing management fees and total expenses for certain target date funds and index funds; (vii) lowering expense caps for certain existing funds and classes, and converting certain voluntary expense caps to contractual caps, to reduce expenses borne by shareholders; (viii) rationalizing product lines and gaining increased efficiencies from fund mergers, liquidations, and share class consolidations; (ix) continuing to develop, acquire and implement systems and technology to improve services to the funds and shareholders, strengthen information security, and increase efficiency; and (x) continuing to implement enhancements to further strengthen Fidelity's product line to increase investors' probability of success in achieving their investment goals, including retirement income goals.
Investment Performance. The Board considered whether the fund has operated in accordance with its investment objective, as well as its record of compliance with its investment restrictions and its performance history.
The Board took into account discussions with representatives of the Investment Advisers about fund investment performance. In this regard the Board noted that as part of regularly scheduled fund reviews and other reports to the Board on fund performance, the Board considers annualized return information for the fund for different time periods, measured against the securities market index the fund seeks to track. The Board also periodically considers the fund's tracking error versus its benchmark index. In its evaluation of fund investment performance, the Board gave particular attention to information indicating underperformance of certain Fidelity funds for specific time periods and discussed with the Investment Advisers the reasons for such underperformance.
In addition to reviewing absolute and relative fund performance, the Independent Trustees periodically consider the appropriateness of fund performance metrics in evaluating the results achieved. In general, the Independent Trustees believe that an index fund's performance should be evaluated based on gross performance (before fees and expenses but after transaction costs) compared to a fund's benchmark index, over appropriate time periods, taking into account relevant factors including the following: general market conditions; the characteristics of the fund's benchmark index; the extent to which statistical sampling is employed; any securities lending revenues; and fund cash flows and other factors. Depending on the circumstances, the Independent Trustees may be satisfied with a fund's performance notwithstanding that it lags its benchmark index for certain periods.
The Independent Trustees recognize that shareholders evaluate performance on a net basis (after fees and expenses) over their own holding periods, for which one-, three-, and five-year periods are often used as a proxy. For this reason, the performance information reviewed by the Board also included net calendar year total return information for the fund and its benchmark index for the most recent one-year period.
Based on its review, the Board concluded that the nature, extent, and quality of services provided to the fund under the Advisory Contracts should continue to benefit the shareholders of the fund.
Competitiveness of Management Fee and Total Expense Ratio. The Board considered the fund's management fee and total expense ratio compared to "mapped groups" of competitive funds and classes created for the purpose of facilitating the Trustees' competitive analysis of management fees and total expenses. Fidelity creates "mapped groups" by combining similar Lipper investment objective categories that have comparable investment mandates. Combining Lipper investment objective categories aids the Board's management fee and total expense ratio comparisons by broadening the competitive group used for comparison.
Management Fee. The Board considered two proprietary management fee comparisons for the 12-month (or shorter) periods shown in basis points (BP) in the chart below. The group of Lipper funds used by the Board for management fee comparisons is referred to below as the "Total Mapped Group." The Total Mapped Group comparison focuses on a fund's standing in terms of gross management fees before expense reimbursements or caps relative to the total universe of funds with comparable investment mandates, regardless of whether their management fee structures also are comparable. Funds with comparable investment mandates offer exposure to similar types of securities. Funds with comparable management fee structures have similar management fee contractual arrangements (
e.g., flat rate charged for advisory services, all-inclusive fee rate,
etc.). "TMG %" represents the percentage of funds in the Total Mapped Group that had management fees that were lower than the fund's. For example, a hypothetical TMG % of 20% would mean that 80% of the funds in the Total Mapped Group had higher, and 20% had lower, management fees than the fund. The fund's actual TMG %s and the number of funds in the Total Mapped Group are in the chart below. The "Asset-Size Peer Group" (ASPG) comparison focuses on a fund's standing relative to a subset of non-Fidelity funds within the Total Mapped Group that are similar in size and management fee structure. For example, if a fund is in the first quartile of the ASPG, the fund's management fee ranks in the least expensive or lowest 25% of funds in the ASPG. The ASPG represents at least 15% of the funds in the Total Mapped Group with comparable asset size and management fee structures, subject to a minimum of 50 funds (or all funds in the Total Mapped Group if fewer than 50). Additional information, such as the ASPG quartile in which the fund's management fee rate ranked, is also included in the chart and was considered by the Board.
Fidelity U.S. Sustainability Index Fund
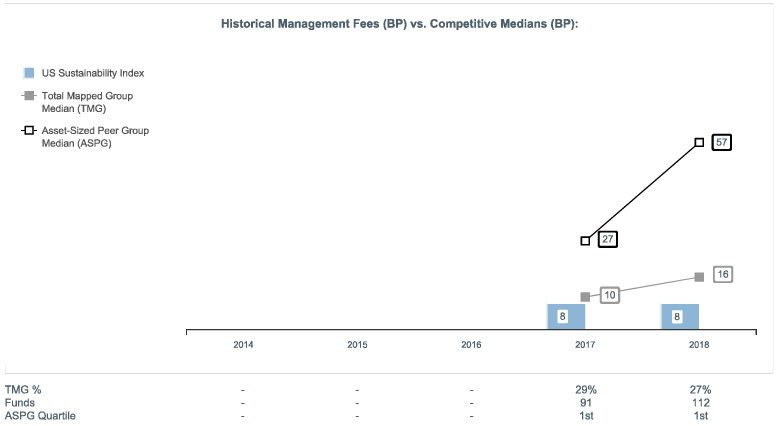
The Board noted that the fund's management fee rate ranked below the median of its Total Mapped Group and below the median of its ASPG for 2018.
The Board considered that, as a result of its approval of the New Contract at the July 2019 meeting, the fund's management fee rate was increased from 0.08% to 0.11% effective August 1, 2019, but that the fund no longer paid operating expenses under separate agreements.
The Board noted that it and the boards of other Fidelity funds formed an ad hoc Committee on Group Fee, which meets periodically, to conduct an in-depth review of the "group fee" component of the management fee of funds with such management fee structures. The Committee's focus included the mechanics of the group fee, the competitive landscape of group fee structures, Fidelity funds with no group fee component (such as the fund) and investment products not included in group fee assets. The Board also considered that, for funds subject to the group fee, FMR agreed to voluntarily waive fees over a specified period of time in amounts designed to account for assets converted from certain funds to certain collective investment trusts.
Based on its review, the Board concluded that the fund's management fee is fair and reasonable in light of the services that the fund receives and the other factors considered.
Total Expense Ratio. In its review of the fund's total expense ratio, the Board considered the fund's unitary fee rate, which covers expenses paid by FMR under the fund's management contract, such as transfer agent fees, pricing and bookkeeping fees and custodial, legal, and audit fees. The Board also noted that Fidelity may agree to waive fees or reimburse expenses from time to time, and the extent to which, if any, it has done so for the fund. As part of its review, the Board also considered the current and historical total expense ratios of the fund compared to competitive fund median expenses. The fund is compared to those funds and classes in the Total Mapped Group (used by the Board for management fee comparisons) that have a similar sales load structure.
The Board noted that the fund's total expense ratio ranked below the competitive median for 2018.
Fees Charged to Other Clients. The Board also considered fee structures applicable to clients of Fidelity and Geode, such as other funds advised or subadvised by Fidelity or Geode, pension plan clients, and other institutional clients with similar mandates. The Board noted that a joint ad hoc committee created by it and the boards of other Fidelity funds periodically reviews and compares Fidelity's institutional investment advisory business with its business of providing services to the Fidelity funds and also noted the most recent findings of the committee. The Board noted that the committee's review included a consideration of the differences in services provided, fees charged, and costs incurred, as well as competition in the markets serving the different categories of clients.
Based on its review of total expense ratios and fees charged to other Fidelity clients, the Board concluded that the fund's total expense ratio was reasonable in light of the services that the fund and its shareholders receive and the other factors considered.
Costs of the Services and Profitability. The Board considered the revenues earned and the expenses incurred by Fidelity in conducting the business of developing, marketing, distributing, managing, administering and servicing the fund and servicing the fund's shareholders. The Board also considered the level of Fidelity's profits in respect of all the Fidelity funds.
On an annual basis, Fidelity presents to the Board information about the profitability of its relationships with the fund. Fidelity calculates profitability information for each fund, as well as aggregate profitability information for groups of Fidelity funds and all Fidelity funds, using a series of detailed revenue and cost allocation methodologies which originate with the books and records of Fidelity on which Fidelity's audited financial statements are based. The Audit Committee of the Board reviews any significant changes from the prior year's methodologies and the full Board approves such changes.
PricewaterhouseCoopers LLP (PwC), auditor to Fidelity and certain Fidelity funds, has been engaged annually by the Board as part of the Board's assessment of Fidelity's profitability analysis. PwC's engagement includes the review and assessment of the methodologies used by Fidelity in determining the revenues and expenses attributable to Fidelity's mutual fund business, and completion of agreed-upon procedures in respect of the mathematical accuracy of the fund profitability information and its conformity to established allocation methodologies. After considering PwC's reports issued under the engagement and information provided by Fidelity, the Board concluded that while other allocation methods may also be reasonable, Fidelity's profitability methodologies are reasonable in all material respects.
The Board also reviewed Fidelity's and Geode's non-fund businesses and potential indirect benefits such businesses may have received as a result of their association with Fidelity's mutual fund business (i.e., fall-out benefits) as well as cases where Fidelity's and Geode's affiliates may benefit from the fund's business. The Board noted that changes to fall-out benefits year-over-year reflect business developments at Fidelity's and Geode's various businesses. The Board considered that a joint ad hoc committee created by it and the boards of other Fidelity funds had recently been established, and meets periodically, to evaluate potential fall-out benefits. The Board noted that the committee was expected to, among other things: (i) discuss the legal framework surrounding potential fall-out benefits; (ii) review the Board's responsibilities and approach to potential fall-out benefits; and (iii) review practices employed by competitor funds regarding the review of potential fall-out benefits. The Board noted that it would consider the committee's findings in connection with future consideration of contract renewals.
The Board considered the costs of the services provided by and the profits realized by Fidelity in connection with the operation of the fund and was satisfied that the profitability was not excessive.
The Board also considered information regarding the profitability of Geode's relationship with the fund.
Economies of Scale. The Board considered whether there have been economies of scale in respect of the management of the Fidelity funds, whether the Fidelity funds (including the fund) have appropriately benefited from any such economies of scale, and whether there is potential for realization of any further economies of scale. The Board considered the extent to which the fund will benefit from economies of scale as assets grow through increased services to the fund, through waivers or reimbursements, or through fee or expense ratio reductions. The Board recognized that, due to the fund's current contractual arrangements, its expense ratio will not decline if the fund's operating costs decrease as assets grow, or rise as assets decrease. The Board also noted that a committee (the Economies of Scale Committee) created by it and the boards of other Fidelity funds periodically analyzes whether Fidelity attains economies of scale in respect of the management and servicing of the Fidelity funds, whether the Fidelity funds have appropriately benefited from such economies of scale, and whether there is potential for realization of any further economies of scale.
The Board concluded, taking into account the analysis of the Economies of Scale Committee, that economies of scale, if any, are being appropriately shared between fund shareholders and Fidelity.
Additional Information Requested by the Board. In order to develop fully the factual basis for consideration of the Fidelity funds' advisory contracts, the Board requested and received additional information on certain topics, including: (i) Fidelity's fund profitability methodology, profitability trends for certain funds, the allocation of various costs to different funds, and the impact of certain factors on fund profitability results; (ii) portfolio manager changes that have occurred during the past year and the amount of the investment that each portfolio manager has made in the Fidelity fund(s) that he or she manages; (iii) Fidelity's compensation structure for portfolio managers, research analysts, and other key personnel, including its effects on fund profitability, the rationale for the compensation structure, and the extent to which current market conditions have affected retention and recruitment; (iv) the arrangements with and compensation paid to certain fund sub-advisers on behalf of the Fidelity funds and the treatment of such compensation within Fidelity's fund profitability methodology; (v) the practices of certain sub-advisers regarding their receipt of research from broker-dealers that execute the funds' portfolio transactions; (vi) the terms of Fidelity's voluntary expense limitation agreements; (vii) the methodology with respect to competitive fund data and peer group classifications; (viii) Fidelity's transfer agent fee, expense, and service structures for different funds and classes relative to competitive trends, and the impact of the increased use of omnibus accounts; (ix) new developments in the retail and institutional marketplaces and the competitive positioning of the funds relative to other investment products and services; (x) the impact on fund profitability of recent changes in total net assets for Fidelity's money market funds, anticipated changes to the competitive landscape for money market funds, and the level of investor comfort with gates, fees, and floating NAVs; (xi) the funds' share class structures and distribution channels; and (xii) explanations regarding the relative total expense ratios of certain funds and classes, total expense competitive trends and methodologies for total expense competitive comparisons, and actions that might be taken by Fidelity to reduce total expense ratios for certain classes. In addition, the Board considered its discussions with Fidelity throughout the year regarding enhanced information security initiatives and the funds' fair valuation policies.
Based on its evaluation of all of the conclusions noted above, and after considering all factors it believed relevant, the Board concluded that the advisory and sub-advisory fee arrangements are fair and reasonable, and that the fund's Advisory Contracts should be renewed and the fund's Amended and Restated Contracts should be approved.
USY-ANN-1219
1.9883815.102
Fidelity® International Sustainability Index Fund
Annual Report
October 31, 2019
See the inside front cover for important information about access to your fund’s shareholder reports.
Beginning on January 1, 2021, as permitted by regulations adopted by the Securities and Exchange Commission, paper copies of a fund’s shareholder reports will no longer be sent by mail, unless you specifically request paper copies of the reports from the fund or from your financial intermediary, such as a financial advisor, broker-dealer or bank. Instead, the reports will be made available on a website, and you will be notified by mail each time a report is posted and provided with a website link to access the report.
If you already elected to receive shareholder reports electronically, you will not be affected by this change and you need not take any action. You may elect to receive shareholder reports and other communications from a fund electronically, by contacting your financial intermediary. For Fidelity customers, visit Fidelity's web site or call Fidelity using the contact information listed below.
You may elect to receive all future reports in paper free of charge. If you wish to continue receiving paper copies of your shareholder reports, you may contact your financial intermediary or, if you are a Fidelity customer, visit Fidelity’s website, or call Fidelity at the applicable toll-free number listed below. Your election to receive reports in paper will apply to all funds held with the fund complex/your financial intermediary.
| Account Type | Website | Phone Number |
| Brokerage, Mutual Fund, or Annuity Contracts: | fidelity.com/mailpreferences | 1-800-343-3548 |
| Employer Provided Retirement Accounts: | netbenefits.fidelity.com/preferences (choose 'no' under Required Disclosures to continue to print) | 1-800-343-0860 |
| Advisor Sold Accounts Serviced Through Your Financial Intermediary: | Contact Your Financial Intermediary | Your Financial Intermediary's phone number |
| Advisor Sold Accounts Serviced by Fidelity: | institutional.fidelity.com | 1-877-208-0098 |
Contents
To view a fund's proxy voting guidelines and proxy voting record for the 12-month period ended June 30, visit http://www.fidelity.com/proxyvotingresults or visit the Securities and Exchange Commission's (SEC) web site at http://www.sec.gov.
You may also call 1-800-544-8544 to request a free copy of the proxy voting guidelines.
The funds or securities referred to herein are not sponsored, endorsed, or promoted by MSCI, and MSCI bears no liability with respect to any such funds or securities or any index on which such funds or securities are based. The prospectus contains a more detailed description of the limited relationship MSCI has with Fidelity and any related funds.
Standard & Poor's, S&P and S&P 500 are registered service marks of The McGraw-Hill Companies, Inc. and have been licensed for use by Fidelity Distributors Corporation.
Other third-party marks appearing herein are the property of their respective owners.
All other marks appearing herein are registered or unregistered trademarks or service marks of FMR LLC or an affiliated company. © 2019 FMR LLC. All rights reserved.
This report and the financial statements contained herein are submitted for the general information of the shareholders of the Fund. This report is not authorized for distribution to prospective investors in the Fund unless preceded or accompanied by an effective prospectus.
A fund files its complete schedule of portfolio holdings with the SEC for the first and third quarters of each fiscal year on Form N-PORT. Forms N-PORT are available on the SEC’s web site at http://www.sec.gov. A fund's Forms N-PORT may be reviewed and copied at the SEC’s Public Reference Room in Washington, DC. Information regarding the operation of the SEC's Public Reference Room may be obtained by calling 1-800-SEC-0330.
For a complete list of a fund's portfolio holdings, view the most recent holdings listing, semiannual report, or annual report on Fidelity's web site at http://www.fidelity.com, http://www.institutional.fidelity.com, or http://www.401k.com, as applicable.
NOT FDIC INSURED •MAY LOSE VALUE •NO BANK GUARANTEE
Neither the Fund nor Fidelity Distributors Corporation is a bank.
Performance: The Bottom Line
Average annual total return reflects the change in the value of an investment, assuming reinvestment of distributions from dividend income and capital gains (the profits earned upon the sale of securities that have grown in value, if any) and assuming a constant rate of performance each year. The hypothetical investment and the average annual total returns do not reflect the deduction of taxes that a shareholder would pay on fund distributions or the redemption of fund shares. During periods of reimbursement by Fidelity, a fund’s total return will be greater than it would be had the reimbursement not occurred. How a fund did yesterday is no guarantee of how it will do tomorrow.
Average Annual Total Returns
| For the periods ended October 31, 2019 | Past 1 year | Life of fundA |
| Fidelity® International Sustainability Index Fund | 12.81% | 4.98% |
A From May 9, 2017
$10,000 Over Life of Fund
Let's say hypothetically that $10,000 was invested in Fidelity® International Sustainability Index Fund on May 9, 2017, when the fund started.
The chart shows how the value of your investment would have changed, and also shows how the MSCI ACWI (All Country World Index) ex USA ESG Leaders Index performed over the same period.
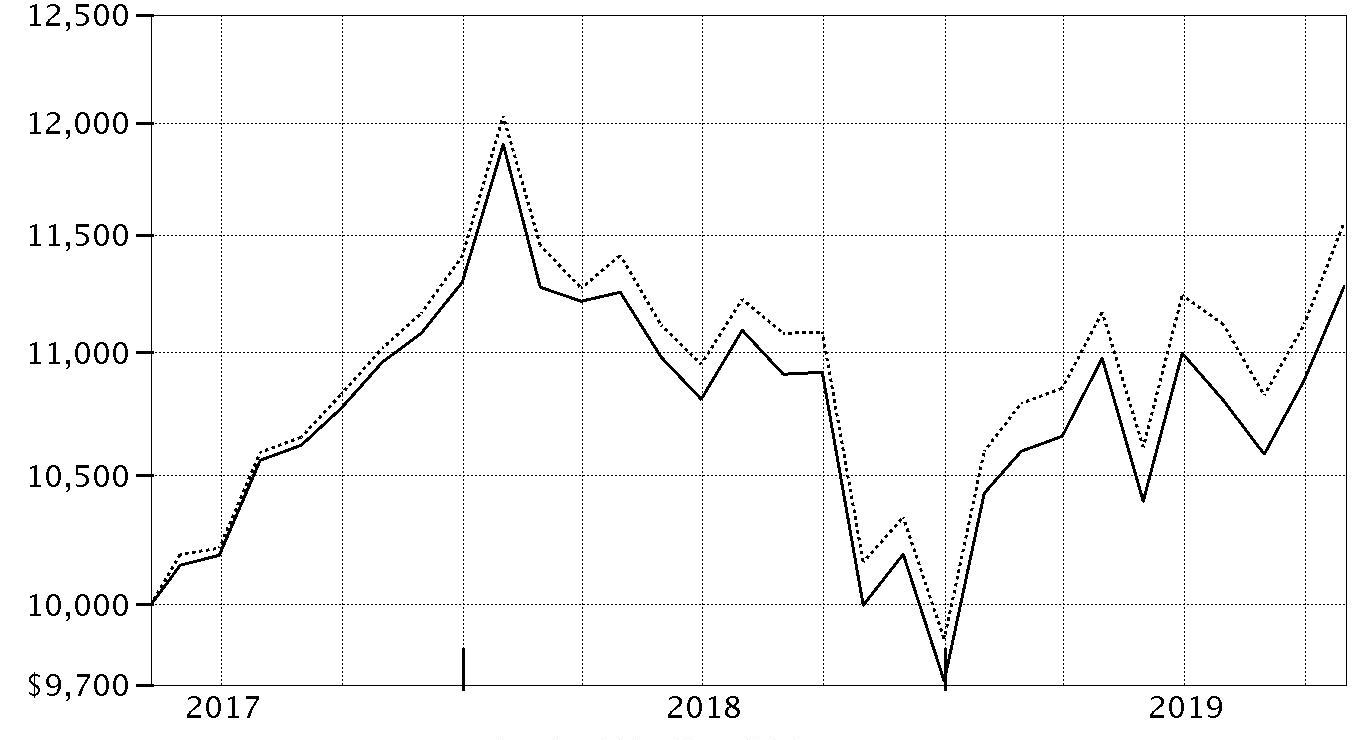
| Period Ending Values |
| $11,279 | Fidelity® International Sustainability Index Fund |
| $11,558 | MSCI ACWI (All Country World Index) ex USA ESG Leaders Index |
Management's Discussion of Fund Performance
Market Recap: The MSCI ACWI (All Country World Index) ex USA Index gained 11.47% for the 12 months ending October 31, 2019, as international stocks reflected a confluence of factors, including escalating trade tension, moderating but still positive global economic growth and uncertainty about the U.K.’s planned “Brexit” from the European Union. In late December, the U.S. Federal Reserve shifted from raising interest rates to a more dovish policy in 2019, joining many foreign central banks that had cut policy rates. In June, international stocks rose 6.03%, as policy stimulus in China stabilized that country’s economic growth. The Fed cut its policy rate in July for the first time since 2008. However, the index returned -1.21% for the month, followed by -3.08% in August. In September, the Fed cut its policy rate another quarter point, citing concerns about slowing economic growth and muted inflation, and did the same in October, leading to monthly gains of 2.59% and 3.49%, respectively. For the full 12 months, the growth-oriented information technology sector (+22%) led the way, followed by utilities (+20%) and real estate (+18%), two high-dividend-yielding categories. Consumer discretionary gained 16%. Conversely, energy was roughly flat, while materials (+6%) and communication services (7%) also lagged. By region, Asia Pacific ex Japan (+16%), Europe ex U.K (+13%), Canada (+12%) and emerging markets (+12%) fared best. Meanwhile, the U.K. (+7%) and Japan (+10%) trailed the broader market.
Comments from the Geode Capital Management, LLC, passive equity index team: For the fiscal year, the fund gained 12.81%, compared with the 13.74% advance of the benchmark MSCI AC (All Country) ex USA ESG Leaders Index.
(The fund's performance relative to the index can be affected by Fidelity's methodologies for valuing certain foreign stocks and for incorporating foreign exchange rates, which differ from those used by the index.) Of the 11 sectors within the index, only one, energy (-1%), declined the past 12 months, whereas most produced double-digit gains. On an individual basis, shares of South African energy and chemical company Sasol (-44%) fell sharply in May, as the firm announced higher-than-expected costs for its Louisiana energy project. Several other energy stocks were notable detractors against a backdrop of sluggish energy pricing as well. These laggards included France's Total (-8%), Norway-based Equinor (-26%) and Canada's Encana (-61%). In contrast, semiconductor foundry Taiwan Semiconductor Manufacturing (+33%) was the leading contributor, after the company reported better-than-expected quarterly financial results. Similarly, shares of Dutch semiconductor equipment supplier ASML Holding (+54%) also rose meaningfully on the heels of higher third-quarter revenue. Chinese e-commerce firm Alibaba (+10%) announced strong quarterly earnings, while China-based internet gaming company Tencent Holdings (+20%), also outperformed.
The views expressed above reflect those of the portfolio manager(s) only through the end of the period as stated on the cover of this report and do not necessarily represent the views of Fidelity or any other person in the Fidelity organization. Any such views are subject to change at any time based upon market or other conditions and Fidelity disclaims any responsibility to update such views. These views may not be relied on as investment advice and, because investment decisions for a Fidelity fund are based on numerous factors, may not be relied on as an indication of trading intent on behalf of any Fidelity fund.
Note to Shareholders: On March 22, 2019, Pat Waddell retired and is no longer a portfolio manager with Geode Capital Management.
Investment Summary (Unaudited)
Top Ten Stocks as of October 31, 2019
| | % of fund's net assets |
| Alibaba Group Holding Ltd. sponsored ADR (Cayman Islands, Internet & Direct Marketing Retail) | 2.3 |
| Taiwan Semiconductor Manufacturing Co. Ltd. (Taiwan, Semiconductors & Semiconductor Equipment) | 2.2 |
| Tencent Holdings Ltd. (Cayman Islands, Interactive Media & Services) | 2.1 |
| Roche Holding AG (participation certificate) (Switzerland, Pharmaceuticals) | 1.9 |
| SAP SE (Germany, Software) | 1.2 |
| Total SA (France, Oil, Gas & Consumable Fuels) | 1.1 |
| GlaxoSmithKline PLC (United Kingdom, Pharmaceuticals) | 1.0 |
| ASML Holding NV (Netherlands) (Netherlands, Semiconductors & Semiconductor Equipment) | 1.0 |
| The Toronto-Dominion Bank (Canada, Banks) | 0.9 |
| Allianz SE (Germany, Insurance) | 0.9 |
| | 14.6 |
Top Market Sectors as of October 31, 2019
| | % of fund's net assets |
| Financials | 22.0 |
| Consumer Discretionary | 11.8 |
| Industrials | 11.7 |
| Information Technology | 9.2 |
| Consumer Staples | 8.8 |
| Health Care | 8.8 |
| Materials | 6.7 |
| Communication Services | 6.7 |
| Energy | 5.0 |
| Utilities | 3.3 |
Geographic Diversification (% of fund's net assets)
| As of October 31, 2019 |
| | Japan | 15.6% |
| | United Kingdom | 7.6% |
| | Canada | 7.3% |
| | Germany | 7.0% |
| | France | 6.3% |
| | Australia | 6.2% |
| | Cayman Islands | 5.5% |
| | Switzerland | 5.1% |
| | Taiwan | 4.2% |
| | Other | 35.2% |
Percentages are based on country or territory of incorporation and are adjusted for the effect of futures contracts, if applicable.
Asset Allocation as of October 31, 2019
| | % of fund's net assets |
| Stocks and Equity Futures | 100.0 |
Schedule of Investments October 31, 2019
Showing Percentage of Net Assets
| Common Stocks - 95.9% | | | |
| | | Shares | Value |
| Argentina - 0.0% | | | |
| BBVA Banco Frances SA sponsored ADR | | 356 | $1,246 |
| Transportadora de Gas del Sur SA Class B sponsored ADR | | 388 | 2,933 |
|
| TOTAL ARGENTINA | | | 4,179 |
|
| Australia - 6.2% | | | |
| AMP Ltd. | | 22,074 | 27,891 |
| APA Group unit | | 7,748 | 62,234 |
| ASX Ltd. | | 1,256 | 71,293 |
| Aurizon Holdings Ltd. | | 12,526 | 50,959 |
| Australia & New Zealand Banking Group Ltd. | | 18,295 | 336,209 |
| Bendigo & Adelaide Bank Ltd. | | 3,162 | 23,206 |
| BlueScope Steel Ltd. | | 3,417 | 31,280 |
| Boral Ltd. | | 7,585 | 26,334 |
| Brambles Ltd. | | 10,069 | 83,241 |
| Coca-Cola Amatil Ltd. | | 3,439 | 24,134 |
| Cochlear Ltd. | | 370 | 53,979 |
| Coles Group Ltd. | | 7,152 | 74,015 |
| Commonwealth Bank of Australia | | 11,416 | 618,977 |
| Computershare Ltd. | | 3,136 | 34,231 |
| CSL Ltd. | | 2,930 | 516,724 |
| DEXUS Property Group unit | | 6,999 | 57,717 |
| Fortescue Metals Group Ltd. | | 8,758 | 53,604 |
| Goodman Group unit | | 10,637 | 105,618 |
| Harvey Norman Holdings Ltd. | | 3,769 | 10,634 |
| Insurance Australia Group Ltd. | | 14,930 | 81,803 |
| Lendlease Group unit | | 3,600 | 46,533 |
| Macquarie Group Ltd. | | 2,092 | 193,170 |
| Mirvac Group unit | | 24,901 | 55,178 |
| National Australia Bank Ltd. | | 18,131 | 355,896 |
| Newcrest Mining Ltd. | | 4,963 | 108,334 |
| Orica Ltd. | | 2,400 | 37,929 |
| Origin Energy Ltd. | | 11,201 | 60,726 |
| Ramsay Health Care Ltd. | | 1,055 | 49,849 |
| SEEK Ltd. | | 2,159 | 33,788 |
| SP AusNet | | 12,365 | 15,795 |
| Stockland Corp. Ltd. unit | | 15,151 | 51,149 |
| Sydney Airport unit | | 7,013 | 42,474 |
| Telstra Corp. Ltd. | | 26,499 | 63,821 |
| The GPT Group unit | | 12,316 | 50,554 |
| Transurban Group unit | | 17,276 | 176,940 |
| Wesfarmers Ltd. | | 7,350 | 201,941 |
| Westpac Banking Corp. | | 22,233 | 431,665 |
| Woodside Petroleum Ltd. | | 6,083 | 134,820 |
| WorleyParsons Ltd. | | 2,238 | 21,006 |
|
| TOTAL AUSTRALIA | | | 4,475,651 |
|
| Austria - 0.1% | | | |
| Andritz AG | | 483 | 21,698 |
| OMV AG | | 931 | 54,326 |
| Voestalpine AG | | 788 | 19,730 |
|
| TOTAL AUSTRIA | | | 95,754 |
|
| Bailiwick of Jersey - 0.3% | | | |
| Ferguson PLC | | 1,459 | 124,589 |
| Polymetal International PLC | | 1,335 | 21,902 |
| WPP PLC | | 8,025 | 100,148 |
|
| TOTAL BAILIWICK OF JERSEY | | | 246,639 |
|
| Belgium - 0.4% | | | |
| Colruyt NV | | 367 | 20,400 |
| KBC Groep NV | | 1,647 | 115,504 |
| Solvay SA Class A | | 489 | 53,175 |
| Titan Cement International Trading SA (a) | | 212 | 4,426 |
| Titan Cement International Trading SA (a) | | 20 | 424 |
| UCB SA | | 830 | 66,891 |
| Umicore SA | | 1,250 | 51,541 |
|
| TOTAL BELGIUM | | | 312,361 |
|
| Bermuda - 0.1% | | | |
| Alibaba Health Information Technology Ltd. (a) | | 24,000 | 24,156 |
| Alibaba Pictures Group Ltd. (a) | | 90,000 | 14,762 |
| Beijing Enterprises Water Group Ltd. | | 38,000 | 19,807 |
| HengTen Networks Group Ltd. (a) | | 204,000 | 2,935 |
| Neo-China Group (Holdings) Ltd. | | 3,000 | 374 |
| Shangri-La Asia Ltd. | | 8,000 | 8,211 |
| Sihuan Pharmaceutical Holdings Group Ltd. | | 30,000 | 3,931 |
|
| TOTAL BERMUDA | | | 74,176 |
|
| Brazil - 0.9% | | | |
| Atacadao Distribuicao Comercio e Industria Ltda | | 2,400 | 11,436 |
| B2W Companhia Global do Varejo (a) | | 1,400 | 17,733 |
| Banco do Brasil SA | | 5,500 | 66,033 |
| Banco Santander SA (Brasil) unit | | 2,700 | 31,682 |
| BM&F BOVESPA SA | | 13,300 | 160,442 |
| BR Malls Participacoes SA | | 5,300 | 20,286 |
| Cielo SA | | 7,100 | 13,384 |
| Cosan SA Industria e Comercio | | 1,000 | 14,410 |
| Energisa SA unit | | 1,000 | 11,949 |
| ENGIE Brasil Energia SA | | 1,350 | 15,235 |
| Klabin SA unit | | 4,500 | 17,751 |
| Localiza Rent A Car SA | | 3,800 | 40,914 |
| Lojas Renner SA | | 5,130 | 64,916 |
| M. Dias Branco SA | | 600 | 5,648 |
| Multiplan Empreendimentos Imobiliarios SA | | 1,900 | 13,838 |
| Natura Cosmeticos SA | | 2,500 | 19,424 |
| Notre Dame Intermedica Participacoes SA | | 2,200 | 32,914 |
| TIM Participacoes SA | | 5,800 | 16,516 |
| Ultrapar Participacoes SA | | 4,500 | 21,173 |
| Weg SA | | 5,440 | 34,589 |
|
| TOTAL BRAZIL | | | 630,273 |
|
| Canada - 7.1% | | | |
| Agnico Eagle Mines Ltd. (Canada) | | 1,510 | 92,806 |
| Alimentation Couche-Tard, Inc. Class B (sub. vtg.) | | 5,681 | 170,374 |
| AltaGas Ltd. | | 1,854 | 26,970 |
| Aurora Cannabis, Inc. (a)(b) | | 4,787 | 17,155 |
| Bank of Montreal | | 4,153 | 307,431 |
| Bank of Nova Scotia | | 7,908 | 453,550 |
| BlackBerry Ltd. (a) | | 3,544 | 18,620 |
| CAE, Inc. | | 1,722 | 43,184 |
| Canadian Imperial Bank of Commerce | | 2,895 | 246,859 |
| Canadian National Railway Co. | | 4,677 | 418,306 |
| Canadian Tire Ltd. Class A (non-vtg.) | | 396 | 42,691 |
| Cenovus Energy, Inc. (Canada) | | 6,790 | 57,842 |
| CGI Group, Inc. Class A (sub. vtg.) (a) | | 1,602 | 124,526 |
| Cronos Group, Inc. (a) | | 1,263 | 10,337 |
| Empire Co. Ltd. Class A (non-vtg.) | | 1,152 | 30,586 |
| Enbridge, Inc. | | 13,042 | 475,002 |
| Encana Corp. (Toronto) | | 8,346 | 32,697 |
| First Capital Realty, Inc. | | 1,170 | 19,365 |
| Fortis, Inc. | | 2,803 | 116,453 |
| Franco-Nevada Corp. | | 1,194 | 115,855 |
| Gildan Activewear, Inc. | | 1,351 | 34,516 |
| Loblaw Companies Ltd. | | 1,183 | 63,089 |
| Lundin Mining Corp. | | 4,411 | 22,271 |
| Magna International, Inc. Class A (sub. vtg.) | | 1,959 | 105,335 |
| Metro, Inc. Class A (sub. vtg.) | | 1,660 | 70,201 |
| Nutrien Ltd. | | 3,794 | 181,505 |
| Open Text Corp. | | 1,777 | 71,803 |
| PrairieSky Royalty Ltd. | | 1,540 | 15,036 |
| Rogers Communications, Inc. Class B (non-vtg.) | | 2,320 | 109,227 |
| Shopify, Inc. Class A (a) | | 642 | 201,310 |
| Sun Life Financial, Inc. | | 3,846 | 172,546 |
| Suncor Energy, Inc. | | 10,173 | 302,464 |
| Teck Resources Ltd. Class B (sub. vtg.) | | 3,280 | 51,848 |
| TELUS Corp. | | 1,329 | 47,273 |
| The Toronto-Dominion Bank | | 11,835 | 675,811 |
| Vermilion Energy, Inc. | | 1,024 | 13,528 |
| West Fraser Timber Co. Ltd. | | 369 | 17,062 |
| Wheaton Precious Metals Corp. | | 2,847 | 79,805 |
| WSP Global, Inc. | | 688 | 42,928 |
|
| TOTAL CANADA | | | 5,098,167 |
|
| Cayman Islands - 5.5% | | | |
| 3SBio, Inc. (a)(c) | | 8,500 | 15,833 |
| 51job, Inc. sponsored ADR (a) | | 168 | 13,233 |
| AAC Technology Holdings, Inc. | | 4,500 | 29,121 |
| Alibaba Group Holding Ltd. sponsored ADR (a) | | 9,171 | 1,620,229 |
| ASM Pacific Technology Ltd. | | 2,000 | 27,926 |
| Baozun, Inc. sponsored ADR (a)(b) | | 236 | 10,271 |
| Chailease Holding Co. Ltd. | | 7,262 | 32,741 |
| China Aoyuan Property Group Ltd. | | 8,000 | 10,223 |
| China Conch Venture Holdings Ltd. | | 10,500 | 41,085 |
| China First Capital Group Ltd. (a) | | 18,000 | 5,118 |
| China Medical System Holdings Ltd. | | 9,000 | 12,205 |
| China Mengniu Dairy Co. Ltd. | | 18,000 | 71,761 |
| Country Garden Services Holdings Co. Ltd. | | 8,000 | 27,107 |
| Dali Foods Group Co. Ltd. (c) | | 14,000 | 9,572 |
| ENN Energy Holdings Ltd. | | 5,000 | 57,043 |
| Geely Automobile Holdings Ltd. | | 32,000 | 60,551 |
| Genscript Biotech Corp. (a) | | 6,000 | 14,376 |
| Greentown Service Group Co. Ltd. | | 8,000 | 9,077 |
| Hutchison China Meditech Ltd. sponsored ADR (a) | | 368 | 6,955 |
| Jiayuan International Group Ltd. | | 3 | 1 |
| Kingdee International Software Group Co. Ltd. | | 15,000 | 16,436 |
| Lee & Man Paper Manufacturing Ltd. | | 11,000 | 6,117 |
| Meituan Dianping Class B (a) | | 6,400 | 76,340 |
| Pinduoduo, Inc. ADR (a) | | 1,234 | 50,446 |
| Shenzhou International Group Holdings Ltd. | | 4,900 | 67,711 |
| Shui On Land Ltd. | | 20,500 | 4,125 |
| Sino Biopharmaceutical Ltd. | | 44,500 | 66,256 |
| SOHO China Ltd. | | 12,000 | 4,095 |
| Tencent Holdings Ltd. | | 36,800 | 1,492,715 |
| Towngas China Co. Ltd. | | 6,080 | 4,687 |
| Vipshop Holdings Ltd. ADR (a) | | 2,824 | 32,589 |
| Wuxi Biologics (Cayman), Inc. (a)(c) | | 3,500 | 41,130 |
| Yuzhou Properties Co. | | 12,707 | 5,368 |
| Zhongsheng Group Holdings Ltd. Class H | | 3,500 | 11,603 |
|
| TOTAL CAYMAN ISLANDS | | | 3,954,046 |
|
| Chile - 0.2% | | | |
| Aguas Andinas SA | | 16,826 | 7,714 |
| Compania de Petroleos de Chile SA (COPEC) | | 2,581 | 23,078 |
| Empresa Nacional de Telecomunicaciones SA (ENTEL) (a) | | 972 | 7,603 |
| Empresas CMPC SA | | 7,496 | 17,082 |
| Enersis SA | | 240,145 | 44,849 |
| LATAM Airlines Group SA | | 1,981 | 21,904 |
| S.A.C.I. Falabella | | 5,164 | 26,287 |
|
| TOTAL CHILE | | | 148,517 |
|
| China - 1.5% | | | |
| Air China Ltd. (H Shares) | | 14,000 | 12,361 |
| Baic Motor Corp. Ltd. (H Shares) (c) | | 9,500 | 5,893 |
| Bank of Shanghai Co. Ltd. (A Shares) | | 3,290 | 4,356 |
| BBMG Corp.: | | | |
| (A Shares) | | 5,200 | 2,407 |
| (H Shares) | | 13,000 | 3,721 |
| BYD Co. Ltd. (H Shares) | | 5,000 | 23,453 |
| China CITIC Bank Corp. Ltd. (H Shares) | | 57,000 | 33,041 |
| China Construction Bank Corp. (H Shares) | | 619,000 | 495,986 |
| China Eastern Airlines Corp. Ltd.: | | | |
| (A Shares) (a) | | 2,000 | 1,470 |
| (H Shares) (a) | | 14,000 | 6,982 |
| China Everbright Bank Co. Ltd. (H Shares) | | 21,000 | 9,664 |
| China International Marine Containers Group Co. Ltd. | | 480 | 661 |
| China Longyuan Power Grid Corp. Ltd. (H Shares) | | 22,000 | 11,885 |
| China Merchants Bank Co. Ltd. (H Shares) | | 25,000 | 119,231 |
| China Merchants Securities Co. Ltd. (A Shares) | | 1,000 | 2,333 |
| China Merchants Shekou Industrial Zone Holdings Co. Ltd. (A Shares) | | 1,800 | 4,781 |
| China Minsheng Banking Corp. Ltd. (H Shares) | | 43,000 | 30,077 |
| China Molybdenum Co. Ltd.: | | | |
| (H Shares) | | 24,000 | 7,563 |
| Class A | | 4,900 | 2,363 |
| China Shenhua Energy Co. Ltd.: | | | |
| (A Shares) | | 1,300 | 3,402 |
| (H Shares) | | 22,500 | 45,696 |
| China Vanke Co. Ltd.: | | | |
| (A Shares) | | 2,500 | 9,406 |
| (H Shares) | | 10,400 | 37,924 |
| Contemporary Amperex Technology Co. Ltd. | | 200 | 1,951 |
| COSCO Shipping Development Co. Ltd. (A Shares) | | 1,500 | 530 |
| Greenland Holdings Corp. Ltd. (A Shares) | | 1,600 | 1,548 |
| Guangzhou Automobile Group Co. Ltd. (H Shares) | | 19,200 | 19,176 |
| Hangzhou Robam Appliances Co. Ltd. (A Shares) | | 300 | 1,341 |
| Huadong Medicine Co. Ltd. (A Shares) | | 480 | 1,777 |
| Huaneng Renewables Corp. Ltd. (H Shares) | | 28,000 | 10,690 |
| Inner Mongolia Yitai Coal Co. Ltd. (B Shares) | | 9,200 | 8,025 |
| Jiangsu Expressway Co. Ltd. (H Shares) | | 8,000 | 10,628 |
| Jinke Properties Group Co. Ltd. (A Shares) | | 1,800 | 1,771 |
| Legend Holdings Corp. (H Shares) (c) | | 2,100 | 4,616 |
| NARI Technology Co. Ltd. (A Shares) | | 700 | 2,180 |
| Offshore Oil Enginering Co. Ltd. (A Shares) | | 1,000 | 856 |
| Poly Developments & Holdings (A Shares) | | 3,200 | 6,541 |
| Shandong Weigao Medical Polymer Co. Ltd. (H Shares) | | 12,000 | 13,776 |
| Shanghai International Airport Co. Ltd. (A Shares) | | 200 | 2,165 |
| Shanghai Pharmaceuticals Holding Co. Ltd.: | | | |
| (A Shares) | | 900 | 2,369 |
| (H Shares) | | 4,600 | 8,312 |
| Shenzhen Inovance Technology Co. Ltd. (A Shares) | | 600 | 2,123 |
| Shenzhen Zhongjin Lingnan Nonfemet Co. Ltd. (A Shares) | | 1,600 | 912 |
| Sichuan Chuantou Energy Co. Ltd. (A Shares) | | 300 | 411 |
| Sinopharm Group Co. Ltd. (H Shares) | | 8,400 | 30,083 |
| Sinotrans Ltd. (H Shares) | | 15,000 | 4,410 |
| Suning.com Co. Ltd. (A Shares) | | 1,500 | 2,246 |
| TBEA Co. Ltd. (A Shares) | | 1,000 | 911 |
| TCL Corp. (A Shares) | | 2,800 | 1,308 |
| Tong Ren Tang Technologies Co. Ltd. (H Shares) | | 4,000 | 3,982 |
| Transfar Zhilian Co. Ltd. | | 1,200 | 1,281 |
| Tus-Sound Environmental Resources Co. Ltd. (A Shares) | | 500 | 615 |
| Wanxiang Qianchao Co. Ltd. (A Shares) | | 600 | 431 |
| Xinjiang Goldwind Science & Technology Co. Ltd.: | | | |
| (A Shares) | | 800 | 1,426 |
| (H Shares) | | 4,818 | 5,746 |
| Zhejiang China Commodities City Group Co. Ltd. (A Shares) | | 1,200 | 664 |
| Zhejiang Expressway Co. Ltd. (H Shares) | | 10,000 | 8,189 |
| Zhejiang Huayou Cobalt Co. Ltd. (A Shares) | | 260 | 905 |
| Zhengzhou Yutong Bus Co. Ltd. (A Shares) | | 600 | 1,217 |
| Zoomlion Heavy Industry Science and Technology Co. Ltd. (A Shares) | | 1,600 | 1,328 |
|
| TOTAL CHINA | | | 1,041,096 |
|
| Colombia - 0.0% | | | |
| Cementos Argos SA | | 3,006 | 6,786 |
| Interconexion Electrica SA ESP | | 2,889 | 16,667 |
| Inversiones Argos SA | | 1,877 | 10,162 |
|
| TOTAL COLOMBIA | | | 33,615 |
|
| Czech Republic - 0.1% | | | |
| Ceske Energeticke Zavody A/S | | 966 | 22,036 |
| Komercni Banka A/S | | 480 | 16,225 |
|
| TOTAL CZECH REPUBLIC | | | 38,261 |
|
| Denmark - 1.7% | | | |
| Christian Hansen Holding A/S | | 671 | 51,517 |
| Coloplast A/S Series B | | 781 | 94,110 |
| Genmab A/S (a) | | 417 | 91,112 |
| H Lundbeck A/S | | 445 | 15,179 |
| ISS Holdings A/S | | 1,035 | 27,085 |
| Novo Nordisk A/S Series B | | 11,438 | 628,961 |
| Novozymes A/S Series B | | 1,351 | 63,609 |
| ORSTED A/S (c) | | 1,241 | 108,857 |
| Pandora A/S | | 641 | 31,520 |
| Tryg A/S | | 776 | 21,674 |
| Vestas Wind Systems A/S | | 1,195 | 97,354 |
| William Demant Holding A/S (a) | | 770 | 20,322 |
|
| TOTAL DENMARK | | | 1,251,300 |
|
| Egypt - 0.1% | | | |
| Commercial International Bank SAE | | 5,467 | 27,437 |
| Commercial International Bank SAE sponsored GDR | | 2,421 | 11,960 |
|
| TOTAL EGYPT | | | 39,397 |
|
| Finland - 0.5% | | | |
| Metso Corp. | | 701 | 26,488 |
| Neste Oyj | | 2,731 | 98,565 |
| Nokian Tyres PLC | | 804 | 22,956 |
| Orion Oyj (B Shares) | | 709 | 31,424 |
| Stora Enso Oyj (R Shares) | | 3,734 | 48,413 |
| UPM-Kymmene Corp. | | 3,457 | 112,352 |
| Wartsila Corp. | | 2,860 | 30,181 |
|
| TOTAL FINLAND | | | 370,379 |
|
| France - 6.3% | | | |
| Accor SA | | 1,187 | 50,995 |
| Air Liquide SA | | 3,048 | 404,873 |
| Atos Origin SA | | 624 | 48,427 |
| AXA SA | | 12,493 | 330,705 |
| BIC SA | | 174 | 12,080 |
| Bouygues SA | | 1,467 | 62,174 |
| Carrefour SA | | 3,822 | 65,027 |
| Casino Guichard Perrachon SA | | 362 | 19,529 |
| CNP Assurances | | 1,160 | 23,003 |
| Compagnie de St. Gobain | | 3,197 | 130,038 |
| Credit Agricole SA | | 7,515 | 98,058 |
| Danone SA | | 3,983 | 329,957 |
| Eiffage SA | | 494 | 53,068 |
| Essilor International SA | | 1,828 | 278,904 |
| Eurazeo SA | | 267 | 18,612 |
| Gecina SA | | 299 | 51,288 |
| Groupe Eurotunnel SA | | 2,789 | 46,690 |
| Imerys SA | | 251 | 9,692 |
| Ingenico SA | | 383 | 40,896 |
| JCDecaux SA | | 543 | 14,837 |
| Kering SA | | 489 | 278,254 |
| L'Oreal SA | | 1,636 | 477,688 |
| Michelin CGDE Series B | | 1,102 | 134,177 |
| Natixis SA | | 6,069 | 27,826 |
| Orange SA | | 12,819 | 206,316 |
| Schneider Electric SA | | 3,558 | 330,682 |
| SR Teleperformance SA | | 382 | 86,572 |
| Total SA | | 15,423 | 815,387 |
| Valeo SA | | 1,523 | 56,631 |
| Wendel SA | | 171 | 24,221 |
| Worldline SA (a)(c) | | 7 | 425 |
|
| TOTAL FRANCE | | | 4,527,032 |
|
| Germany - 6.7% | | | |
| adidas AG | | 1,163 | 359,100 |
| Allianz SE | | 2,733 | 667,461 |
| BASF AG | | 5,940 | 451,554 |
| Bayerische Motoren Werke AG (BMW) | | 1,968 | 150,812 |
| Beiersdorf AG | | 642 | 76,006 |
| Commerzbank AG | | 6,602 | 39,489 |
| Deutsche Borse AG | | 1,227 | 190,013 |
| Deutsche Post AG | | 6,413 | 227,089 |
| Deutsche Wohnen AG (Bearer) | | 2,253 | 84,731 |
| E.ON AG | | 14,366 | 144,874 |
| Fraport AG Frankfurt Airport Services Worldwide | | 285 | 23,820 |
| HeidelbergCement Finance AG | | 961 | 71,404 |
| Henkel AG & Co. KGaA | | 705 | 67,896 |
| Infineon Technologies AG | | 8,114 | 157,158 |
| Merck KGaA | | 829 | 98,838 |
| Metro Wholesale & Food Specialist AG | | 1,198 | 19,507 |
| MTU Aero Engines Holdings AG | | 337 | 89,980 |
| Muenchener Rueckversicherungs-Gesellschaft AG in Muenchen | | 924 | 256,604 |
| RWE AG | | 3,562 | 108,574 |
| SAP SE | | 6,341 | 840,192 |
| Siemens AG | | 4,942 | 570,307 |
| Symrise AG | | 817 | 78,618 |
| Telefonica Deutschland Holding AG | | 6,192 | 19,647 |
|
| TOTAL GERMANY | | | 4,793,674 |
|
| Greece - 0.1% | | | |
| Alpha Bank AE (a) | | 9,287 | 19,794 |
| Hellenic Telecommunications Organization SA | | 1,554 | 23,571 |
| Motor Oil (HELLAS) Corinth Refineries SA | | 406 | 10,025 |
|
| TOTAL GREECE | | | 53,390 |
|
| Hong Kong - 1.8% | | | |
| BOC Hong Kong (Holdings) Ltd. | | 24,500 | 84,173 |
| BYD Electronic International Co. Ltd. | | 4,000 | 6,869 |
| China Agri-Industries Holdings Ltd. | | 16,000 | 5,271 |
| China Everbright International Ltd. | | 24,962 | 18,866 |
| China Overseas Land and Investment Ltd. | | 26,000 | 82,043 |
| China Resources Pharmaceutical Group Ltd. (c) | | 10,500 | 9,697 |
| CLP Holdings Ltd. | | 10,500 | 109,047 |
| CSPC Pharmaceutical Group Ltd. | | 30,000 | 76,834 |
| Fosun International Ltd. | | 17,500 | 22,883 |
| Hang Seng Bank Ltd. | | 4,900 | 102,239 |
| Hong Kong & China Gas Co. Ltd. | | 65,664 | 127,447 |
| Hong Kong Exchanges and Clearing Ltd. | | 7,719 | 240,478 |
| Hysan Development Co. Ltd. | | 4,000 | 15,765 |
| Lenovo Group Ltd. | | 48,000 | 33,463 |
| MTR Corp. Ltd. | | 9,679 | 55,497 |
| PCCW Ltd. | | 26,000 | 15,442 |
| Shanghai Industrial Holdings Ltd. | | 3,000 | 5,584 |
| Shenzhen Investment Ltd. | | 20,000 | 7,872 |
| Sun Hung Kai Properties Ltd. | | 10,500 | 159,110 |
| Swire Pacific Ltd. (A Shares) | | 3,500 | 33,363 |
| Swire Properties Ltd. | | 7,800 | 24,531 |
| Techtronic Industries Co. Ltd. | | 9,000 | 70,335 |
|
| TOTAL HONG KONG | | | 1,306,809 |
|
| Hungary - 0.1% | | | |
| MOL Hungarian Oil and Gas PLC Series A (For. Reg.) | | 2,675 | 26,441 |
| OTP Bank PLC | | 1,412 | 65,039 |
|
| TOTAL HUNGARY | | | 91,480 |
|
| India - 2.8% | | | |
| Ashok Leyland Ltd. | | 7,005 | 7,566 |
| Asian Paints Ltd. | | 1,826 | 46,512 |
| Axis Bank Ltd. | | 13,432 | 139,071 |
| Bajaj Auto Ltd. | | 544 | 24,864 |
| Bharat Petroleum Corp. Ltd. | | 4,164 | 30,816 |
| Bharti Airtel Ltd. | | 13,037 | 68,657 |
| Britannia Industries Ltd. | | 381 | 17,515 |
| Dabur India Ltd. | | 3,479 | 22,618 |
| Eicher Motors Ltd. | | 89 | 28,197 |
| Glenmark Pharmaceuticals Ltd. | | 899 | 3,992 |
| HCL Technologies Ltd. | | 3,459 | 56,677 |
| Hero Motocorp Ltd. | | 657 | 25,002 |
| Hindalco Industries Ltd. | | 7,229 | 19,096 |
| Hindustan Petroleum Corp. Ltd. | | 3,986 | 18,208 |
| Hindustan Unilever Ltd. | | 4,193 | 128,424 |
| Housing Development Finance Corp. Ltd. | | 10,580 | 317,298 |
| Indiabulls Housing Finance Ltd. | | 1,617 | 4,689 |
| Infosys Ltd. | | 22,294 | 214,221 |
| Lupin Ltd. (a) | | 1,496 | 15,701 |
| Mahindra & Mahindra Ltd. | | 4,978 | 42,484 |
| Marico Ltd. | | 2,964 | 15,275 |
| Nestle India Ltd. | | 150 | 31,546 |
| Petronet LNG Ltd. | | 3,552 | 14,323 |
| Pidilite Industries Ltd. (a) | | 807 | 15,924 |
| Piramal Enterprises Ltd. | | 519 | 12,292 |
| Reliance Industries Ltd. | | 18,386 | 378,686 |
| Tata Consultancy Services Ltd. | | 5,814 | 185,164 |
| Tech Mahindra Ltd. | | 3,027 | 31,496 |
| Titan Co. Ltd. | | 1,975 | 37,027 |
| UPL Ltd. (a) | | 3,490 | 29,305 |
| Wipro Ltd. | | 7,003 | 25,626 |
| Yes Bank Ltd. | | 10,494 | 10,385 |
|
| TOTAL INDIA | | | 2,018,657 |
|
| Indonesia - 0.8% | | | |
| PT Astra International Tbk | | 131,700 | 65,139 |
| PT Bank Central Asia Tbk | | 62,400 | 139,672 |
| PT Bank Mandiri (Persero) Tbk | | 122,400 | 61,184 |
| PT Bank Negara Indonesia (Persero) Tbk | | 49,700 | 27,130 |
| PT Bank Rakyat Indonesia Tbk | | 355,400 | 106,490 |
| PT Barito Pacific Tbk | | 172,100 | 11,647 |
| PT Indah Kiat Pulp & Paper Tbk | | 18,100 | 9,370 |
| PT Indofood CBP Sukses Makmur Tbk | | 14,800 | 12,253 |
| PT Indofood Sukses Makmur Tbk | | 28,200 | 15,454 |
| PT Jasa Marga Tbk | | 12,100 | 4,695 |
| PT Kalbe Farma Tbk | | 154,400 | 17,533 |
| PT Pabrik Kertas Tjiwi Kimia Tbk | | 8,100 | 6,097 |
| PT Pakuwon Jati Tbk | | 117,900 | 5,247 |
| PT Perusahaan Gas Negara Tbk Series B | | 72,700 | 10,910 |
| PT Tambang Batubara Bukit Asam Tbk | | 14,000 | 2,242 |
| PT Unilever Indonesia Tbk | | 10,100 | 31,448 |
| PT United Tractors Tbk | | 10,500 | 16,207 |
|
| TOTAL INDONESIA | | | 542,718 |
|
| Ireland - 0.6% | | | |
| CRH PLC | | 5,202 | 189,404 |
| DCC PLC (United Kingdom) | | 625 | 58,582 |
| Kerry Group PLC Class A | | 1,027 | 124,163 |
| Kingspan Group PLC (Ireland) | | 955 | 49,485 |
|
| TOTAL IRELAND | | | 421,634 |
|
| Isle of Man - 0.0% | | | |
| NEPI Rockcastle PLC | | 2,390 | 20,799 |
| Israel - 0.2% | | | |
| Bank Hapoalim BM (Reg.) | | 7,180 | 57,429 |
| Bank Leumi le-Israel BM | | 9,435 | 68,692 |
| Mizrahi Tefahot Bank Ltd. | | 897 | 22,244 |
|
| TOTAL ISRAEL | | | 148,365 |
|
| Italy - 0.6% | | | |
| Assicurazioni Generali SpA | | 6,934 | 140,556 |
| Intesa Sanpaolo SpA | | 96,373 | 241,494 |
| Snam Rete Gas SpA | | 12,888 | 66,120 |
|
| TOTAL ITALY | | | 448,170 |
|
| Japan - 15.6% | | | |
| AEON Co. Ltd. | | 4,200 | 84,506 |
| AEON Financial Service Co. Ltd. | | 700 | 10,668 |
| Agc, Inc. | | 1,200 | 42,192 |
| Ajinomoto Co., Inc. | | 2,800 | 53,234 |
| All Nippon Airways Ltd. | | 700 | 24,037 |
| Asahi Kasei Corp. | | 8,000 | 88,811 |
| Astellas Pharma, Inc. | | 12,200 | 209,385 |
| Benesse Holdings, Inc. | | 500 | 13,385 |
| Bridgestone Corp. | | 3,700 | 153,735 |
| Casio Computer Co. Ltd. | | 1,300 | 21,104 |
| Central Japan Railway Co. | | 900 | 184,621 |
| Chugai Pharmaceutical Co. Ltd. | | 1,500 | 126,234 |
| CyberAgent, Inc. | | 600 | 19,501 |
| Dai Nippon Printing Co. Ltd. | | 1,500 | 40,063 |
| Daicel Chemical Industries Ltd. | | 1,600 | 14,303 |
| Daifuku Co. Ltd. | | 700 | 37,143 |
| Daikin Industries Ltd. | | 1,600 | 223,935 |
| Daiwa House Industry Co. Ltd. | | 3,600 | 123,930 |
| DENSO Corp. | | 2,800 | 130,004 |
| East Japan Railway Co. | | 2,000 | 181,562 |
| Eisai Co. Ltd. | | 1,600 | 115,822 |
| Fast Retailing Co. Ltd. | | 400 | 246,677 |
| Fujitsu Ltd. | | 1,300 | 115,218 |
| Hino Motors Ltd. | | 2,000 | 18,909 |
| Hirose Electric Co. Ltd. | | 200 | 25,194 |
| Hitachi Chemical Co. Ltd. | | 700 | 23,044 |
| Hitachi Construction Machinery Co. Ltd. | | 700 | 18,069 |
| Hitachi High-Technologies Corp. | | 400 | 24,886 |
| Hitachi Metals Ltd. | | 1,400 | 17,570 |
| Honda Motor Co. Ltd. | | 10,500 | 284,067 |
| Hulic Co. Ltd. | | 1,900 | 20,628 |
| Idemitsu Kosan Co. Ltd. | | 10 | 294 |
| INPEX Corp. | | 6,500 | 60,089 |
| Japan Retail Fund Investment Corp. | | 16 | 37,294 |
| JFE Holdings, Inc. | | 3,200 | 40,024 |
| Kajima Corp. | | 2,900 | 39,853 |
| Kaneka Corp. | | 300 | 9,987 |
| Kansai Paint Co. Ltd. | | 1,100 | 26,493 |
| Kao Corp. | | 3,200 | 257,276 |
| Kawasaki Heavy Industries Ltd. | | 900 | 21,599 |
| KDDI Corp. | | 11,400 | 315,451 |
| Keio Corp. | | 700 | 43,304 |
| Keyence Corp. | | 600 | 379,378 |
| Kikkoman Corp. | | 1,000 | 48,103 |
| Kobayashi Pharmaceutical Co. Ltd. | | 300 | 23,988 |
| Kobe Steel Ltd. | | 1,800 | 9,678 |
| Komatsu Ltd. | | 6,000 | 140,489 |
| Konami Holdings Corp. | | 600 | 26,339 |
| Konica Minolta, Inc. | | 3,000 | 22,019 |
| Kubota Corp. | | 6,800 | 108,006 |
| Kuraray Co. Ltd. | | 2,100 | 24,984 |
| Kurita Water Industries Ltd. | | 600 | 17,273 |
| Kyocera Corp. | | 2,100 | 137,774 |
| Kyushu Railway Co. | | 1,000 | 33,038 |
| Lawson, Inc. | | 300 | 16,550 |
| Marui Group Co. Ltd. | | 1,200 | 26,676 |
| Mitsubishi Chemical Holdings Corp. | | 8,200 | 62,494 |
| Mitsubishi Electric Corp. | | 11,800 | 168,592 |
| Mitsubishi Estate Co. Ltd. | | 7,600 | 147,557 |
| Mitsubishi Materials Corp. | | 700 | 20,129 |
| Mitsubishi UFJ Lease & Finance Co. Ltd. | | 2,600 | 15,961 |
| Mitsui Chemicals, Inc. | | 1,200 | 28,538 |
| Mitsui Fudosan Co. Ltd. | | 5,800 | 148,380 |
| Mizuho Financial Group, Inc. | | 155,700 | 241,721 |
| Murata Manufacturing Co. Ltd. | | 3,700 | 201,458 |
| Nabtesco Corp. | | 700 | 22,284 |
| Nagoya Railroad Co. Ltd. | | 1,200 | 38,145 |
| NEC Corp. | | 1,600 | 63,409 |
| NGK Insulators Ltd. | | 1,600 | 24,580 |
| NGK Spark Plug Co. Ltd. | | 1,000 | 20,274 |
| Nikon Corp. | | 2,200 | 28,051 |
| Nintendo Co. Ltd. | | 700 | 256,751 |
| Nippon Express Co. Ltd. | | 500 | 28,528 |
| Nippon Prologis REIT, Inc. | | 13 | 36,313 |
| Nippon Yusen KK | | 900 | 16,169 |
| Nissin Food Holdings Co. Ltd. | | 400 | 30,215 |
| Nitori Holdings Co. Ltd. | | 500 | 76,106 |
| Nitto Denko Corp. | | 1,000 | 55,326 |
| NKSJ Holdings, Inc. | | 2,100 | 82,543 |
| Nomura Real Estate Holdings, Inc. | | 800 | 18,960 |
| Nomura Research Institute Ltd. | | 2,100 | 44,585 |
| NSK Ltd. | | 2,400 | 22,316 |
| NTT DOCOMO, Inc. | | 8,600 | 235,770 |
| Obayashi Corp. | | 4,200 | 43,224 |
| Odakyu Electric Railway Co. Ltd. | | 1,900 | 46,250 |
| OMRON Corp. | | 1,200 | 70,202 |
| Ono Pharmaceutical Co. Ltd. | | 2,500 | 47,092 |
| Oriental Land Co. Ltd. | | 1,300 | 190,581 |
| ORIX Corp. | | 8,400 | 132,005 |
| Osaka Gas Co. Ltd. | | 2,400 | 46,931 |
| Otsuka Corp. | | 700 | 28,223 |
| Panasonic Corp. | | 14,100 | 118,502 |
| Park24 Co. Ltd. | | 700 | 16,532 |
| Rakuten, Inc. | | 5,500 | 52,434 |
| Recruit Holdings Co. Ltd. | | 8,800 | 292,460 |
| Resona Holdings, Inc. | | 13,500 | 58,706 |
| Santen Pharmaceutical Co. Ltd. | | 2,300 | 40,741 |
| Secom Co. Ltd. | | 1,400 | 129,729 |
| Sega Sammy Holdings, Inc. | | 1,200 | 16,888 |
| Sekisui Chemical Co. Ltd. | | 2,400 | 41,846 |
| Sekisui House Ltd. | | 3,900 | 84,101 |
| Seven & i Holdings Co. Ltd. | | 4,900 | 185,124 |
| Sharp Corp. | | 1,500 | 17,207 |
| Shimadzu Corp. | | 1,500 | 40,059 |
| SHIMIZU Corp. | | 3,800 | 35,424 |
| Shin-Etsu Chemical Co. Ltd. | | 2,300 | 256,453 |
| Shiseido Co. Ltd. | | 2,600 | 214,365 |
| Showa Denko K.K. | | 800 | 22,446 |
| Sohgo Security Services Co., Ltd. | | 500 | 27,159 |
| Sony Corp. | | 8,200 | 499,127 |
| Stanley Electric Co. Ltd. | | 800 | 22,139 |
| Sumitomo Chemical Co. Ltd. | | 9,800 | 44,829 |
| Sumitomo Metal Mining Co. Ltd. | | 1,500 | 50,175 |
| Sumitomo Mitsui Trust Holdings, Inc. | | 2,100 | 76,535 |
| Sumitomo Rubber Industries Ltd. | | 1,200 | 15,905 |
| Suntory Beverage & Food Ltd. | | 900 | 38,476 |
| Sysmex Corp. | | 1,100 | 71,773 |
| T&D Holdings, Inc. | | 3,600 | 40,096 |
| Taisei Corp. | | 1,300 | 51,263 |
| Takeda Pharmaceutical Co. Ltd. | | 9,600 | 346,878 |
| Teijin Ltd. | | 1,200 | 24,046 |
| Tobu Railway Co. Ltd. | | 1,200 | 40,044 |
| Toho Co. Ltd. | | 700 | 28,270 |
| Tokyo Electron Ltd. | | 1,000 | 202,599 |
| Tokyo Gas Co. Ltd. | | 2,400 | 58,586 |
| Tokyu Corp. | | 3,200 | 60,524 |
| Toray Industries, Inc. | | 8,800 | 62,191 |
| Toto Ltd. | | 900 | 36,743 |
| Toyo Suisan Kaisha Ltd. | | 600 | 25,263 |
| Toyoda Gosei Co. Ltd. | | 400 | 9,358 |
| Unicharm Corp. | | 2,600 | 88,116 |
| USS Co. Ltd. | | 1,400 | 27,115 |
| West Japan Railway Co. | | 1,000 | 86,890 |
| Yakult Honsha Co. Ltd. | | 800 | 45,848 |
| Yamada Denki Co. Ltd. | | 3,600 | 17,401 |
| Yamaha Corp. | | 900 | 41,912 |
| Yamaha Motor Co. Ltd. | | 1,800 | 35,231 |
| Yaskawa Electric Corp. | | 1,500 | 57,057 |
| Yokogawa Electric Corp. | | 1,500 | 27,484 |
|
| TOTAL JAPAN | | | 11,180,109 |
|
| Korea (South) - 1.4% | | | |
| AMOREPACIFIC Corp. | | 185 | 30,351 |
| AMOREPACIFIC Group, Inc. | | 196 | 14,169 |
| BS Financial Group, Inc. | | 1,643 | 9,757 |
| CJ CheilJedang Corp. | | 57 | 11,129 |
| CJ Corp. | | 105 | 7,393 |
| GS Engineering & Construction Corp. | | 441 | 11,644 |
| GS Holdings Corp. | | 323 | 13,703 |
| Hana Financial Group, Inc. | | 1,951 | 56,182 |
| Hankook Tire Co. Ltd. | | 530 | 14,062 |
| Hanwha Chemical Corp. | | 712 | 9,947 |
| Hyundai Fire & Marine Insurance Co. Ltd. | | 375 | 8,091 |
| Hyundai Robotics Co. Ltd. | | 65 | 18,968 |
| KB Financial Group, Inc. | | 2,542 | 90,976 |
| Korea Gas Corp. | | 159 | 5,339 |
| LG Chemical Ltd. | | 295 | 77,513 |
| LG Corp. | | 616 | 36,530 |
| LG Display Co. Ltd. (a) | | 1,559 | 18,168 |
| LG Electronics, Inc. | | 683 | 39,044 |
| LG Household & Health Care Ltd. | | 60 | 64,651 |
| LG Innotek Co. Ltd. | | 84 | 8,685 |
| Lotte Chemical Corp. | | 115 | 22,306 |
| Lotte Confectionery Co. Ltd. | | 197 | 6,144 |
| Oci Co. Ltd. | | 114 | 6,127 |
| S-Oil Corp. | | 293 | 24,961 |
| Samsung Card Co. Ltd. | | 175 | 5,017 |
| Samsung Fire & Marine Insurance Co. Ltd. | | 199 | 36,814 |
| Samsung SDI Co. Ltd. | | 352 | 68,427 |
| Shinhan Financial Group Co. Ltd. | | 2,862 | 103,668 |
| SK C&C Co. Ltd. | | 224 | 49,478 |
| SK Energy Co. Ltd. | | 356 | 48,672 |
| SK Telecom Co. Ltd. | | 131 | 26,619 |
| Woongjin Coway Co. Ltd. | | 335 | 26,278 |
| Yuhan Corp. | | 60 | 11,510 |
|
| TOTAL KOREA (SOUTH) | | | 982,323 |
|
| Luxembourg - 0.2% | | | |
| Globant SA (a) | | 223 | 20,797 |
| Millicom International Cellular SA (depository receipt) | | 435 | 19,822 |
| SES SA (France) (depositary receipt) | | 2,319 | 44,925 |
| Tenaris SA | | 3,162 | 32,078 |
|
| TOTAL LUXEMBOURG | | | 117,622 |
|
| Malaysia - 0.7% | | | |
| Alliance Bank Malaysia Bhd | | 5,800 | 3,992 |
| AMMB Holdings Bhd | | 11,600 | 11,065 |
| Axiata Group Bhd | | 17,086 | 17,562 |
| Bumiputra-Commerce Holdings Bhd | | 32,017 | 40,182 |
| DiGi.com Bhd | | 19,800 | 22,236 |
| Fraser & Neave Holdings BHD | | 800 | 6,616 |
| Hap Seng Consolidated Bhd | | 4,700 | 11,224 |
| Hartalega Holdings Bhd | | 9,500 | 11,951 |
| Hong Leong Bank Bhd | | 3,900 | 16,059 |
| IHH Healthcare Bhd | | 14,400 | 19,626 |
| Malayan Banking Bhd | | 24,887 | 51,178 |
| Malaysia Airports Holdings Bhd | | 6,600 | 12,492 |
| Maxis Bhd | | 15,000 | 19,315 |
| MISC Bhd | | 7,300 | 14,540 |
| Nestle (Malaysia) BHD | | 500 | 17,304 |
| Petronas Dagangan Bhd | | 1,600 | 9,016 |
| PPB Group Bhd | | 3,000 | 12,978 |
| Press Metal Bhd | | 8,700 | 9,899 |
| Public Bank Bhd | | 20,000 | 97,067 |
| RHB Capital Bhd | | 10,200 | 14,031 |
| Sime Darby Bhd | | 17,800 | 9,651 |
| Sime Darby Property Bhd | | 12,400 | 2,150 |
| SP Setia Bhd | | 10,085 | 2,917 |
| Telekom Malaysia Bhd | | 6,600 | 5,931 |
| Tenaga Nasional Bhd | | 19,900 | 65,904 |
| Top Glove Corp. Bhd | | 10,200 | 10,612 |
| Westports Holdings Bhd | | 4,400 | 4,501 |
| YTL Corp. Bhd | | 22,580 | 4,695 |
|
| TOTAL MALAYSIA | | | 524,694 |
|
| Mexico - 0.4% | | | |
| Alfa SA de CV Series A | | 19,800 | 17,169 |
| Alsea S.A.B. de CV (a) | | 3,700 | 9,871 |
| CEMEX S.A.B. de CV unit | | 97,700 | 36,720 |
| Coca-Cola FEMSA S.A.B. de CV unit | | 3,400 | 18,684 |
| Embotelladoras Arca S.A.B. de CV | | 3,100 | 17,319 |
| Fomento Economico Mexicano S.A.B. de CV unit | | 12,400 | 110,035 |
| Gruma S.A.B. de CV Series B | | 1,230 | 12,906 |
| Grupo Aeroportuario del Sureste S.A.B. de CV Series B | | 1,305 | 21,399 |
| Grupo Bimbo S.A.B. de CV Series A | | 10,200 | 18,951 |
| Industrias Penoles SA de CV | | 930 | 11,160 |
| Infraestructura Energetica Nova S.A.B. de CV | | 3,600 | 15,913 |
| Kimberly-Clark de Mexico SA de CV Series A | | 10,000 | 20,165 |
|
| TOTAL MEXICO | | | 310,292 |
|
| Multi-National - 0.1% | | | |
| HKT Trust/HKT Ltd. unit | | 25,000 | 38,892 |
| Netherlands - 4.1% | | | |
| AEGON NV | | 11,630 | 50,455 |
| Akzo Nobel NV | | 1,470 | 135,340 |
| ASML Holding NV (Netherlands) | | 2,746 | 719,767 |
| CNH Industrial NV | | 6,473 | 70,374 |
| EXOR NV | | 690 | 52,884 |
| ING Groep NV (Certificaten Van Aandelen) | | 25,314 | 286,643 |
| Koninklijke Ahold Delhaize NV | | 7,681 | 191,411 |
| Koninklijke DSM NV | | 1,176 | 139,357 |
| Koninklijke KPN NV | | 22,656 | 70,333 |
| Koninklijke Philips Electronics NV | | 5,994 | 262,981 |
| NN Group NV | | 1,950 | 74,314 |
| QIAGEN NV (Germany) (a) | | 1,475 | 44,269 |
| Unibail-Rodamco SE & WFD Unibail-Rodamco NV unit | | 903 | 139,637 |
| Unilever NV | | 9,406 | 555,473 |
| Vopak NV | | 441 | 24,194 |
| Wolters Kluwer NV | | 1,849 | 136,146 |
|
| TOTAL NETHERLANDS | | | 2,953,578 |
|
| New Zealand - 0.1% | | | |
| Auckland International Airport Ltd. | | 6,276 | 37,404 |
| Fletcher Building Ltd. | | 5,534 | 16,260 |
| Meridian Energy Ltd. | | 8,197 | 24,162 |
| Ryman Healthcare Group Ltd. | | 2,469 | 20,406 |
|
| TOTAL NEW ZEALAND | | | 98,232 |
|
| Norway - 0.5% | | | |
| Aker Bp ASA | | 715 | 19,741 |
| Equinor ASA | | 6,349 | 117,437 |
| Marine Harvest ASA | | 2,771 | 67,556 |
| Norsk Hydro ASA | | 8,982 | 31,738 |
| Orkla ASA | | 4,940 | 47,455 |
| Schibsted ASA (B Shares) | | 665 | 18,570 |
| Telenor ASA | | 4,739 | 88,713 |
|
| TOTAL NORWAY | | | 391,210 |
|
| Philippines - 0.4% | | | |
| Aboitiz Equity Ventures, Inc. | | 14,110 | 15,521 |
| Aboitiz Power Corp. | | 9,600 | 7,551 |
| Alliance Global Group, Inc. | | 26,600 | 6,007 |
| Ayala Land, Inc. | | 48,000 | 45,839 |
| Bank of the Philippine Islands (BPI) | | 5,612 | 10,714 |
| BDO Unibank, Inc. | | 12,880 | 39,263 |
| Globe Telecom, Inc. | | 185 | 6,619 |
| JG Summit Holdings, Inc. | | 18,330 | 27,493 |
| Manila Electric Co. | | 1,470 | 9,797 |
| Metropolitan Bank & Trust Co. | | 11,177 | 14,869 |
| SM Investments Corp. | | 1,515 | 30,692 |
| SM Prime Holdings, Inc. | | 65,100 | 49,950 |
|
| TOTAL PHILIPPINES | | | 264,315 |
|
| Poland - 0.3% | | | |
| Bank Millennium SA (a) | | 3,559 | 5,724 |
| Bank Polska Kasa Opieki SA | | 1,095 | 30,896 |
| Bank Zachodni WBK SA | | 237 | 19,428 |
| BRE Bank SA (a) | | 100 | 9,993 |
| Grupa Lotos SA | | 588 | 14,682 |
| Jastrzebska Spolka Weglowa SA | | 248 | 1,257 |
| KGHM Polska Miedz SA (Bearer) (a) | | 912 | 19,965 |
| NG2 SA | | 169 | 4,936 |
| Polish Oil & Gas Co. SA | | 11,837 | 14,574 |
| Polski Koncern Naftowy Orlen SA | | 1,911 | 52,218 |
| Powszechny Zaklad Ubezpieczen SA | | 4,084 | 39,497 |
| Telekomunikacja Polska SA (a) | | 3,763 | 6,156 |
|
| TOTAL POLAND | | | 219,326 |
|
| Portugal - 0.2% | | | |
| Energias de Portugal SA | | 16,308 | 67,115 |
| Galp Energia SGPS SA Class B | | 3,266 | 52,239 |
| Jeronimo Martins SGPS SA | | 1,711 | 28,710 |
|
| TOTAL PORTUGAL | | | 148,064 |
|
| Qatar - 0.3% | | | |
| Qatar National Bank SAQ (a) | | 29,152 | 153,727 |
| Qatar Telecom (Qtel) Q.S.C. (a) | | 5,442 | 10,911 |
| The Commercial Bank of Qatar (a) | | 12,990 | 15,341 |
|
| TOTAL QATAR | | | 179,979 |
|
| Russia - 0.6% | | | |
| Inter Rao Ues JSC | | 245,000 | 16,506 |
| Lukoil PJSC | | 2,537 | 234,375 |
| NOVATEK OAO GDR (Reg. S) | | 572 | 122,408 |
| Novolipetsk Steel OJSC | | 7,860 | 15,327 |
| PhosAgro OJSC GDR (Reg. S) | | 730 | 9,183 |
| Polyus PJSC | | 180 | 20,966 |
|
| TOTAL RUSSIA | | | 418,765 |
|
| Saudi Arabia - 0.3% | | | |
| Almarai Co. Ltd. | | 1,440 | 19,160 |
| Banque Saudi Fransi | | 3,539 | 31,801 |
| SABIC | | 4,798 | 112,200 |
| Saudi Arabian Mining Co. (a) | | 2,420 | 27,360 |
|
| TOTAL SAUDI ARABIA | | | 190,521 |
|
| Singapore - 1.2% | | | |
| Ascendas Real Estate Investment Trust | | 16,600 | 38,662 |
| BOC Aviation Ltd. Class A (c) | | 1,400 | 13,153 |
| CapitaCommercial Trust (REIT) | | 16,281 | 24,519 |
| CapitaLand Ltd. | | 17,100 | 45,199 |
| CapitaMall Trust | | 17,100 | 31,906 |
| City Developments Ltd. | | 3,000 | 23,758 |
| DBS Group Holdings Ltd. | | 11,600 | 221,106 |
| Jardine Cycle & Carriage Ltd. | | 700 | 16,830 |
| Keppel Corp. Ltd. | | 9,400 | 47,333 |
| Oversea-Chinese Banking Corp. Ltd. | | 20,662 | 166,106 |
| Singapore Airlines Ltd. | | 3,500 | 24,191 |
| Singapore Exchange Ltd. | | 5,200 | 34,141 |
| Singapore Press Holdings Ltd. | | 10,300 | 16,762 |
| Singapore Telecommunications Ltd. | | 52,200 | 126,405 |
| UOL Group Ltd. | | 3,100 | 17,750 |
|
| TOTAL SINGAPORE | | | 847,821 |
|
| South Africa - 2.0% | | | |
| Anglo American Platinum Ltd. | | 340 | 25,374 |
| Aspen Pharmacare Holdings Ltd. | | 2,558 | 17,860 |
| Barclays Africa Group Ltd. | | 4,718 | 48,359 |
| Bidcorp Ltd. | | 2,176 | 50,763 |
| Bidvest Group Ltd. | | 1,962 | 26,756 |
| Clicks Group Ltd. | | 1,608 | 26,155 |
| Exxaro Resources Ltd. | | 1,636 | 13,351 |
| FirstRand Ltd. | | 21,559 | 93,167 |
| Fortress (REIT) Ltd. Class A | | 6,749 | 9,384 |
| Foschini Ltd. | | 1,530 | 17,618 |
| Growthpoint Properties Ltd. | | 19,407 | 28,397 |
| Investec Ltd. | | 1,920 | 10,917 |
| Kumba Iron Ore Ltd. | | 424 | 10,326 |
| Liberty Holdings Ltd. | | 681 | 5,245 |
| Life Healthcare Group Holdings Ltd. | | 9,278 | 14,650 |
| MMI Holdings Ltd. | | 5,405 | 7,226 |
| Mr Price Group Ltd. | | 1,618 | 17,111 |
| MTN Group Ltd. | | 10,980 | 68,007 |
| MultiChoice Group Ltd. (a) | | 2,992 | 24,955 |
| Naspers Ltd. Class N | | 2,827 | 400,045 |
| Nedbank Group Ltd. | | 2,458 | 37,280 |
| Netcare Ltd. | | 7,963 | 9,017 |
| Old Mutual Ltd. | | 30,374 | 39,499 |
| Old Mutual Ltd. | | 29 | 38 |
| Pick 'n Pay Stores Ltd. | | 2,488 | 10,884 |
| PSG Group Ltd. | | 991 | 15,488 |
| Redefine Properties Ltd. | | 37,177 | 18,551 |
| Remgro Ltd. | | 3,410 | 39,102 |
| RMB Holdings Ltd. | | 4,921 | 25,881 |
| Sanlam Ltd. | | 12,279 | 64,660 |
| Sappi Ltd. | | 3,599 | 9,241 |
| Sasol Ltd. | | 3,587 | 65,028 |
| Shoprite Holdings Ltd. | | 3,113 | 27,897 |
| Spar Group Ltd. | | 1,273 | 17,104 |
| Standard Bank Group Ltd. | | 8,296 | 95,239 |
| Vodacom Group Ltd. | | 4,222 | 36,840 |
| Woolworths Holdings Ltd. | | 6,103 | 23,220 |
|
| TOTAL SOUTH AFRICA | | | 1,450,635 |
|
| Spain - 2.5% | | | |
| Amadeus IT Holding SA Class A | | 2,853 | 211,091 |
| Banco Bilbao Vizcaya Argentaria SA | | 43,491 | 229,060 |
| Banco de Sabadell SA | | 36,148 | 39,663 |
| Bankinter SA | | 4,596 | 31,781 |
| CaixaBank SA | | 22,831 | 65,470 |
| Enagas SA | | 1,454 | 35,984 |
| Ferrovial SA | | 3,142 | 92,723 |
| Gas Natural SDG SA | | 1,970 | 53,632 |
| Iberdrola SA | | 38,671 | 397,499 |
| Inditex SA | | 7,048 | 219,705 |
| Red Electrica Corporacion SA | | 2,758 | 55,429 |
| Repsol SA | | 9,403 | 154,959 |
| Telefonica SA | | 30,264 | 232,406 |
|
| TOTAL SPAIN | | | 1,819,402 |
|
| Sweden - 2.2% | | | |
| ASSA ABLOY AB (B Shares) | | 6,524 | 154,934 |
| Atlas Copco AB: | | | |
| (A Shares) | | 4,470 | 157,908 |
| (B Shares) | | 2,379 | 73,693 |
| Boliden AB | | 1,772 | 47,651 |
| Electrolux AB (B Shares) | | 1,440 | 37,806 |
| Essity AB Class B | | 3,956 | 123,444 |
| H&M Hennes & Mauritz AB (B Shares) | | 5,191 | 108,463 |
| Husqvarna AB (B Shares) | | 2,932 | 22,428 |
| ICA Gruppen AB | | 567 | 25,074 |
| Investor AB (B Shares) | | 2,957 | 151,438 |
| Kinnevik AB (B Shares) | | 1,590 | 43,456 |
| Lundbergfoeretagen AB | | 529 | 19,909 |
| Sandvik AB | | 7,355 | 129,760 |
| Skandinaviska Enskilda Banken AB (A Shares) | | 10,708 | 102,603 |
| Skanska AB (B Shares) | | 2,116 | 45,034 |
| SKF AB (B Shares) | | 2,437 | 44,055 |
| Svenska Handelsbanken AB (A Shares) | | 9,690 | 97,247 |
| Swedbank AB (A Shares) | | 5,771 | 80,716 |
| Tele2 AB (B Shares) | | 3,119 | 44,593 |
| Telia Co. AB | | 17,200 | 75,618 |
|
| TOTAL SWEDEN | | | 1,585,830 |
|
| Switzerland - 5.1% | | | |
| ABB Ltd. (Reg.) | | 12,006 | 252,126 |
| Adecco SA (Reg.) | | 1,013 | 60,051 |
| Alcon, Inc. (Switzerland) (a) | | 2,692 | 158,982 |
| Clariant AG (Reg.) | | 1,333 | 27,309 |
| Coca-Cola HBC AG | | 1,266 | 38,538 |
| Compagnie Financiere Richemont SA Series A | | 3,384 | 265,919 |
| Galenica AG | | 296 | 46,523 |
| Givaudan SA | | 60 | 176,199 |
| Kuehne & Nagel International AG | | 342 | 55,243 |
| Lafargeholcim Ltd. (Reg.) | | 12 | 619 |
| Lindt & Spruengli AG (participation certificate) | | 11 | 81,733 |
| Lonza Group AG | | 486 | 174,891 |
| Roche Holding AG (participation certificate) | | 4,530 | 1,363,331 |
| SGS SA (Reg.) | | 34 | 88,507 |
| Sika AG | | 829 | 142,438 |
| Sonova Holding AG Class B | | 349 | 79,953 |
| Swiss Re Ltd. | | 1,968 | 206,076 |
| Swisscom AG | | 162 | 82,765 |
| Zurich Insurance Group Ltd. | | 975 | 381,006 |
|
| TOTAL SWITZERLAND | | | 3,682,209 |
|
| Taiwan - 4.2% | | | |
| Acer, Inc. | | 20,000 | 11,673 |
| Advantech Co. Ltd. | | 2,000 | 19,772 |
| ASE Technology Holding Co. Ltd. | | 22,000 | 56,970 |
| AU Optronics Corp. | | 60,000 | 15,269 |
| Catcher Technology Co. Ltd. | | 4,000 | 33,838 |
| Cathay Financial Holding Co. Ltd. | | 50,000 | 66,070 |
| Cathay Financial Holding Co. Ltd. rights 11/25/19 (a) | | 1,547 | 269 |
| Cheng Shin Rubber Industry Co. Ltd. | | 12,000 | 18,827 |
| Chicony Electronics Co. Ltd. | | 10 | 31 |
| China Airlines Ltd. | | 16,000 | 4,753 |
| China Steel Corp. | | 78,000 | 59,974 |
| Chinatrust Financial Holding Co. Ltd. | | 118,000 | 82,025 |
| Chunghwa Telecom Co. Ltd. | | 24,000 | 88,137�� |
| Delta Electronics, Inc. | | 13,000 | 57,119 |
| E.SUN Financial Holdings Co. Ltd. | | 66,473 | 60,048 |
| EVA Airways Corp. | | 15,072 | 7,042 |
| Evergreen Marine Corp. (Taiwan) (a) | | 16,041 | 6,575 |
| Far Eastern Textile Ltd. | | 21,000 | 20,382 |
| Far EasTone Telecommunications Co. Ltd. | | 10,000 | 23,936 |
| First Financial Holding Co. Ltd. | | 62,863 | 46,068 |
| Fubon Financial Holding Co. Ltd. | | 43,000 | 62,812 |
| Giant Manufacturing Co. Ltd. | | 2,000 | 14,821 |
| HIWIN Technologies Corp. | | 2,095 | 17,963 |
| Hotai Motor Co. Ltd. | | 2,000 | 35,281 |
| Hua Nan Financial Holdings Co. Ltd. | | 49,180 | 35,315 |
| Innolux Corp. | | 58,000 | 12,875 |
| Inventec Corp. | | 17,000 | 12,319 |
| Lite-On Technology Corp. | | 13,000 | 21,398 |
| MediaTek, Inc. | | 10,000 | 133,779 |
| Nan Ya Plastics Corp. | | 33,000 | 77,907 |
| President Chain Store Corp. | | 4,000 | 39,871 |
| Quanta Computer, Inc. | | 17,000 | 32,609 |
| Ruentex Development Co. Ltd. | | 3,400 | 5,184 |
| Sinopac Holdings Co. | | 69,720 | 28,576 |
| Standard Foods Corp. | | 3,040 | 6,120 |
| Taishin Financial Holdings Co. Ltd. | | 61,742 | 28,646 |
| Taiwan Business Bank | | 35,734 | 15,056 |
| Taiwan High Speed Rail Corp. | | 13,000 | 15,367 |
| Taiwan Mobile Co. Ltd. | | 10,000 | 37,216 |
| Taiwan Semiconductor Manufacturing Co. Ltd. | | 159,000 | 1,555,231 |
| Tatung Co. Ltd. (a) | | 14,000 | 8,401 |
| Unified-President Enterprises Corp. | | 31,000 | 76,438 |
| United Microelectronics Corp. | | 75,000 | 34,474 |
| Wistron Corp. | | 19,264 | 17,655 |
| Yuanta Financial Holding Co. Ltd. | | 65,000 | 40,601 |
|
| TOTAL TAIWAN | | | 3,044,693 |
|
| Thailand - 0.9% | | | |
| Advanced Info Service PCL (For. Reg.) | | 7,600 | 57,663 |
| Airports of Thailand PCL (For. Reg.) | | 27,300 | 70,745 |
| Bangkok Dusit Medical Services PCL (For. Reg.) | | 58,900 | 46,831 |
| Banpu PCL (For. Reg.) | | 33,000 | 12,682 |
| BTS Group Holdings PCL | | 4,300 | 1,909 |
| BTS Group Holdings PCL (For. Reg.) | | 36,933 | 16,327 |
| Bumrungrad Hospital PCL (For. Reg.) | | 2,100 | 8,383 |
| C.P. ALL PCL (For. Reg.) | | 37,200 | 96,168 |
| Central Pattana PCL | | 1,000 | 2,120 |
| Central Pattana PCL (For. Reg.) | | 15,500 | 32,864 |
| Electricity Generating PCL (For. Reg.) | | 1,900 | 21,840 |
| Energy Absolute PCL | | 11,300 | 15,346 |
| Home Product Center PCL (For. Reg.) | | 33,900 | 19,309 |
| Indorama Ventures PCL (For. Reg.) | | 11,700 | 10,858 |
| IRPC PCL | | 20,400 | 2,298 |
| IRPC PCL (For. Reg.) | | 58,800 | 6,622 |
| Kasikornbank PCL | | 4,800 | 22,091 |
| Kasikornbank PCL (For. Reg.) | | 8,200 | 37,874 |
| Land & House PCL | | 10,200 | 3,278 |
| Land & House PCL (For. Reg.) | | 46,000 | 14,782 |
| Minor International PCL: | | | |
| warrants 9/30/21 (a) | | 530 | 53 |
| (For. Reg.) | | 18,900 | 22,539 |
| Muangthai Leasing PCL | | 4,400 | 9,041 |
| PTT Global Chemical PCL | | 2,000 | 3,379 |
| PTT Global Chemical PCL (For. Reg.) | | 13,200 | 22,301 |
| Siam Cement PCL (For. Reg.) | | 4,900 | 59,597 |
| Siam Commercial Bank PCL (For. Reg.) | | 5,000 | 18,535 |
| Thai Oil PCL (For. Reg.) | | 7,200 | 16,335 |
| TMB Bank PCL: | | | |
| (For. Reg.) | | 114,200 | 5,445 |
| rights (a) | | 34,544 | 46 |
| True Corp. PCL (For. Reg.) | | 71,100 | 11,779 |
|
| TOTAL THAILAND | | | 669,040 |
|
| Turkey - 0.1% | | | |
| Arcelik A/S (a) | | 1,044 | 3,236 |
| Koc Holding A/S | | 5,162 | 16,911 |
| Turk Sise ve Cam Fabrikalari A/S | | 3,330 | 2,534 |
| Turkcell Iletisim Hizmet A/S | | 7,076 | 15,557 |
|
| TOTAL TURKEY | | | 38,238 |
|
| United Arab Emirates - 0.2% | | | |
| Abu Dhabi Commercial Bank PJSC | | 18,228 | 38,712 |
| DP World Ltd. | | 1,116 | 14,832 |
| Dubai Islamic Bank Pakistan Ltd. (a) | | 10,741 | 15,471 |
| National Bank of Abu Dhabi PJSC | | 17,524 | 72,620 |
|
| TOTAL UNITED ARAB EMIRATES | | | 141,635 |
|
| United Kingdom - 7.6% | | | |
| 3i Group PLC | | 6,099 | 89,116 |
| Associated British Foods PLC | | 2,257 | 65,079 |
| Aviva PLC | | 24,623 | 132,719 |
| Barratt Developments PLC | | 6,421 | 52,500 |
| Berkeley Group Holdings PLC | | 782 | 44,581 |
| British Land Co. PLC | | 5,807 | 46,689 |
| BT Group PLC | | 53,111 | 140,828 |
| Burberry Group PLC | | 2,596 | 68,734 |
| Coca-Cola European Partners PLC | | 1,543 | 82,566 |
| Compass Group PLC | | 9,943 | 264,723 |
| Croda International PLC | | 811 | 50,593 |
| easyJet PLC | | 950 | 15,235 |
| GlaxoSmithKline PLC | | 32,729 | 749,656 |
| Informa PLC | | 7,955 | 79,860 |
| InterContinental Hotel Group PLC | | 1,100 | 66,566 |
| Intertek Group PLC | | 1,012 | 70,159 |
| Investec PLC | | 4,132 | 23,422 |
| ITV PLC | | 23,398 | 40,538 |
| J Sainsbury PLC | | 10,528 | 27,752 |
| John Wood Group PLC | | 3,928 | 17,213 |
| Johnson Matthey PLC | | 1,248 | 49,630 |
| Kingfisher PLC | | 13,787 | 36,985 |
| Legal & General Group PLC | | 37,570 | 128,333 |
| London Stock Exchange Group PLC | | 1,978 | 178,255 |
| Marks & Spencer Group PLC | | 11,678 | 27,511 |
| Meggitt PLC | | 4,839 | 39,139 |
| Merlin Entertainments PLC (c) | | 4,381 | 25,793 |
| Mondi PLC | | 2,001 | 41,407 |
| Mondi PLC | | 1,153 | 23,845 |
| National Grid PLC | | 21,258 | 248,187 |
| Next PLC | | 857 | 73,068 |
| NMC Health PLC | | 558 | 15,779 |
| Pearson PLC | | 5,028 | 44,405 |
| Prudential PLC | | 16,117 | 281,513 |
| Reckitt Benckiser Group PLC | | 4,453 | 344,580 |
| RELX PLC (London Stock Exchange) | | 12,238 | 294,539 |
| Rentokil Initial PLC | | 11,508 | 67,752 |
| RSA Insurance Group PLC | | 6,520 | 44,110 |
| Schroders PLC | | 795 | 31,872 |
| Scottish & Southern Energy PLC | | 6,478 | 107,768 |
| Segro PLC | | 6,777 | 74,109 |
| Smith & Nephew PLC | | 5,472 | 117,464 |
| Spirax-Sarco Engineering PLC | | 464 | 47,633 |
| Standard Chartered PLC (United Kingdom) | | 17,573 | 159,570 |
| Standard Life PLC | | 15,420 | 60,622 |
| Taylor Wimpey PLC | | 21,058 | 45,144 |
| Tesco PLC | | 61,549 | 187,882 |
| Unilever PLC | | 6,979 | 417,885 |
| Whitbread PLC | | 868 | 45,660 |
| WM Morrison Supermarkets PLC | | 15,648 | 40,306 |
|
| TOTAL UNITED KINGDOM | | | 5,429,275 |
|
| TOTAL COMMON STOCKS | | | |
| (Cost $66,608,000) | | | 68,913,239 |
|
| Nonconvertible Preferred Stocks - 1.3% | | | |
| Brazil - 1.0% | | | |
| Banco Bradesco SA (PN) | | 26,064 | 228,568 |
| Companhia Brasileira de Distribuicao Grupo Pao de Acucar (PN) | | 1,100 | 22,763 |
| Companhia Energetica de Minas Gerais (CEMIG) (PN) | | 5,630 | 19,162 |
| Itau Unibanco Holding SA | | 31,350 | 283,209 |
| Itausa-Investimentos Itau SA (PN) | | 28,232 | 96,512 |
| Telefonica Brasil SA | | 2,900 | 38,382 |
|
| TOTAL BRAZIL | | | 688,596 |
|
| Chile - 0.0% | | | |
| Embotelladora Andina SA Class B | | 2,423 | 6,992 |
| Sociedad Quimica y Minera de Chile SA (PN-B) (a) | | 751 | 19,950 |
|
| TOTAL CHILE | | | 26,942 |
|
| Germany - 0.3% | | | |
| Bayerische Motoren Werke AG (BMW) (non-vtg.) | | 582 | 35,863 |
| Henkel AG & Co. KGaA | | 1,130 | 117,434 |
| Sartorius AG (non-vtg.) | | 231 | 44,880 |
|
| TOTAL GERMANY | | | 198,177 |
|
| Korea (South) - 0.0% | | | |
| AMOREPACIFIC Corp. | | 122 | 10,039 |
| LG Chemical Ltd. | | 50 | 7,349 |
| LG Household & Health Care Ltd. | | 13 | 8,209 |
|
| TOTAL KOREA (SOUTH) | | | 25,597 |
|
| TOTAL NONCONVERTIBLE PREFERRED STOCKS | | | |
| (Cost $936,187) | | | 939,312 |
| | | Principal Amount(d) | Value |
|
| Nonconvertible Bonds - 0.0% | | | |
| India - 0.0% | | | |
Britannia Industries Ltd. 8% 8/28/22
(Cost $1) | INR | 270 | 1 |
|
| Government Obligations - 0.2% | | | |
| United States of America - 0.2% | | | |
| U.S. Treasury Bills, yield at date of purchase 1.7% to 1.82% 12/19/19 to 3/19/20 (e) | | | |
| (Cost $159,261) | | 160,000 | 159,382 |
| | | Shares | Value |
|
| Money Market Funds - 2.3% | | | |
| Fidelity Cash Central Fund 1.83% (f) | | 1,601,808 | 1,602,128 |
| Fidelity Securities Lending Cash Central Fund 1.84% (f)(g) | | 23,439 | 23,441 |
| TOTAL MONEY MARKET FUNDS | | | |
| (Cost $1,625,569) | | | 1,625,569 |
| TOTAL INVESTMENT IN SECURITIES - 99.7% | | | |
| (Cost $69,329,018) | | | 71,637,503 |
| NET OTHER ASSETS (LIABILITIES) - 0.3% | | | 237,149 |
| NET ASSETS - 100% | | | $71,874,652 |
| Futures Contracts | | | | | |
| | Number of contracts | Expiration Date | Notional Amount | Value | Unrealized Appreciation/(Depreciation) |
| Purchased | | | | | |
| Equity Index Contracts | | | | | |
| ICE E-mini MSCI EAFE Index Contracts (United States) | 13 | Dec. 2019 | $1,272,180 | $40,679 | $40,679 |
| ICE E-mini MSCI Emerging Markets Index Contracts (United States) | 11 | Dec. 2019 | 572,770 | 11,978 | 11,978 |
| TME S&P/TSX 60 Index Contracts (Canada) | 1 | Dec. 2019 | 149,556 | 1,014 | 1,014 |
| TOTAL FUTURES CONTRACTS | | | | | $53,671 |
The notional amount of futures purchased as a percentage of Net Assets is 2.8%
Currency Abbreviations
INR – Indian rupee
Categorizations in the Schedule of Investments are based on country or territory of incorporation.
Legend
(a) Non-income producing
(b) Security or a portion of the security is on loan at period end.
(c) Security exempt from registration under Rule 144A of the Securities Act of 1933. These securities may be resold in transactions exempt from registration, normally to qualified institutional buyers. At the end of the period, the value of these securities amounted to $234,969 or 0.3% of net assets.
(d) Amount is stated in United States dollars unless otherwise noted.
(e) Security or a portion of the security was pledged to cover margin requirements for futures contracts. At period end, the value of securities pledged amounted to $90,533.
(f) Affiliated fund that is generally available only to investment companies and other accounts managed by Fidelity Investments. The rate quoted is the annualized seven-day yield of the fund at period end. A complete unaudited listing of the fund's holdings as of its most recent quarter end is available upon request. In addition, each Fidelity Central Fund's financial statements, which are not covered by the Fund's Report of Independent Registered Public Accounting Firm, are available on the SEC's website or upon request.
(g) Investment made with cash collateral received from securities on loan.
Additional information on each restricted holding is as follows:
Affiliated Central Funds
Information regarding fiscal year to date income earned by the Fund from investments in Fidelity Central Funds is as follows:
| Fund | Income earned |
| Fidelity Cash Central Fund | $47,041 |
| Fidelity Securities Lending Cash Central Fund | 1,156 |
| Total | $48,197 |
Amounts in the income column in the above table include any capital gain distributions from underlying funds, which are presented in the corresponding line-item in the Statement of Operations, if applicable. Amount for Fidelity Securities Lending Cash Central Fund represents the income earned on investing cash collateral, less rebates paid to borrowers and any lending agent fees associated with the loan, plus any premium payments received for lending certain types of securities.
Investment Valuation
The following is a summary of the inputs used, as of October 31, 2019, involving the Fund's assets and liabilities carried at fair value. The inputs or methodology used for valuing securities may not be an indication of the risk associated with investing in those securities. For more information on valuation inputs, and their aggregation into the levels used below, please refer to the Investment Valuation section in the accompanying Notes to Financial Statements.
| | Valuation Inputs at Reporting Date: |
| Description | Total | Level 1 | Level 2 | Level 3 |
| Investments in Securities: | | | | |
| Equities: | | | | |
| Communication Services | $4,765,873 | $1,225,003 | $3,540,870 | $-- |
| Consumer Discretionary | 8,412,724 | 4,246,636 | 4,166,088 | -- |
| Consumer Staples | 6,357,980 | 3,600,734 | 2,757,246 | -- |
| Energy | 3,762,061 | 1,630,674 | 2,131,387 | -- |
| Financials | 15,512,872 | 6,886,109 | 8,626,763 | -- |
| Health Care | 6,296,465 | 1,012,439 | 5,284,026 | -- |
| Industrials | 8,298,993 | 3,349,879 | 4,949,114 | -- |
| Information Technology | 6,684,079 | 1,133,032 | 5,551,047 | -- |
| Materials | 5,181,389 | 2,967,632 | 2,213,757 | -- |
| Real Estate | 2,182,515 | 485,569 | 1,696,946 | -- |
| Utilities | 2,397,600 | 1,007,262 | 1,390,338 | -- |
| Corporate Bonds | 1 | -- | 1 | -- |
| Government Obligations | 159,382 | -- | 159,382 | -- |
| Money Market Funds | 1,625,569 | 1,625,569 | -- | -- |
| Total Investments in Securities: | $71,637,503 | $29,170,538 | $42,466,965 | $-- |
| Derivative Instruments: | | | | |
| Assets | | | | |
| Futures Contracts | $53,671 | $53,671 | $-- | $-- |
| Total Assets | $53,671 | $53,671 | $-- | $-- |
| Total Derivative Instruments: | $53,671 | $53,671 | $-- | $-- |
Value of Derivative Instruments
The following table is a summary of the Fund's value of derivative instruments by primary risk exposure as of October 31, 2019. For additional information on derivative instruments, please refer to the Derivative Instruments section in the accompanying Notes to Financial Statements.
| Primary Risk Exposure / Derivative Type | Value |
| | Asset | Liability |
| Equity Risk | | |
| Futures Contracts(a) | $53,671 | $0 |
| Total Equity Risk | 53,671 | 0 |
| Total Value of Derivatives | $53,671 | $0 |
(a) Reflects gross cumulative appreciation (depreciation) on futures contracts as presented in the Schedule of Investments. In the Statement of Assets and Liabilities, the period end daily variation margin is included in receivable or payable for daily variation margin on futures contracts, and the net cumulative appreciation (depreciation) is included in Total accumulated earnings (loss).
See accompanying notes which are an integral part of the financial statements.
Financial Statements
Statement of Assets and Liabilities
| | | October 31, 2019 |
| Assets | | |
Investment in securities, at value (including securities loaned of $22,350) — See accompanying schedule:
Unaffiliated issuers (cost $67,703,449) | $70,011,934 | |
| Fidelity Central Funds (cost $1,625,569) | 1,625,569 | |
| Total Investment in Securities (cost $69,329,018) | | $71,637,503 |
| Segregated cash with brokers for derivative instruments | | 1 |
| Cash | | 750 |
| Foreign currency held at value (cost $71,596) | | 71,749 |
| Receivable for fund shares sold | | 62,560 |
| Dividends receivable | | 167,148 |
| Distributions receivable from Fidelity Central Funds | | 4,542 |
| Total assets | | 71,944,253 |
| Liabilities | | |
| Payable for fund shares redeemed | $6,973 | |
| Accrued management fee | 11,273 | |
| Payable for daily variation margin on futures contracts | 7,720 | |
| Other payables and accrued expenses | 20,195 | |
| Collateral on securities loaned | 23,440 | |
| Total liabilities | | 69,601 |
| Net Assets | | $71,874,652 |
| Net Assets consist of: | | |
| Paid in capital | | $69,723,244 |
| Total accumulated earnings (loss) | | 2,151,408 |
| Net Assets | | $71,874,652 |
| Net Asset Value and Maximum Offering Price | | |
| Net Asset Value, offering price and redemption price per share ($71,874,652 ÷ 6,599,852 shares) | | $10.89 |
See accompanying notes which are an integral part of the financial statements.
Statement of Operations
| | | Year ended October 31, 2019 |
| Investment Income | | |
| Dividends | | $1,620,325 |
| Non-Cash dividends | | 264,225 |
| Interest | | 3,723 |
| Income from Fidelity Central Funds (including $1,156 from security lending) | | 48,197 |
| Income before foreign taxes withheld | | 1,936,470 |
| Less foreign taxes withheld | | (191,662) |
| Total income | | 1,744,808 |
| Expenses | | |
| Management fee | $93,128 | |
| Transfer agent fees | 10,877 | |
| Independent trustees' fees and expenses | 203 | |
| Commitment fees | 130 | |
| Total expenses before reductions | 104,338 | |
| Expense reductions | (82) | |
| Total expenses after reductions | | 104,256 |
| Net investment income (loss) | | 1,640,552 |
| Realized and Unrealized Gain (Loss) | | |
| Net realized gain (loss) on: | | |
| Investment securities: | | |
| Unaffiliated issuers | (1,508,355) | |
| Fidelity Central Funds | 1 | |
| Foreign currency transactions | (20,177) | |
| Futures contracts | 189,171 | |
| Total net realized gain (loss) | | (1,339,360) |
| Change in net unrealized appreciation (depreciation) on: | | |
| Investment securities: | | |
| Unaffiliated issuers (net of increase in deferred foreign taxes of $16,308) | 6,070,999 | |
| Assets and liabilities in foreign currencies | 5,947 | |
| Futures contracts | 266,351 | |
| Total change in net unrealized appreciation (depreciation) | | 6,343,297 |
| Net gain (loss) | | 5,003,937 |
| Net increase (decrease) in net assets resulting from operations | | $6,644,489 |
See accompanying notes which are an integral part of the financial statements.
Statement of Changes in Net Assets
| | Year ended October 31, 2019 | Year ended October 31, 2018 |
| Increase (Decrease) in Net Assets | | |
| Operations | | |
| Net investment income (loss) | $1,640,552 | $847,685 |
| Net realized gain (loss) | (1,339,360) | (219,778) |
| Change in net unrealized appreciation (depreciation) | 6,343,297 | (4,778,704) |
| Net increase (decrease) in net assets resulting from operations | 6,644,489 | (4,150,797) |
| Distributions to shareholders | (817,712) | (262,953) |
| Share transactions - net increase (decrease) | 26,641,975 | 25,998,506 |
| Total increase (decrease) in net assets | 32,468,752 | 21,584,756 |
| Net Assets | | |
| Beginning of period | 39,405,900 | 17,821,144 |
| End of period | $71,874,652 | $39,405,900 |
See accompanying notes which are an integral part of the financial statements.
Financial Highlights
Fidelity International Sustainability Index Fund
| Years ended October 31, | 2019 | 2018 | 2017 A |
| Selected Per–Share Data | | | |
| Net asset value, beginning of period | $9.87 | $10.96 | $10.00 |
| Income from Investment Operations | | | |
| Net investment income (loss)B | .32C | .29 | .11 |
| Net realized and unrealized gain (loss) | .91 | (1.24) | .85 |
| Total from investment operations | 1.23 | (.95) | .96 |
| Distributions from net investment income | (.21) | (.09) | – |
| Distributions from net realized gain | – | (.05) | – |
| Total distributions | (.21) | (.14) | – |
| Net asset value, end of period | $10.89 | $9.87 | $10.96 |
| Total ReturnD,E | 12.81% | (8.77)% | 9.60% |
| Ratios to Average Net AssetsF,G | | | |
| Expenses before reductions | .20% | .20% | .20%H |
| Expenses net of fee waivers, if any | .20% | .20% | .20%H |
| Expenses net of all reductions | .20% | .20% | .20%H |
| Net investment income (loss) | 3.14%C | 2.70% | 2.25%H |
| Supplemental Data | | | |
| Net assets, end of period (000 omitted) | $71,875 | $3,810 | $1,968 |
| Portfolio turnover rateI | 17% | 10% | 4%J |
A For the period May 9, 2017 (commencement of operations) to October 31, 2017.
B Calculated based on average shares outstanding during the period.
C Net investment income per share reflects a large, non-recurring dividend which amounted to $.04 per share. Excluding this non-recurring dividend, the ratio of net investment income (loss) to average net assets would have been 2.73%.
D Total returns for periods of less than one year are not annualized.
E Total returns would have been lower if certain expenses had not been reduced during the applicable periods shown.
F Fees and expenses of any underlying Fidelity Central Funds are not included in the Fund's expense ratio. The Fund indirectly bears its proportionate share of the expenses of any underlying Fidelity Central Funds.
G Expense ratios reflect operating expenses of the Fund. Expenses before reductions do not reflect amounts reimbursed by the investment adviser or reductions from expense offset arrangements and do not represent the amount paid by the Fund during periods when reimbursements or reductions occur. Expense ratios before reductions for start-up periods may not be representative of longer-term operating periods. Expenses net of fee waivers reflect expenses after reimbursement by the investment adviser but prior to reductions from expense offset arrangements. Expenses net of all reductions represent the net expenses paid by the Fund.
H Annualized
I Amount does not include the portfolio activity of any underlying Fidelity Central Funds.
J Amount not annualized.
See accompanying notes which are an integral part of the financial statements.
Notes to Financial Statements
For the period ended October 31, 2019
1. Organization.
Fidelity International Sustainability Index Fund (the Fund) is a fund of Fidelity Salem Street Trust (the Trust) and is authorized to issue an unlimited number of shares. The Trust is registered under the Investment Company Act of 1940, as amended (the 1940 Act), as an open-end management investment company organized as a Massachusetts business trust. The Fund's investments in emerging markets can be subject to social, economic, regulatory, and political uncertainties and can be extremely volatile.
Effective after the close of business November 9, 2018, the Fund's publicly offered shares classes were consolidated into a single share class. The surviving class is Fidelity International Sustainability Index Fund (formerly Institutional Class). All current fiscal period dollar and share amounts for the classes that closed, which are presented in the Notes to Financial Statements, are for the period November 1, 2018 through November 9, 2018.
2. Investments in Fidelity Central Funds.
The Fund invests in Fidelity Central Funds, which are open-end investment companies generally available only to other investment companies and accounts managed by the investment adviser and its affiliates. The Fund's Schedule of Investments lists each of the Fidelity Central Funds held as of period end, if any, as an investment of the Fund, but does not include the underlying holdings of each Fidelity Central Fund. As an Investing Fund, the Fund indirectly bears its proportionate share of the expenses of the underlying Fidelity Central Funds.
The Money Market Central Funds seek preservation of capital and current income and are managed by Fidelity Investments Money Management, Inc. (FIMM), an affiliate of the investment adviser. Annualized expenses of the Money Market Central Funds as of their most recent shareholder report date ranged from less than .005% to .01%.
A complete unaudited list of holdings for each Fidelity Central Fund is available upon request or at the Securities and Exchange Commission (the SEC) website at www.sec.gov. In addition, the financial statements of the Fidelity Central Funds, which are not covered by the Fund's Report of Independent Registered Public Accounting Firm, are available on the SEC website or upon request.
3. Significant Accounting Policies.
The Fund is an investment company and applies the accounting and reporting guidance of the Financial Accounting Standards Board (FASB) Accounting Standards Codification Topic 946 Financial Services – Investments Companies. The financial statements have been prepared in conformity with accounting principles generally accepted in the United States of America (GAAP), which require management to make certain estimates and assumptions at the date of the financial statements. Actual results could differ from those estimates. Subsequent events, if any, through the date that the financial statements were issued have been evaluated in the preparation of the financial statements. The following summarizes the significant accounting policies of the Fund:
Investment Valuation. Investments are valued as of 4:00 p.m. Eastern time on the last calendar day of the period. The Board of Trustees (the Board) has delegated the day to day responsibility for the valuation of the Fund's investments to the Fair Value Committee (the Committee) established by the Fund's investment adviser. In accordance with valuation policies and procedures approved by the Board, the Fund attempts to obtain prices from one or more third party pricing vendors or brokers to value its investments. When current market prices, quotations or currency exchange rates are not readily available or reliable, investments will be fair valued in good faith by the Committee, in accordance with procedures adopted by the Board. Factors used in determining fair value vary by investment type and may include market or investment specific events, changes in interest rates and credit quality. The frequency with which these procedures are used cannot be predicted and they may be utilized to a significant extent. The Committee oversees the Fund's valuation policies and procedures and reports to the Board on the Committee's activities and fair value determinations. The Board monitors the appropriateness of the procedures used in valuing the Fund's investments and ratifies the fair value determinations of the Committee.
The Fund categorizes the inputs to valuation techniques used to value its investments into a disclosure hierarchy consisting of three levels as shown below:
- Level 1 – quoted prices in active markets for identical investments
- Level 2 – other significant observable inputs (including quoted prices for similar investments, interest rates, prepayment speeds, etc.)
- Level 3 – unobservable inputs (including the Fund's own assumptions based on the best information available)
Valuation techniques used to value the Fund's investments by major category are as follows:
Equity securities, including restricted securities, for which market quotations are readily available, are valued at the last reported sale price or official closing price as reported by a third party pricing vendor on the primary market or exchange on which they are traded and are categorized as Level 1 in the hierarchy. In the event there were no sales during the day or closing prices are not available, securities are valued at the last quoted bid price or may be valued using the last available price and are generally categorized as Level 2 in the hierarchy. For foreign equity securities, when market or security specific events arise, comparisons to the valuation of American Depositary Receipts (ADRs), futures contracts, Exchange-Traded Funds (ETFs) and certain indexes as well as quoted prices for similar securities may be used and would be categorized as Level 2 in the hierarchy. For equity securities, including restricted securities, where observable inputs are limited, assumptions about market activity and risk are used and these securities may be categorized as Level 3 in the hierarchy.
Debt securities, including restricted securities, are valued based on evaluated prices received from third party pricing vendors or from brokers who make markets in such securities. U.S. government and government agency obligations are valued by pricing vendors who utilize matrix pricing which considers yield or price of bonds of comparable quality, coupon, maturity and type or by broker-supplied prices. When independent prices are unavailable or unreliable, debt securities may be valued utilizing pricing methodologies which consider similar factors that would be used by third party pricing vendors. Debt securities are generally categorized as Level 2 in the hierarchy but may be Level 3 depending on the circumstances.
Futures contracts are valued at the settlement price established each day by the board of trade or exchange on which they are traded and are categorized as Level 1 in the hierarchy. Investments in open-end mutual funds, including the Fidelity Central Funds, are valued at their closing net asset value (NAV) each business day and are categorized as Level 1 in the hierarchy.
Changes in valuation techniques may result in transfers in or out of an assigned level within the disclosure hierarchy. The aggregate value of investments by input level as of October 31, 2019 is included at the end of the Fund's Schedule of Investments.
Foreign Currency. The Fund may use foreign currency contracts to facilitate transactions in foreign-denominated securities. Gains and losses from these transactions may arise from changes in the value of the foreign currency or if the counterparties do not perform under the contracts' terms.
Foreign-denominated assets, including investment securities, and liabilities are translated into U.S. dollars at the exchange rates at period end. Purchases and sales of investment securities, income and dividends received and expenses denominated in foreign currencies are translated into U.S. dollars at the exchange rate in effect on the transaction date.
The effects of exchange rate fluctuations on investments are included with the net realized and unrealized gain (loss) on investment securities. Other foreign currency transactions resulting in realized and unrealized gain (loss) are disclosed separately.
Investment Transactions and Income. For financial reporting purposes, the Fund's investment holdings and NAV include trades executed through the end of the last business day of the period. The NAV per share for processing shareholder transactions is calculated as of the close of business of the New York Stock Exchange (NYSE), normally 4:00 p.m. Eastern time and includes trades executed through the end of the prior business day. Gains and losses on securities sold are determined on the basis of identified cost. Dividend income is recorded on the ex-dividend date, except for certain dividends from foreign securities where the ex-dividend date may have passed, which are recorded as soon as the Fund is informed of the ex-dividend date. Non-cash dividends included in dividend income, if any, are recorded at the fair market value of the securities received. Income and capital gain distributions from Fidelity Central Funds, if any, are recorded on the ex-dividend date. Certain distributions received by the Fund represent a return of capital or capital gain. The Fund determines the components of these distributions subsequent to the ex-dividend date, based upon receipt of tax filings or other correspondence relating to the underlying investment. These distributions are recorded as a reduction of cost of investments and/or as a realized gain. Large, non-recurring dividends recognized by the Fund are presented separately on the Statement of Operations as "Non-cash dividends" and the impact of these dividends is presented in the Financial Highlights. Interest income is accrued as earned and includes coupon interest and amortization of premium and accretion of discount on debt securities as applicable. Investment income is recorded net of foreign taxes withheld where recovery of such taxes is uncertain.
Class Allocations and Expenses. Investment income, realized and unrealized capital gains and losses, common expenses of the Fund, and certain fund-level expense reductions, if any, are allocated daily on a pro-rata basis to each class based on the relative net assets of each class to the total net assets of the Fund. Each class differs with respect to transfer agent fees incurred. Certain expense reductions may also differ by class. For the reporting period, the allocated portion of income and expenses to each class as a percent of its average net assets may vary due to the timing of recording these transactions in relation to fluctuating net assets of the classes. Expenses directly attributable to a fund are charged to that fund. Expenses attributable to more than one fund are allocated among the respective funds on the basis of relative net assets or other appropriate methods. Expense estimates are accrued in the period to which they relate and adjustments are made when actual amounts are known.
Income Tax Information and Distributions to Shareholders. Each year, the Fund intends to qualify as a regulated investment company under Subchapter M of the Internal Revenue Code, including distributing substantially all of its taxable income and realized gains. As a result, no provision for U.S. Federal income taxes is required. As of October 31, 2019, the Fund did not have any unrecognized tax benefits in the financial statements; nor is the Fund aware of any tax positions for which it is reasonably possible that the total amounts of unrecognized tax benefits will significantly change in the next twelve months. The Fund files a U.S. federal tax return, in addition to state and local tax returns as required. The Fund's federal income tax returns are subject to examination by the Internal Revenue Service (IRS) for a period of three fiscal years after they are filed. State and local tax returns may be subject to examination for an additional fiscal year depending on the jurisdiction. Foreign taxes are provided for based on the Fund's understanding of the tax rules and rates that exist in the foreign markets in which it invests. The Fund is subject to a tax imposed on capital gains by certain countries in which it invests. An estimated deferred tax liability for net unrealized appreciation on the applicable securities is included in Other payables and accrued expenses on the Statement of Assets & Liabilities.
Distributions are declared and recorded on the ex-dividend date. Income and capital gain distributions are declared separately for each class. Income and capital gain distributions are determined in accordance with income tax regulations, which may differ from GAAP. In addition, the Fund claimed a portion of the payment made to redeeming shareholders as a distribution for income tax purposes.
Capital accounts within the financial statements are adjusted for permanent book-tax differences. These adjustments have no impact on net assets or the results of operations. Capital accounts are not adjusted for temporary book-tax differences which will reverse in a subsequent period.
Book-tax differences are primarily due to futures contracts, foreign currency transactions, passive foreign investment companies (PFIC), market discount, partnerships, capital loss carryforwards and losses deferred due to wash sales.
As of period end, the cost and unrealized appreciation (depreciation) in securities, and derivatives if applicable, for federal income tax purposes were as follows:
| Gross unrealized appreciation | $6,043,896 |
| Gross unrealized depreciation | (4,728,151) |
| Net unrealized appreciation (depreciation) | $1,315,745 |
| Tax Cost | $70,322,772 |
The tax-based components of distributable earnings as of period end were as follows:
| Undistributed ordinary income | $1,454,420 |
| Capital loss carryforward | $(598,329) |
| Net unrealized appreciation (depreciation) on securities and other investments | $1,315,517 |
Capital loss carryforwards are only available to offset future capital gains of the Fund to the extent provided by regulations and may be limited. Under the Regulated Investment Company Modernization Act of 2010 (the Act), the Fund is permitted to carry forward capital losses incurred in taxable years beginning after December 22, 2010 for an unlimited period and such capital losses are required to be used prior to any losses that expire. The capital loss carryforward information presented below, including any applicable limitation, is estimated as of fiscal period end and is subject to adjustment.
| No expiration | |
| Short-term | $(342,807) |
| Long-term | (255,522) |
| Total capital loss carryforward | $(598,329) |
The tax character of distributions paid was as follows:
| | October 31, 2019 | October 31, 2018 |
| Ordinary Income | $817,712 | $ 234,425 |
| Long-term Capital Gains | – | 28,528 |
| Total | $817,712 | $ 262,953 |
Restricted Securities. The Fund may invest in securities that are subject to legal or contractual restrictions on resale. These securities generally may be resold in transactions exempt from registration or to the public if the securities are registered. Disposal of these securities may involve time-consuming negotiations and expense, and prompt sale at an acceptable price may be difficult. Information regarding restricted securities is included at the end of the Fund's Schedule of Investments.
4. Derivative Instruments.
Risk Exposures and the Use of Derivative Instruments. The Fund's investment objective allows the Fund to enter into various types of derivative contracts, including futures contracts. Derivatives are investments whose value is primarily derived from underlying assets, indices or reference rates and may be transacted on an exchange or over-the-counter (OTC). Derivatives may involve a future commitment to buy or sell a specified asset based on specified terms, to exchange future cash flows at periodic intervals based on a notional principal amount, or for one party to make one or more payments upon the occurrence of specified events in exchange for periodic payments from the other party.
The Fund used derivatives to increase returns and to manage exposure to certain risks as defined below. The success of any strategy involving derivatives depends on analysis of numerous economic factors, and if the strategies for investment do not work as intended, the Fund may not achieve its objectives.
The Fund's use of derivatives increased or decreased its exposure to the following risk:
| Equity Risk | Equity risk relates to the fluctuations in the value of financial instruments as a result of changes in market prices (other than those arising from interest rate risk or foreign exchange risk), whether caused by factors specific to an individual investment, its issuer, or all factors affecting all instruments traded in a market or market segment.
|
The Fund is also exposed to additional risks from investing in derivatives, such as liquidity risk and counterparty credit risk. Liquidity risk is the risk that the Fund will be unable to close out the derivative in the open market in a timely manner. Counterparty credit risk is the risk that the counterparty will not be able to fulfill its obligation to the Fund. Counterparty credit risk related to exchange-traded futures contracts may be mitigated by the protection provided by the exchange on which they trade.
Investing in derivatives may involve greater risks than investing in the underlying assets directly and, to varying degrees, may involve risk of loss in excess of any initial investment and collateral received and amounts recognized in the Statement of Assets and Liabilities. In addition, there may be the risk that the change in value of the derivative contract does not correspond to the change in value of the underlying instrument.
Futures Contracts. A futures contract is an agreement between two parties to buy or sell a specified underlying instrument for a fixed price at a specified future date. The Fund used futures contracts to manage its exposure to the stock market.
Upon entering into a futures contract, a fund is required to deposit either cash or securities (initial margin) with a clearing broker in an amount equal to a certain percentage of the face value of the contract. Futures contracts are marked-to-market daily and subsequent daily payments (variation margin) are made or received by a fund depending on the daily fluctuations in the value of the futures contracts and are recorded as unrealized appreciation or (depreciation). This receivable and/or payable, if any, is included in daily variation margin on futures contracts in the Statement of Assets and Liabilities. Realized gain or (loss) is recorded upon the expiration or closing of a futures contract. The net realized gain (loss) and change in net unrealized appreciation (depreciation) on futures contracts during the period is presented in the Statement of Operations.
Any open futures contracts at period end are presented in the Schedule of Investments under the caption "Futures Contracts". The notional amount at value reflects each contract's exposure to the underlying instrument or index at period end and is representative of volume of activity during the period. Securities deposited to meet initial margin requirements are identified in the Schedule of Investments. Cash deposited to meet initial margin requirements is presented as segregated cash with brokers for derivative instruments in the Statement of Assets and Liabilities.
5. Purchases and Sales of Investments.
Purchases and sales of securities, other than short-term securities, aggregated $40,406,708 and $8,502,990, respectively.
6. Fees and Other Transactions with Affiliates.
Management Fee. Fidelity Management & Research Company (the investment adviser) and its affiliates provide the Fund with investment management related services for which the Fund pays a monthly management fee. During July 2019, the Board approved to change the management fee to an annual rate of .20% of the Fund's average net assets effective August 1, 2019. Prior to August 1, 2019, the annual management fee rate was .17%. Under the management contract, the investment adviser pays all other fund-level operating expenses, except the compensation of the independent Trustees and certain miscellaneous expenses such as proxy and shareholder meeting expenses. During July 2019, the Board also approved to change the management fee structure from a flat fee to a unitary fee effective August 1, 2019, which eliminated the need for a separate expense contract. There is no change to the total expenses paid by the shareholders.
Prior to August 1, 2019, under the expense contract, the investment adviser paid class-level expenses as necessary so that the total expenses did not exceed .20% of each class' average net assets on an annual basis with certain exceptions.
Sub-Adviser. Geode Capital Management, LLC (Geode), serves as sub-adviser for the Fund. Geode provides discretionary investment advisory services to the Fund and is paid by the investment adviser for providing these services.
Transfer Agent Fees. Fidelity Investments Institutional Operations Company, Inc. (FIIOC), an affiliate of the investment adviser, is the transfer, dividend disbursing and shareholder servicing agent for each class. FIIOC receives transfer agent fees at an annual rate of .21%, .11% and .035% of class-level average net assets for Investor Class, Premium Class and Fidelity International Sustainability Index Fund, respectively. FIIOC pays for typesetting, printing and mailing of shareholder reports, except proxy statements. Effective August 1, 2019, the Fund does not pay transfer agent fees. Prior to August 1, 2019, under the expense contract, each Class paid a portion of the transfer agent fees at an annual rate of .03%, of class-level average net assets.
For the period, the total transfer agent fees paid by each applicable class were as follows:
| | Amount |
| Investor Class | $71 |
| Premium Class | 233 |
| Fidelity International Sustainability Index Fund | 10,573 |
| | $ 10,877 |
Interfund Trades. The Fund may purchase from or sell securities to other Fidelity Funds under procedures adopted by the Board. The procedures have been designed to ensure these interfund trades are executed in accordance with Rule 17a-7 of the 1940 Act. Interfund trades are included within the respective purchases and sales amounts shown in the Purchases and Sales of Investments note.
7. Committed Line of Credit.
The Fund participates with other funds managed by the investment adviser or an affiliate in a $4.25 billion credit facility (the "line of credit") to be utilized for temporary or emergency purposes to fund shareholder redemptions or for other short-term liquidity purposes. The Fund has agreed to pay commitment fees on its pro-rata portion of the line of credit, which amounted to $130 and is reflected in Commitment fees on the Statement of Operations. During the period, the Fund did not borrow on this line of credit.
8. Security Lending.
The Fund lends portfolio securities from time to time in order to earn additional income. For equity securities, lending agents are used, including National Financial Services (NFS), an affiliate of the Fund. Pursuant to a securities lending agreement, NFS will receive a fee, which is capped at 9.9% of daily lending revenue, for its services as lending agent. The Fund may lend securities to certain qualified borrowers, including NFS. On the settlement date of the loan, the Fund receives collateral (in the form of U.S. Treasury obligations, letters of credit and/or cash) against the loaned securities and maintains collateral in an amount not less than 100% of the market value of the loaned securities during the period of the loan. The market value of the loaned securities is determined at the close of business of the Fund and any additional required collateral is delivered to the Fund on the next business day. The Fund or borrower may terminate the loan at any time, and if the borrower defaults on its obligation to return the securities loaned because of insolvency or other reasons, the Fund may apply collateral received from the borrower against the obligation. The Fund may experience delays and costs in recovering the securities loaned. Any cash collateral received is invested in the Fidelity Securities Lending Cash Central Fund. The value of loaned securities and cash collateral at period end are disclosed on the Fund's Statement of Assets and Liabilities. Total fees paid by the Fund to NFS, as lending agent, amounted to $12. Security lending income represents the income earned on investing cash collateral, less rebates paid to borrowers and any lending agent fees associated with the loan, plus any premium payments received for lending certain types of securities. Security lending income is presented in the Statement of Operations as a component of income from Fidelity Central Funds. During the period, there were no securities loaned to NFS.
9. Expense Reductions.
Through arrangements with the Fund's custodian, credits realized as a result of certain uninvested cash balances were used to reduce the Fund's expenses. During the period, custodian credits reduced the Fund's expenses by $82.
10. Distributions to Shareholders.
Distributions to shareholders of each class were as follows:
| | Year ended
October 31, 2019 | Year ended
October 31, 2018 |
| Distributions to shareholders | | |
| Investor Class | $– | $47,203 |
| Premium Class | – | 189,289 |
| Fidelity International Sustainability Index Fund | 817,712 | 26,461 |
| Total | $817,712 | $262,953 |
11. Share Transactions.
Share transactions for each class were as follows and may contain automatic conversions between classes or exchanges between affiliated funds:
| | Shares | Shares | Dollars | Dollars |
| | Year ended October 31, 2019 | Year ended October 31, 2018 | Year ended October 31, 2019 | Year ended October 31, 2018 |
| Investor Class | | | | |
| Shares sold | 6,889 | 1,146,028 | $69,117 | $12,374,253 |
| Reinvestment of distributions | – | 4,265 | – | 46,448 |
| Shares redeemed | (851,235) | (624,061) | (8,545,243) | (6,818,242) |
| Net increase (decrease) | (844,346) | 526,232 | $(8,476,126) | $5,602,459 |
| Premium Class | | | | |
| Shares sold | 28,614 | 2,451,631 | $289,153 | $27,025,980 |
| Reinvestment of distributions | – | 16,544 | – | 180,162 |
| Shares redeemed | (2,791,033) | (834,454) | (28,027,291) | (8,899,236) |
| Net increase (decrease) | (2,762,419) | 1,633,721 | $(27,738,138) | $18,306,906 |
| Fidelity International Sustainability Index Fund | | | | |
| Shares sold | 7,693,368 | 280,870 | $77,878,379 | $2,864,880 |
| Reinvestment of distributions | 79,727 | 1,939 | 761,388 | 21,115 |
| Shares redeemed | (1,559,168) | (76,433) | (15,783,528) | (796,854) |
| Net increase (decrease) | 6,213,927 | 206,376 | $62,856,239 | $2,089,141 |
12. Other.
The Fund's organizational documents provide former and current trustees and officers with a limited indemnification against liabilities arising in connection with the performance of their duties to the Fund. In the normal course of business, the Fund may also enter into contracts that provide general indemnifications. The Fund's maximum exposure under these arrangements is unknown as this would be dependent on future claims that may be made against the Fund. The risk of material loss from such claims is considered remote.
Report of Independent Registered Public Accounting Firm
To the Trustees of Fidelity Salem Street Trust and Shareholders of Fidelity International Sustainability Index Fund:
Opinion on the Financial Statements and Financial Highlights
We have audited the accompanying statement of assets and liabilities of Fidelity International Sustainability Index Fund (the "Fund"), a fund of Fidelity Salem Street Trust, including the schedule of investments, as of October 31, 2019, the related statement of operations for the year then ended, the statement of changes in net assets for each of the two years in the period then ended, the financial highlights for each of the 2 years in the period then ended and for the period from May 9, 2017 (commencement of operations) to October 31, 2017, and the related notes. In our opinion, the financial statements and financial highlights present fairly, in all material respects, the financial position of the Fund as of October 31, 2019, and the results of its operations for the year then ended, the changes in its net assets for each of the two years in the period then ended, and the financial highlights for each of the 2 years in the period then ended and for the period from May 9, 2017 (commencement of operations) to October 31, 2017 in conformity with accounting principles generally accepted in the United States of America.
Basis for Opinion
These financial statements and financial highlights are the responsibility of the Fund's management. Our responsibility is to express an opinion on the Fund's financial statements and financial highlights based on our audits. We are a public accounting firm registered with the Public Company Accounting Oversight Board (United States) (PCAOB) and are required to be independent with respect to the Fund in accordance with the U.S. federal securities laws and the applicable rules and regulations of the Securities and Exchange Commission and the PCAOB.
We conducted our audits in accordance with the standards of the PCAOB. Those standards require that we plan and perform the audit to obtain reasonable assurance about whether the financial statements and financial highlights are free of material misstatement, whether due to error or fraud. The Fund is not required to have, nor were we engaged to perform, an audit of its internal control over financial reporting. As part of our audits we are required to obtain an understanding of internal control over financial reporting but not for the purpose of expressing an opinion on the effectiveness of the Fund’s internal control over financial reporting. Accordingly, we express no such opinion.
Our audits included performing procedures to assess the risks of material misstatement of the financial statements and financial highlights, whether due to error or fraud, and performing procedures that respond to those risks. Such procedures included examining, on a test basis, evidence regarding the amounts and disclosures in the financial statements and financial highlights. Our audits also included evaluating the accounting principles used and significant estimates made by management, as well as evaluating the overall presentation of the financial statements and financial highlights. Our procedures included confirmation of securities owned as of October 31, 2019, by correspondence with the custodians and brokers; when replies were not received from brokers, we performed other auditing procedures. We believe that our audits provide a reasonable basis for our opinion.
/s/ Deloitte & Touche LLP
Boston, Massachusetts
December 12, 2019
We have served as the auditor of one or more of the Fidelity investment companies since 1999.
Trustees and Officers
The Trustees, Members of the Advisory Board (if any), and officers of the trust and fund, as applicable, are listed below. The Board of Trustees governs the fund and is responsible for protecting the interests of shareholders. The Trustees are experienced executives who meet periodically throughout the year to oversee the fund's activities, review contractual arrangements with companies that provide services to the fund, oversee management of the risks associated with such activities and contractual arrangements, and review the fund's performance. Except for Jonathan Chiel, each of the Trustees oversees 277 funds. Mr. Chiel oversees 171 funds.
The Trustees hold office without limit in time except that (a) any Trustee may resign; (b) any Trustee may be removed by written instrument, signed by at least two-thirds of the number of Trustees prior to such removal; (c) any Trustee who requests to be retired or who has become incapacitated by illness or injury may be retired by written instrument signed by a majority of the other Trustees; and (d) any Trustee may be removed at any special meeting of shareholders by a two-thirds vote of the outstanding voting securities of the trust. Each Trustee who is not an interested person (as defined in the 1940 Act) of the trust and the fund is referred to herein as an Independent Trustee. Each Independent Trustee shall retire not later than the last day of the calendar year in which his or her 75th birthday occurs. The Independent Trustees may waive this mandatory retirement age policy with respect to individual Trustees. Officers and Advisory Board Members hold office without limit in time, except that any officer or Advisory Board Member may resign or may be removed by a vote of a majority of the Trustees at any regular meeting or any special meeting of the Trustees. Except as indicated, each individual has held the office shown or other offices in the same company for the past five years.
The fund’s Statement of Additional Information (SAI) includes more information about the Trustees. To request a free copy, call Fidelity at 1-800-544-8544.
Experience, Skills, Attributes, and Qualifications of the Trustees. The Governance and Nominating Committee has adopted a statement of policy that describes the experience, qualifications, attributes, and skills that are necessary and desirable for potential Independent Trustee candidates (Statement of Policy). The Board believes that each Trustee satisfied at the time he or she was initially elected or appointed a Trustee, and continues to satisfy, the standards contemplated by the Statement of Policy. The Governance and Nominating Committee also engages professional search firms to help identify potential Independent Trustee candidates who have the experience, qualifications, attributes, and skills consistent with the Statement of Policy. From time to time, additional criteria based on the composition and skills of the current Independent Trustees, as well as experience or skills that may be appropriate in light of future changes to board composition, business conditions, and regulatory or other developments, have also been considered by the professional search firms and the Governance and Nominating Committee. In addition, the Board takes into account the Trustees' commitment and participation in Board and committee meetings, as well as their leadership of standing and ad hoc committees throughout their tenure.
In determining that a particular Trustee was and continues to be qualified to serve as a Trustee, the Board has considered a variety of criteria, none of which, in isolation, was controlling. The Board believes that, collectively, the Trustees have balanced and diverse experience, qualifications, attributes, and skills, which allow the Board to operate effectively in governing the fund and protecting the interests of shareholders. Information about the specific experience, skills, attributes, and qualifications of each Trustee, which in each case led to the Board's conclusion that the Trustee should serve (or continue to serve) as a trustee of the fund, is provided below.
Board Structure and Oversight Function. Abigail P. Johnson is an interested person and currently serves as Chairman. The Trustees have determined that an interested Chairman is appropriate and benefits shareholders because an interested Chairman has a personal and professional stake in the quality and continuity of services provided to the fund. Independent Trustees exercise their informed business judgment to appoint an individual of their choosing to serve as Chairman, regardless of whether the Trustee happens to be independent or a member of management. The Independent Trustees have determined that they can act independently and effectively without having an Independent Trustee serve as Chairman and that a key structural component for assuring that they are in a position to do so is for the Independent Trustees to constitute a substantial majority for the Board. The Independent Trustees also regularly meet in executive session. Arthur E. Johnson serves as Chairman of the Independent Trustees and as such (i) acts as a liaison between the Independent Trustees and management with respect to matters important to the Independent Trustees and (ii) with management prepares agendas for Board meetings.
Fidelity® funds are overseen by different Boards of Trustees. The fund's Board oversees Fidelity's investment-grade bond, money market, asset allocation and certain equity funds, and other Boards oversee Fidelity's high income and other equity funds. The asset allocation funds may invest in Fidelity® funds that are overseen by such other Boards. The use of separate Boards, each with its own committee structure, allows the Trustees of each group of Fidelity® funds to focus on the unique issues of the funds they oversee, including common research, investment, and operational issues. On occasion, the separate Boards establish joint committees to address issues of overlapping consequences for the Fidelity® funds overseen by each Board.
The Trustees operate using a system of committees to facilitate the timely and efficient consideration of all matters of importance to the Trustees, the fund, and fund shareholders and to facilitate compliance with legal and regulatory requirements and oversight of the fund's activities and associated risks. The Board, acting through its committees, has charged FMR and its affiliates with (i) identifying events or circumstances the occurrence of which could have demonstrably adverse effects on the fund's business and/or reputation; (ii) implementing processes and controls to lessen the possibility that such events or circumstances occur or to mitigate the effects of such events or circumstances if they do occur; and (iii) creating and maintaining a system designed to evaluate continuously business and market conditions in order to facilitate the identification and implementation processes described in (i) and (ii) above. Because the day-to-day operations and activities of the fund are carried out by or through FMR, its affiliates, and other service providers, the fund's exposure to risks is mitigated but not eliminated by the processes overseen by the Trustees. While each of the Board's committees has responsibility for overseeing different aspects of the fund's activities, oversight is exercised primarily through the Operations and Audit Committees. In addition, an ad hoc Board committee of Independent Trustees has worked with FMR to enhance the Board's oversight of investment and financial risks, legal and regulatory risks, technology risks, and operational risks, including the development of additional risk reporting to the Board. Appropriate personnel, including but not limited to the fund's Chief Compliance Officer (CCO), FMR's internal auditor, the independent accountants, the fund's Treasurer and portfolio management personnel, make periodic reports to the Board's committees, as appropriate, including an annual review of Fidelity's risk management program for the Fidelity® funds. The responsibilities of each standing committee, including their oversight responsibilities, are described further under "Standing Committees of the Trustees."
Interested Trustees*:
Correspondence intended for a Trustee who is an interested person may be sent to Fidelity Investments, 245 Summer Street, Boston, Massachusetts 02210.
Name, Year of Birth; Principal Occupations and Other Relevant Experience+
Jonathan Chiel (1957)
Year of Election or Appointment: 2016
Trustee
Mr. Chiel also serves as Trustee of other Fidelity® funds. Mr. Chiel is Executive Vice President and General Counsel for FMR LLC (diversified financial services company, 2012-present). Previously, Mr. Chiel served as general counsel (2004-2012) and senior vice president and deputy general counsel (2000-2004) for John Hancock Financial Services; a partner with Choate, Hall & Stewart (1996-2000) (law firm); and an Assistant United States Attorney for the United States Attorney’s Office of the District of Massachusetts (1986-95), including Chief of the Criminal Division (1993-1995). Mr. Chiel is a director on the boards of the Boston Bar Foundation and the Maimonides School.
Abigail P. Johnson (1961)
Year of Election or Appointment: 2009
Trustee
Chairman of the Board of Trustees
Ms. Johnson also serves as Trustee of other Fidelity® funds. Ms. Johnson serves as Chairman (2016-present), Chief Executive Officer (2014-present), and Director (2007-present) of FMR LLC (diversified financial services company), President of Fidelity Financial Services (2012-present) and President of Personal, Workplace and Institutional Services (2005-present). Ms. Johnson is Chairman and Director of FMR Co., Inc. (investment adviser firm, 2011-present) and Chairman and Director of FMR (investment adviser firm, 2011-present). Previously, Ms. Johnson served as Vice Chairman (2007-2016) and President (2013-2016) of FMR LLC, President and a Director of FMR (2001-2005), a Trustee of other investment companies advised by FMR, Fidelity Investments Money Management, Inc. (investment adviser firm), and FMR Co., Inc. (2001-2005), Senior Vice President of the Fidelity® funds (2001-2005), and managed a number of Fidelity® funds. Ms. Abigail P. Johnson and Mr. Arthur E. Johnson are not related.
Jennifer Toolin McAuliffe (1959)
Year of Election or Appointment: 2016
Trustee
Ms. McAuliffe also serves as Trustee of other Fidelity® funds. Ms. McAuliffe previously served as a Member of the Advisory Board of certain Fidelity® funds (2016) and as Co-Head of Fixed Income of Fidelity Investments Limited (now known as FIL Limited (FIL)) (diversified financial services company). Earlier roles at FIL included Director of Research for FIL’s credit and quantitative teams in London, Hong Kong and Tokyo. Ms. McAuliffe also was the Director of Research for taxable and municipal bonds at Fidelity Investments Money Management, Inc. Ms. McAuliffe is also a director or trustee of several not-for-profit entities.
* Determined to be an “Interested Trustee” by virtue of, among other things, his or her affiliation with the trust or various entities under common control with FMR.
+ The information includes the Trustee's principal occupation during the last five years and other information relating to the experience, attributes, and skills relevant to the Trustee's qualifications to serve as a Trustee, which led to the conclusion that the Trustee should serve as a Trustee for the fund.
Independent Trustees:
Correspondence intended for an Independent Trustee may be sent to Fidelity Investments, P.O. Box 55235, Boston, Massachusetts 02205-5235.
Name, Year of Birth; Principal Occupations and Other Relevant Experience+
Elizabeth S. Acton (1951)
Year of Election or Appointment: 2013
Trustee
Ms. Acton also serves as Trustee of other Fidelity® funds. Prior to her retirement in April 2012, Ms. Acton was Executive Vice President, Finance (2011-2012), Executive Vice President, Chief Financial Officer (2002-2011), and Treasurer (2004-2005) of Comerica Incorporated (financial services). Prior to joining Comerica, Ms. Acton held a variety of positions at Ford Motor Company (1983-2002), including Vice President and Treasurer (2000-2002) and Executive Vice President and Chief Financial Officer of Ford Motor Credit Company (1998-2000). Ms. Acton currently serves as a member of the Board of Directors and Audit and Finance Committees of Beazer Homes USA, Inc. (homebuilding, 2012-present). Previously, Ms. Acton served as a Member of the Advisory Board of certain Fidelity® funds (2013-2016).
Ann E. Dunwoody (1953)
Year of Election or Appointment: 2018
Trustee
General Dunwoody also serves as Trustee of other Fidelity® funds. General Dunwoody (United States Army, Retired) was the first woman in U.S. military history to achieve the rank of four-star general and prior to her retirement in 2012 held a variety of positions within the U.S. Army, including Commanding General, U.S. Army Material Command (2008-2012). She is the President of First to Four LLC (leadership and mentoring services, 2012-present). She also serves as a member of the Board of Directors and Nominating and Corporate Governance Committee of L3 Technologies, Inc. (communication, electronic, sensor, and aerospace systems, 2013-present), Board of Directors and Nomination and Corporate Governance Committees of Kforce Inc. (professional staffing services, 2016-present) and Board of Directors of Automattic Inc. (software engineering, 2018-present). Previously, General Dunwoody served as a Member of the Advisory Board of certain Fidelity® funds (2018), a member of the Board of Directors and Audit and Sustainability and Corporate Responsibility Committees of Republic Services, Inc. (waste collection, disposal and recycling, 2013-2016). Ms. Dunwoody also serves on several boards for non-profit organizations, including as a member of the Board of Directors, Chair of the Nomination and Governance Committee and member of the Audit Committee of Logistics Management Institute (consulting non-profit, 2012-present), a member of the Board of Directors of the Army Historical Foundation (2015-present), a member of the Council of Trustees for the Association of the United States Army (advocacy non-profit, 2013-present) and a member of the Board of Trustees of Florida Institute of Technology (2015-present) and ThanksUSA (military family education non-profit, 2014-present).
John Engler (1948)
Year of Election or Appointment: 2014
Trustee
Mr. Engler also serves as Trustee of other Fidelity® funds. He serves on the board of directors for Universal Forest Products (manufacturer and distributor of wood and wood-alternative products, 2003-present) and K12 Inc. (technology-based education company, 2012-present). Previously, Mr. Engler served as interim president of Michigan State University (2018-2019), a Member of the Advisory Board of certain Fidelity® funds (2014-2016), president of the Business Roundtable (2011-2017), a trustee of The Munder Funds (2003-2014), president and CEO of the National Association of Manufacturers (2004-2011), member of the Board of Trustees of the Annie E. Casey Foundation (2004-2015), and as governor of Michigan (1991-2003). He is a past chairman of the National Governors Association.
Robert F. Gartland (1951)
Year of Election or Appointment: 2010
Trustee
Mr. Gartland also serves as Trustee of other Fidelity® funds. Mr. Gartland is Chairman and an investor in Gartland & Mellina Group Corp. (consulting, 2009-present). Previously, Mr. Gartland served as a partner and investor of Vietnam Partners LLC (investments and consulting, 2008-2011). Prior to his retirement, Mr. Gartland held a variety of positions at Morgan Stanley (financial services, 1979-2007), including Managing Director (1987-2007), and Chase Manhattan Bank (1975-1978).
Arthur E. Johnson (1947)
Year of Election or Appointment: 2008
Trustee
Chairman of the Independent Trustees
Mr. Johnson also serves as Trustee of other Fidelity® funds. Mr. Johnson serves as a member of the Board of Directors of Eaton Corporation plc (diversified power management, 2009-present) and Booz Allen Hamilton (management consulting, 2011-present). Prior to his retirement, Mr. Johnson served as Senior Vice President of Corporate Strategic Development of Lockheed Martin Corporation (defense contractor, 1999-2009). Mr. Johnson previously served as Vice Chairman (2015-2018) of the Independent Trustees of certain Fidelity® funds and on the Board of Directors of IKON Office Solutions, Inc. (1999-2008), AGL Resources, Inc. (holding company, 2002-2016), and Delta Airlines (2005-2007). Mr. Arthur E. Johnson is not related to Ms. Abigail P. Johnson.
Michael E. Kenneally (1954)
Year of Election or Appointment: 2009
Trustee
Vice Chairman of the Independent Trustees
Mr. Kenneally also serves as Trustee of other Fidelity® funds. Prior to his retirement, Mr. Kenneally served as Chairman and Global Chief Executive Officer of Credit Suisse Asset Management. Before joining Credit Suisse, he was an Executive Vice President and Chief Investment Officer for Bank of America Corporation. Earlier roles at Bank of America included Director of Research, Senior Portfolio Manager and Research Analyst, and Mr. Kenneally was awarded the Chartered Financial Analyst (CFA) designation in 1991.
Marie L. Knowles (1946)
Year of Election or Appointment: 2001
Trustee
Ms. Knowles also serves as Trustee of other Fidelity® funds. Prior to Ms. Knowles' retirement in June 2000, she served as Executive Vice President and Chief Financial Officer of Atlantic Richfield Company (ARCO) (diversified energy, 1996-2000). From 1993 to 1996, she was a Senior Vice President of ARCO and President of ARCO Transportation Company (pipeline and tanker operations). Ms. Knowles currently serves as a Director and Chairman of the Audit Committee of McKesson Corporation (healthcare service, since 2002). Ms. Knowles is a member of the Board of the Santa Catalina Island Company (real estate, 2009-present). Ms. Knowles is a Member of the Investment Company Institute Board of Governors and a Member of the Governing Council of the Independent Directors Council (2014-present). She also serves as a member of the Advisory Board for the School of Engineering of the University of Southern California. Previously, Ms. Knowles served as a Director of Phelps Dodge Corporation (copper mining and manufacturing, 1994-2007), URS Corporation (engineering and construction, 2000-2003) and America West (airline, 1999-2002). Ms. Knowles previously served as Chairman (2015-2018) and Vice Chairman (2012-2015) of the Independent Trustees of certain Fidelity® funds.
Mark A. Murray (1954)
Year of Election or Appointment: 2016
Trustee
Mr. Murray also serves as Trustee of other Fidelity® funds. Mr. Murray is Vice Chairman (2013-present) of Meijer, Inc. (regional retail chain). Previously, Mr. Murray served as a Member of the Advisory Board of certain Fidelity® funds (2016) and as Co-Chief Executive Officer (2013-2016) and President (2006-2013) of Meijer, Inc. Mr. Murray serves as a member of the Board of Directors and Nuclear Review and Public Policy and Responsibility Committees of DTE Energy Company (diversified energy company, 2009-present). Mr. Murray also serves as a member of the Board of Directors of Spectrum Health (not-for-profit health system, 2015-present). Mr. Murray previously served as President of Grand Valley State University (2001-2006), Treasurer for the State of Michigan (1999-2001), Vice President of Finance and Administration for Michigan State University (1998-1999), and a member of the Board of Directors and Audit Committee and Chairman of the Nominating and Corporate Governance Committee of Universal Forest Products, Inc. (manufacturer and distributor of wood and wood-alternative products, 2004-2016). Mr. Murray is also a director or trustee of many community and professional organizations.
+ The information includes the Trustee's principal occupation during the last five years and other information relating to the experience, attributes, and skills relevant to the Trustee's qualifications to serve as a Trustee, which led to the conclusion that the Trustee should serve as a Trustee for the fund.
Advisory Board Members and Officers:
Correspondence intended for an officer may be sent to Fidelity Investments, 245 Summer Street, Boston, Massachusetts 02210. Officers appear below in alphabetical order.
Name, Year of Birth; Principal Occupation
Elizabeth Paige Baumann (1968)
Year of Election or Appointment: 2017
Anti-Money Laundering (AML) Officer
Ms. Baumann also serves as AML Officer of other funds. She is Chief AML Officer (2012-present) and Senior Vice President (2014-present) of FMR LLC (diversified financial services company) and is an employee of Fidelity Investments. Previously, Ms. Baumann served as AML Officer of the funds (2012-2016), and Vice President (2007-2014) and Deputy Anti-Money Laundering Officer (2007-2012) of FMR LLC.
Craig S. Brown (1977)
Year of Election or Appointment: 2019
Assistant Treasurer
Mr. Brown also serves as Assistant Treasurer of other funds. Mr. Brown is an employee of Fidelity Investments (2013-present).
John J. Burke III (1964)
Year of Election or Appointment: 2018
Chief Financial Officer
Mr. Burke also serves as Chief Financial Officer of other funds. Mr. Burke serves as Head of Investment Operations for Fidelity Fund and Investment Operations (2018-present) and is an employee of Fidelity Investments (1998-present). Previously Mr. Burke served as head of Asset Management Investment Operations (2012-2018).
Jonathan Davis (1968)
Year of Election or Appointment: 2010
Assistant Treasurer
Mr. Davis also serves as Assistant Treasurer of other funds. Mr. Davis serves as Assistant Treasurer of FMR Capital, Inc. (2017-present) and is an employee of Fidelity Investments. Previously, Mr. Davis served as Vice President and Associate General Counsel of FMR LLC (diversified financial services company, 2003-2010).
Adrien E. Deberghes (1967)
Year of Election or Appointment: 2010
Assistant Treasurer
Mr. Deberghes also serves as an officer of other funds. He serves as Assistant Treasurer of FMR Capital, Inc. (2017-present), Executive Vice President of Fidelity Investments Money Management, Inc. (FIMM) (investment adviser firm, 2016-present), and is an employee of Fidelity Investments (2008-present). Previously, Mr. Deberghes served as President and Treasurer of certain Fidelity® funds (2013-2018). Prior to joining Fidelity Investments, Mr. Deberghes was Senior Vice President of Mutual Fund Administration at State Street Corporation (2007-2008), Senior Director of Mutual Fund Administration at Investors Bank & Trust (2005-2007), and Director of Finance for Dunkin' Brands (2000-2005). Previously, Mr. Deberghes served in other fund officer roles.
Laura M. Del Prato (1964)
Year of Election or Appointment: 2018
President and Treasurer
Ms. Del Prato also serves as an officer of other funds. Ms. Del Prato is an employee of Fidelity Investments (2017-present). Prior to joining Fidelity Investments, Ms. Del Prato served as a Managing Director and Treasurer of the JPMorgan Mutual Funds (2014-2017). Prior to JPMorgan, Ms. Del Prato served as a partner at Cohen Fund Audit Services (accounting firm, 2012-2013) and KPMG LLP (accounting firm, 2004-2012).
Colm A. Hogan (1973)
Year of Election or Appointment: 2016
Assistant Treasurer
Mr. Hogan also serves as an officer of other funds. Mr. Hogan serves as Assistant Treasurer of FMR Capital, Inc. (2017-present) and is an employee of Fidelity Investments (2005-present). Previously, Mr. Hogan served as Assistant Treasurer of certain Fidelity® funds (2016-2018).
Cynthia Lo Bessette (1969)
Year of Election or Appointment: 2019
Secretary and Chief Legal Officer (CLO)
Ms. Lo Bessette also serves as Secretary and CLO of other funds. Ms. Lo Bessette serves as CLO, Secretary, and Senior Vice President of Fidelity Management & Research Company and FMR Co., Inc. (investment adviser firms, 2019-present); Secretary of Fidelity SelectCo, LLC and Fidelity Investments Money Management, Inc. (investment adviser firms, 2019-present); and CLO of Fidelity Management & Research (Hong Kong) Limited, FMR Investment Management (UK) Limited, and Fidelity Management & Research (Japan) Limited (investment adviser firms, 2019-present). She is a Senior Vice President and Deputy General Counsel of FMR LLC (diversified financial services company, 2019-present), and is an employee of Fidelity Investments. Previously, Ms. Lo Bessette served as Executive Vice President, General Counsel (2016-2019) and Senior Vice President, Deputy General Counsel (2015-2016) of OppenheimerFunds (investment management company) and Deputy Chief Legal Officer (2013-2015) of Jennison Associates LLC (investment adviser firm).
Chris Maher (1972)
Year of Election or Appointment: 2013
Assistant Treasurer
Mr. Maher serves as Assistant Treasurer of other funds. Mr. Maher is Vice President of Valuation Oversight, serves as Assistant Treasurer of FMR Capital, Inc. (2017-present), and is an employee of Fidelity Investments. Previously, Mr. Maher served as Vice President of Asset Management Compliance (2013), Vice President of the Program Management Group of FMR (investment adviser firm, 2010-2013), and Vice President of Valuation Oversight (2008-2010).
John B. McGinty, Jr. (1962)
Year of Election or Appointment: 2016
Chief Compliance Officer
Mr. McGinty also serves as Chief Compliance Officer of other funds. Mr. McGinty is Senior Vice President of Asset Management Compliance for Fidelity Investments and is an employee of Fidelity Investments (2016-present). Mr. McGinty previously served as Vice President, Senior Attorney at Eaton Vance Management (investment management firm, 2015-2016), and prior to Eaton Vance as global CCO for all firm operations and registered investment companies at GMO LLC (investment management firm, 2009-2015). Before joining GMO LLC, Mr. McGinty served as Senior Vice President, Deputy General Counsel for Fidelity Investments (2007-2009).
Jason P. Pogorelec (1975)
Year of Election or Appointment: 2015
Assistant Secretary
Mr. Pogorelec also serves as Assistant Secretary of other funds. Mr. Pogorelec serves as Vice President, Associate General Counsel (2010-present) and is an employee of Fidelity Investments (2006-present).
Nancy D. Prior (1967)
Year of Election or Appointment: 2014
Vice President
Ms. Prior also serves as Vice President of other funds. Ms. Prior serves as President of Fixed Income (2014-present), President (2016-present) and Director (2014-present) of Fidelity Investments Money Management, Inc. (FIMM) (investment adviser firm), and is an employee of Fidelity Investments (2002-present). Previously, Ms. Prior served as Vice President of Global Asset Allocation Funds (2017-2019); Vice Chairman of FIAM LLC (investment adviser firm, 2014-2018), a Director of FMR Investment Management (UK) Limited (investment adviser firm, 2015-2018), President Multi-Asset Class Strategies of FMR's Global Asset Allocation Division (2017-2018), Vice President of Fidelity's Money Market Funds (2012-2014), and President, Money Market and Short Duration Bond Group of Fidelity Management & Research Company (FMR) (investment adviser firm, 2013-2014).
Stacie M. Smith (1974)
Year of Election or Appointment: 2013
Assistant Treasurer
Ms. Smith also serves as an officer of other funds. Ms. Smith serves as Assistant Treasurer of FMR Capital, Inc. (2017-present), is an employee of Fidelity Investments (2009-present), and has served in other fund officer roles. Prior to joining Fidelity Investments, Ms. Smith served as Senior Audit Manager of Ernst & Young LLP (accounting firm, 1996-2009). Previously, Ms. Smith served as Assistant Treasurer (2013-2018) and Deputy Treasurer (2013-2016) of certain Fidelity® funds.
Marc L. Spector (1972)
Year of Election or Appointment: 2016
Deputy Treasurer
Mr. Spector also serves as an officer of other funds. Mr. Spector serves as Assistant Treasurer of FMR Capital, Inc. (2017-present) and is an employee of Fidelity Investments (2016-present). Prior to joining Fidelity Investments, Mr. Spector served as Director at the Siegfried Group (accounting firm, 2013-2016), and prior to Siegfried Group as audit senior manager at Deloitte & Touche (accounting firm, 2005-2013).
Jim Wegmann (1979)
Year of Election or Appointment: 2019
Assistant Treasurer
Mr. Wegmann also serves as Assistant Treasurer of other funds. Mr. Wegmann is an employee of Fidelity Investments (2011-present).
Shareholder Expense Example
As a shareholder of the Fund, you incur two types of costs: (1) transaction costs, and (2) ongoing costs, including management fees and other Fund expenses. This Example is intended to help you understand your ongoing costs (in dollars) of investing in the Fund and to compare these costs with the ongoing costs of investing in other mutual funds.
The Example is based on an investment of $1,000 invested at the beginning of the period and held for the entire period (May 1, 2019 to October 31, 2019).
Actual Expenses
The first line of the accompanying table provides information about actual account values and actual expenses. You may use the information in this line, together with the amount you invested, to estimate the expenses that you paid over the period. Simply divide your account value by $1,000.00 (for example, an $8,600 account value divided by $1,000.00 = 8.6), then multiply the result by the number in the first line under the heading entitled "Expenses Paid During Period" to estimate the expenses you paid on your account during this period. In addition, the Fund, as a shareholder in the underlying Fidelity Central Funds, will indirectly bear its pro-rata share of the fees and expenses incurred by the underlying Fidelity Central Funds. These fees and expenses are not included in the Fund's annualized expense ratio used to calculate the expense estimate in the table below.
Hypothetical Example for Comparison Purposes
The second line of the accompanying table provides information about hypothetical account values and hypothetical expenses based on the Fund's actual expense ratio and an assumed rate of return of 5% per year before expenses, which is not the Fund's actual return. The hypothetical account values and expenses may not be used to estimate the actual ending account balance or expenses you paid for the period. You may use this information to compare the ongoing costs of investing in the Fund and other funds. To do so, compare this 5% hypothetical example with the 5% hypothetical examples that appear in the shareholder reports of the other funds. In addition, the Fund, as a shareholder in the underlying Fidelity Central Funds, will indirectly bear its pro-rata share of the fees and expenses incurred by the underlying Fidelity Central Funds. These fees and expenses are not included in the Fund's annualized expense ratio used to calculate the expense estimate in the table below.
Please note that the expenses shown in the table are meant to highlight your ongoing costs only and do not reflect any transaction costs. Therefore, the second line of the table is useful in comparing ongoing costs only, and will not help you determine the relative total costs of owning different funds.
| | Annualized Expense Ratio-A | Beginning
Account Value
May 1, 2019 | Ending
Account Value
October 31, 2019 | Expenses Paid
During Period-B
May 1, 2019
to October 31, 2019 |
| Fidelity International Sustainability Index Fund | .20% | | | |
| Actual | | $1,000.00 | $1,027.40 | $1.02 |
| Hypothetical-C | | $1,000.00 | $1,024.20 | $1.02 |
A Annualized expense ratio reflects expenses net of applicable fee waivers.
B Expenses are equal to the Fund's annualized expense ratio, multiplied by the average account value over the period, multiplied by 184/365 (to reflect the one-half year period).
C 5% return per year before expenses
Distributions (Unaudited)
The fund designates 97% of the dividend distributed during the fiscal year as amounts which may be taken into account as a dividend for the purposes of the maximum rate under section 1(h)(11) of the Internal Revenue Code.
The amounts per share which represent income derived from sources within, and taxes paid to, foreign countries or possessions of the United States are $0.2417 and $0.0277 for the dividend paid December 10, 2018.
The fund will notify shareholders in January 2020 of amounts for use in preparing 2019 income tax returns.
Board Approval of Investment Advisory Contracts and Management Fees
Fidelity International Sustainability Index Fund
Each year, the Board of Trustees, including the Independent Trustees (together, the Board), votes on the renewal of the management contract with Fidelity Management & Research Company (FMR) and the sub-advisory agreements (together, the Advisory Contracts) for the fund, including the fund's sub-advisory agreement (Sub-Advisory Agreement) with Geode Capital Management, LLC (Geode). FMR and the sub-advisers are referred to herein as the Investment Advisers. The Board, assisted by the advice of fund counsel and Independent Trustees' counsel, requests and considers a broad range of information relevant to the renewal of the Advisory Contracts throughout the year.
The Board meets regularly and, at each of its meetings, covers an extensive agenda of topics and materials and considers factors that are relevant to its annual consideration of the renewal of the fund's Advisory Contracts, including the services and support provided to the fund and its shareholders. The Board has established four standing committees (Committees) — Operations, Audit, Fair Valuation, and Governance and Nominating — each composed of and chaired by Independent Trustees with varying backgrounds, to which the Board has assigned specific subject matter responsibilities in order to enhance effective decision-making by the Board. The Operations Committee, of which all of the Independent Trustees are members, meets regularly throughout the year and considers, among other matters, information specifically related to the annual consideration of the renewal of the fund's Advisory Contracts. The Board, acting directly and through its Committees, requests and receives information concerning the annual consideration of the renewal of the fund's Advisory Contracts. The Board also meets as needed to review matters specifically related to the Board's annual consideration of the renewal of the Advisory Contracts. Members of the Board may also meet with trustees of other Fidelity funds through joint ad hoc committees to discuss certain matters relevant to all of the Fidelity funds.
At its September 2019 meeting, the Board unanimously determined to renew the fund's Advisory Contracts. In reaching its determination, the Board considered all factors it believed relevant, including (i) the nature, extent, and quality of the services provided to the fund and its shareholders (including the investment performance of the fund); (ii) the competitiveness of the fund's management fee and total expense ratio relative to peer funds; (iii) the total costs of the services provided by and the profits realized by Fidelity and Geode from their respective relationships with the fund; and (iv) the extent to which, if any, economies of scale exist and are realized as the fund grows, and whether any economies of scale are appropriately shared with fund shareholders.
In considering whether to renew the Advisory Contracts for the fund, the Board reached a determination, with the assistance of fund counsel and Independent Trustees' counsel and through the exercise of its business judgment, that the renewal of the Advisory Contracts was in the best interests of the fund and its shareholders and that the compensation payable under the Advisory Contracts was fair and reasonable. The Board's decision to renew the Advisory Contracts was not based on any single factor, but rather was based on a comprehensive consideration of all the information provided to the Board at its meetings throughout the year. The Board, in reaching its determination to renew the Advisory Contracts, was aware that shareholders of the fund have a broad range of investment choices available to them, including a wide choice among funds offered by Fidelity's competitors, and that the fund's shareholders, who have the opportunity to review and weigh the disclosure provided by the fund in its prospectus and other public disclosures, have chosen to invest in this fund, which is part of the Fidelity family of funds.
At its July 2019 meeting, the Board voted to approve an amended and restated management contract to implement a comprehensive unitary fee for the fund (New Contract). In reaching its conclusion to approve the New Contract, the Board considered that it had received and reviewed certain information and made certain findings in connection with the annual renewal of the Advisory Contracts at its September 2018 meeting and considered how, if at all, the approval of the New Contract would change its prior conclusions. The Board considered that the New Contract would implement a comprehensive unitary fee set at the fund's current expense contract level and payable to FMR for managing the fund and paying all of the fund's operating expenses, subject to certain exceptions. The Board considered that, although the proposed unitary fee rate was higher than the fund's current management fee rate, the fund would no longer pay operating expenses under separate agreements and there would be no change to the fund's current total expense ratio. The Board also noted that the New Contract would not change the investment processes, the level or nature of services provided, the resources and personnel allocated, or trading and compliance operations. Based on its evaluation, and after considering all factors it believed relevant, the Board ultimately concluded that the advisory fee structure in the New Contract is fair and reasonable, and that the New Contract should be approved.
Approval of Amended and Restated Advisory Contracts. At its September 2019 meeting, the Board also unanimously determined to approve an amended and restated management contract and sub-advisory agreement with Geode (Amended and Restated Contracts) in connection with an upcoming consolidation of certain of Fidelity's advisory businesses. The Board considered that, on or about January 1, 2020, FMR Co., Inc. (FMRC) expects to merge with and into FMR and, after the merger, FMR expects to redomicile as a Delaware limited liability company. The Board also approved the termination of the sub-advisory agreement with FMRC upon the completion of the merger. The Board noted that references to FMR in the Amended and Restated Contracts would be updated to reflect FMR's new form of organization and domicile. The Board also approved amendments that clarify that the fund pays its non-operating expenses, including brokerage commissions and fees and expenses associated with the fund's securities lending program, if applicable. The Board also noted Fidelity's assurance that neither the planned consolidation nor the Amended and Restated Contracts will change the investment processes, the level or nature of services provided, the resources and personnel allocated, trading and compliance operations, or any fees or expenses paid by the fund.
Nature, Extent, and Quality of Services Provided. The Board considered staffing as it relates to the fund, including the backgrounds of investment personnel of Fidelity and Geode, and also considered the fund's investment objective, strategies, and related investment philosophy. The Independent Trustees also had discussions with senior management of Fidelity's investment operations and investment groups and with representatives of Geode. The Board considered the structure of the investment personnel compensation programs and whether the structures provide appropriate incentives to act in the best interests of the fund. Additionally, the Board considered the portfolio managers' investments, if any, in the funds that they manage.
The Trustees also discussed with representatives of Fidelity, at meetings throughout the year, Fidelity's role in, among other things, overseeing compliance with federal securities laws and other applicable requirements by Geode with respect to the funds and monitoring and overseeing the performance and investment capabilities of Geode. The Trustees considered that the Board had received from Fidelity periodic reports about its oversight and due diligence processes, as well as periodic reports regarding the performance of Geode.
The Board also considered the nature, extent and quality of services provided by Geode. The Trustees noted that under the Sub-Advisory Agreement, subject to oversight by Fidelity, Geode is responsible for, among other things, identifying investments and arranging for execution of portfolio transactions to implement the fund's investment strategy. In addition, the Trustees noted that Geode is responsible for providing such reporting as may be requested by Fidelity to fulfill its oversight responsibilities discussed above.
Resources Dedicated to Investment Management and Support Services. The Board reviewed the general qualifications and capabilities of Fidelity's and Geode's investment staffs, including their size, education, experience, and resources, as well as Fidelity's and Geode's approach to recruiting, managing, and compensating investment personnel. The Board considered that Fidelity's and Geode's investment professionals have extensive resources, tools and capabilities so as to provide competitive investment results over time, and that those professionals also have access to sophisticated tools that permit them to assess portfolio construction and risk and performance attribution characteristics continuously. Additionally, in its deliberations, the Board considered Fidelity's and Geode's trading, risk management, compliance, and technology and operations capabilities and resources, which are integral parts of the investment management process.
Shareholder and Administrative Services. The Board considered (i) the nature, extent, quality, and cost of advisory, administrative, and shareholder services performed by the Investment Advisers and their affiliates under the Advisory Contracts and by FMR's affiliates under separate agreements covering transfer agency, pricing and bookkeeping, and securities lending services for the fund; (ii) the nature and extent of the supervision of third party service providers, principally custodians, subcustodians, and pricing vendors; and (iii) the resources devoted to, and the record of compliance with, the fund's compliance policies and procedures. The Board also reviewed the allocation of fund brokerage, including allocations to brokers affiliated with the Investment Advisers.
The Board noted that the growth of fund assets over time across the complex allows Fidelity to reinvest in the development of services designed to enhance the value and convenience of the Fidelity funds as investment vehicles. These services include 24-hour access to account information and market information over the Internet and through telephone representatives, investor education materials and asset allocation tools, and the expanded availability of Fidelity Investor Centers.
Investment in a Large Fund Family. The Board considered the benefits to shareholders of investing in a Fidelity fund, including the benefits of investing in a fund that is part of a large family of funds offering a variety of investment disciplines and providing a large variety of mutual fund investor services. The Board noted that Fidelity had taken, or had made recommendations that resulted in the Fidelity funds taking, a number of actions over the previous year that benefited particular funds, including: (i) continuing to dedicate additional resources to Fidelity's investment research process, which includes meetings with management of issuers of securities in which the funds invest, and to the support of the senior management team that oversees asset management; (ii) continuing efforts to enhance Fidelity's global research capabilities; (iii) launching new funds with innovative structures, strategies and pricing and making other enhancements to meet client needs; (iv) launching new share classes of existing funds; (v) eliminating purchase minimums and broadening eligibility requirements for certain funds and share classes; (vi) reducing management fees and total expenses for certain target date funds and index funds; (vii) lowering expense caps for certain existing funds and classes, and converting certain voluntary expense caps to contractual caps, to reduce expenses borne by shareholders; (viii) rationalizing product lines and gaining increased efficiencies from fund mergers, liquidations, and share class consolidations; (ix) continuing to develop, acquire and implement systems and technology to improve services to the funds and shareholders, strengthen information security, and increase efficiency; and (x) continuing to implement enhancements to further strengthen Fidelity's product line to increase investors' probability of success in achieving their investment goals, including retirement income goals.
Investment Performance. The Board considered whether the fund has operated in accordance with its investment objective, as well as its record of compliance with its investment restrictions and its performance history.
The Board took into account discussions with representatives of the Investment Advisers about fund investment performance. In this regard the Board noted that as part of regularly scheduled fund reviews and other reports to the Board on fund performance, the Board considers annualized return information for the fund for different time periods, measured against the securities market index the fund seeks to track. The Board also periodically considers the fund's tracking error versus its benchmark index. In its evaluation of fund investment performance, the Board gave particular attention to information indicating underperformance of certain Fidelity funds for specific time periods and discussed with the Investment Advisers the reasons for such underperformance.
In addition to reviewing absolute and relative fund performance, the Independent Trustees periodically consider the appropriateness of fund performance metrics in evaluating the results achieved. In general, the Independent Trustees believe that an index fund's performance should be evaluated based on gross performance (before fees and expenses but after transaction costs) compared to a fund's benchmark index, over appropriate time periods, taking into account relevant factors including the following: general market conditions; the characteristics of the fund's benchmark index; the extent to which statistical sampling is employed; any securities lending revenues; and fund cash flows and other factors. Depending on the circumstances, the Independent Trustees may be satisfied with a fund's performance notwithstanding that it lags its benchmark index for certain periods.
The Independent Trustees recognize that shareholders evaluate performance on a net basis (after fees and expenses) over their own holding periods, for which one-, three-, and five-year periods are often used as a proxy. For this reason, the performance information reviewed by the Board also included net calendar year total return information for the fund and its benchmark index for the most recent one-year period.
Based on its review, the Board concluded that the nature, extent, and quality of services provided to the fund under the Advisory Contracts should continue to benefit the shareholders of the fund.
Competitiveness of Management Fee and Total Expense Ratio. The Board considered the fund's management fee and total expense ratio compared to "mapped groups" of competitive funds and classes created for the purpose of facilitating the Trustees' competitive analysis of management fees and total expenses. Fidelity creates "mapped groups" by combining similar Lipper investment objective categories that have comparable investment mandates. Combining Lipper investment objective categories aids the Board's management fee and total expense ratio comparisons by broadening the competitive group used for comparison.
Management Fee. The Board considered two proprietary management fee comparisons for the 12-month (or shorter) periods shown in basis points (BP) in the chart below. The group of Lipper funds used by the Board for management fee comparisons is referred to below as the "Total Mapped Group." The Total Mapped Group comparison focuses on a fund's standing in terms of gross management fees before expense reimbursements or caps relative to the total universe of funds with comparable investment mandates, regardless of whether their management fee structures also are comparable. Funds with comparable investment mandates offer exposure to similar types of securities. Funds with comparable management fee structures have similar management fee contractual arrangements (
e.g., flat rate charged for advisory services, all-inclusive fee rate,
etc.). "TMG %" represents the percentage of funds in the Total Mapped Group that had management fees that were lower than the fund's. For example, a hypothetical TMG % of 20% would mean that 80% of the funds in the Total Mapped Group had higher, and 20% had lower, management fees than the fund. The fund's actual TMG %s and the number of funds in the Total Mapped Group are in the chart below. The "Asset-Size Peer Group" (ASPG) comparison focuses on a fund's standing relative to a subset of non-Fidelity funds within the Total Mapped Group that are similar in size and management fee structure. For example, if a fund is in the first quartile of the ASPG, the fund's management fee ranks in the least expensive or lowest 25% of funds in the ASPG. The ASPG represents at least 15% of the funds in the Total Mapped Group with comparable asset size and management fee structures, subject to a minimum of 50 funds (or all funds in the Total Mapped Group if fewer than 50). Additional information, such as the ASPG quartile in which the fund's management fee rate ranked, is also included in the chart and was considered by the Board.
Fidelity International Sustainability Index Fund
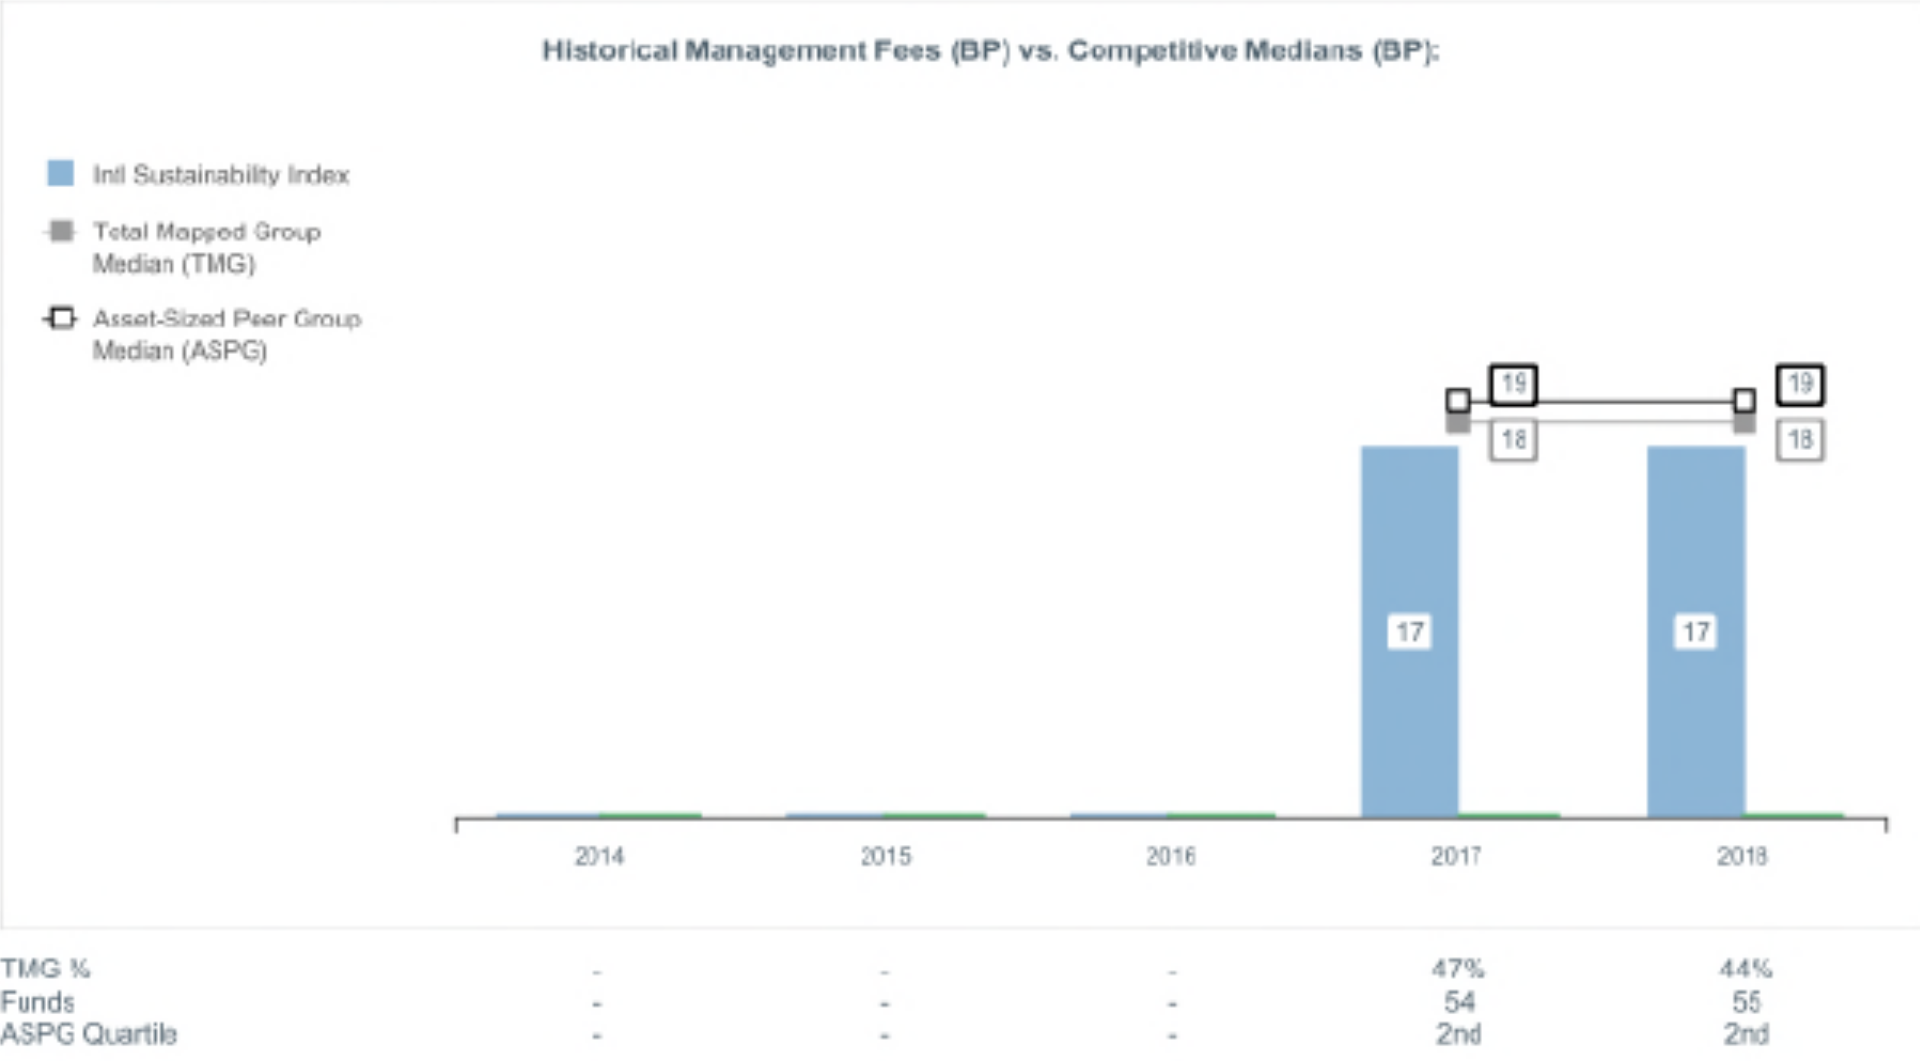
The Board noted that the fund's management fee rate ranked below the median of its Total Mapped Group and below the median of its ASPG for 2018.
The Board considered that, as a result of its approval of the New Contract at the July 2019 meeting, the fund's management fee rate was increased from 0.17% to 0.20% effective August 1, 2019, but that the fund no longer paid operating expenses under separate agreements.
The Board noted that it and the boards of other Fidelity funds formed an ad hoc Committee on Group Fee, which meets periodically, to conduct an in-depth review of the "group fee" component of the management fee of funds with such management fee structures. The Committee's focus included the mechanics of the group fee, the competitive landscape of group fee structures, Fidelity funds with no group fee component (such as the fund) and investment products not included in group fee assets. The Board also considered that, for funds subject to the group fee, FMR agreed to voluntarily waive fees over a specified period of time in amounts designed to account for assets converted from certain funds to certain collective investment trusts.
Based on its review, the Board concluded that the fund's management fee is fair and reasonable in light of the services that the fund receives and the other factors considered.
Total Expense Ratio. In its review of the fund's total expense ratio, the Board considered the fund's unitary fee rate, which covers expenses paid by FMR under the fund's management contract, such as transfer agent fees, pricing and bookkeeping fees and custodial, legal, and audit fees. The Board also noted that Fidelity may agree to waive fees or reimburse expenses from time to time, and the extent to which, if any, it has done so for the fund. As part of its review, the Board also considered the current and historical total expense ratios of the fund compared to competitive fund median expenses. The fund is compared to those funds and classes in the Total Mapped Group (used by the Board for management fee comparisons) that have a similar sales load structure.
The Board noted that the fund's total expense ratio ranked below the competitive median for 2018.
Fees Charged to Other Clients. The Board also considered fee structures applicable to clients of Fidelity and Geode, such as other funds advised or subadvised by Fidelity or Geode, pension plan clients, and other institutional clients with similar mandates. The Board noted that a joint ad hoc committee created by it and the boards of other Fidelity funds periodically reviews and compares Fidelity's institutional investment advisory business with its business of providing services to the Fidelity funds and also noted the most recent findings of the committee. The Board noted that the committee's review included a consideration of the differences in services provided, fees charged, and costs incurred, as well as competition in the markets serving the different categories of clients.
Based on its review of total expense ratios and fees charged to other Fidelity clients, the Board concluded that the fund's total expense ratio was reasonable in light of the services that the fund and its shareholders receive and the other factors considered.
Costs of the Services and Profitability. The Board considered the revenues earned and the expenses incurred by Fidelity in conducting the business of developing, marketing, distributing, managing, administering and servicing the fund and servicing the fund's shareholders. The Board also considered the level of Fidelity's profits in respect of all the Fidelity funds.
On an annual basis, Fidelity presents to the Board information about the profitability of its relationships with the fund. Fidelity calculates profitability information for each fund, as well as aggregate profitability information for groups of Fidelity funds and all Fidelity funds, using a series of detailed revenue and cost allocation methodologies which originate with the books and records of Fidelity on which Fidelity's audited financial statements are based. The Audit Committee of the Board reviews any significant changes from the prior year's methodologies and the full Board approves such changes.
PricewaterhouseCoopers LLP (PwC), auditor to Fidelity and certain Fidelity funds, has been engaged annually by the Board as part of the Board's assessment of Fidelity's profitability analysis. PwC's engagement includes the review and assessment of the methodologies used by Fidelity in determining the revenues and expenses attributable to Fidelity's mutual fund business, and completion of agreed-upon procedures in respect of the mathematical accuracy of the fund profitability information and its conformity to established allocation methodologies. After considering PwC's reports issued under the engagement and information provided by Fidelity, the Board concluded that while other allocation methods may also be reasonable, Fidelity's profitability methodologies are reasonable in all material respects.
The Board also reviewed Fidelity's and Geode's non-fund businesses and potential indirect benefits such businesses may have received as a result of their association with Fidelity's mutual fund business (i.e., fall-out benefits) as well as cases where Fidelity's and Geode's affiliates may benefit from the fund's business. The Board noted that changes to fall-out benefits year-over-year reflect business developments at Fidelity's and Geode's various businesses. The Board considered that a joint ad hoc committee created by it and the boards of other Fidelity funds had recently been established, and meets periodically, to evaluate potential fall-out benefits. The Board noted that the committee was expected to, among other things: (i) discuss the legal framework surrounding potential fall-out benefits; (ii) review the Board's responsibilities and approach to potential fall-out benefits; and (iii) review practices employed by competitor funds regarding the review of potential fall-out benefits. The Board noted that it would consider the committee's findings in connection with future consideration of contract renewals.
The Board considered the costs of the services provided by and the profits realized by Fidelity in connection with the operation of the fund and was satisfied that the profitability was not excessive.
The Board also considered information regarding the profitability of Geode's relationship with the fund.
Economies of Scale. The Board considered whether there have been economies of scale in respect of the management of the Fidelity funds, whether the Fidelity funds (including the fund) have appropriately benefited from any such economies of scale, and whether there is potential for realization of any further economies of scale. The Board considered the extent to which the fund will benefit from economies of scale as assets grow through increased services to the fund, through waivers or reimbursements, or through fee or expense ratio reductions. The Board recognized that, due to the fund's current contractual arrangements, its expense ratio will not decline if the fund's operating costs decrease as assets grow, or rise as assets decrease. The Board also noted that a committee (the Economies of Scale Committee) created by it and the boards of other Fidelity funds periodically analyzes whether Fidelity attains economies of scale in respect of the management and servicing of the Fidelity funds, whether the Fidelity funds have appropriately benefited from such economies of scale, and whether there is potential for realization of any further economies of scale.
The Board concluded, taking into account the analysis of the Economies of Scale Committee, that economies of scale, if any, are being appropriately shared between fund shareholders and Fidelity.
Additional Information Requested by the Board. In order to develop fully the factual basis for consideration of the Fidelity funds' advisory contracts, the Board requested and received additional information on certain topics, including: (i) Fidelity's fund profitability methodology, profitability trends for certain funds, the allocation of various costs to different funds, and the impact of certain factors on fund profitability results; (ii) portfolio manager changes that have occurred during the past year and the amount of the investment that each portfolio manager has made in the Fidelity fund(s) that he or she manages; (iii) Fidelity's compensation structure for portfolio managers, research analysts, and other key personnel, including its effects on fund profitability, the rationale for the compensation structure, and the extent to which current market conditions have affected retention and recruitment; (iv) the arrangements with and compensation paid to certain fund sub-advisers on behalf of the Fidelity funds and the treatment of such compensation within Fidelity's fund profitability methodology; (v) the practices of certain sub-advisers regarding their receipt of research from broker-dealers that execute the funds' portfolio transactions; (vi) the terms of Fidelity's voluntary expense limitation agreements; (vii) the methodology with respect to competitive fund data and peer group classifications; (viii) Fidelity's transfer agent fee, expense, and service structures for different funds and classes relative to competitive trends, and the impact of the increased use of omnibus accounts; (ix) new developments in the retail and institutional marketplaces and the competitive positioning of the funds relative to other investment products and services; (x) the impact on fund profitability of recent changes in total net assets for Fidelity's money market funds, anticipated changes to the competitive landscape for money market funds, and the level of investor comfort with gates, fees, and floating NAVs; (xi) the funds' share class structures and distribution channels; and (xii) explanations regarding the relative total expense ratios of certain funds and classes, total expense competitive trends and methodologies for total expense competitive comparisons, and actions that might be taken by Fidelity to reduce total expense ratios for certain classes. In addition, the Board considered its discussions with Fidelity throughout the year regarding enhanced information security initiatives and the funds' fair valuation policies.
Based on its evaluation of all of the conclusions noted above, and after considering all factors it believed relevant, the Board concluded that the advisory and sub-advisory fee arrangements are fair and reasonable, and that the fund's Advisory Contracts should be renewed and the fund's Amended and Restated Contracts should be approved.
ISY-ANN-1219
1.9883818.102
Fidelity® SAI International Value Index Fund
Offered exclusively to certain clients of the Adviser or its affiliates - not available for sale to the general public. Fidelity SAI is a product name of Fidelity® funds dedicated to certain programs affiliated with Strategic Advisers LLC.
Annual Report
October 31, 2019
See the inside front cover for important information about access to your fund’s shareholder reports.
Beginning on January 1, 2021, as permitted by regulations adopted by the Securities and Exchange Commission, paper copies of a fund’s shareholder reports will no longer be sent by mail, unless you specifically request paper copies of the reports from the fund or from your financial intermediary, such as a financial advisor, broker-dealer or bank. Instead, the reports will be made available on a website, and you will be notified by mail each time a report is posted and provided with a website link to access the report.
If you already elected to receive shareholder reports electronically, you will not be affected by this change and you need not take any action. You may elect to receive shareholder reports and other communications from a fund electronically, by contacting your financial intermediary. For Fidelity customers, visit Fidelity's web site or call Fidelity using the contact information listed below.
You may elect to receive all future reports in paper free of charge. If you wish to continue receiving paper copies of your shareholder reports, you may contact your financial intermediary or, if you are a Fidelity customer, visit Fidelity’s website, or call Fidelity at the applicable toll-free number listed below. Your election to receive reports in paper will apply to all funds held with the fund complex/your financial intermediary.
| Account Type | Website | Phone Number |
| Brokerage, Mutual Fund, or Annuity Contracts: | fidelity.com/mailpreferences | 1-800-343-3548 |
| Employer Provided Retirement Accounts: | netbenefits.fidelity.com/preferences (choose 'no' under Required Disclosures to continue to print) | 1-800-343-0860 |
| Advisor Sold Accounts Serviced Through Your Financial Intermediary: | Contact Your Financial Intermediary | Your Financial Intermediary's phone number |
| Advisor Sold Accounts Serviced by Fidelity: | institutional.fidelity.com | 1-877-208-0098 |
Contents
To view a fund's proxy voting guidelines and proxy voting record for the 12-month period ended June 30, visit http://www.fidelity.com/proxyvotingresults or visit the Securities and Exchange Commission's (SEC) web site at http://www.sec.gov.
You may also call 1-800-544-3455 to request a free copy of the proxy voting guidelines.
Standard & Poor's, S&P and S&P 500 are registered service marks of The McGraw-Hill Companies, Inc. and have been licensed for use by Fidelity Distributors Corporation.
Other third-party marks appearing herein are the property of their respective owners.
All other marks appearing herein are registered or unregistered trademarks or service marks of FMR LLC or an affiliated company. © 2019 FMR LLC. All rights reserved.
This report and the financial statements contained herein are submitted for the general information of the shareholders of the Fund. This report is not authorized for distribution to prospective investors in the Fund unless preceded or accompanied by an effective prospectus.
A fund files its complete schedule of portfolio holdings with the SEC for the first and third quarters of each fiscal year on Form N-PORT. Forms N-PORT are available on the SEC’s web site at http://www.sec.gov. A fund's Forms N-PORT may be reviewed and copied at the SEC’s Public Reference Room in Washington, DC. Information regarding the operation of the SEC's Public Reference Room may be obtained by calling 1-800-SEC-0330.
For a complete list of a fund's portfolio holdings, view the most recent holdings listing, semiannual report, or annual report on Fidelity's web site at http://www.fidelity.com, http://www.institutional.fidelity.com, or http://www.401k.com, as applicable.
NOT FDIC INSURED •MAY LOSE VALUE •NO BANK GUARANTEE
Neither the Fund nor Fidelity Distributors Corporation is a bank.
Performance: The Bottom Line
Average annual total return reflects the change in the value of an investment, assuming reinvestment of distributions from dividend income and capital gains (the profits earned upon the sale of securities that have grown in value, if any) and assuming a constant rate of performance each year. The hypothetical investment and the average annual total returns do not reflect the deduction of taxes that a shareholder would pay on fund distributions or the redemption of fund shares. During periods of reimbursement by Fidelity, a fund’s total return will be greater than it would be had the reimbursement not occurred. How a fund did yesterday is no guarantee of how it will do tomorrow.
Average Annual Total Returns
| For the periods ended October 31, 2019 | Past 1 year | Life of fundA |
| Fidelity® SAI International Value Index Fund | 5.12% | (3.30)% |
A From December 19, 2017
$10,000 Over Life of Fund
Let's say hypothetically that $10,000 was invested in Fidelity® SAI International Value Index Fund on December 19, 2017, when the fund started.
The chart shows how the value of your investment would have changed, and also shows how the Fidelity International Value Focus Index℠ performed over the same period.

| Period Ending Values |
| $9,394 | Fidelity® SAI International Value Index Fund |
| $9,524 | Fidelity International Value Focus Index℠ |
Management's Discussion of Fund Performance
Market Recap: The MSCI ACWI (All Country World Index) ex USA Index gained 11.47% for the 12 months ending October 31, 2019, as international stocks reflected a confluence of factors, including escalating trade tension, and moderating but still positive global economic growth. Currency fluctuations were largely modest and varied by region, muting the overall impact on international equity returns. In late December, the U.S. Federal Reserve shifted from raising interest rates to a more dovish policy in 2019, joining many foreign central banks. In June, international stocks rose 6.03%, as policy stimulus in China stabilized that country’s economic growth. The Fed cut its policy rate in July for the first time since 2008. However, the index returned -1.21% for the month, followed by -3.08% in August. In September, the Fed cut its policy rate another quarter point, citing concerns about slowing economic growth and muted inflation, and did the same in October, leading to monthly gains of 2.59% and 3.49%, respectively. For the full 12 months, the growth-oriented information technology sector (+22%) led the way, followed by utilities (+20%) and real estate (+18%), two high-dividend-yielding categories. Conversely, energy was roughly flat, while materials (+6%) and communication services (7%) also lagged. By region, Asia Pacific ex Japan (+16%), Europe ex U.K (+13%), Canada (+12%) and emerging markets (+12%) fared best. Meanwhile, the U.K. (+7%) and Japan (+10%) trailed the broader market.
Comments from the Geode Capital Management, LLC, passive equity index team: For the fiscal year, the fund gained 5.12%, compared with 5.48% for the Fidelity International Value Focus Index.
(The fund's performance relative to the index can be affected by Fidelity's methodologies for valuing certain foreign stocks and for incorporating foreign exchange rates, which differ from those used by the index.) Japanese electronics giant Sony (+35%) reported better-than-expected quarterly earnings on several occasions. Shares of U.K.-based mining company Anglo American (+25%) rose because several metals experienced price increases, in addition to the company improving its financial position in recent years. Lloyds Banking Group (+41%), based in the U.K., saw its stock gain sharply late in the period, as optimism about a Brexit deal made investors more optimistic about the company's business. Other standouts included Japanese telecommunication services company KDDI (+28%), Belgium-based brewer Anheuser-Busch InBev (+5%) and Italian electric utility Enel (+23%). In contrast, U.K. tobacco companies Imperial Brands (-30%) and British American Tobacco (-14%) struggled due to various investor concerns, including the potential for heightened industry regulation and questions about the health impact of vaping. Additionally, energy producers – including Japan's JXTG Holdings (-28%) and Royal Dutch Shell (-7%), based in the U.K. – lagged, due partly to generally weak oil prices. Luxembourg-based steel manufacturer ArcelorMittal (-40%) also underperformed the past 12 months.
The views expressed above reflect those of the portfolio manager(s) only through the end of the period as stated on the cover of this report and do not necessarily represent the views of Fidelity or any other person in the Fidelity organization. Any such views are subject to change at any time based upon market or other conditions and Fidelity disclaims any responsibility to update such views. These views may not be relied on as investment advice and, because investment decisions for a Fidelity fund are based on numerous factors, may not be relied on as an indication of trading intent on behalf of any Fidelity fund.
Note to shareholders: On March 22, 2019, Pat Waddell retired and is no longer a portfolio manager with Geode Capital Management.
Investment Summary (Unaudited)
Geographic Diversification (% of fund's net assets)
| As of October 31, 2019 |
| | Japan | 28.2% |
| | United Kingdom | 17.1% |
| | France | 12.0% |
| | Germany | 9.1% |
| | Spain | 6.5% |
| | Netherlands | 3.5% |
| | Italy | 3.2% |
| | Hong Kong | 2.4% |
| | Switzerland | 2.1% |
| | Other*,** | 15.9% |
* Foreign investments - 15.9%
** Includes Short-Term investments and Net Other Assets (Liabilities).
Percentages are based on country or territory of incorporation and are adjusted for the effect of futures contracts, if applicable.
Asset Allocation as of October 31, 2019
| | % of fund's net assets |
| Stocks and Equity Futures | 100.0 |
Top Ten Stocks as of October 31, 2019
| | % of fund's net assets |
| Royal Dutch Shell PLC Class B (United Kingdom) (United Kingdom, Oil, Gas & Consumable Fuels) | 2.9 |
| Sanofi SA (France, Pharmaceuticals) | 2.6 |
| Sony Corp. (Japan, Household Durables) | 2.5 |
| British American Tobacco PLC (United Kingdom) (United Kingdom, Tobacco) | 2.4 |
| Bayer AG (Germany, Pharmaceuticals) | 2.4 |
| Banco Santander SA (Spain) (Spain, Banks) | 2.2 |
| BNP Paribas SA (France, Banks) | 2.0 |
| Vodafone Group PLC (United Kingdom, Wireless Telecommunication Services) | 1.8 |
| Anheuser-Busch InBev SA NV (Belgium, Beverages) | 1.8 |
| Mitsubishi UFJ Financial Group, Inc. (Japan, Banks) | 1.7 |
| | 22.3 |
Top Market Sectors as of October 31, 2019
| | % of fund's net assets |
| Financials | 19.6 |
| Industrials | 13.6 |
| Consumer Discretionary | 12.8 |
| Health Care | 9.7 |
| Materials | 9.1 |
| Consumer Staples | 8.8 |
| Communication Services | 7.1 |
| Energy | 6.7 |
| Information Technology | 4.7 |
| Real Estate | 4.0 |
Schedule of Investments October 31, 2019
Showing Percentage of Net Assets
| Common Stocks - 98.4% | | | |
| | | Shares | Value |
| Australia - 1.7% | | | |
| BlueScope Steel Ltd. | | 178,362 | $1,632,759 |
| Fortescue Metals Group Ltd. | | 584,812 | 3,579,416 |
| Qantas Airways Ltd. | | 288,281 | 1,275,106 |
| Rio Tinto Ltd. | | 126,858 | 7,932,815 |
| South32 Ltd. | | 1,755,313 | 3,071,677 |
|
| TOTAL AUSTRALIA | | | 17,491,773 |
|
| Austria - 0.4% | | | |
| OMV AG | | 48,833 | 2,849,527 |
| Raiffeisen International Bank-Holding AG | | 47,361 | 1,164,719 |
|
| TOTAL AUSTRIA | | | 4,014,246 |
|
| Bailiwick of Jersey - 1.5% | | | |
| Glencore Xstrata PLC | | 3,757,530 | 11,341,656 |
| WPP PLC | | 325,577 | 4,063,057 |
|
| TOTAL BAILIWICK OF JERSEY | | | 15,404,713 |
|
| Belgium - 2.1% | | | |
| Anheuser-Busch InBev SA NV | | 224,041 | 18,084,019 |
| UCB SA | | 43,348 | 3,493,484 |
|
| TOTAL BELGIUM | | | 21,577,503 |
|
| Bermuda - 1.0% | | | |
| Hongkong Land Holdings Ltd. | | 401,593 | 2,206,109 |
| Jardine Matheson Holdings Ltd. | | 106,098 | 6,048,755 |
| Jardine Strategic Holdings Ltd. | | 60,773 | 1,962,471 |
|
| TOTAL BERMUDA | | | 10,217,335 |
|
| Cayman Islands - 1.6% | | | |
| Cheung Kong Property Holdings Ltd. | | 873,500 | 6,077,559 |
| CK Hutchison Holdings Ltd. | | 925,000 | 8,540,603 |
| Wharf Real Estate Investment Co. Ltd. | | 396,000 | 2,329,163 |
|
| TOTAL CAYMAN ISLANDS | | | 16,947,325 |
|
| Denmark - 0.9% | | | |
| A.P. Moller - Maersk A/S Series B | | 3,297 | 4,205,661 |
| Danske Bank A/S | | 233,934 | 3,337,823 |
| Pandora A/S | | 34,341 | 1,688,650 |
|
| TOTAL DENMARK | | | 9,232,134 |
|
| Finland - 0.3% | | | |
| Stora Enso Oyj (R Shares) | | 210,763 | 2,732,619 |
| France - 12.0% | | | |
| Atos Origin SA | | 32,881 | 2,551,785 |
| BNP Paribas SA | | 392,508 | 20,512,294 |
| Bouygues SA | | 85,429 | 3,620,601 |
| Capgemini SA | | 53,825 | 6,060,132 |
| Carrefour SA | | 195,789 | 3,331,135 |
| Compagnie de St. Gobain | | 187,246 | 7,616,229 |
| Credit Agricole SA | | 435,759 | 5,685,936 |
| Dassault Aviation SA | | 787 | 1,092,788 |
| Eiffage SA | | 27,450 | 2,948,835 |
| ENGIE | | 626,649 | 10,480,030 |
| Eutelsat Communications | | 57,709 | 1,094,168 |
| Faurecia SA | | 25,614 | 1,193,542 |
| Michelin CGDE Series B | | 61,750 | 7,518,513 |
| Peugeot Citroen SA | | 195,619 | 4,952,547 |
| Publicis Groupe SA | | 76,412 | 3,288,663 |
| Renault SA | | 70,997 | 3,623,412 |
| Rexel SA | | 85,187 | 1,054,601 |
| Sanofi SA | | 293,656 | 27,071,311 |
| Societe Generale Series A | | 273,443 | 7,776,425 |
| Valeo SA | | 82,499 | 3,067,651 |
|
| TOTAL FRANCE | | | 124,540,598 |
|
| Germany - 9.1% | | | |
| alstria office REIT-AG | | 52,955 | 992,220 |
| Bayer AG | | 319,408 | 24,778,458 |
| Bayerische Motoren Werke AG (BMW) | | 124,699 | 9,555,967 |
| Commerzbank AG | | 340,979 | 2,039,516 |
| Continental AG | | 37,204 | 4,983,135 |
| Covestro AG (a) | | 58,110 | 2,790,074 |
| Deutsche Lufthansa AG | | 85,030 | 1,474,194 |
| Deutsche Telekom AG | | 282,144 | 4,964,487 |
| Deutsche Wohnen AG (Bearer) | | 123,321 | 4,637,846 |
| Fresenius Medical Care AG & Co. KGaA | | 72,641 | 5,243,203 |
| Fresenius SE & Co. KGaA | | 140,585 | 7,388,939 |
| HeidelbergCement Finance AG | | 50,464 | 3,749,540 |
| Hochtief AG | | 7,804 | 973,085 |
| Infineon Technologies AG | | 292,665 | 5,668,563 |
| KION Group AG | | 22,561 | 1,499,169 |
| Merck KGaA | | 44,203 | 5,270,128 |
| ProSiebenSat.1 Media AG | | 80,040 | 1,181,916 |
| RWE AG | | 197,231 | 6,011,828 |
| TAG Immobilien AG | | 50,097 | 1,216,918 |
|
| TOTAL GERMANY | | | 94,419,186 |
|
| Hong Kong - 2.4% | | | |
| Bank of East Asia Ltd. | | 536,536 | 1,292,462 |
| BOC Hong Kong (Holdings) Ltd. | | 1,234,500 | 4,241,281 |
| Fosun International Ltd. | | 857,500 | 1,121,248 |
| Henderson Land Development Co. Ltd. | | 563,930 | 2,816,595 |
| New World Development Co. Ltd. | | 1,966,000 | 2,812,239 |
| Sun Hung Kai Properties Ltd. | | 506,500 | 7,675,156 |
| Swire Pacific Ltd. (A Shares) | | 216,000 | 2,058,974 |
| Swire Properties Ltd. | | 362,400 | 1,139,766 |
| Wheelock and Co. Ltd. | | 269,000 | 1,663,659 |
|
| TOTAL HONG KONG | | | 24,821,380 |
|
| Ireland - 0.1% | | | |
| Bank Ireland Group PLC | | 318,933 | 1,533,804 |
| Italy - 3.2% | | | |
| A2A SpA | | 532,679 | 1,068,780 |
| Atlantia SpA | | 161,298 | 3,982,890 |
| Eni SpA | | 866,060 | 13,138,990 |
| Leonardo SpA | | 138,649 | 1,609,753 |
| Telecom Italia SpA (b) | | 5,714,946 | 3,344,923 |
| UniCredit SpA | | 725,167 | 9,194,197 |
| Unione di Banche Italiane SCpA (c) | | 353,647 | 1,075,590 |
|
| TOTAL ITALY | | | 33,415,123 |
|
| Japan - 28.2% | | | |
| Agc, Inc. | | 78,100 | 2,746,004 |
| Aisin Seiki Co. Ltd. | | 62,800 | 2,506,337 |
| Alfresa Holdings Corp. | | 72,300 | 1,614,375 |
| Alps Electric Co. Ltd. | | 74,900 | 1,605,752 |
| Astellas Pharma, Inc. | | 106,100 | 1,820,962 |
| Brother Industries Ltd. | | 89,500 | 1,682,066 |
| Canon, Inc. | | 160,100 | 4,393,100 |
| Daicel Chemical Industries Ltd. | | 108,000 | 965,460 |
| Dainippon Sumitomo Pharma Co. Ltd. | | 58,400 | 1,019,264 |
| Electric Power Development Co. Ltd. | | 59,500 | 1,444,686 |
| Fujifilm Holdings Corp. | | 140,700 | 6,177,046 |
| Fukuoka Financial Group, Inc. | | 65,500 | 1,262,666 |
| Haseko Corp. | | 91,700 | 1,183,332 |
| Hitachi Ltd. | | 331,100 | 12,357,467 |
| Honda Motor Co. Ltd. | | 620,700 | 16,792,414 |
| Idemitsu Kosan Co. Ltd. | | 85,400 | 2,510,357 |
| Iida Group Holdings Co. Ltd. | | 61,100 | 1,017,750 |
| Isuzu Motors Ltd. | | 212,300 | 2,466,907 |
| Itochu Corp. | | 542,400 | 11,340,436 |
| Japan Airlines Co. Ltd. | | 45,200 | 1,408,527 |
| Japan Tobacco, Inc. | | 382,600 | 8,647,798 |
| JFE Holdings, Inc. | | 197,600 | 2,471,511 |
| JTEKT Corp. | | 84,600 | 1,079,021 |
| JX Holdings, Inc. | | 1,138,000 | 5,319,286 |
| Kajima Corp. | | 172,000 | 2,363,723 |
| KDDI Corp. | | 233,100 | 6,450,144 |
| Konica Minolta, Inc. | | 172,200 | 1,263,913 |
| Kyowa Exeo Corp. | | 40,400 | 1,027,855 |
| Lawson, Inc. | | 17,100 | 943,346 |
| Marubeni Corp. | | 596,400 | 4,197,510 |
| Mazda Motor Corp. | | 206,100 | 1,892,064 |
| Medipal Holdings Corp. | | 75,500 | 1,724,990 |
| Mitsubishi Chemical Holdings Corp. | | 485,700 | 3,701,628 |
| Mitsubishi Corp. | | 544,500 | 13,849,039 |
| Mitsubishi Gas Chemical Co., Inc. | | 72,000 | 1,015,698 |
| Mitsubishi Heavy Industries Ltd. | | 115,300 | 4,666,118 |
| Mitsubishi Materials Corp. | | 43,900 | 1,262,346 |
| Mitsubishi Motors Corp. of Japan | | 236,000 | 1,077,529 |
| Mitsubishi Tanabe Pharma Corp. | | 83,700 | 1,001,746 |
| Mitsubishi UFJ Financial Group, Inc. | | 3,411,000 | 17,683,607 |
| Mitsui & Co. Ltd. | | 596,700 | 10,247,703 |
| Mitsui Chemicals, Inc. | | 66,700 | 1,586,223 |
| Nikon Corp. | | 137,300 | 1,750,618 |
| Nippon Steel & Sumitomo Metal Corp. | | 324,400 | 4,734,792 |
| Nippon Telegraph & Telephone Corp. | | 220,000 | 10,921,441 |
| Obayashi Corp. | | 246,600 | 2,537,859 |
| Oji Holdings Corp. | | 352,100 | 1,820,442 |
| ORIX Corp. | | 453,400 | 7,125,133 |
| Resona Holdings, Inc. | | 756,500 | 3,289,689 |
| Ricoh Co. Ltd. | | 254,000 | 2,262,026 |
| Seiko Epson Corp. | | 108,600 | 1,535,718 |
| Showa Denko K.K. | | 51,500 | 1,444,932 |
| Sojitz Corp. | | 382,600 | 1,204,250 |
| Sony Corp. | | 420,400 | 25,589,390 |
| Subaru Corp. | | 121,600 | 3,484,754 |
| Sumco Corp. | | 87,500 | 1,453,451 |
| Sumitomo Chemical Co. Ltd. | | 567,400 | 2,595,504 |
| Sumitomo Corp. | | 428,000 | 6,951,747 |
| Sumitomo Electric Industries Ltd. | | 272,900 | 3,742,485 |
| Sumitomo Heavy Industries Ltd. | | 42,100 | 1,307,712 |
| Sumitomo Mitsui Financial Group, Inc. | | 470,200 | 16,693,603 |
| Suzuken Co. Ltd. | | 27,800 | 1,484,350 |
| Suzuki Motor Corp. | | 150,000 | 7,082,117 |
| Taiheiyo Cement Corp. | | 43,600 | 1,233,400 |
| Taisho Pharmaceutical Holdings Co. Ltd. | | 18,600 | 1,323,845 |
| Tokyo Electric Power Co., Inc. (b) | | 274,200 | 1,269,860 |
| Toppan Printing Co. Ltd. | | 121,600 | 2,249,032 |
| Tosoh Corp. | | 111,400 | 1,525,346 |
| Toyota Tsusho Corp. | | 81,300 | 2,804,732 |
| Yamaha Motor Co. Ltd. | | 108,100 | 2,115,834 |
| Yokohama Rubber Co. Ltd. | | 46,100 | 1,029,654 |
|
| TOTAL JAPAN | | | 292,351,422 |
|
| Luxembourg - 0.6% | | | |
| ArcelorMittal SA (Netherlands) | | 219,976 | 3,245,838 |
| Aroundtown SA | | 306,583 | 2,587,058 |
|
| TOTAL LUXEMBOURG | | | 5,832,896 |
|
| Netherlands - 3.5% | | | |
| Fiat Chrysler Automobiles NV (Italy) | | 378,059 | 5,872,730 |
| Heineken Holding NV | | 34,510 | 3,286,961 |
| ING Groep NV (Certificaten Van Aandelen) | | 1,224,026 | 13,860,253 |
| Koninklijke Ahold Delhaize NV | | 405,910 | 10,115,304 |
| Philips Lighting NV (a) | | 37,618 | 1,100,909 |
| Randstad NV | | 43,012 | 2,381,295 |
|
| TOTAL NETHERLANDS | | | 36,617,452 |
|
| Norway - 0.7% | | | |
| Equinor ASA | | 375,863 | 6,952,289 |
| Singapore - 2.0% | | | |
| Oversea-Chinese Banking Corp. Ltd. | | 1,314,098 | 10,564,308 |
| United Overseas Bank Ltd. | | 415,800 | 8,186,039 |
| Wilmar International Ltd. | | 759,100 | 2,087,131 |
|
| TOTAL SINGAPORE | | | 20,837,478 |
|
| Spain - 6.5% | | | |
| ACS Actividades de Construccion y Servicios SA | | 93,895 | 3,810,086 |
| Banco Bilbao Vizcaya Argentaria SA | | 2,291,378 | 12,068,304 |
| Banco Santander SA (Spain) | | 5,701,000 | 22,851,821 |
| CaixaBank SA | | 1,236,447 | 3,545,636 |
| Enagas SA | | 77,792 | 1,925,236 |
| International Consolidated Airlines Group SA CDI | | 158,894 | 1,093,334 |
| Merlin Properties Socimi SA | | 125,156 | 1,842,542 |
| Repsol SA | | 502,324 | 8,278,159 |
| Telefonica SA | | 1,565,020 | 12,018,233 |
|
| TOTAL SPAIN | | | 67,433,351 |
|
| Sweden - 1.4% | | | |
| Boliden AB | | 93,587 | 2,516,634 |
| SKF AB (B Shares) | | 129,314 | 2,337,662 |
| Trelleborg AB (B Shares) | | 84,802 | 1,369,644 |
| Volvo AB (B Shares) | | 564,110 | 8,436,207 |
|
| TOTAL SWEDEN | | | 14,660,147 |
|
| Switzerland - 2.1% | | | |
| Adecco SA (Reg.) | | 55,691 | 3,301,378 |
| Nestle SA (Reg. S) | | 23,295 | 2,492,130 |
| Novartis AG | | 182,904 | 15,981,288 |
|
| TOTAL SWITZERLAND | | | 21,774,796 |
|
| United Kingdom - 17.1% | | | |
| Anglo American PLC (United Kingdom) | | 474,982 | 12,192,149 |
| Babcock International Group PLC | | 173,904 | 1,247,977 |
| Barclays PLC | | 5,551,080 | 12,040,702 |
| Barratt Developments PLC | | 351,505 | 2,873,992 |
| Bellway PLC | | 42,735 | 1,749,274 |
| Berkeley Group Holdings PLC | | 44,777 | 2,552,663 |
| BHP Billiton PLC | | 533,365 | 11,312,959 |
| British American Tobacco PLC (United Kingdom) | | 712,610 | 24,924,160 |
| BT Group PLC | | 3,019,538 | 8,006,551 |
| Carnival PLC | | 64,431 | 2,578,321 |
| Centrica PLC | | 2,024,479 | 1,902,820 |
| Imperial Brands PLC | | 330,499 | 7,245,365 |
| J Sainsbury PLC | | 604,781 | 1,594,225 |
| Kingfisher PLC | | 742,605 | 1,992,118 |
| Lloyds Banking Group PLC | | 23,548,382 | 17,322,372 |
| Marks & Spencer Group PLC | | 677,303 | 1,595,585 |
| Micro Focus International PLC | | 124,813 | 1,713,085 |
| NMC Health PLC | | 32,341 | 914,522 |
| Persimmon PLC | | 109,745 | 3,236,942 |
| Royal Dutch Shell PLC Class B (United Kingdom) | | 1,043,492 | 30,052,336 |
| Taylor Wimpey PLC | | 1,135,137 | 2,433,512 |
| Tesco PLC | | 2,242,233 | 6,844,538 |
| Vodafone Group PLC | | 9,096,002 | 18,562,409 |
| WM Morrison Supermarkets PLC | | 840,372 | 2,164,633 |
|
| TOTAL UNITED KINGDOM | | | 177,053,210 |
|
| TOTAL COMMON STOCKS | | | |
| (Cost $1,052,250,816) | | | 1,019,860,780 |
| | | Principal Amount | Value |
|
| Government Obligations - 0.2% | | | |
| United States of America - 0.2% | | | |
| U.S. Treasury Bills, yield at date of purchase 1.7% to 1.82% 12/19/19 to 3/19/20 (d) | | | |
| (Cost $2,189,843) | | 2,200,000 | 2,191,497 |
| | | Shares | Value |
|
| Money Market Funds - 0.9% | | | |
| Fidelity Cash Central Fund 1.83% (e) | | 7,674,447 | 7,675,982 |
| Fidelity Securities Lending Cash Central Fund 1.84% (e)(f) | | 1,128,075 | 1,128,188 |
| TOTAL MONEY MARKET FUNDS | | | |
| (Cost $8,804,170) | | | 8,804,170 |
| TOTAL INVESTMENT IN SECURITIES - 99.5% | | | |
| (Cost $1,063,244,829) | | | 1,030,856,447 |
| NET OTHER ASSETS (LIABILITIES) - 0.5% | | | 5,676,046 |
| NET ASSETS - 100% | | | $1,036,532,493 |
| Futures Contracts | | | | | |
| | Number of contracts | Expiration Date | Notional Amount | Value | Unrealized Appreciation/(Depreciation) |
| Purchased | | | | | |
| Equity Index Contracts | | | | | |
| ICE E-mini MSCI EAFE Index Contracts (United States) | 172 | Dec. 2019 | $16,831,920 | $537,011 | $537,011 |
The notional amount of futures purchased as a percentage of Net Assets is 1.6%
Categorizations in the Schedule of Investments are based on country or territory of incorporation.
Legend
(a) Security exempt from registration under Rule 144A of the Securities Act of 1933. These securities may be resold in transactions exempt from registration, normally to qualified institutional buyers. At the end of the period, the value of these securities amounted to $3,890,983 or 0.4% of net assets.
(b) Non-income producing
(c) Security or a portion of the security is on loan at period end.
(d) Security or a portion of the security was pledged to cover margin requirements for futures contracts. At period end, the value of securities pledged amounted to $741,998.
(e) Affiliated fund that is generally available only to investment companies and other accounts managed by Fidelity Investments. The rate quoted is the annualized seven-day yield of the fund at period end. A complete unaudited listing of the fund's holdings as of its most recent quarter end is available upon request. In addition, each Fidelity Central Fund's financial statements, which are not covered by the Fund's Report of Independent Registered Public Accounting Firm, are available on the SEC's website or upon request.
(f) Investment made with cash collateral received from securities on loan.
Affiliated Central Funds
Information regarding fiscal year to date income earned by the Fund from investments in Fidelity Central Funds is as follows:
| Fund | Income earned |
| Fidelity Cash Central Fund | $276,736 |
| Fidelity Securities Lending Cash Central Fund | 5,376 |
| Total | $282,112 |
Amounts in the income column in the above table include any capital gain distributions from underlying funds, which are presented in the corresponding line-item in the Statement of Operations, if applicable. Amount for Fidelity Securities Lending Cash Central Fund represents the income earned on investing cash collateral, less rebates paid to borrowers and any lending agent fees associated with the loan, plus any premium payments received for lending certain types of securities.
Investment Valuation
The following is a summary of the inputs used, as of October 31, 2019, involving the Fund's assets and liabilities carried at fair value. The inputs or methodology used for valuing securities may not be an indication of the risk associated with investing in those securities. For more information on valuation inputs, and their aggregation into the levels used below, please refer to the Investment Valuation section in the accompanying Notes to Financial Statements.
| | Valuation Inputs at Reporting Date: |
| Description | Total | Level 1 | Level 2 | Level 3 |
| Investments in Securities: | | | | |
| Equities: | | | | |
| Communication Services | $73,895,992 | $10,282,635 | $63,613,357 | $-- |
| Consumer Discretionary | 133,199,739 | 42,800,882 | 90,398,857 | -- |
| Consumer Staples | 91,760,745 | 17,622,319 | 74,138,426 | -- |
| Energy | 69,100,944 | 9,801,816 | 59,299,128 | -- |
| Financials | 204,348,180 | 41,197,470 | 163,150,710 | -- |
| Health Care | 100,130,865 | 17,067,073 | 83,063,792 | -- |
| Industrials | 144,085,749 | 47,140,551 | 96,945,198 | -- |
| Information Technology | 48,724,104 | 6,060,132 | 42,663,972 | -- |
| Materials | 90,455,418 | 27,226,854 | 63,228,564 | -- |
| Real Estate | 40,055,804 | 11,276,584 | 28,779,220 | -- |
| Utilities | 24,103,240 | 21,388,694 | 2,714,546 | -- |
| Government Obligations | 2,191,497 | -- | 2,191,497 | -- |
| Money Market Funds | 8,804,170 | 8,804,170 | -- | -- |
| Total Investments in Securities: | $1,030,856,447 | $260,669,180 | $770,187,267 | $-- |
| Derivative Instruments: | | | | |
| Assets | | | | |
| Futures Contracts | $537,011 | $537,011 | $-- | $-- |
| Total Assets | $537,011 | $537,011 | $-- | $-- |
| Total Derivative Instruments: | $537,011 | $537,011 | $-- | $-- |
Value of Derivative Instruments
The following table is a summary of the Fund's value of derivative instruments by primary risk exposure as of October 31, 2019. For additional information on derivative instruments, please refer to the Derivative Instruments section in the accompanying Notes to Financial Statements.
| Primary Risk Exposure / Derivative Type | Value |
| | Asset | Liability |
| Equity Risk | | |
| Futures Contracts(a) | $537,011 | $0 |
| Total Equity Risk | 537,011 | 0 |
| Total Value of Derivatives | $537,011 | $0 |
(a) Reflects gross cumulative appreciation (depreciation) on futures contracts as presented in the Schedule of Investments. In the Statement of Assets and Liabilities, the period end daily variation margin is included in receivable or payable for daily variation margin on futures contracts, and the net cumulative appreciation (depreciation) is included in Total accumulated earnings (loss).
See accompanying notes which are an integral part of the financial statements.
Financial Statements
Statement of Assets and Liabilities
| | | October 31, 2019 |
| Assets | | |
Investment in securities, at value (including securities loaned of $1,075,925) — See accompanying schedule:
Unaffiliated issuers (cost $1,054,440,659) | $1,022,052,277 | |
| Fidelity Central Funds (cost $8,804,170) | 8,804,170 | |
| Total Investment in Securities (cost $1,063,244,829) | | $1,030,856,447 |
| Foreign currency held at value (cost $373,561) | | 377,061 |
| Receivable for fund shares sold | | 1,020,965 |
| Dividends receivable | | 5,743,489 |
| Distributions receivable from Fidelity Central Funds | | 14,732 |
| Prepaid expenses | | 1,177 |
| Total assets | | 1,038,013,871 |
| Liabilities | | |
| Payable for fund shares redeemed | $1,968 | |
| Accrued management fee | 139,742 | |
| Payable for daily variation margin on futures contracts | 47,565 | |
| Other payables and accrued expenses | 163,972 | |
| Collateral on securities loaned | 1,128,131 | |
| Total liabilities | | 1,481,378 |
| Net Assets | | $1,036,532,493 |
| Net Assets consist of: | | |
| Paid in capital | | $1,056,571,974 |
| Total accumulated earnings (loss) | | (20,039,481) |
| Net Assets, for 112,792,066 shares outstanding | | $1,036,532,493 |
| Net Asset Value, offering price and redemption price per share ($1,036,532,493 ÷ 112,792,066 shares) | | $9.19 |
See accompanying notes which are an integral part of the financial statements.
Statement of Operations
| | | Year ended October 31, 2019 |
| Investment Income | | |
| Dividends: | | |
| Unaffiliated issuers | | $31,935,216 |
| Interest | | 15,165 |
| Income from Fidelity Central Funds (including $5,376 from security lending) | | 282,112 |
| Income before foreign taxes withheld | | 32,232,493 |
| Less foreign taxes withheld | | (2,767,884) |
| Total income | | 29,464,609 |
| Expenses | | |
| Management fee | $993,287 | |
| Transfer agent fees | 336,443 | |
| Accounting and security lending fees | 160,887 | |
| Custodian fees and expenses | 128,152 | |
| Independent trustees' fees and expenses | 2,537 | |
| Registration fees | 81,680 | |
| Audit | 56,721 | |
| Legal | 952 | |
| Miscellaneous | 2,716 | |
| Total expenses before reductions | 1,763,375 | |
| Expense reductions | (429,437) | |
| Total expenses after reductions | | 1,333,938 |
| Net investment income (loss) | | 28,130,671 |
| Realized and Unrealized Gain (Loss) | | |
| Net realized gain (loss) on: | | |
| Investment securities: | | |
| Unaffiliated issuers | (10,773,434) | |
| Fidelity Central Funds | 58 | |
| Foreign currency transactions | 133,917 | |
| Futures contracts | (665,174) | |
| Total net realized gain (loss) | | (11,304,633) |
| Change in net unrealized appreciation (depreciation) on: | | |
| Investment securities: | | |
| Unaffiliated issuers | 25,972,055 | |
| Assets and liabilities in foreign currencies | 72,582 | |
| Futures contracts | 317,565 | |
| Total change in net unrealized appreciation (depreciation) | | 26,362,202 |
| Net gain (loss) | | 15,057,569 |
| Net increase (decrease) in net assets resulting from operations | | $43,188,240 |
See accompanying notes which are an integral part of the financial statements.
Statement of Changes in Net Assets
| | Year ended October 31, 2019 | For the period
December 19, 2017 (commencement of operations) to October 31, 2018 |
| Increase (Decrease) in Net Assets | | |
| Operations | | |
| Net investment income (loss) | $28,130,671 | $8,117,479 |
| Net realized gain (loss) | (11,304,633) | (2,939,610) |
| Change in net unrealized appreciation (depreciation) | 26,362,202 | (58,173,160) |
| Net increase (decrease) in net assets resulting from operations | 43,188,240 | (52,995,291) |
| Distributions to shareholders | (10,128,476) | (37,800) |
| Share transactions | | |
| Proceeds from sales of shares | 518,943,553 | 532,575,687 |
| Reinvestment of distributions | 10,128,476 | 37,800 |
| Cost of shares redeemed | (1,108,471) | (4,071,225) |
| Net increase (decrease) in net assets resulting from share transactions | 527,963,558 | 528,542,262 |
| Total increase (decrease) in net assets | 561,023,322 | 475,509,171 |
| Net Assets | | |
| Beginning of period | 475,509,171 | – |
| End of period | $1,036,532,493 | $475,509,171 |
| Other Information | | |
| Shares | | |
| Sold | 58,479,530 | 53,629,539 |
| Issued in reinvestment of distributions | 1,207,208 | 3,757 |
| Redeemed | (128,594) | (399,374) |
| Net increase (decrease) | 59,558,144 | 53,233,922 |
See accompanying notes which are an integral part of the financial statements.
Financial Highlights
Fidelity SAI International Value Index Fund
| | | |
| Years ended October 31, | 2019 | 2018 A |
| Selected Per–Share Data | | |
| Net asset value, beginning of period | $8.93 | $10.00 |
| Income from Investment Operations | | |
| Net investment income (loss)B | .37 | .28 |
| Net realized and unrealized gain (loss) | .07 | (1.34) |
| Total from investment operations | .44 | (1.06) |
| Distributions from net investment income | (.18) | (.01) |
| Distributions from net realized gain | –C | – |
| Total distributions | (.18) | (.01) |
| Net asset value, end of period | $9.19 | $8.93 |
| Total ReturnD,E | 5.12% | (10.64)% |
| Ratios to Average Net AssetsF,G | | |
| Expenses before reductions | .26% | .37%H |
| Expenses net of fee waivers, if any | .20% | .20%H |
| Expenses net of all reductions | .20% | .20%H |
| Net investment income (loss) | 4.22% | 3.32%H |
| Supplemental Data | | |
| Net assets, end of period (000 omitted) | $1,036,532 | $475,509 |
| Portfolio turnover rateI | 59% | 54%H |
A For the period December 19, 2017 (commencement of operations) to October 31, 2018.
B Calculated based on average shares outstanding during the period.
C Amount represents less than $.005 per share.
D Total returns for periods of less than one year are not annualized.
E Total returns would have been lower if certain expenses had not been reduced during the applicable periods shown.
F Fees and expenses of any underlying Fidelity Central Funds are not included in the Fund's expense ratio. The Fund indirectly bears its proportionate share of the expenses of any underlying Fidelity Central Funds.
G Expense ratios reflect operating expenses of the Fund. Expenses before reductions do not reflect amounts reimbursed by the investment adviser or reductions from expense offset arrangements and do not represent the amount paid by the Fund during periods when reimbursements or reductions occur. Expense ratios before reductions for start-up periods may not be representative of longer term operating periods. Expenses net of fee waivers reflect expenses after reimbursement by the investment adviser but prior to reductions from expense offset arrangements. Expenses net of all reductions represent the net expenses paid by the Fund.
H Annualized
I Amount does not include the portfolio activity of any underlying Fidelity Central Funds.
See accompanying notes which are an integral part of the financial statements.
Notes to Financial Statements
For the period ended October 31, 2019
1. Organization.
Fidelity SAI International Value Index Fund (the Fund) is a fund of Fidelity Salem Street Trust (the Trust) and is authorized to issue an unlimited number of shares. Shares are offered exclusively to certain clients of Fidelity Management & Research Company (FMR) or its affiliates. The Trust is registered under the Investment Company Act of 1940, as amended (the 1940 Act), as an open-end management investment company organized as a Massachusetts business trust.
2. Investments in Fidelity Central Funds.
The Fund may invests in Fidelity Central Funds, which are open-end investment companies generally available only to other investment companies and accounts managed by the investment adviser and its affiliates. The Fund's Schedule of Investments lists each of the Fidelity Central Funds held as of period end, if any, as an investment of the Fund, but does not include the underlying holdings of each Fidelity Central Fund. As an Investing Fund, the Fund indirectly bears its proportionate share of the expenses of the underlying Fidelity Central Funds.
The Money Market Central Funds seek preservation of capital and current income and are managed by Fidelity Investments Money Management, Inc. (FIMM), an affiliate of the investment adviser. Annualized expenses of the Money Market Central Funds as of their most recent shareholder report date ranged from less than .005% to .01%.
A complete unaudited list of holdings for each Fidelity Central Fund is available upon request or at the Securities and Exchange Commission (the SEC) website at www.sec.gov. In addition, the financial statements of the Fidelity Central Funds, which are not covered by the Fund's Report of Independent Registered Public Accounting Firm, are available on the SEC website or upon request.
3. Significant Accounting Policies.
The Fund is an investment company and applies the accounting and reporting guidance of the Financial Accounting Standards Board (FASB) Accounting Standards Codification Topic 946 Financial Services – Investments Companies. The financial statements have been prepared in conformity with accounting principles generally accepted in the United States of America (GAAP), which require management to make certain estimates and assumptions at the date of the financial statements. Actual results could differ from those estimates. Subsequent events, if any, through the date that the financial statements were issued have been evaluated in the preparation of the financial statements. The following summarizes the significant accounting policies of the Fund:
Investment Valuation. Investments are valued as of 4:00 p.m. Eastern time on the last calendar day of the period. The Board of Trustees (the Board) has delegated the day to day responsibility for the valuation of the Fund's investments to the Fair Value Committee (the Committee) established by the Fund's investment adviser. In accordance with valuation policies and procedures approved by the Board, the Fund attempts to obtain prices from one or more third party pricing vendors or brokers to value its investments. When current market prices, quotations or currency exchange rates are not readily available or reliable, investments will be fair valued in good faith by the Committee, in accordance with procedures adopted by the Board. Factors used in determining fair value vary by investment type and may include market or investment specific events, changes in interest rates and credit quality. The frequency with which these procedures are used cannot be predicted and they may be utilized to a significant extent. The Committee oversees the Fund's valuation policies and procedures and reports to the Board on the Committee's activities and fair value determinations. The Board monitors the appropriateness of the procedures used in valuing the Fund's investments and ratifies the fair value determinations of the Committee.
The Fund categorizes the inputs to valuation techniques used to value its investments into a disclosure hierarchy consisting of three levels as shown below:
- Level 1 – quoted prices in active markets for identical investments
- Level 2 – other significant observable inputs (including quoted prices for similar investments, interest rates, prepayment speeds, etc.)
- Level 3 – unobservable inputs (including the Fund's own assumptions based on the best information available)
Valuation techniques used to value the Fund's investments by major category are as follows:
Equity securities, including restricted securities, for which market quotations are readily available, are valued at the last reported sale price or official closing price as reported by a third party pricing vendor on the primary market or exchange on which they are traded and are categorized as Level 1 in the hierarchy. In the event there were no sales during the day or closing prices are not available, securities are valued at the last quoted bid price or may be valued using the last available price and are generally categorized as Level 2 in the hierarchy. For foreign equity securities, when market or security specific events arise, comparisons to the valuation of American Depositary Receipts (ADRs), futures contracts, Exchange-Traded Funds (ETFs) and certain indexes as well as quoted prices for similar securities may be used and would be categorized as Level 2 in the hierarchy. For equity securities, including restricted securities, where observable inputs are limited, assumptions about market activity and risk are used and these securities may be categorized as Level 3 in the hierarchy.
Debt securities, including restricted securities, are valued based on evaluated prices received from third party pricing vendors or from brokers who make markets in such securities. U.S. government and government agency obligations are valued by pricing vendors who utilize matrix pricing which considers yield or price of bonds of comparable quality, coupon, maturity and type or by broker-supplied prices. When independent prices are unavailable or unreliable, debt securities may be valued utilizing pricing methodologies which consider similar factors that would be used by third party pricing vendors. Debt securities are generally categorized as Level 2 in the hierarchy but may be Level 3 depending on the circumstances.
Futures contracts are valued at the settlement price established each day by the board of trade or exchange on which they are traded and are categorized as Level 1 in the hierarchy. Investments in open-end mutual funds, including the Fidelity Central Funds, are valued at their closing net asset value (NAV) each business day and are categorized as Level 1 in the hierarchy.
Changes in valuation techniques may result in transfers in or out of an assigned level within the disclosure hierarchy. The aggregate value of investments by input level as of October 31, 2019 is included at the end of the Fund's Schedule of Investments.
Foreign Currency. The Fund may use foreign currency contracts to facilitate transactions in foreign-denominated securities. Gains and losses from these transactions may arise from changes in the value of the foreign currency or if the counterparties do not perform under the contracts' terms.
Foreign-denominated assets, including investment securities, and liabilities are translated into U.S. dollars at the exchange rates at period end. Purchases and sales of investment securities, income and dividends received and expenses denominated in foreign currencies are translated into U.S. dollars at the exchange rate in effect on the transaction date.
The effects of exchange rate fluctuations on investments are included with the net realized and unrealized gain (loss) on investment securities. Other foreign currency transactions resulting in realized and unrealized gain (loss) are disclosed separately.
Investment Transactions and Income. For financial reporting purposes, the Fund's investment holdings and NAV include trades executed through the end of the last business day of the period. The NAV per share for processing shareholder transactions is calculated as of the close of business of the New York Stock Exchange (NYSE), normally 4:00 p.m. Eastern time and includes trades executed through the end of the prior business day. Gains and losses on securities sold are determined on the basis of identified cost. Dividend income is recorded on the ex-dividend date, except for certain dividends from foreign securities where the ex-dividend date may have passed, which are recorded as soon as the Fund is informed of the ex-dividend date. Non-cash dividends included in dividend income, if any, are recorded at the fair market value of the securities received. Income and capital gain distributions from Fidelity Central Funds, if any, are recorded on the ex-dividend date. Interest income is accrued as earned and includes coupon interest and amortization of premium and accretion of discount on debt securities as applicable. Investment income is recorded net of foreign taxes withheld where recovery of such taxes is uncertain.
Expenses. Expenses directly attributable to a fund are charged to that fund. Expenses attributable to more than one fund are allocated among the respective funds on the basis of relative net assets or other appropriate methods. Expense estimates are accrued in the period to which they relate and adjustments are made when actual amounts are known.
Income Tax Information and Distributions to Shareholders. Each year, the Fund intends to qualify as a regulated investment company under Subchapter M of the Internal Revenue Code, including distributing substantially all of its taxable income and realized gains. As a result, no provision for U.S. Federal income taxes is required. As of October 31, 2019, the Fund did not have any unrecognized tax benefits in the financial statements; nor is the Fund aware of any tax positions for which it is reasonably possible that the total amounts of unrecognized tax benefits will significantly change in the next twelve months. The Fund files a U.S. federal tax return, in addition to state and local tax returns as required. The Fund's federal income tax returns are subject to examination by the Internal Revenue Service (IRS) for a period of three fiscal years after they are filed. State and local tax returns may be subject to examination for an additional fiscal year depending on the jurisdiction. Foreign taxes are provided for based on the Fund's understanding of the tax rules and rates that exist in the foreign markets in which it invests.
Distributions are declared and recorded on the ex-dividend date. Income and capital gain distributions are determined in accordance with income tax regulations, which may differ from GAAP. In addition, the Fund claimed a portion of the payment made to redeeming shareholders as a distribution for income tax purposes.
Capital accounts within the financial statements are adjusted for permanent book-tax differences. These adjustments have no impact on net assets or the results of operations. Capital accounts are not adjusted for temporary book-tax differences which will reverse in a subsequent period.
Book-tax differences are primarily due to futures contracts, foreign currency transactions, market discount, passive foreign investment companies (PFIC), certain deemed dividends, capital loss carryforwards and losses deferred due to wash sales.
As of period end, the cost and unrealized appreciation (depreciation) in securities, and derivatives if applicable, for federal income tax purposes were as follows:
| Gross unrealized appreciation | $40,983,743 |
| Gross unrealized depreciation | (86,636,039) |
| Net unrealized appreciation (depreciation) | $(45,652,296) |
| Tax Cost | $1,076,508,743 |
The tax-based components of distributable earnings as of period end were as follows:
| Undistributed ordinary income | $32,935,143 |
| Capital loss carryforward | $(7,362,746) |
| Net unrealized appreciation (depreciation) on securities and other investments | $(45,611,883) |
Capital loss carryforwards are only available to offset future capital gains of the Fund to the extent provided by regulations and may be limited. Under the Regulated Investment Company Modernization Act of 2010 (the Act), the Fund is permitted to carry forward capital losses incurred in taxable years beginning after December 22, 2010 for an unlimited period and such capital losses are required to be used prior to any losses that expire. The capital loss carryforward information presented below, including any applicable limitation, is estimated as of fiscal period end and is subject to adjustment.
| No expiration | |
| Short-term | $(1,208,986) |
| Long-term | (6,153,760) |
| Total capital loss carryforward | $(7,362,746) |
The tax character of distributions paid was as follows:
| | October 31, 2019 | October 31, 2018(a) |
| Ordinary Income | $10,128,476 | $ 37,800 |
(a) For the period December 19, 2017 (commencement of operations) to October 31, 2018.
Restricted Securities. The Fund may invest in securities that are subject to legal or contractual restrictions on resale. These securities generally may be resold in transactions exempt from registration or to the public if the securities are registered. Disposal of these securities may involve time-consuming negotiations and expense, and prompt sale at an acceptable price may be difficult. Information regarding restricted securities is included at the end of the Fund's Schedule of Investments.
4. Derivative Instruments.
Risk Exposures and the Use of Derivative Instruments. The Fund's investment objective allows the Fund to enter into various types of derivative contracts, including futures contracts. Derivatives are investments whose value is primarily derived from underlying assets, indices or reference rates and may be transacted on an exchange or over-the-counter (OTC). Derivatives may involve a future commitment to buy or sell a specified asset based on specified terms, to exchange future cash flows at periodic intervals based on a notional principal amount, or for one party to make one or more payments upon the occurrence of specified events in exchange for periodic payments from the other party.
The Fund used derivatives to increase returns and to manage exposure to certain risks as defined below. The success of any strategy involving derivatives depends on analysis of numerous economic factors, and if the strategies for investment do not work as intended, the Fund may not achieve its objectives.
The Fund's use of derivatives increased or decreased its exposure to the following risk:
| Equity Risk | Equity risk relates to the fluctuations in the value of financial instruments as a result of changes in market prices (other than those arising from interest rate risk or foreign exchange risk), whether caused by factors specific to an individual investment, its issuer, or all factors affecting all instruments traded in a market or market segment.
|
The Fund is also exposed to additional risks from investing in derivatives, such as liquidity risk and counterparty credit risk. Liquidity risk is the risk that the Fund will be unable to close out the derivative in the open market in a timely manner. Counterparty credit risk is the risk that the counterparty will not be able to fulfill its obligation to the Fund. Counterparty credit risk related to exchange-traded futures contracts may be mitigated by the protection provided by the exchange on which they trade.
Investing in derivatives may involve greater risks than investing in the underlying assets directly and, to varying degrees, may involve risk of loss in excess of any initial investment and collateral received and amounts recognized in the Statement of Assets and Liabilities. In addition, there may be the risk that the change in value of the derivative contract does not correspond to the change in value of the underlying instrument.
Futures Contracts. A futures contract is an agreement between two parties to buy or sell a specified underlying instrument for a fixed price at a specified future date. The Fund used futures contracts to manage its exposure to the stock market.
Upon entering into a futures contract, a fund is required to deposit either cash or securities (initial margin) with a clearing broker in an amount equal to a certain percentage of the face value of the contract. Futures contracts are marked-to-market daily and subsequent daily payments (variation margin) are made or received by a fund depending on the daily fluctuations in the value of the futures contracts and are recorded as unrealized appreciation or (depreciation). This receivable and/or payable, if any, is included in daily variation margin on futures contracts in the Statement of Assets and Liabilities. Realized gain or (loss) is recorded upon the expiration or closing of a futures contract. The net realized gain (loss) and change in net unrealized appreciation (depreciation) on futures contracts during the period is presented in the Statement of Operations.
Any open futures contracts at period end are presented in the Schedule of Investments under the caption "Futures Contracts". The notional amount at value reflects each contract's exposure to the underlying instrument or index at period end and is representative of volume of activity during the period. Securities deposited to meet initial margin requirements are identified in the Schedule of Investments.
5. Purchases and Sales of Investments.
Purchases and sales of securities, other than short-term securities, aggregated $932,302,370 and $384,319,912, respectively.
6. Fees and Other Transactions with Affiliates.
Management Fee. Fidelity Management & Research Company (the investment adviser) and its affiliates provide the Fund with investment management related services for which the Fund pays a monthly management fee that is based on an annual rate of .15% of the Fund's average net assets.
Sub-Adviser. Geode Capital Management, LLC (Geode), serves as sub-adviser for the Fund. Geode provides discretionary investment advisory services to the Fund and is paid by the investment adviser for providing these services.
Transfer Agent Fees. Fidelity Investments Institutional Operations Company, Inc. (FIIOC), an affiliate of the investment adviser, is the Fund's transfer, dividend disbursing and shareholder servicing agent. Effective August 1, 2019 transfer agent fees are not paid by the Fund and are instead paid by the investment adviser or an affiliate. Prior to August 1, 2019, FIIOC received an asset-based fee of .075% of the Fund's average net assets. FIIOC paid for typesetting, printing and mailing of shareholder reports, except proxy statements.
Accounting and Security Lending Fees. Fidelity Service Company, Inc. (FSC), an affiliate of the investment adviser, maintains the Fund's accounting records. The accounting fee is based on the level of average net assets for each month. Prior to April 1, 2019, FSC had a separate agreement with the Fund for administration of the security lending program, based on the number and duration of lending transactions. Effective August 1, 2019 accounting fees are not paid by the Fund and are instead paid by the investment adviser or an affiliate. For the period, the total fees paid for accounting and administration of securities lending were equivalent to a rate of .02%.
Interfund Trades. The Fund may purchase from or sell securities to other Fidelity Funds under procedures adopted by the Board. The procedures have been designed to ensure these interfund trades are executed in accordance with Rule 17a-7 of the 1940 Act. Interfund trades are included within the respective purchases and sales amounts shown in the Purchases and Sales of Investments note.
Other. During the period, the investment adviser reimbursed the Fund for certain losses in the amount of $10,759.
7. Committed Line of Credit.
The Fund participates with other funds managed by the investment adviser or an affiliate in a $4.25 billion credit facility (the "line of credit") to be utilized for temporary or emergency purposes to fund shareholder redemptions or for other short-term liquidity purposes. The Fund has agreed to pay commitment fees on its pro-rata portion of the line of credit, which amounted to $1,620 and is reflected in Miscellaneous expenses on the Statement of Operations. During the period, the Fund did not borrow on this line of credit.
8. Security Lending.
The Fund lends portfolio securities from time to time in order to earn additional income. For equity securities, lending agents are used, including National Financial Services (NFS), an affiliate of the Fund. Pursuant to a securities lending agreement, NFS will receive a fee, which is capped at 9.9% of daily lending revenue, for its services as lending agent. The Fund may lend securities to certain qualified borrowers, including NFS. On the settlement date of the loan, the Fund receives collateral (in the form of U.S. Treasury obligations, letters of credit and/or cash) against the loaned securities and maintains collateral in an amount not less than 100% of the market value of the loaned securities during the period of the loan. The market value of the loaned securities is determined at the close of business of the Fund and any additional required collateral is delivered to the Fund on the next business day. The Fund or borrower may terminate the loan at any time, and if the borrower defaults on its obligation to return the securities loaned because of insolvency or other reasons, the Fund may apply collateral received from the borrower against the obligation. The Fund may experience delays and costs in recovering the securities loaned. Any cash collateral received is invested in the Fidelity Securities Lending Cash Central Fund. The value of loaned securities and cash collateral at period end are disclosed on the Fund's Statement of Assets and Liabilities. Security lending income represents the income earned on investing cash collateral, less rebates paid to borrowers and any lending agent fees associated with the loan, plus any premium payments received for lending certain types of securities. Security lending income is presented in the Statement of Operations as a component of income from Fidelity Central Funds. During the period, there were no securities loaned to NFS.
9. Expense Reductions.
The investment adviser contractually agreed to reimburse the Fund to the extent annual operating expenses exceeded .20% of average net assets. This reimbursement will remain in place through February 28, 2021. Some expenses, for example the compensation of the independent Trustees, and certain miscellaneous expenses such as proxy and shareholder meeting expenses, are excluded from this reimbursement. During the period this reimbursement reduced the Fund's expenses by $429,437.
10. Other.
The Fund's organizational documents provide former and current trustees and officers with a limited indemnification against liabilities arising in connection with the performance of their duties to the Fund. In the normal course of business, the Fund may also enter into contracts that provide general indemnifications. The Fund's maximum exposure under these arrangements is unknown as this would be dependent on future claims that may be made against the Fund. The risk of material loss from such claims is considered remote.
At the end of the period, Strategic Advisers Fidelity International Fund was the owner of record of approximately 99% of the total outstanding shares of the Fund.
Report of Independent Registered Public Accounting Firm
To the Board of Trustees of Fidelity Salem Street Trust and Shareholders of Fidelity SAI International Value Index Fund:
Opinion on the Financial Statements
We have audited the accompanying statement of assets and liabilities, including the schedule of investments, of Fidelity SAI International Value Index Fund (one of the funds constituting Fidelity Salem Street Trust, referred to hereafter as the “Fund”) as of October 31, 2019, the related statement of operations for the year ended October 31, 2019 and the statement of changes in net assets and the financial highlights for the year ended October 31, 2019 and for the period December 19, 2017 (commencement of operations) through October 31, 2018, including the related notes (collectively referred to as the “financial statements”). In our opinion, the financial statements present fairly, in all material respects, the financial position of the Fund as of October 31, 2019, the results of its operations for the year ended October 31, 2019, and the changes in its net assets and the financial highlights for the year ended October 31, 2019 and for the period December 19, 2017 (commencement of operations) through October 31, 2018 in conformity with accounting principles generally accepted in the United States of America.
Basis for Opinion
These financial statements are the responsibility of the Fund’s management. Our responsibility is to express an opinion on the Fund’s financial statements based on our audits. We are a public accounting firm registered with the Public Company Accounting Oversight Board (United States) (PCAOB) and are required to be independent with respect to the Fund in accordance with the U.S. federal securities laws and the applicable rules and regulations of the Securities and Exchange Commission and the PCAOB.
We conducted our audits of these financial statements in accordance with the standards of the PCAOB. Those standards require that we plan and perform the audit to obtain reasonable assurance about whether the financial statements are free of material misstatement, whether due to error or fraud.
Our audits included performing procedures to assess the risks of material misstatement of the financial statements, whether due to error or fraud, and performing procedures that respond to those risks. Such procedures included examining, on a test basis, evidence regarding the amounts and disclosures in the financial statements. Our audits also included evaluating the accounting principles used and significant estimates made by management, as well as evaluating the overall presentation of the financial statements. Our procedures included confirmation of securities owned as of October 31, 2019 by correspondence with the custodian and broker. We believe that our audits provide a reasonable basis for our opinion.
PricewaterhouseCoopers LLP
Boston, Massachusetts
December 13, 2019
We have served as the auditor of one or more investment companies in the Fidelity group of funds since 1932.
Trustees and Officers
The Trustees, Members of the Advisory Board (if any), and officers of the trust and fund, as applicable, are listed below. The Board of Trustees governs the fund and is responsible for protecting the interests of shareholders. The Trustees are experienced executives who meet periodically throughout the year to oversee the fund's activities, review contractual arrangements with companies that provide services to the fund, oversee management of the risks associated with such activities and contractual arrangements, and review the fund's performance. Except for Jonathan Chiel, each of the Trustees oversees 277 funds. Mr. Chiel oversees 171 funds.
The Trustees hold office without limit in time except that (a) any Trustee may resign; (b) any Trustee may be removed by written instrument, signed by at least two-thirds of the number of Trustees prior to such removal; (c) any Trustee who requests to be retired or who has become incapacitated by illness or injury may be retired by written instrument signed by a majority of the other Trustees; and (d) any Trustee may be removed at any special meeting of shareholders by a two-thirds vote of the outstanding voting securities of the trust. Each Trustee who is not an interested person (as defined in the 1940 Act) of the trust and the fund is referred to herein as an Independent Trustee. Each Independent Trustee shall retire not later than the last day of the calendar year in which his or her 75th birthday occurs. The Independent Trustees may waive this mandatory retirement age policy with respect to individual Trustees. Officers and Advisory Board Members hold office without limit in time, except that any officer or Advisory Board Member may resign or may be removed by a vote of a majority of the Trustees at any regular meeting or any special meeting of the Trustees. Except as indicated, each individual has held the office shown or other offices in the same company for the past five years.
The fund’s Statement of Additional Information (SAI) includes more information about the Trustees. To request a free copy, call Fidelity at 1-800-544-3455.
Experience, Skills, Attributes, and Qualifications of the Trustees. The Governance and Nominating Committee has adopted a statement of policy that describes the experience, qualifications, attributes, and skills that are necessary and desirable for potential Independent Trustee candidates (Statement of Policy). The Board believes that each Trustee satisfied at the time he or she was initially elected or appointed a Trustee, and continues to satisfy, the standards contemplated by the Statement of Policy. The Governance and Nominating Committee also engages professional search firms to help identify potential Independent Trustee candidates who have the experience, qualifications, attributes, and skills consistent with the Statement of Policy. From time to time, additional criteria based on the composition and skills of the current Independent Trustees, as well as experience or skills that may be appropriate in light of future changes to board composition, business conditions, and regulatory or other developments, have also been considered by the professional search firms and the Governance and Nominating Committee. In addition, the Board takes into account the Trustees' commitment and participation in Board and committee meetings, as well as their leadership of standing and ad hoc committees throughout their tenure.
In determining that a particular Trustee was and continues to be qualified to serve as a Trustee, the Board has considered a variety of criteria, none of which, in isolation, was controlling. The Board believes that, collectively, the Trustees have balanced and diverse experience, qualifications, attributes, and skills, which allow the Board to operate effectively in governing the fund and protecting the interests of shareholders. Information about the specific experience, skills, attributes, and qualifications of each Trustee, which in each case led to the Board's conclusion that the Trustee should serve (or continue to serve) as a trustee of the fund, is provided below.
Board Structure and Oversight Function. Abigail P. Johnson is an interested person and currently serves as Chairman. The Trustees have determined that an interested Chairman is appropriate and benefits shareholders because an interested Chairman has a personal and professional stake in the quality and continuity of services provided to the fund. Independent Trustees exercise their informed business judgment to appoint an individual of their choosing to serve as Chairman, regardless of whether the Trustee happens to be independent or a member of management. The Independent Trustees have determined that they can act independently and effectively without having an Independent Trustee serve as Chairman and that a key structural component for assuring that they are in a position to do so is for the Independent Trustees to constitute a substantial majority for the Board. The Independent Trustees also regularly meet in executive session. Arthur E. Johnson serves as Chairman of the Independent Trustees and as such (i) acts as a liaison between the Independent Trustees and management with respect to matters important to the Independent Trustees and (ii) with management prepares agendas for Board meetings.
Fidelity® funds are overseen by different Boards of Trustees. The fund's Board oversees Fidelity's investment-grade bond, money market, asset allocation and certain equity funds, and other Boards oversee Fidelity's high income and other equity funds. The asset allocation funds may invest in Fidelity® funds that are overseen by such other Boards. The use of separate Boards, each with its own committee structure, allows the Trustees of each group of Fidelity® funds to focus on the unique issues of the funds they oversee, including common research, investment, and operational issues. On occasion, the separate Boards establish joint committees to address issues of overlapping consequences for the Fidelity® funds overseen by each Board.
The Trustees operate using a system of committees to facilitate the timely and efficient consideration of all matters of importance to the Trustees, the fund, and fund shareholders and to facilitate compliance with legal and regulatory requirements and oversight of the fund's activities and associated risks. The Board, acting through its committees, has charged FMR and its affiliates with (i) identifying events or circumstances the occurrence of which could have demonstrably adverse effects on the fund's business and/or reputation; (ii) implementing processes and controls to lessen the possibility that such events or circumstances occur or to mitigate the effects of such events or circumstances if they do occur; and (iii) creating and maintaining a system designed to evaluate continuously business and market conditions in order to facilitate the identification and implementation processes described in (i) and (ii) above. Because the day-to-day operations and activities of the fund are carried out by or through FMR, its affiliates, and other service providers, the fund's exposure to risks is mitigated but not eliminated by the processes overseen by the Trustees. While each of the Board's committees has responsibility for overseeing different aspects of the fund's activities, oversight is exercised primarily through the Operations and Audit Committees. In addition, an ad hoc Board committee of Independent Trustees has worked with FMR to enhance the Board's oversight of investment and financial risks, legal and regulatory risks, technology risks, and operational risks, including the development of additional risk reporting to the Board. Appropriate personnel, including but not limited to the fund's Chief Compliance Officer (CCO), FMR's internal auditor, the independent accountants, the fund's Treasurer and portfolio management personnel, make periodic reports to the Board's committees, as appropriate, including an annual review of Fidelity's risk management program for the Fidelity® funds. The responsibilities of each standing committee, including their oversight responsibilities, are described further under "Standing Committees of the Trustees."
Interested Trustees*:
Correspondence intended for a Trustee who is an interested person may be sent to Fidelity Investments, 245 Summer Street, Boston, Massachusetts 02210.
Name, Year of Birth; Principal Occupations and Other Relevant Experience+
Jonathan Chiel (1957)
Year of Election or Appointment: 2016
Trustee
Mr. Chiel also serves as Trustee of other Fidelity® funds. Mr. Chiel is Executive Vice President and General Counsel for FMR LLC (diversified financial services company, 2012-present). Previously, Mr. Chiel served as general counsel (2004-2012) and senior vice president and deputy general counsel (2000-2004) for John Hancock Financial Services; a partner with Choate, Hall & Stewart (1996-2000) (law firm); and an Assistant United States Attorney for the United States Attorney’s Office of the District of Massachusetts (1986-95), including Chief of the Criminal Division (1993-1995). Mr. Chiel is a director on the boards of the Boston Bar Foundation and the Maimonides School.
Abigail P. Johnson (1961)
Year of Election or Appointment: 2009
Trustee
Chairman of the Board of Trustees
Ms. Johnson also serves as Trustee of other Fidelity® funds. Ms. Johnson serves as Chairman (2016-present), Chief Executive Officer (2014-present), and Director (2007-present) of FMR LLC (diversified financial services company), President of Fidelity Financial Services (2012-present) and President of Personal, Workplace and Institutional Services (2005-present). Ms. Johnson is Chairman and Director of FMR Co., Inc. (investment adviser firm, 2011-present) and Chairman and Director of FMR (investment adviser firm, 2011-present). Previously, Ms. Johnson served as Vice Chairman (2007-2016) and President (2013-2016) of FMR LLC, President and a Director of FMR (2001-2005), a Trustee of other investment companies advised by FMR, Fidelity Investments Money Management, Inc. (investment adviser firm), and FMR Co., Inc. (2001-2005), Senior Vice President of the Fidelity® funds (2001-2005), and managed a number of Fidelity® funds. Ms. Abigail P. Johnson and Mr. Arthur E. Johnson are not related.
Jennifer Toolin McAuliffe (1959)
Year of Election or Appointment: 2016
Trustee
Ms. McAuliffe also serves as Trustee of other Fidelity® funds. Ms. McAuliffe previously served as a Member of the Advisory Board of certain Fidelity® funds (2016) and as Co-Head of Fixed Income of Fidelity Investments Limited (now known as FIL Limited (FIL)) (diversified financial services company). Earlier roles at FIL included Director of Research for FIL’s credit and quantitative teams in London, Hong Kong and Tokyo. Ms. McAuliffe also was the Director of Research for taxable and municipal bonds at Fidelity Investments Money Management, Inc. Ms. McAuliffe is also a director or trustee of several not-for-profit entities.
* Determined to be an “Interested Trustee” by virtue of, among other things, his or her affiliation with the trust or various entities under common control with FMR.
+ The information includes the Trustee's principal occupation during the last five years and other information relating to the experience, attributes, and skills relevant to the Trustee's qualifications to serve as a Trustee, which led to the conclusion that the Trustee should serve as a Trustee for the fund.
Independent Trustees:
Correspondence intended for an Independent Trustee may be sent to Fidelity Investments, P.O. Box 55235, Boston, Massachusetts 02205-5235.
Name, Year of Birth; Principal Occupations and Other Relevant Experience+
Elizabeth S. Acton (1951)
Year of Election or Appointment: 2013
Trustee
Ms. Acton also serves as Trustee of other Fidelity® funds. Prior to her retirement in April 2012, Ms. Acton was Executive Vice President, Finance (2011-2012), Executive Vice President, Chief Financial Officer (2002-2011), and Treasurer (2004-2005) of Comerica Incorporated (financial services). Prior to joining Comerica, Ms. Acton held a variety of positions at Ford Motor Company (1983-2002), including Vice President and Treasurer (2000-2002) and Executive Vice President and Chief Financial Officer of Ford Motor Credit Company (1998-2000). Ms. Acton currently serves as a member of the Board of Directors and Audit and Finance Committees of Beazer Homes USA, Inc. (homebuilding, 2012-present). Previously, Ms. Acton served as a Member of the Advisory Board of certain Fidelity® funds (2013-2016).
Ann E. Dunwoody (1953)
Year of Election or Appointment: 2018
Trustee
General Dunwoody also serves as Trustee of other Fidelity® funds. General Dunwoody (United States Army, Retired) was the first woman in U.S. military history to achieve the rank of four-star general and prior to her retirement in 2012 held a variety of positions within the U.S. Army, including Commanding General, U.S. Army Material Command (2008-2012). She is the President of First to Four LLC (leadership and mentoring services, 2012-present). She also serves as a member of the Board of Directors and Nominating and Corporate Governance Committee of L3 Technologies, Inc. (communication, electronic, sensor, and aerospace systems, 2013-present), Board of Directors and Nomination and Corporate Governance Committees of Kforce Inc. (professional staffing services, 2016-present) and Board of Directors of Automattic Inc. (software engineering, 2018-present). Previously, General Dunwoody served as a Member of the Advisory Board of certain Fidelity® funds (2018), a member of the Board of Directors and Audit and Sustainability and Corporate Responsibility Committees of Republic Services, Inc. (waste collection, disposal and recycling, 2013-2016). Ms. Dunwoody also serves on several boards for non-profit organizations, including as a member of the Board of Directors, Chair of the Nomination and Governance Committee and member of the Audit Committee of Logistics Management Institute (consulting non-profit, 2012-present), a member of the Board of Directors of the Army Historical Foundation (2015-present), a member of the Council of Trustees for the Association of the United States Army (advocacy non-profit, 2013-present) and a member of the Board of Trustees of Florida Institute of Technology (2015-present) and ThanksUSA (military family education non-profit, 2014-present).
John Engler (1948)
Year of Election or Appointment: 2014
Trustee
Mr. Engler also serves as Trustee of other Fidelity® funds. He serves on the board of directors for Universal Forest Products (manufacturer and distributor of wood and wood-alternative products, 2003-present) and K12 Inc. (technology-based education company, 2012-present). Previously, Mr. Engler served as interim president of Michigan State University (2018-2019), a Member of the Advisory Board of certain Fidelity® funds (2014-2016), president of the Business Roundtable (2011-2017), a trustee of The Munder Funds (2003-2014), president and CEO of the National Association of Manufacturers (2004-2011), member of the Board of Trustees of the Annie E. Casey Foundation (2004-2015), and as governor of Michigan (1991-2003). He is a past chairman of the National Governors Association.
Robert F. Gartland (1951)
Year of Election or Appointment: 2010
Trustee
Mr. Gartland also serves as Trustee of other Fidelity® funds. Mr. Gartland is Chairman and an investor in Gartland & Mellina Group Corp. (consulting, 2009-present). Previously, Mr. Gartland served as a partner and investor of Vietnam Partners LLC (investments and consulting, 2008-2011). Prior to his retirement, Mr. Gartland held a variety of positions at Morgan Stanley (financial services, 1979-2007), including Managing Director (1987-2007), and Chase Manhattan Bank (1975-1978).
Arthur E. Johnson (1947)
Year of Election or Appointment: 2008
Trustee
Chairman of the Independent Trustees
Mr. Johnson also serves as Trustee of other Fidelity® funds. Mr. Johnson serves as a member of the Board of Directors of Eaton Corporation plc (diversified power management, 2009-present) and Booz Allen Hamilton (management consulting, 2011-present). Prior to his retirement, Mr. Johnson served as Senior Vice President of Corporate Strategic Development of Lockheed Martin Corporation (defense contractor, 1999-2009). Mr. Johnson previously served as Vice Chairman (2015-2018) of the Independent Trustees of certain Fidelity® funds and on the Board of Directors of IKON Office Solutions, Inc. (1999-2008), AGL Resources, Inc. (holding company, 2002-2016), and Delta Airlines (2005-2007). Mr. Arthur E. Johnson is not related to Ms. Abigail P. Johnson.
Michael E. Kenneally (1954)
Year of Election or Appointment: 2009
Trustee
Vice Chairman of the Independent Trustees
Mr. Kenneally also serves as Trustee of other Fidelity® funds. Prior to his retirement, Mr. Kenneally served as Chairman and Global Chief Executive Officer of Credit Suisse Asset Management. Before joining Credit Suisse, he was an Executive Vice President and Chief Investment Officer for Bank of America Corporation. Earlier roles at Bank of America included Director of Research, Senior Portfolio Manager and Research Analyst, and Mr. Kenneally was awarded the Chartered Financial Analyst (CFA) designation in 1991.
Marie L. Knowles (1946)
Year of Election or Appointment: 2001
Trustee
Ms. Knowles also serves as Trustee of other Fidelity® funds. Prior to Ms. Knowles' retirement in June 2000, she served as Executive Vice President and Chief Financial Officer of Atlantic Richfield Company (ARCO) (diversified energy, 1996-2000). From 1993 to 1996, she was a Senior Vice President of ARCO and President of ARCO Transportation Company (pipeline and tanker operations). Ms. Knowles currently serves as a Director and Chairman of the Audit Committee of McKesson Corporation (healthcare service, since 2002). Ms. Knowles is a member of the Board of the Santa Catalina Island Company (real estate, 2009-present). Ms. Knowles is a Member of the Investment Company Institute Board of Governors and a Member of the Governing Council of the Independent Directors Council (2014-present). She also serves as a member of the Advisory Board for the School of Engineering of the University of Southern California. Previously, Ms. Knowles served as a Director of Phelps Dodge Corporation (copper mining and manufacturing, 1994-2007), URS Corporation (engineering and construction, 2000-2003) and America West (airline, 1999-2002). Ms. Knowles previously served as Chairman (2015-2018) and Vice Chairman (2012-2015) of the Independent Trustees of certain Fidelity® funds.
Mark A. Murray (1954)
Year of Election or Appointment: 2016
Trustee
Mr. Murray also serves as Trustee of other Fidelity® funds. Mr. Murray is Vice Chairman (2013-present) of Meijer, Inc. (regional retail chain). Previously, Mr. Murray served as a Member of the Advisory Board of certain Fidelity® funds (2016) and as Co-Chief Executive Officer (2013-2016) and President (2006-2013) of Meijer, Inc. Mr. Murray serves as a member of the Board of Directors and Nuclear Review and Public Policy and Responsibility Committees of DTE Energy Company (diversified energy company, 2009-present). Mr. Murray also serves as a member of the Board of Directors of Spectrum Health (not-for-profit health system, 2015-present). Mr. Murray previously served as President of Grand Valley State University (2001-2006), Treasurer for the State of Michigan (1999-2001), Vice President of Finance and Administration for Michigan State University (1998-1999), and a member of the Board of Directors and Audit Committee and Chairman of the Nominating and Corporate Governance Committee of Universal Forest Products, Inc. (manufacturer and distributor of wood and wood-alternative products, 2004-2016). Mr. Murray is also a director or trustee of many community and professional organizations.
+ The information includes the Trustee's principal occupation during the last five years and other information relating to the experience, attributes, and skills relevant to the Trustee's qualifications to serve as a Trustee, which led to the conclusion that the Trustee should serve as a Trustee for the fund.
Advisory Board Members and Officers:
Correspondence intended for an officer may be sent to Fidelity Investments, 245 Summer Street, Boston, Massachusetts 02210. Officers appear below in alphabetical order.
Name, Year of Birth; Principal Occupation
Elizabeth Paige Baumann (1968)
Year of Election or Appointment: 2017
Anti-Money Laundering (AML) Officer
Ms. Baumann also serves as AML Officer of other funds. She is Chief AML Officer (2012-present) and Senior Vice President (2014-present) of FMR LLC (diversified financial services company) and is an employee of Fidelity Investments. Previously, Ms. Baumann served as AML Officer of the funds (2012-2016), and Vice President (2007-2014) and Deputy Anti-Money Laundering Officer (2007-2012) of FMR LLC.
Craig S. Brown (1977)
Year of Election or Appointment: 2019
Assistant Treasurer
Mr. Brown also serves as Assistant Treasurer of other funds. Mr. Brown is an employee of Fidelity Investments (2013-present).
John J. Burke III (1964)
Year of Election or Appointment: 2018
Chief Financial Officer
Mr. Burke also serves as Chief Financial Officer of other funds. Mr. Burke serves as Head of Investment Operations for Fidelity Fund and Investment Operations (2018-present) and is an employee of Fidelity Investments (1998-present). Previously Mr. Burke served as head of Asset Management Investment Operations (2012-2018).
Jonathan Davis (1968)
Year of Election or Appointment: 2010
Assistant Treasurer
Mr. Davis also serves as Assistant Treasurer of other funds. Mr. Davis serves as Assistant Treasurer of FMR Capital, Inc. (2017-present) and is an employee of Fidelity Investments. Previously, Mr. Davis served as Vice President and Associate General Counsel of FMR LLC (diversified financial services company, 2003-2010).
Adrien E. Deberghes (1967)
Year of Election or Appointment: 2010
Assistant Treasurer
Mr. Deberghes also serves as an officer of other funds. He serves as Assistant Treasurer of FMR Capital, Inc. (2017-present), Executive Vice President of Fidelity Investments Money Management, Inc. (FIMM) (investment adviser firm, 2016-present), and is an employee of Fidelity Investments (2008-present). Previously, Mr. Deberghes served as President and Treasurer of certain Fidelity® funds (2013-2018). Prior to joining Fidelity Investments, Mr. Deberghes was Senior Vice President of Mutual Fund Administration at State Street Corporation (2007-2008), Senior Director of Mutual Fund Administration at Investors Bank & Trust (2005-2007), and Director of Finance for Dunkin' Brands (2000-2005). Previously, Mr. Deberghes served in other fund officer roles.
Laura M. Del Prato (1964)
Year of Election or Appointment: 2018
President and Treasurer
Ms. Del Prato also serves as an officer of other funds. Ms. Del Prato is an employee of Fidelity Investments (2017-present). Prior to joining Fidelity Investments, Ms. Del Prato served as a Managing Director and Treasurer of the JPMorgan Mutual Funds (2014-2017). Prior to JPMorgan, Ms. Del Prato served as a partner at Cohen Fund Audit Services (accounting firm, 2012-2013) and KPMG LLP (accounting firm, 2004-2012).
Colm A. Hogan (1973)
Year of Election or Appointment: 2016
Assistant Treasurer
Mr. Hogan also serves as an officer of other funds. Mr. Hogan serves as Assistant Treasurer of FMR Capital, Inc. (2017-present) and is an employee of Fidelity Investments (2005-present). Previously, Mr. Hogan served as Assistant Treasurer of certain Fidelity® funds (2016-2018).
Cynthia Lo Bessette (1969)
Year of Election or Appointment: 2019
Secretary and Chief Legal Officer (CLO)
Ms. Lo Bessette also serves as Secretary and CLO of other funds. Ms. Lo Bessette serves as CLO, Secretary, and Senior Vice President of Fidelity Management & Research Company and FMR Co., Inc. (investment adviser firms, 2019-present); Secretary of Fidelity SelectCo, LLC and Fidelity Investments Money Management, Inc. (investment adviser firms, 2019-present); and CLO of Fidelity Management & Research (Hong Kong) Limited, FMR Investment Management (UK) Limited, and Fidelity Management & Research (Japan) Limited (investment adviser firms, 2019-present). She is a Senior Vice President and Deputy General Counsel of FMR LLC (diversified financial services company, 2019-present), and is an employee of Fidelity Investments. Previously, Ms. Lo Bessette served as Executive Vice President, General Counsel (2016-2019) and Senior Vice President, Deputy General Counsel (2015-2016) of OppenheimerFunds (investment management company) and Deputy Chief Legal Officer (2013-2015) of Jennison Associates LLC (investment adviser firm).
Chris Maher (1972)
Year of Election or Appointment: 2013
Assistant Treasurer
Mr. Maher serves as Assistant Treasurer of other funds. Mr. Maher is Vice President of Valuation Oversight, serves as Assistant Treasurer of FMR Capital, Inc. (2017-present), and is an employee of Fidelity Investments. Previously, Mr. Maher served as Vice President of Asset Management Compliance (2013), Vice President of the Program Management Group of FMR (investment adviser firm, 2010-2013), and Vice President of Valuation Oversight (2008-2010).
John B. McGinty, Jr. (1962)
Year of Election or Appointment: 2016
Chief Compliance Officer
Mr. McGinty also serves as Chief Compliance Officer of other funds. Mr. McGinty is Senior Vice President of Asset Management Compliance for Fidelity Investments and is an employee of Fidelity Investments (2016-present). Mr. McGinty previously served as Vice President, Senior Attorney at Eaton Vance Management (investment management firm, 2015-2016), and prior to Eaton Vance as global CCO for all firm operations and registered investment companies at GMO LLC (investment management firm, 2009-2015). Before joining GMO LLC, Mr. McGinty served as Senior Vice President, Deputy General Counsel for Fidelity Investments (2007-2009).
Jason P. Pogorelec (1975)
Year of Election or Appointment: 2015
Assistant Secretary
Mr. Pogorelec also serves as Assistant Secretary of other funds. Mr. Pogorelec serves as Vice President, Associate General Counsel (2010-present) and is an employee of Fidelity Investments (2006-present).
Nancy D. Prior (1967)
Year of Election or Appointment: 2014
Vice President
Ms. Prior also serves as Vice President of other funds. Ms. Prior serves as President of Fixed Income (2014-present), President (2016-present) and Director (2014-present) of Fidelity Investments Money Management, Inc. (FIMM) (investment adviser firm), and is an employee of Fidelity Investments (2002-present). Previously, Ms. Prior served as Vice President of Global Asset Allocation Funds (2017-2019); Vice Chairman of FIAM LLC (investment adviser firm, 2014-2018), a Director of FMR Investment Management (UK) Limited (investment adviser firm, 2015-2018), President Multi-Asset Class Strategies of FMR's Global Asset Allocation Division (2017-2018), Vice President of Fidelity's Money Market Funds (2012-2014), and President, Money Market and Short Duration Bond Group of Fidelity Management & Research Company (FMR) (investment adviser firm, 2013-2014).
Stacie M. Smith (1974)
Year of Election or Appointment: 2013
Assistant Treasurer
Ms. Smith also serves as an officer of other funds. Ms. Smith serves as Assistant Treasurer of FMR Capital, Inc. (2017-present), is an employee of Fidelity Investments (2009-present), and has served in other fund officer roles. Prior to joining Fidelity Investments, Ms. Smith served as Senior Audit Manager of Ernst & Young LLP (accounting firm, 1996-2009). Previously, Ms. Smith served as Assistant Treasurer (2013-2018) and Deputy Treasurer (2013-2016) of certain Fidelity® funds.
Marc L. Spector (1972)
Year of Election or Appointment: 2016
Deputy Treasurer
Mr. Spector also serves as an officer of other funds. Mr. Spector serves as Assistant Treasurer of FMR Capital, Inc. (2017-present) and is an employee of Fidelity Investments (2016-present). Prior to joining Fidelity Investments, Mr. Spector served as Director at the Siegfried Group (accounting firm, 2013-2016), and prior to Siegfried Group as audit senior manager at Deloitte & Touche (accounting firm, 2005-2013).
Jim Wegmann (1979)
Year of Election or Appointment: 2019
Assistant Treasurer
Mr. Wegmann also serves as Assistant Treasurer of other funds. Mr. Wegmann is an employee of Fidelity Investments (2011-present).
Shareholder Expense Example
As a shareholder of the Fund, you incur two types of costs: (1) transaction costs and (2) ongoing costs, including management fees and other Fund expenses. This Example is intended to help you understand your ongoing costs (in dollars) of investing in the Fund and to compare these costs with the ongoing costs of investing in other mutual funds.
The Example is based on an investment of $1,000 invested at the beginning of the period and held for the entire period (May 1, 2019 to October 31, 2019).
Actual Expenses
The first line of the accompanying table provides information about actual account values and actual expenses. You may use the information in this line, together with the amount you invested, to estimate the expenses that you paid over the period. Simply divide your account value by $1,000.00 (for example, an $8,600 account value divided by $1,000.00 = 8.6), then multiply the result by the number in the first line under the heading entitled "Expenses Paid During Period" to estimate the expenses you paid on your account during this period. In addition, the Fund, as a shareholder in the underlying Fidelity Central Funds, will indirectly bear its pro-rata share of the fees and expenses incurred by the underlying Fidelity Central Funds. These fees and expenses are not included in the Fund's annualized expense ratio used to calculate the expense estimate in the table below.
Hypothetical Example for Comparison Purposes
The second line of the accompanying table provides information about hypothetical account values and hypothetical expenses based on the Fund's actual expense ratio and an assumed rate of return of 5% per year before expenses, which is not the Fund's actual return. The hypothetical account values and expenses may not be used to estimate the actual ending account balance or expenses you paid for the period. You may use this information to compare the ongoing costs of investing in the Fund and other funds. To do so, compare this 5% hypothetical example with the 5% hypothetical examples that appear in the shareholder reports of the other funds. In addition, the Fund, as a shareholder in the underlying Fidelity Central Funds, will indirectly bear its pro-rata share of the fees and expenses incurred by the underlying Fidelity Central Funds. These fees and expenses are not included in the Fund's annualized expense ratio used to calculate the expense estimate in the table below.
Please note that the expenses shown in the table are meant to highlight your ongoing costs only and do not reflect any transaction costs. Therefore, the second line of the table is useful in comparing ongoing costs only, and will not help you determine the relative total costs of owning different funds.
| | Annualized Expense Ratio-A | Beginning
Account Value
May 1, 2019 | Ending
Account Value
October 31, 2019 | Expenses Paid
During Period-B
May 1, 2019
to October 31, 2019 |
| Actual | .20% | $1,000.00 | $993.50 | $1.00 |
| Hypothetical-C | | $1,000.00 | $1,024.20 | $1.02 |
A Annualized expense ratio reflects expenses net of applicable fee waivers.
B Expenses are equal to the Fund's annualized expense ratio, multiplied by the average account value over the period, multiplied by 184/365 (to reflect the one-half year period).
C 5% return per year before expenses
Distributions (Unaudited)
The fund designates 91% of the dividend distributed during the fiscal year as amounts which may be taken into account as a dividend for the purposes of the maximum rate under section 1(h)(11) of the Internal Revenue Code.
The amounts per share which represent income derived from sources within, and taxes paid to, foreign countries or possessions of the United States are $.1645 and $.0182 for the dividend paid December 10, 2018.
The fund will notify shareholders in January 2020 of amounts for use in preparing 2019 income tax returns.
Board Approval of Investment Advisory Contracts and Management Fees
Fidelity SAI International Value Index Fund
Each year, the Board of Trustees, including the Independent Trustees (together, the Board), votes on the renewal of the management contract with Fidelity Management & Research Company (FMR) and the sub-advisory agreements (together, the Advisory Contracts) for the fund, including the fund's sub-advisory agreement (Sub-Advisory Agreement) with Geode Capital Management, LLC (Geode). FMR and the sub-advisers are referred to herein as the Investment Advisers. The Board, assisted by the advice of fund counsel and Independent Trustees' counsel, requests and considers a broad range of information relevant to the renewal of the Advisory Contracts throughout the year.
The Board meets regularly and, at each of its meetings, covers an extensive agenda of topics and materials and considers factors that are relevant to its annual consideration of the renewal of the fund's Advisory Contracts, including the services and support provided to the fund and its shareholders. The Board has established four standing committees (Committees) — Operations, Audit, Fair Valuation, and Governance and Nominating — each composed of and chaired by Independent Trustees with varying backgrounds, to which the Board has assigned specific subject matter responsibilities in order to enhance effective decision-making by the Board. The Operations Committee, of which all of the Independent Trustees are members, meets regularly throughout the year and considers, among other matters, information specifically related to the annual consideration of the renewal of the fund's Advisory Contracts. The Board, acting directly and through its Committees, requests and receives information concerning the annual consideration of the renewal of the fund's Advisory Contracts. The Board also meets as needed to review matters specifically related to the Board's annual consideration of the renewal of the Advisory Contracts. Members of the Board may also meet with trustees of other Fidelity funds through joint ad hoc committees to discuss certain matters relevant to all of the Fidelity funds.
At its September 2019 meeting, the Board unanimously determined to renew the fund's Advisory Contracts. In reaching its determination, the Board considered all factors it believed relevant, including (i) the nature, extent, and quality of the services provided to the fund and its shareholders (including the investment performance of the fund); (ii) the competitiveness of the fund's management fee and total expense ratio relative to peer funds; (iii) the total costs of the services provided by and the profits realized by Fidelity and Geode from their respective relationships with the fund; and (iv) the extent to which, if any, economies of scale exist and are realized as the fund grows, and whether any economies of scale are appropriately shared with fund shareholders.
In considering whether to renew the Advisory Contracts for the fund, the Board reached a determination, with the assistance of fund counsel and Independent Trustees' counsel and through the exercise of its business judgment, that the renewal of the Advisory Contracts was in the best interests of the fund and its shareholders and that the compensation payable under the Advisory Contracts was fair and reasonable. The Board's decision to renew the Advisory Contracts was not based on any single factor, but rather was based on a comprehensive consideration of all the information provided to the Board at its meetings throughout the year. The Board, in reaching its determination to renew the Advisory Contracts, was aware that shareholders of the fund have a broad range of investment choices available to them, including a wide choice among funds offered by Fidelity's competitors, and that the fund's shareholders, who have the opportunity to review and weigh the disclosure provided by the fund in its prospectus and other public disclosures, have chosen to invest in this fund, which is part of the Fidelity family of funds.
Approval of Amended and Restated Advisory Contracts. At its September 2019 meeting, the Board also unanimously determined to approve an amended and restated management contract and sub-advisory agreement with Geode (Amended and Restated Contracts) in connection with an upcoming consolidation of certain of Fidelity's advisory businesses. The Board considered that, on or about January 1, 2020, FMR Co., Inc. (FMRC) expects to merge with and into FMR and, after the merger, FMR expects to redomicile as a Delaware limited liability company. The Board also approved the termination of the sub-advisory agreement with FMRC upon the completion of the merger. The Board noted that references to FMR in the Amended and Restated Contracts would be updated to reflect FMR's new form of organization and domicile. The Board also approved amendments that clarify that the fund pays its non-operating expenses, including brokerage commissions and fees and expenses associated with the fund's securities lending program, if applicable. The Board also noted Fidelity's assurance that neither the planned consolidation nor the Amended and Restated Contracts will change the investment processes, the level or nature of services provided, the resources and personnel allocated, trading and compliance operations, or any fees or expenses paid by the fund.
Nature, Extent, and Quality of Services Provided. The Board considered staffing as it relates to the fund, including the backgrounds of investment personnel of Fidelity and Geode, and also considered the fund's investment objective, strategies, and related investment philosophy. The Independent Trustees also had discussions with senior management of Fidelity's investment operations and investment groups and with representatives of Geode. The Board considered the structure of the investment personnel compensation programs and whether the structures provide appropriate incentives to act in the best interests of the fund. Additionally, the Board considered the portfolio managers' investments, if any, in the funds that they manage.
The Trustees also discussed with representatives of Fidelity Fidelity's role in, among other things, overseeing compliance with federal securities laws and other applicable requirements by Geode with respect to the fund and monitoring and overseeing the performance and investment capabilities of Geode. The Trustees considered that the Board had received from Fidelity reports about its oversight and due diligence processes, as well as reports regarding the performance of Geode.
The Board also considered the nature, extent and quality of services provided by Geode. The Trustees noted that under the Sub-Advisory Agreement, subject to oversight by Fidelity, Geode is responsible for, among other things, identifying investments and arranging for execution of portfolio transactions to implement the fund's investment strategy. In addition, the Trustees noted that Geode is responsible for providing such reporting as may be requested by Fidelity to fulfill its oversight responsibilities discussed above.
Resources Dedicated to Investment Management and Support Services. The Board reviewed the general qualifications and capabilities of Fidelity's and Geode's investment staffs, including their size, education, experience, and resources, as well as Fidelity's and Geode's approach to recruiting, managing, and compensating investment personnel. The Board considered that Fidelity's and Geode's investment professionals have extensive resources, tools and capabilities so as to provide competitive investment results over time, and that those professionals also have access to sophisticated tools that permit them to assess portfolio construction and risk and performance attribution characteristics continuously. Additionally, in its deliberations, the Board considered Fidelity's and Geode's trading, risk management, compliance, and technology and operations capabilities and resources, which are integral parts of the investment management process.
Shareholder and Administrative Services. The Board considered (i) the nature, extent, quality, and cost of advisory, administrative, and shareholder services performed by the Investment Advisers and their affiliates under the Advisory Contracts and by FMR's affiliates under separate agreements covering transfer agency, pricing and bookkeeping, and securities lending services for the fund; (ii) the nature and extent of the supervision of third party service providers, principally custodians, subcustodians, and pricing vendors; and (iii) the resources devoted to, and the record of compliance with, the fund's compliance policies and procedures. The Board also reviewed the allocation of fund brokerage, including allocations to brokers affiliated with the Investment Advisers.
The Board noted that the growth of fund assets over time across the complex allows Fidelity to reinvest in the development of services designed to enhance the value and convenience of the Fidelity funds as investment vehicles. These services include 24-hour access to account information and market information over the Internet and through telephone representatives, investor education materials and asset allocation tools, and the expanded availability of Fidelity Investor Centers.
Investment in a Large Fund Family. The Board considered the benefits to shareholders of investing in a Fidelity fund, including the benefits of investing in a fund that is part of a large family of funds offering a variety of investment disciplines and providing a large variety of mutual fund investor services. The Board noted that Fidelity had taken, or had made recommendations that resulted in the Fidelity funds taking, a number of actions over the previous year that benefited particular funds, including: (i) continuing to dedicate additional resources to Fidelity's investment research process, which includes meetings with management of issuers of securities in which the funds invest, and to the support of the senior management team that oversees asset management; (ii) continuing efforts to enhance Fidelity's global research capabilities; (iii) launching new funds with innovative structures, strategies and pricing and making other enhancements to meet client needs; (iv) launching new share classes of existing funds; (v) eliminating purchase minimums and broadening eligibility requirements for certain funds and share classes; (vi) reducing management fees and total expenses for certain target date funds and index funds; (vii) lowering expense caps for certain existing funds and classes, and converting certain voluntary expense caps to contractual caps, to reduce expenses borne by shareholders; (viii) rationalizing product lines and gaining increased efficiencies from fund mergers, liquidations, and share class consolidations; (ix) continuing to develop, acquire and implement systems and technology to improve services to the funds and shareholders, strengthen information security, and increase efficiency; and (x) continuing to implement enhancements to further strengthen Fidelity's product line to increase investors' probability of success in achieving their investment goals, including retirement income goals.
Investment Performance. The Board considered whether the fund has operated in accordance with its investment objective, as well as its record of compliance with its investment restrictions and its performance history.
The Board took into account discussions with representatives of the Investment Advisers about fund investment performance. In this regard the Board noted that as part of regularly scheduled fund reviews and other reports to the Board on fund performance, the Board considers annualized return information for the fund for different time periods, measured against the securities market index the fund seeks to track. The Board also periodically considers the fund's tracking error versus its benchmark index. In its evaluation of fund investment performance, the Board gave particular attention to information indicating underperformance of certain Fidelity funds for specific time periods and discussed with the Investment Advisers the reasons for such underperformance.
In addition to reviewing absolute and relative fund performance, the Independent Trustees periodically consider the appropriateness of fund performance metrics in evaluating the results achieved. In general, the Independent Trustees believe that an index fund's performance should be evaluated based on gross performance (before fees and expenses but after transaction costs) compared to a fund's benchmark index, over appropriate time periods, taking into account relevant factors including the following: general market conditions; the characteristics of the fund's benchmark index; the extent to which statistical sampling is employed; any securities lending revenues; and fund cash flows and other factors. Depending on the circumstances, the Independent Trustees may be satisfied with a fund's performance notwithstanding that it lags its benchmark index for certain periods.
The Independent Trustees recognize that shareholders evaluate performance on a net basis (after fees and expenses) over their own holding periods, for which one-, three-, and five-year periods are often used as a proxy. For this reason, the performance information reviewed by the Board also included net calendar year total return information for the fund and its benchmark index for the most recent one-year period.
Based on its review, the Board concluded that the nature, extent, and quality of services provided to the fund under the Advisory Contracts should continue to benefit the shareholders of the fund.
Competitiveness of Management Fee and Total Expense Ratio. The Board considered the fund's management fee and total expense ratio compared to "mapped groups" of competitive funds and classes created for the purpose of facilitating the Trustees' competitive analysis of management fees and total expenses. Fidelity creates "mapped groups" by combining similar Lipper investment objective categories that have comparable investment mandates. Combining Lipper investment objective categories aids the Board's management fee and total expense ratio comparisons by broadening the competitive group used for comparison.
Management Fee. The Board considered two proprietary management fee comparisons for the 12-month (or shorter) periods shown in basis points (BP) in the chart below. The group of Lipper funds used by the Board for management fee comparisons is referred to below as the "Total Mapped Group." The Total Mapped Group comparison focuses on a fund's standing in terms of gross management fees before expense reimbursements or caps relative to the total universe of funds with comparable investment mandates, regardless of whether their management fee structures also are comparable. Funds with comparable investment mandates offer exposure to similar types of securities. Funds with comparable management fee structures have similar management fee contractual arrangements (
e.g., flat rate charged for advisory services, all-inclusive fee rate,
etc.). "TMG %" represents the percentage of funds in the Total Mapped Group that had management fees that were lower than the fund's. For example, a hypothetical TMG % of 20% would mean that 80% of the funds in the Total Mapped Group had higher, and 20% had lower, management fees than the fund. The fund's actual TMG %s and the number of funds in the Total Mapped Group are in the chart below. The "Asset-Size Peer Group" (ASPG) comparison focuses on a fund's standing relative to a subset of non-Fidelity funds within the Total Mapped Group that are similar in size and management fee structure. For example, if a fund is in the first quartile of the ASPG, the fund's management fee ranks in the least expensive or lowest 25% of funds in the ASPG. The ASPG represents at least 15% of the funds in the Total Mapped Group with comparable asset size and management fee structures, subject to a minimum of 50 funds (or all funds in the Total Mapped Group if fewer than 50). Additional information, such as the ASPG quartile in which the fund's management fee rate ranked, is also included in the chart and was considered by the Board.
Fidelity SAI International Value Index Fund
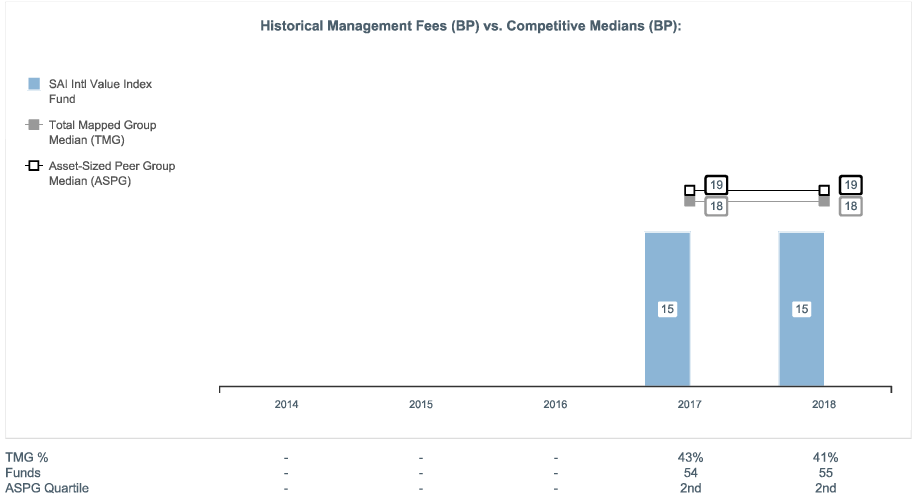
The Board noted that the fund's management fee rate ranked below the median of its Total Mapped Group and below the median of its ASPG for 2018.
The Board noted that it and the boards of other Fidelity funds formed an ad hoc Committee on Group Fee, which meets periodically, to conduct an in-depth review of the "group fee" component of the management fee of funds with such management fee structures. The Committee's focus included the mechanics of the group fee, the competitive landscape of group fee structures, Fidelity funds with no group fee component (such as the fund) and investment products not included in group fee assets. The Board also considered that, for funds subject to the group fee, FMR agreed to voluntarily waive fees over a specified period of time in amounts designed to account for assets converted from certain funds to certain collective investment trusts.
Based on its review, the Board concluded that the fund's management fee is fair and reasonable in light of the services that the fund receives and the other factors considered.
Total Expense Ratio. In its review of the fund's total expense ratio, the Board considered the fund's management fee rate as well as other fund expenses, such as custodial, legal, and audit fees. The Board also noted that Fidelity may agree to waive fees or reimburse expenses from time to time, and the extent to which, if any, it has done so for the fund. As part of its review, the Board also considered the current and historical total expense ratios of the fund compared to competitive fund median expenses. The fund is compared to those funds and classes in the Total Mapped Group (used by the Board for management fee comparisons) that have a similar sales load structure.
The Board noted that the fund's total expense ratio ranked below the competitive median for 2018.
The Board further considered that FMR has contractually agreed to reimburse the fund to the extent that total operating expenses (with certain exceptions), as a percentage of its average net assets, exceed 0.20% through February 29, 2020.
Fees Charged to Other Clients. The Board also considered fee structures applicable to clients of Fidelity and Geode, such as other funds advised or subadvised by Fidelity or Geode, pension plan clients, and other institutional clients with similar mandates. The Board noted that a joint ad hoc committee created by it and the boards of other Fidelity funds periodically reviews and compares Fidelity's institutional investment advisory business with its business of providing services to the Fidelity funds and also noted the most recent findings of the committee. The Board noted that the committee's review included a consideration of the differences in services provided, fees charged, and costs incurred, as well as competition in the markets serving the different categories of clients.
Based on its review of total expense ratios and fees charged to other Fidelity clients, the Board concluded that the fund's total expense ratio was reasonable in light of the services that the fund and its shareholders receive and the other factors considered.
Costs of the Services and Profitability. The Board considered the revenues earned and the expenses incurred by Fidelity in conducting the business of developing, marketing, distributing, managing, administering and servicing the fund and servicing the fund's shareholders. The Board also considered the level of Fidelity's profits in respect of all the Fidelity funds.
On an annual basis, Fidelity presents to the Board information about the profitability of its relationships with the fund. Fidelity calculates profitability information for each fund, as well as aggregate profitability information for groups of Fidelity funds and all Fidelity funds, using a series of detailed revenue and cost allocation methodologies which originate with the books and records of Fidelity on which Fidelity's audited financial statements are based. The Audit Committee of the Board reviews any significant changes from the prior year's methodologies and the full Board approves such changes.
PricewaterhouseCoopers LLP (PwC), auditor to Fidelity and certain Fidelity funds, has been engaged annually by the Board as part of the Board's assessment of Fidelity's profitability analysis. PwC's engagement includes the review and assessment of the methodologies used by Fidelity in determining the revenues and expenses attributable to Fidelity's mutual fund business, and completion of agreed-upon procedures in respect of the mathematical accuracy of the fund profitability information and its conformity to established allocation methodologies. After considering PwC's reports issued under the engagement and information provided by Fidelity, the Board concluded that while other allocation methods may also be reasonable, Fidelity's profitability methodologies are reasonable in all material respects.
The Board also reviewed Fidelity's and Geode's non-fund businesses and potential indirect benefits such businesses may have received as a result of their association with Fidelity's mutual fund business (i.e., fall-out benefits) as well as cases where Fidelity's and Geode's affiliates may benefit from the fund's business. The Board noted that changes to fall-out benefits year-over-year reflect business developments at Fidelity's and Geode's various businesses. The Board considered that a joint ad hoc committee created by it and the boards of other Fidelity funds had recently been established, and meets periodically, to evaluate potential fall-out benefits. The Board noted that the committee was expected to, among other things: (i) discuss the legal framework surrounding potential fall-out benefits; (ii) review the Board's responsibilities and approach to potential fall-out benefits; and (iii) review practices employed by competitor funds regarding the review of potential fall-out benefits. The Board noted that it would consider the committee's findings in connection with future consideration of contract renewals.
The Board considered the costs of the services provided by and the profits realized by Fidelity in connection with the operation of the fund and was satisfied that the profitability was not excessive.
The Board also considered information regarding the profitability of Geode's relationship with the fund.
Economies of Scale. The Board considered whether there have been economies of scale in respect of the management of the Fidelity funds, whether the Fidelity funds (including the fund) have appropriately benefited from any such economies of scale, and whether there is potential for realization of any further economies of scale. The Board considered the extent to which the fund will benefit from economies of scale as assets grow through increased services to the fund, through waivers or reimbursements, or through fee or expense ratio reductions. The Board also noted that a committee (the Economies of Scale Committee) created by it and the boards of other Fidelity funds periodically analyzes whether Fidelity attains economies of scale in respect of the management and servicing of the Fidelity funds, whether the Fidelity funds have appropriately benefited from such economies of scale, and whether there is potential for realization of any further economies of scale.
The Board concluded, taking into account the analysis of the Economies of Scale Committee, that economies of scale, if any, are being appropriately shared between fund shareholders and Fidelity.
Additional Information Requested by the Board. In order to develop fully the factual basis for consideration of the Fidelity funds' advisory contracts, the Board requested and received additional information on certain topics, including: (i) Fidelity's fund profitability methodology, profitability trends for certain funds, the allocation of various costs to different funds, and the impact of certain factors on fund profitability results; (ii) portfolio manager changes that have occurred during the past year and the amount of the investment that each portfolio manager has made in the Fidelity fund(s) that he or she manages; (iii) Fidelity's compensation structure for portfolio managers, research analysts, and other key personnel, including its effects on fund profitability, the rationale for the compensation structure, and the extent to which current market conditions have affected retention and recruitment; (iv) the arrangements with and compensation paid to certain fund sub-advisers on behalf of the Fidelity funds and the treatment of such compensation within Fidelity's fund profitability methodology; (v) the practices of certain sub-advisers regarding their receipt of research from broker-dealers that execute the funds' portfolio transactions; (vi) the terms of Fidelity's voluntary expense limitation agreements; (vii) the methodology with respect to competitive fund data and peer group classifications; (viii) Fidelity's transfer agent fee, expense, and service structures for different funds and classes relative to competitive trends, and the impact of the increased use of omnibus accounts; (ix) new developments in the retail and institutional marketplaces and the competitive positioning of the funds relative to other investment products and services; (x) the impact on fund profitability of recent changes in total net assets for Fidelity's money market funds, anticipated changes to the competitive landscape for money market fund funds, and the level of investor comfort with gates, fees, and floating NAVs; (xi) the funds' share class structures and distribution channels; and (xii) explanations regarding the relative total expense ratios of certain funds and classes, total expense competitive trends and methodologies for total expense competitive comparisons, and actions that might be taken by Fidelity to reduce total expense ratios for certain classes. In addition, the Board considered its discussions with Fidelity throughout the year regarding enhanced information security initiatives and the funds' fair valuation policies.
Based on its evaluation of all of the conclusions noted above, and after considering all factors it believed relevant, the Board concluded that the advisory and sub-advisory fee arrangements are fair and reasonable, and that the fund's Advisory Contracts should be renewed and the fund's Amended and Restated Contracts should be approved.
IIV-ANN-1219
1.9885501.101
Item 2.
Code of Ethics
As of the end of the period, October 31, 2019, Fidelity Salem Street Trust (the trust) has adopted a code of ethics, as defined in Item 2 of Form N-CSR, that applies to its President and Treasurer and its Chief Financial Officer. A copy of the code of ethics is filed as an exhibit to this Form N-CSR.
Item 3.
Audit Committee Financial Expert
The Board of Trustees of the trust has determined that Elizabeth S. Acton is an audit committee financial expert, as defined in Item 3 of Form N-CSR. Ms. Acton is independent for purposes of Item 3 of Form N-CSR.
Item 4.
Principal Accountant Fees and Services
Fees and Services
The following table presents fees billed by Deloitte & Touche LLP, the member firms of Deloitte Touche Tohmatsu, and their respective affiliates (collectively, “Deloitte Entities”) in each of the last two fiscal years for services rendered to Fidelity Emerging Markets Index Fund, Fidelity Flex International Index Fund, Fidelity Global ex U.S. Index Fund, Fidelity International Sustainability Index Fund and Fidelity Series Global ex U.S. Index Fund (the “Fund(s)”):
Services Billed by Deloitte Entities
October 31, 2019 FeesA
| | | | |
| Audit Fees | Audit-Related Fees | Tax Fees | All Other Fees |
Fidelity Emerging Markets Index Fund | $51,000 | $100 | $7,400 | $1,400 |
Fidelity Flex International Index Fund | $54,000 | $100 | $6,300 | $1,300 |
Fidelity Global ex U.S. Index Fund | $60,000 | $100 | $6,300 | $1,400 |
Fidelity International Sustainability Index Fund | $39,000 | $100 | $6,300 | $1,100 |
Fidelity Series Global ex U.S. Index Fund | $59,000 | $100 | $6,300 | $1,500 |
| | | | |
| Audit Fees | Audit-Related Fees | Tax Fees | All Other Fees |
Fidelity Emerging Markets Index Fund | $55,000 | $100 | $7,400 | $1,600 |
Fidelity Flex International Index Fund | $53,000 | $100 | $6,200 | $1,500 |
Fidelity Global ex U.S. Index Fund | $60,000 | $100 | $6,300 | $1,700 |
Fidelity International Sustainability Index Fund | $42,000 | $100 | $6,000 | $1,200 |
Fidelity Series Global ex U.S. Index Fund | $61,000 | $100 | $6,300 | $1,700 |
A Amounts may reflect rounding.
The following table presents fees billed by PricewaterhouseCoopers LLP (“PwC”) in each of the last two fiscal years for services rendered to Fidelity SAI Emerging Markets Index Fund, Fidelity SAI Emerging Markets Low Volatility Index Fund, Fidelity SAI International Index Fund, Fidelity SAI International Low Volatility Index Fund, Fidelity SAI International Value Index Fund, Fidelity SAI U.S. Low Volatility Index Fund, Fidelity Total International Index Fund and Fidelity U.S. Sustainability Index Fund (the “Fund(s)”):
Services Billed by PwC
October 31, 2019 FeesA,B
| | | | |
| Audit Fees | Audit-Related Fees | Tax Fees | All Other Fees |
Fidelity SAI Emerging Markets Index Fund | $48,000 | $3,900 | $3,900 | $2,300 |
Fidelity SAI Emerging Markets Low Volatility Index Fund | $38,000 | $2,300 | $3,500 | $1,300 |
Fidelity SAI International Index Fund | $48,000 | $3,900 | $3,900 | $2,300 |
Fidelity SAI International Low Volatility Index Fund | $43,000 | $3,500 | $3,500 | $2,000 |
Fidelity SAI International Value Index Fund | $46,000 | $3,700 | $3,500 | $2,100 |
Fidelity SAI U.S. Low Volatility Index Fund | $44,000 | $3,600 | $3,500 | $2,100 |
Fidelity Total International Index Fund | $73,000 | $6,100 | $6,800 | $3,500 |
Fidelity U.S. Sustainability Index Fund | $35,000 | $2,800 | $2,600 | $1,600 |
October 31, 2018 FeesA,B,C
| | | | |
| Audit Fees | Audit-Related Fees | Tax Fees | All Other Fees |
Fidelity SAI Emerging Markets Index Fund | $49,000 | $4,300 | $3,900 | $2,400 |
Fidelity SAI Emerging Markets Low Volatility Index Fund | $- | $- | $- | $- |
Fidelity SAI International Index Fund | $49,000 | $4,300 | $3,900 | $2,400 |
Fidelity SAI International Low Volatility Index Fund | $45,000 | $3,900 | $3,500 | $2,200 |
Fidelity SAI International Value Index Fund | $41,000 | $3,000 | $3,500 | $1,700 |
Fidelity SAI U.S. Low Volatility Index Fund | $45,000 | $3,900 | $3,500 | $2,200 |
Fidelity Total International Index Fund | $75,000 | $6,000 | $6,800 | $3,500 |
Fidelity U.S. Sustainability Index Fund | $33,000 | $2,900 | $2,600 | $1,700 |
A Amounts may reflect rounding.
B Fidelity SAI Emerging Markets Low Volatility Index Fund commenced operations on January 30, 2019.
C Fidelity SAI International Value Index Fund commenced operations on December 19, 2017.
The following table(s) present(s) fees billed by Deloitte Entities and PwC that were required to be approved by the Audit Committee for services that relate directly to the operations and financial reporting of the Fund(s) and that are rendered on behalf of Fidelity Management & Research Company ("FMR") and entities controlling, controlled by, or under common control with FMR (not including any sub-adviser whose role is primarily portfolio management and is subcontracted with or overseen by another investment adviser) that provide ongoing services to the Fund(s) (“Fund Service Providers”):
Services Billed by Deloitte Entities
| | |
| October 31, 2019A | October 31, 2018A |
Audit-Related Fees | $290,000 | $5,000 |
Tax Fees | $5,000 | $5,000 |
All Other Fees | $- | $- |
A Amounts may reflect rounding.
Services Billed by PwC
| | | |
| October 31, 2019A,B | October 31, 2018A,B,C |
Audit-Related Fees | $7,890,000 | $7,745,000 | |
Tax Fees | $10,000 | $20,000 | |
All Other Fees | $- | $- | |
A Amounts may reflect rounding.
B May include amounts billed prior to the Fidelity SAI Emerging Markets Low Volatility Index Fund’s commencement of operations.
C May include amounts billed prior to the Fidelity SAI International Value Index Fund’s commencement of operations.
“Audit-Related Fees” represent fees billed for assurance and related services that are reasonably related to the performance of the fund audit or the review of the fund's financial statements and that are not reported under Audit Fees.
“Tax Fees” represent fees billed for tax compliance, tax advice or tax planning that relate directly to the operations and financial reporting of the fund.
“All Other Fees” represent fees billed for services provided to the fund or Fund Service Provider, a significant portion of which are assurance related, that relate directly to the operations and financial reporting of the fund, excluding those services that are reported under Audit Fees, Audit-Related Fees or Tax Fees.
Assurance services must be performed by an independent public accountant.
* * *
The aggregate non-audit fees billed by Deloitte Entities and PwC for services rendered to the Fund(s), FMR (not including any sub-adviser whose role is primarily portfolio management and is subcontracted with or overseen by another investment adviser), and any Fund Service Provider for each of the last two fiscal years of the Fund(s) are as follows:
| | |
Billed By | October 31, 2019A,B | October 31, 2018A,B,C |
Deloitte Entities | $615,000 | $520,000 |
PwC | $12,620,000 | $11,010,000 |
A Amounts may reflect rounding.
B May include amounts billed prior to the Fidelity SAI Emerging Markets Low Volatility Index Fund’s commencement of operations.
C May include amounts billed prior to the Fidelity SAI International Value Index Fund’s commencement of operations.
The trust's Audit Committee has considered non-audit services that were not pre-approved that were provided by Deloitte Entities and PwC to Fund Service Providers to be compatible with maintaining the independence of Deloitte Entities and PwC in its(their) audit of the Fund(s), taking into account representations from Deloitte Entities and PwC, in accordance with Public Company Accounting Oversight Board rules, regarding its independence from the Fund(s) and its(their) related entities and FMR’s review of the appropriateness and permissibility under applicable law of such non-audit services prior to their provision to the Fund(s) Service Providers.
Audit Committee Pre-Approval Policies and Procedures
The trust’s Audit Committee must pre-approve all audit and non-audit services provided by a fund’s independent registered public accounting firm relating to the operations or financial reporting of the fund. Prior to the commencement of any audit or non-audit services to a fund, the Audit Committee reviews the services to determine whether they are appropriate and permissible under applicable law.
The Audit Committee has adopted policies and procedures to, among other purposes, provide a framework for the Committee’s consideration of non-audit services by the audit firms that audit the Fidelity funds. The policies and procedures require that any non-audit service provided by a fund audit firm to a Fidelity fund and any non-audit service provided by a fund auditor to a Fund Service Provider that relates directly to the operations and financial reporting of a Fidelity fund (“Covered Service”) are subject to approval by the Audit Committee before such service is provided.
All Covered Services must be approved in advance of provision of the service either: (i) by formal resolution of the Audit Committee, or (ii) by oral or written approval of the service by the Chair of the Audit Committee (or if the Chair is unavailable, such other member of the Audit Committee as may be designated by the Chair to act in the Chair’s absence). The approval contemplated by (ii) above is permitted where the Treasurer determines that action on such an engagement is necessary before the next meeting of the Audit Committee.
Non-audit services provided by a fund audit firm to a Fund Service Provider that do not relate directly to the operations and financial reporting of a Fidelity fund are reported to the Audit Committee periodically.
Non-Audit Services Approved Pursuant to Rule 2-01(c)(7)(i)(C) and (ii) of Regulation S-X (“De Minimis Exception”)
There were no non-audit services approved or required to be approved by the Audit Committee pursuant to the De Minimis Exception during the Fund’s(s’) last two fiscal years relating to services provided to (i) the Fund(s) or (ii) any Fund Service Provider that relate directly to the operations and financial reporting of the Fund(s).
Item 5.
Audit Committee of Listed Registrants
Not applicable.
Item 6.
Investments
(a)
Not applicable.
(b)
Not applicable.
Item 7.
Disclosure of Proxy Voting Policies and Procedures for Closed-End Management Investment Companies
Not applicable.
Item 8.
Portfolio Managers of Closed-End Management Investment Companies
Not applicable.
Item 9.
Purchase of Equity Securities by Closed-End Management Investment Company and Affiliated Purchasers
Not applicable.
Item 10.
Submission of Matters to a Vote of Security Holders
There were no material changes to the procedures by which shareholders may recommend nominees to the trust’s Board of Trustees.
Item 11.
Controls and Procedures
(a)(i) The President and Treasurer and the Chief Financial Officer have concluded that the trust’s disclosure controls and procedures (as defined in Rule 30a-3(c) under the Investment Company Act) provide reasonable assurances that material information relating to the trust is made known to them by the appropriate persons, based on their evaluation of these controls and procedures as of a date within 90 days of the filing date of this report.
(a)(ii) There was no change in the trust’s internal control over financial reporting (as defined in Rule 30a-3(d) under the Investment Company Act) that occurred during the
period covered by this report that has materially affected, or is reasonably likely to materially affect, the trust’s internal control over financial reporting.
Item 12.
Disclosure of Securities Lending Activities for Closed-End Management
Investment Companies
Not applicable.
Item 13.
Exhibits
| | |
(a) | (1) | Code of Ethics pursuant to Item 2 of Form N-CSR is filed and attached hereto as EX-99.CODE ETH. |
(a) | (2) | Certification pursuant to Rule 30a-2(a) under the Investment Company Act of 1940 (17 CFR 270.30a-2(a)) is filed and attached hereto as Exhibit 99.CERT. |
(a) | (3) | Not applicable. |
(b) |
| Certification pursuant to Rule 30a-2(b) under the Investment Company Act of 1940 (17 CFR 270.30a-2(b)) is furnished and attached hereto as Exhibit 99.906CERT. |
SIGNATURES
Pursuant to the requirements of the Securities Exchange Act of 1934 and the Investment Company Act of 1940, the registrant has duly caused this report to be signed on its behalf by the undersigned, thereunto duly authorized.
Fidelity Salem Street Trust
| |
By: | /s/Laura M. Del Prato |
| Laura M. Del Prato |
| President and Treasurer |
|
|
Date: | December 26, 2019 |
Pursuant to the requirements of the Securities Exchange Act of 1934 and the Investment Company Act of 1940, this report has been signed below by the following persons on behalf of the registrant and in the capacities and on the dates indicated.
| |
By: | /s/Laura M. Del Prato |
| Laura M. Del Prato |
| President and Treasurer |
|
|
Date: | December 26, 2019 |
| |
By: | /s/John J. Burke III |
| John J. Burke III |
| Chief Financial Officer |
|
|
Date: | December 26, 2019 |