UNITED STATES
SECURITIES AND EXCHANGE COMMISSION
Washington, D.C. 20549
FORM N-CSR
CERTIFIED SHAREHOLDER REPORT OF REGISTERED
MANAGEMENT INVESTMENT COMPANIES
Investment Company Act file number 811-2460
Fidelity Union Street Trust
(Exact name of registrant as specified in charter)
82 Devonshire St., Boston, Massachusetts 02109
(Address of principal executive offices) (Zip code)
Scott C. Goebel, Secretary
82 Devonshire St.
Boston, Massachusetts 02109
(Name and address of agent for service)
Registrant's telephone number, including area code: 617-563-7000
Date of fiscal year end: | August 31 |
| |
Date of reporting period: | February 28, 2011 |
Item 1. Reports to Stockholders
Fidelity®
Arizona Municipal
Income Fund
and
Fidelity
Arizona Municipal
Money Market Fund
Semiannual Report
February 28, 2011
(2_fidelity_logos) (Registered_Trademark)
Contents
Chairman's Message | <Click Here> | The Chairman's message to shareholders. |
Shareholder Expense Example | <Click Here> | An example of shareholder expenses. |
Fidelity® Arizona Municipal Income Fund |
Investment Changes | <Click Here> | A summary of major shifts in the fund's investments over the past six months. |
Investments | <Click Here> | A complete list of the fund's investments with their market values. |
Financial Statements | <Click Here> | Statements of assets and liabilities, operations, and changes in net assets,
as well as financial highlights. |
Fidelity Arizona Municipal Money Market Fund |
Investment Changes | <Click Here> | A summary of major shifts in the fund's investments over the past six months, and one year. |
Investments | <Click Here> | A complete list of the fund's investments with their market values. |
Financial Statements | <Click Here> | Statements of assets and liabilities, operations, and changes in net assets,
as well as financial highlights. |
Notes | <Click Here> | Notes to the financial statements. |
Board Approval of Investment Advisory Contracts and Management Fees | <Click Here> | |
To view a fund's proxy voting guidelines and proxy voting record for the 12-month period ended June 30, visit http://www.fidelity.com/proxyvotingresults or visit the Securities and Exchange Commission's (SEC) web site at http://www.sec.gov. You may also call 1-800-544-8544 to request a free copy of the proxy voting guidelines.
Standard & Poor's, S&P and S&P 500 are registered service marks of The McGraw-Hill Companies, Inc. and have been licensed for use by Fidelity Distributors Corporation.
Other third party marks appearing herein are the property of their respective owners.
All other marks appearing herein are registered or unregistered trademarks or service marks of FMR LLC or an affiliated company.
Semiannual Report
This report and the financial statements contained herein are submitted for the general information of the shareholders of the funds. This report is not authorized for distribution to prospective investors in the funds unless preceded or accompanied by an effective prospectus.
A fund files its complete schedule of portfolio holdings with the SEC for the first and third quarters of each fiscal year on Form N-Q. Forms N-Q are available on the SEC's web site at http://www.sec.gov. A fund's Forms N-Q may be reviewed and copied at the SEC's Public Reference Room in Washington, DC. Information regarding the operation of the SEC's Public Reference Room may be obtained by calling 1-800-SEC-0330. For a complete list of a fund's portfolio holdings, view the most recent holdings listing, semiannual report, or annual report on Fidelity's web site at http://www.fidelity.com, http://www.advisor.fidelity.com, or http://www.401k.com, as applicable.
NOT FDIC INSURED • MAY LOSE VALUE • NO BANK GUARANTEE
Neither the funds nor Fidelity Distributors Corporation is a bank.
Semiannual Report
(photo_of_Abigail_P_Johnson)
Dear Shareholder:
Following a year in which the investment environment was volatile but generally supportive of most major asset classes, 2011 has begun on a positive note. U.S. equities gained ground in January and February, reaching their highest point since June 2008, amid indications the U.S. economy had turned a corner. Still, questions remained about the longer-term outlook, most notably persistently high unemployment. Financial markets are always unpredictable, of course, but there also are several time-tested investment principles that can help put the odds in your favor.
One of the basic tenets is to invest for the long term. Over time, riding out the markets' inevitable ups and downs has proven much more effective than selling into panic or chasing the hottest trend. Even missing only a few of the markets' best days can significantly diminish investor returns. Patience also affords the benefits of compounding - of earning interest on additional income or reinvested dividends and capital gains. There can be tax advantages and cost benefits to consider as well. While staying the course doesn't eliminate risk, it can considerably lessen the effect of short-term declines.
You can further manage your investing risk through diversification. And today, more than ever, geographic diversification should be taken into account. Studies indicate that asset allocation is the single most important determinant of a portfolio's long-term success. The right mix of stocks, bonds and cash - aligned to your particular risk tolerance and investment objective - is very important. Age-appropriate rebalancing is also an essential aspect of asset allocation. For younger investors, an emphasis on equities - which historically have been the best-performing asset class over time - is encouraged. As investors near their specific goal, such as retirement or sending a child to college, consideration may be given to replacing volatile assets (e.g. common stocks) with more-stable fixed investments (bonds or savings plans).
A third principle - investing regularly - can help lower the average cost of your purchases. Investing a certain amount of money each month or quarter helps ensure you won't pay for all your shares at market highs. This strategy - known as dollar cost averaging - also reduces "emotion" from investing, helping shareholders avoid selling weak performers just prior to an upswing, or chasing a hot performer just before a correction.
We invite you to contact us via the Internet, through our Investor Centers or by phone. It is our privilege to provide you the information you need to make the investments that are right for you.
Sincerely,
(The chairman's signature appears here.)
Abigail P. Johnson
Semiannual Report
Shareholder Expense Example
As a shareholder of a Fund, you incur two types of costs: (1) transaction costs, including redemption fees, and (2) ongoing costs, including management fees and other Fund expenses. This Example is intended to help you understand your ongoing costs (in dollars) of investing in the Funds and to compare these costs with the ongoing costs of investing in other mutual funds.
The Example is based on an investment of $1,000 invested at the beginning of the period and held for the entire period (September 1, 2010 to February 28, 2011).
Actual Expenses
The first line of the accompanying table for each fund provides information about actual account values and actual expenses. You may use the information in this line, together with the amount you invested, to estimate the expenses that you paid over the period. Simply divide your account value by $1,000.00 (for example, an $8,600 account value divided by $1,000.00 = 8.6), then multiply the result by the number in the first line for a fund under the heading entitled "Expenses Paid During Period" to estimate the expenses you paid on your account during this period. A small balance maintenance fee of $12.00 that is charged once a year may apply for certain accounts with a value of less than $2,000. This fee is not included in the table below. If it was, the estimate of expenses you paid during the period would be higher, and your ending account value lower, by this amount. In addition, each Fund, as a shareholder in the underlying Fidelity Central Funds, will indirectly bear its pro-rata share of the fees and expenses incurred by the underlying Fidelity Central Funds. These fees and expenses are not included in the Fund's annualized expense ratio used to calculate the expense estimate in the table below.
Hypothetical Example for Comparison Purposes
The second line of the accompanying table for each fund provides information about hypothetical account values and hypothetical expenses based on a fund's actual expense ratio and an assumed rate of return of 5% per year before expenses, which is not the Fund's actual return. The hypothetical account values and expenses may not be used to estimate the actual ending account balance or expenses you paid for the period. You may use this information to compare the ongoing costs of investing in the Fund and other funds. To do so, compare this 5% hypothetical example with the 5% hypothetical examples that appear in the shareholder reports of the other funds. A small balance maintenance fee of $12.00 that is charged once a year may apply for certain accounts with a value of less than $2,000. This fee is not included in the table below. If it was, the estimate of expenses you paid during the period would be higher, and your ending account value lower, by this amount. In addition, each Fund, as a shareholder in the underlying Fidelity Central Funds, will indirectly bear its pro-rata share of the fees and expenses incurred by the underlying Fidelity Central Funds. These fees and expenses are not included in the Fund's annualized expense ratio used to calculate the expense estimate in the table below.
Please note that the expenses shown in the table are meant to highlight your ongoing costs only and do not reflect any transaction costs. Therefore, the second line of the table is useful in comparing ongoing costs only, and will not help you determine the relative total costs of owning different funds. In addition, if these transactional costs were included, your costs would have been higher.
Semiannual Report
| Annualized Expense Ratio | Beginning
Account Value
September 1,
2010 | Ending
Account Value
February 28,
2011 | Expenses Paid
During Period*
September 1, 2010
to February 28, 2011 |
Fidelity Arizona Municipal Income Fund | .55% | | | |
Actual | | $ 1,000.00 | $ 965.70 | $ 2.68 |
HypotheticalA | | $ 1,000.00 | $ 1,022.07 | $ 2.76 |
Fidelity Arizona Municipal Money Market Fund | .30% | | | |
Actual | | $ 1,000.00 | $ 1,000.00 | $ 1.49 ** |
HypotheticalA | | $ 1,000.00 | $ 1,023.31 | $ 1.51 ** |
A 5% return per year before expenses
* Expenses are equal to each Fund's annualized expense ratio, multiplied by the average account value over the period, multiplied by 181/365 (to reflect the one-half year period).
** If certain fees were not voluntarily waived by FMR or its affiliates during the period, the annualized expense ratio for the Arizona Municipal Money Market Fund would have been .50% and the expenses paid in the actual and hypothetical examples above would have been $2.48 and $2.51, respectively.
Semiannual Report
Fidelity Arizona Municipal Income Fund
Investment Changes (Unaudited)
Top Five Sectors as of February 28, 2011 |
| % of fund's
net assets | % of fund's net assets
6 months ago |
General Obligations | 21.6 | 24.5 |
Special Tax | 16.9 | 17.0 |
Electric Utilities | 14.8 | 15.0 |
Water & Sewer | 14.6 | 16.4 |
Health Care | 11.0 | 9.2 |
Weighted Average Maturity as of February 28, 2011 |
| | 6 months ago |
Years | 9.2 | 7.0 |
This is a weighted average of all the maturities of the securities held in a fund. Weighted Average Maturity (WAM) can be used as a measure of sensitivity to interest rate changes and markets changes. Generally, the longer the maturity, the greater the sensitivity to such changes. WAM is based on the dollar-weighted average length of time until principal payments must be paid. Depending on the types of securities held in a fund, certain maturity shortening devices (e.g., demand features, interest rate resets, and call options) may be taken into account when calculating the WAM. |
Duration as of February 28, 2011 |
| | 6 months ago |
Years | 8.3 | 8.1 |
Duration estimates how much a bond fund's price will change with a change in comparable interest rates. If rates rise 1%, for example, a fund with a 5-year duration is likely to lose about 5% of its value. Other factors also can influence a bond fund's performance and share price. Accordingly, a bond fund's actual performance may differ from this example. Duration takes into account any call or put option embedded in the bonds. |
Quality Diversification (% of fund's net assets) |
As of February 28, 2011 | As of August 31, 2010 |
 | AAA 3.4% | | | AAA 6.3% | |
 | AA,A 78.6% | | | AA,A 79.4% | |
 | BBB 12.8% | | | BBB 11.8% | |
 | BB and Below 1.0% | |  | BB and Below 0.0% | |
 | Short-Term
Investments and
Net Other Assets 4.2% | | | Short-Term
Investments and
Net Other Assets 2.5% | |

We have used ratings from Moody's Investors Service, Inc. Where Moody's ® ratings are not available, we have used S&P ® ratings. All ratings are as of the report date and do not reflect subsequent changes. |
Semiannual Report
Fidelity Arizona Municipal Income Fund
Investments February 28, 2011 (Unaudited)
Showing Percentage of Net Assets
Municipal Bonds - 95.8% |
| Principal Amount | | Value |
Arizona - 90.9% |
Arizona Board of Regents Arizona State Univ. Rev. (Polytechnic Campus Proj.) Series 2008 C: | | | | |
5.75% 7/1/22 | | $ 1,500,000 | | $ 1,649,220 |
5.75% 7/1/23 | | 250,000 | | 272,398 |
Arizona Board of Regents Ctfs. of Prtn.: | | | | |
(Arizona Biomedical Research Collaborative Bldg. Proj.) Series 2006, 5% 6/1/19 (AMBAC Insured) | | 1,140,000 | | 1,228,019 |
(Univ. of Arizona Projs.) Series 2006 A, 5% 6/1/18 (AMBAC Insured) | | 1,000,000 | | 1,089,250 |
Arizona Ctfs. of Prtn.: | | | | |
Series 2008 A, 5% 9/1/20 (FSA Insured) | | 1,640,000 | | 1,712,734 |
Series 2010 A, 5% 10/1/29 (FSA Insured) | | 5,000,000 | | 4,934,300 |
Arizona Game and Fish Dept. and Commission (AGF Administration Bldg. Proj.) Series 2006: | | | | |
5% 7/1/21 | | 1,280,000 | | 1,326,502 |
5% 7/1/32 | | 470,000 | | 438,980 |
Arizona Health Facilities Auth. Rev. (Banner Health Sys. Proj.): | | | | |
Series 2007 A, 5% 1/1/21 | | 1,000,000 | | 1,027,380 |
Series 2007 B, 1.013% 1/1/37 (b) | | 1,000,000 | | 635,070 |
Series 2008 A, 5.25% 1/1/31 | | 1,000,000 | | 959,480 |
Series 2008 D, 6% 1/1/27 | | 1,000,000 | | 1,050,670 |
Arizona School Facilities Board Ctfs. of Prtn.: | | | | |
Series 2005 A2, 5% 9/1/16 (Nat'l. Pub. Fin. Guarantee Corp. Insured) | | 1,665,000 | | 1,766,615 |
Series 2008, 5.75% 9/1/22 | | 1,000,000 | | 1,065,030 |
Series A2, 5% 9/1/18 (Nat'l. Pub. Fin. Guarantee Corp. Insured) | | 1,000,000 | | 1,043,270 |
Arizona State Lottery Rev. Series 2010 A, 5% 7/1/21 | | 1,000,000 | | 1,067,570 |
Arizona State Univ. Ctfs. of Prtn. (Research Infrastructure Proj.) Series 2004, 5.25% 9/1/24 | | 1,230,000 | | 1,246,421 |
Arizona State Univ. Revs. Series 2005, 5% 7/1/26 (AMBAC Insured) | | 1,000,000 | | 1,014,300 |
Arizona Trans. Board Hwy. Rev.: | | | | |
Series 2006, 5% 7/1/22 | | 400,000 | | 428,712 |
Series 2008 A, 5% 7/1/33 | | 1,000,000 | | 1,014,020 |
Arizona Wtr. Infrastructure Fin. Auth. Rev.: | | | | |
(Wtr. Quality Proj.) Series 2006 A, 5% 10/1/23 | | 500,000 | | 535,075 |
Series 2009 A, 5% 10/1/29 | | 1,000,000 | | 1,041,720 |
Series 2010 A, 5% 10/1/30 | | 2,000,000 | | 2,078,620 |
Avondale Muni. Dev. Corp. Excise Tax Rev. 5% 7/1/28 | | 500,000 | | 506,700 |
Municipal Bonds - continued |
| Principal Amount | | Value |
Arizona - continued |
Cottonwood Wtr. Sys. Rev.: | | | | |
5% 7/1/26 (XL Cap. Assurance, Inc. Insured) | | $ 1,405,000 | | $ 1,390,079 |
5% 7/1/30 (XL Cap. Assurance, Inc. Insured) | | 1,125,000 | | 1,058,006 |
5% 7/1/35 (XL Cap. Assurance, Inc. Insured) | | 1,300,000 | | 1,137,578 |
Downtown Phoenix Hotel Corp. Rev. Series A, 5.25% 7/1/23 (FGIC Insured) | | 1,750,000 | | 1,552,635 |
Glendale Indl. Dev. Auth. (Midwestern Univ. Proj.) Series 2007, 5.25% 5/15/19 | | 1,000,000 | | 1,084,410 |
Glendale Indl. Dev. Auth. Hosp. Rev. (John C. Lincoln Health Network Proj.): | | | | |
Series 2005 B, 5.25% 12/1/19 | | 1,040,000 | | 1,010,807 |
Series 2005, 5% 12/1/35 | | 1,000,000 | | 810,240 |
Series 2007: | | | | |
5% 12/1/27 | | 1,000,000 | | 862,870 |
5% 12/1/32 | | 1,000,000 | | 826,560 |
Glendale Western Loop 101 Pub. Facilities Corp. Series 2008 A: | | | | |
6.25% 7/1/38 | | 3,000,000 | | 3,087,150 |
7% 7/1/33 | | 1,000,000 | | 1,054,190 |
Goodyear McDowell Road Commercial Corridor Impt. District 5.25% 1/1/17 (AMBAC Insured) | | 1,580,000 | | 1,721,947 |
Goodyear Pub. Impt. Corp. Facilities Rev. Series 2008, 6% 7/1/31 | | 1,000,000 | | 1,050,010 |
Marana Muni. Property Corp. Facilities Rev. Series A, 5.25% 7/1/22 | | 1,620,000 | | 1,746,360 |
Maricopa County Indl. Dev. Auth. Health Facilities Rev.: | | | | |
(Catholic Healthcare West Proj.): | | | | |
Series 1998 A, 5% 7/1/16 | | 480,000 | | 480,605 |
Series 2007 A, 5% 7/1/16 | | 1,000,000 | | 1,081,880 |
Series 2009 A, 6% 7/1/39 | | 1,000,000 | | 997,200 |
Series A, 5.25% 7/1/32 | | 1,000,000 | | 930,630 |
(Mayo Clinic Proj.) 5% 11/15/36 | | 1,000,000 | | 943,360 |
Maricopa County Poll. Cont. Rev. (Southern California Edison Co. Proj.) Series 2000 A, 5% 6/1/35 | | 3,000,000 | | 2,881,680 |
Maricopa County Unified School District #60 Higley (School Impt. Proj.) Series B, 5% 7/1/19 (FGIC Insured) | | 1,000,000 | | 1,077,960 |
McAllister Academic Village LLC Rev. (Arizona State Univ. Hassayampa Academic Village Proj.) Series 2008, 5% 7/1/38 | | 1,000,000 | | 919,080 |
Mesa Util. Sys. Rev. 5% 7/1/24 (FGIC Insured) | | 1,000,000 | | 1,068,300 |
Municipal Bonds - continued |
| Principal Amount | | Value |
Arizona - continued |
Navajo County Poll. Cont. Corp. Rev. Bonds (Arizona Pub. Svc. Co. Cholla Proj.) Series 2009 A, 5%, tender 6/1/12 (b) | | $ 2,000,000 | | $ 2,060,820 |
North Campus Facilities LLC (Northern Arizona Univ. Sys. Rev. Proj.) 5% 6/1/31 (AMBAC Insured) | | 1,225,000 | | 1,184,036 |
Northern Arizona Univ. Revs. 5% 6/1/21 (AMBAC Insured) | | 1,085,000 | | 1,140,693 |
Phoenix Civic Impt. Board Arpt. Rev.: | | | | |
Series A, 5% 7/1/33 | | 1,000,000 | | 971,120 |
Series B, 5.25% 7/1/27 (Nat'l. Pub. Fin. Guarantee Corp. Insured) (c) | | 1,100,000 | | 1,100,748 |
Phoenix Civic Impt. Corp. District Rev. (Plaza Expansion Proj.) Series 2005 B, 0% 7/1/38 (a) | | 2,000,000 | | 1,684,520 |
Phoenix Civic Impt. Corp. Excise Tax Rev.: | | | | |
(Civic Plaza Expansion Proj.) Series 2005 A: | | | | |
5% 7/1/18 (FGIC Insured) | | 550,000 | | 584,205 |
5% 7/1/30 (Nat'l. Pub. Fin. Guarantee Corp. Insured) | | 1,000,000 | | 1,000,320 |
Series 2007 A, 5% 7/1/22 (Nat'l. Pub. Fin. Guarantee Corp. Insured) | | 1,250,000 | | 1,297,250 |
Phoenix Civic Impt. Corp. Wastewtr. Sys. Rev.: | | | | |
Series 2004: | | | | |
5% 7/1/24 | | 1,750,000 | | 1,799,525 |
5% 7/1/29 (Nat'l. Pub. Fin. Guarantee Corp. Insured) | | 770,000 | | 779,117 |
Series 2007, 5% 7/1/20 (Nat'l. Pub. Fin. Guarantee Corp. Insured) | | 1,000,000 | | 1,077,960 |
Phoenix Civic Impt. Corp. Wtr. Sys. Rev.: | | | | |
Series 2001, 5.5% 7/1/24 (Nat'l. Pub. Fin. Guarantee Corp. Insured) | | 1,000,000 | | 1,138,180 |
Series 2002, 5.5% 7/1/20 (Nat'l. Pub. Fin. Guarantee Corp. Insured) | | 1,500,000 | | 1,569,210 |
Series 2005: | | | | |
5% 7/1/20 | | 5,000,000 | | 5,443,100 |
5% 7/1/29 | | 1,750,000 | | 1,783,268 |
Phoenix Gen. Oblig. Series 2002 B, 5.375% 7/1/20 | | 1,060,000 | | 1,116,371 |
Phoenix Street & Hwy. User Rev. Series 1992, 6.25% 7/1/11 (Nat'l. Pub. Fin. Guarantee Corp. Insured) | | 10,000 | | 10,040 |
Pima County Ctfs. of Prtn. (Justice Bldg. Proj.): | | | | |
Series 2007 A, 5% 7/1/19 (AMBAC Insured) | | 735,000 | | 780,761 |
Series A, 5% 7/1/21 (AMBAC Insured) | | 935,000 | | 975,074 |
Municipal Bonds - continued |
| Principal Amount | | Value |
Arizona - continued |
Pima County Unified School District #1 Tucson (Proj. of 2004): | | | | |
Series 2007 C, 5% 7/1/23 (FGIC Insured) | | $ 1,000,000 | | $ 1,055,940 |
Series 2008 D, 5% 7/1/25 (FSA Insured) | | 1,000,000 | | 1,036,540 |
Pinal County Indl. Dev. Auth. Correctional Facilities Contract Rev. (Florence West Prison Proj.): | | | | |
Series 2006 A, 5.25% 10/1/12 (ACA Finl. Guaranty Corp. Insured) | | 1,000,000 | | 1,014,310 |
Series 2007 A, 5.25% 10/1/13 (ACA Finl. Guaranty Corp. Insured) | | 1,335,000 | | 1,357,762 |
Pinal County Unified School District #1 Florence (2006 School Impt. Proj.) Series 2007 A: | | | | |
5% 7/1/19 (FGIC Insured) | | 1,000,000 | | 1,077,960 |
5% 7/1/20 (FGIC Insured) | | 1,000,000 | | 1,066,880 |
Pinal County Unified School District #44 J.O. Combs (2006 School Impt. Proj.) Series B, 5% 7/1/21 (Nat'l. Pub. Fin. Guarantee Corp. Insured) | | 860,000 | | 910,568 |
Queen Creek Excise Tax & State Shared Rev. 5% 8/1/22 (Nat'l. Pub. Fin. Guarantee Corp. Insured) | | 1,125,000 | | 1,159,144 |
Salt River Proj. Agricultural Impt. & Pwr. District Elec. Sys. Rev.: | | | | |
Series 2002 B, 5% 1/1/31 | | 1,995,000 | | 2,009,763 |
Series 2005 A, 5% 1/1/35 | | 3,000,000 | | 3,007,440 |
Series 2006 A, 5% 1/1/37 | | 5,690,000 | | 5,694,435 |
Series 2008 A: | | | | |
5% 1/1/24 | | 1,075,000 | | 1,143,241 |
5% 1/1/38 | | 3,400,000 | | 3,379,872 |
Series 2010 B, 5% 12/1/26 | | 2,000,000 | | 2,135,000 |
Salt Verde Finl. Corp. Sr. Gas Rev. Series 2007, 5.5% 12/1/29 | | 3,000,000 | | 2,822,370 |
Scottsdale Indl. Dev. Auth. Hosp. Rev. (Scottsdale Healthcare Proj.): | | | | |
Series 2006 C, 5% 9/1/35 (Assured Guaranty Corp. Insured) | | 1,000,000 | | 920,940 |
Series 2008 A: | | | | |
5% 9/1/16 | | 1,000,000 | | 1,074,390 |
5% 9/1/23 | | 355,000 | | 350,137 |
Scottsdale Muni. Property Corp. Excise Tax Rev. (Wtr. and Swr. Impt. Proj.) Series 2008 A, 5% 7/1/28 | | 1,050,000 | | 1,100,432 |
Sedona Excise Tax Rev.: | | | | |
Series 2004, 5% 7/1/15 (Nat'l. Pub. Fin. Guarantee Corp. Insured) | | 2,120,000 | | 2,261,998 |
Municipal Bonds - continued |
| Principal Amount | | Value |
Arizona - continued |
Sedona Excise Tax Rev.: - continued | | | | |
Series 2005, 5% 7/1/19 (Nat'l. Pub. Fin. Guarantee Corp. Insured) | | $ 1,000,000 | | $ 1,032,100 |
Tempe Gen. Oblig. Series 2006, 5% 7/1/20 | | 3,200,000 | | 3,531,072 |
Tempe Transit Excise Tax Rev. Series 2008, 4.75% 7/1/38 | | 85,000 | | 82,092 |
Tucson Ctfs. of Prtn.: | | | | |
Series 2006 A, 5% 7/1/18 (Nat'l. Pub. Fin. Guarantee Corp. Insured) | | 3,050,000 | | 3,268,929 |
Series 2007, 5% 7/1/18 (Nat'l. Pub. Fin. Guarantee Corp. Insured) | | 1,000,000 | | 1,077,960 |
Univ. Med. Ctr. Corp. Hosp. Rev.: | | | | |
Series 2004: | | | | |
5.25% 7/1/11 | | 210,000 | | 211,709 |
5.25% 7/1/15 | | 1,000,000 | | 1,034,430 |
Series 2005, 5% 7/1/16 | | 1,515,000 | | 1,556,693 |
Univ. of Arizona Univ. Revs.: | | | | |
(Univ. of Arizona Projs.): | | | | |
Series 2003 B, 5% 6/1/31 (AMBAC Insured) | | 300,000 | | 299,220 |
Series 2005 A, 5% 6/1/24 (AMBAC Insured) | | 1,040,000 | | 1,067,092 |
Series 2005 C, 5% 6/1/14 (AMBAC Insured) | | 360,000 | | 392,566 |
Series 2008 A, 5% 6/1/22 | | 1,315,000 | | 1,404,591 |
Series 2009 A, 5% 6/1/39 | | 1,000,000 | | 935,430 |
Yavapai County Indl. Dev. Auth. Solid Waste Disp. Rev. Bonds (Waste Mgmt., Inc. Proj.) Series 2002, 3.5%, tender 6/3/13 (b)(c) | | 1,000,000 | | 996,970 |
| | 136,871,887 |
Guam - 0.3% |
Guam Ed. Fing. Foundation Ctfs. of Prtn. Series A, 5% 10/1/12 | | 500,000 | | 516,225 |
Puerto Rico - 4.1% |
Puerto Rico Commonwealth Hwy. & Trans. Auth. Trans. Rev.: | | | | |
Series 1998, 5.75% 7/1/22 (CIFG North America Insured) | | 700,000 | | 703,108 |
Series 2003, 5.75% 7/1/19 (FGIC Insured) | | 700,000 | | 712,271 |
Puerto Rico Commonwealth Pub. Impt. Gen. Oblig.: | | | | |
Series 2002 A, 5.5% 7/1/18 | | 700,000 | | 736,988 |
Series 2003 A, 5.25% 7/1/14 | | 275,000 | | 287,158 |
Puerto Rico Govt. Dev. Bank: | | | | |
Series 2006 B, 5% 12/1/12 | | 1,000,000 | | 1,047,980 |
Series 2006 C, 5.25% 1/1/15 (c) | | 500,000 | | 502,370 |
Municipal Bonds - continued |
| Principal Amount | | Value |
Puerto Rico - continued |
Puerto Rico Pub. Bldg. Auth. Rev.: | | | | |
Bonds Series M2, 5.75%, tender 7/1/17 (b) | | $ 200,000 | | $ 209,582 |
Series G, 5.25% 7/1/13 | | 315,000 | | 326,274 |
Puerto Rico Sales Tax Fing. Corp. Sales Tax Rev.: | | | | |
Series 2007 A, 0% 8/1/41 (FGIC Insured) | | 3,200,000 | | 409,024 |
Series 2009 A, 6% 8/1/42 | | 1,300,000 | | 1,301,612 |
| | 6,236,367 |
Virgin Islands - 0.5% |
Virgin Islands Pub. Fin. Auth. Series 2009 B, 5% 10/1/25 | | 300,000 | | 295,413 |
Virgin Islands Pub. Fin. Auth. Refinery Facilities Rev. Series 2007, 4.7% 7/1/22 (c) | | 500,000 | | 411,025 |
| | 706,438 |
TOTAL INVESTMENT PORTFOLIO - 95.8% (Cost $146,262,426) | | 144,330,917 |
NET OTHER ASSETS (LIABILITIES) - 4.2% | | 6,294,419 |
NET ASSETS - 100% | $ 150,625,336 |
Legend |
(a) Security initially issued in zero coupon form which converts to coupon form at a specified rate and date. The rate shown is the rate at period end. |
(b) Coupon rates for floating and adjustable rate securities reflect the rates in effect at period end. |
(c) Private activity obligations whose interest is subject to the federal alternative minimum tax for individuals. |
Other Information |
All investments are categorized as Level 2 under the Fair Value Hierarchy. The inputs or methodology used for valuing securities may not be an indication of the risk associated with investing in those securities. For more information on valuation inputs, please refer to the Security Valuation section in the accompanying Notes to Financial Statements. |
The distribution of municipal securities by revenue source, as a percentage of total net assets, is as follows (Unaudited): |
General Obligations | 21.6% |
Special Tax | 16.9% |
Electric Utilities | 14.8% |
Water & Sewer | 14.6% |
Health Care | 11.0% |
Education | 9.9% |
Others* (Individually Less Than 5%) | 11.2% |
| 100.0% |
*Includes net other assets |
Income Tax Information |
At August 31, 2010, the Fund had a capital loss carryforward of approximately $276,075 all of which will expire in fiscal 2017. Capital loss carryforwards are only available to offset future capital gains of the Fund to the extent provided by regulations and may be limited. |
See accompanying notes which are an integral part of the financial statements.
Semiannual Report
Fidelity Arizona Municipal Income Fund
Statement of Assets and Liabilities
| February 28, 2011 (Unaudited) |
| | |
Assets | | |
Investment in securities, at value -
See accompanying schedule: Unaffiliated issuers (cost $146,262,426) | | $ 144,330,917 |
Cash | | 4,642,745 |
Receivable for fund shares sold | | 485,743 |
Interest receivable | | 1,567,928 |
Other receivables | | 249 |
Total assets | | 151,027,582 |
| | |
Liabilities | | |
Payable for fund shares redeemed | $ 154,618 | |
Distributions payable | 180,518 | |
Accrued management fee | 67,110 | |
Total liabilities | | 402,246 |
| | |
Net Assets | | $ 150,625,336 |
Net Assets consist of: | | |
Paid in capital | | $ 152,921,195 |
Undistributed net investment income | | 34,118 |
Accumulated undistributed net realized gain (loss) on investments | | (398,468) |
Net unrealized appreciation (depreciation) on investments | | (1,931,509) |
Net Assets, for 13,514,811 shares outstanding | | $ 150,625,336 |
Net Asset Value, offering price and redemption price per share ($150,625,336 ÷ 13,514,811 shares) | | $ 11.15 |
See accompanying notes which are an integral part of the financial statements.
Semiannual Report
Fidelity Arizona Municipal Income Fund
Financial Statements - continued
Statement of Operations
Six months ended February 28, 2011 (Unaudited) |
| | |
Investment Income | | |
Interest | | $ 3,587,810 |
| | |
Expenses | | |
Management fee | $ 466,817 | |
Independent trustees' compensation | 344 | |
Miscellaneous | 328 | |
Total expenses before reductions | 467,489 | |
Expense reductions | (1,737) | 465,752 |
Net investment income (loss) | | 3,122,058 |
Realized and Unrealized Gain (Loss) Net realized gain (loss) on: | | |
Investment securities: | | |
Unaffiliated issuers | | (122,393) |
Change in net unrealized appreciation (depreciation) on investment securities | | (9,737,122) |
Net gain (loss) | | (9,859,515) |
Net increase (decrease) in net assets resulting from operations | | $ (6,737,457) |
See accompanying notes which are an integral part of the financial statements.
Semiannual Report
Statement of Changes in Net Assets
| Six months ended February 28, 2011 (Unaudited) | Year ended
August 31,
2010 |
Increase (Decrease) in Net Assets | | |
Operations | | |
Net investment income (loss) | $ 3,122,058 | $ 6,231,043 |
Net realized gain (loss) | (122,393) | 261,192 |
Change in net unrealized appreciation (depreciation) | (9,737,122) | 9,261,589 |
Net increase (decrease) in net assets resulting
from operations | (6,737,457) | 15,753,824 |
Distributions to shareholders from net investment income | (3,119,436) | (6,226,317) |
Share transactions
Proceeds from sales of shares | 28,294,623 | 63,302,201 |
Reinvestment of distributions | 1,791,072 | 3,632,180 |
Cost of shares redeemed | (53,806,018) | (47,321,565) |
Net increase (decrease) in net assets resulting from share transactions | (23,720,323) | 19,612,816 |
Redemption fees | 1,983 | 7,644 |
Total increase (decrease) in net assets | (33,575,233) | 29,147,967 |
| | |
Net Assets | | |
Beginning of period | 184,200,569 | 155,052,602 |
End of period (including undistributed net investment income of $34,118 and undistributed net investment income of $31,496, respectively) | $ 150,625,336 | $ 184,200,569 |
Other Information Shares | | |
Sold | 2,499,537 | 5,576,691 |
Issued in reinvestment of distributions | 157,992 | 318,847 |
Redeemed | (4,811,322) | (4,168,259) |
Net increase (decrease) | (2,153,793) | 1,727,279 |
See accompanying notes which are an integral part of the financial statements.
Semiannual Report
Financial Highlights
| Six months ended February 28, 2011 | Years ended August 31, |
| (Unaudited) | 2010 | 2009 | 2008 | 2007 | 2006 |
Selected Per-Share Data | | | | | |
Net asset value, beginning of period | $ 11.76 | $ 11.12 | $ 11.04 | $ 11.13 | $ 11.39 | $ 11.59 |
Income from Investment
Operations | | | | | |
Net investment income (loss) D | .209 | .416 | .425 | .419 | .418 | .417 |
Net realized and unrealized gain (loss) | (.610) | .639 | .112 | (.054) | (.205) | (.149) |
Total from investment operations | (.401) | 1.055 | .537 | .365 | .213 | .268 |
Distributions from net investment income | (.209) | (.416) | (.425) | (.418) | (.418) | (.417) |
Distributions from net realized gain | - | - | (.033) | (.037) | (.055) | (.051) |
Total distributions | (.209) | (.416) | (.458) | (.455) | (.473) | (.468) |
Redemption fees added to paid in capital D | - F | .001 | .001 | - F | - F | - F |
Net asset value, end of period | $ 11.15 | $ 11.76 | $ 11.12 | $ 11.04 | $ 11.13 | $ 11.39 |
Total Return B, C | (3.43)% | 9.69% | 5.15% | 3.33% | 1.87% | 2.41% |
Ratios to Average Net Assets E | | | | | |
Expenses before reductions | .55% A | .55% | .55% | .55% | .55% | .55% |
Expenses net of fee waivers, if any | .55% A | .55% | .55% | .55% | .55% | .55% |
Expenses net of all reductions | .55% A | .55% | .55% | .52% | .48% | .50% |
Net investment income (loss) | 3.70% A | 3.66% | 3.97% | 3.76% | 3.70% | 3.69% |
Supplemental Data | | | | | | |
Net assets, end of period (000 omitted) | $ 150,625 | $ 184,201 | $ 155,053 | $ 143,432 | $ 129,125 | $ 107,024 |
Portfolio turnover rate | 5% A | 10% | 19% | 22% | 15% | 22% |
A Annualized
B Total returns for periods of less than one year are not annualized.
C Total returns would have been lower had certain expenses not been reduced during the periods shown.
D Calculated based on average shares outstanding during the period.
E Expense ratios reflect operating expenses of the Fund. Expenses before reductions do not reflect amounts reimbursed by the investment adviser or reductions from expense offset arrangements and do not represent the amount paid by the Fund during periods when reimbursements or reductions occur. Expenses net of fee waivers reflect expenses after reimbursement by the investment adviser but prior to reductions from expense offset arrangements. Expenses net of all reductions represent the net expenses paid by the Fund.
F Amount represents less than $.001 per share.
See accompanying notes which are an integral part of the financial statements.
Semiannual Report
Fidelity Arizona Municipal Money Market Fund
Investment Changes (Unaudited)
Weighted Average Maturity Diversification |
Days | % of fund's investments 2/28/11 | % of fund's investments 8/31/10 | % of fund's investments 2/28/10 |
0 - 30 | 83.3 | 93.9 | 90.5 |
31 - 90 | 3.0 | 1.0 | 0.0 |
91 - 180 | 10.8 | 0.9 | 8.9 |
181 - 397 | 2.9 | 4.2 | 0.6 |
Weighted Average Maturity |
| 2/28/11 | 8/31/10 | 2/28/10 |
Fidelity Arizona Municipal Money Market Fund | 29 Days | 20 Days | 18 Days |
All Tax Free Money Market Funds Average* | 28 Days | 30 Days | 27 Days |
This is a weighted average of all the maturities of the securities held in a fund. Weighted Average Maturity (WAM) can be used as a measure of sensitivity to interest rate changes and markets changes. Generally, the longer the maturity, the greater the sensitivity to such changes. WAM is based on the dollar-weighted average length of time until principal payments must be paid. Depending on the types of securities held in a fund, certain maturity shortening devices (e.g., demand features, interest rate resets, and call options) may be taken into account when calculating the WAM. |
Weighted Average Life |
| 2/28/11 | 8/31/10 | 2/28/10 |
Fidelity Arizona Municipal Money Market Fund | 29 Days | 20 Days | n/a** |
Weighted Average Life (WAL) is the weighted average of the life of the securities held in a fund or portfolio and can be used as a measure of sensitivity to changes in liquidity and/or credit risk. Generally, the higher the value, the greater the sensitivity. WAL is based on the dollar-weighted average length of time until principal payments must be paid, taking into account any call options exercised by the issuer and any permissible maturity shortening features other than interest rate resets. The difference between WAM and WAL is that WAM takes into account interest rate resets and WAL does not. WAL for money market funds is not the same as WAL of a mortgage- or asset-backed security. |
Asset Allocation (% of fund's net assets) |
As of February 28, 2011 | As of August 31, 2010 |
| Variable Rate
Demand Notes
(VRDNs) 75.6% | | | Variable Rate
Demand Notes
(VRDNs) 82.4% | |
| Commercial Paper (including CP Mode) 5.3% | | | Commercial Paper (including CP Mode) 4.5% | |
| Fidelity Municipal
Cash Central Fund 2.8% | | | Fidelity Municipal
Cash Central Fund 7.9% | |
| Other Investments 14.5% | | | Other Investments 5.2% | |
| Net Other Assets 1.8% | | | Net Other Assets† 0.0% | |

* Source: iMoneyNet, Inc.
** Information not available.
† Net Other Assets is not included in the pie chart.
Semiannual Report
Fidelity Arizona Municipal Money Market Fund
Investments February 28, 2011 (Unaudited)
Showing Percentage of Net Assets
Municipal Securities - 98.2% |
| Principal Amount | | Value |
Arizona - 91.2% |
Arizona Health Facilities Auth. Rev.: | | | |
Bonds (Banner Health Proj.) Series 2008 D, 5% 1/1/12 | $ 2,250,000 | | $ 2,323,375 |
(Banner Health Sys. Proj.): | | | |
Series 2008 B, 0.21%, LOC Bank of Nova Scotia New York Branch, VRDN (a) | 7,700,000 | | 7,700,000 |
Series 2008 C, 0.23%, LOC Bank of Nova Scotia New York Branch, VRDN (a) | 4,540,000 | | 4,540,000 |
Series 2008 E, 0.23%, LOC Bank of America NA, VRDN (a) | 1,600,000 | | 1,600,000 |
Series 2008 F, 0.28%, LOC JPMorgan Chase Bank, VRDN (a) | 1,485,000 | | 1,485,000 |
(Catholic Healthcare West Proj.): | | | |
Series 2008 B, 0.27%, LOC Bank of America NA, VRDN (a) | 13,950,000 | | 13,950,000 |
Series 2009 F, 0.24%, LOC Citibank NA, VRDN (a) | 21,750,000 | | 21,750,000 |
(Southwest Behavioral Health Svcs., Inc. Proj.) Series 2004, 0.28%, LOC JPMorgan Chase Bank, VRDN (a) | 1,770,000 | | 1,770,000 |
Arizona Hsg. Fin. Auth. Multi-family Hsg. Rev. (Santa Carolina Apts. Proj.) Series 2005, 0.31%, LOC Fannie Mae, VRDN (a)(d) | 3,645,000 | | 3,645,000 |
Arizona Trans. Board Excise Tax Rev. Bonds (Maricopa County Reg'l. Area Road Fund Proj.): | | | |
Series 2007, 5% 7/1/11 | 3,000,000 | | 3,046,134 |
Series 2010, 1.5% 7/1/11 | 3,400,000 | | 3,413,114 |
Arizona Trans. Board Hwy. Rev.: | | | |
Bonds Series 2004 A, 5% 7/1/11 | 4,000,000 | | 4,061,426 |
Participating VRDN Series PT 4605, 0.25% (Liquidity Facility Deutsche Postbank AG) (a)(f) | 4,000,000 | | 4,000,000 |
Casa Grande Indl. Dev. Auth. Indl. Dev. Rev. (Price Companies, Inc. Proj.) Series A, 0.49%, LOC Bank of America NA, VRDN (a)(d) | 1,630,000 | | 1,630,000 |
Chandler Gen. Oblig. Participating VRDN Series GS 07 49TP, 0.26% (Liquidity Facility Wells Fargo & Co.) (a)(f) | 4,700,000 | | 4,700,000 |
Coconino County Poll. Cont. Corp. Rev.: | | | |
(Arizona Pub. Svc. Co. Navajo Proj.) Series 2009 B, 0.23%, LOC JPMorgan Chase Bank, VRDN (a)(d) | 11,700,000 | | 11,700,000 |
(Tucson Elec. Pwr. Co. Navajo Proj.) Series 2010 A, 0.32%, LOC JPMorgan Chase Bank, VRDN (a)(d) | 3,500,000 | | 3,500,000 |
Maricopa County Indl. Dev. Auth. Multi-family Hsg. Rev.: | | | |
(Glenn Oaks Apts. Proj.) Series 2001, 0.31%, LOC Fannie Mae, VRDN (a)(d) | 3,299,675 | | 3,299,675 |
(Ranchwood Apts. Proj.) Series 2001 A, 0.29%, LOC Fannie Mae, VRDN (a)(d) | 5,000,000 | | 5,000,000 |
Municipal Securities - continued |
| Principal Amount | | Value |
Arizona - continued |
Maricopa County Indl. Dev. Auth. Multi-family Hsg. Rev.: - continued | | | |
(San Angelin Apts. Proj.) Series 2004, 0.27%, LOC Fannie Mae, VRDN (a)(d) | $ 3,100,000 | | $ 3,100,000 |
(San Lucas Apts. Proj.) Series 2003, 0.27%, LOC Fannie Mae, VRDN (a)(d) | 1,700,000 | | 1,700,000 |
(San Martin Apts. Proj.) Series A1, 0.27%, LOC Fannie Mae, VRDN (a)(d) | 7,000,000 | | 7,000,000 |
(San Miguel Apts. Proj.) Series 2003, 0.27%, LOC Fannie Mae, VRDN (a)(d) | 1,300,000 | | 1,300,000 |
(San Remo Apts. Proj.) Series 2002, 0.27%, LOC Fannie Mae, VRDN (a)(d) | 10,800,000 | | 10,800,000 |
(Village at Sun Valley Apts. Proj.) Series 2008, 0.31%, LOC Freddie Mac, VRDN (a)(d) | 3,500,000 | | 3,500,000 |
(Village Square Apts. Proj.) Series 2004, 0.31%, LOC Fannie Mae, VRDN (a)(d) | 1,000,000 | | 1,000,000 |
Maricopa County Indl. Dev. Auth. Rev. (Clayton Homes, Inc. Proj.) Series 1998, 0.31%, LOC U.S. Bank NA, Minnesota, VRDN (a)(d) | 1,000,000 | | 1,000,000 |
Maricopa County Unified School District #48 Scottsdale Bonds Series 2010, 2.5% 7/1/11 | 3,600,000 | | 3,623,960 |
Mohave County Beneficial Interest Ctfs. Bonds (Mohave Jail Facility Proj.) Series 2008, 3.125% 4/1/11 | 3,110,000 | | 3,116,791 |
Northern Arizona Univ. Revs. Participating VRDN Series Solar 07 14, 0.25% (Liquidity Facility U.S. Bank NA, Minnesota) (a)(f) | 3,600,000 | | 3,600,000 |
Peoria Gen. Oblig. Bonds (Projects of 2000, 2005, & 2008) Series 2010, 3% 7/1/11 | 4,040,000 | | 4,072,541 |
Phoenix Civic Impt. Corp. Series 2009, 0.32% 4/7/11, LOC Bank of America NA, CP | 3,800,000 | | 3,800,000 |
Phoenix Civic Impt. Corp. Wastewtr. Sys. Rev. Bonds Series 2004, 5% 7/1/11 | 5,780,000 | | 5,869,541 |
Phoenix Civic Impt. Corp. Wtr. Sys. Rev.: | | | |
Bonds Series 2005, 5% 7/1/11 | 3,400,000 | | 3,452,617 |
Participating VRDN: | | | |
Series Putters 3458, 0.26% (Liquidity Facility JPMorgan Chase Bank) (a)(f) | 6,000,000 | | 6,000,000 |
Series ROC II R 12311, 0.26% (Liquidity Facility Citibank NA) (a)(f) | 3,500,000 | | 3,500,000 |
Phoenix Gen. Oblig. Participating VRDN Series BBT 2012, 0.25% (Liquidity Facility Branch Banking & Trust Co.) (a)(f) | 7,765,000 | | 7,765,000 |
Phoenix Indl. Dev. Auth. Cultural Facilities Rev. (Phoenix Art Museum Proj.) Series 2006, 0.35%, LOC Wells Fargo Bank NA, VRDN (a) | 200,000 | | 200,000 |
Municipal Securities - continued |
| Principal Amount | | Value |
Arizona - continued |
Phoenix Indl. Dev. Auth. Multi-family Hsg. Rev.: | | | |
(Del Mar Terrance Apts. Proj.) Series 1999 A, 0.28%, LOC Freddie Mac, VRDN (a) | $ 700,000 | | $ 700,000 |
(Paradise Lakes Apt. Proj.): | | | |
Series 2007 A, 0.24%, LOC Wells Fargo Bank NA, VRDN (a) | 3,150,000 | | 3,150,000 |
Series 2007 B, 0.25%, LOC Wells Fargo Bank NA, VRDN (a)(d) | 20,800,000 | | 20,800,000 |
(Westward Ho Apts. Proj.) Series 2003 A, 0.3%, LOC Bank of America NA, VRDN (a)(d) | 1,300,000 | | 1,300,000 |
Phoenix Indl. Dev. Auth. Rev.: | | | |
(Desert Botanical Garden Proj.) Series 2000, 0.28%, LOC JPMorgan Chase Bank, VRDN (a) | 600,000 | | 600,000 |
(Independent Newspaper, Inc. Proj.) Series 2000, 0.47%, LOC Wells Fargo Bank NA, VRDN (a)(d) | 805,000 | | 805,000 |
(Phoenix Expansion Proj.) Series 2002, 0.68%, LOC JPMorgan Chase Bank, VRDN (a)(d) | 2,035,000 | | 2,035,000 |
(Swift Aviation Svcs., Inc. Proj.) Series 2002, 0.26%, LOC U.S. Bank NA, Minnesota, VRDN (a)(d) | 6,125,000 | | 6,125,000 |
Pima County Indl. Dev. Auth. Indl. Rev. (Tucson Elec. Pwr. Co. Proj.) Series 1982 A, 0.28%, LOC Wells Fargo Bank NA, VRDN (a) | 100,000 | | 100,000 |
Pima County Indl. Dev. Auth. Multi-family Hsg. Rev.: | | | |
(River Point Proj.) Series 2001, 0.29%, LOC Fannie Mae, VRDN (a)(d) | 6,000,000 | | 6,000,000 |
Series A, 0.29%, LOC Fannie Mae, VRDN (a)(d) | 3,500,000 | | 3,500,000 |
Pima County Indl. Dev. Auth. Rev. (Broadway Proper Congregate Proj.) Series 2000 A, 0.26%, LOC State Street Bank & Trust Co., Boston, VRDN (a) | 2,000,000 | | 2,000,000 |
Salt River Proj. Agricultural Impt. & Pwr. District Elec. Sys. Rev.: | | | |
Bonds 5.125% 1/1/27 (Pre-Refunded to 1/1/12 @ 101) (e) | 7,500,000 | | 7,871,072 |
Participating VRDN: | | | |
Series EGL 06 14 Class A, 0.26% (Liquidity Facility Citibank NA) (a)(f) | 2,400,000 | | 2,400,000 |
Series Putters 3708Z, 0.26% (Liquidity Facility JPMorgan Chase Bank) (a)(f) | 4,605,000 | | 4,605,000 |
Series ROC II R 11712, 0.26% (Liquidity Facility Citibank NA) (a)(f) | 3,635,000 | | 3,635,000 |
Series WF 09 40C, 0.26% (Liquidity Facility Wells Fargo & Co.) (a)(f) | 3,300,000 | | 3,300,000 |
Series C: | | | |
0.3% 3/8/11, CP | 3,500,000 | | 3,500,000 |
Municipal Securities - continued |
| Principal Amount | | Value |
Arizona - continued |
Salt River Proj. Agricultural Impt. & Pwr. District Elec. Sys. Rev.: - continued | | | |
Series C: | | | |
0.32% 3/16/11, CP | $ 5,000,000 | | $ 5,000,000 |
0.32% 4/21/11, CP | 3,500,000 | | 3,500,000 |
Scottsdale Gen. Oblig. Participating VRDN Series BBT 08 20, 0.25% (Liquidity Facility Branch Banking & Trust Co.) (a)(f) | 11,150,000 | | 11,150,000 |
Show Low Indl. Dev. Auth. Solid Waste Disp. Rev. (Snowflake White Mountain Pwr. LLC Proj.) Series 2006, 0.38%, LOC JPMorgan Chase Bank, VRDN (a)(d) | 4,000,000 | | 4,000,000 |
Tempe Gen. Oblig. Bonds Series 2010 C, 1.25% 7/1/11 | 3,400,000 | | 3,410,486 |
Tempe Indl. Dev. Auth. Rev. (ASUF Brickyard Proj.) Series 2004 A, 0.32%, LOC Bank of America NA, VRDN (a) | 7,250,000 | | 7,250,000 |
Tempe Transit Excise Tax Rev. Series 2006, 0.25% (Liquidity Facility Royal Bank of Canada), VRDN (a) | 25,060,000 | | 25,060,001 |
Tolleson Muni. Fin. Corp. Rev. Bonds (American Wtr. Corp. Proj.) 0.92% tender 3/2/11, CP mode | 1,600,000 | | 1,600,000 |
Tucson Street & Hwy. User Rev. Bonds Series 1994 B, 7.5% 7/1/11 | 515,000 | | 526,789 |
Tucson Wtr. Rev. Bonds Series 2001 A, 5% 7/1/11 | 1,095,000 | | 1,111,799 |
Univ. of Arizona Univ. Revs. Bonds: | | | |
Series 1992 A, 6% 6/1/11 | 1,255,000 | | 1,272,295 |
Series 2004 A, 5.25% 6/1/11 | 3,225,000 | | 3,262,616 |
Yuma Indl. Dev. Auth. Hosp. Rev. (Yuma Reg'l. Med. Ctr. Proj.) Series 2008, 0.29%, LOC JPMorgan Chase Bank, VRDN (a) | 3,500,000 | | 3,500,000 |
| | 320,584,232 |
Kentucky - 0.1% |
Trimble County Poll. Cont. Rev. Bonds 0.85% tender 3/30/11, CP mode (d) | 500,000 | | 500,000 |
Massachusetts - 0.3% |
Massachusetts Indl. Fin. Agcy. Poll. Cont. Rev. Bonds (New England Pwr. Co. Proj.) Series 1992, 0.8% tender 3/18/11, CP mode | 1,100,000 | | 1,100,000 |
North Carolina - 1.4% |
New Hanover County Hosp. Rev. (New Hanover Reg'l. Med. Ctr. Proj.) Series 2008 A, 0.28%, LOC RBC Centura Bank, Rocky Mount, VRDN (a) | 4,800,000 | | 4,800,000 |
Ohio - 0.3% |
Ohio Higher Edl. Facility Commission Rev. (Univ. Hosp. Health Sys. Proj.) Series 2008 B, 0.36%, LOC RBS Citizens NA, VRDN (a) | 1,000,000 | | 1,000,000 |
Municipal Securities - continued |
| Principal Amount | | Value |
Pennsylvania - 0.4% |
Chester County Health & Ed. Auth. Rev. (Jenner's Pond Proj.) Series 2006, 0.35%, LOC Citizens Bank of Pennsylvania, VRDN (a) | $ 1,455,000 | | $ 1,455,000 |
Puerto Rico - 1.4% |
Puerto Rico Commonwealth Hwy. & Trans. Auth. Trans. Rev. Series 1998 A, 0.23%, LOC Bank of Nova Scotia New York Branch, VRDN (a) | 4,800,000 | | 4,800,000 |
Texas - 0.3% |
Greater East Texas Higher Ed. Auth. Student Ln. Rev. Series 1995 B, 0.26%, LOC State Street Bank & Trust Co., Boston, VRDN (a)(d) | 1,000,000 | | 1,000,000 |
| Shares | | |
Other - 2.8% |
Fidelity Municipal Cash Central Fund, 0.25% (b)(c) | 9,685,000 | | 9,685,000 |
TOTAL INVESTMENT PORTFOLIO - 98.2% (Cost $344,924,232) | 344,924,232 |
NET OTHER ASSETS (LIABILITIES) - 1.8% | | 6,386,596 |
NET ASSETS - 100% | $ 351,310,828 |
Security Type Abbreviations |
CP - COMMERCIAL PAPER |
VRDN - VARIABLE RATE DEMAND NOTE
(A debt instrument that is
payable upon demand, either
daily, weekly or monthly) |
Legend |
(a) Coupon rates for floating and adjustable rate securities reflect the rates in effect at period end. |
(b) Information in this report regarding holdings by state and security types does not reflect the holdings of the Fidelity Municipal Cash Central Fund. |
(c) Affiliated fund that is available only to investment companies and other accounts managed by Fidelity Investments. The rate quoted is the annualized seven-day yield of the fund at period end. A complete unaudited listing of the fund's holdings as of its most recent quarter end is available upon request. In addition, each Fidelity Central Fund's financial statements are available on the SEC's website or upon request. |
(d) Private activity obligations whose interest is subject to the federal alternative minimum tax for individuals. |
(e) Security collateralized by an amount sufficient to pay interest and principal. |
(f) Provides evidence of ownership in one or more underlying municipal bonds. |
Affiliated Central Funds |
Information regarding fiscal year to date income earned by the Fund from investments in Fidelity Central Funds is as follows: |
Fund | Income earned |
Fidelity Municipal Cash Central Fund | $ 34,549 |
Other Information |
The date shown for securities represents the date when principal payments must be paid, taking into account any call options exercised by the issuer and any permissible maturity shortening features other than interest rate resets. |
All investments are categorized as Level 2 under the Fair Value Hierarchy. The inputs or methodology used for valuing securities may not be an indication of the risk associated with investing in those securities. For more information on valuation inputs, please refer to the Security Valuation section in the accompanying Notes to Financial Statements. |
Income Tax Information |
At August 31, 2010, the Fund had a capital loss carryforward of approximately $5 all of which will expire in fiscal 2018. Capital loss carryforwards are only available to offset future capital gains of the Fund to the extent provided by regulations and may be limited. |
See accompanying notes which are an integral part of the financial statements.
Semiannual Report
Fidelity Arizona Municipal Money Market Fund
Statement of Assets and Liabilities
| February 28, 2011 (Unaudited) |
| | |
Assets | | |
Investment in securities, at value -
See accompanying schedule: Unaffiliated issuers (cost $335,239,232) | $ 335,239,232 | |
Fidelity Central Funds (cost $9,685,000) | 9,685,000 | |
Total Investments (cost $344,924,232) | | $ 344,924,232 |
Cash | | 304,331 |
Receivable for investments sold | | 3,501,579 |
Receivable for fund shares sold | | 6,315,534 |
Interest receivable | | 456,511 |
Distributions receivable from Fidelity Central Funds | | 3,338 |
Other receivables | | 552 |
Total assets | | 355,506,077 |
| | |
Liabilities | | |
Payable for fund shares redeemed | $ 4,113,337 | |
Distributions payable | 37 | |
Accrued management fee | 81,875 | |
Total liabilities | | 4,195,249 |
| | |
Net Assets | | $ 351,310,828 |
Net Assets consist of: | | |
Paid in capital | | $ 351,310,048 |
Distributions in excess of net investment income | | (28) |
Accumulated undistributed net realized gain (loss) on investments | | 808 |
Net Assets, for 351,118,826 shares outstanding | | $ 351,310,828 |
Net Asset Value, offering price and redemption price per share ($351,310,828 ÷ 351,118,826 shares) | | $ 1.00 |
See accompanying notes which are an integral part of the financial statements.
Semiannual Report
Statement of Operations
Six months ended February 28, 2011 (Unaudited) |
| | |
Investment Income | | |
Interest | | $ 510,237 |
Income from Fidelity Central Funds | | 34,549 |
Total income | | 544,786 |
| | |
Expenses | | |
Management fee | $ 873,095 | |
Independent trustees' compensation | 680 | |
Total expenses before reductions | 873,775 | |
Expense reductions | (346,277) | 527,498 |
Net investment income (loss) | | 17,288 |
Realized and Unrealized Gain (Loss) Net realized gain (loss) on: | | |
Investment securities: | | |
Unaffiliated issuers | | (19) |
Net increase in net assets resulting from operations | | $ 17,269 |
See accompanying notes which are an integral part of the financial statements.
Semiannual Report
Fidelity Arizona Municipal Money Market Fund
Financial Statements - continued
Statement of Changes in Net Assets
| Six months ended February 28, 2011 (Unaudited) | Year ended
August 31,
2010 |
Increase (Decrease) in Net Assets | | |
Operations | | |
Net investment income (loss) | $ 17,288 | $ 36,196 |
Net realized gain (loss) | (19) | (65) |
Net increase in net assets resulting
from operations | 17,269 | 36,131 |
Distributions to shareholders from net investment income | (17,316) | (36,176) |
Share transactions at net asset value of $1.00 per share
Proceeds from sales of shares | 577,069,011 | 1,139,546,855 |
Reinvestment of distributions | 17,147 | 35,756 |
Cost of shares redeemed | (571,137,080) | (1,167,427,147) |
Net increase (decrease) in net assets and shares resulting from share transactions | 5,949,078 | (27,844,536) |
Total increase (decrease) in net assets | 5,949,031 | (27,844,581) |
| | |
Net Assets | | |
Beginning of period | 345,361,797 | 373,206,378 |
End of period (including distributions in excess of net investment income of $28 and net investment income of $0, respectively) | $ 351,310,828 | $ 345,361,797 |
See accompanying notes which are an integral part of the financial statements.
Semiannual Report
Financial Highlights
| Six months ended February 28, 2011 | Years ended August 31, |
| (Unaudited) | 2010 | 2009 | 2008 | 2007 | 2006 |
Selected Per-Share Data | | | | | |
Net asset value, beginning of period | $ 1.00 | $ 1.00 | $ 1.00 | $ 1.00 | $ 1.00 | $ 1.00 |
Income from Investment
Operations | | | | | |
Net investment income (loss) | - G | - G | .006 | .022 | .032 | .027 |
Distributions from net investment income | (-) G | (-) G | (.006) | (.022) | (.032) | (.027) |
Net asset value, end of period | $ 1.00 | $ 1.00 | $ 1.00 | $ 1.00 | $ 1.00 | $ 1.00 |
Total Return B, C | .00% E | .01% | .64% | 2.25% | 3.26% | 2.78% |
Ratios to Average Net Assets D, F | | | | | |
Expenses before reductions | .50% A | .50% | .54% | .50% | .50% | .50% |
Expenses net of fee waivers, if any | .30% A | .33% | .53% | .50% | .50% | .50% |
Expenses net of all reductions | .30% A | .33% | .52% | .41% | .38% | .37% |
Net investment income (loss) | .01% A | .01% | .64% | 2.20% | 3.22% | 2.77% |
Supplemental Data | | | | | | |
Net assets, end of period (000 omitted) | $ 351,311 | $ 345,362 | $ 373,206 | $ 393,043 | $ 340,848 | $ 267,738 |
A Annualized
B Total returns for periods of less than one year are not annualized.
C Total returns would have been lower had certain expenses not been reduced during the periods shown.
D Fees and expenses of the underlying Fidelity Central Funds are not included in the Fund's expense ratio. The Fund indirectly bears its proportionate share of the expenses of any underlying Fidelity Central Funds.
E Amount represents less than .01%.
F Expense ratios reflect operating expenses of the Fund. Expenses before reductions do not reflect amounts reimbursed or waived or reductions from expense offset arrangements and do not represent the amount paid by the Fund during periods when reimbursements, waivers or reductions occur. Expenses net of fee waivers reflect expenses after reimbursement and waivers but prior to reductions from expense offset arrangements. Expenses net of all reductions represent the net expenses paid by the Fund.
G Amount represents less than $.001 per share.
See accompanying notes which are an integral part of the financial statements.
Semiannual Report
Notes to Financial Statements
For the period ended February 28, 2011 (Unaudited)
1. Organization.
Fidelity Arizona Municipal Income Fund (the Income Fund) is a fund of Fidelity Union Street Trust. Fidelity Arizona Municipal Money Market Fund (the Money Market Fund) is a fund of Fidelity Union Street Trust II. Each Trust is registered under the Investment Company Act of 1940, as amended (the 1940 Act), as an open-end management investment company. Fidelity Union Street Trust and Fidelity Union Street Trust II (the Trusts) are organized as a Massachusetts business trust and a Delaware statutory trust, respectively. The Income Fund is a non-diversified fund. Each Fund is authorized to issue an unlimited number of shares. Each Fund may be affected by economic and political developments in the state of Arizona.
2. Investments in Fidelity Central Funds.
The Funds may in Fidelity Central Funds, which are open-end investment companies available only to other investment companies and accounts managed by Fidelity Management & Research Company (FMR) and its affiliates. The Funds' Schedules of Investments list each of the Fidelity Central Funds held as of period end, if any, as an investment of each Fund, but does not include the underlying holdings of each Fidelity Central Fund. As an Investing Fund, the Funds indirectly bear their proportionate share of the expenses of the underlying Fidelity Central Funds.
The Money Market Central Funds seek preservation of capital and current income and are managed by Fidelity Investments Money Management, Inc. (FIMM), an affiliate of FMR.
A complete unaudited list of holdings for each Fidelity Central Fund is available upon request or at the Securities and Exchange Commission (the SEC) web site at www.sec.gov. In addition, the financial statements of the Fidelity Central Funds, are available on the SEC web site or upon request.
3. Significant Accounting Policies.
The financial statements have been prepared in conformity with accounting principles generally accepted in the United States of America (GAAP), which require management to make certain estimates and assumptions at the date of the financial statements. Actual results could differ from those estimates. Subsequent events, if any, through the date that the financial statements were issued have been evaluated in the preparation of the financial statements. The following summarizes the significant accounting policies of the Funds:
Semiannual Report
Notes to Financial Statements (Unaudited) - continued
3. Significant Accounting Policies - continued
Security Valuation. Investments are valued as of 4:00 p.m. Eastern time on the last calendar day of the period. The Income Fund uses independent pricing services approved by the Board of Trustees to value their investments. When current market prices or quotations are not readily available or reliable, valuations may be determined in good faith in accordance with procedures adopted by the Board of Trustees. Factors used in determining value may include market or security specific events, changes in interest rates and credit quality. The frequency with which these procedures are used cannot be predicted and they may be utilized to a significant extent. The value used for net asset value (NAV) calculation under these procedures may differ from published prices for the same securities.
Each Fund categorizes the inputs to valuation techniques used to value their investments into a disclosure hierarchy consisting of three levels as shown below.
Level 1 - quoted prices in active markets for identical investments
Level 2 - other significant observable inputs (including quoted prices for similar investments, interest rates, prepayment speeds, etc.)
Level 3 - unobservable inputs (including the Fund's own assumptions based on the best information available)
For the Income Fund, changes in valuation techniques may result in transfers in or out of an assigned level within the disclosure hierarchy. Valuation techniques used to value each Fund's investments by major category are as follows.
For the Income Fund, debt securities, including restricted securities, are valued based on evaluated prices received from independent pricing services or from dealers who make markets in such securities. For municipal securities, pricing services utilize matrix pricing which considers yield or price of bonds of comparable quality, coupon, maturity and type as well as dealer supplied prices and are generally categorized as Level 2 in the hierarchy.
When independent prices are unavailable or unreliable, debt securities may be valued utilizing pricing matrices which consider similar factors that would be used by independent pricing services. These are generally categorized as Level 2 in the hierarchy but may be Level 3 depending on the circumstances.
For the Money Market Fund, as permitted by compliance with certain conditions under Rule 2a-7 of the 1940 Act, securities are valued at amortized cost, which approximates fair value, and are categorized as Level 2 in the hierarchy.
Semiannual Report
3. Significant Accounting Policies - continued
Investment Transactions and Income. For financial reporting purposes, the Funds' investment holdings and NAV include trades executed through the end of the last business day of the period. The NAV per share for processing shareholder transactions is calculated as of the close of business of the New York Stock Exchange (NYSE), normally 4:00 p.m. Eastern time and includes trades executed through the end of the prior business day for the Income Fund and trades executed through the end of the current business day for the Money Market Fund. Gains and losses on securities sold are determined on the basis of identified cost. Interest income and distributions from the Fidelity Central Funds are accrued as earned. Interest income includes coupon interest and amortization of premium and accretion of discount on debt securities.
Expenses. Expenses directly attributable to a fund are charged to that fund. Expenses attributable to more than one fund are allocated among the respective funds on the basis of relative net assets or other appropriate methods. Expense estimates are accrued in the period to which they relate and adjustments are made when actual amounts are known.
Income Tax Information and Distributions to Shareholders. Each year each Fund intends to qualify as a regulated investment company, including distributing substantially all of its taxable income and realized gains under Subchapter M of the Internal Revenue Code and filing its U.S. federal tax return. As a result, no provision for income taxes is required. A fund's federal tax return is subject to examination by the Internal Revenue Service (IRS) for a period of three years.
Dividends are declared and recorded daily and paid monthly from net investment income. Distributions from realized gains, if any, are declared and recorded on the ex-dividend date. Income and capital gain distributions are determined in accordance with income tax regulations, which may differ from GAAP.
Capital accounts within the financial statements are adjusted for permanent book-tax differences. These adjustments have no impact on net assets or the results of operations. Temporary book-tax differences will reverse in a subsequent period.
Book-tax differences are primarily due to market discount, capital loss carryforwards and losses deferred due to excise tax regulations.
The Funds purchase municipal securities whose interest, in the opinion of the issuer, is free from federal income tax. There is no assurance that the IRS will agree with this opinion. In the event the IRS determines that the issuer does not comply with relevant tax requirements, interest payments from a security could become federally taxable, possibly retroactively to the date the security was issued.
Semiannual Report
Notes to Financial Statements (Unaudited) - continued
3. Significant Accounting Policies - continued
Income Tax Information and Distributions to Shareholders - continued
The federal tax cost of investment securities and unrealized appreciation (depreciation) as of period end were as follows for each Fund:
| Tax cost | Gross unrealized appreciation | Gross unrealized depreciation | Net unrealized appreciation
(depreciation) on securities and
other investments |
Fidelity Arizona Municipal Income Fund | $ 146,230,652 | $ 1,908,152 | $ (3,807,887) | $ (1,899,735) |
Fidelity Arizona Municipal Money Market Fund | 344,924,232 | - | - | - |
Short-Term Trading (Redemption) Fees. Shares held by investors in the Income Fund less than 30 days are subject to a redemption fee equal to ..50% of the net asset value of shares redeemed. All redemption fees, which reduce the proceeds of the shareholder redemption, are retained by the Fund and accounted for as an addition to paid in capital.
4. Purchases and Sales of Investments.
Purchases and sales of securities, other than short-term securities, for the Income Fund aggregated $4,371,680 and $29,353,213, respectively.
5. Fees and Other Transactions with Affiliates.
Management Fee. FMR and its affiliates provides the Funds with investment management related services for which the Funds pay a monthly management fee. FMR pays all other expenses, except the compensation of the independent Trustees and certain exceptions such as interest expense, including commitment fees. The management fee paid to FMR by the Funds is reduced by an amount equal to the fees and expenses paid by the Funds to the independent Trustees. Each Fund's management fee is equal to the following annual rate of average net assets:
Fidelity Arizona Municipal Income Fund | .55% |
Fidelity Arizona Municipal Money Market Fund | .50% |
6. Committed Line of Credit.
The Income Fund participates with other funds managed by FMR or an affiliate in a $3.75 billion credit facility (the "line of credit") to be utilized for temporary or emergency purposes to fund shareholder redemptions or for other short-term liquidity purposes. The participating funds have agreed to pay commitment fees on their pro-rata portion of
Semiannual Report
6. Committed Line of Credit - continued
the line of credit, which are reflected in Miscellaneous expenses on the Statement of Operations, and are as follows:
Fidelity Arizona Municipal Income Fund | $ 328 |
During the period, there were no borrowings on this line of credit.
7. Expense Reductions.
FMR or its affiliates voluntarily agreed to waive certain fees for the Money Market Fund in order to maintain a minimum annualized yield of .01%. Such arrangements may be discontinued by FMR at any time. For the period, the amount of the waiver was $345,479.
In addition, through arrangements with each applicable Fund's custodian, credits realized as a result of uninvested cash balances were used to reduce each applicable Fund's management fee. During the period, these credits reduced management fee by the following amounts:
Fidelity Arizona Municipal Income Fund | $ 1,737 |
Fidelity Arizona Municipal Money Market Fund | 798 |
8. Other.
The Funds' organizational documents provide former and current trustees and officers with a limited indemnification against liabilities arising in connection with the performance of their duties to the Funds. In the normal course of business, the Funds may also enter into contracts that provide general indemnifications. The Funds' maximum exposure under these arrangements is unknown as this would be dependent on future claims that may be made against the Funds. The risk of material loss from such claims is considered remote.
Semiannual Report
Board Approval of Investment Advisory Contracts and Management Fees
Fidelity Arizona Municipal Income Fund / Fidelity Arizona Municipal Money Market Fund
Each year, the Board of Trustees, including the Independent Trustees (together, the Board), votes on the renewal of the management contract and sub-advisory agreements (together, the Advisory Contracts) for each fund. The Board, assisted by the advice of fund counsel and Independent Trustees' counsel, requests and considers a broad range of information relevant to the renewal of the Advisory Contracts throughout the year.
The Board meets regularly and considers at each of its meetings factors that are relevant to its annual consideration of the renewal of each fund's Advisory Contracts, including the services and support provided to each fund and its shareholders. The Board has established three standing committees, each composed of Independent Trustees with varying backgrounds, to which the Board has assigned specific subject matter responsibilities in order to enhance effective decision-making by the Board. The Operations Committee, of which all of the Independent Trustees are members, meets regularly throughout the year and, among other matters, considers matters specifically related to the annual consideration of the renewal of each fund's Advisory Contracts. The Board, acting directly and through its Committees, requests and receives information concerning the annual consideration of the renewal of each fund's Advisory Contracts. The Board also meets as needed to consider matters specifically related to the Board's annual consideration of the renewal of Advisory Contracts. Members of the Board may also meet with trustees of other Fidelity funds through ad hoc joint committees to discuss certain matters relevant to the Fidelity funds.
At its September 2010 meeting, the Board of Trustees, including the Independent Trustees, unanimously determined to renew each fund's Advisory Contracts. In reaching its determination, the Board considered all factors it believed relevant, including (i) the nature, extent, and quality of the services to be provided to each fund and its shareholders (including the investment performance of each fund); (ii) the competitiveness of each fund's management fee and total expenses; (iii) the total costs of the services to be provided by and the profits to be realized by Fidelity from its relationship with each fund; (iv) the extent to which economies of scale would be realized as each fund grows; and (v) whether fee levels reflect these economies of scale, if any, for the benefit of fund shareholders.
In considering whether to renew the Advisory Contracts for each fund, the Board reached a determination, with the assistance of fund counsel and Independent Trustees' counsel and through the exercise of its business judgment, that the renewal of the Advisory Contracts is in the best interests of each fund and its shareholders and that the compensation to be received by Fidelity under the management contracts is fair and reasonable. The Board's decision to renew the Advisory Contracts was not based on any single factor, but rather was based on a comprehensive consideration of all the information provided to the Board at its meetings throughout the year. The Board, in reaching its determination to renew the Advisory Contracts, is aware that shareholders in each fund have a broad range of investment choices available to them, including a wide choice among mutual funds offered by Fidelity's competitors, and that each fund's shareholders, with the opportunity to review and weigh the disclosure provided by the fund in its prospectus and other public disclosures, have chosen to invest in that fund, managed by Fidelity.
Semiannual Report
Board Approval of Investment Advisory Contracts and
Management Fees - continued
Nature, Extent, and Quality of Services Provided. The Board considered the staffing within the investment adviser, FMR, and the sub-advisers (together, the Investment Advisers), including the backgrounds of the funds' investment personnel and the funds' investment objectives and disciplines. The Independent Trustees also had discussions with senior management of Fidelity's investment operations and investment groups. The Board considered the structure of the portfolio manager compensation program and whether this structure provides appropriate incentives to act in the best interest of each fund.
Resources Dedicated to Investment Management and Support Services. The Board reviewed the size, education, and experience of the Investment Advisers' investment staff, their use of technology, and the Investment Advisers' approach to recruiting, training, and retaining portfolio managers and other research, advisory, and management personnel. The Board noted that Fidelity's analysts have access to a variety of technological tools and market and securities data that enable them to perform both fundamental and quantitative analysis and to specialize in various disciplines. The Board considered Fidelity's extensive global research capabilities that enable the Investment Advisers to aggregate data from various sources in an effort to produce positive investment results. The Board also considered that Fidelity's portfolio managers and analysts have access to daily portfolio attribution that allows for monitoring of a fund's portfolio, as well as an electronic communication system that provides immediate real-time access to research concerning issuers and credit enhancers. In addition, the Board considered the trading resources that are an integral part of the fixed-income portfolio management investment process.
Shareholder and Administrative Services. The Board considered (i) the nature, extent, quality, and cost of advisory, administrative, and shareholder services performed by the Investment Advisers and their affiliates under the Advisory Contracts and under separate agreements covering transfer agency and pricing and bookkeeping services for each fund; (ii) the nature and extent of the investment adviser's supervision of third party service providers, principally custodians and subcustodians; and (iii) the resources devoted to, and the record of compliance with, each fund's compliance policies and procedures.
Semiannual Report
The Board noted that the growth of fund assets over time across the complex allows Fidelity to reinvest in the development of services designed to enhance the value or convenience of the Fidelity funds as investment vehicles. These services include 24-hour access to account information and market information through telephone representatives and over the Internet, and investor education materials and asset allocation tools.
Investment in a Large Fund Family. The Board considered the benefits to shareholders of investing in a Fidelity fund, including the benefits of investing in a fund that is part of a large family of funds offering a variety of investment disciplines and providing a large variety of mutual fund investor services. The Board noted that Fidelity had taken, or had made recommendations that resulted in the Fidelity funds taking, a number of actions over the previous year that benefited particular funds, including (i) dedicating additional resources to investment research and restructuring and broadening the focus of the investment research teams; (ii) bolstering the senior management team that oversees asset management; (iii) launching Class F of certain funds as a lower-fee class available to Freedom K and Freedom Index Funds; (iv) lowering the initial investment minimums and ongoing balance requirements for Real Estate High Income Fund; (v) eliminating subsequent purchase minimums for all funds and adding a waiver of the investment minimum requirement for new accounts opened with the proceeds of a systematic withdrawal plan; (vi) eliminating the withdrawal minimum and maximum limits for systematic withdrawals from Advisor funds; (vii) expanding sales load waivers on Class A shares for Destiny Planholders and expanding Institutional Class eligibility for Class O Destiny Planholders; and (viii) changing certain Class A and Class T sales charge structures to further align them with industry practices.
Investment Performance. The Board considered whether each fund has operated in accordance with its investment objective, as well as its record of compliance with its investment restrictions. It also reviewed each fund's absolute investment performance, as well as each fund's relative investment performance measured over multiple periods against (i) a broad-based securities market index (bond fund only, as money market funds are typically not compared against a market index), and (ii) a peer group of mutual funds. For each fund, the following charts considered by the Board show, over the one-, three-, and five-year periods ended December 31, 2009, the fund's cumulative total returns, the cumulative total returns of a broad-based securities market index ("benchmark") (bond fund only), and a range of cumulative total returns of a peer group of mutual funds identified by Lipper Inc. as having an investment objective similar to that of the fund. The box within each chart shows the 25th percentile return (bottom of box) and the 75th percentile return (top of box) of the peer group. Returns shown above the box are in the first quartile and returns shown below the box are in the fourth quartile. The percentage beaten number noted below each chart corresponds to the percentile box and represents the percentage of funds in the peer group whose performance was equal to or lower than that of the fund.
Semiannual Report
Board Approval of Investment Advisory Contracts and
Management Fees - continued
Fidelity Arizona Municipal Income Fund
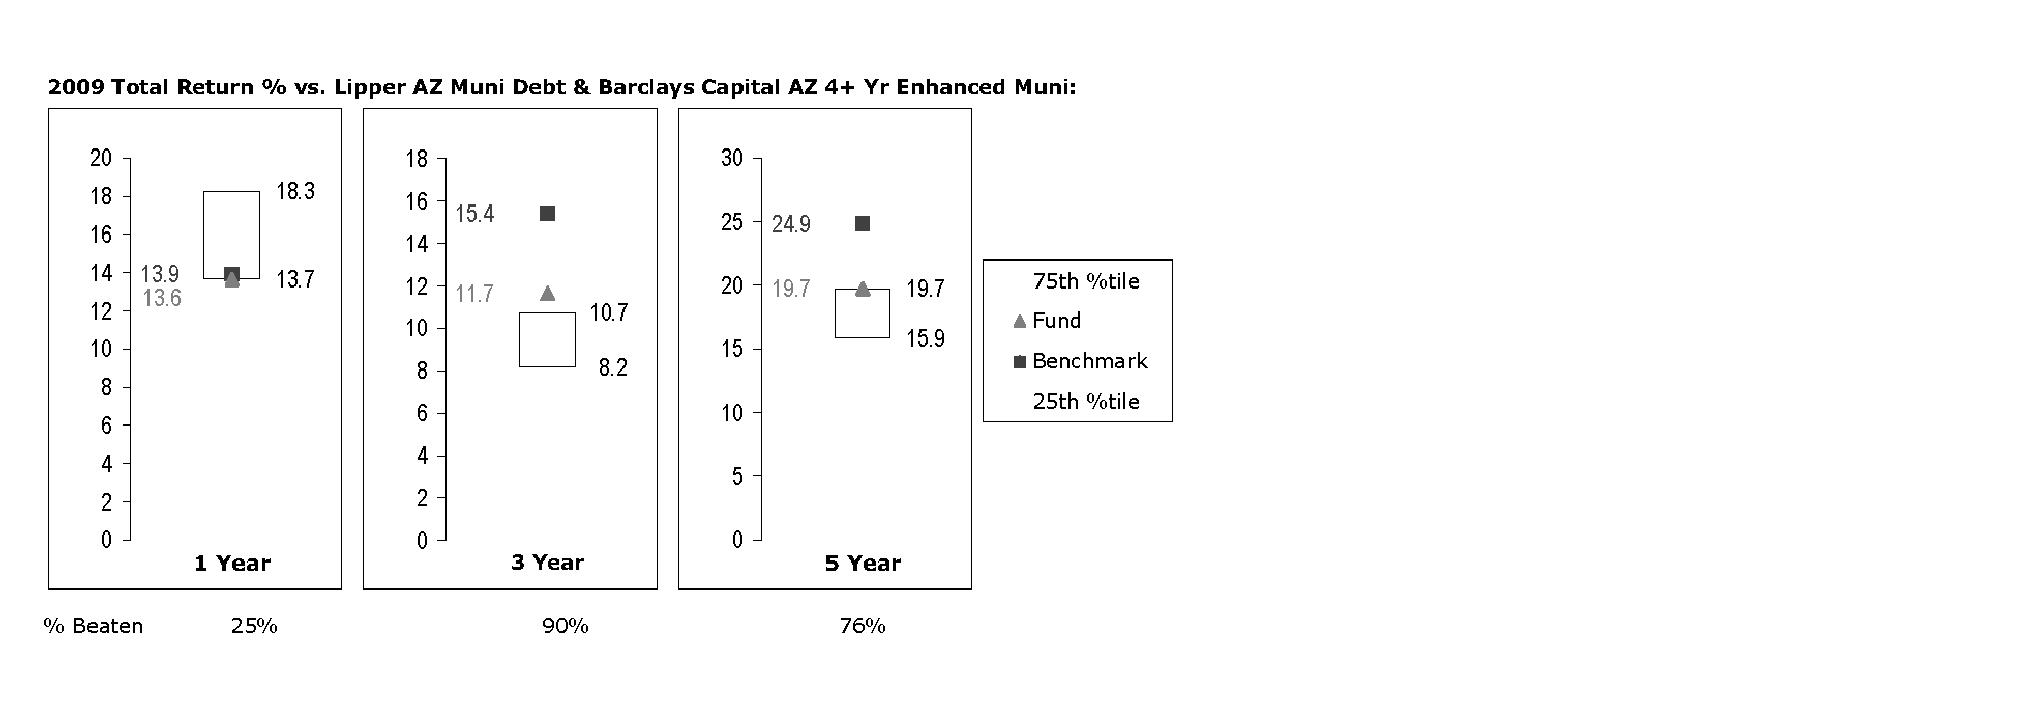
The Board reviewed the fund's relative investment performance against its peer group and noted that the performance of the fund was in the third quartile for the one-year period and the first quartile for the three- and five-year periods. The Board also noted that the investment performance of the fund was lower than its benchmark for all the periods shown. The Board discussed with FMR actions that have been taken by FMR to improve the fund's below-benchmark performance. The Board also reviewed the fund's performance since inception as well as performance in the current year.
Semiannual Report
Fidelity Arizona Municipal Money Market Fund
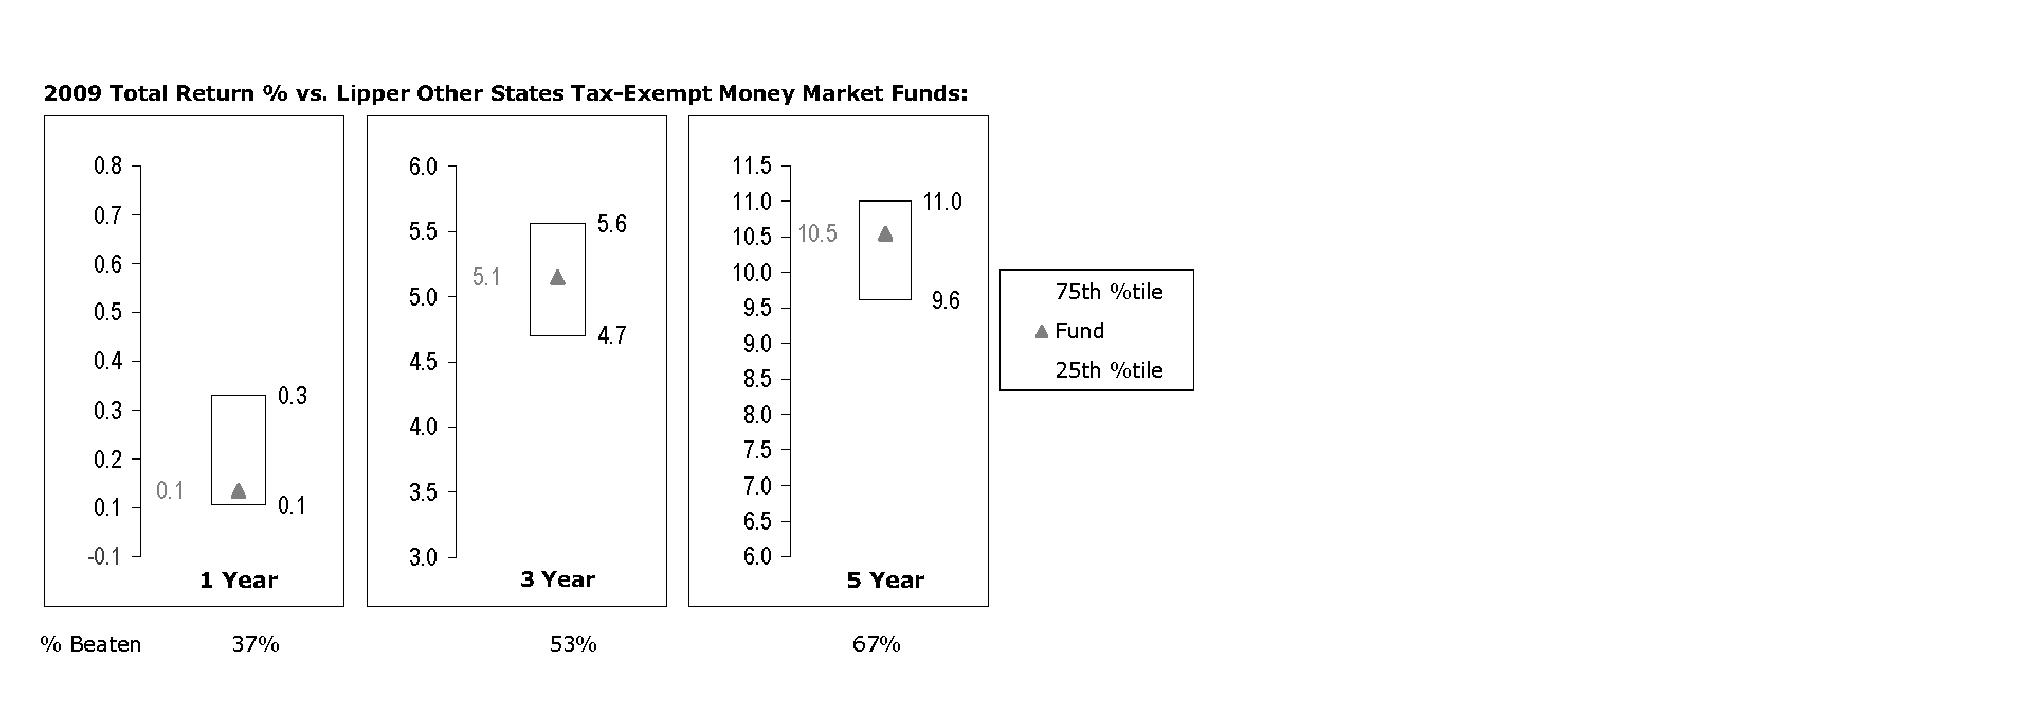
The Board reviewed the fund's relative investment performance against its peer group and noted that the performance of the fund was in the third quartile for the one-year period and the second quartile for the three- and five-year periods. The Board considered that FMR had taken steps to provide shareholders with stability of principal and to enhance safety and liquidity, which contributed to the fund's weakened performance relative to its peer group. The Board noted that FMR does not consider that Lipper peer group to be a particularly meaningful comparison for the fund, however, because the peer group combines tax-exempt money market funds from several different states. The Board also reviewed the fund's performance since inception as well as performance in the current year.
Based on its review, and giving particular weight to the nature and quality of the resources dedicated by the Investment Advisers to maintain and improve relative performance and factoring in the unprecedented market events in recent years, the Board concluded that the nature, extent, and quality of investment management and support services and of shareholder and administrative services provided to each fund will benefit each fund's shareholders, particularly in light of the Board's view that each fund's shareholders benefit from investing in a fund that is part of a large family of funds offering a variety of investment disciplines and services.
Competitiveness of Management Fee and Total Fund Expenses. The Board considered each fund's management fee and total expenses compared to "mapped groups" of competitive funds and classes. Fidelity creates "mapped groups" by combining similar Lipper investment objective categories that have comparable management fee characteristics. Combining Lipper investment objective categories aids the Board's management fee and total expense comparisons by broadening the competitive group used for comparison and by reducing the number of universes to which various Fidelity funds are compared.
Semiannual Report
Board Approval of Investment Advisory Contracts and
Management Fees - continued
Management Fee. The Board considered two proprietary management fee comparisons for the 12-month periods shown in the charts below. The group of Lipper funds used by the Board for management fee comparisons is referred to below as the "Total Mapped Group" and, for the reasons explained above, is broader than the Lipper peer group used by the Board for performance comparisons. The Total Mapped Group comparison focuses on a fund's standing relative to the total universe of comparable funds available to investors, in terms of gross management fees before expense reimbursements or caps. "TMG %" represents the percentage of funds in the Total Mapped Group that had management fees that were lower than a fund's. For example, a TMG % of 26% would mean that 74% of the funds in the Total Mapped Group had higher management fees than a fund. The "Asset-Size Peer Group" (ASPG) comparison focuses on a fund's standing relative to non-Fidelity funds similar in size to the fund within the Total Mapped Group. The ASPG represents at least 15% of the funds in the Total Mapped Group with comparable asset size and management fee characteristics, subject to a minimum of 50 funds (or all funds in the Total Mapped Group if fewer than 50). Additional information, such as the ASPG quartile in which a fund's management fee ranked, is also included in the charts and considered by the Board. For a more meaningful comparison of management fees, each fund is compared on the basis of a hypothetical "net management fee," which is derived by subtracting payments made by FMR for non-management expenses (including transfer agent fees, pricing and bookkeeping fees, and fees paid to non-affiliated custodians) from the fund's all-inclusive fee. In this regard, the Board realizes that net management fees can vary from year to year because of differences in non-management expenses.
Semiannual Report
Fidelity Arizona Municipal Income Fund
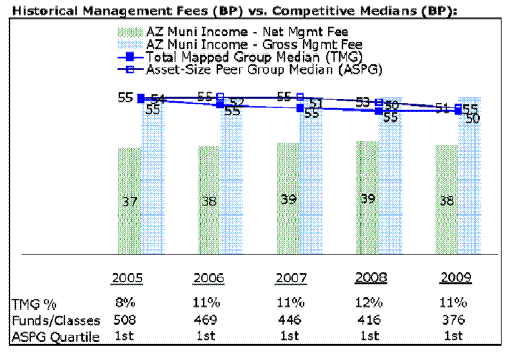
Fidelity Arizona Municipal Money Market Fund
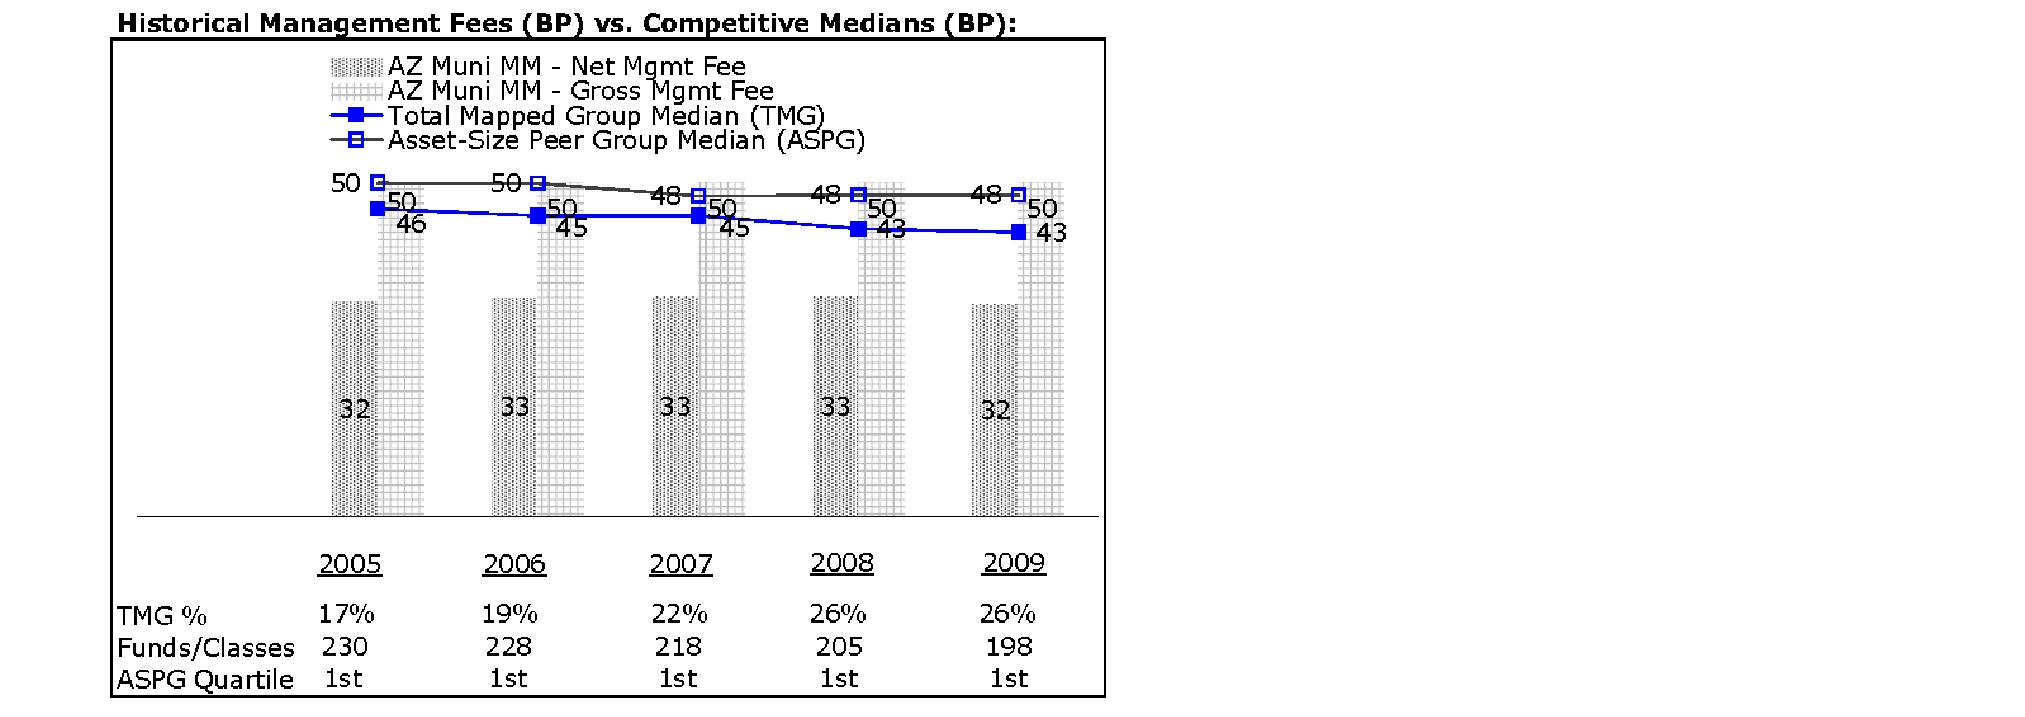
The Board noted that each fund's hypothetical net management fee ranked below the median of its Total Mapped Group and below the median of its ASPG for 2009.
Based on its review, the Board concluded that each fund's management fee is fair and reasonable in light of the services that the fund receives and the other factors considered.
Semiannual Report
Board Approval of Investment Advisory Contracts and
Management Fees - continued
Total Expenses. In its review of each fund's total expenses, the Board considered the fund's hypothetical net management fee as well as the fund's all-inclusive fee. The Board also considered other expenses, such as transfer agent fees, pricing and bookkeeping fees, and custodial, legal, and audit fees, paid by FMR under the all-inclusive arrangement. The Board also noted the effects of any waivers and reimbursements on fees and expenses. As part of its review, the Board also considered current and historical total expenses of each fund compared to competitive fund median expenses. Each fund is compared to those funds and classes in the Total Mapped Group (used by the Board for management fee comparisons) that have a similar sales load structure.
The Board noted that Arizona Municipal Income Fund's total expenses ranked equal to its competitive median for 2009.
The Board noted that Arizona Municipal Money Market Fund's total expenses ranked below its competitive median for 2009. The Board considered that Fidelity has been voluntarily waiving part or all of the management fees to maintain a minimum yield for Fidelity Arizona Municipal Money Market Fund.
Fees Charged to Other Fidelity Clients. The Board also considered Fidelity fee structures and other information with respect to clients of FMR and its affiliates, such as other mutual funds advised or subadvised by FMR or its affiliates, pension plan clients, and other institutional clients. In March 2010, the Board created an ad hoc joint committee with the board of other Fidelity funds (the Committee) to review and compare Fidelity's institutional investment advisory business with its business of providing services to the Fidelity funds, including the differences in services provided, fees charged, and costs incurred, as well as competition in their respective marketplaces.
Based on its review of total expenses and fees charged to other Fidelity clients, the Board concluded that each fund's total expenses were reasonable in light of the services that the fund and its shareholders receive and the other factors considered, including the findings of the Committee.
Costs of the Services and Profitability. The Board considered the revenues earned and the expenses incurred by Fidelity in conducting the business of developing, marketing, distributing, managing, administering and servicing each fund and its shareholders. The Board also considered the level of Fidelity's profits in respect of all the Fidelity funds.
On an annual basis, FMR presents to the Board Fidelity's profitability for each fund. Fidelity calculates the profitability for each fund, as well as aggregate profitability for groups of Fidelity funds and all Fidelity funds, using a series of detailed revenue and cost allocation methodologies which originate with the audited books and records of Fidelity. The Audit Committee of the Board reviews any significant changes from the prior year's methodologies.
Semiannual Report
PricewaterhouseCoopers LLP (PwC), independent registered public accounting firm and auditor to Fidelity and certain Fidelity funds, has been engaged annually by the Board as part of the Board's assessment of Fidelity's profitability analysis. PwC's engagement includes the review and assessment of Fidelity's methodologies used in determining the revenues and expenses attributable to Fidelity's mutual fund business, and completion of agreed-upon procedures surrounding the mathematical accuracy of fund profitability and its conformity to allocation methodologies. After considering PwC's reports issued under the engagement and information provided by Fidelity, the Board believes that while other allocation methods may also be reasonable, Fidelity's profitability methodologies are reasonable in all material respects.
The Board has also reviewed Fidelity's non-fund businesses and fall-out benefits related to the mutual fund business as well as cases where Fidelity's affiliates may benefit from or be related to the funds' business.
The Board considered the costs of the services provided by and the profits realized by Fidelity in connection with the operation of each fund and were satisfied that the profitability was not excessive in the circumstances.
Economies of Scale. The Board considered whether there have been economies of scale in respect of the management of the Fidelity funds, whether the Fidelity funds (including each fund) have appropriately benefited from any such economies of scale, and whether there is potential for realization of any further economies of scale. The Board considered the extent to which each fund will benefit from economies of scale through increased services to the fund, through waivers or reimbursements, or through fee or expense reductions.
In February 2009, the Board and the board of other Fidelity funds created an ad hoc committee (the Economies of Scale Committee) to analyze whether FMR attains economies of scale in respect of the management and servicing of the Fidelity funds, whether the Fidelity funds have appropriately benefited from such economies of scale, and whether there is potential for realization of any further economies of scale.
The Board concluded, considering the findings of the Economies of Scale Committee, that any potential economies of scale are being appropriately shared between fund shareholders and Fidelity.
Additional Information Requested by the Board. In order to develop fully the factual basis for consideration of the Fidelity funds' Advisory Contracts, the Board requested and received additional information on certain topics, including (i) fund performance trends, actions to be taken by FMR to improve certain funds' overall performance, and Fidelity's long-term strategies for certain funds; (ii) Fidelity's fund profitability methodology and profitability trends for certain funds; (iii) portfolio manager changes that have occurred during the past year and the amount of the investment that each portfolio manager has made in the Fidelity fund(s) that he or she manages; (iv) Fidelity's compensation structure for portfolio managers, research analysts, and other key personnel, including its effects on fund profitability, the rationale for the compensation structure, and the extent to which current market conditions have affected retention and recruitment; (v) the compensation paid by FMR to fund sub-advisers on behalf of the Fidelity funds; (vi) Fidelity's fee structures and rationale for recommending different fees among different categories of funds and classes, as well as Fidelity's voluntary waiver of fees to maintain minimum yields for certain funds and classes; (vii) the rationale for any differences between fund fee structures and fee structures in place for other Fidelity clients; and (viii) explanations regarding the relative total expenses borne by certain funds and classes, total expense competitive trends, and actions that might be taken by FMR to reduce total expenses for certain funds and classes or to achieve further economies of scale.
Semiannual Report
Board Approval of Investment Advisory Contracts and
Management Fees - continued
Based on its evaluation of all of the conclusions noted above, and after considering all factors it believed relevant, the Board ultimately concluded that the advisory fee structures are fair and reasonable, and that each fund's Advisory Contracts should be renewed.
Semiannual Report
Managing Your Investments
Fidelity offers several ways to conveniently manage your personal investments via your telephone or PC. You can access your account information, conduct trades and research your investments 24 hours a day.
By Phone
Fidelity Automated Service Telephone provides a single toll-free number to access account balances, positions, quotes and trading. It's easy to navigate the service, and on your first call, the system will help you create a personal identification number (PIN) for security.
(phone_graphic)
Fidelity Automated
Service Telephone (FAST®)
1-800-544-5555
Press
 For mutual fund and brokerage trading.
 For quotes.*
 For account balances and holdings.
 To review orders and mutual
fund activity.
 To change your PIN.

 To speak to a Fidelity representative.
By PC
Fidelity's web site on the Internet provides a wide range of information, including daily financial news, fund performance, interactive planning tools and news about Fidelity products and services.
(computer_graphic)
Fidelity's Web Site
www.fidelity.com
* When you call the quotes line, please remember that a fund's yield and return will vary and, except for money market funds, share price will also vary. This means that you may have a gain or loss when you sell your shares. There is no assurance that money market funds will be able to maintain a stable $1 share price; an investment in a money market fund is not insured or guaranteed by the U.S. government. Total returns are historical and include changes in share price, reinvestment of dividends and capital gains distributions, and the effects of any sales charges.
Semiannual Report
To Visit Fidelity
For directions and hours,
please call 1-800-544-9797.
Arizona
7001 West Ray Road
Chandler, AZ
15445 N. Scottsdale Road
Scottsdale, AZ
17550 North 75th Avenue
Glendale, AZ
5330 E. Broadway Blvd
Tucson, AZ
California
815 East Birch Street
Brea, CA
1411 Chapin Avenue
Burlingame, CA
851 East Hamilton Avenue
Campbell, CA
601 Larkspur Landing Circle
Larkspur, CA
2000 Avenue of the Stars
Los Angeles, CA
27101 Puerta Real
Mission Viejo, CA
73575 El Paseo
Palm Desert, CA
251 University Avenue
Palo Alto, CA
123 South Lake Avenue
Pasadena, CA
16656 Bernardo Ctr. Drive
Rancho Bernardo, CA
1220 Roseville Parkway
Roseville, CA
1740 Arden Way
Sacramento, CA
7676 Hazard Center Drive
San Diego, CA
11943 El Camino Real
San Diego, CA
8 Montgomery Street
San Francisco, CA
3793 State Street
Santa Barbara, CA
1200 Wilshire Boulevard
Santa Monica, CA
398 West El Camino Real
Sunnyvale, CA
111 South Westlake Blvd
Thousand Oaks, CA
21701 Hawthorne Boulevard
Torrance, CA
2001 North Main Street
Walnut Creek, CA
6326 Canoga Avenue
Woodland Hills, CA
2211 Michelson Drive
Irvine, CA
Colorado
281 East Flatiron Circle
Broomfield, CO
1625 Broadway
Denver, CO
9185 Westview Road
Lone Tree, CO
Connecticut
48 West Putnam Avenue
Greenwich, CT
265 Church Street
New Haven, CT
300 Atlantic Street
Stamford, CT
29 South Main Street
West Hartford, CT
1261 Post Road
Fairfield, CT
Delaware
400 Delaware Avenue
Wilmington, DE
Florida
175 East Altamonte Drive
Altamonte Springs, FL
1400 Glades Road
Boca Raton, FL
121 Alhambra Plaza
Coral Gables, FL
2948 N. Federal Highway
Ft. Lauderdale, FL
4671 Town Center Parkway
Jacksonville, FL
8880 Tamiami Trail, North
Naples, FL
230 Royal Palm Way
Palm Beach, FL
3501 PGA Boulevard
Palm Beach Gardens, FL
3550 Tamiami Trail, South
Sarasota, FL
1502 N. Westshore Blvd.
Tampa, FL
2465 State Road 7
Wellington, FL
Georgia
3242 Peachtree Road
Atlanta, GA
1000 Abernathy Road
Atlanta, GA
Illinois
One North LaSalle Street
Chicago, IL
401 North Michigan Avenue
Chicago, IL
One Skokie Valley Road
Highland Park, IL
1415 West 22nd Street
Oak Brook, IL
15105 S LaGrange Road
Orland Park, IL
1572 East Golf Road
Schaumburg, IL
1823 Freedom Drive
Naperville, IL
Indiana
8480 Keystone Crossing
Indianapolis, IN
Kansas
5400 College Boulevard
Overland Park, KS
Maine
Three Canal Plaza
Portland, ME
Maryland
7315 Wisconsin Avenue
Bethesda, MD
610 York Road
Towson, MD
Massachusetts
801 Boylston Street
Boston, MA
155 Congress Street
Boston, MA
300 Granite Street
Braintree, MA
44 Mall Road
Burlington, MA
238 Main Street
Cambridge, MA
200 Endicott Street
Danvers, MA
Fidelity Brokerage Services, Inc., 100 Summer St., Boston, MA 02110 Member NYSE/SIPC
Semiannual Report
405 Cochituate Road
Framingham, MA
551 Boston Turnpike
Shrewsbury, MA
Michigan
500 E. Eisenhower Pkwy.
Ann Arbor, MI
280 N. Old Woodward Ave.
Birmingham, MI
30200 Northwestern Hwy.
Farmington Hills, MI
43420 Grand River Avenue
Novi, MI
3480 28th Street
Grand Rapids, MI
2425 S. Linden Road STE E
Flint, MI
Minnesota
7740 France Avenue South
Edina, MN
8342 3rd Street North
Oakdale, MN
Missouri
1524 South Lindbergh Blvd.
St. Louis, MO
Nevada
2225 Village Walk Drive
Henderson, NV
New Jersey
501 Route 73 South
Marlton, NJ
150 Essex Street
Millburn, NJ
35 Morris Street
Morristown, NJ
396 Route 17, North
Paramus, NJ
3518 Route 1 North
Princeton, NJ
530 Broad Street
Shrewsbury, NJ
New Mexico
2261 Q Street NE
Albuquerque, NM
New York
1130 Franklin Avenue
Garden City, NY
37 West Jericho Turnpike
Huntington Station, NY
1271 Avenue of the Americas
New York, NY
980 Madison Avenue
New York, NY
61 Broadway
New��York, NY
350 Park Avenue
New York, NY
200 Fifth Avenue
New York, NY
733 Third Avenue
New York, NY
2070 Broadway
New York, NY
1075 Northern Blvd.
Roslyn, NY
799 Central Park Avenue
Scarsdale, NY
3349 Monroe Avenue
Rochester, NY
North Carolina
4611 Sharon Road
Charlotte, NC
7011 Fayetteville Road
Durham, NC
Ohio
3805 Edwards Road
Cincinnati, OH
1324 Polaris Parkway
Columbus, OH
1800 Crocker Road
Westlake, OH
28699 Chagrin Boulevard
Woodmere Village, OH
Oregon
7493 SW Bridgeport Road
Tigard, OR
Pennsylvania
600 West DeKalb Pike
King of Prussia, PA
1735 Market Street
Philadelphia, PA
12001 Perry Highway
Wexford, PA
Rhode Island
10 Memorial Boulevard
Providence, RI
Tennessee
3018 Peoples Street
Johnson City, TN
7628 West Farmington Blvd.
Germantown, TN
2035 Mallory Lane
Franklin, TN
Texas
10000 Research Boulevard
Austin, TX
4001 Northwest Parkway
Dallas, TX
12532 Memorial Drive
Houston, TX
2701 Drexel Drive
Houston, TX
6560 Fannin Street
Houston, TX
1701 Lake Robbins Drive
The Woodlands, TX
6500 N. MacArthur Blvd.
Irving, TX
6005 West Park Boulevard
Plano, TX
1576 East Southlake Blvd.
Southlake, TX
15600 Southwest Freeway
Sugar Land, TX
139 N. Loop 1604 East
San Antonio, TX
Utah
279 West South Temple
Salt Lake City, UT
Virginia
1861 International Drive
McLean, VA
11957 Democracy Drive
Reston, VA
Washington
10500 NE 8th Street
Bellevue, WA
1518 6th Avenue
Seattle, WA
304 Strander Blvd
Tukwila, WA
Washington, DC
1900 K Street, N.W.
Washington, DC
Wisconsin
16020 West Bluemound Road
Brookfield, WI
Semiannual Report
Investment Adviser
Fidelity Management & Research Company
Boston, MA
Sub-Advisers
Fidelity Investments
Money Management, Inc.
Fidelity Management & Research
(U.K.) Inc.
Fidelity Management & Research
(Hong Kong) Limited
Fidelity Management & Research
(Japan) Inc.
General Distributor
Fidelity Distributors Corporation
Boston, MA
Transfer and Service Agents
Citibank, N.A.
New York, NY
Fidelity Investments Institutional Operations Company, Inc.
Boston, MA
Fidelity Service Company, Inc.
Boston, MA
Custodian
Citibank, N.A.
New York, NY
The Fidelity Telephone Connection
Mutual Fund 24-Hour Service
Exchanges/Redemptions
and Account Assistance 1-800-544-6666
Product Information 1-800-544-6666
Retirement Accounts 1-800-544-4774 (8 a.m. - 9 p.m.)
TDD Service 1-800-544-0118
for the deaf and hearing impaired
(9 a.m. - 9 p.m. Eastern time)
Fidelity Automated Service
Telephone (FAST®) 1-800-544-5555
Automated line for quickest service
AZI/SPZ-USAN-0411
1.790941.107

Fidelity®
Maryland Municipal Income
Fund
Semiannual Report
February 28, 2011
(2_fidelity_logos) (Registered_Trademark)
Contents
Chairman's Message | <Click Here> | The Chairman's message to shareholders. |
Shareholder Expense Example | <Click Here> | An example of shareholder expenses. |
Investment Changes | <Click Here> | A summary of major shifts in the fund's investments over the past six months. |
Investments | <Click Here> | A complete list of the fund's investments with their market values. |
Financial Statements | <Click Here> | Statements of assets and liabilities, operations, and changes in net assets,
as well as financial highlights. |
Notes | <Click Here> | Notes to the financial statements. |
Board Approval of Investment Advisory Contracts and Management Fees | <Click Here> | |
To view a fund's proxy voting guidelines and proxy voting record for the 12-month period ended June 30, visit http://www.fidelity.com/proxyvotingresults or visit the Securities and Exchange Commission's (SEC) web site at http://www.sec.gov. You may also call 1-800-544-8544 to request a free copy of the proxy voting guidelines.
Standard & Poor's, S&P and S&P 500 are registered service marks of The McGraw-Hill Companies, Inc. and have been licensed for use by Fidelity Distributors Corporation.
Other third party marks appearing herein are the property of their respective owners.
All other marks appearing herein are registered or unregistered trademarks or service marks of FMR LLC or an affiliated company.
This report and the financial statements contained herein are submitted for the general information of the shareholders of the fund. This report is not authorized for distribution to prospective investors in the fund unless preceded or accompanied by an effective prospectus.
A fund files its complete schedule of portfolio holdings with the SEC for the first and third quarters of each fiscal year on Form N-Q. Forms N-Q are available on the SEC's web site at http://www.sec.gov. A fund's Forms N-Q may be reviewed and copied at the SEC's Public Reference Room in Washington, DC. Information regarding the operation of the SEC's Public Reference Room may be obtained by calling 1-800-SEC-0330. For a complete list of a fund's portfolio holdings, view the most recent holdings listing, semiannual report, or annual report on Fidelity's web site at http://www.fidelity.com, http://www.advisor.fidelity.com, or http://www.401k.com, as applicable.
NOT FDIC INSURED • MAY LOSE VALUE • NO BANK GUARANTEE
Neither the fund nor Fidelity Distributors Corporation is a bank.
Semiannual Report
(photo_of_Abigail_P_Johnson)
Dear Shareholder:
Following a year in which the investment environment was volatile but generally supportive of most major asset classes, 2011 has begun on a positive note. U.S. equities gained ground in January and February, reaching their highest point since June 2008, amid indications the U.S. economy had turned a corner. Still, questions remained about the longer-term outlook, most notably persistently high unemployment. Financial markets are always unpredictable, of course, but there also are several time-tested investment principles that can help put the odds in your favor.
One of the basic tenets is to invest for the long term. Over time, riding out the markets' inevitable ups and downs has proven much more effective than selling into panic or chasing the hottest trend. Even missing only a few of the markets' best days can significantly diminish investor returns. Patience also affords the benefits of compounding - of earning interest on additional income or reinvested dividends and capital gains. There can be tax advantages and cost benefits to consider as well. While staying the course doesn't eliminate risk, it can considerably lessen the effect of short-term declines.
You can further manage your investing risk through diversification. And today, more than ever, geographic diversification should be taken into account. Studies indicate that asset allocation is the single most important determinant of a portfolio's long-term success. The right mix of stocks, bonds and cash - aligned to your particular risk tolerance and investment objective - is very important. Age-appropriate rebalancing is also an essential aspect of asset allocation. For younger investors, an emphasis on equities - which historically have been the best-performing asset class over time - is encouraged. As investors near their specific goal, such as retirement or sending a child to college, consideration may be given to replacing volatile assets (e.g. common stocks) with more-stable fixed investments (bonds or savings plans).
A third principle - investing regularly - can help lower the average cost of your purchases. Investing a certain amount of money each month or quarter helps ensure you won't pay for all your shares at market highs. This strategy - known as dollar cost averaging - also reduces "emotion" from investing, helping shareholders avoid selling weak performers just prior to an upswing, or chasing a hot performer just before a correction.
We invite you to contact us via the Internet, through our Investor Centers or by phone. It is our privilege to provide you the information you need to make the investments that are right for you.
Sincerely,
(The chairman's signature appears here.)
Abigail P. Johnson
Semiannual Report
Shareholder Expense Example
As a shareholder of the Fund, you incur two types of costs: (1) transaction costs, including redemption fees, and (2) ongoing costs, including management fees and other Fund expenses. This Example is intended to help you understand your ongoing costs (in dollars) of investing in the Fund and to compare these costs with the ongoing costs of investing in other mutual funds.
The Example is based on an investment of $1,000 invested at the beginning of the period and held for the entire period (September 1, 2010 to February 28, 2011).
Actual Expenses
The first line of the accompanying table provides information about actual account values and actual expenses. You may use the information in this line, together with the amount you invested, to estimate the expenses that you paid over the period. Simply divide your account value by $1,000.00 (for example, an $8,600 account value divided by $1,000.00 = 8.6), then multiply the result by the number in the first line under the heading entitled "Expenses Paid During Period" to estimate the expenses you paid on your account during this period. A small balance maintenance fee of $12.00 that is charged once a year may apply for certain accounts with a value of less than $2,000. This fee is not included in the table below. If it was, the estimate of expenses you paid during the period would be higher, and your ending account value lower, by this amount.
Hypothetical Example for Comparison Purposes
The second line of the accompanying table provides information about hypothetical account values and hypothetical expenses based on the Fund's actual expense ratio and an assumed rate of return of 5% per year before expenses, which is not the Fund's actual return. The hypothetical account values and expenses may not be used to estimate the actual ending account balance or expenses you paid for the period. You may use this information to compare the ongoing costs of investing in the Fund and other funds. To do so, compare this 5% hypothetical example with the 5% hypothetical examples that appear in the shareholder reports of the other funds. A small balance maintenance fee of $12.00 that is charged once a year may apply for certain accounts with a value of less than $2,000. This fee is not included in the table below. If it was, the estimate of expenses you paid during the period would be higher, and your ending account value lower, by this amount.
Please note that the expenses shown in the table are meant to highlight your ongoing costs only and do not reflect any transaction costs. Therefore, the second line of the table is useful in comparing ongoing costs only, and will not help you determine the relative total costs of owning different funds. In addition, if these transactional costs were included, your costs would have been higher.
Semiannual Report
Shareholder Expense Example - continued
| Annualized Expense Ratio | Beginning
Account Value
September 1, 2010 | Ending
Account Value
February 28, 2011 | Expenses Paid
During Period*
September 1, 2010
to February 28, 2011 |
Actual | .55% | $ 1,000.00 | $ 970.00 | $ 2.69 |
Hypothetical (5% return per year before expenses) | | $ 1,000.00 | $ 1,022.07 | $ 2.76 |
* Expenses are equal to the Fund's annualized expense ratio, multiplied by the average account value over the period, multiplied by 181/365 (to reflect the one-half year period).
Semiannual Report
Investment Changes (Unaudited)
Top Five Sectors as of February 28, 2011 |
| % of fund's
net assets | % of fund's net assets
6 months ago |
General Obligations | 30.4 | 32.9 |
Health Care | 14.4 | 13.8 |
Water & Sewer | 11.3 | 11.3 |
Education | 10.6 | 9.8 |
Transportation | 8.5 | 8.7 |
Weighted Average Maturity as of February 28, 2011 |
| | 6 months ago |
Years | 7.4 | 6.0 |
This is a weighted average of all the maturities of the securities held in a fund. Weighted Average Maturity (WAM) can be used as a measure of sensitivity to interest rate changes and markets changes. Generally, the longer the maturity, the greater the sensitivity to such changes. WAM is based on the dollar-weighted average length of time until principal payments must be paid. Depending on the types of securities held in a fund, certain maturity shortening devices (e.g., demand features, interest rate resets, and call options) may be taken into account when calculating the WAM. |
Duration as of February 28, 2011 |
| | 6 months ago |
Years | 7.3 | 7.0 |
Duration estimates how much a bond fund's price will change with a change in comparable interest rates. If rates rise 1%, for example, a fund with a 5-year duration is likely to lose about 5% of its value. Other factors also can influence a bond fund's performance and share price. Accordingly, a bond fund's actual performance may differ from this example. Duration takes into account any call or put option embedded in the bonds. |
Quality Diversification (% of fund's net assets) |
As of February 28, 2011 | As of August 31, 2010 |
| AAA 19.8% | | | AAA 24.2% | |
| AA,A 65.7% | | | AA,A 61.1% | |
| BBB 8.4% | | | BBB 7.9% | |
 | BB and Below 0.1% | |  | BB and Below 0.0% | |
 | Not Rated 1.0% | | | Not Rated 1.0% | |
| Short-Term
Investments and
Net Other Assets 5.0% | | | Short-Term
Investments and
Net Other Assets 5.8% | |

We have used ratings from Moody's Investors Service, Inc. Where Moody's® ratings are not available, we have used S&P® ratings. All ratings are as of the report date and do not reflect subsequent changes. |
Semiannual Report
Investments February 28, 2011 (Unaudited)
Showing Percentage of Net Assets
Municipal Bonds - 95.0% |
| Principal Amount | | Value |
District Of Columbia - 2.4% |
Washington DC Metropolitan Transit Auth. Rev. Series 2009 A, 5% 7/1/19 | | $ 3,780,000 | | $ 4,256,129 |
Guam - 0.3% |
Guam Ed. Fing. Foundation Ctfs. of Prtn. Series 2006 A, 5% 10/1/23 | | 500,000 | | 478,810 |
Maryland - 84.9% |
Baltimore Convention Ctr. Hotel Rev. Series 2006 A: | | | | |
5.25% 9/1/17 (XL Cap. Assurance, Inc. Insured) | | 1,350,000 | | 1,311,701 |
5.25% 9/1/27 (XL Cap. Assurance, Inc. Insured) | | 1,020,000 | | 884,697 |
Baltimore County Ctfs. of Prtn. (Equip. Acquisition Prog.) Series 2004, 5% 6/1/13 (Nat'l. Pub. Fin. Guarantee Corp. Insured) | | 1,500,000 | | 1,629,315 |
Baltimore County Gen. Oblig.: | | | | |
(Consolidated Pub. Impt. Proj.) Series 2004, 5% 8/1/15 | | 2,385,000 | | 2,666,597 |
(Metropolitan District Proj.) Series 71: | | | | |
5% 2/1/31 | | 2,000,000 | | 2,107,300 |
5% 2/1/38 | | 1,930,000 | | 1,984,387 |
(Oak Crest Village, Inc. Proj.) Series 2007 A, 5% 1/1/22 | | 500,000 | | 485,320 |
Baltimore County Metropolitan District 4% 8/1/24 | | 2,950,000 | | 3,019,709 |
Baltimore Ctfs. of Prtn. Series 2010 A, 5% 10/1/17 | | 2,005,000 | | 2,233,851 |
Baltimore Gen. Oblig. (Consolidated Pub. Impt. Proj.): | | | | |
Series 2005 A, 5% 10/15/18 (AMBAC Insured) | | 1,720,000 | | 1,928,670 |
Series 2008 A, 5% 10/15/25 (FSA Insured) | | 1,445,000 | | 1,546,844 |
Baltimore Proj. Rev.: | | | | |
(Wastewtr. Proj.): | | | | |
Series 2002 A: | | | | |
5.125% 7/1/42 (Nat'l. Pub. Fin. Guarantee Corp. Insured) | | 2,315,000 | | 2,318,519 |
5.2% 7/1/32 (Nat'l. Pub. Fin. Guarantee Corp. Insured) | | 250,000 | | 252,118 |
Series 2007 D: | | | | |
5% 7/1/32 (FSA Insured) | | 4,500,000 | | 4,580,280 |
5% 7/1/37 (AMBAC Insured) | | 2,000,000 | | 2,003,080 |
5% 7/1/37 (FSA Insured) | | 4,000,000 | | 3,993,920 |
Series 2008 A: | | | | |
5% 7/1/33 (FSA Insured) | | 2,000,000 | | 2,028,040 |
5% 7/1/38 (FSA Insured) | | 2,000,000 | | 2,002,300 |
Series 2009 C, 5.625% 7/1/39 | | 2,000,000 | | 2,060,780 |
(Wtr. Proj.): | | | | |
Series 1994 A, 5% 7/1/24 (FGIC Insured) | | 370,000 | | 415,625 |
Municipal Bonds - continued |
| Principal Amount | | Value |
Maryland - continued |
Baltimore Proj. Rev.: - continued | | | | |
(Wtr. Proj.): | | | | |
Series 2002 A, 5.125% 7/1/42 (Nat'l. Pub. Fin. Guarantee Corp. Insured) | | $ 355,000 | | $ 355,540 |
City of Westminster (McDaniel College Proj.) Series 2006: | | | | |
5% 11/1/12 | | 500,000 | | 514,260 |
5% 11/1/13 | | 350,000 | | 363,034 |
Frederick County Econ. Dev. Rev.: | | | | |
Series 2005, 5% 8/1/15 (Nat'l. Pub. Fin. Guarantee Corp. Insured) | | 1,000,000 | | 1,139,200 |
Series 2009 A: | | | | |
5% 3/1/25 | | 610,000 | | 657,446 |
5% 3/1/27 | | 1,255,000 | | 1,332,208 |
Frederick County Edl. Facilities Rev. (Mount Saint Mary's Univ. Proj.) Series 2006, 5.5% 9/1/12 | | 195,000 | | 197,956 |
Frederick County Gen. Oblig. Series 2005, 5% 12/1/15 | | 1,000,000 | | 1,151,260 |
Maryland Dept. of Trans. Consolidated Trans. Rev. Series 2009: | | | | |
4% 5/15/20 | | 3,000,000 | | 3,230,100 |
4% 5/15/23 | | 1,390,000 | | 1,434,105 |
Maryland Dept. of Trans. County Trans. Rev. Series 2009, 4% 6/15/23 | | 2,000,000 | | 2,064,020 |
Maryland Econ. Dev. Corp. Lease Rev. (Maryland Aviation Administration Facilities Proj.) Series 2003, 5.5% 6/1/18 (FSA Insured) (b) | | 1,500,000 | | 1,562,805 |
Maryland Econ. Dev. Corp. Poll. Cont. Rev. (Potomac Elec. Proj.) Series 2006, 6.2% 9/1/22 | | 2,700,000 | | 3,069,387 |
Maryland Econ. Dev. Corp. Student Hsg. Rev.: | | | | |
(Towson Univ. Proj.) Series 2007 A, 5.25% 7/1/17 | | 500,000 | | 500,495 |
(Univ. of Maryland, Baltimore County Student Hsg. Proj.) Series 2006: | | | | |
5% 6/1/14 (CIFG North America Insured) | | 700,000 | | 731,248 |
5% 7/1/16 (XL Cap. Assurance, Inc. Insured) | | 500,000 | | 501,125 |
5% 6/1/18 (CIFG North America Insured) | | 2,000,000 | | 2,026,540 |
Maryland Gen. Oblig. (State & Local Facilities Ln. Prog.): | | | | |
First Series 2002 A, 5.5% 3/1/17 | | 2,265,000 | | 2,705,090 |
First Series 2003 A, 5.25% 3/1/17 | | 4,295,000 | | 5,069,217 |
First Series 2009 A, 5% 3/1/21 (Pre-Refunded to 3/1/17 @ 100) (c) | | 750,000 | | 877,898 |
First Series 2009 C, 5% 3/1/18 | | 1,050,000 | | 1,231,461 |
Second Series 2009 A, 5% 8/15/23 | | 2,460,000 | | 2,719,186 |
Municipal Bonds - continued |
| Principal Amount | | Value |
Maryland - continued |
Maryland Health & Higher Edl. Facilities Auth. Rev.: | | | | |
(Anne Arundel Med. Ctr. Proj.) Series 1998, 5.125% 7/1/33 (FSA Insured) | | $ 2,000,000 | | $ 1,999,940 |
(Carroll County Gen. Hosp. Proj.) Series 2006, 5% 7/1/40 | | 1,500,000 | | 1,331,670 |
(Doctors Cmnty. Hosp. Proj.) Series 2010, 5.75% 7/1/38 | | 1,300,000 | | 1,061,424 |
(Good Samaritan Hosp. Proj.) Series 1993: | | | | |
5.75% 7/1/13 (Escrowed to Maturity) (c) | | 240,000 | | 254,057 |
5.75% 7/1/13 (Escrowed to Maturity) (c) | | 55,000 | | 58,221 |
(Hebrew Home of Greater Washington Proj.) Series 2002, 5.8% 1/1/32 | | 1,000,000 | | 999,990 |
(Howard County Gen. Hosp. Proj.) 5.5% 7/1/13 (Escrowed to Maturity) (c) | | 360,000 | | 373,021 |
(Johns Hopkins Hosp. Proj.) Series 2001, 5% 5/15/34 | | 1,500,000 | | 1,473,615 |
(Johns Hopkins Med. Institutions Utils. Proj.) Series 2005 B, 5% 5/15/35 | | 1,475,000 | | 1,484,322 |
(Johns Hopkins Univ. Proj.): | | | | |
Series 2001 B, 5% 7/1/41 | | 3,590,000 | | 3,590,898 |
Series 2002 A, 5% 7/1/32 | | 1,015,000 | | 1,020,105 |
Series 2004 A: | | | | |
5% 7/1/24 | | 1,000,000 | | 1,044,130 |
5% 7/1/33 | | 2,000,000 | | 2,018,760 |
5% 7/1/38 | | 2,000,000 | | 2,007,160 |
(LifeBridge Health Proj.): | | | | |
Series 2004 A, 5% 7/1/11 (Escrowed to Maturity) (c) | | 1,000,000 | | 1,015,150 |
Series 2008: | | | | |
5% 7/1/14 | | 1,845,000 | | 1,997,489 |
5% 7/1/19 (Assured Guaranty Corp. Insured) | | 300,000 | | 324,621 |
(Loyola College Issue Proj.) Series 1999, 5% 10/1/39 | | 2,000,000 | | 1,884,080 |
(MedStar Health Proj.) Series 2007, 5.25% 5/15/46 | | 1,000,000 | | 924,780 |
(Mercy Med. Ctr. Proj.) Series 2007 A, 5.5% 7/1/42 | | 1,000,000 | | 838,980 |
(Peninsula Reg'l. Med. Ctr. Proj.) Series 2006, 5% 7/1/15 | | 1,120,000 | | 1,213,542 |
(Univ. of Maryland Med. Sys. Proj.): | | | | |
Series 2001, 5.25% 7/1/34 (Pre-Refunded to 7/1/11 @ 100) (c) | | 1,525,000 | | 1,549,598 |
Series 2006 A, 5% 7/1/41 | | 1,000,000 | | 909,690 |
Series 2008 F, 5.25% 7/1/19 | | 1,700,000 | | 1,850,620 |
Series 2010, 5.125% 7/1/39 | | 1,700,000 | | 1,606,551 |
(Upper Chesapeake Hosp. Proj.) Series 2008 C, 5.5% 1/1/18 | | 595,000 | | 627,100 |
Municipal Bonds - continued |
| Principal Amount | | Value |
Maryland - continued |
Maryland Health & Higher Edl. Facilities Auth. Rev.: - continued | | | | |
(Washington County Health Sys. Proj.) Series 2008, 6% 1/1/43 | | $ 400,000 | | $ 368,692 |
(Western Maryland Health Sys. Proj.) Series 2006 A: | | | | |
5% 1/1/16 (Nat'l. Pub. Fin. Guarantee Corp. Insured) | | 1,450,000 | | 1,557,097 |
5% 7/1/17 (Nat'l. Pub. Fin. Guarantee Corp. Insured) | | 1,635,000 | | 1,732,789 |
Bonds (Johns Hopkins Health Sys. Obligated Group Proj.) Series 2008 B, 5%, tender 5/15/13 (a) | | 1,400,000 | | 1,500,576 |
Maryland Indl. Dev. Fing. Auth. Rev. (American Ctr. for Physics Proj.) Series 2001: | | | | |
5.25% 12/15/13 | | 1,100,000 | | 1,135,222 |
5.25% 12/15/15 | | 320,000 | | 328,618 |
Maryland Nat'l. Cap. Park & Planning Commission Series 2004 EE2, 5% 1/15/15 | | 2,000,000 | | 2,193,880 |
Maryland Trans. Auth. Grant Rev. Series 2007, 5% 3/1/16 | | 2,000,000 | | 2,285,880 |
Maryland Trans. Auth. Trans. Facility Projects Rev.: | | | | |
Series 2007: | | | | |
5% 7/1/30 | | 2,000,000 | | 2,073,360 |
5% 7/1/31 (FSA Insured) | | 5,000,000 | | 5,155,450 |
Series 2008: | | | | |
5% 7/1/35 | | 880,000 | | 889,627 |
5% 7/1/37 (FSA Insured) | | 4,485,000 | | 4,523,033 |
6.8% 7/1/16 (Escrowed to Maturity) (c) | | 570,000 | | 645,559 |
Montgomery County Econ. Dev. Rev. (Trinity Health Care Group Proj.) Series 2001, 5.125% 12/1/22 | | 2,300,000 | | 2,311,408 |
Montgomery County Gen. Oblig.: | | | | |
(Consolidated Pub. Impt. Proj.): | | | | |
Series 2005 A, 5% 6/1/24 | | 2,000,000 | | 2,123,760 |
Series 2007 A, 5% 5/1/25 | | 1,000,000 | | 1,080,140 |
(Dept. of Liquor Cont. Proj.) Series 2009 A, 5% 4/1/14 | | 1,000,000 | | 1,092,230 |
Morgan State Univ. Academic & Auxiliary Facilities Fees Rev. Series 2003 A, 5% 7/1/20 (Nat'l. Pub. Fin. Guarantee Corp. Insured) | | 500,000 | | 519,440 |
Northeast Maryland Waste Disp. Auth. Solid Waste Rev. Series 2003, 5.5% 4/1/12 (AMBAC Insured) (b) | | 4,500,000 | | 4,714,515 |
Municipal Bonds - continued |
| Principal Amount | | Value |
Maryland - continued |
Prince Georges County Ctfs. of Prtn. Series 1991 A, 0% 6/30/11 (Nat'l. Pub. Fin. Guarantee Corp. Insured) | | $ 415,000 | | $ 412,572 |
Washington Suburban San. District Series 2009 A, 5% 6/1/17 | | 5,000,000 | | 5,841,097 |
| | 148,831,093 |
Puerto Rico - 7.3% |
Puerto Rico Commonwealth Hwy. & Trans. Auth. Hwy. Rev.: | | | | |
Series 1996 Z, 6.25% 7/1/15 (Nat'l. Pub. Fin. Guarantee Corp. Insured) | | 1,000,000 | | 1,077,820 |
Series AA, 5.5% 7/1/19 (Nat'l. Pub. Fin. Guarantee Corp. Insured) | | 1,500,000 | | 1,567,080 |
Series BB, 5.25% 7/1/18 (AMBAC Insured) | | 600,000 | | 618,714 |
Puerto Rico Commonwealth Hwy. & Trans. Auth. Trans. Rev.: | | | | |
Series E, 5.5% 7/1/17 (FSA Insured) | | 1,000,000 | | 1,087,140 |
Series N, 5.25% 7/1/34 (Assured Guaranty Corp. Insured) | | 500,000 | | 473,590 |
Puerto Rico Commonwealth Infrastructure Fing. Auth. Series 2005 C, 5.5% 7/1/23 | | 1,110,000 | | 1,121,799 |
Puerto Rico Commonwealth Pub. Impt. Gen. Oblig.: | | | | |
Series 2002 A: | | | | |
5.5% 7/1/18 | | 700,000 | | 736,988 |
5.5% 7/1/18 (Nat'l. Pub. Fin. Guarantee Corp. Insured) | | 240,000 | | 252,682 |
Series 2007 A, 5.5% 7/1/19 (Nat'l. Pub. Fin. Guarantee Corp. Insured) | | 1,000,000 | | 1,044,720 |
Puerto Rico Elec. Pwr. Auth. Pwr. Rev.: | | | | |
Series 2002 KK, 5.5% 7/1/15 (Nat'l. Pub. Fin. Guarantee Corp. Insured) | | 1,000,000 | | 1,090,530 |
Series II, 5.375% 7/1/16 (Nat'l. Pub. Fin. Guarantee Corp. Insured) | | 1,500,000 | | 1,555,200 |
Series QQ, 5.5% 7/1/17 (XL Cap. Assurance, Inc. Insured) | | 1,000,000 | | 1,090,070 |
Series VV, 5.25% 7/1/24 (FGIC Insured) | | 1,000,000 | | 1,000,870 |
| | 12,717,203 |
Municipal Bonds - continued |
| Principal Amount | | Value |
Virgin Islands - 0.1% |
Virgin Islands Pub. Fin. Auth. Refinery Facilities Rev. Series 2007, 4.7% 7/1/22 (b) | | $ 300,000 | | $ 246,615 |
TOTAL INVESTMENT PORTFOLIO - 95.0% (Cost $165,603,388) | 166,529,850 |
NET OTHER ASSETS (LIABILITIES) - 5.0% | | 8,682,855 |
NET ASSETS - 100% | $ 175,212,705 |
Legend |
(a) Coupon rates for floating and adjustable rate securities reflect the rates in effect at period end. |
(b) Private activity obligations whose interest is subject to the federal alternative minimum tax for individuals. |
(c) Security collateralized by an amount sufficient to pay interest and principal. |
Other Information |
All investments are categorized as Level 2 under the Fair Value Hierarchy. The inputs or methodology used for valuing securities may not be an indication of the risk associated with investing in those securities. For more information on valuation inputs, please refer to the Security Valuation section in the accompanying Notes to Financial Statements. |
The distribution of municipal securities by revenue source, as a percentage of total net assets, is as follows (Unaudited): |
General Obligations | 30.4% |
Health Care | 14.4% |
Water & Sewer | 11.3% |
Education | 10.6% |
Transportation | 8.5% |
Special Tax | 8.1% |
Others* (Individually Less Than 5%) | 16.7% |
| 100.0% |
* Includes net other assets |
Income Tax Information |
At August 31, 2010, the Fund had a capital loss carryforward of approximately $460,866 all of which will expire in fiscal 2017. Capital loss carryforwards are only available to offset future capital gains of the Fund to the extent provided by regulations and may be limited. |
See accompanying notes which are an integral part of the financial statements.
Semiannual Report
Statement of Assets and Liabilities
| February 28, 2011 (Unaudited) |
| | |
Assets | | |
Investment in securities, at value - See accompanying schedule: Unaffiliated issuers (cost $165,603,388) | | $ 166,529,850 |
Cash | | 6,745,966 |
Receivable for fund shares sold | | 336,733 |
Interest receivable | | 1,863,254 |
Other receivables | | 987 |
Total assets | | 175,476,790 |
| | |
Liabilities | | |
Payable for fund shares redeemed | $ 47,883 | |
Distributions payable | 136,983 | |
Accrued management fee | 79,219 | |
Total liabilities | | 264,085 |
| | |
Net Assets | | $ 175,212,705 |
Net Assets consist of: | | |
Paid in capital | | $ 174,755,891 |
Distributions in excess of net investment income | | (1,176) |
Accumulated undistributed net realized gain (loss) on investments | | (468,472) |
Net unrealized appreciation (depreciation) on investments | | 926,462 |
Net Assets, for 16,255,215 shares outstanding | | $ 175,212,705 |
Net Asset Value, offering price and redemption price per share ($175,212,705 ÷ 16,255,215 shares) | | $ 10.78 |
See accompanying notes which are an integral part of the financial statements.
Semiannual Report
Financial Statements - continued
Statement of Operations
Six months ended February 28, 2011 (Unaudited) |
| | |
Investment Income | | |
Interest | | $ 3,613,683 |
| | |
Expenses | | |
Management fee | $ 513,941 | |
Independent trustees' compensation | 374 | |
Miscellaneous | 352 | |
Total expenses before reductions | 514,667 | |
Expense reductions | (3,423) | 511,244 |
Net investment income (loss) | | 3,102,439 |
Realized and Unrealized Gain (Loss) Net realized gain (loss) on: | | |
Investment securities: | | |
Unaffiliated issuers | | (7,606) |
Change in net unrealized appreciation (depreciation) on investment securities | | (9,325,622) |
Net gain (loss) | | (9,333,228) |
Net increase (decrease) in net assets resulting from operations | | $ (6,230,789) |
See accompanying notes which are an integral part of the financial statements.
Semiannual Report
Statement of Changes in Net Assets
| Six months ended February 28, 2011 (Unaudited) | Year ended
August 31,
2010 |
Increase (Decrease) in Net Assets | | |
Operations | | |
Net investment income (loss) | $ 3,102,439 | $ 6,079,309 |
Net realized gain (loss) | (7,606) | 40,528 |
Change in net unrealized appreciation (depreciation) | (9,325,622) | 8,600,183 |
Net increase (decrease) in net assets resulting
from operations | (6,230,789) | 14,720,020 |
Distributions to shareholders from net investment income | (3,101,844) | (6,077,794) |
Share transactions
Proceeds from sales of shares | 27,084,353 | 53,172,995 |
Reinvestment of distributions | 2,146,391 | 4,182,175 |
Cost of shares redeemed | (42,346,516) | (30,817,751) |
Net increase (decrease) in net assets resulting from share transactions | (13,115,772) | 26,537,419 |
Redemption fees | 2,321 | 1,295 |
Total increase (decrease) in net assets | (22,446,084) | 35,180,940 |
| | |
Net Assets | | |
Beginning of period | 197,658,789 | 162,477,849 |
End of period (including distributions in excess of net investment income of $1,176 and distributions in excess of net investment income of $1,771, respectively) | $ 175,212,705 | $ 197,658,789 |
Other Information Shares | | |
Sold | 2,477,257 | 4,841,291 |
Issued in reinvestment of distributions | 196,119 | 379,893 |
Redeemed | (3,904,541) | (2,811,105) |
Net increase (decrease) | (1,231,165) | 2,410,079 |
See accompanying notes which are an integral part of the financial statements.
Semiannual Report
Financial Highlights
| Six months ended
February 28, 2011 | Years ended August 31, |
| (Unaudited) | 2010 | 2009 | 2008 | 2007 | 2006 |
Selected Per-Share Data | | | | | |
Net asset value, beginning of period | $ 11.30 | $ 10.78 | $ 10.64 | $ 10.64 | $ 10.85 | $ 11.06 |
Income from Investment Operations | | | | | | |
Net investment income (loss) D | .182 | .375 | .392 | .397 | .403 | .409 |
Net realized and unrealized gain (loss) | (.520) | .521 | .151 | .022 | (.189) | (.140) |
Total from investment operations | (.338) | .896 | .543 | .419 | .214 | .269 |
Distributions from net investment income | (.182) | (.376) | (.393) | (.397) | (.403) | (.409) |
Distributions from net realized gain | - | - | (.010) | (.022) | (.021) | (.070) |
Total distributions | (.182) | (.376) | (.403) | (.419) | (.424) | (.479) |
Redemption fees added to paid in capital D, F | - | - | - | - | - | - |
Net asset value, end of period | $ 10.78 | $ 11.30 | $ 10.78 | $ 10.64 | $ 10.64 | $ 10.85 |
Total Return B, C | (3.00)% | 8.46% | 5.34% | 4.00% | 1.98% | 2.54% |
Ratios to Average Net Assets E | | | | | |
Expenses before reductions | .55% A | .55% | .55% | .55% | .55% | .55% |
Expenses net of fee waivers, if any | .55% A | .55% | .55% | .55% | .55% | .55% |
Expenses net of all reductions | .55% A | .55% | .54% | .50% | .48% | .50% |
Net investment income (loss) | 3.34% A | 3.42% | 3.79% | 3.71% | 3.73% | 3.79% |
Supplemental Data | | | | | | |
Net assets, end of period (000 omitted) | $ 175,213 | $ 197,659 | $ 162,478 | $ 156,623 | $ 131,645 | $ 111,373 |
Portfolio turnover rate | 19% A | 2% | 23% | 12% | 18% | 22% |
A Annualized
B Total returns for periods of less than one year are not annualized.
C Total returns would have been lower had certain expenses not been reduced during the periods shown.
D Calculated based on average shares outstanding during the period.
E Expense ratios reflect operating expenses of the Fund. Expenses before reductions do not reflect amounts reimbursed by the investment adviser or reductions from expense offset arrangements and do not represent the amount paid by the Fund during periods when reimbursements or reductions occur. Expenses net of fee waivers reflect expenses after reimbursement by the investment adviser but prior to reductions from expense offset arrangements. Expenses net of all reductions represent the net expenses paid by the Fund.
F Amount represents less than $.001 per share.
See accompanying notes which are an integral part of the financial statements.
Semiannual Report
Notes to Financial Statements
For the period ended February 28, 2011 (Unaudited)
1. Organization.
Fidelity Maryland Municipal Income Fund (the Fund) is a non-diversified fund of Fidelity Union Street Trust (the Trust) and is authorized to issue an unlimited number of shares. The Trust is registered under the Investment Company Act of 1940, as amended (the 1940 Act), as an open-end management investment company organized as a Massachusetts business trust. The Fund may be affected by economic and political developments in the state of Maryland.
2. Significant Accounting Policies.
The financial statements have been prepared in conformity with accounting principles generally accepted in the United States of America (GAAP), which require management to make certain estimates and assumptions at the date of the financial statements. Actual results could differ from those estimates. Subsequent events, if any, through the date that the financial statements were issued have been evaluated in the preparation of the financial statements. The following summarizes the significant accounting policies of the Fund:
Security Valuation. Investments are valued as of 4:00 p.m. Eastern time on the last calendar day of the period. The Fund uses independent pricing services approved by the Board of Trustees to value its investments. When current market prices or quotations are not readily available or reliable, valuations may be determined in good faith in accordance with procedures adopted by the Board of Trustees. Factors used in determining value may include market or security specific events, changes in interest rates and credit quality. The frequency with which these procedures are used cannot be predicted and they may be utilized to a significant extent. The value used for net asset value (NAV) calculation under these procedures may differ from published prices for the same securities.
The Fund categorizes the inputs to valuation techniques used to value its investments into a disclosure hierarchy consisting of three levels as shown below.
Level 1 - quoted prices in active markets for identical investments
Level 2 - other significant observable inputs (including quoted prices for similar investments, interest rates, prepayment speeds, etc.)
Level 3 - unobservable inputs (including the Fund's own assumptions based on the best information available)
Changes in valuation techniques may result in transfers in or out of an assigned level within the disclosure hierarchy. Valuation techniques used to value the Fund's investments by major category are as follows.
Semiannual Report
2. Significant Accounting Policies - continued
Security Valuation - continued
Debt securities, including restricted securities, are valued based on evaluated prices received from independent pricing services or from dealers who make markets in such securities. For municipal securities, pricing services utilize matrix pricing which considers yield or price of bonds of comparable quality, coupon, maturity and type as well as dealer supplied prices and are generally categorized as Level 2 in the hierarchy.
When independent prices are unavailable or unreliable, debt securities may be valued utilizing pricing matrices which consider similar factors that would be used by independent pricing services. These are generally categorized as Level 2 in the hierarchy but may be Level 3 depending on the circumstances.
Investment Transactions and Income. For financial reporting purposes, the Fund's investment holdings and NAV include trades executed through the end of the last business day of the period. The NAV per share for processing shareholder transactions is calculated as of the close of business of the New York Stock Exchange (NYSE), normally 4:00 p.m. Eastern time and includes trades executed through the end of the prior business day. Gains and losses on securities sold are determined on the basis of identified cost. Interest income is accrued as earned. Interest income includes coupon interest and amortization of premium and accretion of discount on debt securities.
Expenses. Expenses directly attributable to a fund are charged to that fund. Expenses attributable to more than one fund are allocated among the respective funds on the basis of relative net assets or other appropriate methods. Expense estimates are accrued in the period to which they relate and adjustments are made when actual amounts are known.
Income Tax Information and Distributions to Shareholders. Each year the Fund intends to qualify as a regulated investment company, including distributing substantially all of its taxable income and realized gains under Subchapter M of the Internal Revenue Code and filing its U.S. federal tax return. As a result, no provision for income taxes is required. A fund's federal tax return is subject to examination by the Internal Revenue Service (IRS) for a period of three years.
Dividends are declared and recorded daily and paid monthly from net investment income. Distributions from realized gains, if any, are declared and recorded on the ex-dividend date. Income and capital gain distributions are determined in accordance with income tax regulations, which may differ from GAAP.
Capital accounts within the financial statements are adjusted for permanent book-tax differences. These adjustments have no impact on net assets or the results of operations. Temporary book-tax differences will reverse in a subsequent period.
Semiannual Report
Notes to Financial Statements (Unaudited) - continued
2. Significant Accounting Policies - continued
Income Tax Information and Distributions to Shareholders - continued
Book-tax differences are primarily due to market discount, capital loss carryforwards and losses deferred due to excise tax regulations.
The Fund purchases municipal securities whose interest, in the opinion of the issuer, is free from federal income tax. There is no assurance that the IRS will agree with this opinion. In the event the IRS determines that the issuer does not comply with relevant tax requirements, interest payments from a security could become federally taxable, possibly retroactively to the date the security was issued.
The federal tax cost of investment securities and unrealized appreciation (depreciation) as of period end were as follows:
Gross unrealized appreciation | $ 3,717,099 |
Gross unrealized depreciation | (2,781,736) |
Net unrealized appreciation (depreciation) on securities and other investments | $ 935,363 |
| |
Tax cost | $ 165,594,487 |
Short-Term Trading (Redemption) Fees. Shares held by investors in the Fund less than 30 days are subject to a redemption fee equal to .50% of the net asset value of shares redeemed. All redemption fees, which reduce the proceeds of the shareholder redemption, are retained by the Fund and accounted for as an addition to paid in capital.
3. Purchases and Sales of Investments.
Purchases and sales of securities, other than short-term securities, aggregated $17,301,189 and $27,075,617, respectively.
4. Fees and Other Transactions with Affiliates.
Management Fee. Fidelity Management & Research Company (FMR) and its affiliates provide the Fund with investment management related services for which the Fund pays a monthly management fee that is based on an annual rate of .55% of the Fund's average net assets. FMR pays all other expenses, except the compensation of the independent Trustees and certain exceptions such as interest expense, including commitment fees. The management fee paid to FMR by the Fund is reduced by an amount equal to the fees and expenses paid by the Fund to the independent Trustees.
Semiannual Report
5. Committed Line of Credit.
The Fund participates with other funds managed by FMR or an affiliate in a $3.75 billion credit facility (the "line of credit") to be utilized for temporary or emergency purposes to fund shareholder redemptions or for other short-term liquidity purposes. The Fund has agreed to pay commitment fees on its pro-rata portion of the line of credit, which amounted to $352 and is reflected in Miscellaneous expenses on the Statement of Operations. During the period, there were no borrowings on this line of credit.
6. Expense Reductions.
Through arrangements with the Fund's custodian and transfer agent, credits realized as a result of uninvested cash balances were used to reduce the Fund's management fee. During the period, these credits reduced the Fund's management fee by $3,423.
7. Other.
The Fund's organizational documents provide former and current trustees and officers with a limited indemnification against liabilities arising in connection with the performance of their duties to the Fund. In the normal course of business, the Fund may also enter into contracts that provide general indemnifications. The Fund's maximum exposure under these arrangements is unknown as this would be dependent on future claims that may be made against the Fund. The risk of material loss from such claims is considered remote.
Semiannual Report
Board Approval of Investment Advisory Contracts and Management Fees
Fidelity Maryland Municipal Income Fund
Each year, the Board of Trustees, including the Independent Trustees (together, the Board), votes on the renewal of the management contract and sub-advisory agreements (together, the Advisory Contracts) for the fund. The Board, assisted by the advice of fund counsel and Independent Trustees' counsel, requests and considers a broad range of information relevant to the renewal of the Advisory Contracts throughout the year.
The Board meets regularly and considers at each of its meetings factors that are relevant to its annual consideration of the renewal of the fund's Advisory Contracts, including the services and support provided to the fund and its shareholders. The Board has established three standing committees, each composed of Independent Trustees with varying backgrounds, to which the Board has assigned specific subject matter responsibilities in order to enhance effective decision-making by the Board. The Operations Committee, of which all of the Independent Trustees are members, meets regularly throughout the year and, among other matters, considers matters specifically related to the annual consideration of the renewal of the fund's Advisory Contracts. The Board, acting directly and through its Committees, requests and receives information concerning the annual consideration of the renewal of the fund's Advisory Contracts. The Board also meets as needed to consider matters specifically related to the Board's annual consideration of the renewal of Advisory Contracts. Members of the Board may also meet with trustees of other Fidelity funds through ad hoc joint committees to discuss certain matters relevant to the Fidelity funds.
At its September 2010 meeting, the Board of Trustees, including the Independent Trustees, unanimously determined to renew the fund's Advisory Contracts. In reaching its determination, the Board considered all factors it believed relevant, including (i) the nature, extent, and quality of the services to be provided to the fund and its shareholders (including the investment performance of the fund); (ii) the competitiveness of the fund's management fee and total expenses; (iii) the total costs of the services to be provided by and the profits to be realized by Fidelity from its relationship with the fund; (iv) the extent to which economies of scale would be realized as the fund grows; and (v) whether fee levels reflect these economies of scale, if any, for the benefit of fund shareholders.
In considering whether to renew the Advisory Contracts for the fund, the Board reached a determination, with the assistance of fund counsel and Independent Trustees' counsel and through the exercise of its business judgment, that the renewal of the Advisory Contracts is in the best interests of the fund and its shareholders and that the compensation to be received by Fidelity under the management contract is fair and reasonable. The Board's decision to renew the Advisory Contracts was not based on any single factor, but rather was based on a comprehensive consideration of all the information provided to the Board at its meetings throughout the year. The Board, in reaching its determination to renew the Advisory Contracts, is aware that shareholders in the fund have a broad range of investment choices available to them, including a wide choice among mutual funds offered by Fidelity's competitors, and that the fund's shareholders, with the opportunity to review and weigh the disclosure provided by the fund in its prospectus and other public disclosures, have chosen to invest in this fund, managed by Fidelity.
Semiannual Report
Board Approval of Investment Advisory Contracts and
Management Fees - continued
Nature, Extent, and Quality of Services Provided. The Board considered the staffing within the investment adviser, FMR, and the sub-advisers (together, the Investment Advisers), including the backgrounds of the fund's investment personnel and the fund's investment objective and discipline. The Independent Trustees also had discussions with senior management of Fidelity's investment operations and investment groups. The Board considered the structure of the portfolio manager compensation program and whether this structure provides appropriate incentives to act in the best interest of the fund.
Resources Dedicated to Investment Management and Support Services. The Board reviewed the size, education, and experience of the Investment Advisers' investment staff, their use of technology, and the Investment Advisers' approach to recruiting, training, and retaining portfolio managers and other research, advisory, and management personnel. The Board noted that Fidelity's analysts have access to a variety of technological tools and market and securities data that enable them to perform both fundamental and quantitative analysis and to specialize in various disciplines. The Board considered Fidelity's extensive global research capabilities that enable the Investment Advisers to aggregate data from various sources in an effort to produce positive investment results. The Board also considered that Fidelity's portfolio managers and analysts have access to daily portfolio attribution that allows for monitoring of a fund's portfolio, as well as an electronic communication system that provides immediate real-time access to research concerning issuers and credit enhancers. In addition, the Board considered the trading resources that are an integral part of the fixed-income portfolio management investment process.
Shareholder and Administrative Services. The Board considered (i) the nature, extent, quality, and cost of advisory, administrative, and shareholder services performed by the Investment Advisers and their affiliates under the Advisory Contracts and under separate agreements covering transfer agency and pricing and bookkeeping services for the fund; (ii) the nature and extent of the investment adviser's supervision of third party service providers, principally custodians and subcustodians; and (iii) the resources devoted to, and the record of compliance with, the fund's compliance policies and procedures.
The Board noted that the growth of fund assets over time across the complex allows Fidelity to reinvest in the development of services designed to enhance the value or convenience of the Fidelity funds as investment vehicles. These services include 24-hour access to account information and market information through telephone representatives and over the Internet, and investor education materials and asset allocation tools.
Semiannual Report
Investment in a Large Fund Family. The Board considered the benefits to shareholders of investing in a Fidelity fund, including the benefits of investing in a fund that is part of a large family of funds offering a variety of investment disciplines and providing a large variety of mutual fund investor services. The Board noted that Fidelity had taken, or had made recommendations that resulted in the Fidelity funds taking, a number of actions over the previous year that benefited particular funds, including (i) dedicating additional resources to investment research and restructuring and broadening the focus of the investment research teams; (ii) bolstering the senior management team that oversees asset management; (iii) launching Class F of certain funds as a lower-fee class available to Freedom K and Freedom Index Funds; (iv) lowering the initial investment minimums and ongoing balance requirements for Real Estate High Income Fund; (v) eliminating subsequent purchase minimums for all funds and adding a waiver of the investment minimum requirement for new accounts opened with the proceeds of a systematic withdrawal plan; (vi) eliminating the withdrawal minimum and maximum limits for systematic withdrawals from Advisor funds; (vii) expanding sales load waivers on Class A shares for Destiny Planholders and expanding Institutional Class eligibility for Class O Destiny Planholders; and (viii) changing certain Class A and Class T sales charge structures to further align them with industry practices.
Investment Performance. The Board considered whether the fund has operated in accordance with its investment objective, as well as its record of compliance with its investment restrictions. It also reviewed the fund's absolute investment performance, as well as the fund's relative investment performance measured over multiple periods against (i) a broad-based securities market index, and (ii) a peer group of mutual funds deemed appropriate by Fidelity and reviewed by the Board. The following charts considered by the Board show, over the one-, three-, and five-year periods ended December 31, 2009, the fund's cumulative total returns, the cumulative total returns of a broad-based securities market index ("benchmark"), and a range of cumulative total returns of a peer group of mutual funds identified by Lipper Inc. as having an investment objective similar to that of the fund. The box within each chart shows the 25th percentile return (bottom of box) and the 75th percentile return (top of box) of the peer group. Returns shown above the box are in the first quartile and returns shown below the box are in the fourth quartile. The percentage beaten number noted below each chart corresponds to the percentile box and represents the percentage of funds in the peer group whose performance was equal to or lower than that of the fund.
Semiannual Report
Board Approval of Investment Advisory Contracts and
Management Fees - continued
Fidelity Maryland Municipal Income Fund
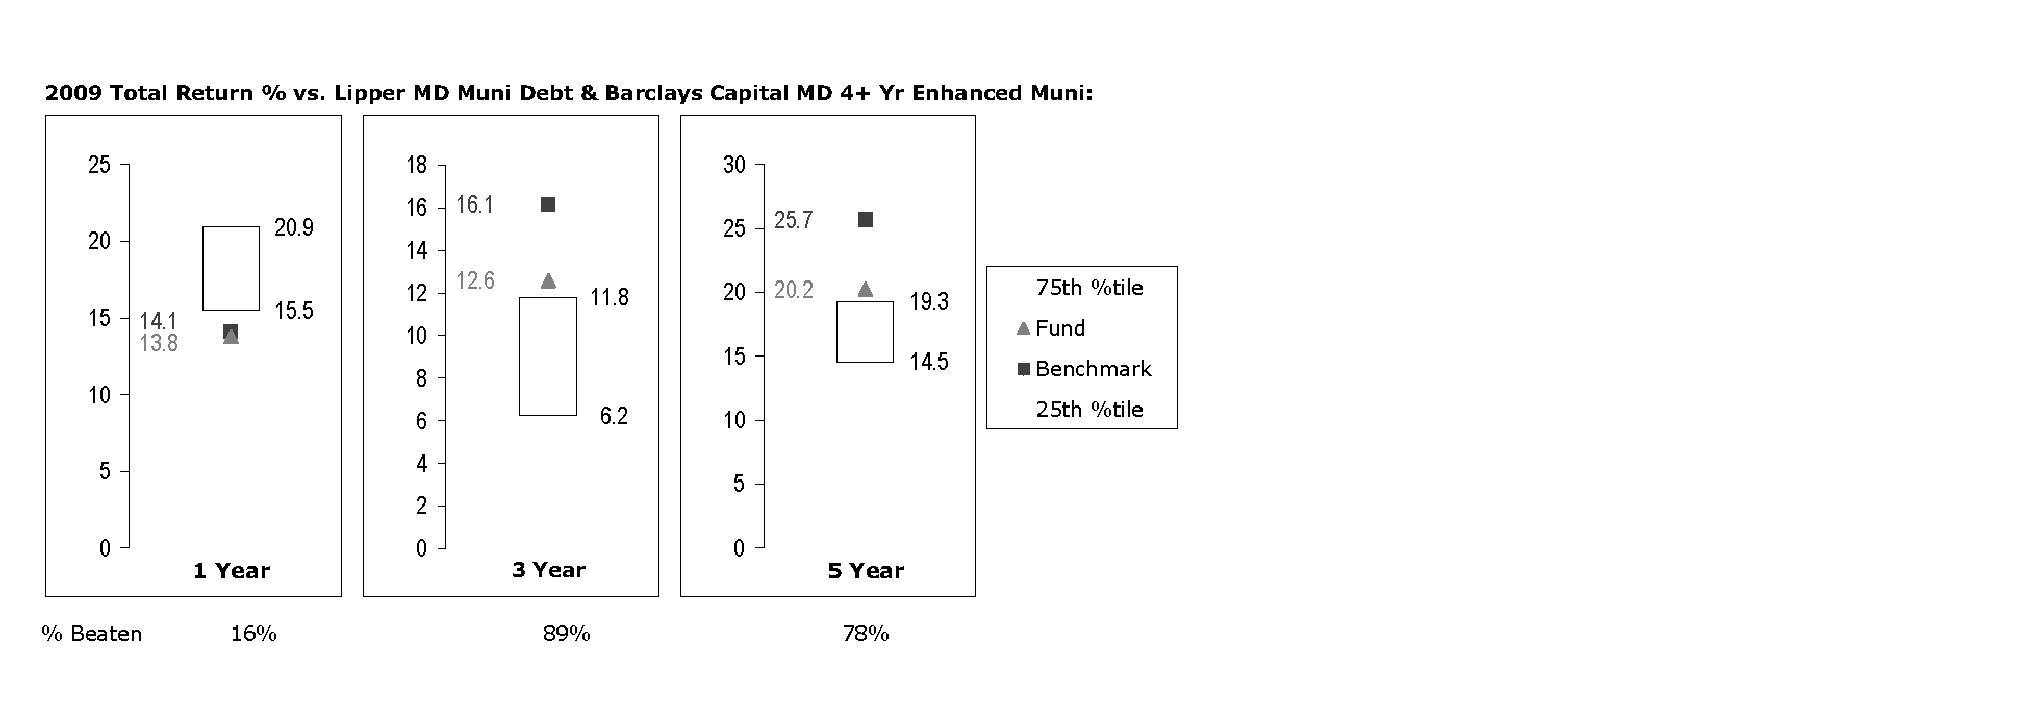
The Board reviewed the fund's relative investment performance against its peer group and noted that the performance of the fund was in the fourth quartile for the one-year period and the first quartile for the three- and five-year periods. The Board also noted that the investment performance of the fund was lower than its benchmark for all the periods shown. The Board discussed with FMR actions that have been taken by FMR to improve the fund's below-benchmark performance. The Board also reviewed the fund's performance since inception as well as performance in the current year.
Based on its review, and giving particular weight to the nature and quality of the resources dedicated by the Investment Advisers to maintain and improve relative performance and factoring in the unprecedented market events in recent years, the Board concluded that the nature, extent, and quality of investment management and support services and of shareholder and administrative services provided to the fund will benefit the fund's shareholders, particularly in light of the Board's view that the fund's shareholders benefit from investing in a fund that is part of a large family of funds offering a variety of investment disciplines and services.
Competitiveness of Management Fee and Total Fund Expenses. The Board considered the fund's management fee and total expenses compared to "mapped groups" of competitive funds and classes. Fidelity creates "mapped groups" by combining similar Lipper investment objective categories that have comparable management fee characteristics. Combining Lipper investment objective categories aids the Board's management fee and total expense comparisons by broadening the competitive group used for comparison and by reducing the number of universes to which various Fidelity funds are compared.
Semiannual Report
Management Fee. The Board considered two proprietary management fee comparisons for the 12-month periods shown in the chart below. The group of Lipper funds used by the Board for management fee comparisons is referred to below as the "Total Mapped Group" and, for the reasons explained above, is broader than the Lipper peer group used by the Board for performance comparisons. The Total Mapped Group comparison focuses on a fund's standing relative to the total universe of comparable funds available to investors, in terms of gross management fees before expense reimbursements or caps. "TMG %" represents the percentage of funds in the Total Mapped Group that had management fees that were lower than the fund's. For example, a TMG % of 11% means that 89% of the funds in the Total Mapped Group had higher management fees than the fund. The "Asset-Size Peer Group" (ASPG) comparison focuses on a fund's standing relative to non-Fidelity funds similar in size to the fund within the Total Mapped Group. The ASPG represents at least 15% of the funds in the Total Mapped Group with comparable asset size and management fee characteristics, subject to a minimum of 50 funds (or all funds in the Total Mapped Group if fewer than 50). Additional information, such as the ASPG quartile in which the fund's management fee ranked, is also included in the chart and considered by the Board. For a more meaningful comparison of management fees, the fund is compared on the basis of a hypothetical "net management fee," which is derived by subtracting payments made by FMR for non-management expenses (including transfer agent fees, pricing and bookkeeping fees, and fees paid to non-affiliated custodians) from the fund's all-inclusive fee. In this regard, the Board realizes that net management fees can vary from year to year because of differences in non-management expenses.
Semiannual Report
Board Approval of Investment Advisory Contracts and
Management Fees - continued
Fidelity Maryland Municipal Income Fund
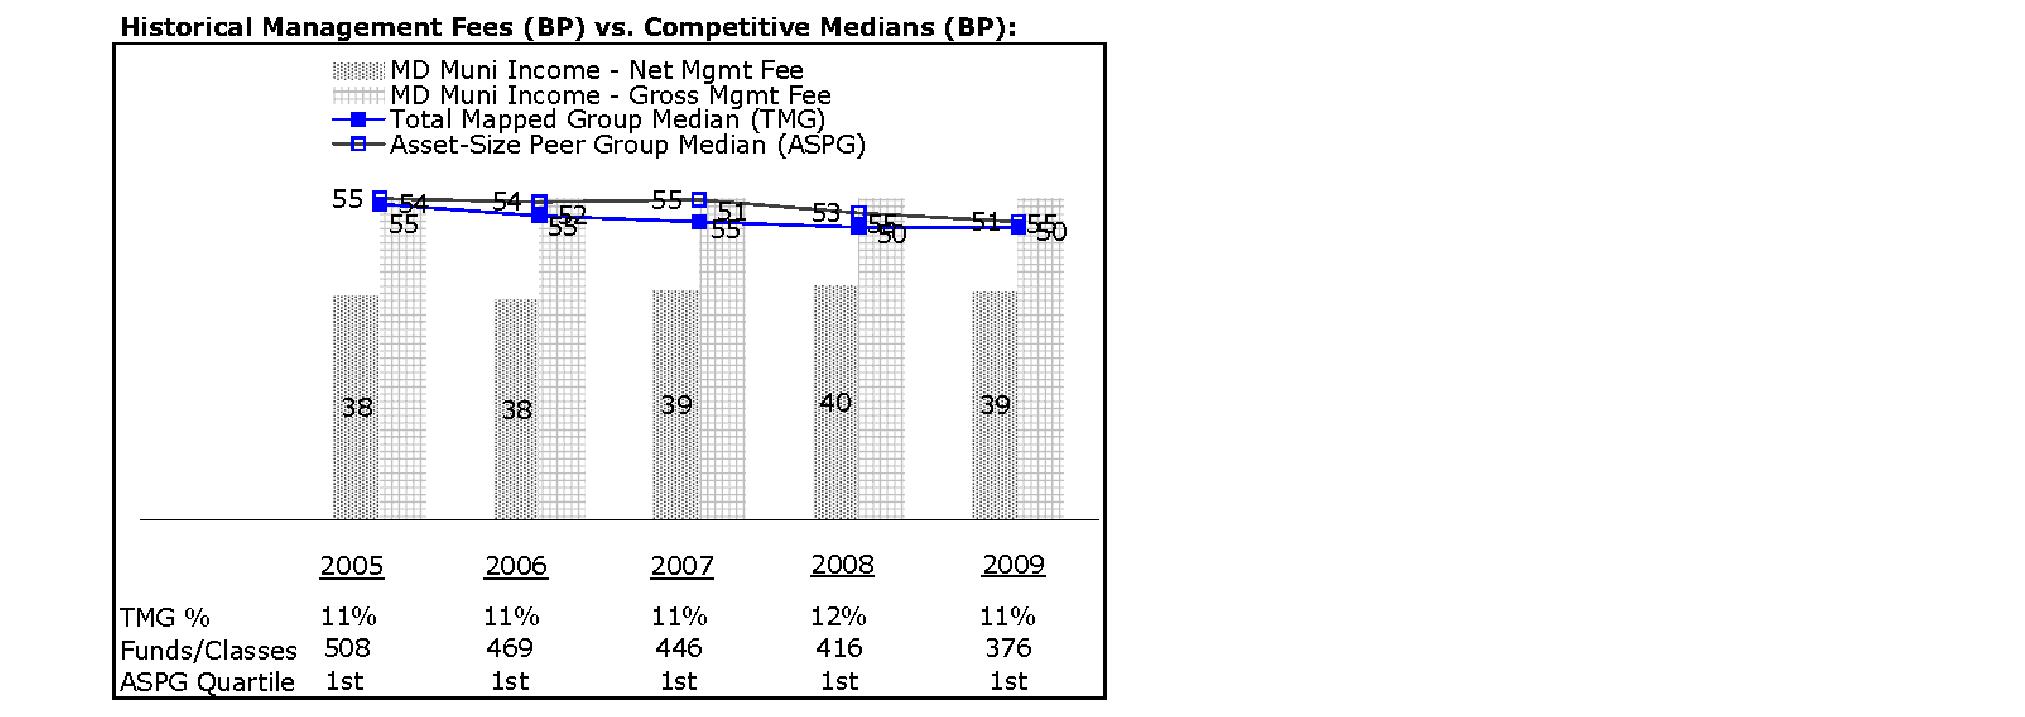
The Board noted that the fund's hypothetical net management fee ranked below the median of its Total Mapped Group and below the median of its ASPG for 2009.
Based on its review, the Board concluded that the fund's management fee is fair and reasonable in light of the services that the fund receives and the other factors considered.
Total Expenses. In its review of the fund's total expenses, the Board considered the fund's hypothetical net management fee as well as the fund's all-inclusive fee. The Board also considered other expenses, such as transfer agent fees, pricing and bookkeeping fees, and custodial, legal, and audit fees, paid by FMR under the all-inclusive arrangement. The Board also noted the effects of any waivers and reimbursements on fees and expenses. As part of its review, the Board also considered current and historical total expenses of the fund compared to competitive fund median expenses. The fund is compared to those funds and classes in the Total Mapped Group (used by the Board for management fee comparisons) that have a similar sales load structure.
The Board noted that the fund's total expenses ranked equal to its competitive median for 2009.
Fees Charged to Other Fidelity Clients. The Board also considered Fidelity fee structures and other information with respect to clients of FMR and its affiliates, such as other mutual funds advised or subadvised by FMR or its affiliates, pension plan clients, and other institutional clients. In March 2010, the Board created an ad hoc joint committee with the board of other Fidelity funds (the Committee) to review and compare Fidelity's institutional investment advisory business with its business of providing services to the Fidelity funds, including the differences in services provided, fees charged, and costs incurred, as well as competition in their respective marketplaces.
Semiannual Report
Based on its review of total expenses and fees charged to other Fidelity clients, the Board concluded that the fund's total expenses were reasonable in light of the services that the fund and its shareholders receive and the other factors considered, including the findings of the Committee.
Costs of the Services and Profitability. The Board considered the revenues earned and the expenses incurred by Fidelity in conducting the business of developing, marketing, distributing, managing, administering and servicing the fund and its shareholders. The Board also considered the level of Fidelity's profits in respect of all the Fidelity funds.
On an annual basis, FMR presents to the Board Fidelity's profitability for the fund. Fidelity calculates the profitability for each fund, as well as aggregate profitability for groups of Fidelity funds and all Fidelity funds, using a series of detailed revenue and cost allocation methodologies which originate with the audited books and records of Fidelity. The Audit Committee of the Board reviews any significant changes from the prior year's methodologies.
PricewaterhouseCoopers LLP (PwC), independent registered public accounting firm and auditor to Fidelity and certain Fidelity funds, has been engaged annually by the Board as part of the Board's assessment of Fidelity's profitability analysis. PwC's engagement includes the review and assessment of Fidelity's methodologies used in determining the revenues and expenses attributable to Fidelity's mutual fund business, and completion of agreed-upon procedures surrounding the mathematical accuracy of fund profitability and its conformity to allocation methodologies. After considering PwC's reports issued under the engagement and information provided by Fidelity, the Board believes that while other allocation methods may also be reasonable, Fidelity's profitability methodologies are reasonable in all material respects.
The Board has also reviewed Fidelity's non-fund businesses and fall-out benefits related to the mutual fund business as well as cases where Fidelity's affiliates may benefit from or be related to the fund's business.
The Board considered the costs of the services provided by and the profits realized by Fidelity in connection with the operation of the fund and were satisfied that the profitability was not excessive in the circumstances.
Economies of Scale. The Board considered whether there have been economies of scale in respect of the management of the Fidelity funds, whether the Fidelity funds (including the fund) have appropriately benefited from any such economies of scale, and whether there is potential for realization of any further economies of scale. The Board considered the extent to which the fund will benefit from economies of scale through increased services to the fund, through waivers or reimbursements, or through fee or expense reductions.
Semiannual Report
Board Approval of Investment Advisory Contracts and
Management Fees - continued
In February 2009, the Board and the board of other Fidelity funds created an ad hoc committee (the Economies of Scale Committee) to analyze whether FMR attains economies of scale in respect of the management and servicing of the Fidelity funds, whether the Fidelity funds have appropriately benefited from such economies of scale, and whether there is potential for realization of any further economies of scale.
The Board concluded, considering the findings of the Economies of Scale Committee, that any potential economies of scale are being appropriately shared between fund shareholders and Fidelity.
Additional Information Requested by the Board. In order to develop fully the factual basis for consideration of the Fidelity funds' Advisory Contracts, the Board requested and received additional information on certain topics, including (i) fund performance trends, actions to be taken by FMR to improve certain funds' overall performance, and Fidelity's long-term strategies for certain funds; (ii) Fidelity's fund profitability methodology and profitability trends for certain funds; (iii) portfolio manager changes that have occurred during the past year and the amount of the investment that each portfolio manager has made in the Fidelity fund(s) that he or she manages; (iv) Fidelity's compensation structure for portfolio managers, research analysts, and other key personnel, including its effects on fund profitability, the rationale for the compensation structure, and the extent to which current market conditions have affected retention and recruitment; (v) the compensation paid by FMR to fund sub-advisers on behalf of the Fidelity funds; (vi) Fidelity's fee structures and rationale for recommending different fees among different categories of funds and classes, as well as Fidelity's voluntary waiver of fees to maintain minimum yields for certain funds and classes; (vii) the rationale for any differences between fund fee structures and fee structures in place for other Fidelity clients; and (viii) explanations regarding the relative total expenses borne by certain funds and classes, total expense competitive trends, and actions that might be taken by FMR to reduce total expenses for certain funds and classes or to achieve further economies of scale.
Based on its evaluation of all of the conclusions noted above, and after considering all factors it believed relevant, the Board ultimately concluded that the advisory fee structures are fair and reasonable, and that the fund's Advisory Contracts should be renewed.
Semiannual Report
Managing Your Investments
Fidelity offers several ways to conveniently manage your personal investments via your telephone or PC. You can access your account information, conduct trades and research your investments 24 hours a day.
By Phone
Fidelity Automated Service Telephone provides a single toll-free number to access account balances, positions, quotes and trading. It's easy to navigate the service, and on your first call, the system will help you create a personal identification number (PIN) for security.
(phone_graphic)
Fidelity Automated
Service Telephone (FAST®)
1-800-544-5555
Press
For mutual fund and brokerage trading.
For quotes.*
For account balances and holdings.
To review orders and mutual
fund activity.
To change your PIN.
To speak to a Fidelity representative.
By PC
Fidelity's web site on the Internet provides a wide range of information, including daily financial news, fund performance, interactive planning tools and news about Fidelity products and services.
(computer_graphic)
Fidelity's Web Site
www.fidelity.com
* When you call the quotes line, please remember that a fund's yield and return will vary and, except for money market funds, share price will also vary. This means that you may have a gain or loss when you sell your shares. There is no assurance that money market funds will be able to maintain a stable $1 share price; an investment in a money market fund is not insured or guaranteed by the U.S. government. Total returns are historical and include changes in share price, reinvestment of dividends and capital gains distributions, and the effects of any sales charges.
Semiannual Report
Investment Adviser
Fidelity Management & Research Company
Boston, MA
Investment Sub-Advisers
Fidelity Investments
Money Management, Inc.
Fidelity Management & Research (U.K.) Inc.
Fidelity Management & Research
(Hong Kong) Limited
Fidelity Management & Research
(Japan) Inc.
General Distributor
Fidelity Distributors Corporation
Boston, MA
Transfer and Service Agents
Citibank, N.A.
New York, NY
Fidelity Service Company, Inc.
Boston, MA
Custodian
Citibank, N.A.
New York, NY
The Fidelity Telephone Connection
Mutual Fund 24-Hour Service
Exchanges/Redemptions
and Account Assistance 1-800-544-6666
Product Information 1-800-544-6666
Retirement Accounts 1-800-544-4774 (8 a.m. - 9 p.m.)
TDD Service 1-800-544-0118
for the deaf and hearing impaired
(9 a.m. - 9 p.m. Eastern time)
Fidelity Automated Service
Telephone (FAST®) 1-800-544-5555
Automated line for quickest service
SMD-USAN-0411
1.790944.107
Item 2. Code of Ethics
Not applicable.
Item 3. Audit Committee Financial Expert
Not applicable.
Item 4. Principal Accountant Fees and Services
Not applicable.
Item 5. Audit Committee of Listed Registrants
Not applicable.
Item 6. Investments
(a) Not applicable.
(b) Not applicable
Item 7. Disclosure of Proxy Voting Policies and Procedures for Closed-End Management Investment Companies
Not applicable.
Item 8. Portfolio Managers of Closed-End Management Investment Companies
Not applicable.
Item 9. Purchase of Equity Securities by Closed-End Management Investment Company and Affiliated Purchasers
Not applicable.
Item 10. Submission of Matters to a Vote of Security Holders
There were no material changes to the procedures by which shareholders may recommend nominees to the Fidelity Union Street Trust's Board of Trustees.
Item 11. Controls and Procedures
(a)(i) The President and Treasurer and the Chief Financial Officer have concluded that the Fidelity Union Street Trust's (the "Trust") disclosure controls and procedures (as defined in Rule 30a-3(c) under the Investment Company Act) provide reasonable assurances that material information relating to the Trust is made known to them by the appropriate persons, based on their evaluation of these controls and procedures as of a date within 90 days of the filing date of this report.
(a)(ii) There was no change in the Trust's internal control over financial reporting (as defined in Rule 30a-3(d) under the Investment Company Act) that occurred during the second fiscal quarter of the period covered by this report that has materially affected, or is reasonably likely to materially affect, the Trust's internal control over financial reporting.
Item 12. Exhibits
(a) | (1) | Not applicable. |
(a) | (2) | Certification pursuant to Rule 30a-2(a) under the Investment Company Act of 1940 (17 CFR 270.30a-2(a)) is filed and attached hereto as Exhibit 99.CERT. |
(a) | (3) | Not applicable. |
(b) | | Certification pursuant to Rule 30a-2(b) under the Investment Company Act of 1940 (17 CFR 270.30a-2(b)) is furnished and attached hereto as Exhibit 99.906CERT. |
SIGNATURES
Pursuant to the requirements of the Securities Exchange Act of 1934 and the Investment Company Act of 1940, the registrant has duly caused this report to be signed on its behalf by the undersigned, thereunto duly authorized.
Fidelity Union Street Trust
By: | /s/John R. Hebble |
| John R. Hebble |
| President and Treasurer |
| |
Date: | April 25, 2011 |
Pursuant to the requirements of the Securities Exchange Act of 1934 and the Investment Company Act of 1940, this report has been signed below by the following persons on behalf of the registrant and in the capacities and on the dates indicated.
By: | /s/John R. Hebble |
| John R. Hebble |
| President and Treasurer |
| |
Date: | April 25, 2011 |
By: | /s/Christine Reynolds |
| Christine Reynolds |
| Chief Financial Officer |
| |
Date: | April 25, 2011 |