UNITED STATES
SECURITIES AND EXCHANGE COMMISSION
Washington, D.C. 20549
FORM N-CSR
CERTIFIED SHAREHOLDER REPORT OF REGISTERED
MANAGEMENT INVESTMENT COMPANIES
Investment Company Act file number 811-2460
Fidelity Union Street Trust
(Exact name of registrant as specified in charter)
82 Devonshire St., Boston, Massachusetts 02109
(Address of principal executive offices) (Zip code)
Scott C. Goebel, Secretary
82 Devonshire St.
Boston, Massachusetts 02109
(Name and address of agent for service)
Registrant's telephone number, including area code: 617-563-7000
Date of fiscal year end: | August 31 |
| |
Date of reporting period: | February 29, 2012 |
Item 1. Reports to Stockholders
Fidelity®
Arizona Municipal
Income Fund
and
Fidelity
Arizona Municipal
Money Market Fund
Semiannual Report
February 29, 2012
(Fidelity Cover Art)
Contents
Shareholder Expense Example | (Click Here) | An example of shareholder expenses. |
Fidelity® Arizona Municipal Income Fund |
Investment Changes | (Click Here) | A summary of major shifts in the fund's investments over the past six months. |
Investments | (Click Here) | A complete list of the fund's investments with their market values. |
Financial Statements | (Click Here) | Statements of assets and liabilities, operations, and changes in net assets, as well as financial highlights. |
Fidelity Arizona Municipal Money Market Fund |
Investment Changes | (Click Here) | A summary of major shifts in the fund's investments over the past six months, and one year. |
Investments | (Click Here) | A complete list of the fund's investments. |
Financial Statements | (Click Here) | Statements of assets and liabilities, operations, and changes in net assets, as well as financial highlights. |
Notes | (Click Here) | Notes to the financial statements. |
Board Approval of Investment Advisory Contracts and Management Fees | (Click Here) | |
To view a fund's proxy voting guidelines and proxy voting record for the 12-month period ended June 30, visit http://www.fidelity.com/proxyvotingresults or visit the Securities and Exchange Commission's (SEC) web site at http://www.sec.gov. You may also call 1-800-544-8544 to request a free copy of the proxy voting guidelines.
Standard & Poor's, S&P and S&P 500 are registered service marks of The McGraw-Hill Companies, Inc. and have been licensed for use by Fidelity Distributors Corporation.
Other third party marks appearing herein are the property of their respective owners.
All other marks appearing herein are registered or unregistered trademarks or service marks of FMR LLC or an affiliated company.
This report and the financial statements contained herein are submitted for the general information of the shareholders of the funds. This report is not authorized for distribution to prospective investors in the funds unless preceded or accompanied by an effective prospectus.
A fund files its complete schedule of portfolio holdings with the SEC for the first and third quarters of each fiscal year on Form N-Q. Forms N-Q are available on the SEC's web site at http://www.sec.gov. A fund's Forms N-Q may be reviewed and copied at the SEC's Public Reference Room in Washington, DC. Information regarding the operation of the SEC's Public Reference Room may be obtained by calling 1-800-SEC-0330. For a complete list of a fund's portfolio holdings, view the most recent holdings listing, semiannual report, or annual report on Fidelity's web site at http://www.fidelity.com, http://www.advisor.fidelity.com, or http://www.401k.com, as applicable.
NOT FDIC INSURED • MAY LOSE VALUE • NO BANK GUARANTEE
Neither the funds nor Fidelity Distributors Corporation is a bank.
Semiannual Report
Shareholder Expense Example
As a shareholder of a Fund, you incur two types of costs: (1) transaction costs, including redemption fees, and (2) ongoing costs, including management fees and other Fund expenses. This Example is intended to help you understand your ongoing costs (in dollars) of investing in the Funds and to compare these costs with the ongoing costs of investing in other mutual funds.
The Example is based on an investment of $1,000 invested at the beginning of the period and held for the entire period (September 1, 2011 to February 29, 2012).
Actual Expenses
The first line of the accompanying table for each fund provides information about actual account values and actual expenses. You may use the information in this line, together with the amount you invested, to estimate the expenses that you paid over the period. Simply divide your account value by $1,000.00 (for example, an $8,600 account value divided by $1,000.00 = 8.6), then multiply the result by the number in the first line for a fund under the heading entitled "Expenses Paid During Period" to estimate the expenses you paid on your account during this period. A small balance maintenance fee of $12.00 that is charged once a year may apply for certain accounts with a value of less than $2,000. This fee is not included in the table below. If it was, the estimate of expenses you paid during the period would be higher, and your ending account value lower, by this amount. In addition, each Fund, as a shareholder in the underlying Fidelity Central Funds, will indirectly bear its pro-rata share of the fees and expenses incurred by the underlying Fidelity Central Funds. These fees and expenses are not included in the Fund's annualized expense ratio used to calculate the expense estimate in the table below.
Hypothetical Example for Comparison Purposes
The second line of the accompanying table for each fund provides information about hypothetical account values and hypothetical expenses based on a fund's actual expense ratio and an assumed rate of return of 5% per year before expenses, which is not the Fund's actual return. The hypothetical account values and expenses may not be used to estimate the actual ending account balance or expenses you paid for the period. You may use this information to compare the ongoing costs of investing in the Fund and other funds. To do so, compare this 5% hypothetical example with the 5% hypothetical examples that appear in the shareholder reports of the other funds. A small balance maintenance fee of $12.00 that is charged once a year may apply for certain accounts with a value of less than $2,000. This fee is not included in the table below. If it was, the estimate of expenses you paid during the period would be higher, and your ending account value lower, by this amount. In addition, each Fund, as a shareholder in the underlying Fidelity Central Funds, will indirectly bear its pro-rata share of the fees and expenses incurred by the underlying Fidelity Central Funds. These fees and expenses are not included in the Fund's annualized expense ratio used to calculate the expense estimate in the table below.
Please note that the expenses shown in the table are meant to highlight your ongoing costs only and do not reflect any transaction costs. Therefore, the second line of the table is useful in comparing ongoing costs only, and will not help you determine the relative total costs of owning different funds. In addition, if these transactional costs were included, your costs would have been higher.
Semiannual Report
| Annualized
Expense Ratio | Beginning
Account Value
September 1, 2011 | Ending
Account Value
February 29, 2012 | Expenses Paid
During Period*
September 1, 2011 to February 29, 2012 |
Fidelity Arizona Municipal Income Fund | .55% | | | |
Actual | | $ 1,000.00 | $ 1,058.50 | $ 2.81 |
HypotheticalA | | $ 1,000.00 | $ 1,022.13 | $ 2.77 |
Fidelity Arizona Municipal Money Market Fund | .17% | | | |
Actual | | $ 1,000.00 | $ 1,000.05 | $ .85** |
HypotheticalA | | $ 1,000.00 | $ 1,024.02 | $ .86** |
A 5% return per year before expenses
* Expenses are equal to each Fund's annualized expense ratio, multiplied by the average account value over the period, multiplied by 182/366 (to reflect the one-half year period).
** If certain fees were not voluntarily waived by FMR or its affiliates during the period, the annualized expense ratio for the Fidelity Arizona Municipal Money Market Fund would have been .50% and the expenses paid in the actual and hypothetical examples above would have been $2.48 and $2.51, respectively.
Semiannual Report
Fidelity Arizona Municipal Income Fund
Investment Changes (Unaudited)
Top Five Sectors as of February 29, 2012 |
| % of fund's
net assets | % of fund's net assets
6 months ago |
General Obligations | 20.2 | 21.8 |
Special Tax | 20.2 | 18.0 |
Electric Utilities | 16.3 | 15.1 |
Water & Sewer | 14.1 | 15.6 |
Health Care | 12.6 | 11.1 |
Weighted Average Maturity as of February 29, 2012 |
| | 6 months ago |
Years | 6.2 | 6.7 |
This is a weighted average of all the maturities of the securities held in a fund. Weighted Average Maturity (WAM) can be used as a measure of sensitivity to interest rate changes and market changes. Generally, the longer the maturity, the greater the sensitivity to such changes. WAM is based on the dollar-weighted average length of time until principal payments must be paid. Depending on the types of securities held in a fund, certain maturity shortening devices (e.g., demand features, interest rate resets, and call options) may be taken into account when calculating the WAM. |
Duration as of February 29, 2012 |
| | 6 months ago |
Years | 7.5 | 7.9 |
Duration estimates how much a bond fund's price will change with a change in comparable interest rates. If rates rise 1%, for example, a fund with a 5-year duration is likely to lose about 5% of its value. Other factors also can influence a bond fund's performance and share price. Accordingly, a bond fund's actual performance may differ from this example. Duration takes into account any call or put option embedded in the bonds. |
Quality Diversification (% of fund's net assets) |
As of February 29, 2012 | As of August 31, 2011 |
 | AAA 4.6% | | | AAA 4.1% | |
 | AA,A 77.7% | | | AA,A 75.0% | |
 | BBB 16.1% | | | BBB 16.5% | |
 | BB and Below 1.0% | | | BB and Below 1.0% | |
 | Not Rated 0.0% | | | Not Rated 0.3% | |
 | Short-Term
Investments and
Net Other Assets 0.6% | | | Short-Term
Investments and
Net Other Assets 3.1% | |

We have used ratings from Moody's Investors Service, Inc. Where Moody's® ratings are not available, we have used S&P® ratings. All ratings are as of the date indicated and do not reflect subsequent changes. |
Semiannual Report
Fidelity Arizona Municipal Income Fund
Investments February 29, 2012 (Unaudited)
Showing Percentage of Net Assets
Municipal Bonds - 99.4% |
| Principal Amount | | Value |
Arizona - 95.0% |
Arizona Board of Regents Arizona State Univ. Rev. (Polytechnic Campus Proj.) Series 2008 C: | | | | |
5.75% 7/1/22 | | $ 1,500,000 | | $ 1,792,110 |
5.75% 7/1/23 | | 250,000 | | 296,910 |
Arizona Board of Regents Ctfs. of Prtn.: | | | | |
(Arizona Biomedical Research Collaborative Bldg. Proj.) Series 2006, 5% 6/1/19 (AMBAC Insured) | | 1,140,000 | | 1,267,007 |
(Univ. of Arizona Projs.) Series 2006 A, 5% 6/1/18 (AMBAC Insured) | | 1,000,000 | | 1,105,860 |
Arizona Ctfs. of Partnership: | | | | |
Series 2008 A, 5% 9/1/20 (FSA Insured) | | 1,640,000 | | 1,842,474 |
Series 2010 A, 5% 10/1/29 (FSA Insured) | | 5,000,000 | | 5,477,550 |
Arizona Game and Fish Dept. and Commission (AGF Administration Bldg. Proj.) Series 2006: | | | | |
5% 7/1/21 | | 1,280,000 | | 1,377,075 |
5% 7/1/32 | | 470,000 | | 487,517 |
Arizona Health Facilities Auth. Rev.: | | | | |
(Banner Health Sys. Proj.): | | | | |
Series 2007 A, 5% 1/1/21 | | 1,000,000 | | 1,119,630 |
Series 2007 B, 1.199% 1/1/37 (c) | | 1,000,000 | | 710,000 |
Series 2008 A, 5.25% 1/1/31 | | 1,000,000 | | 1,083,730 |
Series 2008 D, 6% 1/1/27 | | 1,000,000 | | 1,156,230 |
Series D, 5.375% 1/1/32 | | 1,000,000 | | 1,087,500 |
Series 2011 B1, 5.25% 3/1/39 | | 1,000,000 | | 1,067,900 |
Arizona School Facilities Board Ctfs. of Prtn.: | | | | |
Series 2005 A2, 5% 9/1/16 (Nat'l. Pub. Fin. Guarantee Corp. Insured) | | 1,665,000 | | 1,848,566 |
Series 2008: | | | | |
5.5% 9/1/16 | | 1,680,000 | | 1,944,533 |
5.75% 9/1/22 | | 1,000,000 | | 1,163,620 |
Series A2, 5% 9/1/18 (Nat'l. Pub. Fin. Guarantee Corp. Insured) | | 1,000,000 | | 1,091,430 |
Arizona State Lottery Rev. Series 2010 A, 5% 7/1/21 (FSA Insured) | | 1,000,000 | | 1,164,230 |
Arizona State Univ. Ctfs. of Partnership (Research Infrastructure Proj.) Series 2004, 5.25% 9/1/24 | | 1,230,000 | | 1,291,967 |
Arizona State Univ. Revs. Series 2005, 5% 7/1/26 (AMBAC Insured) | | 1,000,000 | | 1,059,820 |
Arizona Trans. Board Hwy. Rev.: | | | | |
Series 2006, 5% 7/1/22 | | 400,000 | | 455,492 |
Series 2008 A, 5% 7/1/33 | | 1,000,000 | | 1,114,970 |
Series 2011 A, 5.25% 7/1/26 | | 1,250,000 | | 1,512,250 |
Municipal Bonds - continued |
| Principal Amount | | Value |
Arizona - continued |
Arizona Wtr. Infrastructure Fin. Auth. Rev.: | | | | |
(Wtr. Quality Proj.) Series 2006 A, 5% 10/1/23 (Pre-Refunded to 10/1/16 @ 100) | | $ 500,000 | | $ 600,575 |
Series 2009 A, 5% 10/1/29 | | 1,000,000 | | 1,167,720 |
Series 2010 A, 5% 10/1/30 | | 2,000,000 | | 2,334,880 |
Series 2012 A, 5% 10/1/24 (b) | | 2,000,000 | | 2,508,460 |
Avondale Muni. Dev. Corp. Excise Tax Rev. 5% 7/1/28 | | 500,000 | | 555,050 |
Cottonwood Wtr. Sys. Rev.: | | | | |
5% 7/1/26 (XL Cap. Assurance, Inc. Insured) | | 1,405,000 | | 1,480,715 |
5% 7/1/30 (XL Cap. Assurance, Inc. Insured) | | 1,125,000 | | 1,172,363 |
5% 7/1/35 (XL Cap. Assurance, Inc. Insured) | | 1,300,000 | | 1,328,782 |
Downtown Phoenix Hotel Corp. Rev. Series A, 5.25% 7/1/23 (FGIC Insured) | | 1,750,000 | | 1,732,220 |
Glendale Indl. Dev. Auth. (Midwestern Univ. Proj.) Series 2007, 5.25% 5/15/19 | | 1,000,000 | | 1,156,490 |
Glendale Indl. Dev. Auth. Hosp. Rev. (John C. Lincoln Health Network Proj.): | | | | |
Series 2005 B, 5.25% 12/1/19 | | 1,040,000 | | 1,076,629 |
Series 2005, 5% 12/1/35 | | 1,000,000 | | 979,510 |
Series 2007: | | | | |
5% 12/1/27 | | 1,000,000 | | 1,006,370 |
5% 12/1/32 | | 1,000,000 | | 991,000 |
Glendale Western Loop 101 Pub. Facilities Corp. Series 2008 A: | | | | |
6.25% 7/1/38 | | 3,000,000 | | 3,128,040 |
7% 7/1/33 | | 2,000,000 | | 2,185,920 |
Goodyear McDowell Road Commercial Corridor Impt. District 5.25% 1/1/17 (AMBAC Insured) | | 1,580,000 | | 1,792,320 |
Goodyear Pub. Impt. Corp. Facilities Rev. Series 2008, 6% 7/1/31 | | 1,000,000 | | 1,133,360 |
Marana Muni. Property Corp. Facilities Rev. Series A, 5.25% 7/1/22 | | 1,620,000 | | 1,842,410 |
Maricopa County Indl. Dev. Auth. Health Facilities Rev.: | | | | |
(Catholic Healthcare West Proj.): | | | | |
Series 2007 A, 5% 7/1/16 | | 1,000,000 | | 1,123,160 |
Series 2009 A, 6% 7/1/39 | | 1,000,000 | | 1,124,450 |
Series A, 5.25% 7/1/32 | | 1,000,000 | | 1,056,390 |
(Mayo Clinic Proj.) 5% 11/15/36 | | 1,000,000 | | 1,045,280 |
Maricopa County Poll. Cont. Rev. (Southern California Edison Co. Proj.) Series 2000 A, 5% 6/1/35 | | 3,000,000 | | 3,261,300 |
McAllister Academic Village LLC Rev. (Arizona State Univ. Hassayampa Academic Village Proj.) Series 2008, 5% 7/1/38 | | 1,000,000 | | 1,046,780 |
Municipal Bonds - continued |
| Principal Amount | | Value |
Arizona - continued |
Mesa Hwy. Proj. Advancement Series 2011 A: | | | | |
5% 7/1/17 | | $ 500,000 | | $ 564,485 |
5% 7/1/21 | | 1,000,000 | | 1,107,500 |
Mesa Util. Sys. Rev.: | | | | |
Series 2011, 5% 7/1/35 | | 2,000,000 | | 2,225,000 |
5% 7/1/24 (FGIC Insured) | | 1,000,000 | | 1,230,240 |
Navajo County Poll. Cont. Corp. Rev. Bonds (Arizona Pub. Svc. Co. Cholla Proj.) Series 2009 A, 5%, tender 6/1/12 (c) | | 2,000,000 | | 2,020,080 |
Northern Arizona Univ. Revs.: | | | | |
Series 2012: | | | | |
5% 6/1/36 | | 500,000 | | 537,075 |
5% 6/1/41 | | 1,250,000 | | 1,332,750 |
5% 6/1/21 (AMBAC Insured) | | 1,085,000 | | 1,205,544 |
Phoenix Civic Impt. Board Arpt. Rev.: | | | | |
Series A, 5% 7/1/33 | | 1,000,000 | | 1,073,220 |
Series B, 5.25% 7/1/27 (Nat'l. Pub. Fin. Guarantee Corp. Insured) (d) | | 1,100,000 | | 1,104,312 |
Phoenix Civic Impt. Corp. District Rev. (Plaza Expansion Proj.) Series 2005 B, 0% 7/1/38 (a) | | 2,000,000 | | 2,117,080 |
Phoenix Civic Impt. Corp. Excise Tax Rev.: | | | | |
(Civic Plaza Expansion Proj.) Series 2005 A: | | | | |
5% 7/1/18 (FGIC Insured) | | 550,000 | | 612,904 |
5% 7/1/30 (Nat'l. Pub. Fin. Guarantee Corp. Insured) | | 1,000,000 | | 1,067,980 |
Series 2007 A, 5% 7/1/22 (Nat'l. Pub. Fin. Guarantee Corp. Insured) | | 1,250,000 | | 1,394,225 |
Series 2011 A, 5% 7/1/18 | | 1,035,000 | | 1,265,981 |
Series A, 5% 7/1/17 | | 1,000,000 | | 1,208,540 |
Phoenix Civic Impt. Corp. Wastewtr. Sys. Rev.: | | | | |
Series 2004: | | | | |
5% 7/1/24 | | 1,750,000 | | 1,902,653 |
5% 7/1/29 (Nat'l. Pub. Fin. Guarantee Corp. Insured) | | 770,000 | | 810,464 |
Series 2007, 5% 7/1/20 (Nat'l. Pub. Fin. Guarantee Corp. Insured) | | 1,000,000 | | 1,142,570 |
Phoenix Civic Impt. Corp. Wtr. Sys. Rev.: | | | | |
Series 2001, 5.5% 7/1/24 (Nat'l. Pub. Fin. Guarantee Corp. Insured) | | 1,000,000 | | 1,315,180 |
Series 2005: | | | | |
5% 7/1/20 | | 5,000,000 | | 5,564,950 |
5% 7/1/29 | | 1,750,000 | | 1,885,678 |
Phoenix Gen. Oblig. 5.375% 7/1/20 | | 615,000 | | 624,231 |
Municipal Bonds - continued |
| Principal Amount | | Value |
Arizona - continued |
Phoenix-Mesa Gateway Arpt. Auth. (Mesa Proj.) Series 2012: | | | | |
5% 7/1/24 (d) | | $ 380,000 | | $ 415,895 |
5% 7/1/27 (d) | | 400,000 | | 428,984 |
Pima County Ctfs. of Prtn. (Justice Bldg. Proj.): | | | | |
Series 2007 A, 5% 7/1/19 (AMBAC Insured) | | 650,000 | | 710,808 |
Series A, 5% 7/1/21 (AMBAC Insured) | | 910,000 | | 972,981 |
Pima County Gen. Oblig. Series 2011, 5% 7/1/21 | | 1,000,000 | | 1,215,060 |
Pima County Swr. Sys. Rev. Series 2011 B, 5% 7/1/25 | | 1,000,000 | | 1,163,320 |
Pima County Unified School District #1 Tucson (Proj. of 2004): | | | | |
Series 2007 C, 5% 7/1/23 (FGIC Insured) | | 1,000,000 | | 1,114,850 |
Series 2008 D, 5% 7/1/25 (FSA Insured) | | 1,000,000 | | 1,112,530 |
Pinal County Indl. Dev. Auth. Correctional Facilities Contract Rev. (Florence West Prison Proj.): | | | | |
Series 2006 A, 5.25% 10/1/12 (ACA Finl. Guaranty Corp. Insured) | | 1,000,000 | | 1,012,760 |
Series 2007 A, 5.25% 10/1/13 (ACA Finl. Guaranty Corp. Insured) | | 1,335,000 | | 1,372,874 |
Pinal County Unified School District #44 J.O. Combs (2006 School Impt. Proj.) Series B, 5% 7/1/21 (Nat'l. Pub. Fin. Guarantee Corp. Insured) | | 860,000 | | 956,965 |
Queen Creek Excise Tax & State Shared Rev. 5% 8/1/22 (Nat'l. Pub. Fin. Guarantee Corp. Insured) | | 1,125,000 | | 1,224,169 |
Salt River Proj. Agricultural Impt. & Pwr. District Elec. Sys. Rev.: | | | | |
Series 2005 A, 5% 1/1/35 | | 3,000,000 | | 3,309,720 |
Series 2006 A, 5% 1/1/37 | | 5,690,000 | | 6,099,963 |
Series 2008 A: | | | | |
5% 1/1/24 | | 1,075,000 | | 1,246,258 |
5% 1/1/33 | | 1,000,000 | | 1,106,640 |
5% 1/1/38 | | 3,400,000 | | 3,713,140 |
Series 2010 B, 5% 12/1/26 | | 2,000,000 | | 2,391,980 |
Series B, 5% 1/1/31 | | 1,340,000 | | 1,374,023 |
Salt Verde Finl. Corp. Sr. Gas Rev. Series 2007, 5.5% 12/1/29 | | 3,000,000 | | 3,244,890 |
Scottsdale Gen. Oblig. Series 2011, 5% 7/1/20 | | 1,000,000 | | 1,241,910 |
Scottsdale Indl. Dev. Auth. Hosp. Rev. (Scottsdale Healthcare Proj.): | | | | |
Series 2006 C, 5% 9/1/35 (FSA Insured) | | 415,000 | | 445,548 |
Series 2008 A: | | | | |
5% 9/1/16 | | 1,000,000 | | 1,110,920 |
5% 9/1/23 | | 355,000 | | 378,664 |
Municipal Bonds - continued |
| Principal Amount | | Value |
Arizona - continued |
Scottsdale Muni. Property Corp. Excise Tax Rev. (Wtr. and Swr. Impt. Proj.) Series 2008 A, 5% 7/1/28 | | $ 1,050,000 | | $ 1,191,414 |
Sedona Excise Tax Rev.: | | | | |
Series 2004, 5% 7/1/15 (Nat'l. Pub. Fin. Guarantee Corp. Insured) | | 2,120,000 | | 2,279,763 |
Series 2005, 5% 7/1/19 (Nat'l. Pub. Fin. Guarantee Corp. Insured) | | 1,000,000 | | 1,060,150 |
Tempe Gen. Oblig. Series 2006, 5% 7/1/20 | | 3,200,000 | | 3,674,208 |
Tempe Transit Excise Tax Rev. Series 2008, 4.75% 7/1/38 | | 60,000 | | 64,218 |
Tucson Ctfs. of Prtn.: | | | | |
Series 2006 A, 5% 7/1/18 (Nat'l. Pub. Fin. Guarantee Corp. Insured) | | 3,050,000 | | 3,378,912 |
Series 2007, 5% 7/1/18 (Nat'l. Pub. Fin. Guarantee Corp. Insured) | | 1,000,000 | | 1,128,610 |
Univ. Med. Ctr. Corp. Hosp. Rev.: | | | | |
Series 2005, 5% 7/1/16 | | 1,305,000 | | 1,386,928 |
Series 2011, 6% 7/1/39 | | 2,235,000 | | 2,477,028 |
Univ. of Arizona Univ. Revs.: | | | | |
(Univ. of Arizona Projs.): | | | | |
Series 2003 B, 5% 6/1/31 (AMBAC Insured) | | 300,000 | | 305,868 |
Series 2005 A, 5% 6/1/24 (AMBAC Insured) | | 1,040,000 | | 1,092,853 |
Series 2005 C, 5% 6/1/14 (AMBAC Insured) | | 165,000 | | 177,969 |
Series 2008 A, 5% 6/1/22 | | 1,315,000 | | 1,511,145 |
Series 2009 A, 5% 6/1/39 | | 1,000,000 | | 1,084,480 |
Yavapai County Indl. Dev. Auth. (Northern Healthcare Sys. Proj.) Series 2011, 5% 10/1/20 | | 1,000,000 | | 1,164,950 |
Yavapai County Indl. Dev. Auth. Solid Waste Disp. Rev. Bonds (Waste Mgmt., Inc. Proj.) Series 2002, 3.5%, tender 6/3/13 (c)(d) | | 1,000,000 | | 1,028,940 |
| | 163,033,475 |
Guam - 0.3% |
Guam Ed. Fing. Foundation Ctfs. of Prtn. Series A, 5% 10/1/12 | | 500,000 | | 506,475 |
Puerto Rico - 3.9% |
Puerto Rico Commonwealth Hwy. & Trans. Auth. Trans. Rev.: | | | | |
Series 1998, 5.75% 7/1/22 (CIFG North America Insured) | | 700,000 | | 723,443 |
Series 2003, 5.75% 7/1/19 (FGIC Insured) | | 700,000 | | 735,945 |
Puerto Rico Commonwealth Pub. Impt. Gen. Oblig. Series 2002 A, 5.5% 7/1/18 | | 700,000 | | 797,041 |
Municipal Bonds - continued |
| Principal Amount | | Value |
Puerto Rico - continued |
Puerto Rico Govt. Dev. Bank: | | | | |
Series 2006 B, 5% 12/1/12 | | $ 1,000,000 | | $ 1,030,040 |
Series 2006 C, 5.25% 1/1/15 (d) | | 500,000 | | 531,880 |
Puerto Rico Pub. Bldg. Auth. Rev.: | | | | |
Bonds Series M2, 5.75%, tender 7/1/17 (c) | | 200,000 | | 223,004 |
Series G, 5.25% 7/1/13 | | 315,000 | | 318,938 |
Puerto Rico Sales Tax Fing. Corp. Sales Tax Rev.: | | | | |
Series 2007 A, 0% 8/1/41 (FGIC Insured) | | 3,200,000 | | 639,776 |
Series 2009 A, 6% 8/1/42 | | 1,300,000 | | 1,470,508 |
Series 2011 C, 0% 8/1/39 | | 1,200,000 | | 282,348 |
| | 6,752,923 |
Virgin Islands - 0.2% |
Virgin Islands Pub. Fin. Auth. Series 2009 B, 5% 10/1/25 | | 300,000 | | 321,447 |
TOTAL INVESTMENT PORTFOLIO - 99.4% (Cost $160,711,539) | | 170,614,320 |
NET OTHER ASSETS (LIABILITIES) - 0.6% | | 1,102,509 |
NET ASSETS - 100% | $ 171,716,829 |
Legend |
(a) Security initially issued in zero coupon form which converts to coupon form at a specified rate and date. The rate shown is the rate at period end. |
(b) Security or a portion of the security purchased on a delayed delivery or when-issued basis. |
(c) Coupon rates for floating and adjustable rate securities reflect the rates in effect at period end. |
(d) Private activity obligations whose interest is subject to the federal alternative minimum tax for individuals. |
Other Information |
All investments are categorized as Level 2 under the Fair Value Hierarchy. The inputs or methodology used for valuing securities may not be an indication of the risk associated with investing in those securities. For more information on valuation inputs, please refer to the Security Valuation section in the accompanying Notes to Financial Statements. |
The distribution of municipal securities by revenue source, as a percentage of total net assets, is as follows (Unaudited): |
General Obligations | 20.2% |
Special Tax | 20.2% |
Electric Utilities | 16.3% |
Water & Sewer | 14.1% |
Health Care | 12.6% |
Education | 9.4% |
Others* (Individually Less Than 5%) | 7.2% |
| 100.0% |
*Includes net other assets |
See accompanying notes which are an integral part of the financial statements.
Semiannual Report
Fidelity Arizona Municipal Income Fund
Statement of Assets and Liabilities
| February 29, 2012 (Unaudited) |
Assets | | |
Investment in securities, at value - See accompanying schedule: Unaffiliated issuers (cost $160,711,539) | | $ 170,614,320 |
Cash | | 2,015,613 |
Receivable for fund shares sold | | 324,014 |
Interest receivable | | 1,703,034 |
Other receivables | | 186 |
Total assets | | 174,657,167 |
| | |
Liabilities | | |
Payable for investments purchased on a delayed delivery basis | $ 2,499,700 | |
Payable for fund shares redeemed | 163,263 | |
Distributions payable | 199,069 | |
Accrued management fee | 78,306 | |
Total liabilities | | 2,940,338 |
| | |
Net Assets | | $ 171,716,829 |
Net Assets consist of: | | |
Paid in capital | | $ 162,072,508 |
Undistributed net investment income | | 20,898 |
Accumulated undistributed net realized gain (loss) on investments | | (279,358) |
Net unrealized appreciation (depreciation) on investments | | 9,902,781 |
Net Assets, for 14,301,038 shares outstanding | | $ 171,716,829 |
Net Asset Value, offering price and redemption price per share ($171,716,829 ÷ 14,301,038 shares) | | $ 12.01 |
See accompanying notes which are an integral part of the financial statements.
Semiannual Report
Statement of Operations
| Six months ended February 29, 2012 (Unaudited) |
Investment Income | | |
Interest | | $ 3,366,287 |
| | |
Expenses | | |
Management fee | $ 452,990 | |
Independent trustees' compensation | 302 | |
Miscellaneous | 225 | |
Total expenses before reductions | 453,517 | |
Expense reductions | (384) | 453,133 |
Net investment income (loss) | | 2,913,154 |
Realized and Unrealized Gain (Loss) Net realized gain (loss) on: | | |
Investment securities: | | |
Unaffiliated issuers | | 245,234 |
Change in net unrealized appreciation (depreciation) on investment securities | | 6,181,634 |
Net gain (loss) | | 6,426,868 |
Net increase (decrease) in net assets resulting from operations | | $ 9,340,022 |
See accompanying notes which are an integral part of the financial statements.
Semiannual Report
Fidelity Arizona Municipal Income Fund
Financial Statements - continued
Statement of Changes in Net Assets
| Six months ended February 29,
2012
(Unaudited) | Year ended
August 31,
2011 |
Increase (Decrease) in Net Assets | | |
Operations | | |
Net investment income (loss) | $ 2,913,154 | $ 6,009,653 |
Net realized gain (loss) | 245,234 | (221,231) |
Change in net unrealized appreciation (depreciation) | 6,181,634 | (4,084,466) |
Net increase (decrease) in net assets resulting
from operations | 9,340,022 | 1,703,956 |
Distributions to shareholders from net investment income | (2,912,577) | (6,005,226) |
Distributions to shareholders from net realized gain | (27,968) | - |
Total distributions | (2,940,545) | (6,005,226) |
Share transactions
Proceeds from sales of shares | 17,798,814 | 49,336,317 |
Reinvestment of distributions | 1,661,557 | 3,411,126 |
Cost of shares redeemed | (14,521,082) | (72,271,481) |
Net increase (decrease) in net assets resulting from share transactions | 4,939,289 | (19,524,038) |
Redemption fees | 400 | 2,402 |
Total increase (decrease) in net assets | 11,339,166 | (23,822,906) |
| | |
Net Assets | | |
Beginning of period | 160,377,663 | 184,200,569 |
End of period (including undistributed net investment income of $20,898 and undistributed net investment income of $20,321, respectively) | $ 171,716,829 | $ 160,377,663 |
Other Information Shares | | |
Sold | 1,513,228 | 4,364,280 |
Issued in reinvestment of distributions | 141,103 | 301,275 |
Redeemed | (1,237,426) | (6,450,026) |
Net increase (decrease) | 416,905 | (1,784,471) |
See accompanying notes which are an integral part of the financial statements.
Semiannual Report
Financial Highlights
| Six months ended
February 29,
2012 | Years ended August 31, |
| (Unaudited) | 2011 | 2010 | 2009 | 2008 | 2007 |
Selected Per-Share Data |
Net asset value, beginning of period | $ 11.55 | $ 11.76 | $ 11.12 | $ 11.04 | $ 11.13 | $ 11.39 |
Income from Investment Operations | | | | | | |
Net investment income (loss) D | .208 | .420 | .416 | .425 | .419 | .418 |
Net realized and unrealized gain (loss) | .462 | (.210) | .639 | .112 | (.054) | (.205) |
Total from investment operations | .670 | .210 | 1.055 | .537 | .365 | .213 |
Distributions from net investment income | (.208) | (.420) | (.416) | (.425) | (.418) | (.418) |
Distributions from net realized gain | (.002) | - | - | (.033) | (.037) | (.055) |
Total distributions | (.210) | (.420) | (.416) | (.458) | (.455) | (.473) |
Redemption fees added to paid in capital D | - F | - F | .001 | .001 | - F | - F |
Net asset value, end of period | $ 12.01 | $ 11.55 | $ 11.76 | $ 11.12 | $ 11.04 | $ 11.13 |
Total Return B,C | 5.85% | 1.92% | 9.69% | 5.15% | 3.33% | 1.87% |
Ratios to Average Net Assets E |
Expenses before reductions | .55% A | .55% | .55% | .55% | .55% | .55% |
Expenses net of fee waivers, if any | .55% A | .55% | .55% | .55% | .55% | .55% |
Expenses net of all reductions | .55% A | .55% | .55% | .55% | .52% | .48% |
Net investment income (loss) | 3.56% A | 3.71% | 3.66% | 3.97% | 3.76% | 3.70% |
Supplemental Data | | | | | | |
Net assets, end of period (000 omitted) | $ 171,717 | $ 160,378 | $ 184,201 | $ 155,053 | $ 143,432 | $ 129,125 |
Portfolio turnover rate | 6% A | 10% | 10% | 19% | 22% | 15% |
A Annualized
B Total returns for periods of less than one year are not annualized.
C Total returns would have been lower if certain expenses had not been reduced during the applicable periods shown.
D Calculated based on average shares outstanding during the period.
E Expense ratios reflect operating expenses of the Fund. Expenses before reductions do not reflect amounts reimbursed by the investment adviser or reductions from expense offset arrangements and do not represent the amount paid by the Fund during periods when reimbursements or reductions occur. Expenses net of fee waivers reflect expenses after reimbursement by the investment adviser but prior to reductions from expense offset arrangements. Expenses net of all reductions represent the net expenses paid by the Fund.
F Amount represents less than $.001 per share.
See accompanying notes which are an integral part of the financial statements.
Semiannual Report
Fidelity Arizona Municipal Money Market Fund
Investment Changes (Unaudited)
Effective Maturity Diversification |
Days | % of fund's investments 2/29/12 | % of fund's investments 8/31/11 | % of fund's investments 2/28/11 |
1 - 7 | 80.5 | 87.5 | 80.3 |
8 - 30 | 1.7 | 4.0 | 3.0 |
31 - 60 | 0.0 | 1.0 | 3.0 |
61 - 90 | 1.0 | 0.0 | 0.0 |
91 - 180 | 13.7 | 4.3 | 10.8 |
> 180 | 3.1 | 3.2 | 2.9 |
Effective maturity is determined in accordance with the requirements of Rule 2a-7 under the Investment Company Act of 1940. |
Weighted Average Maturity |
| 2/29/12 | 8/31/11 | 2/28/11 |
Fidelity Arizona Municipal Money Market Fund | 31 Days | 21 Days | 29 Days |
All Tax-Free Money Market Funds Average* | 28 Days | 30 Days | 28 Days |
This is a weighted average of all the maturities of the securities held in a fund. Weighted Average Maturity (WAM) can be used as a measure of sensitivity to interest rate changes and market changes. Generally, the longer the maturity, the greater the sensitivity to such changes. WAM is based on the dollar-weighted average length of time until principal payments must be paid. Depending on the types of securities held in a fund, certain maturity shortening devices (e.g., demand features, interest rate resets, and call options) may be taken into account when calculating the WAM. |
Weighted Average Life |
| 2/29/12 | 8/31/11 | 2/28/11 |
Fidelity Arizona Municipal Money Market Fund | 31 Days | 21 Days | 29 Days |
Weighted Average Life (WAL) is the weighted average of the life of the securities held in a fund or portfolio and can be used as a measure of sensitivity to changes in liquidity and/or credit risk. Generally, the higher the value, the greater the sensitivity. WAL is based on the dollar-weighted average length of time until principal payments must be paid, taking into account any call options exercised by the issuer and any permissible maturity shortening features other than interest rate resets. The difference between WAM and WAL is that WAM takes into account interest rate resets and WAL does not. WAL for money market funds is not the same as WAL of a mortgage- or asset-backed security. |
Asset Allocation (% of fund's net assets) |
As of February 29, 2012 | As of August 31, 2011 |
| Variable Rate Demand Notes (VRDNs) 69.8% | | | Variable Rate Demand Notes (VRDNs) 81.8% | |
 | Commercial Paper (including CP Mode) 4.6% | | | Commercial Paper (including CP Mode) 5.0% | |
 | Fidelity Municipal
Cash Central Fund 10.8% | | | Fidelity Municipal
Cash Central Fund 5.7% | |
 | Other Investments 15.1% | | | Other Investments 7.4% | |
 | Net Other Assets† (0.3)% | | | Net Other Assets 0.1% | |

* Source: iMoneyNet, Inc.
† Net Other Assets is not included in the pie chart.
Semiannual Report
Fidelity Arizona Municipal Money Market Fund
Investments February 29, 2012 (Unaudited)
Showing Percentage of Net Assets
Municipal Securities - 100.3% |
| Principal Amount | | Value |
Arizona - 87.0% |
Arizona Ctfs. of Partnership Bonds Series 2010 B, 5% 10/1/12 | $ 2,000,000 | | $ 2,050,599 |
Arizona Health Facilities Auth. Rev.: | | | |
(Banner Health Sys. Proj.) Series 2008 F, 0.13% 3/7/12, LOC JPMorgan Chase Bank, VRDN (a) | 8,570,000 | | 8,570,000 |
(Catholic Healthcare West Proj.): | | | |
Series 2005 B, 0.13% 3/7/12, LOC JPMorgan Chase Bank, VRDN (a) | 11,520,000 | | 11,520,000 |
Series 2009 F, 0.14% 3/7/12, LOC Citibank NA, VRDN (a) | 9,200,000 | | 9,200,000 |
Bonds (Banner Health Sys. Proj.) Series 2008 D, 5% 1/1/13 | 1,000,000 | | 1,038,953 |
Arizona Hsg. Fin. Auth. Multi-family Hsg. Rev. (Santa Carolina Apts. Proj.) Series 2005, 0.2% 3/7/12, LOC Fannie Mae Guaranteed Mtg. pass-thru certificates, VRDN (a)(d) | 3,645,000 | | 3,645,000 |
Arizona School Facilities Board Ctfs. of Prtn. Bonds Series 2008, 5% 9/1/12 | 3,600,000 | | 3,677,812 |
Arizona School Facilities Board Rev. Participating VRDN Series BC 11 102W, 0.18% 3/7/12 (Liquidity Facility Barclays Bank PLC) (a)(e) | 3,600,000 | | 3,600,000 |
Arizona State Trans. Board Bonds Series 2003 A, 5% 7/1/12 | 1,500,000 | | 1,523,799 |
Arizona State Univ. Energy Mgmt. Rev. Bonds (Univ. Proj.-Tempe Campus) Series 2011, 3% 7/1/12 | 1,250,000 | | 1,259,556 |
Arizona Trans. Board Excise Tax Rev.: | | | |
Bonds: | | | |
Series 2009, 4% 7/1/12 | 3,400,000 | | 3,442,591 |
Series 2010, 5% 7/1/12 | 1,200,000 | | 1,218,969 |
Series 2011, 2% 7/1/12 | 3,600,000 | | 3,621,222 |
Participating VRDN Series MT 726, 0.22% 3/7/12 (Liquidity Facility Bank of America NA) (a)(e) | 7,400,000 | | 7,400,000 |
Arizona Trans. Board Hwy. Rev.: | | | |
Bonds: | | | |
Series 2002 B, 5.25% 7/1/12 | 1,600,000 | | 1,626,716 |
Series 2005 A, 5.25% 7/1/12 | 3,845,000 | | 3,909,453 |
Series 2011 A, 2% 7/1/12 | 3,600,000 | | 3,621,368 |
Participating VRDN Series WF 11 138C, 0.17% 3/7/12 (Liquidity Facility Wells Fargo Bank NA) (a)(e) | 5,285,000 | | 5,285,000 |
Arizona Wtr. Infrastructure Fin. Auth. Rev. Bonds: | | | |
Series 2008 A, 5% 10/1/12 | 1,000,000 | | 1,027,280 |
Series 2009 A, 4% 10/1/12 | 605,000 | | 617,877 |
Casa Grande Indl. Dev. Auth. Indl. Dev. Rev. (Price Companies, Inc. Proj.) Series A, 0.53% 3/7/12, LOC Bank of America NA, VRDN (a)(d) | 1,430,000 | | 1,430,000 |
Municipal Securities - continued |
| Principal Amount | | Value |
Arizona - continued |
Chandler Gen. Oblig. Participating VRDN Series GS 07 49TP, 0.16% 3/7/12 (Liquidity Facility Wells Fargo & Co.) (a)(e) | $ 4,470,000 | | $ 4,470,000 |
Coconino County Poll. Cont. Corp. Rev.: | | | |
(Arizona Pub. Svc. Co. Navajo Proj.) Series 2009 B, 0.13% 3/1/12, LOC JPMorgan Chase Bank, VRDN (a)(d) | 11,700,000 | | 11,700,000 |
(Tucson Elec. Pwr. Co. Navajo Proj.) Series 2010 A, 0.18% 3/7/12, LOC JPMorgan Chase Bank, VRDN (a)(d) | 3,500,000 | | 3,500,000 |
Maricopa County Cmnty. College District Bonds Series 2004, 5% 7/1/12 | 1,100,000 | | 1,117,428 |
Maricopa County Indl. Dev. Auth. Multi-family Hsg. Rev.: | | | |
(Glenn Oaks Apts. Proj.) Series 2001, 0.19% 3/7/12, LOC Fannie Mae Guaranteed Mtg. pass-thru certificates, VRDN (a)(d) | 2,399,675 | | 2,399,675 |
(Ranchwood Apts. Proj.) Series 2001 A, 0.17% 3/7/12, LOC Fannie Mae Guaranteed Mtg. pass-thru certificates, VRDN (a)(d) | 1,500,000 | | 1,500,000 |
(San Angelin Apts. Proj.) Series 2004, 0.16% 3/7/12, LOC Fannie Mae Guaranteed Mtg. pass-thru certificates, VRDN (a)(d) | 3,100,000 | | 3,100,000 |
(San Fernando Apts. Proj.) Series 2004, 0.16% 3/7/12, LOC Fannie Mae Guaranteed Mtg. pass-thru certificates, VRDN (a)(d) | 2,700,000 | | 2,700,000 |
(San Lucas Apts. Proj.) Series 2003, 0.16% 3/7/12, LOC Fannie Mae Guaranteed Mtg. pass-thru certificates, VRDN (a)(d) | 1,700,000 | | 1,700,000 |
(San Martin Apts. Proj.) Series A1, 0.16% 3/7/12, LOC Fannie Mae Guaranteed Mtg. pass-thru certificates, VRDN (a)(d) | 7,000,000 | | 7,000,000 |
(San Remo Apts. Proj.) Series 2002, 0.16% 3/7/12, LOC Fannie Mae Guaranteed Mtg. pass-thru certificates, VRDN (a)(d) | 14,200,000 | | 14,200,000 |
(Village at Sun Valley Apts. Proj.) Series 2008, 0.23% 3/7/12, LOC Freddie Mac, VRDN (a)(d) | 6,040,000 | | 6,040,000 |
(Village Square Apts. Proj.) Series 2004, 0.18% 3/7/12, LOC Fannie Mae Guaranteed Mtg. pass-thru certificates, VRDN (a)(d) | 1,000,000 | | 1,000,000 |
Maricopa County Indl. Dev. Auth. Rev.: | | | |
(Clayton Homes, Inc. Proj.) Series 1998, 0.2% 3/7/12, LOC U.S. Bank NA, Cincinnati, VRDN (a)(d) | 1,000,000 | | 1,000,000 |
(Valley of the Sun YMCA Proj.) Series 2008, 0.15% 3/7/12, LOC U.S. Bank NA, Cincinnati, VRDN (a) | 3,700,000 | | 3,700,000 |
Mesa Util. Sys. Rev.: | | | |
Bonds Series 2002, 5.75% 7/1/12 | 750,000 | | 763,487 |
Participating VRDN Series ROC II R 11959X, 0.16% 3/7/12 (Liquidity Facility Citibank NA) (a)(e) | 7,250,000 | | 7,250,000 |
Municipal Securities - continued |
| Principal Amount | | Value |
Arizona - continued |
Northern Arizona Univ. Revs. Participating VRDN Series Solar 07 14, 0.15% 3/7/12 (Liquidity Facility U.S. Bank NA, Cincinnati) (a)(e) | $ 4,600,000 | | $ 4,600,000 |
Phoenix Civic Impt. Corp. Wtr. Sys. Rev.: | | | |
Bonds Series 2005, 5% 7/1/12 | 2,500,000 | | 2,540,300 |
Participating VRDN: | | | |
Series Putters 3458, 0.16% 3/7/12 (Liquidity Facility JPMorgan Chase Bank) (a)(e) | 4,000,000 | | 4,000,000 |
Series ROC II R 12311, 0.16% 3/7/12 (Liquidity Facility Citibank NA) (a)(e) | 3,500,000 | | 3,500,000 |
Phoenix Gen. Oblig. Participating VRDN Series BBT 2012, 0.15% 3/7/12 (Liquidity Facility Branch Banking & Trust Co.) (a)(e) | 7,825,000 | | 7,825,000 |
Phoenix Indl. Dev. Auth. Cultural Facilities Rev. (Phoenix Art Museum Proj.) Series 2006, 0.25% 3/1/12, LOC Wells Fargo Bank NA, VRDN (a) | 100,000 | | 100,000 |
Phoenix Indl. Dev. Auth. Multi-family Hsg. Rev.: | | | |
(Del Mar Terrance Apts. Proj.) Series 1999 A, 0.16% 3/7/12, LOC Freddie Mac, VRDN (a) | 1,100,000 | | 1,100,000 |
(Paradise Lakes Apt. Proj.): | | | |
Series 2007 A, 0.13% 3/7/12, LOC Wells Fargo Bank NA, VRDN (a) | 1,000,000 | | 1,000,000 |
Series 2007 B, 0.15% 3/7/12, LOC Wells Fargo Bank NA, VRDN (a)(d) | 17,000,000 | | 17,000,000 |
(Westward Ho Apts. Proj.) Series 2003 A, 0.27% 3/7/12, LOC Bank of America NA, VRDN (a)(d) | 4,330,000 | | 4,330,000 |
Phoenix Indl. Dev. Auth. Rev.: | | | |
(Desert Botanical Garden Proj.) Series 2000, 0.14% 3/7/12, LOC JPMorgan Chase Bank, VRDN (a) | 600,000 | | 600,000 |
(Independent Newspaper, Inc. Proj.) Series 2000, 0.35% 3/7/12, LOC Wells Fargo Bank NA, VRDN (a)(d) | 720,000 | | 720,000 |
(Phoenix Expansion Proj.) Series 2002, 0.41% 3/7/12, LOC JPMorgan Chase Bank, VRDN (a)(d) | 1,960,000 | | 1,960,000 |
(Swift Aviation Svcs., Inc. Proj.) Series 2002, 0.18% 3/1/12, LOC U.S. Bank NA, Cincinnati, VRDN (a)(d) | 5,725,000 | | 5,725,000 |
Pima County Gen. Oblig. Bonds: | | | |
Series 2009 A, 3% 7/1/12 | 5,000,000 | | 5,046,051 |
Series 2011, 1.5% 7/1/12 | 1,450,000 | | 1,455,997 |
Pima County Indl. Dev. Auth. Multi-family Hsg. Rev.: | | | |
(River Point Proj.) Series 2001, 0.17% 3/7/12, LOC Fannie Mae Guaranteed Mtg. pass-thru certificates, VRDN (a)(d) | 6,000,000 | | 6,000,000 |
Series A, 0.17% 3/7/12, LOC Fannie Mae Guaranteed Mtg. pass-thru certificates, VRDN (a)(d) | 3,300,000 | | 3,300,000 |
Municipal Securities - continued |
| Principal Amount | | Value |
Arizona - continued |
Pima County Indl. Dev. Auth. Rev. (Broadway Proper Congregate Proj.) Series 2000 A, 0.15% 3/7/12, LOC Fed. Home Ln. Bank, San Francisco, VRDN (a) | $ 3,660,000 | | $ 3,660,000 |
Pima County Reg'l. Trans. Auth. Excise Tax Rev. Bonds Series 2011, 1.5% 6/1/12 | 3,500,000 | | 3,510,171 |
Pima County Swr. Sys. Rev. Bonds Series 2011 B, 1% 7/1/12 | 5,225,000 | | 5,238,383 |
Salt River Proj. Agricultural Impt. & Pwr. District Elec. Sys. Rev.: | | | |
Bonds Series 2009 A, 5% 1/1/13 | 300,000 | | 311,853 |
Participating VRDN: | | | |
Series EGL 06 14 Class A, 0.16% 3/7/12 (Liquidity Facility Citibank NA) (a)(e) | 2,400,000 | | 2,400,000 |
Series MT 737, 0.22% 3/7/12 (Liquidity Facility Bank of America NA) (a)(e) | 7,300,000 | | 7,300,000 |
Series RBC O1, 0.14% 3/7/12 (Liquidity Facility Royal Bank of Canada) (a)(e) | 1,600,000 | | 1,600,000 |
Series ROC II R 11712, 0.19% 3/7/12 (Liquidity Facility Citibank NA) (a)(e) | 2,435,000 | | 2,435,000 |
Series ROC II R 11980 X, 0.16% 3/7/12 (Liquidity Facility Citibank NA) (a)(e) | 3,700,000 | | 3,700,000 |
Series WF 09 40C, 0.17% 3/7/12 (Liquidity Facility Wells Fargo & Co.) (a)(e) | 3,300,000 | | 3,300,000 |
Series C: | | | |
0.14% 3/16/12, CP | 4,500,000 | | 4,500,000 |
0.15% 5/8/12, CP | 4,000,000 | | 4,000,000 |
0.2% 8/16/12, CP | 7,200,000 | | 7,200,000 |
Scottsdale Gen. Oblig. Participating VRDN Series BBT 08 20, 0.15% 3/7/12 (Liquidity Facility Branch Banking & Trust Co.) (a)(e) | 11,105,000 | | 11,105,000 |
Scottsdale Muni. Property Corp. Excise Tax Rev. Bonds Series 2004, 5% 7/1/12 | 3,000,000 | | 3,047,816 |
Show Low Indl. Dev. Auth. Solid Waste Disp. Rev. (Snowflake White Mountain Pwr. LLC Proj.) Series 2006, 0.3% 3/7/12, LOC JPMorgan Chase Bank, VRDN (a)(d) | 4,000,000 | | 4,000,000 |
Tempe Gen. Oblig. Bonds: | | | |
Series 2010 C, 2% 7/1/12 | 1,750,000 | | 1,760,214 |
Series 2011 A, 4% 7/1/12 | 1,000,000 | | 1,012,440 |
Tempe Indl. Dev. Auth. Rev. (ASUF Brickyard Proj.) Series 2004 A, 0.22% 3/7/12, LOC Bank of America NA, VRDN (a) | 7,450,000 | | 7,450,000 |
Tempe Transit Excise Tax Rev. Series 2006, 0.14% 3/7/12 (Liquidity Facility Royal Bank of Canada), VRDN (a) | 27,920,000 | | 27,920,000 |
Municipal Securities - continued |
| Principal Amount | | Value |
Arizona - continued |
Yavapai County Indl. Dev. Auth.: | | | |
(Northern Arizona Healthcare Sys. Proj.) Series 2008 B, 0.17% 3/7/12, LOC Wells Fargo Bank NA, VRDN (a) | $ 3,700,000 | | $ 3,700,000 |
Bonds (Northern Healthcare Sys. Proj.) Series 2011, 2% 10/1/12 | 3,400,000 | | 3,429,678 |
| | 335,809,688 |
Kentucky - 0.1% |
Trimble County Poll. Cont. Rev. Bonds (Louisville Gas & Elec. Co. Proj.) Series 2001 B, 0.4% tender 3/22/12, CP mode (d) | 600,000 | | 600,000 |
Massachusetts - 0.4% |
Massachusetts Indl. Fin. Agcy. Poll. Cont. Rev. Bonds (New England Pwr. Co. Proj.) Series 1992: | | | |
0.4% tender 3/13/12, CP mode | 1,100,000 | | 1,100,000 |
0.4% tender 3/13/12, CP mode | 400,000 | | 400,000 |
| | 1,500,000 |
Michigan - 1.2% |
Michigan Fin. Auth. Rev. Series 2011 L, 0.16% 3/7/12, LOC Citibank NA, VRDN (a) | 4,500,000 | | 4,500,000 |
Ohio - 0.3% |
Ohio Higher Edl. Facility Commission Rev. (Univ. Hosp. Health Sys. Proj.) Series 2008 B, 0.16% 3/7/12, LOC RBS Citizens NA, VRDN (a) | 1,000,000 | | 1,000,000 |
Pennsylvania - 0.4% |
Chester County Health & Ed. Auth. Rev. (Jenner's Pond Proj.) Series 2006, 0.15% 3/7/12, LOC Citizens Bank of Pennsylvania, VRDN (a) | 1,455,000 | | 1,455,000 |
Virginia - 0.1% |
Virginia Hsg. Dev. Auth. Commonwealth Mtg. Rev. Participating VRDN Series BA 1047, 0.29% 3/7/12 (Liquidity Facility Bank of America NA) (a)(d)(e) | 500,000 | | 500,000 |
Municipal Securities - continued |
| Shares | | Value |
Other - 10.8% |
Fidelity Municipal Cash Central Fund, 0.15% (b)(c) | 41,599,000 | | $ 41,599,000 |
TOTAL INVESTMENT PORTFOLIO - 100.3% (Cost $386,963,688) | | 386,963,688 |
NET OTHER ASSETS (LIABILITIES) - (0.3)% | | (1,130,877) |
NET ASSETS - 100% | $ 385,832,811 |
Security Type Abbreviations |
CP | - | COMMERCIAL PAPER |
VRDN | - | VARIABLE RATE DEMAND NOTE (A debt instrument that is payable upon demand, either daily, weekly or monthly) |
Legend |
(a) Coupon rates for floating and adjustable rate securities reflect the rates in effect at period end. |
(b) Information in this report regarding holdings by state and security types does not reflect the holdings of the Fidelity Municipal Cash Central Fund. |
(c) Affiliated fund that is available only to investment companies and other accounts managed by Fidelity Investments. The rate quoted is the annualized seven-day yield of the fund at period end. A complete unaudited listing of the fund's holdings as of its most recent quarter end is available upon request. In addition, each Fidelity Central Fund's financial statements are available on the SEC's website or upon request. |
(d) Private activity obligations whose interest is subject to the federal alternative minimum tax for individuals. |
(e) Provides evidence of ownership in one or more underlying municipal bonds. |
Affiliated Central Funds |
Information regarding fiscal year to date income earned by the Fund from investments in Fidelity Central Funds is as follows: |
Fund | Income earned |
Fidelity Municipal Cash Central Fund | $ 8,428 |
Other Information |
The date shown for securities represents the date when principal payments must be paid, taking into account any call options exercised by the issuer and any permissible maturity shortening features other than interest rate resets. |
All investments are categorized as Level 2 under the Fair Value Hierarchy. The inputs or methodology used for valuing securities may not be an indication of the risk associated with investing in those securities. For more information on valuation inputs, please refer to the Security Valuation section in the accompanying Notes to Financial Statements. |
See accompanying notes which are an integral part of the financial statements.
Semiannual Report
Fidelity Arizona Municipal Money Market Fund
Statement of Assets and Liabilities
| February 29, 2012 (Unaudited) |
Assets | | |
Investment in securities, at value - See accompanying schedule: Unaffiliated issuers (cost $345,364,688) | $ 345,364,688 | |
Fidelity Central Funds (cost $41,599,000) | 41,599,000 | |
Total Investments (cost $386,963,688) | | $ 386,963,688 |
Cash | | 88,674 |
Receivable for fund shares sold | | 4,074,713 |
Interest receivable | | 499,127 |
Distributions receivable from Fidelity Central Funds | | 3,520 |
Other receivables | | 128 |
Total assets | | 391,629,850 |
| | |
Liabilities | | |
Payable for investments purchased | $ 2,875,486 | |
Payable for fund shares redeemed | 2,869,556 | |
Distributions payable | 39 | |
Accrued management fee | 51,950 | |
Other affiliated payables | 8 | |
Total liabilities | | 5,797,039 |
| | |
Net Assets | | $ 385,832,811 |
Net Assets consist of: | | |
Paid in capital | | $ 385,832,782 |
Undistributed net investment income | | 32 |
Accumulated undistributed net realized gain (loss) on investments | | (3) |
Net Assets, for 385,640,806 shares outstanding | | $ 385,832,811 |
Net Asset Value, offering price and redemption price per share ($385,832,811 ÷ 385,640,806 shares) | | $ 1.00 |
See accompanying notes which are an integral part of the financial statements.
Semiannual Report
Fidelity Arizona Municipal Money Market Fund
Financial Statements - continued
Statement of Operations
| Six months ended February 29, 2012 (Unaudited) |
Investment Income | | |
Interest | | $ 311,961 |
Income from Fidelity Central Funds | | 8,428 |
Total income | | 320,389 |
| | |
Expenses | | |
Management fee | $ 915,579 | |
Independent trustees' compensation | 680 | |
Total expenses before reductions | 916,259 | |
Expense reductions | (614,171) | 302,088 |
Net investment income (loss) | | 18,301 |
Realized and Unrealized Gain (Loss) Net realized gain (loss) on: | | |
Investment securities: | | |
Unaffiliated issuers | | (14) |
Net increase in net assets resulting from operations | | $ 18,287 |
See accompanying notes which are an integral part of the financial statements.
Semiannual Report
Statement of Changes in Net Assets
| Six months ended February 29,
2012
(Unaudited) | Year ended
August 31,
2011 |
Increase (Decrease) in Net Assets | | |
Operations | | |
Net investment income (loss) | $ 18,301 | $ 35,578 |
Net realized gain (loss) | (14) | (15) |
Net increase in net assets resulting
from operations | 18,287 | 35,563 |
Distributions to shareholders from net investment income | (18,269) | (35,625) |
Share transactions at net asset value of $1.00 per share
Proceeds from sales of shares | 514,875,054 | 1,224,027,384 |
Reinvestment of distributions | 18,012 | 35,233 |
Cost of shares redeemed | (511,748,261) | (1,186,736,364) |
Net increase (decrease) in net assets and shares resulting from share transactions | 3,144,805 | 37,326,253 |
Total increase (decrease) in net assets | 3,144,823 | 37,326,191 |
| | |
Net Assets | | |
Beginning of period | 382,687,988 | 345,361,797 |
End of period (including undistributed net investment income of $32 and undistributed net investment income of $0, respectively) | $ 385,832,811 | $ 382,687,988 |
See accompanying notes which are an integral part of the financial statements.
Semiannual Report
Financial Highlights
| Six months ended February 29,
2012 | Years ended August 31, |
| (Unaudited) | 2011 | 2010 | 2009 | 2008 | 2007 |
Selected Per-Share Data |
Net asset value, beginning of period | $ 1.00 | $ 1.00 | $ 1.00 | $ 1.00 | $ 1.00 | $ 1.00 |
Income from Investment Operations | | | | | | |
Net investment income (loss) | - F | - F | - F | .006 | .022 | .032 |
Net realized and unrealized gain (loss) F | - | - | - | - | - | - |
Total from investment operations | - F | - F | - F | .006 | .022 | .032 |
Distributions from net investment income | - F | - F | - F | (.006) | (.022) | (.032) |
Net asset value, end of period | $ 1.00 | $ 1.00 | $ 1.00 | $ 1.00 | $ 1.00 | $ 1.00 |
Total Return B,C | -% | .01% | .01% | .64% | 2.25% | 3.26% |
Ratios to Average Net Assets D,E |
Expenses before reductions | .50% A | .50% | .50% | .54% | .50% | .50% |
Expenses net of fee waivers, if any | .17% A | .26% | .33% | .53% | .50% | .50% |
Expenses net of all reductions | .17% A | .26% | .33% | .52% | .41% | .38% |
Net investment income (loss) | .01% A | .01% | .01% | .64% | 2.20% | 3.22% |
Supplemental Data | | | | | | |
Net assets, end of period (000 omitted) | $ 385,833 | $ 382,688 | $ 345,362 | $ 373,206 | $ 393,043 | $ 340,848 |
A Annualized
B Total returns for periods of less than one year are not annualized.
C Total returns would have been lower if certain expenses had not been reduced during the applicable periods shown.
D Fees and expenses of any underlying Fidelity Central Funds are not included in the Fund's expense ratio. The Fund indirectly bears its proportionate share of the expenses of any underlying Fidelity Central Funds.
E Expense ratios reflect operating expenses of the Fund. Expenses before reductions do not reflect amounts reimbursed or waived or reductions from expense offset arrangements and do not represent the amount paid by the Fund during periods when reimbursements, waivers or reductions occur. Expenses net of fee waivers reflect expenses after reimbursement and waivers but prior to reductions from expense offset arrangements. Expenses net of all reductions represent the net expenses paid by the Fund.
F Amount represents less than $.001 per share.
See accompanying notes which are an integral part of the financial statements.
Semiannual Report
Notes to Financial Statements
For the period ended February 29, 2012 (Unaudited)
1. Organization.
Fidelity Arizona Municipal Income Fund (the Income Fund) is a fund of Fidelity Union Street Trust. Fidelity Arizona Municipal Money Market Fund (the Money Market Fund)is a fund of Fidelity Union Street Trust II. Each Trust is registered under the Investment Company Act of 1940, as amended (the 1940 Act), as an open-end management investment company. Fidelity Union Street Trust and Fidelity Union Street Trust II (the Trusts) are organized as a Massachusetts business trust and a Delaware statutory trust, respectively. The Income Fund is a non-diversified fund. Each Fund is authorized to issue an unlimited number of shares. Each Fund may be affected by economic and political developments in the state of Arizona.
2. Investments in Fidelity Central Funds.
The Funds may invest in Fidelity Central Funds, which are open-end investment companies available only to other investment companies and accounts managed by Fidelity Management & Research Company (FMR) and its affiliates. The Funds' Schedules of Investments list each of the Fidelity Central Funds held as of period end, if any, as an investment of each Fund, but do not include the underlying holdings of each Fidelity Central Fund. As an Investing Fund, each Fund indirectly bears its proportionate share of the expenses of the underlying Fidelity Central Funds.
The Money Market Central Funds seek preservation of capital and current income and are managed by Fidelity Investments Money Management, Inc. (FIMM), an affiliate of FMR.
A complete unaudited list of holdings for each Fidelity Central Fund is available upon request or at the Securities and Exchange Commission (the SEC) web site at www.sec.gov. In addition, the financial statements of the Fidelity Central Funds are available on the SEC web site or upon request.
3. Significant Accounting Policies.
The financial statements have been prepared in conformity with accounting principles generally accepted in the United States of America (GAAP), which require management to make certain estimates and assumptions at the date of the financial statements. Actual results could differ from those estimates. Subsequent events, if any, through the date that the financial statements were issued have been evaluated in the preparation of the financial statements. The following summarizes the significant accounting policies of the Funds:
Semiannual Report
3. Significant Accounting Policies - continued
Security Valuation. Investments are valued as of 4:00 p.m. Eastern time on the last calendar day of the period. The Income Fund uses independent pricing services approved by the Board of Trustees to value their investments. When current market prices or quotations are not readily available or reliable, valuations may be determined in good faith in accordance with procedures adopted by the Board of Trustees. Factors used in determining value may include market or security specific events, changes in interest rates and credit quality. The frequency with which these procedures are used cannot be predicted and they may be utilized to a significant extent. The value used for net asset value (NAV) calculation under these procedures may differ from published prices for the same securities.
Each Fund categorizes the inputs to valuation techniques used to value their investments into a disclosure hierarchy consisting of three levels as shown below:
Level 1 - quoted prices in active markets for identical investments
Level 2 - other significant observable inputs (including quoted prices for similar investments, interest rates, prepayment speeds, etc.)
Level 3 - unobservable inputs (including the Fund's own assumptions based on the best information available)
For the Income Fund, changes in valuation techniques may result in transfers in or out of an assigned level within the disclosure hierarchy. Valuation techniques used to value each Fund's investments by major category are as follows:
For the Income Fund, debt securities, including restricted securities, are valued based on evaluated prices received from independent pricing services or from dealers who make markets in such securities. For municipal securities, pricing services utilize matrix pricing which considers yield or price of bonds of comparable quality, coupon, maturity and type as well as dealer supplied prices and are generally categorized as Level 2 in the hierarchy. When independent prices are unavailable or unreliable, debt securities may be valued utilizing pricing matrices which consider similar factors that would be used by independent pricing services. These are generally categorized as Level 2 in the hierarchy but may be Level 3 depending on the circumstances.
For the Money Market Fund, as permitted by compliance with certain conditions under Rule 2a-7 of the 1940 Act, securities are valued at amortized cost, which approximates fair value. The amortized cost of an instrument is determined by valuing it at its original cost and thereafter amortizing any discount or premium from its face value at a constant rate until maturity. Securities held by a money market fund are generally high quality and liquid; however, they are reflected as Level 2 because the inputs used to determine fair value are not quoted prices in an active market.
Semiannual Report
Notes to Financial Statements (Unaudited) - continued
3. Significant Accounting Policies - continued
Investment Transactions and Income. For financial reporting purposes, the Funds' investment holdings and NAV include trades executed through the end of the last business day of the period. The NAV per share for processing shareholder transactions is calculated as of the close of business of the New York Stock Exchange (NYSE), normally 4:00 p.m. Eastern time and includes trades executed through the end of the prior business day for the Income Fund and trades executed through the end of the current business day for the Money Market Fund. Gains and losses on securities sold are determined on the basis of identified cost. Interest income and distributions from the Fidelity Central Funds are accrued as earned. Interest income includes coupon interest and amortization of premium and accretion of discount on debt securities.
Expenses. Expenses directly attributable to a fund are charged to that fund. Expenses attributable to more than one fund are allocated among the respective funds on the basis of relative net assets or other appropriate methods. Expense estimates are accrued in the period to which they relate and adjustments are made when actual amounts are known.
Income Tax Information and Distributions to Shareholders. Each year, each Fund intends to qualify as a regulated investment company under Subchapter M of the Internal Revenue Code, including distributing substantially all of its taxable income and realized gains. As a result, no provision for income taxes is required. Each Fund files a U.S. federal tax return, in addition to state and local tax returns as required. A fund's federal income tax returns are subject to examination by the Internal Revenue Service (IRS) for a period of three fiscal years after they are filed. State and local tax returns may be subject to examination for an additional fiscal year depending on the jurisdiction.
Dividends are declared and recorded daily and paid monthly from net investment income. Distributions from realized gains, if any, are declared and recorded on the ex-dividend date. Income and capital gain distributions are determined in accordance with income tax regulations, which may differ from GAAP.
Capital accounts within the financial statements are adjusted for permanent book-tax differences. These adjustments have no impact on net assets or the results of operations. Temporary book-tax differences will reverse in a subsequent period.
Book-tax differences are primarily due to market discount, deferred trustees compensation, capital loss carryforwards and losses deferred due to excise tax regulations.
The Funds purchase municipal securities whose interest, in the opinion of the issuer, is free from federal income tax. There is no assurance that the IRS will agree with this opinion. In the event the IRS determines that the issuer does not comply with relevant tax requirements, interest payments from a security could become federally taxable, possibly retroactively to the date the security was issued.
Semiannual Report
3. Significant Accounting Policies - continued
Income Tax Information and Distributions to Shareholders - continued
The federal tax cost of investment securities and unrealized appreciation (depreciation) as of period end were as follows for each Fund:
| Tax cost | Gross unrealized appreciation | Gross unrealized depreciation | Net unrealized appreciation (depreciation) on securities and other investments |
Fidelity Arizona
Municipal Income Fund | $ 160,707,687 | $ 10,337,480 | $ (430,847) | $ 9,906,633 |
Fidelity Arizona
Municipal Money Market Fund | 386,963,688 | - | - | - |
Capital loss carryforwards are only available to offset future capital gains of the Funds to the extent provided by regulations and may be limited. Under the Regulated Investment Company Modernization Act of 2010 (the Act), the Funds are permitted to carry forward capital losses incurred in taxable years beginning after December 22, 2010 for an unlimited period and such capital losses are required to be used prior to any losses that expire. At August 31, 2011, capital loss carryforwards were as follows:
| Fiscal year of expiration | |
| 2017 | 2018 | 2019 | Total capital loss carryforwards |
Fidelity Arizona Municipal Income Fund | $ (241,334) | $ - | $ - | $ (241,334) |
Fidelity Arizona Municipal Money Market Fund | - | (5) | (60) | (65) |
Short-Term Trading (Redemption) Fees. Shares held by investors in the Income Fund less than 30 days are subject to a redemption fee equal to ..50% of the net asset value of shares redeemed. All redemption fees, which reduce the proceeds of the shareholder redemption, are retained by the Fund and accounted for as an addition to paid in capital.
4. Operating Policies.
Delayed Delivery Transactions and When-Issued Securities. During the period, the Funds transacted in securities on a delayed delivery or when-issued basis. Payment and delivery may take place after the customary settlement period for that security. The price of the underlying securities and the date when the securities will be delivered and paid for are fixed at the time the transaction is negotiated. During the time a delayed delivery sell is outstanding, the contract is marked-to-market daily and equivalent deliverable securities are held for the transaction. The securities purchased on a delayed delivery or when-issued basis are identified as such in each applicable Fund's Schedule
Semiannual Report
Notes to Financial Statements (Unaudited) - continued
4. Operating Policies - continued
Delayed Delivery Transactions and When-Issued Securities - continued
of Investments. The Funds may receive compensation for interest forgone in the purchase of a delayed delivery or when-issued security. With respect to purchase commitments, each applicable Fund identifies securities as segregated in its records with a value at least equal to the amount of the commitment. Losses may arise due to changes in the value of the underlying securities or if the counterparty does not perform under the contract's terms, or if the issuer does not issue the securities due to political, economic, or other factors.
5. Purchases and Sales of Investments.
Purchases and sales of securities, other than short-term securities, for the Income Fund aggregated $14,138,571 and $5,047,998, respectively.
6. Fees and Other Transactions with Affiliates.
Management Fee. FMR and its affiliates provides the Funds with investment management related services for which the Funds pay a monthly management fee. FMR pays all other expenses, except the compensation of the independent Trustees and certain exceptions such as interest expense, including commitment fees. The management fee paid to FMR by the Funds is reduced by an amount equal to the fees and expenses paid by the Funds to the independent Trustees. Each Fund's management fee is equal to the following annual rate of average net assets:
Fidelity Arizona Municipal Income Fund | .55% |
Fidelity Arizona Municipal Money Market Fund | .50% |
7. Committed Line of Credit.
The Income Fund participates with other funds managed by FMR or an affiliate in a $4.0 billion credit facility (the "line of credit") to be utilized for temporary or emergency purposes to fund shareholder redemptions or for other short-term liquidity purposes. The participating funds have agreed to pay commitment fees on their pro-rata portion of the line of credit, which are reflected in Miscellaneous expenses on the Statement of Operations, and are as follows:
Fidelity Arizona Municipal Income Fund | $ 225 |
During the period, there were no borrowings on this line of credit.
Semiannual Report
8. Expense Reductions.
FMR or its affiliates voluntarily agreed to waive certain fees for the Money Market Fund in order to maintain a minimum annualized yield of .01%. Such arrangements may be discontinued by FMR at any time. For the period, the amount of the waiver was $613,970.
In addition, through arrangements with each applicable Fund's custodian, credits realized as a result of uninvested cash balances were used to reduce each applicable Fund's management fee. During the period, these credits reduced management fee by the following amounts:
Fidelity Arizona Municipal Income Fund | $ 384 |
Fidelity Arizona Municipal Money Market Fund | 201 |
9. Other.
The Funds' organizational documents provide former and current trustees and officers with a limited indemnification against liabilities arising in connection with the performance of their duties to the Funds. In the normal course of business, the Funds may also enter into contracts that provide general indemnifications. The Funds' maximum exposure under these arrangements is unknown as this would be dependent on future claims that may be made against the Funds. The risk of material loss from such claims is considered remote.
Semiannual Report
Board Approval of Investment Advisory Contracts and Management Fees
Fidelity Arizona Municipal Income Fund / Fidelity Arizona Municipal Money Market Fund
Each year, the Board of Trustees, including the Independent Trustees (together, the Board), votes on the renewal of the management contract and sub-advisory agreements (together, the Advisory Contracts) for each fund. The Board, assisted by the advice of fund counsel and Independent Trustees' counsel, requests and considers a broad range of information relevant to the renewal of the Advisory Contracts throughout the year.
The Board meets regularly and considers at each of its meetings factors that are relevant to its annual consideration of the renewal of each fund's Advisory Contracts, including the services and support provided to each fund and its shareholders. The Board has established three standing committees, Operations, Audit, and Nominating and Governance, each composed of Independent Trustees with varying backgrounds, to which the Board has assigned specific subject matter responsibilities in order to enhance effective decision-making by the Board. The Operations Committee, of which all of the Independent Trustees are members, meets regularly throughout the year and, among other matters, considers matters specifically related to the annual consideration of the renewal of each fund's Advisory Contracts. The Board, acting directly and through its Committees, requests and receives information concerning the annual consideration of the renewal of each fund's Advisory Contracts. The Board also meets as needed to consider matters specifically related to the Board's annual consideration of the renewal of Advisory Contracts. Members of the Board may also meet with trustees of other Fidelity funds through ad hoc joint committees to discuss certain matters relevant to the Fidelity funds.
At its September 2011 meeting, the Board of Trustees, including the Independent Trustees, unanimously determined to renew each fund's Advisory Contracts. In reaching its determination, the Board considered all factors it believed relevant, including (i) the nature, extent, and quality of the services to be provided to each fund and its shareholders (including the investment performance of each fund); (ii) the competitiveness of each fund's management fee and total expense ratio; (iii) the total costs of the services to be provided by and the profits to be realized by Fidelity from its relationship with each fund; (iv) the extent to which economies of scale would be realized as each fund grows; and (v) whether fee levels reflect these economies of scale, if any, for the benefit of fund shareholders.
In considering whether to renew the Advisory Contracts for each fund, the Board reached a determination, with the assistance of fund counsel and Independent Trustees' counsel and through the exercise of its business judgment, that the renewal of the Advisory Contracts is in the best interests of each fund and its shareholders and that the compensation payable under the Advisory Contracts is fair and reasonable. The Board's decision to renew the Advisory Contracts was not based on any single factor, but rather was based on a comprehensive consideration of all the information provided to the Board at its meetings throughout the year. The Board, in reaching its determination to renew the Advisory Contracts, is aware that shareholders in each fund have a broad range of investment choices available to them, including a wide choice among mutual funds offered by Fidelity's competitors, and that each fund's shareholders, who have the opportunity to review and weigh the disclosure provided by the fund in its prospectus and other public disclosures, have chosen to invest in that fund, managed by Fidelity.
Semiannual Report
Board Approval of Investment Advisory Contracts and
Management Fees - continued
Nature, Extent, and Quality of Services Provided. The Board considered the staffing within the investment adviser, FMR, and the sub-advisers (together, the Investment Advisers), including the backgrounds of the funds' investment personnel and the funds' investment objectives and disciplines. The Independent Trustees also had discussions with senior management of Fidelity's investment operations and investment groups. The Board considered the structure of the portfolio manager compensation program and whether this structure provides appropriate incentives to act in the best interests of each fund.
Resources Dedicated to Investment Management and Support Services. The Board reviewed the general qualifications and capabilities of the Investment Advisers' investment staff, including its size, education, experience, and resources, as well as the Investment Advisers' approach to recruiting, managing, and compensating investment personnel. The Board also noted that FMR has devoted increased resources to non-U.S. offices. The Board noted that Fidelity's analysts have extensive resources, tools and capabilities which allow them to conduct sophisticated quantitative and fundamental analysis, as well as credit analysis of issuers, counterparties and enhancers. The Board also believes that Fidelity's investment professionals have sufficient access to global information and data so as to provide competitive investment results over time, and that those professionals also have access to sophisticated tools which permit them to assess portfolio construction and risk and performance attribution characteristics continuously, as well as to transmit new information and research conclusions rapidly around the world. Additionally, in its deliberations, the Board considered the Investment Advisers' trading capabilities and resources which are an integral part of the investment management process.
Shareholder and Administrative Services. The Board considered (i) the nature, extent, quality, and cost of advisory, administrative, and shareholder services performed by the Investment Advisers and their affiliates under the Advisory Contracts and under separate agreements covering transfer agency and pricing and bookkeeping services for each fund; (ii) the nature and extent of the investment adviser's supervision of third party service providers, principally custodians and subcustodians; and (iii) the resources devoted to, and the record of compliance with, each fund's compliance policies and procedures.
Semiannual Report
The Board noted that the growth of fund assets over time across the complex allows Fidelity to reinvest in the development of services designed to enhance the value or convenience of the Fidelity funds as investment vehicles. These services include 24-hour access to account information and market information through telephone representatives and over the Internet, investor education materials and asset allocation tools, and the expanded availability of Fidelity Investor Centers, with 35 new branches opening since 2010.
Investment in a Large Fund Family. The Board considered the benefits to shareholders of investing in a Fidelity fund, including the benefits of investing in a fund that is part of a large family of funds offering a variety of investment disciplines and providing a large variety of mutual fund investor services. The Board noted that Fidelity had taken, or had made recommendations that resulted in the Fidelity funds taking, a number of actions over the previous year that benefited particular funds, including (i) continuing to dedicate additional resources to investment research and support of the senior management team that oversees asset management; (ii) rationalizing product lines through the mergers of six funds into other funds; (iii) continuing to migrate the Freedom Funds to dedicated lower cost underlying funds; (iv) obtaining shareholder approval to broaden the investment strategies for Fidelity Consumer Finance Portfolio, Fidelity Emerging Asia Fund, and Fidelity Environment and Alternative Energy Portfolio; (v) contractually agreeing to reduce the management fees and impose other expense limitations on Spartan 500 Index Fund and U.S. Bond Index Fund in connection with launching new institutional classes of these funds; (vi) changing the name, primary and supplemental benchmarks, and investment policies of Fidelity Global Strategies Fund to support the fund's flexible investment mandate and global orientation; and (vii) reducing the transfer agency account fee rates on certain accounts.
Investment Performance. The Board considered whether each fund has operated in accordance with its investment objective, as well as its record of compliance with its investment restrictions. It also reviewed each fund's absolute investment performance, as well as each fund's relative investment performance measured over multiple periods against (i) a broad-based securities market index (bond fund only, as money market funds are typically not compared against a market index), and (ii) a peer group of mutual funds deemed appropriate by Fidelity and reviewed by the Board. For each fund, the following charts considered by the Board show, over the one-, three-, and five-year periods ended December 31, 2010, the fund's cumulative total returns, the cumulative total returns of a broad-based securities market index ("benchmark") (bond fund only), and a range of cumulative total returns of a peer group of mutual funds identified by Lipper Inc. as having an investment objective similar to that of the fund. The box within each chart shows the 25th percentile return (bottom of box) and the 75th percentile return (top of box) of the peer group. Returns shown above the box are in the first quartile and returns shown below the box are in the fourth quartile. The percentage beaten number noted below each chart corresponds to the percentile box and represents the percentage of funds in the peer group whose performance was equal to or lower than that of the fund.
Semiannual Report
Board Approval of Investment Advisory Contracts and
Management Fees - continued
Fidelity Arizona Municipal Income Fund
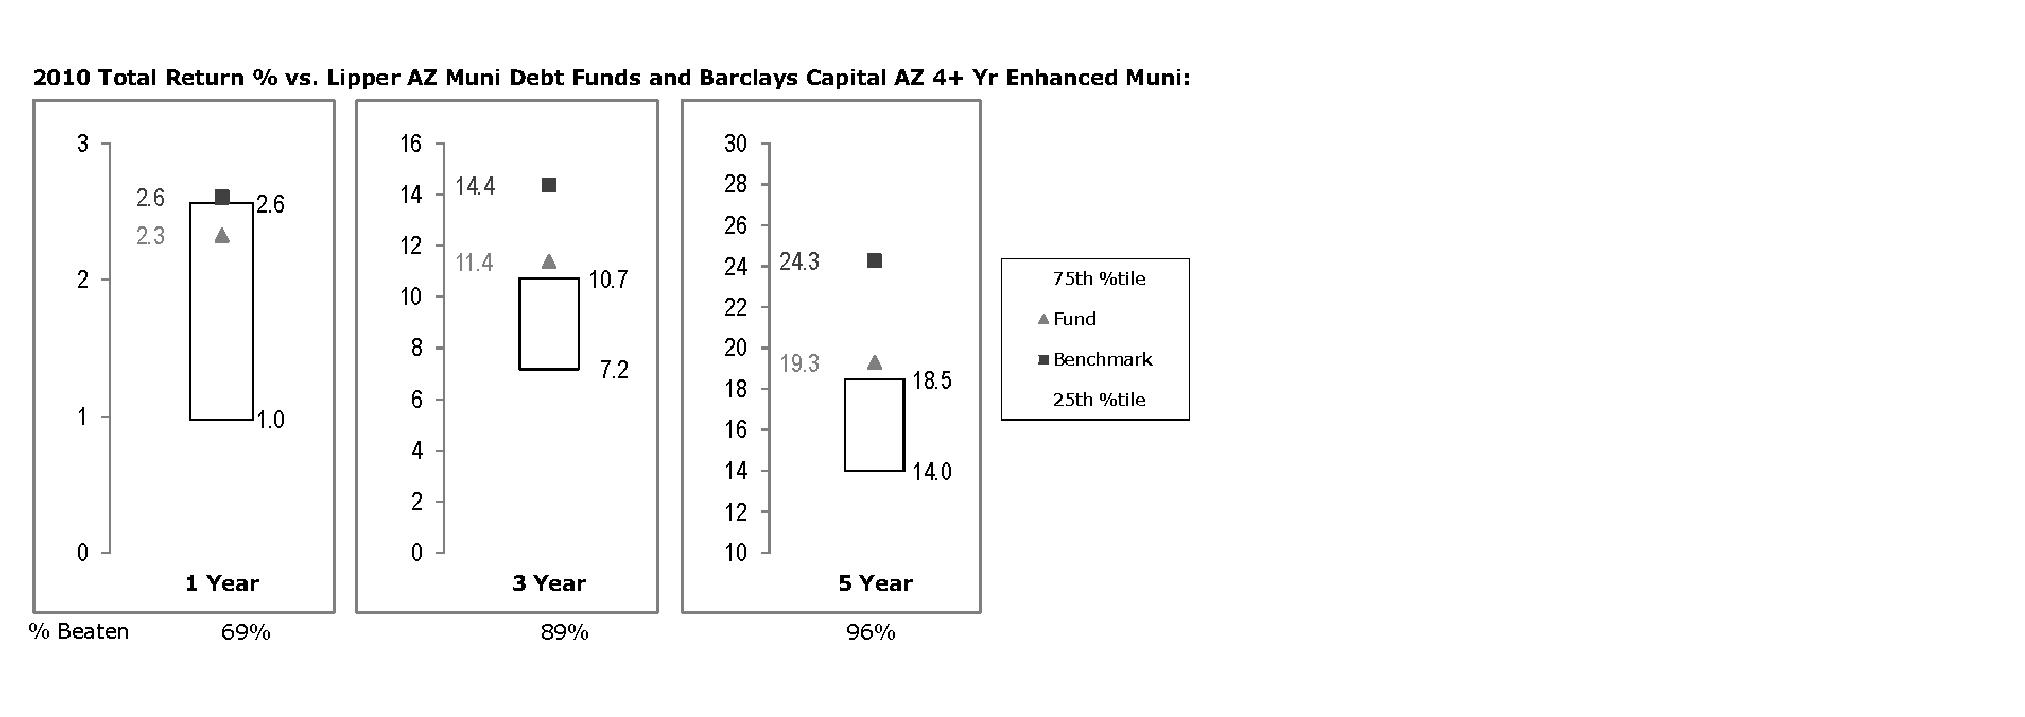
The Board reviewed the fund's relative investment performance against its peer group and noted that the performance of the fund was in the second quartile for the one-year period and the first quartile for the three- and five-year periods. The Board also noted that the investment performance of the fund was lower than its benchmark for all the periods shown. The Board discussed with FMR actions to improve the fund's below-benchmark performance. The Board also reviewed the fund's performance since inception as well as performance in the current year.
Semiannual Report
Fidelity Arizona Municipal Money Market Fund
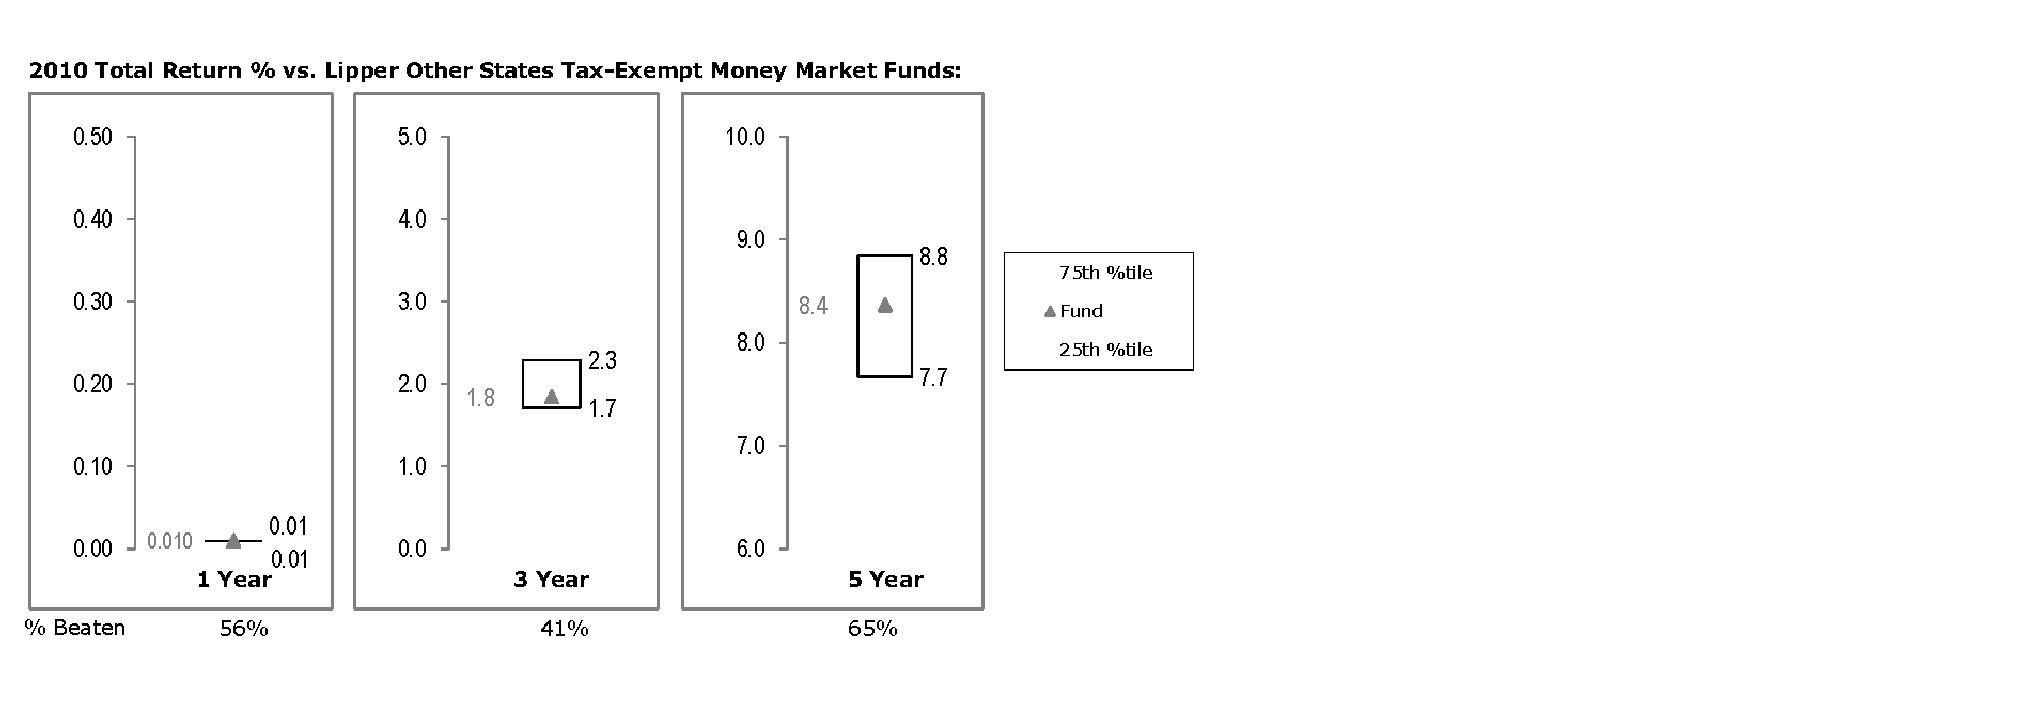
The Board reviewed the fund's relative investment performance against its peer group and noted that the performance of the fund was in the second quartile for the one- and five-year periods and the third quartile for the three-year period. The Board considered that FMR had taken steps to provide shareholders with stability of principal and to enhance safety and liquidity. The Board also reviewed the fund's performance since inception as well as performance in the current year.
Based on its review, the Board concluded that the nature, extent, and quality of services provided to each fund under the Advisory Contracts should benefit each fund's shareholders.
Competitiveness of Management Fee and Total Expense Ratio. The Board considered each fund's management fee and total expense ratio compared to "mapped groups" of competitive funds and classes. Fidelity creates "mapped groups" by combining similar Lipper investment objective categories that have comparable management fee characteristics. Combining Lipper investment objective categories aids the Board's management fee and total expense ratio comparisons by broadening the competitive group used for comparison and by reducing the number of universes to which various Fidelity funds are compared.
Management Fee. The Board considered two proprietary management fee comparisons for the 12-month periods shown in the charts below. The group of Lipper funds used by the Board for management fee comparisons is referred to below as the "Total Mapped Group" and, for the reasons explained above, is broader than the Lipper peer group used by the Board for performance comparisons. The Total Mapped Group comparison focuses on a fund's standing relative to the total universe of comparable funds available to investors in terms of gross management fees before expense reimbursements or caps. "TMG %" represents the percentage of funds in the Total Mapped Group that had management fees that were lower than a fund's. For example, a TMG % of 27% would mean that 73% of the funds in the Total Mapped Group had higher management fees than a fund. The "Asset-Size Peer Group" (ASPG) comparison focuses on a fund's standing relative to non-Fidelity funds similar in size to the fund within the Total Mapped Group. The ASPG represents at least 15% of the funds in the Total Mapped Group with comparable asset size and management fee characteristics, subject to a minimum of 50 funds (or all funds in the Total Mapped Group if fewer than 50). Additional information, such as the ASPG quartile in which a fund's management fee ranked, is also included in the charts and considered by the Board. Because the vast majority of competitor funds' management fees do not cover non-management expenses, for a more meaningful comparison of management fees, each fund is compared on the basis of a hypothetical "net management fee," which is derived by subtracting payments made by FMR for non-management expenses (including transfer agent fees, pricing and bookkeeping fees, and fees paid to non-affiliated custodians) from the fund's all-inclusive fee. In this regard, the Board realized that net management fees can vary from year to year because of differences in non-management expenses.
Semiannual Report
Board Approval of Investment Advisory Contracts and
Management Fees - continued
Fidelity Arizona Municipal Income Fund
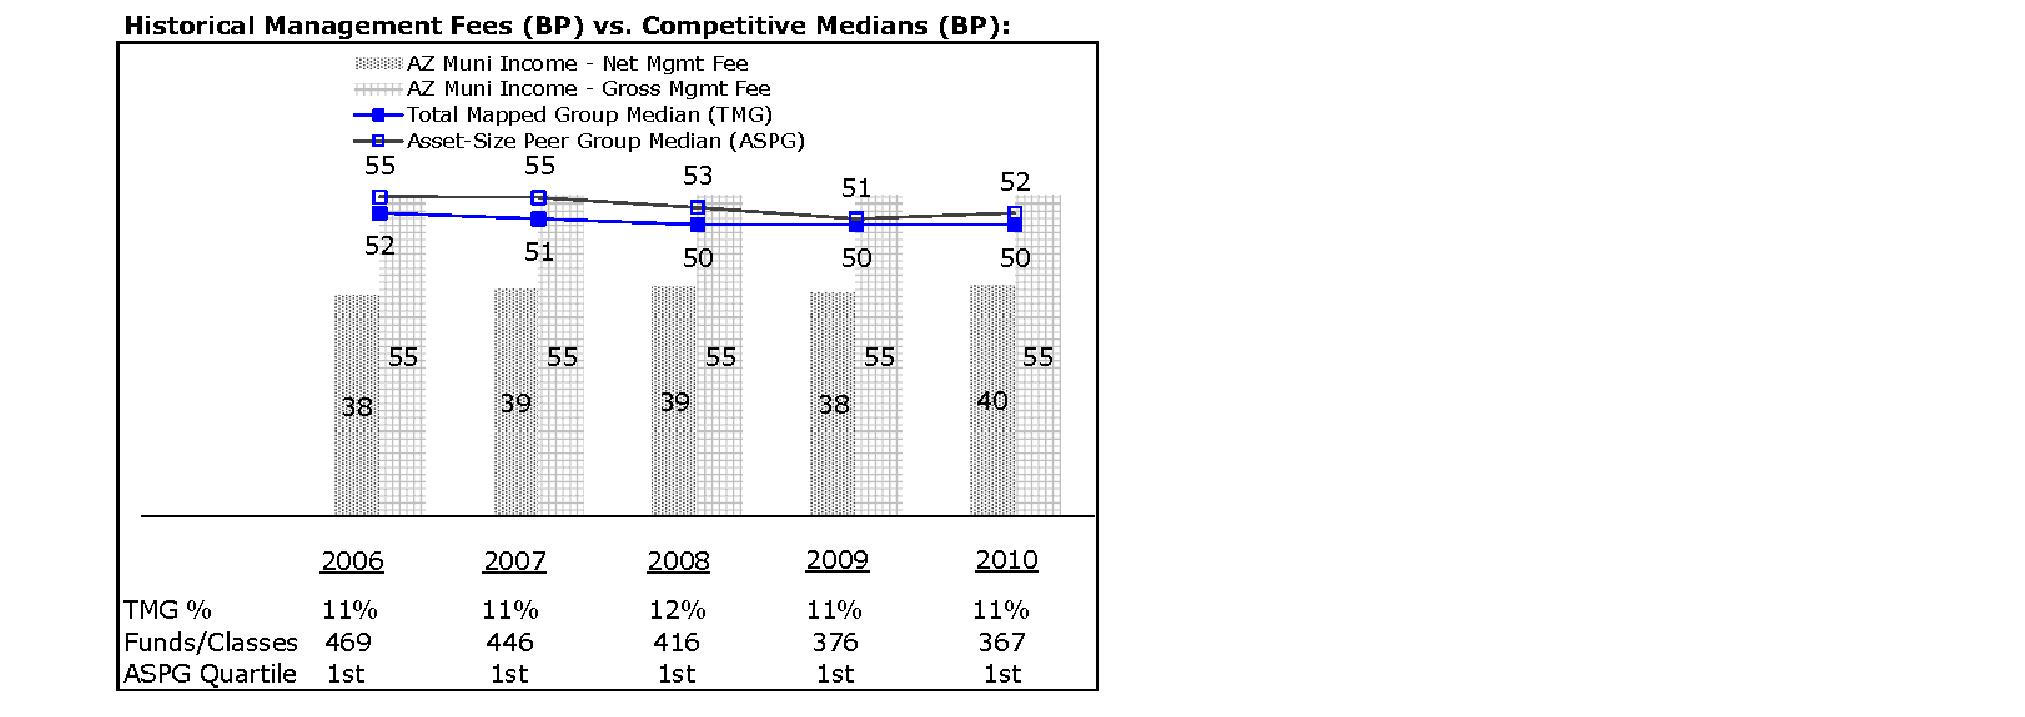
Semiannual Report
Fidelity Arizona Municipal Money Market Fund
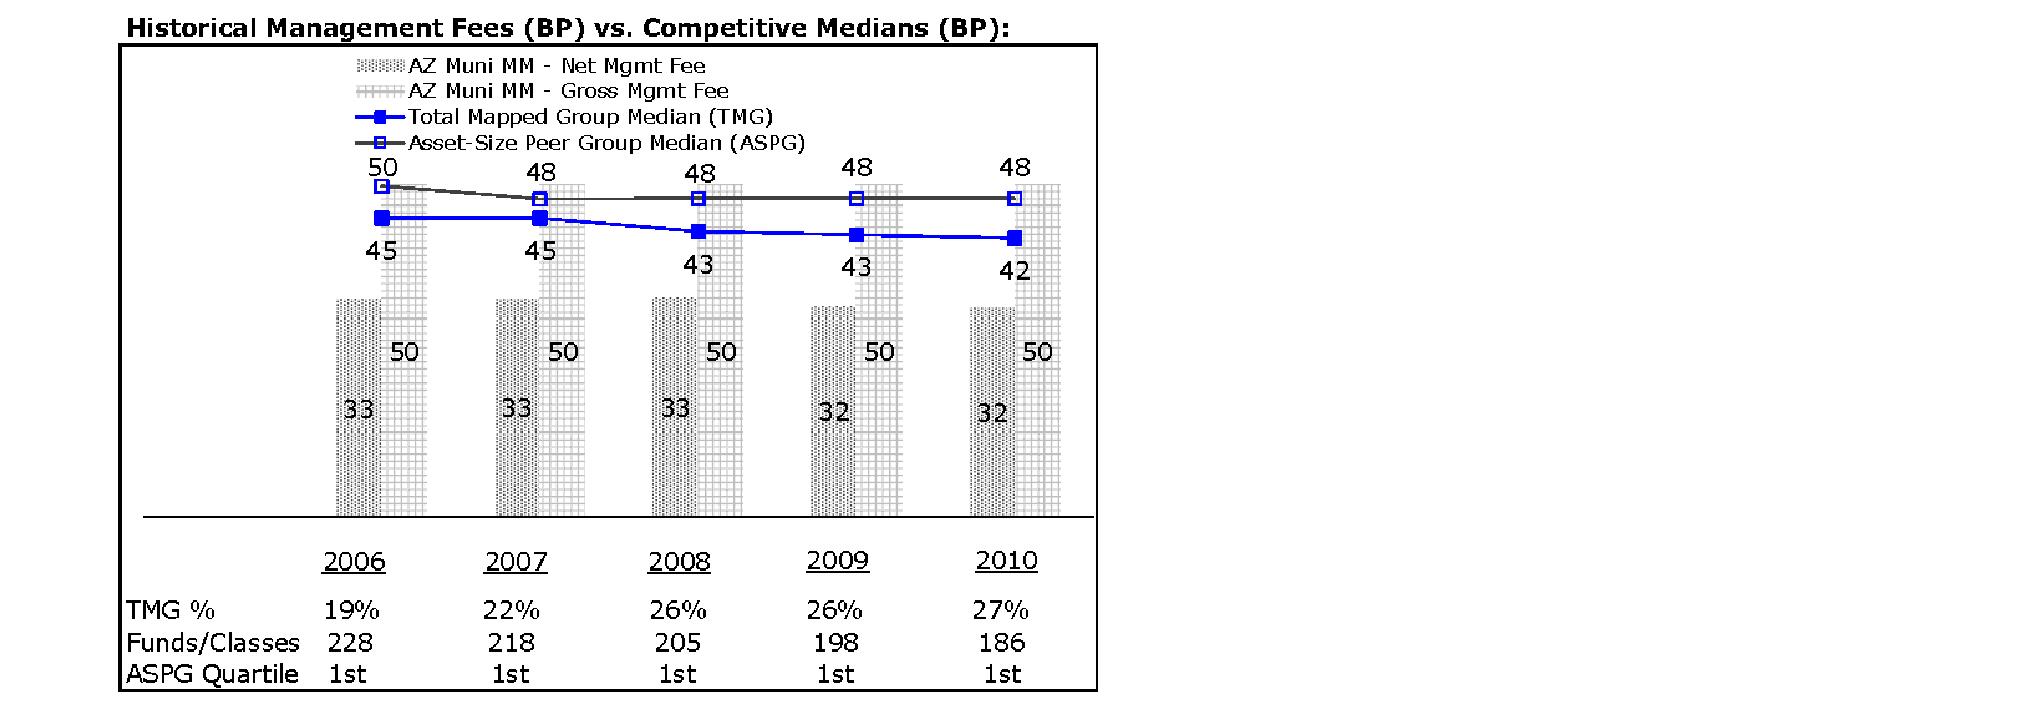
The Board noted that each fund's hypothetical net management fee ranked below the median of its Total Mapped Group and below the median of its ASPG for 2010.
Based on its review, the Board concluded that each fund's management fee is fair and reasonable in light of the services that the fund receives and the other factors considered.
Total Expense Ratio. In its review of each fund's total expense ratio, the Board considered the fund's hypothetical net management fee as well as the fund's all-inclusive fee. The Board also considered other expenses, such as transfer agent fees, pricing and bookkeeping fees, and custodial, legal, and audit fees, paid by FMR under the all-inclusive arrangement. The Board also noted the effects of any waivers and reimbursements on fees and expenses. As part of its review, the Board also considered the current and historical total expense ratios of each fund compared to competitive fund median expenses. Each fund is compared to those funds and classes in the Total Mapped Group (used by the Board for management fee comparisons) that have a similar sales load structure.
The Board noted that Arizona Municipal Income Fund's total expense ratio ranked equal to its competitive median for 2010.
The Board noted that Arizona Municipal Money Market Fund's total expense ratio ranked below its competitive median for 2010. The Board considered that Fidelity has been voluntarily waiving part or all of the management fees to maintain a minimum yield for Fidelity Arizona Municipal Money Market Fund, and also noted that Fidelity retains the ability to be repaid by the fund in certain circumstances.
Semiannual Report
Board Approval of Investment Advisory Contracts and
Management Fees - continued
Fees Charged to Other Fidelity Clients. The Board also considered Fidelity fee structures and other information with respect to clients of FMR and its affiliates, such as other mutual funds advised or subadvised by FMR or its affiliates, pension plan clients, and other institutional clients. In March 2010, the Board created an ad hoc joint committee with the board of other Fidelity funds (the Committee) to review and compare Fidelity's institutional investment advisory business with its business of providing services to the Fidelity funds, including the differences in services provided, fees charged, and costs incurred, as well as competition in their respective marketplaces.
Based on its review of total expense ratios and fees charged to other Fidelity clients, the Board concluded that each fund's total expense ratio was reasonable in light of the services that the fund and its shareholders receive and the other factors considered, including the findings of the Committee.
Costs of the Services and Profitability. The Board considered the revenues earned and the expenses incurred by Fidelity in conducting the business of developing, marketing, distributing, managing, administering and servicing each fund and its shareholders. The Board also considered the level of Fidelity's profits in respect of all the Fidelity funds.
On an annual basis, FMR presents to the Board Fidelity's profitability for each fund. Fidelity calculates the profitability for each fund, as well as aggregate profitability for groups of Fidelity funds and all Fidelity funds, using a series of detailed revenue and cost allocation methodologies which originate with the books and records of Fidelity on which Fidelity's audited financial statements are based. The Audit Committee of the Board reviews any significant changes from the prior year's methodologies.
PricewaterhouseCoopers LLP (PwC), independent registered public accounting firm and auditor to Fidelity and certain Fidelity funds, has been engaged annually by the Board as part of the Board's assessment of Fidelity's profitability analysis. PwC's engagement includes the review and assessment of Fidelity's methodologies used in determining the revenues and expenses attributable to Fidelity's mutual fund business, and completion of agreed-upon procedures surrounding the mathematical accuracy of fund profitability and its conformity to allocation methodologies. After considering PwC's reports issued under the engagement and information provided by Fidelity, the Board concluded that while other allocation methods may also be reasonable, Fidelity's profitability methodologies are reasonable in all material respects.
The Board also reviewed Fidelity's non-fund businesses and fall-out benefits related to the mutual fund business as well as cases where Fidelity's affiliates may benefit from or be related to the funds' business.
The Board considered the costs of the services provided by and the profits realized by Fidelity in connection with the operation of each fund and was satisfied that the profitability was not excessive in the circumstances.
Semiannual Report
Economies of Scale. The Board considered whether there have been economies of scale in respect of the management of the Fidelity funds, whether the Fidelity funds (including each fund) have appropriately benefited from any such economies of scale, and whether there is potential for realization of any further economies of scale. The Board considered the extent to which each fund will benefit from economies of scale through increased services to the fund, through waivers or reimbursements, or through fee or expense reductions. The Board also noted that in 2009, it and the board of other Fidelity funds created an ad hoc committee (the Economies of Scale Committee) to analyze whether FMR attains economies of scale in respect of the management and servicing of the Fidelity funds, whether the Fidelity funds have appropriately benefited from such economies of scale, and whether there is potential for realization of any further economies of scale.
The Board concluded, taking into account the analysis of the Economies of Scale Committee, that any potential economies of scale are being appropriately shared between fund shareholders and Fidelity.
Additional Information Requested by the Board. In order to develop fully the factual basis for consideration of the Fidelity funds' Advisory Contracts, the Board requested and received additional information on certain topics, including: (i) Fidelity's fund profitability methodology, profitability trends for certain funds, and the impact of certain factors on fund profitability results; (ii) portfolio manager changes that have occurred during the past year and the amount of the investment that each portfolio manager has made in the Fidelity fund(s) that he or she manages; (iii) Fidelity's compensation structure for portfolio managers, research analysts, and other key personnel, including its effects on fund profitability, the rationale for the compensation structure, and the extent to which current market conditions have affected retention and recruitment; (iv) the compensation paid to fund sub-advisers on behalf of the Fidelity funds; (v) Fidelity's fee structures and rationale for recommending different fees among different categories of funds and classes, as well as Fidelity's voluntary waiver of its fees to maintain minimum yields for certain money market funds and classes; (vi) the reasons why certain expenses affect various funds and classes differently; (vii) Fidelity's transfer agent fees, expenses, and services and how the benefits of decreased costs and new efficiencies can be shared across all of the Fidelity funds; (viii) the reasons for and consequences of changes to certain product lines compared to competitors; (ix) the allocation of and historical trends in Fidelity's realization of fall-out benefits; and (x) explanations regarding the relative total expense ratios of certain funds and classes, total expense competitive trends, and actions that might be taken by FMR to reduce total expense ratios for certain funds and classes or to achieve further economies of scale.
Based on its evaluation of all of the conclusions noted above, and after considering all factors it believed relevant, the Board ultimately concluded that the advisory fee structures are fair and reasonable, and that each fund's Advisory Contracts should be renewed.
Semiannual Report
Managing Your Investments
Fidelity offers several ways to conveniently manage your personal investments via your telephone or PC. You can access your account information, conduct trades and research your investments 24 hours a day.
By Phone
Fidelity Automated Service Telephone provides a single toll-free number to access account balances, positions, quotes and trading. It's easy to navigate the service, and on your first call, the system will help you create a personal identification number (PIN) for security.
(phone graphic)Fidelity Automated
Service Telephone (FAST®)
1-800-544-5555
Press
1 For mutual fund and brokerage trading.
2 For quotes.*
3 For account balances and holdings.
4 To review orders and mutual
fund activity.
5 To change your PIN.
*0 To speak to a Fidelity representative.
By PC
Fidelity's web site on the Internet provides a wide range of information, including daily financial news, fund performance, interactive planning tools and news about Fidelity products and services.
(computer graphic)Fidelity's Web Site
www.fidelity.com
* When you call the quotes line, please remember that a fund's yield and return will vary and, except for money market funds, share price will also vary. This means that you may have a gain or loss when you sell your shares. There is no assurance that money market funds will be able to maintain a stable $1 share price; an investment in a money market fund is not insured or guaranteed by the U.S. government. Total returns are historical and include changes in share price, reinvestment of dividends and capital gains distributions, and the effects of any sales charges.
Semiannual Report
To Write Fidelity
We'll give your correspondence immediate attention and send you written confirmation upon completion of your request.
(envelope graphic)Making Changes
To Your Account
(such as changing name, address, bank, etc.)
Fidelity Investments
P.O. Box 770001
Cincinnati, OH 45277-0002
(envelope graphic)For Non-Retirement
Accounts
Buying shares
Fidelity Investments
P.O. Box 770001
Cincinnati, OH 45277-0003
Overnight Express
Fidelity Investments
Attn: Distribution Services
100 Crosby Parkway - KC1H
Covington, KY 41015
Selling shares
Fidelity Investments
P.O. Box 770001
Cincinnati, OH 45277-0035
Overnight Express
Fidelity Investments
Attn: Distribution Services
100 Crosby Parkway - KC1H
Covington, KY 41015
General Correspondence
Fidelity Investments
P.O. Box 500
Merrimack, NH 03054-0500
(envelope graphic)For Retirement
Accounts
Buying shares
Fidelity Investments
P.O. Box 770001
Cincinnati, OH 45277-0003
Selling shares
Fidelity Investments
P.O. Box 770001
Cincinnati, OH 45277-0035
Overnight Express
Fidelity Investments
Attn: Distribution Services
100 Crosby Parkway - KC1H
Covington, KY 41015
General Correspondence
Fidelity Investments
P.O. Box 500
Merrimack, NH 03054-0500
Semiannual Report
Investment Adviser
Fidelity Management & Research Company
Boston, MA
Sub-Advisers
Fidelity Investments
Money Management, Inc.
Fidelity Management & Research
(U.K.) Inc.
Fidelity Management & Research
(Hong Kong) Limited
Fidelity Management & Research
(Japan) Inc.
General Distributor
Fidelity Distributors Corporation
Boston, MA
Transfer and Service Agents
Citibank, N.A.
New York, NY
Fidelity Investments Institutional Operations Company, Inc.
Boston, MA
Fidelity Service Company, Inc.
Boston, MA
Custodian
Citibank, N.A.
New York, NY
The Fidelity Telephone Connection
Mutual Fund 24-Hour Service
Exchanges/Redemptions
and Account Assistance 1-800-544-6666
Product Information 1-800-544-6666
Retirement Accounts 1-800-544-4774 (8 a.m. - 9 p.m.)
TDD Service 1-800-544-0118
for the deaf and hearing impaired
(9 a.m. - 9 p.m. Eastern time)
Fidelity Automated Service
Telephone (FAST®)
1-800-544-5555
Automated line for quickest service
AZI/SPZ-USAN-0412
1.790941.108
(Fidelity Investment logo)(registered trademark)
Corporate Headquarters
82 Devonshire St., Boston, MA 02109
www.fidelity.com
Fidelity®
Maryland Municipal Income
Fund
Semiannual Report
February 29, 2012\
(Fidelity Cover Art)
Contents
Shareholder Expense Example | (Click Here) | An example of shareholder expenses. |
Investment Changes | (Click Here) | A summary of major shifts in the fund's investments over the past six months. |
Investments | (Click Here) | A complete list of the fund's investments with their market values. |
Financial Statements | (Click Here) | Statements of assets and liabilities, operations, and changes in net assets, as well as financial highlights. |
Notes | (Click Here) | Notes to the financial statements. |
Board Approval of Investment Advisory Contracts and Management Fees | (Click Here) | |
To view a fund's proxy voting guidelines and proxy voting record for the 12-month period ended June 30, visit http://www.fidelity.com/proxyvotingresults or visit the Securities and Exchange Commission's (SEC) web site at http://www.sec.gov. You may also call 1-800-544-8544 to request a free copy of the proxy voting guidelines.
Standard & Poor's, S&P and S&P 500 are registered service marks of The McGraw-Hill Companies, Inc. and have been licensed for use by Fidelity Distributors Corporation.
Other third party marks appearing herein are the property of their respective owners.
All other marks appearing herein are registered or unregistered trademarks or service marks of FMR LLC or an affiliated company.
This report and the financial statements contained herein are submitted for the general information of the shareholders of the fund. This report is not authorized for distribution to prospective investors in the fund unless preceded or accompanied by an effective prospectus.
A fund files its complete schedule of portfolio holdings with the SEC for the first and third quarters of each fiscal year on Form N-Q. Forms N-Q are available on the SEC's web site at http://www.sec.gov. A fund's Forms N-Q may be reviewed and copied at the SEC's Public Reference Room in Washington, DC. Information regarding the operation of the SEC's Public Reference Room may be obtained by calling 1-800-SEC-0330. For a complete list of a fund's portfolio holdings, view the most recent holdings listing, semiannual report, or annual report on Fidelity's web site at http://www.fidelity.com, http://www.advisor.fidelity.com, or http://www.401k.com, as applicable.
NOT FDIC INSURED • MAY LOSE VALUE • NO BANK GUARANTEE
Neither the fund nor Fidelity Distributors Corporation is a bank.
Semiannual Report
Shareholder Expense Example
As a shareholder of the Fund, you incur two types of costs: (1) transaction costs, including redemption fees, and (2) ongoing costs, including management fees and other Fund expenses. This Example is intended to help you understand your ongoing costs (in dollars) of investing in the Fund and to compare these costs with the ongoing costs of investing in other mutual funds.
The Example is based on an investment of $1,000 invested at the beginning of the period and held for the entire period (September 1, 2011 to February 29, 2012).
Actual Expenses
The first line of the accompanying table provides information about actual account values and actual expenses. You may use the information in this line, together with the amount you invested, to estimate the expenses that you paid over the period. Simply divide your account value by $1,000.00 (for example, an $8,600 account value divided by $1,000.00 = 8.6), then multiply the result by the number in the first line under the heading entitled "Expenses Paid During Period" to estimate the expenses you paid on your account during this period. A small balance maintenance fee of $12.00 that is charged once a year may apply for certain accounts with a value of less than $2,000. This fee is not included in the table below. If it was, the estimate of expenses you paid during the period would be higher, and your ending account value lower, by this amount.
Hypothetical Example for Comparison Purposes
The second line of the accompanying table provides information about hypothetical account values and hypothetical expenses based on the Fund's actual expense ratio and an assumed rate of return of 5% per year before expenses, which is not the Fund's actual return. The hypothetical account values and expenses may not be used to estimate the actual ending account balance or expenses you paid for the period. You may use this information to compare the ongoing costs of investing in the Fund and other funds. To do so, compare this 5% hypothetical example with the 5% hypothetical examples that appear in the shareholder reports of the other funds. A small balance maintenance fee of $12.00 that is charged once a year may apply for certain accounts with a value of less than $2,000. This fee is not included in the table below. If it was, the estimate of expenses you paid during the period would be higher, and your ending account value lower, by this amount.
Please note that the expenses shown in the table are meant to highlight your ongoing costs only and do not reflect any transaction costs. Therefore, the second line of the table is useful in comparing ongoing costs only, and will not help you determine the relative total costs of owning different funds. In addition, if these transactional costs were included, your costs would have been higher.
Semiannual Report
Shareholder Expense Example - continued
| Annualized
Expense Ratio | Beginning
Account Value
September 1, 2011 | Ending
Account Value
February 29, 2012 | Expenses Paid
During Period*
September 1, 2011 to
February 29, 2012 |
Actual | .55% | $ 1,000.00 | $ 1,047.80 | $ 2.80 |
Hypothetical (5% return per year before expenses) | | $ 1,000.00 | $ 1,022.13 | $ 2.77 |
* Expenses are equal to the Fund's annualized expense ratio, multiplied by the average account value over the period, multiplied by 182/366 (to reflect the one-half year period).
Semiannual Report
Investment Changes (Unaudited)
Top Five Sectors as of February 29, 2012 |
| % of fund's
net assets | % of fund's net assets
6 months ago |
General Obligations | 36.7 | 35.3 |
Health Care | 12.0 | 12.8 |
Education | 10.0 | 11.1 |
Water & Sewer | 10.0 | 10.9 |
Transportation | 7.5 | 8.2 |
Weighted Average Maturity as of February 29, 2012 |
| | 6 months ago |
Years | 5.6 | 6.1 |
This is a weighted average of all the maturities of the securities held in a fund. Weighted Average Maturity (WAM) can be used as a measure of sensitivity to interest rate changes and market changes. Generally, the longer the maturity, the greater the sensitivity to such changes. WAM is based on the dollar-weighted average length of time until principal payments must be paid. Depending on the types of securities held in a fund, certain maturity shortening devices (e.g., demand features, interest rate resets, and call options) may be taken into account when calculating the WAM. |
Duration as of February 29, 2012 |
| | 6 months ago |
Years | 6.5 | 7.2 |
Duration estimates how much a bond fund's price will change with a change in comparable interest rates. If rates rise 1%, for example, a fund with a 5-year duration is likely to lose about 5% of its value. Other factors also can influence a bond fund's performance and share price. Accordingly, a bond fund's actual performance may differ from this example. Duration takes into account any call or put option embedded in the bonds. |
Quality Diversification (% of fund's net assets) |
As of February 29, 2012 | As of August 31, 2011 |
| AAA 25.9% | | | AAA 22.2% | |
 | AA,A 59.3% | | | AA,A 64.9% | |
 | BBB 5.7% | | | BBB 9.0% | |
| BB and Below 1.2% | | | BB and Below 0.2% | |
 | Not Rated 0.4% | | | Not Rated 0.4% | |
| Short-Term
Investments and
Net Other Assets 7.5% | | | Short-Term
Investments and
Net Other Assets 3.3% | |

We have used ratings from Moody's Investors Service, Inc. Where Moody's® ratings are not available, we have used S&P® ratings. All ratings are as of the date indicated and do not reflect subsequent changes. |
Semiannual Report
Investments February 29, 2012 (Unaudited)
Showing Percentage of Net Assets
Municipal Bonds - 92.5% |
| Principal Amount | | Value |
District Of Columbia - 2.1% |
Washington DC Metropolitan Transit Auth. Rev. Series 2009 A, 5% 7/1/19 | | $ 3,780,000 | | $ 4,586,009 |
Guam - 0.2% |
Guam Ed. Fing. Foundation Ctfs. of Prtn. Series 2006 A, 5% 10/1/23 | | 500,000 | | 502,615 |
Maryland - 84.3% |
Baltimore Convention Ctr. Hotel Rev. Series 2006 A: | | | | |
5.25% 9/1/17 (XL Cap. Assurance, Inc. Insured) | | 1,350,000 | | 1,407,996 |
5.25% 9/1/27 (XL Cap. Assurance, Inc. Insured) | | 1,020,000 | | 991,562 |
Baltimore County Ctfs. of Prtn. (Equip. Acquisition Prog.) Series 2004, 5% 6/1/13 (Nat'l. Pub. Fin. Guarantee Corp. Insured) | | 1,500,000 | | 1,580,940 |
Baltimore County Gen. Oblig.: | | | | |
(Consolidated Pub. Impt. Proj.) Series 2004, 5% 8/1/15 | | 2,385,000 | | 2,646,778 |
(Metropolitan District Proj.) Series 71: | | | | |
5% 2/1/31 | | 2,000,000 | | 2,257,660 |
5% 2/1/38 | | 1,930,000 | | 2,138,537 |
(Oak Crest Village, Inc. Proj.) Series 2007 A, 5% 1/1/22 | | 500,000 | | 526,185 |
Series 2010, 5% 8/1/20 | | 1,000,000 | | 1,264,600 |
Baltimore County Metropolitan District 4% 8/1/24 | | 3,000,000 | | 3,414,750 |
Baltimore Ctfs. of Prtn. Series 2010 A, 5% 10/1/17 | | 2,005,000 | | 2,403,694 |
Baltimore Gen. Oblig. (Consolidated Pub. Impt. Proj.): | | | | |
Series 2005 A, 5% 10/15/18 (AMBAC Insured) | | 1,720,000 | | 1,960,112 |
Series 2008 A, 5% 10/15/25 (FSA Insured) | | 1,445,000 | | 1,686,835 |
Baltimore Proj. Rev.: | | | | |
(Wastewtr. Proj.): | | | | |
Series 2002 A: | | | | |
5.125% 7/1/42 (Nat'l. Pub. Fin. Guarantee Corp. Insured) | | 2,315,000 | | 2,336,668 |
5.2% 7/1/32 (Nat'l. Pub. Fin. Guarantee Corp. Insured) | | 250,000 | | 252,480 |
Series 2007 D: | | | | |
5% 7/1/32 (FSA Insured) | | 4,500,000 | | 4,946,445 |
5% 7/1/37 (AMBAC Insured) | | 2,000,000 | | 2,159,560 |
5% 7/1/37 (FSA Insured) | | 4,000,000 | | 4,317,080 |
Series 2008 A: | | | | |
5% 7/1/33 (FSA Insured) | | 2,000,000 | | 2,215,360 |
5% 7/1/38 (FSA Insured) | | 2,000,000 | | 2,164,020 |
Series 2009 C, 5.625% 7/1/39 | | 2,000,000 | | 2,282,020 |
Municipal Bonds - continued |
| Principal Amount | | Value |
Maryland - continued |
Baltimore Proj. Rev.: - continued | | | | |
(Wtr. Proj.): | | | | |
Series 1994 A, 5% 7/1/24 (FGIC Insured) | | $ 370,000 | | $ 440,644 |
Series 2002 A, 5.125% 7/1/42 (Nat'l. Pub. Fin. Guarantee Corp. Insured) | | 355,000 | | 358,323 |
City of Westminster (McDaniel College Proj.) Series 2006: | | | | |
5% 11/1/12 | | 500,000 | | 510,040 |
5% 11/1/13 | | 350,000 | | 365,838 |
Frederick County Econ. Dev. Rev.: | | | | |
Series 2005, 5% 8/1/15 (Nat'l. Pub. Fin. Guarantee Corp. Insured) | | 1,000,000 | | 1,147,730 |
Series 2009 A: | | | | |
5% 3/1/25 | | 610,000 | | 730,567 |
5% 3/1/27 | | 1,255,000 | | 1,486,849 |
Frederick County Edl. Facilities Rev. (Mount Saint Mary's Univ. Proj.) Series 2006, 5.5% 9/1/12 | | 195,000 | | 198,592 |
Frederick County Gen. Oblig.: | | | | |
Series 2005, 5% 12/1/15 (Escrowed to Maturity) | | 1,000,000 | | 1,164,450 |
Series 2011 A, 4% 8/1/16 | | 2,205,000 | | 2,532,531 |
Series 2011 B, 4% 8/1/17 | | 2,575,000 | | 3,016,020 |
Howard County Gen. Oblig. Series 2011 B, 5% 8/15/22 | | 3,285,000 | | 4,158,350 |
Maryland Dept. of Trans. Consolidated Trans. Rev. Series 2009: | | | | |
4% 5/15/20 | | 3,000,000 | | 3,500,730 |
4% 5/15/23 | | 1,390,000 | | 1,582,376 |
Maryland Dept. of Trans. County Trans. Rev. Series 2009, 4% 6/15/23 | | 2,000,000 | | 2,259,500 |
Maryland Econ. Dev. Corp. Lease Rev. (Maryland Aviation Administration Facilities Proj.) Series 2003, 5.5% 6/1/18 (FSA Insured) (b) | | 1,500,000 | | 1,570,305 |
Maryland Econ. Dev. Corp. Poll. Cont. Rev. (Potomac Elec. Proj.) Series 2006, 6.2% 9/1/22 | | 2,700,000 | | 3,317,517 |
Maryland Econ. Dev. Corp. Student Hsg. Rev.: | | | | |
(Towson Univ. Proj.) Series 2007 A, 5.25% 7/1/17 | | 500,000 | | 554,680 |
(Univ. of Maryland, Baltimore County Student Hsg. Proj.) Series 2006: | | | | |
5% 6/1/14 (CIFG North America Insured) | | 700,000 | | 759,549 |
5% 7/1/16 (XL Cap. Assurance, Inc. Insured) | | 500,000 | | 522,465 |
5% 6/1/18 (CIFG North America Insured) | | 2,000,000 | | 2,192,240 |
Maryland Gen. Oblig. (State & Local Facilities Ln. Prog.): | | | | |
First Series 2002 A, 5.5% 3/1/17 | | 2,265,000 | | 2,792,111 |
Municipal Bonds - continued |
| Principal Amount | | Value |
Maryland - continued |
Maryland Gen. Oblig. (State & Local Facilities Ln. Prog.): - continued | | | | |
First Series 2003 A, 5.25% 3/1/17 | | $ 4,295,000 | | $ 5,246,729 |
First Series 2009 A, 5% 3/1/21 (Pre-Refunded to 3/1/17 @ 100) | | 750,000 | | 910,718 |
First Series 2009 C, 5% 3/1/18 | | 1,050,000 | | 1,293,558 |
Second Series 2009 A, 5% 8/15/23 | | 2,460,000 | | 2,916,994 |
Second Series 2009 B, 5% 8/15/21 | | 3,000,000 | | 3,713,130 |
Maryland Health & Higher Edl. Facilities Auth. Rev.: | | | | |
(Anne Arundel Health Sys. Proj.) Series 2010, 5% 7/1/28 | | 510,000 | | 547,760 |
(Carroll County Gen. Hosp. Proj.) Series 2006, 5% 7/1/40 | | 1,500,000 | | 1,536,765 |
(Doctors Cmnty. Hosp. Proj.) Series 2010, 5.75% 7/1/38 | | 1,355,000 | | 1,400,094 |
(Good Samaritan Hosp. Proj.) Series 1993, 5.75% 7/1/13 (Escrowed to Maturity) | | 240,000 | | 249,557 |
(Hebrew Home of Greater Washington Proj.) Series 2002, 5.8% 1/1/32 | | 1,000,000 | | 1,000,920 |
(Howard County Gen. Hosp. Proj.) 5.5% 7/1/13 (Escrowed to Maturity) | | 245,000 | | 250,282 |
(Johns Hopkins Med. Institutions Utils. Proj.) Series 2005 B, 5% 5/15/35 | | 1,475,000 | | 1,617,957 |
(Johns Hopkins Univ. Proj.): | | | | |
Series 2002 A, 5% 7/1/32 | | 1,015,000 | | 1,026,317 |
Series 2004 A: | | | | |
5% 7/1/24 | | 1,000,000 | | 1,085,310 |
5% 7/1/33 | | 2,000,000 | | 2,146,760 |
5% 7/1/38 | | 2,000,000 | | 2,140,140 |
Series 2008 A, 5.25% 7/1/38 | | 5,000,000 | | 5,689,550 |
(LifeBridge Health Proj.): | | | | |
Series 2008, 5% 7/1/19 (Assured Guaranty Corp. Insured) | | 300,000 | | 337,785 |
Series 2011, 6% 7/1/41 | | 1,500,000 | | 1,692,825 |
(Loyola College Issue Proj.) Series 1999, 5% 10/1/39 | | 2,000,000 | | 2,001,240 |
(MedStar Health Proj.) Series 2007, 5.25% 5/15/46 | | 1,000,000 | | 1,031,010 |
(Mercy Med. Ctr. Proj.) Series 2007 A, 5.5% 7/1/42 | | 1,000,000 | | 1,025,850 |
(Peninsula Reg'l. Med. Ctr. Proj.) Series 2006, 5% 7/1/15 | | 1,120,000 | | 1,225,930 |
(Univ. of Maryland Med. Sys. Proj.): | | | | |
Series 2006 A, 5% 7/1/41 | | 1,000,000 | | 1,039,680 |
Series 2008 F, 5.25% 7/1/19 | | 1,700,000 | | 1,947,146 |
Series 2010, 5.125% 7/1/39 | | 1,700,000 | | 1,829,200 |
Municipal Bonds - continued |
| Principal Amount | | Value |
Maryland - continued |
Maryland Health & Higher Edl. Facilities Auth. Rev.: - continued | | | | |
(Upper Chesapeake Hosp. Proj.) Series 2008 C, 5.5% 1/1/18 | | $ 525,000 | | $ 585,995 |
(Washington County Health Sys. Proj.) Series 2008, 6% 1/1/43 | | 400,000 | | 418,520 |
(Western Maryland Health Sys. Proj.) Series 2006 A: | | | | |
5% 1/1/16 (Nat'l. Pub. Fin. Guarantee Corp. Insured) | | 1,450,000 | | 1,639,544 |
5% 7/1/17 (Nat'l. Pub. Fin. Guarantee Corp. Insured) | | 1,635,000 | | 1,865,486 |
Bonds (Johns Hopkins Health Sys. Obligated Group Proj.) Series 2008 B, 5%, tender 5/15/13 (a) | | 1,400,000 | | 1,476,314 |
Series 2011 A, 5% 5/15/23 | | 1,500,000 | | 1,781,865 |
Series 2011, 5% 8/15/22 | | 1,000,000 | | 1,166,100 |
Maryland Indl. Dev. Fing. Auth. Rev. (American Ctr. for Physics Proj.) Series 2001: | | | | |
5.25% 12/15/13 | | 1,100,000 | | 1,103,850 |
5.25% 12/15/15 | | 320,000 | | 321,018 |
Maryland Nat'l. Cap. Park & Planning Commission Series 2004 EE2, 5% 1/15/15 | | 2,000,000 | | 2,167,680 |
Maryland Trans. Auth. Grant Rev. Series 2007, 5% 3/1/16 | | 2,000,000 | | 2,344,620 |
Maryland Trans. Auth. Trans. Facility Projects Rev.: | | | | |
Series 2007: | | | | |
5% 7/1/30 | | 2,000,000 | | 2,215,040 |
5% 7/1/31 (FSA Insured) | | 5,000,000 | | 5,514,200 |
Series 2008: | | | | |
5% 7/1/35 | | 880,000 | | 965,747 |
5% 7/1/37 (FSA Insured) | | 4,485,000 | | 4,866,046 |
6.8% 7/1/16 (Escrowed to Maturity) | | 490,000 | | 560,668 |
Montgomery County Gen. Oblig.: | | | | |
(Consolidated Pub. Impt. Proj.): | | | | |
Series 2005 A, 5% 6/1/24 | | 2,000,000 | | 2,222,460 |
Series 2007 A, 5% 5/1/25 | | 1,000,000 | | 1,146,240 |
(Dept. of Liquor Cont. Proj.): | | | | |
Series 2009 A, 5% 4/1/14 | | 1,000,000 | | 1,087,220 |
Series 2011 A, 5% 4/1/20 | | 1,405,000 | | 1,730,693 |
(Trinity Health Cr. Group Proj.) Series 2011 MD, 5% 12/1/40 | | 1,000,000 | | 1,107,160 |
Series 2011 A, 5% 7/1/24 | | 2,000,000 | | 2,408,240 |
Municipal Bonds - continued |
| Principal Amount | | Value |
Maryland - continued |
Morgan State Univ. Academic & Auxiliary Facilities Fees Rev. Series 2003 A, 5% 7/1/20 (Nat'l. Pub. Fin. Guarantee Corp. Insured) | | $ 500,000 | | $ 519,730 |
Northeast Maryland Waste Disp. Auth. Solid Waste Rev. Series 2003, 5.5% 4/1/12 (AMBAC Insured) (b) | | 4,500,000 | | 4,516,650 |
Prince Georges County Gen. Oblig.: | | | | |
Series 2011 A, 5% 9/15/26 | | 2,500,000 | | 3,072,175 |
Series 2011 B, 5% 9/15/22 | | 1,880,000 | | 2,378,238 |
Washington Suburban San. District: | | | | |
Series 2009 A, 5% 6/1/17 | | 5,000,000 | | 6,109,797 |
5% 6/1/20 | | 2,000,000 | | 2,470,720 |
| | 180,779,912 |
Puerto Rico - 5.9% |
Puerto Rico Commonwealth Hwy. & Trans. Auth. Hwy. Rev. Series AA: | | | | |
5.5% 7/1/19 (Escrowed to Maturity) | | 1,240,000 | | 1,599,600 |
5.5% 7/1/19 (Nat'l. Pub. Fin. Guarantee Corp. Insured) | | 260,000 | | 296,018 |
Puerto Rico Commonwealth Hwy. & Trans. Auth. Trans. Rev. Series E, 5.5% 7/1/17 (FSA Insured) | | 1,000,000 | | 1,151,290 |
Puerto Rico Commonwealth Infrastructure Fing. Auth. Series 2005 C, 5.5% 7/1/23 | | 1,110,000 | | 1,237,839 |
Puerto Rico Commonwealth Pub. Impt. Gen. Oblig.: | | | | |
Series 2002 A: | | | | |
5.5% 7/1/18 | | 700,000 | | 797,041 |
5.5% 7/1/18 (Nat'l. Pub. Fin. Guarantee Corp. Insured) | | 230,000 | | 261,885 |
Series 2007 A, 5.5% 7/1/19 (Nat'l. Pub. Fin. Guarantee Corp. Insured) | | 1,000,000 | | 1,138,530 |
Puerto Rico Elec. Pwr. Auth. Pwr. Rev.: | | | | |
Series 2002 KK, 5.5% 7/1/15 (Nat'l. Pub. Fin. Guarantee Corp. Insured) | | 1,000,000 | | 1,118,430 |
Series II, 5.375% 7/1/16 (Nat'l. Pub. Fin. Guarantee Corp. Insured) | | 1,500,000 | | 1,534,890 |
Series QQ, 5.5% 7/1/17 (XL Cap. Assurance, Inc. Insured) | | 1,000,000 | | 1,163,220 |
Municipal Bonds - continued |
| Principal Amount | | Value |
Puerto Rico - continued |
Puerto Rico Elec. Pwr. Auth. Pwr. Rev.: - continued | | | | |
Series VV, 5.25% 7/1/24 (FGIC Insured) | | $ 1,000,000 | | $ 1,155,440 |
Puerto Rico Sales Tax Fing. Corp. Sales Tax Rev. Series 2011 C, 0% 8/1/39 | | 5,000,000 | | 1,176,450 |
| | 12,630,633 |
TOTAL INVESTMENT PORTFOLIO - 92.5% (Cost $185,139,005) | | 198,499,169 |
NET OTHER ASSETS (LIABILITIES) - 7.5% | | 16,089,517 |
NET ASSETS - 100% | $ 214,588,686 |
Legend |
(a) Coupon rates for floating and adjustable rate securities reflect the rates in effect at period end. |
(b) Private activity obligations whose interest is subject to the federal alternative minimum tax for individuals. |
Other Information |
All investments are categorized as Level 2 under the Fair Value Hierarchy. The inputs or methodology used for valuing securities may not be an indication of the risk associated with investing in those securities. For more information on valuation inputs, please refer to the Security Valuation section in the accompanying Notes to Financial Statements. |
The distribution of municipal securities by revenue source, as a percentage of total net assets, is as follows (Unaudited): |
General Obligations | 36.7% |
Health Care | 12.0% |
Education | 10.0% |
Water & Sewer | 10.0% |
Transportation | 7.5% |
Special Tax | 6.8% |
Others (Individually less than 5%) | 9.5% |
Net Other Assets | 7.5% |
| 100.0% |
See accompanying notes which are an integral part of the financial statements.
Semiannual Report
Statement of Assets and Liabilities
| February 29, 2012 (Unaudited) |
| | |
Assets | | |
Investment in securities, at value - See accompanying schedule: Unaffiliated issuers (cost $185,139,005) | | $ 198,499,169 |
Cash | | 13,723,166 |
Receivable for fund shares sold | | 633,322 |
Interest receivable | | 2,010,386 |
Other receivables | | 871 |
Total assets | | 214,866,914 |
| | |
Liabilities | | |
Payable for fund shares redeemed | $ 49,040 | |
Distributions payable | 132,193 | |
Accrued management fee | 96,995 | |
Total liabilities | | 278,228 |
| | |
Net Assets | | $ 214,588,686 |
Net Assets consist of: | | |
Paid in capital | | $ 201,392,484 |
Undistributed net investment income | | 783 |
Accumulated undistributed net realized gain (loss) on investments | | (164,745) |
Net unrealized appreciation (depreciation) on investments | | 13,360,164 |
Net Assets, for 18,613,756 shares outstanding | | $ 214,588,686 |
Net Asset Value, offering price and redemption price per share ($214,588,686 ÷ 18,613,756 shares) | | $ 11.53 |
See accompanying notes which are an integral part of the financial statements.
Semiannual Report
Statement of Operations
| Six months ended February 29, 2012 (Unaudited) |
| | |
Investment Income | | |
Interest | | $ 3,509,502 |
| | |
Expenses | | |
Management fee | $ 542,613 | |
Independent trustees' compensation | 358 | |
Miscellaneous | 265 | |
Total expenses before reductions | 543,236 | |
Expense reductions | (1,319) | 541,917 |
Net investment income (loss) | | 2,967,585 |
Realized and Unrealized Gain (Loss) Net realized gain (loss) on: | | |
Investment securities: | | |
Unaffiliated issuers | 193,516 | |
Investment not meeting investment restrictions | (1,122) | |
Payment from investment advisor for loss on investment not meeting investment restrictions | 1,122 | |
Total net realized gain (loss) | | 193,516 |
Change in net unrealized appreciation (depreciation) on investment securities | | 6,128,611 |
Net gain (loss) | | 6,322,127 |
Net increase (decrease) in net assets resulting from operations | | $ 9,289,712 |
See accompanying notes which are an integral part of the financial statements.
Semiannual Report
Financial Statements - continued
Statement of Changes in Net Assets
| Six months ended
February 29, 2012
(Unaudited) | Year ended
August 31,
2011 |
Increase (Decrease) in Net Assets | | |
Operations | | |
Net investment income (loss) | $ 2,967,585 | $ 6,146,587 |
Net realized gain (loss) | 193,516 | 102,605 |
Change in net unrealized appreciation (depreciation) | 6,128,611 | (3,020,531) |
Net increase (decrease) in net assets resulting
from operations | 9,289,712 | 3,228,661 |
Distributions to shareholders from net investment income | (2,966,622) | (6,145,085) |
Share transactions
Proceeds from sales of shares | 29,229,444 | 46,278,332 |
Reinvestment of distributions | 2,052,774 | 4,220,305 |
Cost of shares redeemed | (11,029,745) | (57,232,181) |
Net increase (decrease) in net assets resulting from share transactions | 20,252,473 | (6,733,544) |
Redemption fees | 1,939 | 2,363 |
Total increase (decrease) in net assets | 26,577,502 | (9,647,605) |
| | |
Net Assets | | |
Beginning of period | 188,011,184 | 197,658,789 |
End of period (including undistributed net investment income of $783 and distributions in excess of net investment income of $180, respectively) | $ 214,588,686 | $ 188,011,184 |
Other Information Shares | | |
Sold | 2,574,172 | 4,232,205 |
Issued in reinvestment of distributions | 181,061 | 385,772 |
Redeemed | (976,764) | (5,269,070) |
Net increase (decrease) | 1,778,469 | (651,093) |
See accompanying notes which are an integral part of the financial statements.
Semiannual Report
Financial Highlights
| Six months ended
February 29, 2012 | Years ended August 31, |
| (Unaudited) | 2011 | 2010 | 2009 | 2008 | 2007 |
Selected Per-Share Data | | | | | |
Net asset value, beginning of period | $ 11.17 | $ 11.30 | $ 10.78 | $ 10.64 | $ 10.64 | $ 10.85 |
Income from Investment Operations | | | | | | |
Net investment income (loss) D | .170 | .366 | .375 | .392 | .397 | .403 |
Net realized and unrealized gain (loss) | .360 | (.130) | .521 | .151 | .022 | (.189) |
Total from investment operations | .530 | .236 | .896 | .543 | .419 | .214 |
Distributions from net investment income | (.170) | (.366) | (.376) | (.393) | (.397) | (.403) |
Distributions from net realized gain | - | - | - | (.010) | (.022) | (.021) |
Total distributions | (.170) | (.366) | (.376) | (.403) | (.419) | (.424) |
Redemption fees added to paid in capital D, F | - | - | - | - | - | - |
Net asset value, end of period | $ 11.53 | $ 11.17 | $ 11.30 | $ 10.78 | $ 10.64 | $ 10.64 |
Total Return B, C | 4.78% | 2.21% | 8.46% | 5.34% | 4.00% | 1.98% |
Ratios to Average Net Assets E | | | | | |
Expenses before reductions | .55% A | .55% | .55% | .55% | .55% | .55% |
Expenses net of fee waivers, if any | .55% A | .55% | .55% | .55% | .55% | .55% |
Expenses net of all reductions | .55% A | .55% | .55% | .54% | .50% | .48% |
Net investment income (loss) | 3.02% A | 3.35% | 3.42% | 3.79% | 3.71% | 3.73% |
Supplemental Data | | | | | | |
Net assets, end of period (000 omitted) | $ 214,589 | $ 188,011 | $ 197,659 | $ 162,478 | $ 156,623 | $ 131,645 |
Portfolio turnover rate | 7% A | 22% | 2% | 23% | 12% | 18% |
A Annualized
B Total returns for periods of less than one year are not annualized.
C Total returns would have been lower if certain expenses had not been reduced during the applicable periods shown.
D Calculated based on average shares outstanding during the period.
E Expense ratios reflect operating expenses of the Fund. Expenses before reductions do not reflect amounts reimbursed by the investment adviser or reductions from expense offset arrangements and do not represent the amount paid by the Fund during periods when reimbursements or reductions occur. Expenses net of fee waivers reflect expenses after reimbursement by the investment adviser but prior to reductions from expense offset arrangements. Expenses net of all reductions represent the net expenses paid by the Fund.
F Amount represents less than $.001 per share.
See accompanying notes which are an integral part of the financial statements.
Semiannual Report
Notes to Financial Statements
For the period ended February 29, 2012 (Unaudited)
1. Organization.
Fidelity Maryland Municipal Income Fund (the Fund) is a non-diversified fund of Fidelity Union Street Trust (the Trust) and is authorized to issue an unlimited number of shares. The Trust is registered under the Investment Company Act of 1940, as amended (the 1940 Act), as an open-end management investment company organized as a Massachusetts business trust. The Fund may be affected by economic and political developments in the state of Maryland.
2. Significant Accounting Policies.
The financial statements have been prepared in conformity with accounting principles generally accepted in the United States of America (GAAP), which require management to make certain estimates and assumptions at the date of the financial statements. Actual results could differ from those estimates. Subsequent events, if any, through the date that the financial statements were issued have been evaluated in the preparation of the financial statements. The following summarizes the significant accounting policies of the Fund:
Security Valuation. Investments are valued as of 4:00 p.m. Eastern time on the last calendar day of the period. The Fund uses independent pricing services approved by the Board of Trustees to value its investments. When current market prices or quotations are not readily available or reliable, valuations may be determined in good faith in accordance with procedures adopted by the Board of Trustees. Factors used in determining value may include market or security specific events, changes in interest rates and credit quality. The frequency with which these procedures are used cannot be predicted and they may be utilized to a significant extent. The value used for net asset value (NAV) calculation under these procedures may differ from published prices for the same securities.
The Fund categorizes the inputs to valuation techniques used to value its investments into a disclosure hierarchy consisting of three levels as shown below:
Level 1 - quoted prices in active markets for identical investments
Level 2 - other significant observable inputs (including quoted prices for similar investments, interest rates, prepayment speeds, etc.)
Level 3 - unobservable inputs (including the Fund's own assumptions based on the best information available)
Changes in valuation techniques may result in transfers in or out of an assigned level within the disclosure hierarchy. Valuation techniques used to value the Fund's investments by major category are as follows:
Semiannual Report
Notes to Financial Statements (Unaudited) - continued
2. Significant Accounting Policies - continued
Security Valuation - continued
Debt securities, including restricted securities, are valued based on evaluated prices received from independent pricing services or from dealers who make markets in such securities. For municipal securities, pricing services utilize matrix pricing which considers yield or price of bonds of comparable quality, coupon, maturity and type as well as dealer supplied prices and are generally categorized as Level 2 in the hierarchy. When independent prices are unavailable or unreliable, debt securities may be valued utilizing pricing matrices which consider similar factors that would be used by independent pricing services. These are generally categorized as Level 2 in the hierarchy but may be Level 3 depending on the circumstances.
Investment Transactions and Income. For financial reporting purposes, the Fund's investment holdings and NAV include trades executed through the end of the last business day of the period. The NAV per share for processing shareholder transactions is calculated as of the close of business of the New York Stock Exchange (NYSE), normally 4:00 p.m. Eastern time and includes trades executed through the end of the prior business day. Gains and losses on securities sold are determined on the basis of identified cost. Interest income is accrued as earned. Interest income includes coupon interest and amortization of premium and accretion of discount on debt securities.
Expenses. Expenses directly attributable to a fund are charged to that fund. Expenses attributable to more than one fund are allocated among the respective funds on the basis of relative net assets or other appropriate methods. Expense estimates are accrued in the period to which they relate and adjustments are made when actual amounts are known.
Income Tax Information and Distributions to Shareholders. Each year, the Fund intends to qualify as a regulated investment company under Subchapter M of the Internal Revenue Code, including distributing substantially all of its taxable income and realized gains. As a result, no provision for income taxes is required. The Fund files a U.S. federal tax return, in addition to state and local tax returns as required. A fund's federal income tax returns are subject to examination by the Internal Revenue Service (IRS) for a period of three fiscal years after they are filed. State and local tax returns may be subject to examination for an additional fiscal year depending on the jurisdiction.
Dividends are declared and recorded daily and paid monthly from net investment income. Distributions from realized gains, if any, are declared and recorded on the ex-dividend date. Income and capital gain distributions are determined in accordance with income tax regulations, which may differ from GAAP.
Capital accounts within the financial statements are adjusted for permanent book-tax differences. These adjustments have no impact on net assets or the results of operations. Temporary book-tax differences will reverse in a subsequent period.
Semiannual Report
2. Significant Accounting Policies - continued
Income Tax Information and Distributions to Shareholders - continued
Book-tax differences are primarily due to market discount, deferred trustees compensation, capital loss carryforwards and losses deferred due to excise tax regulations.
The Fund purchases municipal securities whose interest, in the opinion of the issuer, is free from federal income tax. There is no assurance that the IRS will agree with this opinion. In the event the IRS determines that the issuer does not comply with relevant tax requirements, interest payments from a security could become federally taxable, possibly retroactively to the date the security was issued.
The federal tax cost of investment securities and unrealized appreciation (depreciation) as of period end were as follows:
Gross unrealized appreciation | $ 13,460,010 |
Gross unrealized depreciation | (89,083) |
Net unrealized appreciation (depreciation) on securities and other investments | $ 13,370,927 |
| |
Tax cost | $ 185,128,242 |
Capital loss carryforwards are only available to offset future capital gains of the Fund to the extent provided by regulations and may be limited. Under the Regulated Investment Company Modernization Act of 2010 (the Act), the Fund is permitted to carry forward capital losses incurred in taxable years beginning after December 22, 2010 for an unlimited period and such capital losses are required to be used prior to any losses that expire. At August 31, 2011 capital loss carryforwards were as follows:
Fiscal year of expiration | |
| |
2017 | $ (315,116) |
Short-Term Trading (Redemption) Fees. Shares held by investors in the Fund less than 30 days are subject to a redemption fee equal to .50% of the net asset value of shares redeemed. All redemption fees, which reduce the proceeds of the shareholder redemption, are retained by the Fund and accounted for as an addition to paid in capital.
3. Purchases and Sales of Investments.
Purchases and sales of securities, other than short-term securities, aggregated $17,780,192 and $6,591,200, respectively.
The Fund realized a loss on the sale of an investment not meeting the investment restrictions of the Fund. The loss was fully reimbursed by the Fund's investment advisor.
Semiannual Report
Notes to Financial Statements (Unaudited) - continued
4. Fees and Other Transactions with Affiliates.
Management Fee. Fidelity Management & Research Company (FMR) and its affiliates provide the Fund with investment management related services for which the Fund pays a monthly management fee that is based on an annual rate of .55% of the Fund's average net assets. FMR pays all other expenses, except the compensation of the independent Trustees and certain exceptions such as interest expense, including commitment fees. The management fee paid to FMR by the Fund is reduced by an amount equal to the fees and expenses paid by the Fund to the independent Trustees.
5. Committed Line of Credit.
The Fund participates with other funds managed by FMR or an affiliate in a $4.0 billion credit facility (the "line of credit") to be utilized for temporary or emergency purposes to fund shareholder redemptions or for other short-term liquidity purposes. The Fund has agreed to pay commitment fees on its pro-rata portion of the line of credit, which amounted to $265 and is reflected in Miscellaneous expenses on the Statement of Operations. During the period, there were no borrowings on this line of credit.
6. Expense Reductions.
Through arrangements with the Fund's custodian and transfer agent, credits realized as a result of uninvested cash balances were used to reduce the Fund's management fee. During the period, these credits reduced the Fund's management fee by $1,319.
7. Other.
The Fund's organizational documents provide former and current trustees and officers with a limited indemnification against liabilities arising in connection with the performance of their duties to the Fund. In the normal course of business, the Fund may also enter into contracts that provide general indemnifications. The Fund's maximum exposure under these arrangements is unknown as this would be dependent on future claims that may be made against the Fund. The risk of material loss from such claims is considered remote.
Semiannual Report
Board Approval of Investment Advisory Contracts and Management Fees
Fidelity Maryland Municipal Income Fund
Each year, the Board of Trustees, including the Independent Trustees (together, the Board), votes on the renewal of the management contract and sub-advisory agreements (together, the Advisory Contracts) for the fund. The Board, assisted by the advice of fund counsel and Independent Trustees' counsel, requests and considers a broad range of information relevant to the renewal of the Advisory Contracts throughout the year.
The Board meets regularly and considers at each of its meetings factors that are relevant to its annual consideration of the renewal of the fund's Advisory Contracts, including the services and support provided to the fund and its shareholders. The Board has established three standing committees, Operations, Audit, and Nominating and Governance, each composed of Independent Trustees with varying backgrounds, to which the Board has assigned specific subject matter responsibilities in order to enhance effective decision-making by the Board. The Operations Committee, of which all of the Independent Trustees are members, meets regularly throughout the year and, among other matters, considers matters specifically related to the annual consideration of the renewal of the fund's Advisory Contracts. The Board, acting directly and through its Committees, requests and receives information concerning the annual consideration of the renewal of the fund's Advisory Contracts. The Board also meets as needed to consider matters specifically related to the Board's annual consideration of the renewal of Advisory Contracts. Members of the Board may also meet with trustees of other Fidelity funds through ad hoc joint committees to discuss certain matters relevant to the Fidelity funds.
At its September 2011 meeting, the Board of Trustees, including the Independent Trustees, unanimously determined to renew the fund's Advisory Contracts. In reaching its determination, the Board considered all factors it believed relevant, including (i) the nature, extent, and quality of the services to be provided to the fund and its shareholders (including the investment performance of the fund); (ii) the competitiveness of the fund's management fee and total expense ratio; (iii) the total costs of the services to be provided by and the profits to be realized by Fidelity from its relationship with the fund; (iv) the extent to which economies of scale would be realized as the fund grows; and (v) whether fee levels reflect these economies of scale, if any, for the benefit of fund shareholders.
In considering whether to renew the Advisory Contracts for the fund, the Board reached a determination, with the assistance of fund counsel and Independent Trustees' counsel and through the exercise of its business judgment, that the renewal of the Advisory Contracts is in the best interests of the fund and its shareholders and that the compensation payable under the Advisory Contracts is fair and reasonable. The Board's decision to renew the Advisory Contracts was not based on any single factor, but rather was based on a comprehensive consideration of all the information provided to the Board at its meetings throughout the year. The Board, in reaching its determination to renew the Advisory Contracts, is aware that shareholders in the fund have a broad range of investment choices available to them, including a wide choice among mutual funds offered by Fidelity's competitors, and that the fund's shareholders, who have the opportunity to review and weigh the disclosure provided by the fund in its prospectus and other public disclosures, have chosen to invest in this fund, managed by Fidelity.
Semiannual Report
Nature, Extent, and Quality of Services Provided. The Board considered the staffing within the investment adviser, FMR, and the sub-advisers (together, the Investment Advisers), including the backgrounds of the fund's investment personnel and the fund's investment objective and discipline. The Independent Trustees also had discussions with senior management of Fidelity's investment operations and investment groups. The Board considered the structure of the portfolio manager compensation program and whether this structure provides appropriate incentives to act in the best interests of the fund.
Resources Dedicated to Investment Management and Support Services. The Board reviewed the general qualifications and capabilities of the Investment Advisers' investment staff, including its size, education, experience, and resources, as well as the Investment Advisers' approach to recruiting, managing, and compensating investment personnel. The Board also noted that FMR has devoted increased resources to non-U.S. offices. The Board noted that Fidelity's analysts have extensive resources, tools and capabilities which allow them to conduct sophisticated quantitative and fundamental analysis, as well as credit analysis of issuers, counterparties and enhancers. The Board also believes that Fidelity's investment professionals have sufficient access to global information and data so as to provide competitive investment results over time, and that those professionals also have access to sophisticated tools which permit them to assess portfolio construction and risk and performance attribution characteristics continuously, as well as to transmit new information and research conclusions rapidly around the world. Additionally, in its deliberations, the Board considered the Investment Advisers' trading capabilities and resources which are an integral part of the investment management process.
Shareholder and Administrative Services. The Board considered (i) the nature, extent, quality, and cost of advisory, administrative, and shareholder services performed by the Investment Advisers and their affiliates under the Advisory Contracts and under separate agreements covering transfer agency and pricing and bookkeeping services for the fund; (ii) the nature and extent of the investment adviser's supervision of third party service providers, principally custodians and subcustodians; and (iii) the resources devoted to, and the record of compliance with, the fund's compliance policies and procedures.
The Board noted that the growth of fund assets over time across the complex allows Fidelity to reinvest in the development of services designed to enhance the value or convenience of the Fidelity funds as investment vehicles. These services include 24-hour access to account information and market information through telephone representatives and over the Internet, investor education materials and asset allocation tools, and the expanded availability of Fidelity Investor Centers, with 35 new branches opening since 2010.
Semiannual Report
Board Approval of Investment Advisory Contracts and
Management Fees - continued
Investment in a Large Fund Family. The Board considered the benefits to shareholders of investing in a Fidelity fund, including the benefits of investing in a fund that is part of a large family of funds offering a variety of investment disciplines and providing a large variety of mutual fund investor services. The Board noted that Fidelity had taken, or had made recommendations that resulted in the Fidelity funds taking, a number of actions over the previous year that benefited particular funds, including (i) continuing to dedicate additional resources to investment research and support of the senior management team that oversees asset management; (ii) rationalizing product lines through the mergers of six funds into other funds; (iii) continuing to migrate the Freedom Funds to dedicated lower cost underlying funds; (iv) obtaining shareholder approval to broaden the investment strategies for Fidelity Consumer Finance Portfolio, Fidelity Emerging Asia Fund, and Fidelity Environment and Alternative Energy Portfolio; (v) contractually agreeing to reduce the management fees and impose other expense limitations on Spartan 500 Index Fund and U.S. Bond Index Fund in connection with launching new institutional classes of these funds; (vi) changing the name, primary and supplemental benchmarks, and investment policies of Fidelity Global Strategies Fund to support the fund's flexible investment mandate and global orientation; and (vii) reducing the transfer agency account fee rates on certain accounts.
Investment Performance. The Board considered whether the fund has operated in accordance with its investment objective, as well as its record of compliance with its investment restrictions. It also reviewed the fund's absolute investment performance, as well as the fund's relative investment performance measured over multiple periods against (i) a broad-based securities market index, and (ii) a peer group of mutual funds deemed appropriate by Fidelity and reviewed by the Board. The following charts considered by the Board show, over the one-, three-, and five-year periods ended December 31, 2010, the fund's cumulative total returns, the cumulative total returns of a broad-based securities market index ("benchmark"), and a range of cumulative total returns of a peer group of mutual funds identified by Lipper Inc. as having an investment objective similar to that of the fund. The box within each chart shows the 25th percentile return (bottom of box) and the 75th percentile return (top of box) of the peer group. Returns shown above the box are in the first quartile and returns shown below the box are in the fourth quartile. The percentage beaten number noted below each chart corresponds to the percentile box and represents the percentage of funds in the peer group whose performance was equal to or lower than that of the fund.
Semiannual Report
Fidelity Maryland Municipal Income Fund
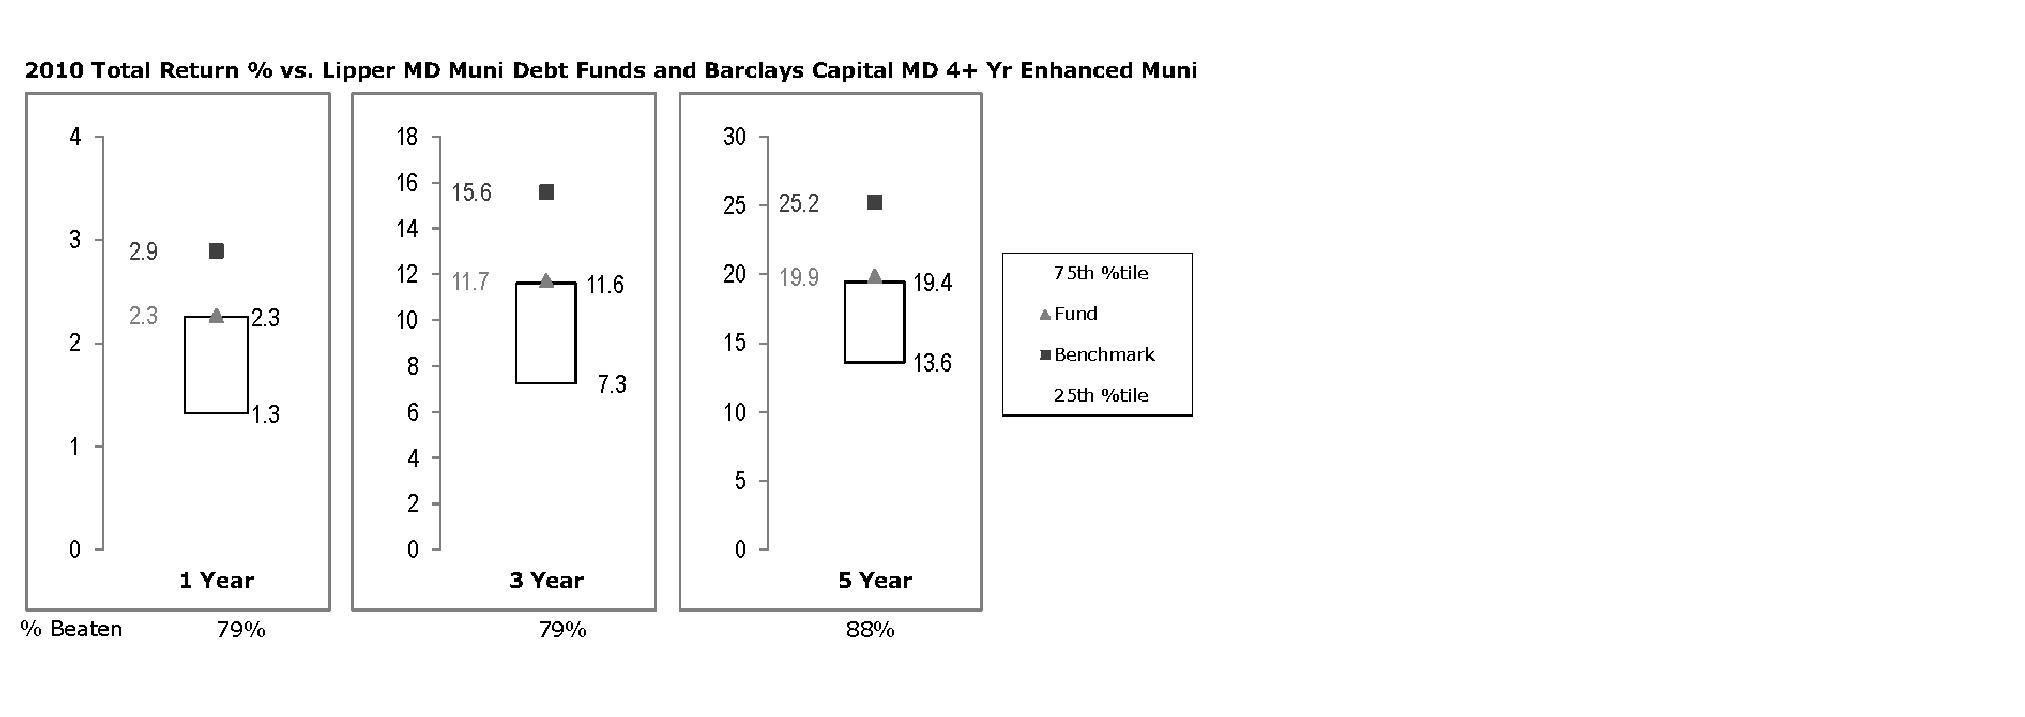
The Board reviewed the fund's relative investment performance against its peer group and noted that the performance of the fund was in the first quartile for all the periods shown. The Board also noted that the investment performance of the fund was lower than its benchmark for all the periods shown. The Board discussed with FMR actions to improve the fund's below-benchmark performance. The Board also reviewed the fund's performance since inception as well as performance in the current year.
Based on its review, the Board concluded that the nature, extent, and quality of services provided to the fund under the Advisory Contracts should benefit the fund's shareholders.
Competitiveness of Management Fee and Total Expense Ratio. The Board considered the fund's management fee and total expense ratio compared to "mapped groups" of competitive funds and classes. Fidelity creates "mapped groups" by combining similar Lipper investment objective categories that have comparable management fee characteristics. Combining Lipper investment objective categories aids the Board's management fee and total expense ratio comparisons by broadening the competitive group used for comparison and by reducing the number of universes to which various Fidelity funds are compared.
Management Fee. The Board considered two proprietary management fee comparisons for the 12-month periods shown in the chart below. The group of Lipper funds used by the Board for management fee comparisons is referred to below as the "Total Mapped Group" and, for the reasons explained above, is broader than the Lipper peer group used by the Board for performance comparisons. The Total Mapped Group comparison focuses on a fund's standing relative to the total universe of comparable funds available to investors in terms of gross management fees before expense reimbursements or caps. "TMG %" represents the percentage of funds in the Total Mapped Group that had management fees that were lower than the fund's. For example, a TMG % of 11% means that 89% of the funds in the Total Mapped Group had higher management fees than the fund. The "Asset-Size Peer Group" (ASPG) comparison focuses on a fund's standing relative to non-Fidelity funds similar in size to the fund within the Total Mapped Group. The ASPG represents at least 15% of the funds in the Total Mapped Group with comparable asset size and management fee characteristics, subject to a minimum of 50 funds (or all funds in the Total Mapped Group if fewer than 50). Additional information, such as the ASPG quartile in which the fund's management fee ranked, is also included in the chart and considered by the Board. Because the vast majority of competitor funds' management fees do not cover non-management expenses, for a more meaningful comparison of management fees, the fund is compared on the basis of a hypothetical "net management fee," which is derived by subtracting payments made by FMR for non-management expenses (including transfer agent fees, pricing and bookkeeping fees, and fees paid to non-affiliated custodians) from the fund's all-inclusive fee. In this regard, the Board realized that net management fees can vary from year to year because of differences in non-management expenses.
Semiannual Report
Board Approval of Investment Advisory Contracts and
Management Fees - continued
Fidelity Maryland Municipal Income Fund
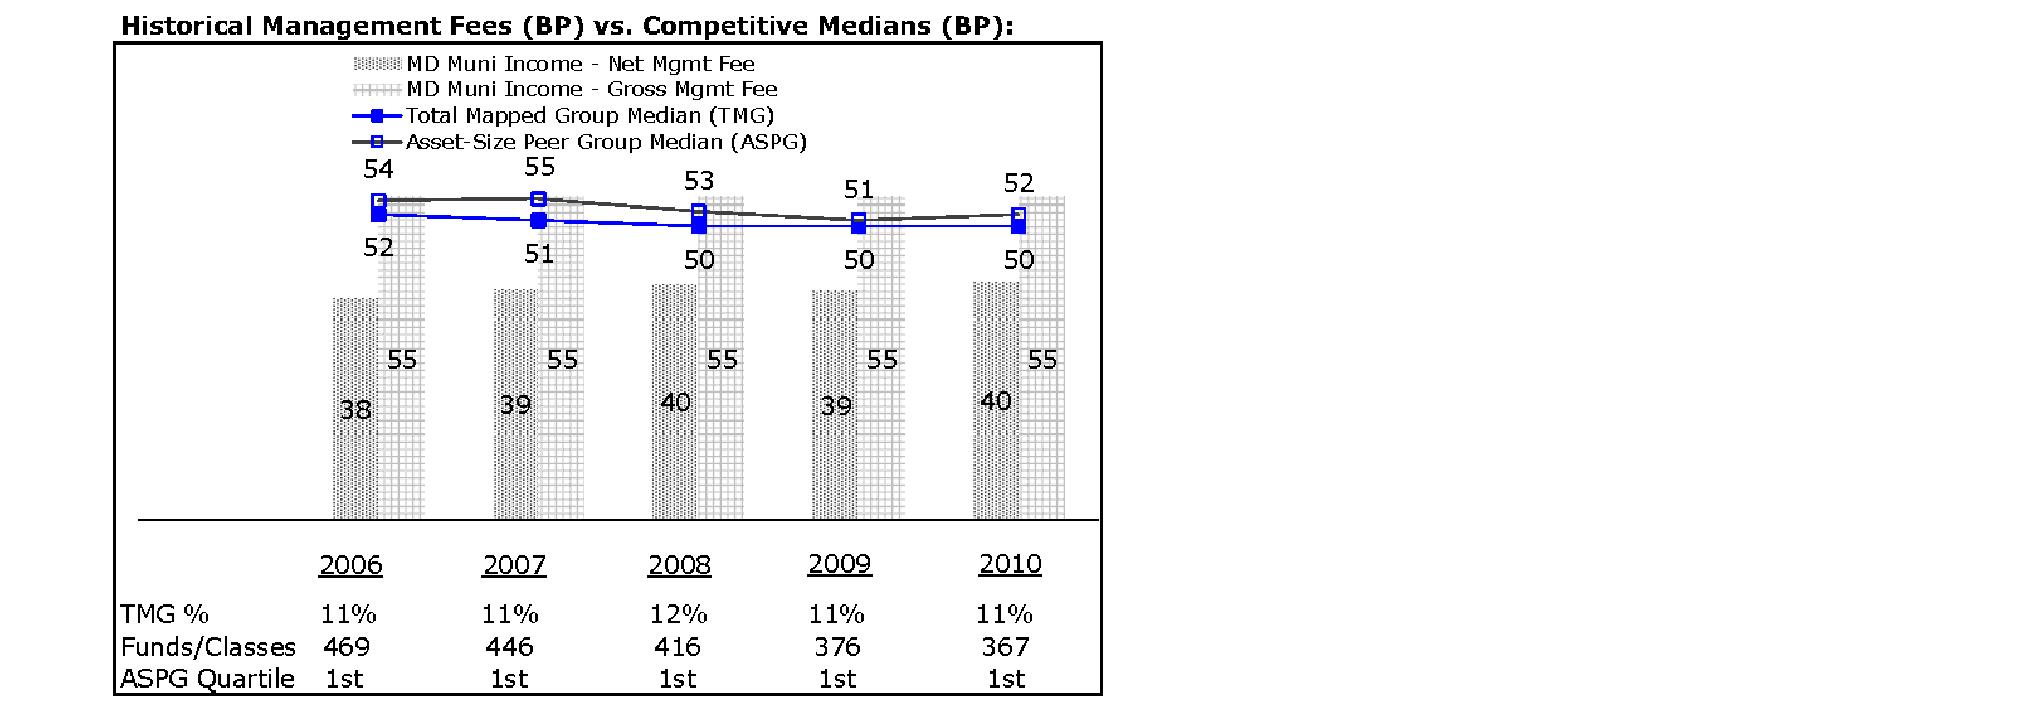
The Board noted that the fund's hypothetical net management fee ranked below the median of its Total Mapped Group and below the median of its ASPG for 2010.
Semiannual Report
Based on its review, the Board concluded that the fund's management fee is fair and reasonable in light of the services that the fund receives and the other factors considered.
Total Expense Ratio. In its review of the fund's total expense ratio, the Board considered the fund's hypothetical net management fee as well as the fund's all-inclusive fee. The Board also considered other expenses, such as transfer agent fees, pricing and bookkeeping fees, and custodial, legal, and audit fees, paid by FMR under the all-inclusive arrangement. The Board also noted the effects of any waivers and reimbursements on fees and expenses. As part of its review, the Board also considered the current and historical total expense ratios of the fund compared to competitive fund median expenses. The fund is compared to those funds and classes in the Total Mapped Group (used by the Board for management fee comparisons) that have a similar sales load structure.
The Board noted that the fund's total expense ratio ranked equal to its competitive median for 2010.
Fees Charged to Other Fidelity Clients. The Board also considered Fidelity fee structures and other information with respect to clients of FMR and its affiliates, such as other mutual funds advised or subadvised by FMR or its affiliates, pension plan clients, and other institutional clients. In March 2010, the Board created an ad hoc joint committee with the board of other Fidelity funds (the Committee) to review and compare Fidelity's institutional investment advisory business with its business of providing services to the Fidelity funds, including the differences in services provided, fees charged, and costs incurred, as well as competition in their respective marketplaces.
Based on its review of total expense ratios and fees charged to other Fidelity clients, the Board concluded that the fund's total expense ratio was reasonable in light of the services that the fund and its shareholders receive and the other factors considered, including the findings of the Committee.
Costs of the Services and Profitability. The Board considered the revenues earned and the expenses incurred by Fidelity in conducting the business of developing, marketing, distributing, managing, administering and servicing the fund and its shareholders. The Board also considered the level of Fidelity's profits in respect of all the Fidelity funds.
On an annual basis, FMR presents to the Board Fidelity's profitability for the fund. Fidelity calculates the profitability for each fund, as well as aggregate profitability for groups of Fidelity funds and all Fidelity funds, using a series of detailed revenue and cost allocation methodologies which originate with the books and records of Fidelity on which Fidelity's audited financial statements are based. The Audit Committee of the Board reviews any significant changes from the prior year's methodologies.
Semiannual Report
Board Approval of Investment Advisory Contracts and
Management Fees - continued
PricewaterhouseCoopers LLP (PwC), independent registered public accounting firm and auditor to Fidelity and certain Fidelity funds, has been engaged annually by the Board as part of the Board's assessment of Fidelity's profitability analysis. PwC's engagement includes the review and assessment of Fidelity's methodologies used in determining the revenues and expenses attributable to Fidelity's mutual fund business, and completion of agreed-upon procedures surrounding the mathematical accuracy of fund profitability and its conformity to allocation methodologies. After considering PwC's reports issued under the engagement and information provided by Fidelity, the Board concluded that while other allocation methods may also be reasonable, Fidelity's profitability methodologies are reasonable in all material respects.
The Board also reviewed Fidelity's non-fund businesses and fall-out benefits related to the mutual fund business as well as cases where Fidelity's affiliates may benefit from or be related to the fund's business.
The Board considered the costs of the services provided by and the profits realized by Fidelity in connection with the operation of the fund and was satisfied that the profitability was not excessive in the circumstances.
Economies of Scale. The Board considered whether there have been economies of scale in respect of the management of the Fidelity funds, whether the Fidelity funds (including the fund) have appropriately benefited from any such economies of scale, and whether there is potential for realization of any further economies of scale. The Board considered the extent to which the fund will benefit from economies of scale through increased services to the fund, through waivers or reimbursements, or through fee or expense reductions. The Board also noted that in 2009, it and the board of other Fidelity funds created an ad hoc committee (the Economies of Scale Committee) to analyze whether FMR attains economies of scale in respect of the management and servicing of the Fidelity funds, whether the Fidelity funds have appropriately benefited from such economies of scale, and whether there is potential for realization of any further economies of scale.
The Board concluded, taking into account the analysis of the Economies of Scale Committee, that any potential economies of scale are being appropriately shared between fund shareholders and Fidelity.
Additional Information Requested by the Board. In order to develop fully the factual basis for consideration of the Fidelity funds' Advisory Contracts, the Board requested and received additional information on certain topics, including: (i) Fidelity's fund profitability methodology, profitability trends for certain funds, and the impact of certain factors on fund profitability results; (ii) portfolio manager changes that have occurred during the past year and the amount of the investment that each portfolio manager has made in the Fidelity fund(s) that he or she manages; (iii) Fidelity's compensation structure for portfolio managers, research analysts, and other key personnel, including its effects on fund profitability, the rationale for the compensation structure, and the extent to which current market conditions have affected retention and recruitment; (iv) the compensation paid to fund sub-advisers on behalf of the Fidelity funds; (v) Fidelity's fee structures and rationale for recommending different fees among different categories of funds and classes, as well as Fidelity's voluntary waiver of its fees to maintain minimum yields for certain money market funds and classes; (vi) the reasons why certain expenses affect various funds and classes differently; (vii) Fidelity's transfer agent fees, expenses, and services and how the benefits of decreased costs and new efficiencies can be shared across all of the Fidelity funds; (viii) the reasons for and consequences of changes to certain product lines compared to competitors; (ix) the allocation of and historical trends in Fidelity's realization of fall-out benefits; and (x) explanations regarding the relative total expense ratios of certain funds and classes, total expense competitive trends, and actions that might be taken by FMR to reduce total expense ratios for certain funds and classes or to achieve further economies of scale.
Semiannual Report
Based on its evaluation of all of the conclusions noted above, and after considering all factors it believed relevant, the Board ultimately concluded that the advisory fee structures are fair and reasonable, and that the fund's Advisory Contracts should be renewed.
Semiannual Report
Investment Adviser
Fidelity Management & Research Company
Boston, MA
Investment Sub-Advisers
Fidelity Investments
Money Management, Inc.
Fidelity Management & Research (U.K.) Inc.
Fidelity Management & Research
(Hong Kong) Limited
Fidelity Management & Research
(Japan) Inc.
General Distributor
Fidelity Distributors Corporation
Boston, MA
Transfer and Service Agents
Citibank, N.A.
New York, NY
Fidelity Service Company, Inc.
Boston, MA
Custodian
Citibank, N.A.
New York, NY
The Fidelity Telephone Connection
Mutual Fund 24-Hour Service
Exchanges/Redemptions
and Account Assistance 1-800-544-6666
Product Information 1-800-544-6666
Retirement Accounts 1-800-544-4774 (8 a.m. - 9 p.m.)
TDD Service 1-800-544-0118
for the deaf and hearing impaired
(9 a.m. - 9 p.m. Eastern time)
Fidelity Automated Service
Telephone (FAST®)
1-800-544-5555
Automated line for quickest service
SMD-USAN-0412
1.790944.108
(Fidelity Investment logo)(registered trademark)
Corporate Headquarters
82 Devonshire St., Boston, MA 02109
www.fidelity.com
Item 2. Code of Ethics
Not applicable.
Item 3. Audit Committee Financial Expert
Not applicable.
Item 4. Principal Accountant Fees and Services
Not applicable.
Item 5. Audit Committee of Listed Registrants
Not applicable.
Item 6. Investments
(a) Not applicable.
(b) Not applicable
Item 7. Disclosure of Proxy Voting Policies and Procedures for Closed-End Management Investment Companies
Not applicable.
Item 8. Portfolio Managers of Closed-End Management Investment Companies
Not applicable.
Item 9. Purchase of Equity Securities by Closed-End Management Investment Company and Affiliated Purchasers
Not applicable.
Item 10. Submission of Matters to a Vote of Security Holders
There were no material changes to the procedures by which shareholders may recommend nominees to the Fidelity Union Street Trust's Board of Trustees.
Item 11. Controls and Procedures
(a)(i) The President and Treasurer and the Chief Financial Officer have concluded that the Fidelity Union Street Trust's (the "Trust") disclosure controls and procedures (as defined in Rule 30a-3(c) under the Investment Company Act) provide reasonable assurances that material information relating to the Trust is made known to them by the appropriate persons, based on their evaluation of these controls and procedures as of a date within 90 days of the filing date of this report.
(a)(ii) There was no change in the Trust's internal control over financial reporting (as defined in Rule 30a-3(d) under the Investment Company Act) that occurred during the second fiscal quarter of the period covered by this report that has materially affected, or is reasonably likely to materially affect, the Trust's internal control over financial reporting.
Item 12. Exhibits
(a) | (1) | Not applicable. |
(a) | (2) | Certification pursuant to Rule 30a-2(a) under the Investment Company Act of 1940 (17 CFR 270.30a-2(a)) is filed and attached hereto as Exhibit 99.CERT. |
(a) | (3) | Not applicable. |
(b) | | Certification pursuant to Rule 30a-2(b) under the Investment Company Act of 1940 (17 CFR 270.30a-2(b)) is furnished and attached hereto as Exhibit 99.906CERT. |
SIGNATURES
Pursuant to the requirements of the Securities Exchange Act of 1934 and the Investment Company Act of 1940, the registrant has duly caused this report to be signed on its behalf by the undersigned, thereunto duly authorized.
Fidelity Union Street Trust
By: | /s/John R. Hebble |
| John R. Hebble |
| President and Treasurer |
| |
Date: | April 20, 2012 |
Pursuant to the requirements of the Securities Exchange Act of 1934 and the Investment Company Act of 1940, this report has been signed below by the following persons on behalf of the registrant and in the capacities and on the dates indicated.
By: | /s/John R. Hebble |
| John R. Hebble |
| President and Treasurer |
| |
Date: | April 20, 2012 |
By: | /s/Christine Reynolds |
| Christine Reynolds |
| Chief Financial Officer |
| |
Date: | April 20, 2012 |